Verdict: Asus TUF Gaming A16 now with a better display and faster GPU
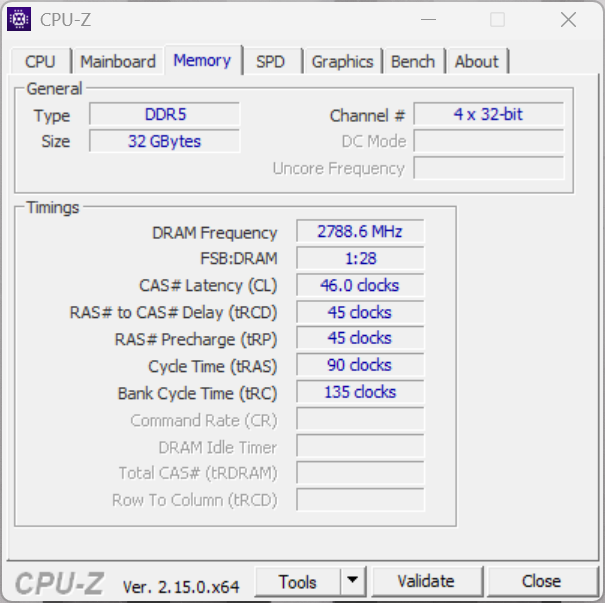
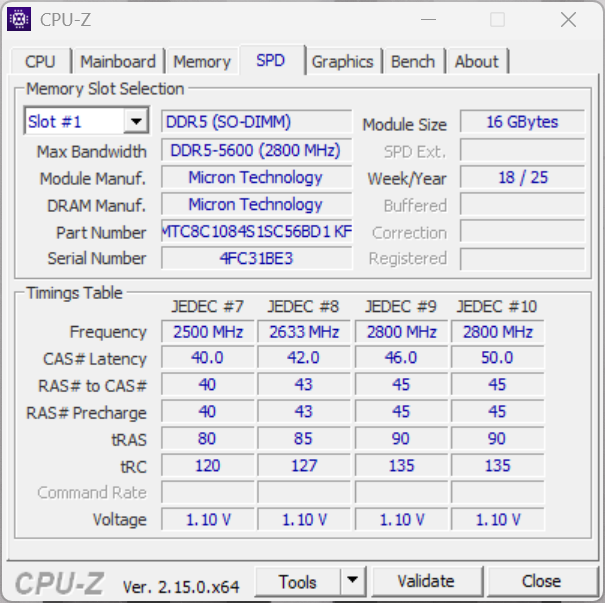
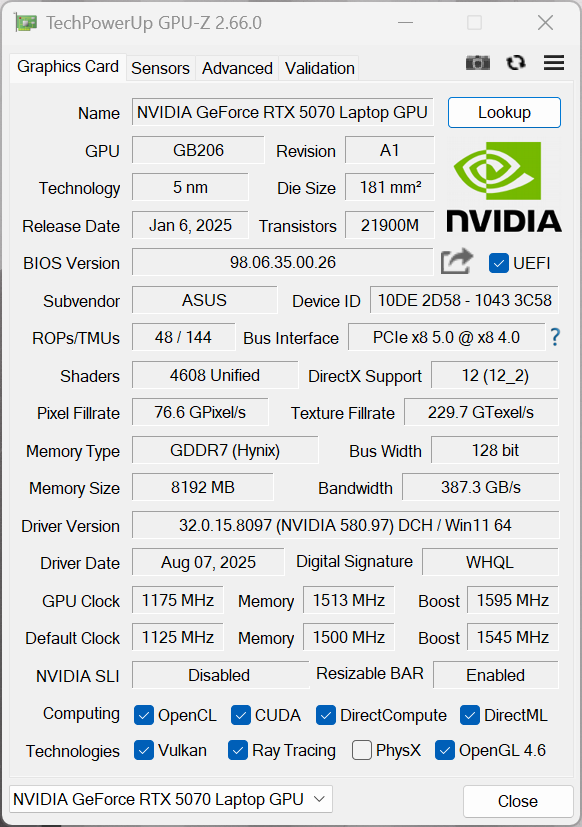
Asus has brought several improvements to its 16-inch TUF Gaming A16 gaming laptop, particularly the display, and the RAM can also be easily upgraded now. The new Nvidia Blackwell generation is used for the GPU, and the GeForce RTX 5070 Laptop can play most current titles even in QHD resolution, although there may be limitations due to the lower 8 GB VRAM.
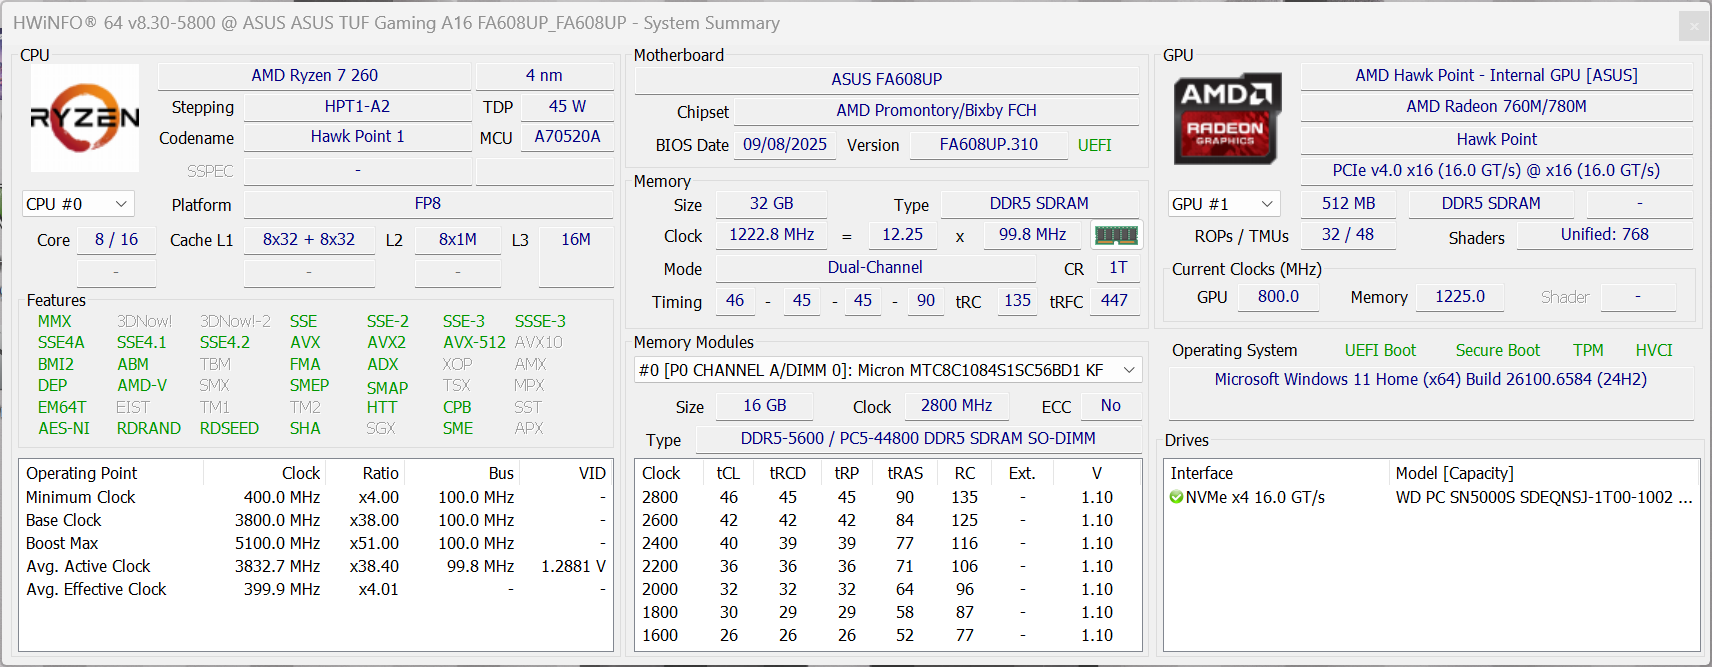
However, the choice of processor does not make immediate sense to us. The AMD Ryzen 7 260 is based on the Zen 4 architecture that is not exactly new, and this also has a negative effect on performance in some games. At this point, the TUF Gaming A16 seems somewhat unbalanced.
This picture also continues with the features. As mentioned, there are good maintenance options and other useful features such as G-Sync and Advanced Optimus graphics switching, but you have to do without USB 4 or Wi-Fi 7. That being said, input devices are comfortable and battery life is once again very good.
All in all, the new TUF Gaming A16 is a good gaming laptop, but the price is also quite high at €2,200. We currently have the competitor XMG Core 16 in the comparison, which is around €300 cheaper with a more up-to-date Zen 5 processor and RTX 5070 Laptop along with a comparable memory specification.
Pros
Cons
Price and Availability
The reviewed configuration of the Asus TUF Gaming A16 can be ordered directly from the Asus Store for €2,199.
The Asus TUF Gaming A16 with a Ryzen 9 290, RTX 5070 Laptop, and FHD+ 165 Hz display can be had for $1,779 on Amazon US.
Table of Contents
- Verdict: Asus TUF Gaming A16 now with a better display and faster GPU
- Specifications
- Chassis and equipment: Good build quality with enough maintenance options
- Input devices: Comfortable keyboard
- Display: 165 Hz QHD with G-Sync and no PWM
- Performance: Hawk Point Zen 4 meets Blackwell
- Emissions and Energy: Low surface temps and good battery life
- Notebookcheck's overall impressions of the Asus TUF Gaming A16
- Potential competitors in comparison
With the TUF Gaming A16, Asus has a 16-inch gaming notebook on offer that features the new GeForce RTX 5070 Laptop used in conjunction with a fast 165 Hz display.
To reduce costs, however, Asus uses an older Zen 4 processor from AMD. Our test device has an RRP of €2,199 that gets you a Ryzen 7 260 APU, 32 GB RAM, 1 TB SSD, RTX 5070 Laptop GPU, and a 165 Hz WQHD panel.
Was this the right choice, or would it have been better to forego some features in favor of a current processor?
Specifications
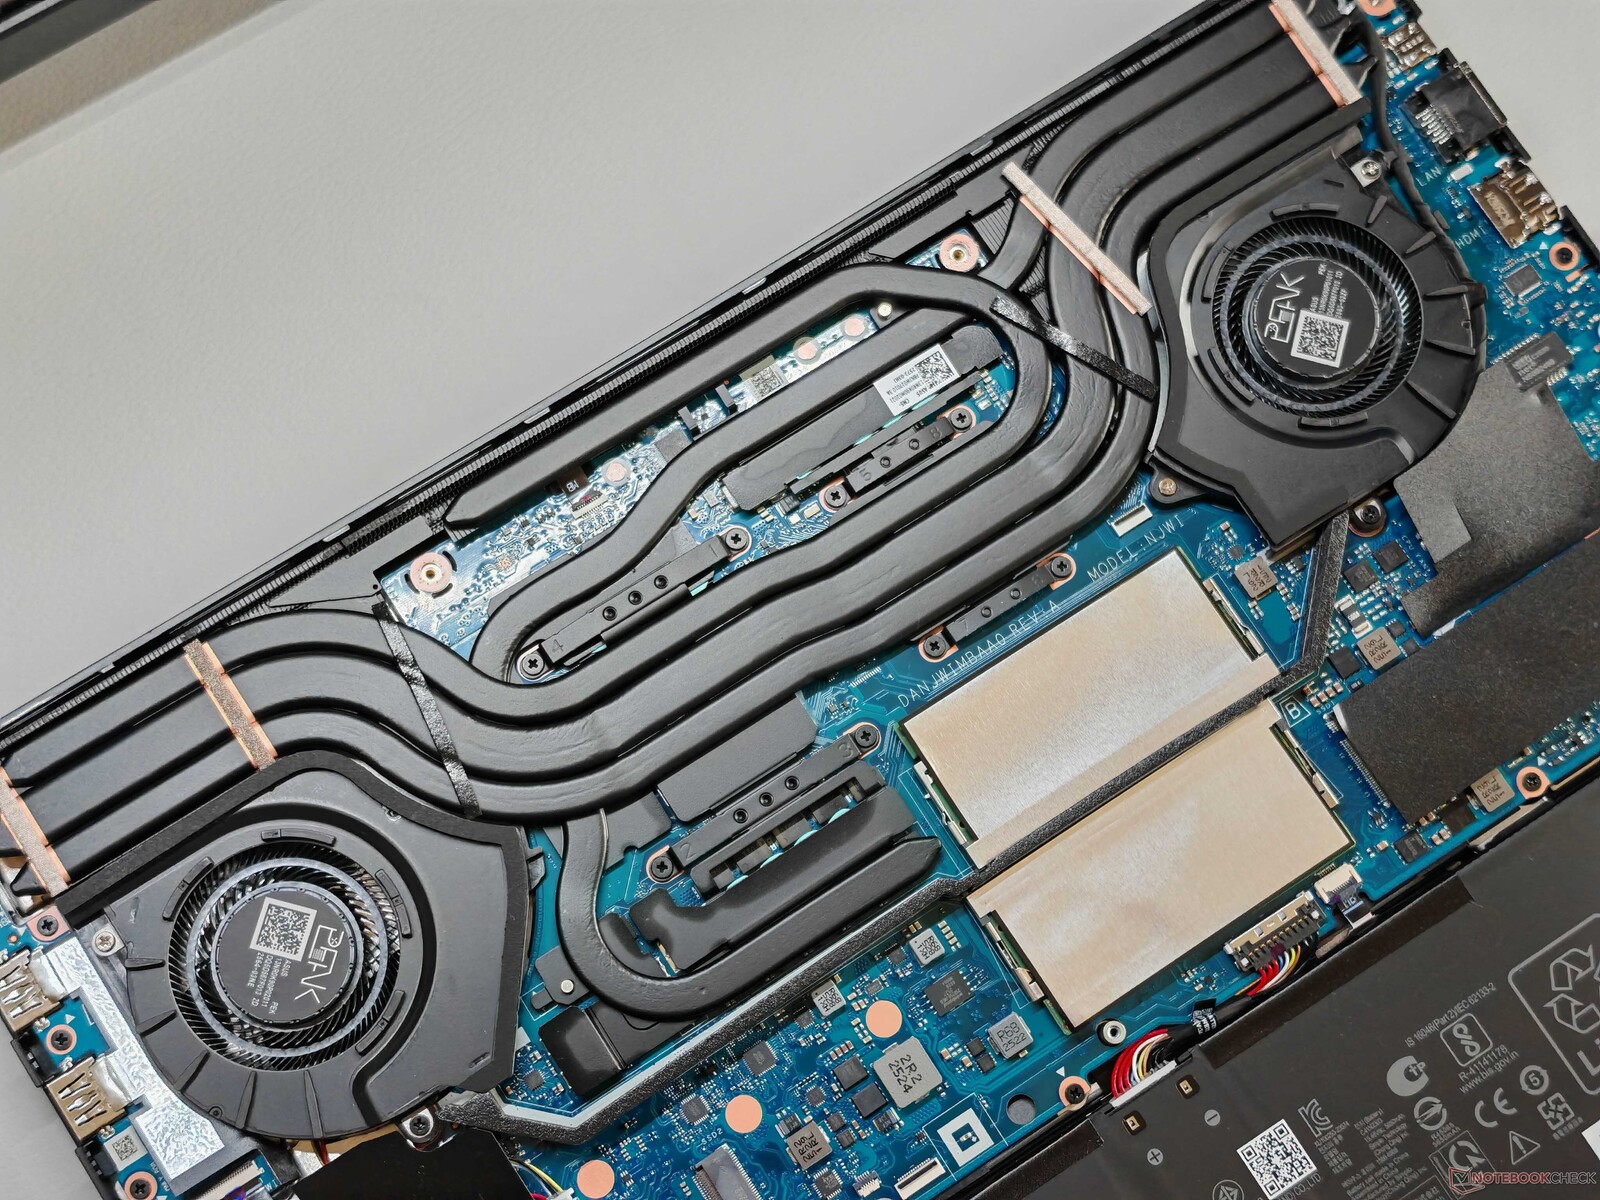
Chassis and equipment: Good build quality with enough maintenance options
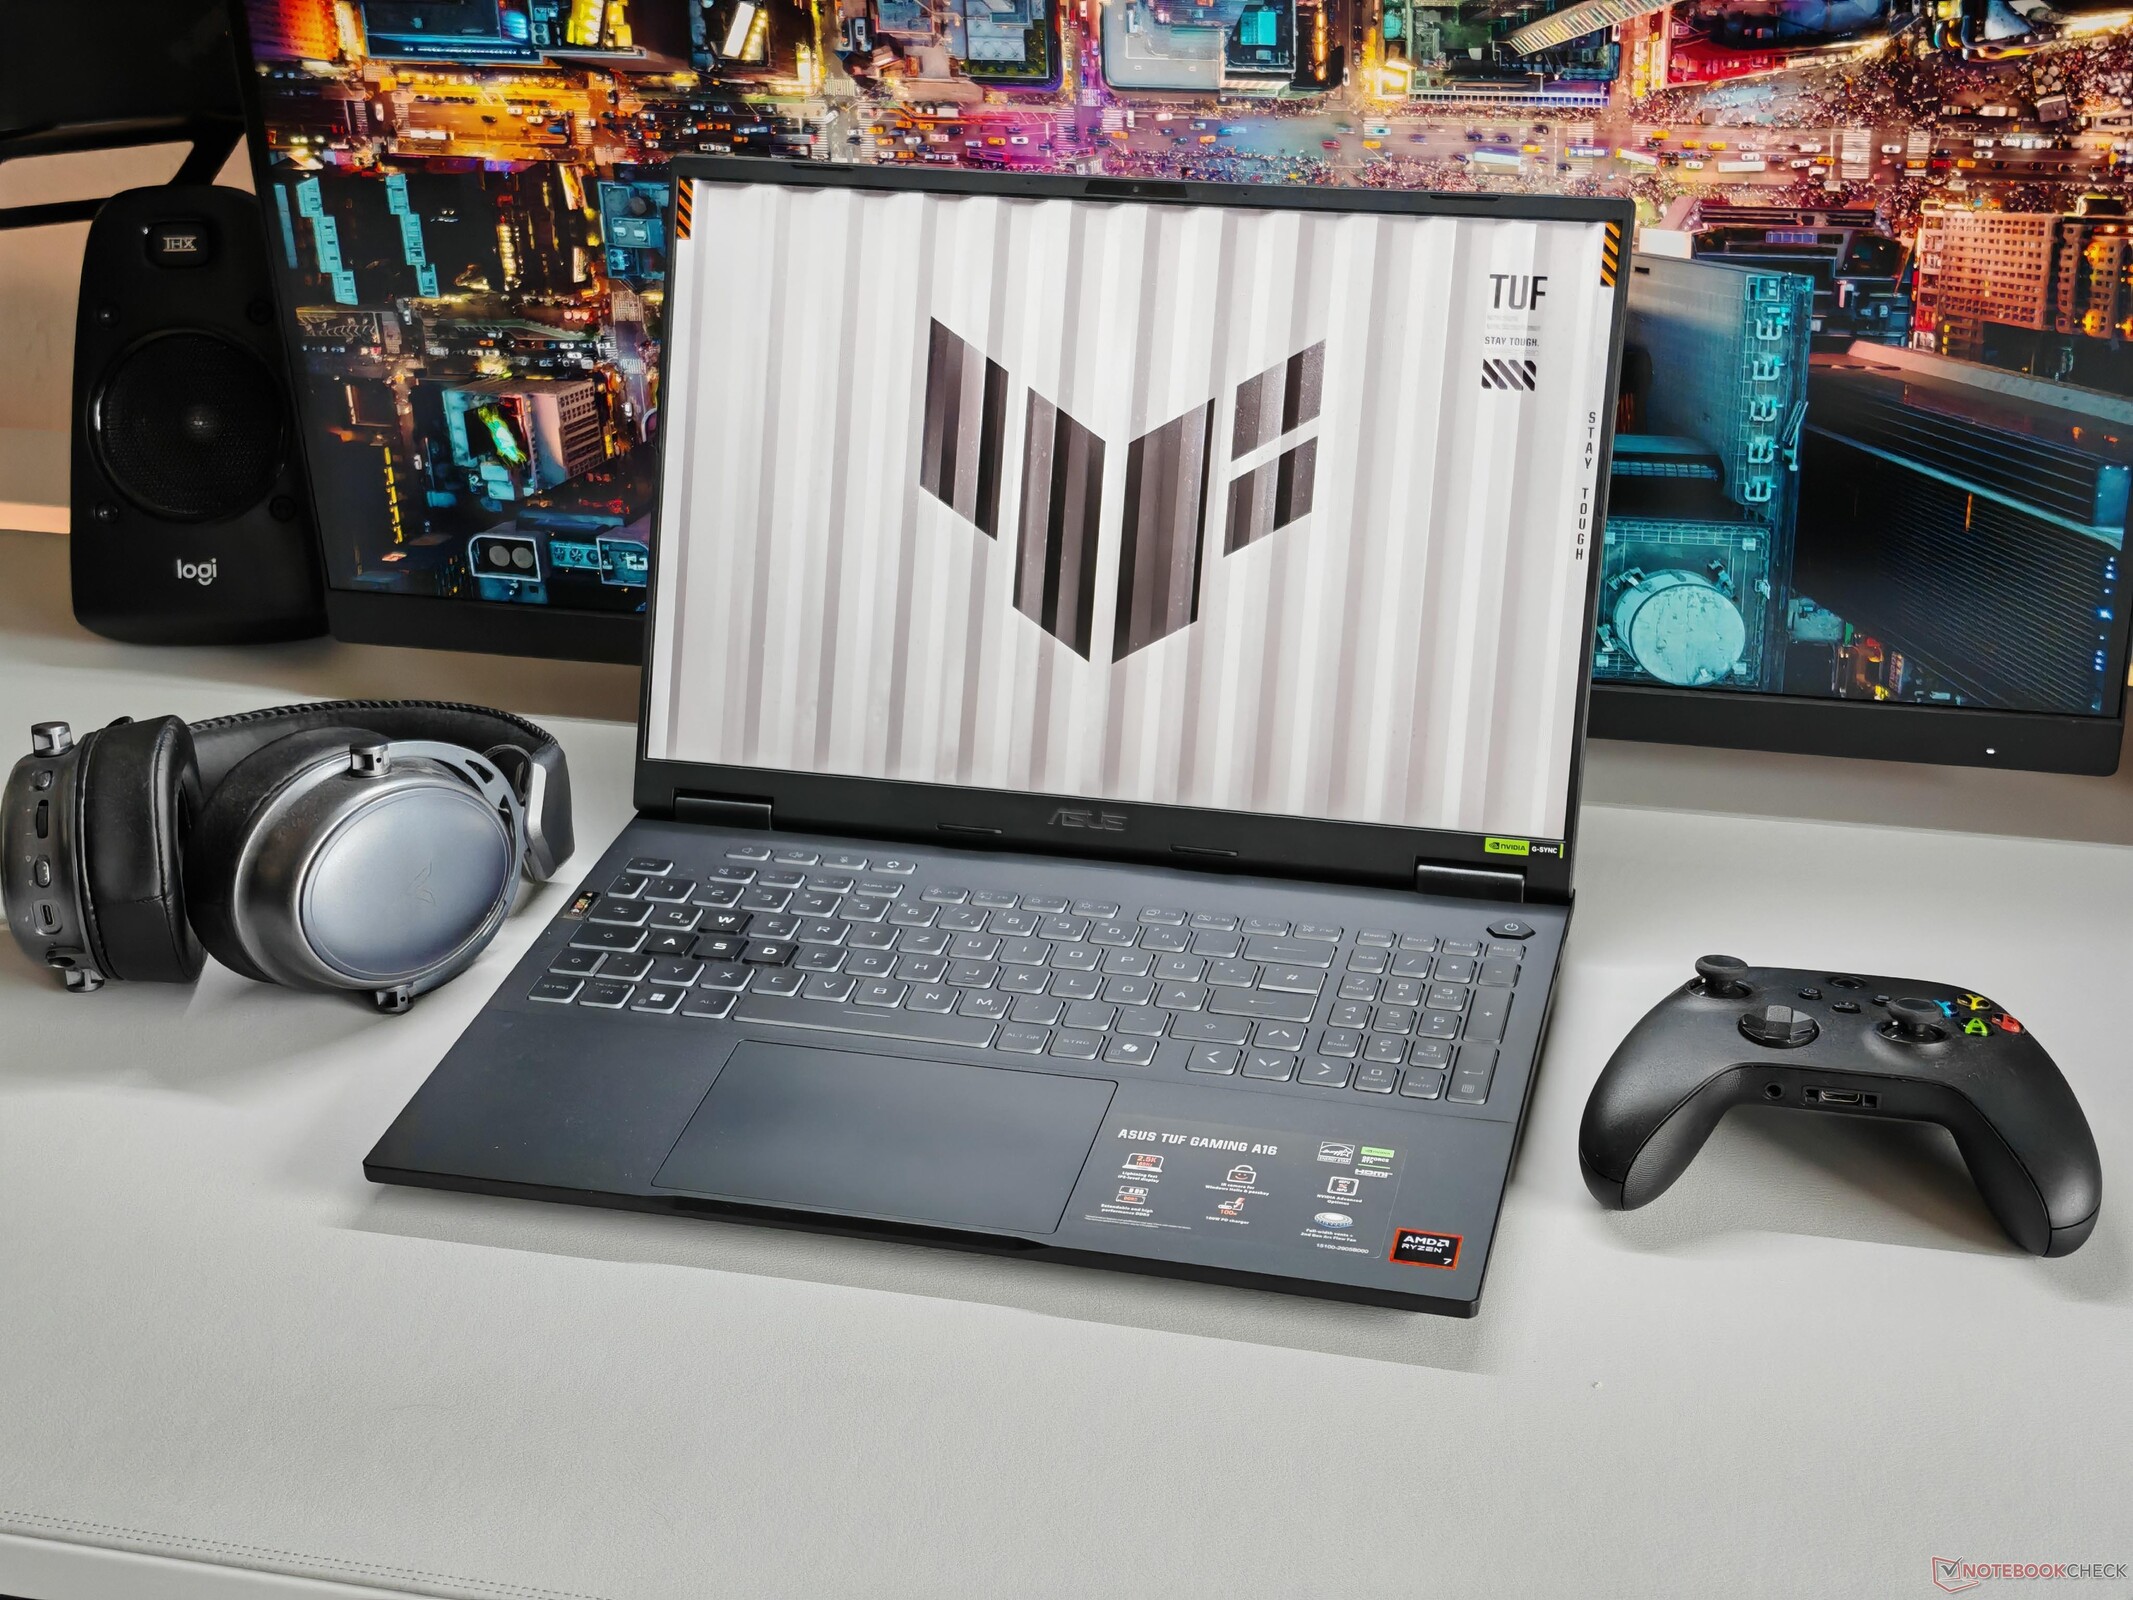
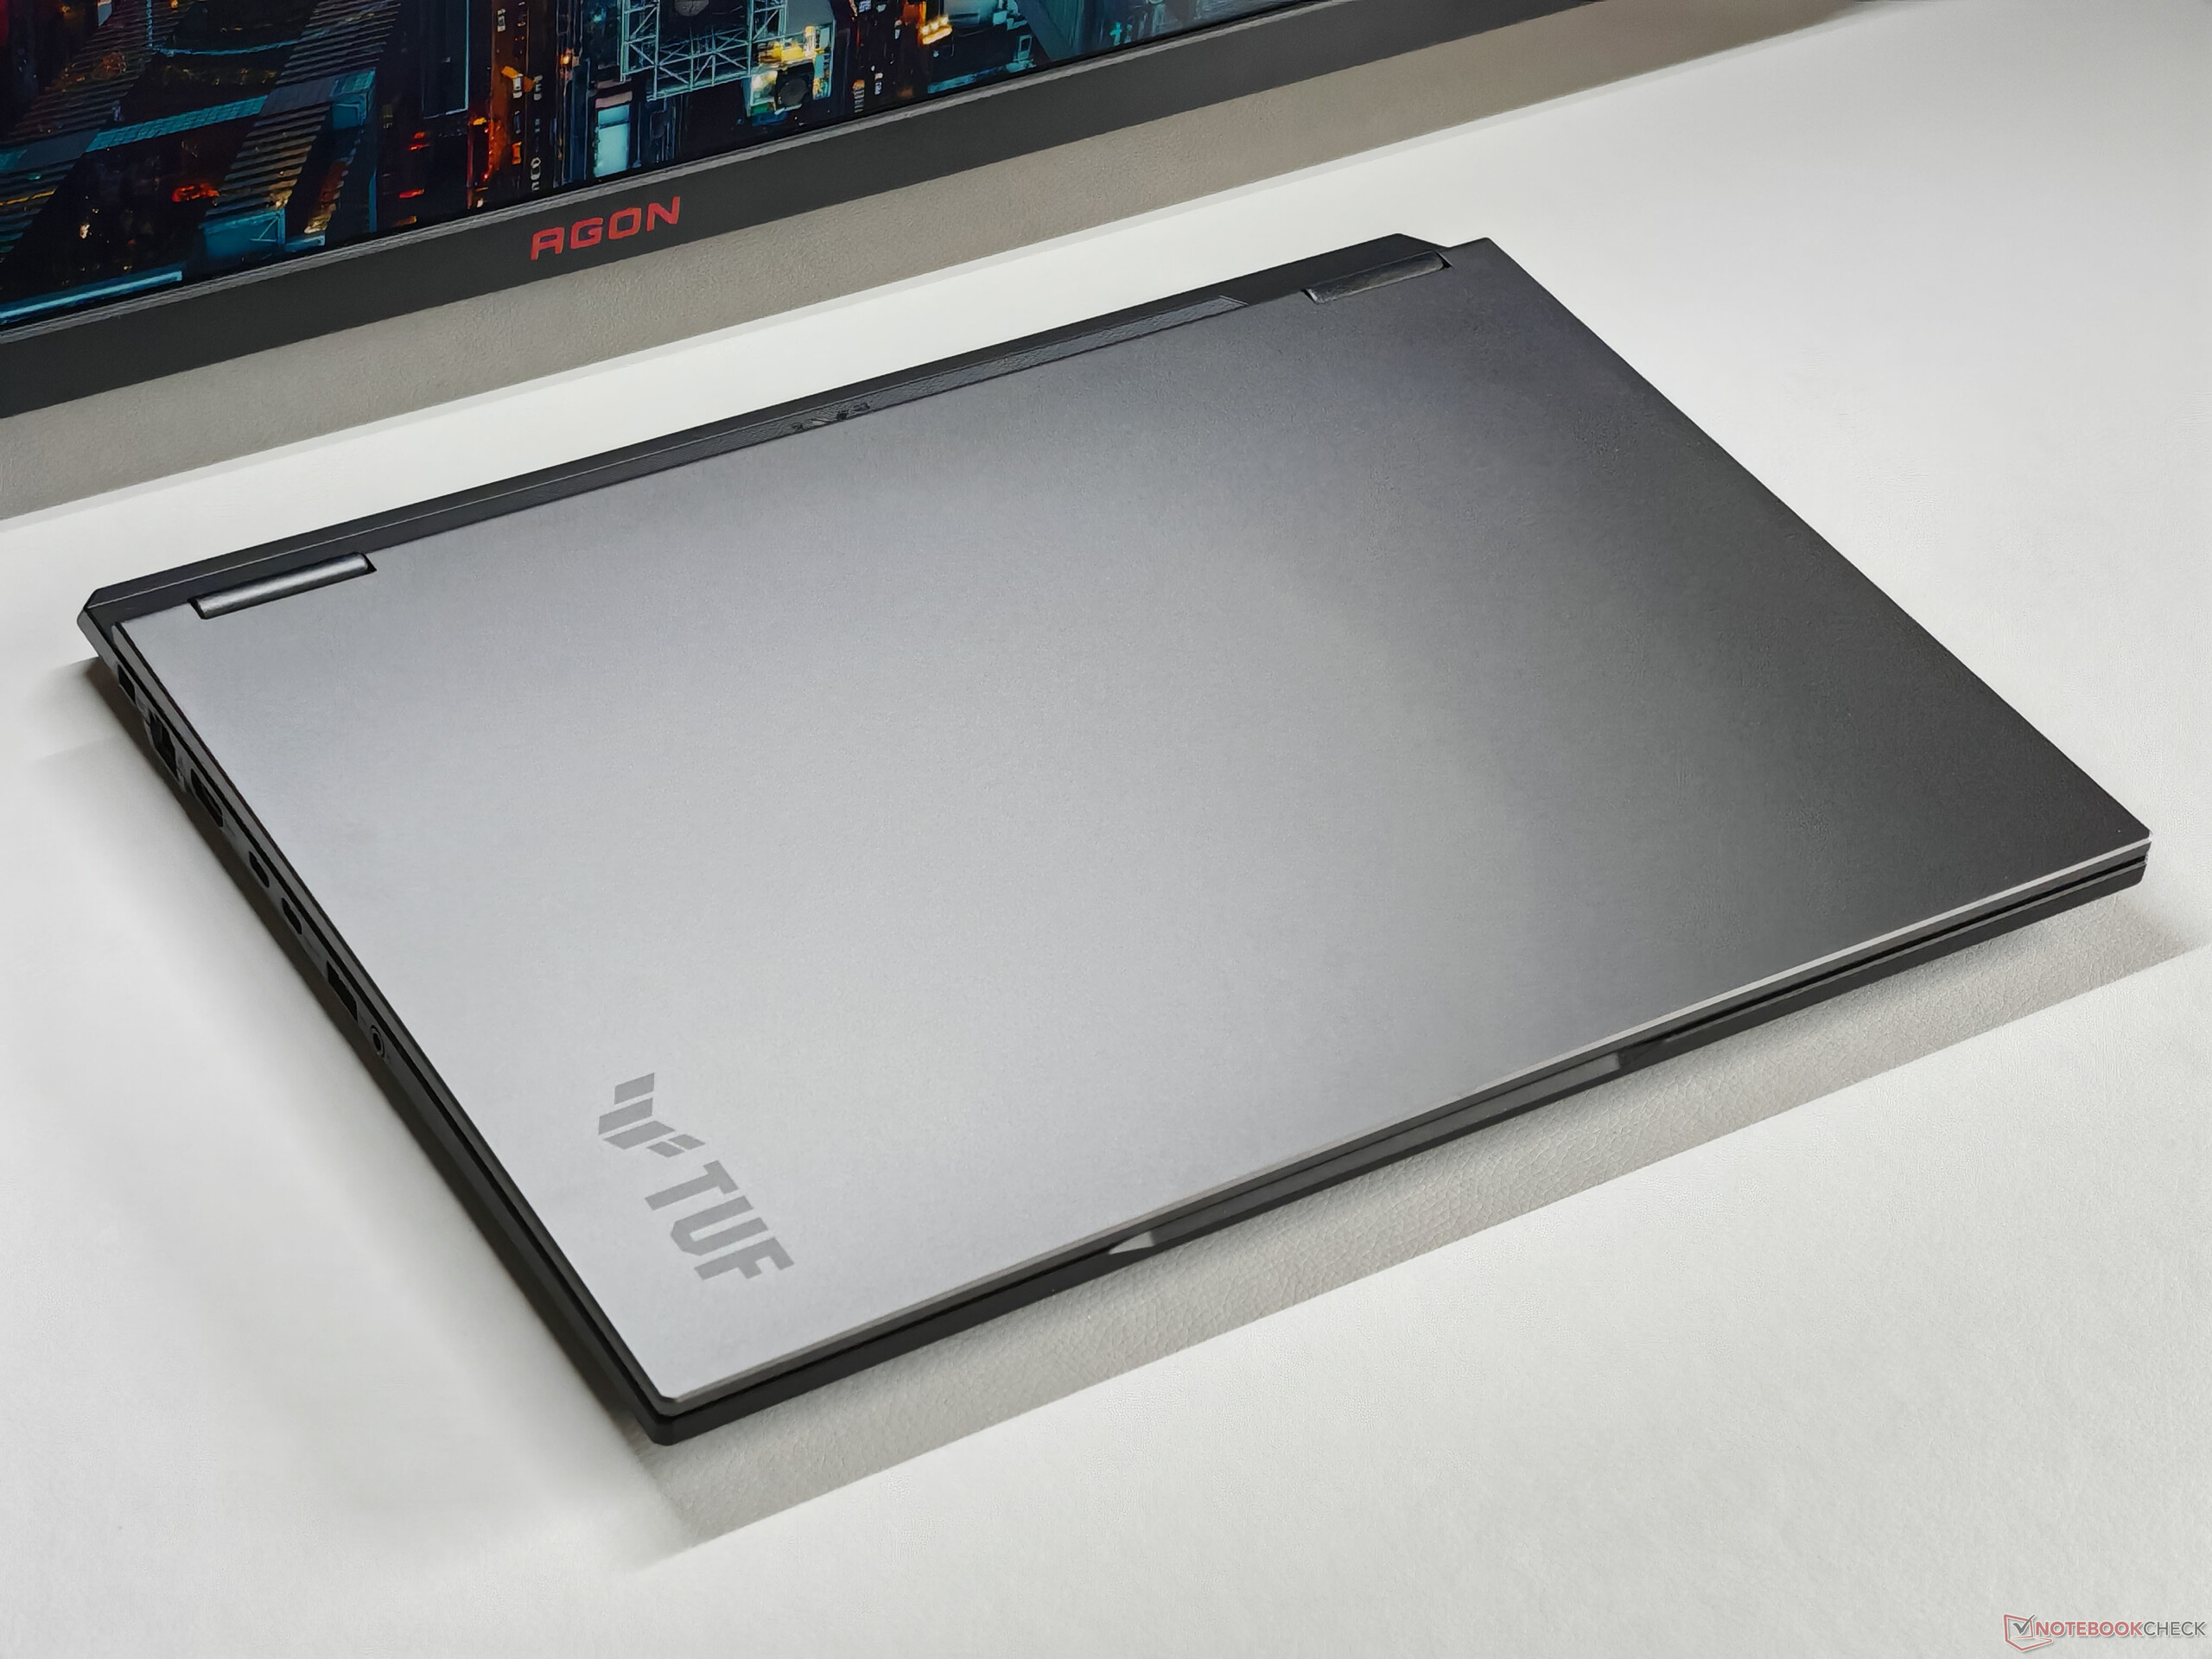
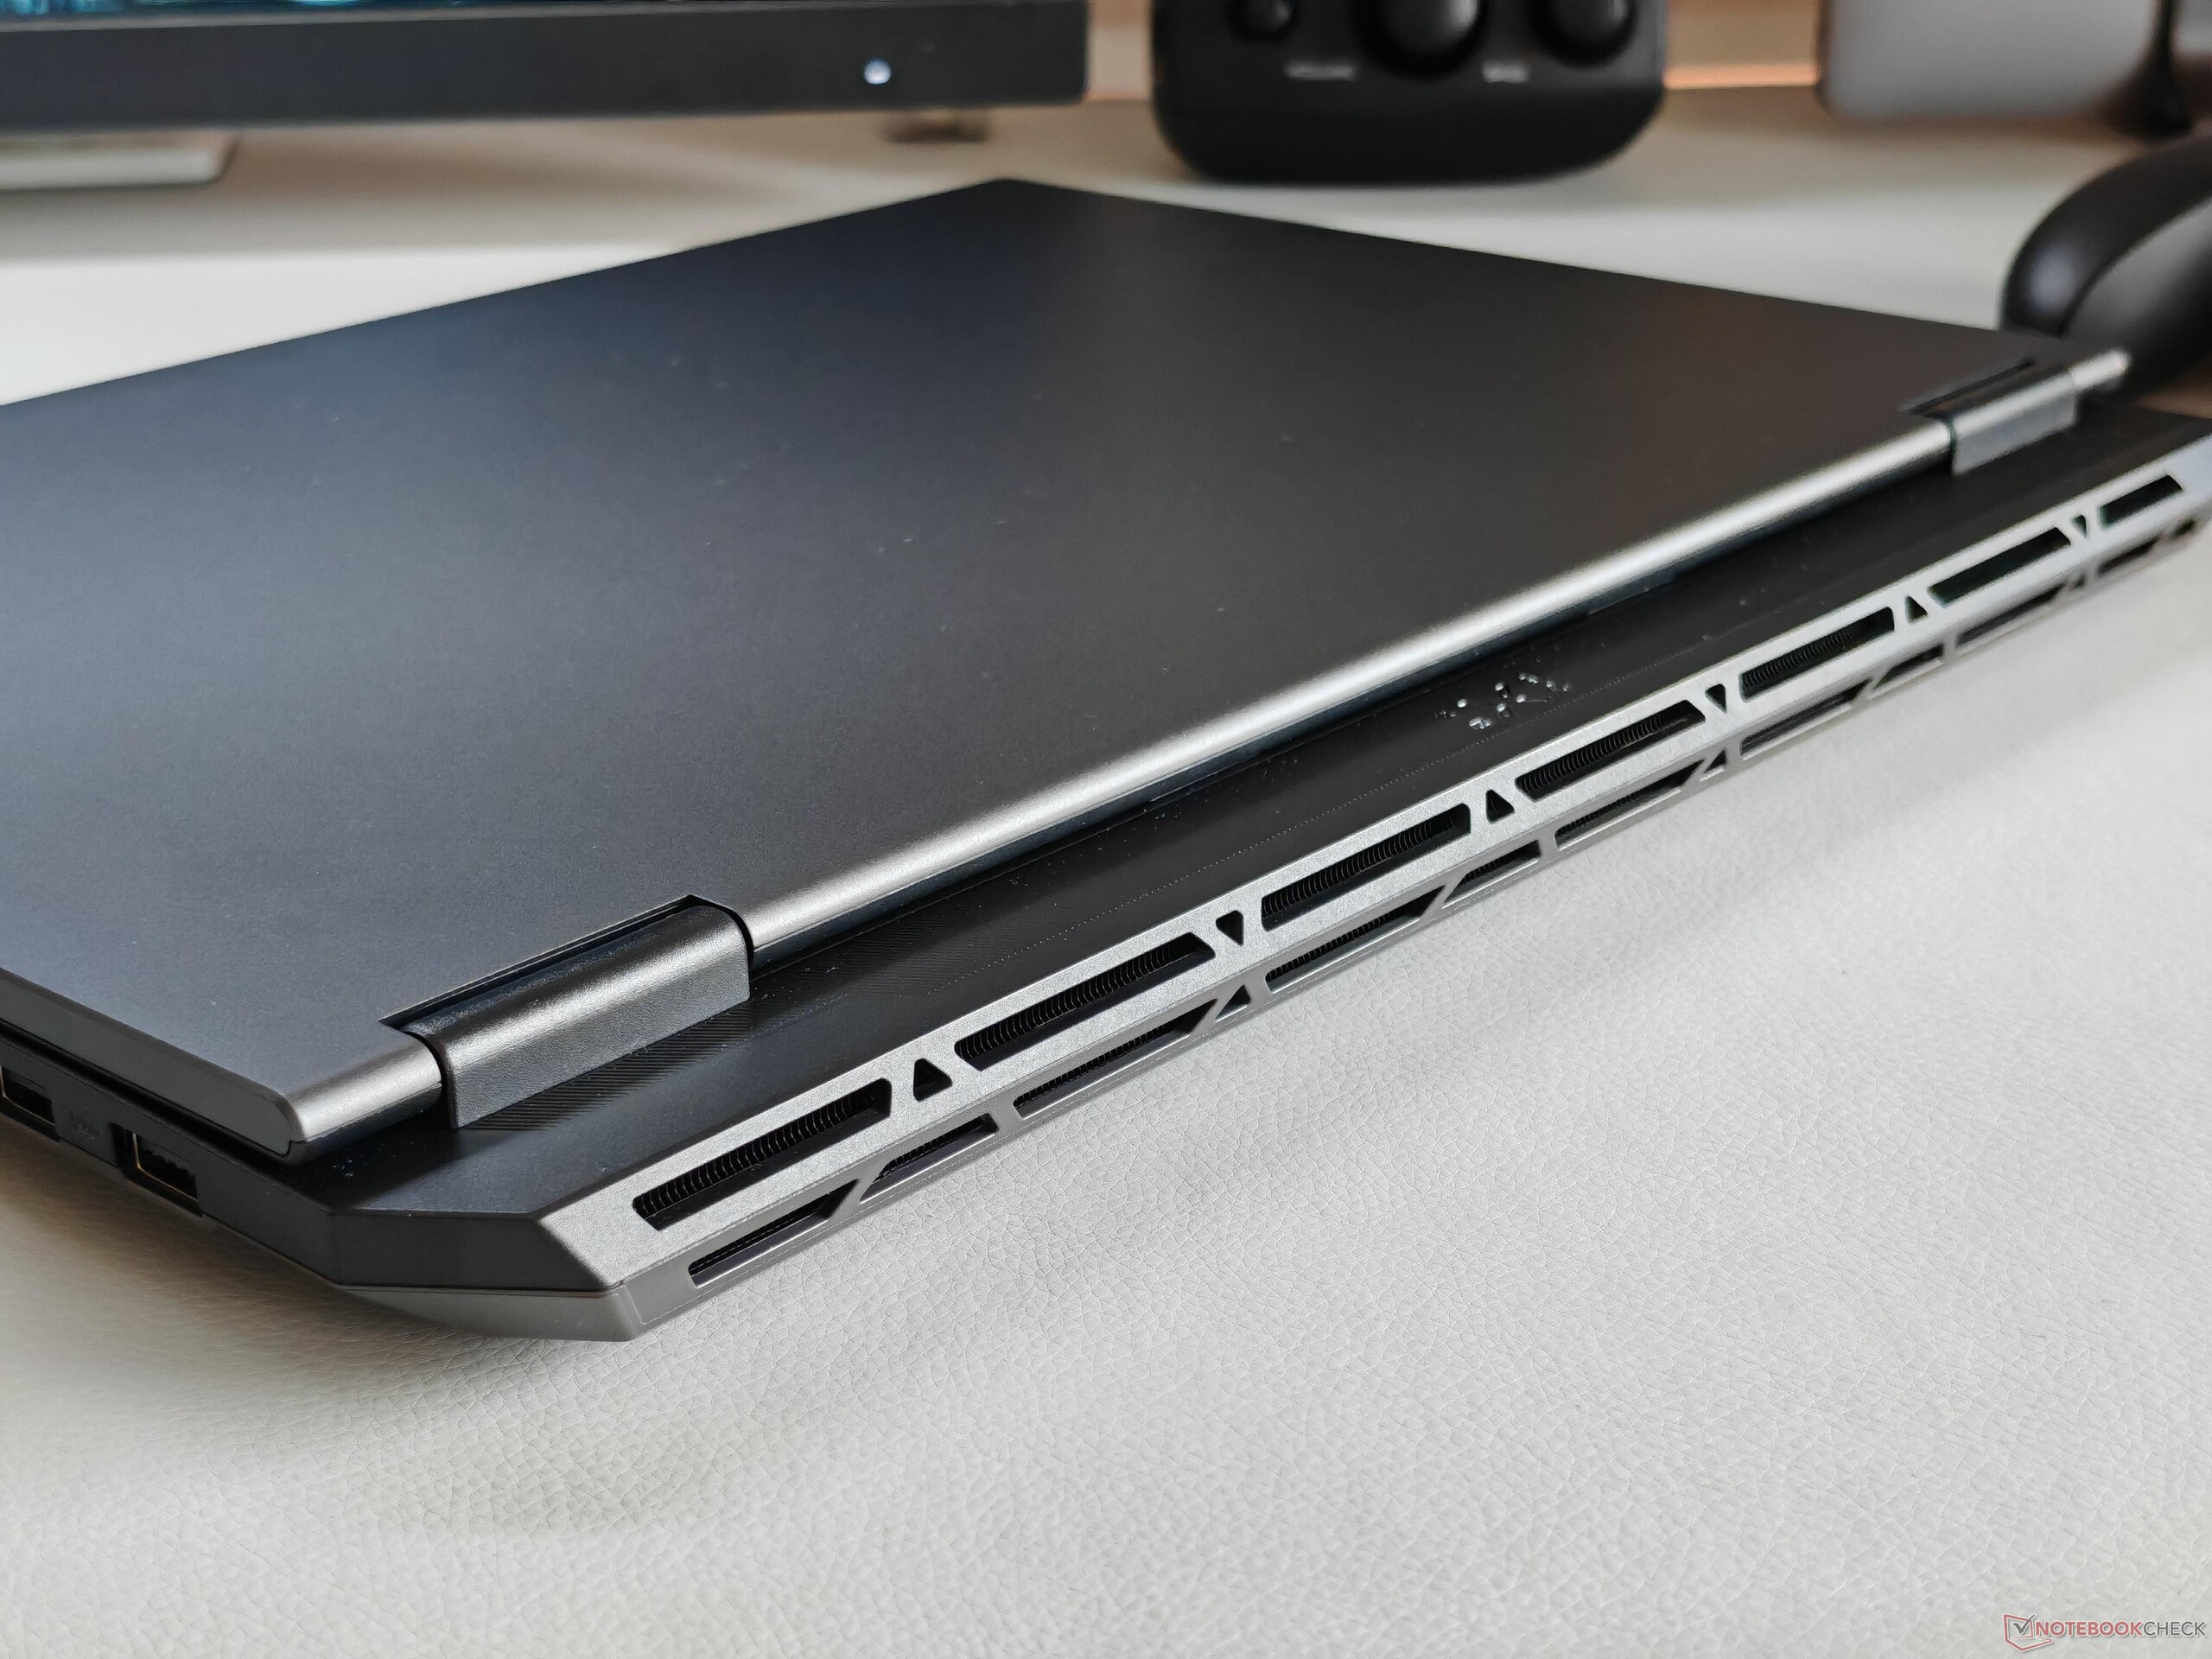
The chassis design of the TUF Gaming A16 is very subdued, and it can even fit well within a professional environment without any problems owing to the black and gray finish. This was also the case with the TUF Gaming A16 based on AMD Strix Point-HX that we've reviewed before.
There are no RGB lighting elements or large logos. In contrast to the more expensive Zephyrus models, the TUF Gaming A16 is almost exclusively made of plastic, with only the lid being aluminum.
Nevertheless, the build quality is perfectly acceptable, and the surfaces are not particularly sensitive to fingerprints. There is also not much to criticize in terms of stability, and we were unable to provoke any creaking noises.
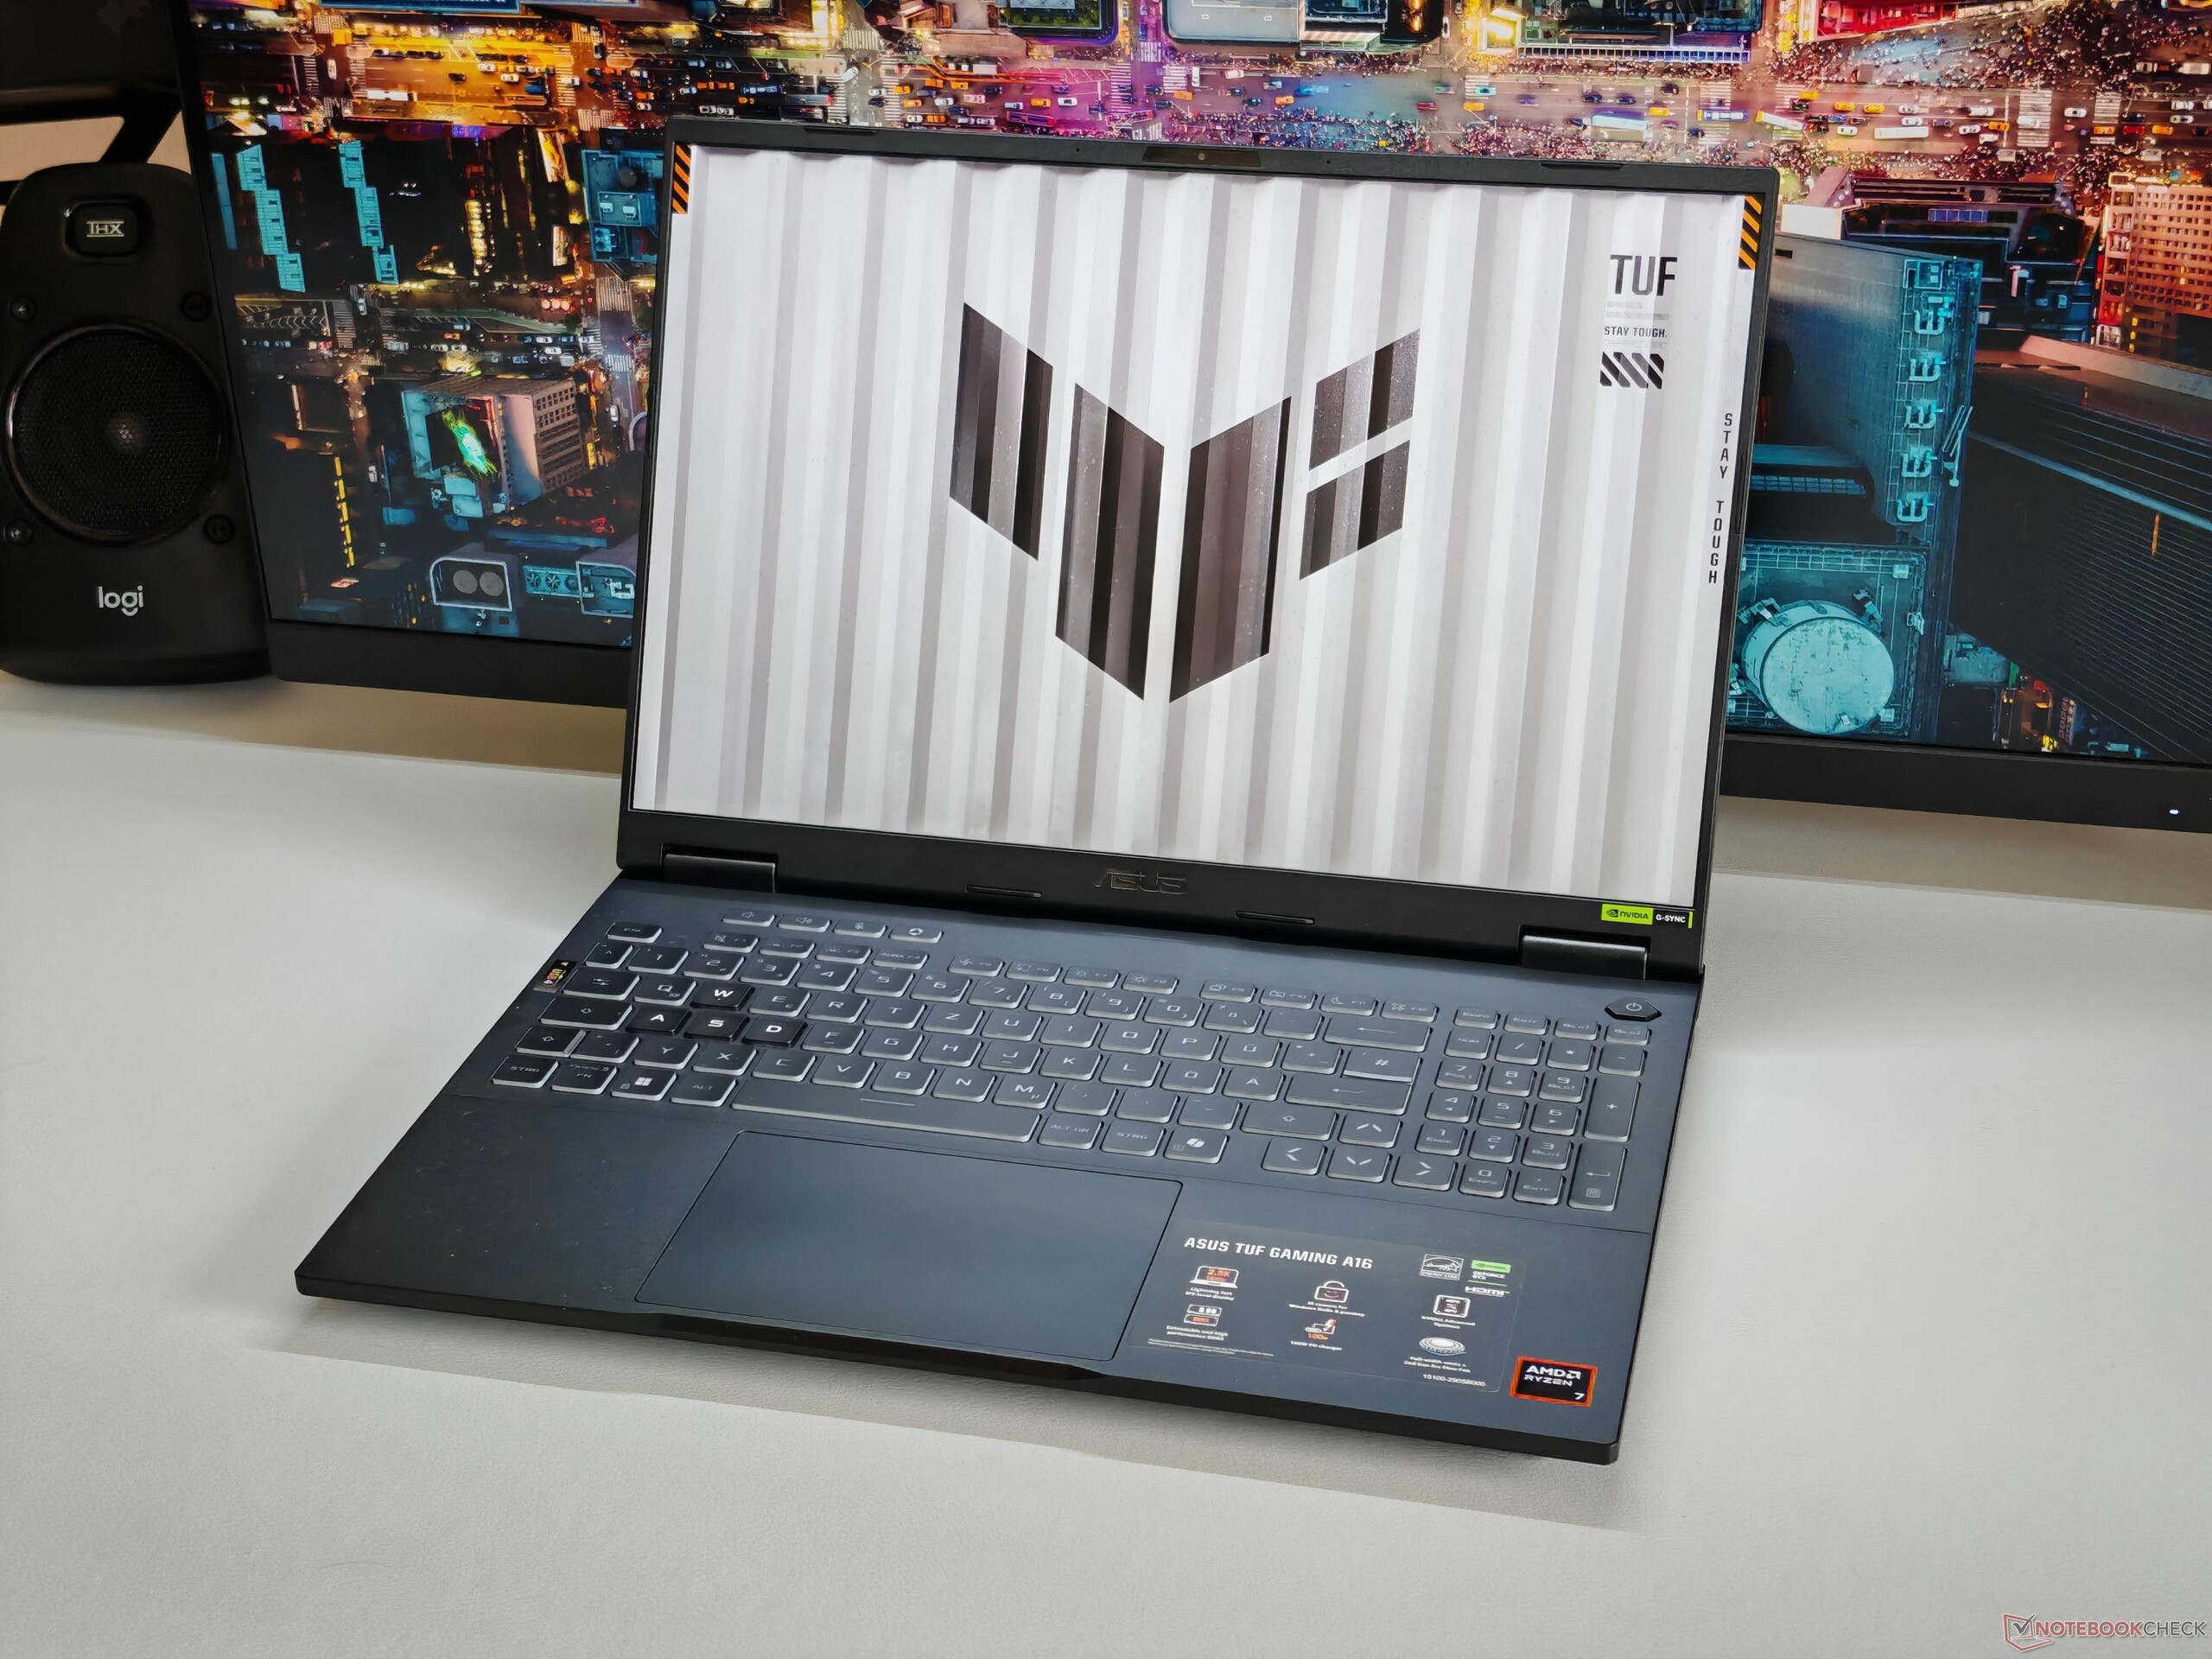
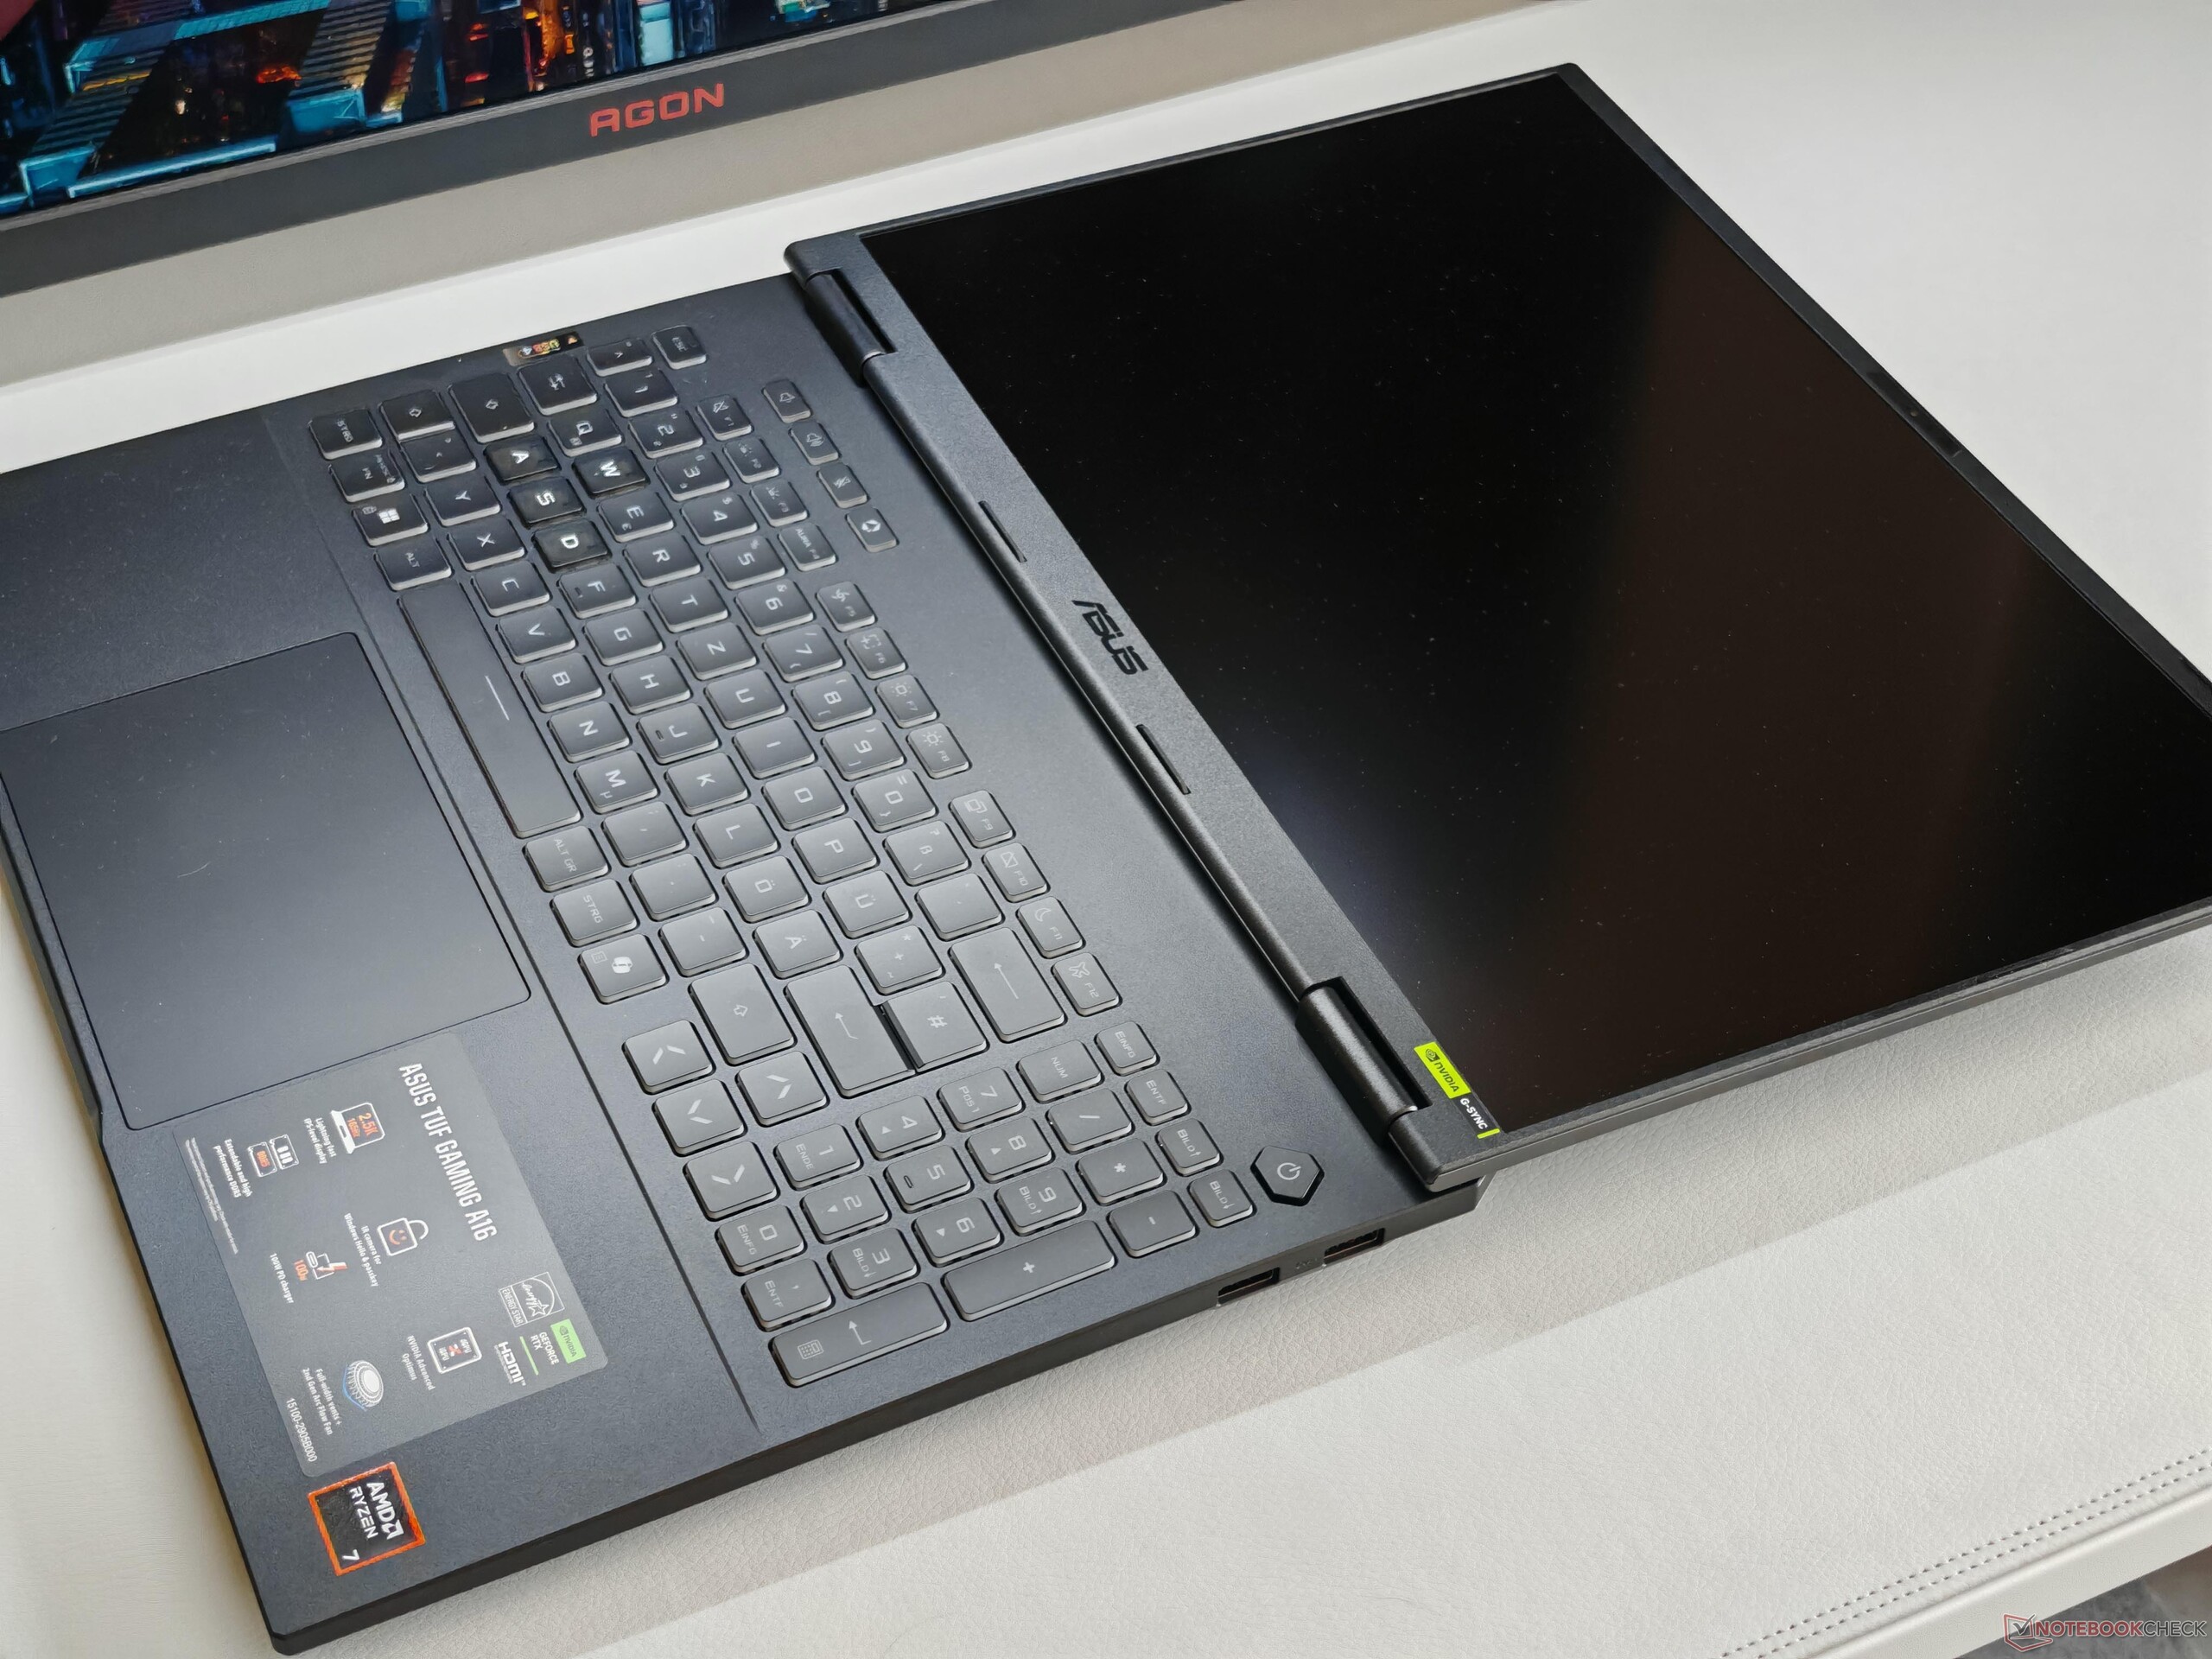
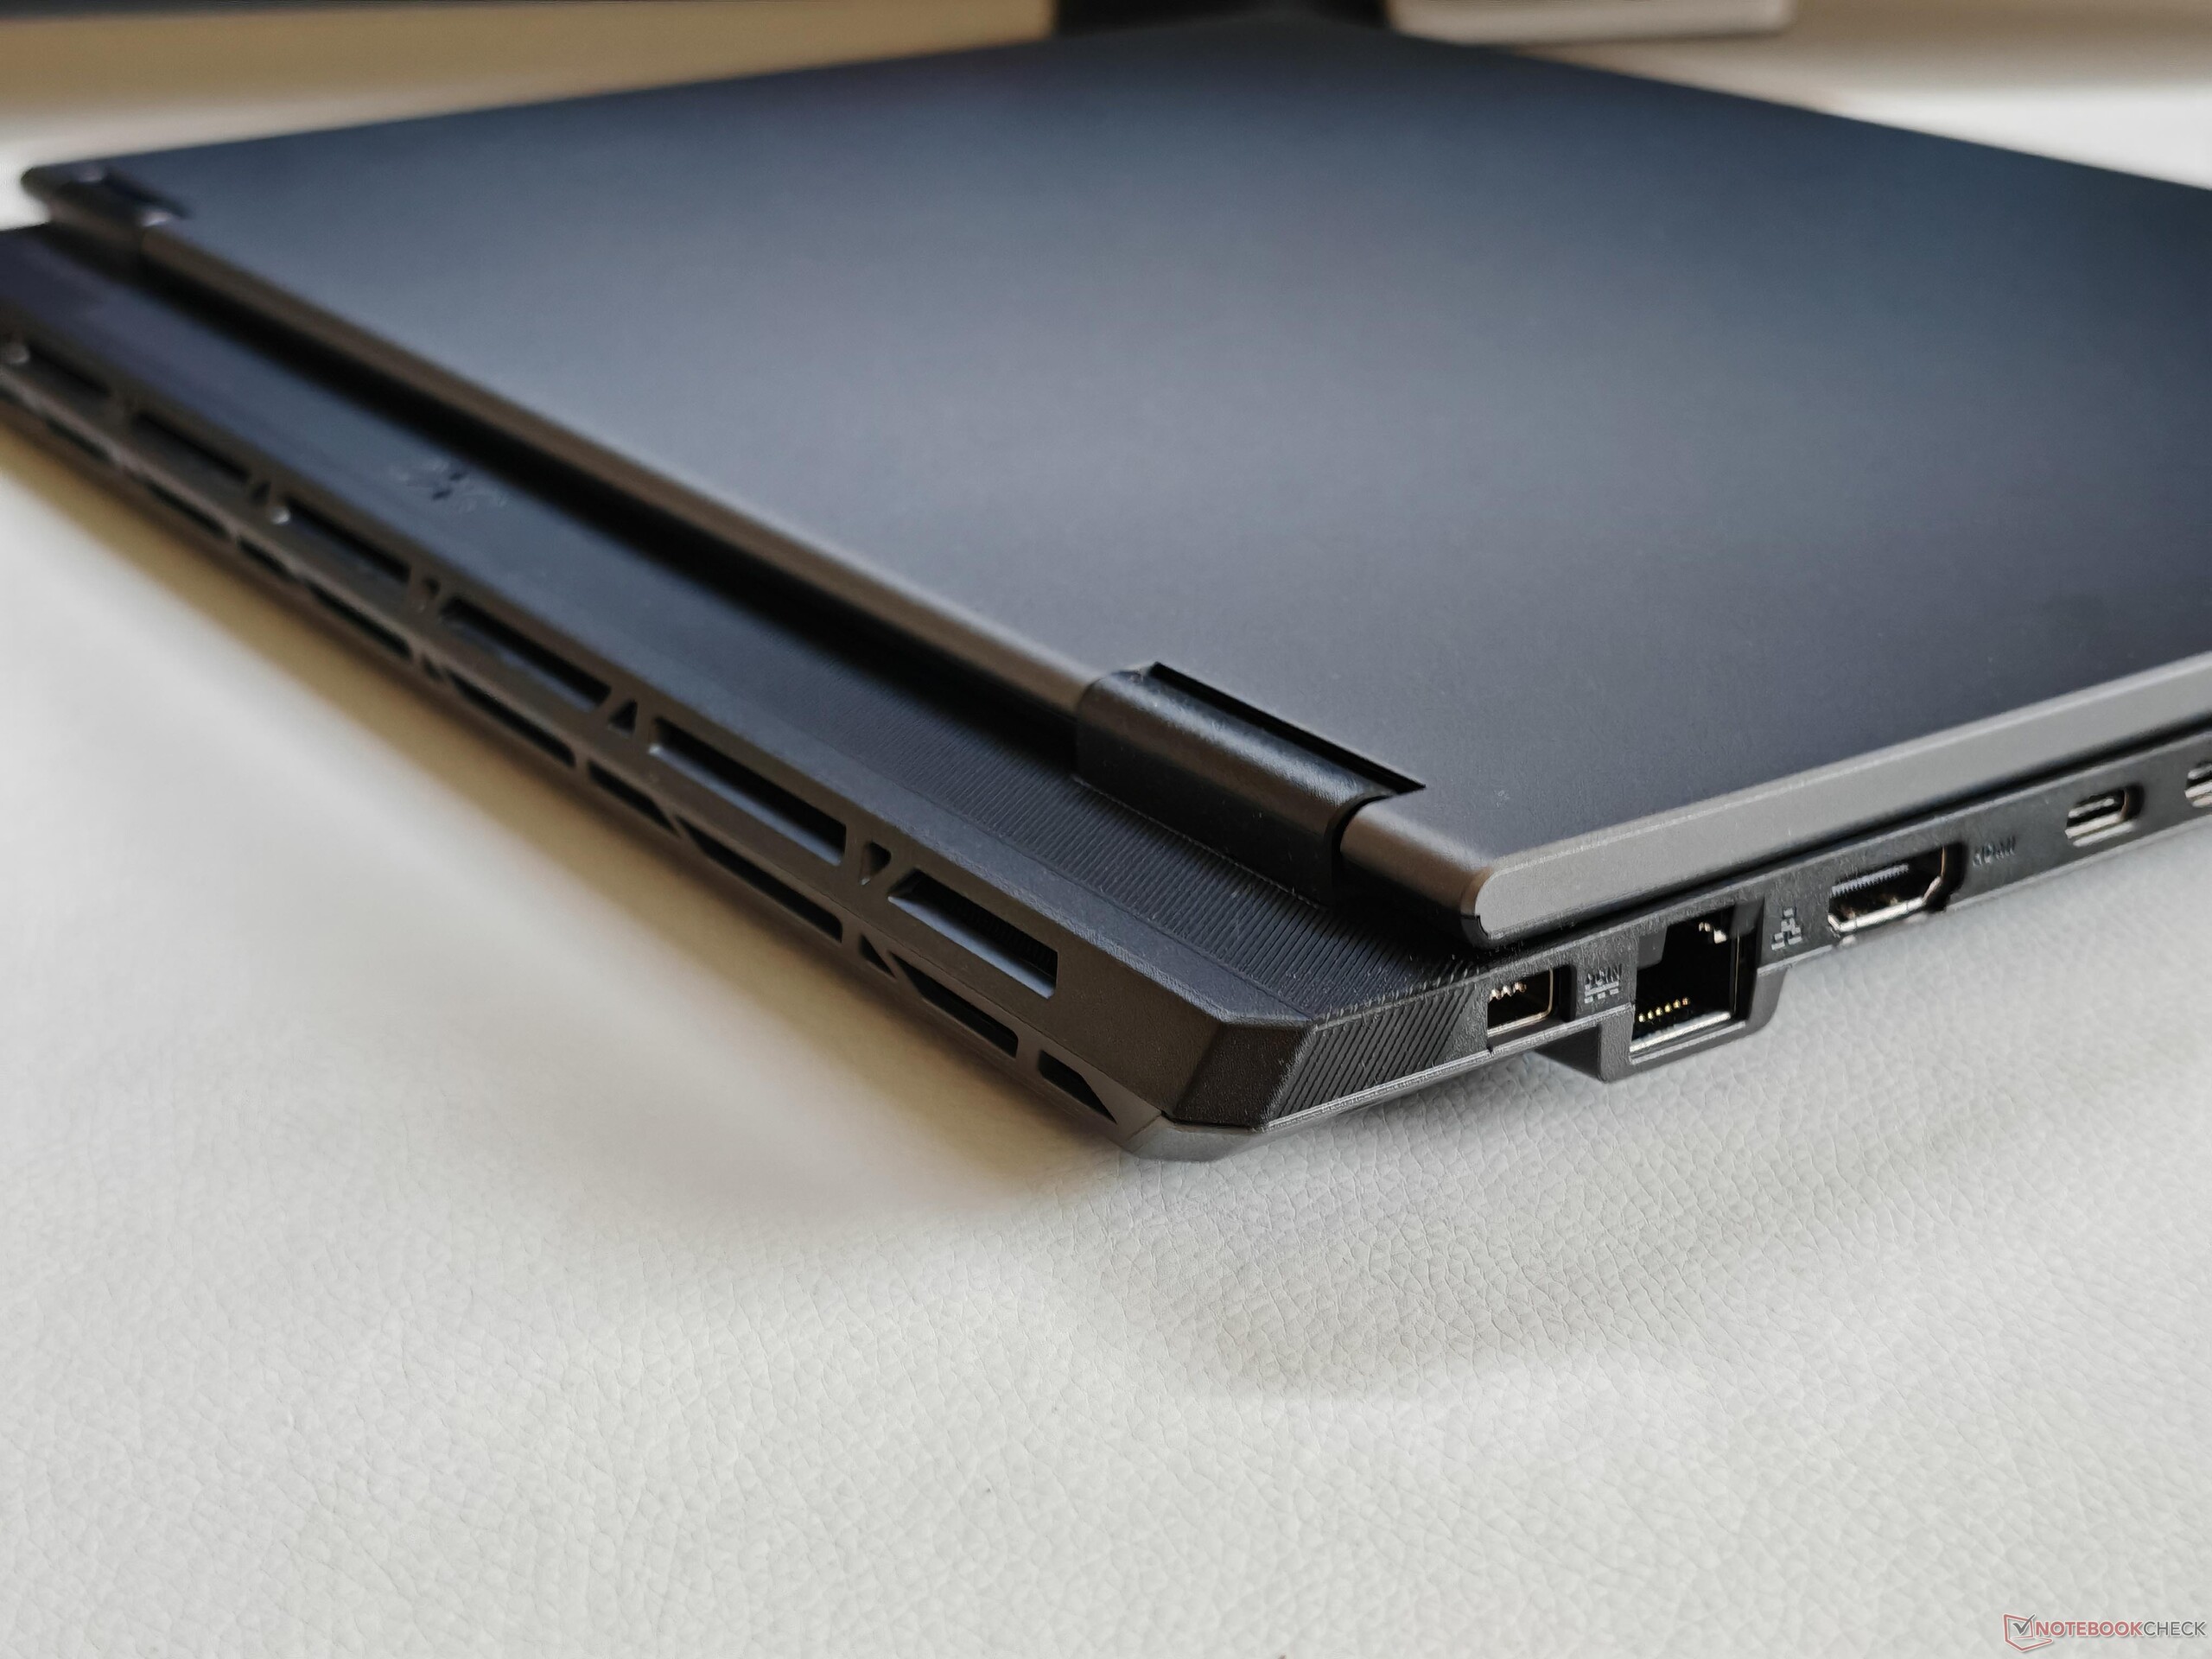
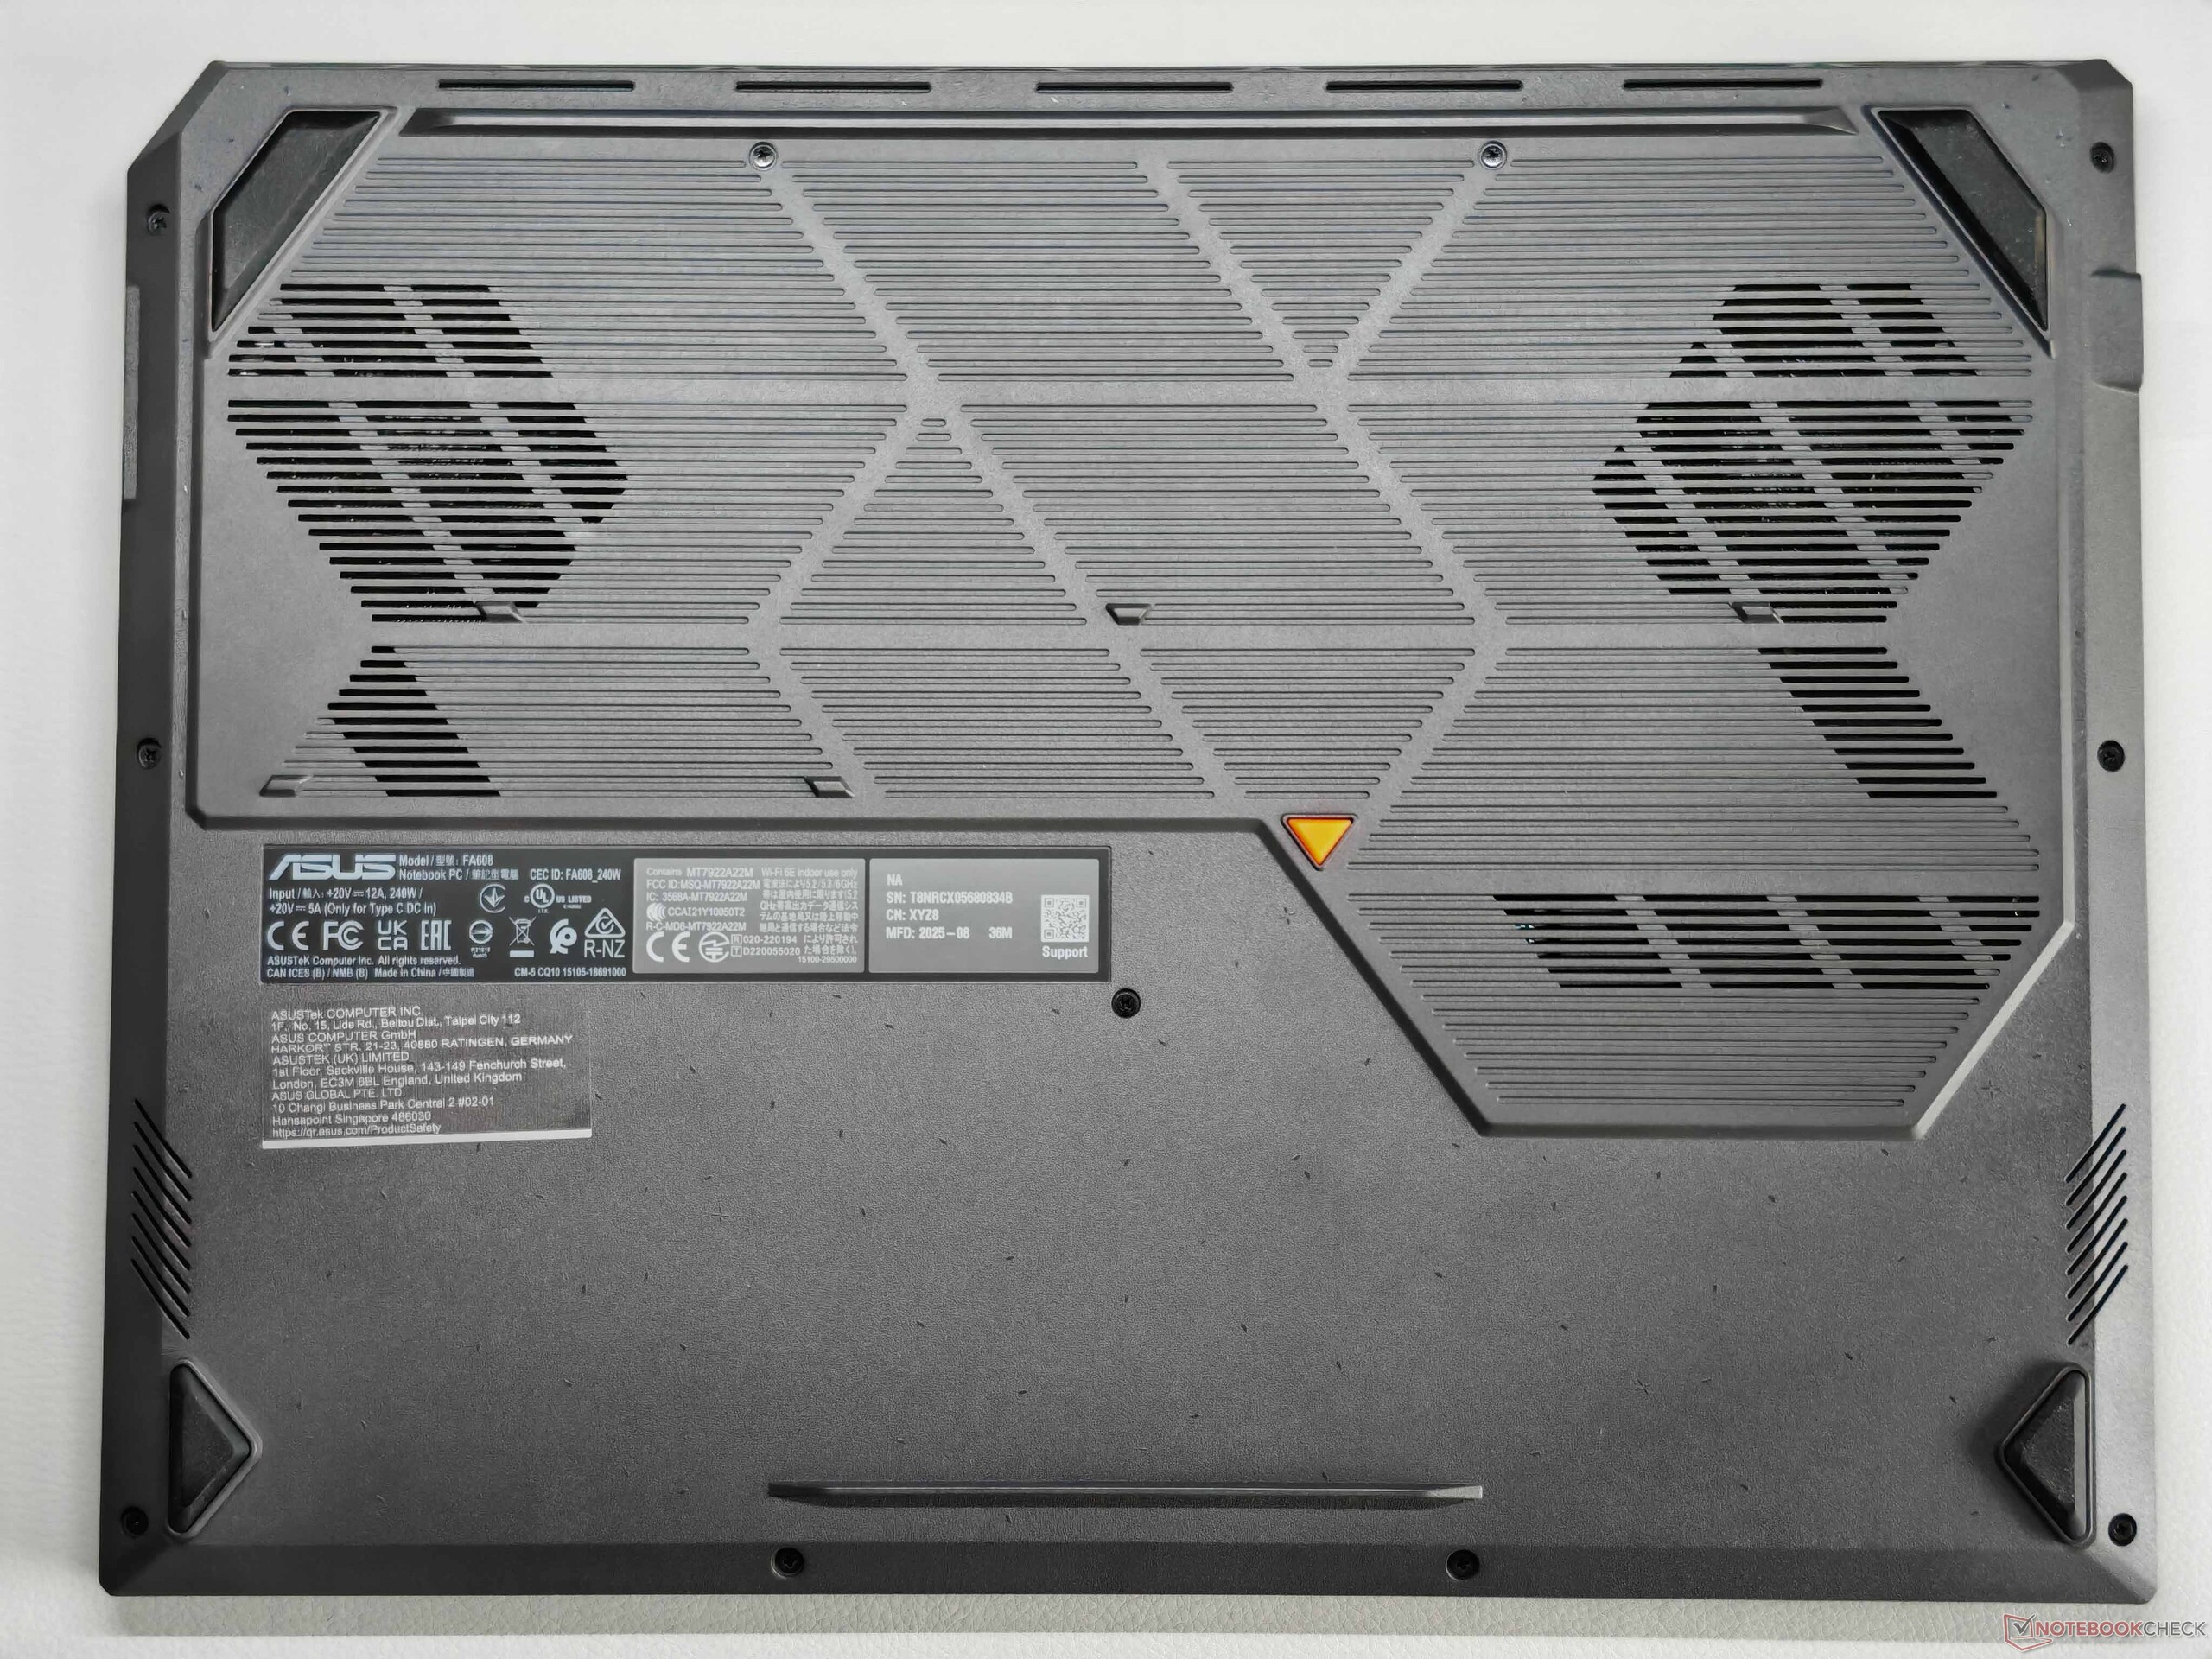
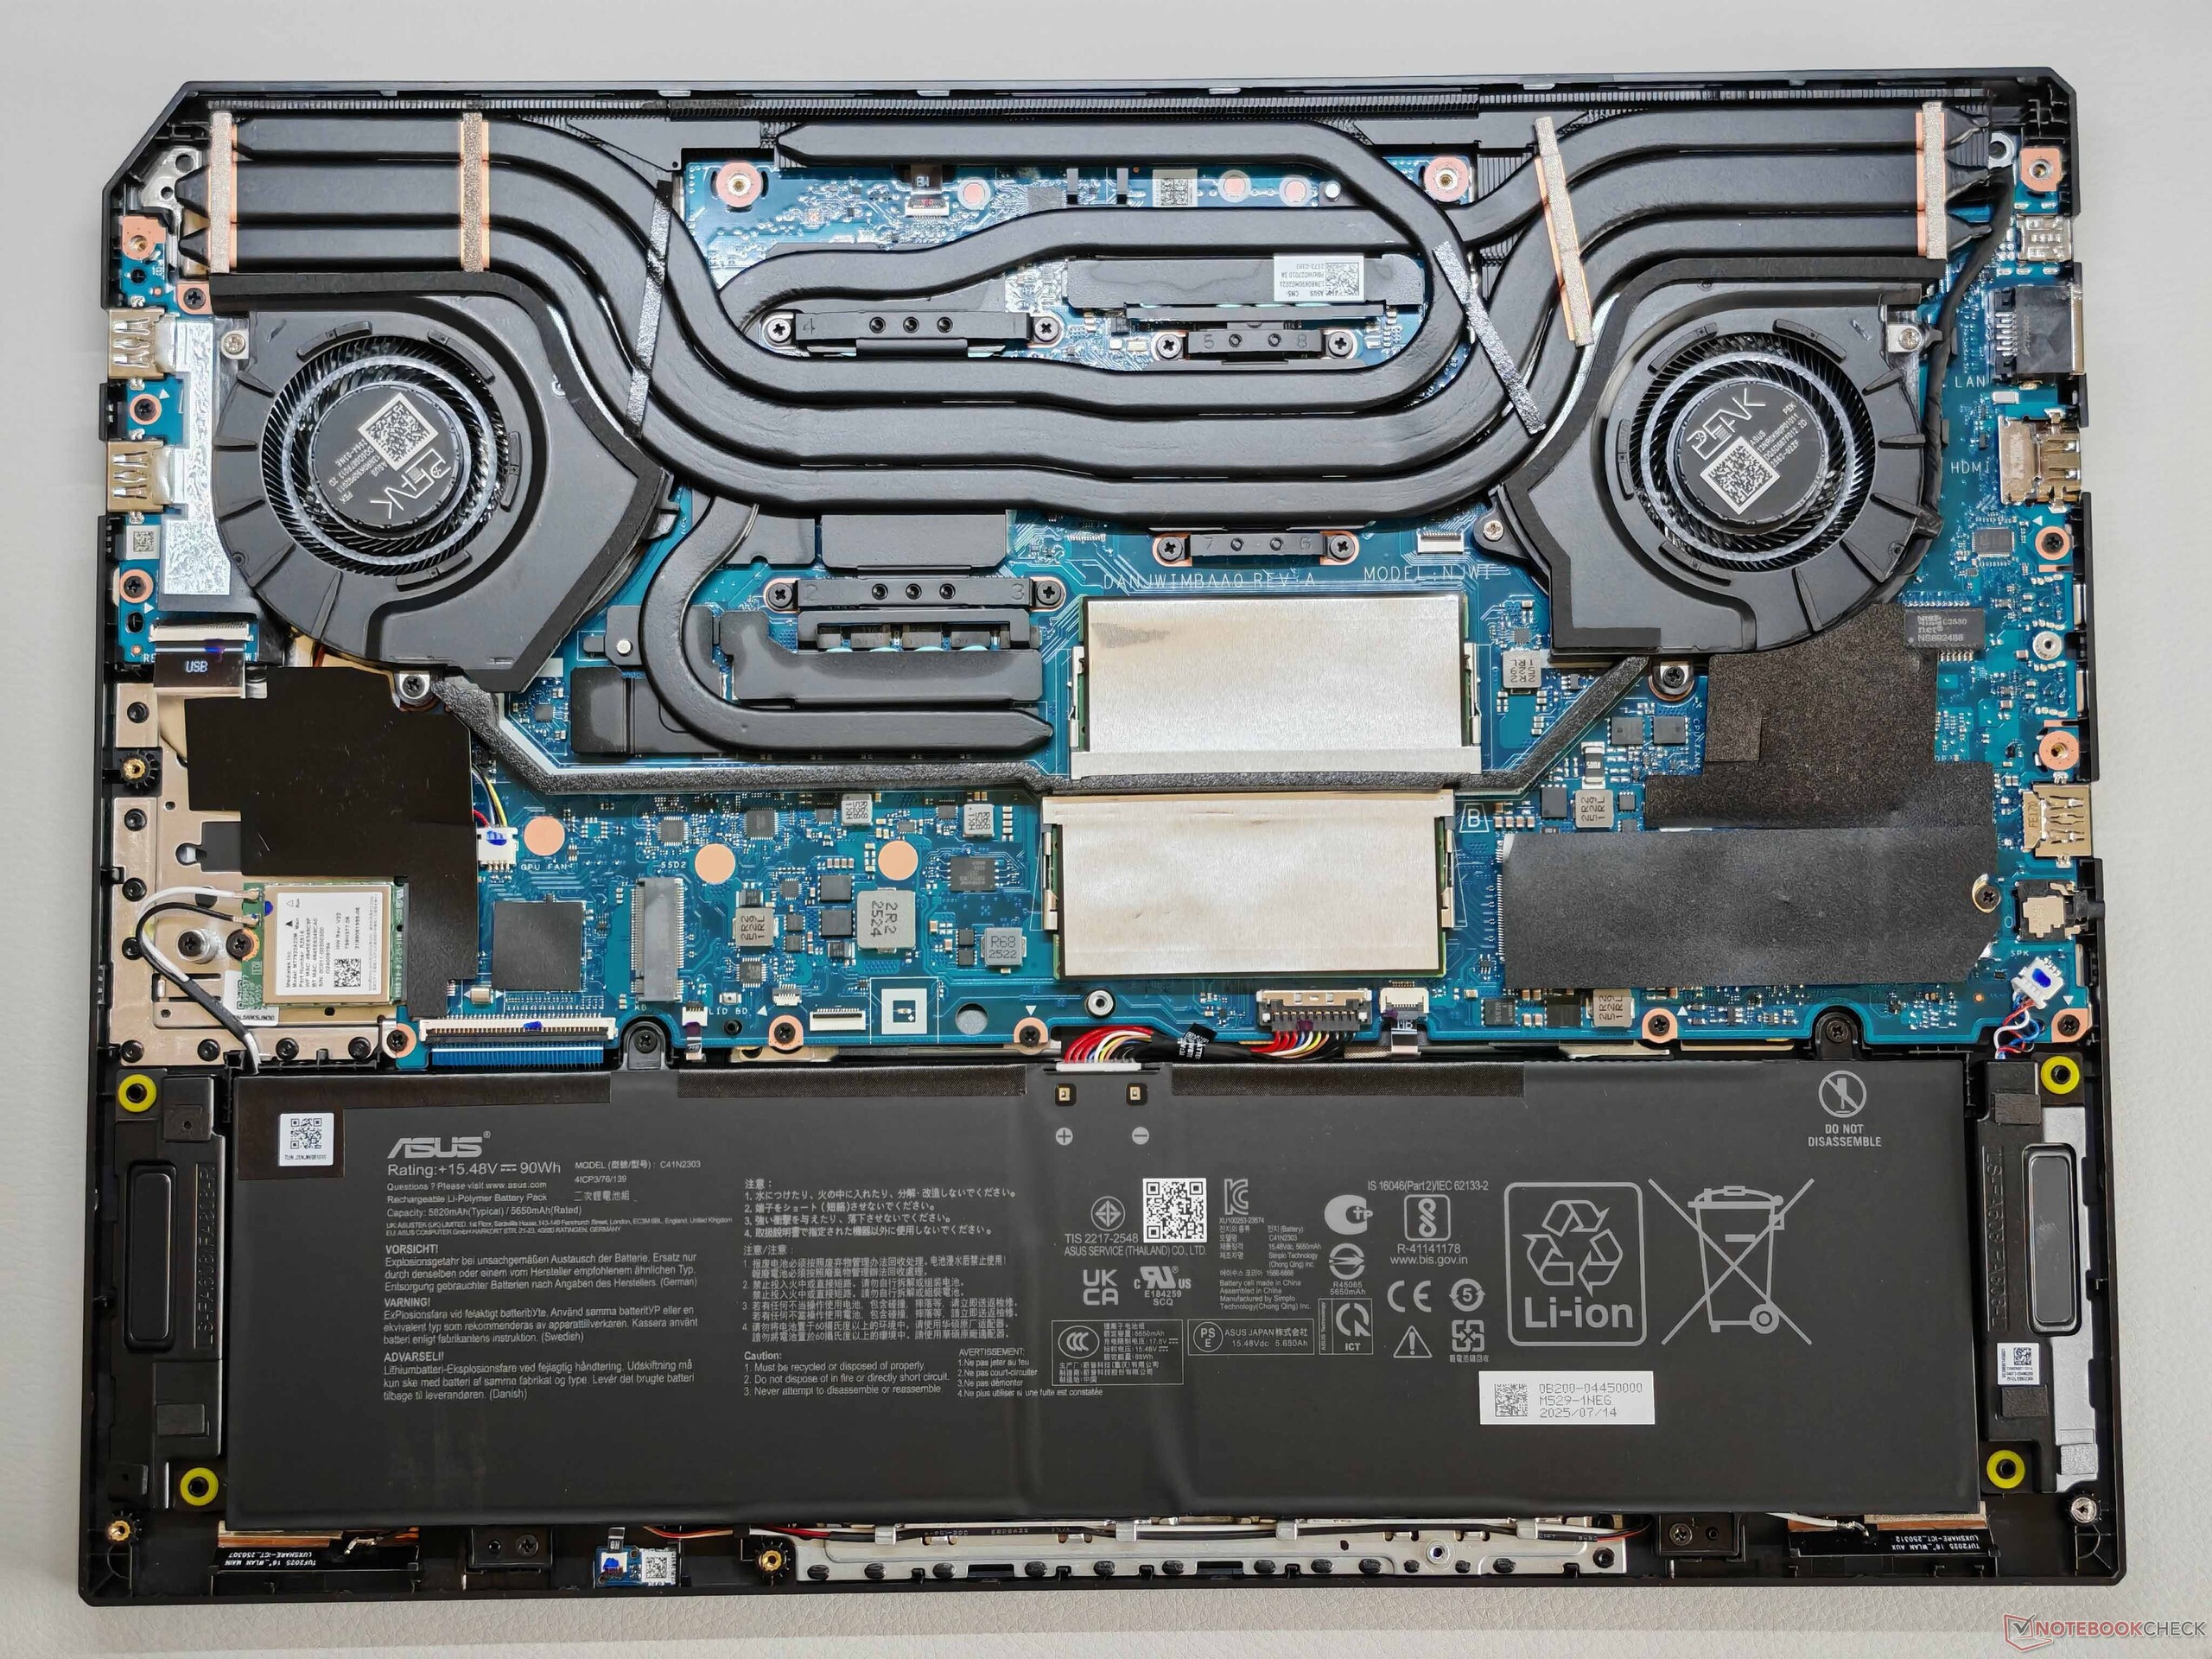
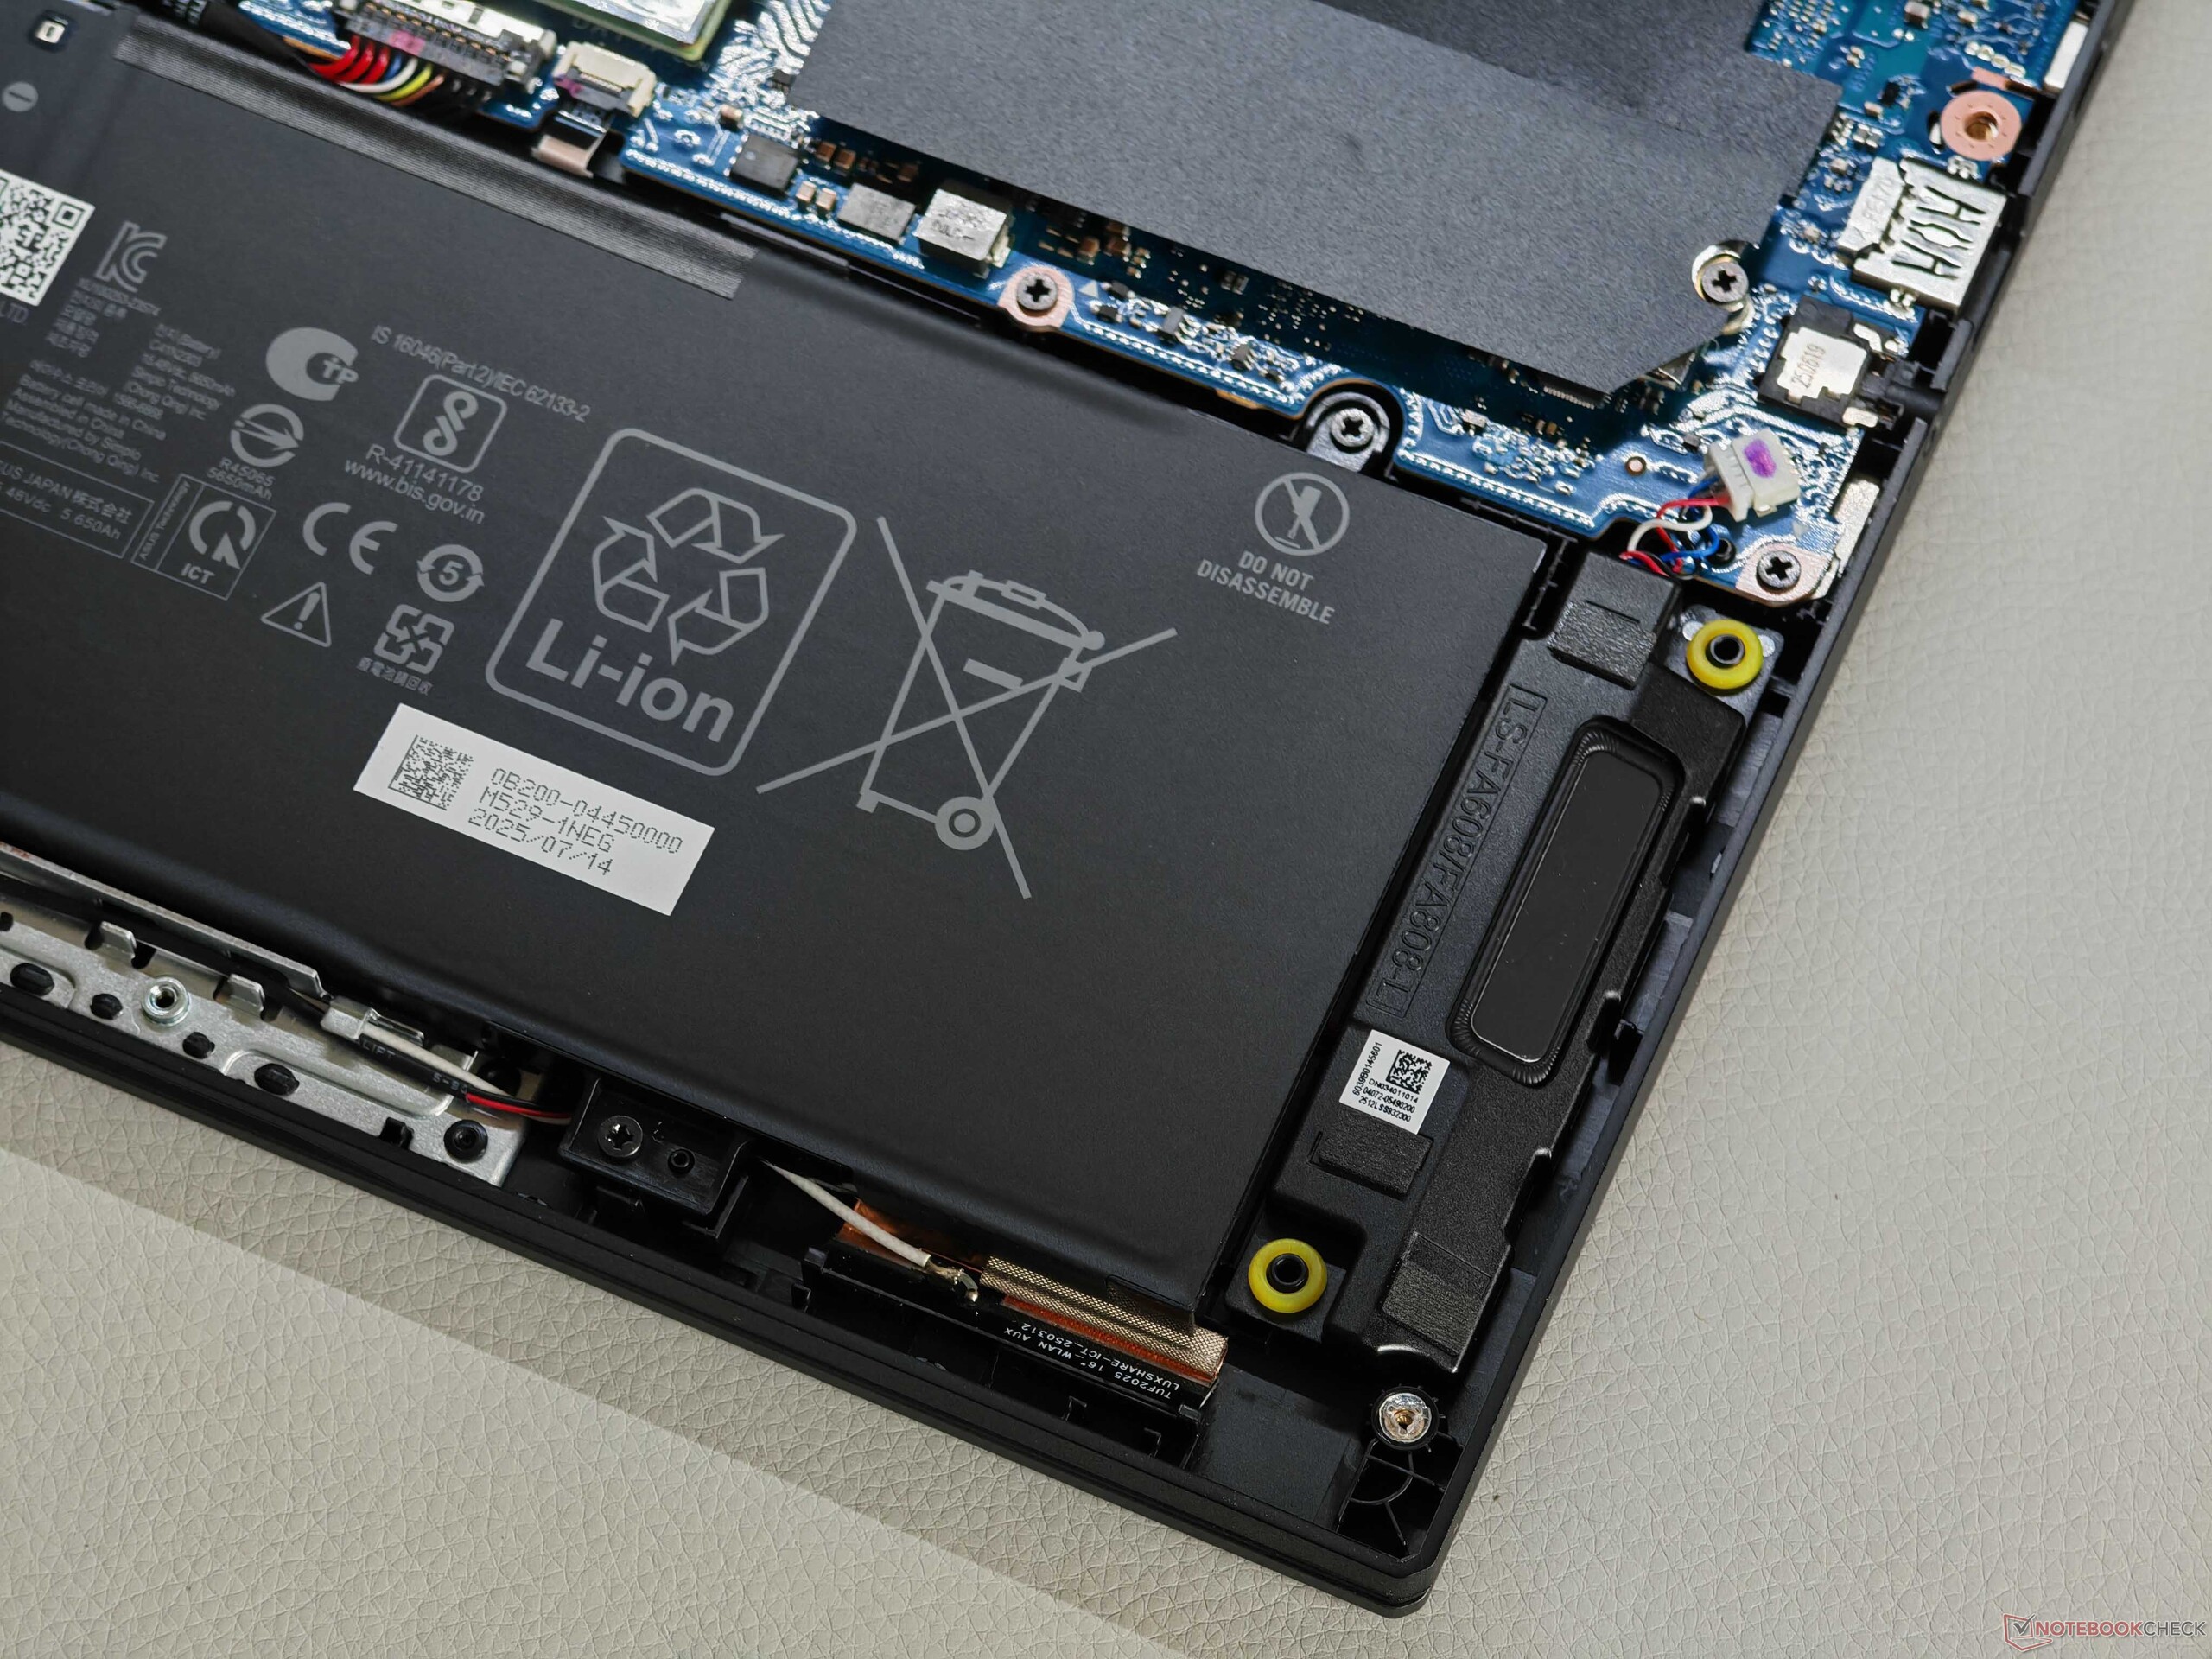
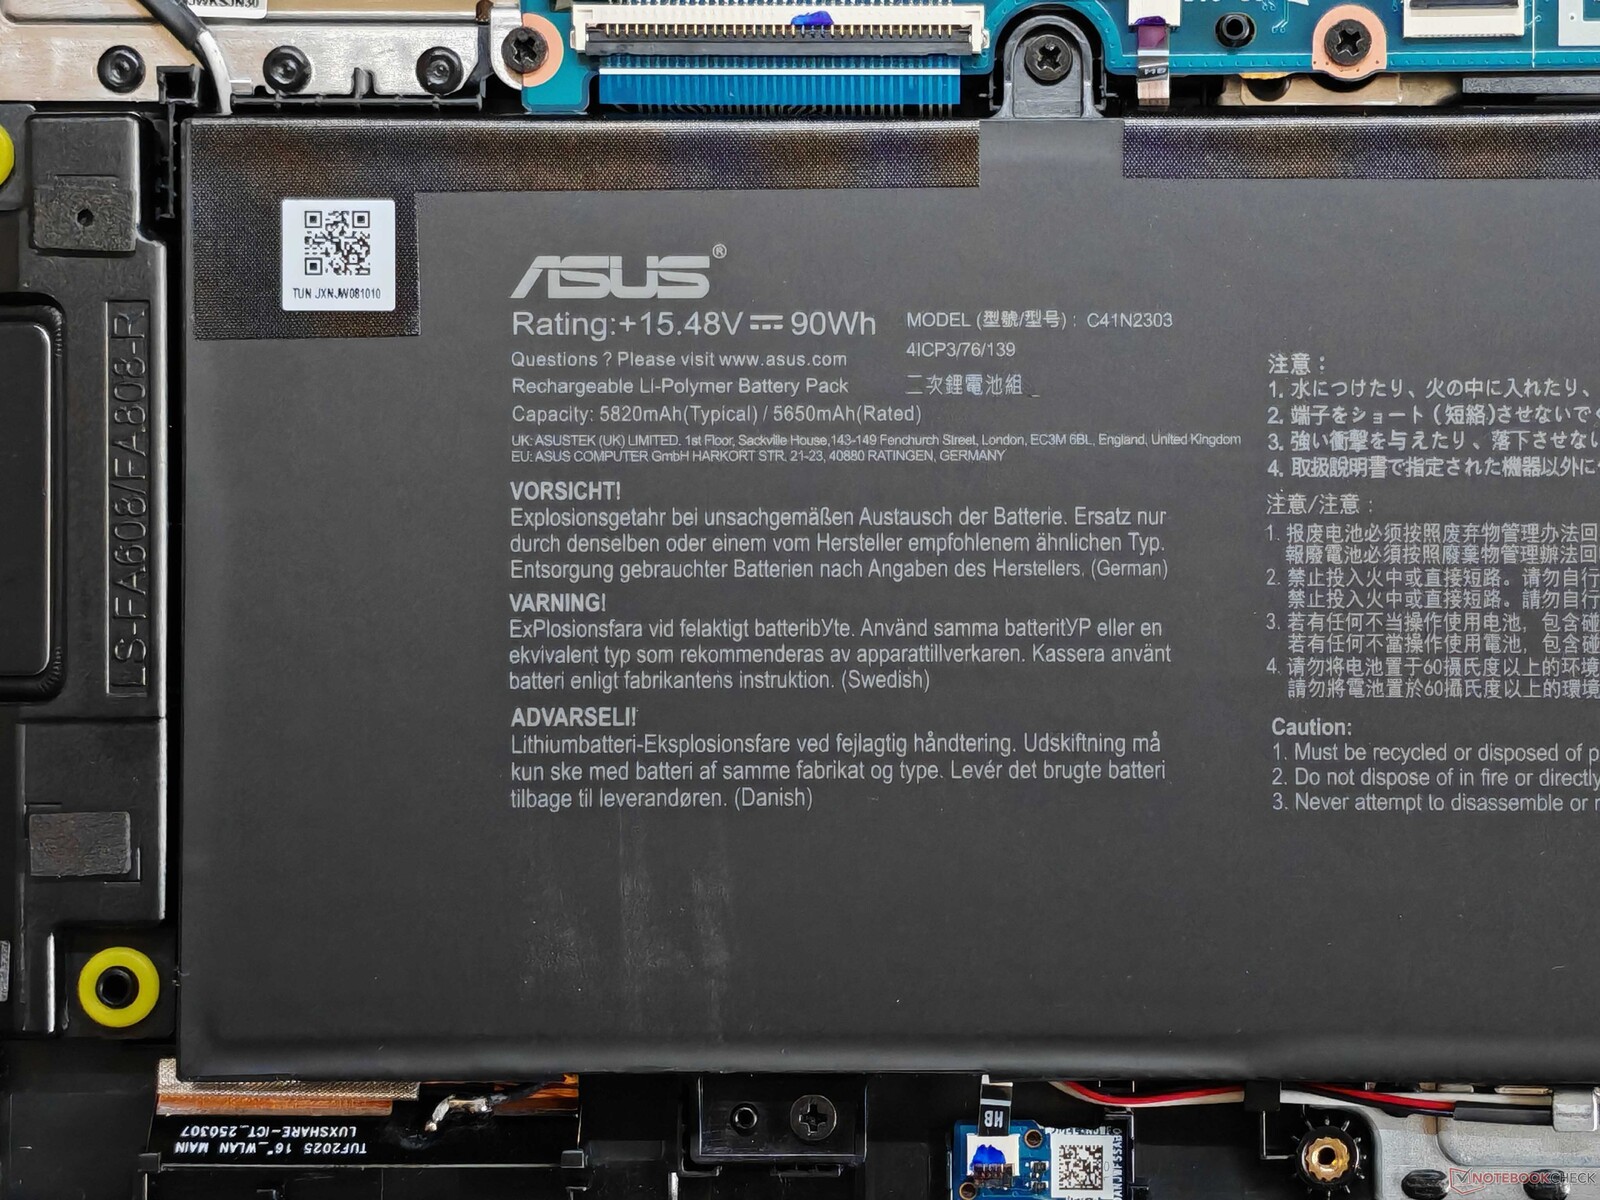
The display hinges are very well adjusted and allow an opening angle of 180°. Maintenance options are extensive with 2x RAM, 2x SSD, the WLAN module, and the removable battery. This rectifies a major criticism of the previous model that featured soldered RAM.
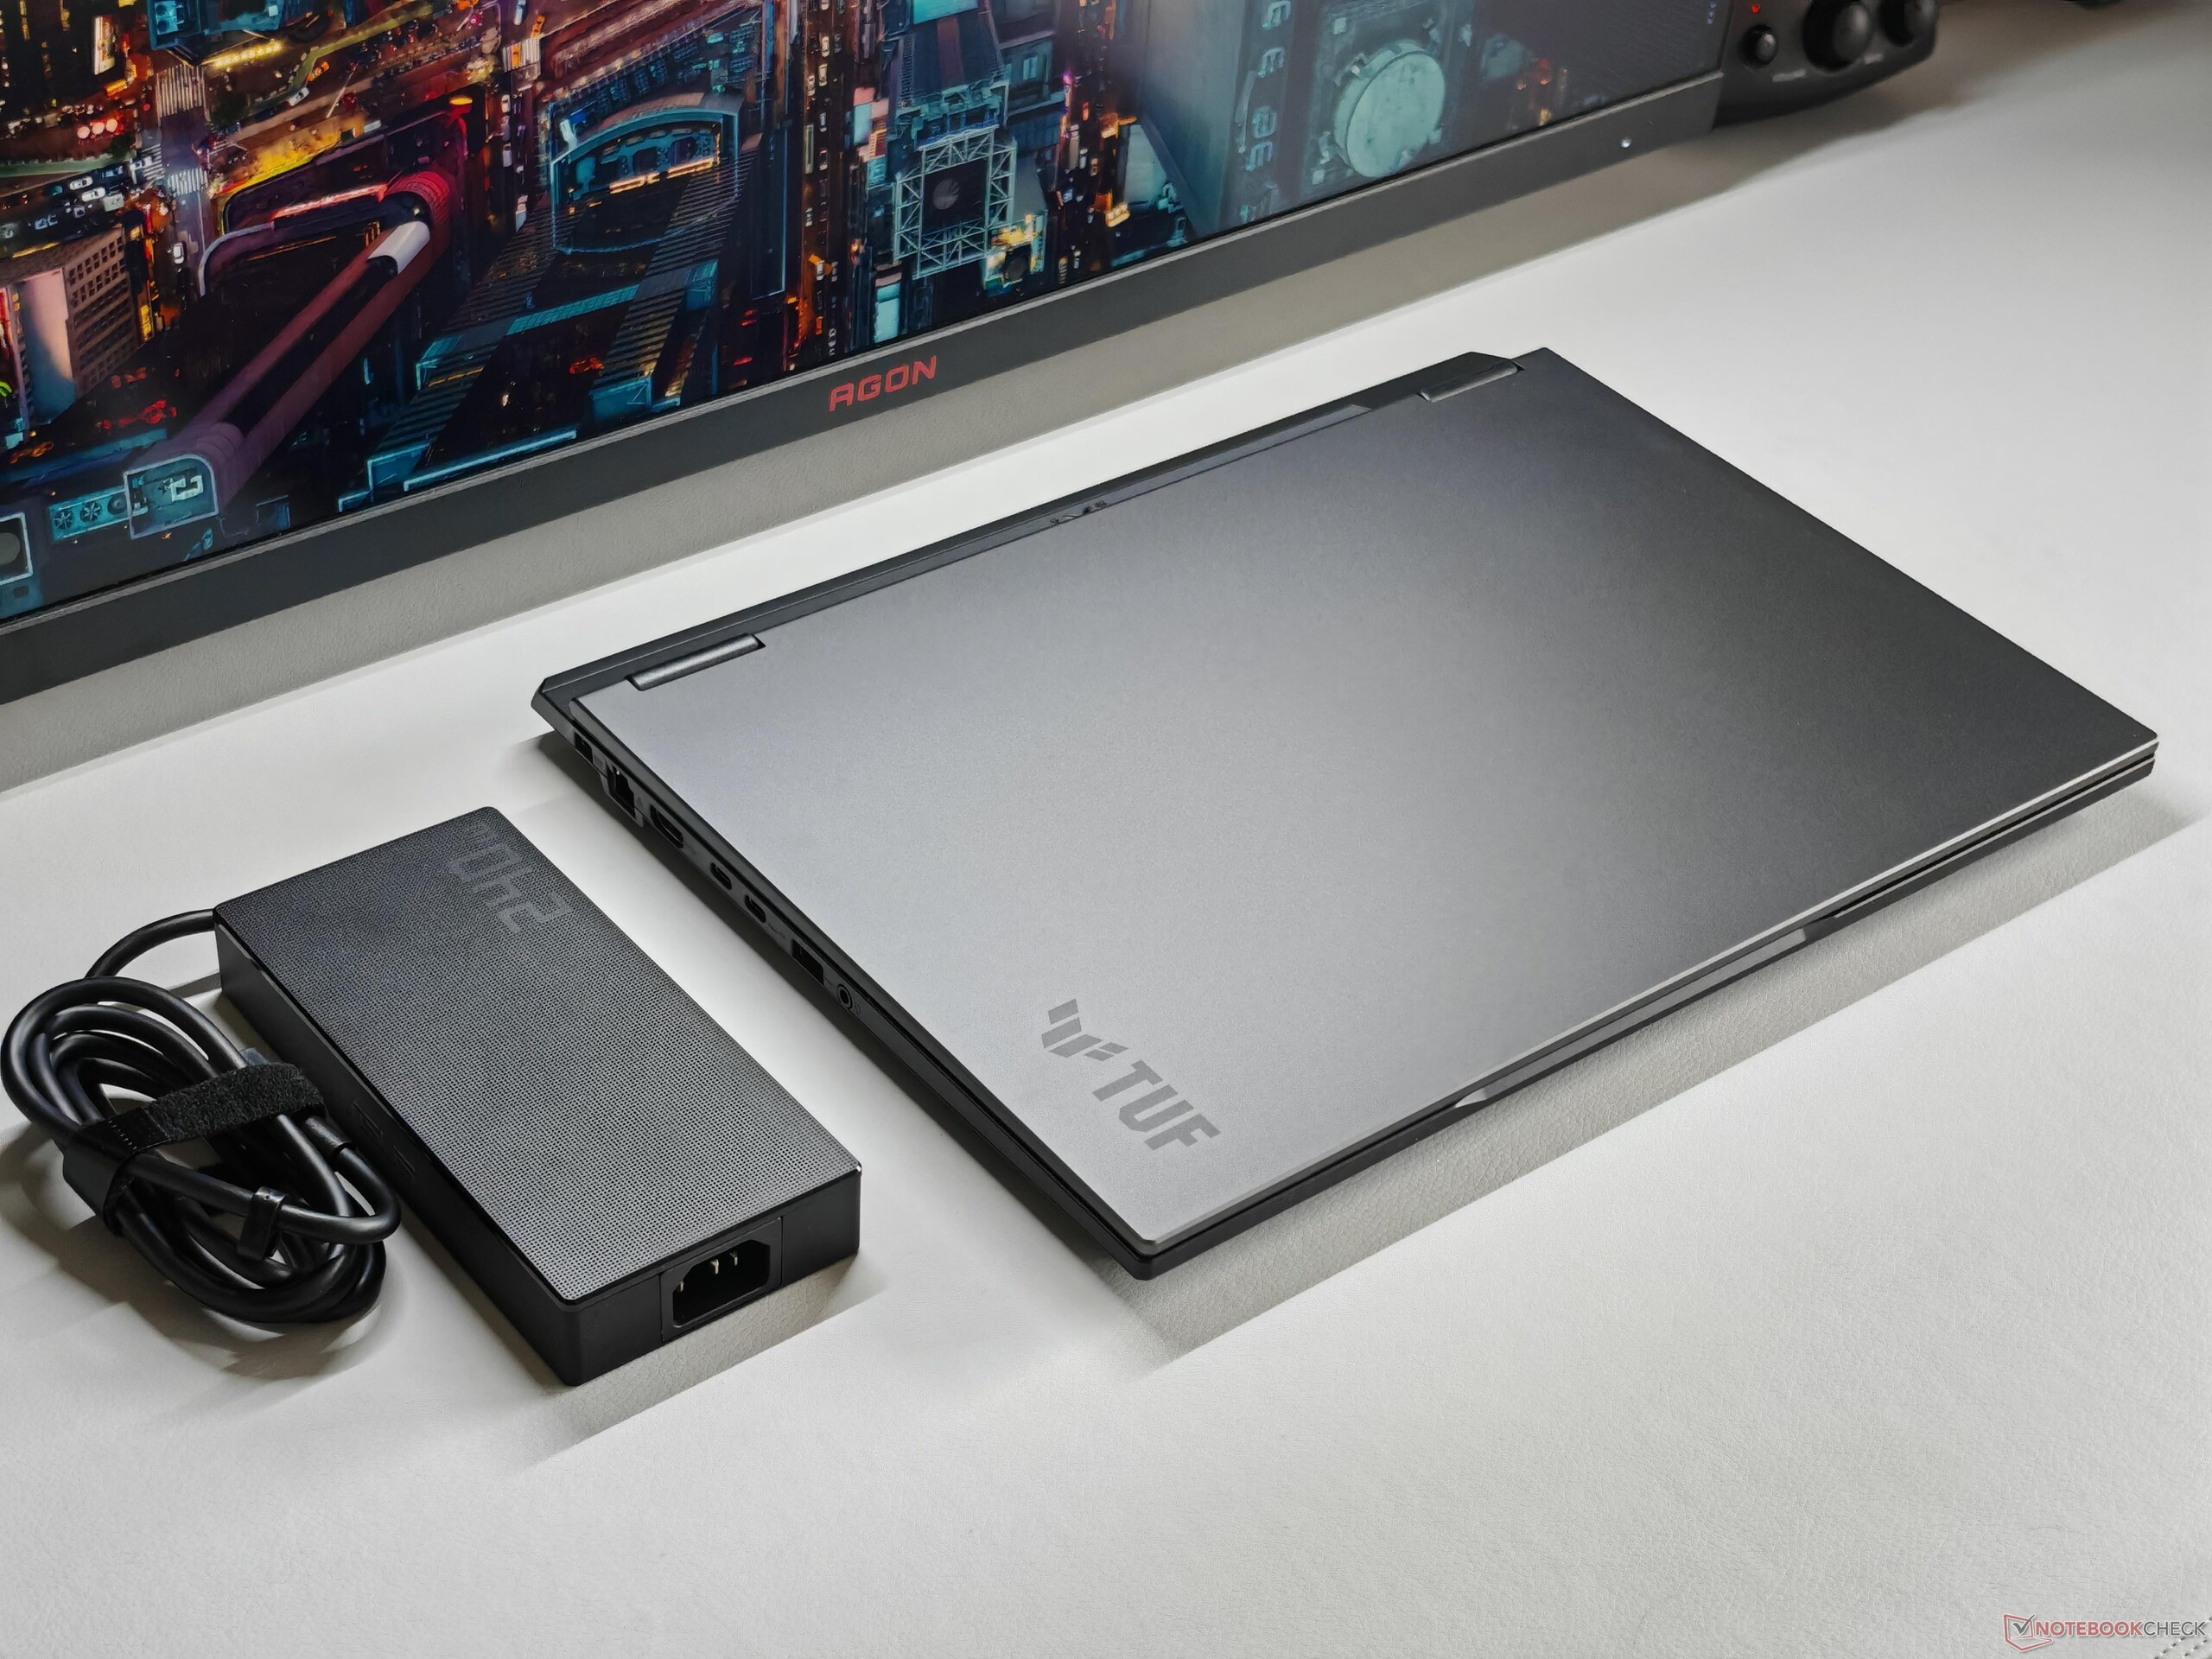
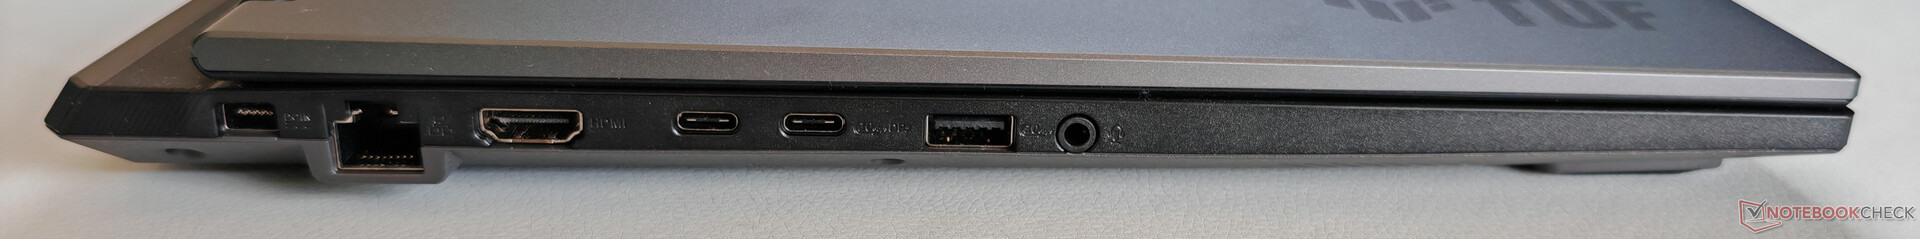
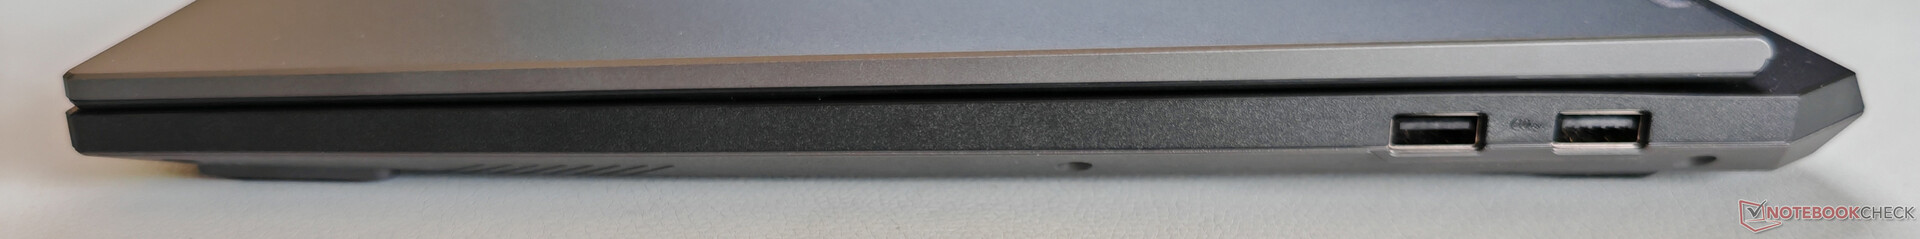
There are plenty of ports, but you have to do without USB 4.0. The 1080p webcam (includes IR sensor for face recognition) takes decent pictures and the Wi-Fi 6E module enables high transfer rates, although Wi-Fi 7 is not available.

| Networking | |
| Asus TUF Gaming A16 FA608UP | |
| iperf3 transmit AXE11000 | |
| iperf3 receive AXE11000 | |
| Alienware 16X Aurora, RTX 5070 | |
| iperf3 transmit AXE11000 | |
| iperf3 receive AXE11000 | |
| iperf3 transmit AXE11000 6GHz | |
| iperf3 receive AXE11000 6GHz | |
| Gigabyte Gaming A16 GA6H | |
| iperf3 transmit AXE11000 | |
| iperf3 receive AXE11000 | |
| Asus TUF Gaming A16 FA608WV | |
| iperf3 transmit AXE11000 | |
| iperf3 receive AXE11000 | |
| iperf3 transmit AXE11000 6GHz | |
| iperf3 receive AXE11000 6GHz | |
| Gigabyte Aero X16 1WH | |
| iperf3 transmit AXE11000 | |
| iperf3 receive AXE11000 | |
| Schenker XMG Pro 16 (E25) | |
| iperf3 transmit AXE11000 | |
| iperf3 receive AXE11000 | |


Input devices: Comfortable keyboard
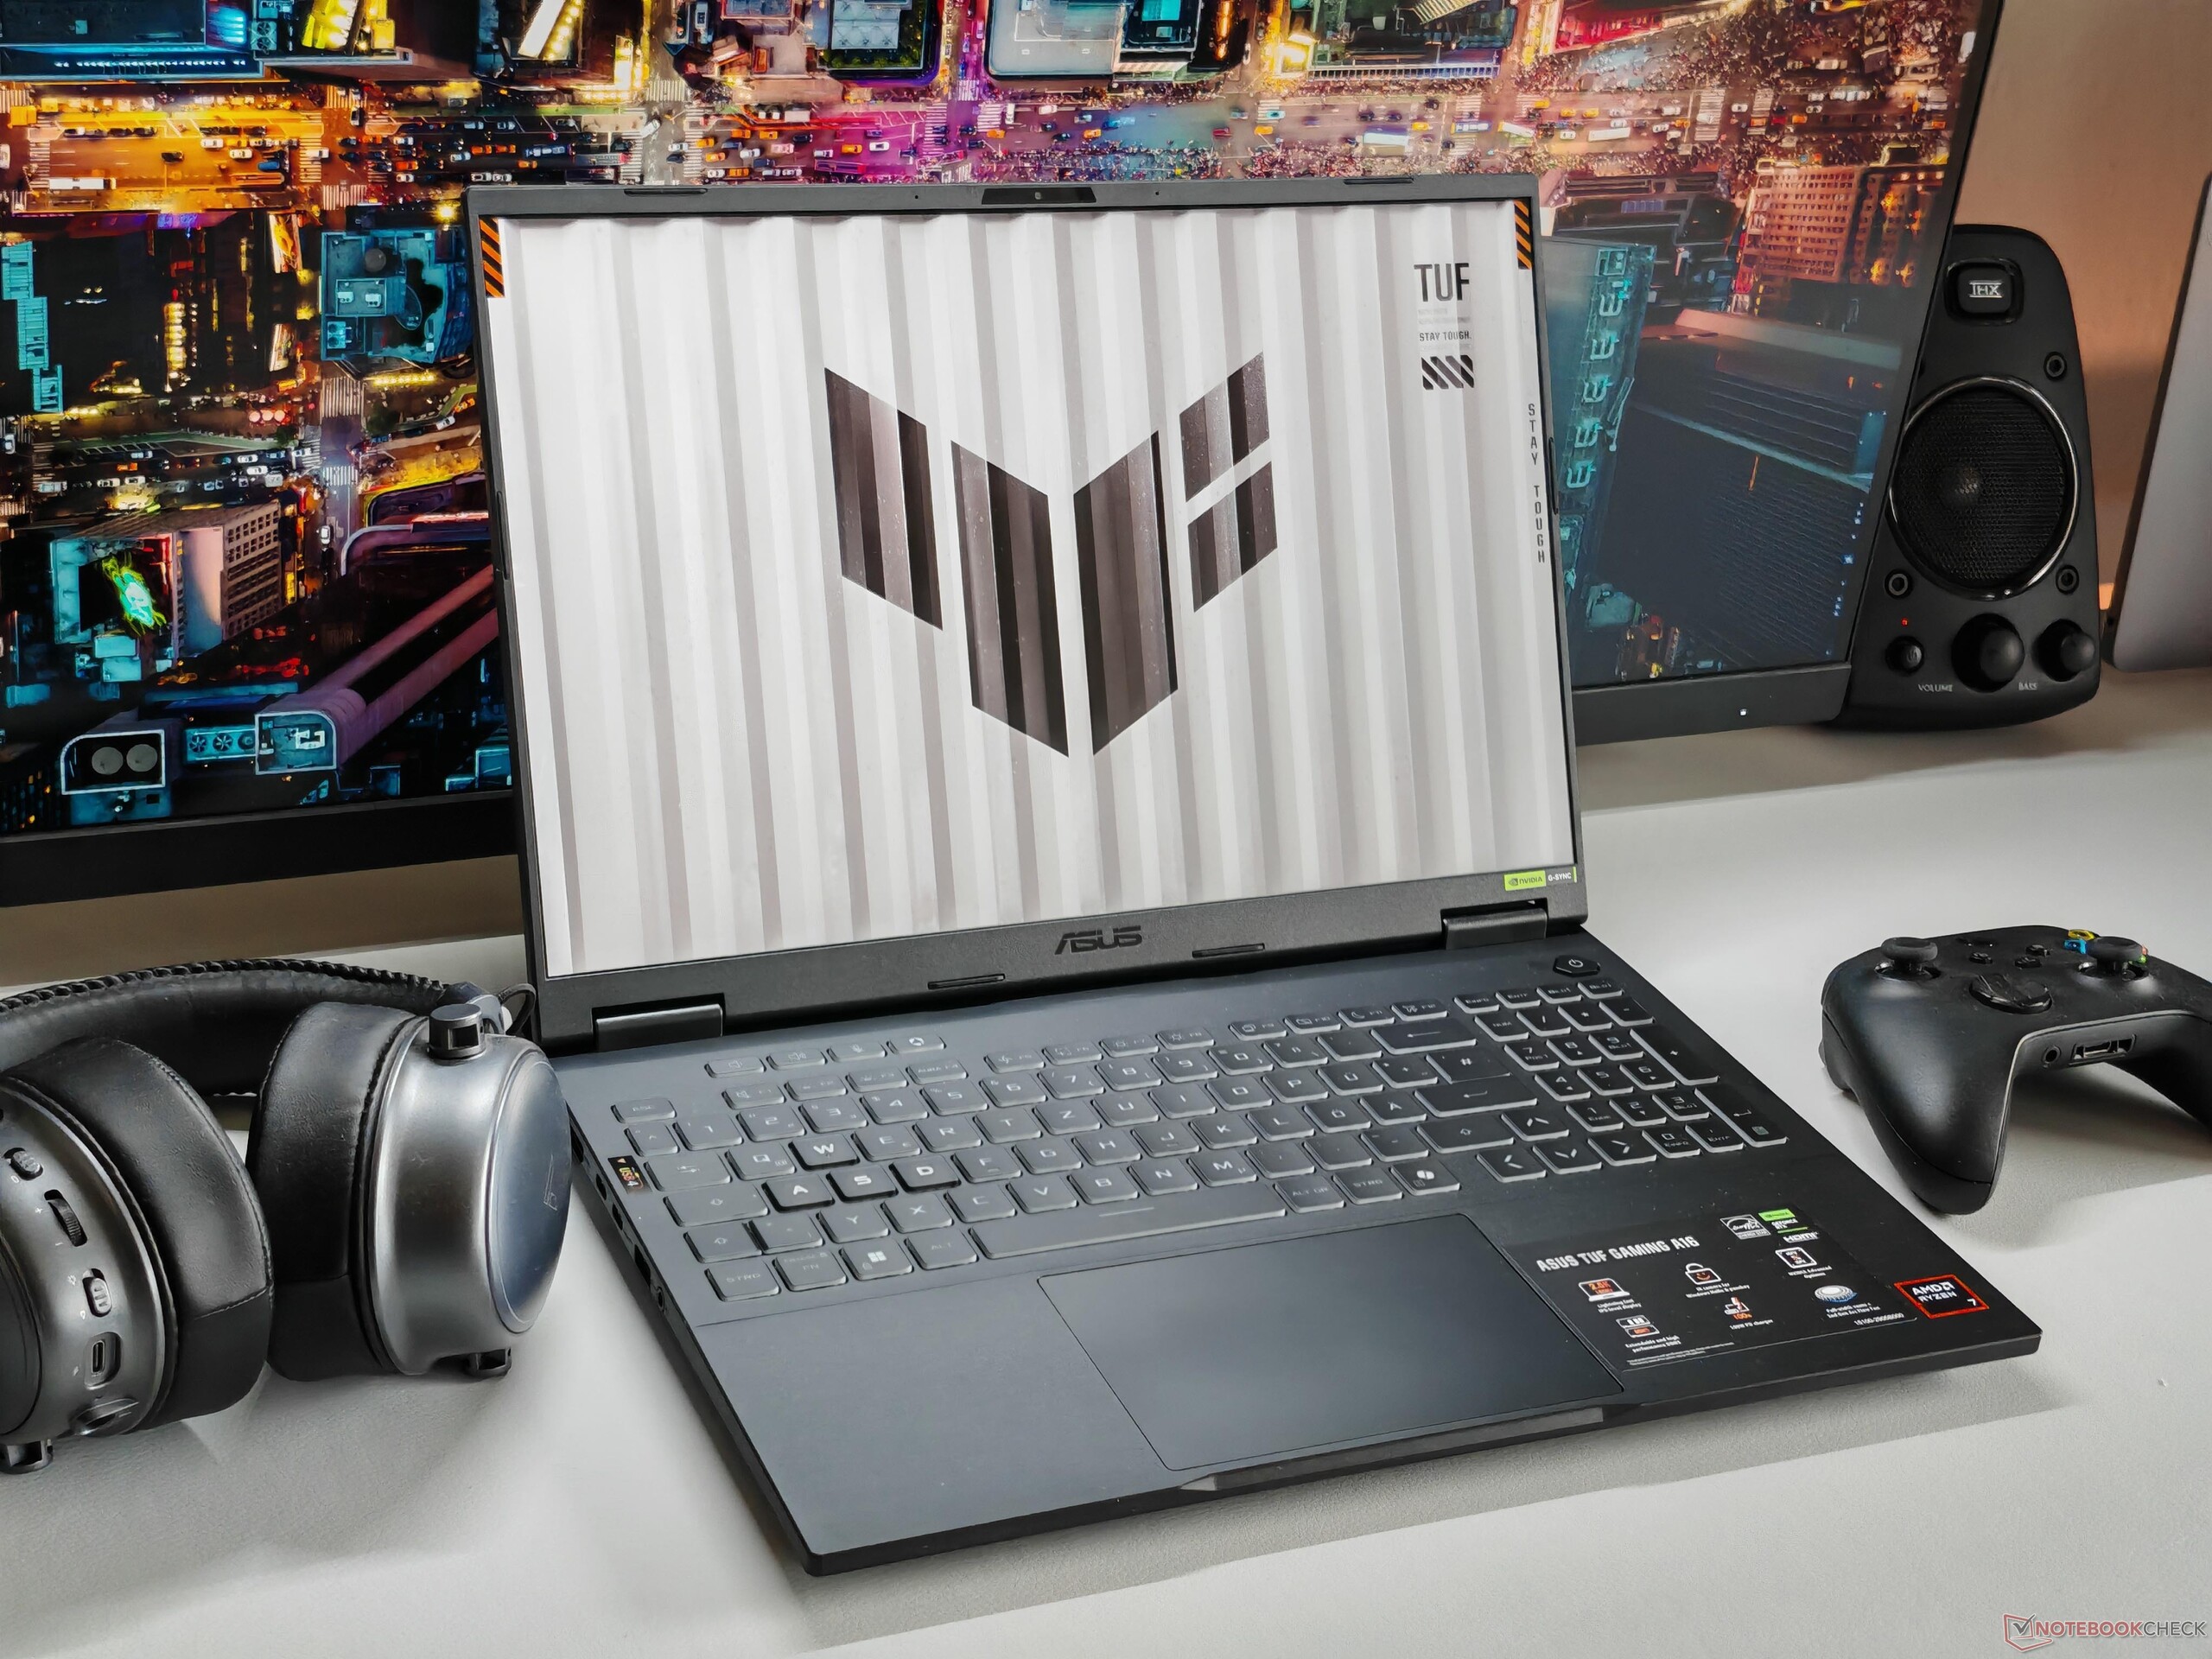
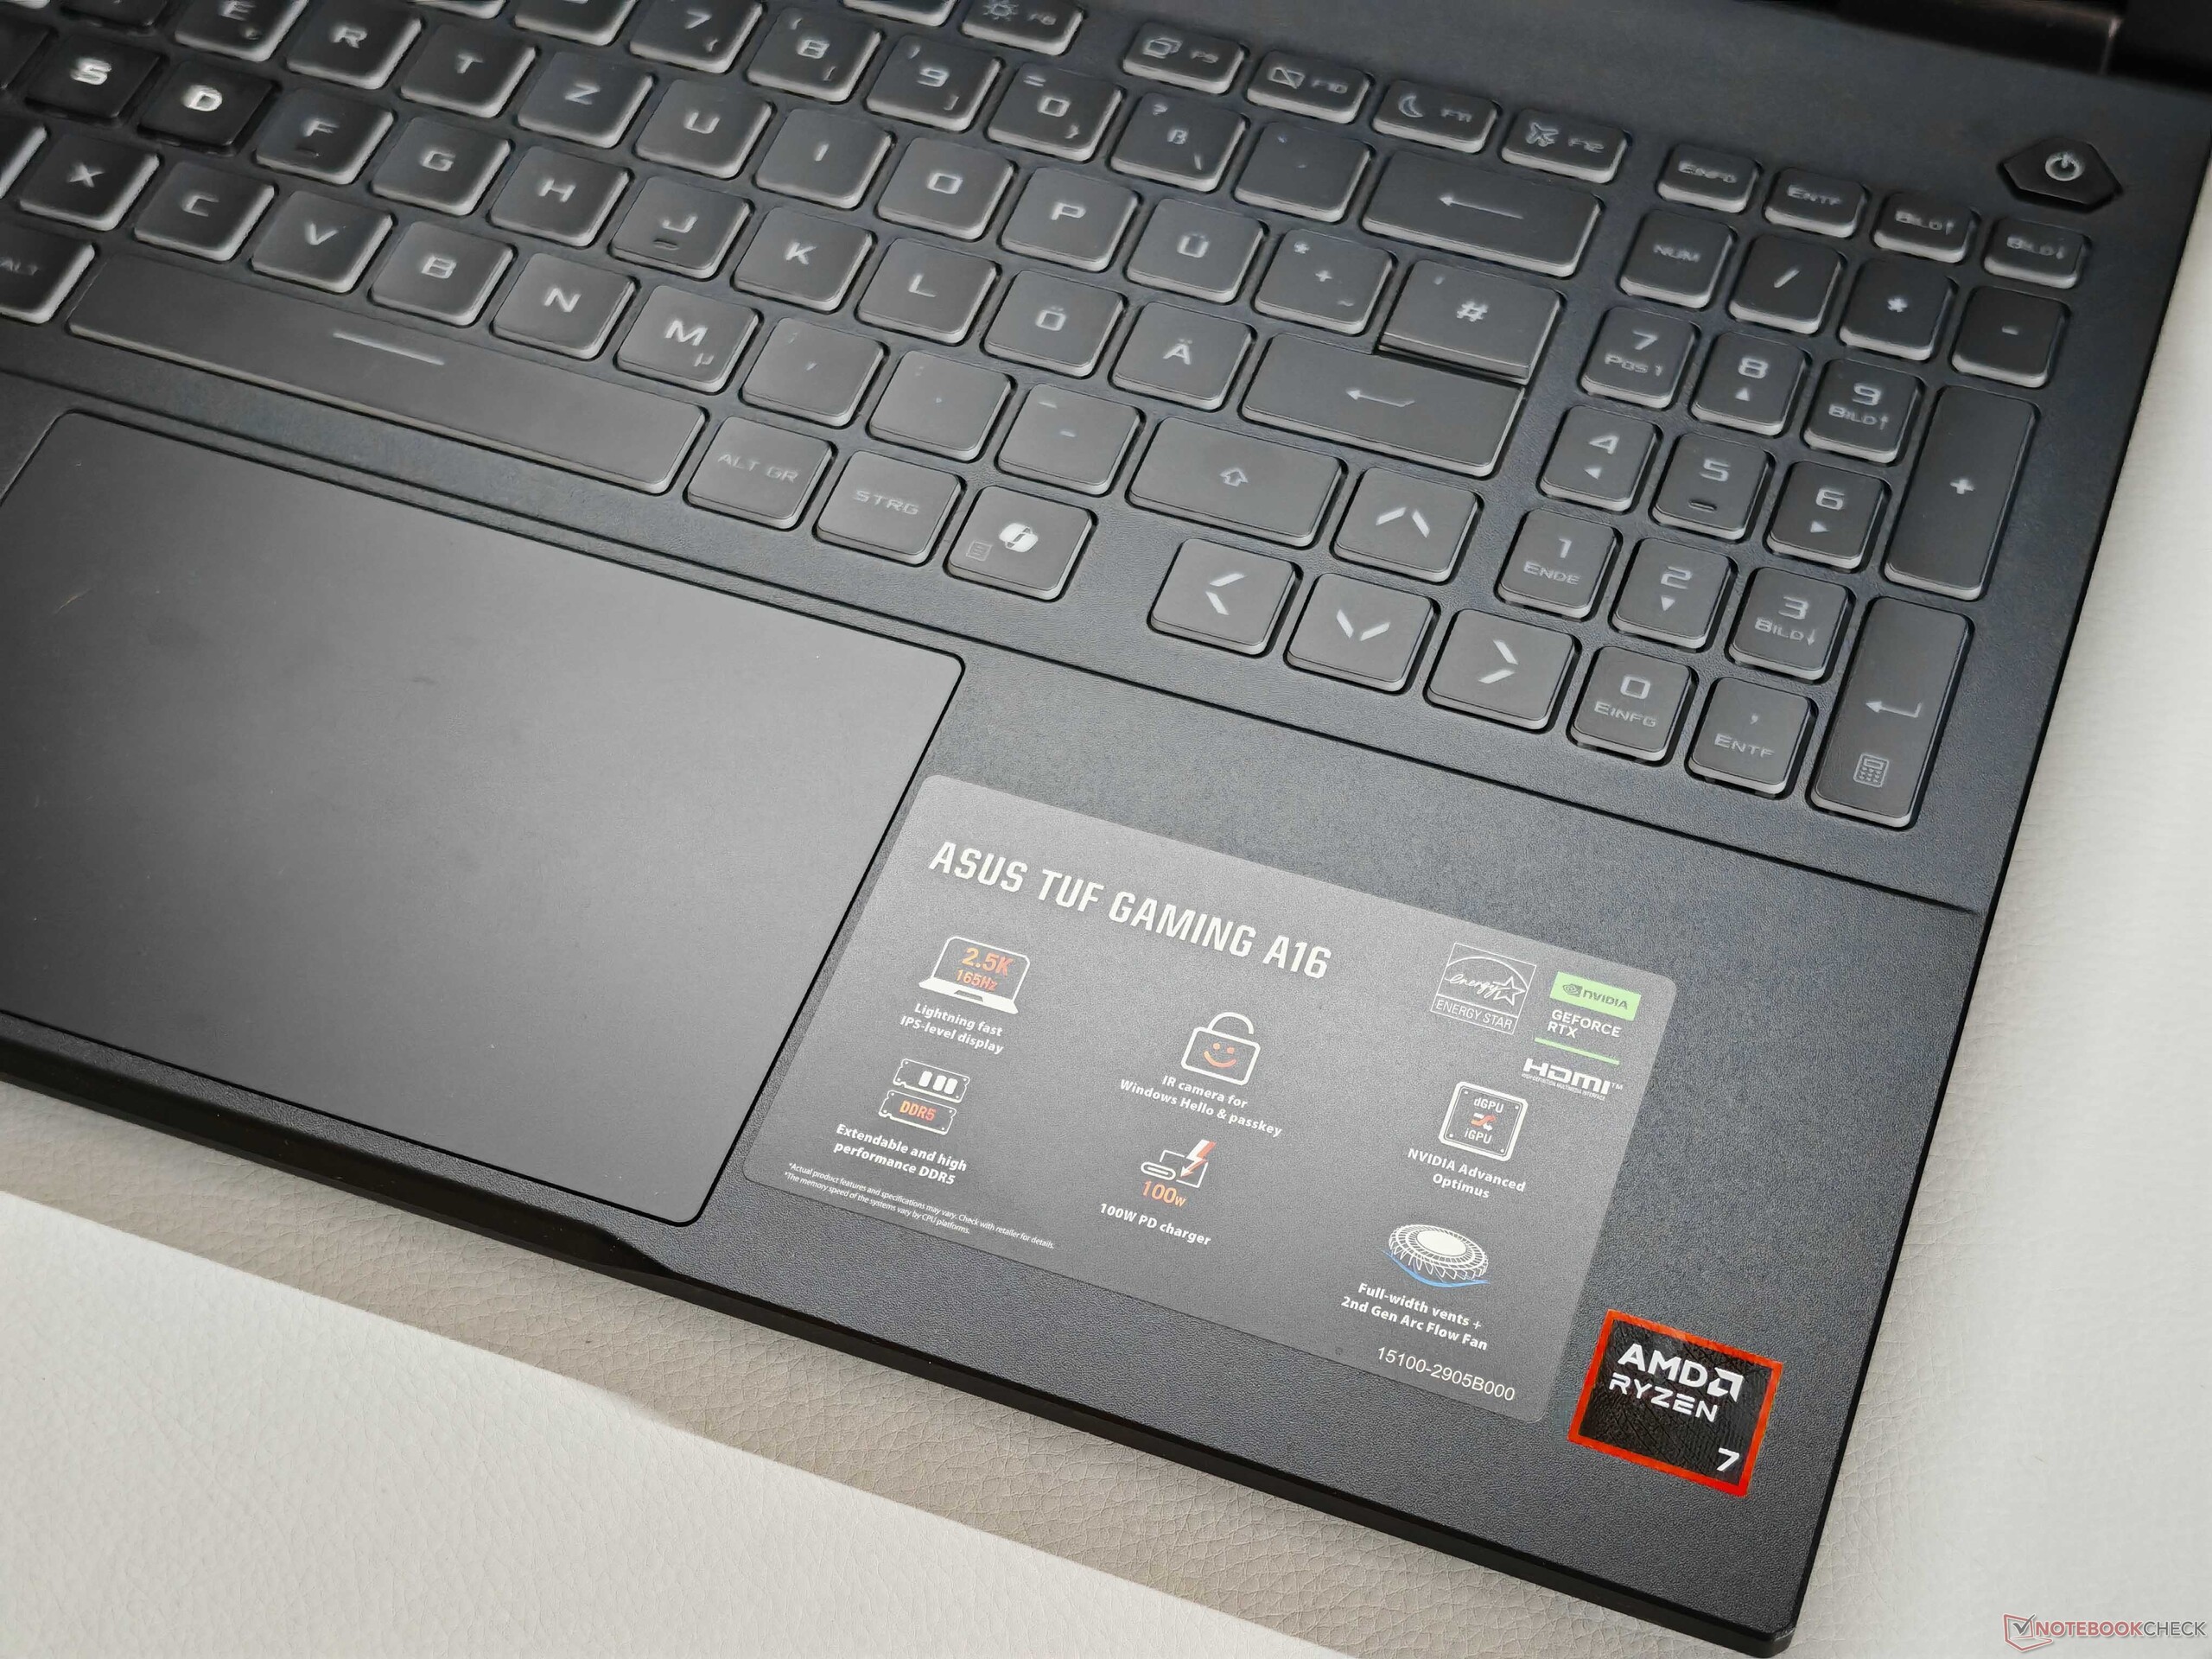
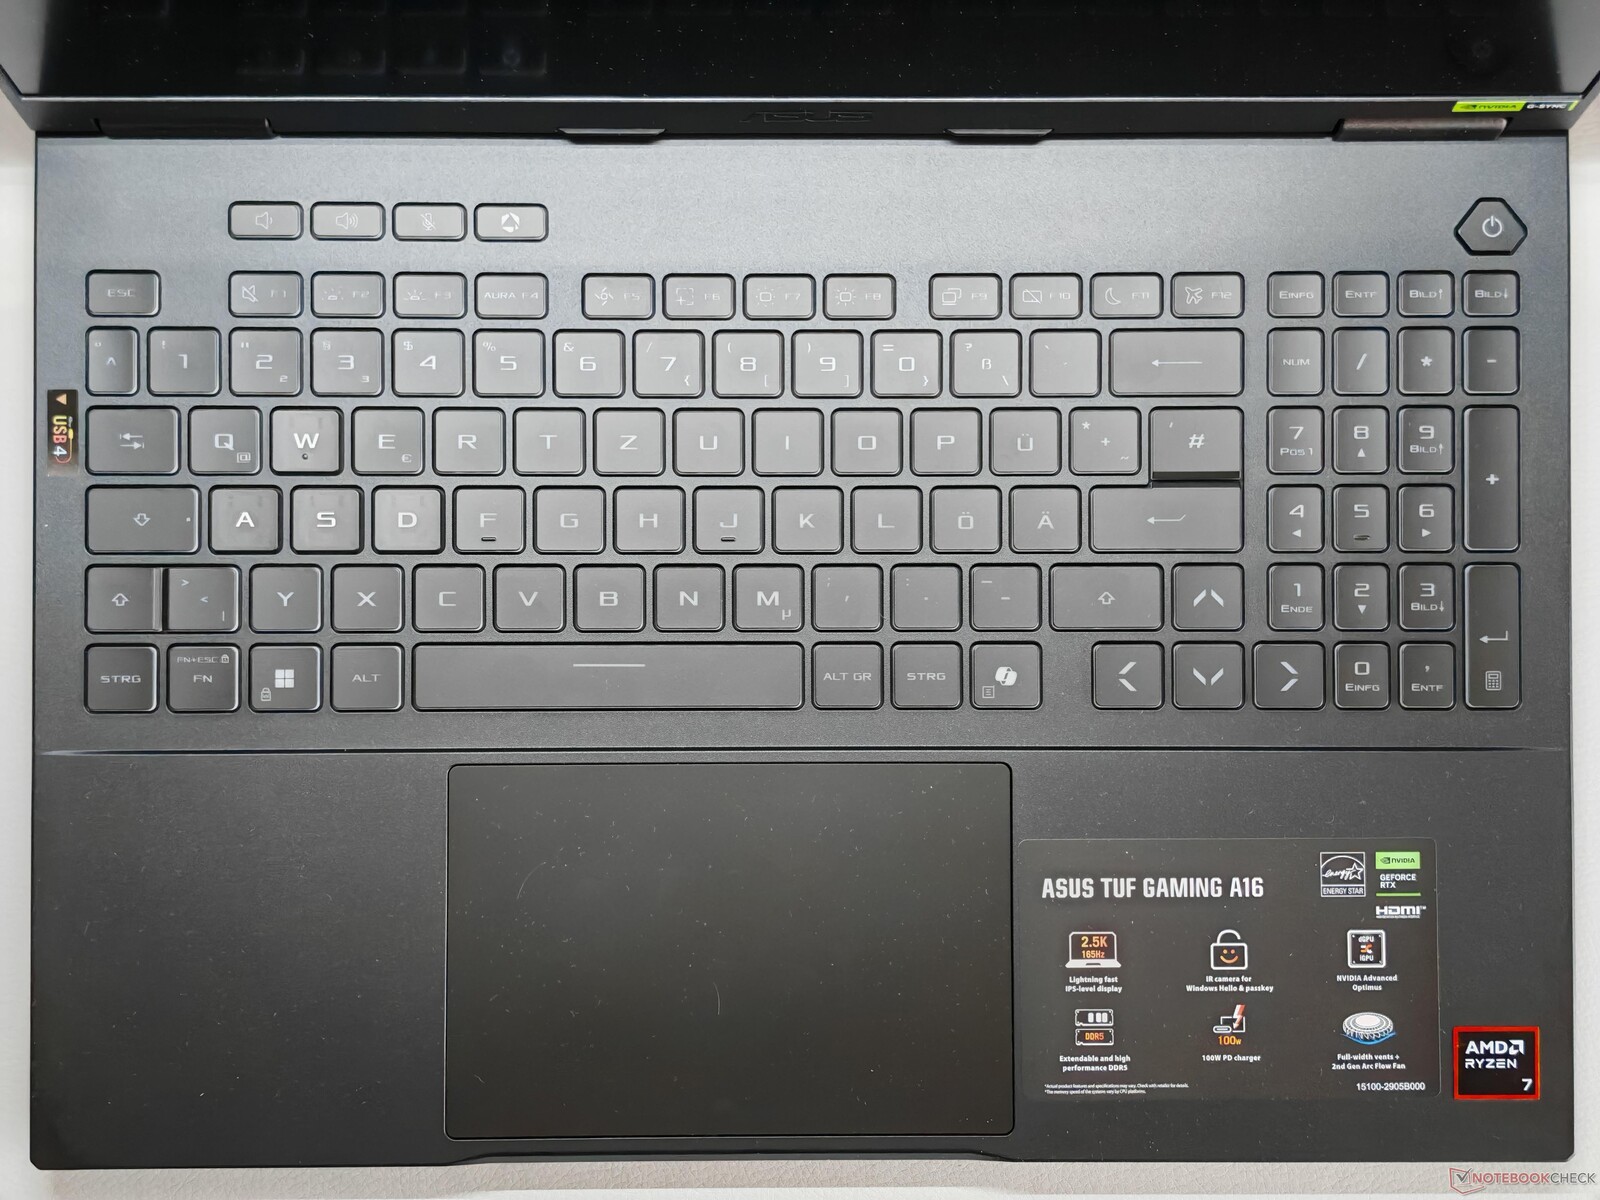
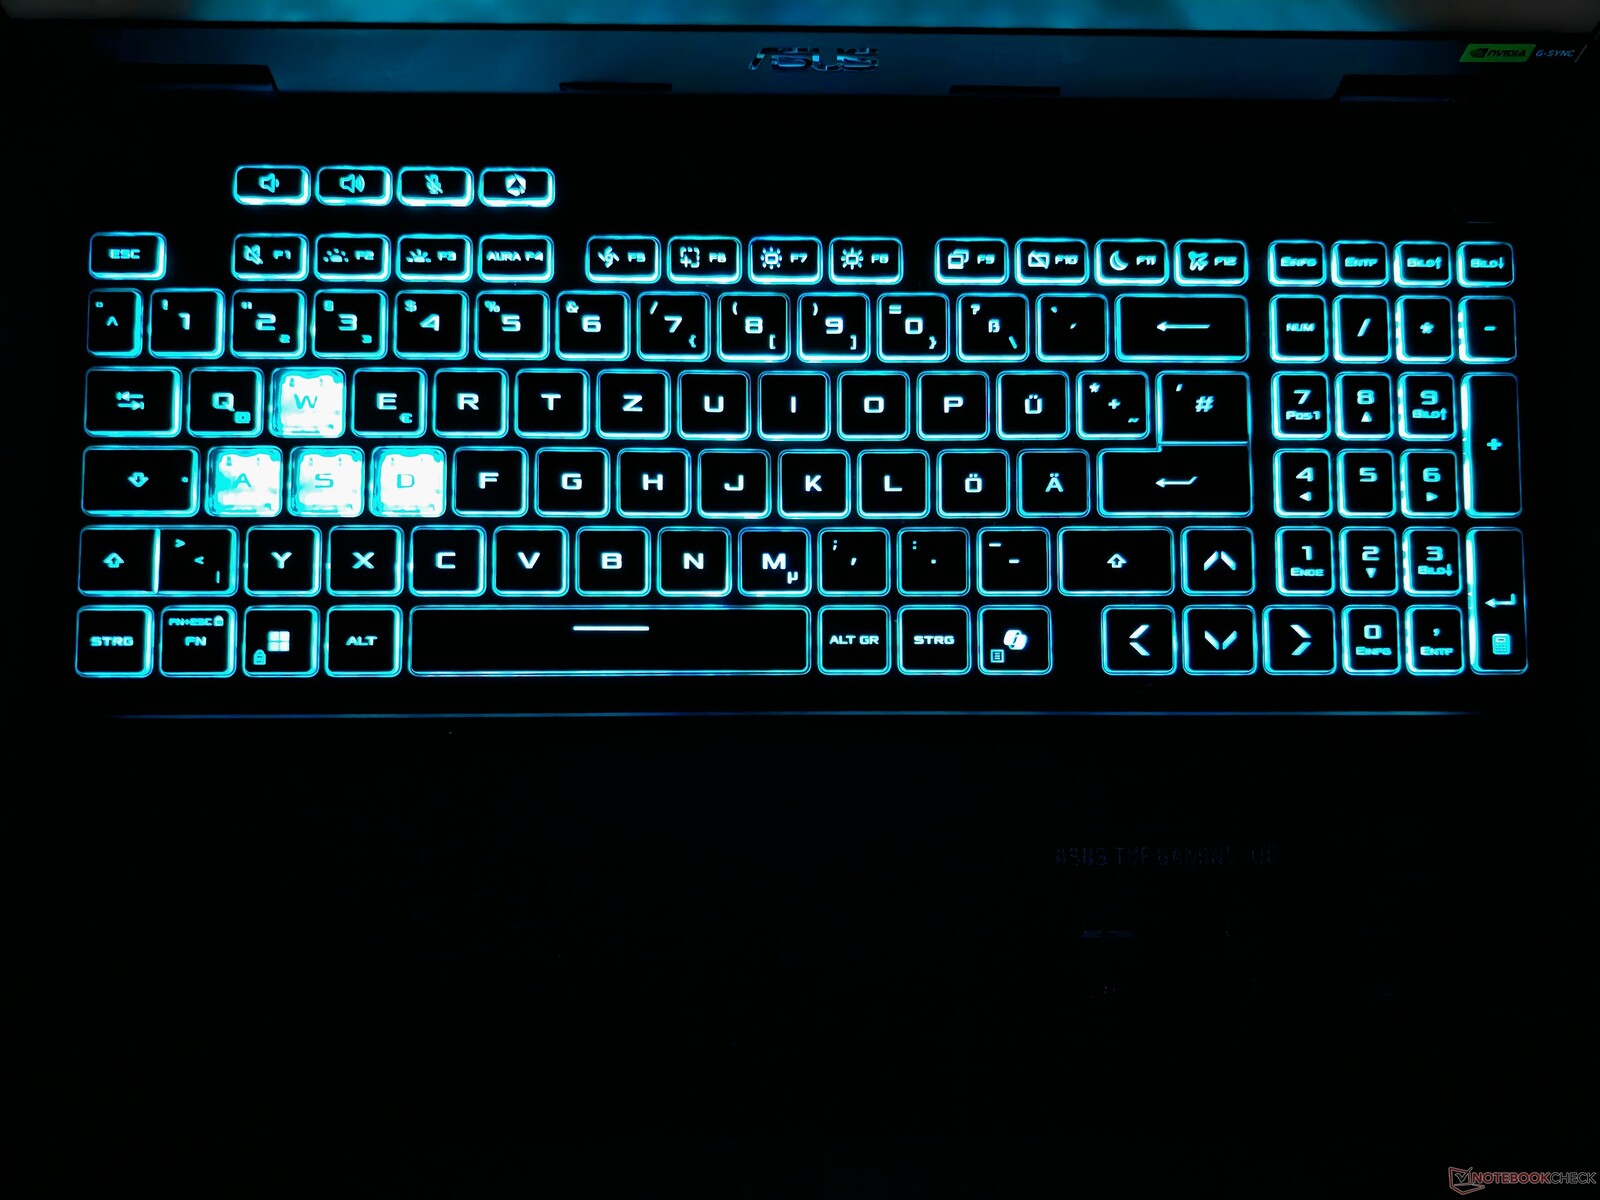
The keyboard has a dedicated numeric keypad and a few additional keys. Overall, the layout does not pose any puzzles and the typing experience is very comfortable thanks to the long 1.7 mm travel.
The WASD keys are slightly offset in terms of design, which is also clearly recognizable when the one-zone RGB lighting is activated.
The large 13 x 8.5 cm touchpad offers very good gliding properties and the mechanical clicks in the lower area are not too loud. However, the pad is slightly shifted to the left, which may take some getting used to.
Display: 165 Hz QHD with G-Sync and no PWM
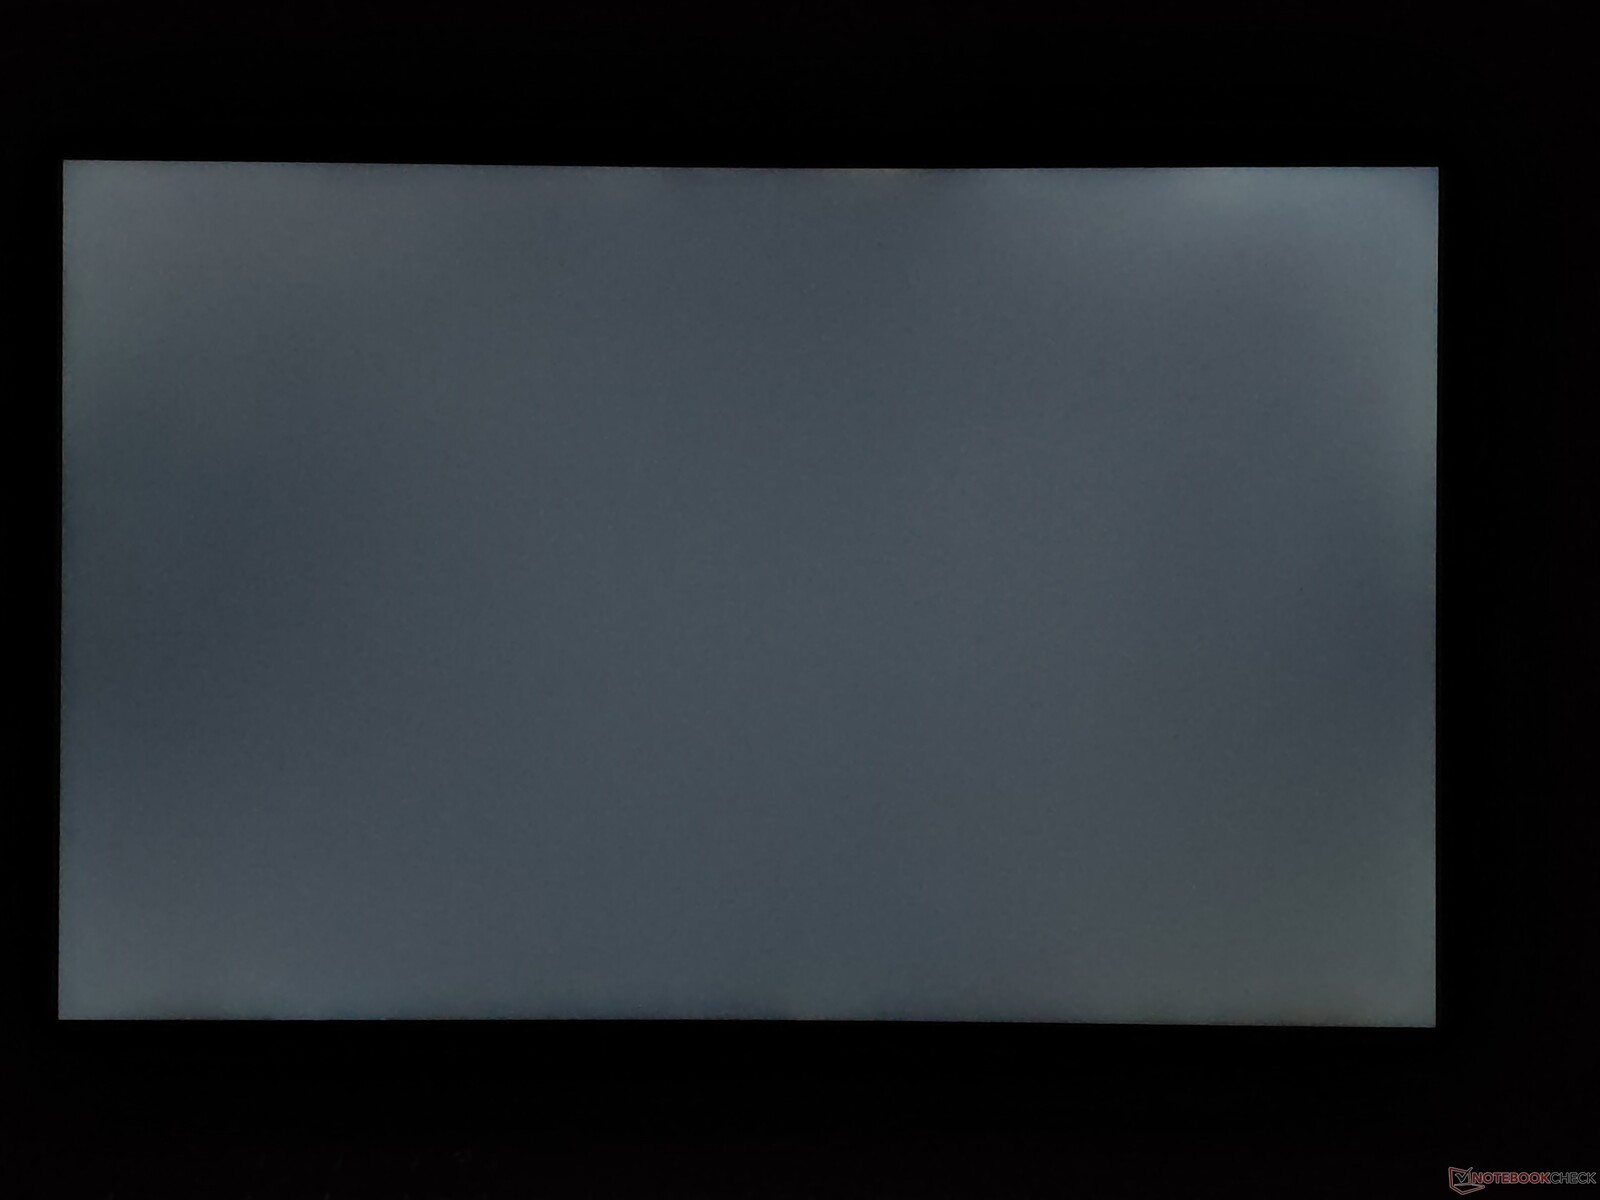
The matte IPS panel with a resolution of 2,560 x 1,600 pixels offers good subjective picture quality and even bright content does not appear grainy. Movements benefit from the high 165 Hz refresh rate as well as the fast response times and G-Sync. There is also no PWM flickering.
We determine an average brightness of 450 cd/m² in combination with a black value of 0.32 cd/m², which results in a good measured contrast ratio of 1,500:1.
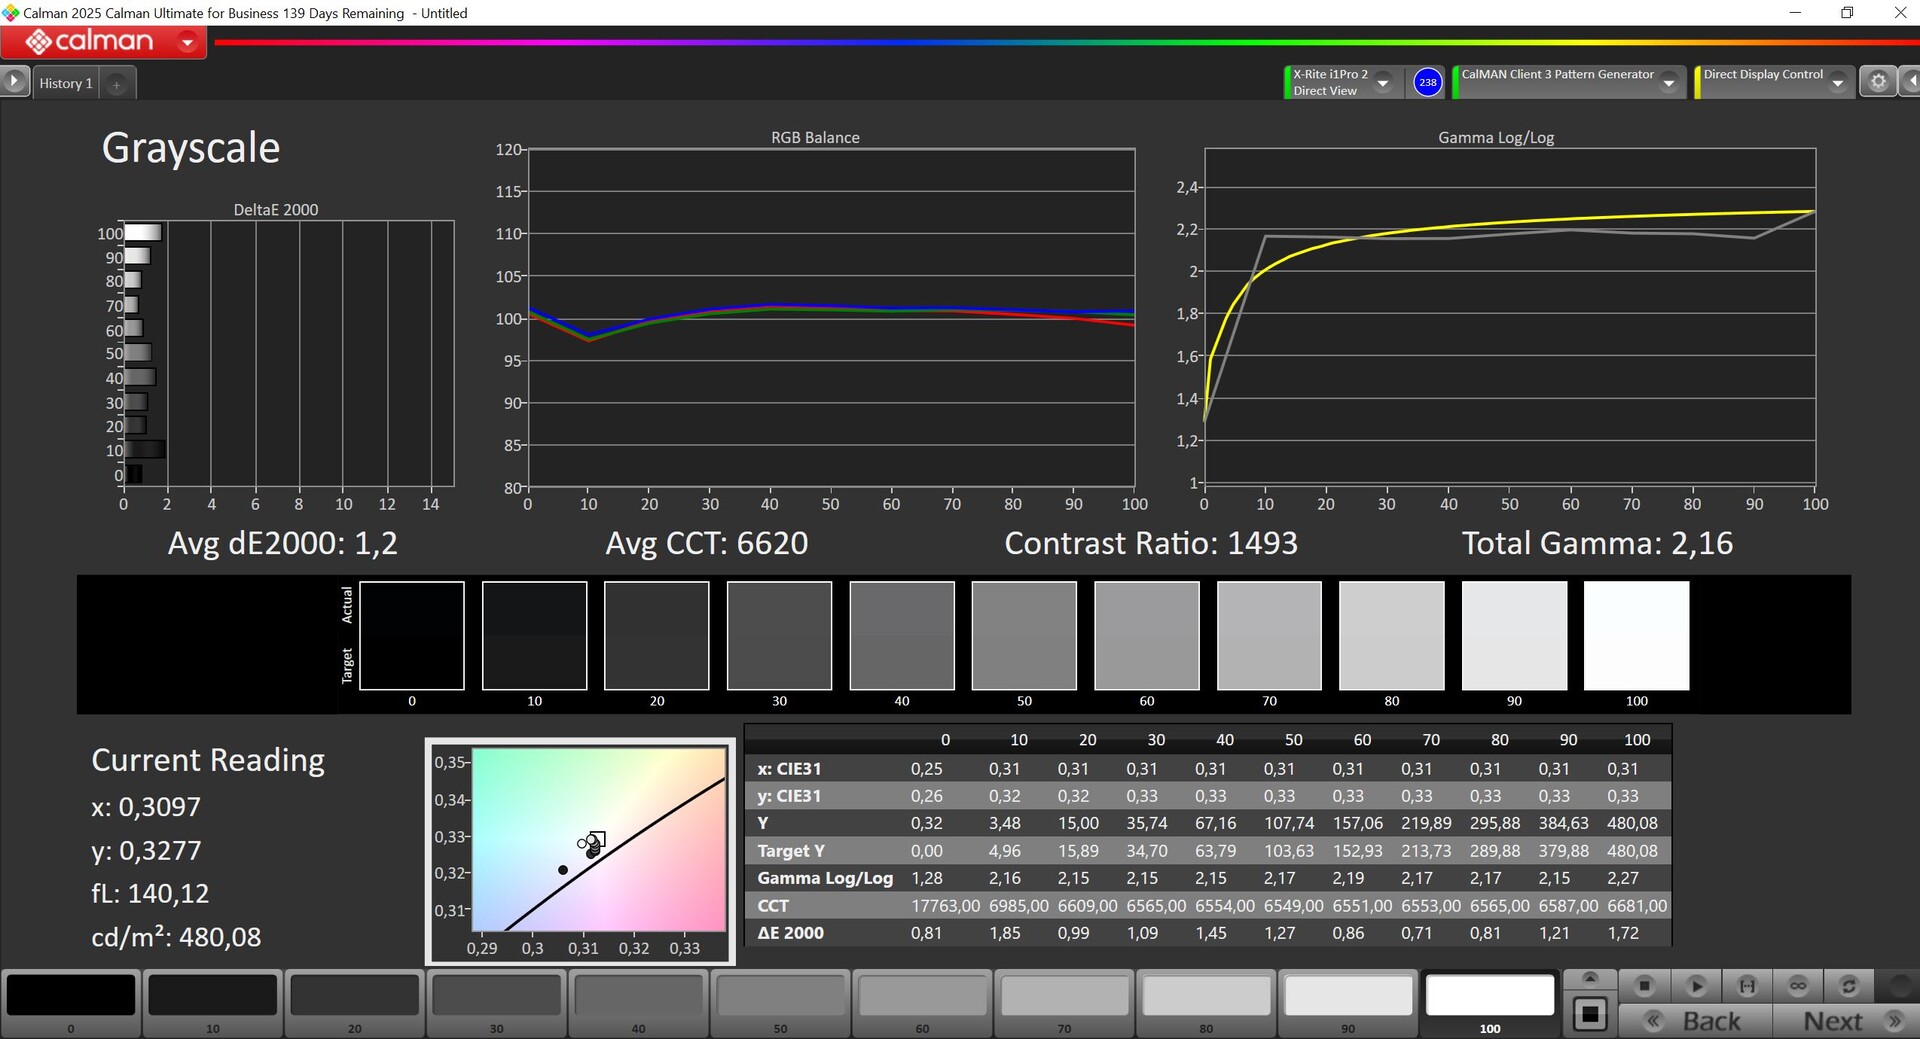
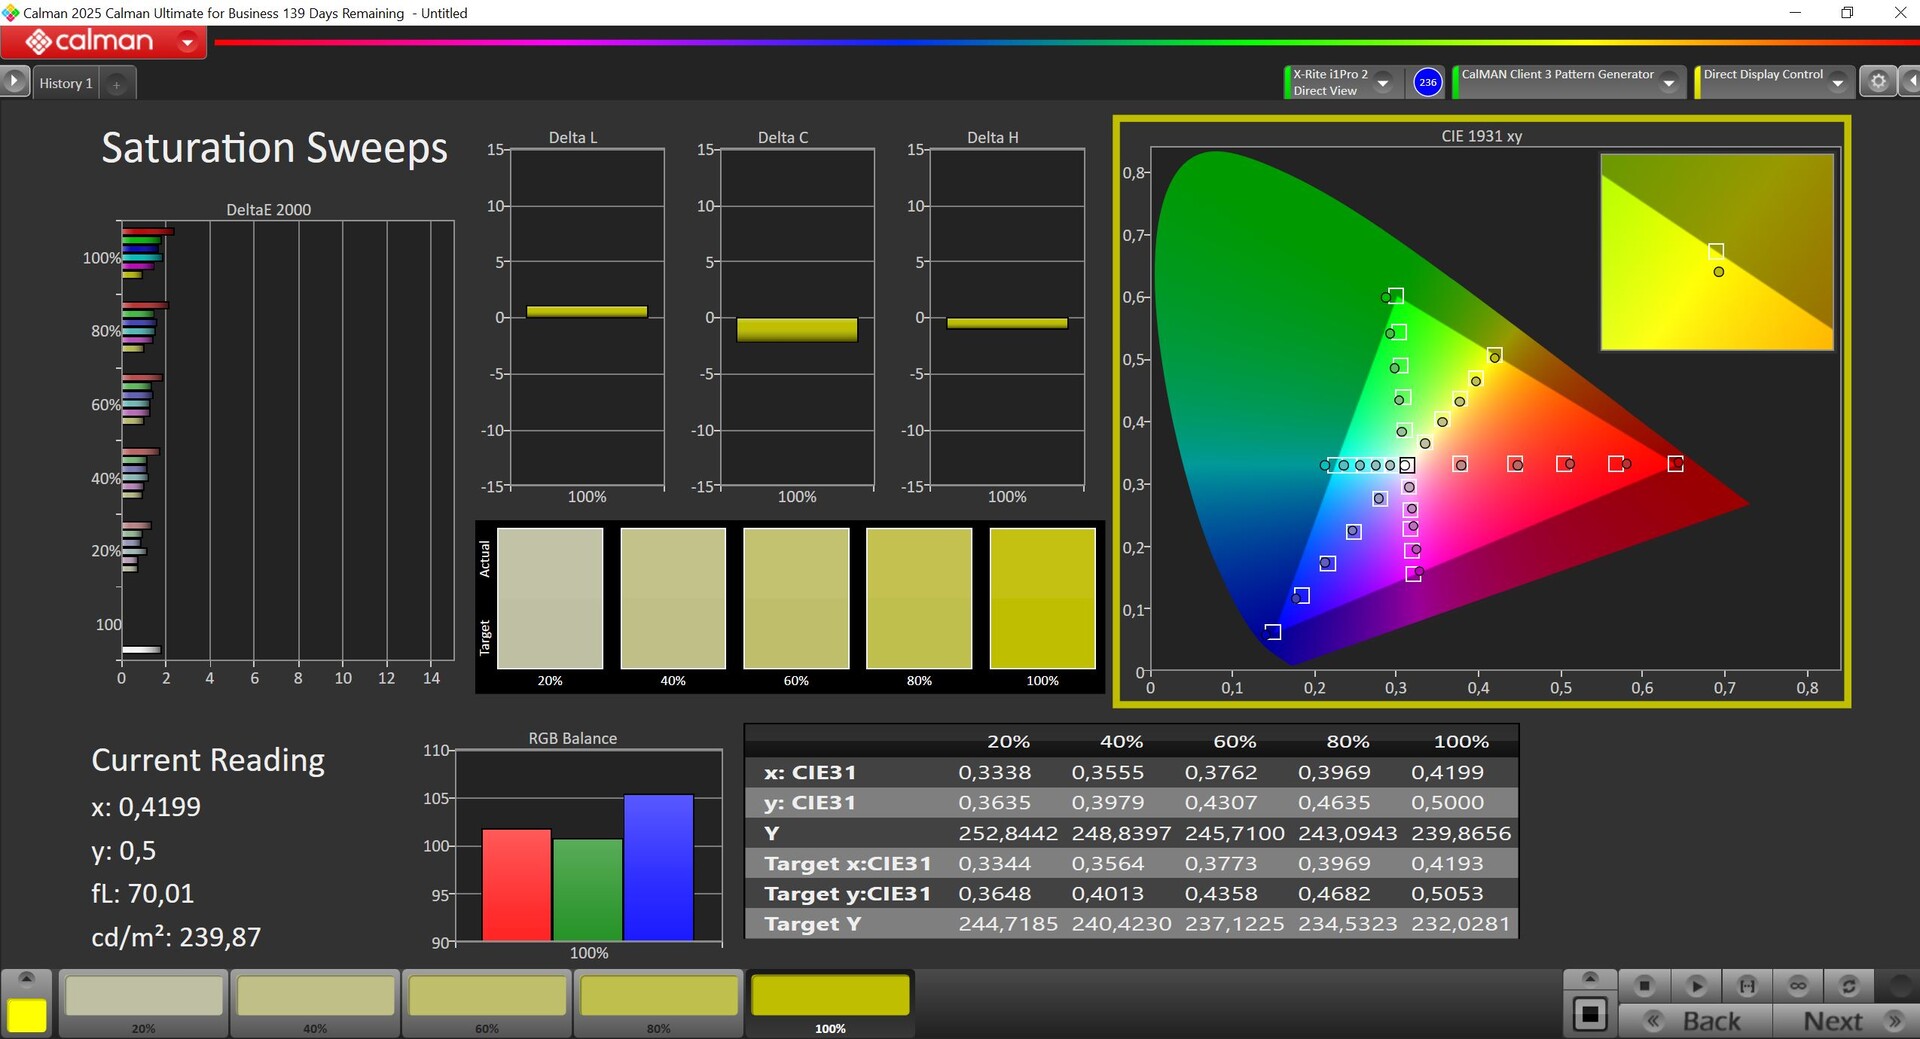
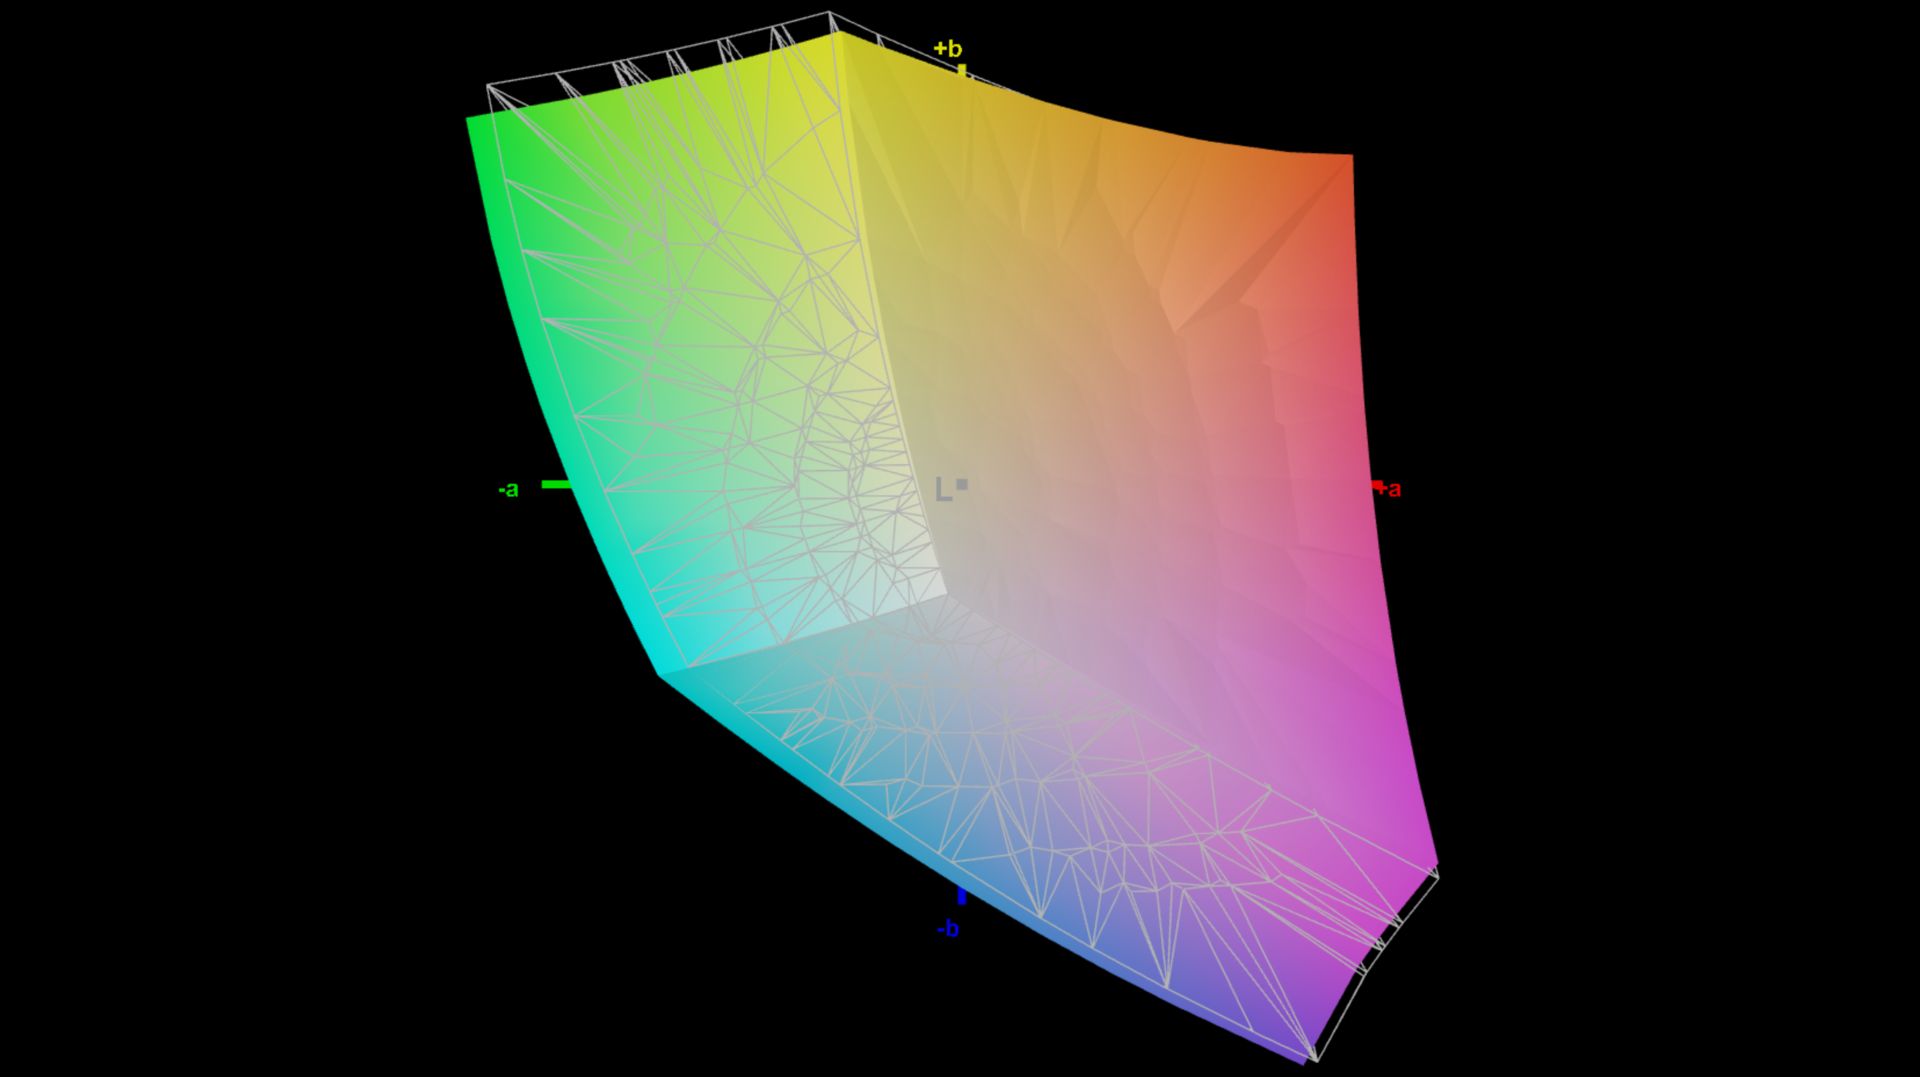
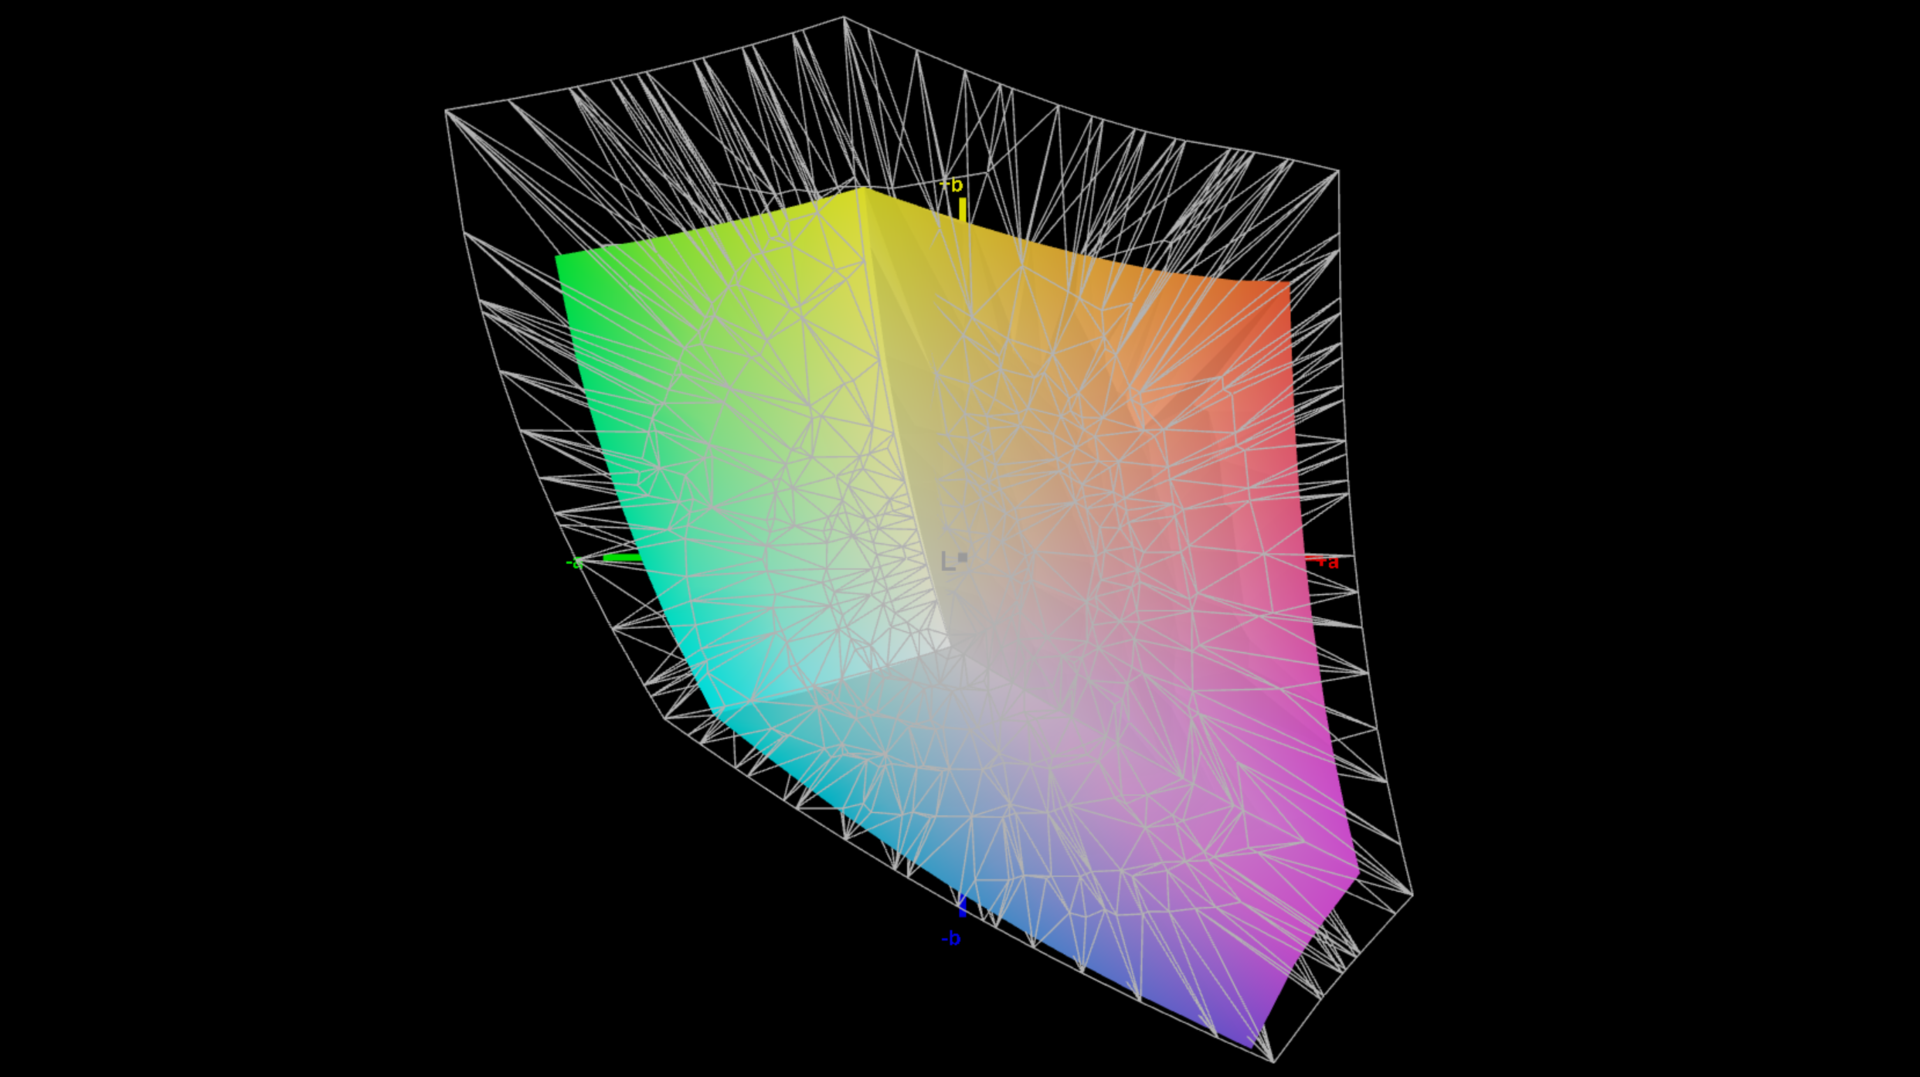
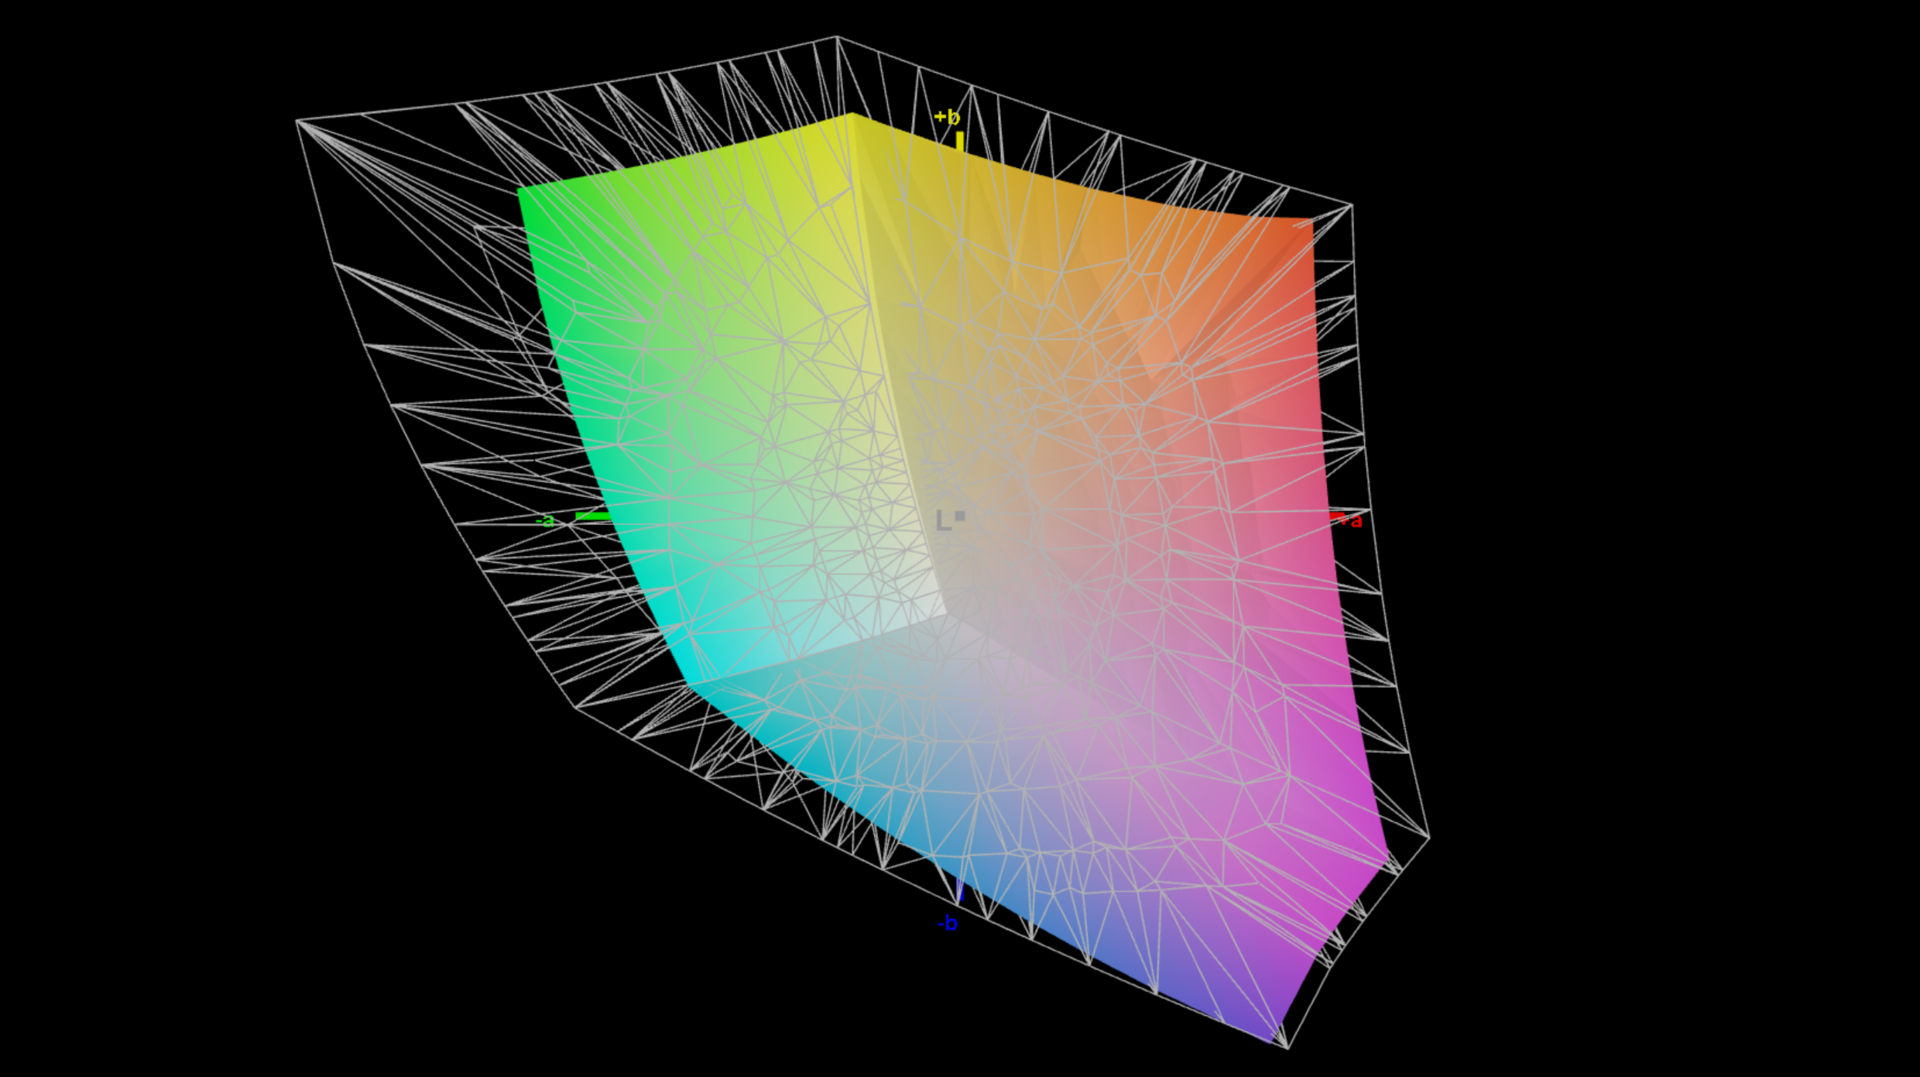
In contrast to the more expensive Zephyrus models, the panel only covers the sRGB color space and there is only a single color profile, but this is already set very well ex-works.
Our analysis with the professional Calman Ultimate software from Portrait Displays shows minor color deviations and there is also no color cast in the grayscale. We could improve the display slightly with our own calibration, but this is not really necessary.
| |||||||||||||||||||||||||
Brightness Distribution: 91 %
Contrast: 1500:1 (Black: 0.32 cd/m²)
ΔE ColorChecker Calman: 1.4 | ∀{0.5-29.43 Ø4.76}
calibrated: 1.3
ΔE Greyscale Calman: 1.2 | ∀{0.09-98 Ø5}
71.9% AdobeRGB 1998 (Argyll 3D)
97.2% sRGB (Argyll 3D)
69.4% Display P3 (Argyll 3D)
Gamma: 2.16
CCT: 6620 K
| Asus TUF Gaming A16 FA608UP MNG007DA5-3, IPS, 2560x1600, 16", 165 Hz | Alienware 16X Aurora, RTX 5070 LG Philips 160WQG, IPS, 2560x1600, 16", 240 Hz | Gigabyte Gaming A16 GA6H NE160QDM-NYJ (BOE0C80), IPS, 2560x1600, 16", 165 Hz | Asus TUF Gaming A16 FA608WV B160UAN08.1 (AUO9BB0), IPS, 1920x1200, 16", 144 Hz | Gigabyte Aero X16 1WH MNG007DA5-1, IPS, 2560x1600, 16", 165 Hz | Schenker XMG Pro 16 (E25) NE160QDM-NZL, IPS, 2560x1600, 16", 300 Hz | |
|---|---|---|---|---|---|---|
| Display | 23% | 1% | -42% | -1% | 5% | |
| Display P3 Coverage (%) | 69.4 | 96.9 40% | 69.4 0% | 39.8 -43% | 68.7 -1% | 74.7 8% |
| sRGB Coverage (%) | 97.2 | 99.8 3% | 99.5 2% | 59.7 -39% | 96.1 -1% | 99.8 3% |
| AdobeRGB 1998 Coverage (%) | 71.9 | 89.7 25% | 71.6 0% | 41.1 -43% | 71.2 -1% | 75.4 5% |
| Response Times | -25% | -87% | -96% | -54% | -40% | |
| Response Time Grey 50% / Grey 80% * (ms) | 6.3 ? | 4.3 ? 32% | 14.3 ? -127% | 13.6 ? -116% | 12 ? -90% | 10.5 ? -67% |
| Response Time Black / White * (ms) | 4.8 ? | 8.7 ? -81% | 7 ? -46% | 8.4 ? -75% | 5.6 ? -17% | 5.4 ? -13% |
| PWM Frequency (Hz) | ||||||
| Screen | -64% | -105% | -173% | -12% | -34% | |
| Brightness middle (cd/m²) | 480 | 493.2 3% | 432 -10% | 347 -28% | 395 -18% | 538 12% |
| Brightness (cd/m²) | 456 | 477 5% | 425 -7% | 321 -30% | 398 -13% | 508 11% |
| Brightness Distribution (%) | 91 | 93 2% | 91 0% | 88 -3% | 97 7% | 88 -3% |
| Black Level * (cd/m²) | 0.32 | 0.5 -56% | 0.37 -16% | 0.3 6% | 0.32 -0% | 0.47 -47% |
| Contrast (:1) | 1500 | 986 -34% | 1168 -22% | 1157 -23% | 1234 -18% | 1145 -24% |
| Colorchecker dE 2000 * | 1.4 | 3.57 -155% | 4.76 -240% | 5.89 -321% | 1.3 7% | 1.9 -36% |
| Colorchecker dE 2000 max. * | 2.5 | 7.03 -181% | 8.59 -244% | 19.26 -670% | 2.8 -12% | 4 -60% |
| Colorchecker dE 2000 calibrated * | 1.3 | 0.68 48% | 1.18 9% | 4.3 -231% | 1.4 -8% | |
| Greyscale dE 2000 * | 1.2 | 3.7 -208% | 6.2 -417% | 4.27 -256% | 1.8 -50% | 2.7 -125% |
| Gamma | 2.16 102% | 2.16 102% | 2.079 106% | 2.47 89% | 2.2 100% | 2.24 98% |
| CCT | 6620 98% | 5876 111% | 6690 97% | 7158 91% | 6842 95% | 7027 93% |
| Total Average (Program / Settings) | -22% /
-40% | -64% /
-80% | -104% /
-134% | -22% /
-15% | -23% /
-26% |
* ... smaller is better


Display Response Times
| ↔ Response Time Black to White | ||
|---|---|---|
| 4.8 ms ... rise ↗ and fall ↘ combined | ↗ 1.7 ms rise | 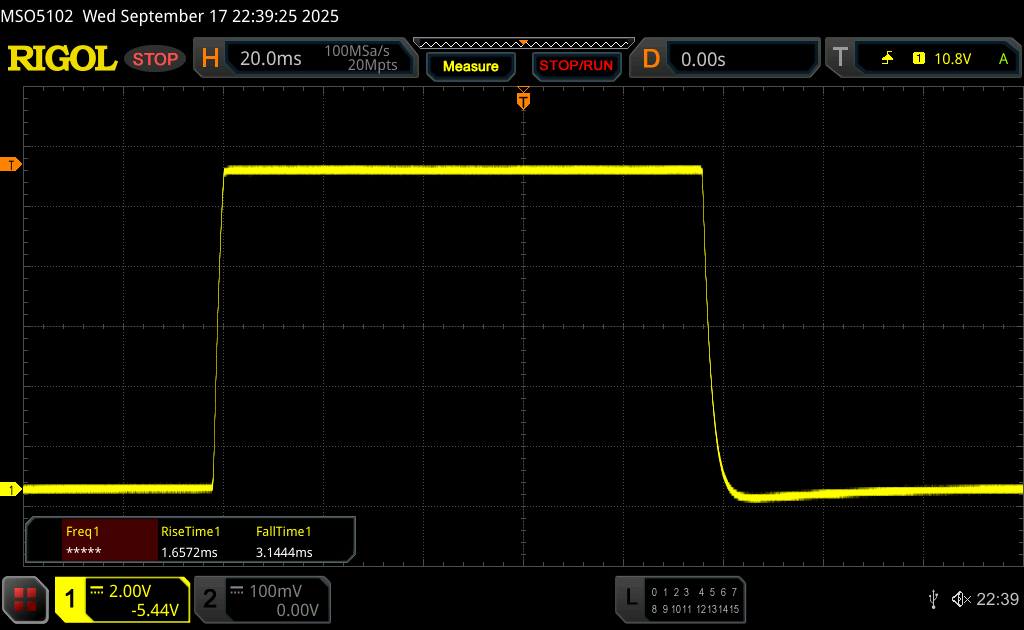 |
| ↘ 3.1 ms fall | ||
| The screen shows very fast response rates in our tests and should be very well suited for fast-paced gaming. In comparison, all tested devices range from 0.1 (minimum) to 240 (maximum) ms. » 16 % of all devices are better. This means that the measured response time is better than the average of all tested devices (20.1 ms). | ||
| ↔ Response Time 50% Grey to 80% Grey | ||
| 6.3 ms ... rise ↗ and fall ↘ combined | ↗ 2.8 ms rise |  |
| ↘ 3.5 ms fall | ||
| The screen shows very fast response rates in our tests and should be very well suited for fast-paced gaming. In comparison, all tested devices range from 0.165 (minimum) to 636 (maximum) ms. » 18 % of all devices are better. This means that the measured response time is better than the average of all tested devices (31.5 ms). | ||
Screen Flickering / PWM (Pulse-Width Modulation)
| Screen flickering / PWM not detected |  | ||
In comparison: 53 % of all tested devices do not use PWM to dim the display. If PWM was detected, an average of 8023 (minimum: 5 - maximum: 343500) Hz was measured. | |||


Performance: Hawk Point Zen 4 meets Blackwell
Test conditions
As usual, Asus offers various energy profiles in the Armoury Crate software, which we have listed in the following table. We performed the benchmarks and measurements in Turbo mode to show the maximum performance.
| Energy profile | CPU TDP | CB 2024 Multi | GPU TGP | Time Spy Graphics | Cyberpunk 2077 QHD | Max. fan volume |
|---|---|---|---|---|---|---|
| Quiet | 65 / 54 W | 912 points | 65 W | 10,722 points | 47.8 fps | 39.3 dB(A) |
| Performance | 80 / 70 W | 967 points | 95 W | 13,842 points | 65 fps | 46.7 dB(A) |
| Turbo | 80 W | 990 points | 115 W | 14,771 points | 69.1 fps | 57.1 dB(A) |
| Battery (Performance) | 75 / 55 W | 963 points | 42 W | 8,895 points | 42.9 fps | 39.3 dB(A) |
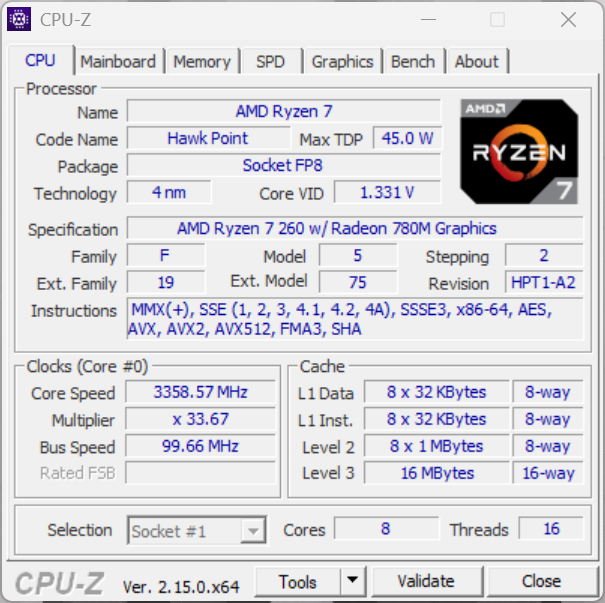
Processor: AMD Ryzen 7 260
Our test device is equipped with the AMD Ryzen 7 260 (Hawk Point), which offers eight Zen 4 cores with a maximum boost of 5.1 GHz. Ultimately, this is a Ryzen 7 8845HS and the multi-core performance in particular is still okay, especially with the 80 W TDP in the test device.
However, the single-core performance is definitely a weak point compared to the competition. The TUF A16 is also optionally available with the Ryzen 9 8940HX (Zen 4, but with 16 cores).
Cinebench R15 multi-core loop
Cinebench R23: Multi Core | Single Core
Cinebench R20: CPU (Multi Core) | CPU (Single Core)
Cinebench R15: CPU Multi 64Bit | CPU Single 64Bit
Blender: v2.79 BMW27 CPU
7-Zip 18.03: 7z b 4 | 7z b 4 -mmt1
Geekbench 6.5: Multi-Core | Single-Core
Geekbench 5.5: Multi-Core | Single-Core
HWBOT x265 Benchmark v2.2: 4k Preset
LibreOffice : 20 Documents To PDF
R Benchmark 2.5: Overall mean
| CPU Performance rating | |
| Schenker XMG Pro 16 (E25) | |
| Alienware 16X Aurora, RTX 5070 | |
| Average of class Gaming | |
| Asus TUF Gaming A16 FA608WV | |
| Gigabyte Aero X16 1WH | |
| Asus TUF Gaming A16 FA608UP | |
| Average AMD Ryzen 7 260 | |
| Gigabyte Gaming A16 GA6H | |
| Cinebench R23 / Multi Core | |
| Schenker XMG Pro 16 (E25) | |
| Alienware 16X Aurora, RTX 5070 | |
| Average of class Gaming (5668 - 40970, n=136, last 2 years) | |
| Asus TUF Gaming A16 FA608WV | |
| Gigabyte Aero X16 1WH | |
| Asus TUF Gaming A16 FA608UP | |
| Average AMD Ryzen 7 260 (15864 - 17712, n=5) | |
| Gigabyte Gaming A16 GA6H | |
| Cinebench R23 / Single Core | |
| Schenker XMG Pro 16 (E25) | |
| Alienware 16X Aurora, RTX 5070 | |
| Asus TUF Gaming A16 FA608WV | |
| Average of class Gaming (1136 - 2267, n=136, last 2 years) | |
| Gigabyte Aero X16 1WH | |
| Gigabyte Gaming A16 GA6H | |
| Average AMD Ryzen 7 260 (1760 - 1801, n=5) | |
| Asus TUF Gaming A16 FA608UP | |
| Cinebench R20 / CPU (Multi Core) | |
| Schenker XMG Pro 16 (E25) | |
| Alienware 16X Aurora, RTX 5070 | |
| Average of class Gaming (2179 - 16108, n=135, last 2 years) | |
| Asus TUF Gaming A16 FA608WV | |
| Asus TUF Gaming A16 FA608UP | |
| Gigabyte Aero X16 1WH | |
| Average AMD Ryzen 7 260 (6161 - 6969, n=5) | |
| Gigabyte Gaming A16 GA6H | |
| Cinebench R20 / CPU (Single Core) | |
| Schenker XMG Pro 16 (E25) | |
| Alienware 16X Aurora, RTX 5070 | |
| Asus TUF Gaming A16 FA608WV | |
| Gigabyte Aero X16 1WH | |
| Average of class Gaming (439 - 870, n=135, last 2 years) | |
| Gigabyte Gaming A16 GA6H | |
| Average AMD Ryzen 7 260 (679 - 697, n=5) | |
| Asus TUF Gaming A16 FA608UP | |
| Cinebench R15 / CPU Multi 64Bit | |
| Alienware 16X Aurora, RTX 5070 | |
| Schenker XMG Pro 16 (E25) | |
| Average of class Gaming (1537 - 6271, n=135, last 2 years) | |
| Asus TUF Gaming A16 FA608WV | |
| Asus TUF Gaming A16 FA608UP | |
| Average AMD Ryzen 7 260 (2543 - 2831, n=5) | |
| Gigabyte Aero X16 1WH | |
| Gigabyte Gaming A16 GA6H | |
| Cinebench R15 / CPU Single 64Bit | |
| Schenker XMG Pro 16 (E25) | |
| Alienware 16X Aurora, RTX 5070 | |
| Asus TUF Gaming A16 FA608WV | |
| Average of class Gaming (188.8 - 343, n=134, last 2 years) | |
| Average AMD Ryzen 7 260 (275 - 283, n=5) | |
| Asus TUF Gaming A16 FA608UP | |
| Gigabyte Gaming A16 GA6H | |
| Gigabyte Aero X16 1WH | |
| Blender / v2.79 BMW27 CPU | |
| Gigabyte Gaming A16 GA6H | |
| Average AMD Ryzen 7 260 (182 - 204, n=5) | |
| Gigabyte Aero X16 1WH | |
| Asus TUF Gaming A16 FA608UP | |
| Average of class Gaming (80 - 517, n=131, last 2 years) | |
| Asus TUF Gaming A16 FA608WV | |
| Alienware 16X Aurora, RTX 5070 | |
| Schenker XMG Pro 16 (E25) | |
| 7-Zip 18.03 / 7z b 4 | |
| Schenker XMG Pro 16 (E25) | |
| Alienware 16X Aurora, RTX 5070 | |
| Average of class Gaming (23795 - 148086, n=133, last 2 years) | |
| Asus TUF Gaming A16 FA608WV | |
| Asus TUF Gaming A16 FA608UP | |
| Average AMD Ryzen 7 260 (63076 - 73490, n=5) | |
| Gigabyte Aero X16 1WH | |
| Gigabyte Gaming A16 GA6H | |
| 7-Zip 18.03 / 7z b 4 -mmt1 | |
| Schenker XMG Pro 16 (E25) | |
| Alienware 16X Aurora, RTX 5070 | |
| Average AMD Ryzen 7 260 (6101 - 6566, n=5) | |
| Average of class Gaming (4199 - 7508, n=133, last 2 years) | |
| Asus TUF Gaming A16 FA608UP | |
| Asus TUF Gaming A16 FA608WV | |
| Gigabyte Aero X16 1WH | |
| Gigabyte Gaming A16 GA6H | |
| Geekbench 6.5 / Multi-Core | |
| Schenker XMG Pro 16 (E25) | |
| Alienware 16X Aurora, RTX 5070 | |
| Average of class Gaming (5340 - 22104, n=134, last 2 years) | |
| Gigabyte Aero X16 1WH | |
| Asus TUF Gaming A16 FA608WV | |
| Asus TUF Gaming A16 FA608UP | |
| Average AMD Ryzen 7 260 (9977 - 13349, n=5) | |
| Gigabyte Gaming A16 GA6H | |
| Geekbench 6.5 / Single-Core | |
| Schenker XMG Pro 16 (E25) | |
| Alienware 16X Aurora, RTX 5070 | |
| Asus TUF Gaming A16 FA608WV | |
| Gigabyte Aero X16 1WH | |
| Average of class Gaming (1490 - 3259, n=134, last 2 years) | |
| Asus TUF Gaming A16 FA608UP | |
| Average AMD Ryzen 7 260 (2622 - 2686, n=5) | |
| Gigabyte Gaming A16 GA6H | |
| Geekbench 5.5 / Multi-Core | |
| Schenker XMG Pro 16 (E25) | |
| Alienware 16X Aurora, RTX 5070 | |
| Average of class Gaming (4557 - 27010, n=133, last 2 years) | |
| Asus TUF Gaming A16 FA608WV | |
| Gigabyte Aero X16 1WH | |
| Asus TUF Gaming A16 FA608UP | |
| Average AMD Ryzen 7 260 (9837 - 12597, n=5) | |
| Gigabyte Gaming A16 GA6H | |
| Geekbench 5.5 / Single-Core | |
| Schenker XMG Pro 16 (E25) | |
| Alienware 16X Aurora, RTX 5070 | |
| Asus TUF Gaming A16 FA608WV | |
| Gigabyte Aero X16 1WH | |
| Average of class Gaming (986 - 2474, n=133, last 2 years) | |
| Asus TUF Gaming A16 FA608UP | |
| Average AMD Ryzen 7 260 (1836 - 1986, n=5) | |
| Gigabyte Gaming A16 GA6H | |
| HWBOT x265 Benchmark v2.2 / 4k Preset | |
| Schenker XMG Pro 16 (E25) | |
| Alienware 16X Aurora, RTX 5070 | |
| Average of class Gaming (7.7 - 44.3, n=133, last 2 years) | |
| Asus TUF Gaming A16 FA608WV | |
| Gigabyte Aero X16 1WH | |
| Asus TUF Gaming A16 FA608UP | |
| Average AMD Ryzen 7 260 (17.6 - 22.4, n=5) | |
| Gigabyte Gaming A16 GA6H | |
| LibreOffice / 20 Documents To PDF | |
| Asus TUF Gaming A16 FA608UP | |
| Average AMD Ryzen 7 260 (49.6 - 63.5, n=5) | |
| Gigabyte Gaming A16 GA6H | |
| Gigabyte Aero X16 1WH | |
| Asus TUF Gaming A16 FA608WV | |
| Schenker XMG Pro 16 (E25) | |
| Average of class Gaming (19 - 88.8, n=133, last 2 years) | |
| Alienware 16X Aurora, RTX 5070 | |
| R Benchmark 2.5 / Overall mean | |
| Gigabyte Gaming A16 GA6H | |
| Asus TUF Gaming A16 FA608UP | |
| Average AMD Ryzen 7 260 (0.4432 - 0.4479, n=5) | |
| Average of class Gaming (0.3439 - 0.759, n=134, last 2 years) | |
| Alienware 16X Aurora, RTX 5070 | |
| Asus TUF Gaming A16 FA608WV | |
| Gigabyte Aero X16 1WH | |
| Schenker XMG Pro 16 (E25) | |
* ... smaller is better
AIDA64: FP32 Ray-Trace | FPU Julia | CPU SHA3 | CPU Queen | FPU SinJulia | FPU Mandel | CPU AES | CPU ZLib | FP64 Ray-Trace | CPU PhotoWorxx
| Performance rating | |
| Schenker XMG Pro 16 (E25) | |
| Alienware 16X Aurora, RTX 5070 | |
| Asus TUF Gaming A16 FA608WV | |
| Average of class Gaming | |
| Asus TUF Gaming A16 FA608UP | |
| Average AMD Ryzen 7 260 | |
| Gigabyte Aero X16 1WH | |
| Gigabyte Gaming A16 GA6H | |
| AIDA64 / FP32 Ray-Trace | |
| Asus TUF Gaming A16 FA608WV | |
| Schenker XMG Pro 16 (E25) | |
| Alienware 16X Aurora, RTX 5070 | |
| Average of class Gaming (7192 - 85542, n=133, last 2 years) | |
| Asus TUF Gaming A16 FA608UP | |
| Gigabyte Aero X16 1WH | |
| Average AMD Ryzen 7 260 (25995 - 29330, n=5) | |
| Gigabyte Gaming A16 GA6H | |
| AIDA64 / FPU Julia | |
| Schenker XMG Pro 16 (E25) | |
| Alienware 16X Aurora, RTX 5070 | |
| Asus TUF Gaming A16 FA608WV | |
| Average of class Gaming (35040 - 238426, n=133, last 2 years) | |
| Asus TUF Gaming A16 FA608UP | |
| Average AMD Ryzen 7 260 (106250 - 121427, n=5) | |
| Gigabyte Aero X16 1WH | |
| Gigabyte Gaming A16 GA6H | |
| AIDA64 / CPU SHA3 | |
| Schenker XMG Pro 16 (E25) | |
| Alienware 16X Aurora, RTX 5070 | |
| Average of class Gaming (1728 - 9817, n=133, last 2 years) | |
| Asus TUF Gaming A16 FA608WV | |
| Asus TUF Gaming A16 FA608UP | |
| Average AMD Ryzen 7 260 (4636 - 5026, n=5) | |
| Gigabyte Aero X16 1WH | |
| Gigabyte Gaming A16 GA6H | |
| AIDA64 / CPU Queen | |
| Alienware 16X Aurora, RTX 5070 | |
| Schenker XMG Pro 16 (E25) | |
| Average AMD Ryzen 7 260 (115108 - 123832, n=5) | |
| Asus TUF Gaming A16 FA608UP | |
| Average of class Gaming (49785 - 173351, n=133, last 2 years) | |
| Asus TUF Gaming A16 FA608WV | |
| Gigabyte Aero X16 1WH | |
| Gigabyte Gaming A16 GA6H | |
| AIDA64 / FPU SinJulia | |
| Asus TUF Gaming A16 FA608WV | |
| Asus TUF Gaming A16 FA608UP | |
| Average AMD Ryzen 7 260 (14810 - 15497, n=5) | |
| Average of class Gaming (4424 - 33636, n=133, last 2 years) | |
| Schenker XMG Pro 16 (E25) | |
| Gigabyte Aero X16 1WH | |
| Alienware 16X Aurora, RTX 5070 | |
| Gigabyte Gaming A16 GA6H | |
| AIDA64 / FPU Mandel | |
| Schenker XMG Pro 16 (E25) | |
| Alienware 16X Aurora, RTX 5070 | |
| Asus TUF Gaming A16 FA608WV | |
| Average of class Gaming (17585 - 128721, n=133, last 2 years) | |
| Asus TUF Gaming A16 FA608UP | |
| Average AMD Ryzen 7 260 (56974 - 65308, n=5) | |
| Gigabyte Aero X16 1WH | |
| Gigabyte Gaming A16 GA6H | |
| AIDA64 / CPU AES | |
| Schenker XMG Pro 16 (E25) | |
| Alienware 16X Aurora, RTX 5070 | |
| Average of class Gaming (19065 - 247074, n=133, last 2 years) | |
| Asus TUF Gaming A16 FA608UP | |
| Gigabyte Aero X16 1WH | |
| Asus TUF Gaming A16 FA608WV | |
| Average AMD Ryzen 7 260 (66825 - 91093, n=5) | |
| Gigabyte Gaming A16 GA6H | |
| AIDA64 / CPU ZLib | |
| Schenker XMG Pro 16 (E25) | |
| Alienware 16X Aurora, RTX 5070 | |
| Asus TUF Gaming A16 FA608WV | |
| Average of class Gaming (373 - 2531, n=133, last 2 years) | |
| Gigabyte Aero X16 1WH | |
| Average AMD Ryzen 7 260 (1039 - 1133, n=5) | |
| Asus TUF Gaming A16 FA608UP | |
| Gigabyte Gaming A16 GA6H | |
| AIDA64 / FP64 Ray-Trace | |
| Asus TUF Gaming A16 FA608WV | |
| Schenker XMG Pro 16 (E25) | |
| Alienware 16X Aurora, RTX 5070 | |
| Average of class Gaming (3856 - 45446, n=133, last 2 years) | |
| Asus TUF Gaming A16 FA608UP | |
| Gigabyte Aero X16 1WH | |
| Average AMD Ryzen 7 260 (13944 - 15751, n=5) | |
| Gigabyte Gaming A16 GA6H | |
| AIDA64 / CPU PhotoWorxx | |
| Schenker XMG Pro 16 (E25) | |
| Alienware 16X Aurora, RTX 5070 | |
| Gigabyte Aero X16 1WH | |
| Average of class Gaming (10805 - 62916, n=133, last 2 years) | |
| Asus TUF Gaming A16 FA608UP | |
| Asus TUF Gaming A16 FA608WV | |
| Average AMD Ryzen 7 260 (23097 - 40796, n=5) | |
| Gigabyte Gaming A16 GA6H | |
System performance
The subjective system performance of the TUF A16 is very good, but the Zen 4 processor's limitations are noticeable in the benchmarks.
In addition, we were unable to run PCMark 10 tests on the test device as it aborted repeatedly. This is probably due to the current Nvidia driver, but there were no other problems during the test.
CrossMark: Overall | Productivity | Creativity | Responsiveness
WebXPRT 3: Overall
WebXPRT 4: Overall
Mozilla Kraken 1.1: Total
| Performance rating | |
| Alienware 16X Aurora, RTX 5070 | |
| Schenker XMG Pro 16 (E25) | |
| Average of class Gaming | |
| Gigabyte Aero X16 1WH | |
| Gigabyte Gaming A16 GA6H | |
| Asus TUF Gaming A16 FA608WV | |
| Average AMD Ryzen 7 260, NVIDIA GeForce RTX 5070 Laptop | |
| Asus TUF Gaming A16 FA608UP | |
| CrossMark / Overall | |
| Alienware 16X Aurora, RTX 5070 | |
| Schenker XMG Pro 16 (E25) | |
| Average of class Gaming (1247 - 2344, n=113, last 2 years) | |
| Gigabyte Gaming A16 GA6H | |
| Asus TUF Gaming A16 FA608WV | |
| Gigabyte Aero X16 1WH | |
| Average AMD Ryzen 7 260, NVIDIA GeForce RTX 5070 Laptop (1712 - 1758, n=3) | |
| Asus TUF Gaming A16 FA608UP | |
| CrossMark / Productivity | |
| Alienware 16X Aurora, RTX 5070 | |
| Schenker XMG Pro 16 (E25) | |
| Average of class Gaming (1299 - 2211, n=113, last 2 years) | |
| Gigabyte Gaming A16 GA6H | |
| Average AMD Ryzen 7 260, NVIDIA GeForce RTX 5070 Laptop (1648 - 1725, n=3) | |
| Gigabyte Aero X16 1WH | |
| Asus TUF Gaming A16 FA608UP | |
| Asus TUF Gaming A16 FA608WV | |
| CrossMark / Creativity | |
| Schenker XMG Pro 16 (E25) | |
| Alienware 16X Aurora, RTX 5070 | |
| Average of class Gaming (1275 - 2729, n=113, last 2 years) | |
| Asus TUF Gaming A16 FA608WV | |
| Gigabyte Aero X16 1WH | |
| Average AMD Ryzen 7 260, NVIDIA GeForce RTX 5070 Laptop (1782 - 1986, n=3) | |
| Asus TUF Gaming A16 FA608UP | |
| Gigabyte Gaming A16 GA6H | |
| CrossMark / Responsiveness | |
| Alienware 16X Aurora, RTX 5070 | |
| Gigabyte Gaming A16 GA6H | |
| Schenker XMG Pro 16 (E25) | |
| Average of class Gaming (1030 - 2330, n=113, last 2 years) | |
| Average AMD Ryzen 7 260, NVIDIA GeForce RTX 5070 Laptop (1441 - 1578, n=3) | |
| Gigabyte Aero X16 1WH | |
| Asus TUF Gaming A16 FA608UP | |
| Asus TUF Gaming A16 FA608WV | |
| WebXPRT 3 / Overall | |
| Alienware 16X Aurora, RTX 5070 | |
| Schenker XMG Pro 16 (E25) | |
| Gigabyte Aero X16 1WH | |
| Average of class Gaming (237 - 532, n=115, last 2 years) | |
| Asus TUF Gaming A16 FA608UP | |
| Average AMD Ryzen 7 260, NVIDIA GeForce RTX 5070 Laptop (288 - 297, n=3) | |
| Asus TUF Gaming A16 FA608WV | |
| Gigabyte Gaming A16 GA6H | |
| WebXPRT 4 / Overall | |
| Schenker XMG Pro 16 (E25) | |
| Alienware 16X Aurora, RTX 5070 | |
| Average of class Gaming (176.4 - 345, n=114, last 2 years) | |
| Gigabyte Aero X16 1WH | |
| Asus TUF Gaming A16 FA608WV | |
| Gigabyte Gaming A16 GA6H | |
| Asus TUF Gaming A16 FA608UP | |
| Average AMD Ryzen 7 260, NVIDIA GeForce RTX 5070 Laptop (237 - 239, n=3) | |
| Mozilla Kraken 1.1 / Total | |
| Asus TUF Gaming A16 FA608UP | |
| Average AMD Ryzen 7 260, NVIDIA GeForce RTX 5070 Laptop (522 - 565, n=3) | |
| Gigabyte Gaming A16 GA6H | |
| Average of class Gaming (397 - 674, n=124, last 2 years) | |
| Gigabyte Aero X16 1WH | |
| Asus TUF Gaming A16 FA608WV | |
| Alienware 16X Aurora, RTX 5070 | |
| Schenker XMG Pro 16 (E25) | |
* ... smaller is better
| AIDA64 / Memory Copy | |
| Asus TUF Gaming A16 FA608WV | |
| Schenker XMG Pro 16 (E25) | |
| Alienware 16X Aurora, RTX 5070 | |
| Gigabyte Aero X16 1WH | |
| Average of class Gaming (21750 - 108104, n=133, last 2 years) | |
| Asus TUF Gaming A16 FA608UP | |
| Average AMD Ryzen 7 260 (35762 - 69413, n=5) | |
| Gigabyte Gaming A16 GA6H | |
| AIDA64 / Memory Read | |
| Asus TUF Gaming A16 FA608WV | |
| Schenker XMG Pro 16 (E25) | |
| Alienware 16X Aurora, RTX 5070 | |
| Average of class Gaming (22956 - 104349, n=133, last 2 years) | |
| Gigabyte Aero X16 1WH | |
| Asus TUF Gaming A16 FA608UP | |
| Average AMD Ryzen 7 260 (30070 - 61170, n=5) | |
| Gigabyte Gaming A16 GA6H | |
| AIDA64 / Memory Write | |
| Asus TUF Gaming A16 FA608WV | |
| Asus TUF Gaming A16 FA608UP | |
| Gigabyte Aero X16 1WH | |
| Schenker XMG Pro 16 (E25) | |
| Alienware 16X Aurora, RTX 5070 | |
| Average of class Gaming (22297 - 133486, n=133, last 2 years) | |
| Average AMD Ryzen 7 260 (42757 - 87114, n=5) | |
| Gigabyte Gaming A16 GA6H | |
| AIDA64 / Memory Latency | |
| Alienware 16X Aurora, RTX 5070 | |
| Asus TUF Gaming A16 FA608WV | |
| Schenker XMG Pro 16 (E25) | |
| Gigabyte Gaming A16 GA6H | |
| Average of class Gaming (59.5 - 259, n=133, last 2 years) | |
| Gigabyte Aero X16 1WH | |
| Asus TUF Gaming A16 FA608UP | |
| Average AMD Ryzen 7 260 (91.5 - 94.1, n=5) | |
* ... smaller is better
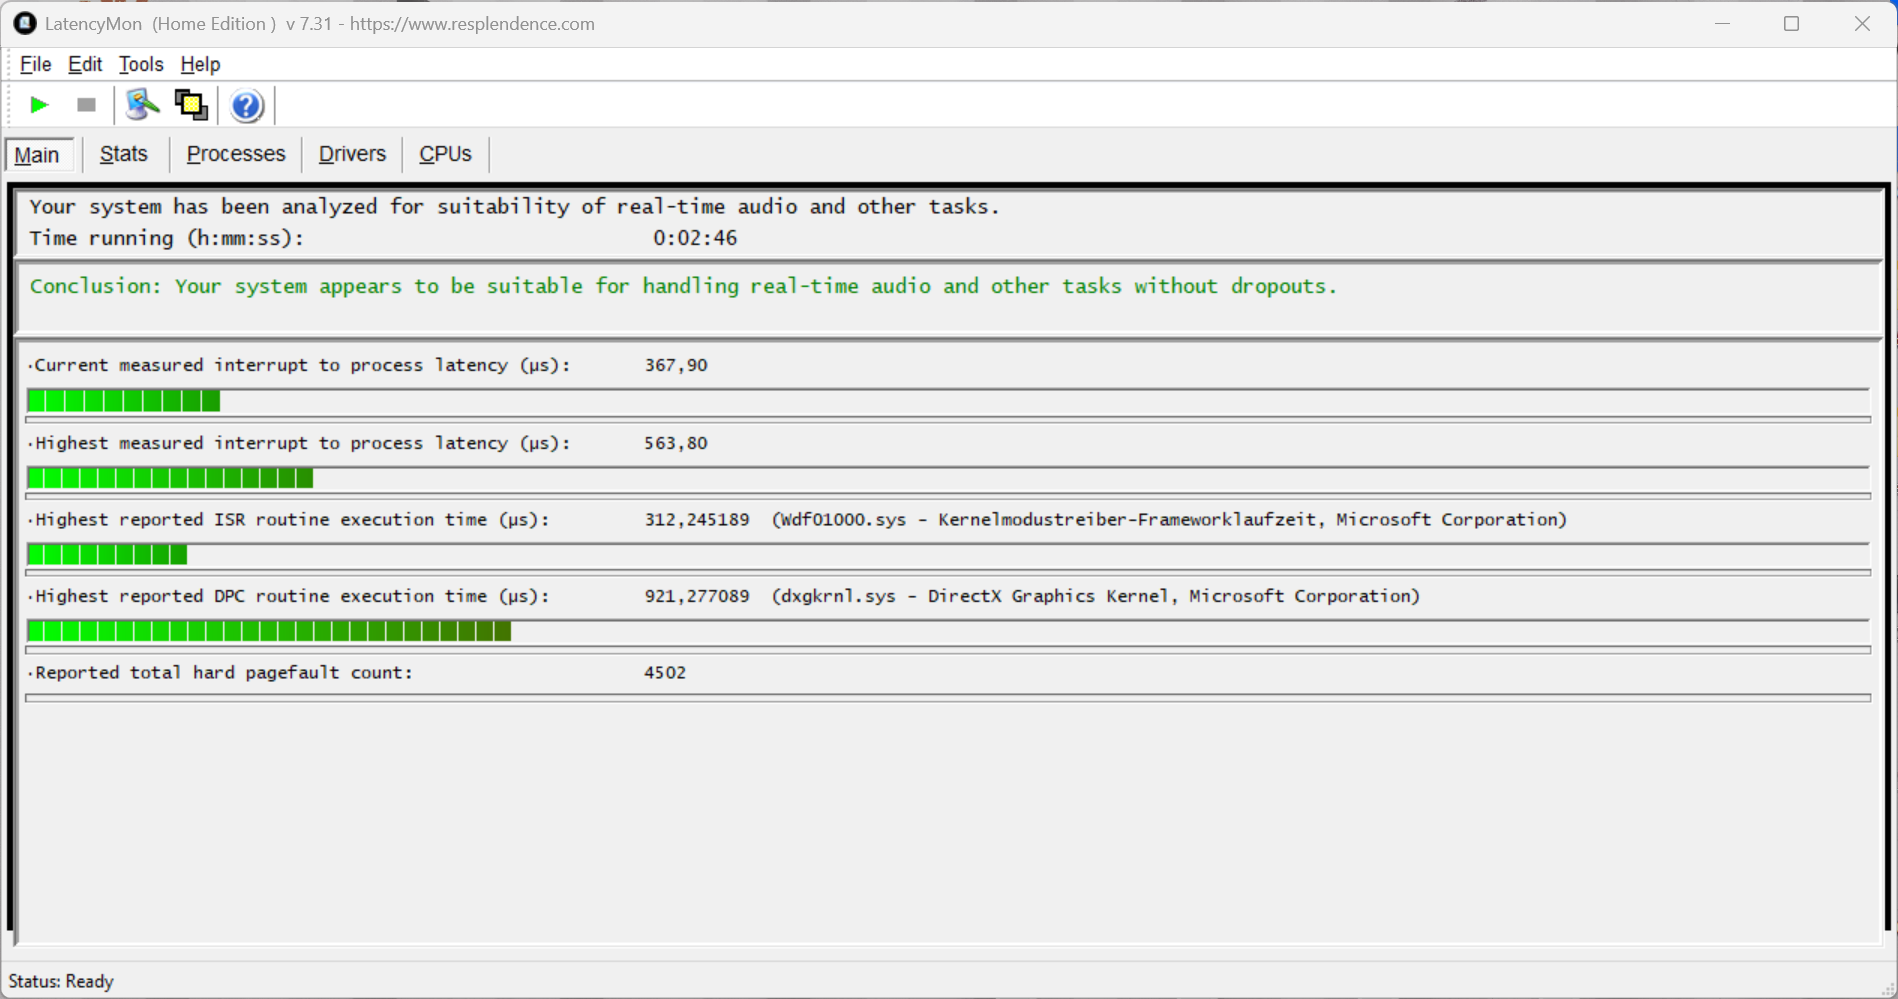
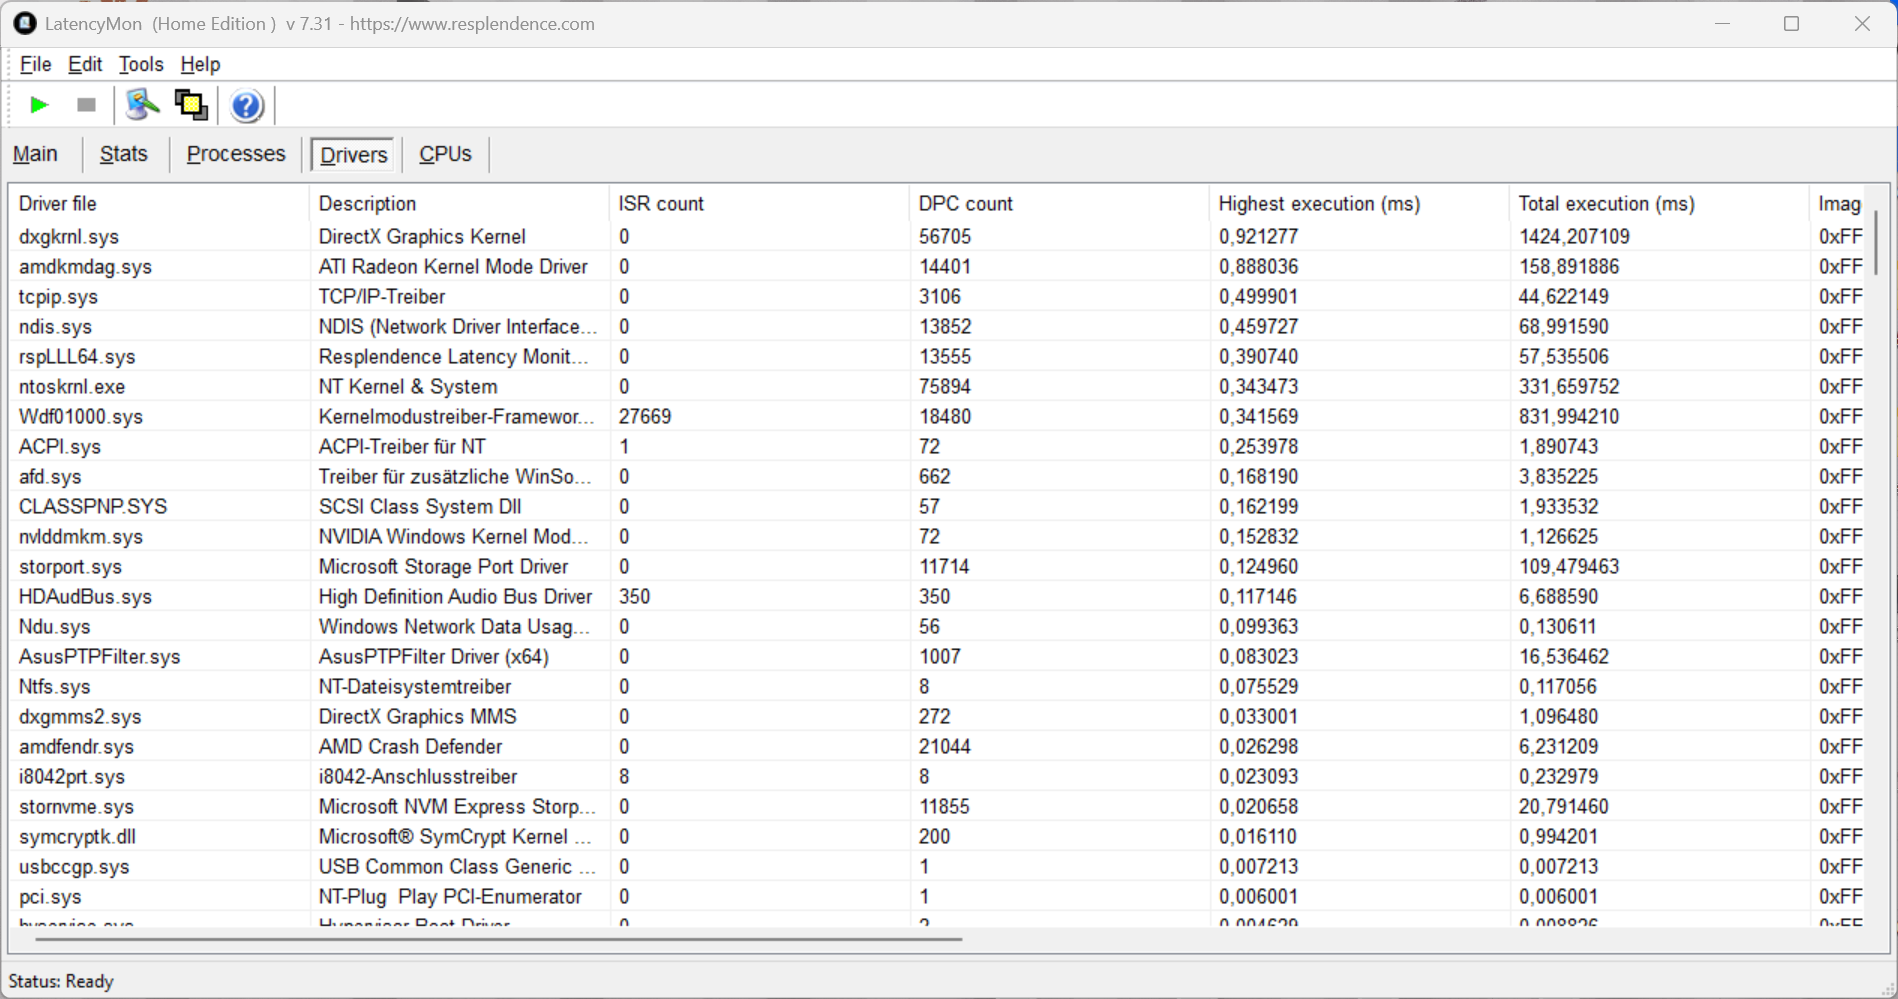
DPC latency
In our standardized latency test that includes surfing the Internet, 4K YouTube playback and CPU load, the TUF Gaming A16 with the current BIOS version shows no major latency issues when using real-time audio applications.
| DPC Latencies / LatencyMon - interrupt to process latency (max), Web, Youtube, Prime95 | |
| Gigabyte Gaming A16 GA6H | |
| Gigabyte Aero X16 1WH | |
| Alienware 16X Aurora, RTX 5070 | |
| Schenker XMG Pro 16 (E25) | |
| Asus TUF Gaming A16 FA608WV | |
| Asus TUF Gaming A16 FA608UP | |
* ... smaller is better
Storage devices
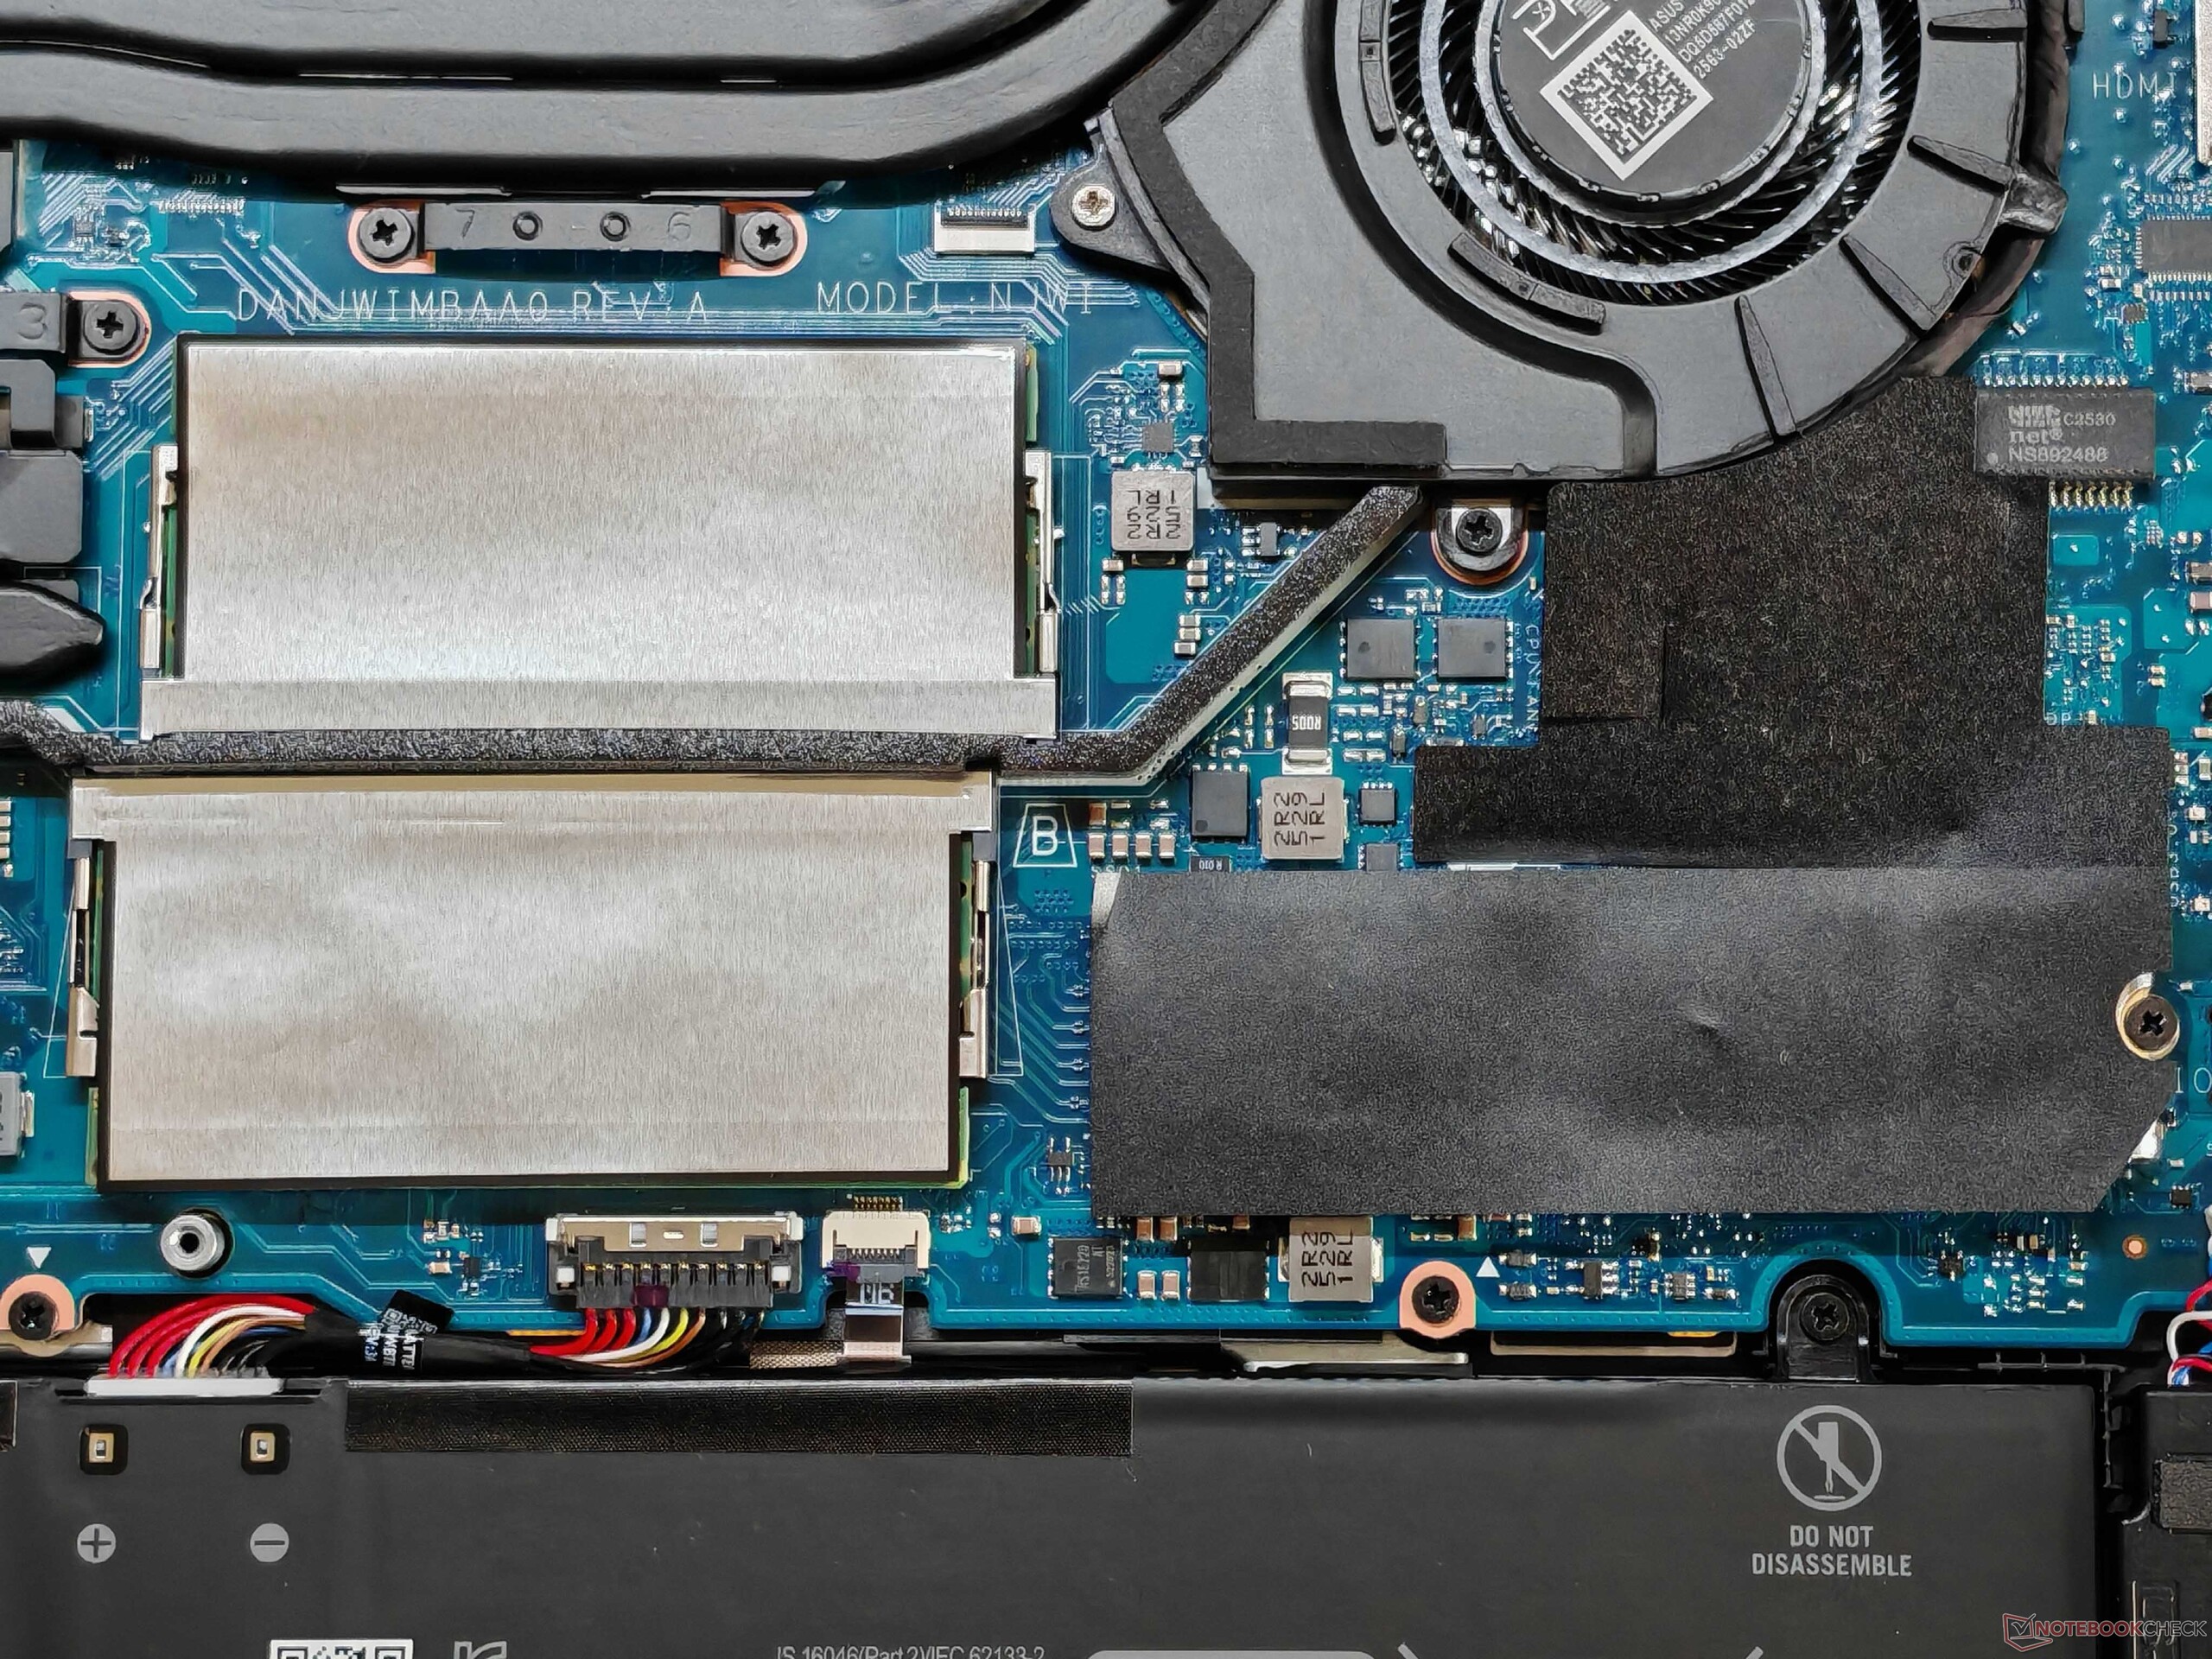
The TUF A16 offers two M.2-2280 slots (PCIe 4.0) for SSDs and our test device is equipped with the 1 TB version of WD PC SN5000S with 859 GB free.
The performance is somewhat decent, but the drive does not remain completely stable under constant load. That being said, the sequential values are still more than 4 GB/s, so the effects in everyday gaming are negligible.
Further SSD benchmarks are available here.

* ... smaller is better
Disk throttling: DiskSpd Read Loop, Queue Depth 8
GPU performance
Asus uses the GeForce RTX 5070 Laptop in the TUF Gaming A16 with Advanced Optimus and a maximum TGP of 115 W, i.e. the fastest variant. The GPU's performance in synthetic tests is very good, and it is one of the fastest RTX 5070 GPUs that we have tested so far.
However, the comparatively weak Zen 4 processor is noticeable in some games, particularly in comparison with fast HX series CPUs. Additionally, the limited 8 GB VRAM can still be a weak point, especially if you want to play in QHD resolution.
In principle, however, the RTX 5070 Laptop's performance is also sufficient for high details and, of course, upscaling and frame generation are available depending on the game.
| 3DMark 11 Performance | 37035 points | |
| 3DMark Fire Strike Score | 31388 points | |
| 3DMark Time Spy Score | 13950 points | |
| 3DMark Steel Nomad Score | 2952 points | |
| 3DMark Steel Nomad Light Score | 14954 points | |
Help | ||
| Blender / v3.3 Classroom OPTIX/RTX | |
| Asus TUF Gaming A16 FA608WV | |
| Gigabyte Gaming A16 GA6H | |
| Gigabyte Aero X16 1WH | |
| Asus TUF Gaming A16 FA608UP | |
| Average NVIDIA GeForce RTX 5070 Laptop (17 - 24, n=25) | |
| Average of class Gaming (9 - 95, n=131, last 2 years) | |
| Alienware 16X Aurora, RTX 5070 | |
| Schenker XMG Pro 16 (E25) | |
| Blender / v3.3 Classroom CUDA | |
| Asus TUF Gaming A16 FA608WV | |
| Average NVIDIA GeForce RTX 5070 Laptop (29 - 228, n=26) | |
| Gigabyte Aero X16 1WH | |
| Gigabyte Gaming A16 GA6H | |
| Average of class Gaming (15 - 228, n=134, last 2 years) | |
| Asus TUF Gaming A16 FA608UP | |
| Alienware 16X Aurora, RTX 5070 | |
| Schenker XMG Pro 16 (E25) | |
| Blender / v3.3 Classroom CPU | |
| Gigabyte Gaming A16 GA6H | |
| Gigabyte Aero X16 1WH | |
| Asus TUF Gaming A16 FA608UP | |
| Average of class Gaming (122 - 962, n=130, last 2 years) | |
| Average NVIDIA GeForce RTX 5070 Laptop (137 - 507, n=23) | |
| Asus TUF Gaming A16 FA608WV | |
| Alienware 16X Aurora, RTX 5070 | |
| Schenker XMG Pro 16 (E25) | |
* ... smaller is better
| Cyberpunk 2077 - 1920x1080 Ultra Preset (FSR off) | |
| Schenker XMG Pro 16 (E25) | |
| Asus TUF Gaming A16 FA608UP | |
| Alienware 16X Aurora, RTX 5070 | |
| Average of class Gaming (17.7 - 169.9, n=141, last 2 years) | |
| Gigabyte Aero X16 1WH | |
| Gigabyte Gaming A16 GA6H | |
| Asus TUF Gaming A16 FA608WV | |
| Final Fantasy XV Benchmark - 1920x1080 High Quality | |
| Alienware 16X Aurora, RTX 5070 | |
| Schenker XMG Pro 16 (E25) | |
| Asus TUF Gaming A16 FA608UP | |
| Average of class Gaming (37.9 - 215, n=126, last 2 years) | |
| Gigabyte Aero X16 1WH | |
| Asus TUF Gaming A16 FA608WV | |
| Gigabyte Gaming A16 GA6H | |
| Strange Brigade - 1920x1080 ultra AA:ultra AF:16 | |
| Average of class Gaming (76.3 - 456, n=116, last 2 years) | |
| Alienware 16X Aurora, RTX 5070 | |
| Gigabyte Aero X16 1WH | |
| Asus TUF Gaming A16 FA608UP | |
| Gigabyte Gaming A16 GA6H | |
| Asus TUF Gaming A16 FA608WV | |
| Schenker XMG Pro 16 (E25) | |
| Dota 2 Reborn - 1920x1080 ultra (3/3) best looking | |
| Alienware 16X Aurora, RTX 5070 | |
| Schenker XMG Pro 16 (E25) | |
| Average of class Gaming (65.1 - 248, n=133, last 2 years) | |
| Gigabyte Gaming A16 GA6H | |
| Asus TUF Gaming A16 FA608WV | |
| Gigabyte Aero X16 1WH | |
| Asus TUF Gaming A16 FA608UP | |
Cyberpunk 2077 1080p Ultra fps chart
| low | med. | high | ultra | QHD DLSS | QHD | |
|---|---|---|---|---|---|---|
| GTA V (2015) | 124.8 | 113.9 | ||||
| Dota 2 Reborn (2015) | 148.8 | 140.9 | 129.3 | 123.2 | ||
| Final Fantasy XV Benchmark (2018) | 216 | 187.8 | 142.3 | 107.4 | ||
| X-Plane 11.11 (2018) | 108.2 | 97.9 | 80.7 | |||
| Strange Brigade (2018) | 260 | 253 | 241 | 219 | 175.3 | |
| Baldur's Gate 3 (2023) | 181.7 | 152.9 | 134.5 | 127.5 | 89 | |
| Cyberpunk 2077 (2023) | 148.7 | 142.6 | 121.2 | 109.4 | 81 | 68.2 |
| F1 24 (2024) | 234 | 88.8 | 85.4 | 56.9 |
Emissions and Energy: Low surface temps and good battery life
Noise emissions
The volume of the two fans depends largely on the energy profile chosen. In Turbo mode, the dual fans always run at around 32 dB(A) even when idling.
If you don't need the full performance, you should definitely use one of the weaker profiles. Turbo mode is also extremely loud with around 54 dB(A) during gaming and 57 dB(A) in the stress test.
Overall, the performance mode seems much more pleasant here with a maximum sound pressure level (SPL) of 46.7 dB(A). There were no other electronic noises on the test device.
Noise level
| Idle |
| 32.2 / 32.2 / 32.2 dB(A) |
| Load |
| 38.1 / 57.1 dB(A) |
 | ||
30 dB silent 40 dB(A) audible 50 dB(A) loud |
||
min: | ||
| Asus TUF Gaming A16 FA608UP R7 260, GeForce RTX 5070 Laptop | Alienware 16X Aurora, RTX 5070 Ultra 9 275HX, GeForce RTX 5070 Laptop | Gigabyte Gaming A16 GA6H i7-13620H, GeForce RTX 5070 Laptop | Asus TUF Gaming A16 FA608WV Ryzen AI 9 HX 370, GeForce RTX 4060 Laptop GPU | Gigabyte Aero X16 1WH Ryzen AI 7 350, GeForce RTX 5070 Laptop | Schenker XMG Pro 16 (E25) Ultra 9 275HX, GeForce RTX 5070 Ti Laptop | |
|---|---|---|---|---|---|---|
| Noise | 16% | 3% | 23% | 16% | 9% | |
| off / environment * (dB) | 25.1 | 23.7 6% | 24 4% | 23 8% | 23.9 5% | 23.3 7% |
| Idle Minimum * (dB) | 32.2 | 23.9 26% | 25 22% | 23 29% | 23.9 26% | 25 22% |
| Idle Average * (dB) | 32.2 | 23.9 26% | 26 19% | 23 29% | 23.9 26% | 25 22% |
| Idle Maximum * (dB) | 32.2 | 26.1 19% | 27 16% | 29.11 10% | 23.9 26% | 25 22% |
| Load Average * (dB) | 38.1 | 26.8 30% | 54 -42% | 31 19% | 33.2 13% | 45.5 -19% |
| Cyberpunk 2077 ultra * (dB) | 53.9 | 51.8 4% | 54 -0% | 36.23 33% | 50.2 7% | 53.3 1% |
| Load Maximum * (dB) | 57.1 | 58 -2% | 55 4% | 39.44 31% | 50.2 12% | 53.3 7% |
* ... smaller is better
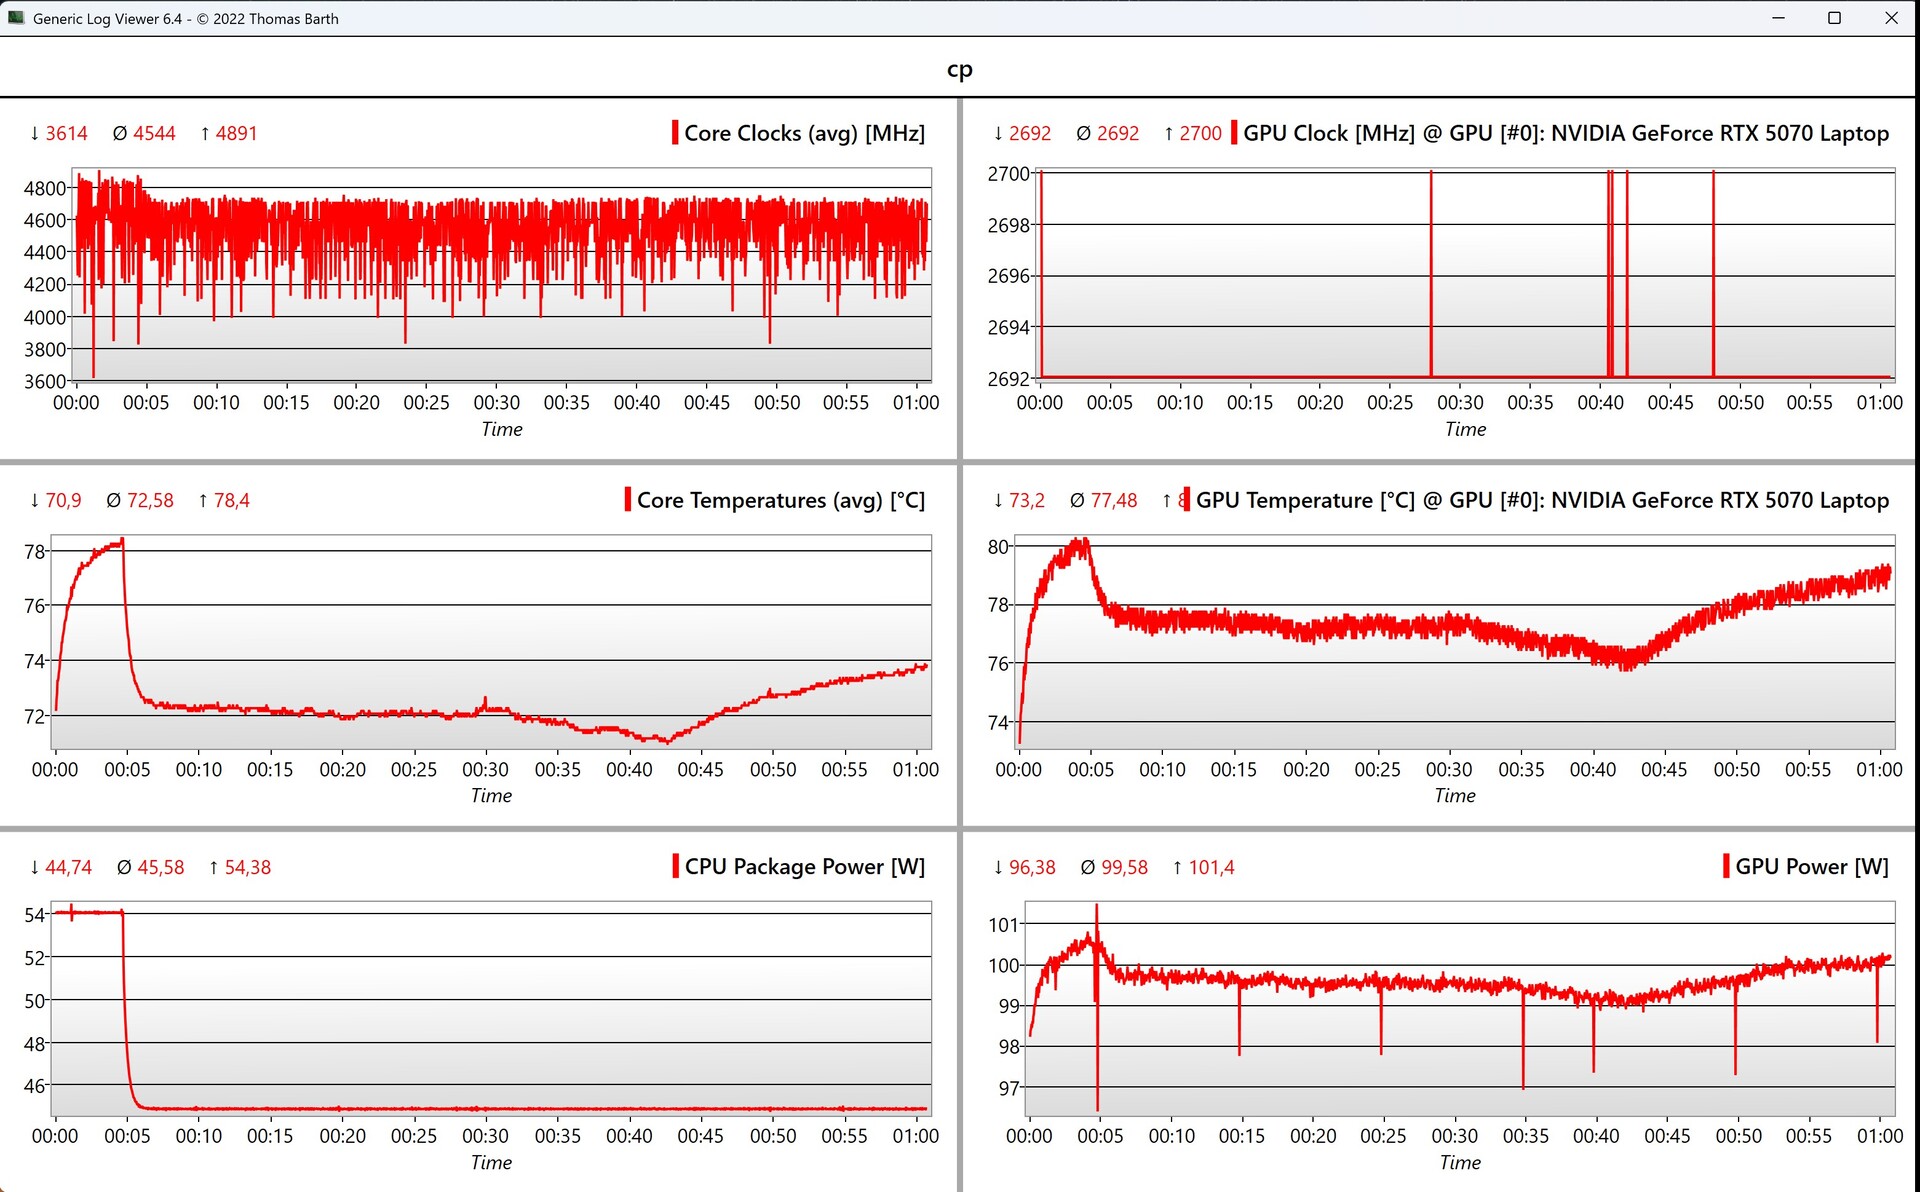
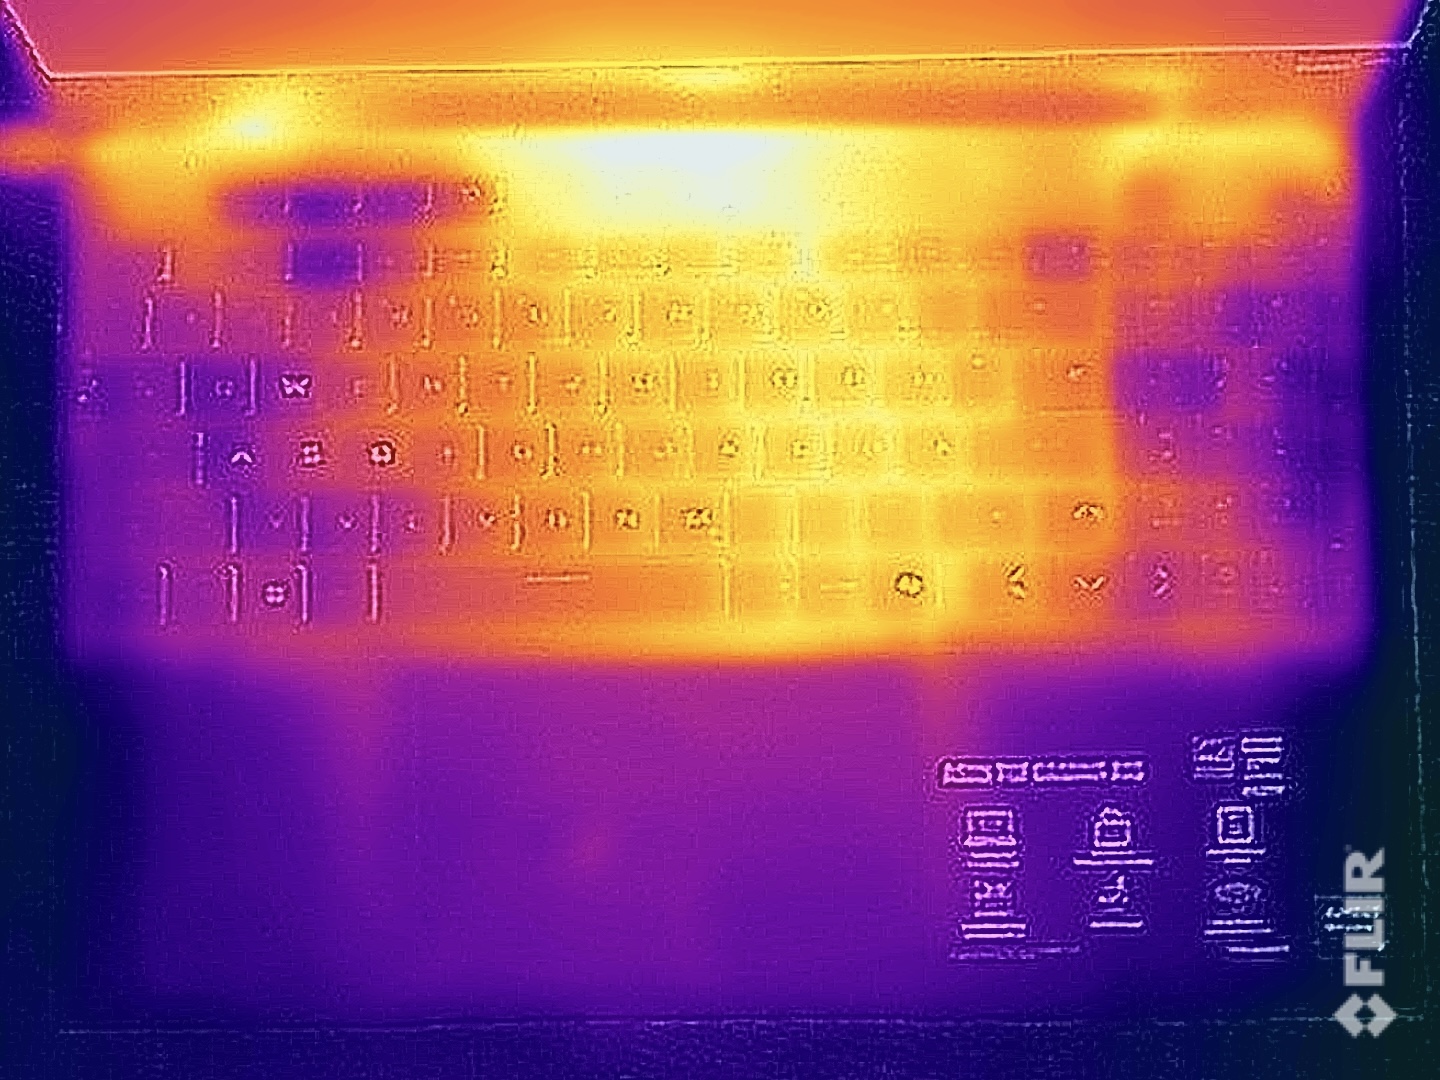
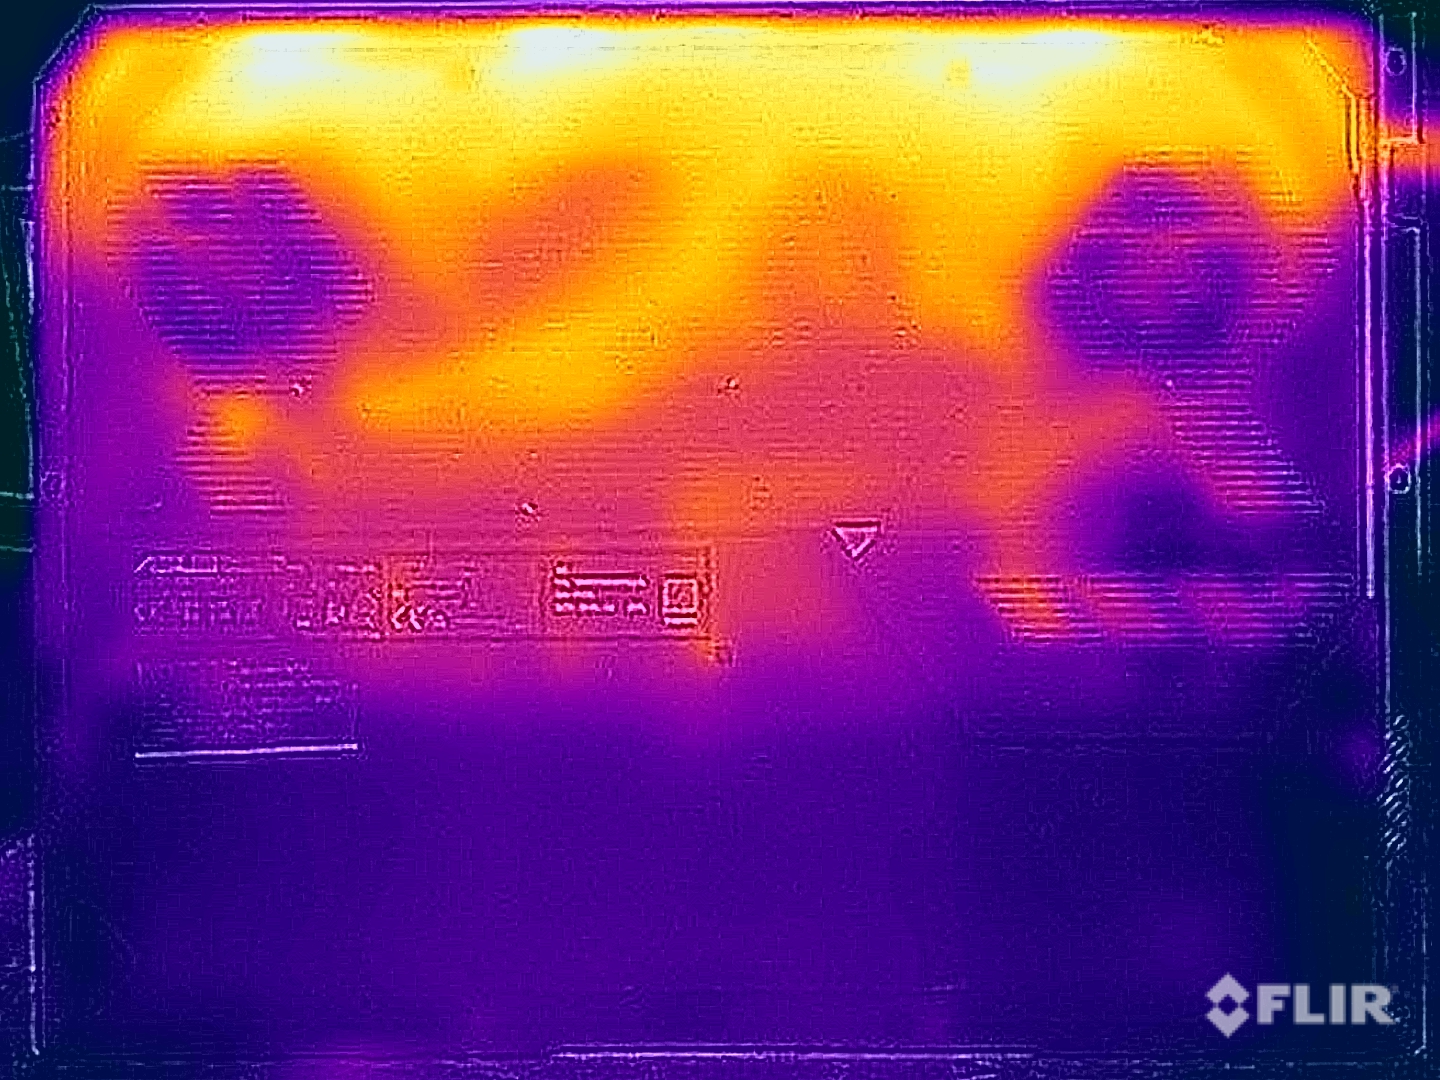
Surface temperatures
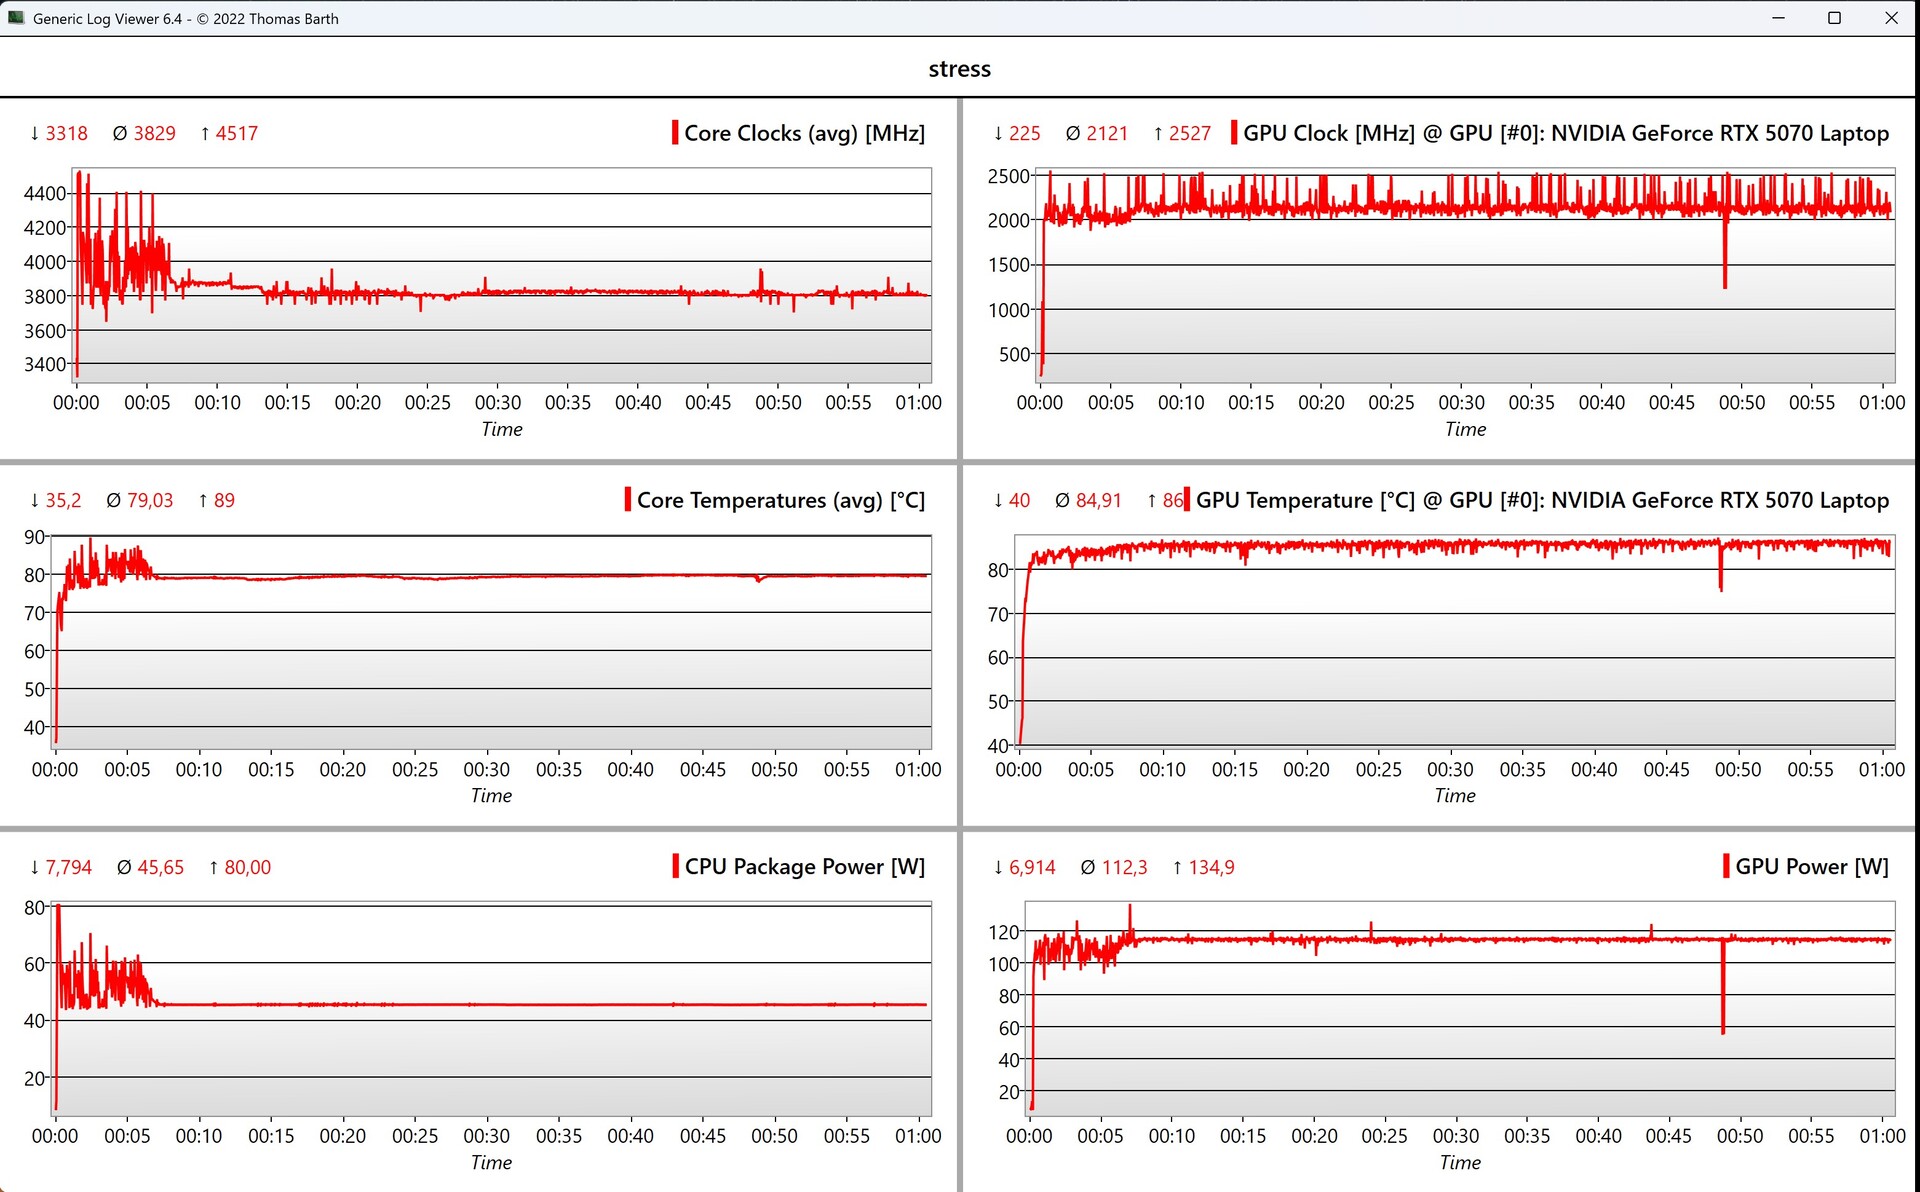
The loud fans lead to low surface temperatures. Even during the stress test, the temperatures were only slightly higher than 40 °C in a few places, so there are no restrictions during use.
During the stress test, the CPU stabilized at 45 W (80 °C) and the GPU at just under 115 W (85 °C).
(+) The maximum temperature on the upper side is 39.5 °C / 103 F, compared to the average of 40.4 °C / 105 F, ranging from 21.2 to 68.8 °C for the class Gaming.
(-) The bottom heats up to a maximum of 45.1 °C / 113 F, compared to the average of 43.3 °C / 110 F
(+) In idle usage, the average temperature for the upper side is 25 °C / 77 F, compared to the device average of 33.9 °C / 93 F.
(±) 3: The average temperature for the upper side is 32.7 °C / 91 F, compared to the average of 33.9 °C / 93 F for the class Gaming.
(+) The palmrests and touchpad are cooler than skin temperature with a maximum of 27.2 °C / 81 F and are therefore cool to the touch.
(±) The average temperature of the palmrest area of similar devices was 28.8 °C / 83.8 F (+1.6 °C / 2.8 F).
| Asus TUF Gaming A16 FA608UP AMD Ryzen 7 260, NVIDIA GeForce RTX 5070 Laptop | Alienware 16X Aurora, RTX 5070 Intel Core Ultra 9 275HX, NVIDIA GeForce RTX 5070 Laptop | Gigabyte Gaming A16 GA6H Intel Core i7-13620H, NVIDIA GeForce RTX 5070 Laptop | Asus TUF Gaming A16 FA608WV AMD Ryzen AI 9 HX 370, NVIDIA GeForce RTX 4060 Laptop GPU | Gigabyte Aero X16 1WH AMD Ryzen AI 7 350, NVIDIA GeForce RTX 5070 Laptop | Schenker XMG Pro 16 (E25) Intel Core Ultra 9 275HX, NVIDIA GeForce RTX 5070 Ti Laptop | |
|---|---|---|---|---|---|---|
| Heat | -13% | -26% | -1% | -10% | -239% | |
| Maximum Upper Side * (°C) | 39.5 | 51 -29% | 50 -27% | 38 4% | 43.3 -10% | 43.2 -9% |
| Maximum Bottom * (°C) | 45.1 | 45.6 -1% | 49 -9% | 37 18% | 50.3 -12% | 46 -2% |
| Idle Upper Side * (°C) | 25.7 | 29.8 -16% | 35 -36% | 28 -9% | 27 -5% | 27.7 -8% |
| Idle Bottom * (°C) | 25.5 | 27.4 -7% | 34 -33% | 30 -18% | 28.3 -11% | 264 -935% |
* ... smaller is better
Loudspeaker
The two stereo speakers do a good job overall, but they can't overpower the loud fans when gaming.
Asus TUF Gaming A16 FA608UP audio analysis
(±) | speaker loudness is average but good (80.2 dB)
Bass 100 - 315 Hz
(±) | reduced bass - on average 11.8% lower than median
(±) | linearity of bass is average (8.7% delta to prev. frequency)
Mids 400 - 2000 Hz
(+) | balanced mids - only 3% away from median
(+) | mids are linear (3% delta to prev. frequency)
Highs 2 - 16 kHz
(+) | balanced highs - only 4.4% away from median
(±) | linearity of highs is average (7.4% delta to prev. frequency)
Overall 100 - 16.000 Hz
(+) | overall sound is linear (12.6% difference to median)
Compared to same class
» 15% of all tested devices in this class were better, 3% similar, 81% worse
» The best had a delta of 6%, average was 18%, worst was 132%
Compared to all devices tested
» 11% of all tested devices were better, 2% similar, 87% worse
» The best had a delta of 4%, average was 24%, worst was 134%
Alienware 16X Aurora, RTX 5070 audio analysis
(+) | speakers can play relatively loud (82.1 dB)
Bass 100 - 315 Hz
(-) | nearly no bass - on average 21.6% lower than median
(±) | linearity of bass is average (12.9% delta to prev. frequency)
Mids 400 - 2000 Hz
(+) | balanced mids - only 2.3% away from median
(+) | mids are linear (4% delta to prev. frequency)
Highs 2 - 16 kHz
(+) | balanced highs - only 1.3% away from median
(+) | highs are linear (3.7% delta to prev. frequency)
Overall 100 - 16.000 Hz
(+) | overall sound is linear (14.5% difference to median)
Compared to same class
» 27% of all tested devices in this class were better, 7% similar, 66% worse
» The best had a delta of 6%, average was 18%, worst was 132%
Compared to all devices tested
» 18% of all tested devices were better, 4% similar, 78% worse
» The best had a delta of 4%, average was 24%, worst was 134%
Gigabyte Gaming A16 GA6H audio analysis
(±) | speaker loudness is average but good (81 dB)
Bass 100 - 315 Hz
(±) | reduced bass - on average 13.3% lower than median
(±) | linearity of bass is average (12.1% delta to prev. frequency)
Mids 400 - 2000 Hz
(+) | balanced mids - only 4.9% away from median
(+) | mids are linear (5.2% delta to prev. frequency)
Highs 2 - 16 kHz
(+) | balanced highs - only 2.2% away from median
(+) | highs are linear (6.4% delta to prev. frequency)
Overall 100 - 16.000 Hz
(+) | overall sound is linear (13.3% difference to median)
Compared to same class
» 19% of all tested devices in this class were better, 5% similar, 77% worse
» The best had a delta of 6%, average was 18%, worst was 132%
Compared to all devices tested
» 13% of all tested devices were better, 3% similar, 84% worse
» The best had a delta of 4%, average was 24%, worst was 134%
Gigabyte Aero X16 1WH audio analysis
(±) | speaker loudness is average but good (76 dB)
Bass 100 - 315 Hz
(-) | nearly no bass - on average 15.4% lower than median
(±) | linearity of bass is average (13.1% delta to prev. frequency)
Mids 400 - 2000 Hz
(+) | balanced mids - only 3.3% away from median
(+) | mids are linear (5.5% delta to prev. frequency)
Highs 2 - 16 kHz
(+) | balanced highs - only 2.8% away from median
(+) | highs are linear (5.7% delta to prev. frequency)
Overall 100 - 16.000 Hz
(±) | linearity of overall sound is average (15.5% difference to median)
Compared to same class
» 35% of all tested devices in this class were better, 7% similar, 59% worse
» The best had a delta of 6%, average was 18%, worst was 132%
Compared to all devices tested
» 22% of all tested devices were better, 4% similar, 73% worse
» The best had a delta of 4%, average was 24%, worst was 134%
Schenker XMG Pro 16 (E25) audio analysis
(±) | speaker loudness is average but good (79.2 dB)
Bass 100 - 315 Hz
(±) | reduced bass - on average 14.2% lower than median
(±) | linearity of bass is average (10.6% delta to prev. frequency)
Mids 400 - 2000 Hz
(±) | higher mids - on average 8.2% higher than median
(±) | linearity of mids is average (9.9% delta to prev. frequency)
Highs 2 - 16 kHz
(+) | balanced highs - only 3.8% away from median
(+) | highs are linear (5.9% delta to prev. frequency)
Overall 100 - 16.000 Hz
(±) | linearity of overall sound is average (18.5% difference to median)
Compared to same class
» 60% of all tested devices in this class were better, 8% similar, 32% worse
» The best had a delta of 6%, average was 18%, worst was 132%
Compared to all devices tested
» 41% of all tested devices were better, 8% similar, 51% worse
» The best had a delta of 4%, average was 24%, worst was 134%
Energy consumption
The TUF Gaming A16 is quite economical in idle with a maximum consumption of 10 W; expect around 200 W when gaming.
In the stress test, we briefly measured up to 235 W at the beginning, but this quickly leveled off at around 210 W.
The included 240 W power supply is, therefore, sufficient to power the laptop under stress.
| Off / Standby | |
| Idle | |
| Load |
|
Key:
min: | |
| Asus TUF Gaming A16 FA608UP GeForce RTX 5070 Laptop, R7 260, Western Digital PC SN5000S SDEQNSJ-1T00 | Alienware 16X Aurora, RTX 5070 GeForce RTX 5070 Laptop, Ultra 9 275HX | Gigabyte Gaming A16 GA6H GeForce RTX 5070 Laptop, i7-13620H, Kingston OM8PGP41024Q-A0 | Asus TUF Gaming A16 FA608WV GeForce RTX 4060 Laptop GPU, Ryzen AI 9 HX 370, Micron 2400 MTFDKBA1T0QFM | Gigabyte Aero X16 1WH GeForce RTX 5070 Laptop, Ryzen AI 7 350, Kingston OM8PGP41024Q-A0 | Schenker XMG Pro 16 (E25) GeForce RTX 5070 Ti Laptop, Ultra 9 275HX, Samsung 9100 Pro 1 TB | |
|---|---|---|---|---|---|---|
| Power Consumption | -114% | -22% | -10% | 6% | -60% | |
| Idle Minimum * (Watt) | 4.6 | 20.1 -337% | 9 -96% | 6.8 -48% | 5.8 -26% | 11.7 -154% |
| Idle Average * (Watt) | 9.8 | 27.6 -182% | 11 -12% | 12.7 -30% | 10.9 -11% | 16.6 -69% |
| Idle Maximum * (Watt) | 10.2 | 31.8 -212% | 23 -125% | 15.2 -49% | 11.2 -10% | 17.1 -68% |
| Load Average * (Watt) | 76.1 | 102.7 -35% | 91 -20% | 85 -12% | 91.3 -20% | 122.4 -61% |
| Cyberpunk 2077 ultra external monitor * (Watt) | 198.1 | 192.3 3% | 130 34% | 143 28% | 117.9 40% | 241 -22% |
| Cyberpunk 2077 ultra * (Watt) | 198.9 | 217 -9% | 132.5 33% | 145 27% | 123.8 38% | 245 -23% |
| Load Maximum * (Watt) | 235.2 | 292 -24% | 155 34% | 199 15% | 155.3 34% | 291.5 -24% |
* ... smaller is better
Power consumption: Cyberpunk 2077 / Stress test
Power consumption: External monitor
Battery life
The combination of low power draws and the large 90 Whr battery enables long battery run times.
At a brightness of 150 cd/m² (55% in the Windows slider) and a 60 Hz refresh rate, we measured just under 13 hours and nearly 9 hours at full brightness.
| Asus TUF Gaming A16 FA608UP R7 260, GeForce RTX 5070 Laptop, 90 Wh | Alienware 16X Aurora, RTX 5070 Ultra 9 275HX, GeForce RTX 5070 Laptop, 96 Wh | Gigabyte Gaming A16 GA6H i7-13620H, GeForce RTX 5070 Laptop, 76 Wh | Asus TUF Gaming A16 FA608WV Ryzen AI 9 HX 370, GeForce RTX 4060 Laptop GPU, 90 Wh | Gigabyte Aero X16 1WH Ryzen AI 7 350, GeForce RTX 5070 Laptop, 76 Wh | Schenker XMG Pro 16 (E25) Ultra 9 275HX, GeForce RTX 5070 Ti Laptop, 99.8 Wh | Average of class Gaming | |
|---|---|---|---|---|---|---|---|
| Battery Runtime | -67% | -41% | 9% | -31% | -30% | -45% | |
| WiFi Websurfing (h) | 13 | 4.3 -67% | 7.7 -41% | 14.2 9% | 8.6 -34% | 9.1 -30% | 6.7 ? -48% |
| WiFi Websurfing max. Brightness (h) | 8.9 | 6.5 -27% | 6.2 -30% | 5.16 ? -42% |
Notebookcheck's overall impressions of the Asus TUF Gaming A16
The Asus TUF Gaming A16 enables fast QHD Ultra gaming thanks to its 115 W RTX 5070 Laptop GPU, and offers good battery run times. However, the laptop could have surely benefitted from a more modern AMD APU, considering the high asking price.
Asus TUF Gaming A16 FA608UP
- 09/23/2025 v8
Andreas Osthoff
 Total Sustainability Score:
 Potential competitors in comparison
Image | Model / Review | Price | Weight | Height | Display |
|---|---|---|---|---|---|
1. 83.8%  | Asus TUF Gaming A16 FA608UP AMD Ryzen 7 260 ⎘ NVIDIA GeForce RTX 5070 Laptop ⎘ 32 GB Memory, 1024 GB SSD | Amazon: List Price: 2199€ | 2.2 kg | 25.7 mm | 16.00" 2560x1600 189 PPI IPS |
2. 84.9%  | Alienware 16X Aurora, RTX 5070 Intel Core Ultra 9 275HX ⎘ NVIDIA GeForce RTX 5070 Laptop ⎘ 32 GB Memory | List Price: 1800 USD | 2.5 kg | 23.4 mm | 16.00" 2560x1600 189 PPI IPS |
3. 80.1%  | Gigabyte Gaming A16 GA6H Intel Core i7-13620H ⎘ NVIDIA GeForce RTX 5070 Laptop ⎘ 16 GB Memory, 1024 GB SSD | Amazon: 1. GIGABYTE - Gaming A16 Gaming... 2. 180W/150W Laptop AC Power Ad... 3. Smatree Laptop Sleeve for 16... List Price: 1700 EUR | 2.3 kg | 23 mm | 16.00" 2560x1600 189 PPI IPS |
4. 83% 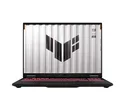 | Asus TUF Gaming A16 FA608WV AMD Ryzen AI 9 HX 370 ⎘ NVIDIA GeForce RTX 4060 Laptop GPU ⎘ 16 GB Memory, 1024 GB SSD | Amazon: List Price: 1399 Euro | 2.2 kg | 25.7 mm | 16.00" 1920x1200 142 PPI IPS |
5. 83.7%  | Gigabyte Aero X16 1WH AMD Ryzen AI 7 350 ⎘ NVIDIA GeForce RTX 5070 Laptop ⎘ 32 GB Memory, 1024 GB SSD | Amazon: 1. GIGABYTE AERO X16; Copilot+ ... 2. GIGABYTE AERO X16, Copilot+ ... 3. 180W/150W Laptop AC Power Ad... List Price: 1799€ | 2 kg | 19.9 mm | 16.00" 2560x1600 189 PPI IPS |
6. 87.4%  | Schenker XMG Pro 16 (E25) Intel Core Ultra 9 275HX ⎘ NVIDIA GeForce RTX 5070 Ti Laptop ⎘ 32 GB Memory, 1024 GB SSD | Amazon: 1. atFoliX Screen Protector com... 2. atFoliX Screen Protection Fi... 3. atFoliX Plastic Glass Protec... List Price: 2480€ | 2.5 kg | 26.5 mm | 16.00" 2560x1600 189 PPI IPS |
Transparency
The selection of devices to be reviewed is made by our editorial team. The test sample was provided to the author as a loan by the manufacturer or retailer for the purpose of this review. The lender had no influence on this review, nor did the manufacturer receive a copy of this review before publication. There was no obligation to publish this review. As an independent media company, Notebookcheck is not subjected to the authority of manufacturers, retailers or publishers.
This is how Notebookcheck is testing
Every year, Notebookcheck independently reviews hundreds of laptops and smartphones using standardized procedures to ensure that all results are comparable. We have continuously developed our test methods for around 20 years and set industry standards in the process. In our test labs, high-quality measuring equipment is utilized by experienced technicians and editors. These tests involve a multi-stage validation process. Our complex rating system is based on hundreds of well-founded measurements and benchmarks, which maintains objectivity. Further information on our test methods can be found here.

