Notebookcheck Logo

Intel Arc Graphics 140T analysis – Arrow Lake-H iGPU gains frame generation support

Intel is equipping the new Arrow Lake-H mobile processors with the Arc Graphics 140T and 130T, which are enhanced versions of the Intel Arc Graphics from the Meteor Lake generation. However, the 140T has little in common with the Arc Graphics 140V found in Lunar Lake chips.
Overview Intel Arc Graphics Arrow Lake (Source: Intel)

Intel has just launched its latest Arrow Lake mobile processors (Core Ultra 200 series), and we’ve already had the opportunity to put the H-series CPUs through a detailed test. Alongside the CPU improvements, the integrated Arc Graphics 140T and Arc Graphics 130T have received a significant upgrade.

In this article, we analyze the technology and performance of these new iGPUs, comparing them to Intel’s own Lunar Lake graphics, AMD’s Zen 5 iGPUs, and the latest ARM GPUs from Apple and Qualcomm.

Overview Intel Arc Graphics 140T

The two new integrated graphics solutions, Intel Arc Graphics 140T and 130T, are technically quite different from the Lunar Lake iGPUs (Arc Graphics 140V/130V). While Lunar Lake GPUs feature second-generation XeSS cores, the Arrow Lake iGPUs are enhanced versions of the Arc Graphics from the Meteor Lake generation. They still utilize first-generation Xe cores, but with notable improvements.

Differences to the previous generation (Source: Intel)

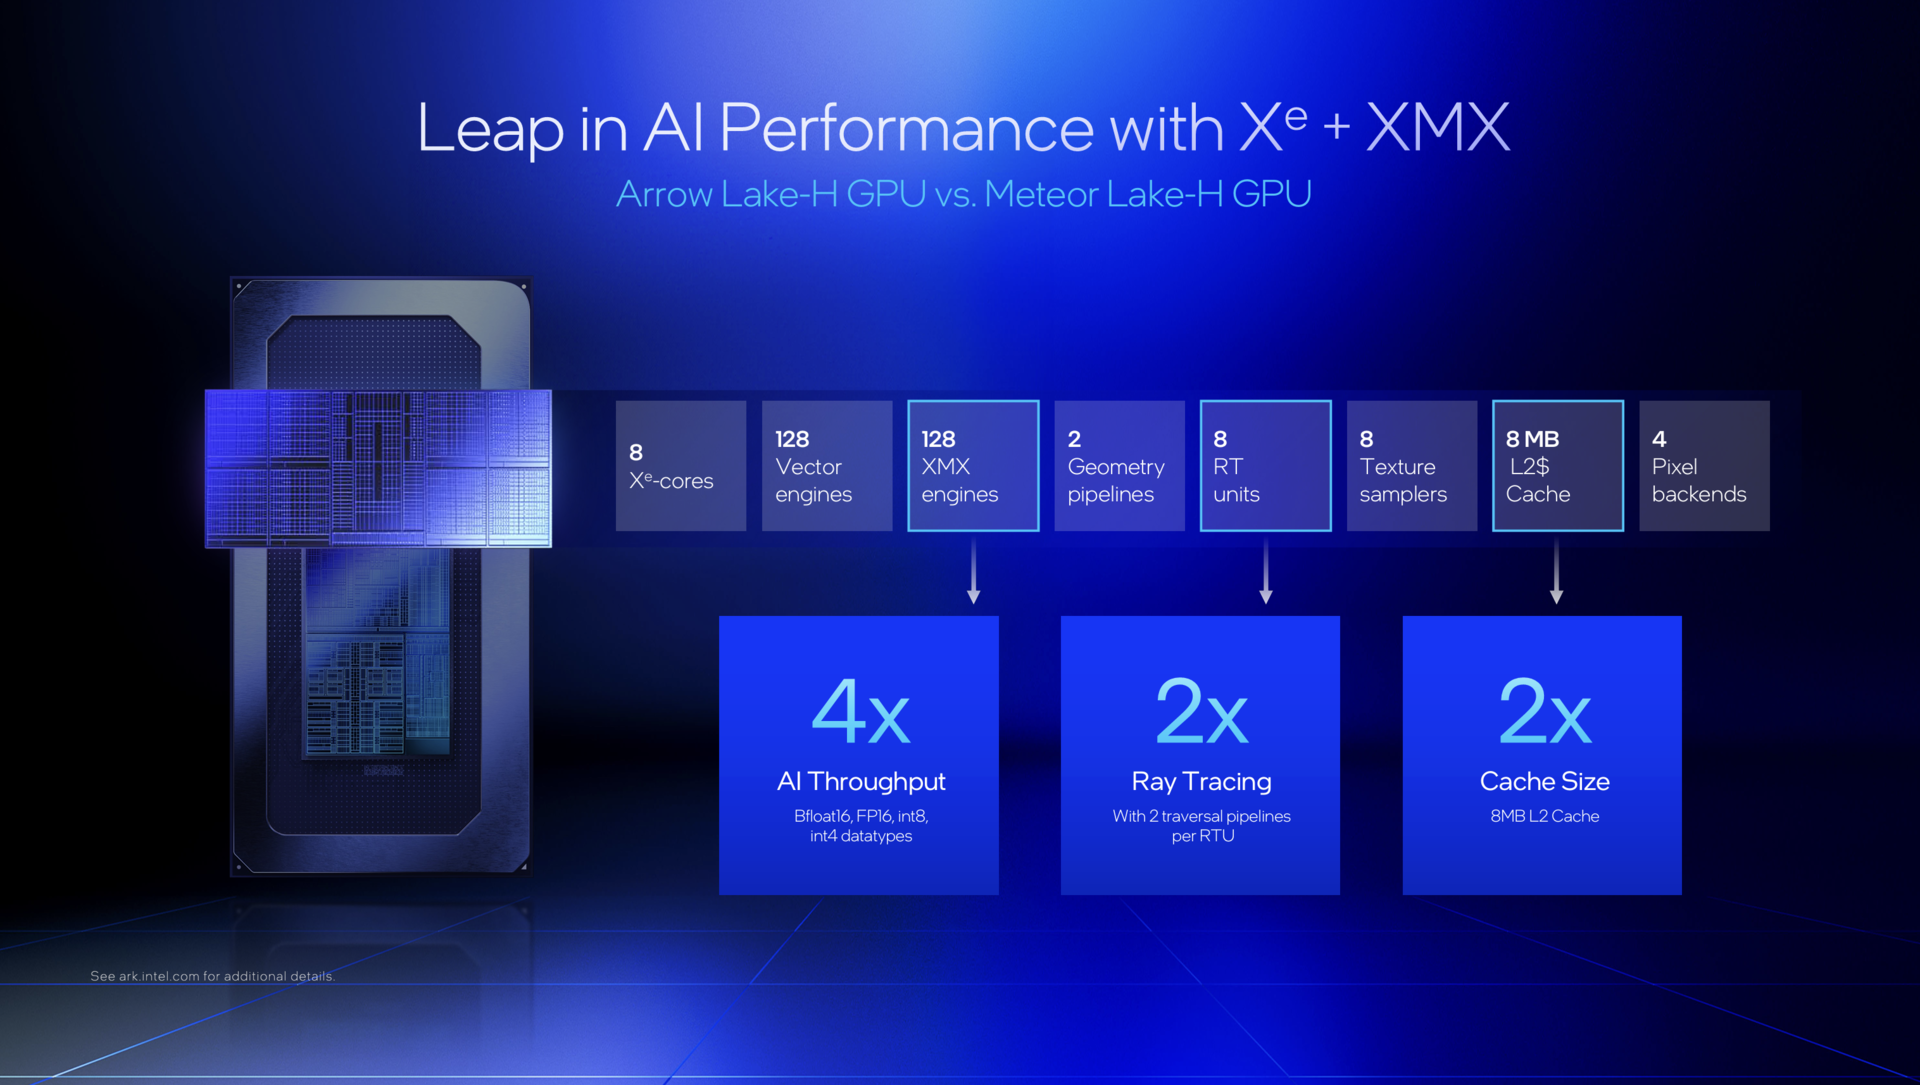
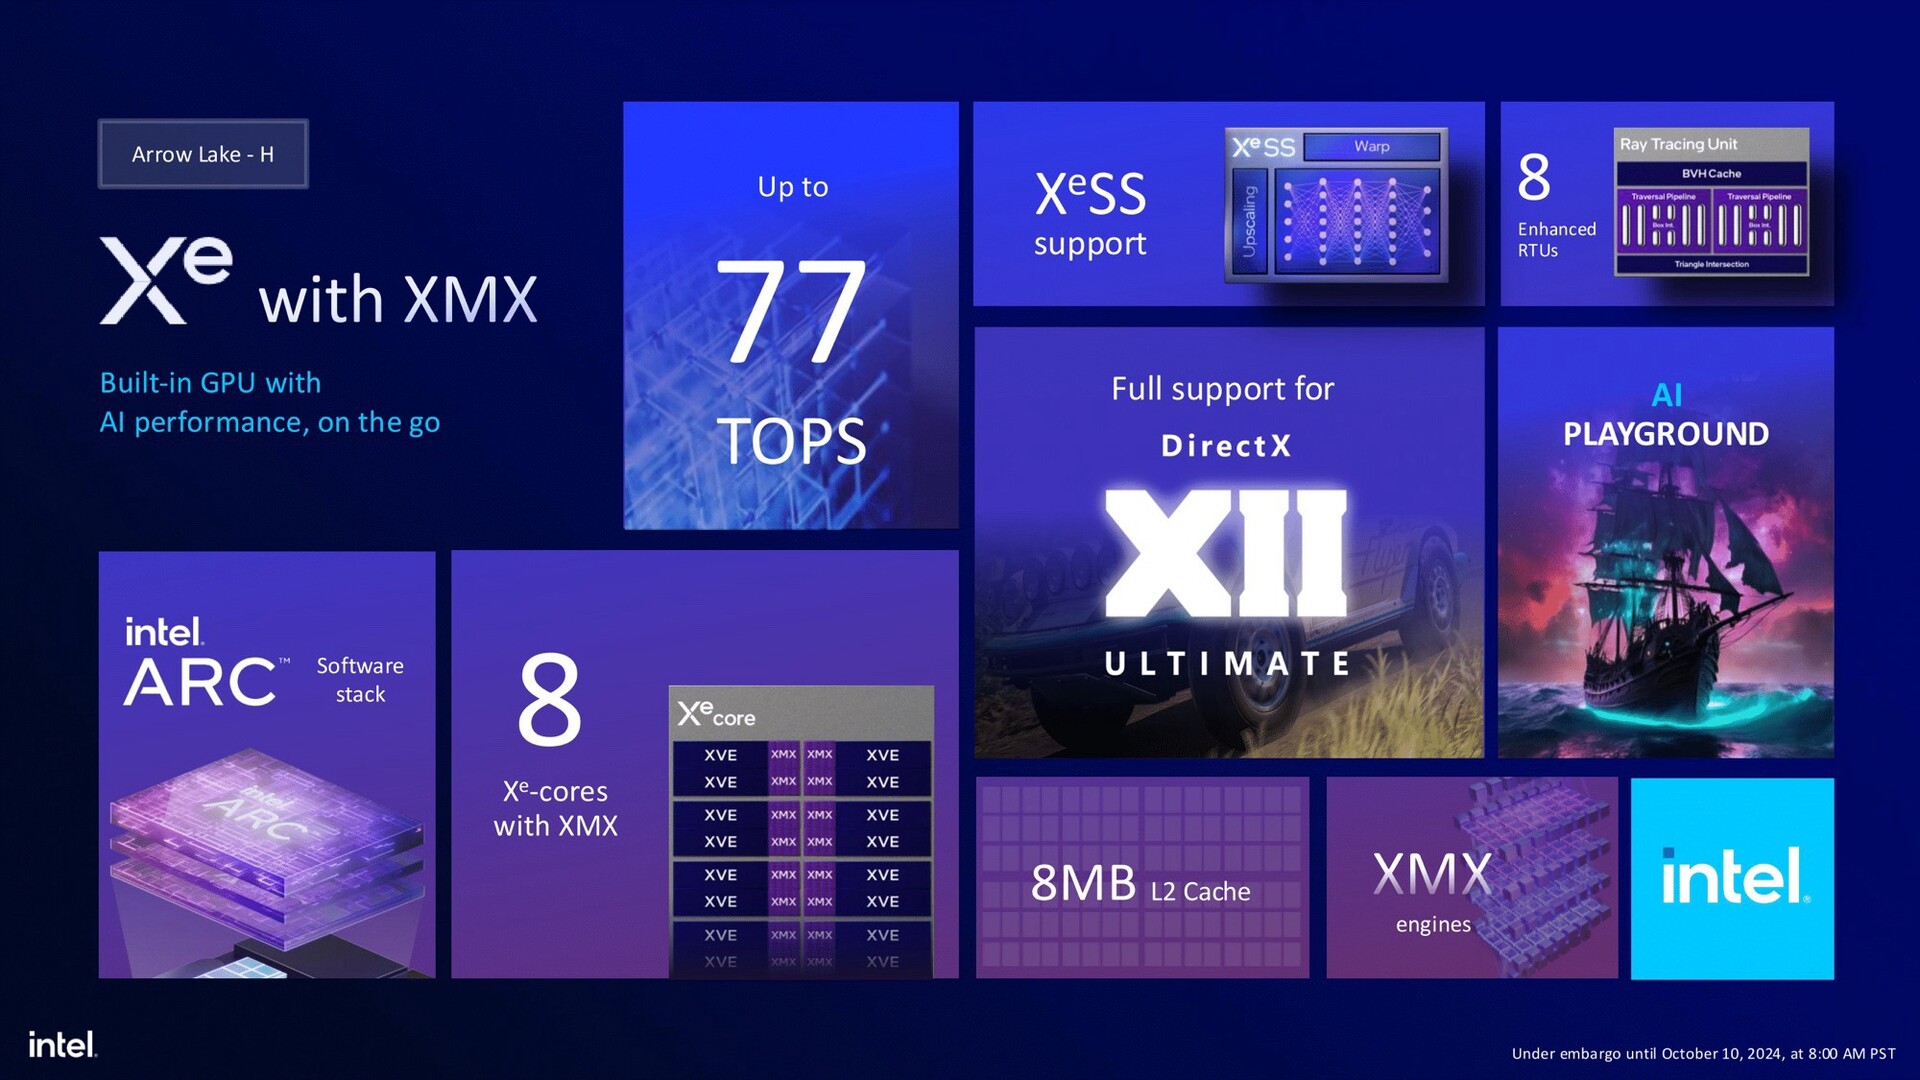
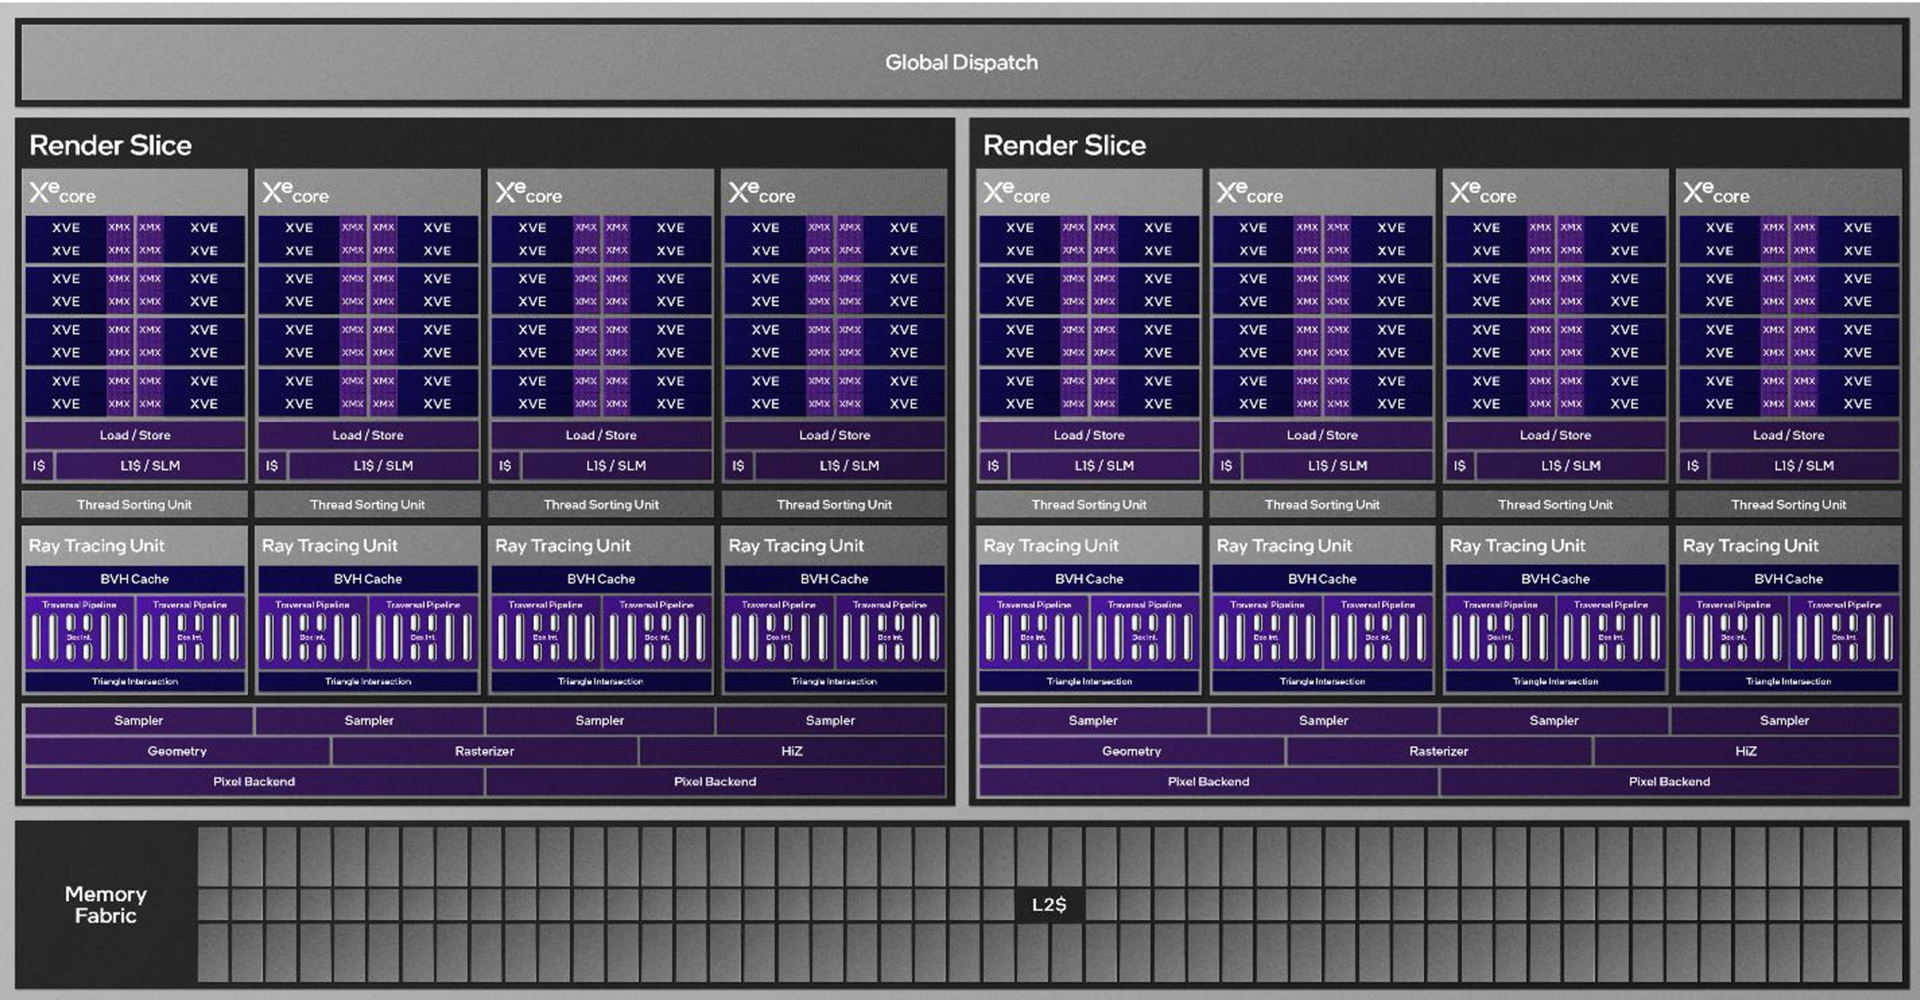
Like the Lunar Lake iGPUs, the new Arc Graphics 140T and 130T now incorporate XMX engines, significantly boosting AI performance to 77 TOPS. Additionally, ray tracing capabilities have been doubled, with the number of ray tracing units increasing to 8, and the L2 cache expanding to 8 MB.

Each Xe core still features 16 Xe vector engines and maintains full support for DirectX 12 Ultimate, including hardware-accelerated ray tracing and mesh shading.

Structure Arc Graphics 140T (Source: Intel)

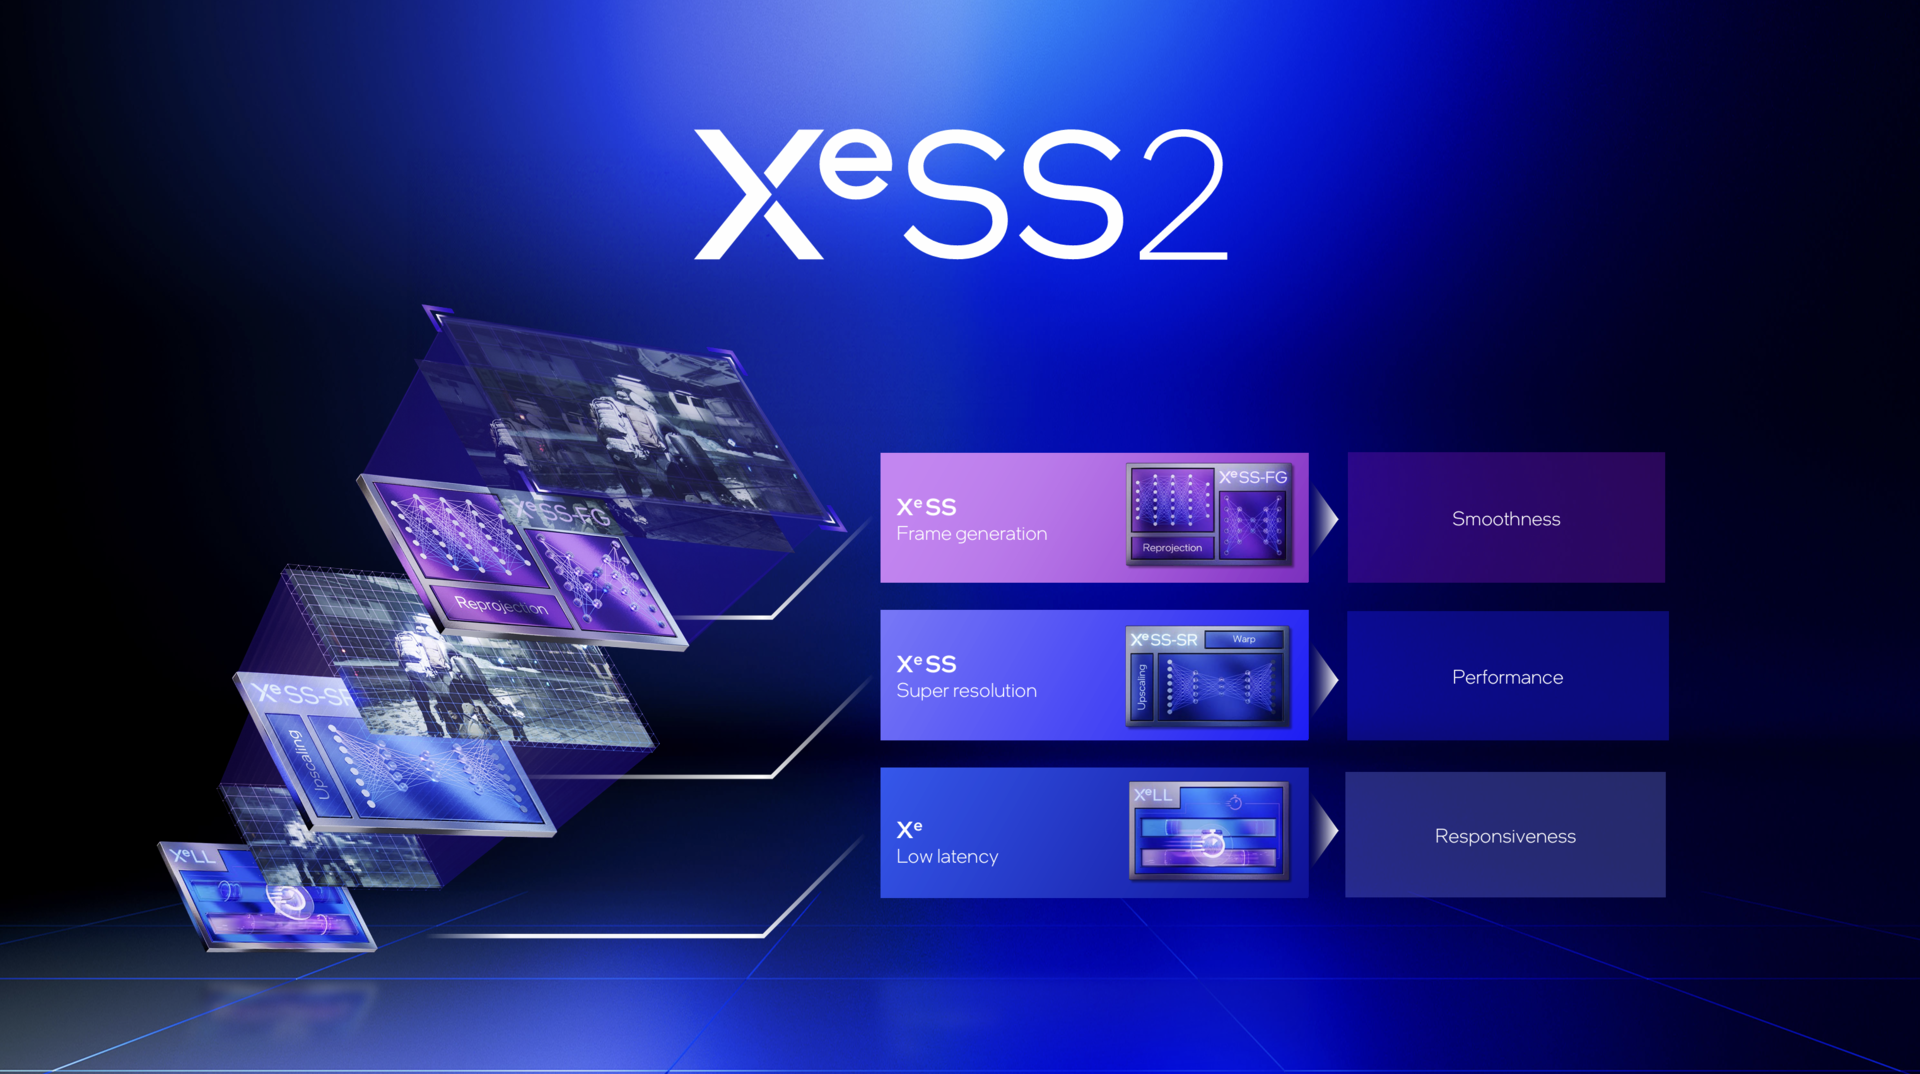
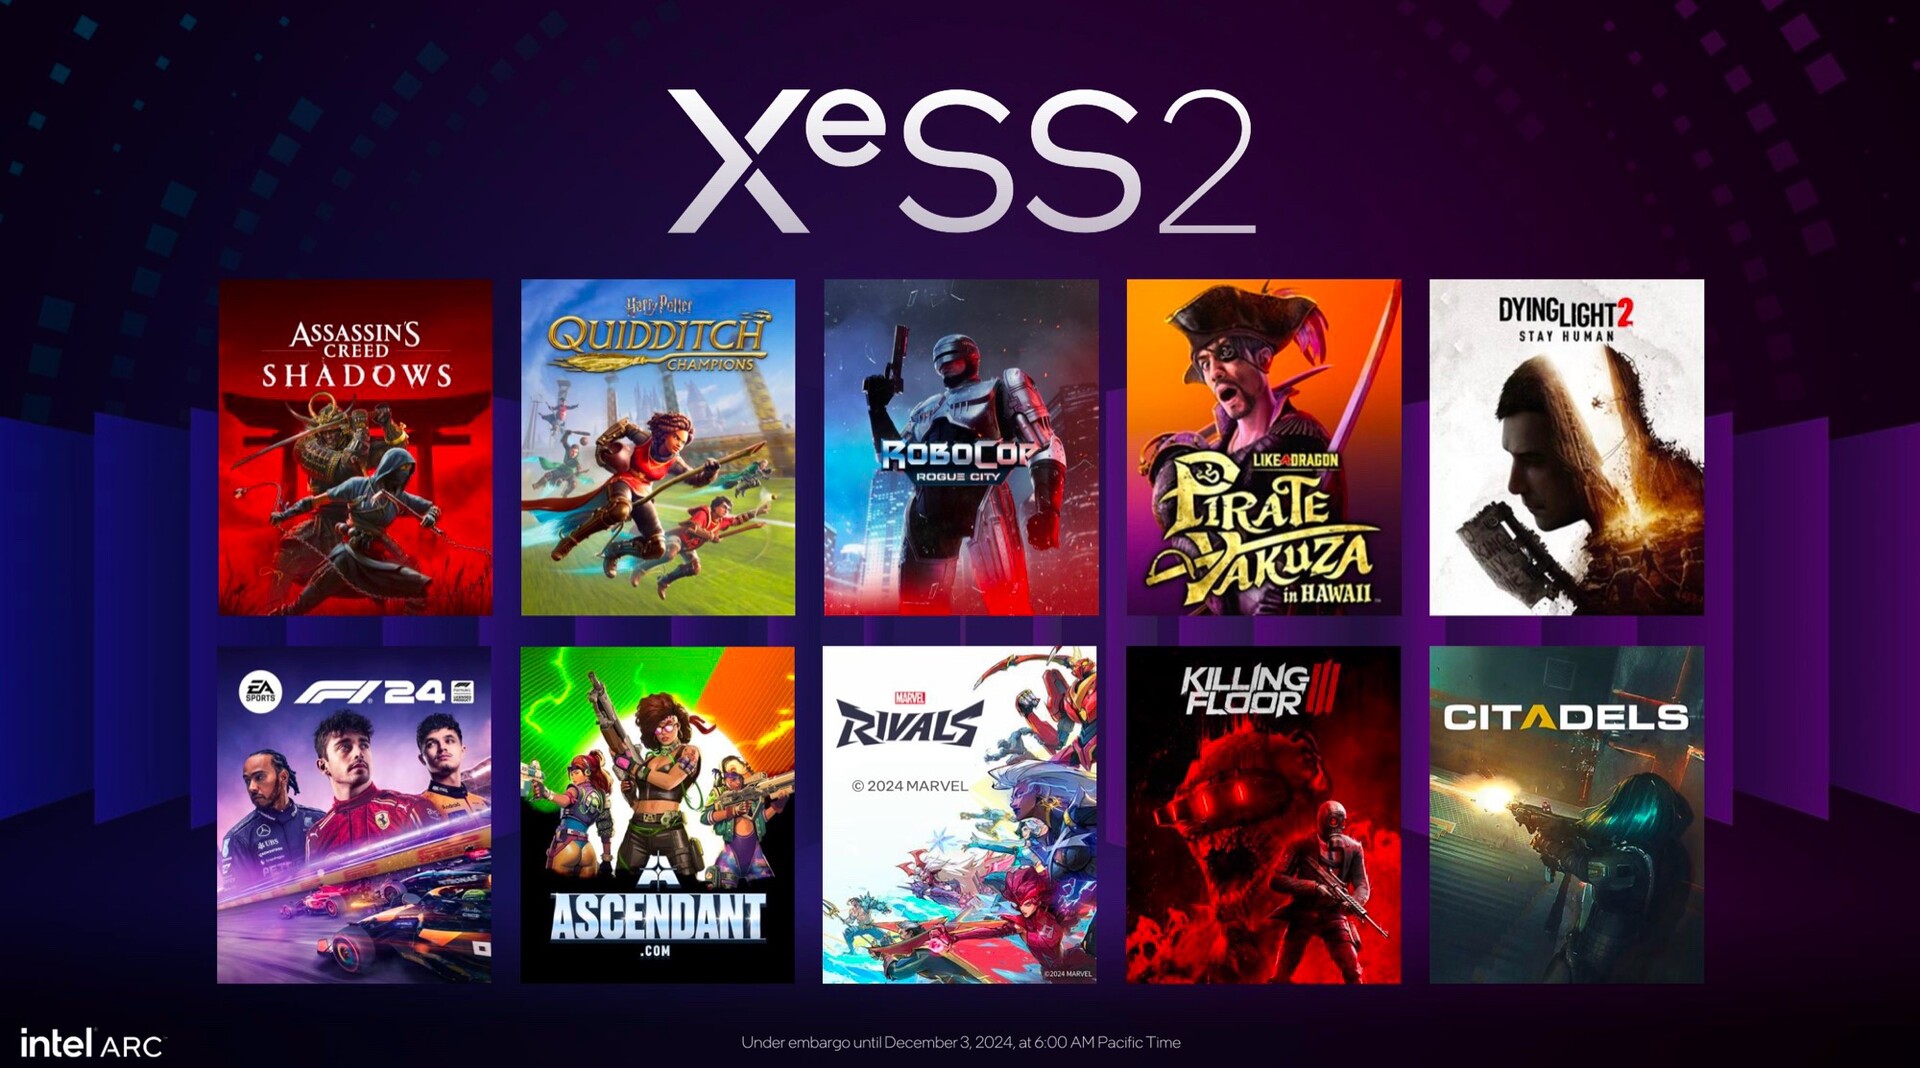
At the end of last year, Intel introduced the second generation of its Xe Super Sampling (XeSS) technology, which now includes several new features. These enhancements include Super Resolution (XeSS-SR), Frame Generation (XeSS-FG), and Low Latency (XeLL).

Currently, all games that support XeSS 2—though still limited in number—fully integrate all three of these new features.

Overview XeSS 2 (Source: Intel)
Compatible games (Source: Intel)

The new Arrow Lake-H GPUs fully support XeSS 2, including all its features, but the same applies to Lunar Lake models. Older iGPUs also offer XeSS 2 support, though not all features are available on those architectures.

The following table provides an overview of different GPU generations and their respective XeSS 2 capabilities.

Chip Generation XeSS Super Resolution XeSS Frame Generation Xe Low Latency
Lunar Lake/Arrow Lake-H Yes Yes Yes
Meteor Lake/Arrow Lake-S Yes No Yes
Tiger Lake/Alder Lake/Raptor Lake Yes No No

Test systems - Asus and MSI deliver the first models

GPU-Z Intel Arc Graphics 140T

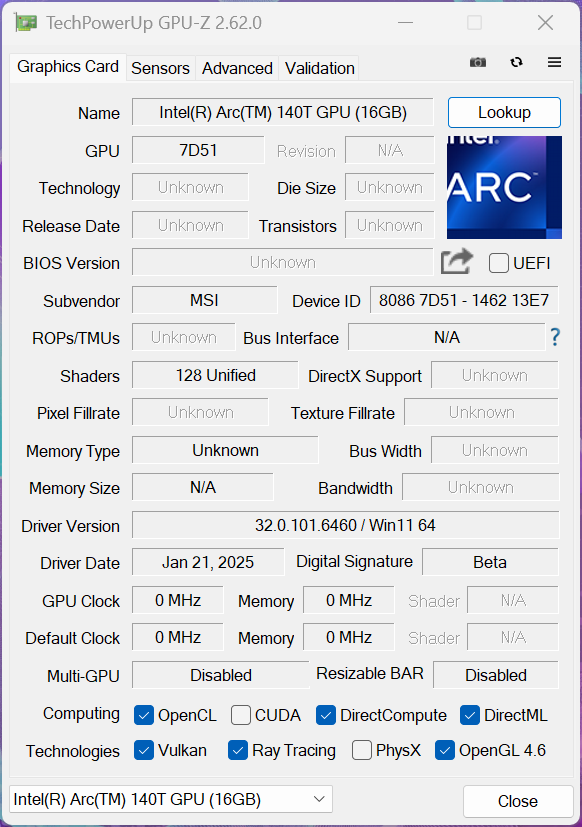
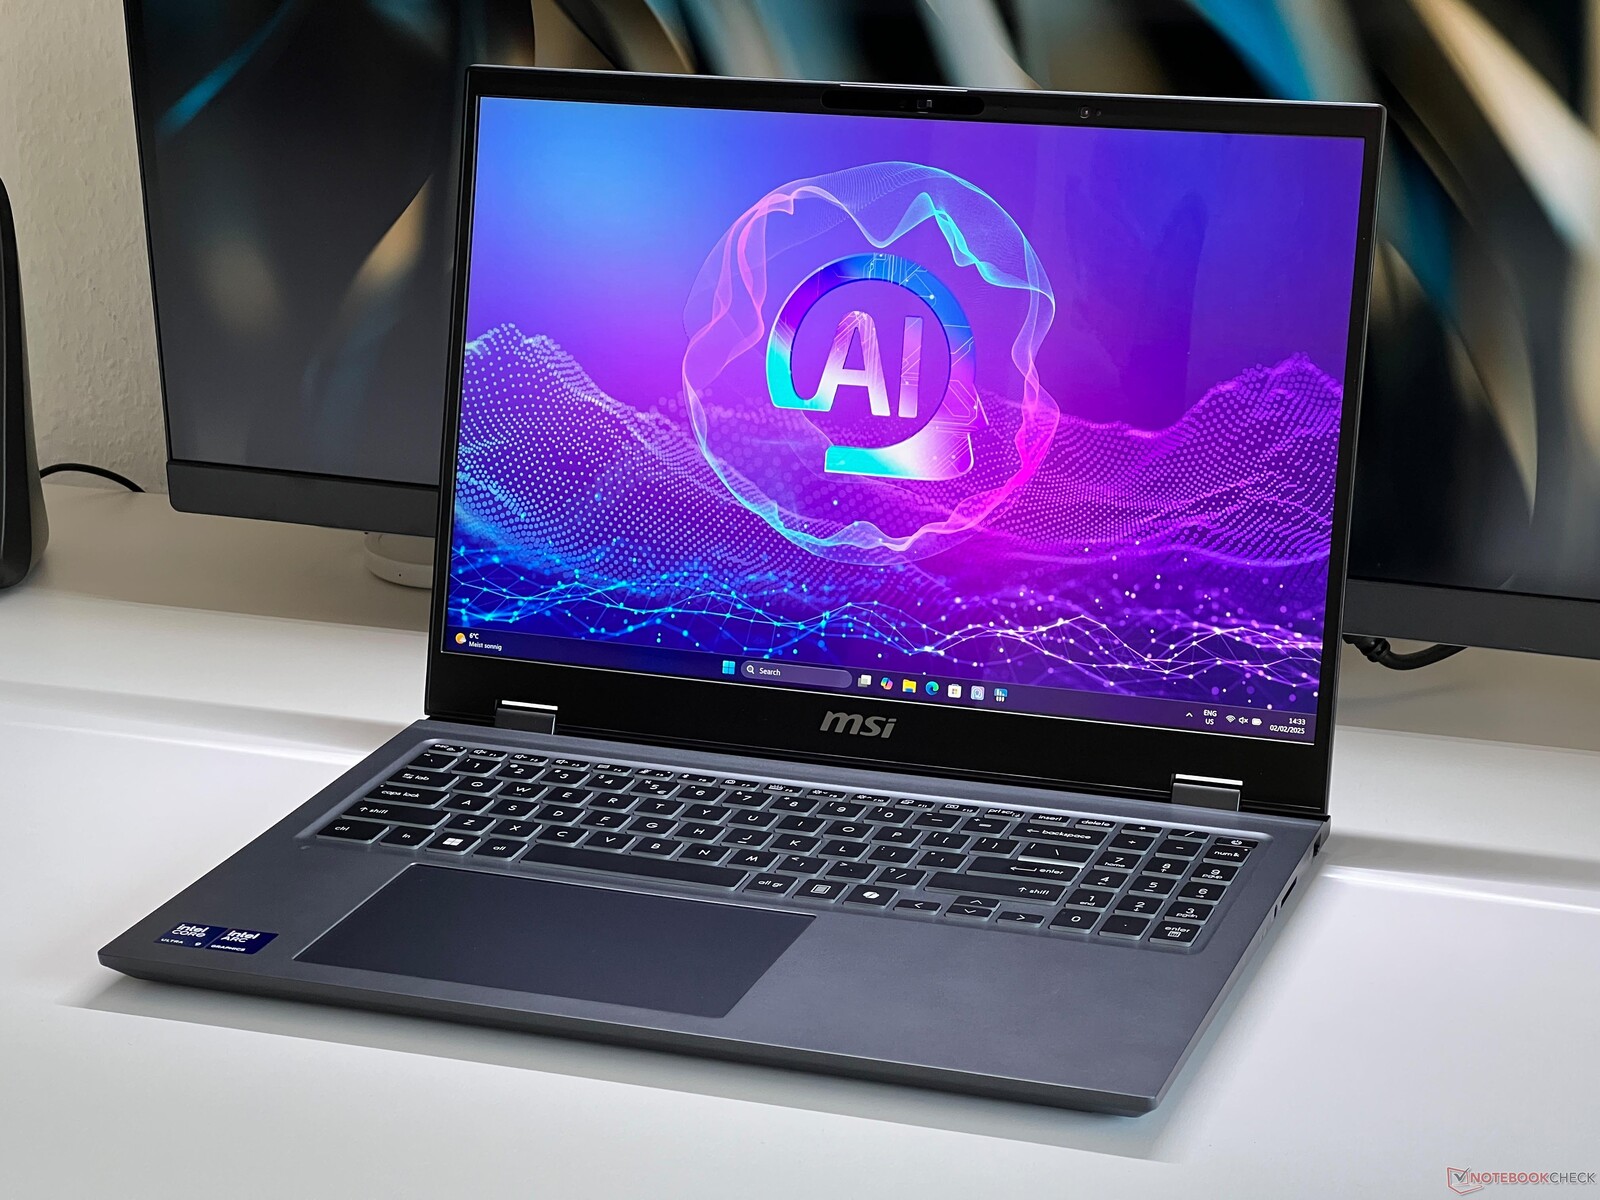
The two test notebooks are the Asus Zenbook Duo and the MSI Prestige 16 AI, both equipped with the Core Ultra 9 285H and the fastest version of the Intel Arc Graphics 140T.

These devices feature different power implementations, affecting performance. In the Zenbook Duo, the processor peaks at 60 watts but stabilizes at 24 watts under sustained load. In contrast, the Prestige 16 briefly reaches 115 watts before quickly settling at 45 watts.

Both laptops are equipped with 32GB of LPDDR5x RAM (7467 or 7500 MHz), and the maximum core clock of the Arc Graphics 140T is 2.25 GHz.

We will also be adding benchmark results for the Arc Graphics 130T soon.

MSI Prestige 16 AI Evo
Asus Zenbook Duo OLED

Test procedure

To ensure a meaningful comparison between the different graphics cards, we analyze power consumption alongside synthetic benchmark performance to determine overall efficiency.

All power consumption measurements are conducted using an external device to eliminate variations caused by internal factors. However, we measure total system consumption, not just raw TDP values, to provide a more comprehensive performance assessment. 

GPU performance

Now, let's move on to performance, starting with synthetic benchmarks. It is clear that the Arc Graphics 140T performs at a level similar to high-end implementations of the Lunar Lake Arc Graphics 140V, occasionally holding a slight advantage. Intel claims a 20% performance improvement over the Meteor Lake Arc Graphics, and our tests confirm this on average.

This means the Arc Graphics 140T outperforms AMD’s Radeon 880M and Radeon 890M iGPUs. However, dedicated GPUs such as the GeForce RTX 3050 Ti, GeForce RTX 4050 Laptop, and Radeon RX 6550M still hold a clear performance advantage.

For ARM GPU comparisons, we focus on Steel Nomad tests in 3DMark, as they run natively on ARM systems. The Arc Graphics 140T is 40-50% faster than the Adreno X1-85 (4.6 TFLOPS variant), although this higher-end model is rarely found on the market. The more widely available X1-85 (3.8 TFLOPS) trails further behind, with the Arc Graphics 140T leading by around 70%.

Against Apple's M4 generation, the Arc Graphics 140T narrowly looses to the standard M4 GPU (-7%) and falls significantly behind the lowest M4 Pro GPU, which is over 80% faster.

3DMark / Time Spy Graphics
NVIDIA GeForce RTX 4050 Laptop GPU
Dell XPS 14 2024 OLED, , Ultra 7 155H
5107 Points +22%
NVIDIA GeForce RTX 3050 6GB Laptop GPU
Lenovo Slim Pro 7 14ARP8, , R7 7735HS
4820 Points +15%
NVIDIA GeForce RTX 3050 Ti Laptop GPU
SCHENKER Vision 14 2022 RTX 3050 Ti, , i7-12700H
4773 Points +14%
AMD Radeon RX 6550M
Lenovo ThinkPad Z16 Gen 2, , R9 PRO 7940HS
4546 Points +8%
Intel Arc Graphics 140V
Asus Zenbook S 14 UX5406 Core Ultra 9, Zenbook S 14 Fullspeed Mode, Core Ultra 9 288V
4227 Points +1%
Intel Arc Graphics 140T
MSI Prestige 16 AI Evo B2HMG, , Ultra 9 285H
4194 Points
Intel Arc Graphics 140V
Asus Zenbook S 14 UX5406, Zenbook S 14 Fullspeed Mode, Core Ultra 7 258V
4118 Points -2%
Intel Arc Graphics 140T
Asus ZenBook Duo OLED UX8406CA, , Ultra 9 285H
4074 Points -3%
Intel Arc Graphics 140V
Asus Zenbook S 14 UX5406, Zenbook S 14 Performance Mode, Core Ultra 7 258V
4047 Points -4%
NVIDIA GeForce RTX 3050 4GB Laptop GPU
LG gram Pro 16Z90SP, , Ultra 7 155H
3786 Points -10%
Intel Arc 8-Core iGPU
Huawei MateBook X Pro 2024, , Ultra 9 185H
3719 Points -11%
AMD Radeon 890M
Minisforum EliteMini AI370, , Ryzen AI 9 HX 370
3533 Points -16%
NVIDIA GeForce RTX 3050 4GB Laptop GPU
Asus VivoBook 14X K3405, , i5-13500H
3493 Points -17%
Intel Arc 8-Core iGPU
Asus NUC 14 Pro+, , Ultra 9 185H
3476 Points -17%
AMD Radeon 880M
Lenovo ThinkBook 16 G7+ AMD, , Ryzen AI 9 365
3464 Points -17%
AMD Radeon 890M
Asus Zenbook S 16 UM5606-RK333W, Zenbook S 16, Ryzen AI 9 HX 370
3421 Points -18%
NVIDIA GeForce RTX 2050 Mobile
Asus ExpertBook B3 B3404CVF, , i7-1355U
3242 Points -23%
Intel Arc 8-Core iGPU
Asus ZenBook 14 UX3405MA, , Ultra 7 155H
3206 Points -24%
Intel Arc Graphics 140V
SCHENKER Lunar Lake Engineering Sample, , Core Ultra 7 256V
3162 Points -25%
Intel Arc 7-Core iGPU
Samsung Galaxy Book4 Pro 360, , Ultra 5 125H
3000 Points -28%
AMD Radeon 880M
Asus Zenbook S 16 UM5606WA-RK052W, , Ryzen AI 9 365
2970 Points -29%
NVIDIA RTX A500 Laptop GPU
Lenovo ThinkPad P14s G4 21HF0017GE, , i7-1370P
2873 Points -31%
AMD Radeon 780M
SCHENKER XMG Evo 14 (M24), , R7 8845HS
2860 Points -32%
Intel Graphics 4-Core iGPU (Arc)
Lenovo ThinkPad X1 2in1 G9 21KE004AGE, , Ultra 7 165U
2049 Points -51%
Qualcomm SD X Adreno X1-85 4.6 TFLOPS
Samsung Galaxy Book4 Edge 16 X1E-84-100, Galaxy Book4 Edge 16, SD X Elite X1E-84-100
1989 Points -53%
Qualcomm SD X Adreno X1-85 3.8 TFLOPS
Lenovo Yoga Slim 7X 14Q8X9, , SD X Elite X1E-78-100
1717 Points -59%
Qualcomm SD X Adreno X1-85 3.8 TFLOPS
Samsung Galaxy Book4 Edge 14, , SD X Elite X1E-80-100
1546 Points -63%
Qualcomm SD X Adreno X1-45 1.7 TFLOPS
Asus ProArt PZ13 HT5306, ProArt PZ13 Standard Mode, SD X Plus X1P-42-100
877 Points -79%
3DMark / Steel Nomad Light Score
Apple M4 Pro 16-Core GPU
Apple MacBook Pro 14 2024 M4 Pro Entry, , M4 Pro (12 cores)
6739 Points +83%
NVIDIA GeForce RTX 3050 4GB Laptop GPU
LG gram Pro 16Z90SP, , Ultra 7 155H
3940 Points +7%
NVIDIA GeForce RTX 3050 4GB Laptop GPU
LG gram Pro 16Z90SP, , Ultra 7 155H
3903 Points +6%
Apple M4 10-core GPU
Apple MacBook Pro 14 2024 M4, , M4 (10 cores)
3932 Points +7%
Intel Arc Graphics 140T
MSI Prestige 16 AI Evo B2HMG, , Ultra 9 285H
3692 Points
Intel Arc Graphics 140T
Asus ZenBook Duo OLED UX8406CA, , Ultra 9 285H
3620 Points -2%
Intel Arc Graphics 140V
Asus Zenbook S 14 UX5406 Core Ultra 9, Zenbook S 14 Fullspeed Mode, Core Ultra 9 288V
3406 Points -8%
AMD Radeon 880M
Lenovo ThinkBook 16 G7+ AMD, , Ryzen AI 9 365
3281 Points -11%
AMD Radeon 890M
Minisforum EliteMini AI370, , Ryzen AI 9 HX 370
3211 Points -13%
AMD Radeon 890M
Asus Zenbook S 16 UM5606-RK333W, Zenbook S 16, Ryzen AI 9 HX 370
3198 Points -13%
Intel Arc 8-Core iGPU
Asus NUC 14 Pro+, , Ultra 9 185H
3026 Points -18%
AMD Radeon 780M
SCHENKER XMG Evo 14 (M24), , R7 8845HS
2816 Points -24%
Intel Arc Graphics 140V
SCHENKER Lunar Lake Engineering Sample, , Core Ultra 7 256V
2596 Points -30%
Qualcomm SD X Adreno X1-85 4.6 TFLOPS
Samsung Galaxy Book4 Edge 16 X1E-84-100, Galaxy Book4 Edge 16, SD X Elite X1E-84-100
2467 Points -33%
Qualcomm SD X Adreno X1-85 3.8 TFLOPS
Lenovo Yoga Slim 7X 14Q8X9, , SD X Elite X1E-78-100
2118 Points -43%
Qualcomm SD X Adreno X1-85 3.8 TFLOPS
Samsung Galaxy Book4 Edge 14, , SD X Elite X1E-80-100
2071 Points -44%
Qualcomm SD X Adreno X1-45 1.7 TFLOPS
Asus ProArt PZ13 HT5306, ProArt PZ13 Standard Mode, SD X Plus X1P-42-100
1148 Points -69%
3DMark / Steel Nomad Score
Intel Arc Graphics 140T
MSI Prestige 16 AI Evo B2HMG, , Ultra 9 285H
919 Points
Intel Arc Graphics 140V
Asus Zenbook S 14 UX5406 Core Ultra 9, Zenbook S 14 Fullspeed Mode, Core Ultra 9 288V
915 Points 0%
Intel Arc Graphics 140T
Asus ZenBook Duo OLED UX8406CA, , Ultra 9 285H
834 Points -9%
Intel Arc 8-Core iGPU
Asus NUC 14 Pro+, , Ultra 9 185H
714 Points -22%
Intel Arc Graphics 140V
SCHENKER Lunar Lake Engineering Sample, , Core Ultra 7 256V
601 Points -35%
Qualcomm SD X Adreno X1-85 4.6 TFLOPS
Samsung Galaxy Book4 Edge 16 X1E-84-100, Galaxy Book4 Edge 16, SD X Elite X1E-84-100
590 Points -36%
AMD Radeon 890M
Minisforum EliteMini AI370, , Ryzen AI 9 HX 370
583 Points -37%
AMD Radeon 880M
Lenovo ThinkBook 16 G7+ AMD, , Ryzen AI 9 365
572 Points -38%
AMD Radeon 890M
Asus Zenbook S 16 UM5606-RK333W, Zenbook S 16, Ryzen AI 9 HX 370
557 Points -39%
Qualcomm SD X Adreno X1-85 3.8 TFLOPS
Lenovo Yoga Slim 7X 14Q8X9, , SD X Elite X1E-78-100
512 Points -44%
Qualcomm SD X Adreno X1-85 3.8 TFLOPS
Samsung Galaxy Book4 Edge 14, , SD X Elite X1E-80-100
510 Points -45%
AMD Radeon 780M
SCHENKER XMG Evo 14 (M24), , R7 8845HS
500 Points -46%
Qualcomm SD X Adreno X1-45 1.7 TFLOPS
Asus ProArt PZ13 HT5306, ProArt PZ13 Standard Mode, SD X Plus X1P-42-100
233 Points -75%
NVIDIA GeForce RTX 3050 4GB Laptop GPU
LG gram Pro 16Z90SP, , Ultra 7 155H
223 Points -76%
NVIDIA GeForce RTX 3050 4GB Laptop GPU
LG gram Pro 16Z90SP, , Ultra 7 155H
47 Points -95%

In Geekbench’s OpenCL test, the Arc Graphics 140V performs on par with the Radeon 890M and well ahead of the Arc Graphics 140V, which surprisingly lags slightly behind even the older Meteor Lake Arc Graphics. Snapdragon GPUs are clearly outperformed, and while the M4 GPU is just edged out, the M4 Pro remains far ahead. In the Vulkan test, the two latest Intel iGPUs are almost evenly matched.

In GFXBench OpenGL tests, the Arc Graphics 140T only narrowly outperforms the older Arc Graphics, while the Lunar Lake Arc Graphics 140V falls further behind. AMD’s Radeon iGPUs are also surpassed, but the Adreno X1-85 holds a slight performance edge over the 140T. Meanwhile, Apple’s M3 and M4 GPUs remain significantly faster across the board.

Geekbench 6.4 / GPU OpenCL
NVIDIA GeForce RTX 4050 Laptop GPU
Dell XPS 14 2024 OLED, , Ultra 7 155H
64570 Points +55%
Apple M4 Pro 16-Core GPU
Apple MacBook Pro 14 2024 M4 Pro Entry, , M4 Pro (12 cores)
60506 Points +45%
Apple M3 Pro 18-Core GPU
Apple MacBook Pro 16 2023 M3 Pro, , Apple M3 Pro 12-Core
50373 Points +21%
NVIDIA GeForce RTX 3050 4GB Laptop GPU
LG gram Pro 16Z90SP, , Ultra 7 155H
48462 Points +16%
NVIDIA GeForce RTX 2050 Mobile
Asus ExpertBook B3 B3404CVF, , i7-1355U
43378 Points +4%
AMD Radeon 890M
Asus ProArt P16 H7606WI, ProArt P16 80W TDP, Ryzen AI 9 HX 370
43082 Points +3%
Intel Arc Graphics 140T
Asus ZenBook Duo OLED UX8406CA, , Ultra 9 285H
43036 Points +3%
Apple M3 Pro 14-Core GPU
Apple MacBook Pro 14 2023 M3 Pro, , Apple M3 Pro 11-Core
42798 Points +2%
NVIDIA RTX A500 Laptop GPU
Lenovo ThinkPad P14s G4 21HF0017GE, , i7-1370P
42411 Points +2%
Intel Arc Graphics 140T
MSI Prestige 16 AI Evo B2HMG, , Ultra 9 285H
41775 Points
Apple M4 10-core GPU
Apple MacBook Pro 14 2024 M4, , M4 (10 cores)
38291 Points -8%
Intel Arc 8-Core iGPU
Huawei MateBook X Pro 2024, , Ultra 9 185H
36741 Points -12%
AMD Radeon 890M
Asus Zenbook S 16 UM5606-RK333W, Zenbook S 16, Ryzen AI 9 HX 370
34259 Points -18%
AMD Radeon 880M
Lenovo Yoga Pro 7 14ASP G9, , Ryzen AI 9 365
33856 Points -19%
Intel Arc 8-Core iGPU
Asus ZenBook 14 UX3405MA, , Ultra 7 155H
32096 Points -23%
Intel Arc 7-Core iGPU
Samsung Galaxy Book4 Pro 360, , Ultra 5 125H
31245 Points -25%
AMD Radeon RX 6550M
Lenovo ThinkPad Z16 Gen 2, , R9 PRO 7940HS
30568 Points -27%
Apple M3 10-Core GPU
Apple MacBook Air 13 M3 10C GPU, , M3
30506 Points -27%
Apple M3 10-Core GPU
Apple MacBook Air 15 M3, , M3
30470 Points -27%
Intel Arc Graphics 140V
Asus Zenbook S 14 UX5406 Core Ultra 9, Zenbook S 14 Fullspeed Mode, Core Ultra 9 288V
30092 Points -28%
AMD Radeon 780M
SCHENKER XMG Evo 14 (M24), , R7 8845HS
29852 Points -29%
Intel Arc Graphics 140V
Asus Zenbook S 14 UX5406, Zenbook S 14 Standard Mode, Core Ultra 7 258V
29389 Points -30%
Intel Arc 8-Core iGPU
Xiaomi RedmiBook Pro 14 2024, , Ultra 7 155H
29233 Points -30%
AMD Radeon 880M
Asus Zenbook S 16 UM5606WA-RK052W, , Ryzen AI 9 365
27595 Points -34%
Qualcomm SD X Adreno X1-85 3.8 TFLOPS
Samsung Galaxy Book4 Edge 14, , SD X Elite X1E-80-100
20677 Points -51%
Qualcomm SD X Adreno X1-85 3.8 TFLOPS
Lenovo Yoga Slim 7X 14Q8X9, , SD X Elite X1E-78-100
20592 Points -51%
Qualcomm SD X Adreno X1-85 3.8 TFLOPS
Microsoft Surface Laptop 7 13.8 Copilot+, , SD X Elite X1E-80-100
20147 Points -52%
Intel Graphics 4-Core iGPU (Arc)
Lenovo ThinkPad X1 2in1 G9 21KE004AGE, , Ultra 7 165U
17704 Points -58%
Qualcomm SD X Adreno X1-45 1.7 TFLOPS
Asus VivoBook S 15 Snapdragon 8-Core, VivoBook S 15 Snapdragon 8-Core Standard Mode, SD X Plus X1P-42-100
9994 Points -76%
Qualcomm SD X Adreno X1-45 1.7 TFLOPS
Asus ProArt PZ13 HT5306, ProArt PZ13 Standard Mode, SD X Plus X1P-42-100
9991 Points -76%
Geekbench 6.4 / GPU Vulkan
AMD Radeon 890M
Asus ProArt P16 H7606WI, ProArt P16 80W TDP, Ryzen AI 9 HX 370
47829 Points +40%
AMD Radeon 880M
Lenovo Yoga Pro 7 14ASP G9, , Ryzen AI 9 365
42000 Points +23%
NVIDIA GeForce RTX 2050 Mobile
Asus ExpertBook B3 B3404CVF, , i7-1355U
41279 Points +21%
AMD Radeon 890M
Asus Zenbook S 16 UM5606-RK333W, Zenbook S 16, Ryzen AI 9 HX 370
38270 Points +12%
Intel Arc Graphics 140T
Asus ZenBook Duo OLED UX8406CA, , Ultra 9 285H
38138 Points +12%
AMD Radeon 880M
Asus Zenbook S 16 UM5606WA-RK052W, , Ryzen AI 9 365
36750 Points +8%
Intel Arc Graphics 140V
Asus Zenbook S 14 UX5406 Core Ultra 9, Zenbook S 14 Fullspeed Mode, Core Ultra 9 288V
36196 Points +6%
NVIDIA GeForce RTX 4050 Laptop GPU
Dell XPS 14 2024 OLED, , Ultra 7 155H
35419 Points +4%
Intel Arc 8-Core iGPU
Huawei MateBook X Pro 2024, , Ultra 9 185H
35076 Points +3%
Intel Arc 8-Core iGPU
Asus ZenBook 14 UX3405MA, , Ultra 7 155H
34432 Points +1%
Intel Arc Graphics 140V
Asus Zenbook S 14 UX5406, Zenbook S 14 Standard Mode, Core Ultra 7 258V
34432 Points +1%
Intel Arc Graphics 140T
MSI Prestige 16 AI Evo B2HMG, , Ultra 9 285H
34146 Points
NVIDIA GeForce RTX 3050 4GB Laptop GPU
LG gram Pro 16Z90SP, , Ultra 7 155H
33133 Points -3%
AMD Radeon RX 6550M
Lenovo ThinkPad Z16 Gen 2, , R9 PRO 7940HS
29898 Points -12%
Intel Arc 7-Core iGPU
Samsung Galaxy Book4 Pro 360, , Ultra 5 125H
28903 Points -15%
AMD Radeon 780M
SCHENKER XMG Evo 14 (M24), , R7 8845HS
28131 Points -18%
Qualcomm SD X Adreno X1-85 3.8 TFLOPS
Samsung Galaxy Book4 Edge 14, , SD X Elite X1E-80-100
23722 Points -31%
Qualcomm SD X Adreno X1-85 3.8 TFLOPS
Lenovo Yoga Slim 7X 14Q8X9, , SD X Elite X1E-78-100
23247 Points -32%
Qualcomm SD X Adreno X1-85 3.8 TFLOPS
Microsoft Surface Laptop 7 13.8 Copilot+, , SD X Elite X1E-80-100
23174 Points -32%
NVIDIA RTX A500 Laptop GPU
Lenovo ThinkPad P14s G4 21HF0017GE, , i7-1370P
20666 Points -39%
Intel Graphics 4-Core iGPU (Arc)
Lenovo ThinkPad X1 2in1 G9 21KE004AGE, , Ultra 7 165U
19484 Points -43%
Qualcomm SD X Adreno X1-45 1.7 TFLOPS
Asus VivoBook S 15 Snapdragon 8-Core, VivoBook S 15 Snapdragon 8-Core Standard Mode, SD X Plus X1P-42-100
11351 Points -67%
Qualcomm SD X Adreno X1-45 1.7 TFLOPS
Asus ProArt PZ13 HT5306, ProArt PZ13 Standard Mode, SD X Plus X1P-42-100
11315 Points -67%
GFXBench / 4K Aztec Ruins High Tier Offscreen
Apple M4 Pro 16-Core GPU
Apple MacBook Pro 14 2024 M4 Pro Entry, , M4 Pro (12 cores)
103.3 fps +134%
Apple M3 Pro 18-Core GPU
Apple MacBook Pro 16 2023 M3 Pro, , Apple M3 Pro 12-Core
97.8 fps +122%
Apple M3 Pro 14-Core GPU
Apple MacBook Pro 14 2023 M3 Pro, , Apple M3 Pro 11-Core
79 fps +79%
Apple M4 10-core GPU
Apple MacBook Pro 14 2024 M4, , M4 (10 cores)
59.8 fps +36%
Apple M3 10-Core GPU
Apple MacBook Air 15 M3, , M3
52.6 fps +19%
Apple M3 10-Core GPU
Apple MacBook Air 13 M3 10C GPU, , M3
51.8 fps +17%
Qualcomm SD X Adreno X1-85 3.8 TFLOPS
Microsoft Surface Laptop 7 13.8 Copilot+, , SD X Elite X1E-80-100
48.6 fps +10%
Intel Arc Graphics 140T
MSI Prestige 16 AI Evo B2HMG, , Ultra 9 285H
44.1 fps
Intel Arc 8-Core iGPU
Xiaomi RedmiBook Pro 14 2024, , Ultra 7 155H
41.6 fps -6%
AMD Radeon 890M
Asus ProArt P16 H7606WI, ProArt P16 80W TDP, Ryzen AI 9 HX 370
39.7 fps -10%
AMD Radeon 880M
Lenovo Yoga Pro 7 14ASP G9, , Ryzen AI 9 365
38.3 fps -13%
AMD Radeon 880M
Asus Zenbook S 16 UM5606WA-RK052W, , Ryzen AI 9 365
36.4 fps -17%
Intel Arc 7-Core iGPU
Samsung Galaxy Book4 Pro 360, , Ultra 5 125H
33.9 fps -23%
Intel Arc Graphics 140V
Asus Zenbook S 14 UX5406 Core Ultra 9, Zenbook S 14 Fullspeed Mode, Core Ultra 9 288V
28.5 fps -35%
NVIDIA RTX A500 Laptop GPU
Lenovo ThinkPad P14s G4 21HF0017GE, , i7-1370P
28.463 fps -35%
Intel Arc Graphics 140V
Asus Zenbook S 14 UX5406, Zenbook S 14 Standard Mode, Core Ultra 7 258V
28.4 fps -36%
GFXBench / Aztec Ruins High Tier Offscreen
Apple M4 Pro 16-Core GPU
Apple MacBook Pro 14 2024 M4 Pro Entry, , M4 Pro (12 cores)
234.5 fps +134%
Apple M3 Pro 18-Core GPU
Apple MacBook Pro 16 2023 M3 Pro, , Apple M3 Pro 12-Core
219.7 fps +119%
Apple M3 Pro 14-Core GPU
Apple MacBook Pro 14 2023 M3 Pro, , Apple M3 Pro 11-Core
178.7 fps +78%
Apple M4 10-core GPU
Apple MacBook Pro 14 2024 M4, , M4 (10 cores)
136.6 fps +36%
Apple M3 10-Core GPU
Apple MacBook Air 15 M3, , M3
120 fps +20%
Apple M3 10-Core GPU
Apple MacBook Air 13 M3 10C GPU, , M3
114.4 fps +14%
Qualcomm SD X Adreno X1-85 3.8 TFLOPS
Microsoft Surface Laptop 7 13.8 Copilot+, , SD X Elite X1E-80-100
106.6 fps +6%
Intel Arc Graphics 140T
MSI Prestige 16 AI Evo B2HMG, , Ultra 9 285H
100.3 fps
Intel Arc 8-Core iGPU
Xiaomi RedmiBook Pro 14 2024, , Ultra 7 155H
91.5 fps -9%
AMD Radeon 890M
Asus ProArt P16 H7606WI, ProArt P16 80W TDP, Ryzen AI 9 HX 370
84.6 fps -16%
AMD Radeon 880M
Lenovo Yoga Pro 7 14ASP G9, , Ryzen AI 9 365
83.5 fps -17%
Intel Arc 7-Core iGPU
Samsung Galaxy Book4 Pro 360, , Ultra 5 125H
77.4 fps -23%
AMD Radeon 880M
Asus Zenbook S 16 UM5606WA-RK052W, , Ryzen AI 9 365
73.3 fps -27%
Intel Arc Graphics 140V
Asus Zenbook S 14 UX5406 Core Ultra 9, Zenbook S 14 Fullspeed Mode, Core Ultra 9 288V
66.1 fps -34%
NVIDIA RTX A500 Laptop GPU
Lenovo ThinkPad P14s G4 21HF0017GE, , i7-1370P
64.7296 fps -35%
Intel Arc Graphics 140V
Asus Zenbook S 14 UX5406, Zenbook S 14 Standard Mode, Core Ultra 7 258V
60.6 fps -40%

Gaming performance

In gaming benchmarks, the Arc Graphics 140T fails to fully replicate its strong performance from synthetic tests. In our standard gaming tests, the 140T falls behind the faster 140V variants, with AMD’s iGPUs performing at a similar level, though performance may vary depending on power limits.

Overall, the gaming performance of the 140-series iGPUs is fairly comparable, with no major advantages for any particular variant. However, the older  Arc Graphics with 8 Xe cores is outperformed by approximately 11-17% in well-optimized implementations.

We will conduct additional gaming benchmarks in the coming days to further evaluate real-world performance.

Performance Rating - Percent
Average of class Multimedia
 
100 pt
Intel Arc Graphics 140V
Asus Zenbook S 14 UX5406 Core Ultra 9, Zenbook S 14 Fullspeed Mode, Core Ultra 9 288V
69.5 pt
AMD Radeon 880M
Lenovo Yoga Pro 7 14ASP G9, , Ryzen AI 9 365
68.4 pt
Intel Arc Graphics 140V
Asus Zenbook S 14 UX5406, Zenbook S 14 Fullspeed Mode, Core Ultra 7 258V
65.7 pt
Intel Arc Graphics 140V
Asus Zenbook S 14 UX5406, Zenbook S 14 Performance Mode, Core Ultra 7 258V
65.6 pt
AMD Radeon 890M
HP OmniBook Ultra 14, , Ryzen AI 9 HX 375
64.2 pt
Intel Arc Graphics 140T
MSI Prestige 16 AI Evo B2HMG, , Ultra 9 285H
62.4 pt
AMD Radeon 890M
Asus VivoBook S 14 OLED M5406WA, , Ryzen AI 9 HX 370
61.3 pt
Intel Arc Graphics 140T
Asus ZenBook Duo OLED UX8406CA, , Ultra 9 285H
59.1 pt
AMD Radeon 890M
Asus Zenbook S 16 UM5606-RK333W, Zenbook S 16, Ryzen AI 9 HX 370
56.5 pt
Intel Arc 8-Core iGPU
Lenovo Yoga Slim 7 14IMH9, , Ultra 7 155H
53.1 pt
Intel Arc 8-Core iGPU
Honor MagicBook Art 14, , Ultra 7 155H
50.2 pt
Intel Arc Graphics 140V
SCHENKER Lunar Lake Engineering Sample, , Core Ultra 7 256V
42.6 pt
Qualcomm SD X Adreno X1-85 3.8 TFLOPS
Lenovo Yoga Slim 7X 14Q8X9, , SD X Elite X1E-78-100
40.1 pt
Intel Arc 8-Core iGPU -1!
Samsung Galaxy Book4 Pro 14, , Ultra 7 155H
38.6 pt
Cyberpunk 2077 2.2 Phantom Liberty - 1920x1080 Medium Preset (FSR off)
Average of class Multimedia
  (9.42 - 120.9, n=55, last 2 years)
46.9 fps +35%
Intel Arc Graphics 140V
Asus Zenbook S 14 UX5406 Core Ultra 9, Zenbook S 14 Fullspeed Mode, Core Ultra 9 288V
39.3 (32.6min) fps +13%
AMD Radeon 890M
HP OmniBook Ultra 14, , Ryzen AI 9 HX 375
38.1 (32.3min) fps +10%
Intel Arc Graphics 140V
Asus Zenbook S 14 UX5406, Zenbook S 14 Fullspeed Mode, Core Ultra 7 258V
37.7 (30.7min) fps +9%
Intel Arc Graphics 140V
Asus Zenbook S 14 UX5406, Zenbook S 14 Performance Mode, Core Ultra 7 258V
37.2 (31.1min) fps +7%
AMD Radeon 890M
Asus VivoBook S 14 OLED M5406WA, , Ryzen AI 9 HX 370
36.3 (30min) fps +5%
Intel Arc Graphics 140T
MSI Prestige 16 AI Evo B2HMG, , Ultra 9 285H
34.7 (30.7min) fps
AMD Radeon 880M
Lenovo Yoga Pro 7 14ASP G9, , Ryzen AI 9 365
32.4 (27.8min) fps -7%
Intel Arc Graphics 140T
Asus ZenBook Duo OLED UX8406CA, , Ultra 9 285H
32.3 (27.1min) fps -7%
AMD Radeon 890M
Asus Zenbook S 16 UM5606-RK333W, Zenbook S 16, Ryzen AI 9 HX 370
31.3 (19.7min) fps -10%
Intel Arc 8-Core iGPU
Lenovo Yoga Slim 7 14IMH9, , Ultra 7 155H
26.8 (20.8min) fps -23%
Intel Arc 8-Core iGPU
Honor MagicBook Art 14, , Ultra 7 155H
25.1 (21.5min) fps -28%
Intel Arc Graphics 140V
SCHENKER Lunar Lake Engineering Sample, , Core Ultra 7 256V
24.3 (20.3min) fps -30%
Qualcomm SD X Adreno X1-85 3.8 TFLOPS
Lenovo Yoga Slim 7X 14Q8X9, , SD X Elite X1E-78-100
19.7 (15.8min) fps -43%
Intel Arc 8-Core iGPU
Samsung Galaxy Book4 Pro 14, , Ultra 7 155H
16.3 (7.08min) fps -53%
Baldur's Gate 3 - 1920x1080 Medium Preset
Average of class Multimedia
  (10.8 - 136.6, n=45, last 2 years)
55.5 fps +77%
AMD Radeon 890M
HP OmniBook Ultra 14, , Ryzen AI 9 HX 375
37.9 fps +21%
AMD Radeon 890M
Asus Zenbook S 16 UM5606-RK333W, Zenbook S 16, Ryzen AI 9 HX 370
35.8 fps +14%
AMD Radeon 890M
Asus VivoBook S 14 OLED M5406WA, , Ryzen AI 9 HX 370
35.4 (26.6min, 26.6P0.1, 30P1) fps +13%
AMD Radeon 880M
Lenovo Yoga Pro 7 14ASP G9, , Ryzen AI 9 365
32.7 fps +4%
Intel Arc Graphics 140V
Asus Zenbook S 14 UX5406 Core Ultra 9, Zenbook S 14 Fullspeed Mode, Core Ultra 9 288V
32.5 fps +4%
Intel Arc Graphics 140V
Asus Zenbook S 14 UX5406, Zenbook S 14 Fullspeed Mode, Core Ultra 7 258V
31.4 fps 0%
Intel Arc Graphics 140T
MSI Prestige 16 AI Evo B2HMG, , Ultra 9 285H
31.4 fps
Intel Arc Graphics 140V
Asus Zenbook S 14 UX5406, Zenbook S 14 Performance Mode, Core Ultra 7 258V
30.9 fps -2%
Intel Arc Graphics 140T
Asus ZenBook Duo OLED UX8406CA, , Ultra 9 285H
30.7 fps -2%
Intel Arc 8-Core iGPU
Lenovo Yoga Slim 7 14IMH9, , Ultra 7 155H
28.8 fps -8%
Intel Arc 8-Core iGPU
Honor MagicBook Art 14, , Ultra 7 155H
25.6 fps -18%
Qualcomm SD X Adreno X1-85 3.8 TFLOPS
Lenovo Yoga Slim 7X 14Q8X9, , SD X Elite X1E-78-100
20.1 fps -36%
Intel Arc Graphics 140V
SCHENKER Lunar Lake Engineering Sample, , Core Ultra 7 256V
19.6 fps -38%
GTA V - 1920x1080 Highest Settings possible AA:4xMSAA + FX AF:16x
Average of class Multimedia
  (9.38 - 141.6, n=79, last 2 years)
53.8 fps +216%
AMD Radeon 880M
Lenovo Yoga Pro 7 14ASP G9, , Ryzen AI 9 365
32.7 (2.22min, 22.7P1) fps +92%
AMD Radeon 890M
Asus VivoBook S 14 OLED M5406WA, , Ryzen AI 9 HX 370
32.4 (3.71min, 23.8P1) fps +91%
AMD Radeon 890M
HP OmniBook Ultra 14, , Ryzen AI 9 HX 375
31.9 (1.982min, 22.2P1) fps +88%
AMD Radeon 890M
Asus Zenbook S 16 UM5606-RK333W, Zenbook S 16, Ryzen AI 9 HX 370
30.4 (3.23min, 21.7P1) fps +79%
Intel Arc Graphics 140V
Asus Zenbook S 14 UX5406 Core Ultra 9, Zenbook S 14 Fullspeed Mode, Core Ultra 9 288V
28.4 (3.12min, 21.7P1) fps +67%
Intel Arc Graphics 140V
Asus Zenbook S 14 UX5406, Zenbook S 14 Performance Mode, Core Ultra 7 258V
27.3 (7.84min, 21.7P1) fps +61%
Intel Arc Graphics 140V
Asus Zenbook S 14 UX5406, Zenbook S 14 Fullspeed Mode, Core Ultra 7 258V
27 (8.38min, 21.3P1) fps +59%
Qualcomm SD X Adreno X1-85 3.8 TFLOPS
Lenovo Yoga Slim 7X 14Q8X9, , SD X Elite X1E-78-100
21.1 (3.6min, 13P1) fps +24%
Intel Arc 8-Core iGPU
Honor MagicBook Art 14, , Ultra 7 155H
18.3 (2.18min, 11.9P1) fps +8%
Intel Arc Graphics 140T
MSI Prestige 16 AI Evo B2HMG, , Ultra 9 285H
17 (6.65min, 13P1) fps
Intel Arc Graphics 140T
Asus ZenBook Duo OLED UX8406CA, , Ultra 9 285H
16.8 (3.75min, 12.8P1) fps -1%
Intel Arc Graphics 140V
SCHENKER Lunar Lake Engineering Sample, , Core Ultra 7 256V
15.4 (1.579min, 9.9P1) fps -9%
Intel Arc 8-Core iGPU
Lenovo Yoga Slim 7 14IMH9, , Ultra 7 155H
14.3 (4.16min, 9.17P1) fps -16%
Intel Arc 8-Core iGPU
Samsung Galaxy Book4 Pro 14, , Ultra 7 155H
11 (0.636min, 4.48P1) fps -35%
Final Fantasy XV Benchmark - 1920x1080 High Quality
Average of class Multimedia
  (7.61 - 141.8, n=80, last 2 years)
52.2 fps +71%
Intel Arc Graphics 140V
Asus Zenbook S 14 UX5406 Core Ultra 9, Zenbook S 14 Fullspeed Mode, Core Ultra 9 288V
34.2 fps +12%
Intel Arc Graphics 140V
Asus Zenbook S 14 UX5406, Zenbook S 14 Fullspeed Mode, Core Ultra 7 258V
33.2 fps +8%
Intel Arc Graphics 140V
Asus Zenbook S 14 UX5406, Zenbook S 14 Performance Mode, Core Ultra 7 258V
32.1 fps +5%
AMD Radeon 880M
Lenovo Yoga Pro 7 14ASP G9, , Ryzen AI 9 365
32 fps +5%
AMD Radeon 890M
HP OmniBook Ultra 14, , Ryzen AI 9 HX 375
31.5 fps +3%
AMD Radeon 890M
Asus VivoBook S 14 OLED M5406WA, , Ryzen AI 9 HX 370
31.2 fps +2%
Intel Arc Graphics 140T
MSI Prestige 16 AI Evo B2HMG, , Ultra 9 285H
30.6 fps
Intel Arc Graphics 140T
Asus ZenBook Duo OLED UX8406CA, , Ultra 9 285H
29.4 fps -4%
AMD Radeon 890M
Asus Zenbook S 16 UM5606-RK333W, Zenbook S 16, Ryzen AI 9 HX 370
28.6 fps -7%
Intel Arc 8-Core iGPU
Honor MagicBook Art 14, , Ultra 7 155H
26.5 fps -13%
Intel Arc 8-Core iGPU
Lenovo Yoga Slim 7 14IMH9, , Ultra 7 155H
24.4 fps -20%
Intel Arc Graphics 140V
SCHENKER Lunar Lake Engineering Sample, , Core Ultra 7 256V
23 fps -25%
Intel Arc 8-Core iGPU
Samsung Galaxy Book4 Pro 14, , Ultra 7 155H
21 fps -31%
Qualcomm SD X Adreno X1-85 3.8 TFLOPS
Lenovo Yoga Slim 7X 14Q8X9, , SD X Elite X1E-78-100
15.7 fps -49%
Strange Brigade - 1920x1080 ultra AA:ultra AF:16
Average of class Multimedia
  (13.3 - 233, n=79, last 2 years)
90.4 fps +47%
Intel Arc Graphics 140T
MSI Prestige 16 AI Evo B2HMG, , Ultra 9 285H
61.6 (45.2min, 49.5P1) fps
Intel Arc Graphics 140T
Asus ZenBook Duo OLED UX8406CA, , Ultra 9 285H
61.2 (37.9min, 48.3P1) fps -1%
Intel Arc Graphics 140V
Asus Zenbook S 14 UX5406 Core Ultra 9, Zenbook S 14 Fullspeed Mode, Core Ultra 9 288V
60.6 (39.9min, 47.5P1) fps -2%
Intel Arc Graphics 140V
Asus Zenbook S 14 UX5406, Zenbook S 14 Fullspeed Mode, Core Ultra 7 258V
57.4 (27.7min, 42.6P1) fps -7%
Intel Arc Graphics 140V
Asus Zenbook S 14 UX5406, Zenbook S 14 Performance Mode, Core Ultra 7 258V
56.2 (24.3min, 30.1P1) fps -9%
AMD Radeon 880M
Lenovo Yoga Pro 7 14ASP G9, , Ryzen AI 9 365
55.7 (40.1min, 43.3P1) fps -10%
AMD Radeon 890M
HP OmniBook Ultra 14, , Ryzen AI 9 HX 375
54.6 (32.9min, 42.3P1) fps -11%
AMD Radeon 890M
Asus VivoBook S 14 OLED M5406WA, , Ryzen AI 9 HX 370
54.2 (16.1min, 20.1P1) fps -12%
Intel Arc 8-Core iGPU
Lenovo Yoga Slim 7 14IMH9, , Ultra 7 155H
50.3 (5.9min, 10.8P1) fps -18%
Intel Arc 8-Core iGPU
Honor MagicBook Art 14, , Ultra 7 155H
50 fps -19%
AMD Radeon 890M
Asus Zenbook S 16 UM5606-RK333W, Zenbook S 16, Ryzen AI 9 HX 370
49.8 (31.1min, 37.7P1) fps -19%
Intel Arc Graphics 140V
SCHENKER Lunar Lake Engineering Sample, , Core Ultra 7 256V
39 (5.5min, 14.7P1) fps -37%
Qualcomm SD X Adreno X1-85 3.8 TFLOPS
Lenovo Yoga Slim 7X 14Q8X9, , SD X Elite X1E-78-100
34 fps -45%
Intel Arc 8-Core iGPU
Samsung Galaxy Book4 Pro 14, , Ultra 7 155H
31 fps -50%
Dota 2 Reborn - 1920x1080 ultra (3/3) best looking
Average of class Multimedia
  (29 - 179.9, n=81, last 2 years)
96.4 fps +15%
AMD Radeon 880M
Lenovo Yoga Pro 7 14ASP G9, , Ryzen AI 9 365
90.5 (80.2min) fps +8%
Intel Arc Graphics 140T
MSI Prestige 16 AI Evo B2HMG, , Ultra 9 285H
83.8 (45.3min) fps
Intel Arc Graphics 140V
Asus Zenbook S 14 UX5406 Core Ultra 9, Zenbook S 14 Fullspeed Mode, Core Ultra 9 288V
81.1 (54.4min) fps -3%
Intel Arc Graphics 140V
Asus Zenbook S 14 UX5406, Zenbook S 14 Fullspeed Mode, Core Ultra 7 258V
80.4 (53.3min) fps -4%
Intel Arc Graphics 140V
Asus Zenbook S 14 UX5406, Zenbook S 14 Performance Mode, Core Ultra 7 258V
80.3 (52.7min) fps -4%
Intel Arc 8-Core iGPU
Lenovo Yoga Slim 7 14IMH9, , Ultra 7 155H
74.4 (51.9min) fps -11%
Intel Arc Graphics 140T
Asus ZenBook Duo OLED UX8406CA, , Ultra 9 285H
69.5 (31.7min) fps -17%
Intel Arc 8-Core iGPU
Honor MagicBook Art 14, , Ultra 7 155H
60.8 (34min) fps -27%
Intel Arc 8-Core iGPU
Samsung Galaxy Book4 Pro 14, , Ultra 7 155H
59.6 (44min) fps -29%
Intel Arc Graphics 140V
SCHENKER Lunar Lake Engineering Sample, , Core Ultra 7 256V
54.8 (31.5min) fps -35%
Qualcomm SD X Adreno X1-85 3.8 TFLOPS
Lenovo Yoga Slim 7X 14Q8X9, , SD X Elite X1E-78-100
51 (38min) fps -39%
AMD Radeon 890M
HP OmniBook Ultra 14, , Ryzen AI 9 HX 375
44.7 (32.4min) fps -47%
AMD Radeon 890M
Asus VivoBook S 14 OLED M5406WA, , Ryzen AI 9 HX 370
33.6 (17.1min) fps -60%
AMD Radeon 890M
Asus Zenbook S 16 UM5606-RK333W, Zenbook S 16, Ryzen AI 9 HX 370
33.1 (18.7min) fps -61%
Far Cry 5 - 1920x1080 High Preset AA:T
Average of class Multimedia
  (18 - 154, n=57, last 2 years)
72.3 fps +64%
Intel Arc Graphics 140V
Asus Zenbook S 14 UX5406 Core Ultra 9, Zenbook S 14 Fullspeed Mode, Core Ultra 9 288V
54 fps +23%
AMD Radeon 890M
Asus VivoBook S 14 OLED M5406WA, , Ryzen AI 9 HX 370
53 (46min) fps +20%
AMD Radeon 880M
Lenovo Yoga Pro 7 14ASP G9, , Ryzen AI 9 365
53 fps +20%
AMD Radeon 890M
HP OmniBook Ultra 14, , Ryzen AI 9 HX 375
53 (48min) fps +20%
Intel Arc Graphics 140V
Asus Zenbook S 14 UX5406, Zenbook S 14 Performance Mode, Core Ultra 7 258V
48 fps +9%
AMD Radeon 890M
Asus Zenbook S 16 UM5606-RK333W, Zenbook S 16, Ryzen AI 9 HX 370
46 fps +5%
Intel Arc Graphics 140V
Asus Zenbook S 14 UX5406, Zenbook S 14 Fullspeed Mode, Core Ultra 7 258V
45 fps +2%
Intel Arc Graphics 140T
Asus ZenBook Duo OLED UX8406CA, , Ultra 9 285H
45 fps +2%
Intel Arc Graphics 140T
MSI Prestige 16 AI Evo B2HMG, , Ultra 9 285H
44 fps
Intel Arc 8-Core iGPU
Lenovo Yoga Slim 7 14IMH9, , Ultra 7 155H
41 (37min) fps -7%
Intel Arc 8-Core iGPU
Honor MagicBook Art 14, , Ultra 7 155H
35 fps -20%
Qualcomm SD X Adreno X1-85 3.8 TFLOPS
Lenovo Yoga Slim 7X 14Q8X9, , SD X Elite X1E-78-100
31 fps -30%
Intel Arc 8-Core iGPU
Samsung Galaxy Book4 Pro 14, , Ultra 7 155H
29 fps -34%
Intel Arc Graphics 140V
SCHENKER Lunar Lake Engineering Sample, , Core Ultra 7 256V
28 fps -36%

As previously mentioned, only a few titles currently support XeSS 2, one of which is F1 24. We tested the game with XeSS and Frame Generation at both high and maximum settings. Interestingly, Frame Generation can be enabled in F1 24 even without XeSS activated.

The results are promising, with Frame Generation delivering a significant performance boost. When combined with XeSS in quality mode, performance increases by nearly 78% at high settings and an impressive 180% at maximum settings, which also includes ray tracing.

Native Frame Generation XeSS Quality XeSS Quality + Frame Generation
F1 24 1080p High 59 FPS 87 FPS 73 FPS 105 FPS
F1 24 1080p Ultra 20 FPS 36 FPS 32 FPS 56 FPS

Video/image editing performance

Using PugetBench benchmarks for Adobe Photoshop and Adobe Premiere Pro, we evaluated the performance of the Arc Graphics 140T in image and video editing. Since these benchmarks recently received a major update, our comparative data is somewhat limited.

Despite this, the Arc Graphics 140T outperforms competing iGPUs from Intel and AMD, though we do not yet have results for the Radeon 890M. However, Apple’s M4 GPUs remain clearly superior in these workloads.

In our Asus Zenbook Duo review, we also tested real-world video editing by working on one of our YouTube videos. The process ran smoothly, with only minor limitations in timeline resolution (see the following review video).

Photoshop PugetBench: Overall Score 1.01 | Premiere Pro PugetBench: Overall Score 1.1
Photoshop PugetBench / Overall Score 1.01
Apple M4 Pro 20-Core GPU
Apple MacBook Pro 16 2024 M4 Pro, M4 Pro (14 cores)
12494 Points
Apple M4 10-core GPU
Apple MacBook Pro 14 2024 M4, M4 (10 cores)
10502 Points
Intel Arc Graphics 140T
Asus ZenBook Duo OLED UX8406CA, Ultra 9 285H
7934 Points
AMD Radeon 880M
Lenovo ThinkPad T14s Gen 6 21M2S00G00, Ryzen AI 7 PRO 360
7343 Points
Intel Arc Graphics 140V
Dell XPS 13 9350, Core Ultra 7 256V
6854 Points
Intel Arc 8-Core iGPU
Honor MagicBook Art 14, Ultra 7 155H
5787 Points
Premiere Pro PugetBench / Overall Score 1.1
Apple M4 Pro 20-Core GPU
Apple MacBook Pro 16 2024 M4 Pro, M4 Pro (14 cores)
8835 Points
Apple M4 10-core GPU
Apple MacBook Pro 14 2024 M4, M4 (10 cores)
4903 Points
Intel Arc Graphics 140T
Asus ZenBook Duo OLED UX8406CA, Ultra 9 285H
3627 Points
Intel Arc Graphics 140V
Dell XPS 13 9350, Core Ultra 7 256V
3330 Points
AMD Radeon 880M
Lenovo ThinkPad T14s Gen 6 21M2S00G00, Ryzen AI 7 PRO 360
2661 Points
Intel Arc 8-Core iGPU
Honor MagicBook Art 14, Ultra 7 155H
2126 Points

GPU performance at various power limits

Comparing GPU performance across different laptops is always challenging due to varying power limits, and this is particularly true for Intel’s new iGPUs. Lunar Lake systems typically operate at lower power limits, making direct comparisons more complex.

To address this, we restricted the maximum power consumption of the GPUs using ThrottleStop and Universal x86 Tuning Utility, then tested their performance in the 3DMark Time Spy benchmark. The results clearly show that Arc Graphics 140V performs better at lower power limits, with its Xe-2 cores providing an advantage.

This makes Lunar Lake processors a better choice for gaming handhelds compared to Arrow Lake-H. However, in this test, the Arc Graphics 140T outperforms both of AMD’s current iGPUs.

Time Spy Graphics
TDP Arc Graphics 140T Arc Graphics 140V Radeon 890M Arc Graphics (8 Xe Cores)
15 watts 2,317 points 2,847 points 2,547 points 1,884 points
20 Watt 3,012 points 3,462 points 2,950 points 2,636 points
28 Watt 3,627 points 3,992 points 3,135 points 3,178 points

GPU efficiency

For our efficiency analysis, we tested Cyberpunk 2077 on an external monitor. However, it's important to note that the game is not yet available natively on Apple's MacBooks, meaning the Apple M4 GPU results are not fully representative. This will change once the native macOS version of the game is released.

The Arc Graphics 140T delivers solid performance, performing on par with AMD's iGPUs. However, as seen in previous tests, the Arc Graphics 140V in Lunar Lake processors consistently demonstrates better efficiency, making it the more power-efficient choice in most scenarios.

Power Consumption / Cyberpunk 2077 ultra Efficiency
Intel Arc Graphics 140V
Asus Zenbook S 14 UX5406, Core Ultra 7 258V
0.696 fps per Watt +89%
Intel Arc Graphics 140V
MSI Prestige 13 AI Plus Evo A2VMG, Core Ultra 7 258V
0.542 fps per Watt +47%
Intel Arc Graphics 140V
Dell XPS 13 9350, Core Ultra 7 256V
0.515 fps per Watt +40%
Intel Arc 8-Core iGPU
Honor MagicBook Art 14, Ultra 7 155H
0.4816 fps per Watt +31%
Intel Arc Graphics 130V
Asus Vivobook S 14 OLED S5406SA, Core Ultra 5 226V
0.4797 fps per Watt +30%
Apple M4 10-core GPU
Apple MacBook Pro 14 2024 M4, M4 (10 cores)
0.4652 fps per Watt +26%
Intel Arc Graphics 140T
Asus ZenBook Duo OLED UX8406CA, Ultra 9 285H
0.4468 fps per Watt +21%
NVIDIA GeForce RTX 4050 Laptop GPU
Lenovo IdeaPad Pro 5 16IMH G9 RTX 4050, Ultra 9 185H
0.4205 fps per Watt +14%
AMD Radeon 890M
Asus Zenbook S 16 UM5606-RK333W, Ryzen AI 9 HX 370
0.4176 fps per Watt +13%
AMD Radeon 880M
Lenovo Yoga Pro 7 14ASP G9, Ryzen AI 9 365
0.3805 fps per Watt +3%
Intel Arc Graphics 140T
MSI Prestige 16 AI Evo B2HMG, Ultra 9 285H
0.368 fps per Watt
Intel Arc Graphics 140V
Lenovo Yoga Slim 7 15ILL9 Aura, Core Ultra 7 256V
0.3549 fps per Watt -4%
AMD Radeon 880M
Lenovo ThinkBook 16 G7+ AMD, Ryzen AI 9 365
0.3226 fps per Watt -12%
NVIDIA GeForce RTX 2050 Mobile
Acer Aspire 16 A16-51GM-77G2, Core 7 150U
0.2806 fps per Watt -24%
Intel Arc 8-Core iGPU
Asus NUC 14 Pro+, Ultra 9 185H
0.274 fps per Watt -26%
Power Consumption / Cyberpunk 2077 FHD ultra no FSR (external Monitor)
NVIDIA GeForce RTX 4050 Laptop GPU
Lenovo IdeaPad Pro 5 16IMH G9 RTX 4050, Ultra 9 185H
135.8 (116.2min, 129.7P1 - 145.6max) Watt * -101%
Nvidia RTX 500 Ada Generation Laptop GPU
Lenovo ThinkPad P14s G5 21G3S00A00, Ultra 7 155H
84.6 (83.6min, 83.8P1 - 87.3max) Watt * -26%
NVIDIA GeForce RTX 3050 4GB Laptop GPU
HP Envy 17-da0076ng, Ultra 7 155U
79.3 (68.8min, 76.9P1 - 83.9max) Watt * -18%
Apple M4 Pro 20-Core GPU
Apple MacBook Pro 16 2024 M4 Pro, M4 Pro (14 cores)
79.3 (77.3min, 77.5P1 - 81.3max) Watt * -18%
AMD Radeon 880M
Lenovo ThinkBook 16 G7+ AMD, Ryzen AI 9 365
77.5 (71min, 73.9P1 - 79.8max) Watt * -15%
Intel Arc 8-Core iGPU
Asus NUC 14 Pro+, Ultra 9 185H
74.1 (62.4min, 65.1P1 - 78.7max) Watt * -10%
NVIDIA GeForce RTX 2050 Mobile
Acer Aspire 16 A16-51GM-77G2, Core 7 150U
72 Watt * -7%
Intel Arc Graphics 140T
MSI Prestige 16 AI Evo B2HMG, Ultra 9 285H
67.4 (64.9min, 65.2P1 - 68.2max) Watt *
AMD Radeon 890M
Asus VivoBook S 14 OLED M5406WA, Ryzen AI 9 HX 370
61.9 (56.1min, 56.2P1 - 69.2max) Watt * +8%
AMD Radeon 880M
Lenovo Yoga Pro 7 14ASP G9, Ryzen AI 9 365
61.5 (58.7min, 60.2P1 - 64.9max) Watt * +9%
NVIDIA RTX A500 Laptop GPU
HP ZBook Firefly 14 G11, Ultra 7 165H
58.1 (56.4min, 56.4P1 - 60.7max) Watt * +14%
Apple M4 Pro 16-Core GPU
Apple MacBook Pro 14 2024 M4 Pro Entry, M4 Pro (12 cores)
56.6 (44.8min, 49.1P1 - 69.6max) Watt * +16%
Intel Arc Graphics 140T
Asus ZenBook Duo OLED UX8406CA, Ultra 9 285H
47 (44.4min, 44.8P1 - 53.2max) Watt * +30%
AMD Radeon 890M
Asus Zenbook S 16 UM5606-RK333W, Ryzen AI 9 HX 370
46.7 (30.7min, 31P1 - 53.8max) Watt * +31%
Intel Arc Graphics 140V
MSI Prestige 13 AI Plus Evo A2VMG, Core Ultra 7 258V
45.6 (44.1min, 44.7P1 - 48.6max) Watt * +32%
Intel Arc Graphics 140V
Lenovo Yoga Slim 7 15ILL9 Aura, Core Ultra 7 256V
44.8 (43min, 43.2P1 - 47.8max) Watt * +34%
Intel Arc Graphics 140V
Dell XPS 13 9350, Core Ultra 7 256V
43.1 (39.3min, 41P1 - 47.2max) Watt * +36%
Intel Arc Graphics 130V
Asus Vivobook S 14 OLED S5406SA, Core Ultra 5 226V
41.9 (40.3min, 40.5P1 - 46.2max) Watt * +38%
Intel Arc 8-Core iGPU
Honor MagicBook Art 14, Ultra 7 155H
40.7 (26.2min, 32.7P1 - 44.2max) Watt * +40%
Apple M4 10-core GPU
Apple MacBook Pro 14 2024 M4, M4 (10 cores)
40.2 (39.2min, 39.3P1 - 44.1max) Watt * +40%
Qualcomm SD X Adreno X1-85 3.8 TFLOPS
Dell XPS 13 9345, SD X Elite X1E-80-100
39.4 (38min, 38.1P1 - 48.6max) Watt * +42%
Qualcomm SD X Adreno X1-85 4.6 TFLOPS
Samsung Galaxy Book4 Edge 16 X1E-84-100, SD X Elite X1E-84-100
39 (37.4min, 37.5P1 - 42.1max) Watt * +42%
Qualcomm SD X Adreno X1-85 3.8 TFLOPS
Lenovo Yoga Slim 7X 14Q8X9, SD X Elite X1E-78-100
35.3 (34.1min, 34.2P1 - 38.3max) Watt * +48%
Intel Arc Graphics 140V
Asus Zenbook S 14 UX5406, Core Ultra 7 258V
28.6 (27.6min, 27.7P1 - 30.6max) Watt * +58%
Qualcomm SD X Adreno X1-85 3.8 TFLOPS
Lenovo ThinkPad T14s Gen 6 21N10007GE, SD X Elite X1E-78-100
27.9 (24.8min, 25.1P1 - 35.2max) Watt * +59%

* ... smaller is better

Conclusion: Arc Graphics 140T closes the performance gap, but Lunar Lake GPU remains more efficient

As with our CPU analysis of the new Arrow Lake-H mobile processors, testing the integrated Arc Graphics 140T paints a mixed picture. Based on the Arc Graphics from the Meteor Lake generation, Intel has increased performance and narrowed the gap to AMD and the Lunar Lake GPU (Arc Graphics 140V). However, the Lunar Lake iGPU remains more efficient, making it the better choice for handheld gaming, where maximizing performance at low power limits is crucial.

While the Arc Graphics 140T offers slightly higher performance, it also consumes more power. Ultimately, this results in two very similar products competing in the same market. Had Intel focused on a single solution, the end result might have been even better.

The new XeSS 2 features look promising, and our initial testing with F1 24 produced good results, especially with ray tracing enabled. However, XeSS 2 will also be available on Lunar Lake iGPUs, meaning this advantage is not exclusive to Arrow Lake. The biggest challenge remains the limited number of supported titles, though Assassin's Creed Shadows will soon add another major release to the list.

Read all 3 comments / answer
static version load dynamic
Loading comments
Comment on this article
Please share our article, every link counts!
Mail Logo
> Expert Reviews and News on Laptops, Smartphones and Tech Innovations > Reviews > Intel Arc Graphics 140T analysis – Arrow Lake-H iGPU gains frame generation support
Andreas Osthoff, 2025-02-13 (Update: 2025-02-13)