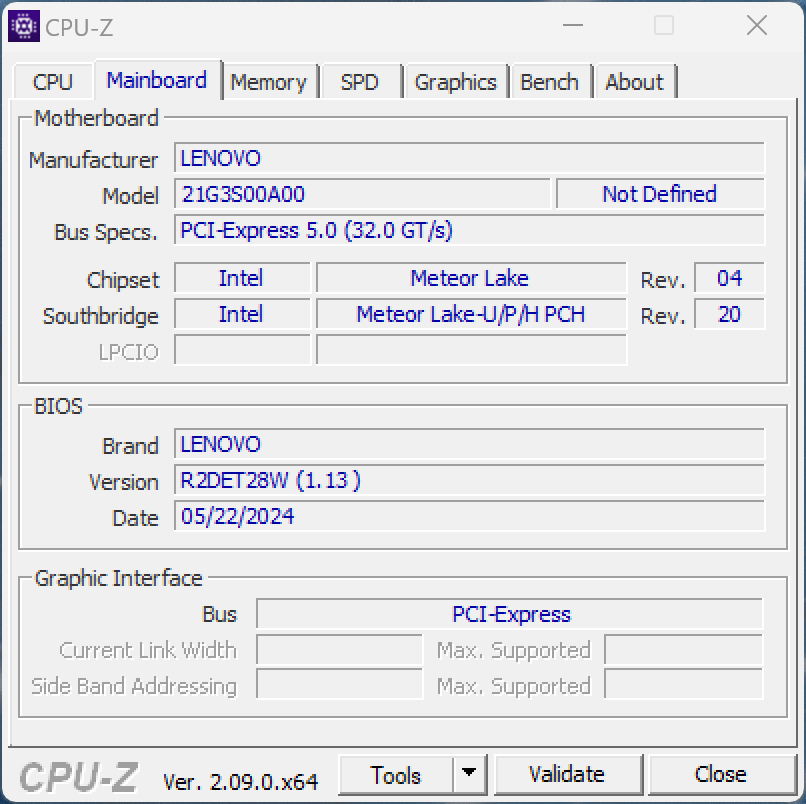
Lenovo ThinkPad P14s G5 laptop review - The mobile workstation now with an RTX 500 Ada and a 3K IPS panel
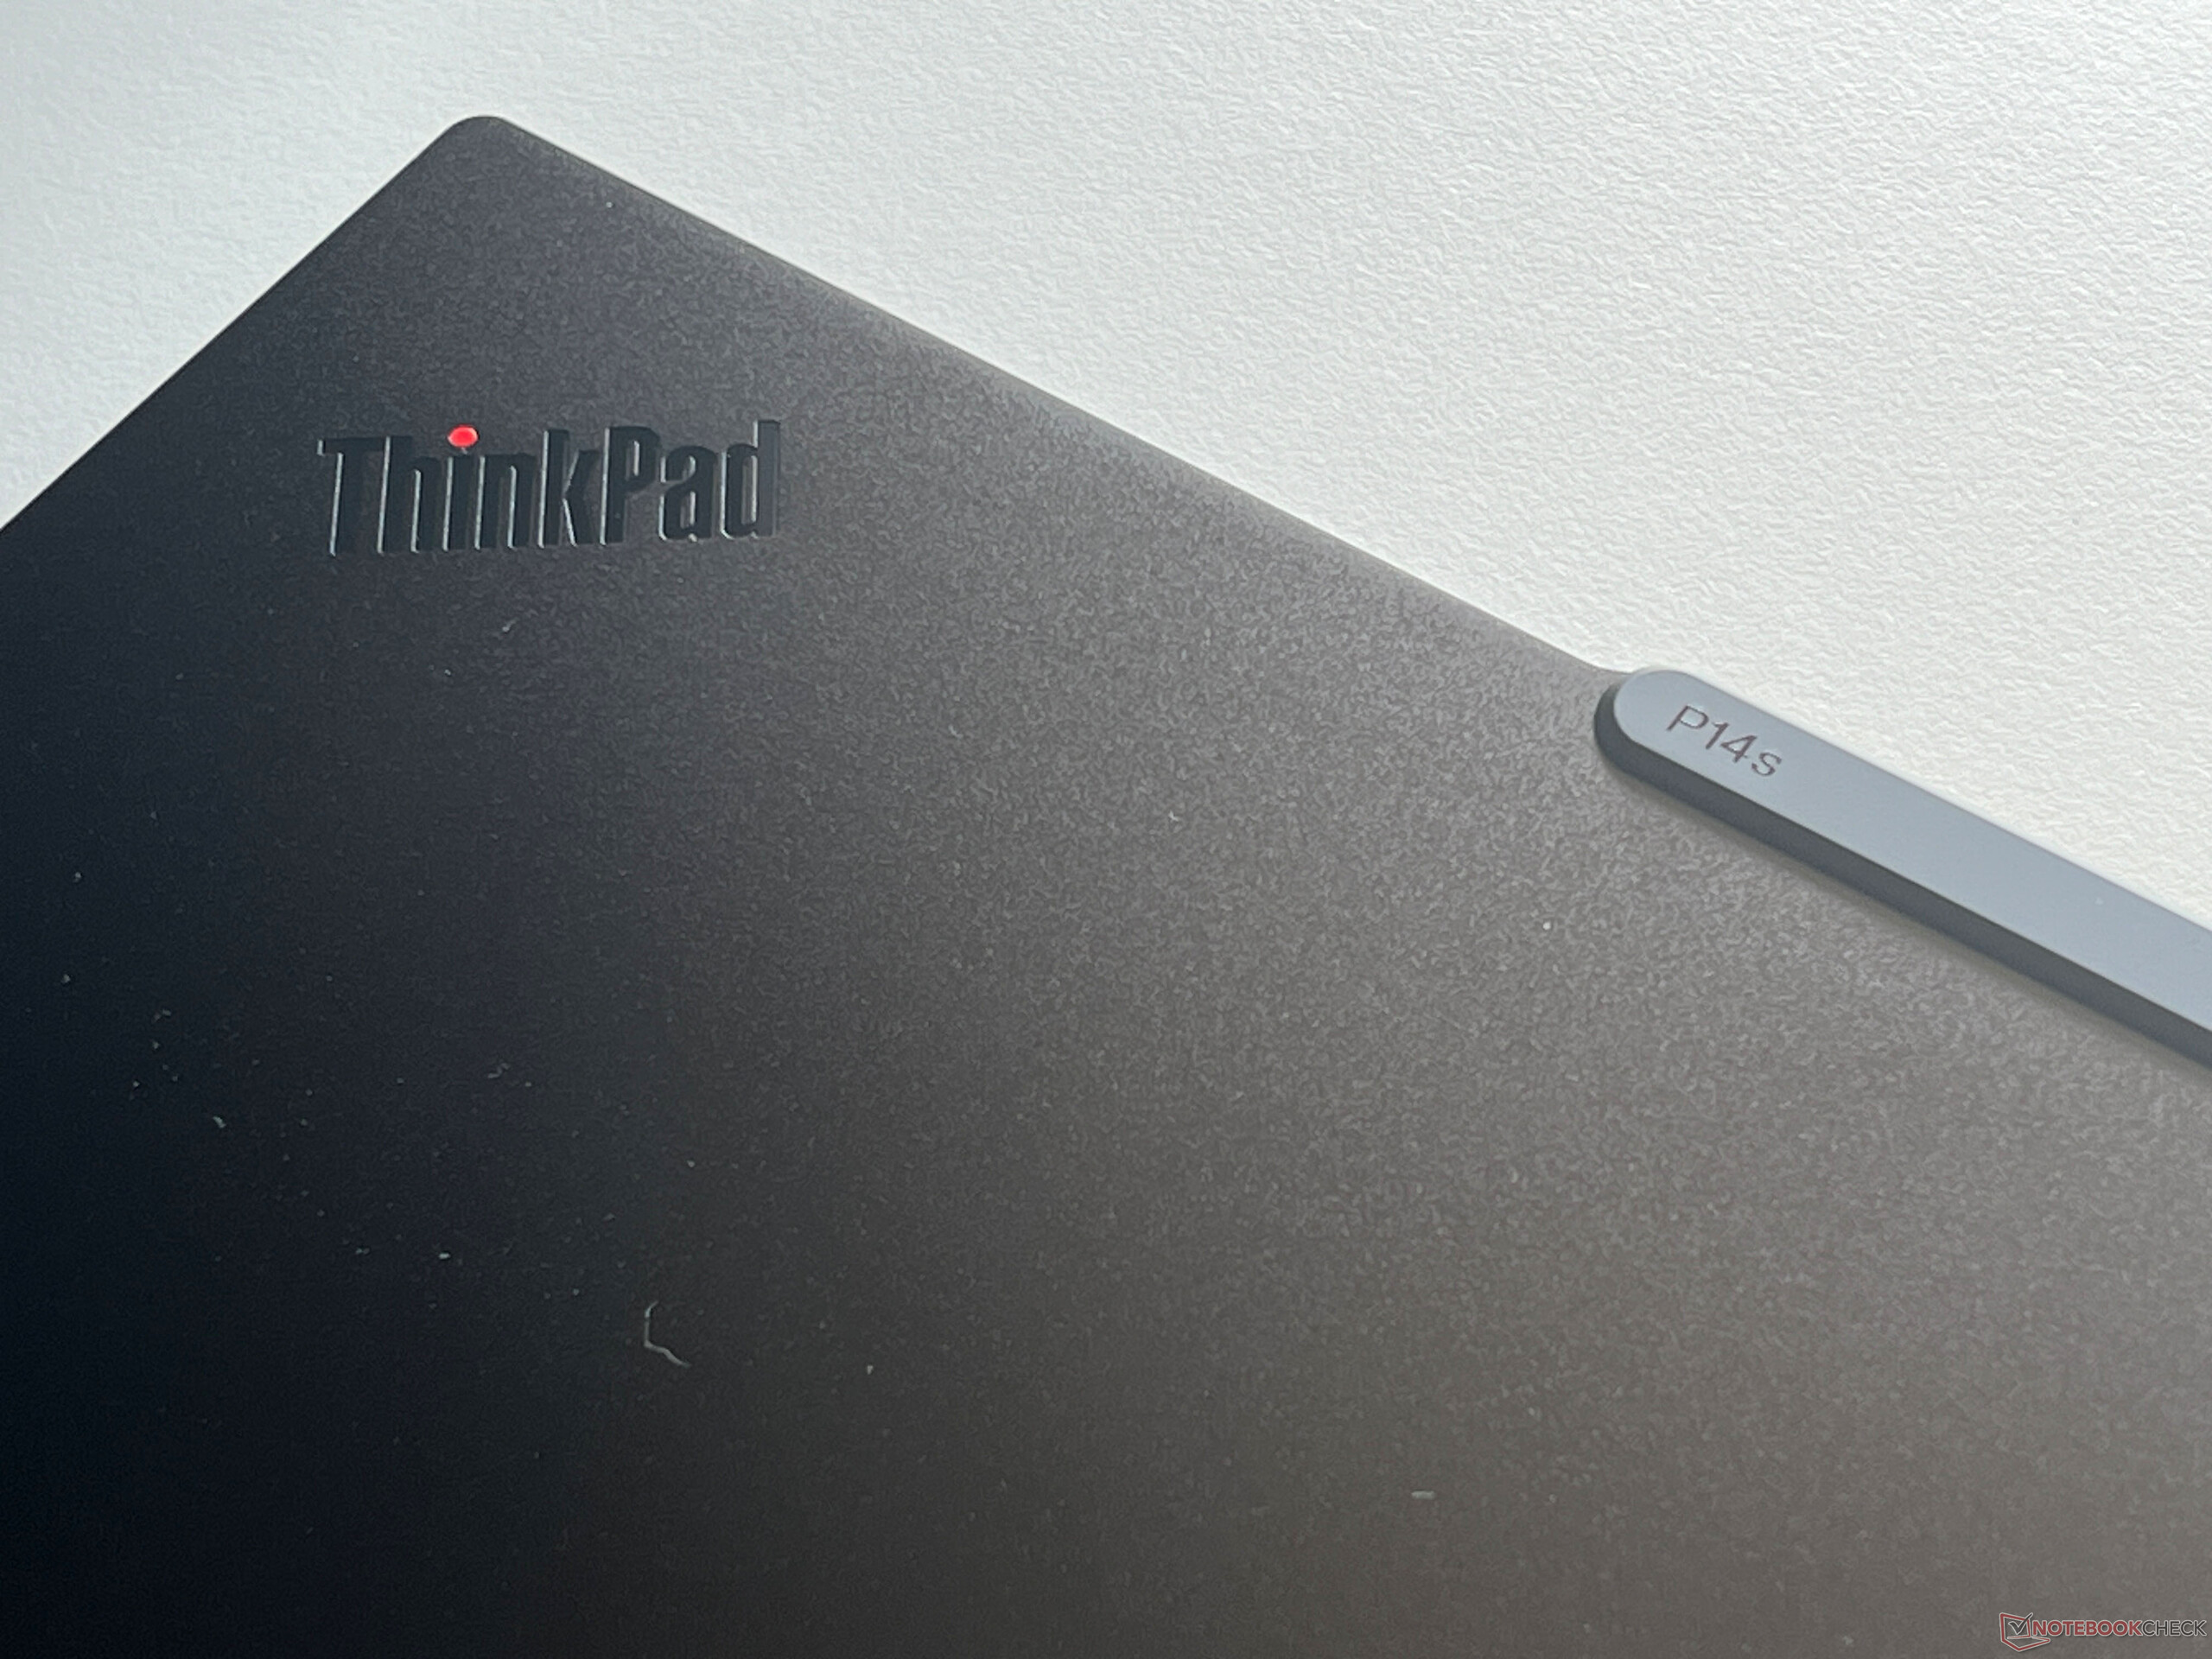
Lenovo has taken a new route with its ThinkPad P14s G5 mobile workstation, as while the predecessor models were always based on the respective T-series models, the new P14s G5 with Intel CPUs has received its very own design including a new 14.5-inch display (previously 14 inches). The P14s G5 with the AMD processors, on the other hand, still uses the old case alongside its 14-inch panel.
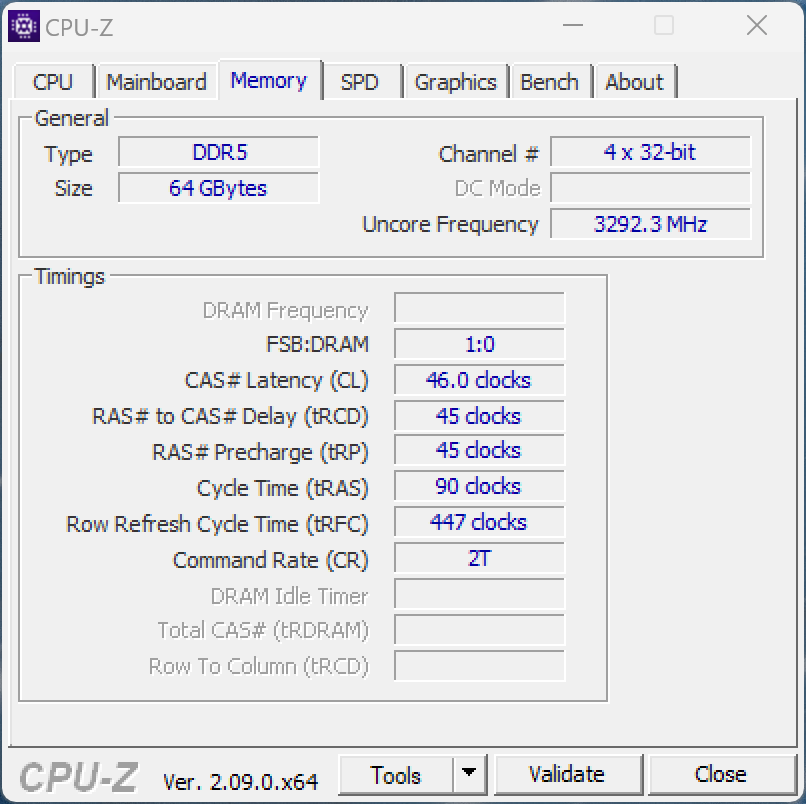
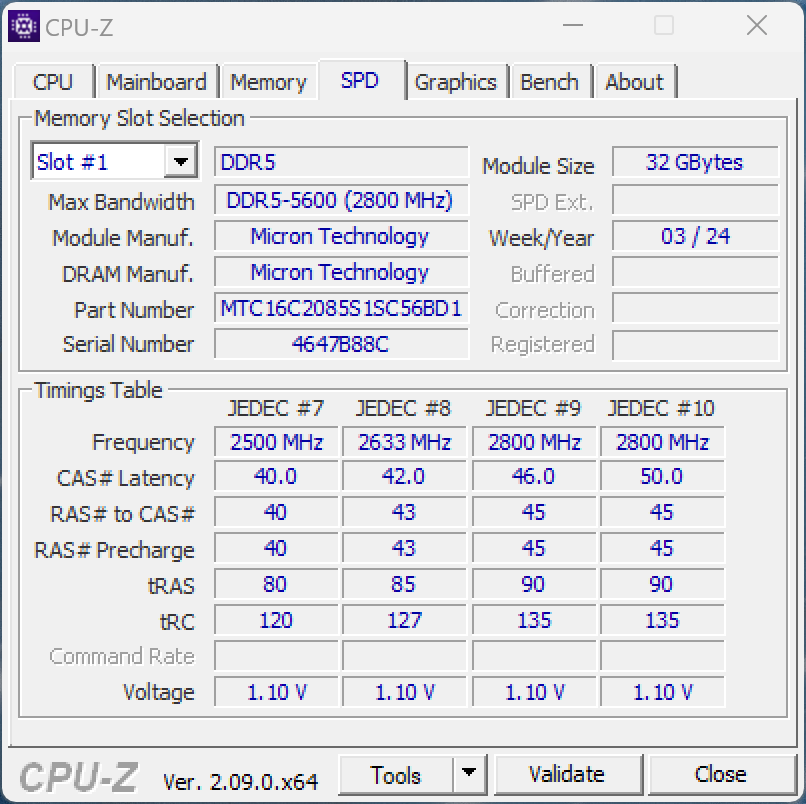
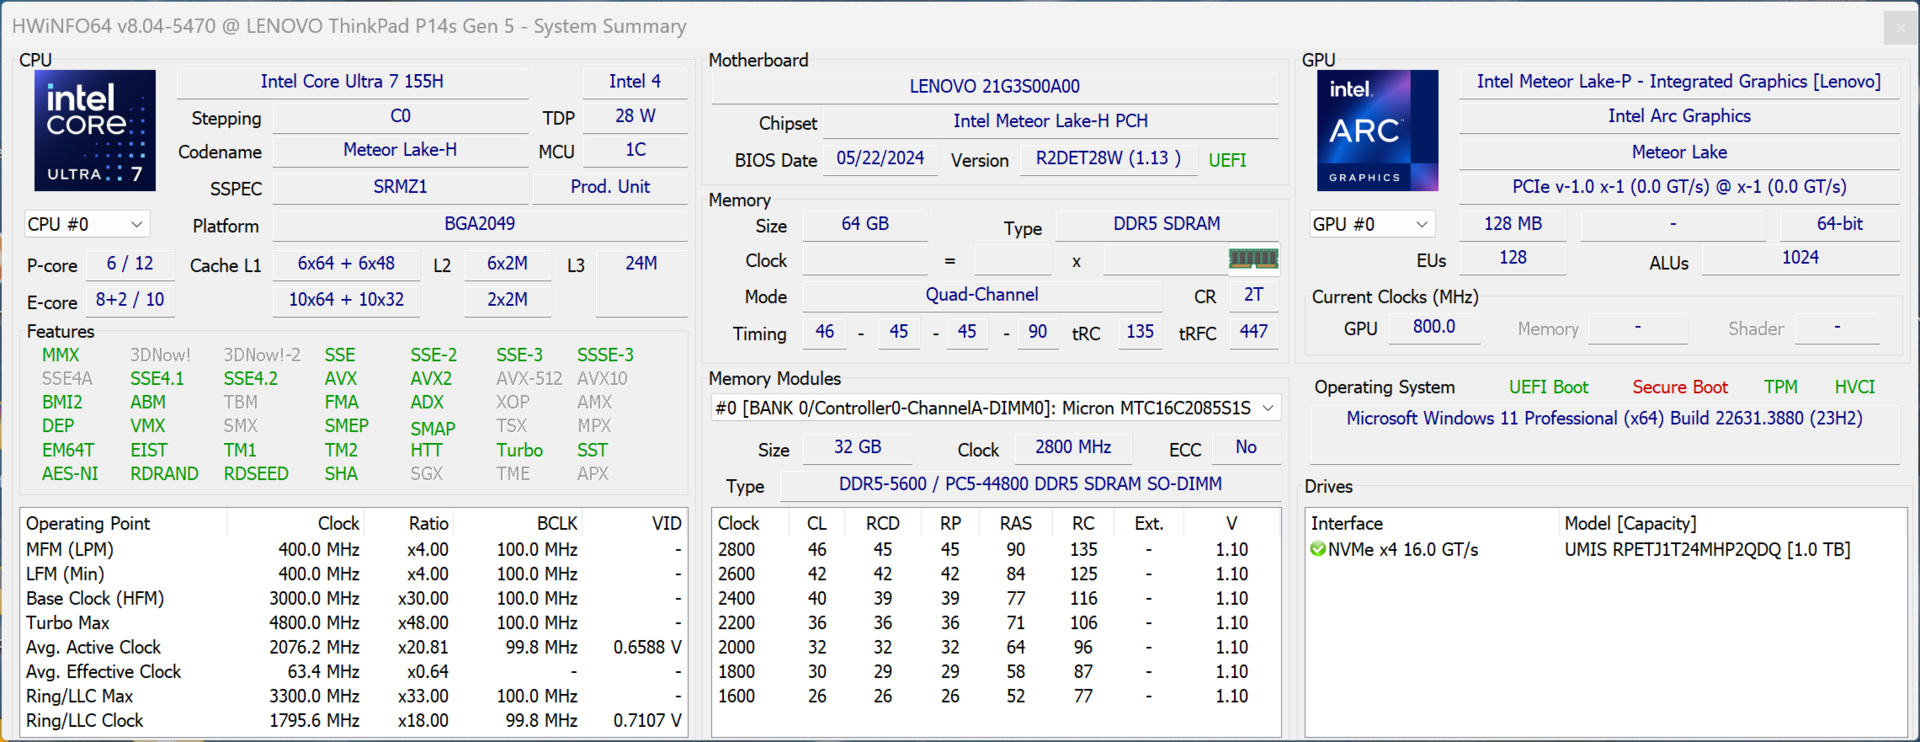
Our test device is the Campus version 21G3S00A00 for around US$2,100 without an operating system but with a very good configuration. Aside from its new 3K display, it has been equipped with the Core Ultra 7 155H in combination with 64 GB RAM, a 1-TB SSD as well as the dedicated Nvidia RTX 500 Ada. There is currently no corresponding top-selling model for private customers; if you configure the device via Lenovo's website, you will currently end up at a little over US$2,700 including Windows 11 Home.
Possible competitors compared
Rating | Version | Date | Model | Weight | Height | Size | Resolution | Price |
|---|---|---|---|---|---|---|---|---|
| 82.5 % | v8 | 07 / 2024 | Lenovo ThinkPad P14s G5 21G3S00A00 Ultra 7 155H, RTX 500 Ada Generation Laptop | 1.7 kg | 22 mm | 14.50" | 3072x1920 | |
| 80.3 % | v8 | 07 / 2024 | HP ZBook Firefly 14 G11 Ultra 7 165H, RTX A500 Laptop GPU | 1.5 kg | 19.2 mm | 14.00" | 2560x1600 | |
| 81 % | v8 | 07 / 2024 | Lenovo ThinkPad P14s G4 21HF0017GE i7-1370P, RTX A500 Laptop GPU | 1.5 kg | 22.7 mm | 14.00" | 2880x1800 | |
| 89.3 % v7 (old) | v7 (old) | 04 / 2024 | Dell Precision 5000 5490 Ultra 9 185H, RTX 3000 Ada Generation Laptop | 1.6 kg | 18.95 mm | 14.00" | 2560x1600 | |
| 85.5 % v7 (old) | v7 (old) | 10 / 2023 | Microsoft Surface Laptop Studio 2 RTX 4060 i7-13700H, GeForce RTX 4060 Laptop GPU | 2 kg | 22 mm | 14.40" | 2400x1600 | |
| 89.8 % v7 (old) | v7 (old) | 07 / 2023 | Lenovo Yoga Pro 9-14IRP G8 i7-13705H, GeForce RTX 4050 Laptop GPU | 1.7 kg | 17.6 mm | 14.50" | 3072x1920 |
Please note: We have recently updated our rating system and the results of version 8 are not comparable with the results of version 7. More information is available here .
Case - Lenovo has cheated with its dimensions
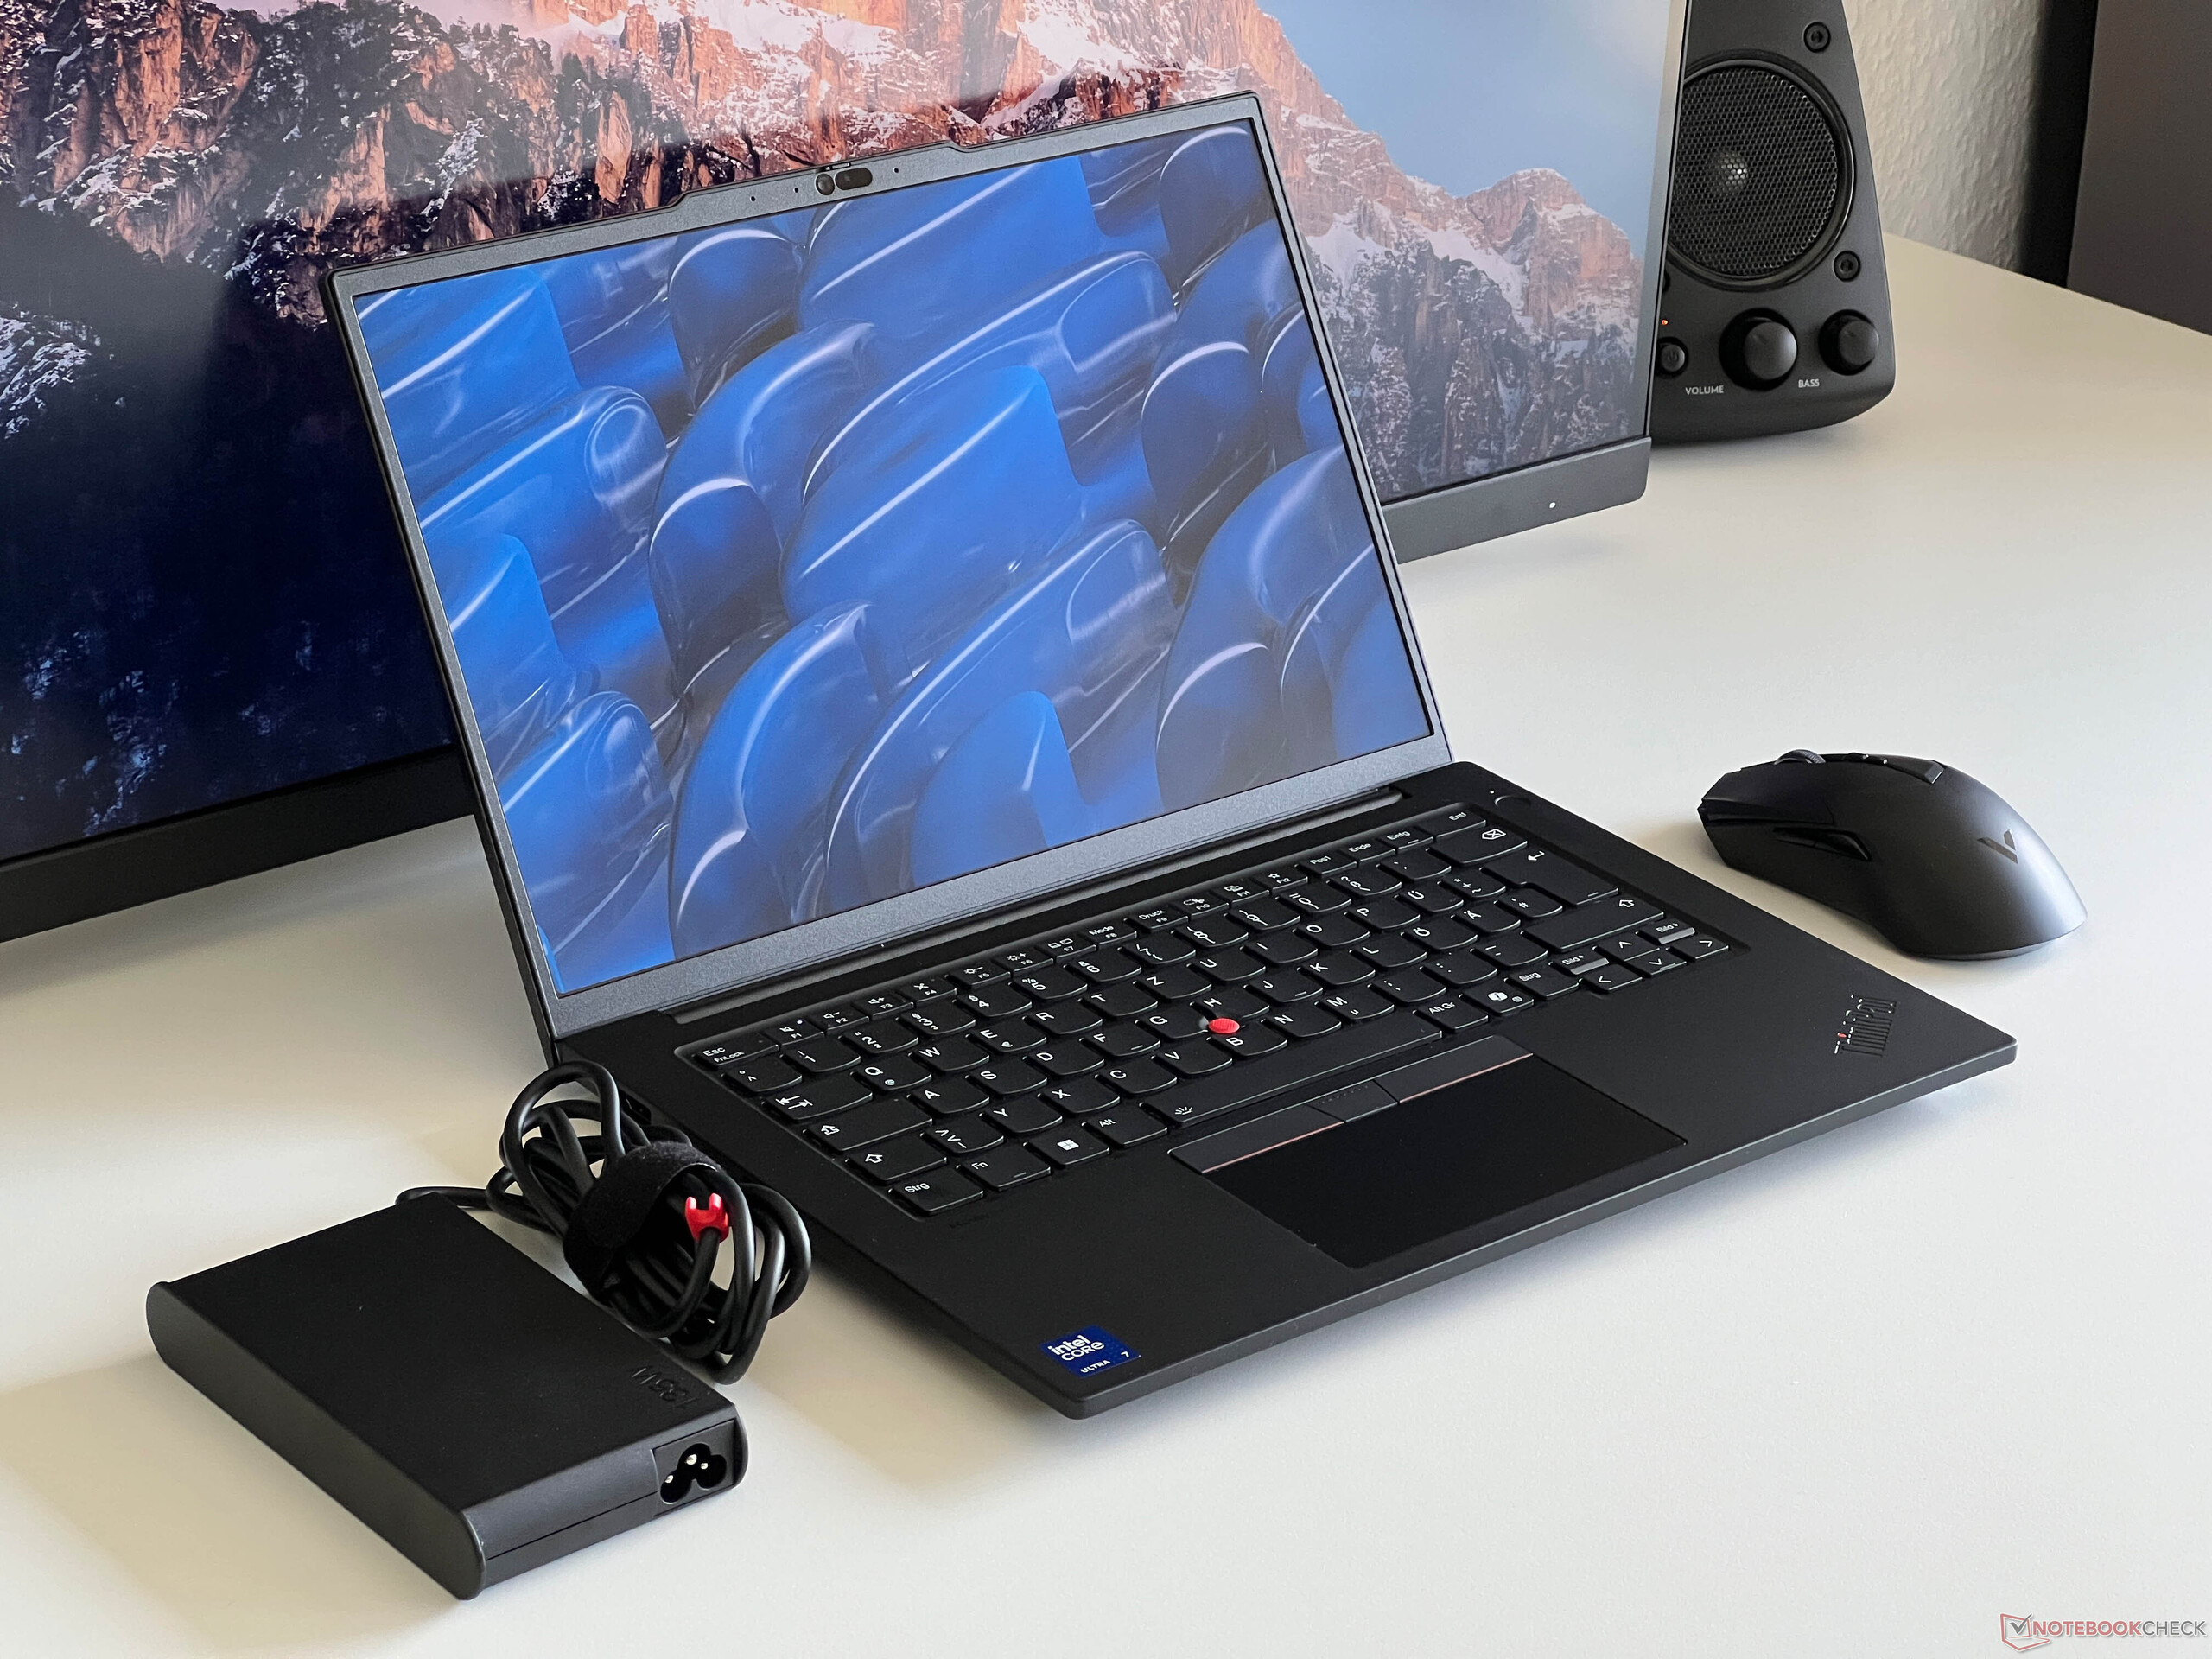
The ThinkPad P14s is a mobile workstation and when you pick it up for the first time, you immediately notice that it is definitely not a particularly thin or lightweight device. When we looked at its datasheet, however, we were surprised because Lenovo states a height of 18.5 mm, which is simply not correct. We measured around 22 mm without the feet, which makes another significant difference.
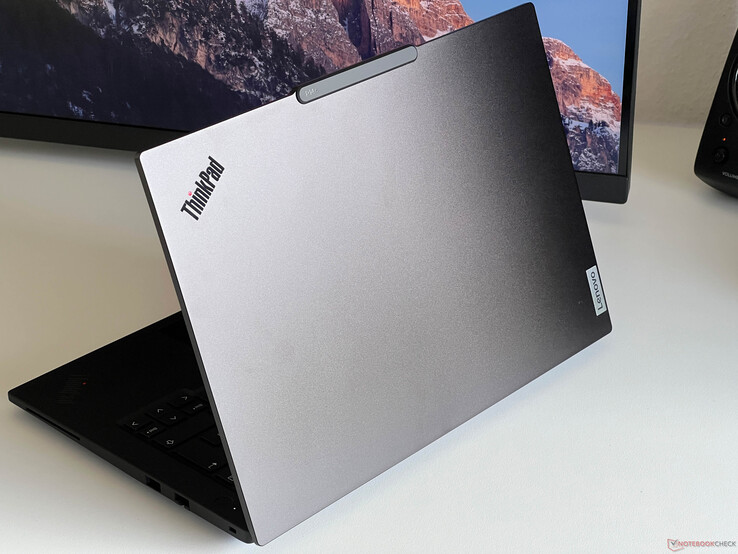
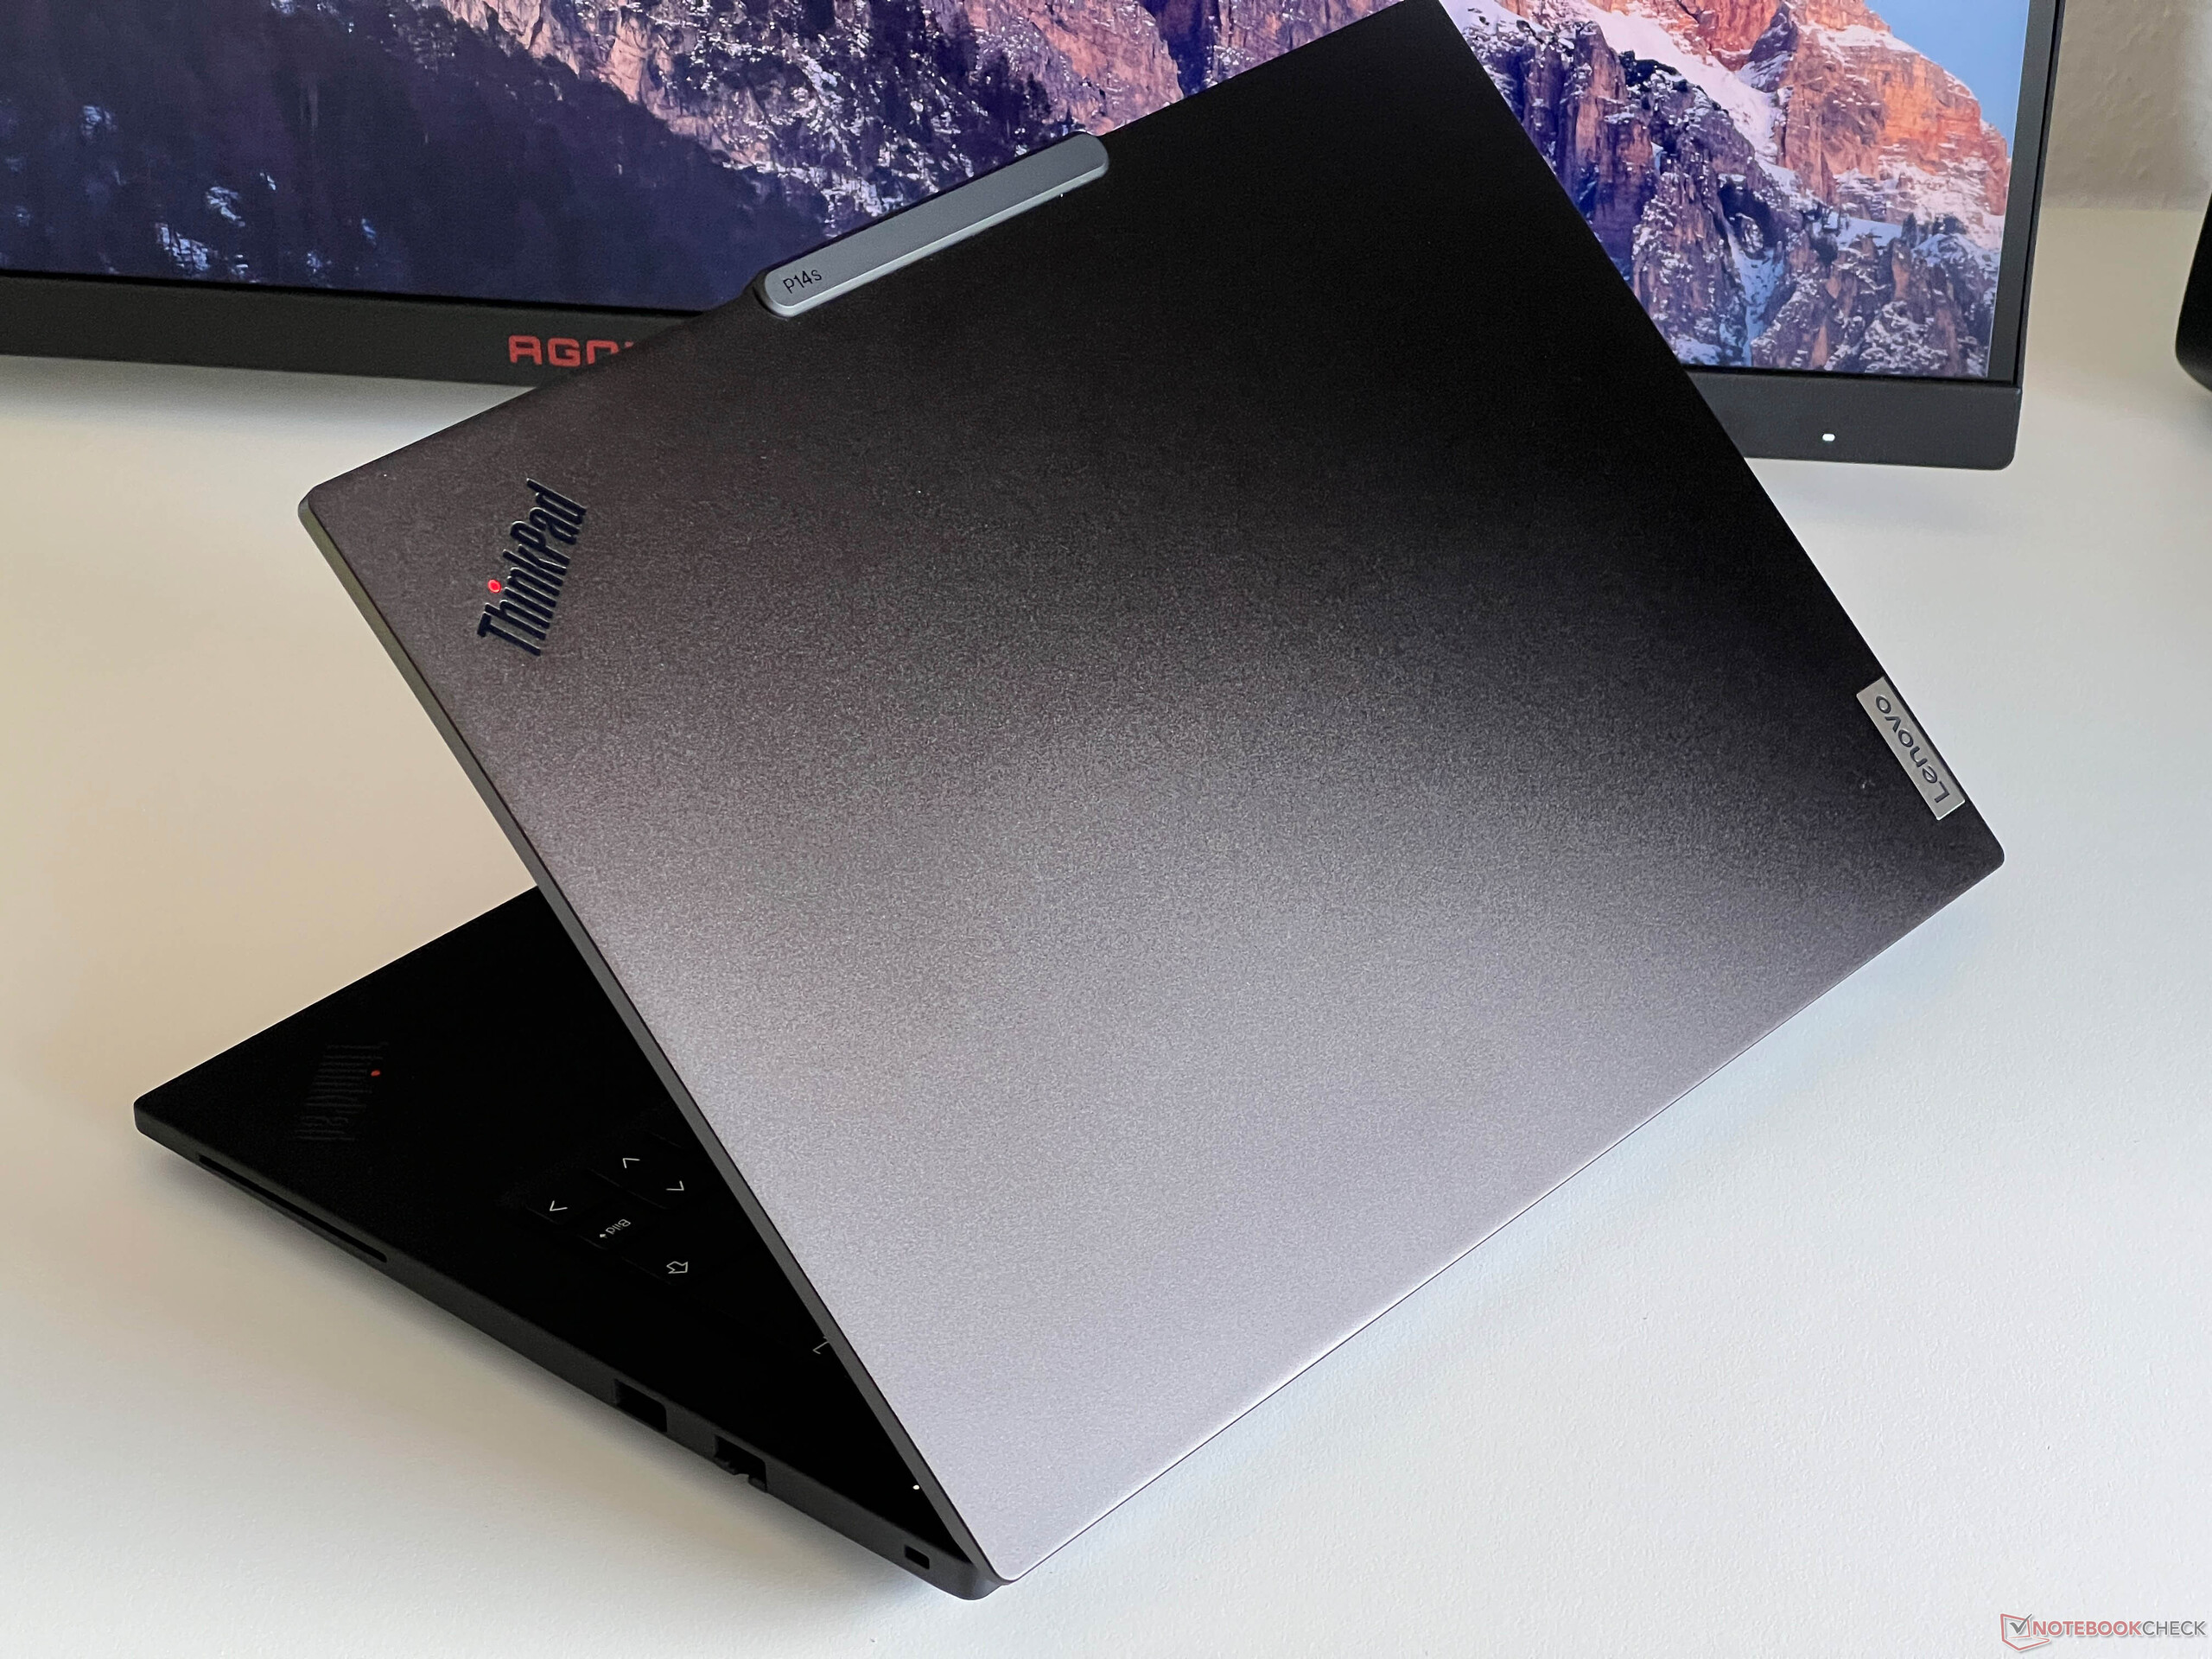
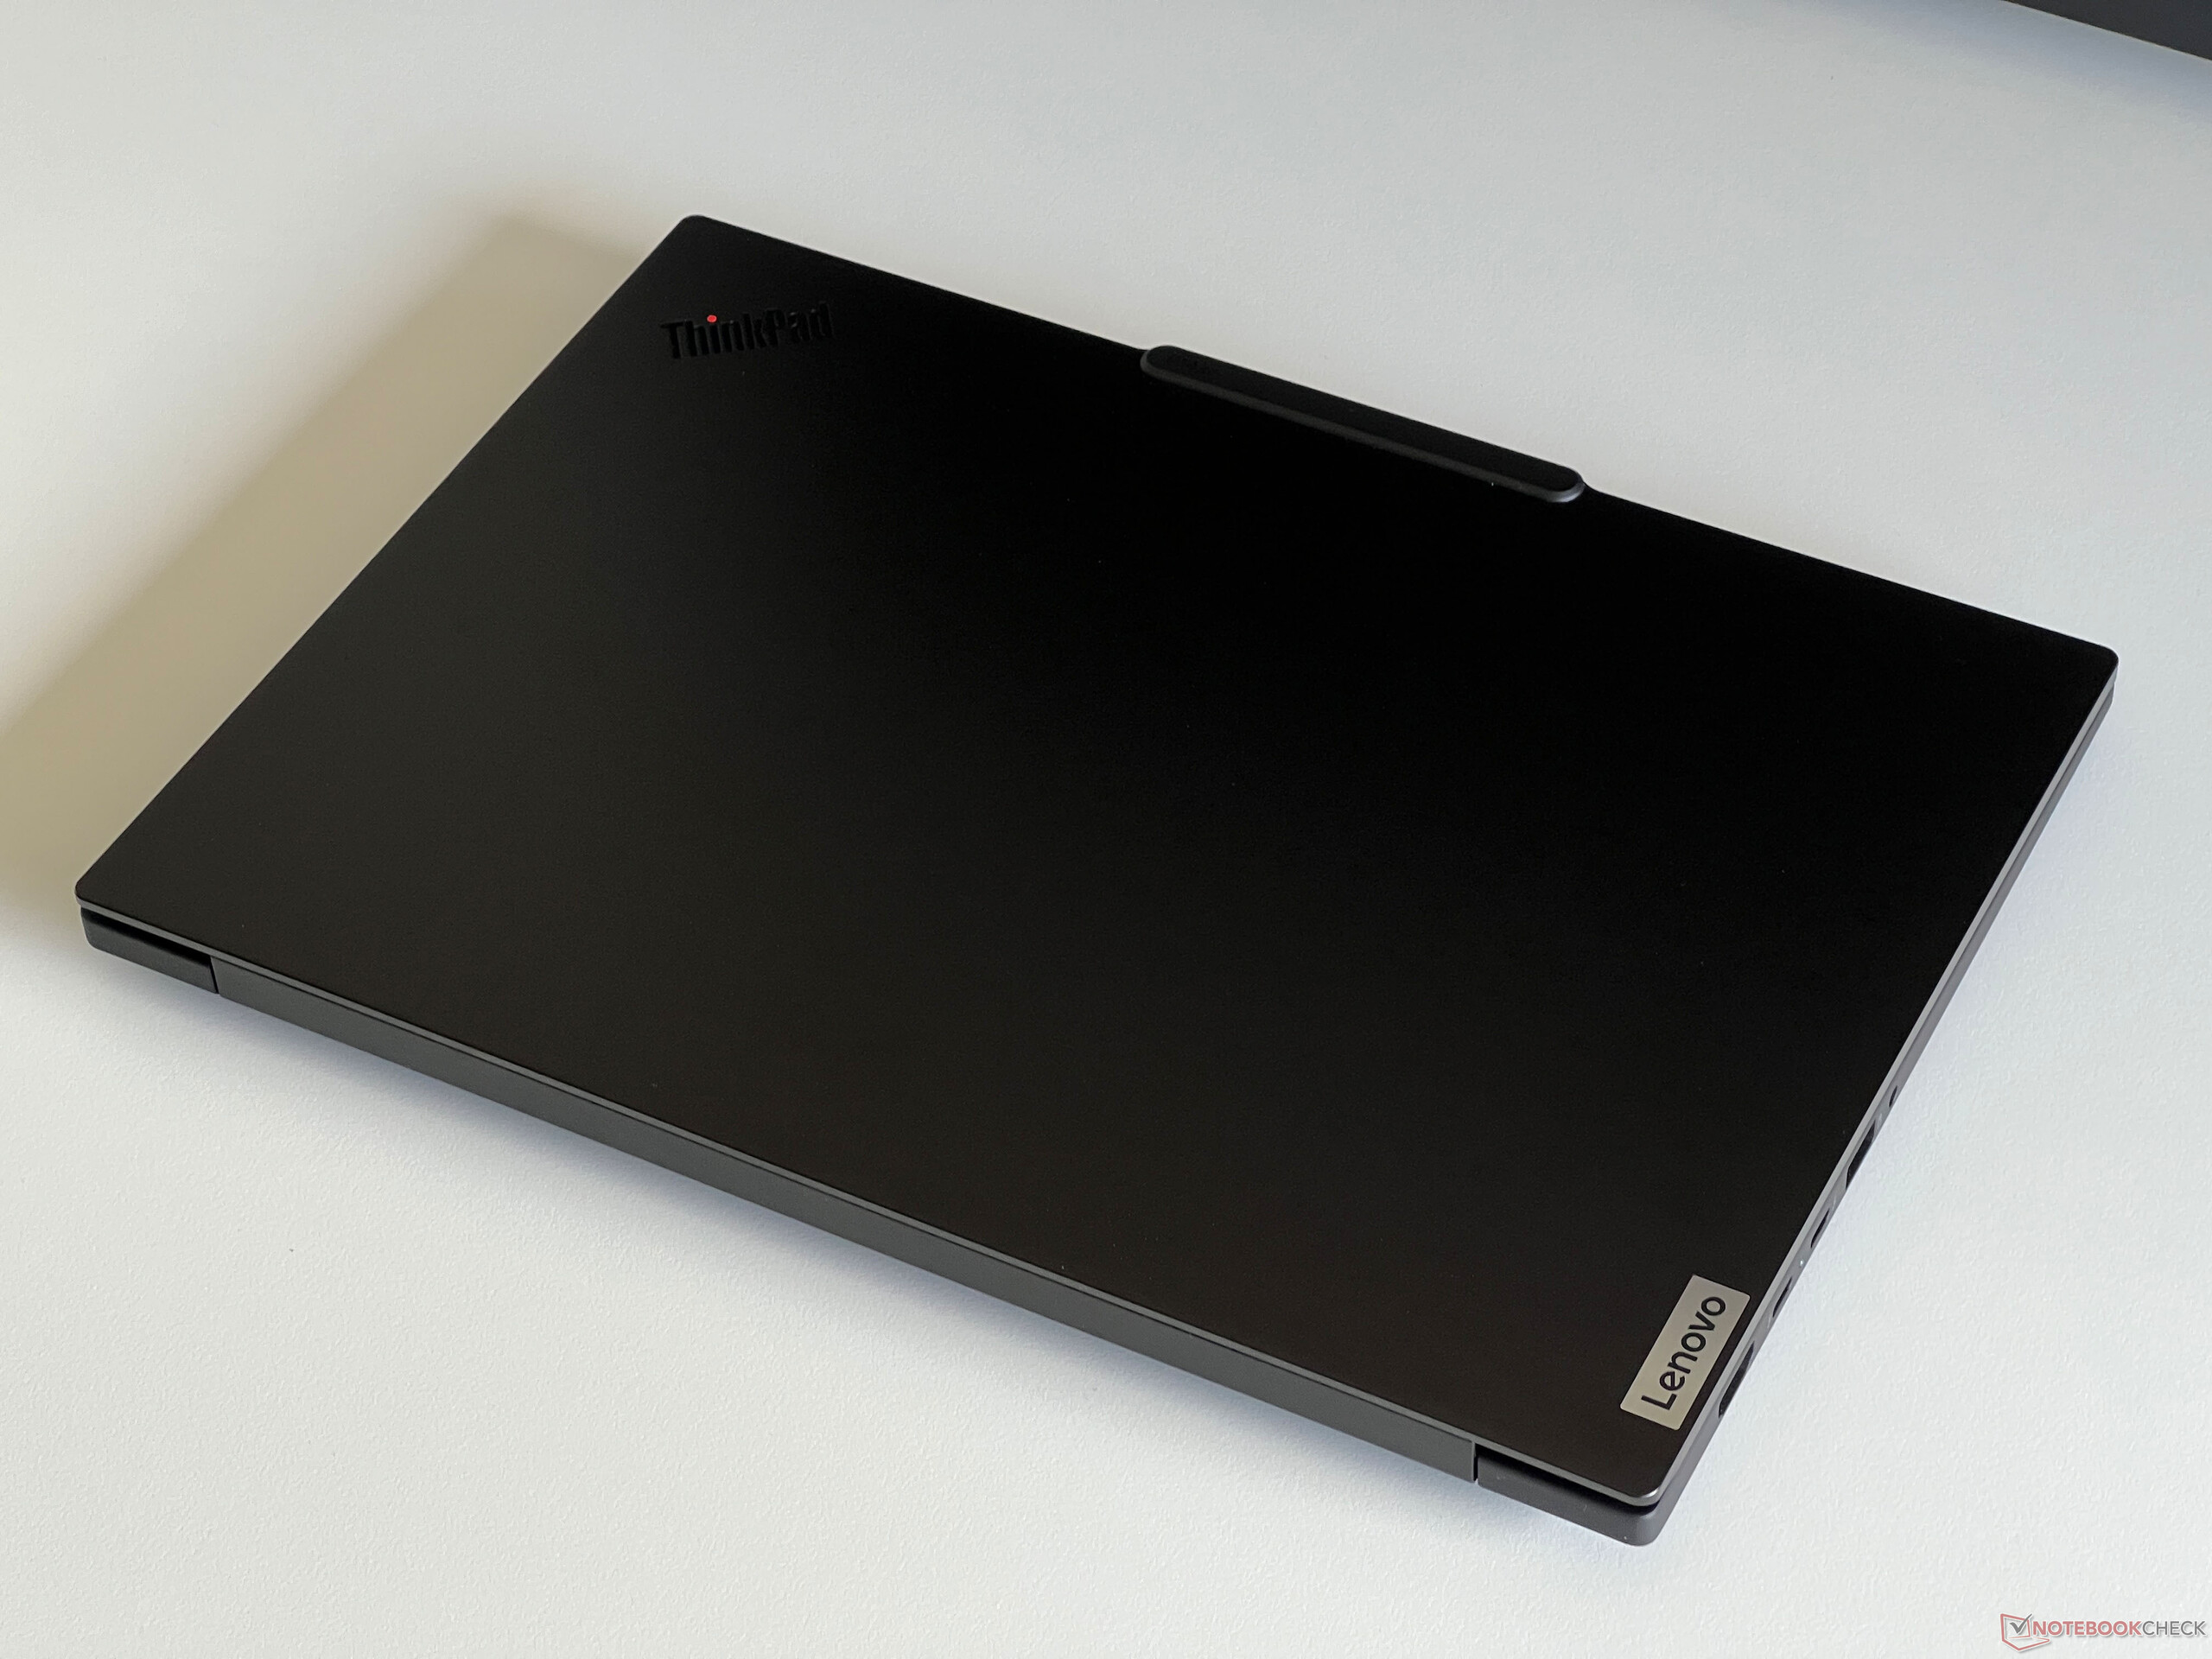
From the outside, the ThinkPad P14s G5 features the same design as the manufacturer's current models, which unfortunately includes the unattractive and protruding camera bump. Apart from that, its design has been kept simple and, for some people, perhaps a little boring. The smooth surfaces of the lid and the underside (both aluminum) are very susceptible to collecting fingerprint marks, while the top of the base unit (magnesium/aluminum alloy) has a slightly rubberized feel and doesn't have as big an issue with this. The screen's bezels are slightly narrower than on the predecessor model, which is why there is room for the larger 14.5-inch panel.
The stability of the base unit is outstanding and nothing can be pressed in or twisted—but applying pressure on the area to the right of the keyboard produces slight creaking noises on our test device. The screen's lid is also very stable and we couldn't provoke any image errors during our test. The hinges are pretty tight overall, but you can still open the device with one hand. However, it isn't possible to completely prevent it from rocking when changing the opening angle (max. 180 degrees).
We have already talked about its height, but the new P14s G5 is also one of the largest models in our comparison group when it comes to its footprint. Its weight is 1.72 kg and the 135-watt power supply weighs in at another 527 grams.
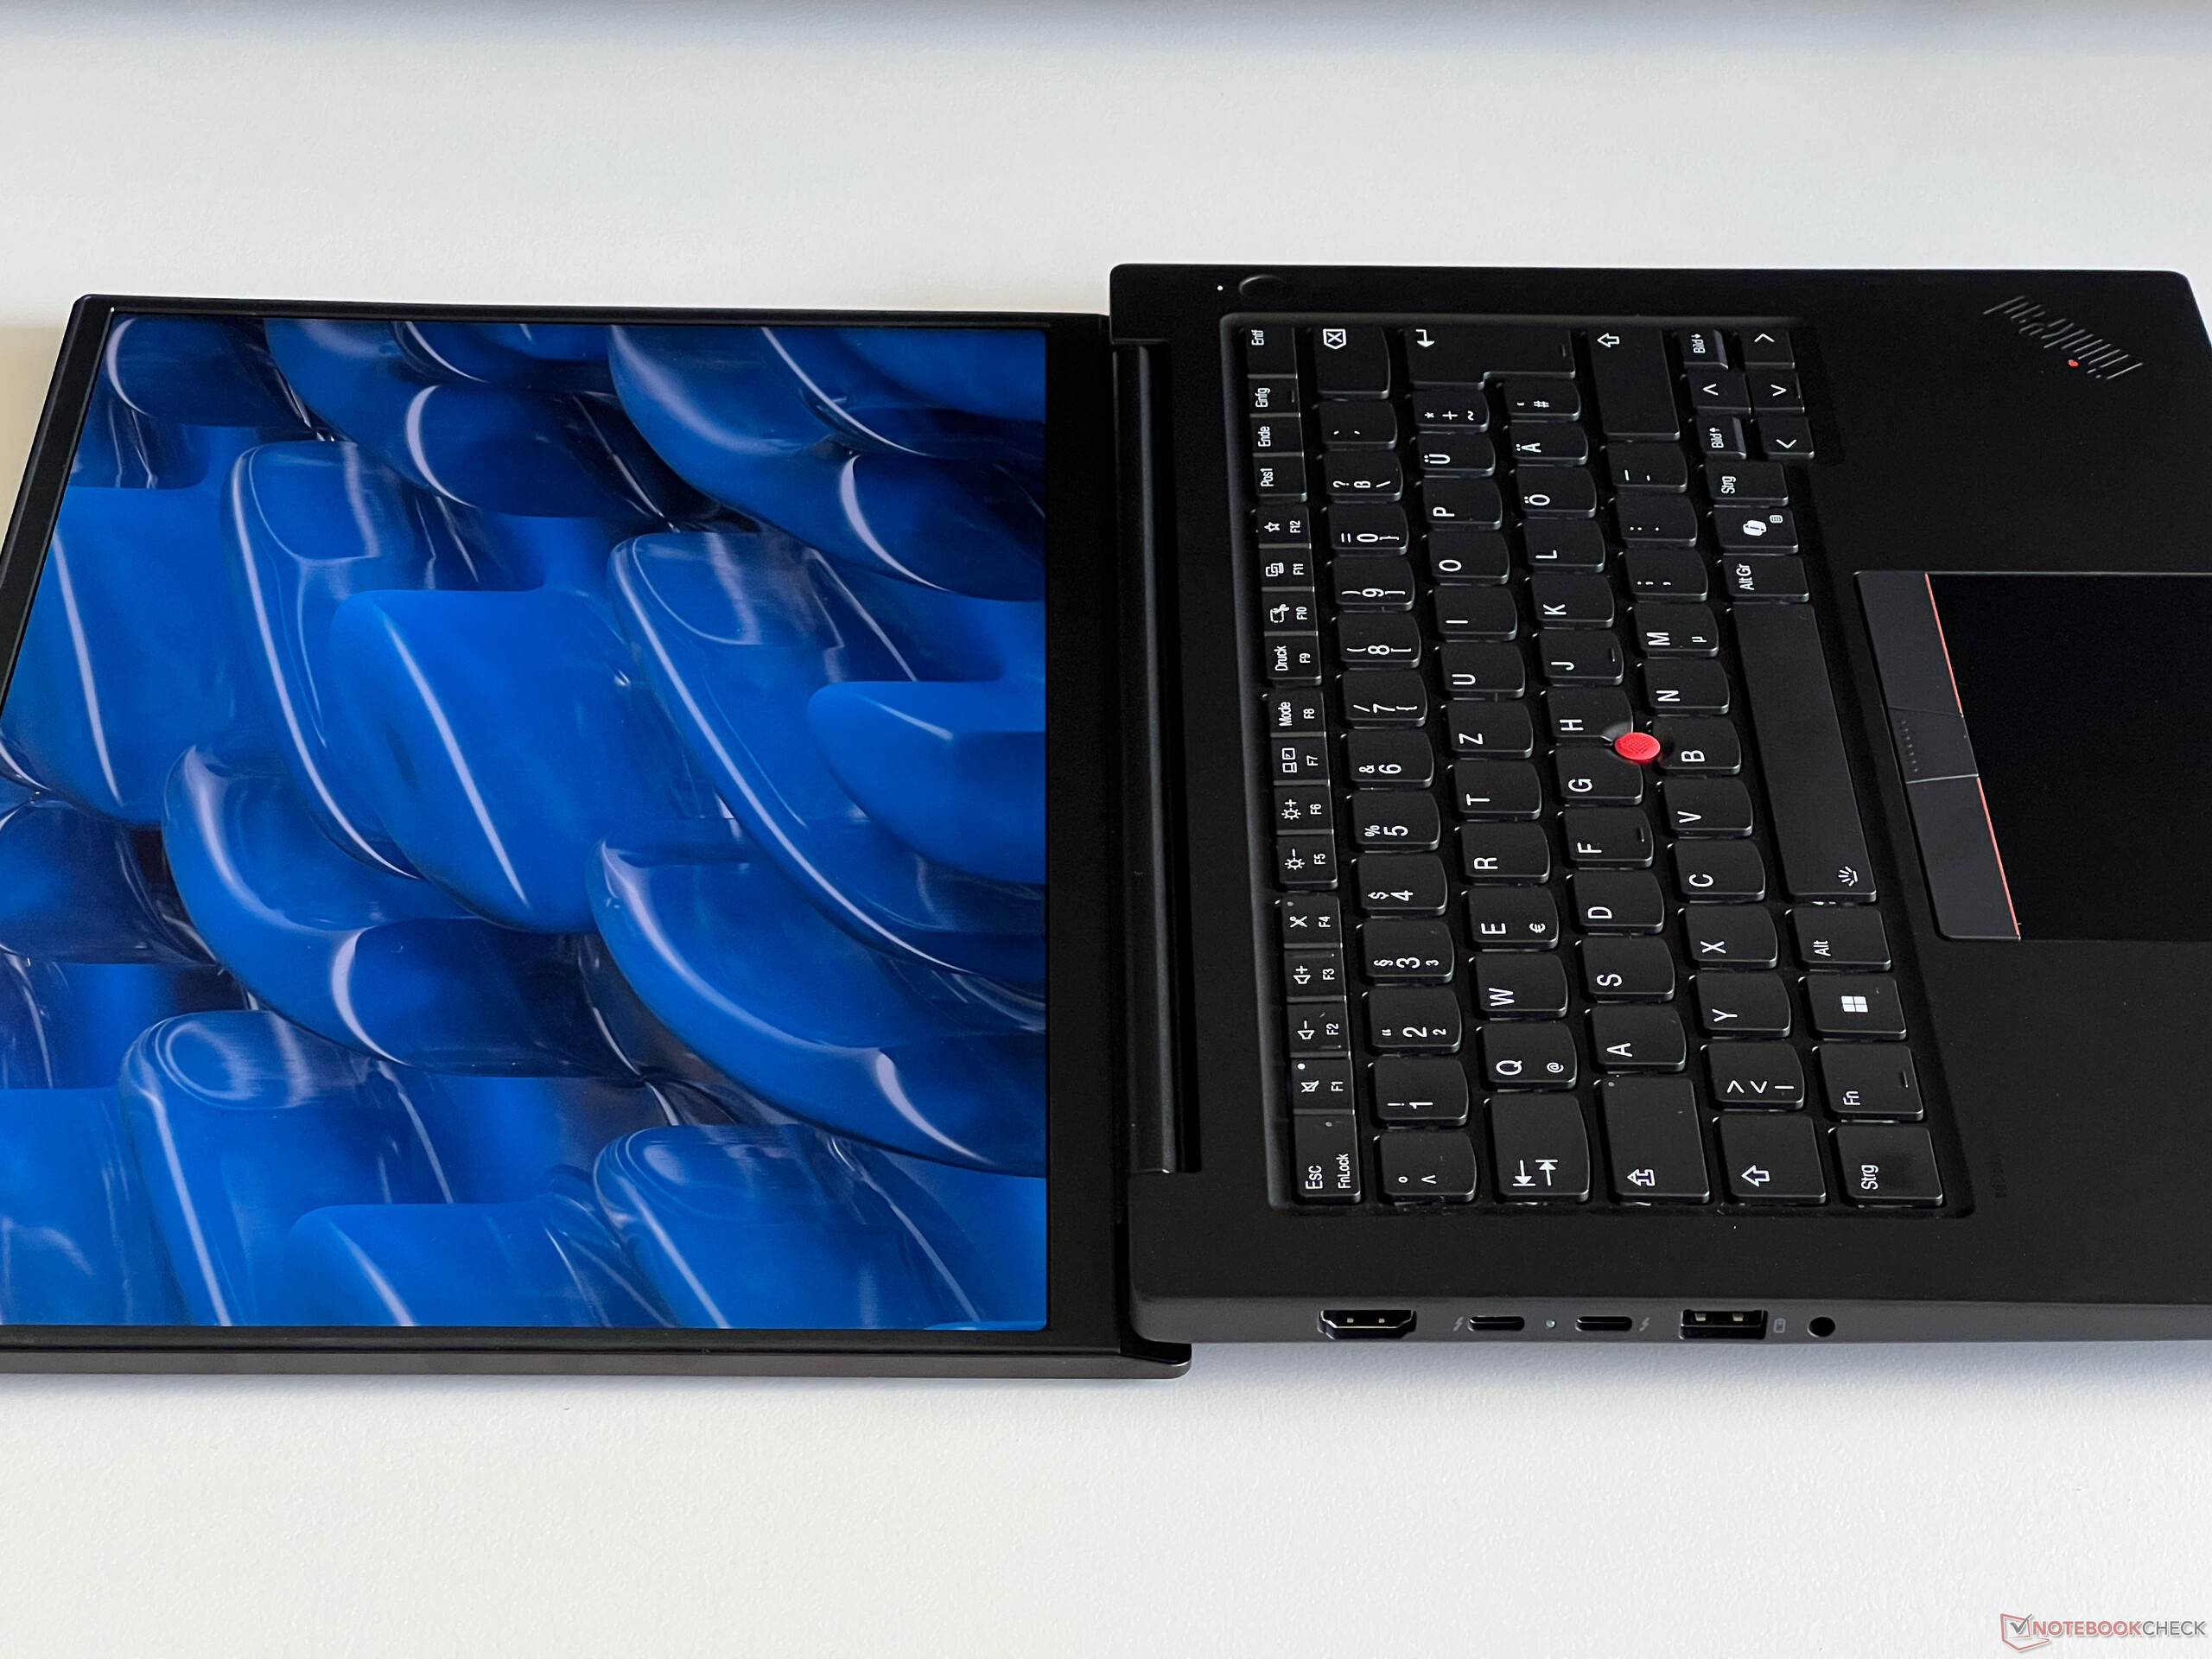
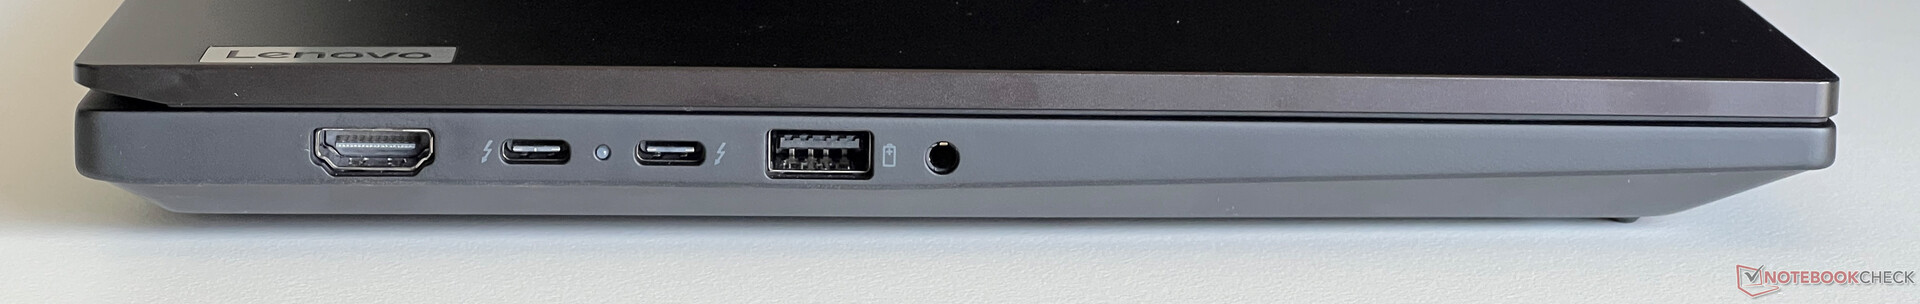
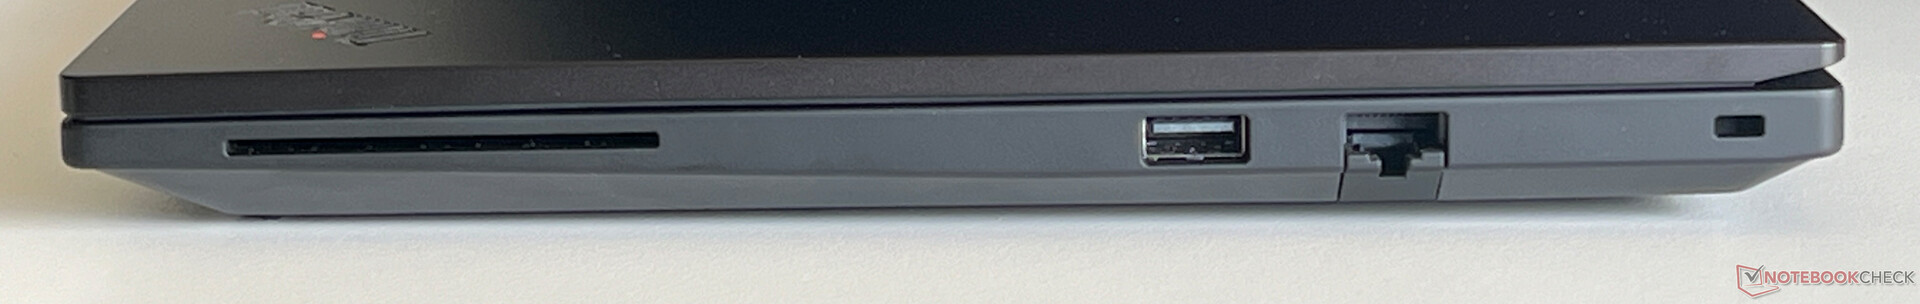
Connectivity - Thunderbolt 4 and a SmartCard reader
There are no surprises in store for users when it comes to connections and, in addition to modern Thunderbolt 4 ports, there are also two regular USB-A ports installed. This means you won't have to reach for adapters during everyday use. Our test device is also equipped with an optional SmartCard reader, but it doesn't have an SD card reader.
Communication
Lenovo has installed the Intel AX211 WLAN module which also supports modern 6 GHz networks and Bluetooth 5.3. However, a Wi-Fi 7 module is not on board. In our test using our reference router from Asus, its transfer rates were excellent and also very stable, so there should be no problems during use in this respect. A Gigabit Ethernet port (Intel i219-V) is also available for wired networks.
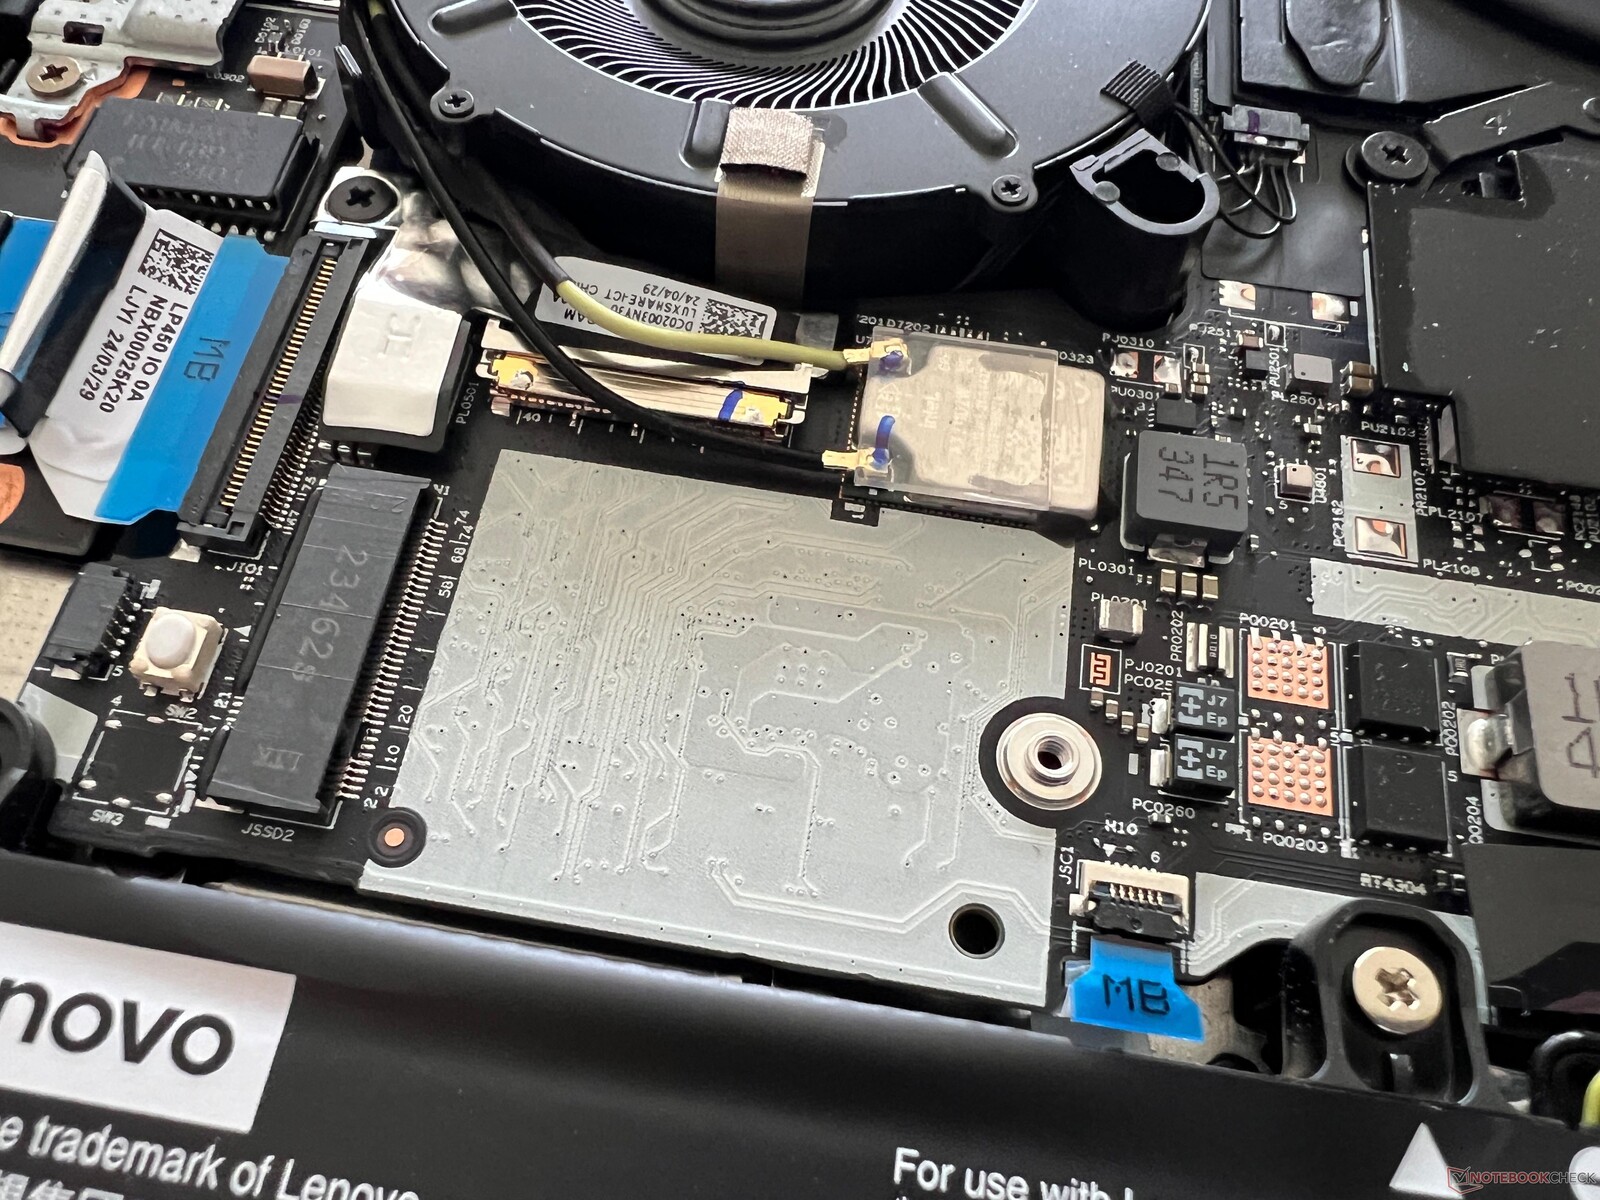
The P14s G5 additionally features an M.2-2242 slot for a WWAN module, but no corresponding configurations are currently available in Germany (where this test was carried out) due to a legal dispute. The necessary antennas are also missing (not WWAN-ready), so a module cannot be retrofitted by users without taking additional steps.
| Networking | |
| Lenovo ThinkPad P14s G5 21G3S00A00 | |
| iperf3 transmit AXE11000 | |
| iperf3 receive AXE11000 | |
| HP ZBook Firefly 14 G11 | |
| iperf3 transmit AXE11000 | |
| iperf3 receive AXE11000 | |
| iperf3 transmit AXE11000 6GHz | |
| iperf3 receive AXE11000 6GHz | |
| Dell Precision 5000 5490 | |
| iperf3 transmit AXE11000 | |
| iperf3 receive AXE11000 | |
| iperf3 transmit AXE11000 6GHz | |
| iperf3 receive AXE11000 6GHz | |
| Lenovo ThinkPad P14s G4 21HF0017GE | |
| iperf3 transmit AXE11000 | |
| iperf3 receive AXE11000 | |
| iperf3 transmit AXE11000 6GHz | |
| iperf3 receive AXE11000 6GHz | |
| Microsoft Surface Laptop Studio 2 RTX 4060 | |
| iperf3 transmit AXE11000 | |
| iperf3 receive AXE11000 | |
| Lenovo Yoga Pro 9-14IRP G8 | |
| iperf3 transmit AXE11000 | |
| iperf3 receive AXE11000 | |
Webcam
The webcam can capture images at up to 5 MP in 4:3 (2,592 x 1,944 pixels) or 3.7 MP in 16:9 (2,560 x 1,440 pixels). Its image sharpness is better than with the usual 2 MP sensors and the additional Windows Studio effects are also supported.


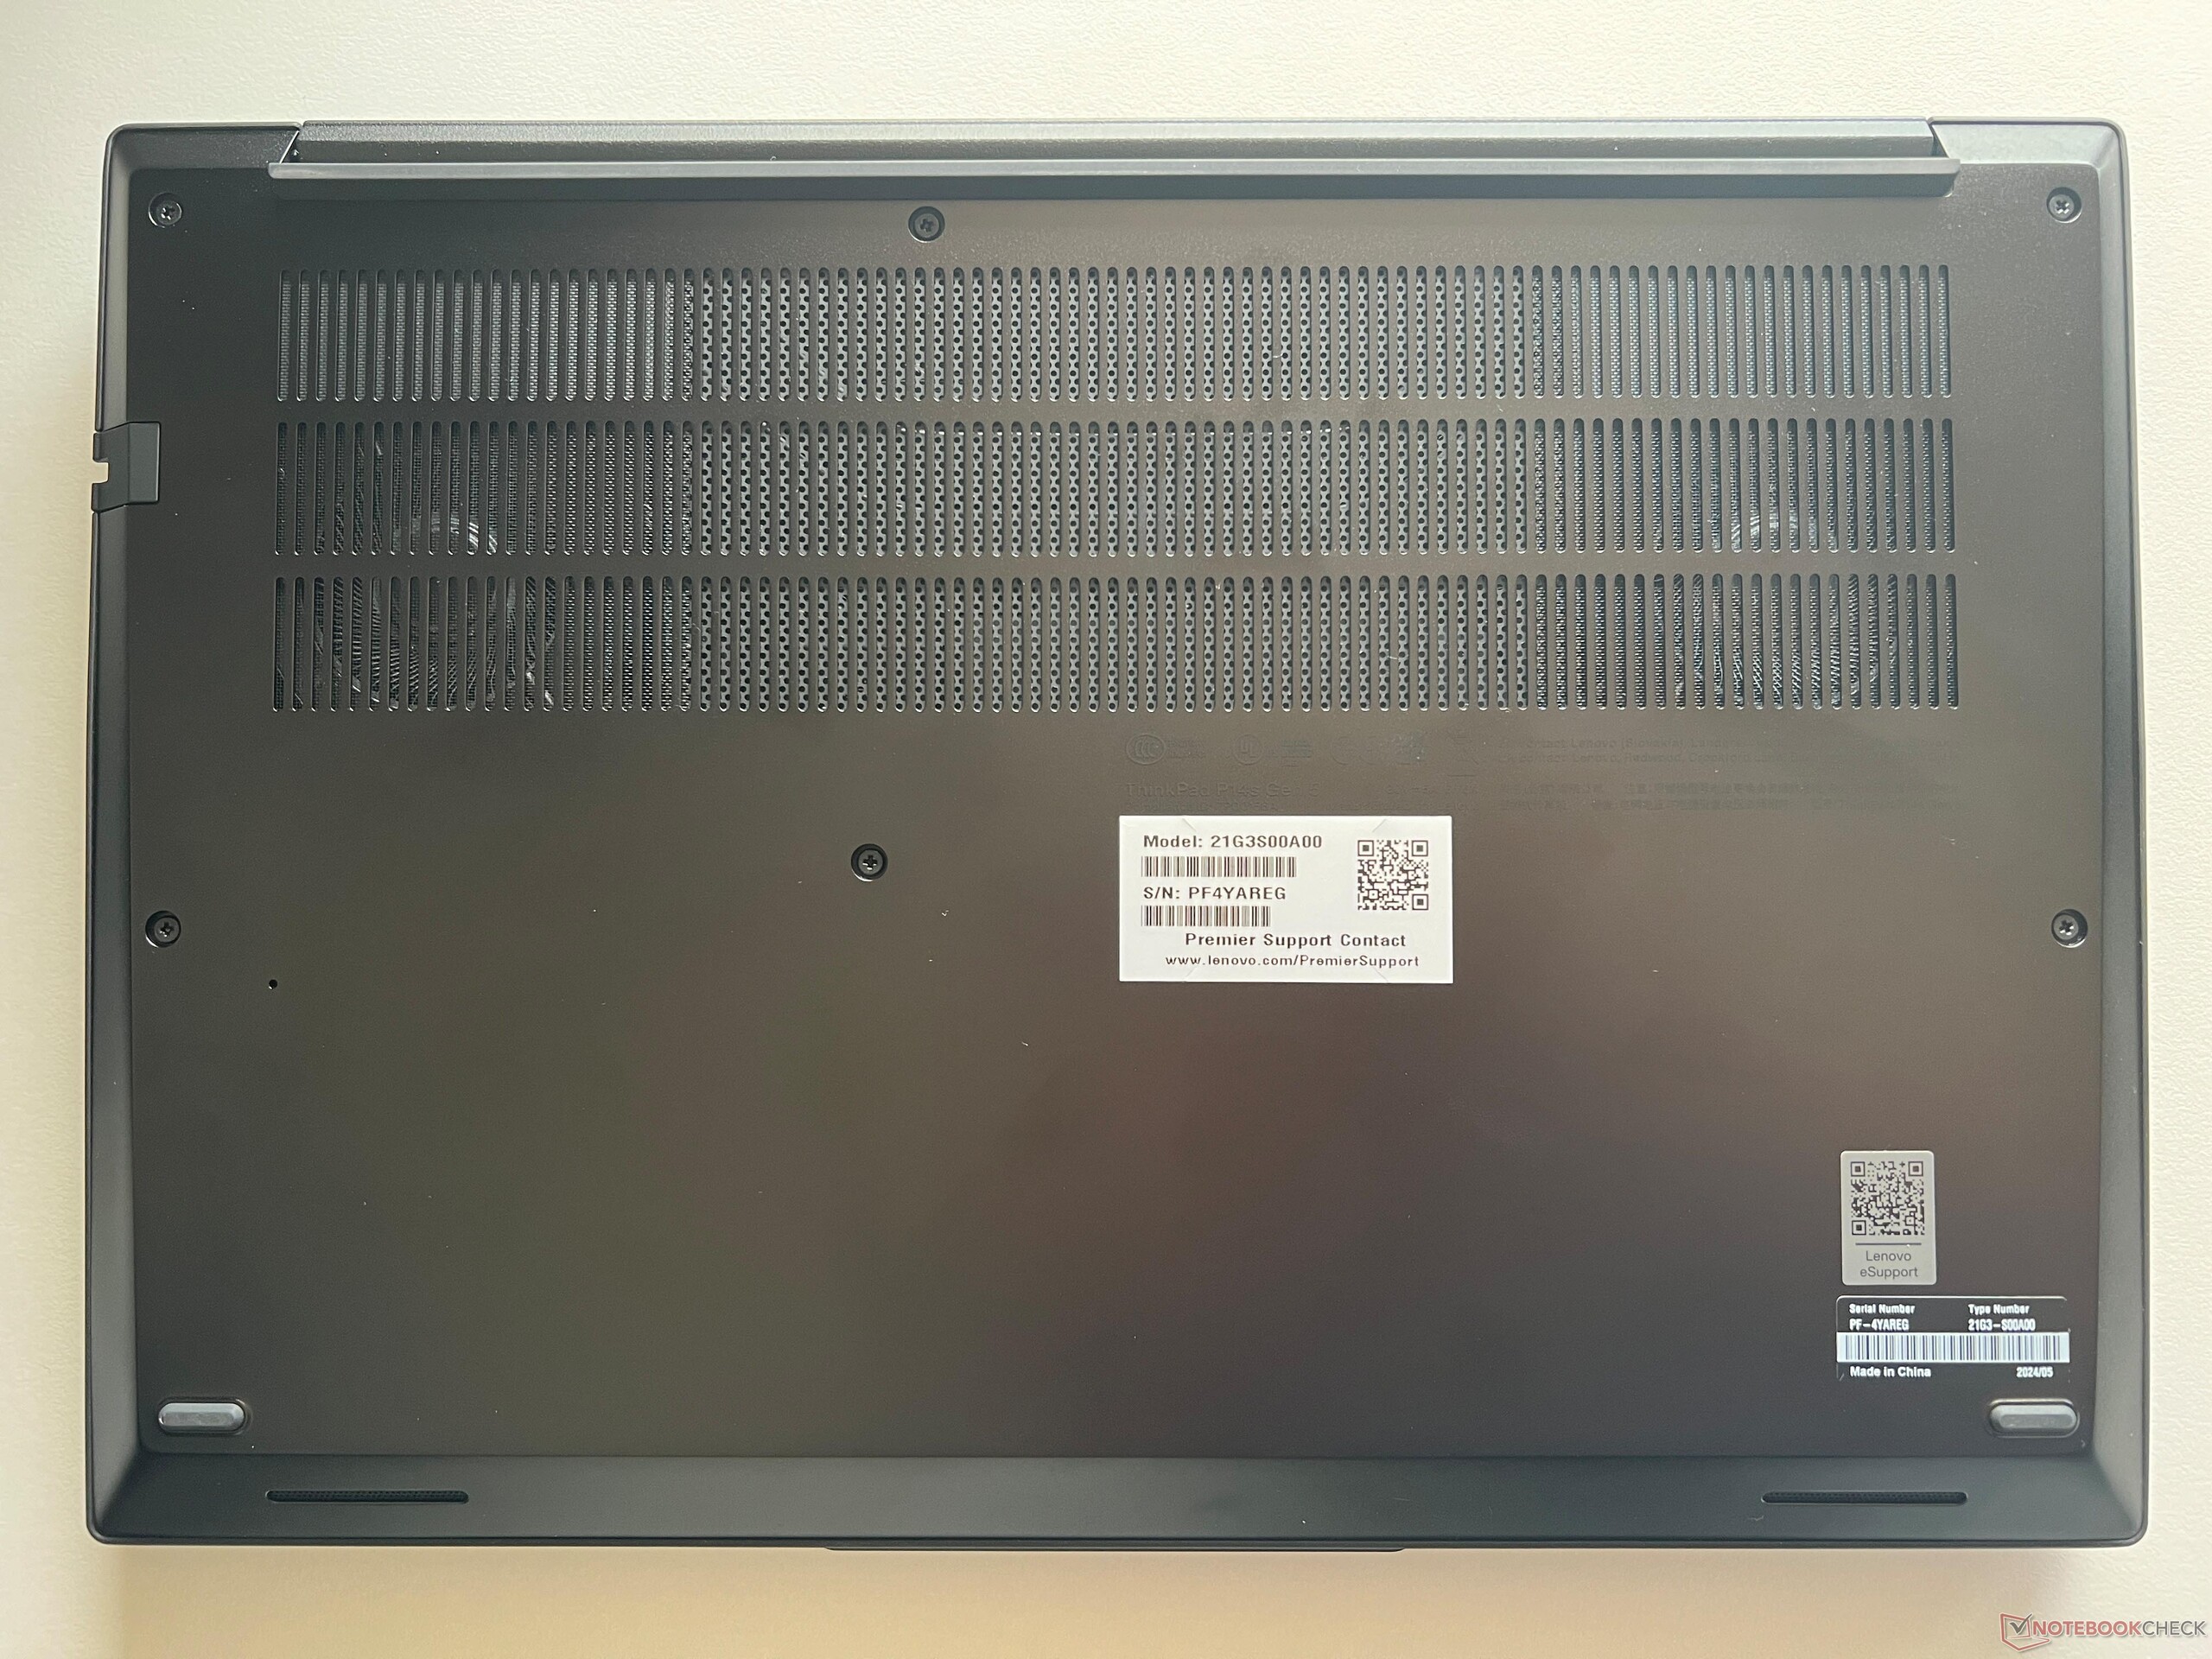
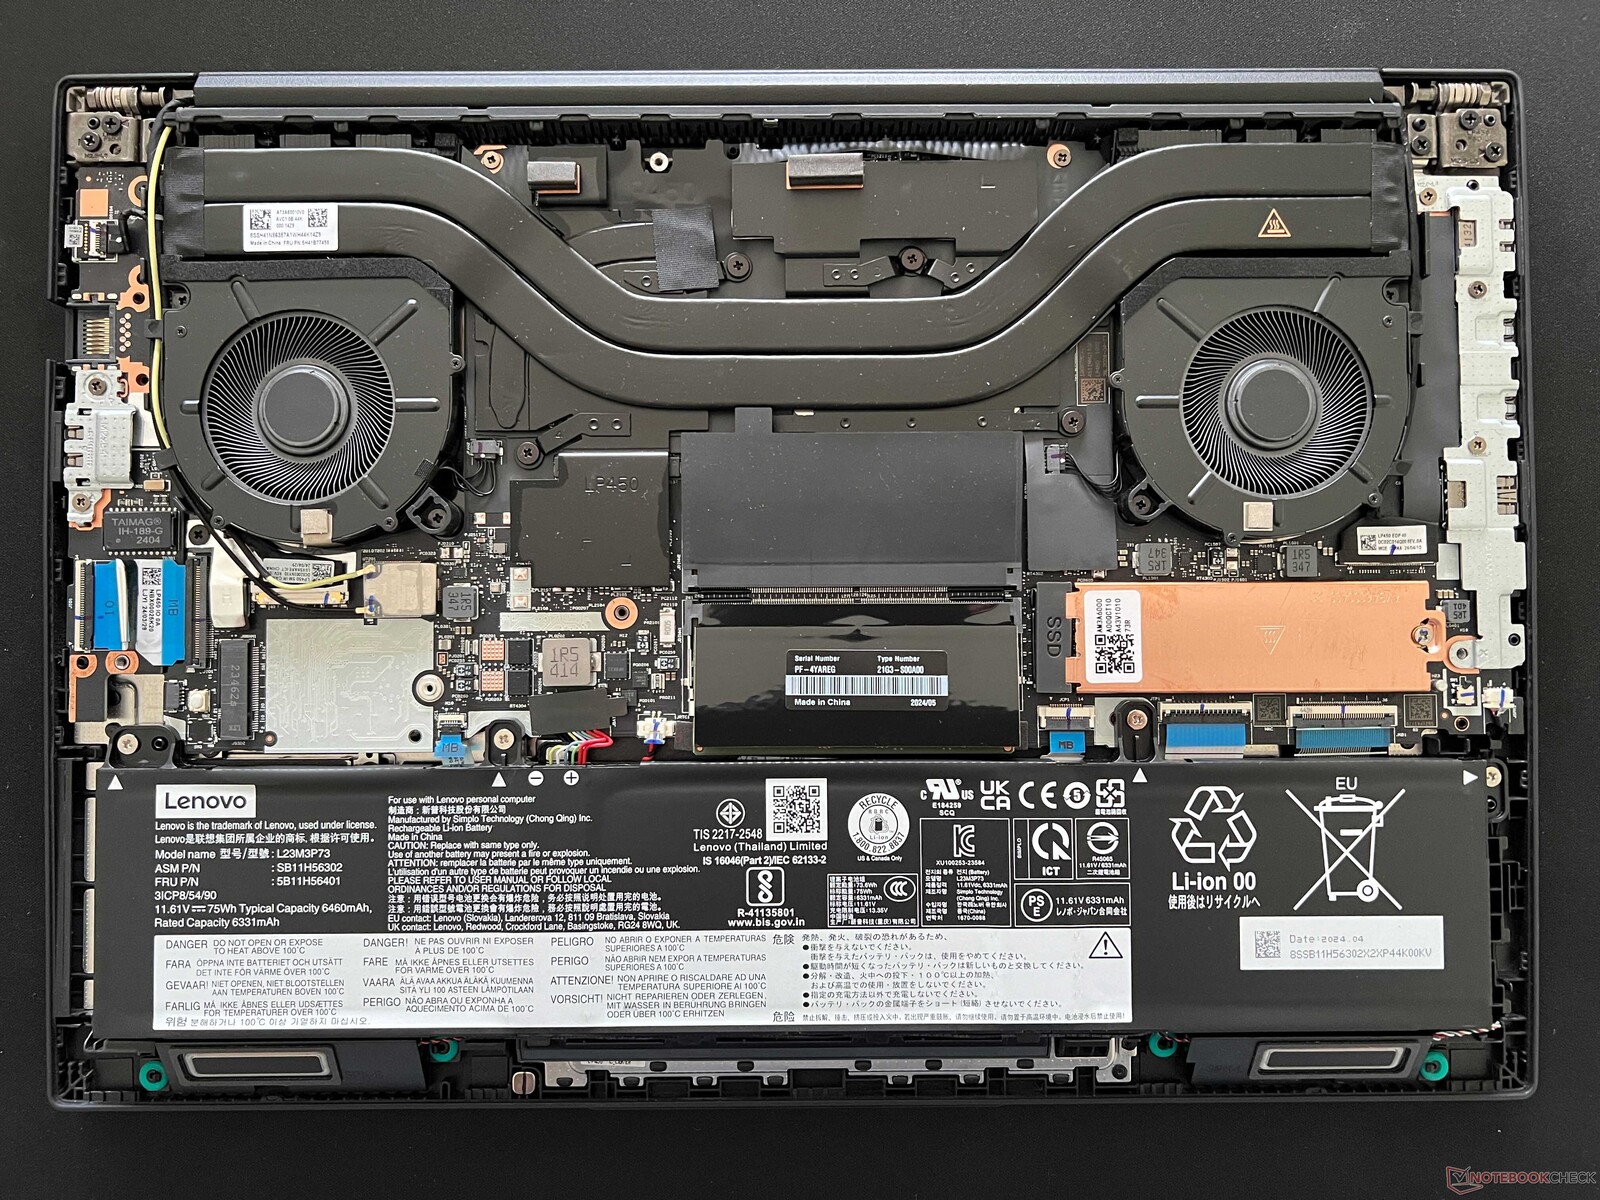
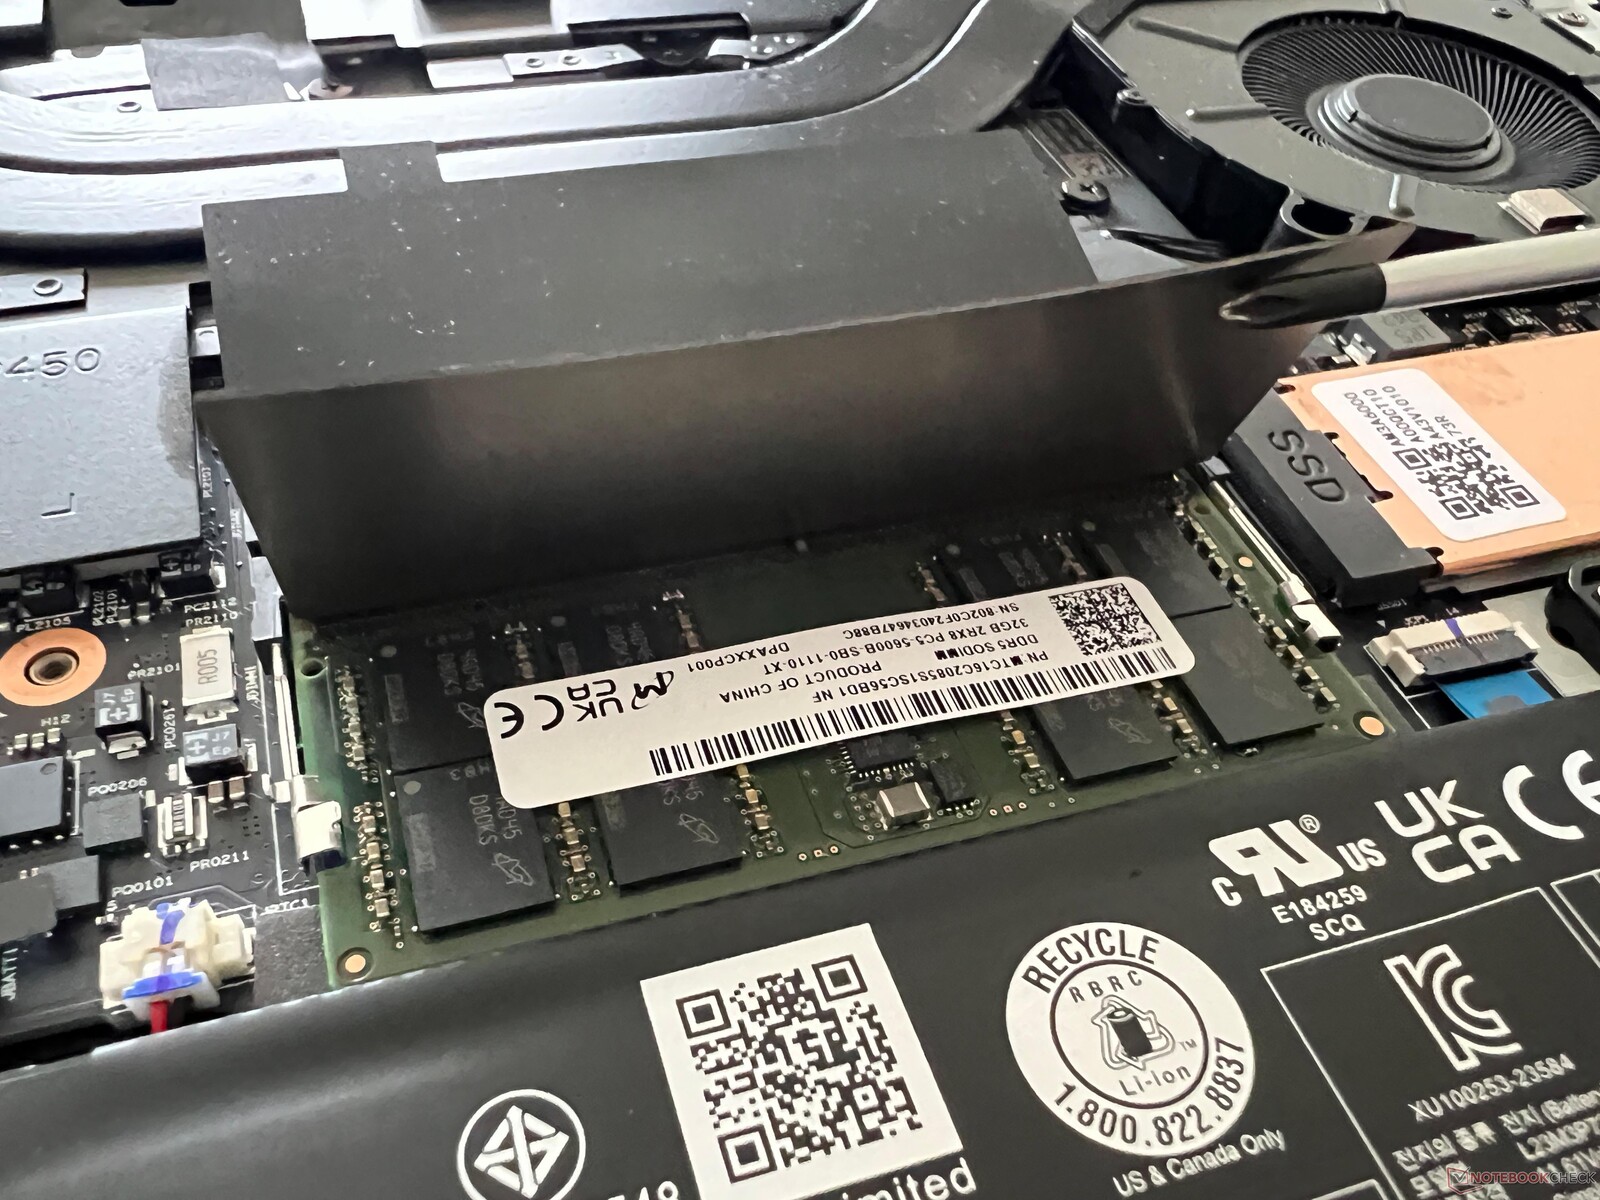
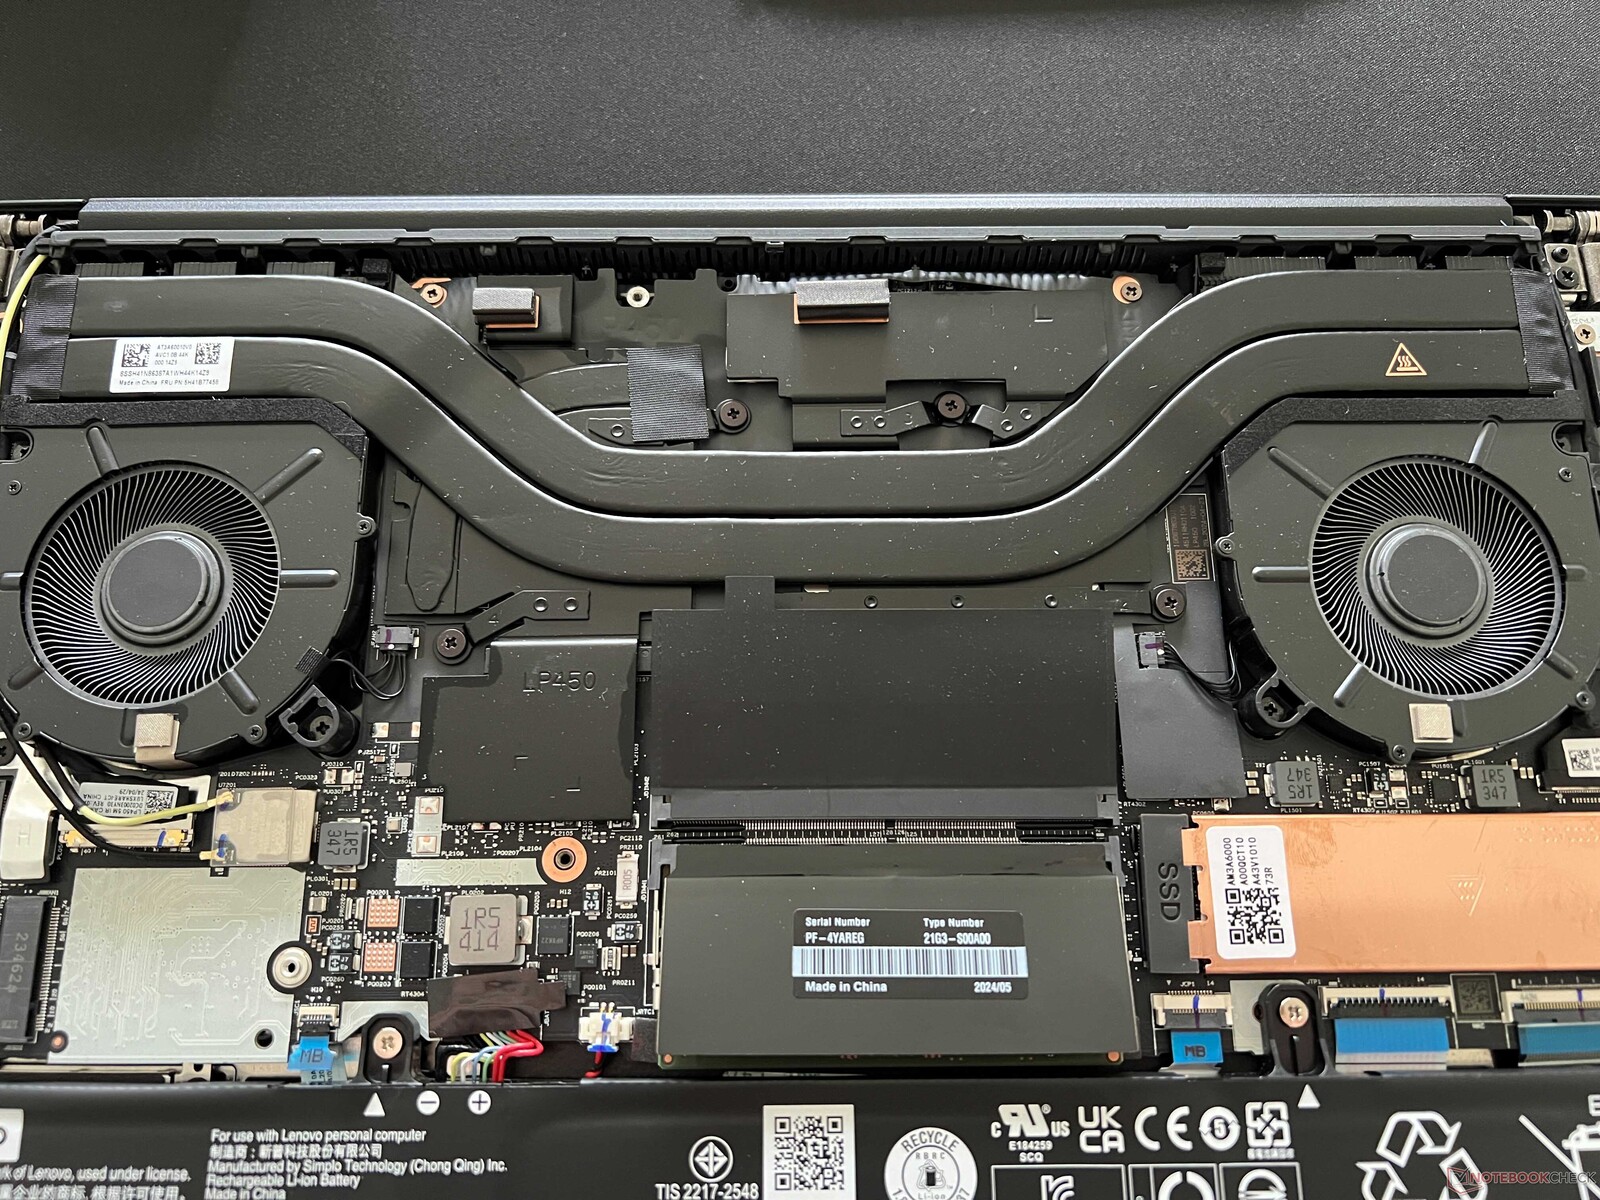
Maintenance
The bottom case cover is secured with six Phillips screws and can be removed easily. The processor, graphics card and WLAN module are all soldered on, but both the M.2 2280 SSD and the RAM can be upgraded. The two DIMM slots can accommodate modules with a maximum of 48 GB, meaning a total of 96 GB RAM can be installed into the laptop.
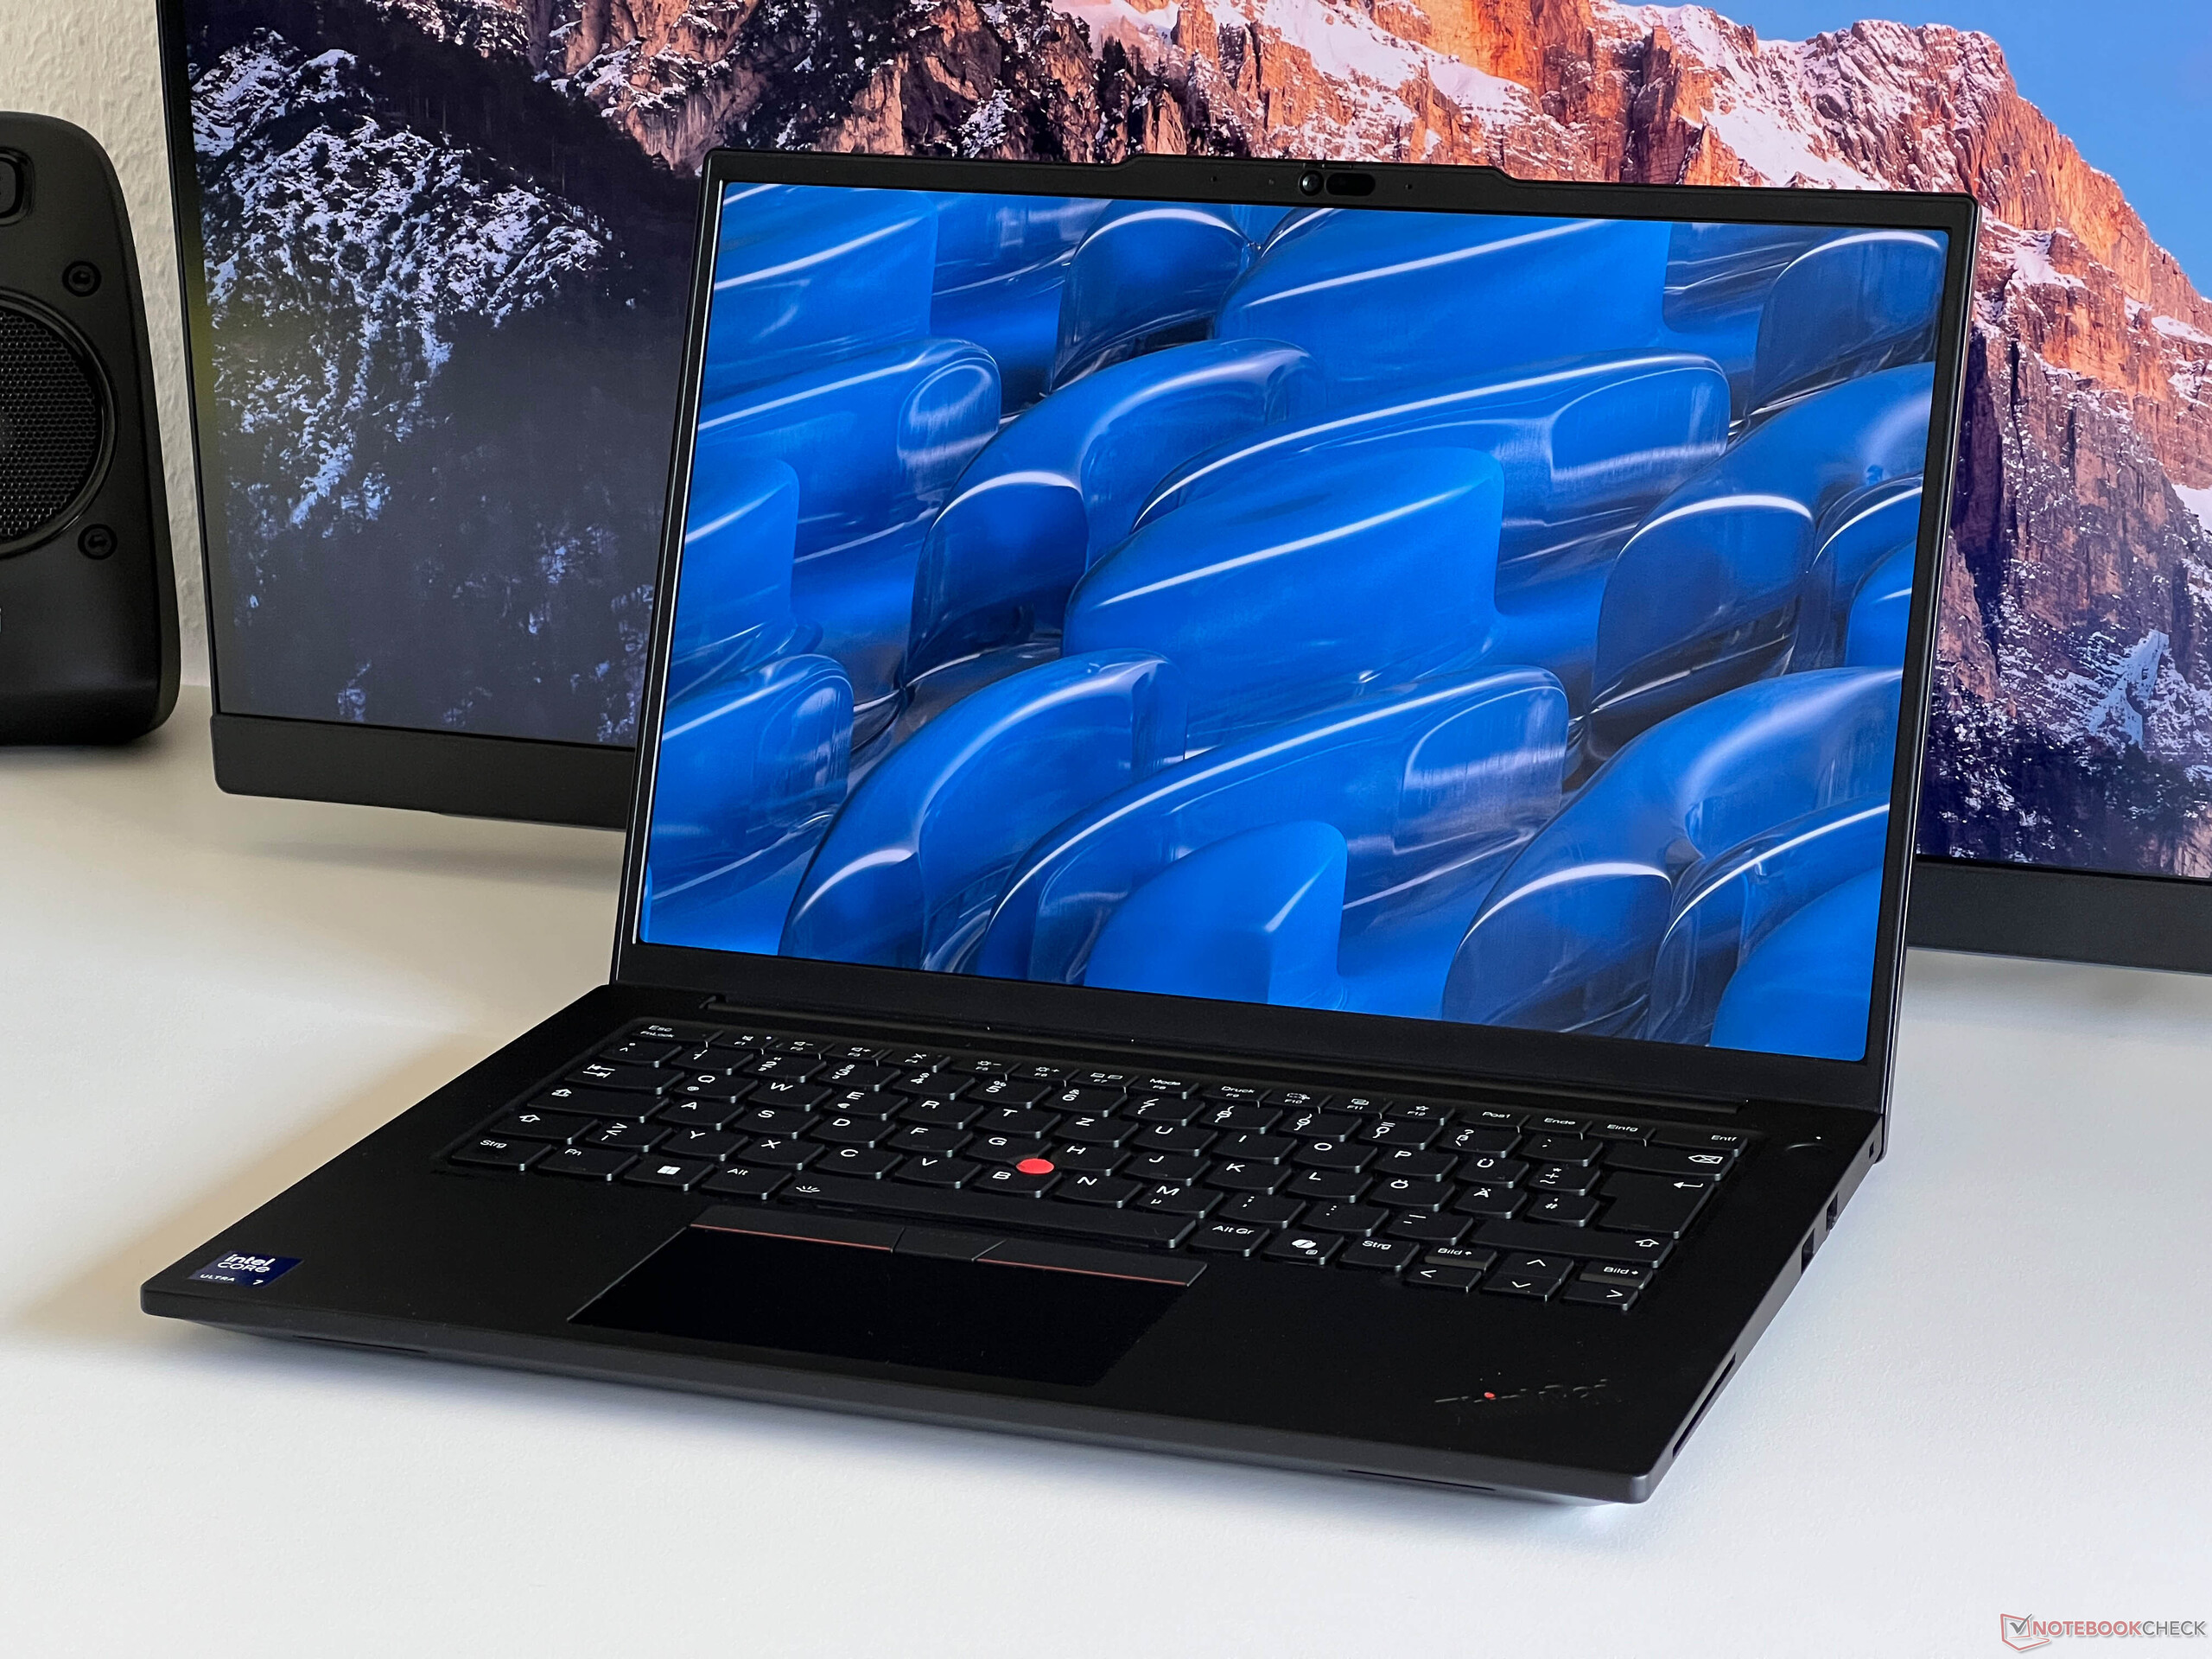
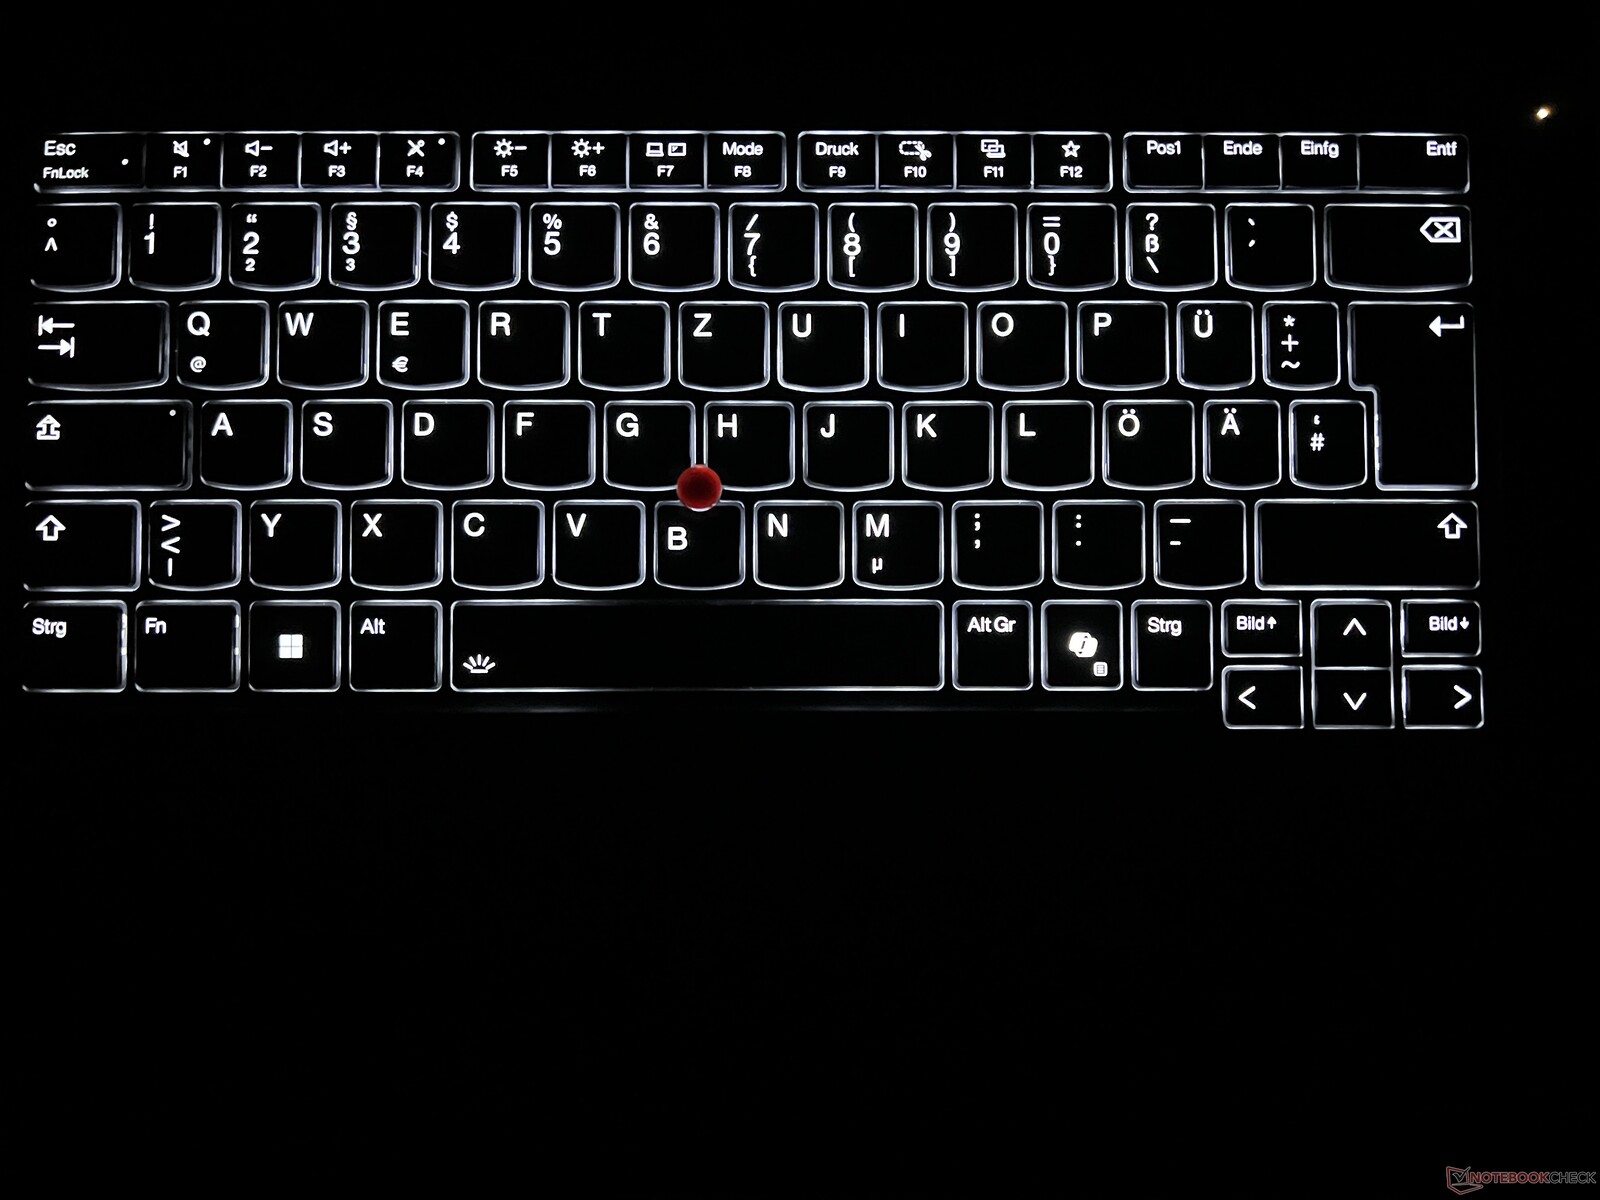
Input devices - 1.5 mm lift and new positioning of the Fn key
The keyboard is a familiar model with a lift of 1.5 mm. It feels nice to type on, but this ThinkPad can no longer stand out from other competitors in this respect. We also still have a ThinkPad X1 Carbon with a 1.8 mm key lift in use and you can definitely feel the difference. New since the year 2024 is its replacement of the Fn and Ctrl keys, which will certainly cause some problems for ThinkPad veterans at first. A Co-Pilot key is now also installed. The keyboard's two-level white backlighting can't be activated via a sensor. The power button is located at the top right next to the keyboard and also serves as a fingerprint scanner.
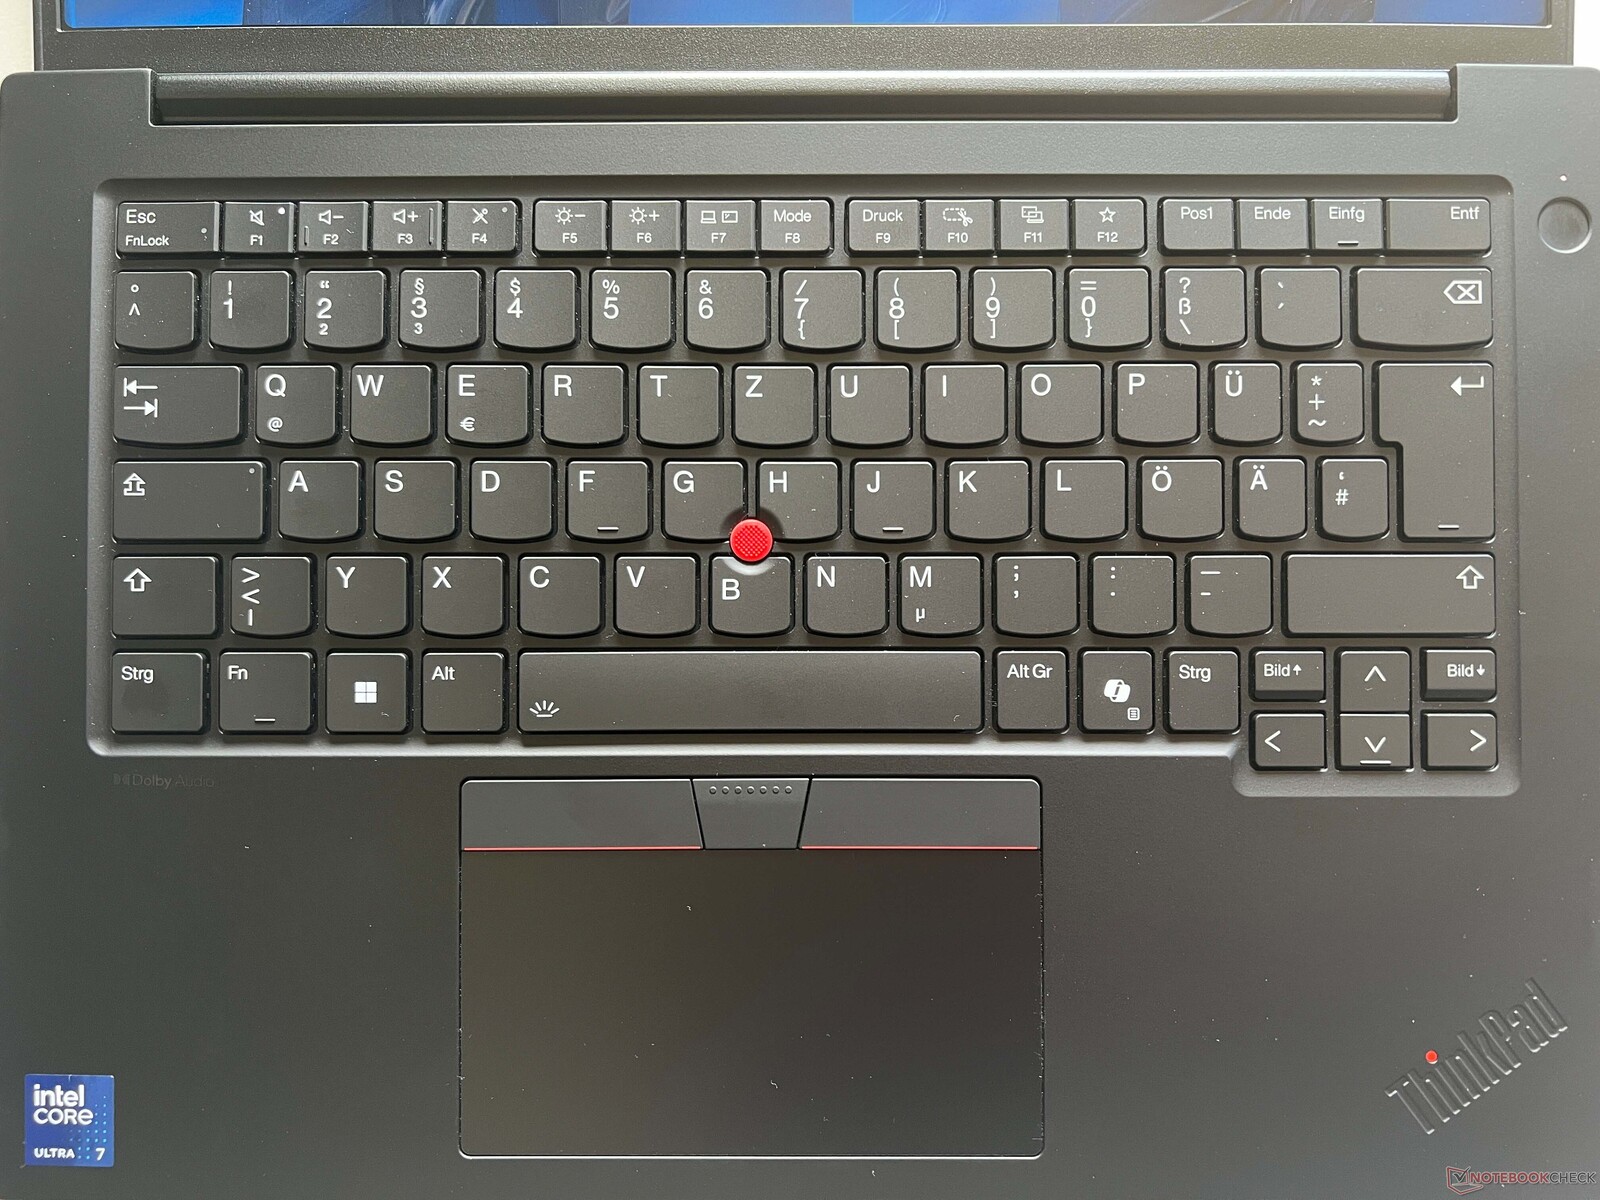
By today's standards, the laptop's 11.5 x 6 cm clickpad isn't particularly large, as it also has to make room for the additional buttons for the TrackPoint. However, it feels nice and smooth—only the clicking noise itself is a little too loud. Of course, the TrackPoint is also available to use as an alternative, which works very well (once you get used to it). The dedicated keys made a very good impression on our test device thanks to their high-quality, muffled clicks, and we noted no slack whatsoever.
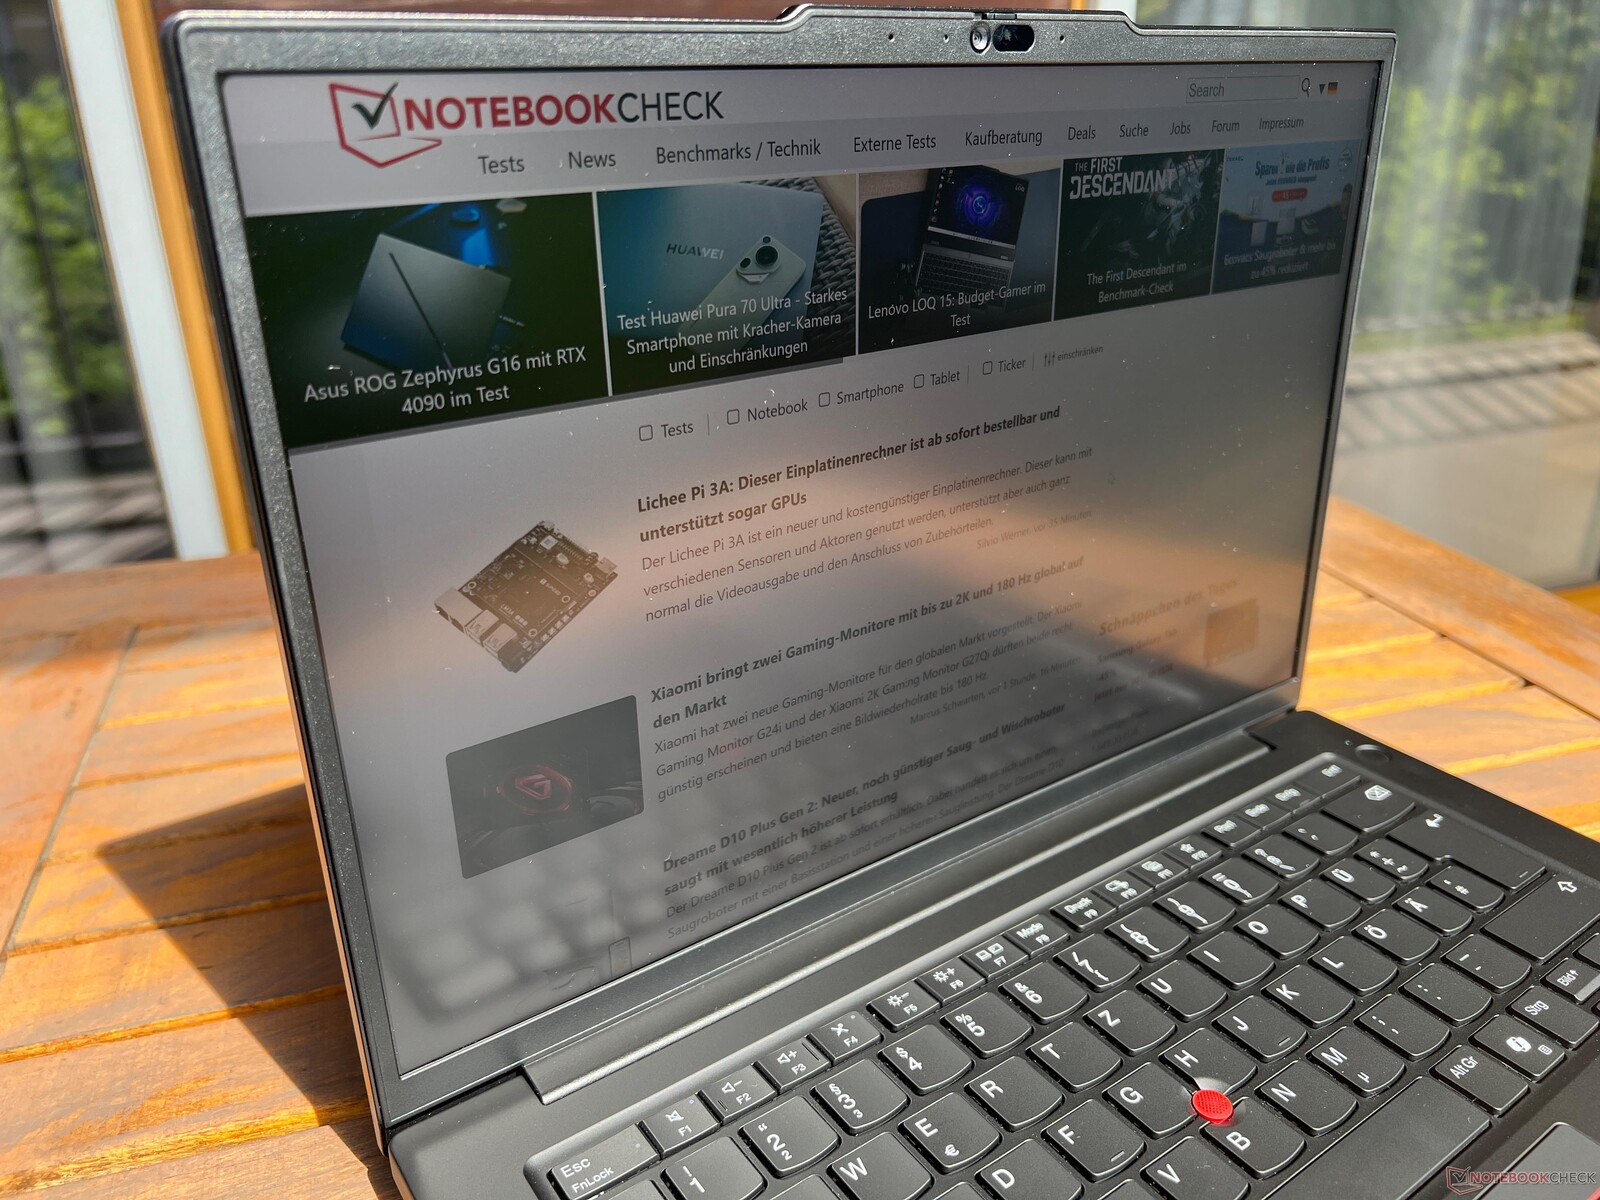
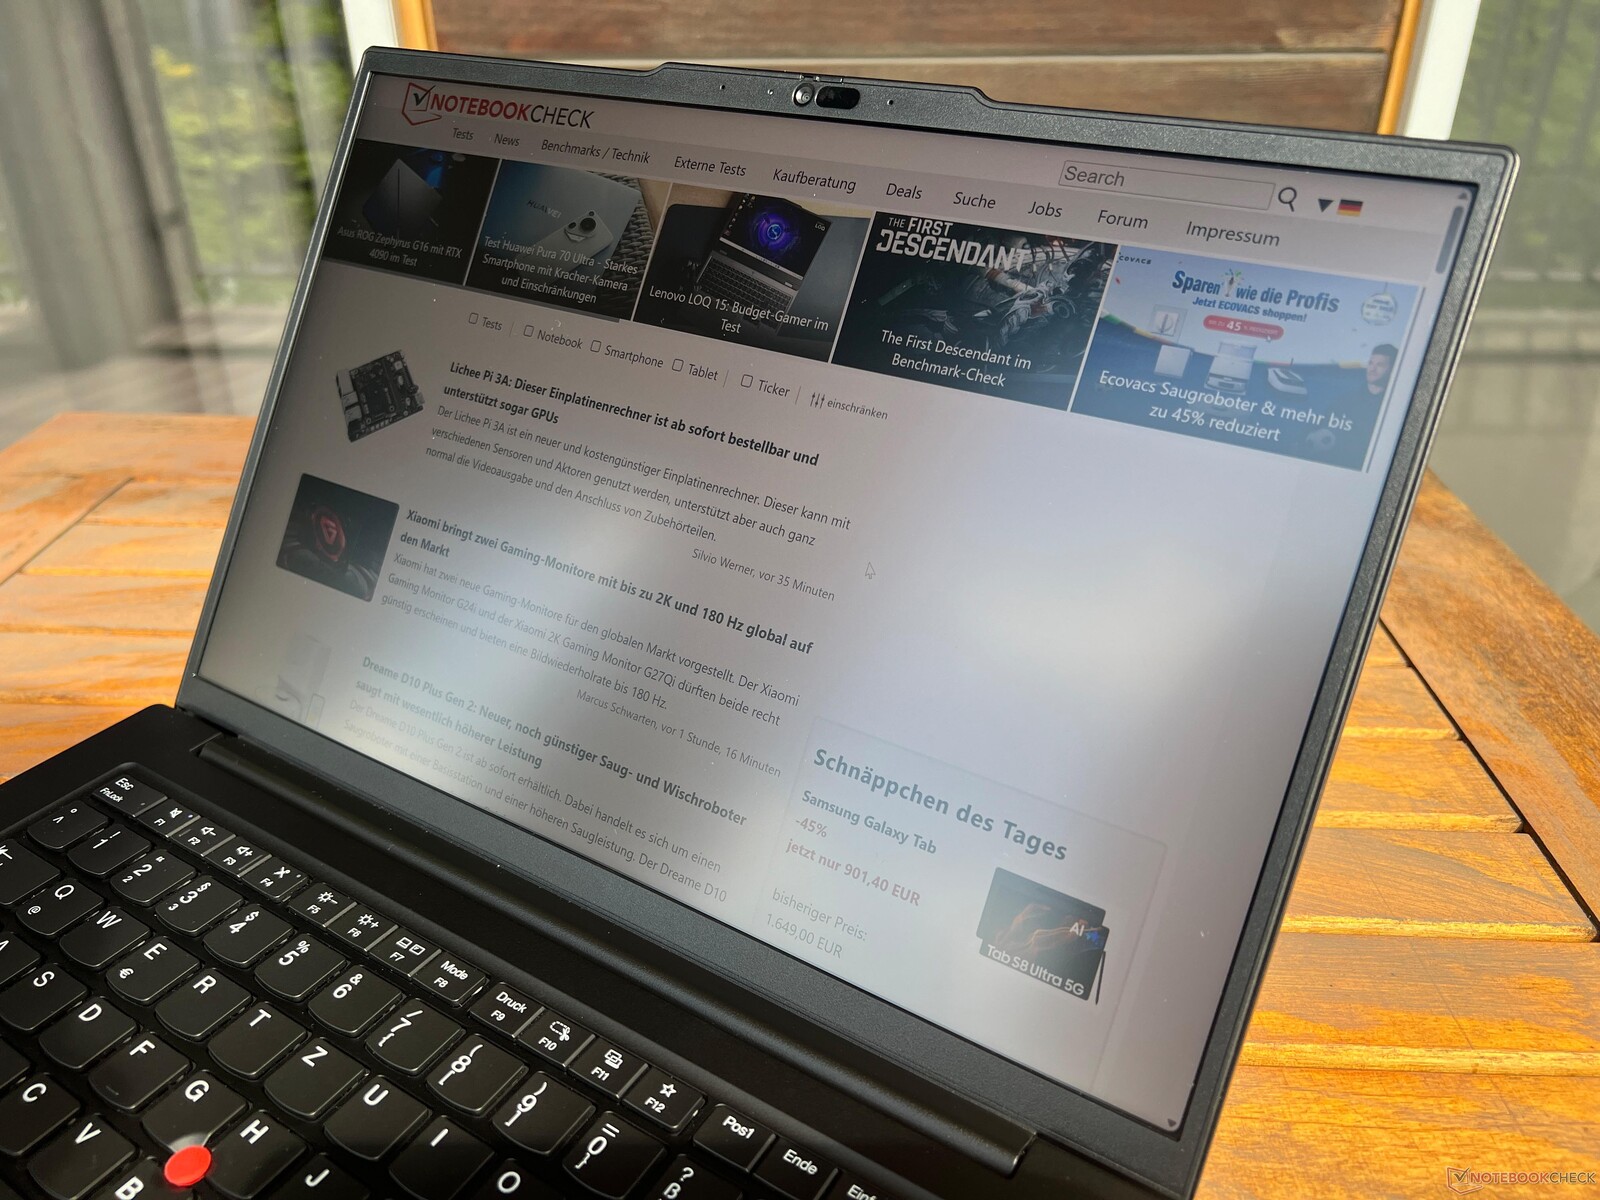
Display - 3K IPS at 120 Hz
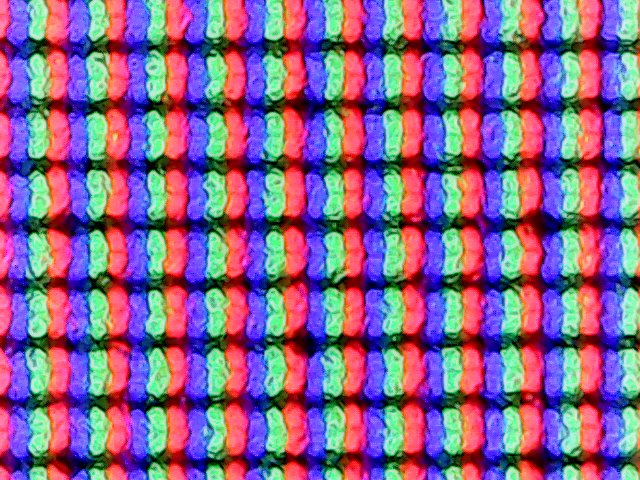
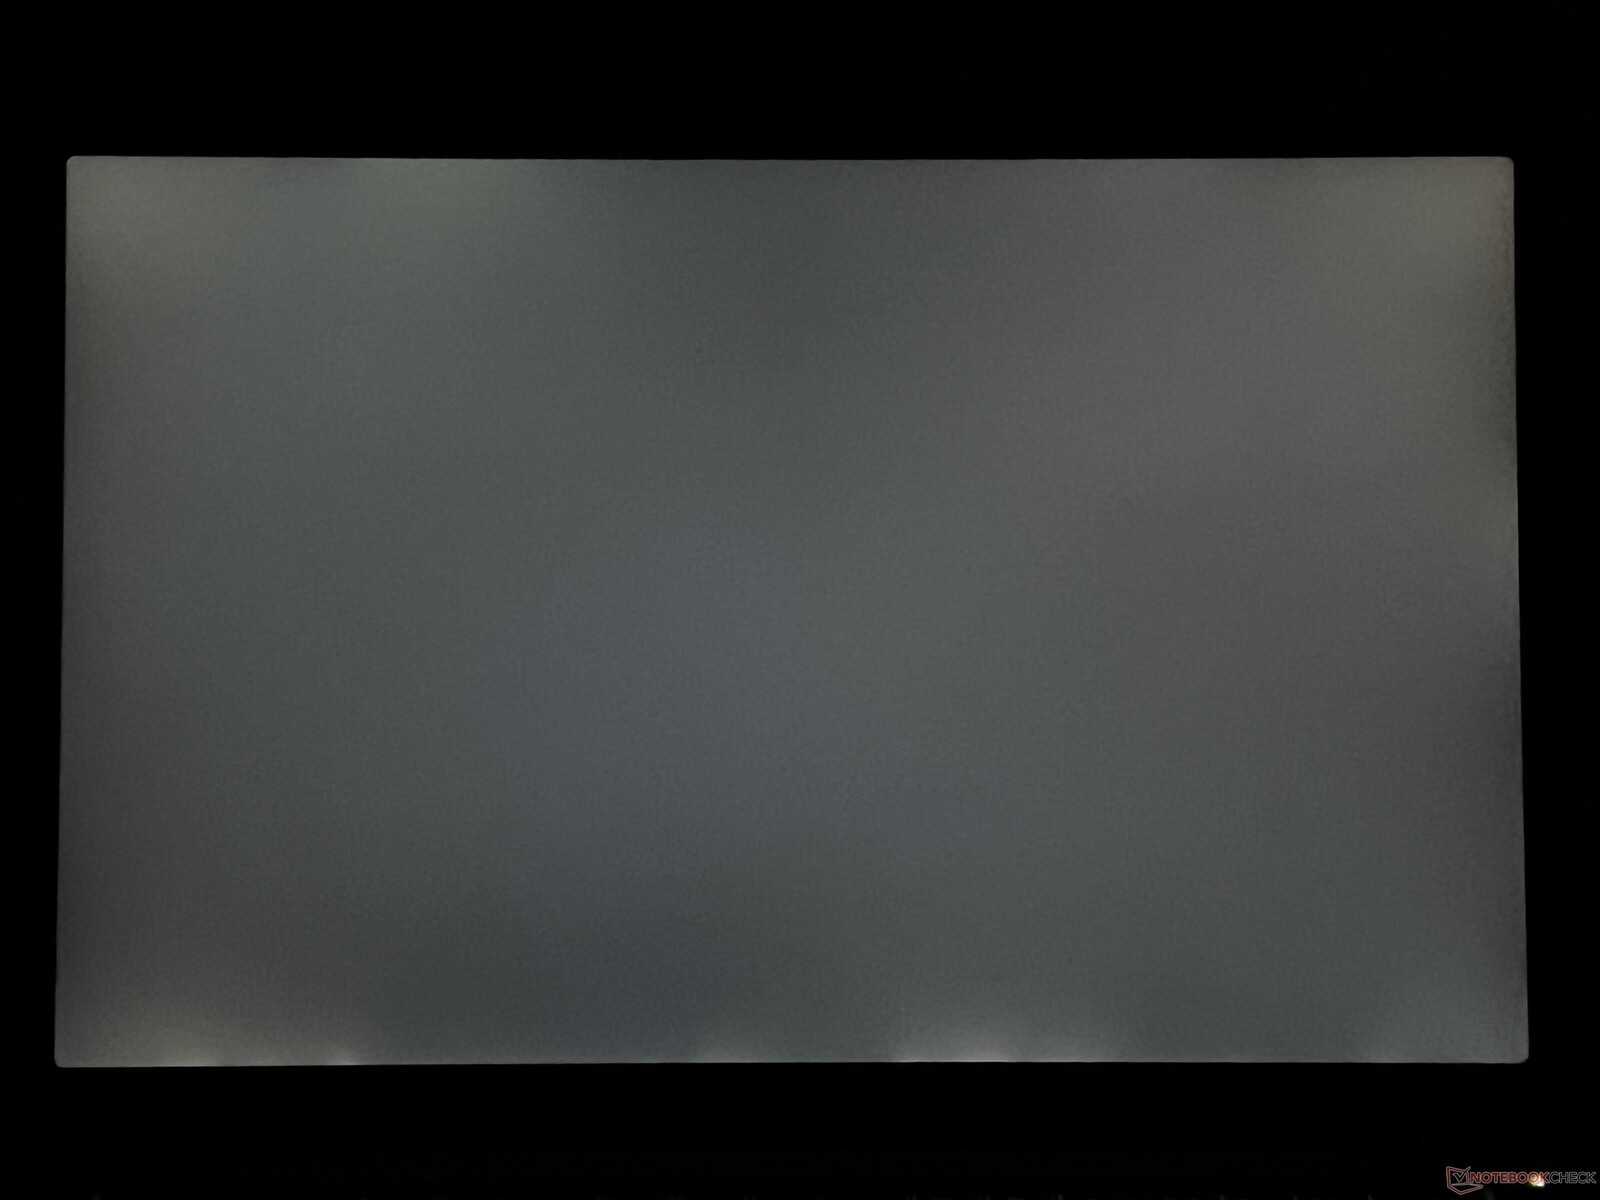
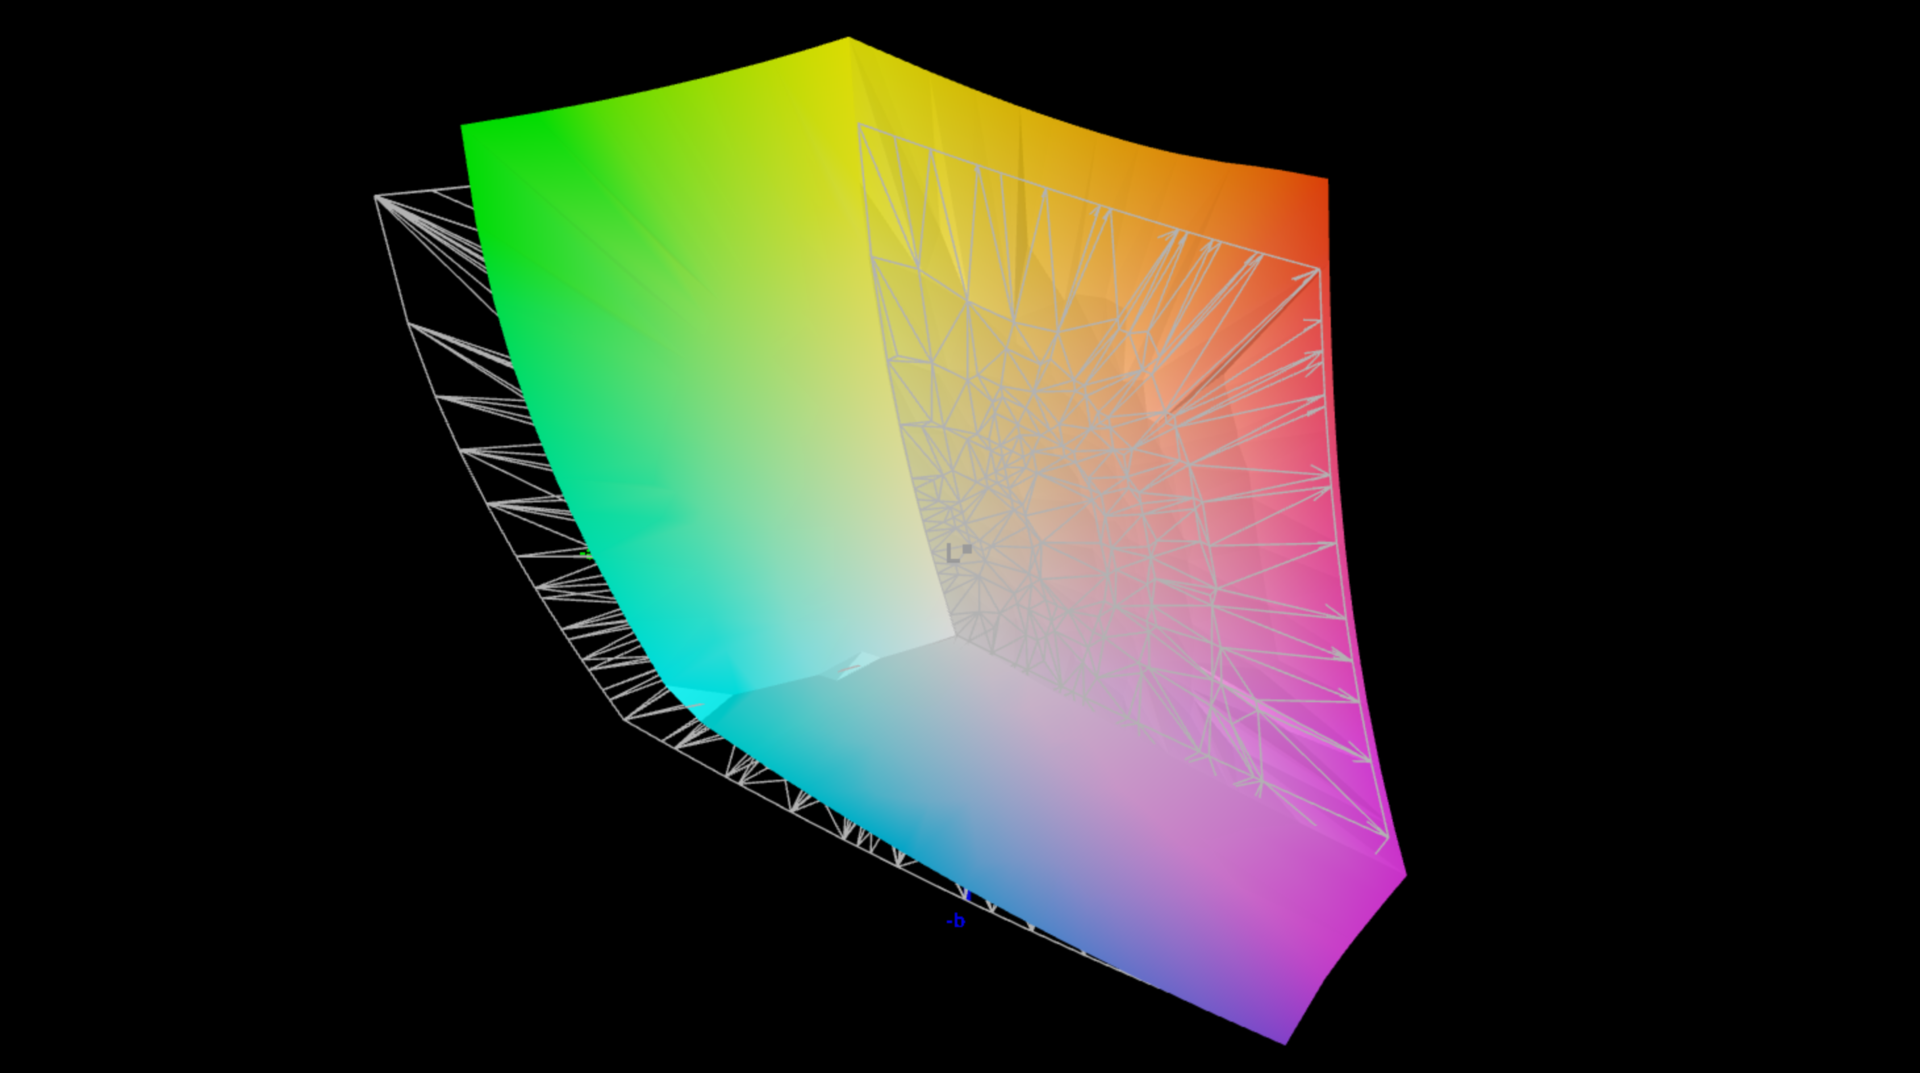
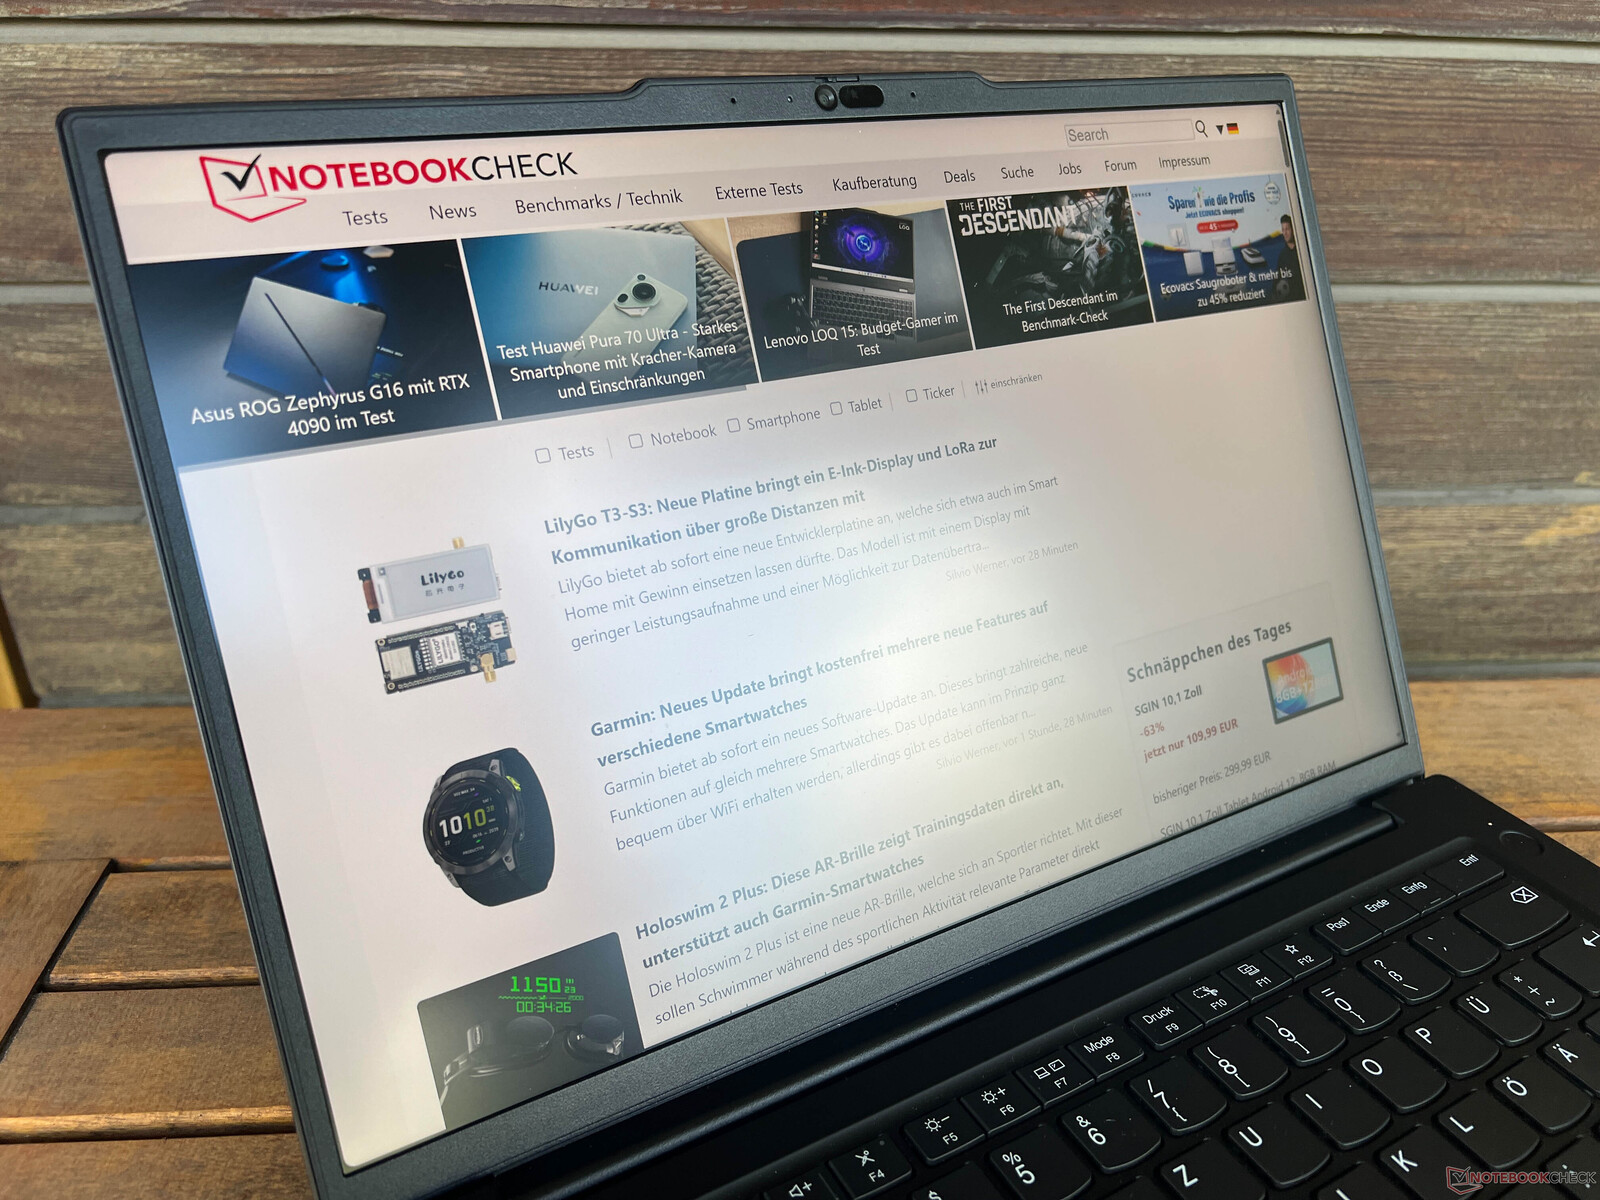
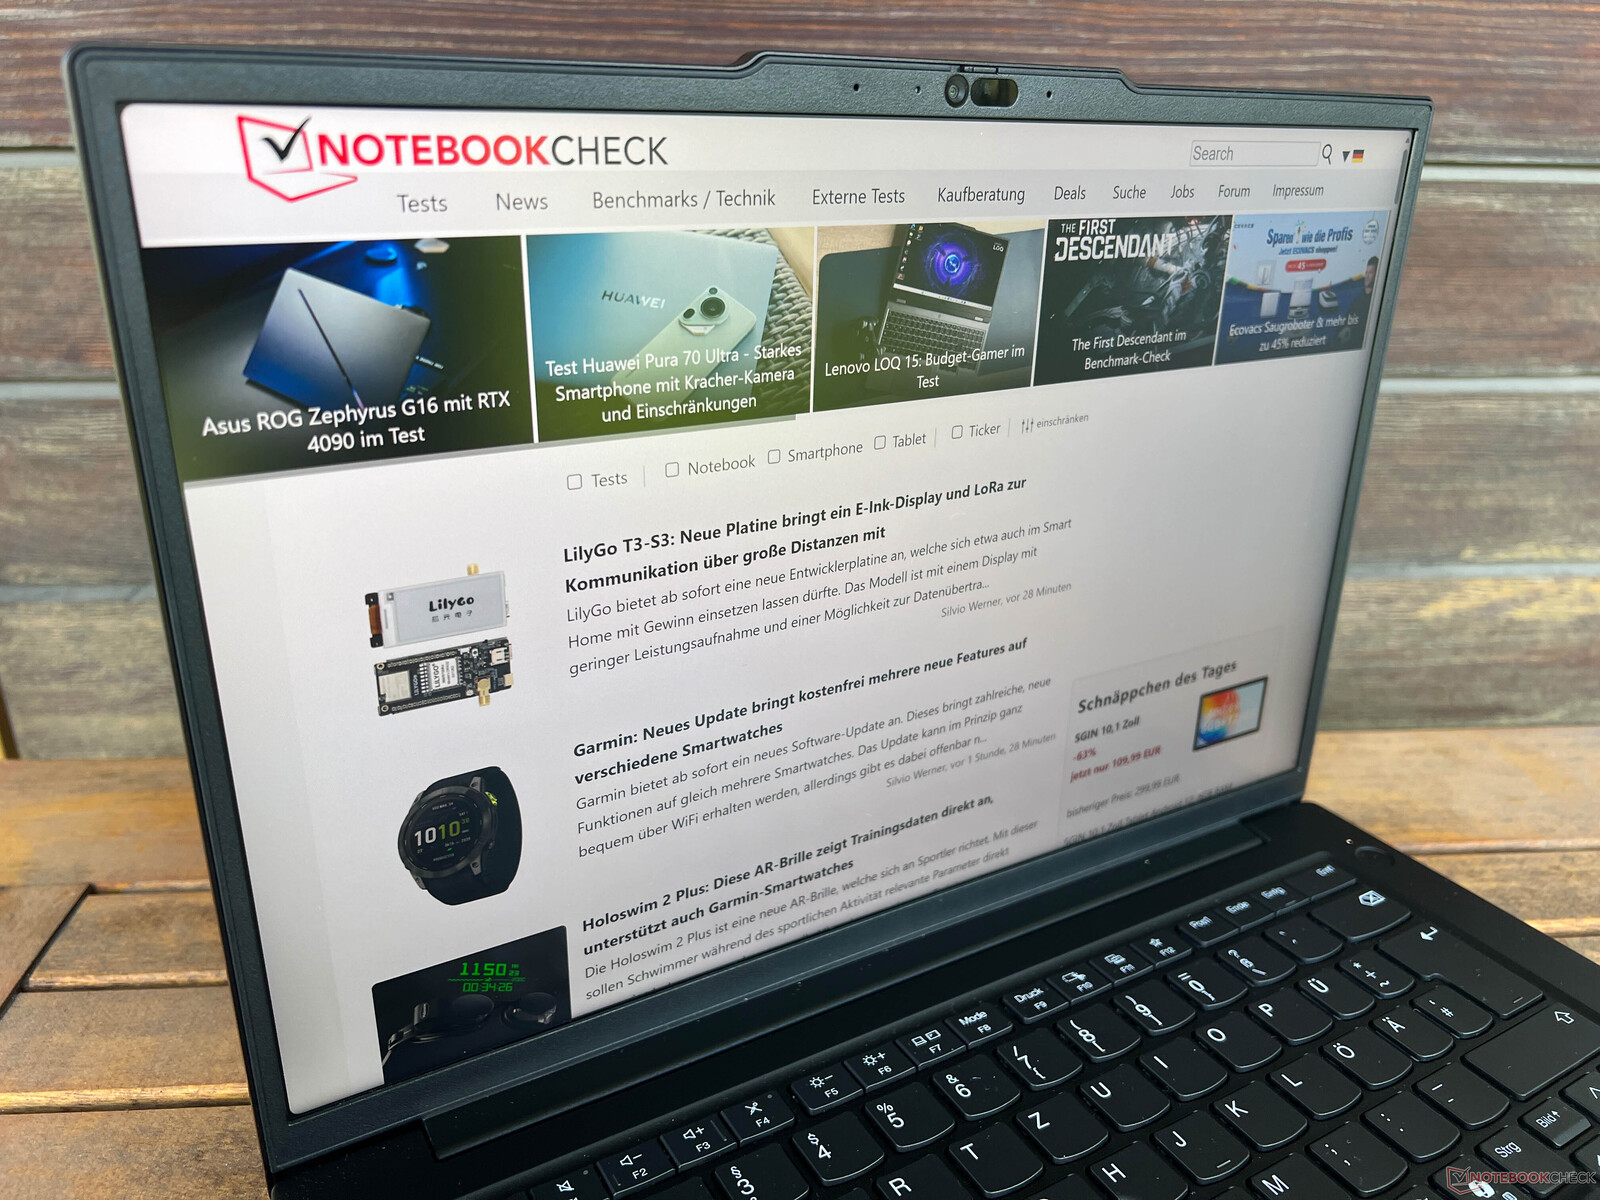
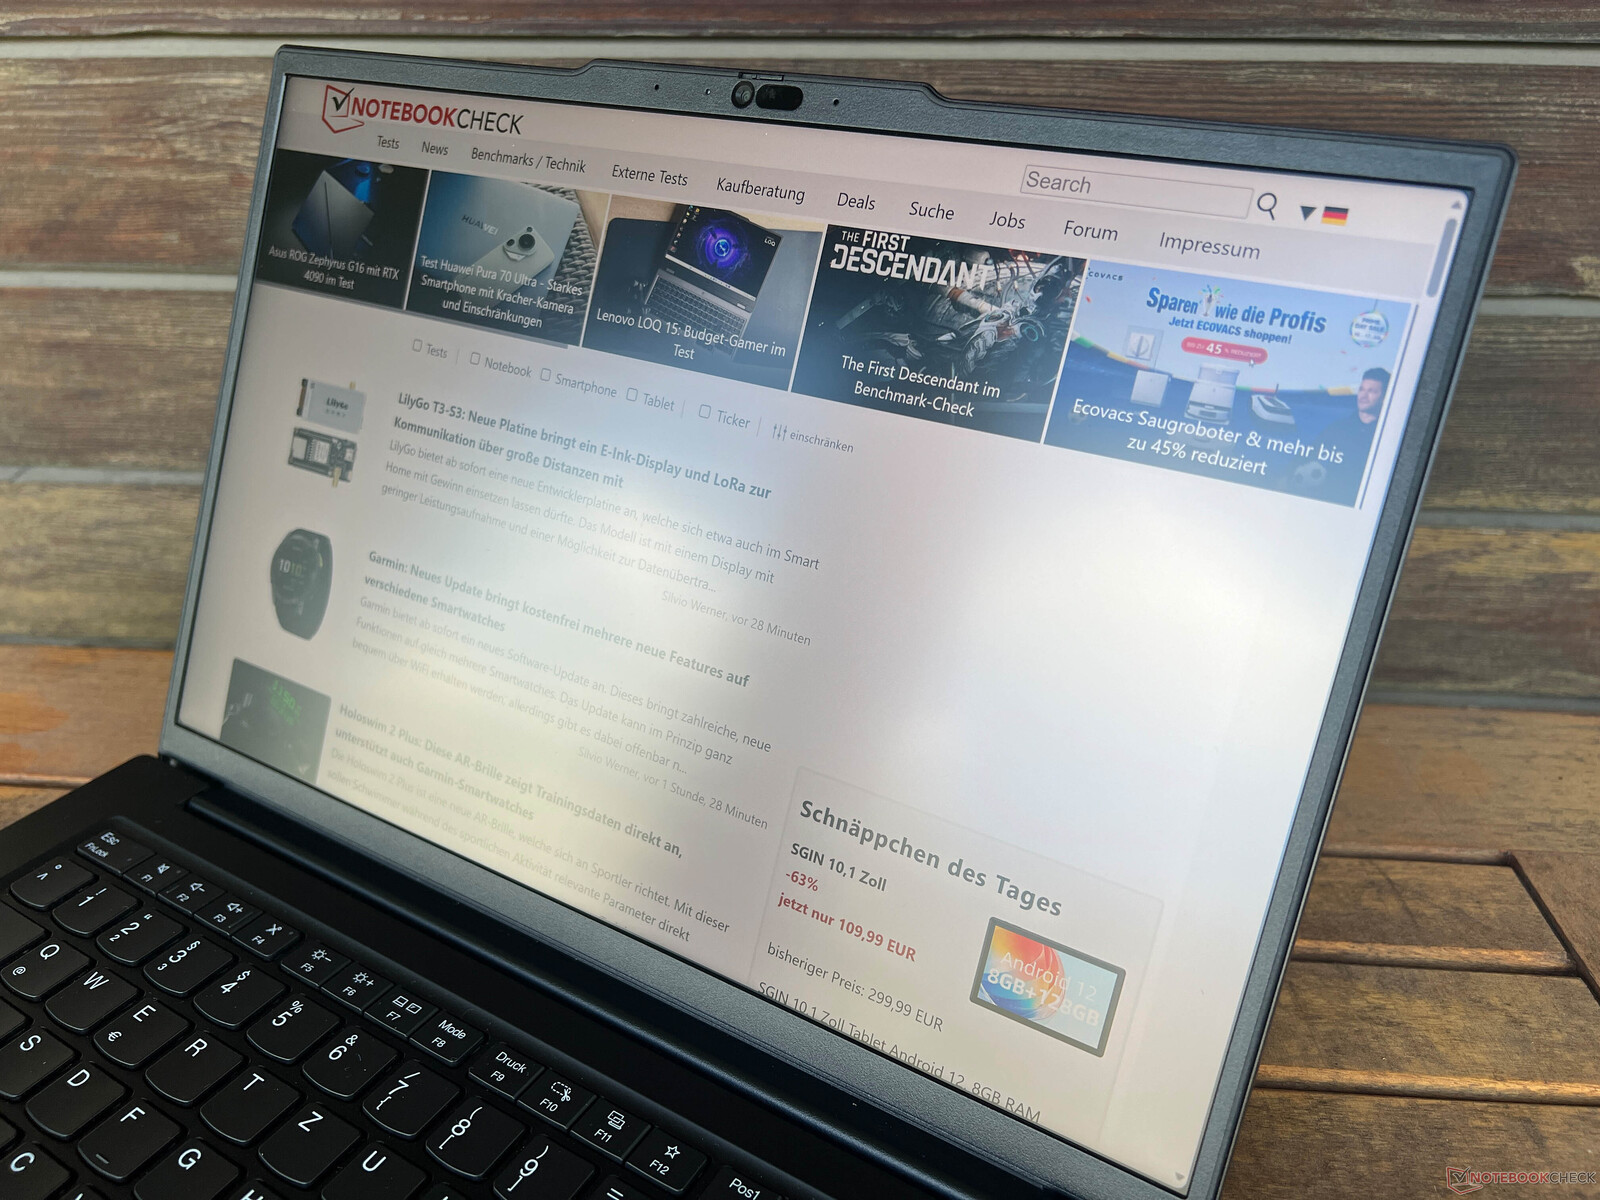
Lenovo no longer offers the optional OLED screen seen in the P14s G4 in this updated Intel model; instead, you can only choose matte, 14.5-inch IPS panels. The new 3K model with a resolution of 3,072 x 1,920 pixels, a refresh rate of 120 Hz and P3 color space coverage is installed in our test device. Subjectively, its picture quality is great, as even on closer inspection, you can only see minimal graininess when depicting light content. Thankfully, this isn't noticeable when viewing the screen from a normal distance. All content is depicted very sharp and colors look super vibrant. Of course, the colors on this display aren't as vibrant as on OLED panels, but the screen is at least matte and doesn't use PWM. Movements look smooth thanks to its increased refresh rate, and its response times are fine (no ghosting). With the brightness set to high levels and when viewing a dark picture, slight backlight bleeding can be seen along the edges of the screen. Neither its brightness nor its color temperature can be adjusted automatically, and HDR content is not supported.
Lenovo advertises a brightness of 430 cd/m², but we could only confirm this in the center of the screen. On average, its brightness is only just over 400 cd/m². The display's black value is 0.32 cd/m², resulting in a maximum contrast ratio of just under 1,400.1. These are reasonable values overall, but you can't really call them good either. This can also be seen in comparison to the competition, as the new HP ZBook Firefly G11, for example, manages a brightness of around 550 cd/m² with its 120 Hz display (even if its resolution is slightly lower). Lenovo also has other panels on offer, such as the superior mini LED panel at 165 Hz inside the Yoga Pro 9i 14 (also 14.5 inches, 3,072 x 1,920 pixels).
| |||||||||||||||||||||||||
Brightness Distribution: 87 %
Center on Battery: 439 cd/m²
Contrast: 1372:1 (Black: 0.32 cd/m²)
ΔE ColorChecker Calman: 2.1 | ∀{0.5-29.43 Ø4.73}
calibrated: 0.8
ΔE Greyscale Calman: 3.9 | ∀{0.09-98 Ø4.97}
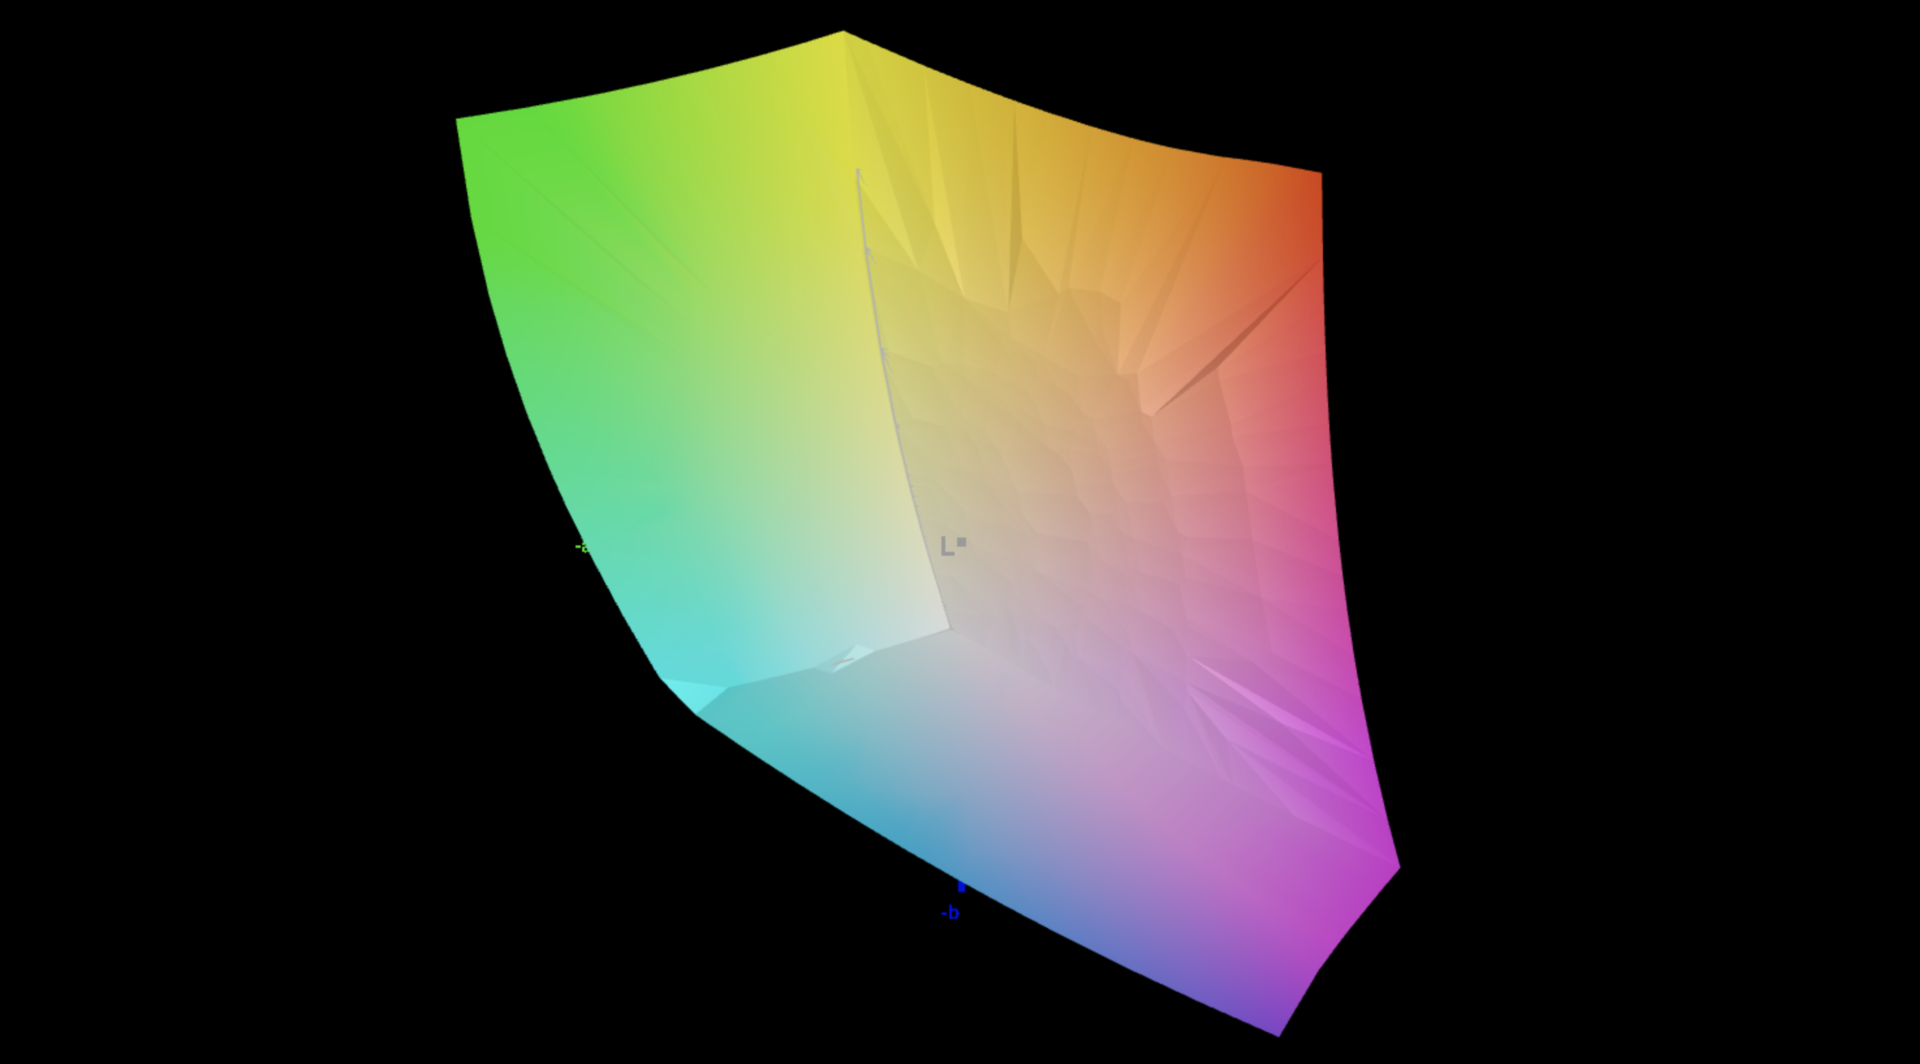
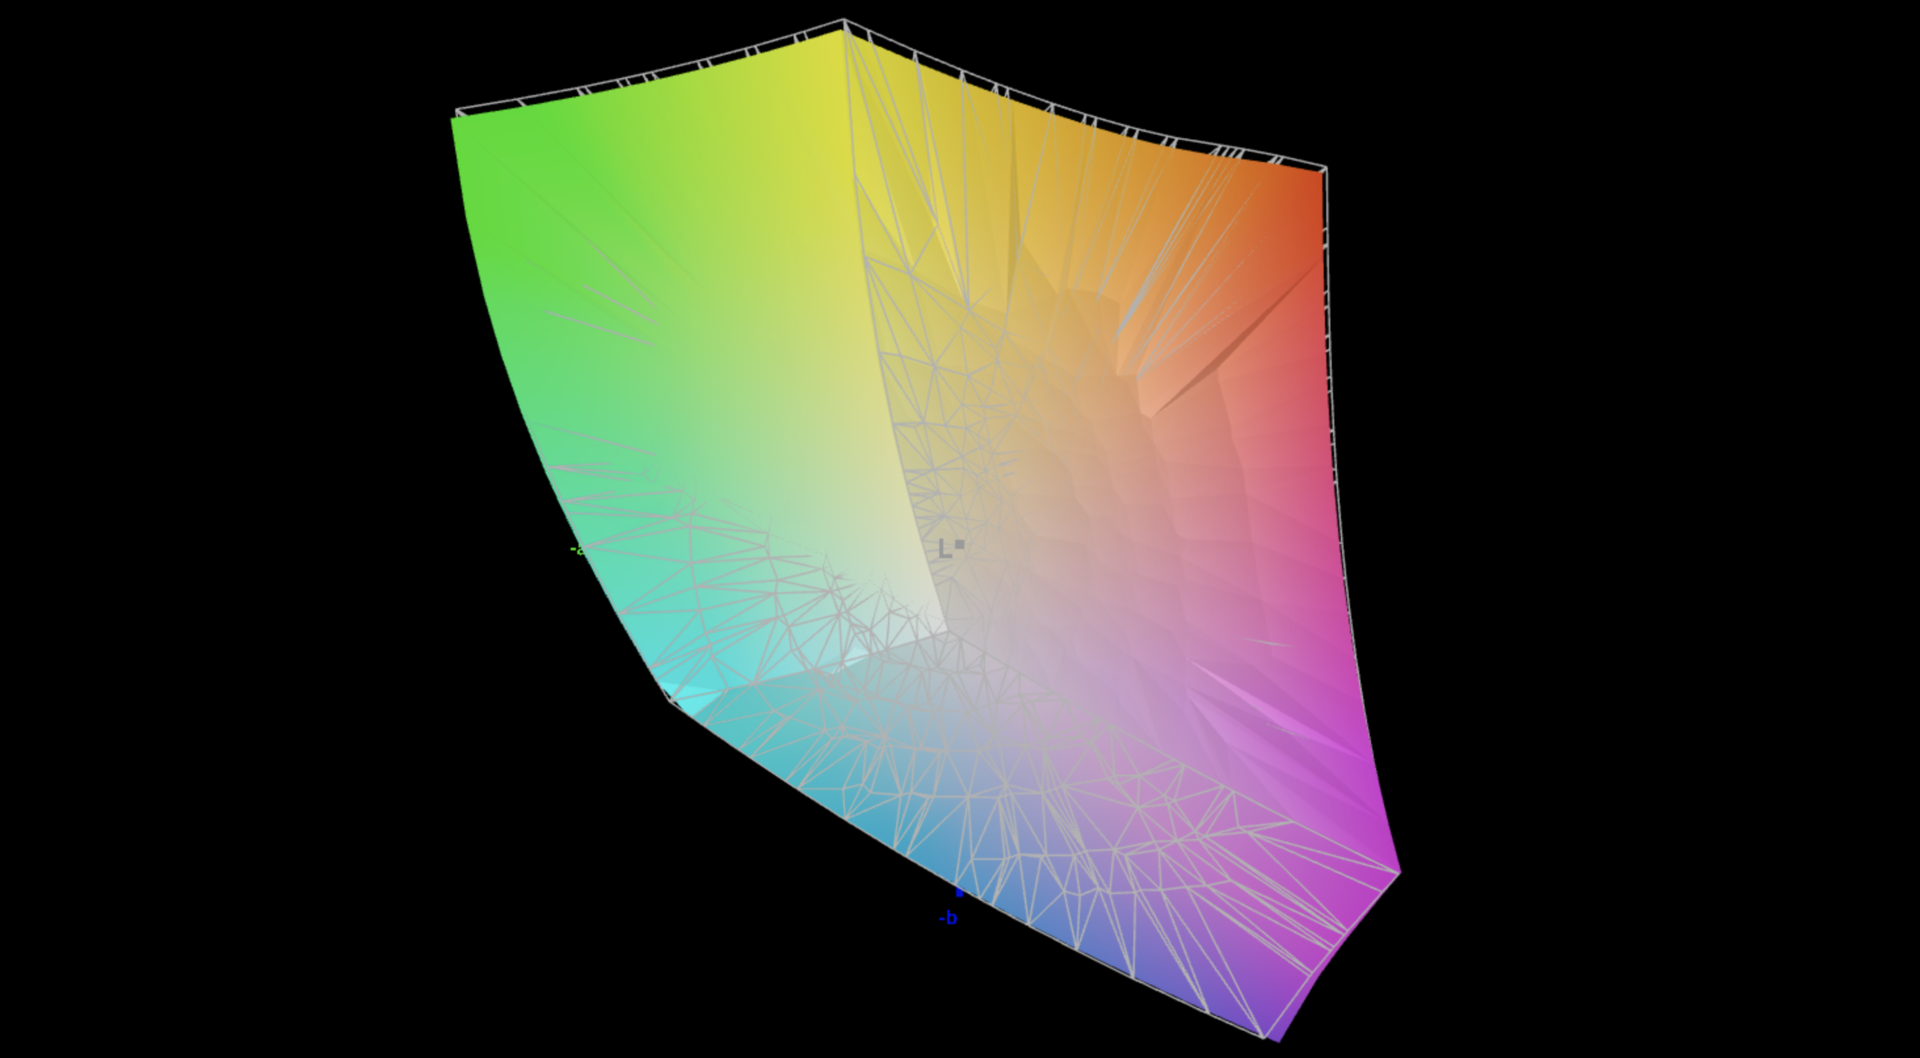
87.4% AdobeRGB 1998 (Argyll 3D)
100% sRGB (Argyll 3D)
98.4% Display P3 (Argyll 3D)
Gamma: 2.2
CCT: 7013 K
| Lenovo ThinkPad P14s G5 21G3S00A00 LEN145-3K, IPS, 3072x1920, 14.5", 120 Hz | HP ZBook Firefly 14 G11 AUO6DA8, IPS, 2560x1600, 14", 120 Hz | Dell Precision 5000 5490 AU Optronics B140QAN, IPS, 2560x1600, 14", 60 Hz | Lenovo ThinkPad P14s G4 21HF0017GE ATNA40YK15-0, OLED, 2880x1800, 14", 60 Hz | Microsoft Surface Laptop Studio 2 RTX 4060 LQ144P1JX01, IPS, 2400x1600, 14.4", 120 Hz | Lenovo Yoga Pro 9-14IRP G8 CSOT T3 MNE507HZ2-1, Mini-LED, 3072x1920, 14.5", 165 Hz | |
|---|---|---|---|---|---|---|
| Display | 0% | -9% | 4% | -18% | 1% | |
| Display P3 Coverage (%) | 98.4 | 98.9 1% | 79.7 -19% | 99.9 2% | 66.7 -32% | 92 -7% |
| sRGB Coverage (%) | 100 | 99.9 0% | 100 0% | 100 0% | 99 -1% | 99.7 0% |
| AdobeRGB 1998 Coverage (%) | 87.4 | 86.6 -1% | 79.5 -9% | 97 11% | 68.9 -21% | 96.9 11% |
| Response Times | 52% | -98% | 88% | -143% | 41% | |
| Response Time Grey 50% / Grey 80% * (ms) | 30.2 ? | 12.3 ? 59% | 52.3 ? -73% | 3 ? 90% | 77.6 ? -157% | 12.7 ? 58% |
| Response Time Black / White * (ms) | 15 ? | 8.3 ? 45% | 33.3 ? -122% | 2.2 ? 85% | 34.3 ? -129% | 11.4 ? 24% |
| PWM Frequency (Hz) | 360 ? | 17600 ? | 6000 ? | |||
| PWM Amplitude * (%) | 25 | |||||
| Screen | 6% | 9% | -90% | 43% | 19% | |
| Brightness middle (cd/m²) | 439 | 554.1 26% | 485.1 11% | 432 -2% | 511 16% | 670 53% |
| Brightness (cd/m²) | 406 | 540 33% | 471 16% | 432 6% | 503 24% | 680 67% |
| Brightness Distribution (%) | 87 | 93 7% | 90 3% | 98 13% | 89 2% | 89 2% |
| Black Level * (cd/m²) | 0.32 | 0.58 -81% | 0.38 -19% | 0.26 19% | 0.19 41% | |
| Contrast (:1) | 1372 | 955 -30% | 1277 -7% | 1965 43% | 3526 157% | |
| Colorchecker dE 2000 * | 2.1 | 2.54 -21% | 2.15 -2% | 4.8 -129% | 0.5 76% | 4 -90% |
| Colorchecker dE 2000 max. * | 6.2 | 4.99 20% | 5.39 13% | 9.2 -48% | 1.1 82% | 4.5 27% |
| Colorchecker dE 2000 calibrated * | 0.8 | 0.56 30% | 0.67 16% | 4.9 -513% | 1.3 -63% | |
| Greyscale dE 2000 * | 3.9 | 1 74% | 2 49% | 2.3 41% | 0.8 79% | 4.9 -26% |
| Gamma | 2.2 100% | 2.3 96% | 2.3 96% | 2.23 99% | 2.19 100% | 2.22 99% |
| CCT | 7013 93% | 6556 99% | 6826 95% | 6391 102% | 6650 98% | 5735 113% |
| Total Average (Program / Settings) | 19% /
12% | -33% /
-10% | 1% /
-37% | -39% /
0% | 20% /
18% |
* ... smaller is better
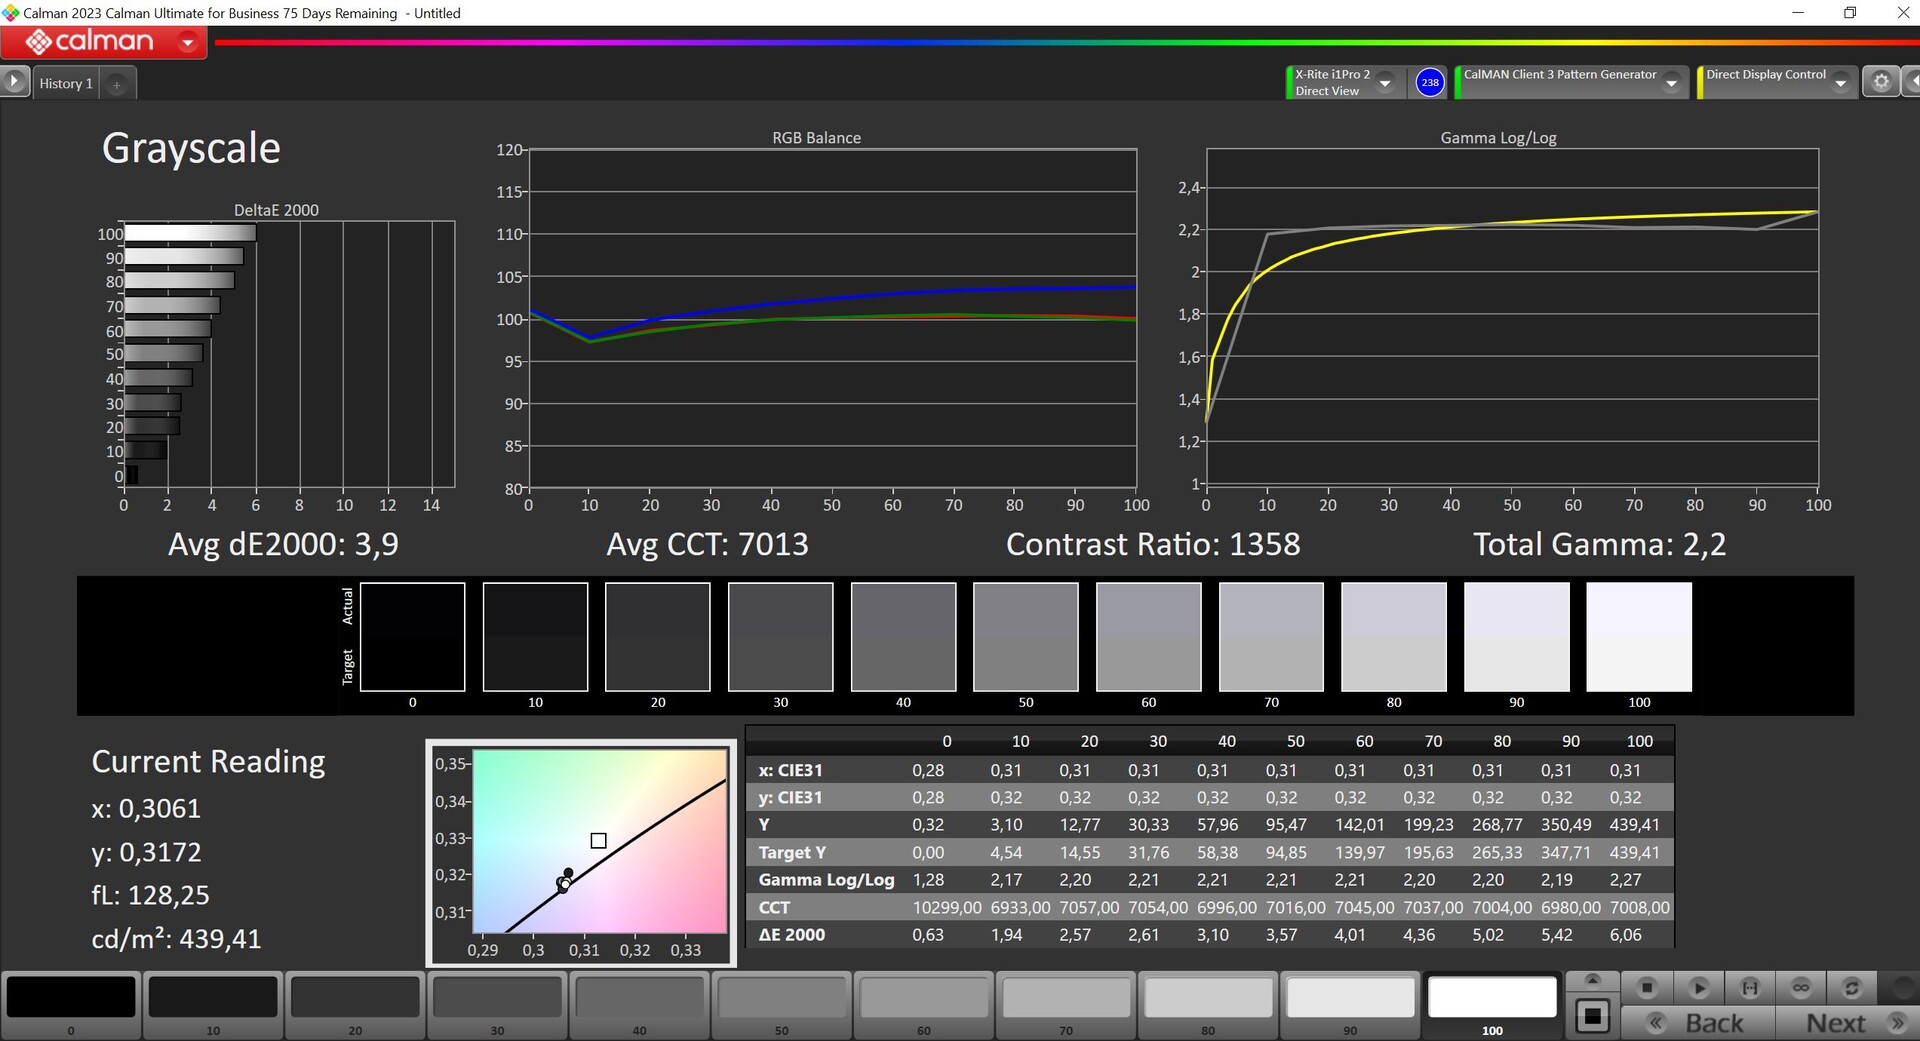
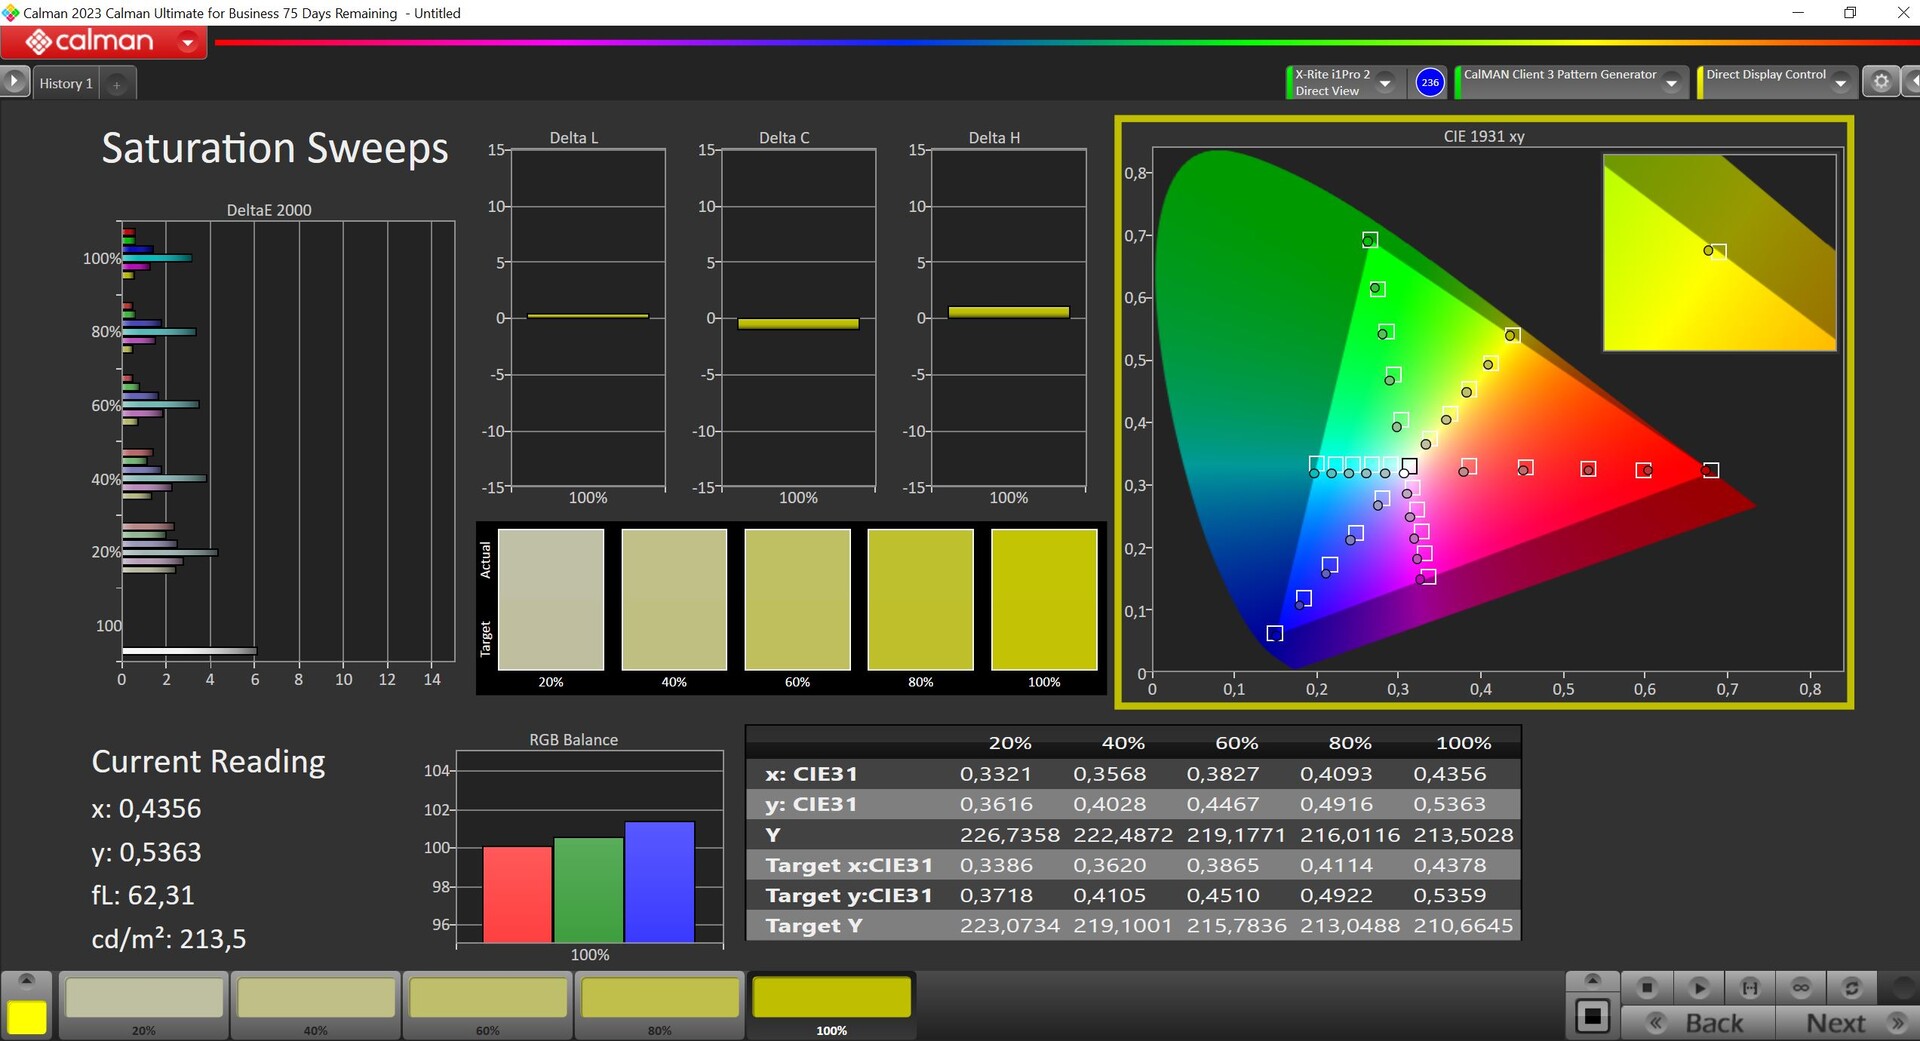
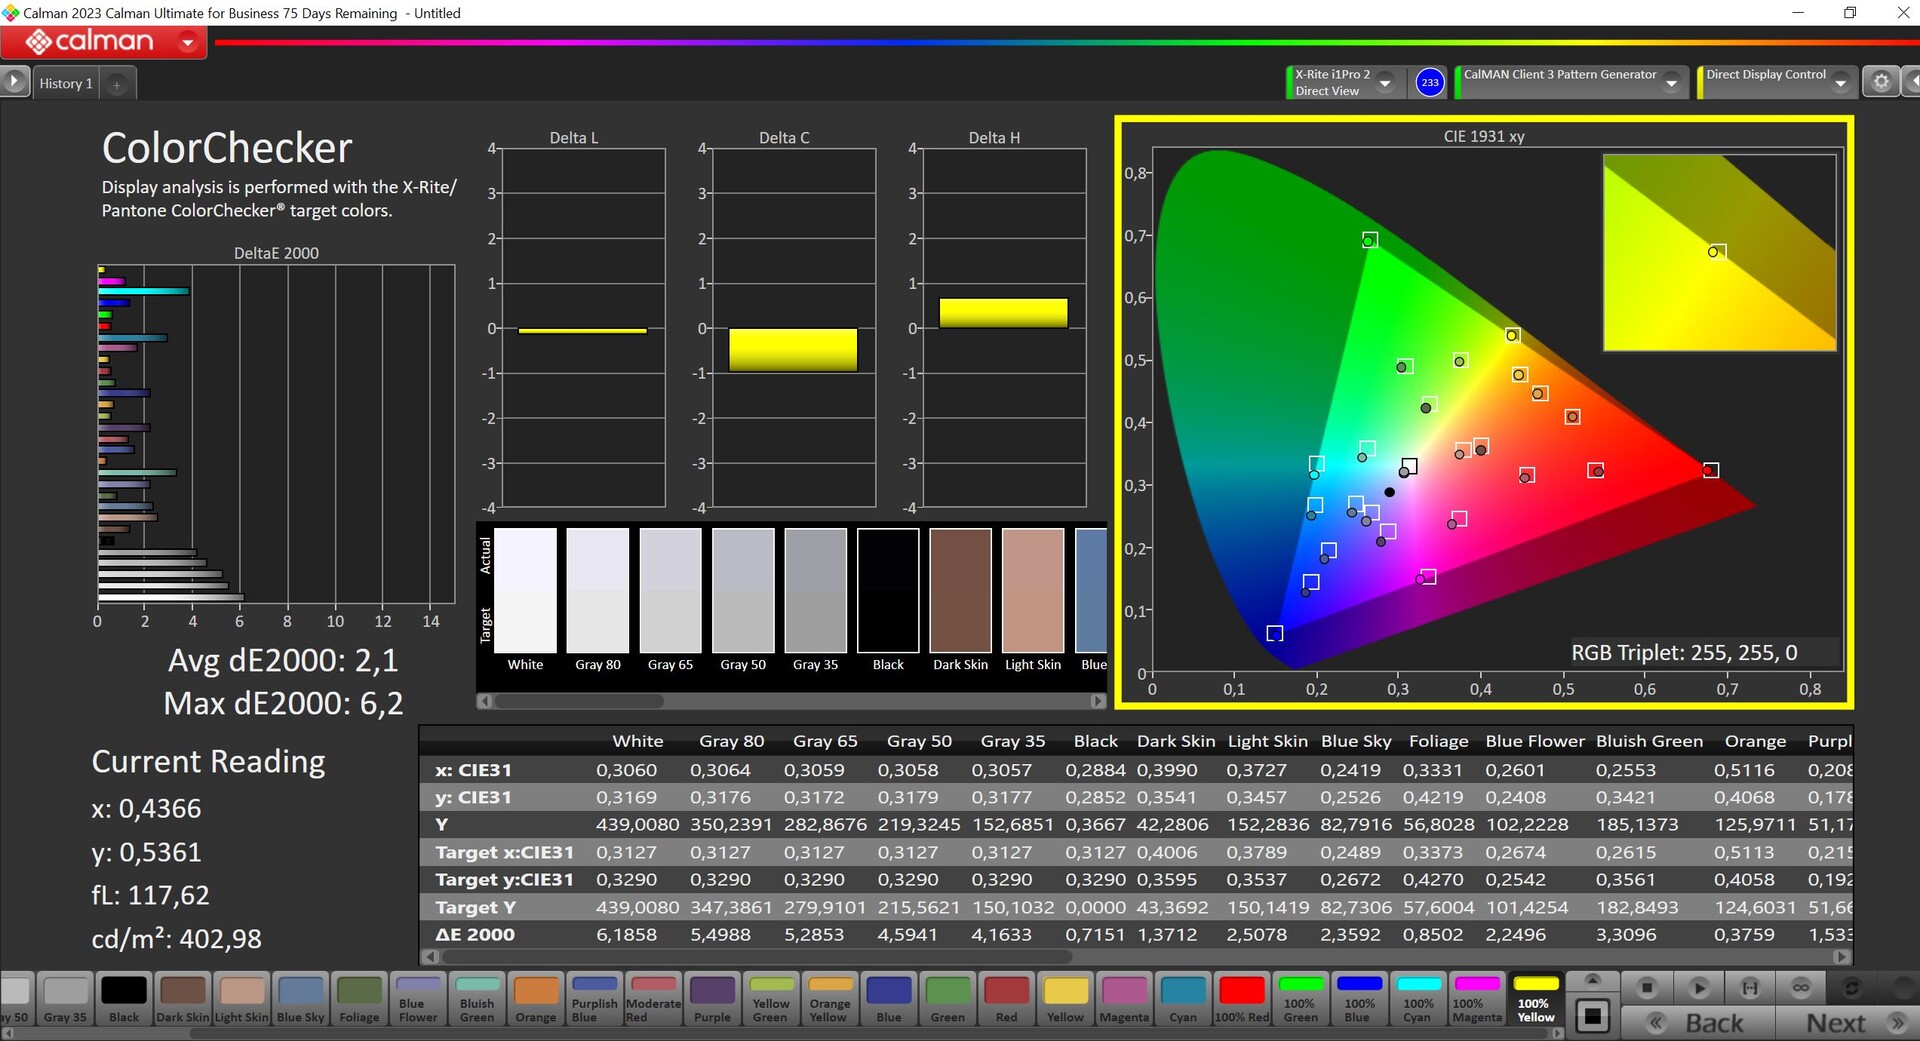
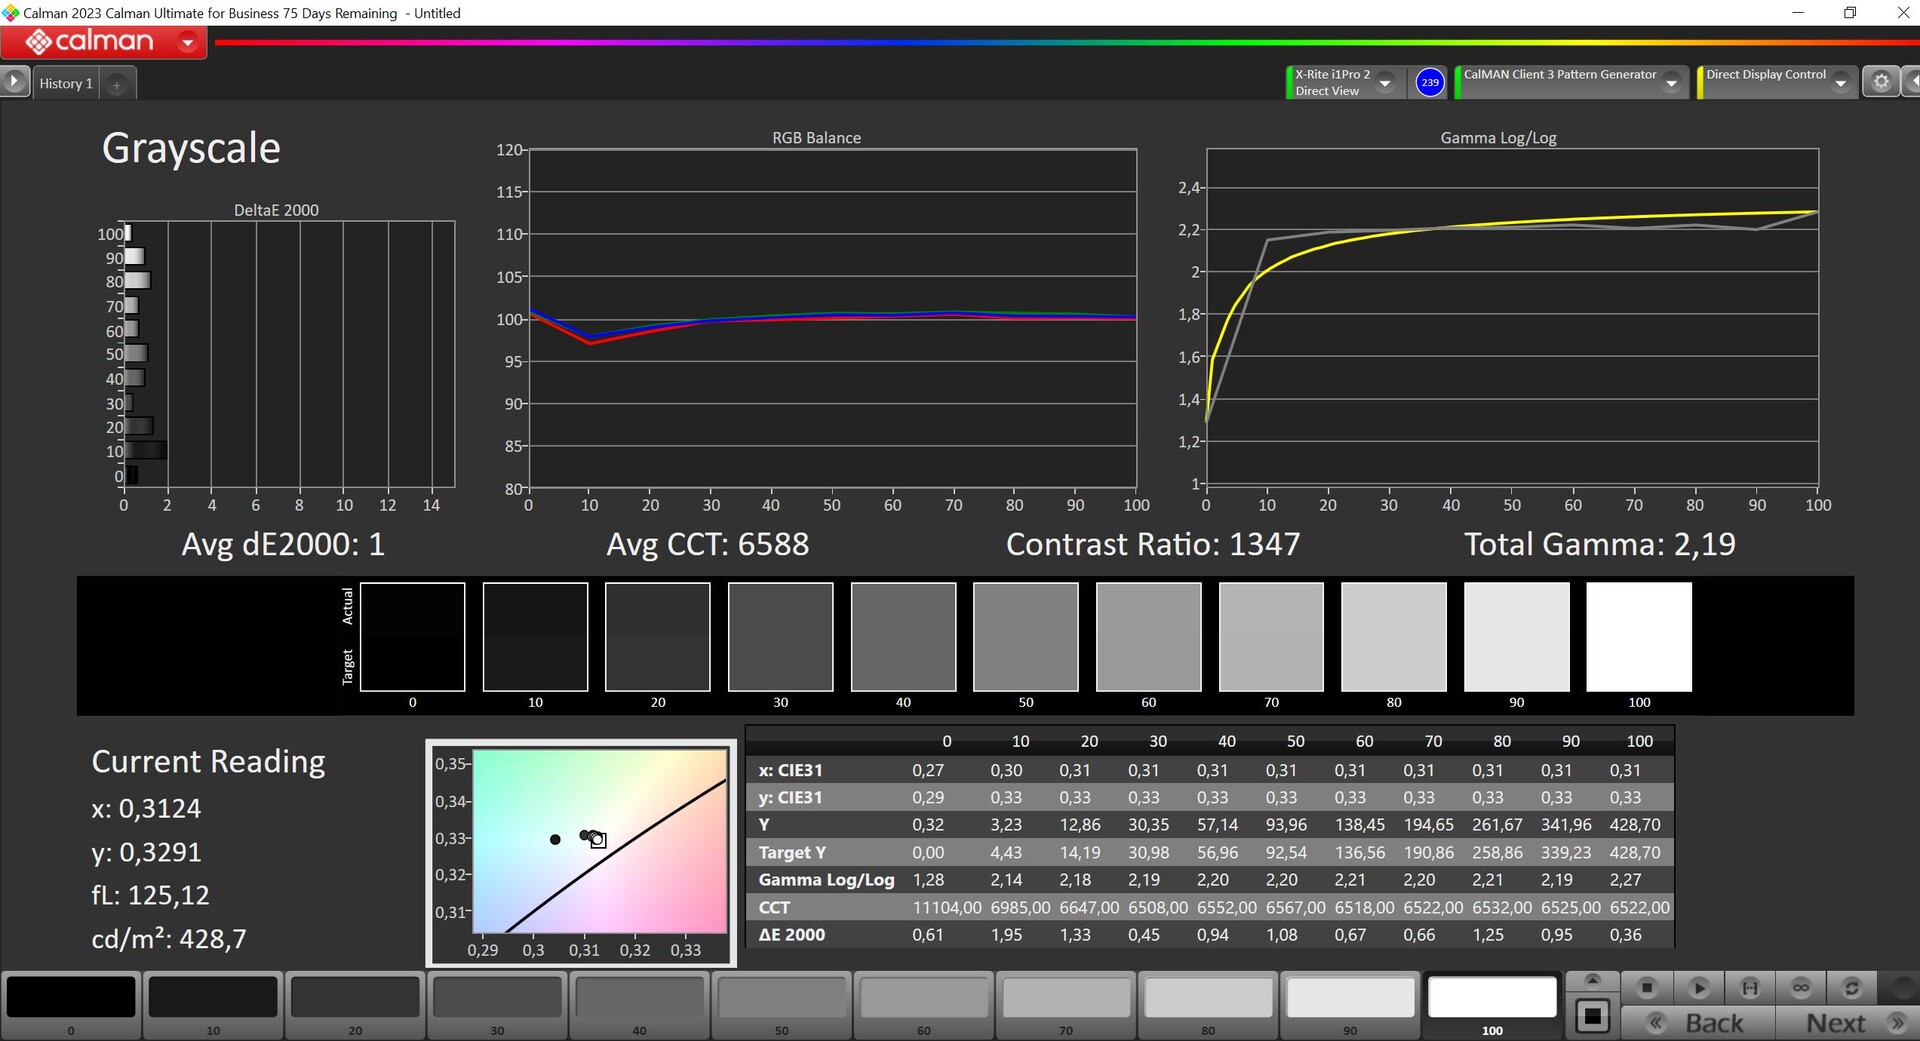
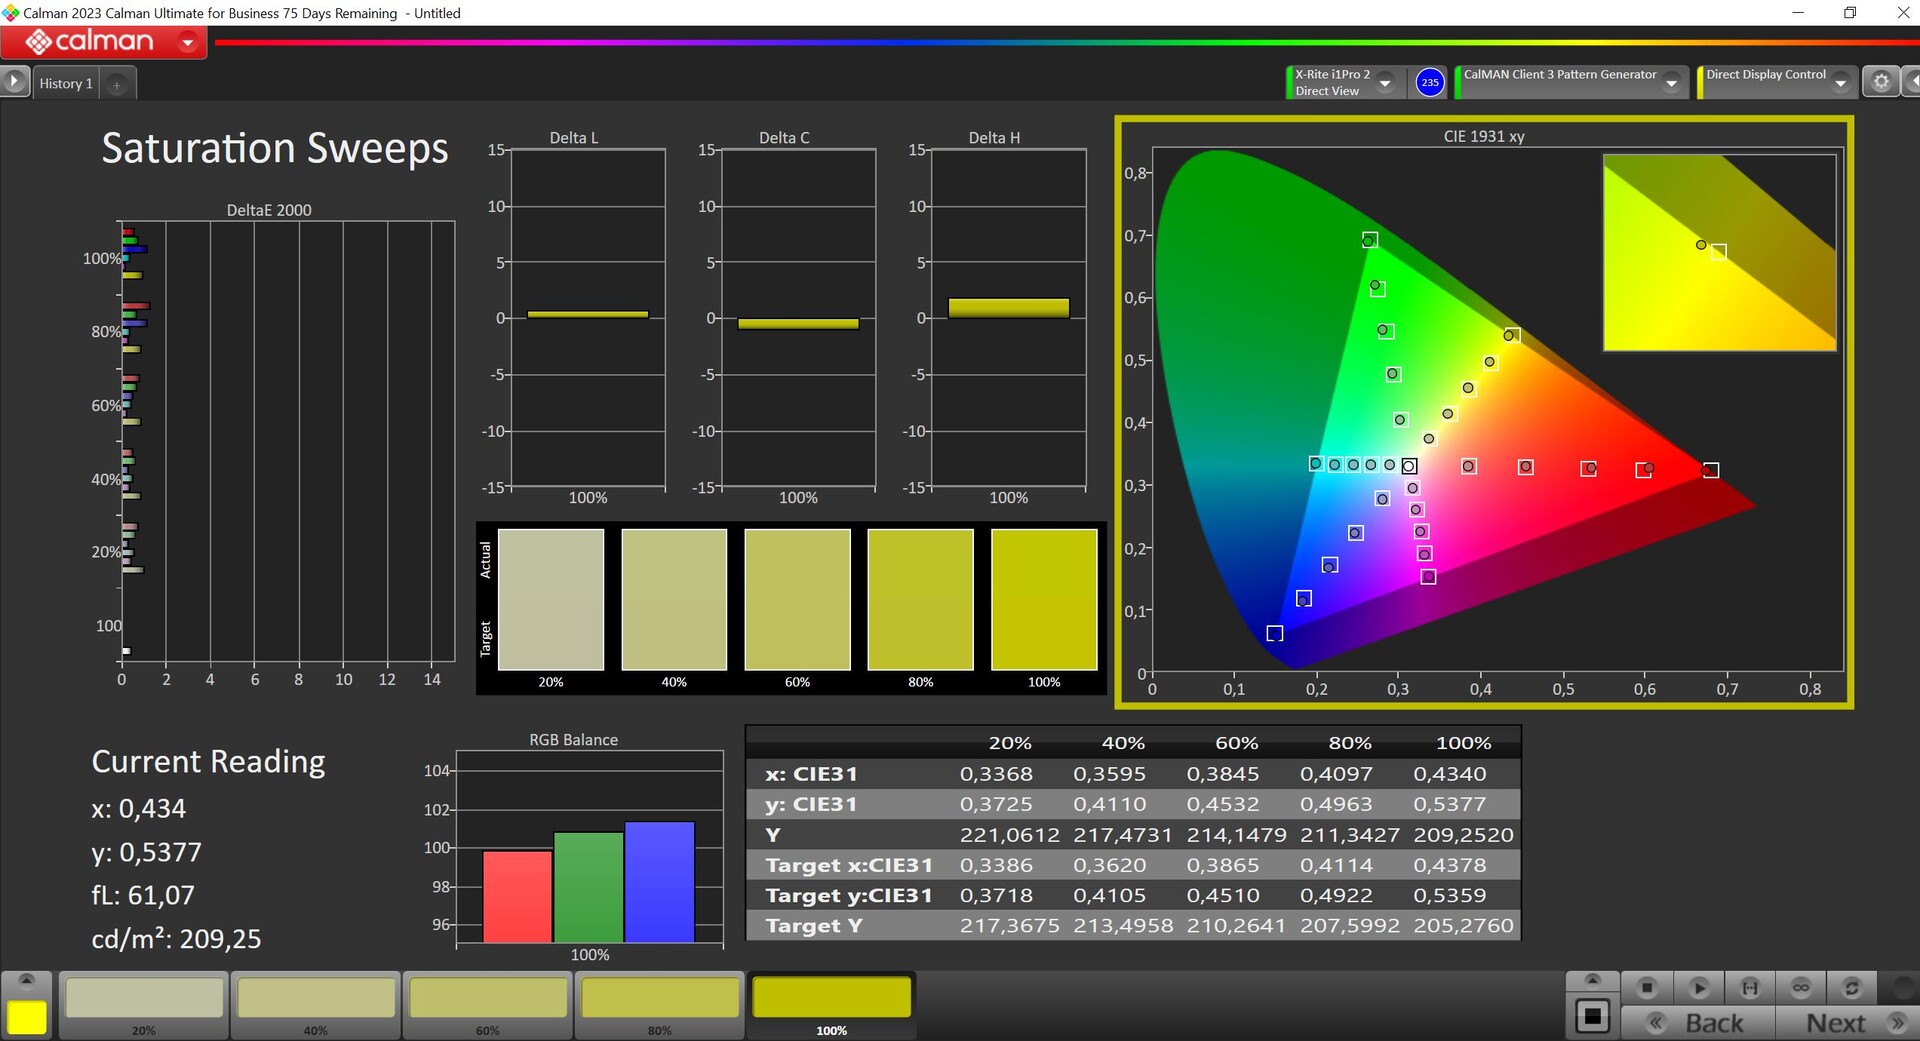

We analyzed the panel using the professional CalMAN software (X-Rite i1 Pro 2), but Lenovo doesn't provide an sRGB profile. Straight out of the box, the display has a blue cast in combination with a color temperature that is too cool, and some color deviations are above the target value of 3. By performing our own calibration, we significantly improved its depiction and corrected its grayscale and color deviations. The corresponding profile is available to download for free above. The panel fully covers the P3 and sRGB color spaces.
Display Response Times
| ↔ Response Time Black to White | ||
|---|---|---|
| 15 ms ... rise ↗ and fall ↘ combined | ↗ 5.8 ms rise | 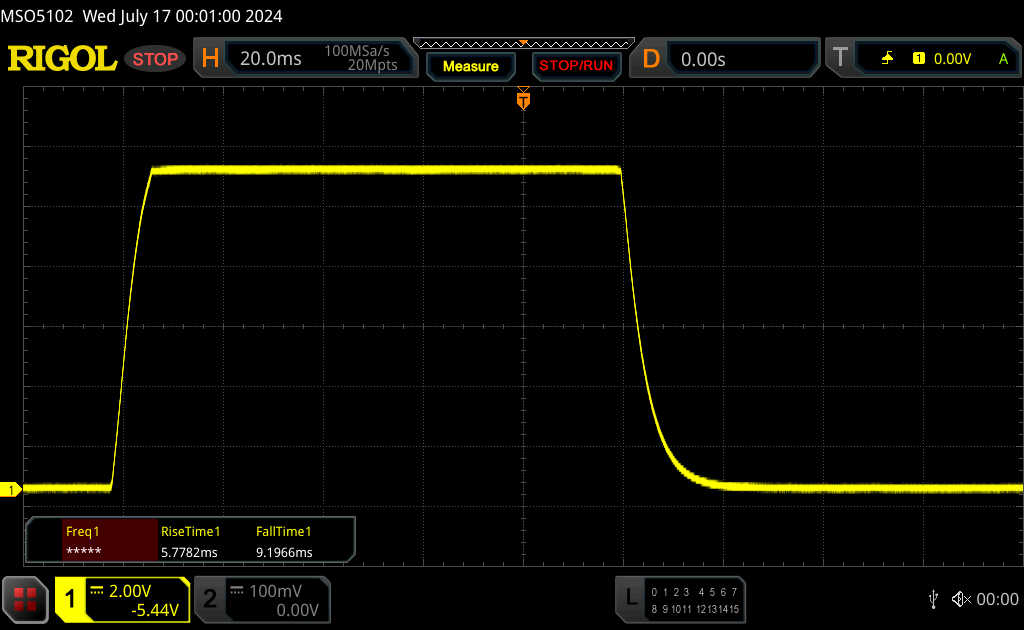 |
| ↘ 9.2 ms fall | ||
| The screen shows good response rates in our tests, but may be too slow for competitive gamers. In comparison, all tested devices range from 0.1 (minimum) to 240 (maximum) ms. » 36 % of all devices are better. This means that the measured response time is better than the average of all tested devices (19.9 ms). | ||
| ↔ Response Time 50% Grey to 80% Grey | ||
| 30.2 ms ... rise ↗ and fall ↘ combined | ↗ 14 ms rise | 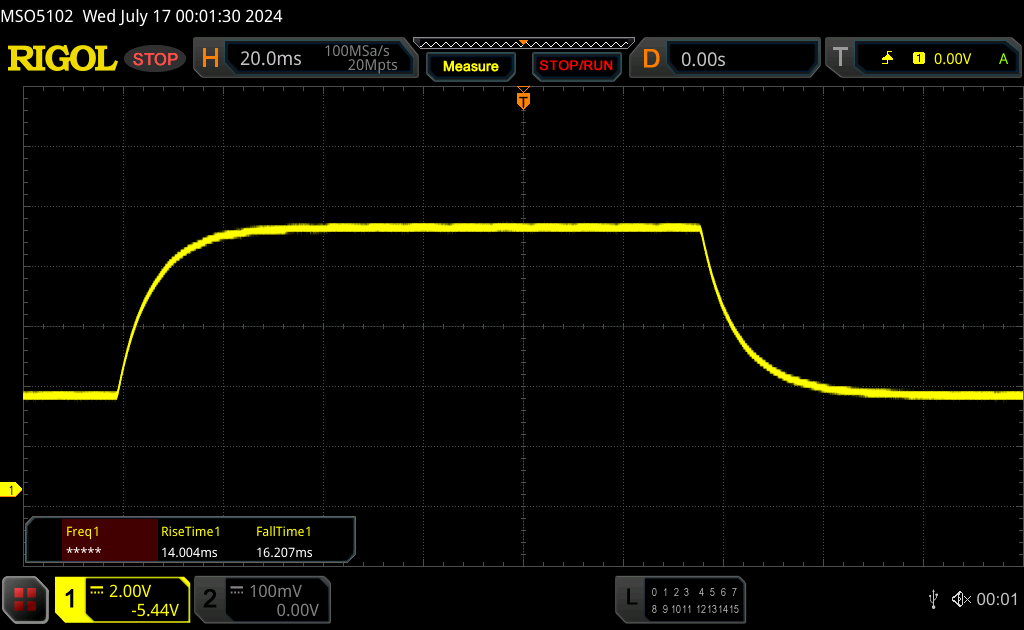 |
| ↘ 16.2 ms fall | ||
| The screen shows slow response rates in our tests and will be unsatisfactory for gamers. In comparison, all tested devices range from 0.165 (minimum) to 636 (maximum) ms. » 41 % of all devices are better. This means that the measured response time is similar to the average of all tested devices (31.1 ms). | ||
Screen Flickering / PWM (Pulse-Width Modulation)
| Screen flickering / PWM not detected | 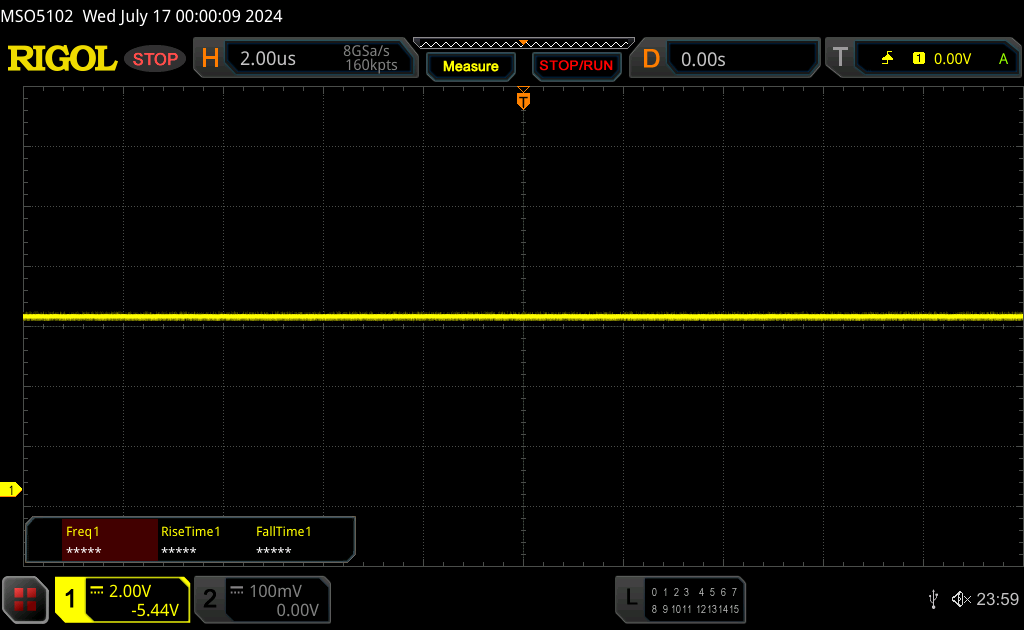 | ||
In comparison: 52 % of all tested devices do not use PWM to dim the display. If PWM was detected, an average of 7791 (minimum: 5 - maximum: 343500) Hz was measured. | |||
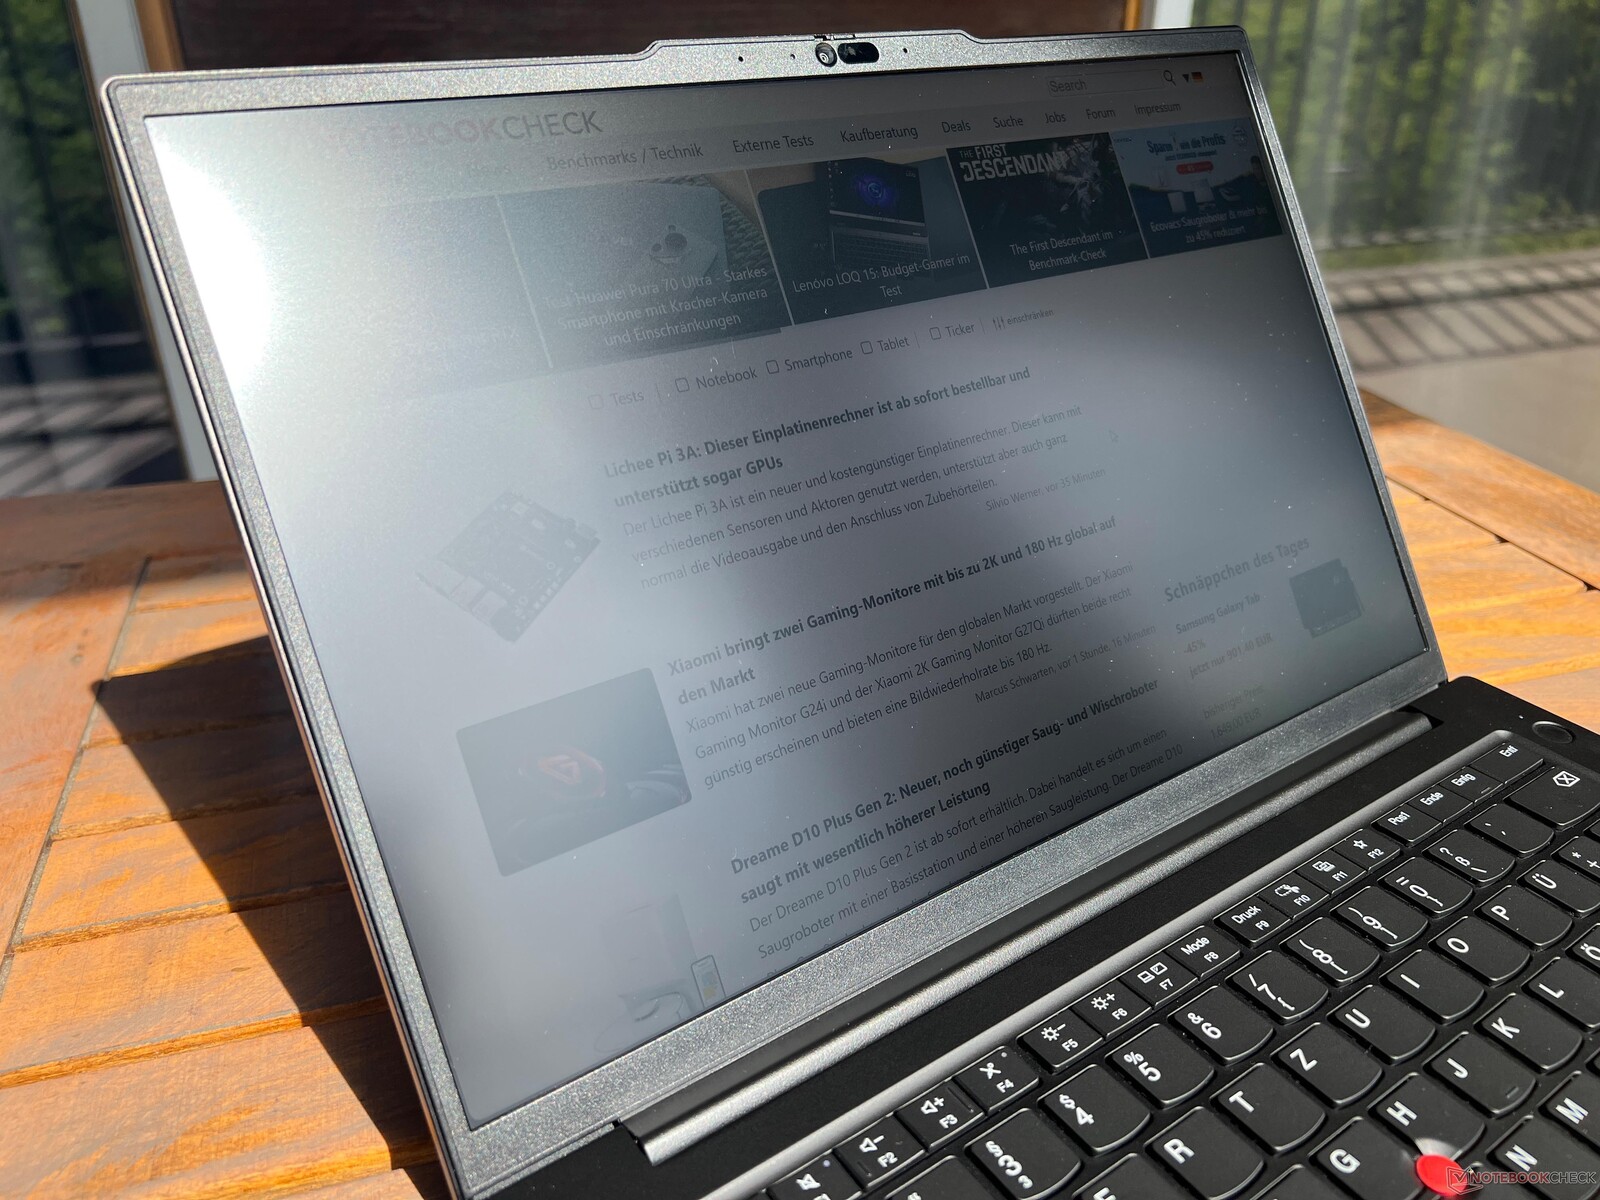
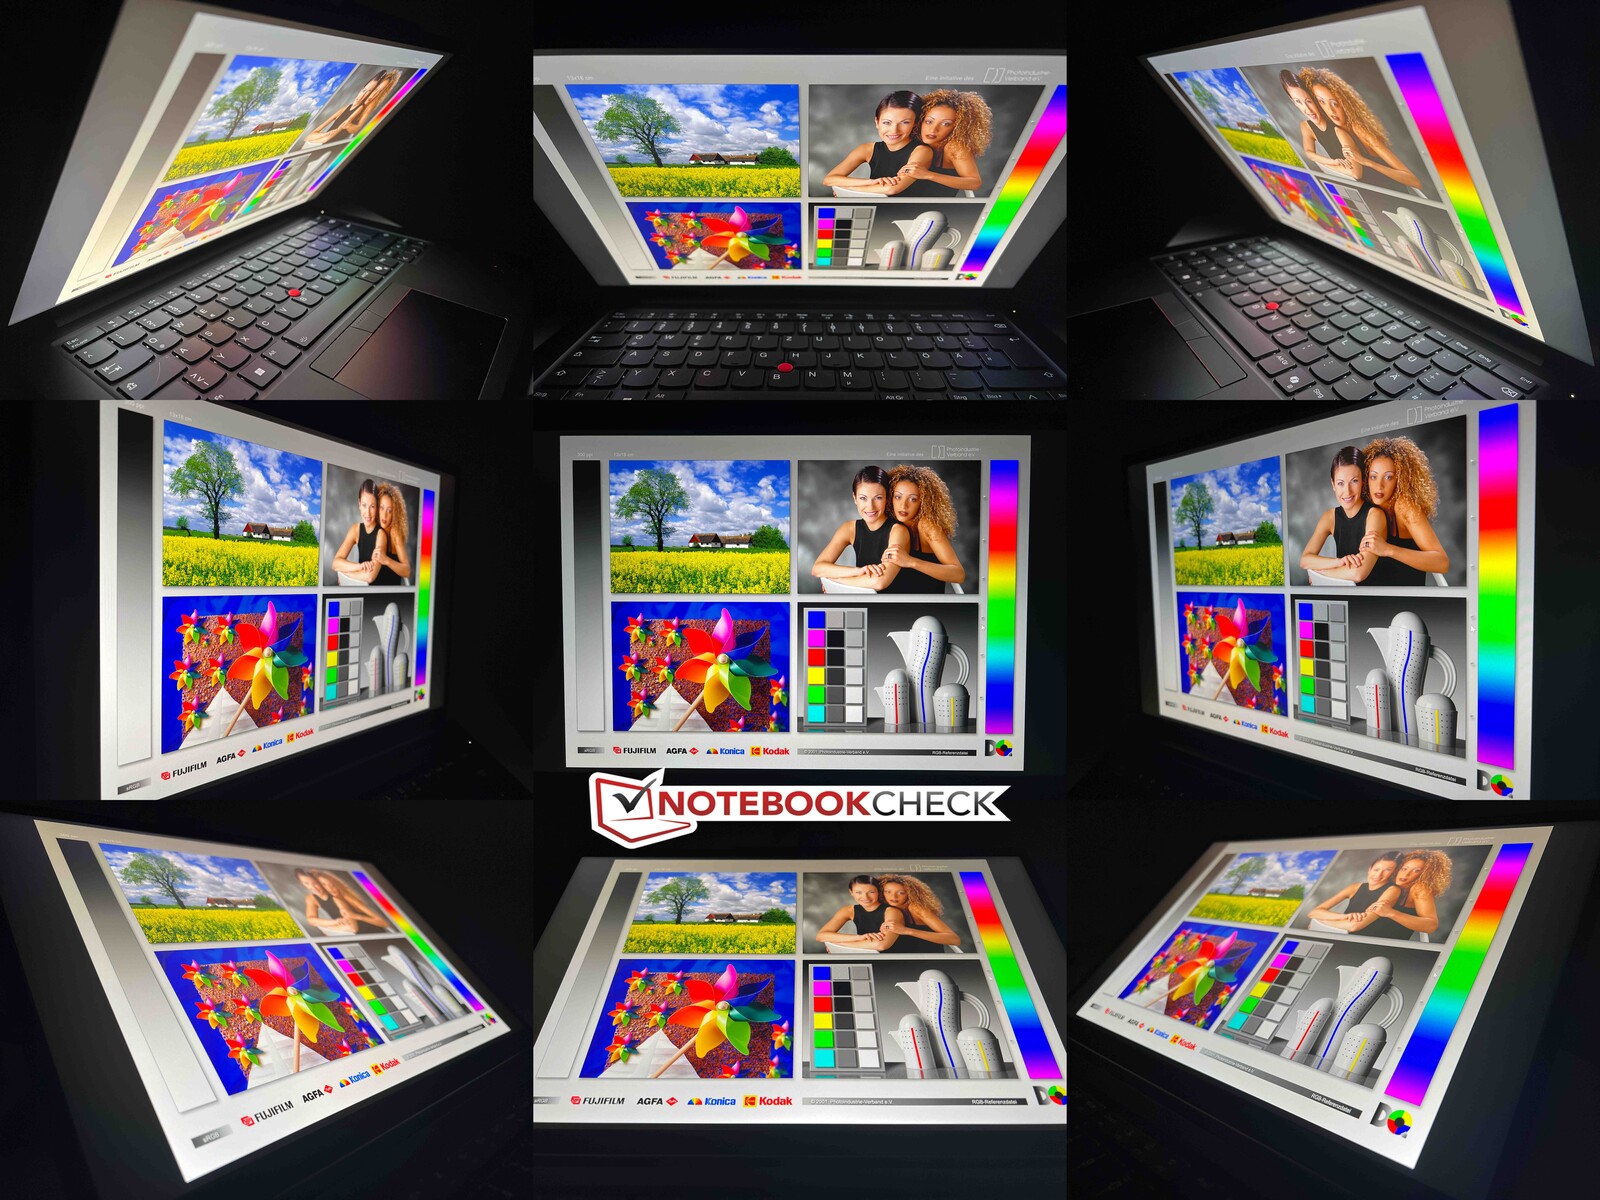
The matte panel does well outside but its brightness in particular could do with being a little better on very bright days. The IPS panel's viewing angle stability is good.
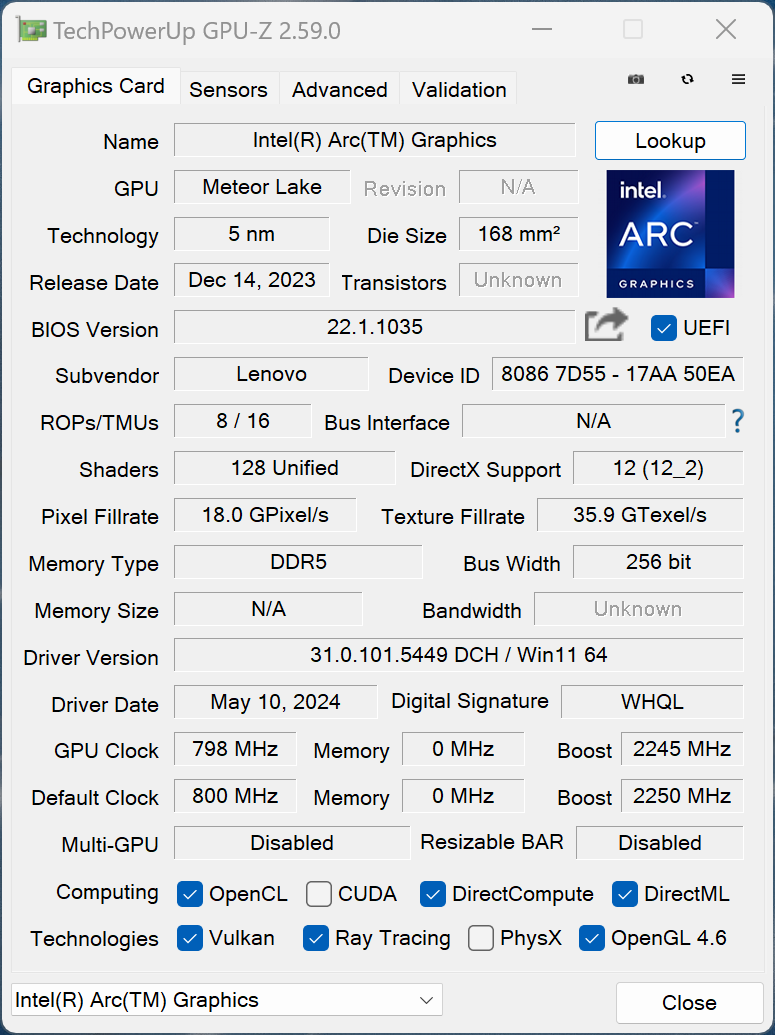
Performance - Meteor Lake & RTX 500 Ada
The Intel version of the ThinkPad P14s G5 is only available with Meteor Lake CPUs. When it comes to the GPU, you can choose between the integrated Intel Arc Graphics and the dedicated Nvidia RTX 500 Ada. The AMD version of the P14s G5 with the old design, on the other hand, is only available with an iGPU.
Testing conditions
Lenovo has long linked its own ThinkPad energy profiles directly to Windows' power settings. The following table summarizes the corresponding TDP/TGP settings. We performed the benchmarks and measurements using best performance, which is set by default.
| Performance mode | CPU TDP | CB R23 Multi | GPU TGP | Time Spy graphics | Stress test | max. fan noise emissions |
|---|---|---|---|---|---|---|
| Best energy saving | 80/30 watts | 12,089 points | 35 watts | 4,848 points | CPU: 15 watts GPU: 35 watts |
38.3 dB(A) |
| Balanced | 80/40 watts | 17,620 points | 40 watts | 4,981 points | CPU: 17 watts GPU: 35 watts |
44.8 dB(A) |
| Best performance | 80/50 watts | 17,612 points | 50 watts | 5,278 points | CPU: 25 watts GPU: 35 watts |
46.8 dB(A) |
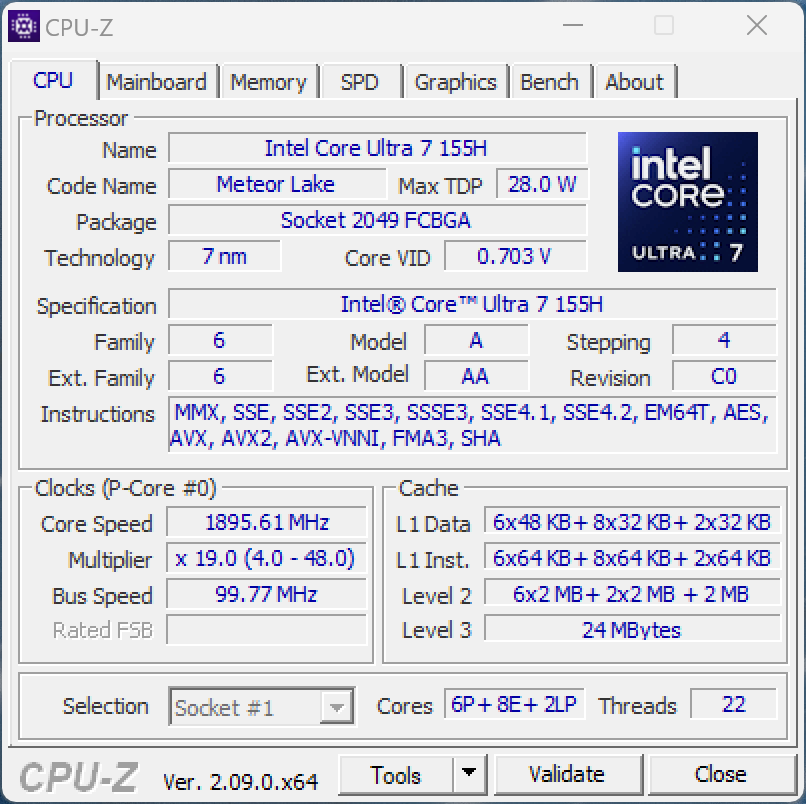
Processor - Intel Core Ultra 7 155H
The Core Ultra 7 155H is part of Intel's current Meteor Lake generation and is used in many laptops. Thanks to its high power limits, the processor's benchmark results were very good and it outperformed both the Core i7-1370P and the AMD Ryzen 7 PRO 7840U in the P14s-G4 models. Even the nominally faster Core Ultra 7 165H inside the ZBook Firefly 14 G11 was significantly slower. However, it should also be mentioned that the old Raptor Lake chips from Intel (e.g. the Core i7-13700H) offered higher single-core performance. In battery mode, the processor can consume a maximum of 55 watts, which is why its multi-core performance is 8% lower. Further CPU benchmarks can be found in our tech section.
Cinebench R15 Multi continuous test
Cinebench R23: Multi Core | Single Core
Cinebench R20: CPU (Multi Core) | CPU (Single Core)
Cinebench R15: CPU Multi 64Bit | CPU Single 64Bit
Blender: v2.79 BMW27 CPU
7-Zip 18.03: 7z b 4 | 7z b 4 -mmt1
Geekbench 6.7: Multi-Core | Single-Core
Geekbench 5.5: Multi-Core | Single-Core
HWBOT x265 Benchmark v2.2: 4k Preset
LibreOffice : 20 Documents To PDF
R Benchmark 2.5: Overall mean
| CPU Performance rating | |
| Average of class Workstation | |
| Lenovo Yoga Pro 9-14IRP G8 | |
| Microsoft Surface Laptop Studio 2 RTX 4060 | |
| Lenovo ThinkPad P14s G5 21G3S00A00 | |
| Dell Precision 5000 5490 | |
| Lenovo ThinkPad P14s G4 21HF0017GE | |
| Average Intel Core Ultra 7 155H | |
| HP ZBook Firefly 14 G11 | |
| Lenovo ThinkPad P14s G4 21K5000LGE | |
| Cinebench R23 / Multi Core | |
| Average of class Workstation (14055 - 38520, n=25, last 2 years) | |
| Lenovo Yoga Pro 9-14IRP G8 | |
| Lenovo ThinkPad P14s G5 21G3S00A00 | |
| Dell Precision 5000 5490 | |
| Microsoft Surface Laptop Studio 2 RTX 4060 | |
| Average Intel Core Ultra 7 155H (9769 - 19007, n=52) | |
| Lenovo ThinkPad P14s G4 21HF0017GE | |
| HP ZBook Firefly 14 G11 | |
| Lenovo ThinkPad P14s G4 21K5000LGE | |
| Cinebench R23 / Single Core | |
| Average of class Workstation (1712 - 2228, n=25, last 2 years) | |
| Lenovo ThinkPad P14s G4 21HF0017GE | |
| Microsoft Surface Laptop Studio 2 RTX 4060 | |
| Lenovo Yoga Pro 9-14IRP G8 | |
| Lenovo ThinkPad P14s G5 21G3S00A00 | |
| Dell Precision 5000 5490 | |
| HP ZBook Firefly 14 G11 | |
| Average Intel Core Ultra 7 155H (1496 - 1815, n=52) | |
| Lenovo ThinkPad P14s G4 21K5000LGE | |
| Cinebench R20 / CPU (Multi Core) | |
| Average of class Workstation (5471 - 15043, n=25, last 2 years) | |
| Lenovo Yoga Pro 9-14IRP G8 | |
| Lenovo ThinkPad P14s G5 21G3S00A00 | |
| Dell Precision 5000 5490 | |
| Microsoft Surface Laptop Studio 2 RTX 4060 | |
| Average Intel Core Ultra 7 155H (3798 - 7409, n=50) | |
| Lenovo ThinkPad P14s G4 21HF0017GE | |
| Lenovo ThinkPad P14s G4 21K5000LGE | |
| HP ZBook Firefly 14 G11 | |
| Cinebench R20 / CPU (Single Core) | |
| Average of class Workstation (671 - 857, n=25, last 2 years) | |
| Microsoft Surface Laptop Studio 2 RTX 4060 | |
| Lenovo ThinkPad P14s G4 21HF0017GE | |
| Lenovo Yoga Pro 9-14IRP G8 | |
| Lenovo ThinkPad P14s G5 21G3S00A00 | |
| Dell Precision 5000 5490 | |
| HP ZBook Firefly 14 G11 | |
| Average Intel Core Ultra 7 155H (601 - 696, n=50) | |
| Lenovo ThinkPad P14s G4 21K5000LGE | |
| Cinebench R15 / CPU Multi 64Bit | |
| Average of class Workstation (2489 - 5810, n=25, last 2 years) | |
| Dell Precision 5000 5490 | |
| Lenovo Yoga Pro 9-14IRP G8 | |
| Lenovo ThinkPad P14s G5 21G3S00A00 | |
| Microsoft Surface Laptop Studio 2 RTX 4060 | |
| HP ZBook Firefly 14 G11 | |
| Average Intel Core Ultra 7 155H (1932 - 2880, n=56) | |
| Lenovo ThinkPad P14s G4 21HF0017GE | |
| Lenovo ThinkPad P14s G4 21K5000LGE | |
| Cinebench R15 / CPU Single 64Bit | |
| Average of class Workstation (191.4 - 328, n=25, last 2 years) | |
| Microsoft Surface Laptop Studio 2 RTX 4060 | |
| Lenovo Yoga Pro 9-14IRP G8 | |
| Lenovo ThinkPad P14s G4 21K5000LGE | |
| Lenovo ThinkPad P14s G5 21G3S00A00 | |
| Lenovo ThinkPad P14s G4 21HF0017GE | |
| HP ZBook Firefly 14 G11 | |
| Dell Precision 5000 5490 | |
| Average Intel Core Ultra 7 155H (99.6 - 268, n=52) | |
| Blender / v2.79 BMW27 CPU | |
| HP ZBook Firefly 14 G11 | |
| Lenovo ThinkPad P14s G4 21HF0017GE | |
| Microsoft Surface Laptop Studio 2 RTX 4060 | |
| Lenovo ThinkPad P14s G4 21K5000LGE | |
| Average Intel Core Ultra 7 155H (175 - 381, n=47) | |
| Dell Precision 5000 5490 | |
| Lenovo ThinkPad P14s G5 21G3S00A00 | |
| Lenovo Yoga Pro 9-14IRP G8 | |
| Average of class Workstation (91 - 261, n=25, last 2 years) | |
| 7-Zip 18.03 / 7z b 4 | |
| Average of class Workstation (54741 - 116969, n=25, last 2 years) | |
| Lenovo Yoga Pro 9-14IRP G8 | |
| Lenovo ThinkPad P14s G5 21G3S00A00 | |
| Dell Precision 5000 5490 | |
| Microsoft Surface Laptop Studio 2 RTX 4060 | |
| Average Intel Core Ultra 7 155H (41739 - 70254, n=50) | |
| Lenovo ThinkPad P14s G4 21K5000LGE | |
| HP ZBook Firefly 14 G11 | |
| Lenovo ThinkPad P14s G4 21HF0017GE | |
| 7-Zip 18.03 / 7z b 4 -mmt1 | |
| Microsoft Surface Laptop Studio 2 RTX 4060 | |
| Lenovo ThinkPad P14s G4 21HF0017GE | |
| Average of class Workstation (5126 - 6960, n=25, last 2 years) | |
| Lenovo Yoga Pro 9-14IRP G8 | |
| Lenovo ThinkPad P14s G4 21K5000LGE | |
| Lenovo ThinkPad P14s G5 21G3S00A00 | |
| Dell Precision 5000 5490 | |
| HP ZBook Firefly 14 G11 | |
| Average Intel Core Ultra 7 155H (4594 - 5621, n=50) | |
| Geekbench 6.7 / Multi-Core | |
| Average of class Workstation (12196 - 20887, n=25, last 2 years) | |
| Lenovo Yoga Pro 9-14IRP G8 | |
| Lenovo Yoga Pro 9-14IRP G8 | |
| Dell Precision 5000 5490 | |
| Microsoft Surface Laptop Studio 2 RTX 4060 | |
| Lenovo ThinkPad P14s G5 21G3S00A00 | |
| Lenovo ThinkPad P14s G4 21HF0017GE | |
| Average Intel Core Ultra 7 155H (7732 - 13656, n=55) | |
| HP ZBook Firefly 14 G11 | |
| Lenovo ThinkPad P14s G4 21K5000LGE | |
| Geekbench 6.7 / Single-Core | |
| Average of class Workstation (2389 - 3065, n=25, last 2 years) | |
| Lenovo ThinkPad P14s G4 21HF0017GE | |
| Microsoft Surface Laptop Studio 2 RTX 4060 | |
| Lenovo Yoga Pro 9-14IRP G8 | |
| Lenovo Yoga Pro 9-14IRP G8 | |
| Lenovo ThinkPad P14s G4 21K5000LGE | |
| Lenovo ThinkPad P14s G5 21G3S00A00 | |
| HP ZBook Firefly 14 G11 | |
| Dell Precision 5000 5490 | |
| Average Intel Core Ultra 7 155H (1901 - 2473, n=52) | |
| Geekbench 5.5 / Multi-Core | |
| Average of class Workstation (11542 - 25554, n=25, last 2 years) | |
| Lenovo Yoga Pro 9-14IRP G8 | |
| Lenovo ThinkPad P14s G5 21G3S00A00 | |
| Microsoft Surface Laptop Studio 2 RTX 4060 | |
| Dell Precision 5000 5490 | |
| HP ZBook Firefly 14 G11 | |
| Average Intel Core Ultra 7 155H (10017 - 13556, n=52) | |
| Lenovo ThinkPad P14s G4 21HF0017GE | |
| Lenovo ThinkPad P14s G4 21K5000LGE | |
| Geekbench 5.5 / Single-Core | |
| Average of class Workstation (1781 - 2183, n=25, last 2 years) | |
| Lenovo Yoga Pro 9-14IRP G8 | |
| Microsoft Surface Laptop Studio 2 RTX 4060 | |
| Lenovo ThinkPad P14s G4 21HF0017GE | |
| Lenovo ThinkPad P14s G5 21G3S00A00 | |
| HP ZBook Firefly 14 G11 | |
| Dell Precision 5000 5490 | |
| Average Intel Core Ultra 7 155H (1462 - 1824, n=52) | |
| Lenovo ThinkPad P14s G4 21K5000LGE | |
| HWBOT x265 Benchmark v2.2 / 4k Preset | |
| Average of class Workstation (14.4 - 40.5, n=25, last 2 years) | |
| Lenovo ThinkPad P14s G5 21G3S00A00 | |
| Lenovo Yoga Pro 9-14IRP G8 | |
| Microsoft Surface Laptop Studio 2 RTX 4060 | |
| Dell Precision 5000 5490 | |
| Lenovo ThinkPad P14s G4 21K5000LGE | |
| Average Intel Core Ultra 7 155H (9.93 - 21.2, n=50) | |
| Lenovo ThinkPad P14s G4 21HF0017GE | |
| HP ZBook Firefly 14 G11 | |
| LibreOffice / 20 Documents To PDF | |
| Lenovo ThinkPad P14s G4 21K5000LGE | |
| HP ZBook Firefly 14 G11 | |
| Lenovo ThinkPad P14s G5 21G3S00A00 | |
| Average Intel Core Ultra 7 155H (37.5 - 79.2, n=49) | |
| Average of class Workstation (37.1 - 74.7, n=25, last 2 years) | |
| Lenovo Yoga Pro 9-14IRP G8 | |
| Microsoft Surface Laptop Studio 2 RTX 4060 | |
| Lenovo ThinkPad P14s G4 21HF0017GE | |
| Dell Precision 5000 5490 | |
| R Benchmark 2.5 / Overall mean | |
| Average Intel Core Ultra 7 155H (0.4457 - 0.53, n=49) | |
| Lenovo ThinkPad P14s G4 21K5000LGE | |
| Dell Precision 5000 5490 | |
| Lenovo ThinkPad P14s G5 21G3S00A00 | |
| HP ZBook Firefly 14 G11 | |
| Microsoft Surface Laptop Studio 2 RTX 4060 | |
| Average of class Workstation (0.3825 - 0.603, n=25, last 2 years) | |
| Lenovo ThinkPad P14s G4 21HF0017GE | |
| Lenovo Yoga Pro 9-14IRP G8 | |
* ... smaller is better
AIDA64: FP32 Ray-Trace | FPU Julia | CPU SHA3 | CPU Queen | FPU SinJulia | FPU Mandel | CPU AES | CPU ZLib | FP64 Ray-Trace | CPU PhotoWorxx
| Performance rating | |
| Average of class Workstation | |
| Lenovo Yoga Pro 9-14IRP G8 | |
| Lenovo ThinkPad P14s G5 21G3S00A00 | |
| Dell Precision 5000 5490 | |
| Average Intel Core Ultra 7 155H | |
| Microsoft Surface Laptop Studio 2 RTX 4060 | |
| Lenovo ThinkPad P14s G4 21HF0017GE | |
| HP ZBook Firefly 14 G11 | |
| AIDA64 / FP32 Ray-Trace | |
| Average of class Workstation (10658 - 61611, n=25, last 2 years) | |
| Lenovo Yoga Pro 9-14IRP G8 | |
| Lenovo ThinkPad P14s G5 21G3S00A00 | |
| Dell Precision 5000 5490 | |
| Average Intel Core Ultra 7 155H (6670 - 18470, n=50) | |
| Microsoft Surface Laptop Studio 2 RTX 4060 | |
| Lenovo ThinkPad P14s G4 21HF0017GE | |
| HP ZBook Firefly 14 G11 | |
| AIDA64 / FPU Julia | |
| Average of class Workstation (56664 - 186971, n=25, last 2 years) | |
| Lenovo ThinkPad P14s G5 21G3S00A00 | |
| Lenovo Yoga Pro 9-14IRP G8 | |
| Dell Precision 5000 5490 | |
| Microsoft Surface Laptop Studio 2 RTX 4060 | |
| Average Intel Core Ultra 7 155H (40905 - 93181, n=50) | |
| Lenovo ThinkPad P14s G4 21HF0017GE | |
| HP ZBook Firefly 14 G11 | |
| AIDA64 / CPU SHA3 | |
| Average of class Workstation (2608 - 8975, n=25, last 2 years) | |
| Dell Precision 5000 5490 | |
| Lenovo ThinkPad P14s G5 21G3S00A00 | |
| Lenovo Yoga Pro 9-14IRP G8 | |
| Average Intel Core Ultra 7 155H (1940 - 4436, n=50) | |
| Microsoft Surface Laptop Studio 2 RTX 4060 | |
| Lenovo ThinkPad P14s G4 21HF0017GE | |
| HP ZBook Firefly 14 G11 | |
| AIDA64 / CPU Queen | |
| Average of class Workstation (60778 - 144411, n=25, last 2 years) | |
| Lenovo Yoga Pro 9-14IRP G8 | |
| Microsoft Surface Laptop Studio 2 RTX 4060 | |
| Lenovo ThinkPad P14s G4 21HF0017GE | |
| Dell Precision 5000 5490 | |
| HP ZBook Firefly 14 G11 | |
| Lenovo ThinkPad P14s G5 21G3S00A00 | |
| Average Intel Core Ultra 7 155H (64698 - 94181, n=50) | |
| AIDA64 / FPU SinJulia | |
| Average of class Workstation (8165 - 29343, n=25, last 2 years) | |
| Lenovo Yoga Pro 9-14IRP G8 | |
| Lenovo ThinkPad P14s G5 21G3S00A00 | |
| Dell Precision 5000 5490 | |
| Average Intel Core Ultra 7 155H (5639 - 10647, n=50) | |
| Microsoft Surface Laptop Studio 2 RTX 4060 | |
| HP ZBook Firefly 14 G11 | |
| Lenovo ThinkPad P14s G4 21HF0017GE | |
| AIDA64 / FPU Mandel | |
| Average of class Workstation (27301 - 98153, n=25, last 2 years) | |
| Lenovo Yoga Pro 9-14IRP G8 | |
| Lenovo ThinkPad P14s G5 21G3S00A00 | |
| Dell Precision 5000 5490 | |
| Average Intel Core Ultra 7 155H (18236 - 47685, n=50) | |
| Microsoft Surface Laptop Studio 2 RTX 4060 | |
| Lenovo ThinkPad P14s G4 21HF0017GE | |
| HP ZBook Firefly 14 G11 | |
| AIDA64 / CPU AES | |
| Average of class Workstation (56077 - 187841, n=25, last 2 years) | |
| Lenovo ThinkPad P14s G5 21G3S00A00 | |
| Average Intel Core Ultra 7 155H (45713 - 152179, n=50) | |
| Dell Precision 5000 5490 | |
| Lenovo Yoga Pro 9-14IRP G8 | |
| Microsoft Surface Laptop Studio 2 RTX 4060 | |
| Lenovo ThinkPad P14s G4 21HF0017GE | |
| HP ZBook Firefly 14 G11 | |
| AIDA64 / CPU ZLib | |
| Average of class Workstation (742 - 2148, n=25, last 2 years) | |
| Lenovo ThinkPad P14s G5 21G3S00A00 | |
| Lenovo Yoga Pro 9-14IRP G8 | |
| Dell Precision 5000 5490 | |
| Average Intel Core Ultra 7 155H (557 - 1250, n=50) | |
| Microsoft Surface Laptop Studio 2 RTX 4060 | |
| Lenovo ThinkPad P14s G4 21HF0017GE | |
| HP ZBook Firefly 14 G11 | |
| AIDA64 / FP64 Ray-Trace | |
| Average of class Workstation (5580 - 32891, n=25, last 2 years) | |
| Lenovo Yoga Pro 9-14IRP G8 | |
| Lenovo ThinkPad P14s G5 21G3S00A00 | |
| Dell Precision 5000 5490 | |
| Microsoft Surface Laptop Studio 2 RTX 4060 | |
| Average Intel Core Ultra 7 155H (3569 - 9802, n=50) | |
| Lenovo ThinkPad P14s G4 21HF0017GE | |
| HP ZBook Firefly 14 G11 | |
| AIDA64 / CPU PhotoWorxx | |
| Lenovo Yoga Pro 9-14IRP G8 | |
| Dell Precision 5000 5490 | |
| Average of class Workstation (37151 - 93684, n=25, last 2 years) | |
| Lenovo ThinkPad P14s G5 21G3S00A00 | |
| Average Intel Core Ultra 7 155H (32719 - 54223, n=50) | |
| HP ZBook Firefly 14 G11 | |
| Microsoft Surface Laptop Studio 2 RTX 4060 | |
| Lenovo ThinkPad P14s G4 21HF0017GE | |
System performance
The ThinkPad P14s G5 is a super fast laptop, which was also confirmed during the synthetic benchmarks. Although other devices were sometimes even faster during this test, the overall differences are small and all inputs are processed quickly by the system. In addition, we had no problems with the system's stability during the test.
CrossMark: Overall | Productivity | Creativity | Responsiveness
WebXPRT 3: Overall
WebXPRT 4: Overall
Mozilla Kraken 1.1: Total
| PCMark 10 / Score | |
| Average of class Workstation (6436 - 10409, n=21, last 2 years) | |
| Lenovo Yoga Pro 9-14IRP G8 | |
| Dell Precision 5000 5490 | |
| Microsoft Surface Laptop Studio 2 RTX 4060 | |
| Lenovo ThinkPad P14s G4 21HF0017GE | |
| Lenovo ThinkPad P14s G5 21G3S00A00 | |
| Average Intel Core Ultra 7 155H, NVIDIA RTX 500 Ada Generation Laptop (n=1) | |
| HP ZBook Firefly 14 G11 | |
| PCMark 10 / Essentials | |
| Lenovo Yoga Pro 9-14IRP G8 | |
| Dell Precision 5000 5490 | |
| Lenovo ThinkPad P14s G5 21G3S00A00 | |
| Average Intel Core Ultra 7 155H, NVIDIA RTX 500 Ada Generation Laptop (n=1) | |
| Microsoft Surface Laptop Studio 2 RTX 4060 | |
| Lenovo ThinkPad P14s G4 21HF0017GE | |
| Average of class Workstation (9622 - 11157, n=21, last 2 years) | |
| HP ZBook Firefly 14 G11 | |
| PCMark 10 / Productivity | |
| Average of class Workstation (8789 - 20616, n=21, last 2 years) | |
| Lenovo ThinkPad P14s G4 21HF0017GE | |
| HP ZBook Firefly 14 G11 | |
| Lenovo ThinkPad P14s G5 21G3S00A00 | |
| Average Intel Core Ultra 7 155H, NVIDIA RTX 500 Ada Generation Laptop (n=1) | |
| Microsoft Surface Laptop Studio 2 RTX 4060 | |
| Dell Precision 5000 5490 | |
| Lenovo Yoga Pro 9-14IRP G8 | |
| PCMark 10 / Digital Content Creation | |
| Average of class Workstation (7744 - 15631, n=21, last 2 years) | |
| Lenovo Yoga Pro 9-14IRP G8 | |
| Microsoft Surface Laptop Studio 2 RTX 4060 | |
| Dell Precision 5000 5490 | |
| Lenovo ThinkPad P14s G5 21G3S00A00 | |
| Average Intel Core Ultra 7 155H, NVIDIA RTX 500 Ada Generation Laptop (n=1) | |
| Lenovo ThinkPad P14s G4 21HF0017GE | |
| HP ZBook Firefly 14 G11 | |
| CrossMark / Overall | |
| Average of class Workstation (1307 - 2267, n=24, last 2 years) | |
| Lenovo Yoga Pro 9-14IRP G8 | |
| Lenovo ThinkPad P14s G4 21HF0017GE | |
| Dell Precision 5000 5490 | |
| Microsoft Surface Laptop Studio 2 RTX 4060 | |
| Lenovo ThinkPad P14s G5 21G3S00A00 | |
| Average Intel Core Ultra 7 155H, NVIDIA RTX 500 Ada Generation Laptop (n=1) | |
| HP ZBook Firefly 14 G11 | |
| CrossMark / Productivity | |
| Average of class Workstation (1130 - 2122, n=24, last 2 years) | |
| Lenovo Yoga Pro 9-14IRP G8 | |
| Lenovo ThinkPad P14s G4 21HF0017GE | |
| Dell Precision 5000 5490 | |
| Microsoft Surface Laptop Studio 2 RTX 4060 | |
| HP ZBook Firefly 14 G11 | |
| Lenovo ThinkPad P14s G5 21G3S00A00 | |
| Average Intel Core Ultra 7 155H, NVIDIA RTX 500 Ada Generation Laptop (n=1) | |
| CrossMark / Creativity | |
| Average of class Workstation (1657 - 2725, n=24, last 2 years) | |
| Lenovo Yoga Pro 9-14IRP G8 | |
| Lenovo ThinkPad P14s G4 21HF0017GE | |
| Microsoft Surface Laptop Studio 2 RTX 4060 | |
| Dell Precision 5000 5490 | |
| HP ZBook Firefly 14 G11 | |
| Lenovo ThinkPad P14s G5 21G3S00A00 | |
| Average Intel Core Ultra 7 155H, NVIDIA RTX 500 Ada Generation Laptop (n=1) | |
| CrossMark / Responsiveness | |
| Average of class Workstation (993 - 2096, n=24, last 2 years) | |
| Lenovo ThinkPad P14s G4 21HF0017GE | |
| Lenovo Yoga Pro 9-14IRP G8 | |
| Lenovo ThinkPad P14s G5 21G3S00A00 | |
| Average Intel Core Ultra 7 155H, NVIDIA RTX 500 Ada Generation Laptop (n=1) | |
| Dell Precision 5000 5490 | |
| Microsoft Surface Laptop Studio 2 RTX 4060 | |
| HP ZBook Firefly 14 G11 | |
| WebXPRT 3 / Overall | |
| Average of class Workstation (260 - 360, n=25, last 2 years) | |
| Lenovo Yoga Pro 9-14IRP G8 | |
| Microsoft Surface Laptop Studio 2 RTX 4060 | |
| Lenovo ThinkPad P14s G4 21HF0017GE | |
| HP ZBook Firefly 14 G11 | |
| Dell Precision 5000 5490 | |
| Lenovo ThinkPad P14s G5 21G3S00A00 | |
| Average Intel Core Ultra 7 155H, NVIDIA RTX 500 Ada Generation Laptop (n=1) | |
| WebXPRT 4 / Overall | |
| Average of class Workstation (189.2 - 326, n=25, last 2 years) | |
| Microsoft Surface Laptop Studio 2 RTX 4060 | |
| Lenovo Yoga Pro 9-14IRP G8 | |
| Lenovo ThinkPad P14s G4 21HF0017GE | |
| Lenovo ThinkPad P14s G4 21HF0017GE | |
| Dell Precision 5000 5490 | |
| HP ZBook Firefly 14 G11 | |
| Lenovo ThinkPad P14s G5 21G3S00A00 | |
| Average Intel Core Ultra 7 155H, NVIDIA RTX 500 Ada Generation Laptop (n=1) | |
| Mozilla Kraken 1.1 / Total | |
| Lenovo ThinkPad P14s G5 21G3S00A00 | |
| Average Intel Core Ultra 7 155H, NVIDIA RTX 500 Ada Generation Laptop (n=1) | |
| Dell Precision 5000 5490 | |
| HP ZBook Firefly 14 G11 | |
| Lenovo Yoga Pro 9-14IRP G8 | |
| Microsoft Surface Laptop Studio 2 RTX 4060 | |
| Lenovo ThinkPad P14s G4 21HF0017GE | |
| Average of class Workstation (411 - 538, n=25, last 2 years) | |
* ... smaller is better
| PCMark 10 Score | 6974 points | |
Help | ||
| AIDA64 / Memory Copy | |
| Dell Precision 5000 5490 | |
| Average Intel Core Ultra 7 155H (62397 - 96791, n=50) | |
| Average of class Workstation (56003 - 164795, n=25, last 2 years) | |
| Lenovo Yoga Pro 9-14IRP G8 | |
| Lenovo ThinkPad P14s G5 21G3S00A00 | |
| HP ZBook Firefly 14 G11 | |
| Microsoft Surface Laptop Studio 2 RTX 4060 | |
| Lenovo ThinkPad P14s G4 21HF0017GE | |
| AIDA64 / Memory Read | |
| Dell Precision 5000 5490 | |
| Average Intel Core Ultra 7 155H (60544 - 90647, n=50) | |
| Lenovo ThinkPad P14s G5 21G3S00A00 | |
| Average of class Workstation (55795 - 121563, n=25, last 2 years) | |
| HP ZBook Firefly 14 G11 | |
| Lenovo Yoga Pro 9-14IRP G8 | |
| Microsoft Surface Laptop Studio 2 RTX 4060 | |
| Lenovo ThinkPad P14s G4 21HF0017GE | |
| AIDA64 / Memory Write | |
| Dell Precision 5000 5490 | |
| Lenovo Yoga Pro 9-14IRP G8 | |
| Average of class Workstation (55663 - 214520, n=25, last 2 years) | |
| Microsoft Surface Laptop Studio 2 RTX 4060 | |
| Lenovo ThinkPad P14s G5 21G3S00A00 | |
| Average Intel Core Ultra 7 155H (58692 - 93451, n=50) | |
| HP ZBook Firefly 14 G11 | |
| Lenovo ThinkPad P14s G4 21HF0017GE | |
| AIDA64 / Memory Latency | |
| Average Intel Core Ultra 7 155H (116.2 - 233, n=50) | |
| Dell Precision 5000 5490 | |
| Average of class Workstation (84.5 - 165.2, n=25, last 2 years) | |
| HP ZBook Firefly 14 G11 | |
| Lenovo ThinkPad P14s G5 21G3S00A00 | |
| Lenovo ThinkPad P14s G4 21HF0017GE | |
| Lenovo Yoga Pro 9-14IRP G8 | |
| Microsoft Surface Laptop Studio 2 RTX 4060 | |
* ... smaller is better
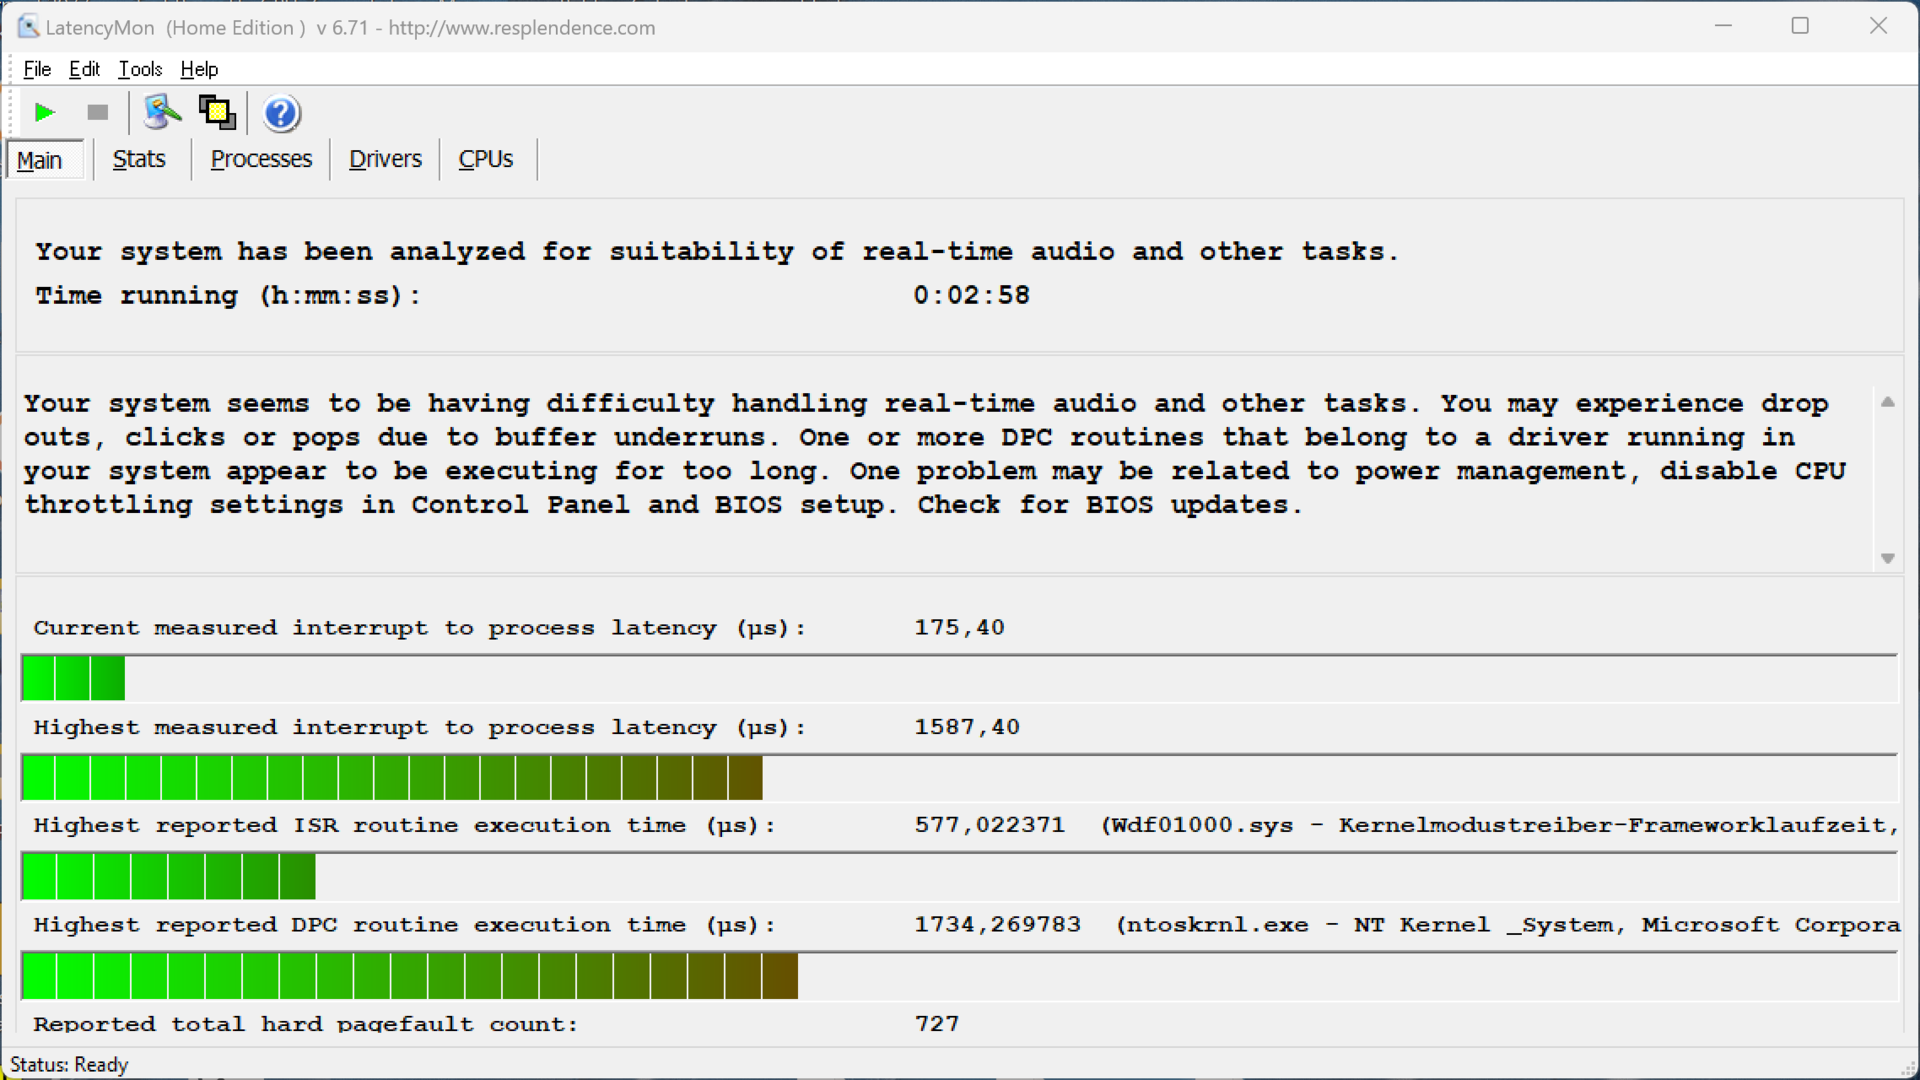
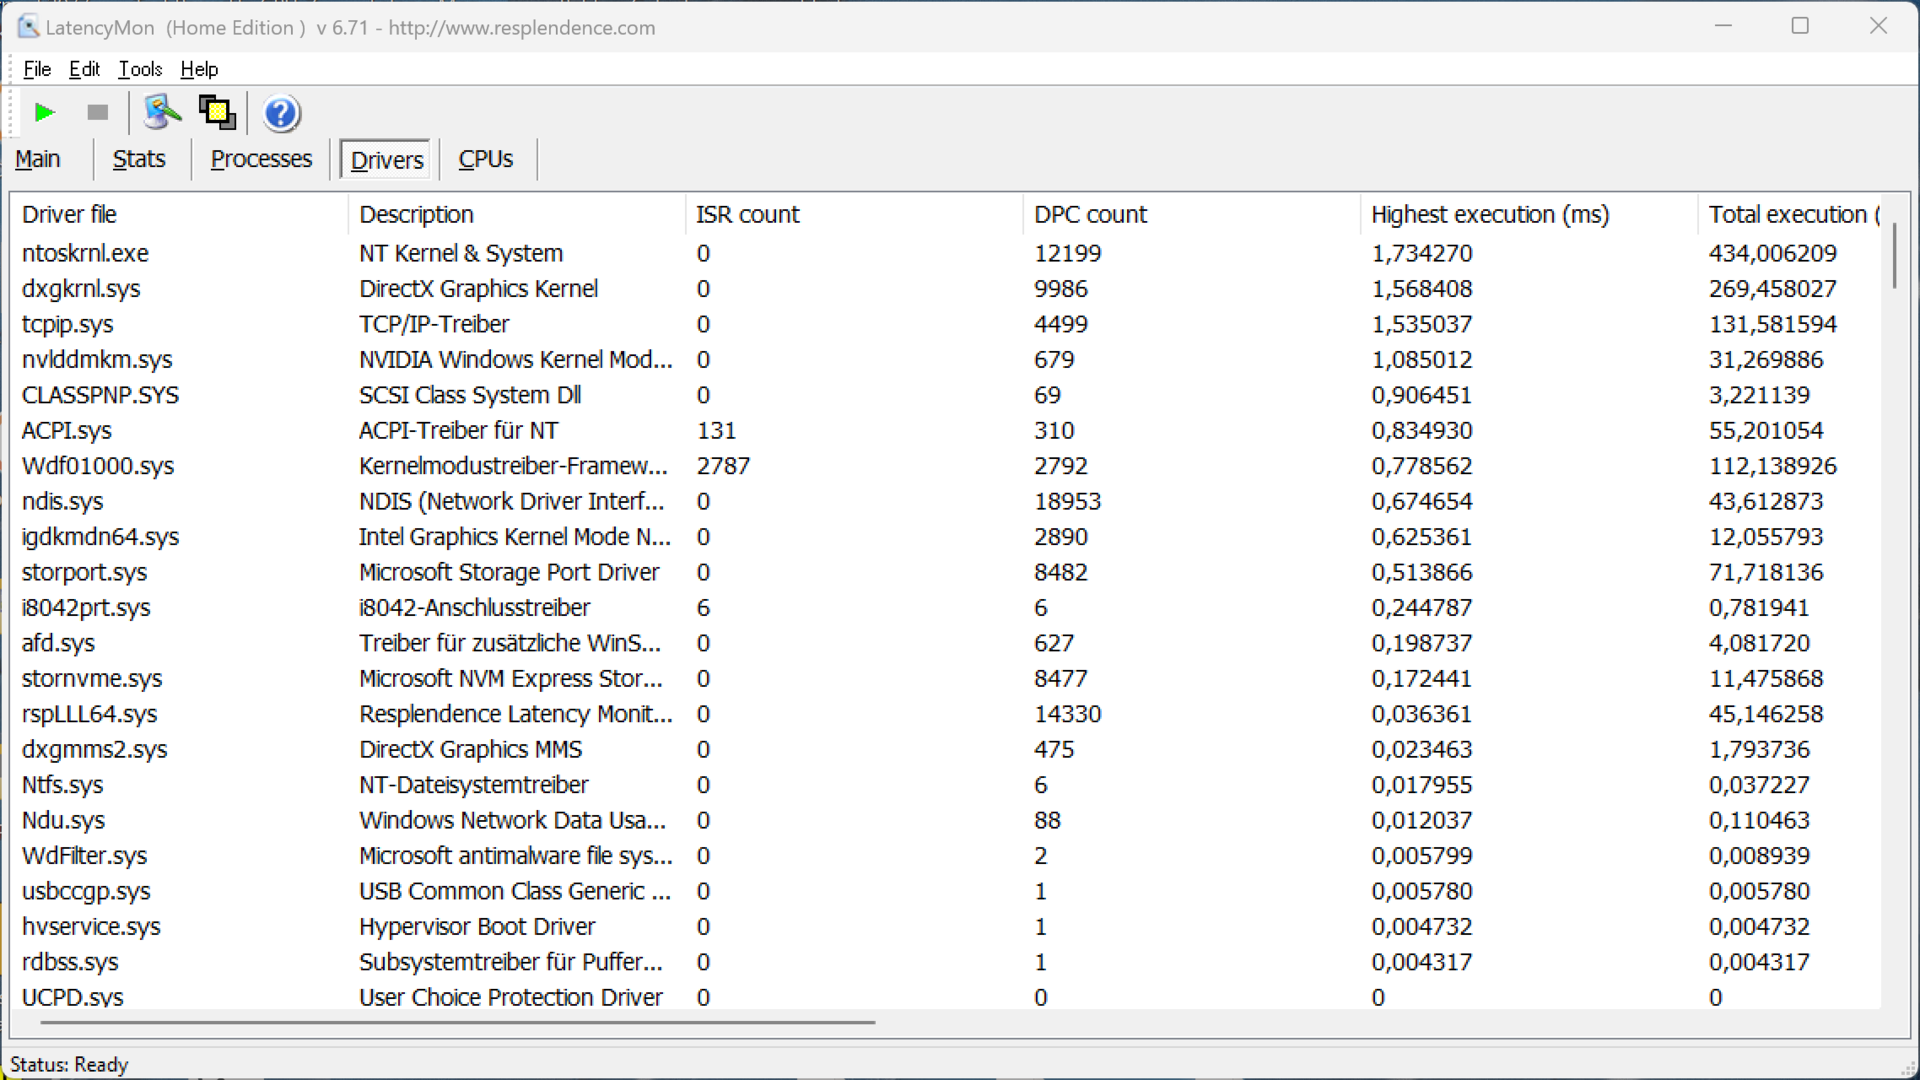
DPC latencies
In our standardized latency test (surfing the web, 4K YouTube video, CPU load), the test device with the current BIOS version showed slight limitations when using real-time audio applications.
| DPC Latencies / LatencyMon - interrupt to process latency (max), Web, Youtube, Prime95 | |
| Microsoft Surface Laptop Studio 2 RTX 4060 | |
| HP ZBook Firefly 14 G11 | |
| Dell Precision 5000 5490 | |
| Lenovo ThinkPad P14s G4 21HF0017GE | |
| Lenovo ThinkPad P14s G5 21G3S00A00 | |
| Lenovo Yoga Pro 9-14IRP G8 | |
* ... smaller is better
Storage device
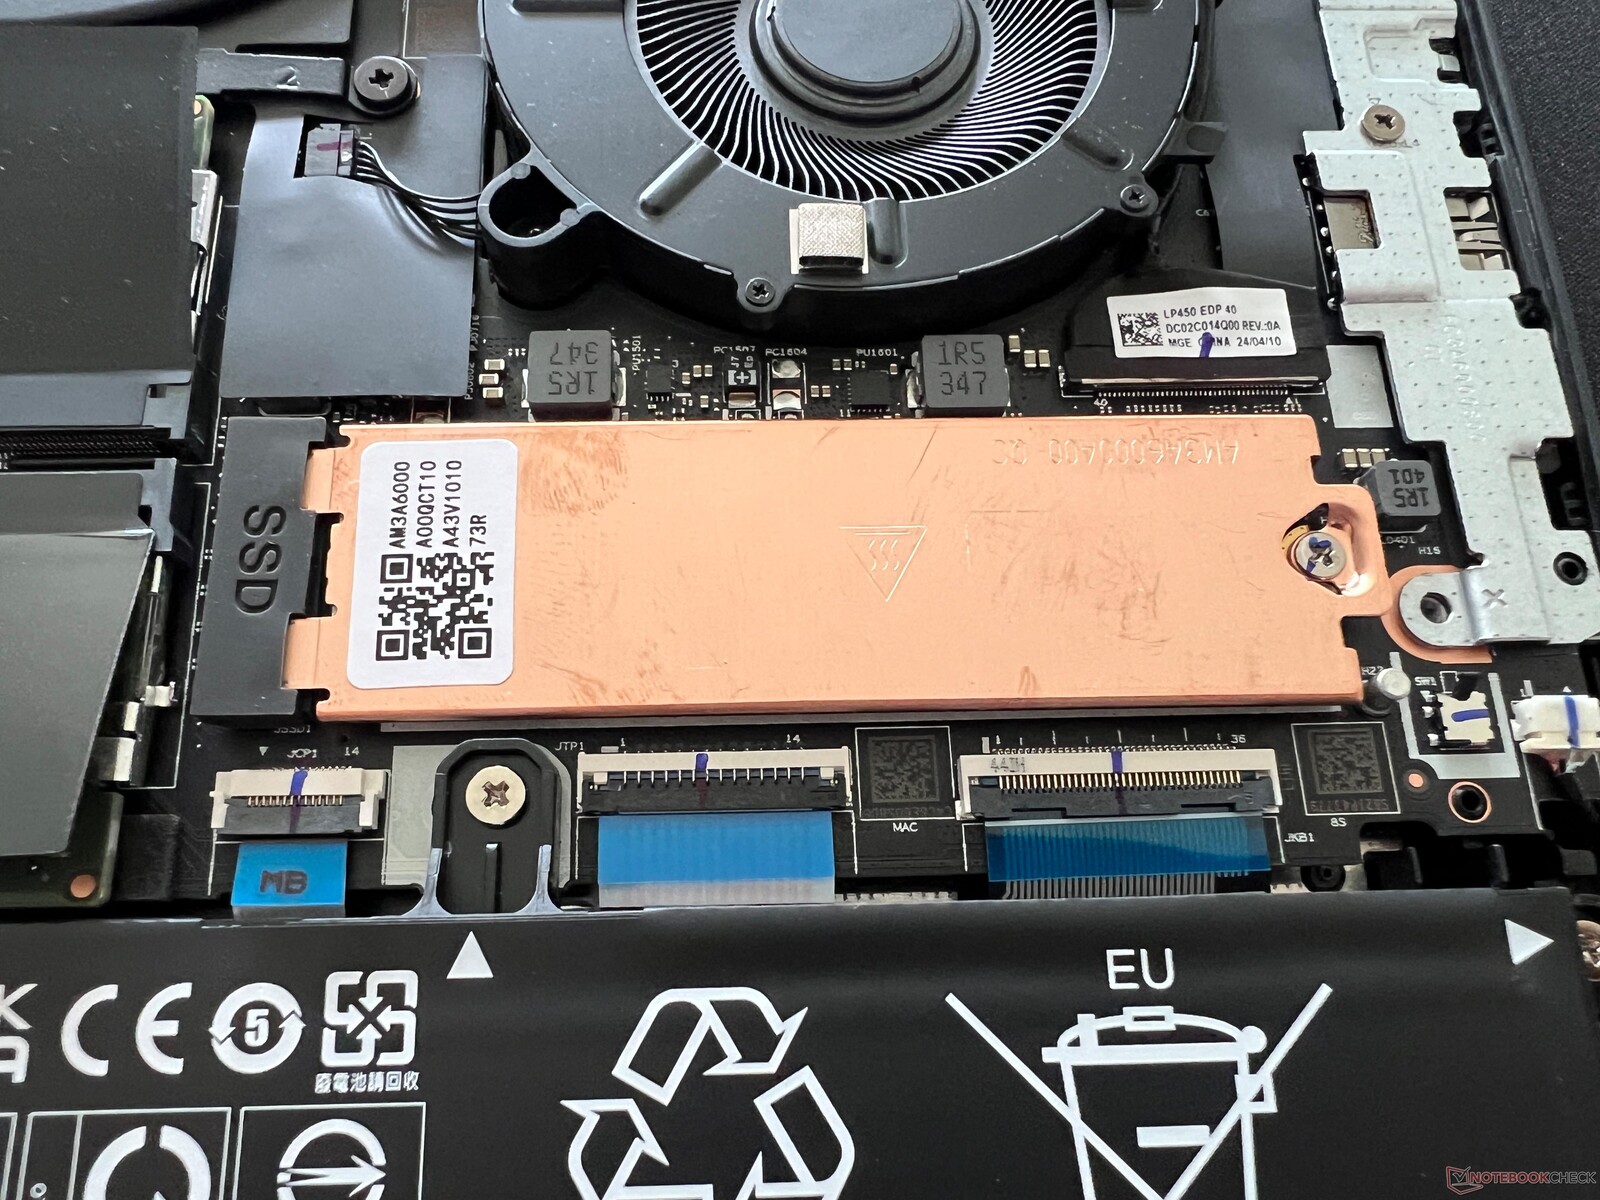
The P14s G5 features one M.2 2280 slot which is connected via PCIe 4.0. The 1 TB version of the UMIS AM630 is installed in our test device. After first starting up the device, users have 871 GB at their disposal. With transfer rates of up to 7 GB/s, its performance is very good—although it can't keep these values completely constant under continuous load. However, as the values are then still over 4 GB/s, users should face no limitations. Further SSD benchmarks are available here.

* ... smaller is better
Reading continuous performance: DiskSpd Read Loop, Queue Depth 8
Graphics card - Nvidia RTX 500 Ada
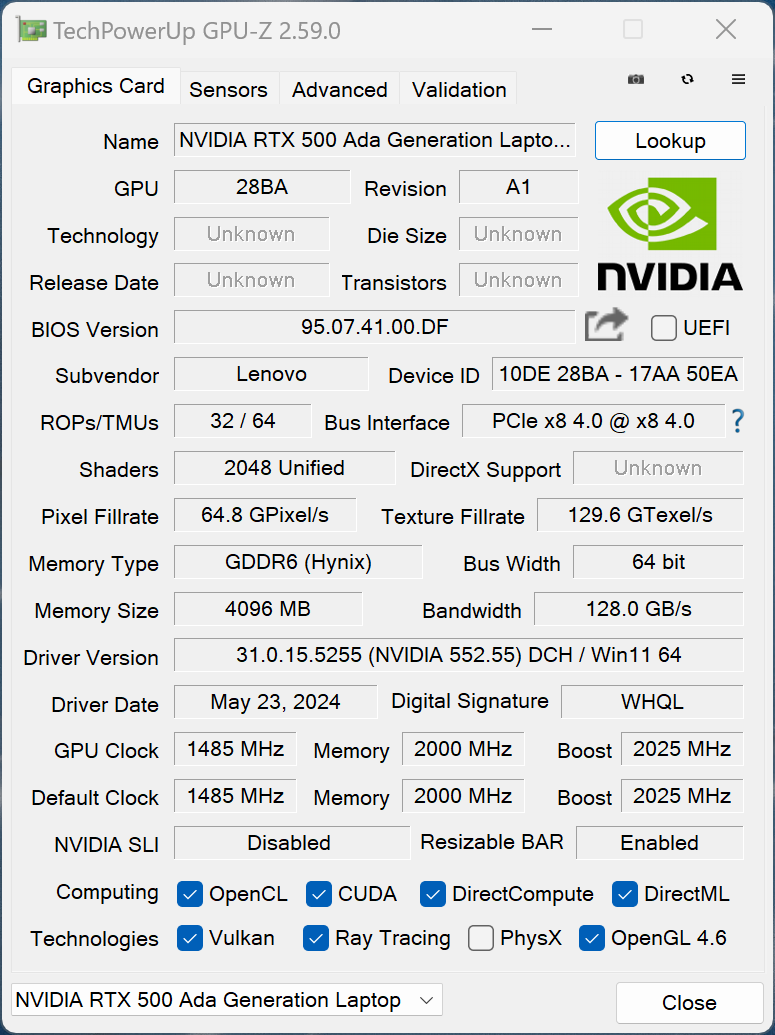
You can optionally get the P14s G5 with the Nvidia RTX 500 Ada, which is currently the smallest professional mobile GPU from Nvidia. The RTX 500 Ada is based on the AD107GLM chip with 2,048 CUDA cores and 4 GB GDDR6 VRAM. It is therefore a slimmed-down version of the RTX 1000 Ada and, as a result, also of the GeForce RTX 4050 Laptop—both of which are equipped with 2,560 CUDA cores and 6 GB VRAM. Inside the ThinkPad P14s G5, the RTX 500 Ada can consume a maximum of 50 watts and the system supports graphics switching via Nvidia's Optimus technology. Compared to the GeForce models, the professional GPUs offer ISV certifications that guarantee maximum compatibility with professional applications.
Compared to the old RTX A500 Laptop (which is based on the GeForce RTX 3050 and is used in the current ZBook Firefly 14 G11, for example), its performance in both the 3DMark and professional SPECviewperf tests was significantly better (50-80 %), but the consumer GeForce RTX 4050 Laptop offers even more 3D performance. It's a shame that Lenovo doesn't also offer the RTX 1000 Ada inside the P14s G5.
The GPU's performance remains stable under constant load and in battery mode. Further GPU benchmarks are available here.
| 3DMark 06 Standard Score | 50935 points | |
| 3DMark Vantage P Result | 66297 points | |
| 3DMark 11 Performance | 20426 points | |
| 3DMark Fire Strike Score | 12761 points | |
| 3DMark Time Spy Score | 5745 points | |
| 3DMark Steel Nomad Score | 981 points | |
| 3DMark Steel Nomad Light Score | 5441 points | |
Help | ||
| Performance rating - Percent | |
| Dell Precision 5000 5490 -1! | |
| Lenovo ThinkPad P14s G5 21G3S00A00 | |
| Lenovo ThinkPad P14s G4 21HF0017GE -1! | |
| HP ZBook Firefly 14 G11 -1! | |
| Blender / v3.3 Classroom OPTIX/RTX | |
| HP ZBook Firefly 14 G11 | |
| Lenovo ThinkPad P14s G4 21HF0017GE | |
| Average NVIDIA RTX 500 Ada Generation Laptop (39 - 43, n=2) | |
| Lenovo ThinkPad P14s G5 21G3S00A00 | |
| Lenovo Yoga Pro 9-14IRP G8 | |
| Dell Precision 5000 5490 | |
| Average of class Workstation (10 - 95, n=19, last 2 years) | |
| Microsoft Surface Laptop Studio 2 RTX 4060 | |
| Blender / v3.3 Classroom CUDA | |
| Lenovo ThinkPad P14s G4 21HF0017GE | |
| HP ZBook Firefly 14 G11 | |
| Average NVIDIA RTX 500 Ada Generation Laptop (71 - 72, n=2) | |
| Lenovo ThinkPad P14s G5 21G3S00A00 | |
| Lenovo Yoga Pro 9-14IRP G8 | |
| Dell Precision 5000 5490 | |
| Average of class Workstation (16 - 142, n=19, last 2 years) | |
| Microsoft Surface Laptop Studio 2 RTX 4060 | |
| Blender / v3.3 Classroom CPU | |
| Lenovo ThinkPad P14s G4 21HF0017GE | |
| HP ZBook Firefly 14 G11 | |
| Microsoft Surface Laptop Studio 2 RTX 4060 | |
| Dell Precision 5000 5490 | |
| Lenovo ThinkPad P14s G5 21G3S00A00 | |
| Lenovo Yoga Pro 9-14IRP G8 | |
| Average NVIDIA RTX 500 Ada Generation Laptop (280 - 343, n=2) | |
| Average of class Workstation (148 - 464, n=25, last 2 years) | |
* ... smaller is better
Gaming performance
You can also play games on the ThinkPad P14s G5 if you'd like to wind down after work, although its performance is once again significantly below that of the consumer GeForce RTX 4050 Laptop. This means you are generally limited to 1080p resolution and high or maximum details are only possible when playing older or less demanding games. In turn, current games such as F1 24 or Cyberpunk 2077 require a further reduction in details. DLSS upsampling can also be used for supported games; for example, we were able to increase the laptop's performance when running Cyberpunk 2077 (1080p, Ultra) from 25fps to 45fps (DLSS Balanced). Its gaming performance remains completely stable even during longer sessions.
| GTA V - 1920x1080 Highest AA:4xMSAA + FX AF:16x | |
| Average of class Workstation (18.1 - 156.1, n=24, last 2 years) | |
| Microsoft Surface Laptop Studio 2 RTX 4060 | |
| Lenovo Yoga Pro 9-14IRP G8 | |
| Lenovo ThinkPad P14s G5 21G3S00A00 | |
| Lenovo ThinkPad P14s G4 21HF0017GE | |
| F1 23 - 1920x1080 Ultra High Preset AA:T AF:16x | |
| Microsoft Surface Laptop Studio 2 RTX 4060 | |
| Lenovo ThinkPad P14s G5 21G3S00A00 | |
| Average NVIDIA RTX 500 Ada Generation Laptop (n=1) | |
| Average of class Workstation (n=1last 2 years) | |
| Lenovo ThinkPad P14s G4 21HF0017GE | |
| F1 24 - 1920x1080 Ultra High Preset AA:T AF:16x | |
| Average of class Workstation (12 - 147.7, n=12, last 2 years) | |
| Lenovo ThinkPad P14s G5 21G3S00A00 | |
| Average NVIDIA RTX 500 Ada Generation Laptop (n=1) | |
| Lenovo ThinkPad P14s G4 21HF0017GE | |
Cyberpunk 2077 ultra FPS diagram
| low | med. | high | ultra | QHD | |
|---|---|---|---|---|---|
| GTA V (2015) | 182.7 | 177.4 | 138.2 | 64.6 | 45.1 |
| The Witcher 3 (2015) | 278 | 175 | 91 | 51 | 36 |
| Dota 2 Reborn (2015) | 176.2 | 156.1 | 148.1 | 137.4 | |
| Final Fantasy XV Benchmark (2018) | 130.5 | 71 | 50 | 36.1 | |
| X-Plane 11.11 (2018) | 128.3 | 103.5 | 81.5 | ||
| Far Cry 5 (2018) | 135 | 86 | 78 | 74 | 50 |
| Strange Brigade (2018) | 316 | 126 | 104 | 91 | 63 |
| Far Cry 6 (2021) | 126 | 80 | 68 | ||
| F1 22 (2022) | 150.4 | 134.4 | 99.6 | 32.9 | |
| F1 23 (2023) | 136.5 | 119.8 | 84.1 | 25 | 16 |
| Baldur's Gate 3 (2023) | 69.4 | 53.6 | 39 | 38.9 | 26.8 |
| Cyberpunk 2077 (2023) | 52.9 | 37.7 | 25.4 | 25 | 19.8 |
| Assassin's Creed Mirage (2023) | 78 | 69 | 55 | 40 | 32 |
| Total War Pharaoh (2023) | 199 | 129 | 73 | 56 | 39 |
| Call of Duty Modern Warfare 3 2023 (2023) | 88 | 78 | 58 | 49 | 33 |
| Avatar Frontiers of Pandora (2023) | 42 | 38 | 32 | 20 | |
| Ghost of Tsushima (2024) | 56.4 | 47.1 | 40.2 | 30.9 | 22 |
| F1 24 (2024) | 112.9 | 80.8 | 26.5 | 16 | 22 |
Emissions - Noisy fans
Noise emissions
The laptop's cooling system consists of two fans and starts up very quickly even during short load peaks. Even when doing very simple things like playing YouTube videos, the fans were actually always active at low speeds during our test—this could only be reduced somewhat by using a weaker energy profile. The device also quickly got louder under load and we measured 46.8 dB(A) both when gaming and in the stress test. The balanced mode wasn't much quieter at 44.8 dB(A) and even when using best energy saving mode, the fans were still clearly audible at up to 38.3 dB(A). No other electronic noises came from our test device during the test phase.
Noise level
| Idle |
| 24.6 / 24.6 / 27.5 dB(A) |
| Load |
| 41.2 / 46.8 dB(A) |
 | ||
30 dB silent 40 dB(A) audible 50 dB(A) loud |
||
min: | ||
| Lenovo ThinkPad P14s G5 21G3S00A00 RTX 500 Ada Generation Laptop, Ultra 7 155H, Lenovo UMIS AM630 RPETJ1T24MGE2QDQ | HP ZBook Firefly 14 G11 RTX A500 Laptop GPU, Ultra 7 165H, Kioxia XG8 KXG80ZNV512G | Dell Precision 5000 5490 RTX 3000 Ada Generation Laptop, Ultra 9 185H, Kioxia XG8 KXG80ZNV1T02 | Lenovo ThinkPad P14s G4 21HF0017GE RTX A500 Laptop GPU, i7-1370P, SK Hynix HFS002TEJ9X162N | Microsoft Surface Laptop Studio 2 RTX 4060 GeForce RTX 4060 Laptop GPU, i7-13700H, Kioxia XG8 KXG80ZNV1T02 | Lenovo Yoga Pro 9-14IRP G8 GeForce RTX 4050 Laptop GPU, i7-13705H, Samsung PM9A1 MZVL21T0HCLR | |
|---|---|---|---|---|---|---|
| Noise | 3% | 3% | 2% | -3% | -4% | |
| off / environment * (dB) | 24.6 | 24.3 1% | 22.8 7% | 24.6 -0% | 23.9 3% | 24.8 -1% |
| Idle Minimum * (dB) | 24.6 | 24.6 -0% | 23.8 3% | 24.6 -0% | 23.9 3% | 24.8 -1% |
| Idle Average * (dB) | 24.6 | 25.2 -2% | 23.8 3% | 24.6 -0% | 24.4 1% | 24.8 -1% |
| Idle Maximum * (dB) | 27.5 | 26.8 3% | 24.7 10% | 25.9 6% | 26.9 2% | 24.8 10% |
| Load Average * (dB) | 41.2 | 38.9 6% | 38.9 6% | 41.3 -0% | 48.5 -18% | 47.4 -15% |
| Cyberpunk 2077 ultra * (dB) | 46.8 | 41.8 11% | 44.2 6% | |||
| Load Maximum * (dB) | 46.8 | 45.8 2% | 51.4 -10% | 46.2 1% | 51.8 -11% | 52.9 -13% |
| Witcher 3 ultra * (dB) | 49.9 | 46 | 51.8 | 52.9 |
* ... smaller is better
Temperature
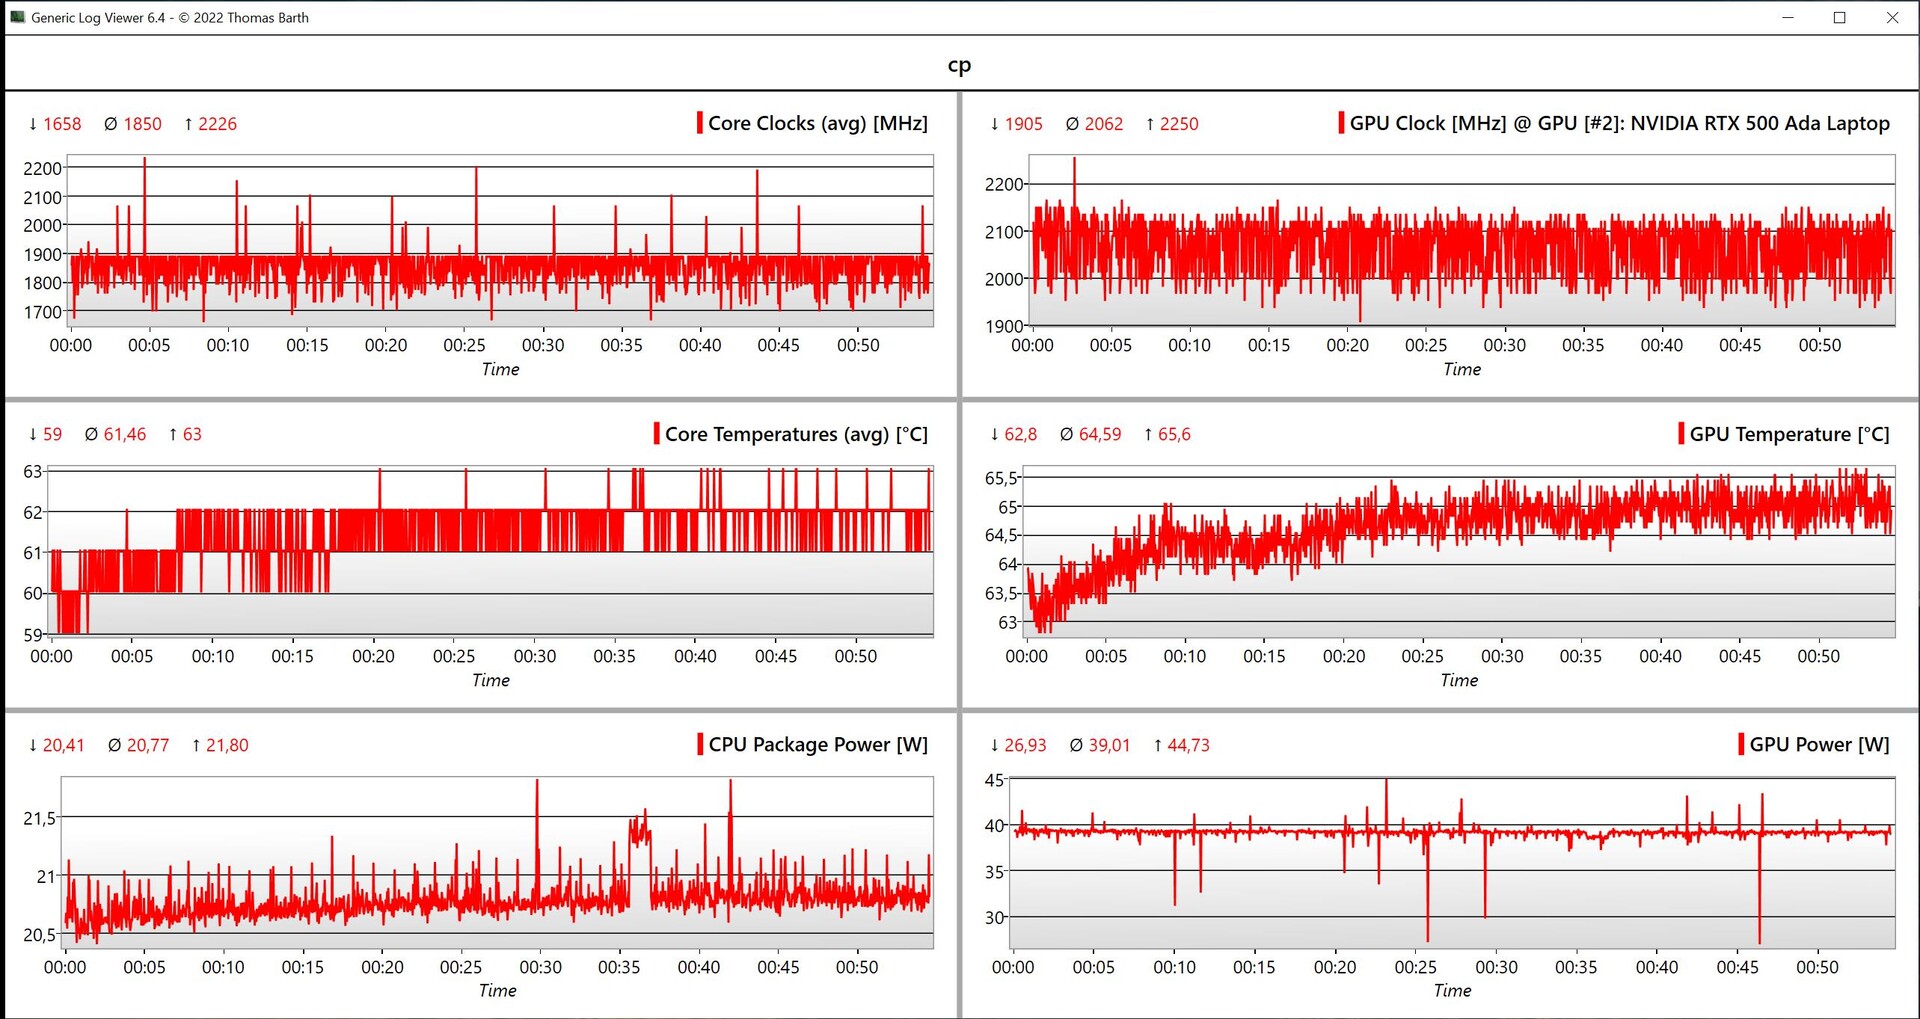
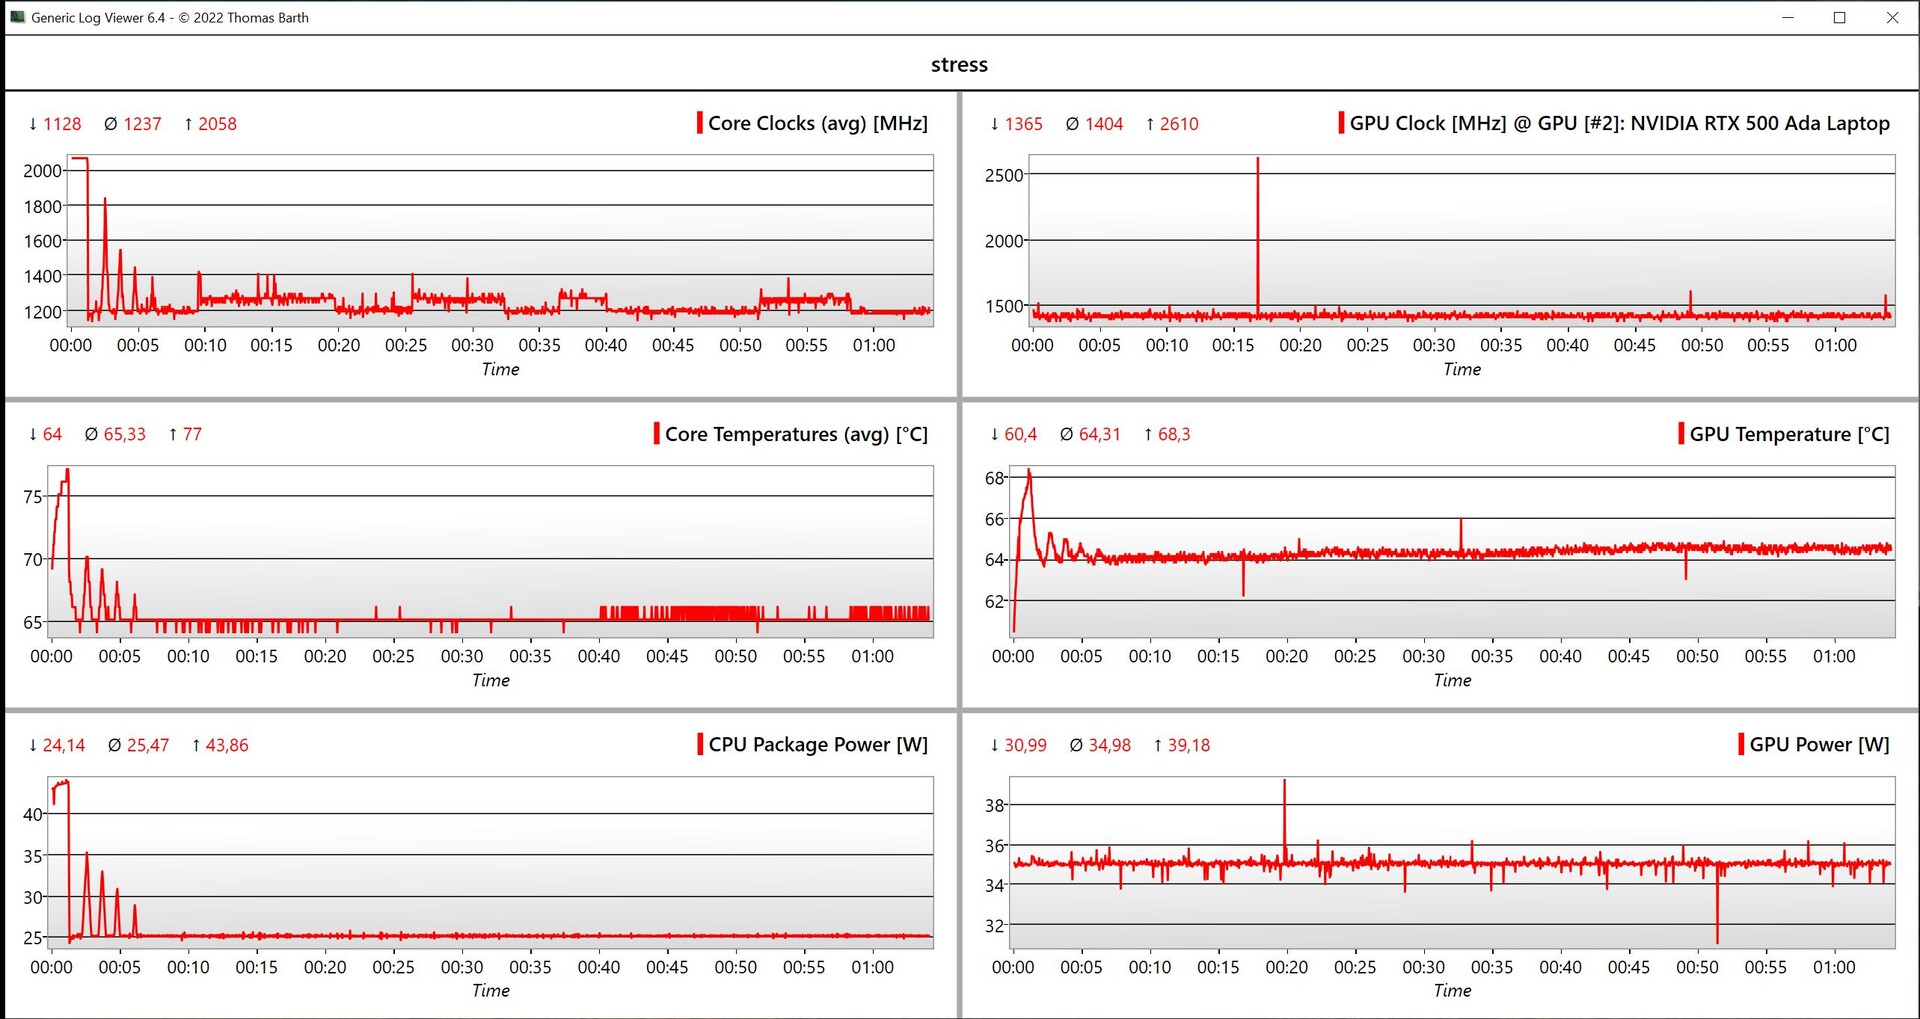
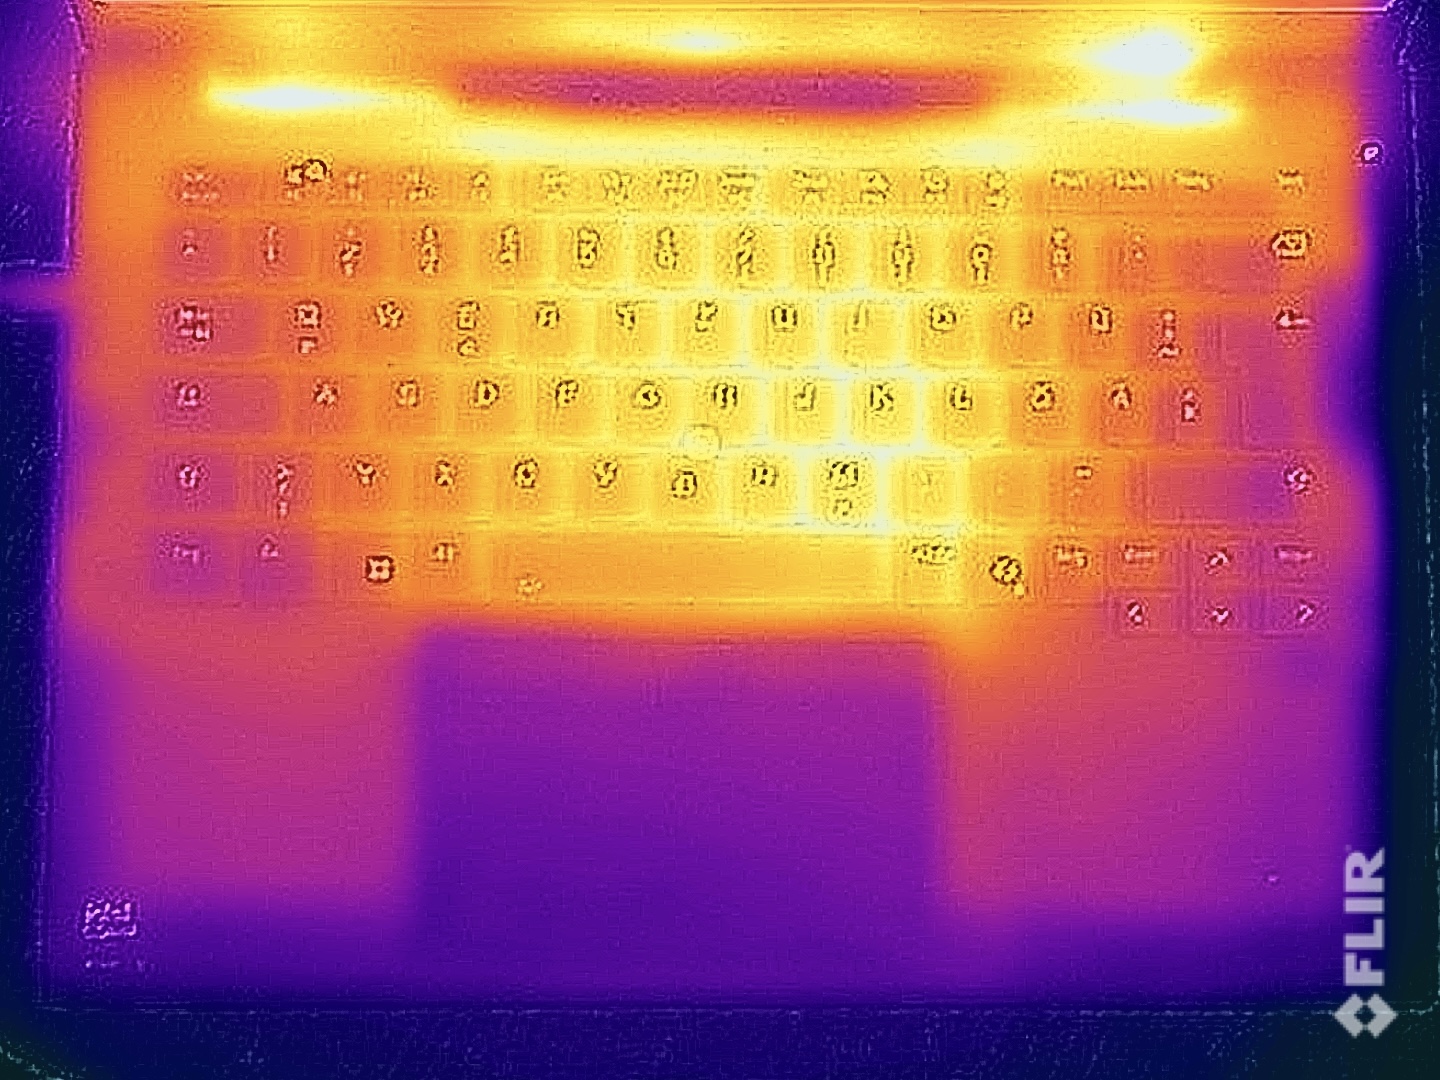
Some parts of the ThinkPad P14s G5's surface already reached temperatures of 30 °C when idling, so the device's passive cooling capabilities don't seem to be the best. Under load, we noted a hotspot of about 47 °C in the rear middle area of the underside, but this value isn't critical. Even so, you probably shouldn't place the laptop on your thighs. The keyboard area also gets noticeably warm—we measured a peak of 41 °C, but this shouldn't pose any limitations during use.
During the stress test with combined CPU/GPU load, the graphics card was preferred by the system and ran constantly at 35 watts, while the processor quickly stabilized at just 25 watts. In total, the system can cool 60 watts permanently.
(±) The maximum temperature on the upper side is 41.3 °C / 106 F, compared to the average of 38.2 °C / 101 F, ranging from 22.2 to 69.8 °C for the class Workstation.
(-) The bottom heats up to a maximum of 47 °C / 117 F, compared to the average of 41.1 °C / 106 F
(+) In idle usage, the average temperature for the upper side is 29.1 °C / 84 F, compared to the device average of 32 °C / 90 F.
(±) 3: The average temperature for the upper side is 36.3 °C / 97 F, compared to the average of 32 °C / 90 F for the class Workstation.
(+) The palmrests and touchpad are cooler than skin temperature with a maximum of 30.2 °C / 86.4 F and are therefore cool to the touch.
(-) The average temperature of the palmrest area of similar devices was 27.8 °C / 82 F (-2.4 °C / -4.4 F).

| Lenovo ThinkPad P14s G5 21G3S00A00 Intel Core Ultra 7 155H, NVIDIA RTX 500 Ada Generation Laptop | HP ZBook Firefly 14 G11 Intel Core Ultra 7 165H, NVIDIA RTX A500 Laptop GPU | Dell Precision 5000 5490 Intel Core Ultra 9 185H, NVIDIA RTX 3000 Ada Generation Laptop | Lenovo ThinkPad P14s G4 21HF0017GE Intel Core i7-1370P, NVIDIA RTX A500 Laptop GPU | Microsoft Surface Laptop Studio 2 RTX 4060 Intel Core i7-13700H, NVIDIA GeForce RTX 4060 Laptop GPU | Lenovo Yoga Pro 9-14IRP G8 Intel Core i7-13705H, NVIDIA GeForce RTX 4050 Laptop GPU | |
|---|---|---|---|---|---|---|
| Heat | 2% | 4% | -8% | 11% | 0% | |
| Maximum Upper Side * (°C) | 41.3 | 42.8 -4% | 43.2 -5% | 55.3 -34% | 40.4 2% | 41 1% |
| Maximum Bottom * (°C) | 47 | 44 6% | 38.4 18% | 48.7 -4% | 42.2 10% | 56.7 -21% |
| Idle Upper Side * (°C) | 30.2 | 30.6 -1% | 31.6 -5% | 31 -3% | 26.6 12% | 27.4 9% |
| Idle Bottom * (°C) | 33.2 | 31.4 5% | 30.6 8% | 29.9 10% | 27 19% | 29.1 12% |
* ... smaller is better
Speakers
The two stereo speakers are located under the front edge of the base unit and emit sound downwards, where it is ideally reflected back to the user from a hard surface. During our analysis, the modules performed well, not only because they were loud but also because of how balanced the trebles and mids sounded. This also benefits vocals. Only the bass sounded a little weak, which is why music or movies don't come across as powerful as they could.
Lenovo ThinkPad P14s G5 21G3S00A00 audio analysis
(+) | speakers can play relatively loud (87 dB)
Bass 100 - 315 Hz
(-) | nearly no bass - on average 18.8% lower than median
(±) | linearity of bass is average (8.3% delta to prev. frequency)
Mids 400 - 2000 Hz
(+) | balanced mids - only 2.7% away from median
(+) | mids are linear (2.8% delta to prev. frequency)
Highs 2 - 16 kHz
(+) | balanced highs - only 2.4% away from median
(+) | highs are linear (3.5% delta to prev. frequency)
Overall 100 - 16.000 Hz
(+) | overall sound is linear (12.2% difference to median)
Compared to same class
» 18% of all tested devices in this class were better, 3% similar, 79% worse
» The best had a delta of 7%, average was 17%, worst was 35%
Compared to all devices tested
» 10% of all tested devices were better, 2% similar, 88% worse
» The best had a delta of 4%, average was 24%, worst was 134%
HP ZBook Firefly 14 G11 audio analysis
(+) | speakers can play relatively loud (83.7 dB)
Bass 100 - 315 Hz
(-) | nearly no bass - on average 21.6% lower than median
(±) | linearity of bass is average (10% delta to prev. frequency)
Mids 400 - 2000 Hz
(+) | balanced mids - only 4.5% away from median
(+) | mids are linear (4.3% delta to prev. frequency)
Highs 2 - 16 kHz
(+) | balanced highs - only 3.4% away from median
(+) | highs are linear (3.2% delta to prev. frequency)
Overall 100 - 16.000 Hz
(±) | linearity of overall sound is average (16.2% difference to median)
Compared to same class
» 43% of all tested devices in this class were better, 7% similar, 50% worse
» The best had a delta of 7%, average was 17%, worst was 35%
Compared to all devices tested
» 26% of all tested devices were better, 6% similar, 68% worse
» The best had a delta of 4%, average was 24%, worst was 134%
Lenovo Yoga Pro 9-14IRP G8 audio analysis
(±) | speaker loudness is average but good (81.8 dB)
Bass 100 - 315 Hz
(±) | reduced bass - on average 5.9% lower than median
(±) | linearity of bass is average (7.8% delta to prev. frequency)
Mids 400 - 2000 Hz
(+) | balanced mids - only 2.3% away from median
(+) | mids are linear (3.2% delta to prev. frequency)
Highs 2 - 16 kHz
(+) | balanced highs - only 2.5% away from median
(+) | highs are linear (3.4% delta to prev. frequency)
Overall 100 - 16.000 Hz
(+) | overall sound is linear (7.3% difference to median)
Compared to same class
» 6% of all tested devices in this class were better, 1% similar, 94% worse
» The best had a delta of 5%, average was 17%, worst was 45%
Compared to all devices tested
» 1% of all tested devices were better, 0% similar, 99% worse
» The best had a delta of 4%, average was 24%, worst was 134%
Power management - The 3K panel needs a lot of power
Power consumption
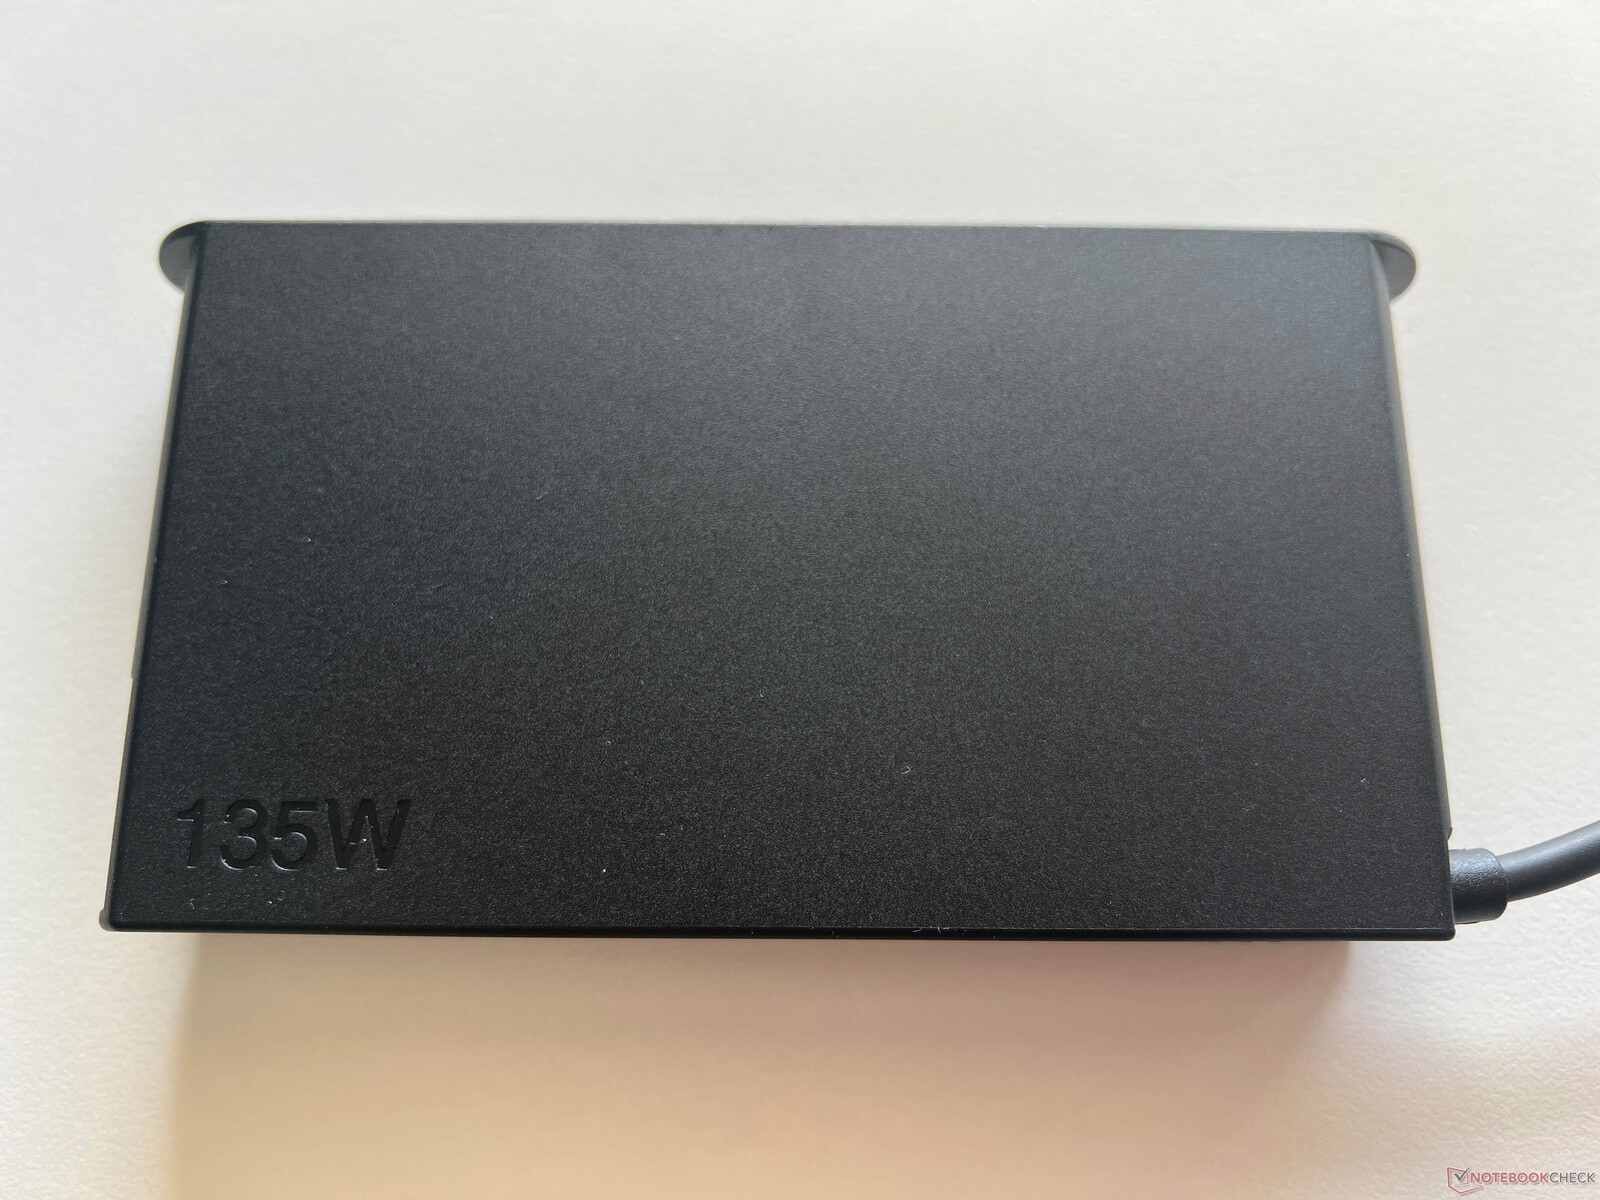
Our consumption measurements clearly showed that the new 3K panel requires a lot of power. Despite its lower maximum brightness, the laptop's maximum idle consumption is higher than that of the ZBook Firefly 14 G11, for example. When gaming, the device requires between 80-90 watts, while we saw 137 watts for a few seconds during the stress test. However, this value then quickly stabilized at 90 watts and remained at this level. The 135-watt power supply is therefore sufficient in size. Configurations without the RTX 500 Ada come delivered with a weaker 100-watt power supply unit.
| Off / Standby | |
| Idle | |
| Load |
|
Key:
min: | |
| Lenovo ThinkPad P14s G5 21G3S00A00 Ultra 7 155H, RTX 500 Ada Generation Laptop, Lenovo UMIS AM630 RPETJ1T24MGE2QDQ, IPS, 3072x1920, 14.5" | HP ZBook Firefly 14 G11 Ultra 7 165H, RTX A500 Laptop GPU, Kioxia XG8 KXG80ZNV512G, IPS, 2560x1600, 14" | Dell Precision 5000 5490 Ultra 9 185H, RTX 3000 Ada Generation Laptop, Kioxia XG8 KXG80ZNV1T02, IPS, 2560x1600, 14" | Lenovo ThinkPad P14s G4 21HF0017GE i7-1370P, RTX A500 Laptop GPU, SK Hynix HFS002TEJ9X162N, OLED, 2880x1800, 14" | Microsoft Surface Laptop Studio 2 RTX 4060 i7-13700H, GeForce RTX 4060 Laptop GPU, Kioxia XG8 KXG80ZNV1T02, IPS, 2400x1600, 14.4" | Lenovo Yoga Pro 9-14IRP G8 i7-13705H, GeForce RTX 4050 Laptop GPU, Samsung PM9A1 MZVL21T0HCLR, Mini-LED, 3072x1920, 14.5" | Average NVIDIA RTX 500 Ada Generation Laptop | Average of class Workstation | |
|---|---|---|---|---|---|---|---|---|
| Power Consumption | 21% | -9% | 30% | 37% | -23% | 11% | -13% | |
| Idle Minimum * (Watt) | 7.5 | 6.6 12% | 11.1 -48% | 6.3 16% | 3 60% | 10.9 -45% | 6.5 ? 13% | 8.94 ? -19% |
| Idle Average * (Watt) | 13.5 | 12.7 6% | 14.8 -10% | 7 48% | 7.1 47% | 17.7 -31% | 11 ? 19% | 13.8 ? -2% |
| Idle Maximum * (Watt) | 14.2 | 13.3 6% | 16.5 -16% | 8.1 43% | 7.6 46% | 19.3 -36% | 11.5 ? 19% | 17.5 ? -23% |
| Load Average * (Watt) | 100.2 | 67 33% | 70.1 30% | 84.6 16% | 73.1 27% | 93.3 7% | 94.1 ? 6% | 95 ? 5% |
| Cyberpunk 2077 ultra * (Watt) | 86.7 | 63.4 27% | ||||||
| Cyberpunk 2077 ultra external monitor * (Watt) | 84.6 | 58.1 31% | ||||||
| Load Maximum * (Watt) | 137.4 | 94.9 31% | 137.5 -0% | 98.3 28% | 128.5 6% | 150.2 -9% | 137.2 ? -0% | 175.2 ? -28% |
| Witcher 3 ultra * (Watt) | 93.1 | 56.5 | 113.9 | 129.5 |
* ... smaller is better
Power consumption Cyberpunk / stress test
Power consumption with external monitor
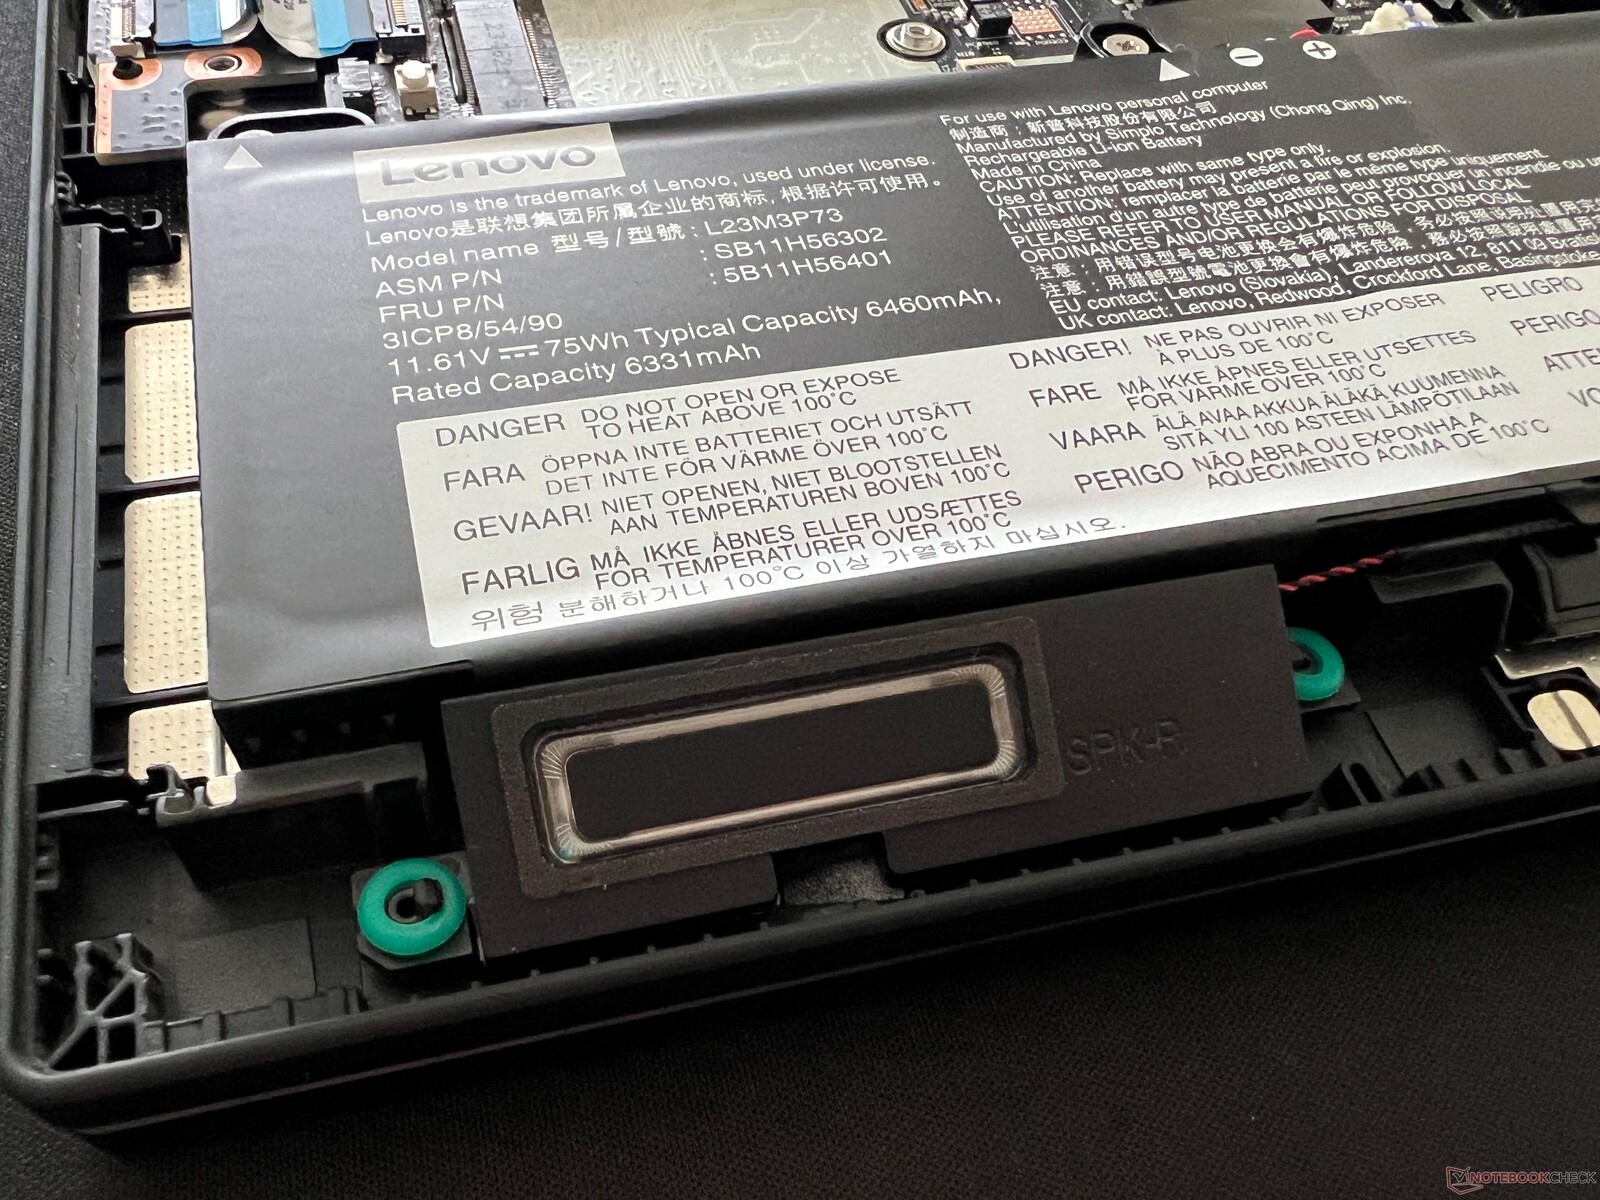
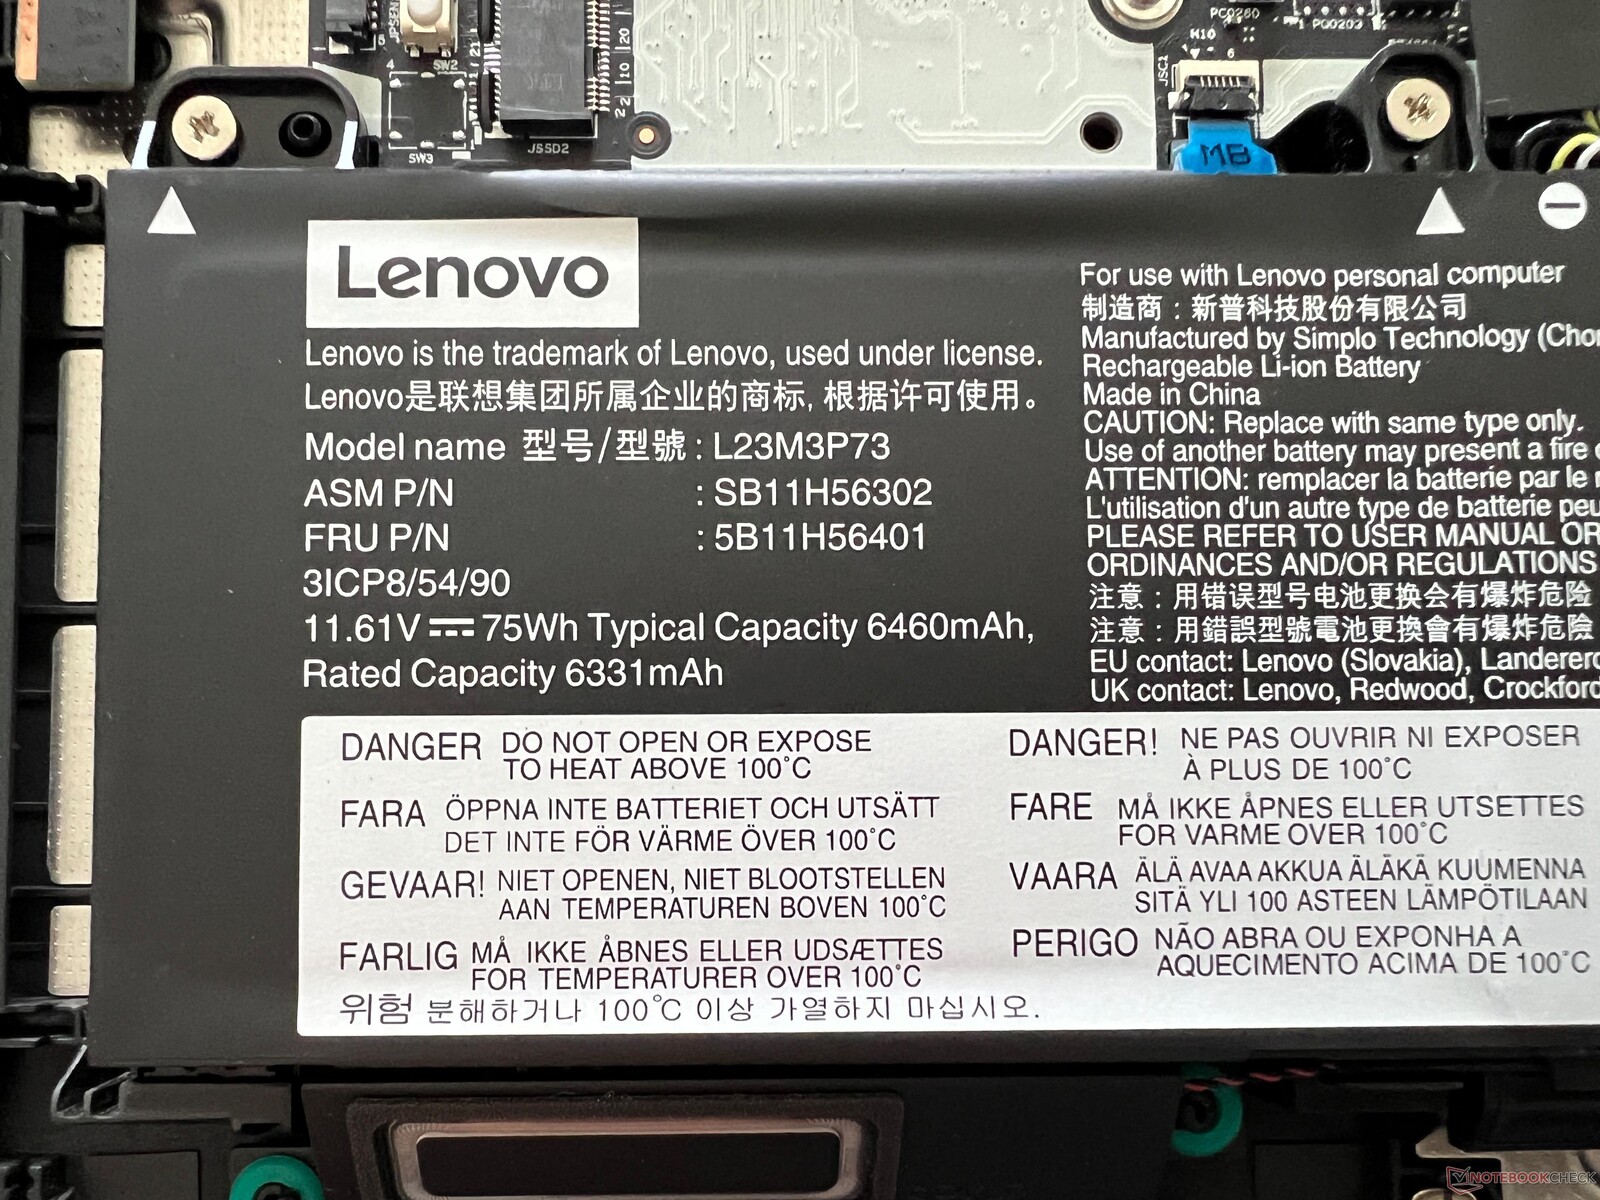
Runtimes
The new ThinkPad P14s G5 Intel is available with two different battery sizes (57 or 75 Wh). Our test device is equipped with the larger 75 Wh battery, which is needed to achieve decent runtimes since it features a 3K panel. Incidentally, its refresh rate can't currently be changed, as the active signal mode always remains at 120 Hz; Lenovo could do with improving this with an update. At 120 Hz, its results are only average. During the WLAN test at 150 cd/m² (corresponds to 66 % of our test device's maximum brightness), we noted just under 8 hours, which was only undercut by the old P14s G4 with its 52.5 Wh battery. At full brightness, the WLAN test only ran for 5:43 hours. In the video test, it lasted for just under 9 hours and under load, the battery was drained in around 80 minutes.
It takes 128 minutes to charge the device fully using the 135-watt power supply when it is switched on, whereby 80 % of its capacity is available again after 75 minutes.
| Lenovo ThinkPad P14s G5 21G3S00A00 Ultra 7 155H, RTX 500 Ada Generation Laptop, 75 Wh | HP ZBook Firefly 14 G11 Ultra 7 165H, RTX A500 Laptop GPU, 56 Wh | Dell Precision 5000 5490 Ultra 9 185H, RTX 3000 Ada Generation Laptop, 72 Wh | Lenovo ThinkPad P14s G4 21HF0017GE i7-1370P, RTX A500 Laptop GPU, 52.5 Wh | Microsoft Surface Laptop Studio 2 RTX 4060 i7-13700H, GeForce RTX 4060 Laptop GPU, 58 Wh | Lenovo Yoga Pro 9-14IRP G8 i7-13705H, GeForce RTX 4050 Laptop GPU, 75 Wh | Average of class Workstation | |
|---|---|---|---|---|---|---|---|
| Battery runtime | 9% | 39% | -23% | 34% | -2% | 8% | |
| H.264 (h) | 8.9 | 11.3 27% | 9.1 2% | 9.51 ? 7% | |||
| WiFi v1.3 (h) | 7.9 | 8.6 9% | 11 39% | 6.1 -23% | 8.3 5% | 8 1% | 8.53 ? 8% |
| Load (h) | 1.3 | 1 -23% | 2.2 69% | 1.2 -8% | 1.429 ? 10% |
Pros
Cons
Verdict - The ThinkPad P14s G5 now with a faster GPU


At the beginning of this test, we asked the question of whether this laptop's development is heading in the right direction again. The new ThinkPad P14s G5 (Intel) shows a lot of potential—the decision not to use the thinnest possible case, its switch from the optional OLED panel to a matte IPS screen without PWM as well as its upgradable RAM all benefit a mobile workstation greatly. However, these steps aren't enough in our eyes. Even though the components' performance is generally fine, you simply have to question why the manufacturer doesn't offer the faster RTX 1000 Ada, for example, considering the laptop's thick case—or why even the optional IPS panel with its 3K resolution still trails behind the competition in terms of brightness. At the end of the day, Lenovo has managed to use more powerful components and a much brighter mini LED panel within the Yoga Pro 9 14—all inside a thinner case.
The new IPS display itself, with its 3K resolution and P3 coverage, is a pretty decent panel, but Lenovo should give users access to an sRGB profile—plus, you currently can't reduce its refresh rate to 60 Hz, which would improve the device's battery life a little more. The RTX 500 Ada's graphics performance is a lot better than that of the old RTX A500 Laptop and its Meteor Lake processor doesn't disappoint either, whereas the laptop's cooling reached its limit during the stress test. In view of its thick base unit, a maximum cooling capacity of 60 watts (CPU/GPU combined) isn't terribly impressive, especially when compared with powerful 14-inch multimedia laptops. As for its keyboard, the Fn key's new position will certainly take some getting used to for ThinkPad veterans, but the quality of the keyboard itself hasn't changed. So the keyboard is good, but nothing special. Again, we have to ask ourselves why a 1.8 mm keyboard couldn't have been installed in such a thick base unit.
The Intel version of the ThinkPad P14s G5 offers good maintenance options as well as a new 14.5-inch display. Its performance is also a little better than its predecessor but despite its thick base unit, the mobile workstation can only be purchased with the entry-level GPU from Nvidia at best, namely the RTX 500 Ada.
The ThinkPad P14s offers further advantages such as good maintenance options—including two RAM slots for up to 96 GB of RAM. There are enough ports and its 5 MP webcam does a decent job. In terms of performance, it is also clearly superior to its direct competitor, the HP ZBook Firefly 14 G11. However, if you aren't dependent on ISV certifications, you can get significantly more performance from multimedia devices nowadays, especially in terms of graphics cards. The big difference between the Intel and AMD models is also not a good situation for customers.
Price and availability
The ThinkPad P14s G5 can be configured via Lenovo's online shop, with prices starting from US$2,439.
Please note: We have recently updated our rating system and the results of version 8 are not comparable with the results of version 7. More information is available here.
Lenovo ThinkPad P14s G5 21G3S00A00
- 07/18/2024 v8
Andreas Osthoff
 Total Sustainability Score:
 Transparency
The selection of devices to be reviewed is made by our editorial team. The test sample was provided to the author as a loan by the manufacturer or retailer for the purpose of this review. The lender had no influence on this review, nor did the manufacturer receive a copy of this review before publication. There was no obligation to publish this review. As an independent media company, Notebookcheck is not subjected to the authority of manufacturers, retailers or publishers.
This is how Notebookcheck is testing
Every year, Notebookcheck independently reviews hundreds of laptops and smartphones using standardized procedures to ensure that all results are comparable. We have continuously developed our test methods for around 20 years and set industry standards in the process. In our test labs, high-quality measuring equipment is utilized by experienced technicians and editors. These tests involve a multi-stage validation process. Our complex rating system is based on hundreds of well-founded measurements and benchmarks, which maintains objectivity. Further information on our test methods can be found here.
Price comparison

