HP ZBook Firefly 14 G11 laptop review: Core Ultra update with Nvidia RTX A500 graphics
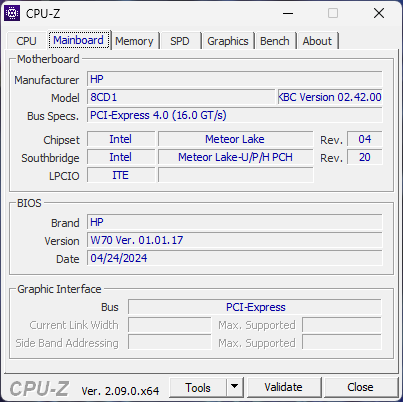
The ZBook Firefly 14 has been refreshed this year for the 11th time in a row. Called the ZBook Firefly 14 G11, it succeeds the ZBook Firefly 14 G10 by updating the CPU to Intel Meteor Lake and the option for discrete Nvidia graphics. The chassis is otherwise the same as yesteryear and so we recommend checking out our review on the Firefly 14 G10 or G9 to learn more about the physical features of the model.
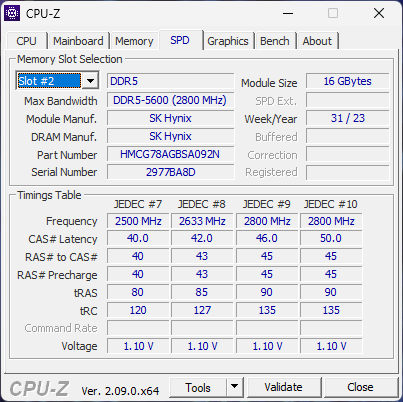
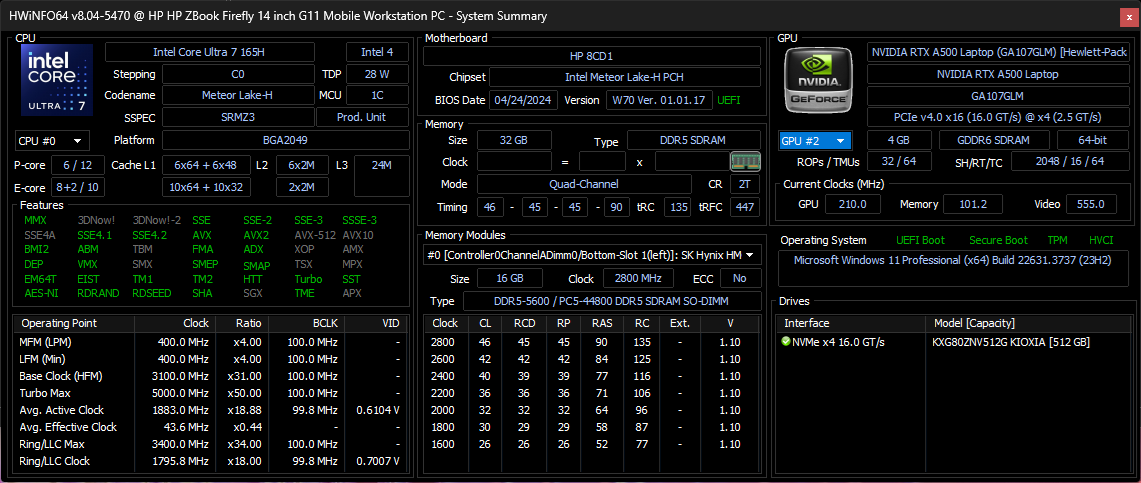
Our test unit is the higher-end configuration with the vPro-enabled Core Ultra 7 165H CPU, RTX A500 GPU, and 2560 x 1600 resolution IPS display for approximately $3500 retail. As per usual with ZBooks, configurable options are much wider than most consumer models with CPUs ranging from the Core Ultra 5 125U up to the Core Ultra 7 165H and either integrated or Nvidia RTX A500 graphics. AMD SKUs with Ryzen Zen 4 processors are also available under the name ZBook Firefly 14 G11 A.
Alternatives to the ZBook Firefly 14 include other slim 14-inch mobile workstations like the Dell Precision 5490 or Lenovo ThinkPad P14s G4.
More HP reviews:
Potential Competitors in Comparison
Rating | Version | Date | Model | Weight | Height | Size | Resolution | Price |
|---|---|---|---|---|---|---|---|---|
| 80.3 % | v8 | 07 / 2024 | HP ZBook Firefly 14 G11 Ultra 7 165H, RTX A500 Laptop GPU | 1.5 kg | 19.2 mm | 14.00" | 2560x1600 | |
| 87.4 % v7 (old) | v7 (old) | 10 / 2023 | HP ZBook Firefly 14 G10 A R5 PRO 7640HS, Radeon 760M | 1.5 kg | 20 mm | 14.00" | 1920x1200 | |
| 83.6 % v7 (old) | v7 (old) | 10 / 2022 | HP ZBook Firefly 14 G9-6B8A2EA i7-1265U, T550 Laptop GPU | 1.5 kg | 19.9 mm | 14.00" | 1920x1200 | |
| 89.3 % v7 (old) | v7 (old) | 04 / 2024 | Dell Precision 5000 5490 Ultra 9 185H, RTX 3000 Ada Generation Laptop | 1.6 kg | 18.95 mm | 14.00" | 2560x1600 | |
| 81 % | v8 | 07 / 2024 | Lenovo ThinkPad P14s G4 21HF0017GE i7-1370P, RTX A500 Laptop GPU | 1.5 kg | 22.7 mm | 14.00" | 2880x1800 | |
| 84.3 % v7 (old) | v7 (old) | 04 / 2024 | Asus ExpertBook B3 B3404CVF i7-1355U, GeForce RTX 2050 Mobile | 1.7 kg | 23.9 mm | 14.00" | 1920x1200 |
Hinweis: Wir haben unser Rating-System kürzlich aktualisiert und die Ergebnisse von Version 8 sind nicht mit den Ergebnissen von Version 7 vergleichbar. Weitere Informationen dazu sind hier verfügbar.
Note: We have recently updated our rating system and the results of version 8 are not comparable with the results of version 7. More information is available here .
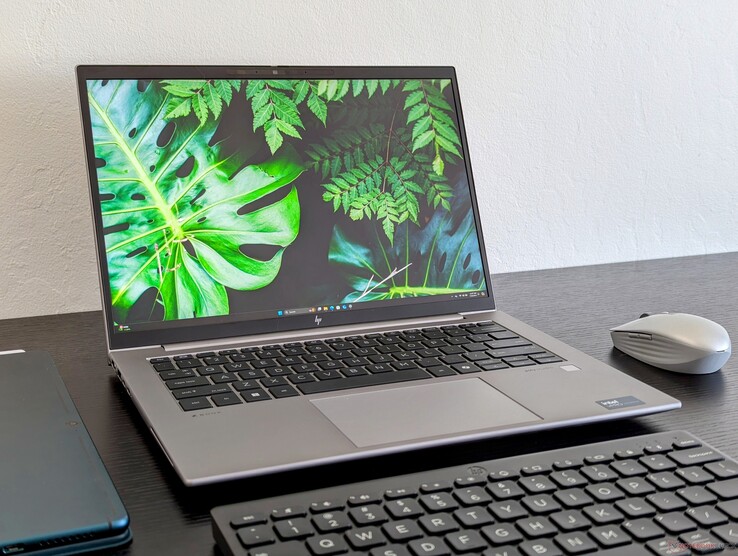
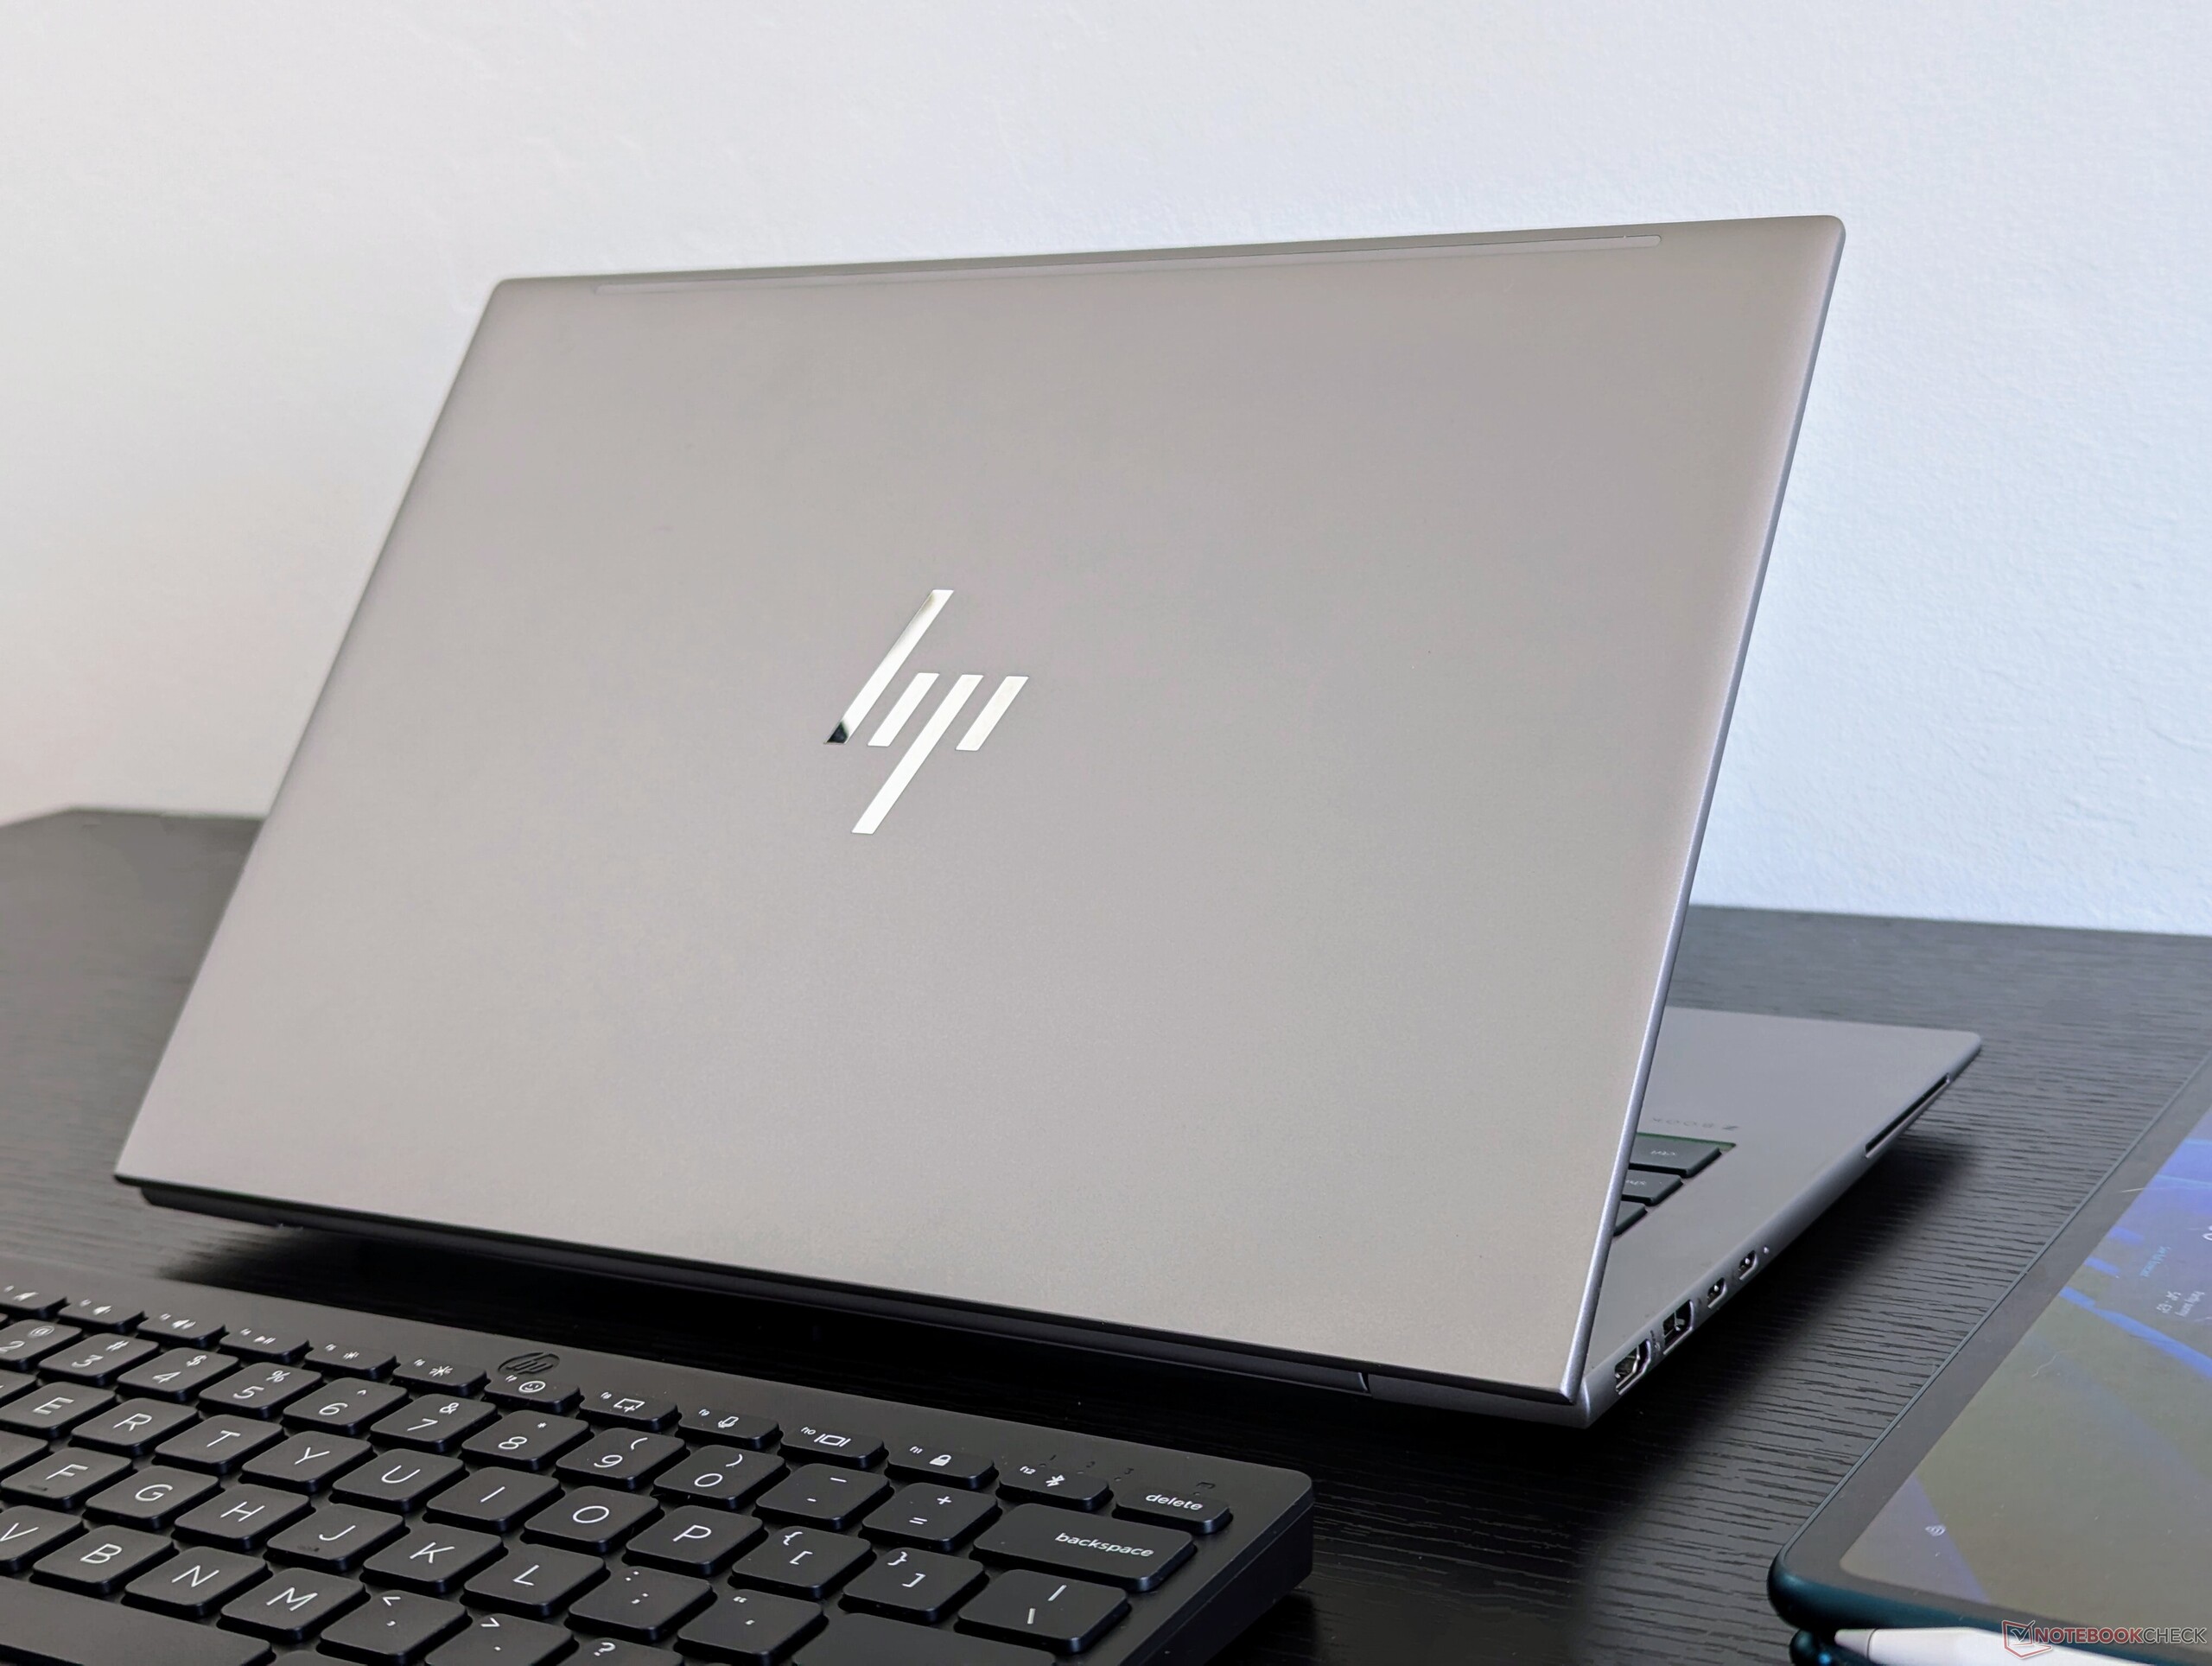
Case — Familiar ZBook Look And Feel
Although the chassis remains unchanged, you can still distinguish the ZBook Firefly 14 G11 from previous entries in the series by looking for the new Co-Pilot key on the keyboard. Most Windows PCs running Meteor Lake will have an integrated Co-Pilot key as they are expected to become compatible with future AI-accelerated features.
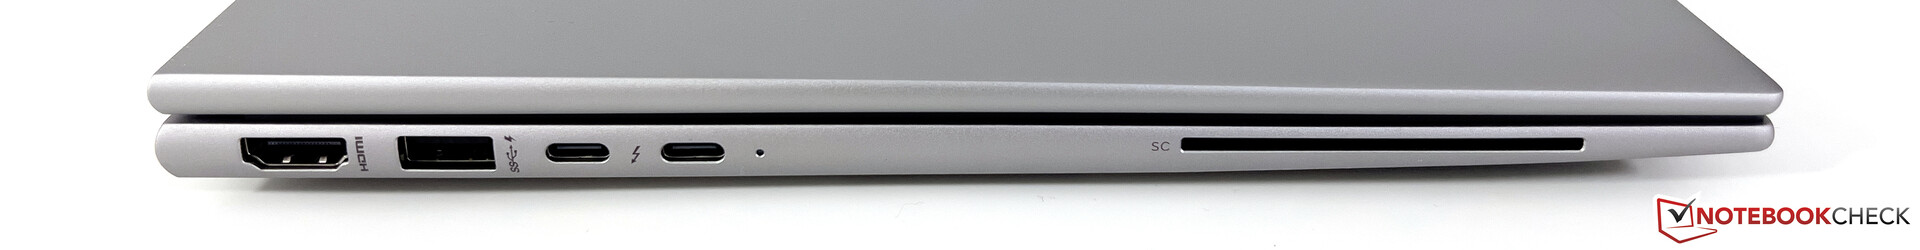
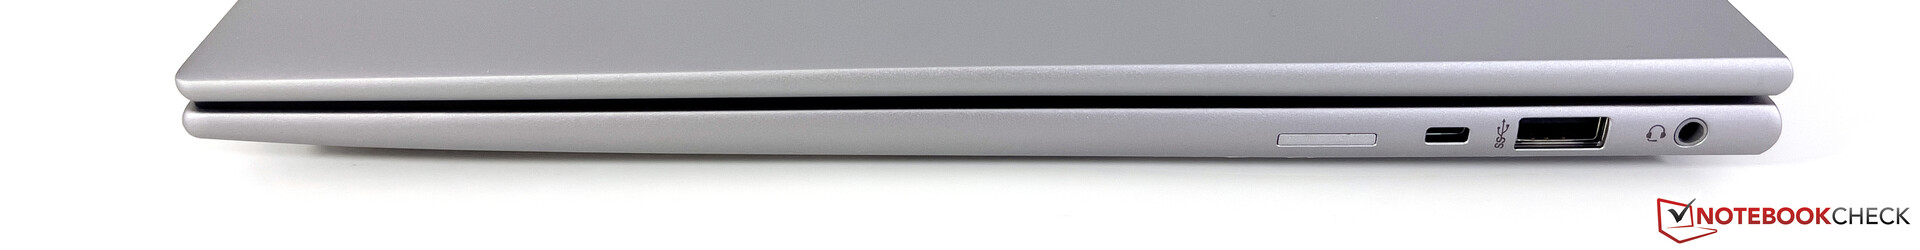
Connectivity
Communication
| Networking | |
| iperf3 transmit AX12 | |
| HP ZBook Firefly 14 G8 2C9Q2EA | |
| iperf3 receive AX12 | |
| HP ZBook Firefly 14 G8 2C9Q2EA | |
| iperf3 transmit AXE11000 | |
| HP ZBook Firefly 14 G11 | |
| Asus ExpertBook B3 B3404CVF | |
| Dell Precision 5000 5490 | |
| HP ZBook Firefly 14 G10 A | |
| Lenovo ThinkPad P14s G4 21HF0017GE | |
| iperf3 receive AXE11000 | |
| HP ZBook Firefly 14 G10 A | |
| Lenovo ThinkPad P14s G4 21HF0017GE | |
| HP ZBook Firefly 14 G11 | |
| Asus ExpertBook B3 B3404CVF | |
| Dell Precision 5000 5490 | |
| iperf3 transmit AXE11000 6GHz | |
| Asus ExpertBook B3 B3404CVF | |
| HP ZBook Firefly 14 G11 | |
| Dell Precision 5000 5490 | |
| Lenovo ThinkPad P14s G4 21HF0017GE | |
| iperf3 receive AXE11000 6GHz | |
| HP ZBook Firefly 14 G11 | |
| Lenovo ThinkPad P14s G4 21HF0017GE | |
| Dell Precision 5000 5490 | |
| Asus ExpertBook B3 B3404CVF | |
Webcam
The 5 MP webcam remains unchanged from the 2023 model. Both an IR sensor and physical shutter slider come built-in.


Maintenance
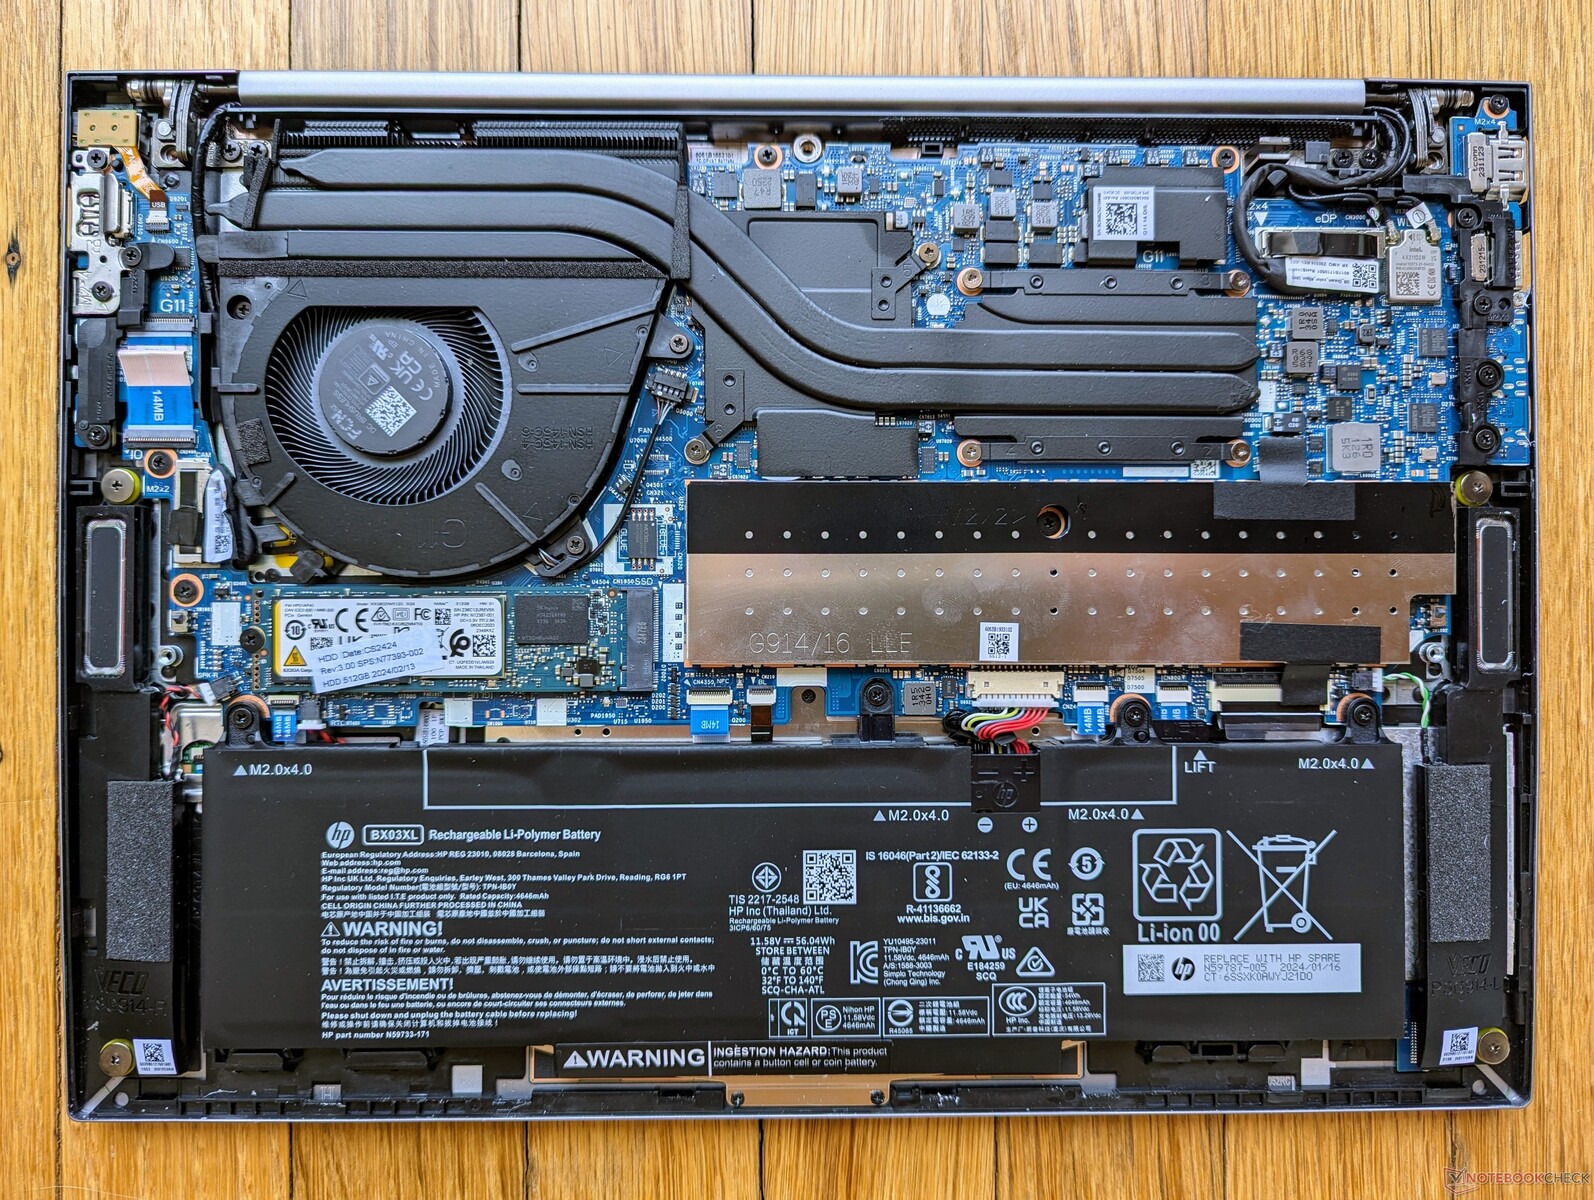
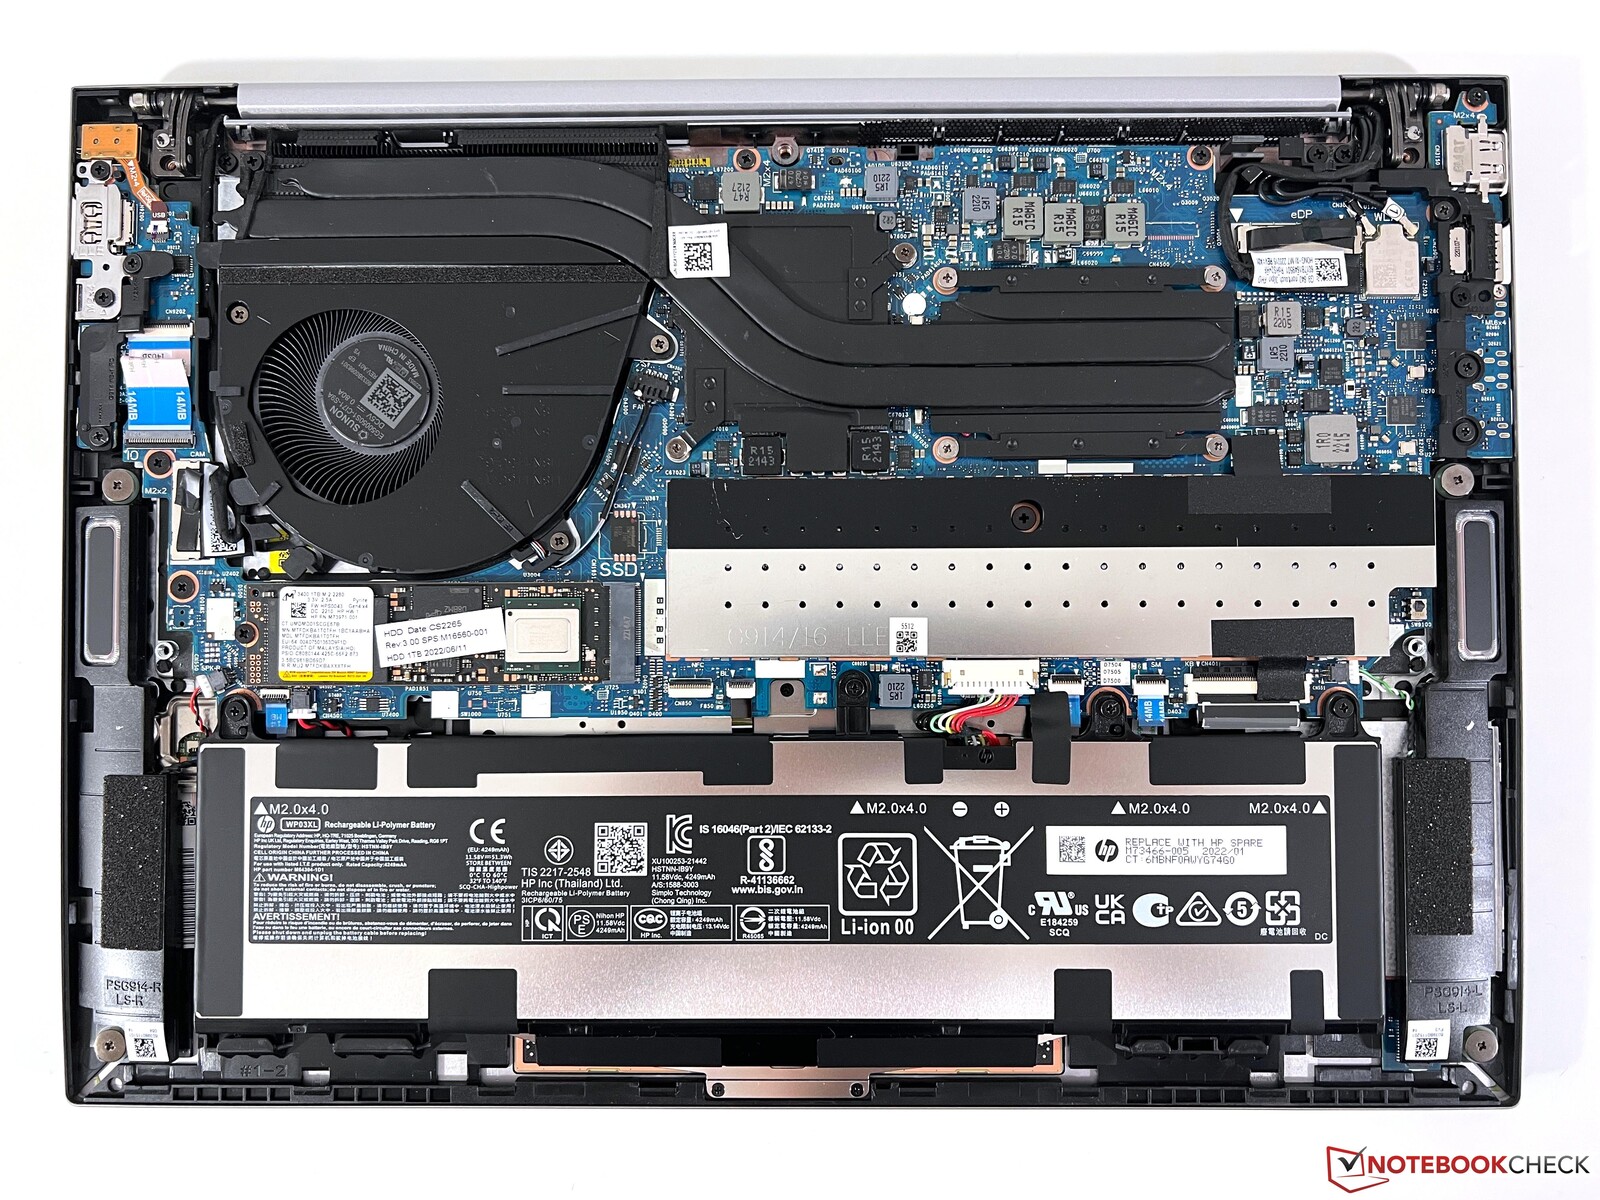
The bottom panel requires only a Phillips screwdriver to remove for easy servicing. Internals have remained mostly the same since the 2022 ZBook Firefly 14 G9.
Warranty
Only a one-year limited manufacturer warranty comes standard if purchased in the US whereas larger ZBook models typically come with three years instead.
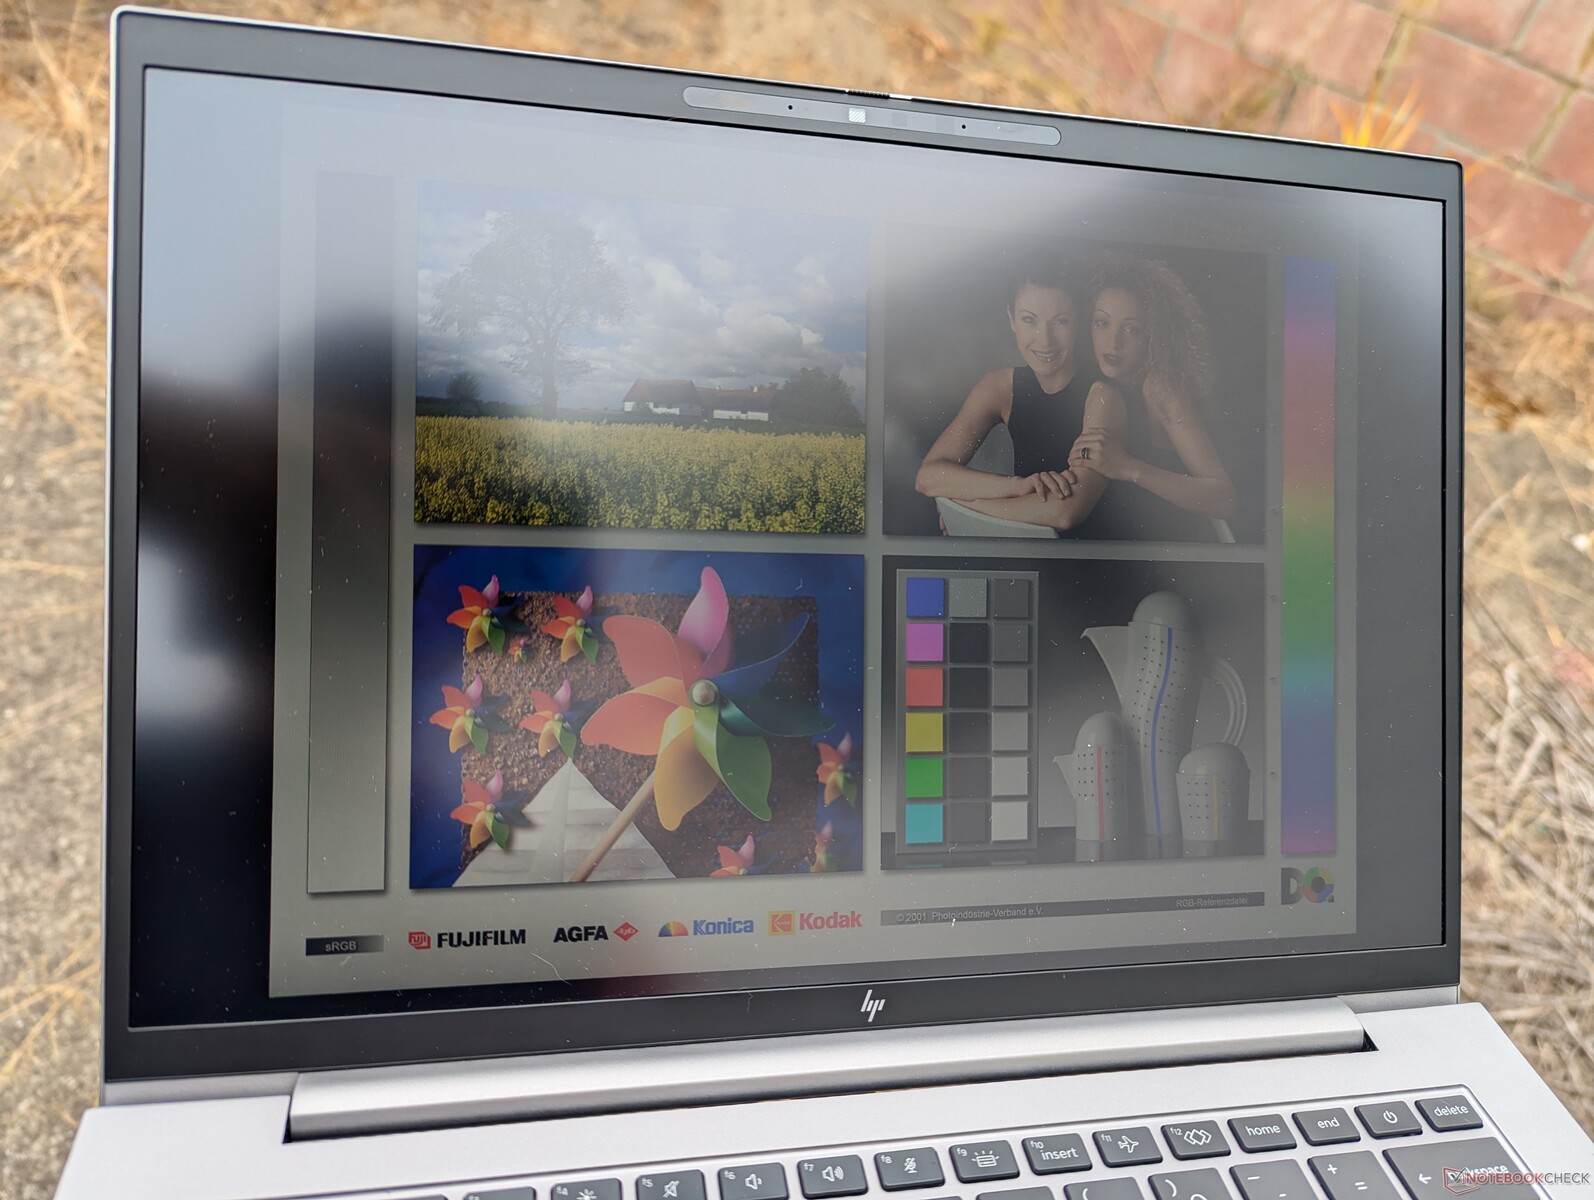
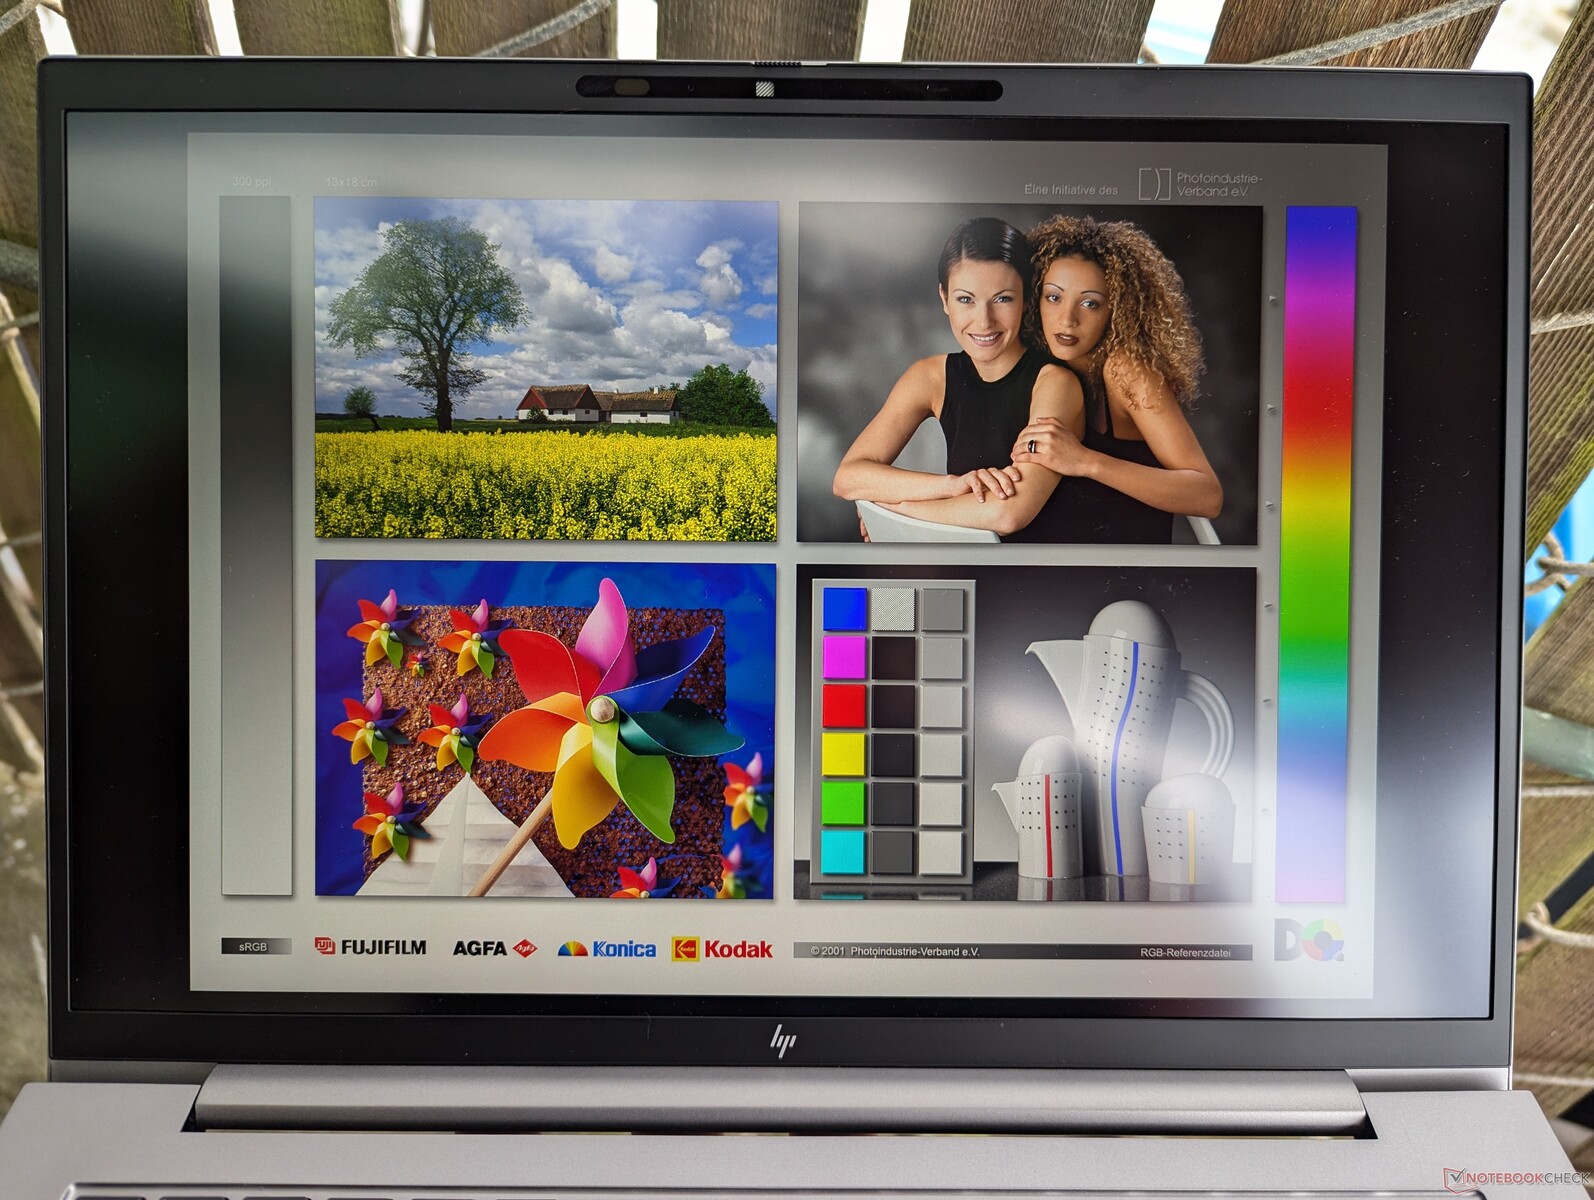
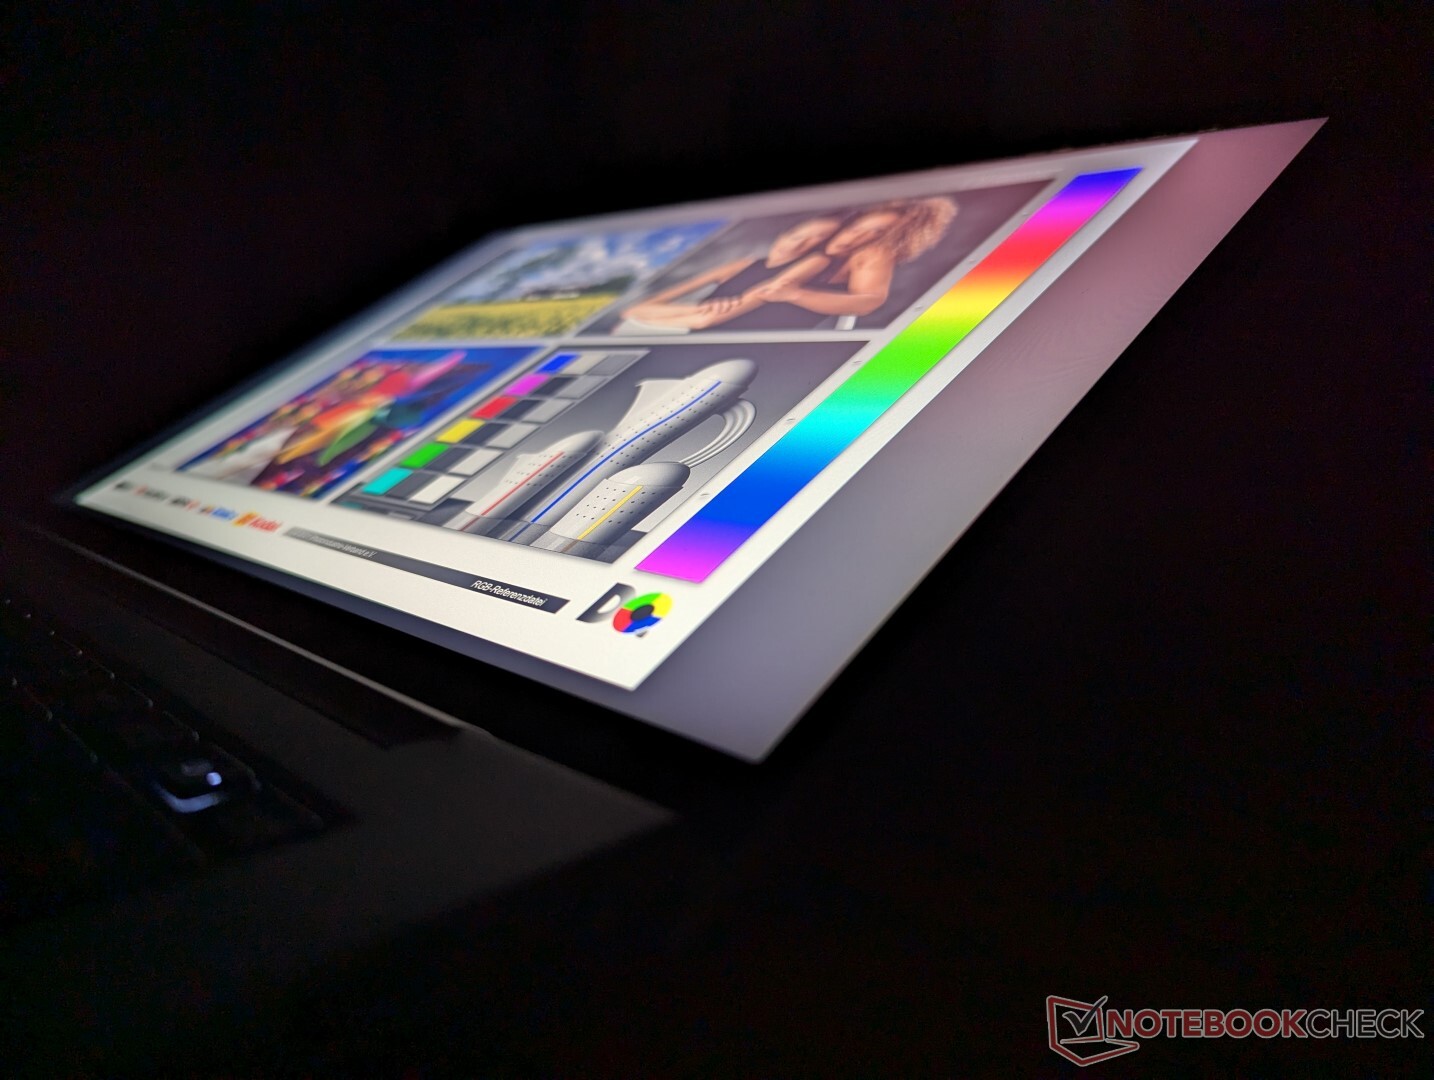
Display — Putting The Dream In DreamColor
A total of five display options are available as follows in order from high-end to low-end. Note that only one panel option is available with touchscreen. Our test unit comes equipped with the bolded option below.
- 2560 x 1600, 120 Hz, IPS, matte, 500 nits, 100% DCI-P3, HP DreamColor
- 1920 x 1200, 60 Hz, IPS, matte, 400 nits, 100% sRGB
- 1920 x 1200, 60 Hz IPS, matte, 1000 nits, 100% sRGB, HP Sure View
- 1920 x 1200, 60 Hz, IPS, matte, 300 nits, ~60% sRGB, touchscreen
- 1920 x 1200, 60 Hz, IPS, matte, 300 nits, ~60% sRGB
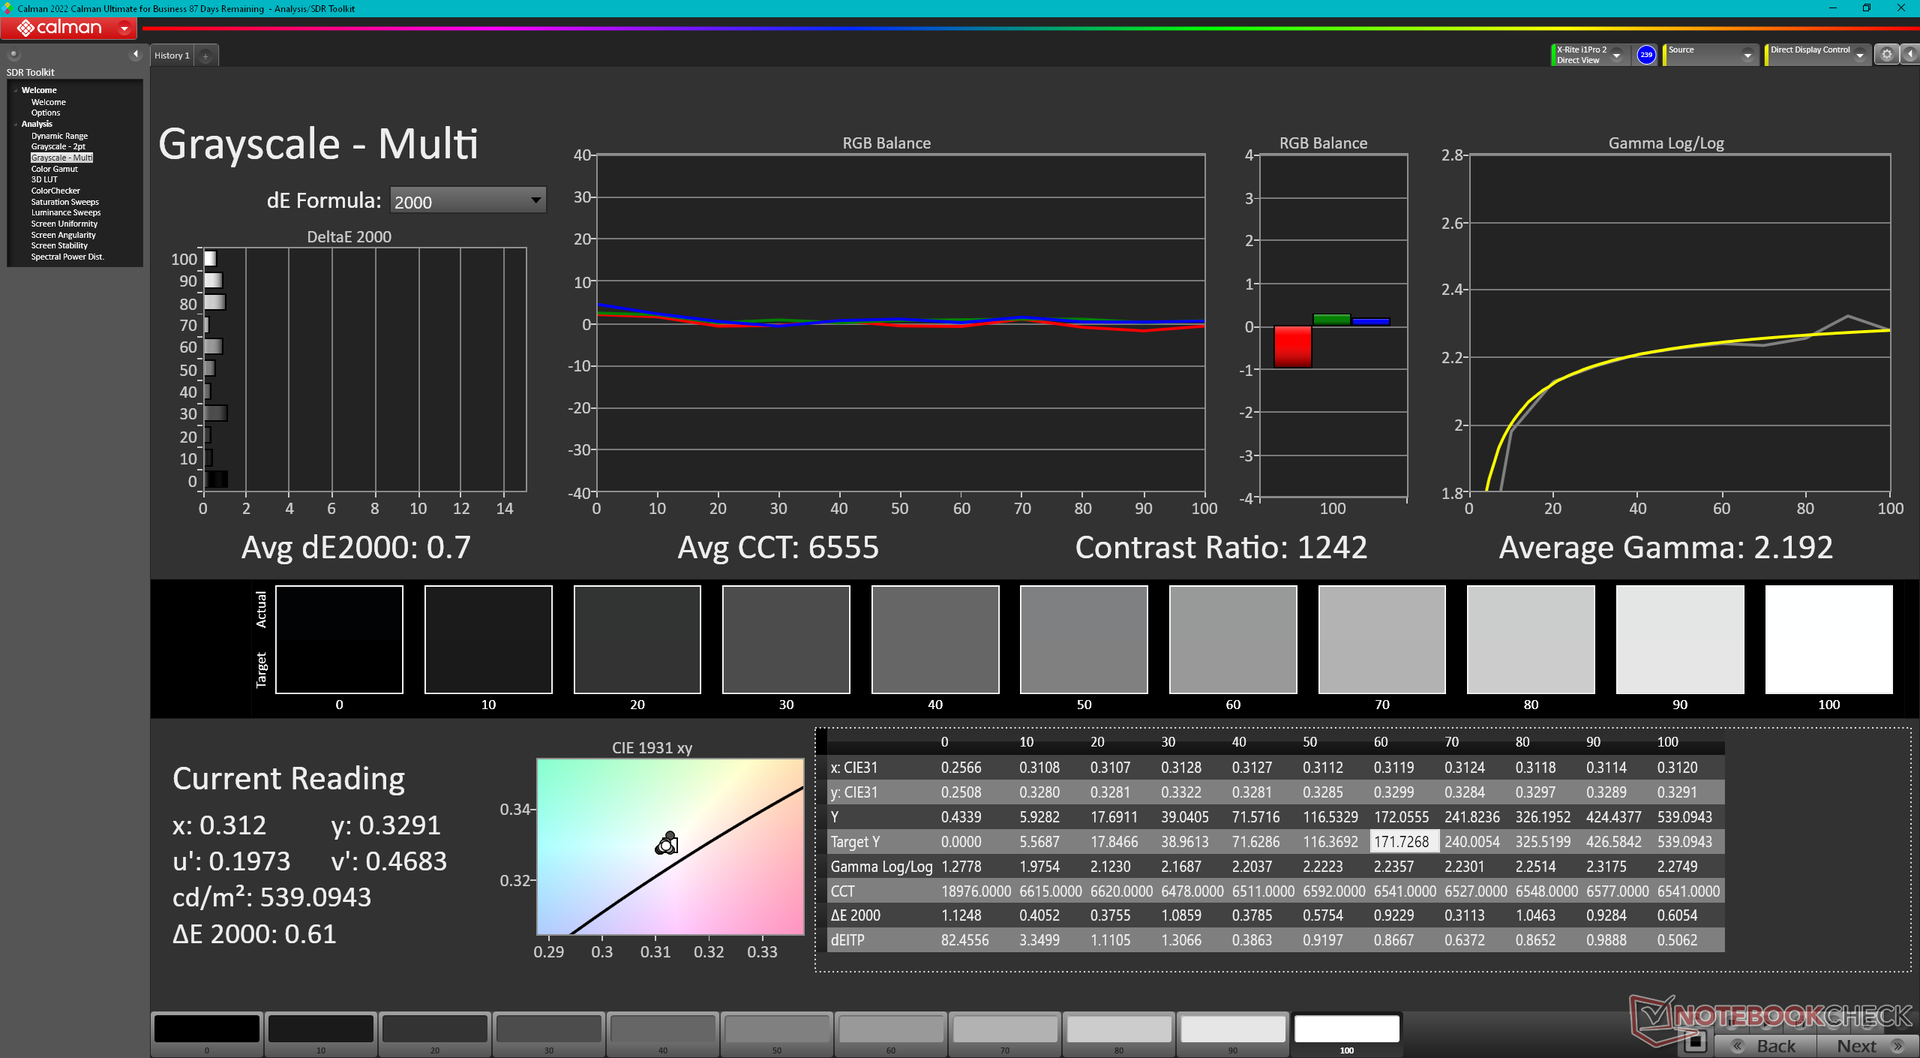
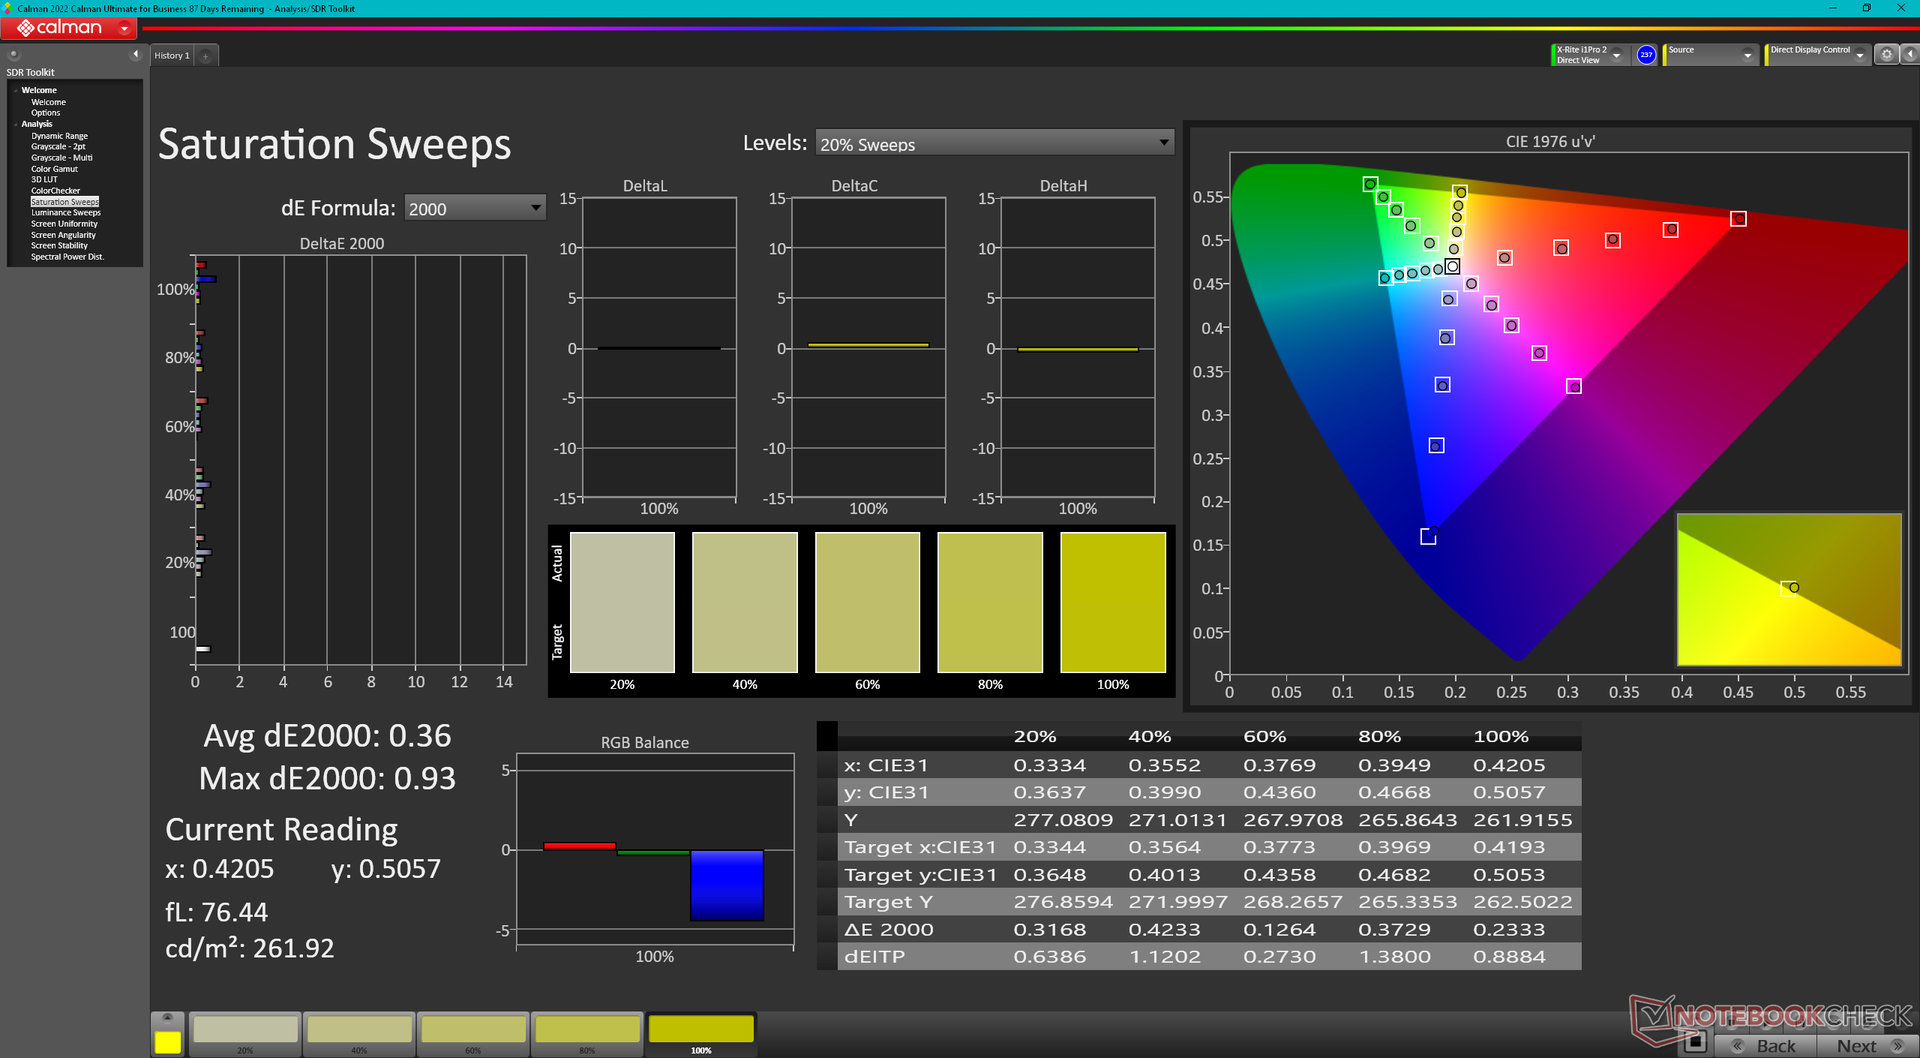
The ZBook Firefly 14 G11 is one of the few 14-inch workstations to come with a 1600p120 display option. The 1600p panel on the Precision 5490, for example, is limited to only 60 Hz in comparison. This is one of the best 14-inch 2K displays we've seen as it offers fast refresh rates, full DCI-P3 colors, and even faster black-white and gray-gray response times than most other workstations to limit ghosting. It's still unfortunate that the model comes with no OLED options, however.

| |||||||||||||||||||||||||
Brightness Distribution: 93 %
Center on Battery: 554.1 cd/m²
Contrast: 955:1 (Black: 0.58 cd/m²)
ΔE ColorChecker Calman: 2.54 | ∀{0.5-29.43 Ø4.73}
calibrated: 0.56
ΔE Greyscale Calman: 1 | ∀{0.09-98 Ø4.97}
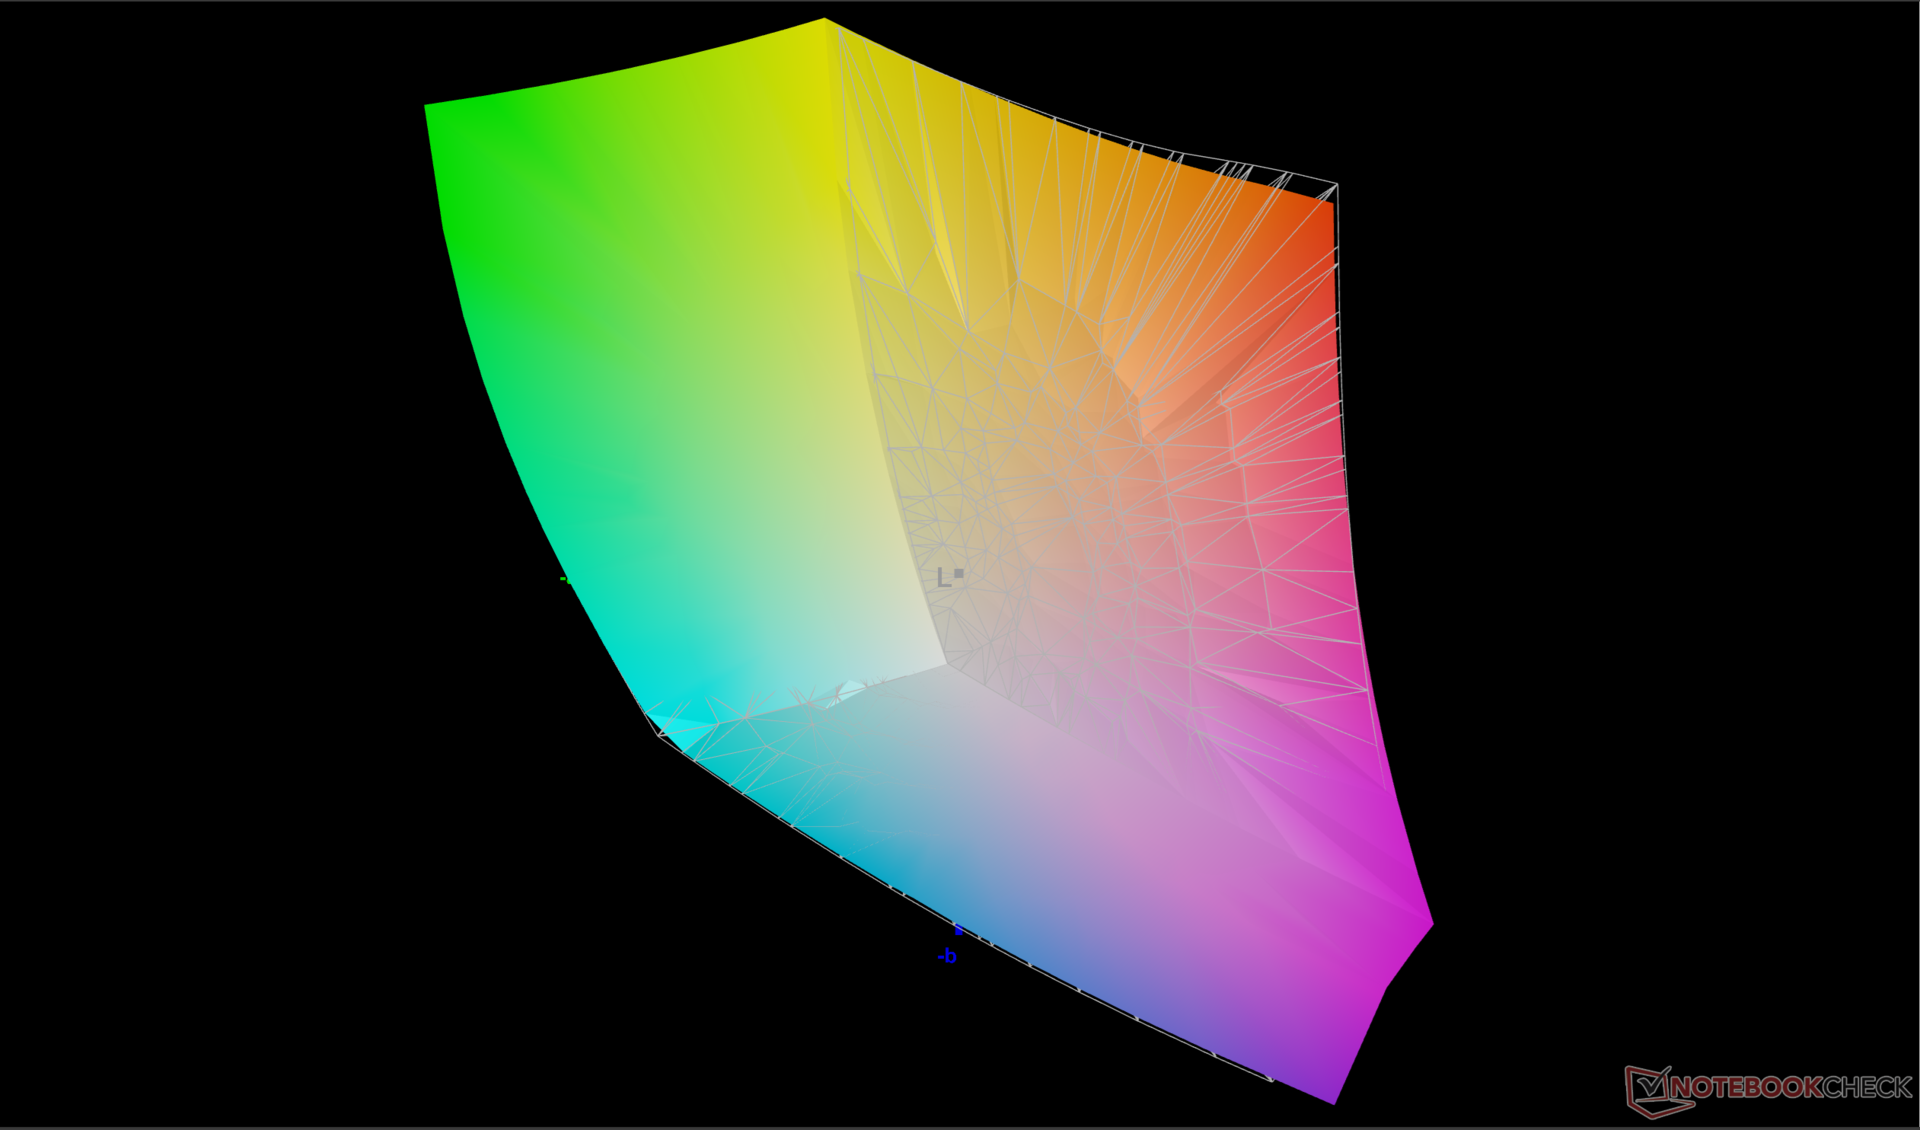
86.6% AdobeRGB 1998 (Argyll 3D)
99.9% sRGB (Argyll 3D)
98.9% Display P3 (Argyll 3D)
Gamma: 2.3
CCT: 6556 K
| HP ZBook Firefly 14 G11 AUO6DA8, IPS, 2560x1600, 14" | HP ZBook Firefly 14 G10 A CMN1435, IPS, 1920x1200, 14" | HP ZBook Firefly 14 G8 2C9Q2EA AU Optronics AUO068B, IPS, 1920x1080, 14" | Dell Precision 5000 5490 AU Optronics B140QAN, IPS, 2560x1600, 14" | Lenovo ThinkPad P14s G4 21HF0017GE ATNA40YK15-0, OLED, 2880x1800, 14" | Asus ExpertBook B3 B3404CVF BOE NV140WUM-N43, IPS, 1920x1200, 14" | |
|---|---|---|---|---|---|---|
| Display | -17% | -16% | -9% | 4% | -52% | |
| Display P3 Coverage (%) | 98.9 | 68.7 -31% | 70 -29% | 79.7 -19% | 99.9 1% | 39.4 -60% |
| sRGB Coverage (%) | 99.9 | 98.2 -2% | 99.5 0% | 100 0% | 100 0% | 58.2 -42% |
| AdobeRGB 1998 Coverage (%) | 86.6 | 70.8 -18% | 71.4 -18% | 79.5 -8% | 97 12% | 40.7 -53% |
| Response Times | -281% | -338% | -313% | 75% | -114% | |
| Response Time Grey 50% / Grey 80% * (ms) | 12.3 ? | 56.2 ? -357% | 64.4 ? -424% | 52.3 ? -325% | 3 ? 76% | 23 ? -87% |
| Response Time Black / White * (ms) | 8.3 ? | 25.2 ? -204% | 29.2 ? -252% | 33.3 ? -301% | 2.2 ? 73% | 20 ? -141% |
| PWM Frequency (Hz) | 360 ? | |||||
| PWM Amplitude * (%) | 25 | |||||
| Screen | -20% | -37% | -8% | -159% | -125% | |
| Brightness middle (cd/m²) | 554.1 | 397 -28% | 461 -17% | 485.1 -12% | 432 -22% | 319 -42% |
| Brightness (cd/m²) | 540 | 367 -32% | 439 -19% | 471 -13% | 432 -20% | 312 -42% |
| Brightness Distribution (%) | 93 | 86 -8% | 89 -4% | 90 -3% | 98 5% | 91 -2% |
| Black Level * (cd/m²) | 0.58 | 0.25 57% | 0.24 59% | 0.38 34% | 0.3515 39% | |
| Contrast (:1) | 955 | 1588 66% | 1921 101% | 1277 34% | 908 -5% | |
| Colorchecker dE 2000 * | 2.54 | 2.35 7% | 2.6 -2% | 2.15 15% | 4.8 -89% | 5.47 -115% |
| Colorchecker dE 2000 max. * | 4.99 | 4.68 6% | 5.8 -16% | 5.39 -8% | 9.2 -84% | 9.44 -89% |
| Colorchecker dE 2000 calibrated * | 0.56 | 1.15 -105% | 1.1 -96% | 0.67 -20% | 4.9 -775% | 3.89 -595% |
| Greyscale dE 2000 * | 1 | 2.4 -140% | 4.4 -340% | 2 -100% | 2.3 -130% | 3.7 -270% |
| Gamma | 2.3 96% | 2.067 106% | 2.29 96% | 2.3 96% | 2.23 99% | 1.97 112% |
| CCT | 6556 99% | 6409 101% | 6478 100% | 6826 95% | 6391 102% | 6712 97% |
| Color Space (Percent of AdobeRGB 1998) (%) | 65.2 | |||||
| Color Space (Percent of sRGB) (%) | 99.4 | |||||
| Total Average (Program / Settings) | -106% /
-56% | -130% /
-76% | -110% /
-52% | -27% /
-79% | -97% /
-107% |
* ... smaller is better

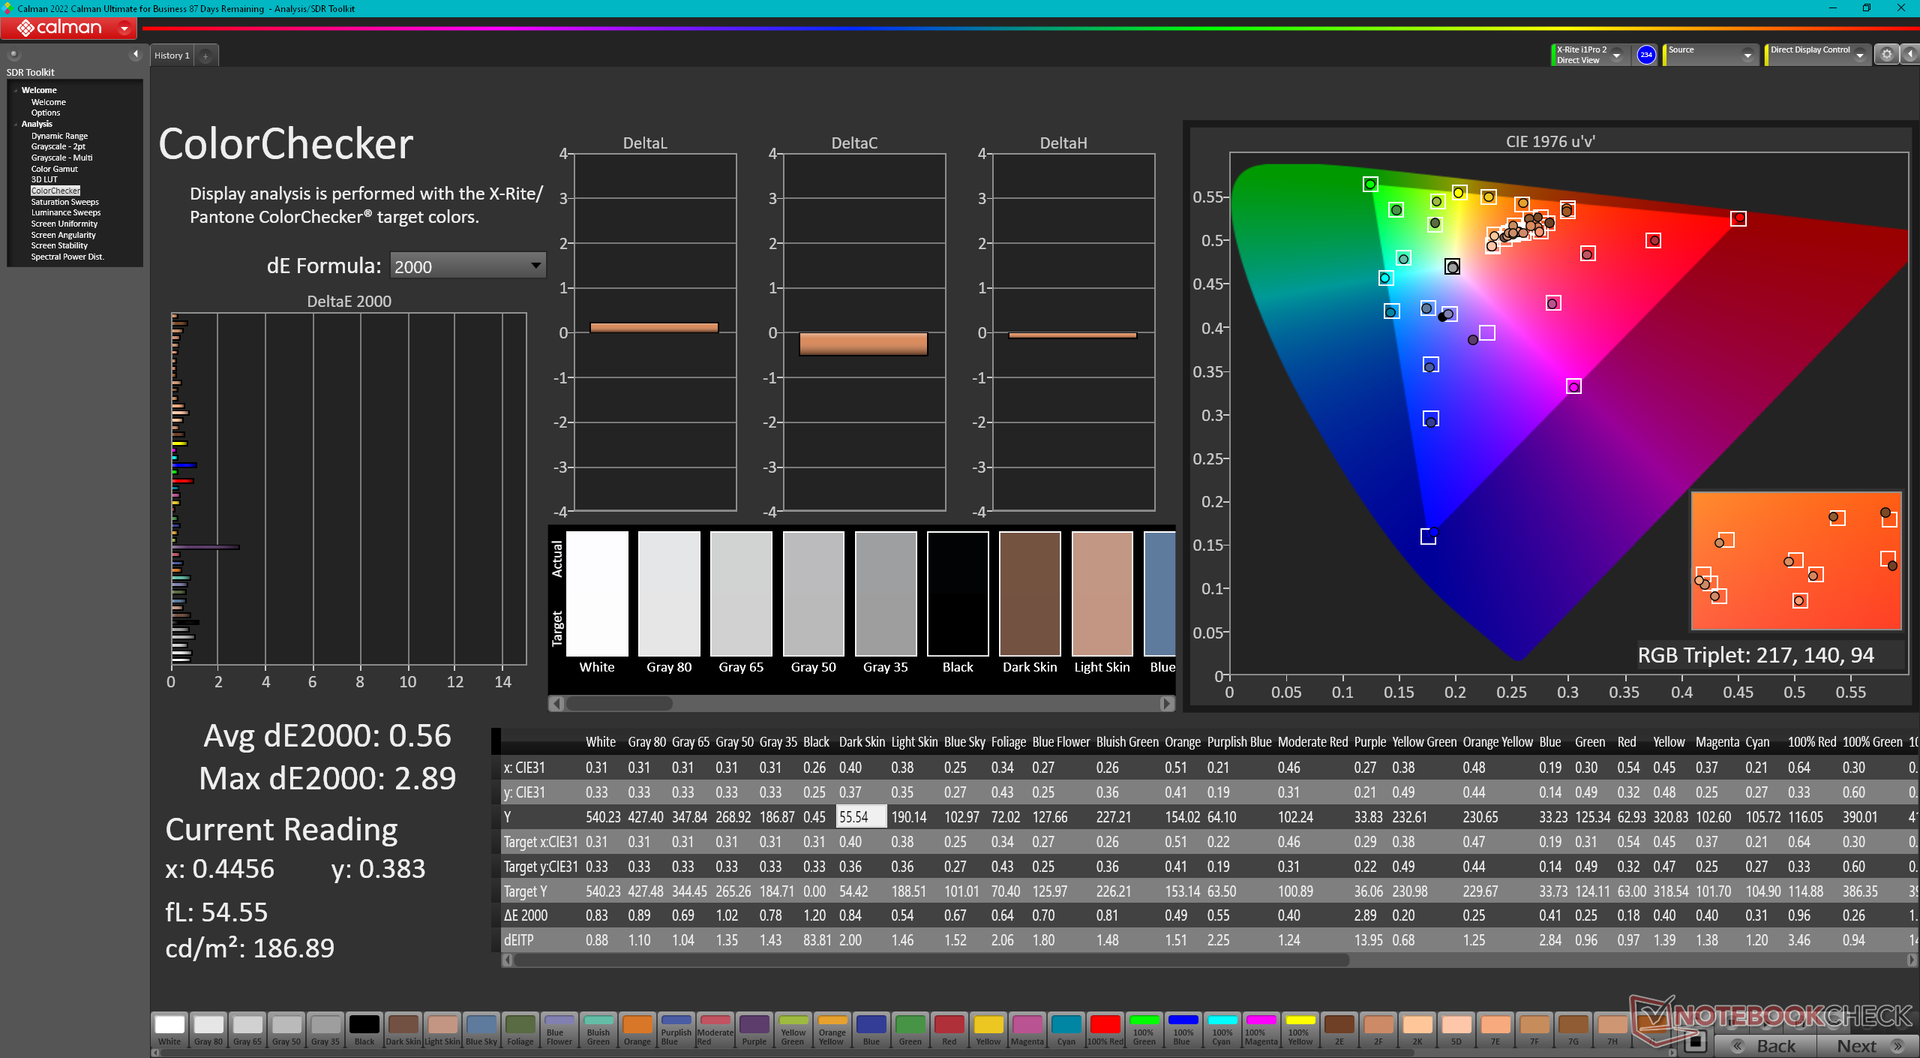
The display comes pre-calibrated against the DCI-P3 standard for excellent accuracy out of the box. Average grayscale and color deltaE values are just 1.0 and 2.54, respectively, meaning an end-user calibration won't be necessary for most.


Screen Flickering / PWM (Pulse-Width Modulation)
| Screen flickering / PWM not detected |  | ||
In comparison: 52 % of all tested devices do not use PWM to dim the display. If PWM was detected, an average of 7798 (minimum: 5 - maximum: 343500) Hz was measured. | |||
Performance — 14th Gen Meteor Lake Boost


Testing Conditions
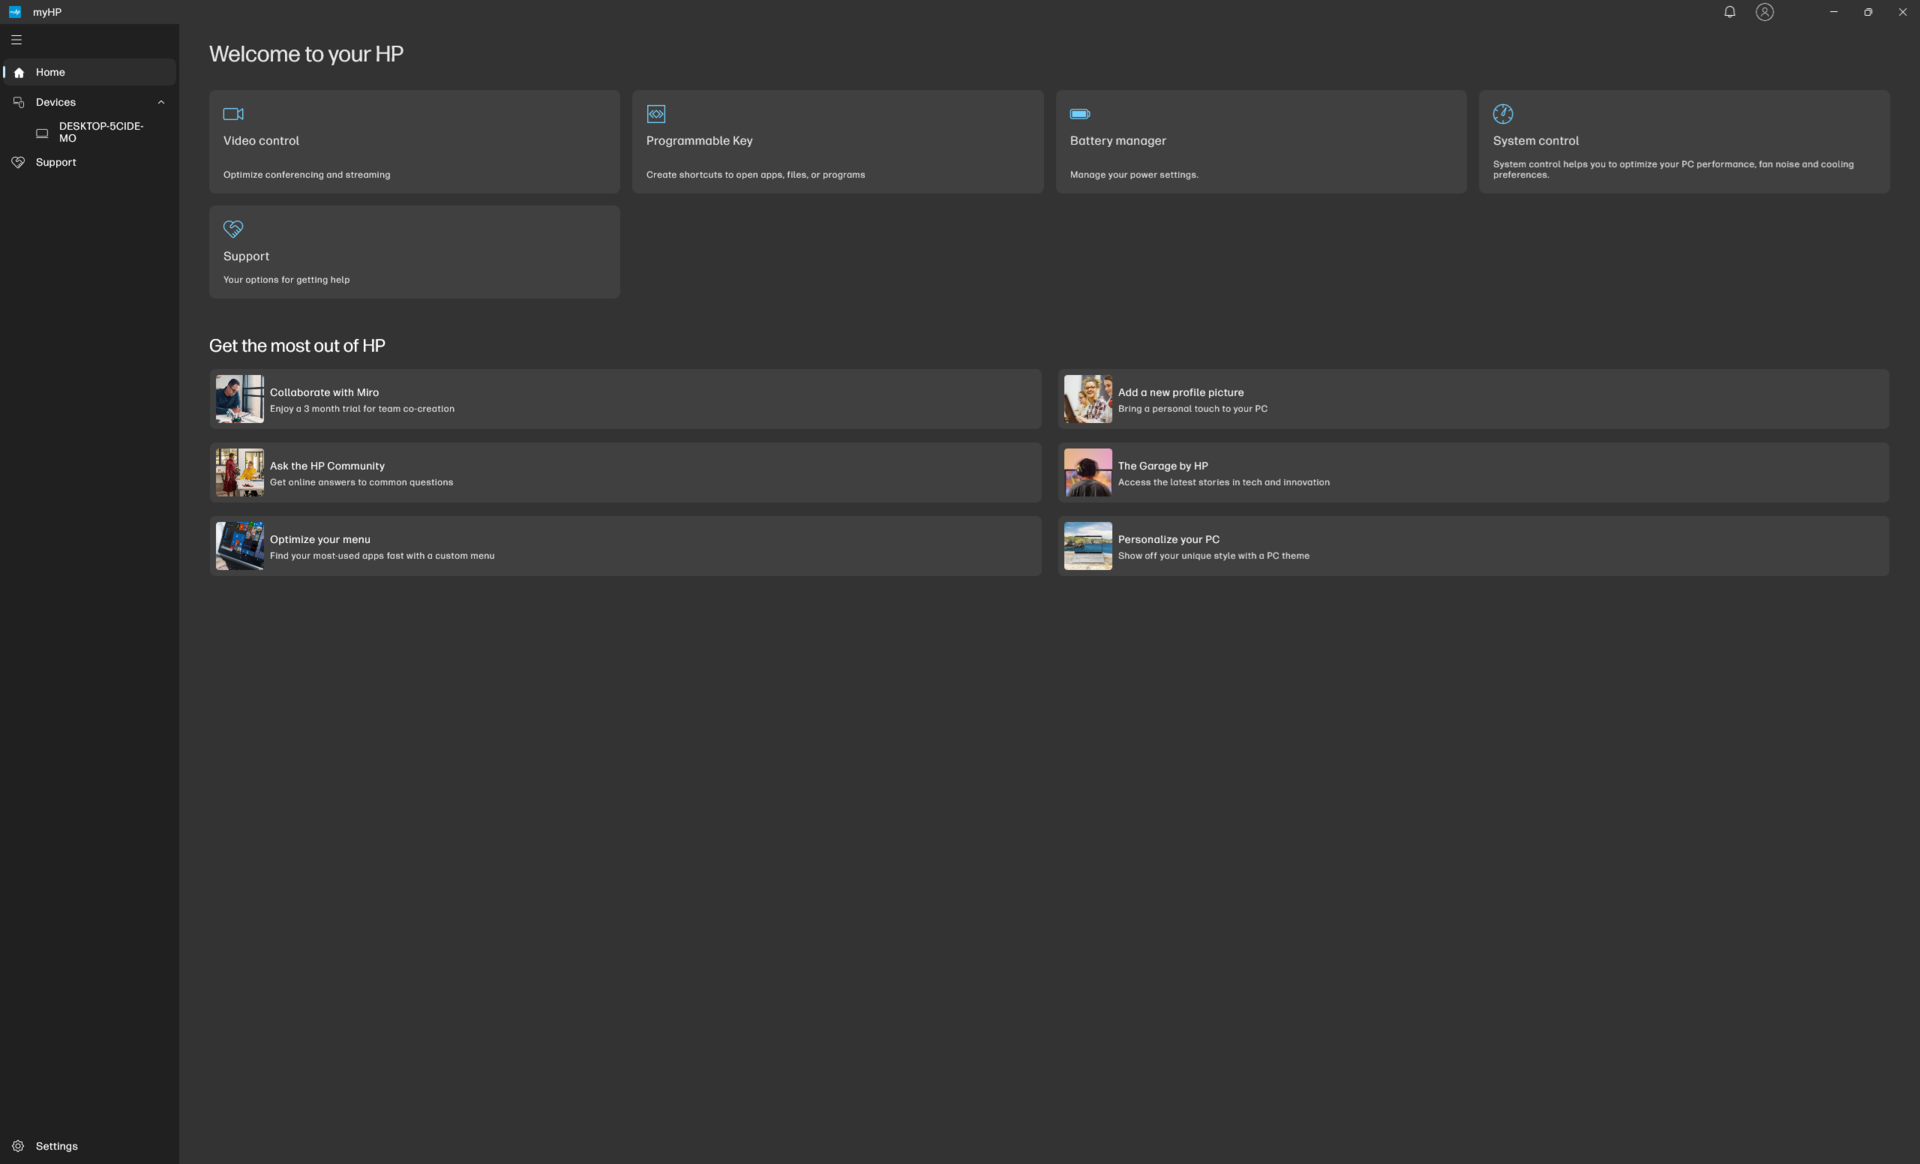
We set both Windows and MyHP to Performance mode prior to running the benchmarks below.

Processor
The Core Ultra 7 165H is roughly 20 to 25 percent faster over the Ryzen 5 Pro 7640HS in last year's Firefly G10 A when it comes to multi-threaded workloads. Unfortunately, the Intel CPU in our Firefly G11 would throttle quite heavily after just two loops into our CineBench R15 xT stress test as shown by the comparison graph below. Multi-thread performance can drop by as much as 35 percent over time which is one of the steeper dips we've seen from a Core H-series laptop. Performance differences between the Core Ultra 7 165H and Ryzen 5 Pro 7640HS become much narrower after accounting for any throttling.
Configuring with lower-end Core U-series options like the Core Ultra 7 165U is expected to impact performance by as much as 25 to 30 percent based on our time with the Dell Latitude 9450 2-in-1. However, any throttling with the Core U-series CPU may be less severe and so the performance delta between our Core Ultra 7 165H and the Core Ultra 7 165U might be narrower than expected. Either way, the full performance benefits of the Core Ultra 7 165H can't be sustained for long periods on the HP.
Cinebench R15 Multi Loop
Cinebench R23: Multi Core | Single Core
Cinebench R20: CPU (Multi Core) | CPU (Single Core)
Cinebench R15: CPU Multi 64Bit | CPU Single 64Bit
Blender: v2.79 BMW27 CPU
7-Zip 18.03: 7z b 4 | 7z b 4 -mmt1
Geekbench 6.7: Multi-Core | Single-Core
Geekbench 5.5: Multi-Core | Single-Core
HWBOT x265 Benchmark v2.2: 4k Preset
LibreOffice : 20 Documents To PDF
R Benchmark 2.5: Overall mean
* ... smaller is better
AIDA64: FP32 Ray-Trace | FPU Julia | CPU SHA3 | CPU Queen | FPU SinJulia | FPU Mandel | CPU AES | CPU ZLib | FP64 Ray-Trace | CPU PhotoWorxx
| Performance rating | |
| Dell Precision 5000 5490 | |
| HP ZBook Firefly 14 G10 A | |
| Average Intel Core Ultra 7 165H | |
| Lenovo ThinkPad P14s G4 21HF0017GE | |
| HP ZBook Firefly 14 G11 | |
| Asus ExpertBook B3 B3404CVF | |
| HP ZBook Firefly 14 G8 2C9Q2EA | |
| AIDA64 / FP32 Ray-Trace | |
| HP ZBook Firefly 14 G10 A | |
| Dell Precision 5000 5490 | |
| Average Intel Core Ultra 7 165H (10658 - 14235, n=3) | |
| Lenovo ThinkPad P14s G4 21HF0017GE | |
| HP ZBook Firefly 14 G11 | |
| Asus ExpertBook B3 B3404CVF | |
| HP ZBook Firefly 14 G8 2C9Q2EA | |
| AIDA64 / FPU Julia | |
| HP ZBook Firefly 14 G10 A | |
| Dell Precision 5000 5490 | |
| Average Intel Core Ultra 7 165H (56664 - 75077, n=3) | |
| Lenovo ThinkPad P14s G4 21HF0017GE | |
| HP ZBook Firefly 14 G11 | |
| Asus ExpertBook B3 B3404CVF | |
| HP ZBook Firefly 14 G8 2C9Q2EA | |
| AIDA64 / CPU SHA3 | |
| Dell Precision 5000 5490 | |
| HP ZBook Firefly 14 G10 A | |
| Average Intel Core Ultra 7 165H (2608 - 3473, n=3) | |
| Lenovo ThinkPad P14s G4 21HF0017GE | |
| HP ZBook Firefly 14 G11 | |
| Asus ExpertBook B3 B3404CVF | |
| HP ZBook Firefly 14 G8 2C9Q2EA | |
| AIDA64 / CPU Queen | |
| Lenovo ThinkPad P14s G4 21HF0017GE | |
| Dell Precision 5000 5490 | |
| HP ZBook Firefly 14 G10 A | |
| HP ZBook Firefly 14 G11 | |
| Average Intel Core Ultra 7 165H (82058 - 86192, n=3) | |
| Asus ExpertBook B3 B3404CVF | |
| HP ZBook Firefly 14 G8 2C9Q2EA | |
| AIDA64 / FPU SinJulia | |
| HP ZBook Firefly 14 G10 A | |
| Dell Precision 5000 5490 | |
| Average Intel Core Ultra 7 165H (8232 - 9798, n=3) | |
| HP ZBook Firefly 14 G11 | |
| Lenovo ThinkPad P14s G4 21HF0017GE | |
| Asus ExpertBook B3 B3404CVF | |
| HP ZBook Firefly 14 G8 2C9Q2EA | |
| AIDA64 / FPU Mandel | |
| HP ZBook Firefly 14 G10 A | |
| Dell Precision 5000 5490 | |
| Average Intel Core Ultra 7 165H (27301 - 36957, n=3) | |
| Lenovo ThinkPad P14s G4 21HF0017GE | |
| HP ZBook Firefly 14 G11 | |
| Asus ExpertBook B3 B3404CVF | |
| HP ZBook Firefly 14 G8 2C9Q2EA | |
| AIDA64 / CPU AES | |
| Dell Precision 5000 5490 | |
| HP ZBook Firefly 14 G8 2C9Q2EA | |
| Average Intel Core Ultra 7 165H (56077 - 73297, n=3) | |
| HP ZBook Firefly 14 G10 A | |
| Lenovo ThinkPad P14s G4 21HF0017GE | |
| HP ZBook Firefly 14 G11 | |
| Asus ExpertBook B3 B3404CVF | |
| AIDA64 / CPU ZLib | |
| Dell Precision 5000 5490 | |
| Average Intel Core Ultra 7 165H (742 - 1018, n=3) | |
| Lenovo ThinkPad P14s G4 21HF0017GE | |
| HP ZBook Firefly 14 G10 A | |
| HP ZBook Firefly 14 G11 | |
| Asus ExpertBook B3 B3404CVF | |
| HP ZBook Firefly 14 G8 2C9Q2EA | |
| AIDA64 / FP64 Ray-Trace | |
| HP ZBook Firefly 14 G10 A | |
| Dell Precision 5000 5490 | |
| Average Intel Core Ultra 7 165H (5580 - 7521, n=3) | |
| Lenovo ThinkPad P14s G4 21HF0017GE | |
| HP ZBook Firefly 14 G11 | |
| Asus ExpertBook B3 B3404CVF | |
| HP ZBook Firefly 14 G8 2C9Q2EA | |
| AIDA64 / CPU PhotoWorxx | |
| Dell Precision 5000 5490 | |
| Average Intel Core Ultra 7 165H (44396 - 48762, n=3) | |
| Asus ExpertBook B3 B3404CVF | |
| HP ZBook Firefly 14 G11 | |
| Lenovo ThinkPad P14s G4 21HF0017GE | |
| HP ZBook Firefly 14 G10 A | |
| HP ZBook Firefly 14 G8 2C9Q2EA | |
Stress Test
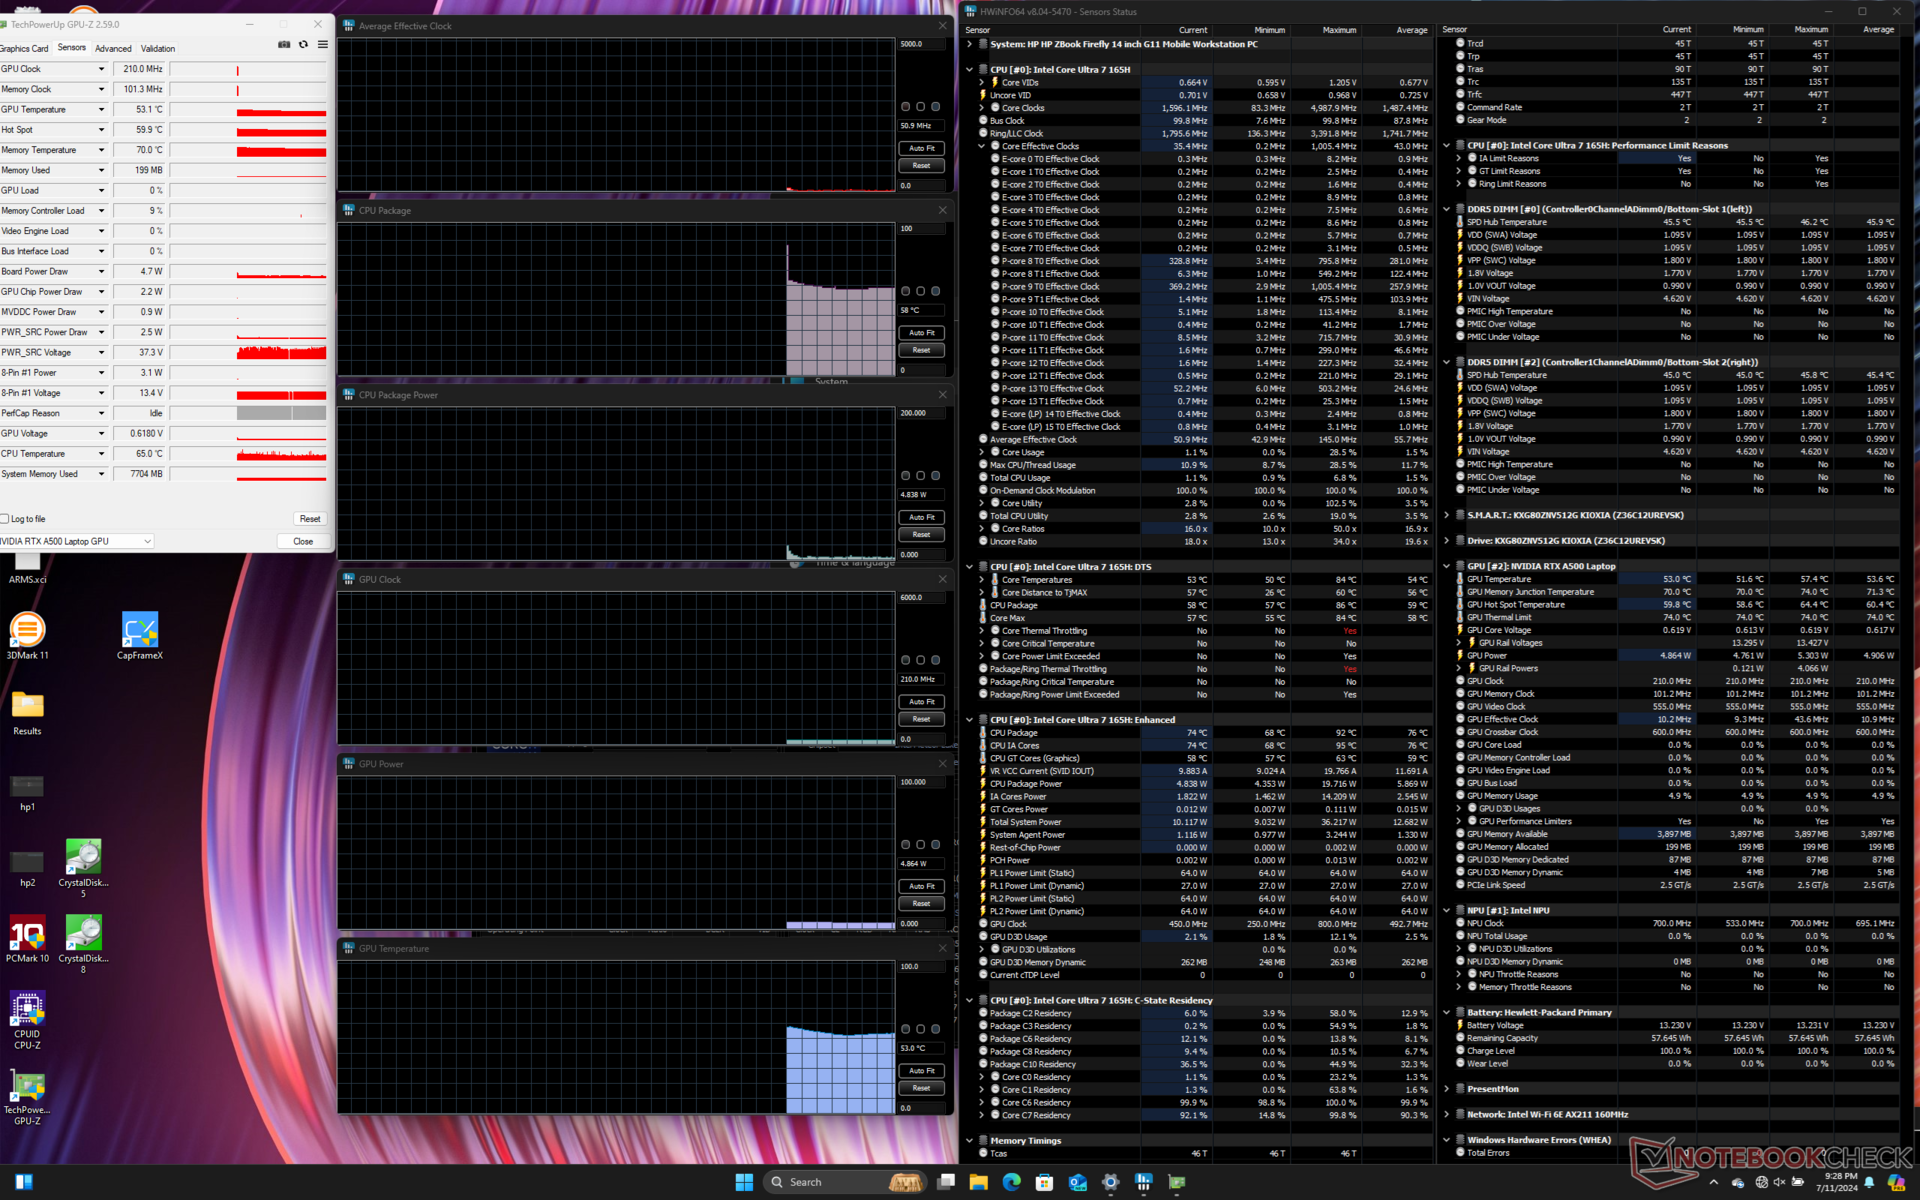
When running Prime95 stress, the CPU would boost to 2.9 GHz and 63 W before reaching 93 C just a few seconds later. Thereafter, it would drop sharply to just 1.2 GHz and 26 W in order to maintain a cooler core temperature of 78 C. The very limited Turbo Boost performance aligns with our CineBench R15 xT loop results noted above.
Both the CPU and GPU tend to hover in the mid 70 C range when running demanding loads for long periods which is about average for a subnotebook and close to what we recorded on the Firefly 14 G10 A.
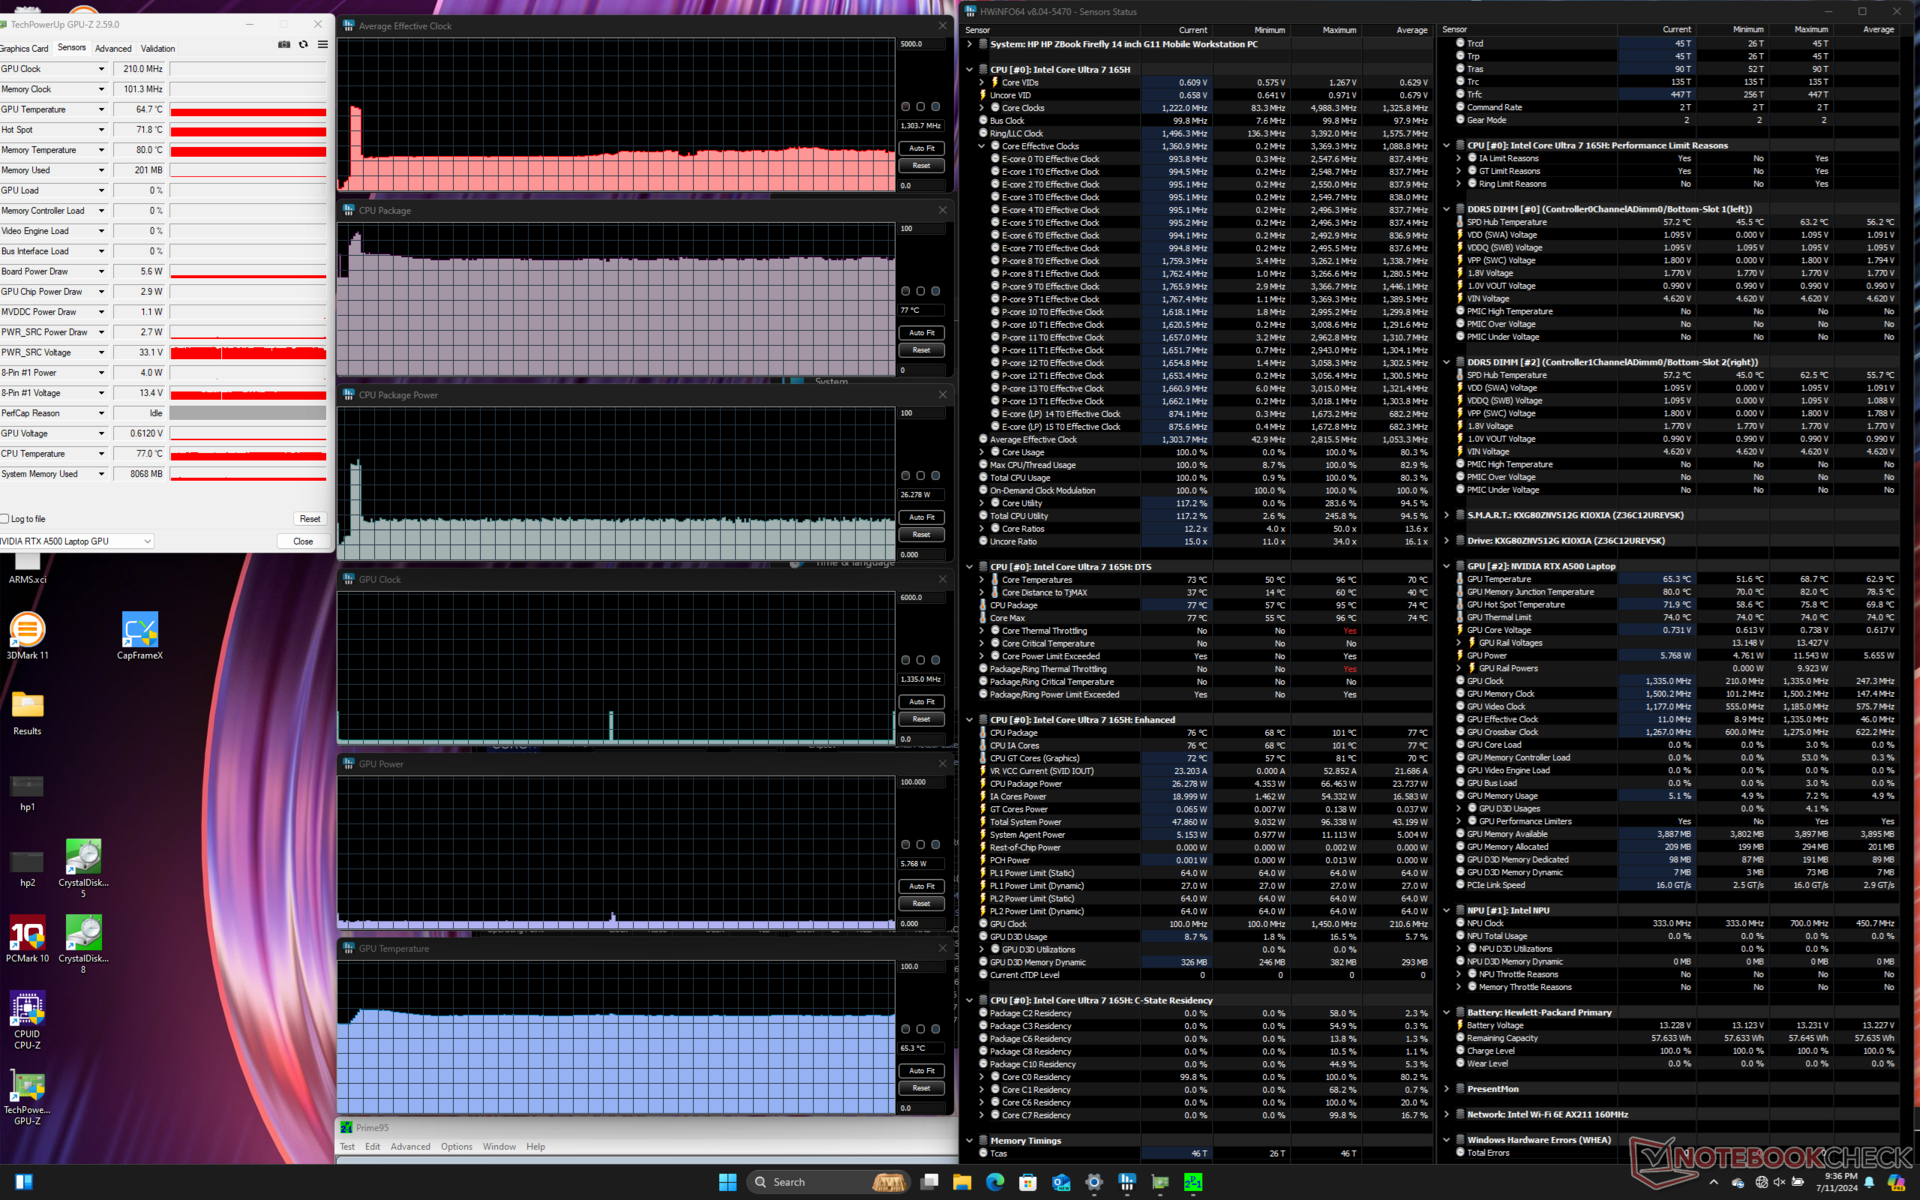
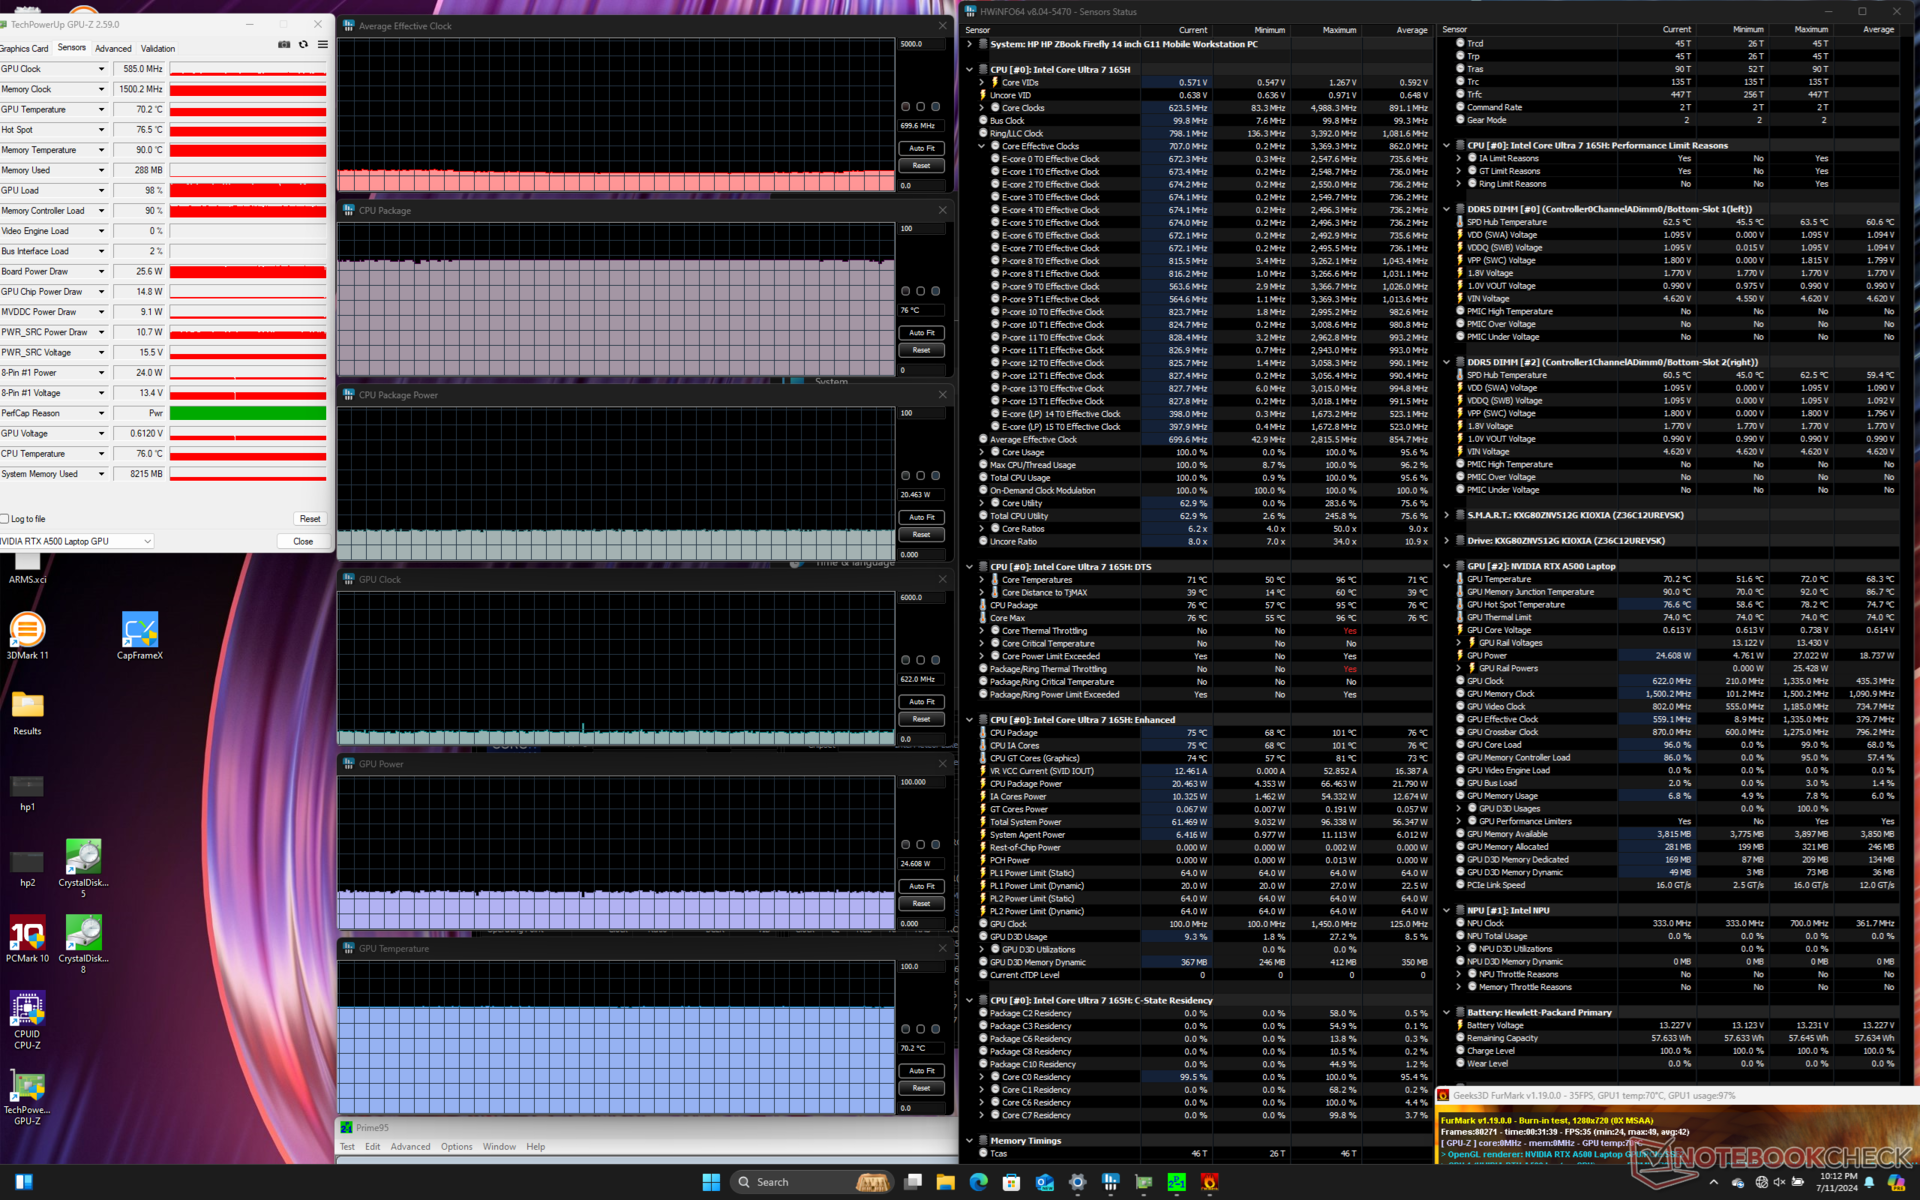
| Average CPU Clock (GHz) | GPU Clock (MHz) | Average CPU Temperature (°C) | Average GPU Temperature (°C) | |
| System Idle | -- | -- | 58 | 53 |
| Prime95 Stress | 1.3 | -- | 77 | 65 |
| Prime95 + FurMark Stress | 0.7 | 622 | 76 | 70 |
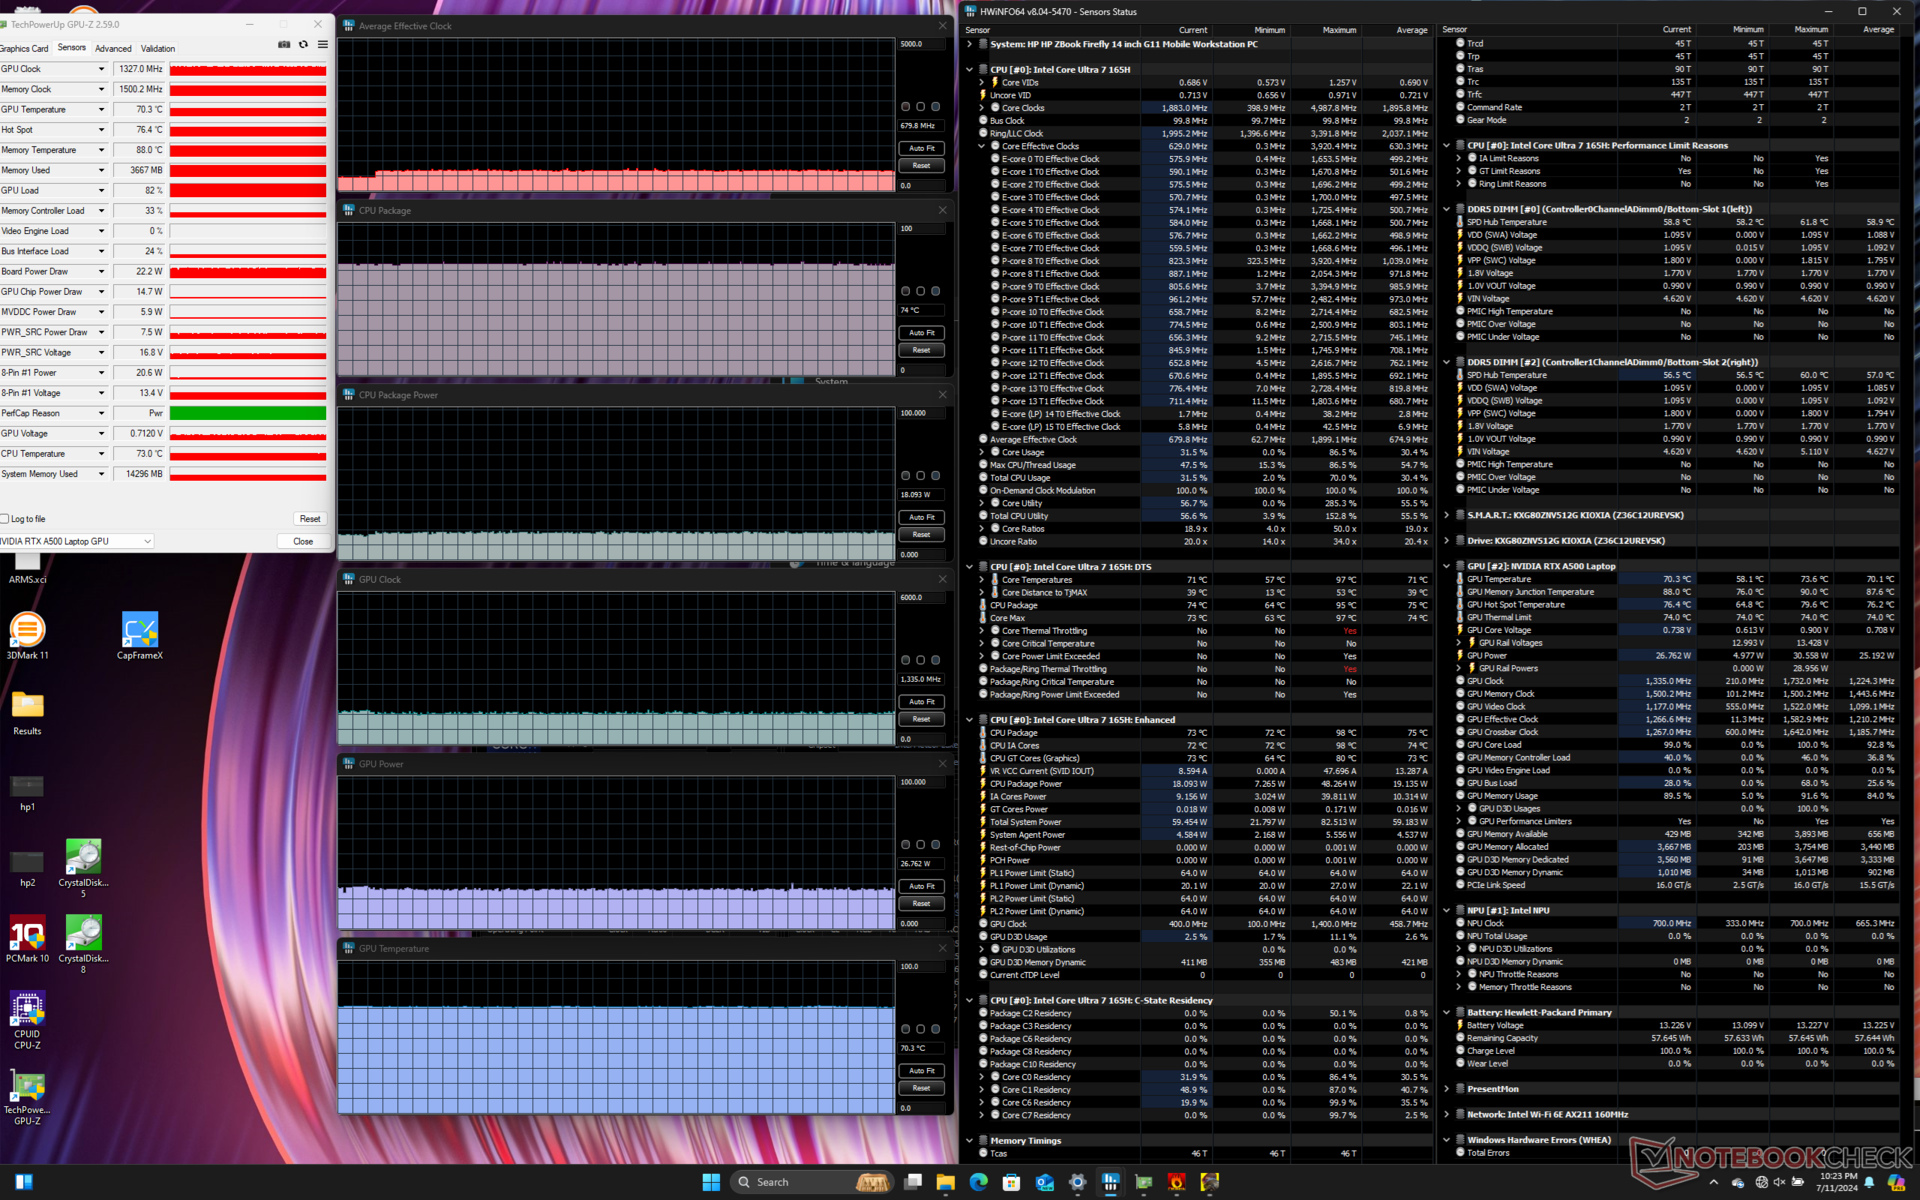
| Cyberpunk 2077 Stress | ~0.7 | 1335 | 74 | 70 |
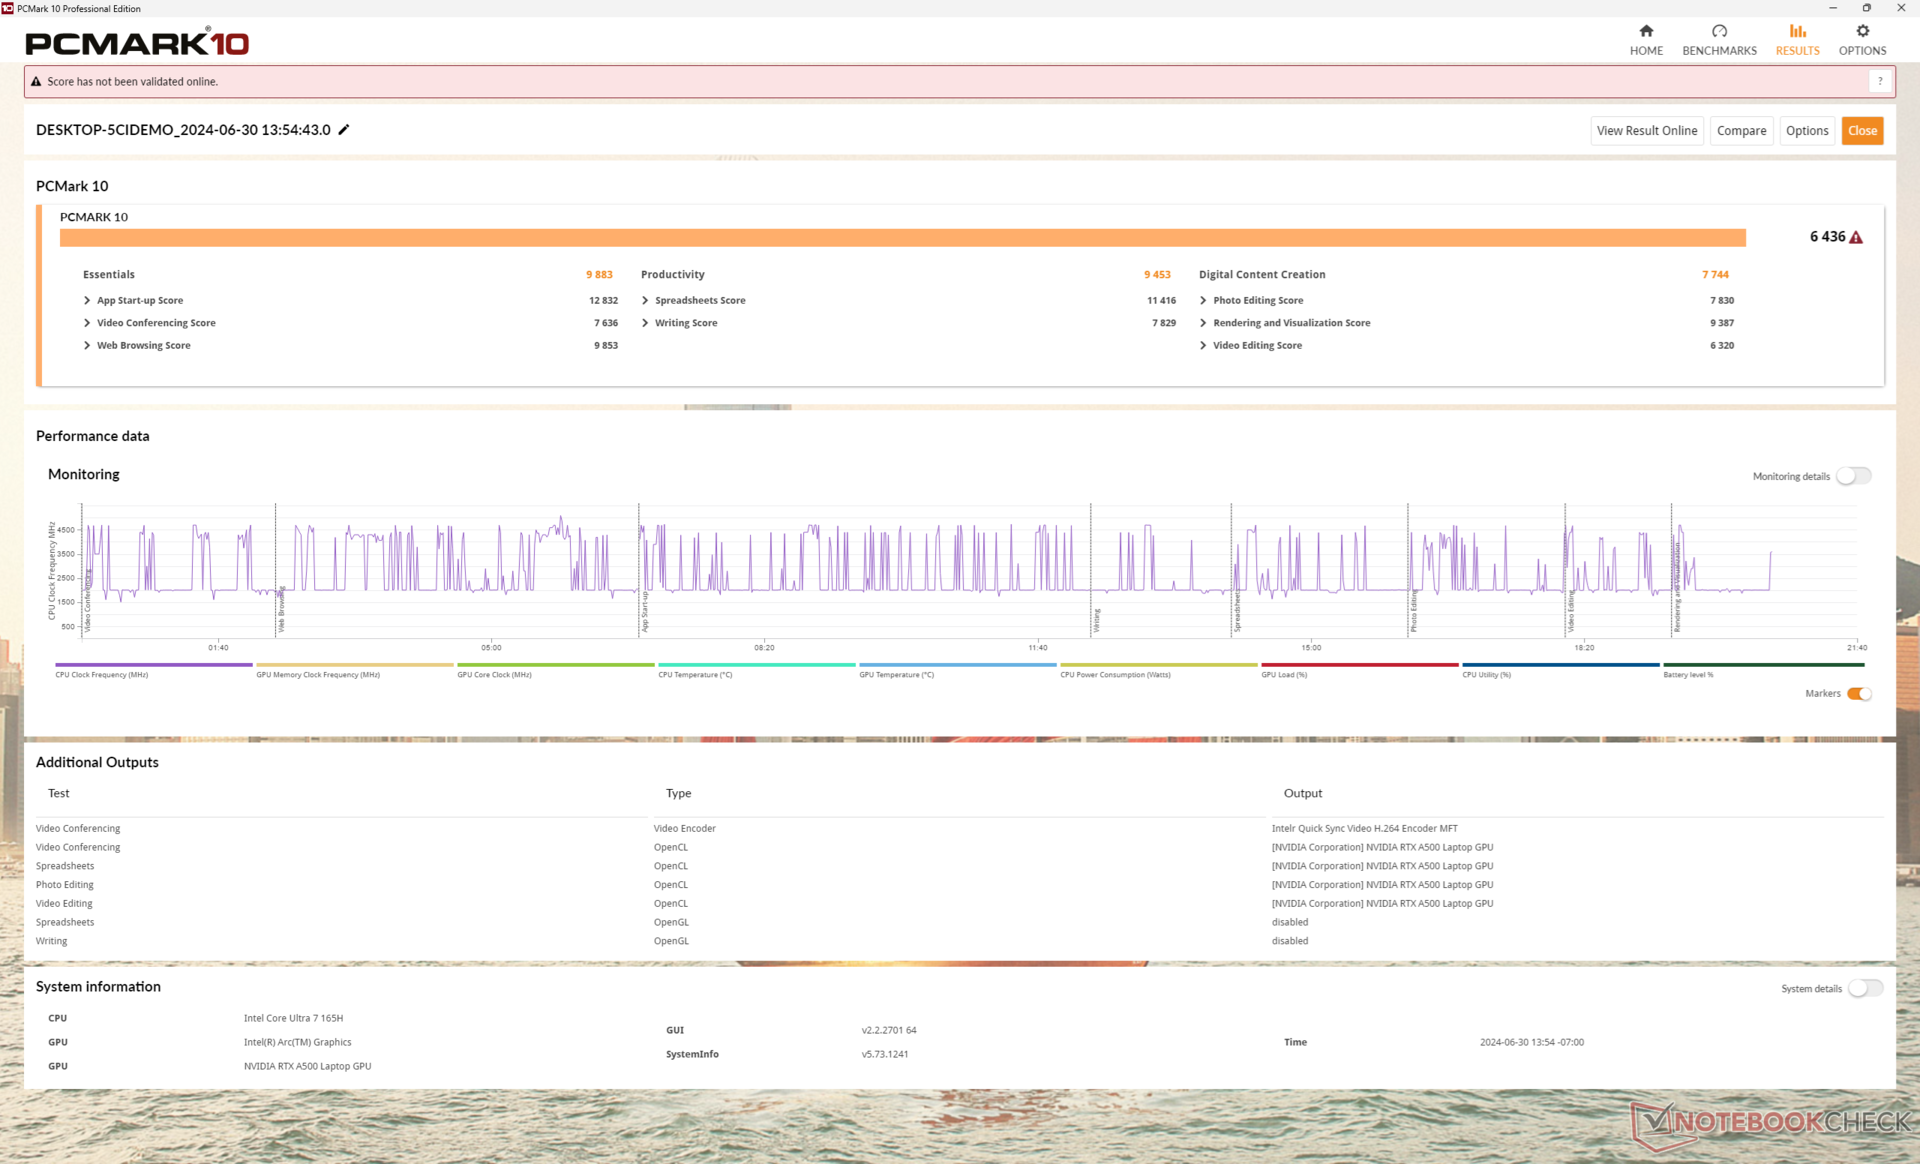
System Performance
PCMark scores are nearly identical to the Firefly 14 G10 A to show that most day-to-day applications don't run any faster on the latest model. Of course, other more demanding applications favor our Firefly 14 G11 much more consistently as shown by our GPU Performance section below.
CrossMark: Overall | Productivity | Creativity | Responsiveness
WebXPRT 3: Overall
WebXPRT 4: Overall
Mozilla Kraken 1.1: Total
| PCMark 10 / Score | |
| Dell Precision 5000 5490 | |
| Lenovo ThinkPad P14s G4 21HF0017GE | |
| HP ZBook Firefly 14 G11 | |
| Average Intel Core Ultra 7 165H, NVIDIA RTX A500 Laptop GPU (n=1) | |
| HP ZBook Firefly 14 G10 A | |
| Asus ExpertBook B3 B3404CVF | |
| HP ZBook Firefly 14 G8 2C9Q2EA | |
| PCMark 10 / Essentials | |
| Dell Precision 5000 5490 | |
| Asus ExpertBook B3 B3404CVF | |
| Lenovo ThinkPad P14s G4 21HF0017GE | |
| HP ZBook Firefly 14 G11 | |
| Average Intel Core Ultra 7 165H, NVIDIA RTX A500 Laptop GPU (n=1) | |
| HP ZBook Firefly 14 G10 A | |
| HP ZBook Firefly 14 G8 2C9Q2EA | |
| PCMark 10 / Productivity | |
| Lenovo ThinkPad P14s G4 21HF0017GE | |
| HP ZBook Firefly 14 G11 | |
| Average Intel Core Ultra 7 165H, NVIDIA RTX A500 Laptop GPU (n=1) | |
| HP ZBook Firefly 14 G10 A | |
| Dell Precision 5000 5490 | |
| Asus ExpertBook B3 B3404CVF | |
| HP ZBook Firefly 14 G8 2C9Q2EA | |
| PCMark 10 / Digital Content Creation | |
| Dell Precision 5000 5490 | |
| Lenovo ThinkPad P14s G4 21HF0017GE | |
| HP ZBook Firefly 14 G11 | |
| Average Intel Core Ultra 7 165H, NVIDIA RTX A500 Laptop GPU (n=1) | |
| HP ZBook Firefly 14 G10 A | |
| Asus ExpertBook B3 B3404CVF | |
| HP ZBook Firefly 14 G8 2C9Q2EA | |
| CrossMark / Overall | |
| Lenovo ThinkPad P14s G4 21HF0017GE | |
| Asus ExpertBook B3 B3404CVF | |
| Dell Precision 5000 5490 | |
| HP ZBook Firefly 14 G11 | |
| Average Intel Core Ultra 7 165H, NVIDIA RTX A500 Laptop GPU (n=1) | |
| CrossMark / Productivity | |
| Asus ExpertBook B3 B3404CVF | |
| Lenovo ThinkPad P14s G4 21HF0017GE | |
| Dell Precision 5000 5490 | |
| HP ZBook Firefly 14 G11 | |
| Average Intel Core Ultra 7 165H, NVIDIA RTX A500 Laptop GPU (n=1) | |
| CrossMark / Creativity | |
| Lenovo ThinkPad P14s G4 21HF0017GE | |
| Dell Precision 5000 5490 | |
| HP ZBook Firefly 14 G11 | |
| Average Intel Core Ultra 7 165H, NVIDIA RTX A500 Laptop GPU (n=1) | |
| Asus ExpertBook B3 B3404CVF | |
| CrossMark / Responsiveness | |
| Asus ExpertBook B3 B3404CVF | |
| Lenovo ThinkPad P14s G4 21HF0017GE | |
| Dell Precision 5000 5490 | |
| HP ZBook Firefly 14 G11 | |
| Average Intel Core Ultra 7 165H, NVIDIA RTX A500 Laptop GPU (n=1) | |
| WebXPRT 3 / Overall | |
| Lenovo ThinkPad P14s G4 21HF0017GE | |
| HP ZBook Firefly 14 G11 | |
| Average Intel Core Ultra 7 165H, NVIDIA RTX A500 Laptop GPU (n=1) | |
| Dell Precision 5000 5490 | |
| Asus ExpertBook B3 B3404CVF | |
| HP ZBook Firefly 14 G10 A | |
| HP ZBook Firefly 14 G10 A | |
| WebXPRT 4 / Overall | |
| Lenovo ThinkPad P14s G4 21HF0017GE | |
| Lenovo ThinkPad P14s G4 21HF0017GE | |
| Dell Precision 5000 5490 | |
| Asus ExpertBook B3 B3404CVF | |
| HP ZBook Firefly 14 G11 | |
| Average Intel Core Ultra 7 165H, NVIDIA RTX A500 Laptop GPU (n=1) | |
| Mozilla Kraken 1.1 / Total | |
| HP ZBook Firefly 14 G8 2C9Q2EA | |
| HP ZBook Firefly 14 G10 A | |
| HP ZBook Firefly 14 G10 A | |
| Dell Precision 5000 5490 | |
| HP ZBook Firefly 14 G11 | |
| Average Intel Core Ultra 7 165H, NVIDIA RTX A500 Laptop GPU (n=1) | |
| Asus ExpertBook B3 B3404CVF | |
| Lenovo ThinkPad P14s G4 21HF0017GE | |
* ... smaller is better
| PCMark 10 Score | 6436 points | |
Help | ||
| AIDA64 / Memory Copy | |
| Dell Precision 5000 5490 | |
| Average Intel Core Ultra 7 165H (72539 - 88831, n=3) | |
| HP ZBook Firefly 14 G11 | |
| Asus ExpertBook B3 B3404CVF | |
| HP ZBook Firefly 14 G10 A | |
| Lenovo ThinkPad P14s G4 21HF0017GE | |
| HP ZBook Firefly 14 G8 2C9Q2EA | |
| AIDA64 / Memory Read | |
| Dell Precision 5000 5490 | |
| Average Intel Core Ultra 7 165H (73908 - 87187, n=3) | |
| HP ZBook Firefly 14 G11 | |
| Asus ExpertBook B3 B3404CVF | |
| HP ZBook Firefly 14 G10 A | |
| Lenovo ThinkPad P14s G4 21HF0017GE | |
| HP ZBook Firefly 14 G8 2C9Q2EA | |
| AIDA64 / Memory Write | |
| Dell Precision 5000 5490 | |
| HP ZBook Firefly 14 G10 A | |
| Average Intel Core Ultra 7 165H (72057 - 75839, n=3) | |
| HP ZBook Firefly 14 G11 | |
| Asus ExpertBook B3 B3404CVF | |
| Lenovo ThinkPad P14s G4 21HF0017GE | |
| HP ZBook Firefly 14 G8 2C9Q2EA | |
| AIDA64 / Memory Latency | |
| Dell Precision 5000 5490 | |
| Average Intel Core Ultra 7 165H (120.8 - 145.6, n=3) | |
| HP ZBook Firefly 14 G11 | |
| HP ZBook Firefly 14 G10 A | |
| Lenovo ThinkPad P14s G4 21HF0017GE | |
| Asus ExpertBook B3 B3404CVF | |
| HP ZBook Firefly 14 G8 2C9Q2EA | |
* ... smaller is better
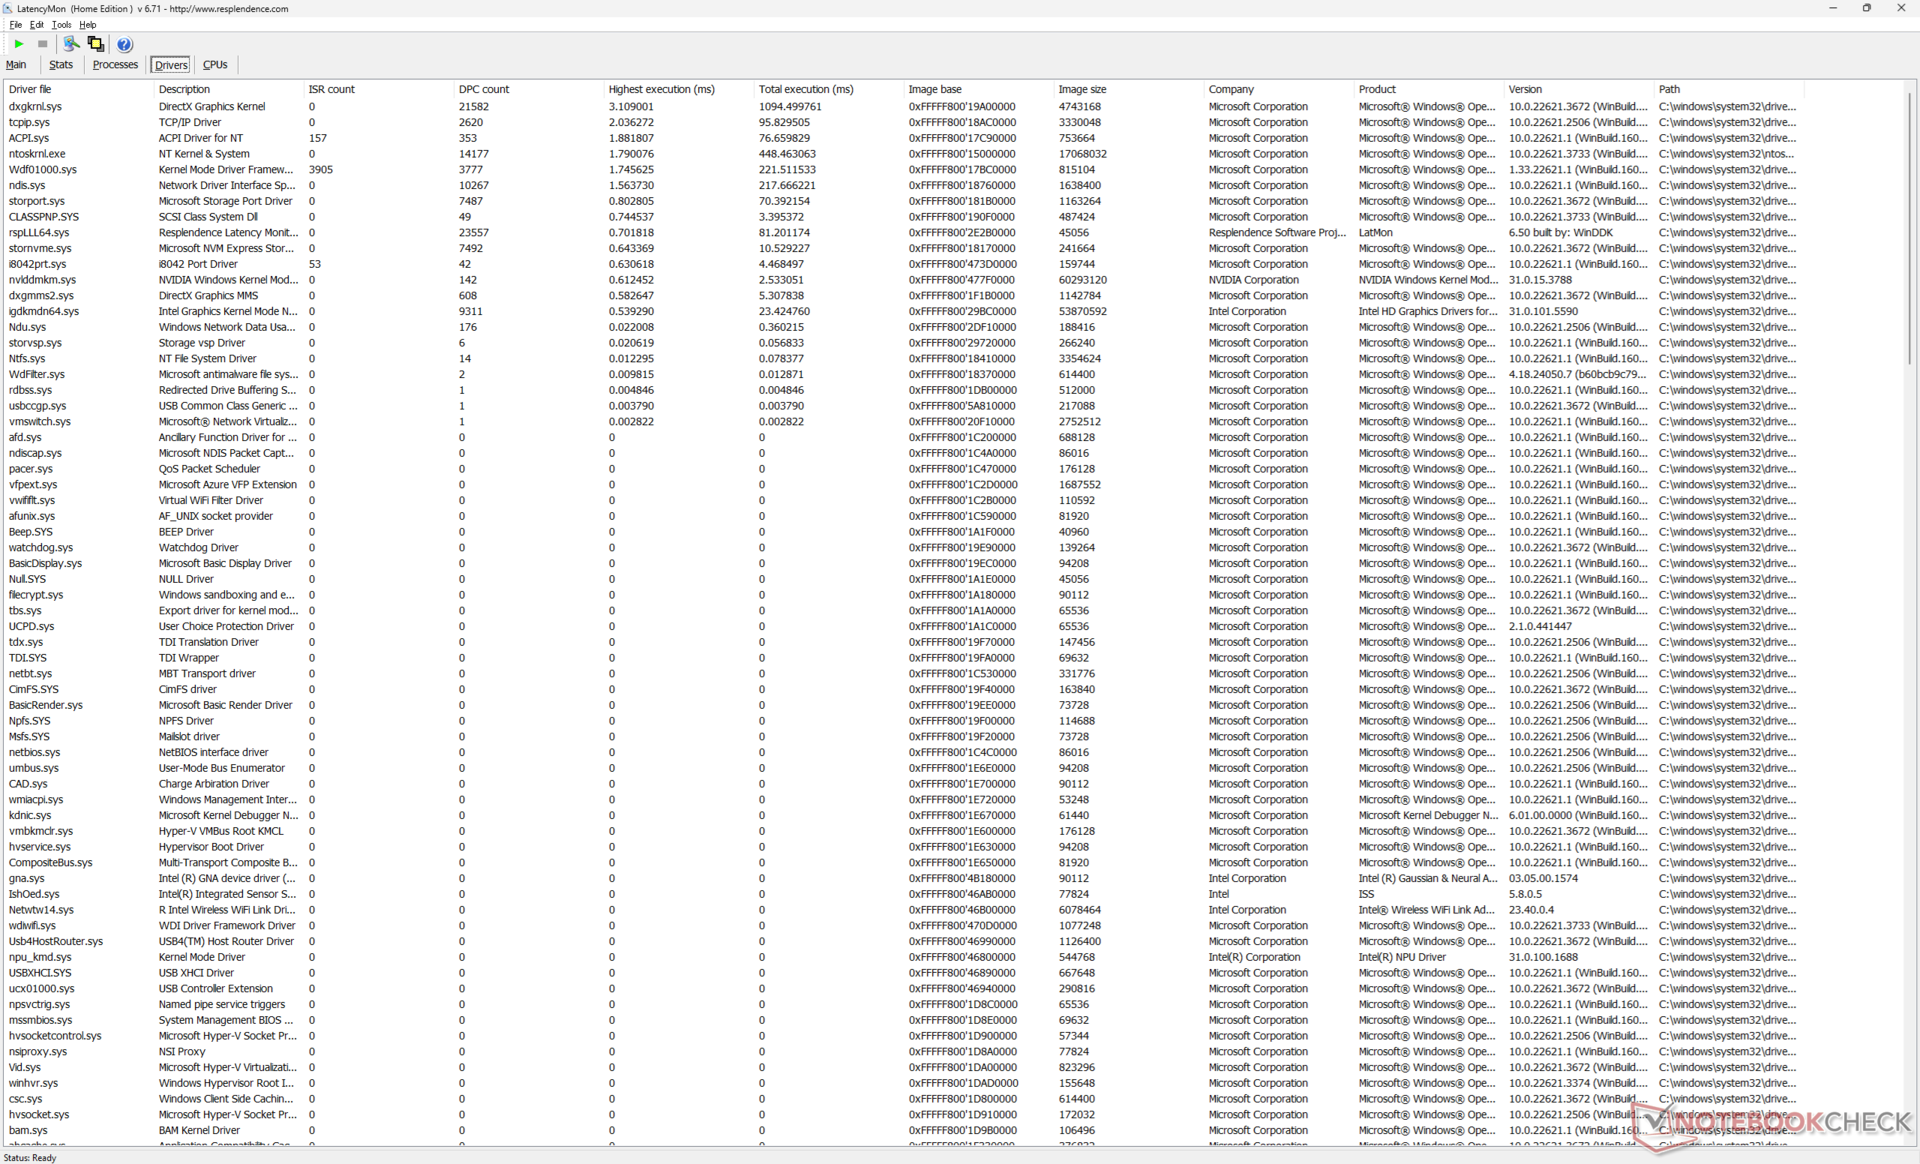
DPC Latency
LatencyMon reveals DPC issues when opening multiple browser tabs of our homepage. 4K video playback at 60 FPS is otherwise perfect with no dropped frames recorded, but CPU utilization would be unusually high with spikes of up to 50 percent throughout the test.

| DPC Latencies / LatencyMon - interrupt to process latency (max), Web, Youtube, Prime95 | |
| HP ZBook Firefly 14 G8 2C9Q2EA | |
| HP ZBook Firefly 14 G11 | |
| Dell Precision 5000 5490 | |
| Lenovo ThinkPad P14s G4 21HF0017GE | |
| HP ZBook Firefly 14 G10 A | |
| Asus ExpertBook B3 B3404CVF | |
* ... smaller is better
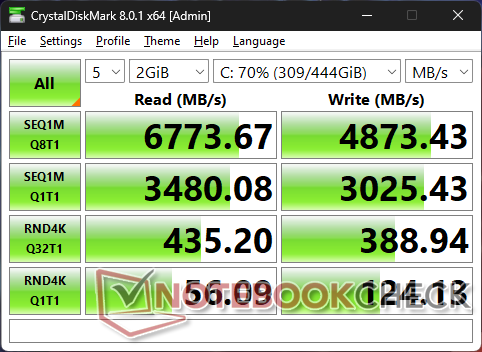
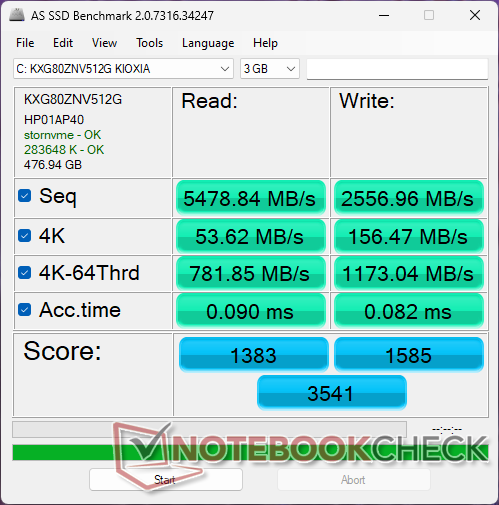
Storage Devices
HP appears to be sticking with drives from either Kioxia or Samsung for its Firefly 14 series. In this case, our unit ships with the same Kioxia XG8 KXG80ZNV512G as found on the three-year old Firefly 14 G8. The PCIe4 x4 drive can offer transfer rates of up to 6700 MB/s, but it unfortunately throttles down to 3600 MB/s after just a minute into our DiskSpd loop stress test as shown by the graph below.

| Drive Performance rating - Percent | |
| Lenovo ThinkPad P14s G4 21HF0017GE | |
| Asus ExpertBook B3 B3404CVF | |
| Dell Precision 5000 5490 | |
| HP ZBook Firefly 14 G11 | |
| HP ZBook Firefly 14 G8 2C9Q2EA | |
| HP ZBook Firefly 14 G10 A | |
* ... smaller is better
Disk Throttling: DiskSpd Read Loop, Queue Depth 8
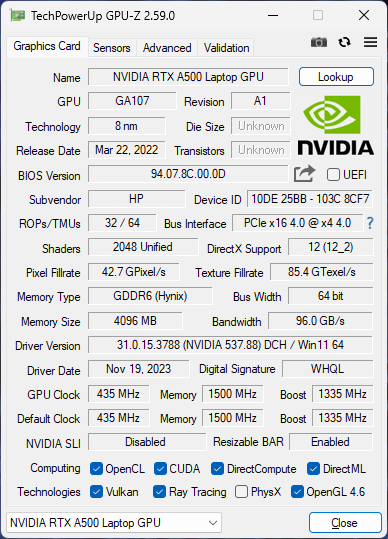
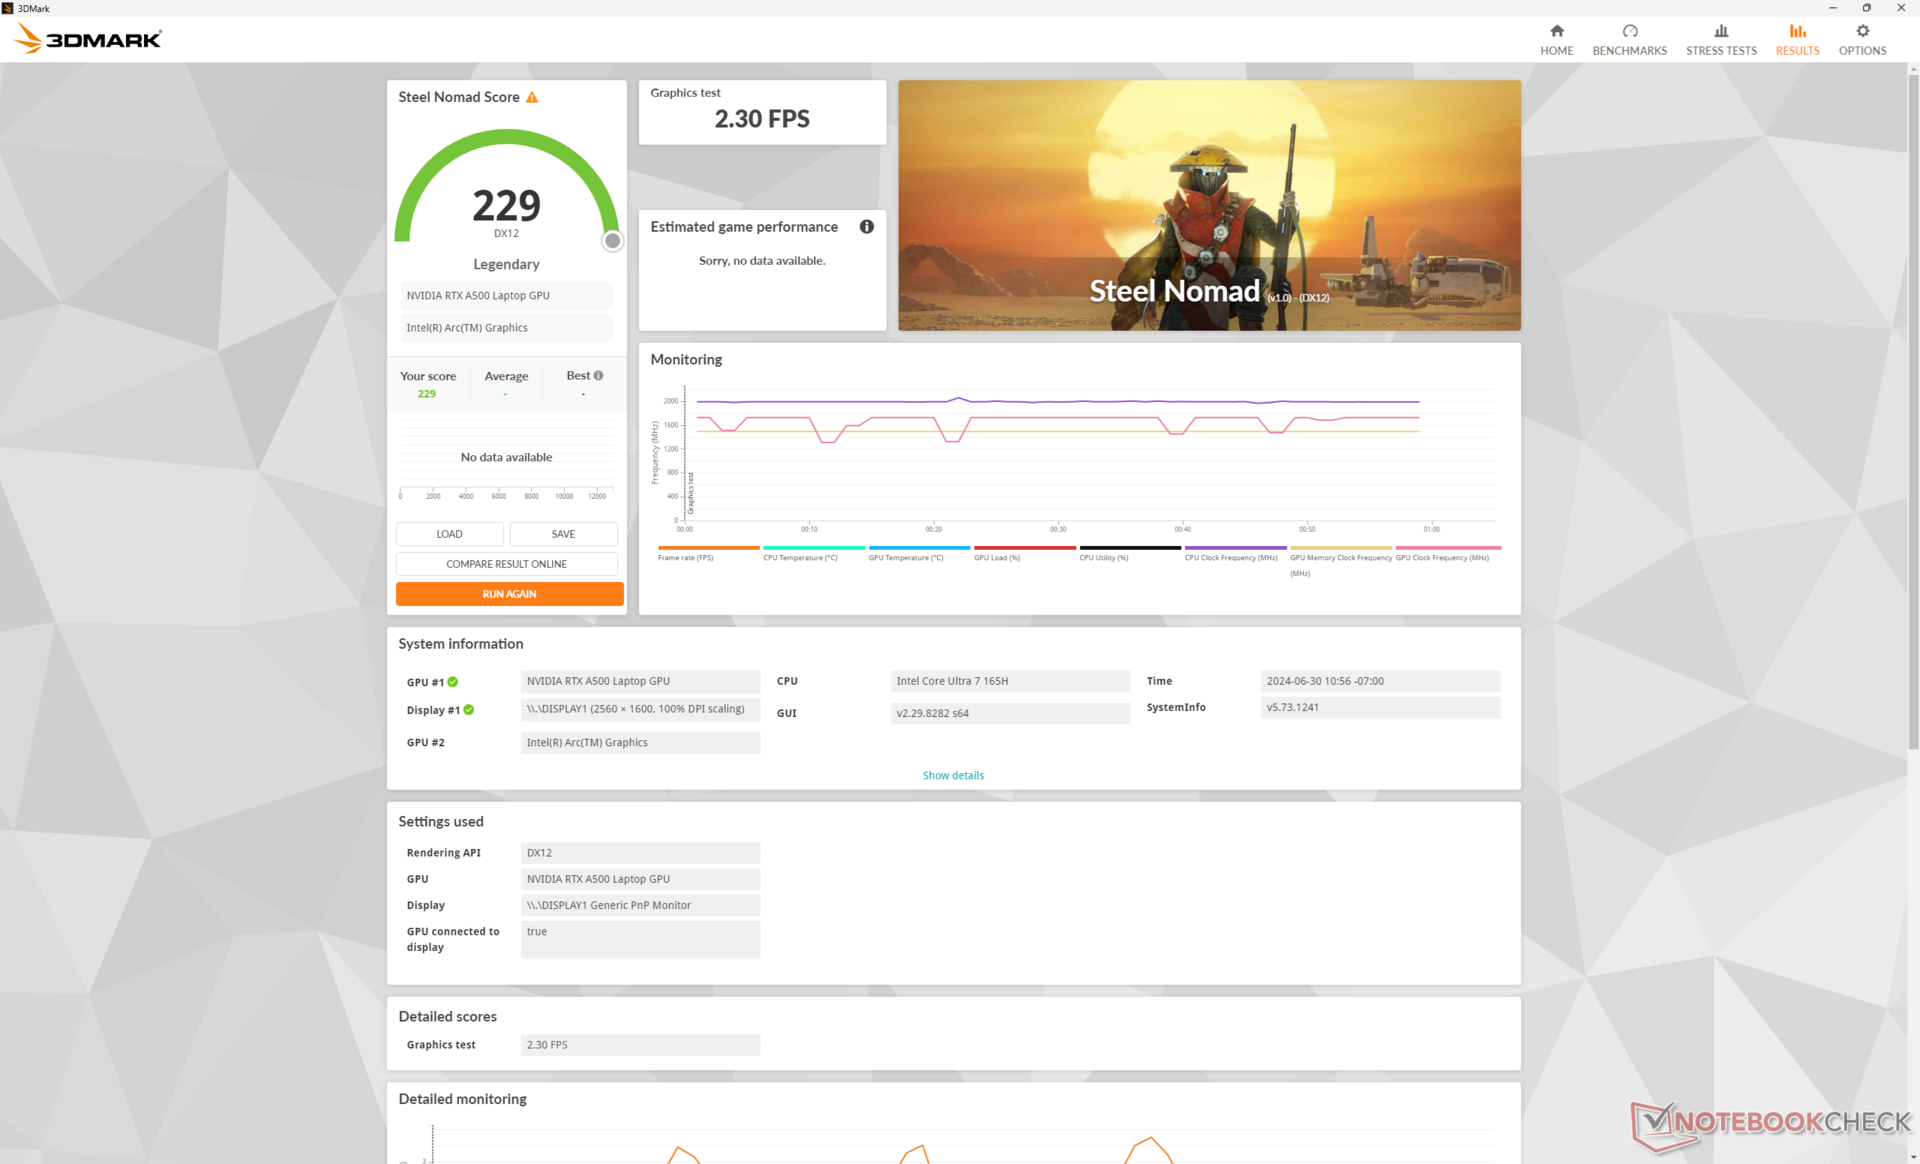
GPU Performance — Older Nvidia RTX A500 Graphics
The RTX A500 is the slowest discrete professional GPU available based on the older Ampere architecture and it is the only discrete option for the Firefly 14 G11. The GPU is starting to show its age as the latest competing integrated GPUs like the Arc 8 or Radeon 780M can nearly match the RTX A500 in 3DMark benchmarks and games. However, the Nvidia GPU still runs laps around the Intel and AMD iGPUs when it comes to professional applications like Blender or those represented in SPECviewperf.
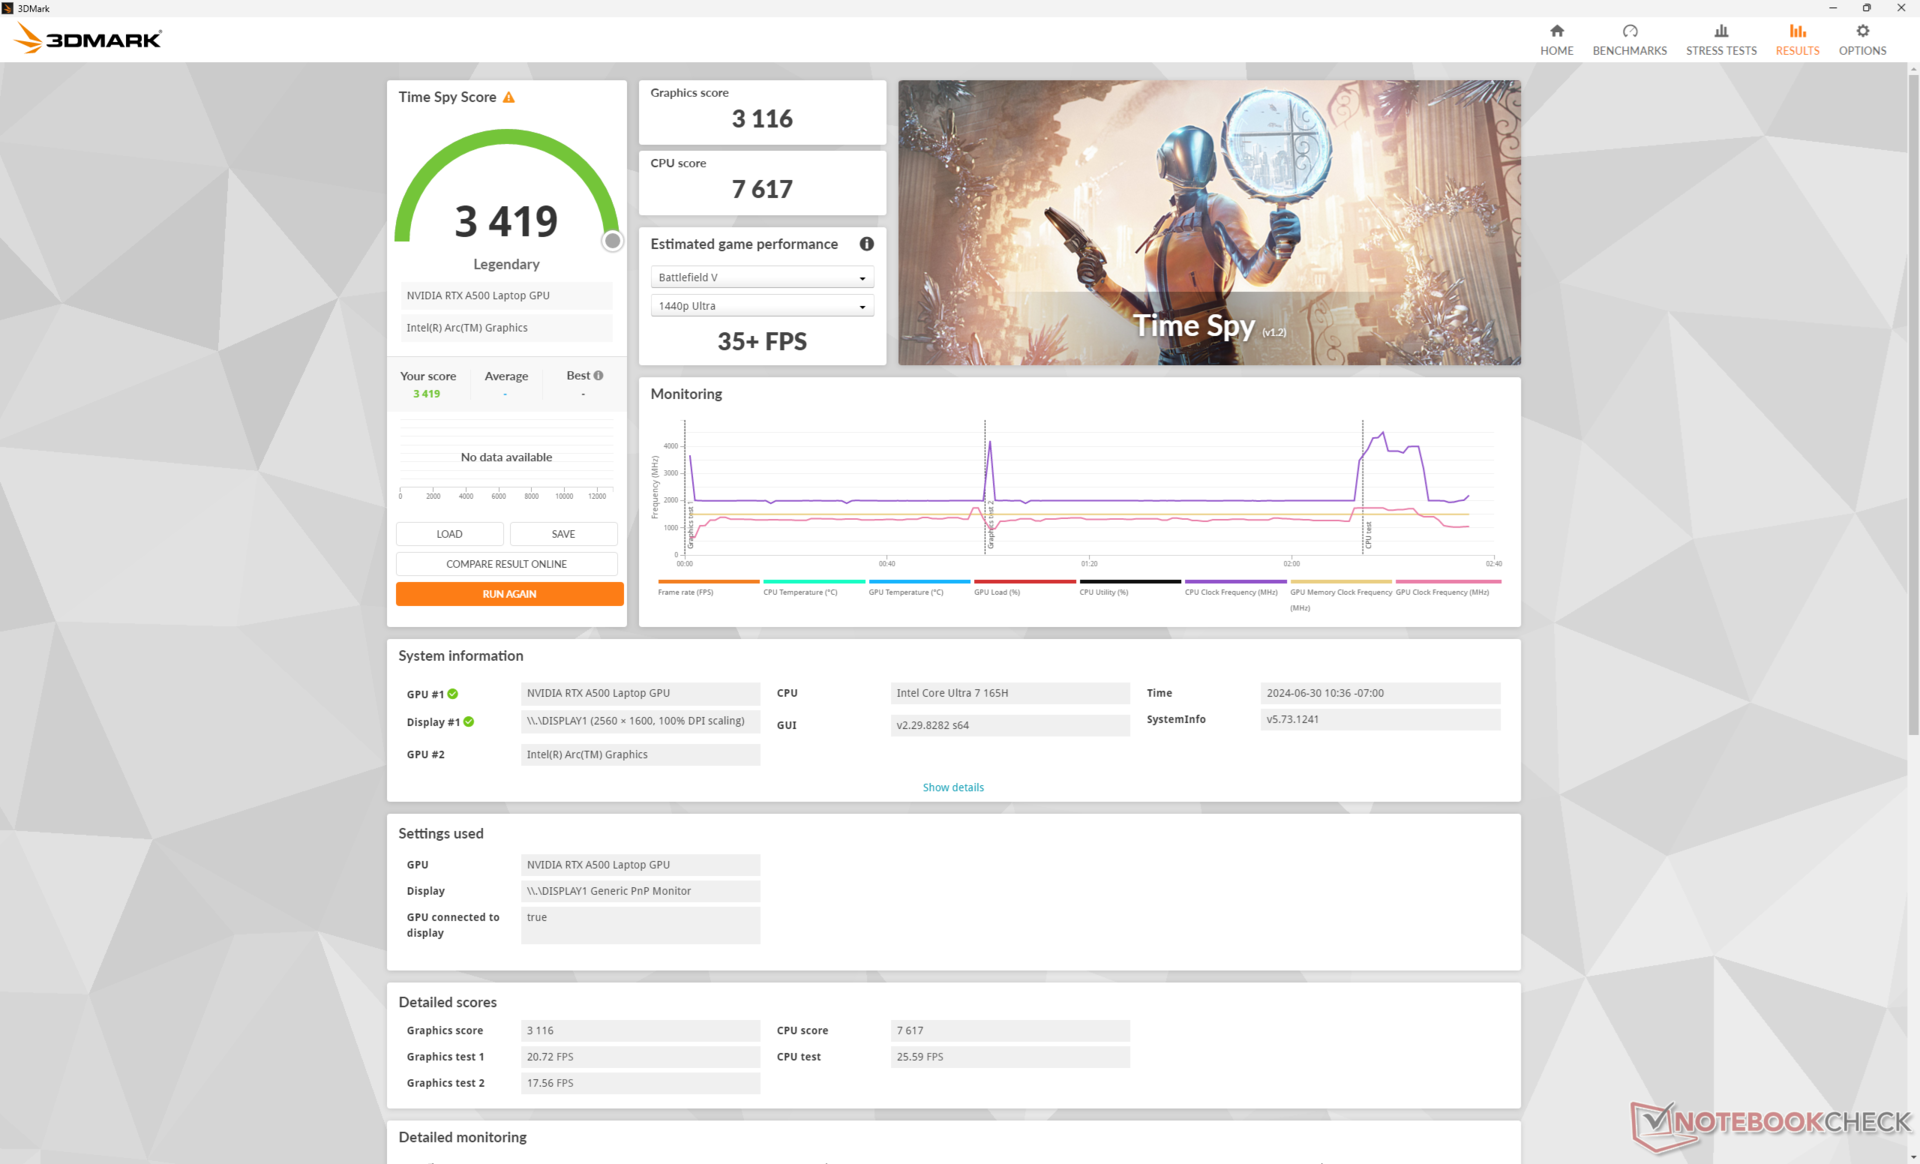
| Power Profile | Graphics Score | Physics Score | Combined Score |
| Performance Mode | 7578 | 23240 | 2687 |
| Balanced Mode | 7554 (-0%) | 22308 (-4%) | 2695 (-0%) |
| Battery Power | 5706 (-25%) | 16248 (-30%) | 2120 (-21%) |
There appears to be little to no performance differences between setting the system to Performance mode or Balanced mode as shown by our Fire Strike results table above. Running on battery power, however, impacts both the CPU and GPU much more significantly.
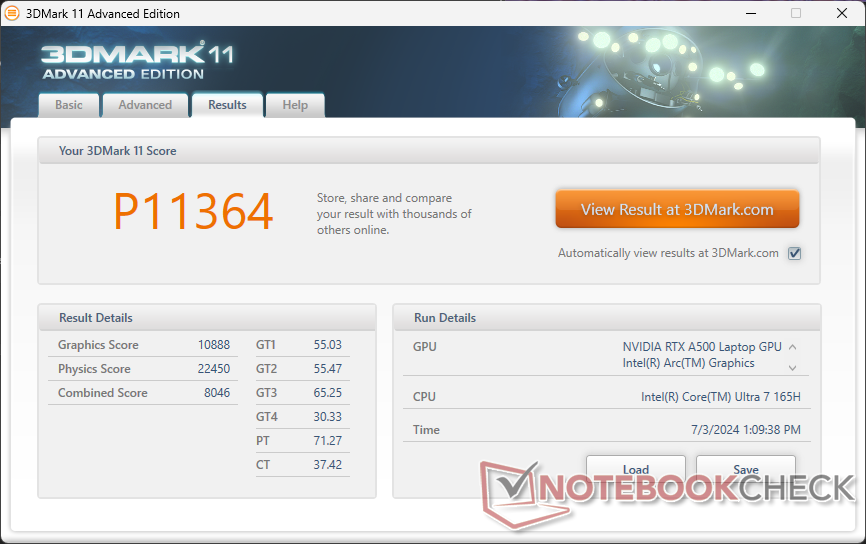

| 3DMark 11 Performance | 11364 points | |
| 3DMark Cloud Gate Standard Score | 30528 points | |
| 3DMark Fire Strike Score | 7010 points | |
| 3DMark Time Spy Score | 3419 points | |
| 3DMark Steel Nomad Score | 229 points | |
Help | ||
* ... smaller is better
| Performance rating - Percent | |
| Dell Precision 5000 5490 | |
| Asus ExpertBook B3 B3404CVF -1! | |
| Lenovo ThinkPad P14s G4 21HF0017GE | |
| HP ZBook Firefly 14 G11 | |
| HP ZBook Firefly 14 G8 2C9Q2EA -1! | |
| HP ZBook Firefly 14 G10 A -1! | |
| The Witcher 3 - 1920x1080 Ultra Graphics & Postprocessing (HBAO+) | |
| Dell Precision 5000 5490 | |
| Asus ExpertBook B3 B3404CVF | |
| Lenovo ThinkPad P14s G4 21HF0017GE | |
| HP ZBook Firefly 14 G11 | |
| HP ZBook Firefly 14 G10 A | |
| HP ZBook Firefly 14 G8 2C9Q2EA | |
| Final Fantasy XV Benchmark - 1920x1080 High Quality | |
| Dell Precision 5000 5490 | |
| Asus ExpertBook B3 B3404CVF | |
| Lenovo ThinkPad P14s G4 21HF0017GE | |
| HP ZBook Firefly 14 G11 | |
| HP ZBook Firefly 14 G10 A | |
| HP ZBook Firefly 14 G8 2C9Q2EA | |
| Strange Brigade - 1920x1080 ultra AA:ultra AF:16 | |
| Dell Precision 5000 5490 | |
| Asus ExpertBook B3 B3404CVF | |
| HP ZBook Firefly 14 G11 | |
| Lenovo ThinkPad P14s G4 21HF0017GE | |
| HP ZBook Firefly 14 G10 A | |
| Dota 2 Reborn - 1920x1080 ultra (3/3) best looking | |
| Dell Precision 5000 5490 | |
| Asus ExpertBook B3 B3404CVF | |
| Lenovo ThinkPad P14s G4 21HF0017GE | |
| HP ZBook Firefly 14 G11 | |
| HP ZBook Firefly 14 G8 2C9Q2EA | |
| HP ZBook Firefly 14 G10 A | |
| X-Plane 11.11 - 1920x1080 high (fps_test=3) | |
| Asus ExpertBook B3 B3404CVF | |
| HP ZBook Firefly 14 G11 | |
| Dell Precision 5000 5490 | |
| Lenovo ThinkPad P14s G4 21HF0017GE | |
| HP ZBook Firefly 14 G8 2C9Q2EA | |
| HP ZBook Firefly 14 G10 A | |
| Far Cry 5 - 1920x1080 Ultra Preset AA:T | |
| Dell Precision 5000 5490 | |
| Lenovo ThinkPad P14s G4 21HF0017GE | |
| HP ZBook Firefly 14 G11 | |
| HP ZBook Firefly 14 G8 2C9Q2EA | |
| Tiny Tina's Wonderlands | |
| 1920x1080 Low Preset (DX12) | |
| Dell Precision 5480 | |
| Dell Precision 5000 5490 | |
| HP ZBook Firefly 14 G11 | |
| Average NVIDIA RTX A500 Laptop GPU (n=1) | |
| 1920x1080 Medium Preset (DX12) | |
| Dell Precision 5480 | |
| Dell Precision 5000 5490 | |
| HP ZBook Firefly 14 G11 | |
| Average NVIDIA RTX A500 Laptop GPU (n=1) | |
| 1920x1080 High Preset (DX12) | |
| Dell Precision 5000 5490 | |
| Dell Precision 5480 | |
| HP ZBook Firefly 14 G11 | |
| Average NVIDIA RTX A500 Laptop GPU (n=1) | |
| 1920x1080 Badass Preset (DX12) | |
| Dell Precision 5000 5490 | |
| Dell Precision 5480 | |
| HP ZBook Firefly 14 G11 | |
| Average NVIDIA RTX A500 Laptop GPU (n=1) | |
Cyberpunk 2077 ultra FPS Chart
| low | med. | high | ultra | |
|---|---|---|---|---|
| The Witcher 3 (2015) | 134.6 | 81.6 | 53.4 | 26.3 |
| Dota 2 Reborn (2015) | 160.4 | 130.5 | 96.2 | 91.6 |
| Final Fantasy XV Benchmark (2018) | 78.6 | 44.2 | 31.4 | |
| X-Plane 11.11 (2018) | 113.3 | 98 | 81.6 | |
| Far Cry 5 (2018) | 81 | 51 | 46 | 44 |
| Strange Brigade (2018) | 168.9 | 74.9 | 62.5 | 54.5 |
| Tiny Tina's Wonderlands (2022) | 66.2 | 53.5 | 36.2 | 27.6 |
| F1 22 (2022) | 92.5 | 85.2 | 57.8 | 16.9 |
| Baldur's Gate 3 (2023) | 39.9 | 34.5 | 31.2 | 30.2 |
| Cyberpunk 2077 (2023) | 39.8 | 31.1 | 23.6 | 19.6 |
Emissions
System Noise
It doesn't take much to get the fan going leading to more frequent and audible pulses of higher RPMs and lower RPMs. Simply idling on desktop, for example, would cause the fan to cycle between 24 and 29 dB(A). Once higher loads are introduced, fan speeds would increase rather quickly and so the system is never quiet for very long when put to work. Fan noise ceiling appears to be the same as on the slower ZBook Firefly 14 G10 A at 46 dB(A) since the underlying cooling solution has not changed.

Noise level
| Idle |
| 24.6 / 25.2 / 26.8 dB(A) |
| Load |
| 38.9 / 45.8 dB(A) |
 | ||
30 dB silent 40 dB(A) audible 50 dB(A) loud |
||
min: | ||
| HP ZBook Firefly 14 G11 RTX A500 Laptop GPU, Ultra 7 165H, Kioxia XG8 KXG80ZNV512G | HP ZBook Firefly 14 G10 A Radeon 760M, R5 PRO 7640HS, Samsung PM9B1 512GB MZVL4512HBLU | HP ZBook Firefly 14 G8 2C9Q2EA T500 Laptop GPU, i7-1165G7, Toshiba XG6 KXG60ZNV1T02 | Dell Precision 5000 5490 RTX 3000 Ada Generation Laptop, Ultra 9 185H, Kioxia XG8 KXG80ZNV1T02 | Lenovo ThinkPad P14s G4 21HF0017GE RTX A500 Laptop GPU, i7-1370P, SK Hynix HFS002TEJ9X162N | Asus ExpertBook B3 B3404CVF GeForce RTX 2050 Mobile, i7-1355U, Micron 2400 MTFDKBA1T0QFM | |
|---|---|---|---|---|---|---|
| Noise | -4% | -5% | 2% | -1% | -4% | |
| off / environment * (dB) | 24.3 | 25 -3% | 28.7 -18% | 22.8 6% | 24.6 -1% | 24.5 -1% |
| Idle Minimum * (dB) | 24.6 | 25 -2% | 28.7 -17% | 23.8 3% | 24.6 -0% | 25.5 -4% |
| Idle Average * (dB) | 25.2 | 26 -3% | 28.7 -14% | 23.8 6% | 24.6 2% | 25.5 -1% |
| Idle Maximum * (dB) | 26.8 | 27 -1% | 28.7 -7% | 24.7 8% | 25.9 3% | 27.5 -3% |
| Load Average * (dB) | 38.9 | 45 -16% | 34 13% | 38.9 -0% | 41.3 -6% | 42.3 -9% |
| Cyberpunk 2077 ultra * (dB) | 41.8 | 44.2 -6% | ||||
| Load Maximum * (dB) | 45.8 | 46 -0% | 40.1 12% | 51.4 -12% | 46.2 -1% | 49.3 -8% |
| Witcher 3 ultra * (dB) | 45 | 40.1 | 49.9 | 46 |
* ... smaller is better
Temperature
Surface temperatures are not any warmer than what we recorded on the ZBook Firefly 14 G10 A despite the presence of a dGPU in our ZBook Firefly 14 G11 unit. In fact, we recorded cooler temperatures than before on average. This can be attributed to the steeper performance throttling levels of the Firefly 14 G11 when subjected to high stress which naturally leads to lower consumption and more controlled temperatures. This also aligns with our CineBench R15 xT loop results above and power consumption observations.
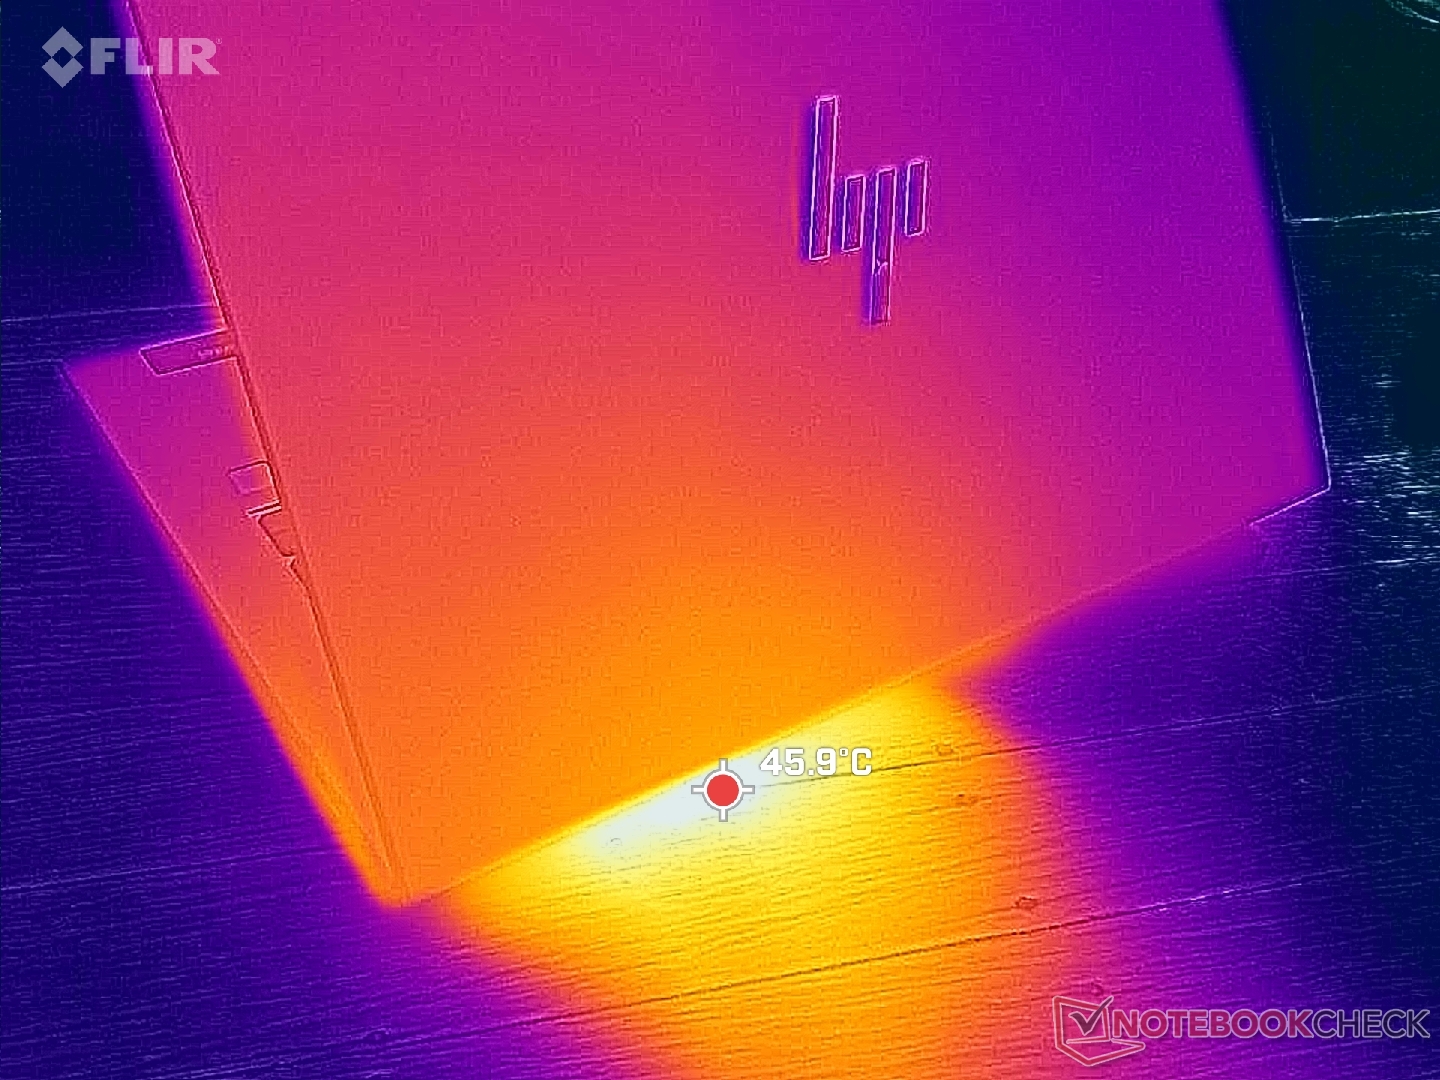
(±) The maximum temperature on the upper side is 42.8 °C / 109 F, compared to the average of 38.2 °C / 101 F, ranging from 22.2 to 69.8 °C for the class Workstation.
(±) The bottom heats up to a maximum of 44 °C / 111 F, compared to the average of 41.1 °C / 106 F
(+) In idle usage, the average temperature for the upper side is 28.5 °C / 83 F, compared to the device average of 32 °C / 90 F.
(+) The palmrests and touchpad are reaching skin temperature as a maximum (33.2 °C / 91.8 F) and are therefore not hot.
(-) The average temperature of the palmrest area of similar devices was 27.8 °C / 82 F (-5.4 °C / -9.8 F).


| HP ZBook Firefly 14 G11 Intel Core Ultra 7 165H, NVIDIA RTX A500 Laptop GPU | HP ZBook Firefly 14 G10 A AMD Ryzen 5 PRO 7640HS, AMD Radeon 760M | HP ZBook Firefly 14 G8 2C9Q2EA Intel Core i7-1165G7, NVIDIA T500 Laptop GPU | Dell Precision 5000 5490 Intel Core Ultra 9 185H, NVIDIA RTX 3000 Ada Generation Laptop | Lenovo ThinkPad P14s G4 21HF0017GE Intel Core i7-1370P, NVIDIA RTX A500 Laptop GPU | Asus ExpertBook B3 B3404CVF Intel Core i7-1355U, NVIDIA GeForce RTX 2050 Mobile | |
|---|---|---|---|---|---|---|
| Heat | -0% | 8% | 3% | -9% | 12% | |
| Maximum Upper Side * (°C) | 42.8 | 50 -17% | 42.6 -0% | 43.2 -1% | 55.3 -29% | 33.2 22% |
| Maximum Bottom * (°C) | 44 | 51 -16% | 49.4 -12% | 38.4 13% | 48.7 -11% | 40.4 8% |
| Idle Upper Side * (°C) | 30.6 | 25 18% | 24.2 21% | 31.6 -3% | 31 -1% | 28.3 8% |
| Idle Bottom * (°C) | 31.4 | 27 14% | 24.6 22% | 30.6 3% | 29.9 5% | 28 11% |
* ... smaller is better
Speakers
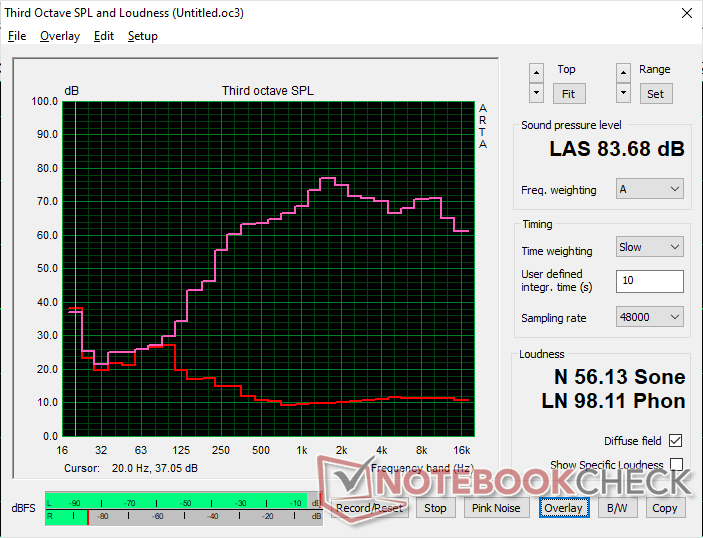
HP ZBook Firefly 14 G11 audio analysis
(+) | speakers can play relatively loud (83.7 dB)
Bass 100 - 315 Hz
(-) | nearly no bass - on average 21.6% lower than median
(±) | linearity of bass is average (10% delta to prev. frequency)
Mids 400 - 2000 Hz
(+) | balanced mids - only 4.5% away from median
(+) | mids are linear (4.3% delta to prev. frequency)
Highs 2 - 16 kHz
(+) | balanced highs - only 3.4% away from median
(+) | highs are linear (3.2% delta to prev. frequency)
Overall 100 - 16.000 Hz
(±) | linearity of overall sound is average (16.2% difference to median)
Compared to same class
» 43% of all tested devices in this class were better, 7% similar, 50% worse
» The best had a delta of 7%, average was 17%, worst was 35%
Compared to all devices tested
» 26% of all tested devices were better, 6% similar, 68% worse
» The best had a delta of 4%, average was 24%, worst was 134%
Apple MacBook Pro 16 2021 M1 Pro audio analysis
(+) | speakers can play relatively loud (84.7 dB)
Bass 100 - 315 Hz
(+) | good bass - only 3.8% away from median
(+) | bass is linear (5.2% delta to prev. frequency)
Mids 400 - 2000 Hz
(+) | balanced mids - only 1.3% away from median
(+) | mids are linear (2.1% delta to prev. frequency)
Highs 2 - 16 kHz
(+) | balanced highs - only 1.9% away from median
(+) | highs are linear (2.7% delta to prev. frequency)
Overall 100 - 16.000 Hz
(+) | overall sound is linear (4.6% difference to median)
Compared to same class
» 0% of all tested devices in this class were better, 0% similar, 100% worse
» The best had a delta of 5%, average was 17%, worst was 45%
Compared to all devices tested
» 0% of all tested devices were better, 0% similar, 100% worse
» The best had a delta of 4%, average was 24%, worst was 134%
Energy Management — More Demanding Than Before
Power Consumption
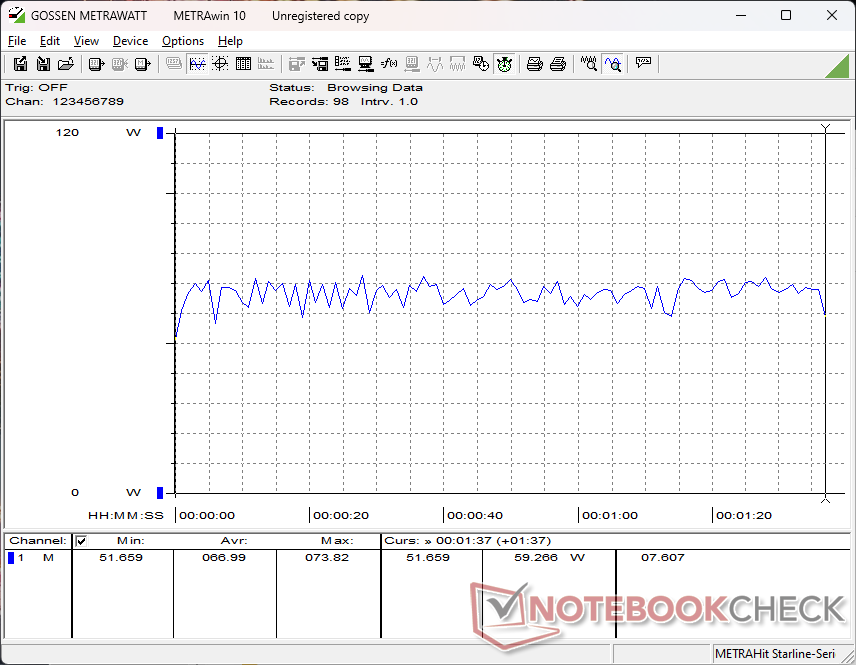
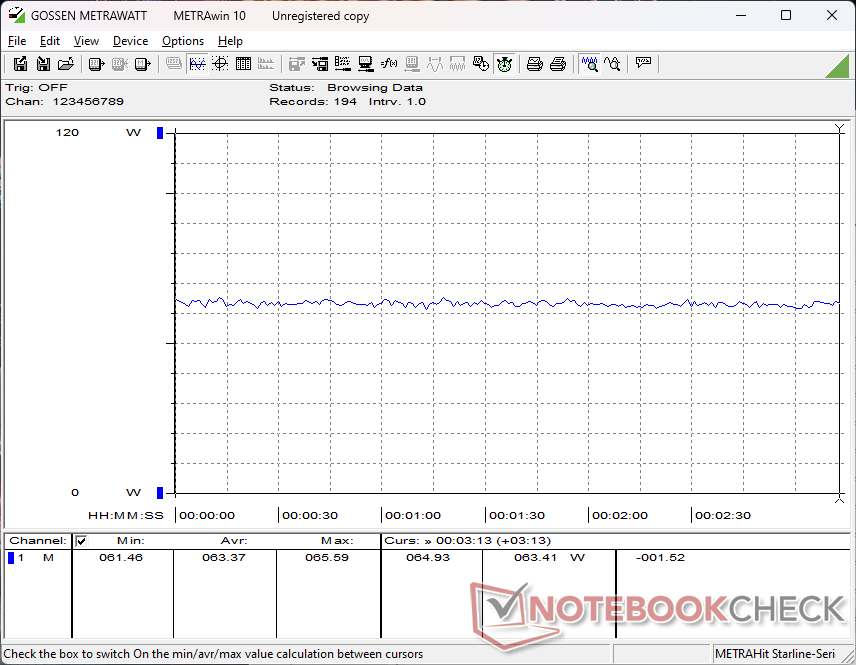
Idling on desktop demands almost 2x more power than on the ZBook Firefly 14 G10 A due largely to the discrete GPU, higher display resolution, and faster refresh rate. Though the nominal differences are only a few watts, the impact to battery life over several hours can be significant as demonstrated by our battery life tests below. Consumption when running more demanding loads like Cyberpunk 2077 is also generally higher on our Intel-powered ZBook Firefly 14 G11 by several watts.
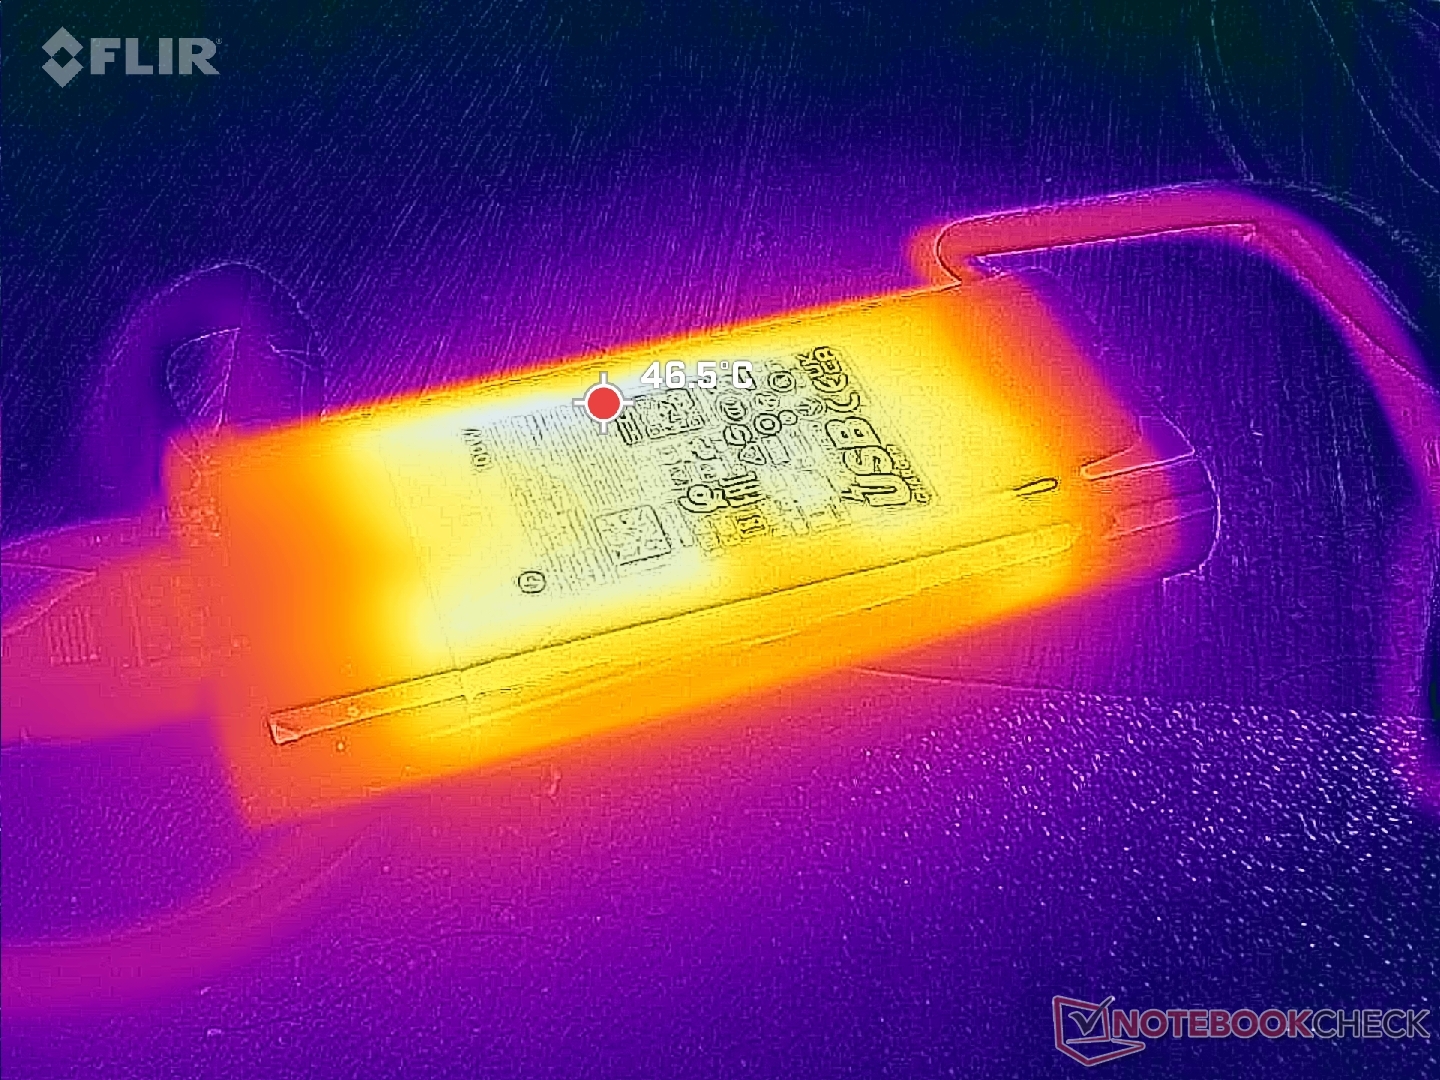
Our system ships with a larger (~13.5 x 6 x 2.3 cm) 100 W USB-C AC adapter compared to the 65 W USB-C AC adapter for the ZBook Firefly 14 G10 A because of the more demanding specifications. We're able to measure a temporary maximum draw of 95 W when the CPU and GPU are fully stressed.


| Off / Standby | |
| Idle | |
| Load |
|
Key:
min: | |
| HP ZBook Firefly 14 G11 Ultra 7 165H, RTX A500 Laptop GPU, Kioxia XG8 KXG80ZNV512G, IPS, 2560x1600, 14" | HP ZBook Firefly 14 G10 A R5 PRO 7640HS, Radeon 760M, Samsung PM9B1 512GB MZVL4512HBLU, IPS, 1920x1200, 14" | HP ZBook Firefly 14 G8 2C9Q2EA i7-1165G7, T500 Laptop GPU, Toshiba XG6 KXG60ZNV1T02, IPS, 1920x1080, 14" | Dell Precision 5000 5490 Ultra 9 185H, RTX 3000 Ada Generation Laptop, Kioxia XG8 KXG80ZNV1T02, IPS, 2560x1600, 14" | Lenovo ThinkPad P14s G4 21HF0017GE i7-1370P, RTX A500 Laptop GPU, SK Hynix HFS002TEJ9X162N, OLED, 2880x1800, 14" | Asus ExpertBook B3 B3404CVF i7-1355U, GeForce RTX 2050 Mobile, Micron 2400 MTFDKBA1T0QFM, IPS, 1920x1200, 14" | |
|---|---|---|---|---|---|---|
| Power Consumption | 42% | 36% | -32% | 12% | 21% | |
| Idle Minimum * (Watt) | 6.6 | 3 55% | 3.1 53% | 11.1 -68% | 6.3 5% | 4.95 25% |
| Idle Average * (Watt) | 12.7 | 4 69% | 4.7 63% | 14.8 -17% | 7 45% | 5.5 57% |
| Idle Maximum * (Watt) | 13.3 | 8 40% | 8.6 35% | 16.5 -24% | 8.1 39% | 8.2 38% |
| Load Average * (Watt) | 67 | 56 16% | 64.8 3% | 70.1 -5% | 84.6 -26% | 77.9 -16% |
| Cyberpunk 2077 ultra * (Watt) | 63.4 | |||||
| Cyberpunk 2077 ultra external monitor * (Watt) | 58.1 | |||||
| Load Maximum * (Watt) | 94.9 | 66 30% | 68.5 28% | 137.5 -45% | 98.3 -4% | 95 -0% |
| Witcher 3 ultra * (Watt) | 58.2 | 59.6 | 93.1 | 56.5 | 59.1 |
* ... smaller is better
Power Consumption Cyberpunk / Stress Test
Power Consumption external Monitor
Battery Life
WLAN runtime is over 4 hours shorter than what we recorded on last year's AMD-powered ZBook Firefly 14 G10 A. This can be attributed to the GPU and display differences mentioned above. Even so, 8.5 hours of real-world browsing is still pretty good for a ZBook powered by an H-series CPU and Nvidia RTX graphics.
Charging from empty to full capacity is relatively fast at only around 80 minutes.
| HP ZBook Firefly 14 G11 Ultra 7 165H, RTX A500 Laptop GPU, 56 Wh | HP ZBook Firefly 14 G10 A R5 PRO 7640HS, Radeon 760M, 51 Wh | HP ZBook Firefly 14 G8 2C9Q2EA i7-1165G7, T500 Laptop GPU, 53 Wh | Dell Precision 5000 5490 Ultra 9 185H, RTX 3000 Ada Generation Laptop, 72 Wh | Lenovo ThinkPad P14s G4 21HF0017GE i7-1370P, RTX A500 Laptop GPU, 52.5 Wh | Asus ExpertBook B3 B3404CVF i7-1355U, GeForce RTX 2050 Mobile, 63 Wh | |
|---|---|---|---|---|---|---|
| Battery runtime | 51% | 49% | 28% | -29% | 27% | |
| WiFi v1.3 (h) | 8.6 | 13 51% | 12.8 49% | 11 28% | 6.1 -29% | 10.9 27% |
| Load (h) | 4.3 | 1 |
Pros
Cons
Verdict — Best With Core Ultra U-series Options
When it comes to configurations, most laptop models typically stick to one family of processor options for better optimization. On the Firefly 14 G11, however, users can select between Core Ultra U and Core Ultra H processors plus integrated and/or discrete Nvidia graphics. Since H-series CPUs and dGPUs have much higher power envelopes than Core U-series and iGPU options, the laptop cooling solution must be up to par to support the more demanding chips.
Unfortunately for the Firefly 14 G11, CPU throttling would occur quite readily on our high-end configuration to suggest that the cooling solution and chassis were designed more for the Core U-series processors instead. Opting for a higher-end H-series SKU may net you more performance for very short bursts, but steep throttling kicks in when running longer workloads. This makes configurations with Intel H-series processors more difficult to recommend as power users won't be able to fully exploit the high-performance CPU.
The Firefly 14 G11 looks and feels top of its class especially if configured with the new 120 Hz display. Its performance options, however, are limited by the aging cooling solution and chassis design.
Other than the processor complications, the aging RTX A500 GPU is starting to feel underpowered especially when other 14-inch workstations like the Dell Precision 5490 offer much faster RTX GPUs from the newer Ada Lovelace generation.
The Firefly 14 G11 still feels great to use with its portable form factor, respectable 120 Hz display, and comfortable keyboard and clickpad. Its discrete GPU options and performance balancing, however, could use some more fine tuning.
Price and Availability
HP is now shipping the Firefly 14 G11 starting at $2100 for the base Core Ultra 125U configuration with no discrete graphics up to over $3500 as reviewed.
Hinweis: Wir haben unser Rating-System kürzlich aktualisiert und die Ergebnisse von Version 8 sind nicht mit den Ergebnissen von Version 7 vergleichbar. Weitere Informationen dazu sind hier verfügbar.
Note: We have recently updated our rating system and the results of version 8 are not comparable with the results of version 7. More information is available here .
HP ZBook Firefly 14 G11
- 07/16/2024 v8
Allen Ngo
 Total Sustainability Score:
 Transparency
The selection of devices to be reviewed is made by our editorial team. The test sample was provided to the author as a loan by the manufacturer or retailer for the purpose of this review. The lender had no influence on this review, nor did the manufacturer receive a copy of this review before publication. There was no obligation to publish this review. As an independent media company, Notebookcheck is not subjected to the authority of manufacturers, retailers or publishers.
This is how Notebookcheck is testing
Every year, Notebookcheck independently reviews hundreds of laptops and smartphones using standardized procedures to ensure that all results are comparable. We have continuously developed our test methods for around 20 years and set industry standards in the process. In our test labs, high-quality measuring equipment is utilized by experienced technicians and editors. These tests involve a multi-stage validation process. Our complex rating system is based on hundreds of well-founded measurements and benchmarks, which maintains objectivity. Further information on our test methods can be found here.
Price comparison
