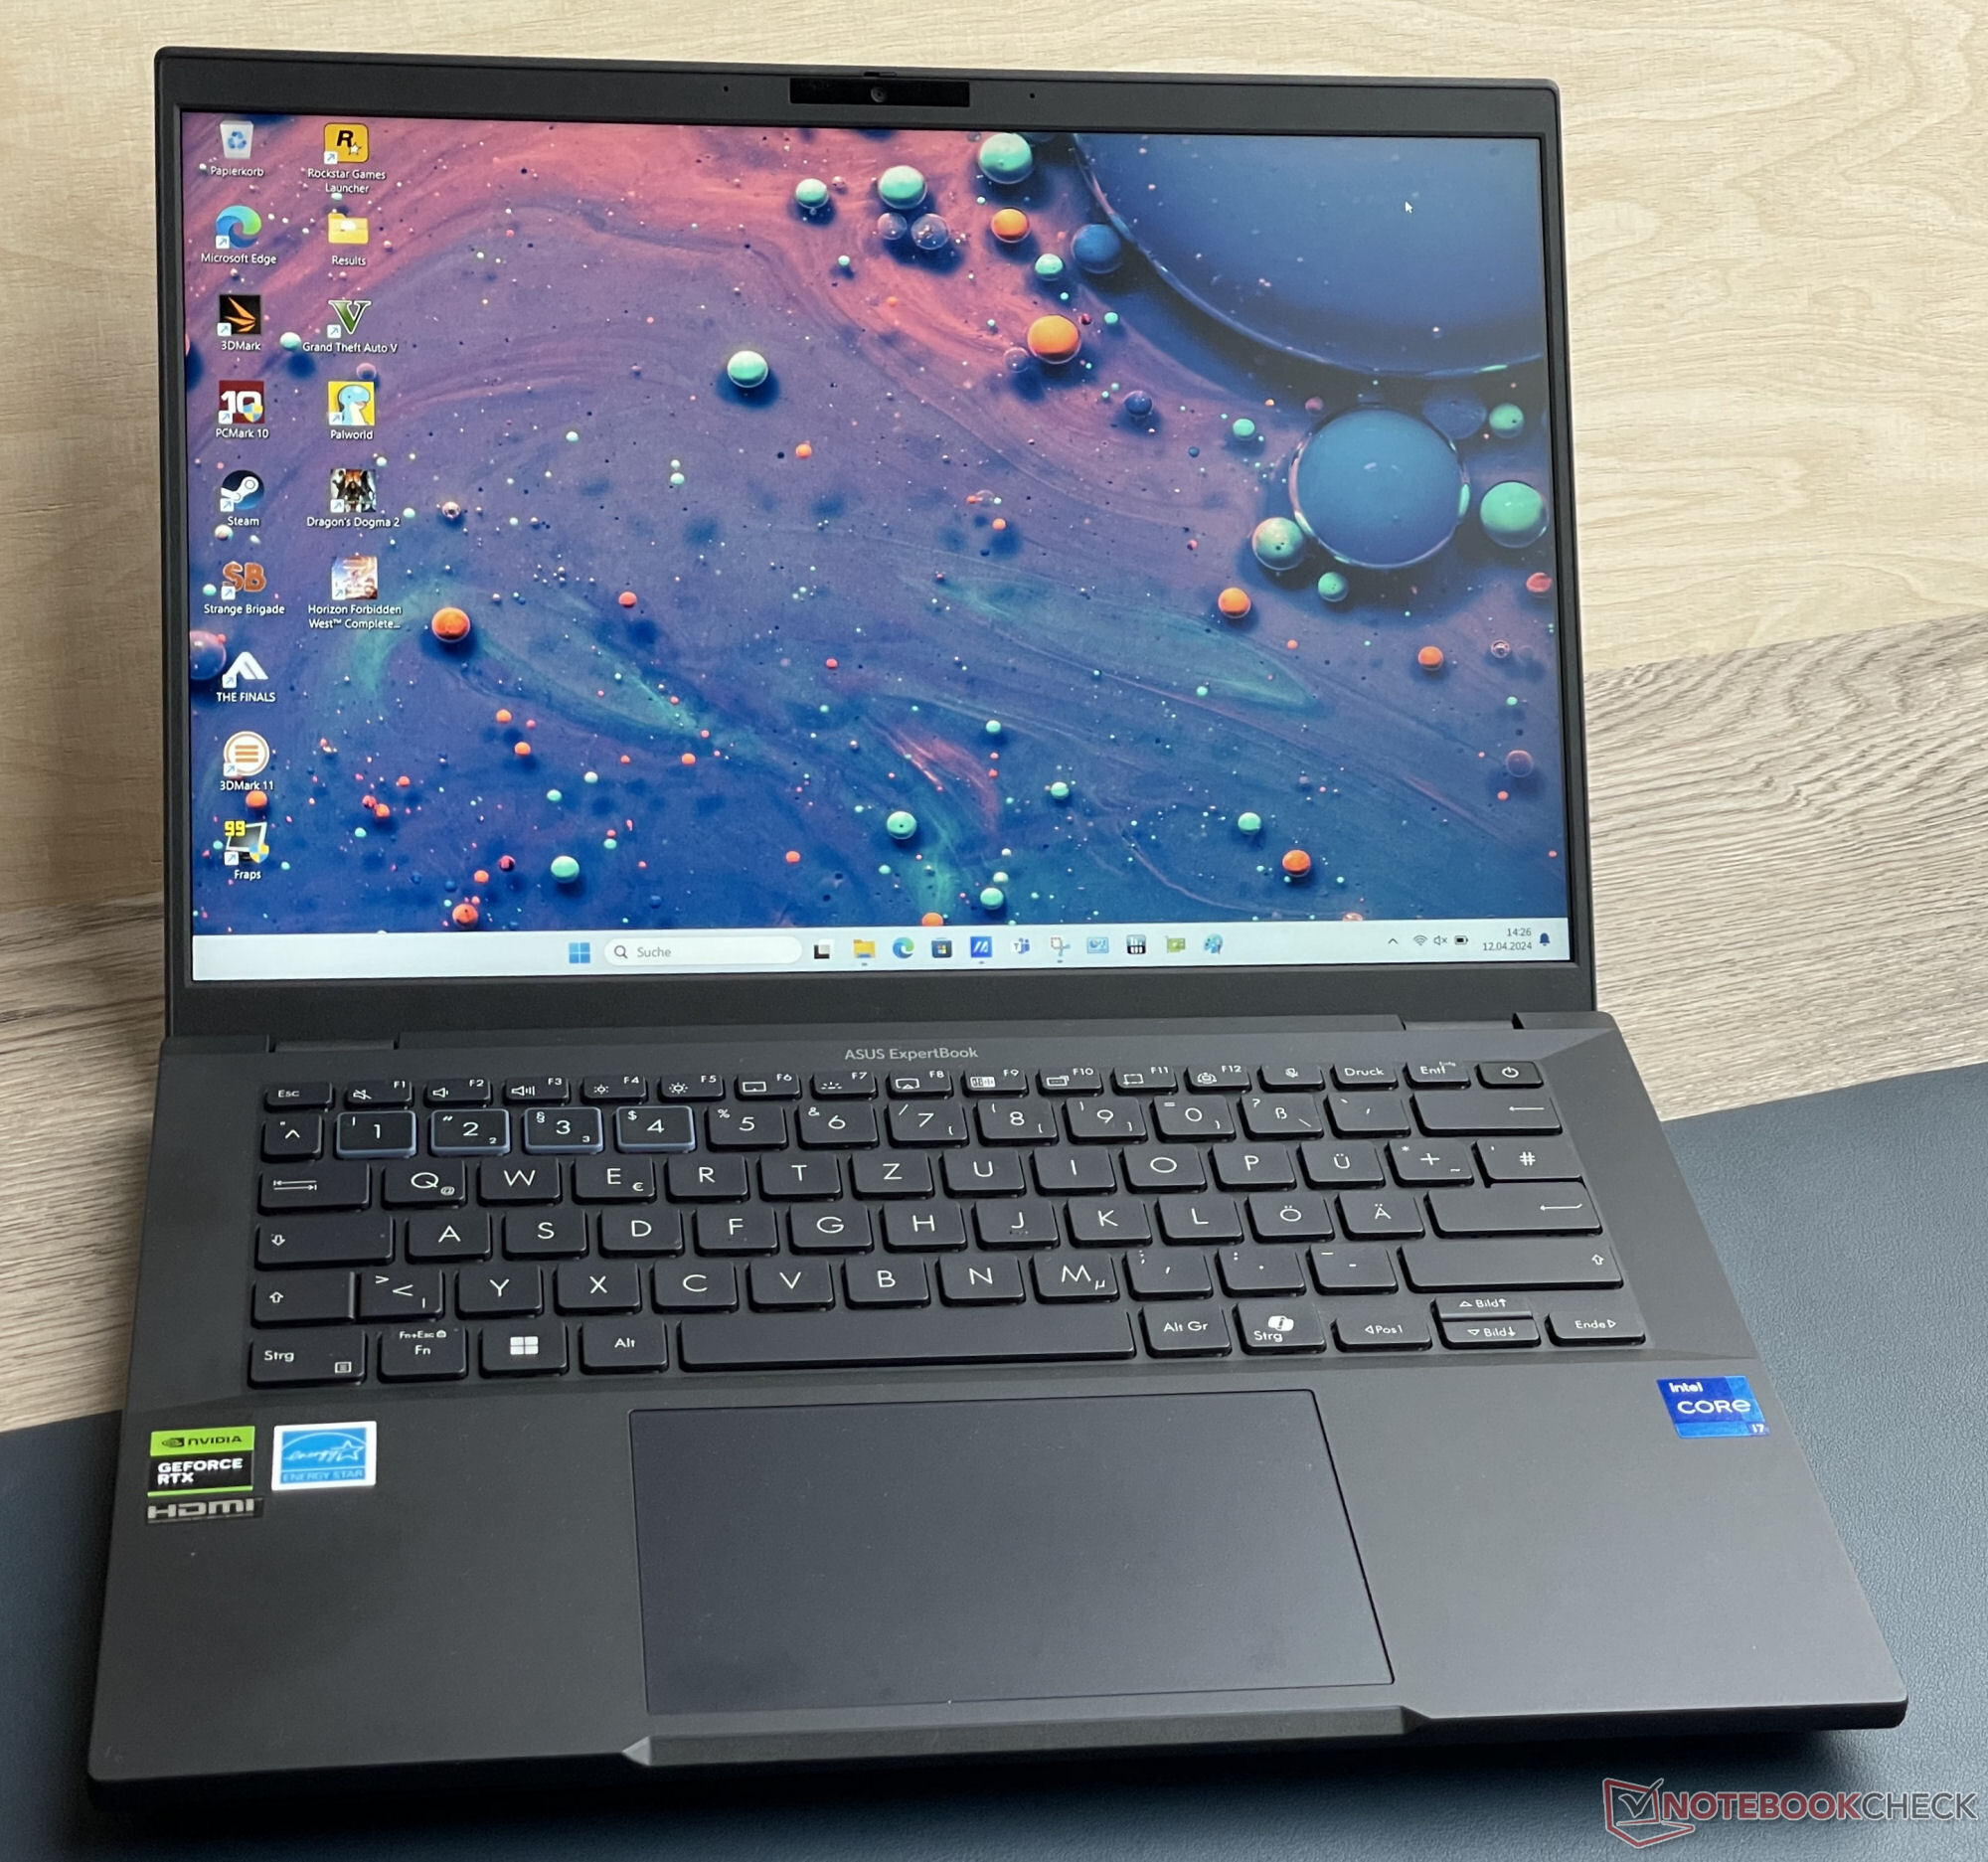
Asus ExpertBook B3 review: The powerful office laptop with 11-hour runtimes

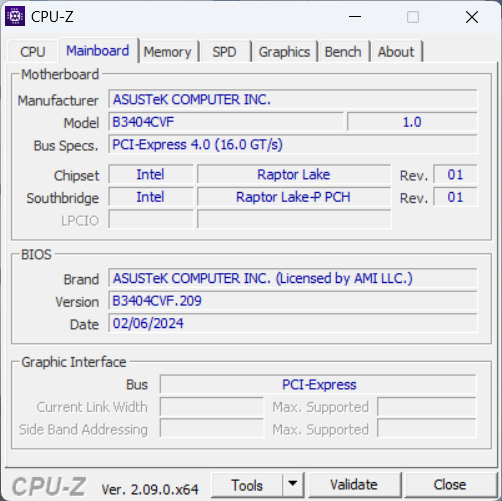
The Asus ExpertBook B3 B3404CVF—a 14-inch business laptop—is powered by a Core i7-1355U and a GeForce RTX 2050. Praiseworthy: Asus delivers the B3 with a three-year warranty as standard. Its competition includes devices such as the Acer TravelMate P4, HP ProBook 450 G10 and the Lenovo ThinkPad L14 G4.
Possible competitors compared
Rating | Date | Model | Weight | Height | Size | Resolution | Price |
|---|---|---|---|---|---|---|---|
| 84.3 % v7 (old) | 04 / 2024 | Asus ExpertBook B3 B3404CVF i7-1355U, GeForce RTX 2050 Mobile | 1.7 kg | 23.9 mm | 14.00" | 1920x1200 | |
| 85.9 % v7 (old) | 01 / 2024 | Acer TravelMate P4 TMP414-53-58XQ i5-1335U, Iris Xe G7 80EUs | 1.5 kg | 22 mm | 14.00" | 1920x1200 | |
| 86.2 % v7 (old) | 12 / 2023 | HP ProBook 450 G10 i7-1355U, GeForce RTX 2050 Mobile | 1.8 kg | 19.9 mm | 15.60" | 1920x1080 | |
| 88.6 % v7 (old) | 08 / 2023 | Lenovo ThinkPad L14 G4 21H6S00900 R5 7530U, Vega 7 | 1.5 kg | 19.83 mm | 14.00" | 1920x1080 |
Case & connectivity - The B3 with Thunderbolt 4 and Power Delivery
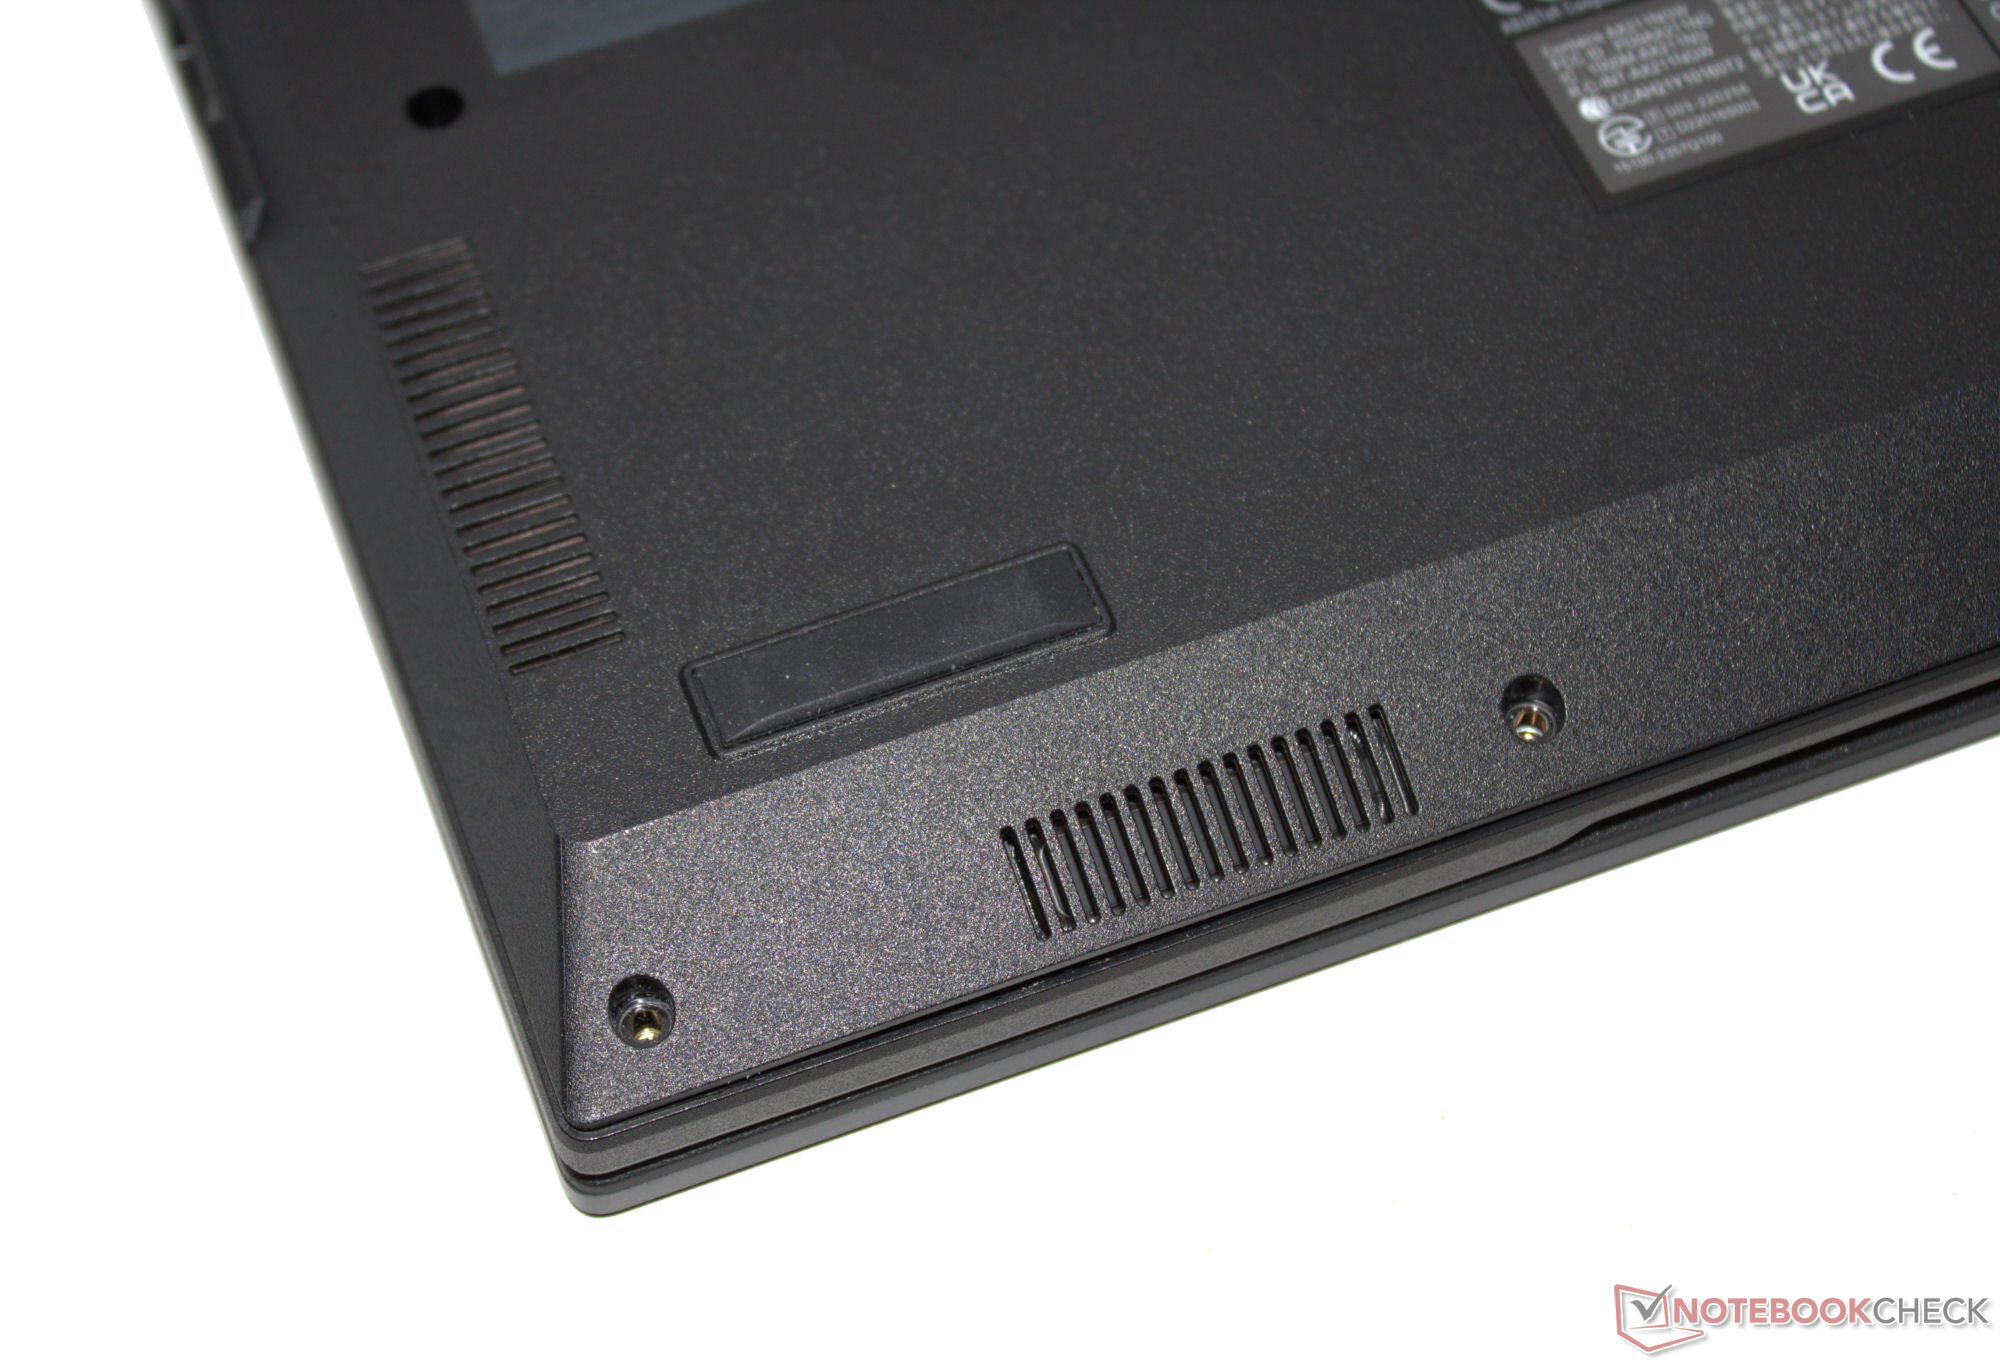
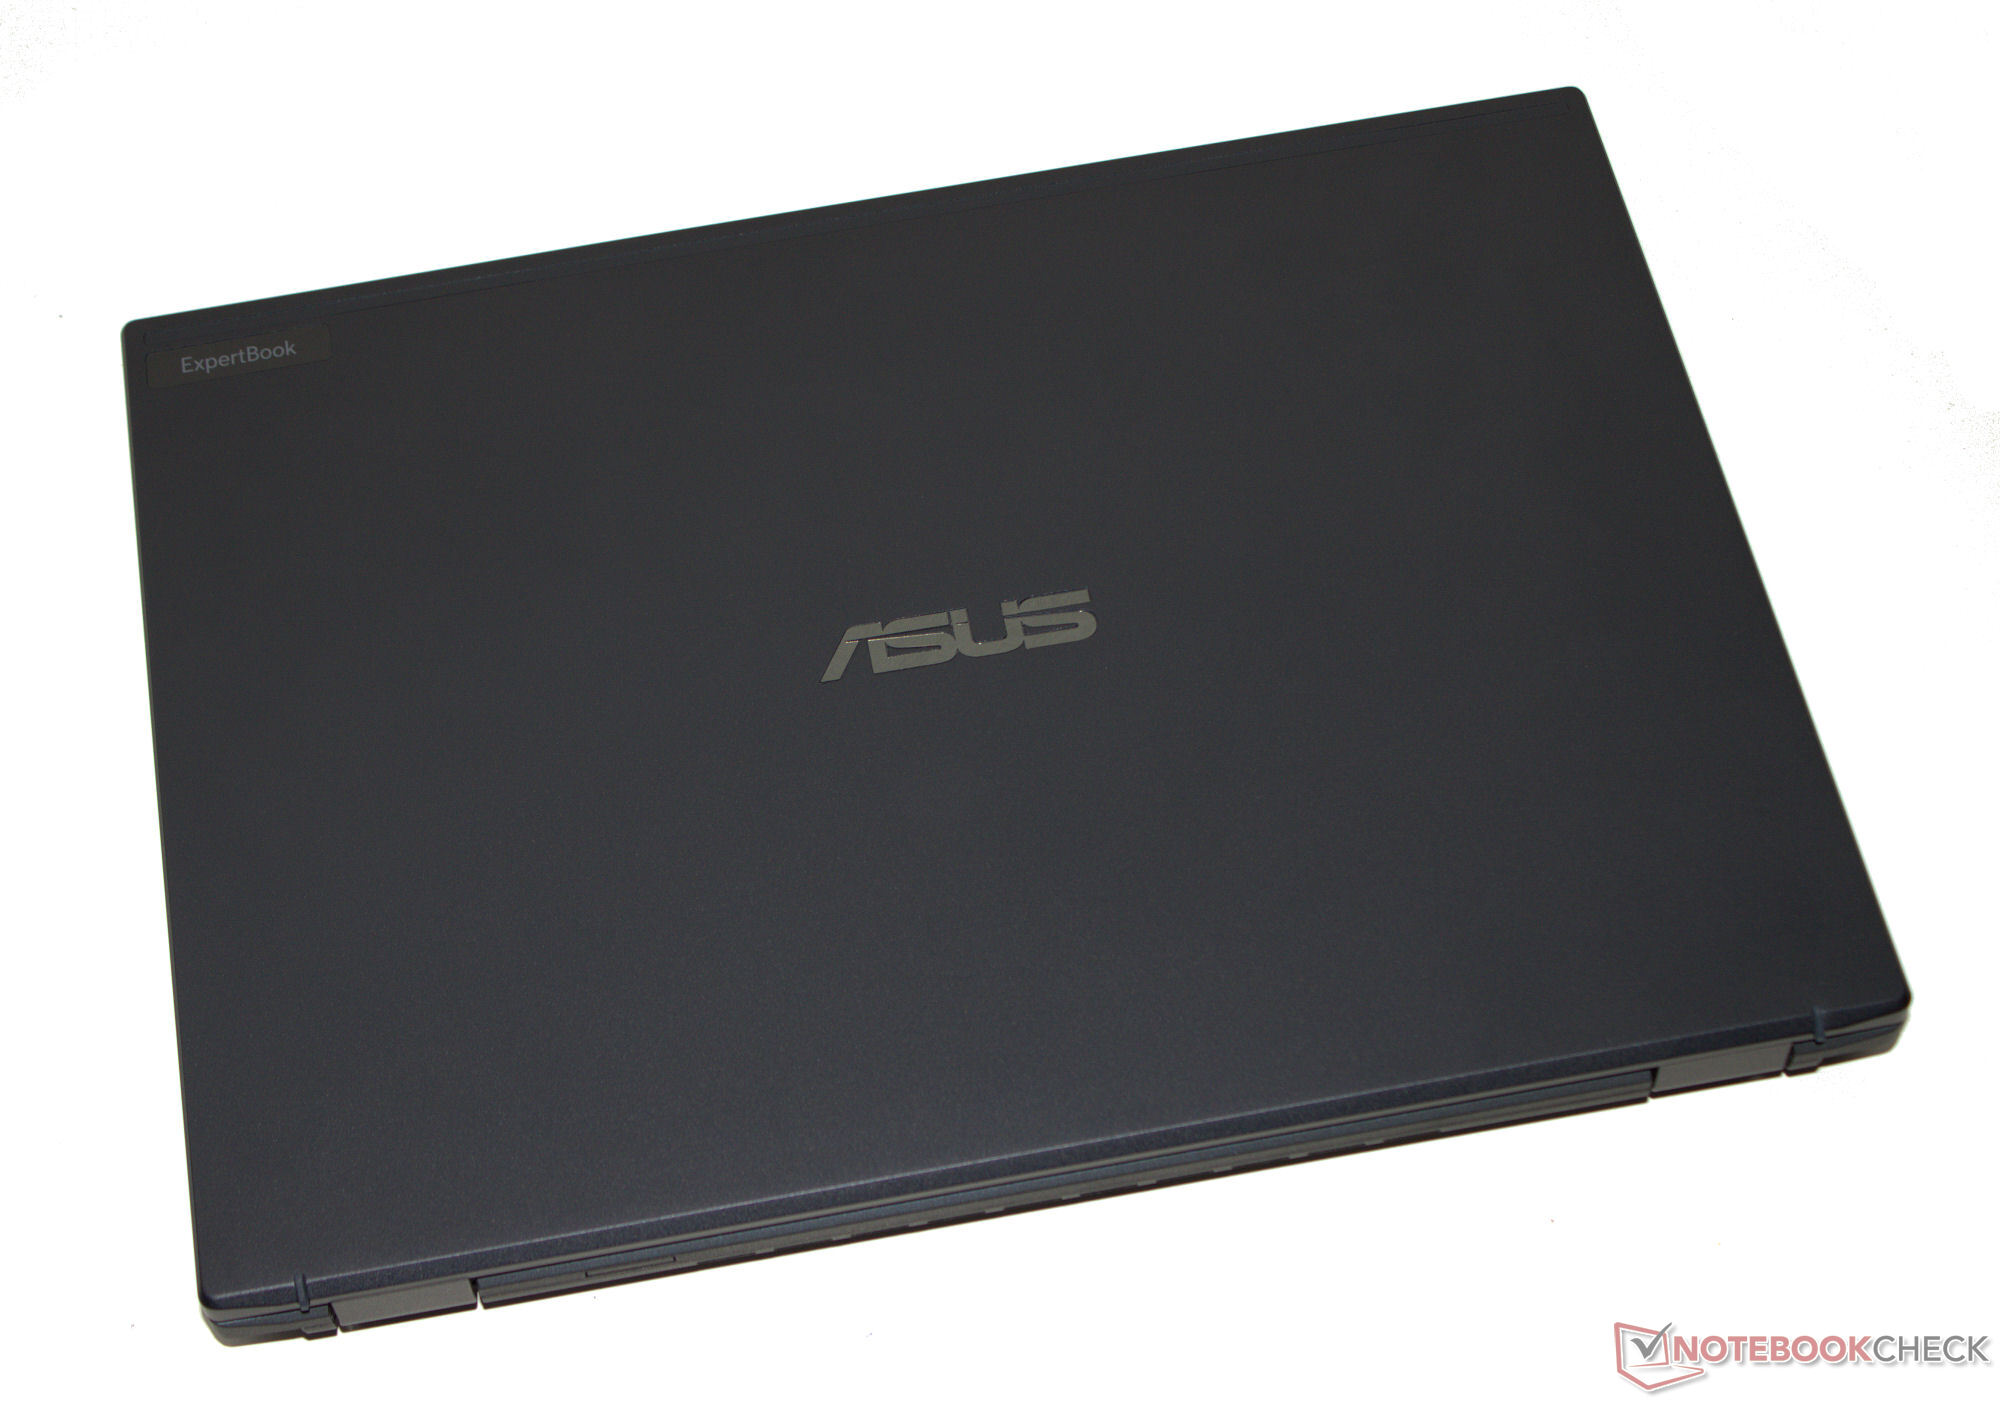
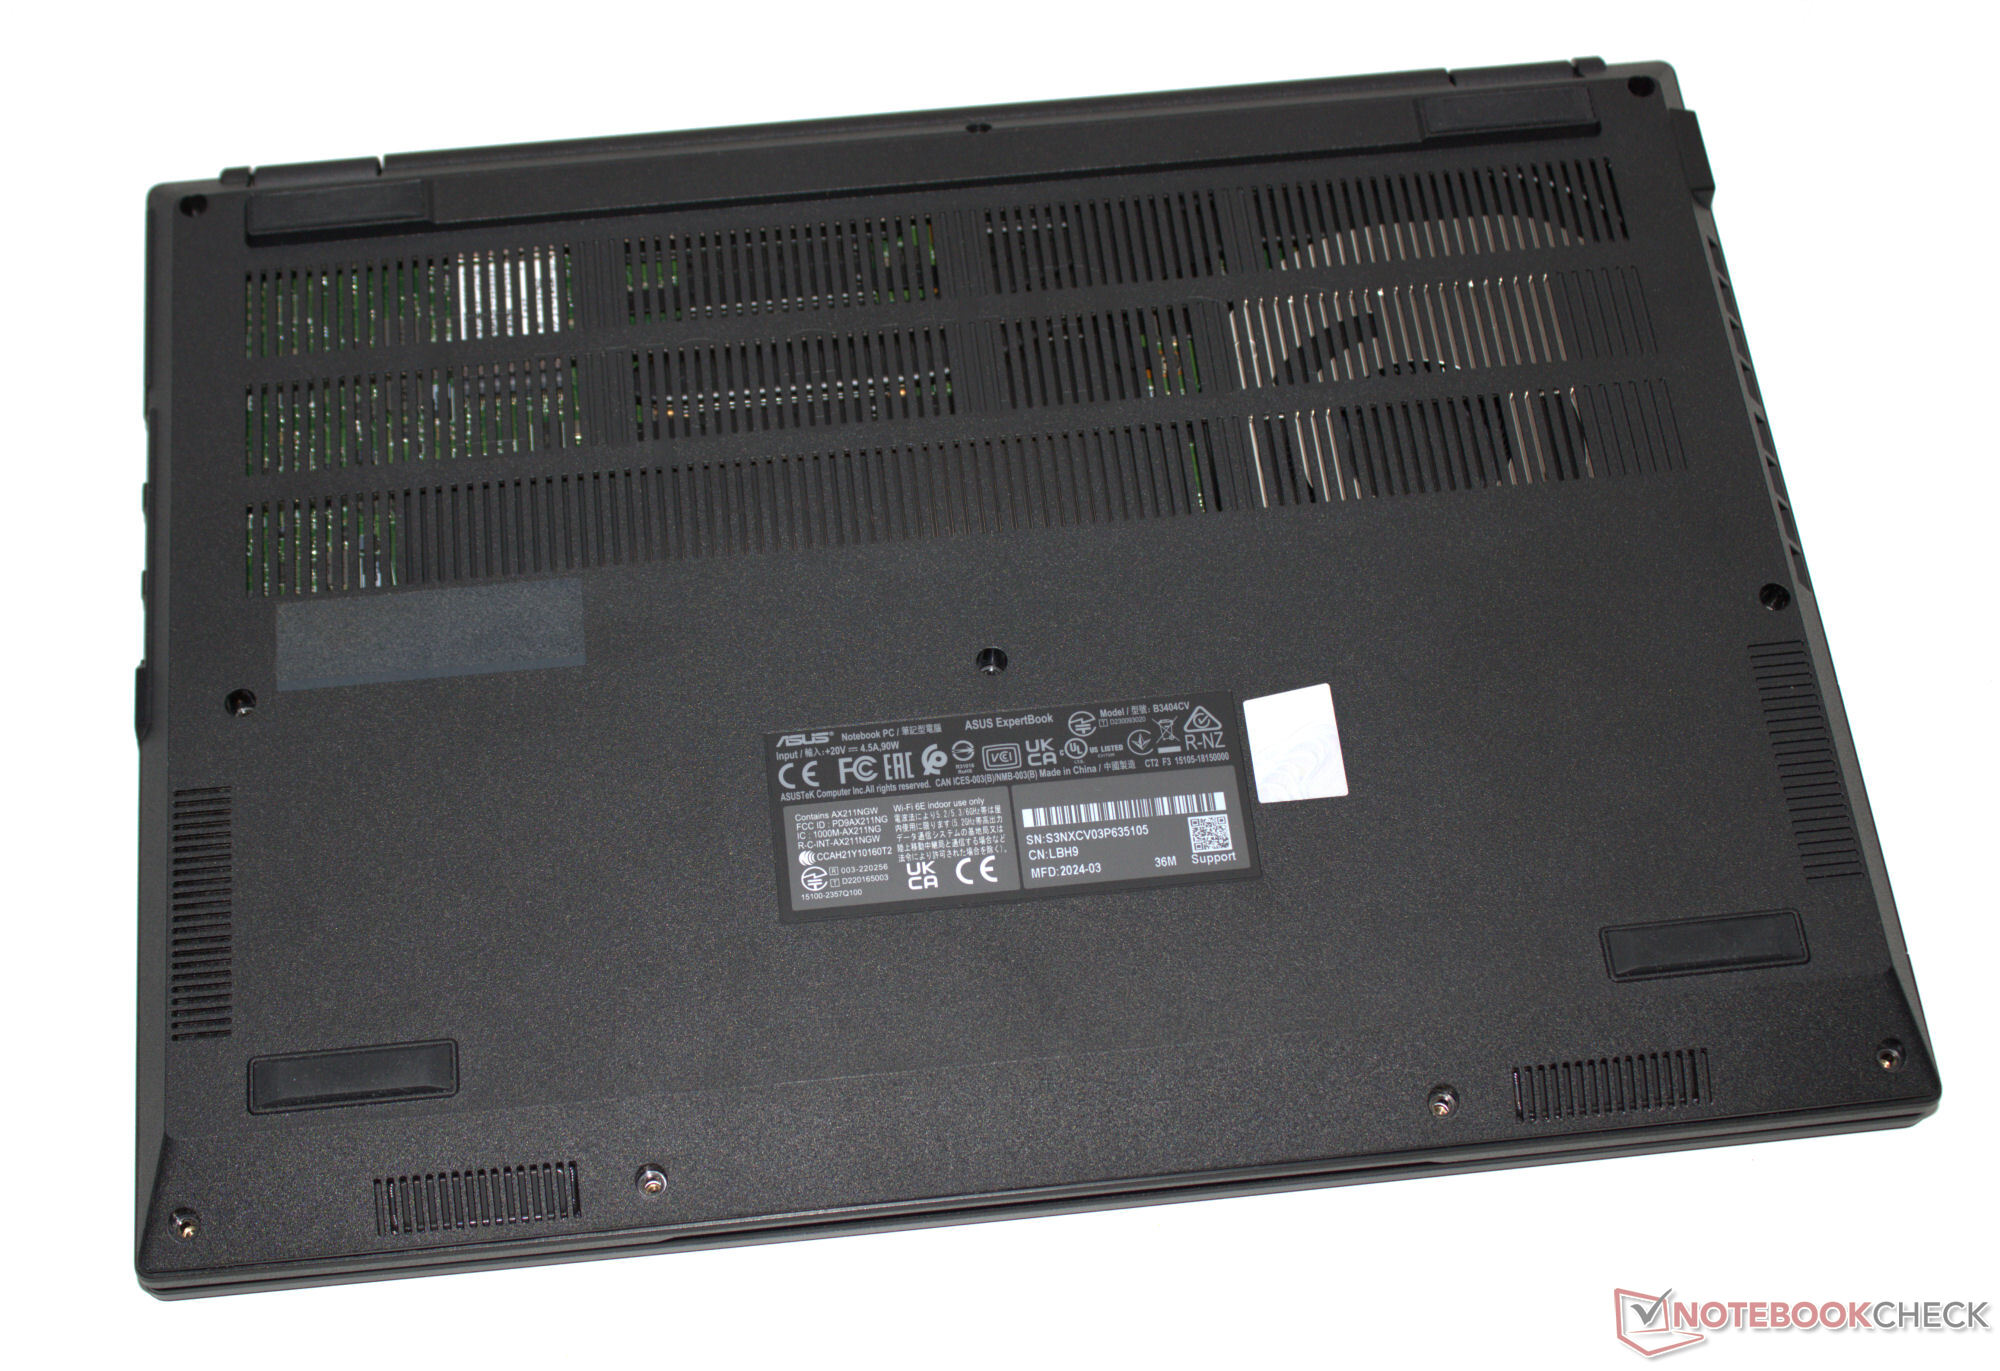
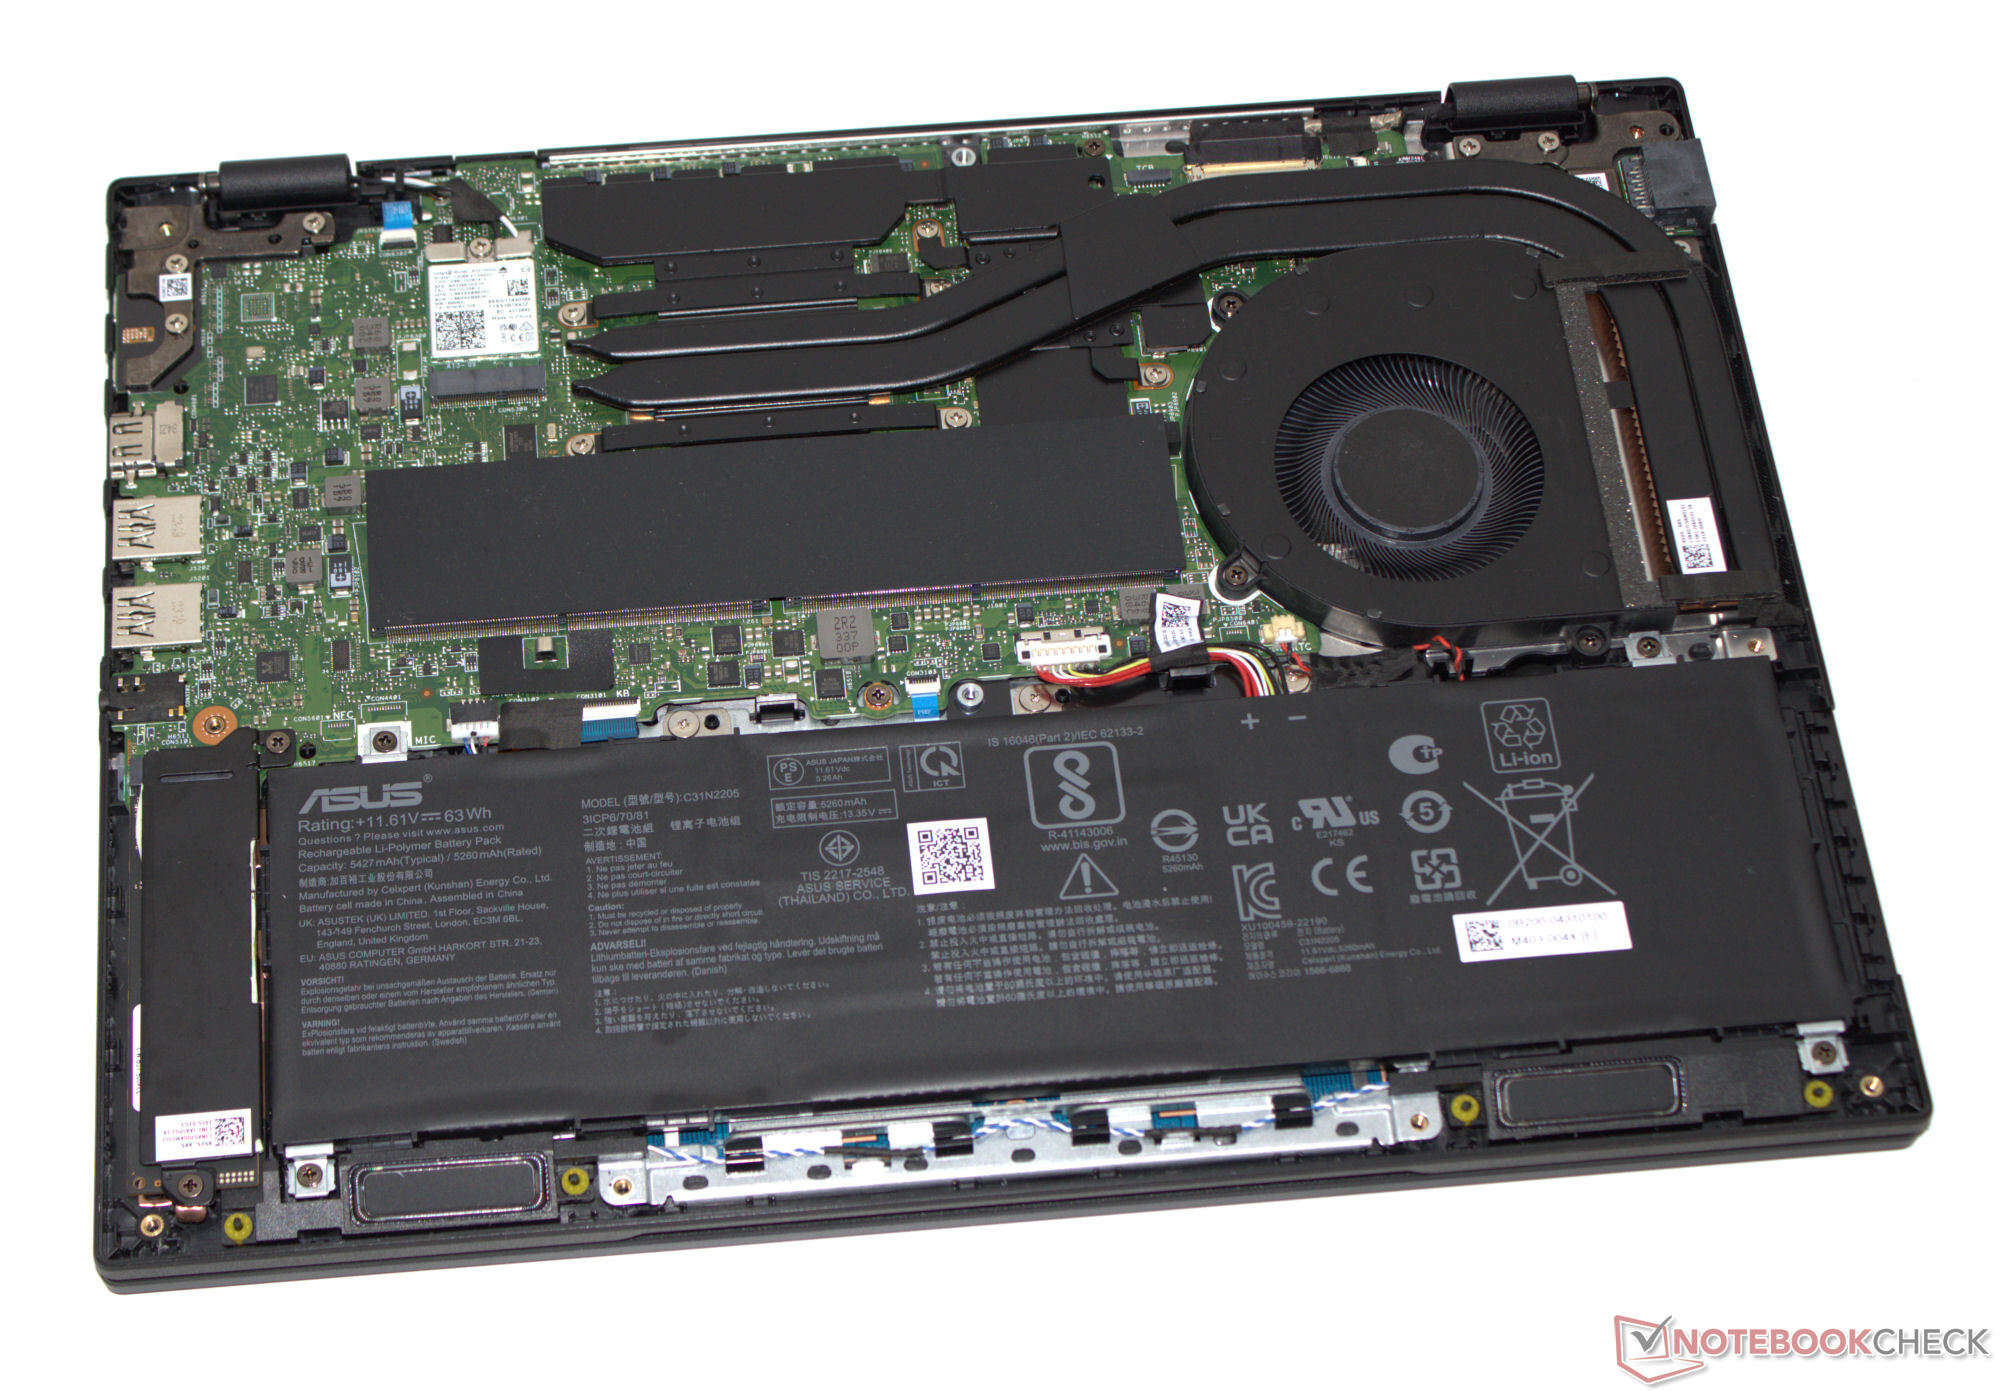
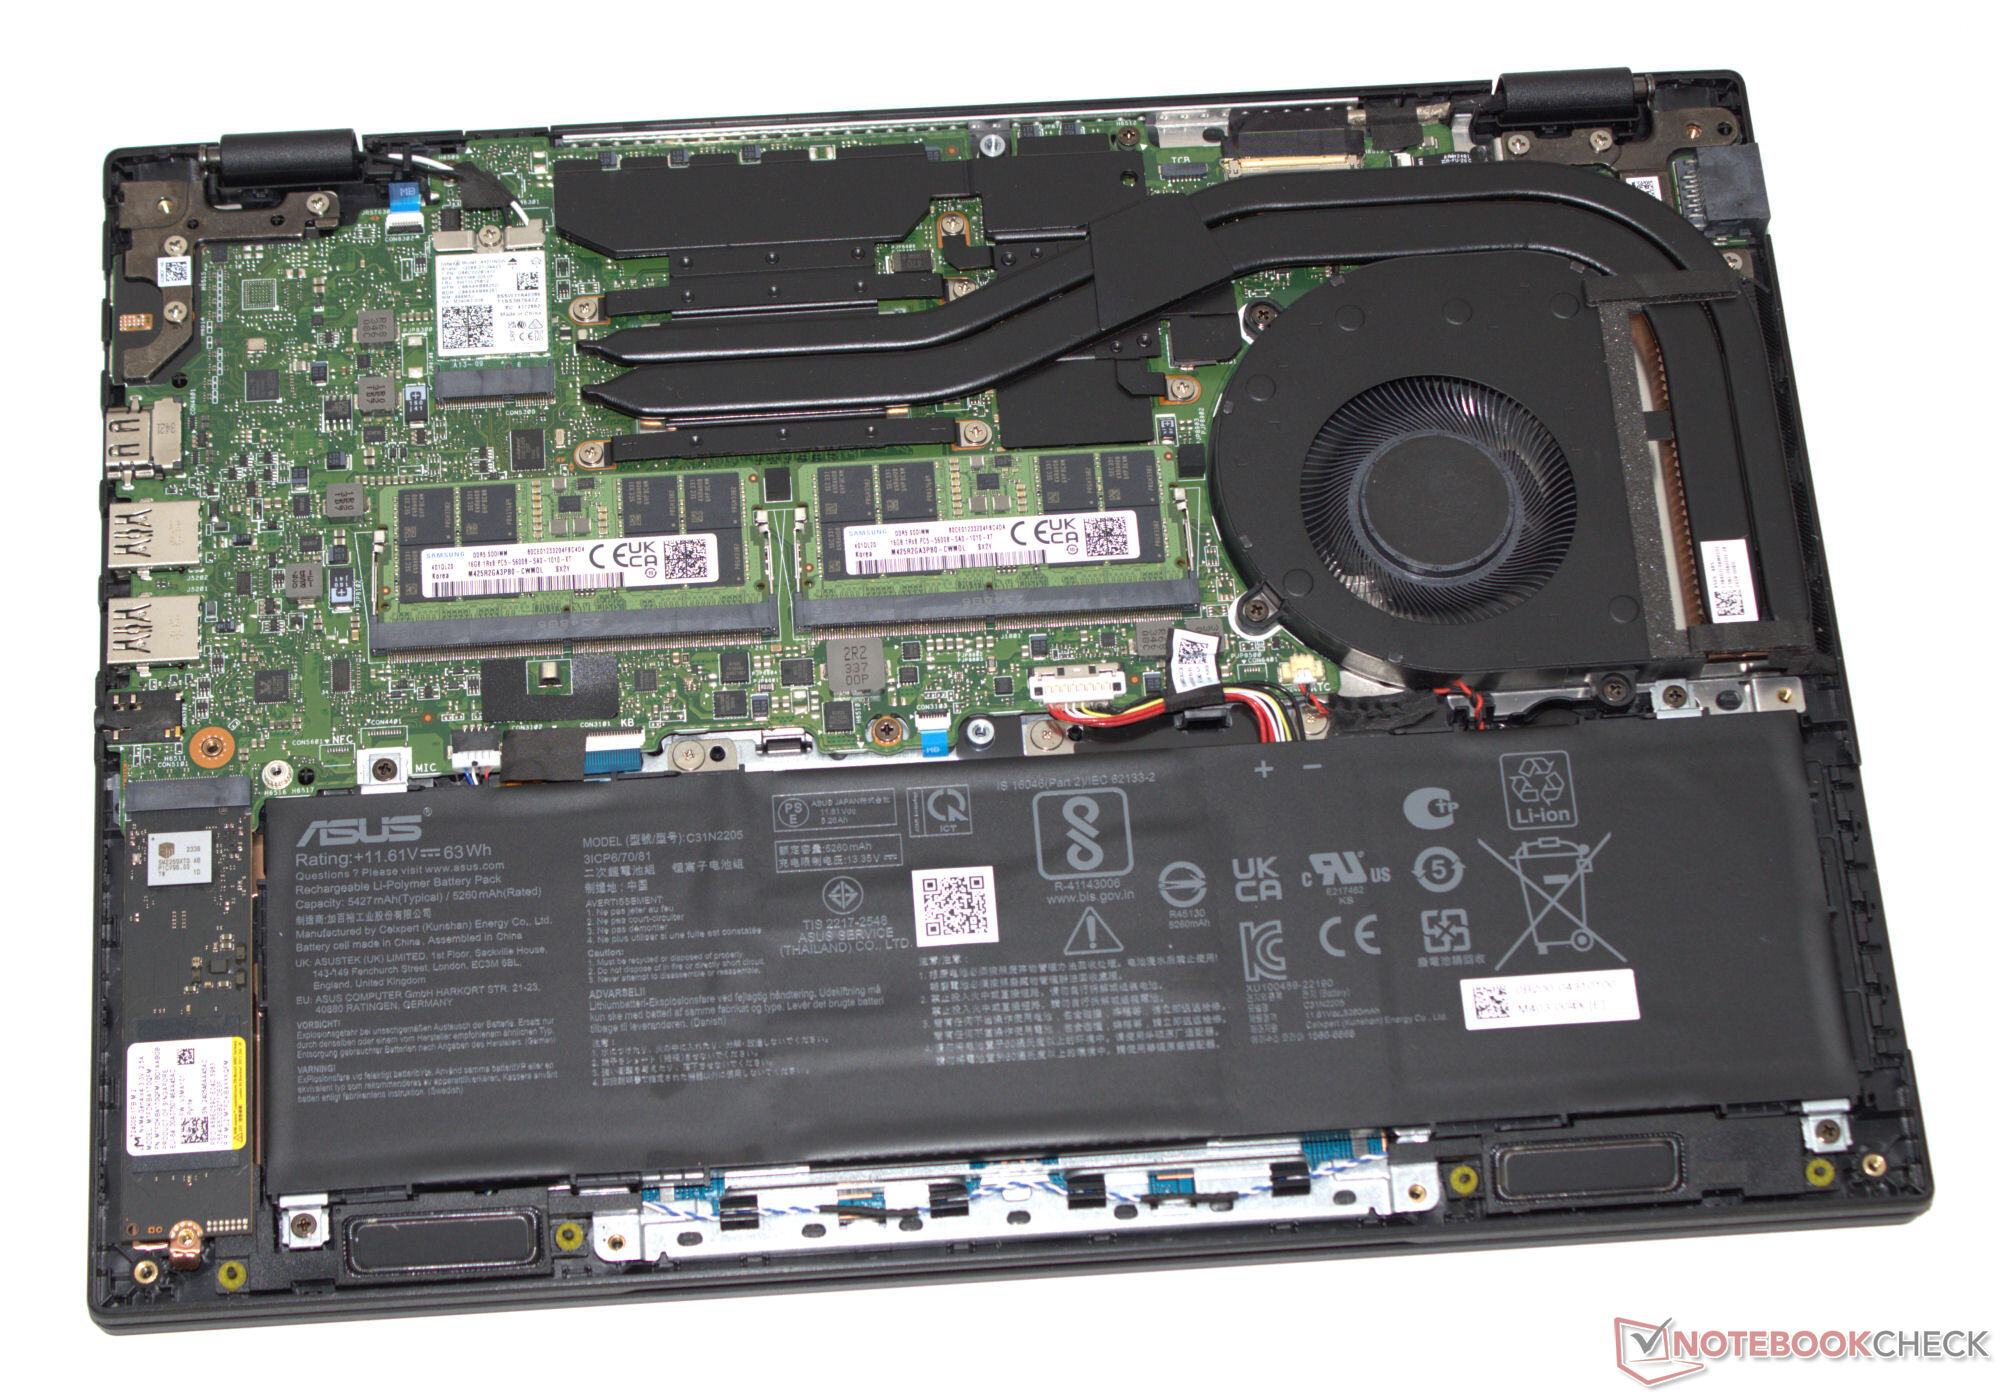
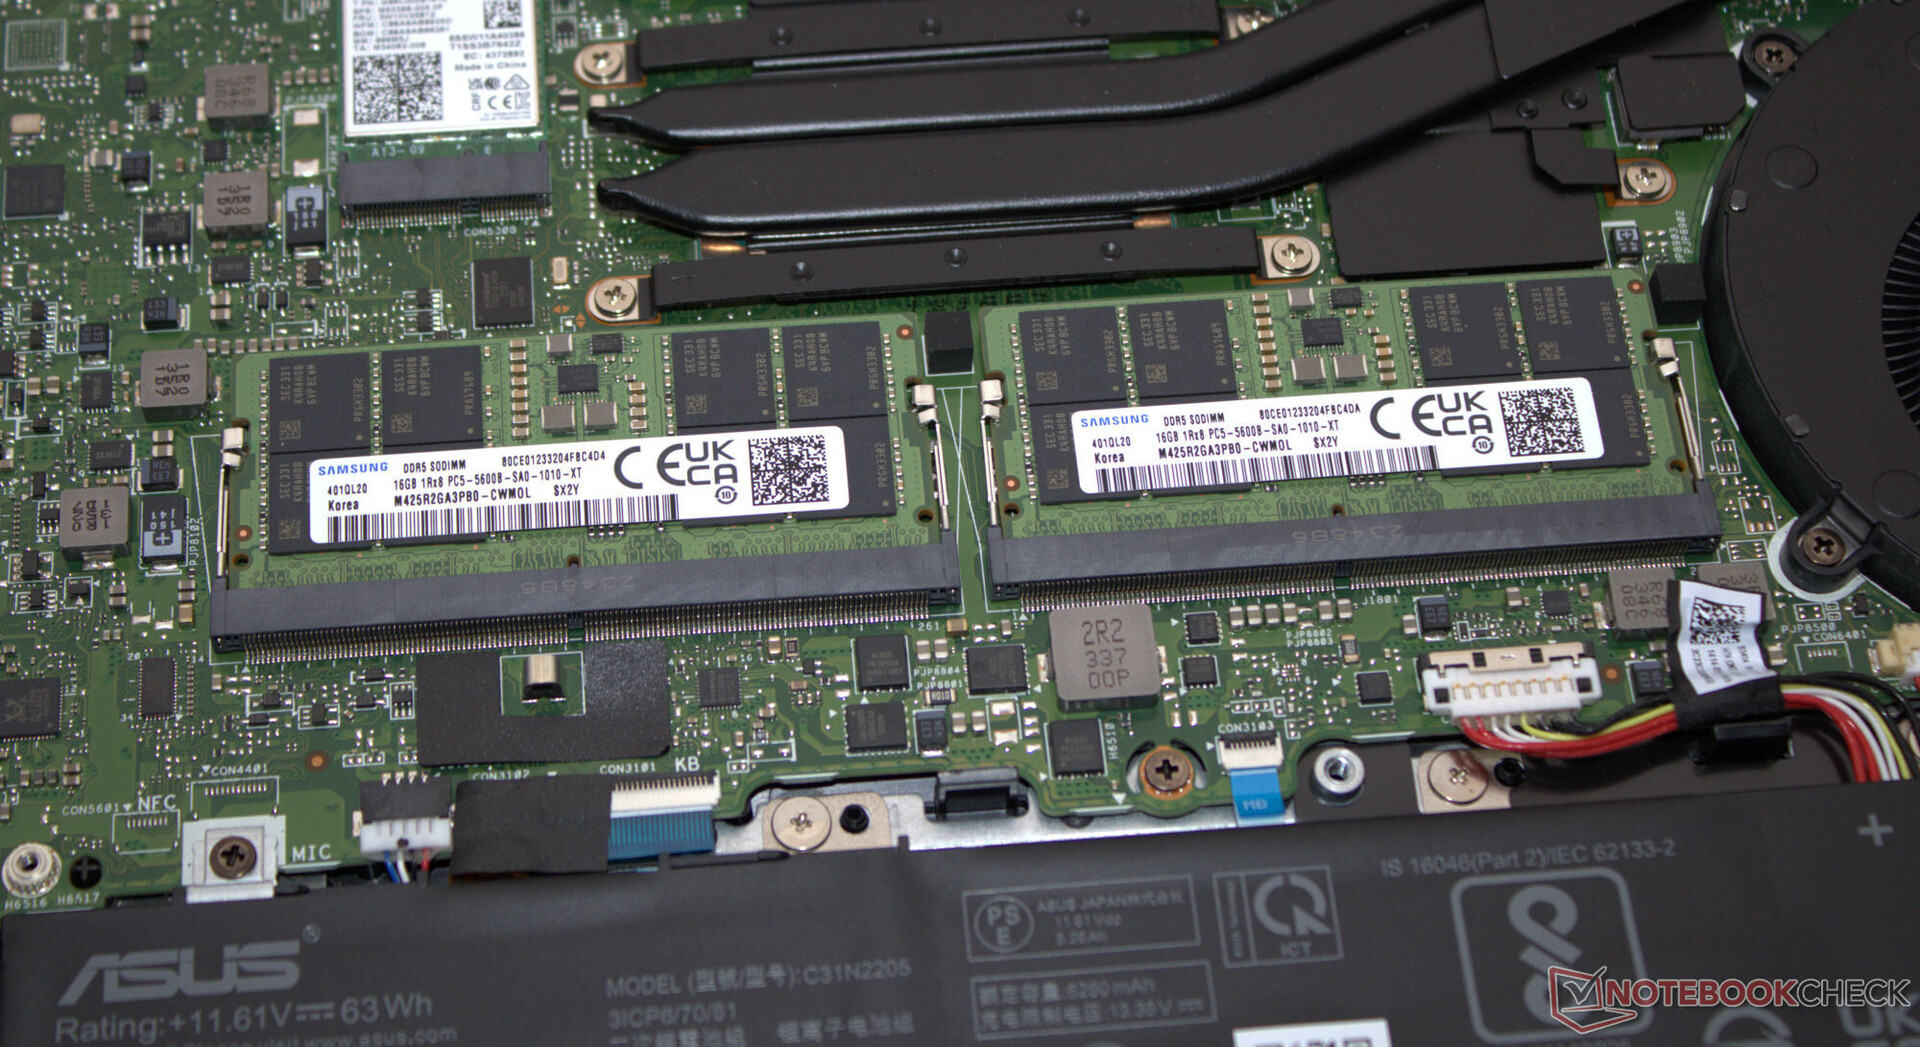
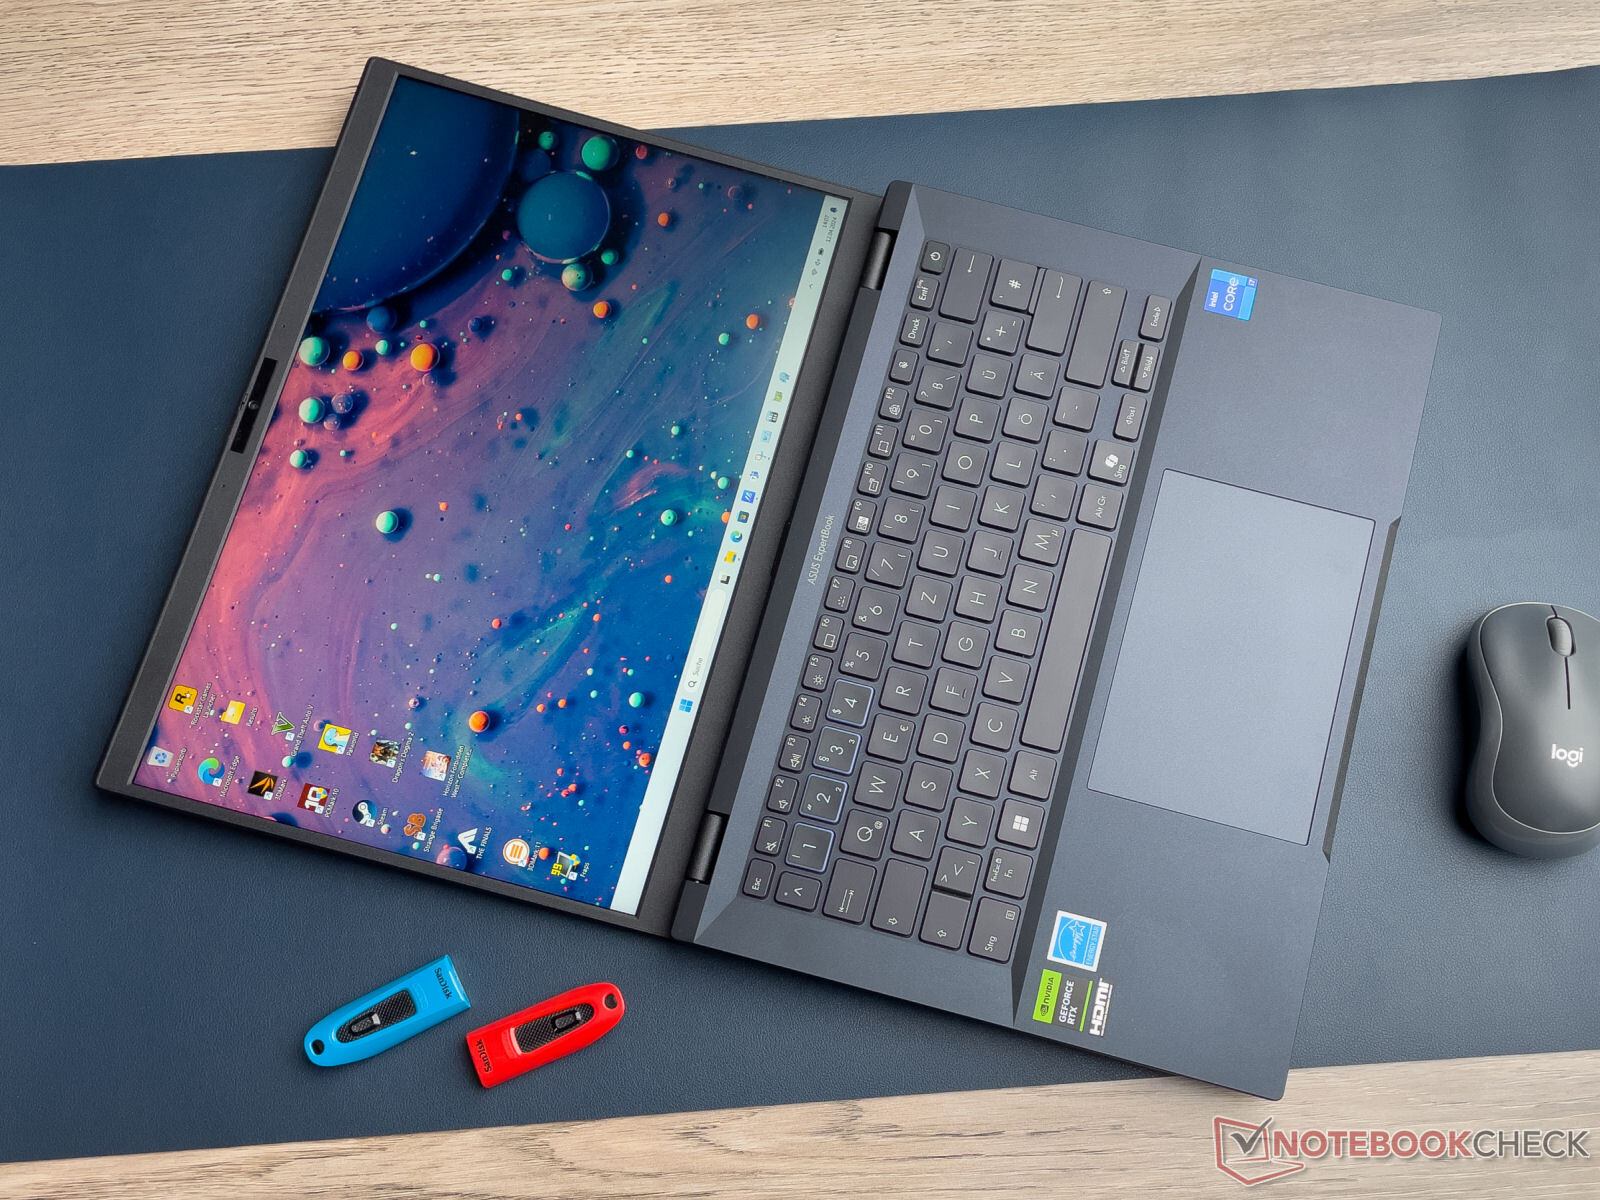
You will look in vain for high-quality materials: the well-made case is made of matte black plastic with smooth surfaces. The base unit and lid can be twisted slightly, but this is nothing out of the ordinary. Tightly adjusted hinges allow the lid a maximum opening angle of 180 degrees. The battery and other internal components can be accessed after removing the base plate.
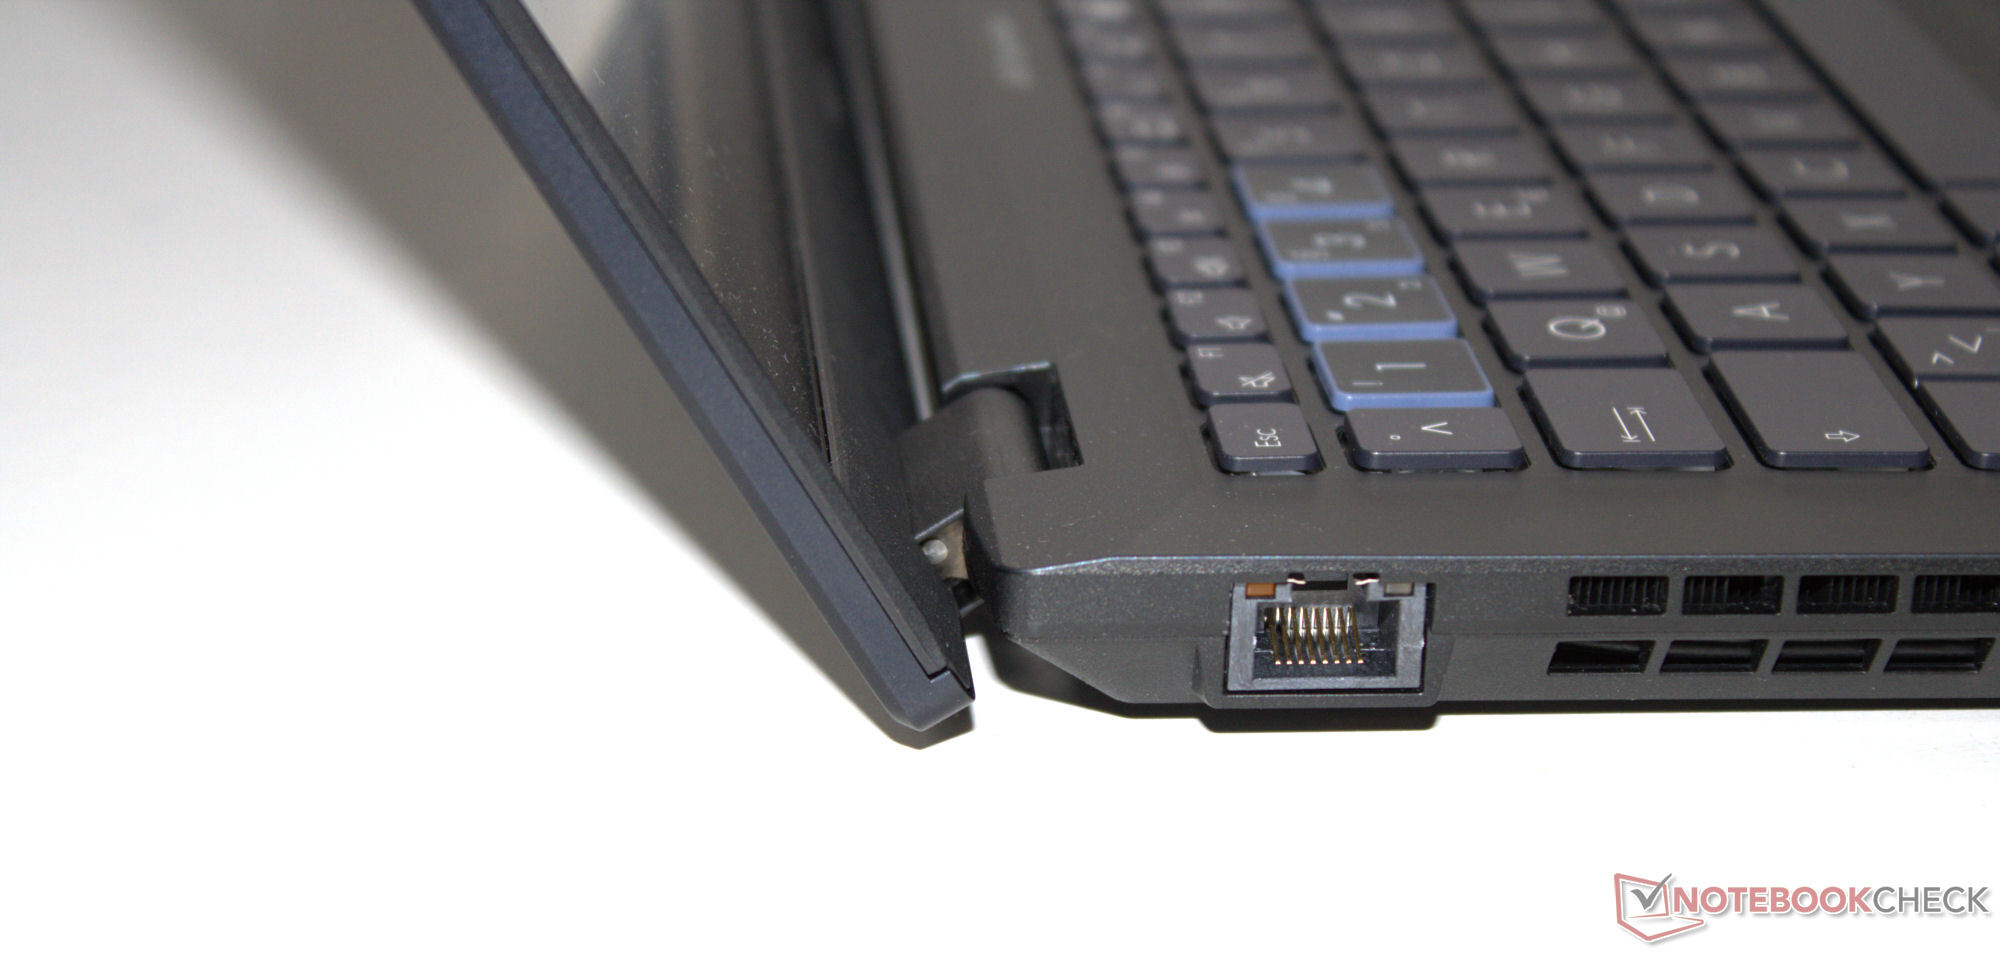
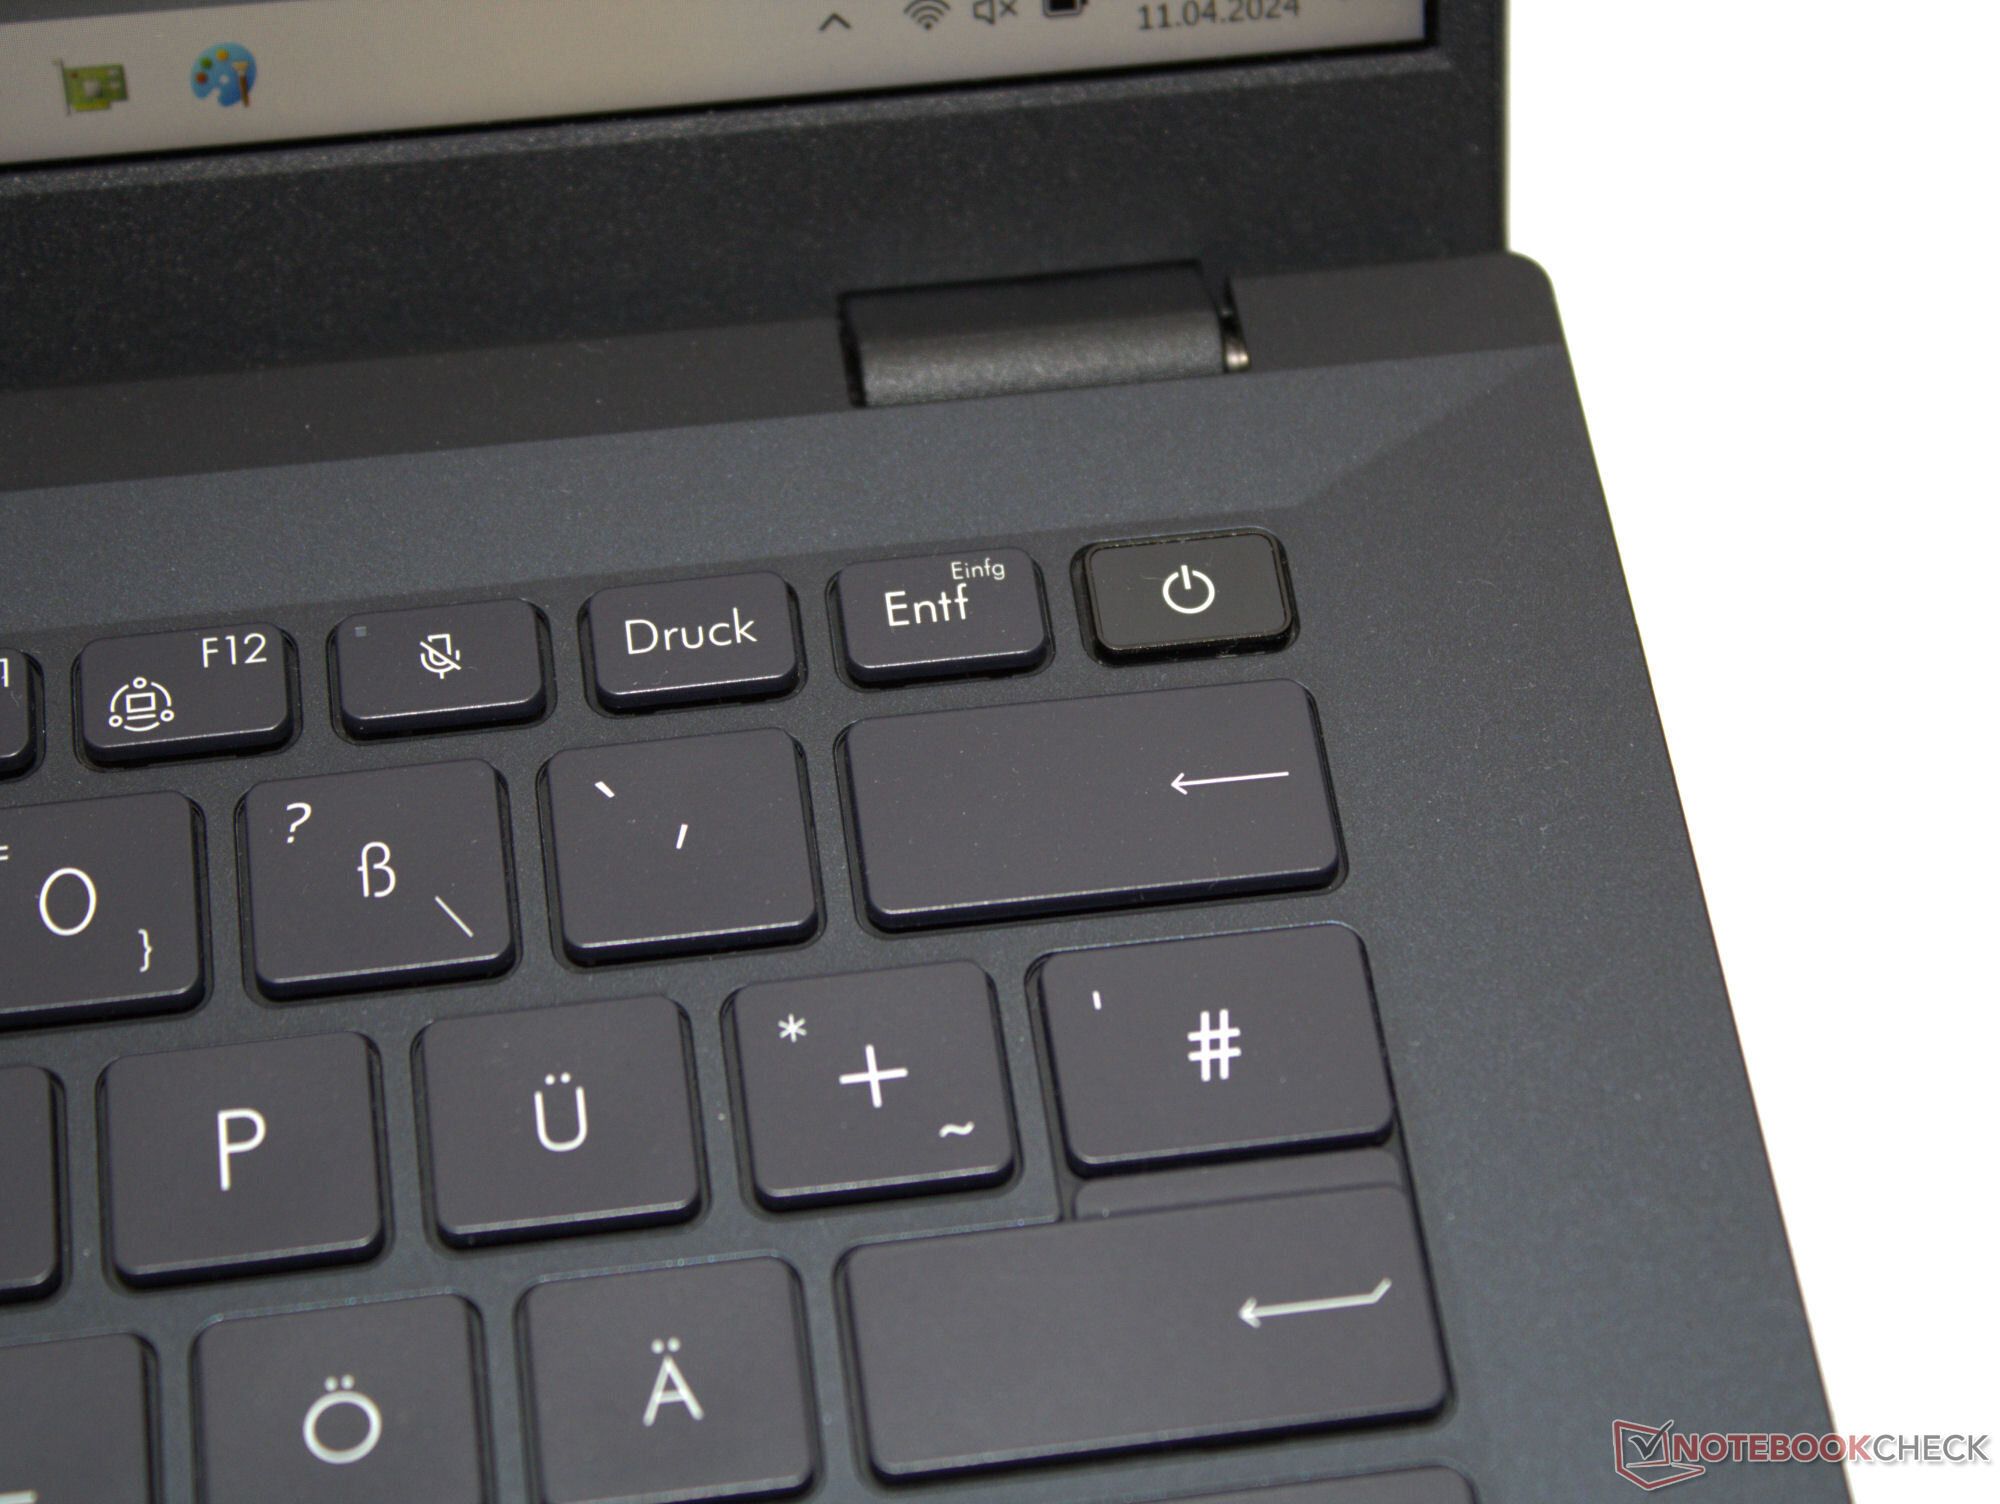
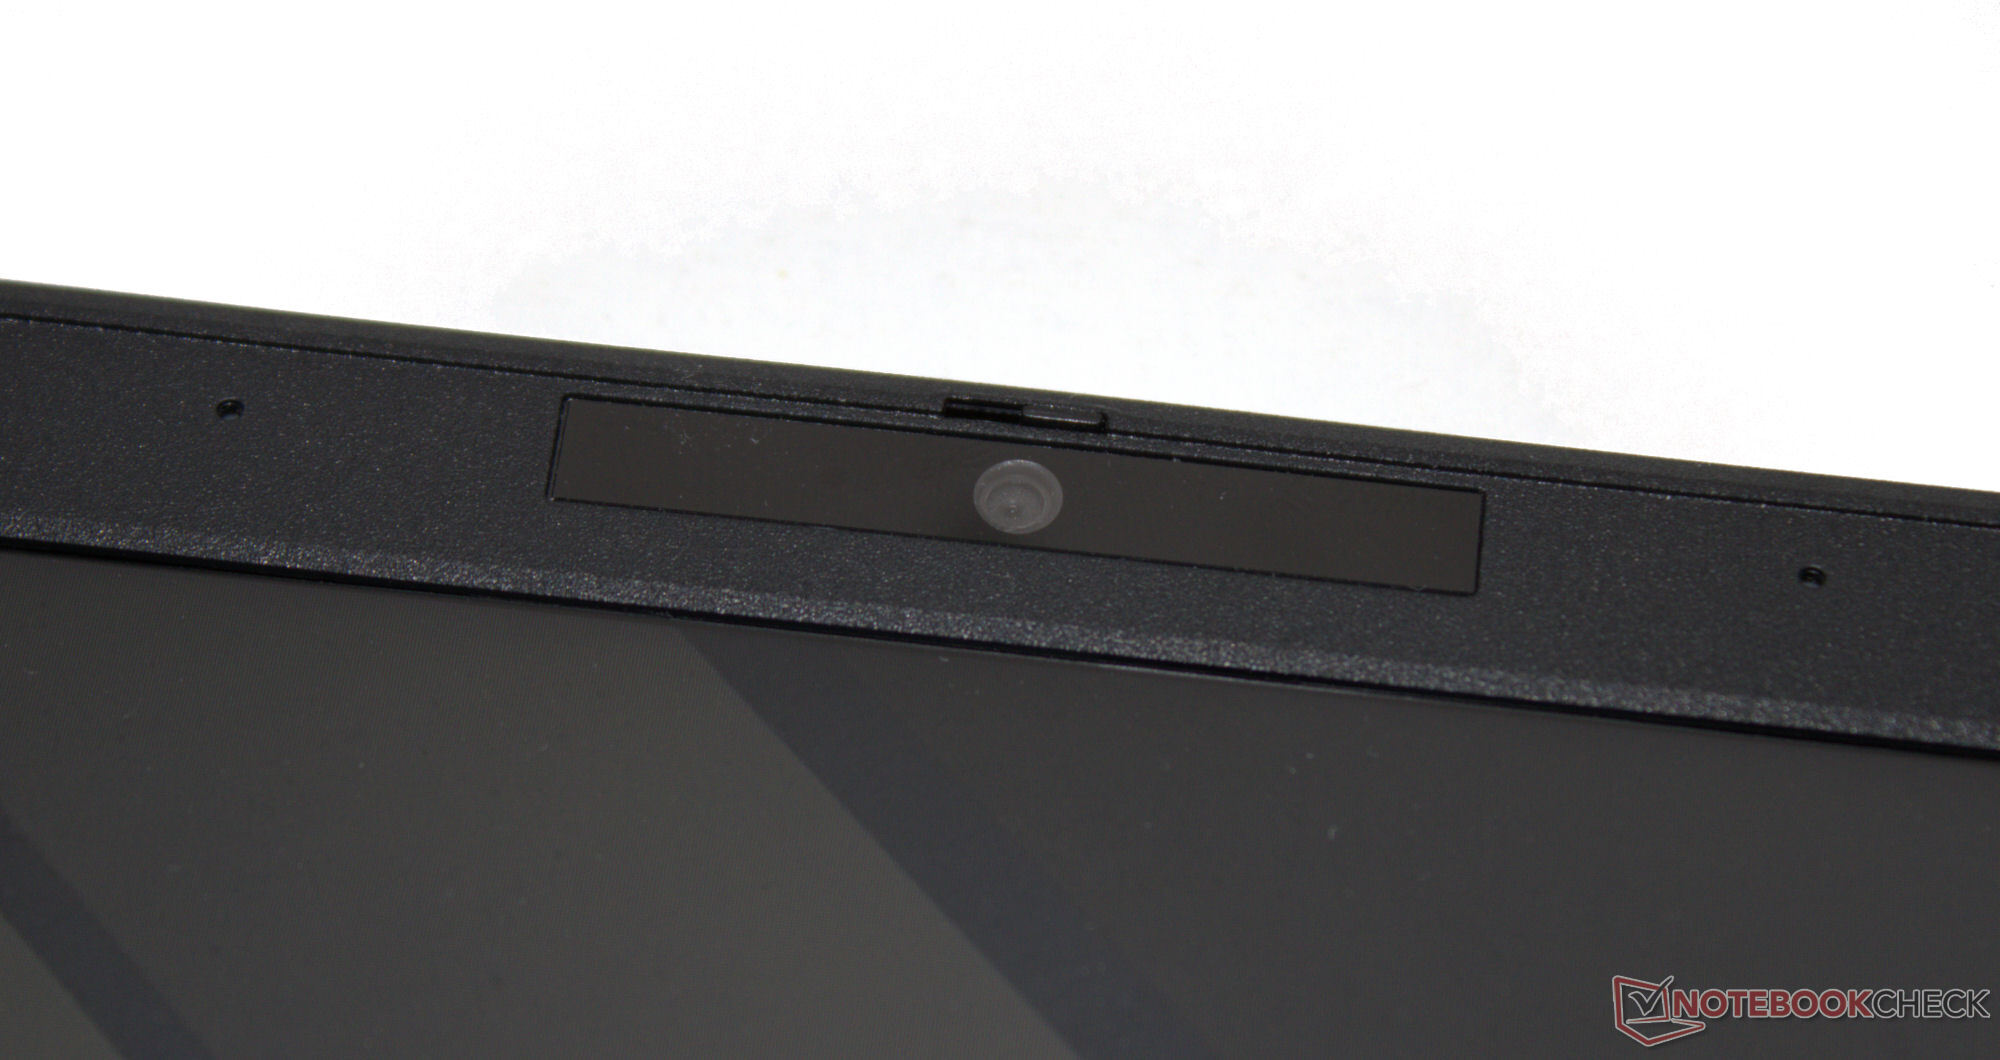
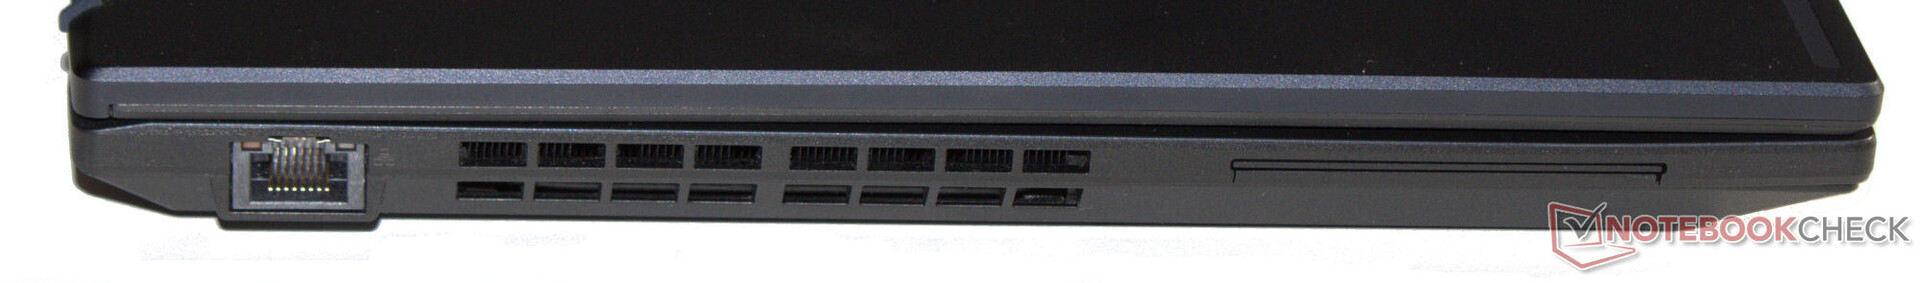
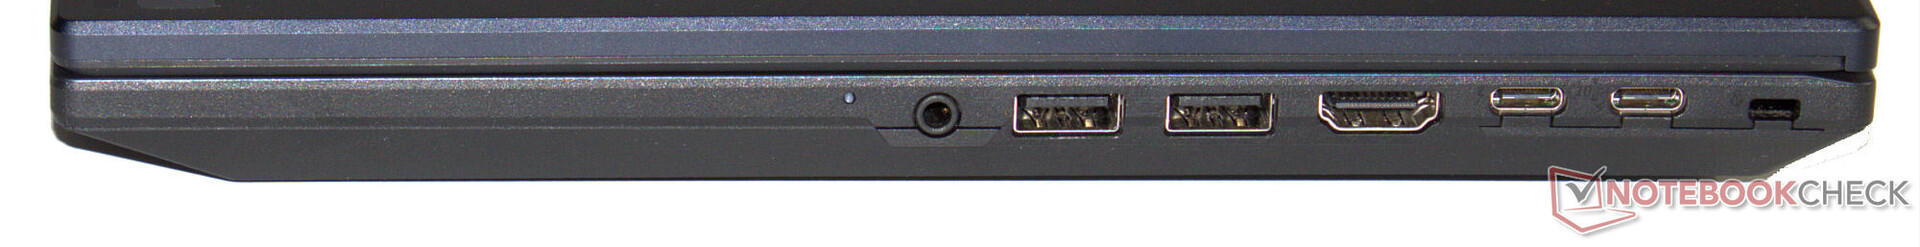
The laptop features two USB-A ports (USB 3.2 Gen 2) and two USB-C ports (1x Thunderbolt 4, 1x USB 3.2 Gen 2). The latter two support Power Delivery and the TB4 port can also output a DisplayPort signal. This means the B3 has a total of two video outputs (HDMI, DP). It doesn't have an SD card reader. Its webcam (0.9 MP) doesn't stand out from the crowd but it at least has a mechanical cover.
Under optimum conditions (no WLAN devices in close vicinity, short distance between laptop and server PC), it achieved very good WiFi data rates. The B3 uses a WiFi 6E chip (Intel AX211). Wired connections are taken care of by a controller from Intel (I219-LM; 1 GBit/s). There are variants of the ExpertBook series that come equipped with an LTE modem (model B3404CMA).
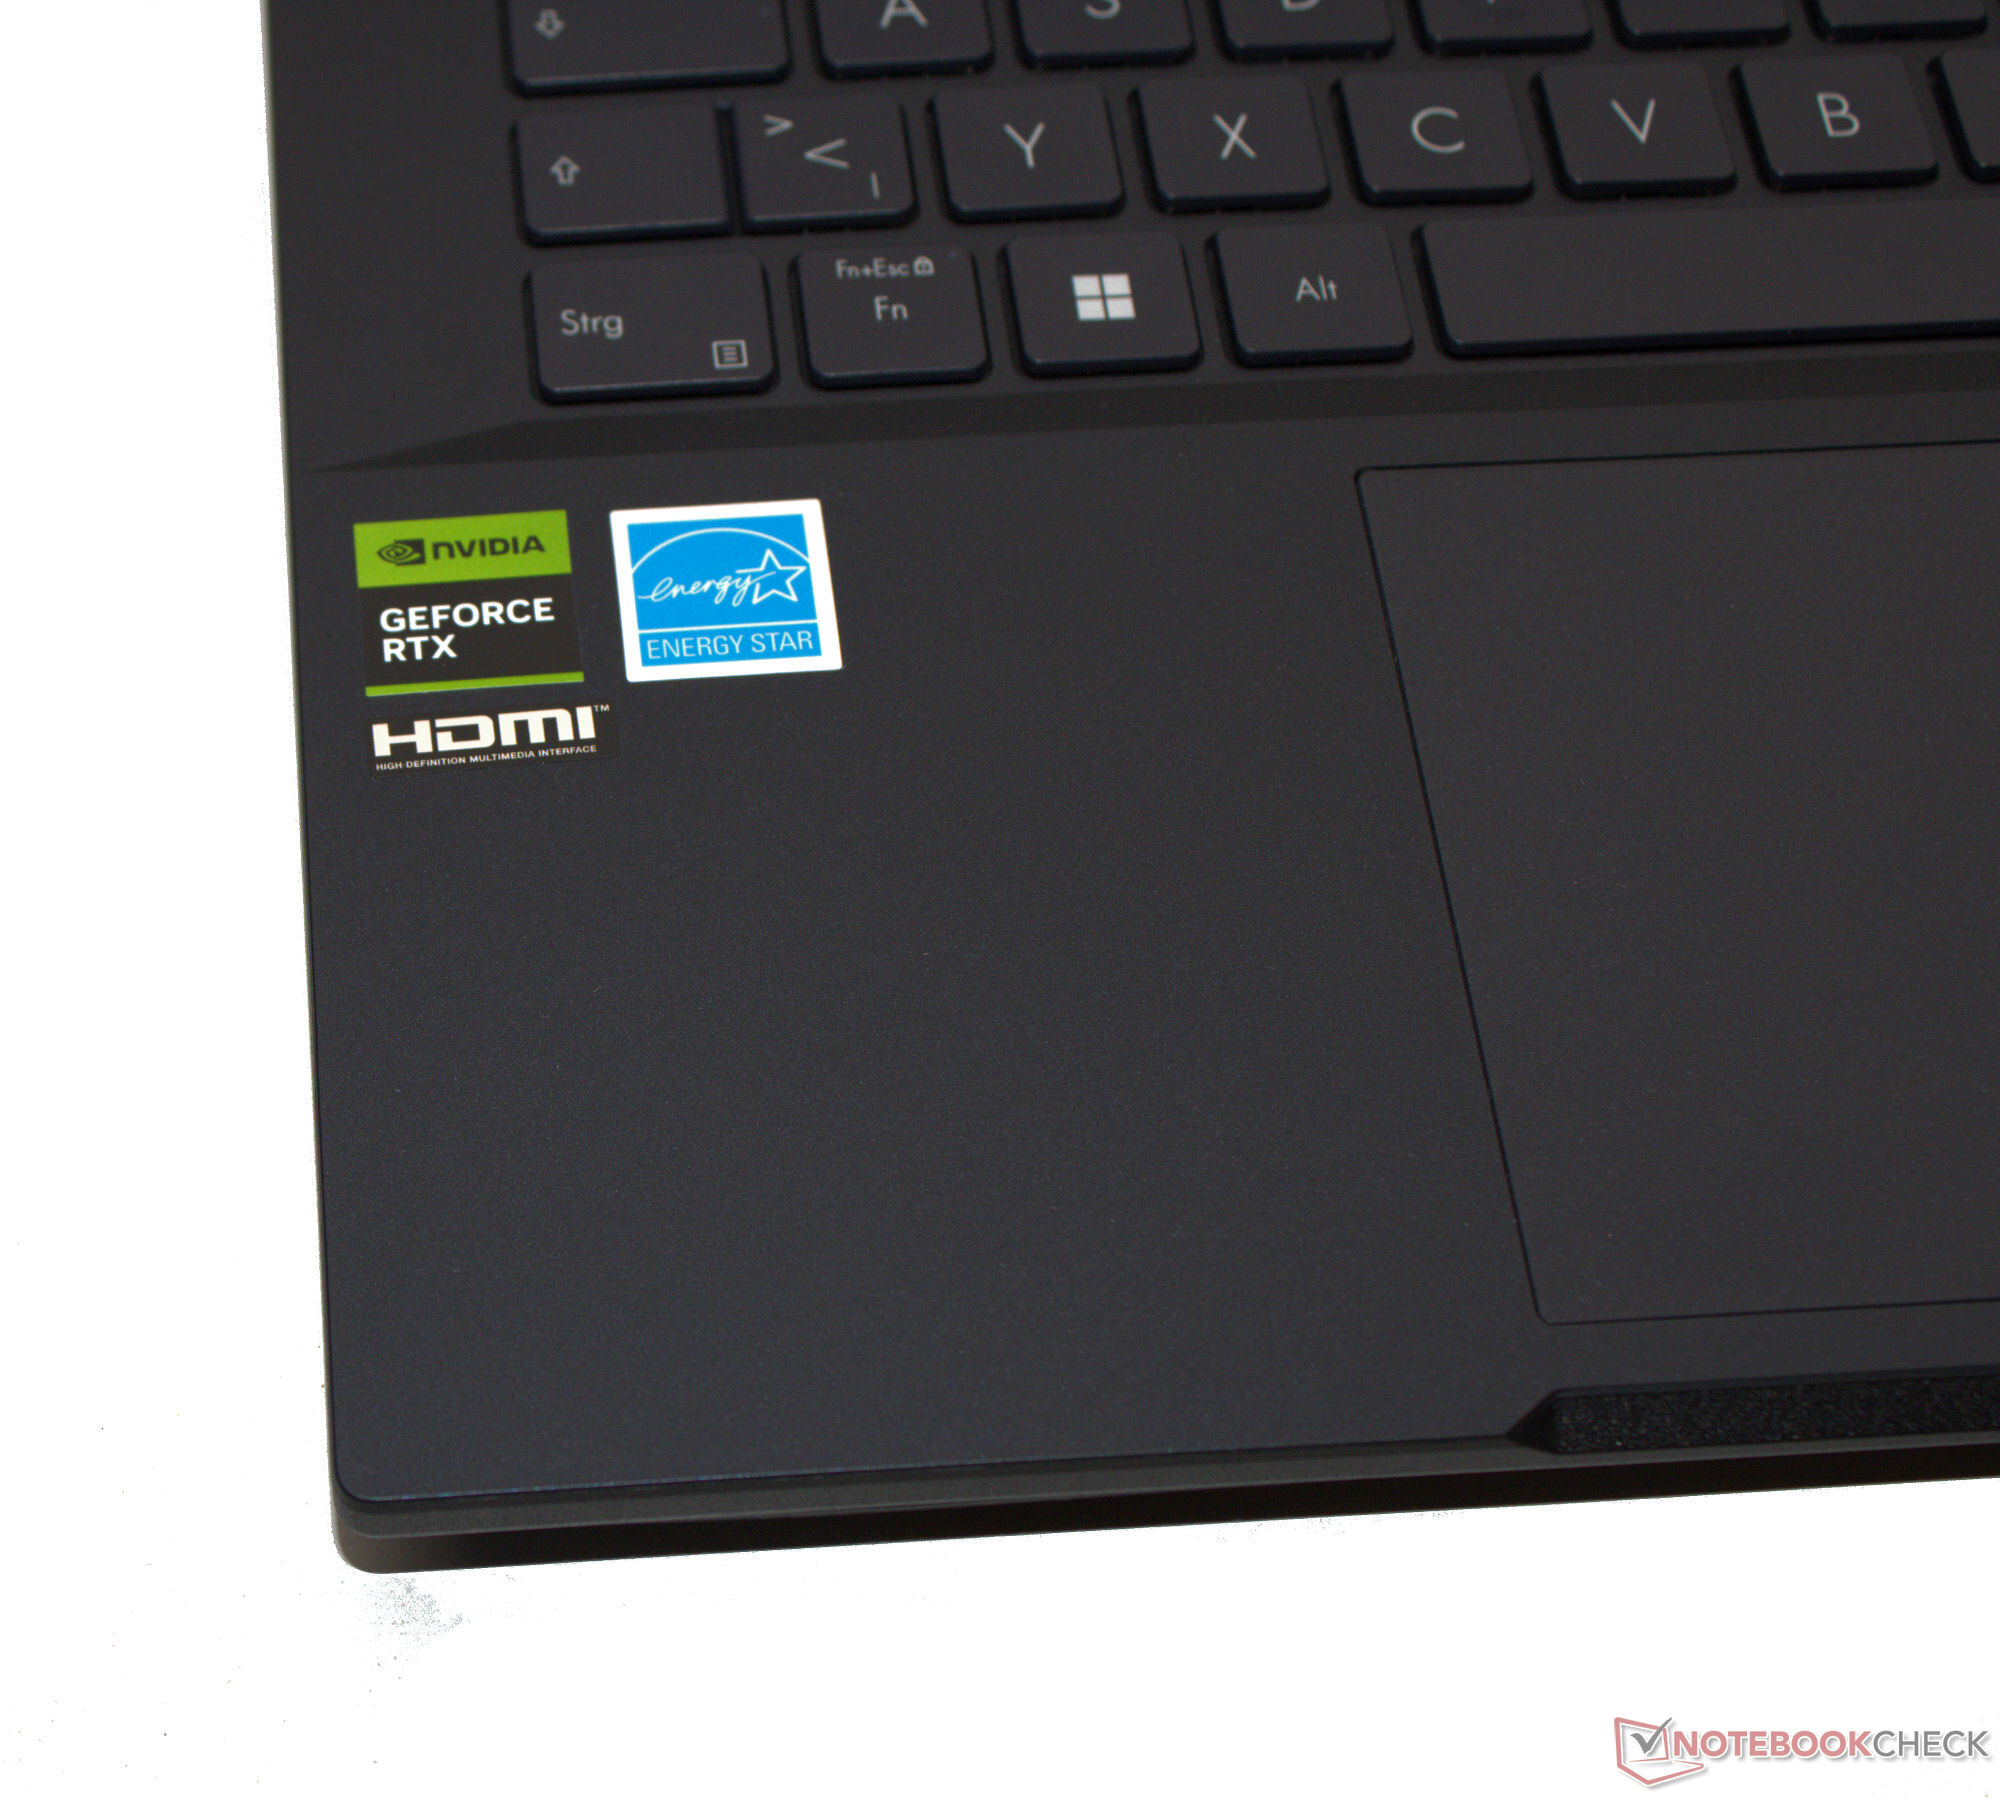
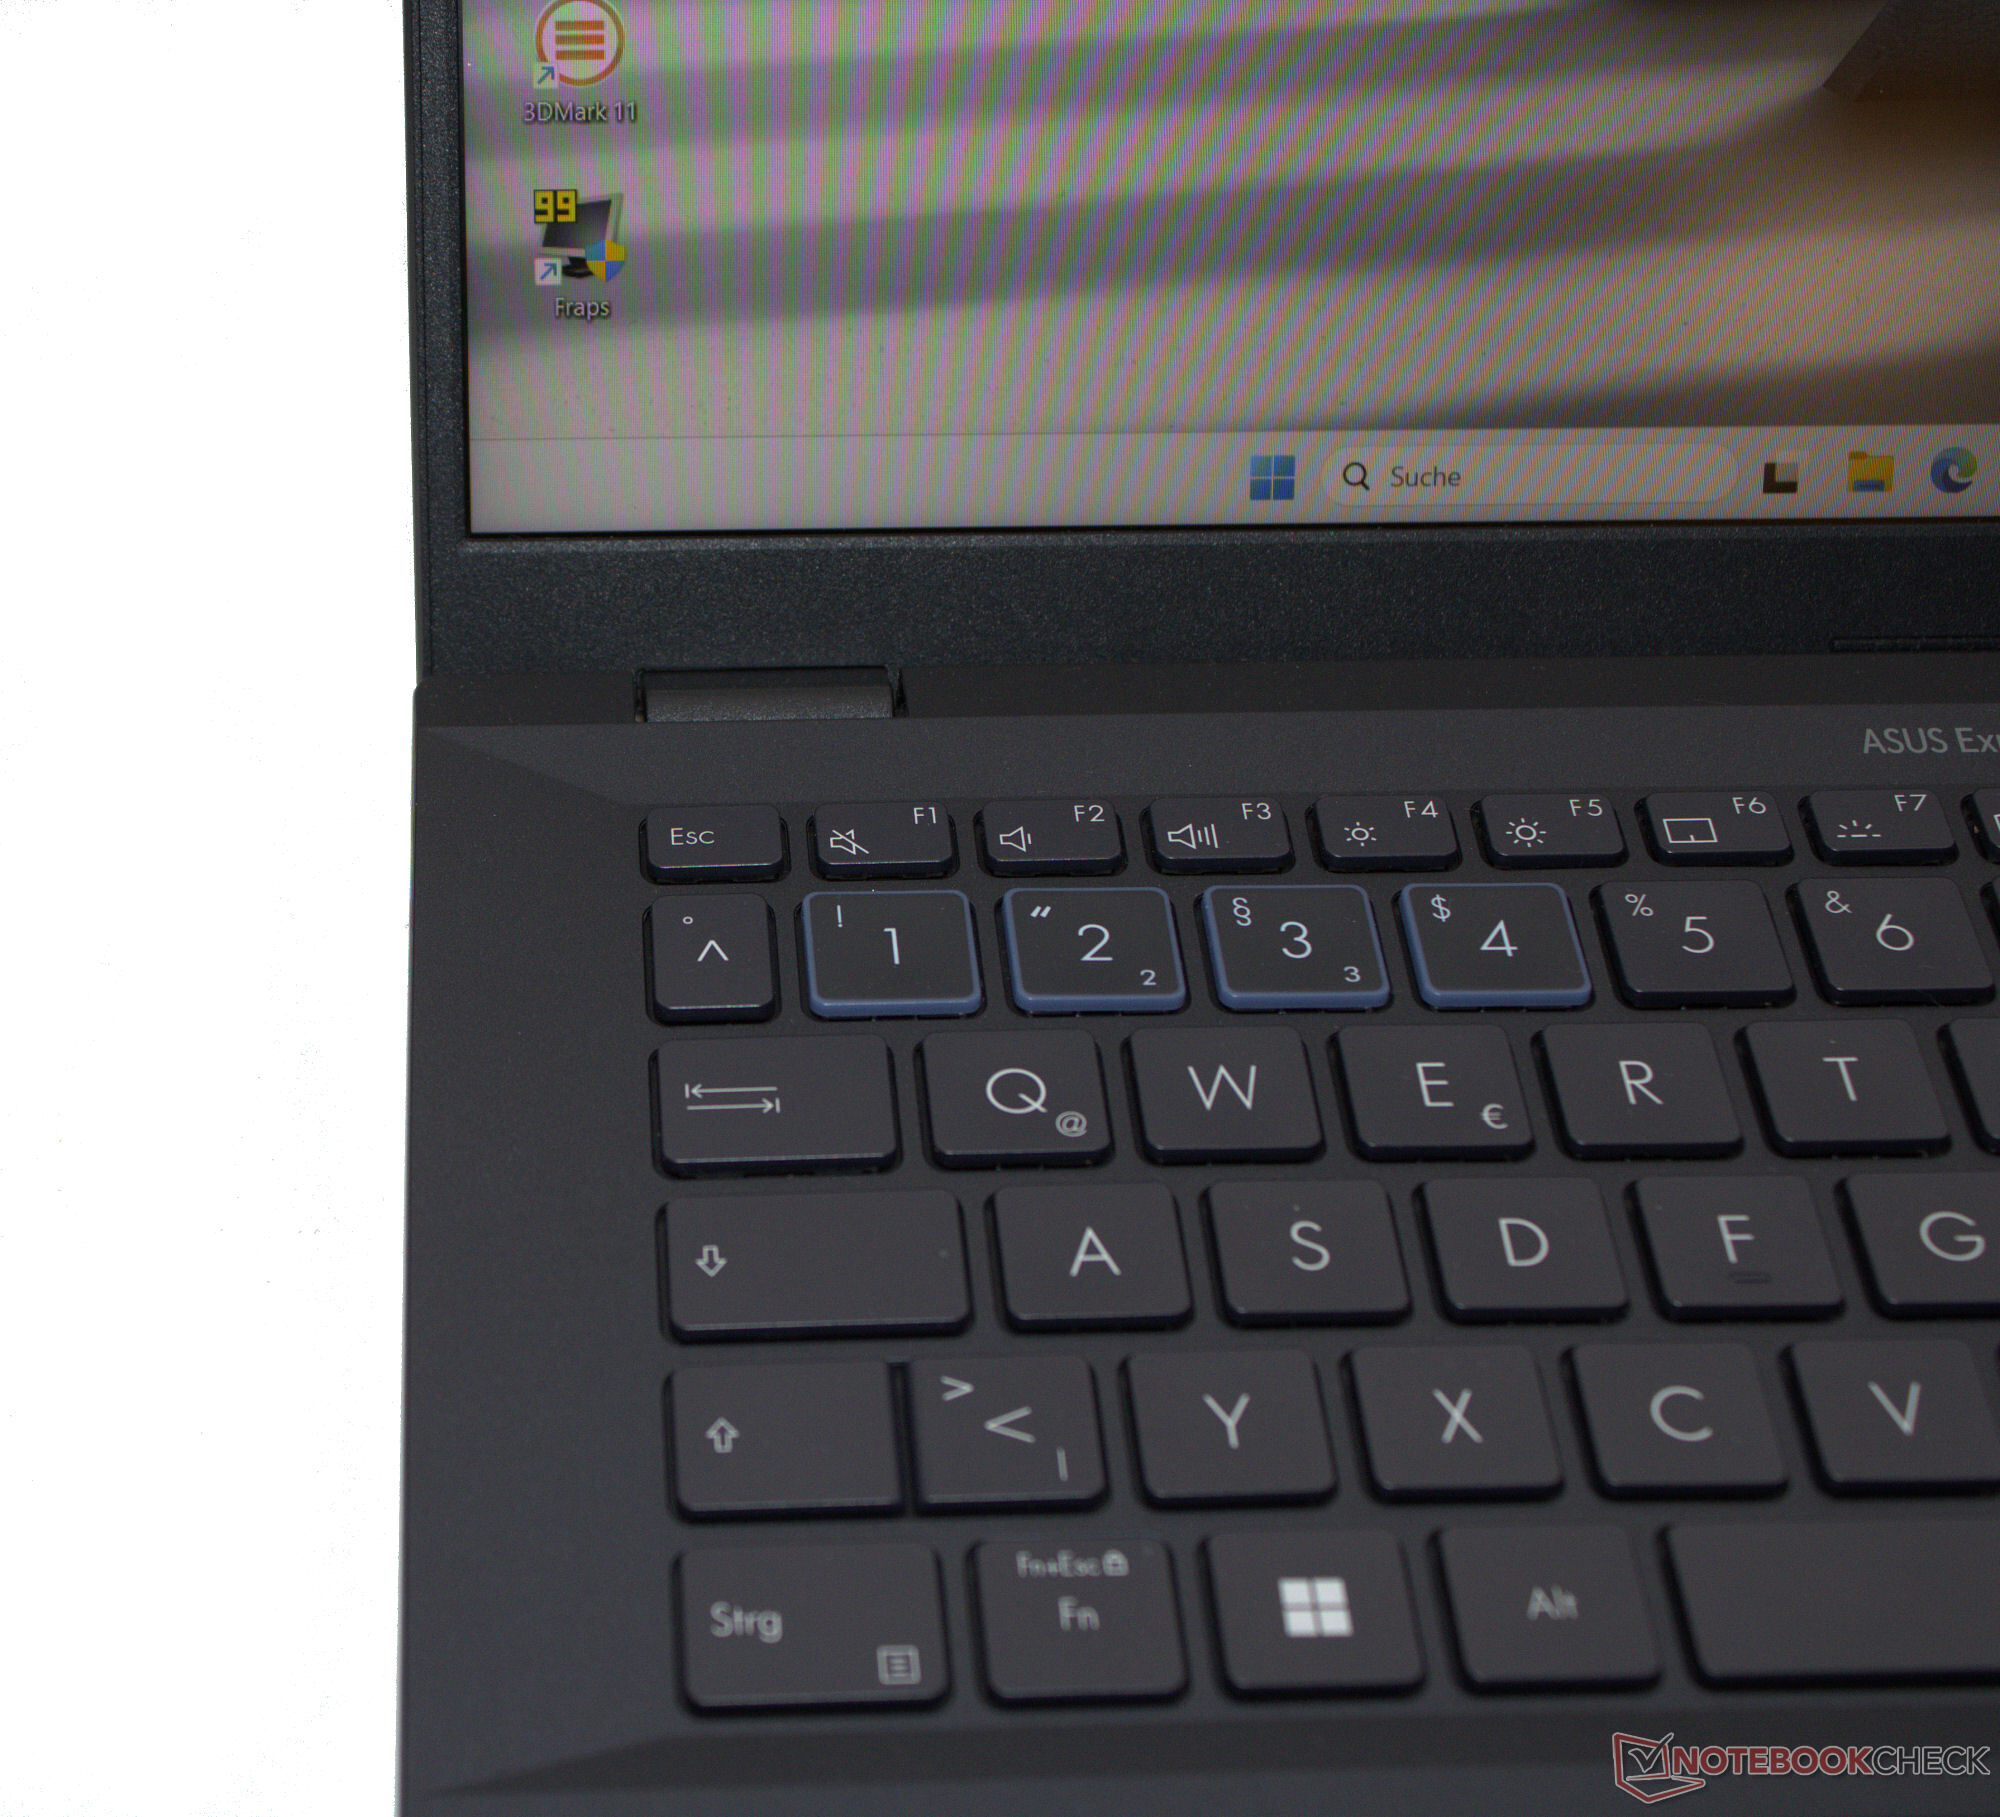
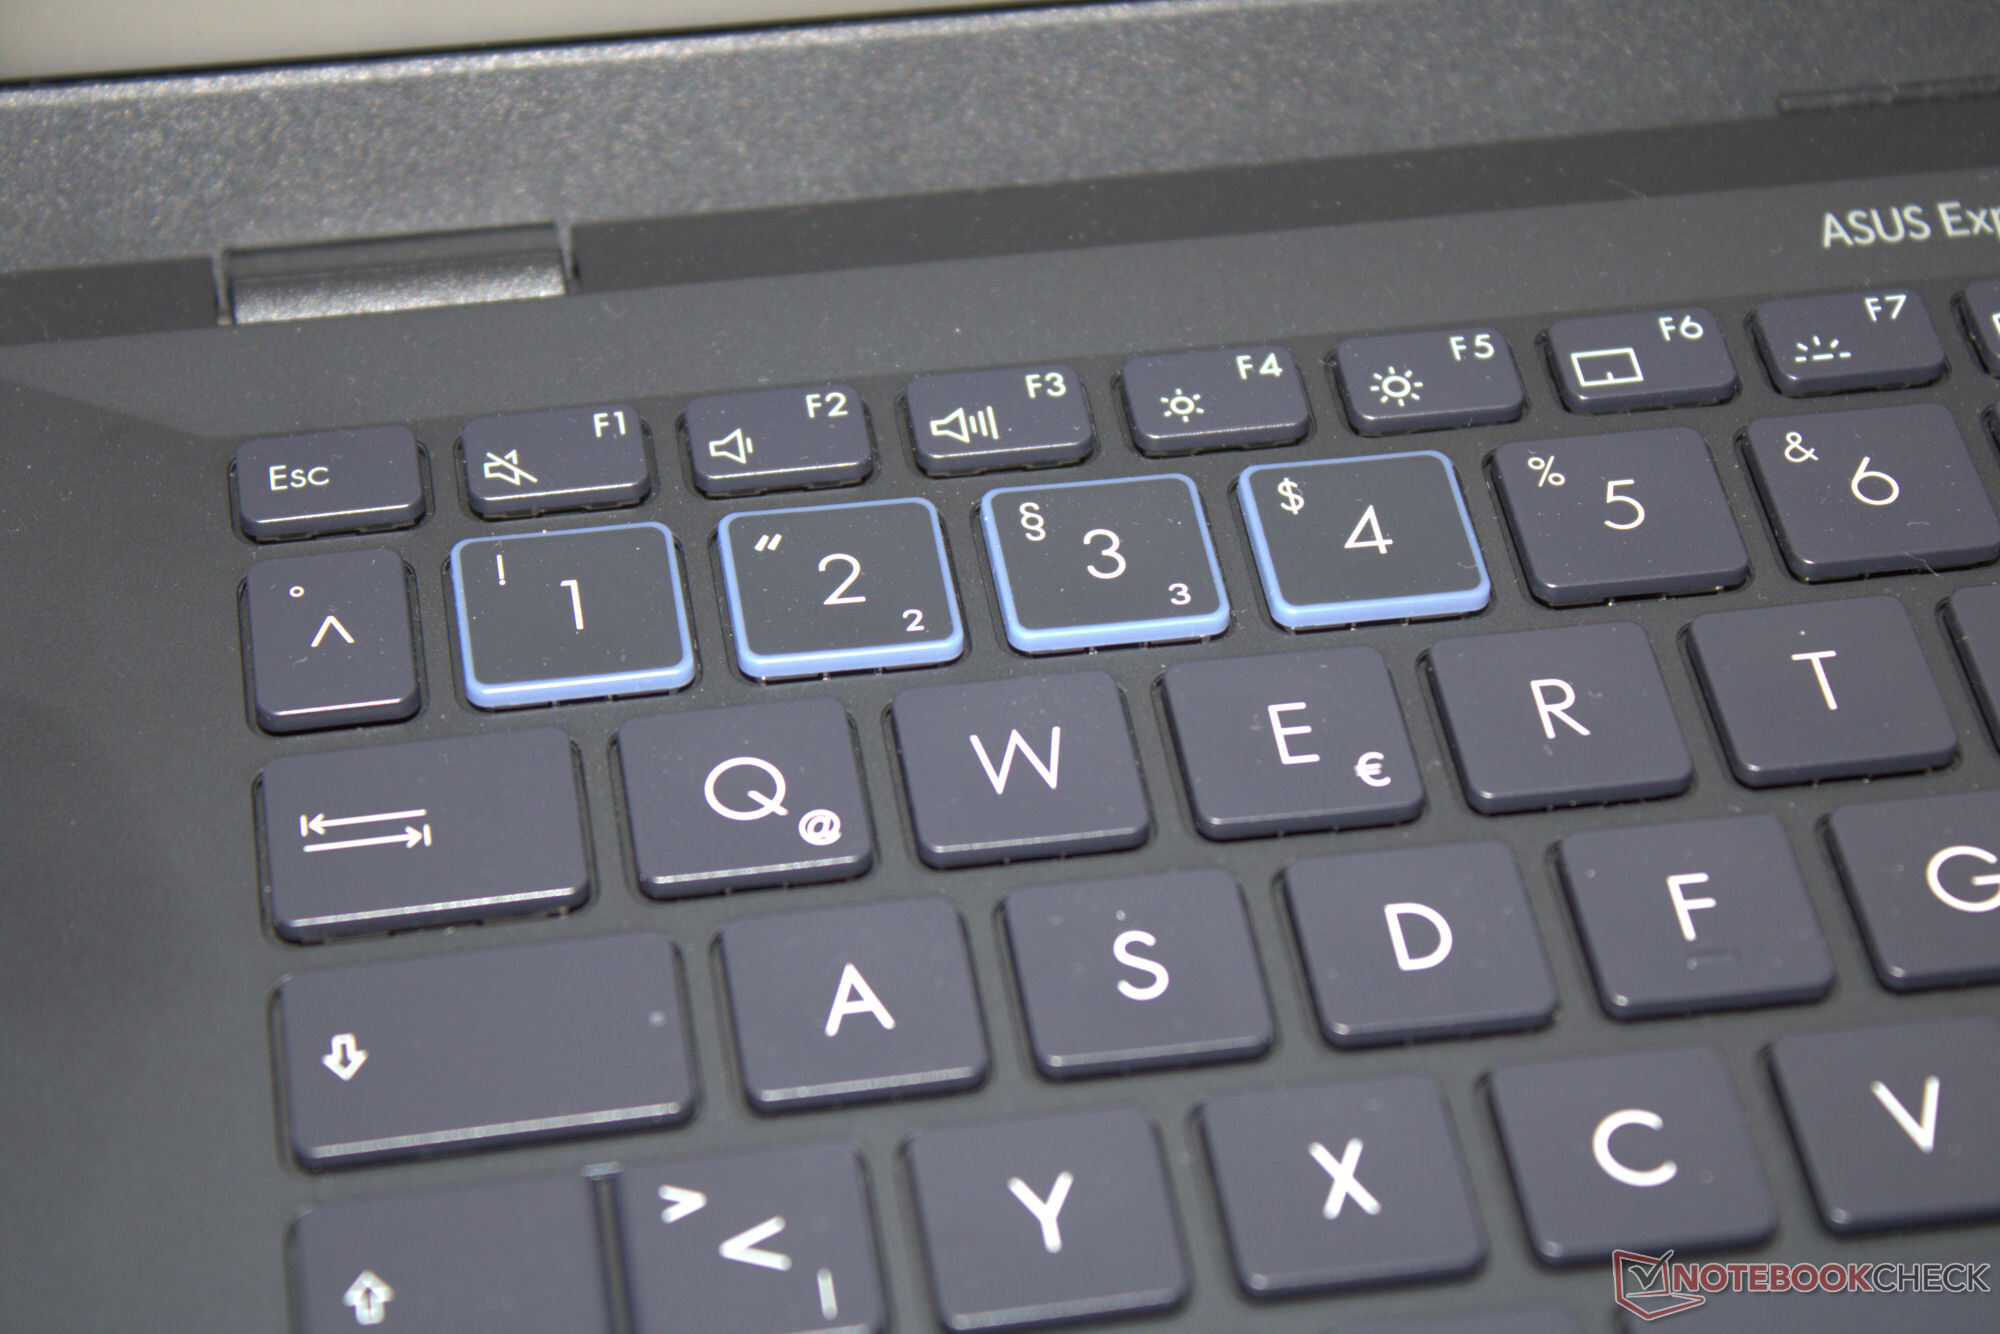


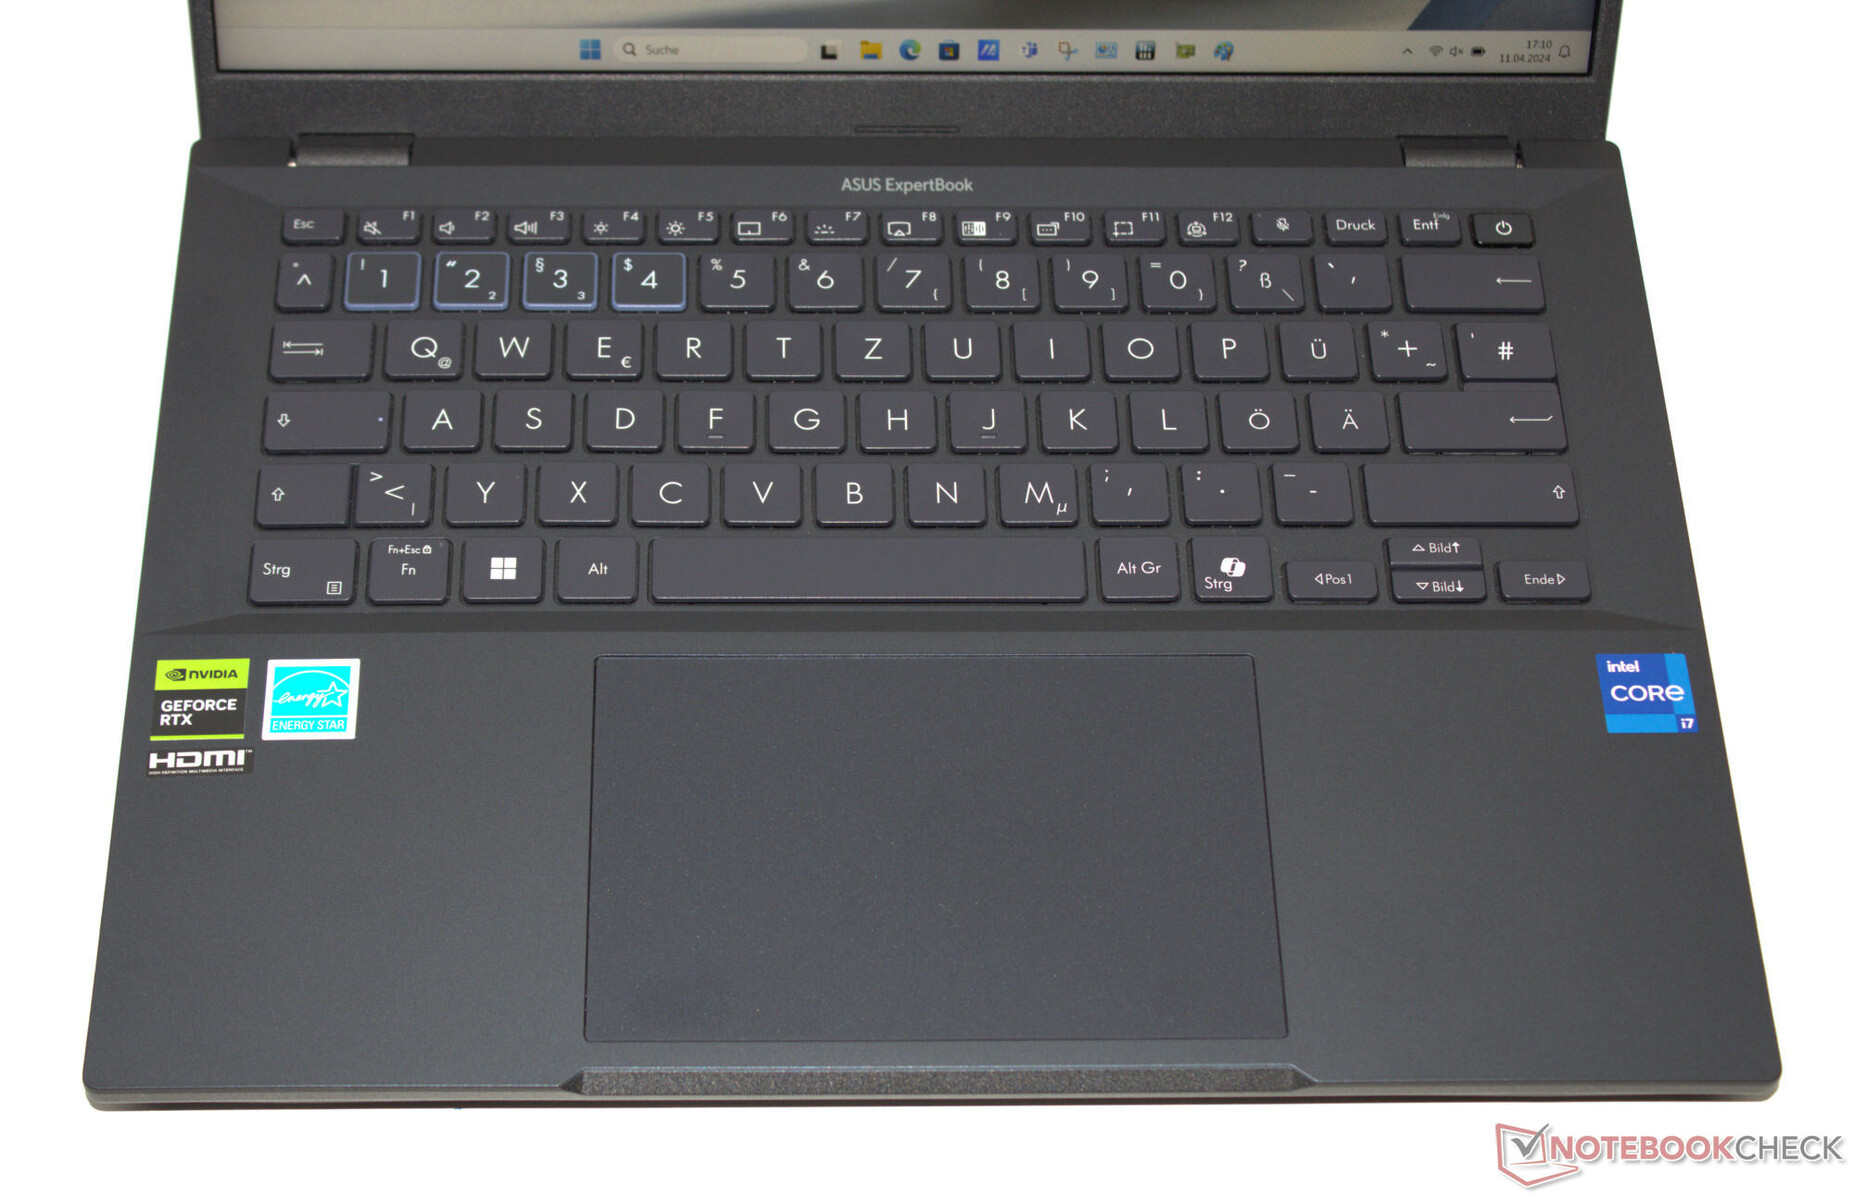
Input devices - The business laptop features a backlit keyboard
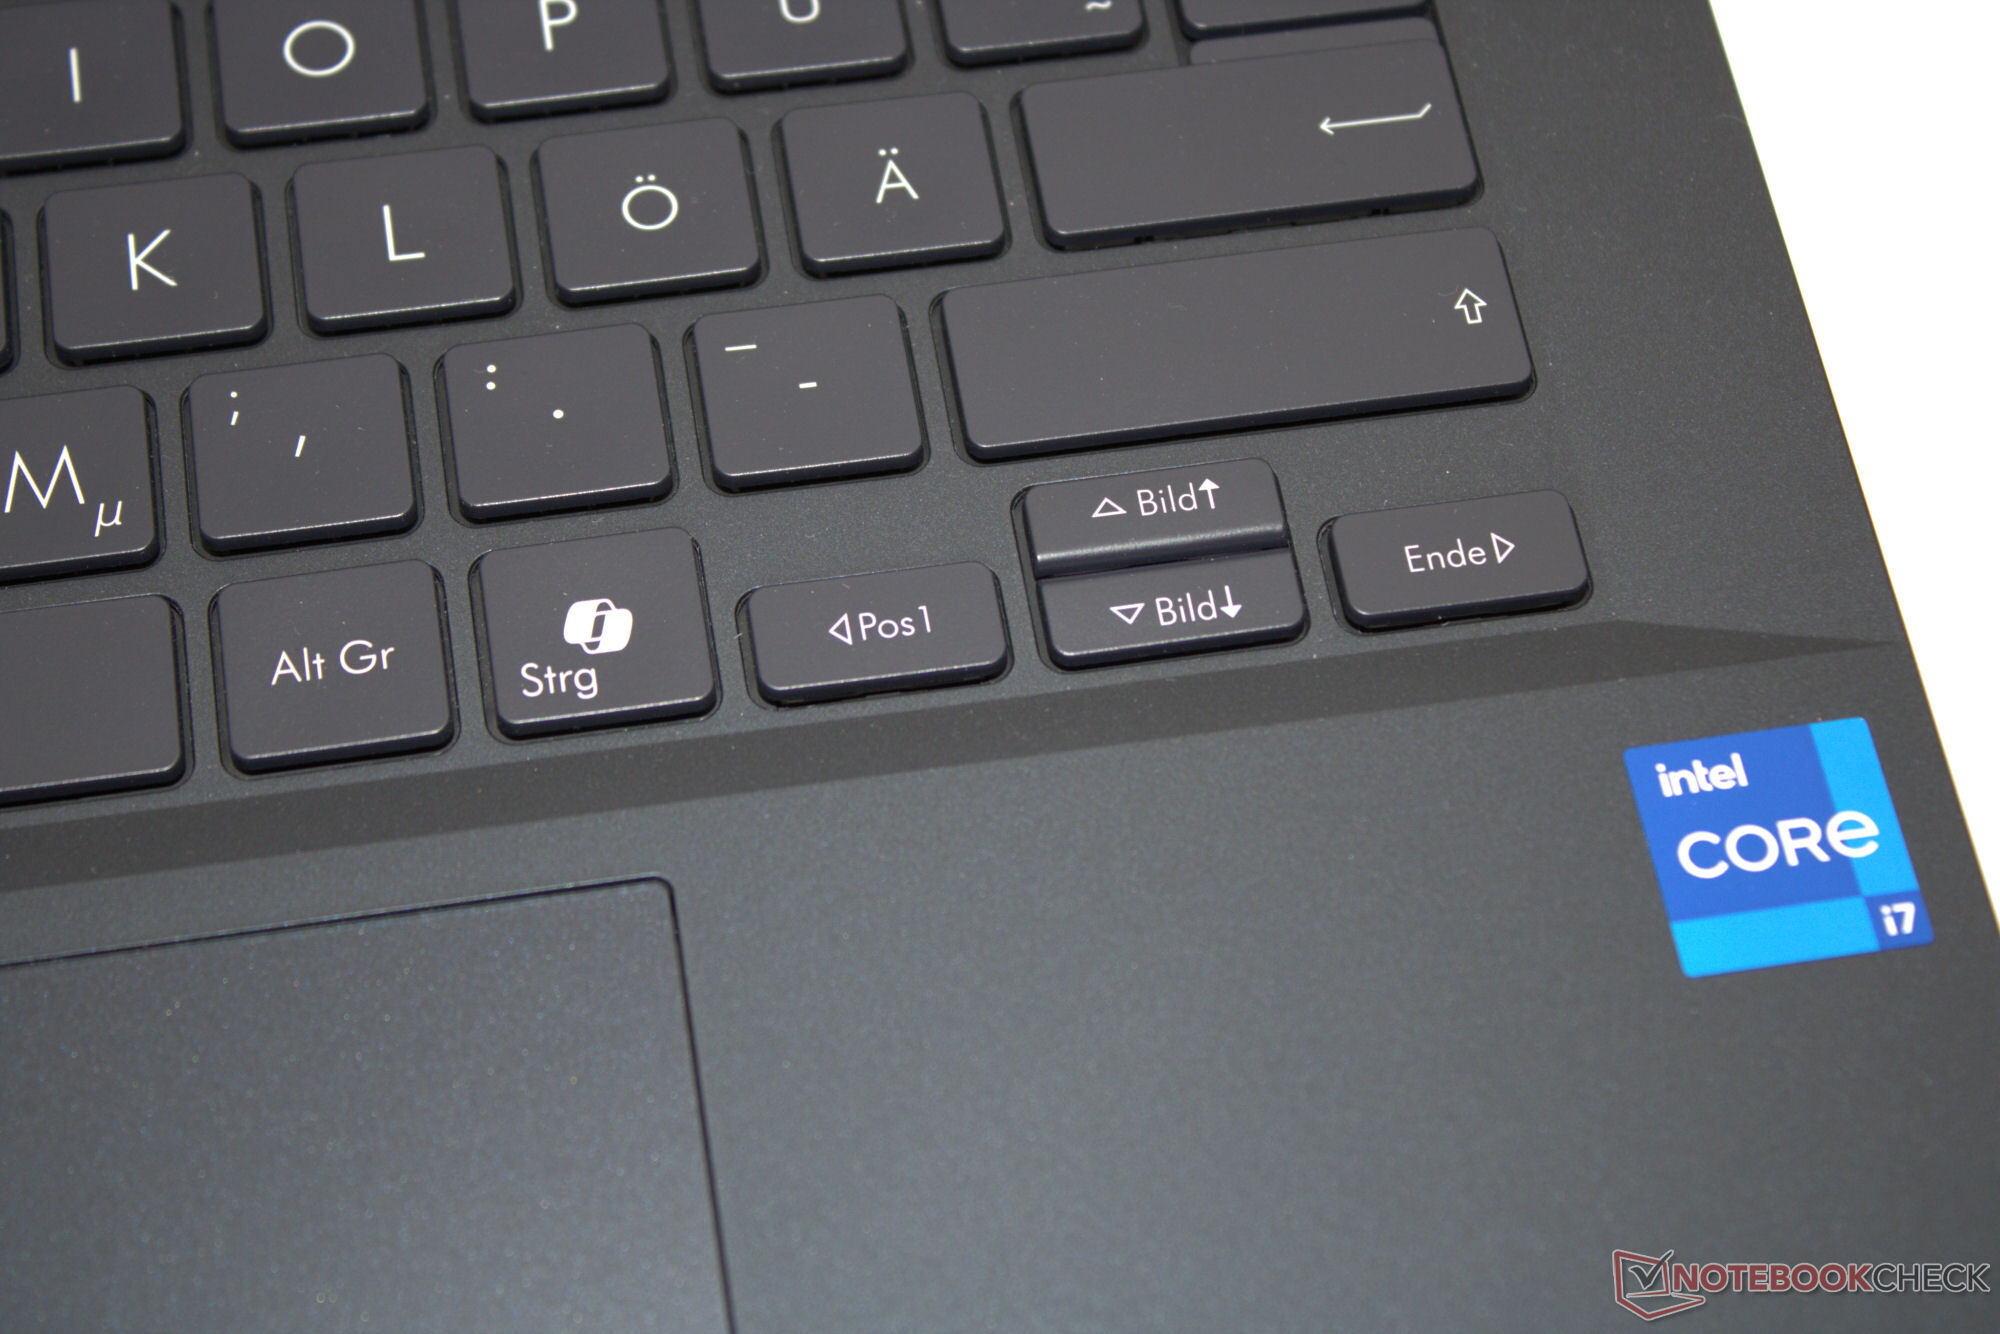
The chiclet keyboard's concave keys (one-level backlighting, protected against splashes of water) feature a medium lift and a clear pressure point. In our eyes, the key resistance could do with being a little more crisp. A slight yielding of the keyboard did not prove to be an issue for us. Negative: The arrow keys and Enter key are a little on the small side. A multi-touch-enabled clickpad (approx. 13 x 8.2 cm) serves as a mouse replacement and it features a short lift and a clear pressure point.
Display - 16:10 panel with low color space coverage
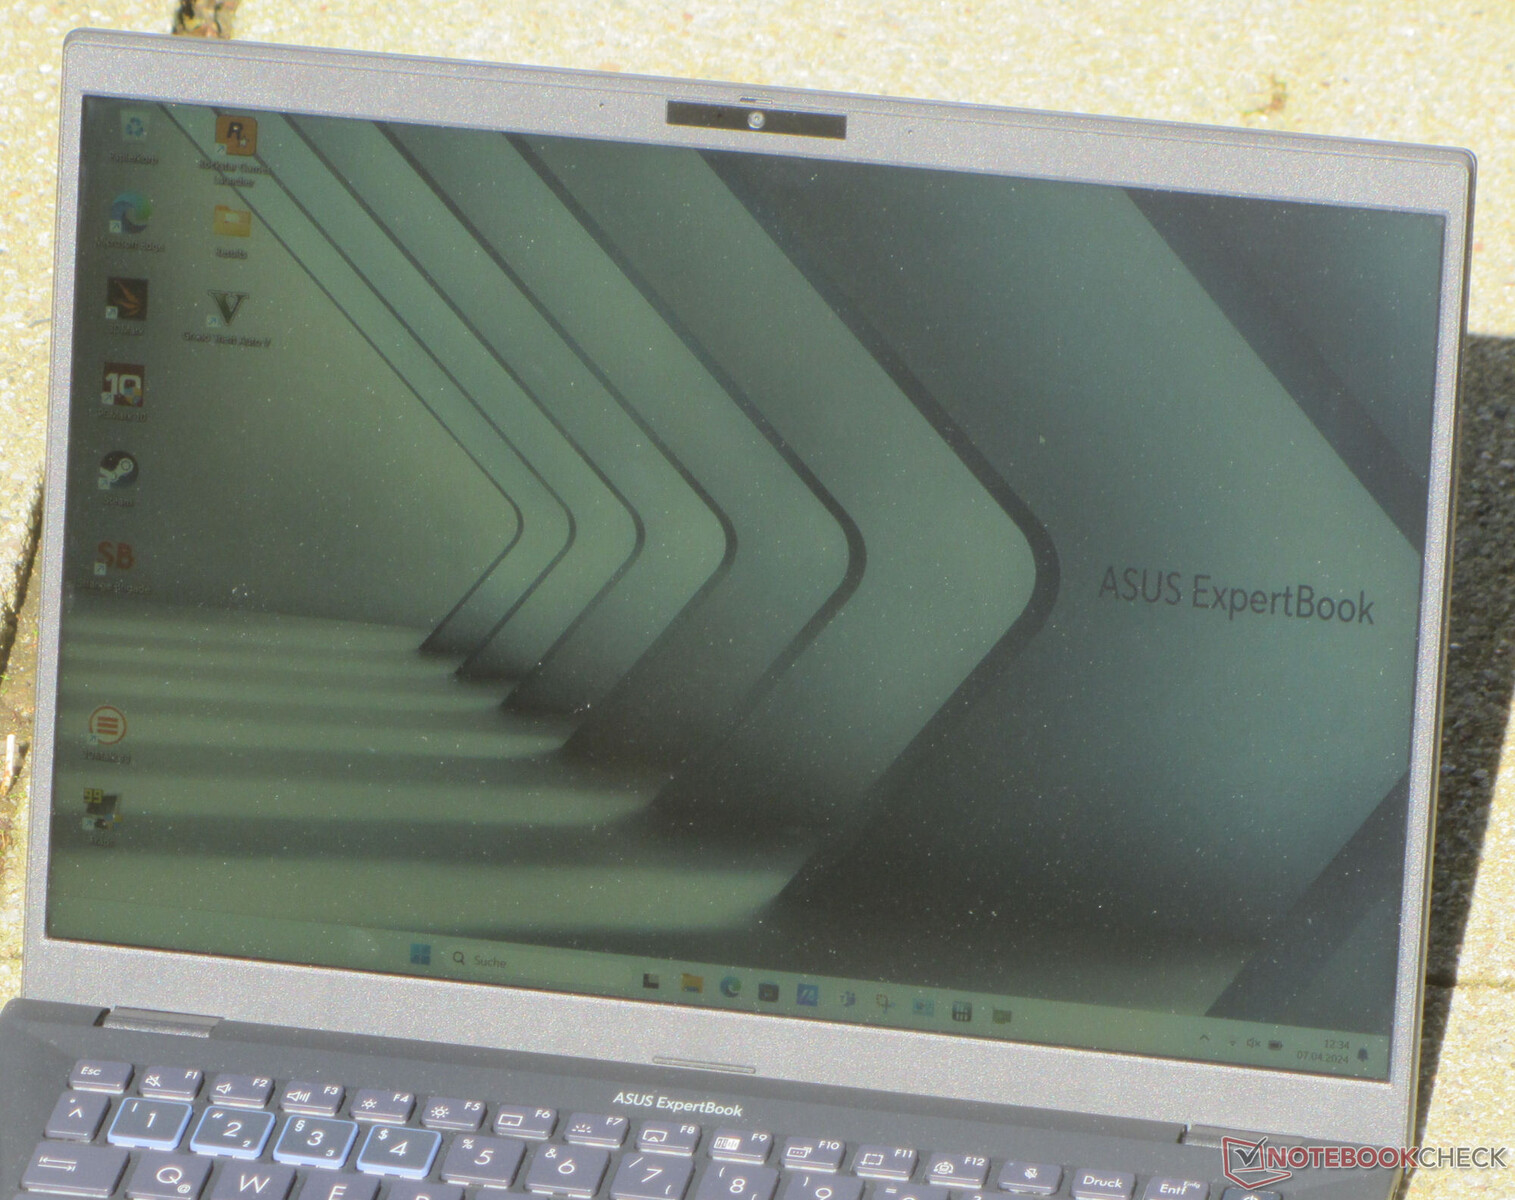
Asus has equipped this ExpertBook with a matte 14-inch display (1,920 x 1,200 pixels) which features a work-friendly 16:10 aspect ratio. Good: We didn't note any PWM flickering. Its brightness and contrast both miss their respective target values (> 300 cd/m² and 1,000:1). You can alternatively select the B3 with a brighter 500-nit panel (2,560 x 1,600 pixels). Both displays can also optionally be selected as touchscreens.


| |||||||||||||||||||||||||
Brightness Distribution: 91 %
Center on Battery: 315 cd/m²
Contrast: 908:1 (Black: 0.3515 cd/m²)
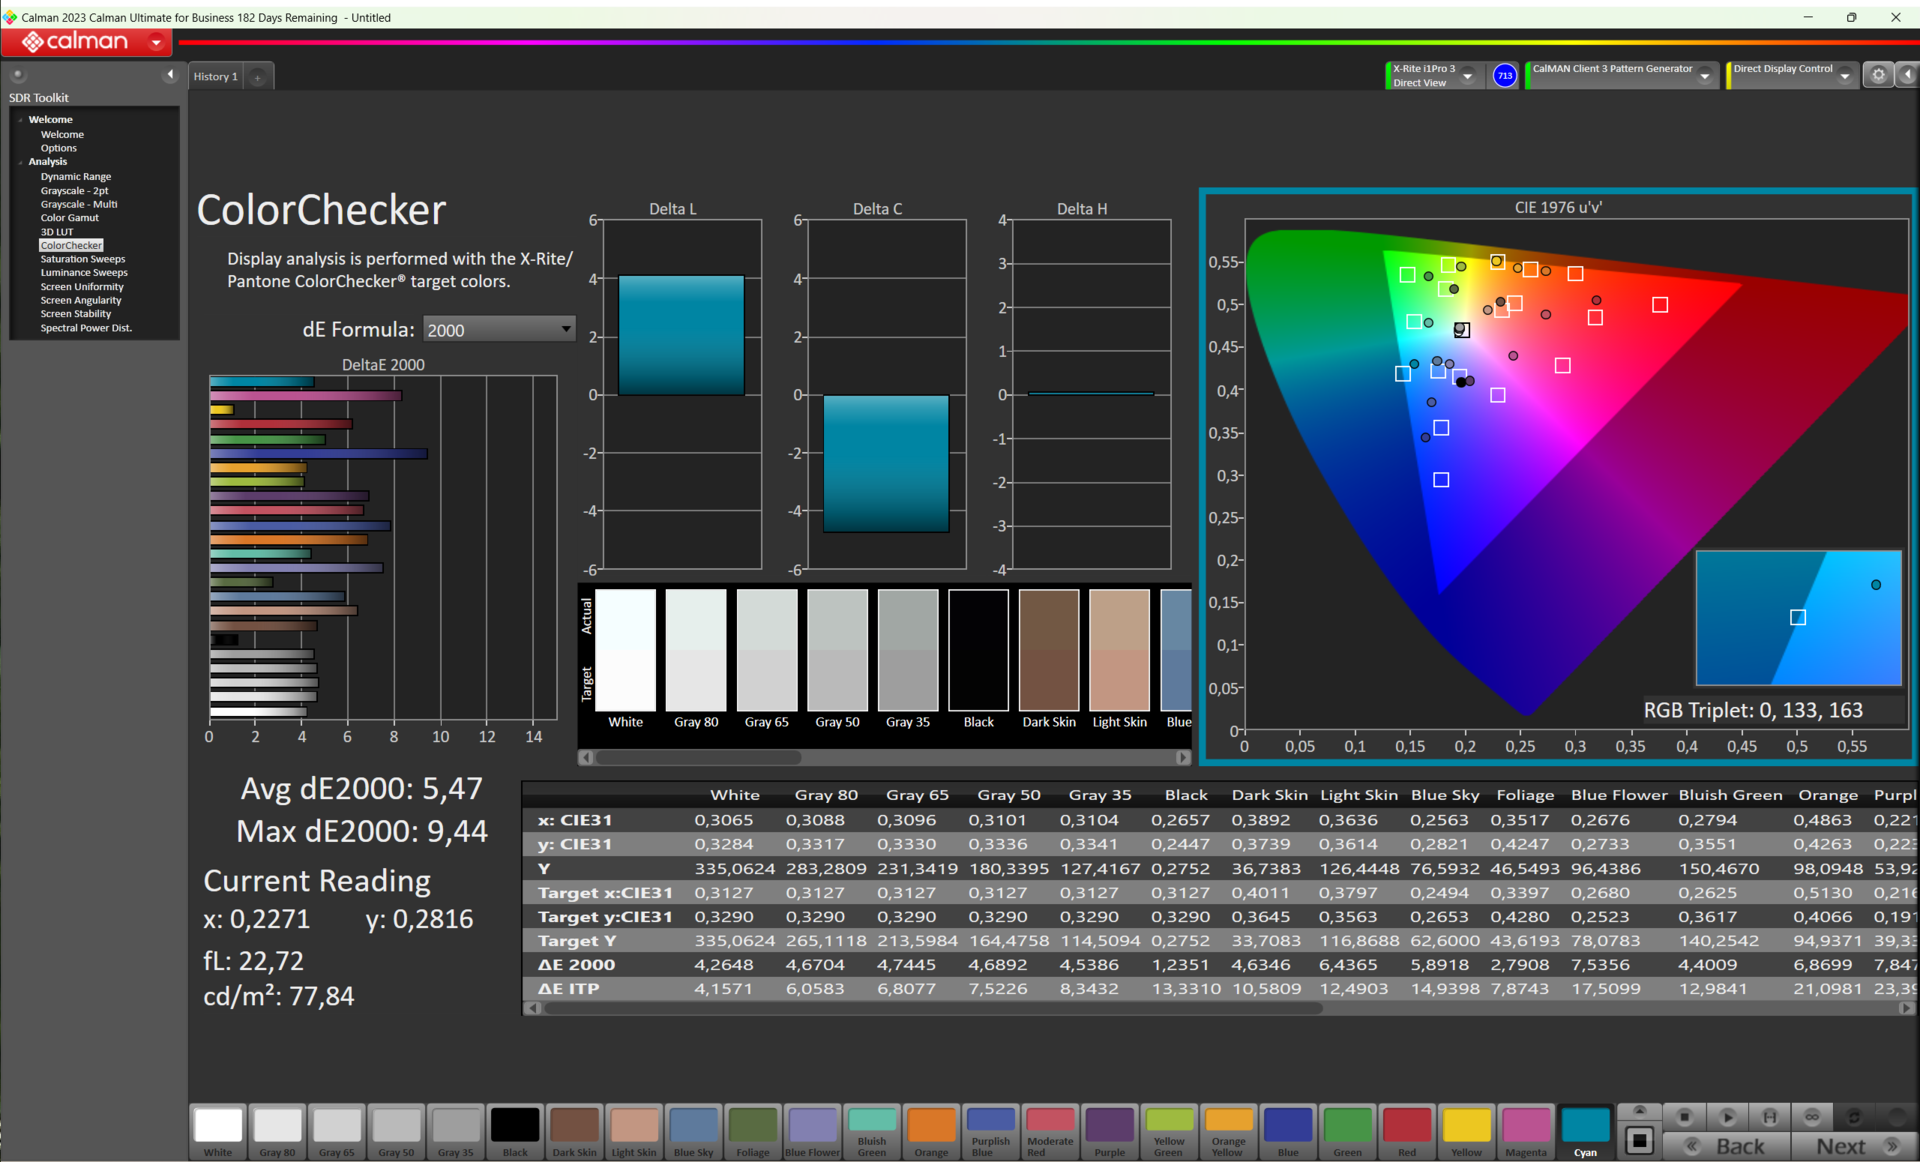
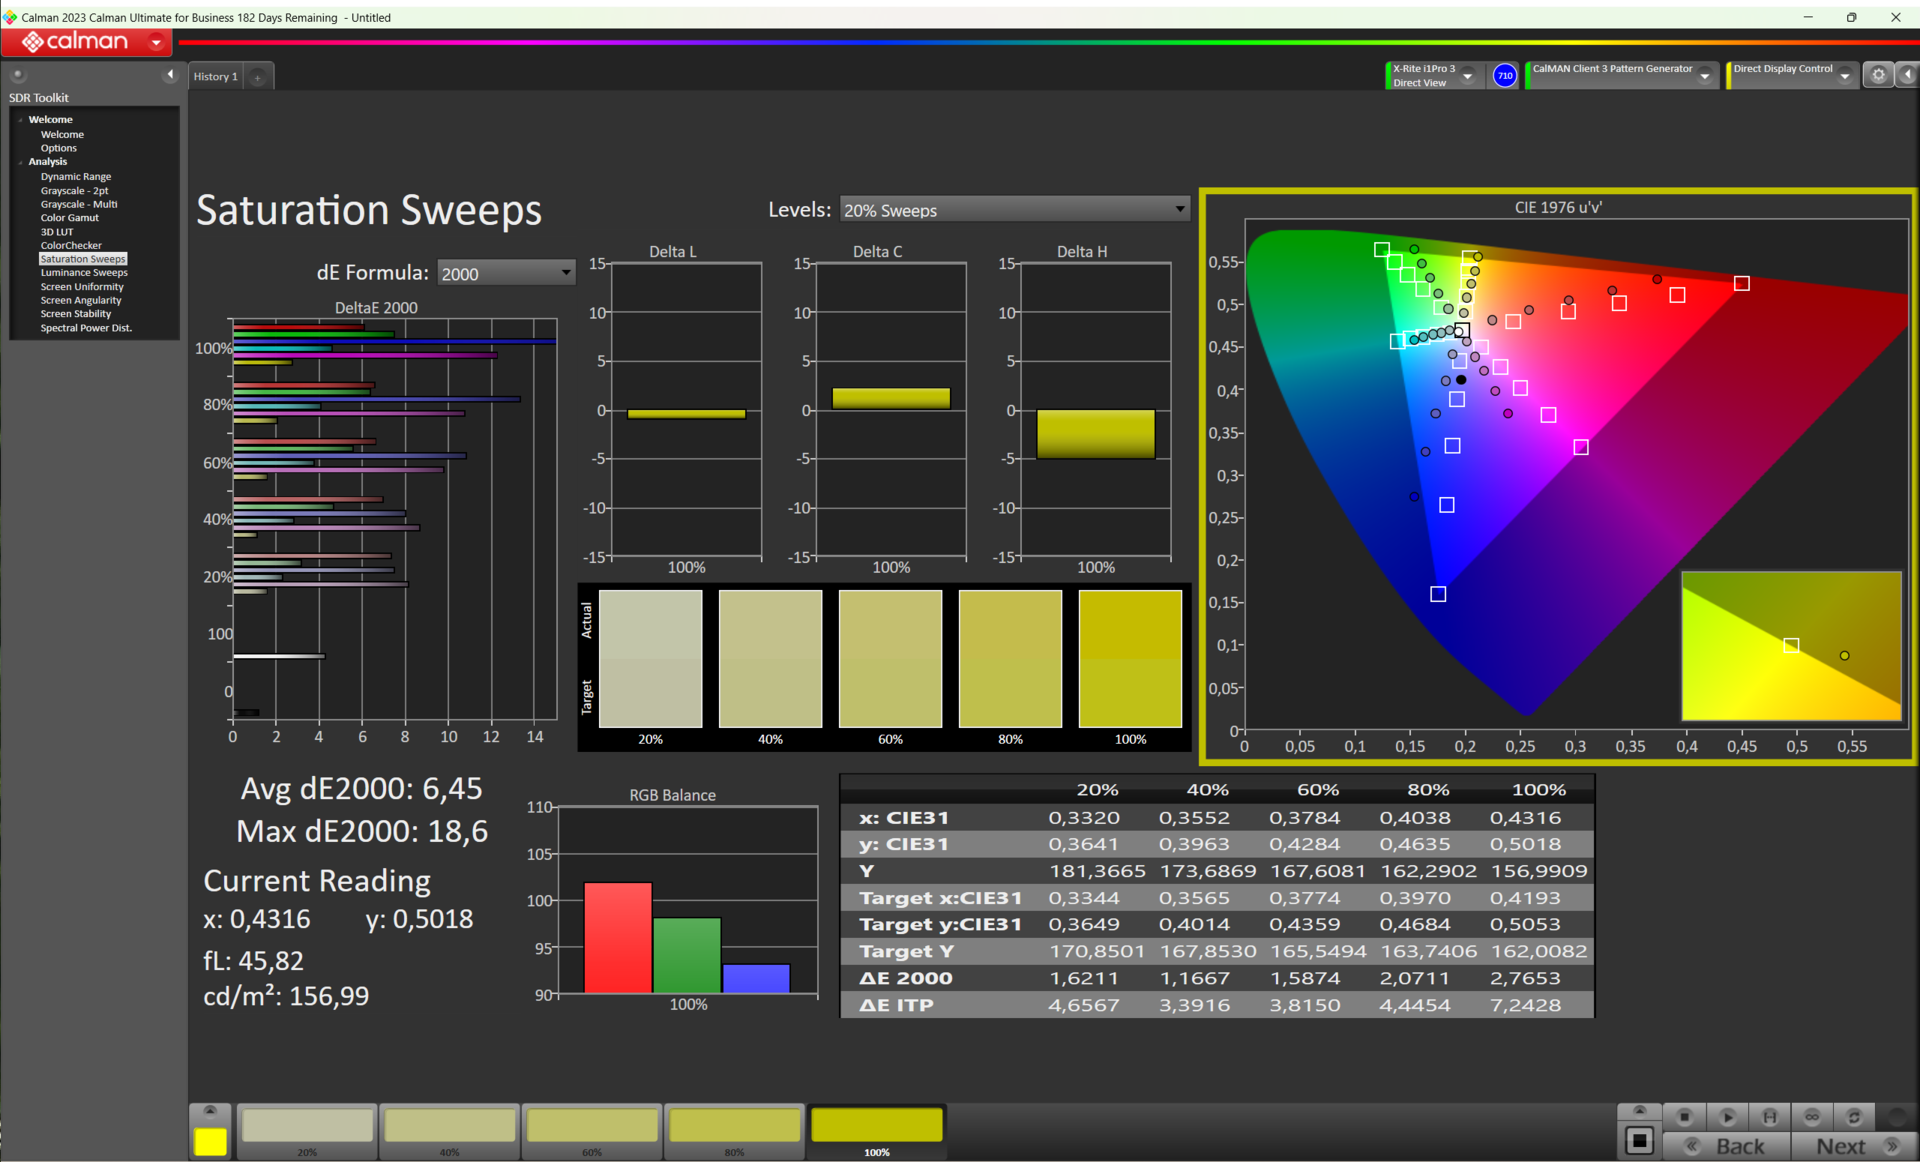
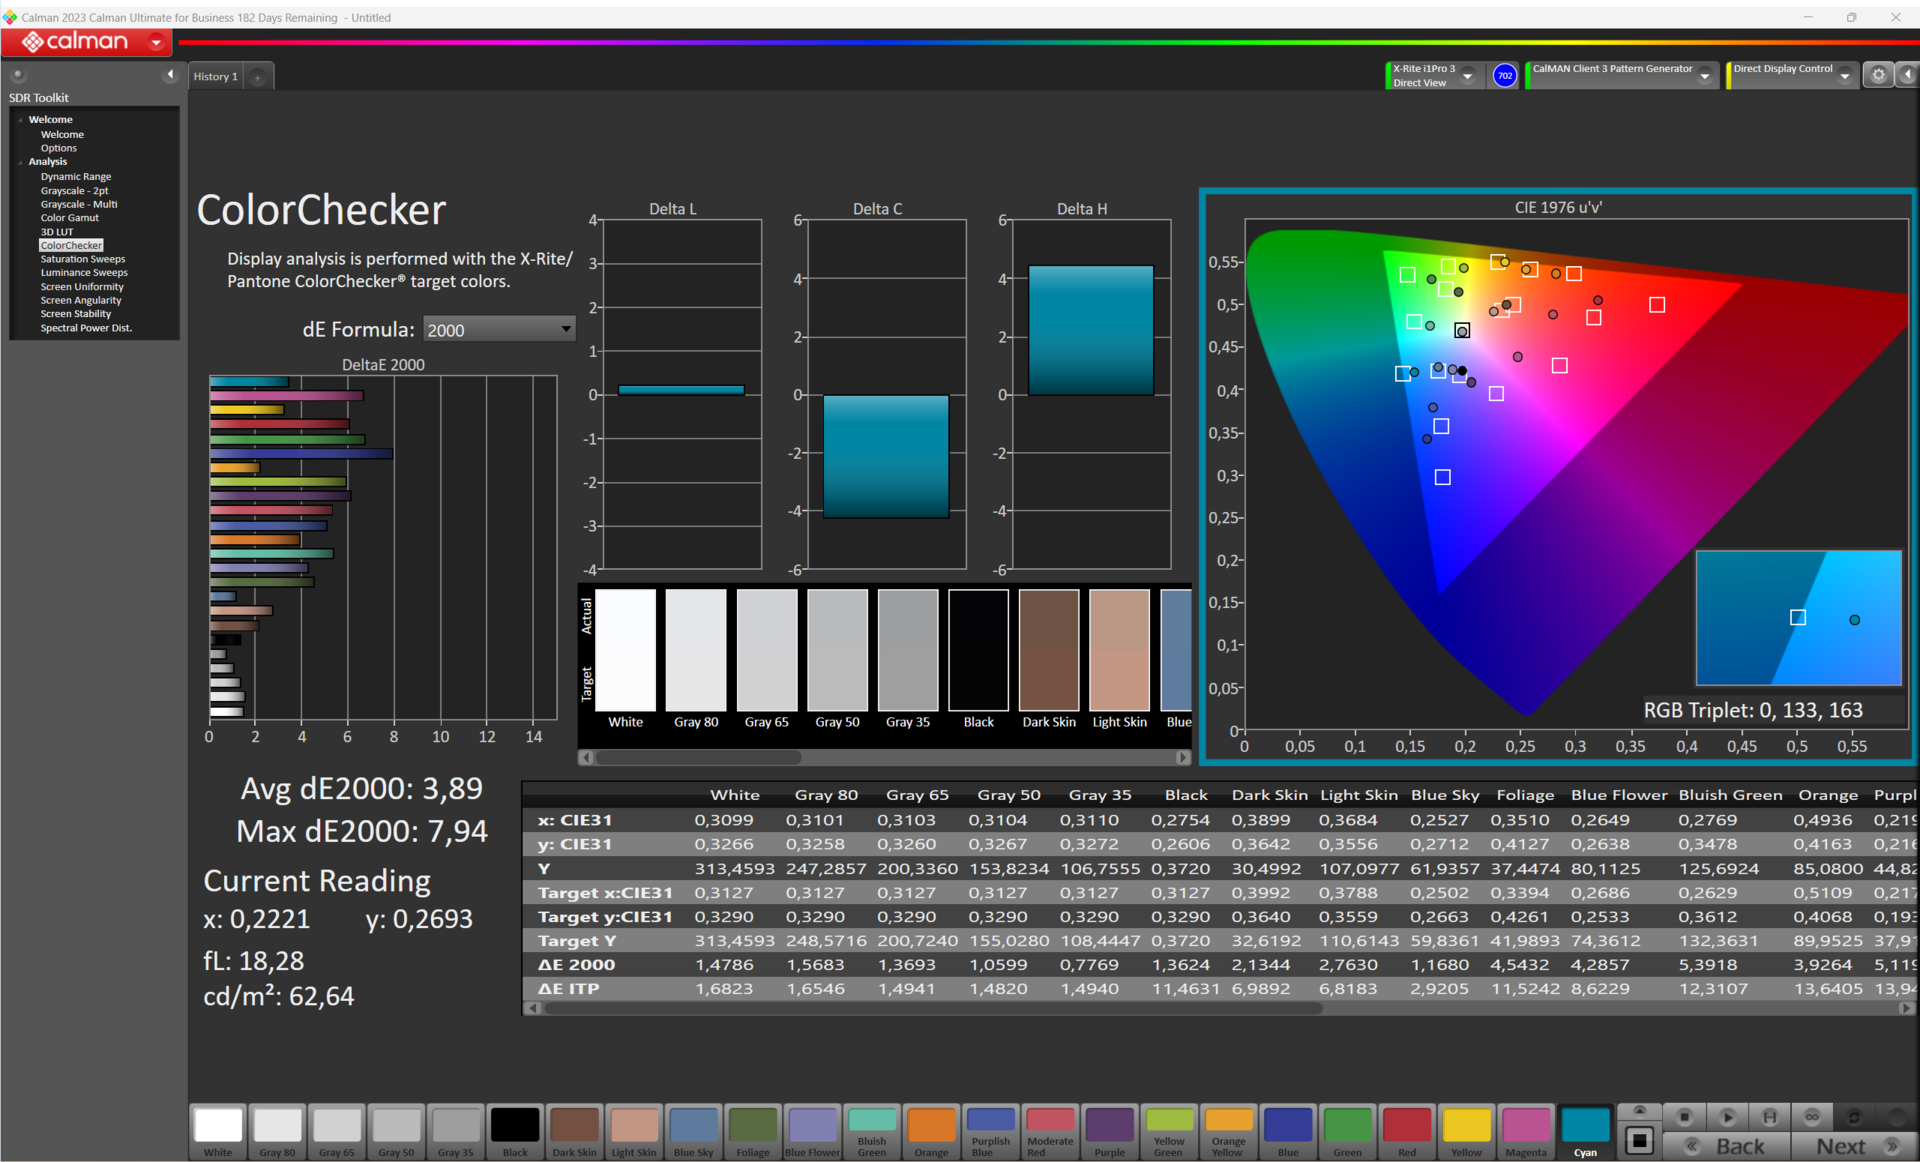
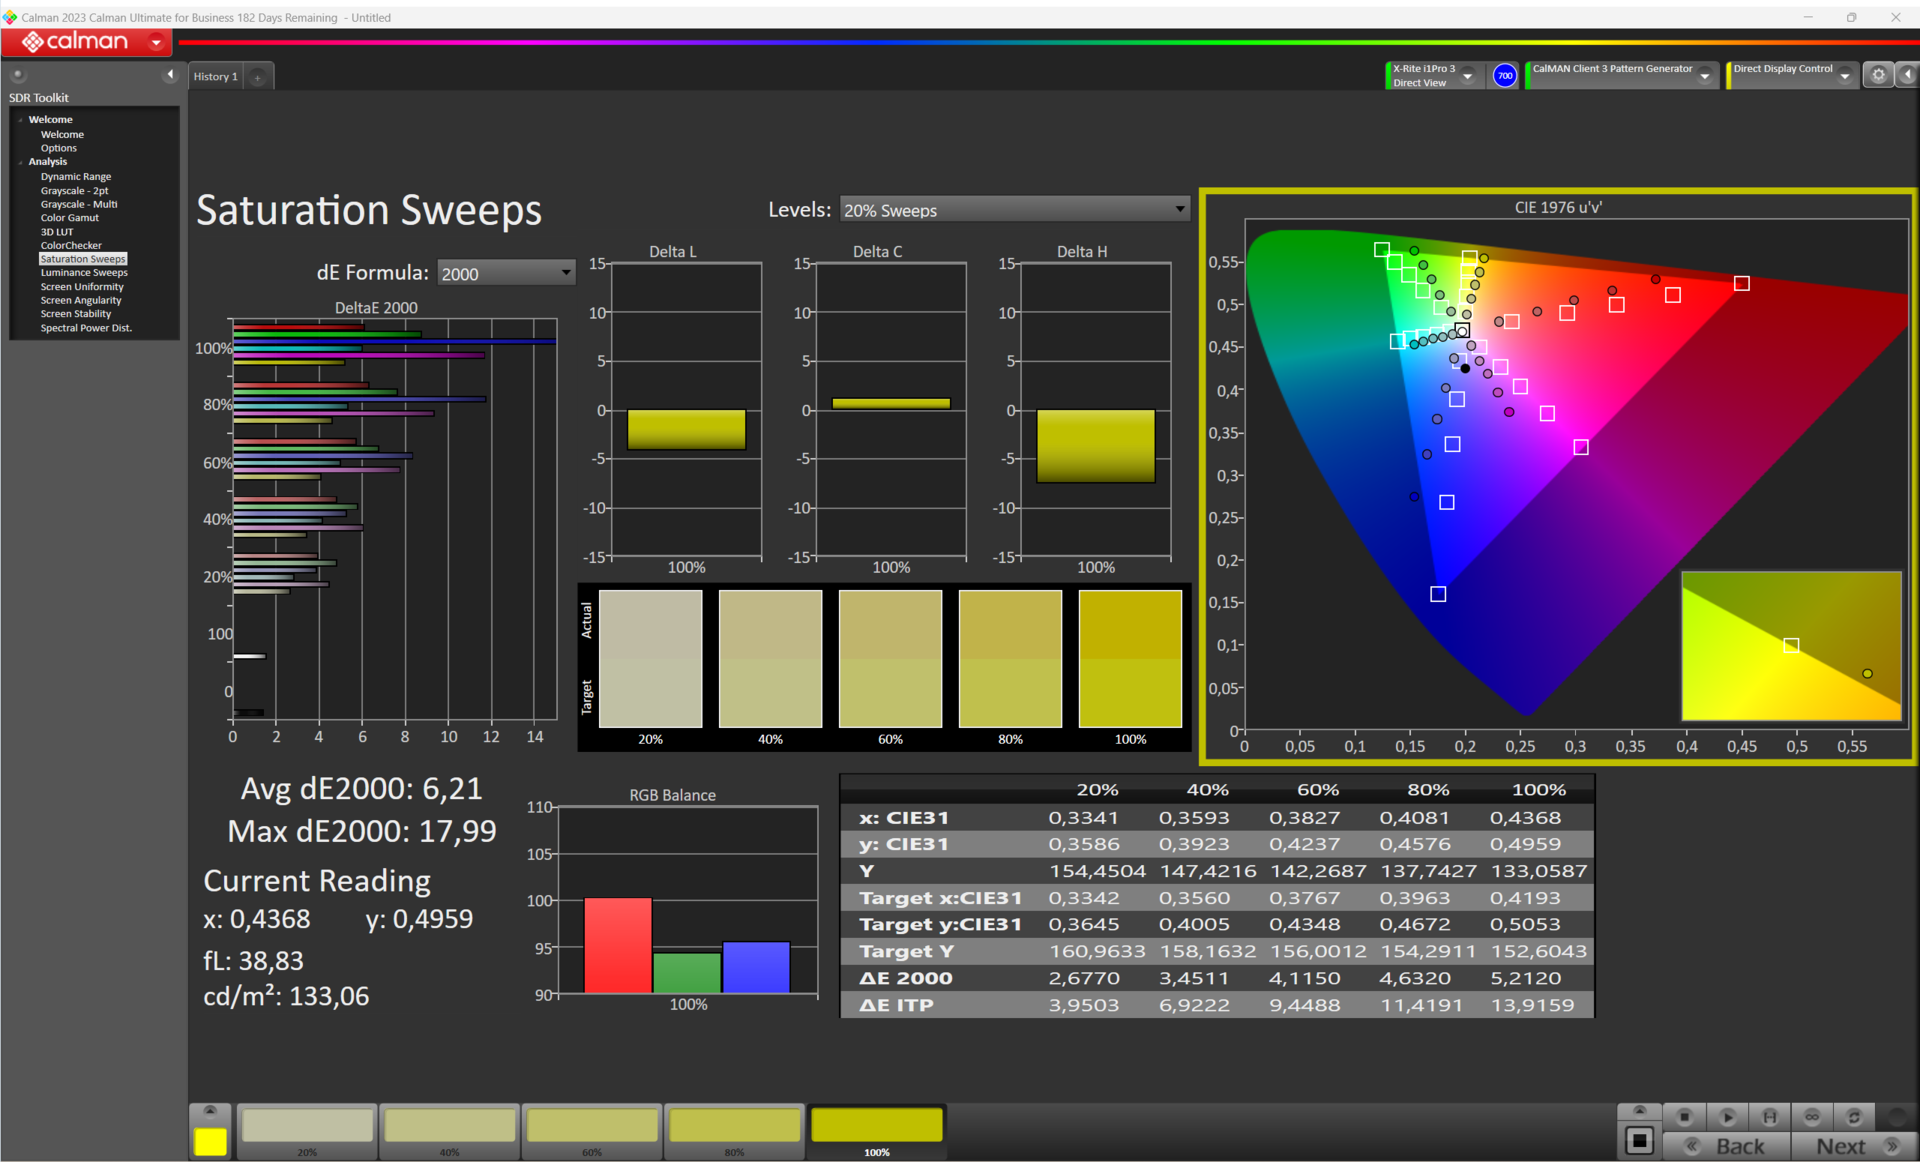
ΔE ColorChecker Calman: 5.47 | ∀{0.5-29.43 Ø4.73}
calibrated: 3.89
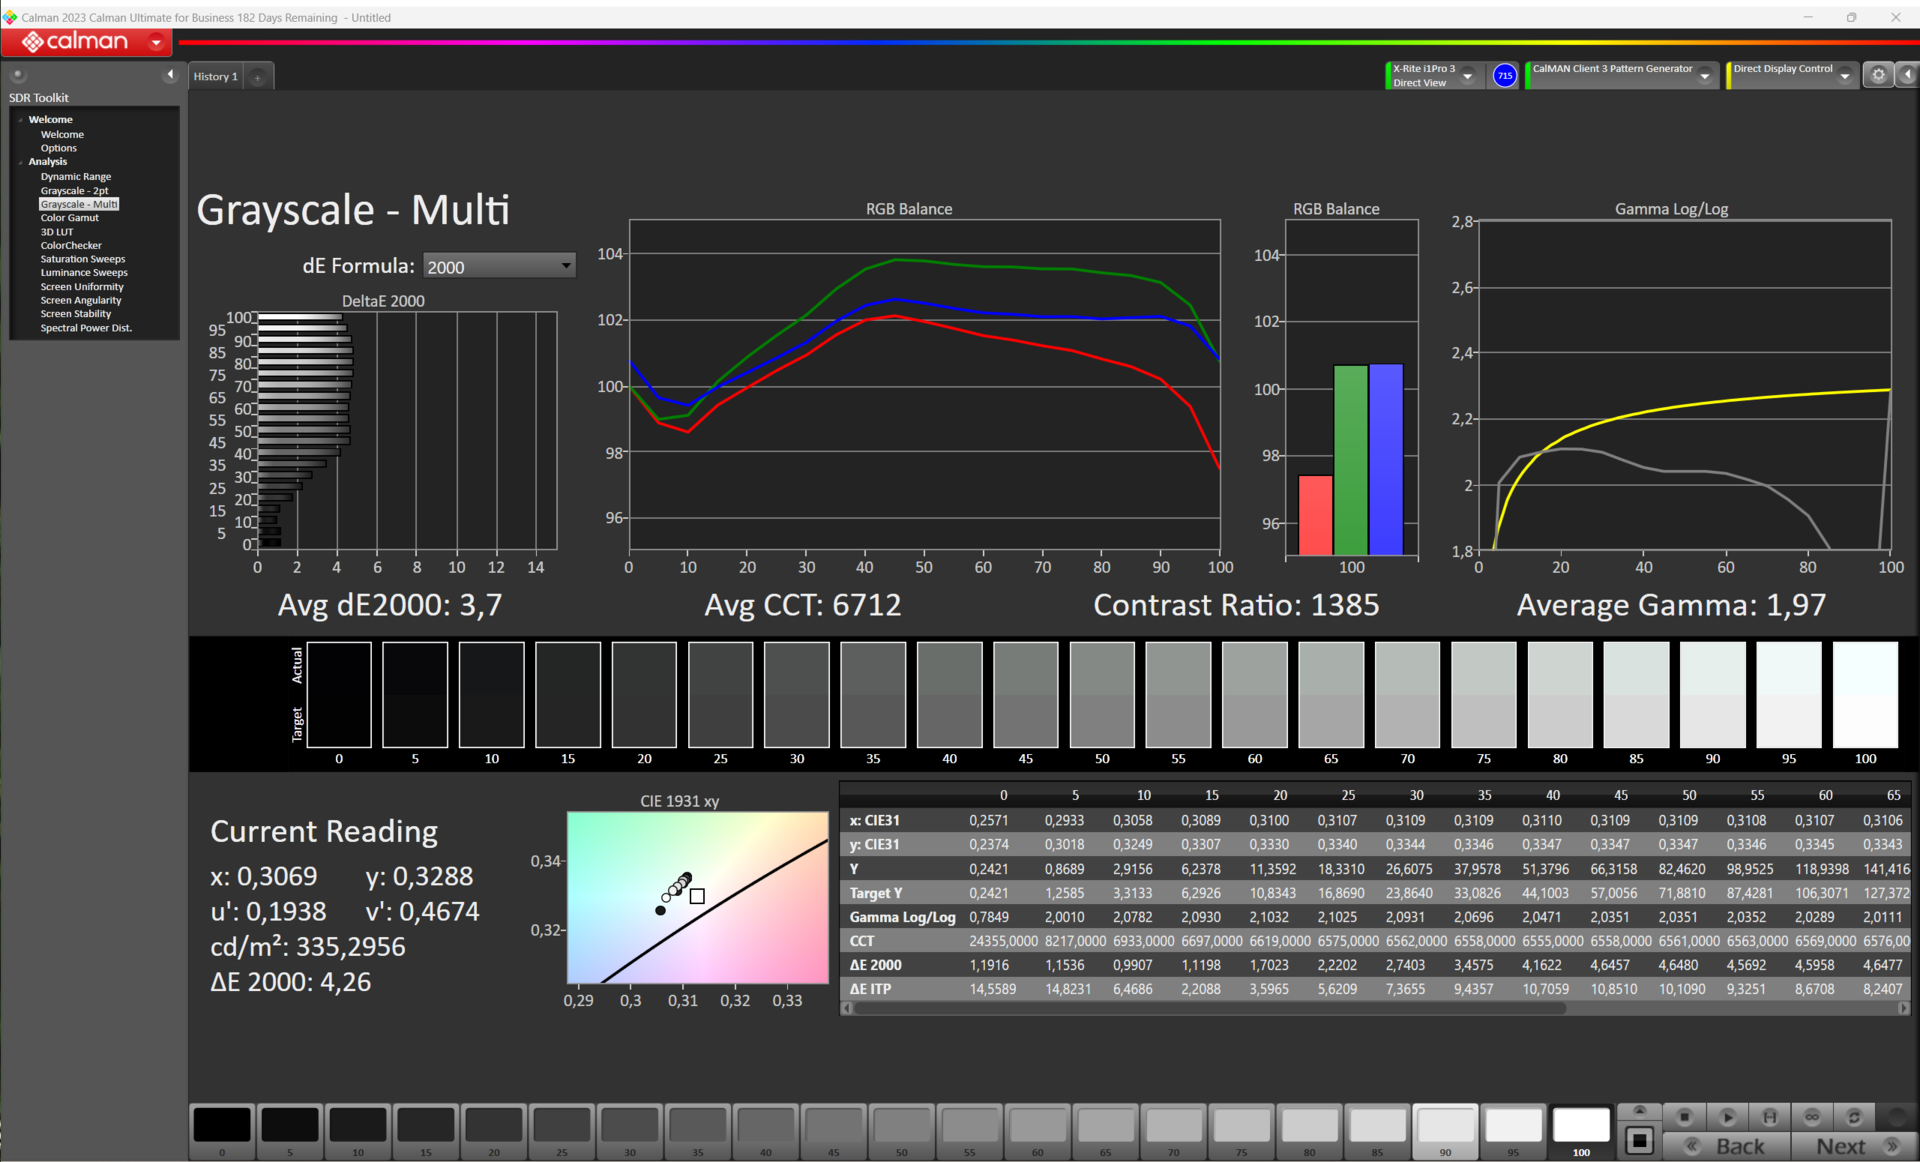
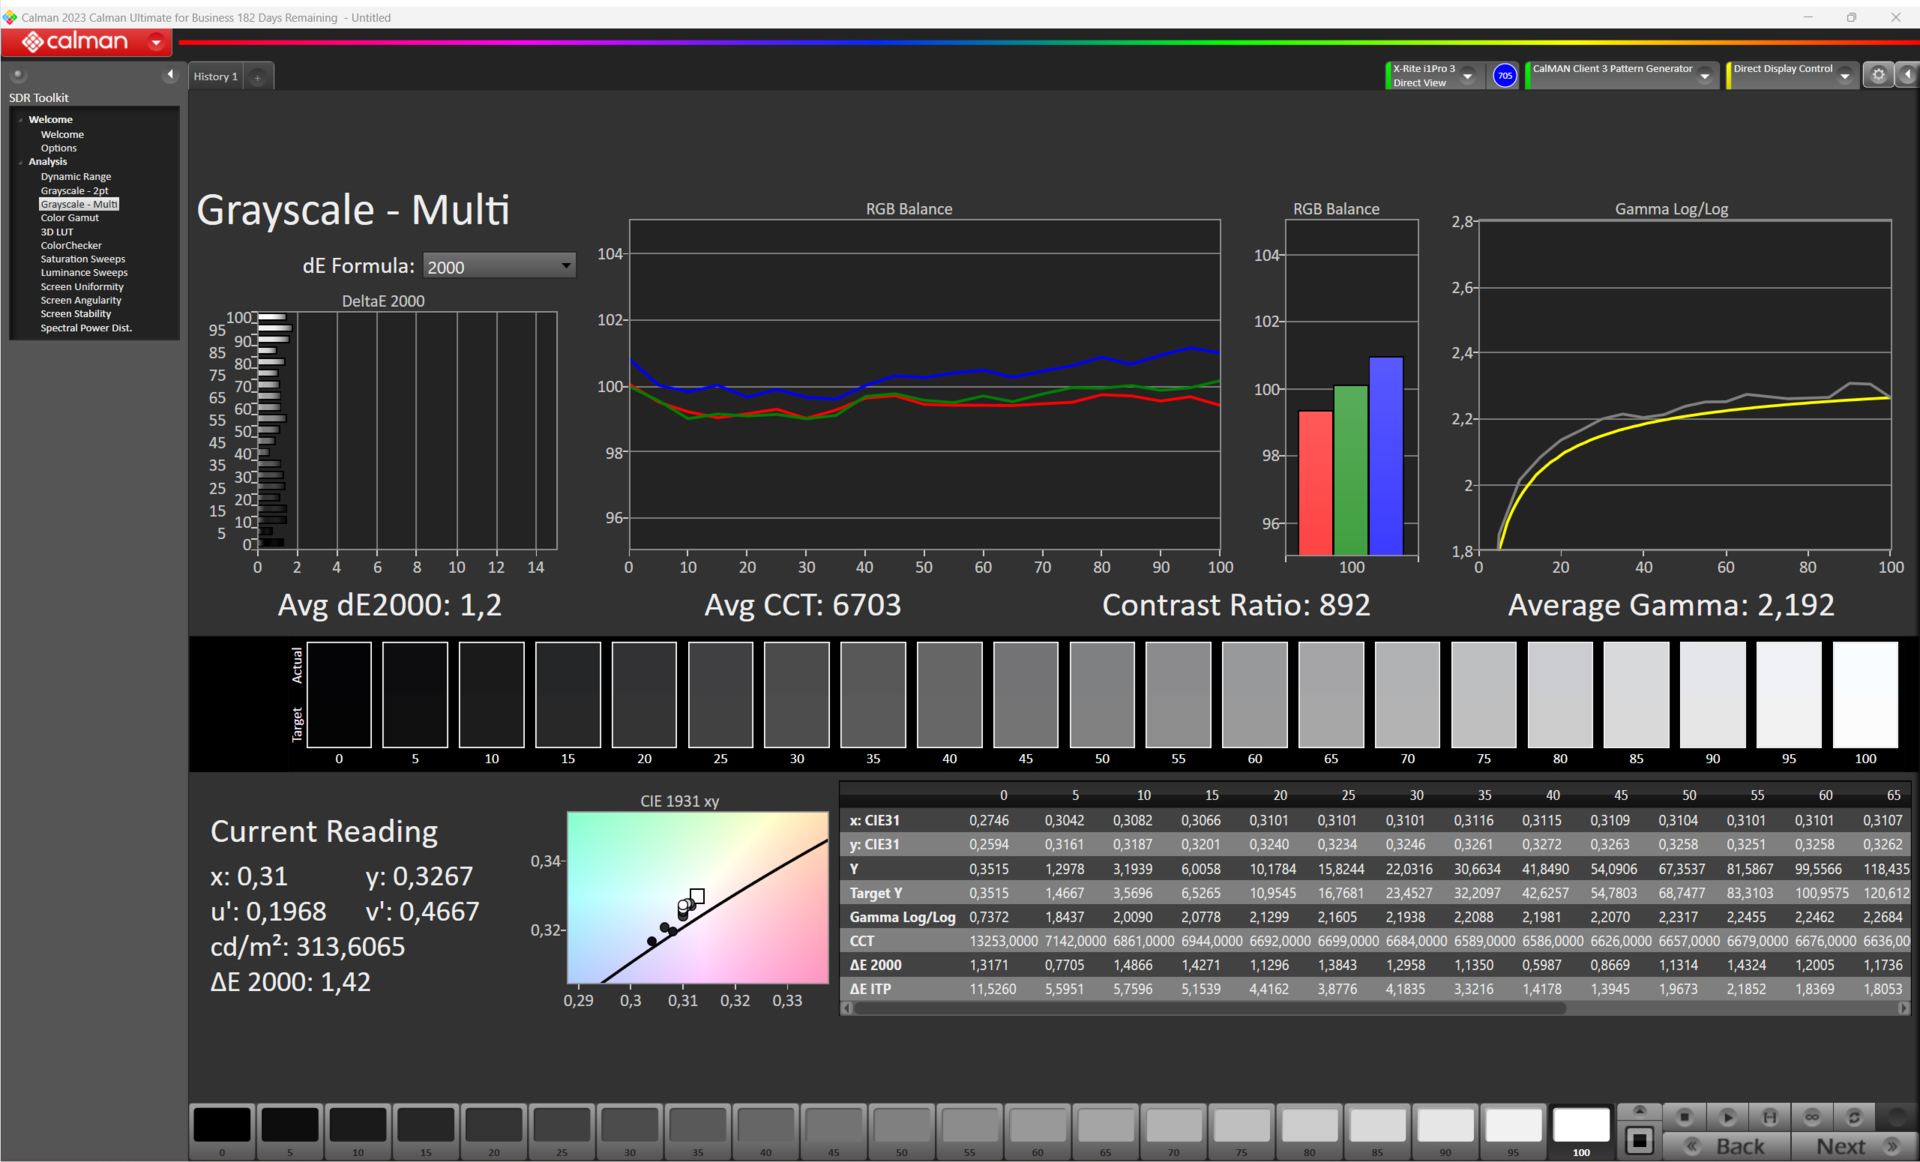
ΔE Greyscale Calman: 3.7 | ∀{0.09-98 Ø4.97}
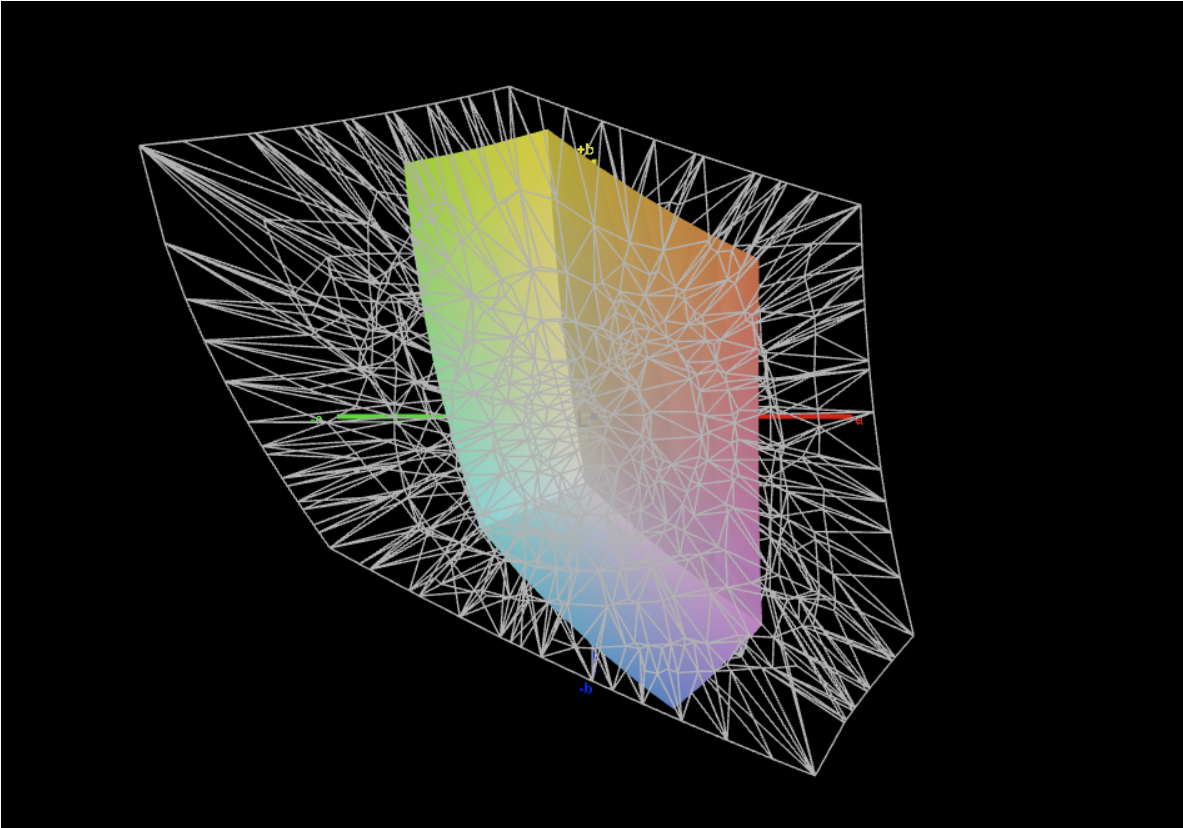
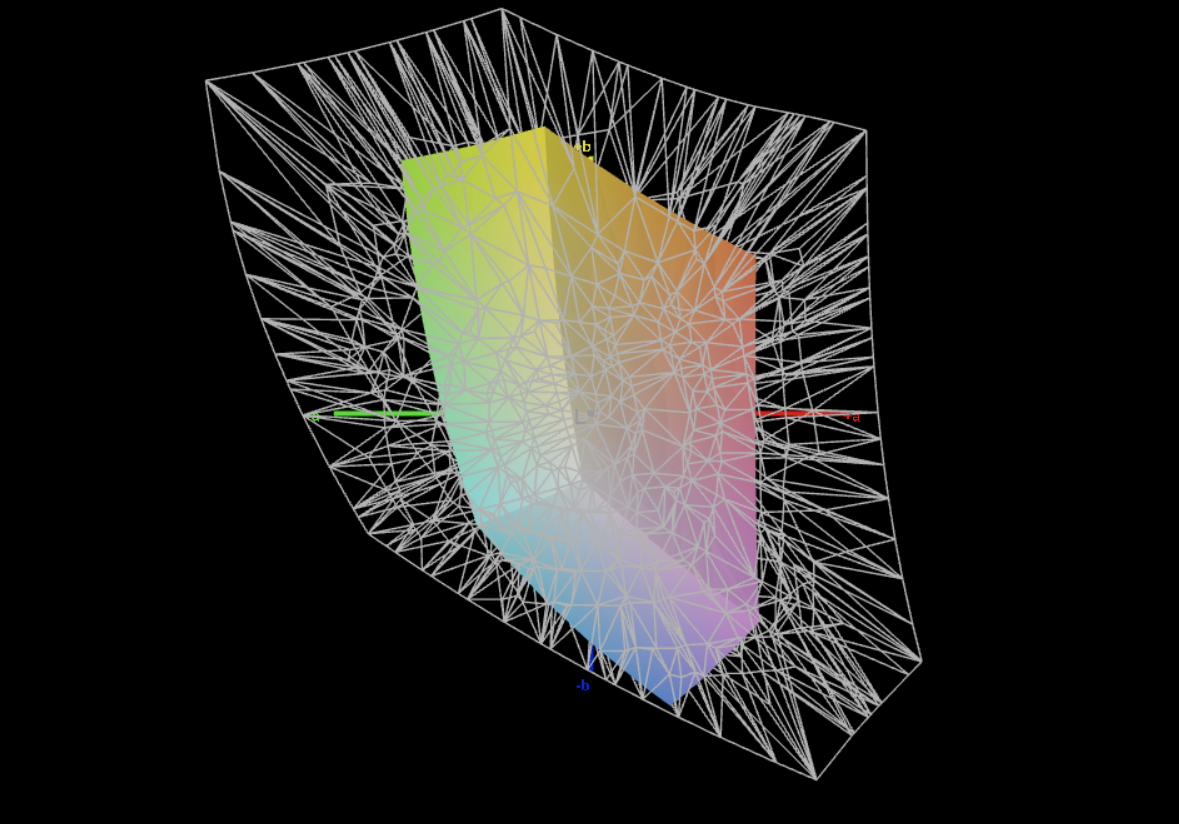
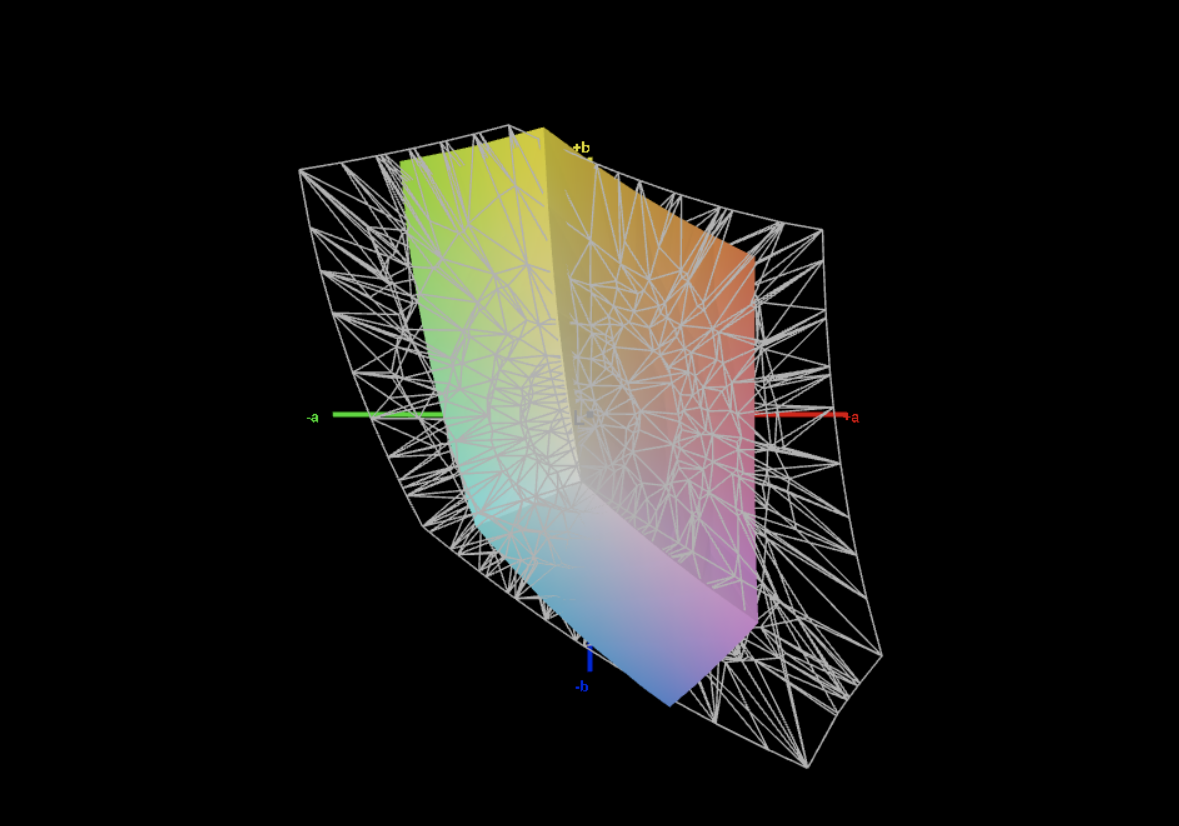
40.7% AdobeRGB 1998 (Argyll 3D)
58.2% sRGB (Argyll 3D)
39.4% Display P3 (Argyll 3D)
Gamma: 1.97
CCT: 6712 K
| Asus ExpertBook B3 B3404CVF BOE NV140WUM-N43, IPS, 1920x1200, 14" | Acer TravelMate P4 TMP414-53-58XQ BOE NV140WUM-N41, IPS, 1920x1200, 14" | HP ProBook 450 G10 LG Philips LP156WFC-SPMD, IPS, 1920x1080, 15.6" | Lenovo ThinkPad L14 G4 21H6S00900 B140HAN06.9, IPS LED, 1920x1080, 14" | |
|---|---|---|---|---|
| Display | 1% | -2% | 79% | |
| Display P3 Coverage (%) | 39.4 | 39.98 1% | 38.4 -3% | 73.2 86% |
| sRGB Coverage (%) | 58.2 | 58.8 1% | 57.3 -2% | 98.9 70% |
| AdobeRGB 1998 Coverage (%) | 40.7 | 41.3 1% | 39.7 -2% | 73.9 82% |
| Response Times | -4% | -35% | -109% | |
| Response Time Grey 50% / Grey 80% * (ms) | 23 ? | 22.8 ? 1% | 35.5 ? -54% | 58.1 ? -153% |
| Response Time Black / White * (ms) | 20 ? | 21.5 ? -8% | 23 ? -15% | 32.7 ? -64% |
| PWM Frequency (Hz) | ||||
| Screen | -5% | -16% | 35% | |
| Brightness middle (cd/m²) | 319 | 253 -21% | 285 -11% | 430 35% |
| Brightness (cd/m²) | 312 | 238 -24% | 266 -15% | 409 31% |
| Brightness Distribution (%) | 91 | 91 0% | 88 -3% | 88 -3% |
| Black Level * (cd/m²) | 0.3515 | 0.18 49% | 0.26 26% | 0.31 12% |
| Contrast (:1) | 908 | 1406 55% | 1096 21% | 1387 53% |
| Colorchecker dE 2000 * | 5.47 | 5.5 -1% | 6.3 -15% | 2.4 56% |
| Colorchecker dE 2000 max. * | 9.44 | 20.19 -114% | 18.3 -94% | 4.7 50% |
| Colorchecker dE 2000 calibrated * | 3.89 | 4.99 -28% | 5.2 -34% | 1.4 64% |
| Greyscale dE 2000 * | 3.7 | 2.3 38% | 4.3 -16% | 3 19% |
| Gamma | 1.97 112% | 2.036 108% | 2.32 95% | 2.3 96% |
| CCT | 6712 97% | 6443 101% | 6374 102% | 6489 100% |
| Total Average (Program / Settings) | -3% /
-4% | -18% /
-16% | 2% /
24% |
* ... smaller is better
Straight out of the box, the screen depicts colors acceptably: However, with a deviation of around 5.5, its target (DeltaE < 3) has been missed. Calibrating the display lowers this value to 3.9 and results in more balanced graytones. The color spaces DCI-P3, sRGB and AdobeRGB aren't covered by the panel—although the same can also be said for most of its competitors' screens. The alternatively available 500-nit panel (WQXGA) supposedly offers better color depiction (DCI-P3).
Display Response Times
| ↔ Response Time Black to White | ||
|---|---|---|
| 20 ms ... rise ↗ and fall ↘ combined | ↗ 11.5 ms rise |  |
| ↘ 8.5 ms fall | ||
| The screen shows good response rates in our tests, but may be too slow for competitive gamers. In comparison, all tested devices range from 0.1 (minimum) to 240 (maximum) ms. » 44 % of all devices are better. This means that the measured response time is similar to the average of all tested devices (19.9 ms). | ||
| ↔ Response Time 50% Grey to 80% Grey | ||
| 23 ms ... rise ↗ and fall ↘ combined | ↗ 10 ms rise |  |
| ↘ 13 ms fall | ||
| The screen shows good response rates in our tests, but may be too slow for competitive gamers. In comparison, all tested devices range from 0.165 (minimum) to 636 (maximum) ms. » 34 % of all devices are better. This means that the measured response time is better than the average of all tested devices (31.1 ms). | ||
Screen Flickering / PWM (Pulse-Width Modulation)
| Screen flickering / PWM not detected |  | ||
In comparison: 52 % of all tested devices do not use PWM to dim the display. If PWM was detected, an average of 7791 (minimum: 5 - maximum: 343500) Hz was measured. | |||
The viewing-angle stable IPS panel remains legible from everyday position. Outside, you can read from the screen as long as the sun isn't shining too brightly.
Performance - Raptor Lake and Ampere power the 14-inch device
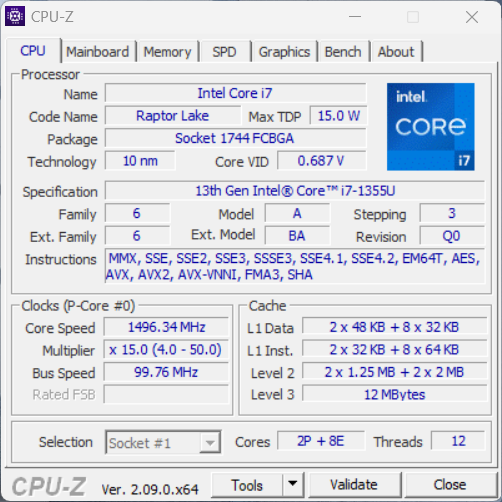
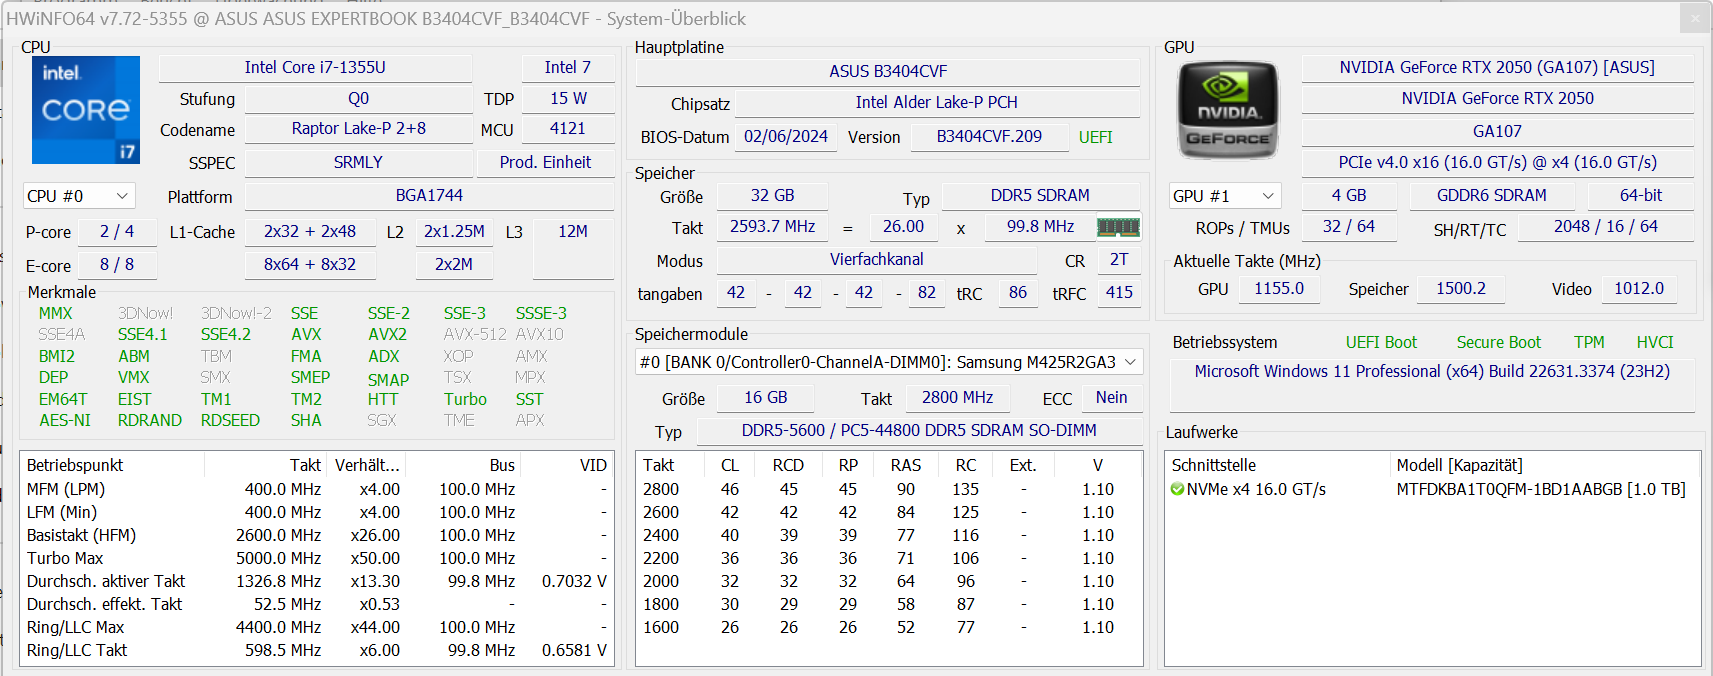
The ExpertBook-B3-B3404C series stands for 14-inch laptops from the business segment. Within the series, Raptor Lake (B3404CVA, B3404CVF) and Meteor Lake CPUs (B3404CMA) are used. You can optionally select models which feature a dedicated GeForce-RTX-2050 GPU—our test device is one of these.
Testing conditions
You can switch between the three manufacturer-specific fan modes (see table) using the key combination "Fn" + "F". We used Performance mode (benchmarks) and Whisper mode (battery test). The former is only available when connected to the mains. The modes affect the CPU and GPU performance.
| Performance mode | Standard mode | Whisper mode | |
|---|---|---|---|
| Power Limit 1 (HWInfo) | 35 watts | 35 watts | 17 watts |
| Power Limit 2 (HWInfo) | 55 watts | 55 watts | 55 watts |
Processor
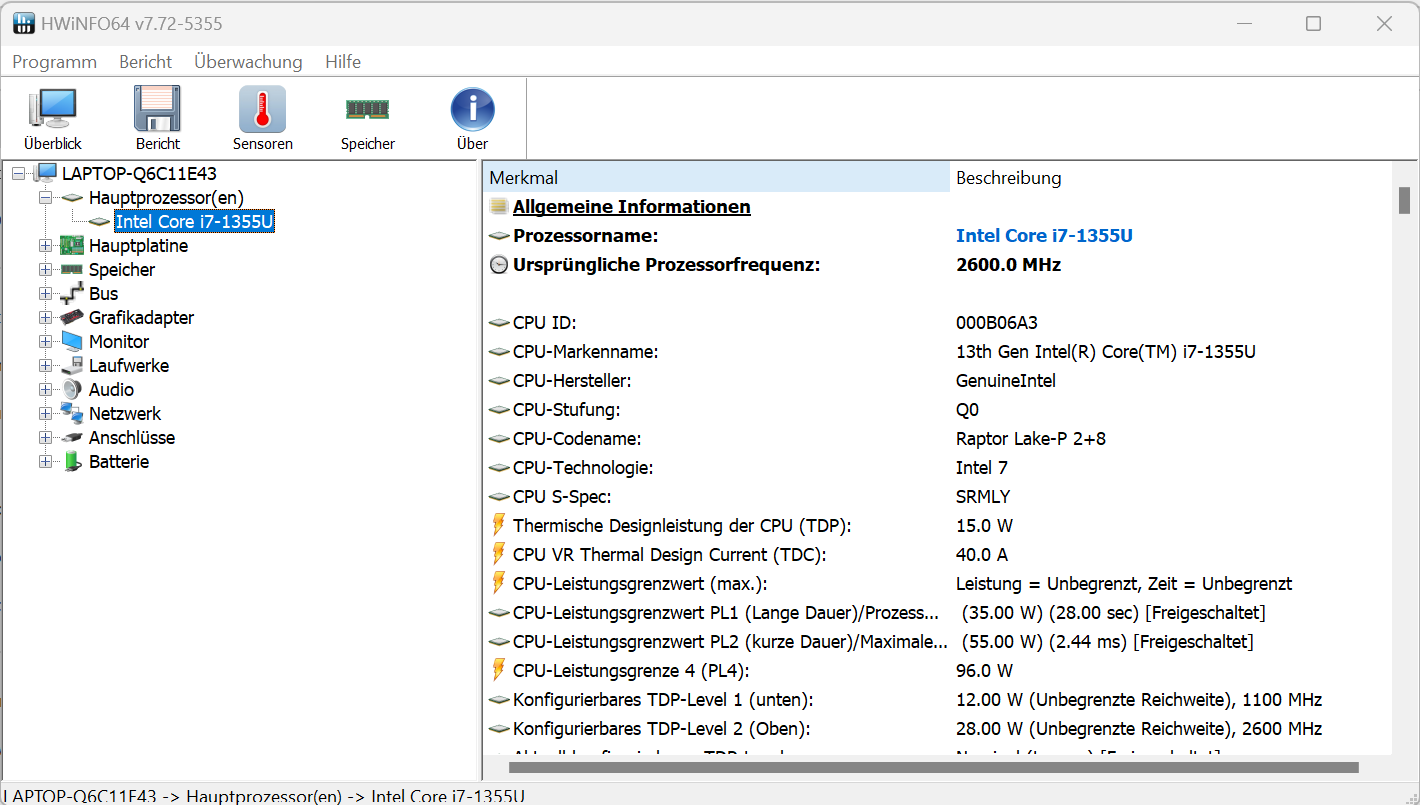
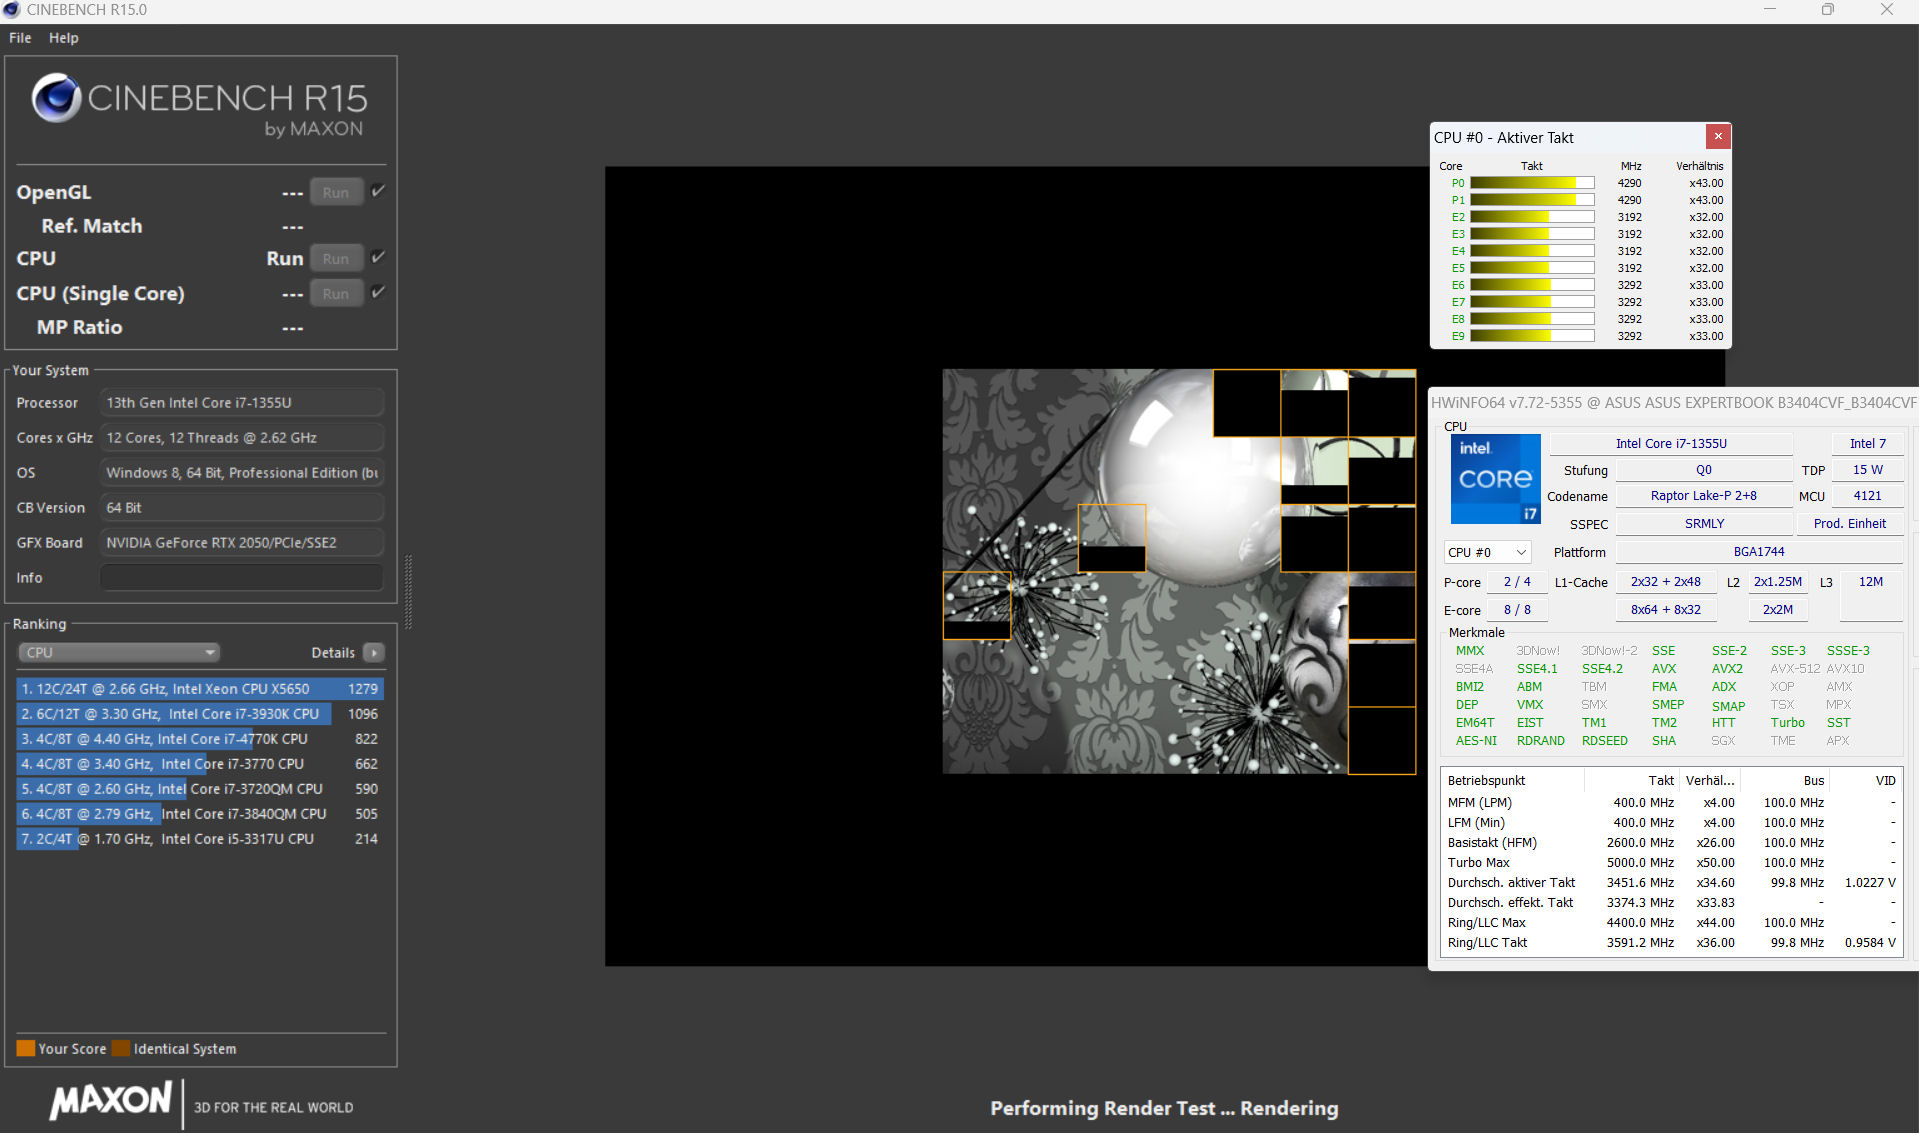
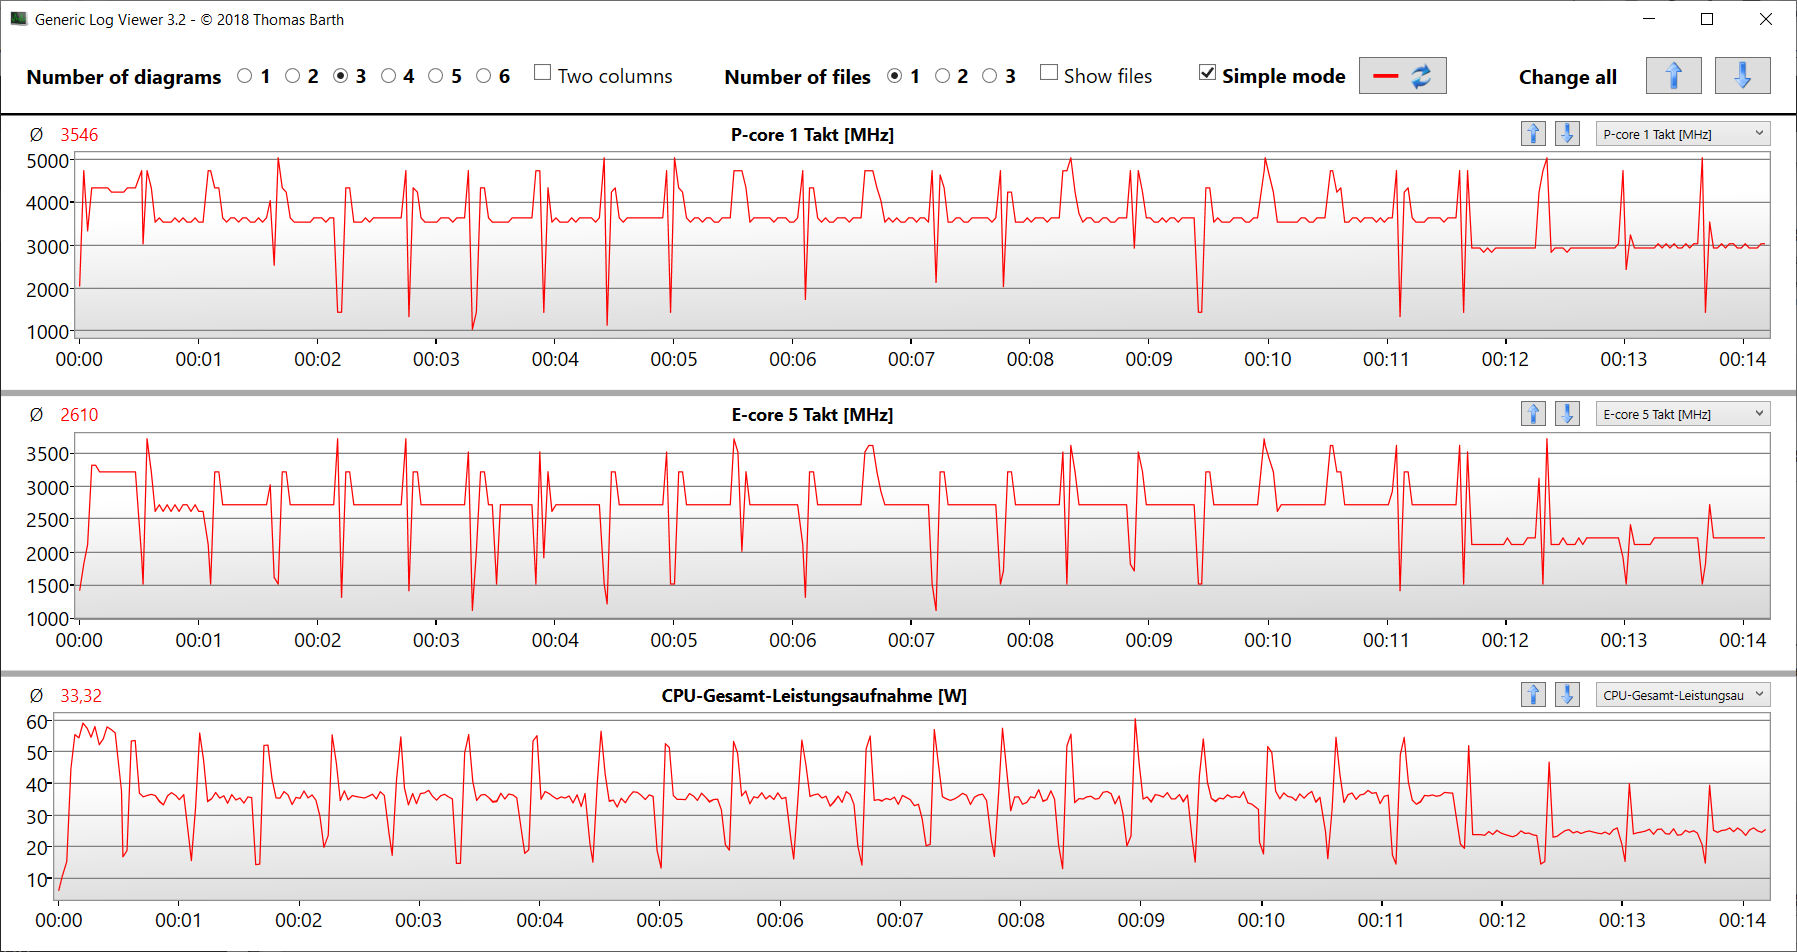
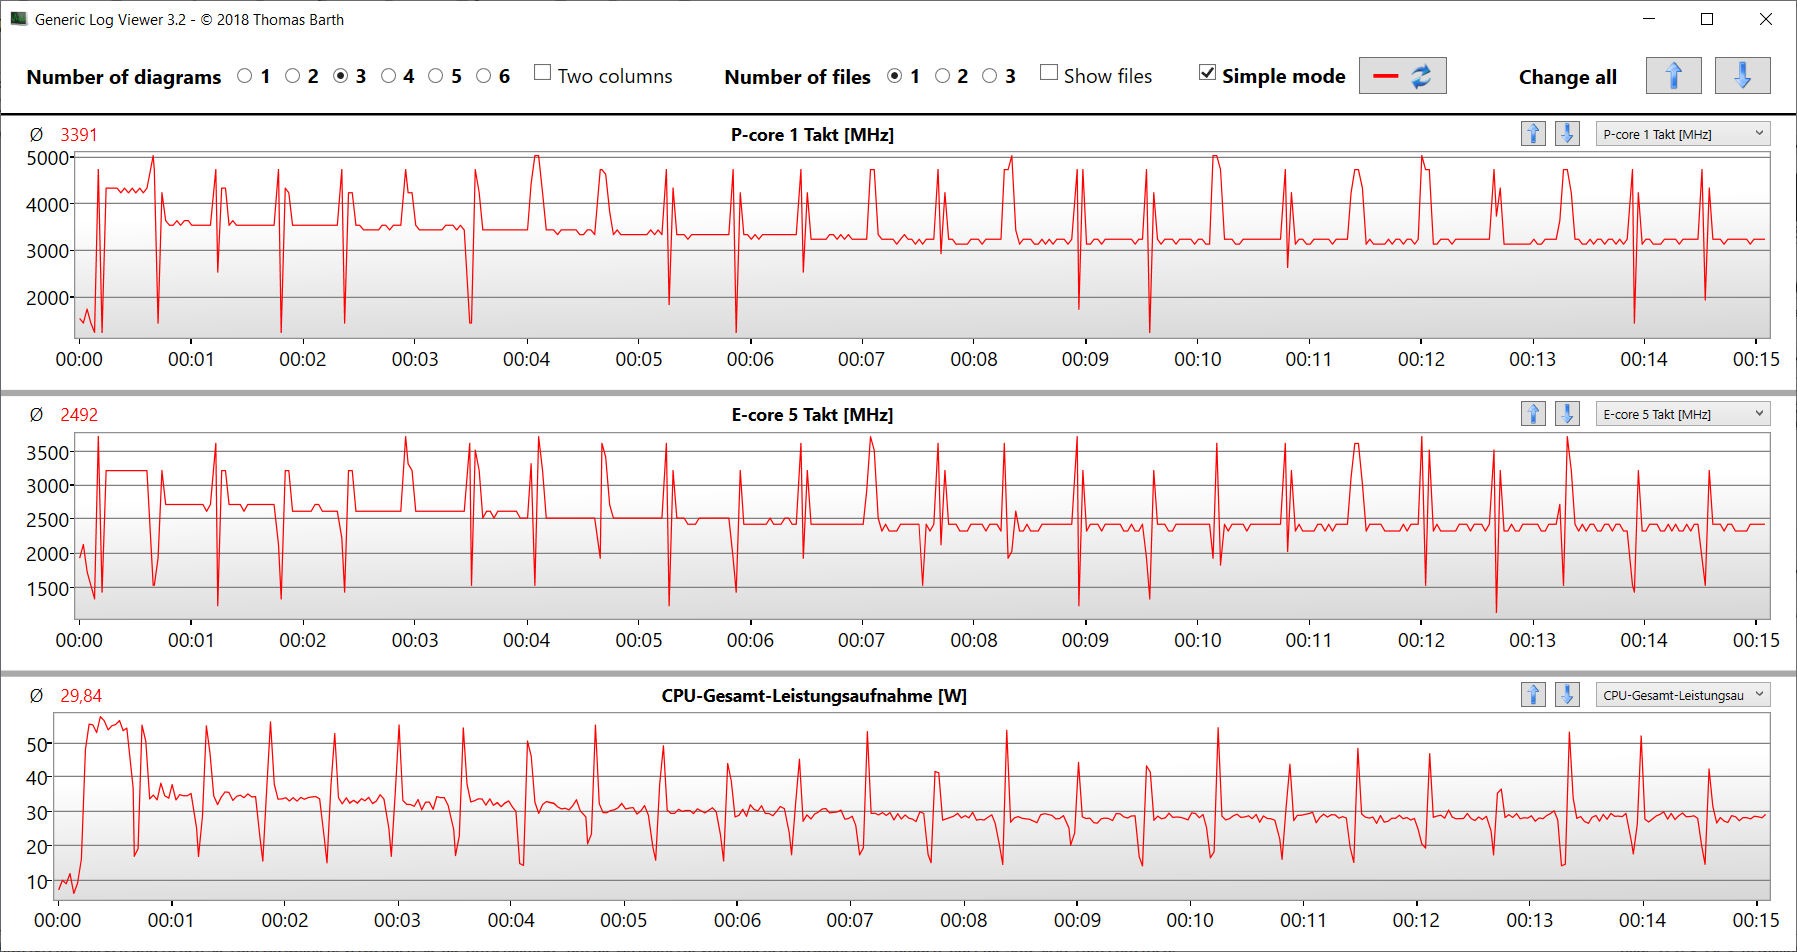
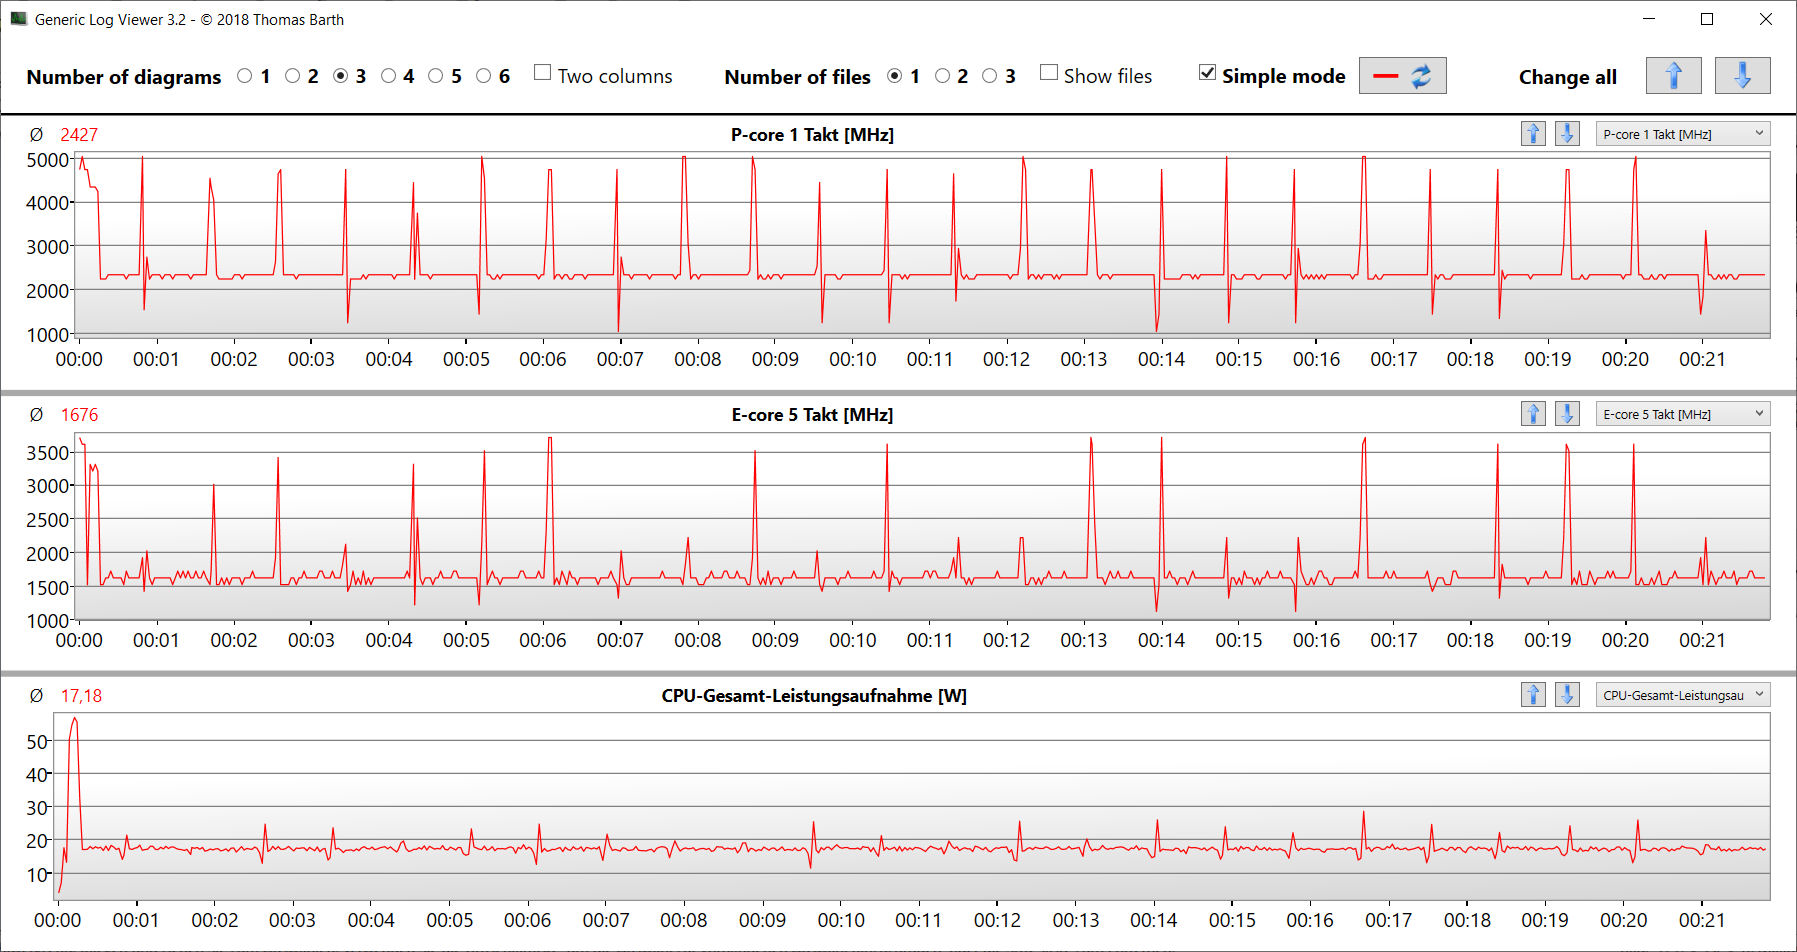
The Core i7-1355U's 10 CPU cores (2P, 8E) achieve maximum clock rates of 5 GHz (P) and 3.7 GHz (E). Continuous multi-thread load (CB15 Loop) caused its clock rate to drop slightly from the first to the second and again from the twenty-first to the twenty-second run. After that, a constant level was maintained in each case. We noted benchmark values above the previous CPU average (connected to mains). In battery mode, both the single-thread and multi-thread performance were halved.
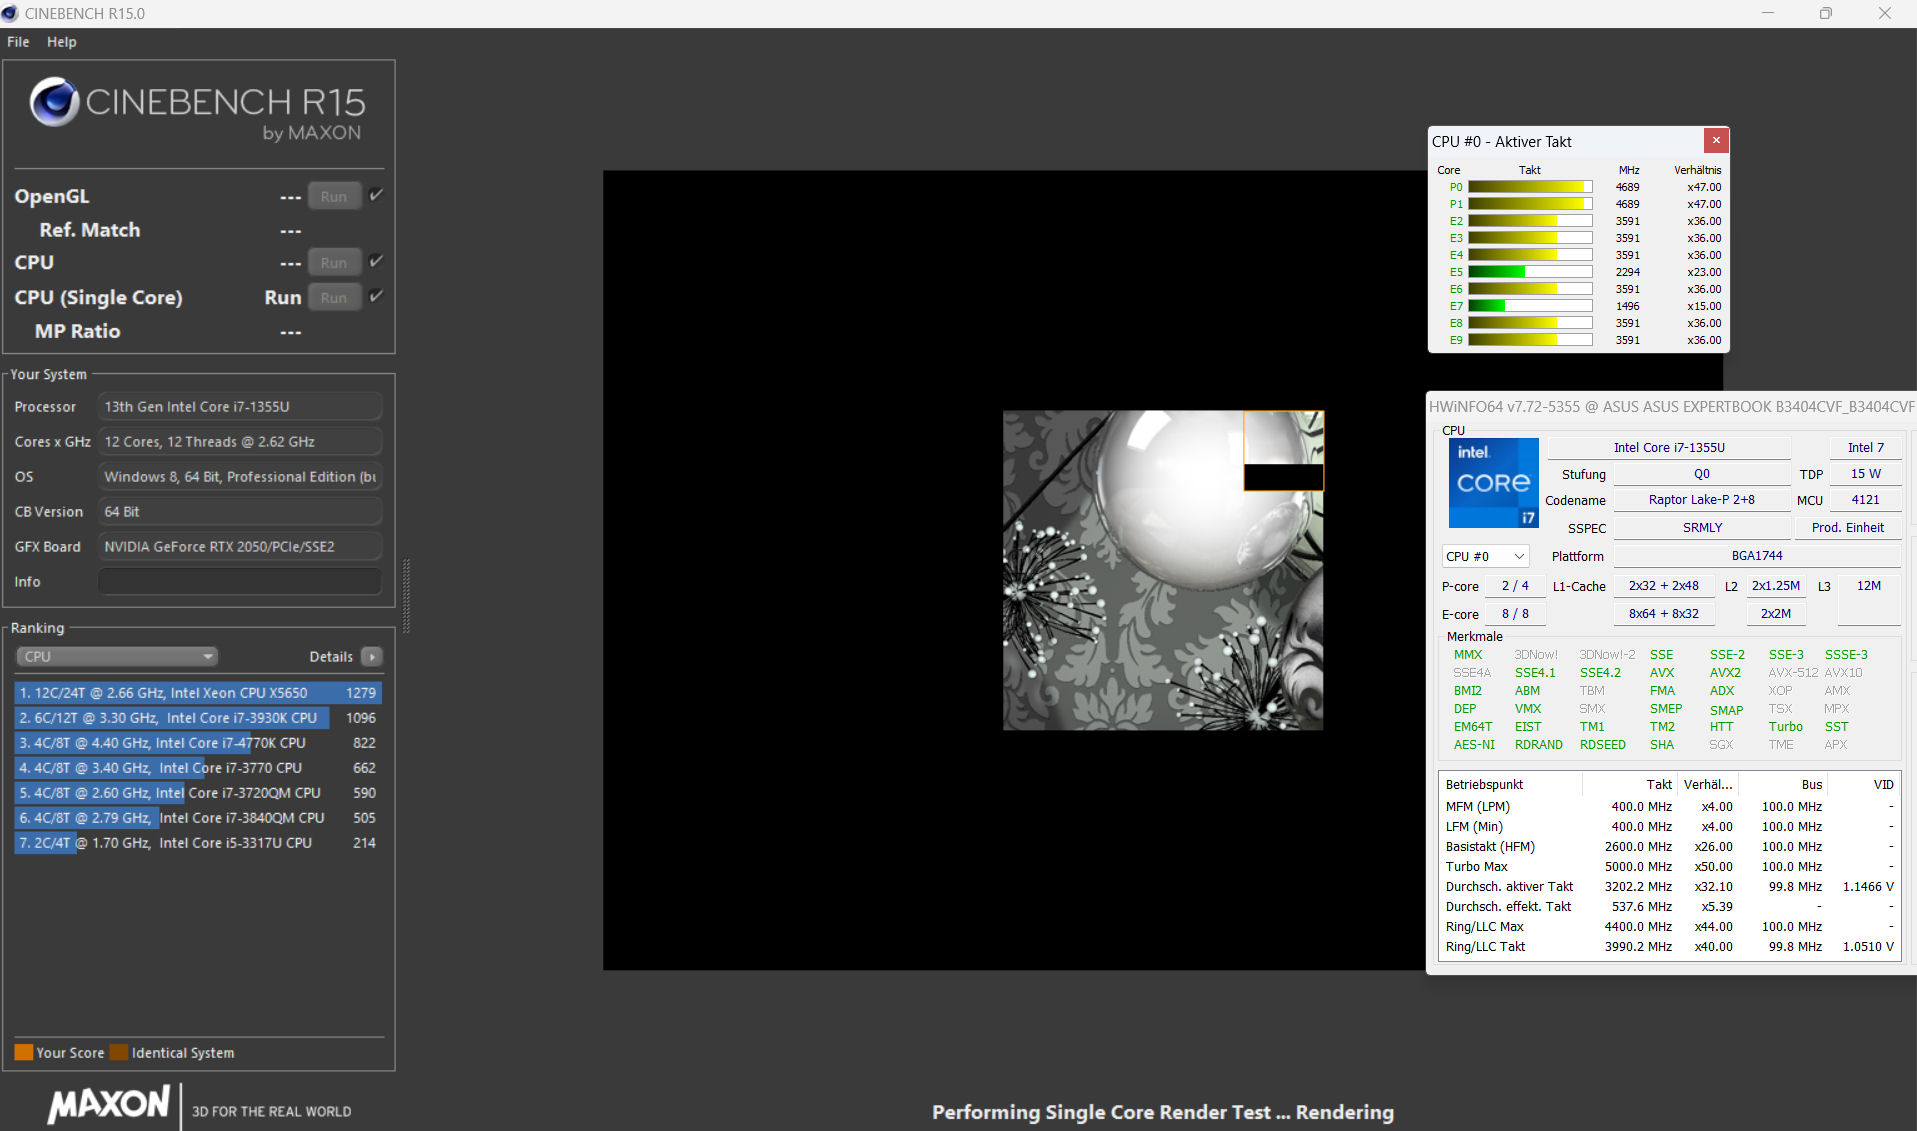
Cinebench R15 Multi continuous test
| CPU Performance rating - Percent | |
| Asus ExpertBook B3 B3404CVF | |
| Average of class Office | |
| Average Intel Core i7-1355U | |
| HP ProBook 450 G10 | |
| Acer TravelMate P4 TMP414-53-58XQ | |
| Lenovo ThinkPad L14 G4 21H6S00900 -2! | |
* ... smaller is better
AIDA64: FP32 Ray-Trace | FPU Julia | CPU SHA3 | CPU Queen | FPU SinJulia | FPU Mandel | CPU AES | CPU ZLib | FP64 Ray-Trace | CPU PhotoWorxx
| Performance rating | |
| Average of class Office | |
| Lenovo ThinkPad L14 G4 21H6S00900 | |
| Asus ExpertBook B3 B3404CVF | |
| Average Intel Core i7-1355U | |
| Acer TravelMate P4 TMP414-53-58XQ | |
| HP ProBook 450 G10 | |
| AIDA64 / FP32 Ray-Trace | |
| Average of class Office (2083 - 31245, n=80, last 2 years) | |
| Lenovo ThinkPad L14 G4 21H6S00900 | |
| Asus ExpertBook B3 B3404CVF | |
| Acer TravelMate P4 TMP414-53-58XQ | |
| HP ProBook 450 G10 | |
| Average Intel Core i7-1355U (5673 - 8424, n=18) | |
| AIDA64 / FPU Julia | |
| Average of class Office (8191 - 125394, n=80, last 2 years) | |
| Lenovo ThinkPad L14 G4 21H6S00900 | |
| Asus ExpertBook B3 B3404CVF | |
| Acer TravelMate P4 TMP414-53-58XQ | |
| Average Intel Core i7-1355U (29580 - 42706, n=18) | |
| HP ProBook 450 G10 | |
| AIDA64 / CPU SHA3 | |
| Average of class Office (433 - 5755, n=80, last 2 years) | |
| Asus ExpertBook B3 B3404CVF | |
| Acer TravelMate P4 TMP414-53-58XQ | |
| Lenovo ThinkPad L14 G4 21H6S00900 | |
| Average Intel Core i7-1355U (1529 - 2200, n=18) | |
| HP ProBook 450 G10 | |
| AIDA64 / CPU Queen | |
| Lenovo ThinkPad L14 G4 21H6S00900 | |
| HP ProBook 450 G10 | |
| Asus ExpertBook B3 B3404CVF | |
| Average of class Office (22784 - 115197, n=69, last 2 years) | |
| Average Intel Core i7-1355U (21547 - 66907, n=18) | |
| Acer TravelMate P4 TMP414-53-58XQ | |
| AIDA64 / FPU SinJulia | |
| Lenovo ThinkPad L14 G4 21H6S00900 | |
| Average of class Office (1378 - 18321, n=80, last 2 years) | |
| Asus ExpertBook B3 B3404CVF | |
| Acer TravelMate P4 TMP414-53-58XQ | |
| HP ProBook 450 G10 | |
| Average Intel Core i7-1355U (4045 - 5426, n=18) | |
| AIDA64 / FPU Mandel | |
| Lenovo ThinkPad L14 G4 21H6S00900 | |
| Average of class Office (4601 - 66922, n=80, last 2 years) | |
| Asus ExpertBook B3 B3404CVF | |
| Acer TravelMate P4 TMP414-53-58XQ | |
| Average Intel Core i7-1355U (14596 - 21627, n=18) | |
| HP ProBook 450 G10 | |
| AIDA64 / CPU AES | |
| Lenovo ThinkPad L14 G4 21H6S00900 | |
| Average of class Office (4854 - 155900, n=80, last 2 years) | |
| Asus ExpertBook B3 B3404CVF | |
| Acer TravelMate P4 TMP414-53-58XQ | |
| Average Intel Core i7-1355U (31432 - 75408, n=18) | |
| HP ProBook 450 G10 | |
| AIDA64 / CPU ZLib | |
| Average of class Office (114.6 - 1366, n=80, last 2 years) | |
| Asus ExpertBook B3 B3404CVF | |
| Acer TravelMate P4 TMP414-53-58XQ | |
| Average Intel Core i7-1355U (454 - 684, n=18) | |
| HP ProBook 450 G10 | |
| Lenovo ThinkPad L14 G4 21H6S00900 | |
| AIDA64 / FP64 Ray-Trace | |
| Average of class Office (1109 - 17834, n=80, last 2 years) | |
| Lenovo ThinkPad L14 G4 21H6S00900 | |
| Asus ExpertBook B3 B3404CVF | |
| Acer TravelMate P4 TMP414-53-58XQ | |
| HP ProBook 450 G10 | |
| Average Intel Core i7-1355U (2991 - 4453, n=18) | |
| AIDA64 / CPU PhotoWorxx | |
| Asus ExpertBook B3 B3404CVF | |
| Average of class Office (11090 - 65229, n=80, last 2 years) | |
| Average Intel Core i7-1355U (21800 - 46154, n=18) | |
| HP ProBook 450 G10 | |
| Acer TravelMate P4 TMP414-53-58XQ | |
| Lenovo ThinkPad L14 G4 21H6S00900 | |
System performance
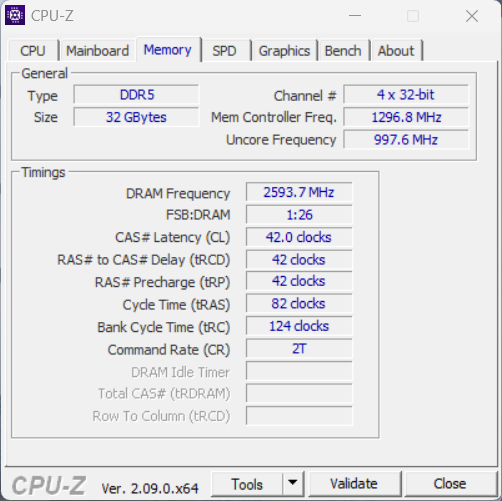
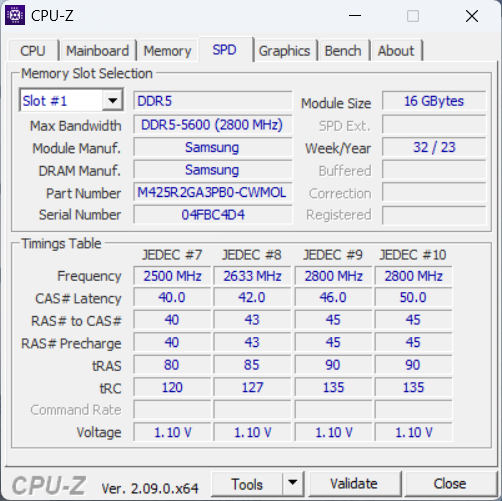
The smooth-running system is designed for office and internet applications, GPU-heavy programs and games with moderate requirements. The RAM's data rates are at a normal level for DDR5-5600 RAM. Its PCMark results were good.
CrossMark: Overall | Productivity | Creativity | Responsiveness
WebXPRT 3: Overall
WebXPRT 4: Overall
Mozilla Kraken 1.1: Total
| PCMark 10 / Score | |
| Average of class Office (2601 - 9298, n=64, last 2 years) | |
| Average Intel Core i7-1355U, NVIDIA GeForce RTX 2050 Mobile (6235 - 6540, n=3) | |
| Asus ExpertBook B3 B3404CVF | |
| HP ProBook 450 G10 | |
| Lenovo ThinkPad L14 G4 21H6S00900 | |
| Acer TravelMate P4 TMP414-53-58XQ | |
| PCMark 10 / Essentials | |
| Average Intel Core i7-1355U, NVIDIA GeForce RTX 2050 Mobile (10174 - 20841, n=3) | |
| Asus ExpertBook B3 B3404CVF | |
| Acer TravelMate P4 TMP414-53-58XQ | |
| Lenovo ThinkPad L14 G4 21H6S00900 | |
| HP ProBook 450 G10 | |
| Average of class Office (3245 - 11594, n=64, last 2 years) | |
| PCMark 10 / Productivity | |
| Average of class Office (5336 - 17243, n=64, last 2 years) | |
| Lenovo ThinkPad L14 G4 21H6S00900 | |
| HP ProBook 450 G10 | |
| Average Intel Core i7-1355U, NVIDIA GeForce RTX 2050 Mobile (8449 - 8841, n=3) | |
| Asus ExpertBook B3 B3404CVF | |
| Acer TravelMate P4 TMP414-53-58XQ | |
| PCMark 10 / Digital Content Creation | |
| Average of class Office (2049 - 13541, n=64, last 2 years) | |
| Average Intel Core i7-1355U, NVIDIA GeForce RTX 2050 Mobile (7278 - 7967, n=3) | |
| HP ProBook 450 G10 | |
| Asus ExpertBook B3 B3404CVF | |
| Acer TravelMate P4 TMP414-53-58XQ | |
| Lenovo ThinkPad L14 G4 21H6S00900 | |
| CrossMark / Overall | |
| Asus ExpertBook B3 B3404CVF | |
| Average Intel Core i7-1355U, NVIDIA GeForce RTX 2050 Mobile (1629 - 1794, n=3) | |
| HP ProBook 450 G10 | |
| Average of class Office (381 - 2010, n=73, last 2 years) | |
| Acer TravelMate P4 TMP414-53-58XQ | |
| Lenovo ThinkPad L14 G4 21H6S00900 | |
| CrossMark / Productivity | |
| Average Intel Core i7-1355U, NVIDIA GeForce RTX 2050 Mobile (1635 - 1870, n=3) | |
| Asus ExpertBook B3 B3404CVF | |
| HP ProBook 450 G10 | |
| Average of class Office (464 - 1880, n=73, last 2 years) | |
| Acer TravelMate P4 TMP414-53-58XQ | |
| Lenovo ThinkPad L14 G4 21H6S00900 | |
| CrossMark / Creativity | |
| Asus ExpertBook B3 B3404CVF | |
| Average Intel Core i7-1355U, NVIDIA GeForce RTX 2050 Mobile (1655 - 1766, n=3) | |
| HP ProBook 450 G10 | |
| Average of class Office (319 - 2361, n=73, last 2 years) | |
| Acer TravelMate P4 TMP414-53-58XQ | |
| Lenovo ThinkPad L14 G4 21H6S00900 | |
| CrossMark / Responsiveness | |
| Asus ExpertBook B3 B3404CVF | |
| Average Intel Core i7-1355U, NVIDIA GeForce RTX 2050 Mobile (1504 - 2017, n=3) | |
| HP ProBook 450 G10 | |
| Acer TravelMate P4 TMP414-53-58XQ | |
| Average of class Office (360 - 1690, n=73, last 2 years) | |
| Lenovo ThinkPad L14 G4 21H6S00900 | |
| WebXPRT 3 / Overall | |
| Average Intel Core i7-1355U, NVIDIA GeForce RTX 2050 Mobile (284 - 297, n=3) | |
| HP ProBook 450 G10 | |
| Average of class Office (129.9 - 455, n=74, last 2 years) | |
| Asus ExpertBook B3 B3404CVF | |
| Lenovo ThinkPad L14 G4 21H6S00900 | |
| WebXPRT 4 / Overall | |
| Average Intel Core i7-1355U, NVIDIA GeForce RTX 2050 Mobile (261 - 263, n=2) | |
| Asus ExpertBook B3 B3404CVF | |
| Average of class Office (104.2 - 313, n=75, last 2 years) | |
| Lenovo ThinkPad L14 G4 21H6S00900 | |
| Mozilla Kraken 1.1 / Total | |
| Lenovo ThinkPad L14 G4 21H6S00900 | |
| Acer TravelMate P4 TMP414-53-58XQ | |
| Average of class Office (391 - 1297, n=76, last 2 years) | |
| HP ProBook 450 G10 | |
| HP ProBook 450 G10 | |
| Asus ExpertBook B3 B3404CVF | |
| Average Intel Core i7-1355U, NVIDIA GeForce RTX 2050 Mobile (501 - 509, n=4) | |
* ... smaller is better
| PCMark 10 Score | 6242 points | |
Help | ||
| AIDA64 / Memory Copy | |
| Asus ExpertBook B3 B3404CVF | |
| Average of class Office (20075 - 110930, n=77, last 2 years) | |
| Average Intel Core i7-1355U (35017 - 71600, n=18) | |
| HP ProBook 450 G10 | |
| Acer TravelMate P4 TMP414-53-58XQ | |
| Lenovo ThinkPad L14 G4 21H6S00900 | |
| AIDA64 / Memory Read | |
| Asus ExpertBook B3 B3404CVF | |
| Average of class Office (10084 - 128030, n=78, last 2 years) | |
| Average Intel Core i7-1355U (38551 - 73377, n=18) | |
| HP ProBook 450 G10 | |
| Acer TravelMate P4 TMP414-53-58XQ | |
| Lenovo ThinkPad L14 G4 21H6S00900 | |
| AIDA64 / Memory Write | |
| Asus ExpertBook B3 B3404CVF | |
| Average Intel Core i7-1355U (35910 - 93342, n=18) | |
| Average of class Office (20073 - 119858, n=78, last 2 years) | |
| HP ProBook 450 G10 | |
| Acer TravelMate P4 TMP414-53-58XQ | |
| Lenovo ThinkPad L14 G4 21H6S00900 | |
| AIDA64 / Memory Latency | |
| Average Intel Core i7-1355U (72.2 - 346, n=18) | |
| Average of class Office (7.6 - 162.9, n=73, last 2 years) | |
| Lenovo ThinkPad L14 G4 21H6S00900 | |
| Asus ExpertBook B3 B3404CVF | |
| Acer TravelMate P4 TMP414-53-58XQ | |
| HP ProBook 450 G10 | |
* ... smaller is better
DPC latencies
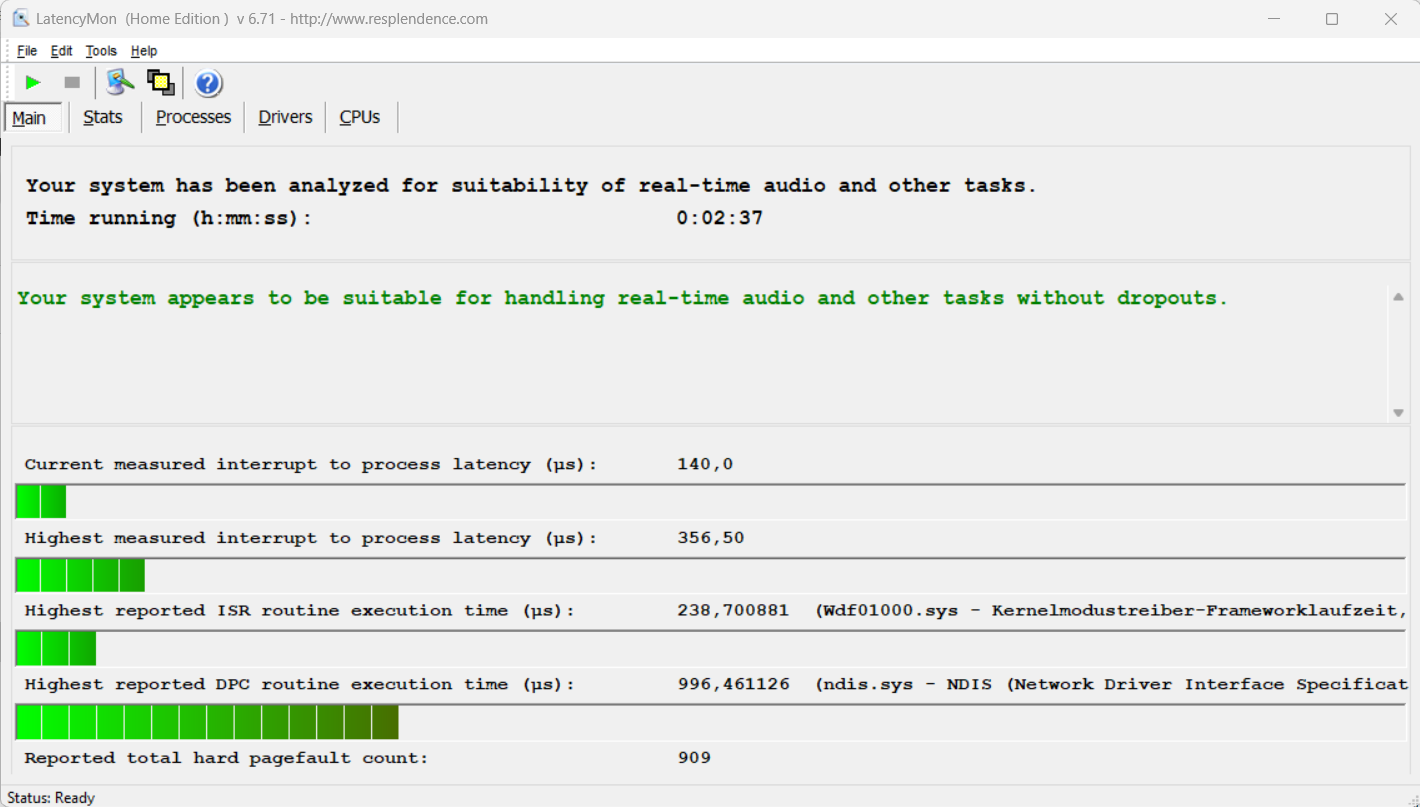
The standardized latency monitor test (web surfing, 4k video playback, Prime95 high load) did not reveal any abnormalities. The system appears to be suitable for video and audio editing in real-time. Future software updates could lead to improvements or even deteriorations.
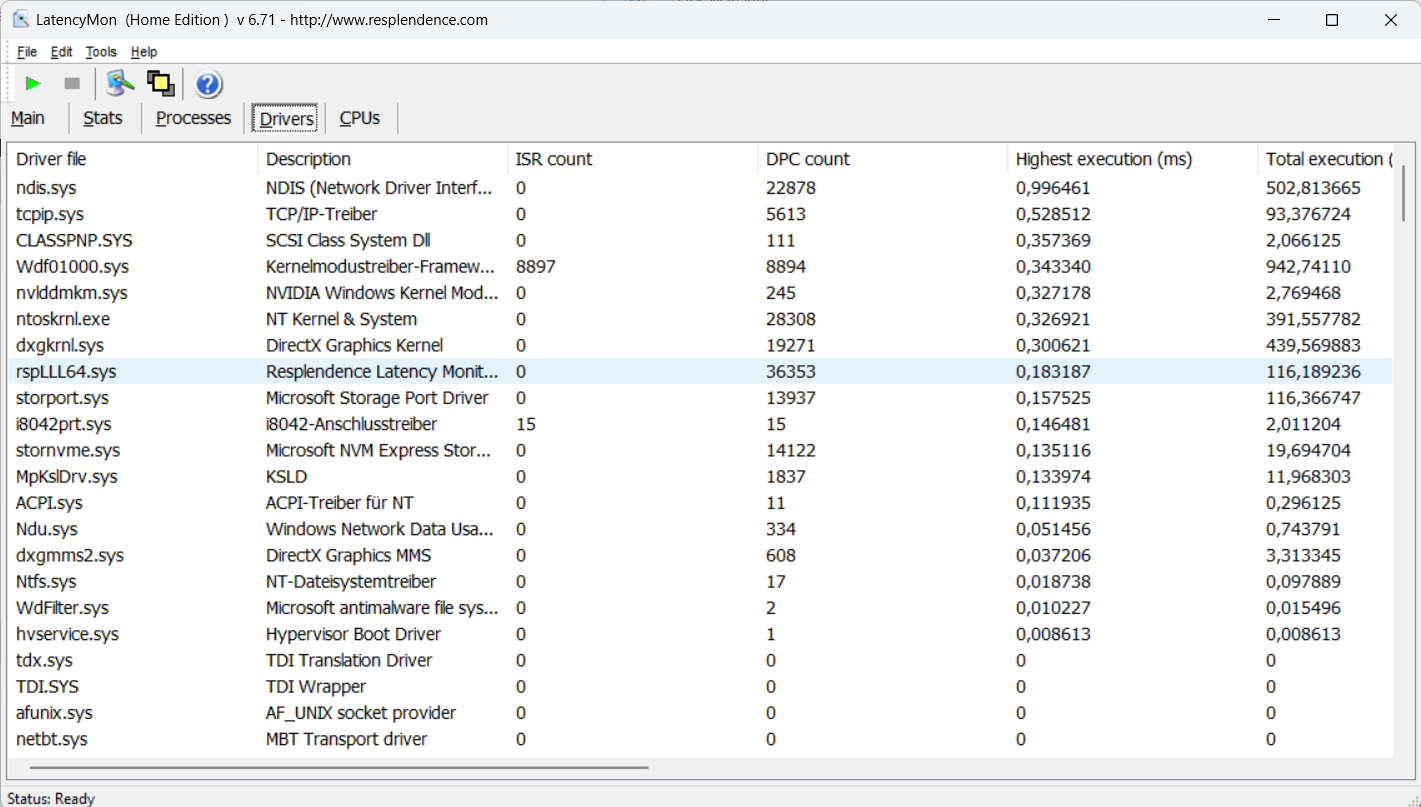
| DPC Latencies / LatencyMon - interrupt to process latency (max), Web, Youtube, Prime95 | |
| Acer TravelMate P4 TMP414-53-58XQ | |
| HP ProBook 450 G10 | |
| Lenovo ThinkPad L14 G4 21H6S00900 | |
| Asus ExpertBook B3 B3404CVF | |
* ... smaller is better
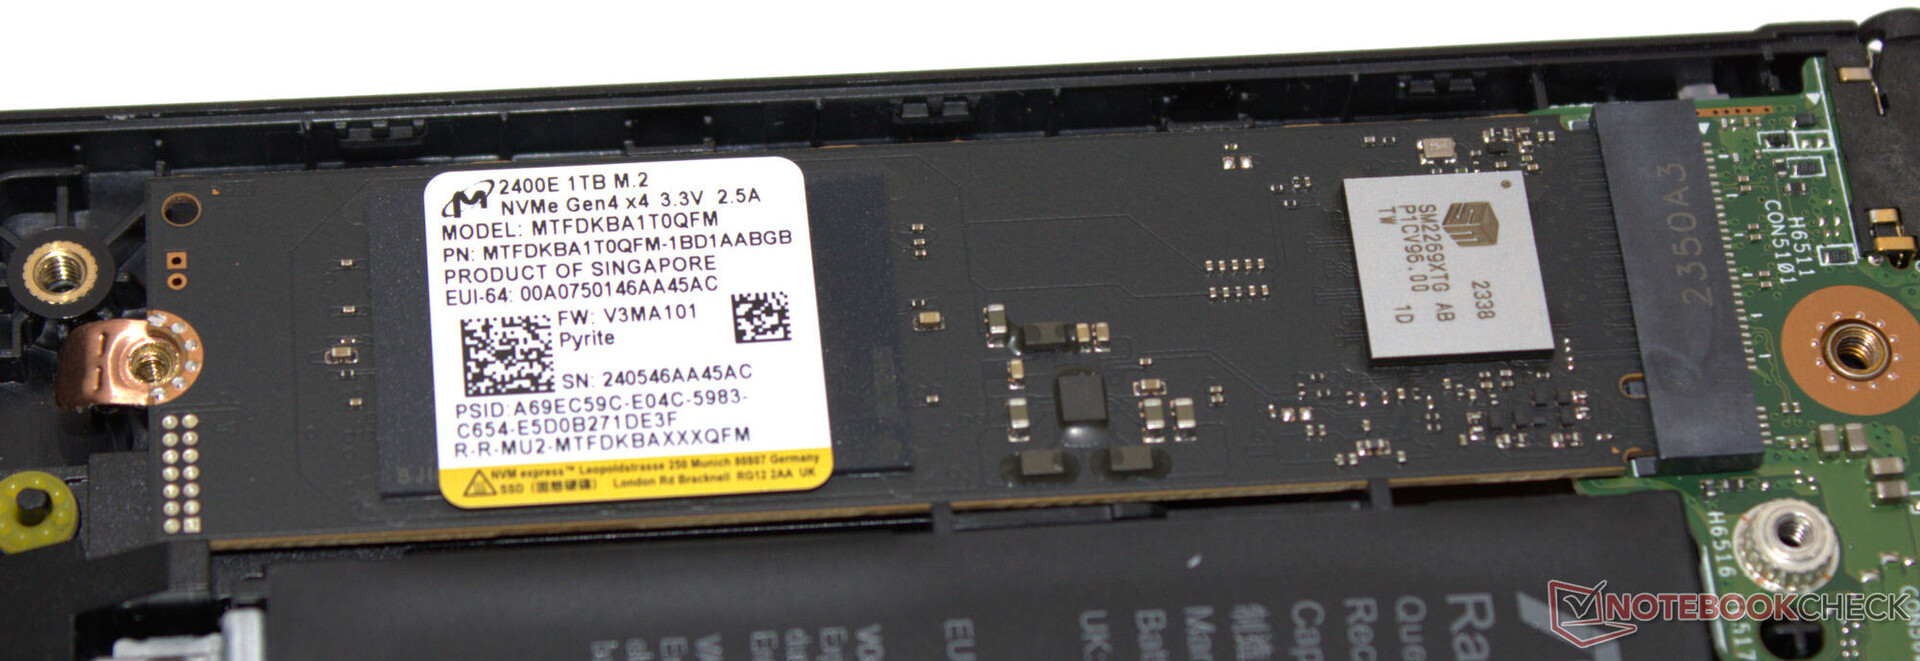
Storage device
The device's PCIe 4 SSD (M.2-2280) from Micron features a storage capacity of 1 TB and delivers good transfer rates. Positive: Thermally induced throttling did not occur. The laptop has no space for an additional SSD. Our overview list provides measured values for all of the SSDs and HDDs we have tested so far.

* ... smaller is better
Reading continuous performance: DiskSpd Read Loop, Queue Depth 8
Graphics card
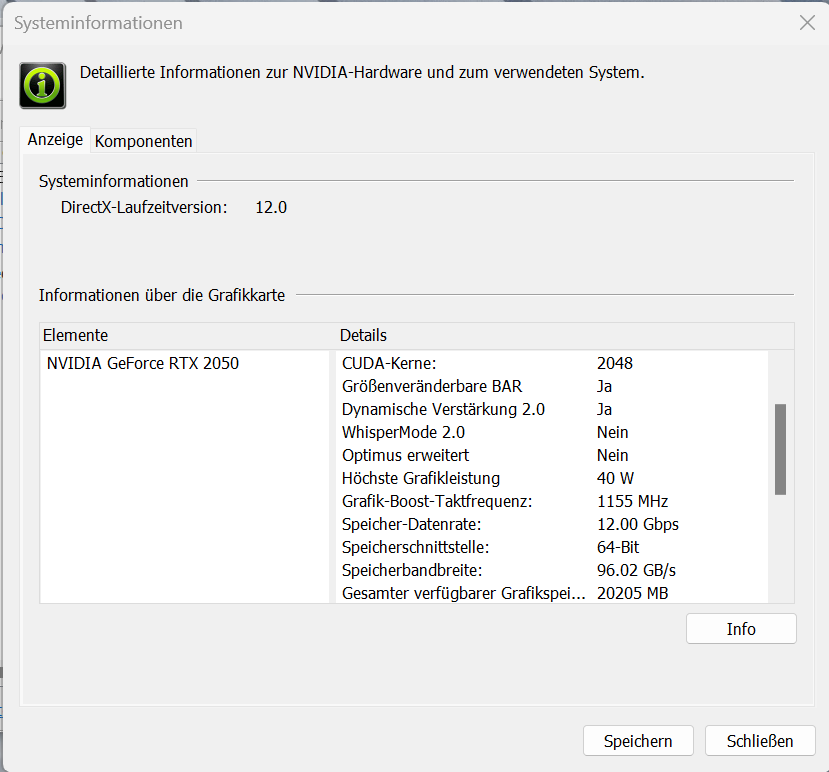
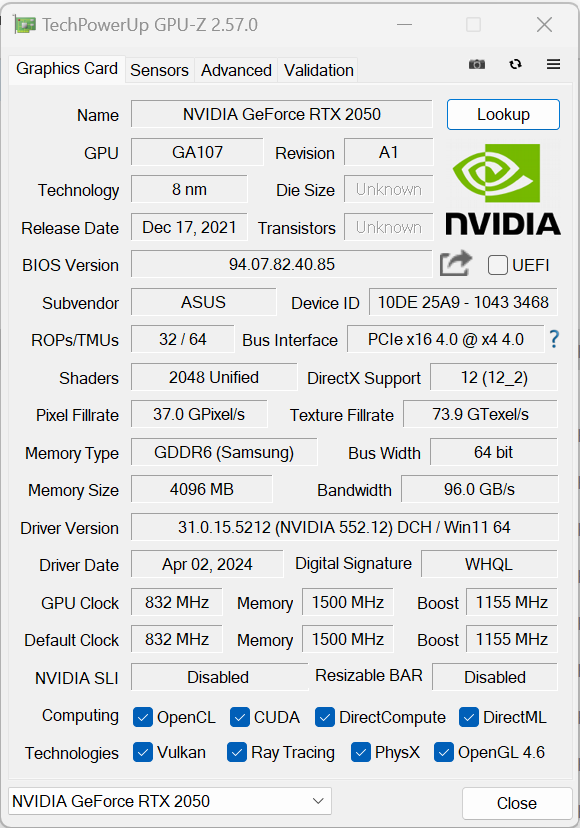
Within Nvidia's current RTX GPU lineup, the GeForce RTX 2050 (2,048 shaders, 64-bit bus, 4 GB GDDR6, ray-tracing, DLSS) comes in near the bottom in terms of performance. Asus has given it a TGP of 40 watts. Its benchmark results and frame rates were slightly above the GPU's average. The GPU allows for FHD gaming at low to high settings. Less demanding games allow for more. Current games will often require the settings to be reduced.
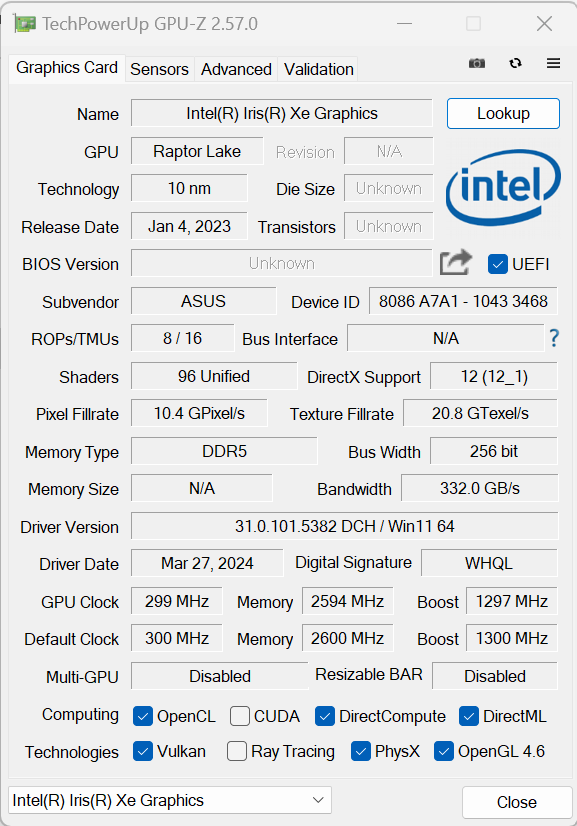
The TravelMate and ThinkPad are equipped with iGPUs that cannot hold a candle to the RTX 2050. The clear difference is due to their RAM running in single-channel mode. Installing a second memory module would give both computers significantly better results. Despite having the same GPU, the ProBook cannot keep up with the B3 either—HP has set its TGP to 30 watts.
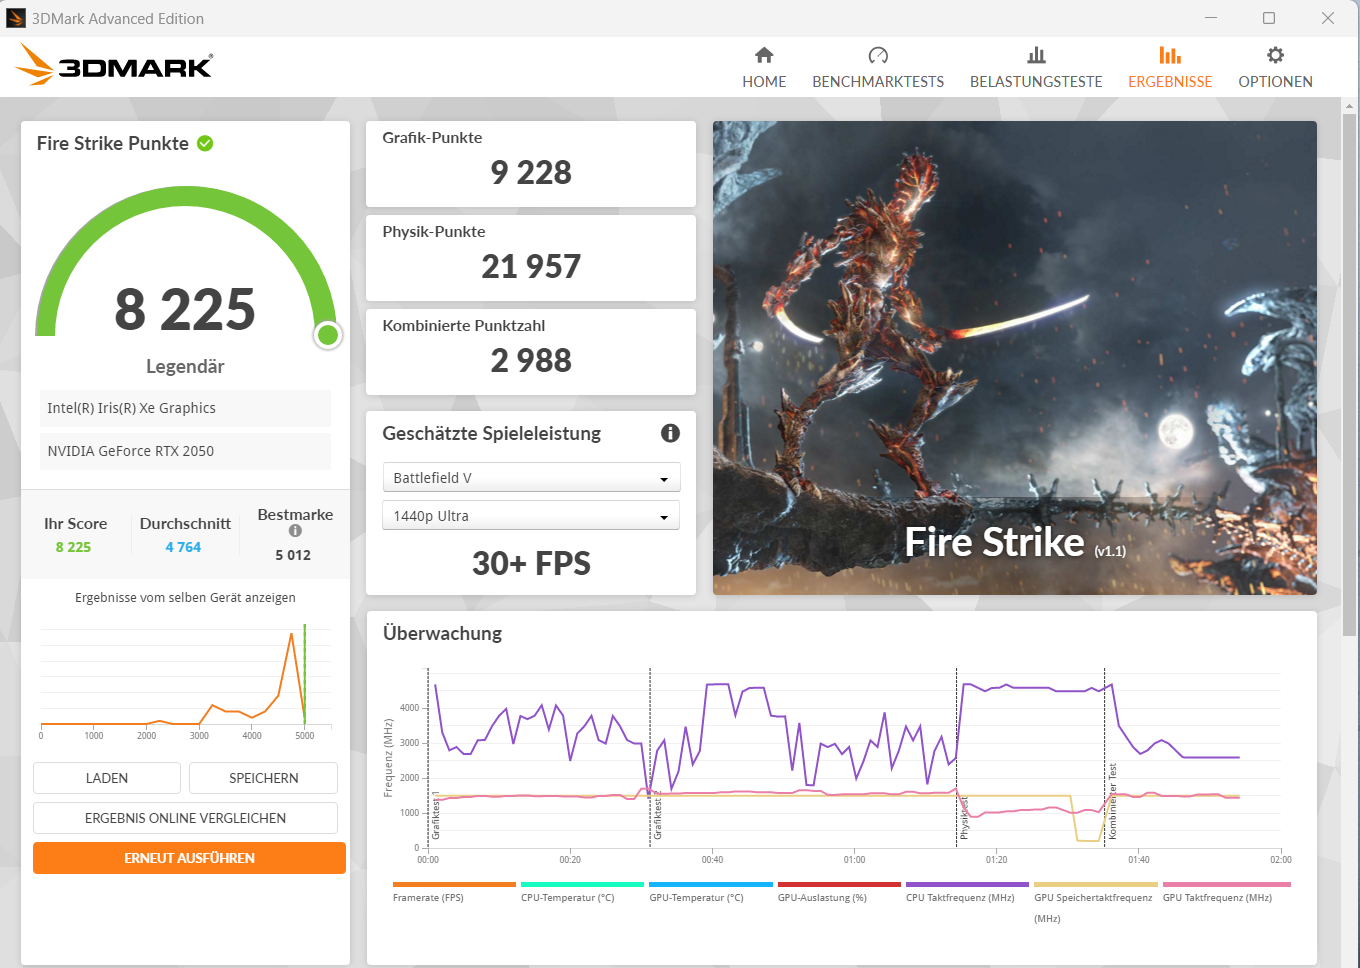

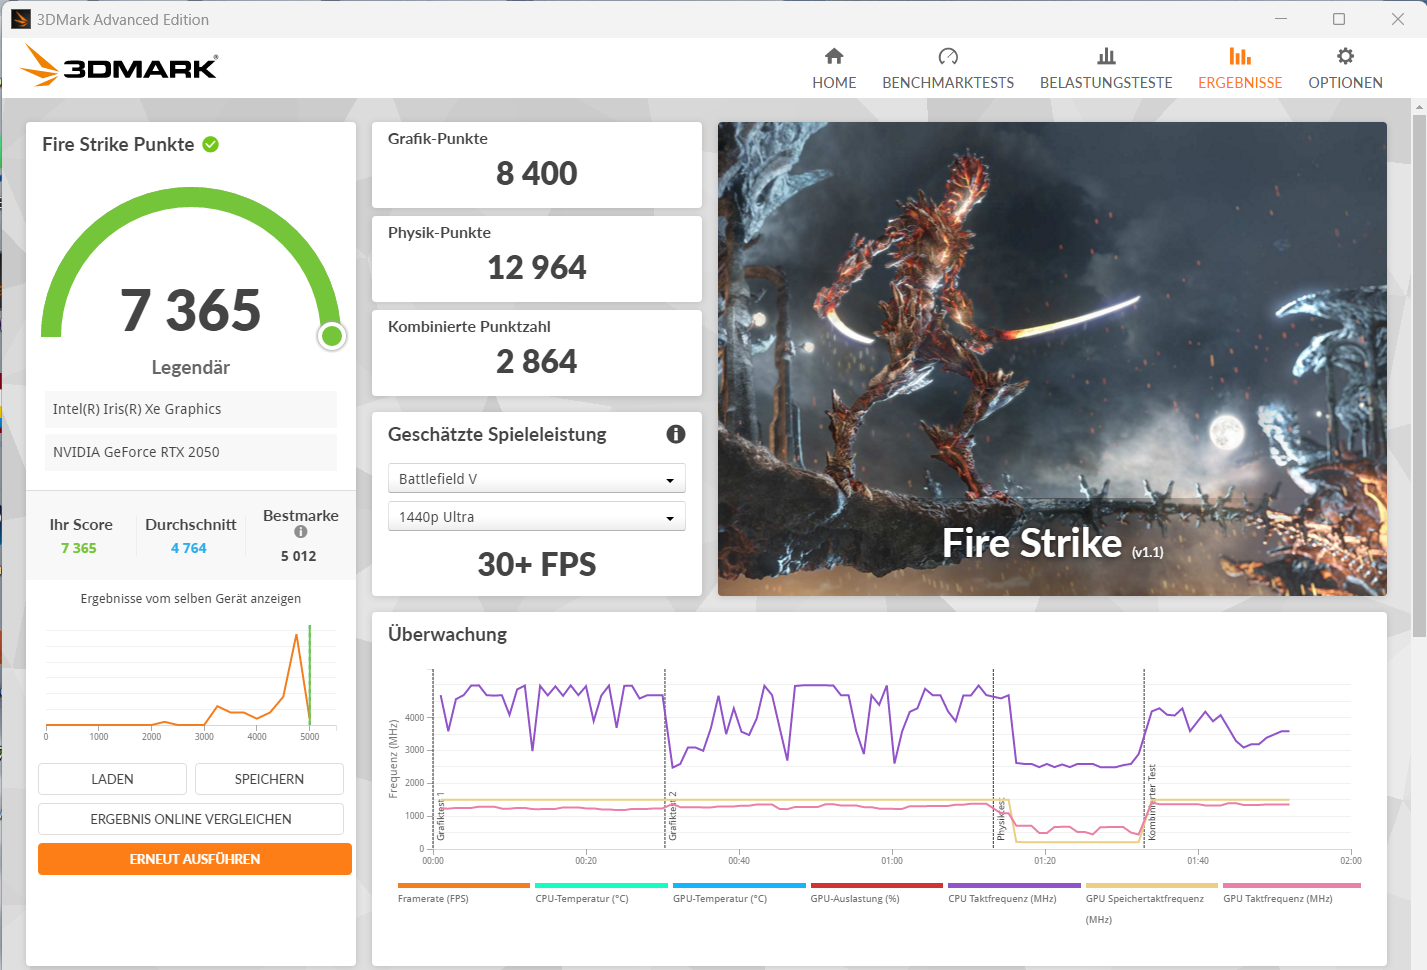
| 3DMark 11 Performance | 13299 points | |
| 3DMark Fire Strike Score | 8225 points | |
| 3DMark Time Spy Score | 3573 points | |
Help | ||
* ... smaller is better
| The Witcher 3 - 1920x1080 Ultra Graphics & Postprocessing (HBAO+) | |
| Average NVIDIA GeForce RTX 2050 Mobile (24.3 - 39.6, n=9) | |
| Asus ExpertBook B3 B3404CVF | |
| HP ProBook 450 G10 | |
| Average of class Office (14.8 - 18.1, n=4, last 2 years) | |
| Acer TravelMate P4 TMP414-53-58XQ | |
| Lenovo ThinkPad L14 G4 21H6S00900 | |
| GTA V - 1920x1080 Highest AA:4xMSAA + FX AF:16x | |
| Asus ExpertBook B3 B3404CVF | |
| Average NVIDIA GeForce RTX 2050 Mobile (35.6 - 55.8, n=10) | |
| HP ProBook 450 G10 | |
| Average of class Office (5.77 - 45.3, n=65, last 2 years) | |
| Lenovo ThinkPad L14 G4 21H6S00900 | |
| Final Fantasy XV Benchmark - 1920x1080 High Quality | |
| Asus ExpertBook B3 B3404CVF | |
| Average NVIDIA GeForce RTX 2050 Mobile (24.8 - 42.9, n=10) | |
| HP ProBook 450 G10 | |
| Average of class Office (8.09 - 79.5, n=68, last 2 years) | |
| Acer TravelMate P4 TMP414-53-58XQ | |
| Lenovo ThinkPad L14 G4 21H6S00900 | |
| Strange Brigade - 1920x1080 ultra AA:ultra AF:16 | |
| Asus ExpertBook B3 B3404CVF | |
| Average NVIDIA GeForce RTX 2050 Mobile (46.2 - 65.3, n=9) | |
| HP ProBook 450 G10 | |
| Average of class Office (12.9 - 142.1, n=50, last 2 years) | |
| Acer TravelMate P4 TMP414-53-58XQ | |
| Lenovo ThinkPad L14 G4 21H6S00900 | |
| Dota 2 Reborn - 1920x1080 ultra (3/3) best looking | |
| Asus ExpertBook B3 B3404CVF | |
| Average NVIDIA GeForce RTX 2050 Mobile (66.1 - 130.1, n=10) | |
| HP ProBook 450 G10 | |
| Average of class Office (14.6 - 135, n=74, last 2 years) | |
| Acer TravelMate P4 TMP414-53-58XQ | |
| Lenovo ThinkPad L14 G4 21H6S00900 | |
Witcher 3 FPS diagram
| low | med. | high | ultra | |
|---|---|---|---|---|
| GTA V (2015) | 176.4 | 171.4 | 97.5 | 47.8 |
| The Witcher 3 (2015) | 177 | 106.3 | 57.7 | 32.5 |
| Dota 2 Reborn (2015) | 161.8 | 146.2 | 130.9 | 121.2 |
| Final Fantasy XV Benchmark (2018) | 103.1 | 51.7 | 35.7 | |
| X-Plane 11.11 (2018) | 128.2 | 115.3 | 92.6 | |
| Strange Brigade (2018) | 175.7 | 77.2 | 64.5 | 56.5 |
| Cyberpunk 2077 (2023) | 44.2 | 34.3 | 27.6 | 23 |
| The Finals (2023) | 107.7 | 76.4 | 67.8 | 50.9 |
| Ready or Not (2023) | 120.7 | 86.1 | 74.5 | 51.5 |
| Prince of Persia The Lost Crown (2024) | 264 | 195 | 184.1 | |
| Palworld (2024) | 57.2 | 48 | 37.5 | 35 |
| Enshrouded (2024) | 34 | 29.9 | 24 | 19.9 |
| Helldivers 2 (2024) | 50.4 | 19.4 | 18.8 | 17.4 |
| Skull & Bones (2024) | 53 | 47 | 33 | 23 |
| Last Epoch (2024) | 91.7 | 64.8 | 53.8 | 40.2 |
| Dragon's Dogma 2 (2024) | 15.8 | 14.5 | ||
| Horizon Forbidden West (2024) | 35.4 | 26.9 | 15.1 | 9.87 |
Emissions & power - The Asus computer with a good battery life
Noise emissions
In everyday use, the fan is pretty inactive, often standing completely still. Under load, the laptop's noise emissions rise considerably: We noted noise levels up to 49.3 dB(A) but on average, it isn't quite as loud. Using Whisper mode leads to reduced total noise emissions—at the cost of some computing performance.
In general, the fan noise can be tolerated well—especially at low to medium rotation speeds. It doesn't emit any annoying sounds from it. Negative: We sometimes noted an electronic crackling sound coming from the laptop's innards—this is presumably the SSD.
Noise level
| Idle |
| 25.5 / 25.5 / 27.5 dB(A) |
| Load |
| 42.3 / 49.3 dB(A) |
 | ||
30 dB silent 40 dB(A) audible 50 dB(A) loud |
||
min: | ||
| Asus ExpertBook B3 B3404CVF GeForce RTX 2050 Mobile, i7-1355U, Micron 2400 MTFDKBA1T0QFM | Acer TravelMate P4 TMP414-53-58XQ Iris Xe G7 80EUs, i5-1335U, Kingston OM8SEP4512Q-AA | HP ProBook 450 G10 GeForce RTX 2050 Mobile, i7-1355U, Micron 3400 1TB MTFDKBA1T0TFH | Lenovo ThinkPad L14 G4 21H6S00900 Vega 7, R5 7530U, Kioxia BG5 KBG5AZNT512G | |
|---|---|---|---|---|
| Noise | 0% | 10% | 8% | |
| off / environment * (dB) | 24.5 | 25.5 -4% | 23.5 4% | 25.2 -3% |
| Idle Minimum * (dB) | 25.5 | 25.5 -0% | 23.5 8% | 25.2 1% |
| Idle Average * (dB) | 25.5 | 25.5 -0% | 23.5 8% | 25.2 1% |
| Idle Maximum * (dB) | 27.5 | 30.5 -11% | 23.5 15% | 27.3 1% |
| Load Average * (dB) | 42.3 | 36.29 14% | 38 10% | 32.1 24% |
| Load Maximum * (dB) | 49.3 | 48.34 2% | 41.4 16% | 38.3 22% |
| Witcher 3 ultra * (dB) | 38.2 | 35.7 |
* ... smaller is better
Temperature
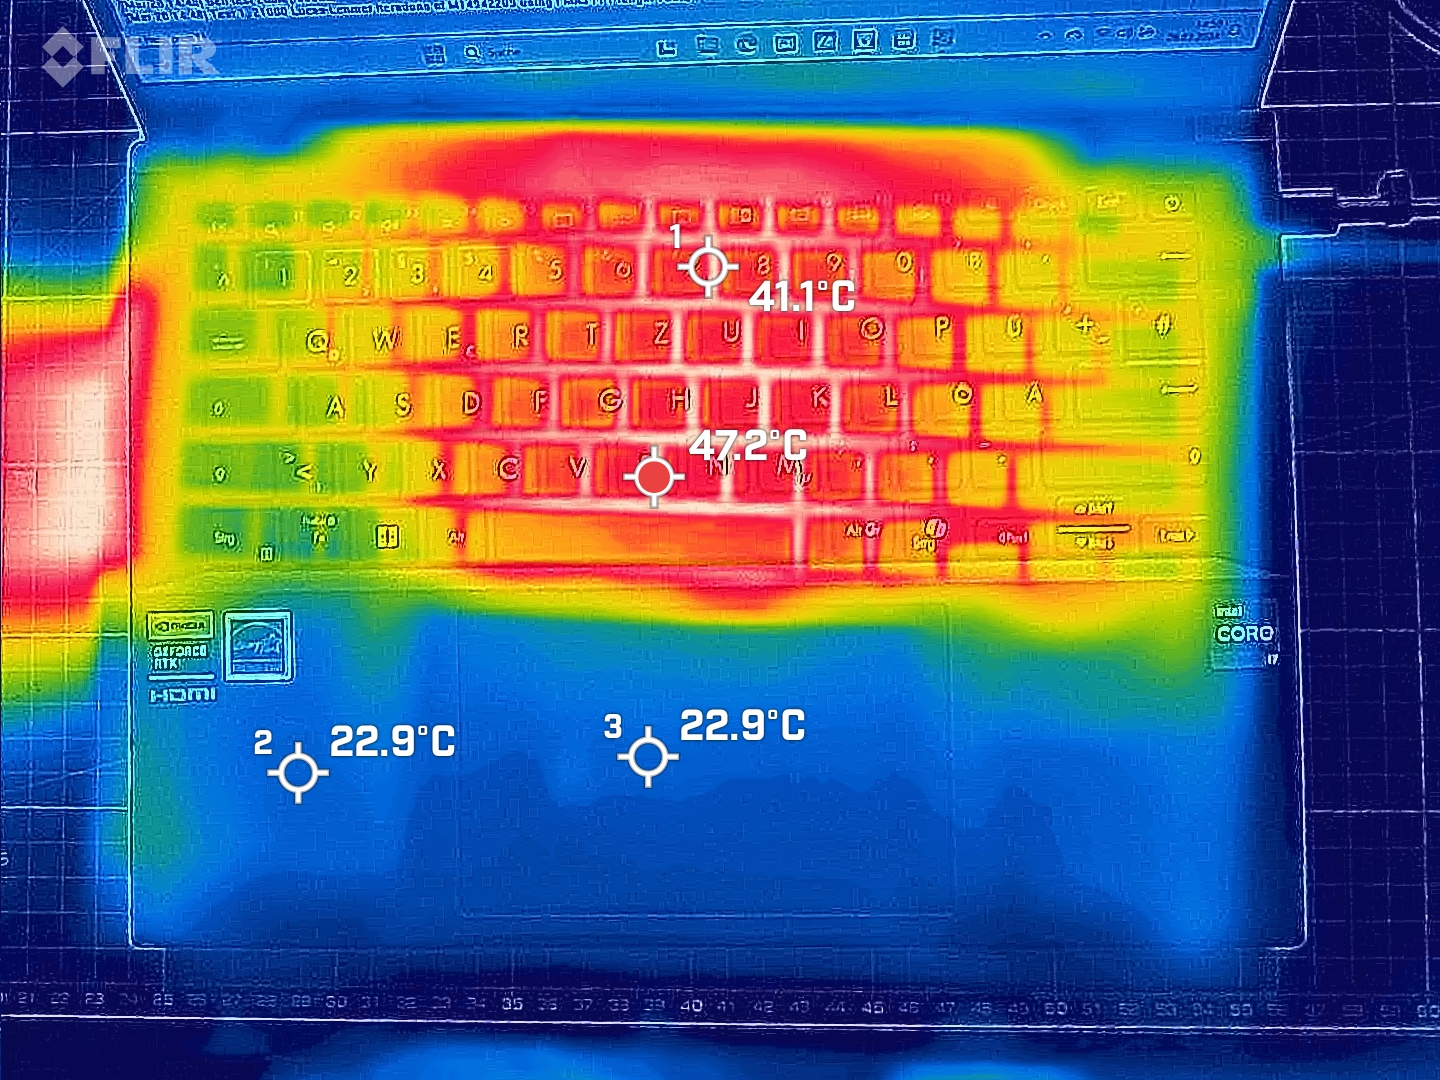
Under load (stress test, Witcher 3 test), the computer doesn't heat up very much. We occasionally measured values around the lower 40-degree Celsius range. In everyday use (office, internet), its values remain in the green zone.
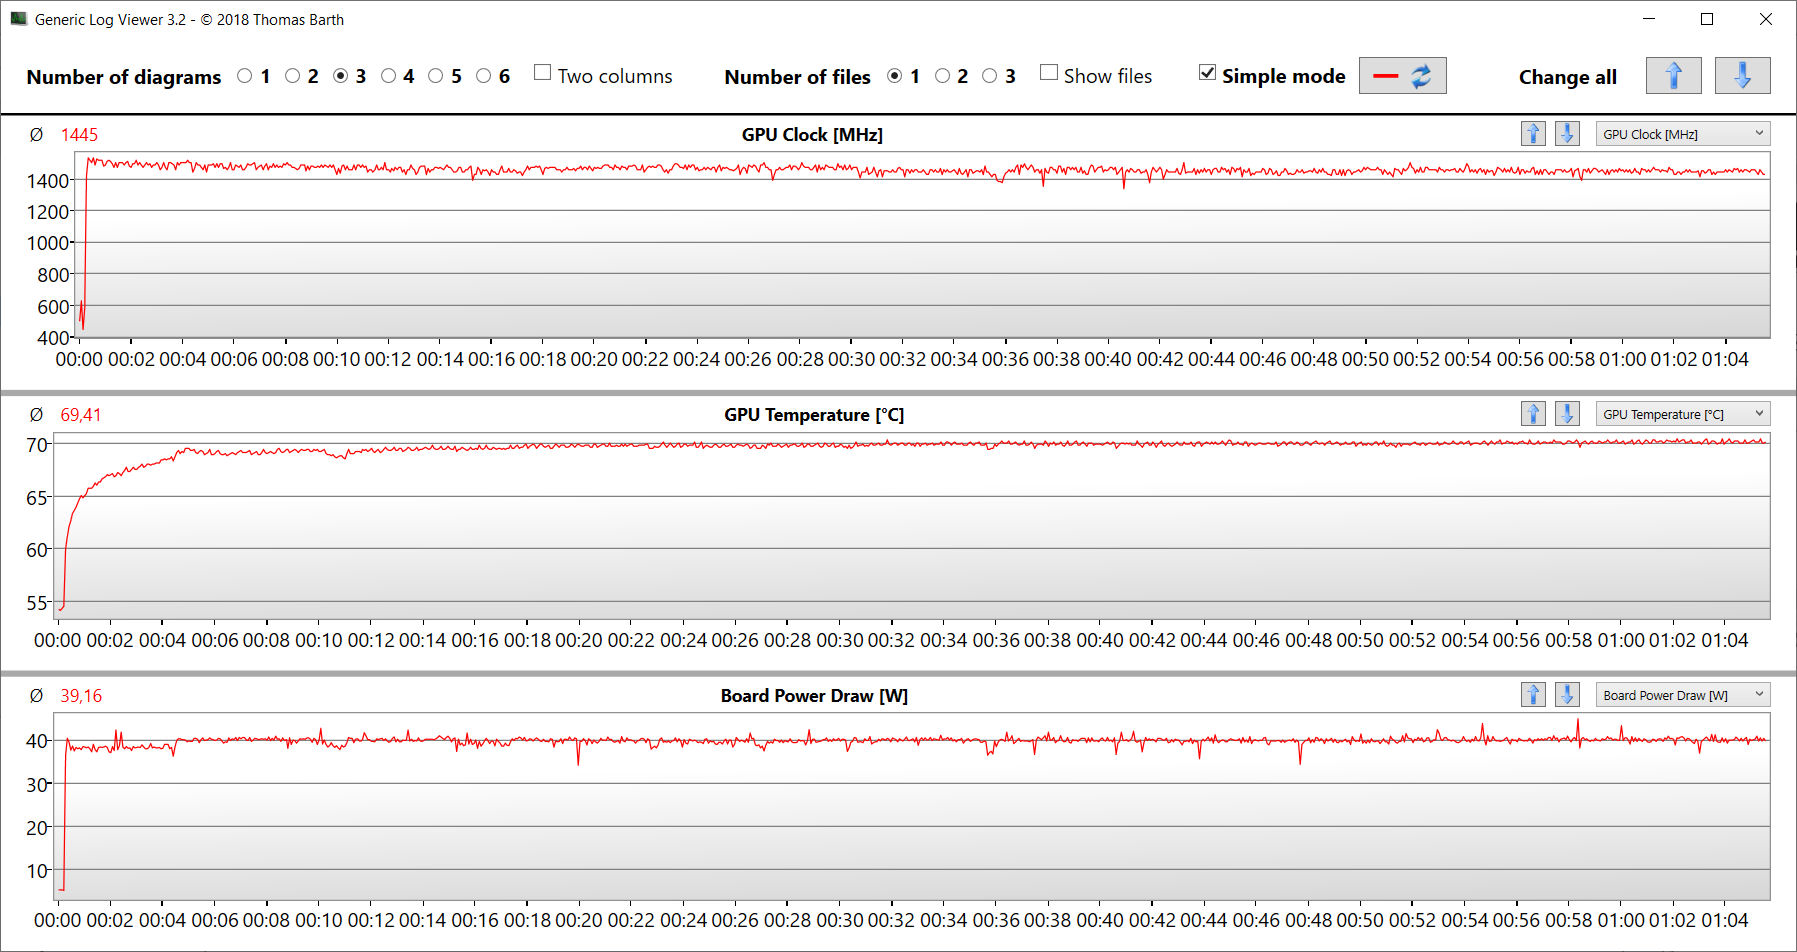
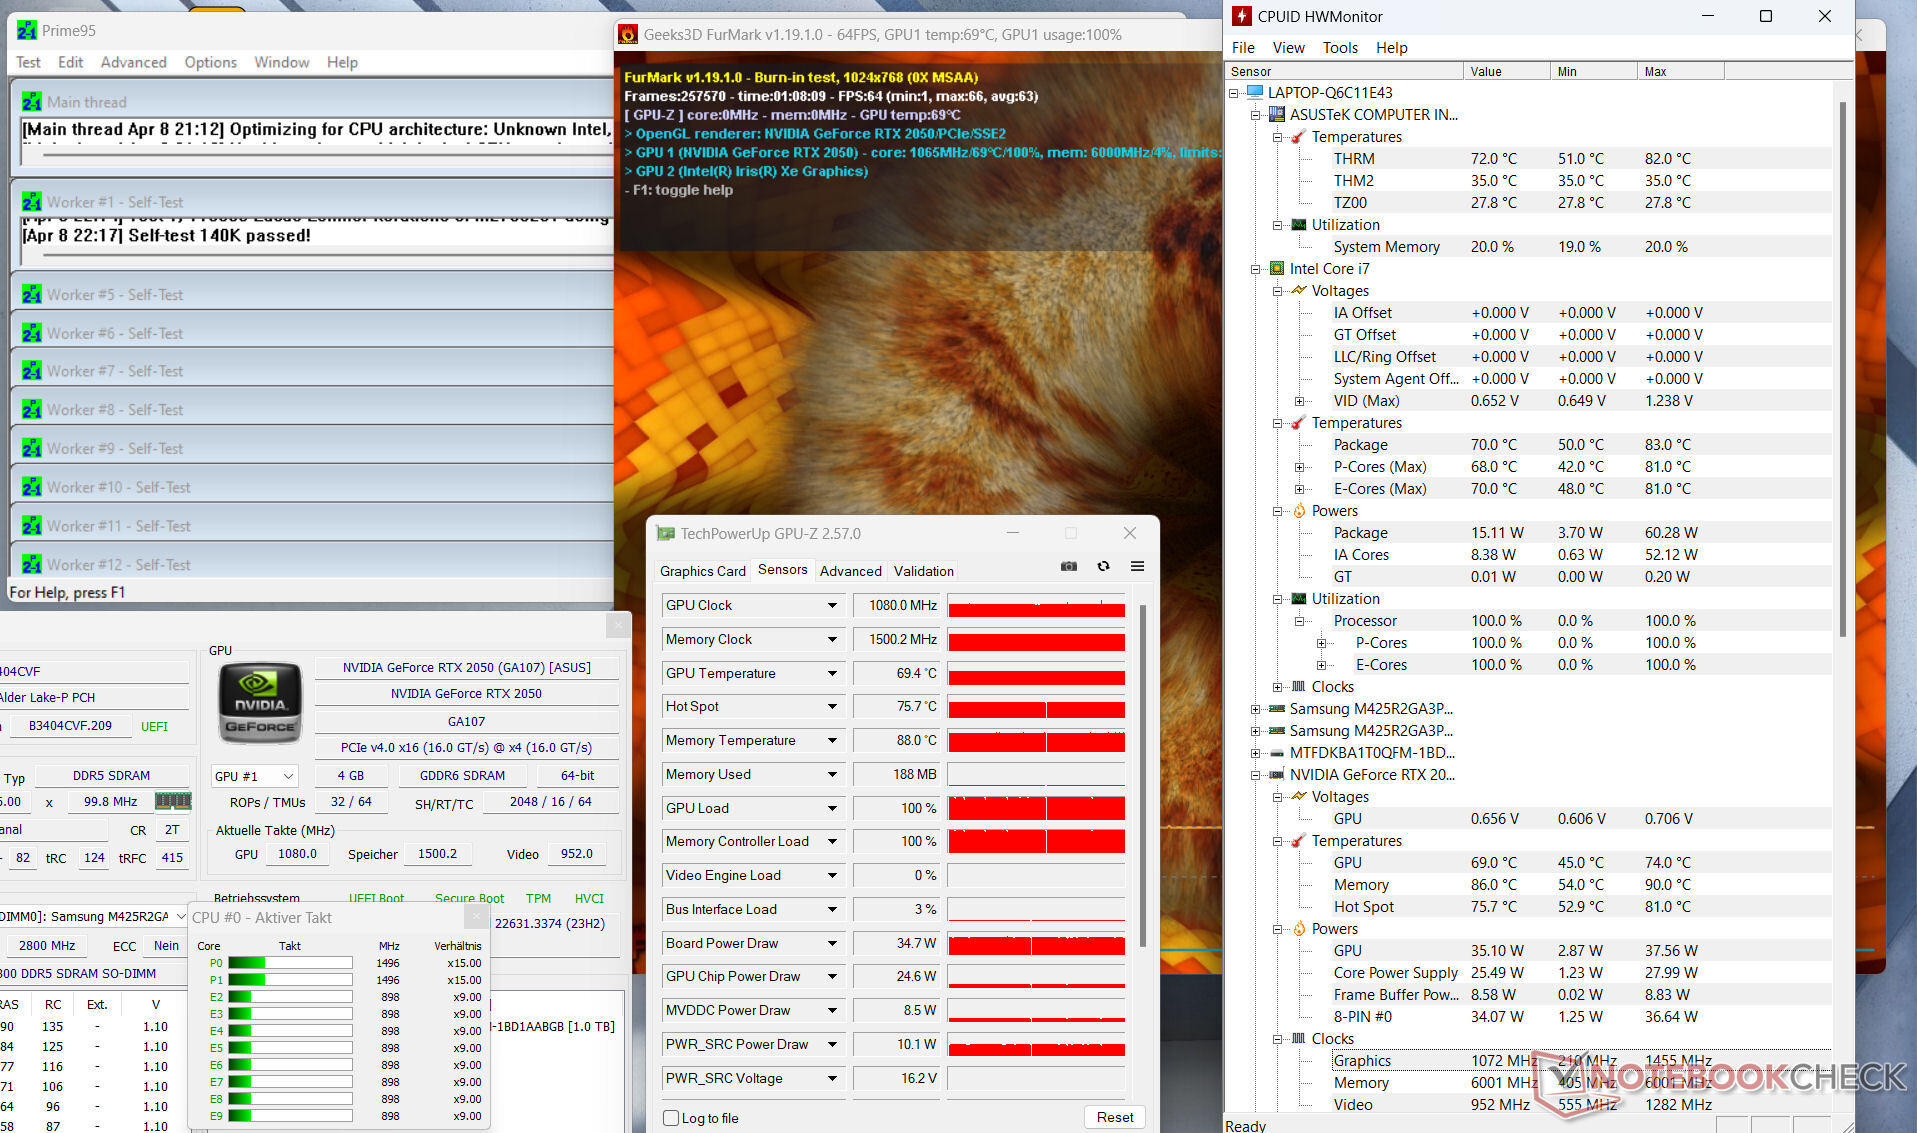
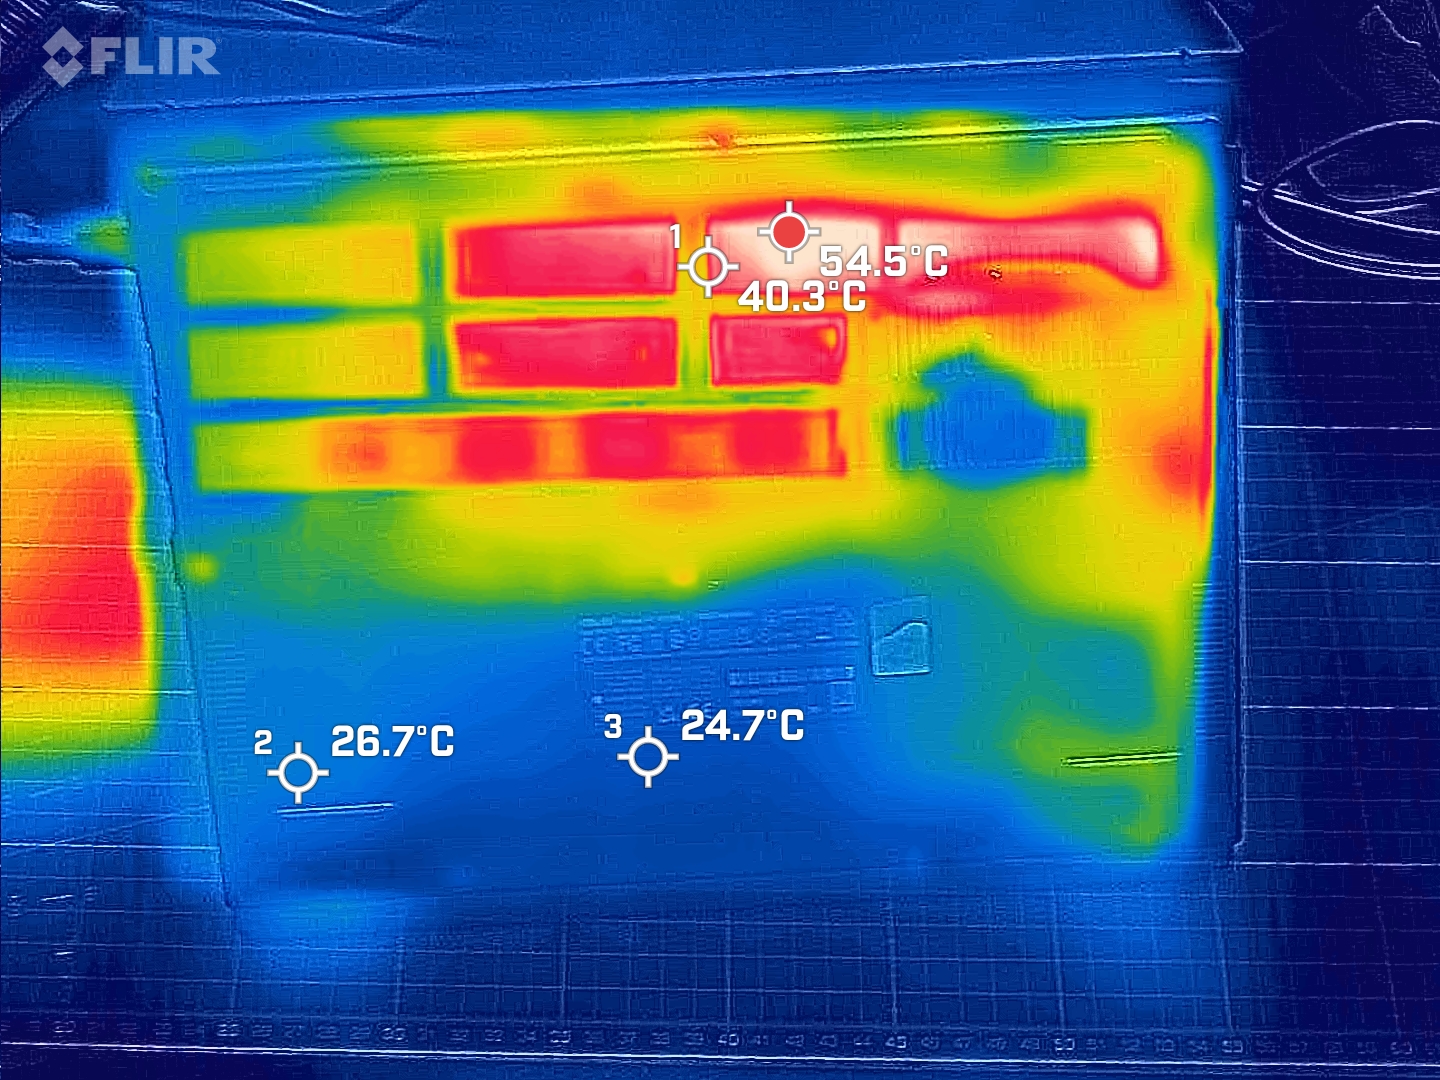
Our extreme stress test scenario (Prime95 and Furmark in continuous operation) checks the system's stability under full load. The CPU clock dropped from an initial 3.8 GHz (P) and 2.9 GHz (E) to values below the base clock within a few seconds. The graphics core ran at around 1,000 to 1,100 MHz.
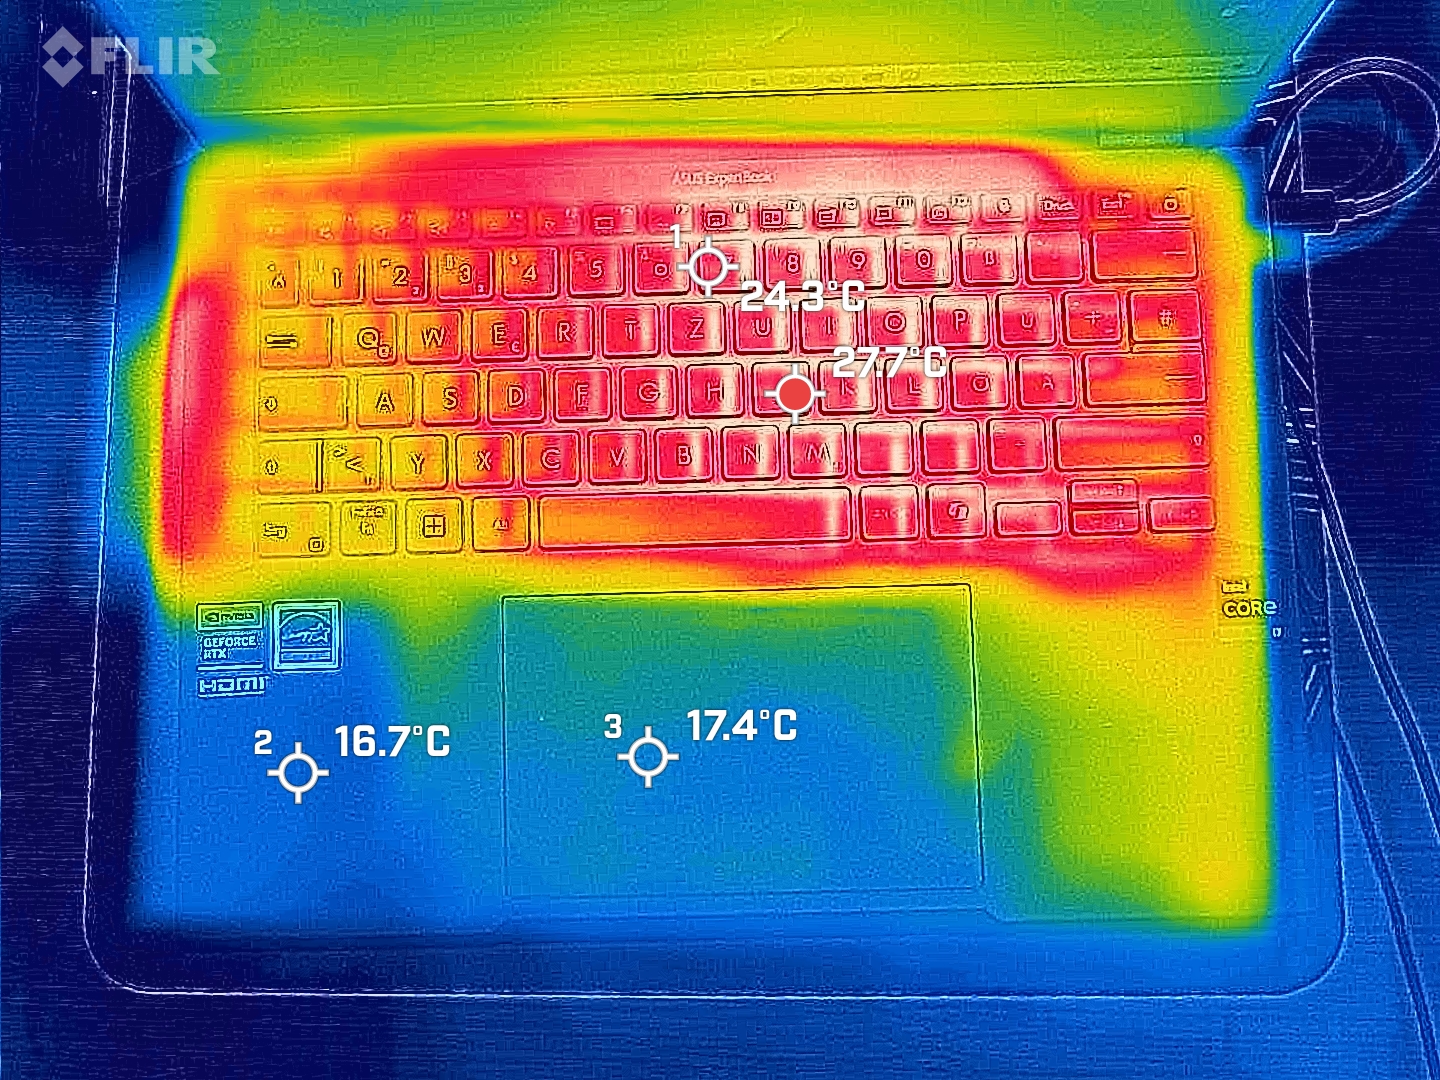
(+) The maximum temperature on the upper side is 33.2 °C / 92 F, compared to the average of 34.3 °C / 94 F, ranging from 21.2 to 62.5 °C for the class Office.
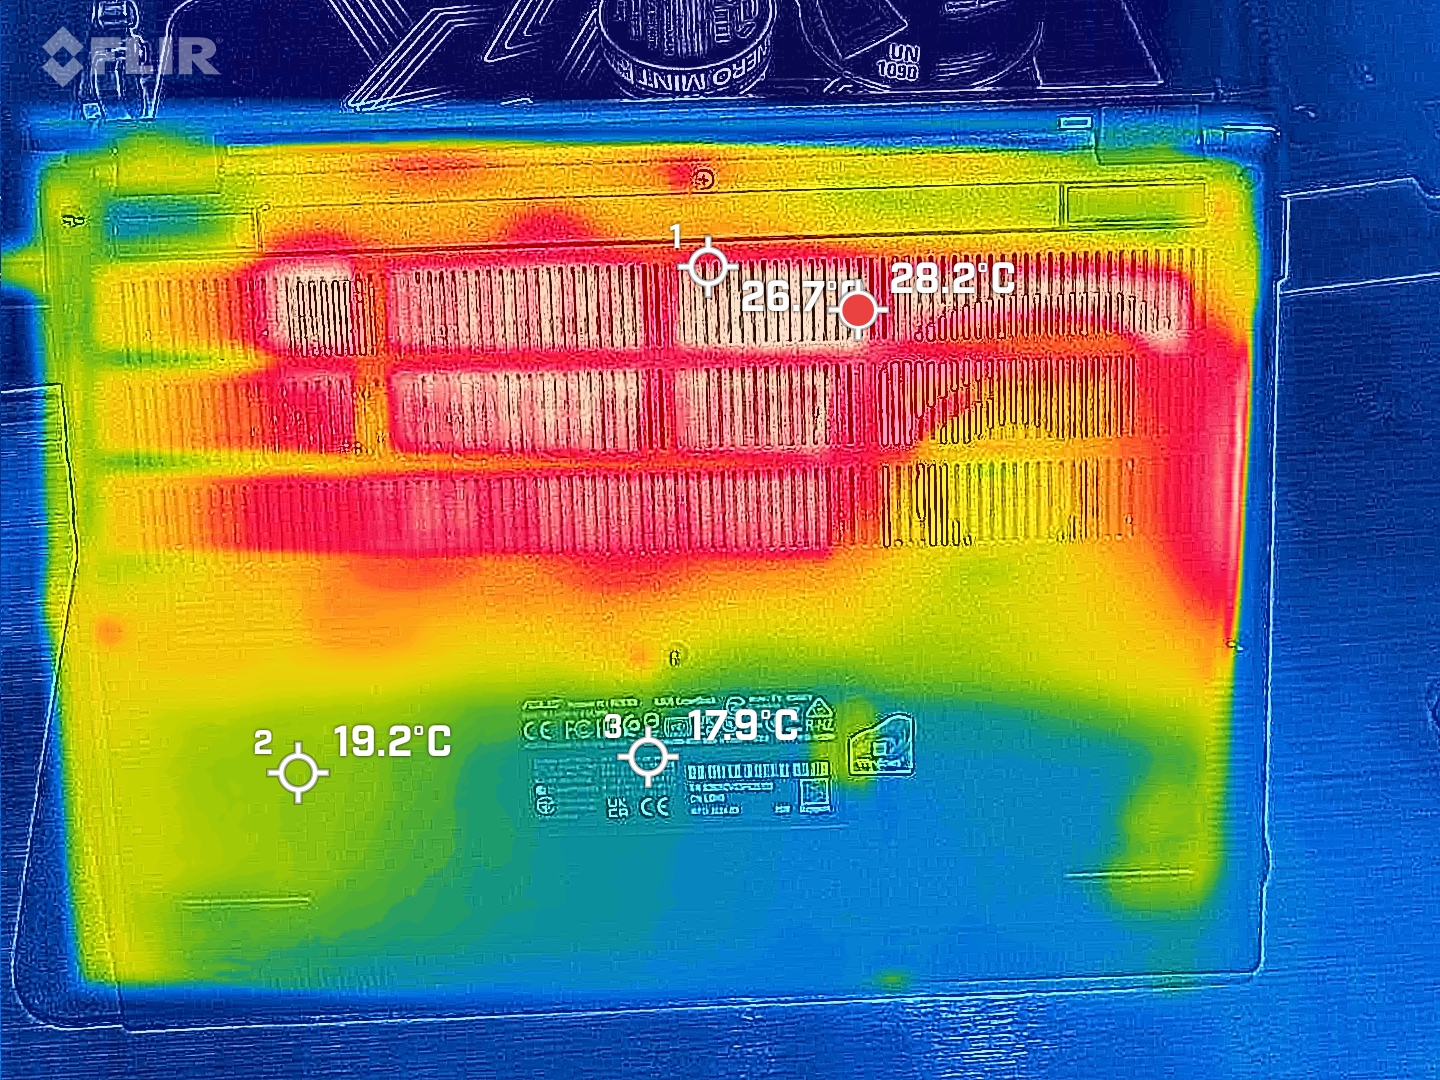
(±) The bottom heats up to a maximum of 40.4 °C / 105 F, compared to the average of 36.8 °C / 98 F
(+) In idle usage, the average temperature for the upper side is 24.4 °C / 76 F, compared to the device average of 29.5 °C / 85 F.
(+) The palmrests and touchpad are cooler than skin temperature with a maximum of 24.5 °C / 76.1 F and are therefore cool to the touch.
(+) The average temperature of the palmrest area of similar devices was 27.5 °C / 81.5 F (+3 °C / 5.4 F).
| Asus ExpertBook B3 B3404CVF Intel Core i7-1355U, NVIDIA GeForce RTX 2050 Mobile | Acer TravelMate P4 TMP414-53-58XQ Intel Core i5-1335U, Intel Iris Xe Graphics G7 80EUs | HP ProBook 450 G10 Intel Core i7-1355U, NVIDIA GeForce RTX 2050 Mobile | Lenovo ThinkPad L14 G4 21H6S00900 AMD Ryzen 5 7530U, AMD Radeon RX Vega 7 | |
|---|---|---|---|---|
| Heat | -16% | -6% | -15% | |
| Maximum Upper Side * (°C) | 33.2 | 35.8 -8% | 39.9 -20% | 39 -17% |
| Maximum Bottom * (°C) | 40.4 | 41.5 -3% | 43 -6% | 46.3 -15% |
| Idle Upper Side * (°C) | 28.3 | 35 -24% | 26.4 7% | 26.3 7% |
| Idle Bottom * (°C) | 28 | 35.7 -28% | 29 -4% | 37.5 -34% |
* ... smaller is better
Speakers
The stereo speakers produce an overall decent sound. An even better sound experience can be achieved using headphones or external speakers.
Asus ExpertBook B3 B3404CVF audio analysis
(±) | speaker loudness is average but good (81 dB)
Bass 100 - 315 Hz
(±) | reduced bass - on average 13% lower than median
(±) | linearity of bass is average (8.6% delta to prev. frequency)
Mids 400 - 2000 Hz
(+) | balanced mids - only 3.3% away from median
(+) | mids are linear (6.9% delta to prev. frequency)
Highs 2 - 16 kHz
(±) | higher highs - on average 7.5% higher than median
(+) | highs are linear (6.9% delta to prev. frequency)
Overall 100 - 16.000 Hz
(±) | linearity of overall sound is average (16.6% difference to median)
Compared to same class
» 21% of all tested devices in this class were better, 7% similar, 72% worse
» The best had a delta of 7%, average was 21%, worst was 53%
Compared to all devices tested
» 29% of all tested devices were better, 6% similar, 65% worse
» The best had a delta of 4%, average was 24%, worst was 134%
Acer TravelMate P4 TMP414-53-58XQ audio analysis
(±) | speaker loudness is average but good (79.3 dB)
Bass 100 - 315 Hz
(-) | nearly no bass - on average 31.1% lower than median
(±) | linearity of bass is average (13.7% delta to prev. frequency)
Mids 400 - 2000 Hz
(+) | balanced mids - only 4.5% away from median
(+) | mids are linear (6.4% delta to prev. frequency)
Highs 2 - 16 kHz
(+) | balanced highs - only 3.9% away from median
(+) | highs are linear (2.9% delta to prev. frequency)
Overall 100 - 16.000 Hz
(±) | linearity of overall sound is average (23.3% difference to median)
Compared to same class
» 81% of all tested devices in this class were better, 3% similar, 17% worse
» The best had a delta of 5%, average was 18%, worst was 53%
Compared to all devices tested
» 70% of all tested devices were better, 5% similar, 25% worse
» The best had a delta of 4%, average was 24%, worst was 134%
Power consumption
We didn't note anything out of the ordinary regarding the laptop's power consumption. As a result of the CPU being throttled, its power consumption sank a few seconds after beginning the stress test. Its power consumption remained constant during the Witcher 3 test. The power supply (90 watts) is sufficient in size.
| Off / Standby | |
| Idle | |
| Load |
|
Key:
min: | |
Power consumption Witcher 3 / stress test
Power consumption with external monitor
Runtimes
The 14-inch device achieved runtimes of 10:55 h during our realistic WLAN test (mapping the load when accessing websites via a script)—a good value. The ThinkPad L14 G4 delivers significantly more endurance.
Pros
Cons
Verdict - A business companion and casual gamer
Office and internet tasks are child's play for the installed combination consisting of a Core i7-1355U and 32 GB RAM (dual-channel). GPU-demanding applications and gaming profit from the GeForce RTX 2050. A speedy 1-TB SSD ensures short loading times.
Asus' ExpertBook B3 B3404CVF is a well-rounded work device for companies, organisations and educational institutions.
The laptop is portable thanks to its moderate weight (approx. 1.65 kg) and good runtimes (WiFi approx. 11 h). Two USB-C ports allow for easy integration into existing workplace setups. Furthermore, they can be used to supply the device with power and they open up additional expansion options (display, docking, external GPU).
For a compact laptop with a dedicated GPU, its emission values are okay. Its installed 16:10 WUXGA screen (IPS, 14 inches) only offers limited color space coverage and its contrast remains below the target value (> 1,000:1). You can optionally select a nominally better 500-nit panel (WQXGA) from Asus which covers the DCI-P3 color space.
An alternative to the B3 could be the Lenovo ThinkPad L14 G4. This laptop offers better runtimes, whereas its performance trails behind the ExpertBook. The L14 doesn't come with Thunderbolt 4, USB 4 or a dGPU.
Price and availability
At the time of writing, the ExpertBook B3 B3404CVF is not yet available to purchase in the United States.
Asus ExpertBook B3 B3404CVF
- 04/14/2024 v7 (old)
Sascha Mölck
Transparency
The selection of devices to be reviewed is made by our editorial team. The test sample was provided to the author as a loan by the manufacturer or retailer for the purpose of this review. The lender had no influence on this review, nor did the manufacturer receive a copy of this review before publication. There was no obligation to publish this review. As an independent media company, Notebookcheck is not subjected to the authority of manufacturers, retailers or publishers.
This is how Notebookcheck is testing
Every year, Notebookcheck independently reviews hundreds of laptops and smartphones using standardized procedures to ensure that all results are comparable. We have continuously developed our test methods for around 20 years and set industry standards in the process. In our test labs, high-quality measuring equipment is utilized by experienced technicians and editors. These tests involve a multi-stage validation process. Our complex rating system is based on hundreds of well-founded measurements and benchmarks, which maintains objectivity. Further information on our test methods can be found here.
Price comparison

