Nvidia RTX 3000 Ada performance debut: Dell Precision 5480 workstation review

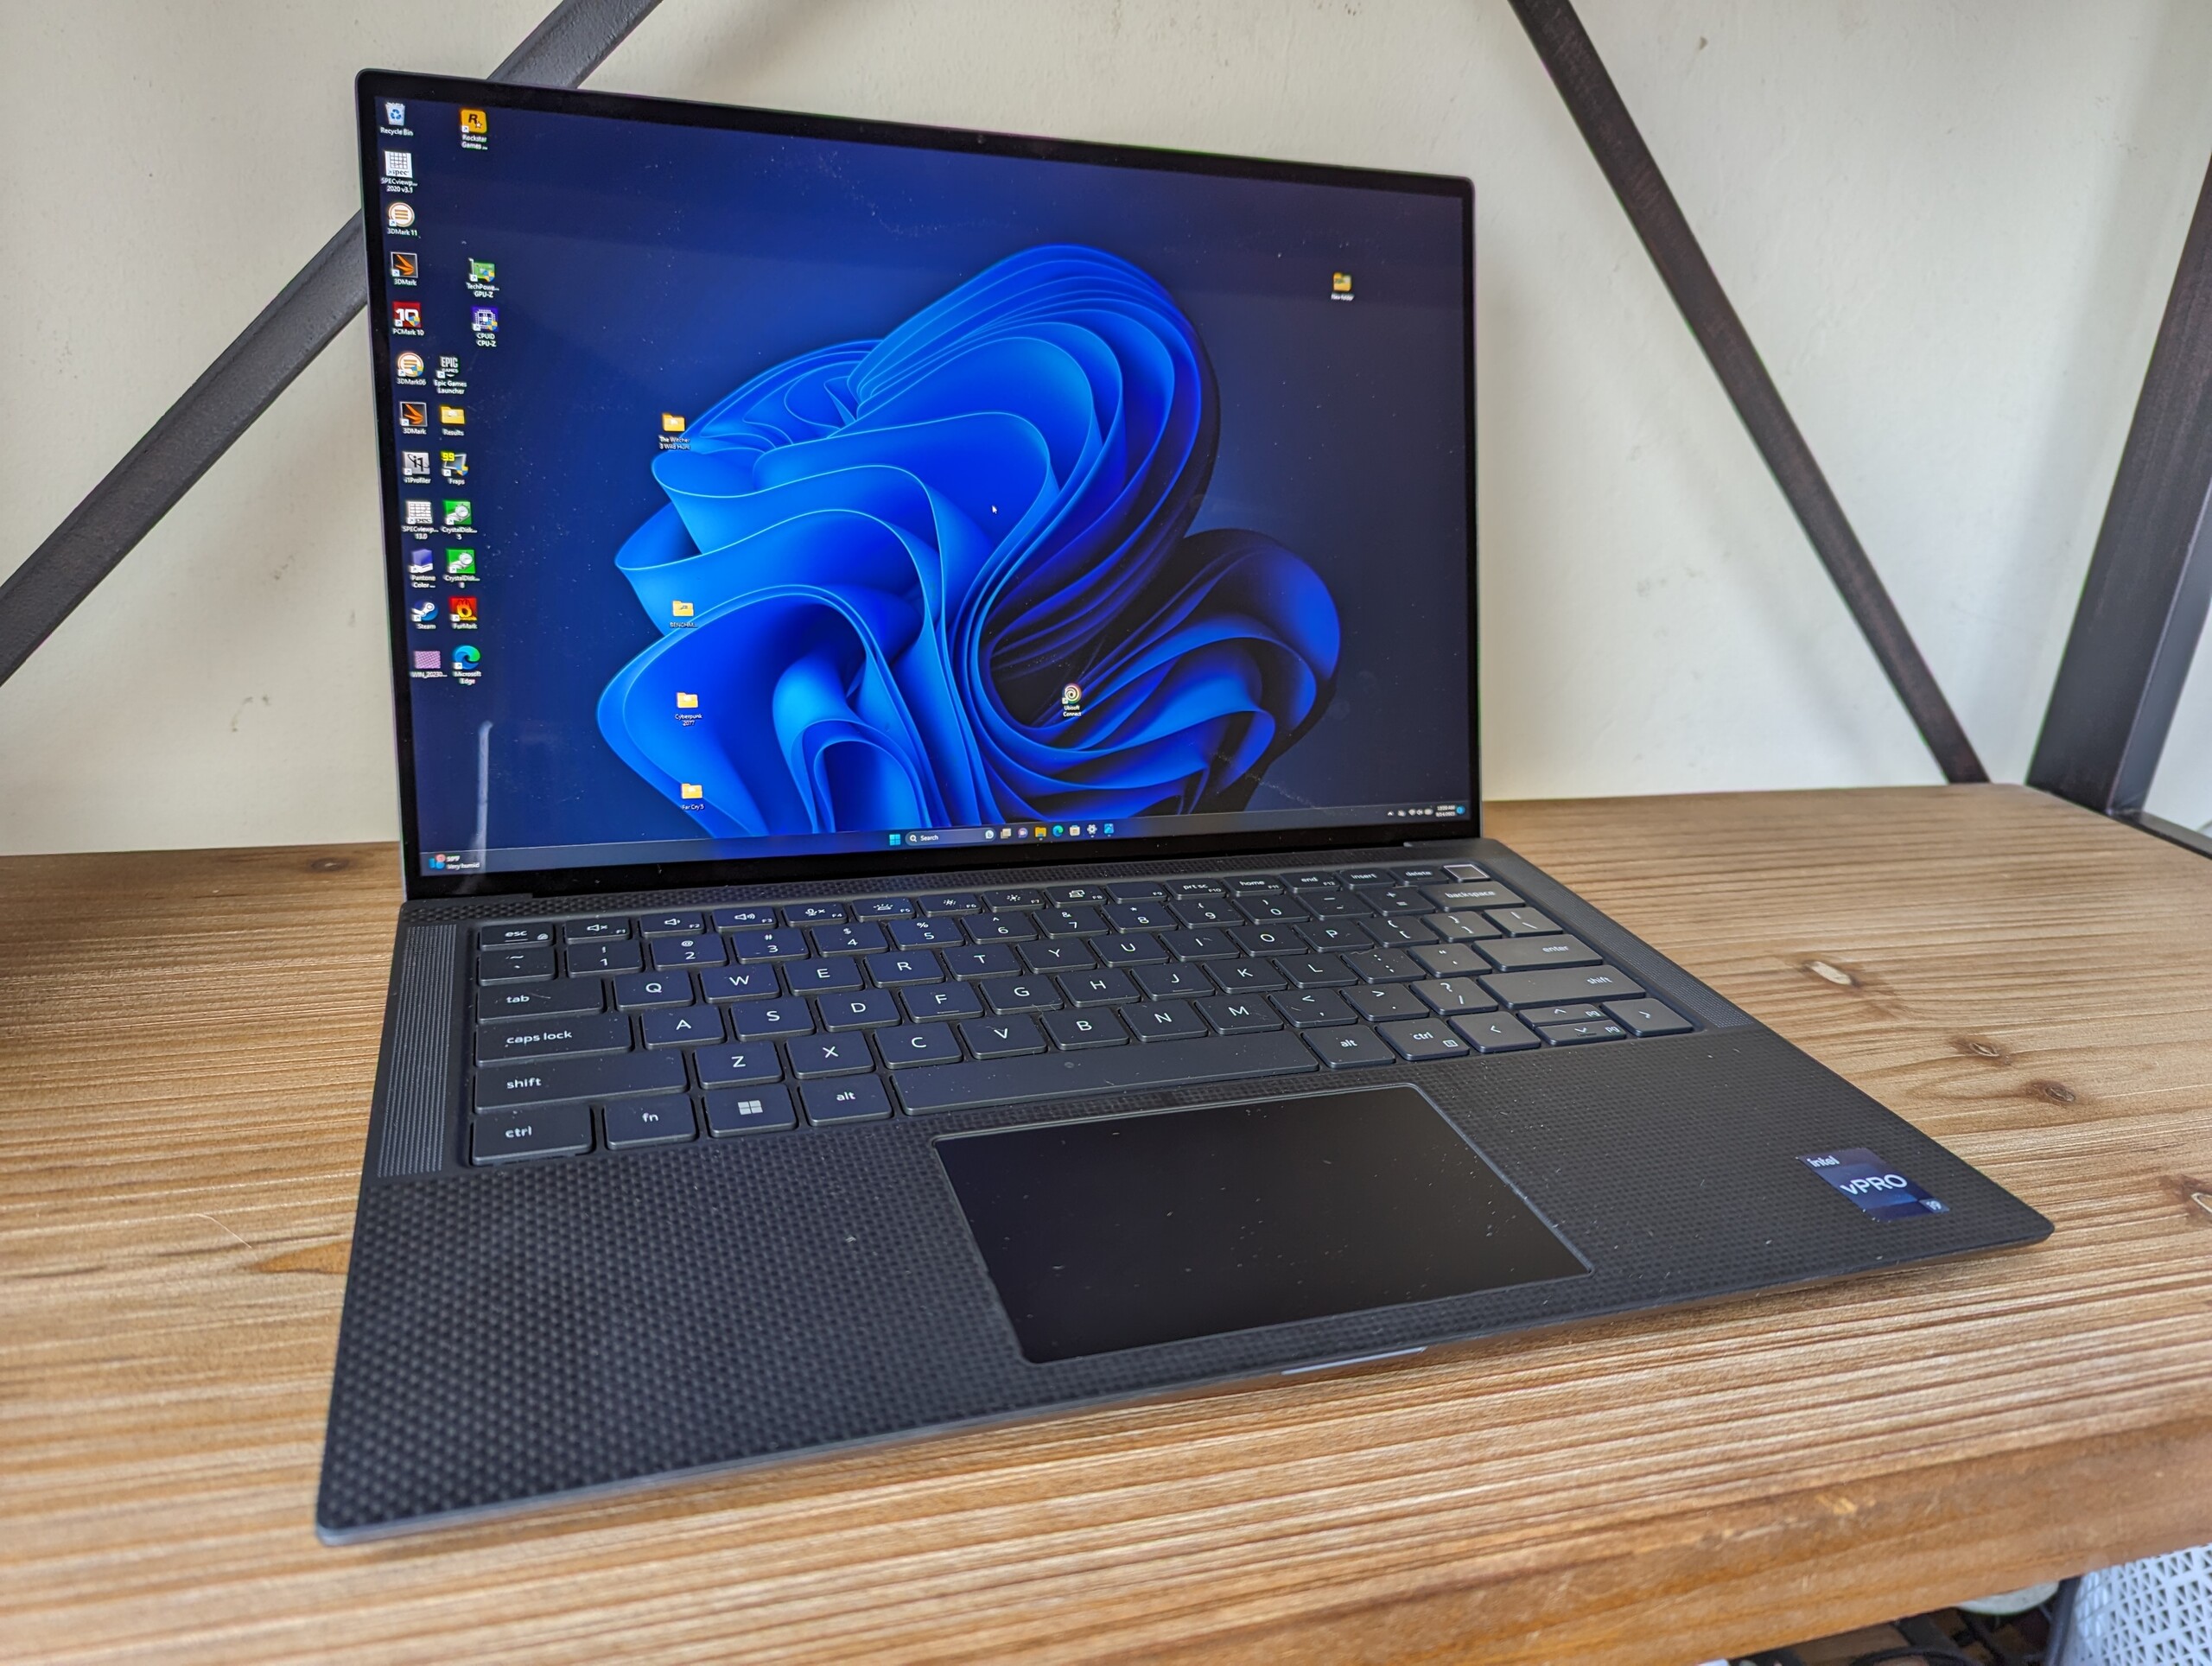
The Precision 5480 directly succeeds last year's Precision 5470 by updating the 12th gen Alder Lake-H CPU and Nvidia Ampere GPU with 13th gen Raptor Lake-H and Ada Lovelace options, respectively. It also happens to be one of the first mobile workstations to carry the RTX 3000 Ada. The chassis or skeleton otherwise remains the same as on the Precision 5470 and so we recommend checking out our review on last year's model to learn more about the physical features of the Precision 5480.
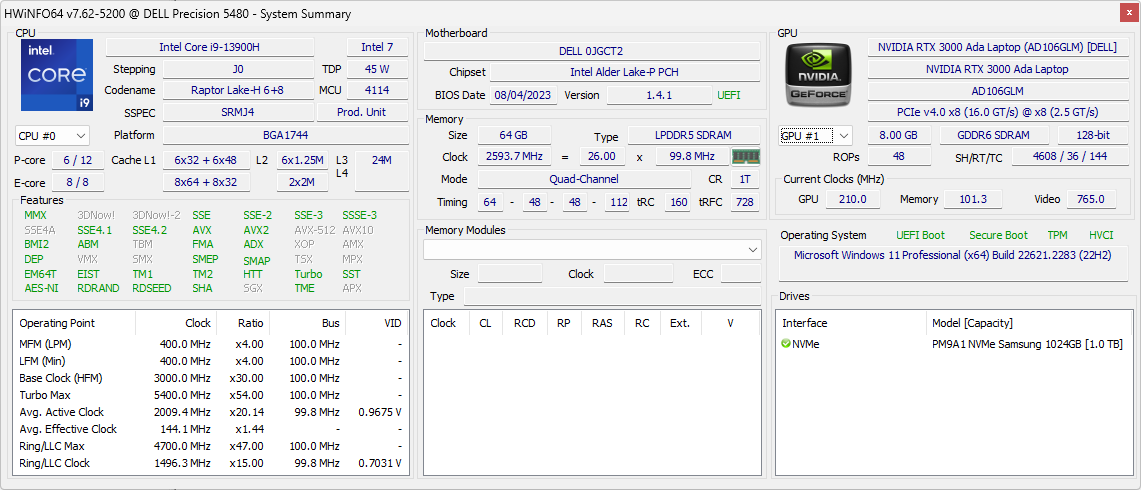
Our specific test unit is a higher-end configuration with the Core i9-13900H CPU, RTX 3000 Ada GPU, and QHD+ touchscreen for approximately $4400 USD. Lesser SKUs with the Core i5-13500H, integrated Iris Xe graphics, and non-touch FHD+ display are also available starting at $2300.
The 14-inch subnotebook workstation space is relatively small, but there are still a few alternatives including the Lenovo ThinkPad P14s and HP ZBook Firefly 14 series.
More Dell reviews:
Potential Competitors in Comparison
Rating | Date | Model | Weight | Height | Size | Resolution | Price |
|---|---|---|---|---|---|---|---|
| 89.6 % v7 (old) | 09 / 2023 | Dell Precision 5480 i9-13900H, RTX 3000 Ada Generation Laptop | 1.6 kg | 18.95 mm | 14.00" | 2560x1600 | |
| 87.6 % v7 (old) | 09 / 2022 | Dell Precision 5000 5470 i9-12900H, RTX A1000 Laptop GPU | 1.6 kg | 18.95 mm | 14.00" | 2560x1600 | |
| 88.3 % v7 (old) | 10 / 2021 | Dell Precision 5000 5560 i7-11850H, RTX A2000 Laptop GPU | 2 kg | 18 mm | 15.60" | 3840x2400 | |
| 86.9 % v7 (old) | 04 / 2023 | Lenovo ThinkPad P14s G3 AMD 21J6S05000 R7 PRO 6850U, Radeon 680M | 1.5 kg | 17.9 mm | 14.00" | 1920x1200 | |
| 87.4 % v7 (old) | 01 / 2023 | HP ZBook Firefly 14 G9-6B8A2EA i7-1265U, T550 Laptop GPU | 1.5 kg | 19.9 mm | 14.00" | 1920x1200 | |
| 87.8 % v7 (old) | 04 / 2023 | Lenovo ThinkPad P15v G3 21EM001AGE R7 PRO 6850H, RTX A2000 Laptop GPU | 2.2 kg | 22.7 mm | 15.60" | 3840x2160 |
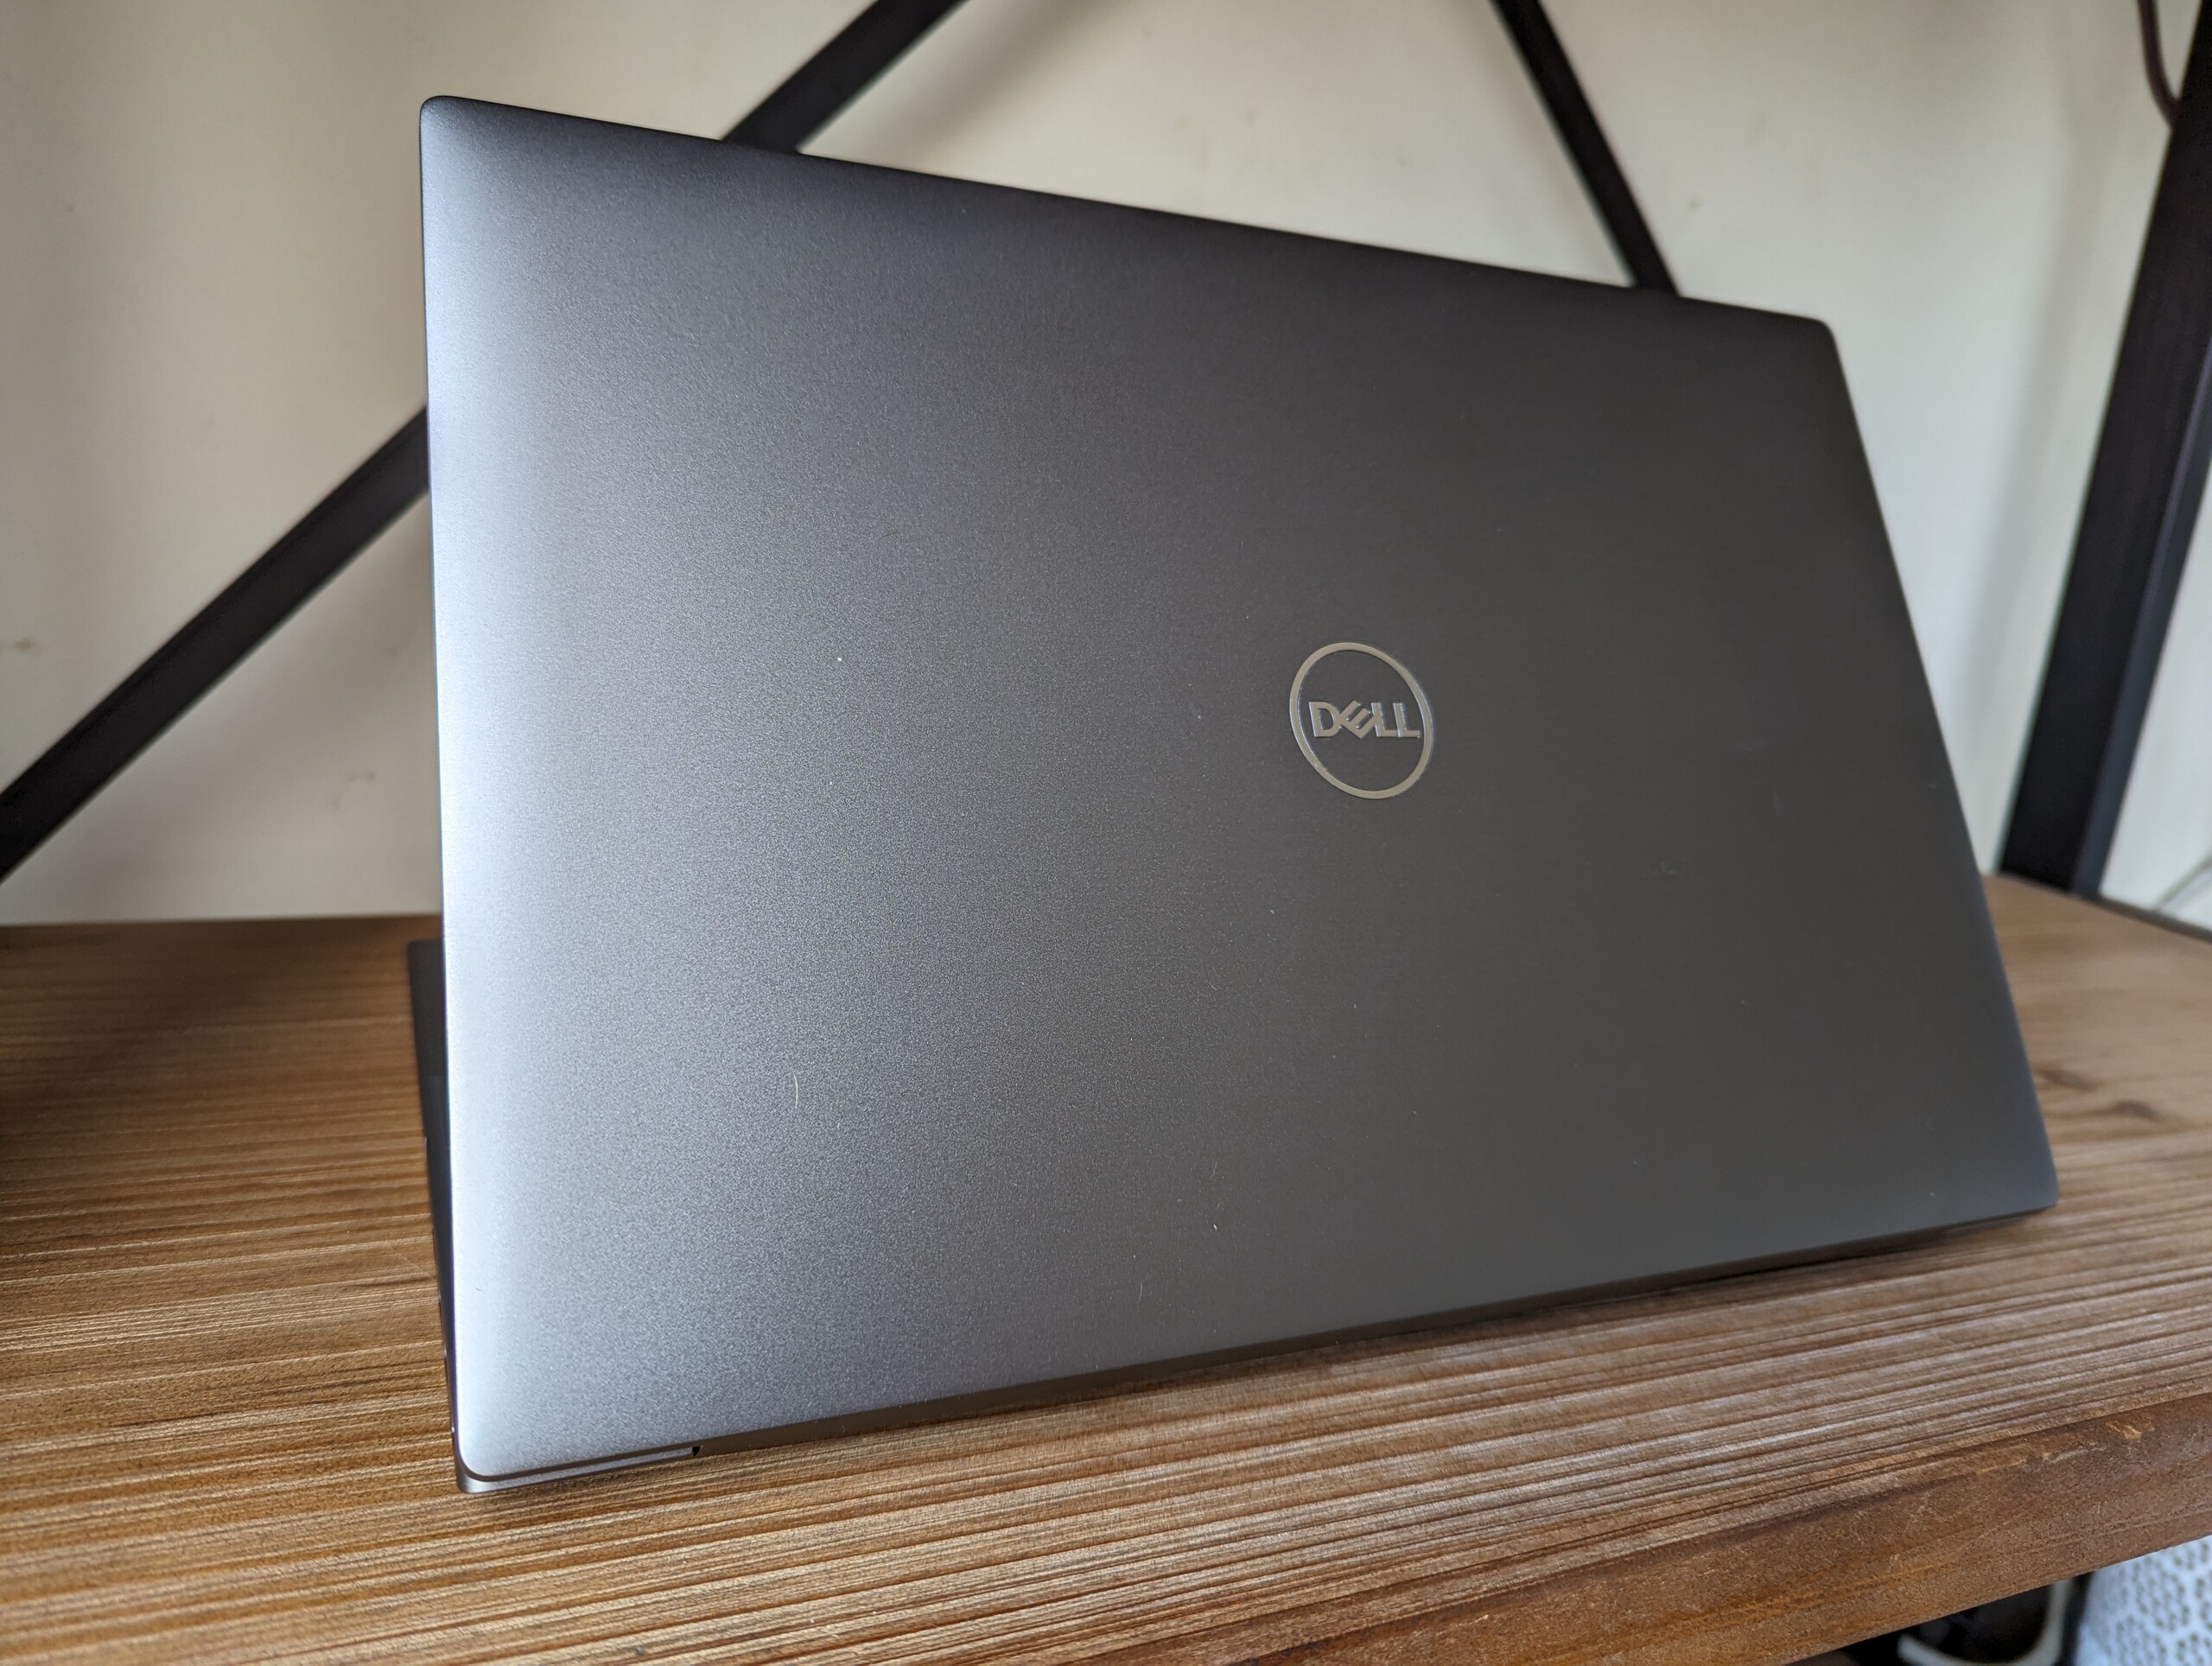
Case — Inspired By The XPS
SD Card Reader
| SD Card Reader | |
| average JPG Copy Test (av. of 3 runs) | |
| Dell Precision 5000 5560 (AV Pro V60) | |
| Lenovo ThinkPad P15v G3 21EM001AGE (AV Pro V60) | |
| Dell Precision 5000 5470 (AV Pro V60) | |
| Dell Precision 5480 (AV Pro V60) | |
| maximum AS SSD Seq Read Test (1GB) | |
| Dell Precision 5000 5470 (AV Pro V60) | |
| Lenovo ThinkPad P15v G3 21EM001AGE (AV Pro V60) | |
| Dell Precision 5000 5560 (AV Pro V60) | |
| Dell Precision 5480 (AV Pro V60) | |
Communication
| Networking | |
| iperf3 transmit AX12 | |
| Dell Precision 5000 5560 | |
| iperf3 receive AX12 | |
| Dell Precision 5000 5560 | |
| iperf3 transmit AXE11000 | |
| Dell Precision 5480 | |
| Lenovo ThinkPad P14s G3 AMD 21J6S05000 | |
| Lenovo ThinkPad P15v G3 21EM001AGE | |
| iperf3 receive AXE11000 | |
| Lenovo ThinkPad P14s G3 AMD 21J6S05000 | |
| Lenovo ThinkPad P15v G3 21EM001AGE | |
| Dell Precision 5480 | |
| iperf3 transmit AXE11000 6GHz | |
| Dell Precision 5480 | |
| Lenovo ThinkPad P14s G3 AMD 21J6S05000 | |
| Dell Precision 5000 5470 | |
| Lenovo ThinkPad P15v G3 21EM001AGE | |
| iperf3 receive AXE11000 6GHz | |
| Lenovo ThinkPad P14s G3 AMD 21J6S05000 | |
| Lenovo ThinkPad P15v G3 21EM001AGE | |
| Dell Precision 5480 | |
| Dell Precision 5000 5470 | |
Webcam
Dell is still shipping 720p webcams on many of its flagship products including the XPS series and Precision laptops based on the XPS design. Other makers have already moved on to 2 MP or 5 MP sensors and we expect Dell to do the same for any future redesigns.


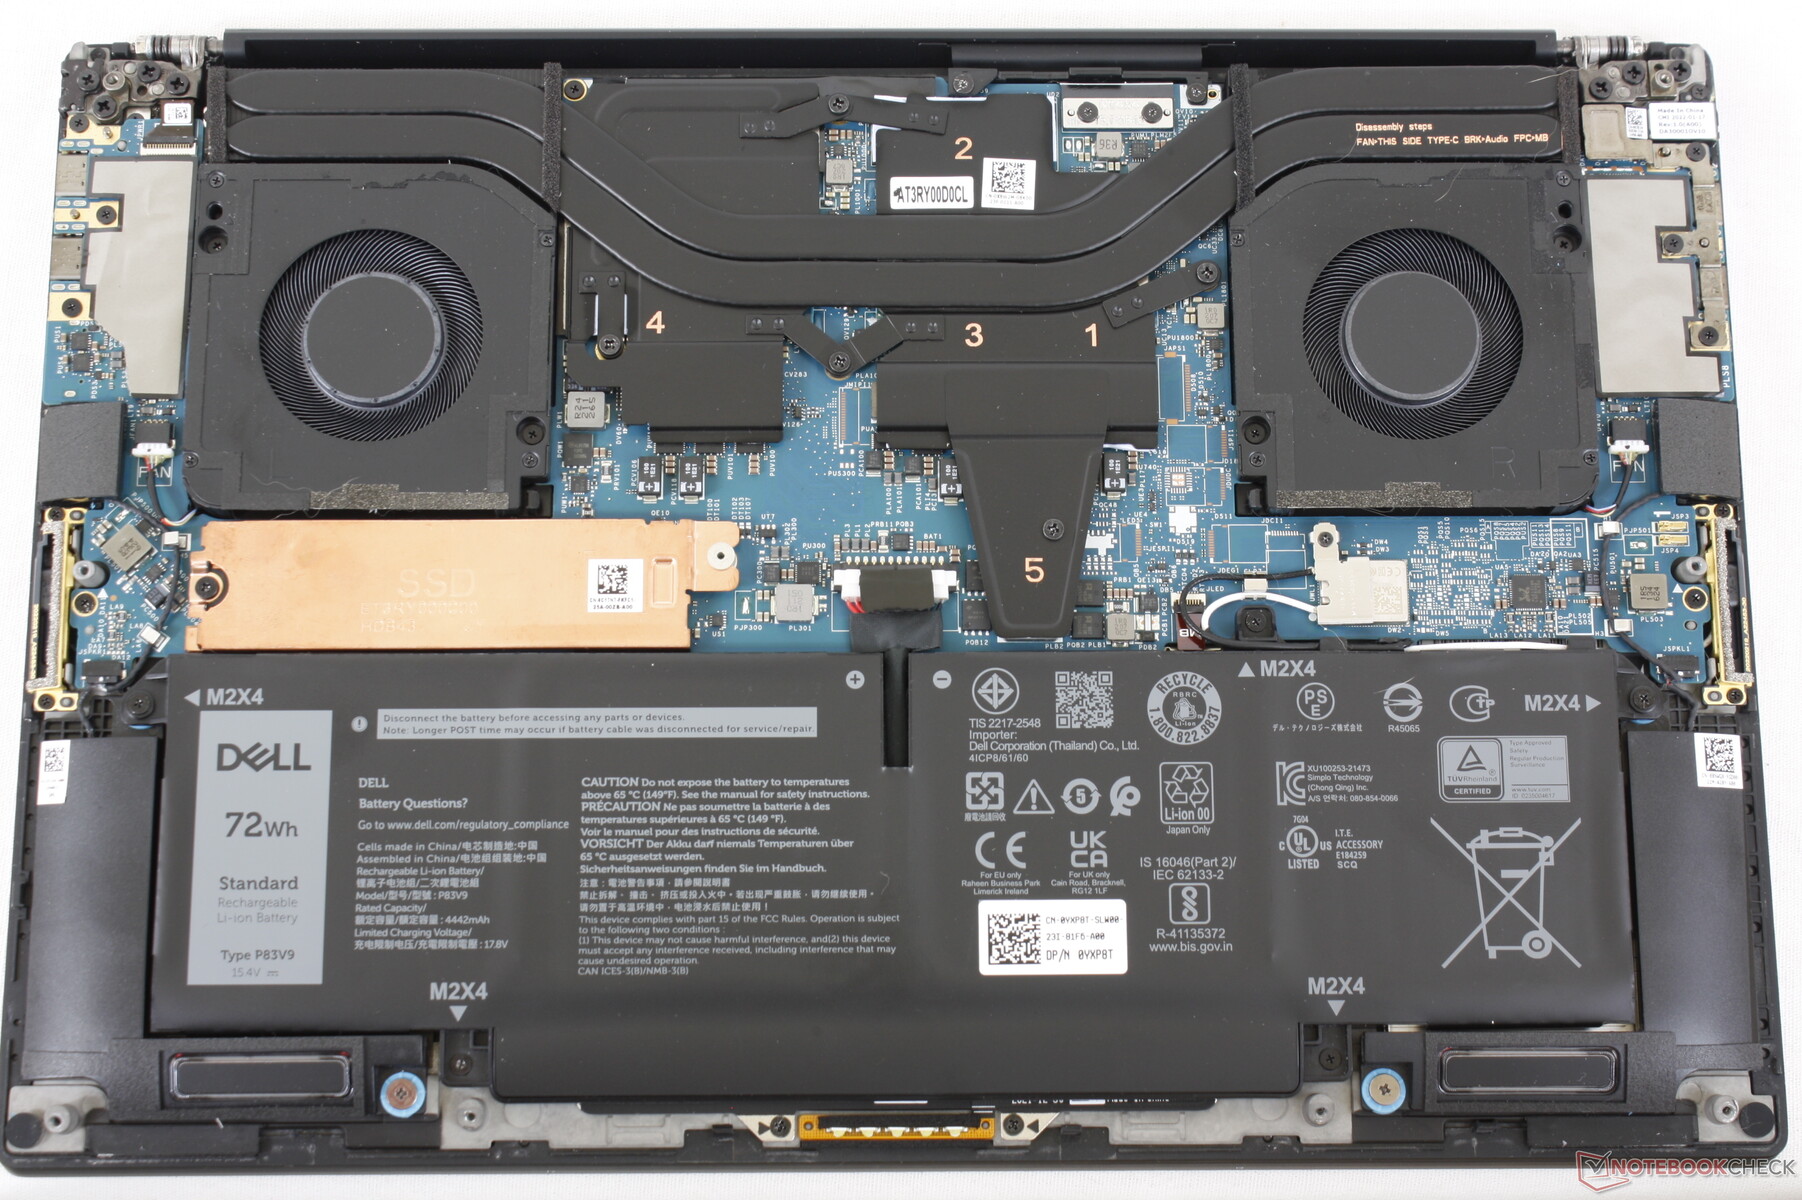
Maintenance
Accessories And Warranty
The retail box includes the same USB-C to HDMI and USB-A adapter as on last year's model in addition to the paperwork and 130 W USB-C AC adapter. Dell also offers a smaller 100 W USB-C AC adapter which should suffice for configurations with no discrete Nvidia graphics.
A three-year warranty comes standard if purchased from Dell in the US similar to the Precision 7000 series.
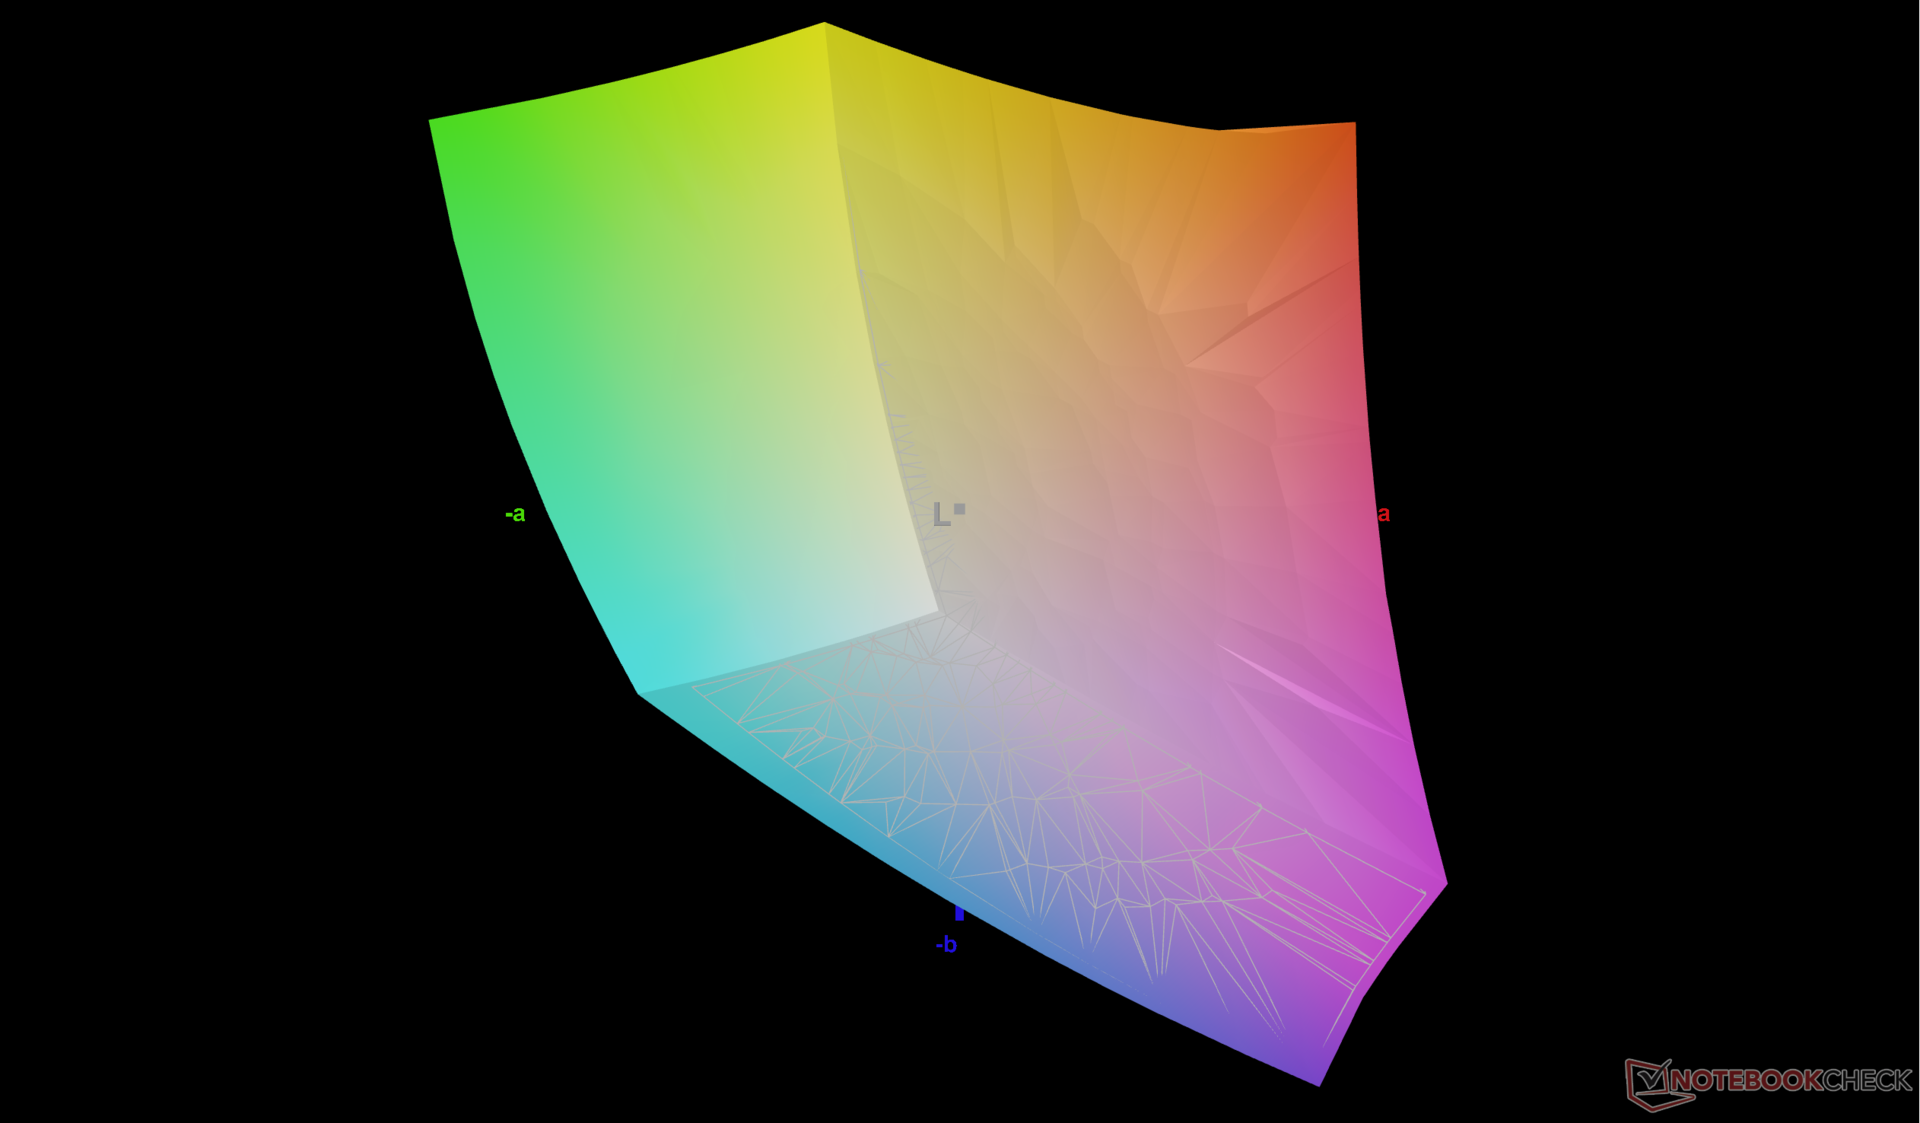
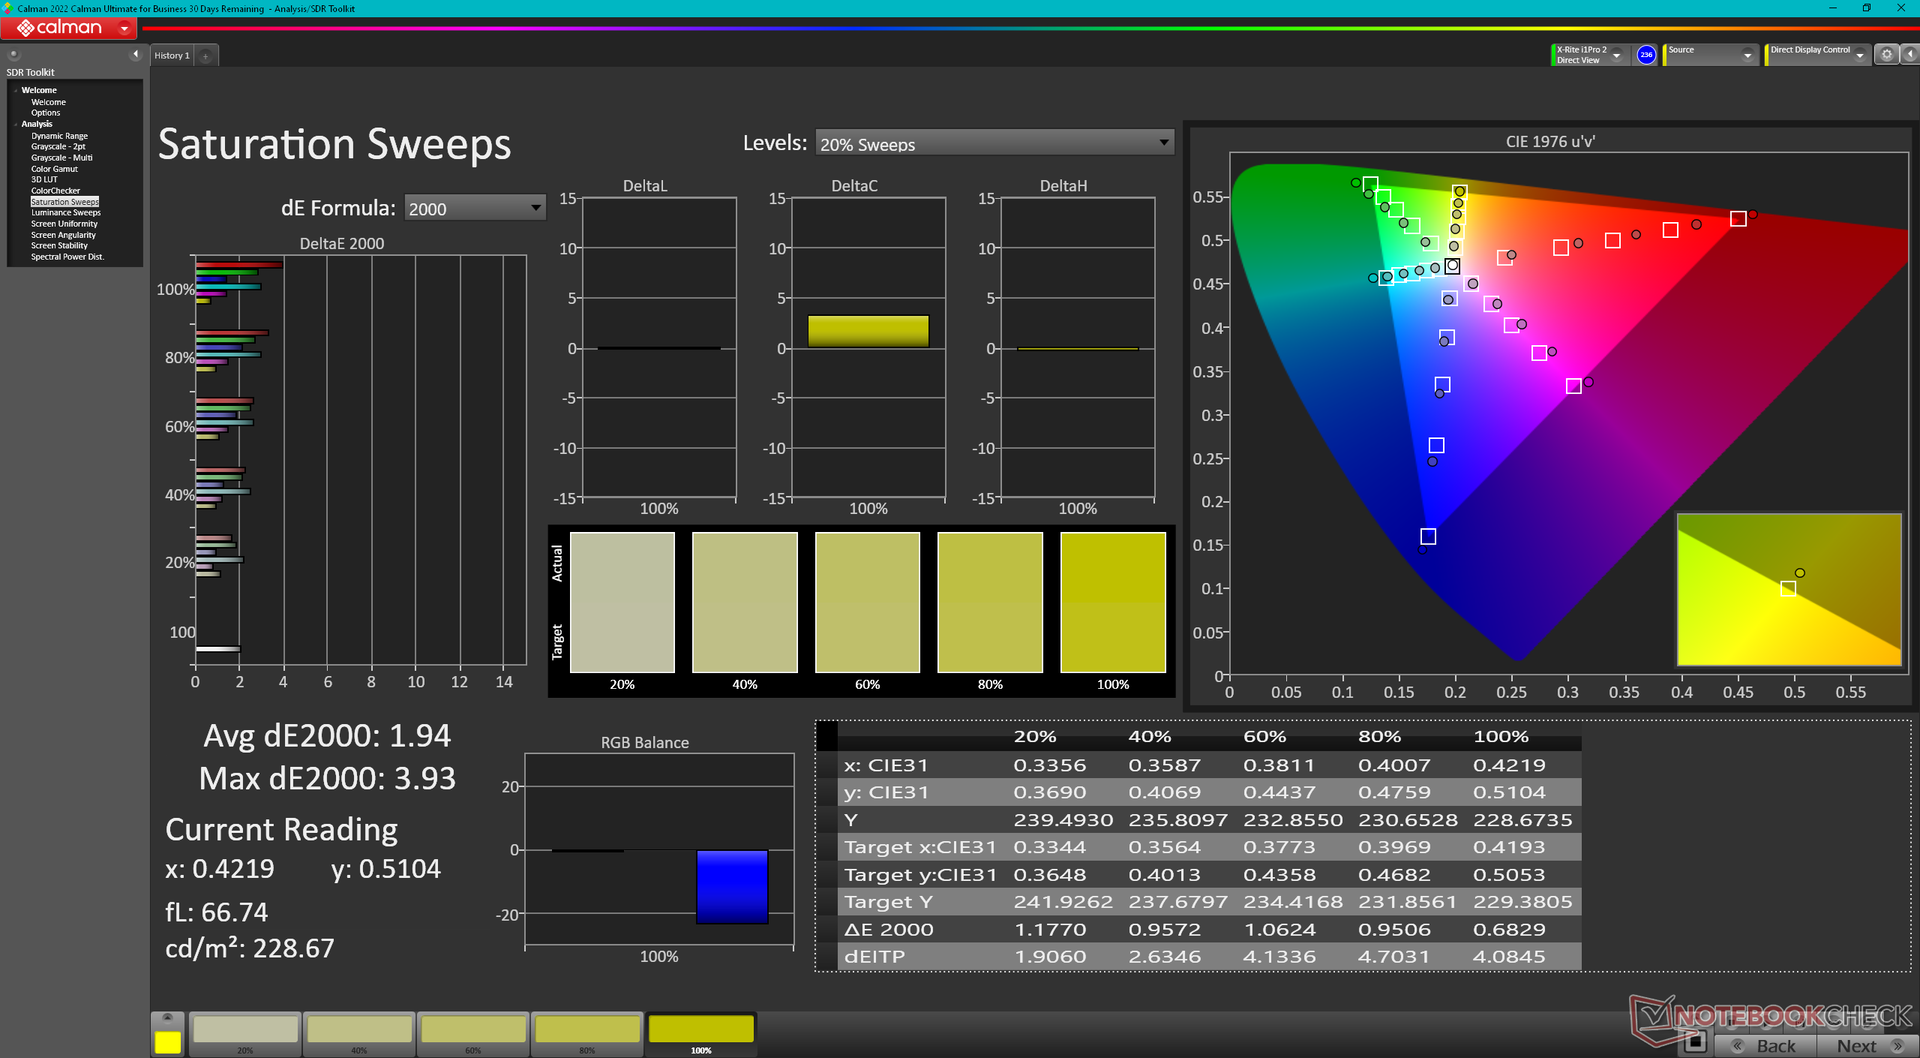
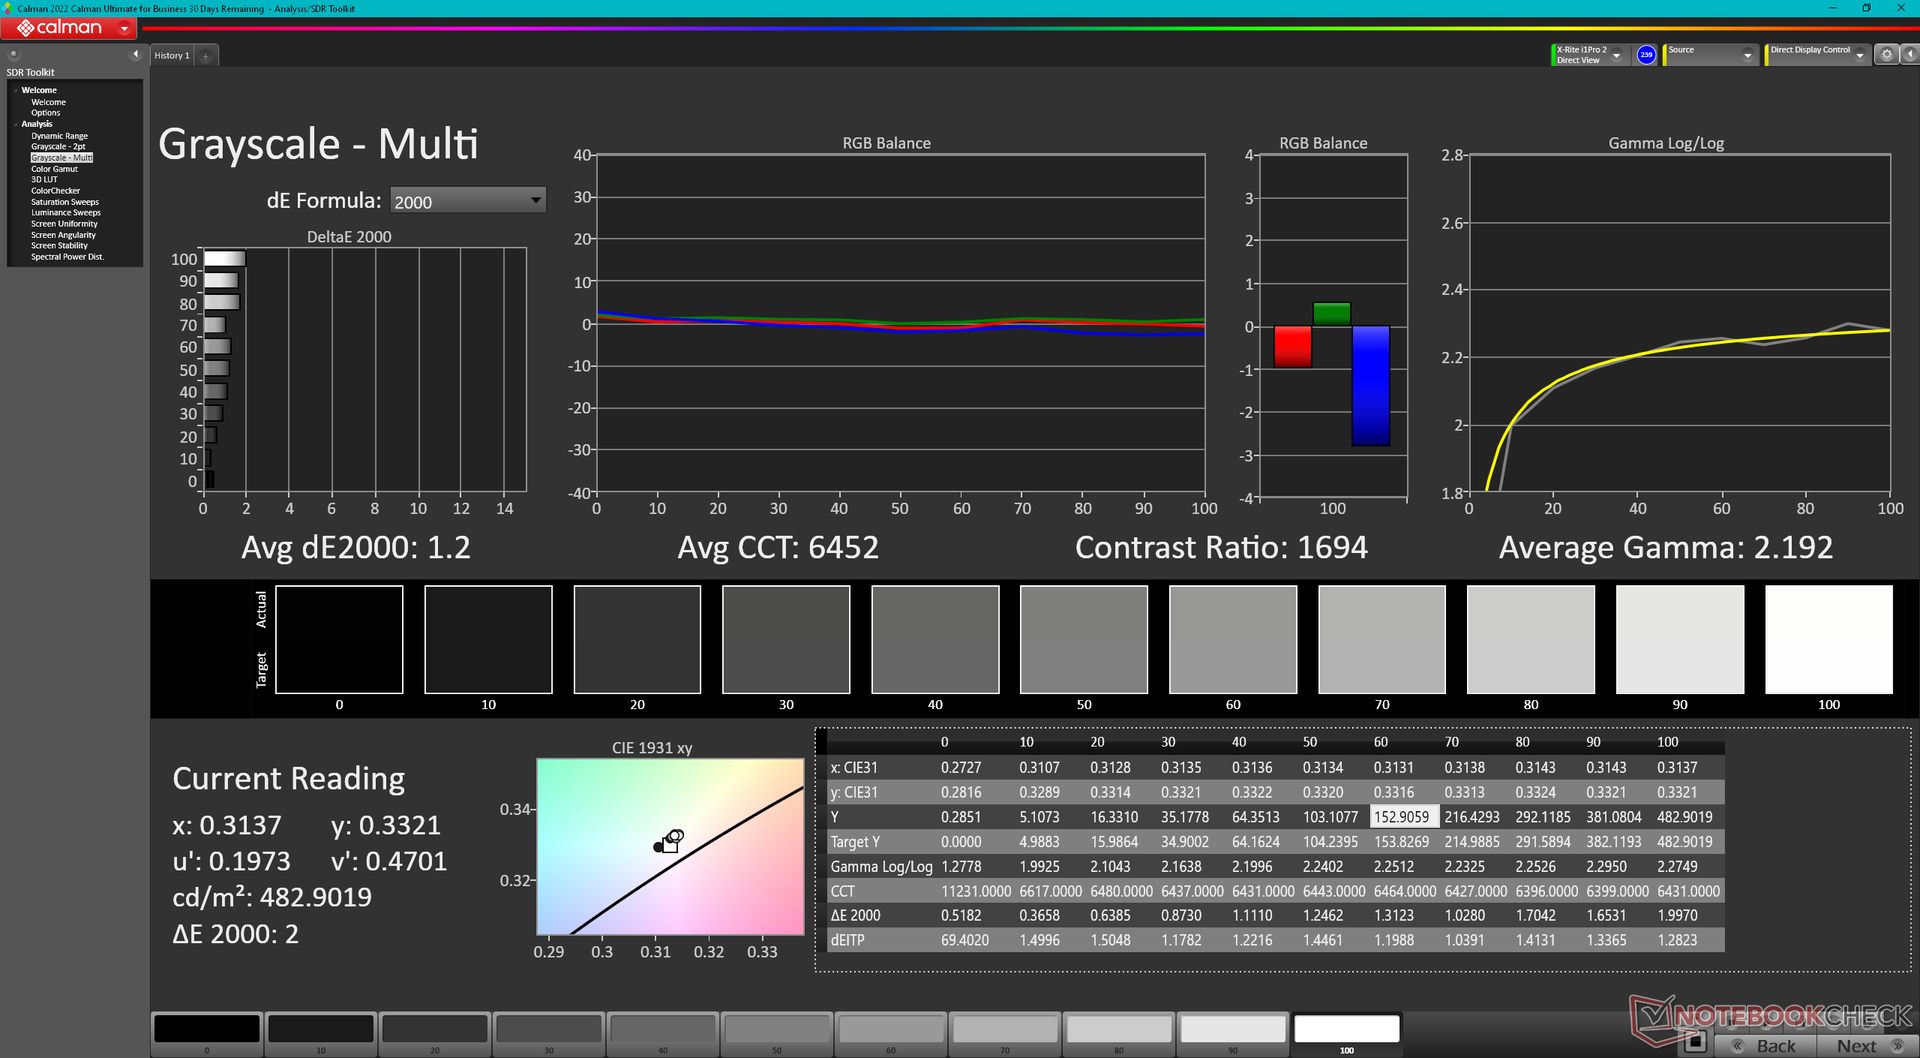
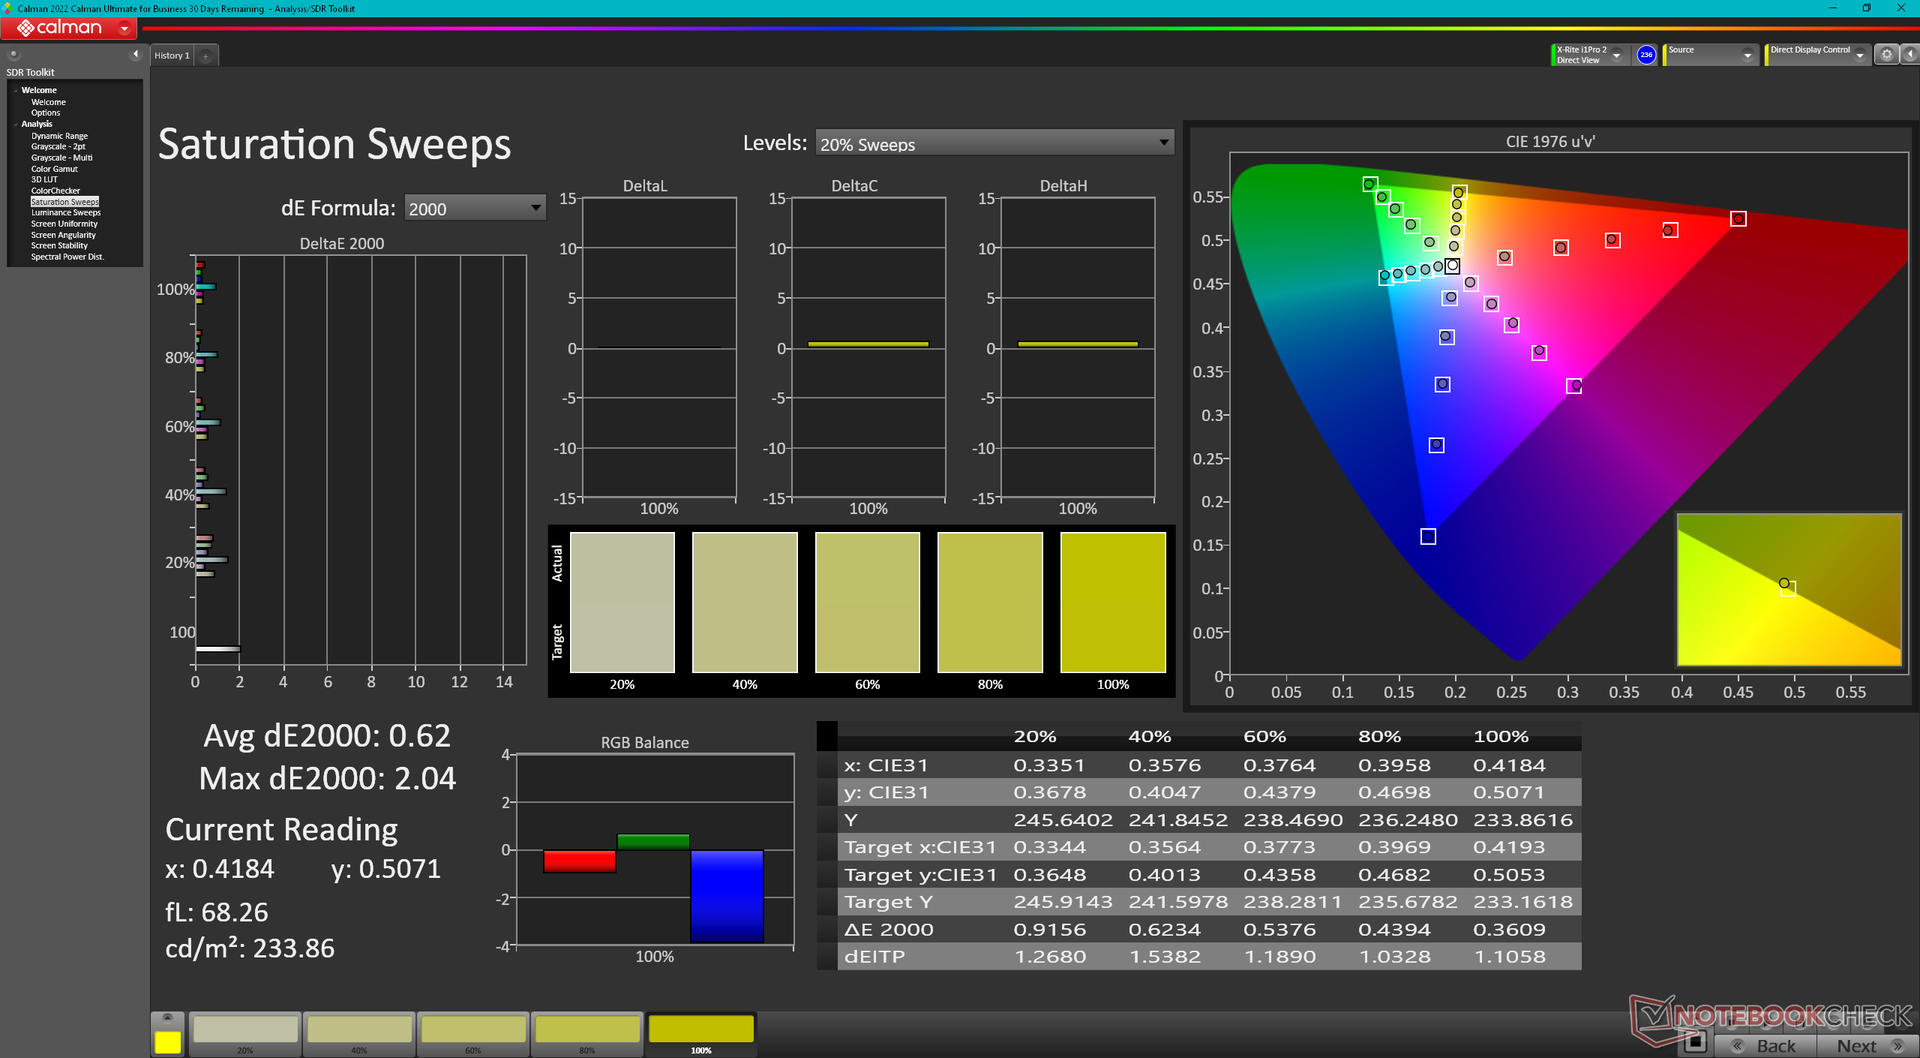
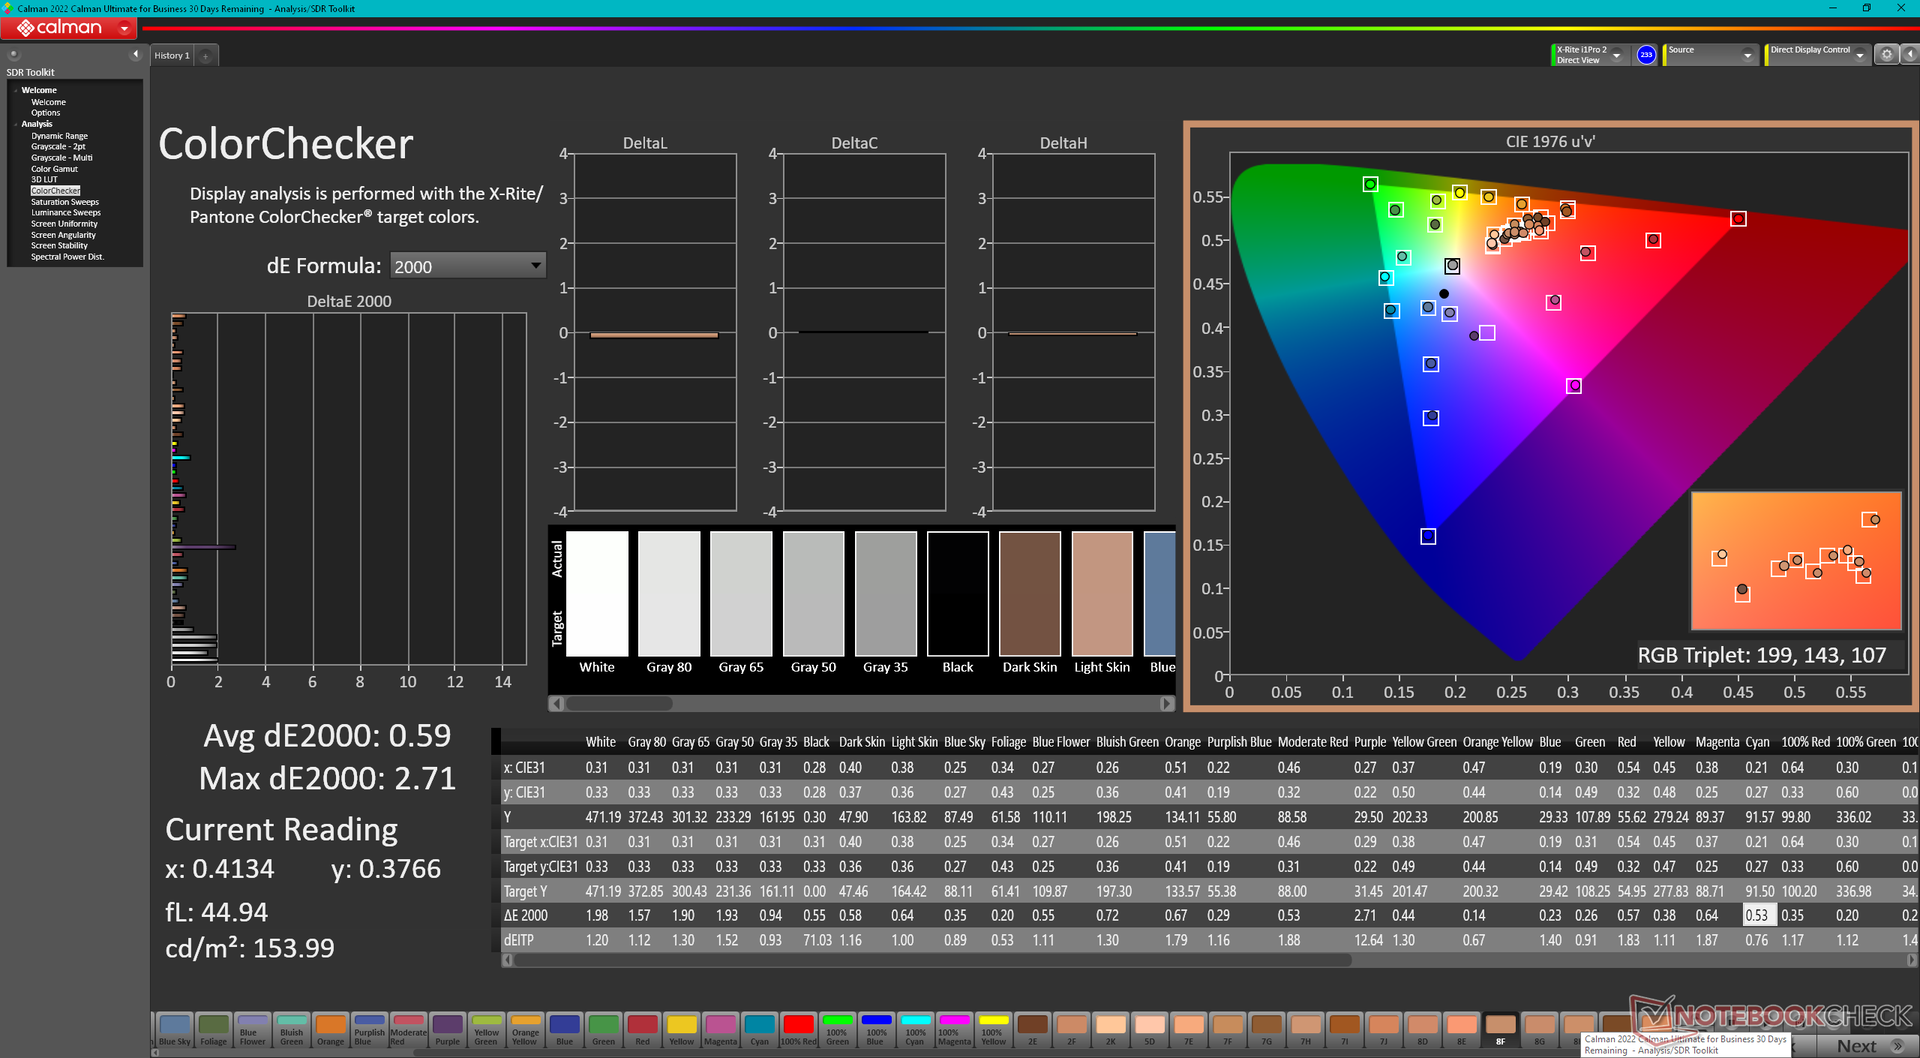
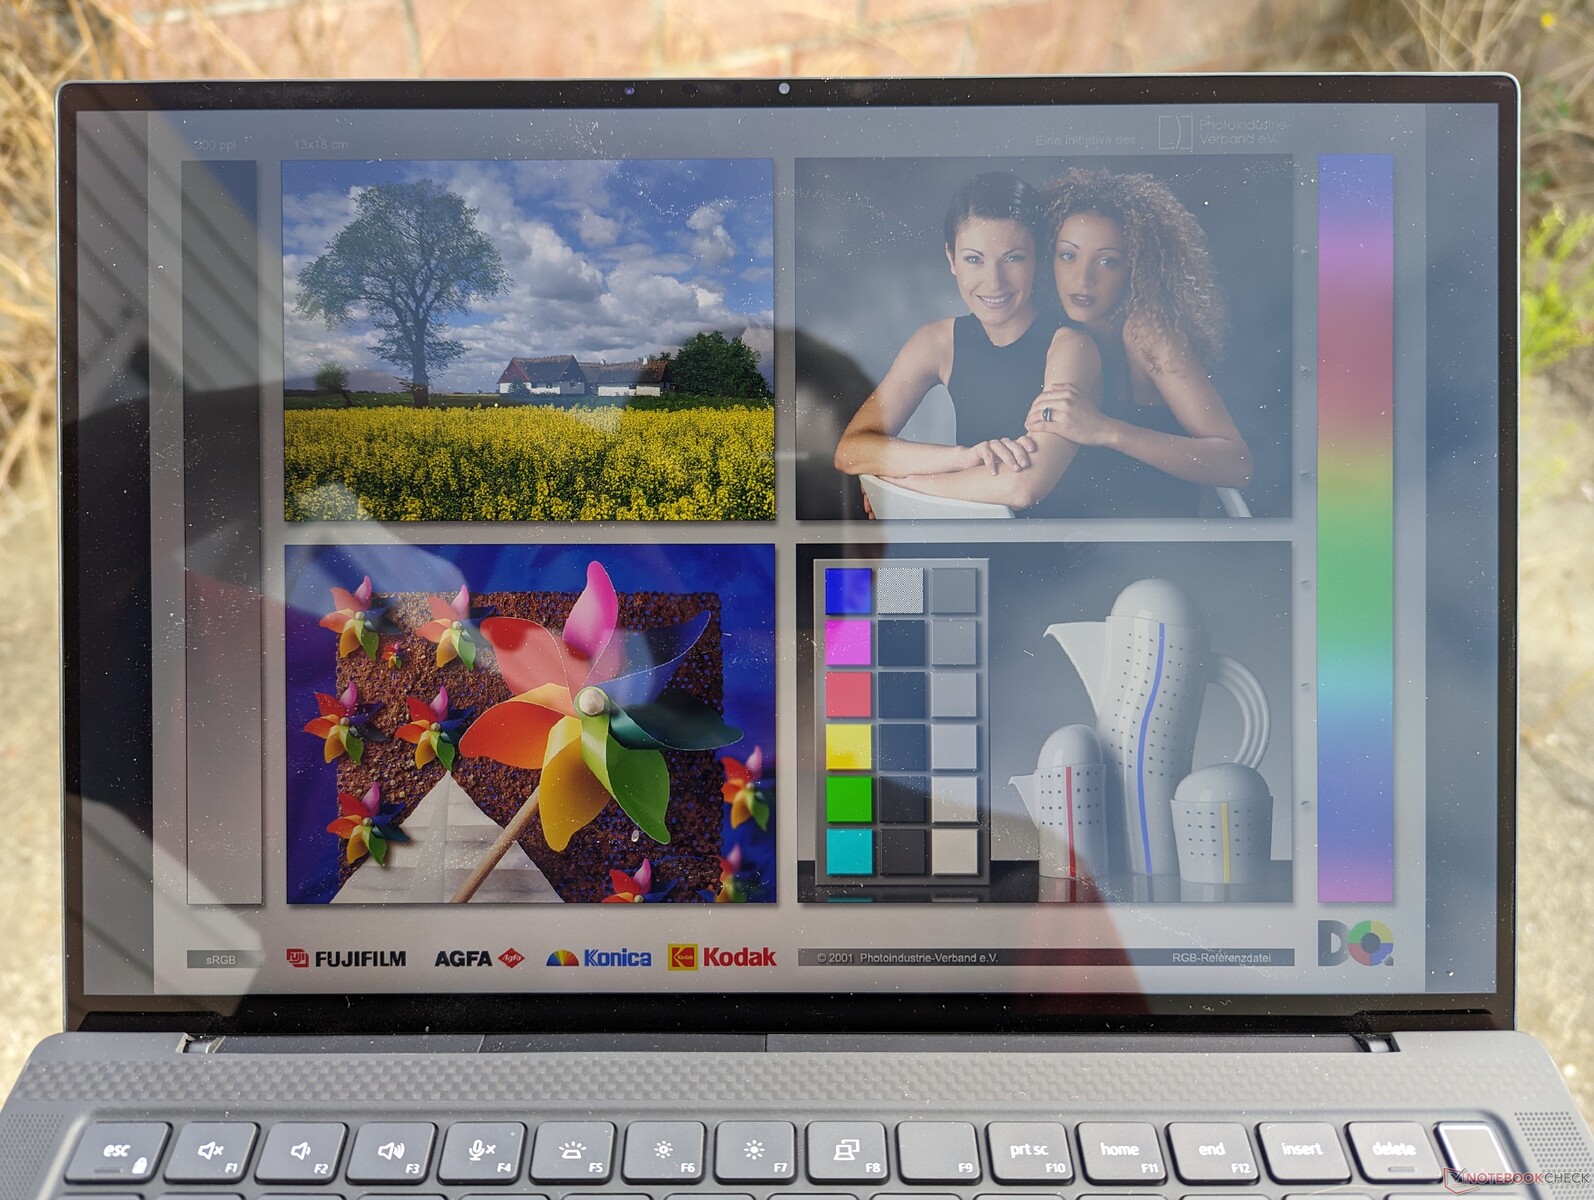
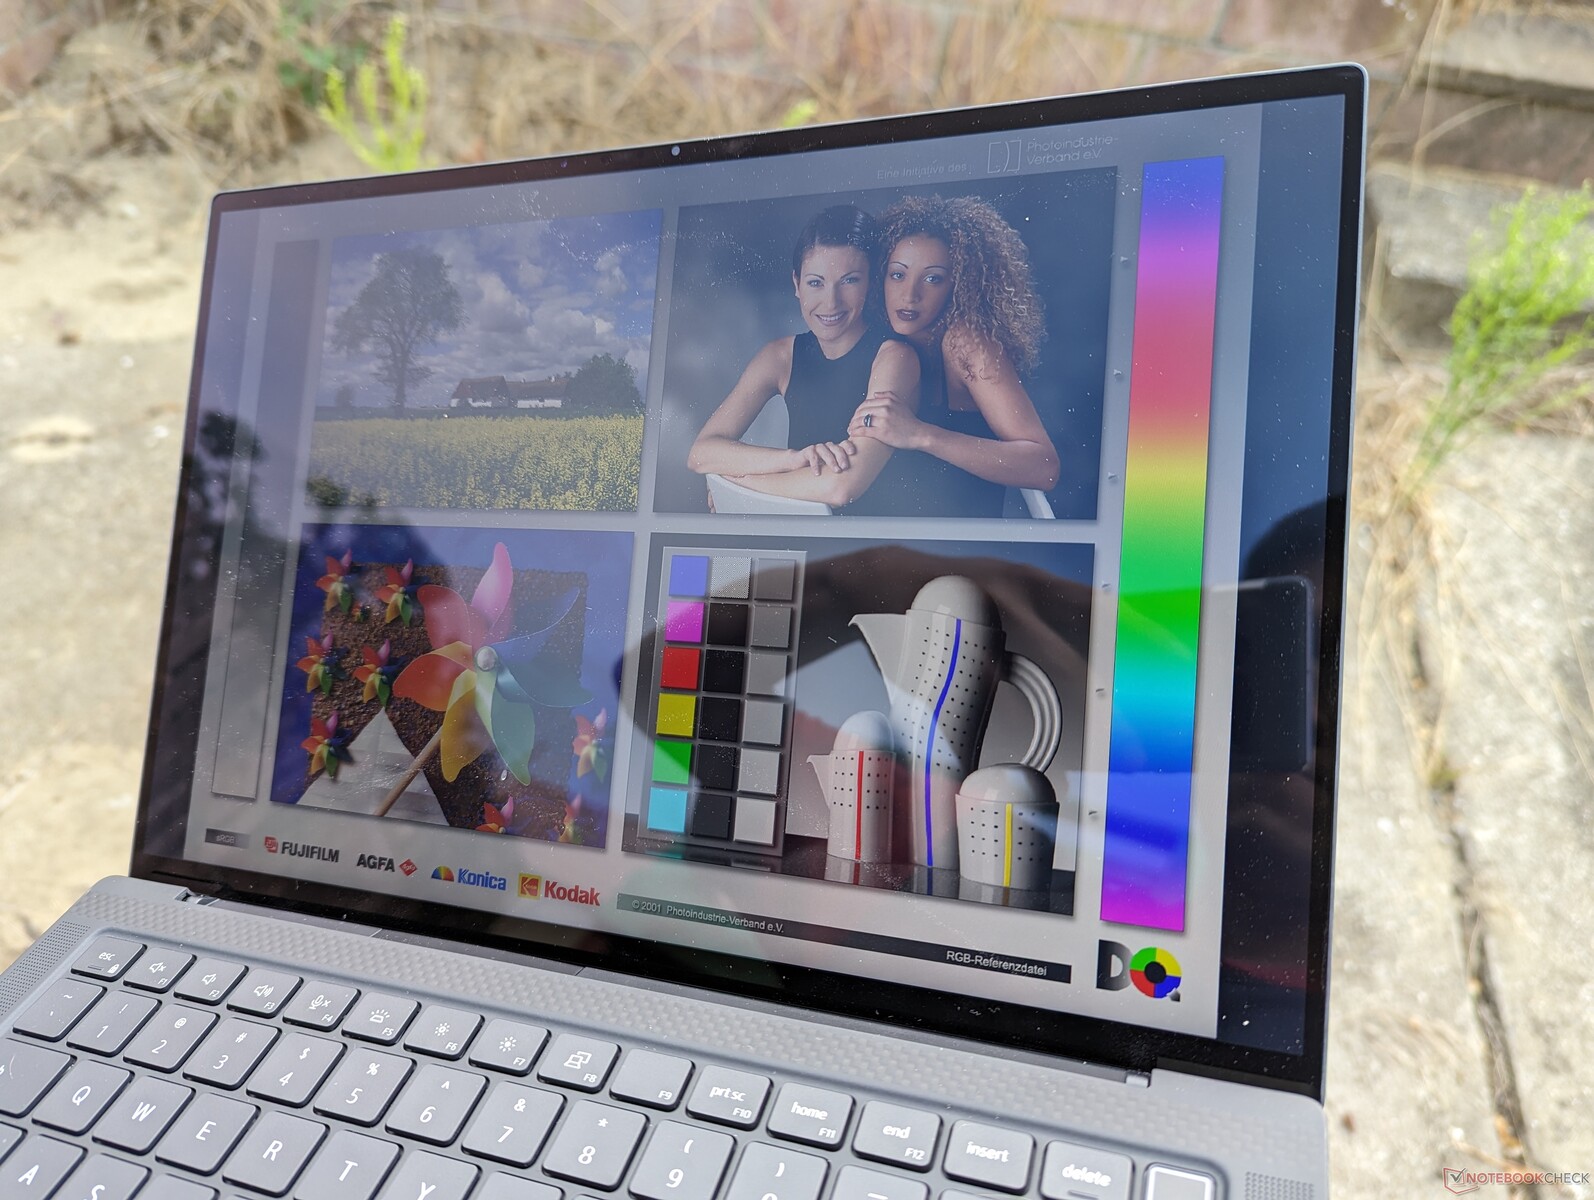
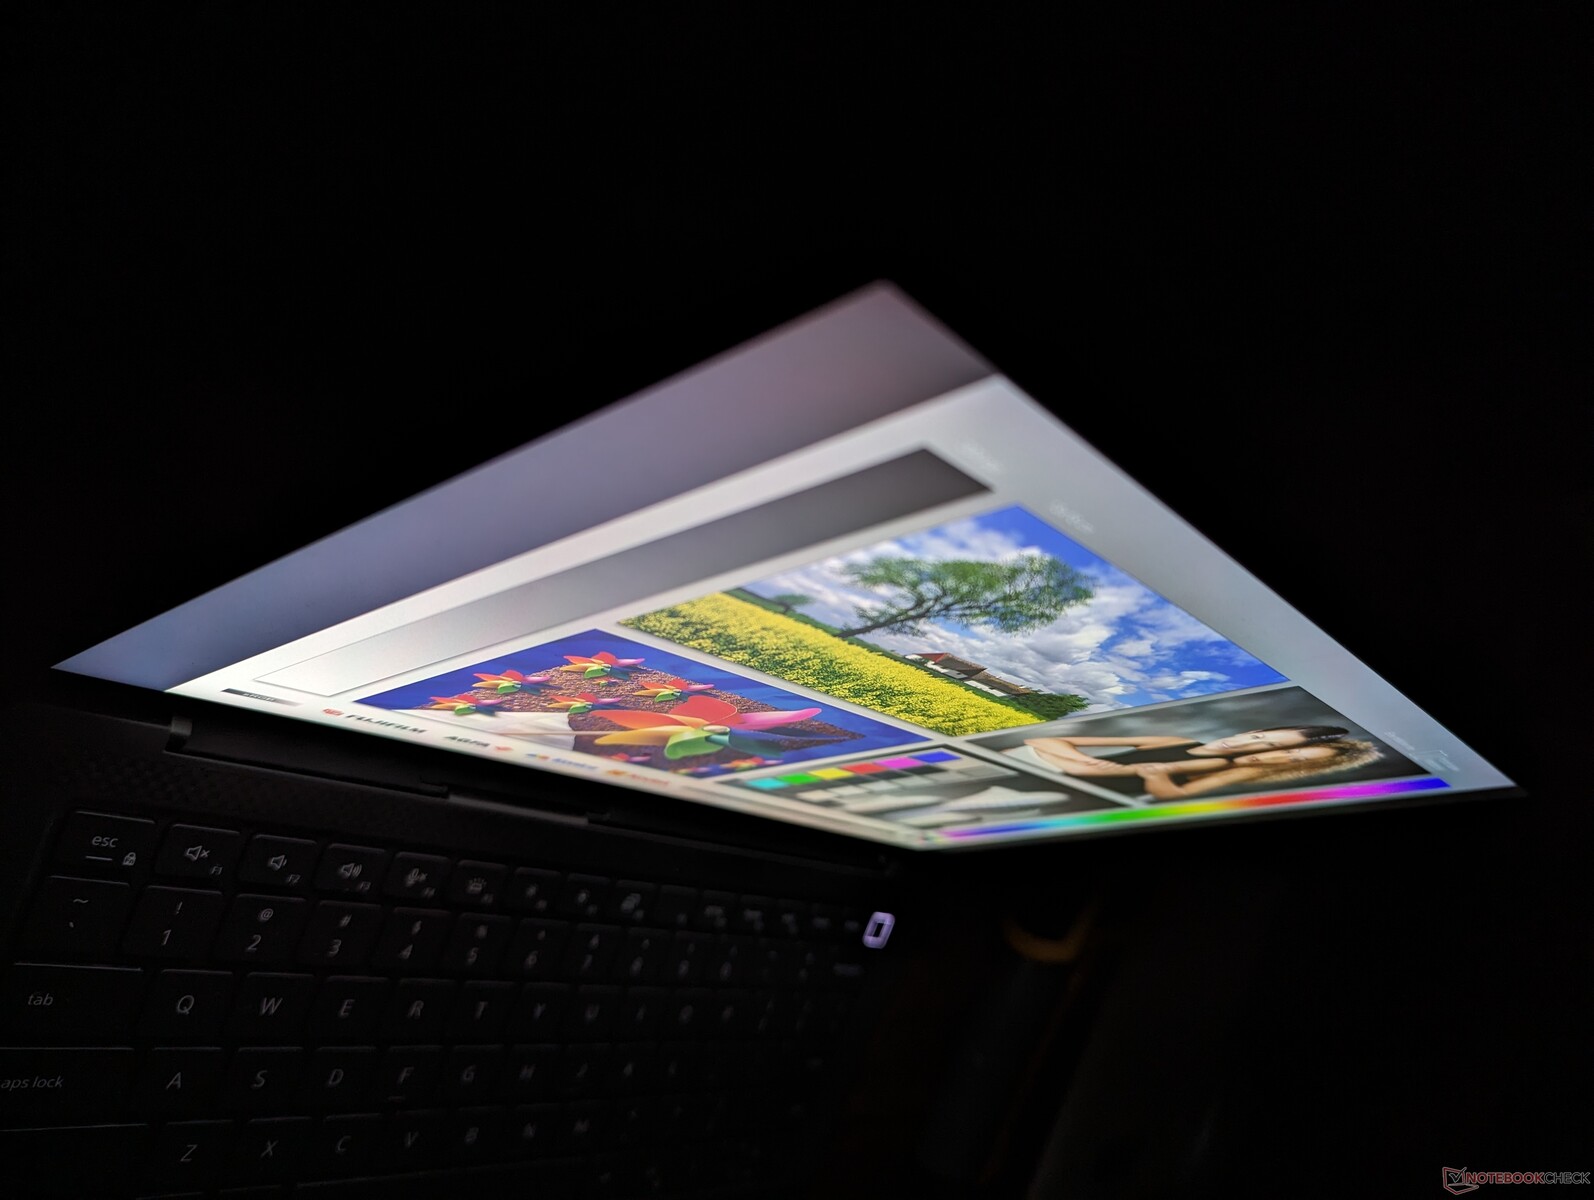
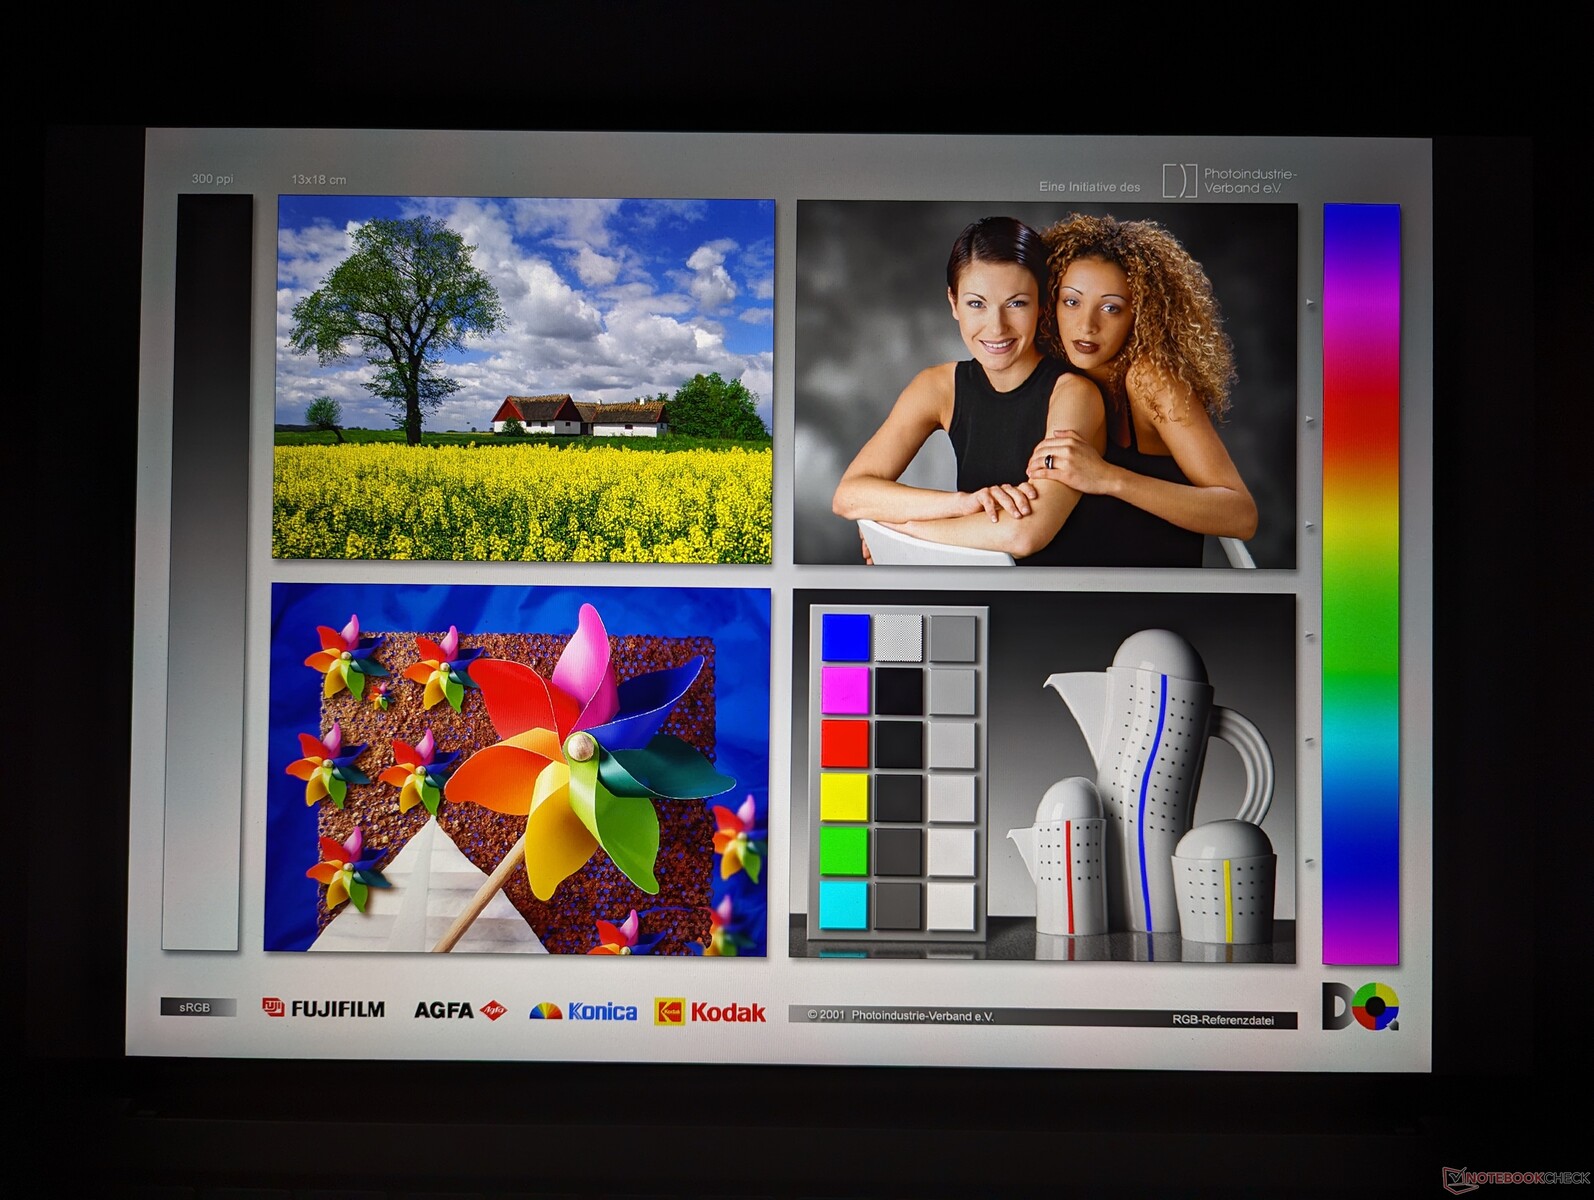
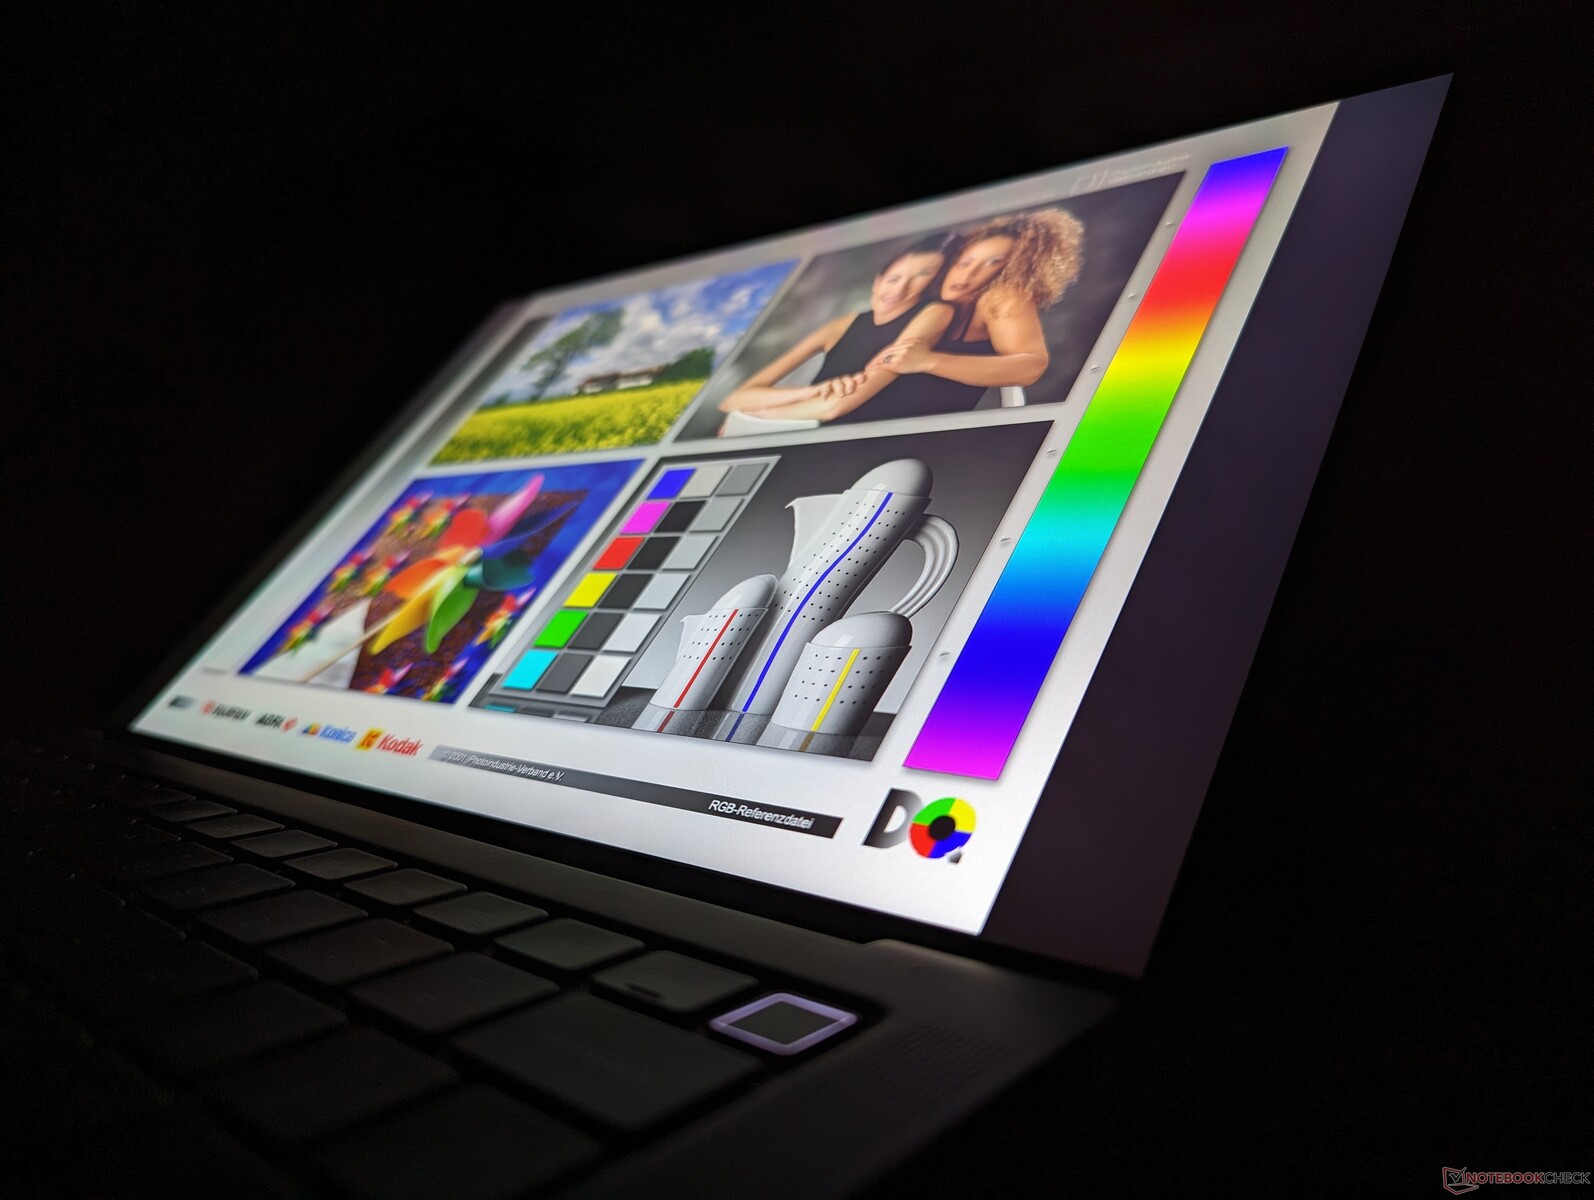
Display — QHD+ With Full sRGB Colors
Our test unit ships with the same AU Optronics B140QAN IPS panel as found on last year's model. Dell is not offering any new panel options for this year's refresh meaning full DCi-P3 colors or OLED are still out of reach.
| |||||||||||||||||||||||||
Brightness Distribution: 87 %
Center on Battery: 472.8 cd/m²
Contrast: 1351:1 (Black: 0.35 cd/m²)
ΔE ColorChecker Calman: 2.1 | ∀{0.5-29.43 Ø4.72}
calibrated: 0.59
ΔE Greyscale Calman: 1.7 | ∀{0.09-98 Ø4.96}
78% AdobeRGB 1998 (Argyll 3D)
99.8% sRGB (Argyll 3D)
77.6% Display P3 (Argyll 3D)
Gamma: 2.26
CCT: 6493 K
| Dell Precision 5480 AU Optronics B140QAN, IPS, 2560x1600, 14" | Dell Precision 5000 5470 AU Optronics B140QAN, IPS, 2560x1600, 14" | Dell Precision 5000 5560 Sharp LQ156R1, IPS, 3840x2400, 15.6" | Lenovo ThinkPad P14s G3 AMD 21J6S05000 LP140WU1-SPB2, IPS LED, 1920x1200, 14" | Lenovo ThinkPad P15v G3 21EM001AGE NE156QUM-N6C, IPS LED, 3840x2160, 15.6" | HP ZBook Firefly 14 G9-6B8A2EA CMN1435, IPS, 1920x1200, 14" | |
|---|---|---|---|---|---|---|
| Display | 1% | 17% | -11% | 15% | -6% | |
| Display P3 Coverage (%) | 77.6 | 79.3 2% | 94.9 22% | 65.9 -15% | 89.9 16% | 69.6 -10% |
| sRGB Coverage (%) | 99.8 | 100 0% | 100 0% | 94.3 -6% | 100 0% | 99.9 0% |
| AdobeRGB 1998 Coverage (%) | 78 | 78.7 1% | 100 28% | 68.2 -13% | 99.9 28% | 71.1 -9% |
| Response Times | -24% | -14% | 13% | -7% | -16% | |
| Response Time Grey 50% / Grey 80% * (ms) | 43.9 ? | 52.4 ? -19% | 47.2 ? -8% | 33.5 ? 24% | 46.7 ? -6% | 56.3 ? -28% |
| Response Time Black / White * (ms) | 25.3 ? | 32.4 ? -28% | 30.4 ? -20% | 24.9 ? 2% | 27.3 ? -8% | 26.2 ? -4% |
| PWM Frequency (Hz) | ||||||
| Screen | -8% | -35% | -13% | -55% | -26% | |
| Brightness middle (cd/m²) | 472.8 | 537 14% | 501.5 6% | 448 -5% | 588 24% | 432 -9% |
| Brightness (cd/m²) | 469 | 518 10% | 467 0% | 422 -10% | 536 14% | 407 -13% |
| Brightness Distribution (%) | 87 | 94 8% | 83 -5% | 85 -2% | 83 -5% | 91 5% |
| Black Level * (cd/m²) | 0.35 | 0.33 6% | 0.44 -26% | 0.23 34% | 0.38 -9% | 0.28 20% |
| Contrast (:1) | 1351 | 1627 20% | 1140 -16% | 1948 44% | 1547 15% | 1543 14% |
| Colorchecker dE 2000 * | 2.1 | 2.97 -41% | 4.73 -125% | 2.5 -19% | 3.9 -86% | 3.1 -48% |
| Colorchecker dE 2000 max. * | 5.54 | 5.33 4% | 8.45 -53% | 3.7 33% | 8.8 -59% | 5.6 -1% |
| Colorchecker dE 2000 calibrated * | 0.59 | 0.88 -49% | 0.51 14% | 1.3 -120% | 1 -69% | 0.8 -36% |
| Greyscale dE 2000 * | 1.7 | 2.4 -41% | 3.6 -112% | 2.9 -71% | 7.1 -318% | 4.5 -165% |
| Gamma | 2.26 97% | 2.06 107% | 2.08 106% | 2.03 108% | 2.12 104% | 2 110% |
| CCT | 6493 100% | 6668 97% | 6447 101% | 6840 95% | 7268 89% | 6528 100% |
| Total Average (Program / Settings) | -10% /
-8% | -11% /
-21% | -4% /
-9% | -16% /
-33% | -16% /
-20% |
* ... smaller is better
The display still comes well-calibrated out of the box with average grayscale and color deltaE values of just 1.7 and 2.1, respectively. An end-user calibration is possible but not required.


Display Response Times
| ↔ Response Time Black to White | ||
|---|---|---|
| 25.3 ms ... rise ↗ and fall ↘ combined | ↗ 12.6 ms rise | 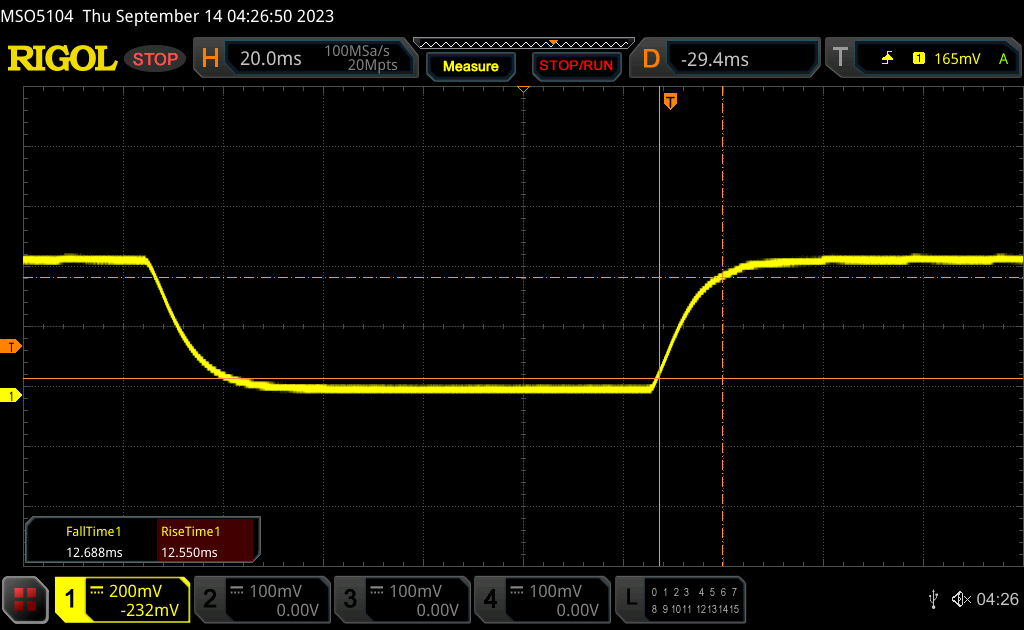 |
| ↘ 12.7 ms fall | ||
| The screen shows relatively slow response rates in our tests and may be too slow for gamers. In comparison, all tested devices range from 0.1 (minimum) to 240 (maximum) ms. » 61 % of all devices are better. This means that the measured response time is worse than the average of all tested devices (19.8 ms). | ||
| ↔ Response Time 50% Grey to 80% Grey | ||
| 43.9 ms ... rise ↗ and fall ↘ combined | ↗ 19.2 ms rise | 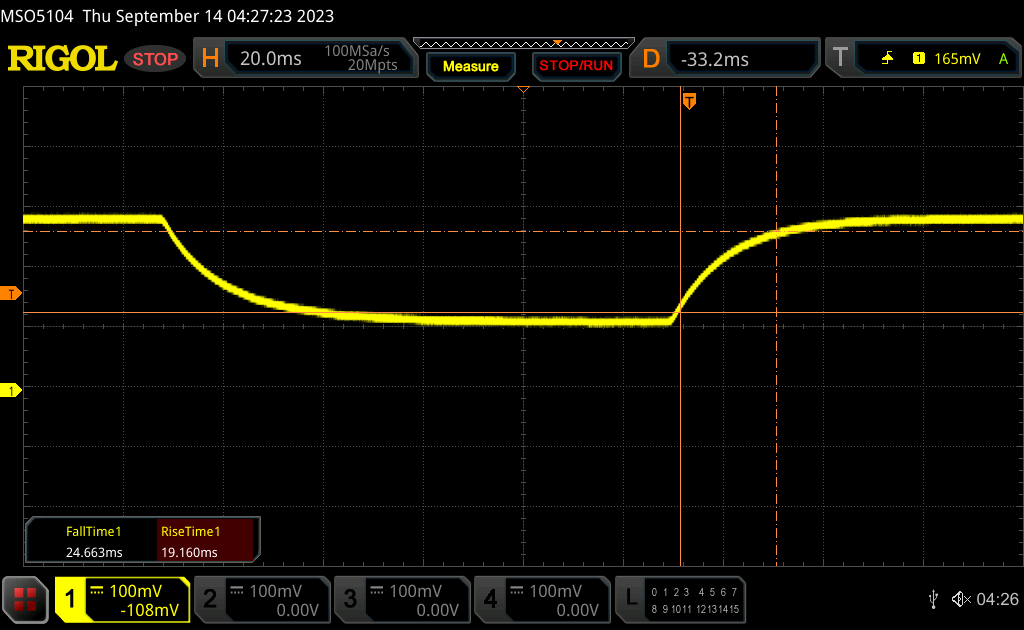 |
| ↘ 24.7 ms fall | ||
| The screen shows slow response rates in our tests and will be unsatisfactory for gamers. In comparison, all tested devices range from 0.165 (minimum) to 636 (maximum) ms. » 73 % of all devices are better. This means that the measured response time is worse than the average of all tested devices (31 ms). | ||
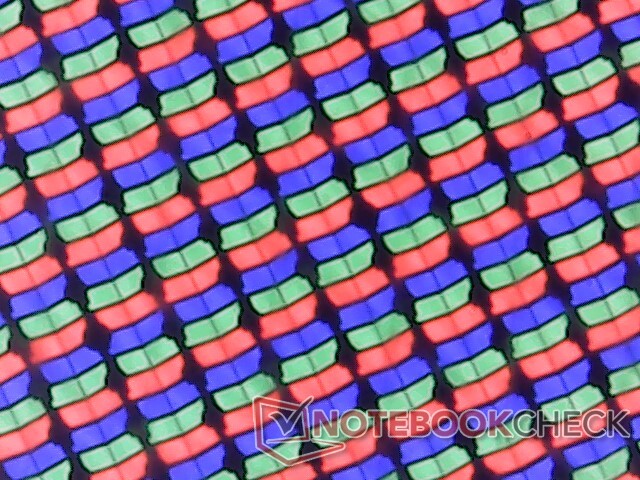
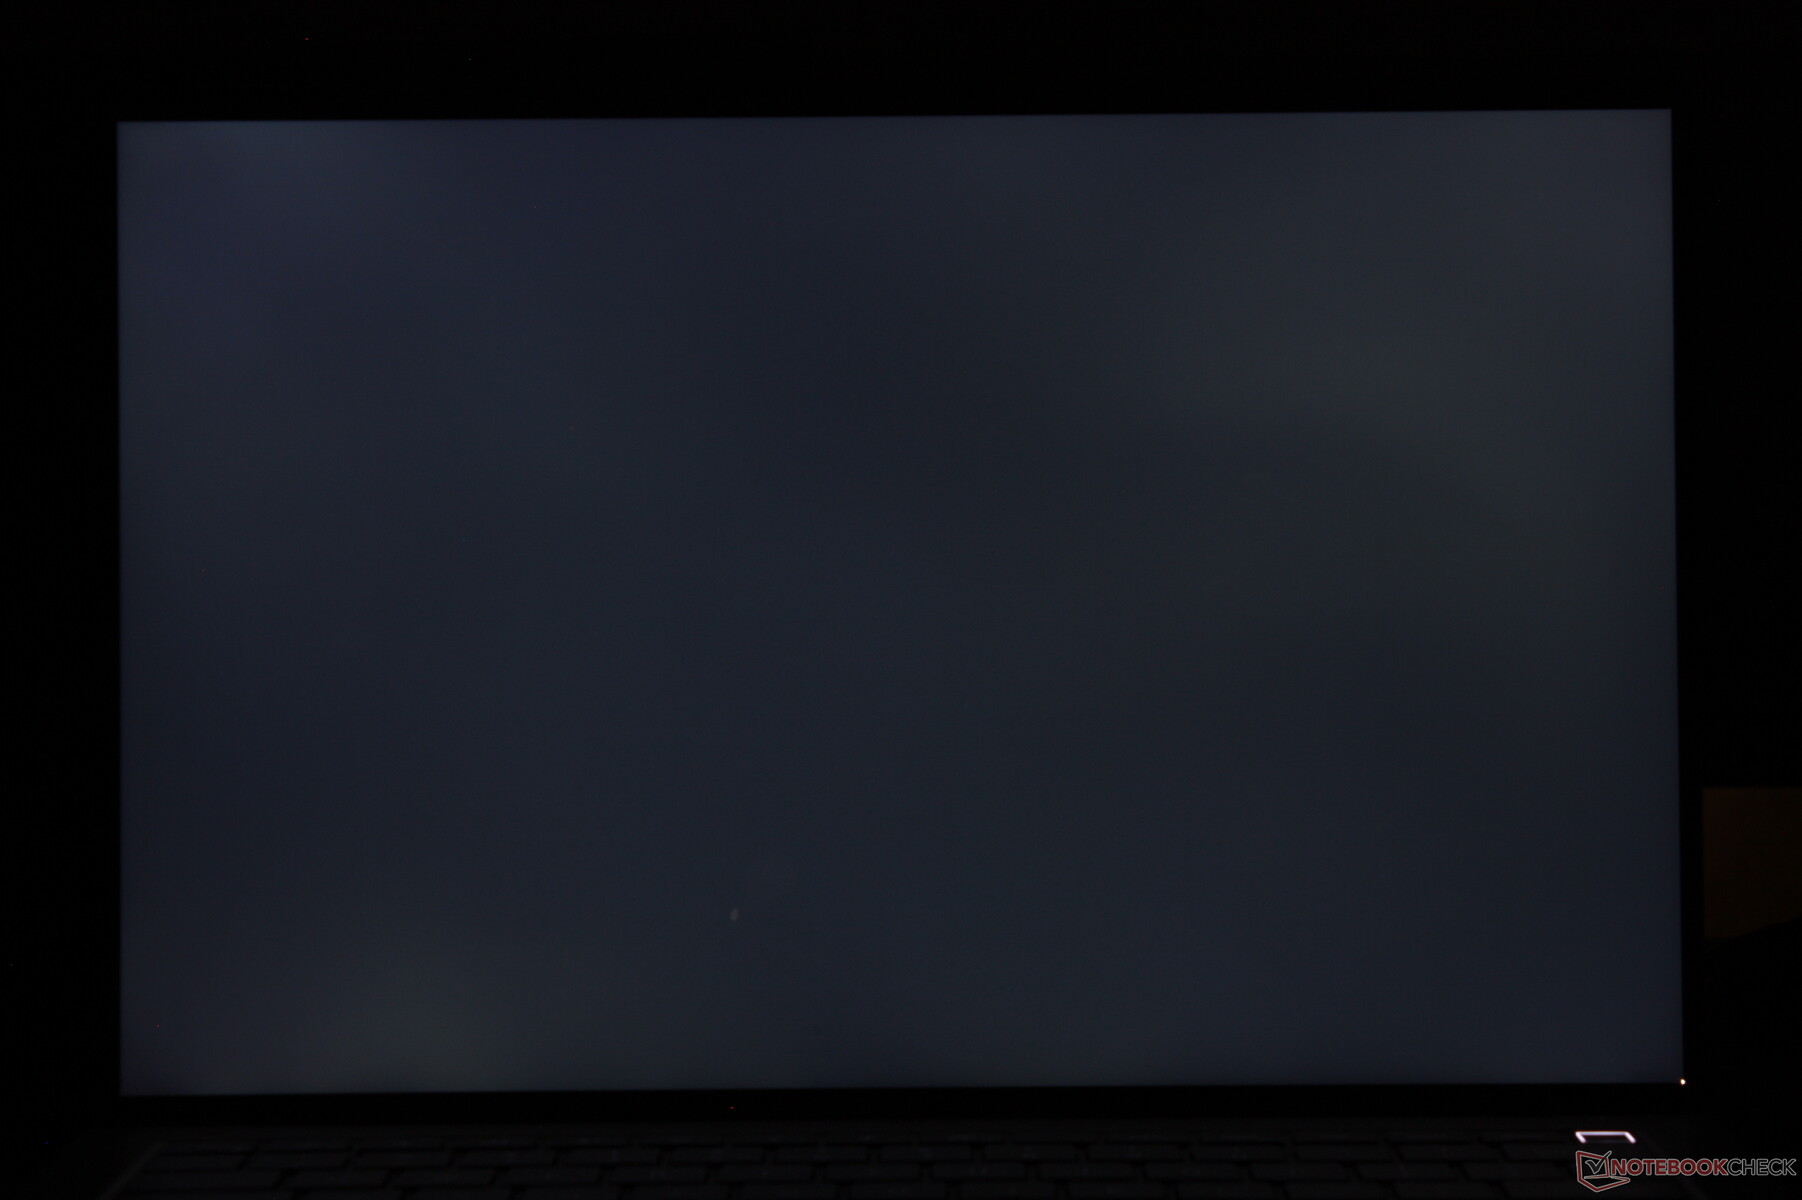
Screen Flickering / PWM (Pulse-Width Modulation)
| Screen flickering / PWM not detected | 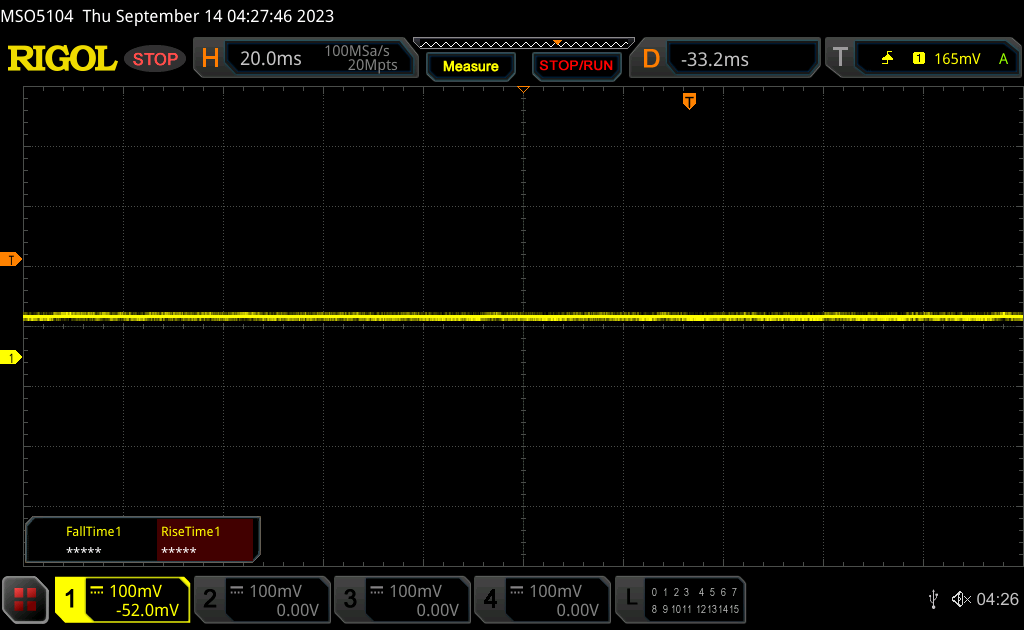 | ||
In comparison: 52 % of all tested devices do not use PWM to dim the display. If PWM was detected, an average of 7747 (minimum: 5 - maximum: 343500) Hz was measured. | |||
Performance — 13th Gen Raptor Lake-H
Testing Conditions
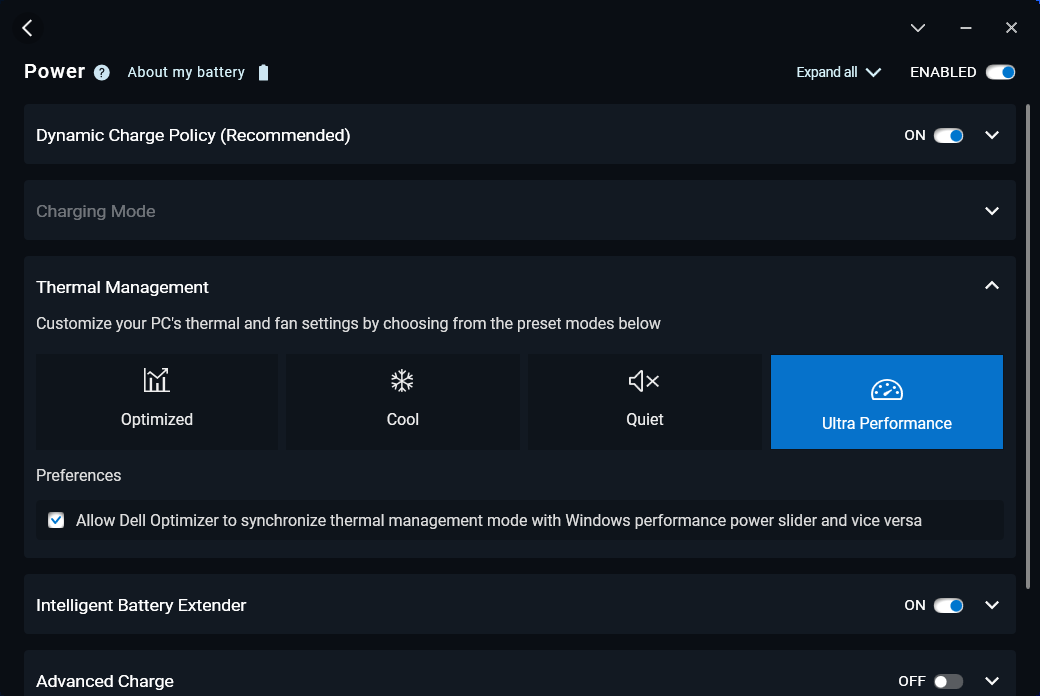
We set our unit to Ultra Performance mode via Dell Optimizer prior to running the benchmarks below. The Optimizer power profiles can synchronize with the Windows power profiles unlike on most other laptops.
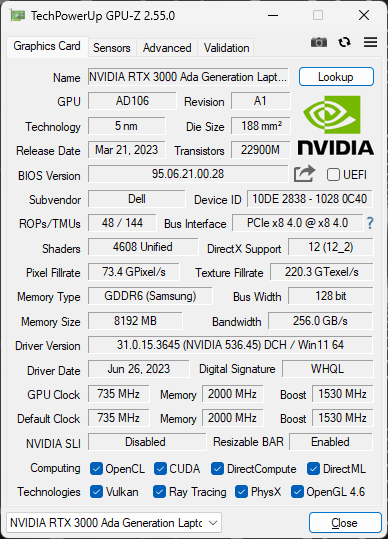
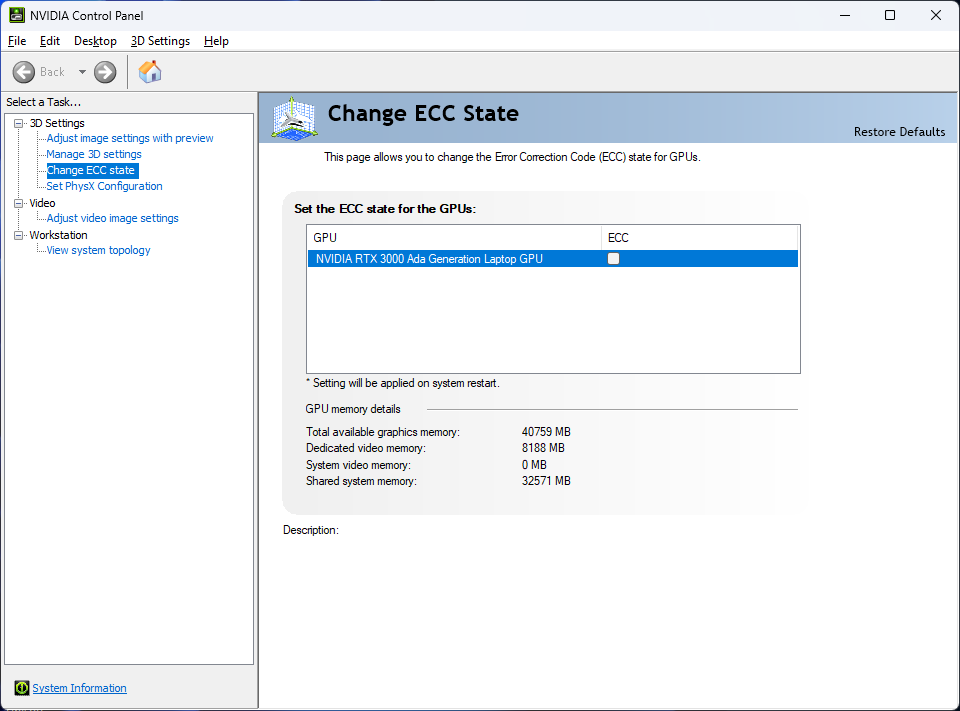
Advanced Optimus, MUX, and G-Sync are not supported on the internal display. VRAM ECC mode can be toggled on or off via the Nvidia Control Panel much like on other workstation-class RTX GPUs from the Ada Lovelace generation.
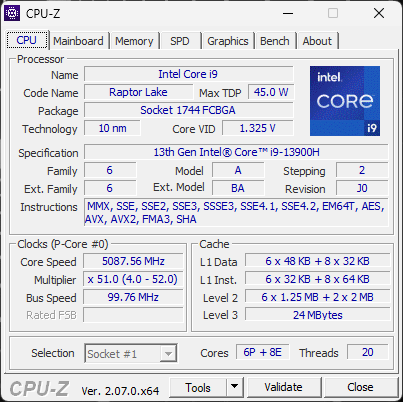
Processor
Our Core i9-13900H offers up to 25 to 35 percent faster multi-thread performance over the Core i9-12900H in last year's Precision 5470. The notable uptick can be attributed to the more stable Turbo Boost performance of the Precision 5480 when compared to the Precision 5470 as shown by our CineBench R15 xT loop test results below.
Average performance is still slower than expected for a laptop powered by the Core i9-13900H likely due to the small size of the Precision 5480. The larger Precision 5680, for example, carries the same CPU and yet it performs about 15 percent faster.
Cinebench R15 Multi Loop
Cinebench R23: Multi Core | Single Core
Cinebench R20: CPU (Multi Core) | CPU (Single Core)
Cinebench R15: CPU Multi 64Bit | CPU Single 64Bit
Blender: v2.79 BMW27 CPU
7-Zip 18.03: 7z b 4 | 7z b 4 -mmt1
Geekbench 5.5: Multi-Core | Single-Core
HWBOT x265 Benchmark v2.2: 4k Preset
LibreOffice : 20 Documents To PDF
R Benchmark 2.5: Overall mean
* ... smaller is better
AIDA64: FP32 Ray-Trace | FPU Julia | CPU SHA3 | CPU Queen | FPU SinJulia | FPU Mandel | CPU AES | CPU ZLib | FP64 Ray-Trace | CPU PhotoWorxx
| Performance rating | |
| Lenovo ThinkPad P15v G3 21EM001AGE | |
| Dell Precision 5480 | |
| Average Intel Core i9-13900H | |
| Lenovo ThinkPad P14s G3 AMD 21J6S05000 | |
| Dell Precision 5000 5470 | |
| HP ZBook Firefly 14 G9-6B8A2EA | |
| AIDA64 / FP32 Ray-Trace | |
| Dell Precision 5480 | |
| Average Intel Core i9-13900H (6788 - 19557, n=25) | |
| Lenovo ThinkPad P15v G3 21EM001AGE | |
| Dell Precision 5000 5470 | |
| Lenovo ThinkPad P14s G3 AMD 21J6S05000 | |
| HP ZBook Firefly 14 G9-6B8A2EA | |
| AIDA64 / FPU Julia | |
| Lenovo ThinkPad P15v G3 21EM001AGE | |
| Lenovo ThinkPad P14s G3 AMD 21J6S05000 | |
| Dell Precision 5480 | |
| Average Intel Core i9-13900H (22551 - 95579, n=25) | |
| Dell Precision 5000 5470 | |
| HP ZBook Firefly 14 G9-6B8A2EA | |
| AIDA64 / CPU SHA3 | |
| Average Intel Core i9-13900H (2491 - 4270, n=25) | |
| Dell Precision 5480 | |
| Lenovo ThinkPad P15v G3 21EM001AGE | |
| Dell Precision 5000 5470 | |
| Lenovo ThinkPad P14s G3 AMD 21J6S05000 | |
| HP ZBook Firefly 14 G9-6B8A2EA | |
| AIDA64 / CPU Queen | |
| Dell Precision 5480 | |
| Dell Precision 5000 5470 | |
| Average Intel Core i9-13900H (65121 - 120936, n=25) | |
| Lenovo ThinkPad P15v G3 21EM001AGE | |
| Lenovo ThinkPad P14s G3 AMD 21J6S05000 | |
| HP ZBook Firefly 14 G9-6B8A2EA | |
| AIDA64 / FPU SinJulia | |
| Lenovo ThinkPad P15v G3 21EM001AGE | |
| Lenovo ThinkPad P14s G3 AMD 21J6S05000 | |
| Dell Precision 5480 | |
| Average Intel Core i9-13900H (6108 - 11631, n=25) | |
| Dell Precision 5000 5470 | |
| HP ZBook Firefly 14 G9-6B8A2EA | |
| AIDA64 / FPU Mandel | |
| Lenovo ThinkPad P15v G3 21EM001AGE | |
| Lenovo ThinkPad P14s G3 AMD 21J6S05000 | |
| Dell Precision 5480 | |
| Average Intel Core i9-13900H (11283 - 48474, n=25) | |
| Dell Precision 5000 5470 | |
| HP ZBook Firefly 14 G9-6B8A2EA | |
| AIDA64 / CPU AES | |
| Lenovo ThinkPad P15v G3 21EM001AGE | |
| Average Intel Core i9-13900H (3691 - 149377, n=25) | |
| Dell Precision 5480 | |
| Lenovo ThinkPad P14s G3 AMD 21J6S05000 | |
| HP ZBook Firefly 14 G9-6B8A2EA | |
| Dell Precision 5000 5470 | |
| AIDA64 / CPU ZLib | |
| Average Intel Core i9-13900H (789 - 1254, n=25) | |
| Dell Precision 5480 | |
| Lenovo ThinkPad P15v G3 21EM001AGE | |
| Lenovo ThinkPad P14s G3 AMD 21J6S05000 | |
| HP ZBook Firefly 14 G9-6B8A2EA | |
| Dell Precision 5000 5470 | |
| AIDA64 / FP64 Ray-Trace | |
| Average Intel Core i9-13900H (3655 - 10716, n=25) | |
| Dell Precision 5480 | |
| Lenovo ThinkPad P15v G3 21EM001AGE | |
| Dell Precision 5000 5470 | |
| Lenovo ThinkPad P14s G3 AMD 21J6S05000 | |
| HP ZBook Firefly 14 G9-6B8A2EA | |
| AIDA64 / CPU PhotoWorxx | |
| Dell Precision 5480 | |
| Dell Precision 5000 5470 | |
| HP ZBook Firefly 14 G9-6B8A2EA | |
| Average Intel Core i9-13900H (10871 - 50488, n=25) | |
| Lenovo ThinkPad P14s G3 AMD 21J6S05000 | |
| Lenovo ThinkPad P15v G3 21EM001AGE | |
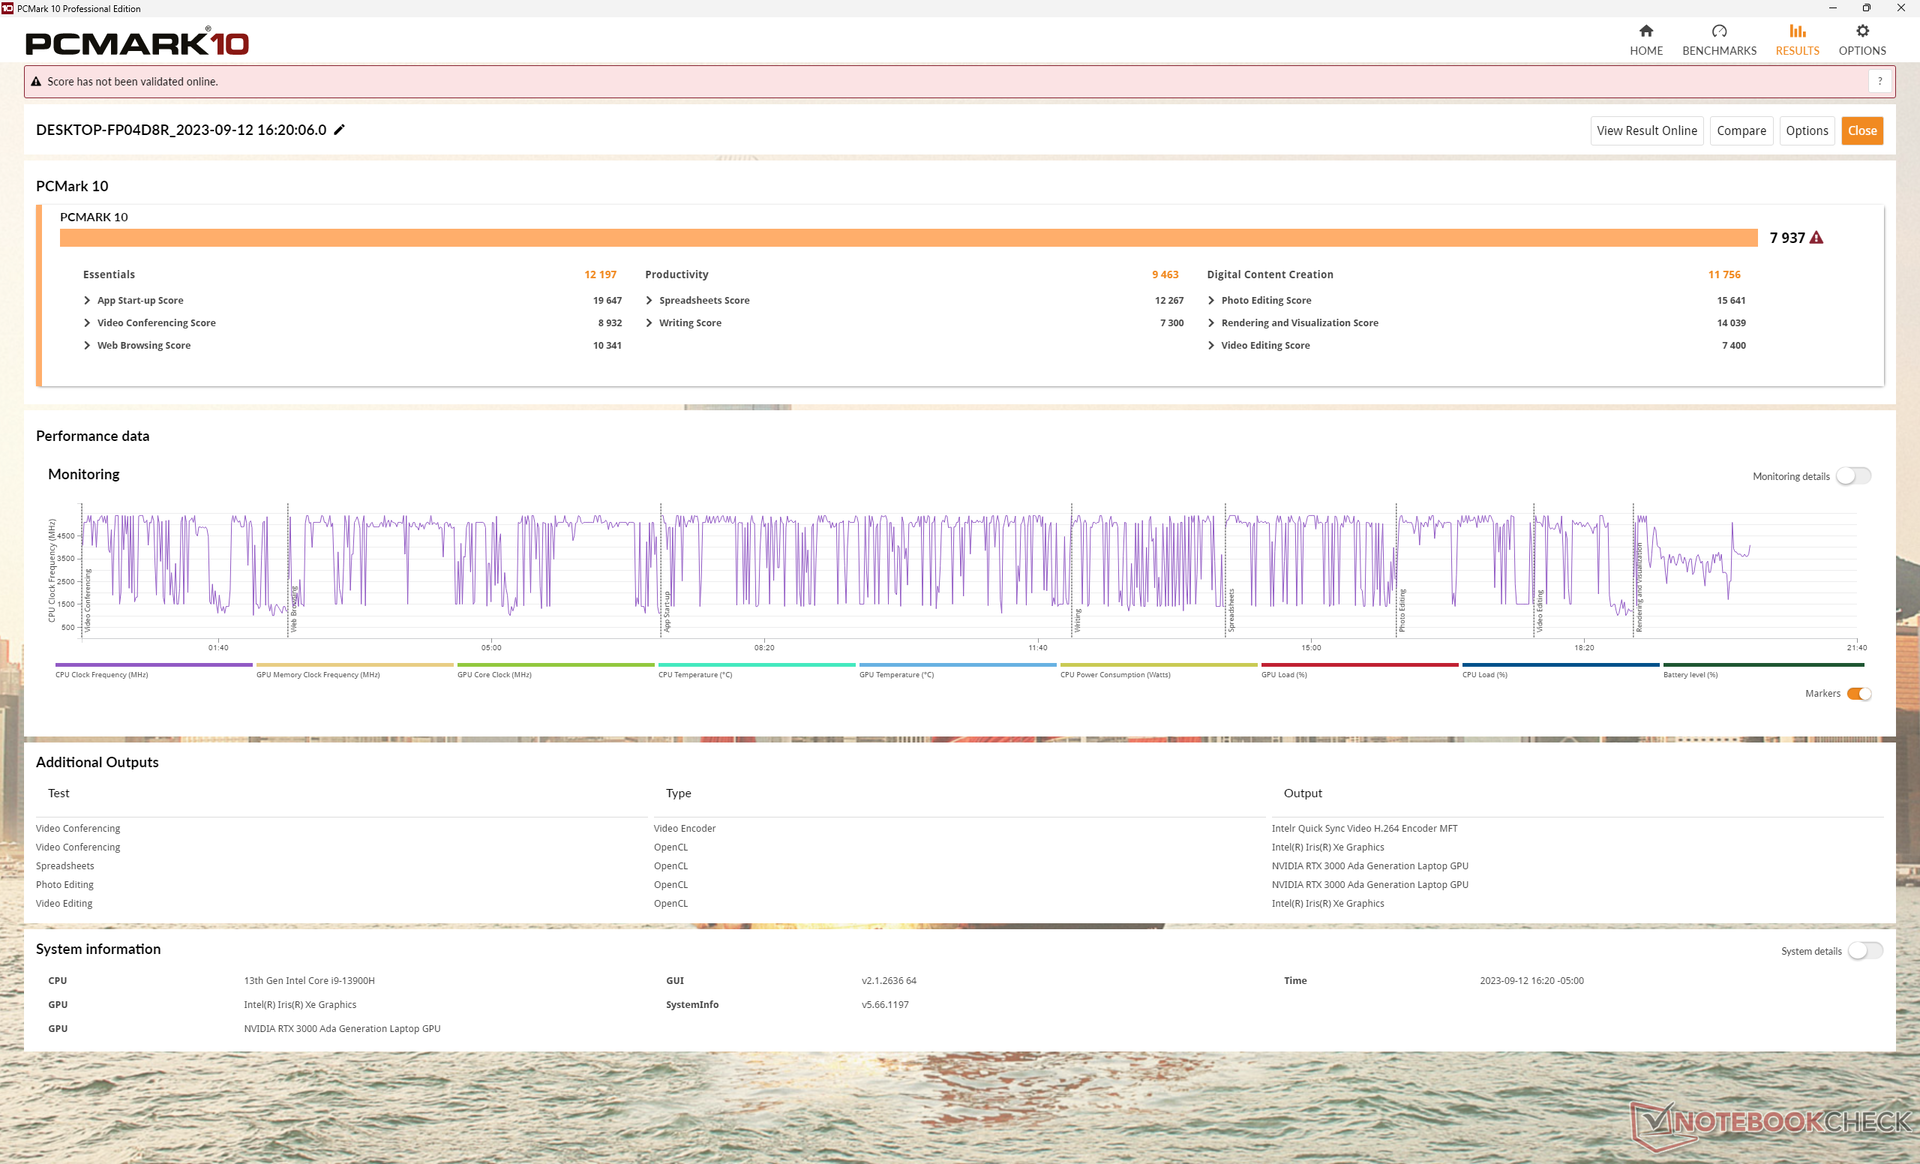
System Performance
PCMark scores are higher than other 14-inch workstations we've tested thus far. Much of the gain can be attributed to the new RTX 3000 Ada GPU which offers significant performance advantages over last year's Ampere options as our GPU Performance section below will show.
CrossMark: Overall | Productivity | Creativity | Responsiveness
| CrossMark / Overall | |
| Dell Precision 5480 | |
| Dell Precision 5000 5470 | |
| HP ZBook Firefly 14 G9-6B8A2EA | |
| Lenovo ThinkPad P15v G3 21EM001AGE | |
| Lenovo ThinkPad P14s G3 AMD 21J6S05000 | |
| CrossMark / Productivity | |
| Dell Precision 5480 | |
| Dell Precision 5000 5470 | |
| HP ZBook Firefly 14 G9-6B8A2EA | |
| Lenovo ThinkPad P15v G3 21EM001AGE | |
| Lenovo ThinkPad P14s G3 AMD 21J6S05000 | |
| CrossMark / Creativity | |
| Dell Precision 5480 | |
| Dell Precision 5000 5470 | |
| HP ZBook Firefly 14 G9-6B8A2EA | |
| Lenovo ThinkPad P15v G3 21EM001AGE | |
| Lenovo ThinkPad P14s G3 AMD 21J6S05000 | |
| CrossMark / Responsiveness | |
| Dell Precision 5480 | |
| Dell Precision 5000 5470 | |
| HP ZBook Firefly 14 G9-6B8A2EA | |
| Lenovo ThinkPad P15v G3 21EM001AGE | |
| Lenovo ThinkPad P14s G3 AMD 21J6S05000 | |
| PCMark 10 Score | 7937 points | |
Help | ||
| AIDA64 / Memory Copy | |
| Dell Precision 5480 | |
| Dell Precision 5000 5470 | |
| Average Intel Core i9-13900H (37448 - 74486, n=25) | |
| HP ZBook Firefly 14 G9-6B8A2EA | |
| Lenovo ThinkPad P14s G3 AMD 21J6S05000 | |
| Lenovo ThinkPad P15v G3 21EM001AGE | |
| AIDA64 / Memory Read | |
| Dell Precision 5000 5470 | |
| Dell Precision 5480 | |
| HP ZBook Firefly 14 G9-6B8A2EA | |
| Average Intel Core i9-13900H (41599 - 75433, n=25) | |
| Lenovo ThinkPad P14s G3 AMD 21J6S05000 | |
| Lenovo ThinkPad P15v G3 21EM001AGE | |
| AIDA64 / Memory Write | |
| Dell Precision 5480 | |
| Average Intel Core i9-13900H (36152 - 88505, n=25) | |
| HP ZBook Firefly 14 G9-6B8A2EA | |
| Dell Precision 5000 5470 | |
| Lenovo ThinkPad P14s G3 AMD 21J6S05000 | |
| Lenovo ThinkPad P15v G3 21EM001AGE | |
| AIDA64 / Memory Latency | |
| Lenovo ThinkPad P14s G3 AMD 21J6S05000 | |
| Dell Precision 5000 5470 | |
| Lenovo ThinkPad P15v G3 21EM001AGE | |
| Dell Precision 5480 | |
| Average Intel Core i9-13900H (75.8 - 102.3, n=25) | |
| HP ZBook Firefly 14 G9-6B8A2EA | |
* ... smaller is better
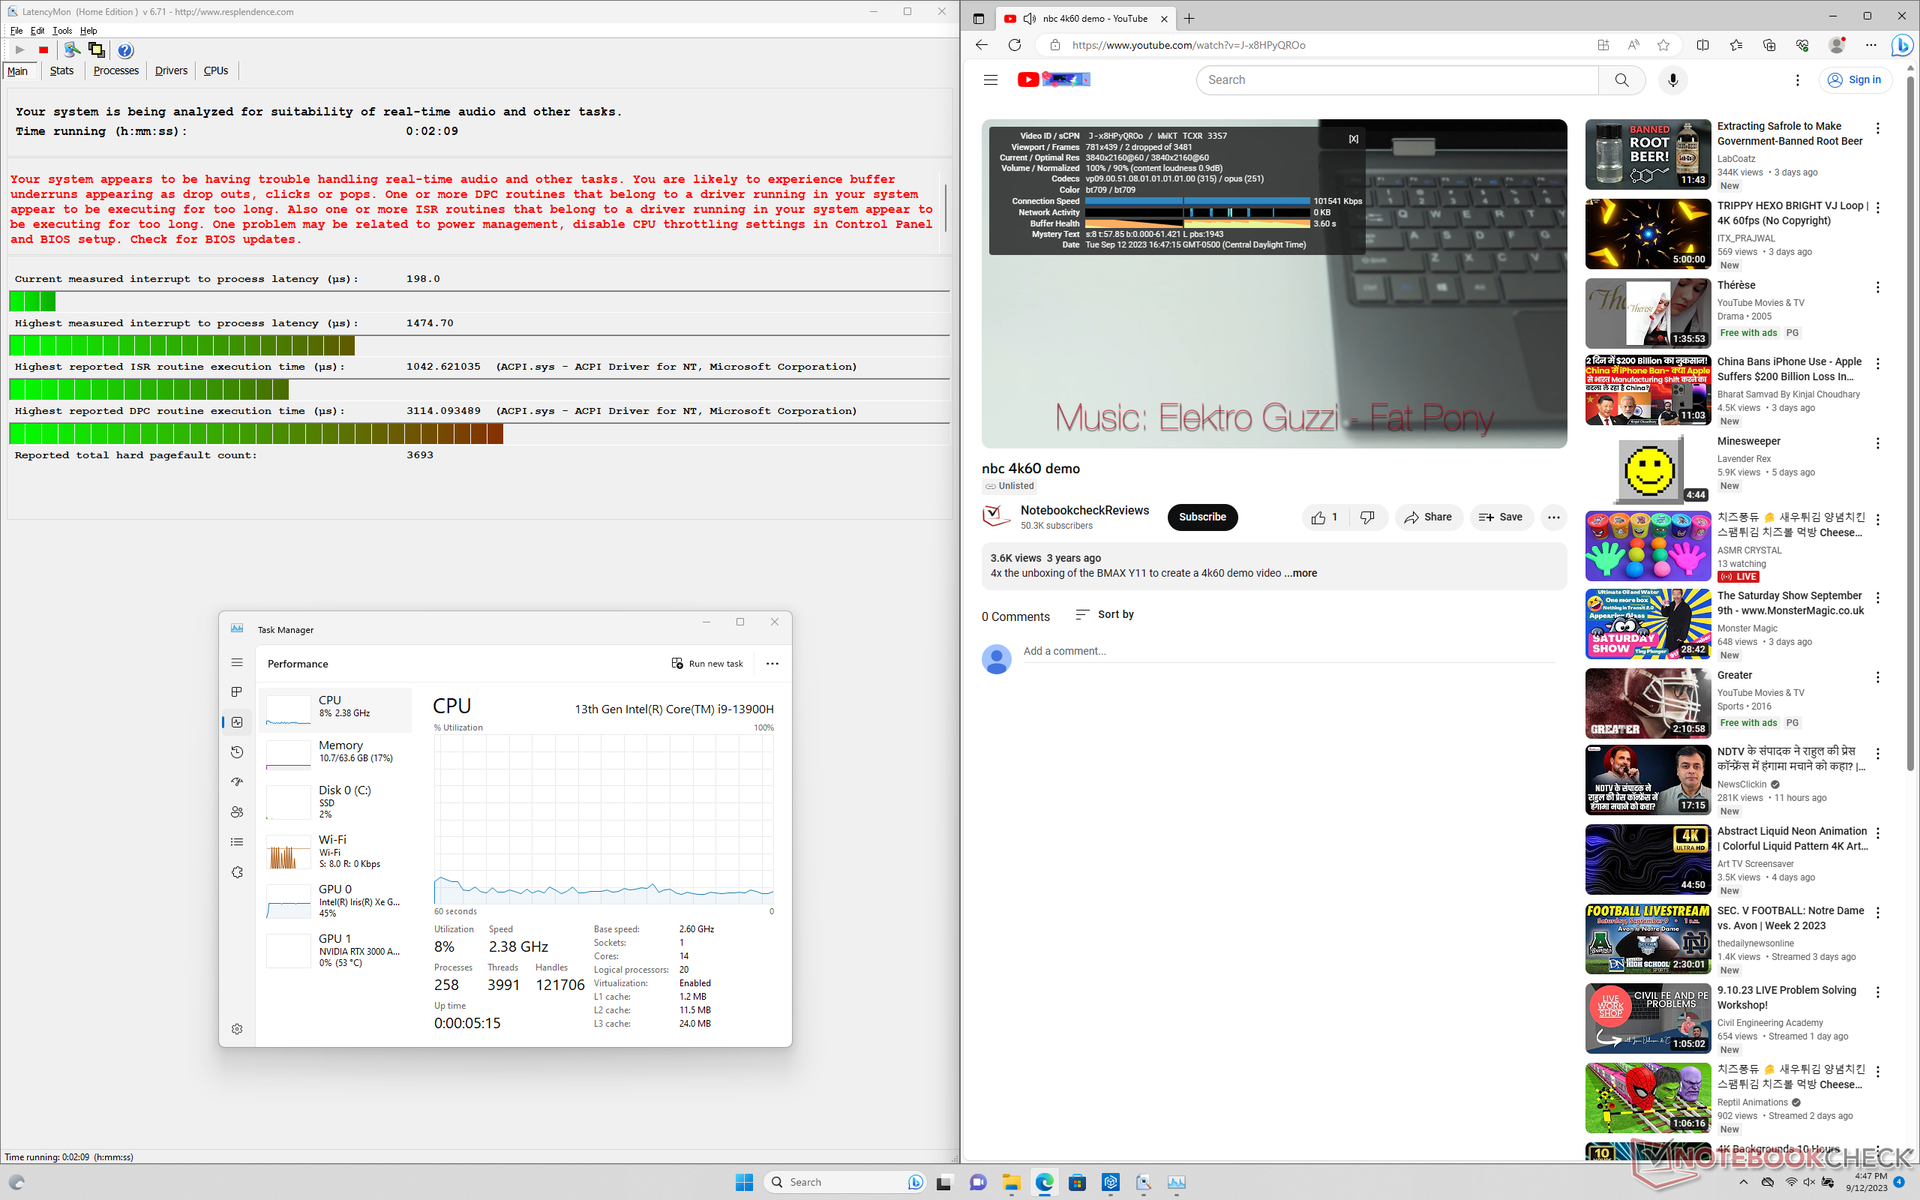
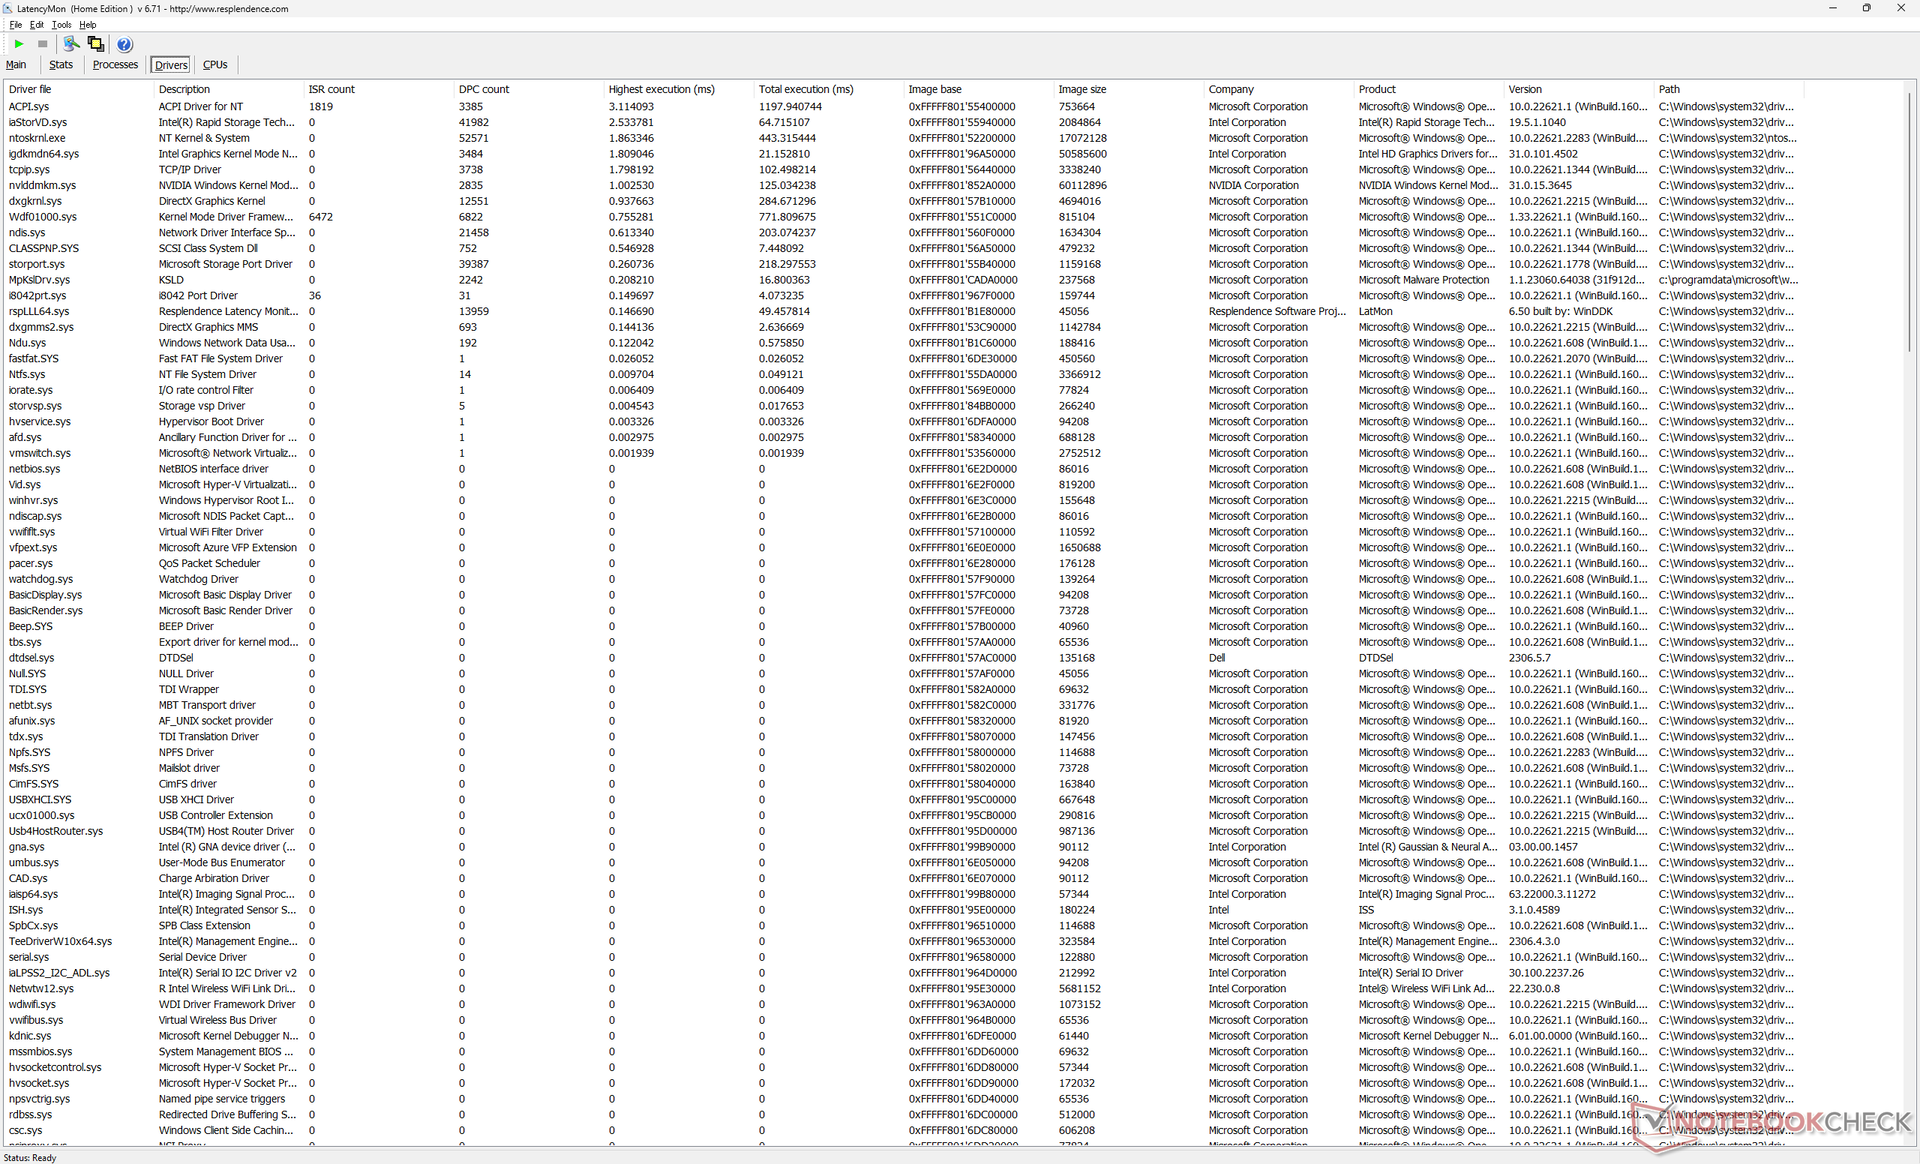
DPC Latency
LatencyMon reveals DPC issues when opening multiple browser tabs of our homepage. We're also able to record 2 dropped frames during a minute-long 4K60 video which is unfortunate to see on a mobile workstation.
| DPC Latencies / LatencyMon - interrupt to process latency (max), Web, Youtube, Prime95 | |
| Dell Precision 5480 | |
| Dell Precision 5000 5470 | |
| Lenovo ThinkPad P14s G3 AMD 21J6S05000 | |
| Dell Precision 5000 5560 | |
| Lenovo ThinkPad P15v G3 21EM001AGE | |
* ... smaller is better
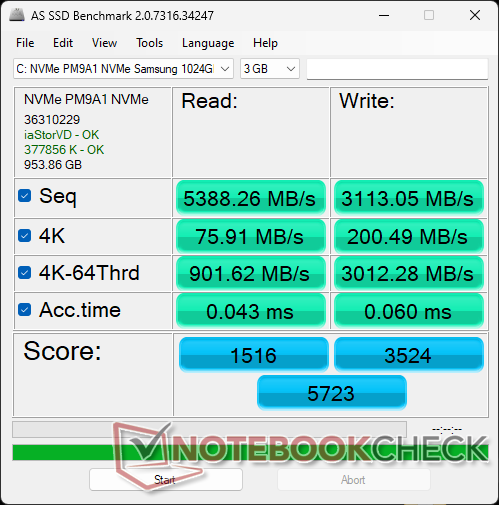
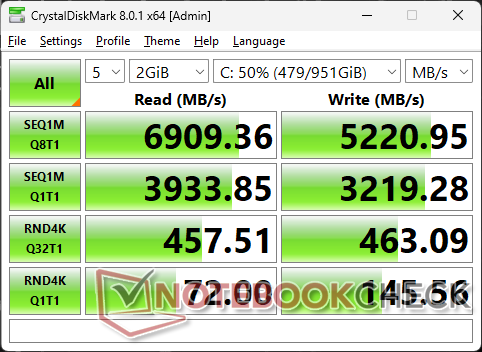
Storage Devices
Dell appears to be utilizing Samsung PM9A1 SSDs for most of its Precision models including the Precision 5470 and 5560. Maximum transfer rates are steady at about 6900 MB/s with no throttling issues.
Self-encrypting drives are optional from Dell, but the model can only support one internal SSD.

* ... smaller is better
Disk Throttling: DiskSpd Read Loop, Queue Depth 8
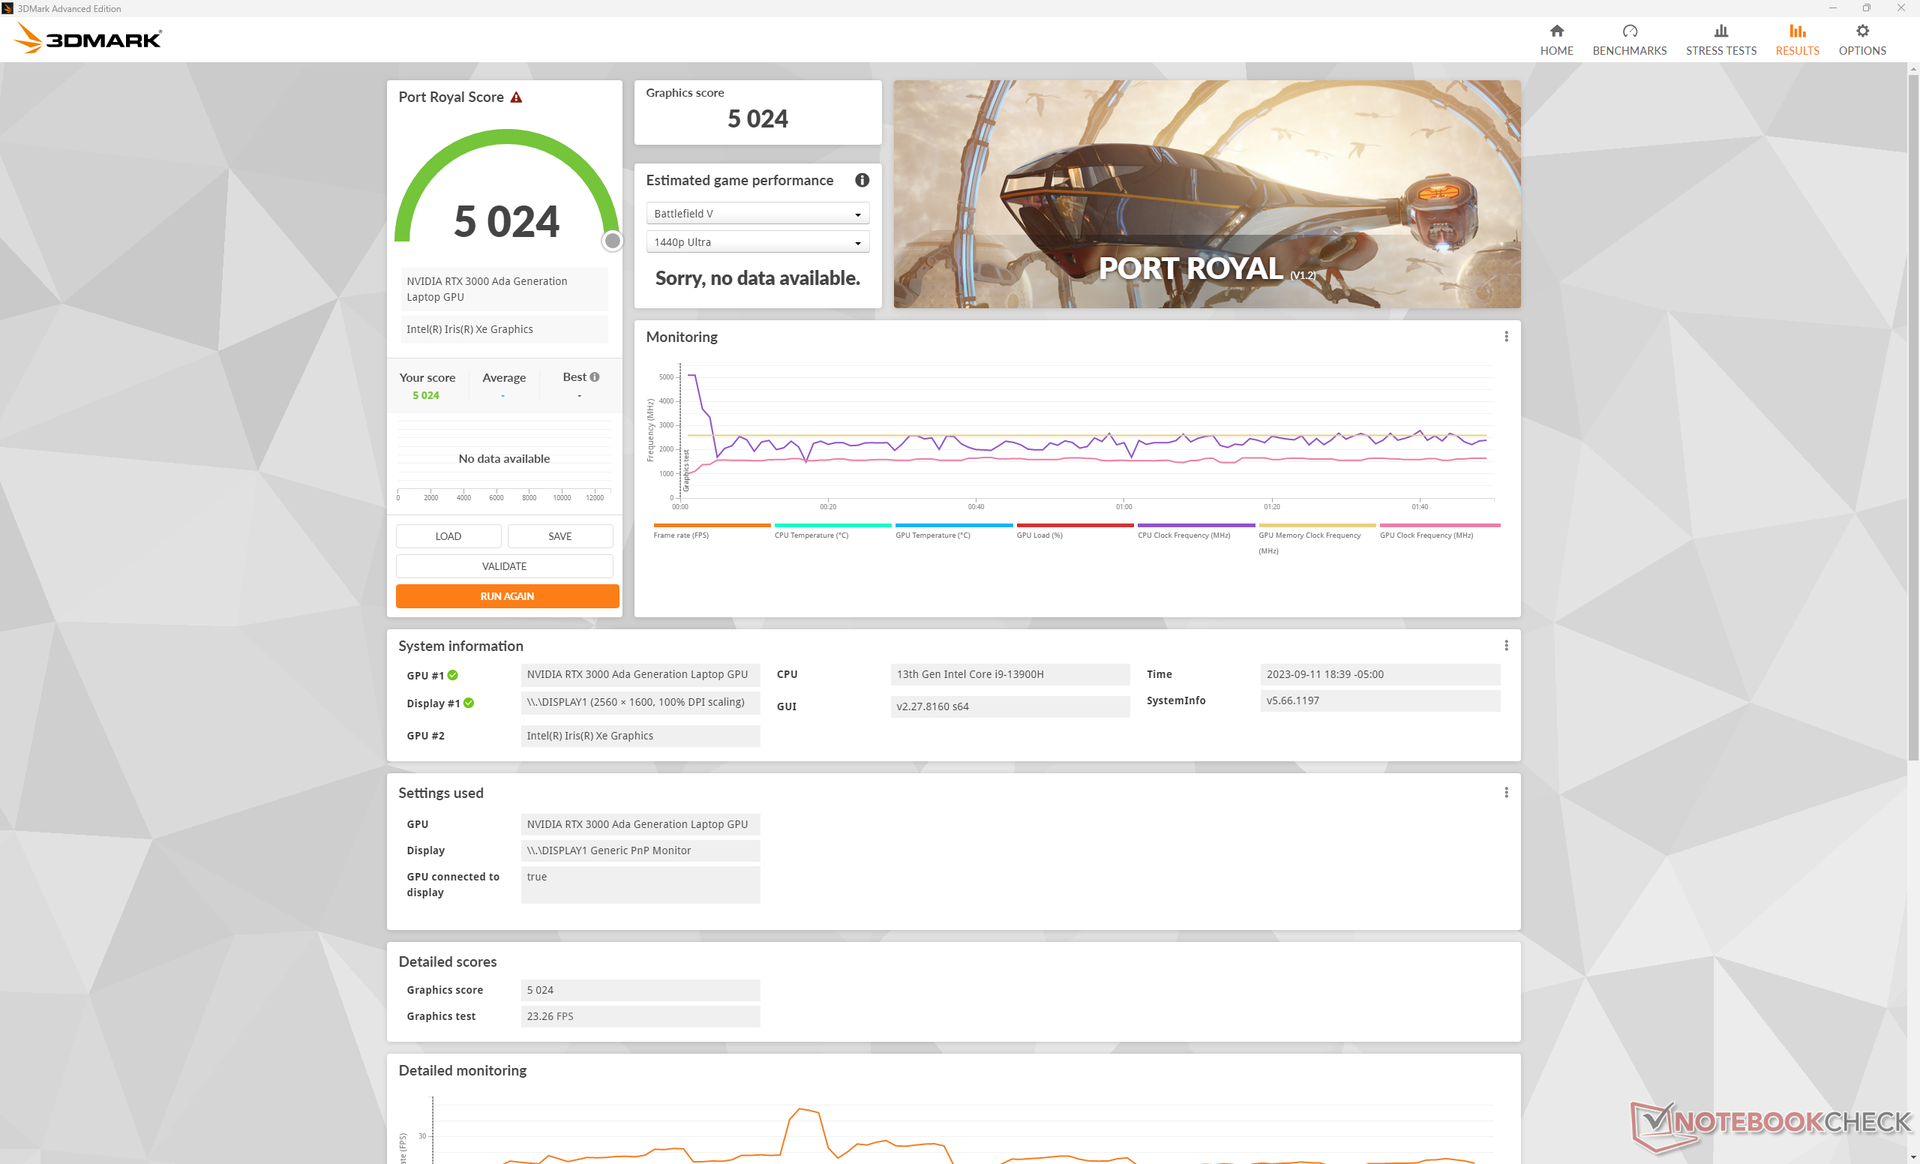
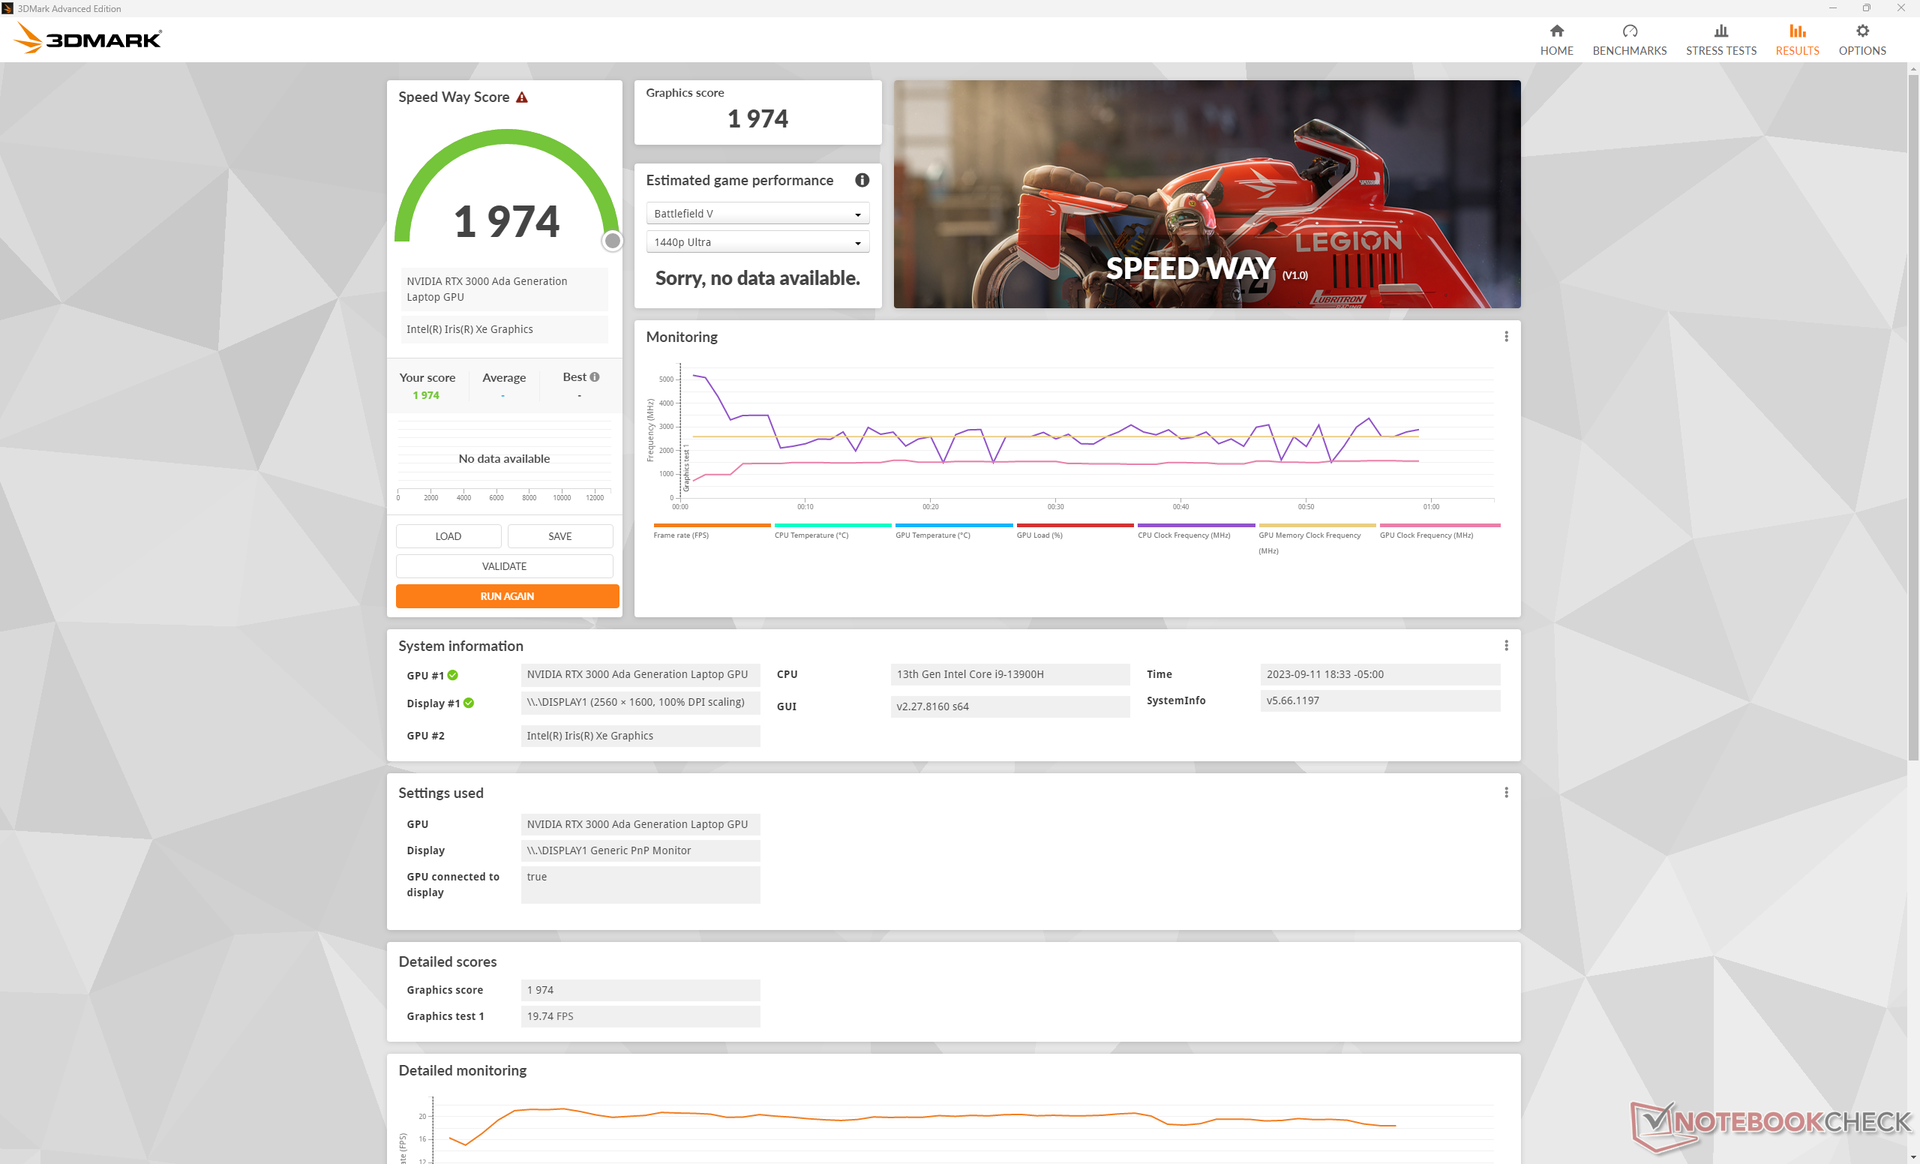
GPU Performance
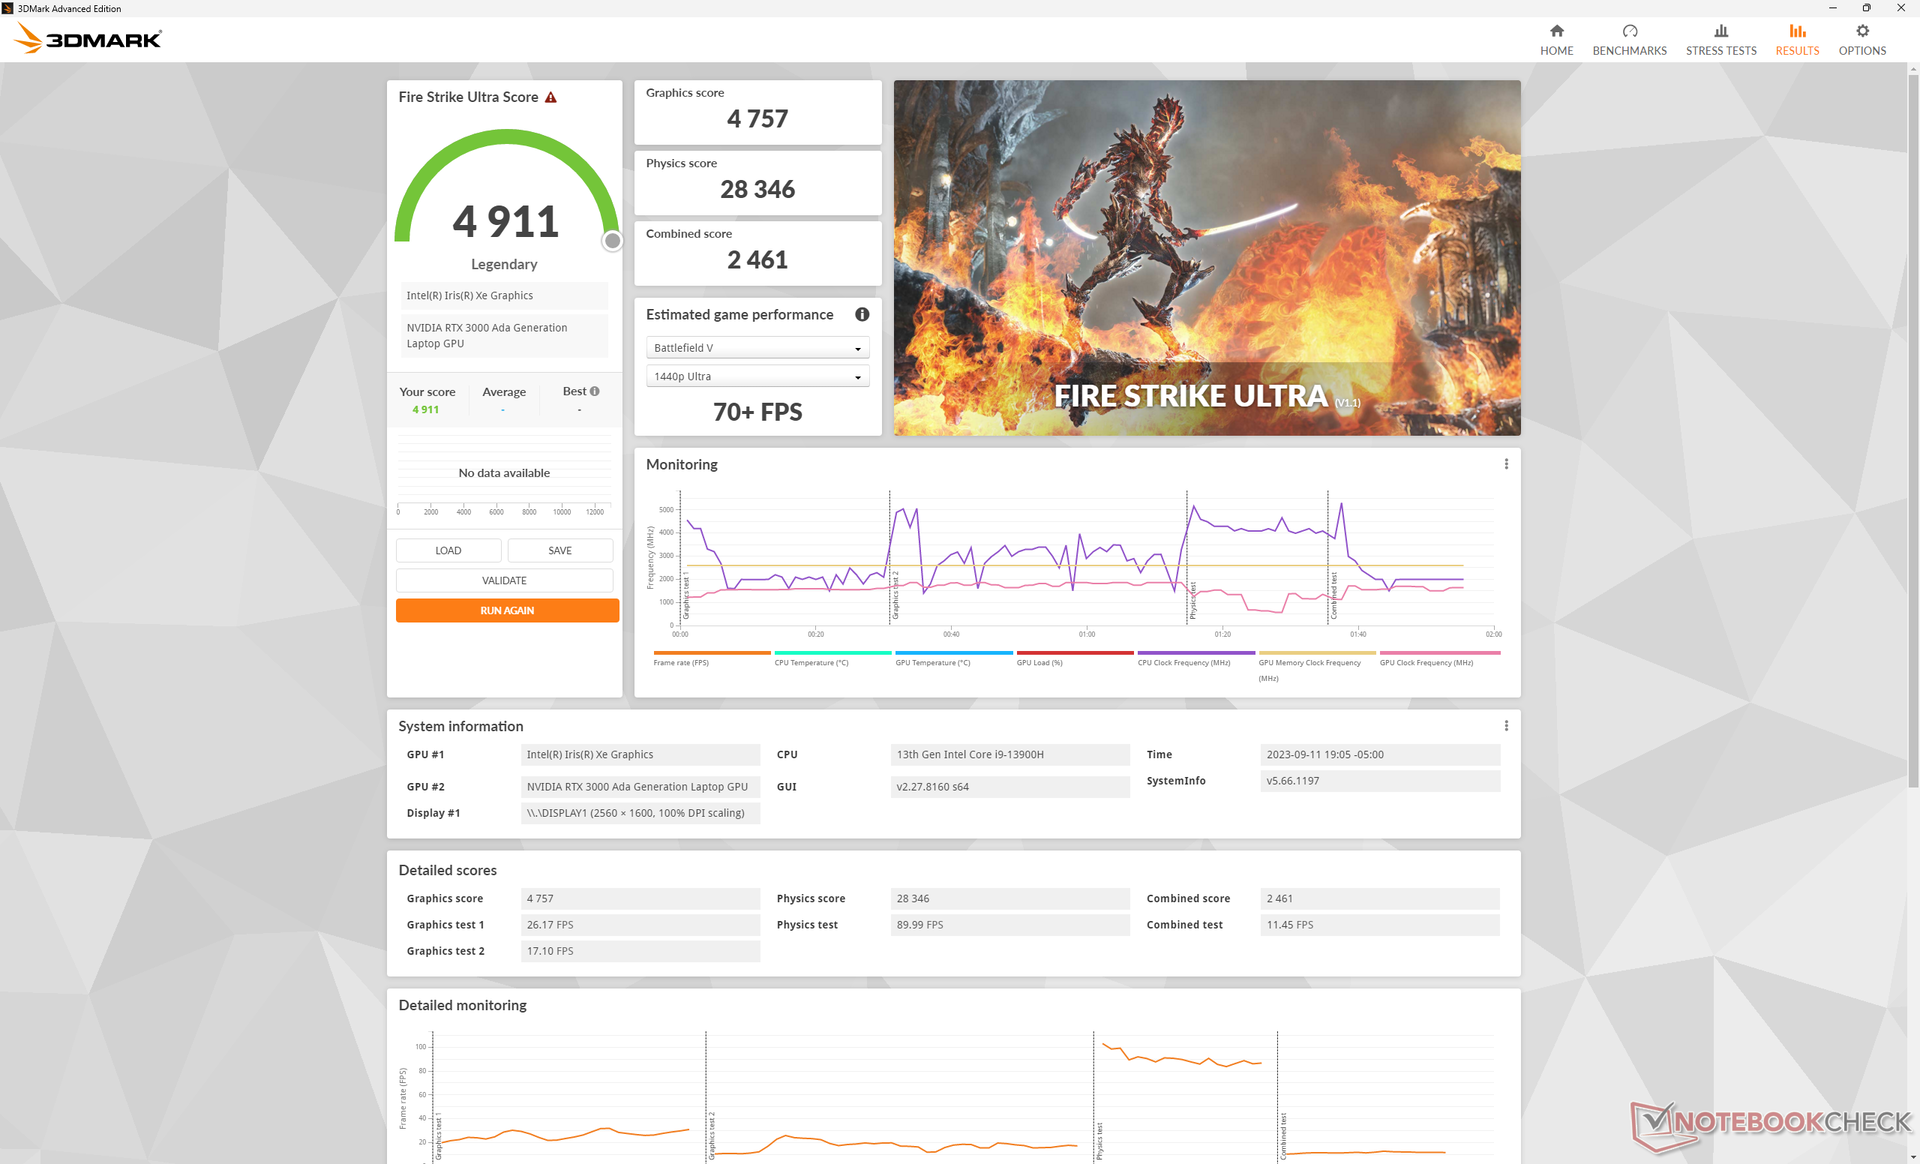
The RTX 3000 Ada is about 60 to 80 percent faster than the RTX A1000 on last year's Precision 5470 or about 10 to 15 percent faster than the RTX A3000 that it directly replaces. The newer GPU targets a slightly higher TGP of 50 W whereas the GPU in the Precision 5470 was limited to 40 W.
Last generation's RTX A1000 is still configurable on the Precision 5480, but the RTX 3000 Ada is highly recommended for its significant performance boosts. The newer Ada GPU is only a bit behind the older ampere RTX A5500 as found on much larger workstations like the HP ZBook Fury 16 G9.
Running on Balanced mode impacts CPU performance more than GPU performance as shown by our Fire Strike results in the table below. The deficits are relatively minor and in the single-digit percentage points even if running on battery mode.
Interestingly, two SpecViewPerf 12 subtests (energy and medical) would always crash on our unit and so these scores have been omitted from the graphs below.
| Power Profile | Physics Score | Graphics Score | Combined Score |
| Performance Mode | 29061 | 20908 | 8316 |
| Balanced Mode | 26880 (-8%) | 20411 (-2%) | 7633 (-8%) |
| Battery Mode | 27852 (-4%) | 19755 (-6%) | 7569 (-9%) |
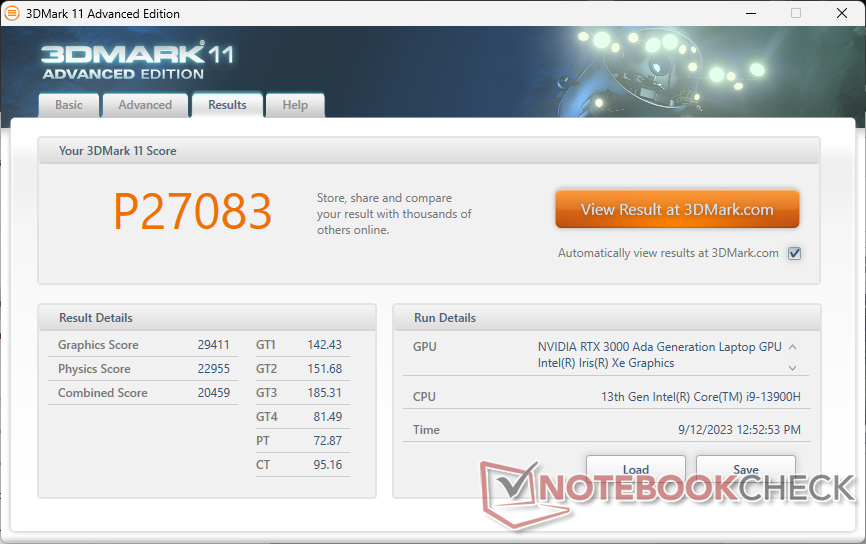
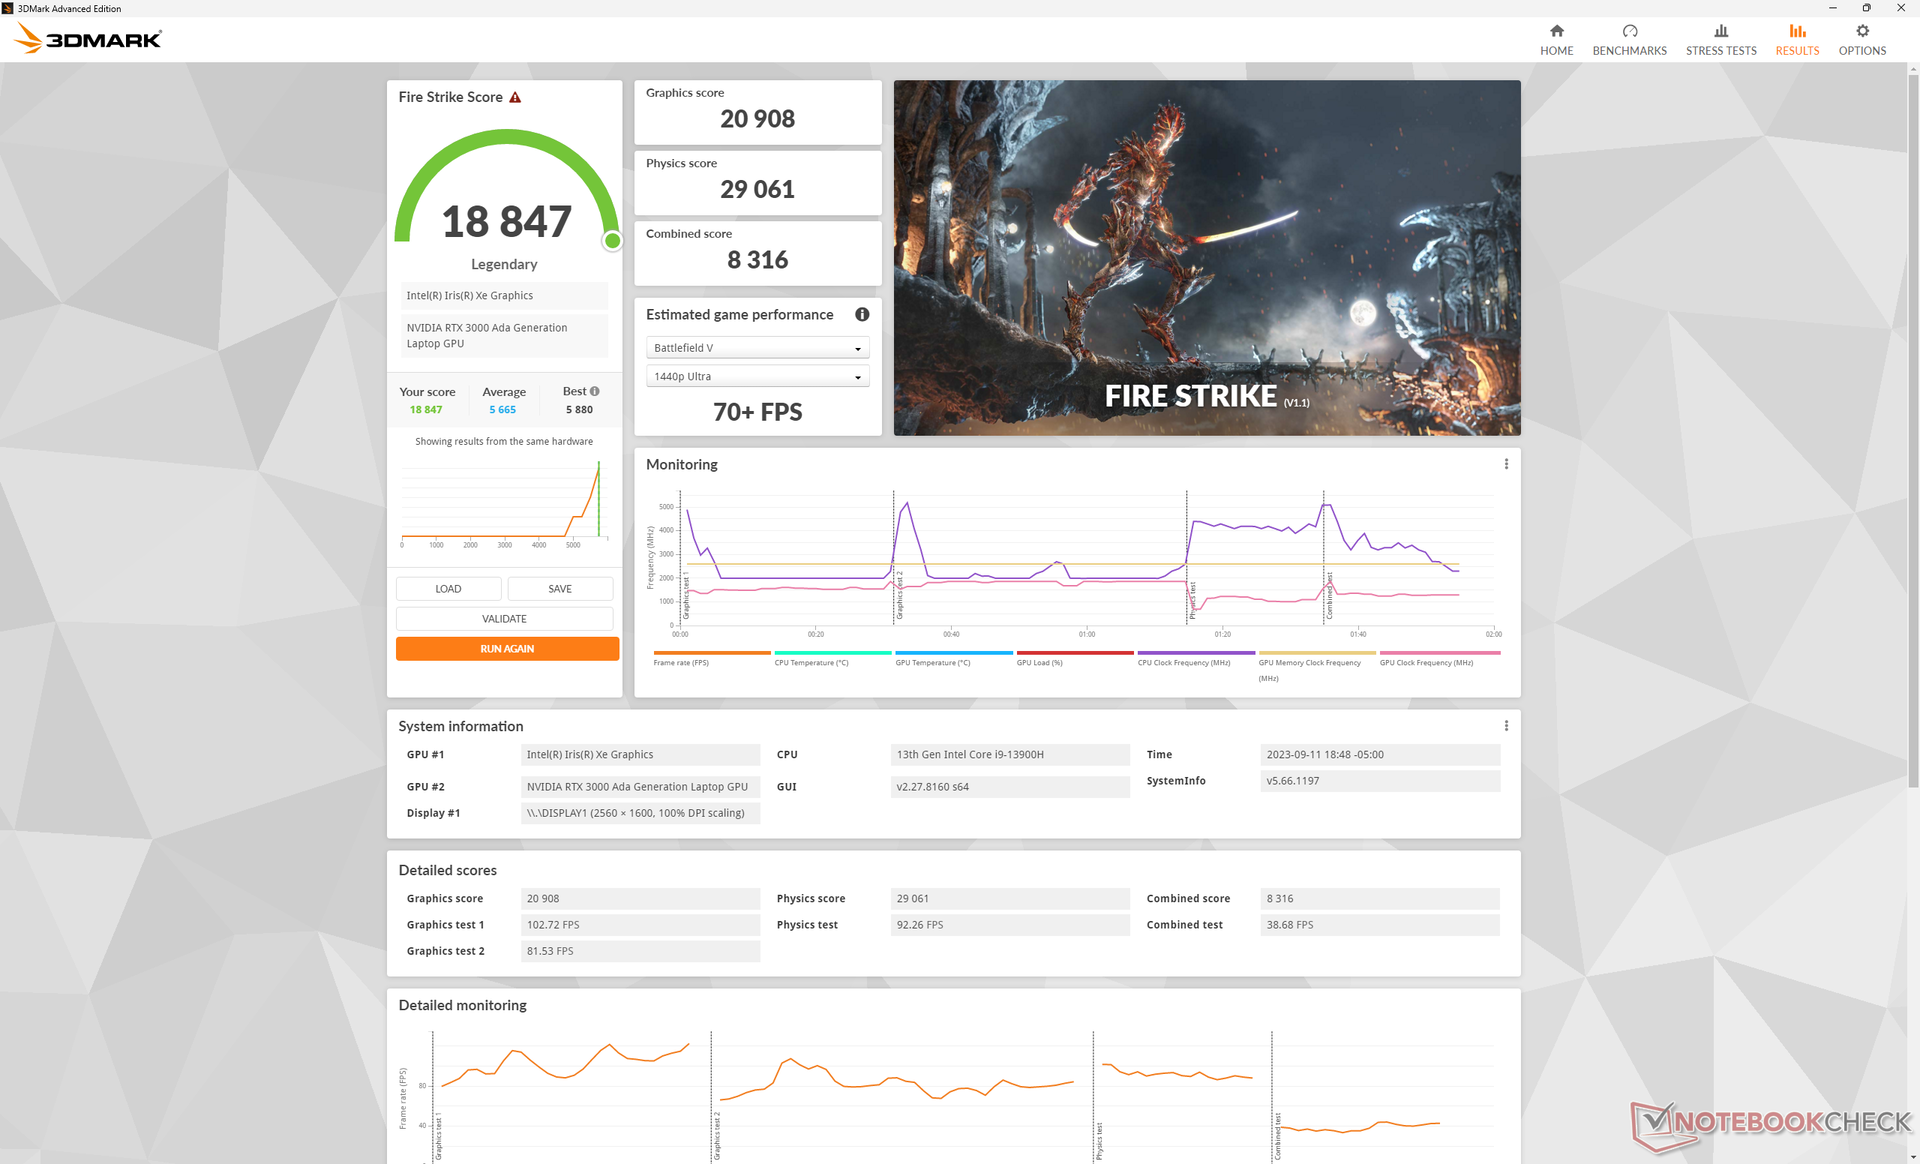
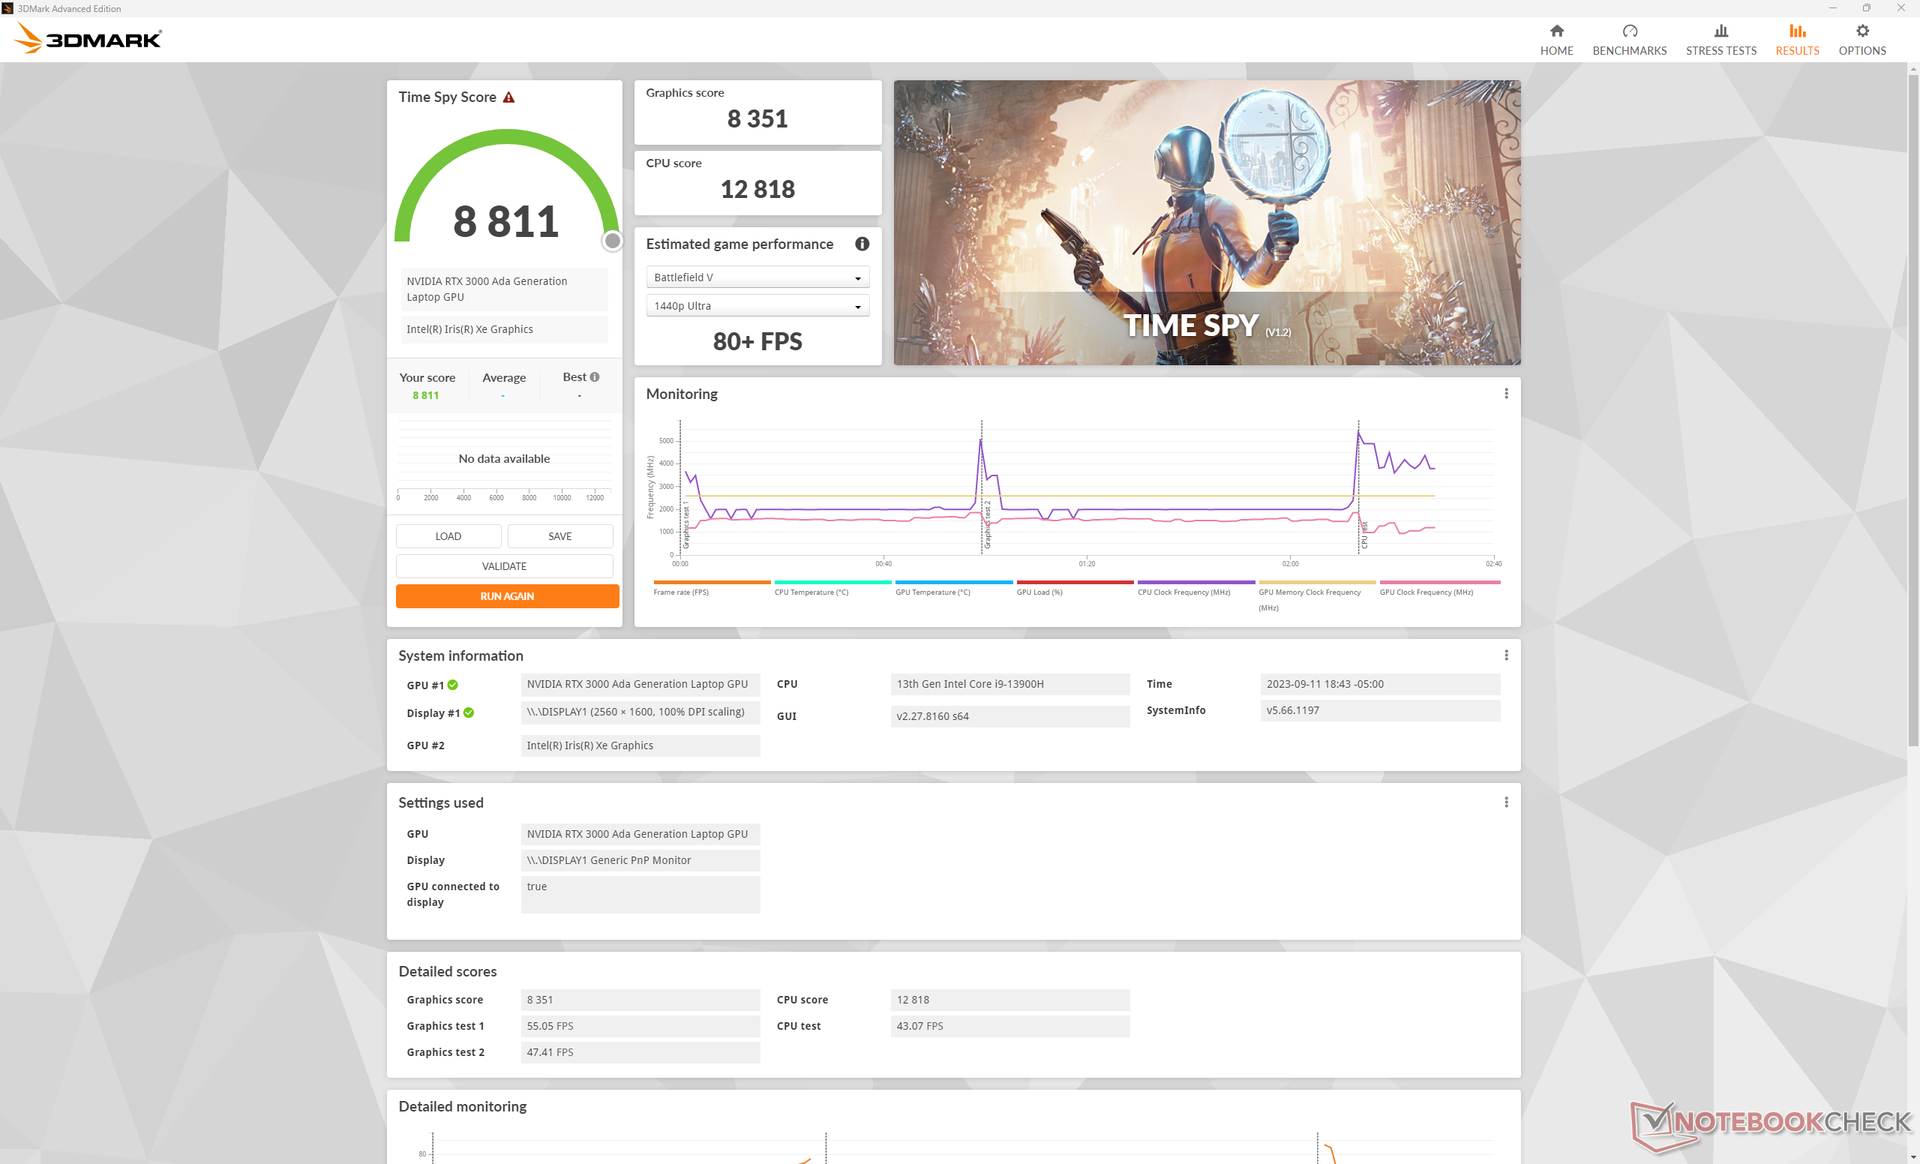
| 3DMark 11 Performance | 27083 points | |
| 3DMark Fire Strike Score | 18847 points | |
| 3DMark Time Spy Score | 8811 points | |
Help | ||
* ... smaller is better
Gaming Performance
Gaming performance is most similar to laptops running on the GeForce RTX 4060 like the recent Inspiron 16 Plus 7630. Our workstation is able to run demanding titles like Cyberpunk 2077 at 1080p very well while native QHD+ will require lower settings or DLSS to keep frame rates afloat.
Witcher 3 FPS Chart
| low | med. | high | ultra | |
|---|---|---|---|---|
| GTA V (2015) | 183.2 | 177 | 164.1 | 88.2 |
| The Witcher 3 (2015) | 364.1 | 242.5 | 150.1 | 78.7 |
| Dota 2 Reborn (2015) | 175.7 | 160.8 | 151.5 | 142.9 |
| Final Fantasy XV Benchmark (2018) | 155.1 | 108 | 78.9 | |
| X-Plane 11.11 (2018) | 152 | 126.8 | 102 | |
| Far Cry 5 (2018) | 155 | 116 | 106 | 101 |
| Strange Brigade (2018) | 400 | 191.3 | 160.1 | 140.7 |
| Cyberpunk 2077 1.6 (2022) | 92.3 | 72.4 | 61.2 | 56.2 |
| Tiny Tina's Wonderlands (2022) | 156 | 131.4 | 88 | 69 |
| F1 22 (2022) | 162.7 | 159.6 | 133.4 | 51.1 |
Emissions
System Noise
Fan noise and behavior haven't really changed from last year's model. Higher loads equivalent to games would induce a fan noise of just over 50 dB(A) to be one of the loudest 14-inch workstations in the market. Interestingly, this maximum remains the same between Balanced and Performance modes and so there is little to no benefit from running on Balanced mode in terms of noise.
Noise level
| Idle |
| 23.5 / 23.5 / 23.5 dB(A) |
| Load |
| 39.9 / 51 dB(A) |
 | ||
30 dB silent 40 dB(A) audible 50 dB(A) loud |
||
min: | ||
| Dell Precision 5480 RTX 3000 Ada Generation Laptop, i9-13900H, Samsung PM9A1 MZVL21T0HCLR | Dell Precision 5000 5470 RTX A1000 Laptop GPU, i9-12900H, Samsung PM9A1 MZVL21T0HCLR | Dell Precision 5000 5560 RTX A2000 Laptop GPU, i7-11850H, Samsung PM9A1 MZVL22T0HBLB | Lenovo ThinkPad P14s G3 AMD 21J6S05000 Radeon 680M, R7 PRO 6850U, Samsung PM9A1 MZVL21T0HCLR | HP ZBook Firefly 14 G9-6B8A2EA T550 Laptop GPU, i7-1265U, Micron 3400 1TB MTFDKBA1T0TFH | Lenovo ThinkPad P15v G3 21EM001AGE RTX A2000 Laptop GPU, R7 PRO 6850H, SK Hynix PC711 1TB HFS001TDE9X081N | |
|---|---|---|---|---|---|---|
| Noise | -2% | 11% | 11% | 4% | 9% | |
| off / environment * (dB) | 23.5 | 23 2% | 23.4 -0% | 22.9 3% | 23.6 -0% | 23.2 1% |
| Idle Minimum * (dB) | 23.5 | 23.3 1% | 23.6 -0% | 22.9 3% | 23.6 -0% | 23.2 1% |
| Idle Average * (dB) | 23.5 | 23.3 1% | 23.6 -0% | 22.9 3% | 23.6 -0% | 23.2 1% |
| Idle Maximum * (dB) | 23.5 | 23.3 1% | 23.6 -0% | 22.9 3% | 23.6 -0% | 23.2 1% |
| Load Average * (dB) | 39.9 | 48.5 -22% | 25.8 35% | 30.8 23% | 42.5 -7% | 35 12% |
| Witcher 3 ultra * (dB) | 50.1 | 48.6 3% | 40.1 20% | 39.4 21% | 42.5 15% | 37.9 24% |
| Load Maximum * (dB) | 51 | 50.4 1% | 41.4 19% | 39.5 23% | 42.5 17% | 37.5 26% |
* ... smaller is better
Temperature
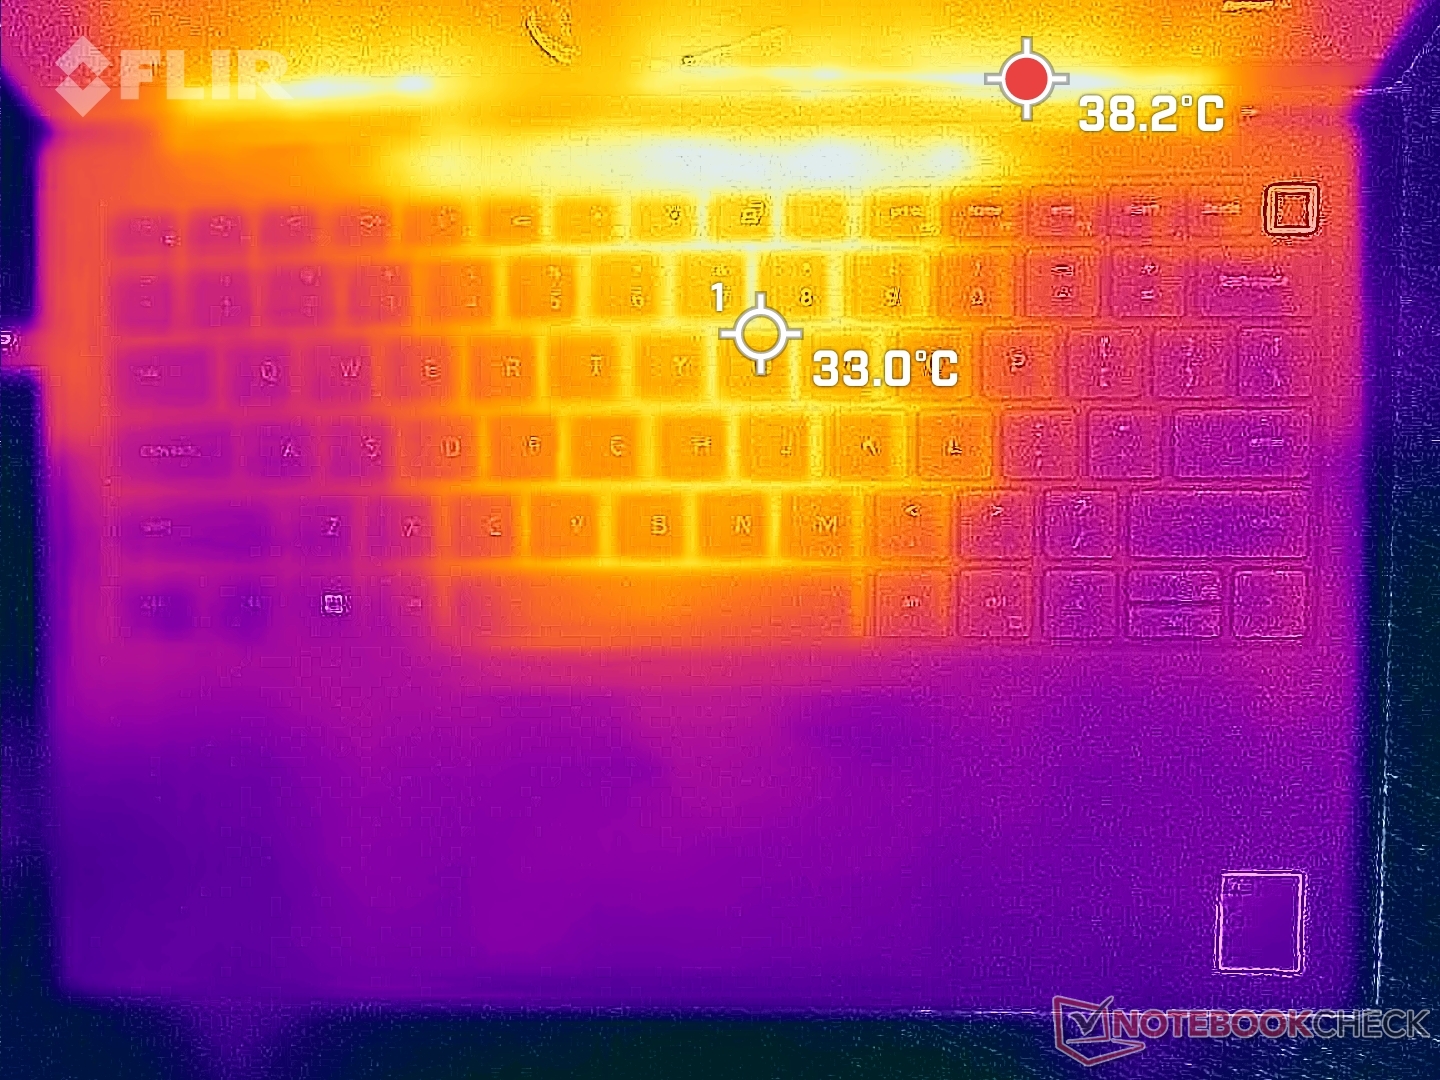
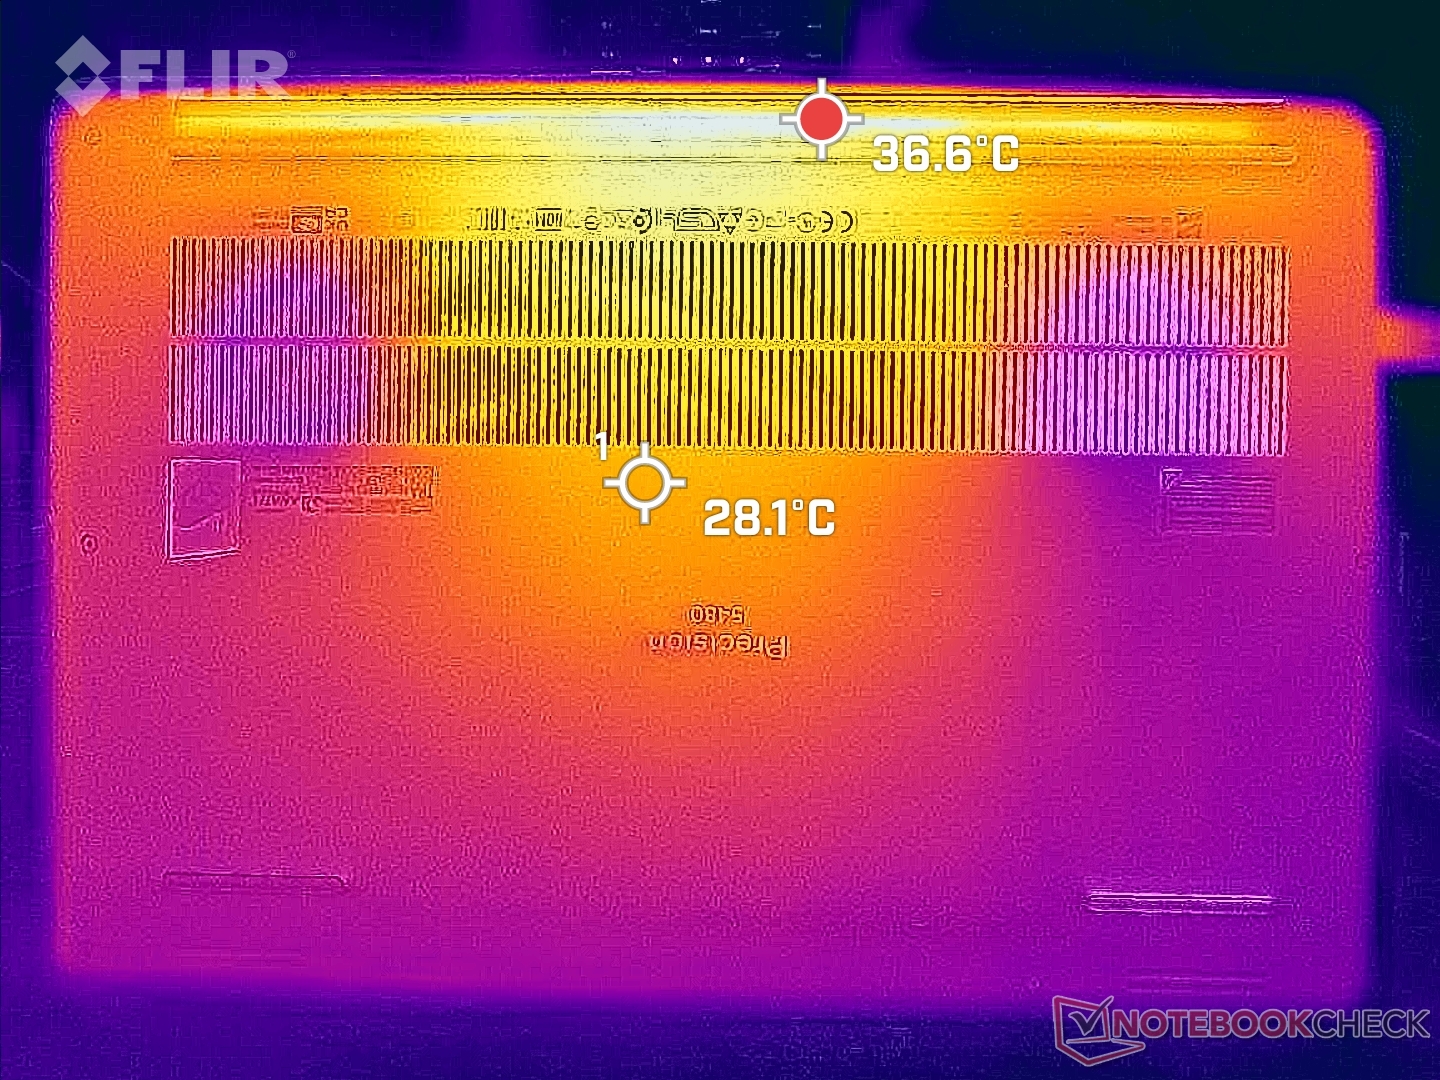
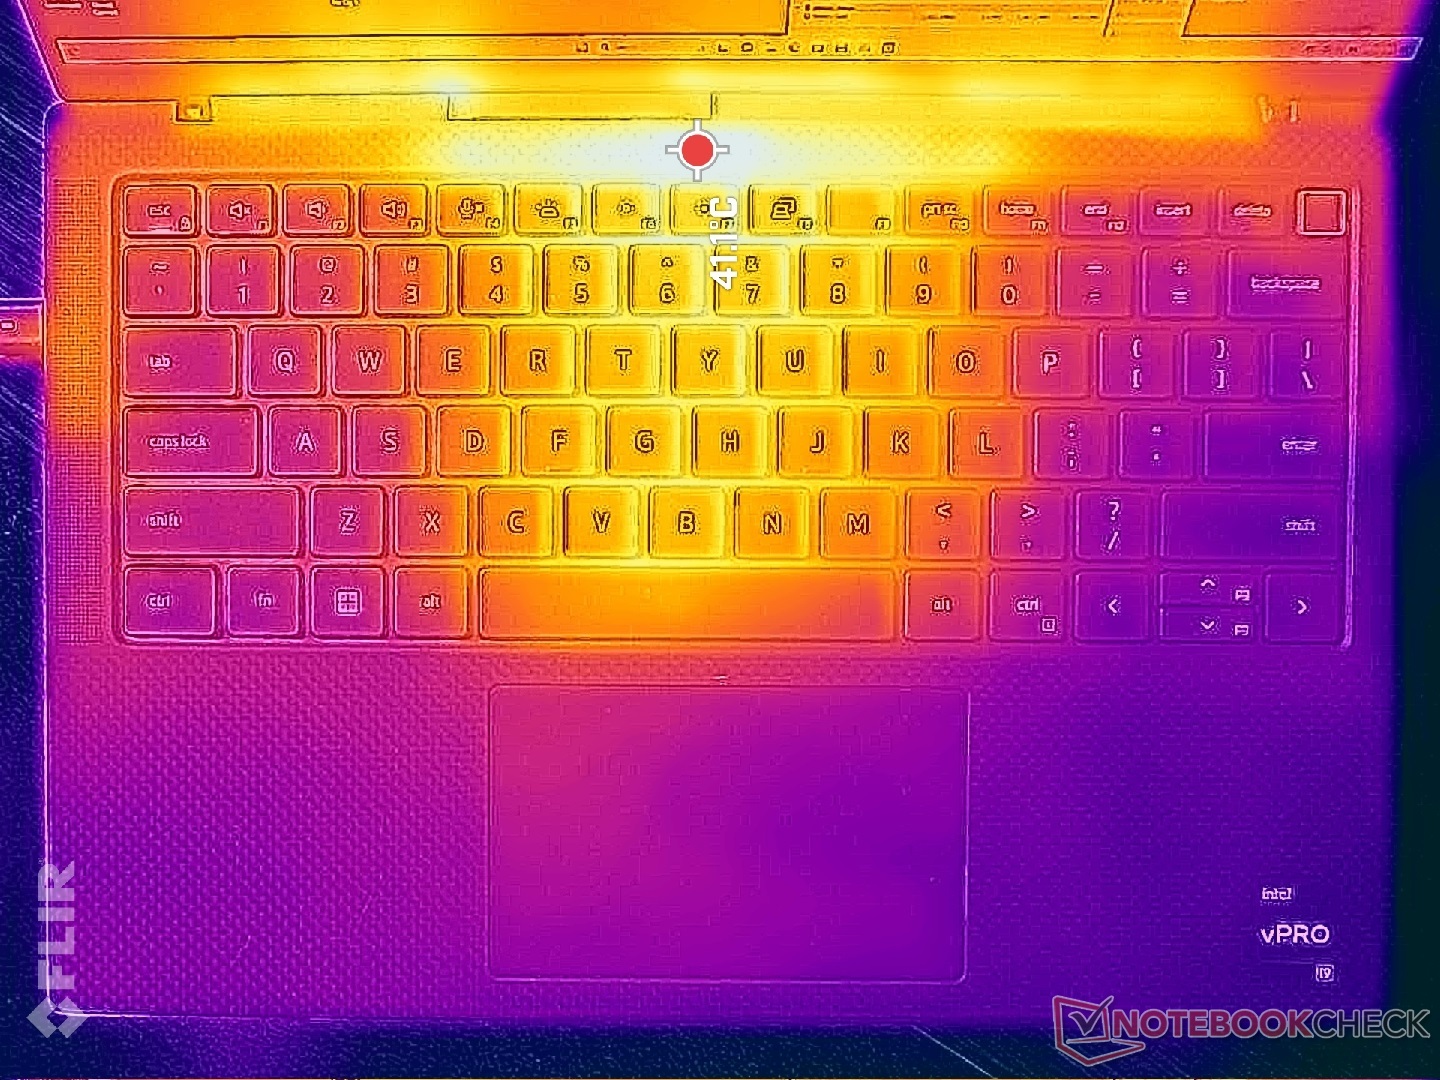
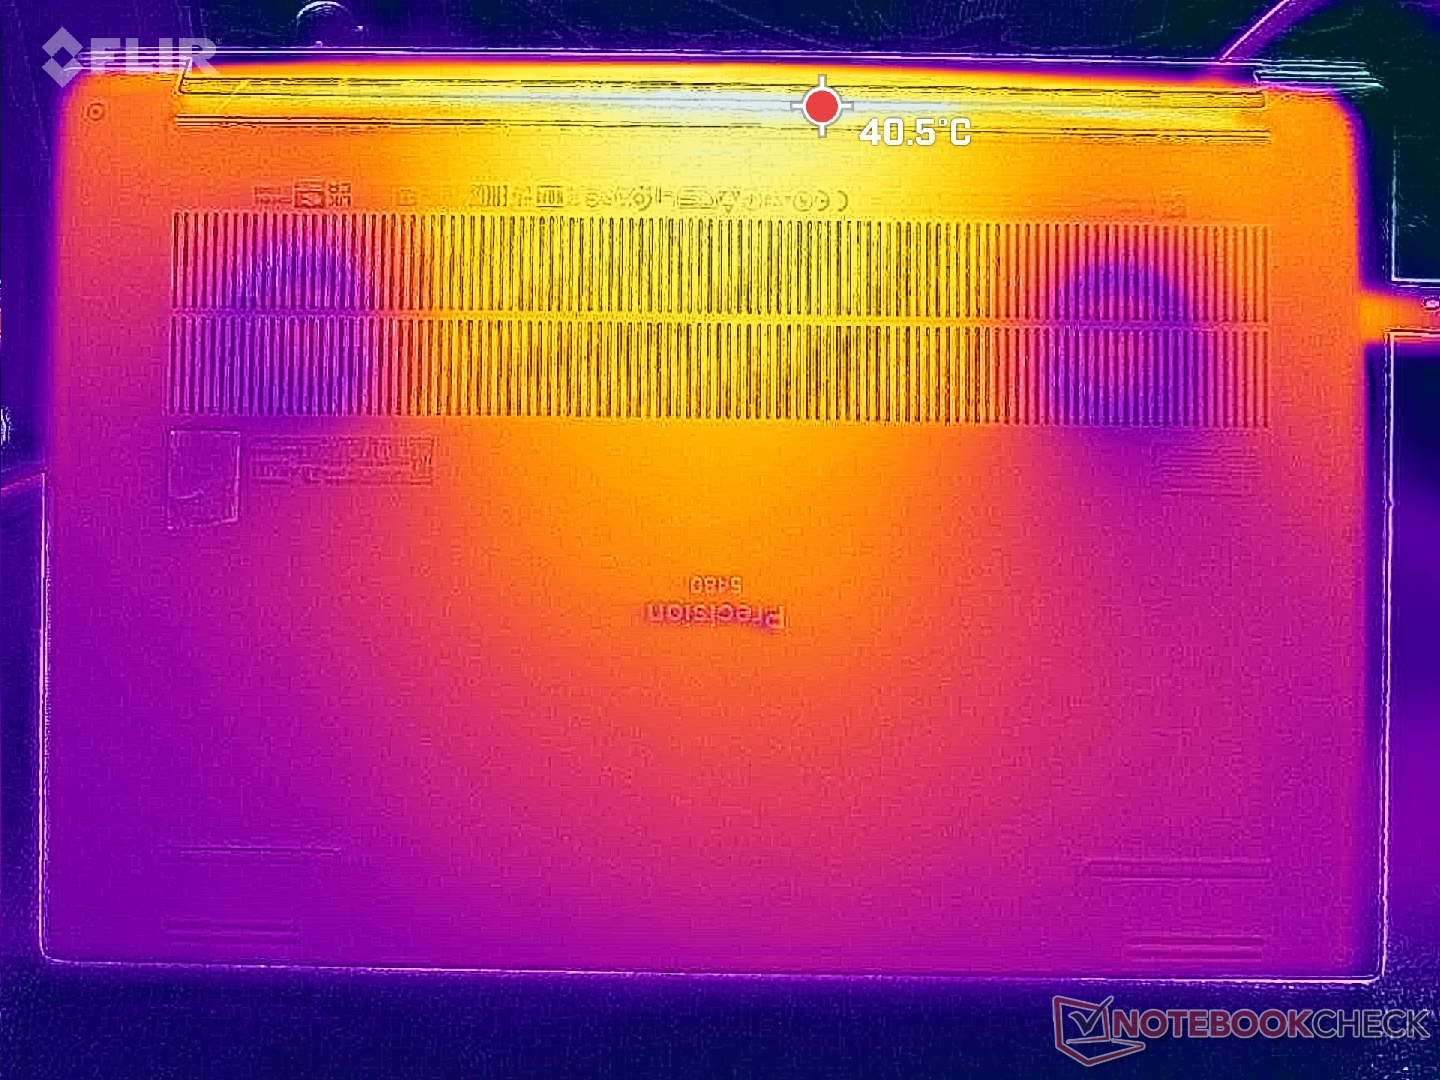
Surface temperatures are warmer than usual near the center of the unit when idling on desktop due to the inert fans. Thus, the cost of silence when running undemanding loads is warm surface temperatures which may or may not bother some users.
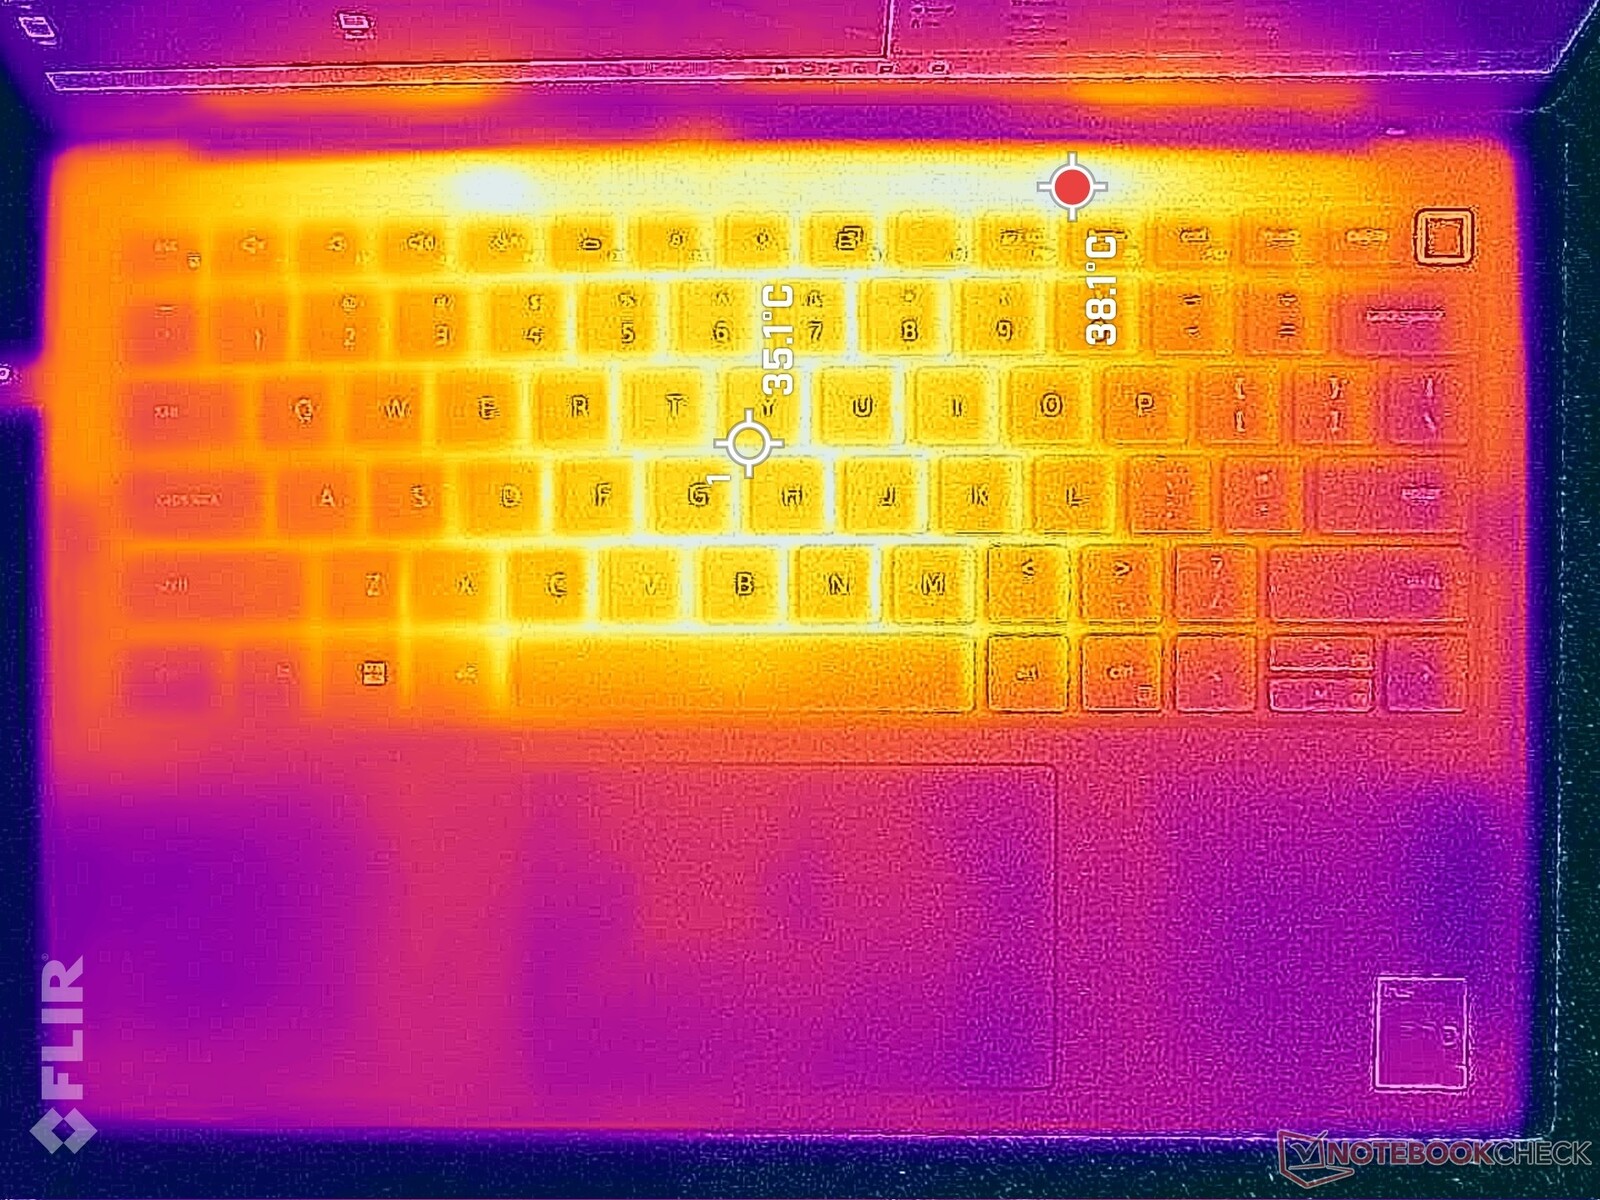
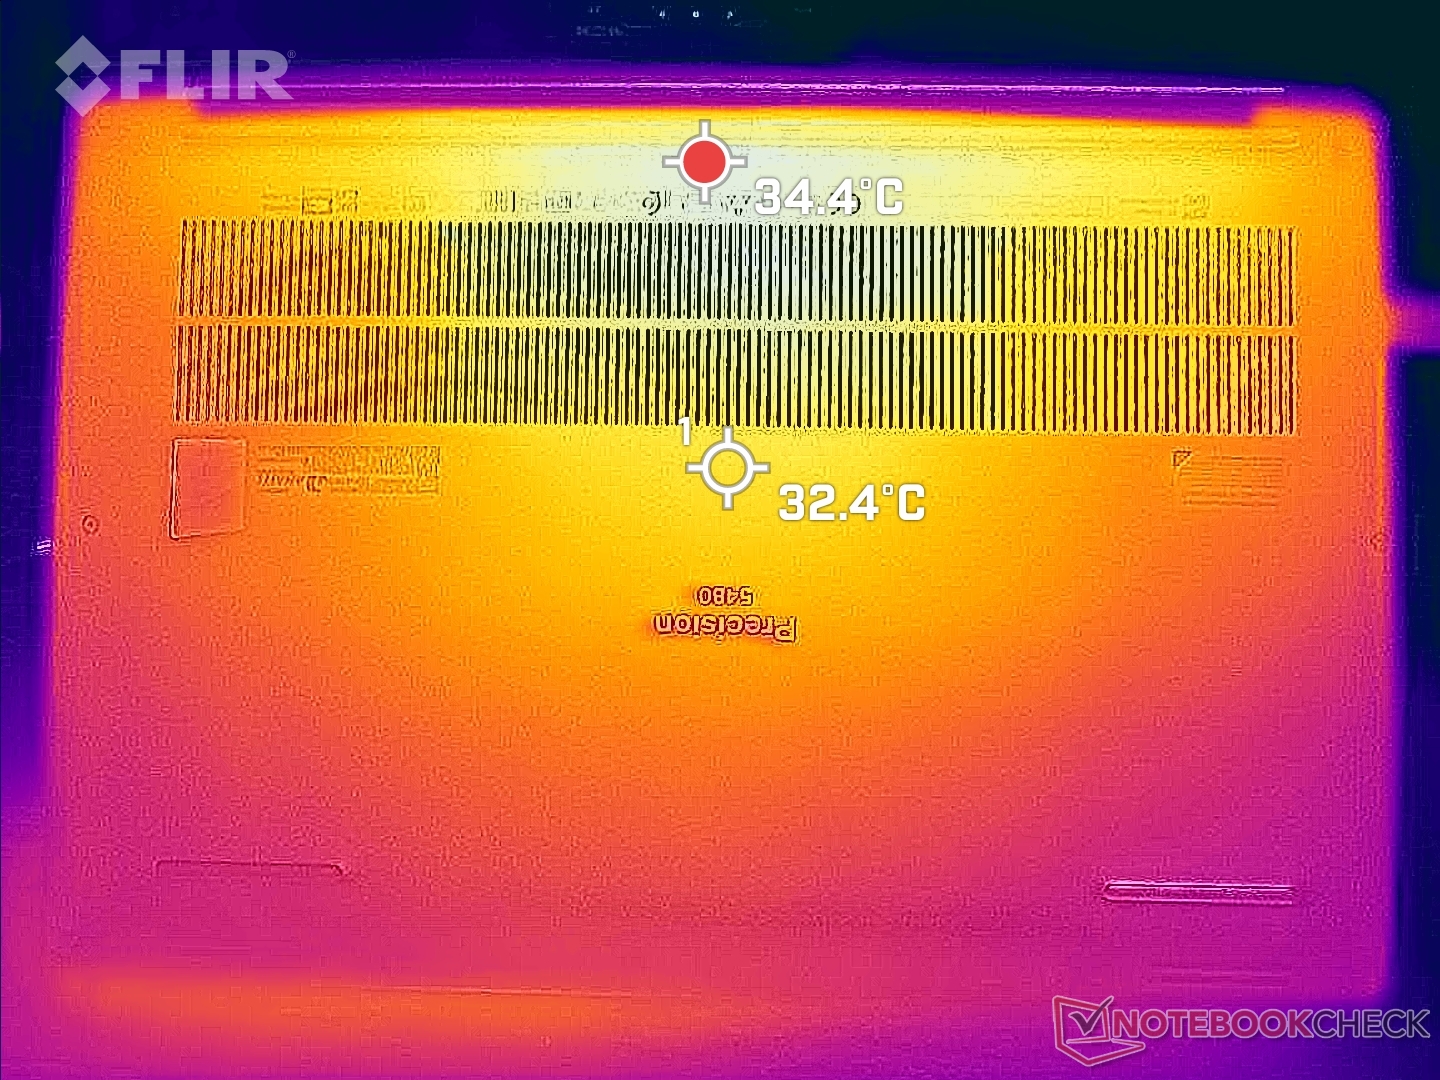
Hot spots can reach over 40 C on the top and bottom sides of the chassis when running Prime95 and FurMark simultaneously. They're concentrated near the rear of the unit and so the carbon fiber palm rests still remain comfortable to the touch, but most of the metal bottom will be very warm.
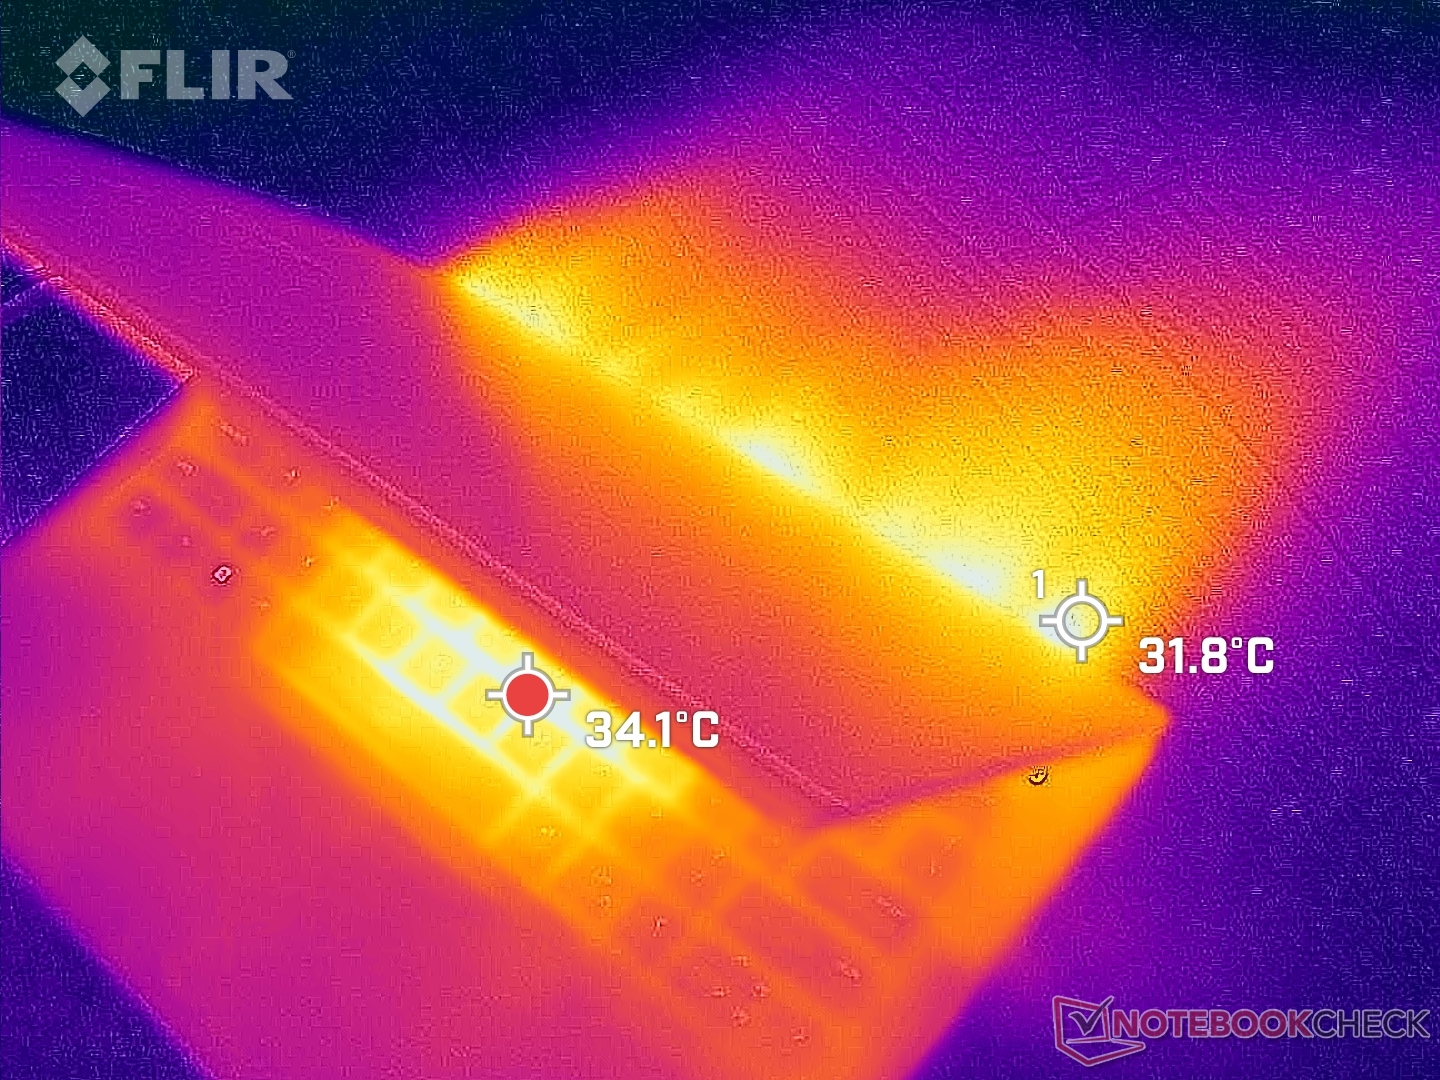
(±) The maximum temperature on the upper side is 44 °C / 111 F, compared to the average of 38.2 °C / 101 F, ranging from 22.2 to 69.8 °C for the class Workstation.
(+) The bottom heats up to a maximum of 38.2 °C / 101 F, compared to the average of 41.1 °C / 106 F
(±) In idle usage, the average temperature for the upper side is 34.2 °C / 94 F, compared to the device average of 32 °C / 90 F.
(±) Playing The Witcher 3, the average temperature for the upper side is 32 °C / 90 F, compared to the device average of 32 °C / 90 F.
(+) The palmrests and touchpad are cooler than skin temperature with a maximum of 29.6 °C / 85.3 F and are therefore cool to the touch.
(±) The average temperature of the palmrest area of similar devices was 27.8 °C / 82 F (-1.8 °C / -3.3 F).
| Dell Precision 5480 Intel Core i9-13900H, NVIDIA RTX 3000 Ada Generation Laptop | Dell Precision 5000 5470 Intel Core i9-12900H, NVIDIA RTX A1000 Laptop GPU | Dell Precision 5000 5560 Intel Core i7-11850H, NVIDIA RTX A2000 Laptop GPU | Lenovo ThinkPad P14s G3 AMD 21J6S05000 AMD Ryzen 7 PRO 6850U, AMD Radeon 680M | Lenovo ThinkPad P15v G3 21EM001AGE AMD Ryzen 7 PRO 6850H, NVIDIA RTX A2000 Laptop GPU | HP ZBook Firefly 14 G9-6B8A2EA Intel Core i7-1265U, NVIDIA T550 Laptop GPU | |
|---|---|---|---|---|---|---|
| Heat | 9% | -1% | 14% | 7% | 11% | |
| Maximum Upper Side * (°C) | 44 | 41.8 5% | 48.2 -10% | 42.7 3% | 48.7 -11% | 41.2 6% |
| Maximum Bottom * (°C) | 38.2 | 36 6% | 42.6 -12% | 43.1 -13% | 50.5 -32% | 47.9 -25% |
| Idle Upper Side * (°C) | 38.8 | 34.6 11% | 34.8 10% | 25.7 34% | 25 36% | 26.5 32% |
| Idle Bottom * (°C) | 38.6 | 33.6 13% | 35.2 9% | 26.4 32% | 25.4 34% | 27 30% |
* ... smaller is better
Stress Test
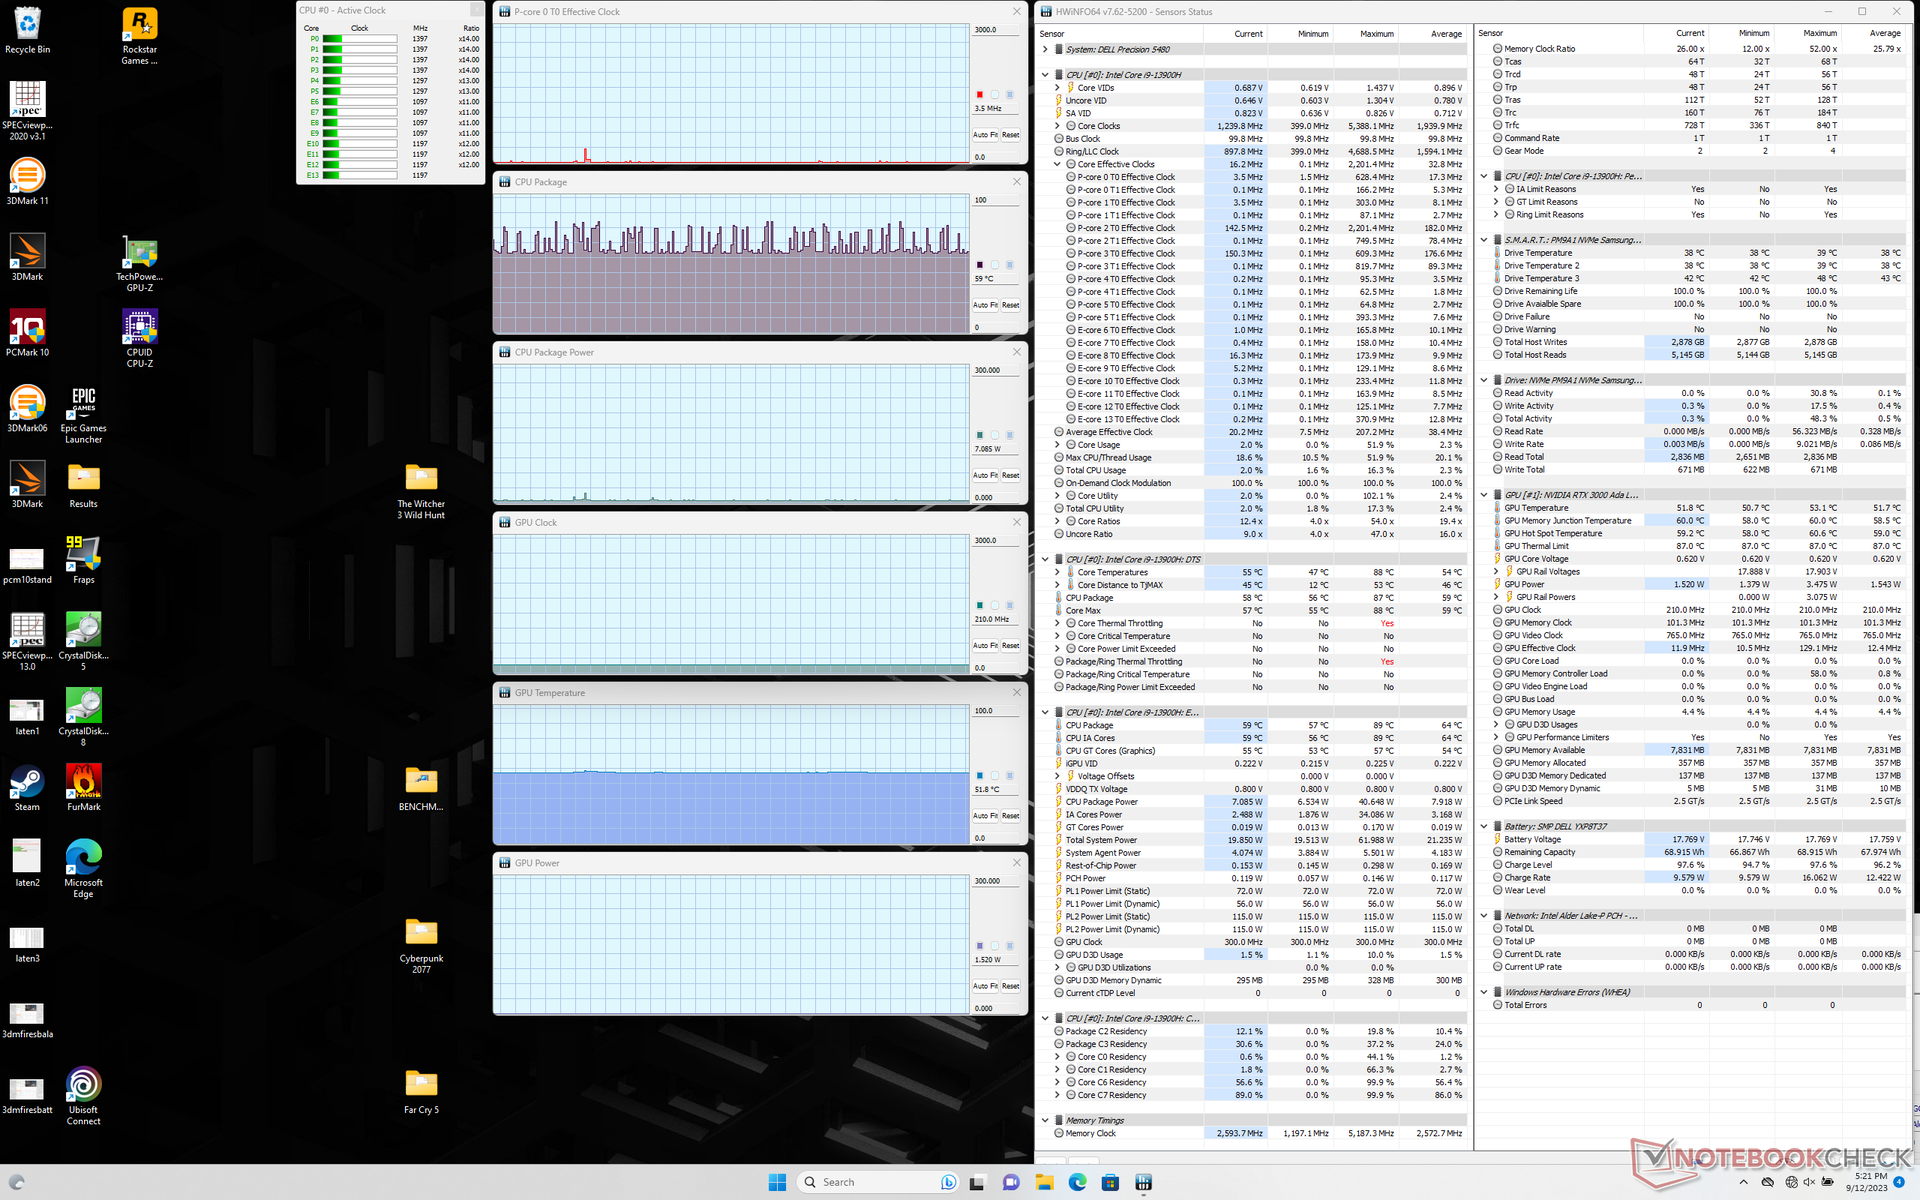
When running Prime95 stress, the CPU would spike to 3.4 GHz, 88 W, and 100 C lasting for only a couple of minutes. It would eventually stabilize at around 2.4 GHz and 51 W in order to maintain a slightly cooler but more manageable core temperature of 93 C. Maximum Turbo Boost is therefore not indefinite but still pretty good considering the small 14-inch form factor.
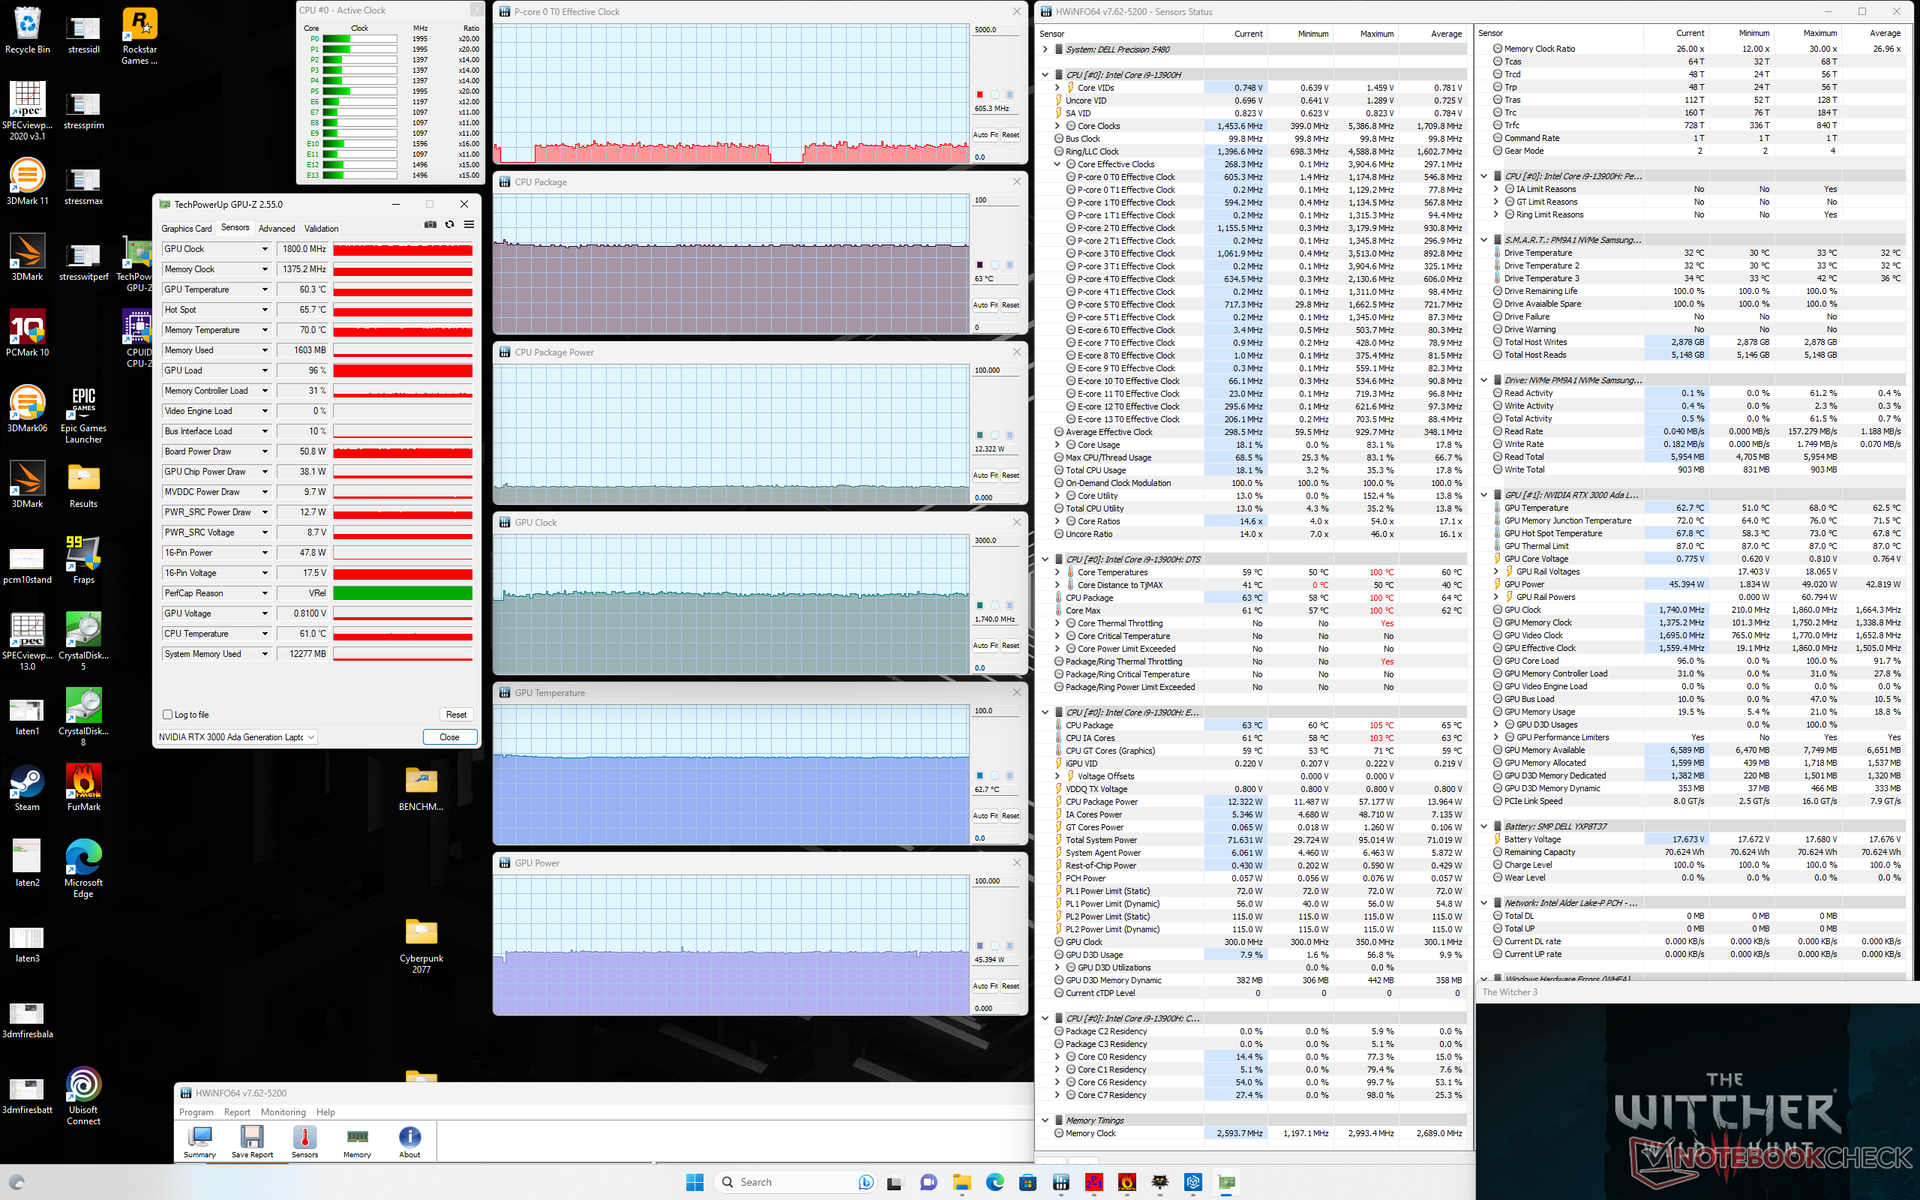
The CPU and GPU would stabilize at around 64 C each when running Witcher 3 to represent high loads. Interestingly, this would not change when switching between Balanced and Performance modes to suggest that Balanced mode should be sufficient for most types of workloads. Note that the GPU board power draw is higher at around 45 W to 50 W compared to just 36 W on last year's Precision 5470. Core temperatures would still be cooler than on last year's model nonetheless when under similar gaming-type loads.
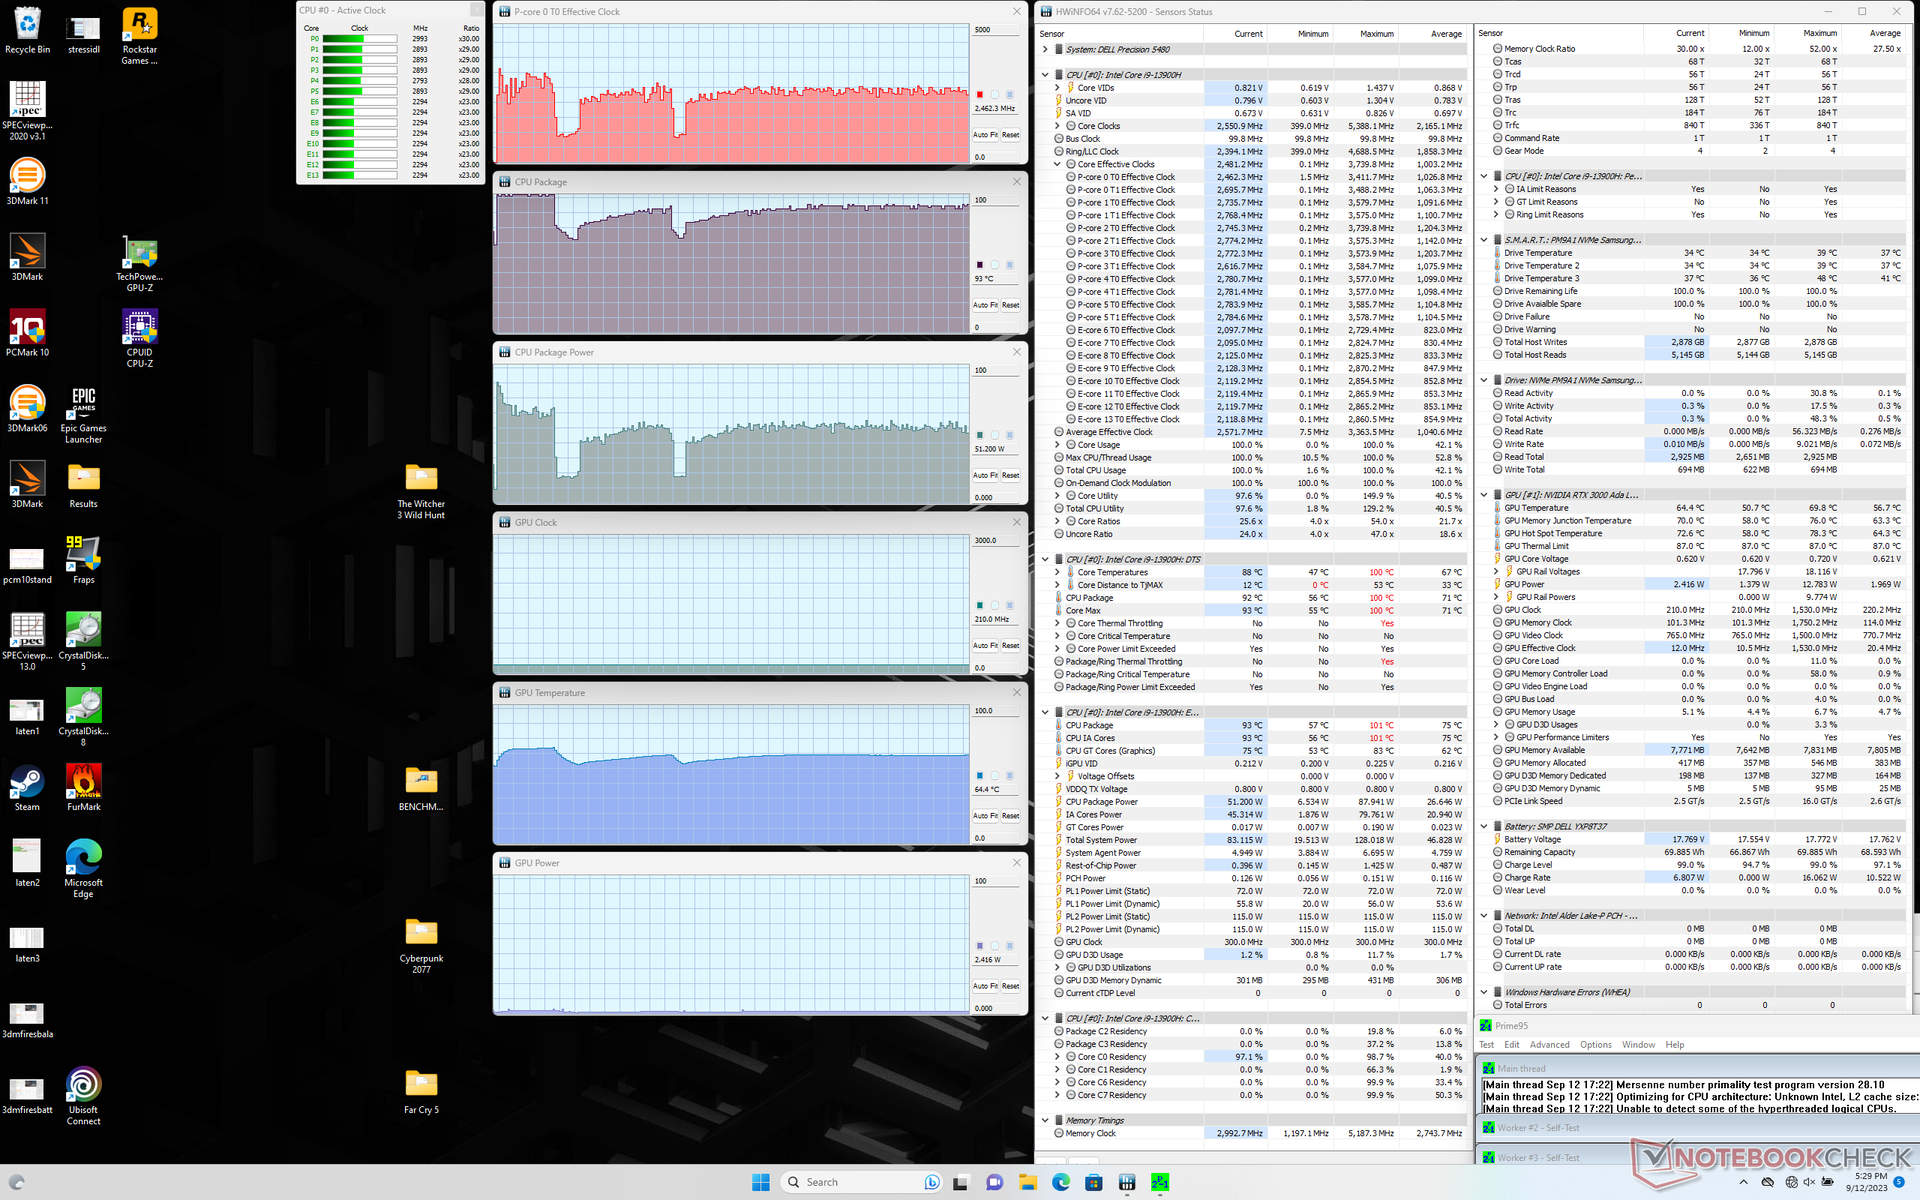
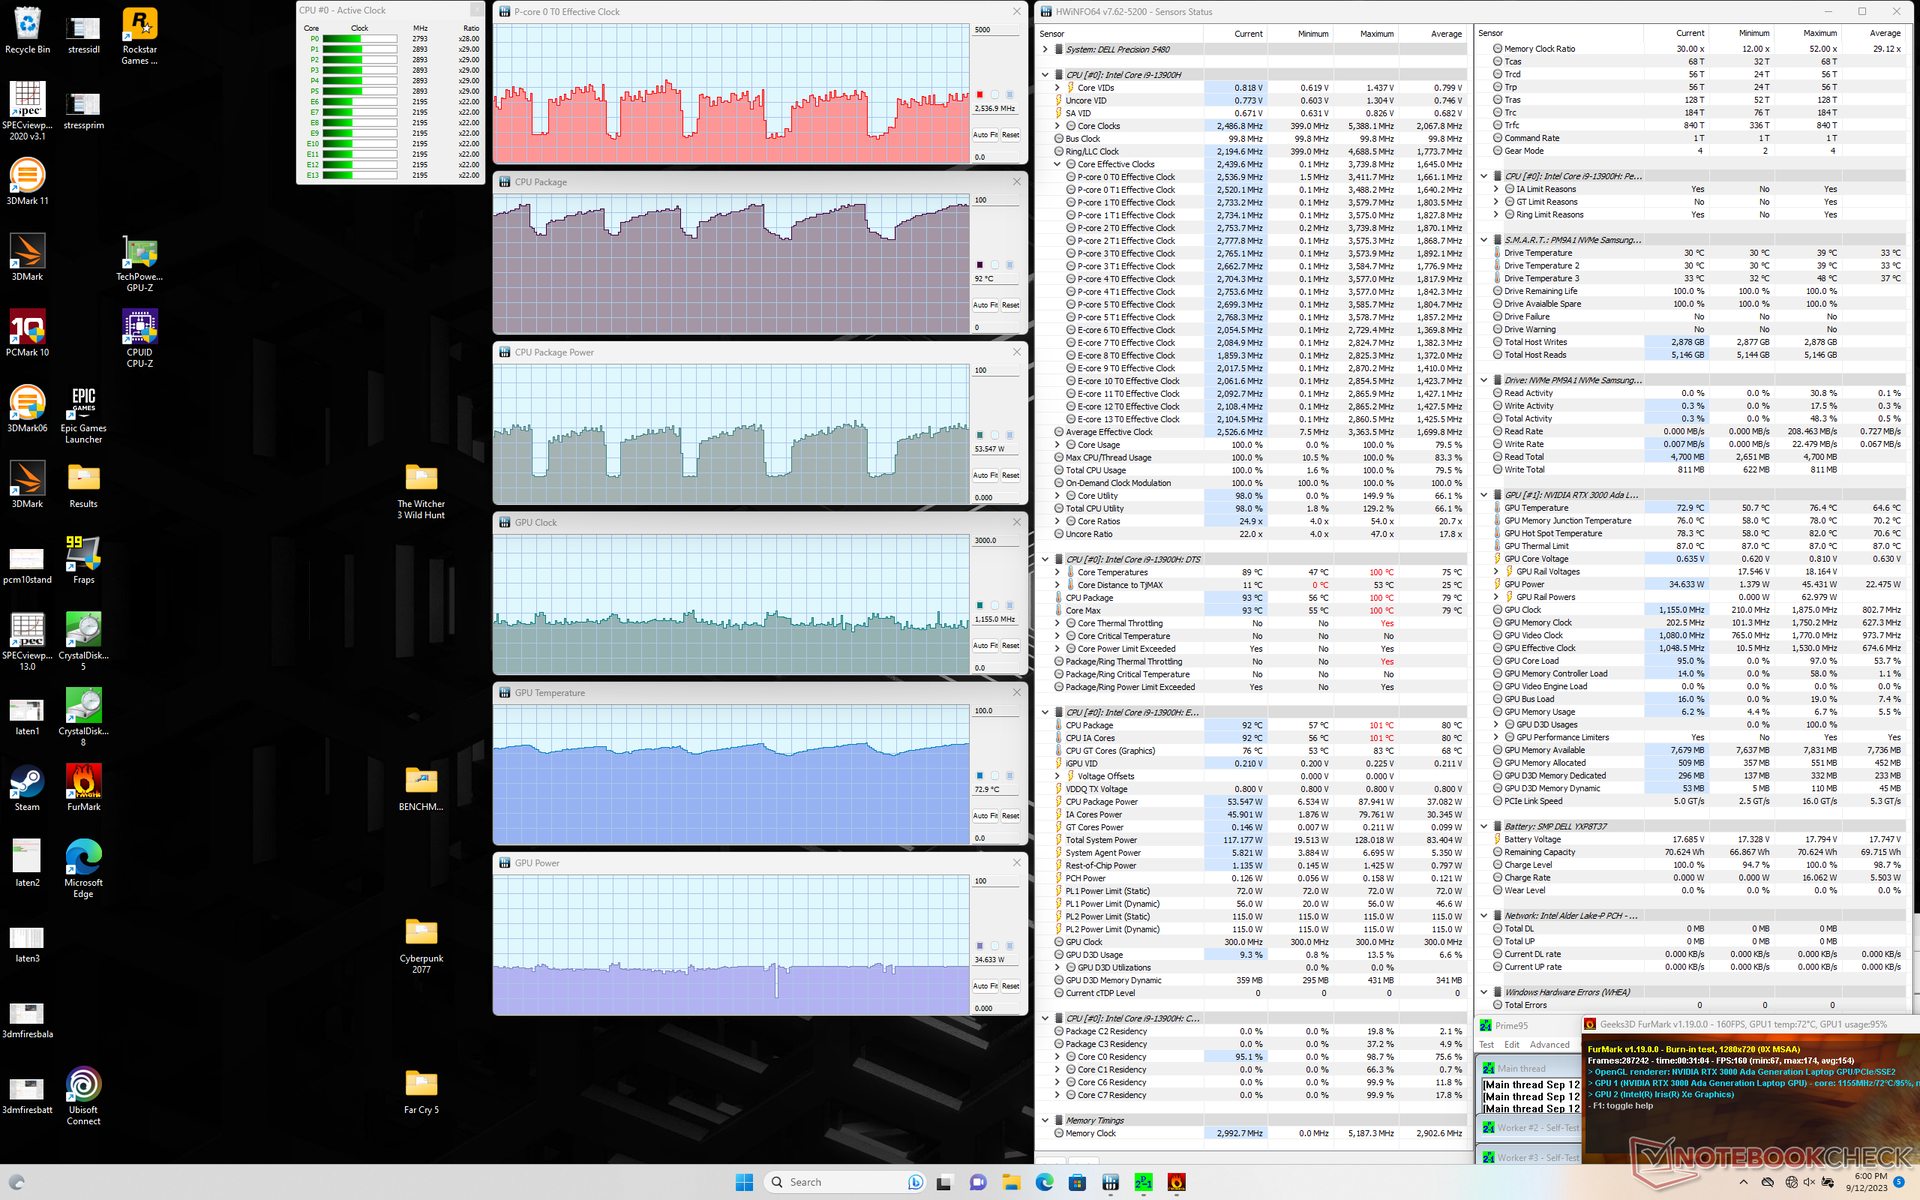
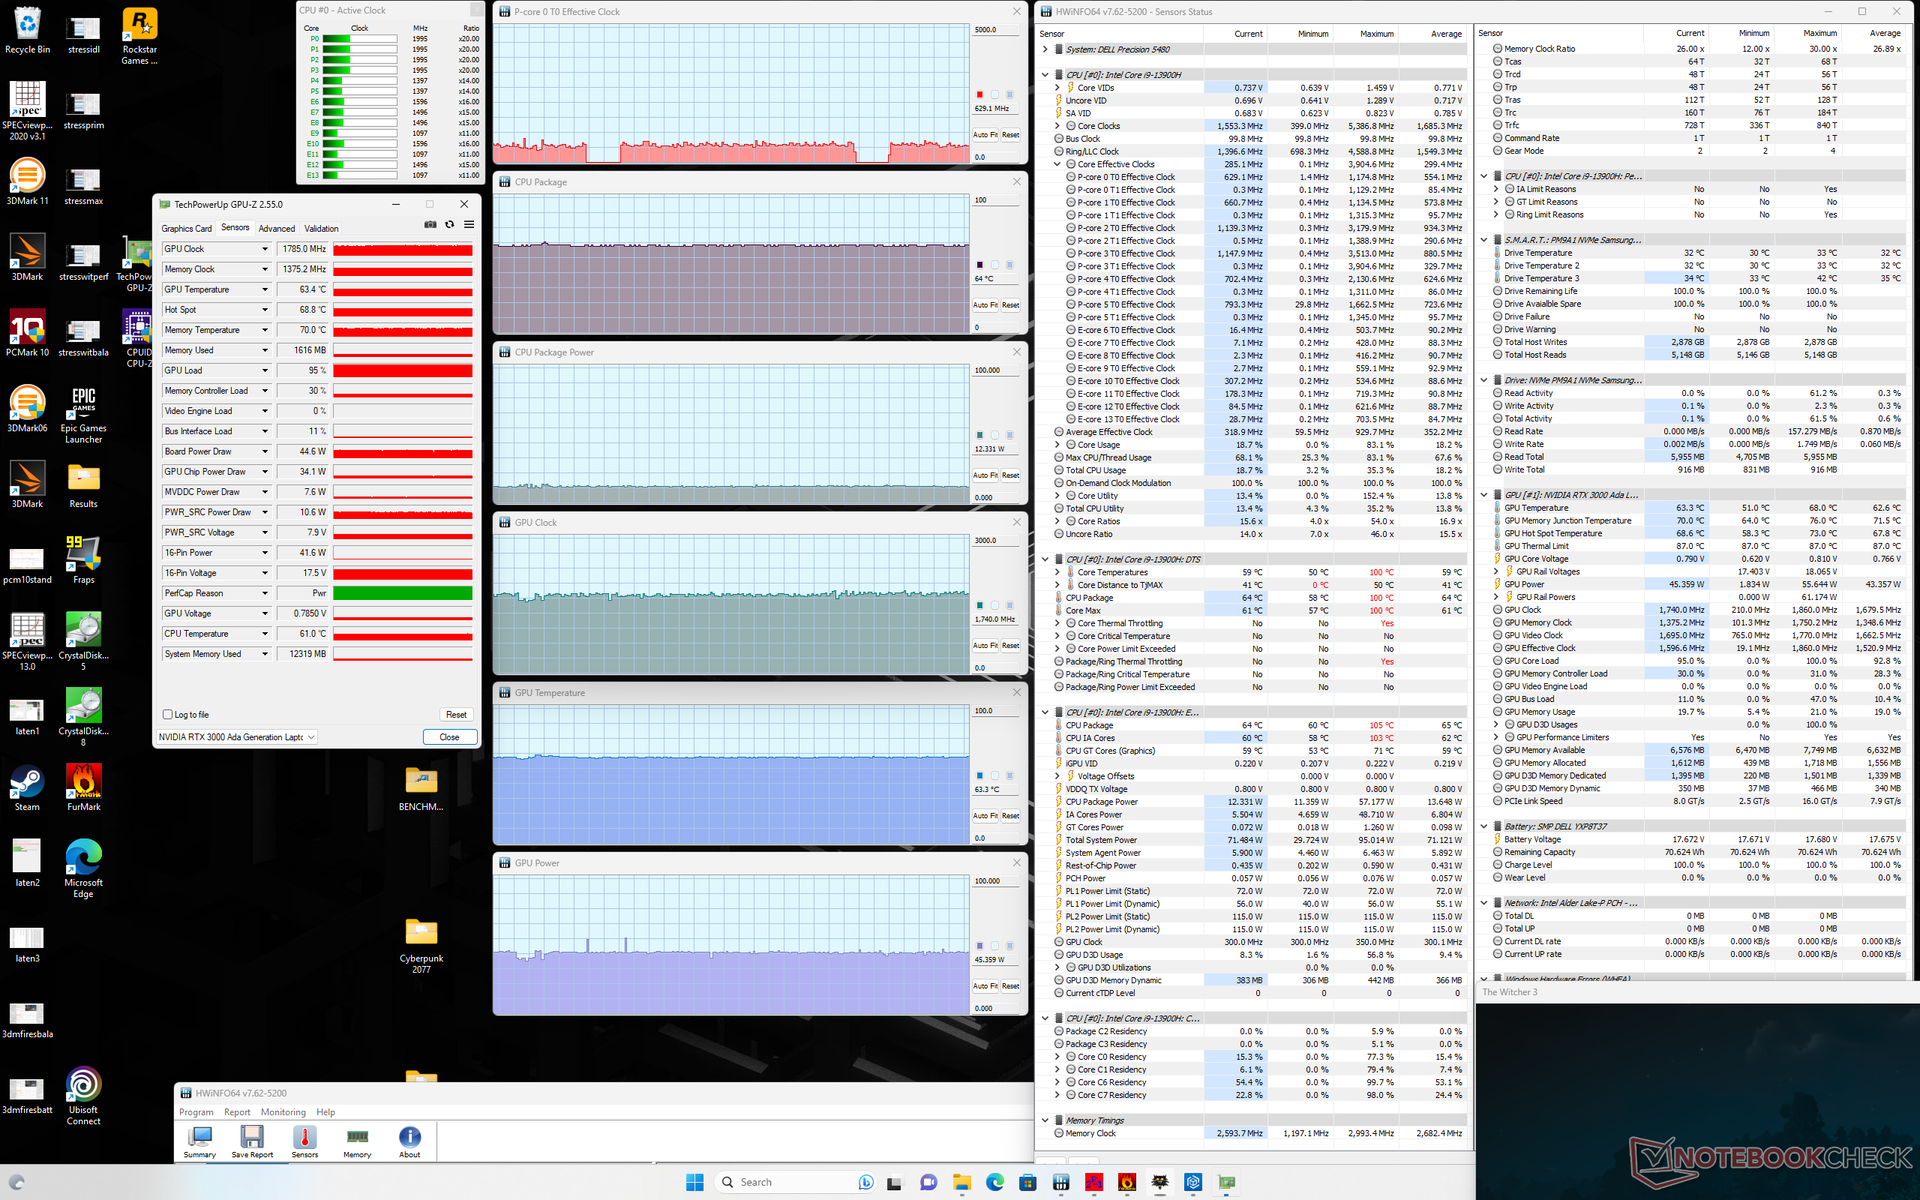
| CPU Clock (GHz) | GPU Clock (MHz) | Average CPU Temperature (°C) | Average GPU Temperature (°C) | |
| System Idle | -- | -- | 59 | 52 |
| Prime95 Stress | 2.5 | -- | 93 | 65 |
| Prime95 + FurMark Stress | 1.0 - 2.6 | 1155 | 69 - 92 | 66 - 73 |
| Witcher 3 Stress (Balanced mode) | 0.6 | 1740 | 63 | 63 |
| Witcher 3 Stress (Performance mode) | 0.6 | 1740 | 64 | 63 |
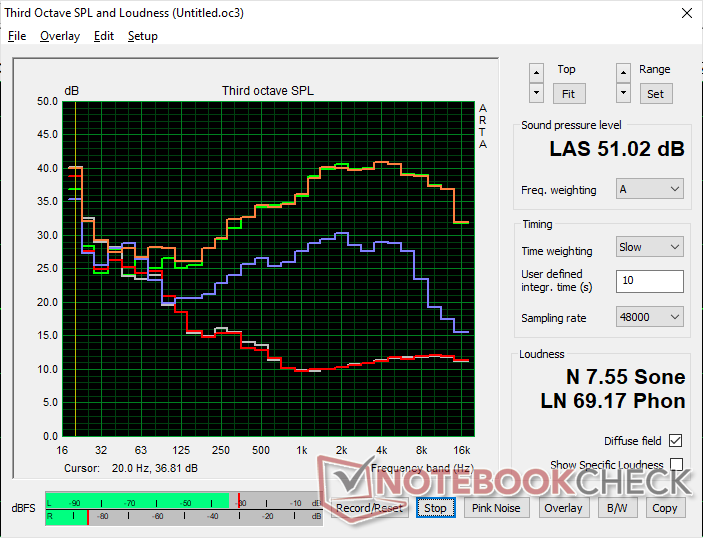
Speakers
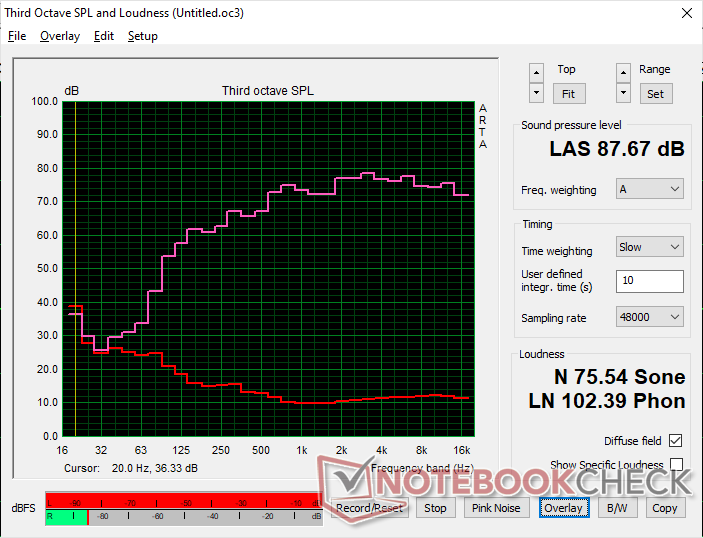
Dell Precision 5480 audio analysis
(+) | speakers can play relatively loud (87.7 dB)
Bass 100 - 315 Hz
(±) | reduced bass - on average 12.9% lower than median
(±) | linearity of bass is average (7% delta to prev. frequency)
Mids 400 - 2000 Hz
(+) | balanced mids - only 2.8% away from median
(+) | mids are linear (3.6% delta to prev. frequency)
Highs 2 - 16 kHz
(+) | balanced highs - only 2.9% away from median
(+) | highs are linear (2% delta to prev. frequency)
Overall 100 - 16.000 Hz
(+) | overall sound is linear (9% difference to median)
Compared to same class
» 4% of all tested devices in this class were better, 2% similar, 94% worse
» The best had a delta of 7%, average was 17%, worst was 35%
Compared to all devices tested
» 3% of all tested devices were better, 1% similar, 96% worse
» The best had a delta of 4%, average was 23%, worst was 134%
Apple MacBook Pro 16 2021 M1 Pro audio analysis
(+) | speakers can play relatively loud (84.7 dB)
Bass 100 - 315 Hz
(+) | good bass - only 3.8% away from median
(+) | bass is linear (5.2% delta to prev. frequency)
Mids 400 - 2000 Hz
(+) | balanced mids - only 1.3% away from median
(+) | mids are linear (2.1% delta to prev. frequency)
Highs 2 - 16 kHz
(+) | balanced highs - only 1.9% away from median
(+) | highs are linear (2.7% delta to prev. frequency)
Overall 100 - 16.000 Hz
(+) | overall sound is linear (4.6% difference to median)
Compared to same class
» 0% of all tested devices in this class were better, 0% similar, 100% worse
» The best had a delta of 5%, average was 17%, worst was 45%
Compared to all devices tested
» 0% of all tested devices were better, 0% similar, 100% worse
» The best had a delta of 4%, average was 23%, worst was 134%
Energy Management
Power Consumption
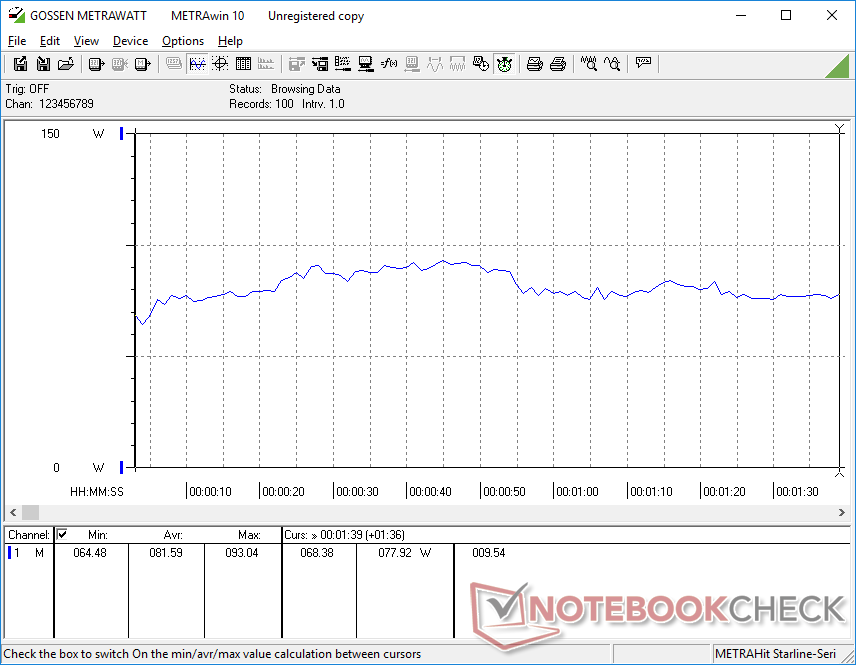
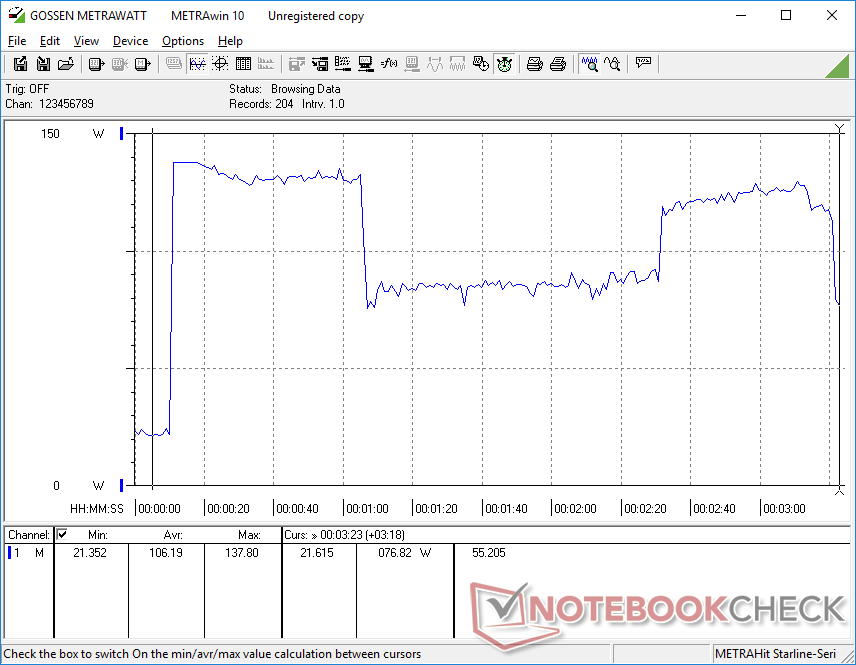
The Precision 5480 is more demanding than the outgoing Precision 5470 when running demanding loads. Witcher 3, for example, would draw around 90 W compared to 83 W on last year's model, but the slight consumption increase is dwarfed by the significant jump in performance as noted above.
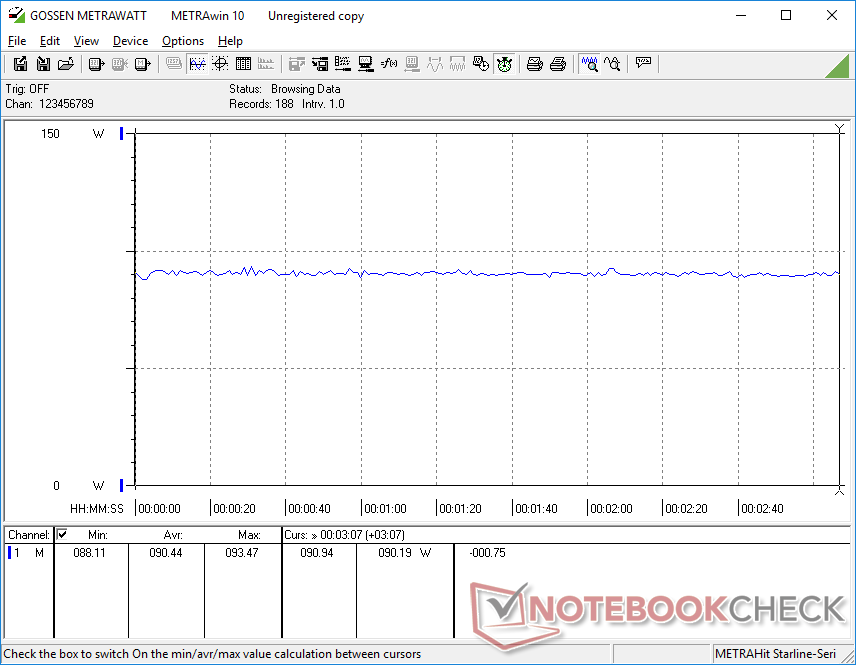
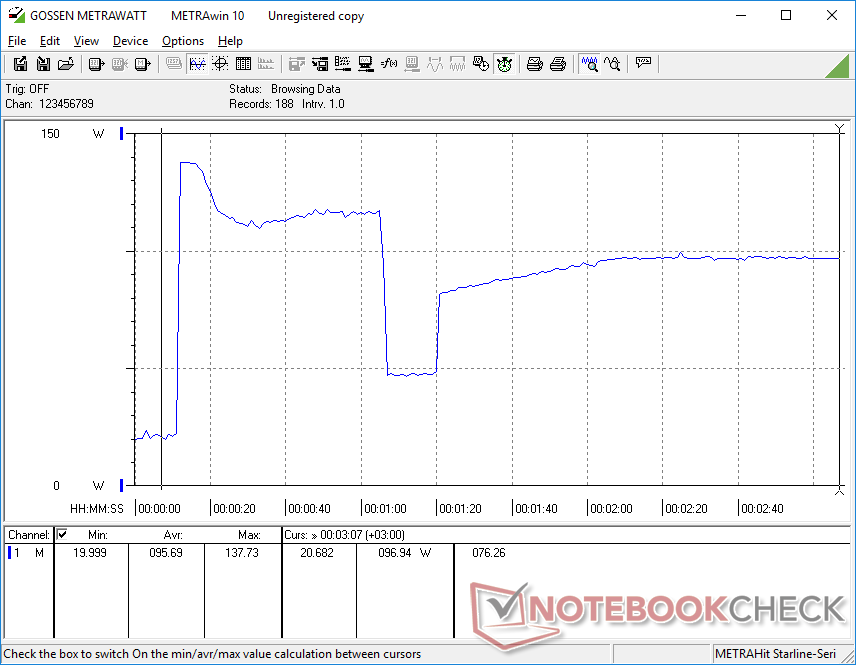
Interestingly, power consumption when running Prime95 would be over 2x higher than on last year's model (98 W vs. 42 W) after accounting for anything performance throttling as shown by the graphs below. The year-over-year increase in processor performance therefore comes at a much higher price when compared to the increase in graphics performance.
It's also worth mentioning that our unit would draw more power than expected when simply idling on desktop with no running applications which may be partly responsible for the generally warmer surface temperatures as noted earlier.
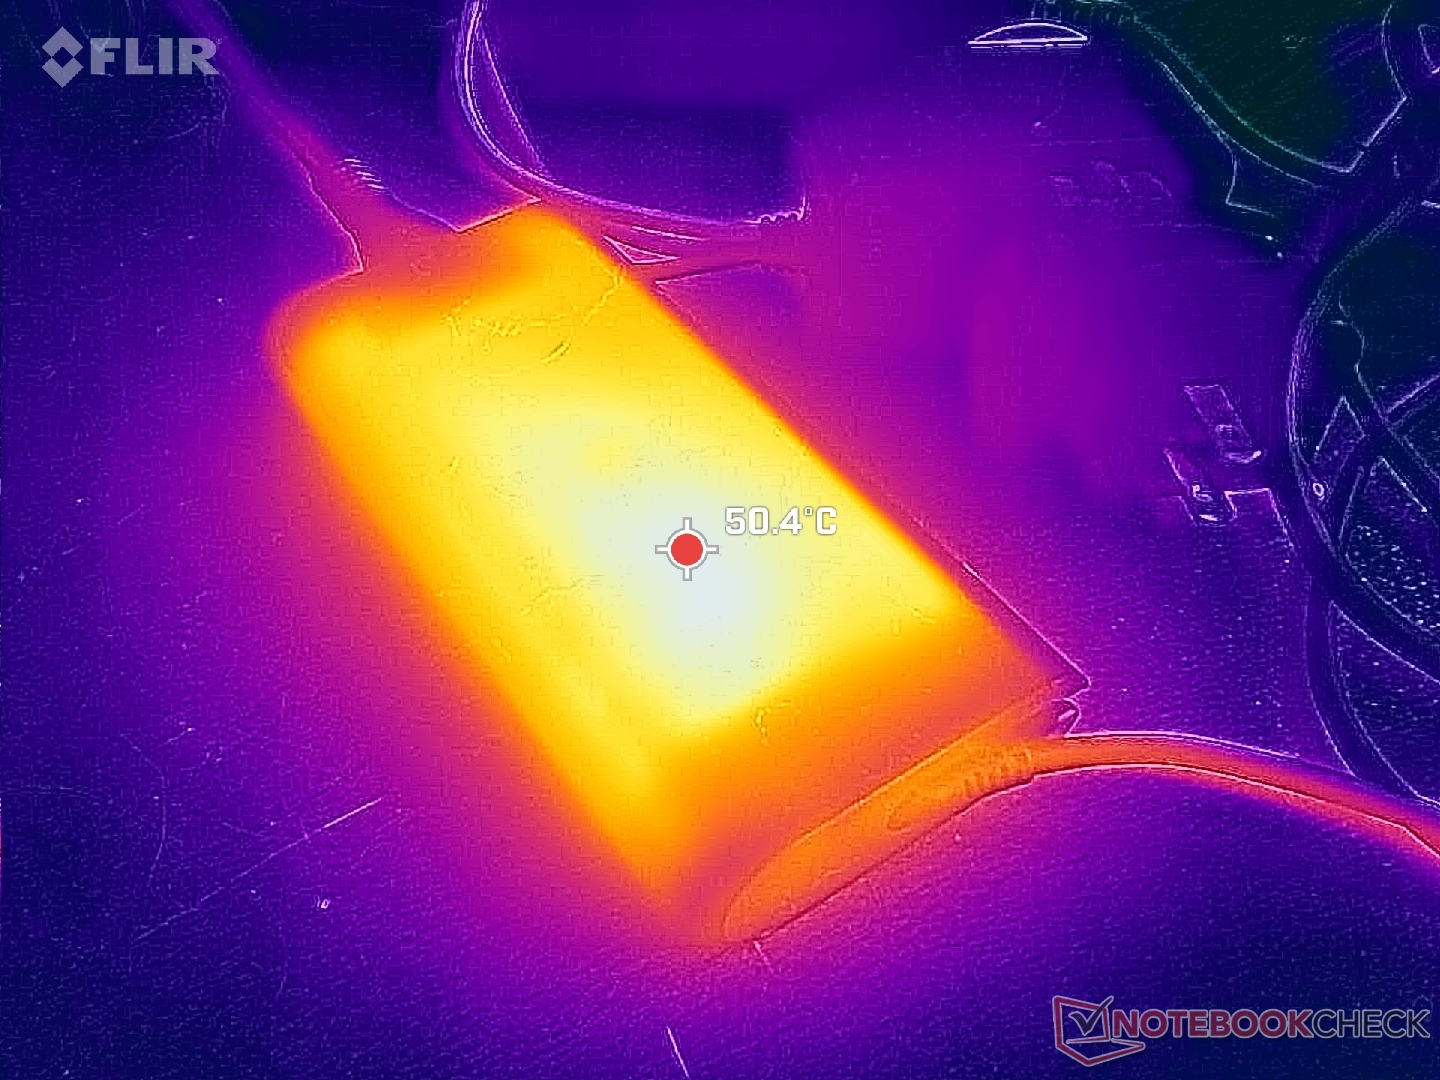
We're able to measure a temporary maximum consumption of 138 W from the small-medium (~14.3 x 6.5 x 2.1 cm) 130 W USB-C AC adapter when the CPU and GPU are fully stressed. This high consumption rate is not consistent as it would cycle between 76 W and 138 W every minute or so as shown by the graph below which correlates with the cycling clock rates.
| Off / Standby | |
| Idle | |
| Load |
|
Key:
min: | |
| Dell Precision 5480 i9-13900H, RTX 3000 Ada Generation Laptop, Samsung PM9A1 MZVL21T0HCLR, IPS, 2560x1600, 14" | Dell Precision 5000 5470 i9-12900H, RTX A1000 Laptop GPU, Samsung PM9A1 MZVL21T0HCLR, IPS, 2560x1600, 14" | Dell Precision 5000 5560 i7-11850H, RTX A2000 Laptop GPU, Samsung PM9A1 MZVL22T0HBLB, IPS, 3840x2400, 15.6" | Lenovo ThinkPad P14s G3 AMD 21J6S05000 R7 PRO 6850U, Radeon 680M, Samsung PM9A1 MZVL21T0HCLR, IPS LED, 1920x1200, 14" | Lenovo ThinkPad P15v G3 21EM001AGE R7 PRO 6850H, RTX A2000 Laptop GPU, SK Hynix PC711 1TB HFS001TDE9X081N, IPS LED, 3840x2160, 15.6" | HP ZBook Firefly 14 G9-6B8A2EA i7-1265U, T550 Laptop GPU, Micron 3400 1TB MTFDKBA1T0TFH, IPS, 1920x1200, 14" | |
|---|---|---|---|---|---|---|
| Power Consumption | 25% | 15% | 63% | 24% | 60% | |
| Idle Minimum * (Watt) | 14.9 | 4.3 71% | 6.2 58% | 2.6 83% | 6.3 58% | 4.2 72% |
| Idle Average * (Watt) | 19.5 | 8.9 54% | 13.9 29% | 5 74% | 13.9 29% | 6.5 67% |
| Idle Maximum * (Watt) | 27.2 | 18.9 31% | 23.8 12% | 5.6 79% | 14.5 47% | 7.2 74% |
| Load Average * (Watt) | 81.6 | 94 -15% | 95.7 -17% | 49.7 39% | 82.8 -1% | 47.7 42% |
| Witcher 3 ultra * (Watt) | 90.4 | 83.2 8% | 87 4% | 50.6 44% | 88.8 2% | 42.9 53% |
| Load Maximum * (Watt) | 137.8 | 137.5 -0% | 132.6 4% | 61.1 56% | 124.8 9% | 68.2 51% |
* ... smaller is better
Power Consumption Witcher 3 / Stresstest
Power Consumption external Monitor
Battery Life
WLAN runtime is slightly longer than on last year's model by about 1 to 2 hours which is pretty good considering the year-over-year performance advantages. Meanwhile, charging from empty to full capacity takes a little over 2 hours.
| Dell Precision 5480 i9-13900H, RTX 3000 Ada Generation Laptop, 72 Wh | Dell Precision 5000 5470 i9-12900H, RTX A1000 Laptop GPU, 72 Wh | Dell Precision 5000 5560 i7-11850H, RTX A2000 Laptop GPU, 86 Wh | Lenovo ThinkPad P14s G3 AMD 21J6S05000 R7 PRO 6850U, Radeon 680M, 52.5 Wh | Lenovo ThinkPad P15v G3 21EM001AGE R7 PRO 6850H, RTX A2000 Laptop GPU, 68 Wh | HP ZBook Firefly 14 G9-6B8A2EA i7-1265U, T550 Laptop GPU, 51 Wh | |
|---|---|---|---|---|---|---|
| Battery runtime | 5% | 29% | 17% | 32% | -19% | |
| WiFi v1.3 (h) | 10.9 | 9.6 -12% | 6.3 -42% | 12.2 12% | 6.9 -37% | 8.8 -19% |
| Load (h) | 0.9 | 1.1 22% | 1.8 100% | 1.1 22% | 1.8 100% | |
| Reader / Idle (h) | 14.7 | 12 | ||||
| H.264 (h) | 12 | 10.7 |
Pros
Cons
Verdict — RTX 3000 Ada Impresses
The Precision 5480 is an internal refinement of last year's Precision 5470. CPU performance is faster and more stable than before while the Ada GPU is the real star of the show and the biggest reason to purchase the Precision 5480 over the older Precision 5470. Power consumption may be a bit higher, but battery life hasn't significantly changed and the performance uptick will be well worth it for demanding users.
Perhaps the biggest drawback to the system is how loud it can be when putting the pedal to the metal. While performance-per-volume is very high, all that power in such a small and portable package comes at the price of fan noise. Other 14-inch workstations like the Lenovo ThinkPad P14s or HP ZBook Firefly 14 G9 run much more quietly, but you'll have to sacrifice a huge chunk of graphics performance along the way.
The 14-inch Precision 5480 is for on-the-go power users who know they can fully exploit the fast RTX 3000 Ada GPU. Otherwise, alternatives from Lenovo and HP tend to run much quieter and more discreetly.
Price and Availability
Dell is now shipping its Precision 5480 workstation starting at $2070 USD for the base Core i5 configuration with no discrete graphics up to over $4400 for our Core i7 RTX 3000 Ada configuration.
Dell Precision 5480
- 09/15/2023 v7 (old)
Allen Ngo
Transparency
The selection of devices to be reviewed is made by our editorial team. The test sample was provided to the author as a loan by the manufacturer or retailer for the purpose of this review. The lender had no influence on this review, nor did the manufacturer receive a copy of this review before publication. There was no obligation to publish this review. As an independent media company, Notebookcheck is not subjected to the authority of manufacturers, retailers or publishers.
This is how Notebookcheck is testing
Every year, Notebookcheck independently reviews hundreds of laptops and smartphones using standardized procedures to ensure that all results are comparable. We have continuously developed our test methods for around 20 years and set industry standards in the process. In our test labs, high-quality measuring equipment is utilized by experienced technicians and editors. These tests involve a multi-stage validation process. Our complex rating system is based on hundreds of well-founded measurements and benchmarks, which maintains objectivity. Further information on our test methods can be found here.
Price comparison
