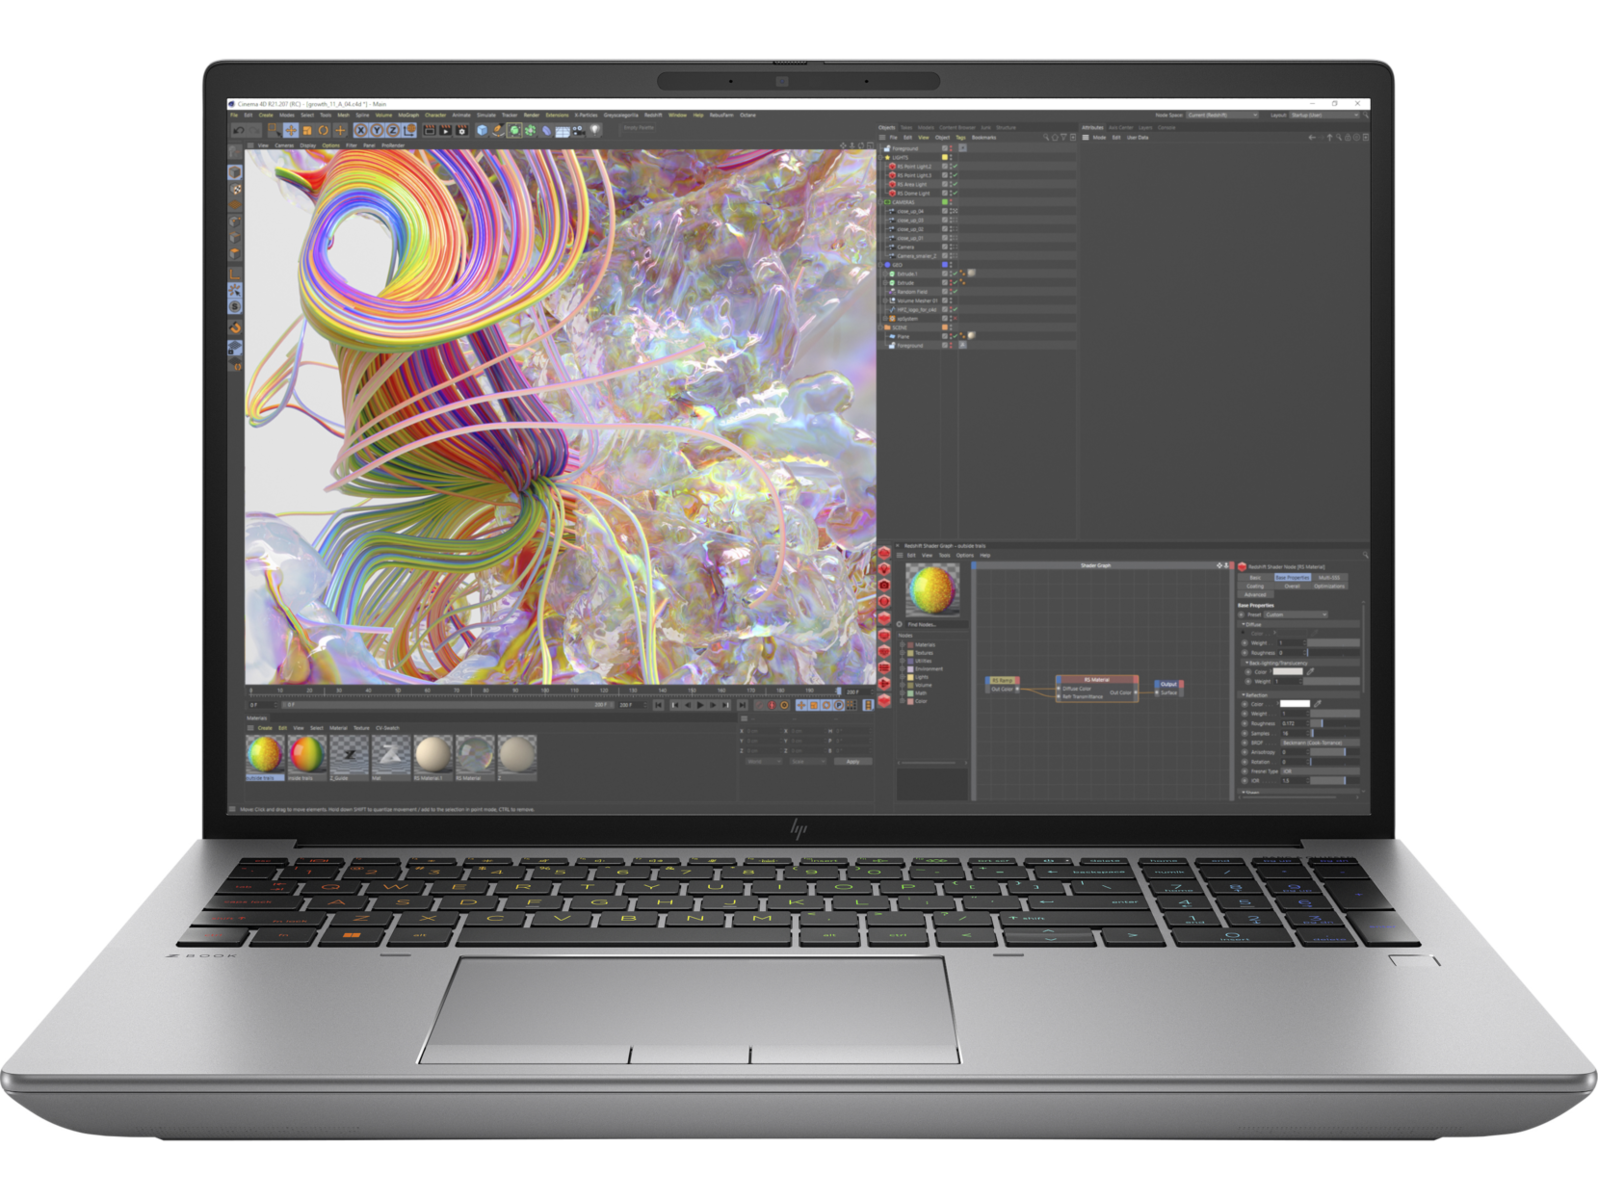
HP ZBook Fury 16 G9 workstation review: Dell Precision 7670 and ThinkPad P16 G1 alternative

The ZBook Fury series is home to HP's highest-performing mobile workstations in contrast to the mid-range ZBook Studio series and ultrathin ZBook Firefly series.
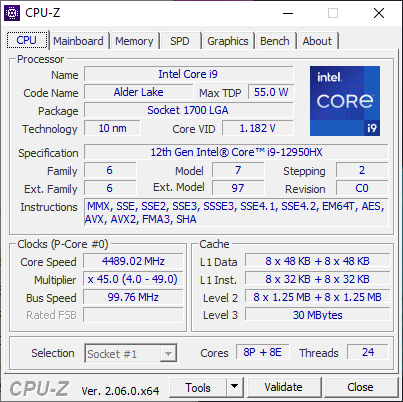
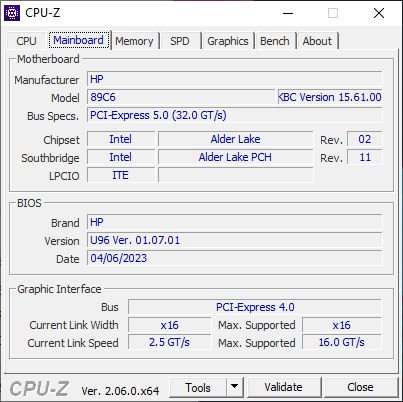
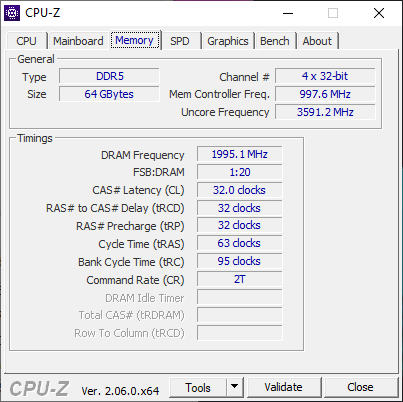
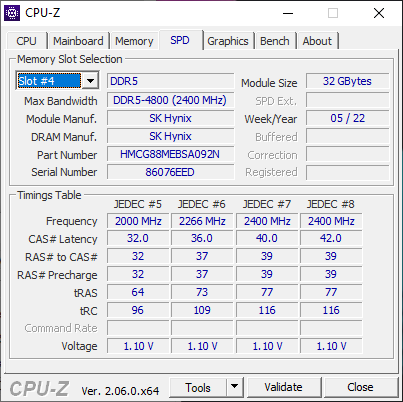
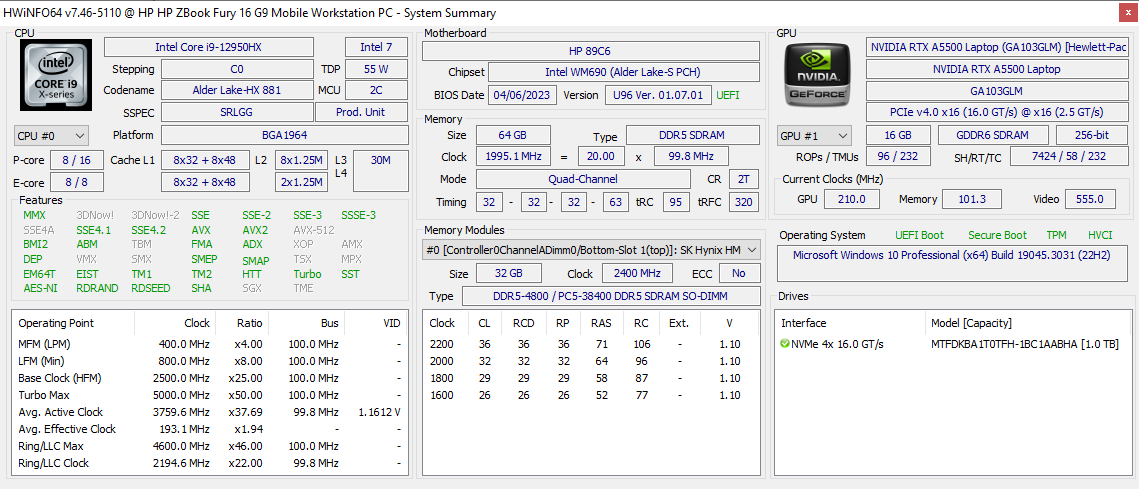
Our unit in review is a high-end configuration of the Fury 16 G9 with the 12th gen Alder Lake-H Core i9-12950HX CPU, RTX A5500 Ampere GPU, 64 GB RAM, and 3840 x 2400 IPS display retailing for just over $4000 USD. Configurable options are vast with LTE, 5G, and even OLED panels as listed here. Note that the ZBook Fury G10 with newer 13th gen Intel options are also available, but the chassis remains identical to our Fury G9.
Alternatives to the ZBook Fury 16 G9 include other flagship 16-inch mobile workstations like the Dell Precision 7670, MSI CreatorPro Z16P, Asus ProArt StudioBook 16, or Lenovo ThinkPad P16 G1.
More HP reviews:
Potential Competitors in Comparison
Rating | Date | Model | Weight | Height | Size | Resolution | Price |
|---|---|---|---|---|---|---|---|
| 91 % v7 (old) | 06 / 2023 | HP ZBook Fury 16 G9 i9-12950HX, RTX A5500 Laptop GPU | 2.6 kg | 28.5 mm | 16.00" | 3840x2400 | |
| 90.1 % v7 (old) | 11 / 2022 | HP ZBook Studio 16 G9 62U04EA i7-12800H, RTX A2000 Laptop GPU | 1.8 kg | 19 mm | 16.00" | 3840x2400 | |
| 82.9 % v7 (old) | 10 / 2022 | HP ZBook Firefly 16 G9-6B897EA i7-1265U, T550 Laptop GPU | 2 kg | 19.2 mm | 16.00" | 1920x1200 | |
| 91 % v7 (old) | 02 / 2023 | Lenovo ThinkPad P16 G1 RTX A5500 i9-12950HX, RTX A5500 Laptop GPU | 3 kg | 30.23 mm | 16.00" | 3840x2400 | |
| 89.1 % v7 (old) | 12 / 2022 | Dell Precision 7000 7670 Performance i9-12950HX, RTX A5500 Laptop GPU | 2.8 kg | 25.95 mm | 16.00" | 3840x2400 | |
| 84.3 % v7 (old) | 11 / 2022 | MSI CreatorPro Z16P B12UKST i7-12700H, RTX A3000 Laptop GPU | 2.4 kg | 19 mm | 16.00" | 2560x1600 |
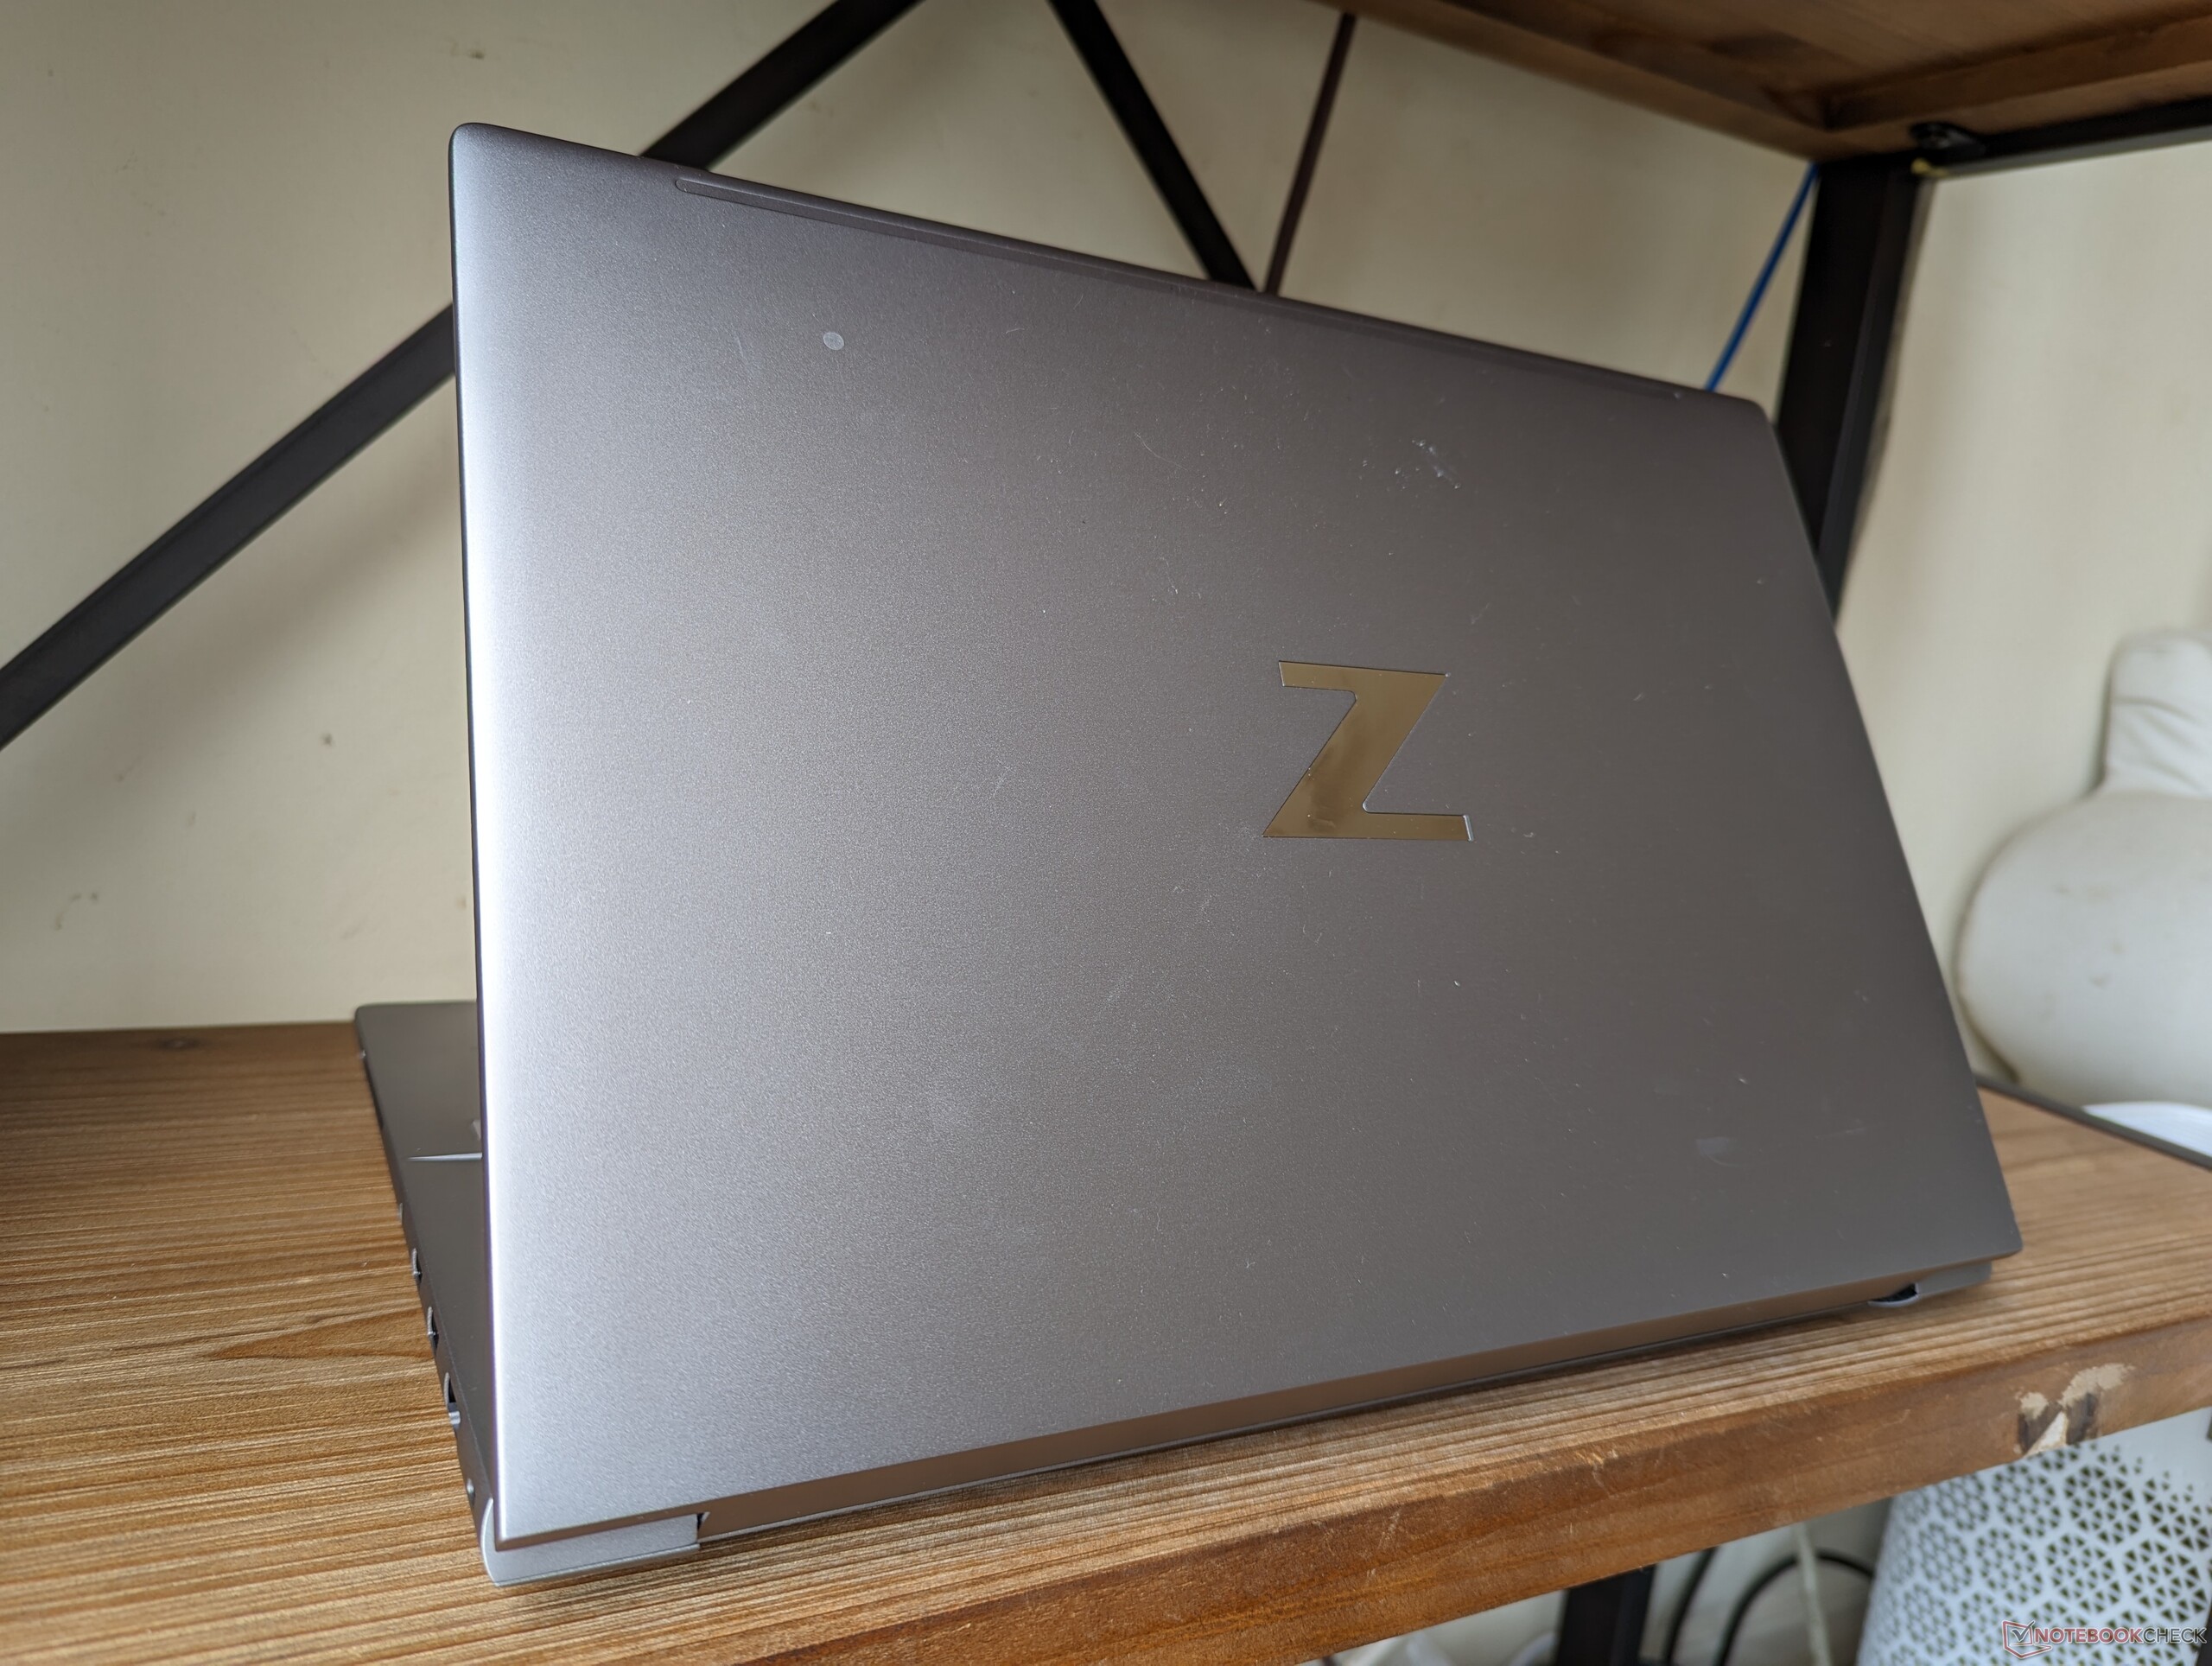
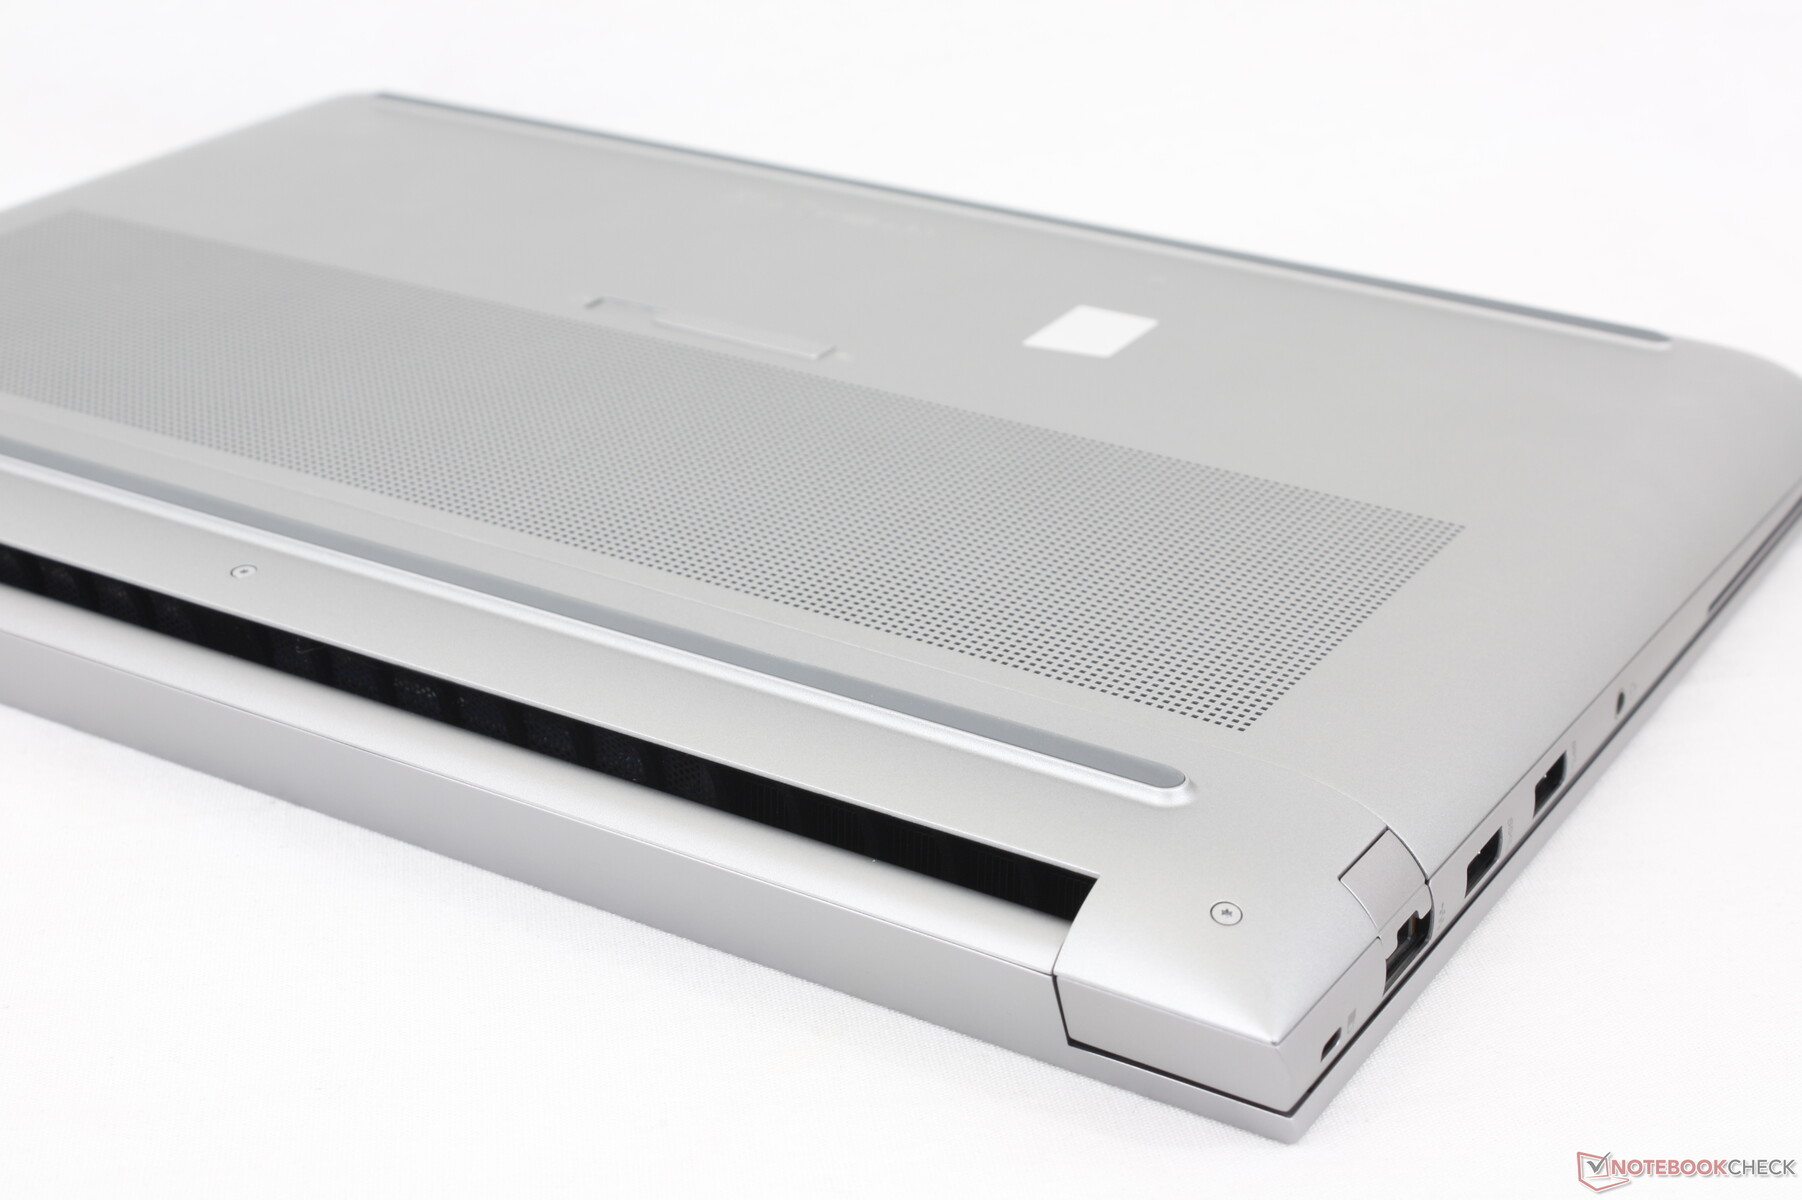
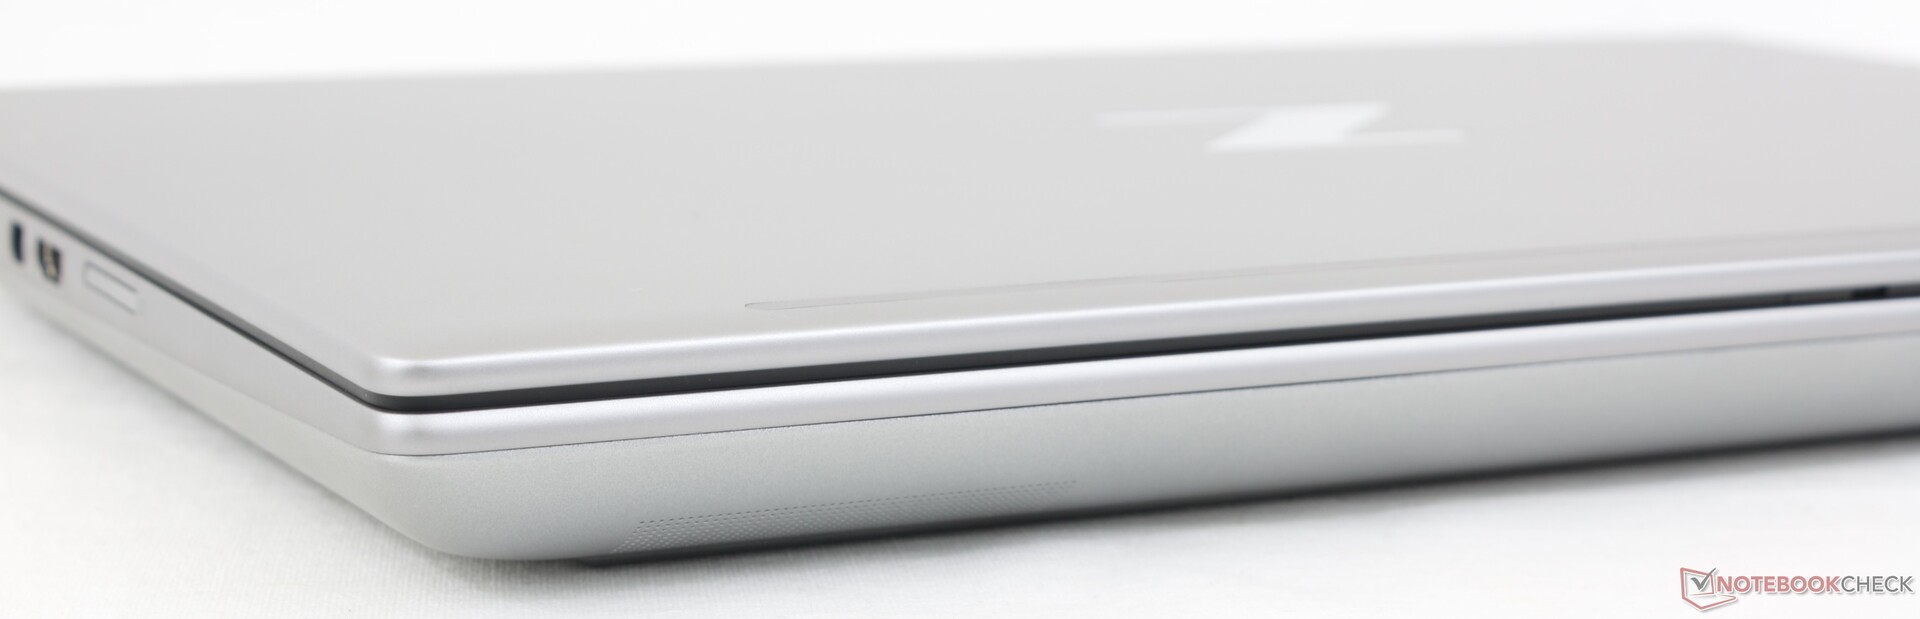
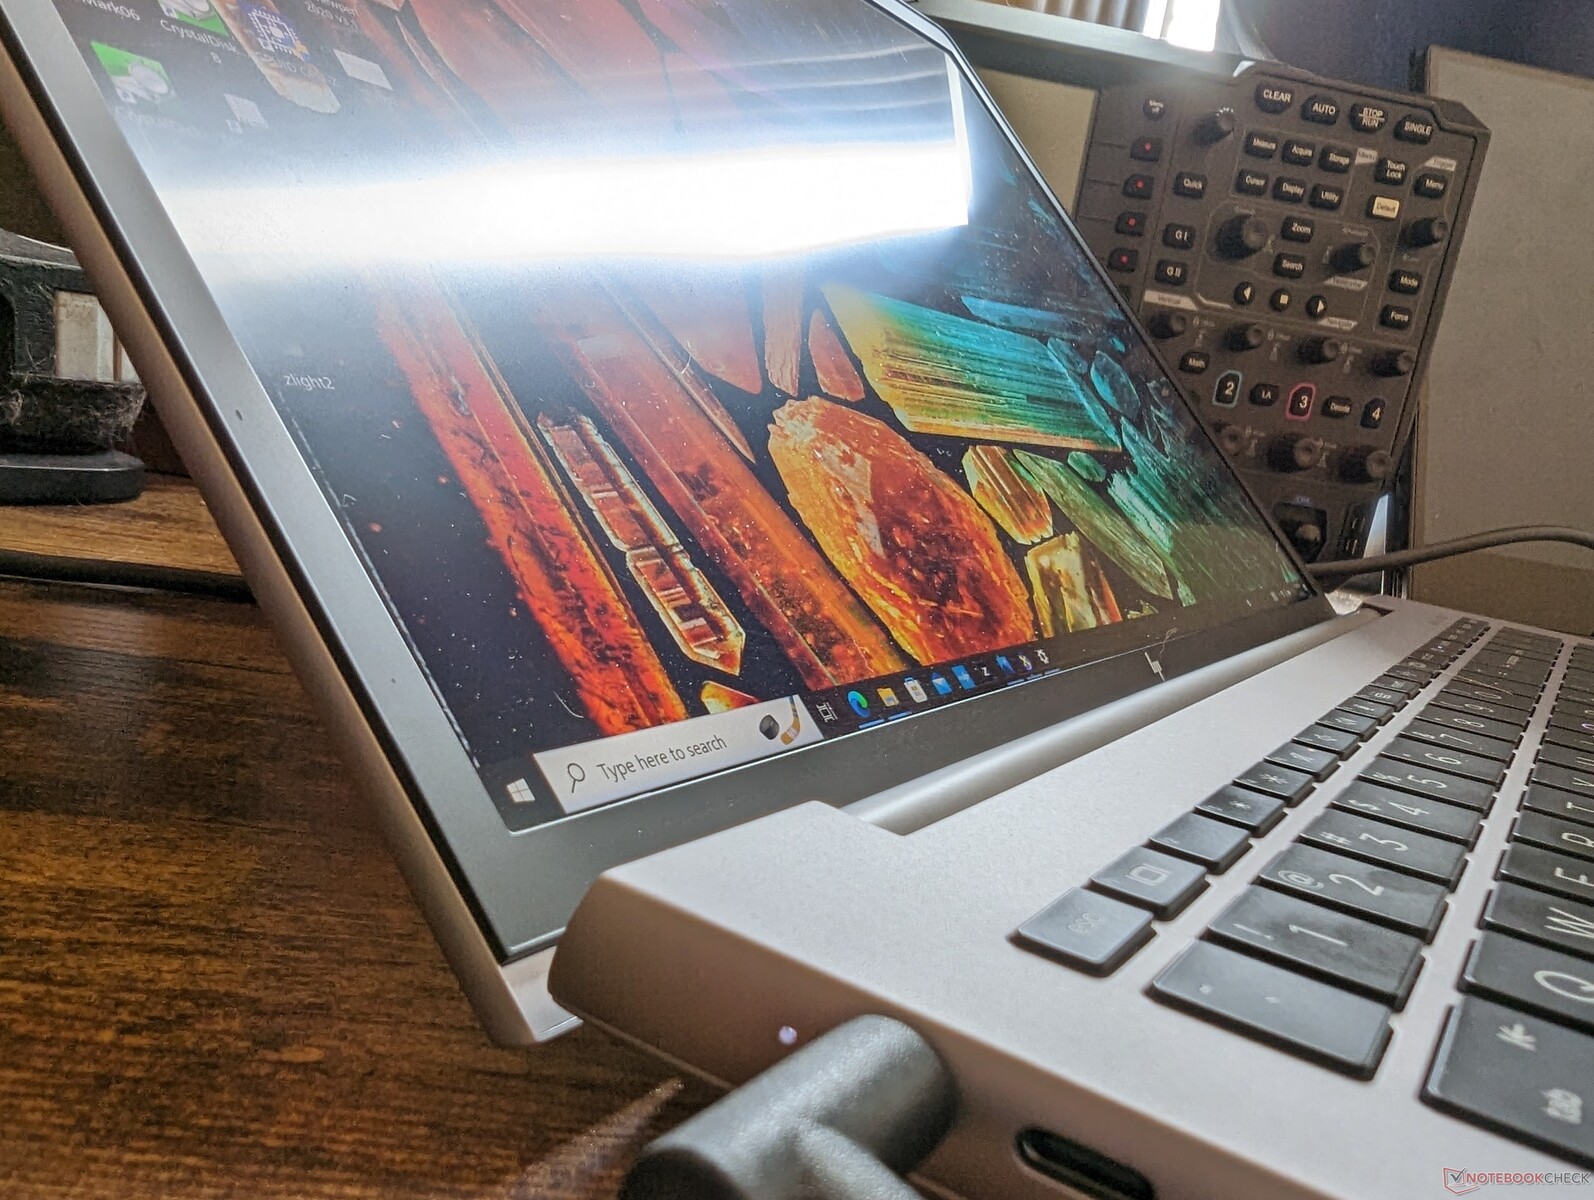
Case — Classic ZBook
The chassis consists of the same aluminum alloy materials that ZBook owners are already familiar with. Twists, warps, and creaks are minimal and comparable to the Precision 7670 for strong first impressions and no problematic areas. Flexing is most noticeable when applying pressure on the center of outer lid where the "Z" logo is located, but it's not a cause for any long term concerns.
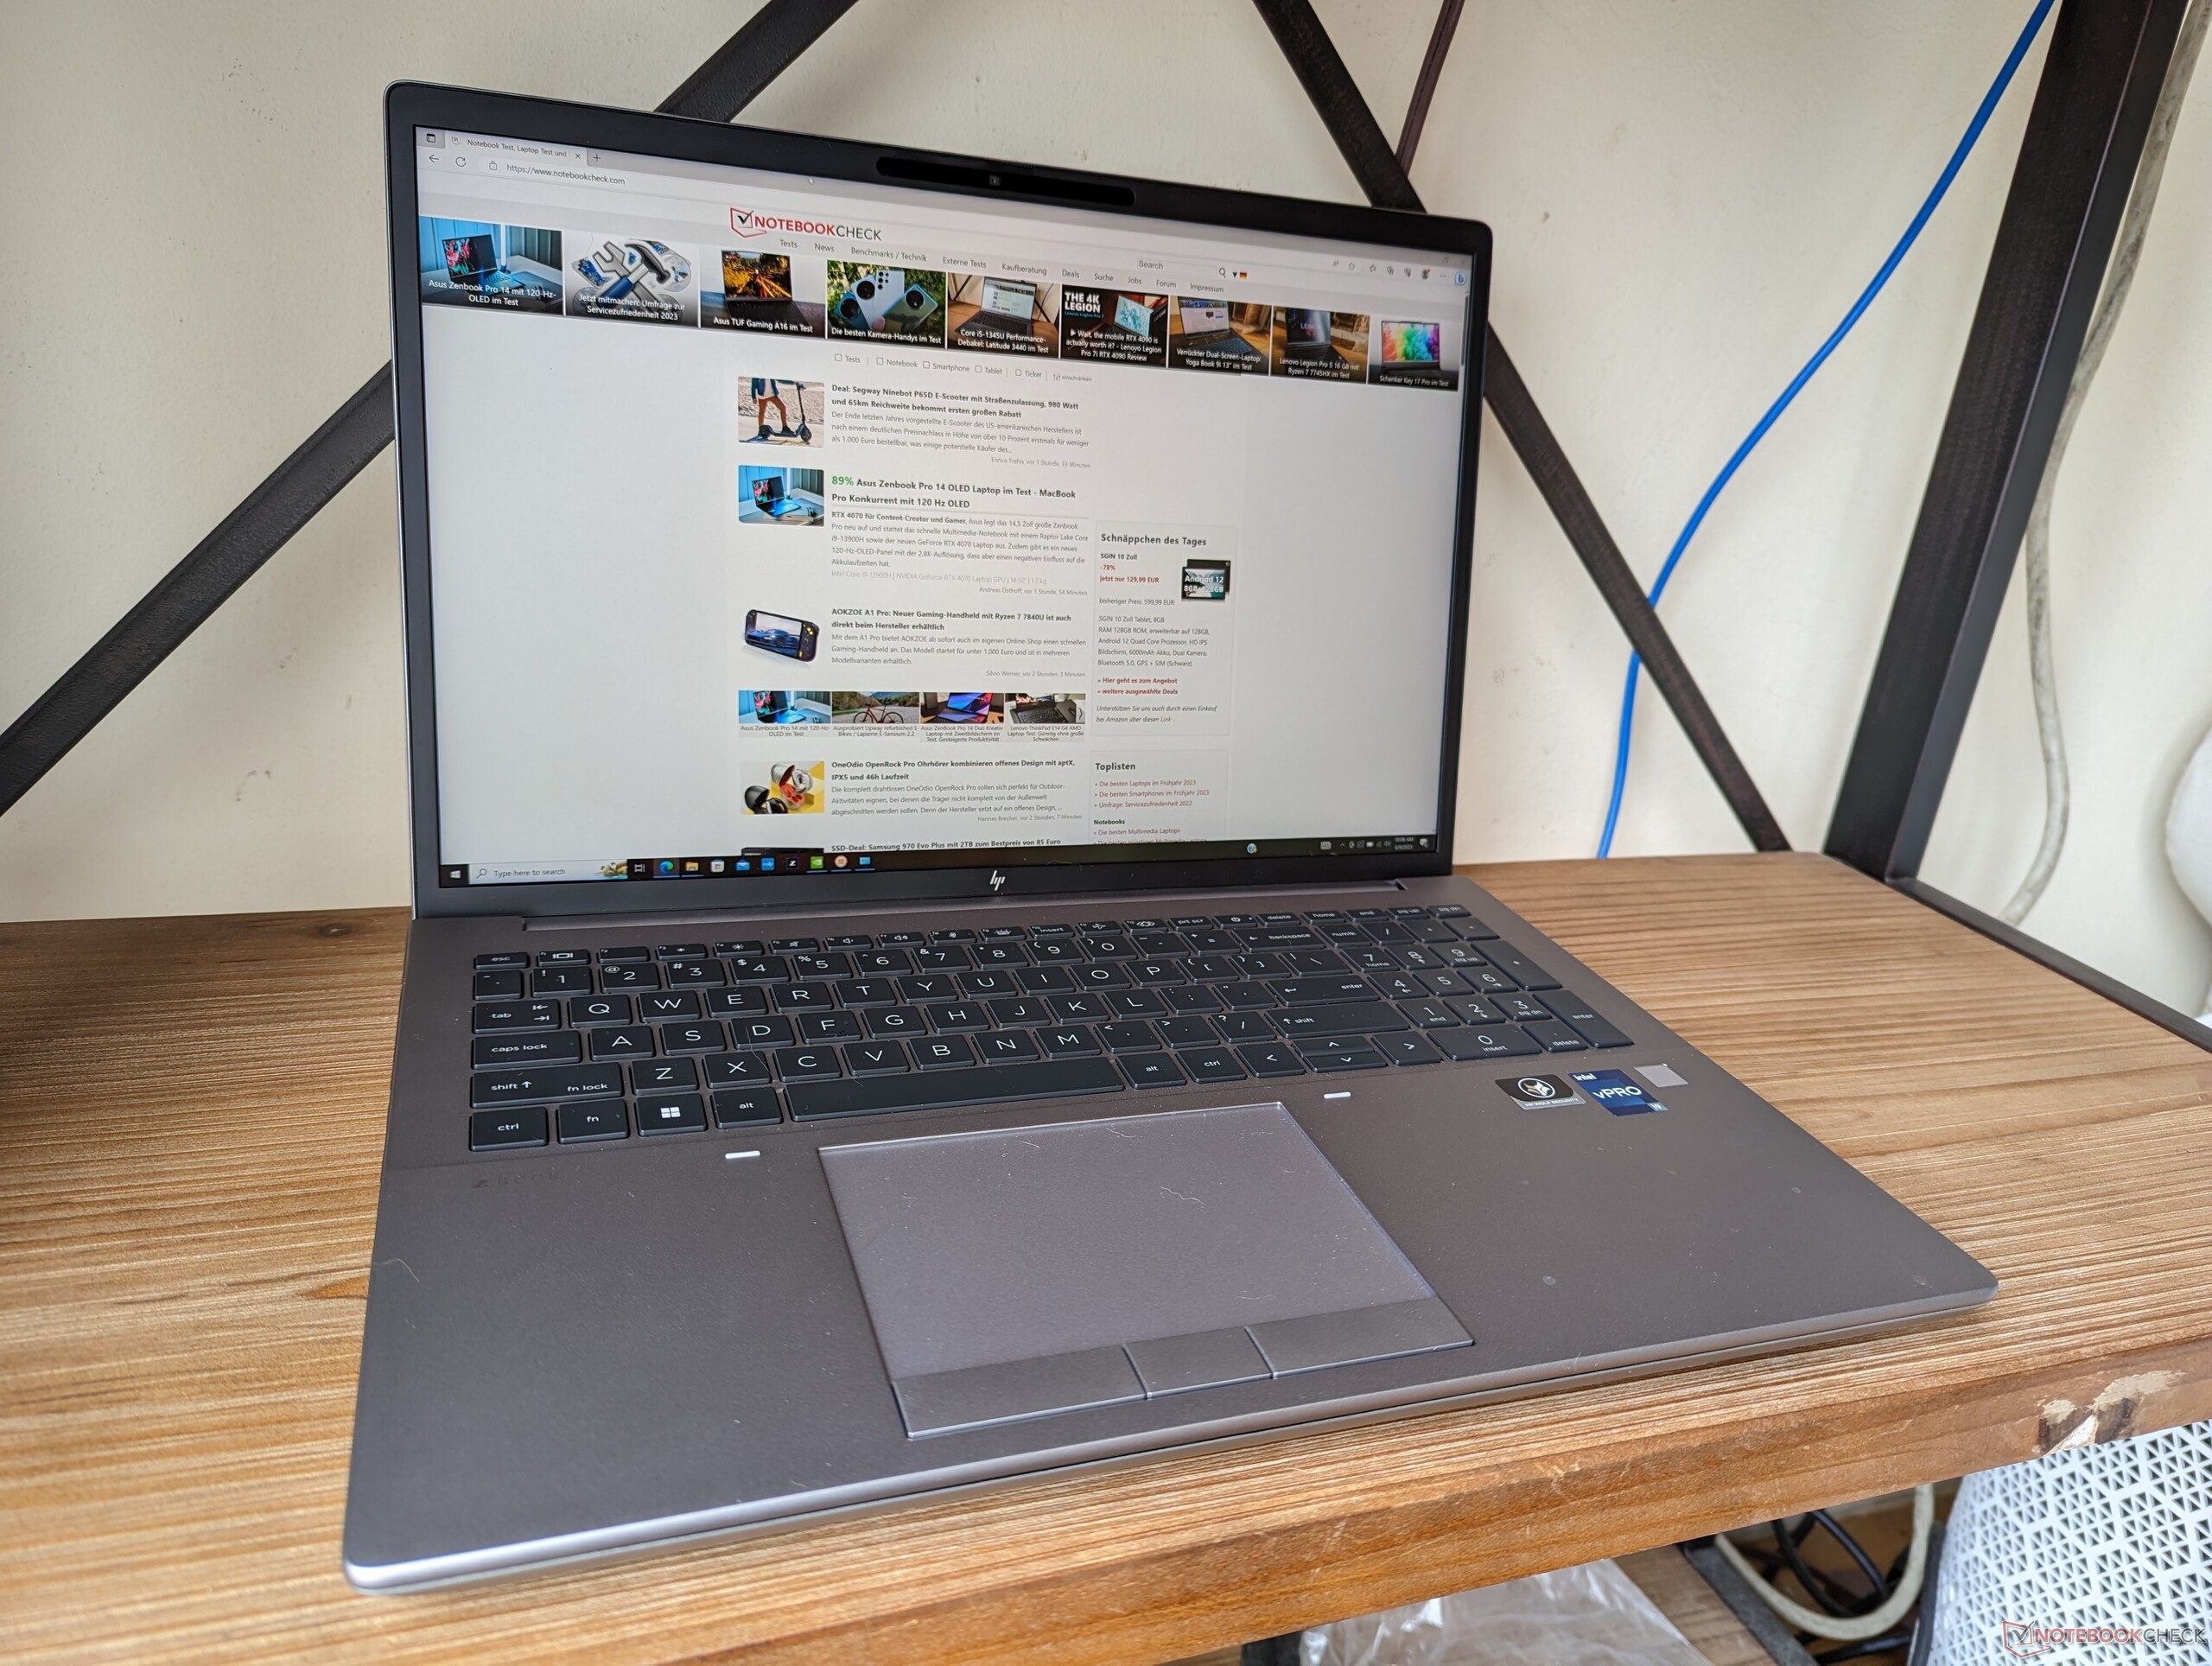
The HP is noticeably lighter than both the ThinkPad P16 G1 and Precision 7670 even though they all come with similar CPU and GPU options. However, this comes at the cost of performance as our benchmark comparisons below will show. For something more portable, users can consider the much thinner ZBook Firefly 16 G9 or ZBook Studio 16 G9 instead.
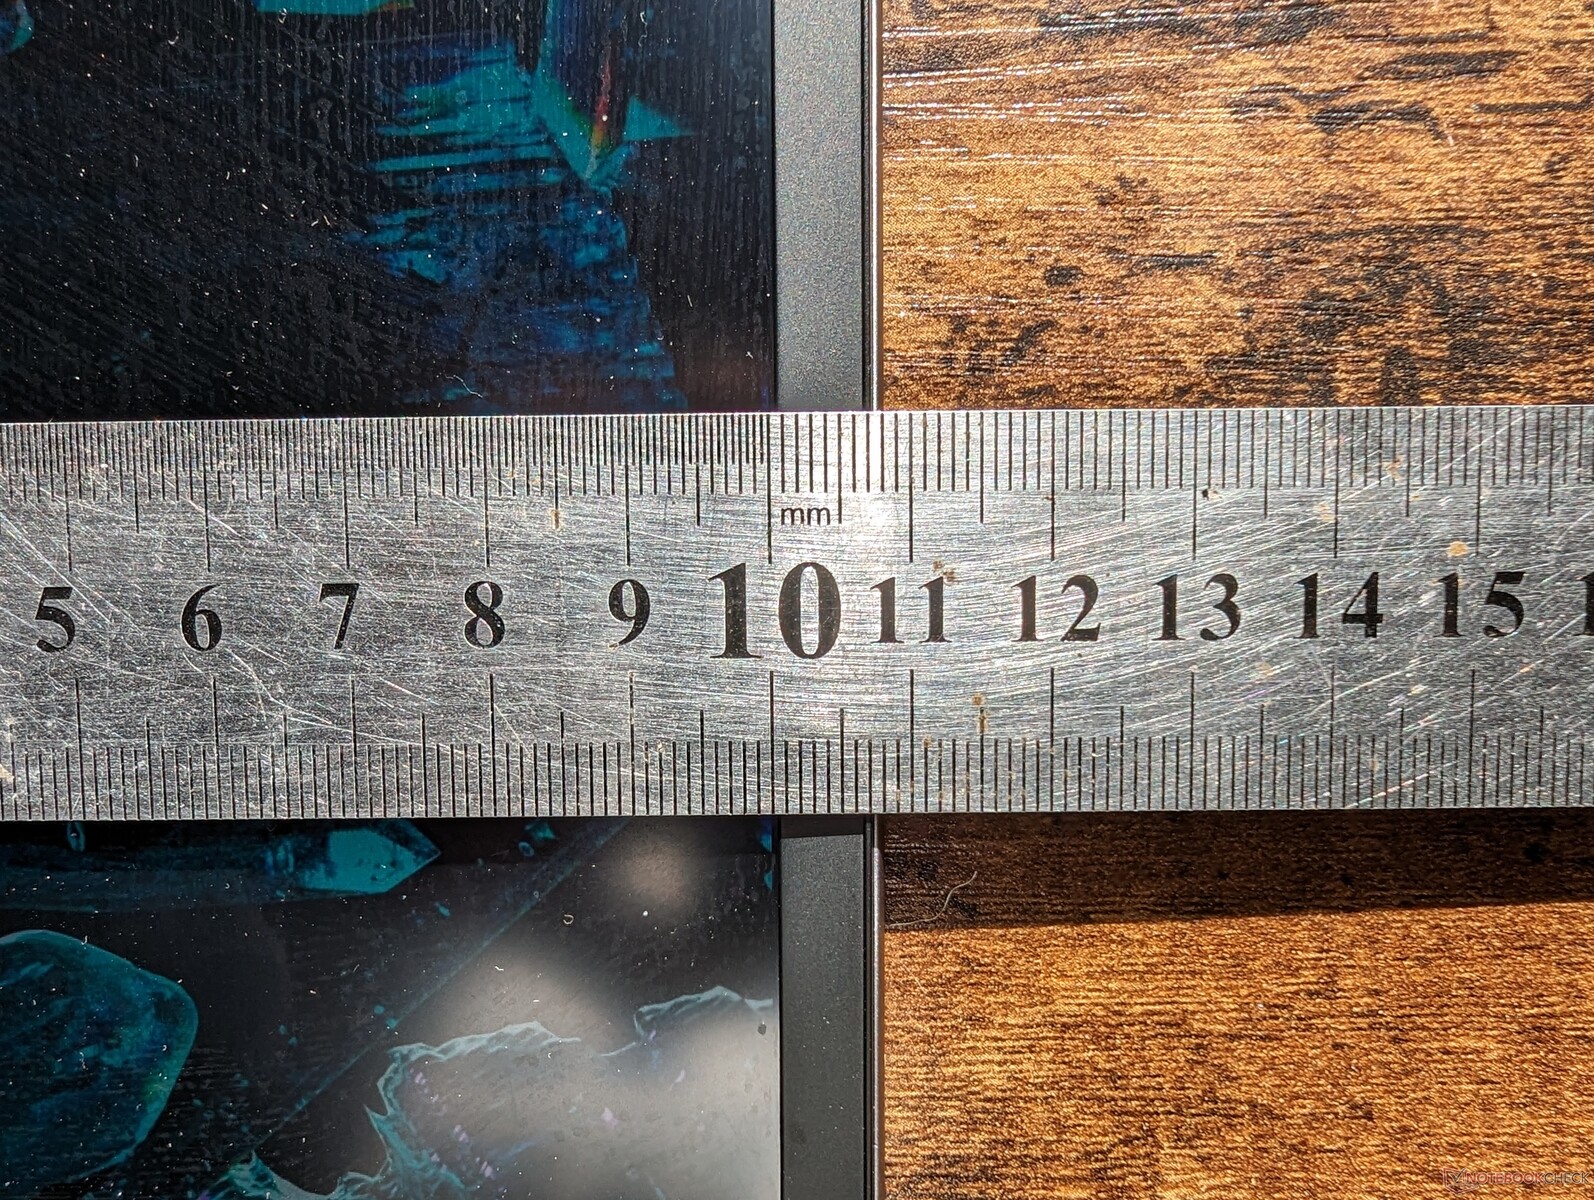
The bottom bezel of the Fury G9 is surprisingly narrow for a workstation which contributes to the model being shorter in length than most other 16-inch alternatives.
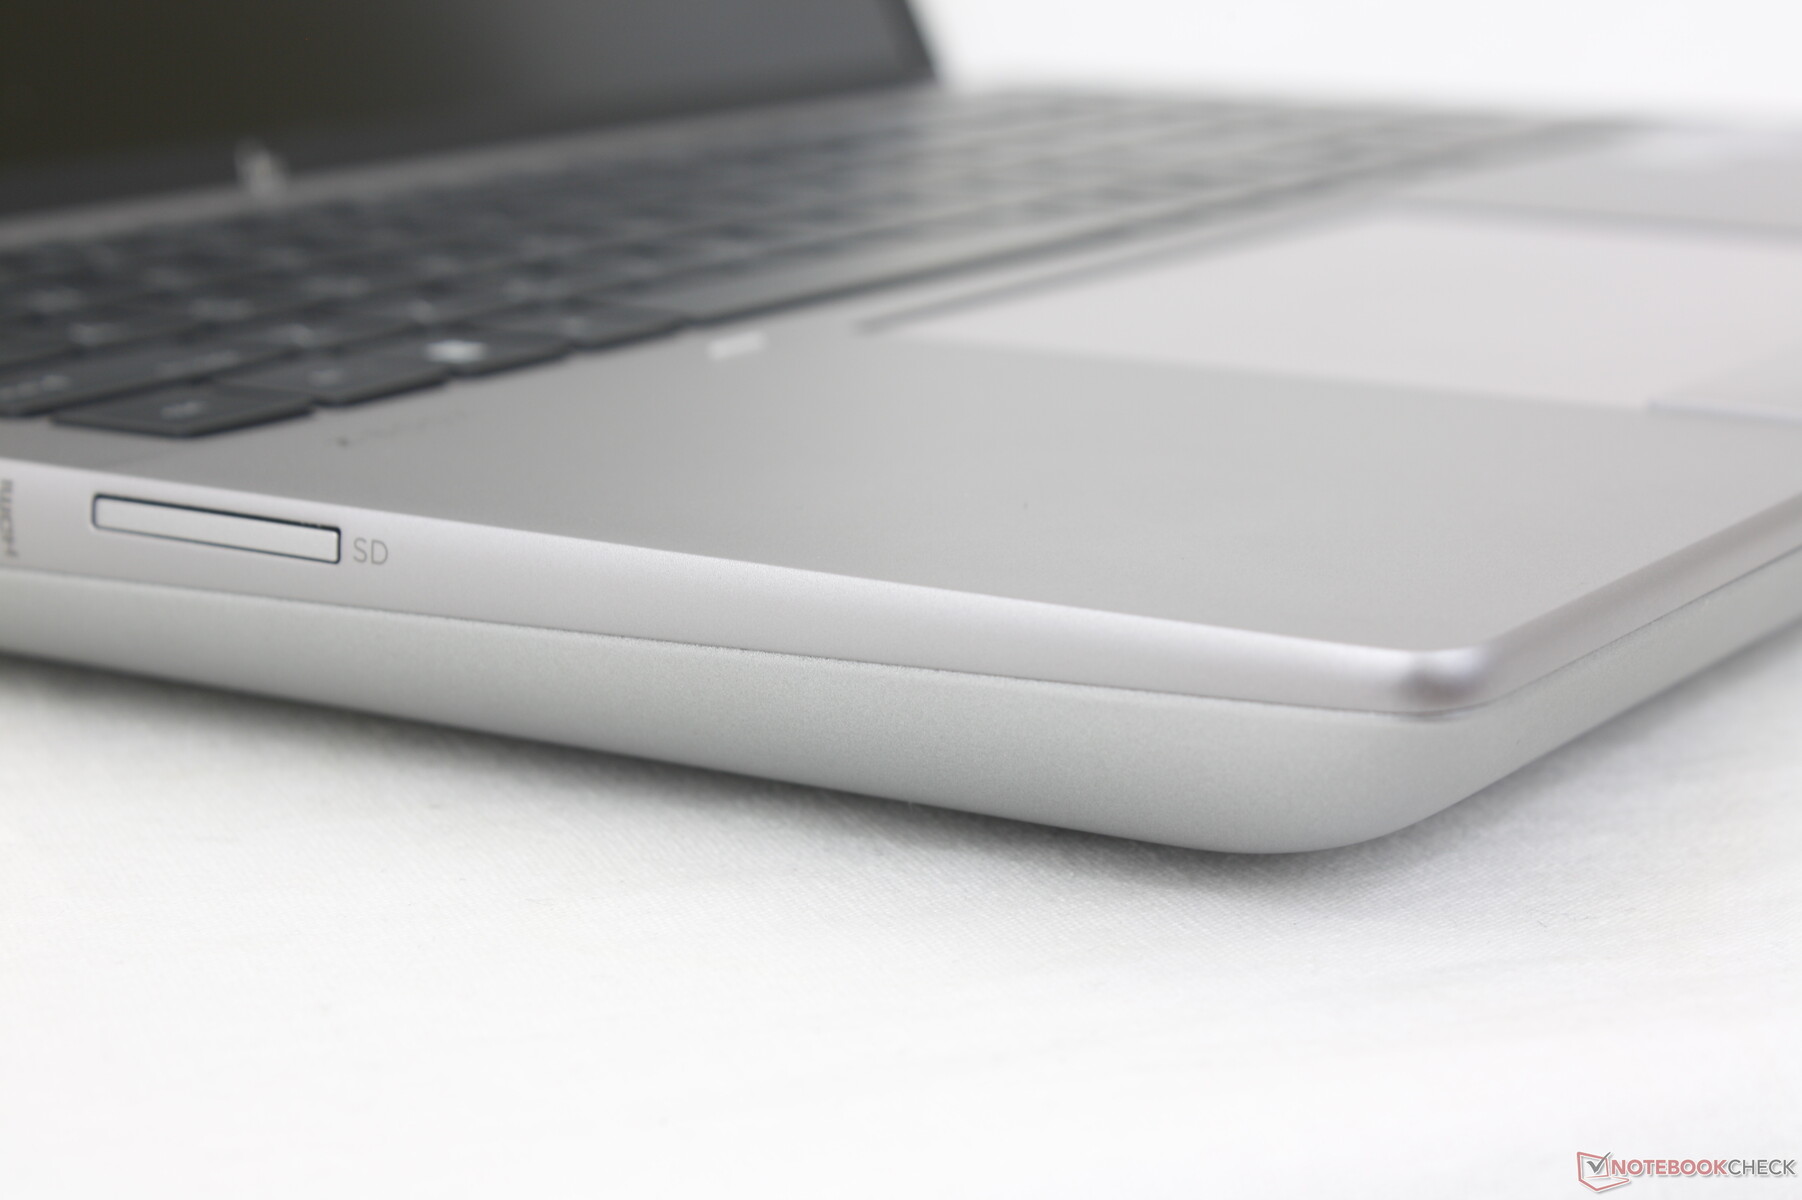
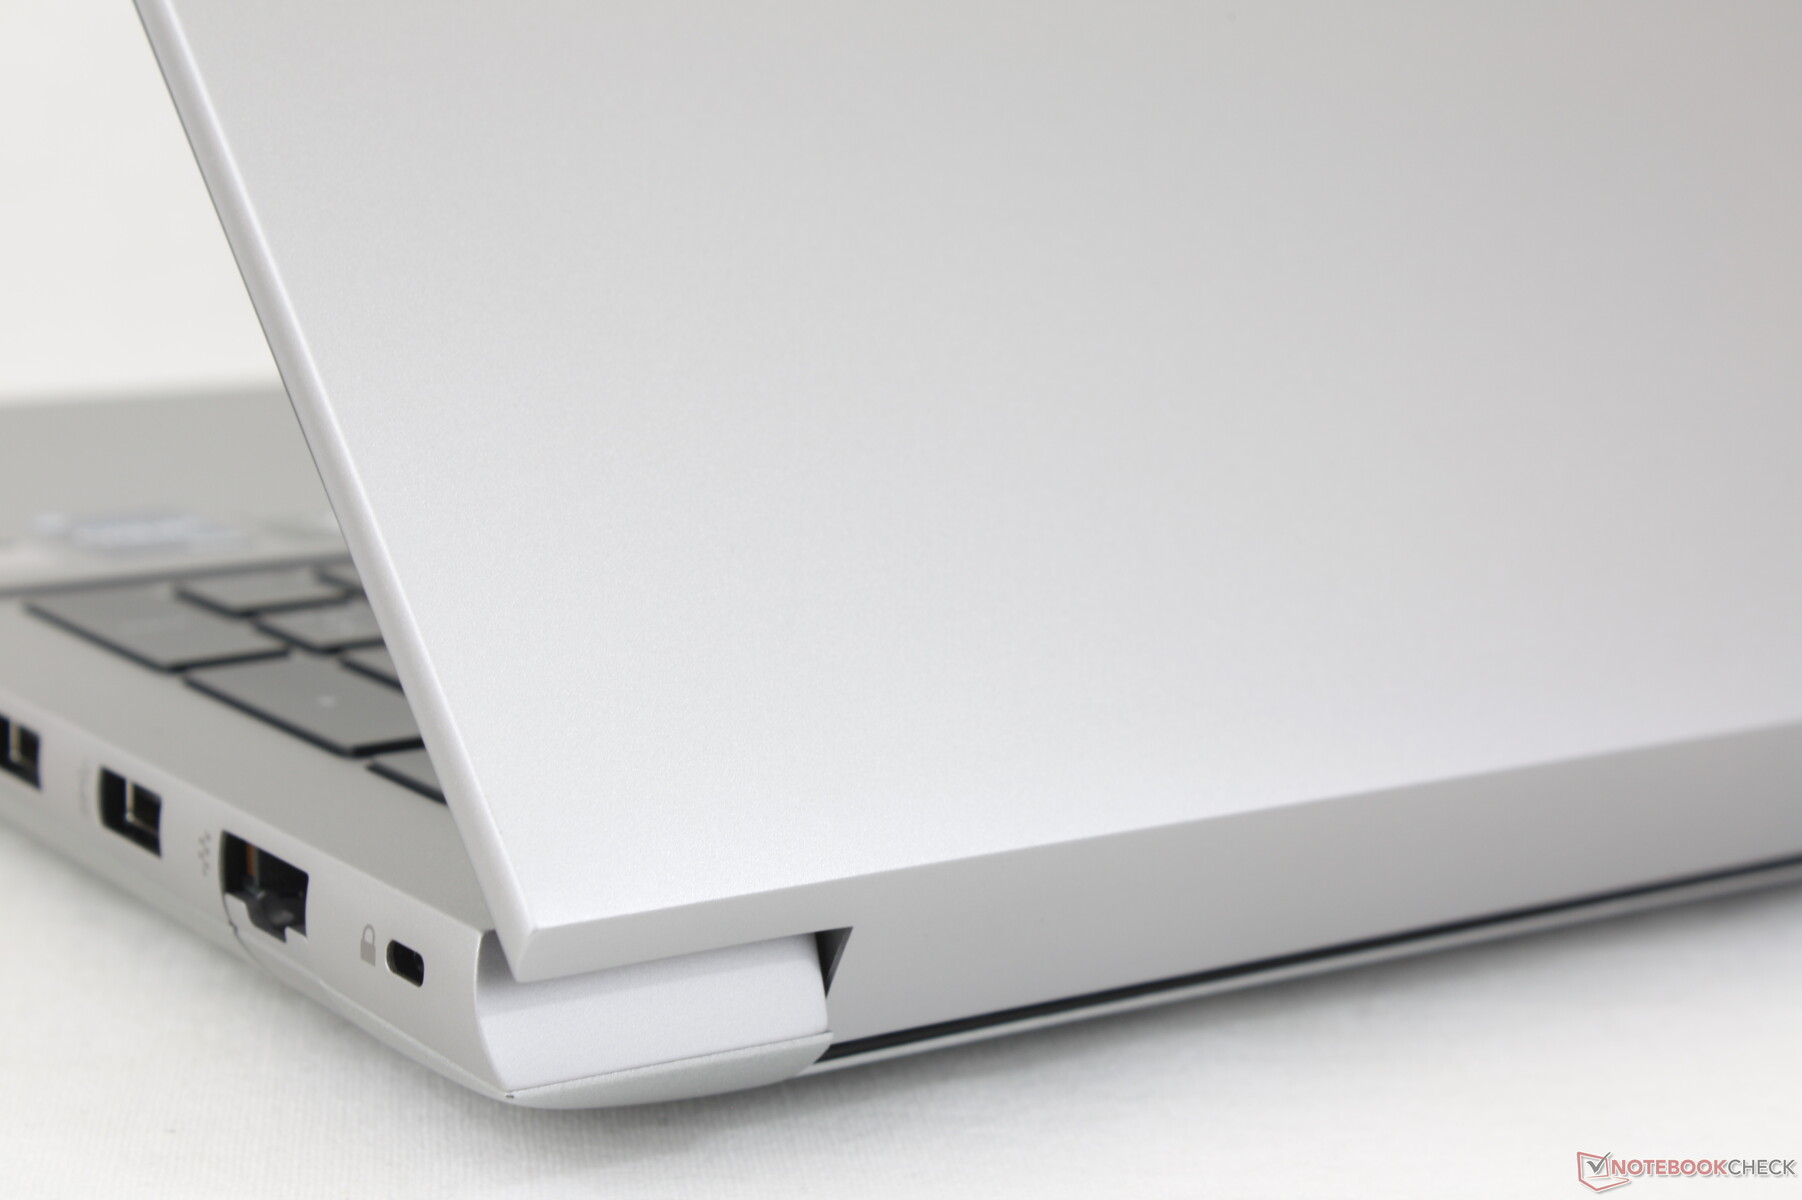
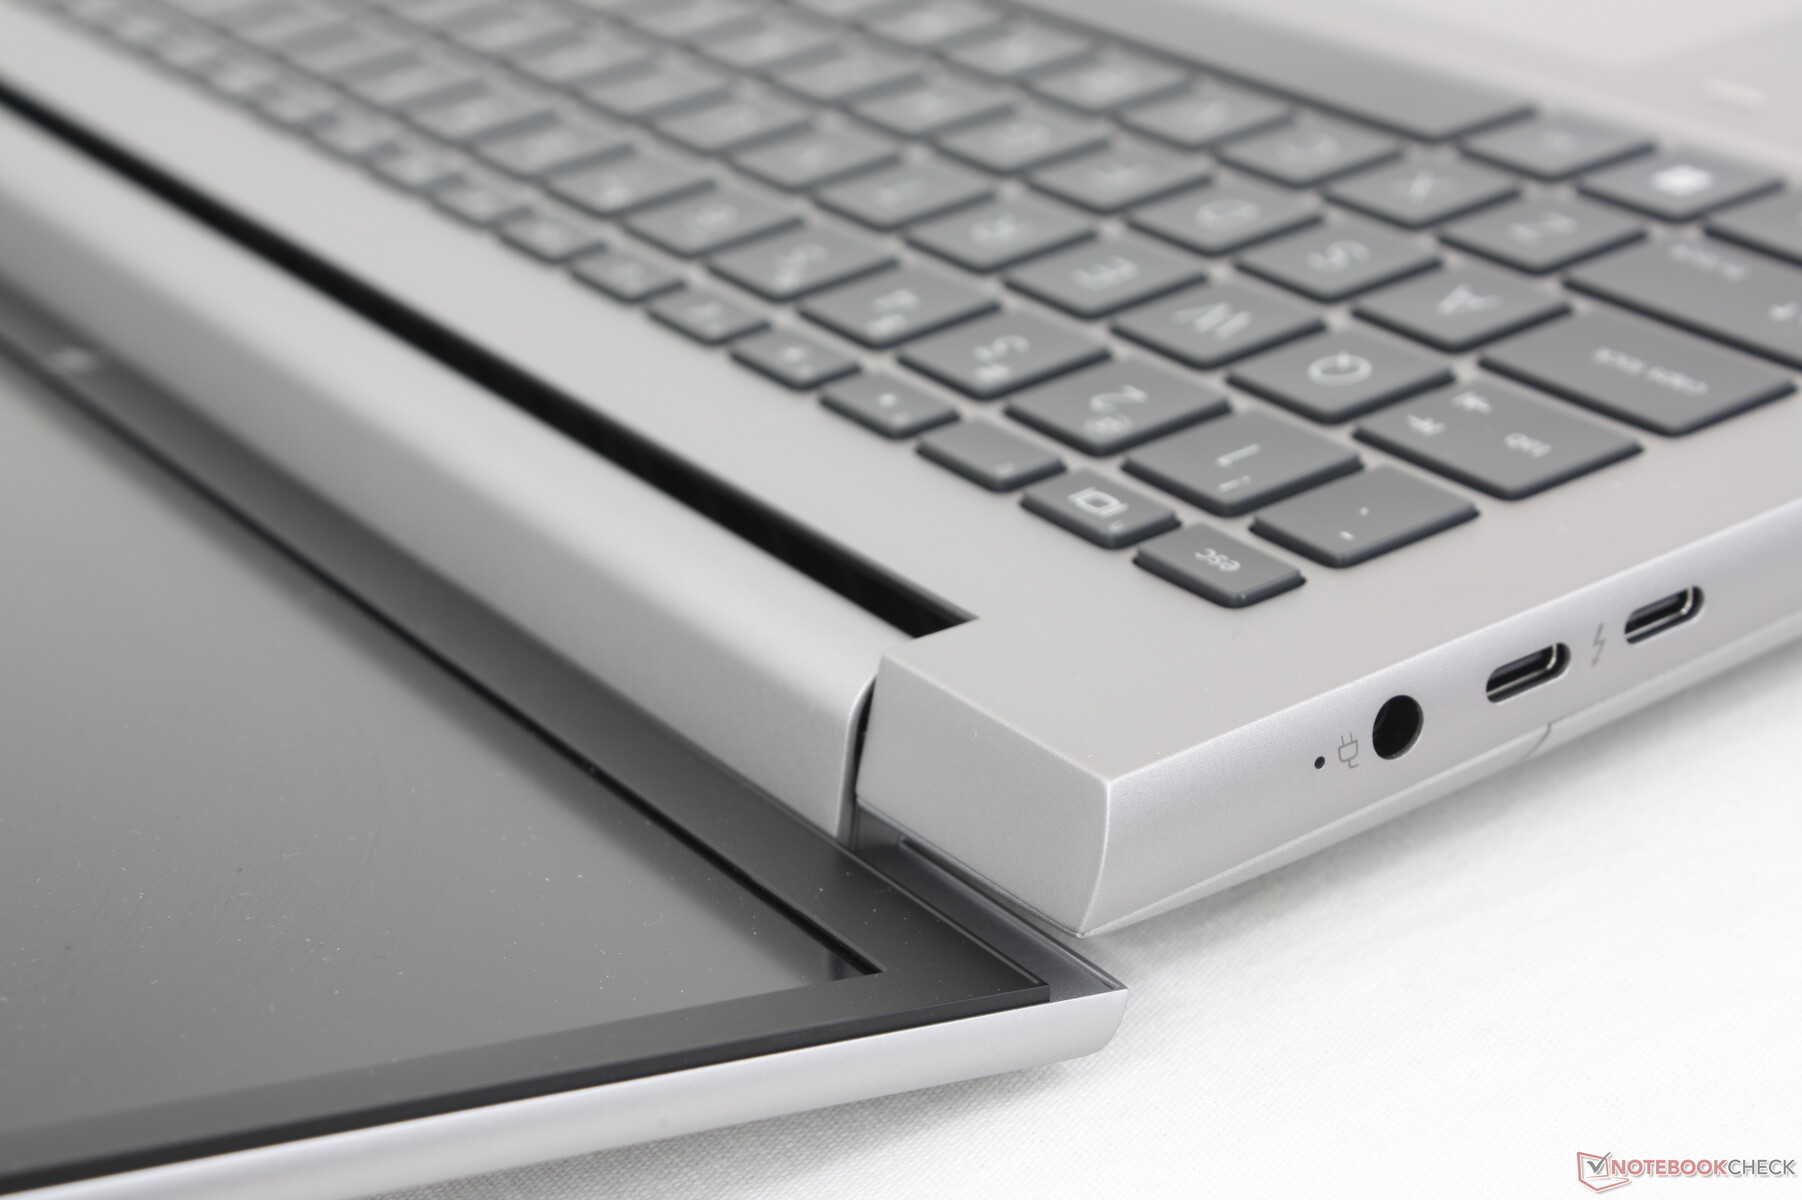
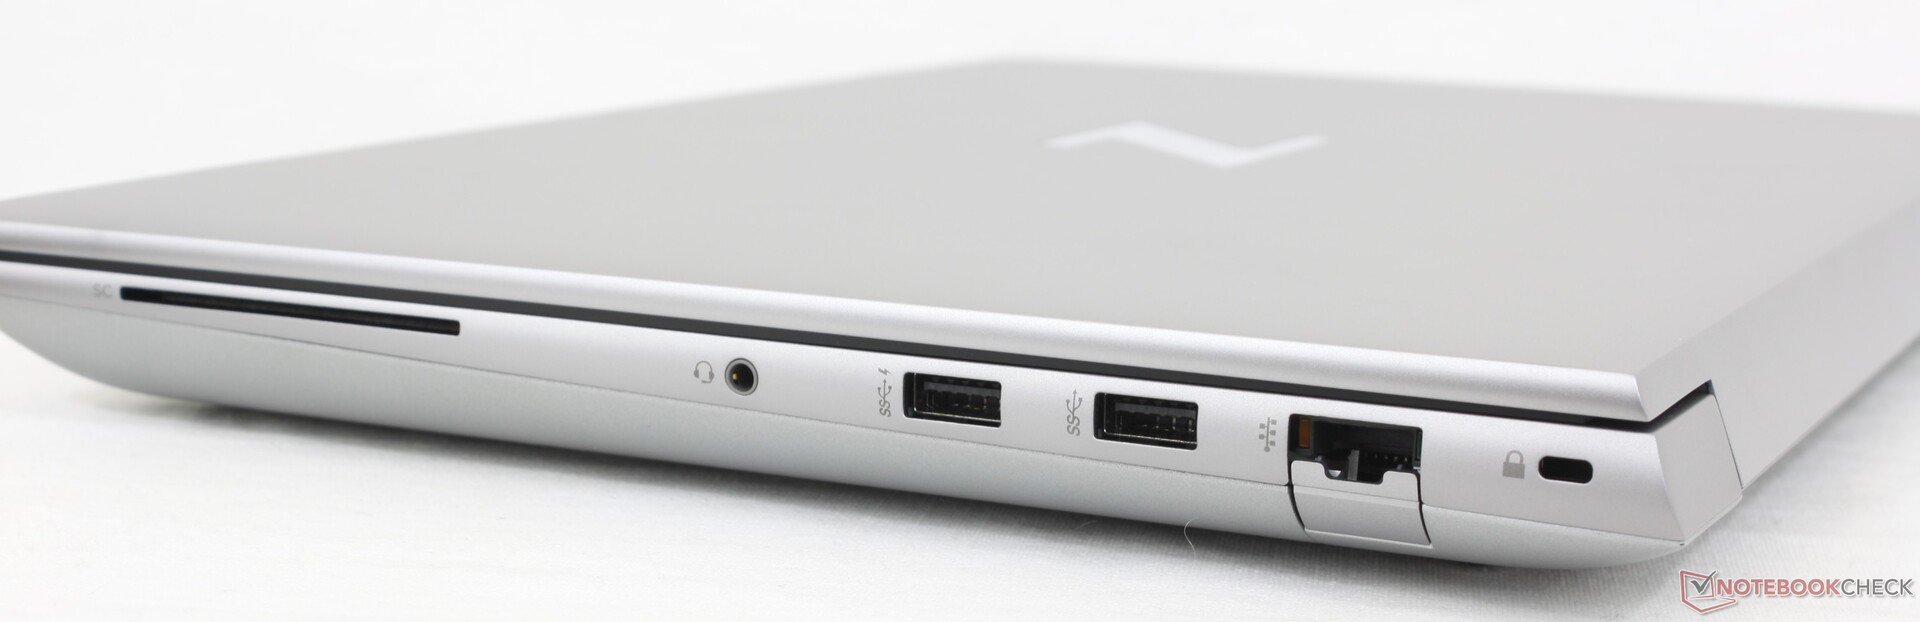
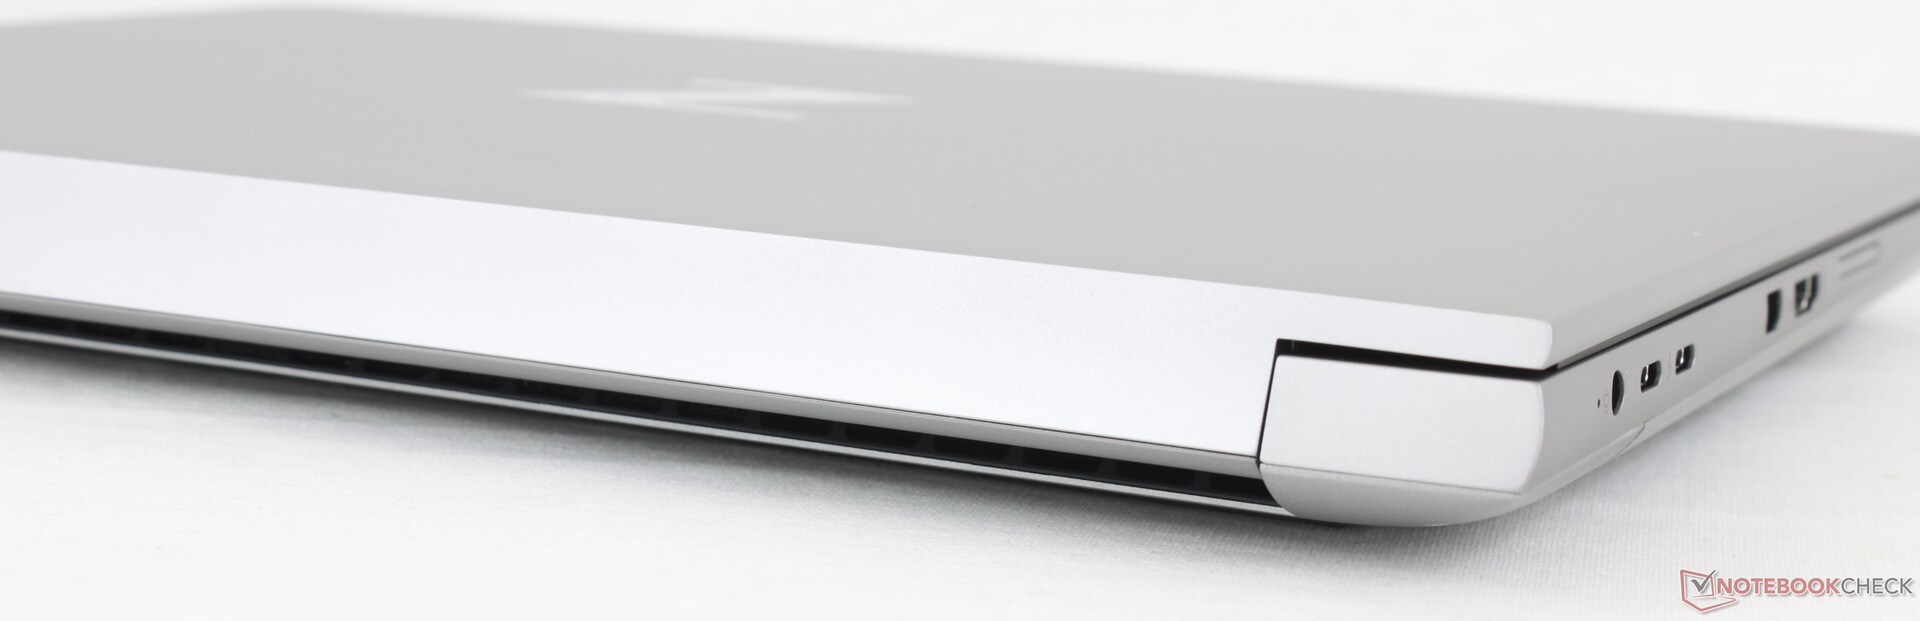
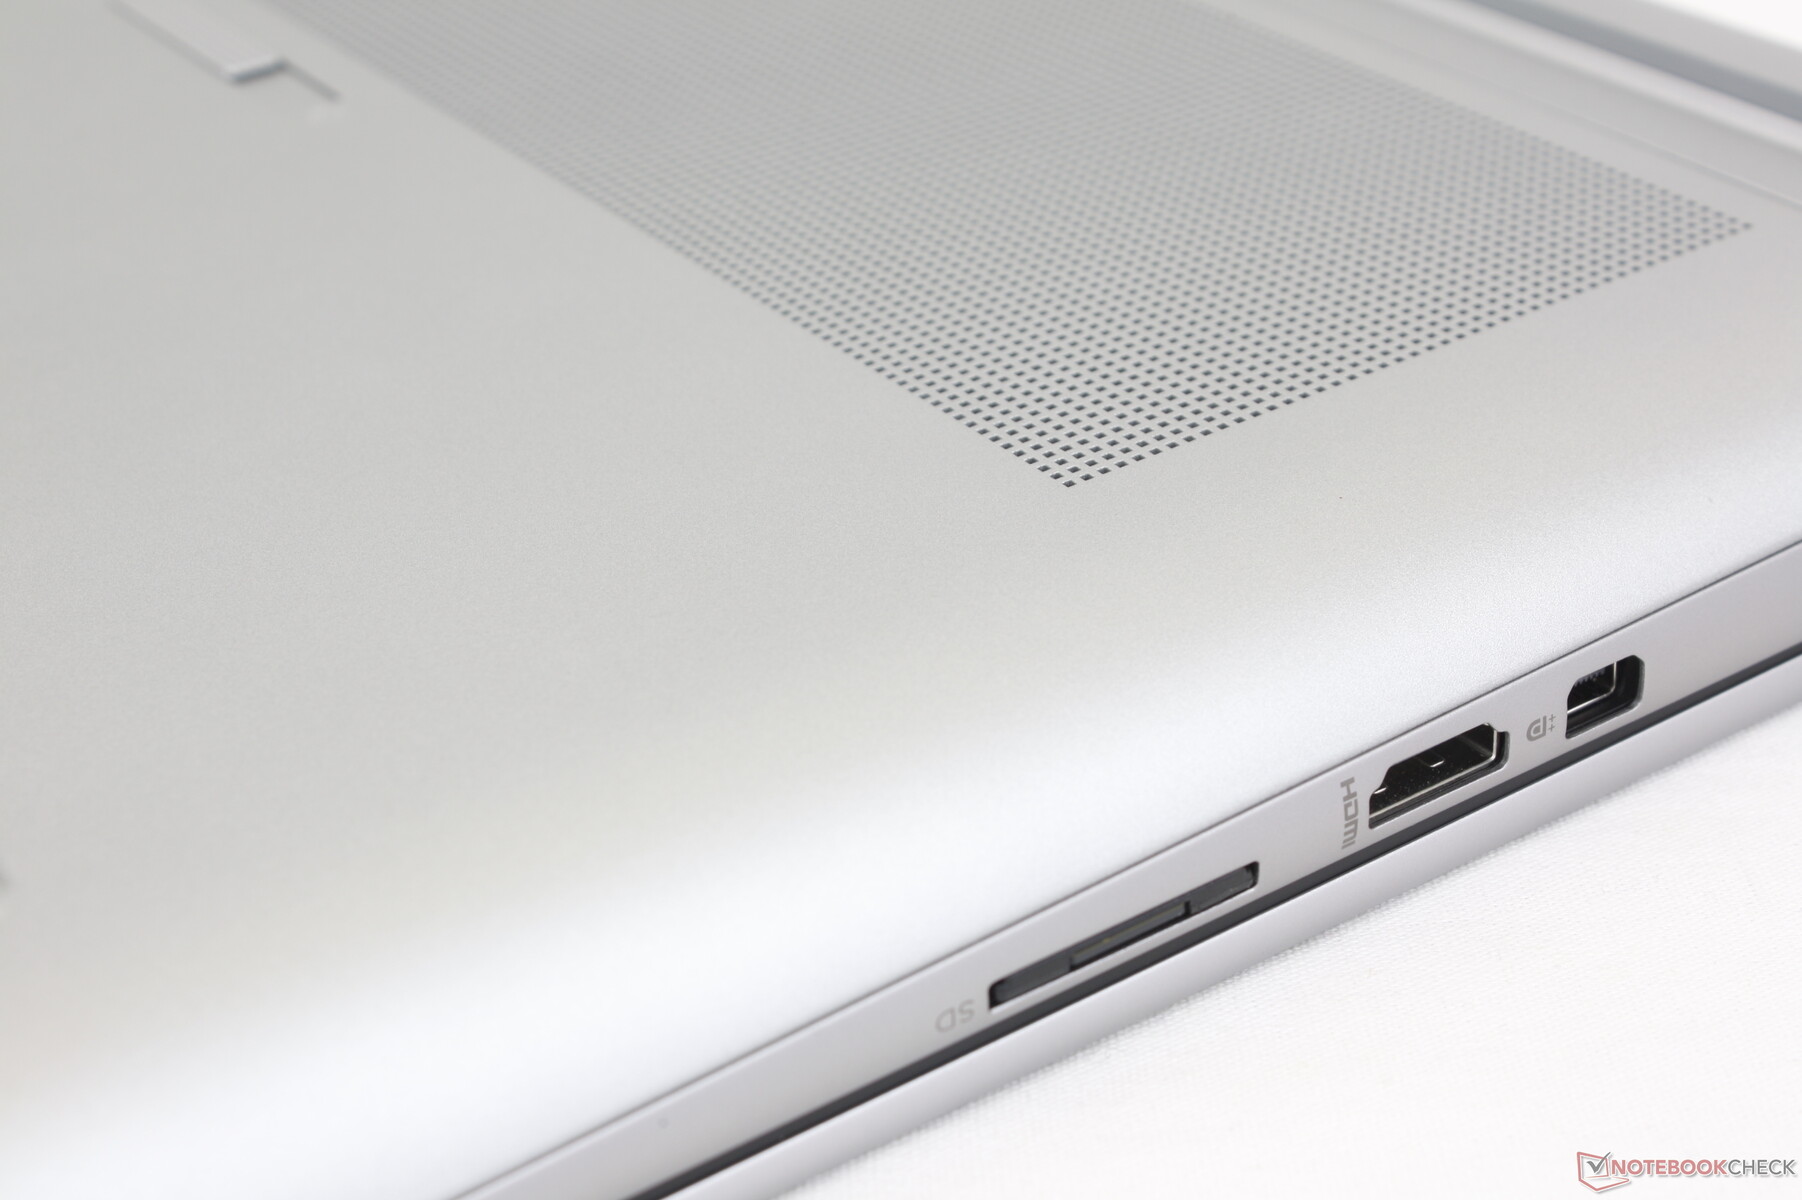
Connectivity
Our HP includes all ports as found on the Precision 7670 but with an integrated mini-DisplayPort in lieu of a third USB-C port. In fact, this is one of the few mobile workstations with a mini-DisplayPort option.
Port positioning could have been better in regards to the two USB-C ports as they are packed very tightly together next to the AC adapter port. Plugging in certain adapters or cables on one port, for example, could potentially block access to the other two ports.
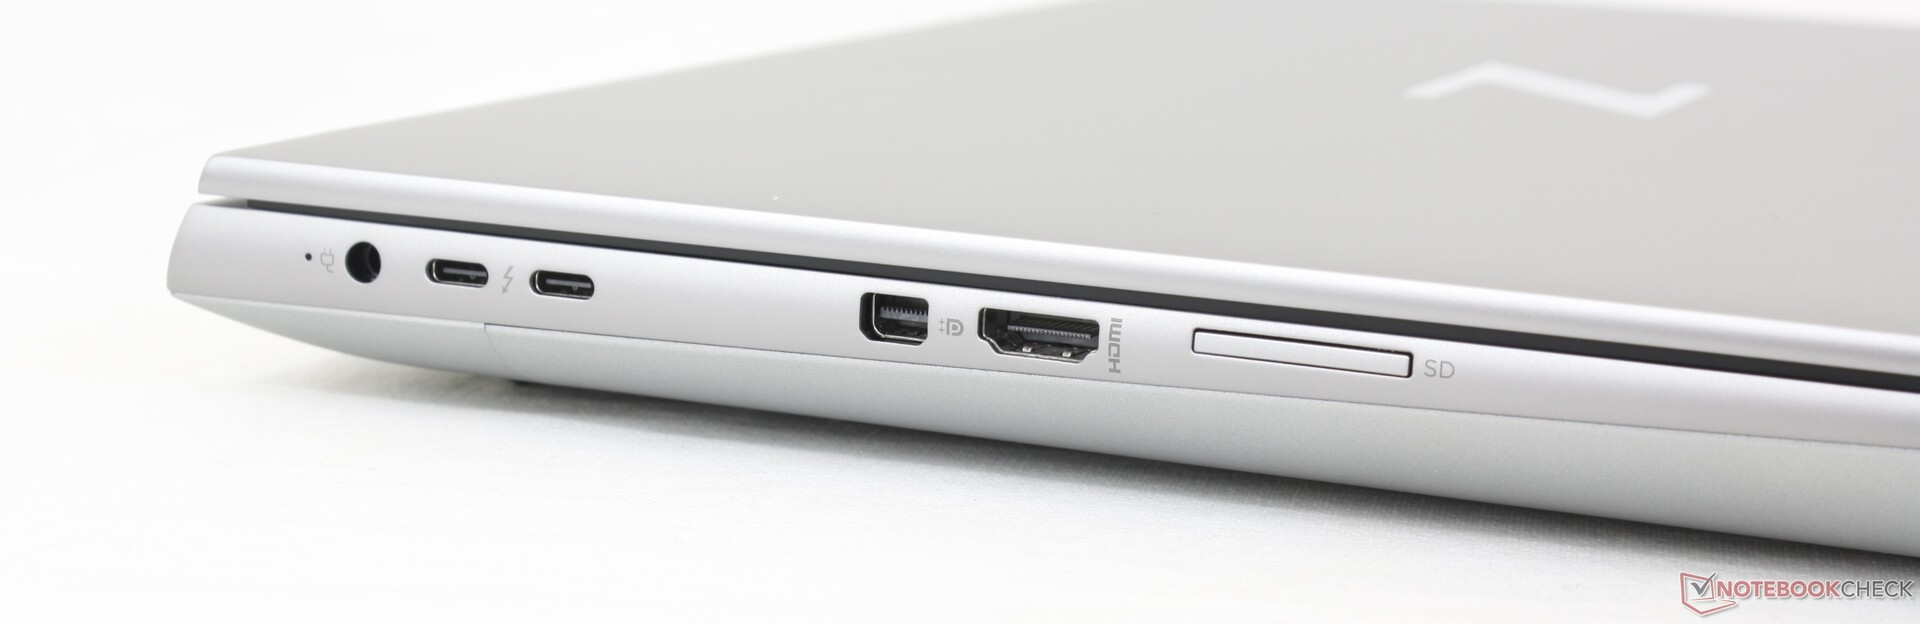
SD Card Reader
Transfer rates top out at about 80 MB/s with our PNY EliteX-PRO60 test card even though the card is capable of transfer rates of up to 280 MB/s. In comparison, the integrated SD reader on the Precision 7670 is over 2x faster. Users who rely on SD cards for video and file transfers may be disappointed by the Fury 16 G9 in this regard.
| SD Card Reader | |
| average JPG Copy Test (av. of 3 runs) | |
| Dell Precision 7000 7670 Performance (Toshiba Exceria Pro SDXC 64 GB UHS-II) | |
| MSI CreatorPro Z16P B12UKST (AV Pro V60) | |
| HP ZBook Fury 16 G9 (PNY EliteX-PRO60) | |
| Lenovo ThinkPad P16 G1 RTX A5500 (Toshiba Exceria Pro SDXC 64 GB UHS-II) | |
| HP ZBook Studio 16 G9 62U04EA (Angelbird AV PRO V60) | |
| maximum AS SSD Seq Read Test (1GB) | |
| Dell Precision 7000 7670 Performance (Toshiba Exceria Pro SDXC 64 GB UHS-II) | |
| HP ZBook Fury 16 G9 (PNY EliteX-PRO60) | |
| MSI CreatorPro Z16P B12UKST (AV Pro V60) | |
| Lenovo ThinkPad P16 G1 RTX A5500 (Toshiba Exceria Pro SDXC 64 GB UHS-II) | |
| HP ZBook Studio 16 G9 62U04EA (Angelbird AV PRO V60) | |
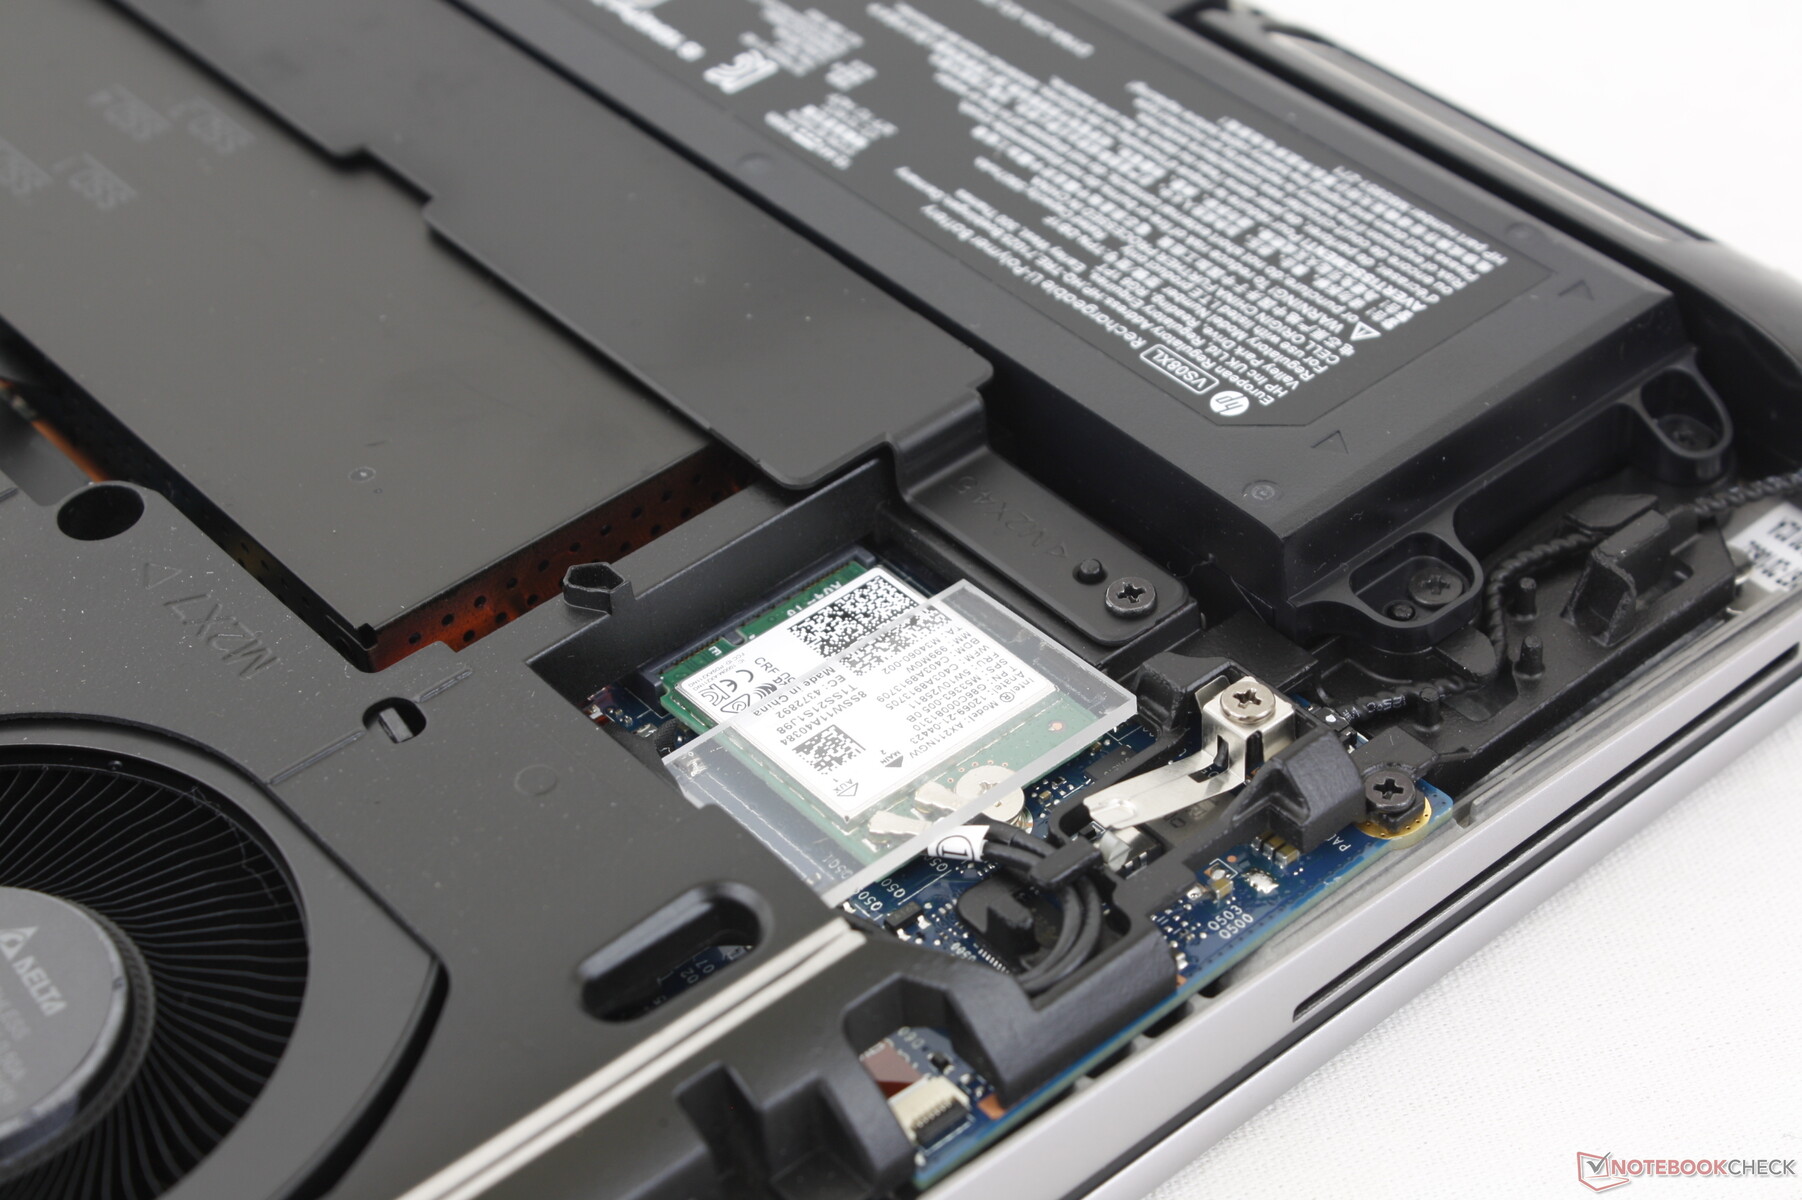
Communication
Our Windows 10 unit comes with the Intel AX211 for Wi-Fi 6E and Bluetooth 5.2 connectivity. Unfortunately, Wi-Fi 6E is disabled on Windows 10 as Microsoft has (idiotically) made it exclusive to Windows 11. Thus, you'll want to configure with Windows 11 if you wish to reap the benefits of 6 GHz Wi-Fi. We otherwise experienced no performance issues when paired to our regular Wi-Fi 6 network.
Webcam
The ZBook Fury 16 G9 has inherited the 5 MP webcam on the latest Spectre and EliteBook models. Image quality is crisper than on most other laptops where 1 MP and 2 MP sensors are still commonplace including on the competing ThinkPad P16 and Precision 7670.
A sliding shutter and IR sensor are included for privacy and Hello support, respectively.


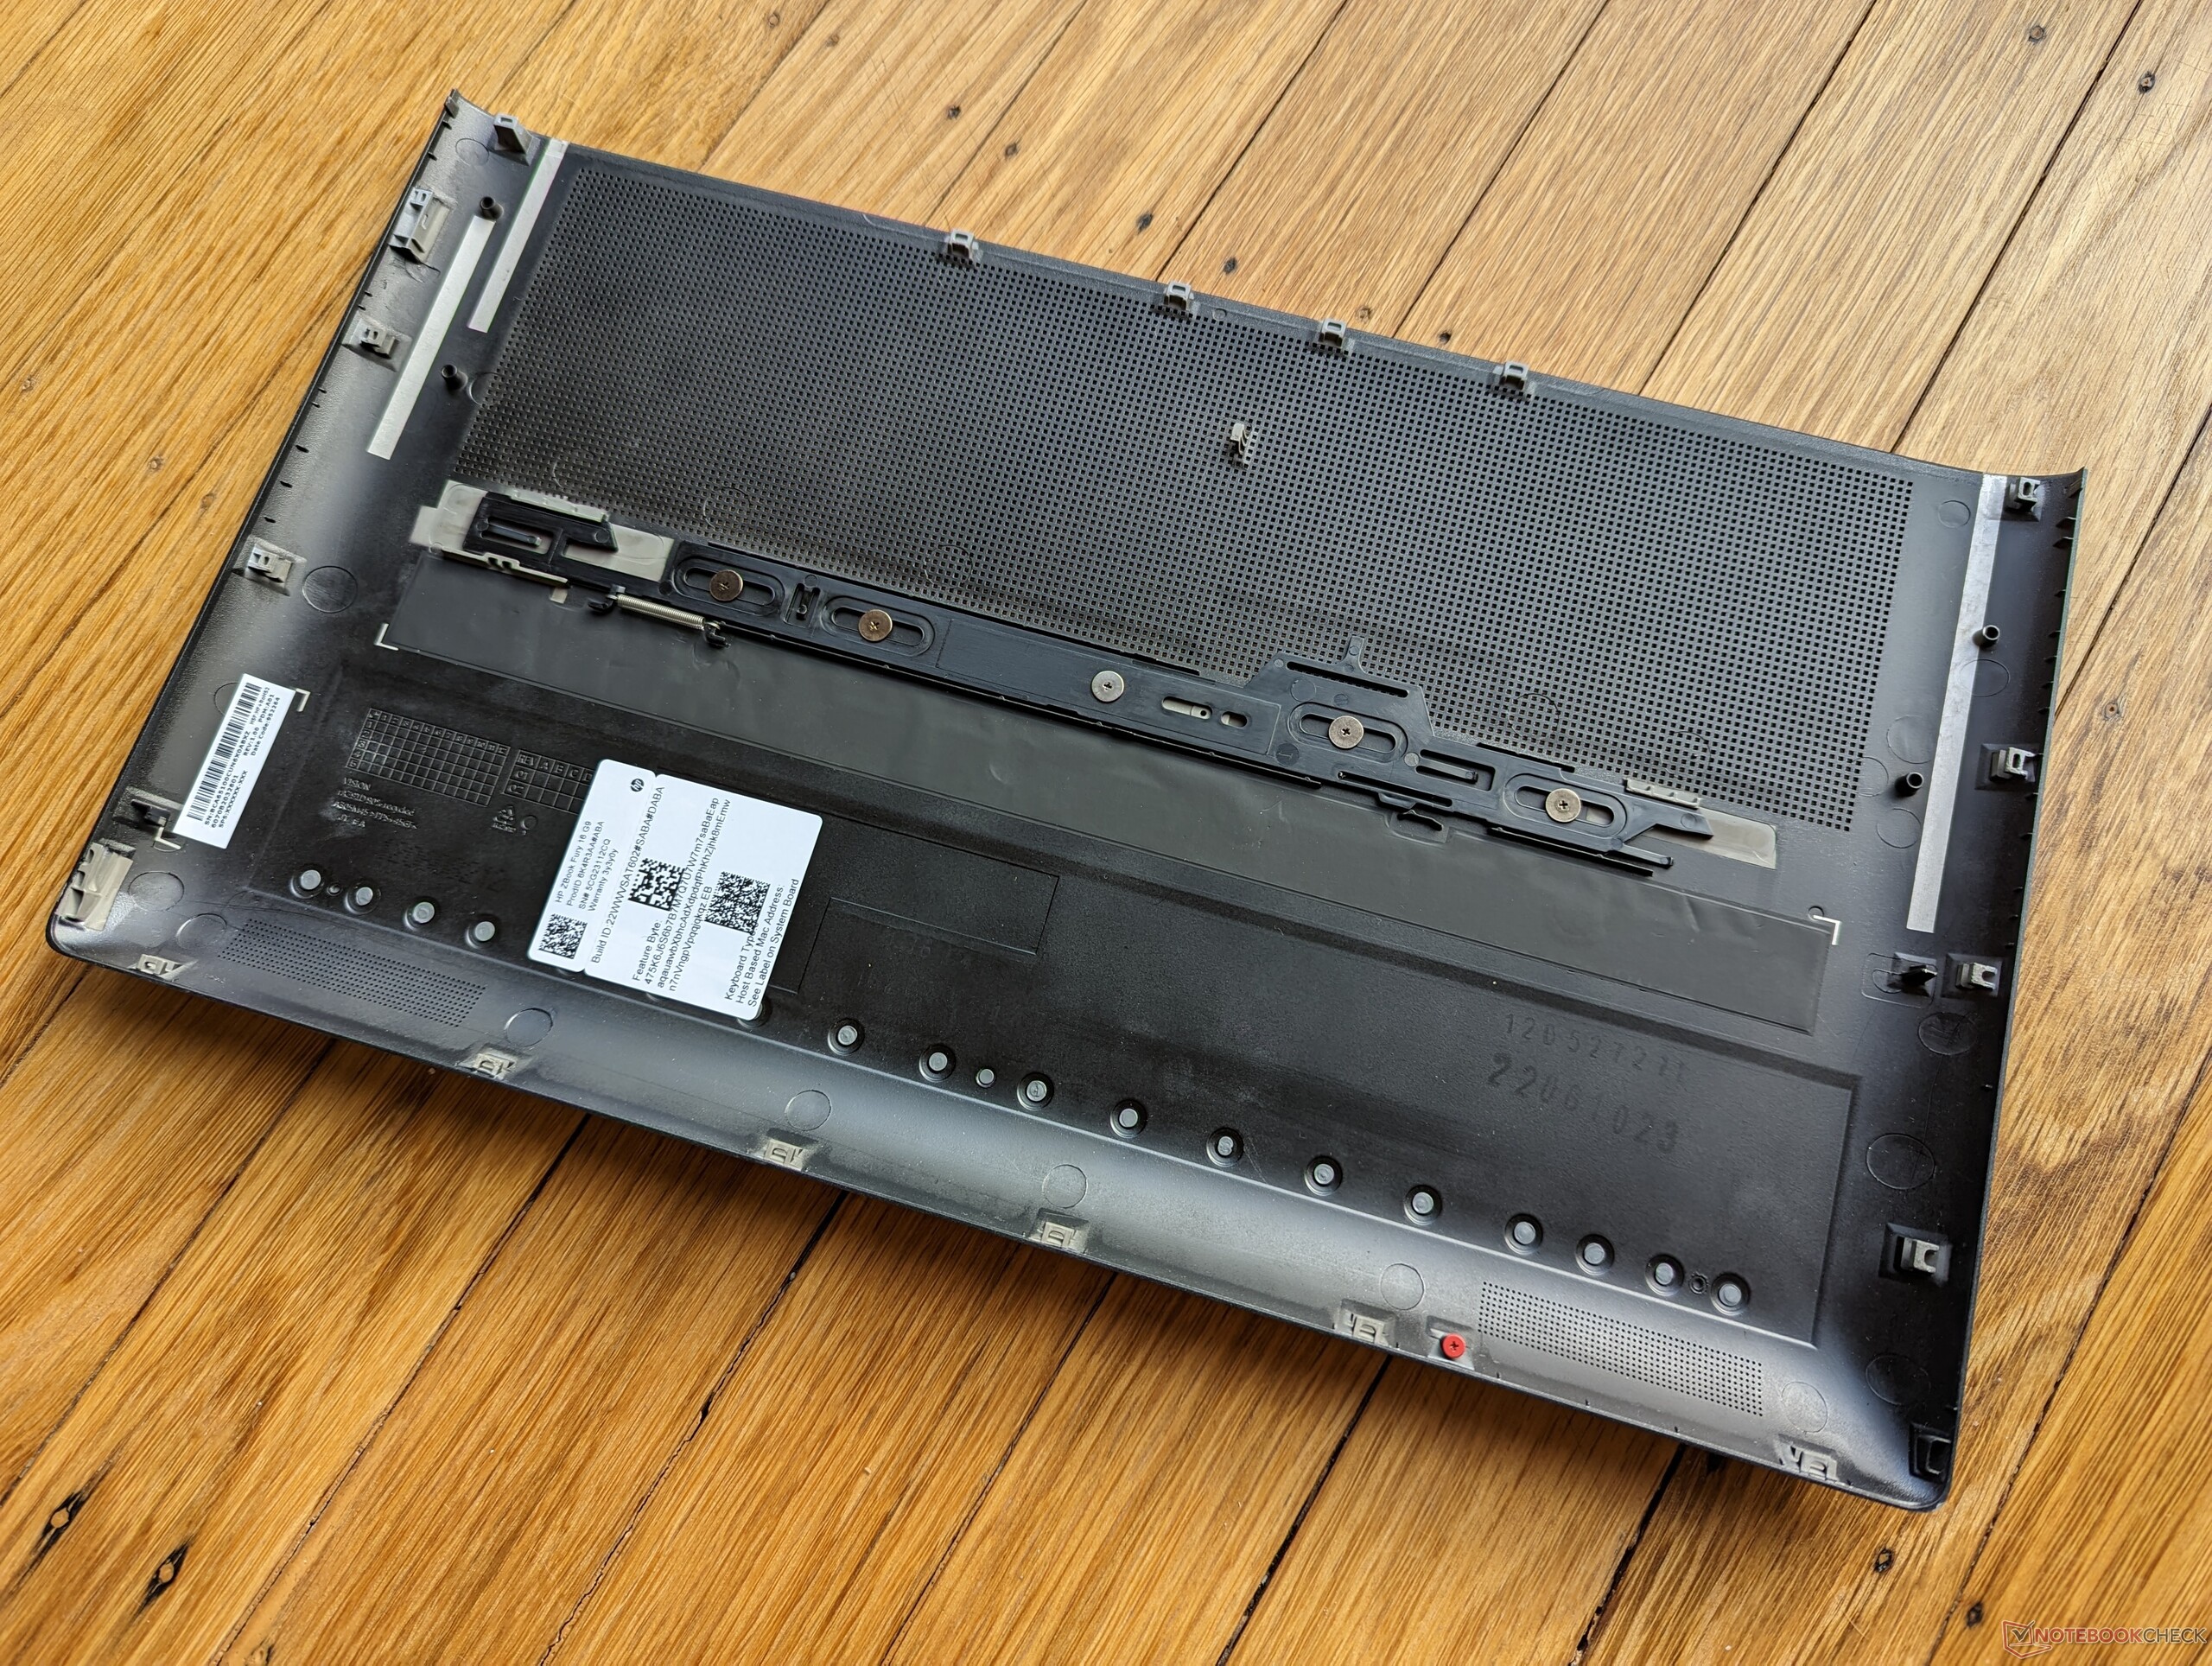
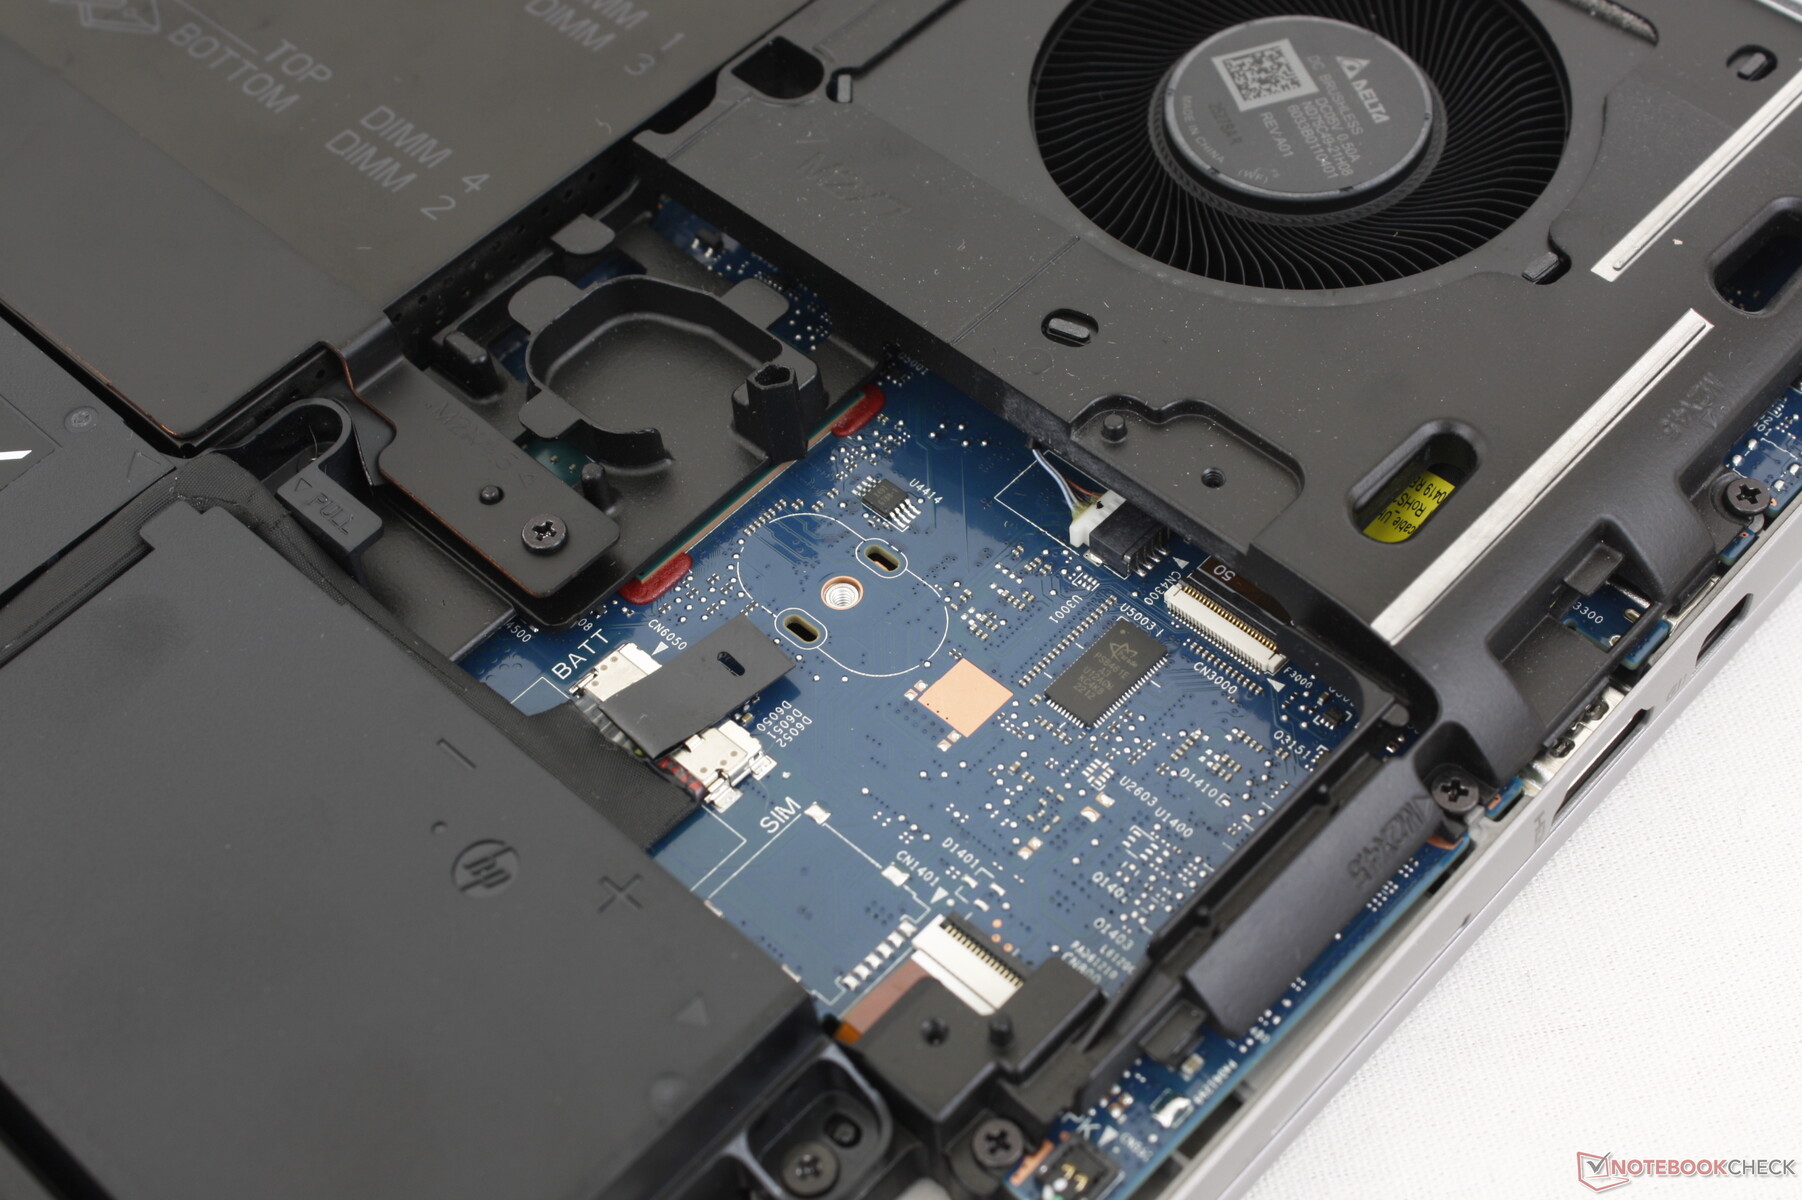
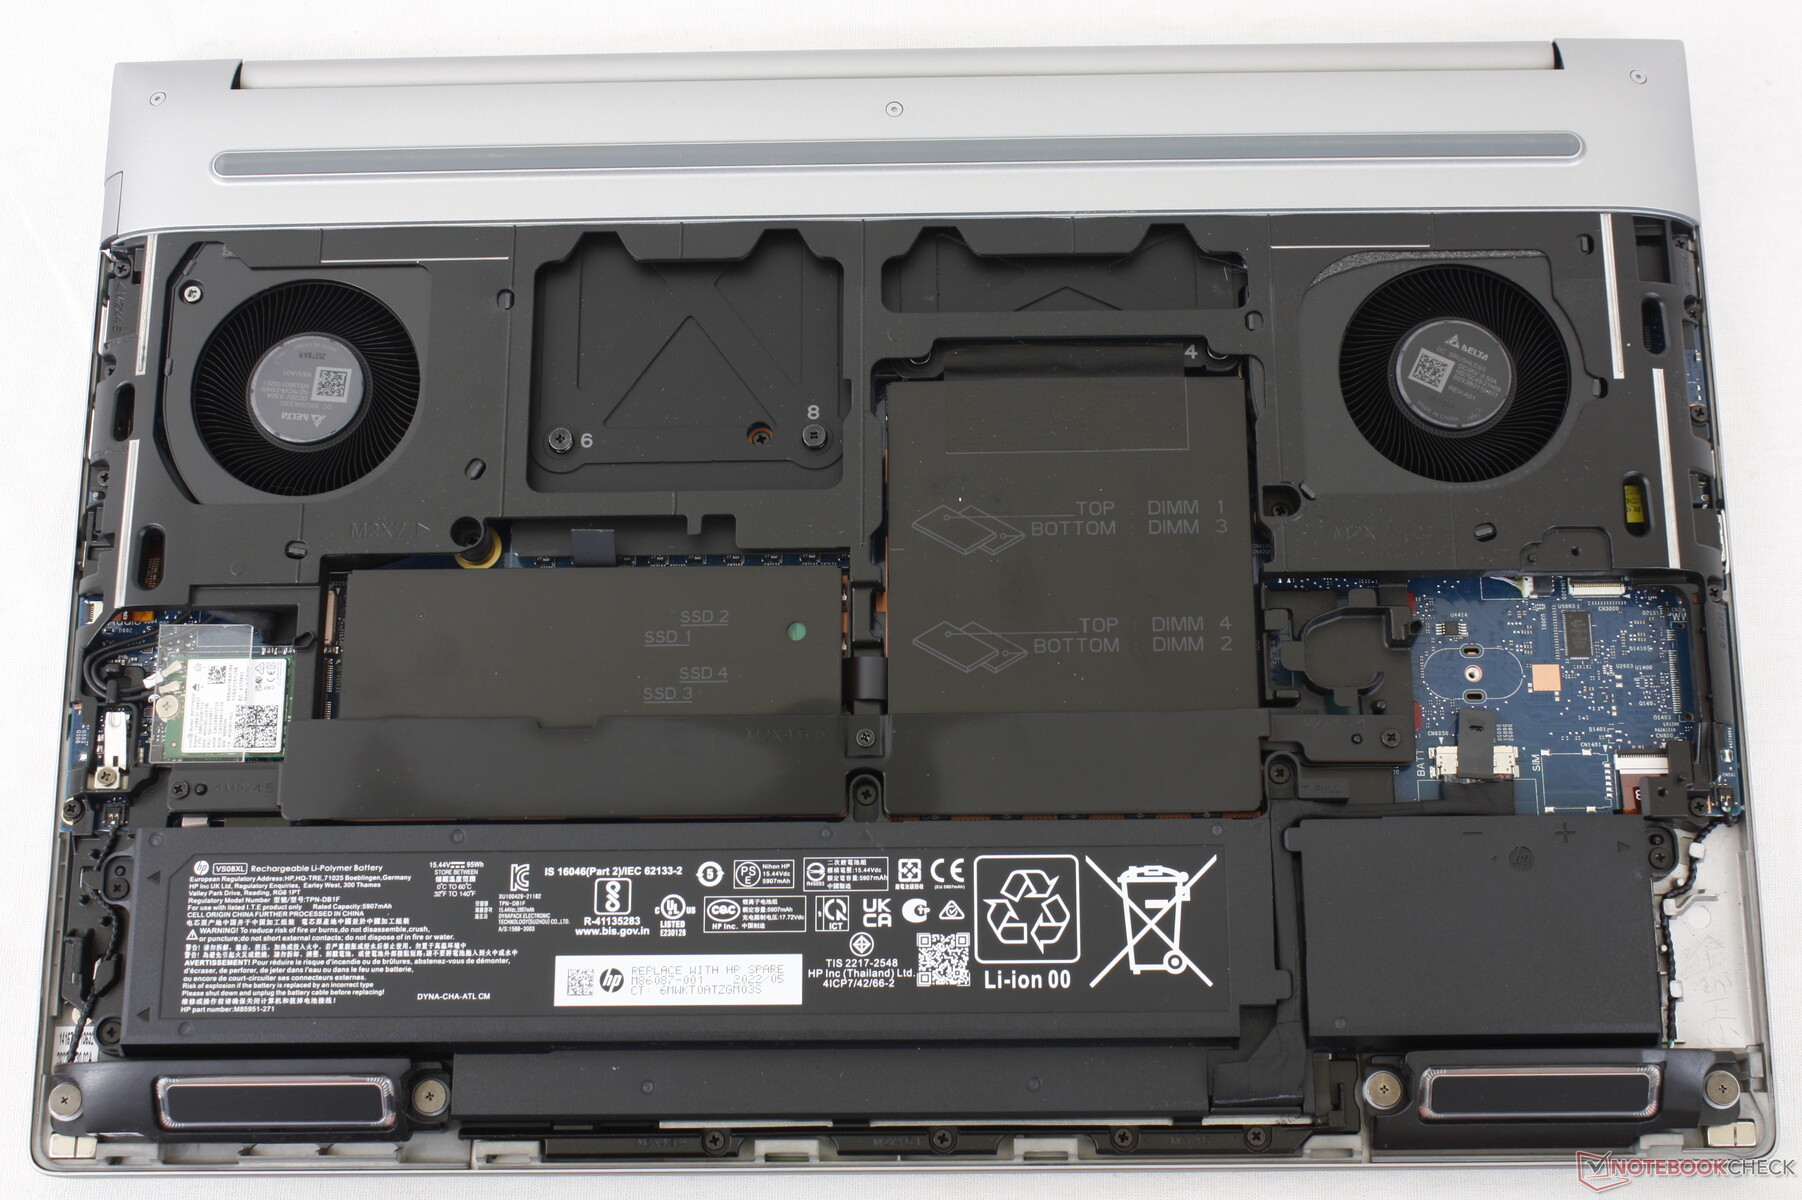
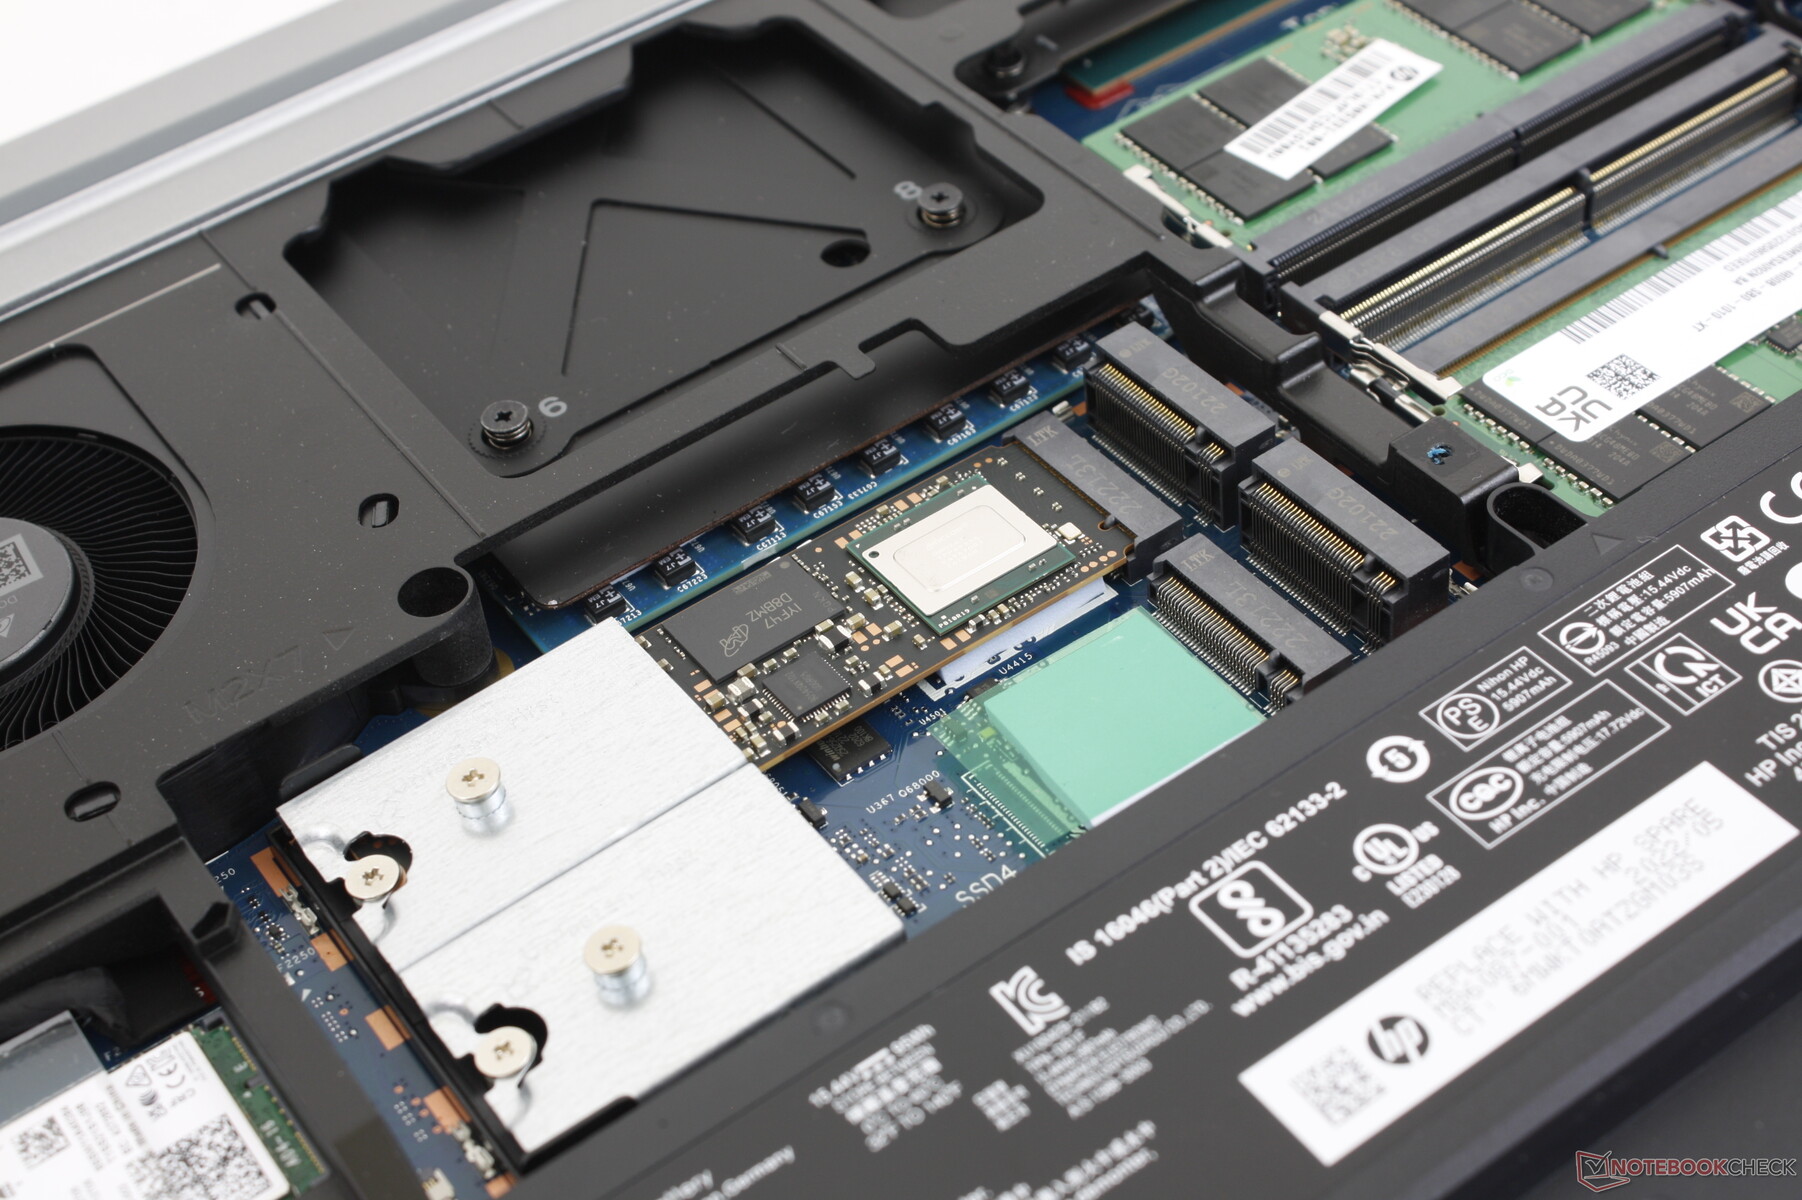
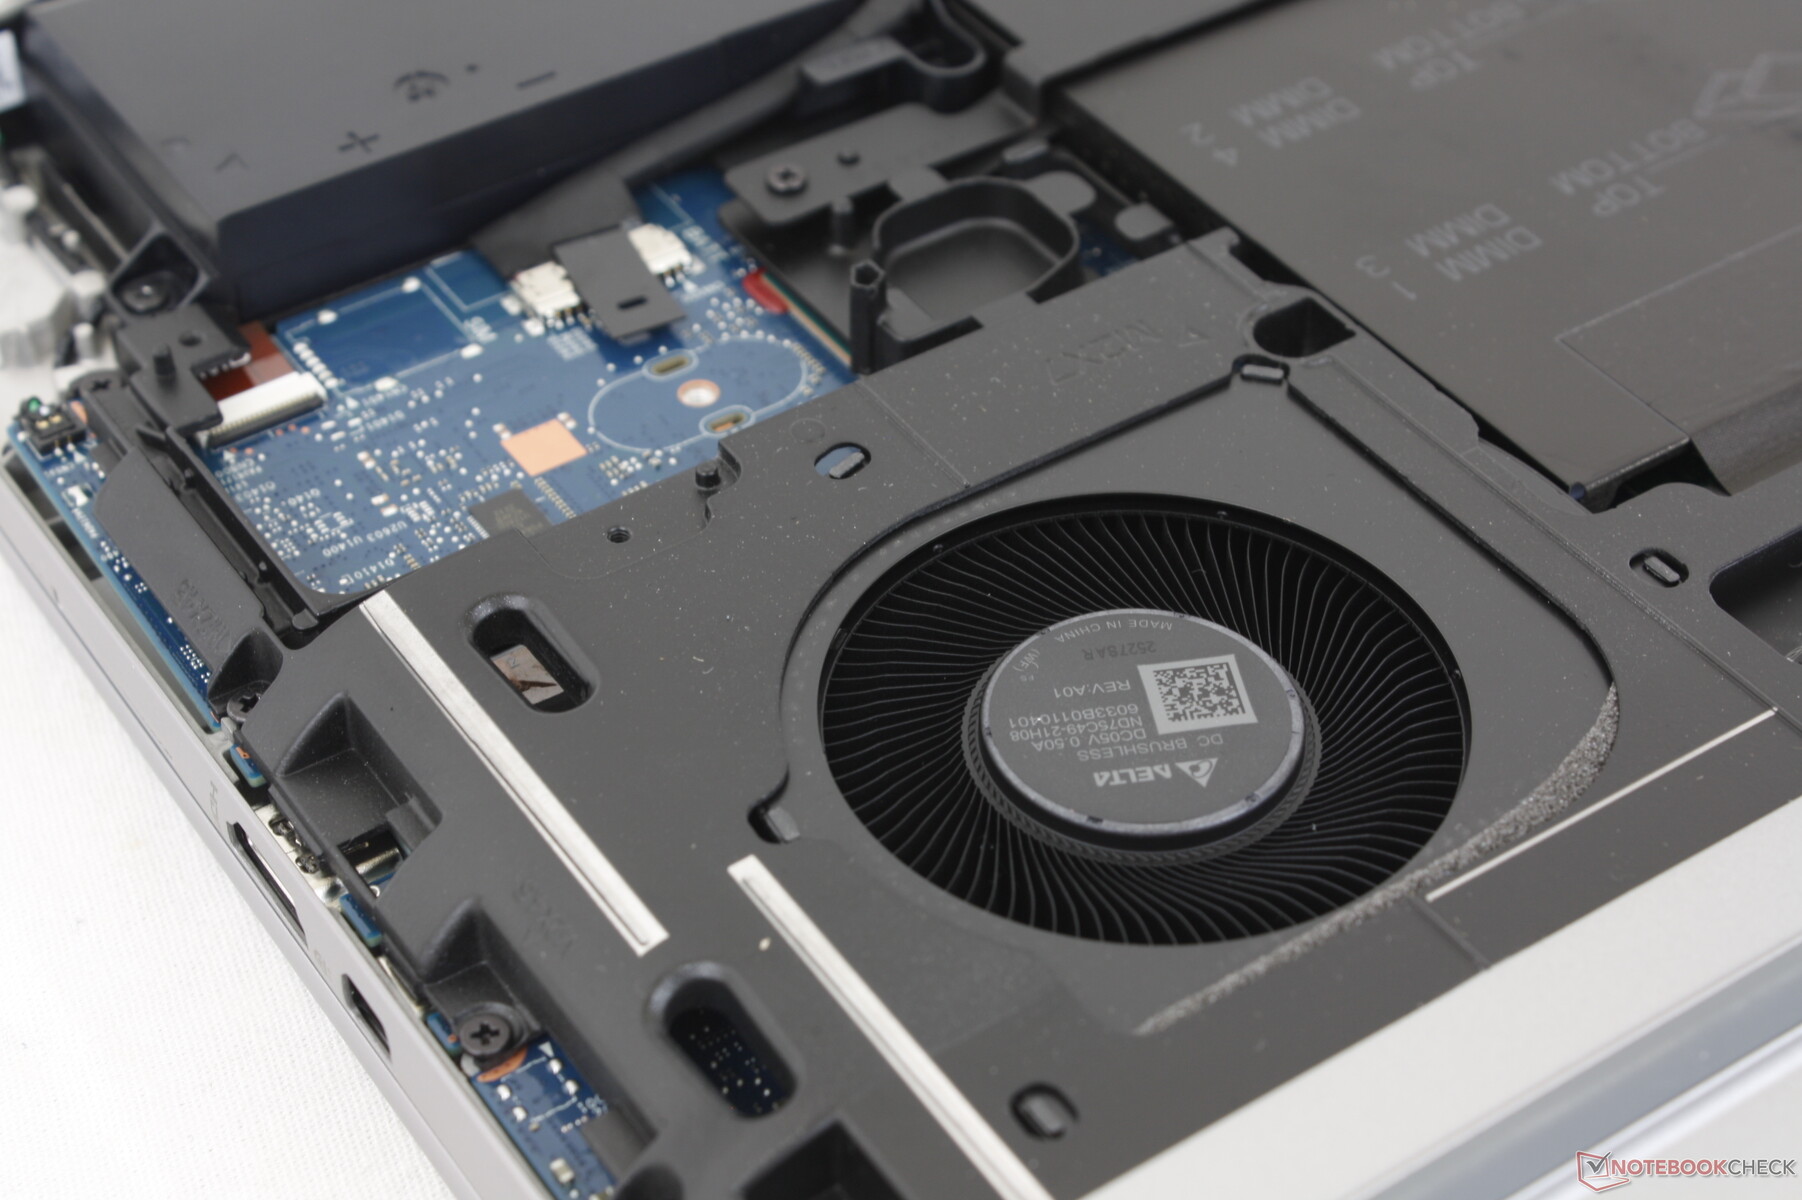
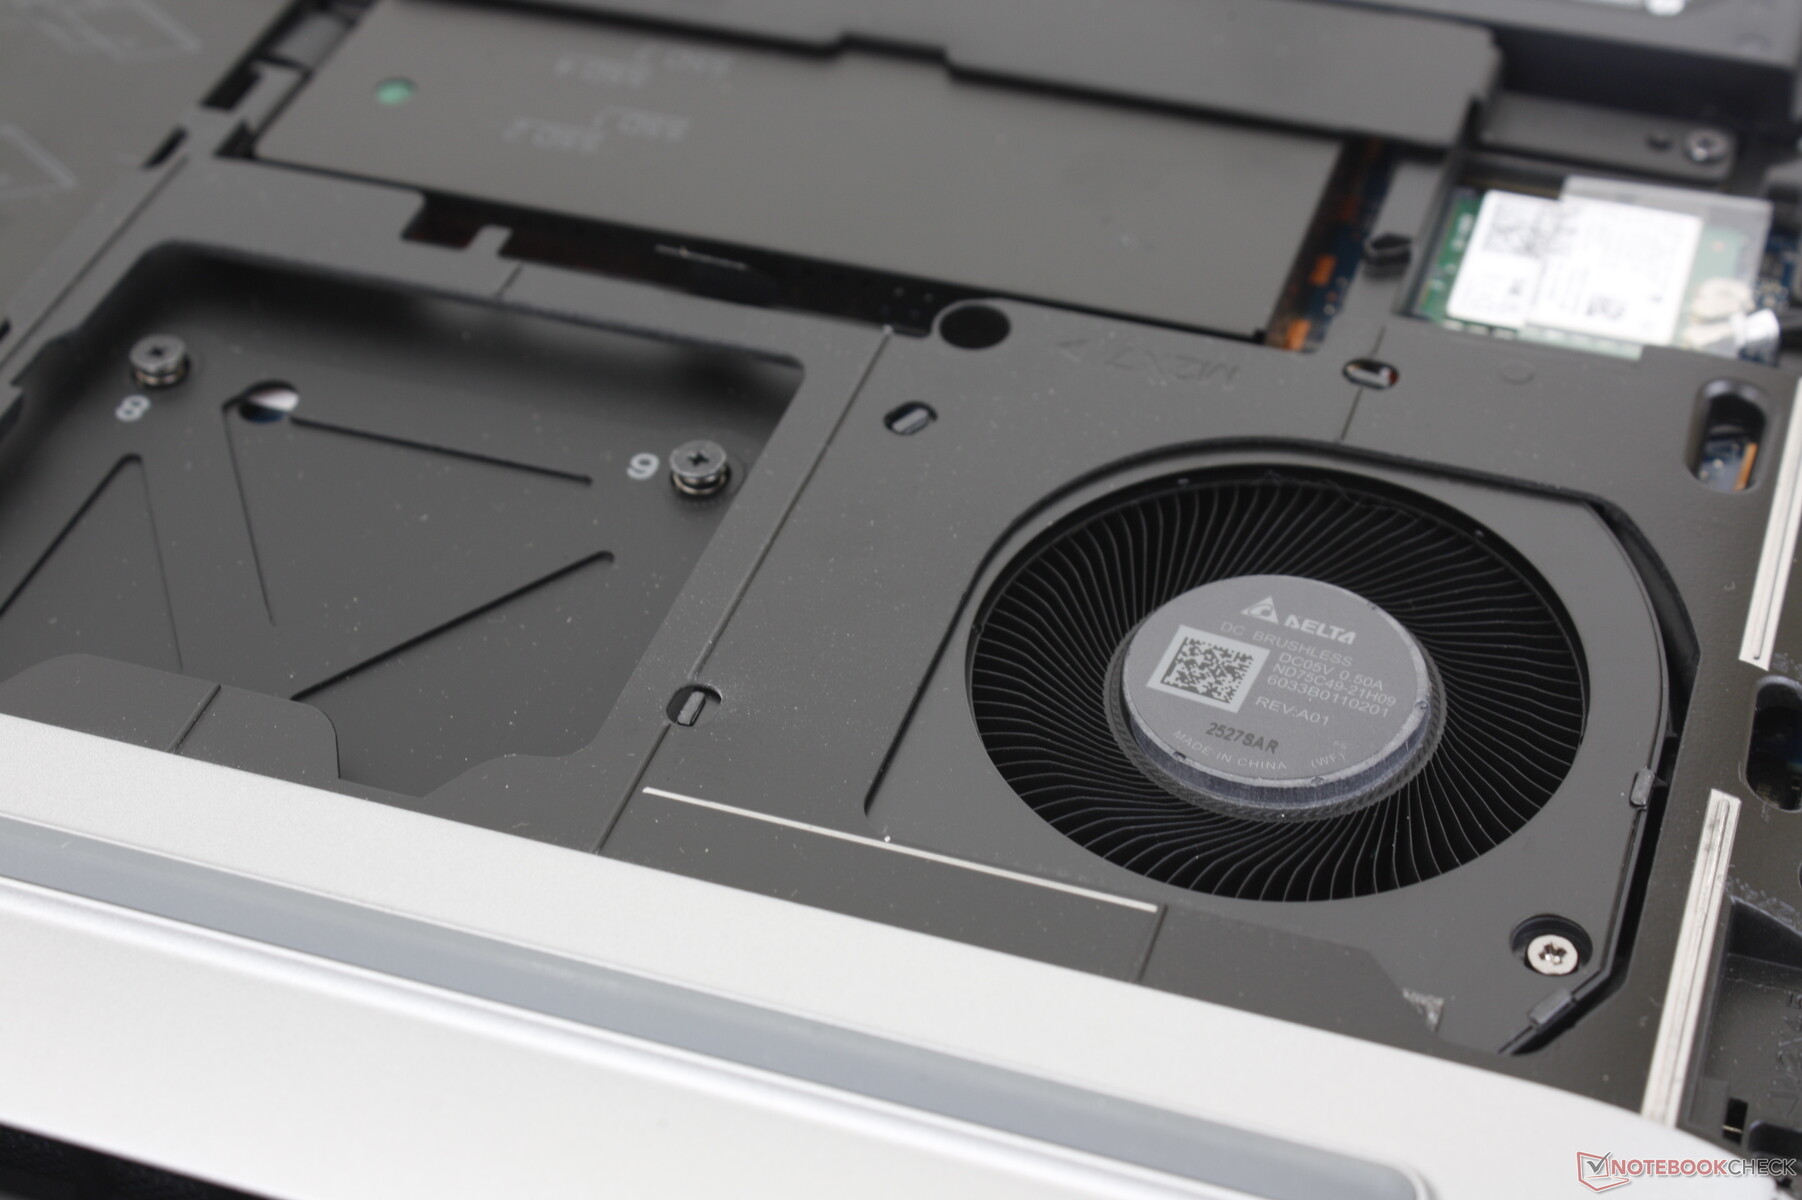
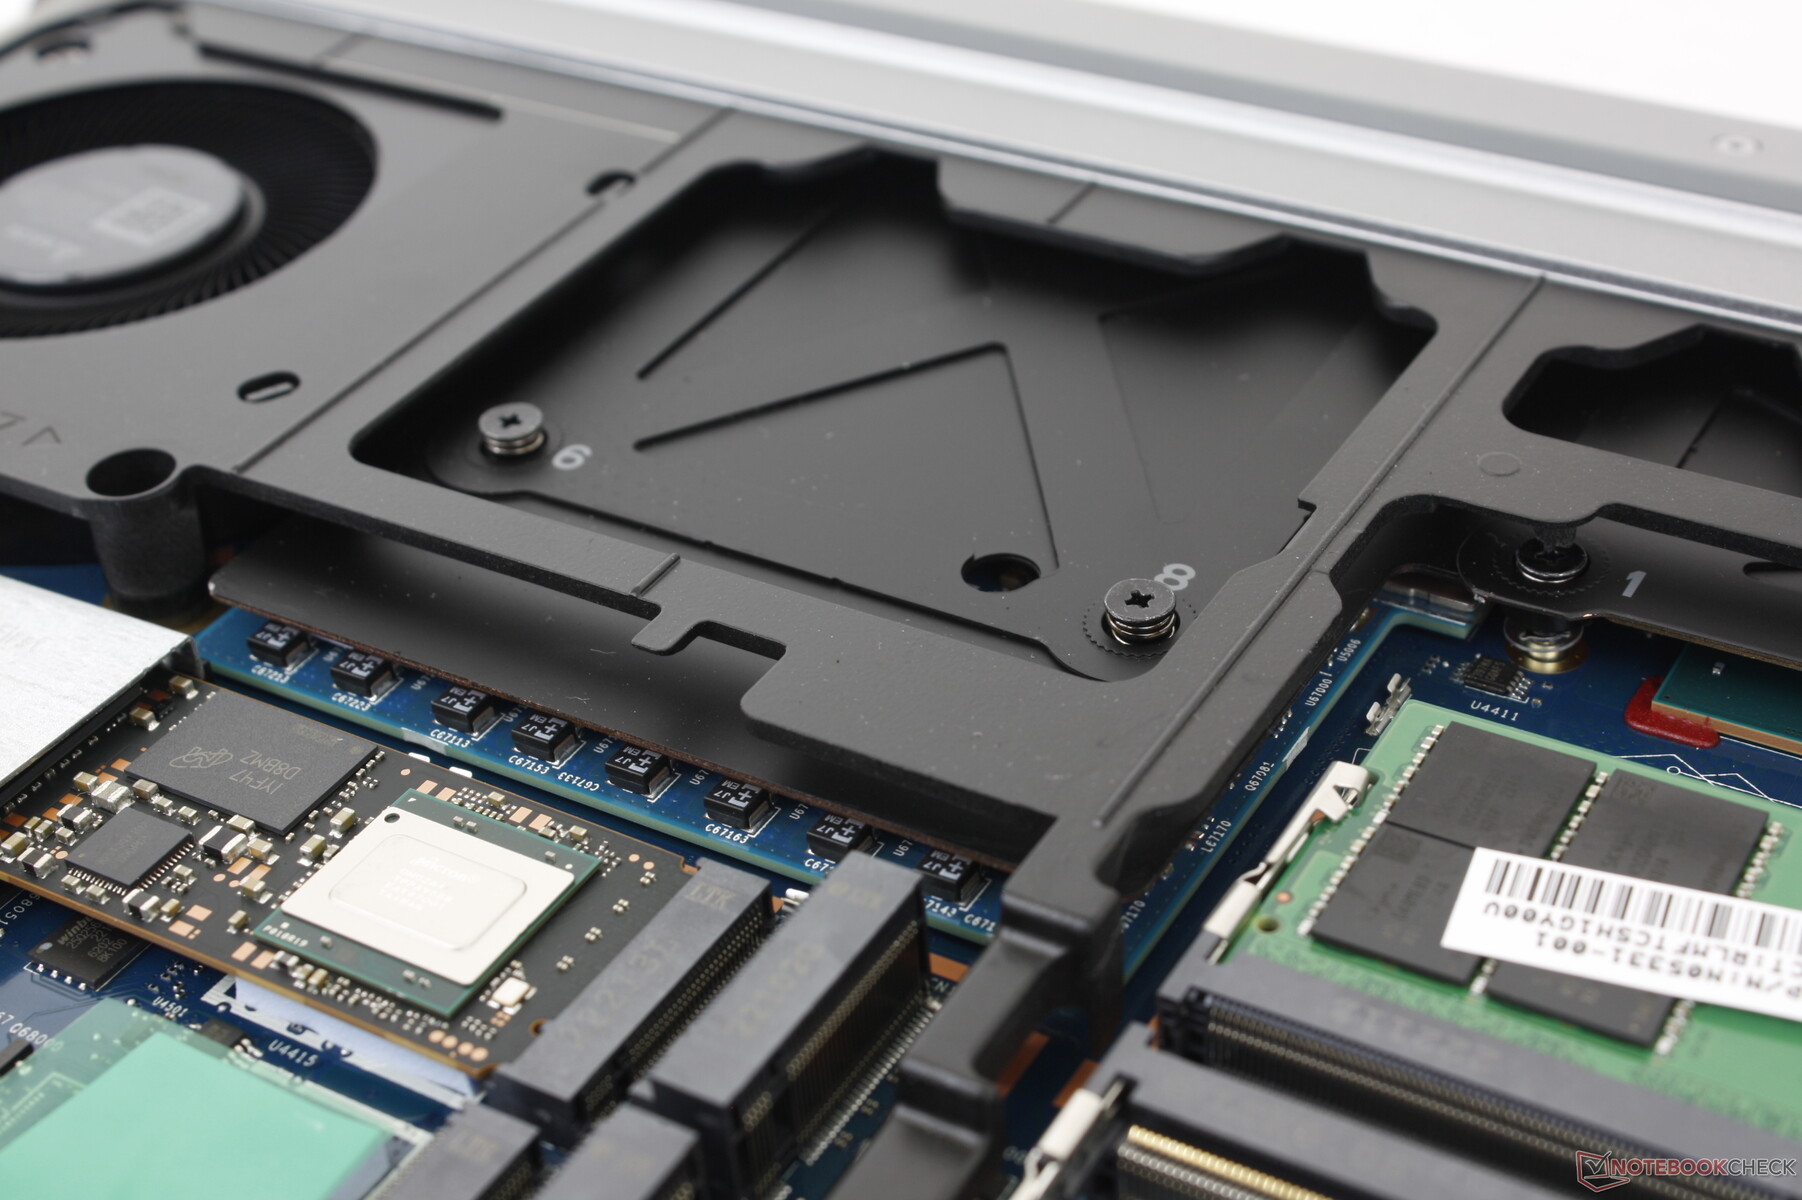
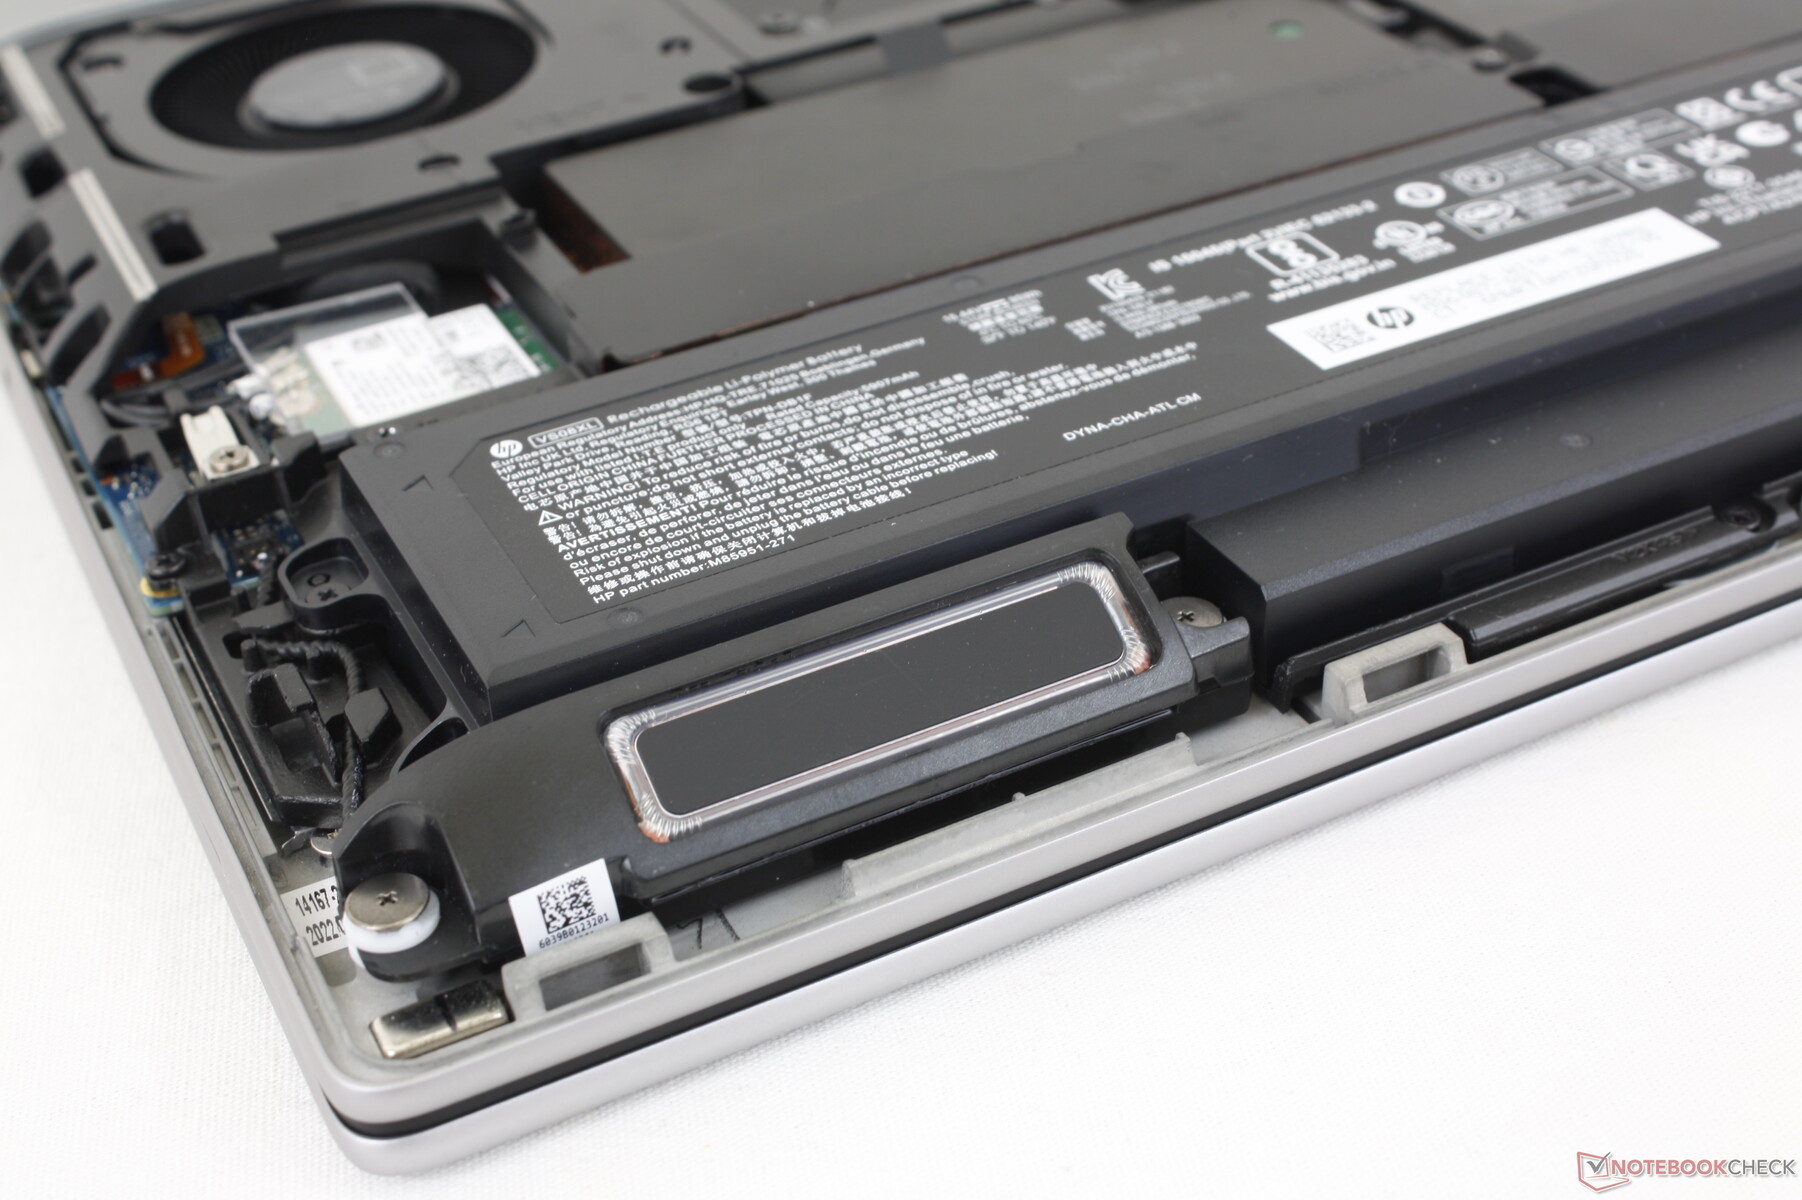
Maintenance
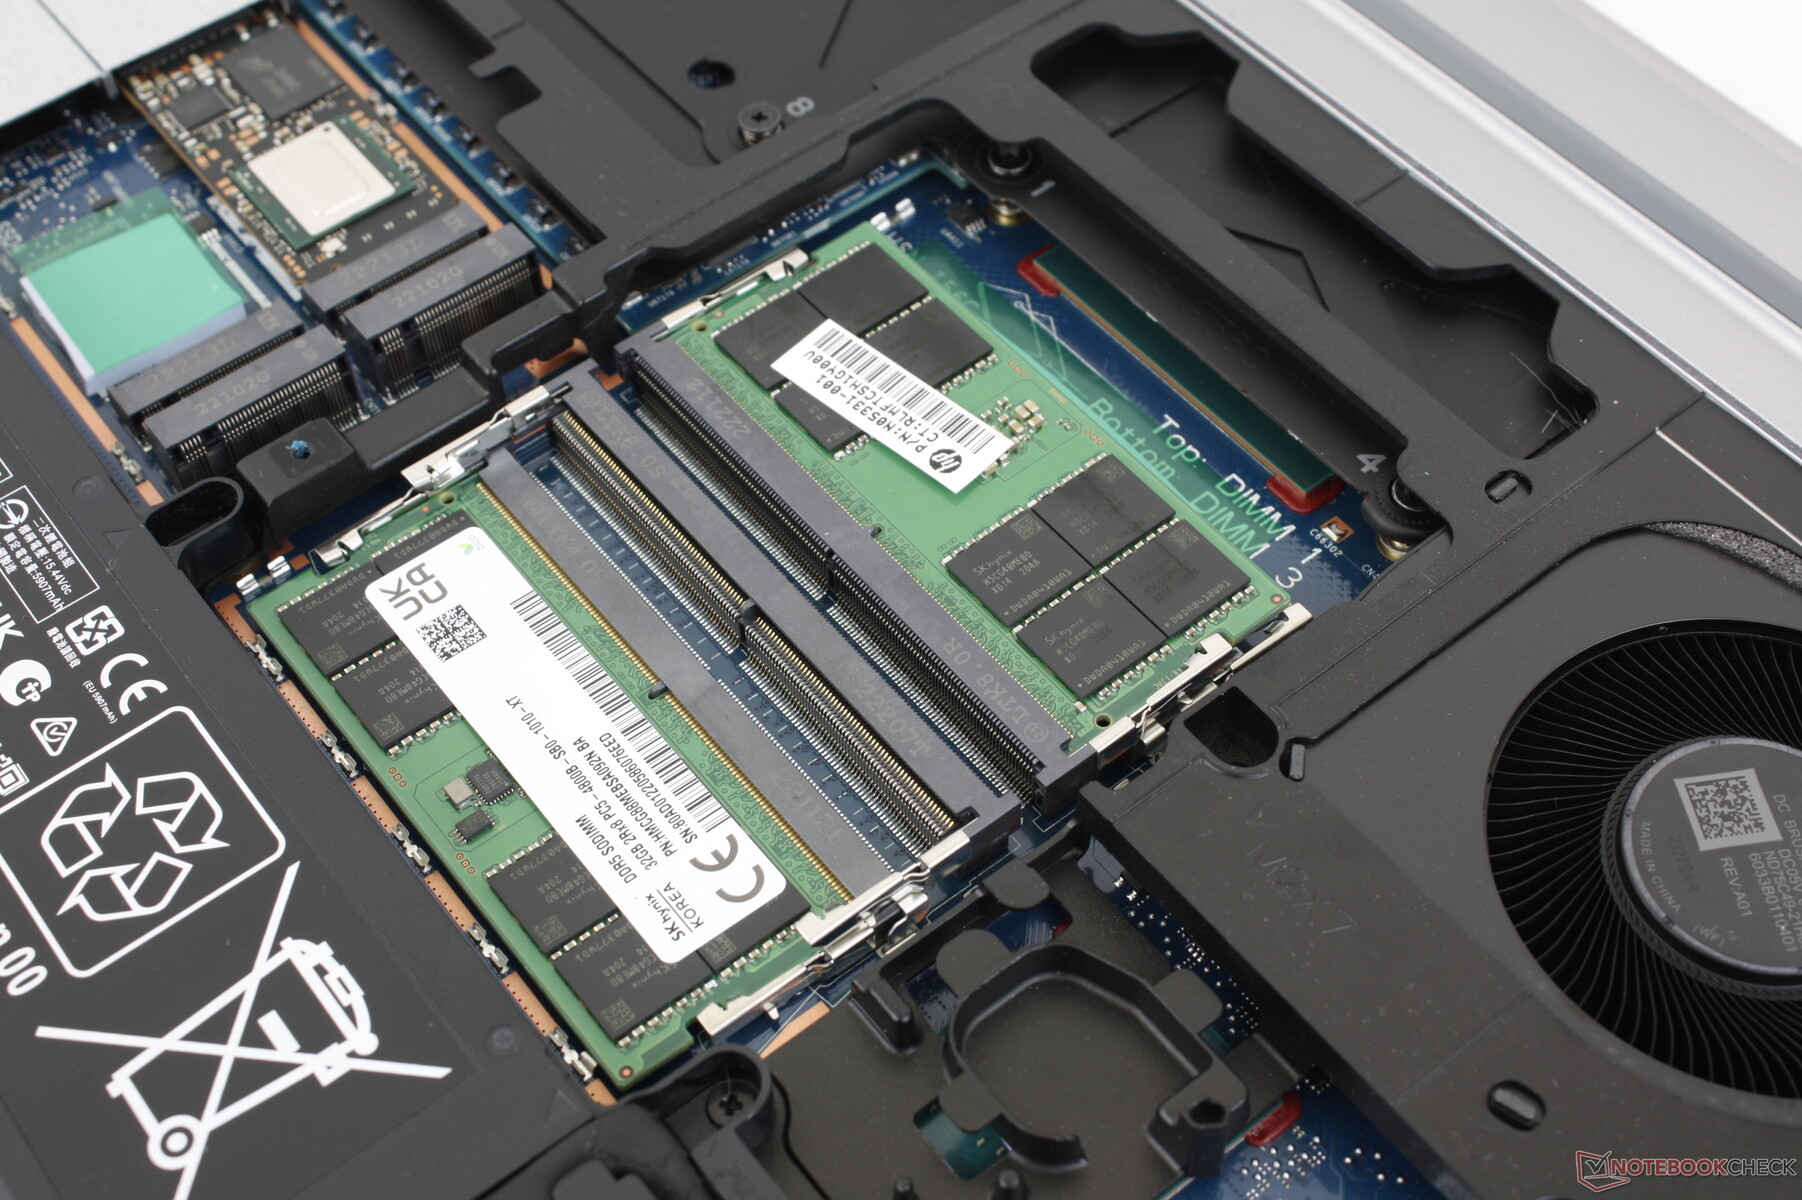
The bottom panel is "toolless" in that it slides off easily without any tools. Unfortunately, a screwdriver is still required as the storage bays and SODIMM slots are protected by aluminum plates. The model supports up to 4x M.2 2280 SSDs and 4x DDR5 RAM modules which is more than what the Precision 7670 and ThinkPad P16 can offer.
Accessories and Warranty
There are no included extras in the retail box aside from the usual AC adapter and paperwork. A three-year limited warranty comes standard if purchased in the US.
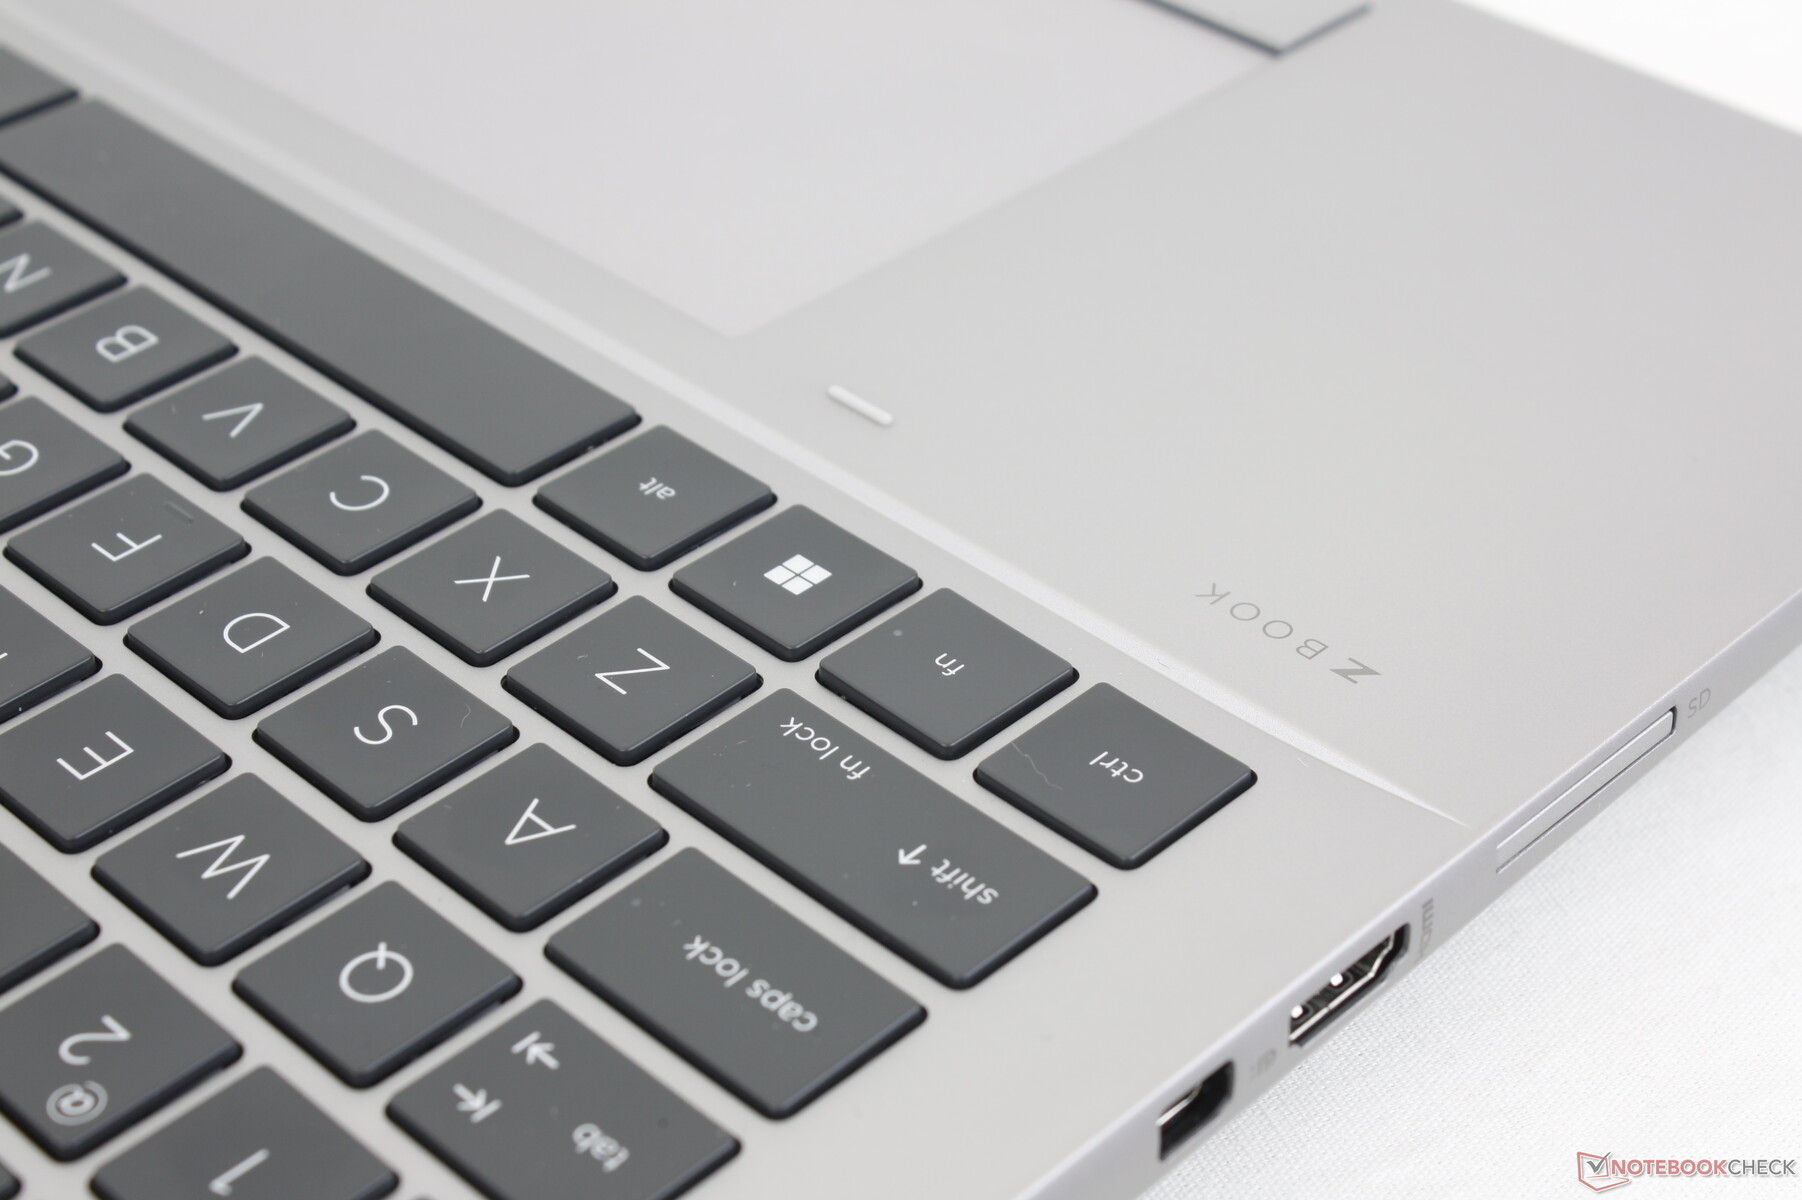
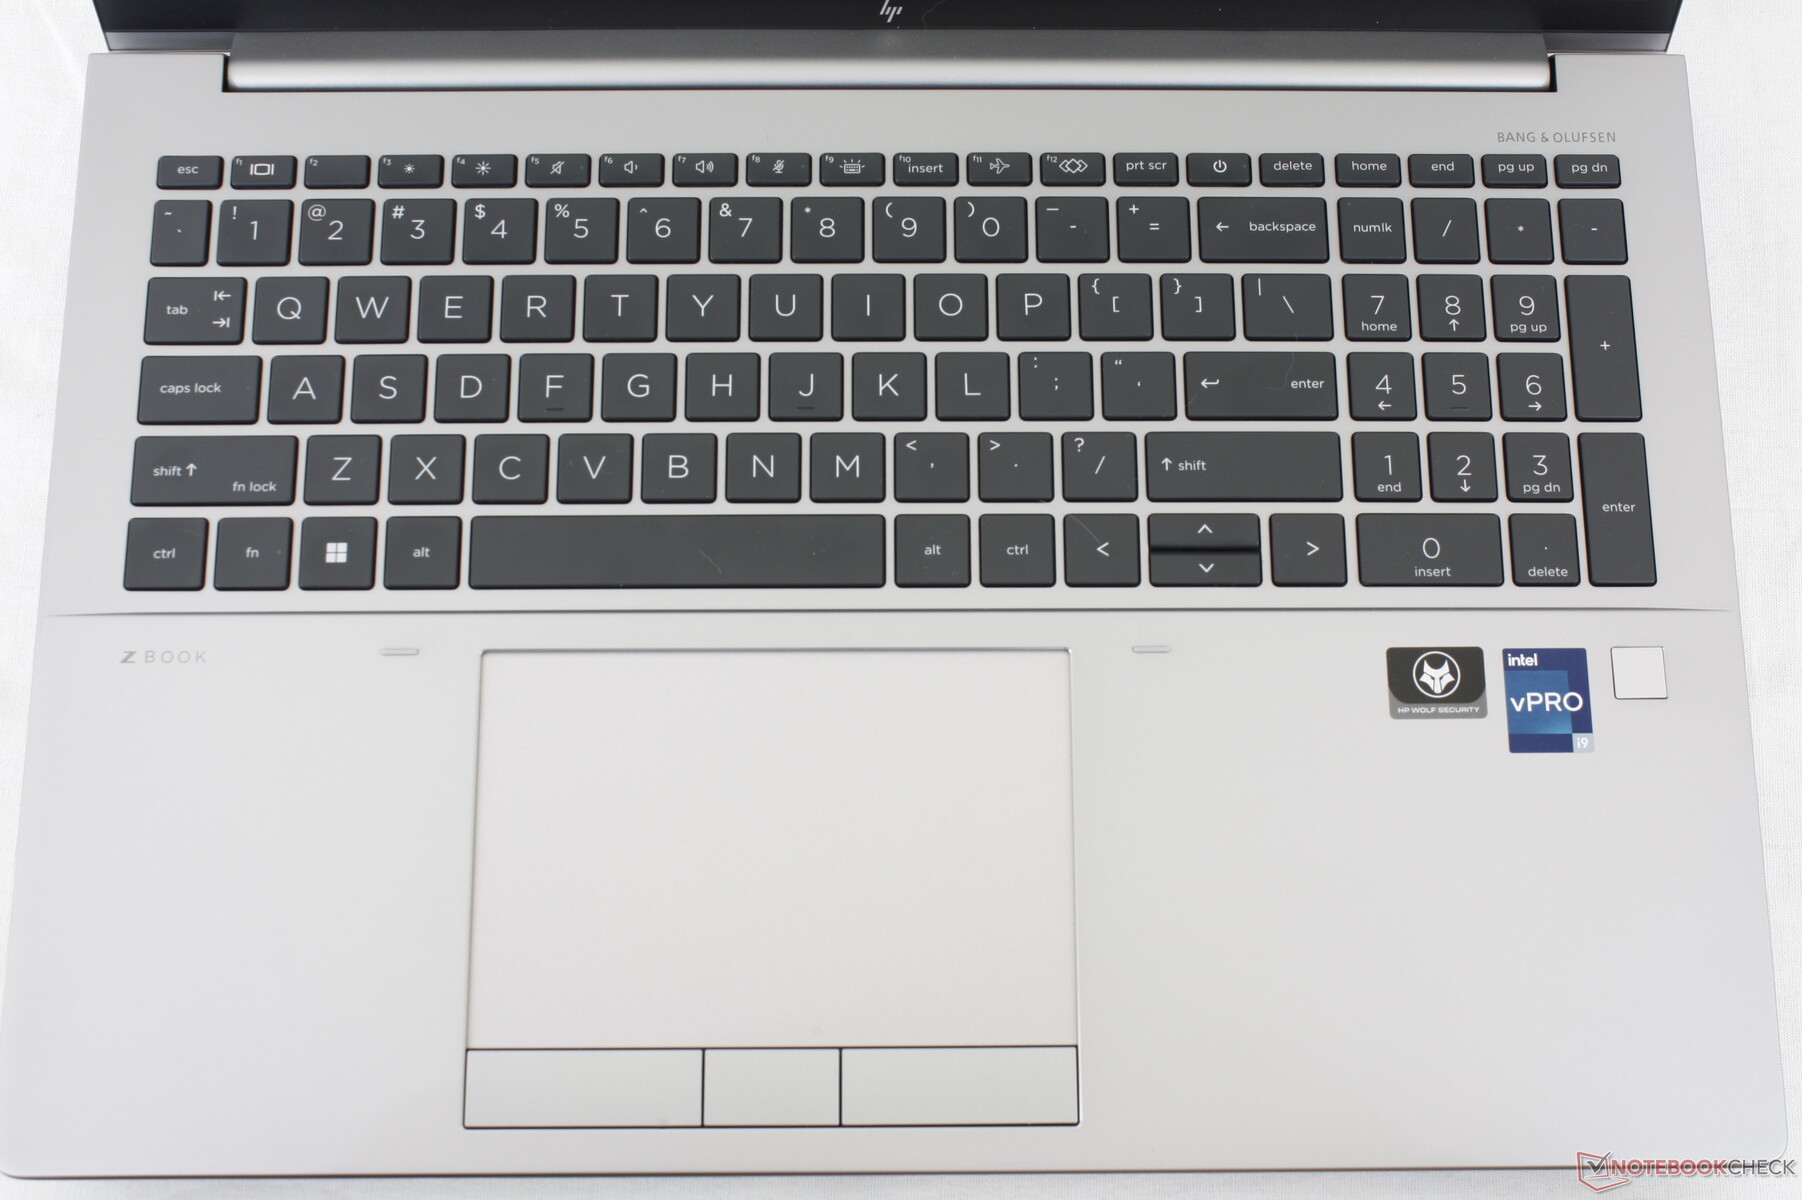
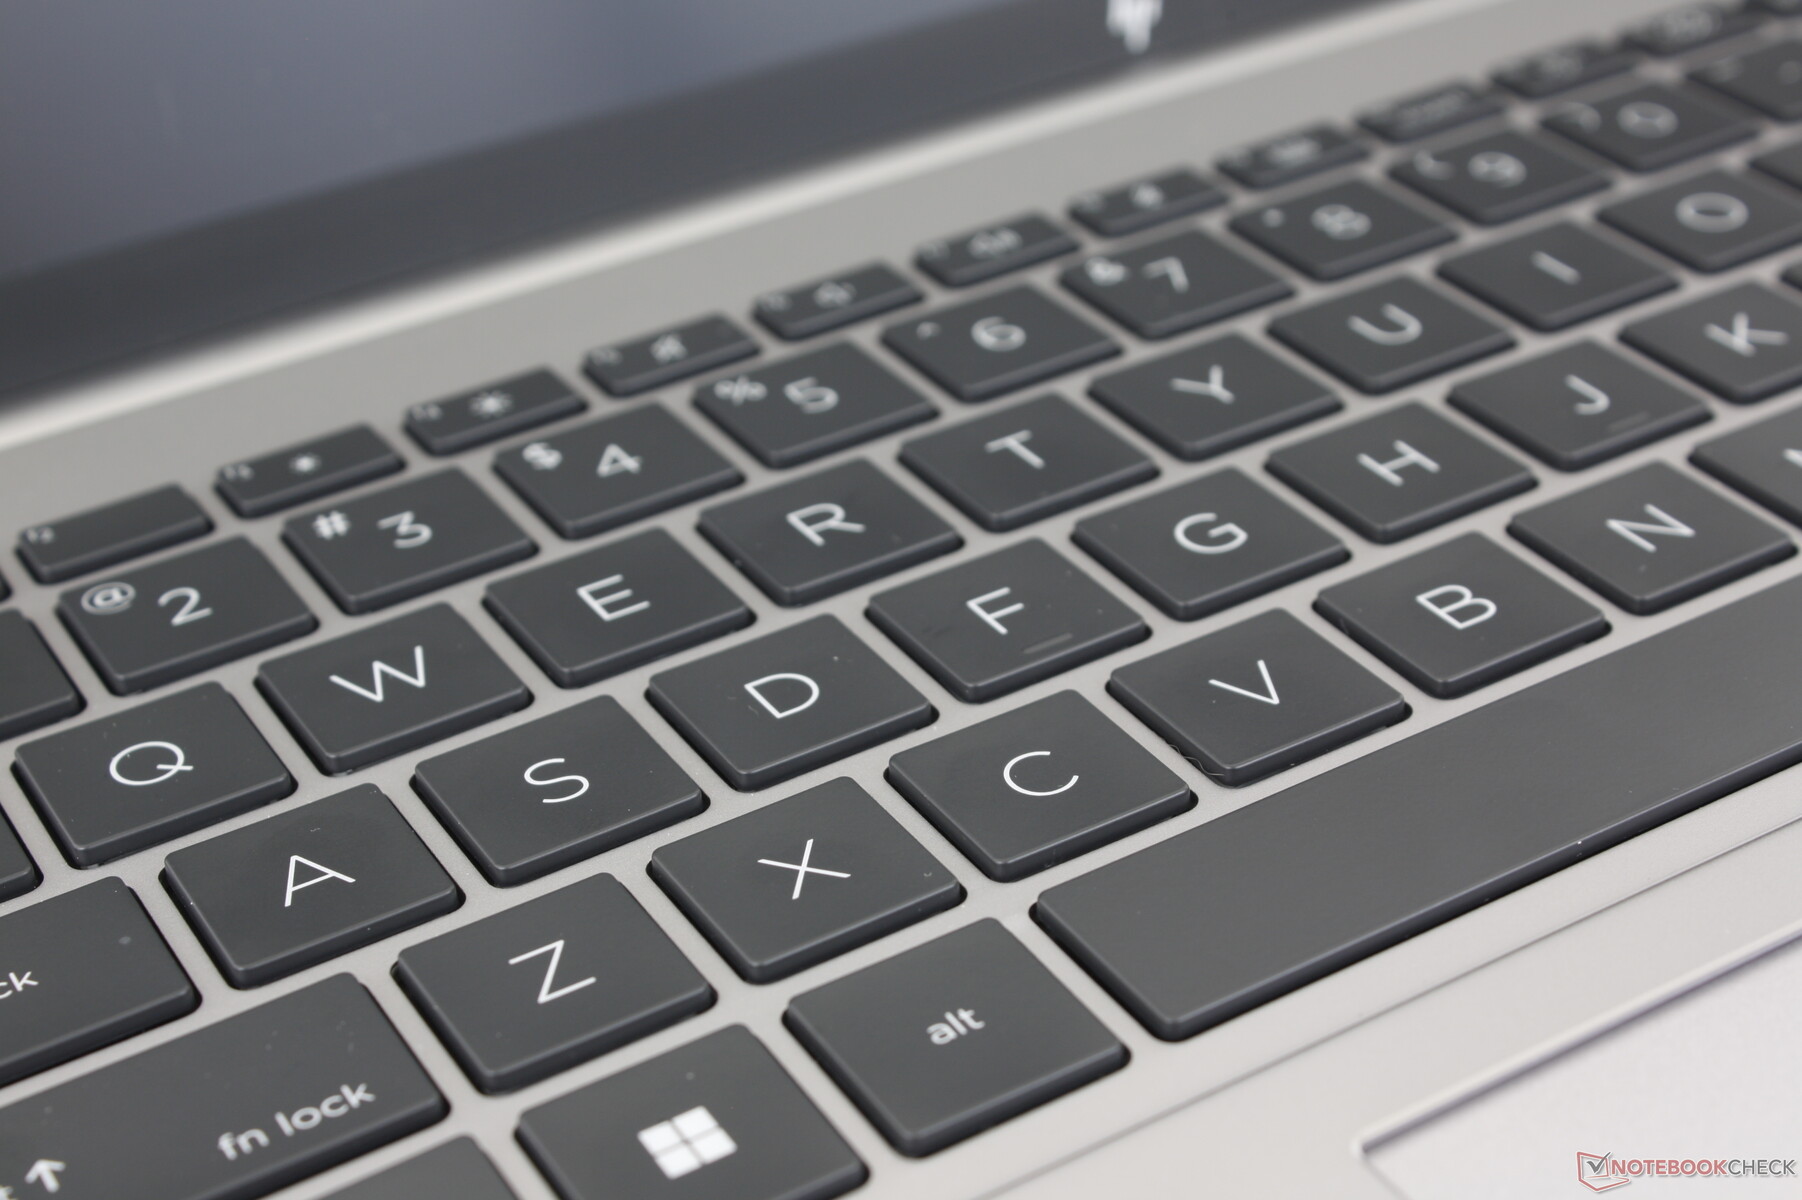
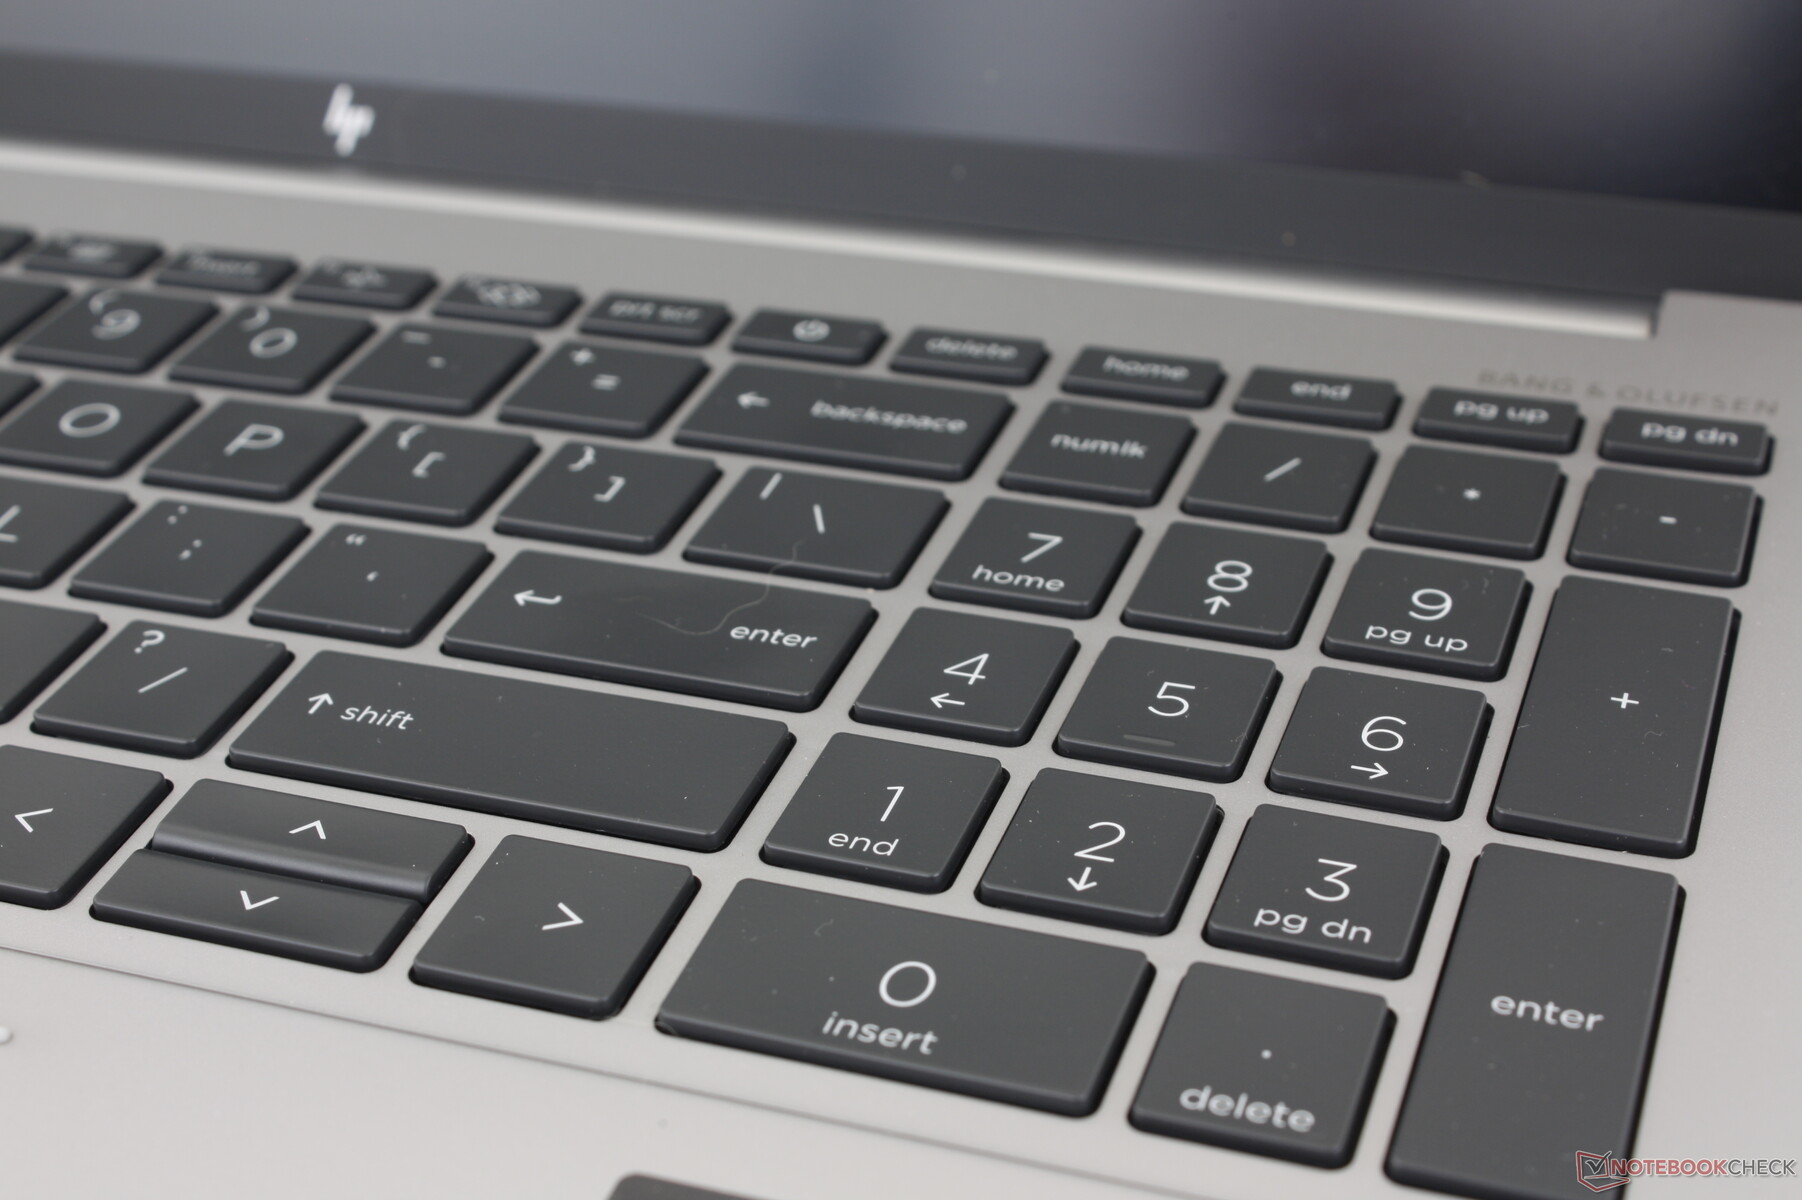
Input Devices — Spacious And Comfortable
Keyboard
The HP Spectre, EliteBook, and ZBook families all have some of the best keyboards in their respective categories when it comes to feedback and travel. The keys on the Fury 16 G9 are firm for a satisfying typing experience. Clatter is louder than on the ThinkPad P16 G1 or Precision 7670, however, especially when pressing on the Space or Enter keys. Typists who prefer quieter keys may want to try out the ZBook keyboard first before committing.
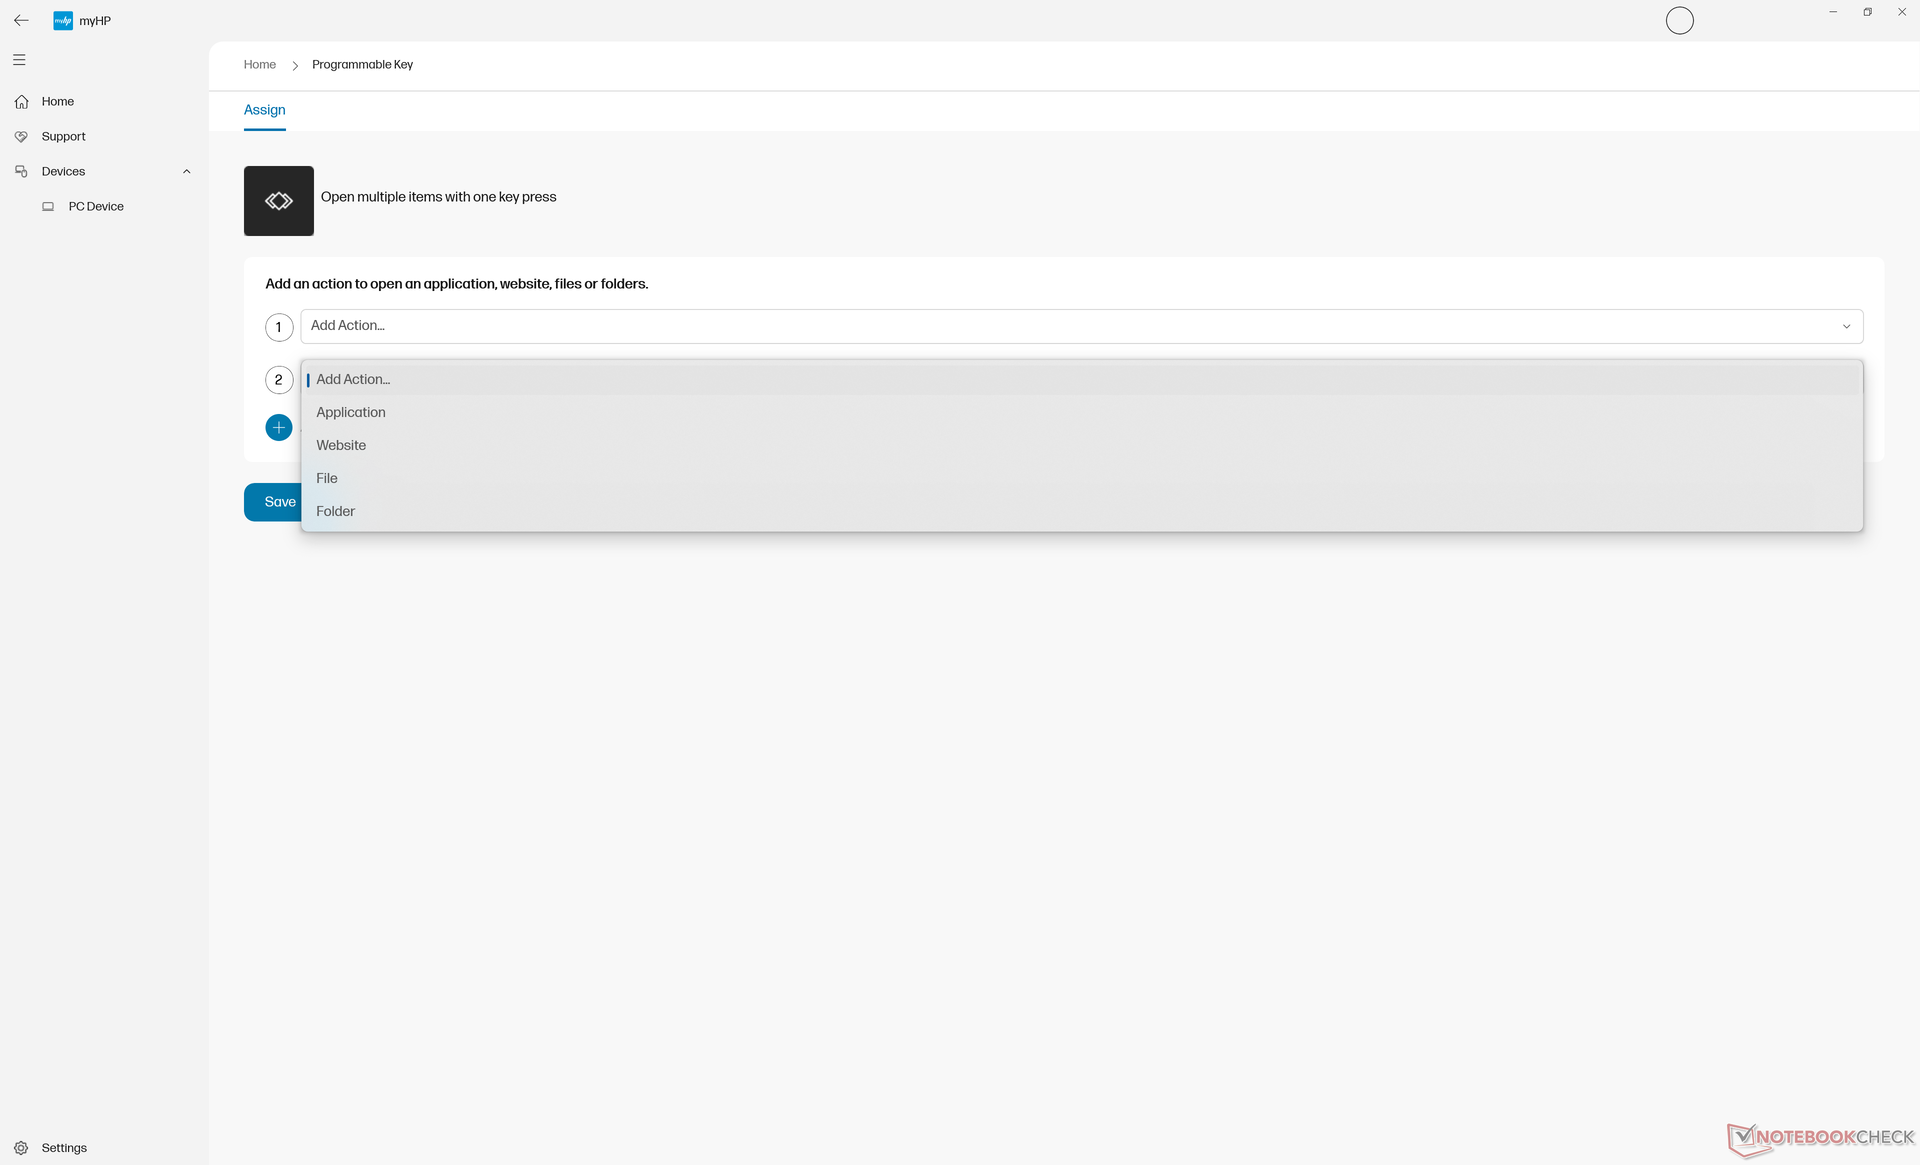
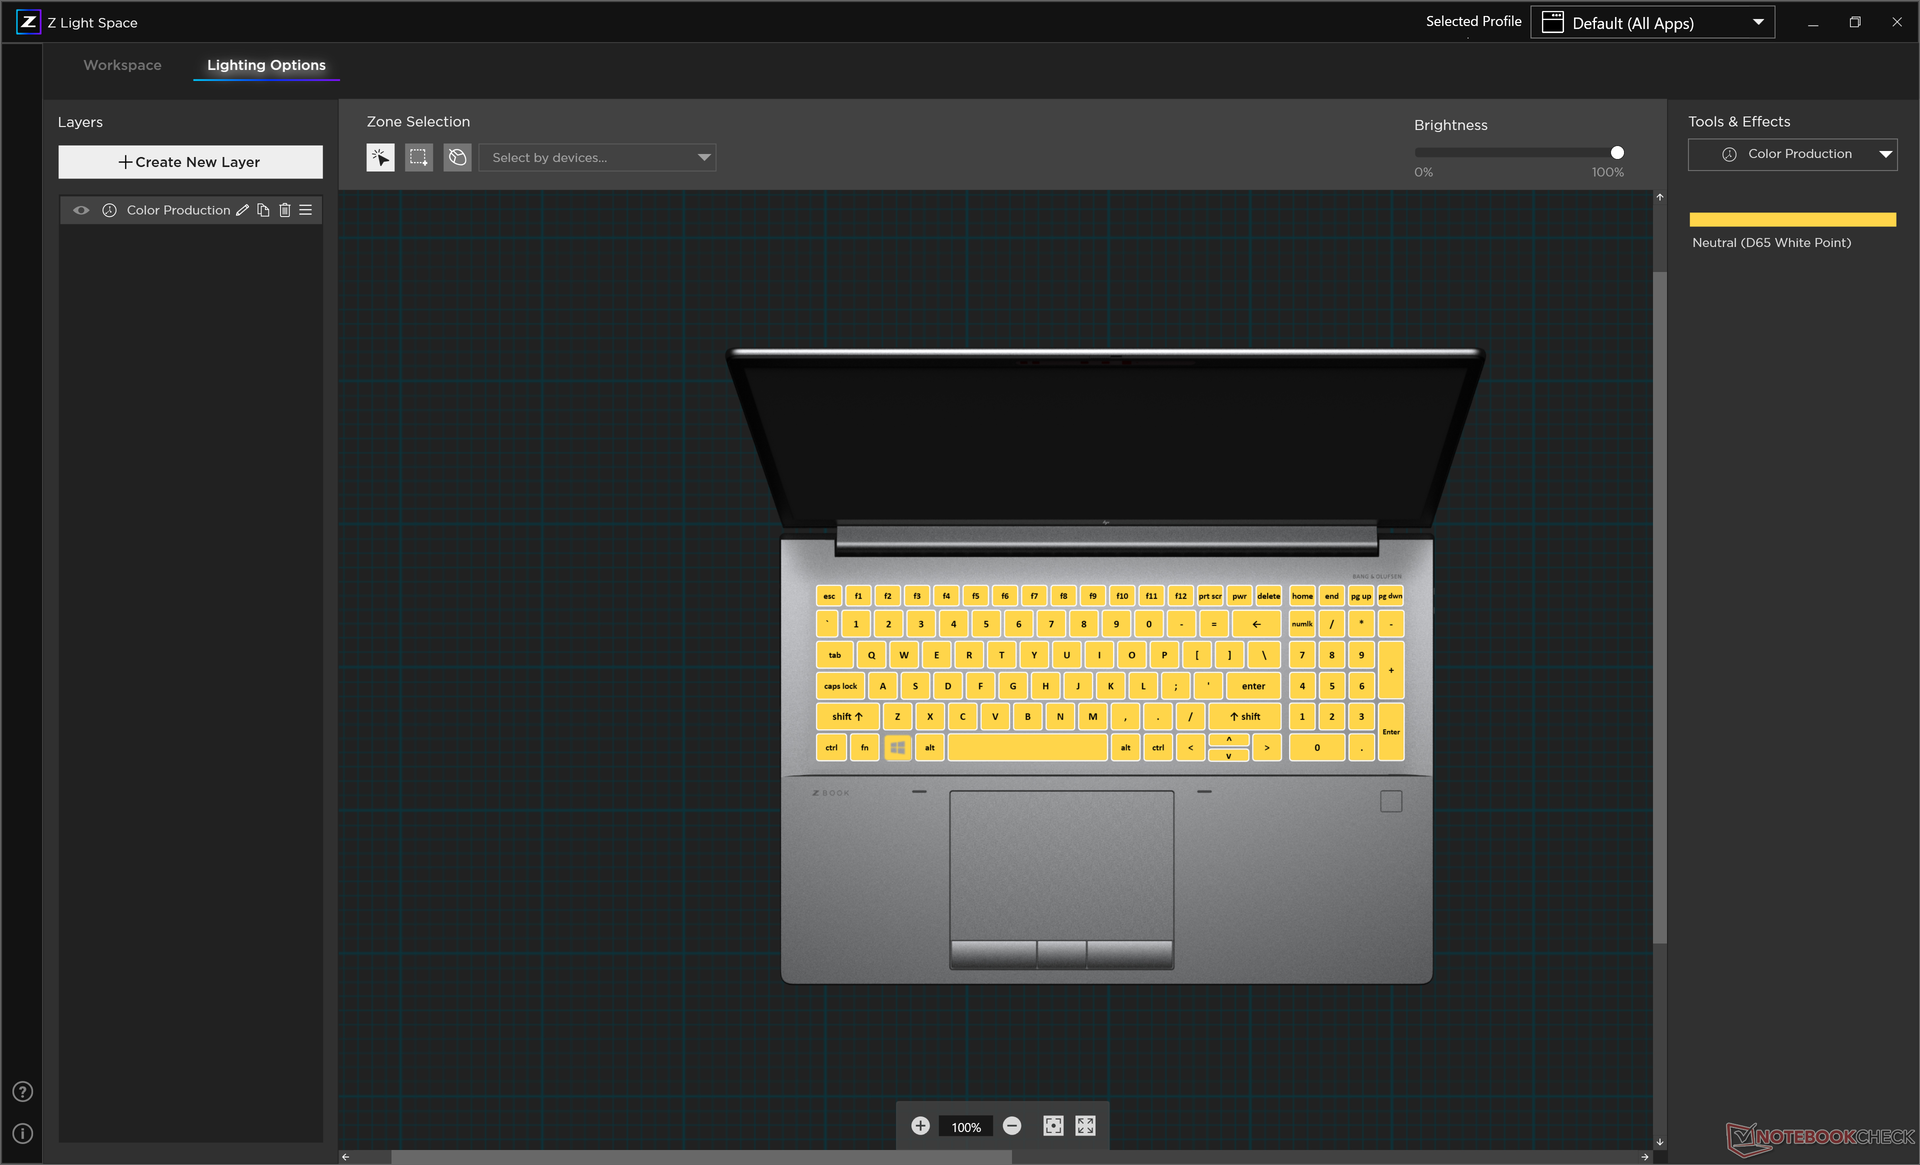
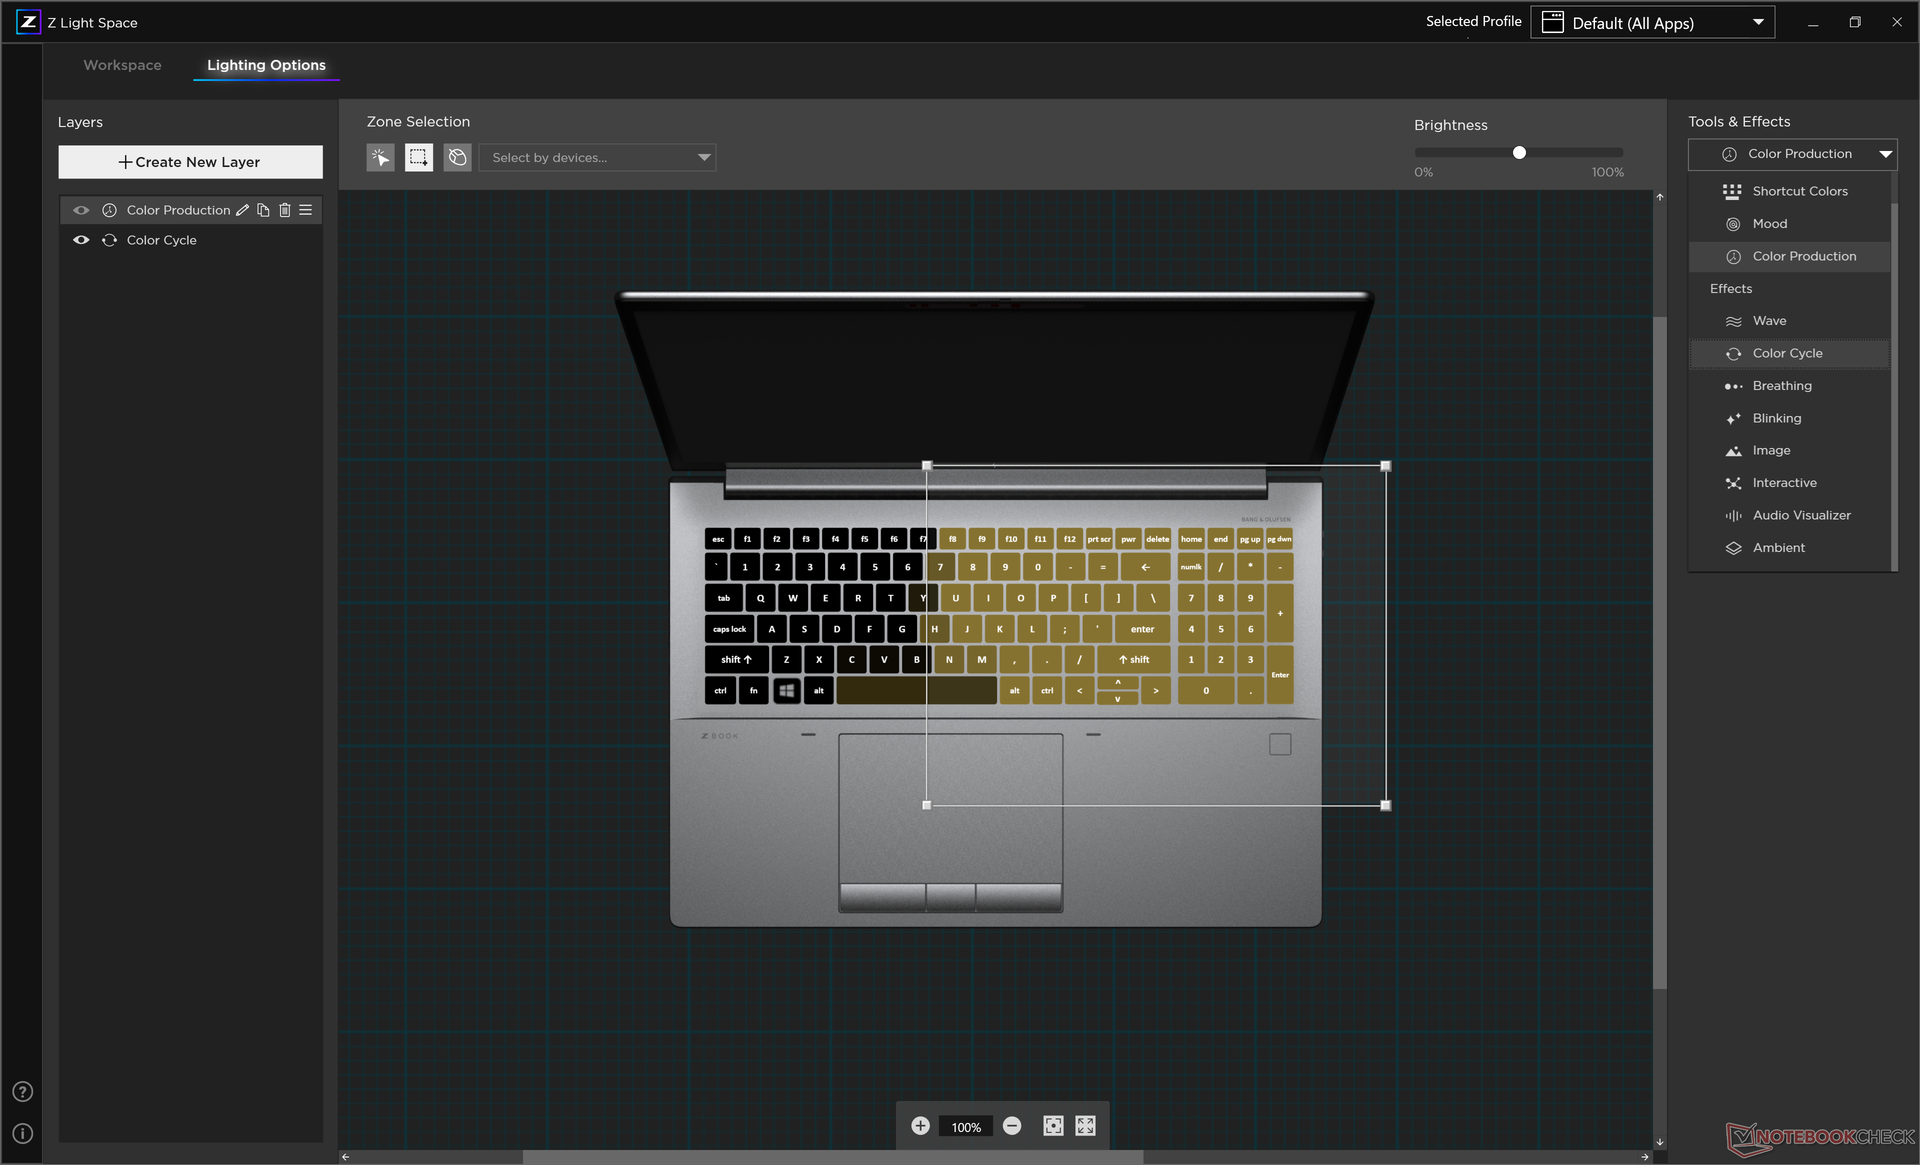
Notable features of the ZBook keyboard include per-key RGB backlighting and the single programmable/customizable key. Most other workstations do not yet come with similar auxiliary features.
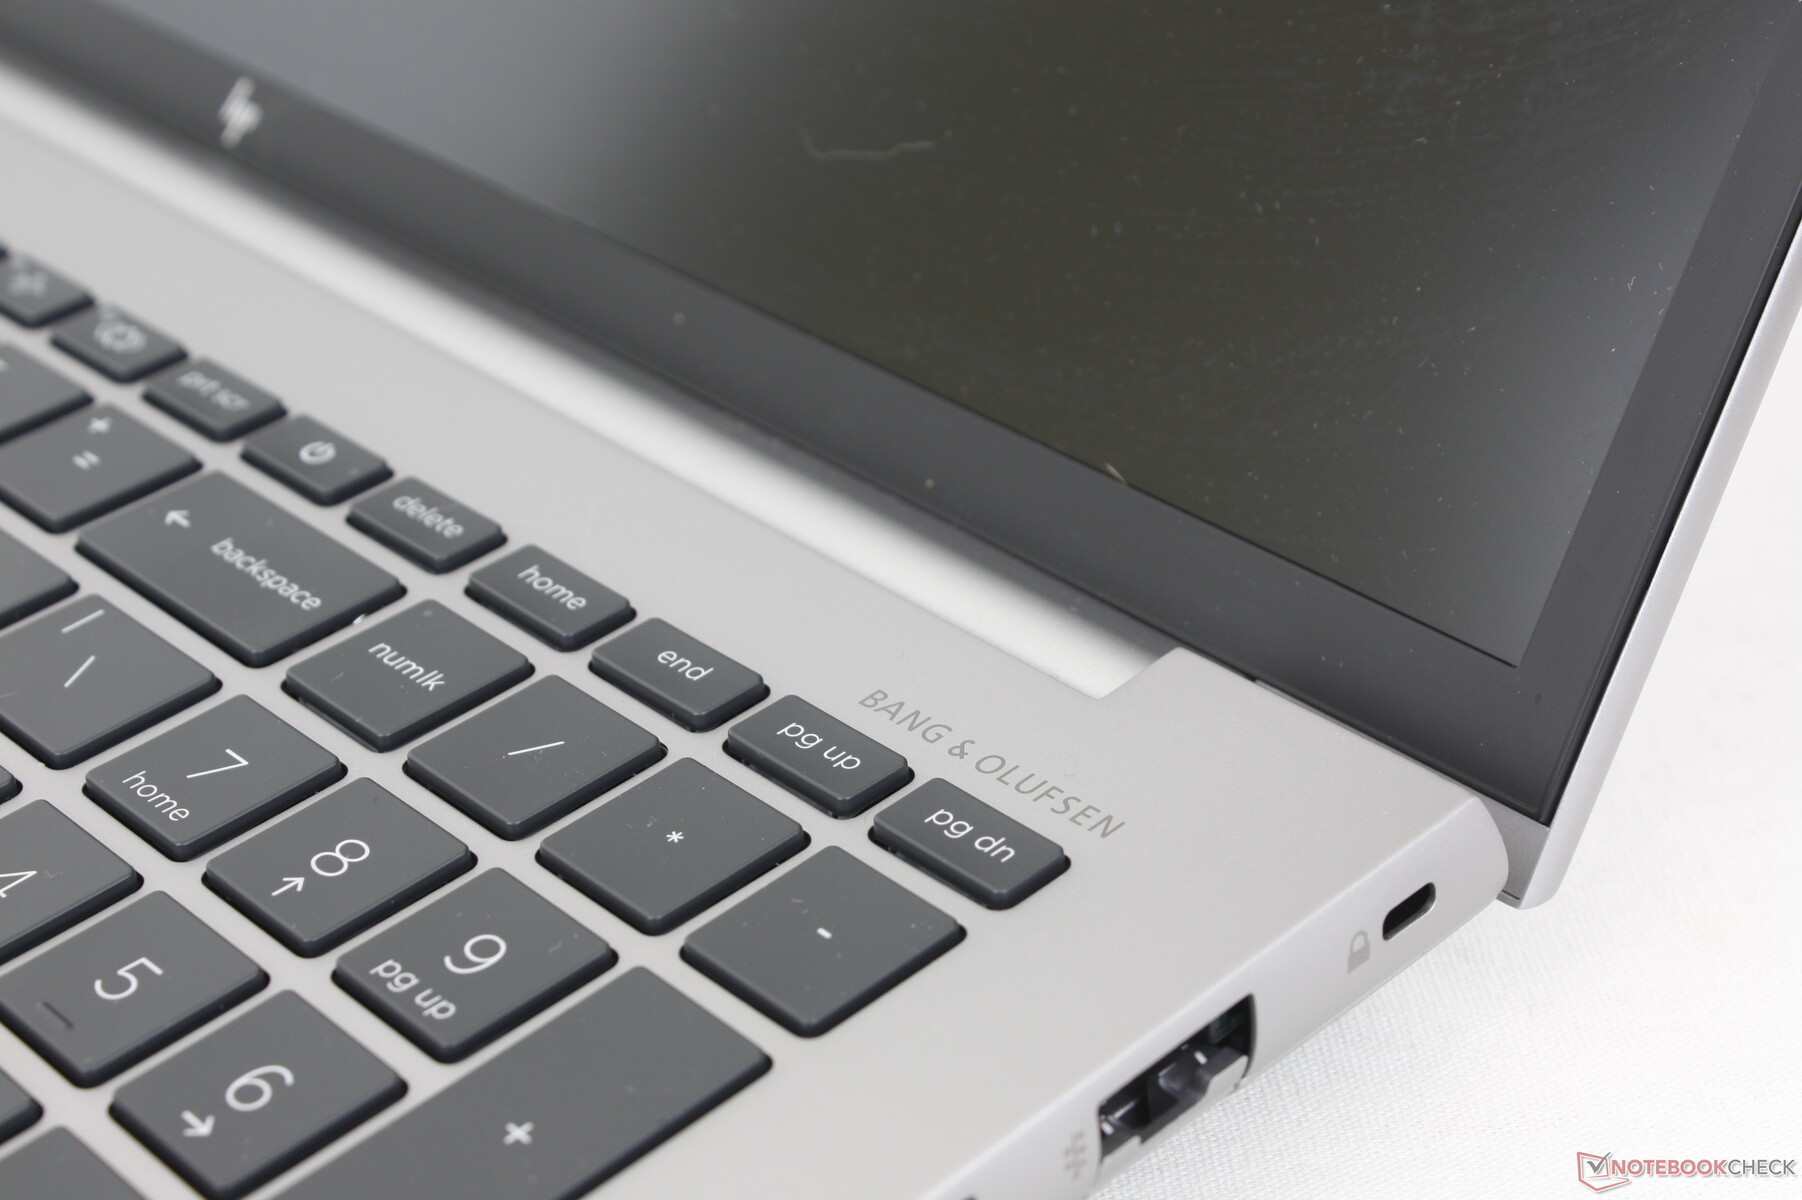
Touchpad
The touchpad is one of the best we've used on any laptop be it a workstation or otherwise. Not only is it larger (12.4 x 8.3 cm) than the touchpads on the ThinkPad P16 G1 (11.5 x 6.9 cm) or Precision 7670 (11.5 x 8 cm), but its gliding properties are smooth for reliable cursor control at any speed. Meanwhile, the dedicated mouse buttons have deeper travel than on most other laptops while maintaining a satisfying click when pressed. In comparison, the Precision 7670 lacks dedicated mouse buttons in favor of a clickpad solution.

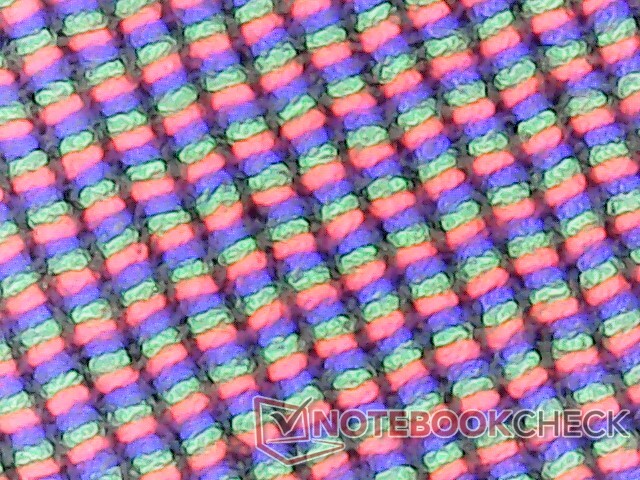
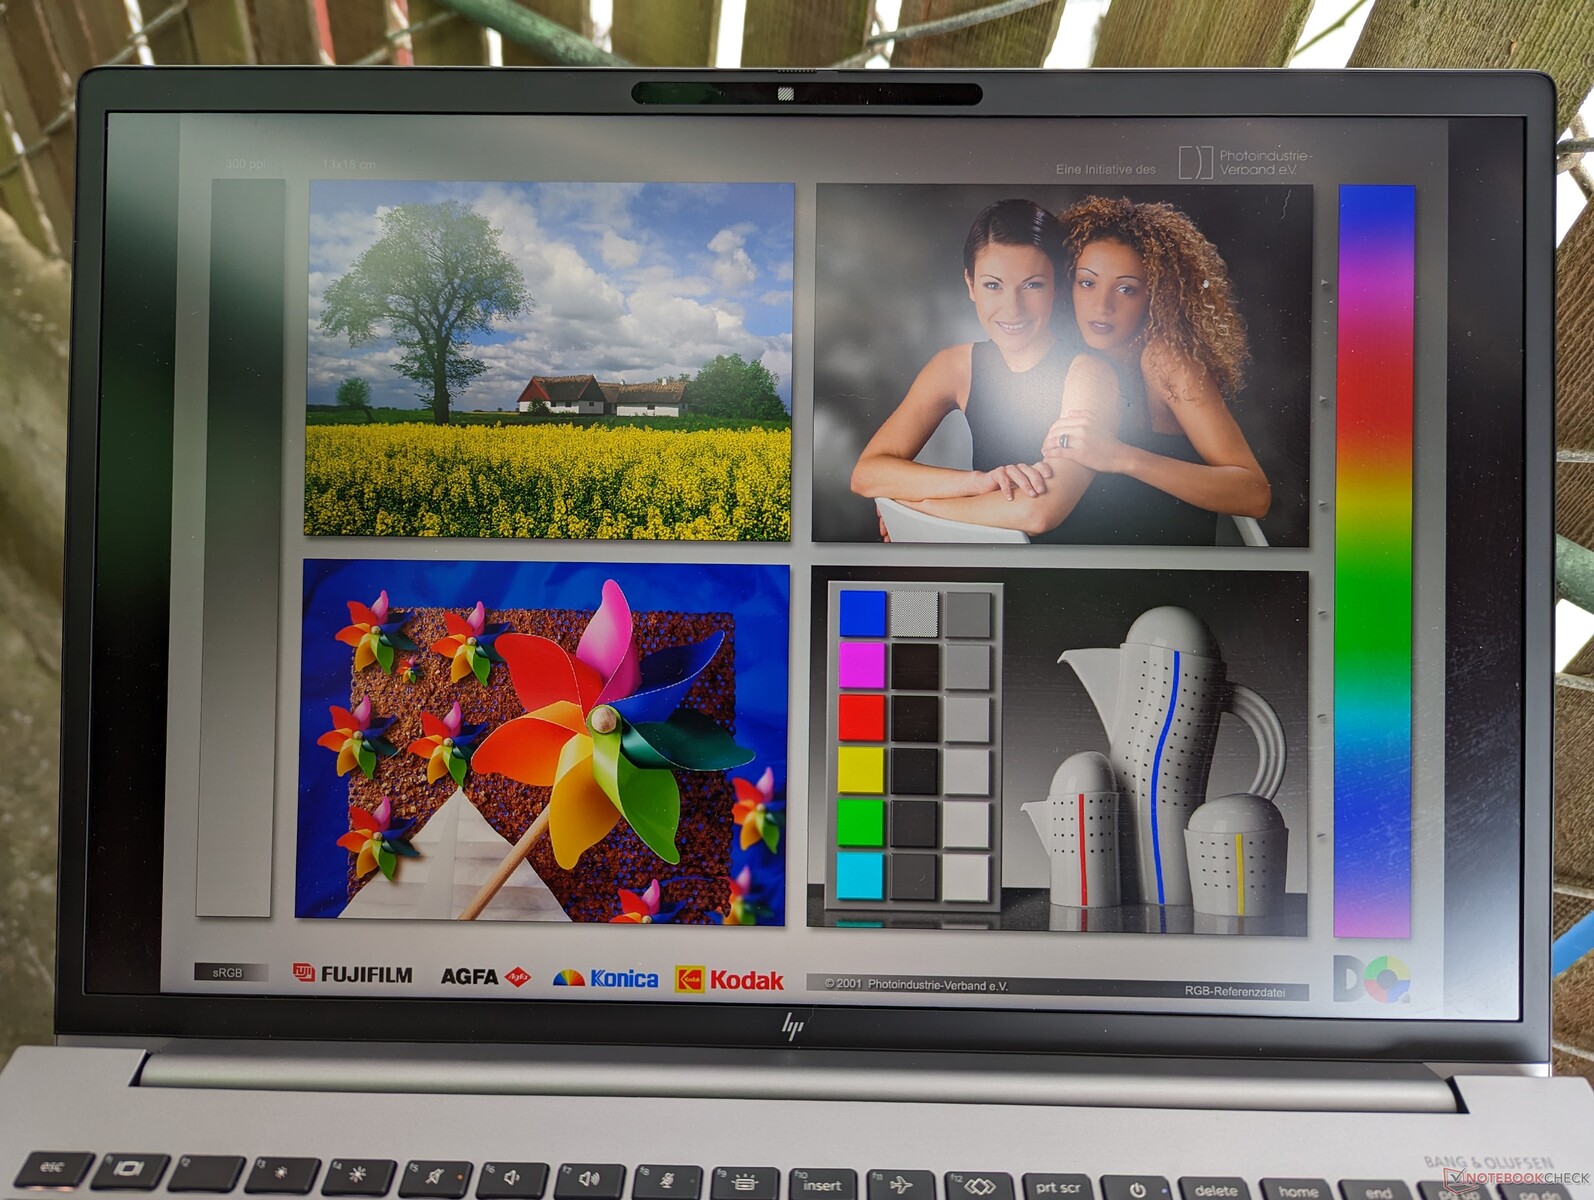
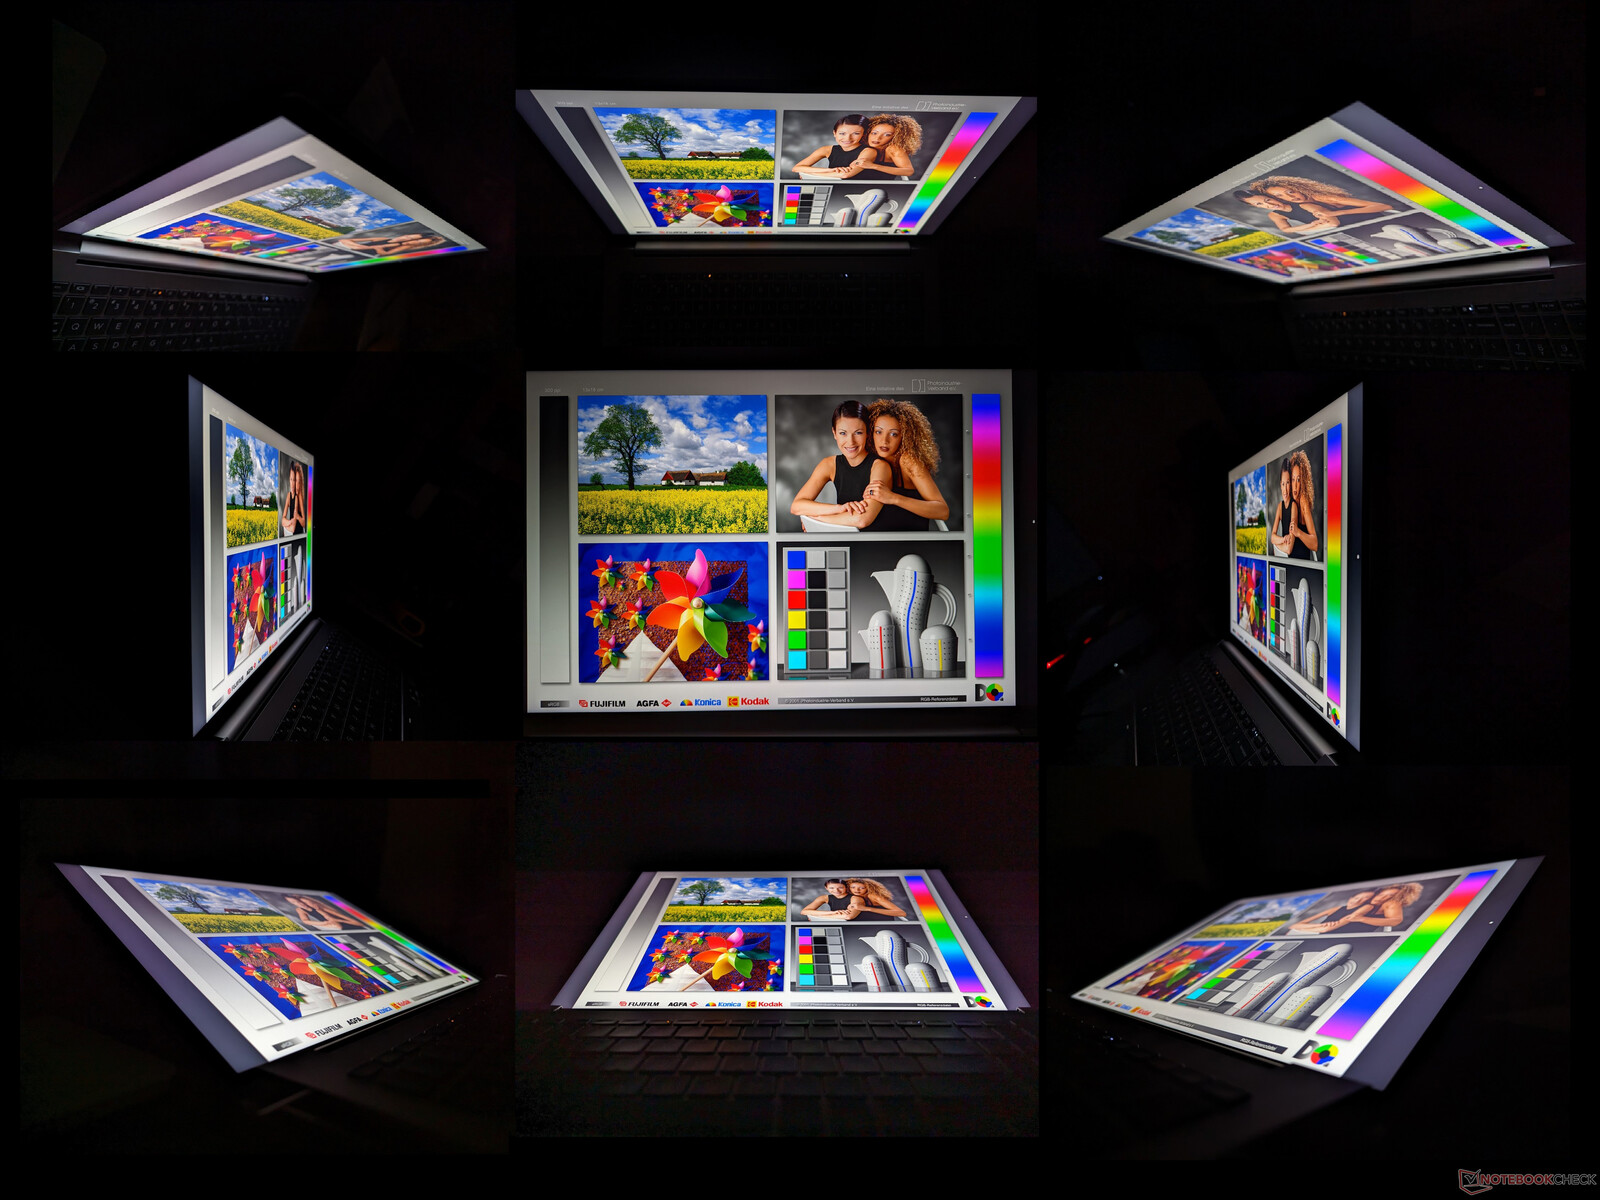
Display — Excellent Colors With Good Response Times
HP employs the same BOE panel options across many of its 16-inch laptops. The ZBook Studio 16 G9, for example, utilizes the same 16:10 4K panel as our ZBook Fury 16 G9 as exemplified by their similar attributes in the table below.
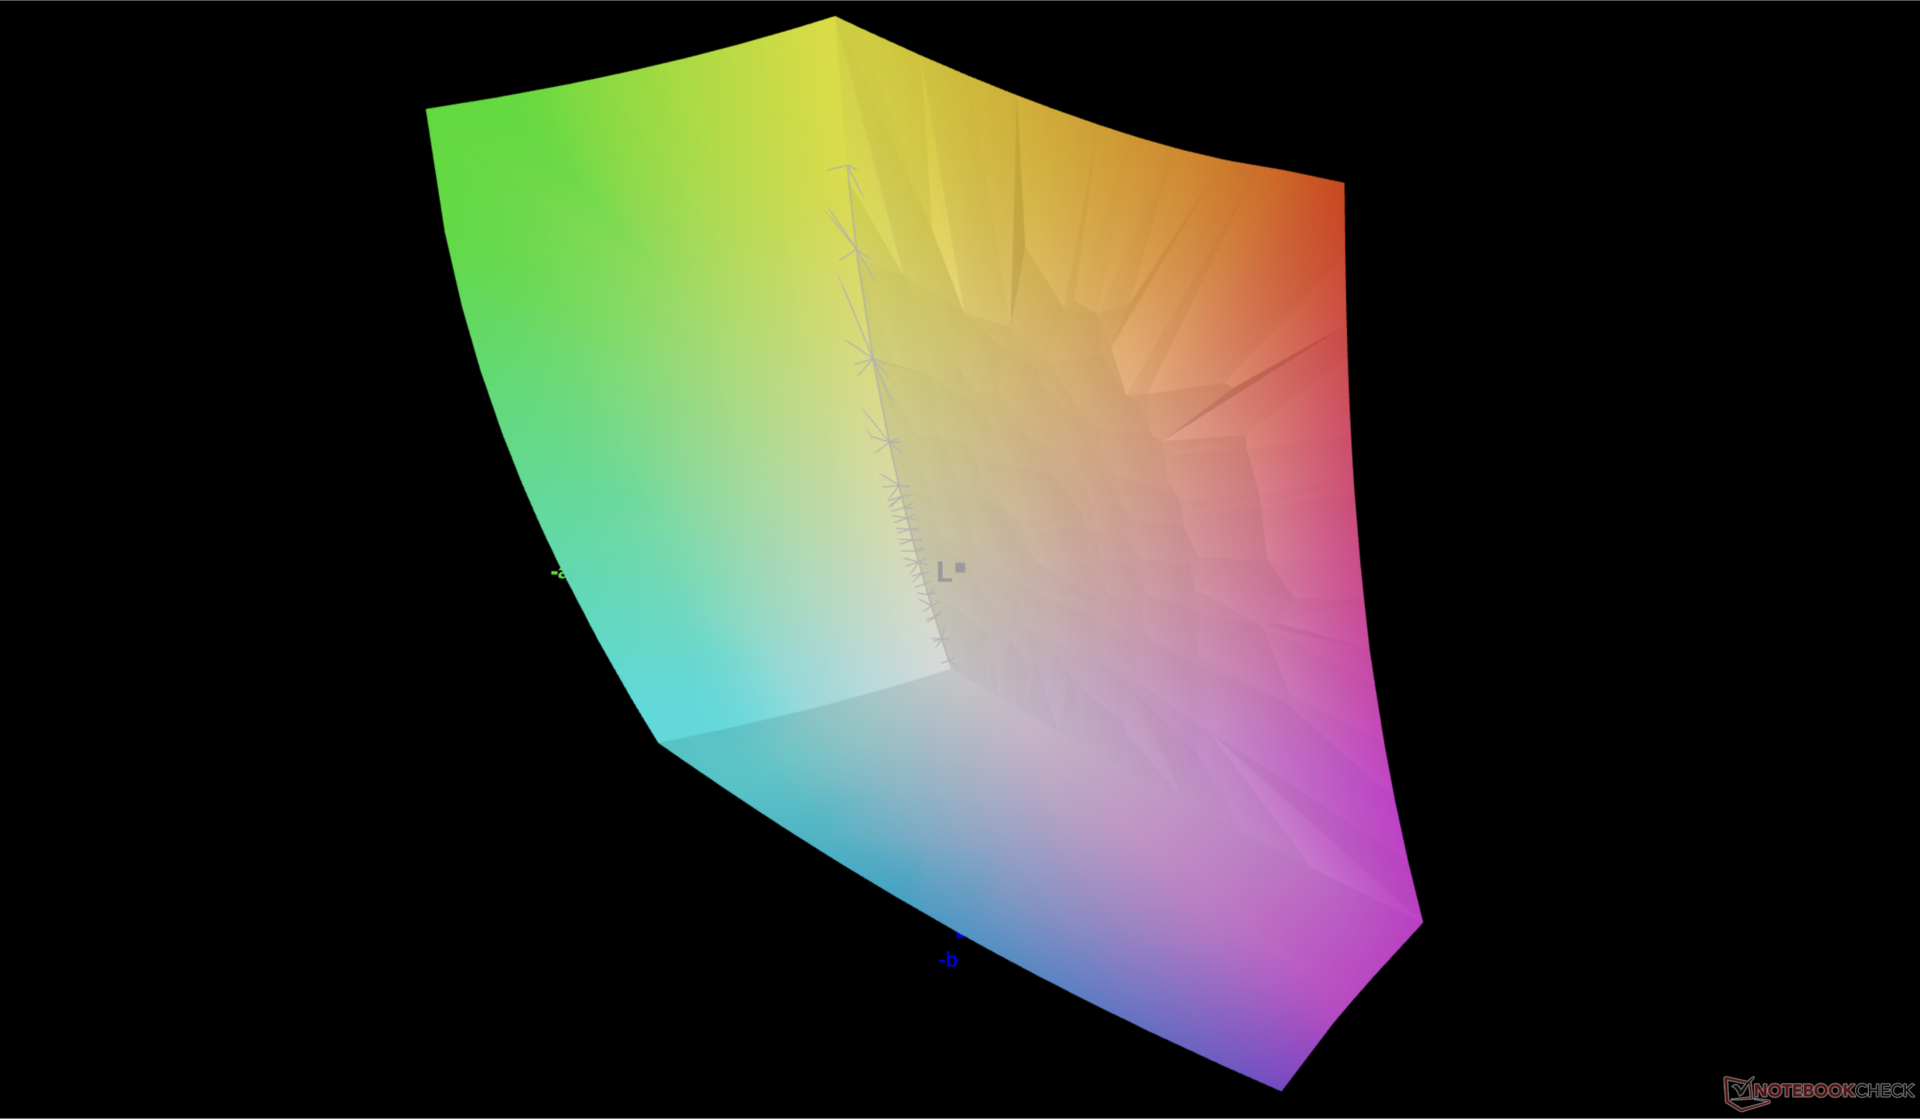
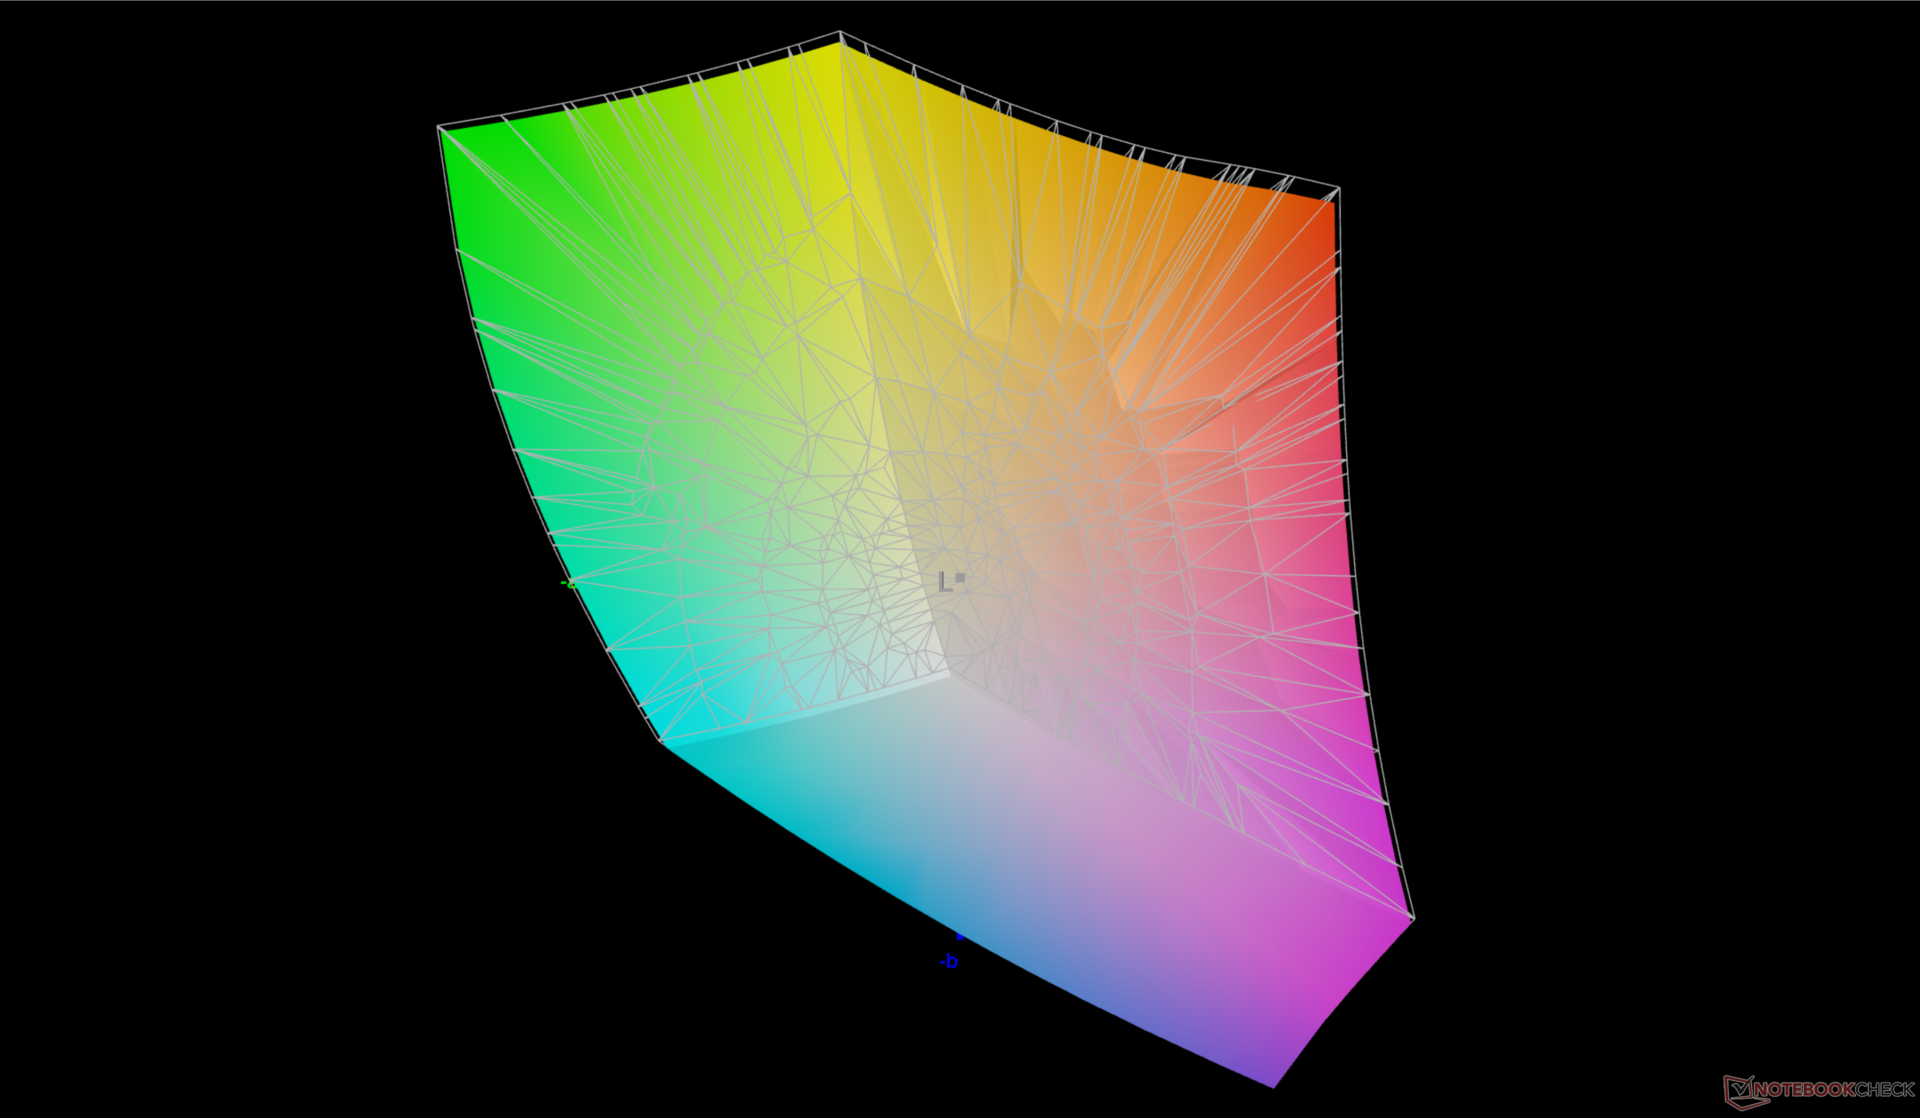
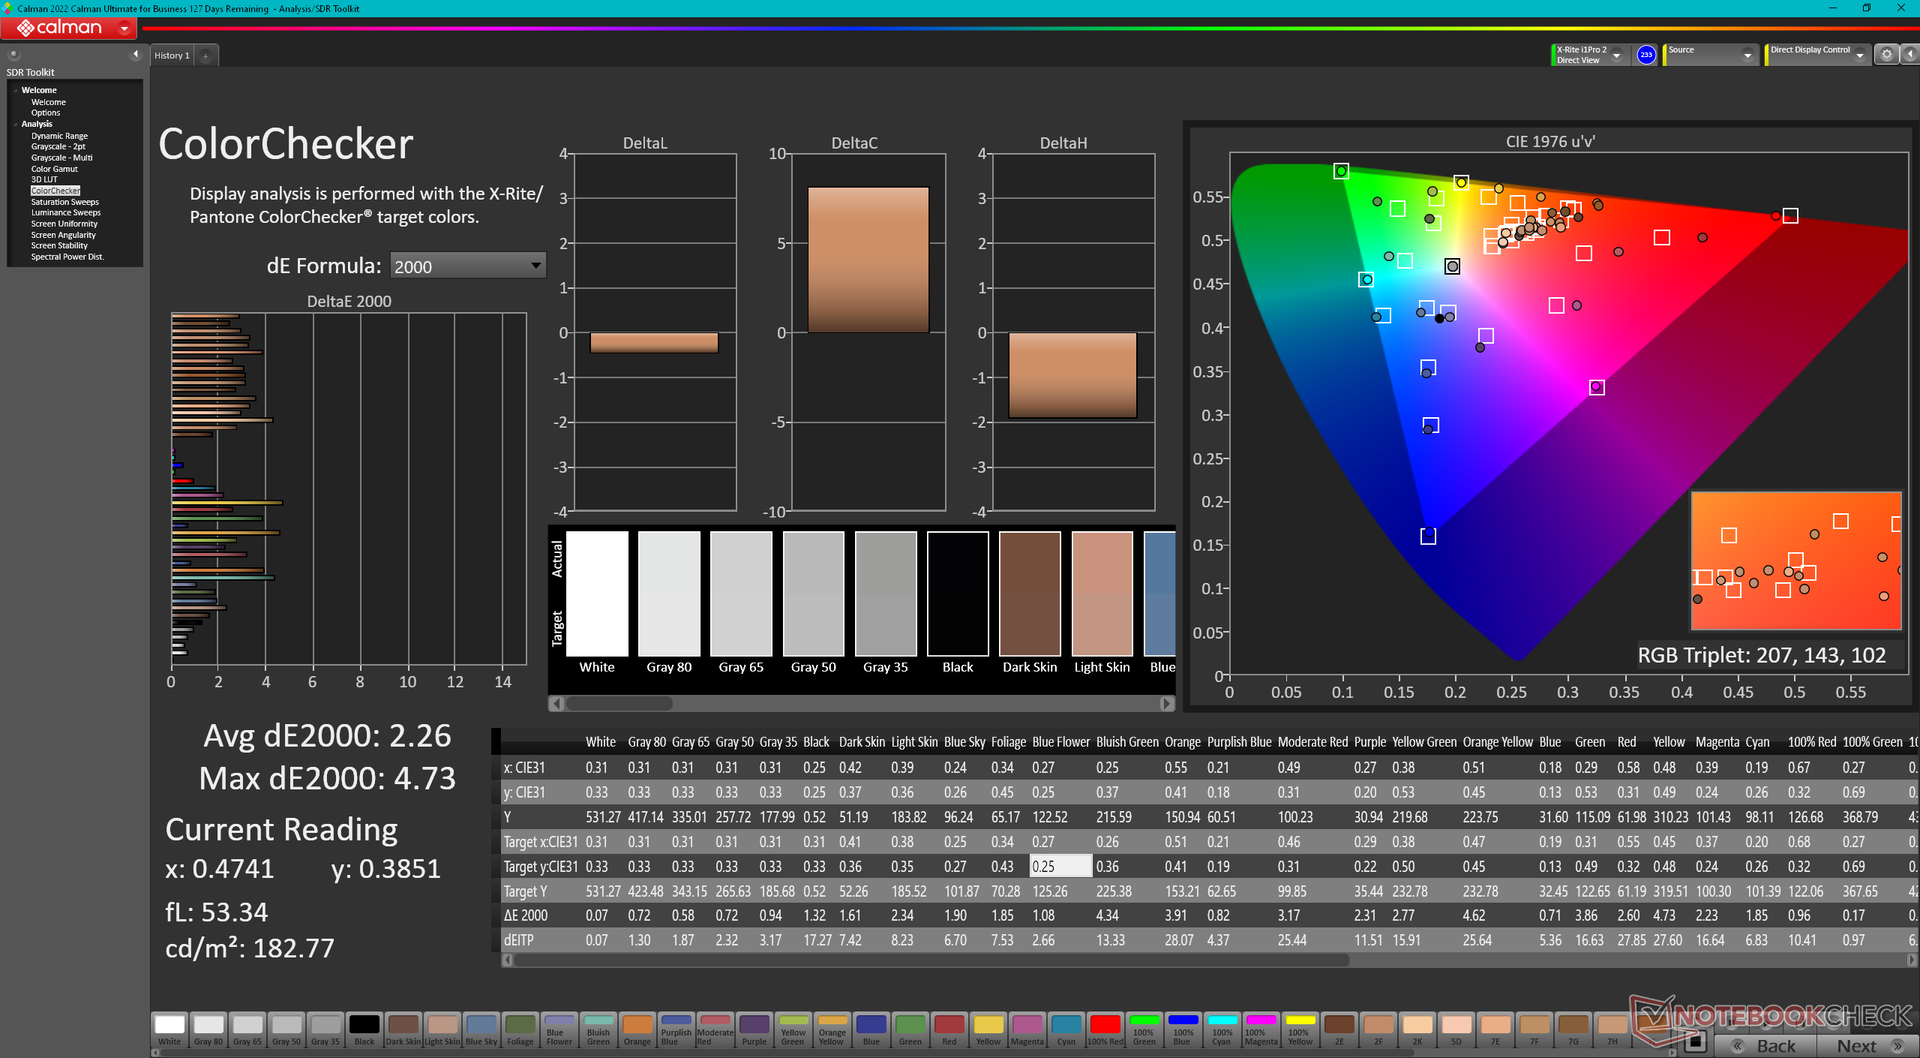
Our particular 4K IPS panel is a high-end offering with its wide P3 colors and good black-white and gray-gray response times to be suitable for both content creation and gaming applications. However, the matte overlay isn't as sharp as a glossy alternative and contrast ratio is limited to just ~1000:1. Fortunately, HP offers an OLED option to directly address these two shortcomings.
| |||||||||||||||||||||||||
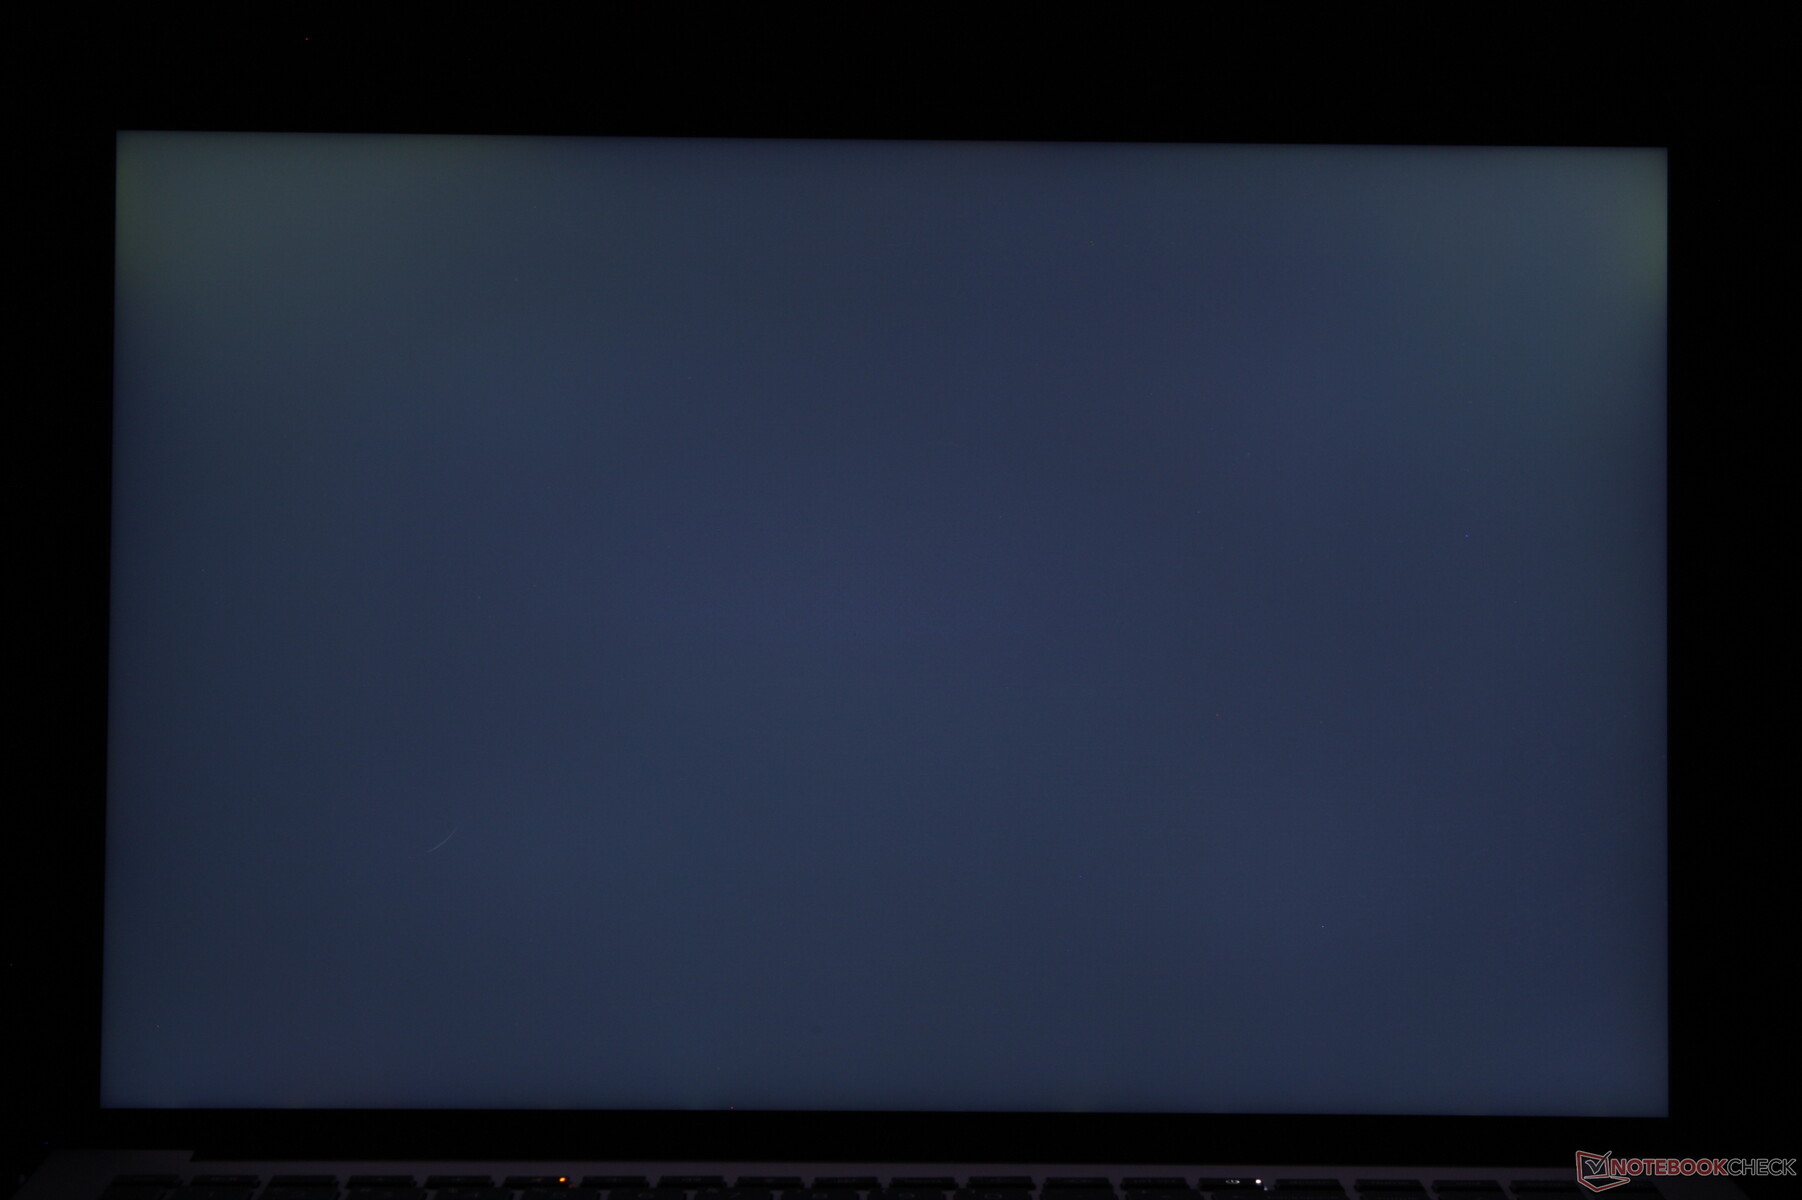
Brightness Distribution: 83 %
Center on Battery: 451.7 cd/m²
Contrast: 931:1 (Black: 0.57 cd/m²)
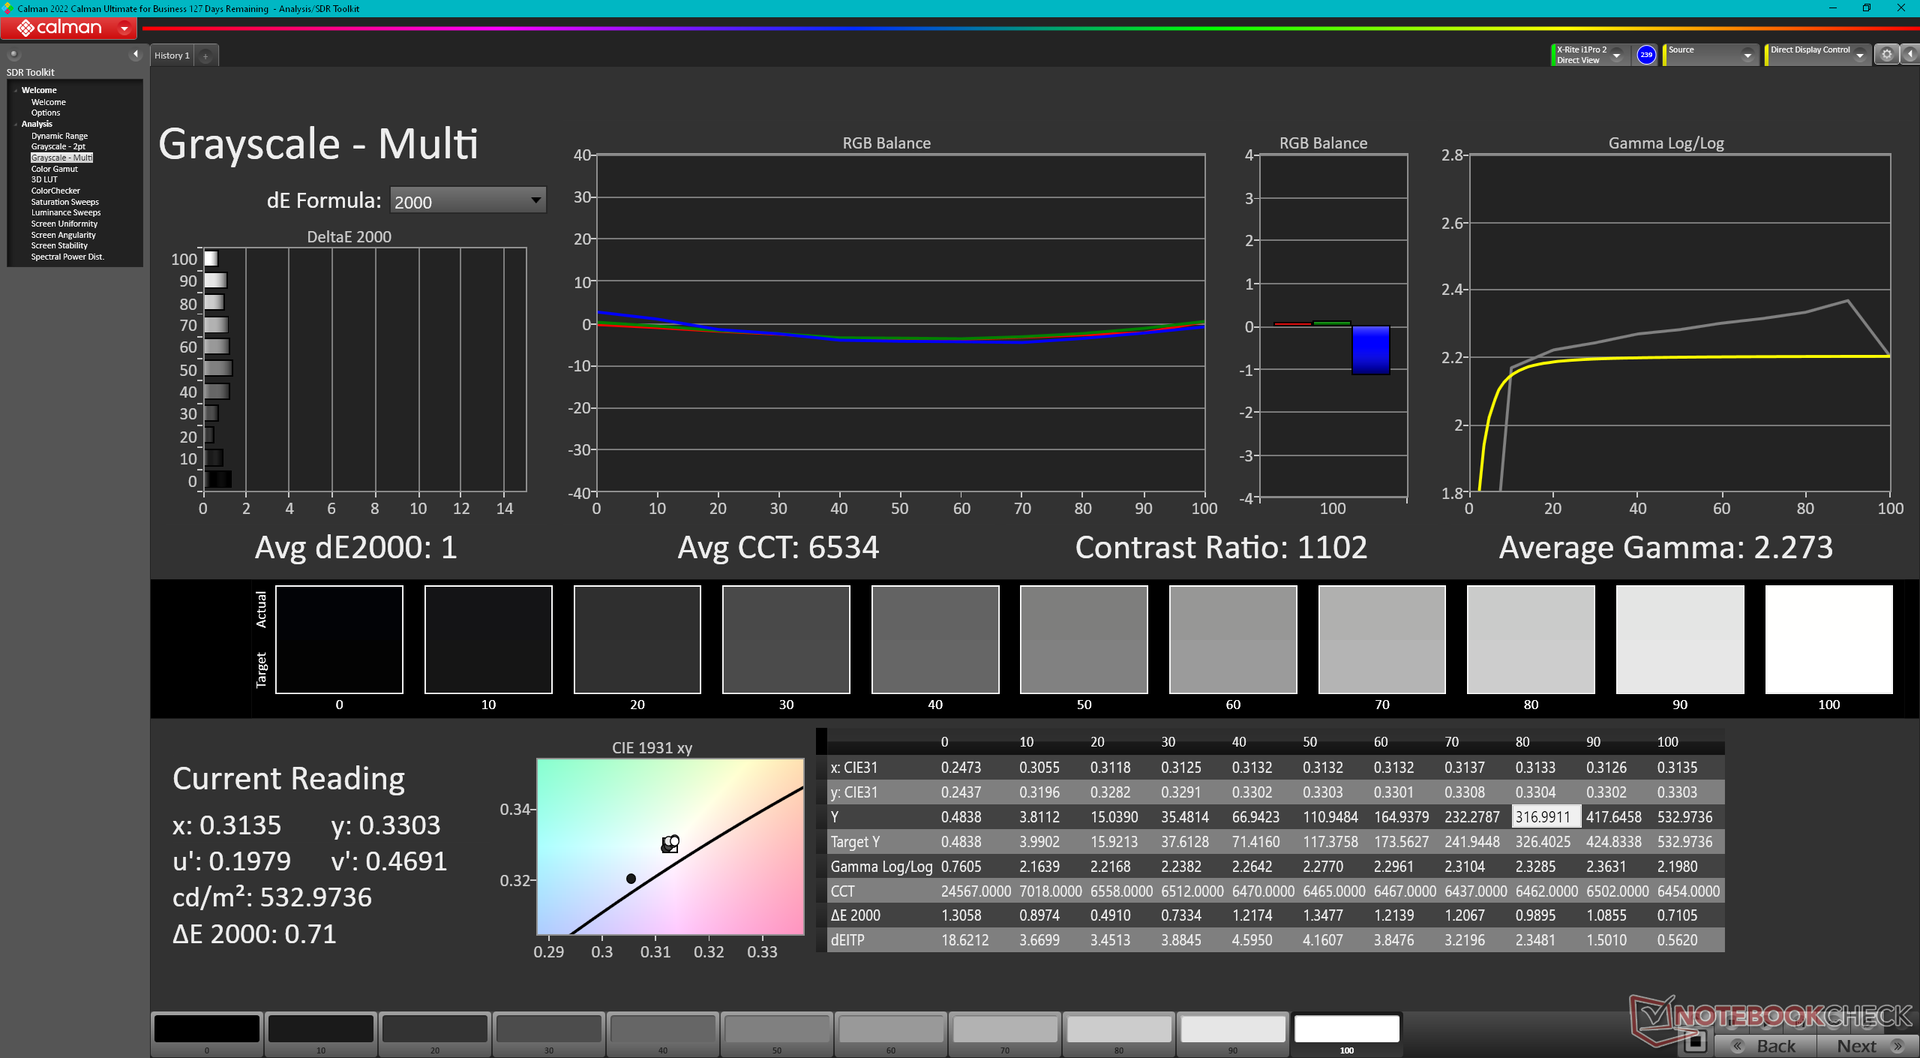
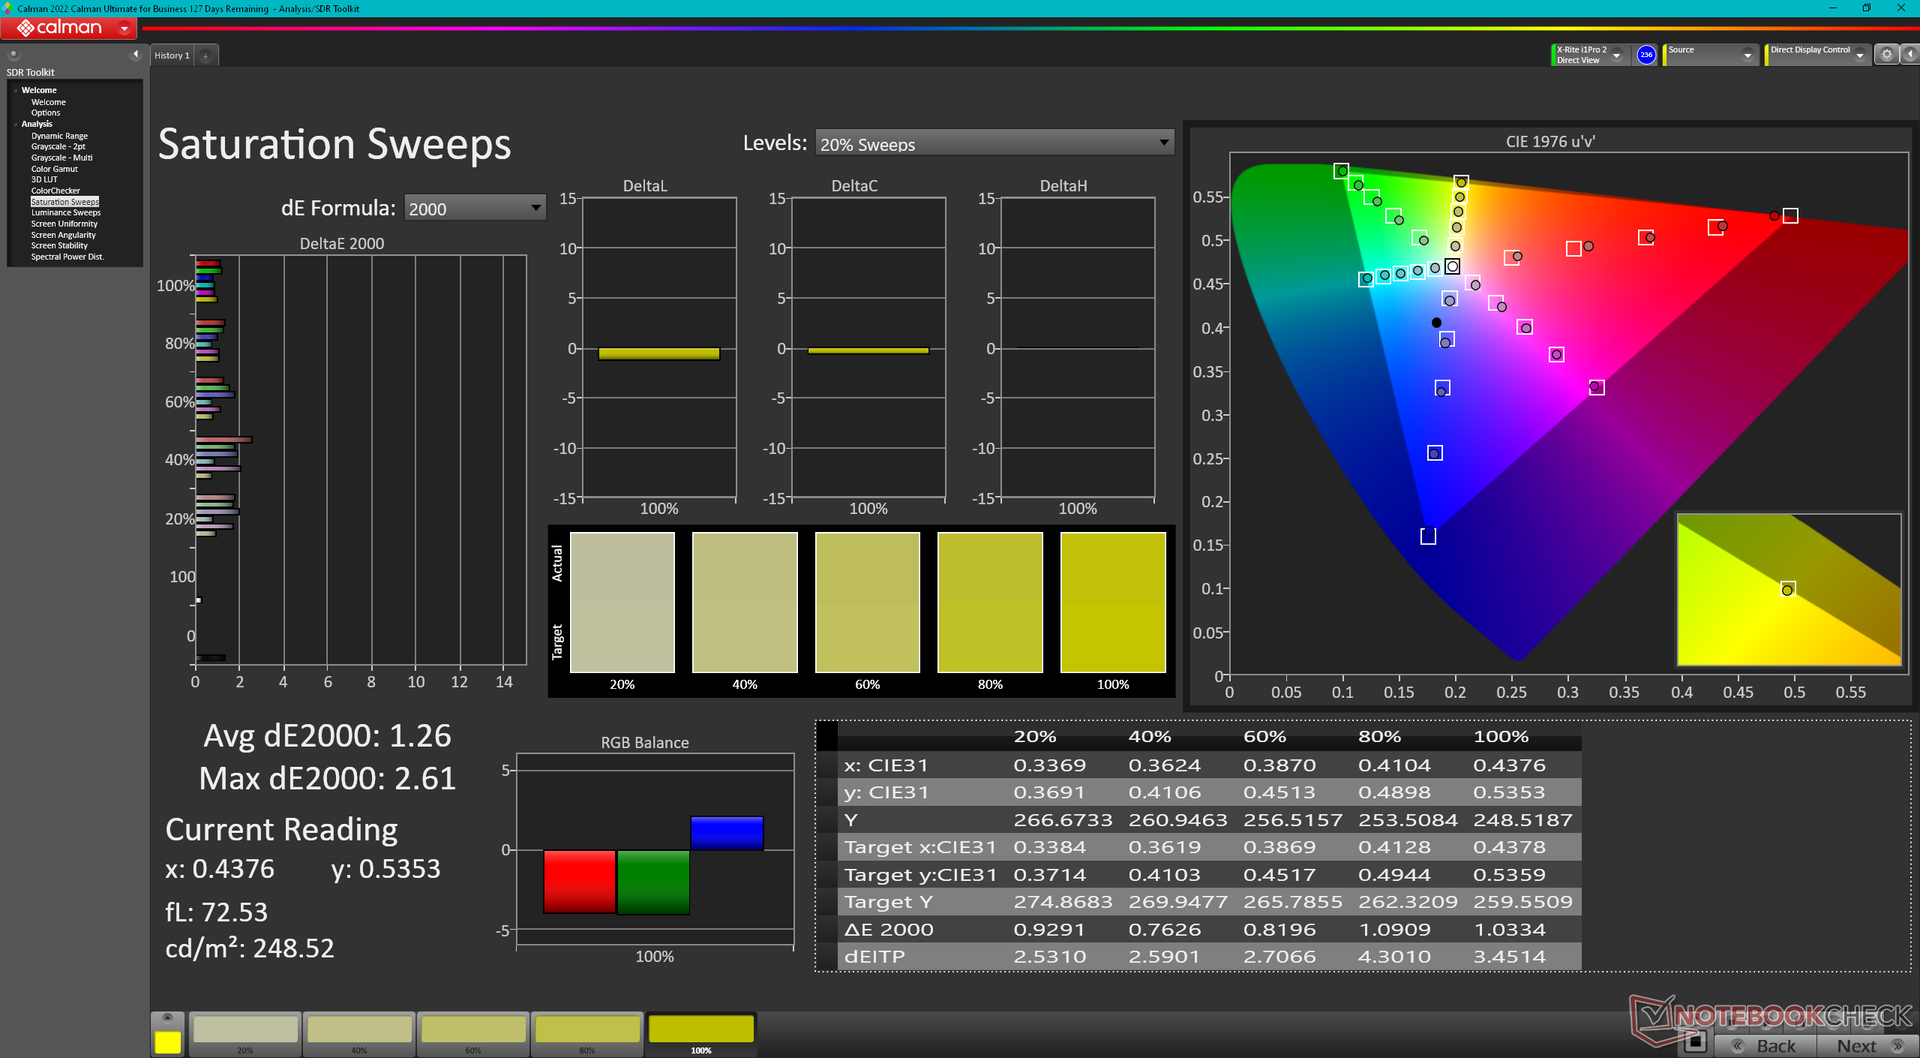
ΔE ColorChecker Calman: 2.26 | ∀{0.5-29.43 Ø4.73}
calibrated: 4.73
ΔE Greyscale Calman: 1 | ∀{0.09-98 Ø4.97}
86.3% AdobeRGB 1998 (Argyll 3D)
99.9% sRGB (Argyll 3D)
97.4% Display P3 (Argyll 3D)
Gamma: 2.28
CCT: 6543 K
| HP ZBook Fury 16 G9 BOE0A52, IPS, 3840x2400, 16" | HP ZBook Studio 16 G9 62U04EA BOE0A52, IPS, 3840x2400, 16" | HP ZBook Firefly 16 G9-6B897EA BOE0A02, IPS, 1920x1200, 16" | Lenovo ThinkPad P16 G1 RTX A5500 LP160UQ1-SPB1, IPS, 3840x2400, 16" | Dell Precision 7000 7670 Performance Samsung 160YV03, OLED, 3840x2400, 16" | MSI CreatorPro Z16P B12UKST B160QAN02.N, IPS, 2560x1600, 16" | |
|---|---|---|---|---|---|---|
| Display | 0% | -18% | -2% | 6% | 0% | |
| Display P3 Coverage (%) | 97.4 | 97.5 0% | 68.1 -30% | 82.9 -15% | 99.9 3% | 97.6 0% |
| sRGB Coverage (%) | 99.9 | 99.9 0% | 96.1 -4% | 98.9 -1% | 100 0% | 99.9 0% |
| AdobeRGB 1998 Coverage (%) | 86.3 | 86.3 0% | 70 -19% | 95.9 11% | 98.1 14% | 87.4 1% |
| Response Times | 9% | -206% | -281% | 83% | 11% | |
| Response Time Grey 50% / Grey 80% * (ms) | 13.7 ? | 15.3 ? -12% | 52.8 ? -285% | 45.6 ? -233% | 1.84 ? 87% | 12.8 ? 7% |
| Response Time Black / White * (ms) | 8.6 ? | 6.1 ? 29% | 19.5 ? -127% | 36.8 ? -328% | 1.92 ? 78% | 7.4 ? 14% |
| PWM Frequency (Hz) | 59.52 ? | |||||
| Screen | 18% | -40% | -12% | -61% | 5% | |
| Brightness middle (cd/m²) | 530.5 | 554 4% | 526 -1% | 601.9 13% | 325.2 -39% | 407 -23% |
| Brightness (cd/m²) | 476 | 516 8% | 499 5% | 569 20% | 328 -31% | 388 -18% |
| Brightness Distribution (%) | 83 | 84 1% | 93 12% | 77 -7% | 97 17% | 88 6% |
| Black Level * (cd/m²) | 0.57 | 0.47 18% | 0.31 46% | 0.47 18% | 0.36 37% | |
| Contrast (:1) | 931 | 1179 27% | 1697 82% | 1281 38% | 1131 21% | |
| Colorchecker dE 2000 * | 2.26 | 1 56% | 3.6 -59% | 2.45 -8% | 4.59 -103% | 1.3 42% |
| Colorchecker dE 2000 calibrated * | 4.73 | 0.6 87% | 2.6 45% | 0.7 85% | ||
| Greyscale dE 2000 * | 1 | 1.6 -60% | 5.5 -450% | 2.6 -160% | 2.5 -150% | 2.1 -110% |
| Gamma | 2.28 96% | 2.29 96% | 2.02 109% | 2.3 96% | 2.1 105% | 2.26 97% |
| CCT | 6543 99% | 6458 101% | 6527 100% | 6805 96% | 6541 99% | 6437 101% |
| Colorchecker dE 2000 max. * | 2.4 | 6.6 | 4.46 | 7.65 | 2.5 | |
| Total Average (Program / Settings) | 9% /
12% | -88% /
-60% | -98% /
-54% | 9% /
-12% | 5% /
5% |
* ... smaller is better
The display is calibrated out of the box against the P3 standard with average grayscale and color DeltaE values of just 1.0 and 2.26, respectively.
Display Response Times
| ↔ Response Time Black to White | ||
|---|---|---|
| 8.6 ms ... rise ↗ and fall ↘ combined | ↗ 4.7 ms rise | 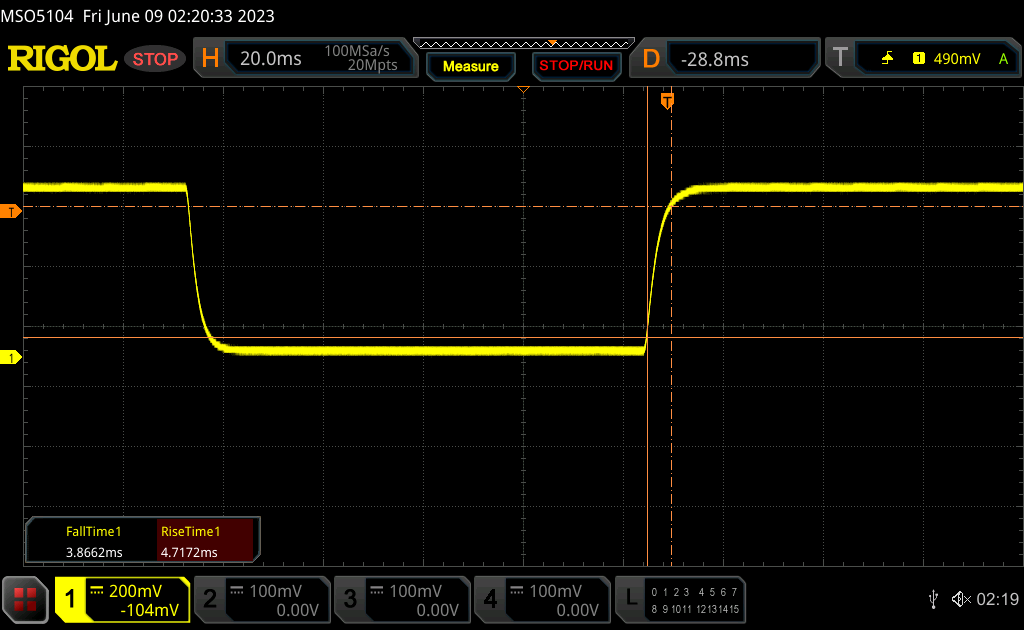 |
| ↘ 3.9 ms fall | ||
| The screen shows fast response rates in our tests and should be suited for gaming. In comparison, all tested devices range from 0.1 (minimum) to 240 (maximum) ms. » 24 % of all devices are better. This means that the measured response time is better than the average of all tested devices (19.9 ms). | ||
| ↔ Response Time 50% Grey to 80% Grey | ||
| 13.7 ms ... rise ↗ and fall ↘ combined | ↗ 6.6 ms rise |  |
| ↘ 7.1 ms fall | ||
| The screen shows good response rates in our tests, but may be too slow for competitive gamers. In comparison, all tested devices range from 0.165 (minimum) to 636 (maximum) ms. » 27 % of all devices are better. This means that the measured response time is better than the average of all tested devices (31.1 ms). | ||
Screen Flickering / PWM (Pulse-Width Modulation)
| Screen flickering / PWM not detected | 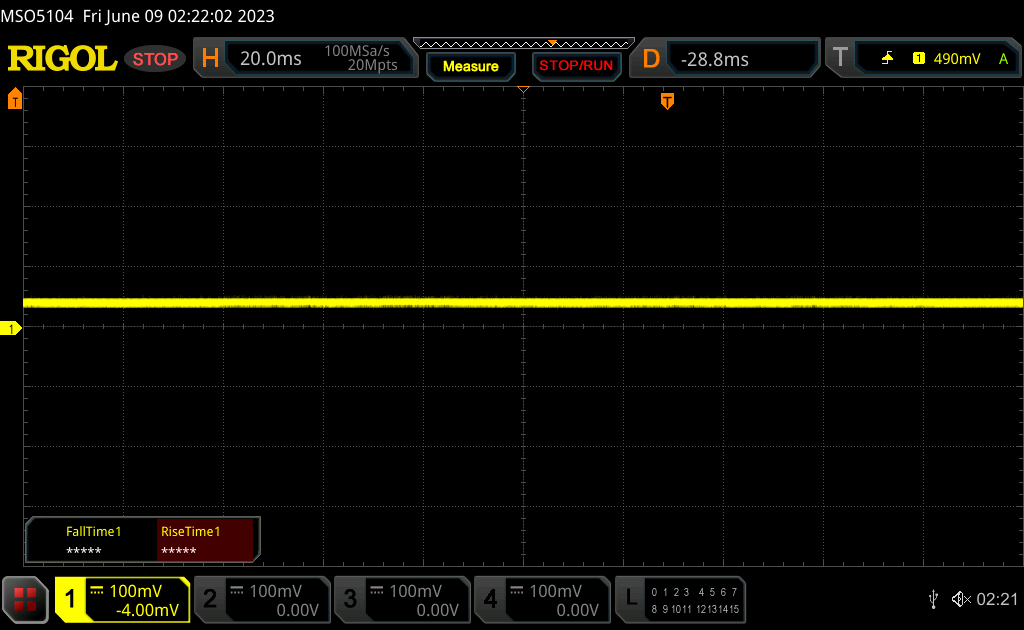 | ||
In comparison: 52 % of all tested devices do not use PWM to dim the display. If PWM was detected, an average of 7794 (minimum: 5 - maximum: 343500) Hz was measured. | |||
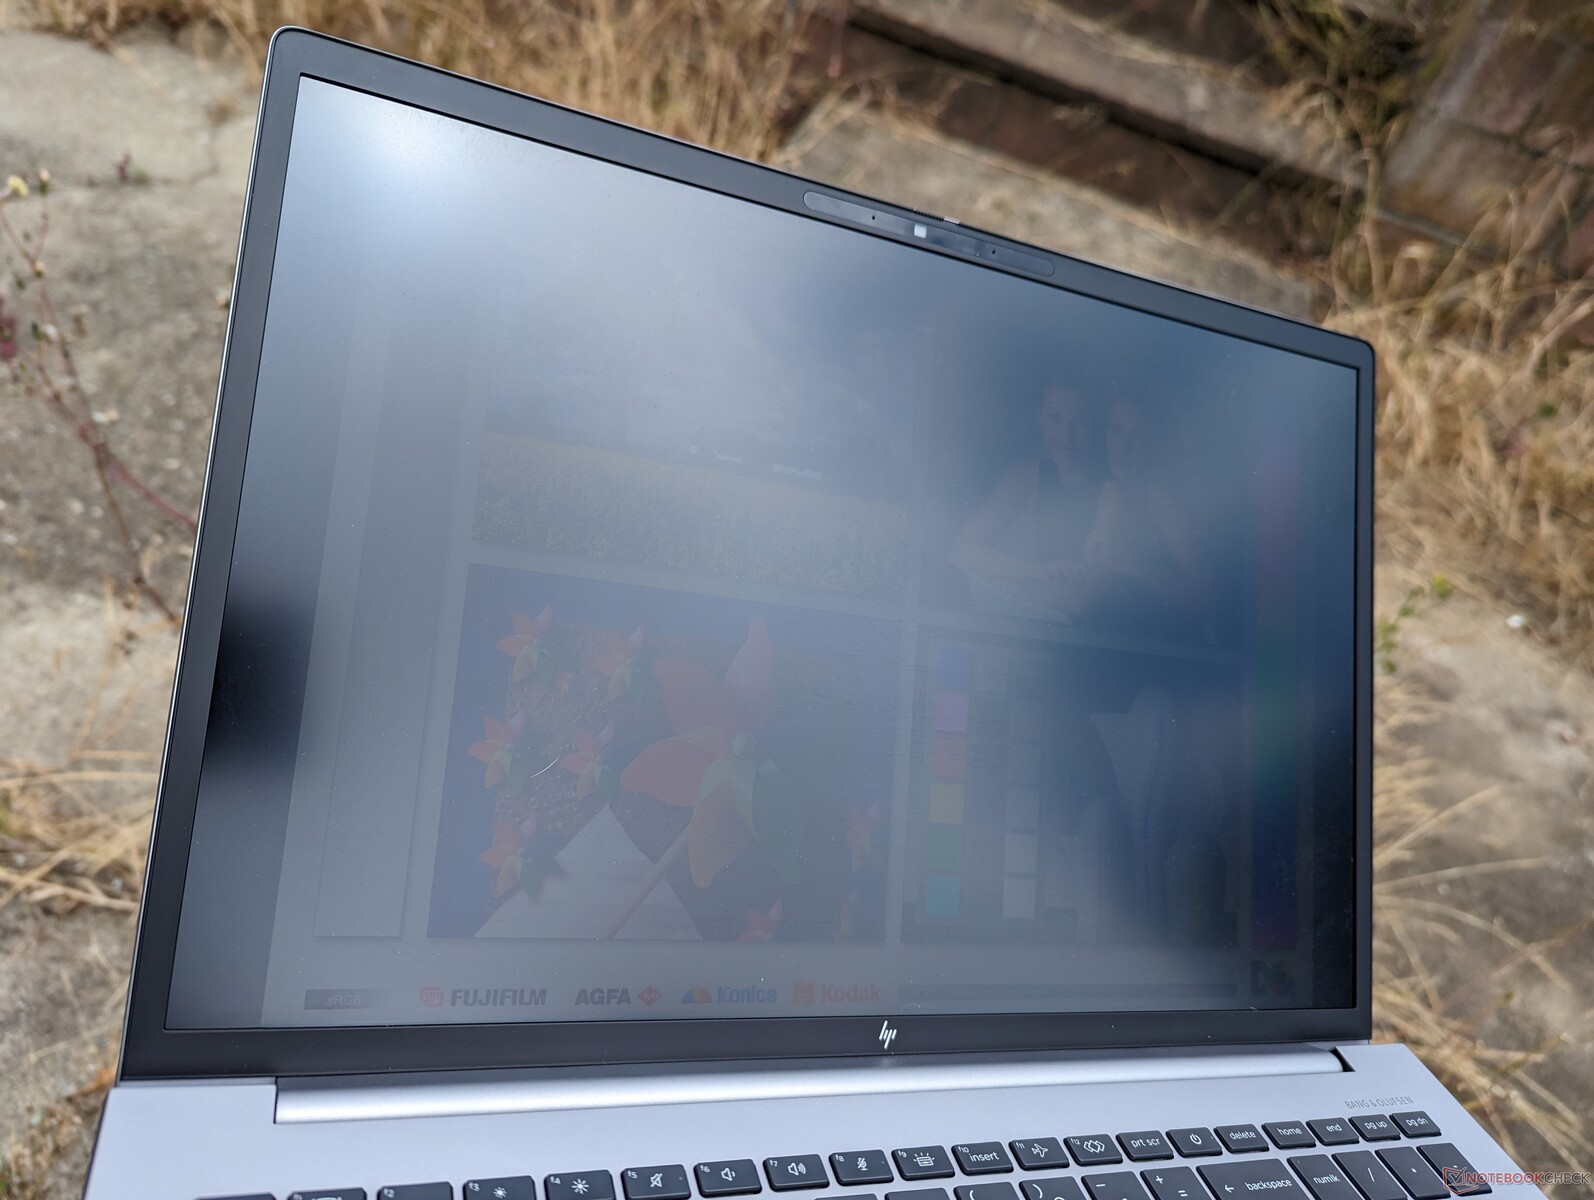
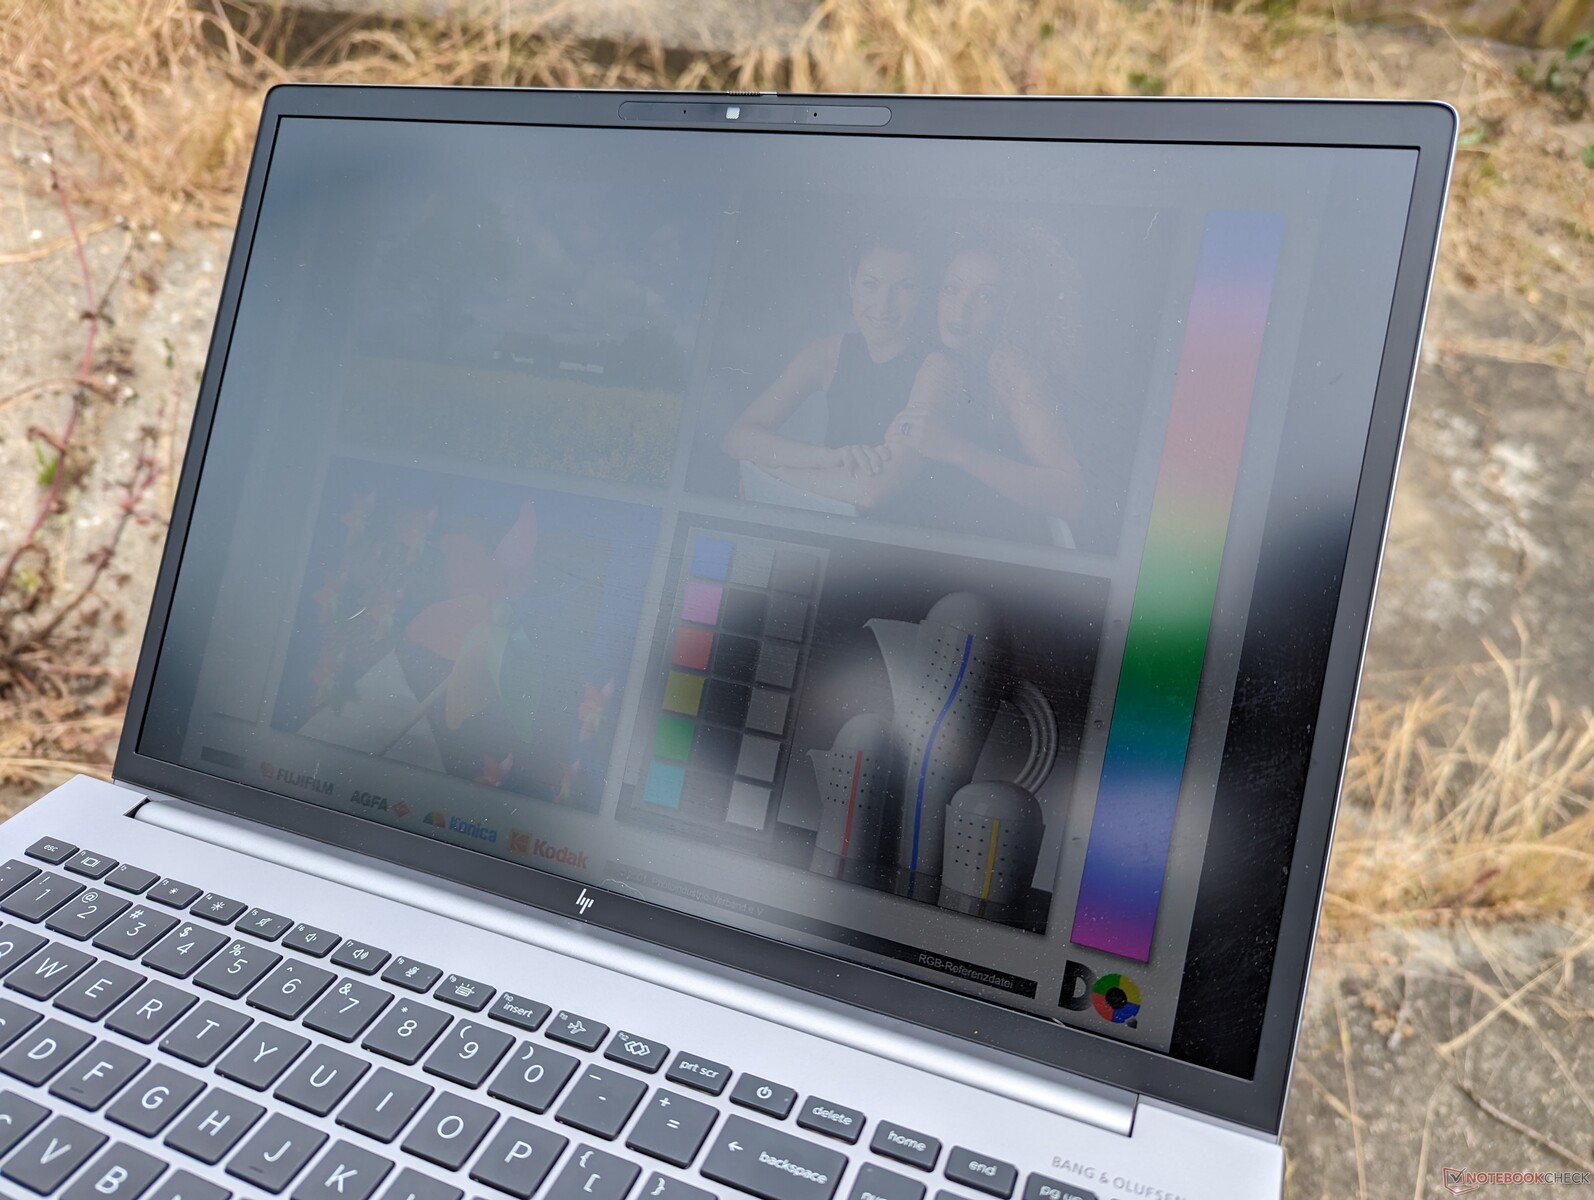
Outdoor visibility is decent under shade and comparable to many consumer Ultrabooks as 400 nits is a common target. HP offers a much brighter 1000-nit option if outdoor visibility is a priority, but the panels are limited to IPS and a resolution of only 1920 x 1200 for now.
It's worth noting that Display Power Savings is enabled by default meaning that the maximum brightness of the display will drop by as much as 80 nits if running on battery power. To prevent this, launch Intel Graphics Command Center and go into the System and Power submenus to toggle off Display Power Savings.
Performance — 12th Gen Intel Alder Lake-H With Nvidia RTX Ampere
Testing Conditions
We set our unit to Performance mode prior to running the benchmarks below. HP has no additional power profiles aside from the standard Windows ones and advanced features like Optimus 2.0 or MUX are not supported.
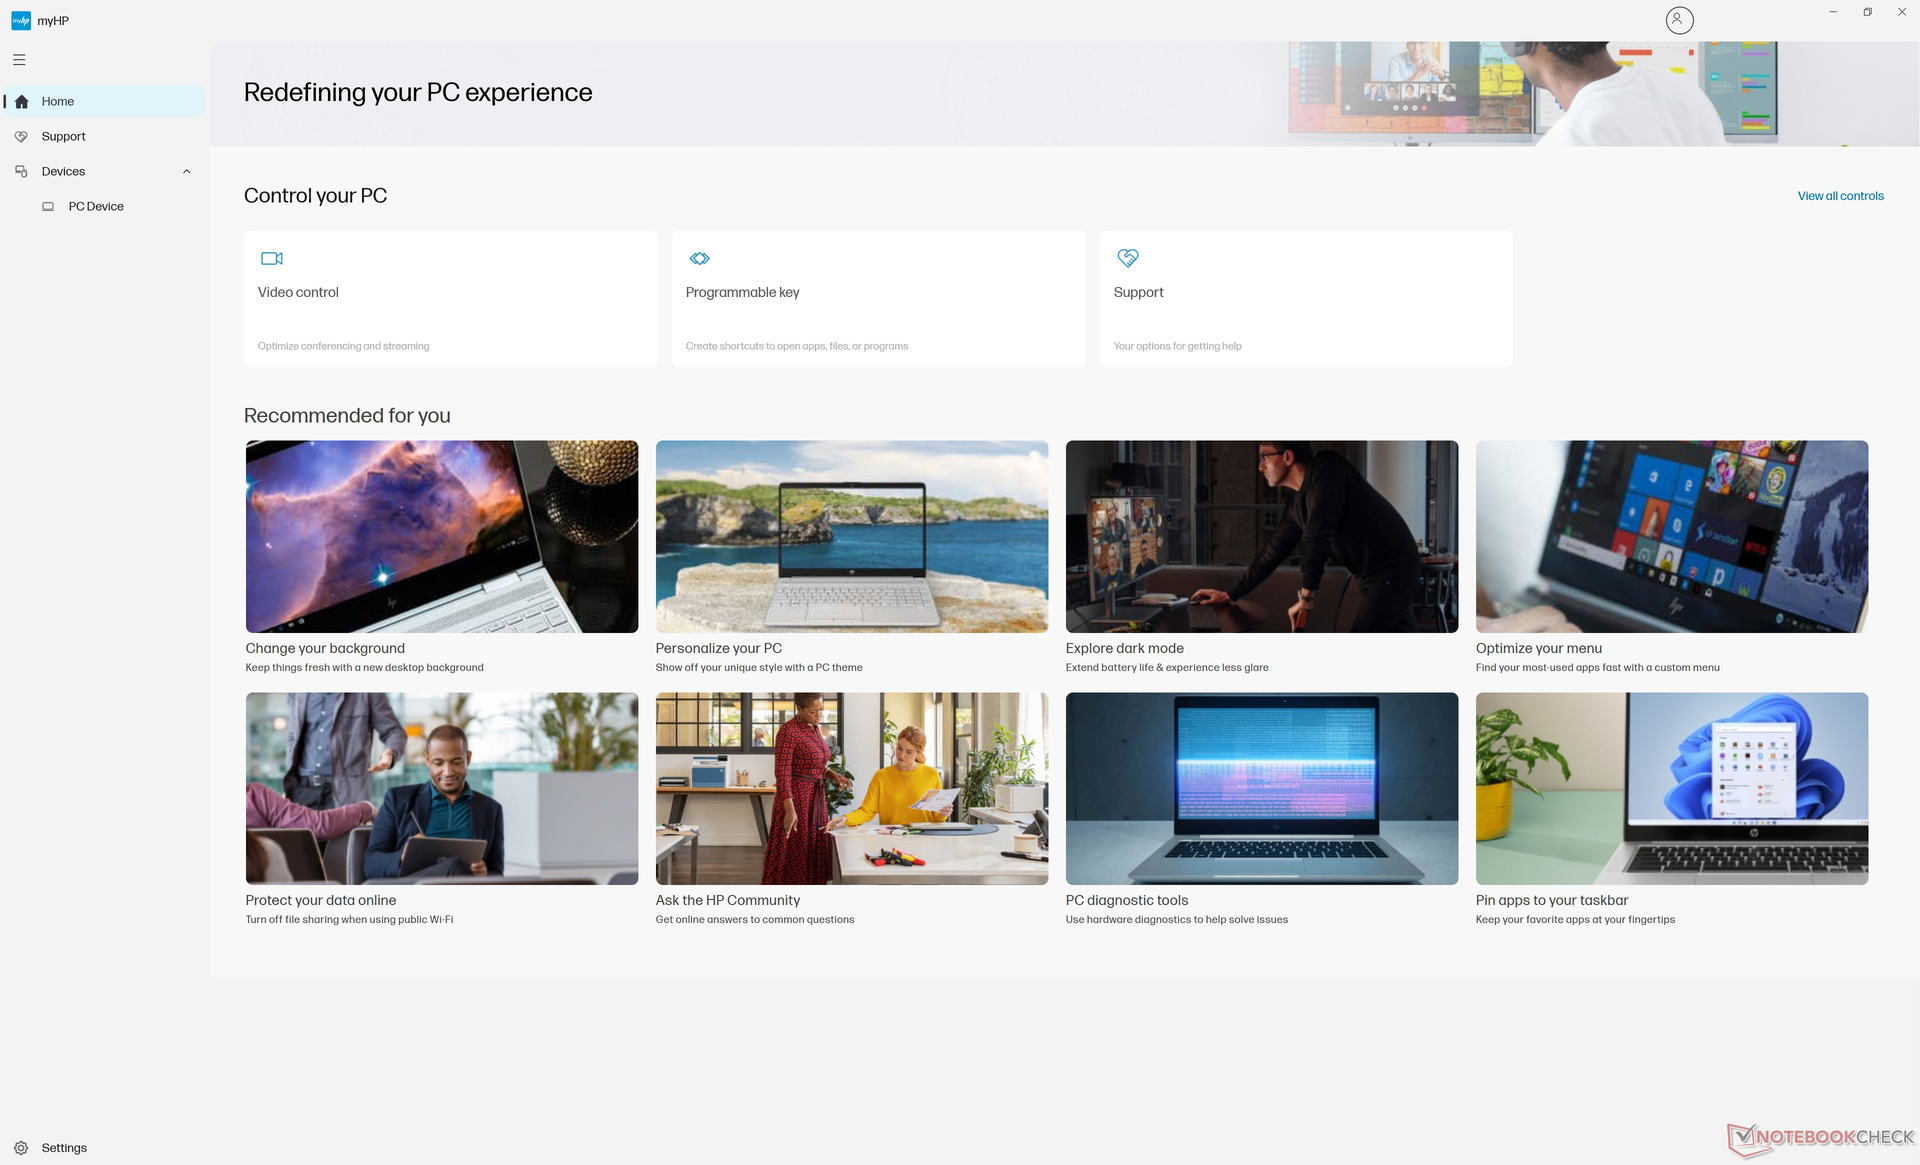
It's recommended that users become familiar with MyHP and Z Light Space for HP-specific software updates and RGB keyboard settings, respectively.
Processor
The 12th gen Core i9-12950HX was one of the fastest mobile CPUs available with both vPro and ECC support up until the launch of the 13th gen Core i9-13950HX. For 13th gen options, the Fury 16 G10 has recently begun shipping.
The processor in our HP underperforms slightly by about 5 percent when compared to the average laptop in our database equipped with the same Core i9-12950HX CPU. Even worse, the CPU appears throttle more sharply when subjected to long periods of stress. When running CineBench R15 xT in a loop, for example, performance would drop by about 20 percent after the 7th or 8th loop. The ThinkPad P16 G1 experiences a shallower degree of CPU throttling as shown by our comparison graph below.
Downgrading to the Core i7-12850HX configuration from our Core i9-12950HX is expected to impact both single- and multi-thread performances by about 15 to 20 percent.
Cinebench R15 Multi Loop
Cinebench R23: Multi Core | Single Core
Cinebench R20: CPU (Multi Core) | CPU (Single Core)
Cinebench R15: CPU Multi 64Bit | CPU Single 64Bit
Blender: v2.79 BMW27 CPU
7-Zip 18.03: 7z b 4 | 7z b 4 -mmt1
Geekbench 5.5: Multi-Core | Single-Core
HWBOT x265 Benchmark v2.2: 4k Preset
LibreOffice : 20 Documents To PDF
R Benchmark 2.5: Overall mean
* ... smaller is better
AIDA64: FP32 Ray-Trace | FPU Julia | CPU SHA3 | CPU Queen | FPU SinJulia | FPU Mandel | CPU AES | CPU ZLib | FP64 Ray-Trace | CPU PhotoWorxx
| Performance rating | |
| Average Intel Core i9-12950HX | |
| Lenovo ThinkPad P16 G1 RTX A5500 | |
| HP ZBook Fury 16 G9 | |
| MSI CreatorPro Z16P B12UKST | |
| HP ZBook Studio 16 G9 62U04EA | |
| Dell Precision 7000 7670 Performance | |
| HP ZBook Firefly 16 G9-6B897EA | |
| AIDA64 / FP32 Ray-Trace | |
| Lenovo ThinkPad P16 G1 RTX A5500 | |
| Average Intel Core i9-12950HX (15499 - 22868, n=7) | |
| HP ZBook Fury 16 G9 | |
| Dell Precision 7000 7670 Performance | |
| HP ZBook Studio 16 G9 62U04EA | |
| MSI CreatorPro Z16P B12UKST | |
| HP ZBook Firefly 16 G9-6B897EA | |
| AIDA64 / FPU Julia | |
| HP ZBook Fury 16 G9 | |
| Lenovo ThinkPad P16 G1 RTX A5500 | |
| Average Intel Core i9-12950HX (77846 - 115907, n=7) | |
| HP ZBook Studio 16 G9 62U04EA | |
| Dell Precision 7000 7670 Performance | |
| MSI CreatorPro Z16P B12UKST | |
| HP ZBook Firefly 16 G9-6B897EA | |
| AIDA64 / CPU SHA3 | |
| Lenovo ThinkPad P16 G1 RTX A5500 | |
| Average Intel Core i9-12950HX (3426 - 5069, n=7) | |
| HP ZBook Fury 16 G9 | |
| HP ZBook Studio 16 G9 62U04EA | |
| MSI CreatorPro Z16P B12UKST | |
| Dell Precision 7000 7670 Performance | |
| HP ZBook Firefly 16 G9-6B897EA | |
| AIDA64 / CPU Queen | |
| HP ZBook Studio 16 G9 62U04EA | |
| Average Intel Core i9-12950HX (102752 - 104726, n=7) | |
| Lenovo ThinkPad P16 G1 RTX A5500 | |
| Dell Precision 7000 7670 Performance | |
| HP ZBook Fury 16 G9 | |
| MSI CreatorPro Z16P B12UKST | |
| HP ZBook Firefly 16 G9-6B897EA | |
| AIDA64 / FPU SinJulia | |
| Lenovo ThinkPad P16 G1 RTX A5500 | |
| HP ZBook Fury 16 G9 | |
| Average Intel Core i9-12950HX (10134 - 12823, n=7) | |
| Dell Precision 7000 7670 Performance | |
| HP ZBook Studio 16 G9 62U04EA | |
| MSI CreatorPro Z16P B12UKST | |
| HP ZBook Firefly 16 G9-6B897EA | |
| AIDA64 / FPU Mandel | |
| HP ZBook Fury 16 G9 | |
| Lenovo ThinkPad P16 G1 RTX A5500 | |
| Average Intel Core i9-12950HX (37146 - 57340, n=7) | |
| HP ZBook Studio 16 G9 62U04EA | |
| Dell Precision 7000 7670 Performance | |
| MSI CreatorPro Z16P B12UKST | |
| HP ZBook Firefly 16 G9-6B897EA | |
| AIDA64 / CPU AES | |
| MSI CreatorPro Z16P B12UKST | |
| Average Intel Core i9-12950HX (72599 - 181128, n=7) | |
| HP ZBook Fury 16 G9 | |
| Lenovo ThinkPad P16 G1 RTX A5500 | |
| HP ZBook Studio 16 G9 62U04EA | |
| Dell Precision 7000 7670 Performance | |
| HP ZBook Firefly 16 G9-6B897EA | |
| AIDA64 / CPU ZLib | |
| Lenovo ThinkPad P16 G1 RTX A5500 | |
| HP ZBook Fury 16 G9 | |
| Average Intel Core i9-12950HX (996 - 1417, n=7) | |
| HP ZBook Studio 16 G9 62U04EA | |
| MSI CreatorPro Z16P B12UKST | |
| Dell Precision 7000 7670 Performance | |
| HP ZBook Firefly 16 G9-6B897EA | |
| AIDA64 / FP64 Ray-Trace | |
| Lenovo ThinkPad P16 G1 RTX A5500 | |
| Average Intel Core i9-12950HX (8455 - 12432, n=7) | |
| HP ZBook Fury 16 G9 | |
| HP ZBook Studio 16 G9 62U04EA | |
| Dell Precision 7000 7670 Performance | |
| MSI CreatorPro Z16P B12UKST | |
| HP ZBook Firefly 16 G9-6B897EA | |
| AIDA64 / CPU PhotoWorxx | |
| MSI CreatorPro Z16P B12UKST | |
| Dell Precision 7000 7670 Performance | |
| Average Intel Core i9-12950HX (35479 - 42655, n=7) | |
| Lenovo ThinkPad P16 G1 RTX A5500 | |
| HP ZBook Fury 16 G9 | |
| HP ZBook Studio 16 G9 62U04EA | |
| HP ZBook Firefly 16 G9-6B897EA | |
System Performance
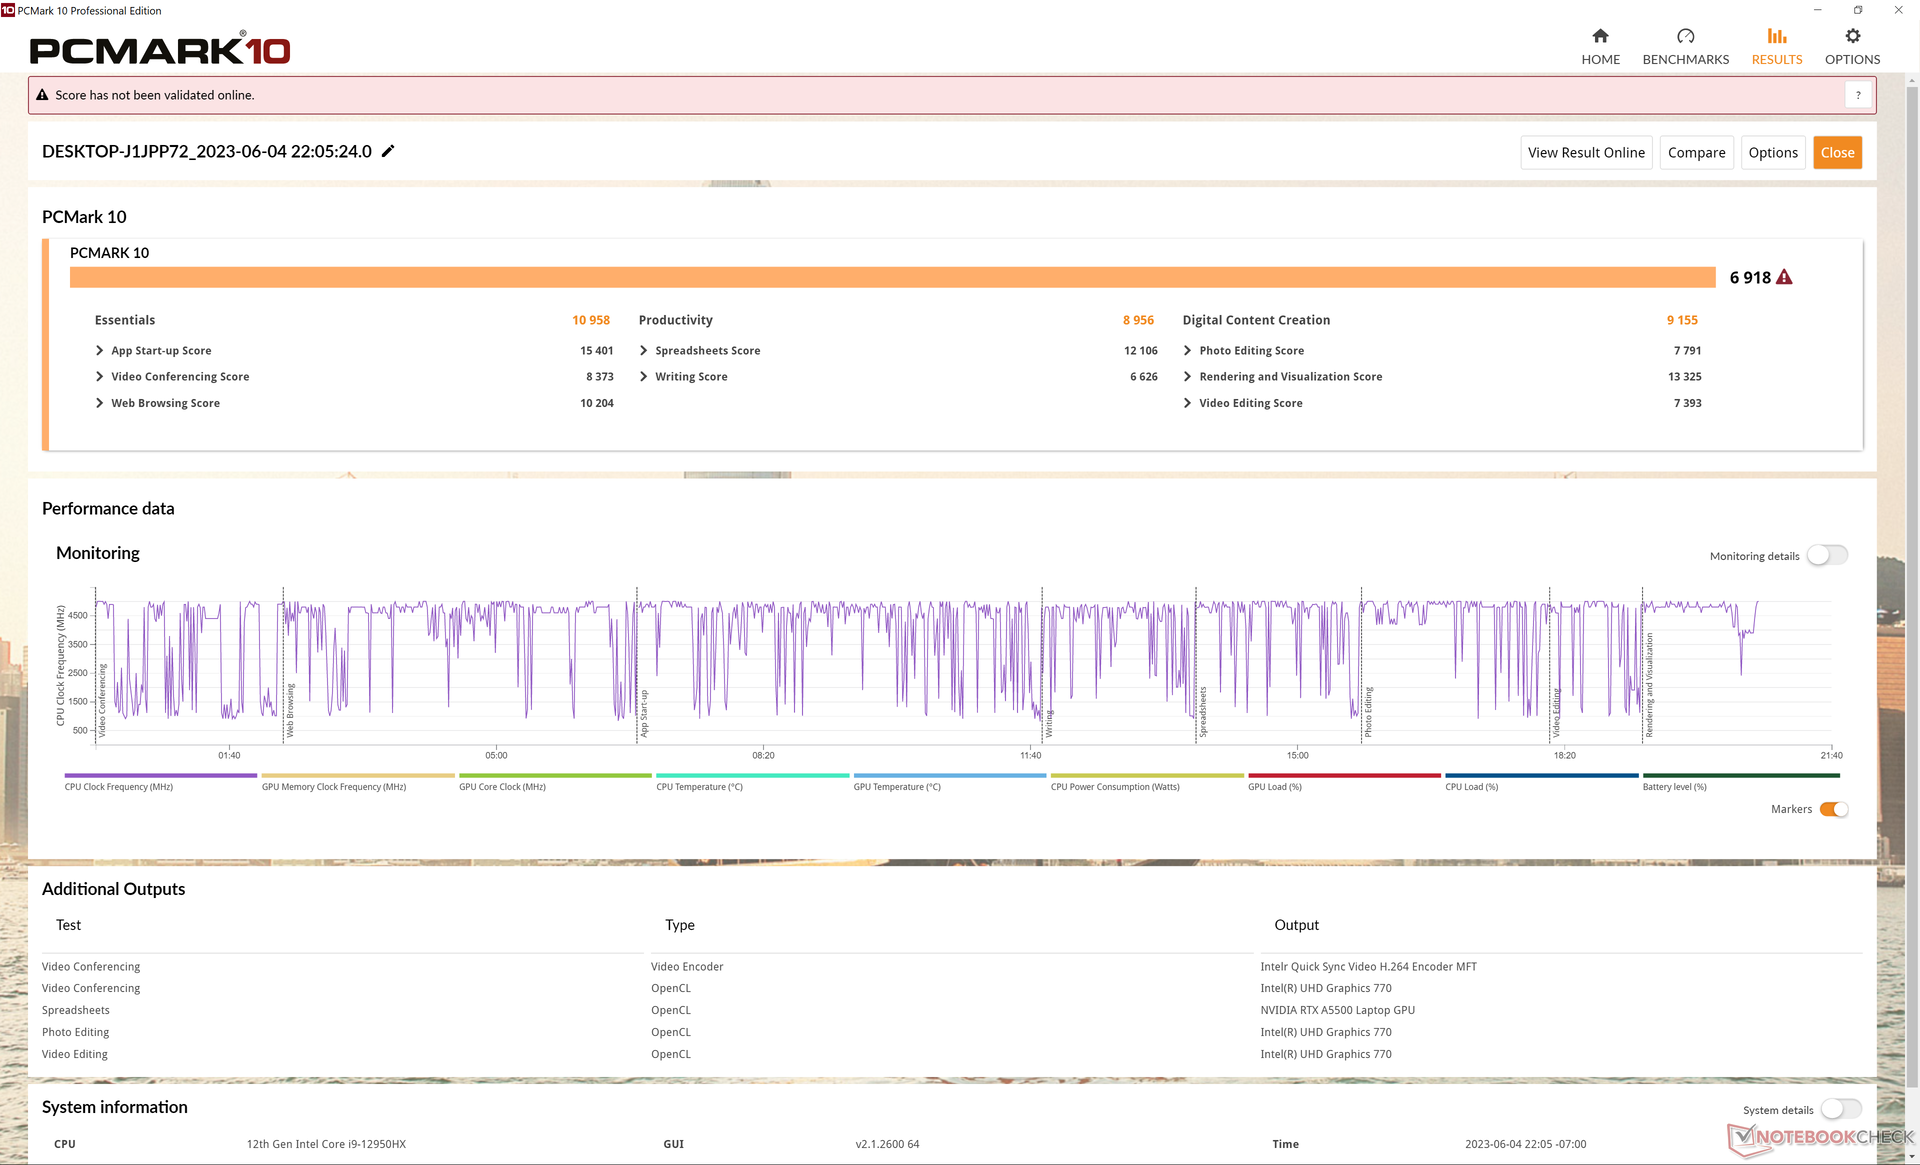
PCMark results are comparable to both the Dell Precision 7670 and Lenovo ThinkPad P16 G1. Note the significant advantage over the smaller ZBook Firefly 16 G9 in the Digital Content Creation subtest due to the faster RTX A5500 GPU in our Fury 16 G9.
CrossMark: Overall | Productivity | Creativity | Responsiveness
| PCMark 10 / Score | |
| Lenovo ThinkPad P16 G1 RTX A5500 | |
| MSI CreatorPro Z16P B12UKST | |
| Average Intel Core i9-12950HX, NVIDIA RTX A5500 Laptop GPU (6883 - 7236, n=3) | |
| HP ZBook Fury 16 G9 | |
| Dell Precision 7000 7670 Performance | |
| HP ZBook Studio 16 G9 62U04EA | |
| HP ZBook Firefly 16 G9-6B897EA | |
| PCMark 10 / Essentials | |
| Dell Precision 7000 7670 Performance | |
| Average Intel Core i9-12950HX, NVIDIA RTX A5500 Laptop GPU (10898 - 11465, n=3) | |
| HP ZBook Fury 16 G9 | |
| Lenovo ThinkPad P16 G1 RTX A5500 | |
| MSI CreatorPro Z16P B12UKST | |
| HP ZBook Firefly 16 G9-6B897EA | |
| HP ZBook Studio 16 G9 62U04EA | |
| PCMark 10 / Productivity | |
| Lenovo ThinkPad P16 G1 RTX A5500 | |
| MSI CreatorPro Z16P B12UKST | |
| HP ZBook Fury 16 G9 | |
| Average Intel Core i9-12950HX, NVIDIA RTX A5500 Laptop GPU (8054 - 9489, n=3) | |
| HP ZBook Firefly 16 G9-6B897EA | |
| Dell Precision 7000 7670 Performance | |
| HP ZBook Studio 16 G9 62U04EA | |
| PCMark 10 / Digital Content Creation | |
| Lenovo ThinkPad P16 G1 RTX A5500 | |
| MSI CreatorPro Z16P B12UKST | |
| Dell Precision 7000 7670 Performance | |
| Average Intel Core i9-12950HX, NVIDIA RTX A5500 Laptop GPU (9155 - 9944, n=3) | |
| HP ZBook Studio 16 G9 62U04EA | |
| HP ZBook Fury 16 G9 | |
| HP ZBook Firefly 16 G9-6B897EA | |
| CrossMark / Overall | |
| MSI CreatorPro Z16P B12UKST | |
| HP ZBook Fury 16 G9 | |
| Lenovo ThinkPad P16 G1 RTX A5500 | |
| Average Intel Core i9-12950HX, NVIDIA RTX A5500 Laptop GPU (1801 - 1889, n=3) | |
| HP ZBook Studio 16 G9 62U04EA | |
| Dell Precision 7000 7670 Performance | |
| HP ZBook Firefly 16 G9-6B897EA | |
| CrossMark / Productivity | |
| MSI CreatorPro Z16P B12UKST | |
| HP ZBook Fury 16 G9 | |
| Lenovo ThinkPad P16 G1 RTX A5500 | |
| Average Intel Core i9-12950HX, NVIDIA RTX A5500 Laptop GPU (1684 - 1785, n=3) | |
| HP ZBook Studio 16 G9 62U04EA | |
| Dell Precision 7000 7670 Performance | |
| HP ZBook Firefly 16 G9-6B897EA | |
| CrossMark / Creativity | |
| Lenovo ThinkPad P16 G1 RTX A5500 | |
| HP ZBook Fury 16 G9 | |
| Average Intel Core i9-12950HX, NVIDIA RTX A5500 Laptop GPU (2042 - 2192, n=3) | |
| HP ZBook Studio 16 G9 62U04EA | |
| MSI CreatorPro Z16P B12UKST | |
| Dell Precision 7000 7670 Performance | |
| HP ZBook Firefly 16 G9-6B897EA | |
| CrossMark / Responsiveness | |
| MSI CreatorPro Z16P B12UKST | |
| HP ZBook Fury 16 G9 | |
| HP ZBook Studio 16 G9 62U04EA | |
| Average Intel Core i9-12950HX, NVIDIA RTX A5500 Laptop GPU (1501 - 1585, n=3) | |
| Dell Precision 7000 7670 Performance | |
| Lenovo ThinkPad P16 G1 RTX A5500 | |
| HP ZBook Firefly 16 G9-6B897EA | |
| PCMark 10 Score | 6918 points | |
Help | ||
| AIDA64 / Memory Copy | |
| Dell Precision 7000 7670 Performance | |
| Average Intel Core i9-12950HX (59731 - 64732, n=7) | |
| Lenovo ThinkPad P16 G1 RTX A5500 | |
| MSI CreatorPro Z16P B12UKST | |
| HP ZBook Studio 16 G9 62U04EA | |
| HP ZBook Fury 16 G9 | |
| HP ZBook Firefly 16 G9-6B897EA | |
| AIDA64 / Memory Read | |
| Dell Precision 7000 7670 Performance | |
| Average Intel Core i9-12950HX (59744 - 70359, n=7) | |
| MSI CreatorPro Z16P B12UKST | |
| HP ZBook Studio 16 G9 62U04EA | |
| Lenovo ThinkPad P16 G1 RTX A5500 | |
| HP ZBook Fury 16 G9 | |
| HP ZBook Firefly 16 G9-6B897EA | |
| AIDA64 / Memory Write | |
| MSI CreatorPro Z16P B12UKST | |
| Dell Precision 7000 7670 Performance | |
| HP ZBook Studio 16 G9 62U04EA | |
| Average Intel Core i9-12950HX (57750 - 67899, n=7) | |
| HP ZBook Firefly 16 G9-6B897EA | |
| Lenovo ThinkPad P16 G1 RTX A5500 | |
| HP ZBook Fury 16 G9 | |
| AIDA64 / Memory Latency | |
| MSI CreatorPro Z16P B12UKST | |
| HP ZBook Fury 16 G9 | |
| Lenovo ThinkPad P16 G1 RTX A5500 | |
| HP ZBook Firefly 16 G9-6B897EA | |
| HP ZBook Studio 16 G9 62U04EA | |
| Average Intel Core i9-12950HX (84.5 - 92.2, n=7) | |
| Dell Precision 7000 7670 Performance | |
* ... smaller is better
DPC Latency
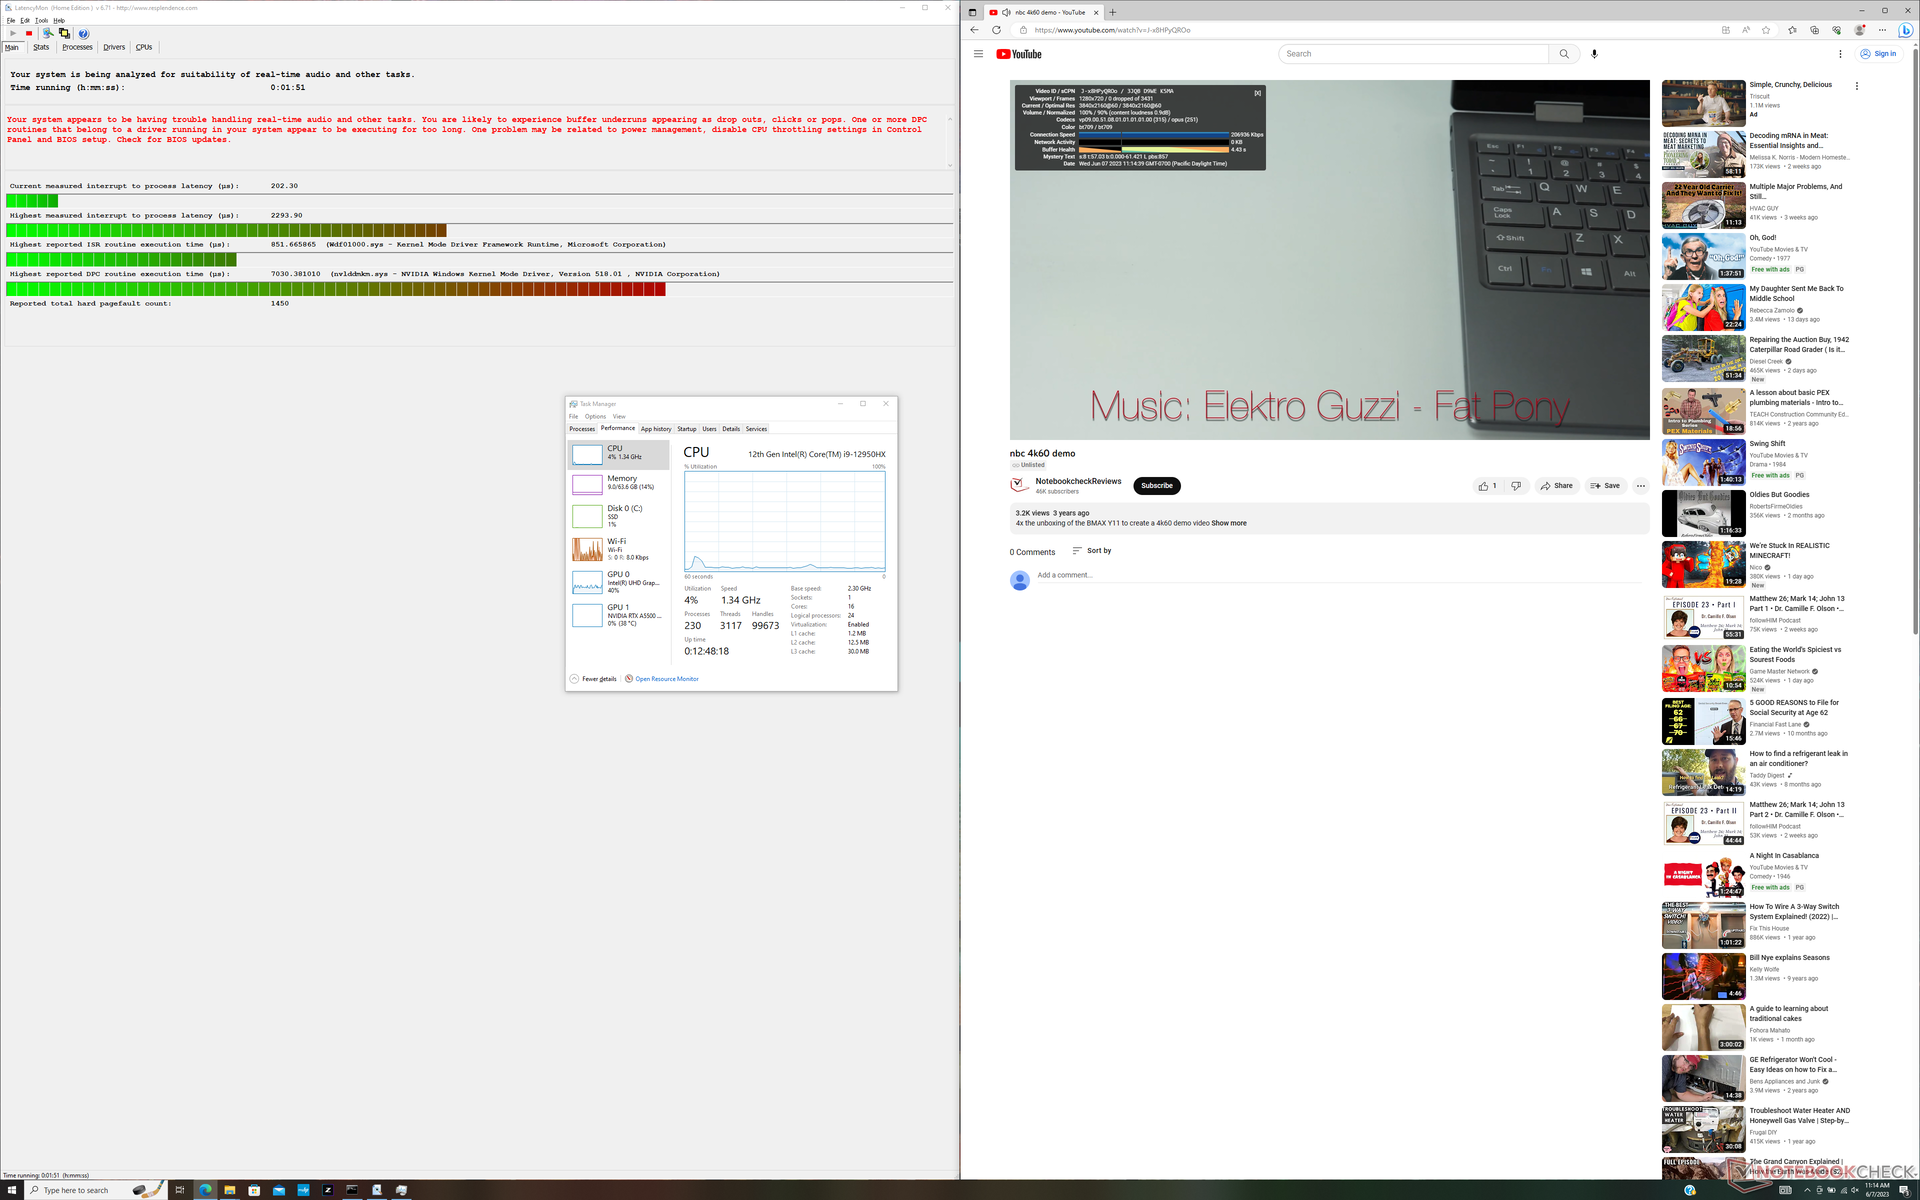
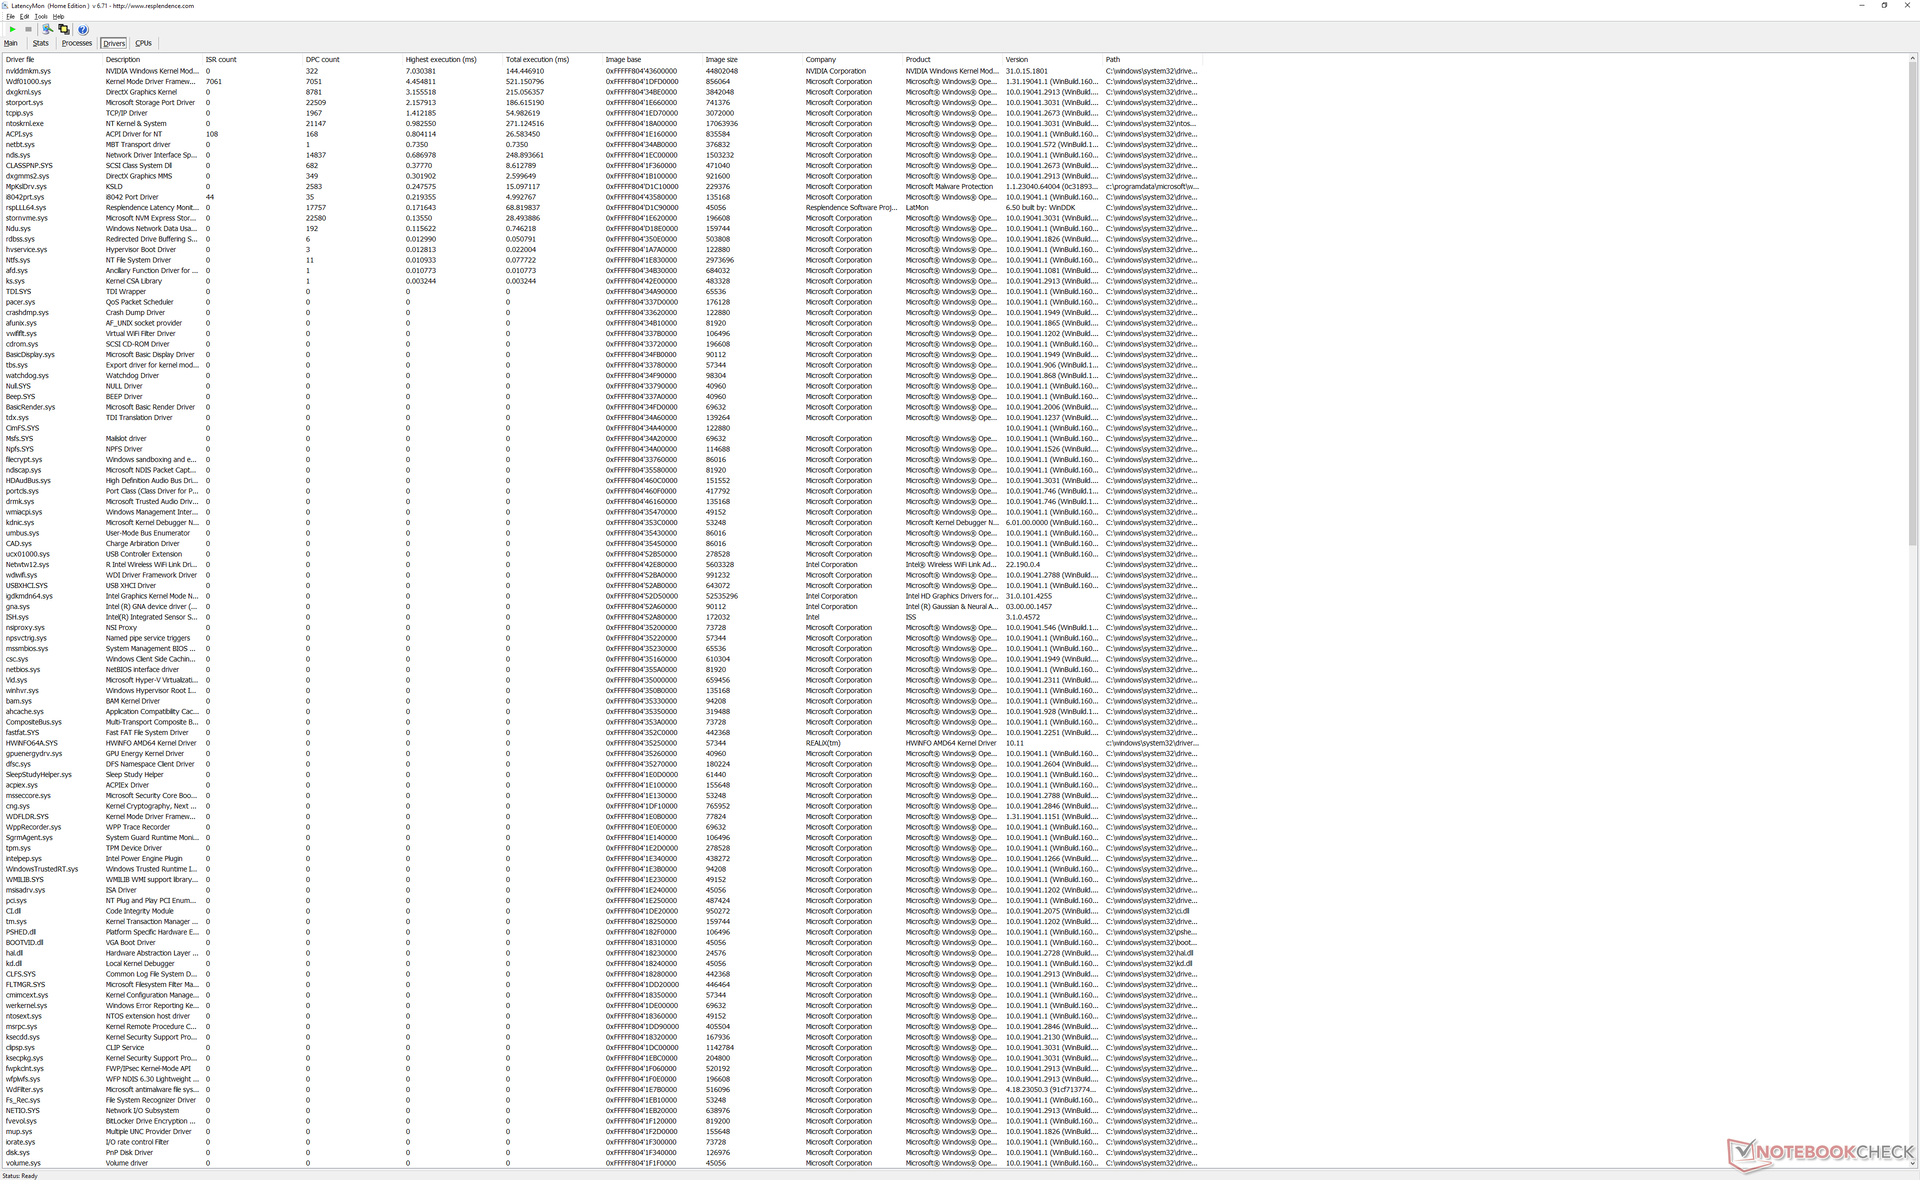
LatencyMon reveals DPC issues when opening multiple browser tabs of our homepage. 4K video playback at 60 FPS is otherwise perfect with zero dropped frames during testing.
| DPC Latencies / LatencyMon - interrupt to process latency (max), Web, Youtube, Prime95 | |
| HP ZBook Fury 16 G9 | |
| Dell Precision 7000 7670 Performance | |
| Lenovo ThinkPad P16 G1 RTX A5500 | |
| HP ZBook Studio 16 G9 62U04EA | |
| HP ZBook Firefly 16 G9-6B897EA | |
| MSI CreatorPro Z16P B12UKST | |
* ... smaller is better
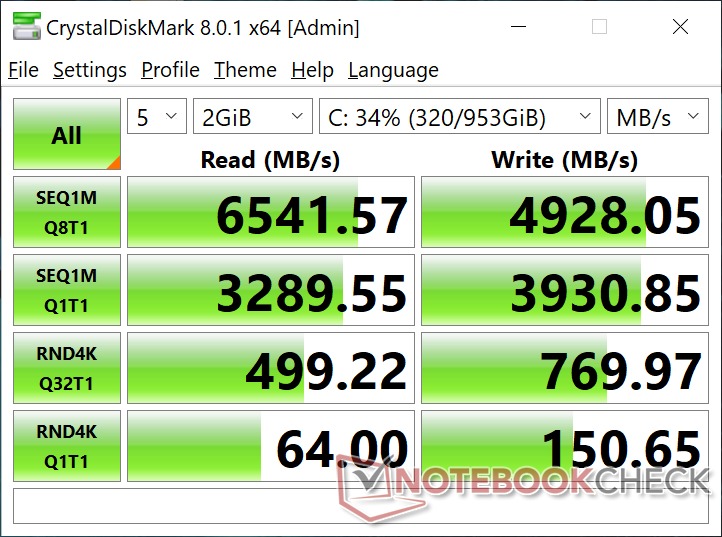
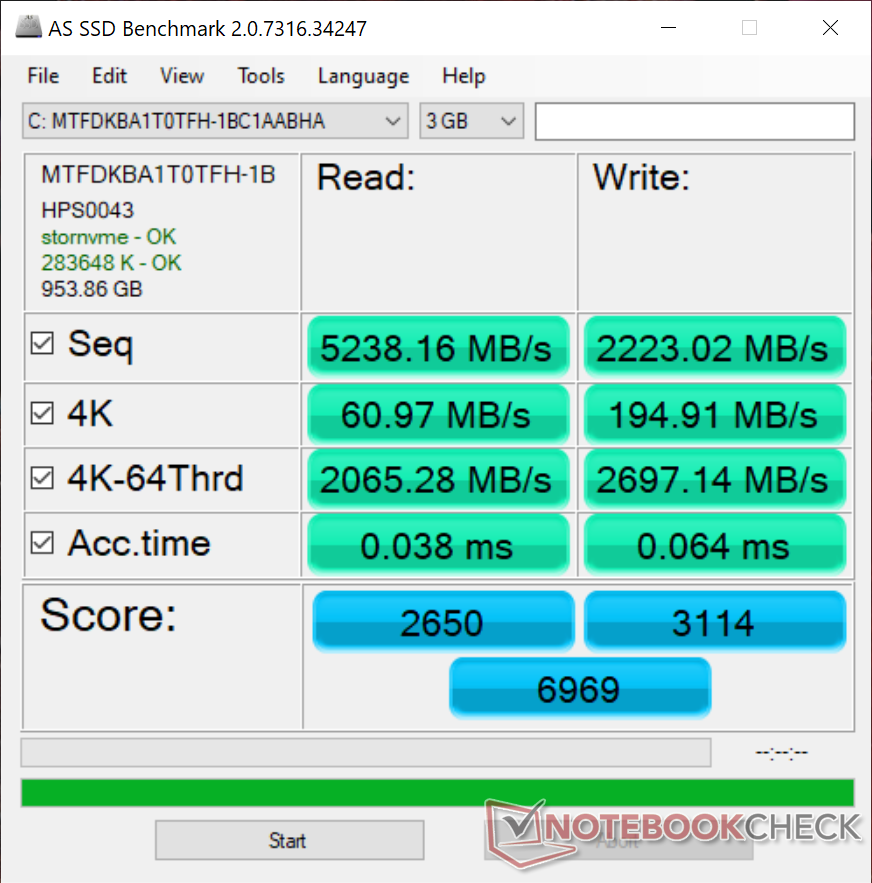
Storage Devices — Potential Performance Throttling
Our test unit ships with the same 1 TB Micron 3400 MTFDKBA1T0TFH SSD as found on the Lenovo ThinkPad X1 Extreme G5. Unfortunately, the SSD in our HP appears to suffer from major performance throttling issues as shown by the comparison graph below. When running DiskSpd in a loop, transfer rates would occasionally plummet from 6500 MB/s to as low as 1700 MB/s whereas the same drive in the Lenovo would run at 6500 MB/s indefinitely. This suggests that the Fury 16 may have issues cooling the SSDs. Results would not improve even after multiplies retests.

* ... smaller is better
Disk Throttling: DiskSpd Read Loop, Queue Depth 8
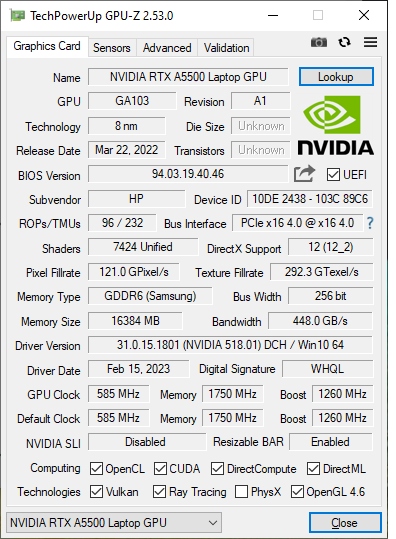
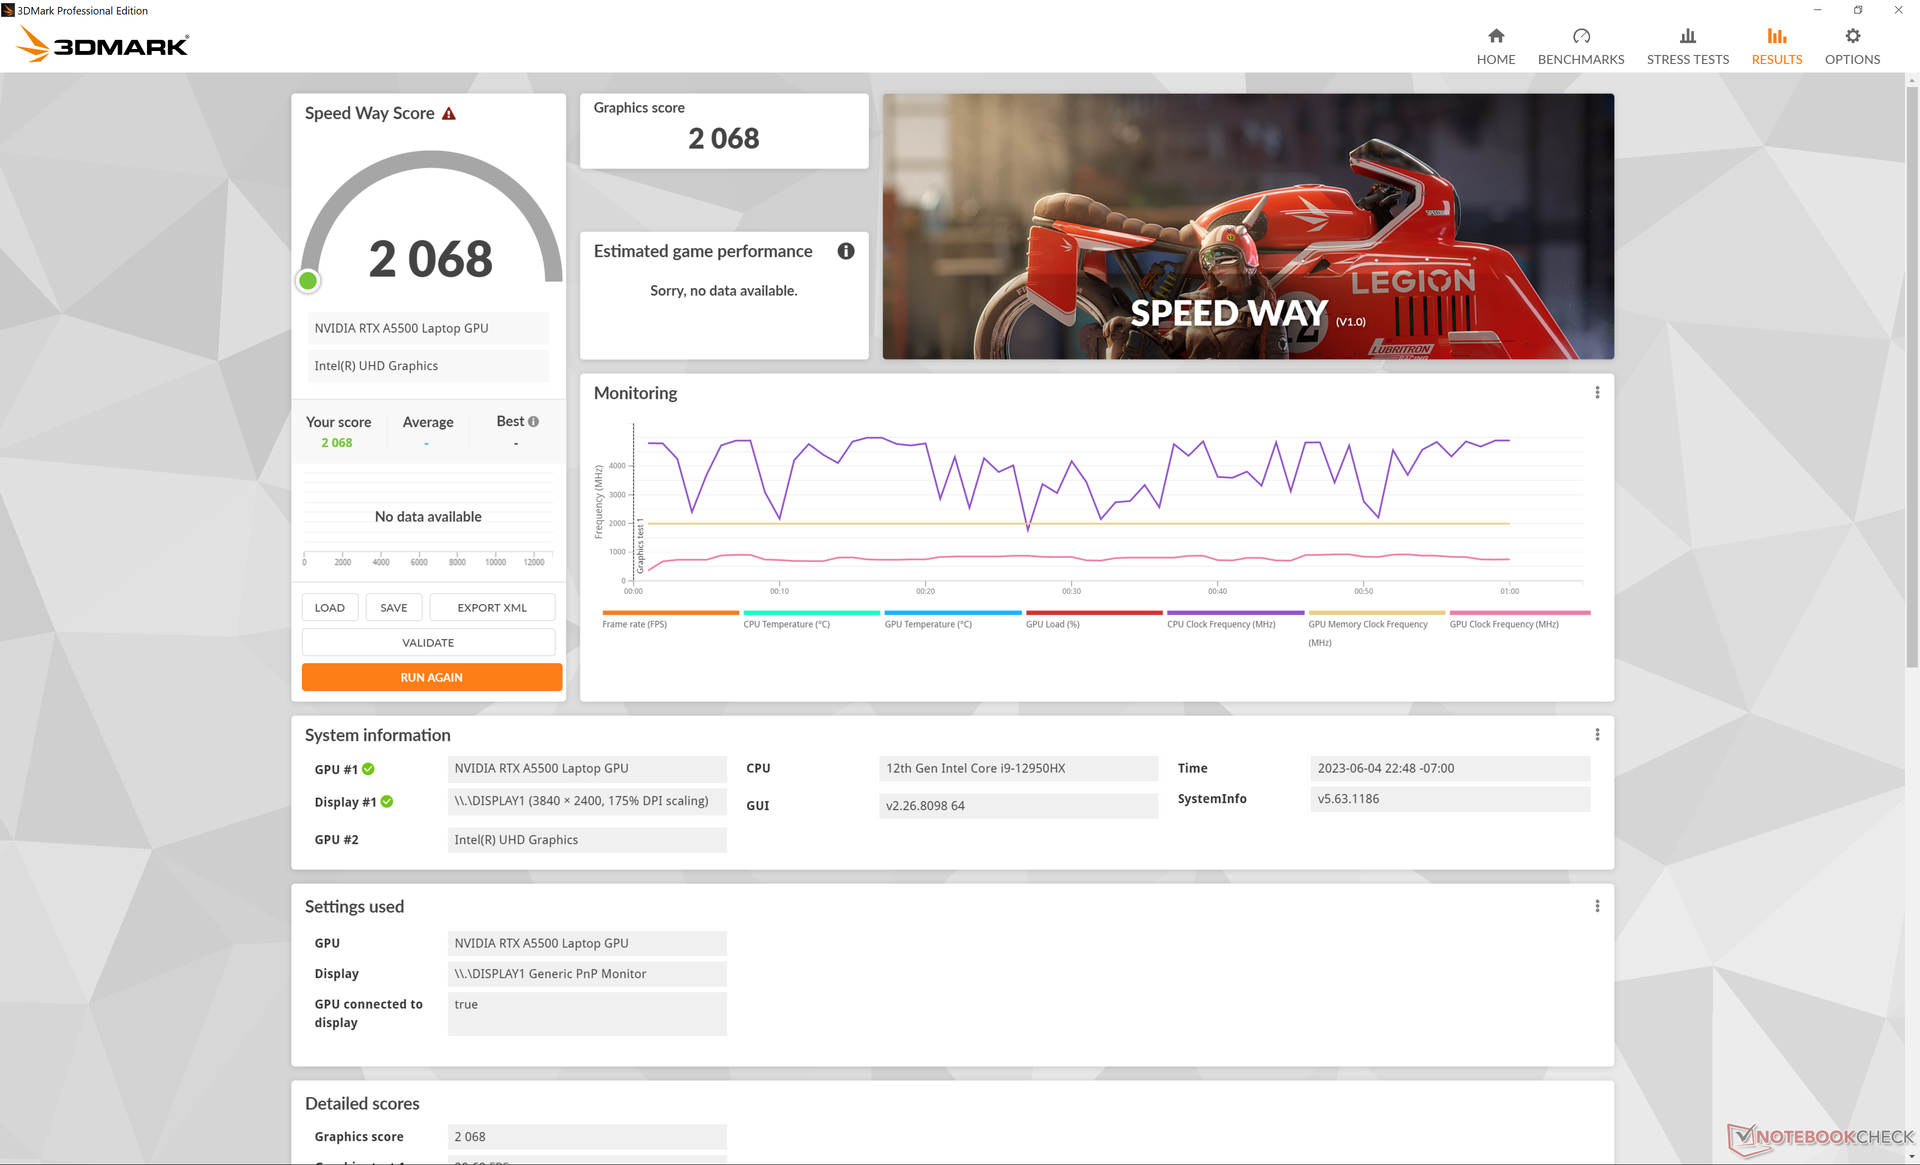
GPU Performance — 100 W TGP
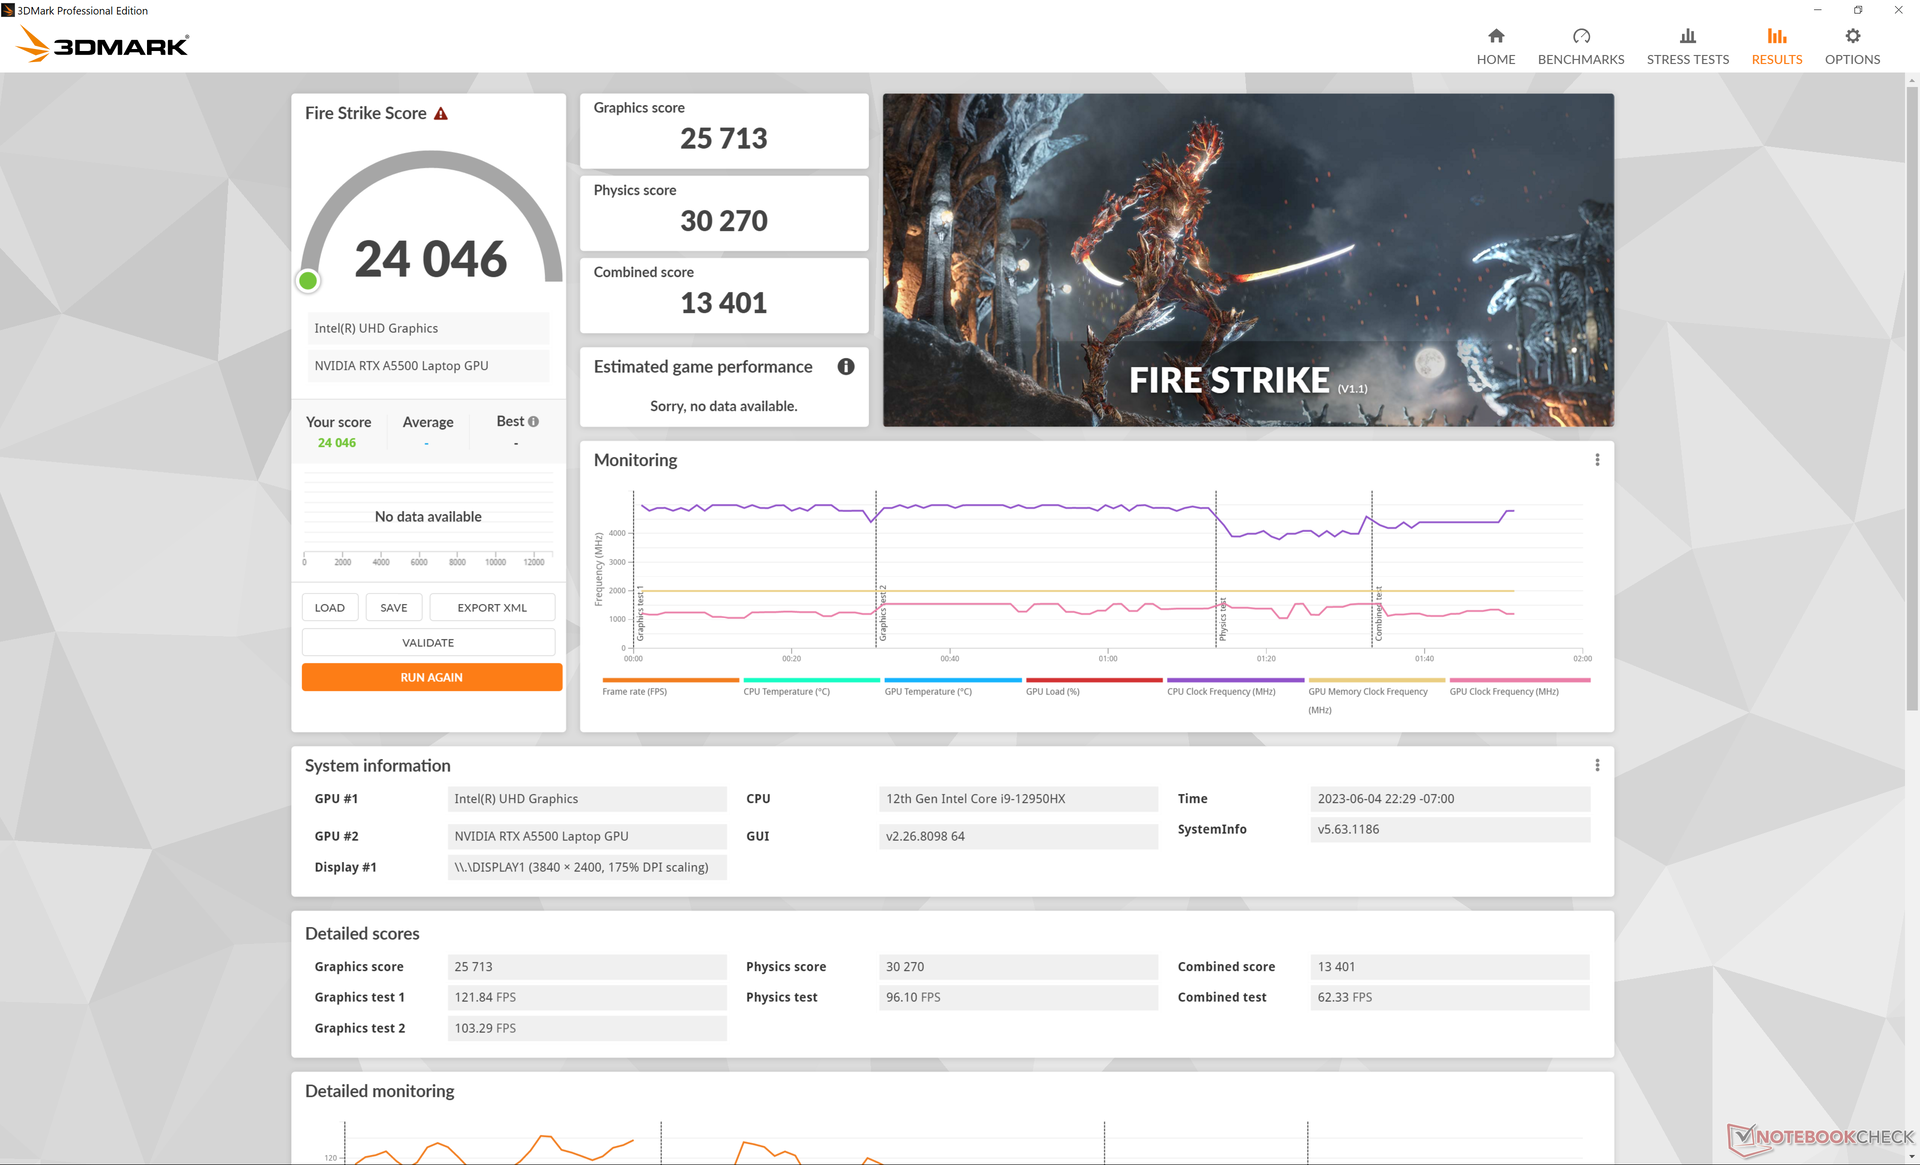
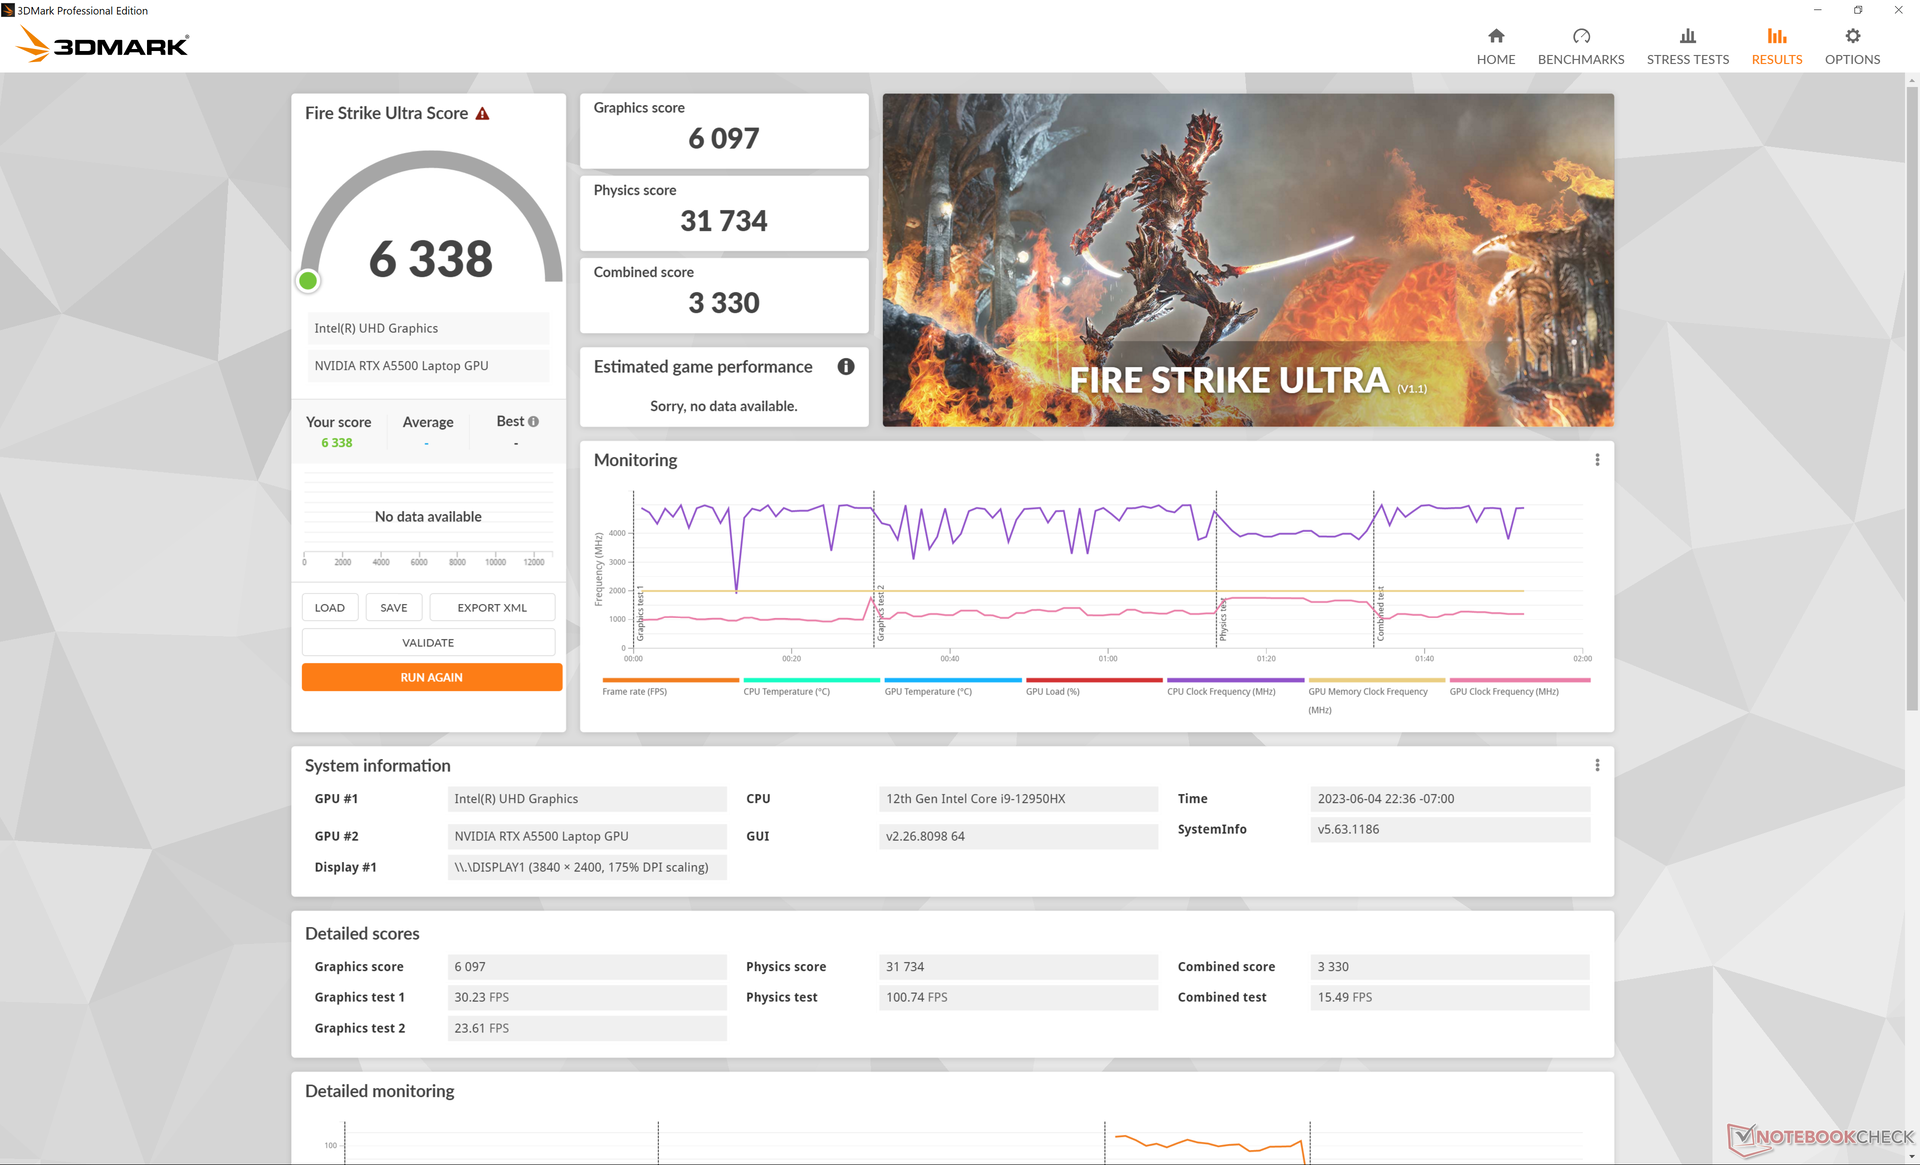
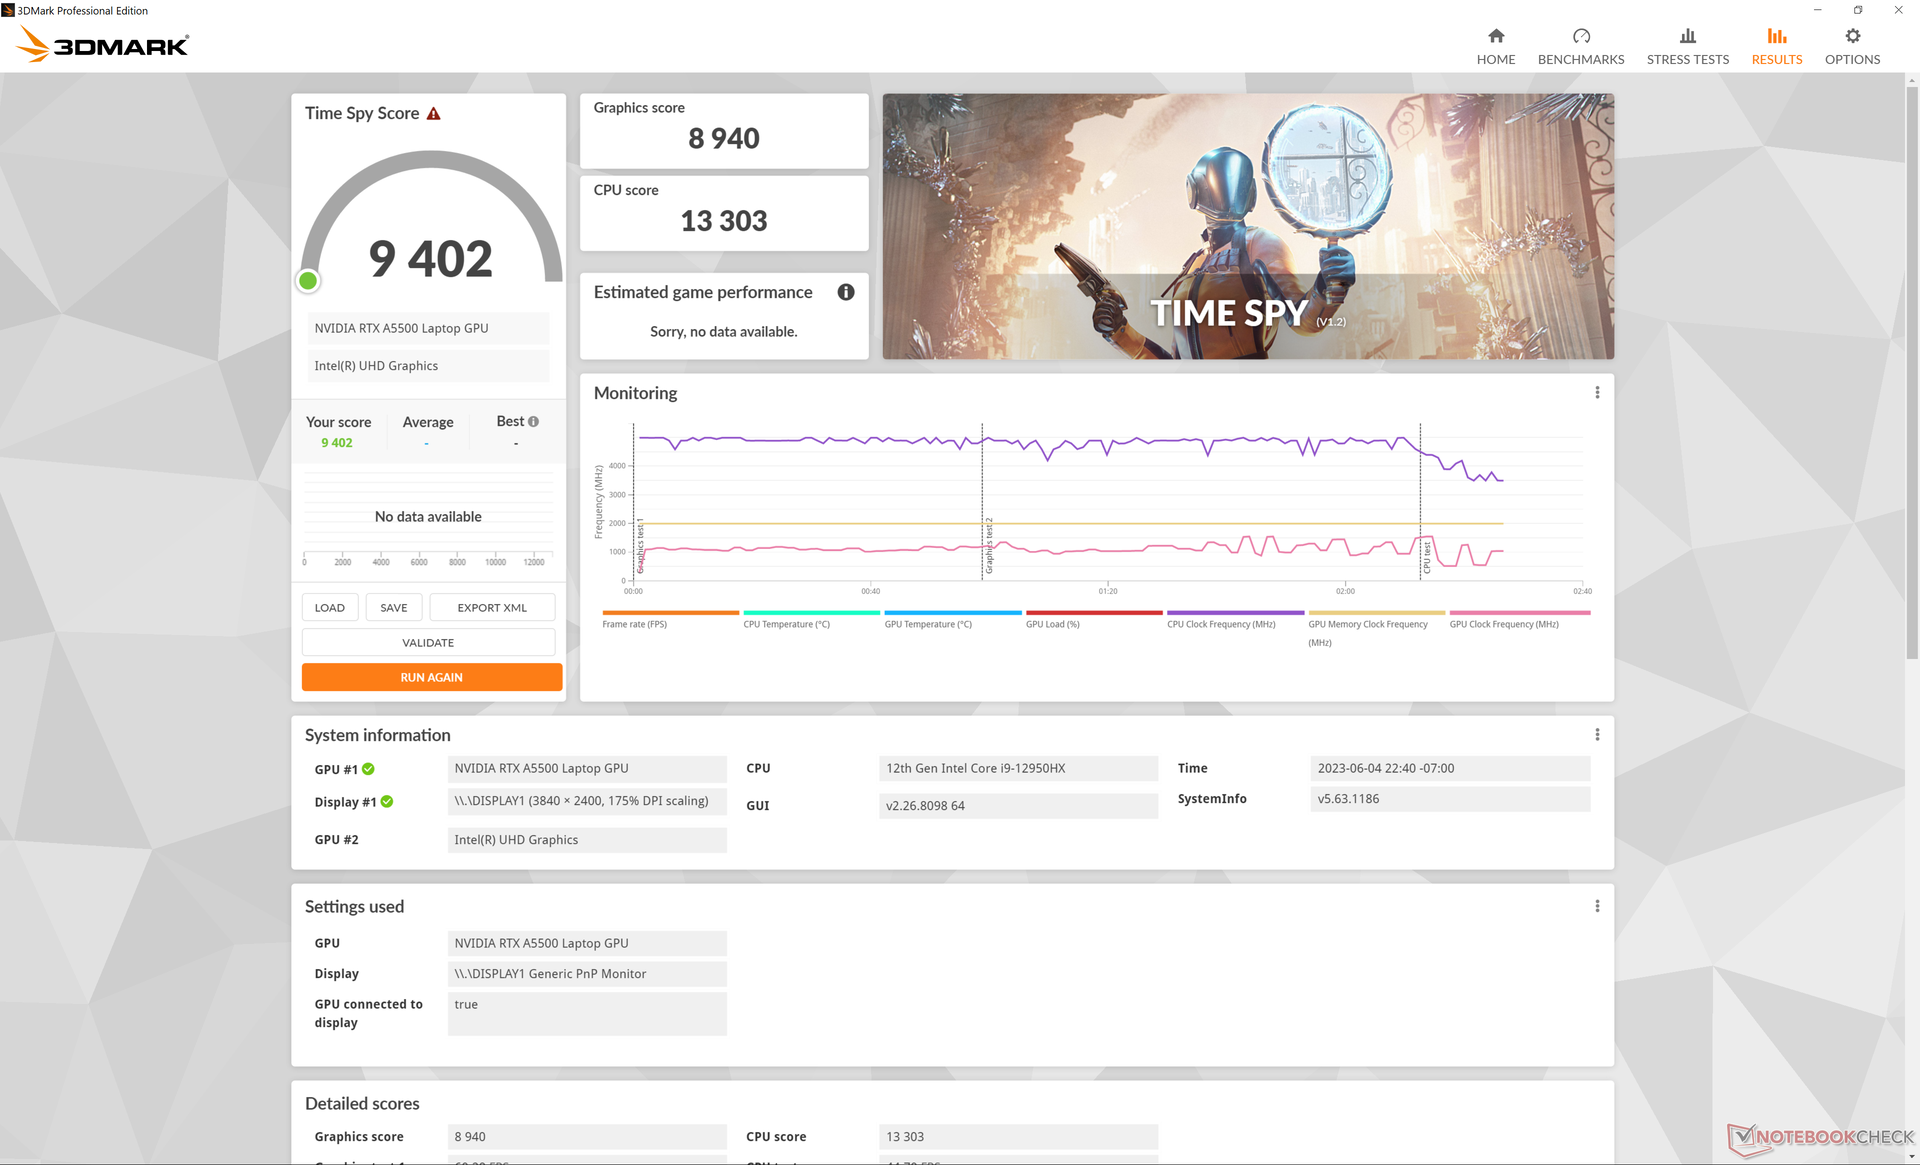
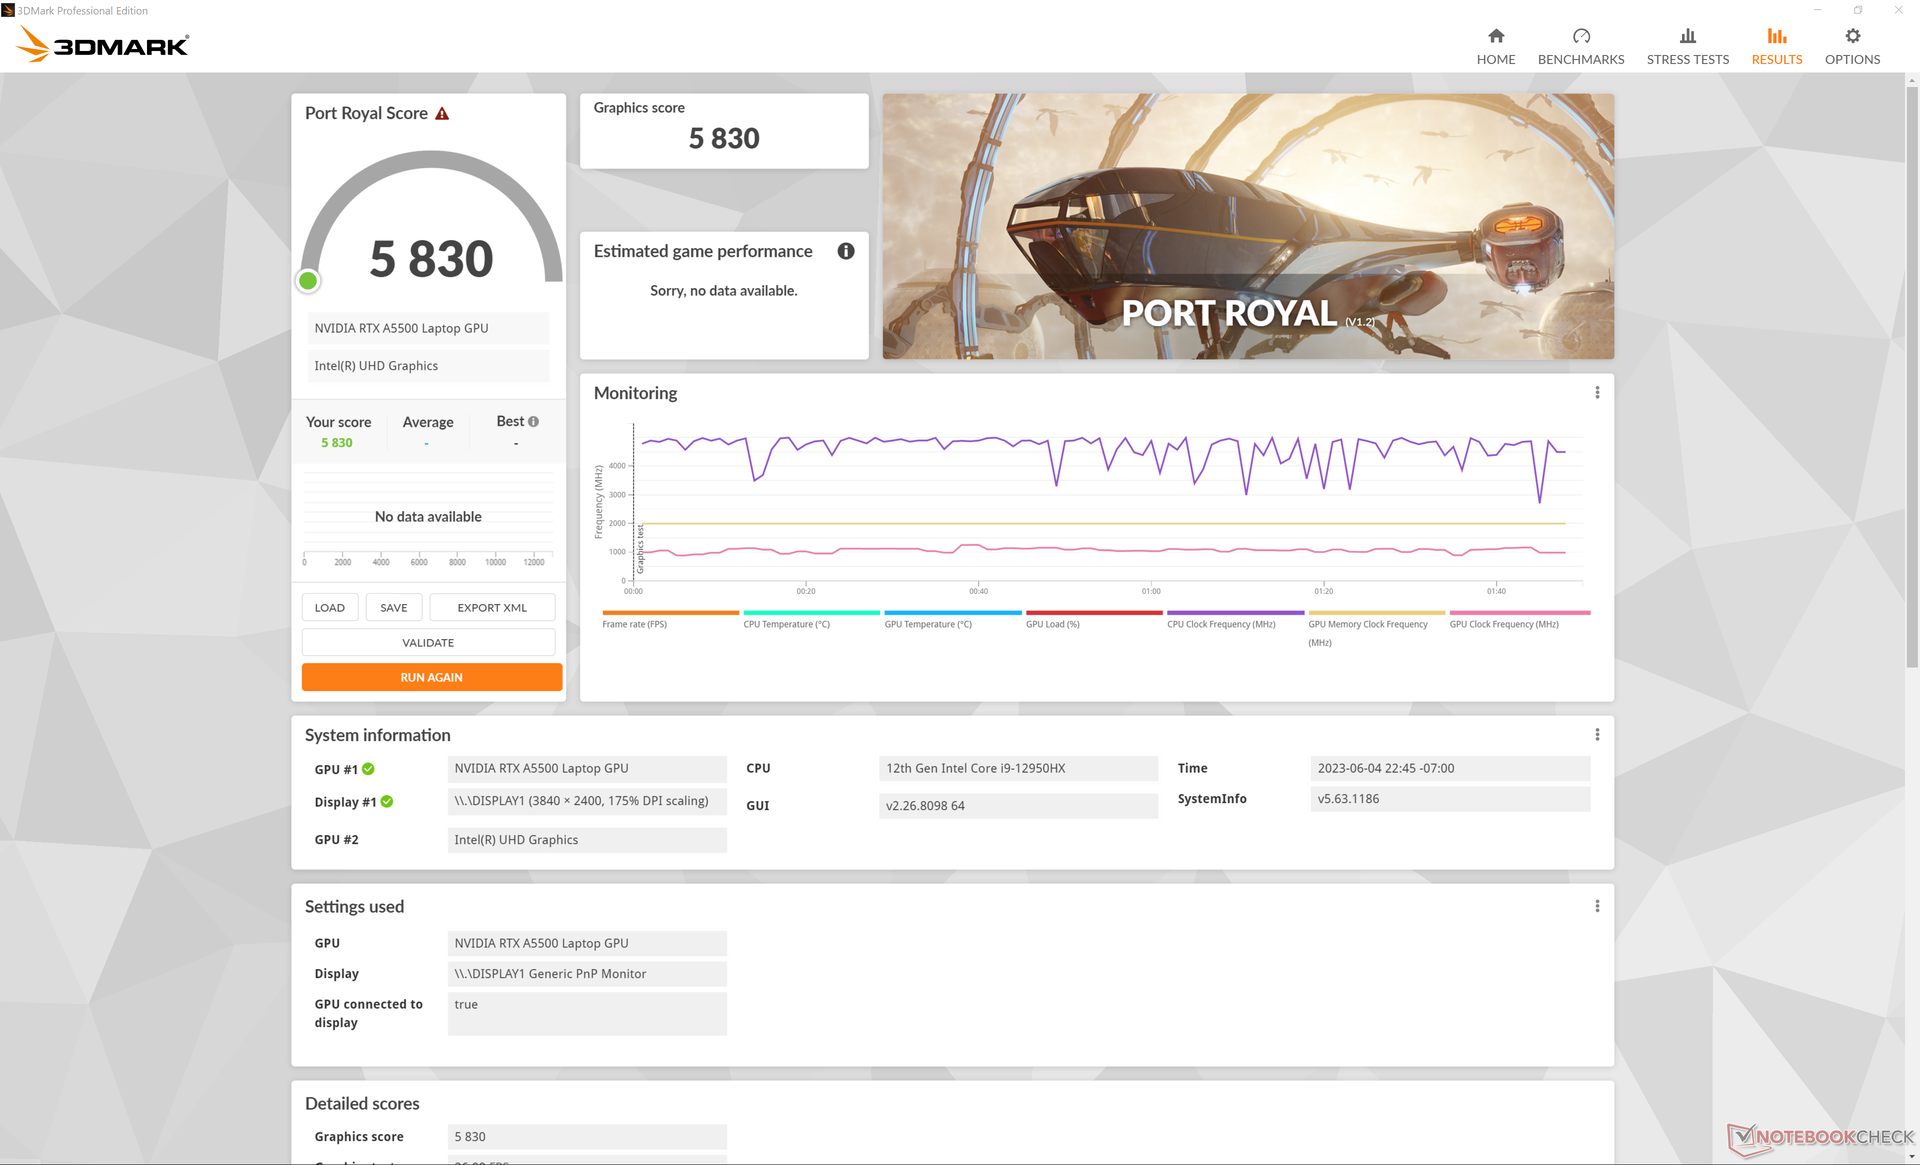
The RTX A5500 in our HP targets a TGP of 100 W compared to 130 W and 135 W on the ThinkPad P16 G1 and Precision 7670, respectively. Thus, graphics performance should be slightly slower on the HP even though all three systems are using the same RTX A5500 GPU. 3DMark and SpecViewPerf results confirm this as our HP would be consistently behind both the Dell and Lenovo models by up to 15 percent in some cases. It's still a very fast workstation, of course, but it's not the fastest option out there.
Downgrading to the RTX A3000 configuration from our top-end RTX A5500 is expected to reduce graphics performance by 20 to 30 percent.
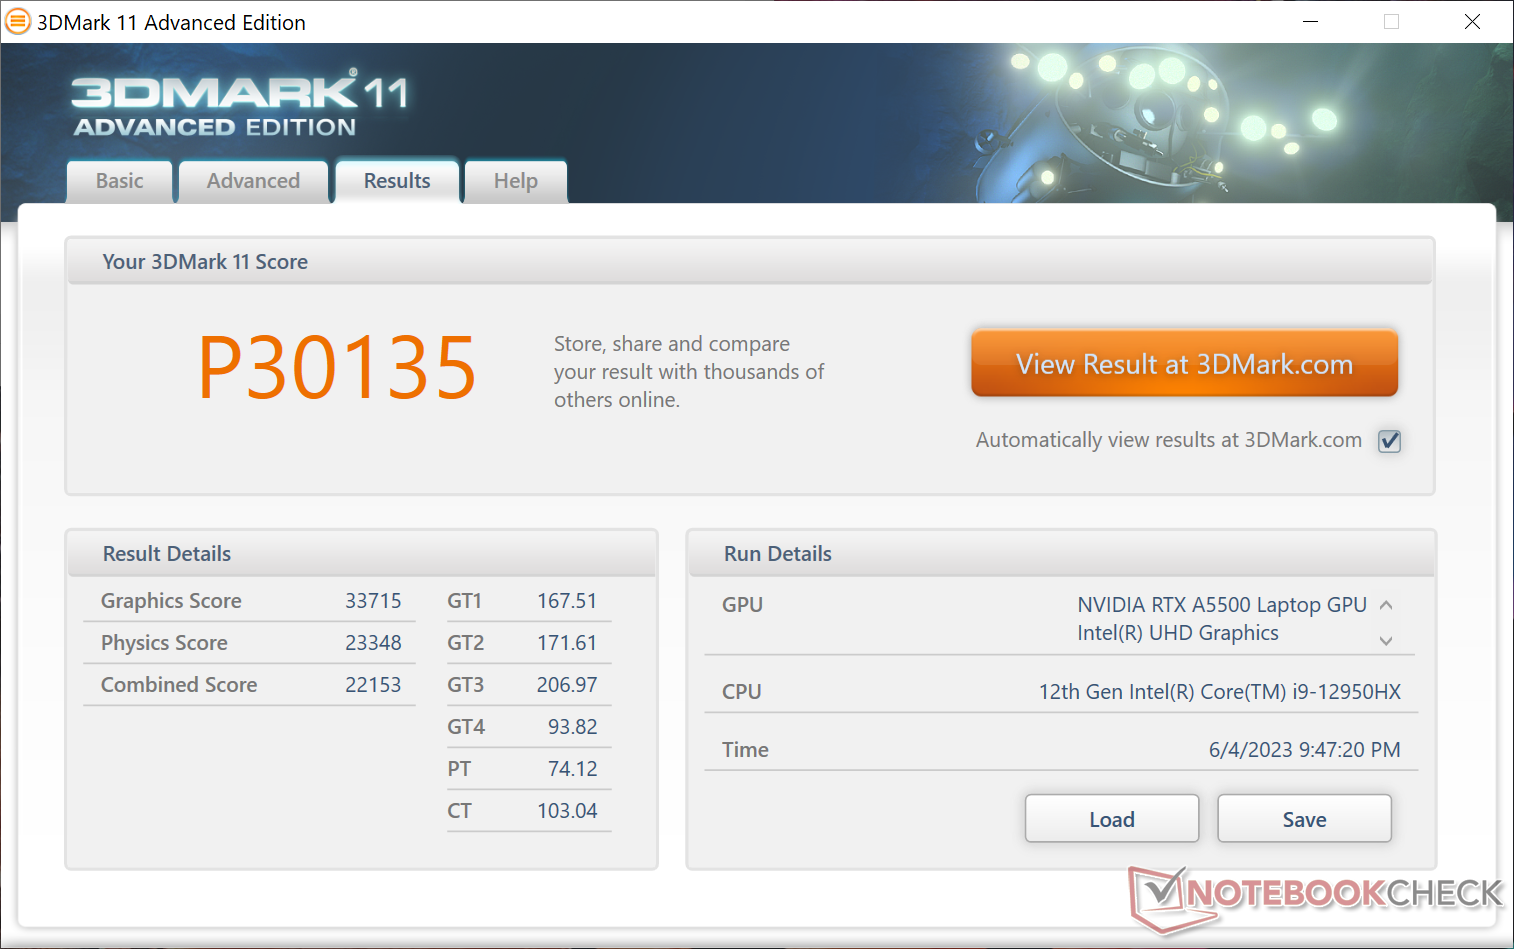
| 3DMark 11 Performance | 30135 points | |
| 3DMark Fire Strike Score | 24046 points | |
| 3DMark Time Spy Score | 9402 points | |
Help | ||
* ... smaller is better
Gaming Performance
Though it's not a gaming GPU, the RTX A5500 is more than capable of playing the latest titles at high resolutions and settings. Users can expect gaming performance to be on par with the mobile GeForce RTX 4070.
| Tiny Tina's Wonderlands | |
| 1920x1080 Low Preset (DX12) | |
| Lenovo Legion Pro 5 16IRX8 | |
| HP ZBook Fury 16 G9 | |
| Average NVIDIA RTX A5500 Laptop GPU (n=1) | |
| Dell XPS 17 9730 RTX 4070 | |
| 1920x1080 Medium Preset (DX12) | |
| Lenovo Legion Pro 5 16IRX8 | |
| HP ZBook Fury 16 G9 | |
| Average NVIDIA RTX A5500 Laptop GPU (n=1) | |
| Dell XPS 17 9730 RTX 4070 | |
| 1920x1080 High Preset (DX12) | |
| Lenovo Legion Pro 5 16IRX8 | |
| HP ZBook Fury 16 G9 | |
| Average NVIDIA RTX A5500 Laptop GPU (n=1) | |
| Dell XPS 17 9730 RTX 4070 | |
| 1920x1080 Badass Preset (DX12) | |
| Asus Zephyrus Duo 16 GX650PY-NM006W | |
| Lenovo Legion Pro 5 16IRX8 | |
| HP ZBook Fury 16 G9 | |
| Average NVIDIA RTX A5500 Laptop GPU (n=1) | |
| Dell XPS 17 9730 RTX 4070 | |
| 2560x1440 Badass Preset (DX12) | |
| Asus Zephyrus Duo 16 GX650PY-NM006W | |
| Lenovo Legion Pro 5 16IRX8 | |
| HP ZBook Fury 16 G9 | |
| Average NVIDIA RTX A5500 Laptop GPU (n=1) | |
| Dell XPS 17 9730 RTX 4070 | |
| 3840x2160 Badass Preset (DX12) | |
| Lenovo Legion Pro 5 16IRX8 | |
| HP ZBook Fury 16 G9 | |
| Average NVIDIA RTX A5500 Laptop GPU (n=1) | |
| Dell XPS 17 9730 RTX 4070 | |
Witcher 3 FPS Chart
| low | med. | high | ultra | QHD | 4K | |
|---|---|---|---|---|---|---|
| GTA V (2015) | 185.4 | 182.7 | 170.7 | 118.5 | 97.5 | 97.1 |
| The Witcher 3 (2015) | 447 | 308.5 | 169.3 | 92.8 | 62.2 | |
| Dota 2 Reborn (2015) | 191.3 | 173.1 | 162.4 | 150.7 | 116.1 | |
| Final Fantasy XV Benchmark (2018) | 180.1 | 131.6 | 103.5 | 75.1 | 39.4 | |
| X-Plane 11.11 (2018) | 151.3 | 130.9 | 103.6 | 81.9 | ||
| Strange Brigade (2018) | 447 | 235 | 190.2 | 168.6 | 122 | 67.6 |
| Cyberpunk 2077 1.6 (2022) | 128.7 | 114.4 | 87.6 | 69.8 | 41.4 | 18.1 |
| Tiny Tina's Wonderlands (2022) | 193.7 | 158.6 | 109.5 | 87.5 | 57.9 | 29.6 |
| F1 22 (2022) | 224 | 209 | 170.2 | 60.9 | 37.2 | 17.6 |
| Returnal (2023) | 70 | 68 | 64 | 59 | 42 | 20 |
Emissions — Quiet Under Low Loads
System Noise
Fan noise is quiet when running undemanding loads. It tends to hover between 29 dB(A) and 35 dB(A) during low to low-medium loads which is just barely audible in most office environments.
Running more demanding loads like games may induce a maximum fan noise of just under 50 dB(A) which is close to what we recorded on the ThinkPad P16 G1 or Precision 7670. Nonetheless, the ThinkPad P16 G1 is able to remain quieter for longer periods. When running 3DMark 06, for example, fan noise on our HP would top out at 36 dB(A) towards the end of the first benchmark scene compared to just 29 dB(A) on the Lenovo.
Noise level
| Idle |
| 22.7 / 22.7 / 28.8 dB(A) |
| Load |
| 36.2 / 49.3 dB(A) |
 | ||
30 dB silent 40 dB(A) audible 50 dB(A) loud |
||
min: | ||
| HP ZBook Fury 16 G9 RTX A5500 Laptop GPU, i9-12950HX, Micron 3400 1TB MTFDKBA1T0TFH | HP ZBook Studio 16 G9 62U04EA RTX A2000 Laptop GPU, i7-12800H, Micron 3400 1TB MTFDKBA1T0TFH | HP ZBook Firefly 16 G9-6B897EA T550 Laptop GPU, i7-1265U, Samsung PM9A1 MZVL21T0HCLR | Lenovo ThinkPad P16 G1 RTX A5500 RTX A5500 Laptop GPU, i9-12950HX, WDC PC SN810 2TB | Dell Precision 7000 7670 Performance RTX A5500 Laptop GPU, i9-12950HX | MSI CreatorPro Z16P B12UKST RTX A3000 Laptop GPU, i7-12700H, Samsung PM9A1 MZVL21T0HCLR | |
|---|---|---|---|---|---|---|
| Noise | -4% | 4% | 4% | -9% | -6% | |
| off / environment * (dB) | 22.6 | 24 -6% | 23.8 -5% | 23.1 -2% | 23.9 -6% | 24.1 -7% |
| Idle Minimum * (dB) | 22.7 | 24 -6% | 23.8 -5% | 23.1 -2% | 24 -6% | 27.1 -19% |
| Idle Average * (dB) | 22.7 | 27.7 -22% | 23.8 -5% | 23.1 -2% | 24 -6% | 27.1 -19% |
| Idle Maximum * (dB) | 28.8 | 27.7 4% | 23.8 17% | 23.1 20% | 38 -32% | 27.1 6% |
| Load Average * (dB) | 36.2 | 39.8 -10% | 39.4 -9% | 28.9 20% | 46.3 -28% | 42.9 -19% |
| Witcher 3 ultra * (dB) | 49.5 | 44.3 11% | 40.5 18% | 51.6 -4% | 41.9 15% | 44 11% |
| Load Maximum * (dB) | 49.3 | 47.7 3% | 41.4 16% | 51.4 -4% | 47.9 3% | 47 5% |
* ... smaller is better
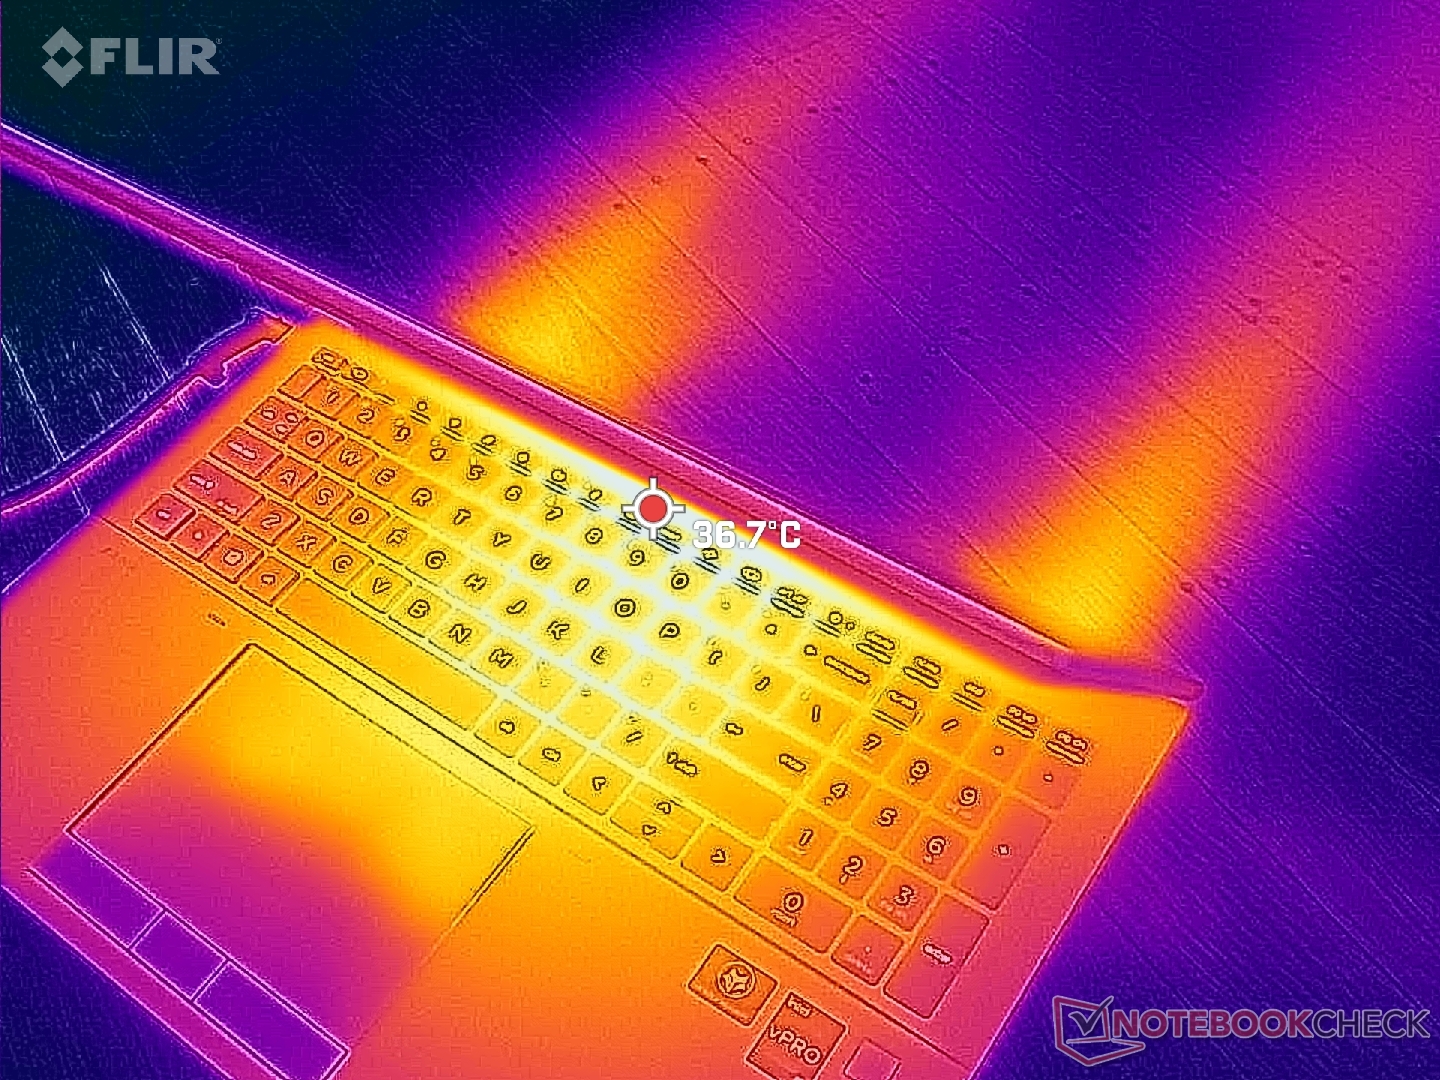
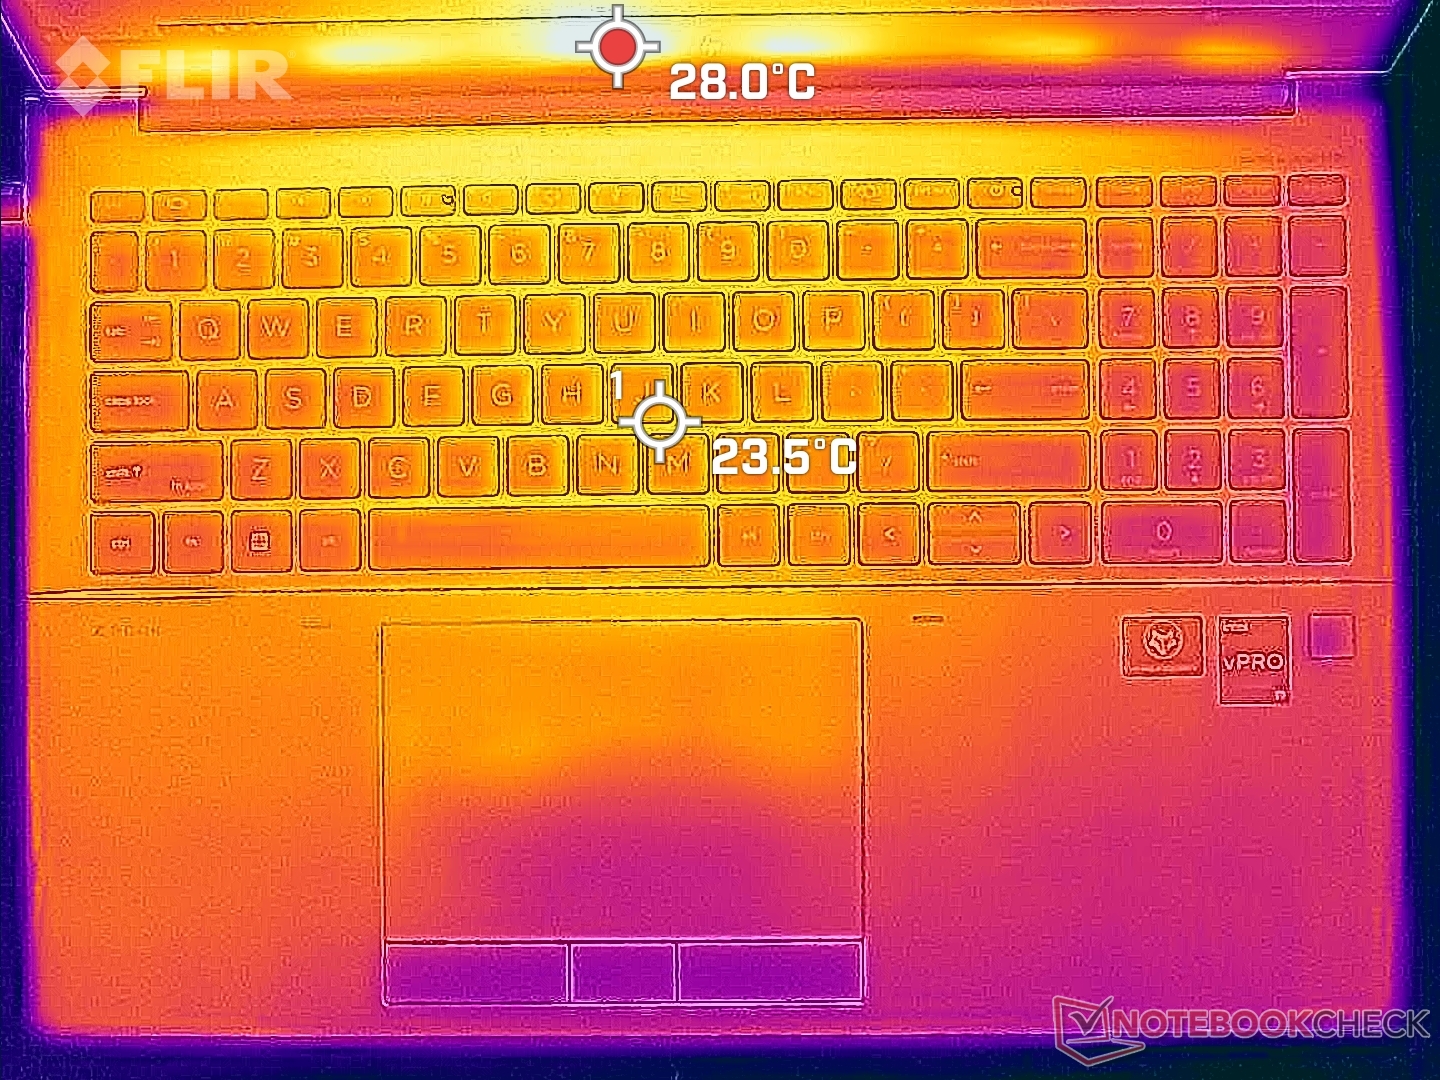
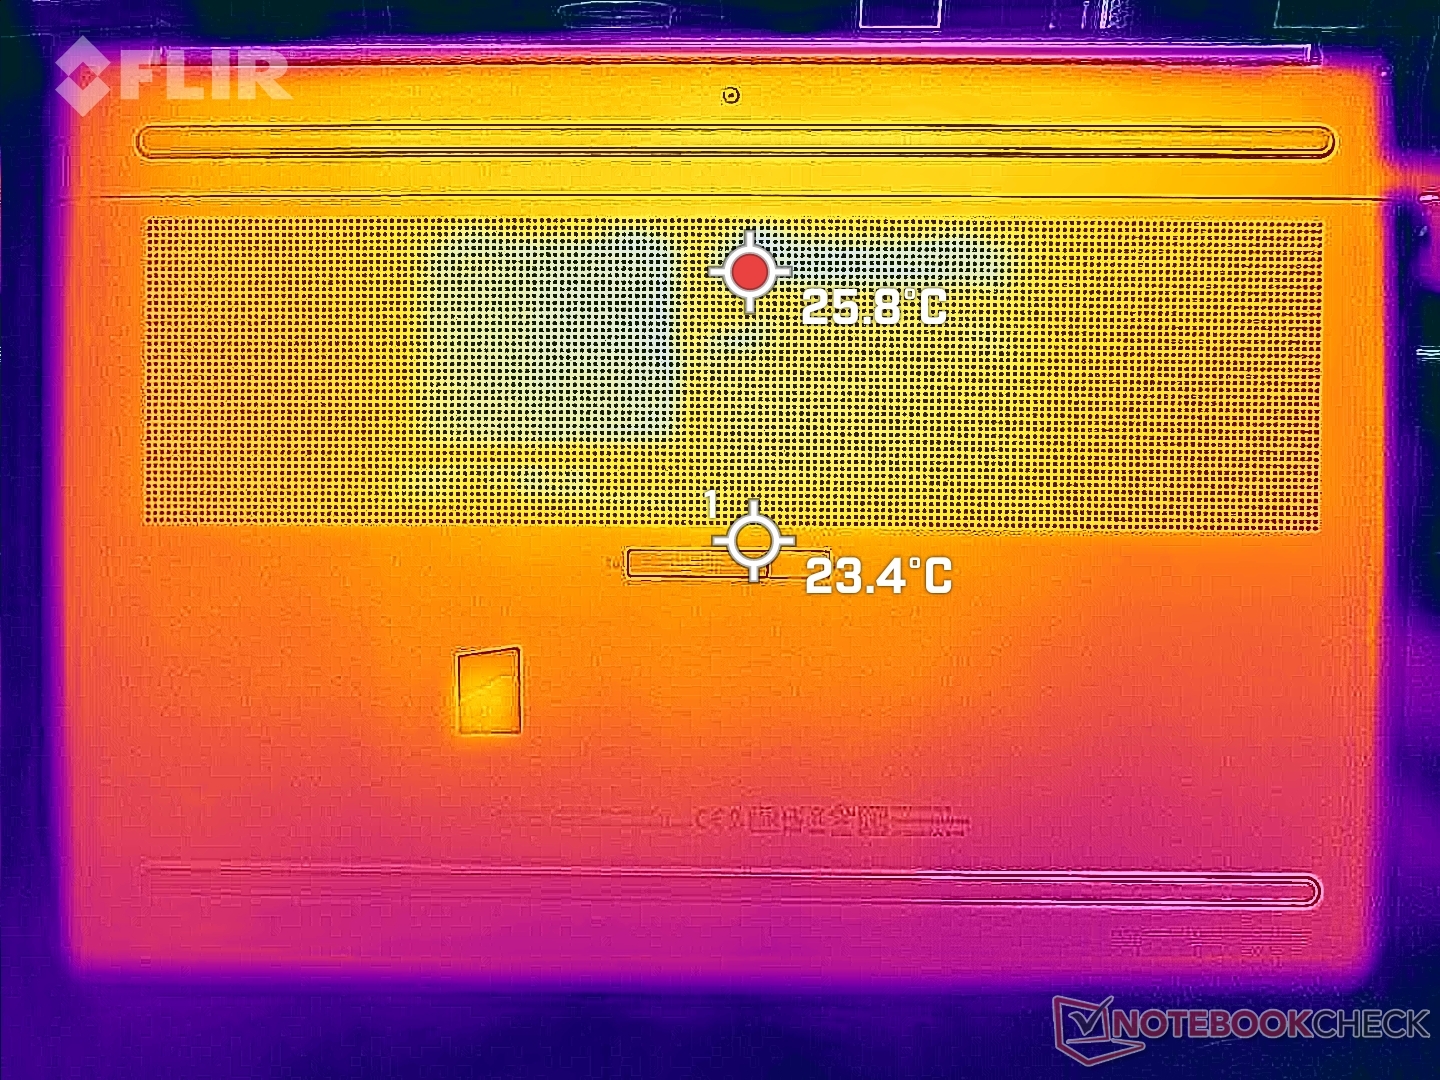
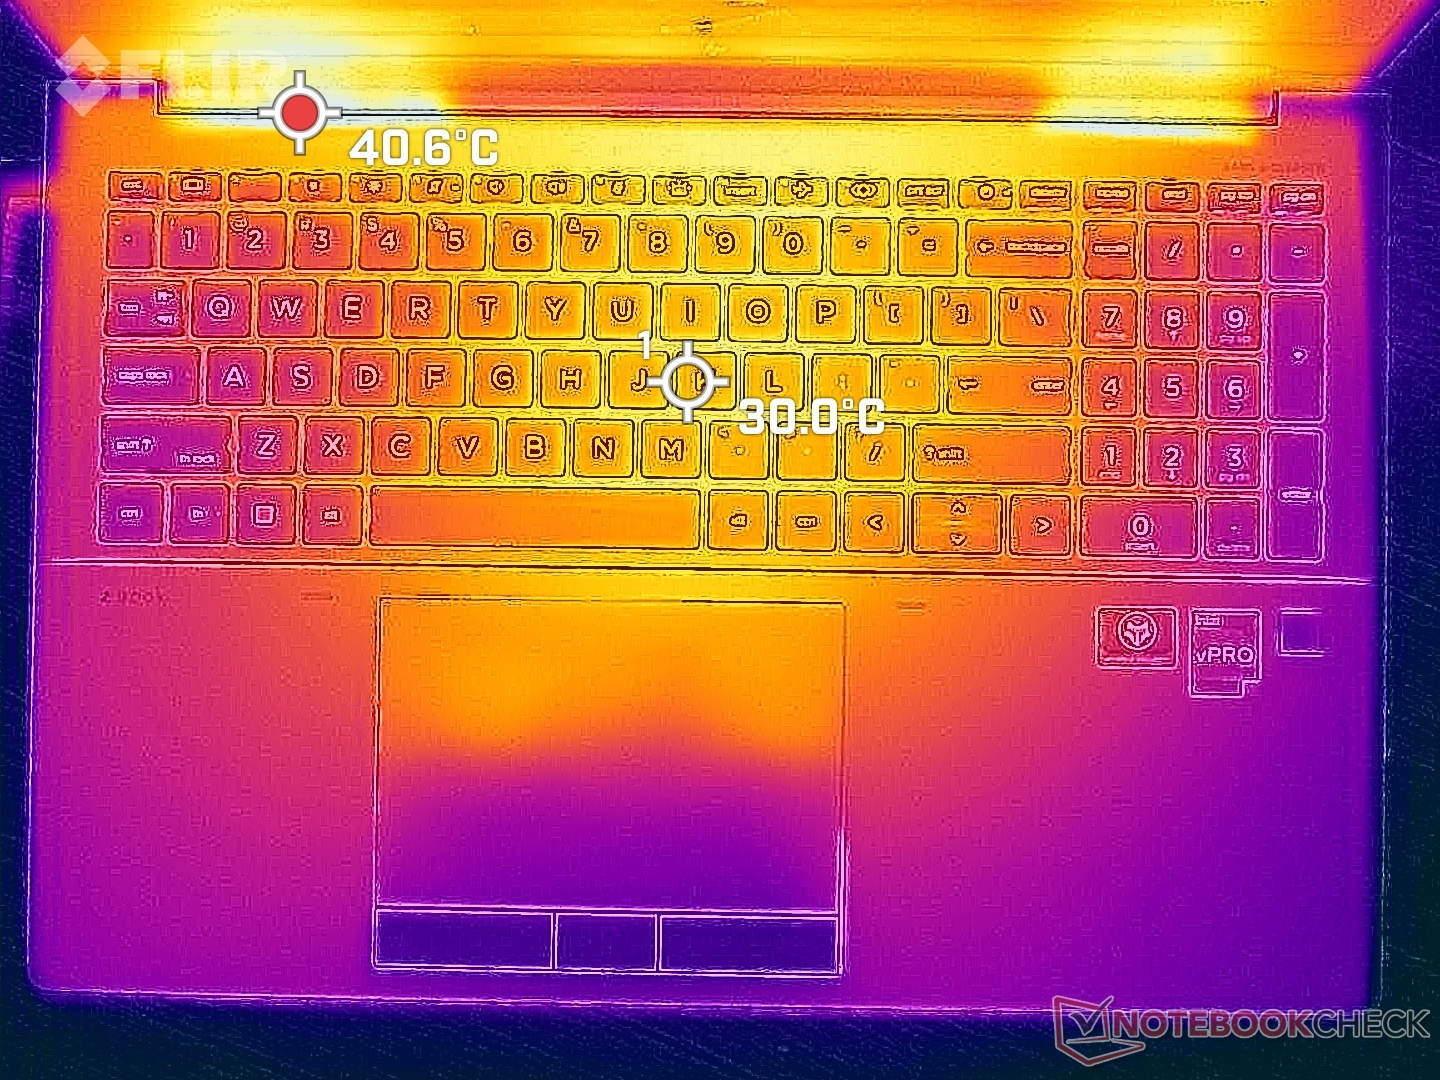
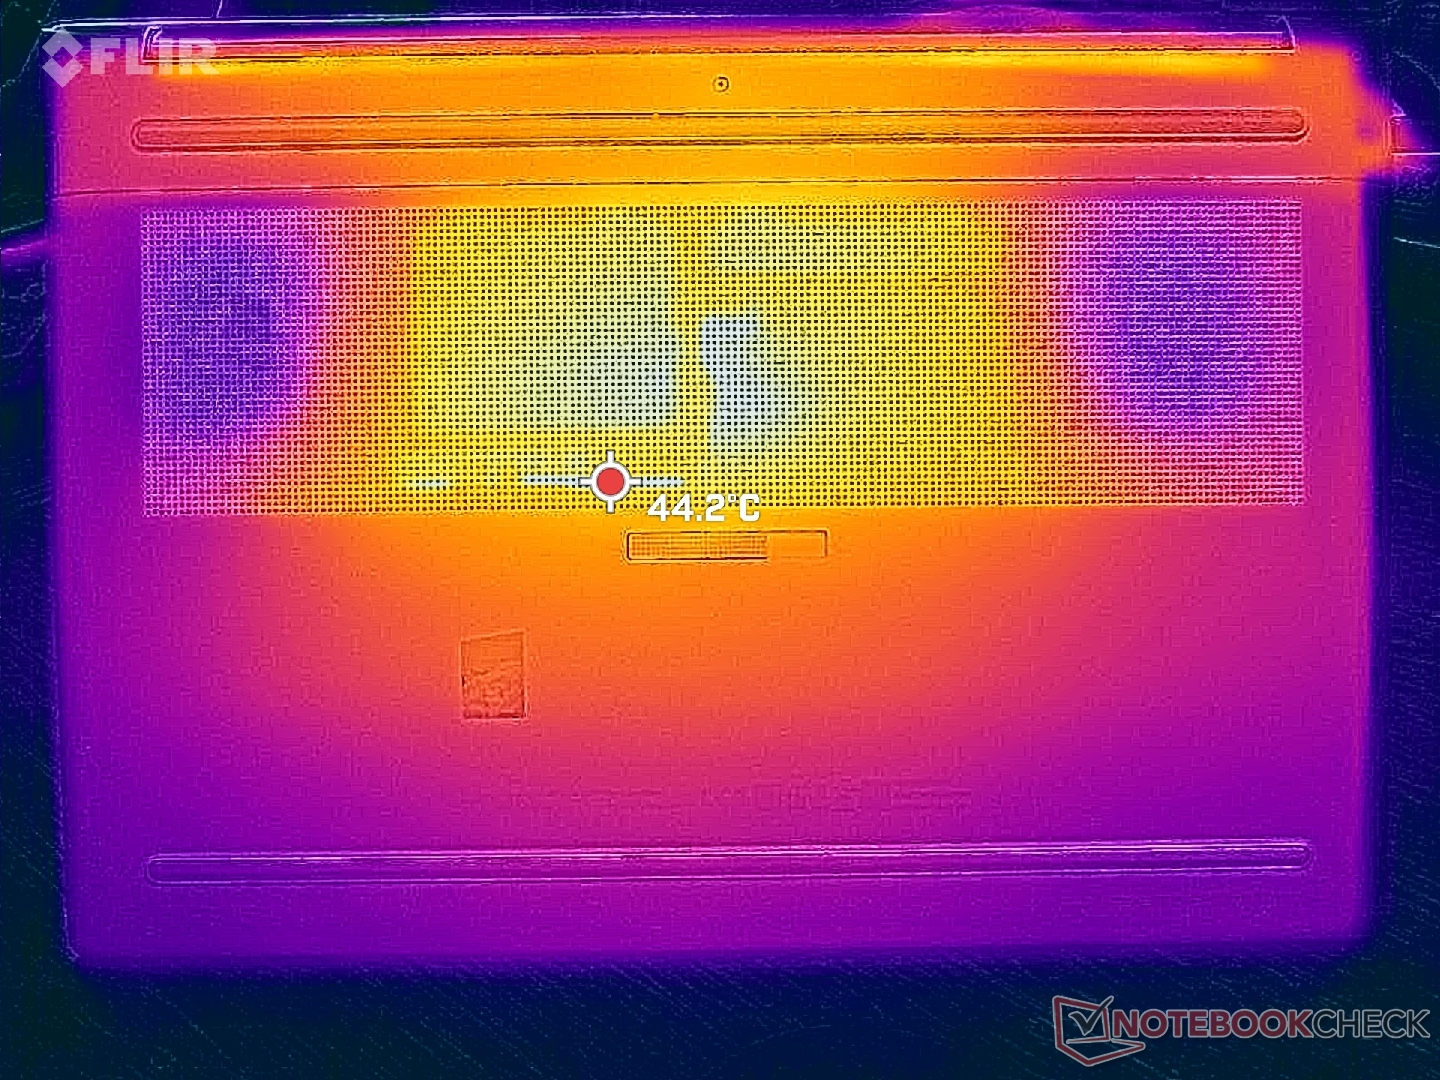
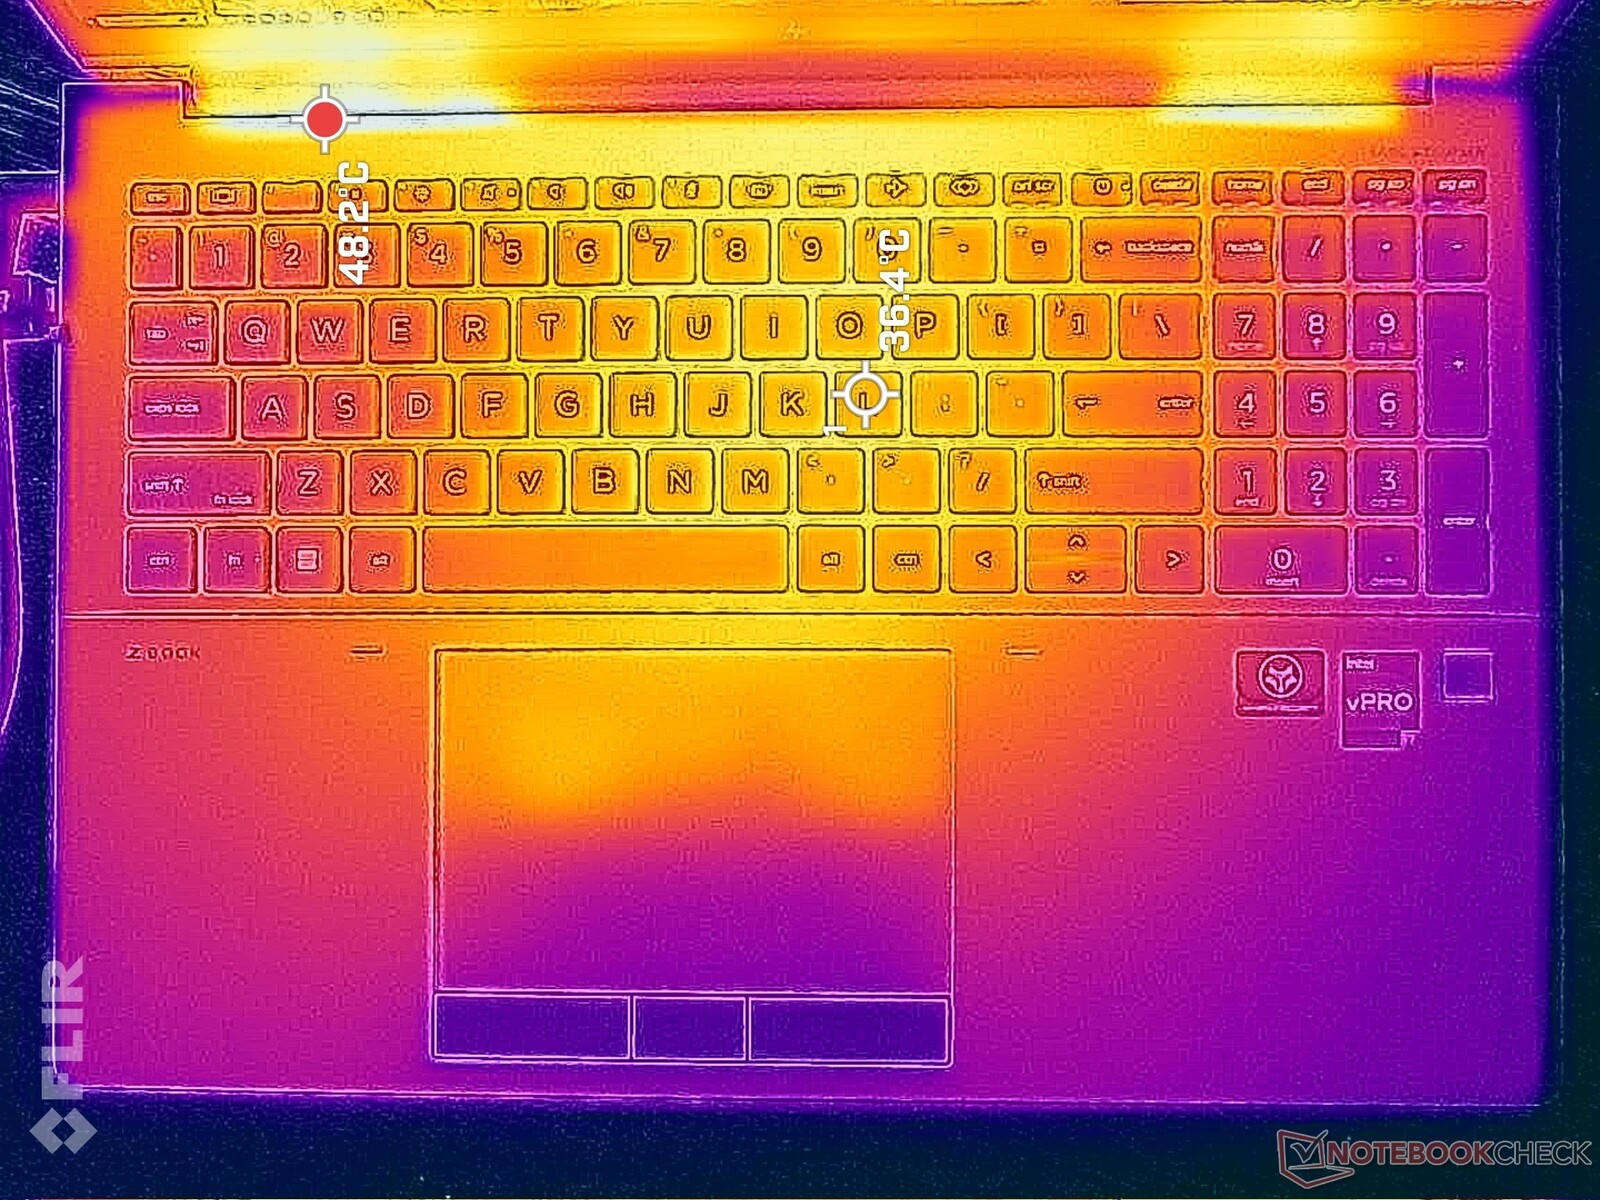
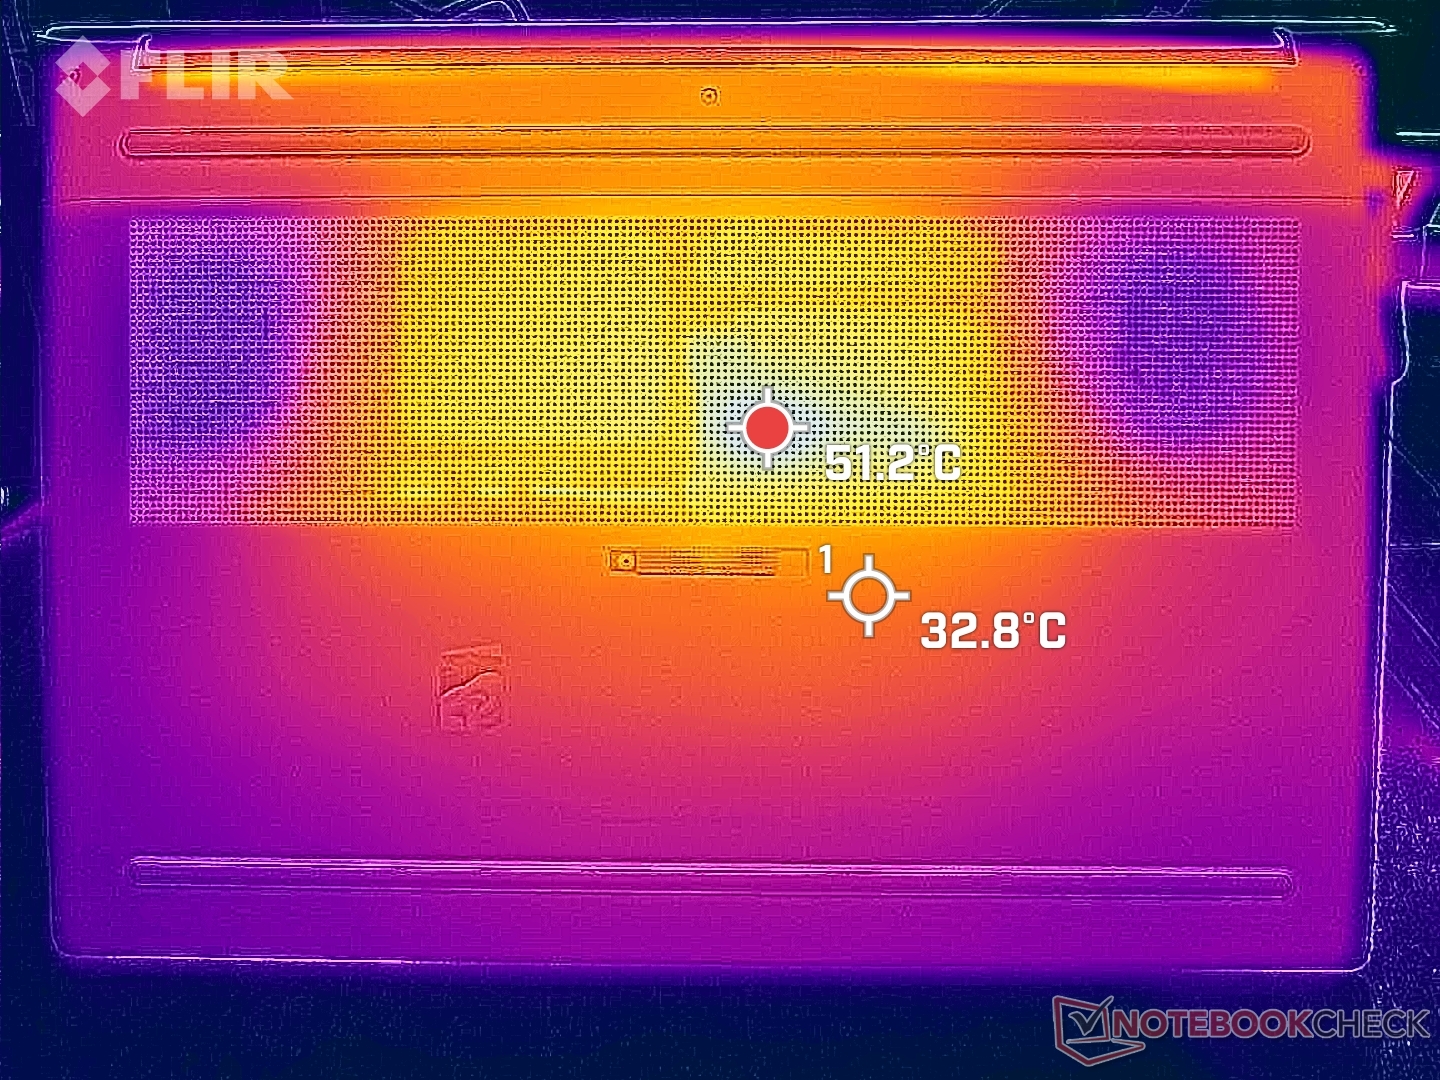
Temperature — Warm Palm Rests Under Load
Surface temperatures tend to be warmer toward the keyboard center where it can reach over 36 C when under extreme processing loads. Temperature development is more symmetrical than on the Precision 7670 or ThinkPad P16, but the touchpad and palm rests can become warmer than we would like. When running demanding loads, for example, the touchpad on the HP can reach over 35 C compared to 30 C or lower on the aforementioned Lenovo and Dell alternatives.
(±) The maximum temperature on the upper side is 43.2 °C / 110 F, compared to the average of 38.2 °C / 101 F, ranging from 22.2 to 69.8 °C for the class Workstation.
(-) The bottom heats up to a maximum of 50.4 °C / 123 F, compared to the average of 41.1 °C / 106 F
(+) In idle usage, the average temperature for the upper side is 27.1 °C / 81 F, compared to the device average of 32 °C / 90 F.
(±) Playing The Witcher 3, the average temperature for the upper side is 34 °C / 93 F, compared to the device average of 32 °C / 90 F.
(+) The palmrests and touchpad are reaching skin temperature as a maximum (35.6 °C / 96.1 F) and are therefore not hot.
(-) The average temperature of the palmrest area of similar devices was 27.8 °C / 82 F (-7.8 °C / -14.1 F).
| HP ZBook Fury 16 G9 Intel Core i9-12950HX, NVIDIA RTX A5500 Laptop GPU | HP ZBook Studio 16 G9 62U04EA Intel Core i7-12800H, NVIDIA RTX A2000 Laptop GPU | HP ZBook Firefly 16 G9-6B897EA Intel Core i7-1265U, NVIDIA T550 Laptop GPU | Lenovo ThinkPad P16 G1 RTX A5500 Intel Core i9-12950HX, NVIDIA RTX A5500 Laptop GPU | Dell Precision 7000 7670 Performance Intel Core i9-12950HX, NVIDIA RTX A5500 Laptop GPU | MSI CreatorPro Z16P B12UKST Intel Core i7-12700H, NVIDIA RTX A3000 Laptop GPU | |
|---|---|---|---|---|---|---|
| Heat | -1% | -4% | -12% | -15% | -12% | |
| Maximum Upper Side * (°C) | 43.2 | 38.7 10% | 42.1 3% | 44.8 -4% | 53 -23% | 56.3 -30% |
| Maximum Bottom * (°C) | 50.4 | 53.4 -6% | 48 5% | 49.8 1% | 43.2 14% | 68.3 -36% |
| Idle Upper Side * (°C) | 28.6 | 27.3 5% | 29.9 -5% | 30.6 -7% | 36.8 -29% | 25.2 12% |
| Idle Bottom * (°C) | 28.2 | 31.6 -12% | 32.9 -17% | 38.6 -37% | 33.8 -20% | 25.9 8% |
* ... smaller is better
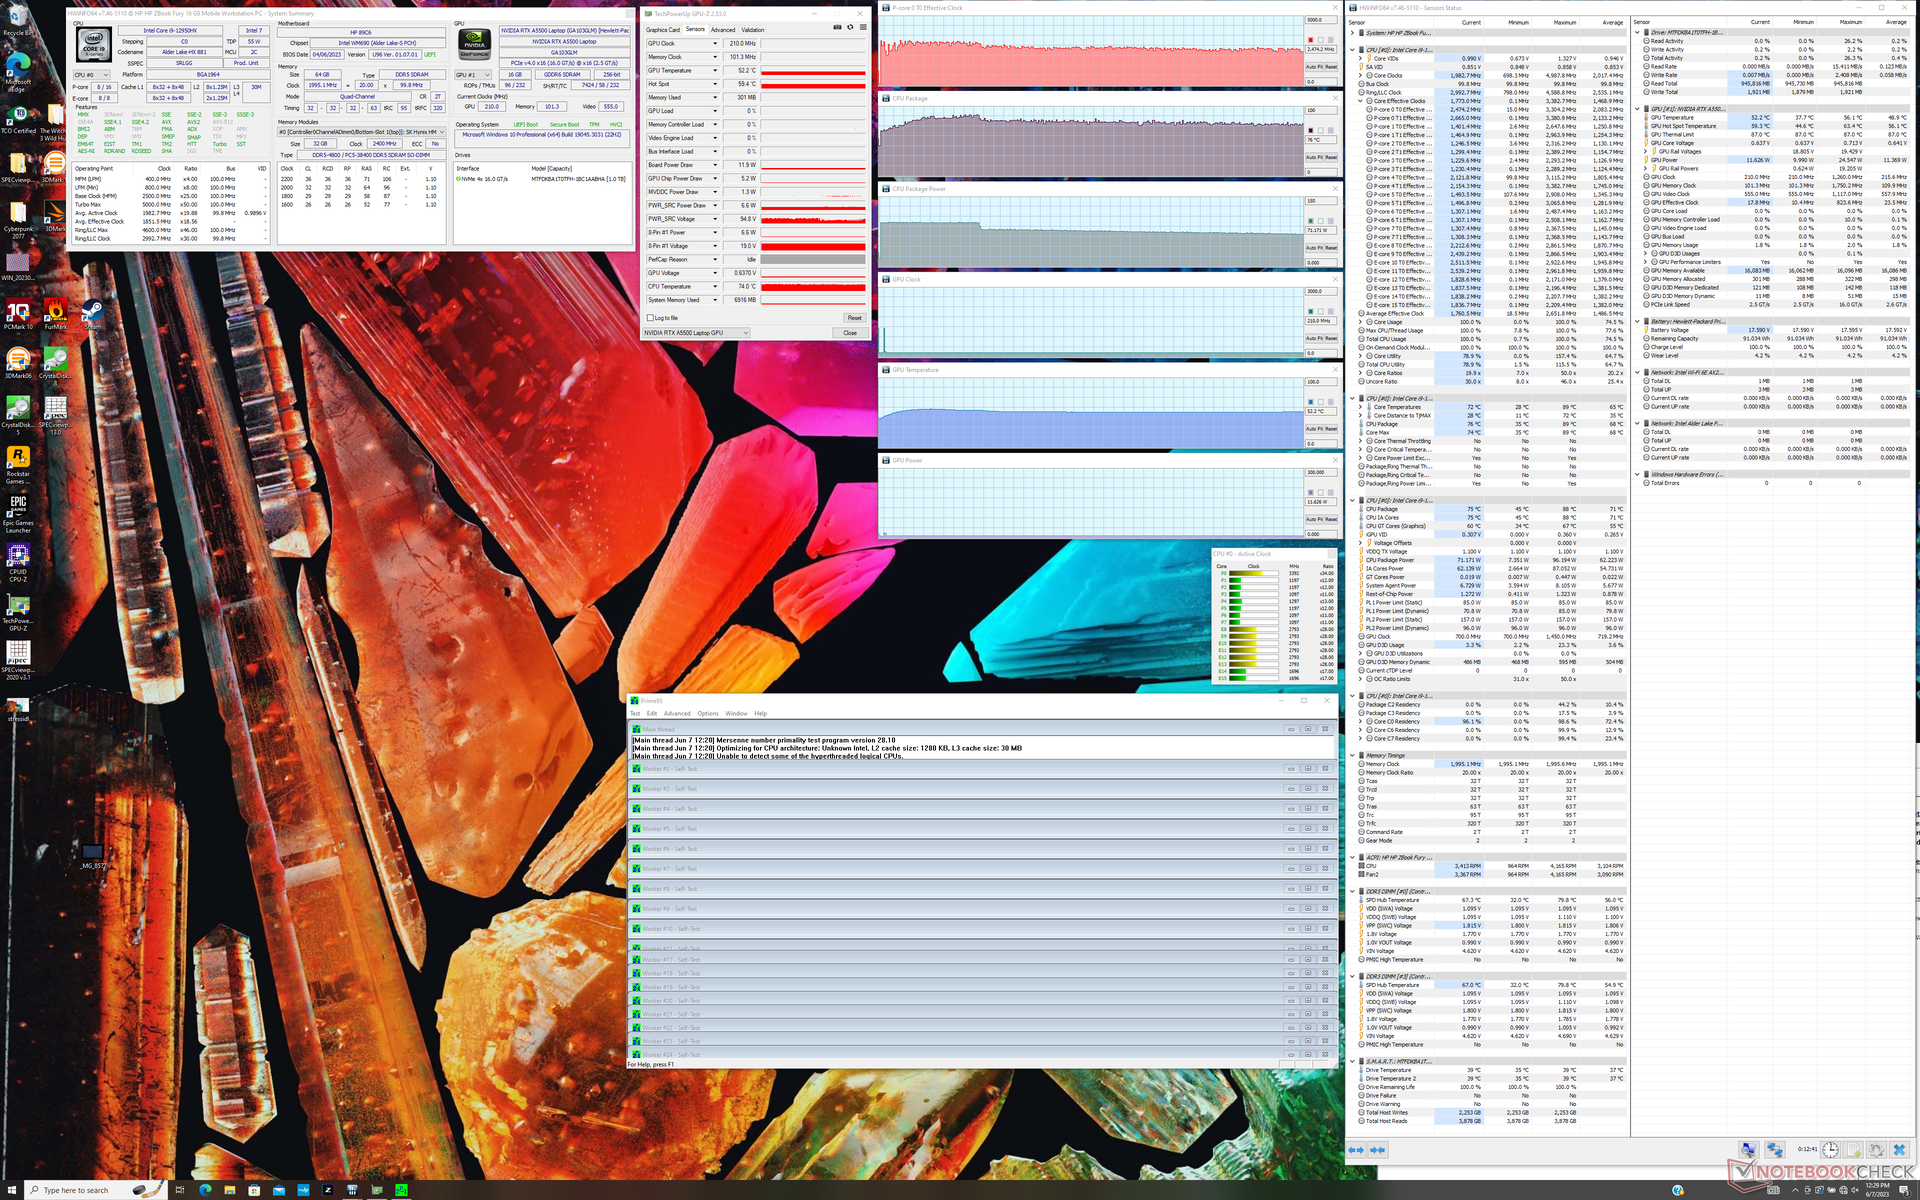
Stress Test
When running Prime95 to stress the CPU, clock rates and board power draw would spike to 3.1 GHz and 96 W, respectively, lasting for just a couple of minutes or until core temperature reaches 89 C. Thereafter, the CPU would fall further before stabilizing at 2.4 GHz, 76 C, and 71 W. Repeating this test on the ThinkPad P16 G1 with the exact same Core i9-12950HX CPU would result in a higher stable clock rate (3.0 GHz) and power draw (81 W) at the cost of a much higher core temperature (100 C). HP is taking a more reserved approach in this regard which aligns with our CineBench results above.
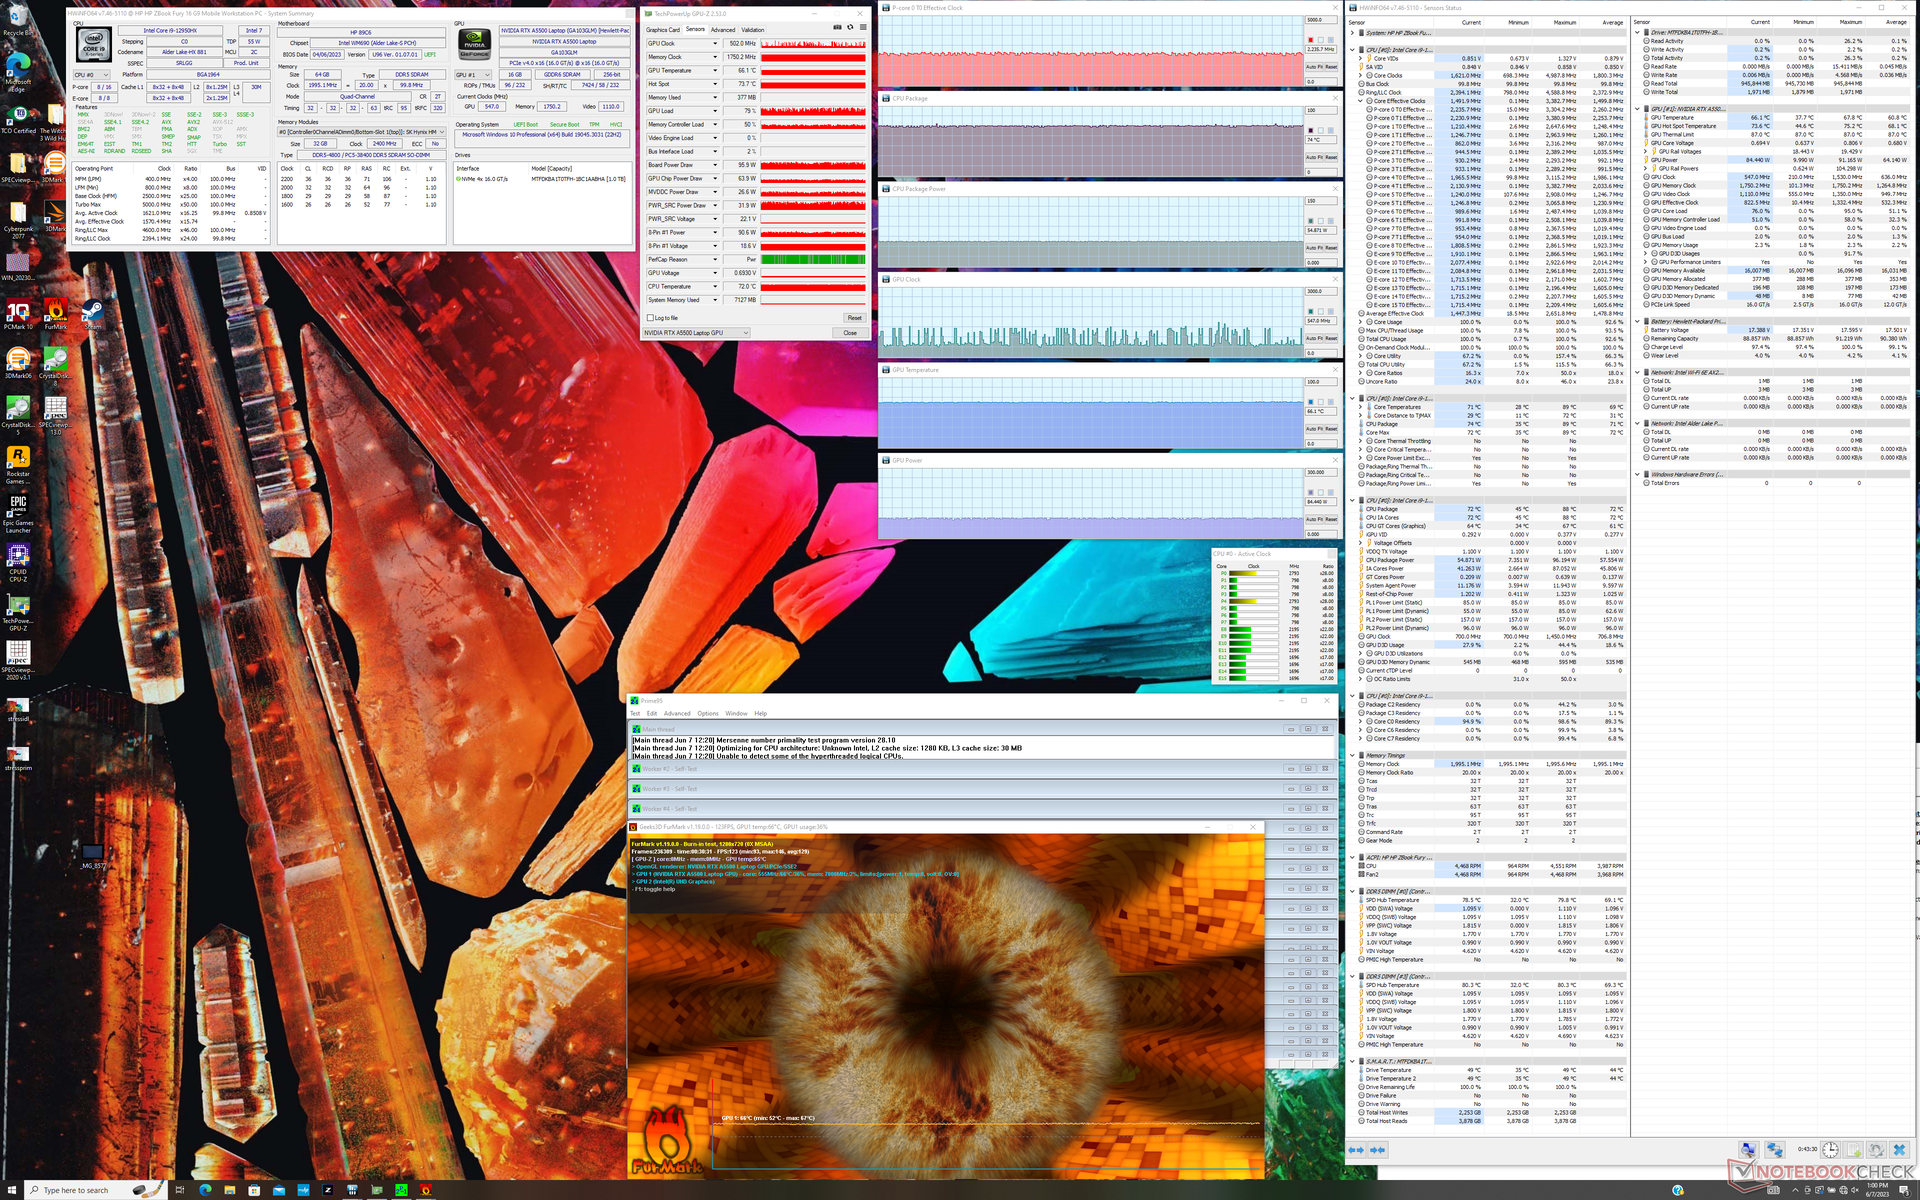
Running Witcher 3 to represent high graphics load would result in a stable GPU clock rate, temperature, and board power draw of 1297 MHz, 70 C, and 92 W, respectively. Repeating this test on the ThinkPad P16 G1 would result in higher stable values across the board at 1477 MHz, 78 C, and 129 W. GPU memory clock would also be higher on the ThinkPad.
Running on battery power limits performance even when on the Performance profile. A Fire Strike test on batteries would return Physics and Graphics scores of 22837 and 5625 points, respectively, compared to 30270 and 25713 points when on mains.
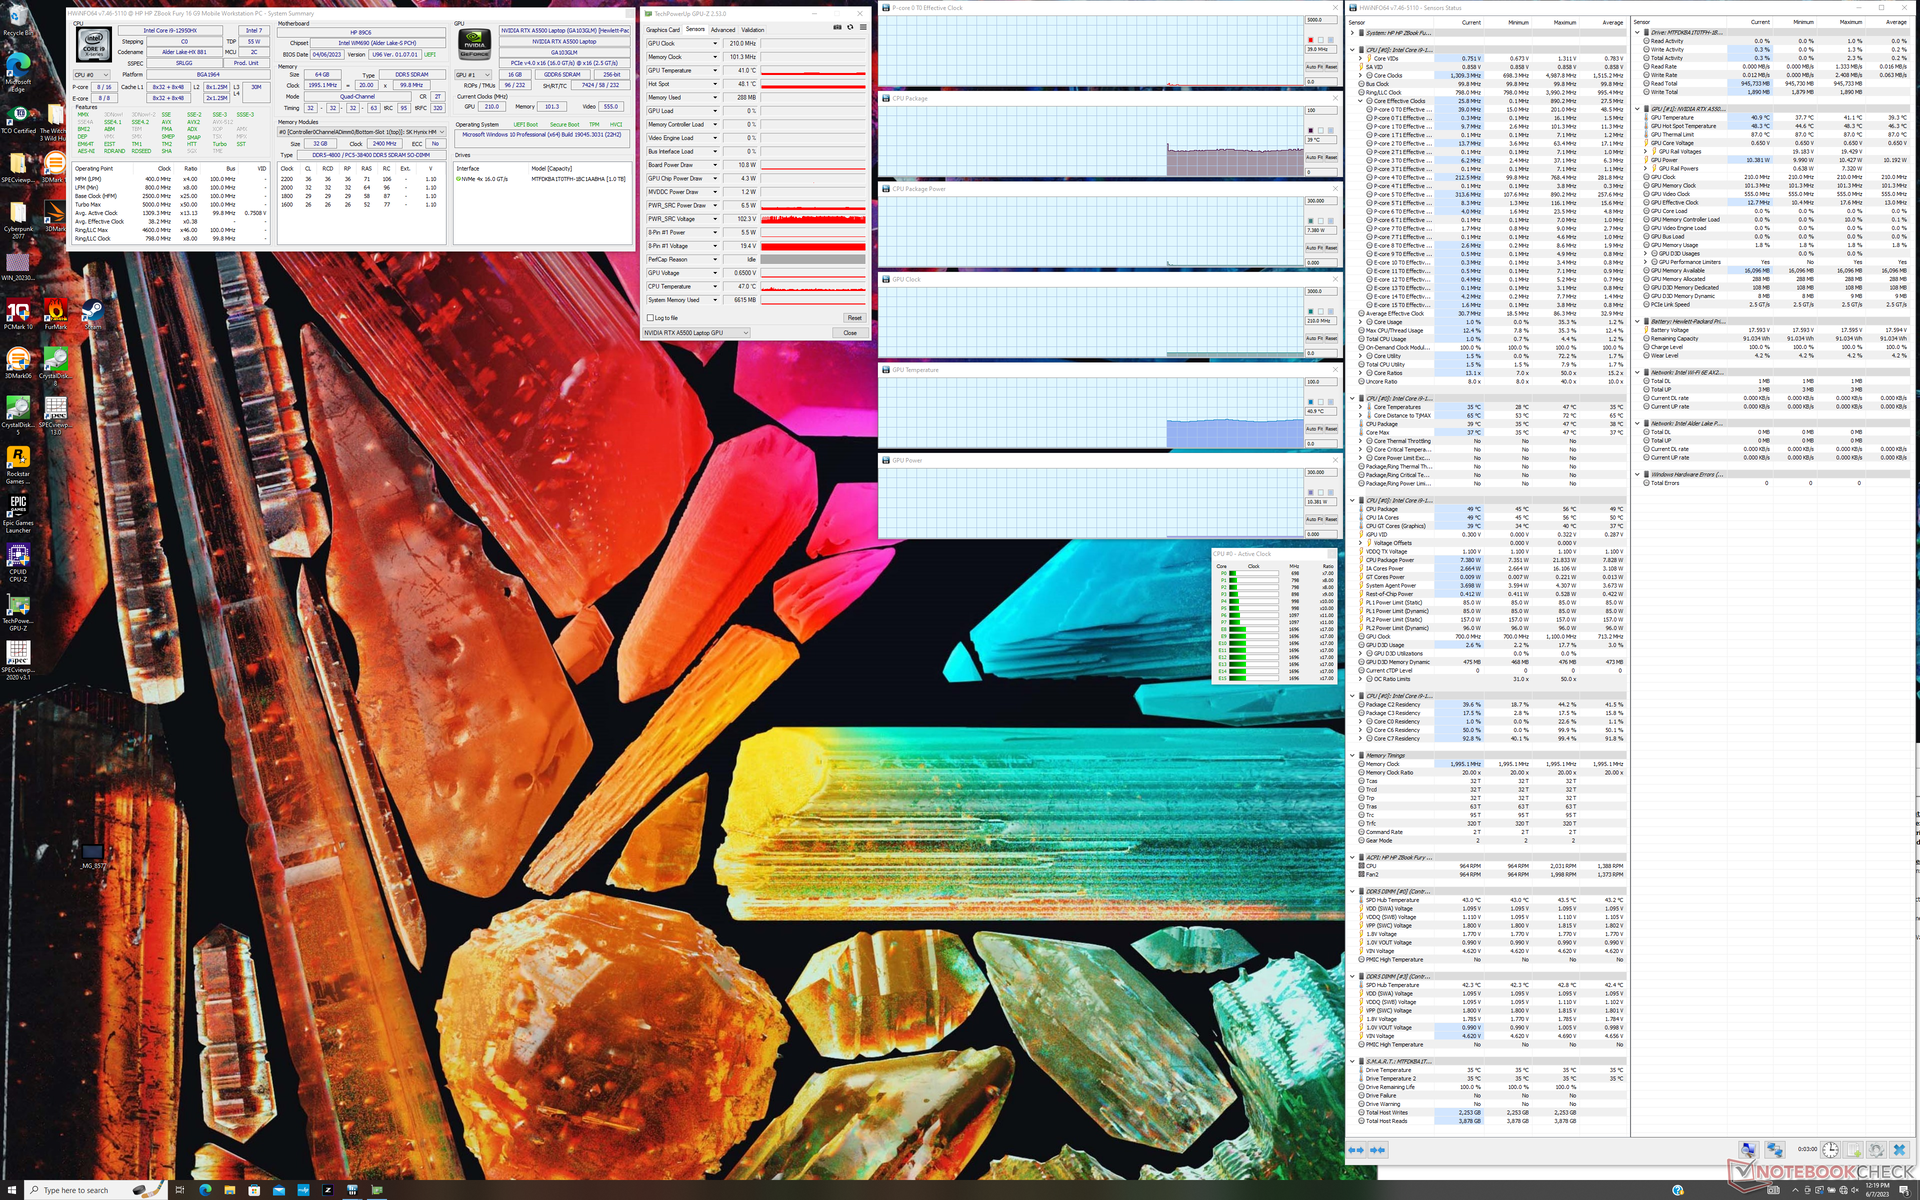
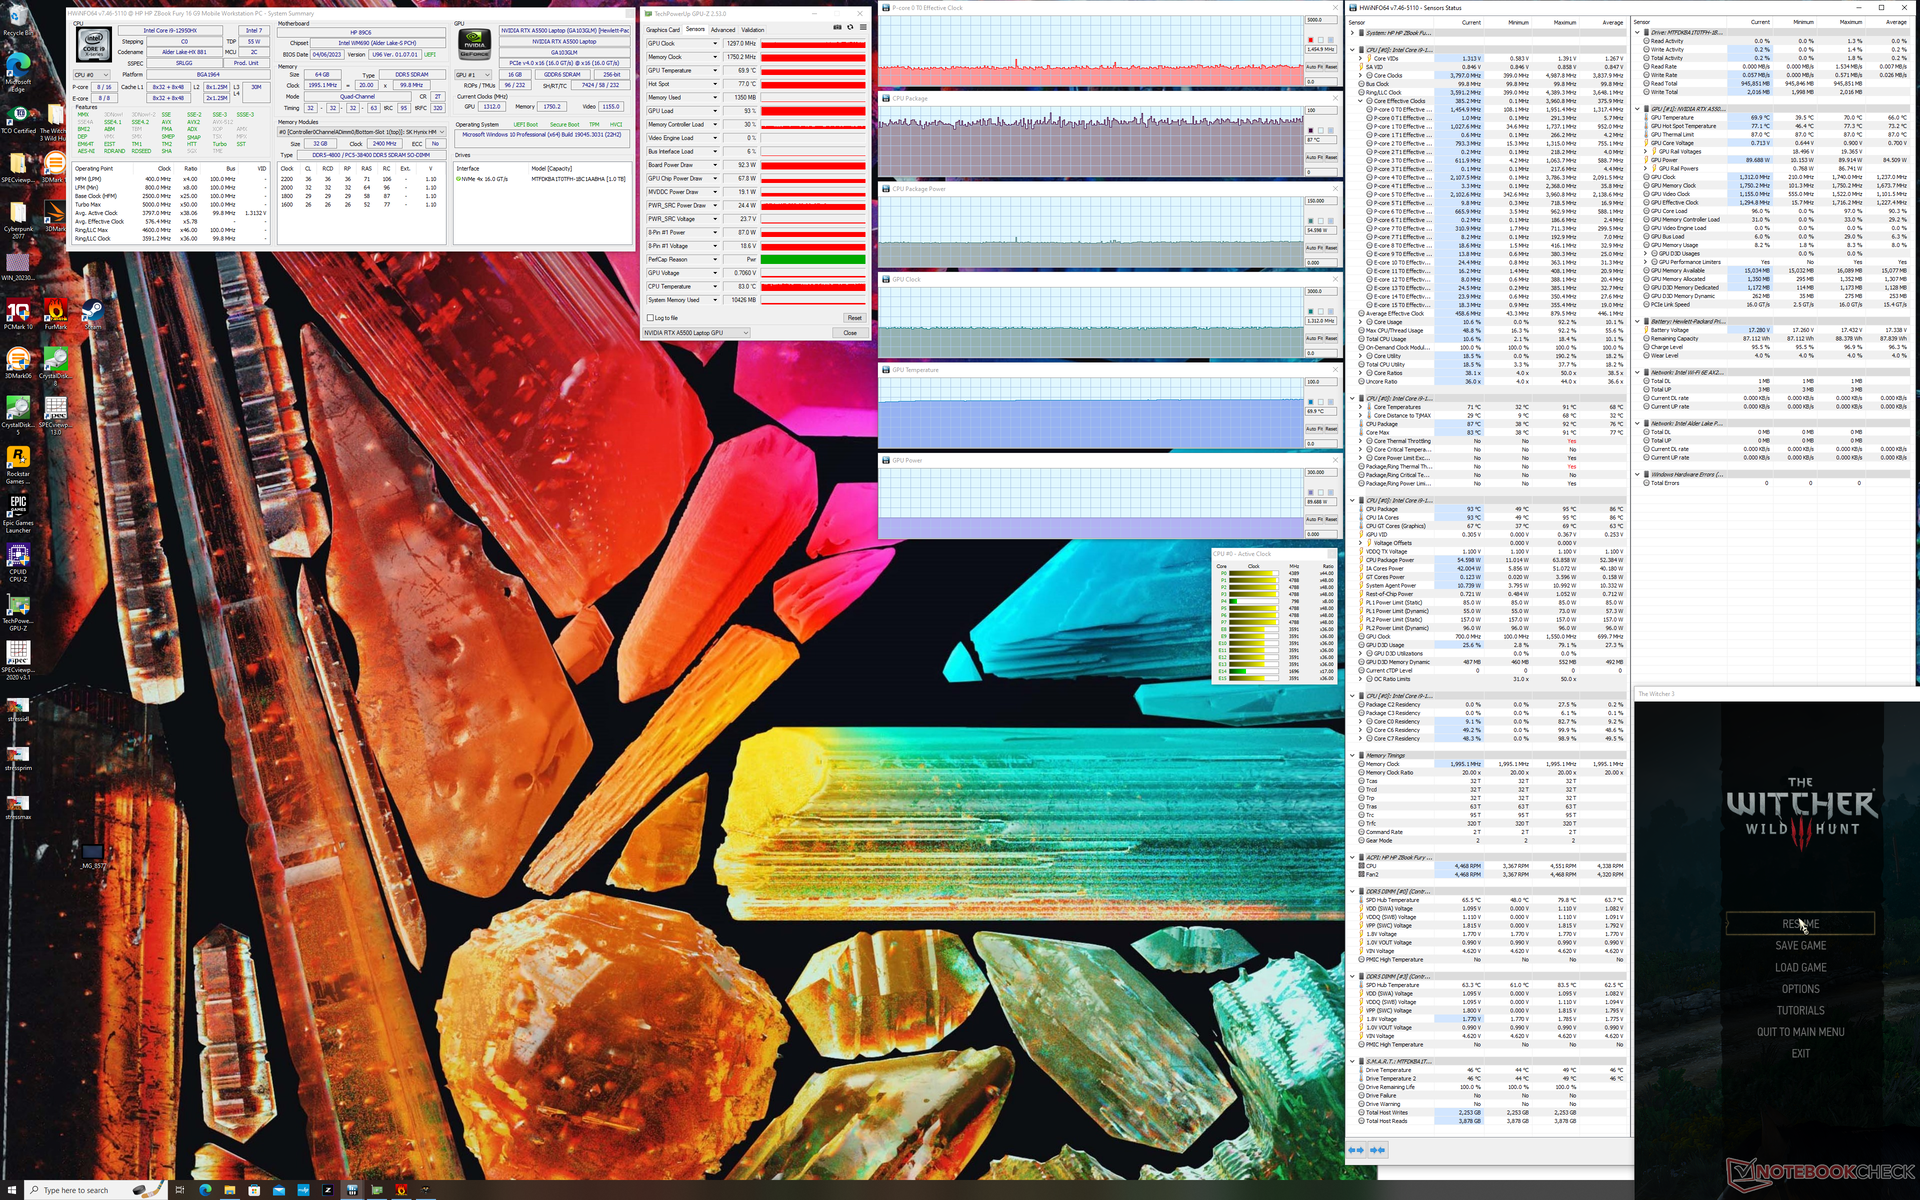
| CPU Clock (GHz) | GPU Clock (MHz) | Average CPU Temperature (°C) | Average GPU Temperature (°C) | |
| System Idle | -- | -- | 39 | 41 |
| Prime95 Stress | 2.5 - 2.7 | -- | 76 | 52 |
| Prime95 + FurMark Stress | 2.2 - 2.3 | 547 - 1200 | 74 | 66 |
| Witcher 3 Stress | ~1.4 | 1297 | 87 | 70 |
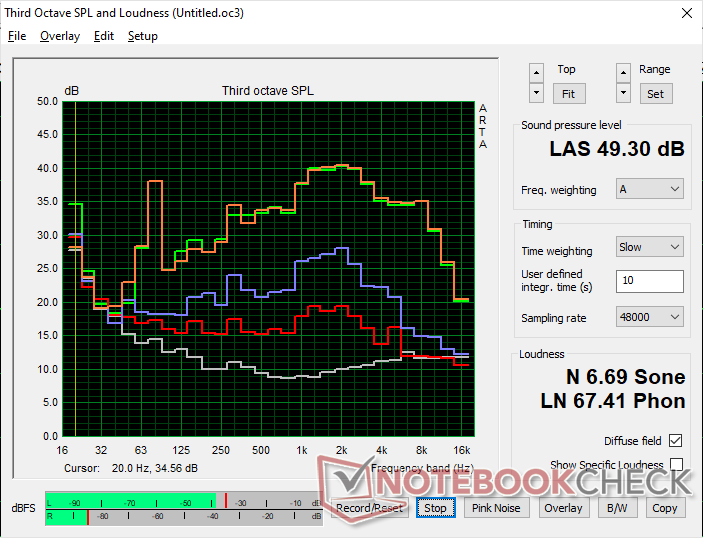
Speakers
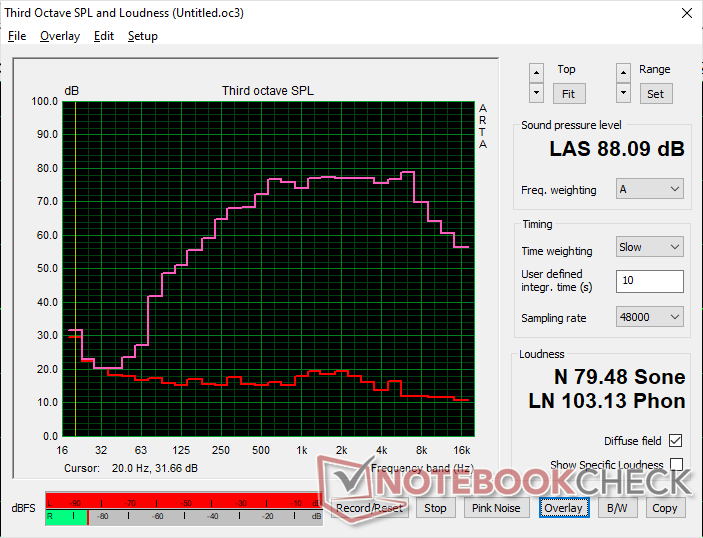
HP ZBook Fury 16 G9 audio analysis
(+) | speakers can play relatively loud (88.1 dB)
Bass 100 - 315 Hz
(-) | nearly no bass - on average 16.1% lower than median
(±) | linearity of bass is average (7.5% delta to prev. frequency)
Mids 400 - 2000 Hz
(+) | balanced mids - only 2.7% away from median
(+) | mids are linear (3.2% delta to prev. frequency)
Highs 2 - 16 kHz
(+) | balanced highs - only 4.2% away from median
(+) | highs are linear (4.9% delta to prev. frequency)
Overall 100 - 16.000 Hz
(+) | overall sound is linear (13.5% difference to median)
Compared to same class
» 26% of all tested devices in this class were better, 5% similar, 70% worse
» The best had a delta of 7%, average was 17%, worst was 35%
Compared to all devices tested
» 14% of all tested devices were better, 4% similar, 82% worse
» The best had a delta of 4%, average was 24%, worst was 134%
Apple MacBook Pro 16 2021 M1 Pro audio analysis
(+) | speakers can play relatively loud (84.7 dB)
Bass 100 - 315 Hz
(+) | good bass - only 3.8% away from median
(+) | bass is linear (5.2% delta to prev. frequency)
Mids 400 - 2000 Hz
(+) | balanced mids - only 1.3% away from median
(+) | mids are linear (2.1% delta to prev. frequency)
Highs 2 - 16 kHz
(+) | balanced highs - only 1.9% away from median
(+) | highs are linear (2.7% delta to prev. frequency)
Overall 100 - 16.000 Hz
(+) | overall sound is linear (4.6% difference to median)
Compared to same class
» 0% of all tested devices in this class were better, 0% similar, 100% worse
» The best had a delta of 5%, average was 17%, worst was 45%
Compared to all devices tested
» 0% of all tested devices were better, 0% similar, 100% worse
» The best had a delta of 4%, average was 24%, worst was 134%
Energy Management
Power Consumption
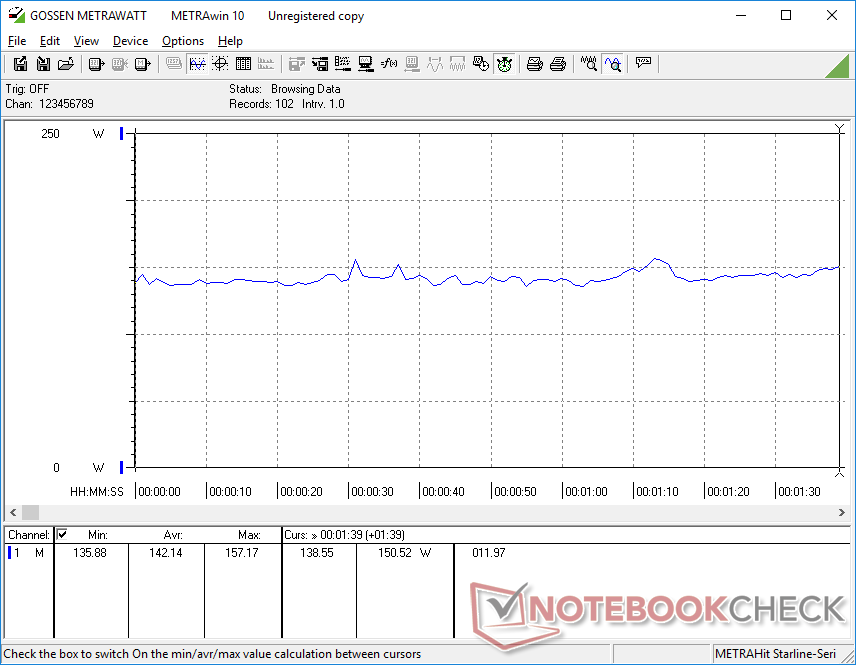
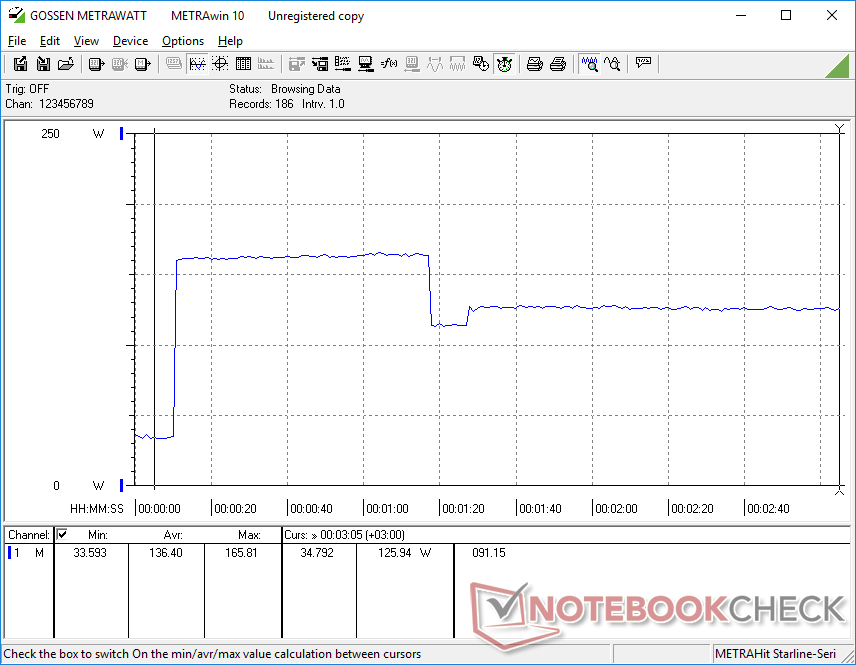
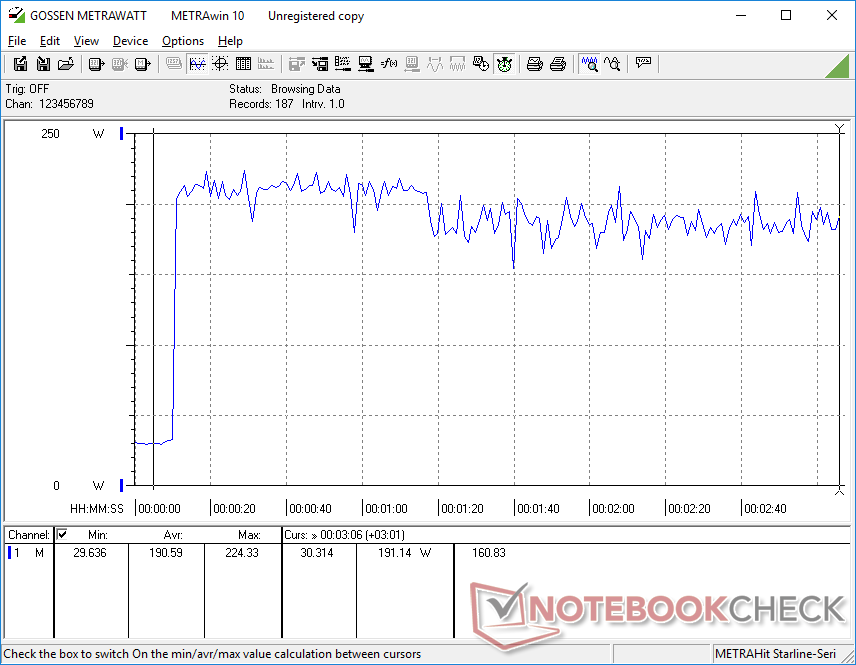
Power consumption is relatively high across the board. Idling on desktop, for example, would consume just over 19 W even when on the Power Saver profile and the minimum brightness setting compared to 7 W or 16 W on the ThinkPad P16 G1 or Precision 7670, respectively. Running more demanding loads like Witcher 3 would consume 189 W or almost 30 W more than on the Precision 7670 even though the Dell offers slightly faster graphics performance.
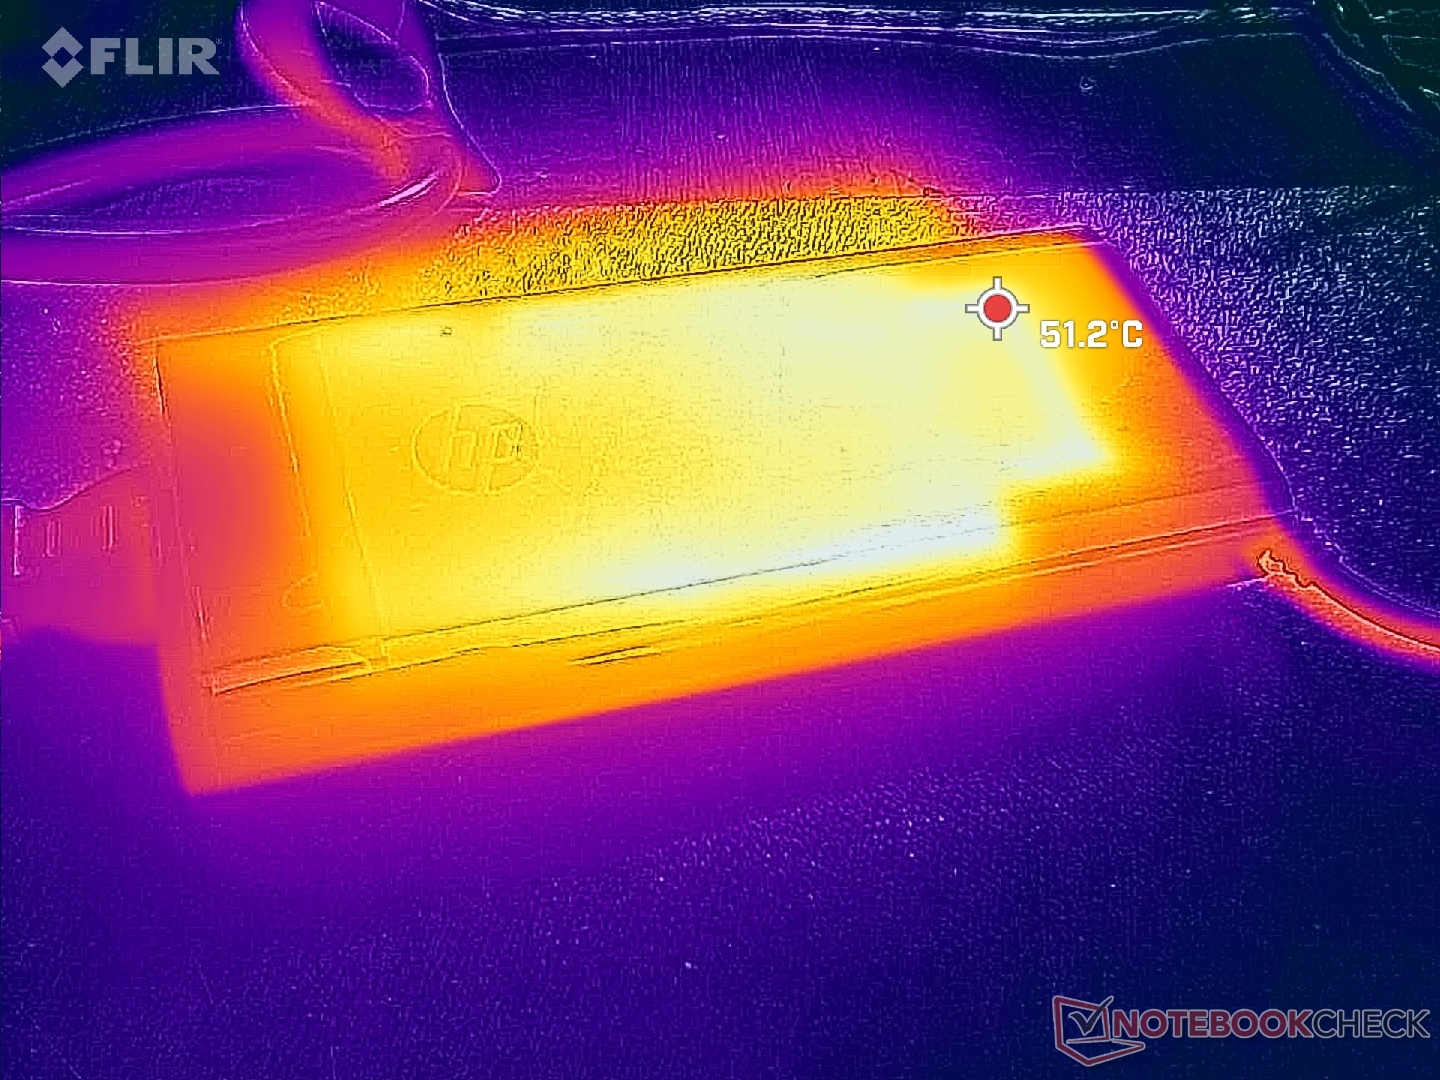
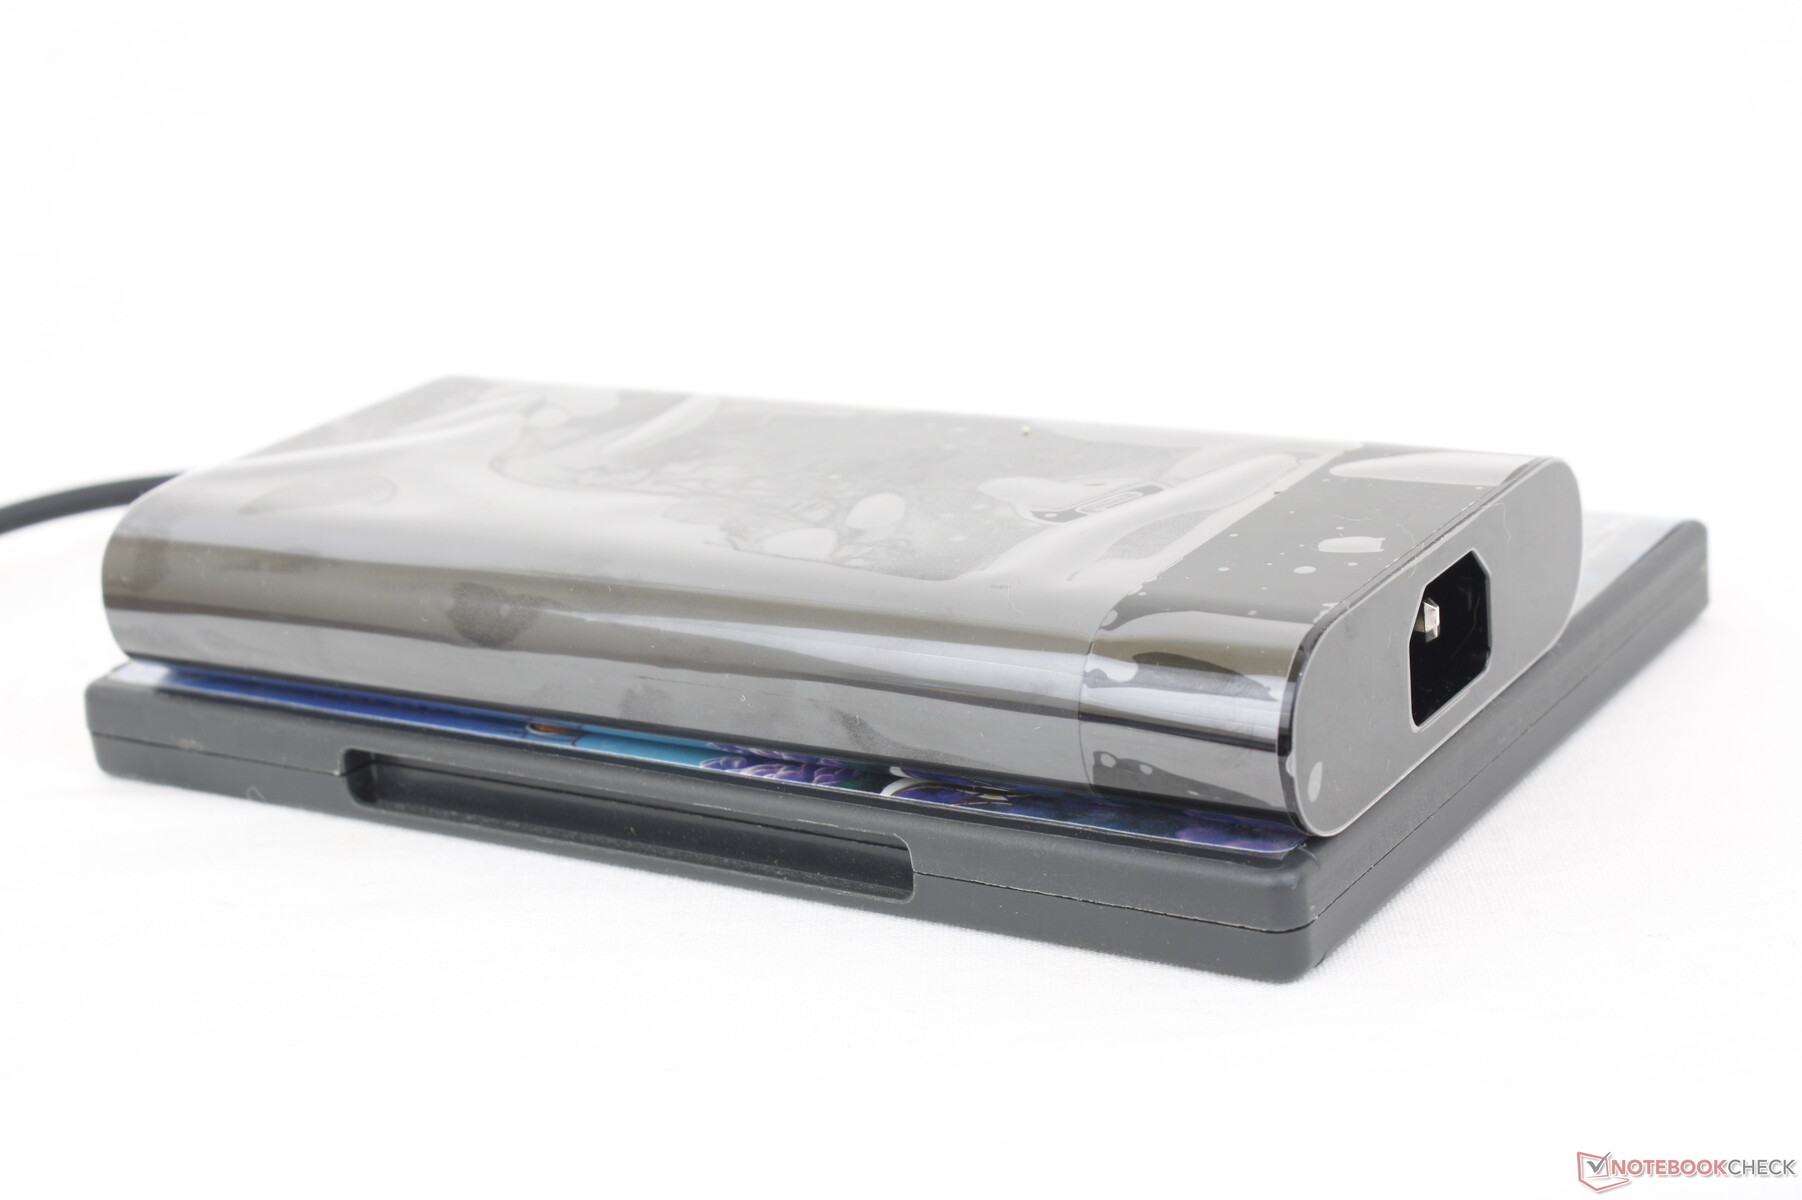
We're able to record a temporary maximum draw of 224 W from the medium-sized (~18 x 8.9 x 2.7 cm) 230 W AC adapter when the CPU and GPU are each at 100 percent utilization. Charging would therefore slow to a crawl if running such high loads simultaneously. Repeating this test on the Precision 7670 or ThinkPad P16 G1 would result in much higher temporary power consumption levels of around 300 W each since they have both higher TGP/TDP targets and thus higher Turbo Boost ceilings.

| Off / Standby | |
| Idle | |
| Load |
|
Key:
min: | |
| HP ZBook Fury 16 G9 i9-12950HX, RTX A5500 Laptop GPU, Micron 3400 1TB MTFDKBA1T0TFH, IPS, 3840x2400, 16" | HP ZBook Studio 16 G9 62U04EA i7-12800H, RTX A2000 Laptop GPU, Micron 3400 1TB MTFDKBA1T0TFH, IPS, 3840x2400, 16" | HP ZBook Firefly 16 G9-6B897EA i7-1265U, T550 Laptop GPU, Samsung PM9A1 MZVL21T0HCLR, IPS, 1920x1200, 16" | Lenovo ThinkPad P16 G1 RTX A5500 i9-12950HX, RTX A5500 Laptop GPU, WDC PC SN810 2TB, IPS, 3840x2400, 16" | Dell Precision 7000 7670 Performance i9-12950HX, RTX A5500 Laptop GPU, , OLED, 3840x2400, 16" | MSI CreatorPro Z16P B12UKST i7-12700H, RTX A3000 Laptop GPU, Samsung PM9A1 MZVL21T0HCLR, IPS, 2560x1600, 16" | |
|---|---|---|---|---|---|---|
| Power Consumption | 40% | 71% | 10% | -8% | 35% | |
| Idle Minimum * (Watt) | 19.5 | 7.2 63% | 4.5 77% | 7.5 62% | 16.4 16% | 10.8 45% |
| Idle Average * (Watt) | 29 | 18.1 38% | 8 72% | 20.1 31% | 35.9 -24% | 16.3 44% |
| Idle Maximum * (Watt) | 40.7 | 18.5 55% | 8.7 79% | 40 2% | 47 -15% | 16.9 58% |
| Load Average * (Watt) | 142.1 | 112.8 21% | 48.3 66% | 137 4% | 147.1 -4% | 111.7 21% |
| Witcher 3 ultra * (Watt) | 188.6 | 106.7 43% | 45.3 76% | 208 -10% | 158.8 16% | 152.1 19% |
| Load Maximum * (Watt) | 224.4 | 186 17% | 94.7 58% | 285.9 -27% | 311 -39% | 177.4 21% |
* ... smaller is better
Power Consumption Witcher 3 / Stresstest
Power Consumption external Monitor
Battery Life — Buggy Runtimes
The 6-hour WLAN runtime is comparable to the ZBook Studio 16 G9 and ThinkPad P16 G1 while being over an hour longer than the Precision 7670. The thinner ZBook Firefly 16 G9 can last for almost two times longer since it utilizes a slower Core U-series CPU.
Charging the 95 Wh battery from empty to full capacity is fast at just over an hour with the included AC adapter. The system can be recharged via third-party USB-C adapters as well, but compatibility is not guaranteed for smaller capacities. For example, connecting our 65 W USB-C adapter to the Fury 16 G9 would return a Windows pop-up claiming insufficient power to charge. On the other hand, our 130 W USB-C AC adapter would charge the system without any issues. Performance is reduced if charging via USB-C as to be expected.
Strangely, battery life when idling on Power Saver and on the lowest brightness setting would be shorter than our Balanced WLAN settings even after multiple retests. This is likely a bug with the model pointing to poor background resource management or buggy CPU states related to the Windows power profile settings.
| HP ZBook Fury 16 G9 i9-12950HX, RTX A5500 Laptop GPU, 95 Wh | HP ZBook Studio 16 G9 62U04EA i7-12800H, RTX A2000 Laptop GPU, 86 Wh | HP ZBook Firefly 16 G9-6B897EA i7-1265U, T550 Laptop GPU, 76 Wh | Lenovo ThinkPad P16 G1 RTX A5500 i9-12950HX, RTX A5500 Laptop GPU, 94 Wh | Dell Precision 7000 7670 Performance i9-12950HX, RTX A5500 Laptop GPU, 93 Wh | MSI CreatorPro Z16P B12UKST i7-12700H, RTX A3000 Laptop GPU, 90 Wh | |
|---|---|---|---|---|---|---|
| Battery runtime | -2% | 92% | -3% | -22% | -3% | |
| Reader / Idle (h) | 5.3 | |||||
| WiFi v1.3 (h) | 6 | 6.3 5% | 13 117% | 5.8 -3% | 4.7 -22% | 5.8 -3% |
| Load (h) | 1.2 | 1.1 -8% | 2 67% | |||
| H.264 (h) | 8.5 | 18.4 |
Pros
Cons
Verdict — Good Performance, But Lenovo And Dell Do It Faster
The ZBook Fury 16 G9 offers features not available on most other mobile workstations. The super-bright 1000-nit panel, optional OLED, per-key RGB lighting, dedicated Programmable Key, and support for up to 4x SSDs and 4x SODIMM modules are all features that enthusiasts can appreciate. Meanwhile, the comfortable keyboard and touchpad are something we wish other manufacturers can emulate.
The main drawback preventing the ZBook Fury 16 G9 from being an instant recommendation is its steeper performance throttling when compared to the Lenovo ThinkPad P16 G1 or Dell Precision 7670. While it's true that the HP can support 4x internal drives, the performance of those drives tends to throttle when stressed. It's also disappointing that the RTX A5500 targets a TGP of only 100 W when the aforementioned Lenovo and Dell models each target ~130 W for faster performance. Even the CPU slightly underperforms when compared to other models with the same processor option.
The HP ZBook Fury 16 G9 is lighter and more feature-rich than many other 16-inch workstations. Performance suffers slightly, however, due to lower TGP and TDP targets and insufficient SSD cooling.
If the above auxiliary features don't interest you, then you're better off maximizing performance by going with the ThinkPad P16 G1 or Precision 7670 instead. If you don't mind shaving off some performance for those features, however, then the lighter HP Fury may be worth considering.
Price and Availability
HP is now shipping its ZBook Fury 16 G9 starting at $1490 USD for the base configuration up to over $4000 USD for our review configuration. The Fury 16 G10 is also available.
HP ZBook Fury 16 G9
- 06/09/2023 v7 (old)
Allen Ngo
Transparency
The selection of devices to be reviewed is made by our editorial team. The test sample was provided to the author as a loan by the manufacturer or retailer for the purpose of this review. The lender had no influence on this review, nor did the manufacturer receive a copy of this review before publication. There was no obligation to publish this review. As an independent media company, Notebookcheck is not subjected to the authority of manufacturers, retailers or publishers.
This is how Notebookcheck is testing
Every year, Notebookcheck independently reviews hundreds of laptops and smartphones using standardized procedures to ensure that all results are comparable. We have continuously developed our test methods for around 20 years and set industry standards in the process. In our test labs, high-quality measuring equipment is utilized by experienced technicians and editors. These tests involve a multi-stage validation process. Our complex rating system is based on hundreds of well-founded measurements and benchmarks, which maintains objectivity. Further information on our test methods can be found here.
Price comparison
