HP ZBook Studio 16 G9 laptop review: Workstation with 120 Hz DreamColor display
HP's ZBook Studio is a high-quality and slim mobile workstation that stands in direct competition to models such as the Dell Precision 5560 or the Lenovo ThinkPad P1. While it does house powerful components, the focus on mobility is greater compared to HP's much bulkier ZBook Fury series.
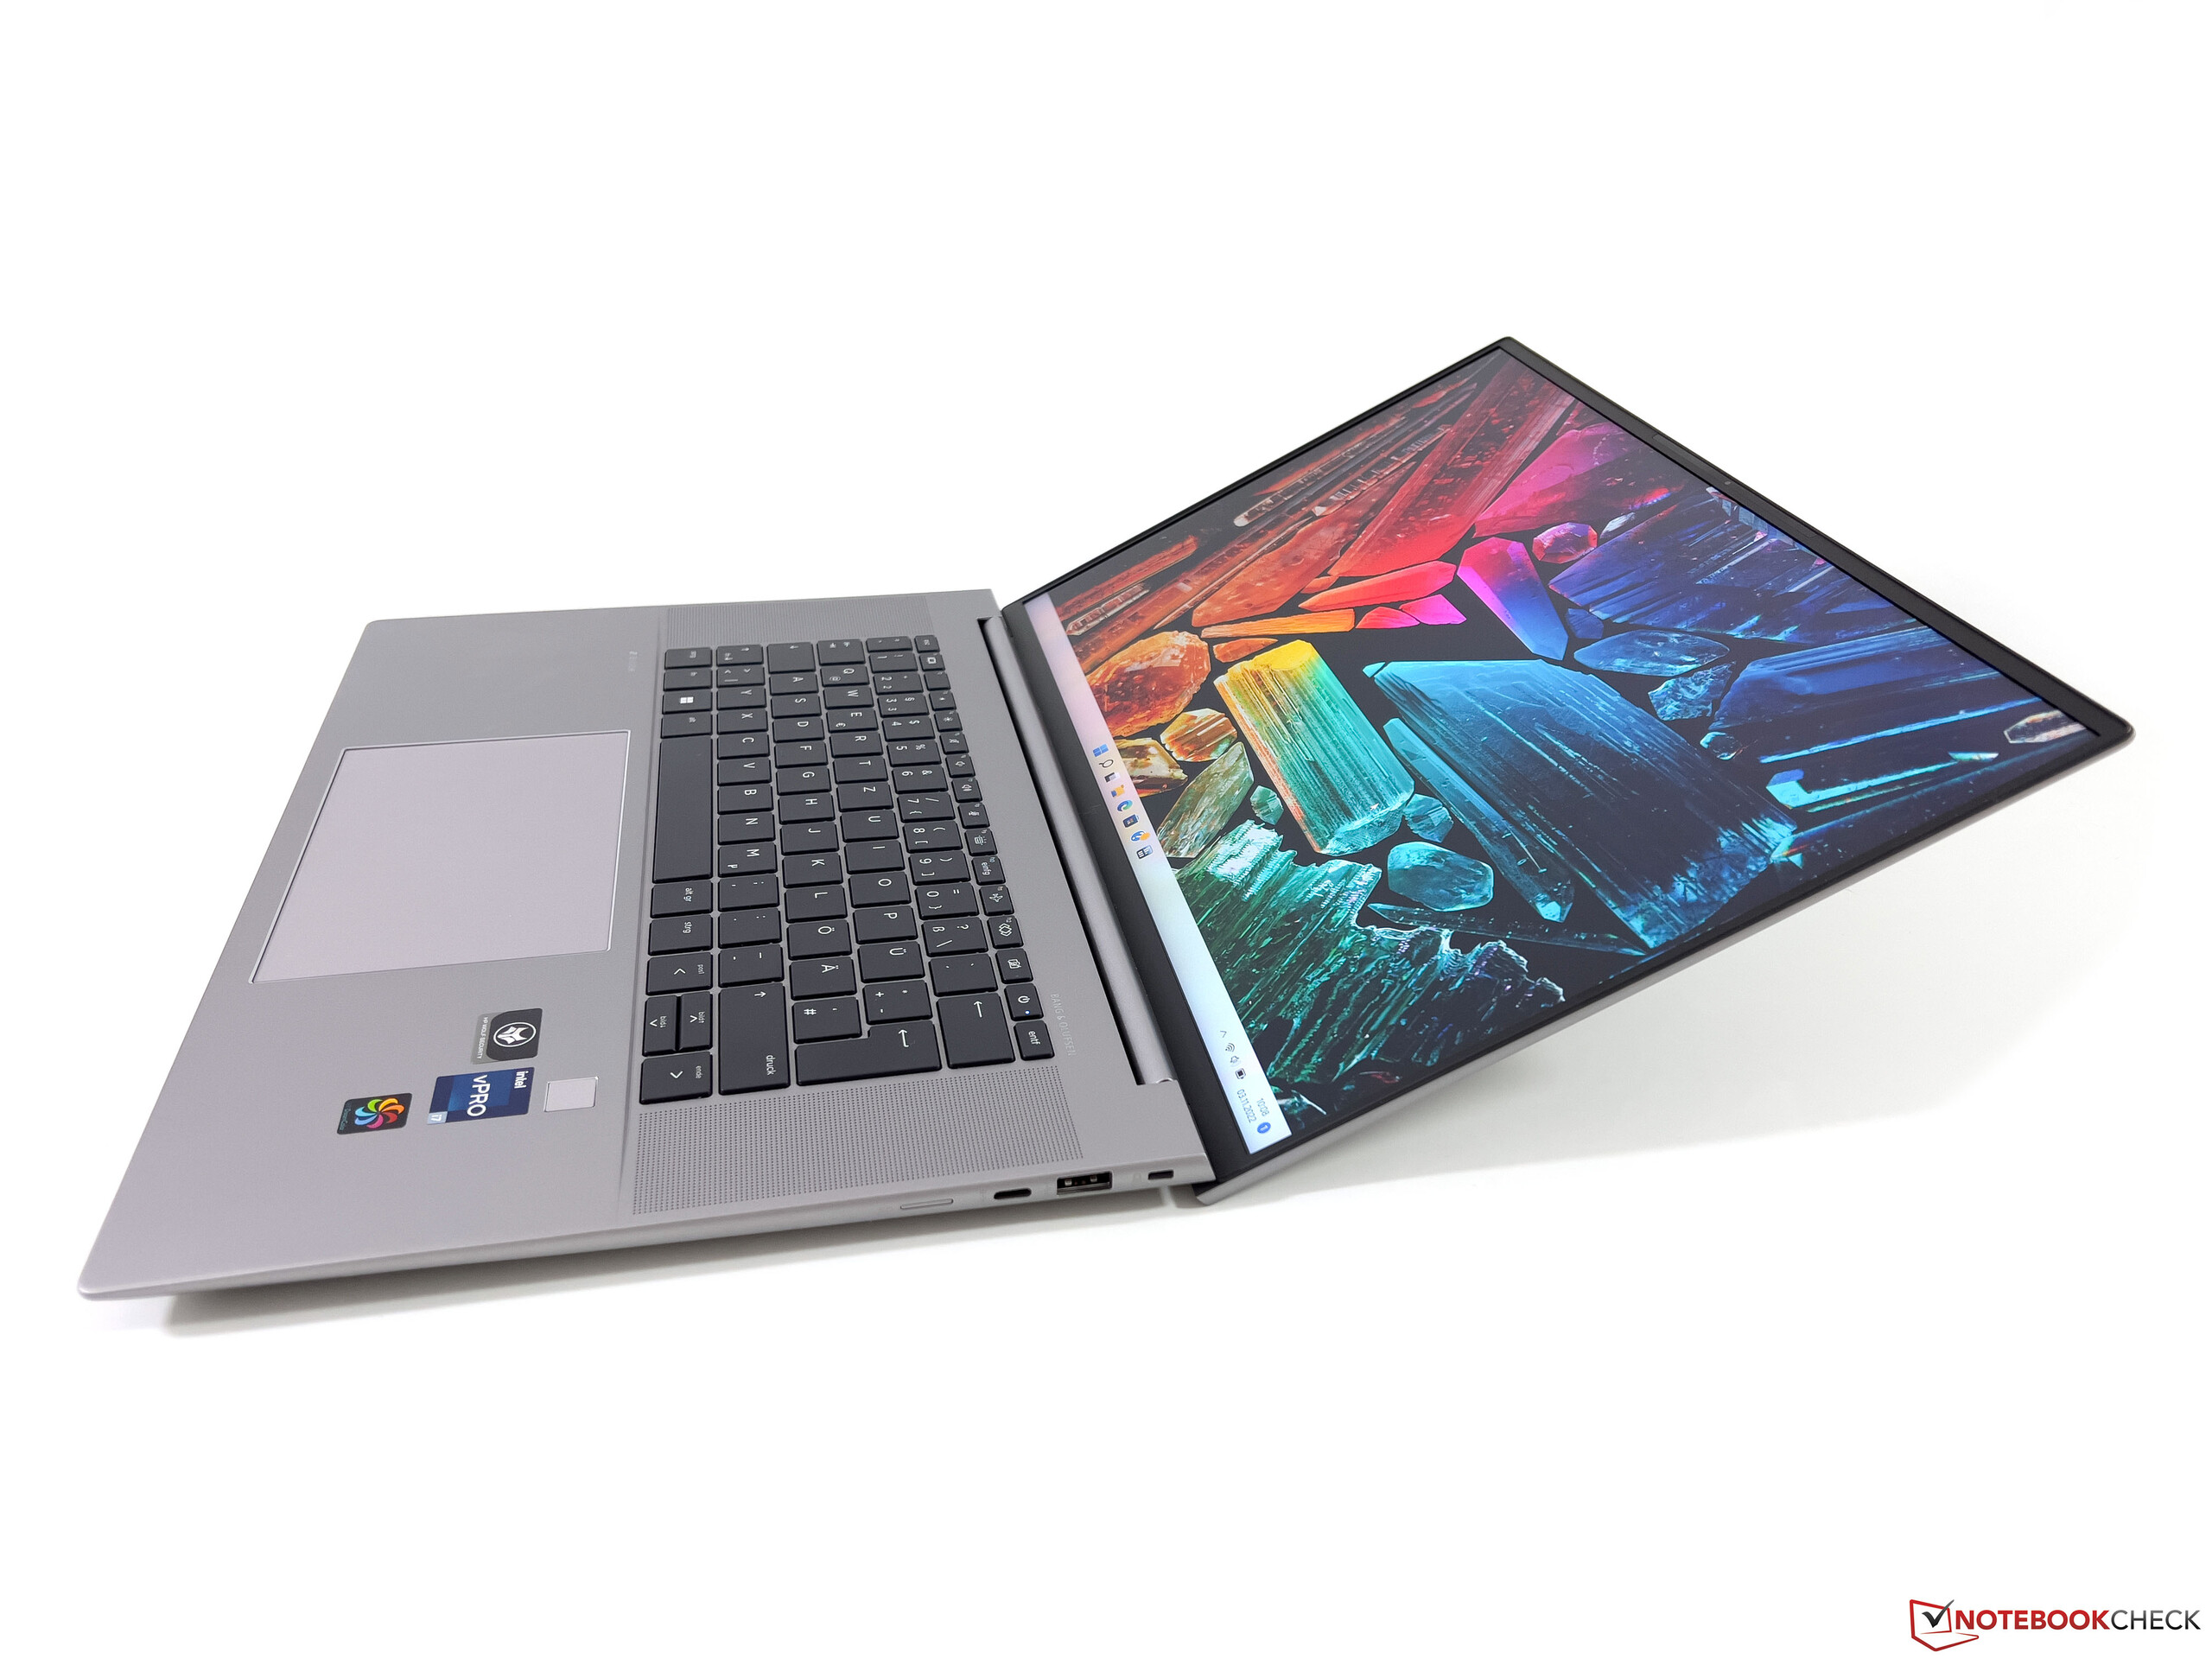
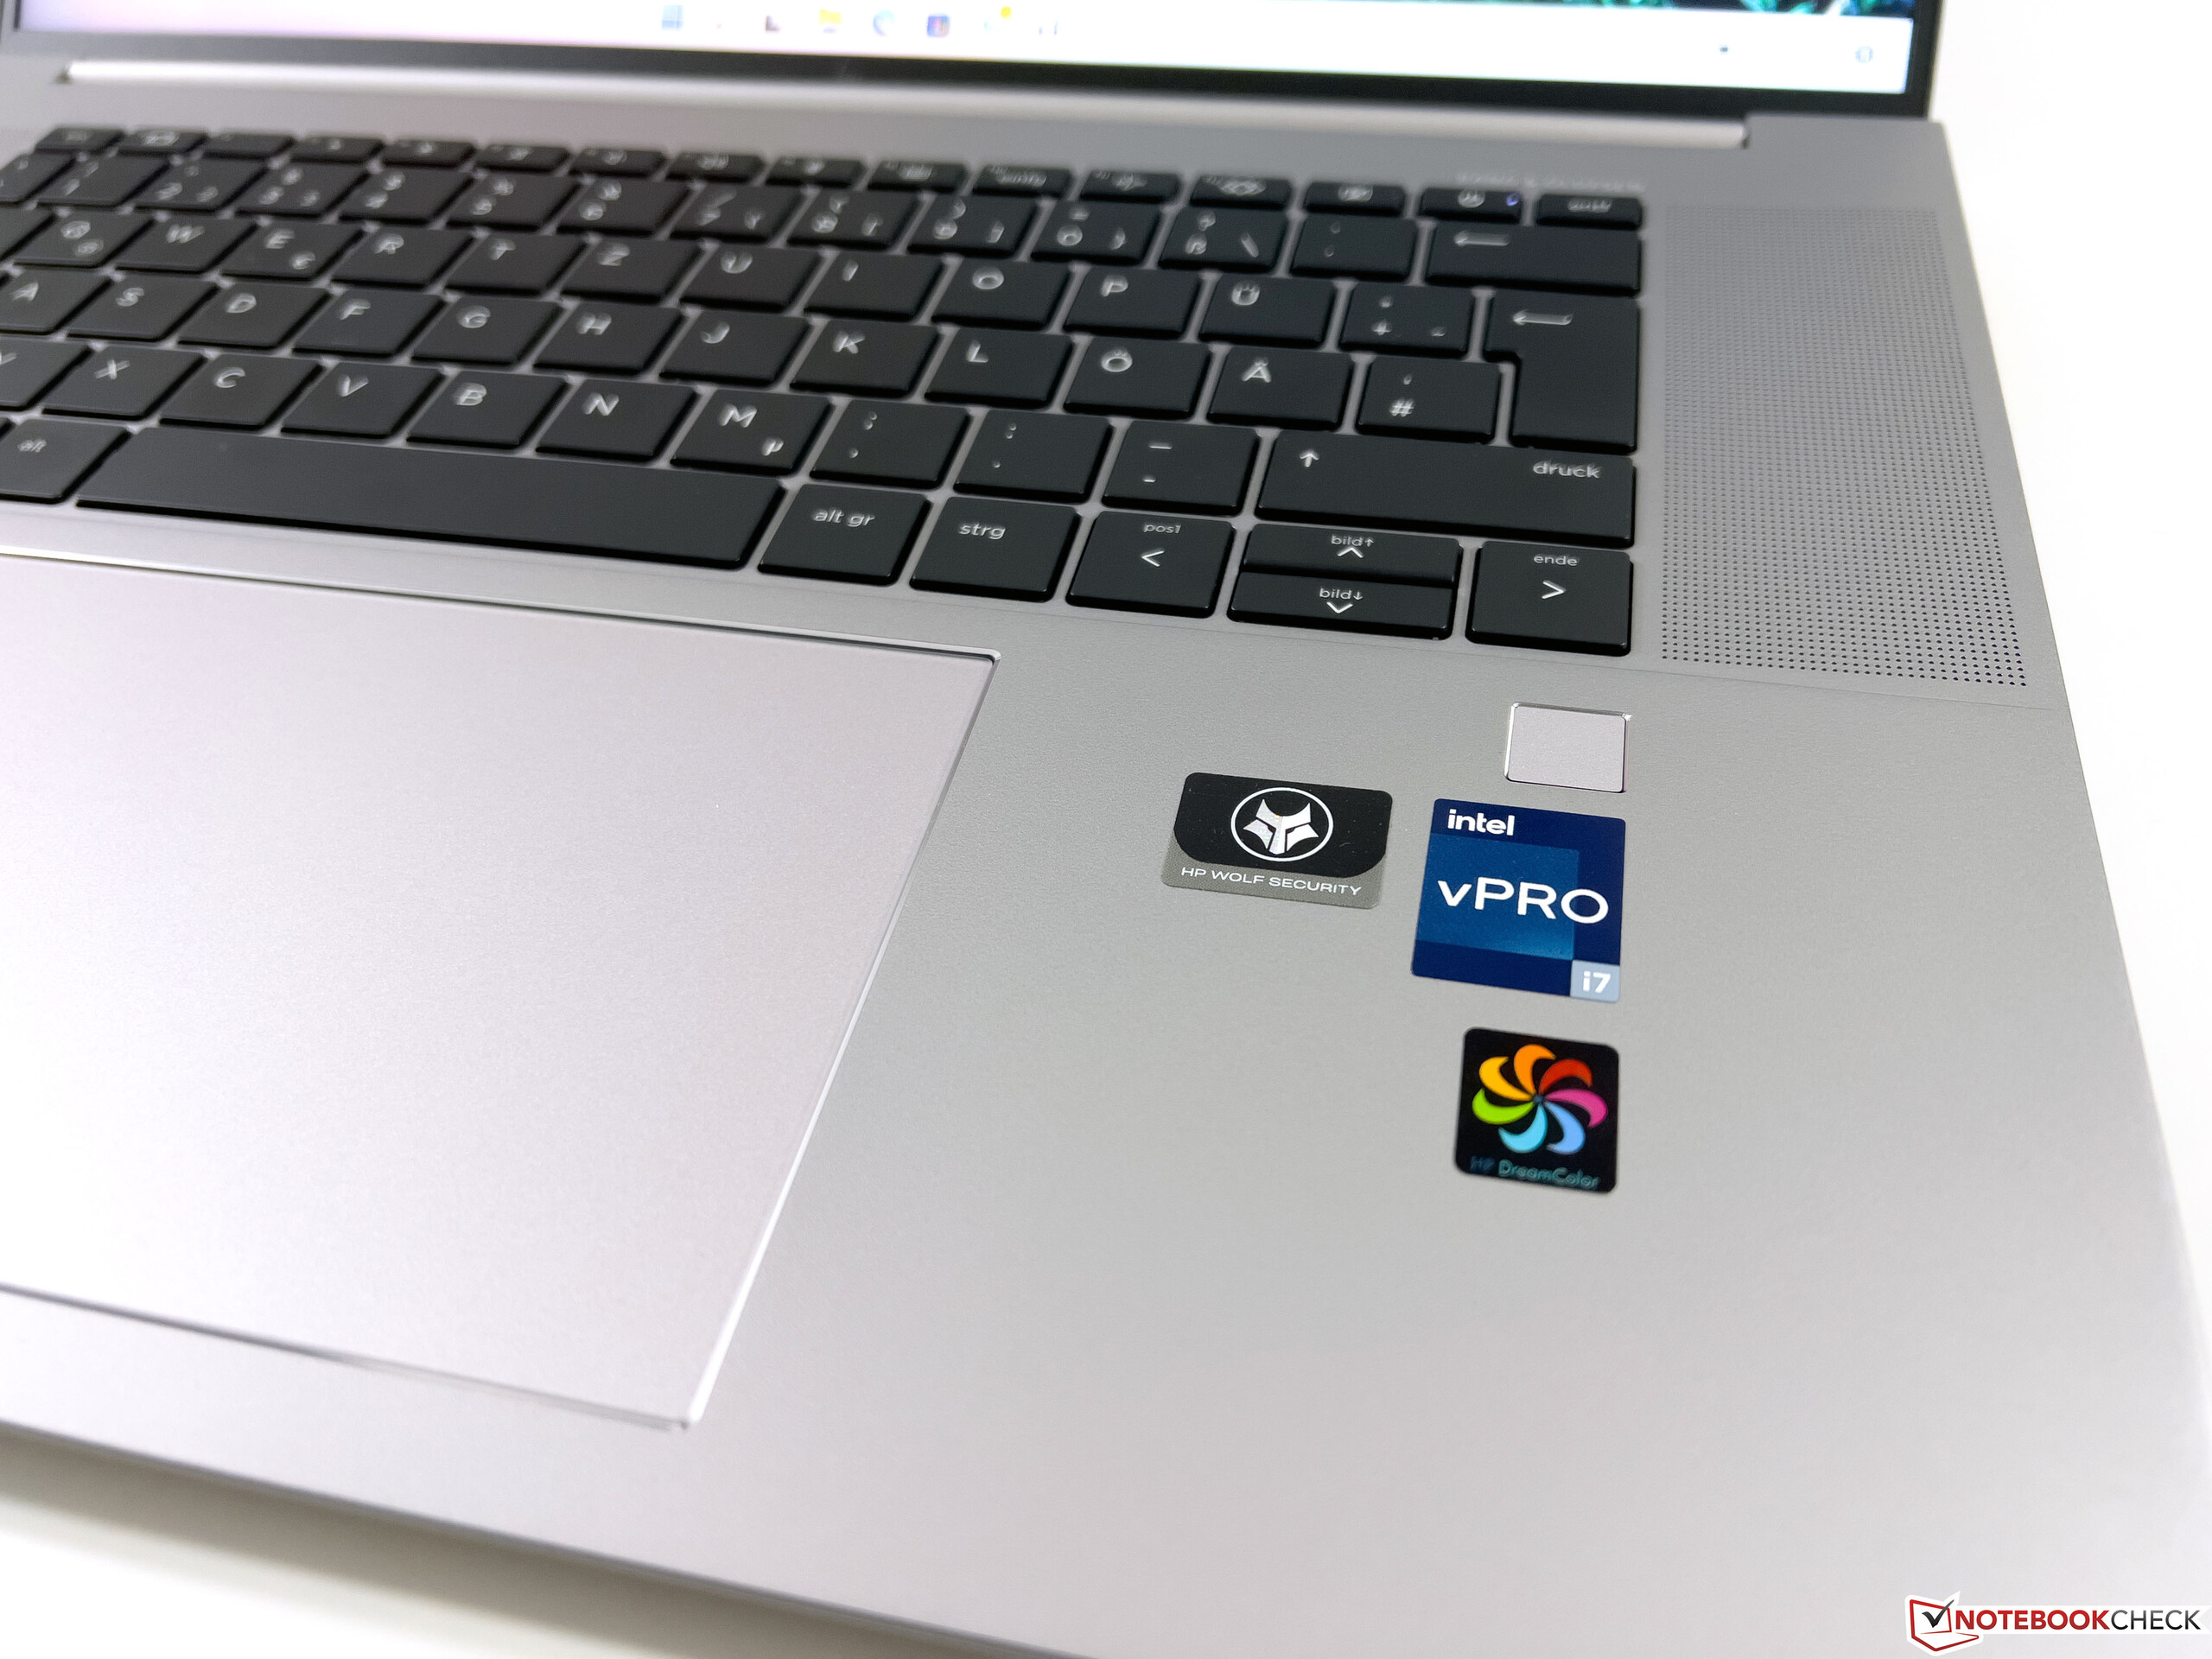
The new ZBook Studio 16 G9 offers several major upgrades, as HP has made the switch from the 15.6-inch display (16:9) of the old G8 model to new 16-inch panels in the 16:10 form factor, accompanied by a completely new case. A wide range of configurations are on offer, especially in terms of graphics cards. Our ~US$ 3,300 expensive review device is well equipped, as the current Core i7-12800H processor from Intel is supported by 32 GB of RAM and a 1 TB PCIe 4.0 SSD. A 4K DreamColor panel with 120 Hz also comes into play, and demanding graphics processing is handled by the professional Nvidia RTX A2000 (comparable to the GeForce RTX 3050 Ti).
Possible Competitors in Comparison
Rating | Date | Model | Weight | Height | Size | Resolution | Price |
|---|---|---|---|---|---|---|---|
| 90.1 % v7 (old) | 11 / 2022 | HP ZBook Studio 16 G9 62U04EA i7-12800H, RTX A2000 Laptop GPU | 1.8 kg | 19 mm | 16.00" | 3840x2400 | |
| 89.3 % v7 (old) | 02 / 2022 | Lenovo ThinkPad P1 G4-20Y4Z9DVUS i7-11800H, T1200 Laptop GPU | 1.8 kg | 17.7 mm | 16.00" | 2560x1600 | |
| 92.5 % v7 (old) | 11 / 2021 | Apple MacBook Pro 16 2021 M1 Max M1 Max, M1 Max 32-Core GPU | 2.2 kg | 16.8 mm | 16.20" | 3456x2234 | |
| 88.3 % v7 (old) | 10 / 2021 | Dell Precision 5000 5560 i7-11850H, RTX A2000 Laptop GPU | 2 kg | 18 mm | 15.60" | 3840x2400 | |
| 87.8 % v7 (old) | 08 / 2021 | HP ZBook Studio 15 G8 i9-11950H, GeForce RTX 3070 Laptop GPU | 1.9 kg | 18 mm | 15.60" | 3840x2160 |
Case - ZBook with aluminum case
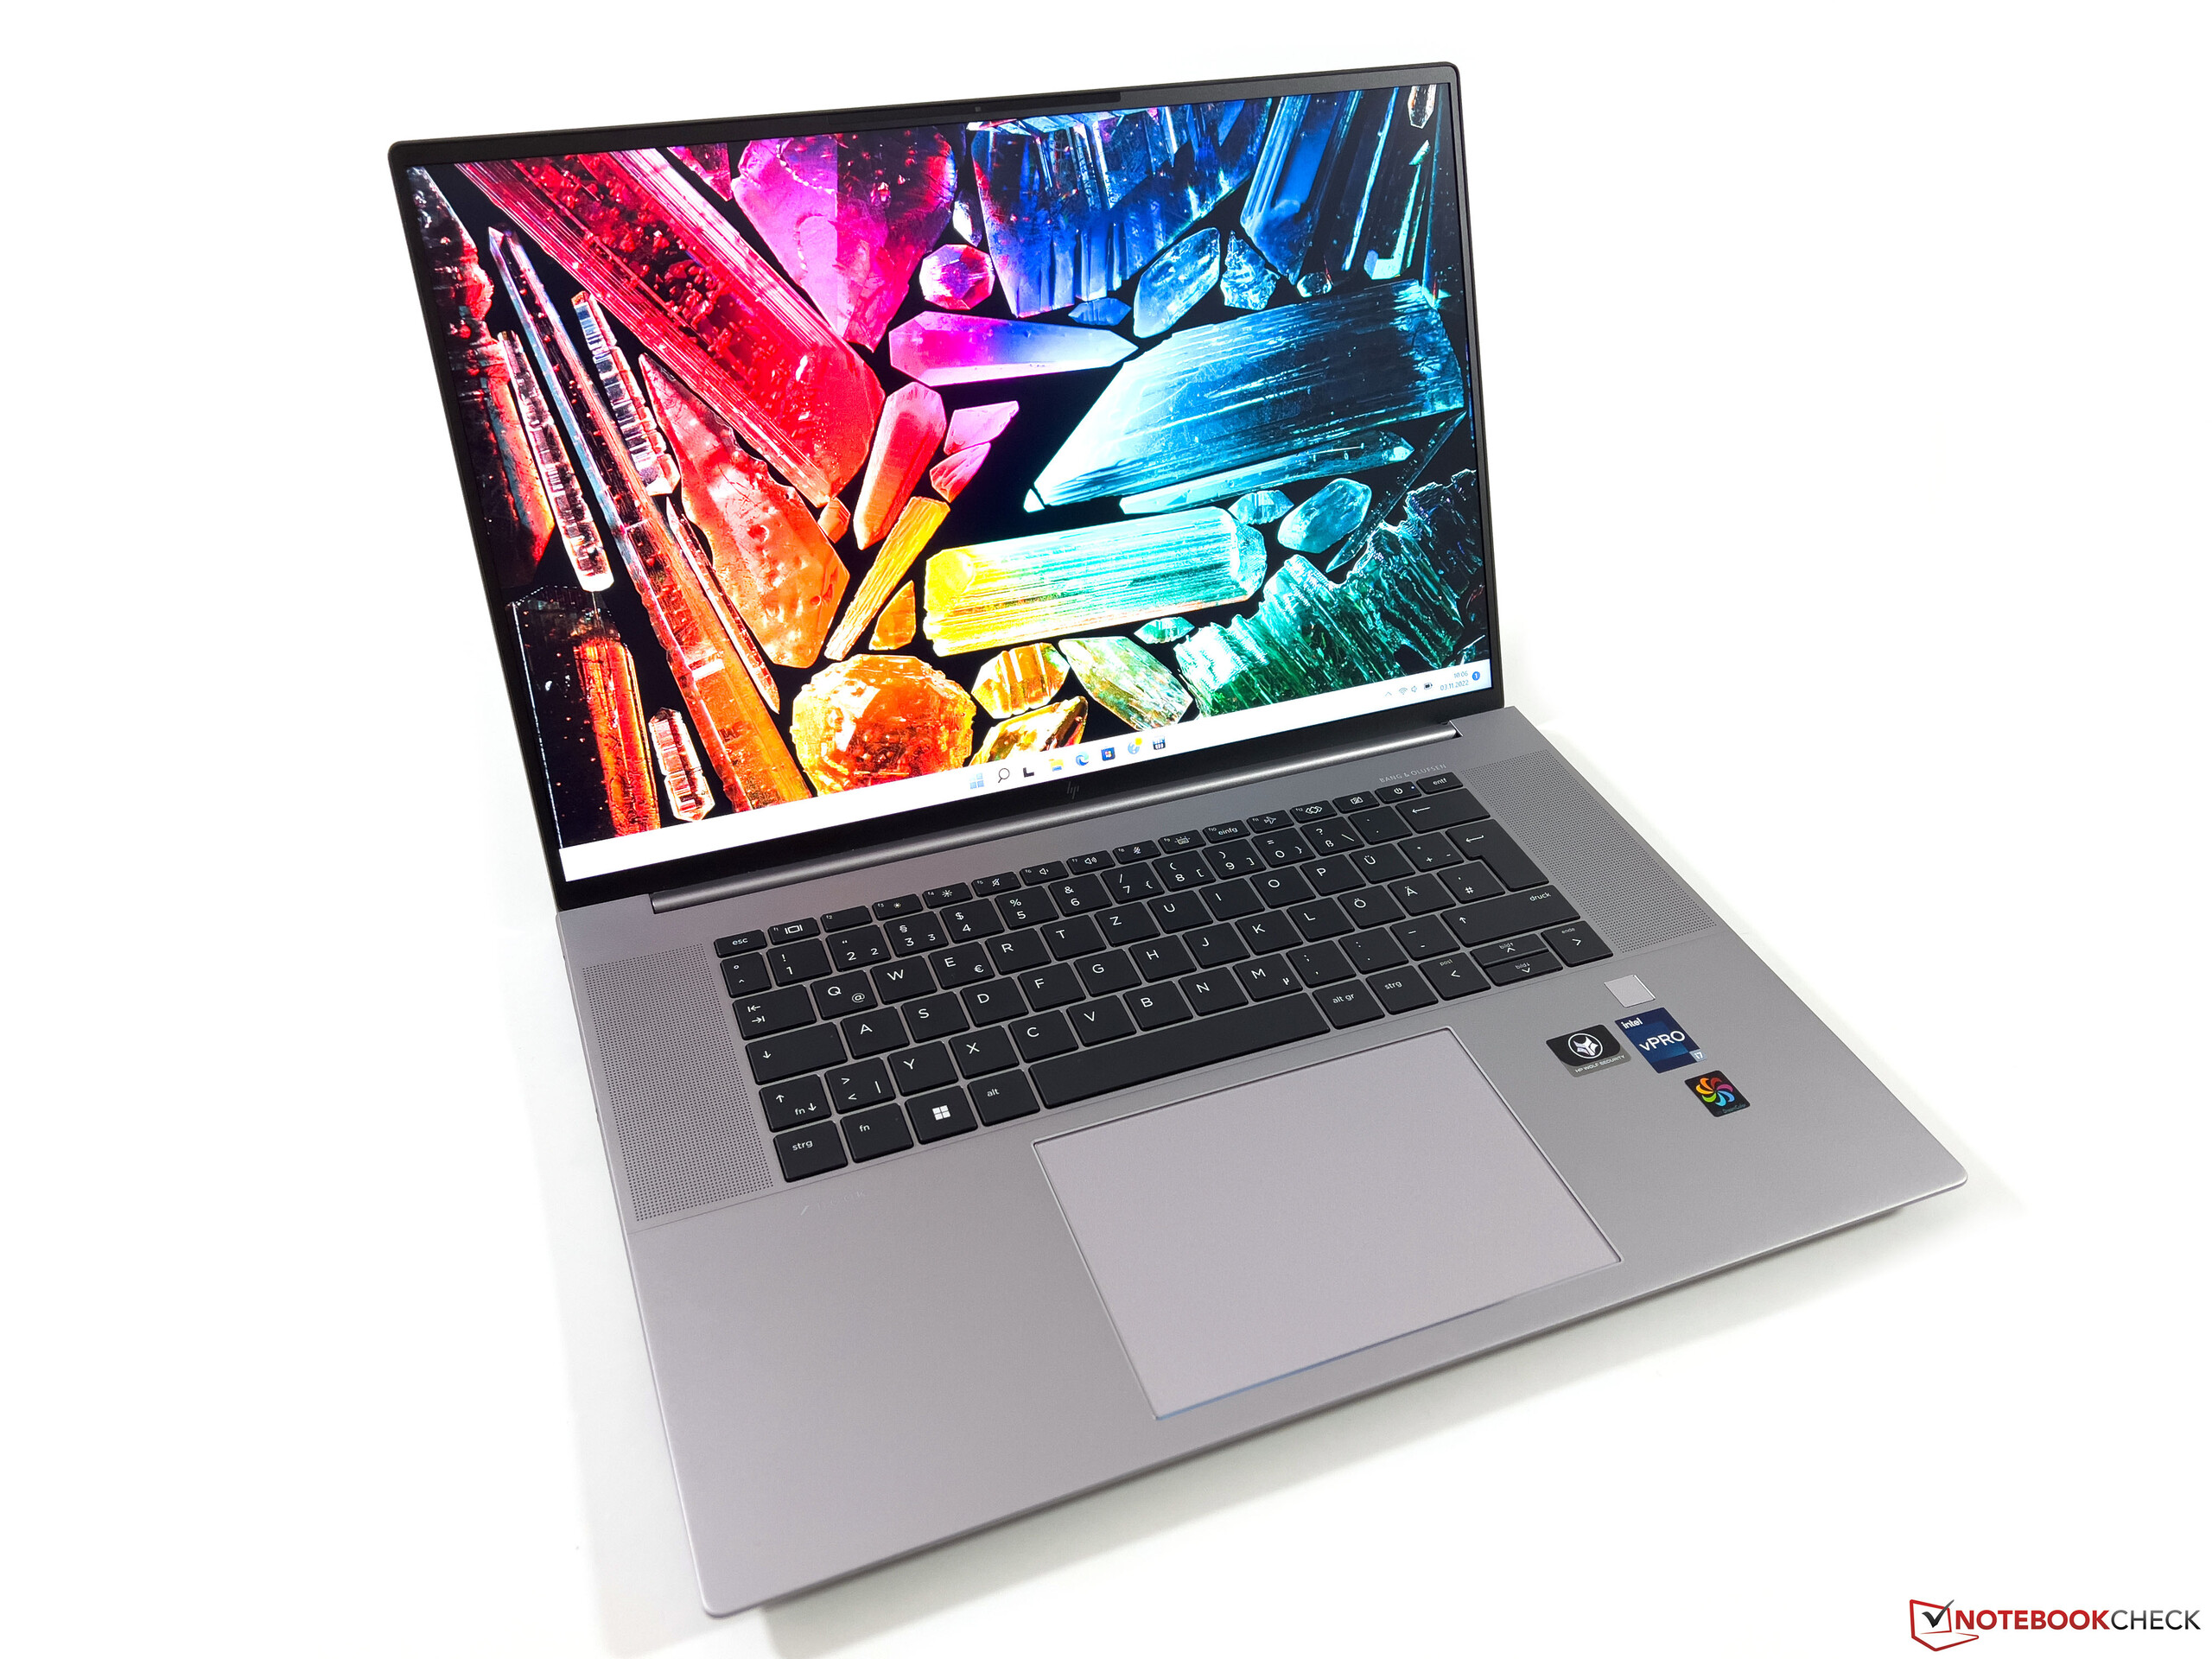
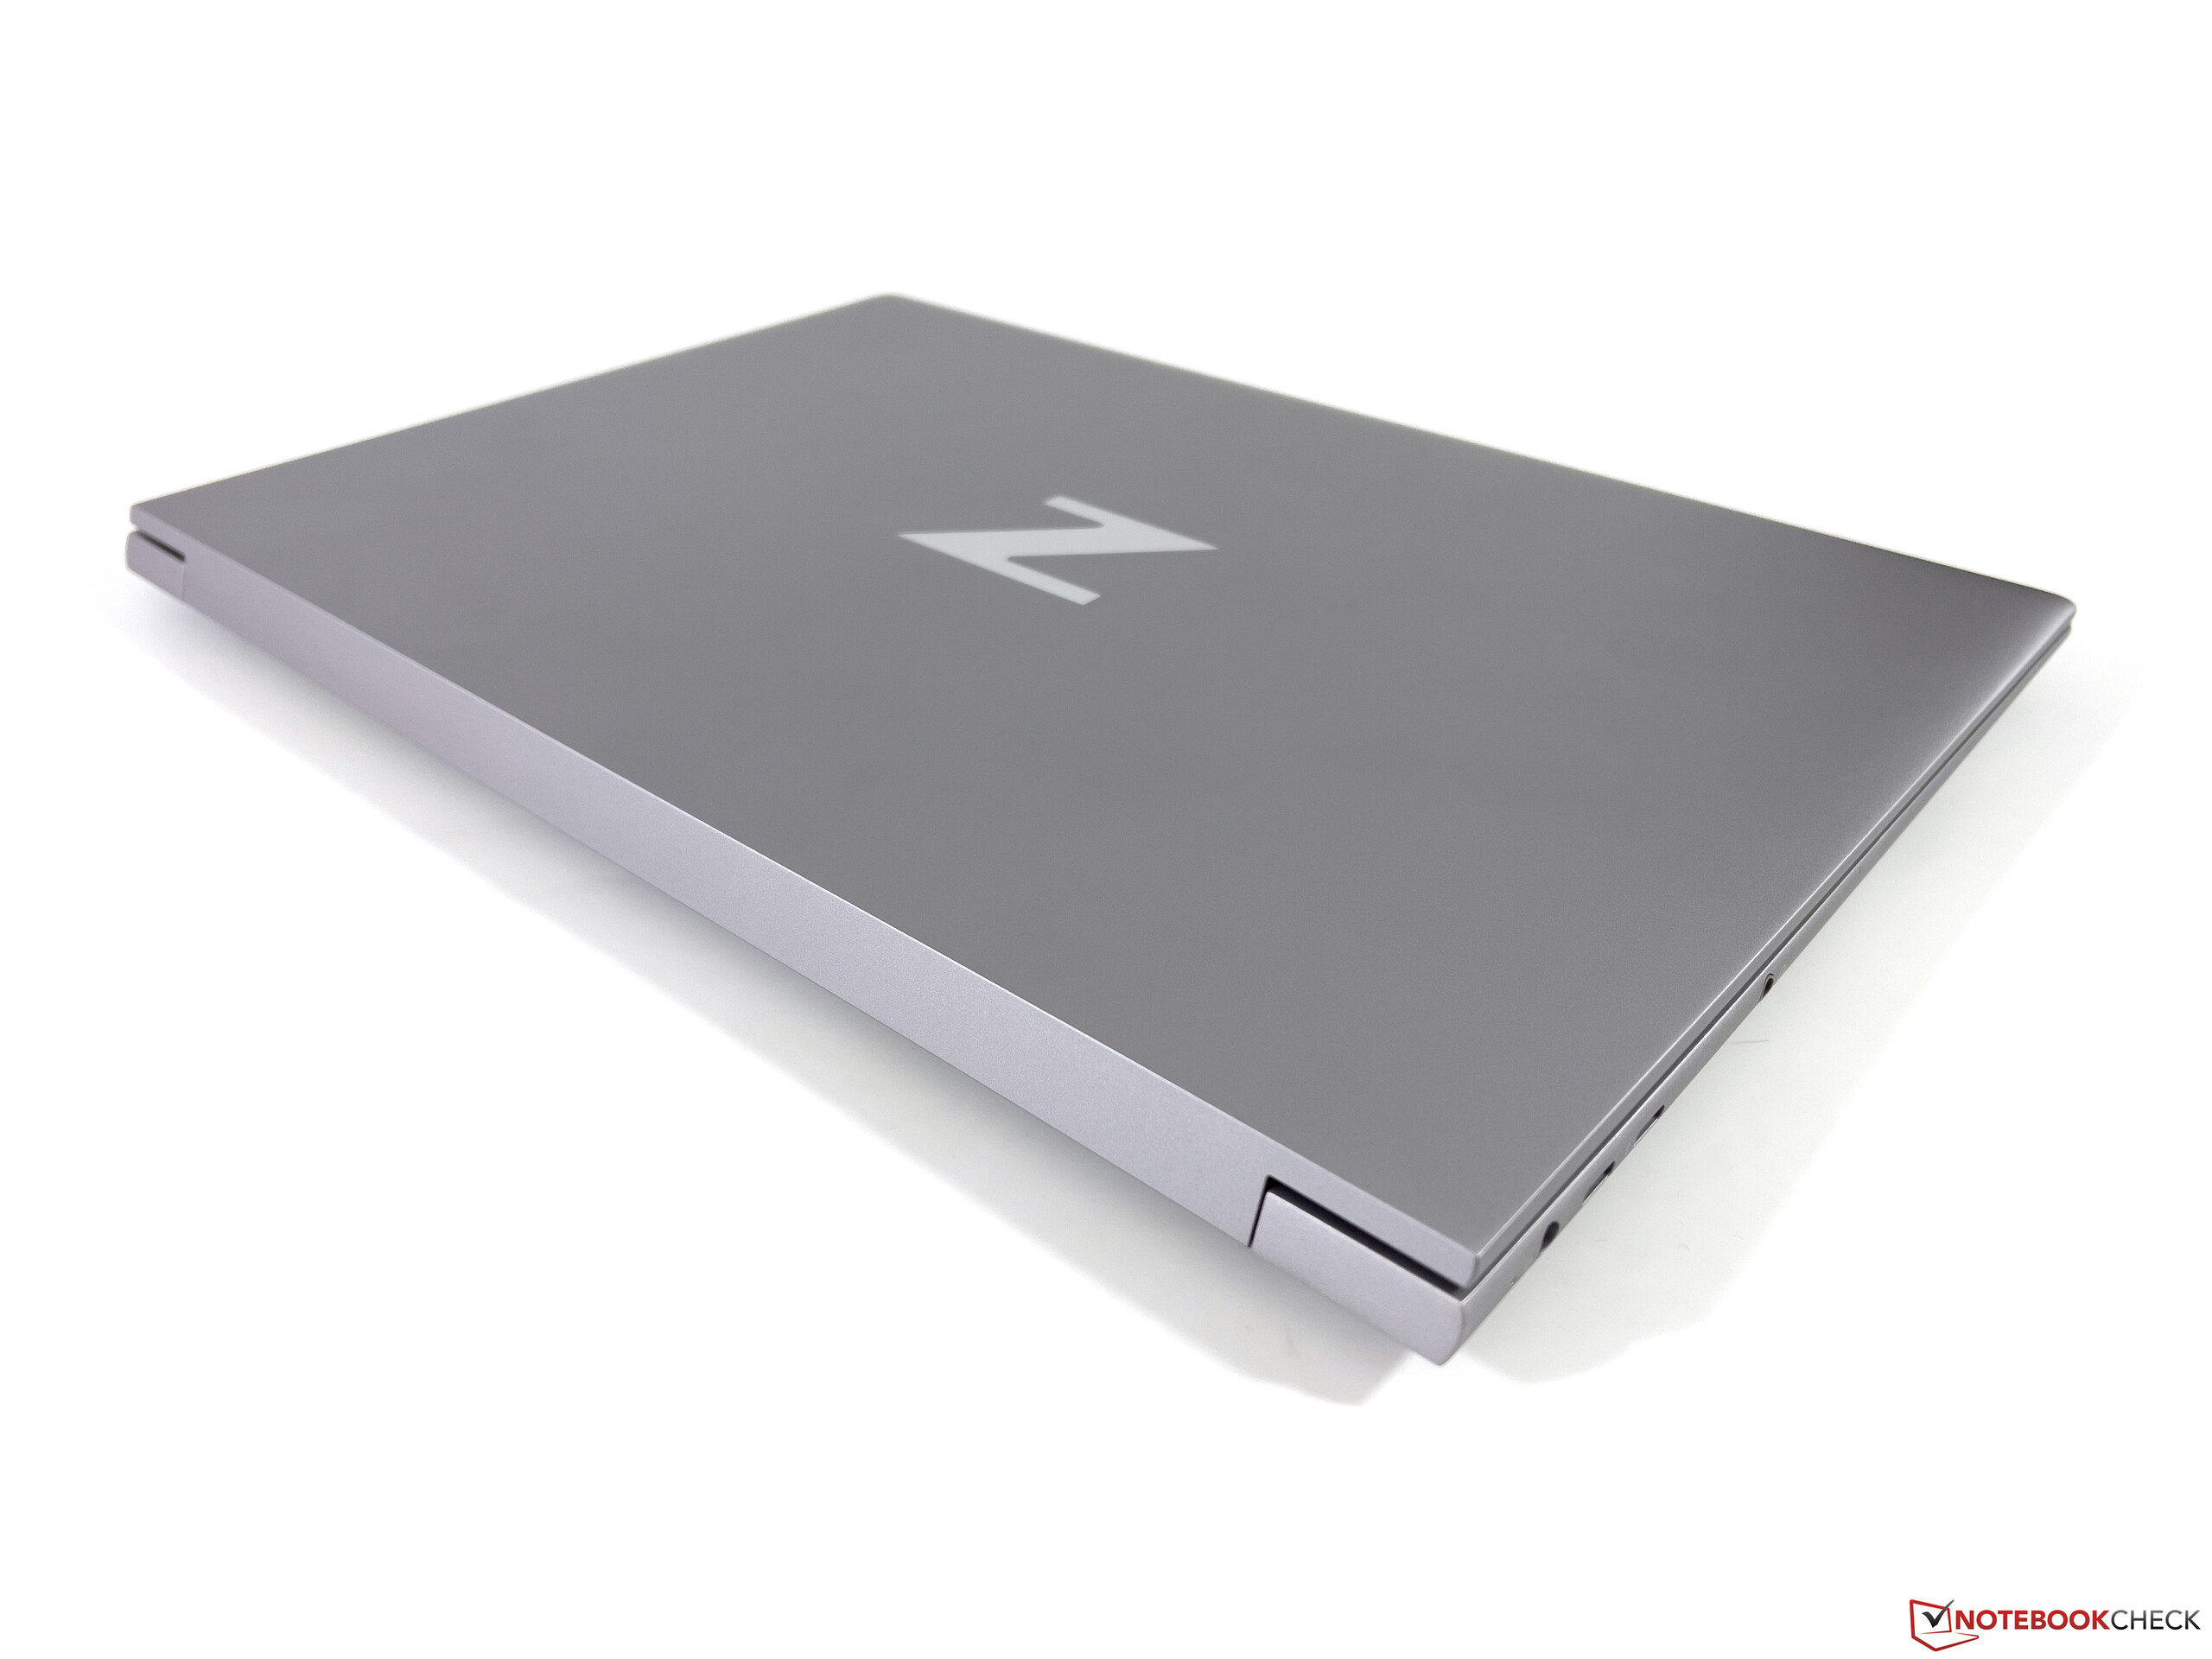
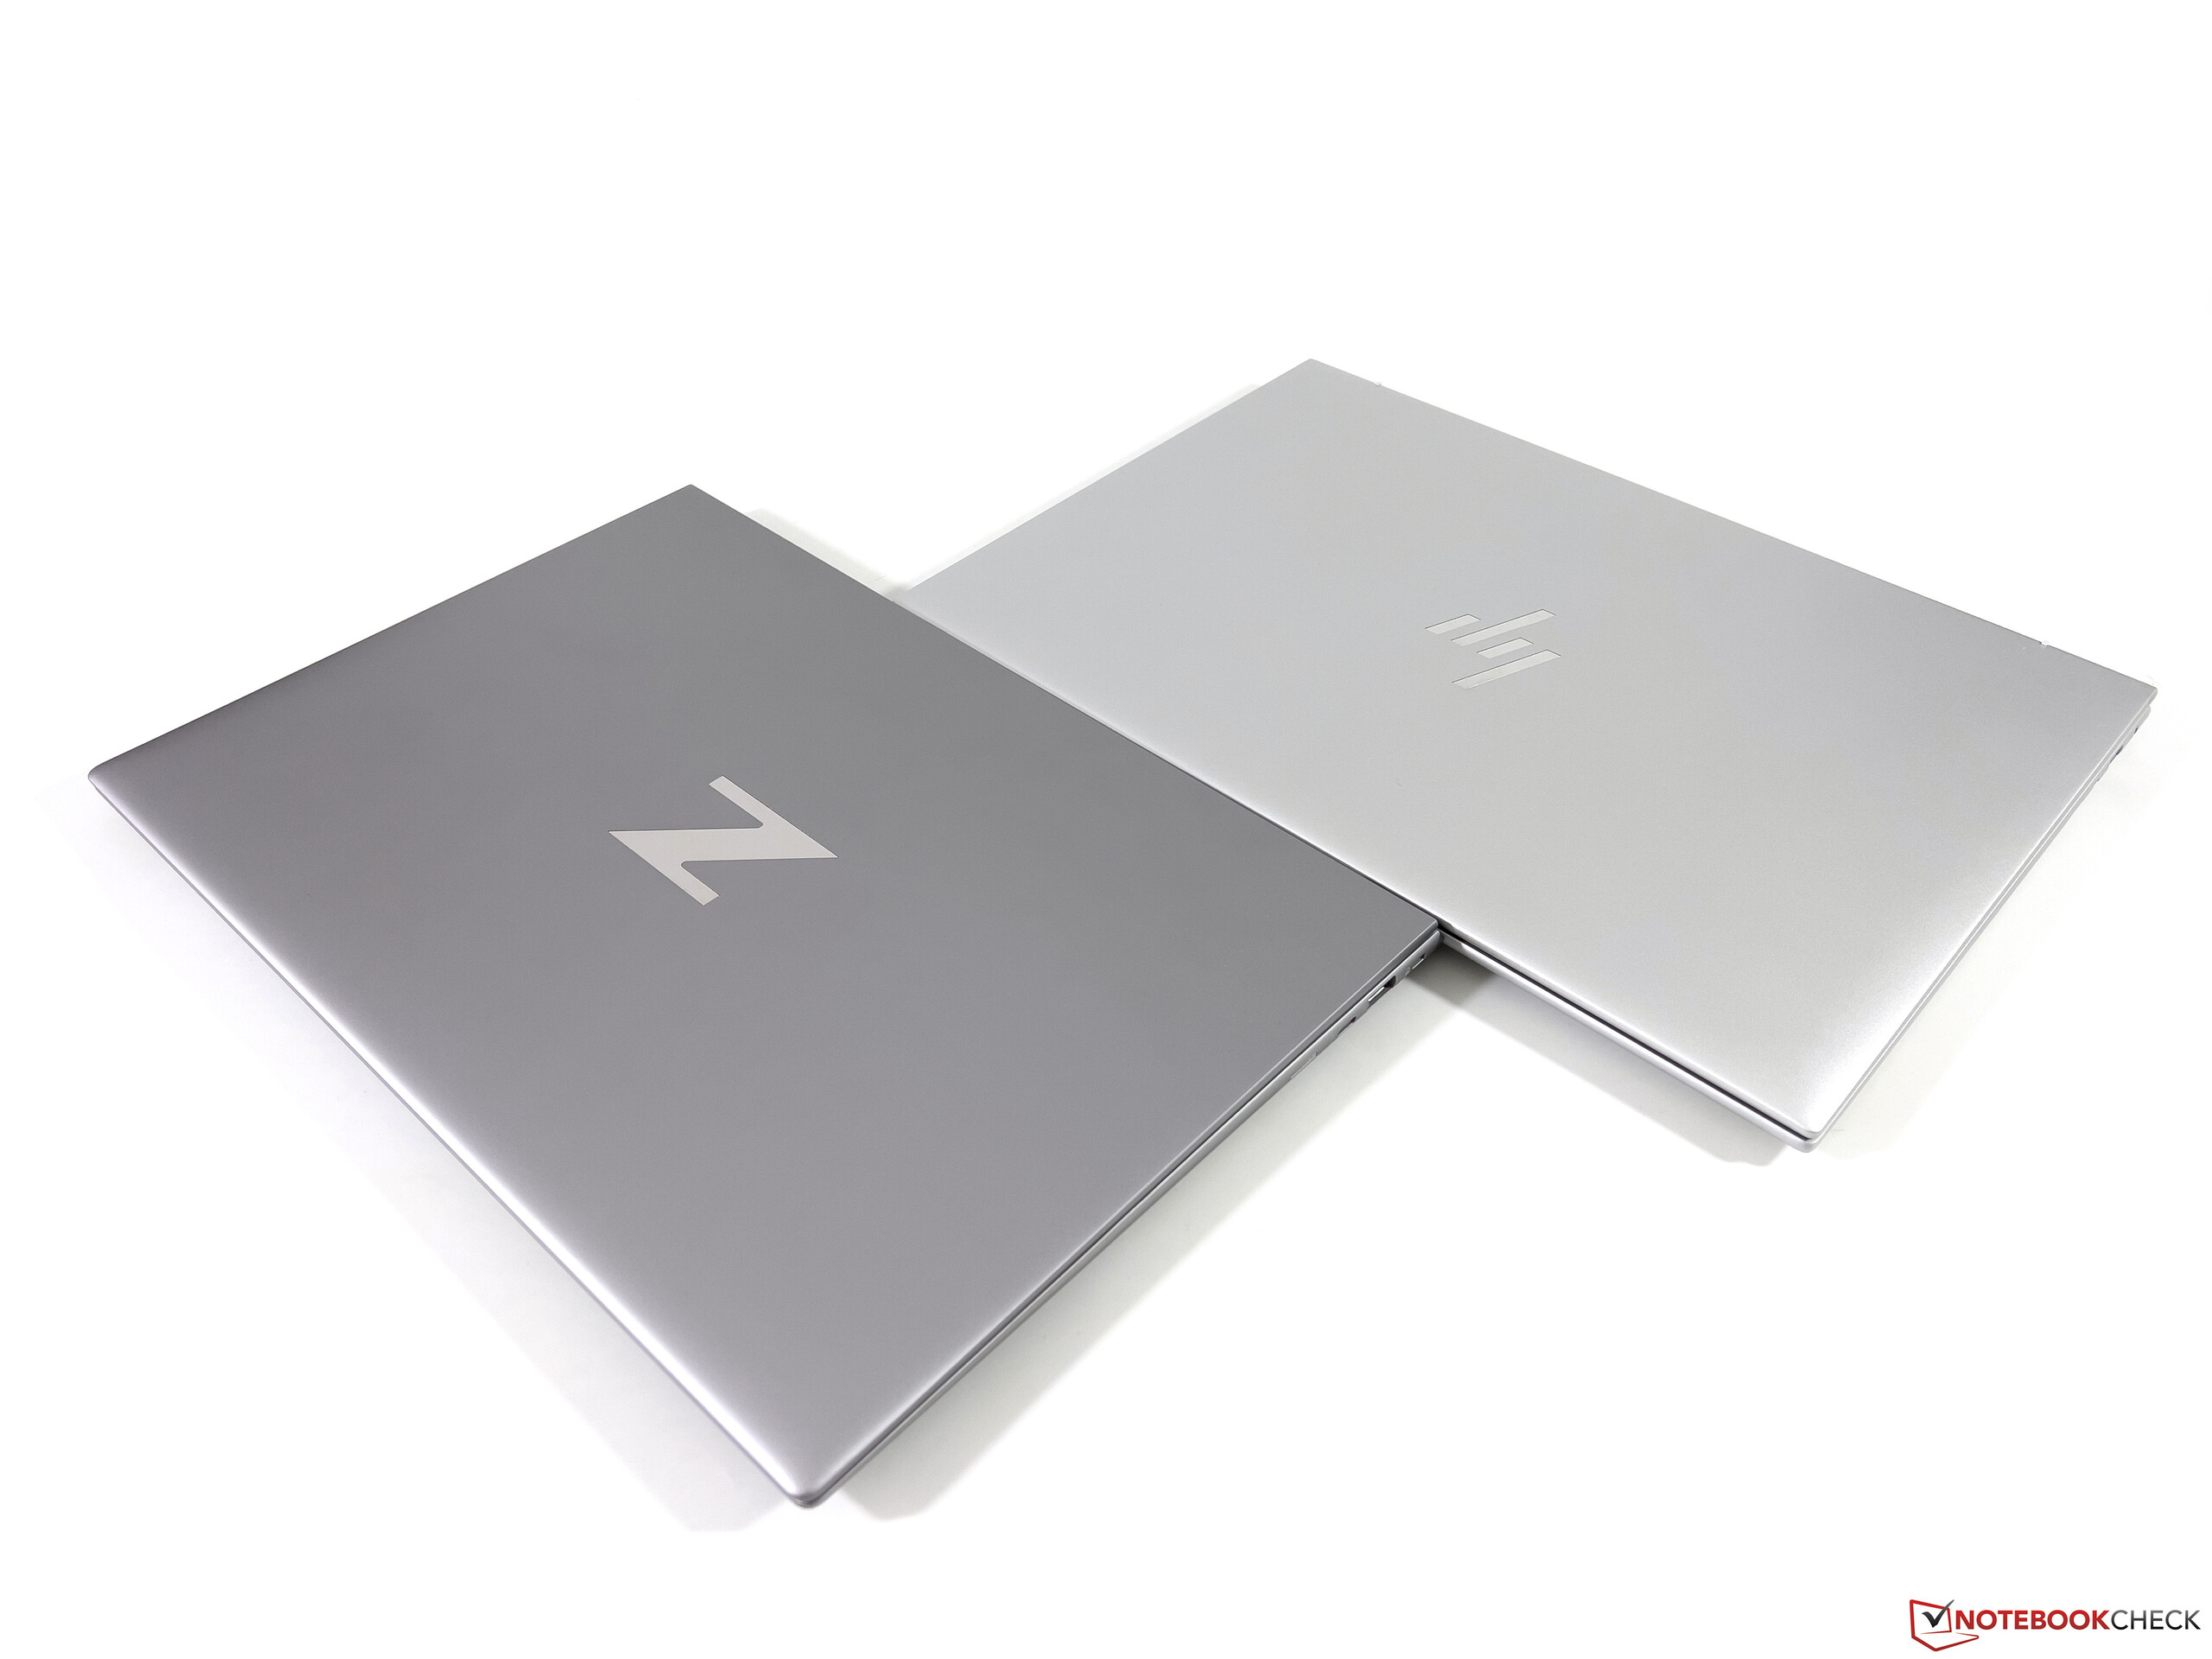
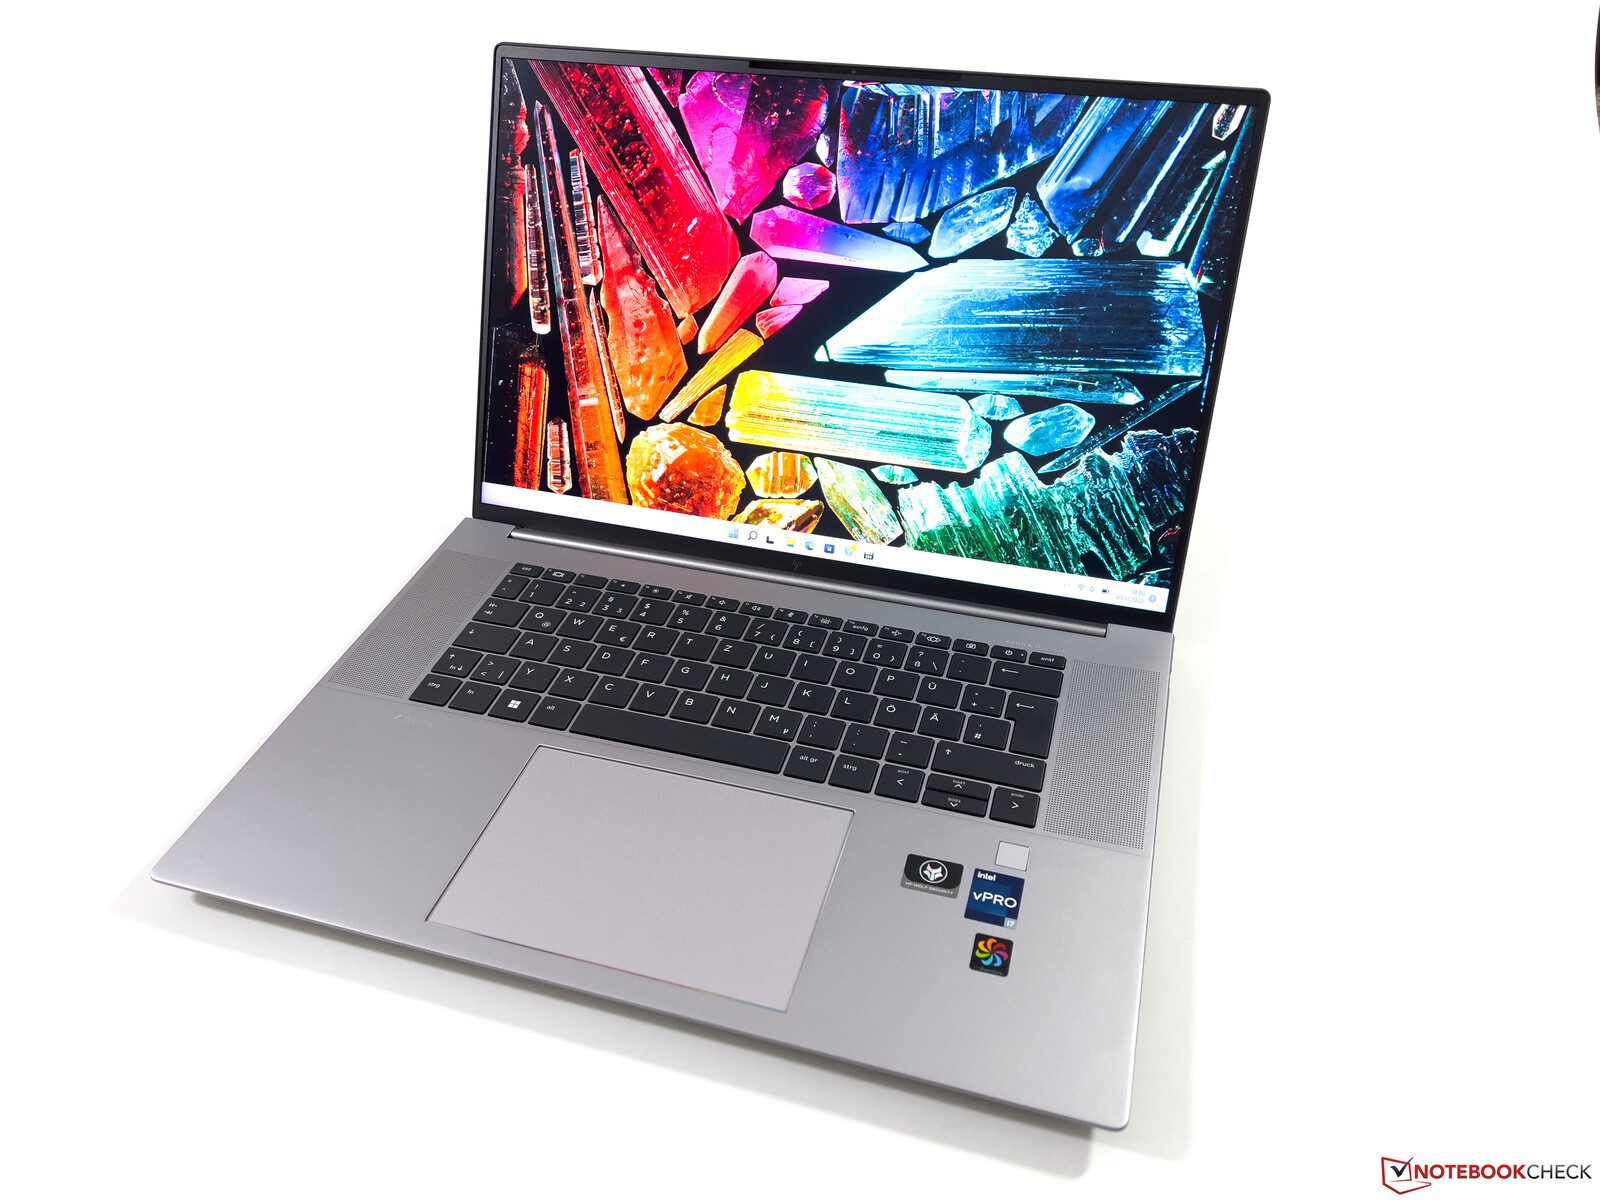
Even though not immediately obvious, HP uses a completely new case for the new ZBook Studio 16 G9. Edges at the back are still angular, but the rest of the case is now a little rounder. Compared to the regular EliteBook models (silver), this model sports a darker gray, which is clearly noticeable in the comparison picture below. As soon as you open the screen panel, you immediately notice the narrow screen edges, which look very contemporary.
Qualitatively, the metal case is beyond reproach, since both the base unit and the comparatively thin screen lid are extremely stable. We were thus unable to elicit any creaking noises or image errors. The screen's hinge is also very well adjusted and there is only minimal teetering when changing the opening angle, which extends to a maximum of around 150 degrees.
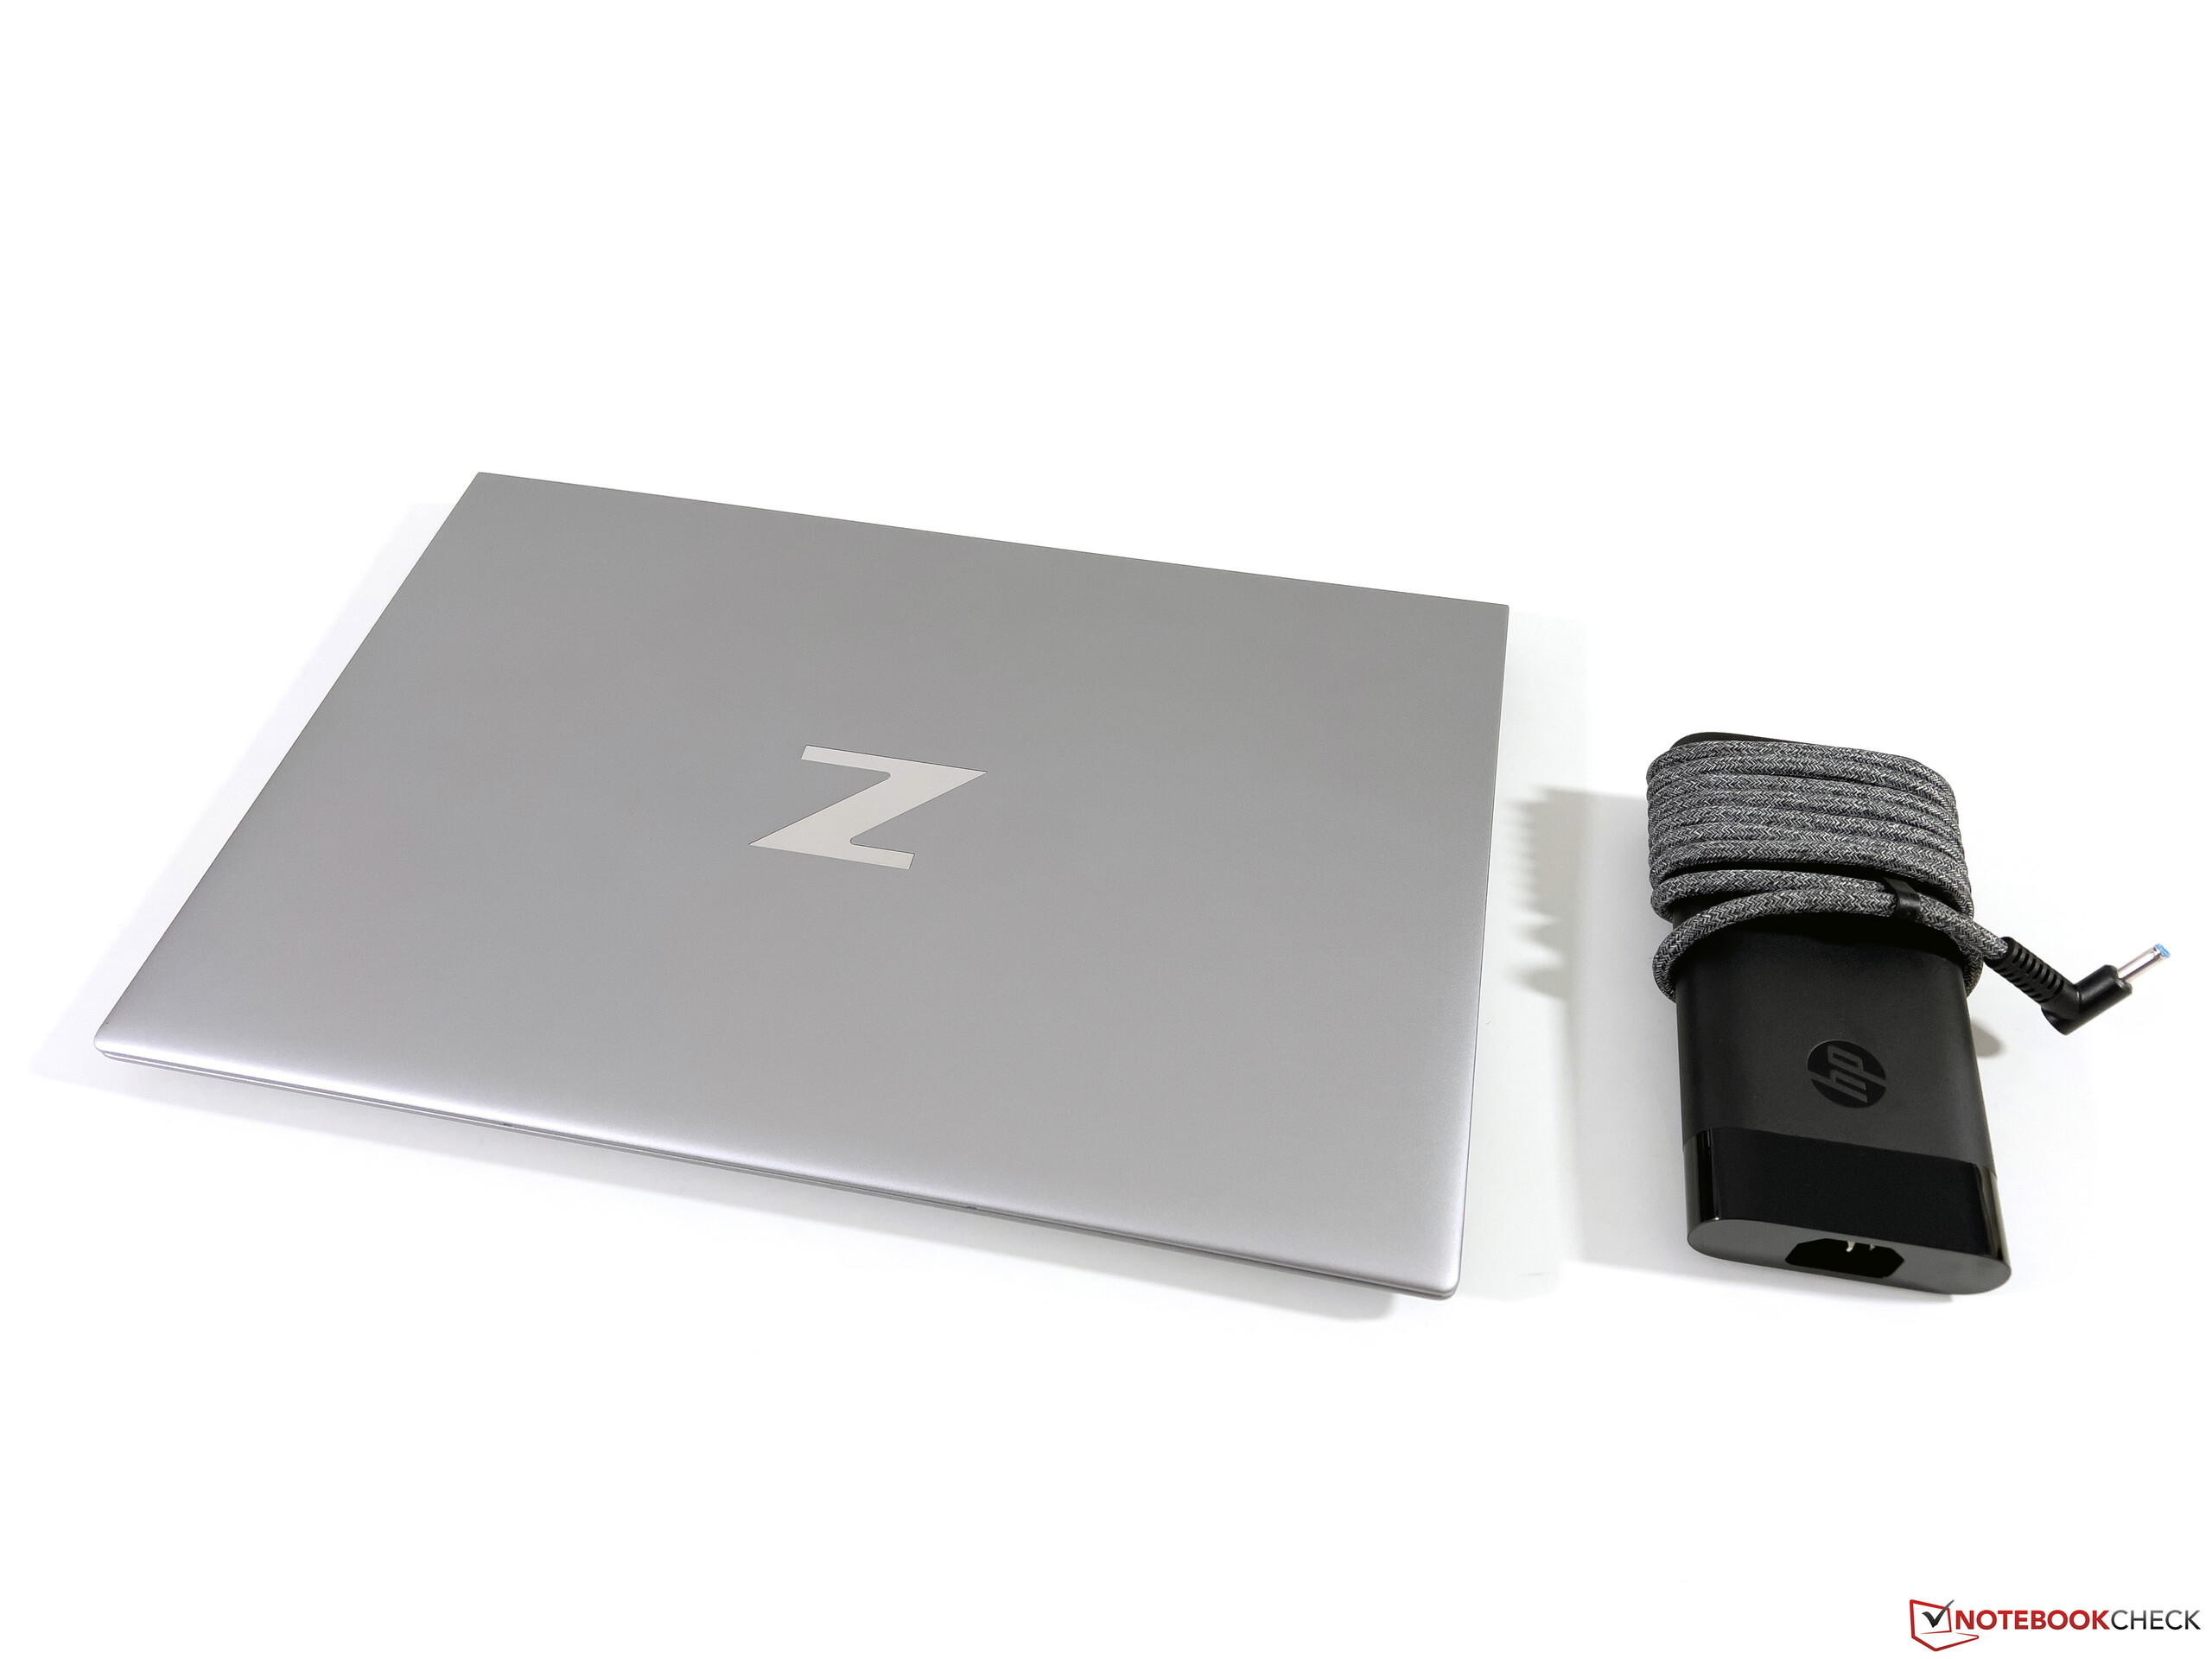
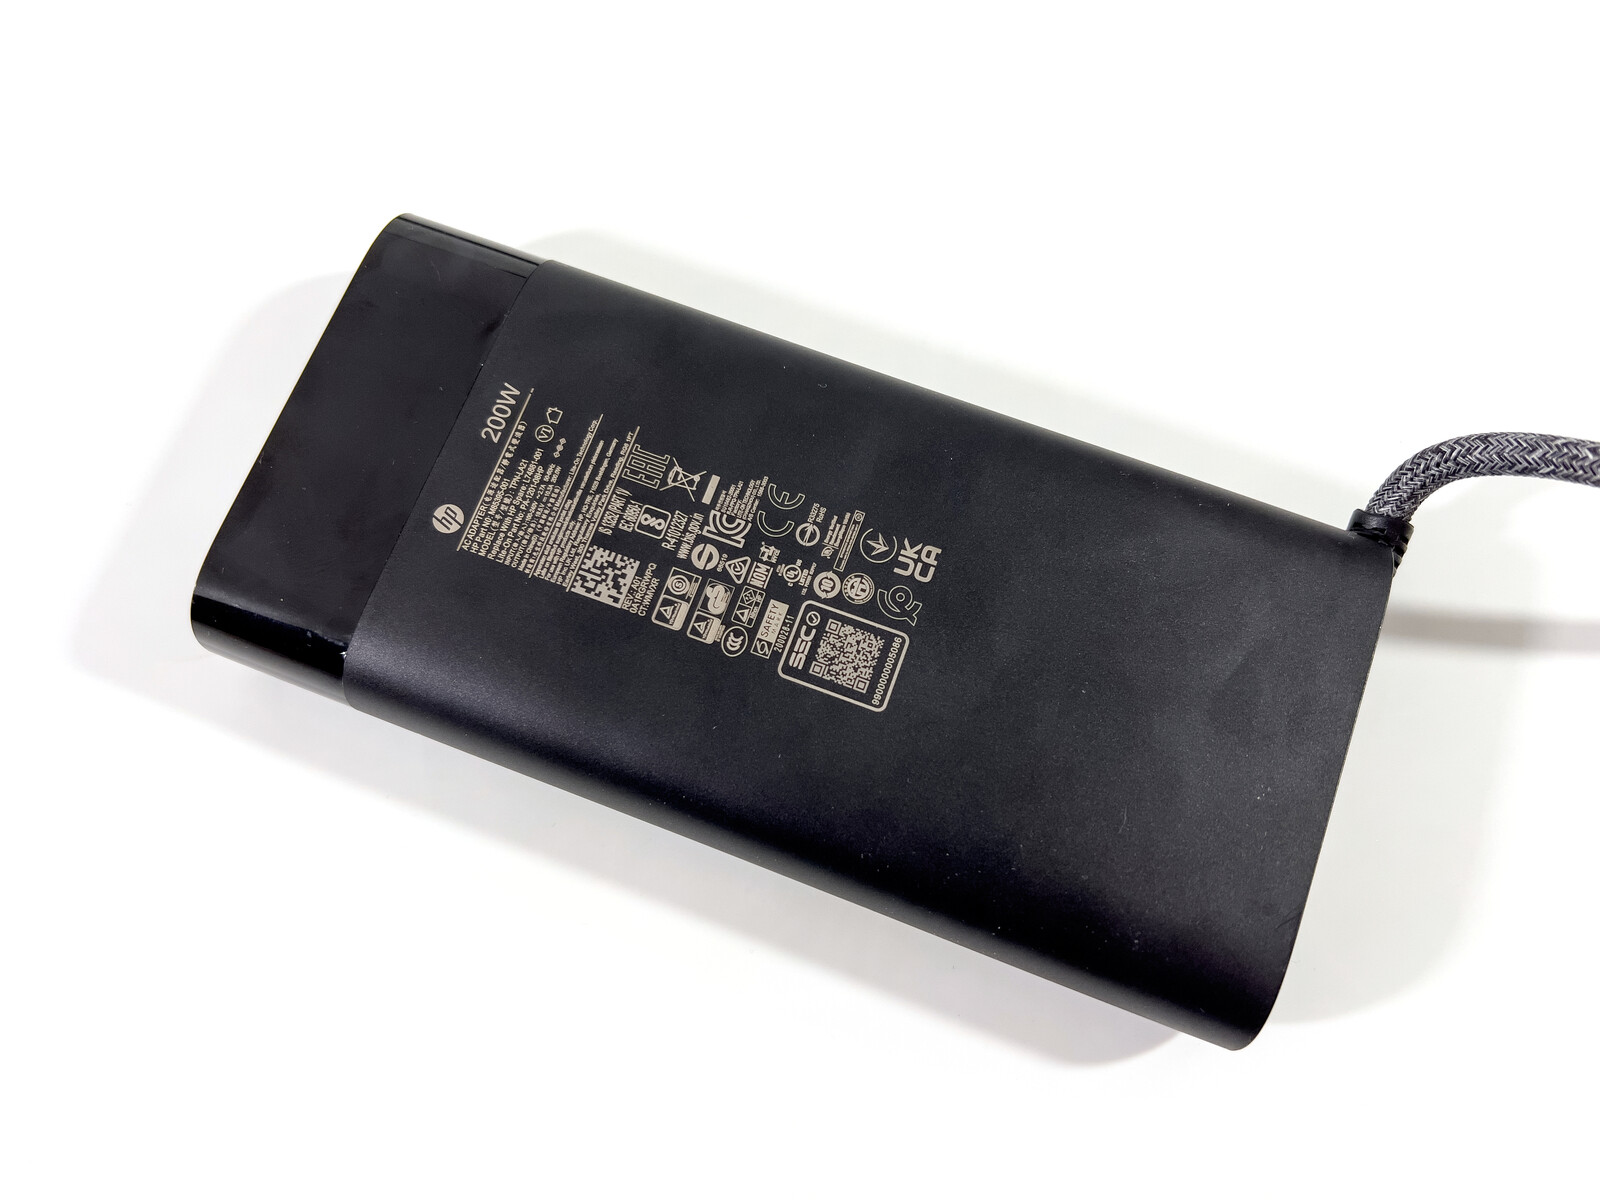
Compared to the old ZBook Studio 15 G8, the new 16-inch model has become slightly deeper and slightly wider. On the other hand, the new ZBook is one of the lightest models at just over 1.8 kg in this configuration. The 200-watt power adapter adds another 613 grams.
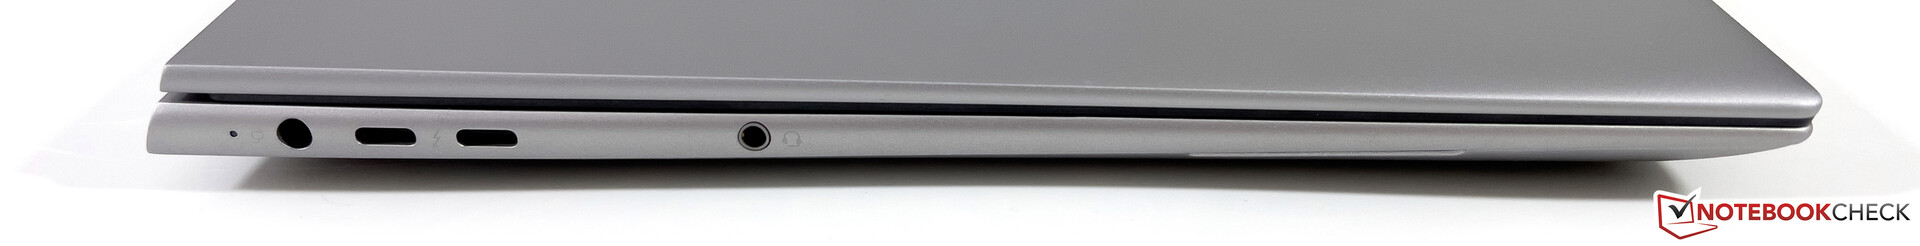
Equipment - 2x Thunderbolt 4
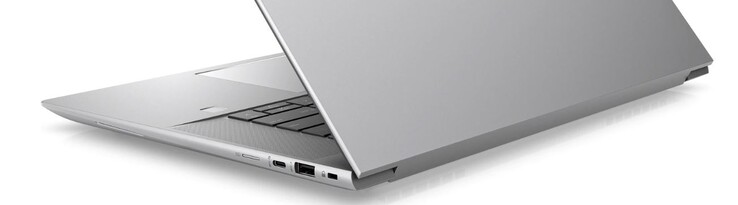
There have been some minor changes to the ports, as the DisplayPort had to make way for another USB-C port. The layout has also changed compared to the predecessor; the fact that the ZBook cannot be charged via USB-C is annoying.
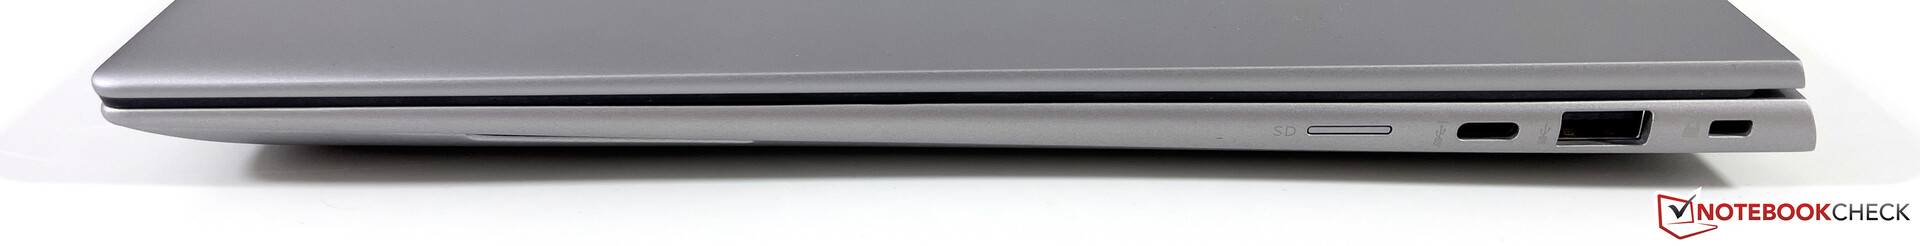
SD Card Reader
HP has swapped the Studio 15 G8's full-fledged SD reader for a microSD reader that fully accepts microSD cards. The reader has a spring mechanism and removing inserted cards can be a bit tricky. In terms of speed, the card reader remains on the same level at around 80 MB/s, but the competition is faster.
| SD Card Reader | |
| average JPG Copy Test (av. of 3 runs) | |
| Lenovo ThinkPad P1 G4-20Y4Z9DVUS (Angelbird AV Pro V60) | |
| Dell Precision 5000 5560 (AV Pro V60) | |
| Average of class Workstation (49.6 - 681, n=14, last 2 years) | |
| HP ZBook Studio 15 G8 (AV Pro V60) | |
| HP ZBook Studio 16 G9 62U04EA (Angelbird AV PRO V60) | |
| maximum AS SSD Seq Read Test (1GB) | |
| Average of class Workstation (87.6 - 1455, n=14, last 2 years) | |
| Dell Precision 5000 5560 (AV Pro V60) | |
| Lenovo ThinkPad P1 G4-20Y4Z9DVUS (Angelbird AV Pro V60) | |
| HP ZBook Studio 15 G8 (AV Pro V60) | |
| HP ZBook Studio 16 G9 62U04EA (Angelbird AV PRO V60) | |
Communication
The modern AX211 module from Intel supports the current Wi-Fi 6E standard and we were able to connect to the 6 GHz network of our reference router from Asus without issue. The transfer rates are very good and no problems with the signal quality were detected. A WWAN module (LTE or 5G) is not available in the ZBook Studio 16 G9.
| Networking | |
| HP ZBook Studio 16 G9 62U04EA | |
| iperf3 receive AXE11000 6GHz | |
| iperf3 transmit AXE11000 6GHz | |
| Lenovo ThinkPad P1 G4-20Y4Z9DVUS | |
| iperf3 receive AX12 | |
| iperf3 transmit AX12 | |
| Dell Precision 5000 5560 | |
| iperf3 receive AX12 | |
| iperf3 transmit AX12 | |
| Apple MacBook Pro 16 2021 M1 Pro | |
| iperf3 receive AXE11000 | |
| iperf3 transmit AXE11000 | |
| iperf3 receive AX12 | |
| iperf3 transmit AX12 | |
Webcam
In regard to the webcam, the new ZBook Studio is disappointing because it only has a 720p sensor at its disposal. The colors are still okay, but the pictures are just not very sharp and detailed.


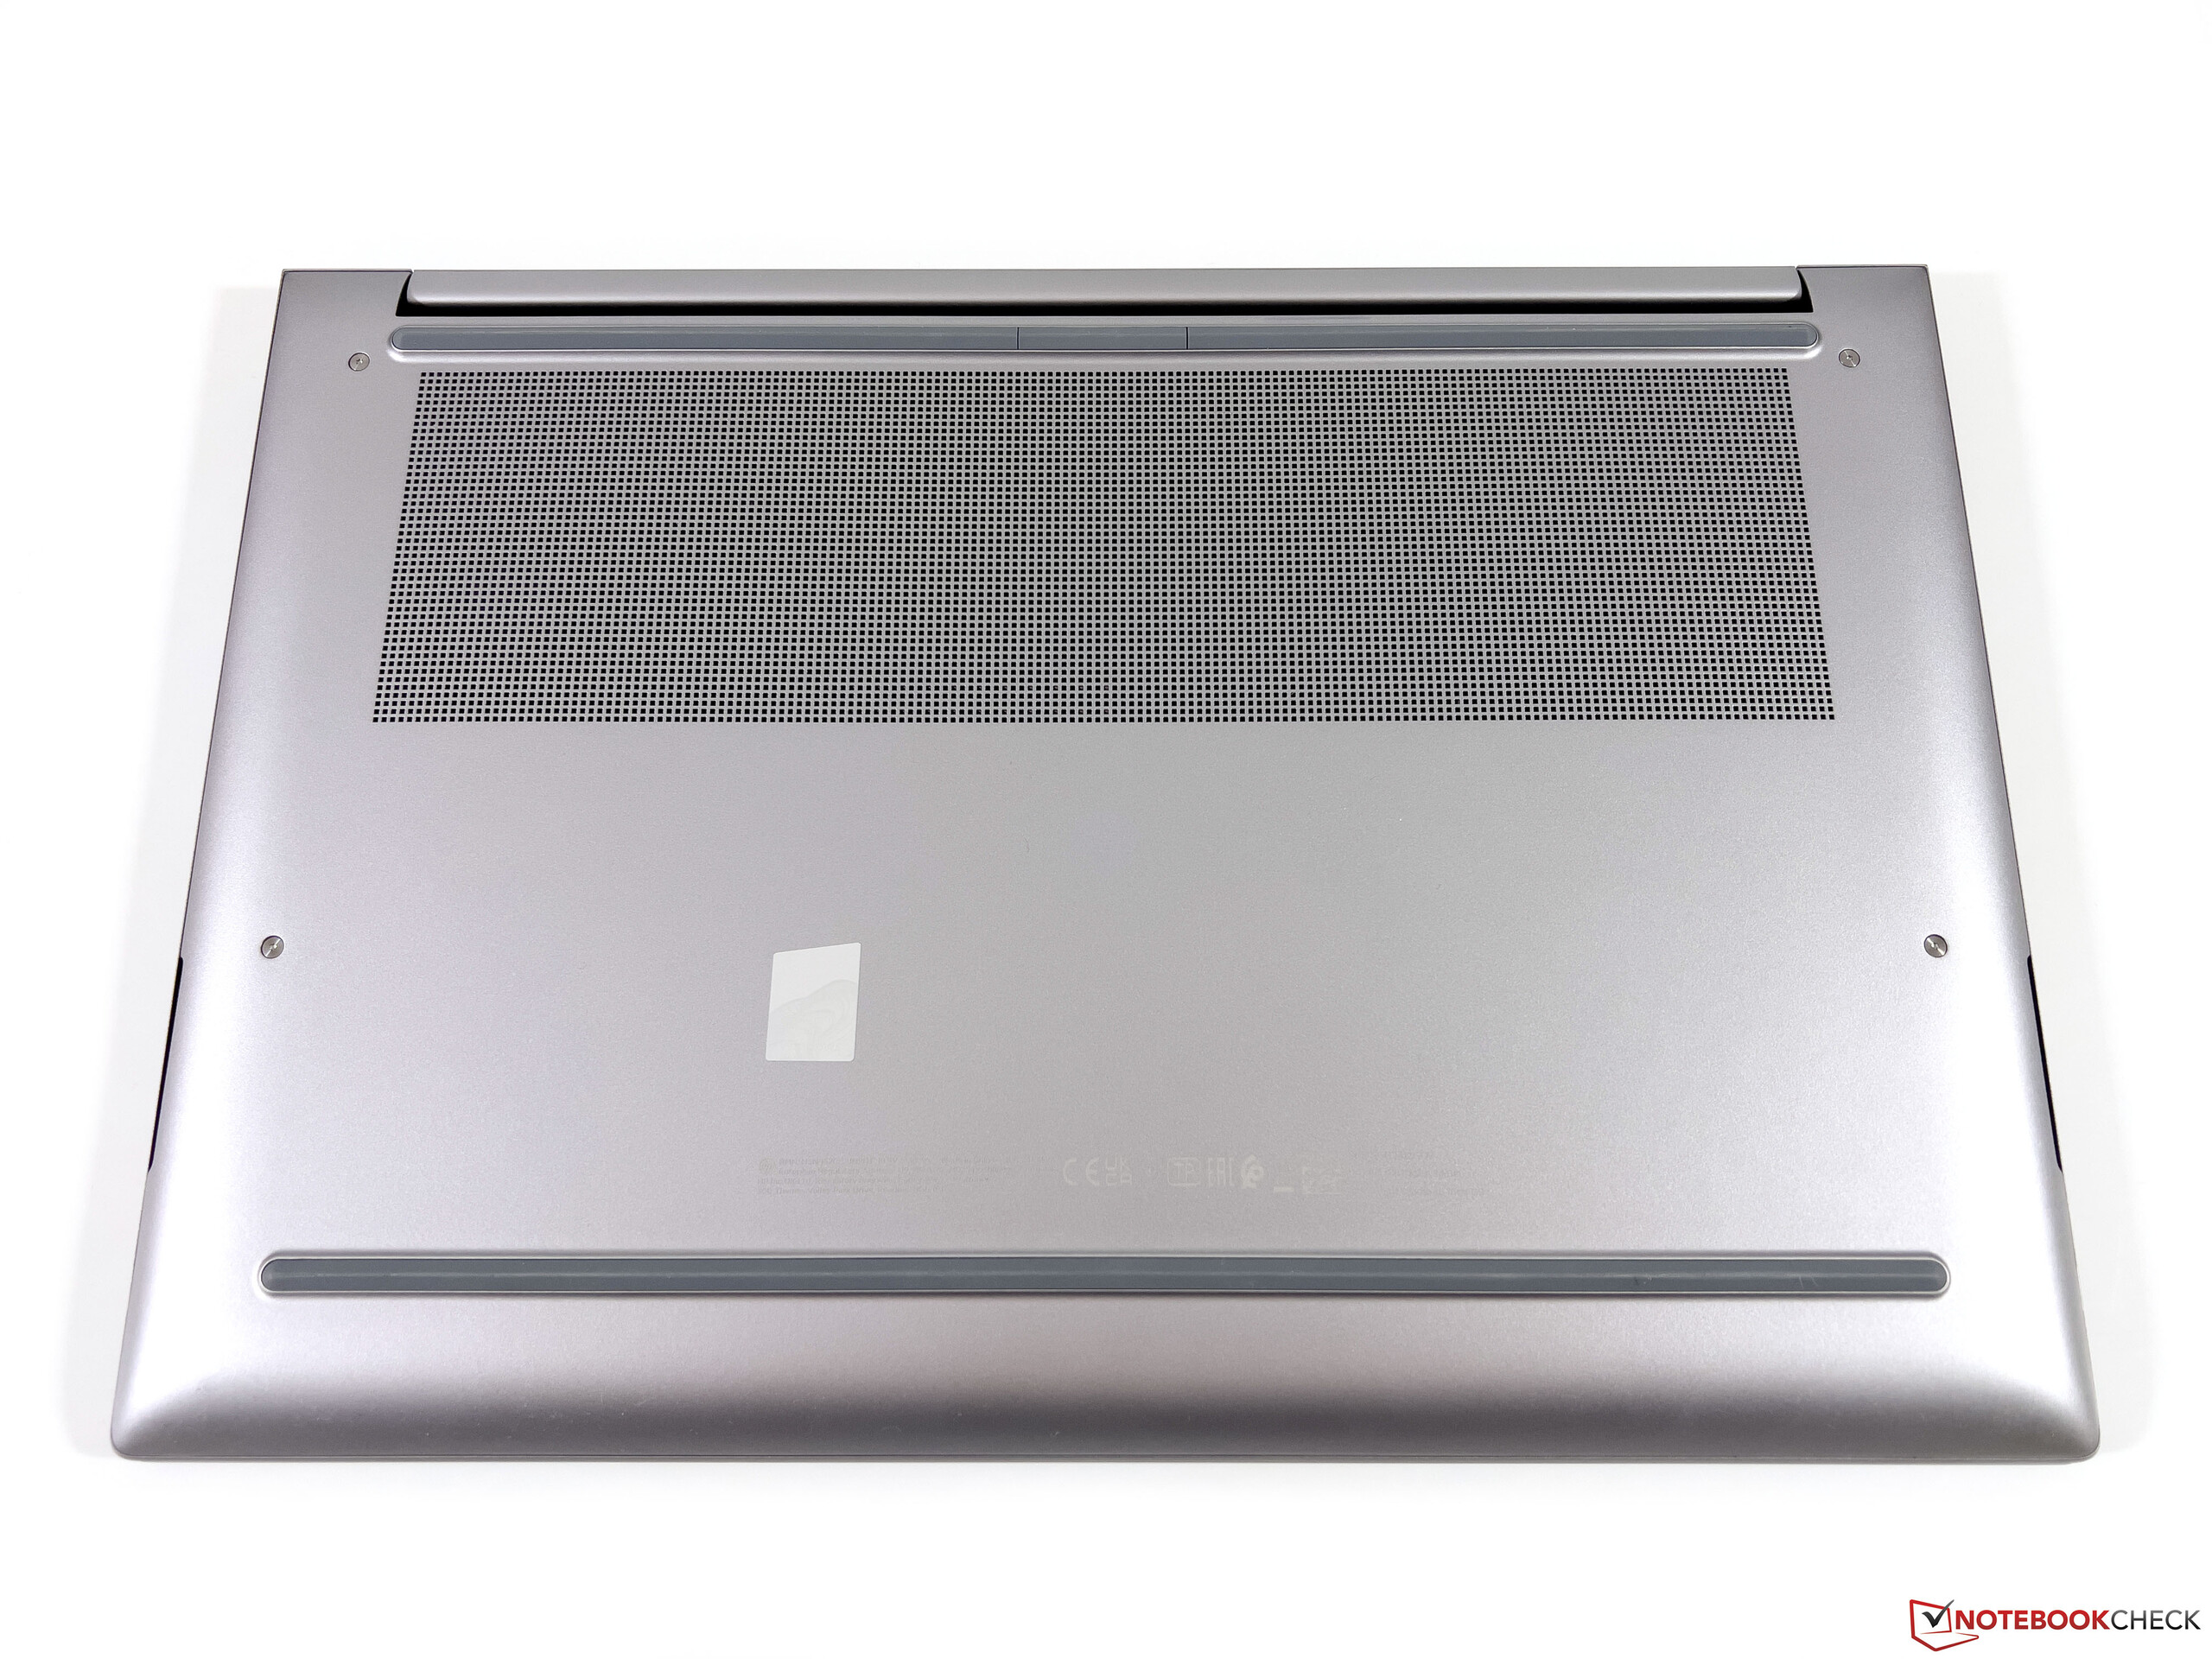
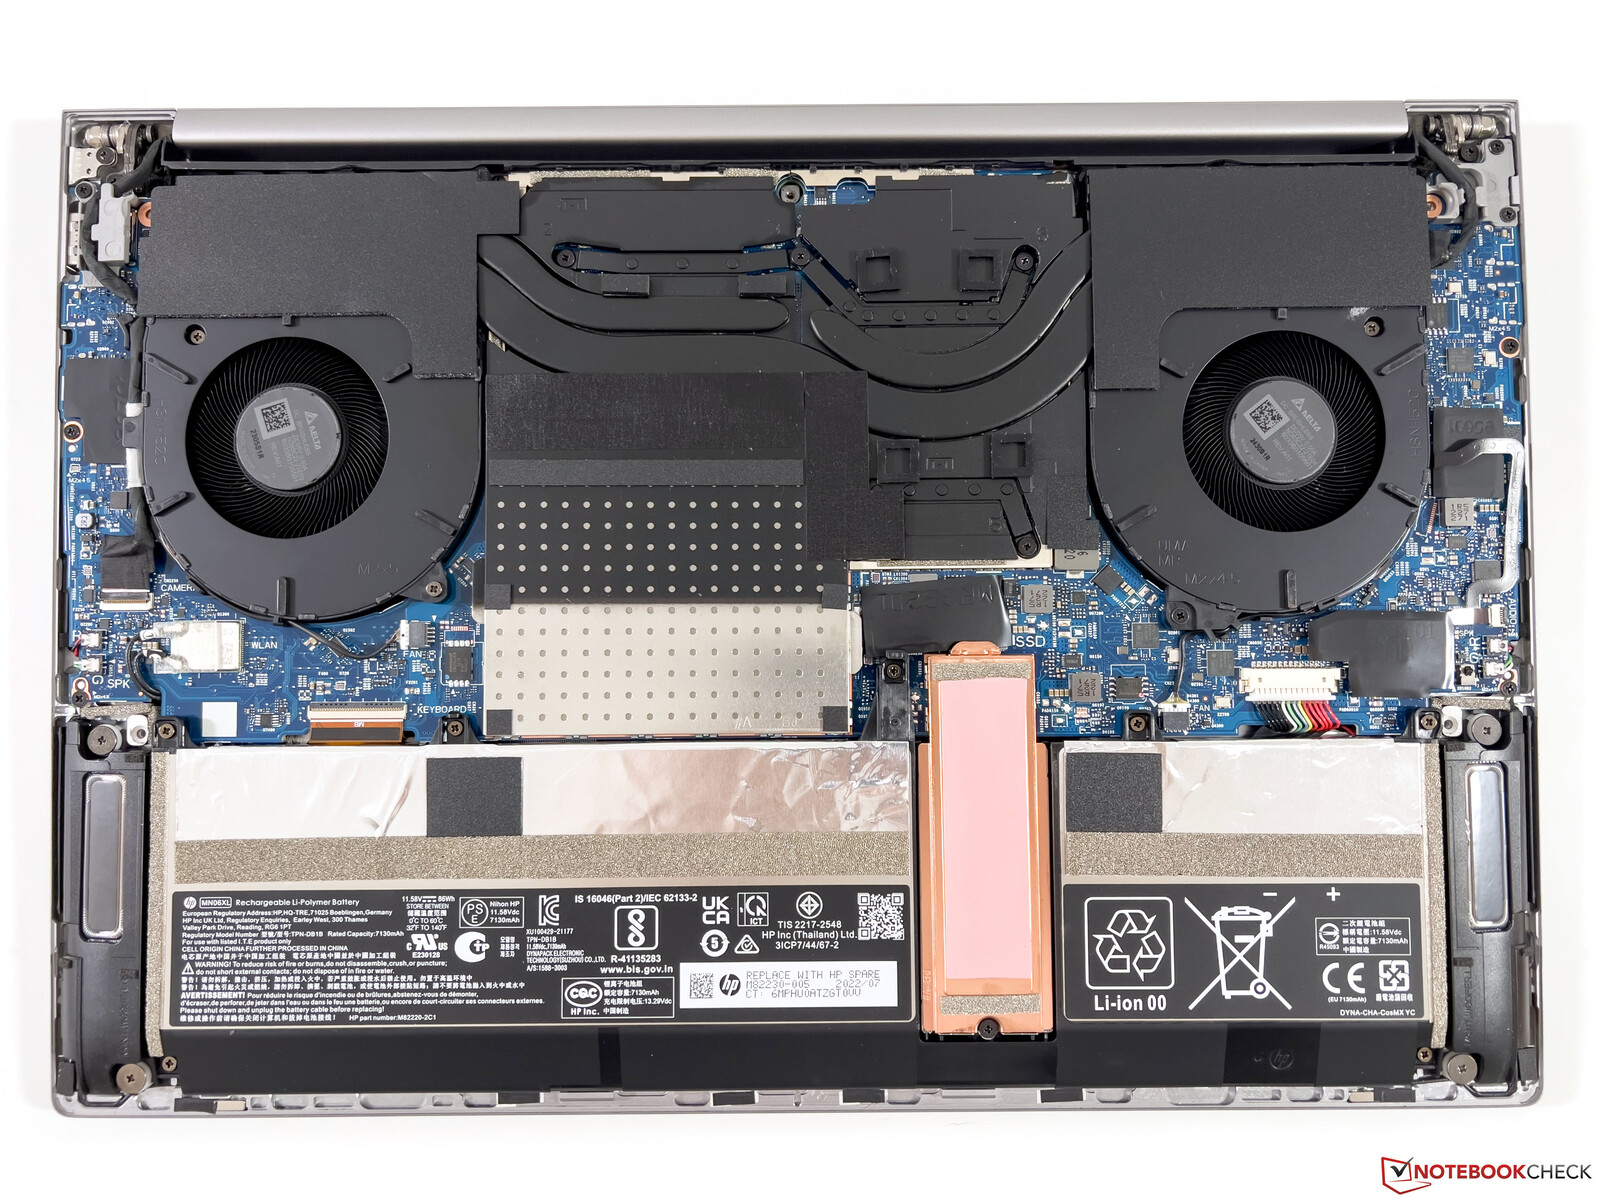
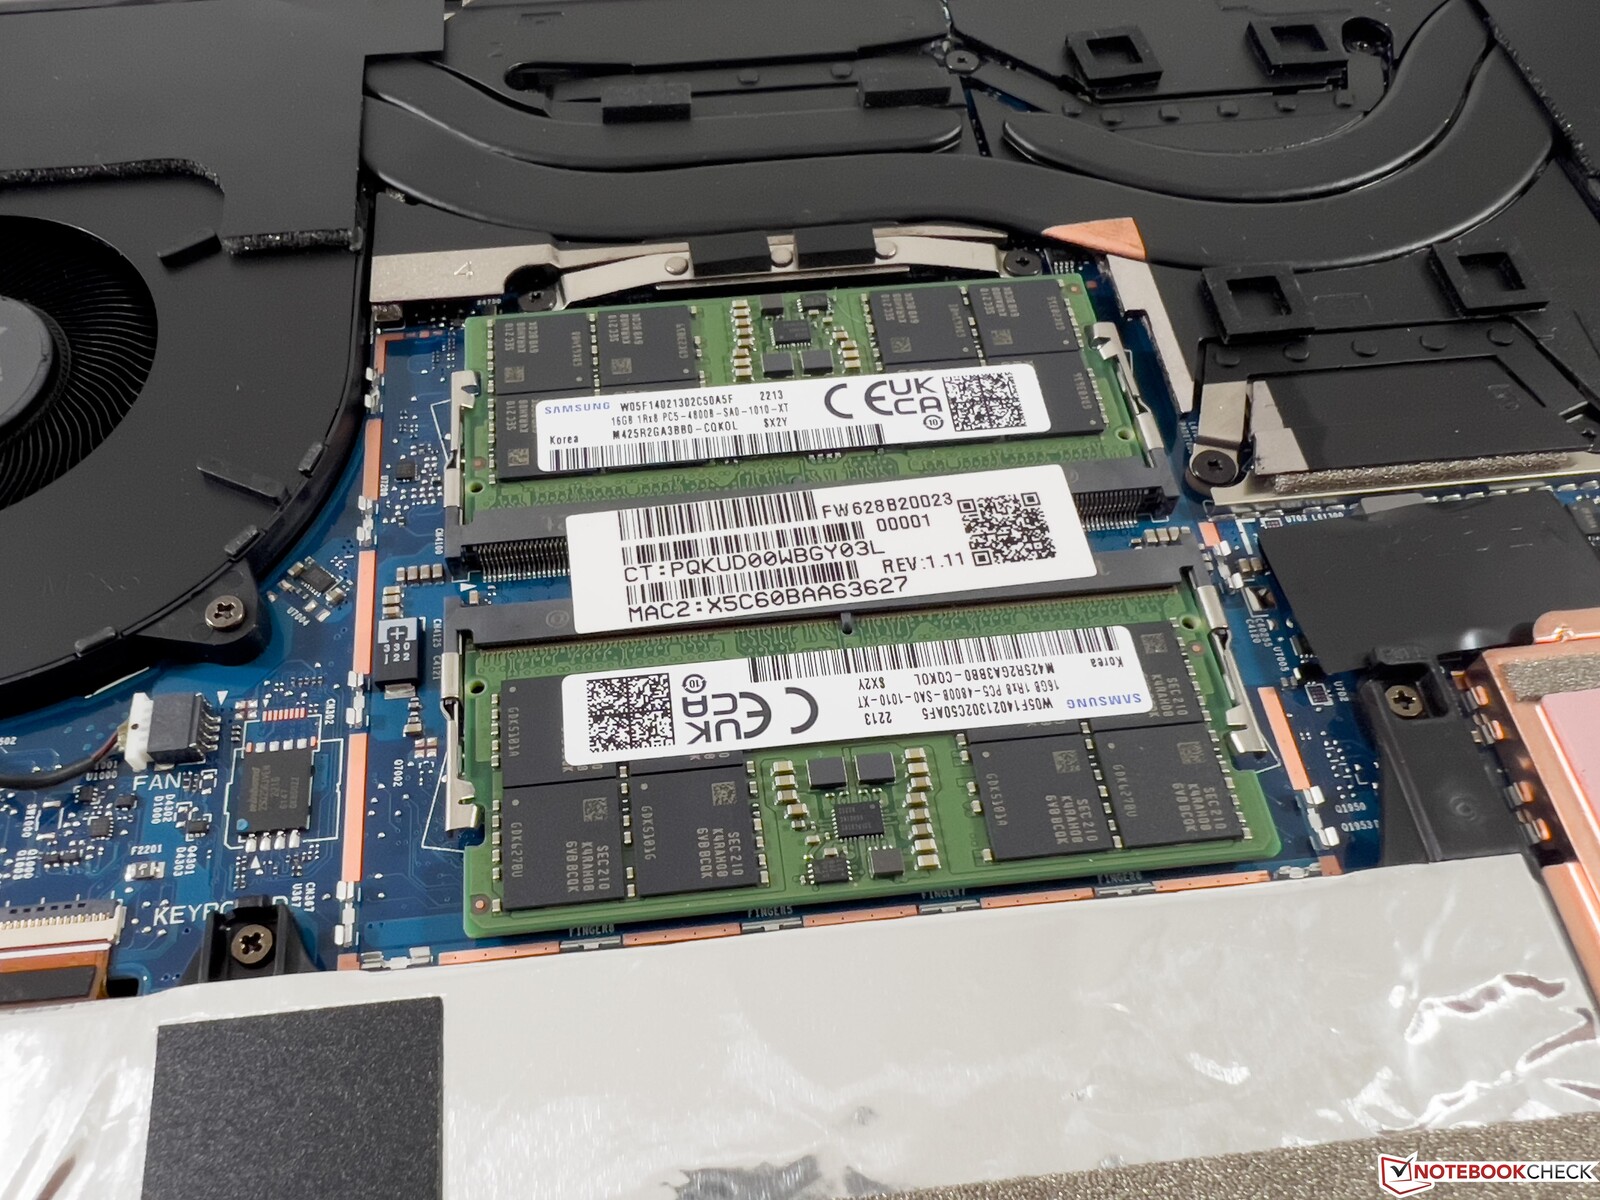
Maintenance
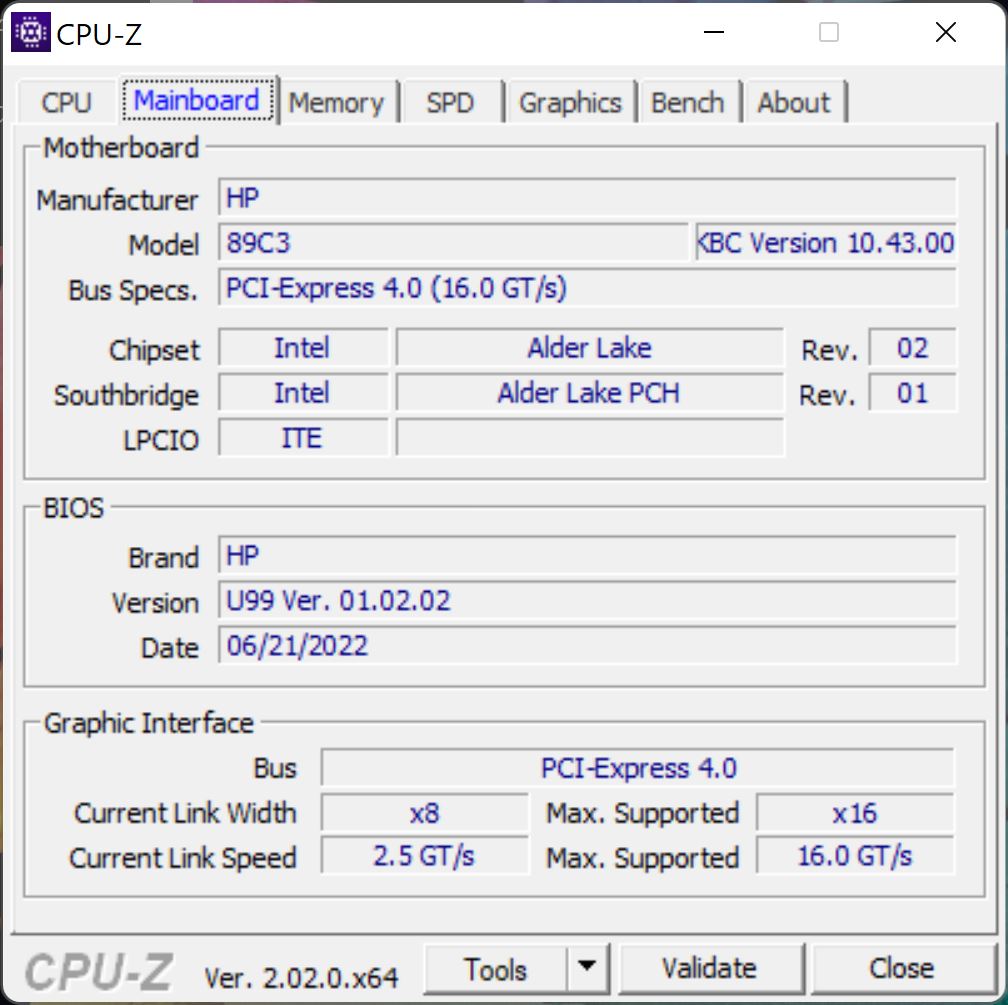
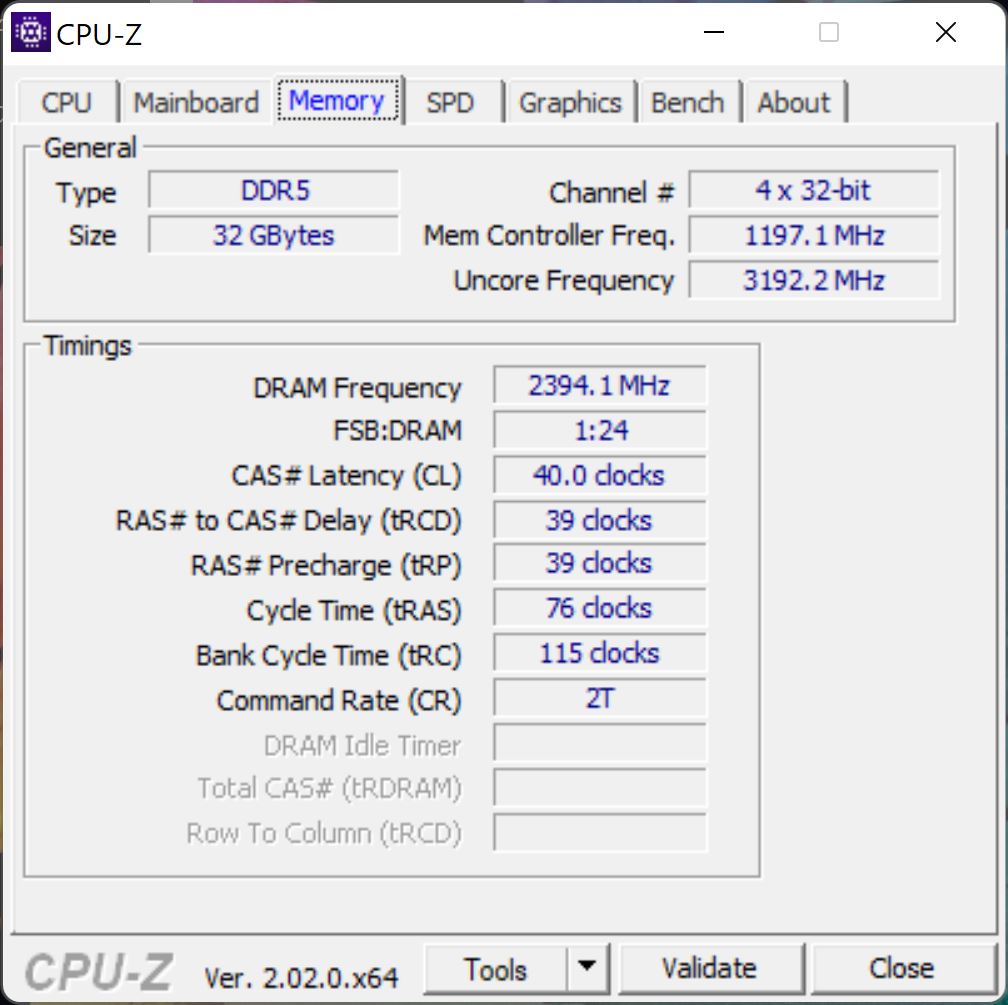
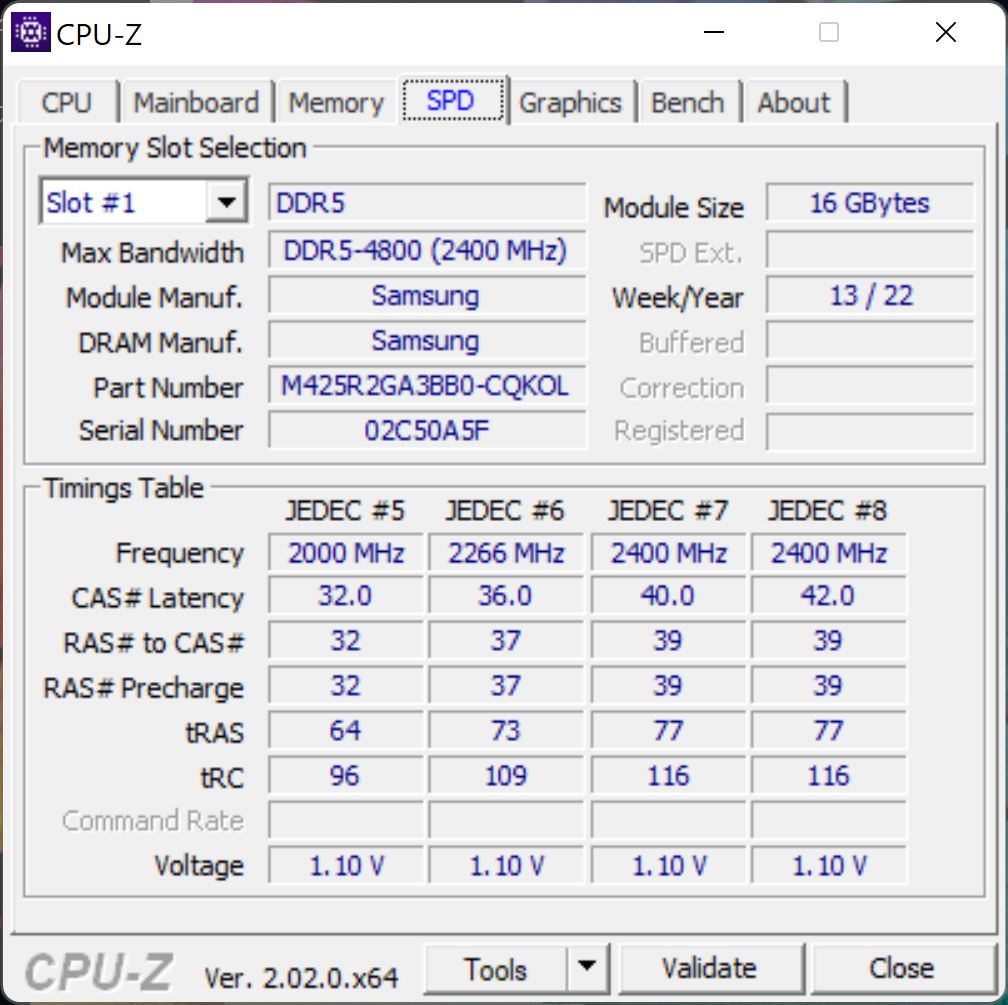
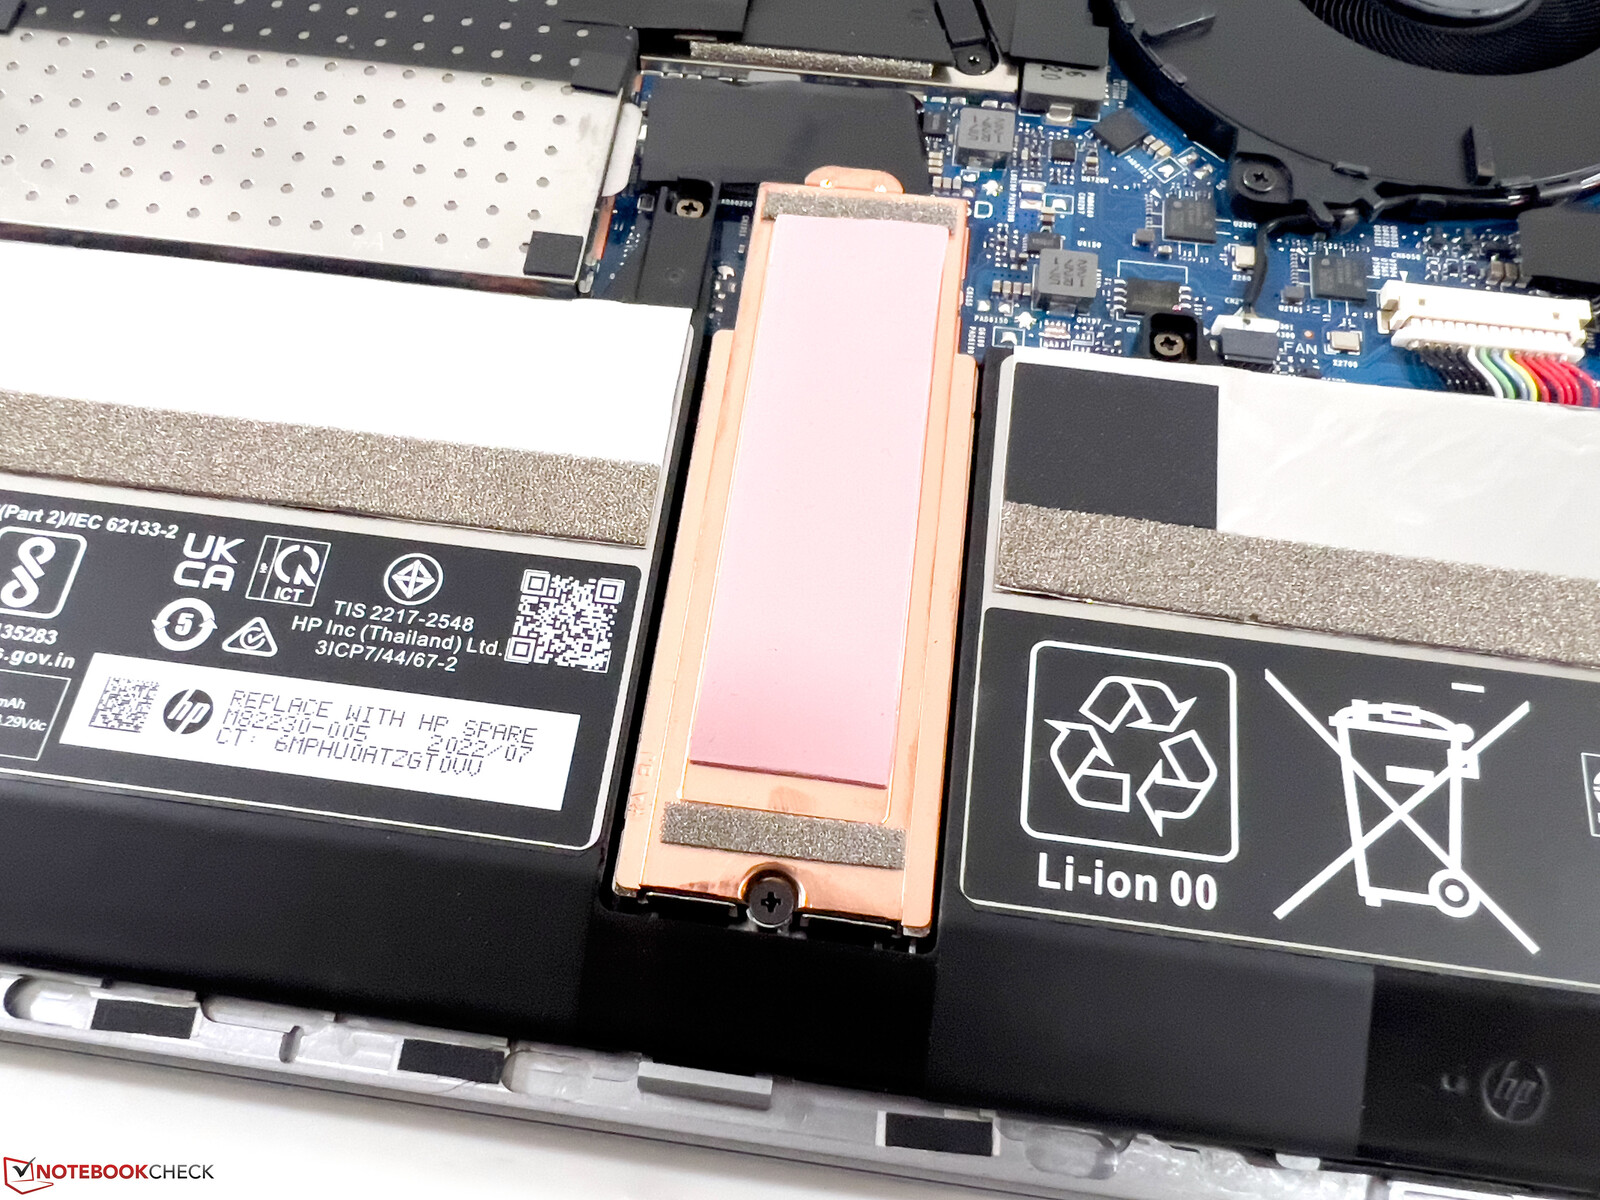
Maintenance options have improved somewhat, for HP has reintroduced SO-DIMM RAM bays in the Studio 16 G9, which is why the RAM can now be upgraded once again. This also applies to the M.2-2280 SSD, and the fans can also be cleaned. However, the WLAN module is soldered to the motherboard. According to the spec sheet, models with the Vapor-Chamber cooling should also have two SODIMM slots.
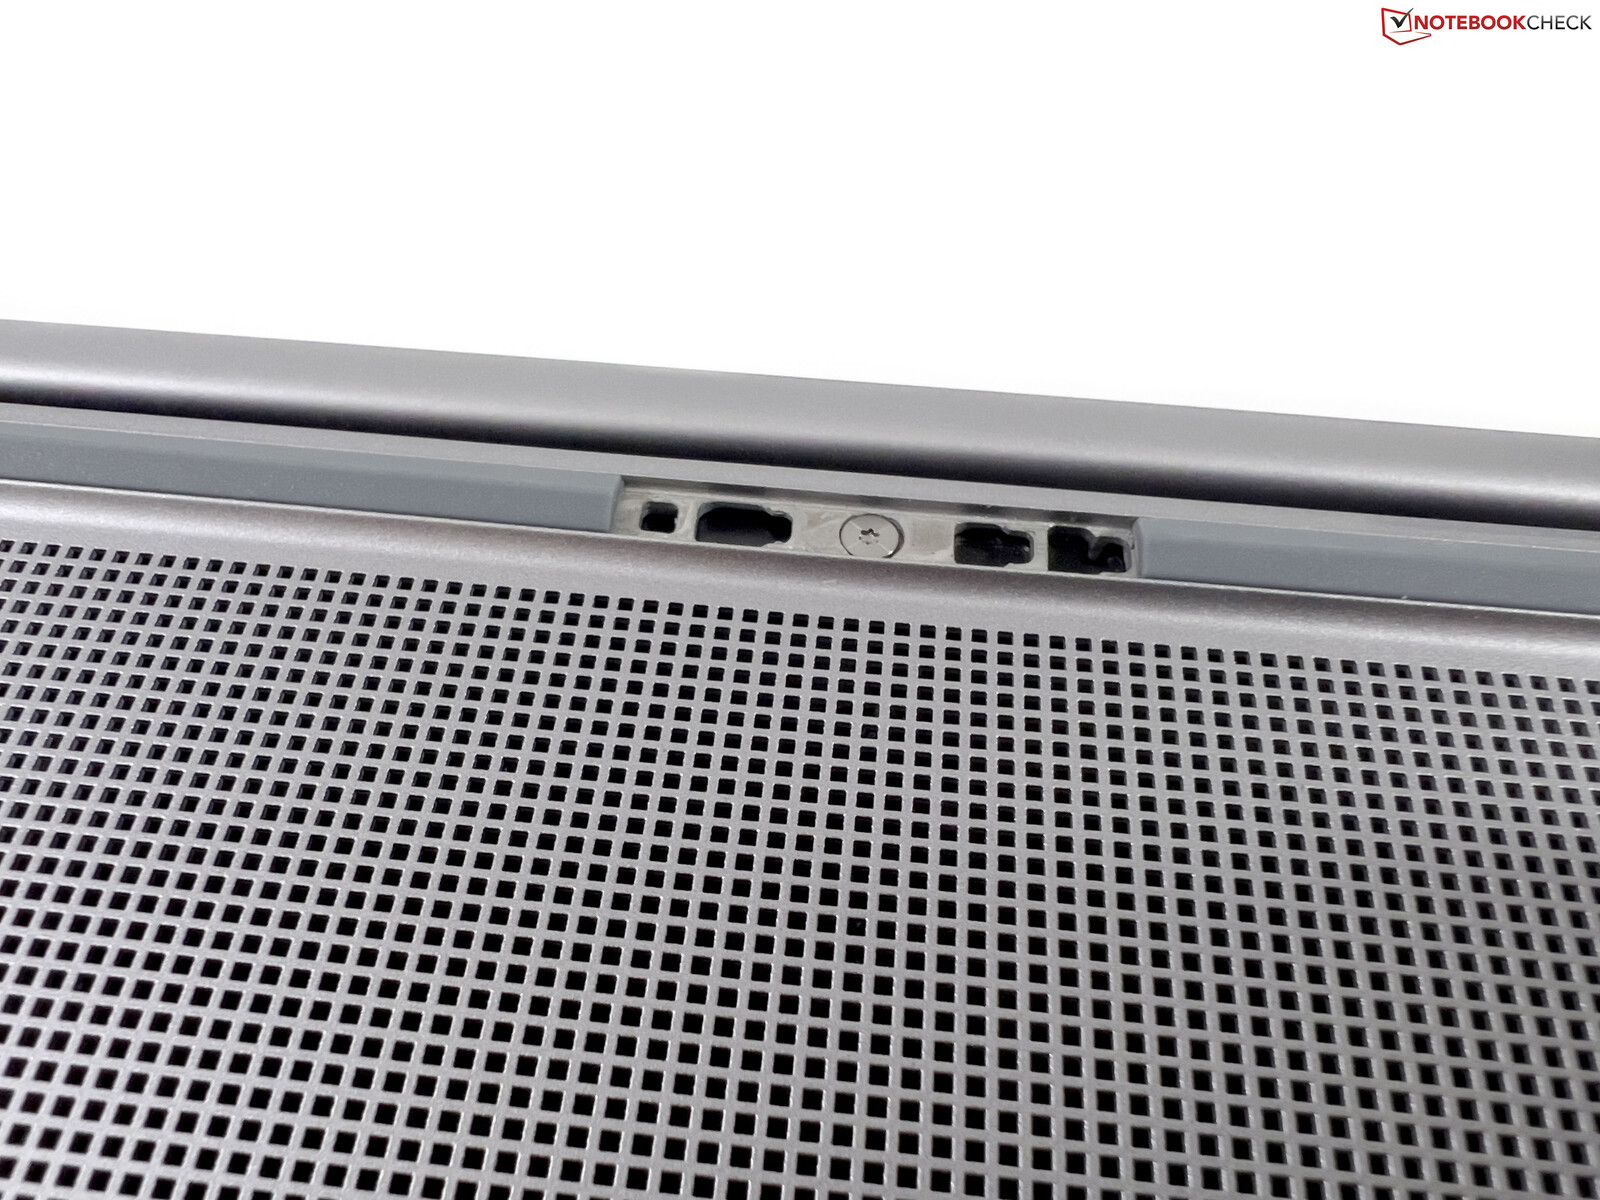
Accessing the components is very difficult because a case screw is located underneath the rear rubber foot. In the middle, the rubber foot can be removed with a bit of pressure, but the material is very hard and deformations quickly occur. The small part is unlikely to survive several removals unscathed.
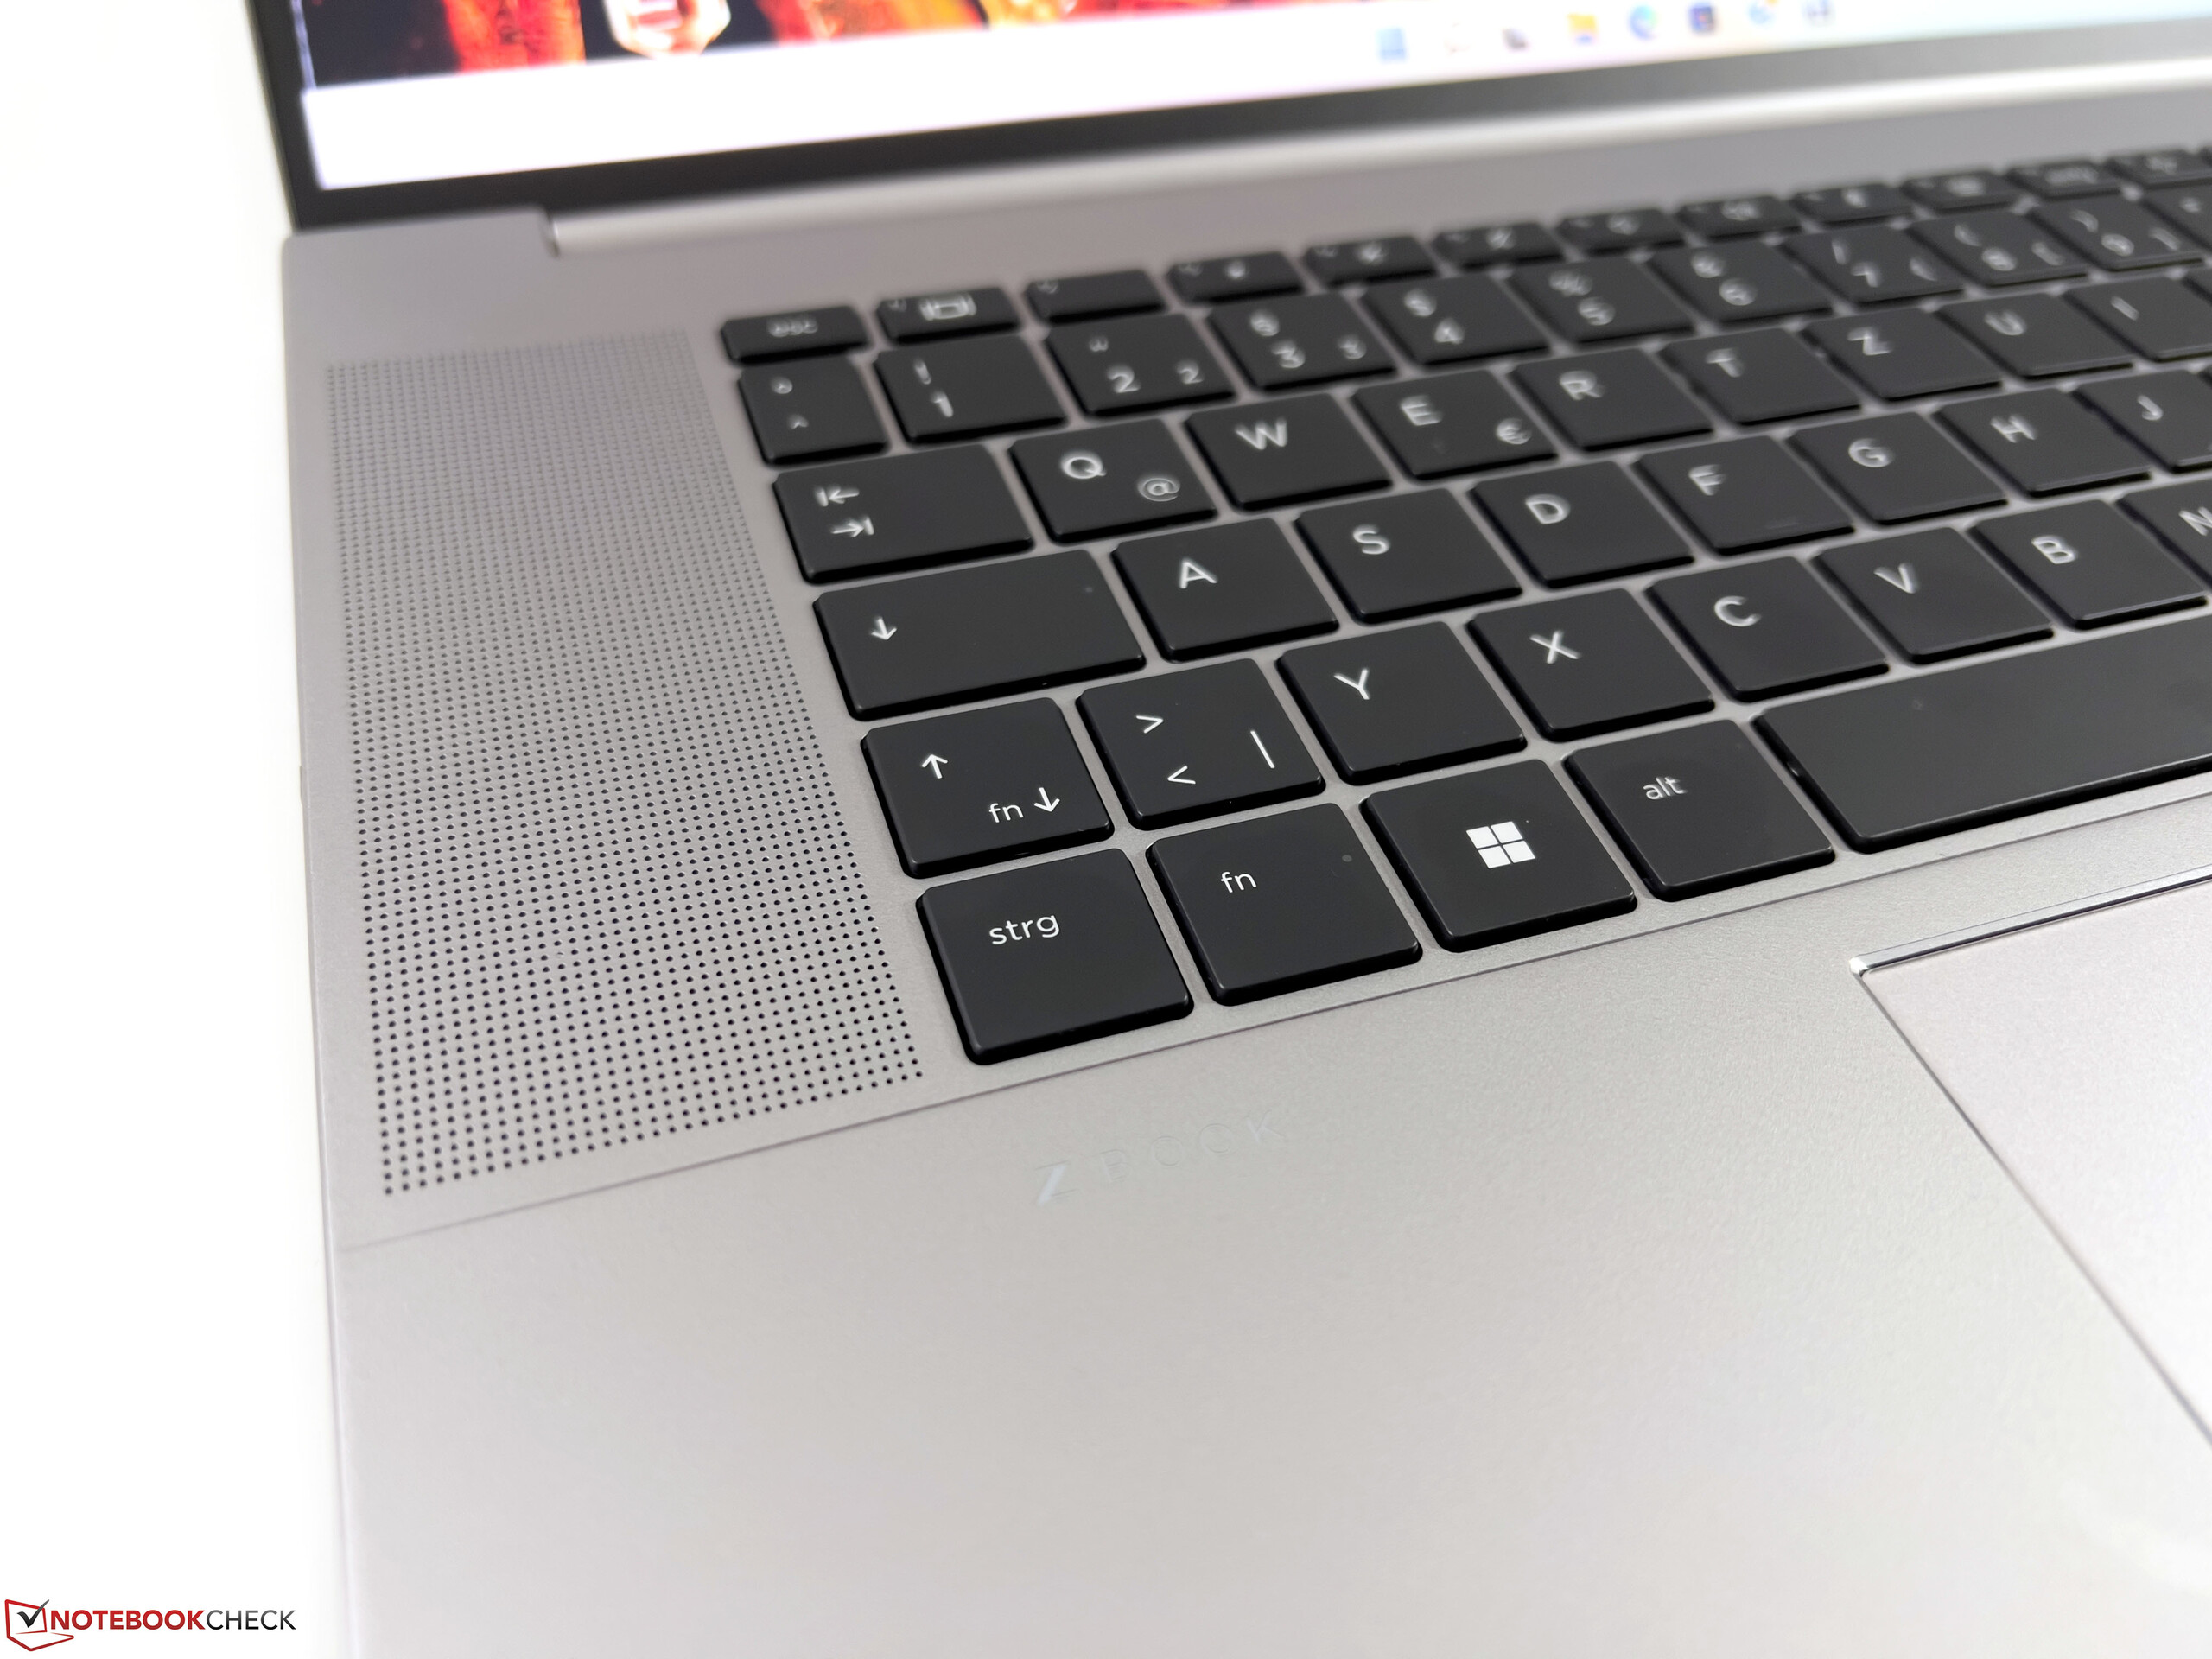
Input Devices - Smaller and weaker keyboard
Keyboard
Compared to the old model, HP now installs a more compact keyboard without the additional keys on the right side. Actually, there is more than enough room for a full keyboard with number pad here (such as in the ZBook Firefly 16 G9), but this space is used for the speakers. Consequently, this also means that there are no longer dedicated keys for the Page Up & Page Down functions. Overall, the keyboard has moved more towards the screen within the base unit.
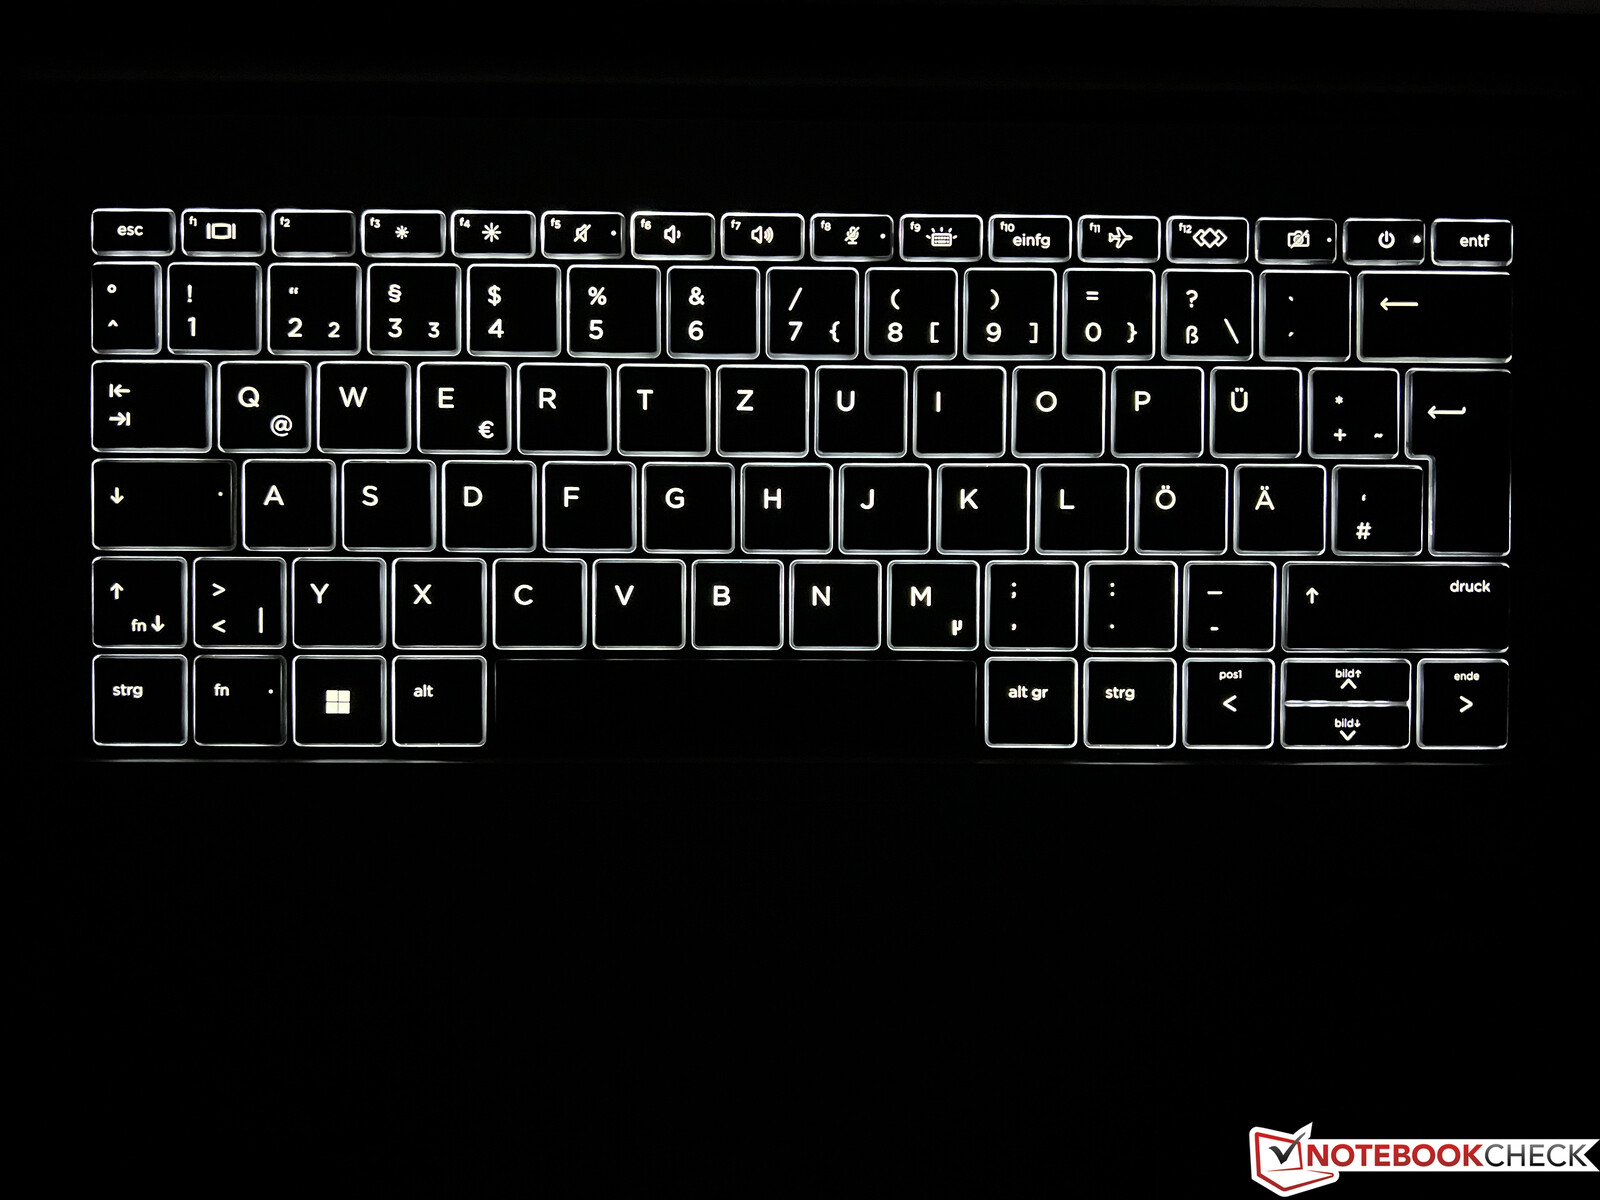
The keyboard has a backlight and is water resistant, but the mechanics are not completely convincing. The keystroke is slightly more rickety and overall not quite as good as in the ZBook Firefly 16 G9 (or the identically built EliteBook 865 G9). Compared to the predecessor, it is also a slight step backwards.
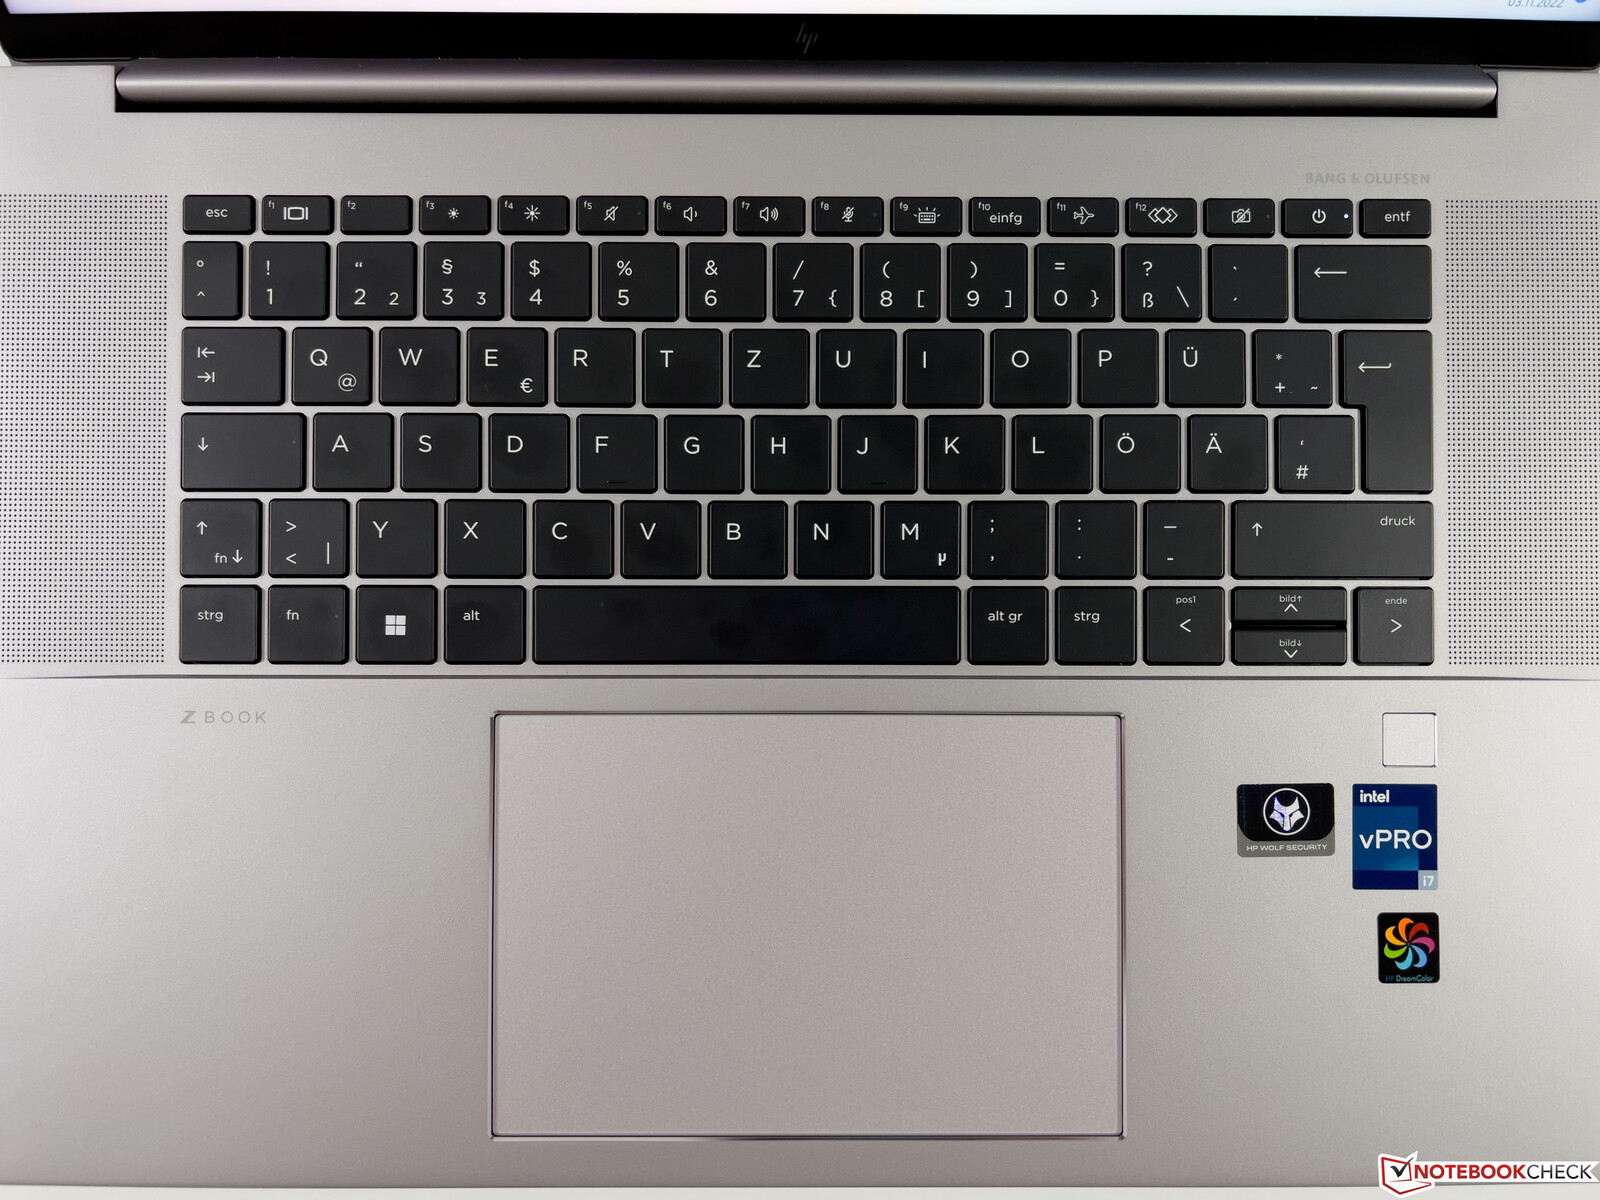
Touchpad
HP banished the PointStick and the dedicated mouse buttons from the ZBook Studio a few years ago, and now deploys a large ClickPad instead, which is even larger than the old model at 13.4 x 8.9 cm. The ClickPad scores well: operation is flawless, gliding properties are excellent and the pad produces a muffled, yet high-quality clicking noise.
Display - 4K DreamColor at 120 Hz
HP now uses larger 16-inch displays in the 16:10 format and there are a total of four different panels to choose from:
- 1,920 x 1,200 pixels, IPS, matte, 400 nits, low power, 100% sRGB.
- 1,920 x 1,200 pixels, IPS, matte, 1,000 nits, SureView privacy filter, 72% NTSC
- 3,840 x 2,400 pixels, IPS, matte, 500 nits, DreamColor, 120 Hz, 100% DCI-P3
- 3.840 x 2.400 pixels, OLED, 400 nits, Corning Gorilla Glass 5, 100% DCI-P3
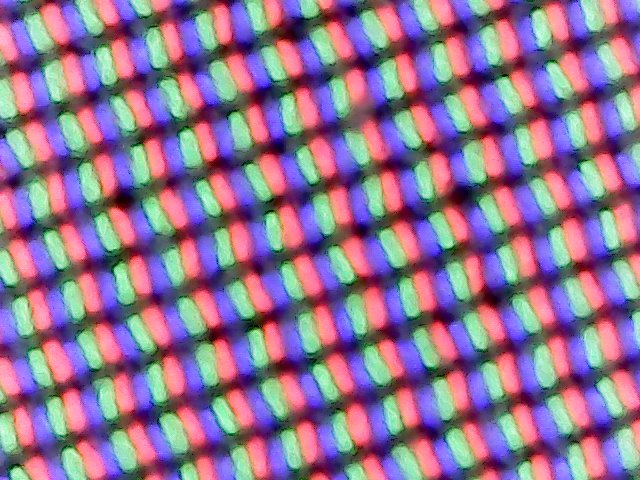
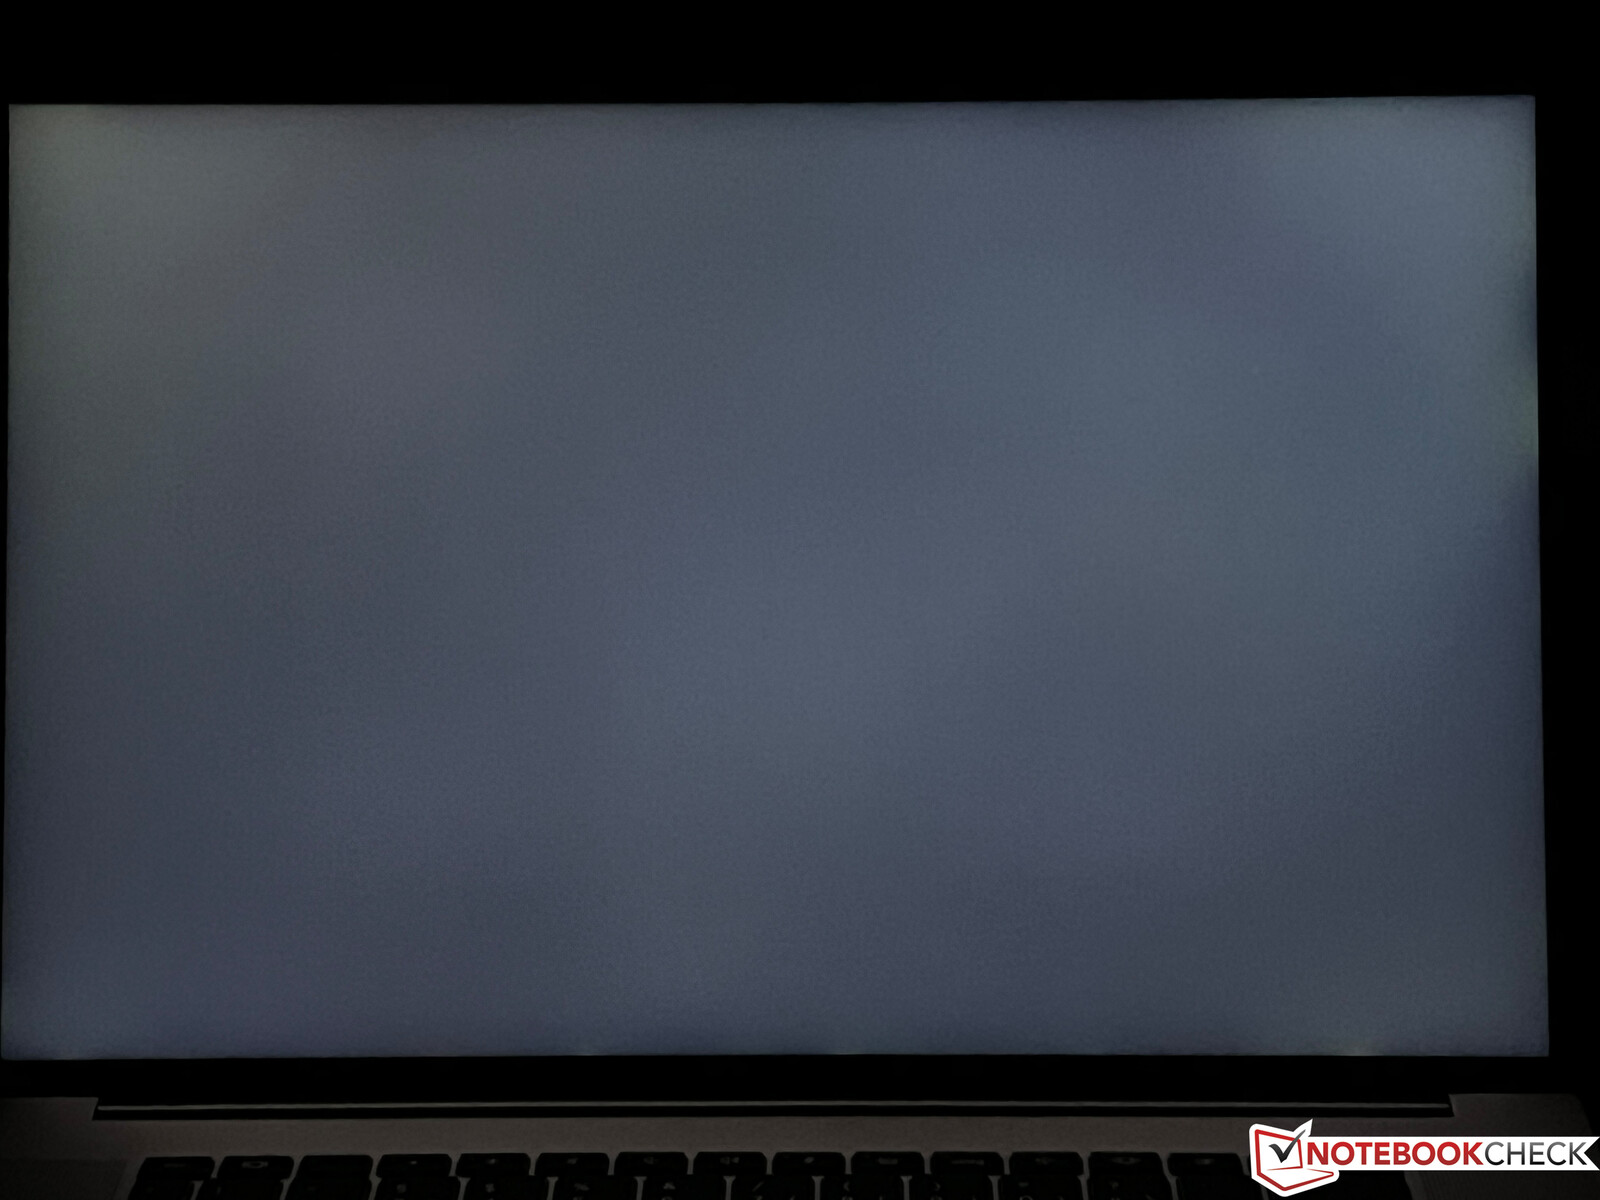
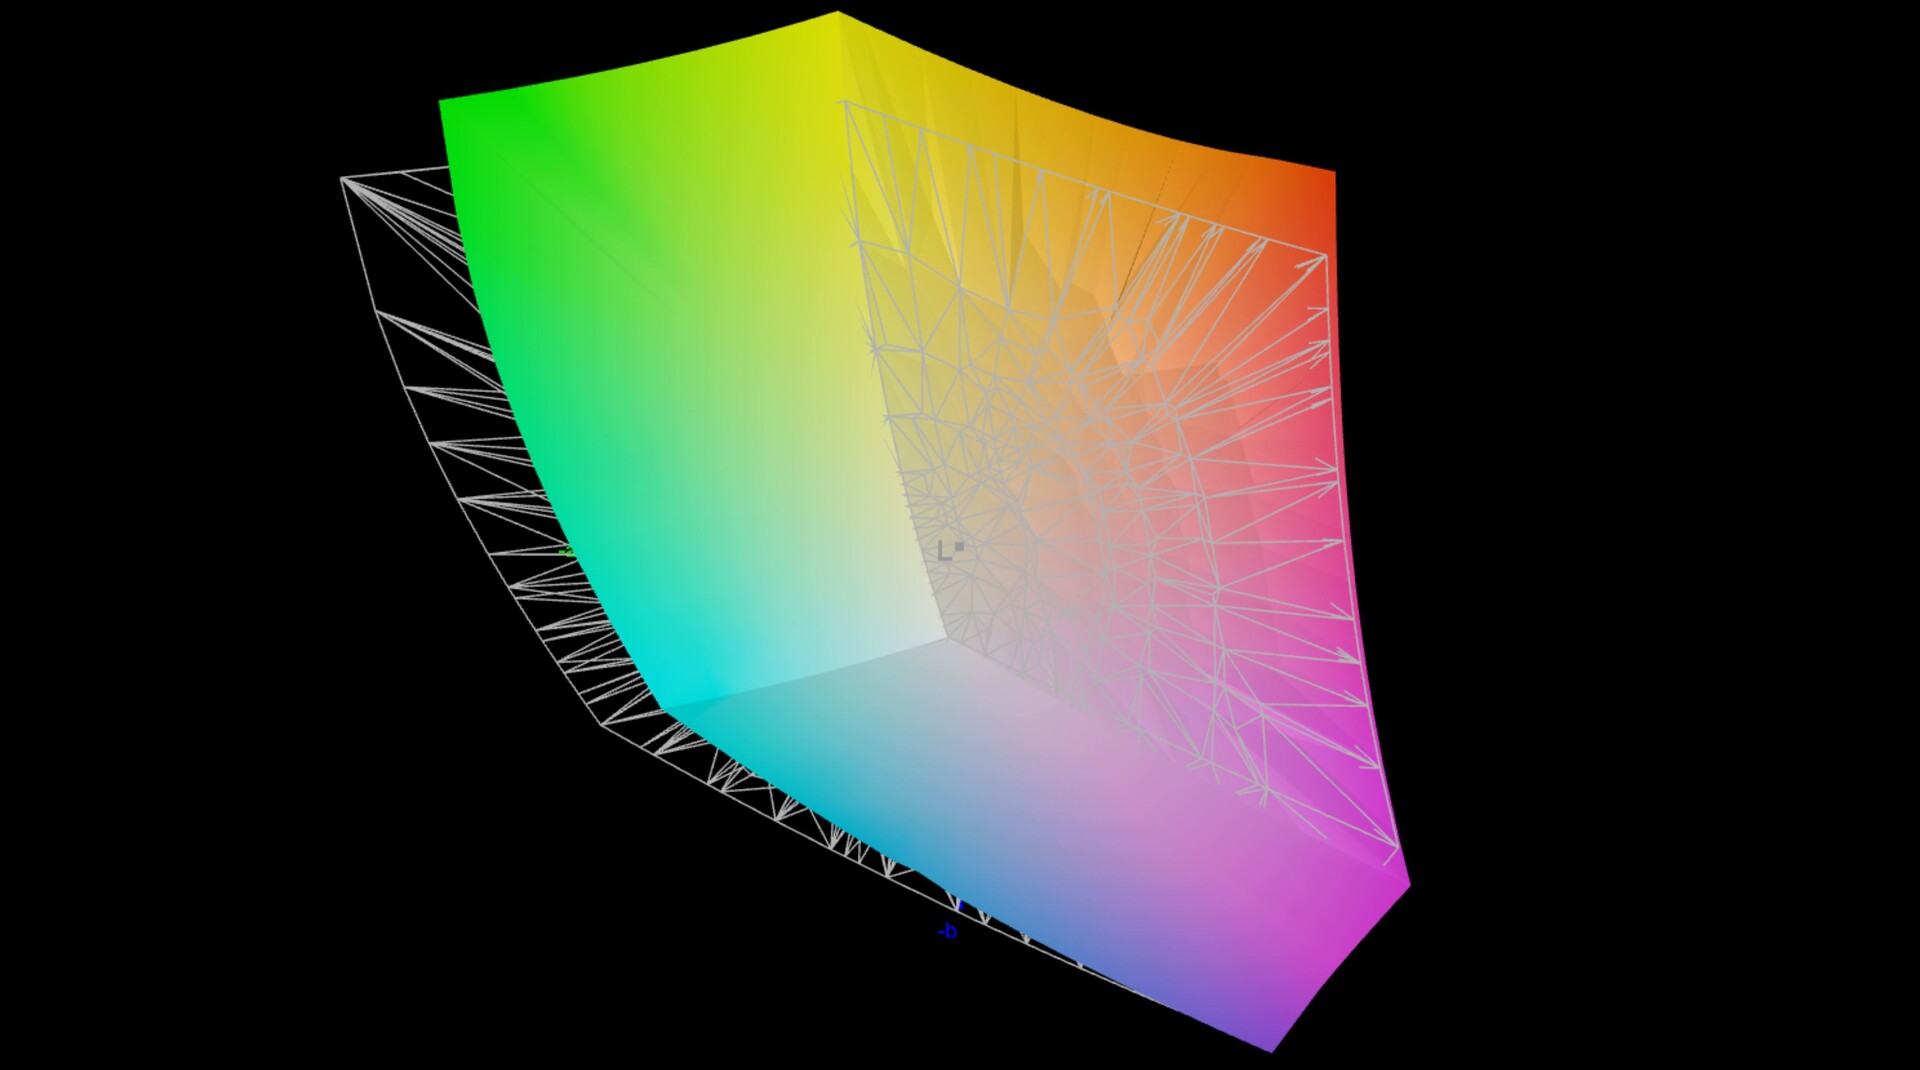
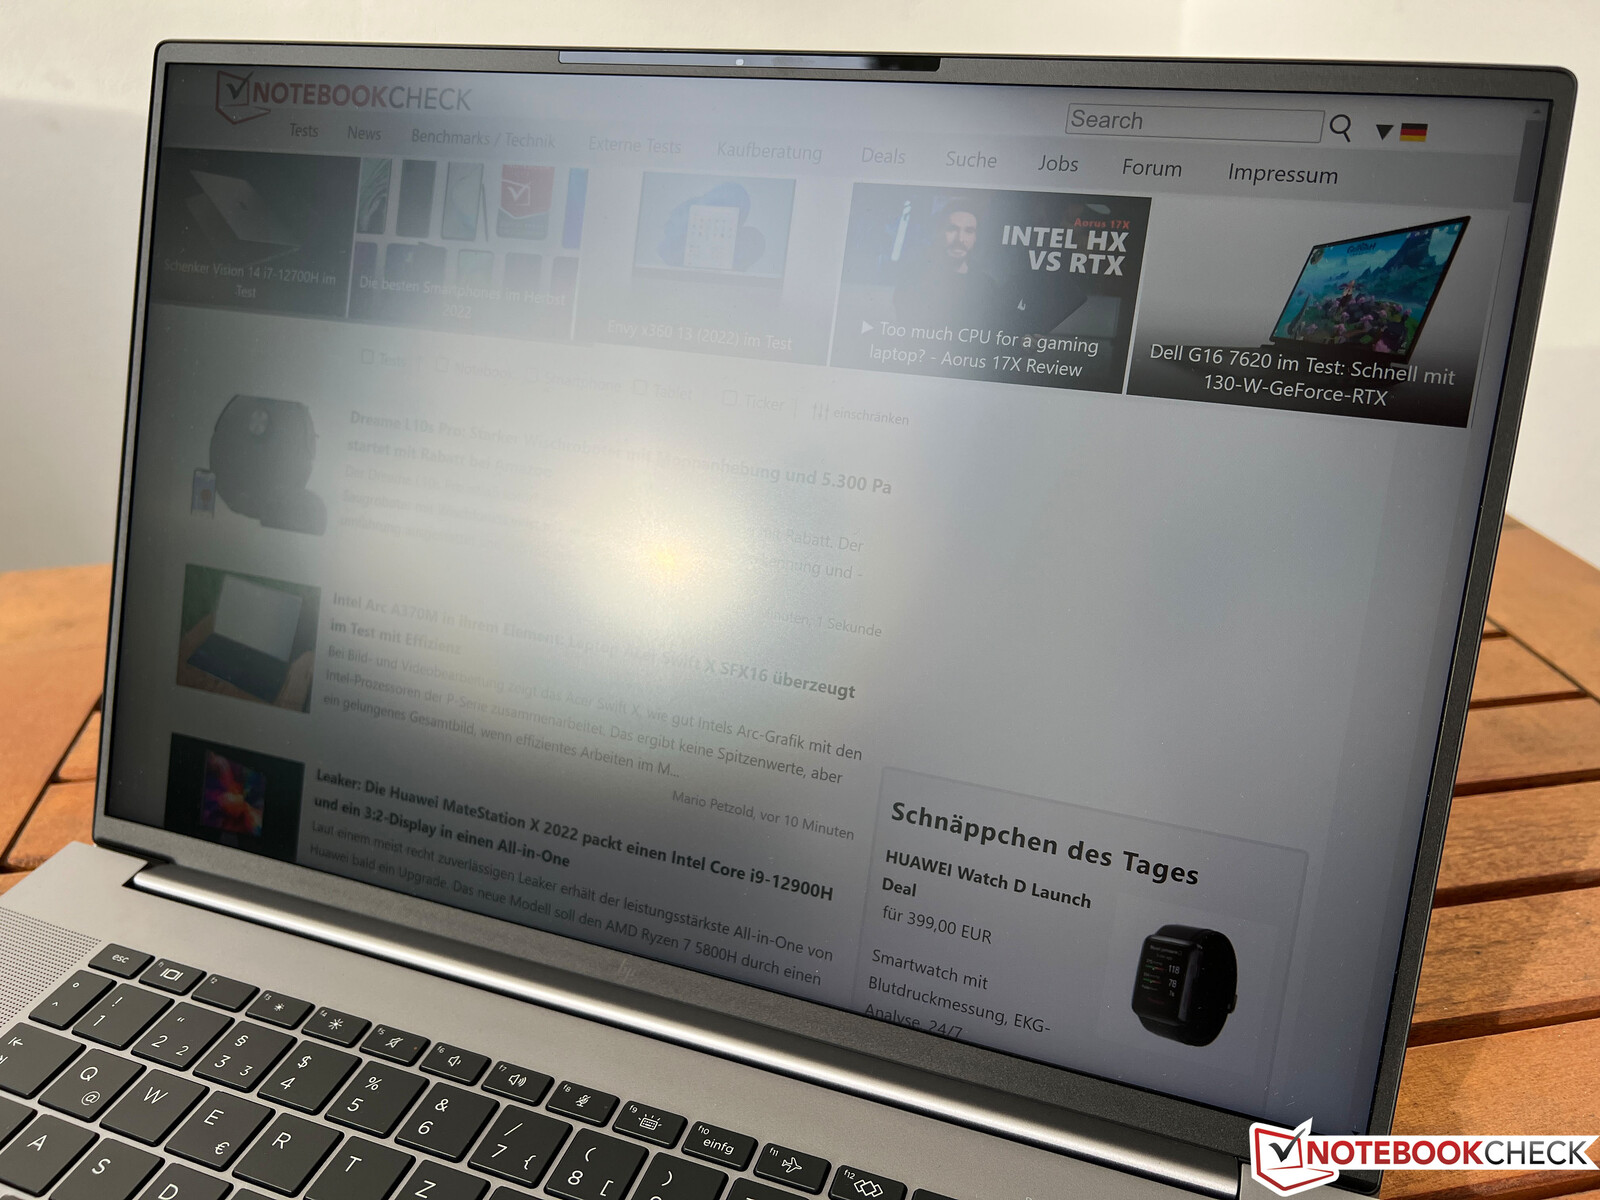
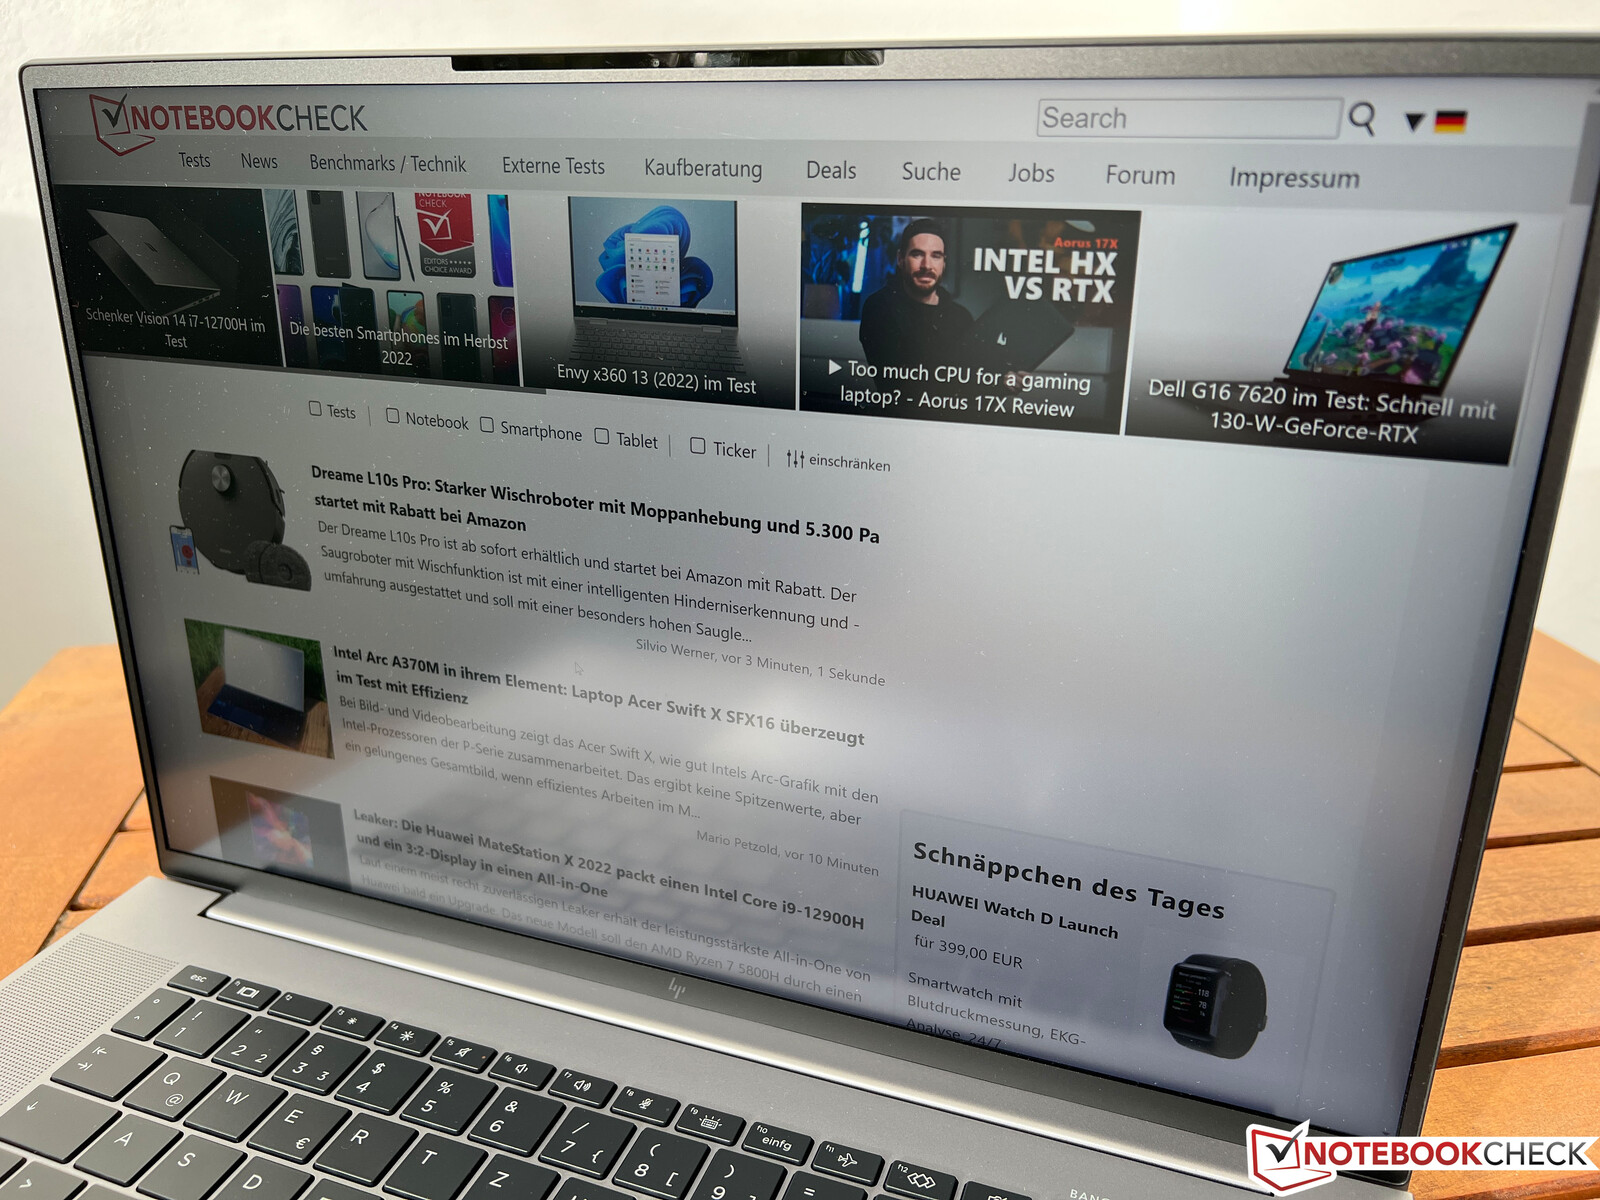
Our review device is equipped with the 4K DreamColor panel, which offers excellent subjective picture quality. The matte screen is only slightly grainy, even on bright surfaces, but this is not noticeable when sitting at a normal distance. At the same time, content is extremely sharp and the colors very vivid. We determined an average brightness of good cd/m², but the black value of 0.47 is very high, which results in a decent contrast ratio of "only" ~1,200:1.
The higher frequency of 120 Hz is also noticeable in practice, as screen movements are very smooth, especially when scrolling through documents or websites, and the response times are also very fast for an IPS panel. PWM flickering is absent and the viewing angle stability is very good, and there are no annoying halos.
| |||||||||||||||||||||||||
Brightness Distribution: 84 %
Center on Battery: 553 cd/m²
Contrast: 1179:1 (Black: 0.47 cd/m²)
ΔE ColorChecker Calman: 1 | ∀{0.5-29.43 Ø4.72}
calibrated: 0.6
ΔE Greyscale Calman: 1.6 | ∀{0.09-98 Ø4.97}
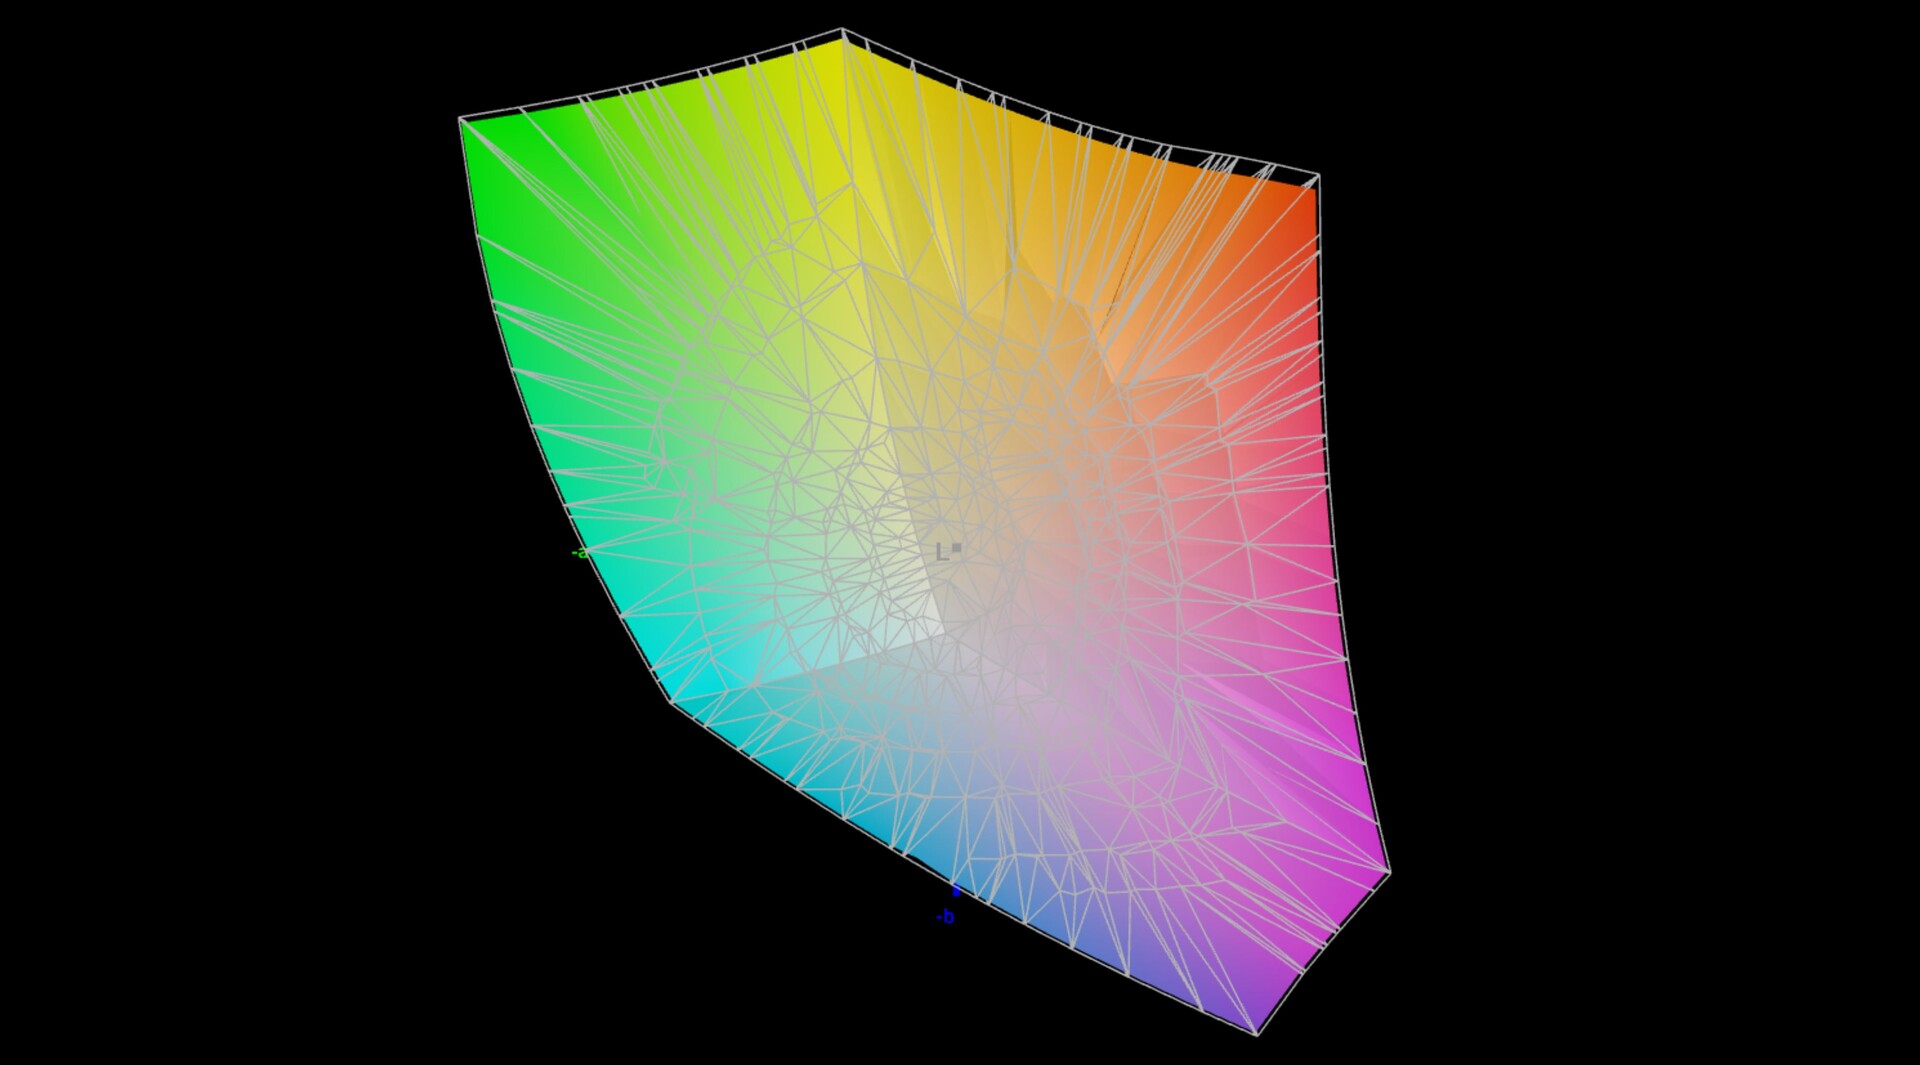
86.3% AdobeRGB 1998 (Argyll 3D)
99.9% sRGB (Argyll 3D)
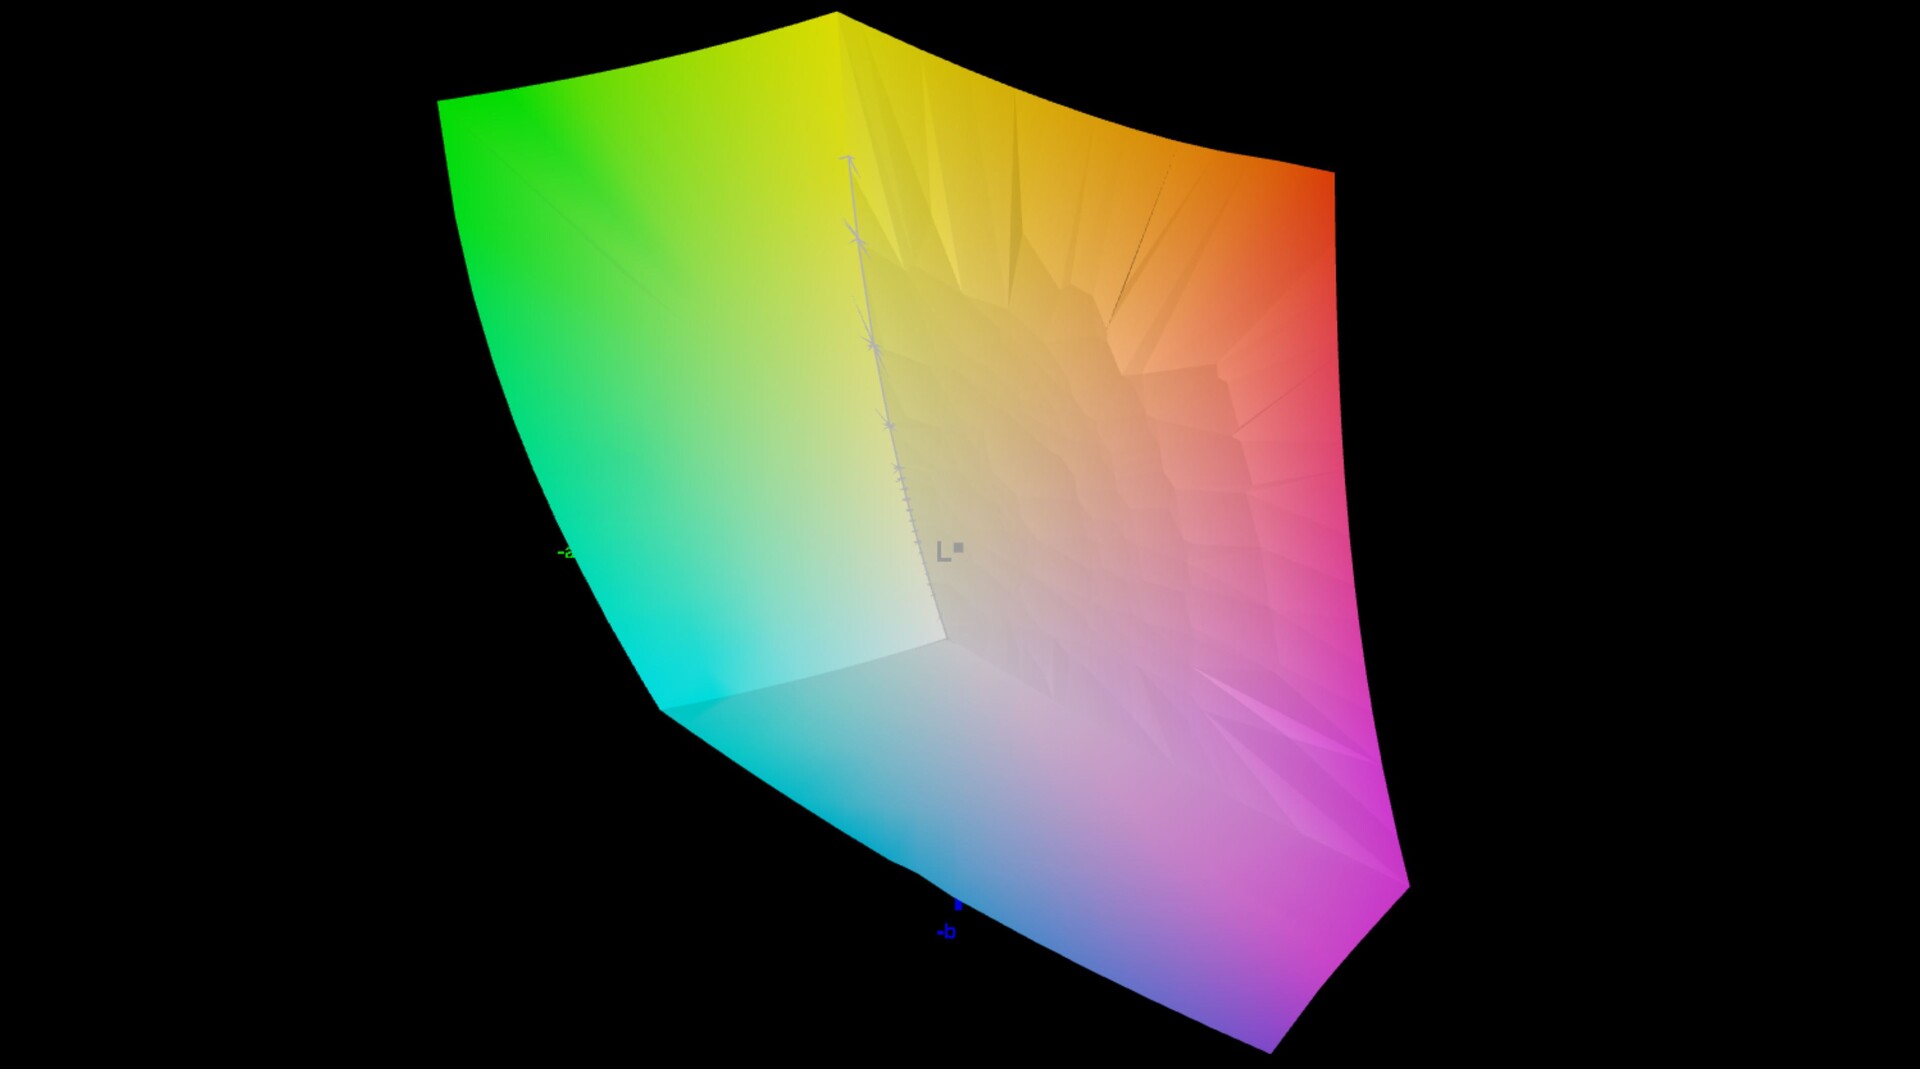
97.5% Display P3 (Argyll 3D)
Gamma: 2.29
CCT: 6458 K
| HP ZBook Studio 16 G9 62U04EA BOE0A52, IPS, 3840x2400, 16" | Lenovo ThinkPad P1 G4-20Y4Z9DVUS NE160QDM-N63, IPS, 2560x1600, 16" | Apple MacBook Pro 16 2021 M1 Max Mini-LED, 3456x2234, 16.2" | Dell Precision 5000 5560 Sharp LQ156R1, IPS, 3840x2400, 15.6" | HP ZBook Studio 15 G8 SDC4145, OLED, 3840x2160, 15.6" | |
|---|---|---|---|---|---|
| Display | -13% | 4% | 4% | ||
| Display P3 Coverage (%) | 97.5 | 72.7 -25% | 94.9 -3% | 99.9 2% | |
| sRGB Coverage (%) | 99.9 | 99.3 -1% | 100 0% | 100 0% | |
| AdobeRGB 1998 Coverage (%) | 86.3 | 74.7 -13% | 100 16% | 95.3 10% | |
| Response Times | -204% | -303% | 73% | ||
| Response Time Grey 50% / Grey 80% * (ms) | 15.3 ? | 40.8 -167% | 47.2 ? -208% | 2.4 ? 84% | |
| Response Time Black / White * (ms) | 6.1 ? | 20.8 -241% | 30.4 ? -398% | 2.4 ? 61% | |
| PWM Frequency (Hz) | 240.4 ? | ||||
| Screen | -60% | 256% | -83% | -166% | |
| Brightness middle (cd/m²) | 554 | 441 -20% | 507 -8% | 501.5 -9% | 379.6 -31% |
| Brightness (cd/m²) | 516 | 420 -19% | 494 -4% | 467 -9% | 380 -26% |
| Brightness Distribution (%) | 84 | 90 7% | 96 14% | 83 -1% | 95 13% |
| Black Level * (cd/m²) | 0.47 | 0.27 43% | 0.02 96% | 0.44 6% | |
| Contrast (:1) | 1179 | 1633 39% | 25350 2050% | 1140 -3% | |
| Colorchecker dE 2000 * | 1 | 2.6 -160% | 1.4 -40% | 4.73 -373% | 5.15 -415% |
| Colorchecker dE 2000 max. * | 2.4 | 6 -150% | 2.8 -17% | 8.45 -252% | 7.79 -225% |
| Colorchecker dE 2000 calibrated * | 0.6 | 1.2 -100% | 0.51 15% | 3.1 -417% | |
| Greyscale dE 2000 * | 1.6 | 4.5 -181% | 2.3 -44% | 3.6 -125% | 2.6 -63% |
| Gamma | 2.29 96% | 2.18 101% | 2.27 97% | 2.08 106% | 1.99 111% |
| CCT | 6458 101% | 6623 98% | 6792 96% | 6447 101% | 6166 105% |
| Total Average (Program / Settings) | -92% /
-71% | 256% /
256% | -127% /
-96% | -30% /
-84% |
* ... smaller is better


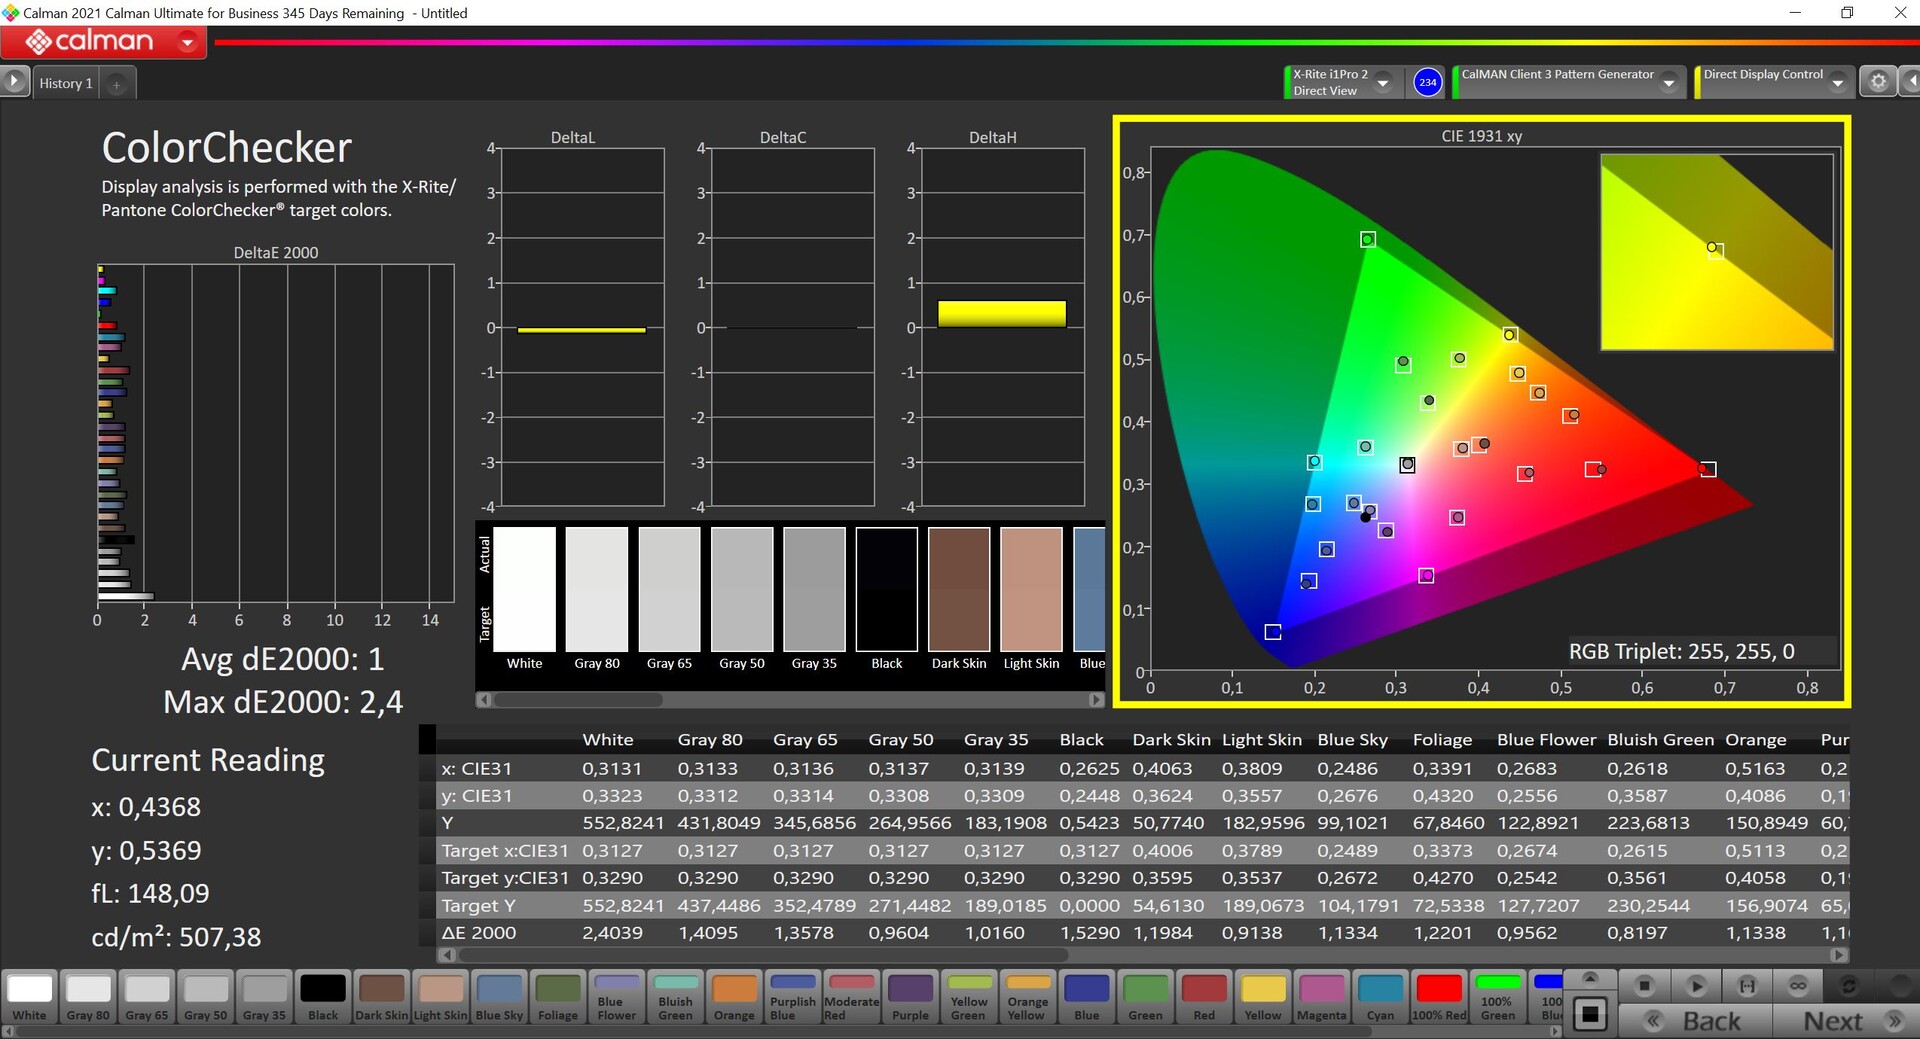
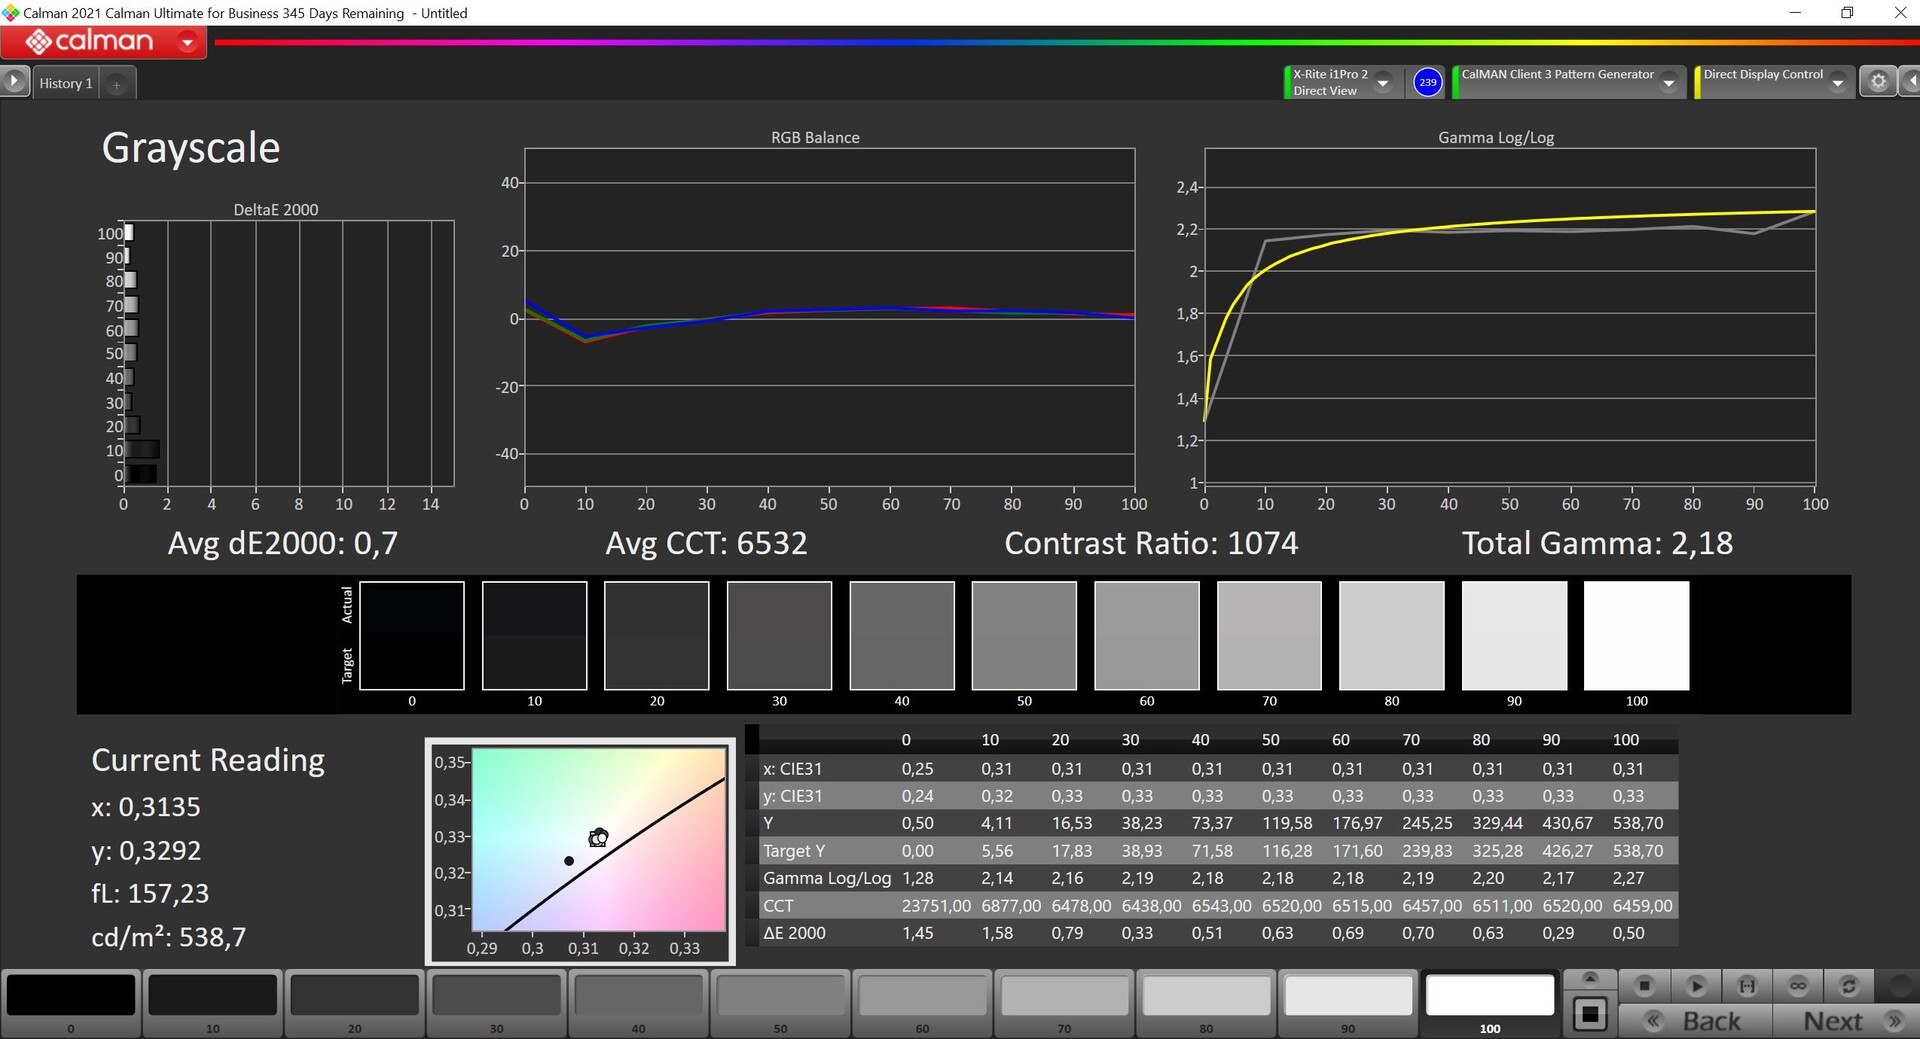
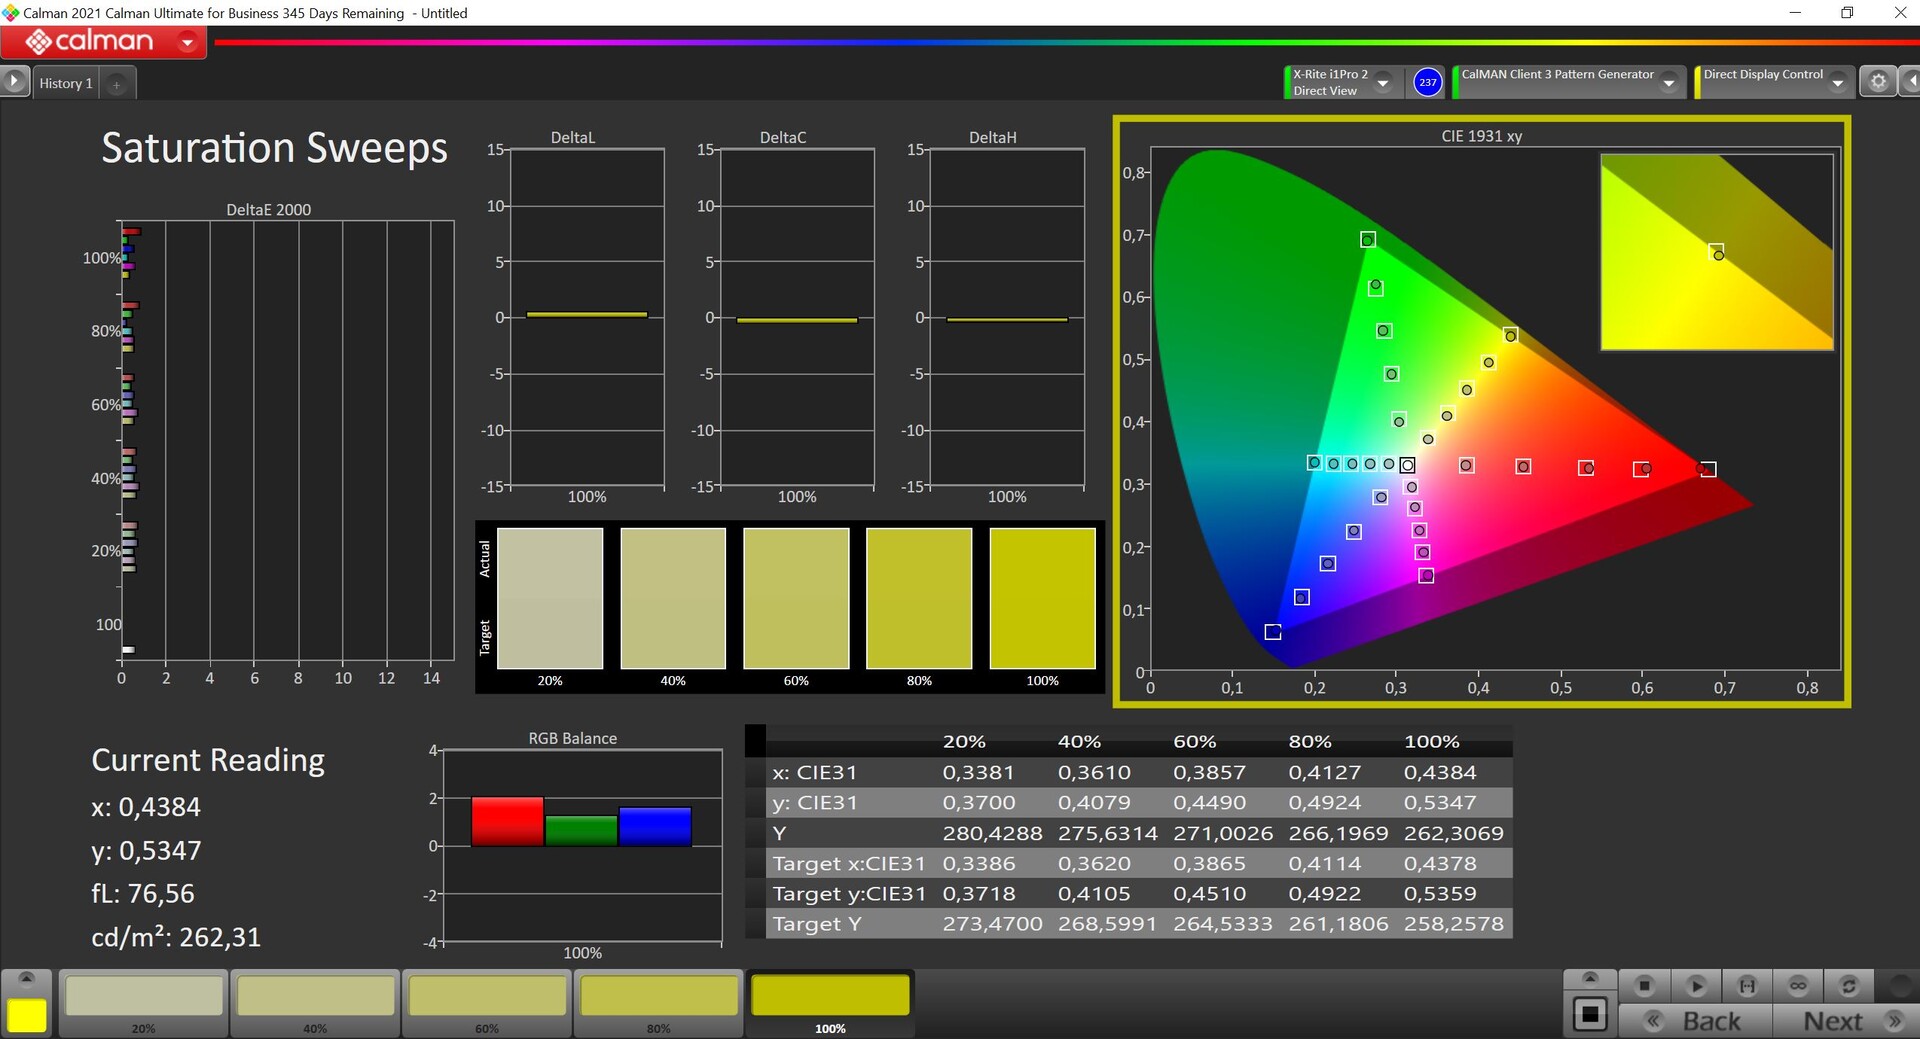

The DreamColor display is already very well adjusted ex works. In our analysis with the professional CalMAN software, all deviations are already under important limit of 3 and no color cast is present. We were able to squeeze a little more out of the panel with our own calibration, but this difference is only measurable, not perceptible.
However, we are still not completely satisfied because, compared to earlier DreamColor models, only the DCI-P3 color space saw complete coverage for some time, whereas this used to be AdobeRGB. Furthermore, there used to be DreamColor software that could be used to switch the color space, so you could work in the sRGB color space, for example.
Display Response Times
| ↔ Response Time Black to White | ||
|---|---|---|
| 6.1 ms ... rise ↗ and fall ↘ combined | ↗ 2.1 ms rise | 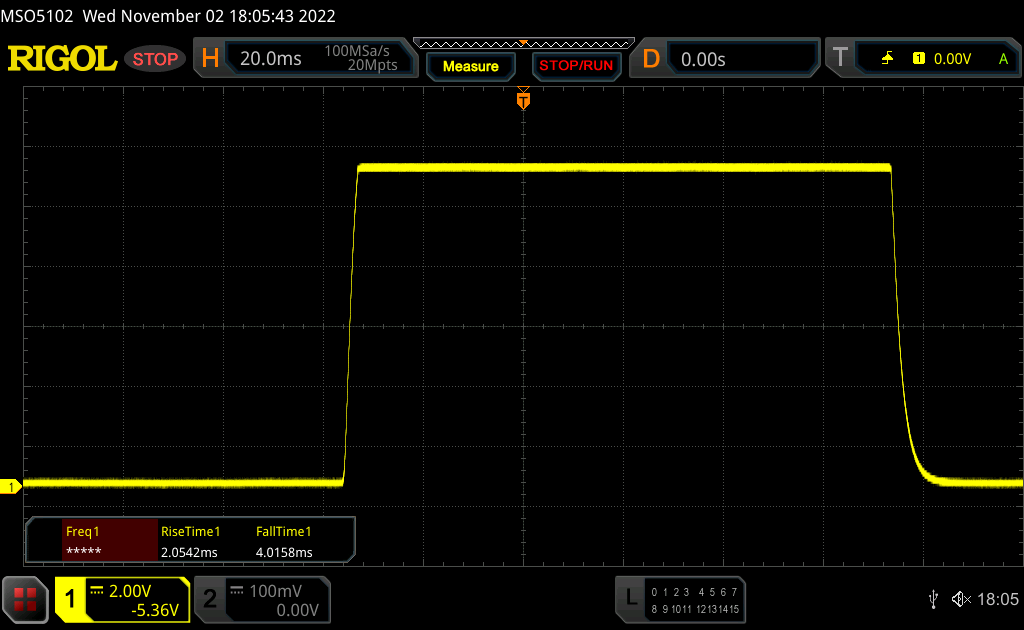 |
| ↘ 4 ms fall | ||
| The screen shows very fast response rates in our tests and should be very well suited for fast-paced gaming. In comparison, all tested devices range from 0.1 (minimum) to 240 (maximum) ms. » 20 % of all devices are better. This means that the measured response time is better than the average of all tested devices (19.8 ms). | ||
| ↔ Response Time 50% Grey to 80% Grey | ||
| 15.3 ms ... rise ↗ and fall ↘ combined | ↗ 6.9 ms rise | 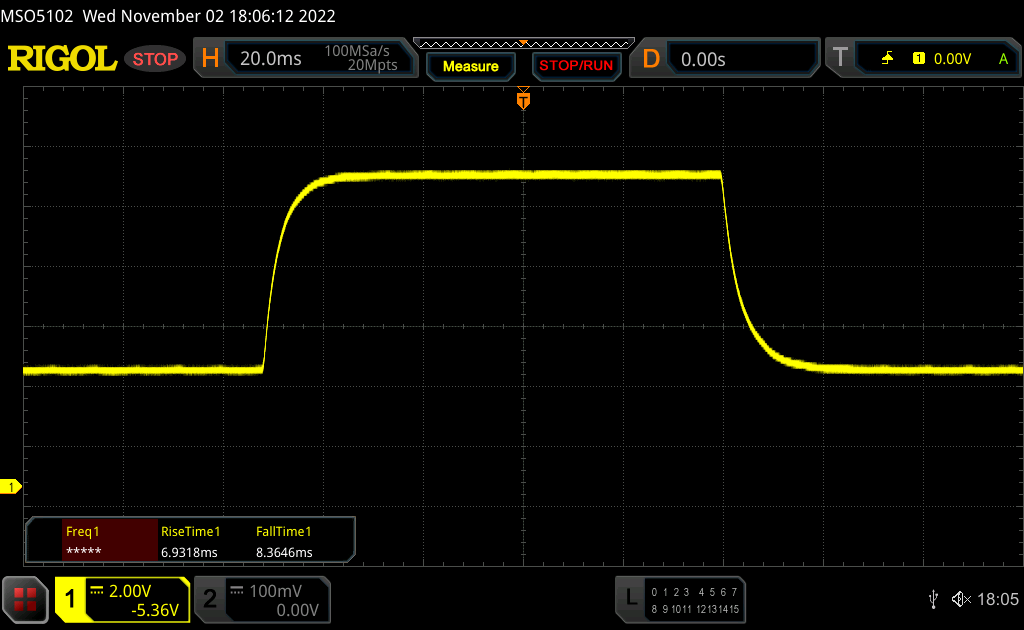 |
| ↘ 8.4 ms fall | ||
| The screen shows good response rates in our tests, but may be too slow for competitive gamers. In comparison, all tested devices range from 0.165 (minimum) to 636 (maximum) ms. » 30 % of all devices are better. This means that the measured response time is better than the average of all tested devices (31 ms). | ||
Screen Flickering / PWM (Pulse-Width Modulation)
| Screen flickering / PWM not detected | 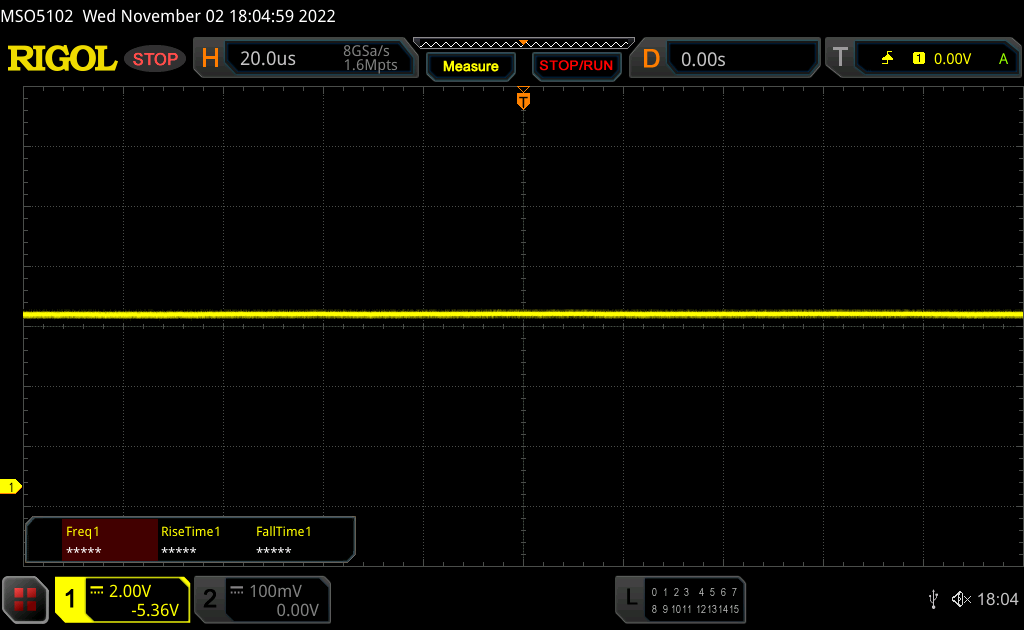 | ||
In comparison: 52 % of all tested devices do not use PWM to dim the display. If PWM was detected, an average of 7750 (minimum: 5 - maximum: 343500) Hz was measured. | |||
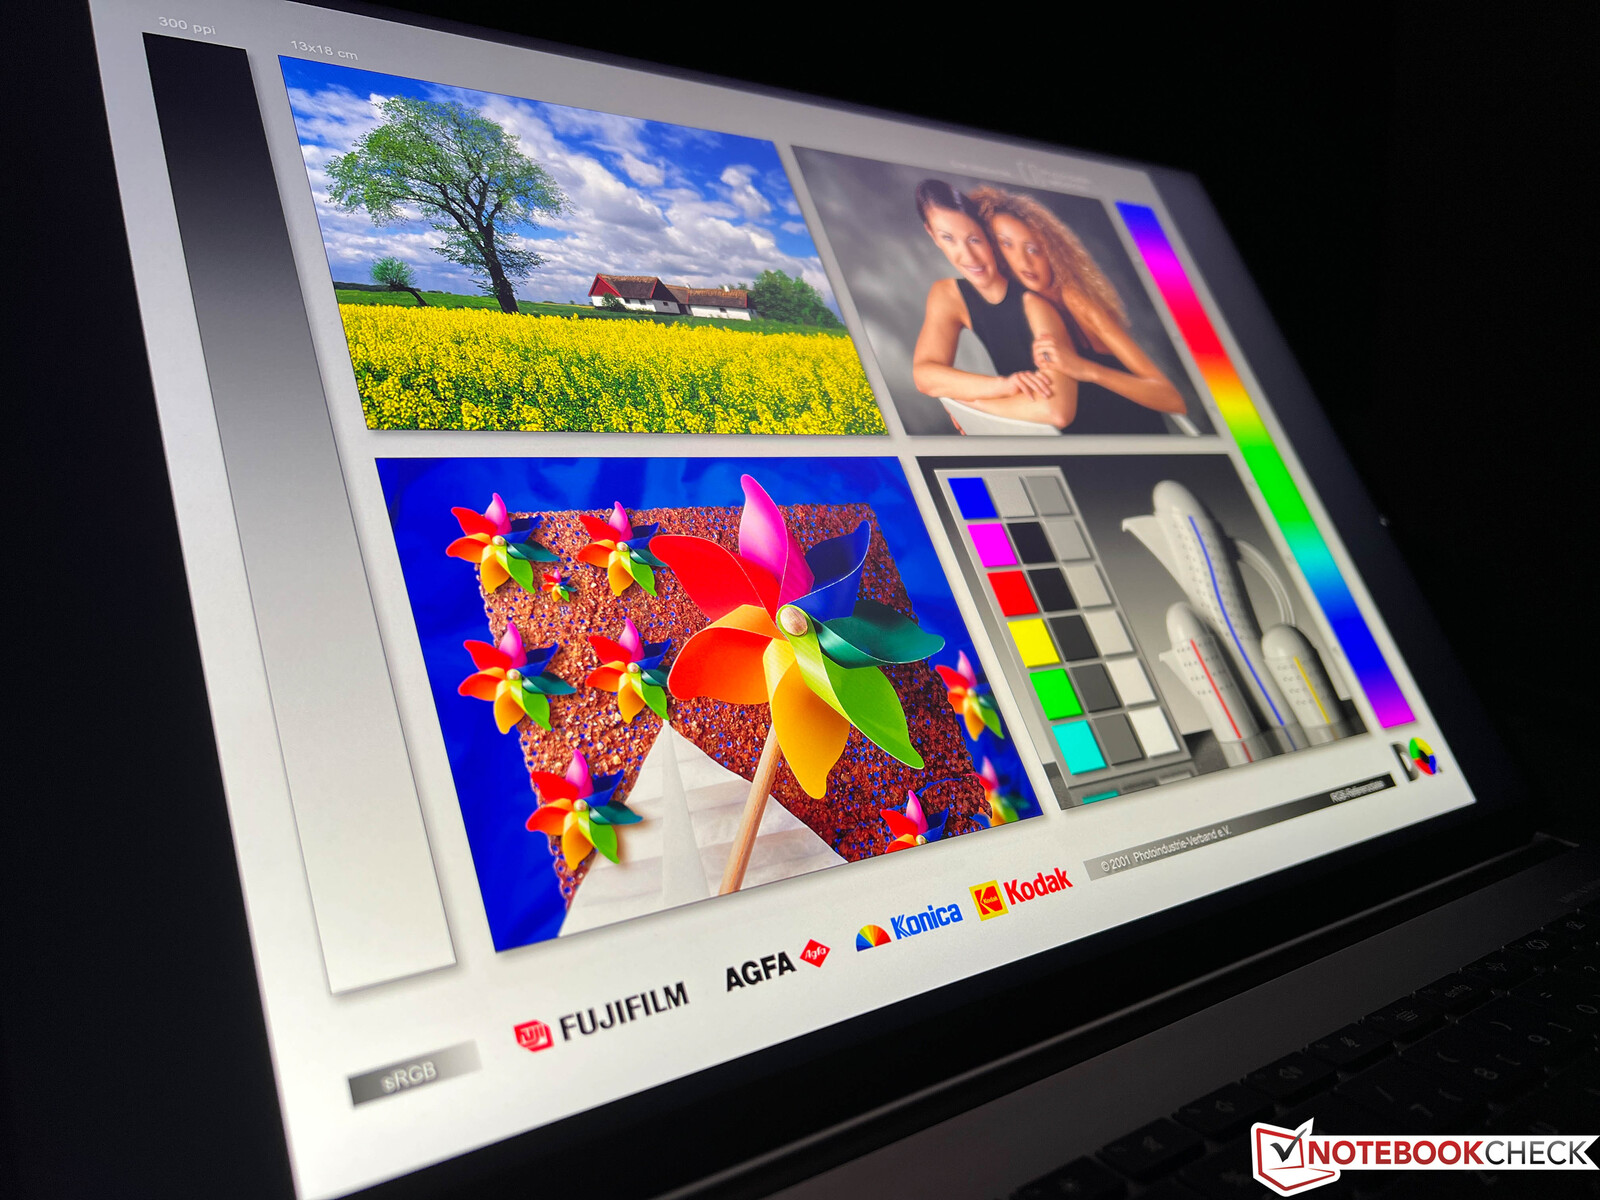
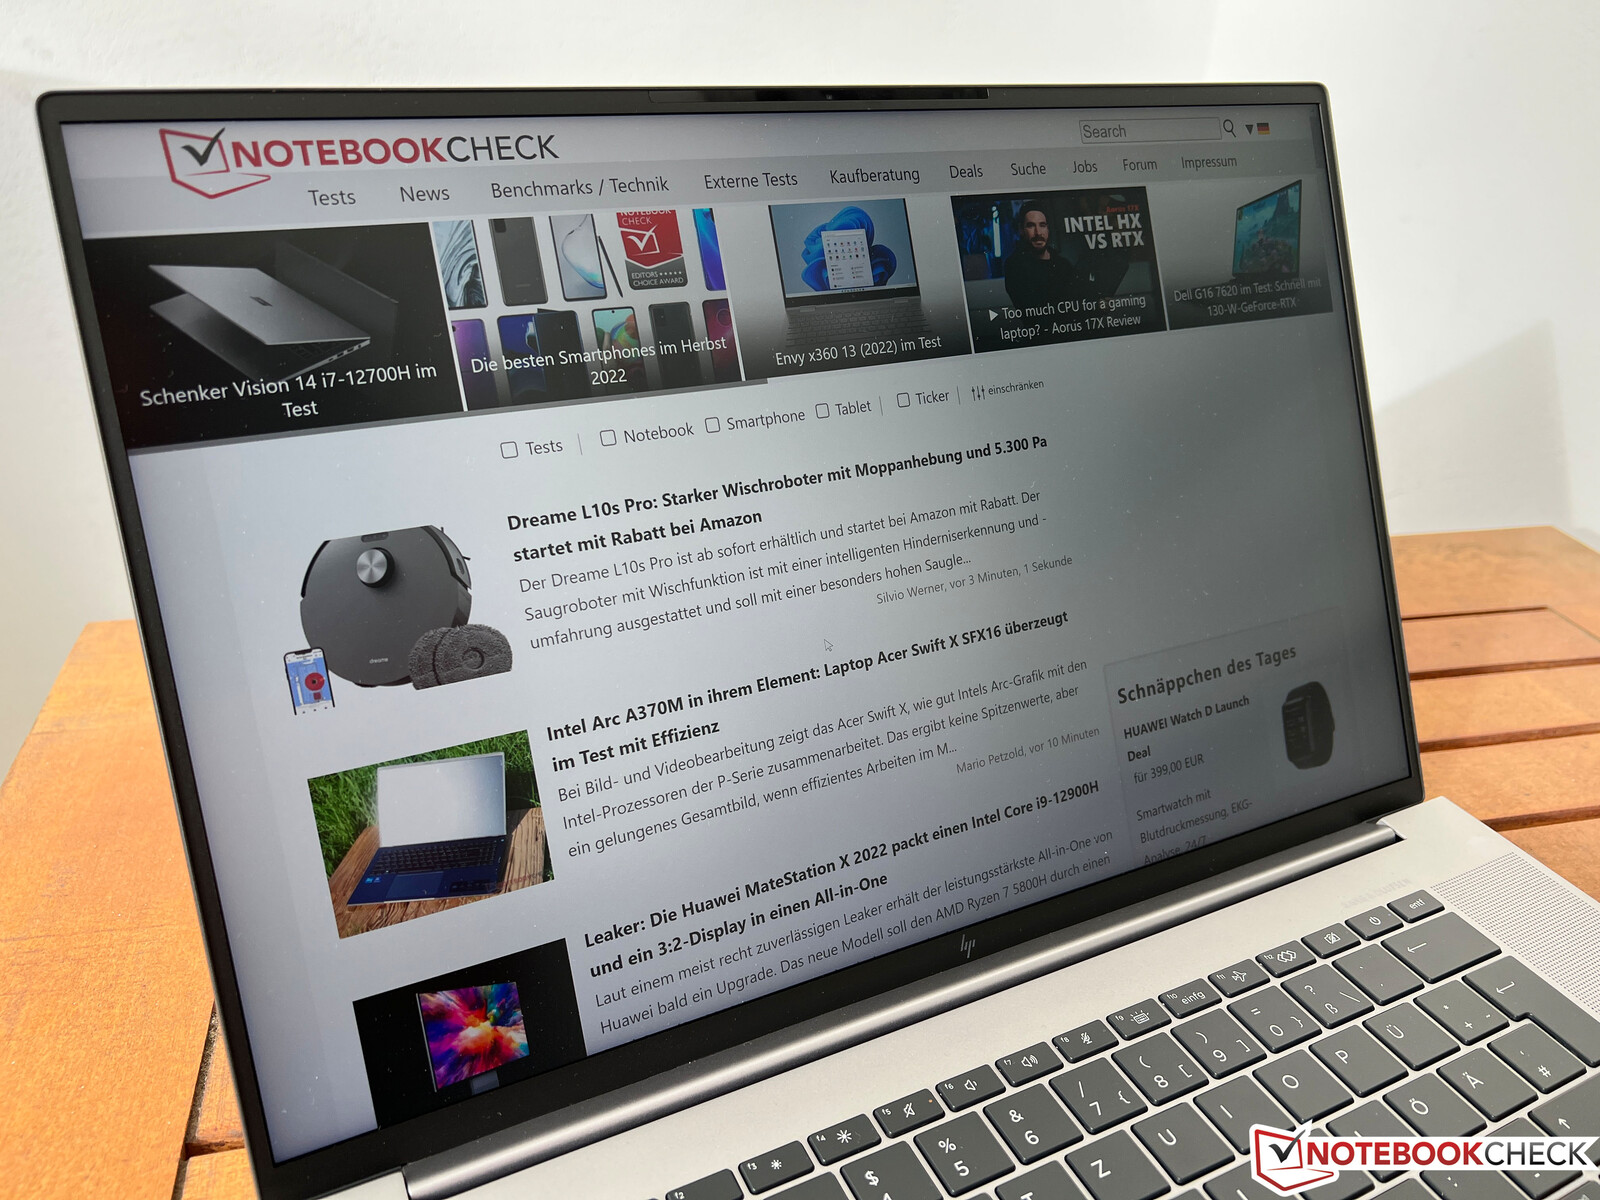
Outdoors, you can work comfortably with the ZBook Studio 16 G9. Thanks to the matte surface and the good brightness, screen content is easily visible, even on bright days. Only direct reflections from light sources should be avoided.
Performance - Alder Lake and lots of GPUs
HP offers the ZBook Studio 16 G9 with either the Core i7-12800H or the Core i9-12900H, both of which are from Intel's current Alder Lake generation and support vPro. In terms of graphics card selection, however, you can choose from Nvidia's entire portfolio of professional GPUs, ranging from the RTX A1000 up to the RTX A5500 with 16 GB of VRAM. The professional AMD Radeon Pro 6600M is also available. If you don't need any special driver certifications, HP still offers the latest GeForce GPUs (RTX 3060 to RTX 3080 Ti). The ZBook also offers two SODIMM slots (DDR5-4800 RAM) for a maximum of 64 GB (2x 32 GB).
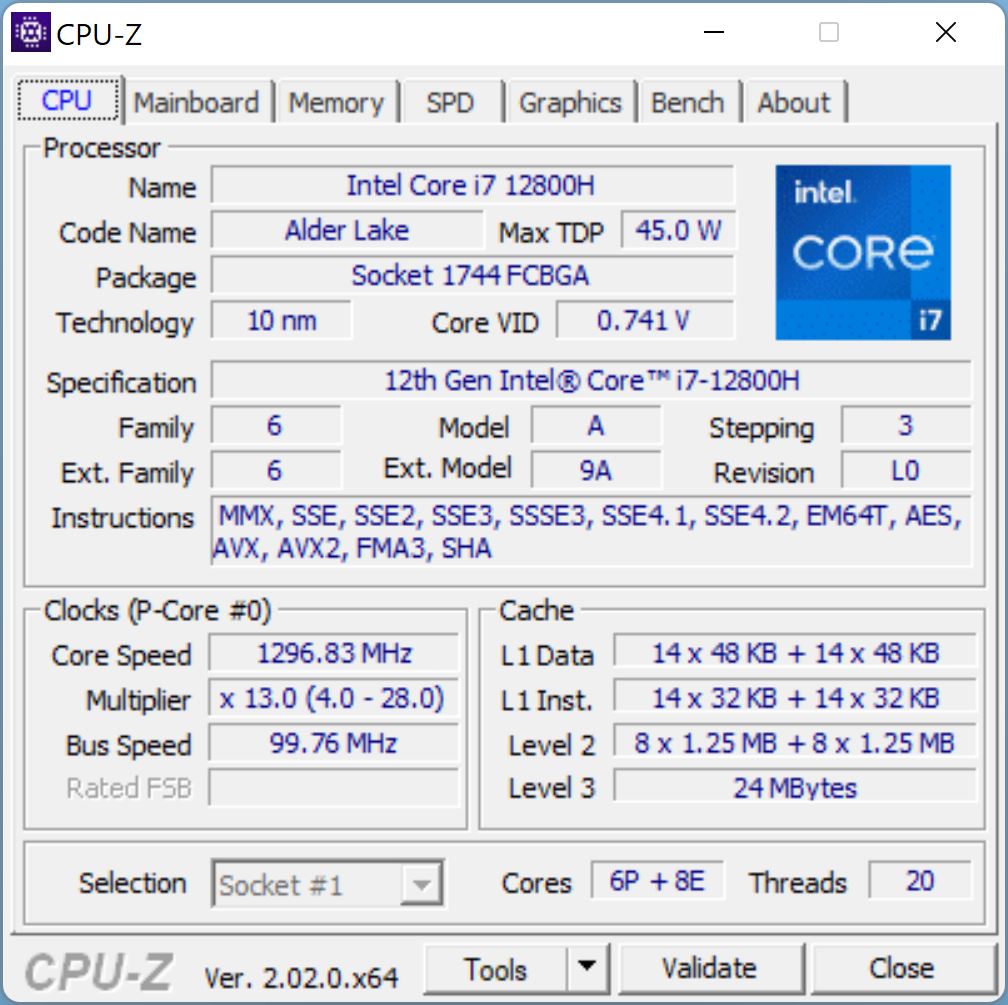
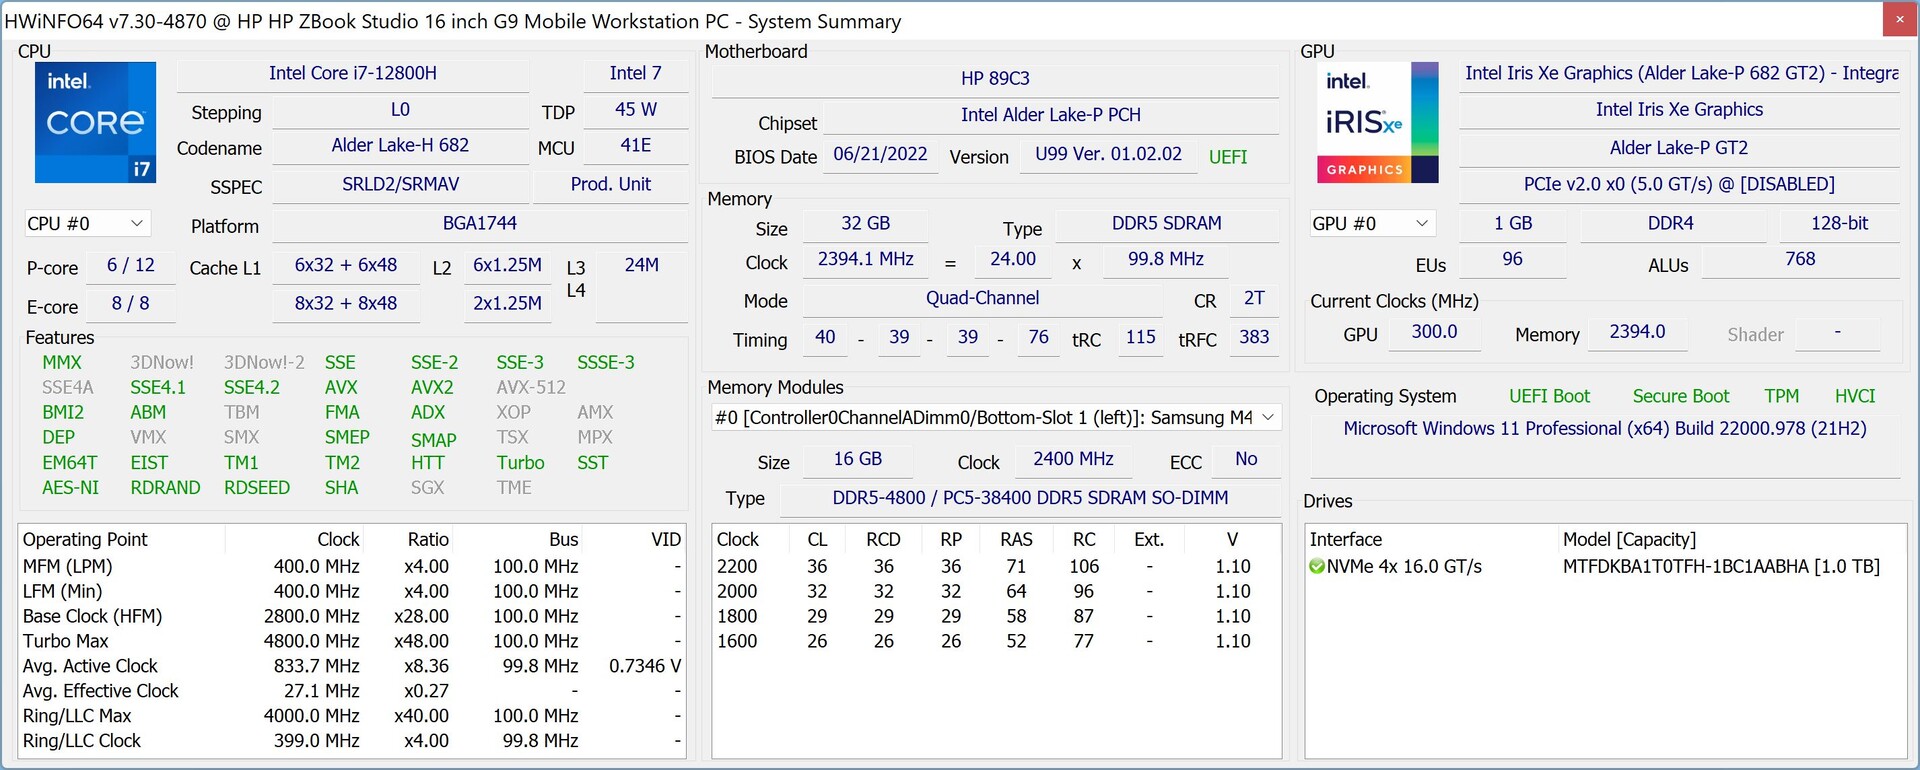
Processor - Core i7-12800H
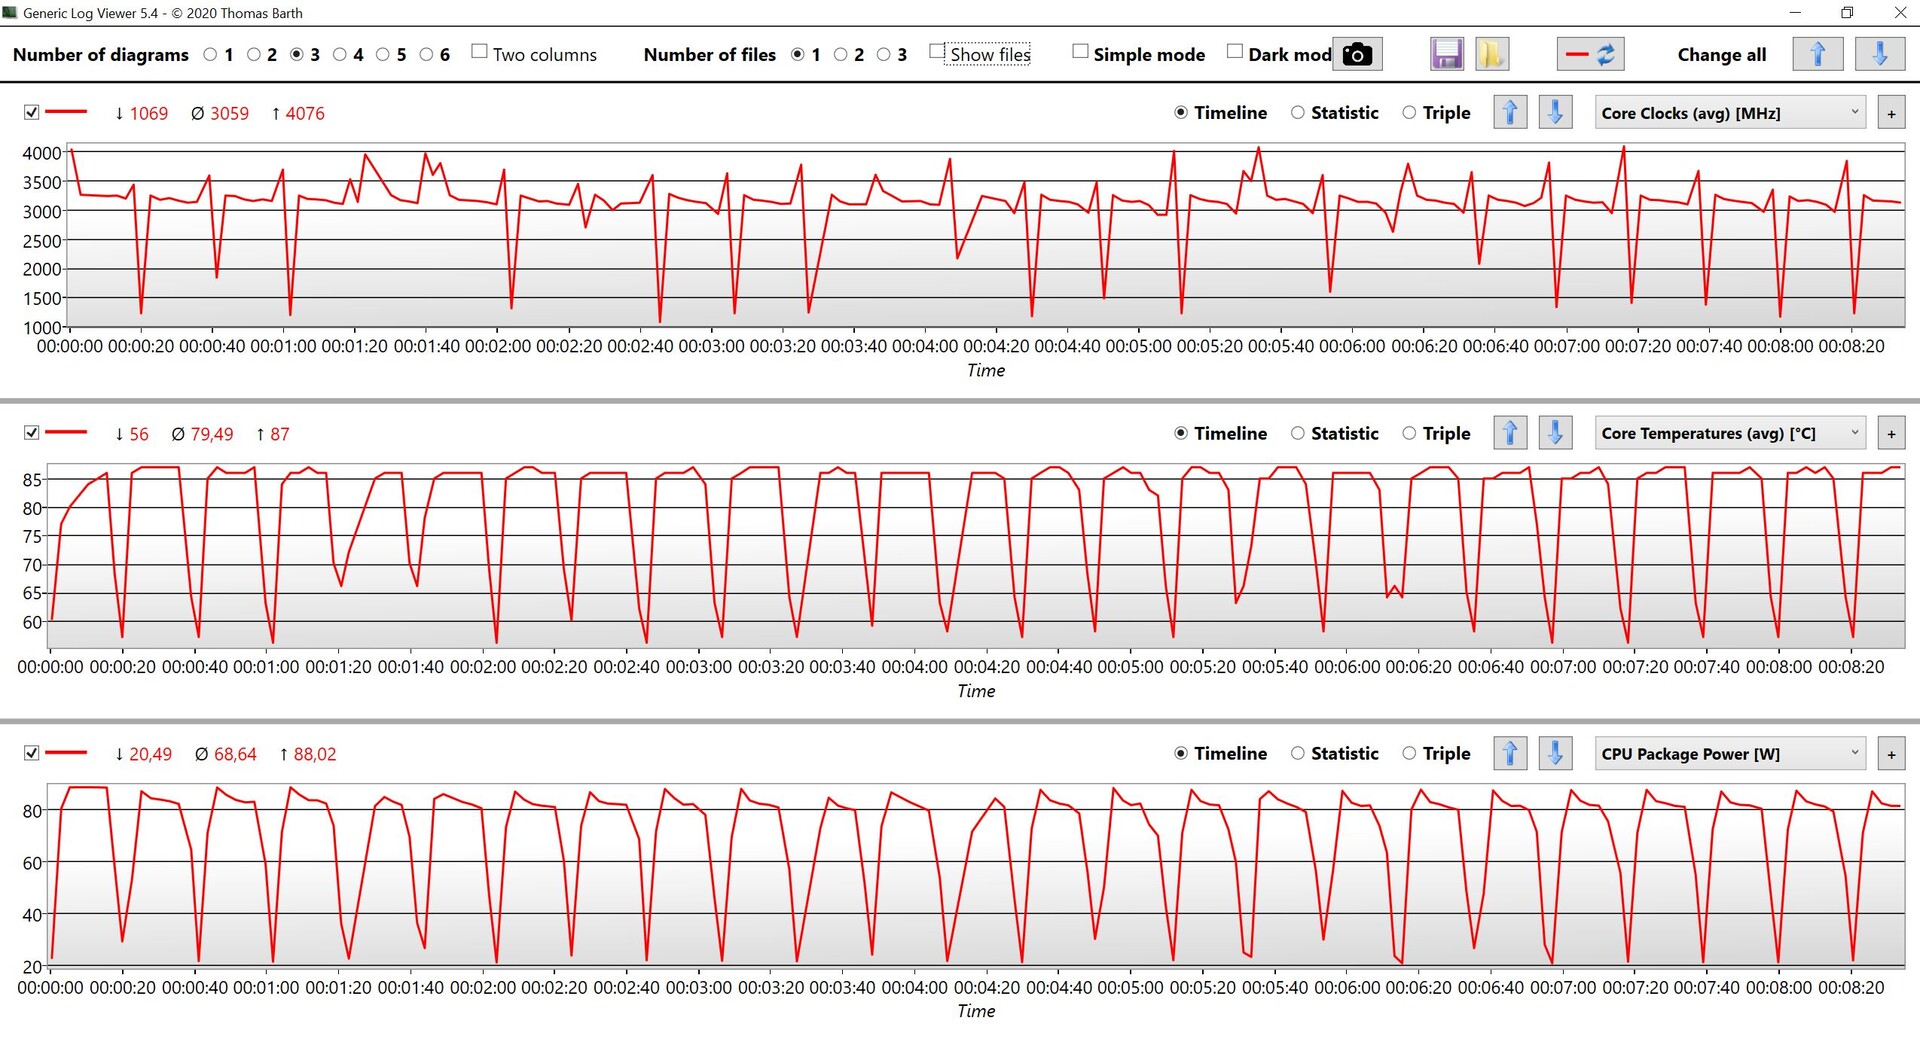
The Core i7-12800H combines 6 fast performance cores with 8 efficiency cores. In principle, this corresponds to the regular Core i7-12700H, but achieves minimally higher Turbo frequencies and also supports Intel's vPro technology. Performance values in the ZBook Studio 16 G9 are very good, as the processor is able to consume a maximum of 88 watts and levels off at 70 watts under sustained load. During our Cinebench R15 loop, the processor recovers very quickly and is also able to utilize the high Turbo clock very well. Single-core results are also excellent. Taking all CPU benchmarks together, the new model is 30% faster than the previous ZBook Studio 15 G8 with the Core i9-11950H.
On battery power, the processor can draw on a maximum of 60 watts, which is why multi-core performance is slightly lower (-18%). More CPU benchmarks are available here.
Cinebench R15 Multi Sustained Load
Cinebench R23: Multi Core | Single Core
Cinebench R20: CPU (Multi Core) | CPU (Single Core)
Cinebench R15: CPU Multi 64Bit | CPU Single 64Bit
Blender: v2.79 BMW27 CPU
7-Zip 18.03: 7z b 4 | 7z b 4 -mmt1
Geekbench 5.5: Multi-Core | Single-Core
HWBOT x265 Benchmark v2.2: 4k Preset
LibreOffice : 20 Documents To PDF
R Benchmark 2.5: Overall mean
| CPU Performance rating | |
| Average of class Workstation | |
| HP ZBook Studio 16 G9 62U04EA | |
| Average Intel Core i7-12800H | |
| Apple MacBook Pro 16 2021 M1 Max -5! | |
| HP ZBook Studio 15 G8 | |
| Lenovo ThinkPad P1 G4-20Y4Z9DVUS | |
| Dell Precision 5000 5560 -2! | |
| Cinebench R23 / Multi Core | |
| Average of class Workstation (14621 - 38520, n=24, last 2 years) | |
| HP ZBook Studio 16 G9 62U04EA | |
| Average Intel Core i7-12800H (9777 - 16597, n=5) | |
| Apple MacBook Pro 16 2021 M1 Max | |
| Lenovo ThinkPad P1 G4-20Y4Z9DVUS | |
| HP ZBook Studio 15 G8 | |
| Dell Precision 5000 5560 | |
| Cinebench R23 / Single Core | |
| Average of class Workstation (1712 - 2228, n=24, last 2 years) | |
| HP ZBook Studio 16 G9 62U04EA | |
| Average Intel Core i7-12800H (1796 - 1859, n=5) | |
| HP ZBook Studio 15 G8 | |
| Apple MacBook Pro 16 2021 M1 Max | |
| Dell Precision 5000 5560 | |
| Lenovo ThinkPad P1 G4-20Y4Z9DVUS | |
| Cinebench R20 / CPU (Multi Core) | |
| Average of class Workstation (5760 - 15043, n=24, last 2 years) | |
| HP ZBook Studio 16 G9 62U04EA | |
| Average Intel Core i7-12800H (3741 - 6433, n=5) | |
| Lenovo ThinkPad P1 G4-20Y4Z9DVUS | |
| HP ZBook Studio 15 G8 | |
| Dell Precision 5000 5560 | |
| Apple MacBook Pro 16 2021 M1 Max | |
| Cinebench R20 / CPU (Single Core) | |
| Average of class Workstation (671 - 857, n=24, last 2 years) | |
| HP ZBook Studio 16 G9 62U04EA | |
| Average Intel Core i7-12800H (690 - 714, n=5) | |
| HP ZBook Studio 15 G8 | |
| Lenovo ThinkPad P1 G4-20Y4Z9DVUS | |
| Dell Precision 5000 5560 | |
| Apple MacBook Pro 16 2021 M1 Max | |
| Cinebench R15 / CPU Multi 64Bit | |
| Average of class Workstation (2489 - 5810, n=24, last 2 years) | |
| HP ZBook Studio 16 G9 62U04EA | |
| Average Intel Core i7-12800H (1566 - 2697, n=5) | |
| Lenovo ThinkPad P1 G4-20Y4Z9DVUS | |
| HP ZBook Studio 15 G8 | |
| Apple MacBook Pro 16 2021 M1 Max | |
| Dell Precision 5000 5560 | |
| Cinebench R15 / CPU Single 64Bit | |
| Average of class Workstation (191.4 - 328, n=24, last 2 years) | |
| HP ZBook Studio 16 G9 62U04EA | |
| Average Intel Core i7-12800H (242 - 269, n=5) | |
| HP ZBook Studio 15 G8 | |
| Dell Precision 5000 5560 | |
| Lenovo ThinkPad P1 G4-20Y4Z9DVUS | |
| Apple MacBook Pro 16 2021 M1 Max | |
| Blender / v2.79 BMW27 CPU | |
| Dell Precision 5000 5560 | |
| HP ZBook Studio 15 G8 | |
| Lenovo ThinkPad P1 G4-20Y4Z9DVUS | |
| Average Intel Core i7-12800H (192 - 306, n=5) | |
| HP ZBook Studio 16 G9 62U04EA | |
| Apple MacBook Pro 16 2021 M1 Max | |
| Average of class Workstation (91 - 222, n=24, last 2 years) | |
| 7-Zip 18.03 / 7z b 4 | |
| Average of class Workstation (60489 - 116969, n=24, last 2 years) | |
| HP ZBook Studio 16 G9 62U04EA | |
| Average Intel Core i7-12800H (44553 - 68930, n=5) | |
| Lenovo ThinkPad P1 G4-20Y4Z9DVUS | |
| HP ZBook Studio 15 G8 | |
| Dell Precision 5000 5560 | |
| 7-Zip 18.03 / 7z b 4 -mmt1 | |
| Average of class Workstation (5126 - 6960, n=24, last 2 years) | |
| HP ZBook Studio 16 G9 62U04EA | |
| Average Intel Core i7-12800H (5726 - 5976, n=5) | |
| HP ZBook Studio 15 G8 | |
| Dell Precision 5000 5560 | |
| Lenovo ThinkPad P1 G4-20Y4Z9DVUS | |
| Geekbench 5.5 / Multi-Core | |
| Average of class Workstation (11542 - 25554, n=24, last 2 years) | |
| HP ZBook Studio 16 G9 62U04EA | |
| Apple MacBook Pro 16 2021 M1 Max | |
| Average Intel Core i7-12800H (9607 - 12940, n=5) | |
| Lenovo ThinkPad P1 G4-20Y4Z9DVUS | |
| HP ZBook Studio 15 G8 | |
| Geekbench 5.5 / Single-Core | |
| Average of class Workstation (1783 - 2183, n=24, last 2 years) | |
| HP ZBook Studio 16 G9 62U04EA | |
| Average Intel Core i7-12800H (1739 - 1842, n=5) | |
| Apple MacBook Pro 16 2021 M1 Max | |
| HP ZBook Studio 15 G8 | |
| Lenovo ThinkPad P1 G4-20Y4Z9DVUS | |
| HWBOT x265 Benchmark v2.2 / 4k Preset | |
| Average of class Workstation (17.8 - 40.5, n=24, last 2 years) | |
| HP ZBook Studio 16 G9 62U04EA | |
| Average Intel Core i7-12800H (11.7 - 19.4, n=5) | |
| HP ZBook Studio 15 G8 | |
| Lenovo ThinkPad P1 G4-20Y4Z9DVUS | |
| Dell Precision 5000 5560 | |
| LibreOffice / 20 Documents To PDF | |
| Lenovo ThinkPad P1 G4-20Y4Z9DVUS | |
| HP ZBook Studio 15 G8 | |
| Dell Precision 5000 5560 | |
| Average of class Workstation (37.1 - 74.7, n=24, last 2 years) | |
| Average Intel Core i7-12800H (41.3 - 51.5, n=5) | |
| HP ZBook Studio 16 G9 62U04EA | |
| R Benchmark 2.5 / Overall mean | |
| Lenovo ThinkPad P1 G4-20Y4Z9DVUS | |
| HP ZBook Studio 15 G8 | |
| Dell Precision 5000 5560 | |
| Average Intel Core i7-12800H (0.4442 - 0.4715, n=5) | |
| HP ZBook Studio 16 G9 62U04EA | |
| Average of class Workstation (0.3825 - 0.603, n=24, last 2 years) | |
* ... smaller is better
AIDA64: FP32 Ray-Trace | FPU Julia | CPU SHA3 | CPU Queen | FPU SinJulia | FPU Mandel | CPU AES | CPU ZLib | FP64 Ray-Trace | CPU PhotoWorxx
| Performance rating | |
| Average of class Workstation | |
| HP ZBook Studio 16 G9 62U04EA | |
| Lenovo ThinkPad P1 G4-20Y4Z9DVUS | |
| HP ZBook Studio 15 G8 | |
| Average Intel Core i7-12800H | |
| AIDA64 / FP32 Ray-Trace | |
| Average of class Workstation (15143 - 61611, n=24, last 2 years) | |
| Lenovo ThinkPad P1 G4-20Y4Z9DVUS | |
| HP ZBook Studio 16 G9 62U04EA | |
| HP ZBook Studio 15 G8 | |
| Average Intel Core i7-12800H (5839 - 15206, n=5) | |
| AIDA64 / FPU Julia | |
| Average of class Workstation (81575 - 186971, n=24, last 2 years) | |
| HP ZBook Studio 16 G9 62U04EA | |
| Lenovo ThinkPad P1 G4-20Y4Z9DVUS | |
| HP ZBook Studio 15 G8 | |
| Average Intel Core i7-12800H (27801 - 80002, n=5) | |
| AIDA64 / CPU SHA3 | |
| Average of class Workstation (3833 - 8975, n=24, last 2 years) | |
| Lenovo ThinkPad P1 G4-20Y4Z9DVUS | |
| HP ZBook Studio 15 G8 | |
| HP ZBook Studio 16 G9 62U04EA | |
| Average Intel Core i7-12800H (2013 - 3684, n=5) | |
| AIDA64 / CPU Queen | |
| HP ZBook Studio 16 G9 62U04EA | |
| Average of class Workstation (60778 - 144411, n=24, last 2 years) | |
| HP ZBook Studio 15 G8 | |
| Average Intel Core i7-12800H (85965 - 108084, n=5) | |
| Lenovo ThinkPad P1 G4-20Y4Z9DVUS | |
| AIDA64 / FPU SinJulia | |
| Average of class Workstation (8165 - 29343, n=24, last 2 years) | |
| HP ZBook Studio 15 G8 | |
| Lenovo ThinkPad P1 G4-20Y4Z9DVUS | |
| HP ZBook Studio 16 G9 62U04EA | |
| Average Intel Core i7-12800H (7027 - 9658, n=5) | |
| AIDA64 / FPU Mandel | |
| Average of class Workstation (40055 - 98153, n=24, last 2 years) | |
| HP ZBook Studio 16 G9 62U04EA | |
| Lenovo ThinkPad P1 G4-20Y4Z9DVUS | |
| HP ZBook Studio 15 G8 | |
| Average Intel Core i7-12800H (15765 - 38179, n=5) | |
| AIDA64 / CPU AES | |
| Average of class Workstation (73133 - 187841, n=24, last 2 years) | |
| Lenovo ThinkPad P1 G4-20Y4Z9DVUS | |
| HP ZBook Studio 15 G8 | |
| HP ZBook Studio 16 G9 62U04EA | |
| Average Intel Core i7-12800H (55371 - 73928, n=5) | |
| AIDA64 / CPU ZLib | |
| Average of class Workstation (929 - 2148, n=24, last 2 years) | |
| HP ZBook Studio 16 G9 62U04EA | |
| Average Intel Core i7-12800H (701 - 1047, n=5) | |
| Lenovo ThinkPad P1 G4-20Y4Z9DVUS | |
| HP ZBook Studio 15 G8 | |
| AIDA64 / FP64 Ray-Trace | |
| Average of class Workstation (7813 - 32891, n=24, last 2 years) | |
| HP ZBook Studio 16 G9 62U04EA | |
| Lenovo ThinkPad P1 G4-20Y4Z9DVUS | |
| HP ZBook Studio 15 G8 | |
| Average Intel Core i7-12800H (3257 - 8559, n=5) | |
| AIDA64 / CPU PhotoWorxx | |
| Average of class Workstation (37151 - 93684, n=24, last 2 years) | |
| HP ZBook Studio 16 G9 62U04EA | |
| Average Intel Core i7-12800H (31329 - 40992, n=5) | |
| HP ZBook Studio 15 G8 | |
| Lenovo ThinkPad P1 G4-20Y4Z9DVUS | |
System Performance
The ZBook Studio 16 G9 is a very powerful and responsive device, which is also confirmed by good benchmark results. No problems were observed during testing.
CrossMark: Overall | Productivity | Creativity | Responsiveness
| PCMark 10 / Score | |
| Average of class Workstation (6563 - 10409, n=20, last 2 years) | |
| HP ZBook Studio 15 G8 | |
| Dell Precision 5000 5560 | |
| HP ZBook Studio 16 G9 62U04EA | |
| Average Intel Core i7-12800H, NVIDIA RTX A2000 Laptop GPU (n=1) | |
| Lenovo ThinkPad P1 G4-20Y4Z9DVUS | |
| PCMark 10 / Essentials | |
| Dell Precision 5000 5560 | |
| Average of class Workstation (9622 - 11157, n=20, last 2 years) | |
| Lenovo ThinkPad P1 G4-20Y4Z9DVUS | |
| HP ZBook Studio 15 G8 | |
| HP ZBook Studio 16 G9 62U04EA | |
| Average Intel Core i7-12800H, NVIDIA RTX A2000 Laptop GPU (n=1) | |
| PCMark 10 / Productivity | |
| Average of class Workstation (8789 - 20616, n=20, last 2 years) | |
| Dell Precision 5000 5560 | |
| HP ZBook Studio 15 G8 | |
| Lenovo ThinkPad P1 G4-20Y4Z9DVUS | |
| HP ZBook Studio 16 G9 62U04EA | |
| Average Intel Core i7-12800H, NVIDIA RTX A2000 Laptop GPU (n=1) | |
| PCMark 10 / Digital Content Creation | |
| Average of class Workstation (8108 - 15631, n=20, last 2 years) | |
| HP ZBook Studio 15 G8 | |
| HP ZBook Studio 16 G9 62U04EA | |
| Average Intel Core i7-12800H, NVIDIA RTX A2000 Laptop GPU (n=1) | |
| Dell Precision 5000 5560 | |
| Lenovo ThinkPad P1 G4-20Y4Z9DVUS | |
| CrossMark / Overall | |
| Average of class Workstation (1307 - 2267, n=23, last 2 years) | |
| HP ZBook Studio 16 G9 62U04EA | |
| Average Intel Core i7-12800H, NVIDIA RTX A2000 Laptop GPU (n=1) | |
| Apple MacBook Pro 16 2021 M1 Max | |
| Lenovo ThinkPad P1 G4-20Y4Z9DVUS | |
| CrossMark / Productivity | |
| Average of class Workstation (1130 - 2122, n=23, last 2 years) | |
| HP ZBook Studio 16 G9 62U04EA | |
| Average Intel Core i7-12800H, NVIDIA RTX A2000 Laptop GPU (n=1) | |
| Lenovo ThinkPad P1 G4-20Y4Z9DVUS | |
| Apple MacBook Pro 16 2021 M1 Max | |
| CrossMark / Creativity | |
| Average of class Workstation (1657 - 2725, n=23, last 2 years) | |
| Apple MacBook Pro 16 2021 M1 Max | |
| HP ZBook Studio 16 G9 62U04EA | |
| Average Intel Core i7-12800H, NVIDIA RTX A2000 Laptop GPU (n=1) | |
| Lenovo ThinkPad P1 G4-20Y4Z9DVUS | |
| CrossMark / Responsiveness | |
| Average of class Workstation (993 - 2096, n=23, last 2 years) | |
| HP ZBook Studio 16 G9 62U04EA | |
| Average Intel Core i7-12800H, NVIDIA RTX A2000 Laptop GPU (n=1) | |
| Lenovo ThinkPad P1 G4-20Y4Z9DVUS | |
| Apple MacBook Pro 16 2021 M1 Max | |
| PCMark 10 Score | 6321 points | |
Help | ||
| AIDA64 / Memory Copy | |
| Average of class Workstation (56003 - 164795, n=24, last 2 years) | |
| HP ZBook Studio 16 G9 62U04EA | |
| Average Intel Core i7-12800H (48643 - 62522, n=5) | |
| HP ZBook Studio 15 G8 | |
| Lenovo ThinkPad P1 G4-20Y4Z9DVUS | |
| AIDA64 / Memory Read | |
| Average of class Workstation (55795 - 121563, n=24, last 2 years) | |
| HP ZBook Studio 16 G9 62U04EA | |
| Average Intel Core i7-12800H (56629 - 66199, n=5) | |
| HP ZBook Studio 15 G8 | |
| Lenovo ThinkPad P1 G4-20Y4Z9DVUS | |
| AIDA64 / Memory Write | |
| Average of class Workstation (55663 - 214520, n=24, last 2 years) | |
| HP ZBook Studio 16 G9 62U04EA | |
| Average Intel Core i7-12800H (50923 - 66074, n=5) | |
| HP ZBook Studio 15 G8 | |
| Lenovo ThinkPad P1 G4-20Y4Z9DVUS | |
| AIDA64 / Memory Latency | |
| Average of class Workstation (84.5 - 165.2, n=24, last 2 years) | |
| HP ZBook Studio 16 G9 62U04EA | |
| Lenovo ThinkPad P1 G4-20Y4Z9DVUS | |
| HP ZBook Studio 15 G8 | |
| Average Intel Core i7-12800H (89.3 - 95.2, n=5) | |
* ... smaller is better
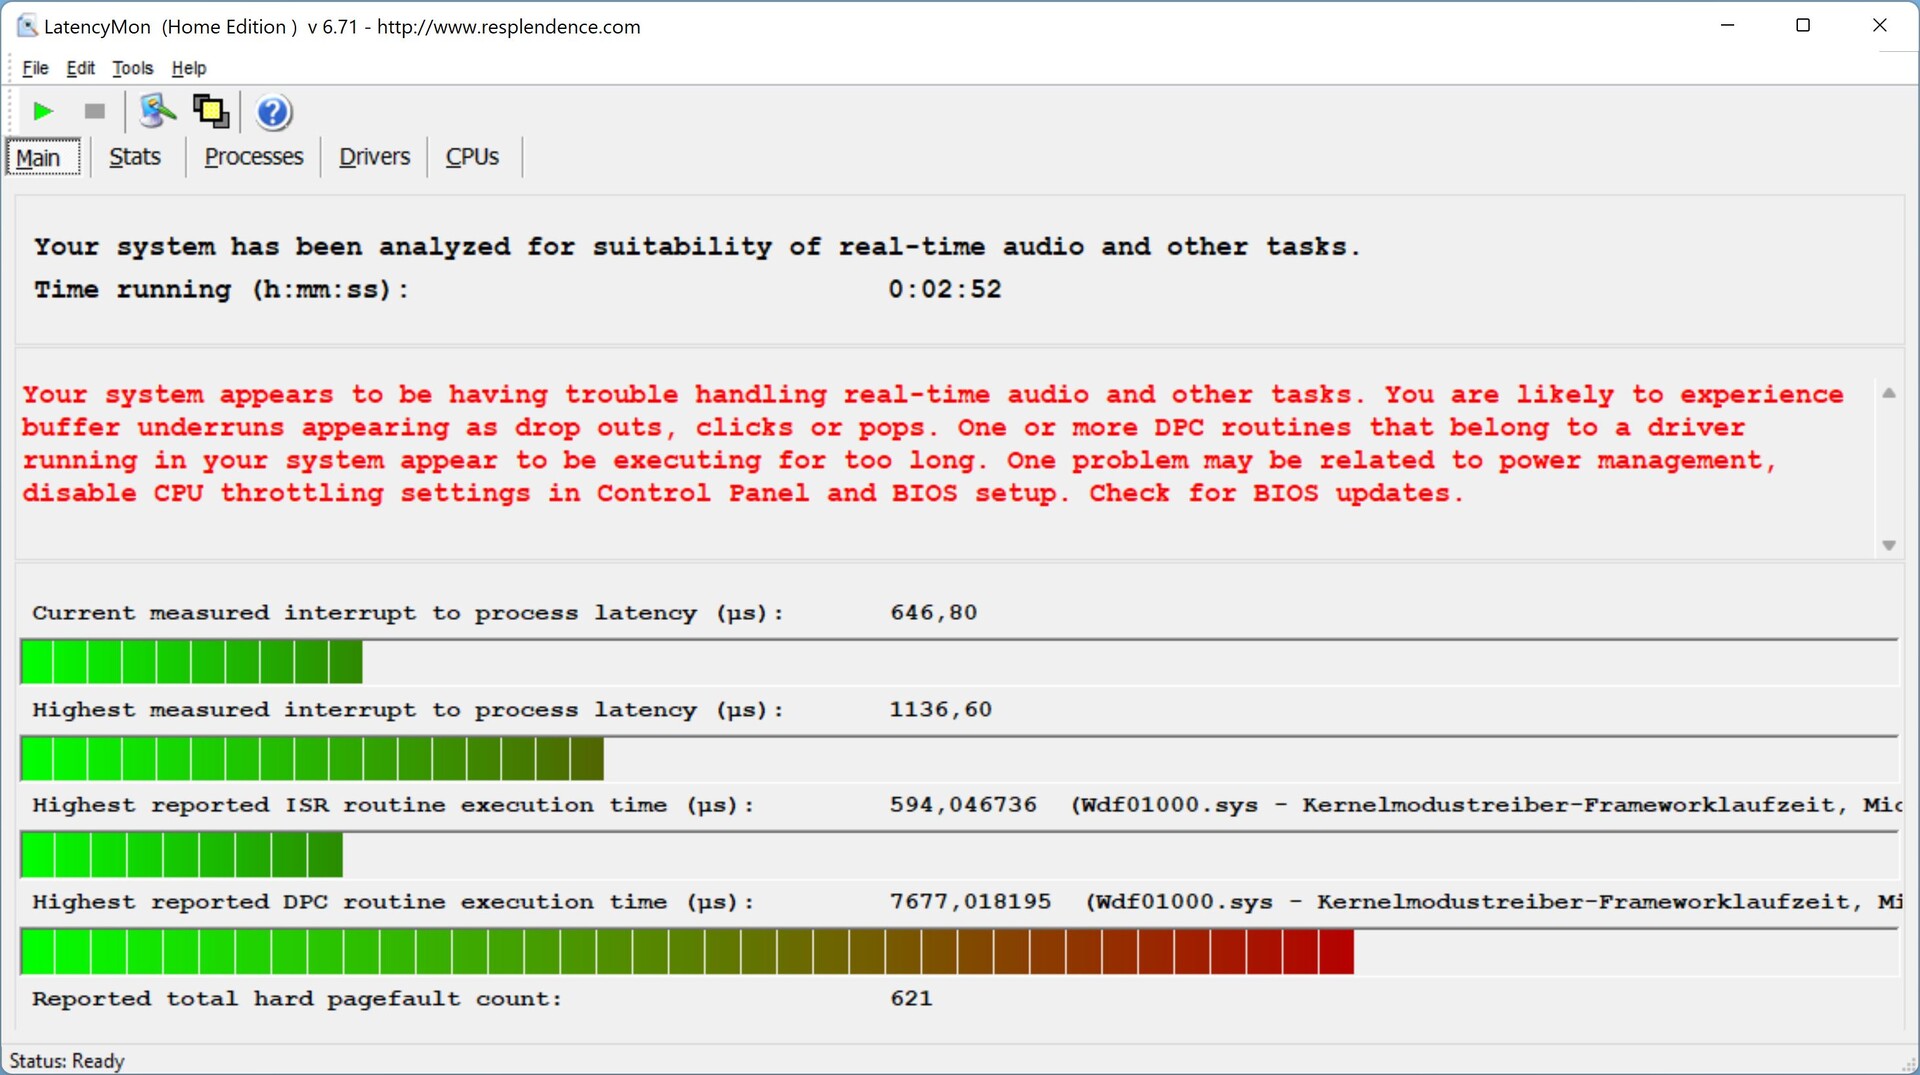
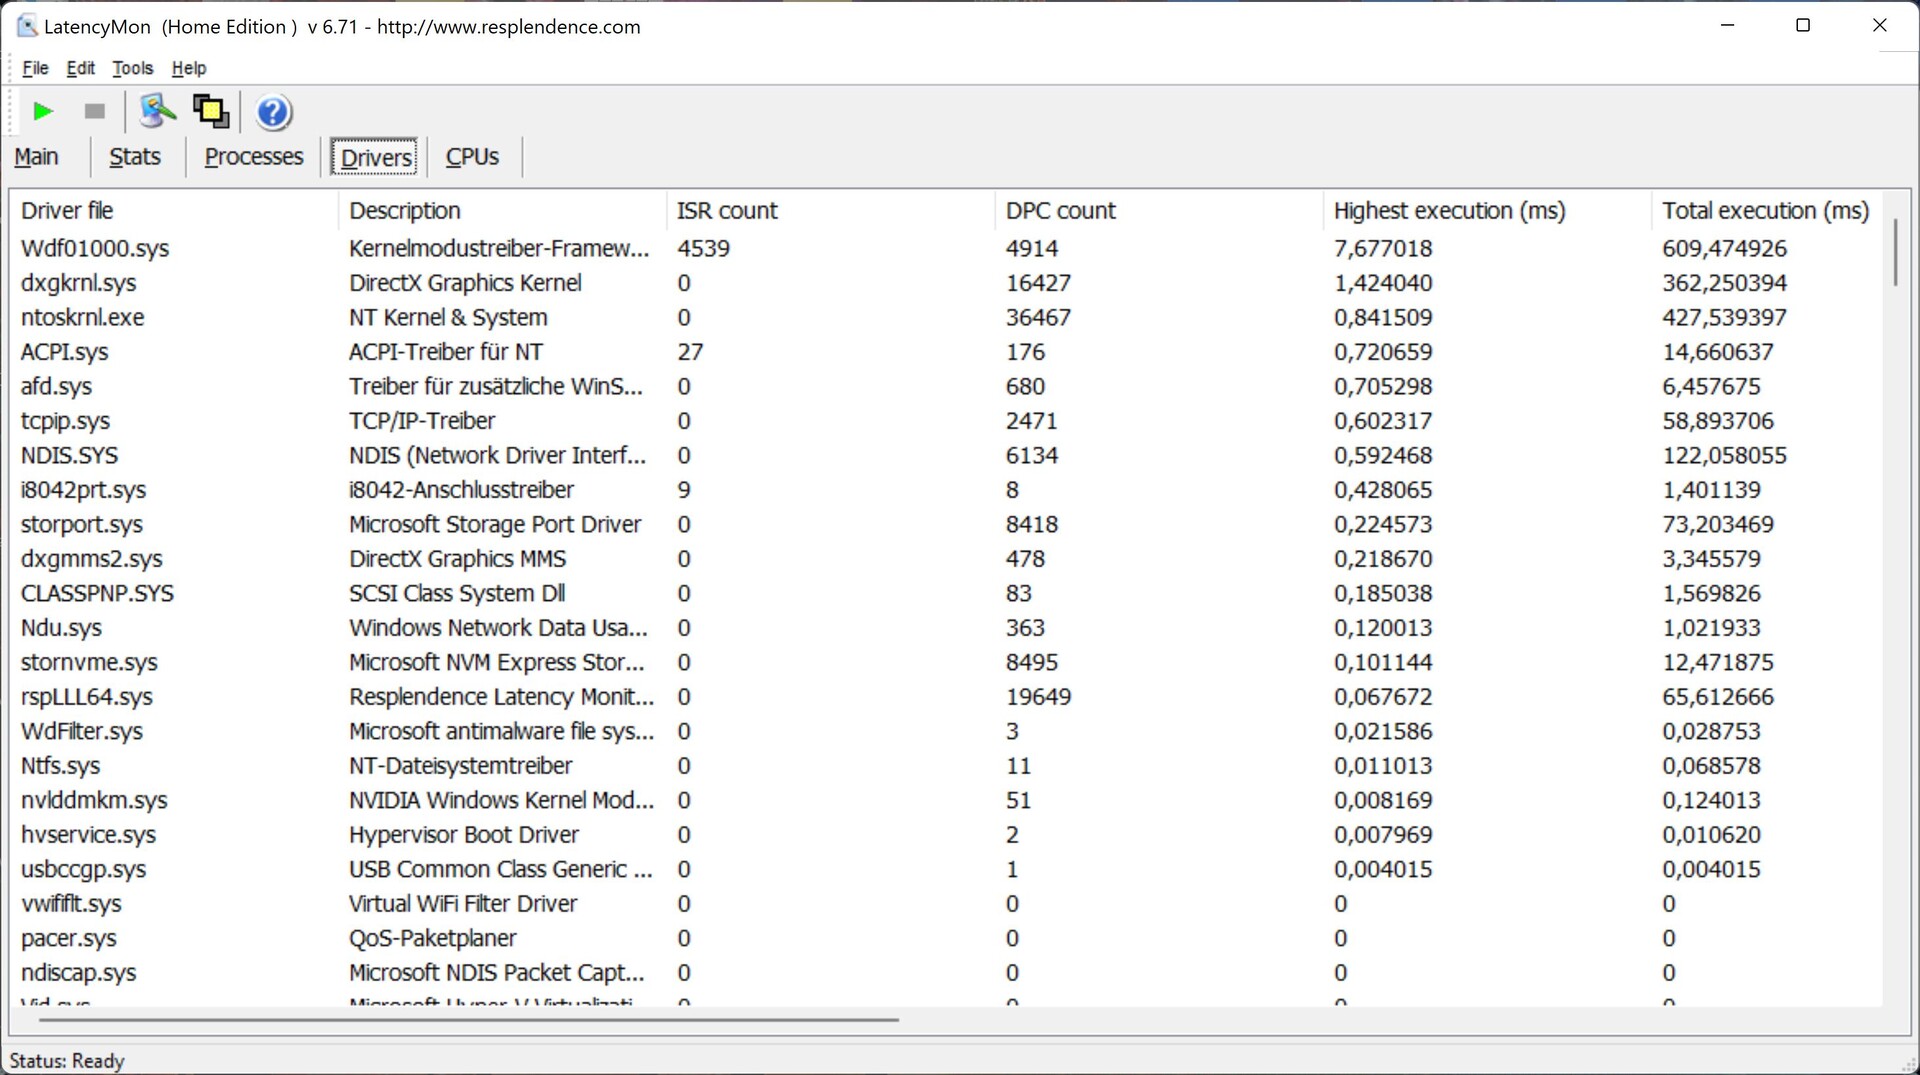
DPC Latency
The current BIOS version in our review device shows slight limitations in our standardized latency test (web browsing, 4K YouTube playback, CPU load) and is therefore not optimally suited for real-time audio applications.
| DPC Latencies / LatencyMon - interrupt to process latency (max), Web, Youtube, Prime95 | |
| HP ZBook Studio 15 G8 | |
| Lenovo ThinkPad P1 G4-20Y4Z9DVUS | |
| HP ZBook Studio 16 G9 62U04EA | |
| Dell Precision 5000 5560 | |
* ... smaller is better
Storage Devices
HP uses the fast PCIe 4.0 Micron 3400 SSD with a storage capacity of 1 TB (880 GB available after the first start-up). Transfer rates are very high and there is only a minimal performance drop after a few minutes, even under permanent load, but this does not matter in practice. More SSD benchmarks are available here.

* ... smaller is better
Sustained Read Performance: DiskSpd Read Loop, Queue Depth 8
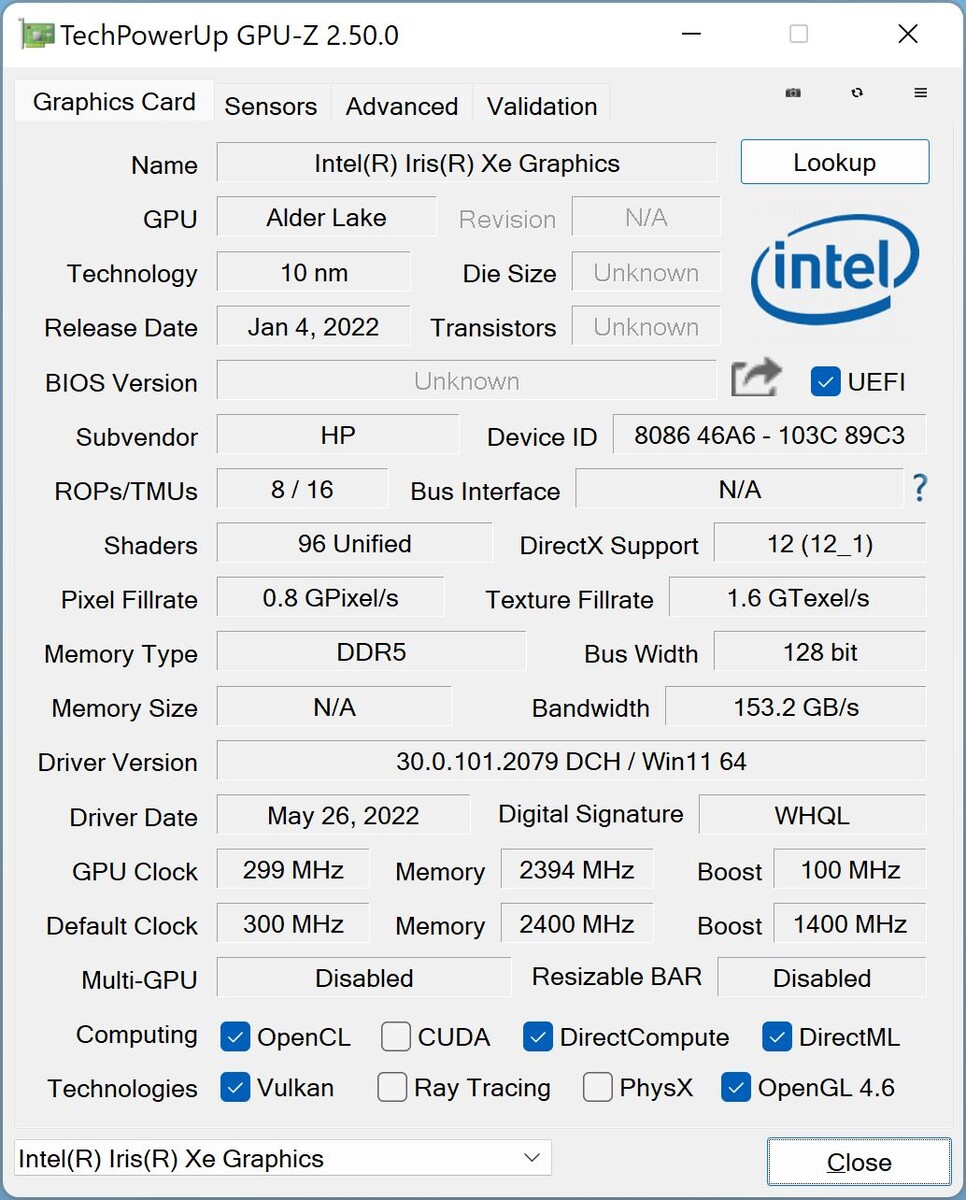
Graphics card - Nvidia RTX A2000
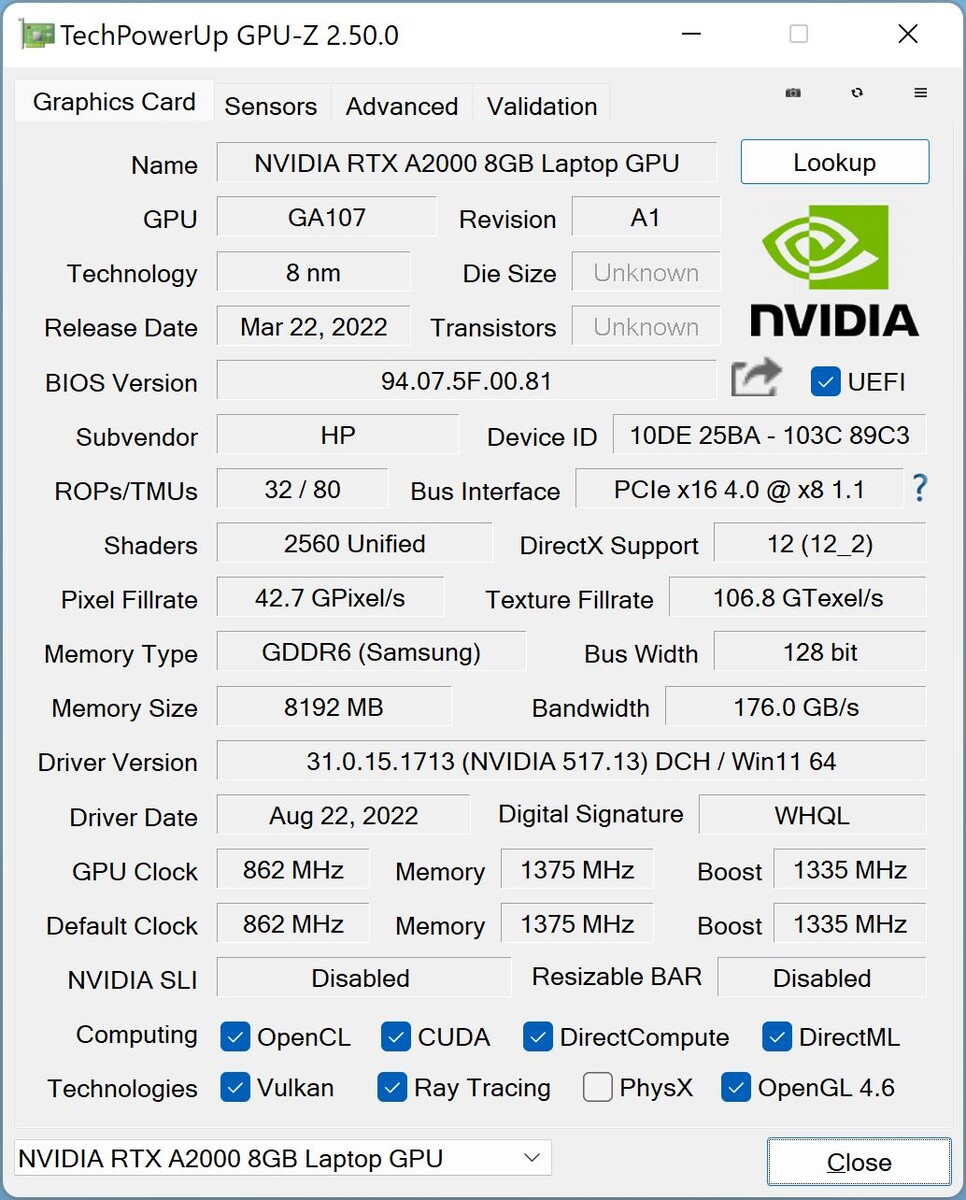
The Nvidia RTX A2000 is a professional GPU based on the GA107 chip and shares many similarities with the GeForce RTX 3050 Ti. Despite the identical designation, the RTX A2000 received an upgrade this year: instead of 4 GB GDDR6 VRAM, it now houses 8 GB of VRAM with a slightly higher speed.
HP uses the 45-watt version of the RTX A2000, whereby an additional 5 watts is available for use by the processor. This makes it one of the slower versions, and the average scores for this GPU in our database are also slightly higher. In terms of raw performance, the RTX A2000 in the ZBook Studio 16 G9 is roughly on par with the M1-Pro-GPU in the MacBook Pro 16.
The RTX 3070 of the old Studio 15 G8 is of course superior in terms of raw performance, but in the professional tests, the RTX A2000 occasionally has clear advantages thanks to the professional drivers. Moreover, the performance of the RTX A2000 remains completely stable under permanent load, which is evident in the 3DMark stress test as well as in our Witcher 3 loop. Gaming is also possible with the ZBook; depending on the title, it often offers enough power for high to maximum details in Full HD.
On battery power, the GPU's power consumption is limited to 35 watts, which corresponds to a deficit of around 20%. More GPU benchmarks are listed in our tech section.
| 3DMark Performance rating - Percent | |
| Average of class Workstation | |
| Apple MacBook Pro 16 2021 M1 Max -21! | |
| Average NVIDIA RTX A2000 Laptop GPU | |
| HP ZBook Studio 15 G8 -11! | |
| Dell Precision 5000 5560 -3! | |
| HP ZBook Studio 16 G9 62U04EA | |
| Apple MacBook Pro 16 2021 M1 Pro -21! | |
| Lenovo ThinkPad P1 G4-20Y4Z9DVUS -1! | |
| 3DMark 11 Performance | 18475 points | |
| 3DMark Fire Strike Score | 12211 points | |
| 3DMark Time Spy Score | 5523 points | |
Help | ||
* ... smaller is better
Witcher 3 FPS chart
| low | med. | high | ultra | QHD | 4K | |
|---|---|---|---|---|---|---|
| GTA V (2015) | 185.7 | 181.1 | 146.3 | 72.1 | 51.8 | 44.1 |
| The Witcher 3 (2015) | 282 | 188 | 103 | 48.8 | 33 | |
| Dota 2 Reborn (2015) | 181.5 | 166.9 | 157.4 | 149.4 | 72.3 | |
| Final Fantasy XV Benchmark (2018) | 141.7 | 78 | 56.4 | 41 | 23.1 | |
| X-Plane 11.11 (2018) | 138.8 | 119 | 97 | 76.5 | ||
| Far Cry 5 (2018) | 165 | 96 | 88 | 83 | 57 | 26 |
| Strange Brigade (2018) | 289 | 134 | 106 | 92 | 66 | 35 |
| F1 2021 (2021) | 290 | 166 | 138.5 | 68.4 | 48.3 | 25.7 |
| Cyberpunk 2077 1.6 (2022) | 69 | 59 | 44 | 37 | 23 | |
| F1 22 (2022) | 155.4 | 147.8 | 111.6 | 33.6 | 20.7 | 9.76 |
Emissions - Zbook with very good speakers
Noise
The two fans of the ZBook Studio 16 G9 start up quickly, even under low load, and the overall performance of the passive cooling system is not very good. Even when opening the webbrowser, the fans fired up. Under higher load, the fans accelerate very quickly: we measured between 45-48 dB(A) under combined load. Interestingly, the fans even get a little louder under a raw CPU load of 51 dB(A). No electronic noises were detected.
Noise level
| Idle |
| 24 / 27.7 / 27.7 dB(A) |
| Load |
| 39.8 / 47.7 dB(A) |
 | ||
30 dB silent 40 dB(A) audible 50 dB(A) loud |
||
min: | ||
| HP ZBook Studio 16 G9 62U04EA RTX A2000 Laptop GPU, i7-12800H, Micron 3400 1TB MTFDKBA1T0TFH | Lenovo ThinkPad P1 G4-20Y4Z9DVUS T1200 Laptop GPU, i7-11800H, Samsung PM9A1 MZVL2512HCJQ | Apple MacBook Pro 16 2021 M1 Max M1 Max 32-Core GPU, M1 Max, Apple SSD AP2048R | Dell Precision 5000 5560 RTX A2000 Laptop GPU, i7-11850H, Samsung PM9A1 MZVL22T0HBLB | HP ZBook Studio 15 G8 GeForce RTX 3070 Laptop GPU, i9-11950H, Samsung PM981a MZVLB2T0HALB | |
|---|---|---|---|---|---|
| Noise | -1% | 5% | 13% | -1% | |
| off / environment * (dB) | 24 | 24.3 -1% | 24.2 -1% | 23.4 2% | 23.5 2% |
| Idle Minimum * (dB) | 24 | 24.3 -1% | 24.2 -1% | 23.6 2% | 25.3 -5% |
| Idle Average * (dB) | 27.7 | 24.3 12% | 24.2 13% | 23.6 15% | 25.3 9% |
| Idle Maximum * (dB) | 27.7 | 26.6 4% | 24.2 13% | 23.6 15% | 25.3 9% |
| Load Average * (dB) | 39.8 | 46.8 -18% | 42.9 -8% | 25.8 35% | 41.2 -4% |
| Witcher 3 ultra * (dB) | 44.3 | 46.8 -6% | 39.5 11% | 40.1 9% | 49.4 -12% |
| Load Maximum * (dB) | 47.7 | 46.8 2% | 42.9 10% | 41.4 13% | 49.4 -4% |
* ... smaller is better
Temperature
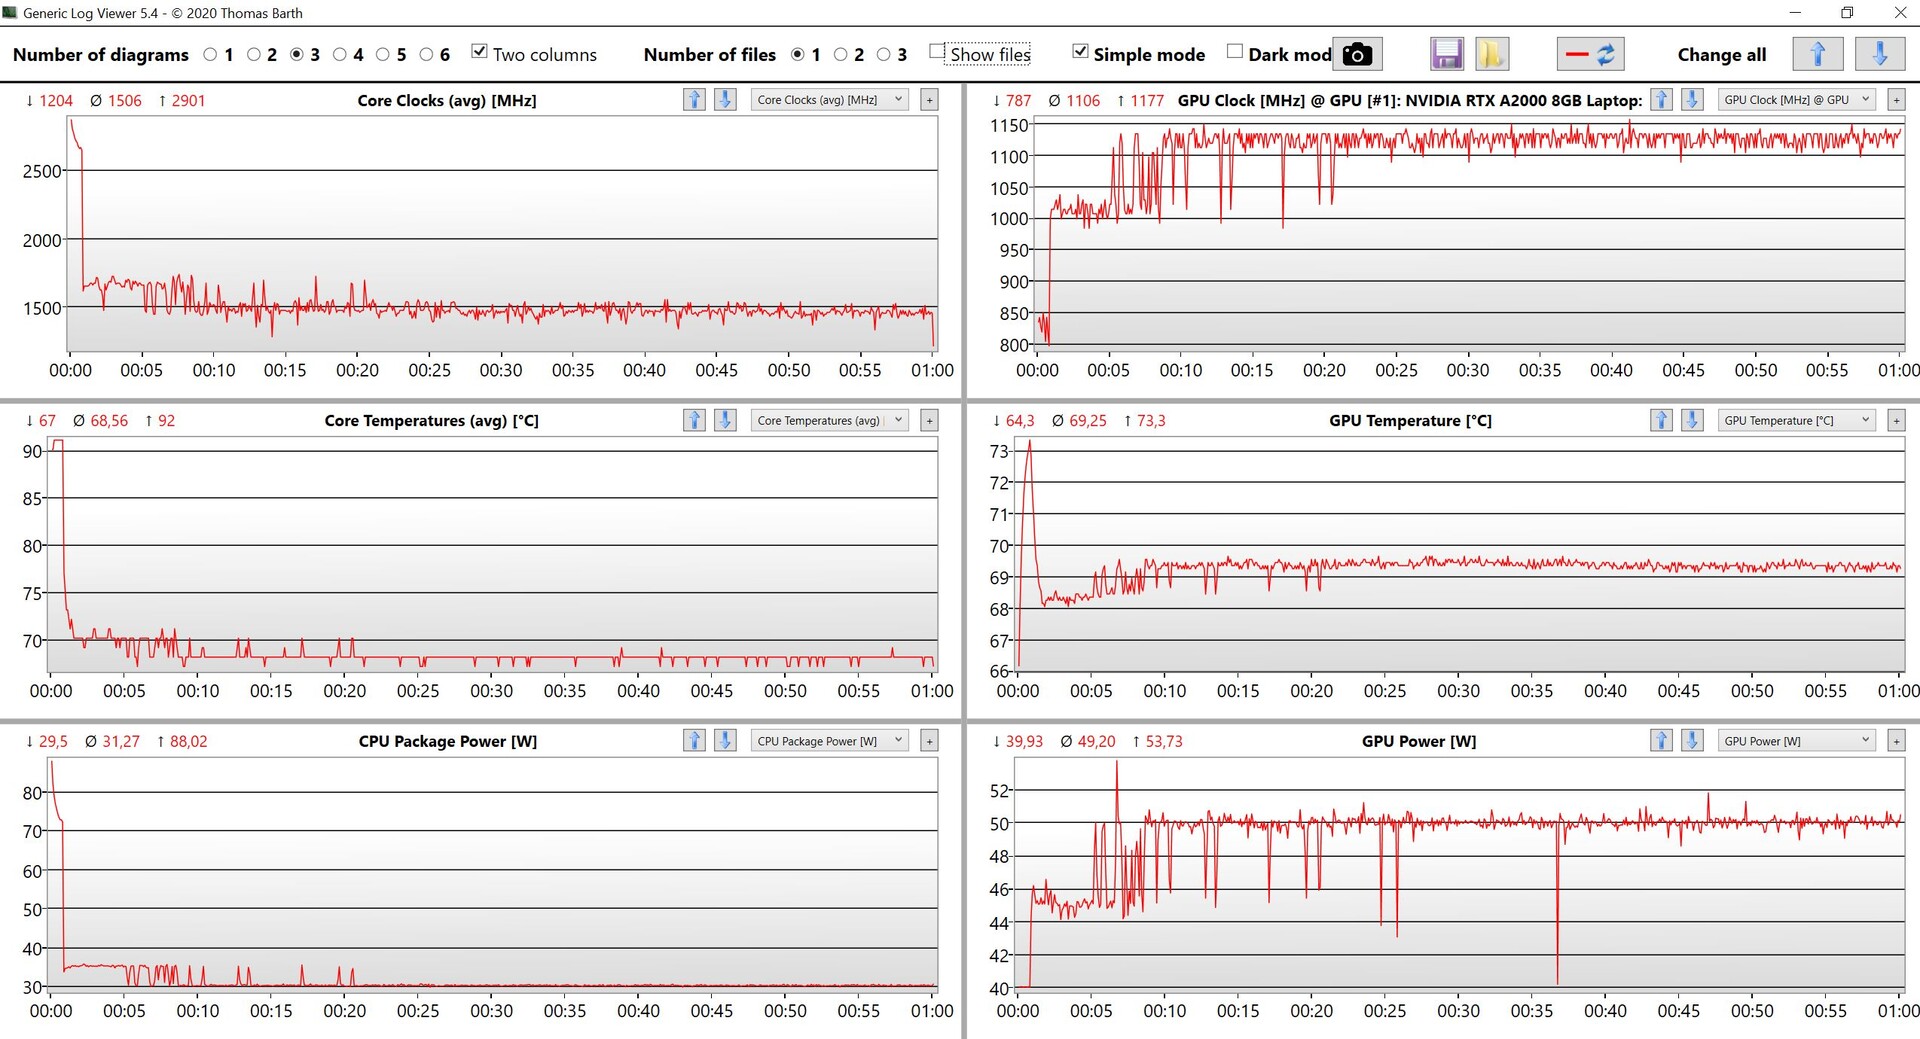
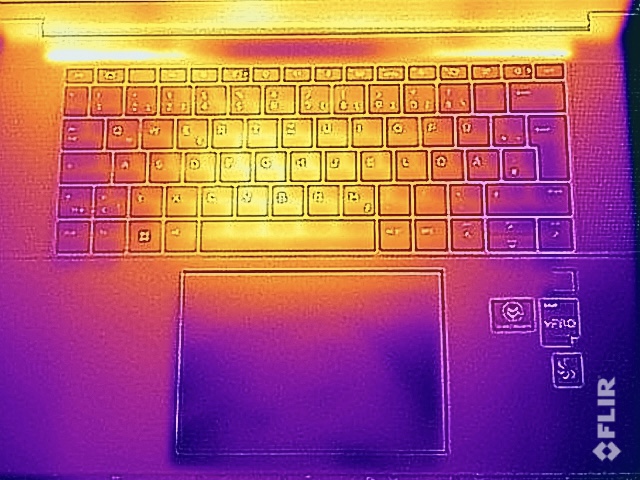
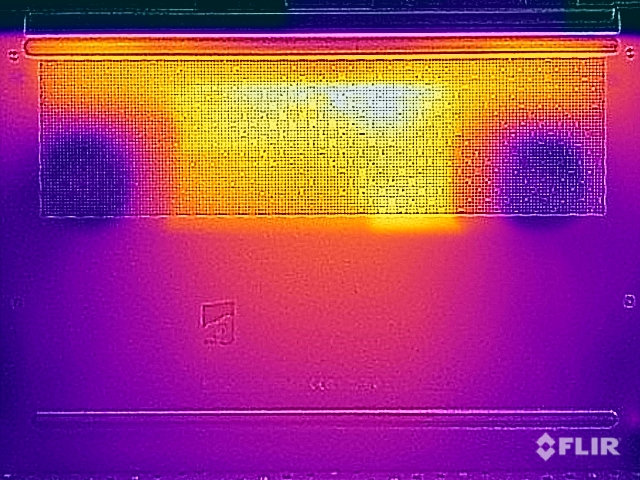
HP has the surface temperatures of the new ZBook Studio 16 G9 well under control. The case barely heats up under low load and the entire keyboard area remains at pleasant temperatures with a maximum of just under 36 °C, even under maximum load. It gets a little warmer on the underside and you should take care to avoid skin contact with the hotspot in the middle area (~53 °C), but there are no general restrictions here.
In the stress test, the processor initially levels off at 35 watts and the graphics card at 45 watts. However, this ratio shifts in the course of further testing, with the processor dropping to 30 watts, while the GPU rises to 50 watts at the same time. This confirms that the cooling system is able to keep a total of around 80 watts permanently cool. Unfortunately, we cannot make any statements regarding configurations with stronger graphics cards (from the RTX A3000 to the GeForce RTX 3060), since a stronger Vapor-Chamber cooling is used here.
(+) The maximum temperature on the upper side is 38.7 °C / 102 F, compared to the average of 38.2 °C / 101 F, ranging from 22.2 to 69.8 °C for the class Workstation.
(-) The bottom heats up to a maximum of 53.4 °C / 128 F, compared to the average of 41.1 °C / 106 F
(+) In idle usage, the average temperature for the upper side is 25.9 °C / 79 F, compared to the device average of 32 °C / 90 F.
(+) Playing The Witcher 3, the average temperature for the upper side is 30.6 °C / 87 F, compared to the device average of 32 °C / 90 F.
(+) The palmrests and touchpad are cooler than skin temperature with a maximum of 28.1 °C / 82.6 F and are therefore cool to the touch.
(±) The average temperature of the palmrest area of similar devices was 27.8 °C / 82 F (-0.3 °C / -0.6 F).
| HP ZBook Studio 16 G9 62U04EA Intel Core i7-12800H, NVIDIA RTX A2000 Laptop GPU | Lenovo ThinkPad P1 G4-20Y4Z9DVUS Intel Core i7-11800H, NVIDIA T1200 Laptop GPU | Apple MacBook Pro 16 2021 M1 Max Apple M1 Max, Apple M1 Max 32-Core GPU | Dell Precision 5000 5560 Intel Core i7-11850H, NVIDIA RTX A2000 Laptop GPU | HP ZBook Studio 15 G8 Intel Core i9-11950H, NVIDIA GeForce RTX 3070 Laptop GPU | |
|---|---|---|---|---|---|
| Heat | -3% | 12% | -11% | -5% | |
| Maximum Upper Side * (°C) | 38.7 | 49.9 -29% | 42.3 -9% | 48.2 -25% | 49 -27% |
| Maximum Bottom * (°C) | 53.4 | 56.7 -6% | 41.7 22% | 42.6 20% | 54.2 -1% |
| Idle Upper Side * (°C) | 27.3 | 25.5 7% | 23.9 12% | 34.8 -27% | 26.2 4% |
| Idle Bottom * (°C) | 31.6 | 26.2 17% | 23.9 24% | 35.2 -11% | 30.2 4% |
* ... smaller is better
Speakers
As previously mentioned, HP has now placed the speakers next to the keyboard and the performance of the four modules is very good. The sound is very voluminous and a stereo effect is produced. Only the bass could do with some improvement, but this would be considered hairsplitting by some.
HP ZBook Studio 16 G9 62U04EA audio analysis
(±) | speaker loudness is average but good (81.6 dB)
Bass 100 - 315 Hz
(±) | reduced bass - on average 8.7% lower than median
(±) | linearity of bass is average (10.4% delta to prev. frequency)
Mids 400 - 2000 Hz
(+) | balanced mids - only 3.7% away from median
(+) | mids are linear (4.6% delta to prev. frequency)
Highs 2 - 16 kHz
(+) | balanced highs - only 2.7% away from median
(+) | highs are linear (3.5% delta to prev. frequency)
Overall 100 - 16.000 Hz
(+) | overall sound is linear (10.6% difference to median)
Compared to same class
» 9% of all tested devices in this class were better, 5% similar, 87% worse
» The best had a delta of 7%, average was 17%, worst was 35%
Compared to all devices tested
» 6% of all tested devices were better, 1% similar, 93% worse
» The best had a delta of 4%, average was 23%, worst was 134%
Apple MacBook Pro 16 2021 M1 Pro audio analysis
(+) | speakers can play relatively loud (84.7 dB)
Bass 100 - 315 Hz
(+) | good bass - only 3.8% away from median
(+) | bass is linear (5.2% delta to prev. frequency)
Mids 400 - 2000 Hz
(+) | balanced mids - only 1.3% away from median
(+) | mids are linear (2.1% delta to prev. frequency)
Highs 2 - 16 kHz
(+) | balanced highs - only 1.9% away from median
(+) | highs are linear (2.7% delta to prev. frequency)
Overall 100 - 16.000 Hz
(+) | overall sound is linear (4.6% difference to median)
Compared to same class
» 0% of all tested devices in this class were better, 0% similar, 100% worse
» The best had a delta of 5%, average was 17%, worst was 45%
Compared to all devices tested
» 0% of all tested devices were better, 0% similar, 100% worse
» The best had a delta of 4%, average was 23%, worst was 134%
Power Management - DreamColor consumes a lot of power
Power Consumption
The high-resolution DreamColor panel requires lot of power, as confirmed by measurements of almost 19 watts in idle mode. The 4K OLED panel of the predecessor was even hungrier in this regard. No abnormalities under load were registered.
We measured a maximum peak consumption of 186 watts, but this quickly levels off at around 120 watts. The included 200-watt power supply is therefore perfectly adequate.
| Off / Standby | |
| Idle | |
| Load |
|
Key:
min: | |
| HP ZBook Studio 16 G9 62U04EA i7-12800H, RTX A2000 Laptop GPU, Micron 3400 1TB MTFDKBA1T0TFH, IPS, 3840x2400, 16" | Lenovo ThinkPad P1 G4-20Y4Z9DVUS i7-11800H, T1200 Laptop GPU, Samsung PM9A1 MZVL2512HCJQ, IPS, 2560x1600, 16" | Apple MacBook Pro 16 2021 M1 Max M1 Max, M1 Max 32-Core GPU, Apple SSD AP2048R, Mini-LED, 3456x2234, 16.2" | Dell Precision 5000 5560 i7-11850H, RTX A2000 Laptop GPU, Samsung PM9A1 MZVL22T0HBLB, IPS, 3840x2400, 15.6" | HP ZBook Studio 15 G8 i9-11950H, GeForce RTX 3070 Laptop GPU, Samsung PM981a MZVLB2T0HALB, OLED, 3840x2160, 15.6" | Average NVIDIA RTX A2000 Laptop GPU | Average of class Workstation | |
|---|---|---|---|---|---|---|---|
| Power Consumption | 6% | 15% | 12% | -25% | 12% | 4% | |
| Idle Minimum * (Watt) | 7.2 | 9.9 -38% | 5.4 25% | 6.2 14% | 11 -53% | 6.6 ? 8% | 9.04 ? -26% |
| Idle Average * (Watt) | 18.1 | 13.9 23% | 16.4 9% | 13.9 23% | 18.8 -4% | 11.8 ? 35% | 13.8 ? 24% |
| Idle Maximum * (Watt) | 18.5 | 14.6 21% | 16.7 10% | 23.8 -29% | 31.7 -71% | 16.7 ? 10% | 17.7 ? 4% |
| Load Average * (Watt) | 112.8 | 95 16% | 94 17% | 95.7 15% | 105.2 7% | 116.3 ? -3% | 96.2 ? 15% |
| Witcher 3 ultra * (Watt) | 106.7 | 98.9 7% | 104 3% | 87 18% | 148 -39% | ||
| Load Maximum * (Watt) | 186 | 170.8 8% | 135 27% | 132.6 29% | 171.8 8% | 171.2 ? 8% | 178.5 ? 4% |
* ... smaller is better
Power consumption Witcher 3 / Stress test
Power consumption with an external monitor
Battery Life
Despite the large 86 Wh battery, the battery life is not particularly long. For our Wi-Fi testm, we recorded between 4.5-6.5 hours, depending on the brightness. Of course, this is completely sufficient for occasional meetings, but not enough to cover a complete workday without a power adapter. In view of these results, the ZBook Studio 16 G9 thus ranks at the end of the comparison field. If you are interested in the ZBook Studio and need a longer battery life, you should choose a configuration with the low-power display (400 nits).
A full battery recharge takes 2 hours when the device is turned on; 80% of the capacity is available after just about one hour.
| HP ZBook Studio 16 G9 62U04EA i7-12800H, RTX A2000 Laptop GPU, 86 Wh | Lenovo ThinkPad P1 G4-20Y4Z9DVUS i7-11800H, T1200 Laptop GPU, 90 Wh | Apple MacBook Pro 16 2021 M1 Max M1 Max, M1 Max 32-Core GPU, 99.6 Wh | Dell Precision 5000 5560 i7-11850H, RTX A2000 Laptop GPU, 86 Wh | HP ZBook Studio 15 G8 i9-11950H, GeForce RTX 3070 Laptop GPU, 83 Wh | Average of class Workstation | |
|---|---|---|---|---|---|---|
| Battery runtime | 40% | 79% | 32% | 31% | 26% | |
| H.264 (h) | 8.5 | 17 100% | 9.51 ? 12% | |||
| WiFi v1.3 (h) | 6.3 | 8.8 40% | 14.9 137% | 6.3 0% | 6.2 -2% | 8.52 ? 35% |
| Load (h) | 1.1 | 1.1 0% | 1.8 64% | 1.8 64% | 1.429 ? 30% |
Pros
Cons
Verdict - ZBook Studio G9 a solid advancement
The new ZBook Studio 16 G9 is a solid upgrae in several areas. HP's mobile workstation laptop remains extremely high-quality, but now looks much more contemporary with the new 16:10 display. In addition, two SODIMM slots are on board once again, so the RAM can be easily upgraded. The only problem here is the difficult access to the components.
The performance of the two main components is good overall: The Core i7 processor benefits from the high power limits and the Nvidia RTX A2000 offers stable performance, even if it is one of the slower versions with a maximum of 50 watts (TGP). However, the conventional cooling reaches its limits under combined load, which is why HP installs a vapor-chamber cooling in models with stronger GPUs. The DreamColor display with 120 Hz offers very good subjective picture quality and also impresses with accurate colors under testing, but also requires a lot of power.
The HP ZBook Studio 16 G9 is a high-quality and powerful mobile workstation that is still quite mobile despite its 16-inch form factor
Traditionally, the ZBook Studio does not offer a dedicated number pad and the space next to the keyboard is used for the (very good) sound system. However, we have to mention here that the keyboard of the cheaper ZBook Firefly 16 G9 (as well as the EliteBook 865 G9) is just a bit better and also offers a number pad. Another point of criticism, albeit at a superficial level, is the typing feel of the more expensive ZBook Studio 16 G93, which really should not fare worse here. You should also keep in mind that the fans also fire up relatively quickly in everyday use.
We are yet to review other current and competing mobile workstations, but the new ZBook Studio 16 G9 gets many things right and is a very solid package overall.
Price and Availability
Interested buyers are advised to check directly via HP's laptop online store (where applicable) for availability. Each region offers varying hardware (especially the panels) and specifications. For example, configurations in the US range from US$ 2,374.05 all the way up to US$ 6,432.00. This also applies to other countries such as the UK, India and Australia.
Prices are as of 13.11.2022 and are subject to change.
HP ZBook Studio 16 G9 62U04EA
- 11/10/2022 v7 (old)
Andreas Osthoff
Price comparison

