HP Victus 15 laptop review: Expensive for a budget gamer
The HP Victus series consists of budget gaming laptops to contrast the manufacturer's higher-end Omen series. As such, Victus models have lower-end specifications and limited configurable options in order to keep prices low and competitive. Two models make up the series so far: The 15.6-inch Victus 15 and 16.1-inch Victus 16.
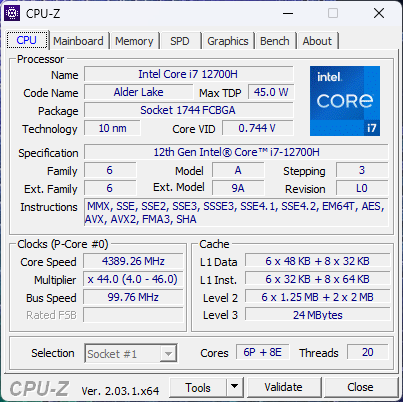
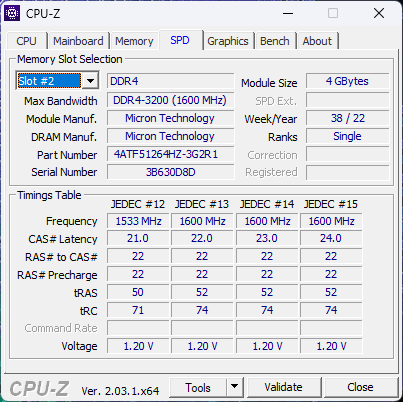
Our test unit is the Victus 15 equipped with an Intel 12th gen Core i7-12700H CPU, GeForce RTX 3050 Ti, 144 Hz 1080p IPS display, and just 8 GB of RAM for approximately $1200 to $1300 USD retail. Lesser SKUs are available with the Core i7-12650H, AMD Ryzen 7 5800H, RTX 3050, or 60 Hz 1080p display for several hundred dollars less, but our CPU and GPU configuration is the highest for this model.
Competitors to the Victus 15 include other entry-level 15.6-inch gaming laptops like the Dell G5 15, Lenovo IdeaPad Gaming 3, MSI GF or GP series, or the Asus TUF series.
More HP reviews:
Potential Competitors in Comparison
Rating | Date | Model | Weight | Height | Size | Resolution | Price |
|---|---|---|---|---|---|---|---|
| 81 % v7 (old) | 12 / 2022 | HP Victus 15 fa0020nr i7-12700H, GeForce RTX 3050 Ti Laptop GPU | 2.3 kg | 23.6 mm | 15.60" | 1920x1080 | |
| 82.8 % v7 (old) | 01 / 2021 | HP Omen 15-en0375ng R7 4800H, GeForce RTX 2060 Mobile | 2.2 kg | 23 mm | 15.60" | 1920x1080 | |
| 82.7 % v7 (old) | 10 / 2021 | Dell G15 5515 R7 5800H, GeForce RTX 3050 Ti Laptop GPU | 2.4 kg | 24.9 mm | 15.60" | 1920x1080 | |
| 84.9 % v7 (old) | 08 / 2022 | Asus TUF Dash F15 FX517ZC i7-12650H, GeForce RTX 3050 4GB Laptop GPU | 1.9 kg | 20.7 mm | 15.60" | 2560x1440 | |
| 78.2 % v7 (old) | 04 / 2022 | MSI Bravo 15 B5DD-010US R5 5600H, Radeon RX 5500M | 2.3 kg | 24.95 mm | 15.60" | 1920x1080 | |
| 87.5 % v7 (old) | 11 / 2022 | Lenovo Legion 5 15IAH7H 82RB i7-12700H, GeForce RTX 3060 Laptop GPU | 2.4 kg | 19.99 mm | 15.60" | 1920x1080 |
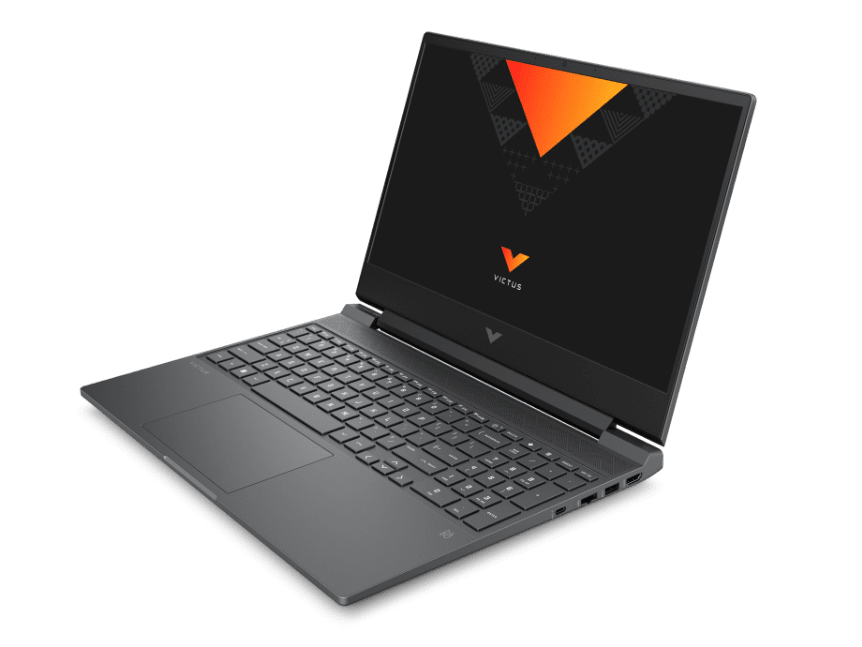
Case — Good-looking On A Budget
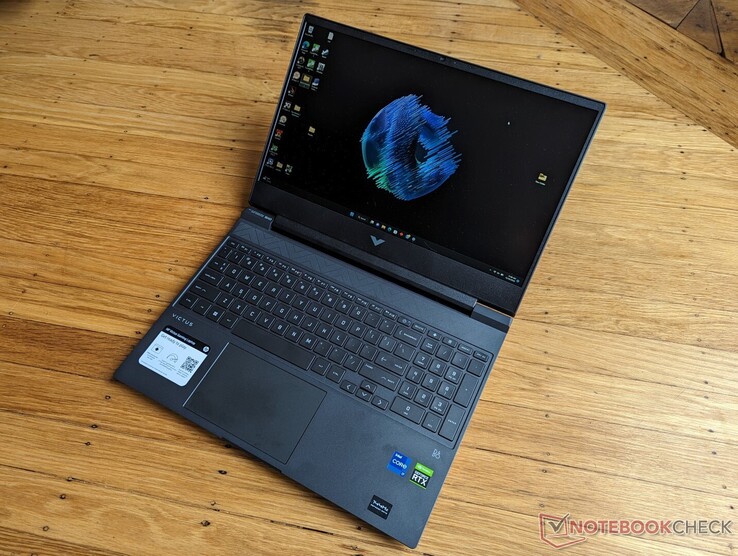
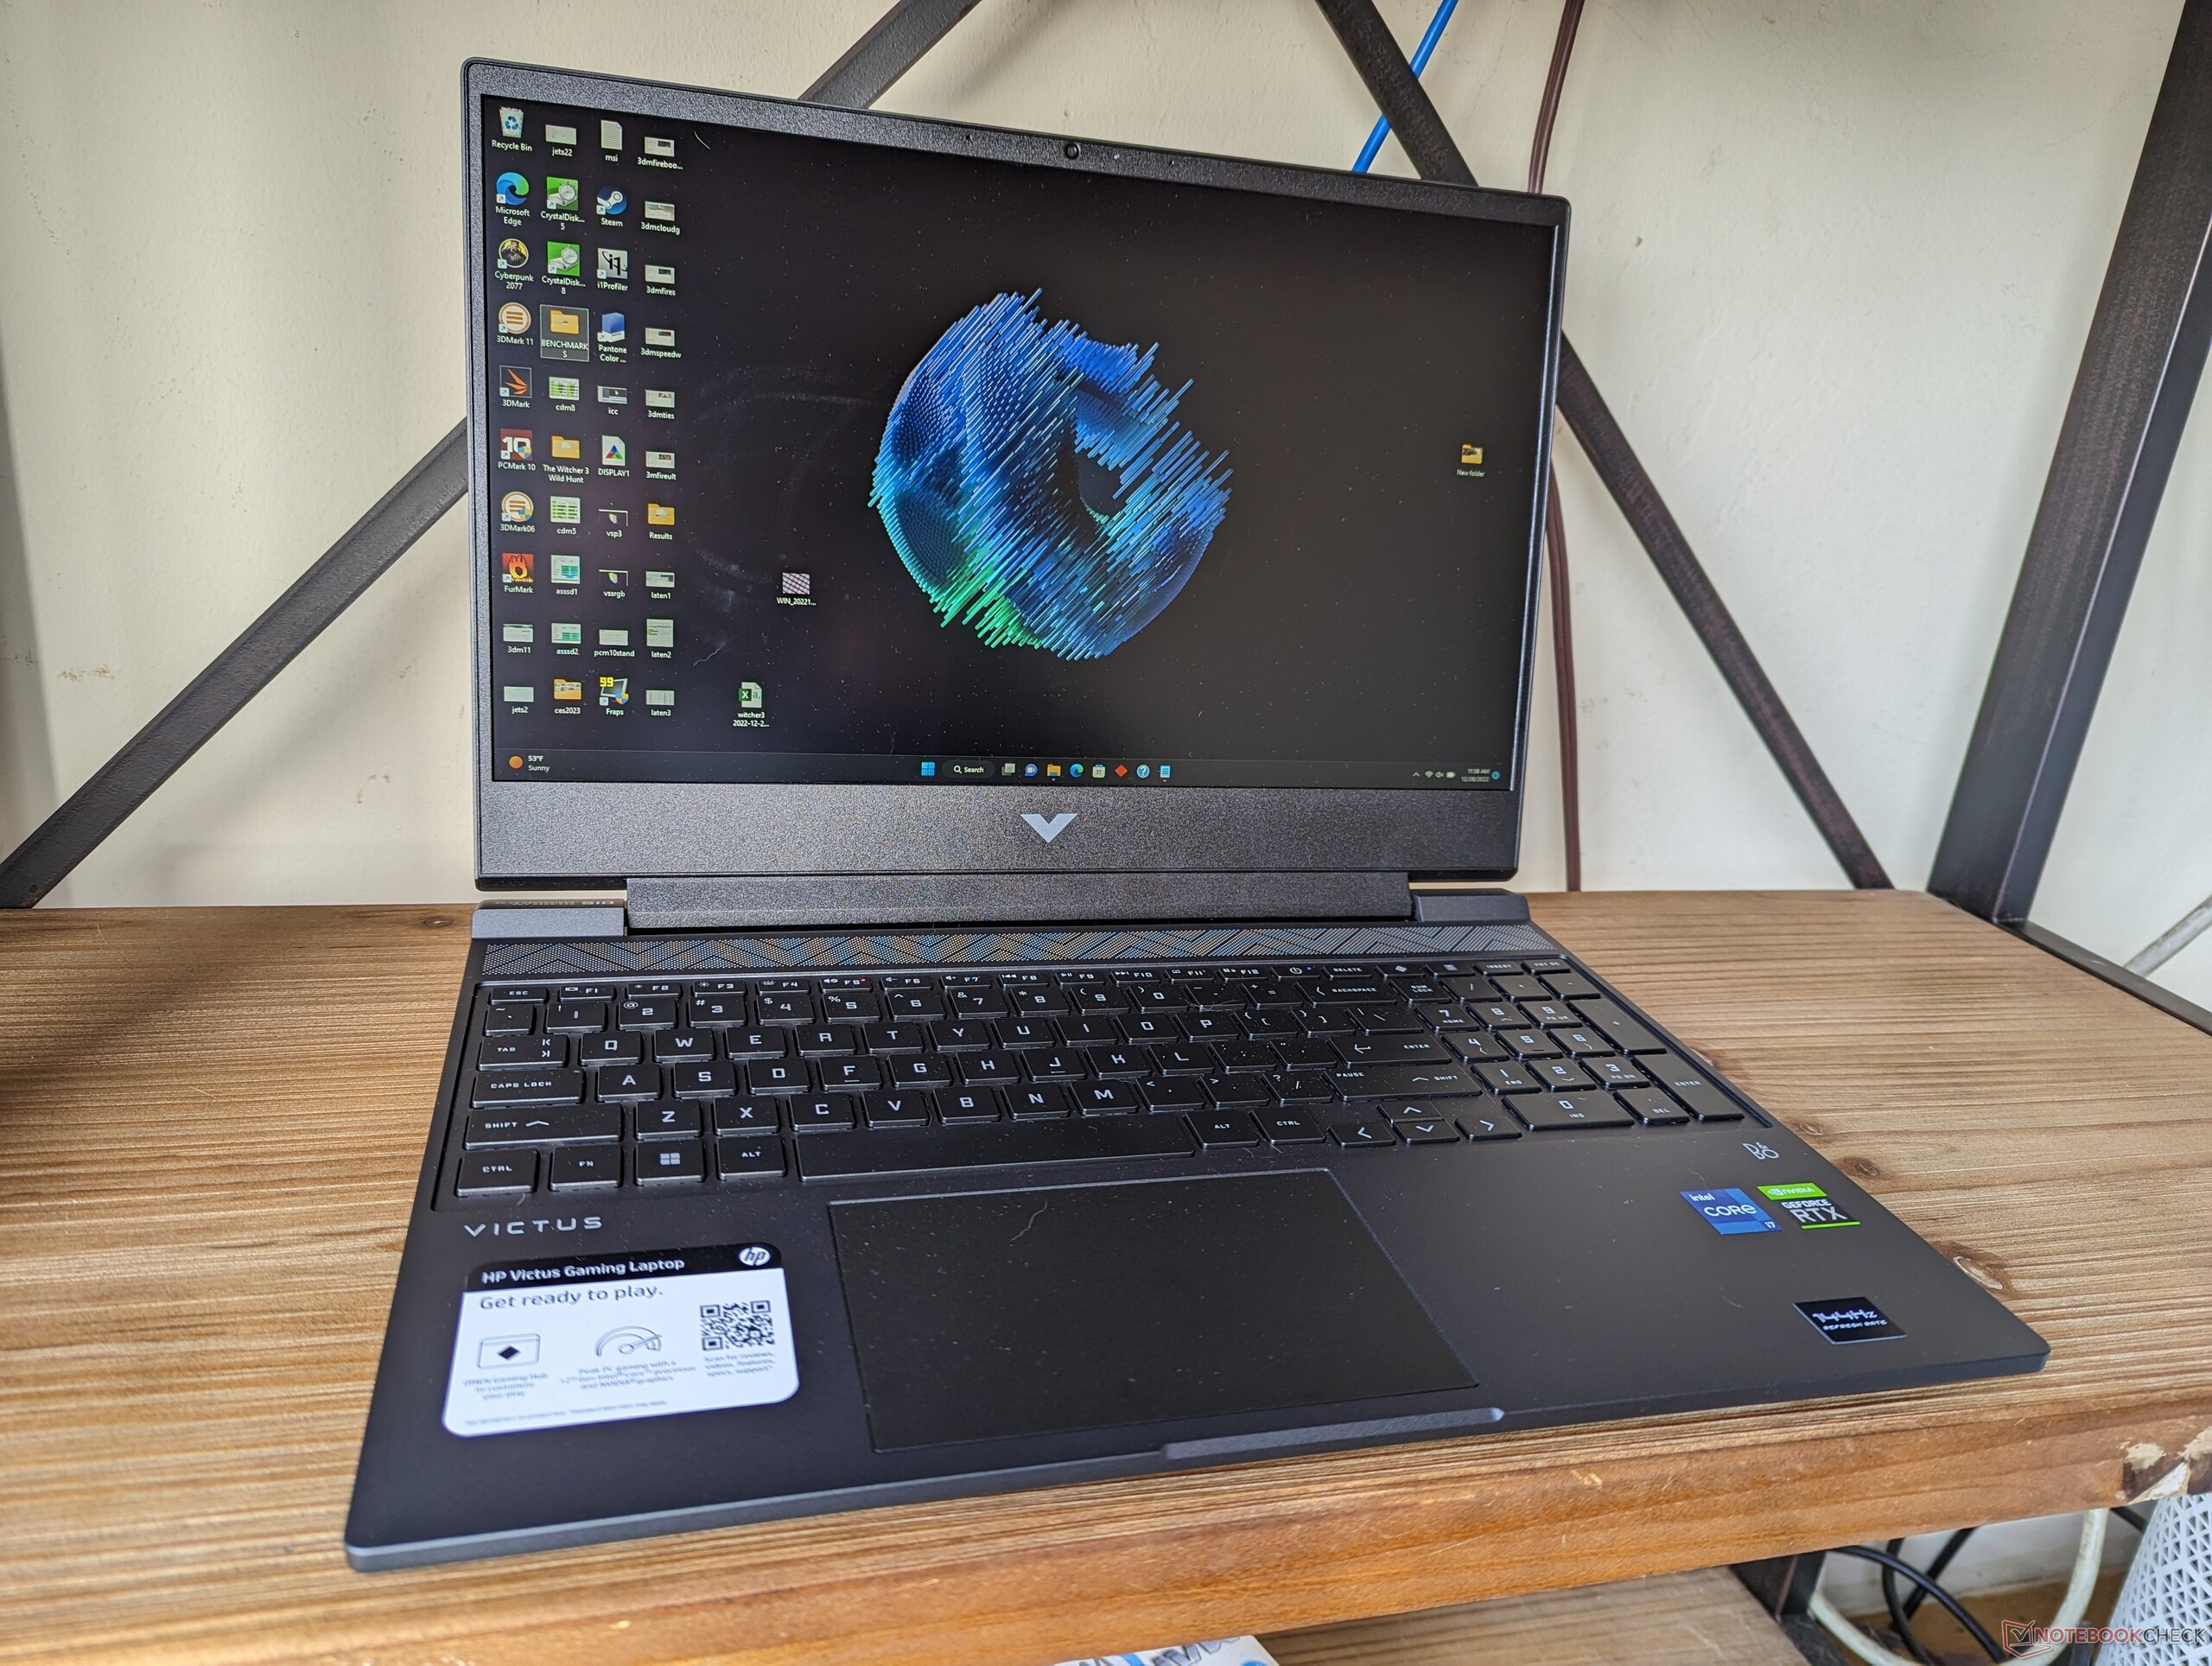
The chassis consists of sharper contours and a larger rear to contrast the simpler and squarer look of the Omen 15 or 16. It's an inoffensive all-black design without any of the unnecessary superficial accents or obvious "gamer" aesthetics that other entry-level gaming laptops tend to have.
Chassis rigidity is a step down from the Omen series especially in regards to the hinges. The display tends to creak when adjusting angles and the hinges don't feel very sturdy when they are opened all the way. The base is otherwise pretty good for a budget system with only minor warping when attempting to twist it.
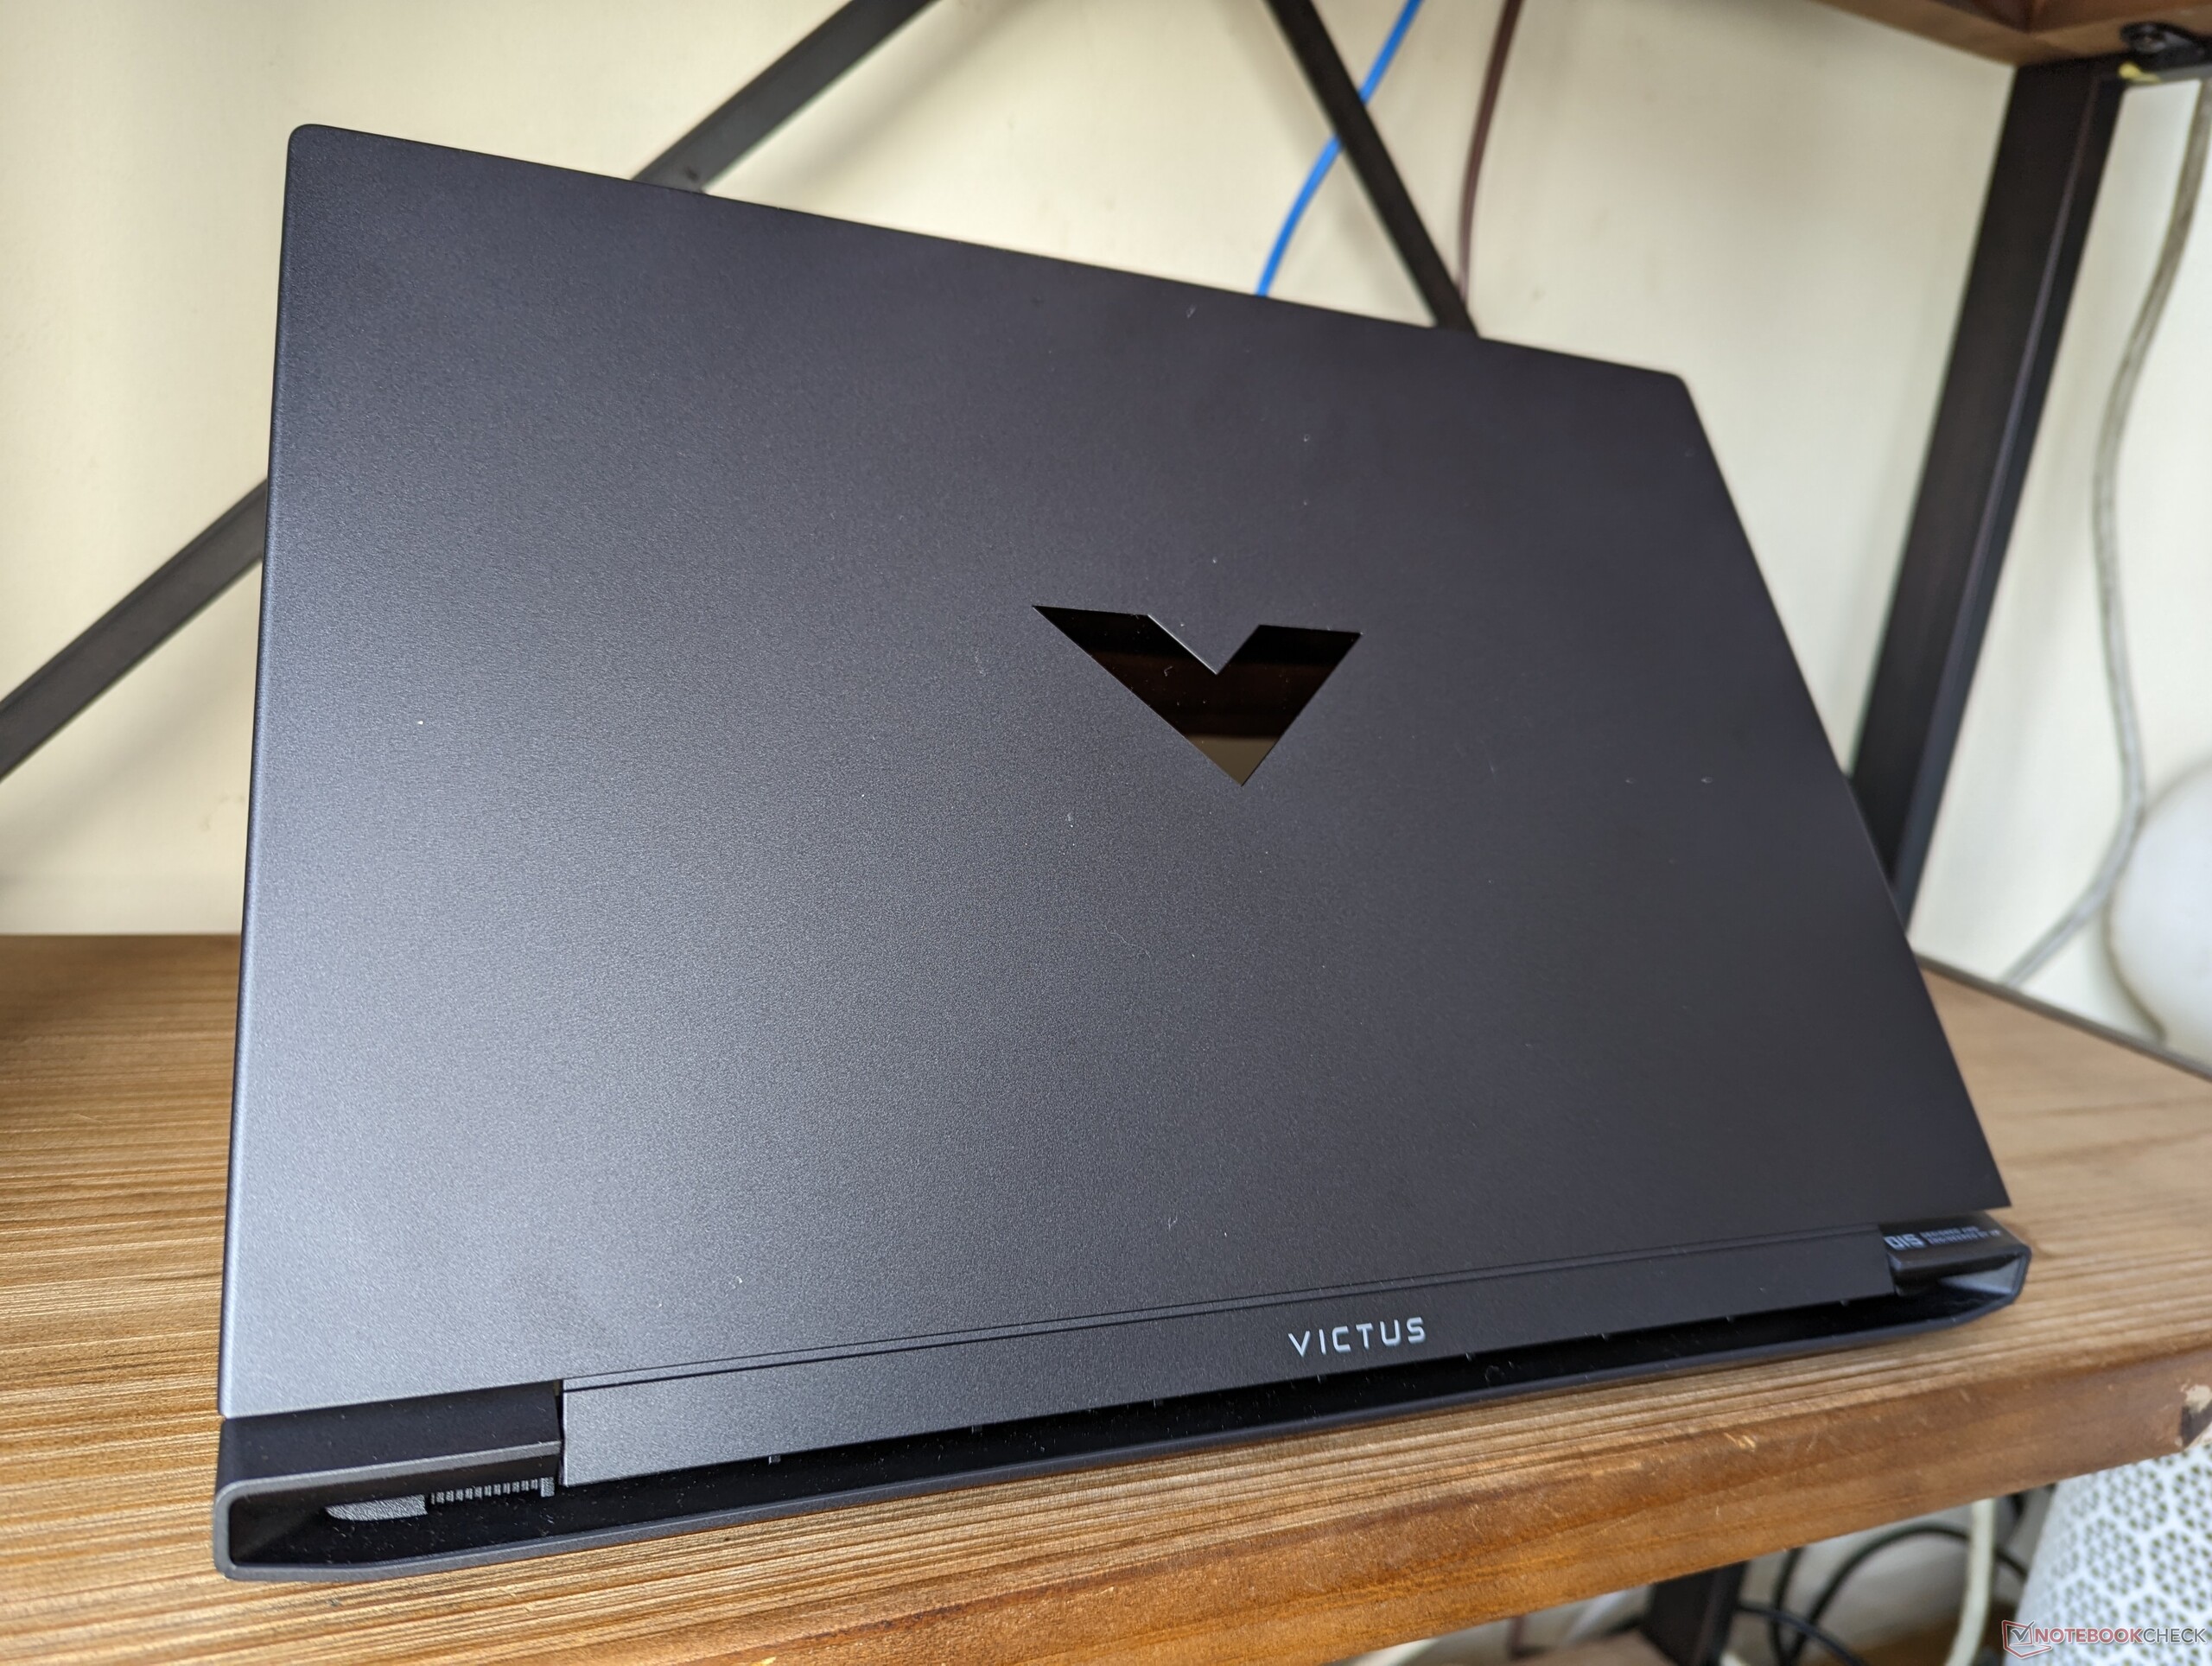
The system is both larger and heavier than the more expensive Omen 15 even though the Victus 15 a a slower laptop. It's thankfully not as bulky as the competing Dell G15, but it's still on the heavy side at 2.3 kg. The Asus TUF Dash F15 is several hundred grams lighter in comparison.

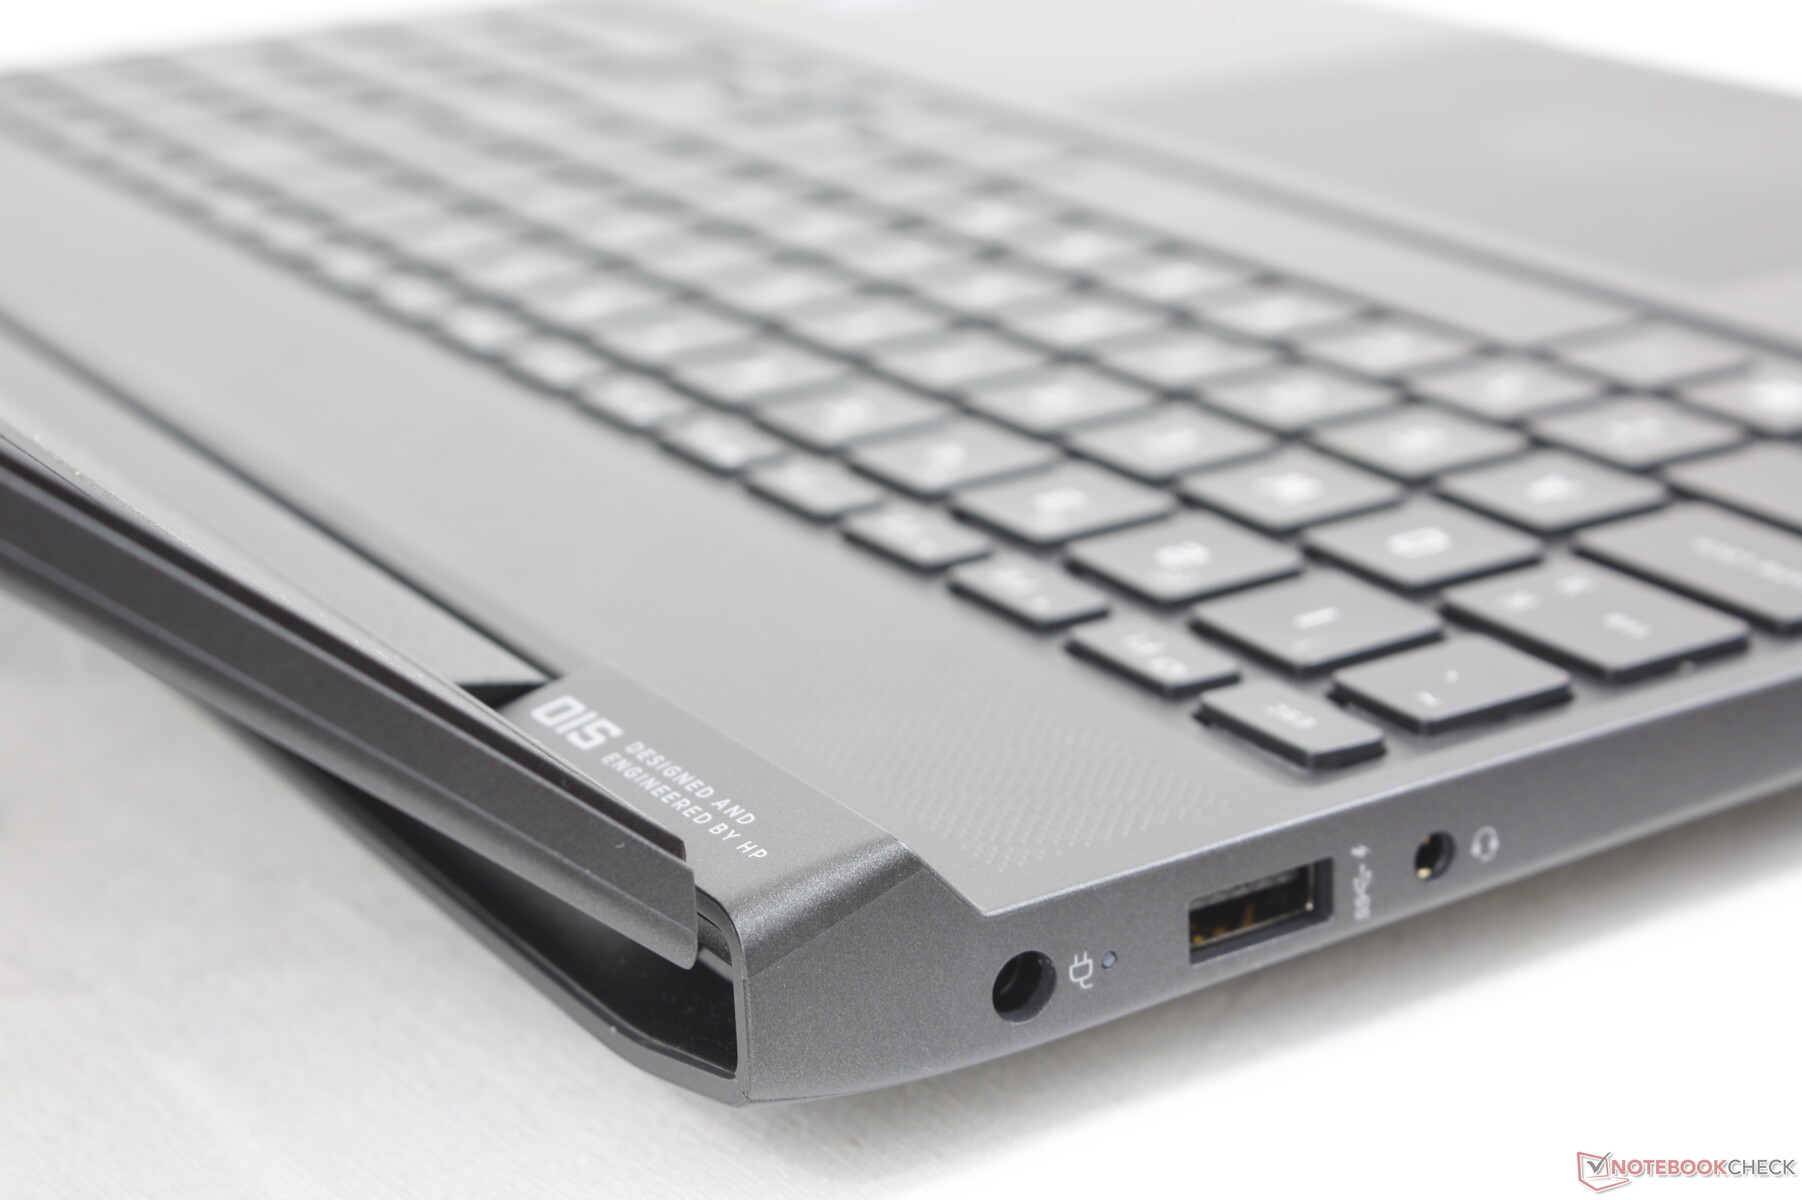
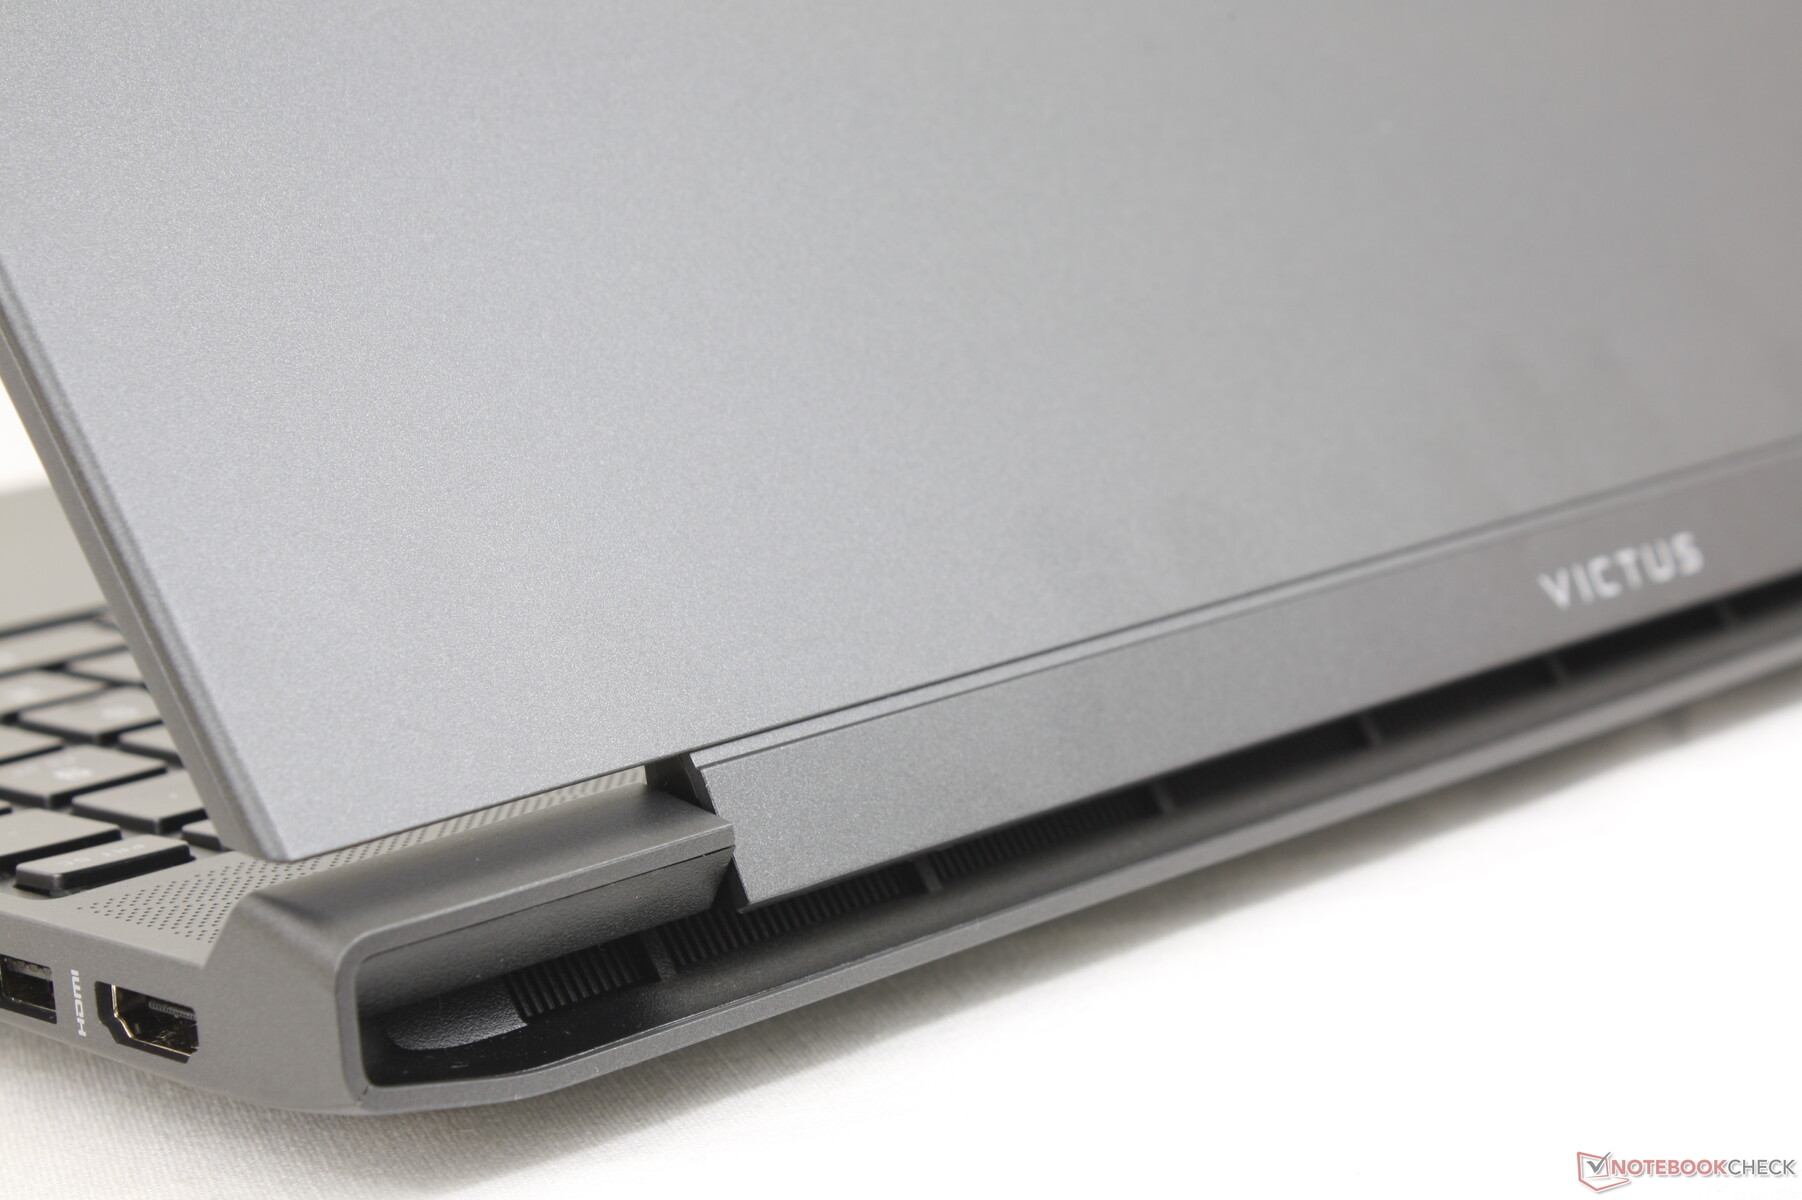
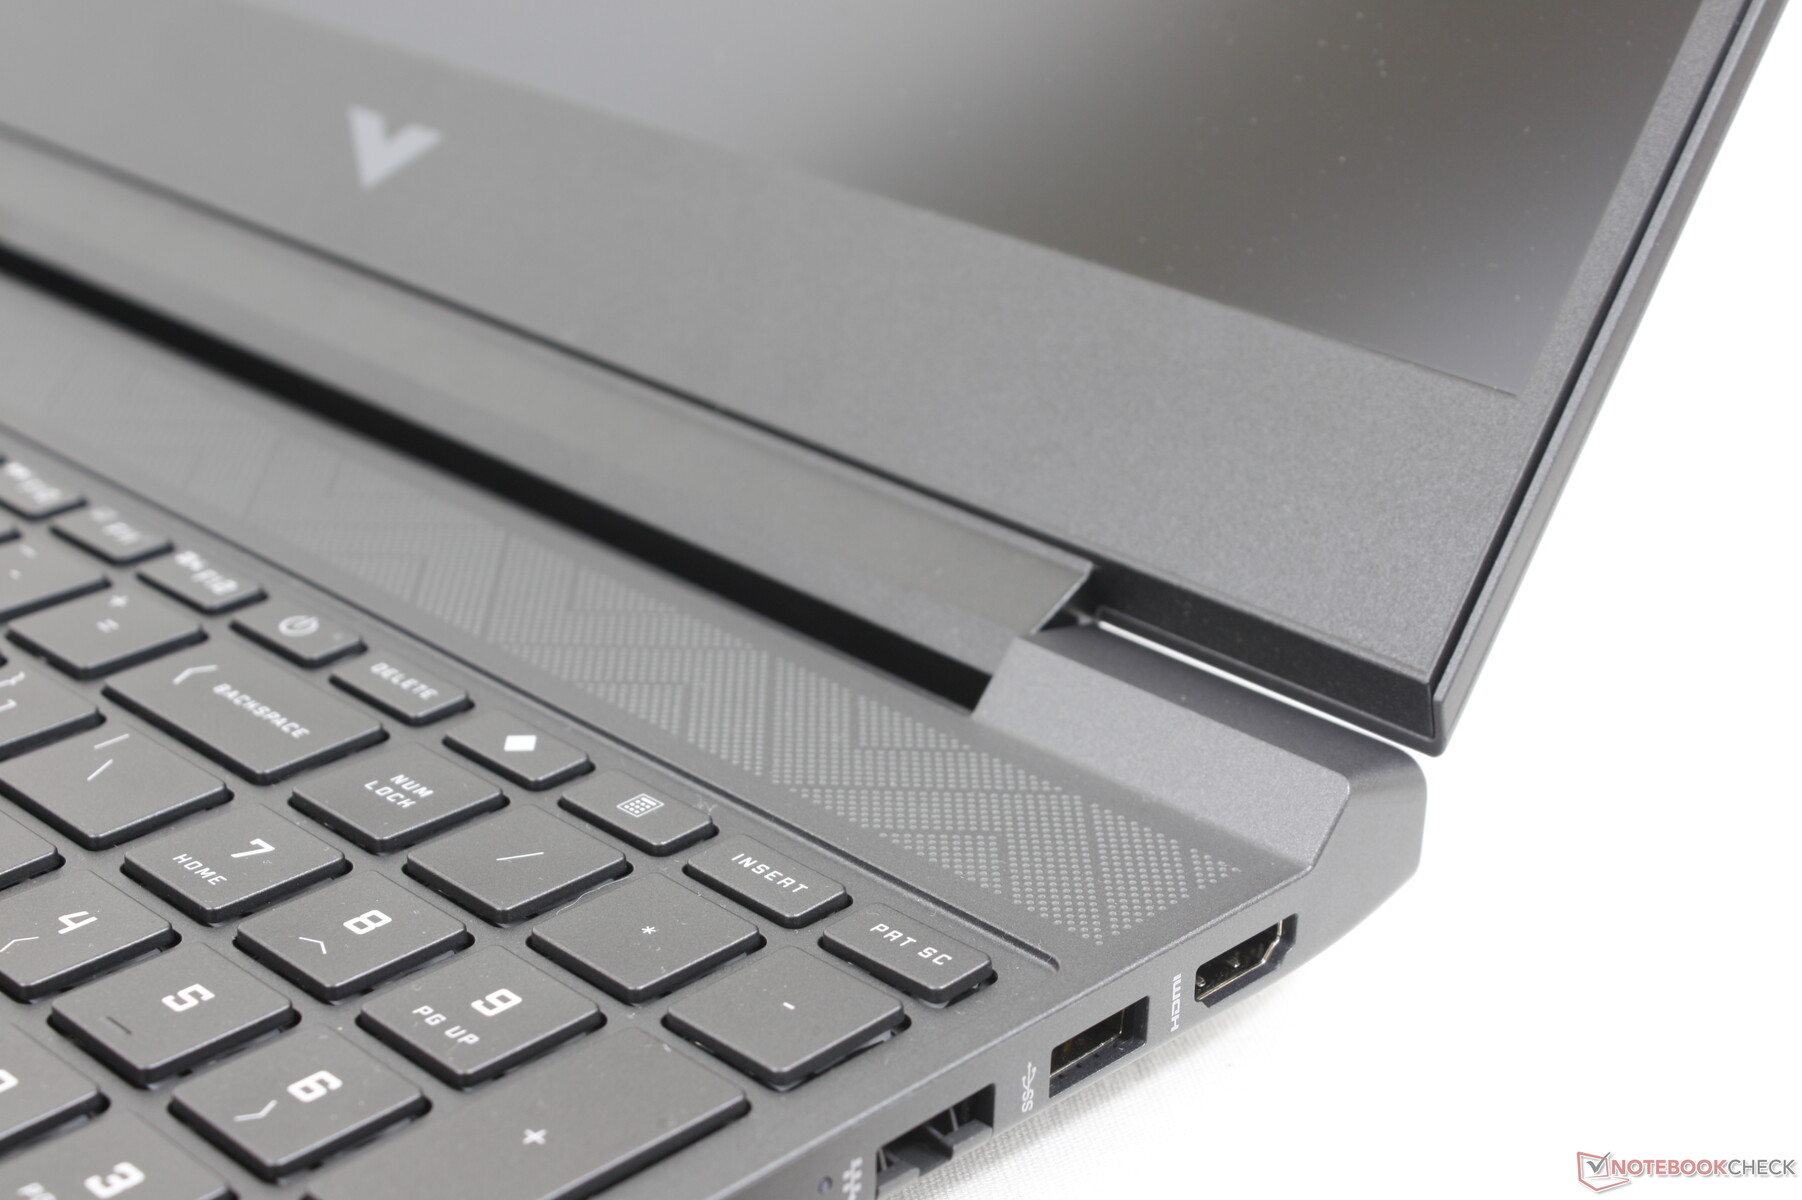
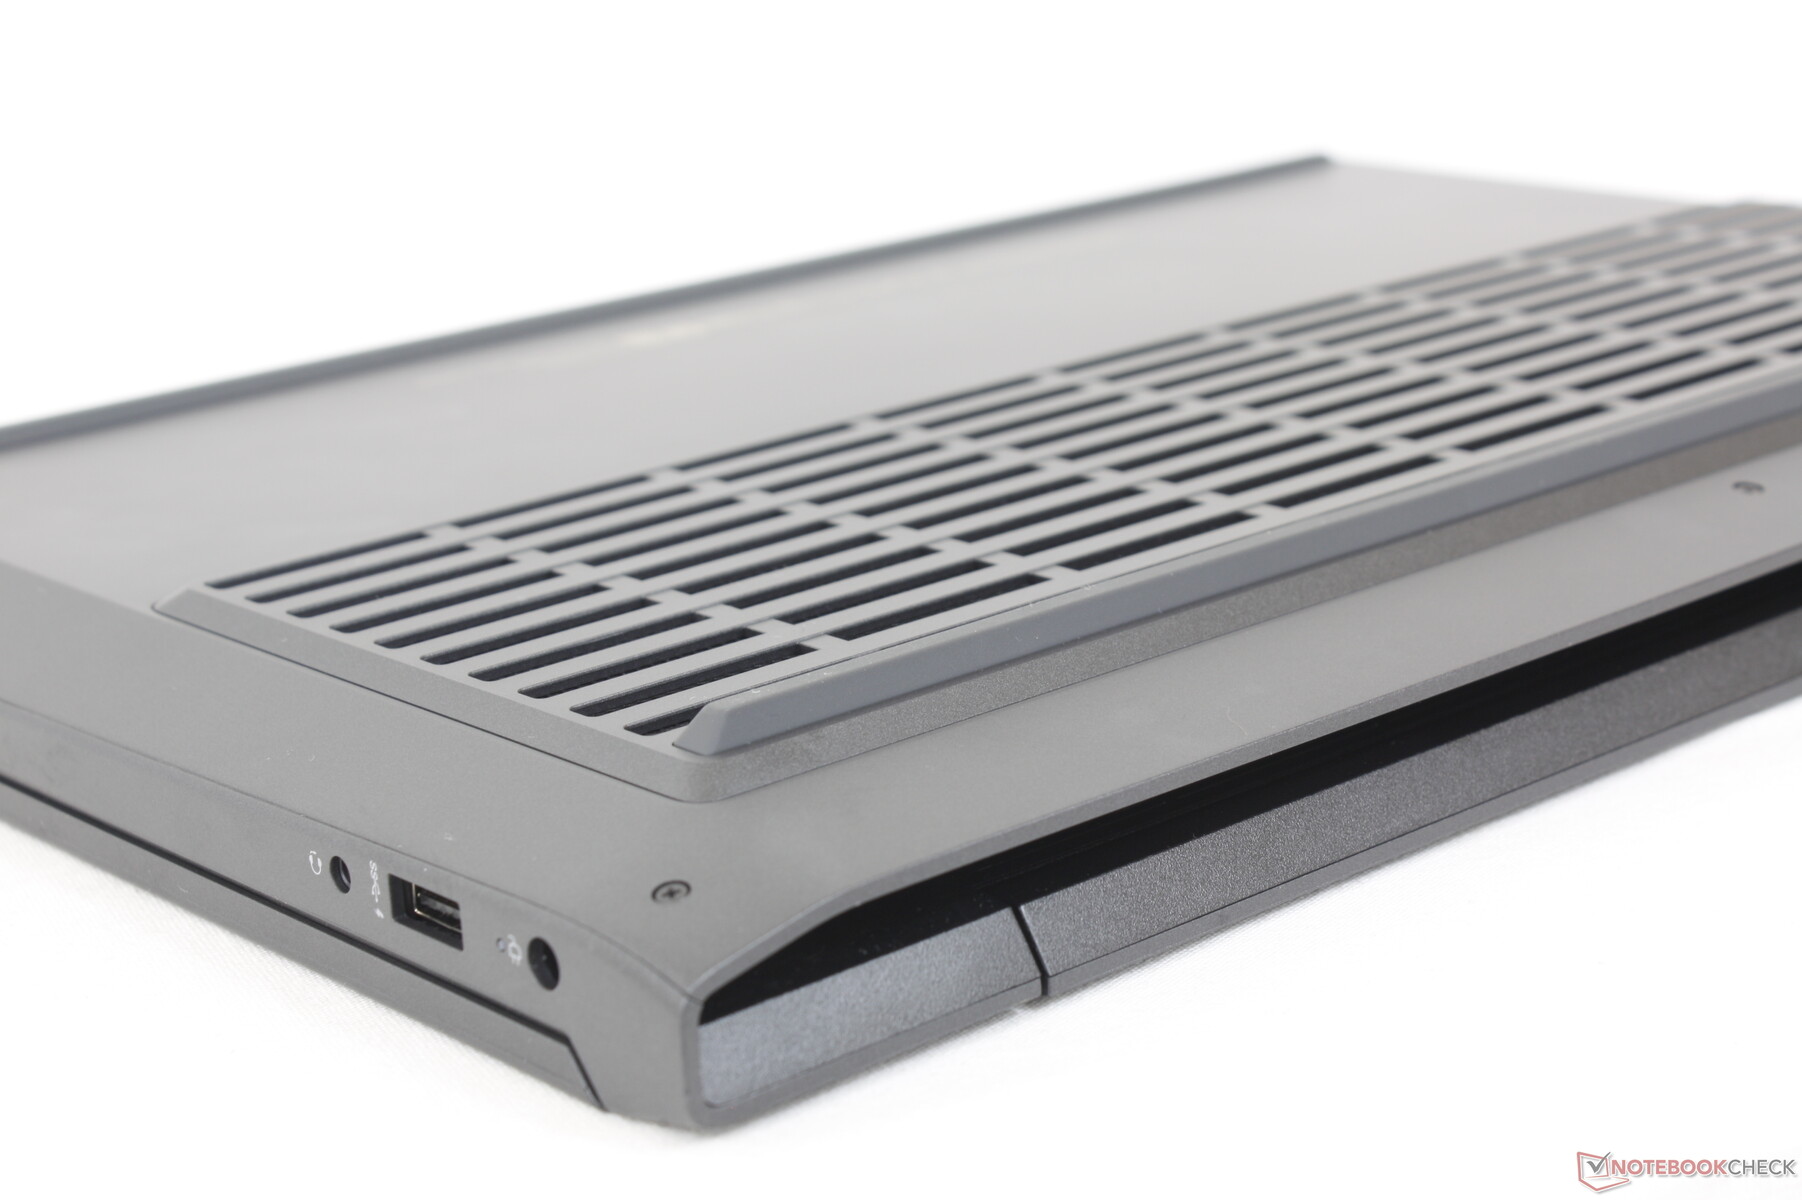
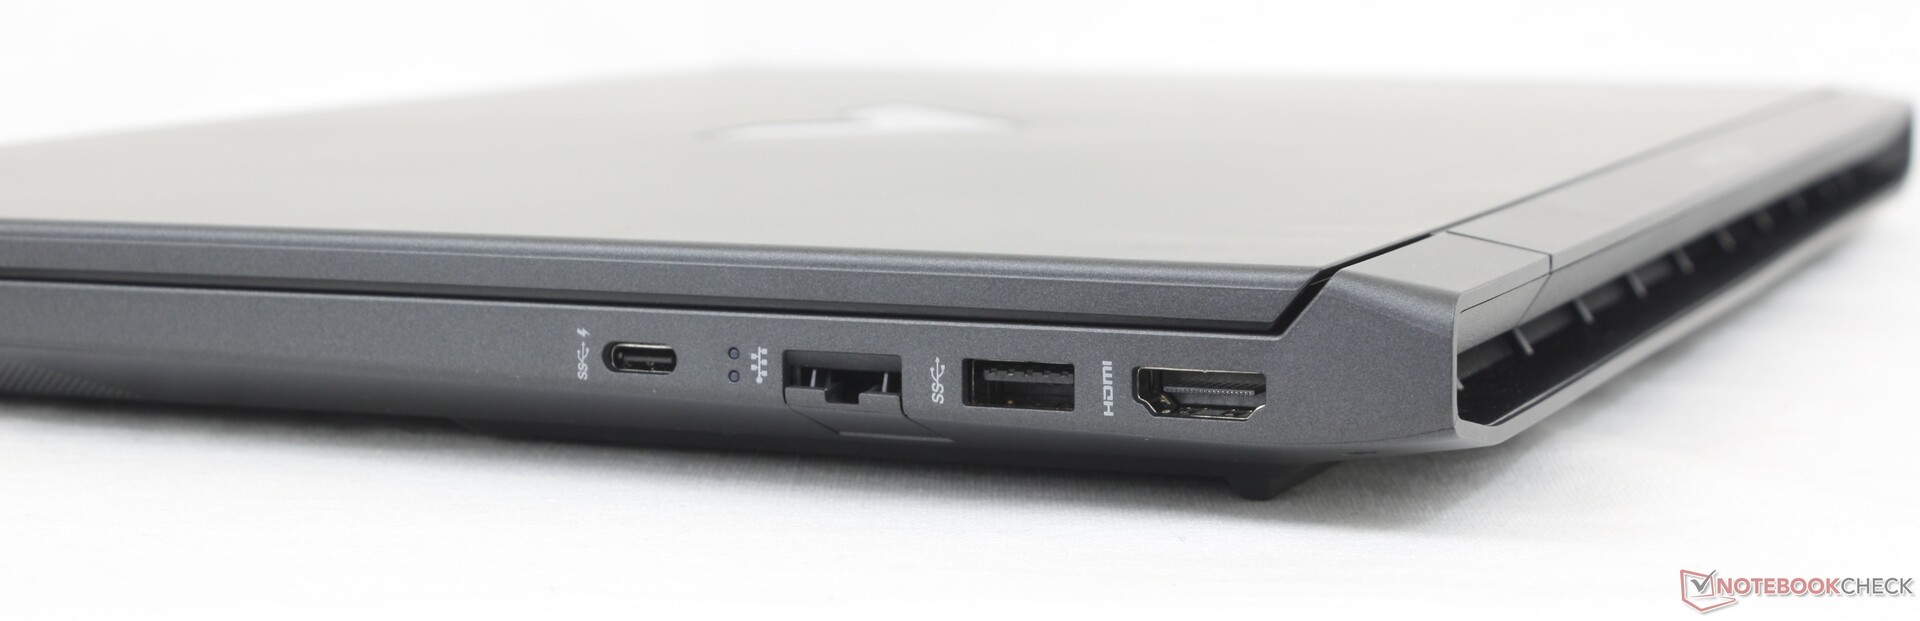
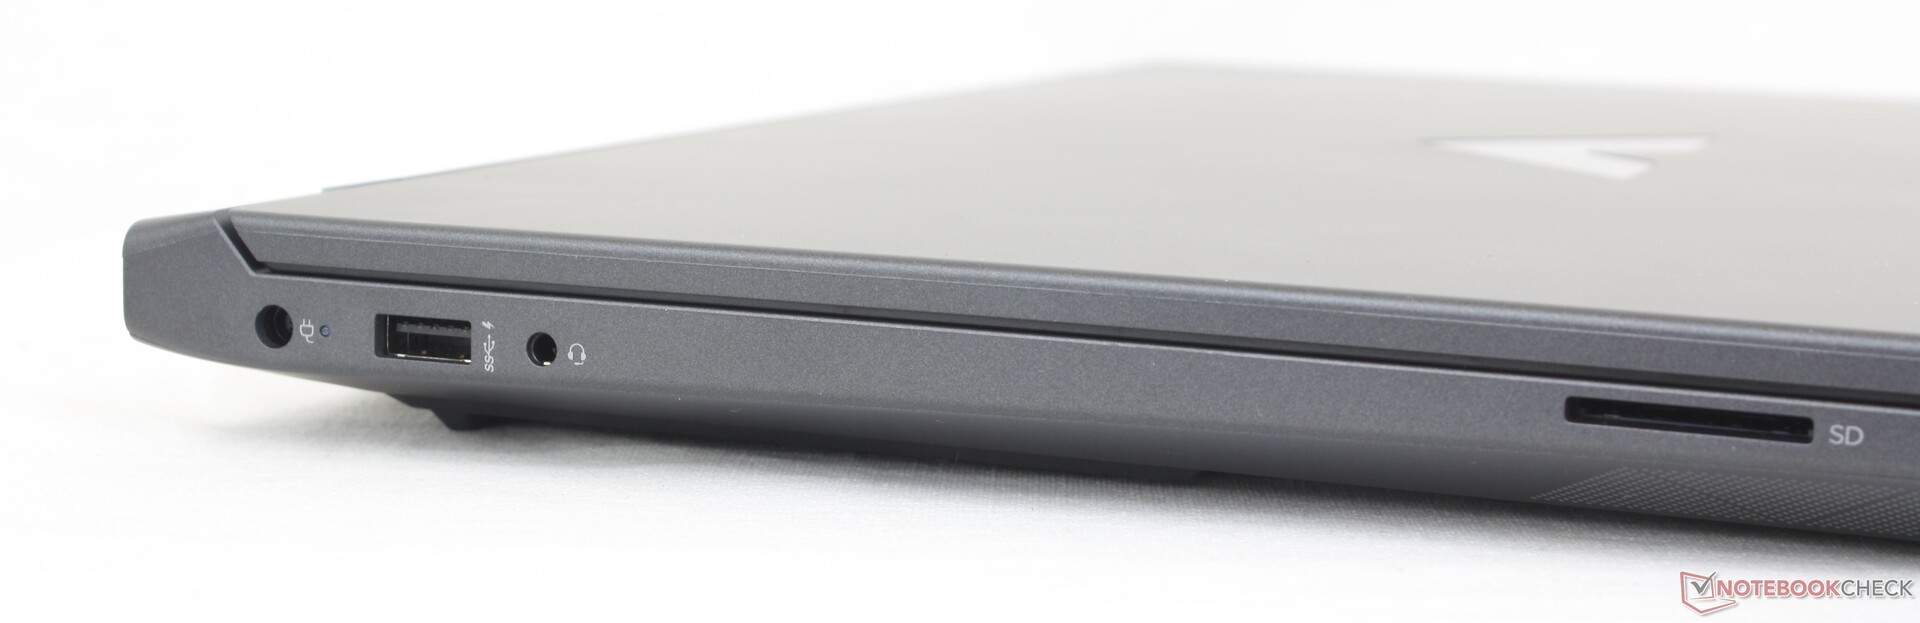
Connectivity — No Thunderbolt Support
All the ports on the Omen 15 are present on the Victus 15 except for one USB-A port. Thunderbolt is not supported here likely to save on costs.
Port positioning is arguably better than on the Dell G15 or Lenovo Legion 5 15 as there are no ports along the rear of the HP for easier reach.
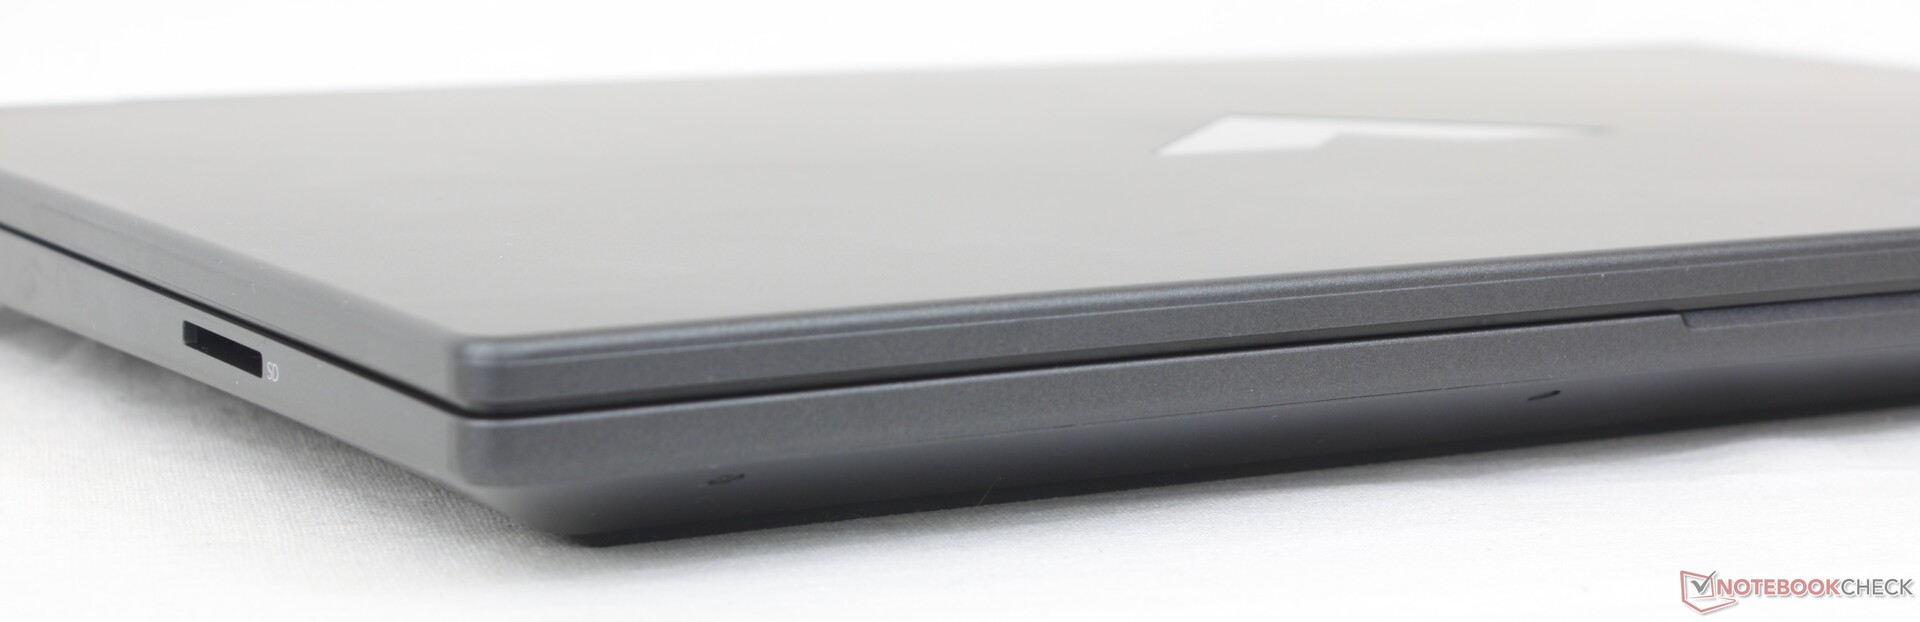
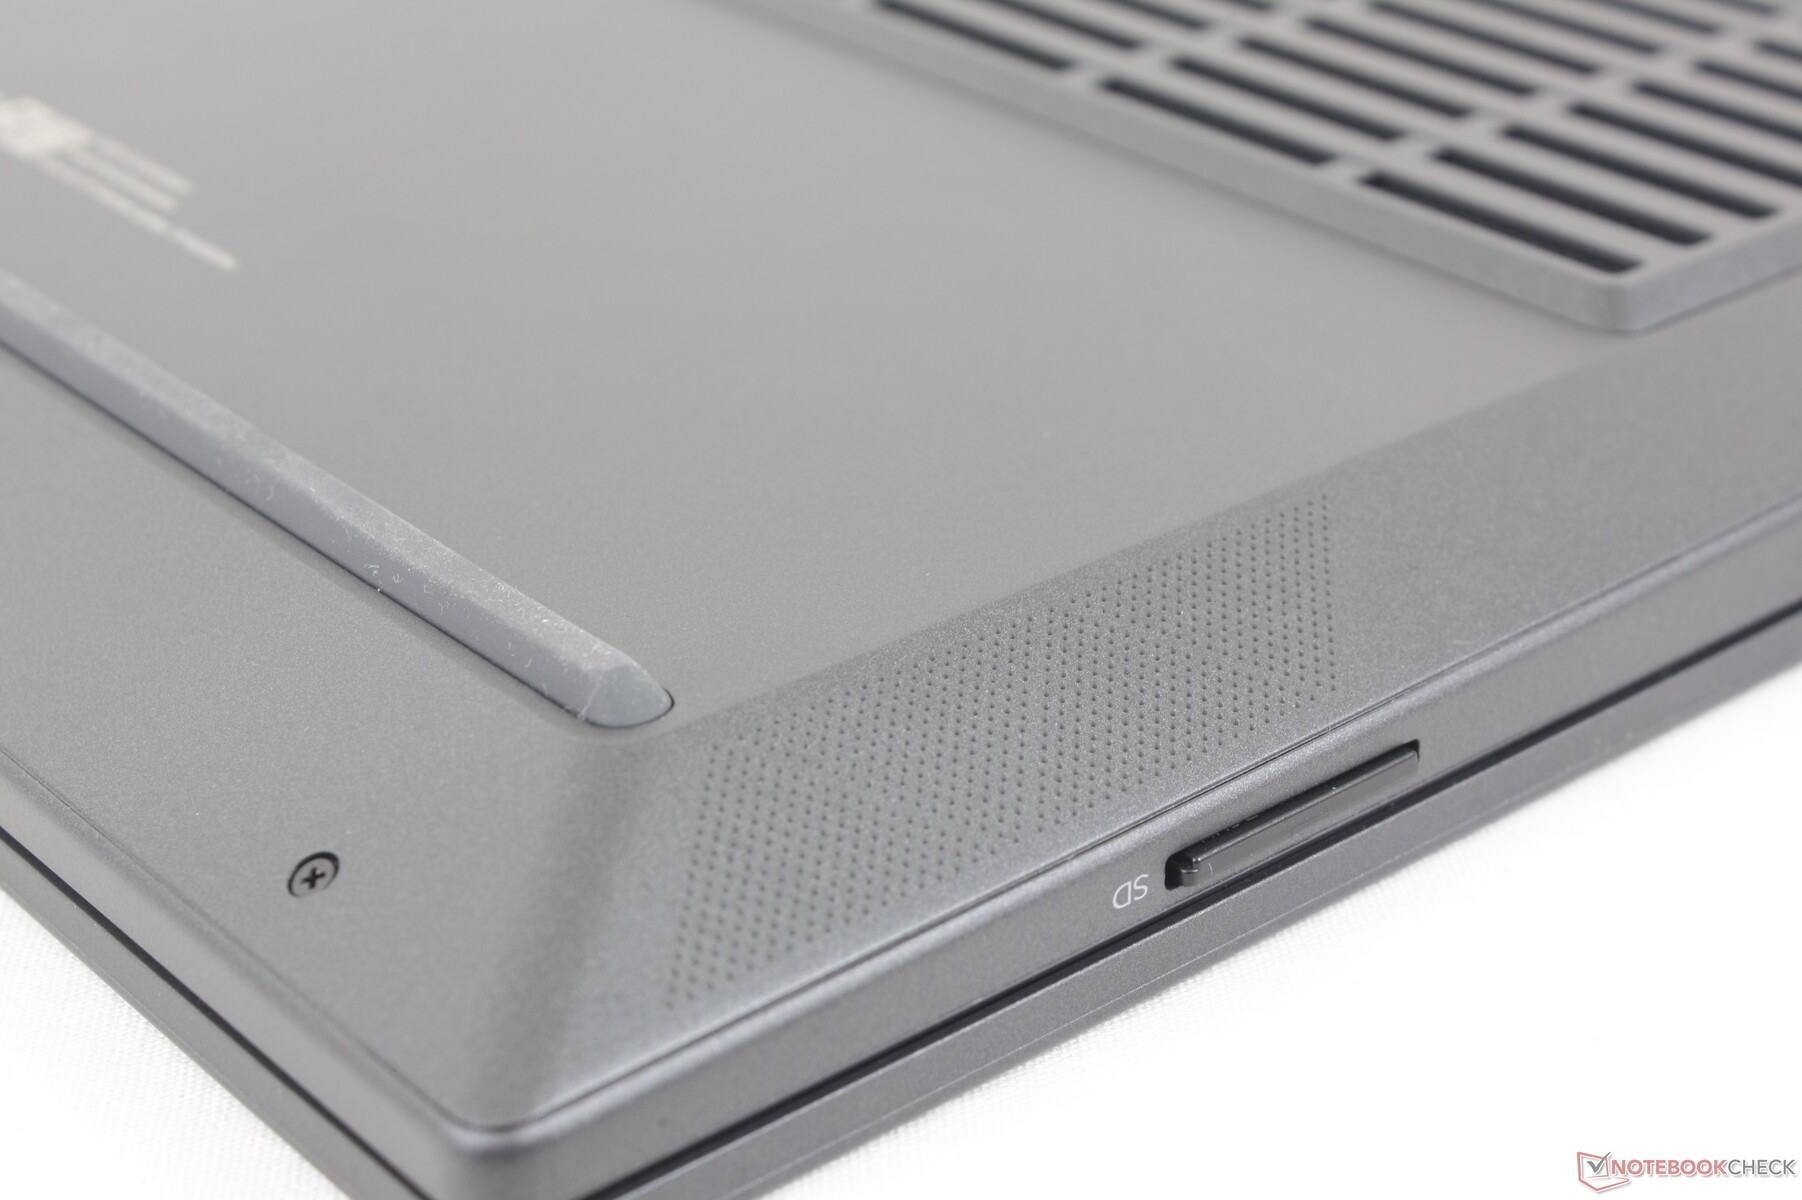
SD Card Reader
We're surprised to see an integrated SD card reader as many budget gaming laptops omit it. Transfer rates are only half as fast as the card readers on the Alienware x15 or Razer Blade, but it's better than no card reader at all.
| SD Card Reader | |
| average JPG Copy Test (av. of 3 runs) | |
| Alienware x15 R2 P111F (AV PRO microSD 128 GB V60) | |
| Razer Blade 17 (i7-12800H, RTX 3070 Ti) | |
| MSI GE67 HX 12UGS (Toshiba Exceria Pro SDXC 64 GB UHS-II) | |
| HP Victus 15 fa0020nr (Toshiba Exceria Pro SDXC 64 GB UHS-II) | |
| HP Omen 15-en0375ng (Toshiba Exceria Pro SDXC 64 GB UHS-II) | |
| HP Omen 15-ek0456ng (Toshiba Exceria Pro SDXC 64 GB UHS-II) | |
| maximum AS SSD Seq Read Test (1GB) | |
| Alienware x15 R2 P111F (AV PRO microSD 128 GB V60) | |
| Razer Blade 17 (i7-12800H, RTX 3070 Ti) | |
| HP Omen 15-en0375ng (Toshiba Exceria Pro SDXC 64 GB UHS-II) | |
| HP Victus 15 fa0020nr (Toshiba Exceria Pro SDXC 64 GB UHS-II) | |
| MSI GE67 HX 12UGS (Toshiba Exceria Pro SDXC 64 GB UHS-II) | |
| HP Omen 15-ek0456ng (Toshiba Exceria Pro SDXC 64 GB UHS-II) | |
Communication
A MediaTek MT7921 is included for 2x2 Wi-Fi 6 and Bluetooth 5.2 connectivity. An Intel AX211 is optional at an additional cost for Wi-Fi 6E. Transfer rates are nonetheless steady in our tests even though performance is lagging behind most other laptops with an Intel AX solution.
| Networking | |
| iperf3 transmit AX12 | |
| Dell G15 5515 | |
| MSI Bravo 15 B5DD-010US | |
| HP Omen 15-en0375ng | |
| iperf3 receive AX12 | |
| Dell G15 5515 | |
| MSI Bravo 15 B5DD-010US | |
| HP Omen 15-en0375ng | |
| iperf3 receive AXE11000 6GHz | |
| Lenovo Legion 5 15IAH7H 82RB | |
| iperf3 receive AXE11000 | |
| Asus TUF Dash F15 FX517ZC | |
| Lenovo Legion 5 15IAH7H 82RB | |
| HP Victus 15 fa0020nr | |
| iperf3 transmit AXE11000 | |
| Asus TUF Dash F15 FX517ZC | |
| Lenovo Legion 5 15IAH7H 82RB | |
| HP Victus 15 fa0020nr | |
| iperf3 transmit AXE11000 6GHz | |
| Lenovo Legion 5 15IAH7H 82RB | |
Webcam
The webcam is the basic 1 MP sensor with no IR or even privacy shutter. HP has some of the best laptop webcams as seen on the latest Spectre and EliteBook models and so the blurry webcam on our Victus is clearly a cost-cutting measure.


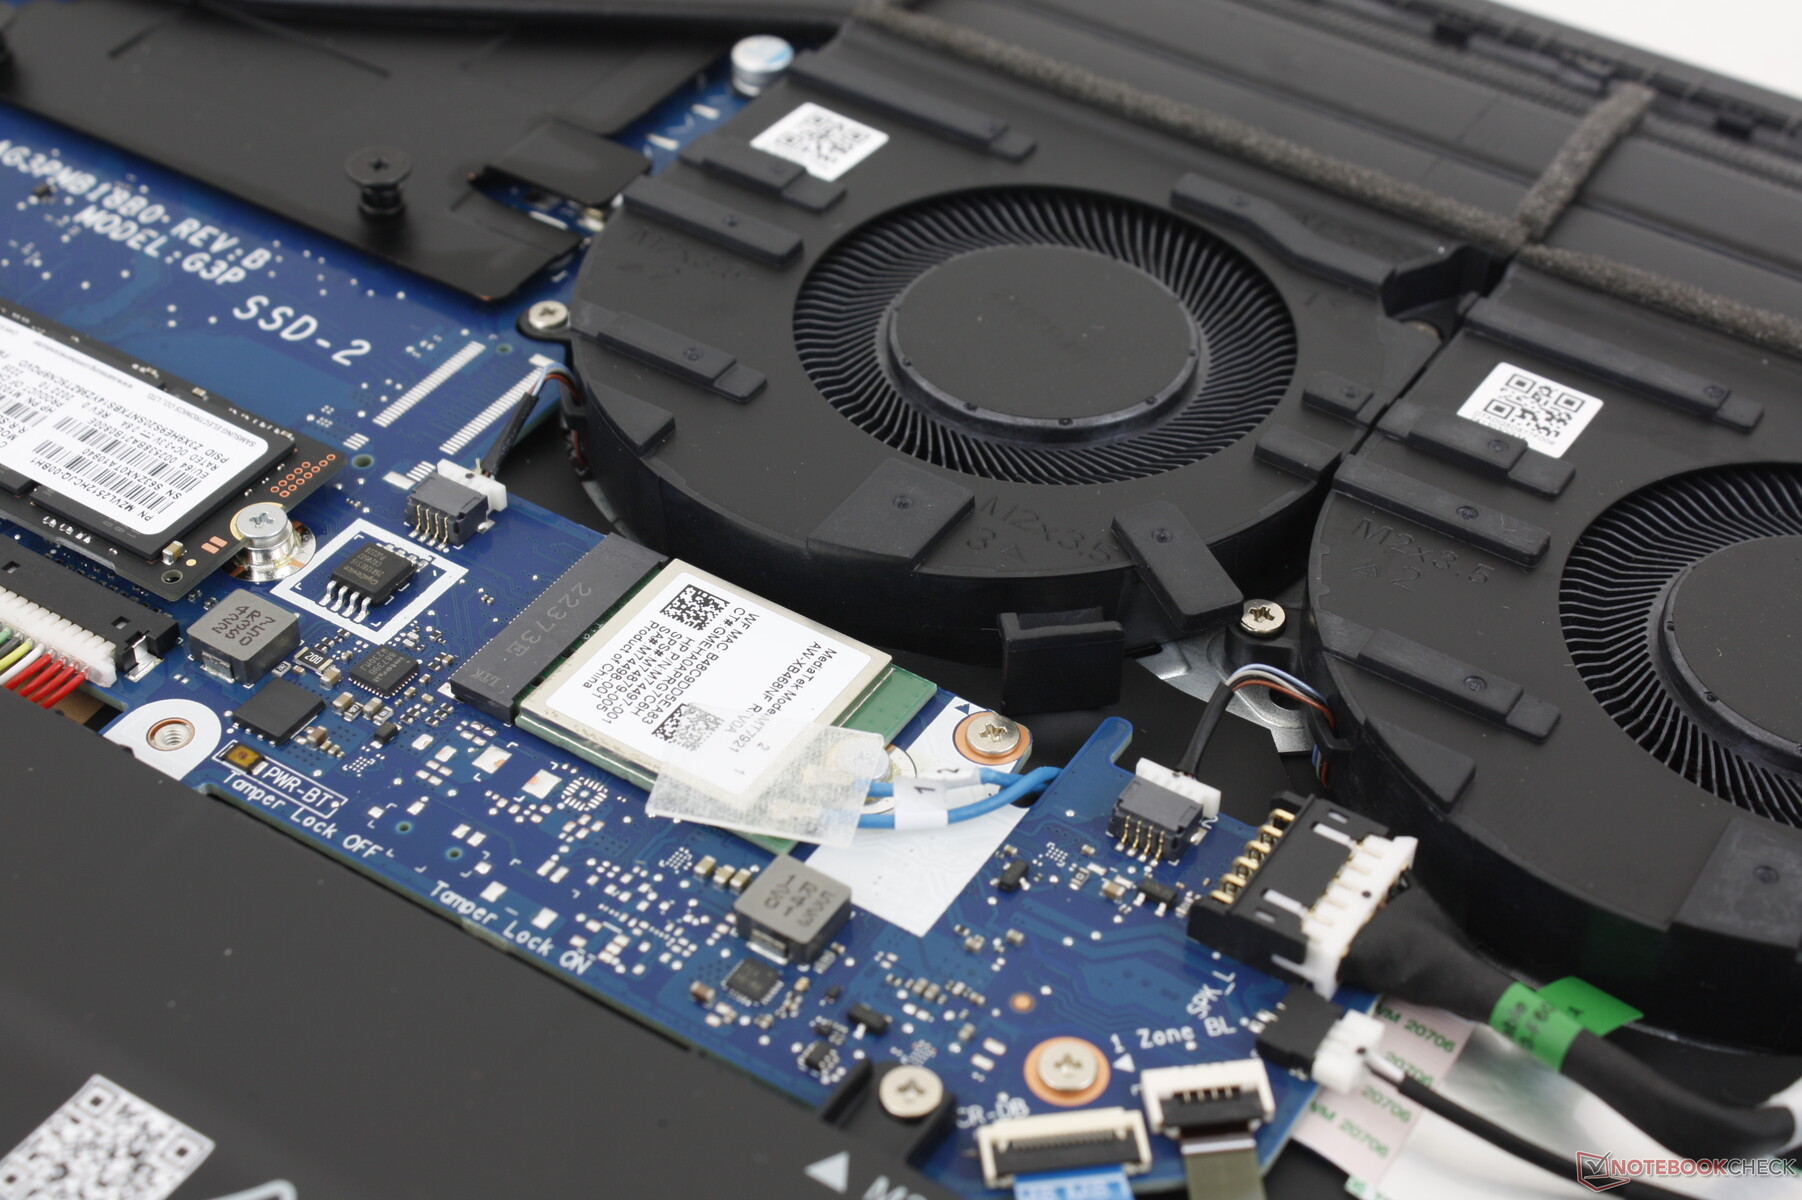
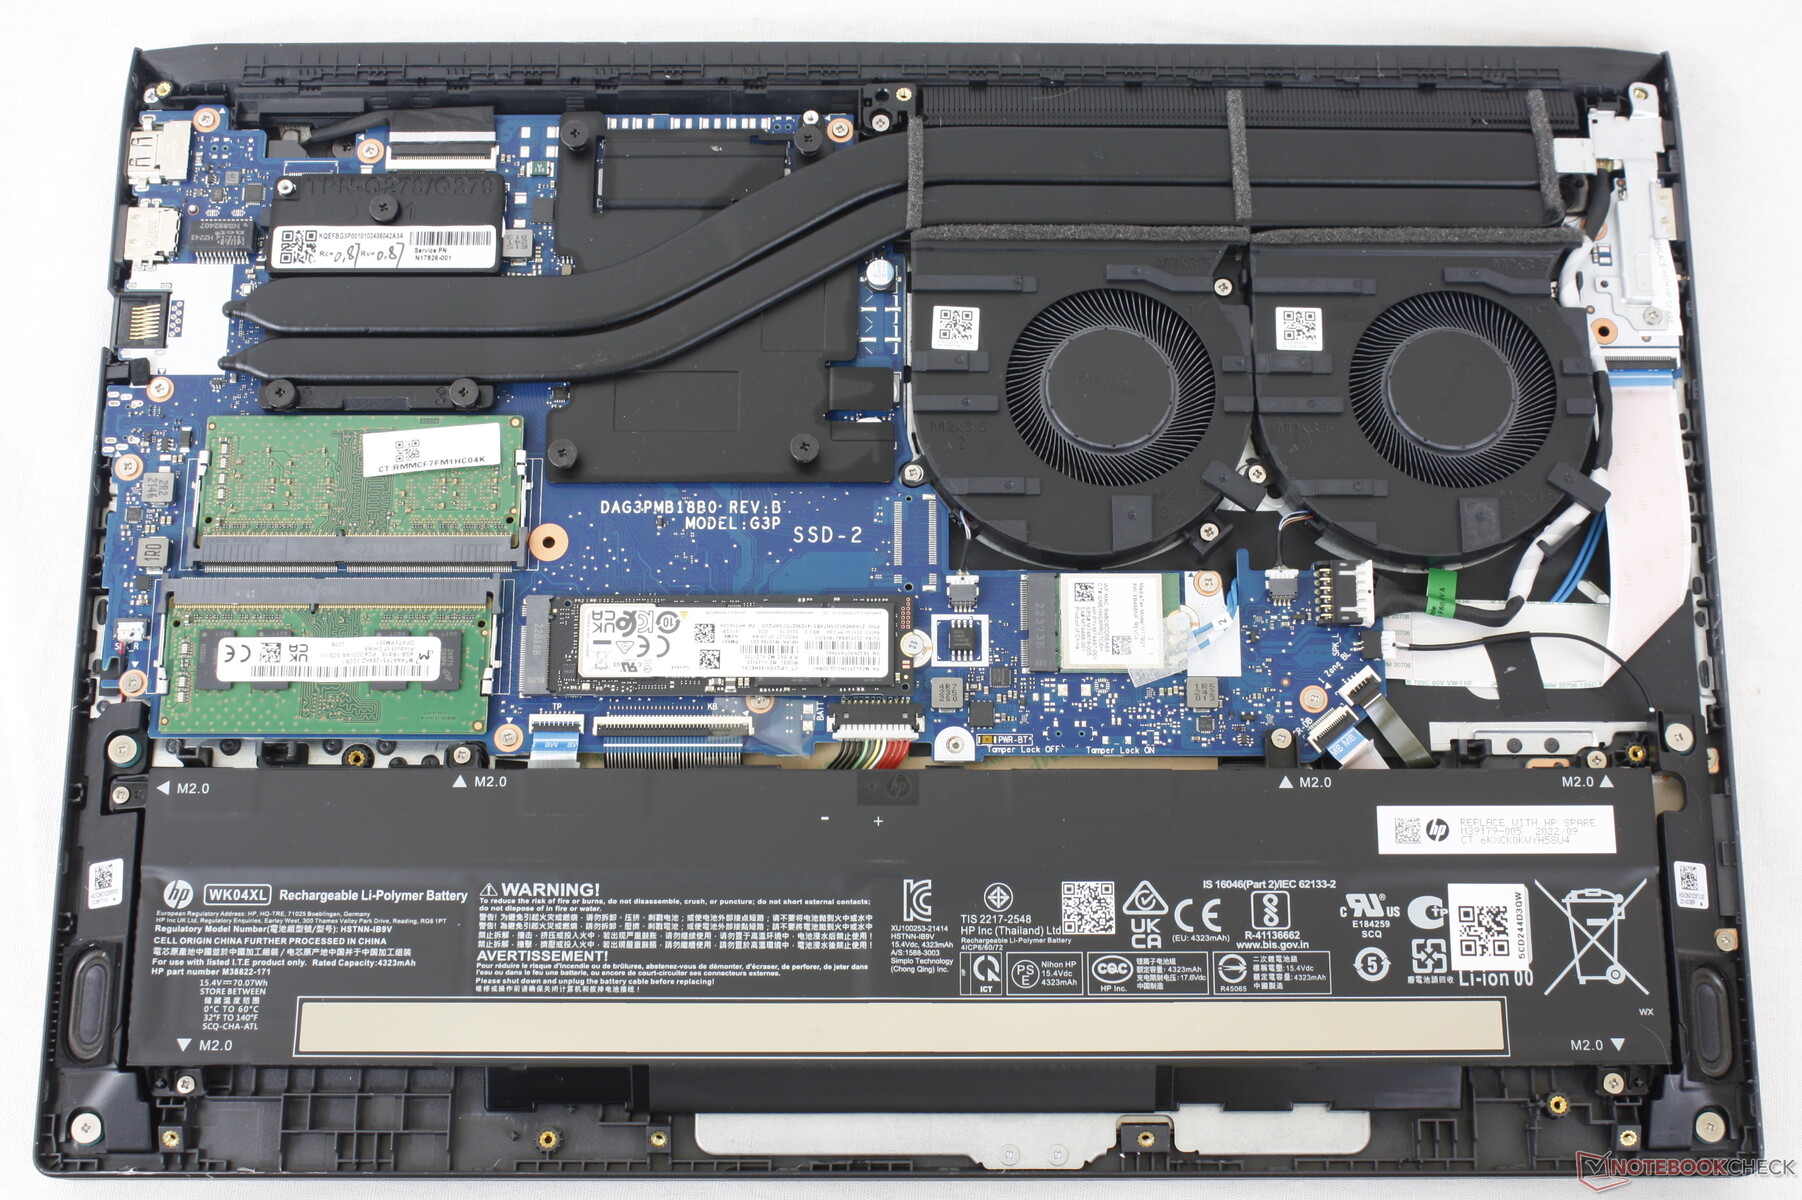
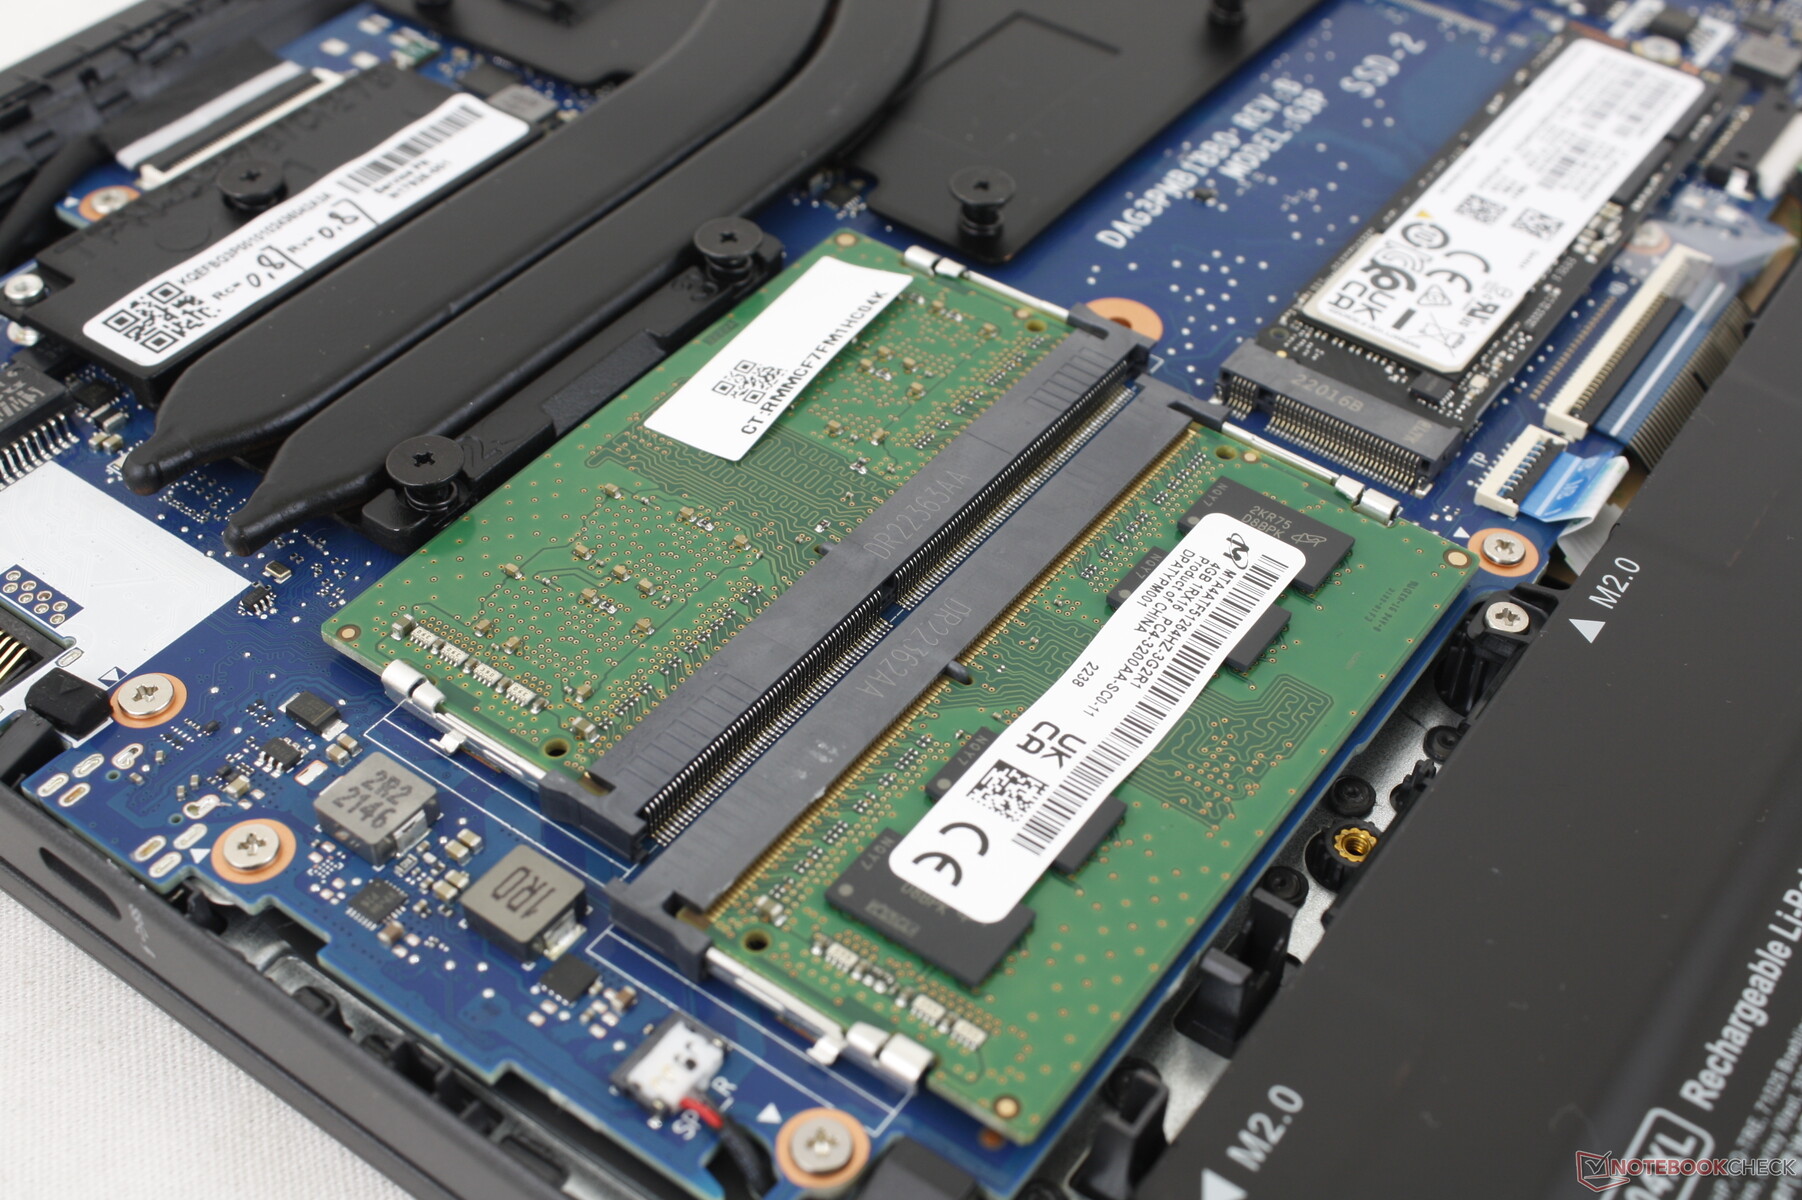
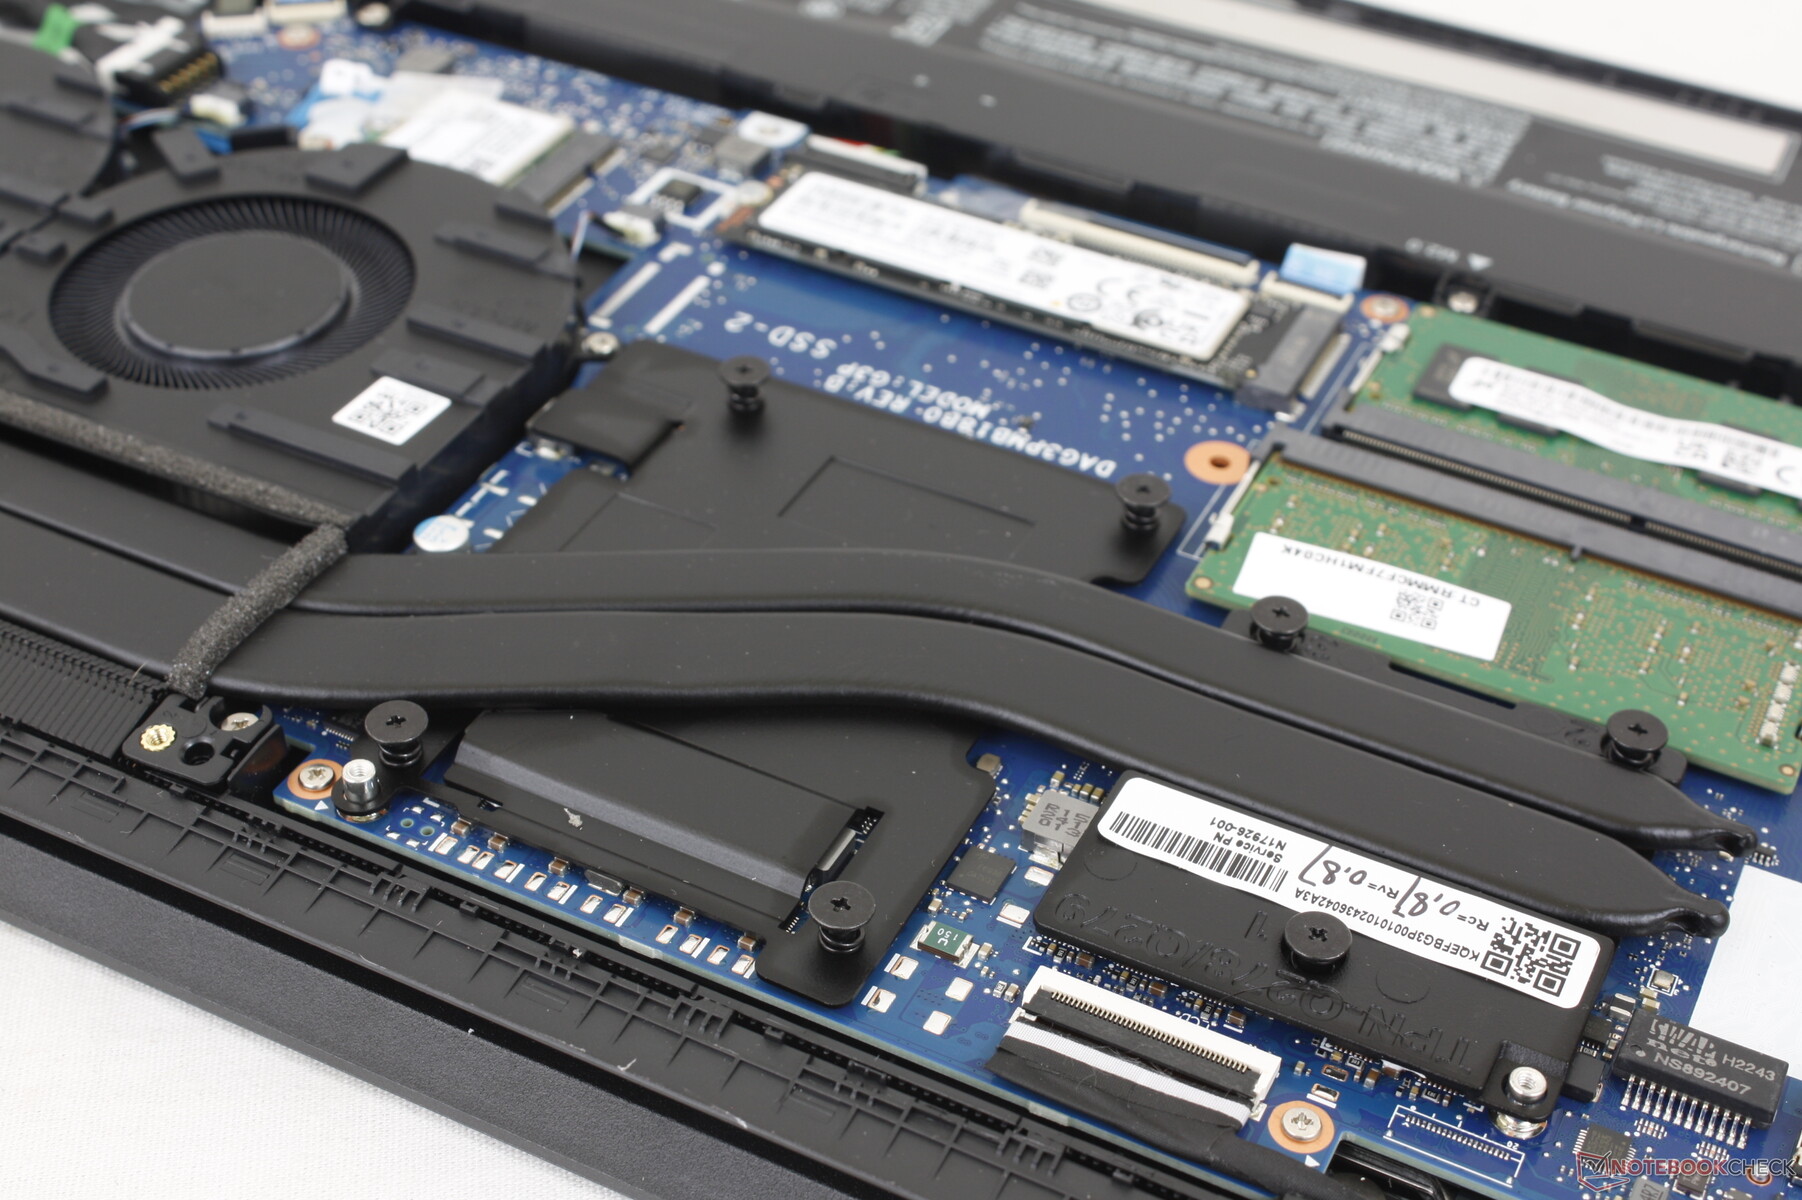
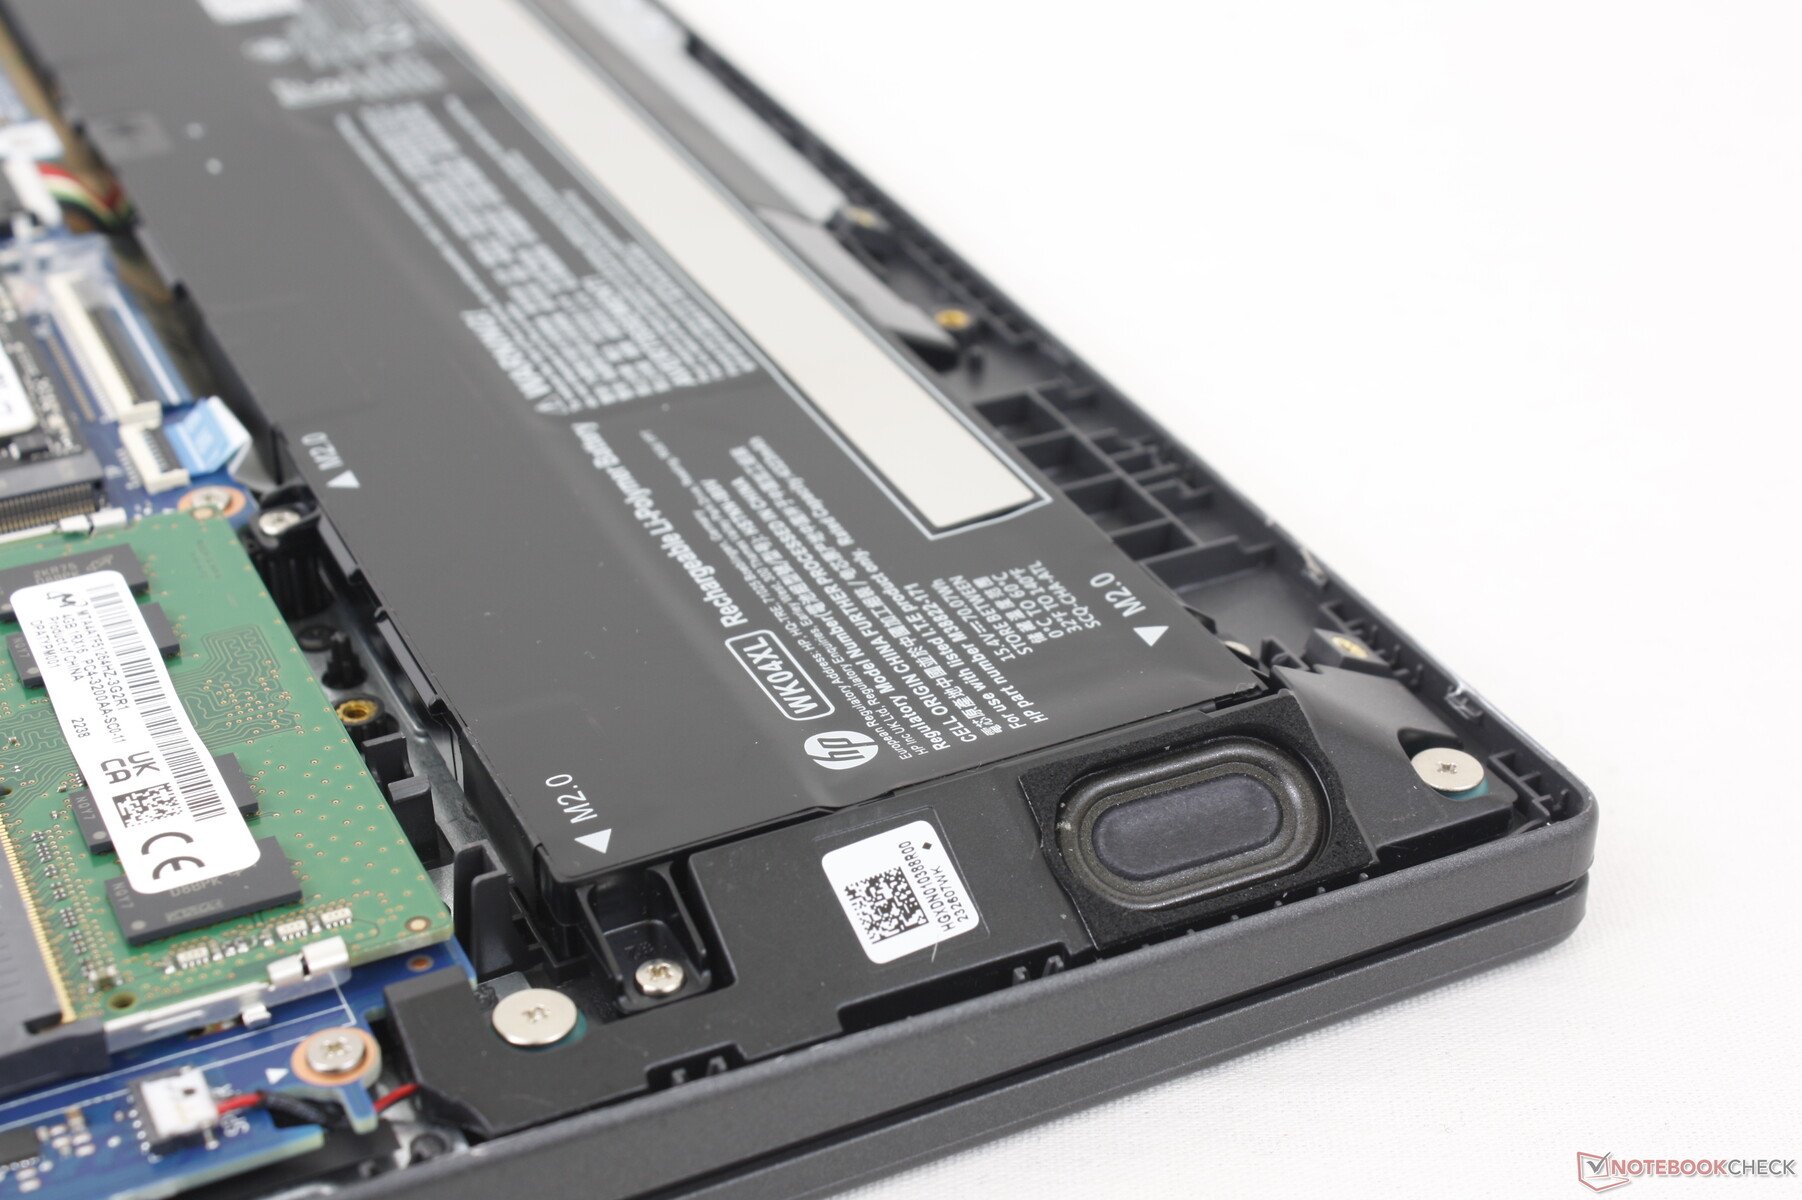
Maintenance
The bottom panel is secured by seven Philips screws for relatively easy servicing. Owners have direct access to the single M.2 PCIe4 x4 2280 slot, removable WLAN module, and 2x SODIMM slots. The competing Asus TUF Dash F15 FX517ZC supports up to two M.2 SSDs whereas our HP can support just one.
Accessories and Warranty
There are no extras in the retail box beyond the AC adapter and paperwork. The usual one-year limited manufacturer warranty applies if purchased in the US.
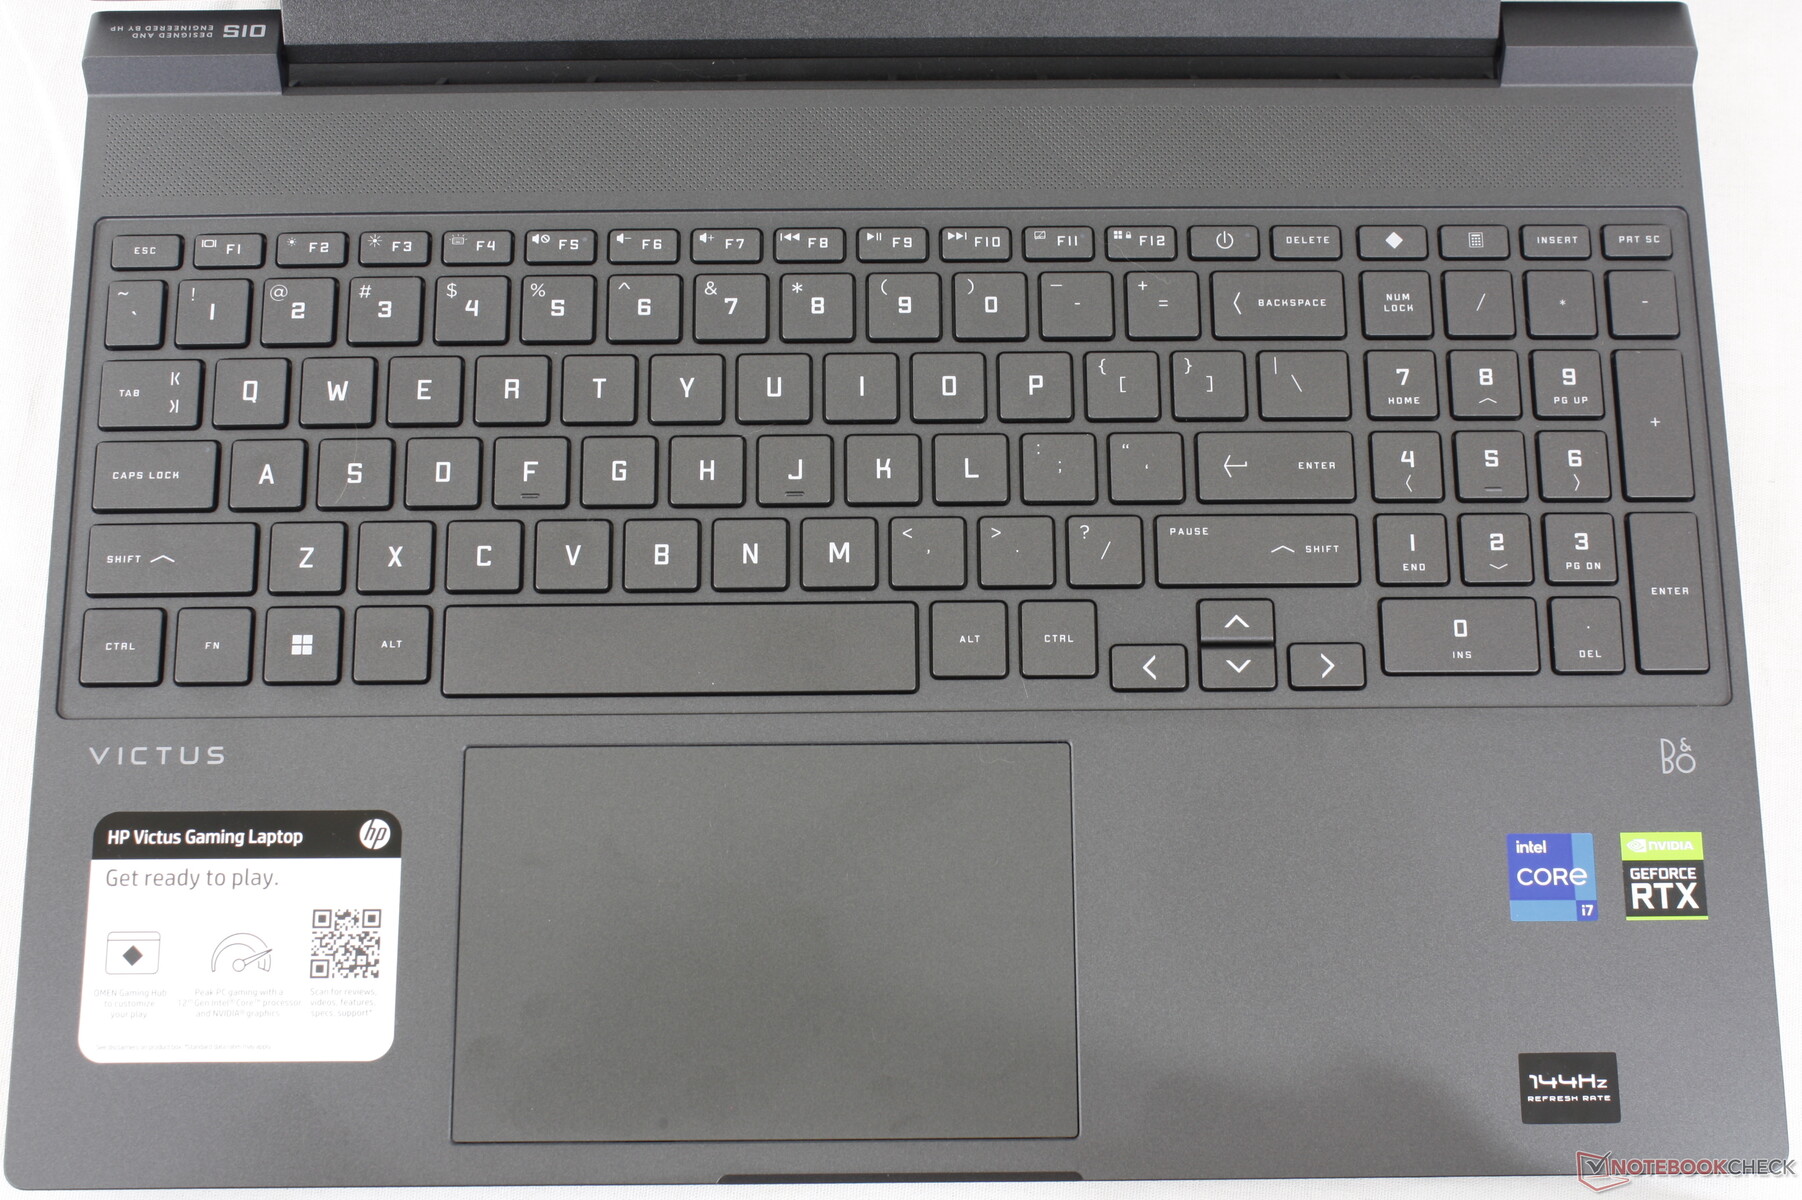
Input Devices — Spacious Keyboard And ClickPad
Keyboard
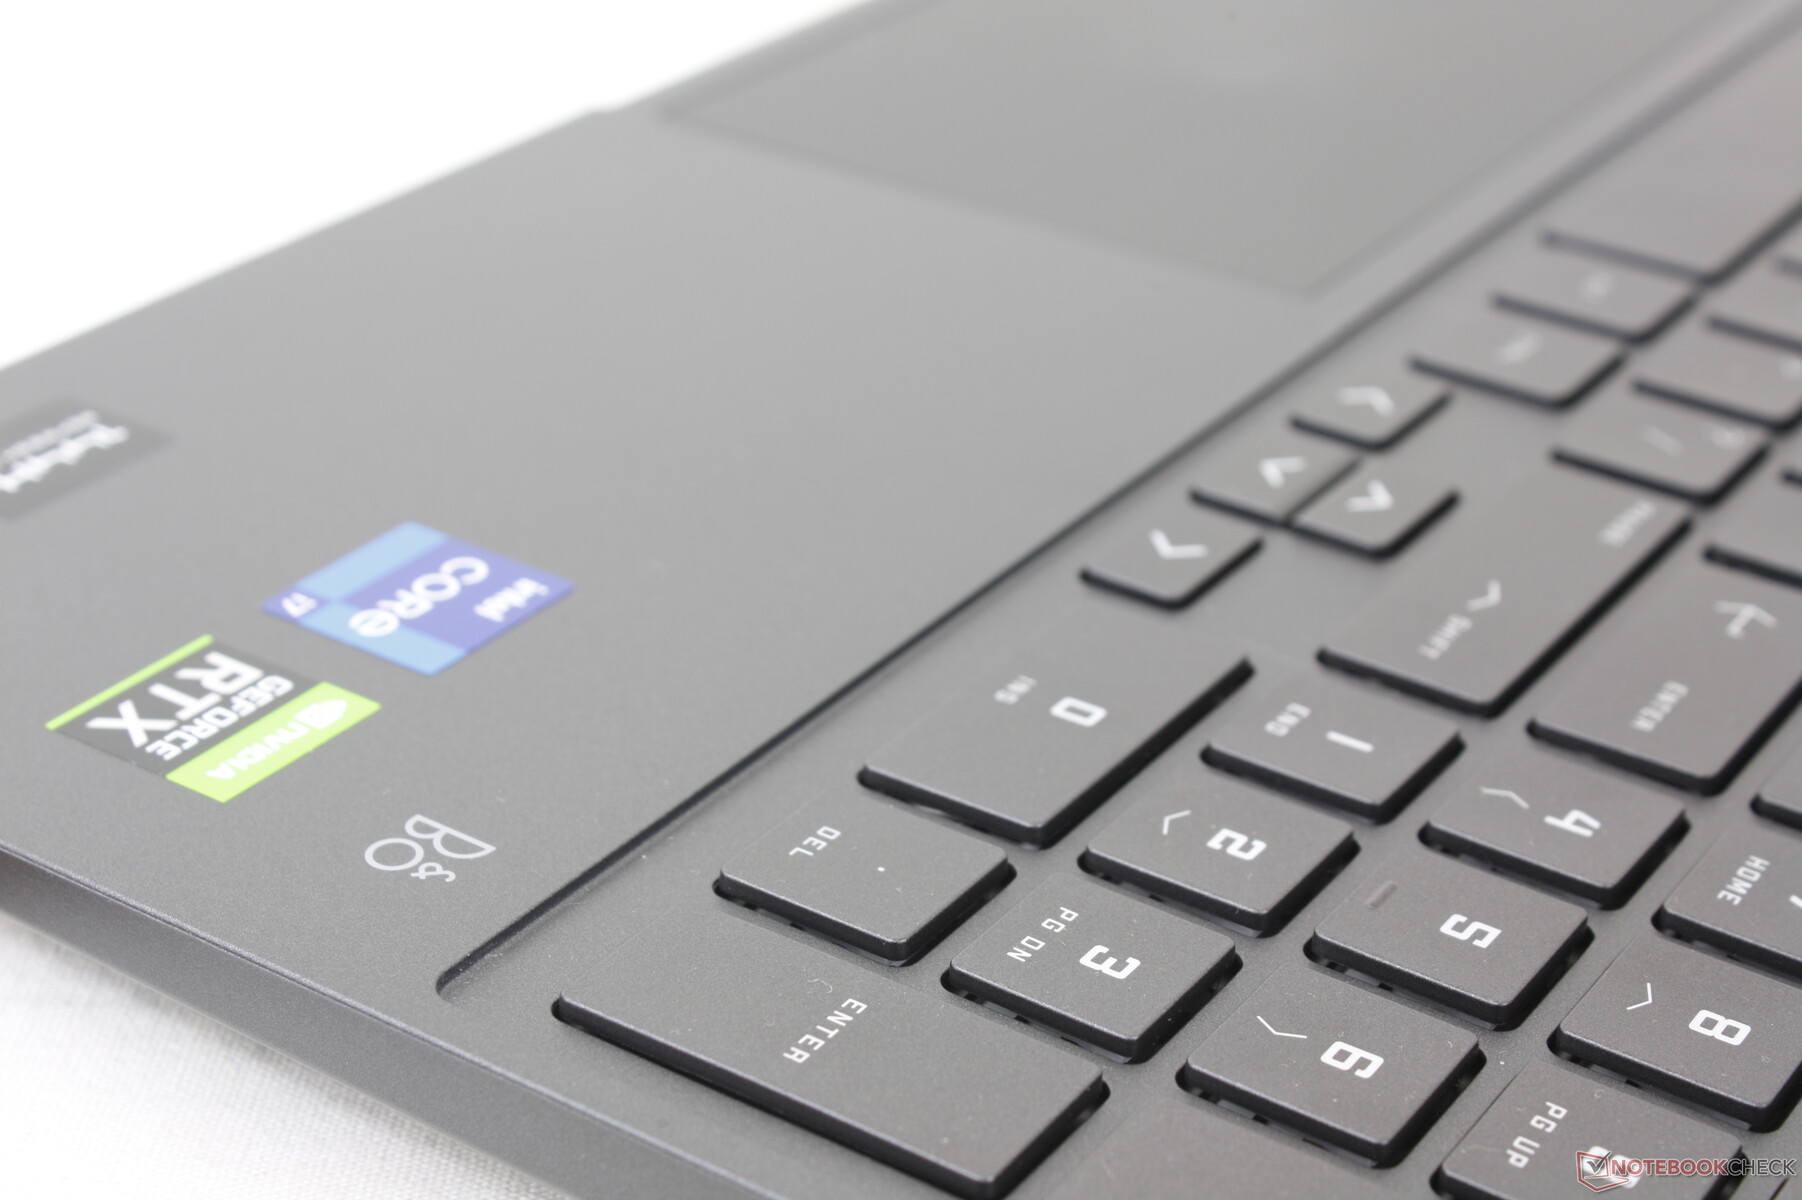
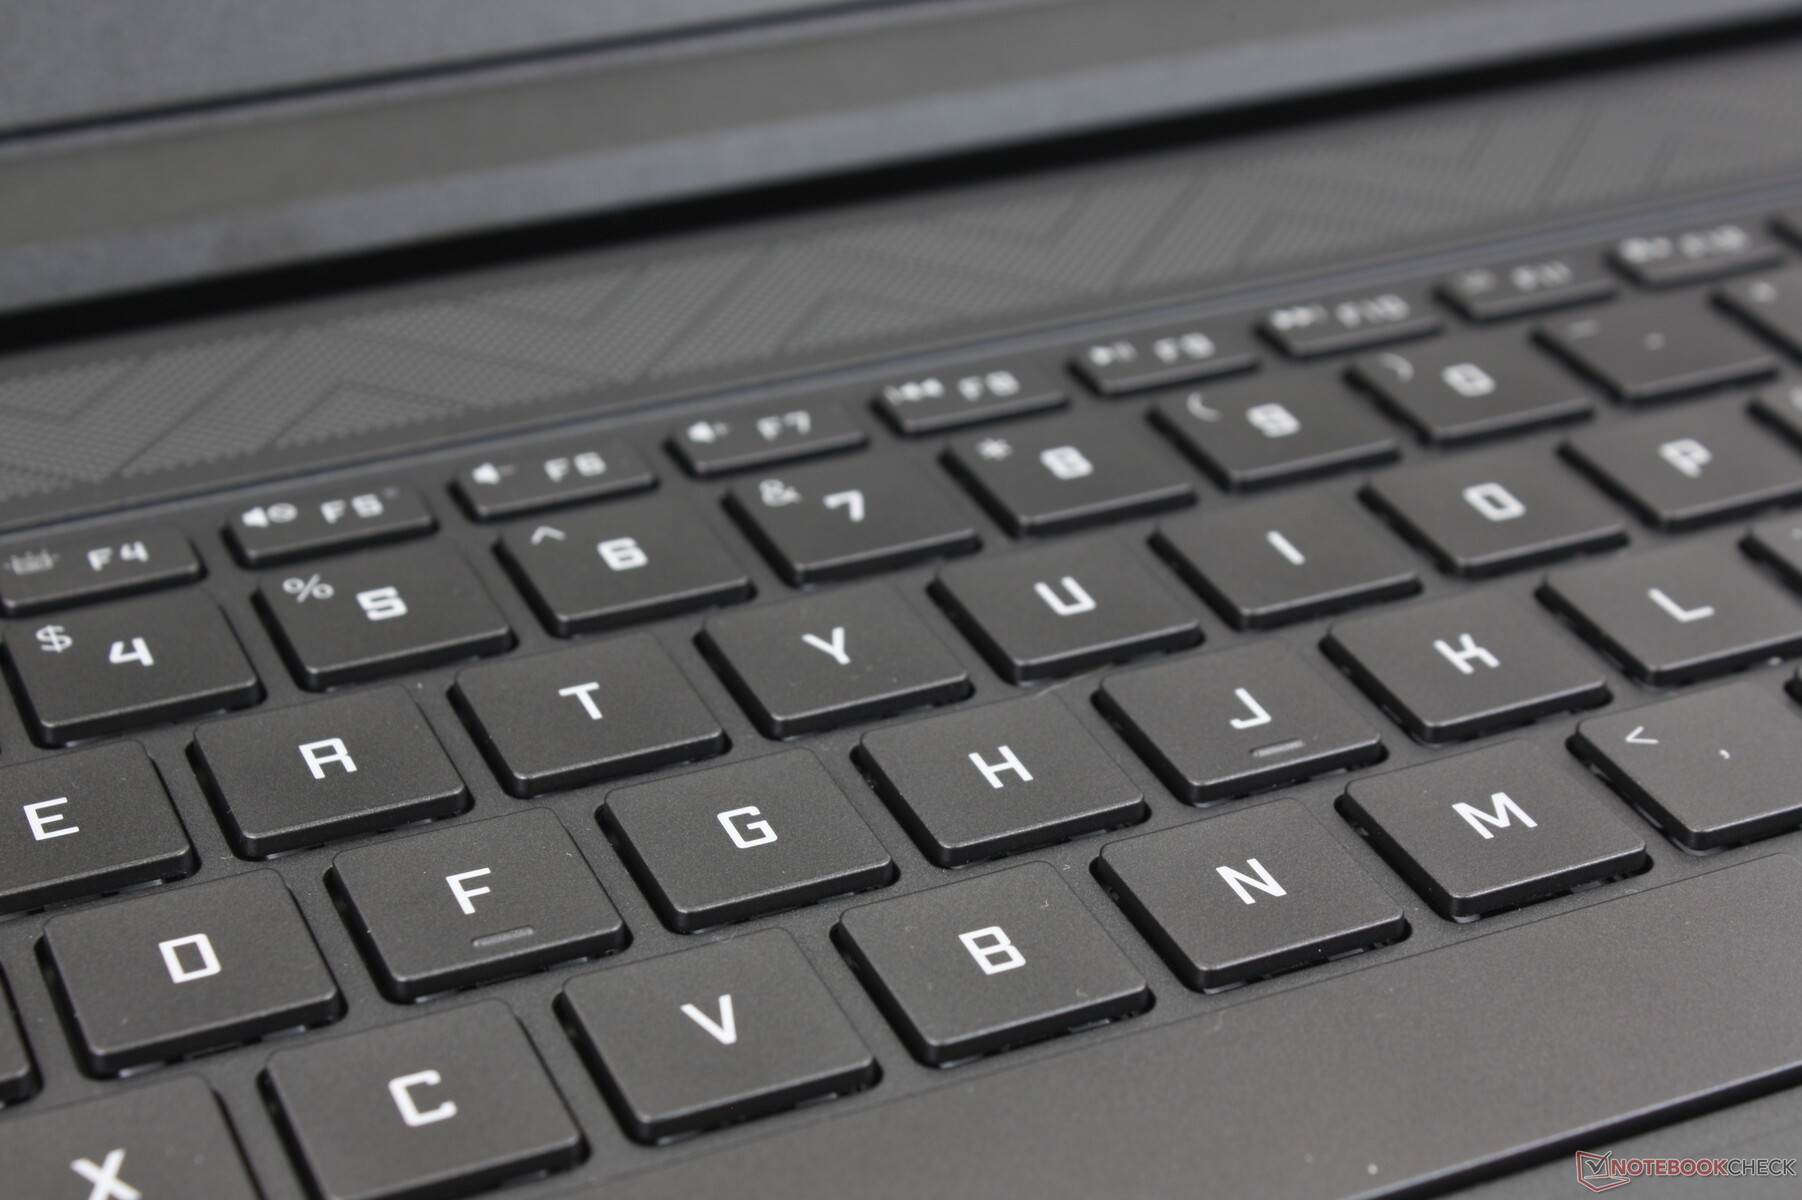
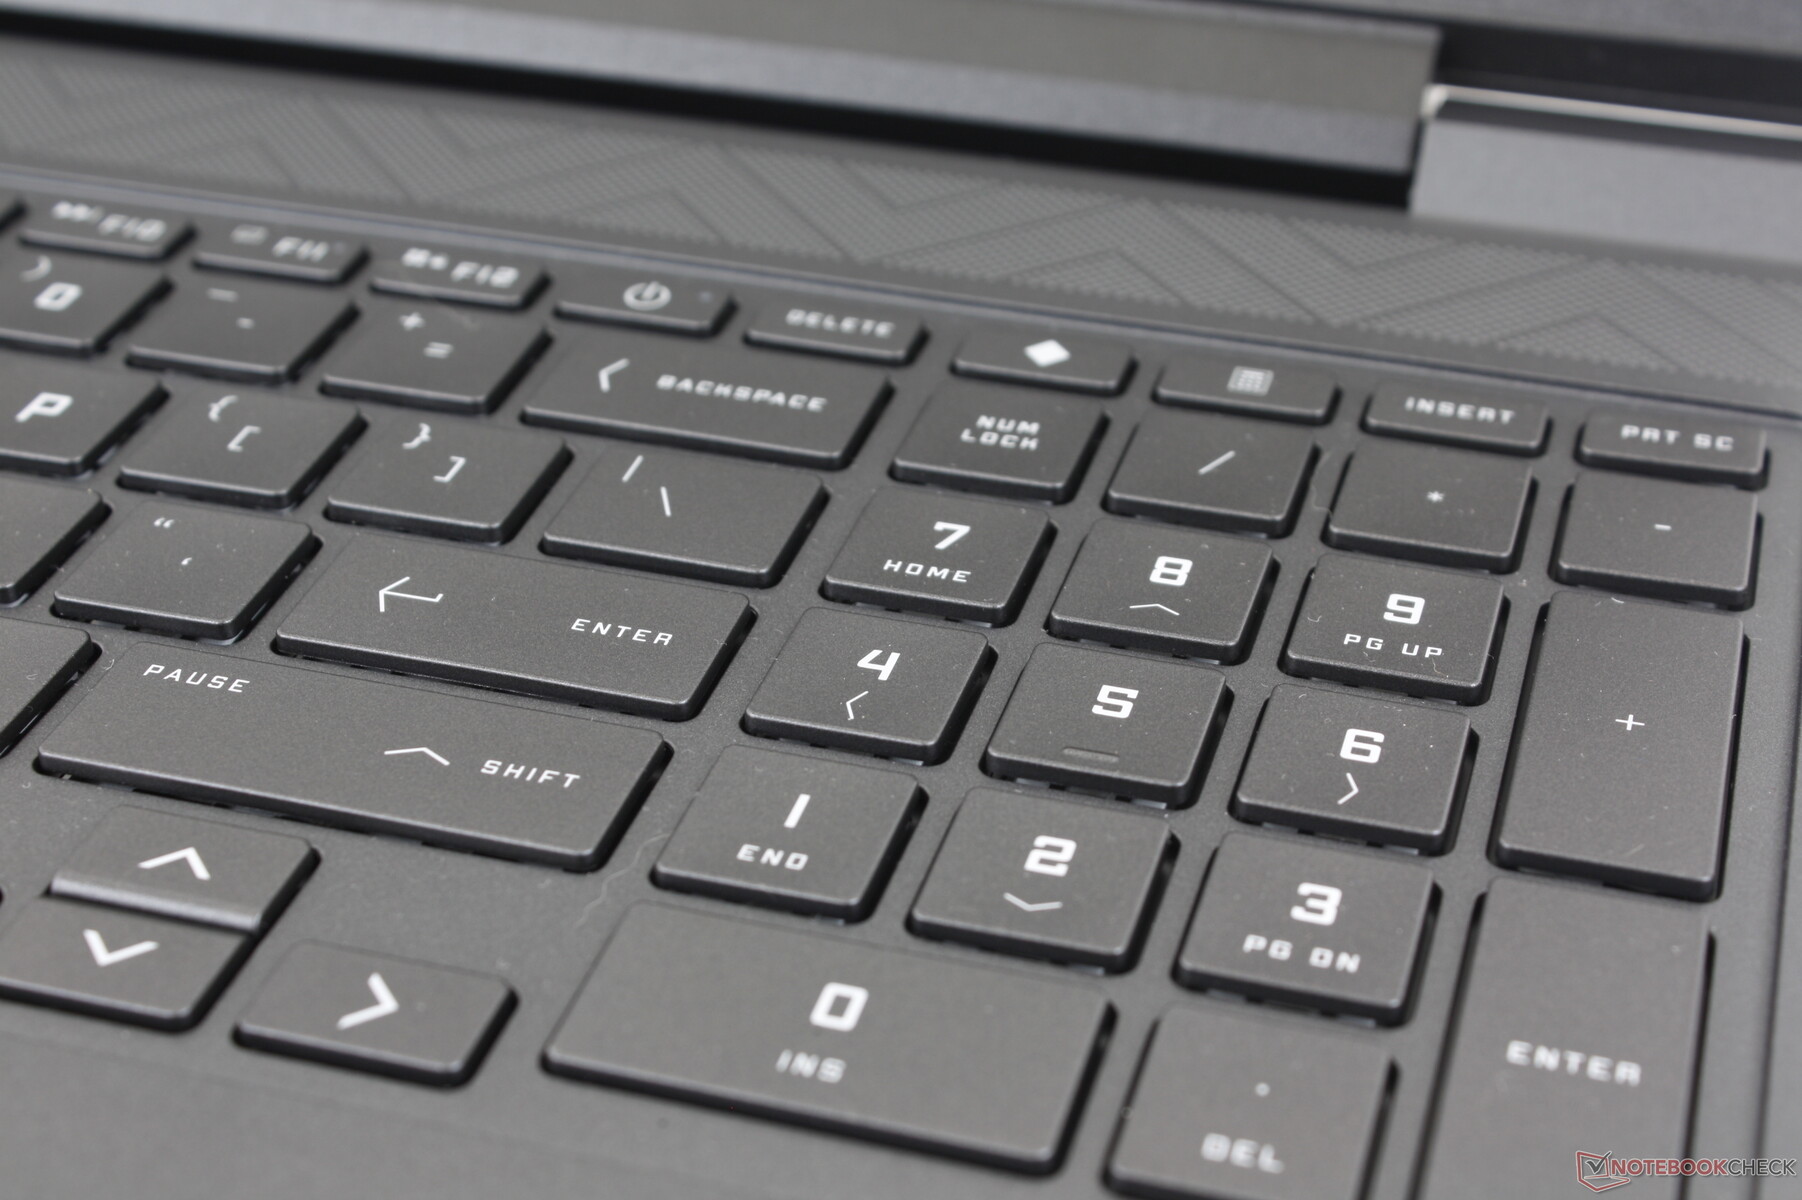
More gaming laptops are starting to integrate numpads and the Victus 15 is no exception. We especially appreciate that the numpad keys aren't narrower than the main QWERTY keys unlike the cramped numpads on the Dell G15 or Asus TUF Dash F15.
Key feedback when typing is slightly softer and thus quieter on the Victus. The Enter and Backspace keys, however, are a bit too soft and could have benefited from firmer feedback.
A single-zone white backlight comes standard to illuminate all keys and symbols whereas most other gaming laptops have RGB options. There isn't even a backlight brightness setting here — it's either on or off with nothing in between.
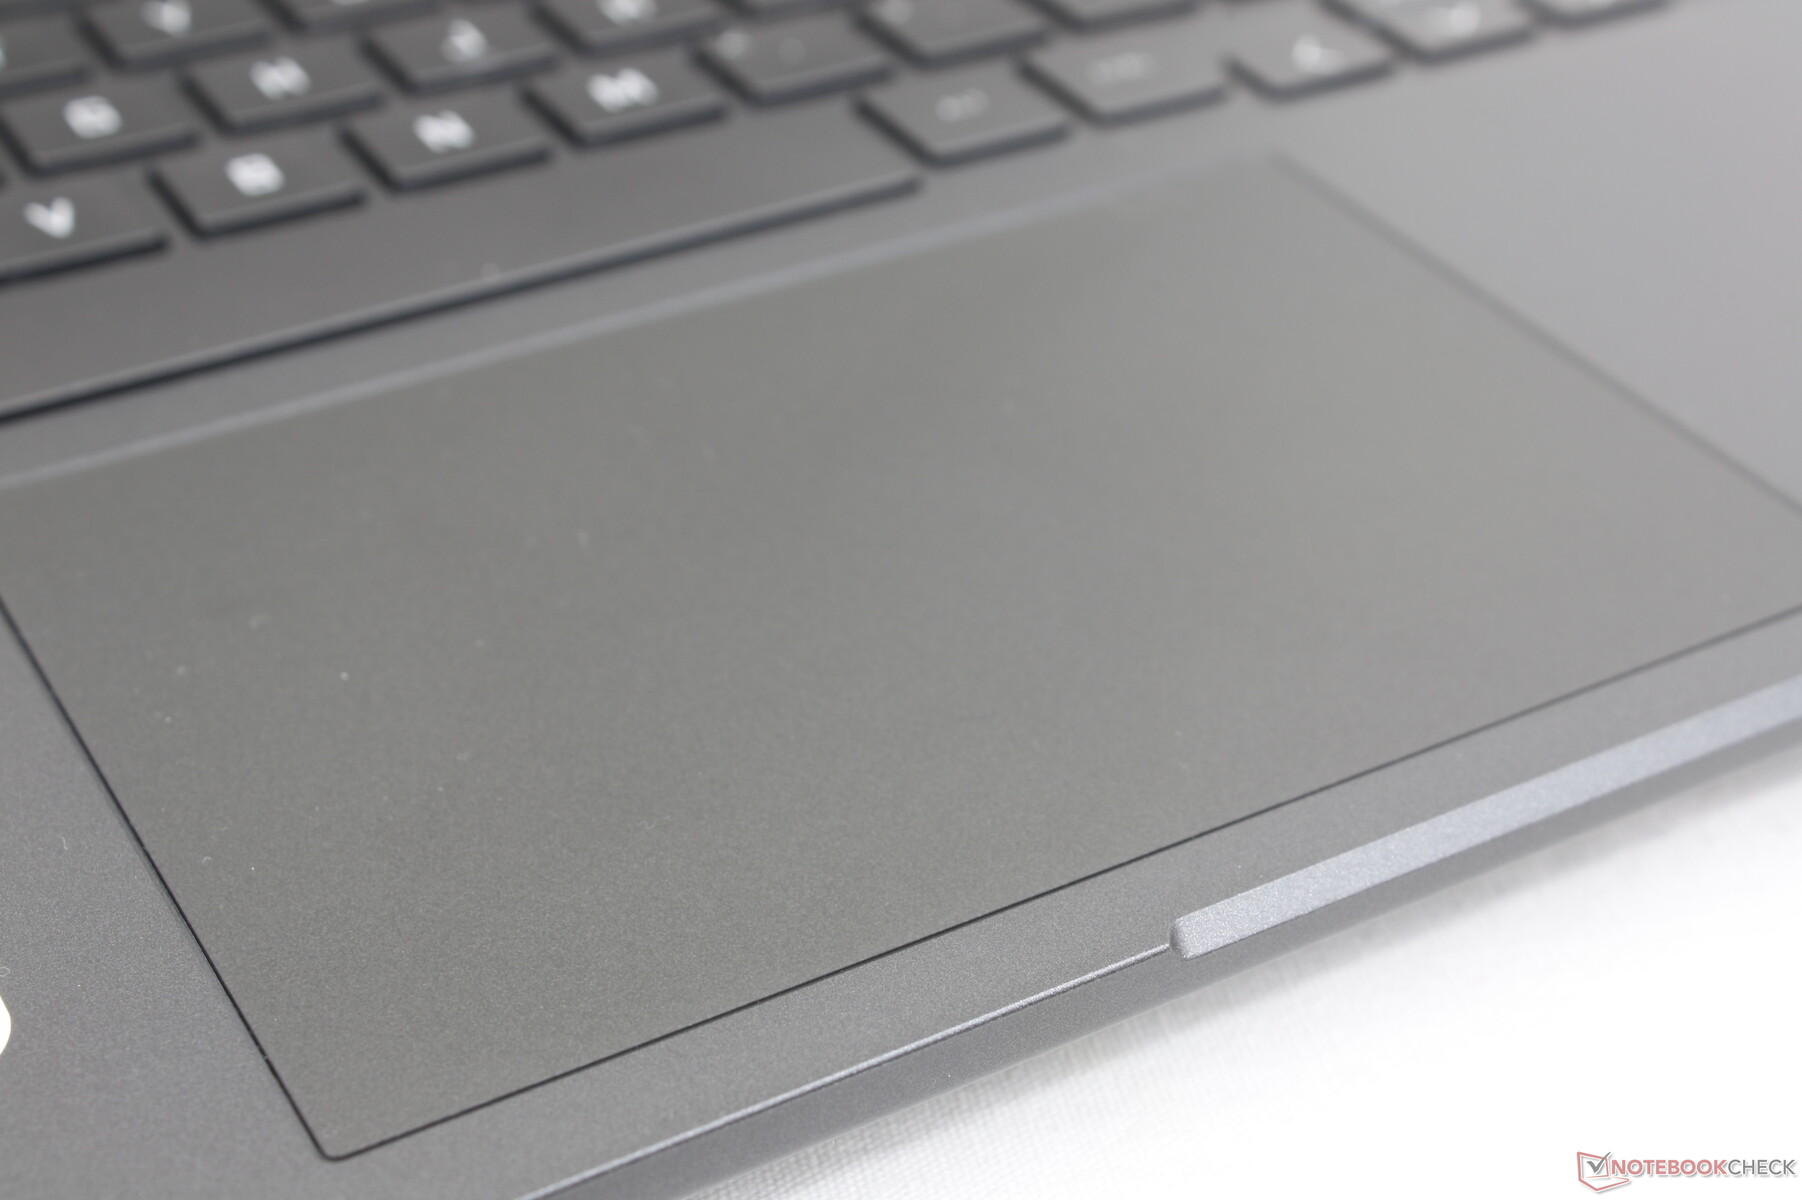
Touchpad
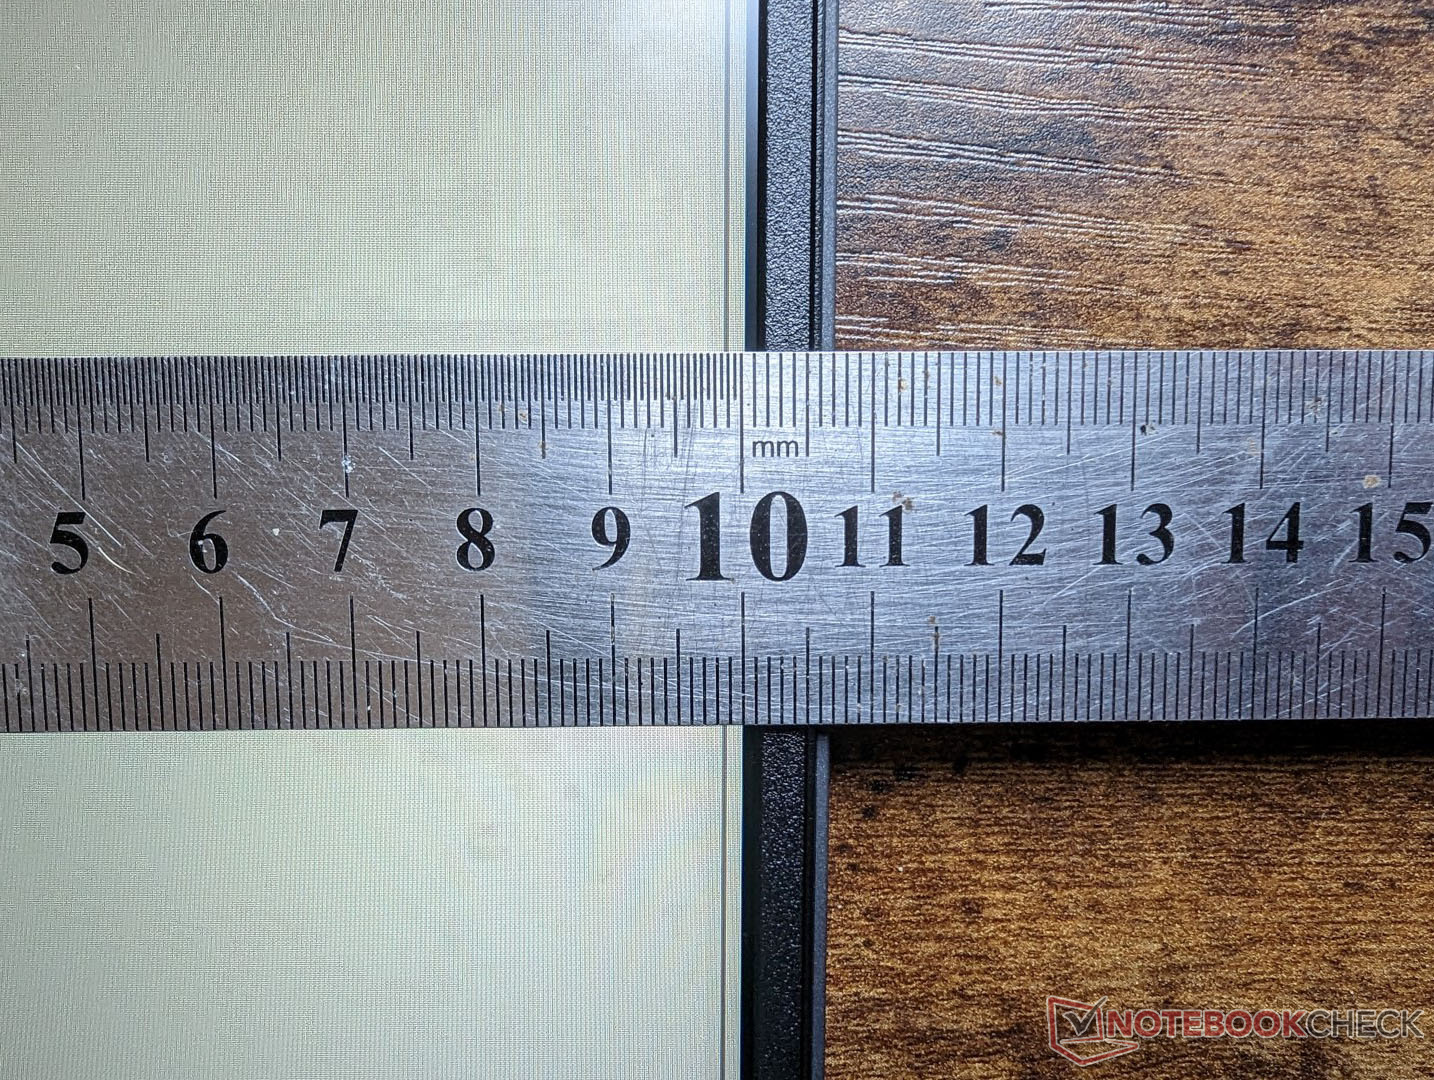
The spacious clickpad is just slightly larger than the one on the Legion 5 15 (12.5 x 8 cm vs. 12.5 x 7.5 cm). Traction is smooth on the plastic surface with only a bit of sticking at slower speeds for more accurate inputs. The integrated keys are clicky as well and not too spongy.
The two biggest drawbacks to the clickpad are its loud feedback when pressed and overall tendency to accumulate fingerprints. Expect the palm rests, keys, and clickpad to look glossy and greasy in a short period of time.
Display — 1080p Only
Four display options are available as follows:
- 1920 x 1080, 60 Hz, 250 nits, TN
- 1920 x 1080, 60 Hz, 250 nits, IPS
- 1920 x 1080, 144 Hz, 250 nits, IPS
- 1920 x 1080, 60 Hz, 300 nits, IPS
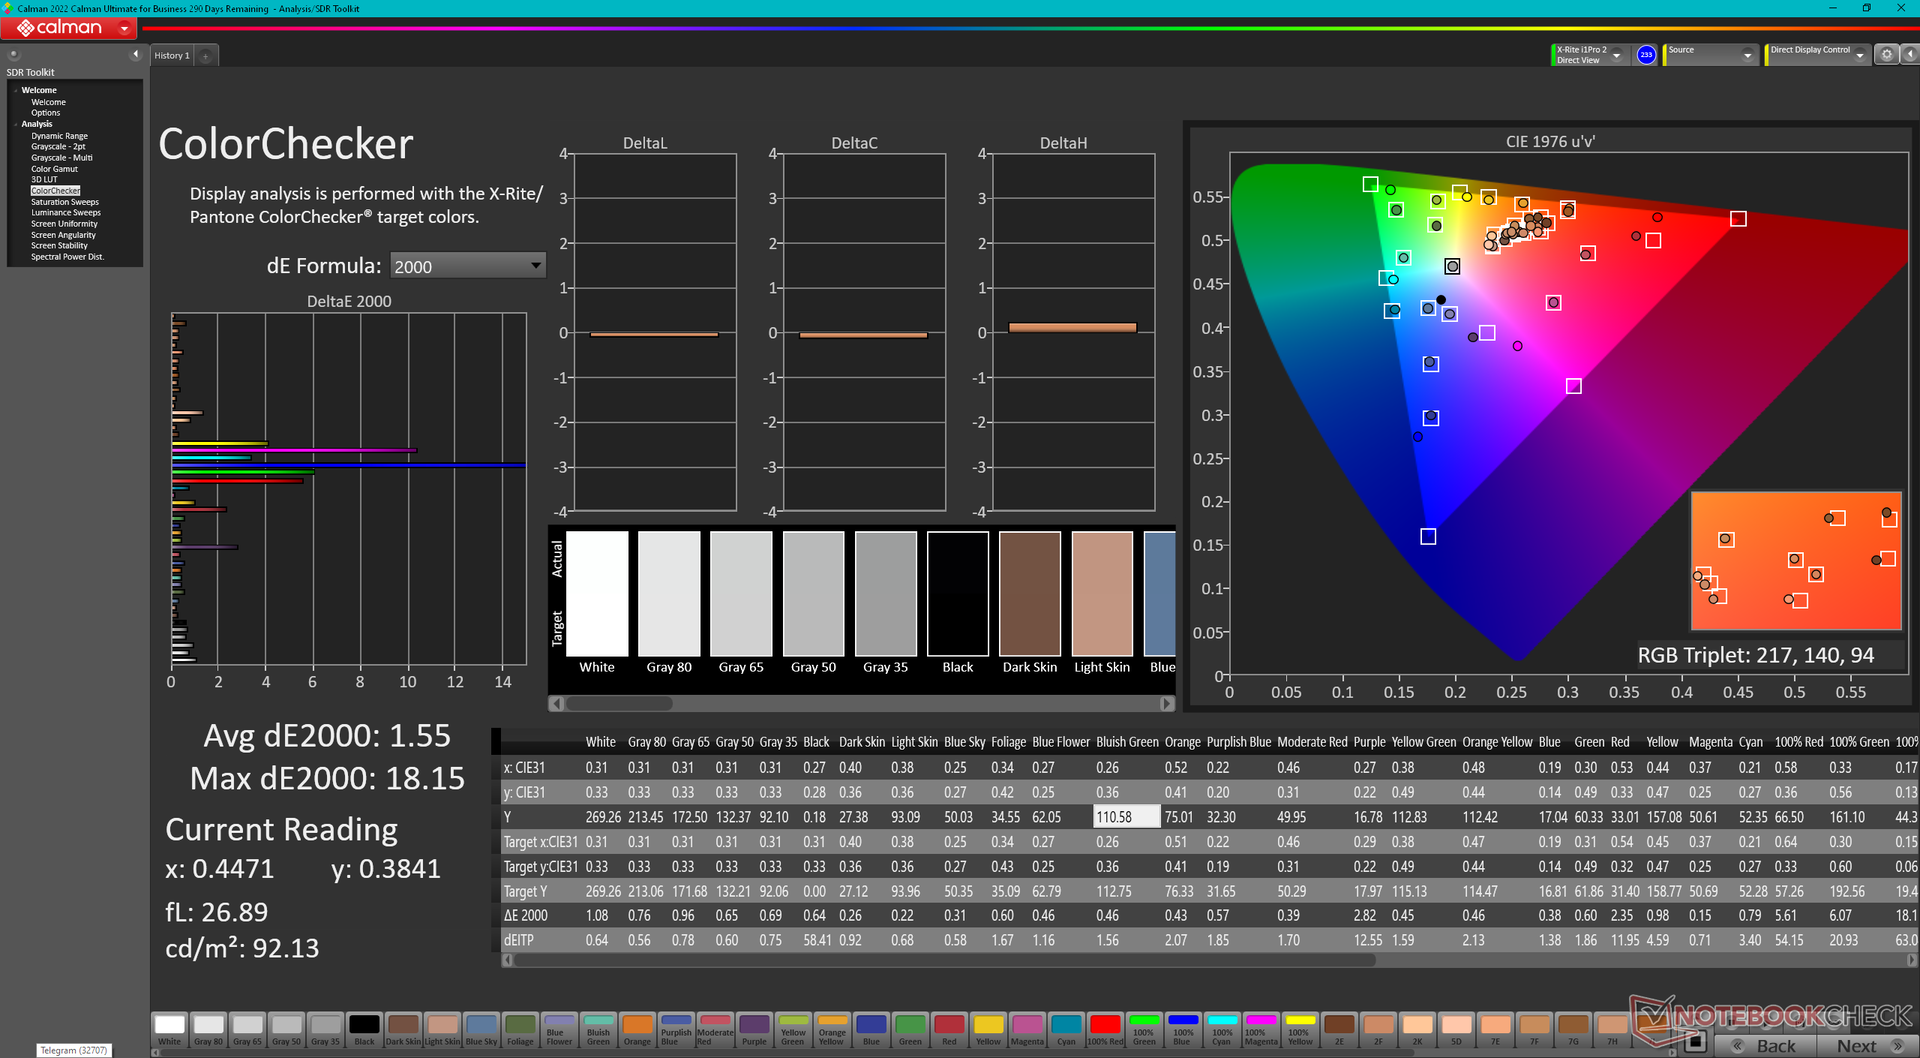
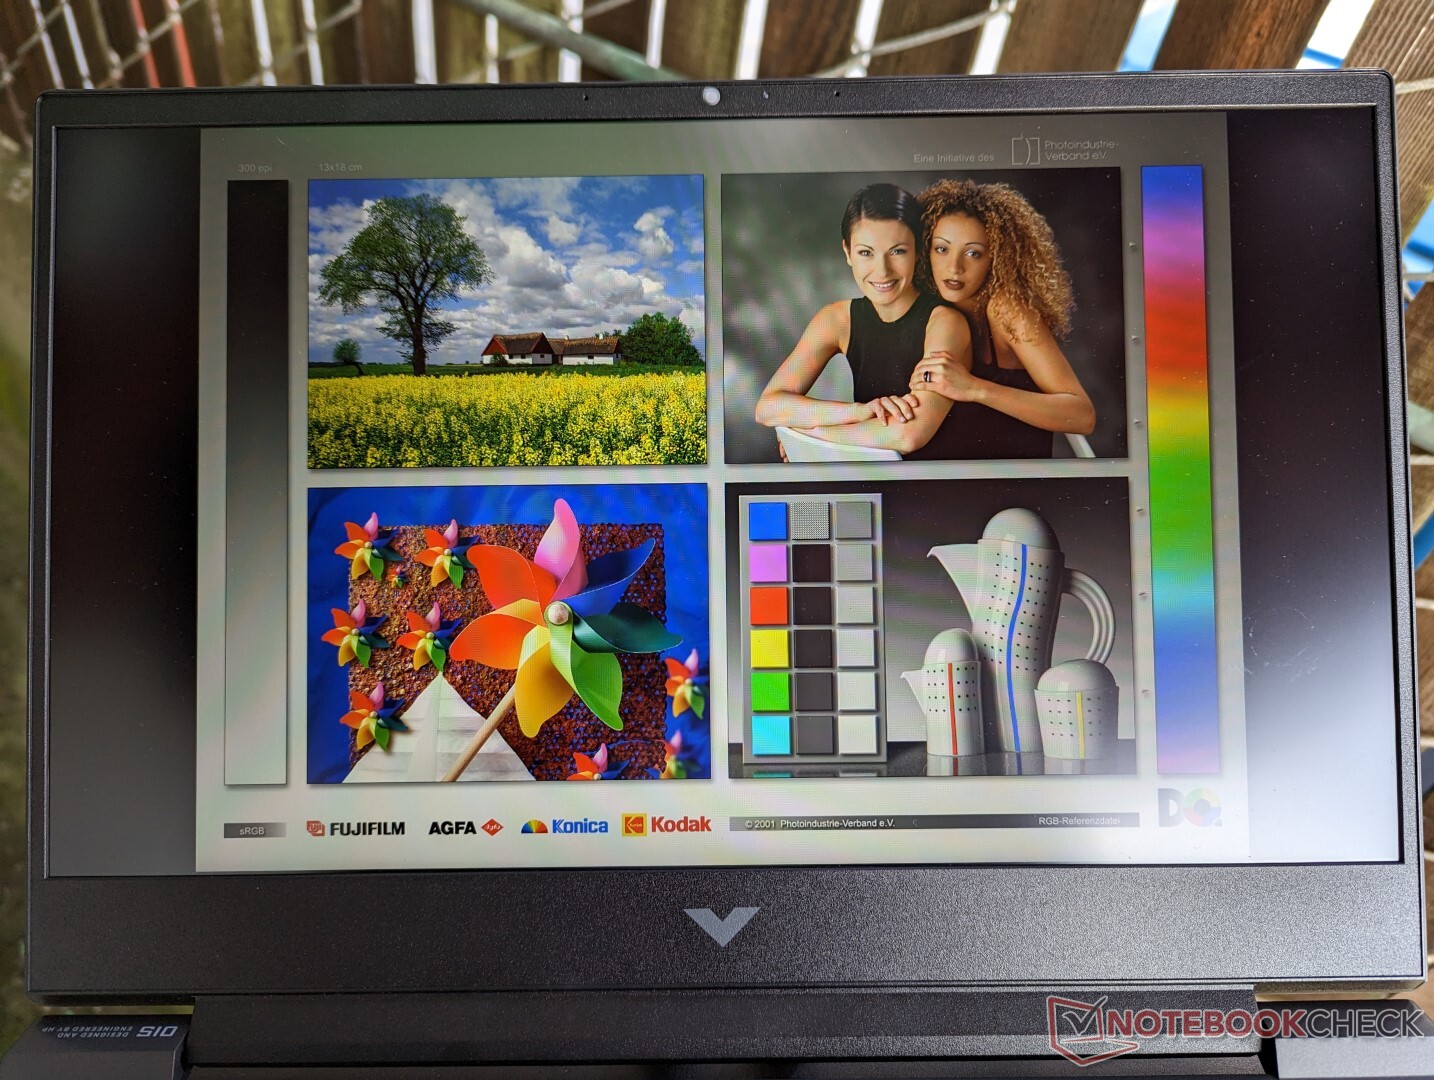
All options are matte with no OLED or higher resolution panels to choose from. Our specific review unit comes with the bolded option above for a smoother user experience, but the poor colors and average response times are the main differentiating factors separating the Victus 15 from more expensive gaming laptops with better displays. The Omen 16 series, for example, offers full sRGB coverage and faster response times.
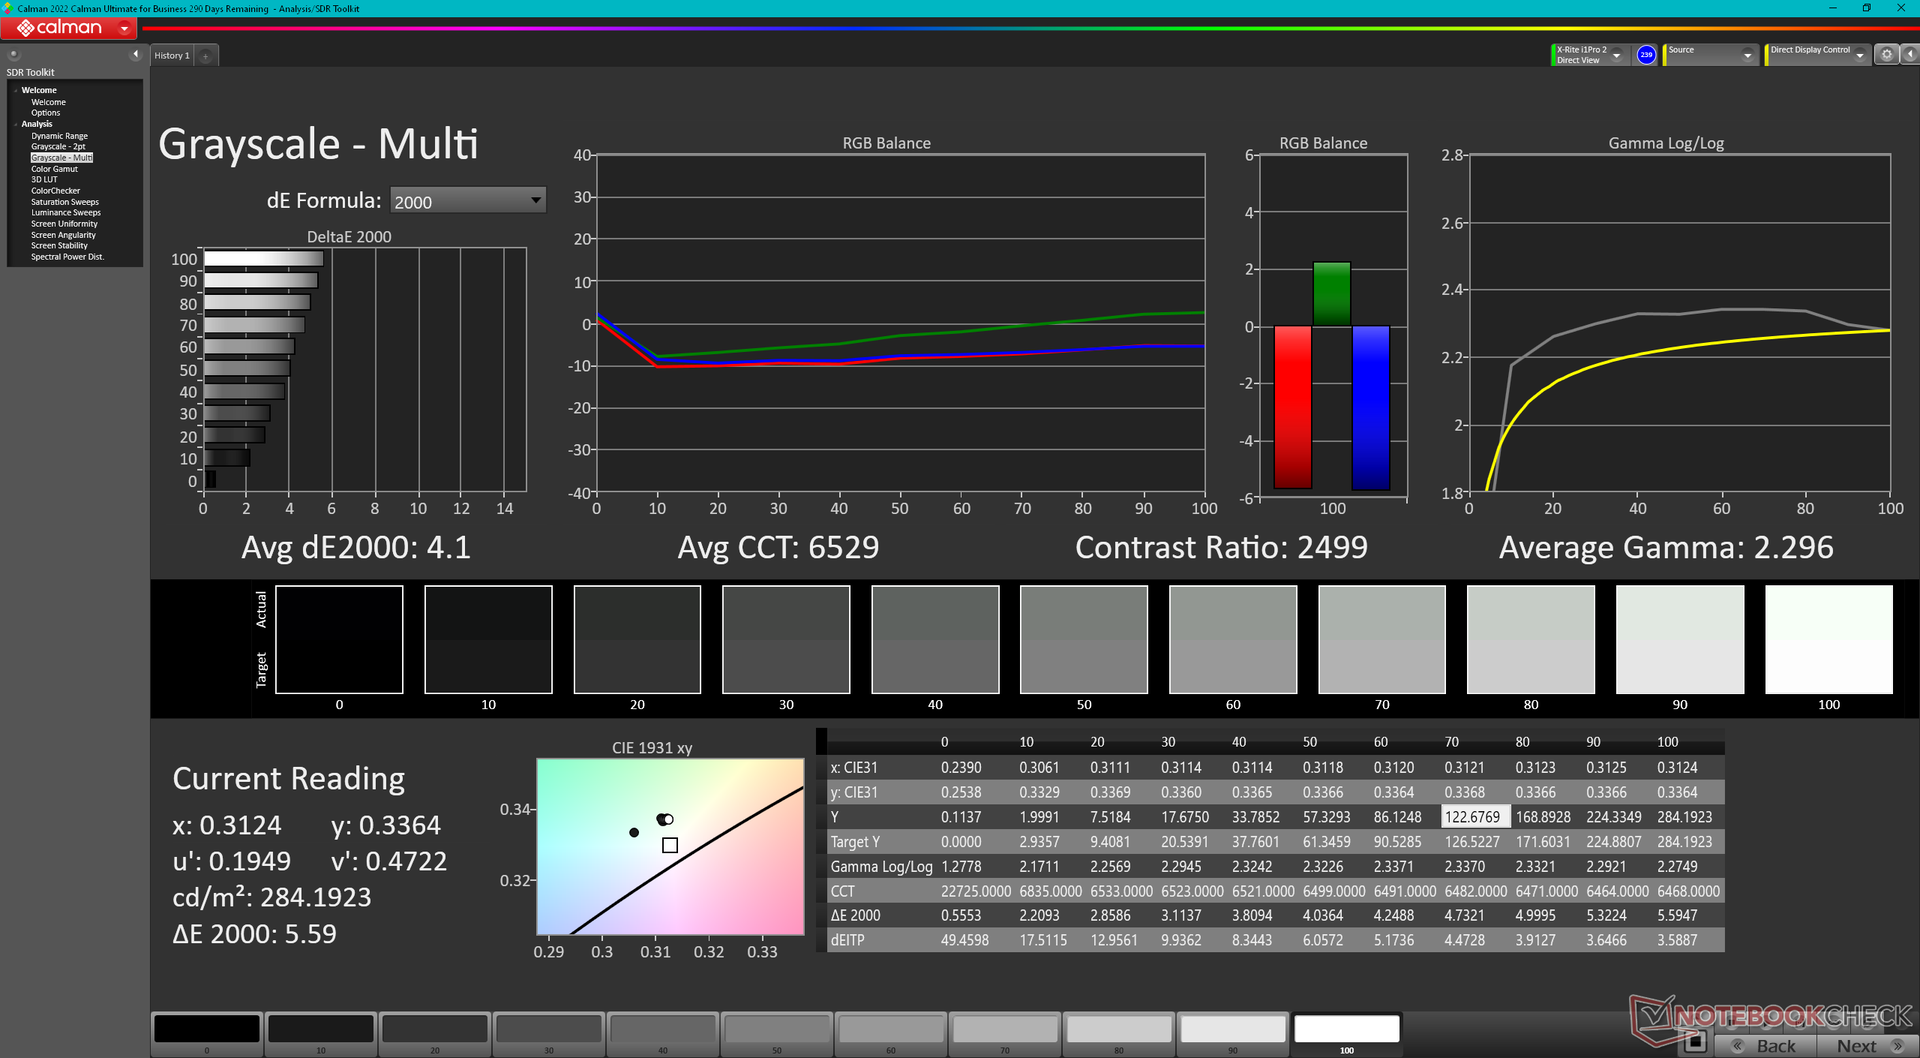
Contrast ratio is at least very good for a budget gaming laptop at about 1500:1. Even so, colors and content don't pop due to the limited gamut of the panel.


| |||||||||||||||||||||||||
Brightness Distribution: 87 %
Center on Battery: 284.3 cd/m²
Contrast: 1672:1 (Black: 0.17 cd/m²)
ΔE ColorChecker Calman: 4.52 | ∀{0.5-29.43 Ø4.73}
calibrated: 1.55
ΔE Greyscale Calman: 4.1 | ∀{0.09-98 Ø4.97}
43.4% AdobeRGB 1998 (Argyll 3D)
62.7% sRGB (Argyll 3D)
42% Display P3 (Argyll 3D)
Gamma: 2.3
CCT: 6529 K
| HP Victus 15 fa0020nr CMN1521, IPS, 1920x1080, 15.6" | HP Omen 15-en0375ng BOE0852, IPS, 1920x1080, 15.6" | Dell G15 5515 BOE092A, IPS, 1920x1080, 15.6" | Asus TUF Dash F15 FX517ZC BOE CQ NE156QHM-NY1, IPS, 2560x1440, 15.6" | MSI Bravo 15 B5DD-010US Chi Mei N156HRA-EA1, IPS, 1920x1080, 15.6" | Lenovo Legion 5 15IAH7H 82RB CSOT MNF601CA1-3, IPS, 1920x1080, 15.6" | |
|---|---|---|---|---|---|---|
| Display | -7% | -8% | 94% | 0% | 62% | |
| Display P3 Coverage (%) | 42 | 39.12 -7% | 39.1 -7% | 95.8 128% | 42.1 0% | 69.1 65% |
| sRGB Coverage (%) | 62.7 | 57.6 -8% | 56.9 -9% | 99.9 59% | 62.8 0% | 99.5 59% |
| AdobeRGB 1998 Coverage (%) | 43.4 | 40.42 -7% | 40.4 -7% | 85.1 96% | 43.6 0% | 70 61% |
| Response Times | 19% | 33% | 69% | 22% | 57% | |
| Response Time Grey 50% / Grey 80% * (ms) | 35.2 ? | 30.4 ? 14% | 25.2 ? 28% | 8.4 ? 76% | 25.6 ? 27% | 14.8 ? 58% |
| Response Time Black / White * (ms) | 27.2 ? | 20.8 ? 24% | 16.8 ? 38% | 10.4 ? 62% | 22.8 ? 16% | 12 ? 56% |
| PWM Frequency (Hz) | 200 ? | 200 ? | ||||
| Screen | -31% | -43% | -9% | -37% | -3% | |
| Brightness middle (cd/m²) | 284.3 | 297 4% | 278 -2% | 354.2 25% | 265.1 -7% | 363.5 28% |
| Brightness (cd/m²) | 262 | 275 5% | 262 0% | 330 26% | 245 -6% | 350 34% |
| Brightness Distribution (%) | 87 | 88 1% | 83 -5% | 88 1% | 87 0% | 89 2% |
| Black Level * (cd/m²) | 0.17 | 0.33 -94% | 0.36 -112% | 0.32 -88% | 0.35 -106% | 0.39 -129% |
| Contrast (:1) | 1672 | 900 -46% | 772 -54% | 1107 -34% | 757 -55% | 932 -44% |
| Colorchecker dE 2000 * | 4.52 | 4.54 -0% | 5.74 -27% | 4.06 10% | 4.68 -4% | 3.68 19% |
| Colorchecker dE 2000 max. * | 18.67 | 18.92 -1% | 19.63 -5% | 8.81 53% | 19.96 -7% | 8.92 52% |
| Colorchecker dE 2000 calibrated * | 1.55 | 4.66 -201% | 4.7 -203% | 3.7 -139% | 0.53 66% | |
| Greyscale dE 2000 * | 4.1 | 2.1 49% | 3.1 24% | 6.7 -63% | 4.5 -10% | 6.5 -59% |
| Gamma | 2.3 96% | 2.066 106% | 2.011 109% | 2.12 104% | 2.22 99% | 2.2 100% |
| CCT | 6529 100% | 6291 103% | 6207 105% | 6731 97% | 6632 98% | 5995 108% |
| Color Space (Percent of AdobeRGB 1998) (%) | 40 | |||||
| Color Space (Percent of sRGB) (%) | 58 | |||||
| Total Average (Program / Settings) | -6% /
-19% | -6% /
-24% | 51% /
27% | -5% /
-21% | 39% /
19% |
* ... smaller is better
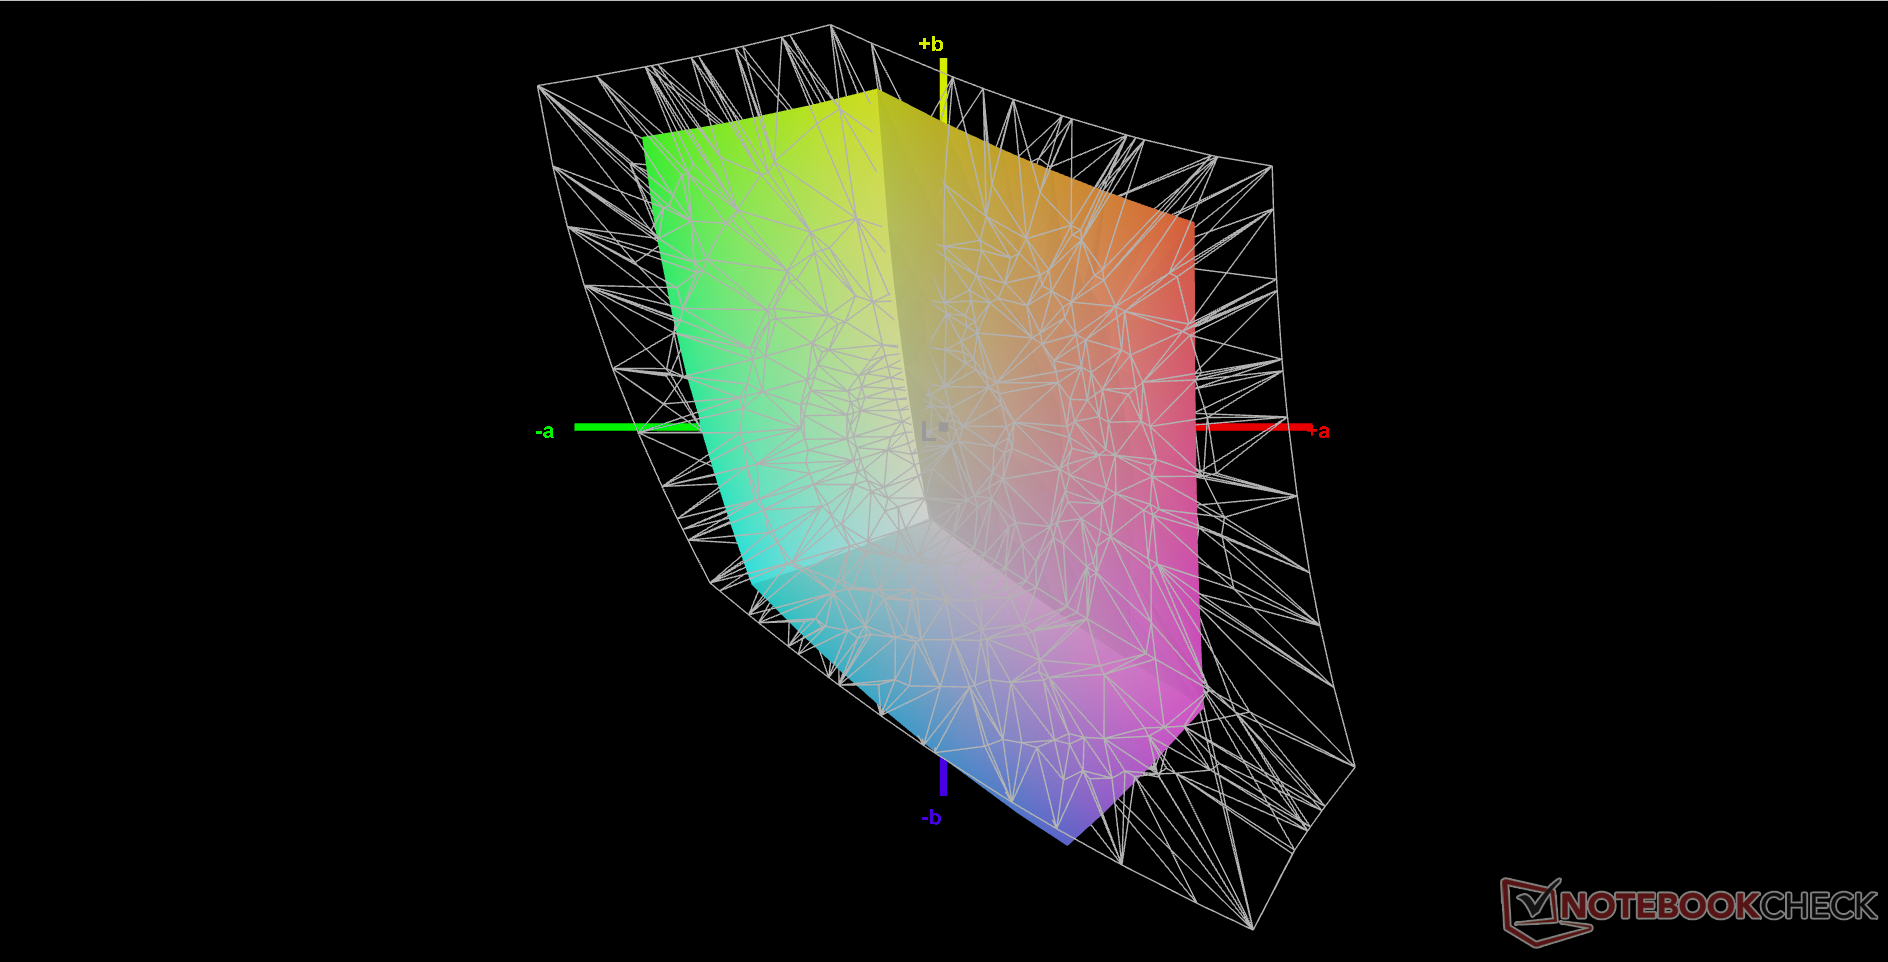
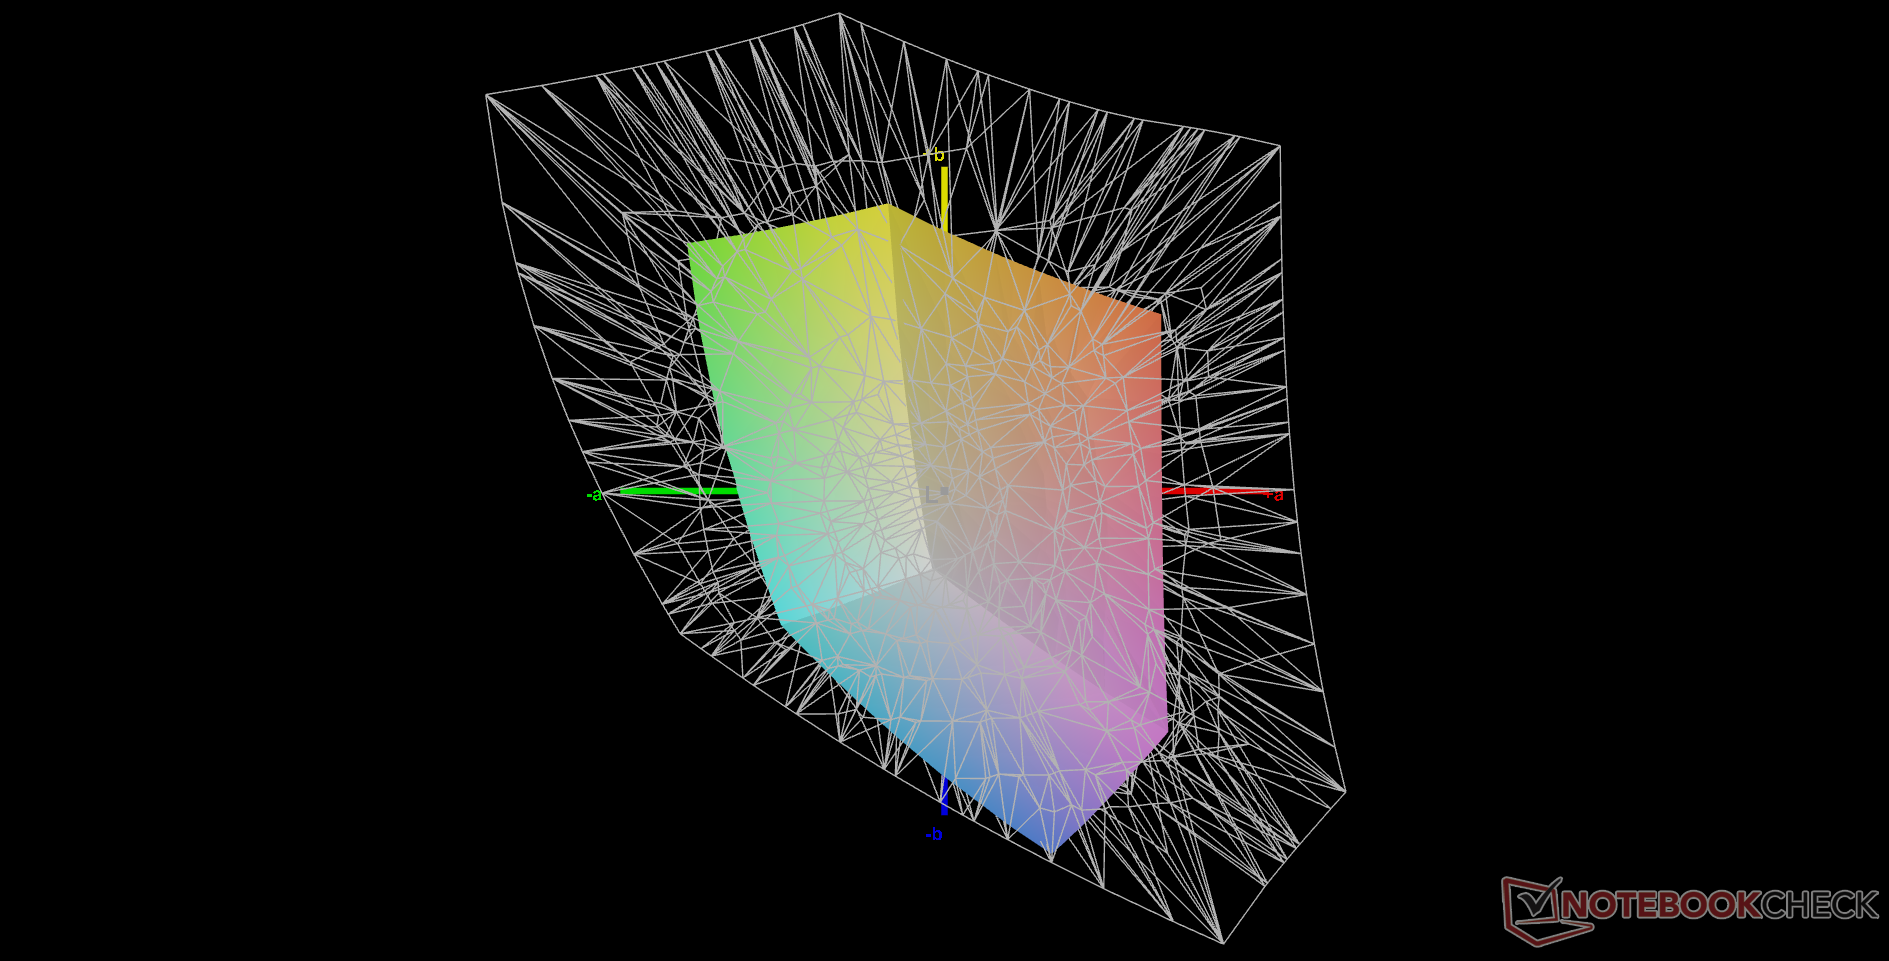
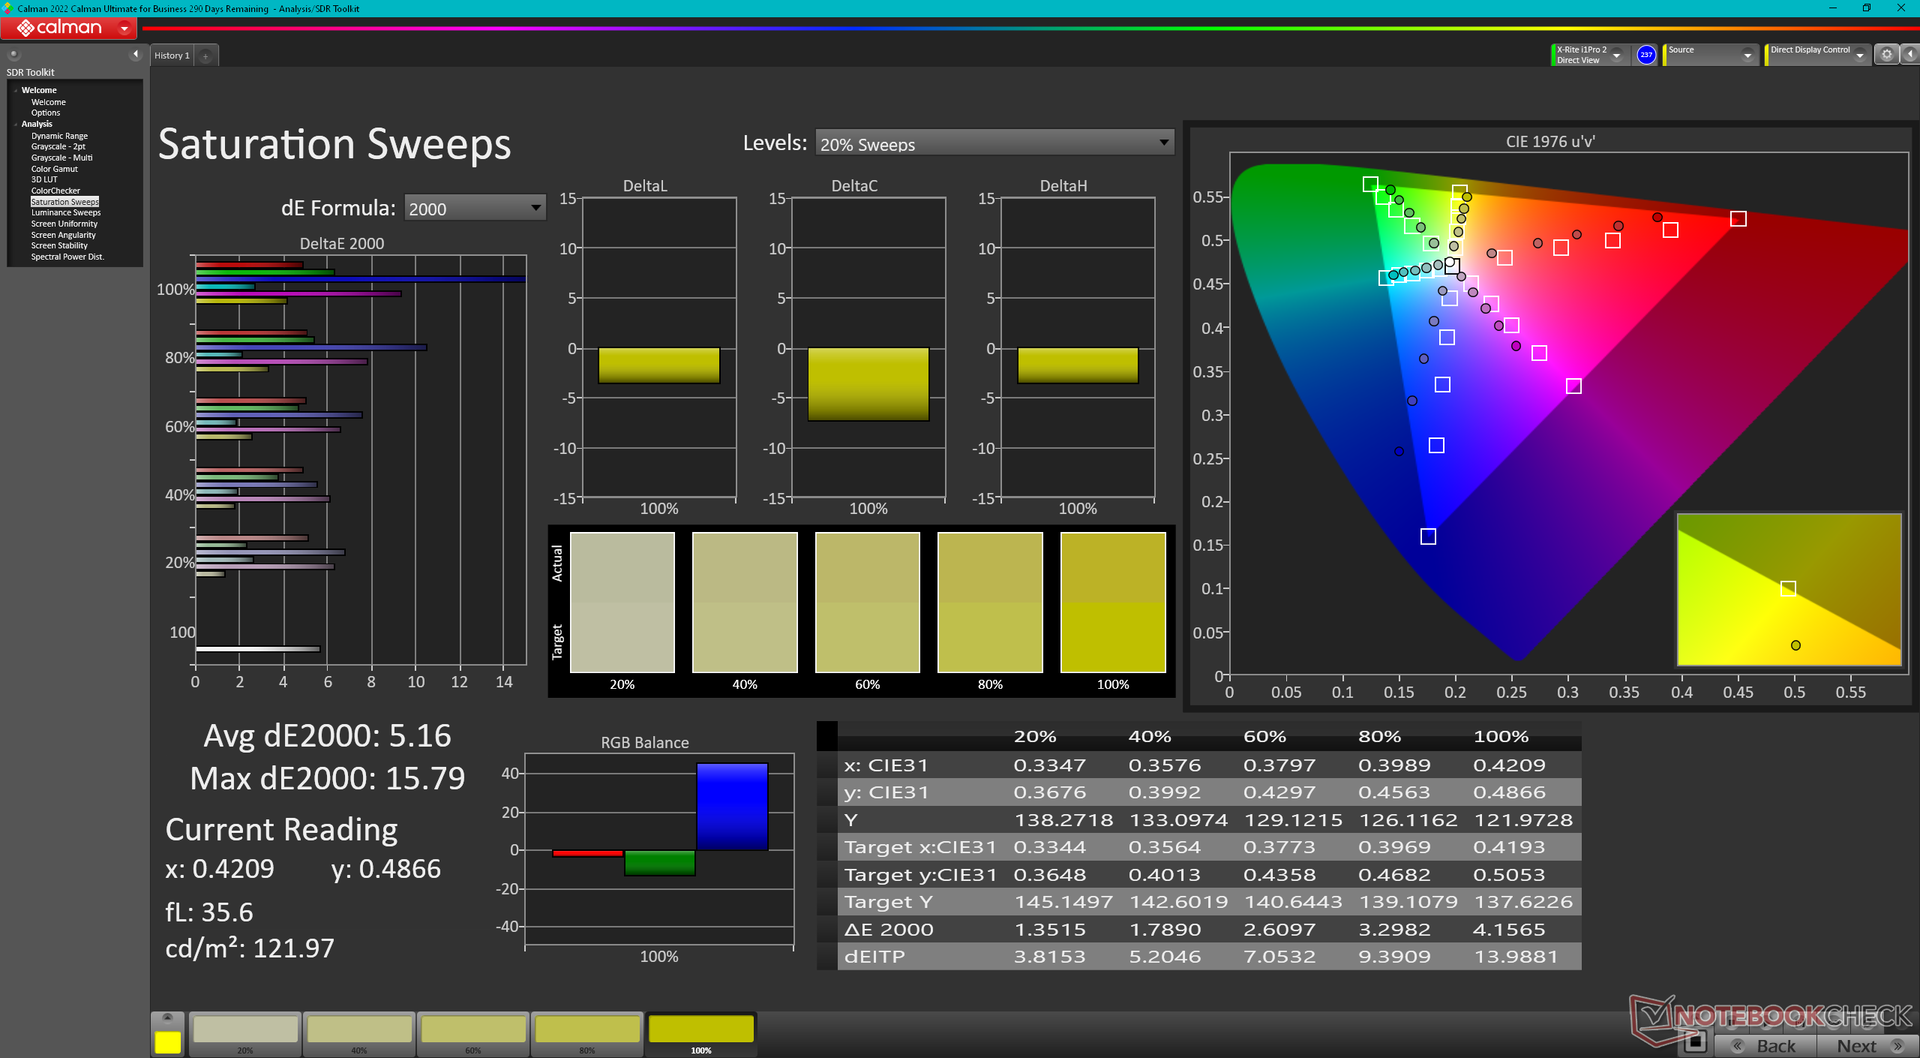
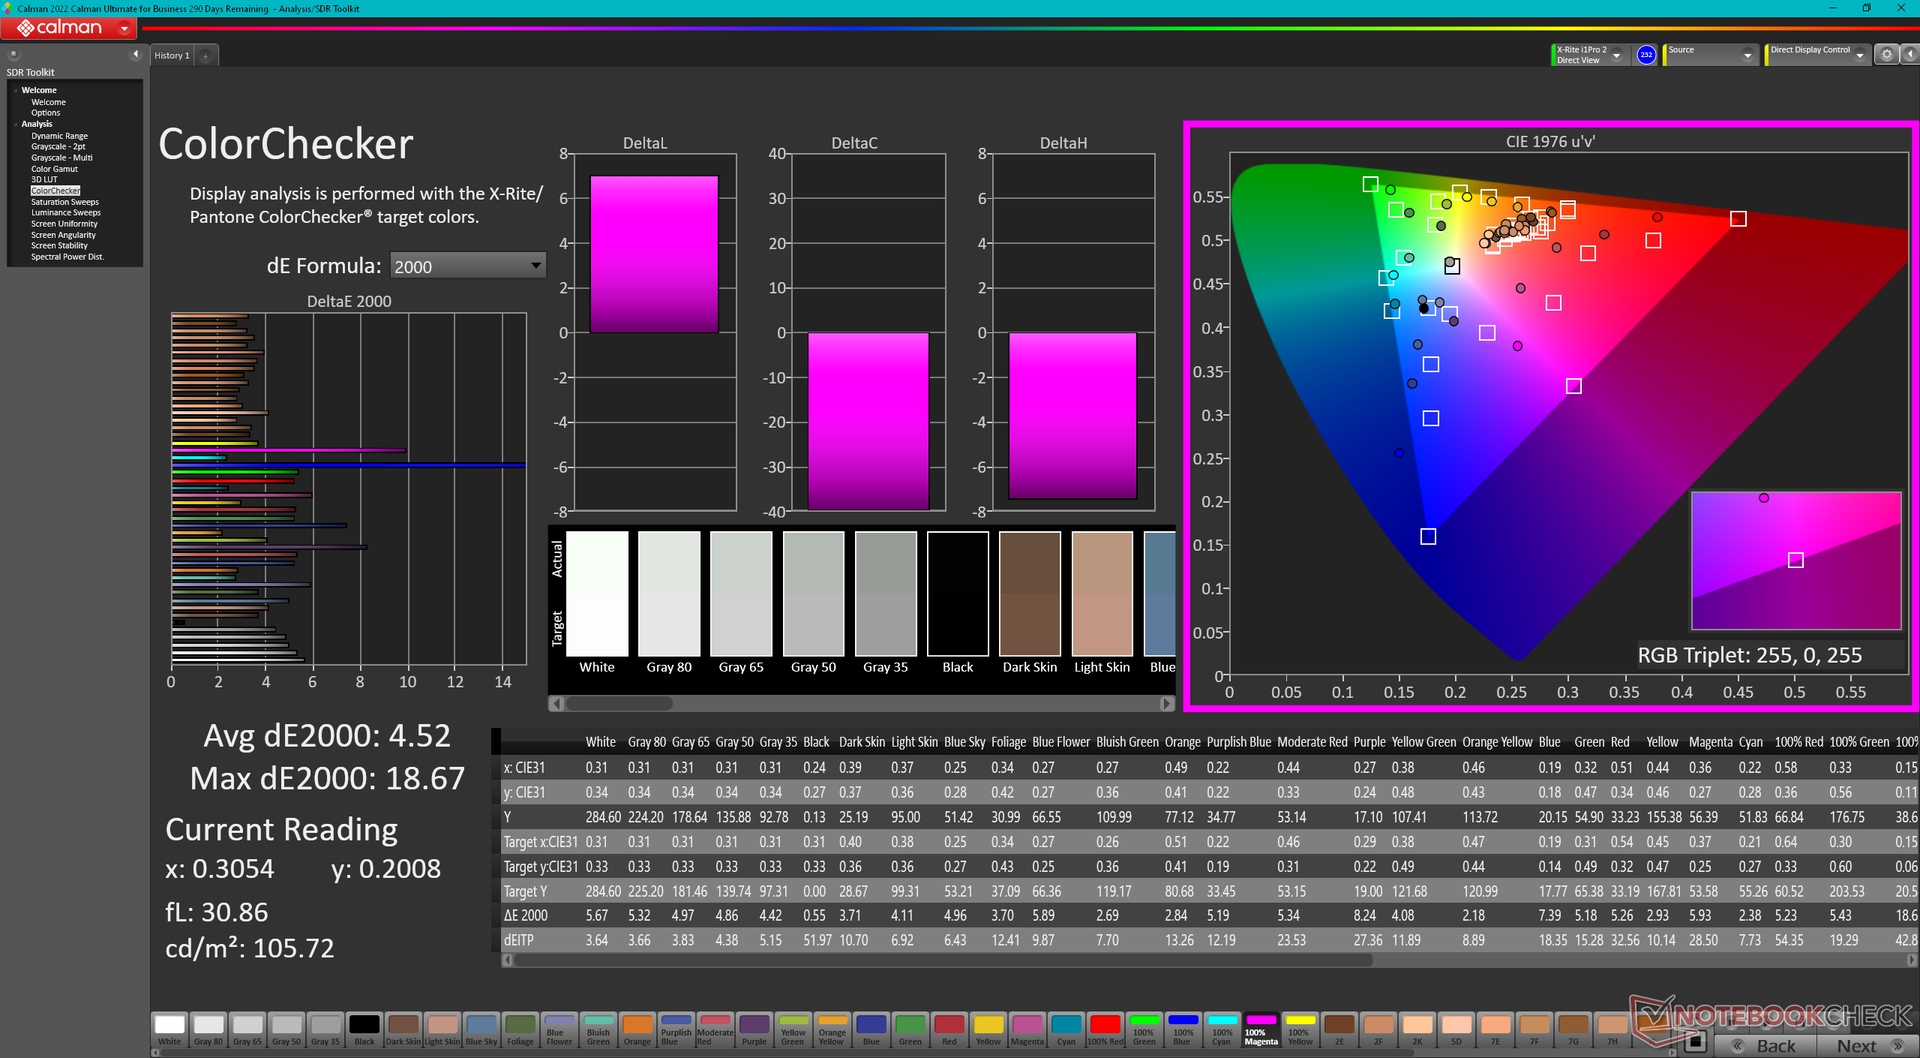
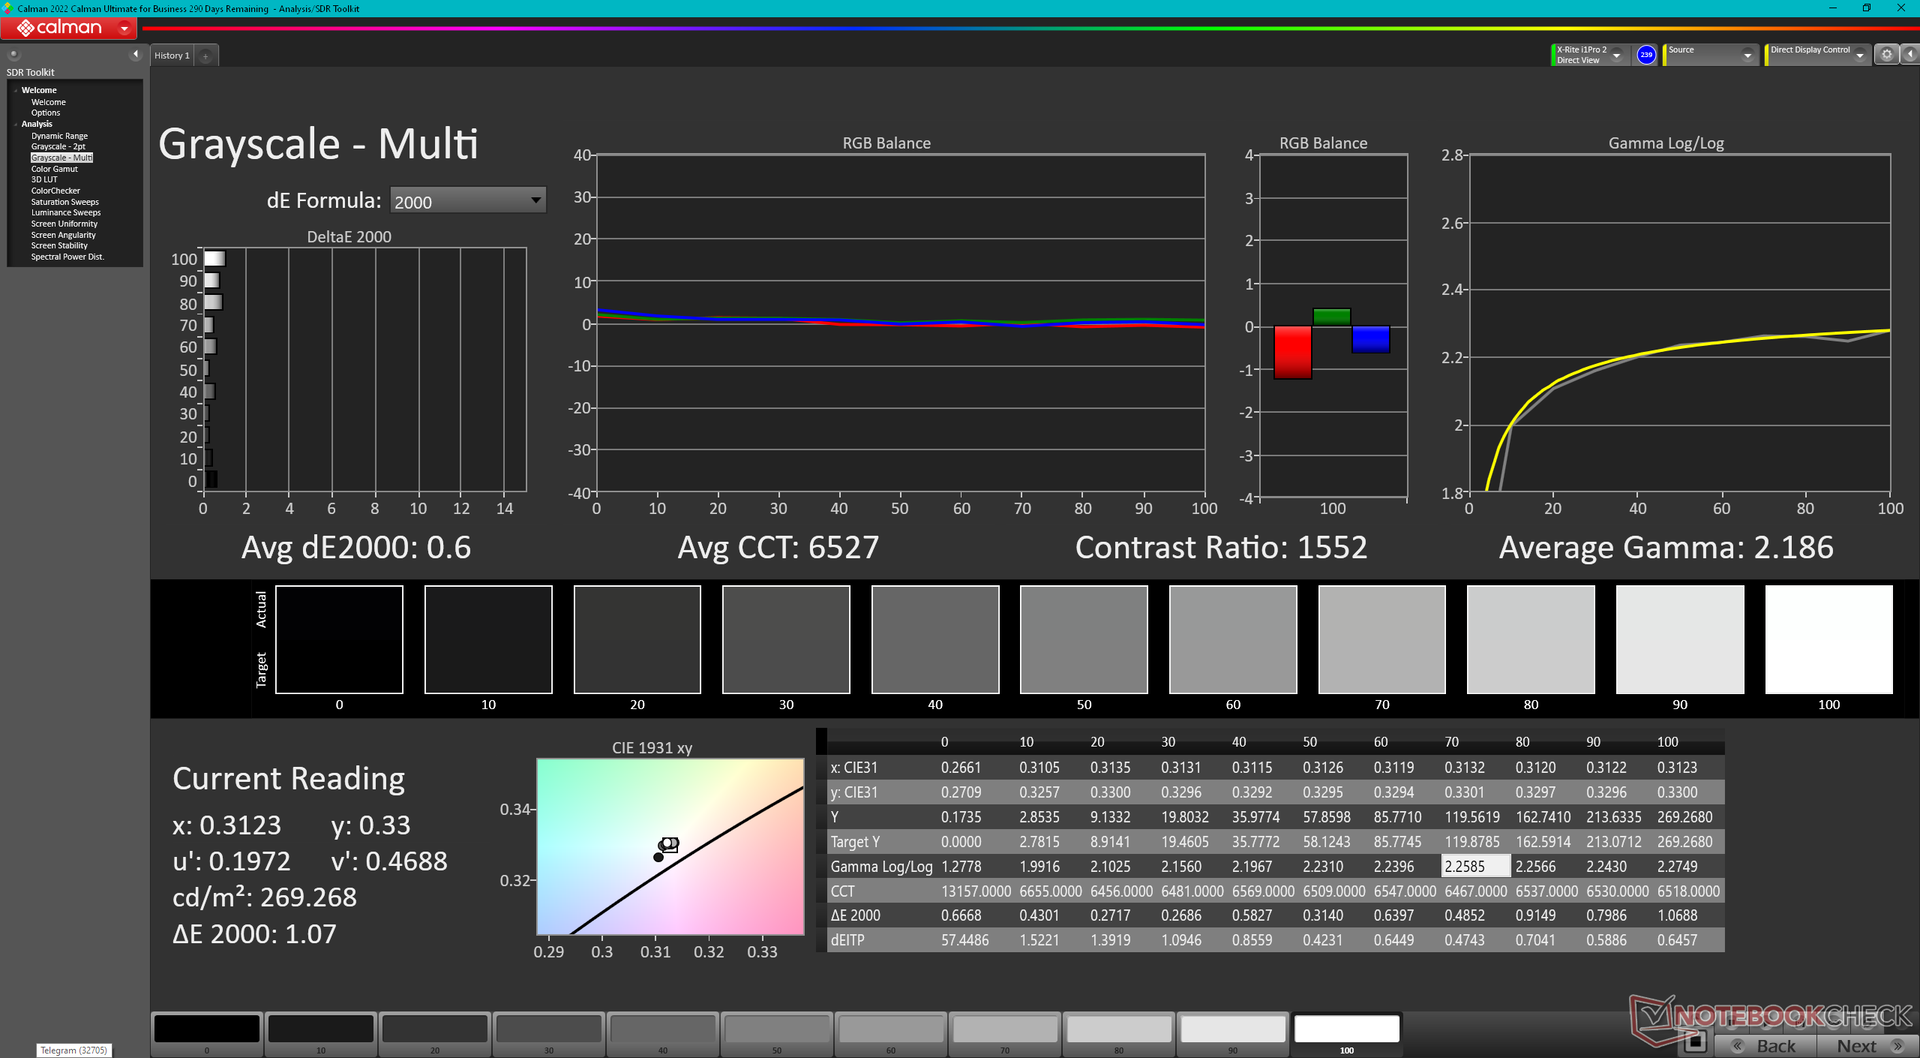
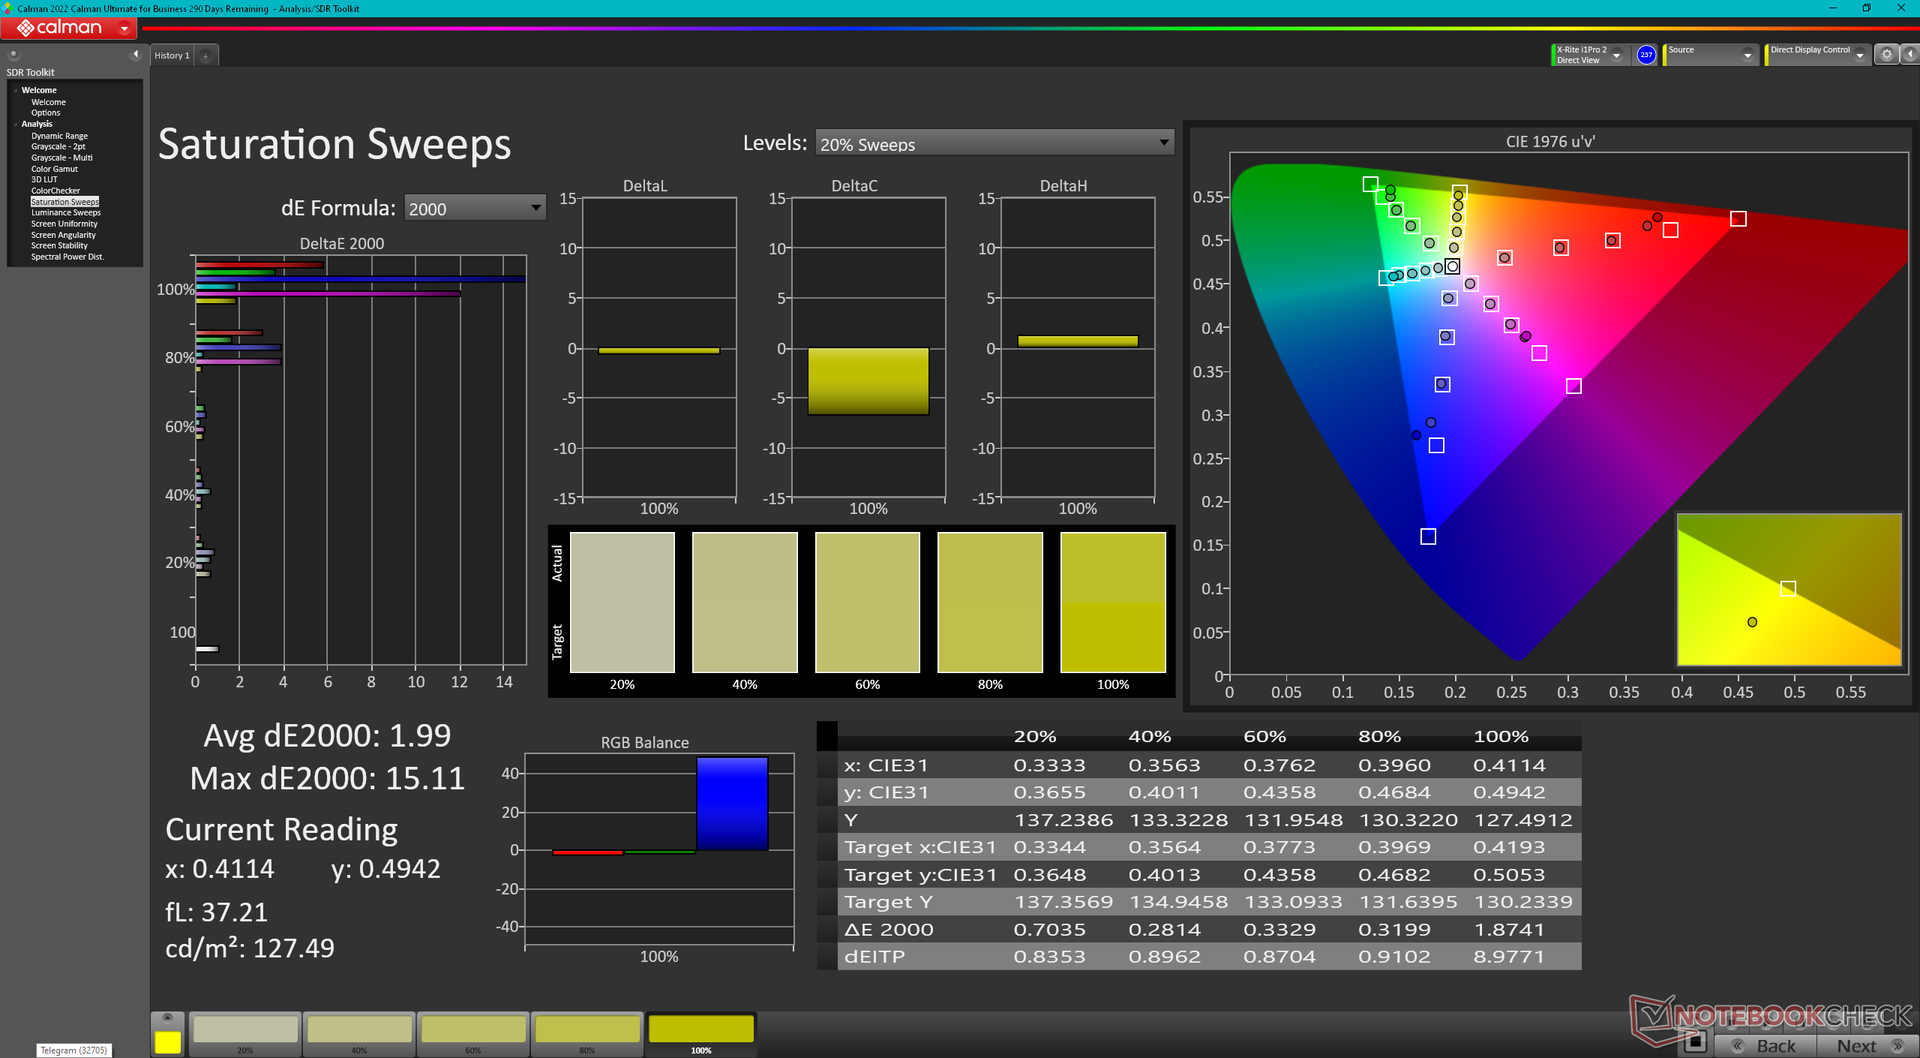
The display is not calibrated out of the box with average grayscale and color deltaE values as high as 4.1 and 4.52, respectively. Calibrating the panel ourselves would bring these values down to just 0.6 and 1.55, respectively, but higher saturation levels are still very inaccurate due to the narrow sRGB coverage mentioned above. Our Calman screenshots below show blue and magenta colors in particular to be much more inaccurate than others.
We recommend applying our calibrated ICM profile above which can help improve color accuracy at lower saturation levels.
Display Response Times
| ↔ Response Time Black to White | ||
|---|---|---|
| 27.2 ms ... rise ↗ and fall ↘ combined | ↗ 15.6 ms rise | 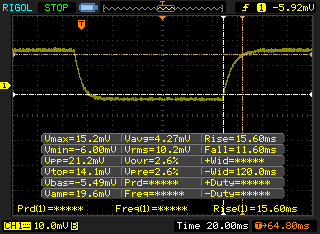 |
| ↘ 11.6 ms fall | ||
| The screen shows relatively slow response rates in our tests and may be too slow for gamers. In comparison, all tested devices range from 0.1 (minimum) to 240 (maximum) ms. » 69 % of all devices are better. This means that the measured response time is worse than the average of all tested devices (19.9 ms). | ||
| ↔ Response Time 50% Grey to 80% Grey | ||
| 35.2 ms ... rise ↗ and fall ↘ combined | ↗ 18 ms rise | 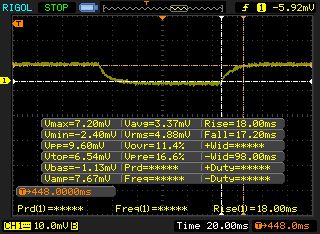 |
| ↘ 17.2 ms fall | ||
| The screen shows slow response rates in our tests and will be unsatisfactory for gamers. In comparison, all tested devices range from 0.165 (minimum) to 636 (maximum) ms. » 49 % of all devices are better. This means that the measured response time is worse than the average of all tested devices (31.1 ms). | ||
Screen Flickering / PWM (Pulse-Width Modulation)
| Screen flickering / PWM not detected | 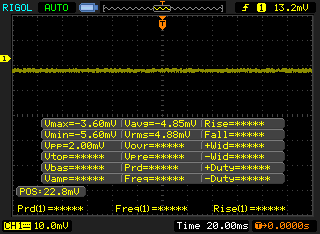 | ||
In comparison: 52 % of all tested devices do not use PWM to dim the display. If PWM was detected, an average of 7798 (minimum: 5 - maximum: 343500) Hz was measured. | |||
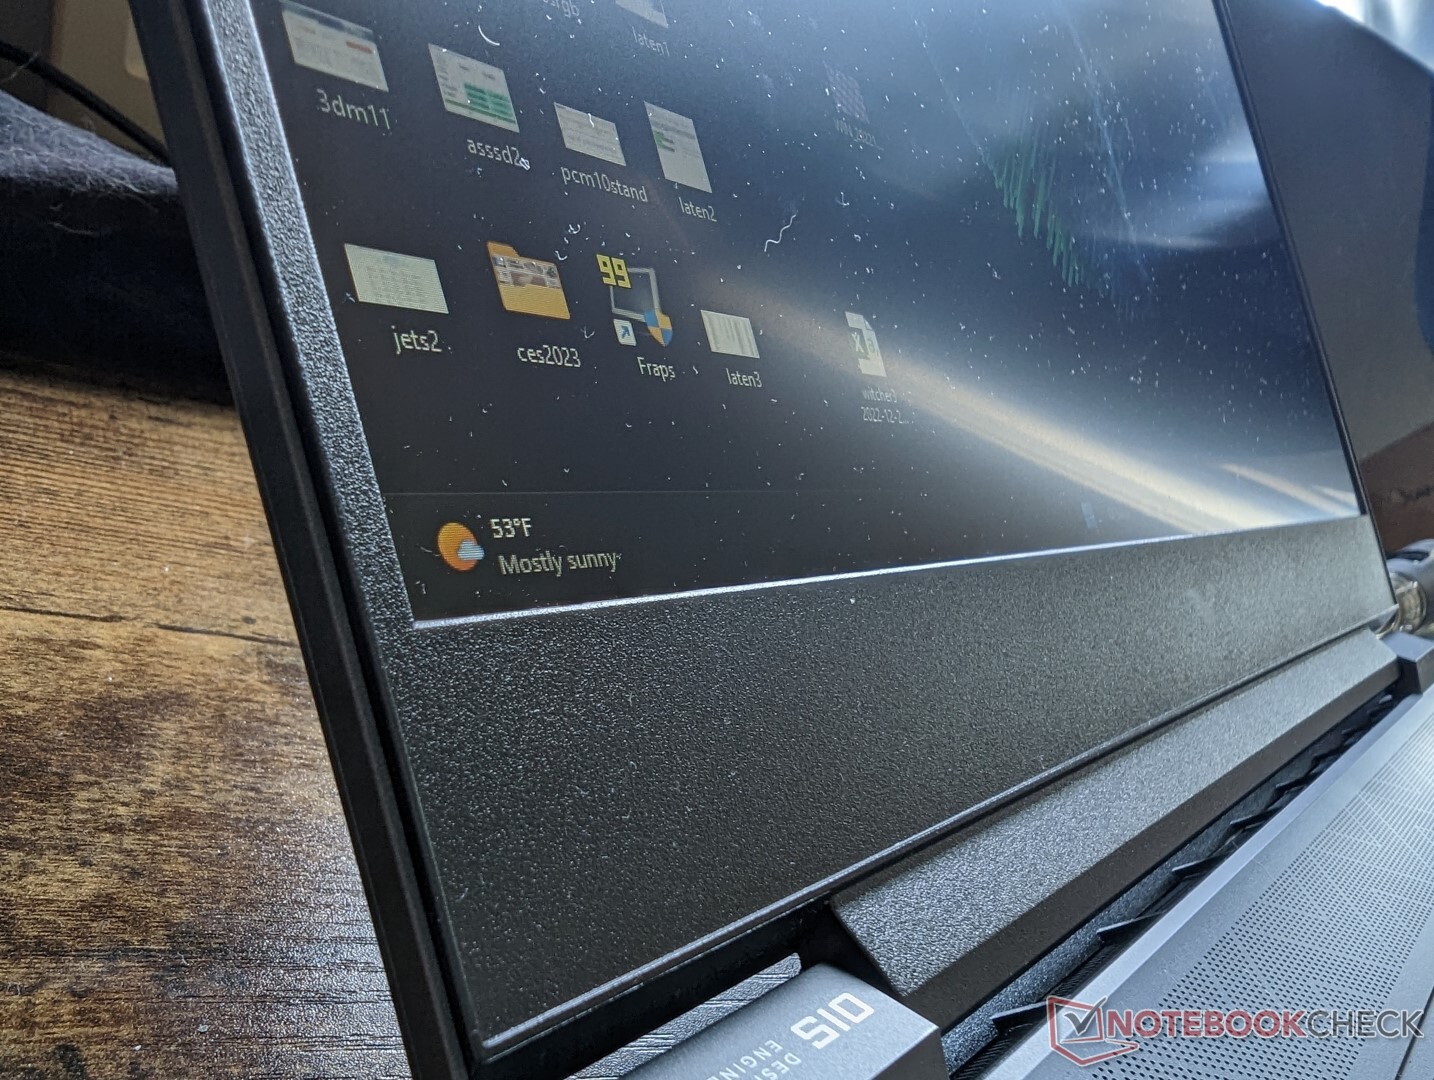
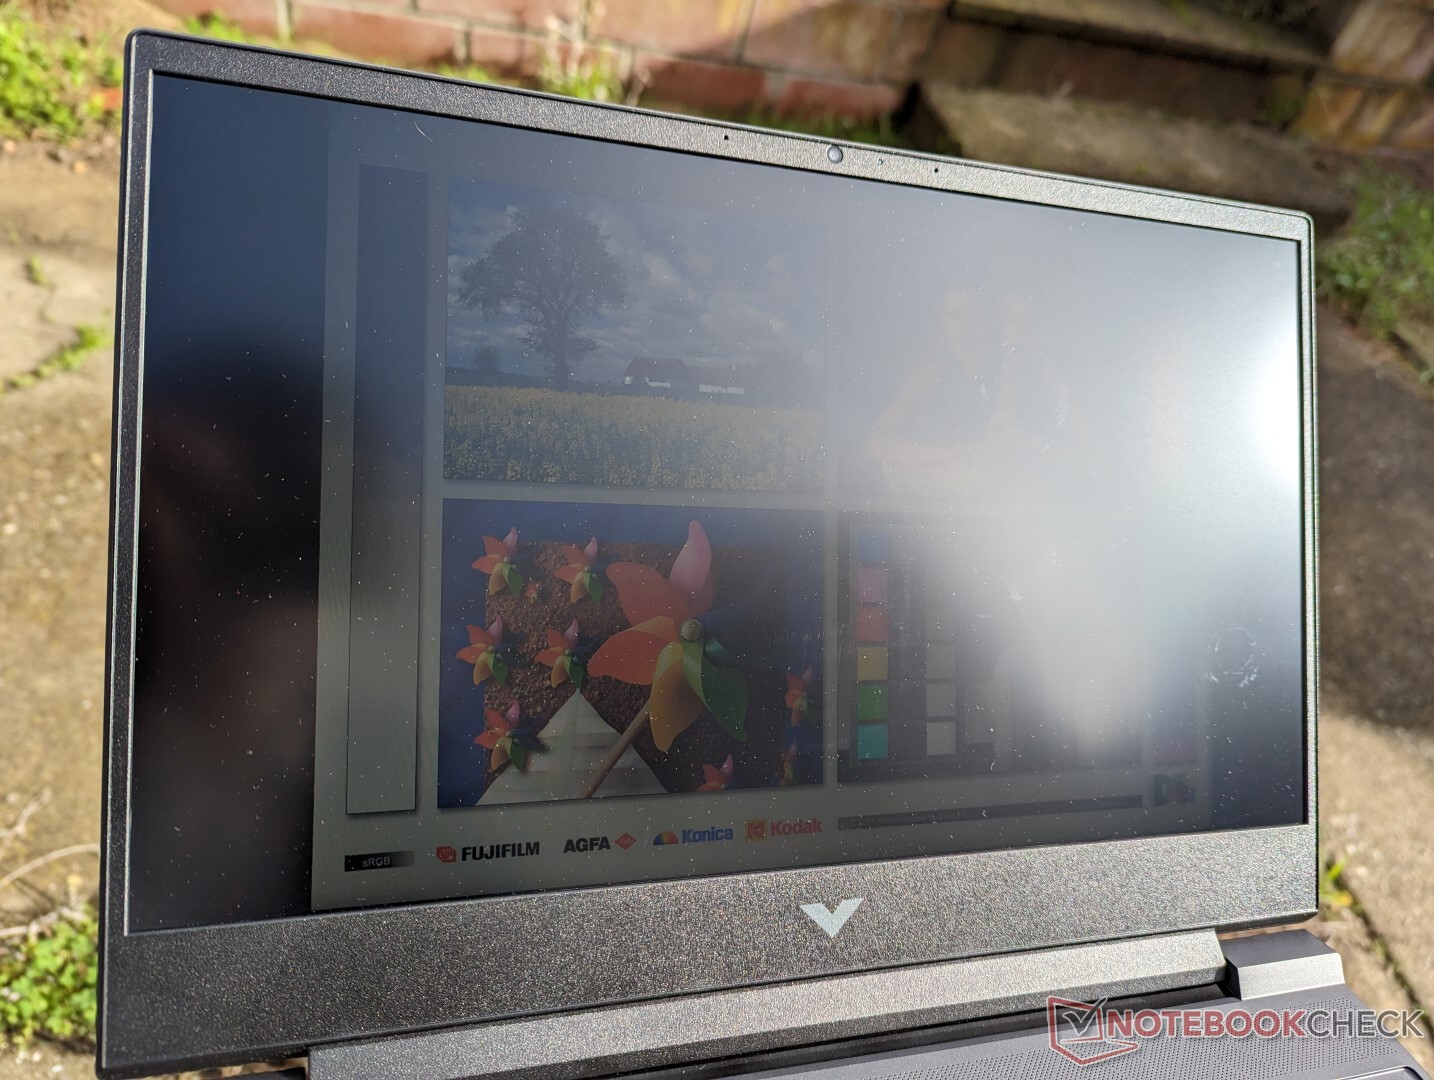
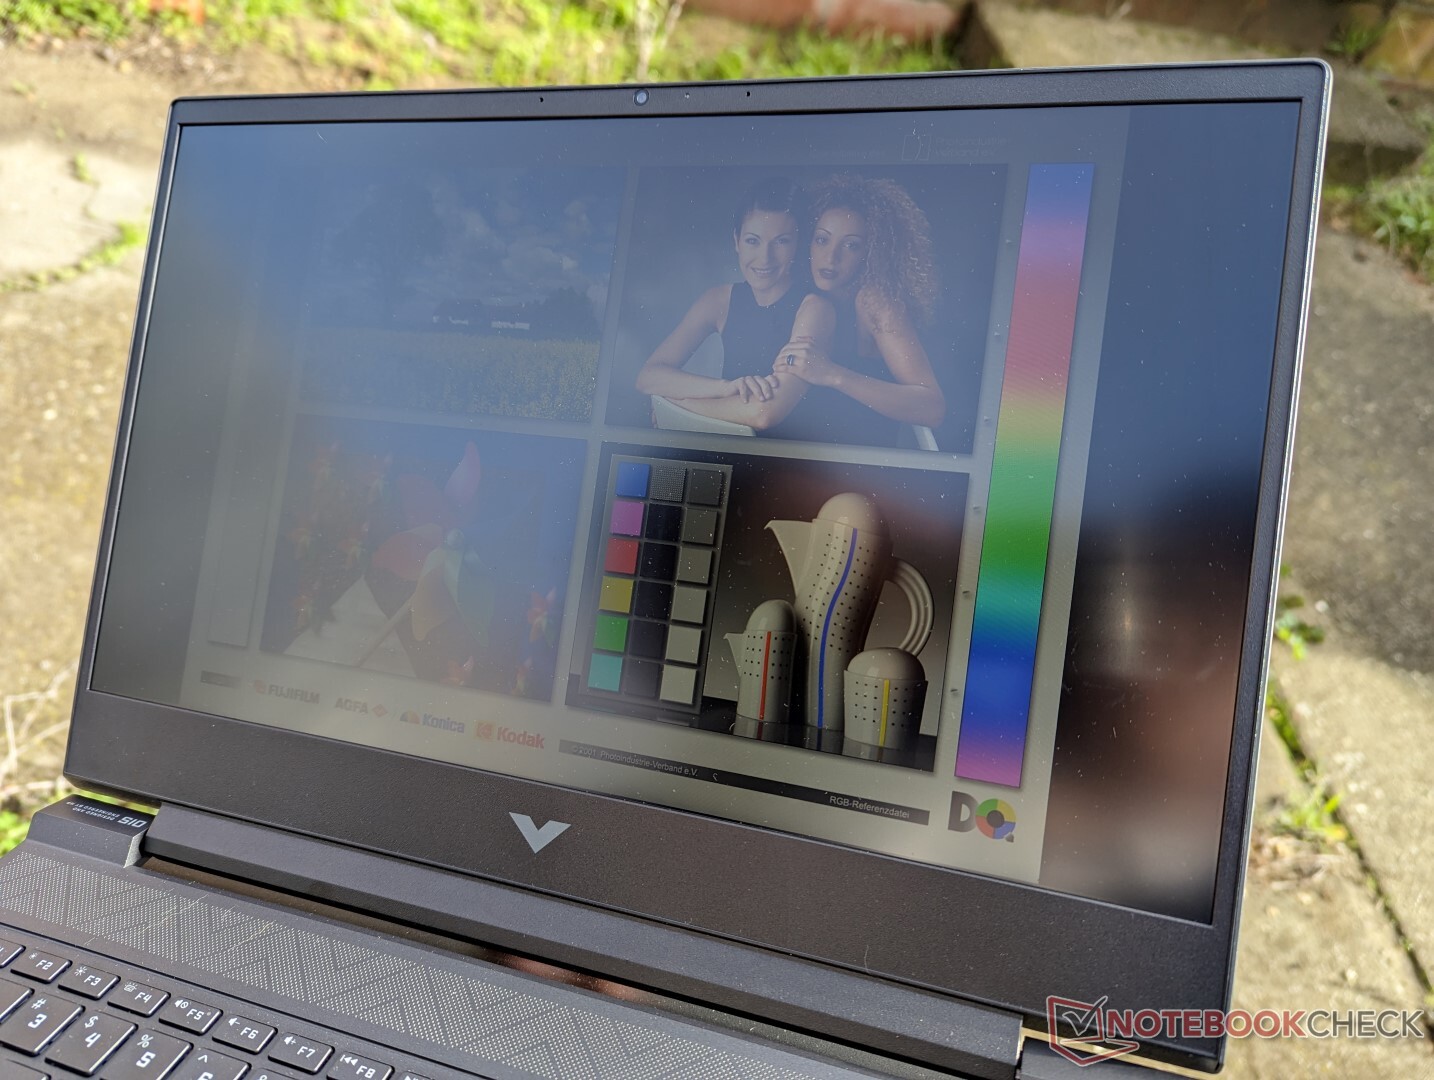
The matte panel is not bright enough for comfortable viewing outdoors. Glare is ever present and colors become washed out as a result. You'll have to invest in a pricier gaming laptop with brighter displays like the Razer Blade 15 for an easier time outdoors.
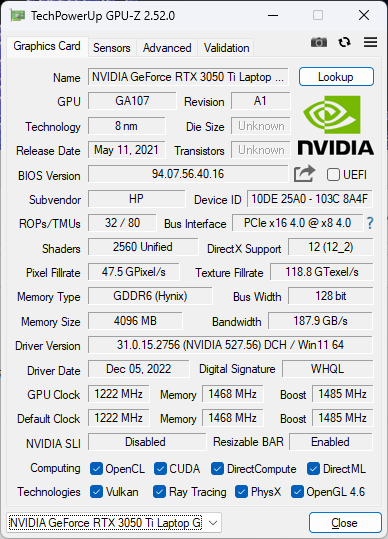
Performance — Intel Alder Lake-H 12th Gen
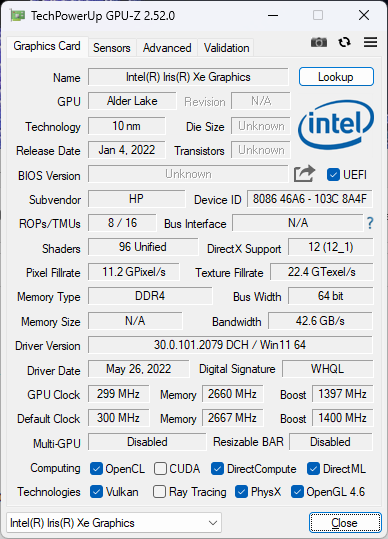
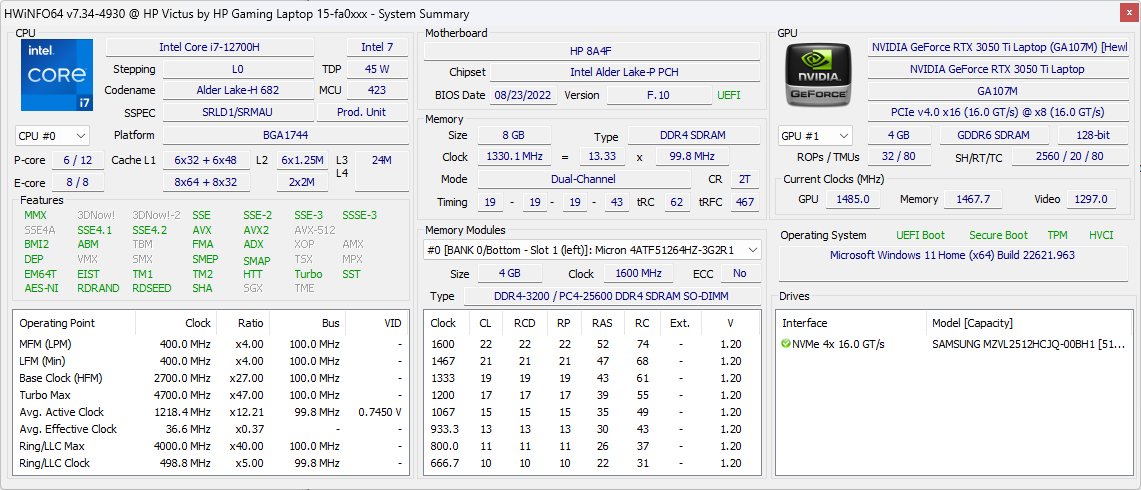
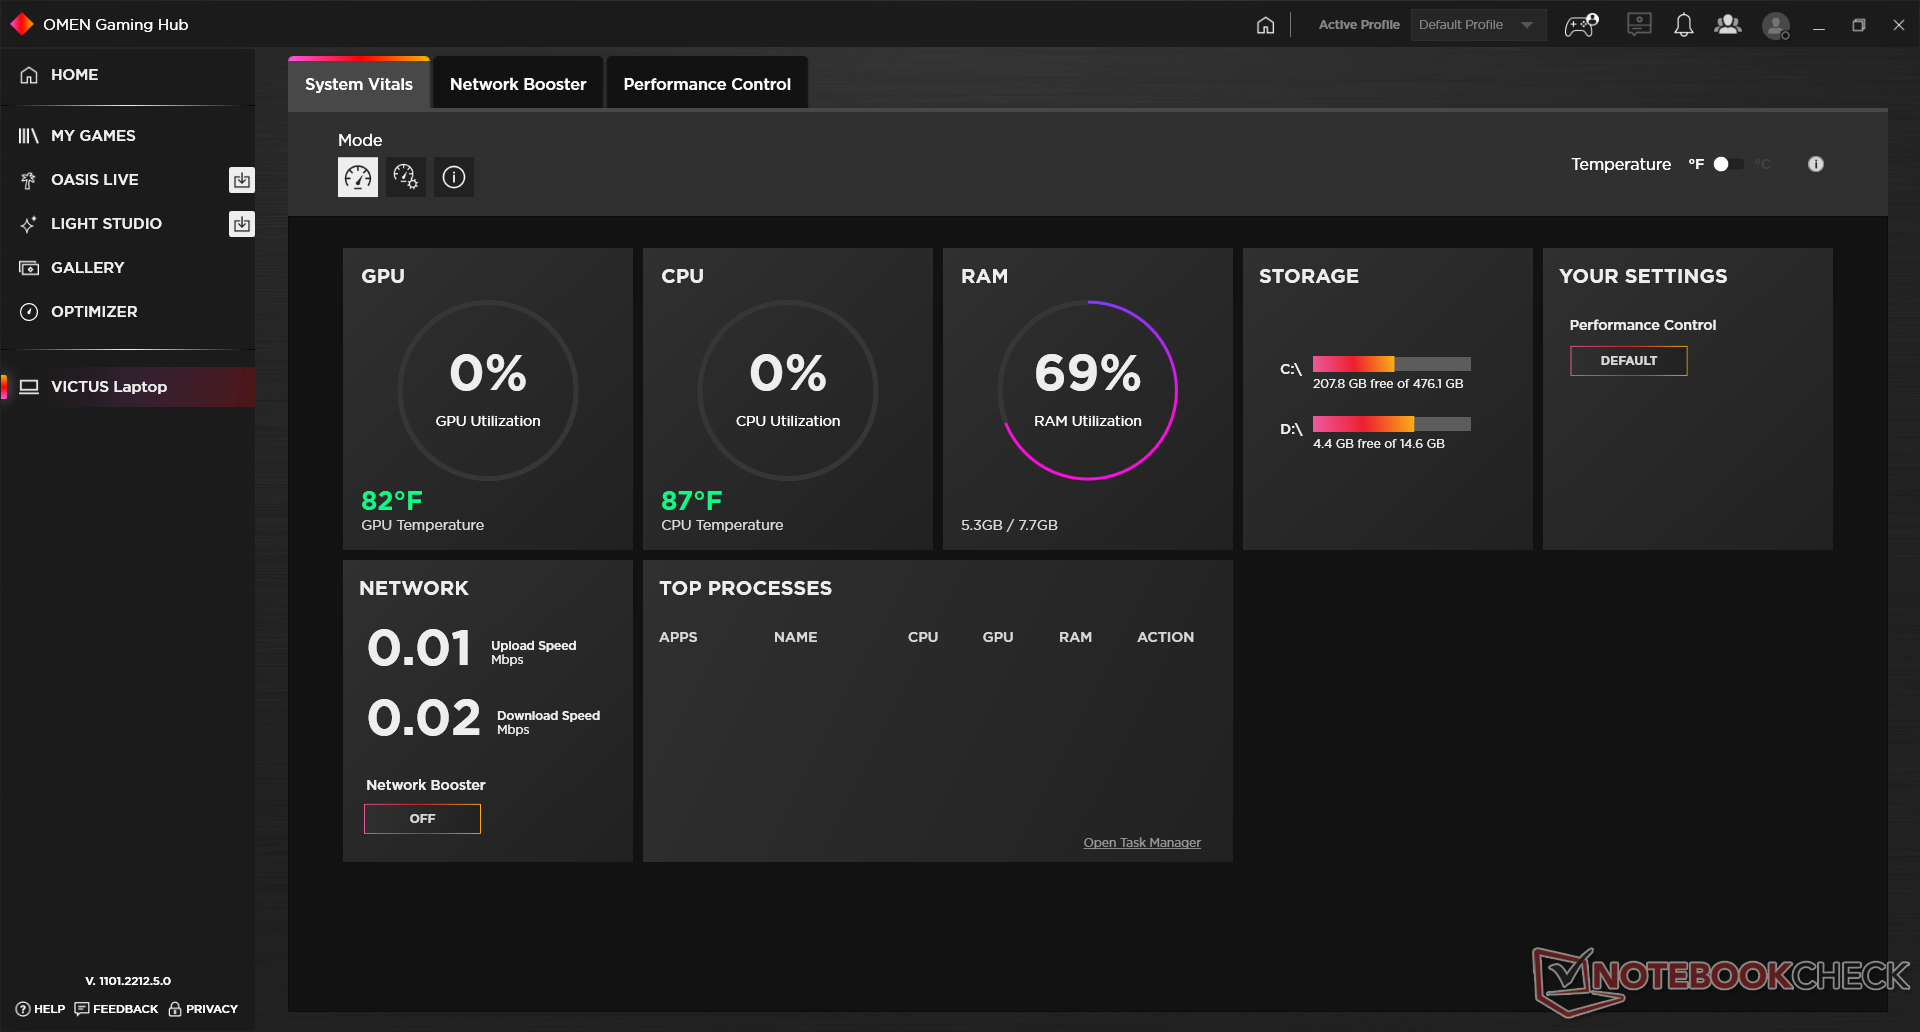
Testing Conditions
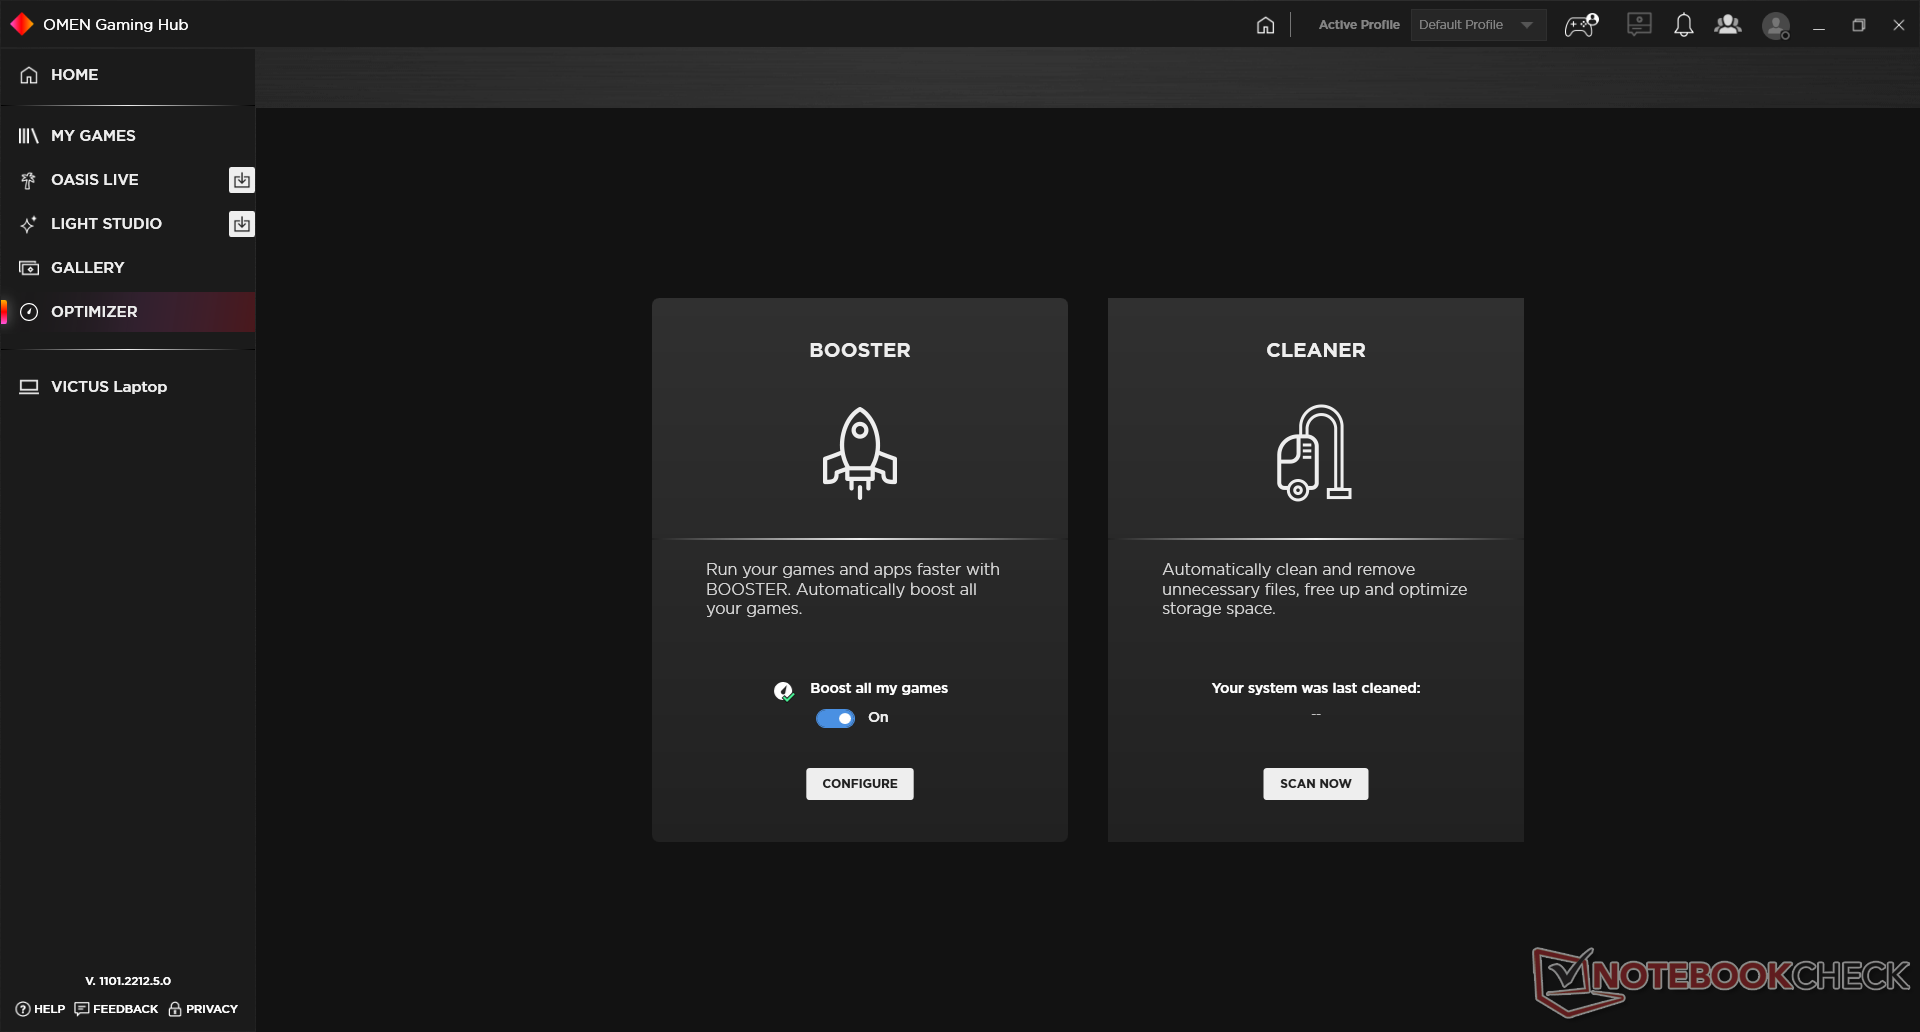
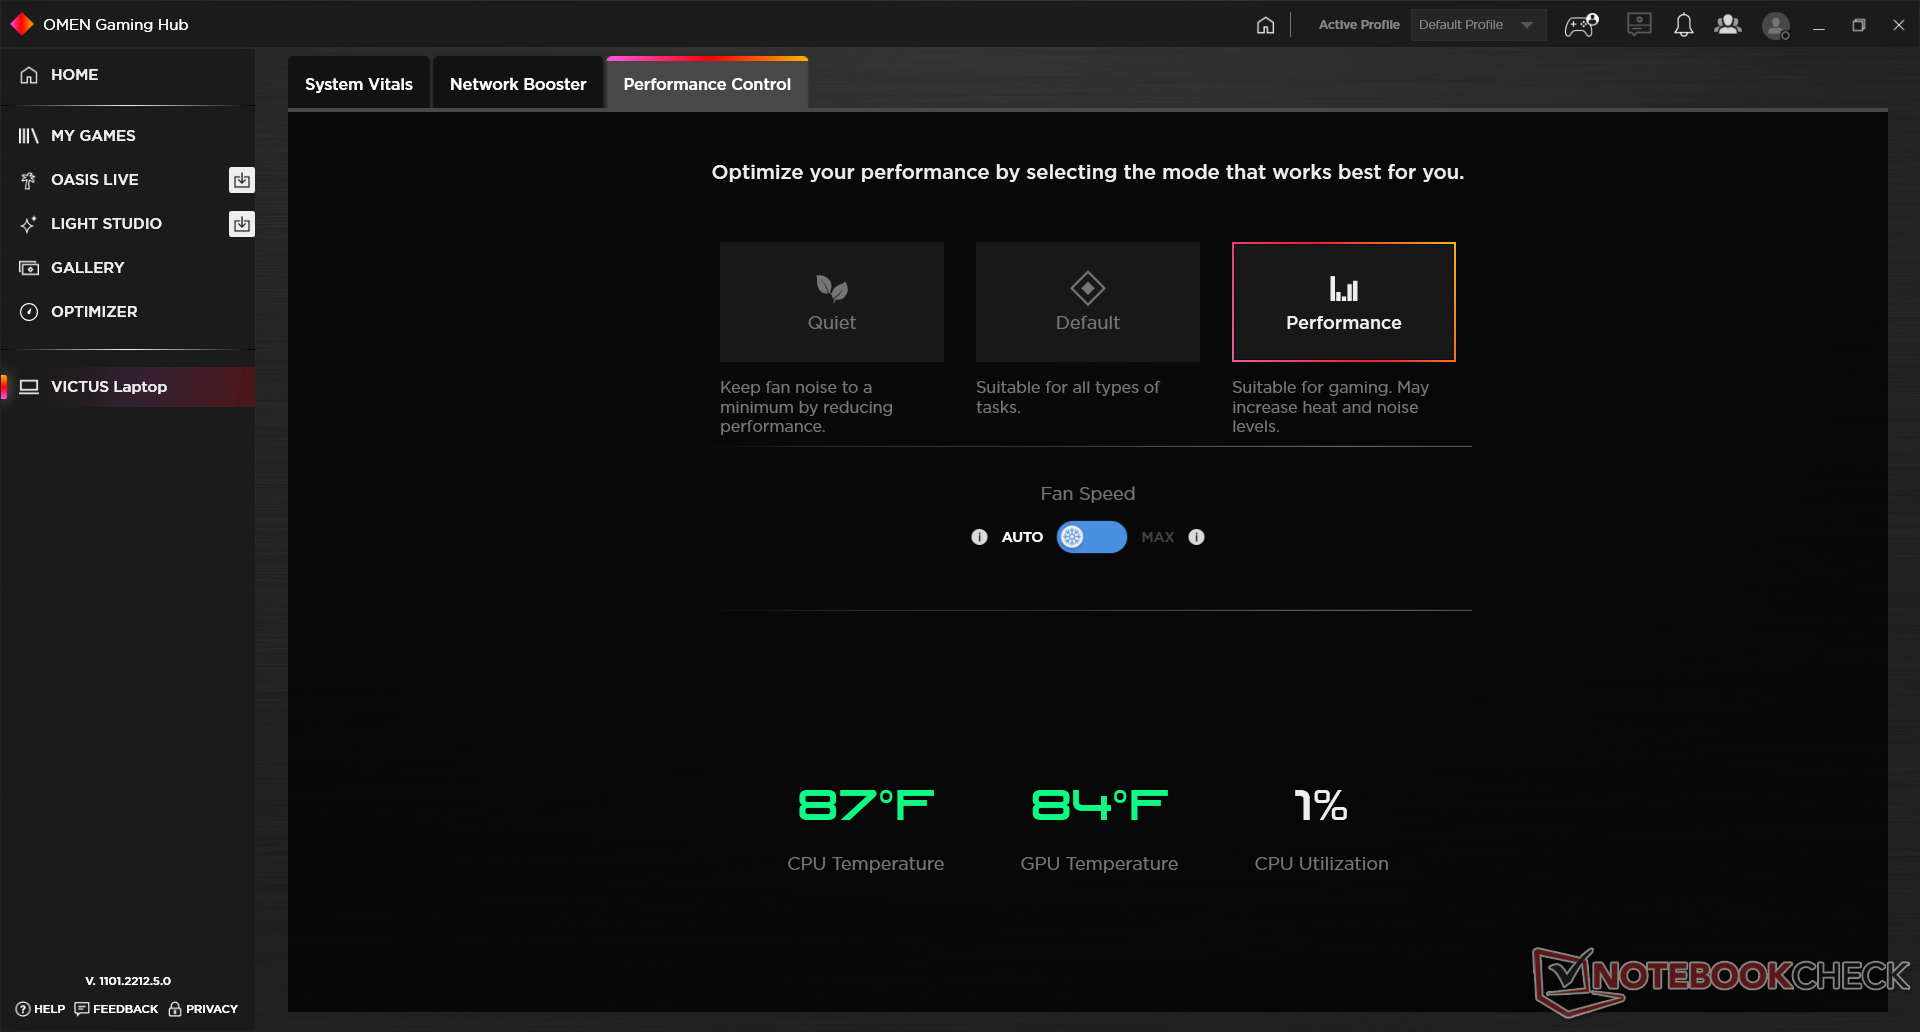
We set our unit to Performance mode via both Windows and the pre-installed Omen Gaming Hub software prior to running any benchmarks below. We also made sure to enable both HP Boost mode and the Nvidia GPU as shown by the screenshots below. The fact that there are so many individual power settings hidden beneath multiple menus can be frustrating especially if you're constantly switching between lower and higher performance levels.

Processor — Limited Turbo Boost
CPU performance is good, but performance sustainability could be better. Performance would drop by as much as 28 percent when running CineBench R15 xT in a loop as shown by the comparison graph below. This dip would occur even when running the system on Performance mode with HP Boost active which is disappointing to see on a gaming laptop. The Lenovo Legion 5 15, which ships with the same Core i7-12700H CPU as our Victus 15, can offer 46 percent faster multi-thread performance because its CPU doesn't throttle nearly as heavily.
Opting for the less expensive AMD Ryzen 5800H SKU of the Victus 15 will result in a performance deficit of about 20 to 25 percent when compared to our Core i7-12700H.
Cinebench R15 Multi Loop
Cinebench R23: Multi Core | Single Core
Cinebench R20: CPU (Multi Core) | CPU (Single Core)
Cinebench R15: CPU Multi 64Bit | CPU Single 64Bit
Blender: v2.79 BMW27 CPU
7-Zip 18.03: 7z b 4 | 7z b 4 -mmt1
Geekbench 5.5: Multi-Core | Single-Core
HWBOT x265 Benchmark v2.2: 4k Preset
LibreOffice : 20 Documents To PDF
R Benchmark 2.5: Overall mean
| HWBOT x265 Benchmark v2.2 / 4k Preset | |
| MSI GE67 HX 12UGS | |
| Lenovo Legion 5 15IAH7H 82RB | |
| Alienware x15 R2 P111F | |
| Average Intel Core i7-12700H (4.67 - 21.8, n=64) | |
| Razer Blade 17 (i7-12800H, RTX 3070 Ti) | |
| HP Victus 15 fa0020nr | |
| Asus ROG Strix G15 G513QY | |
| Dell G15 5515 | |
| Asus TUF Dash F15 FX517ZC | |
| HP Omen 15-en0375ng | |
| MSI Bravo 15 B5DD-010US | |
| HP Omen 15-ek0456ng | |
* ... smaller is better
AIDA64: FP32 Ray-Trace | FPU Julia | CPU SHA3 | CPU Queen | FPU SinJulia | FPU Mandel | CPU AES | CPU ZLib | FP64 Ray-Trace | CPU PhotoWorxx
| Performance rating | |
| Lenovo Legion 5 15IAH7H 82RB | |
| Dell G15 5515 | |
| HP Omen 15-en0375ng | |
| Average Intel Core i7-12700H | |
| HP Victus 15 fa0020nr | |
| MSI Bravo 15 B5DD-010US | |
| Asus TUF Dash F15 FX517ZC | |
| AIDA64 / FP32 Ray-Trace | |
| Lenovo Legion 5 15IAH7H 82RB | |
| HP Omen 15-en0375ng | |
| Dell G15 5515 | |
| HP Victus 15 fa0020nr | |
| Average Intel Core i7-12700H (2585 - 17957, n=64) | |
| MSI Bravo 15 B5DD-010US | |
| Asus TUF Dash F15 FX517ZC | |
| AIDA64 / FPU Julia | |
| Dell G15 5515 | |
| Lenovo Legion 5 15IAH7H 82RB | |
| HP Omen 15-en0375ng | |
| MSI Bravo 15 B5DD-010US | |
| HP Victus 15 fa0020nr | |
| Average Intel Core i7-12700H (12439 - 90760, n=64) | |
| Asus TUF Dash F15 FX517ZC | |
| AIDA64 / CPU SHA3 | |
| Lenovo Legion 5 15IAH7H 82RB | |
| Average Intel Core i7-12700H (833 - 4242, n=64) | |
| Dell G15 5515 | |
| HP Victus 15 fa0020nr | |
| HP Omen 15-en0375ng | |
| MSI Bravo 15 B5DD-010US | |
| Asus TUF Dash F15 FX517ZC | |
| AIDA64 / CPU Queen | |
| Lenovo Legion 5 15IAH7H 82RB | |
| HP Victus 15 fa0020nr | |
| HP Omen 15-en0375ng | |
| Average Intel Core i7-12700H (57923 - 103202, n=63) | |
| Dell G15 5515 | |
| MSI Bravo 15 B5DD-010US | |
| Asus TUF Dash F15 FX517ZC | |
| AIDA64 / FPU SinJulia | |
| HP Omen 15-en0375ng | |
| Dell G15 5515 | |
| Lenovo Legion 5 15IAH7H 82RB | |
| MSI Bravo 15 B5DD-010US | |
| Average Intel Core i7-12700H (3249 - 9939, n=64) | |
| HP Victus 15 fa0020nr | |
| Asus TUF Dash F15 FX517ZC | |
| AIDA64 / FPU Mandel | |
| Dell G15 5515 | |
| Lenovo Legion 5 15IAH7H 82RB | |
| HP Omen 15-en0375ng | |
| MSI Bravo 15 B5DD-010US | |
| HP Victus 15 fa0020nr | |
| Average Intel Core i7-12700H (7135 - 44760, n=64) | |
| Asus TUF Dash F15 FX517ZC | |
| AIDA64 / CPU AES | |
| Lenovo Legion 5 15IAH7H 82RB | |
| Dell G15 5515 | |
| MSI Bravo 15 B5DD-010US | |
| Average Intel Core i7-12700H (31839 - 144360, n=64) | |
| HP Omen 15-en0375ng | |
| HP Victus 15 fa0020nr | |
| Asus TUF Dash F15 FX517ZC | |
| AIDA64 / CPU ZLib | |
| Lenovo Legion 5 15IAH7H 82RB | |
| Average Intel Core i7-12700H (305 - 1171, n=64) | |
| HP Omen 15-en0375ng | |
| HP Victus 15 fa0020nr | |
| Dell G15 5515 | |
| Asus TUF Dash F15 FX517ZC | |
| MSI Bravo 15 B5DD-010US | |
| AIDA64 / FP64 Ray-Trace | |
| Lenovo Legion 5 15IAH7H 82RB | |
| HP Omen 15-en0375ng | |
| Dell G15 5515 | |
| HP Victus 15 fa0020nr | |
| Average Intel Core i7-12700H (1437 - 9692, n=64) | |
| MSI Bravo 15 B5DD-010US | |
| Asus TUF Dash F15 FX517ZC | |
| AIDA64 / CPU PhotoWorxx | |
| Lenovo Legion 5 15IAH7H 82RB | |
| Average Intel Core i7-12700H (12863 - 52207, n=64) | |
| Asus TUF Dash F15 FX517ZC | |
| HP Omen 15-en0375ng | |
| MSI Bravo 15 B5DD-010US | |
| HP Victus 15 fa0020nr | |
| Dell G15 5515 | |
System Performance
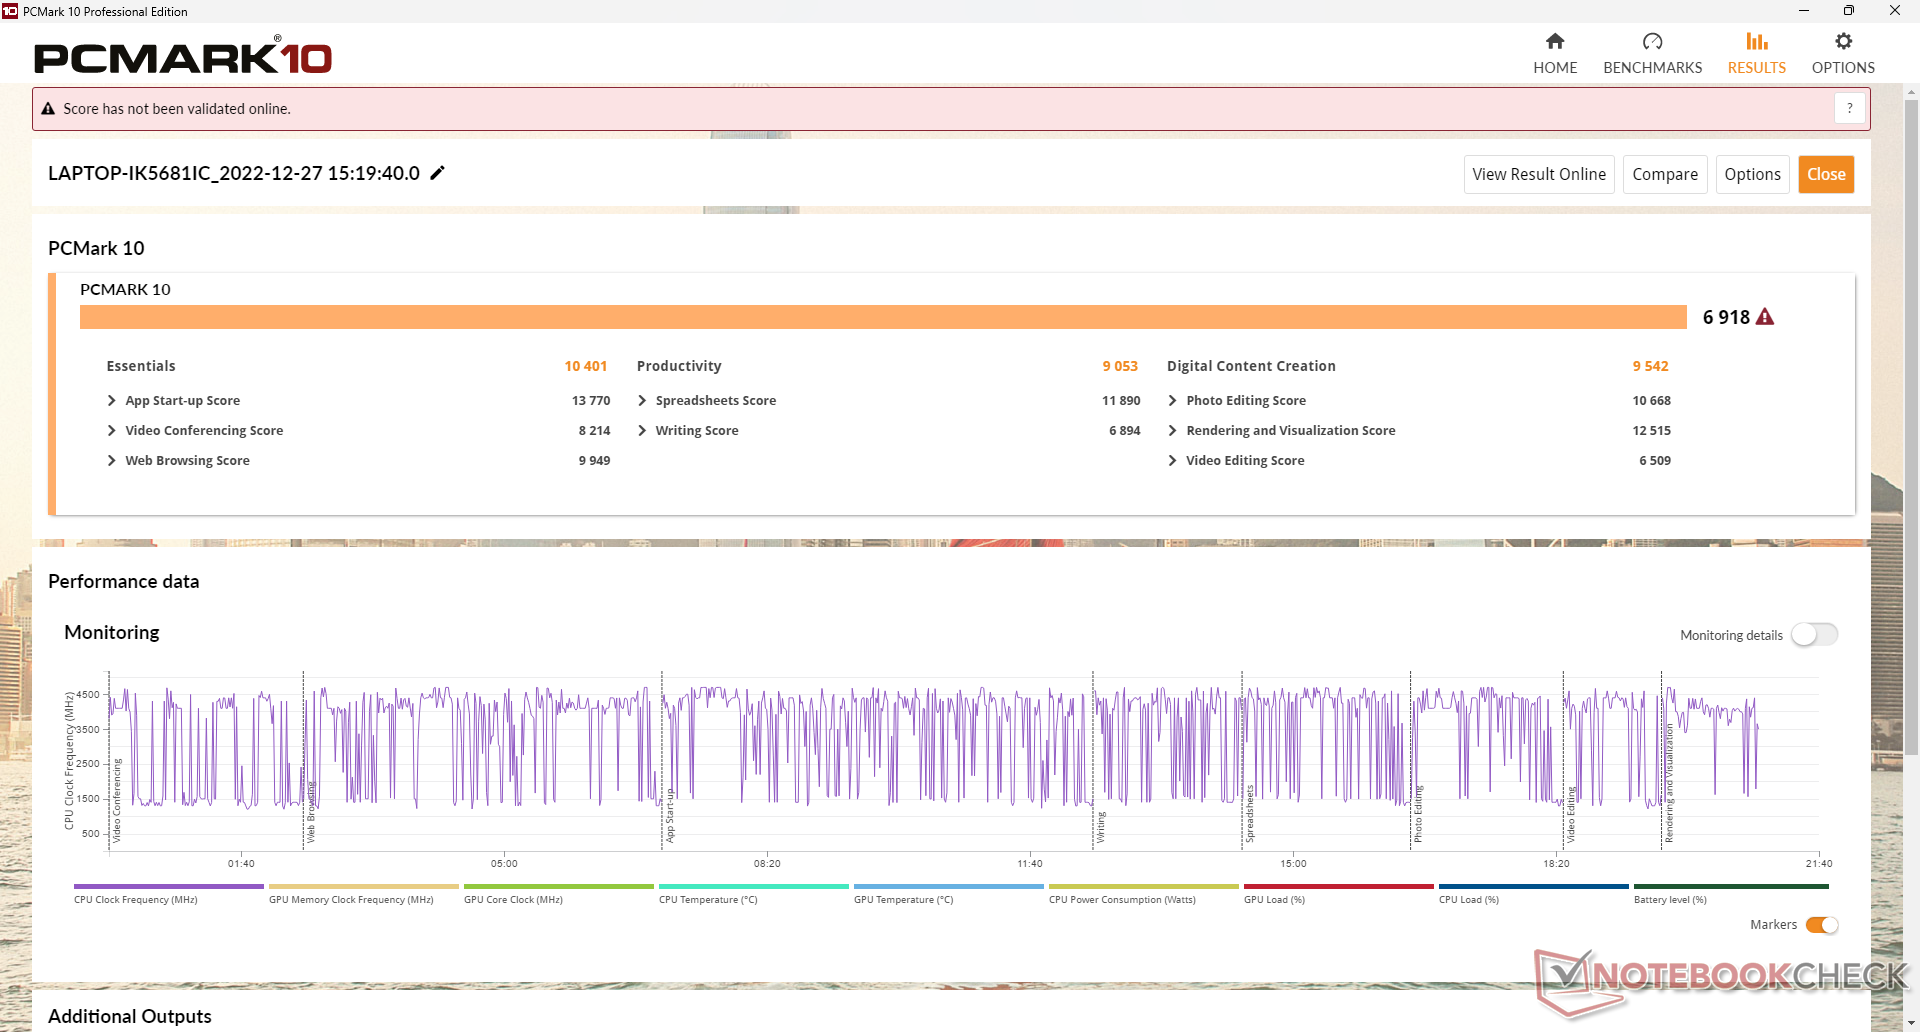
PCMark results are higher than many other older or budget gaming laptops due to the much faster 12th gen Intel CPU and PCIe4 x4 NVMe SSD. Nonetheless, it still falls behind laptops with the faster RTX 3060 GPU such as the Lenovo Legion 5 15.
CrossMark: Overall | Productivity | Creativity | Responsiveness
| PCMark 10 / Score | |
| Lenovo Legion 5 15IAH7H 82RB | |
| HP Victus 15 fa0020nr | |
| Asus TUF Dash F15 FX517ZC | |
| Average Intel Core i7-12700H, NVIDIA GeForce RTX 3050 Ti Laptop GPU (6623 - 7075, n=5) | |
| MSI Bravo 15 B5DD-010US | |
| Dell G15 5515 | |
| HP Omen 15-en0375ng | |
| PCMark 10 / Essentials | |
| Lenovo Legion 5 15IAH7H 82RB | |
| Asus TUF Dash F15 FX517ZC | |
| HP Victus 15 fa0020nr | |
| Average Intel Core i7-12700H, NVIDIA GeForce RTX 3050 Ti Laptop GPU (9540 - 10970, n=5) | |
| MSI Bravo 15 B5DD-010US | |
| Dell G15 5515 | |
| HP Omen 15-en0375ng | |
| PCMark 10 / Productivity | |
| Lenovo Legion 5 15IAH7H 82RB | |
| Asus TUF Dash F15 FX517ZC | |
| HP Victus 15 fa0020nr | |
| Average Intel Core i7-12700H, NVIDIA GeForce RTX 3050 Ti Laptop GPU (8530 - 9555, n=5) | |
| MSI Bravo 15 B5DD-010US | |
| Dell G15 5515 | |
| HP Omen 15-en0375ng | |
| PCMark 10 / Digital Content Creation | |
| Lenovo Legion 5 15IAH7H 82RB | |
| HP Victus 15 fa0020nr | |
| Average Intel Core i7-12700H, NVIDIA GeForce RTX 3050 Ti Laptop GPU (8855 - 9542, n=5) | |
| Asus TUF Dash F15 FX517ZC | |
| HP Omen 15-en0375ng | |
| MSI Bravo 15 B5DD-010US | |
| Dell G15 5515 | |
| CrossMark / Overall | |
| Lenovo Legion 5 15IAH7H 82RB | |
| Asus TUF Dash F15 FX517ZC | |
| Average Intel Core i7-12700H, NVIDIA GeForce RTX 3050 Ti Laptop GPU (1654 - 1872, n=5) | |
| HP Victus 15 fa0020nr | |
| CrossMark / Productivity | |
| Lenovo Legion 5 15IAH7H 82RB | |
| Asus TUF Dash F15 FX517ZC | |
| Average Intel Core i7-12700H, NVIDIA GeForce RTX 3050 Ti Laptop GPU (1595 - 1792, n=5) | |
| HP Victus 15 fa0020nr | |
| CrossMark / Creativity | |
| Lenovo Legion 5 15IAH7H 82RB | |
| Asus TUF Dash F15 FX517ZC | |
| Average Intel Core i7-12700H, NVIDIA GeForce RTX 3050 Ti Laptop GPU (1699 - 1993, n=5) | |
| HP Victus 15 fa0020nr | |
| CrossMark / Responsiveness | |
| Lenovo Legion 5 15IAH7H 82RB | |
| Asus TUF Dash F15 FX517ZC | |
| Average Intel Core i7-12700H, NVIDIA GeForce RTX 3050 Ti Laptop GPU (1383 - 1768, n=5) | |
| HP Victus 15 fa0020nr | |
| PCMark 10 Score | 6918 points | |
Help | ||
| AIDA64 / Memory Copy | |
| Average Intel Core i7-12700H (25615 - 80511, n=64) | |
| Lenovo Legion 5 15IAH7H 82RB | |
| Asus TUF Dash F15 FX517ZC | |
| MSI Bravo 15 B5DD-010US | |
| HP Victus 15 fa0020nr | |
| HP Omen 15-en0375ng | |
| Dell G15 5515 | |
| AIDA64 / Memory Read | |
| Lenovo Legion 5 15IAH7H 82RB | |
| Average Intel Core i7-12700H (25586 - 79442, n=64) | |
| Asus TUF Dash F15 FX517ZC | |
| MSI Bravo 15 B5DD-010US | |
| HP Victus 15 fa0020nr | |
| HP Omen 15-en0375ng | |
| Dell G15 5515 | |
| AIDA64 / Memory Write | |
| Lenovo Legion 5 15IAH7H 82RB | |
| Average Intel Core i7-12700H (23679 - 88660, n=64) | |
| Asus TUF Dash F15 FX517ZC | |
| HP Omen 15-en0375ng | |
| HP Victus 15 fa0020nr | |
| MSI Bravo 15 B5DD-010US | |
| Dell G15 5515 | |
| AIDA64 / Memory Latency | |
| Lenovo Legion 5 15IAH7H 82RB | |
| HP Omen 15-en0375ng | |
| HP Victus 15 fa0020nr | |
| Average Intel Core i7-12700H (76.2 - 133.9, n=62) | |
| Dell G15 5515 | |
| MSI Bravo 15 B5DD-010US | |
| Asus TUF Dash F15 FX517ZC | |
* ... smaller is better
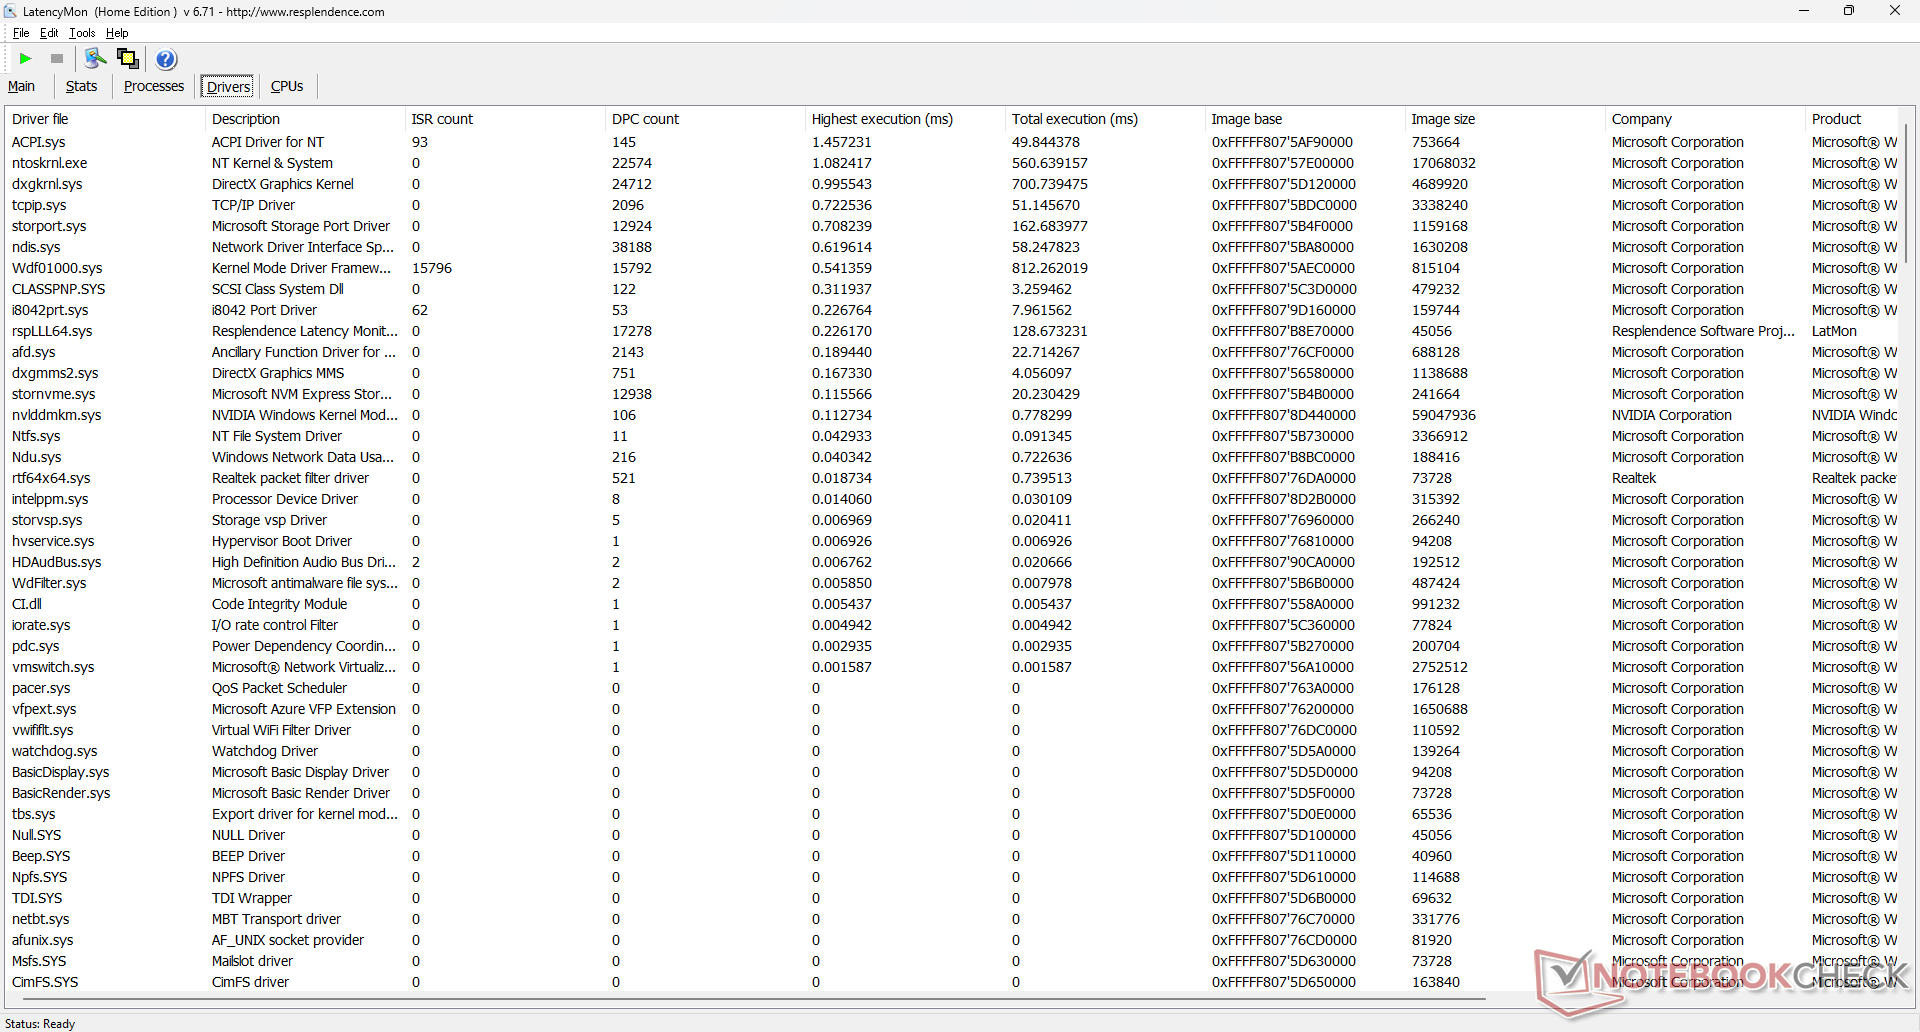
DPC Latency
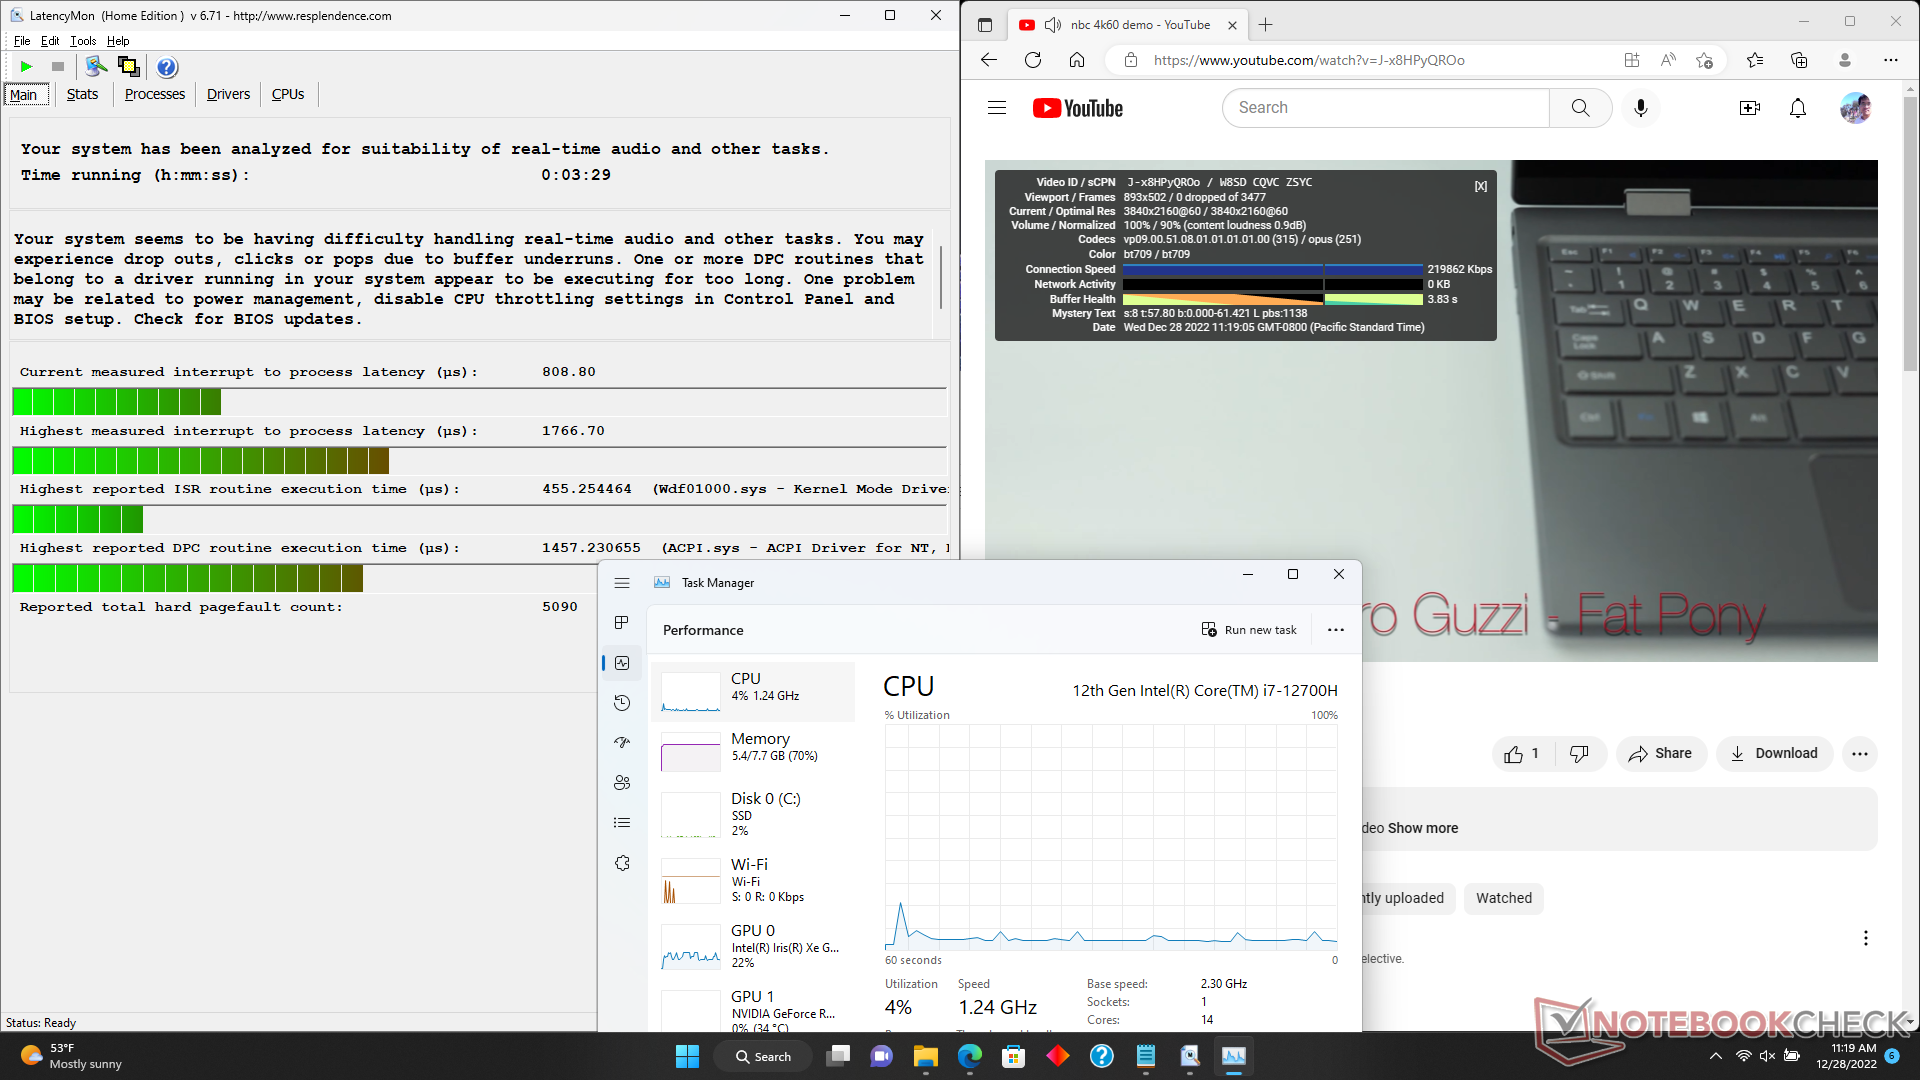
LatencyMon reveals DPC issues when opening multiple browser tabs on our homepage. 4K video playback at 60 FPS is otherwise perfect and with no dropped frames.
| DPC Latencies / LatencyMon - interrupt to process latency (max), Web, Youtube, Prime95 | |
| HP Victus 15 fa0020nr | |
| MSI Bravo 15 B5DD-010US | |
| Asus TUF Dash F15 FX517ZC | |
| Lenovo Legion 5 15IAH7H 82RB | |
| HP Omen 15-en0375ng | |
| Dell G15 5515 | |
* ... smaller is better
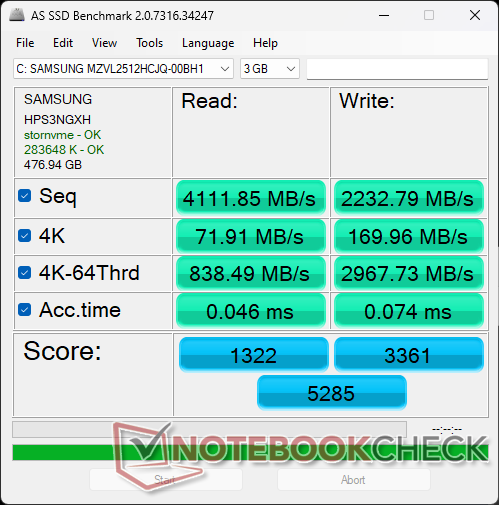
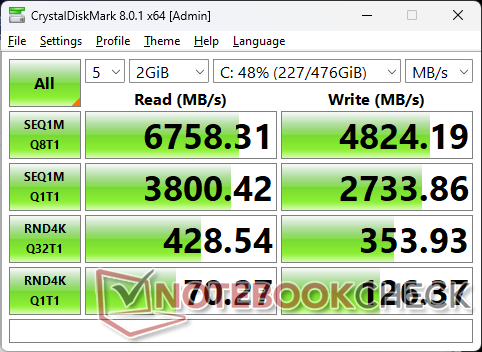
Storage Devices — One Drive Only
Our test unit includes a fast Samsung PM9A1 PCIe4 x4 NVMe SSD promising sequential read and write rates of up to 6900 MB/s and 5000 MB/s, respectively. Performance throttles after about 5 minutes of stress, however, as shown by our DiskSpd loop test results below. Though zero throttling is preferable, the delayed performance loss is unlikely to impact the user experience.
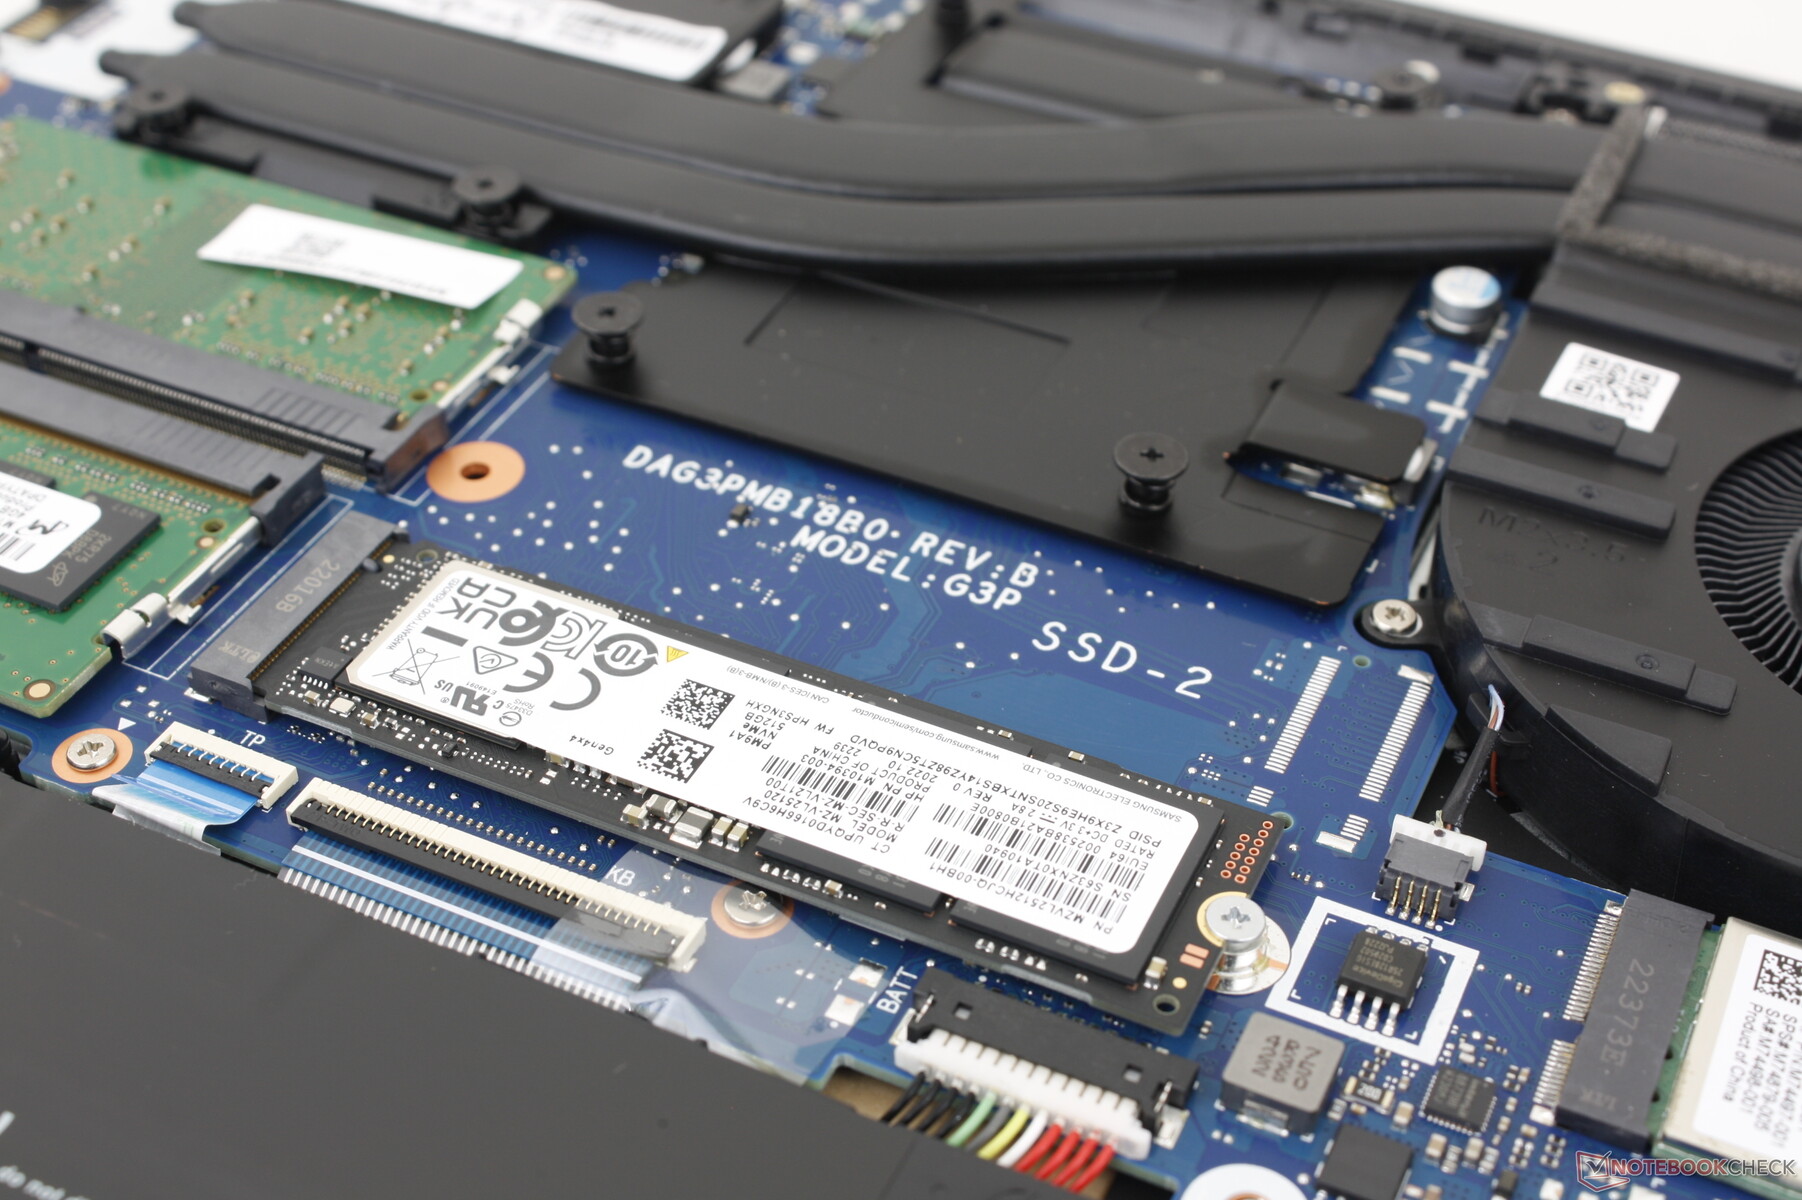

| Drive Performance rating - Percent | |
| Lenovo Legion 5 15IAH7H 82RB | |
| HP Victus 15 fa0020nr | |
| HP Omen 15-en0375ng | |
| Asus TUF Dash F15 FX517ZC | |
| Dell G15 5515 | |
| MSI Bravo 15 B5DD-010US | |
* ... smaller is better
Disk Throttling: DiskSpd Read Loop, Queue Depth 8
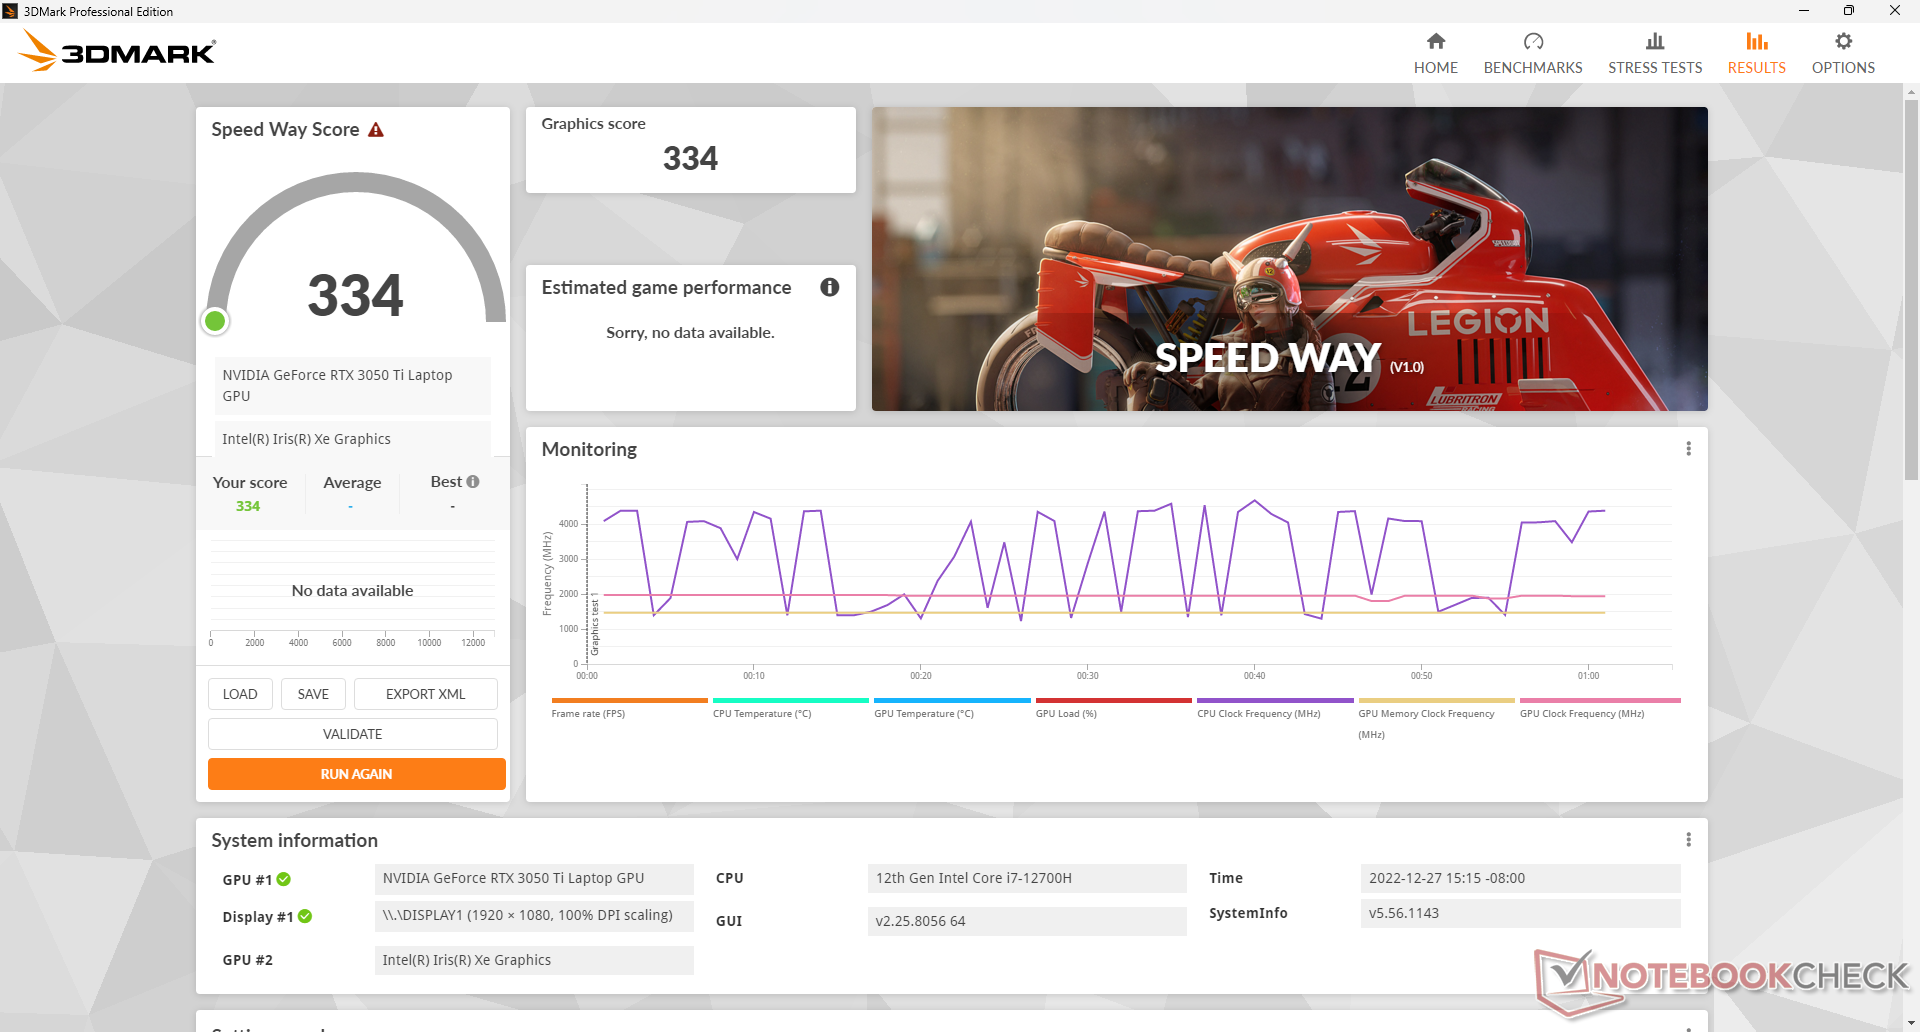
GPU Performance — 75 W TGP
Graphics performance is comparable to the older GeForce GTX 1660 Ti or mobile RTX 2060 while being about 10 percent faster than the standard mobile RTX 3050. The RTX 3050 series has been somewhat disappointing since the competing Radeon RX 6600M retails for roughly the same price but with up to 50 percent faster performance. Even so, most titles remain playable at the native 1080p resolution including Cyberpunk 2077.
We're surprised to see that most games can still run very well in spite of our limited 8 GB of system RAM. Average frame rates are where we expect them to be relative to other laptops with the same GPU except on very demanding titles like Cyberpunk 2077 where performance can be about 10 percent slower if on Ultra settings.
Advanced graphics features such as Optimus 2.0, integrated G-Sync, or MUX are not supported on this budget machine. There are no GeForce RTX 3060 options or higher, either.
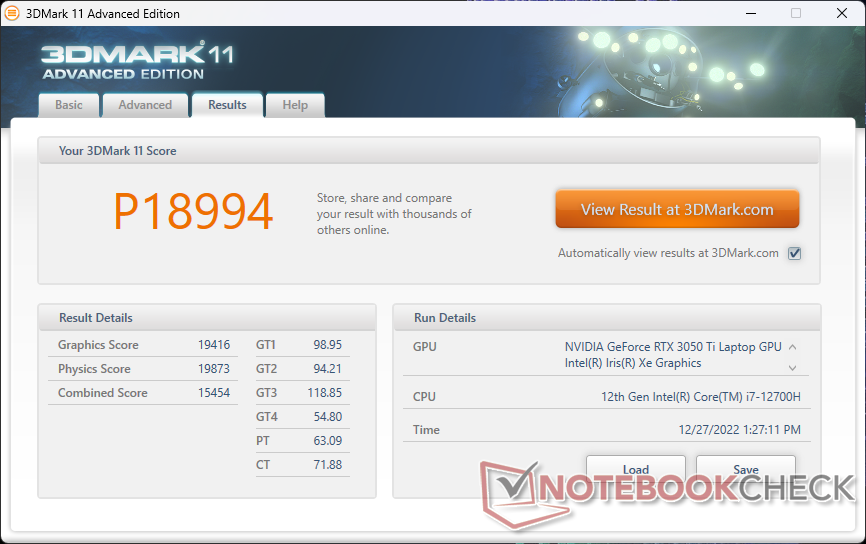
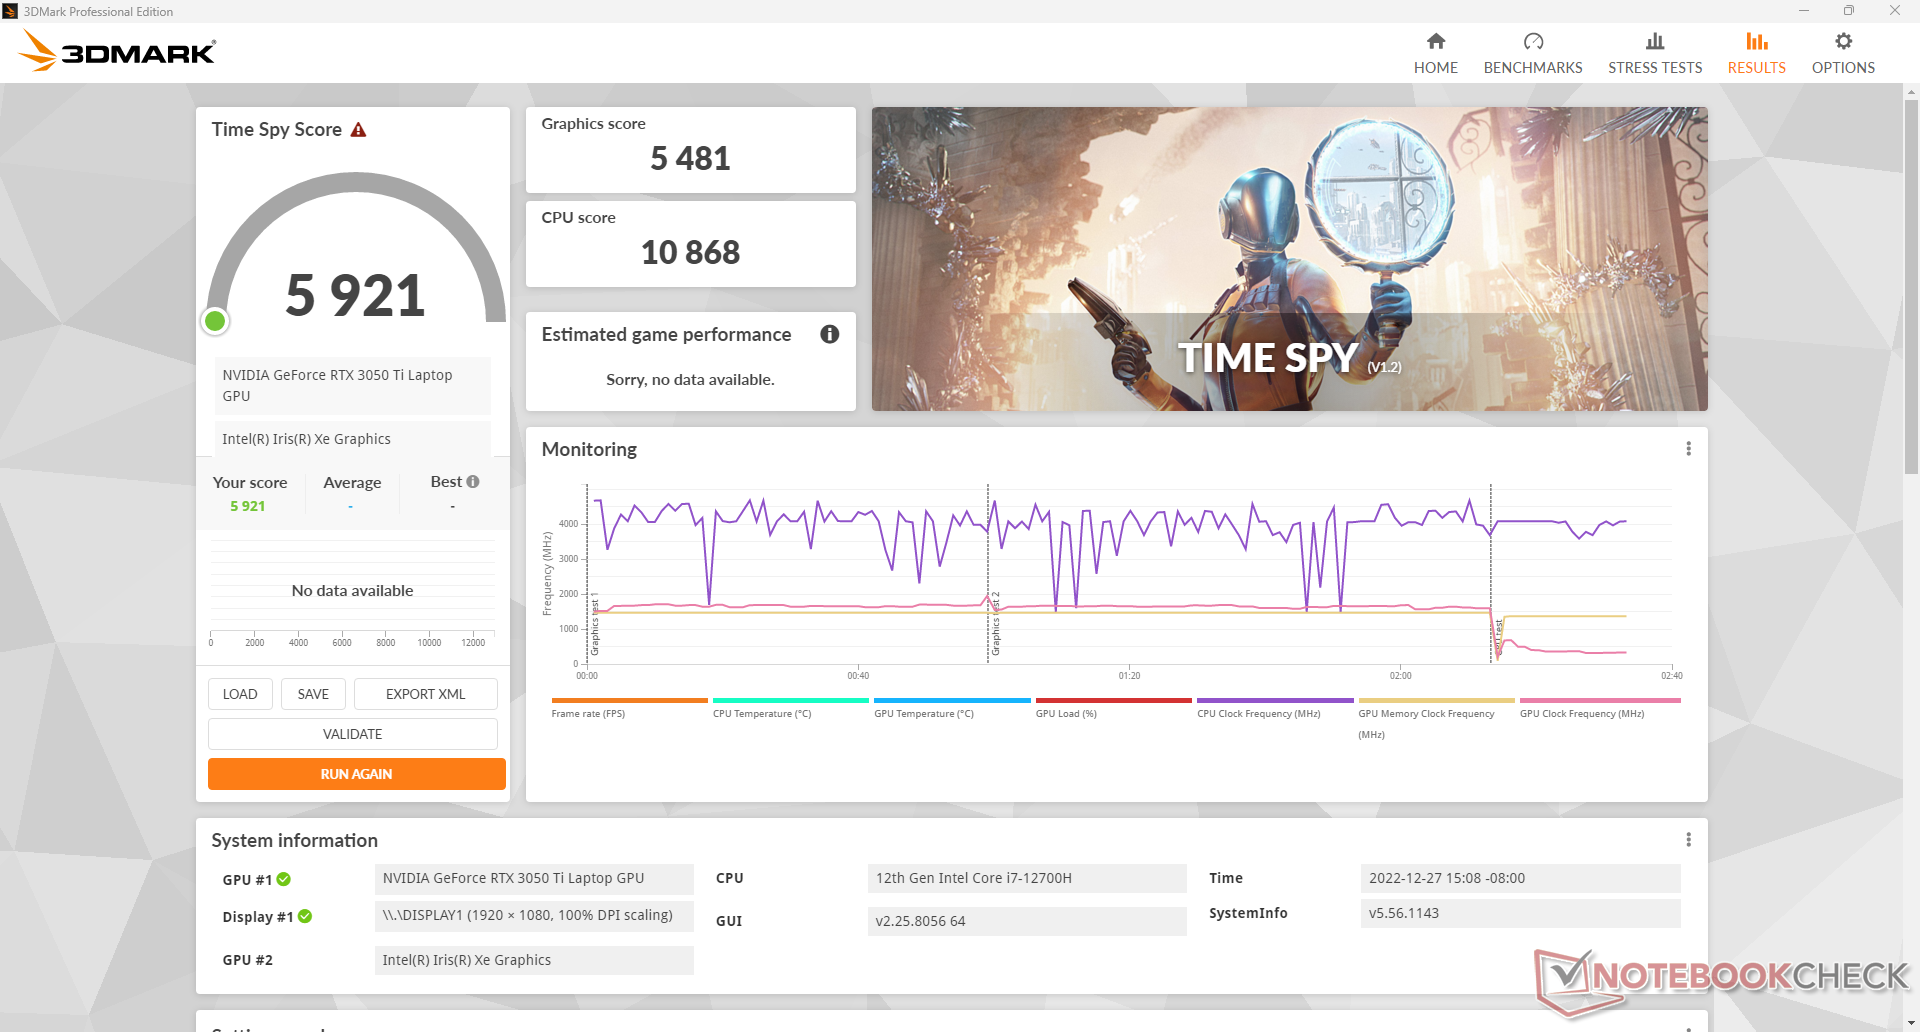
| 3DMark 11 Performance | 18994 points | |
| 3DMark Cloud Gate Standard Score | 50957 points | |
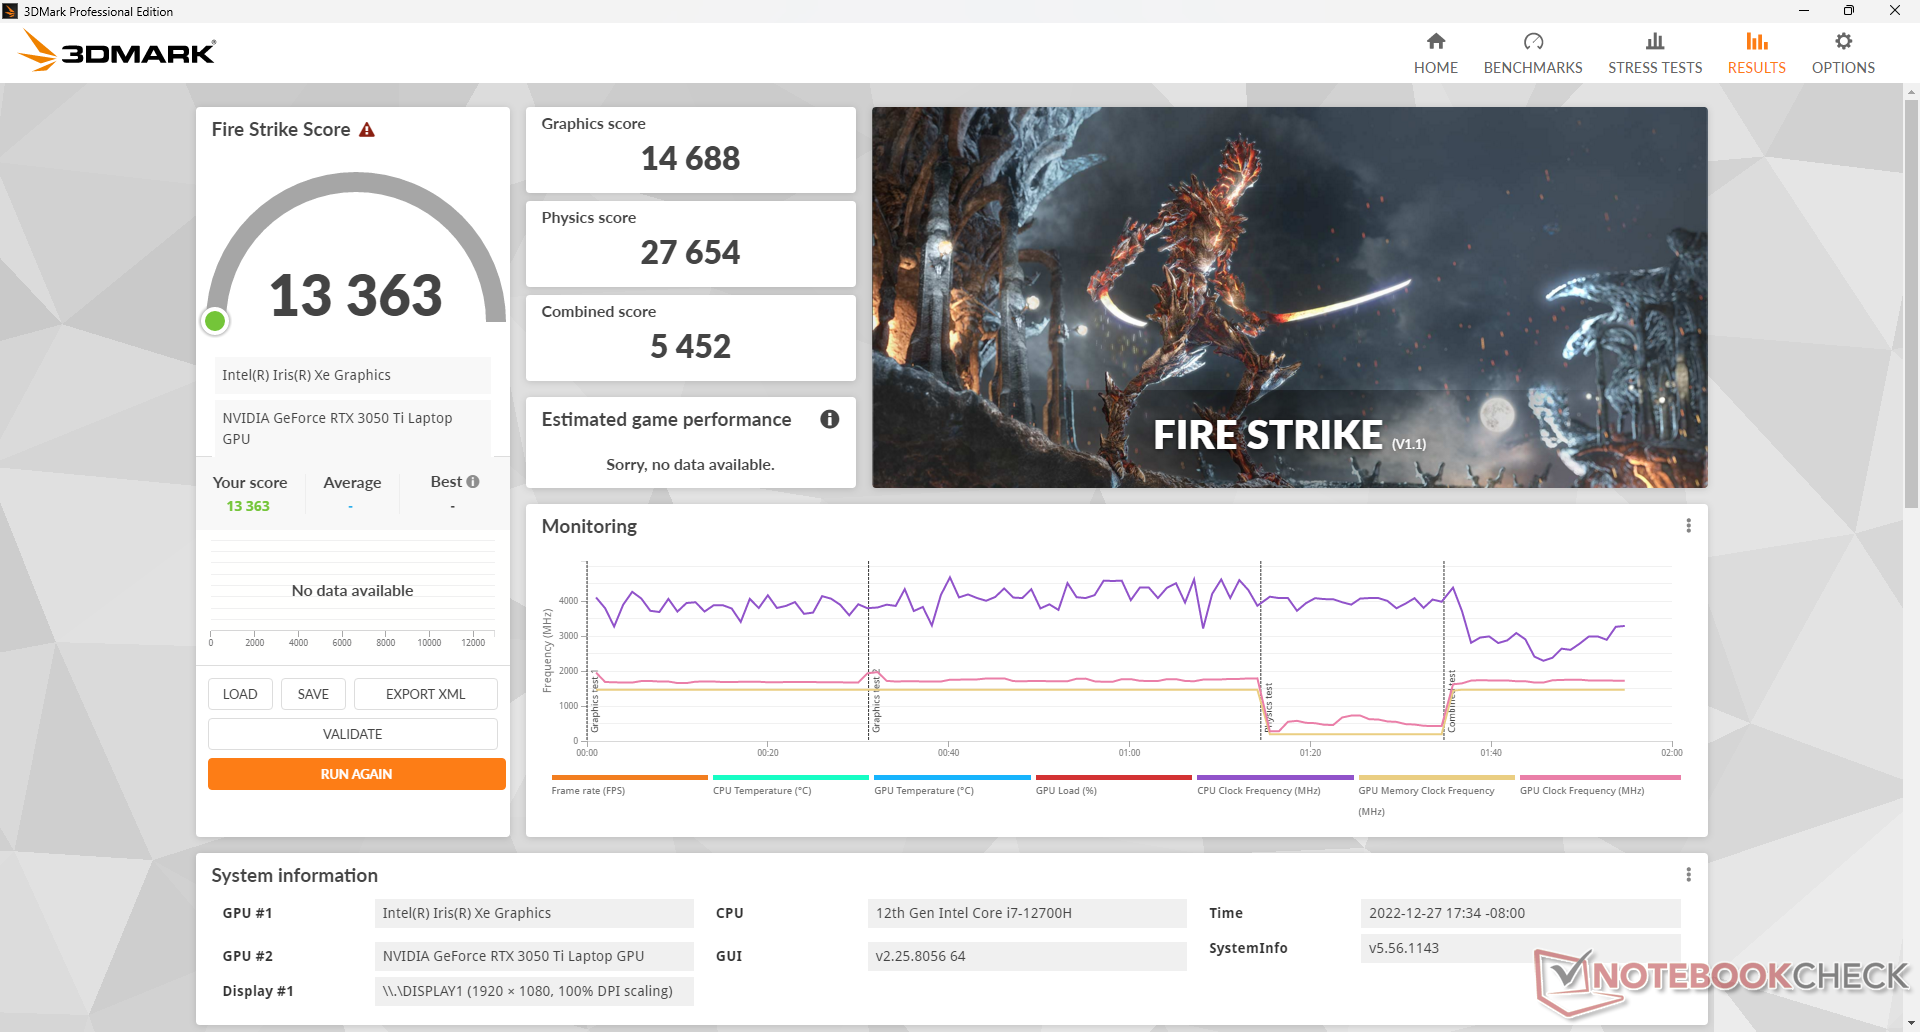
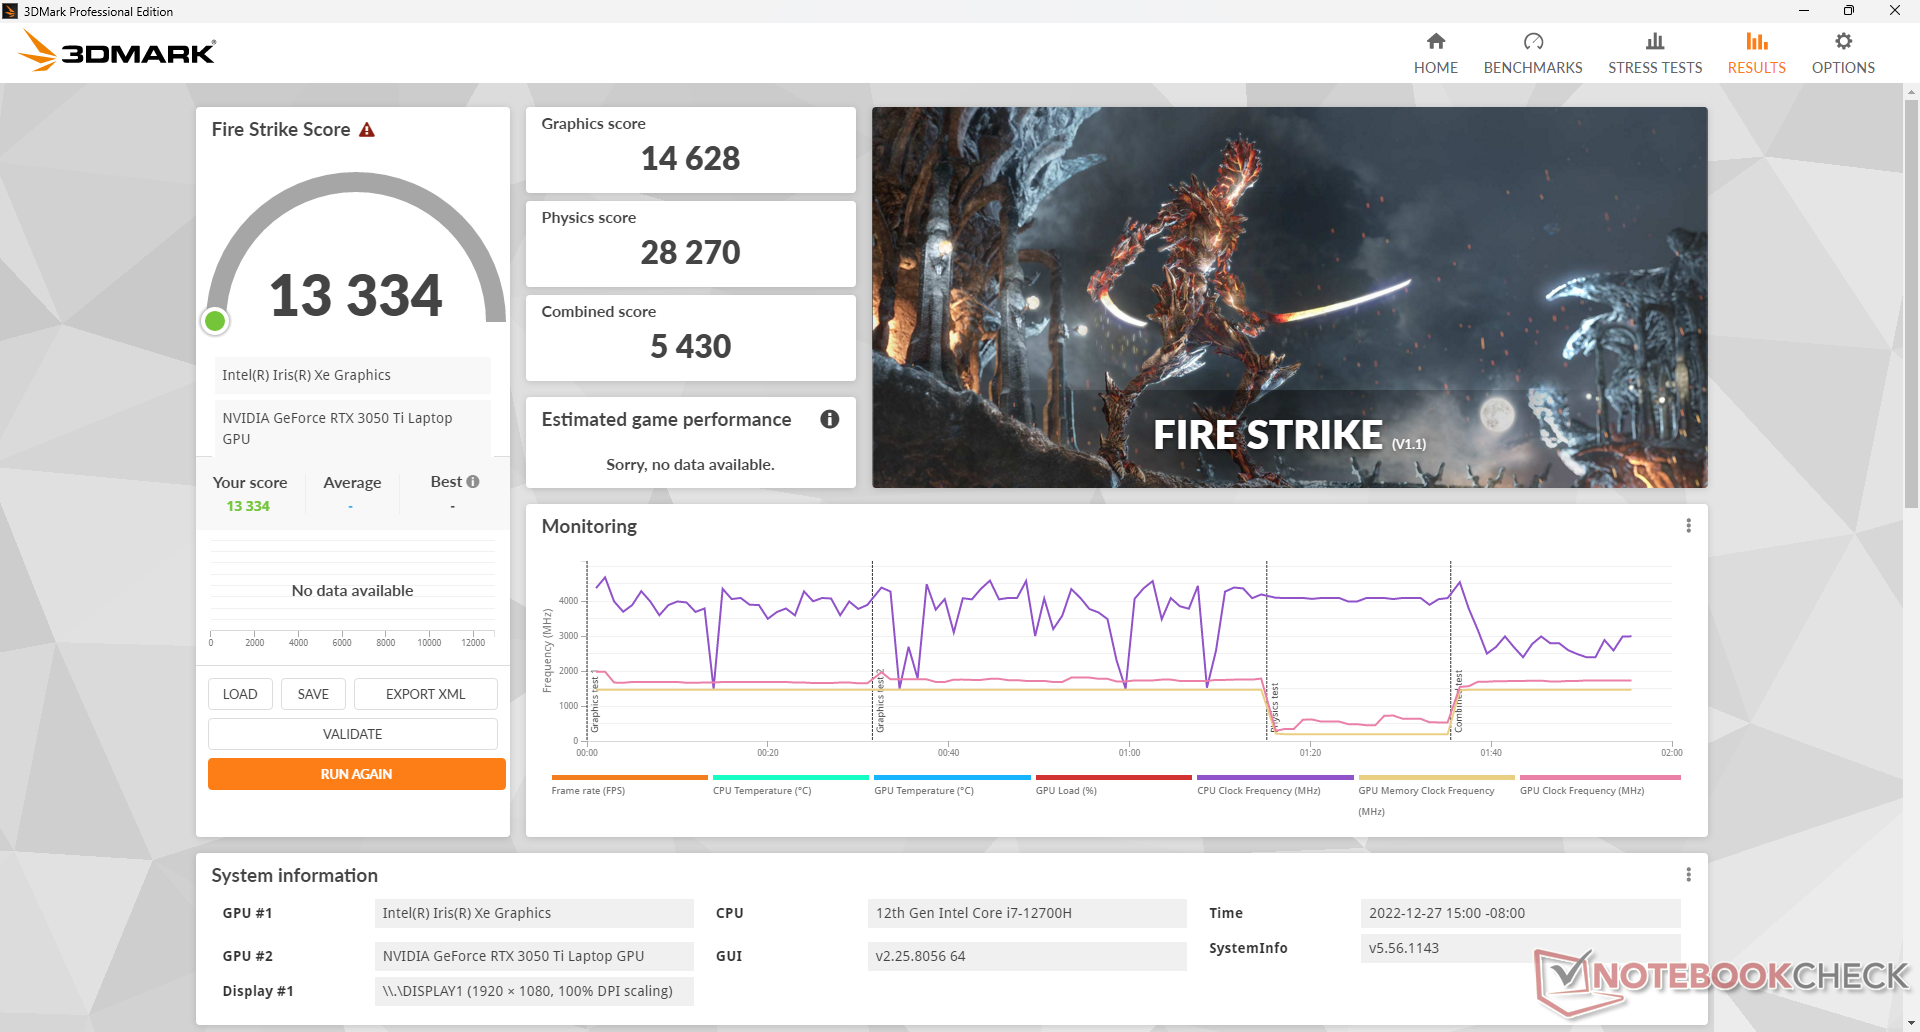
| 3DMark Fire Strike Score | 13334 points | |
| 3DMark Time Spy Score | 5921 points | |
Help | ||
* ... smaller is better
| The Witcher 3 - 1920x1080 Ultra Graphics & Postprocessing (HBAO+) | |
| Average of class Gaming (95 - 240, n=8, last 2 years) | |
| Average NVIDIA GeForce RTX 3060 Laptop GPU (58.2 - 91.5, n=48) | |
| Average NVIDIA GeForce RTX 2060 Mobile (50.6 - 74, n=40) | |
| HP Victus 15 fa0020nr | |
| Average NVIDIA GeForce RTX 3050 Ti Laptop GPU (19 - 58.5, n=29) | |
| Average NVIDIA GeForce RTX 3050 4GB Laptop GPU (31.5 - 55.8, n=21) | |
| Cyberpunk 2077 1.6 - 1920x1080 Ultra Preset | |
| Average NVIDIA GeForce RTX 3060 Laptop GPU (40 - 78.8, n=16) | |
| Average NVIDIA GeForce RTX 3050 Ti Laptop GPU (31 - 50.5, n=9) | |
| HP Victus 15 fa0020nr | |
| Average NVIDIA GeForce RTX 3050 4GB Laptop GPU (25.3 - 36.5, n=7) | |
Witcher 3 FPS Chart
| low | med. | high | ultra | |
|---|---|---|---|---|
| GTA V (2015) | 179.5 | 173 | 144.7 | 73.1 |
| The Witcher 3 (2015) | 284.4 | 186.2 | 106.5 | 54.7 |
| Dota 2 Reborn (2015) | 161.7 | 140.3 | 132.2 | 123.8 |
| Final Fantasy XV Benchmark (2018) | 138.1 | 81.7 | 54.7 | |
| X-Plane 11.11 (2018) | 127.1 | 115.6 | 92.9 | |
| Strange Brigade (2018) | 297 | 138.8 | 112.2 | 97.4 |
| Cyberpunk 2077 1.6 (2022) | 78.3 | 65.7 | 46.9 | 36.8 |
Emissions
System Noise — Louder On Quiet Mode
Fan noise is tied to the three HP performance settings: Quiet, Default, and Performance. Strangely, fan noise is louder on Quiet mode than it is on Default (29.2 dB(A) vs. 26.2 dB(A)) when idling on desktop which we suspect is likely a bug. Regardless, it's disappointing that the fans are always active no matter the onscreen load and so the system is never truly silent.
The good news is that while fan noise is relatively loud during lower loads, it is quieter than many other gaming laptops when running higher loads like games. Fan noise would stabilize at just over 41 dB(A) when running Witcher 3 on Performance mode compared to 48 dB(A) and 44 dB(A) on the HP Omen 15 and Dell G5 15, respectively. The fans are more lethargic and take longer to ramp up as well.
Our test unit would also suffer from slight coil whine or electronic noise.
Noise level
| Idle |
| 26.2 / 29.2 / 29.4 dB(A) |
| Load |
| 29.9 / 45.5 dB(A) |
 | ||
30 dB silent 40 dB(A) audible 50 dB(A) loud |
||
min: | ||
| HP Victus 15 fa0020nr GeForce RTX 3050 Ti Laptop GPU, i7-12700H, Samsung PM9A1 MZVL2512HCJQ | HP Omen 15-en0375ng GeForce RTX 2060 Mobile, R7 4800H, WDC PC SN730 SDBPNTY-512G | Dell G15 5515 GeForce RTX 3050 Ti Laptop GPU, R7 5800H, Samsung PM991a MZ9LQ512HBLU-00BD1 | Asus TUF Dash F15 FX517ZC GeForce RTX 3050 4GB Laptop GPU, i7-12650H, Intel SSD 670p SSDPEKNU512GZ | MSI Bravo 15 B5DD-010US Radeon RX 5500M, R5 5600H, Kingston OM8PCP3512F-AB | Lenovo Legion 5 15IAH7H 82RB GeForce RTX 3060 Laptop GPU, i7-12700H | |
|---|---|---|---|---|---|---|
| Noise | -12% | -6% | -11% | -9% | 1% | |
| off / environment * (dB) | 24.8 | 24 3% | 24 3% | 23.9 4% | 24.5 1% | 23.3 6% |
| Idle Minimum * (dB) | 26.2 | 24 8% | 25 5% | 24 8% | 24.5 6% | 23.5 10% |
| Idle Average * (dB) | 29.2 | 25 14% | 26 11% | 24 18% | 32.8 -12% | 23.5 20% |
| Idle Maximum * (dB) | 29.4 | 37 -26% | 30 -2% | 32.3 -10% | 32.8 -12% | 26.8 9% |
| Load Average * (dB) | 29.9 | 45 -51% | 44 -47% | 43.7 -46% | 34.5 -15% | 29.3 2% |
| Witcher 3 ultra * (dB) | 41.1 | 48 -17% | 44 -7% | 53.4 -30% | 42.5 -3% | 51.4 -25% |
| Load Maximum * (dB) | 45.5 | 51 -12% | 48 -5% | 53.6 -18% | 58.5 -29% | 53 -16% |
* ... smaller is better
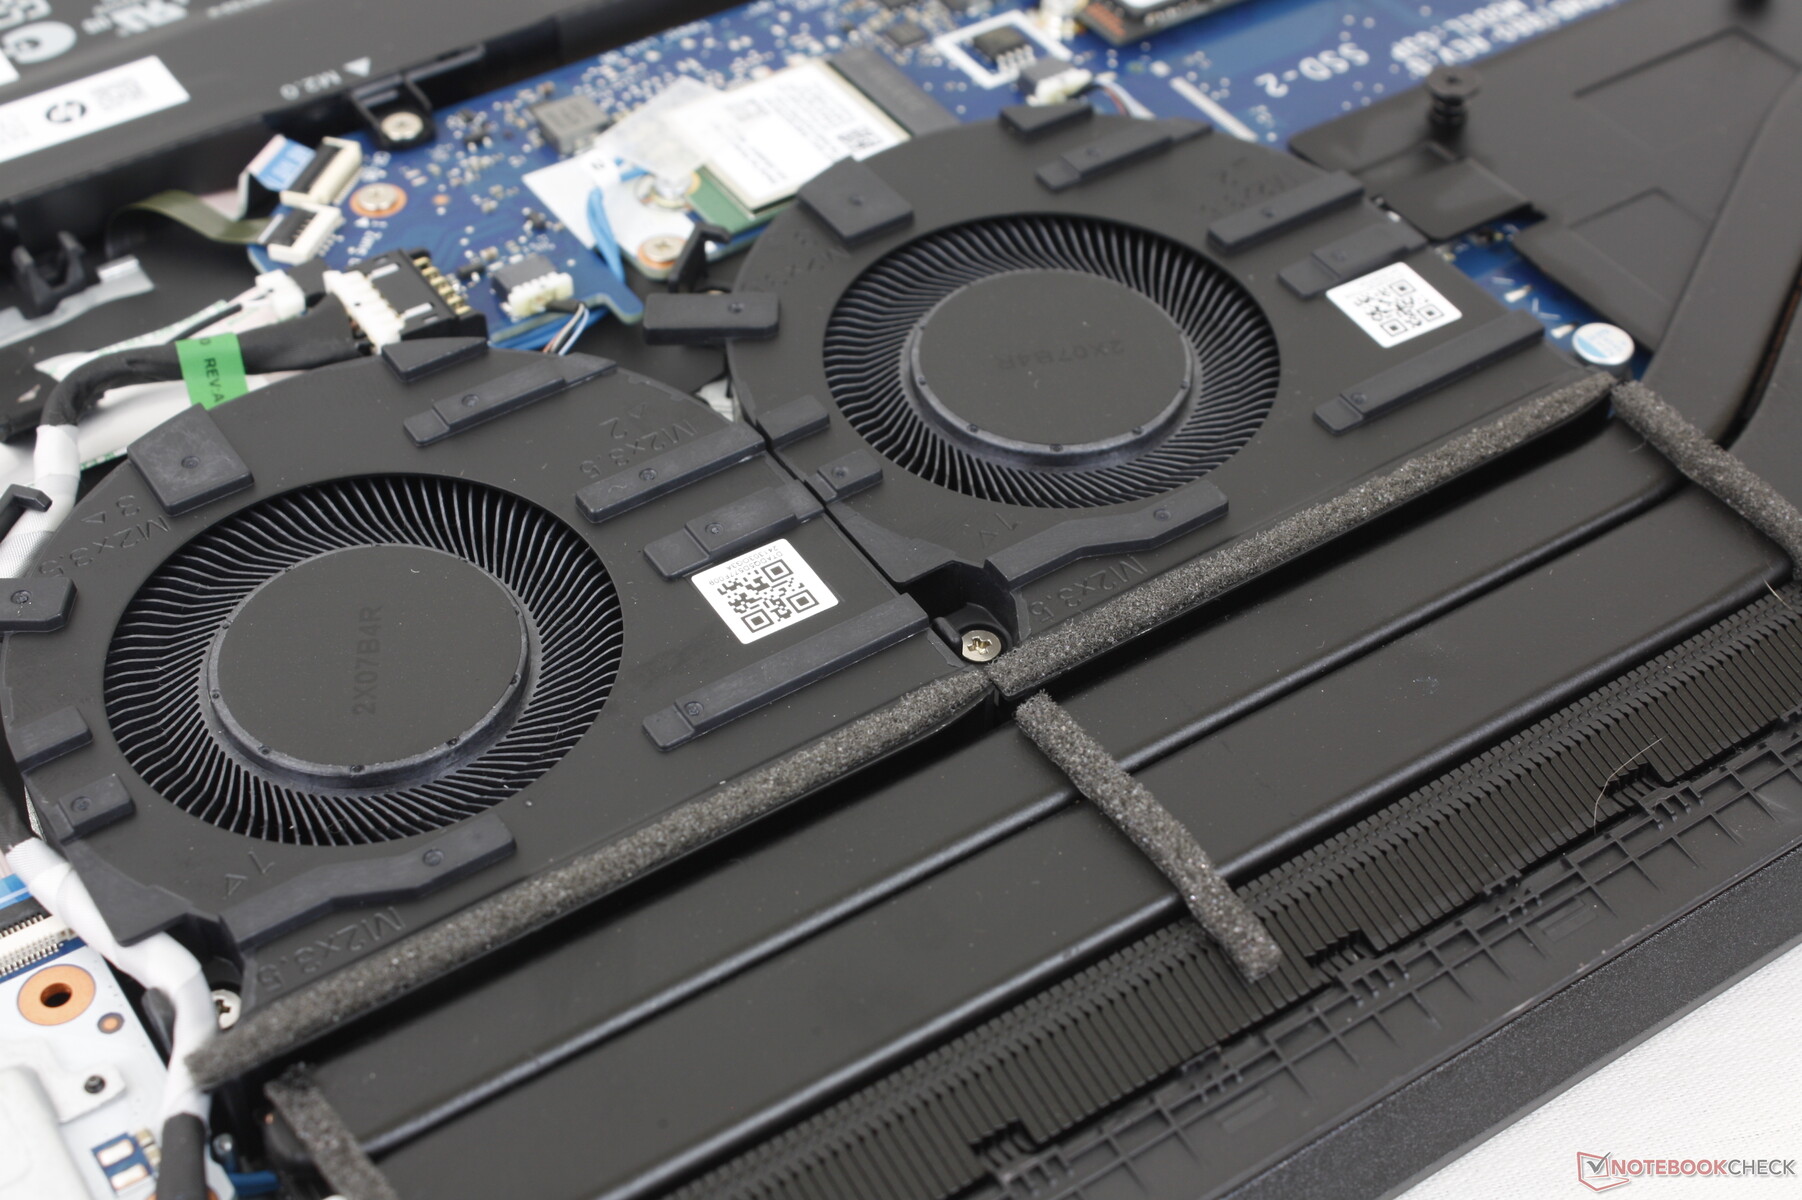
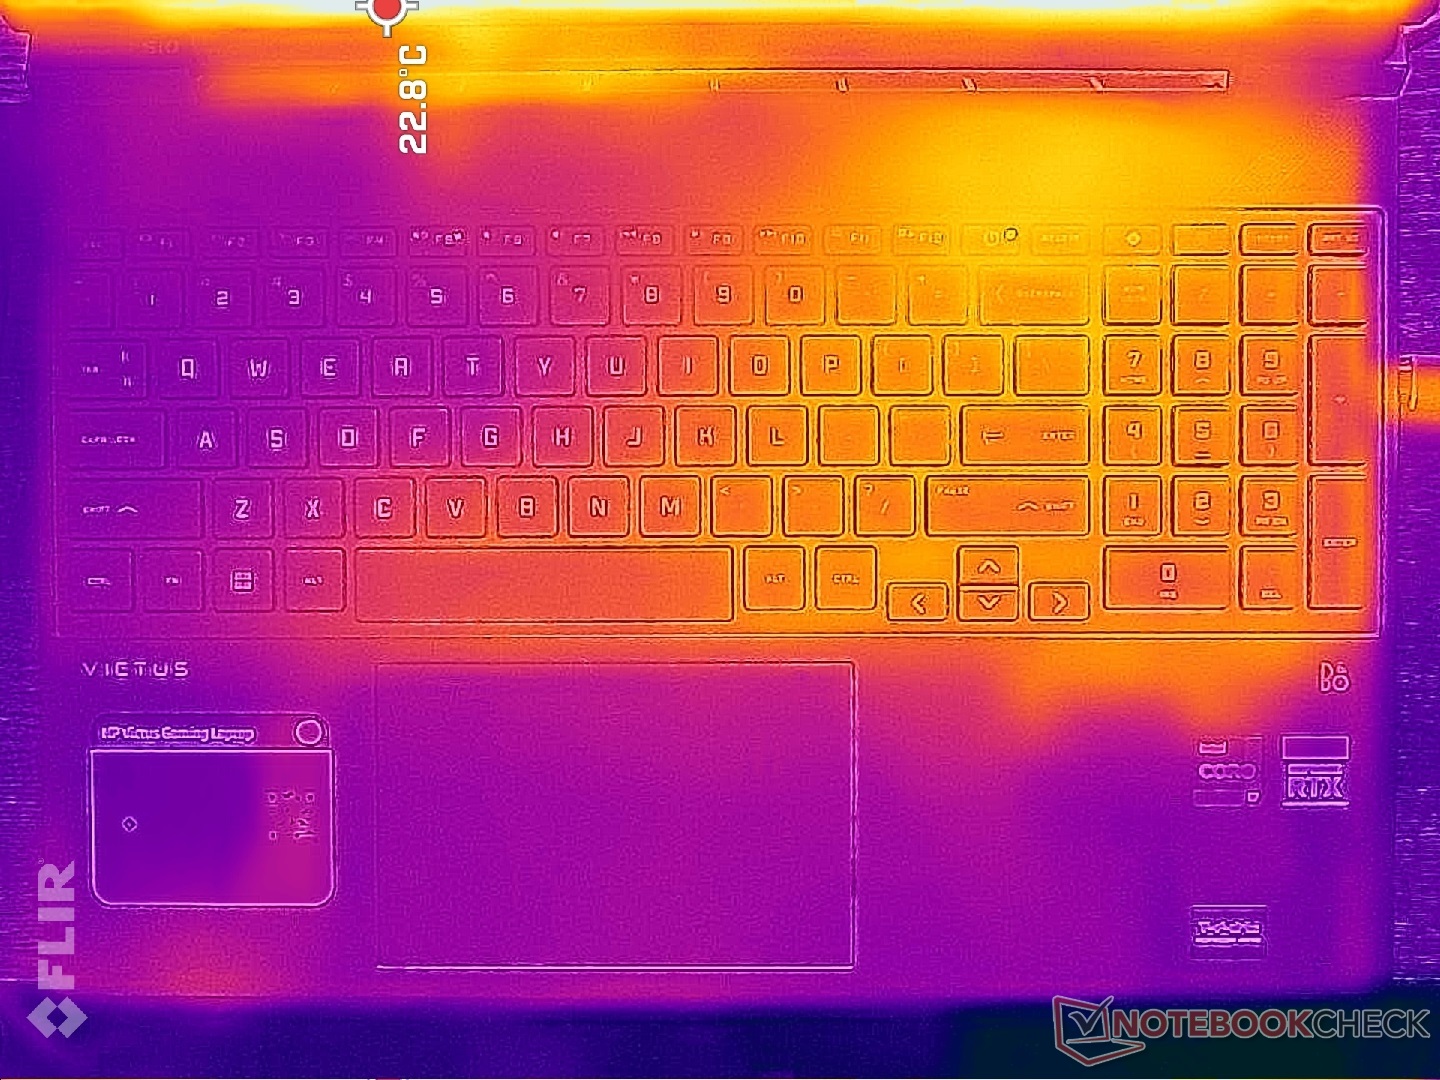
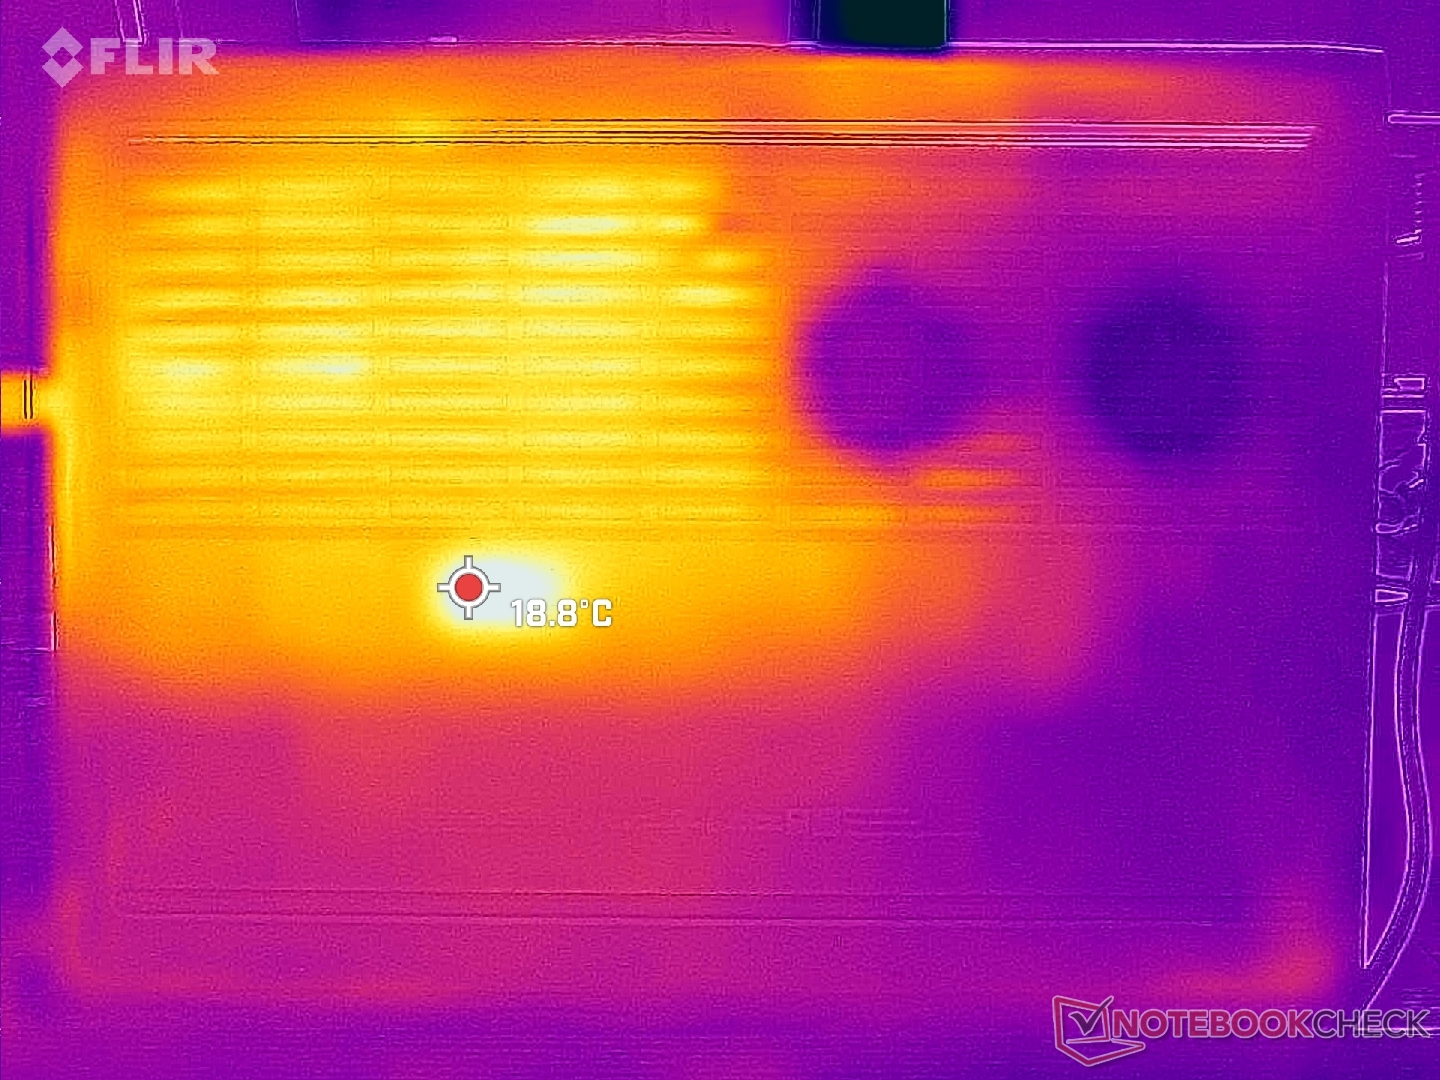
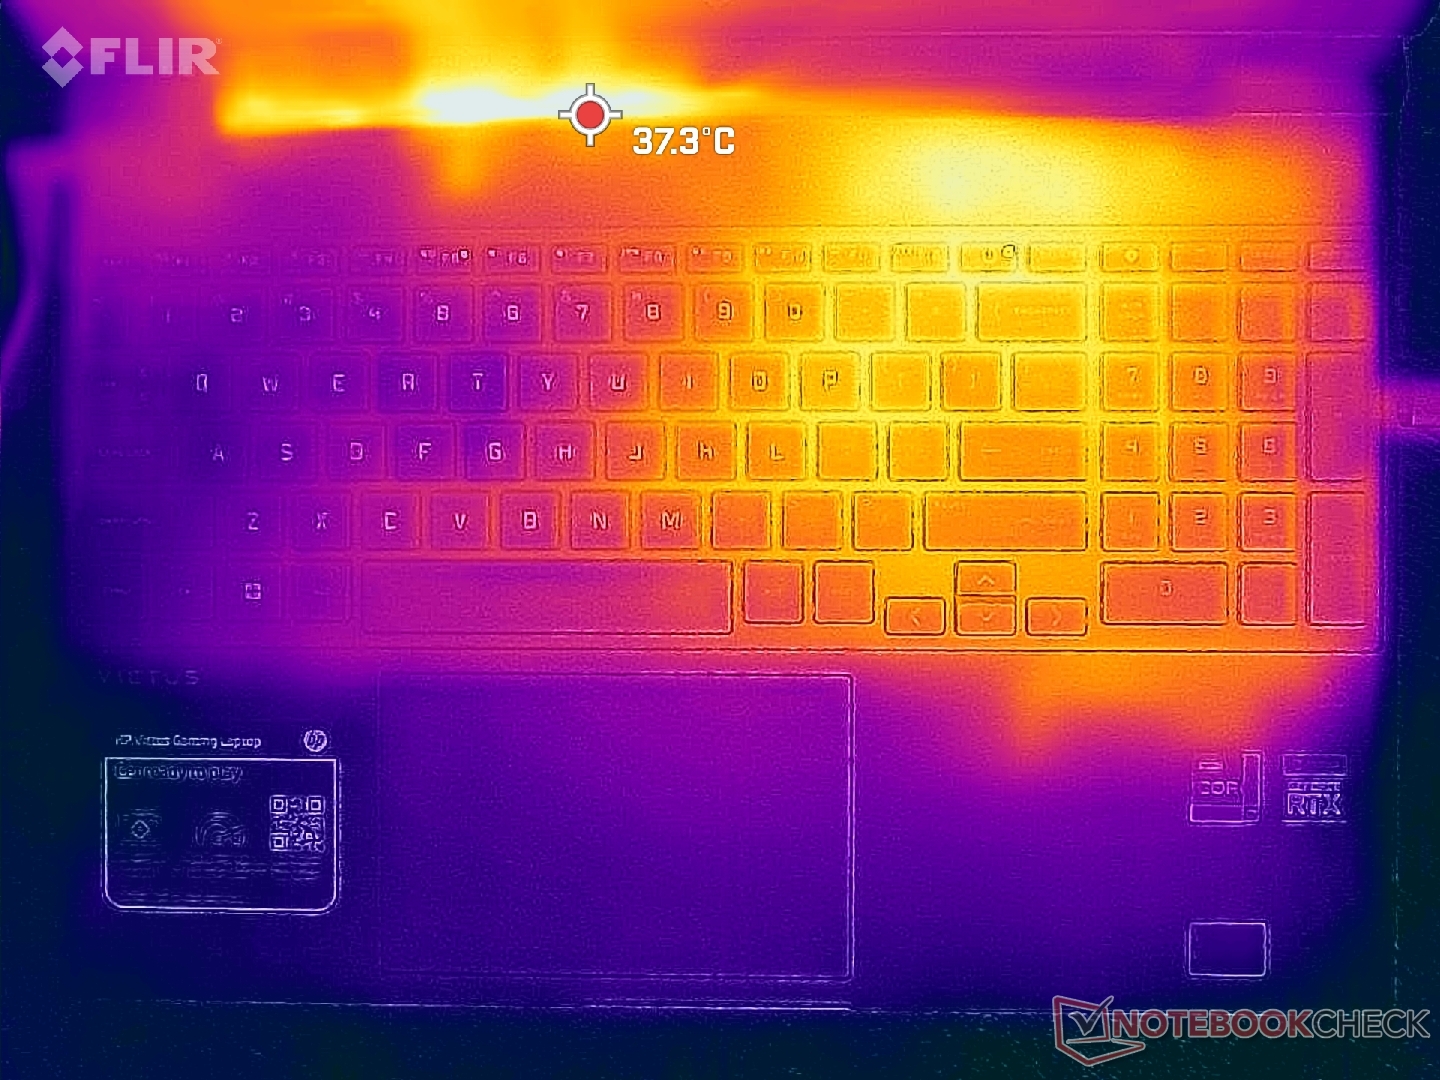
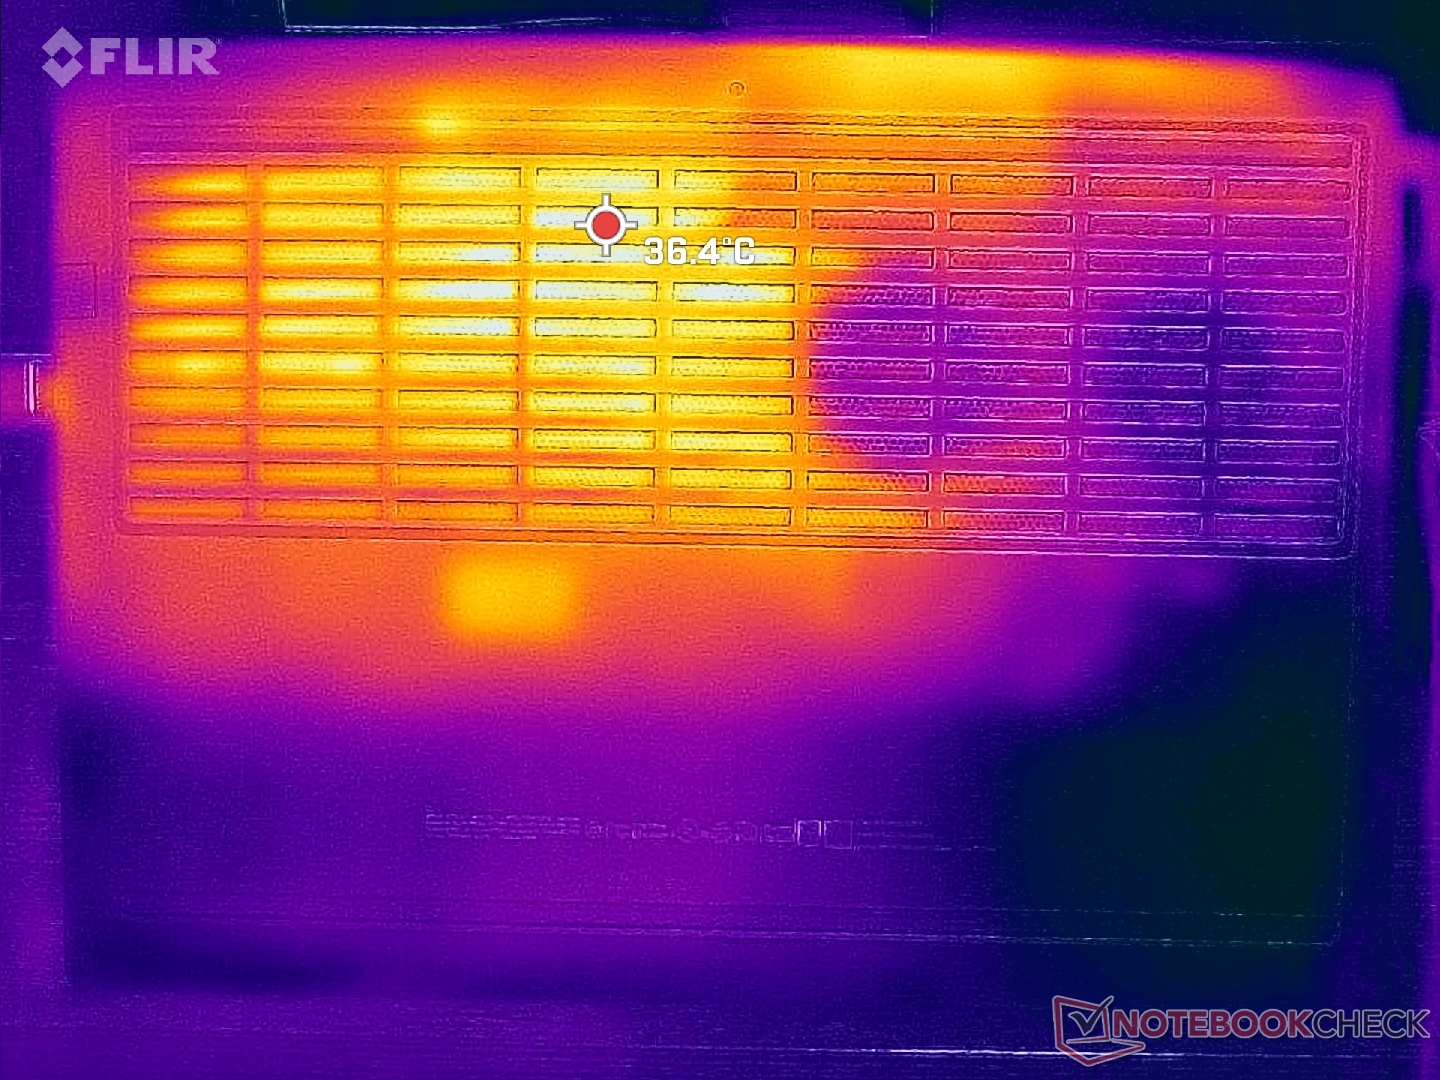
Temperature
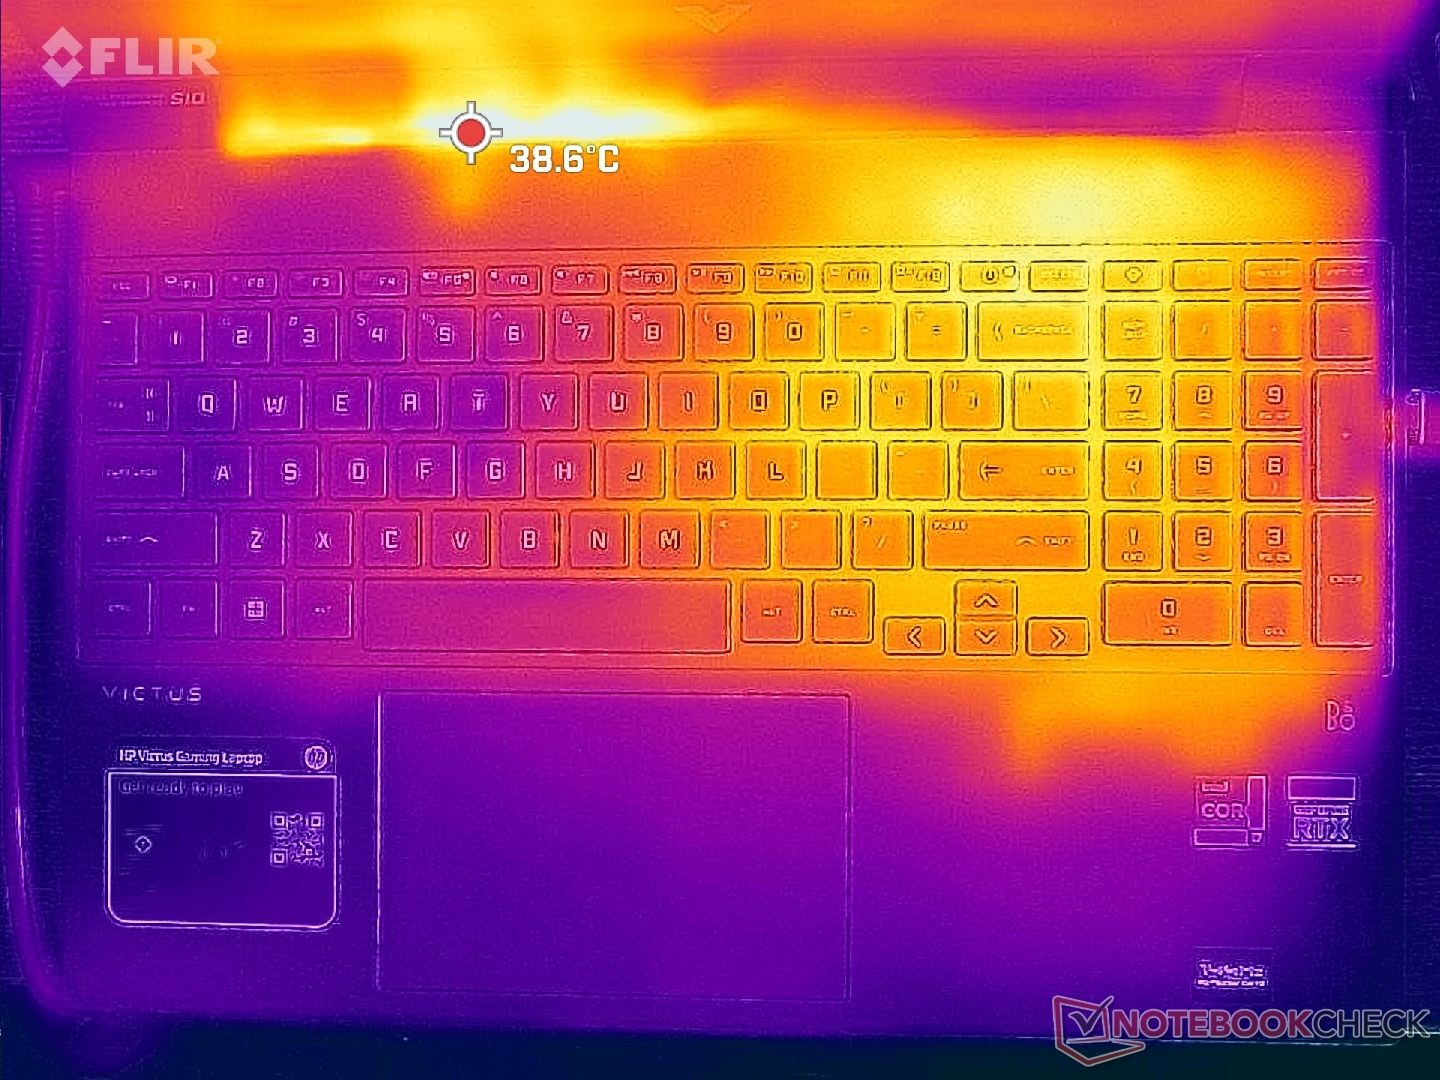
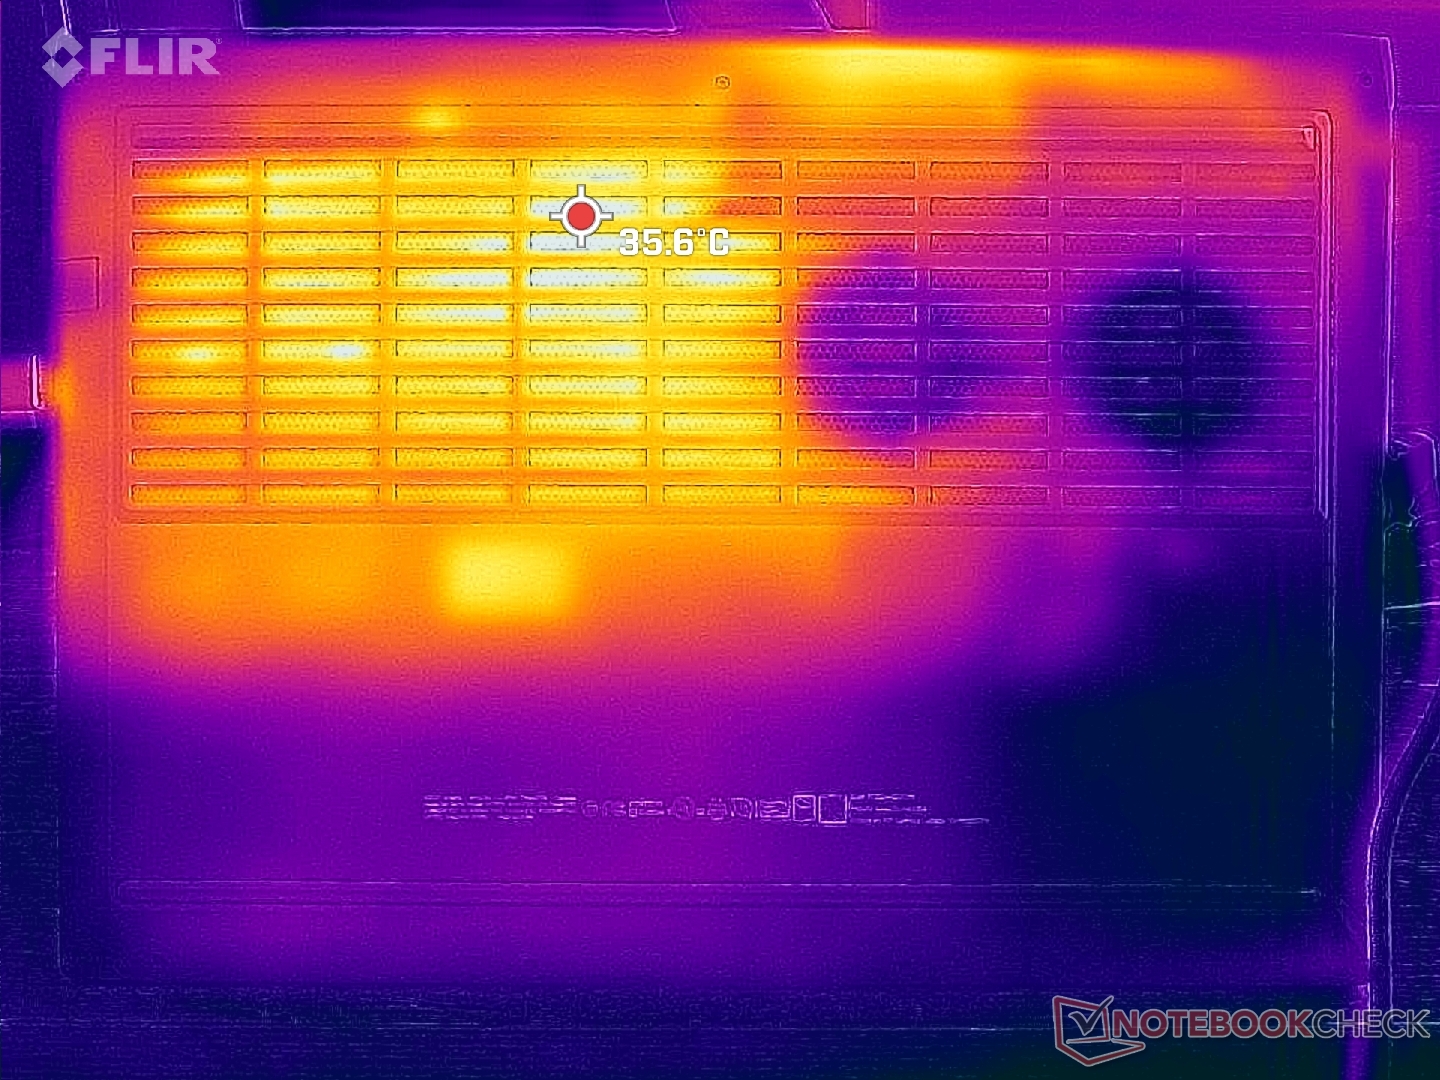
The cooling solution is not symmetrical unlike on the majority of gaming laptops. Thus, one half of the Victus 15 chassis will always be warmer than the other half as shown by our temperature maps below. Hot spots are thankfully not all that bad at just over 38 C on the top or 36 C on the bottom compared to almost 50 C on the Dell G5 15 equipped with the same Nvidia GPU. The palm rests and left half of the keyboard remain relatively cool no matter the onscreen load.
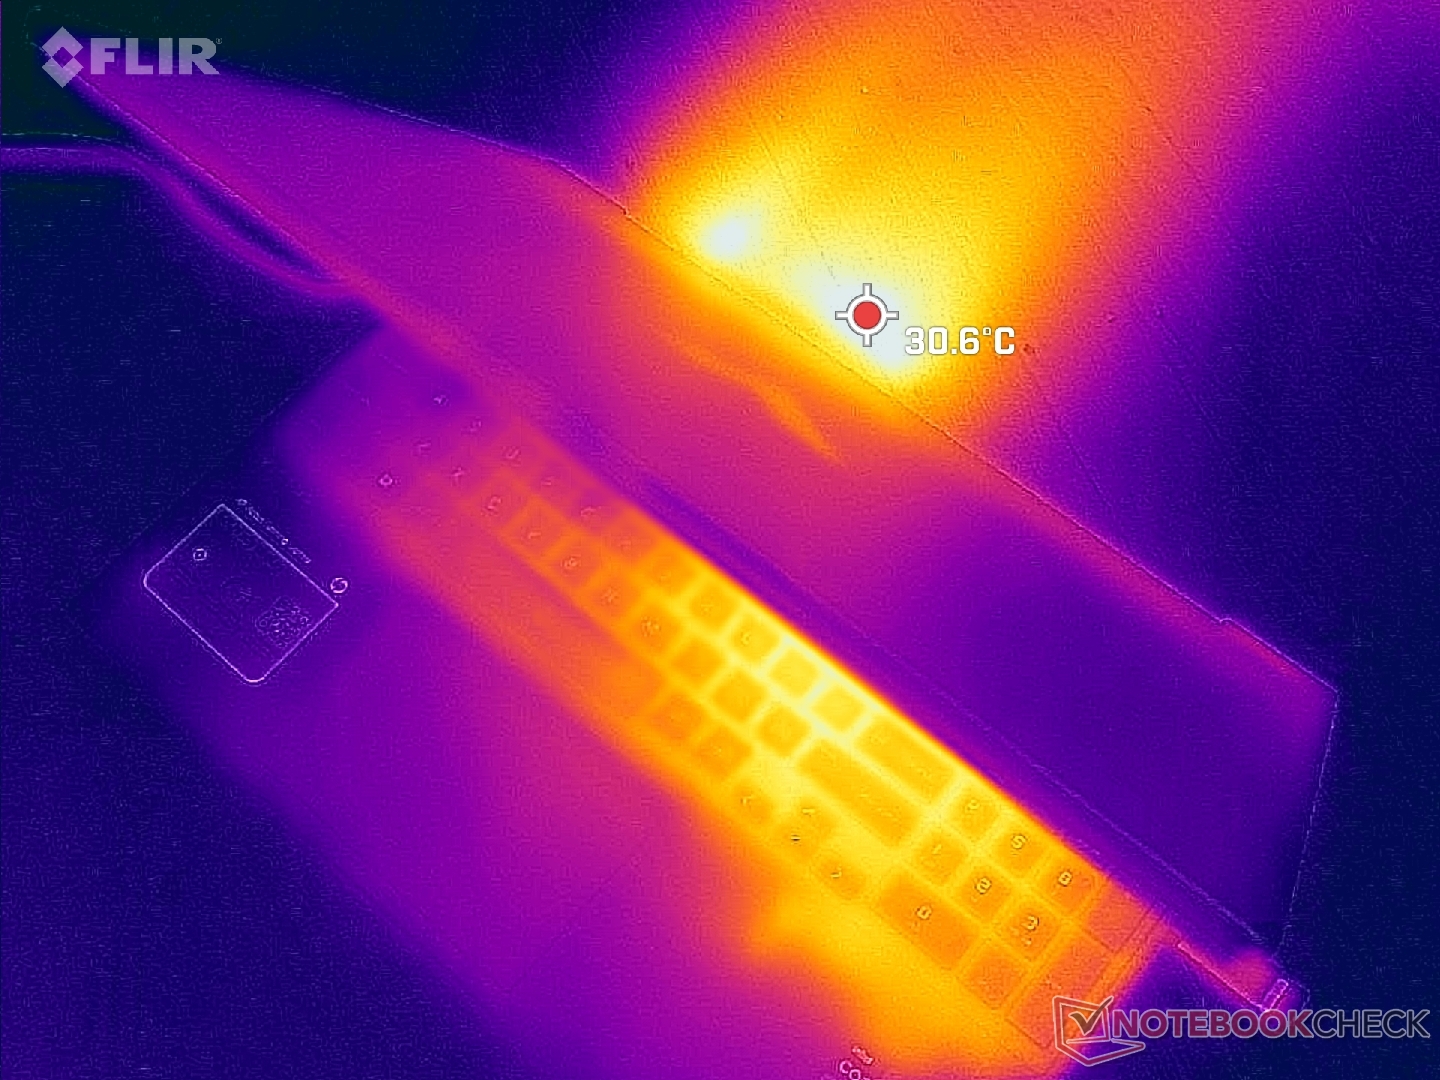
(+) The maximum temperature on the upper side is 37.2 °C / 99 F, compared to the average of 40.4 °C / 105 F, ranging from 21.2 to 68.8 °C for the class Gaming.
(+) The bottom heats up to a maximum of 35.4 °C / 96 F, compared to the average of 43.2 °C / 110 F
(+) In idle usage, the average temperature for the upper side is 20.4 °C / 69 F, compared to the device average of 33.9 °C / 93 F.
(+) Playing The Witcher 3, the average temperature for the upper side is 27.2 °C / 81 F, compared to the device average of 33.9 °C / 93 F.
(+) The palmrests and touchpad are cooler than skin temperature with a maximum of 23.2 °C / 73.8 F and are therefore cool to the touch.
(+) The average temperature of the palmrest area of similar devices was 28.8 °C / 83.8 F (+5.6 °C / 10 F).
| HP Victus 15 fa0020nr Intel Core i7-12700H, NVIDIA GeForce RTX 3050 Ti Laptop GPU | HP Omen 15-en0375ng AMD Ryzen 7 4800H, NVIDIA GeForce RTX 2060 Mobile | Dell G15 5515 AMD Ryzen 7 5800H, NVIDIA GeForce RTX 3050 Ti Laptop GPU | Asus TUF Dash F15 FX517ZC Intel Core i7-12650H, NVIDIA GeForce RTX 3050 4GB Laptop GPU | MSI Bravo 15 B5DD-010US AMD Ryzen 5 5600H, AMD Radeon RX 5500M | Lenovo Legion 5 15IAH7H 82RB Intel Core i7-12700H, NVIDIA GeForce RTX 3060 Laptop GPU | |
|---|---|---|---|---|---|---|
| Heat | -30% | -26% | -11% | -43% | -22% | |
| Maximum Upper Side * (°C) | 37.2 | 42 -13% | 50 -34% | 43.4 -17% | 52.2 -40% | 37.8 -2% |
| Maximum Bottom * (°C) | 35.4 | 54 -53% | 49 -38% | 44.4 -25% | 48.6 -37% | 51 -44% |
| Idle Upper Side * (°C) | 22.4 | 28 -25% | 26 -16% | 21.2 5% | 38 -70% | 25.8 -15% |
| Idle Bottom * (°C) | 22.6 | 29 -28% | 26 -15% | 24 -6% | 28.4 -26% | 28.8 -27% |
* ... smaller is better
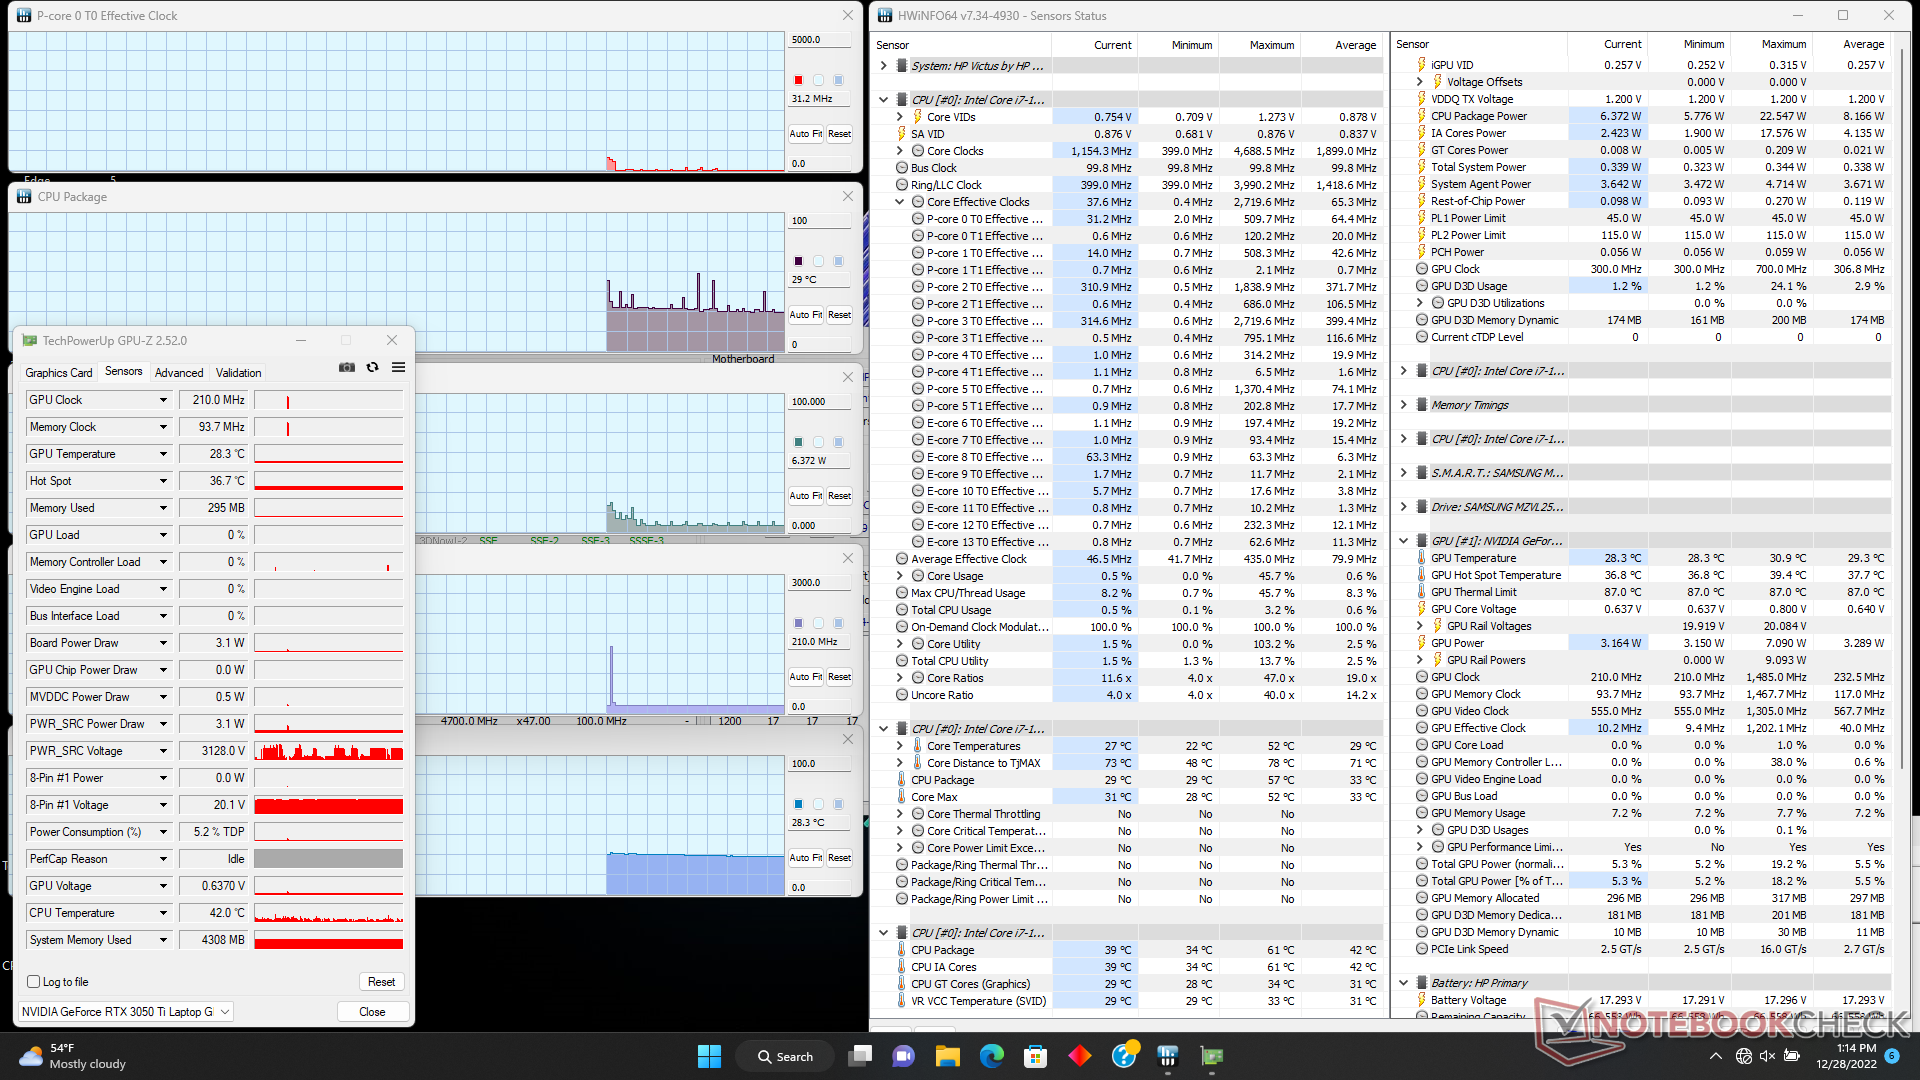
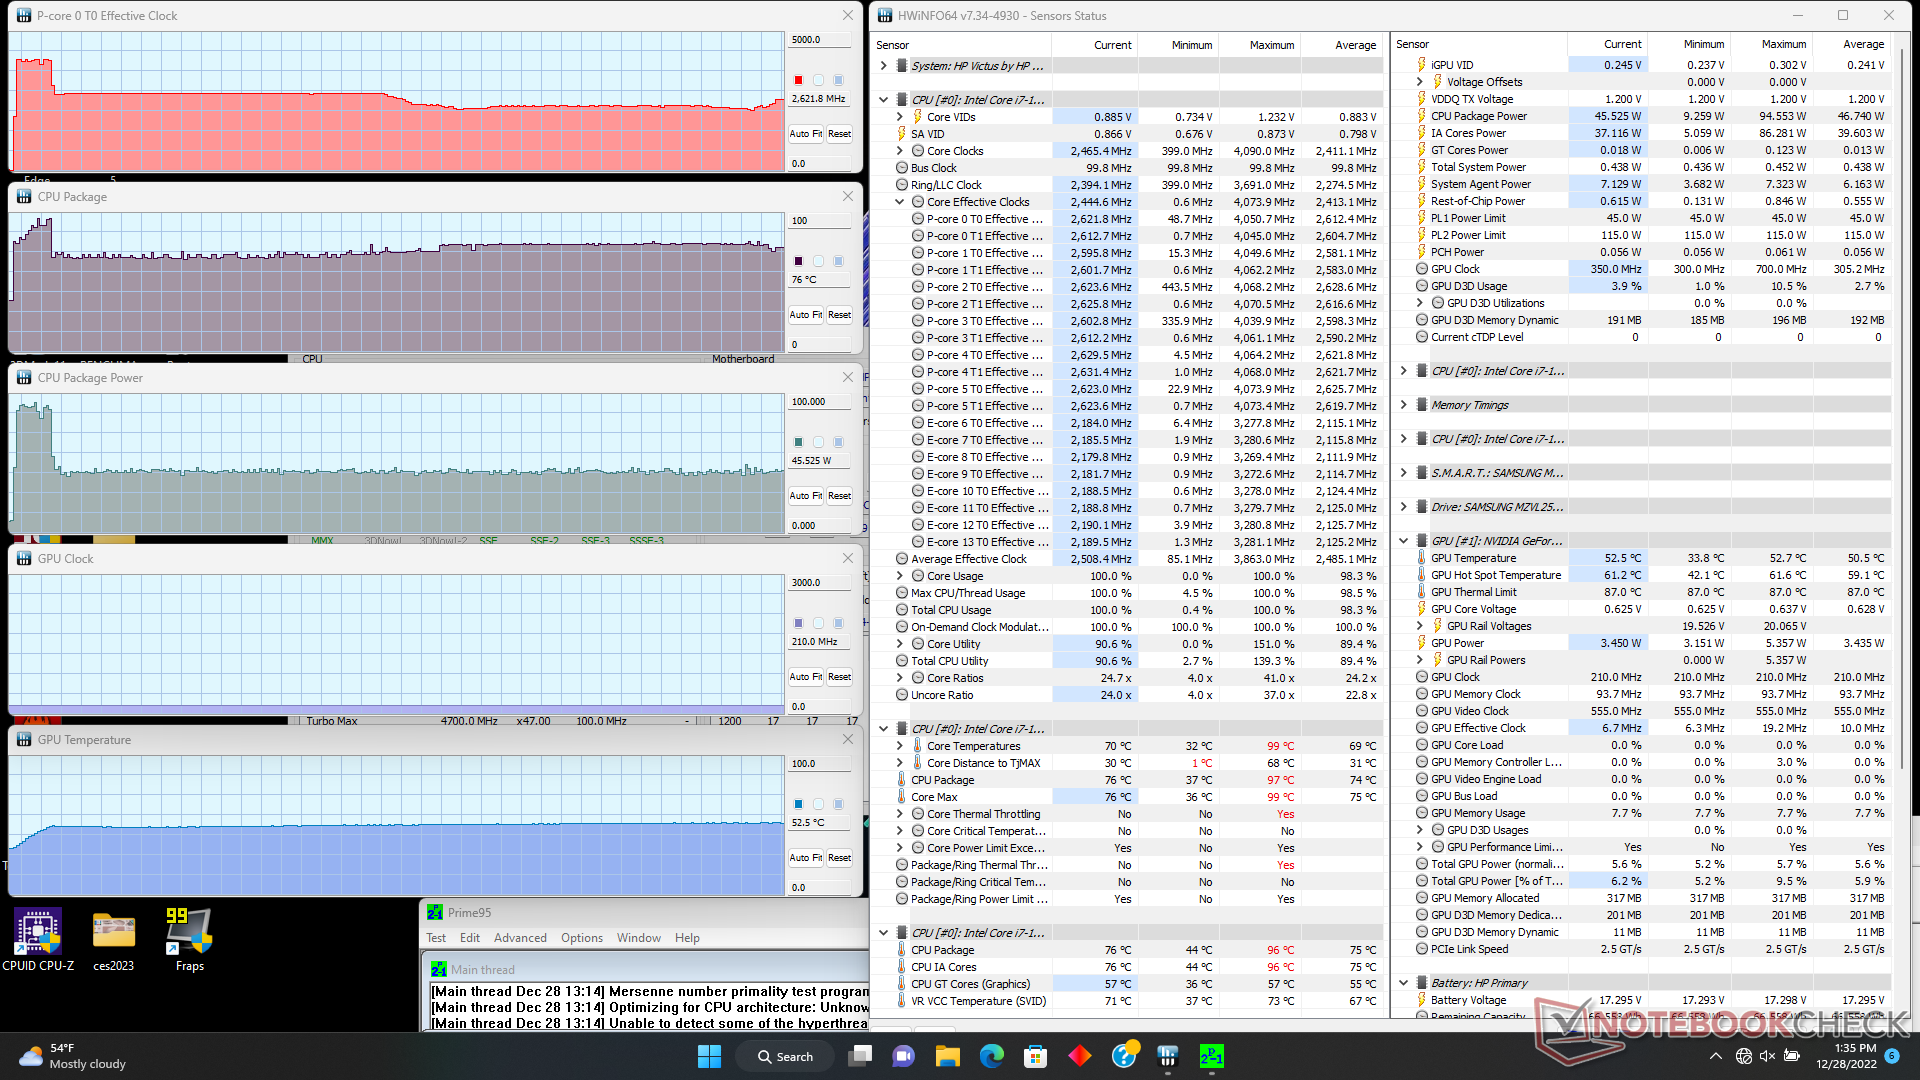
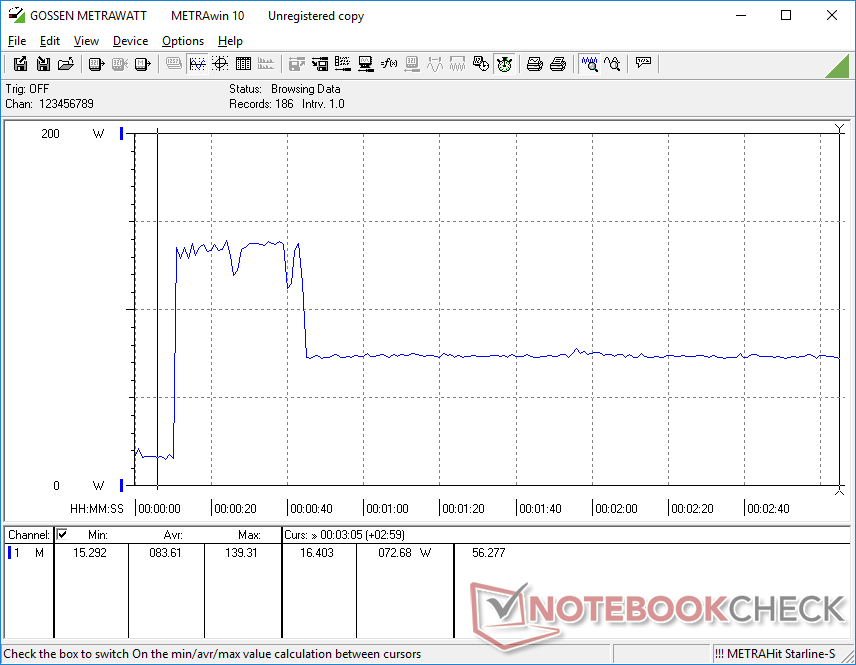
Stress Test
When running Prime95 to stress the CPU, clock rates and board power draw can be observed boosting to as high as 4.1 GHz and 93 W, respectively. Once core temperature reaches 97 C about 30 seconds later, however, clock rates and board power draw would drop to just ~2.4 GHz and 45 W, respectively, in order to maintain a cooler core temperature of around 76 C. In comparison, repeating this same test on the Lenovo Legion 5 15 with the same CPU would result in a faster stable clock rate of 3.6 GHz and a warmer core temperature of 97 C. The Victus 15 is therefore playing it conservatively even when set to its highest performance settings.
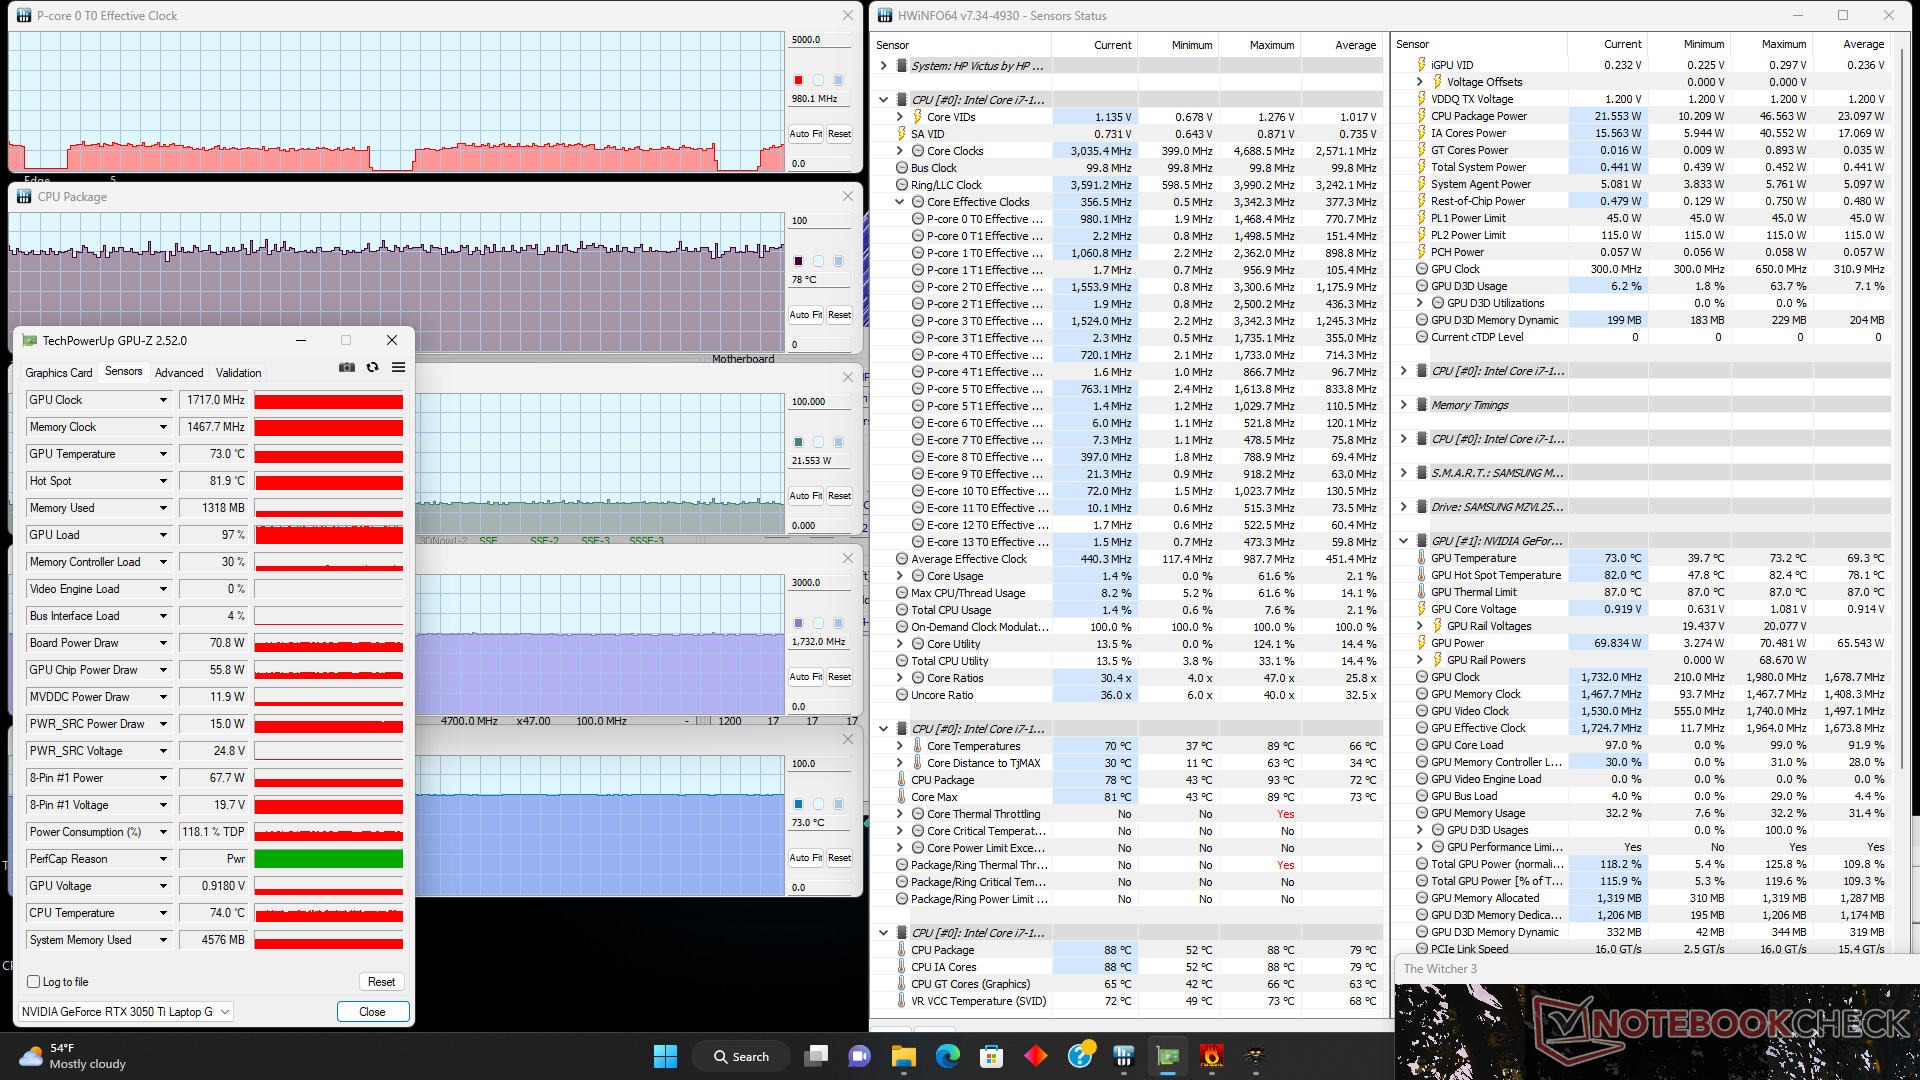
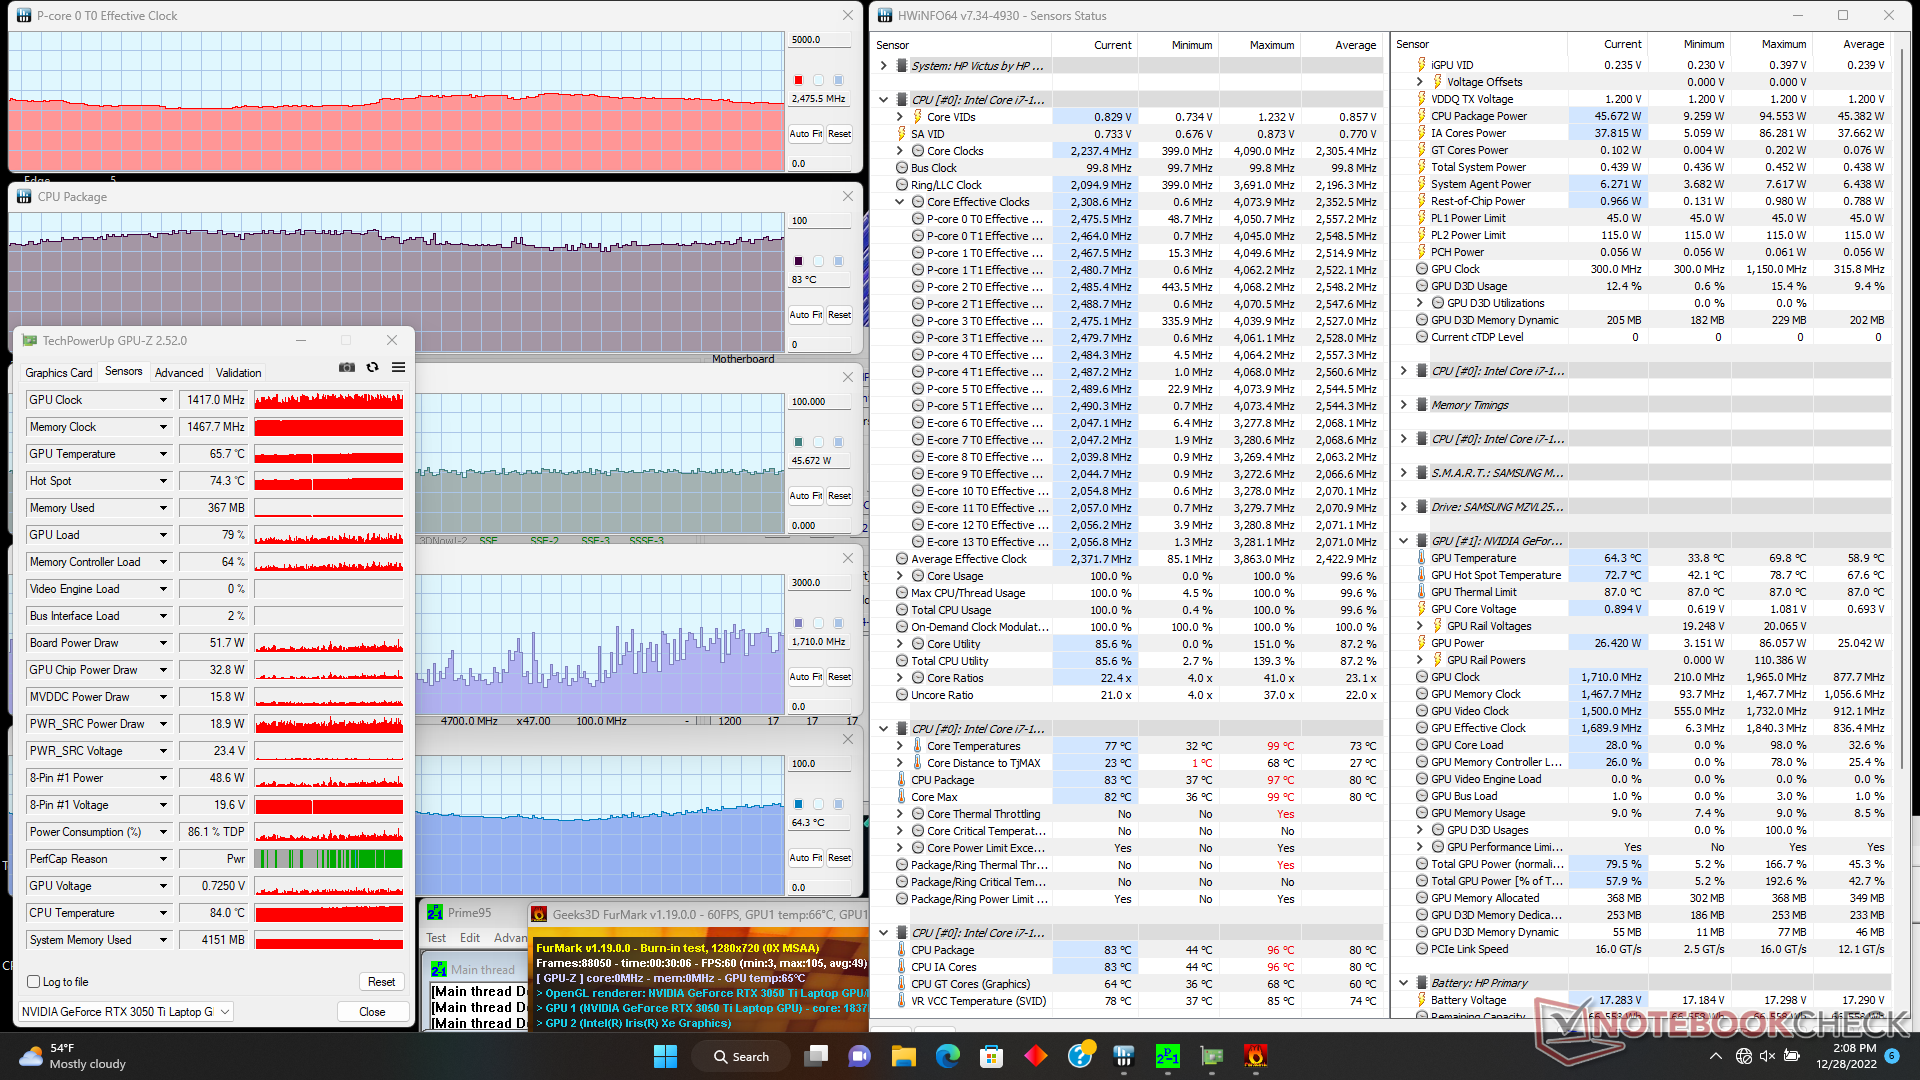
GPU clock rates, temperature, and board power draw would stabilize at 1717 MHz, 73 C, and 71 W, respectively, when running Witcher 3. TGP is rated for 75 W and so the 71 W real-world power draw comes quite close. Repeating this test on the Dell G5 with the same GPU would result in slightly higher values across the board (1845 MHz core clock, 1500 MHz memory clock, 79 C, and 80 W draw). The generally lower core temperatures of the HP when under load contribute to its cooler surface temperatures mentioned above.
Running on battery power limits performance. A 3DMark Fire Strike test on batteries would return Physics and Graphics scores of 22703 and 9496 points, respectively, compared to 28270 and 14628 points when on mains.
| CPU Clock (GHz) | GPU Clock (MHz) | Average CPU Temperature (°C) | Average GPU Temperature (°C) | |
| System Idle | -- | -- | 29 | 28 |
| Prime95 Stress | 2.2 - 2.6 | -- | 76 | 53 |
| Prime95 + FurMark Stress | 2.2 - 2.8 | ~1417 - 1710 | 70 - 90 | 54 - 69 |
| Witcher 3 Stress | ~1.0 | 1717 | 78 | 73 |
Speakers
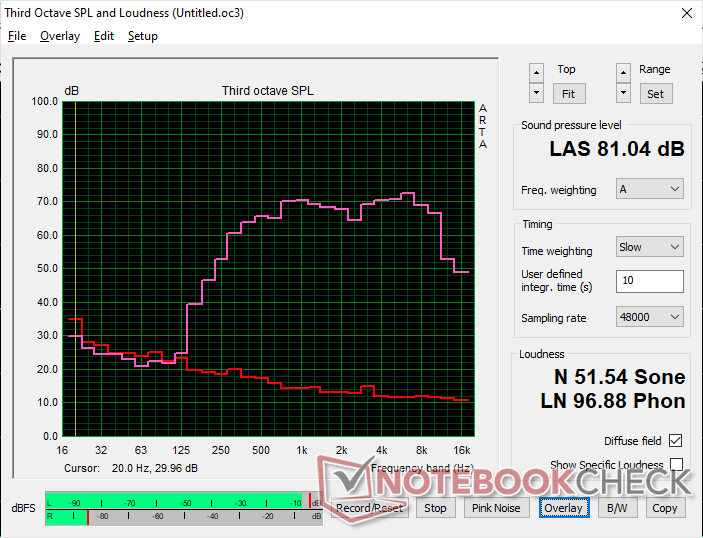
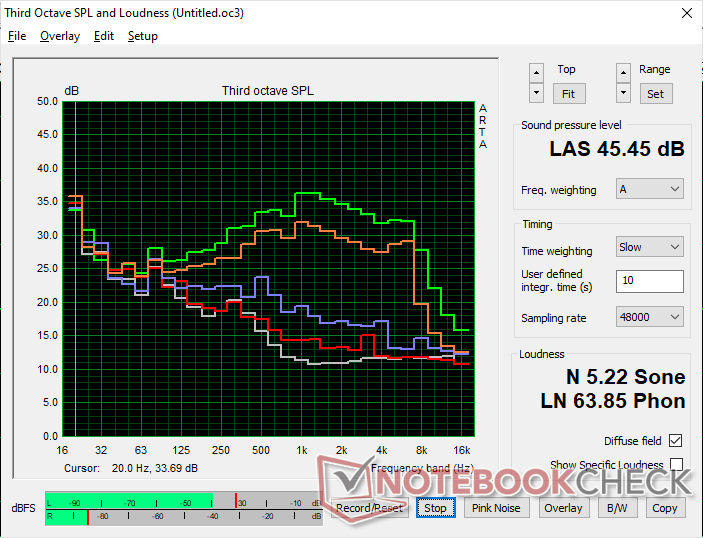
HP Victus 15 fa0020nr audio analysis
(±) | speaker loudness is average but good (81 dB)
Bass 100 - 315 Hz
(-) | nearly no bass - on average 24.6% lower than median
(±) | linearity of bass is average (12.8% delta to prev. frequency)
Mids 400 - 2000 Hz
(+) | balanced mids - only 2.5% away from median
(+) | mids are linear (3.4% delta to prev. frequency)
Highs 2 - 16 kHz
(+) | balanced highs - only 3.7% away from median
(+) | highs are linear (4.9% delta to prev. frequency)
Overall 100 - 16.000 Hz
(±) | linearity of overall sound is average (19.7% difference to median)
Compared to same class
» 69% of all tested devices in this class were better, 6% similar, 25% worse
» The best had a delta of 6%, average was 18%, worst was 132%
Compared to all devices tested
» 50% of all tested devices were better, 7% similar, 43% worse
» The best had a delta of 4%, average was 24%, worst was 134%
Apple MacBook Pro 16 2021 M1 Pro audio analysis
(+) | speakers can play relatively loud (84.7 dB)
Bass 100 - 315 Hz
(+) | good bass - only 3.8% away from median
(+) | bass is linear (5.2% delta to prev. frequency)
Mids 400 - 2000 Hz
(+) | balanced mids - only 1.3% away from median
(+) | mids are linear (2.1% delta to prev. frequency)
Highs 2 - 16 kHz
(+) | balanced highs - only 1.9% away from median
(+) | highs are linear (2.7% delta to prev. frequency)
Overall 100 - 16.000 Hz
(+) | overall sound is linear (4.6% difference to median)
Compared to same class
» 0% of all tested devices in this class were better, 0% similar, 100% worse
» The best had a delta of 5%, average was 17%, worst was 45%
Compared to all devices tested
» 0% of all tested devices were better, 0% similar, 100% worse
» The best had a delta of 4%, average was 24%, worst was 134%
Energy Management
Power Consumption — Similar To GeForce RTX 2060
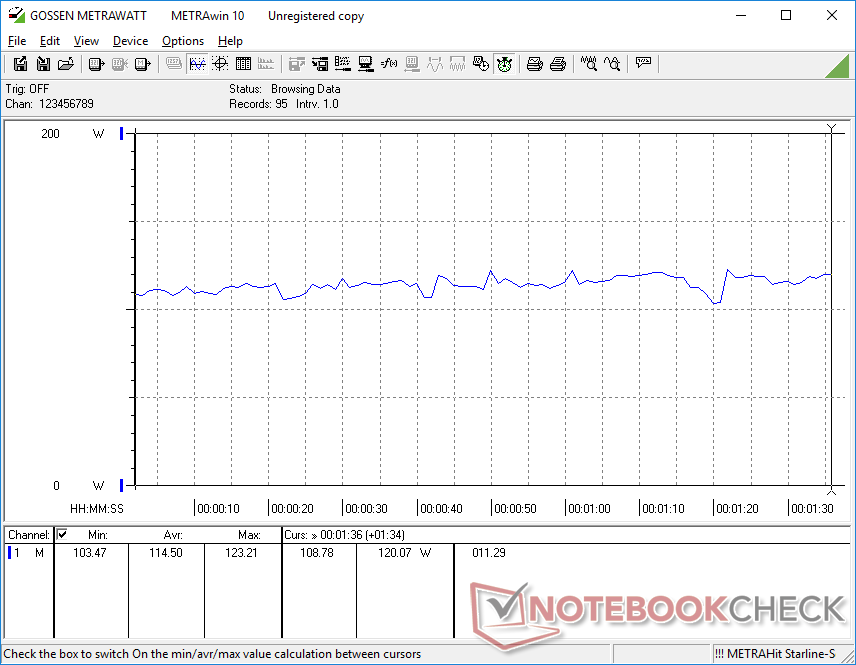
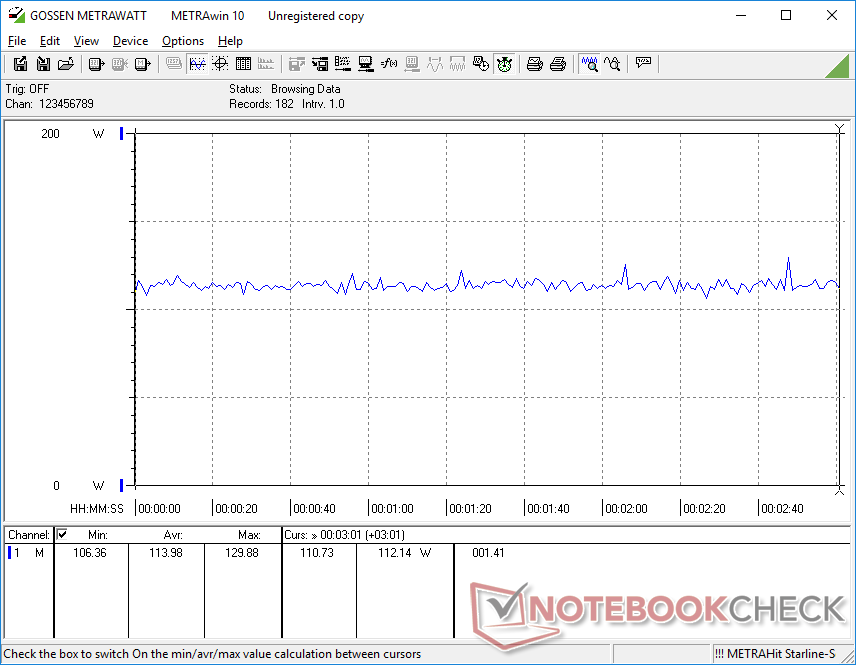
Idling on desktop consumes between 5 W and 19 W depending on the power profile, brightness level, and Optimus setting. When gaming, overall consumption becomes very close to the Omen 15 with the older RTX 2060. It's disappointing that the performance-per-watt of the RTX 3050 Ti isn't much better than the RTX 2060 despite them being a full generation apart and with similar performance levels.
Laptops with the competing Radeon RX 6600M like the MSI Alpha 15 may consume about 15 percent more power than our HP when gaming, but the appreciable 30 to 50 percent gain in graphics performance makes it a good tradeoff.
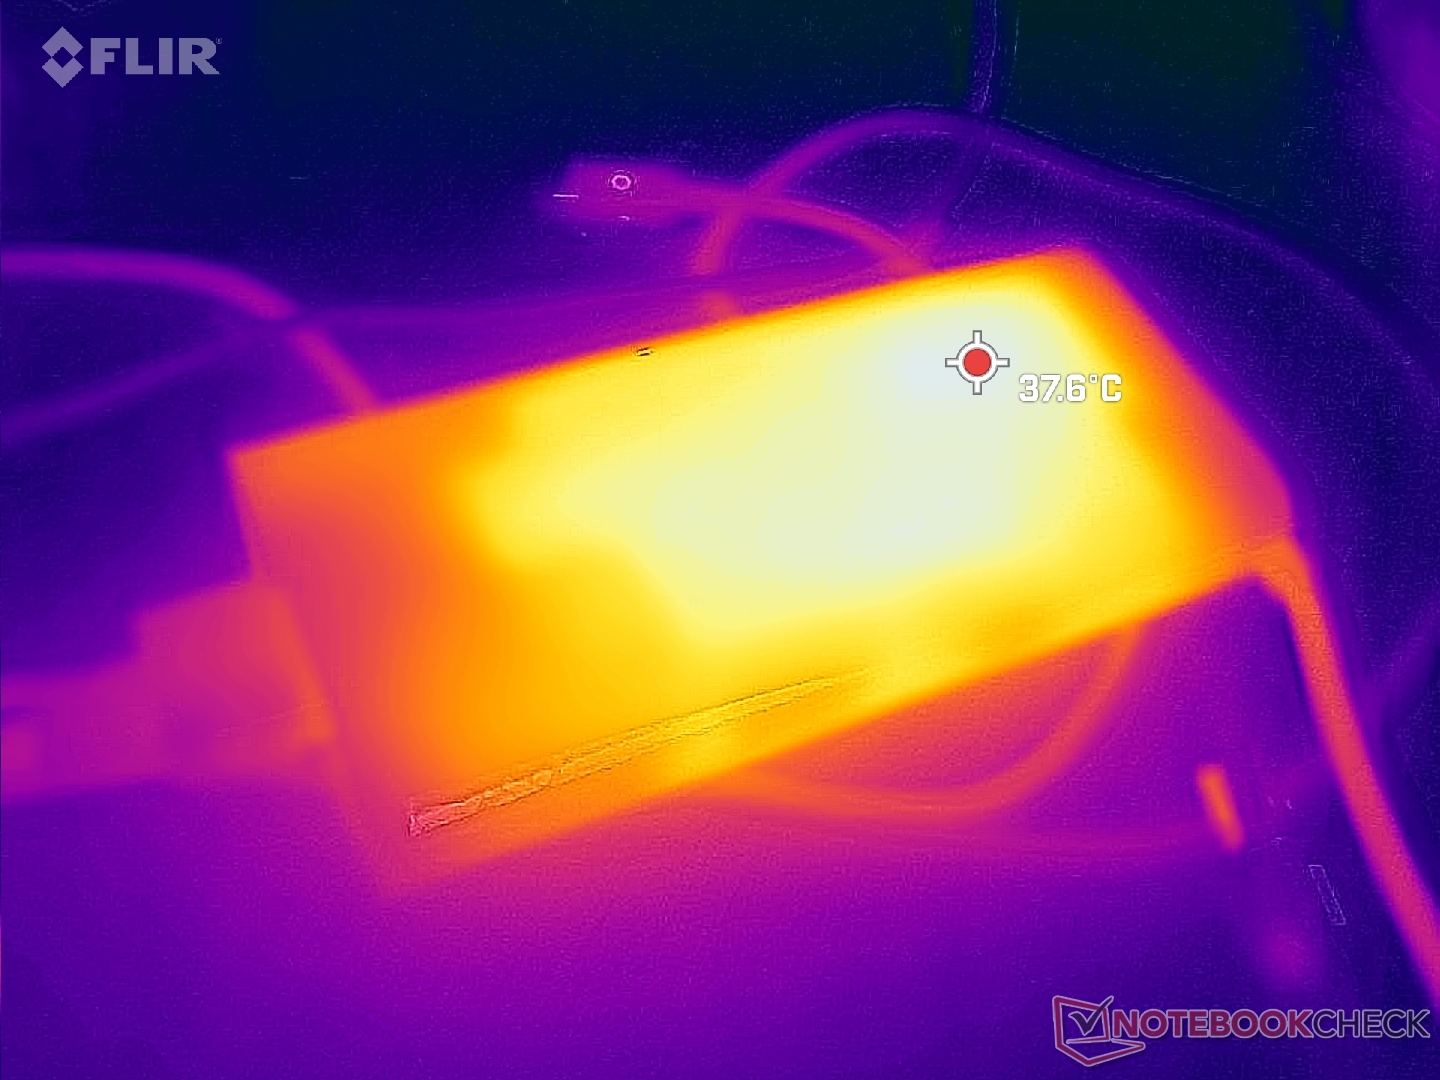
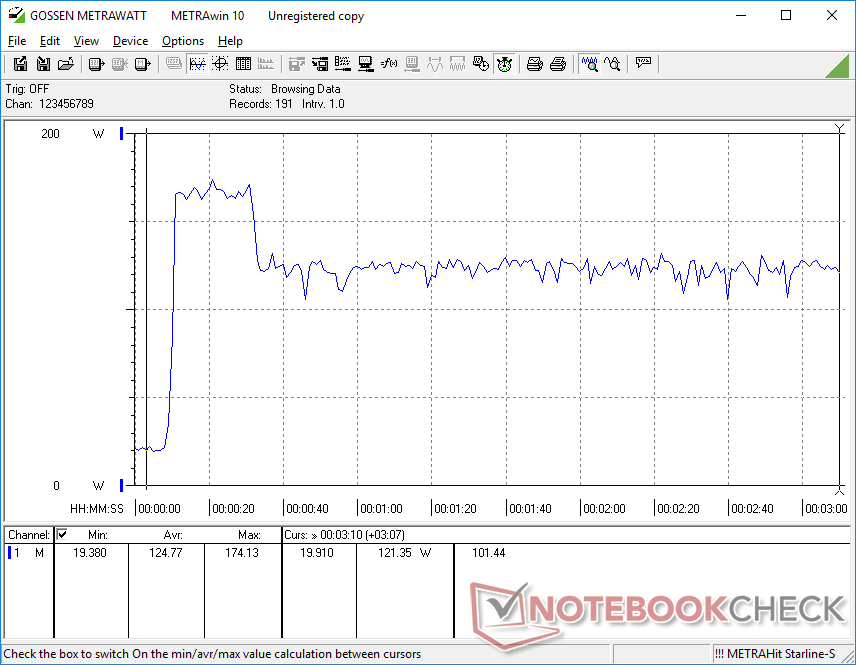
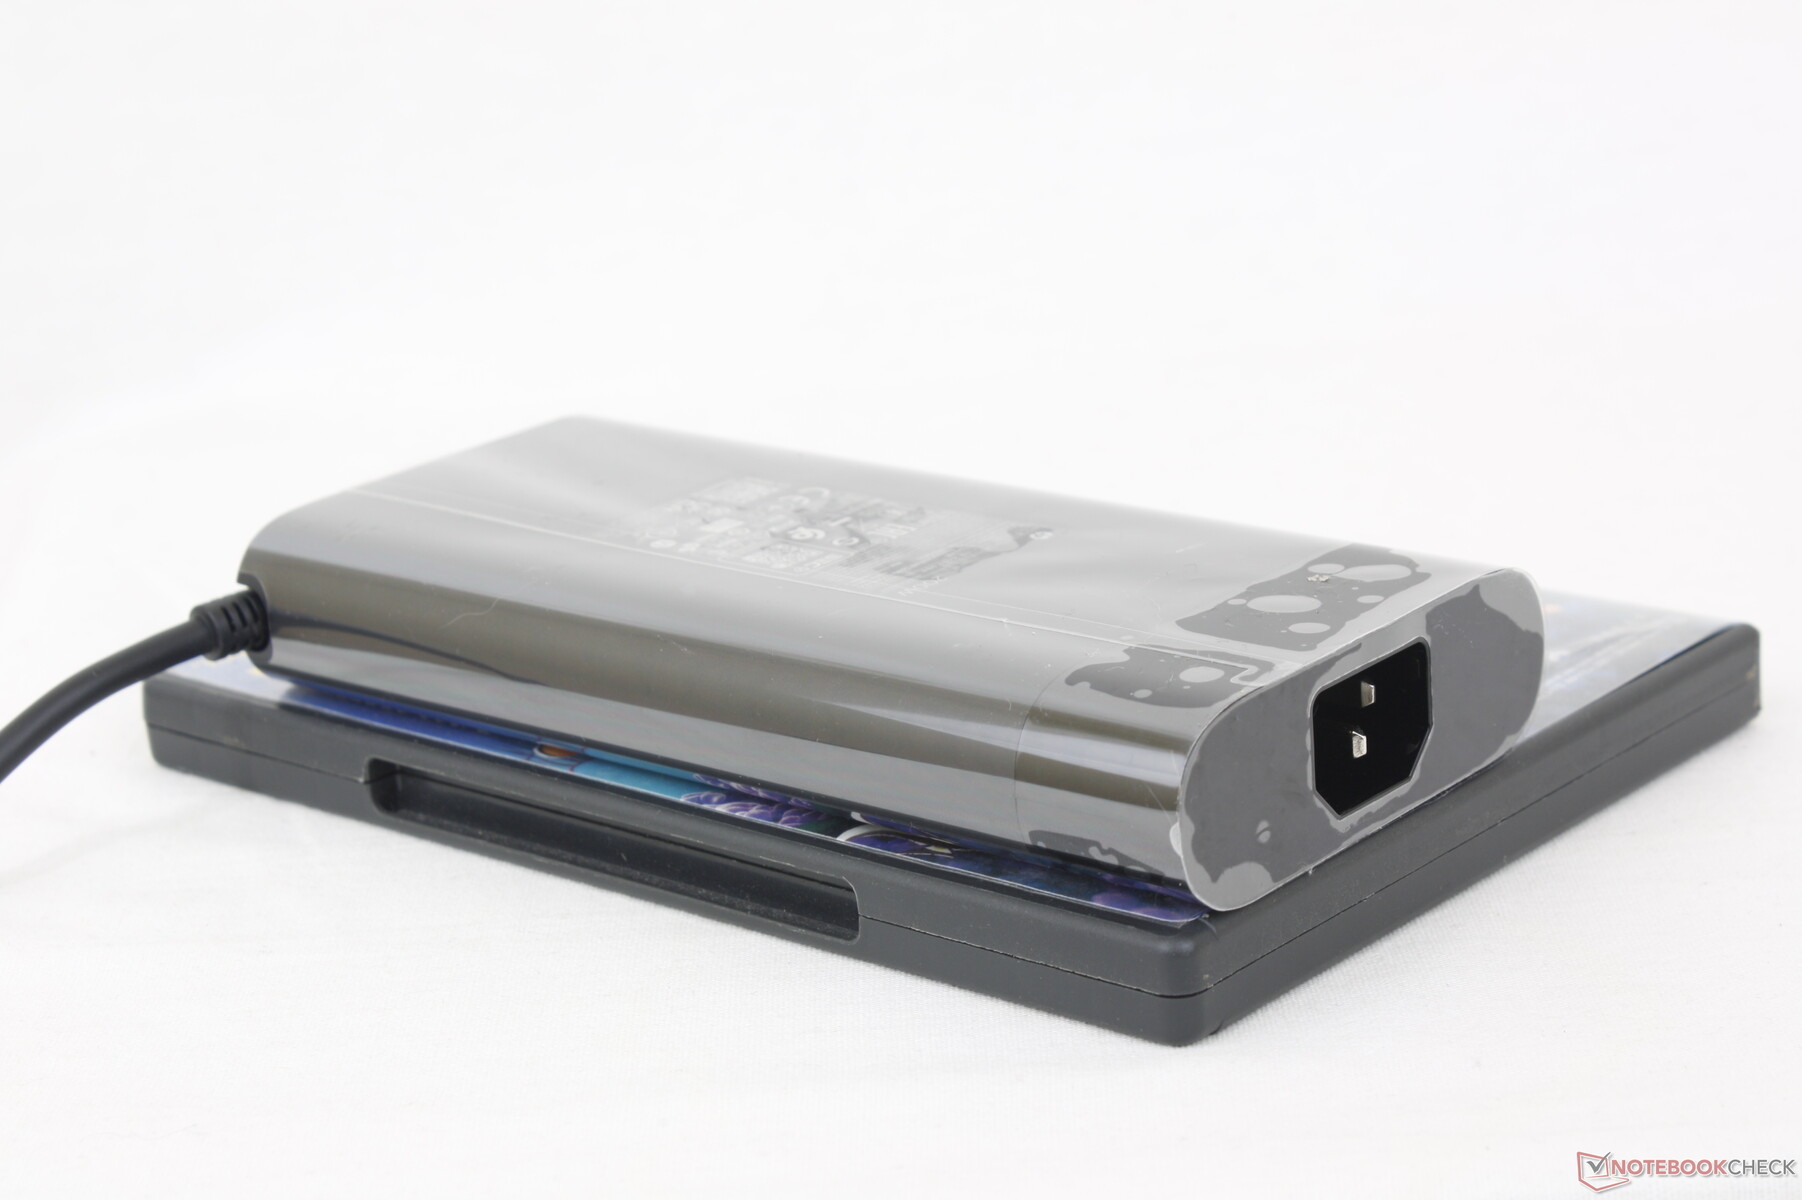
We're able to measure a maximum draw of 175 W from the medium-sized (~16.5 x 7.8 x 2.5 cm) 200 W AC adapter when at maximum utilization as shown by the screenshot below. This rate is temporary since the cooling solution cannot sufficiently cool the CPU for indefinite Turbo Boost usage.
| Off / Standby | |
| Idle | |
| Load |
|
Key:
min: | |
| HP Victus 15 fa0020nr i7-12700H, GeForce RTX 3050 Ti Laptop GPU, Samsung PM9A1 MZVL2512HCJQ, IPS, 1920x1080, 15.6" | HP Omen 15-en0375ng R7 4800H, GeForce RTX 2060 Mobile, WDC PC SN730 SDBPNTY-512G, IPS, 1920x1080, 15.6" | Dell G15 5515 R7 5800H, GeForce RTX 3050 Ti Laptop GPU, Samsung PM991a MZ9LQ512HBLU-00BD1, IPS, 1920x1080, 15.6" | Asus TUF Dash F15 FX517ZC i7-12650H, GeForce RTX 3050 4GB Laptop GPU, Intel SSD 670p SSDPEKNU512GZ, IPS, 2560x1440, 15.6" | MSI Bravo 15 B5DD-010US R5 5600H, Radeon RX 5500M, Kingston OM8PCP3512F-AB, IPS, 1920x1080, 15.6" | Lenovo Legion 5 15IAH7H 82RB i7-12700H, GeForce RTX 3060 Laptop GPU, , IPS, 1920x1080, 15.6" | |
|---|---|---|---|---|---|---|
| Power Consumption | 7% | 7% | -29% | 15% | -106% | |
| Idle Minimum * (Watt) | 5.1 | 4 22% | 5 2% | 9.2 -80% | 6.6 -29% | 19.8 -288% |
| Idle Average * (Watt) | 15.1 | 9 40% | 9 40% | 15.9 -5% | 9.8 35% | 26.2 -74% |
| Idle Maximum * (Watt) | 18.9 | 22 -16% | 20 -6% | 29.5 -56% | 10.8 43% | 48.2 -155% |
| Load Average * (Watt) | 114.5 | 102 11% | 94 18% | 124.8 -9% | 70.5 38% | 102.9 10% |
| Witcher 3 ultra * (Watt) | 113.9 | 119 -4% | 123 -8% | 129.2 -13% | 103.2 9% | 186.7 -64% |
| Load Maximum * (Watt) | 165.8 | 182 -10% | 172 -4% | 178.4 -8% | 175 -6% | 268 -62% |
* ... smaller is better
Power Consumption Witcher 3 / Stresstest
Power Consumption external Monitor
Battery Life — Poor On All Settings
Runtimes are so bad that we suspect there could be a software bug with our configuration or model as a whole. We're only able to squeeze out just 2.5 hours of battery life when simply idling on desktop at the lowest brightness setting with the iGPU active and WLAN disabled. We repeated the test just to be sure and results would not improve. Task Manager would show no particular application being a resource hog, either. The competing Dell G5 or MSI Bravo 15 can last for several hours longer despite having smaller internal batteries.
Charging from empty to full capacity takes between 1.5 to 2 hours. The system cannot be recharged via USB-C.
| HP Victus 15 fa0020nr i7-12700H, GeForce RTX 3050 Ti Laptop GPU, 70 Wh | HP Omen 15-en0375ng R7 4800H, GeForce RTX 2060 Mobile, 70.9 Wh | Dell G15 5515 R7 5800H, GeForce RTX 3050 Ti Laptop GPU, 56 Wh | Asus TUF Dash F15 FX517ZC i7-12650H, GeForce RTX 3050 4GB Laptop GPU, 76 Wh | MSI Bravo 15 B5DD-010US R5 5600H, Radeon RX 5500M, 53 Wh | Lenovo Legion 5 15IAH7H 82RB i7-12700H, GeForce RTX 3060 Laptop GPU, 80 Wh | |
|---|---|---|---|---|---|---|
| Battery runtime | 378% | 245% | 90% | 148% | 117% | |
| Reader / Idle (h) | 2.6 | 20 669% | 13.5 419% | 9.2 254% | 8.1 212% | |
| WiFi v1.3 (h) | 2.1 | 10.5 400% | 8 281% | 4 90% | 6.3 200% | 5 138% |
| Load (h) | 1.1 | 1.8 64% | 1.5 36% | 1 -9% | 1.1 0% | |
| H.264 (h) | 8.8 |
Pros
Cons
Verdict — Pricey And Buggy
For $1200 to $1300 USD, the HP Victus 15 doesn't offer enough for its price range. The competing Lenovo Legion 5 15 is currently available with the AMD Ryzen 6800H CPU and much faster GeForce RTX 3060 GPU for $1280 USD which puts our HP model to shame. For our HP model to be competitive, it would have to retail for closer to $1000 USD or lower especially since the GeForce RTX 3050 Ti performs so similarly to the older RTX 2060 and GTX 1660 Ti.
The HP Victus 15 would have been a solid gaming laptop had it retailed for $1000 USD or less. For $1200 USD and up, however, its GeForce RTX 3050 Ti GPU just doesn't cut it when RTX 3060 alternatives are available.
Furthermore, the notable bugs dampened our overall experience even after updating to the latest HP drivers and software versions at the time of publishing. It's easier to forgive small bugs here and there, but crucial aspects like battery life and fan noise should be problem-free out of the box.
There are a few things the Victus 15 gets right. Its overall design is visually appealing, for example, while SSD and RAM upgrades are relatively straightforward. The full-size numpad is great and core temperatures are pretty cool. Nonetheless, the poor performance-per-dollar and bugs detract a lot from an otherwise attractive system.
Price and Availability
HP Victus 15 fa0020nr
- 12/31/2022 v7 (old)
Allen Ngo
