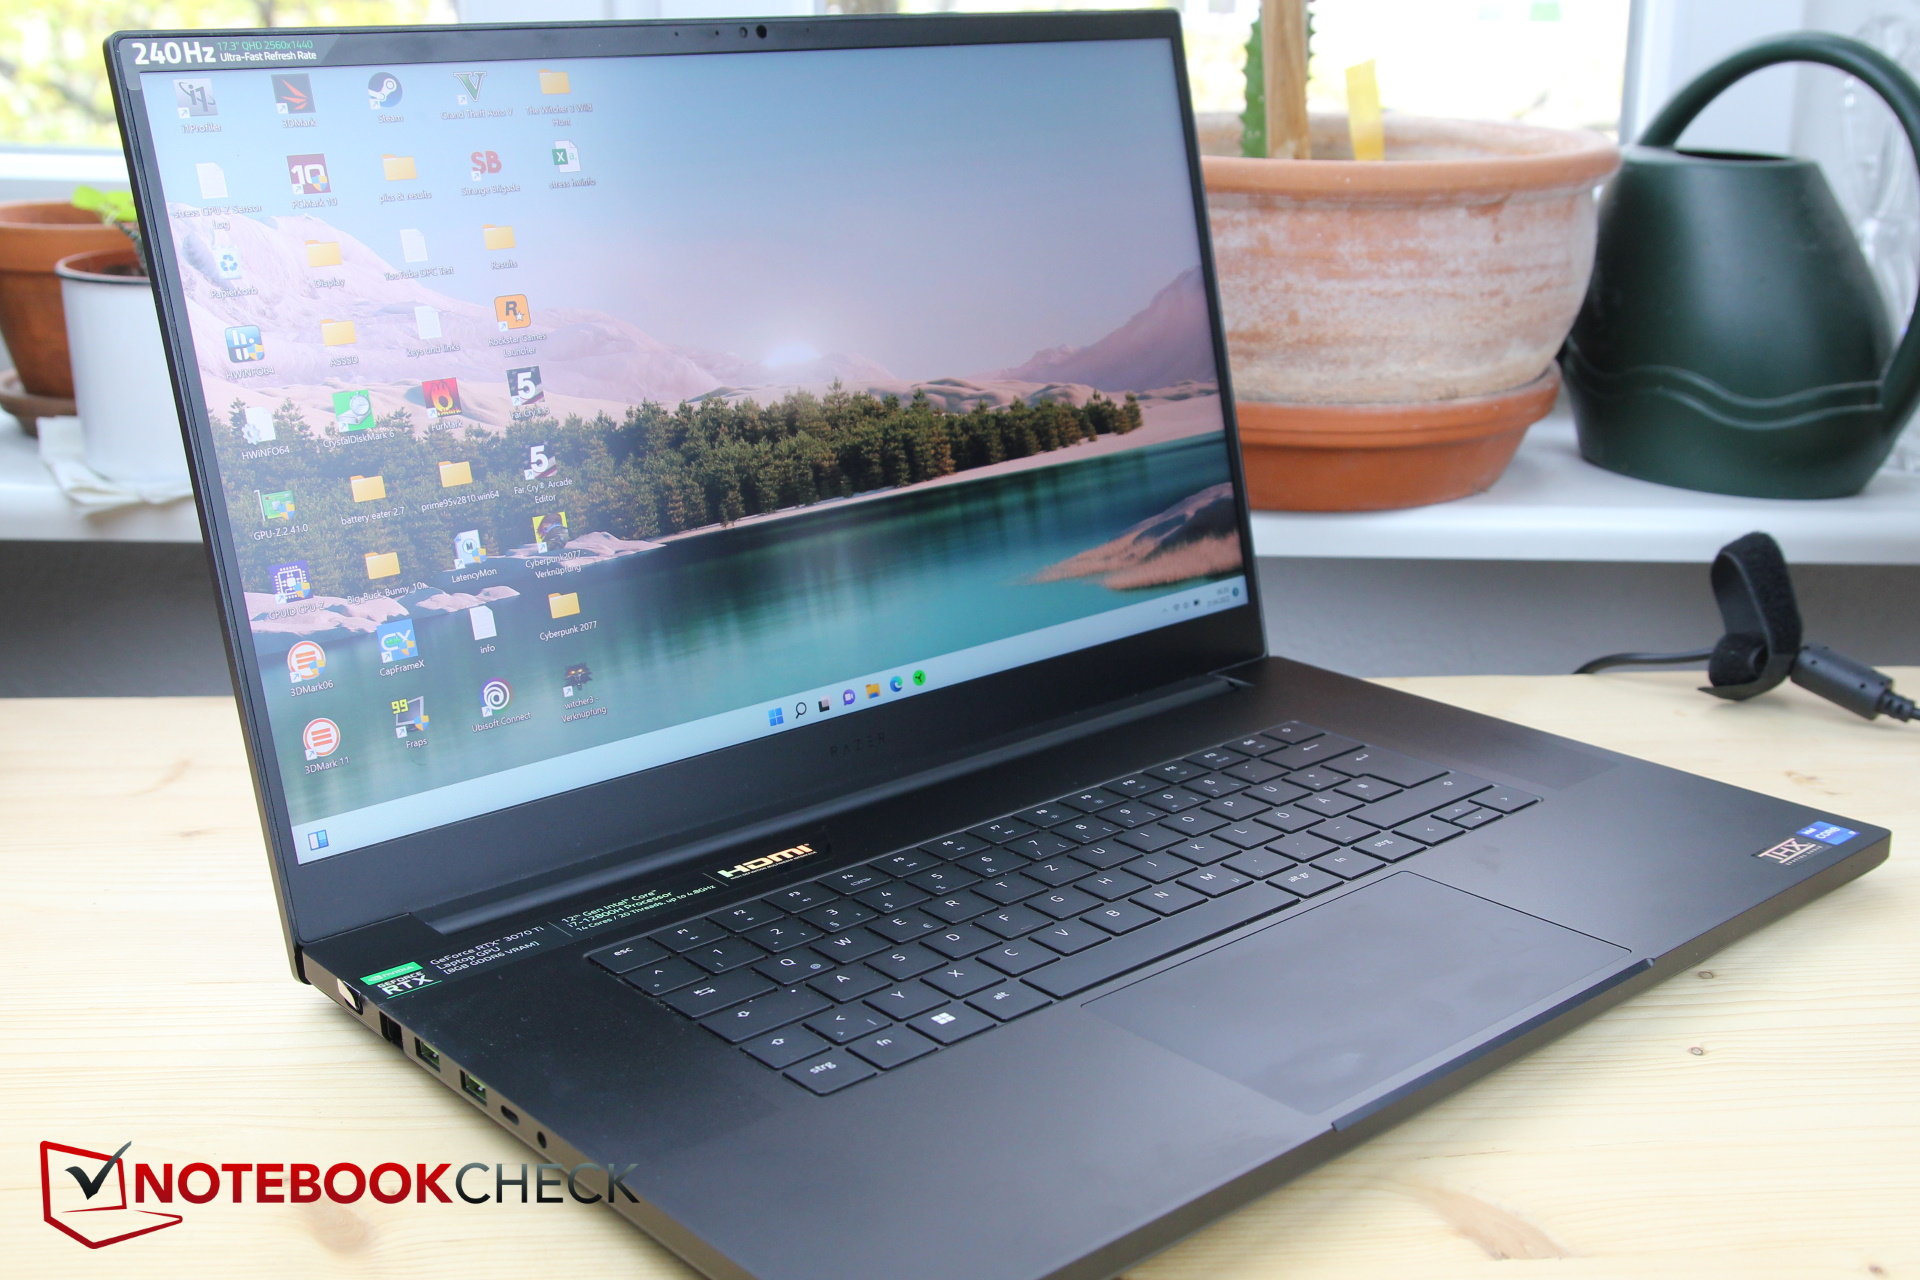
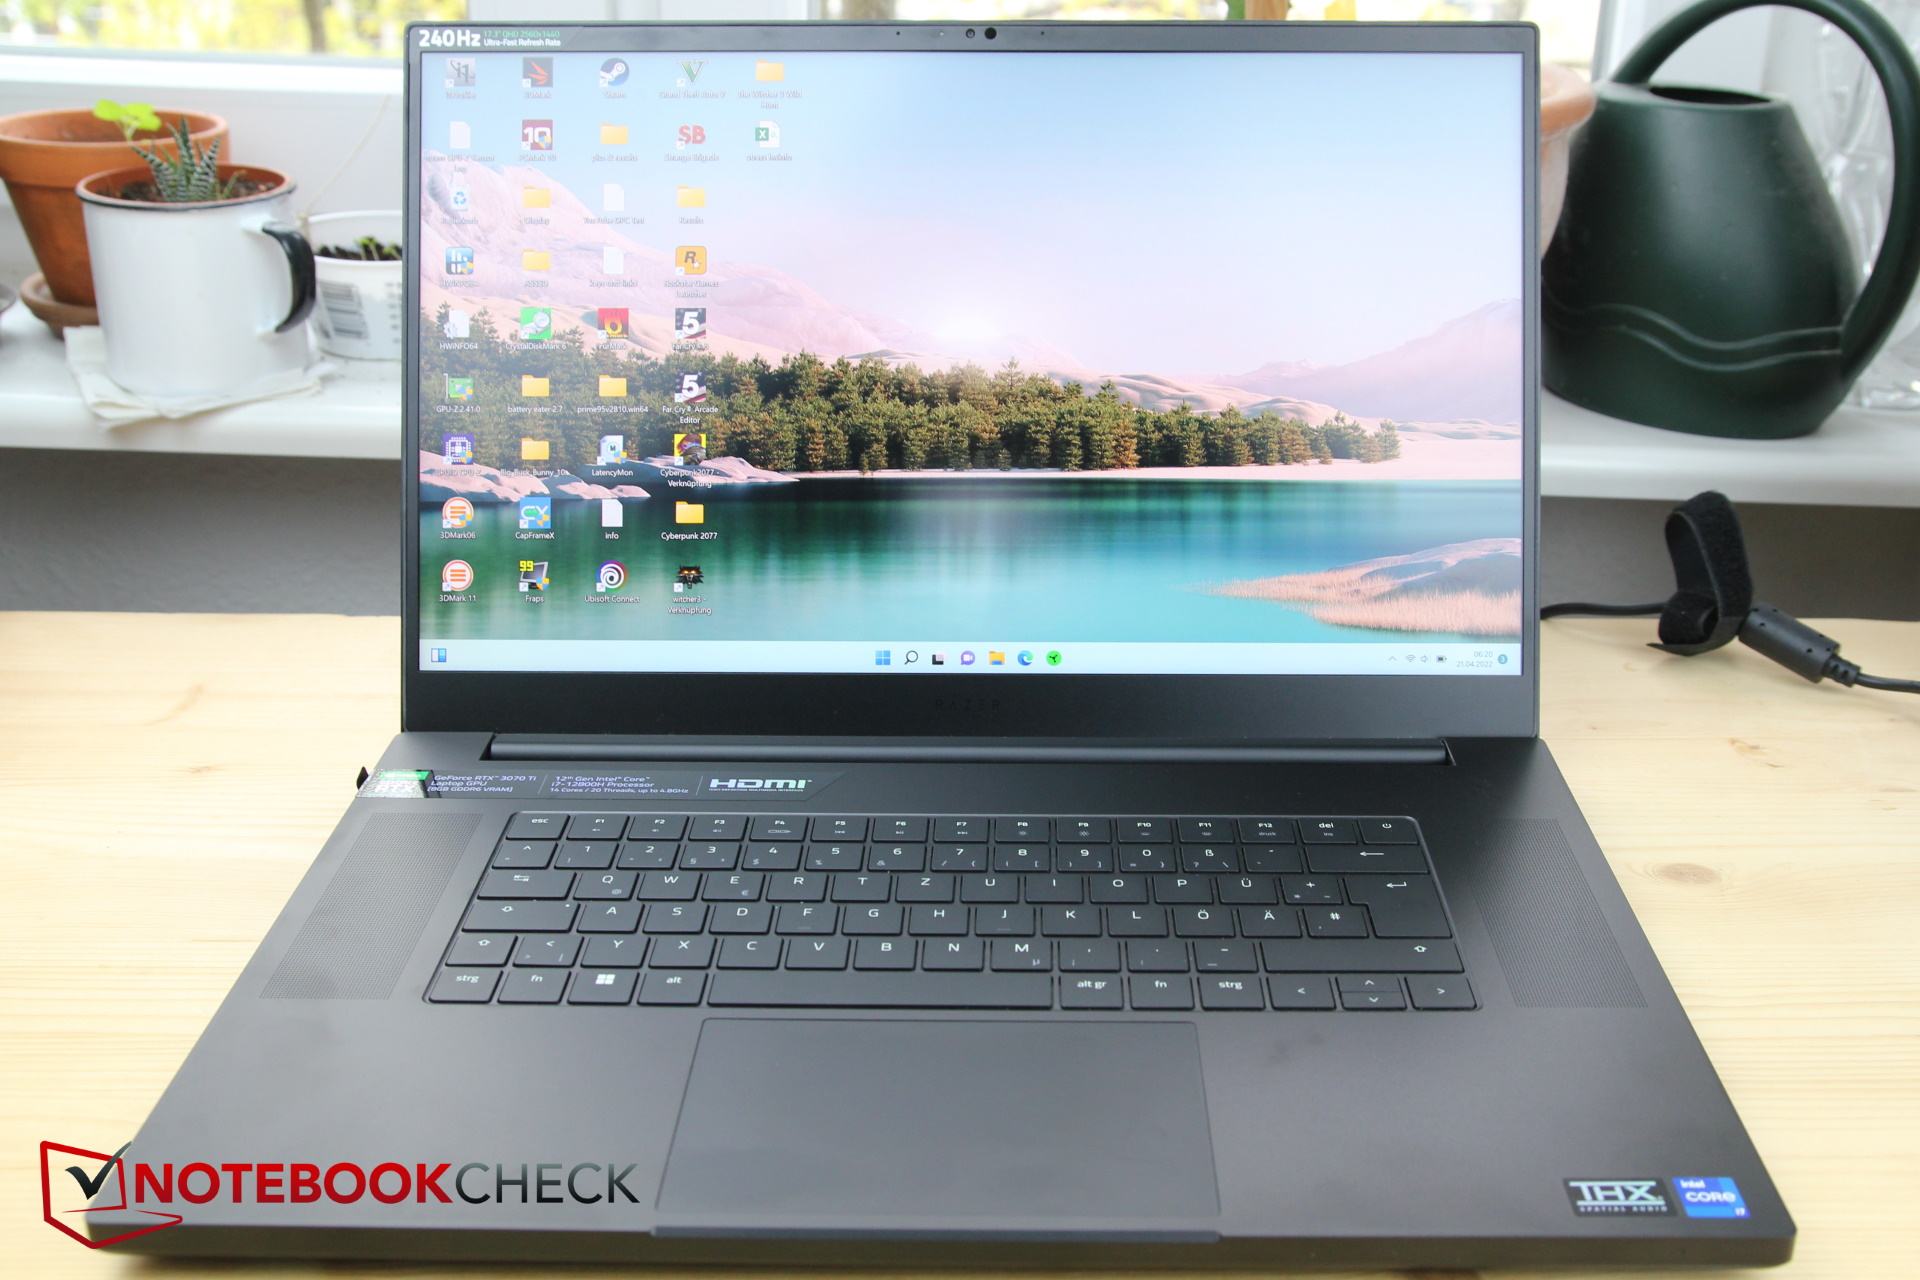
Razer Blade 17 laptop review: RTX 3070 Ti or RTX 3080 Ti - Which is the superior Blade?

We already reviewed the Razer Blade 17 2022 with the RTX 3080 Ti at the beginning of April, and the model with the RTX 3070 Ti, which costs 3,500 Euros (~$3,682), has now made its way over to us. Therefore, we'll compare the performance of the two and see whether the more expensive price of 4,300 Euros (~$4,524) is worth it for the top model.
Since virtually nothing else has changed in the laptop, we'll refer to the review of the model with the RTX 3080 Ti and omit sections like the one regarding the case and all others where there have been no modifications.
In addition to the top model, we compare the performance with other 17-inch gaming laptops equipped with the RTX 3070 Ti found in our system. The only problem - there are no other 17-inch laptops with the RTX 3070 Ti in our system yet. For this reason, we'll include the following 15-inch and 16-inch comparison models: The Lenovo Legion 5 Pro 16 G7, the MSI Vector GP66 12UGS, the MSI Stealth GS66 12UGS, as well as the predecessor, the Razer Blade 17 with a Tiger Lake CPU and the non-Ti RTX 3070.
Possible contenders in comparison
Rating | Date | Model | Weight | Height | Size | Resolution | Price |
|---|---|---|---|---|---|---|---|
| 90.1 % v7 (old) | 05 / 2022 | Razer Blade 17 (i7-12800H, RTX 3070 Ti) i7-12800H, GeForce RTX 3070 Ti Laptop GPU | 2.8 kg | 19.9 mm | 17.30" | 2560x1440 | |
| 91.2 % v7 (old) | 03 / 2022 | Razer Blade 17 RTX 3080 Ti i7-12800H, GeForce RTX 3080 Ti Laptop GPU | 2.7 kg | 19.9 mm | 17.30" | 2560x1440 | |
| 89.4 % v7 (old) | 09 / 2021 | Razer Blade 17 RTX 3070 i7-11800H, GeForce RTX 3070 Laptop GPU | 2.8 kg | 19.9 mm | 17.30" | 1920x1080 | |
| 88 % v7 (old) | 03 / 2022 | Lenovo Legion 5 Pro 16 G7 i7 RTX 3070Ti i7-12700H, GeForce RTX 3070 Ti Laptop GPU | 2.6 kg | 26.6 mm | 16.00" | 2560x1600 | |
| 86.9 % v7 (old) | 03 / 2022 | MSI Vector GP66 12UGS i9-12900H, GeForce RTX 3070 Ti Laptop GPU | 2.3 kg | 23.4 mm | 15.60" | 1920x1080 | |
| 84.5 % v7 (old) | 02 / 2022 | MSI Stealth GS66 12UGS i7-12700H, GeForce RTX 3070 Ti Laptop GPU | 2.2 kg | 19.8 mm | 15.60" | 2560x1440 |
Case - Slim and fully made of metal
Connectivity - 2x Thunderbolt 4
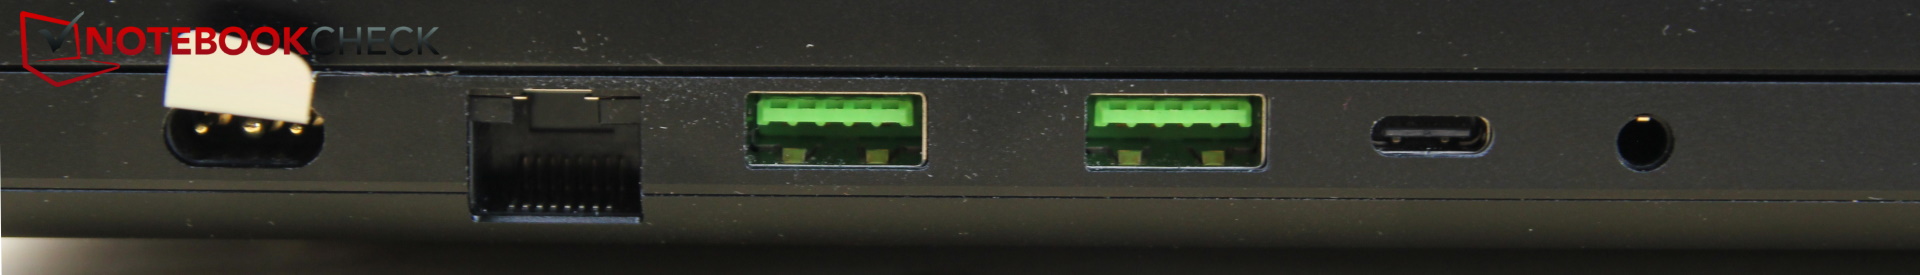
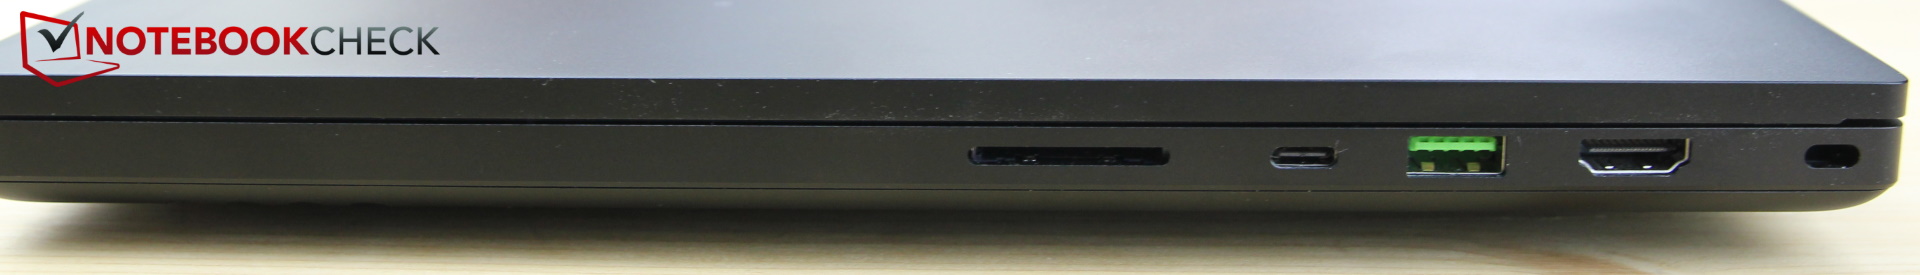
SD card reader
| SD Card Reader | |
| average JPG Copy Test (av. of 3 runs) | |
| Razer Blade 17 RTX 3070 (AV Pro V60) | |
| Razer Blade 17 (i7-12800H, RTX 3070 Ti) | |
| Razer Blade 17 RTX 3080 Ti (AV Pro V60) | |
| Average of class Gaming (20.9 - 210, n=53, last 2 years) | |
| maximum AS SSD Seq Read Test (1GB) | |
| Razer Blade 17 RTX 3070 (AV Pro V60) | |
| Razer Blade 17 (i7-12800H, RTX 3070 Ti) | |
| Razer Blade 17 RTX 3080 Ti (AV Pro V60) | |
| Average of class Gaming (25.5 - 261, n=50, last 2 years) | |
Communication
Webcam

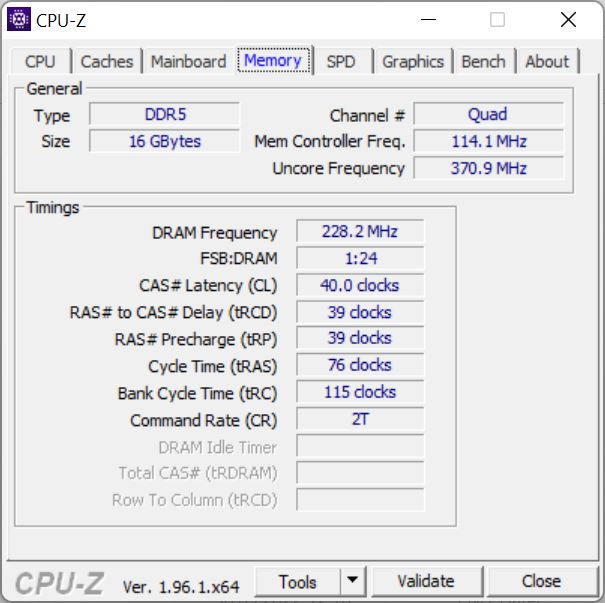
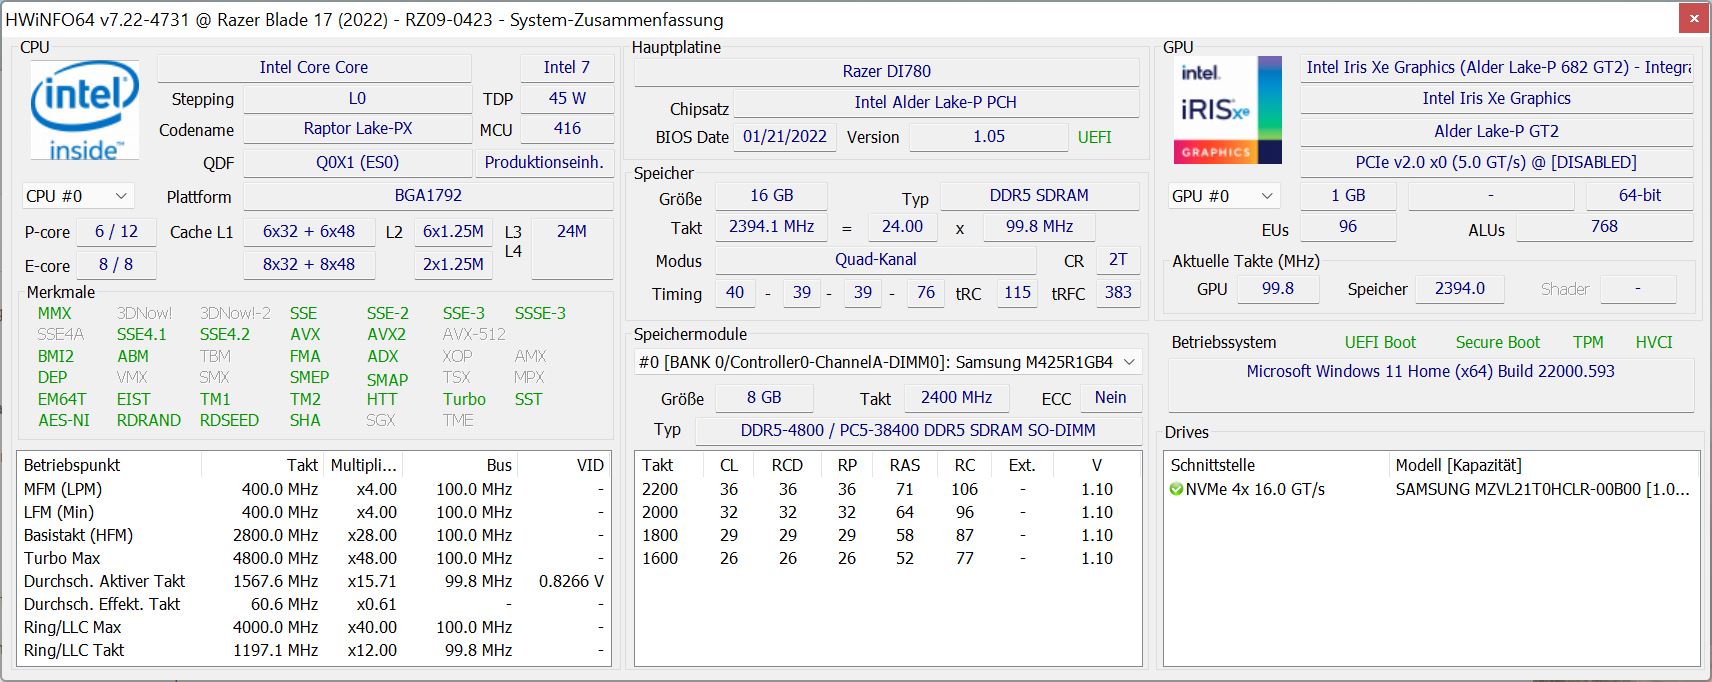
 GeForce RTX 3070 Ti Laptop GPU, i7-12800H, Samsung PM9A1 MZVL21T0HCLR")
 GeForce RTX 3070 Ti Laptop GPU, i7-12800H, Samsung PM9A1 MZVL21T0HCLR")
Input devices - Special functions poorly illuminated
Keyboard
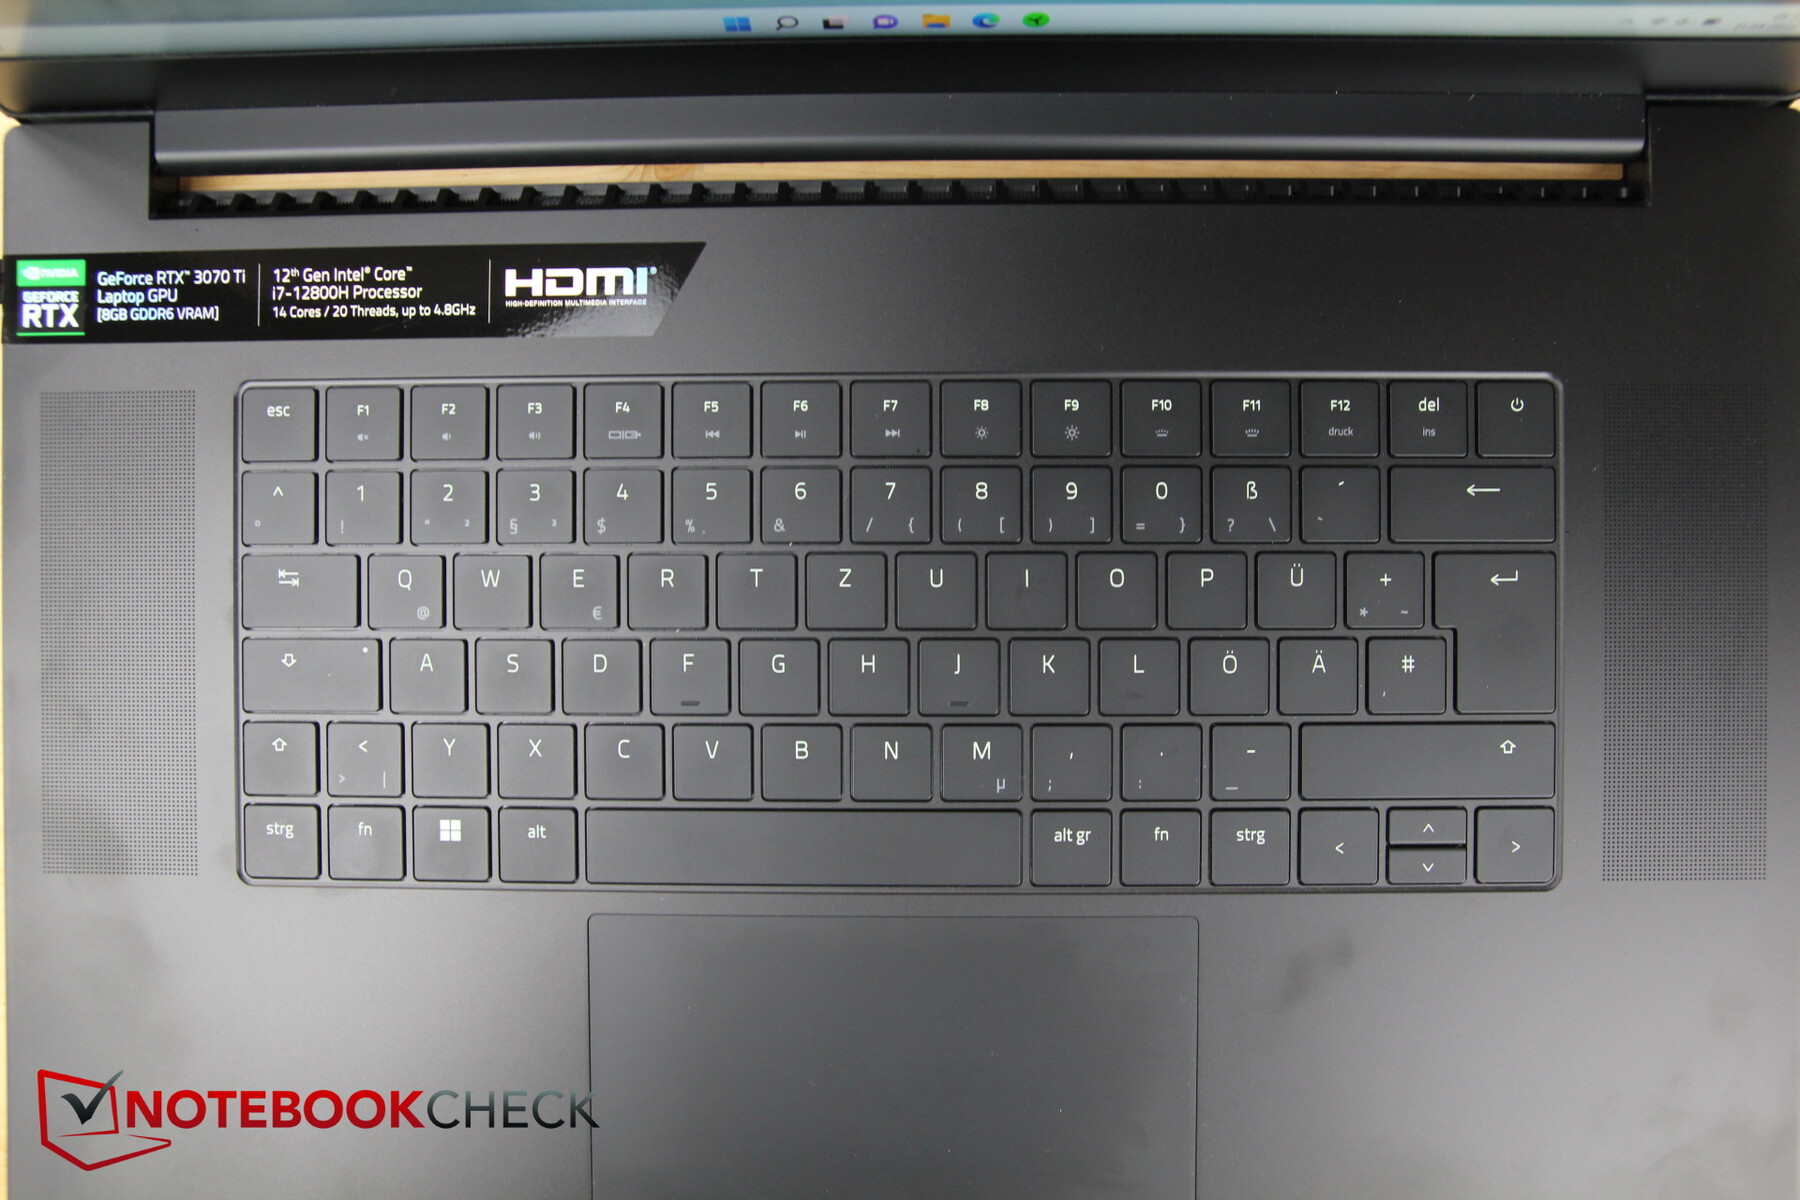
One more word on the keyboard's backlight: Only the main functions of the keys are illuminated. Of all things, the secondary functions of the F-keys are very small and faintly labeled, and they aren't illuminated, so you'll have to look hard for special functions in dark settings, even with the keyboard backlight enabled. For example, we wanted to dim the display's brightness in a dark environment, but the corresponding key can hardly be found in dark surroundings.
We would love for Razer to improve on this, because the keys corresponding to functions like louder/quieter, print, display brightness, etc., are hardly visible in the dark, since they aren't illuminated, and the labels are very small as well as pale gray.
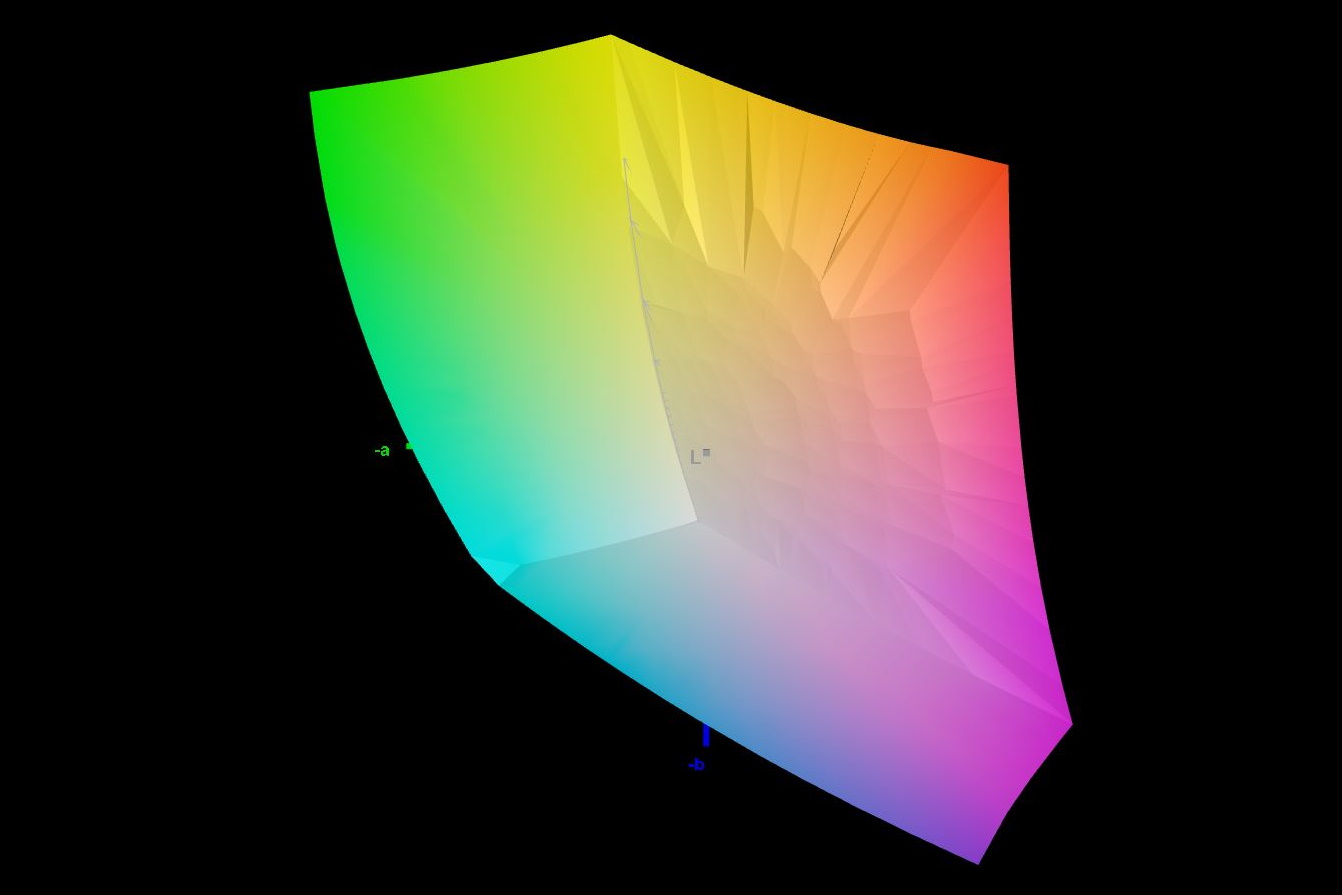
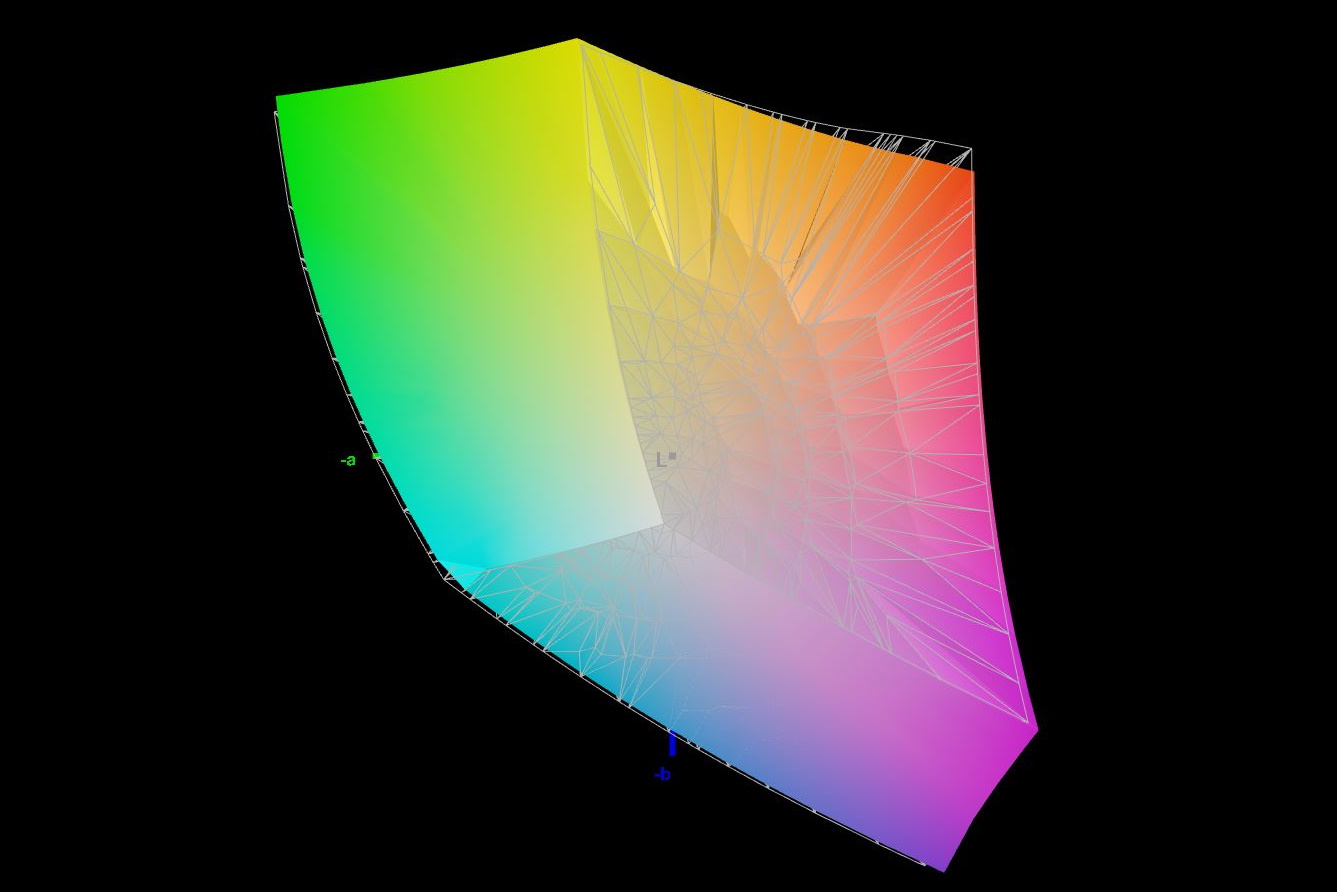
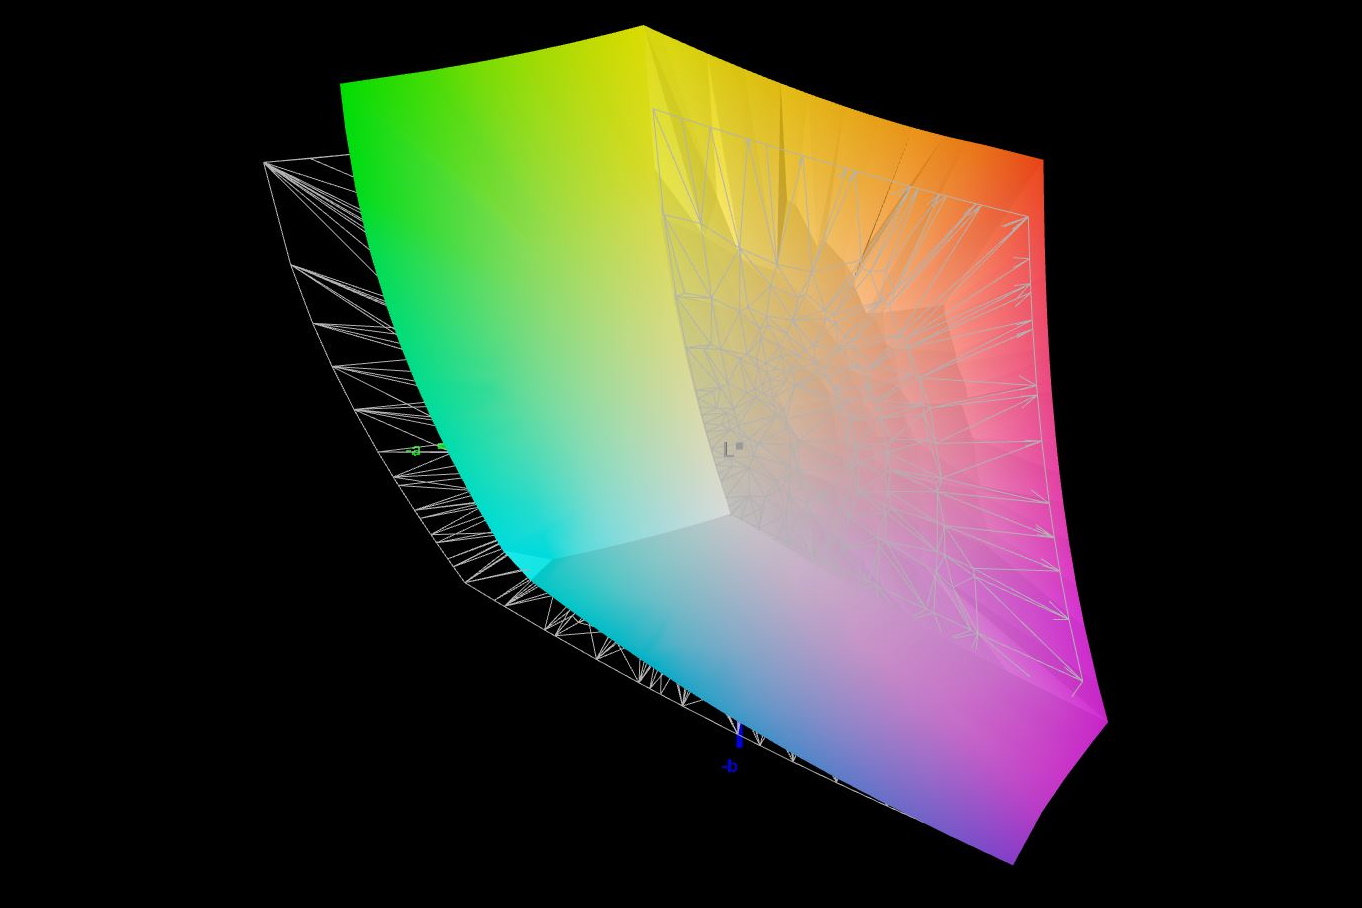
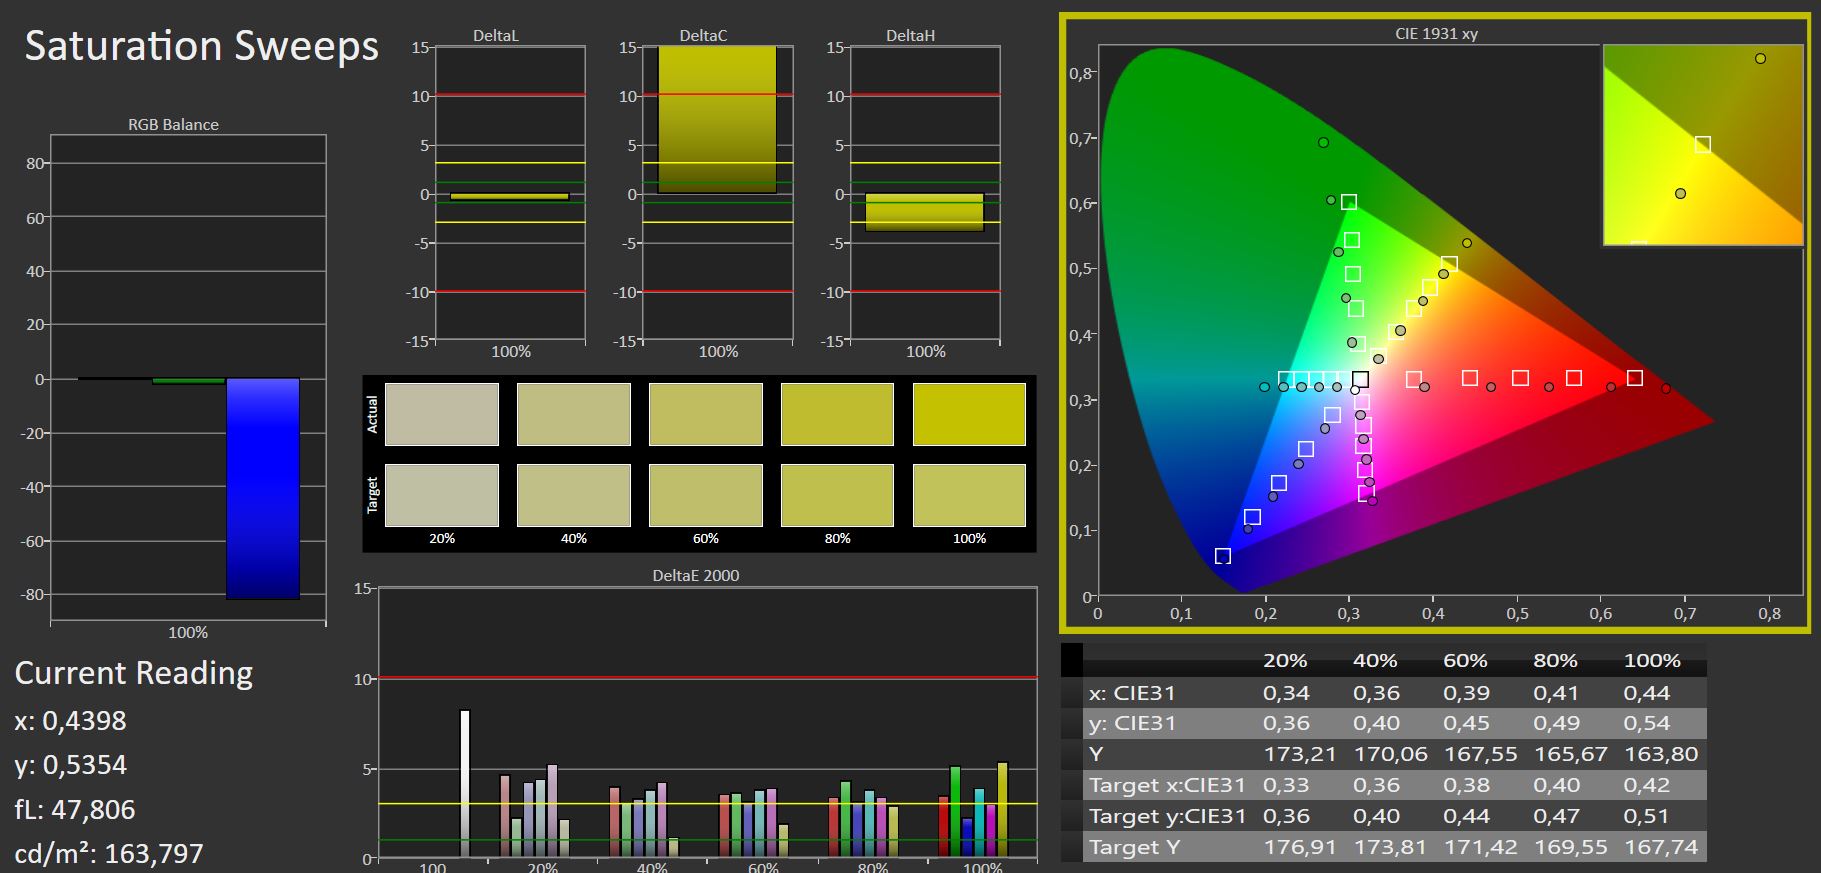
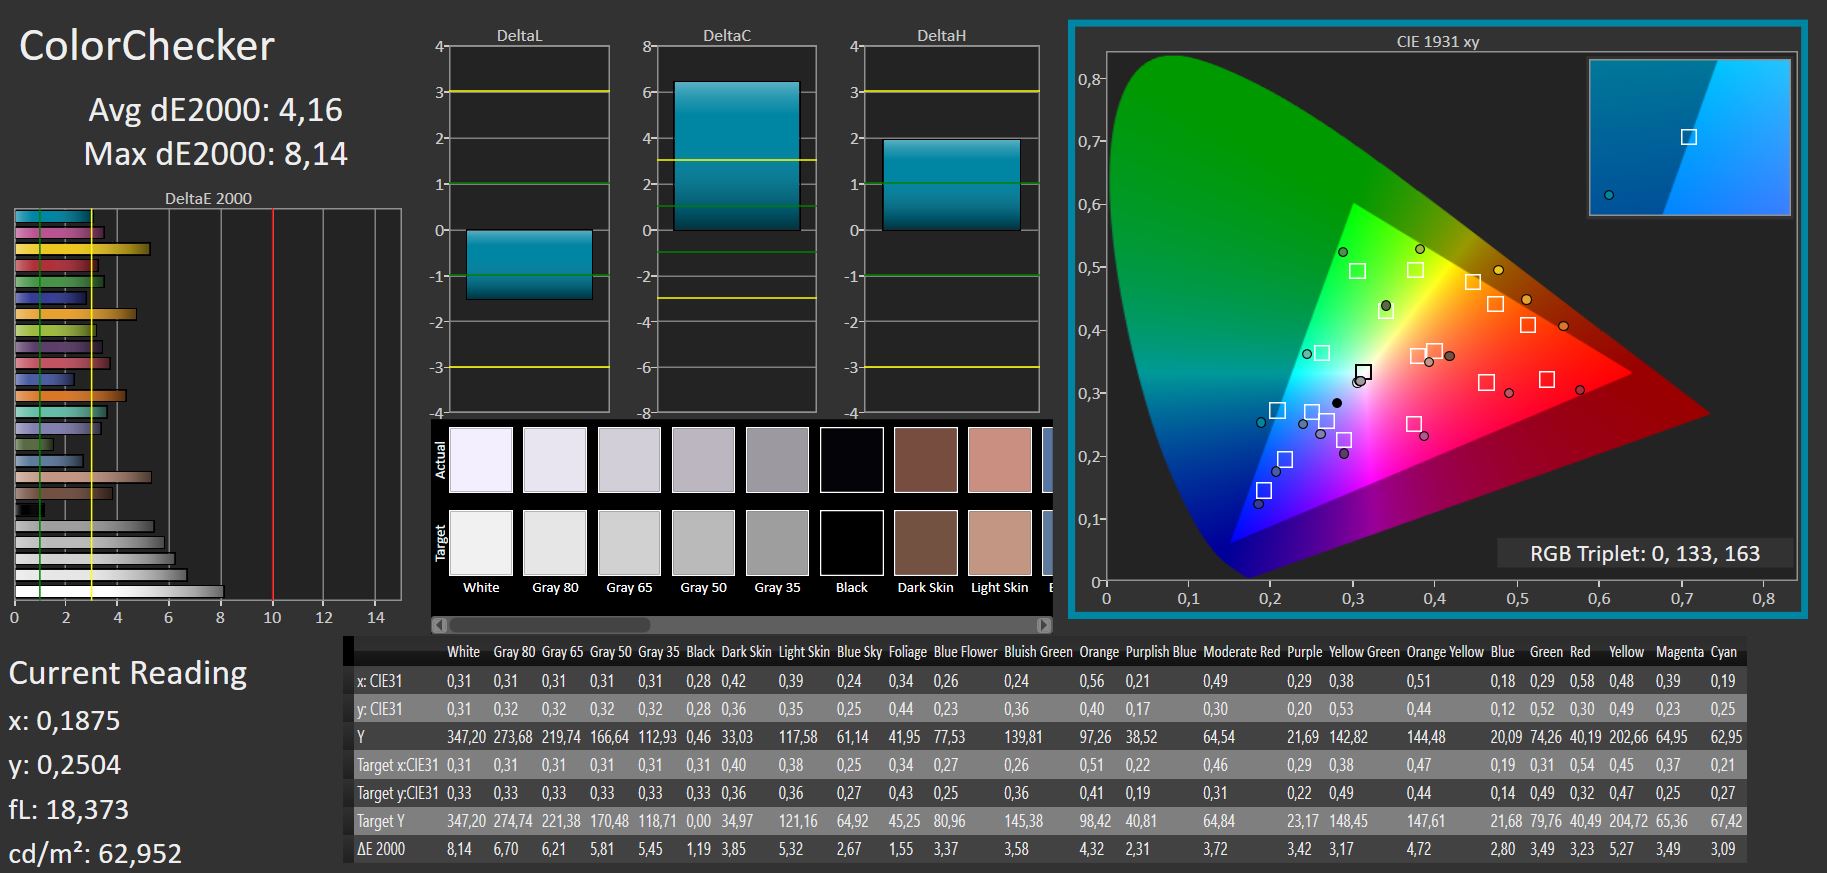
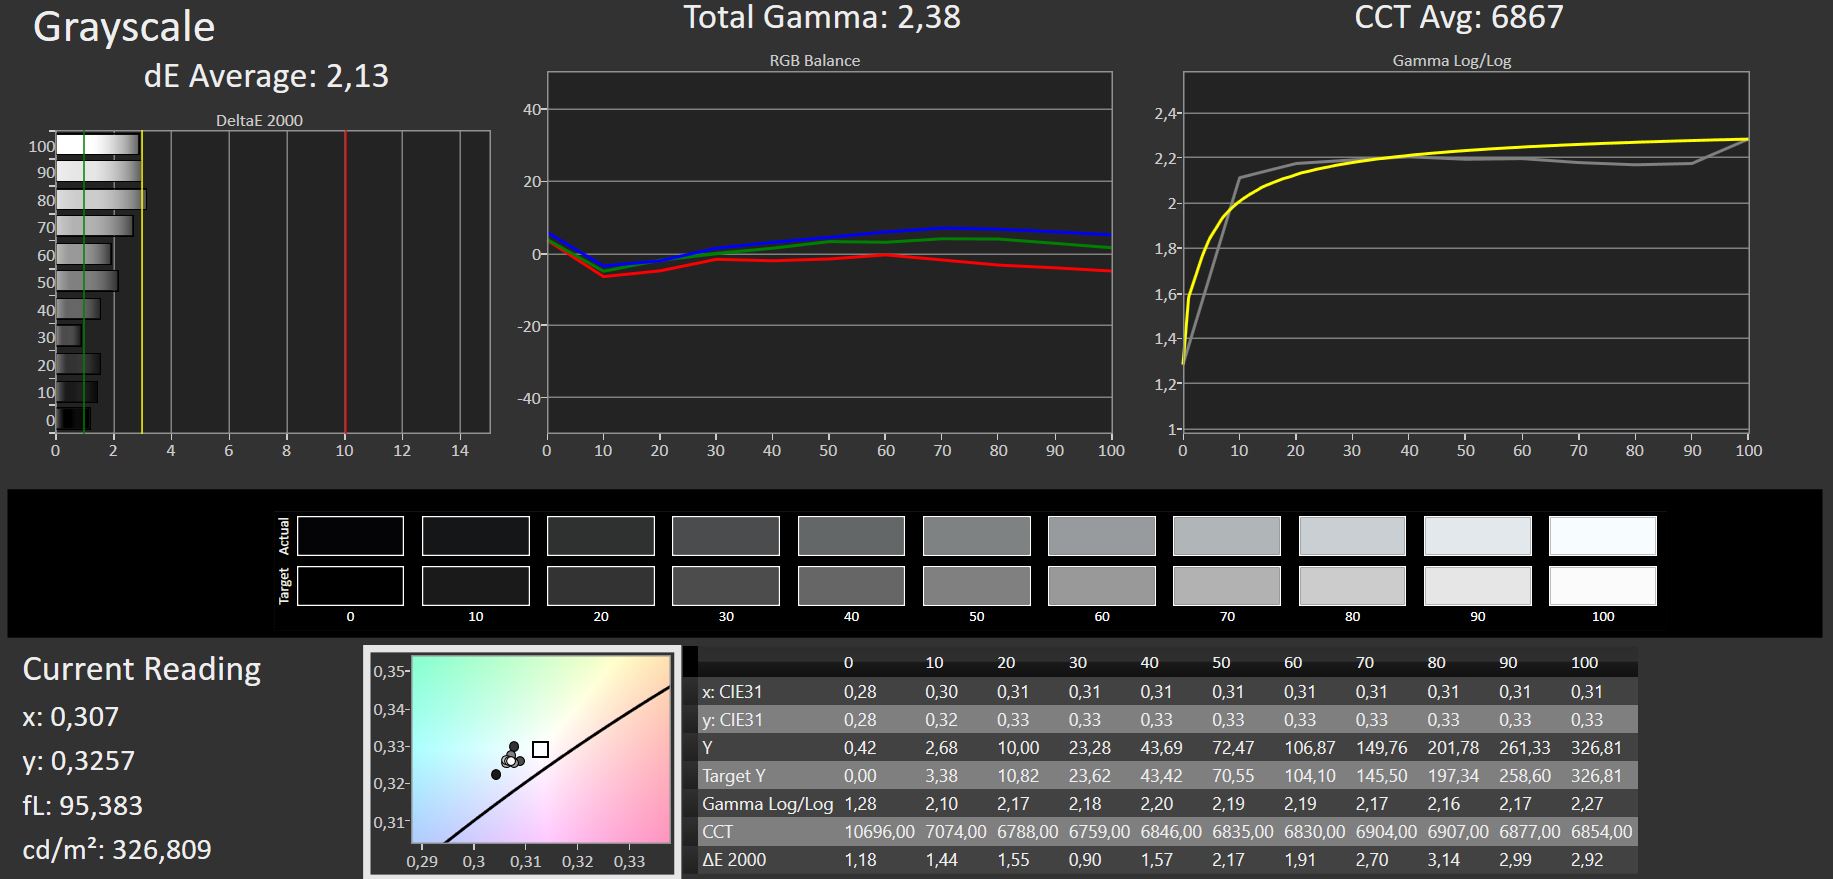
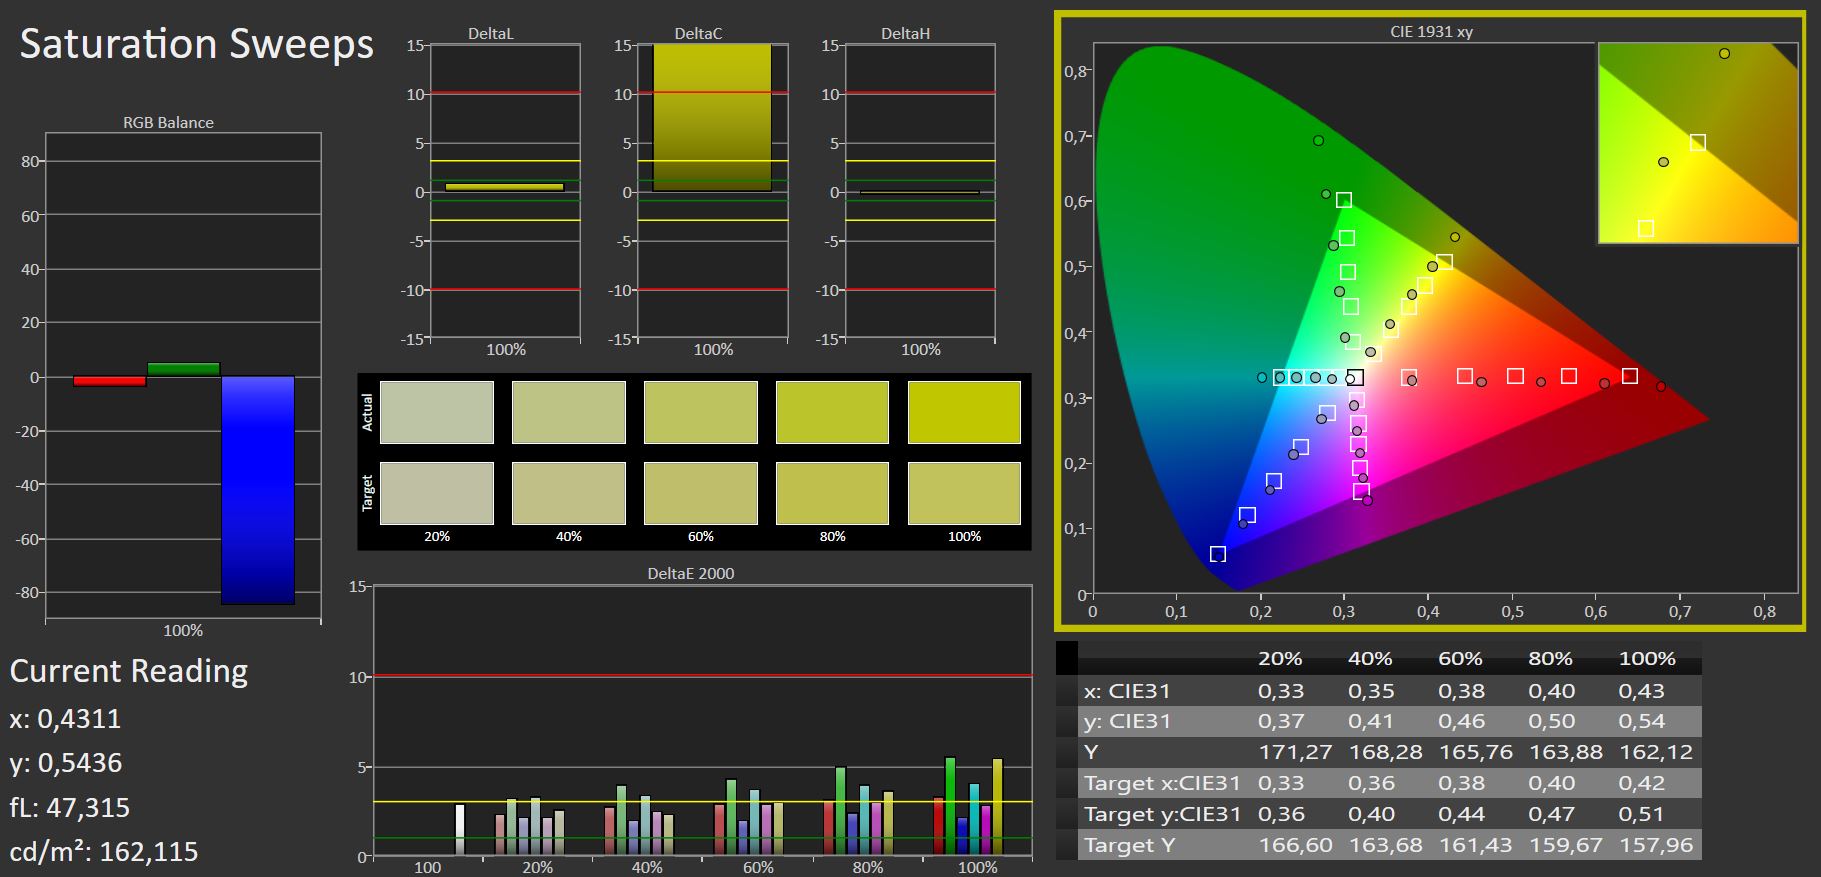
Display - Good color-space coverage

Our configuration is equipped with the same matte BOE IPS display with 2560x1440 pixels that is used in the variant with RTX 3080 Ti.
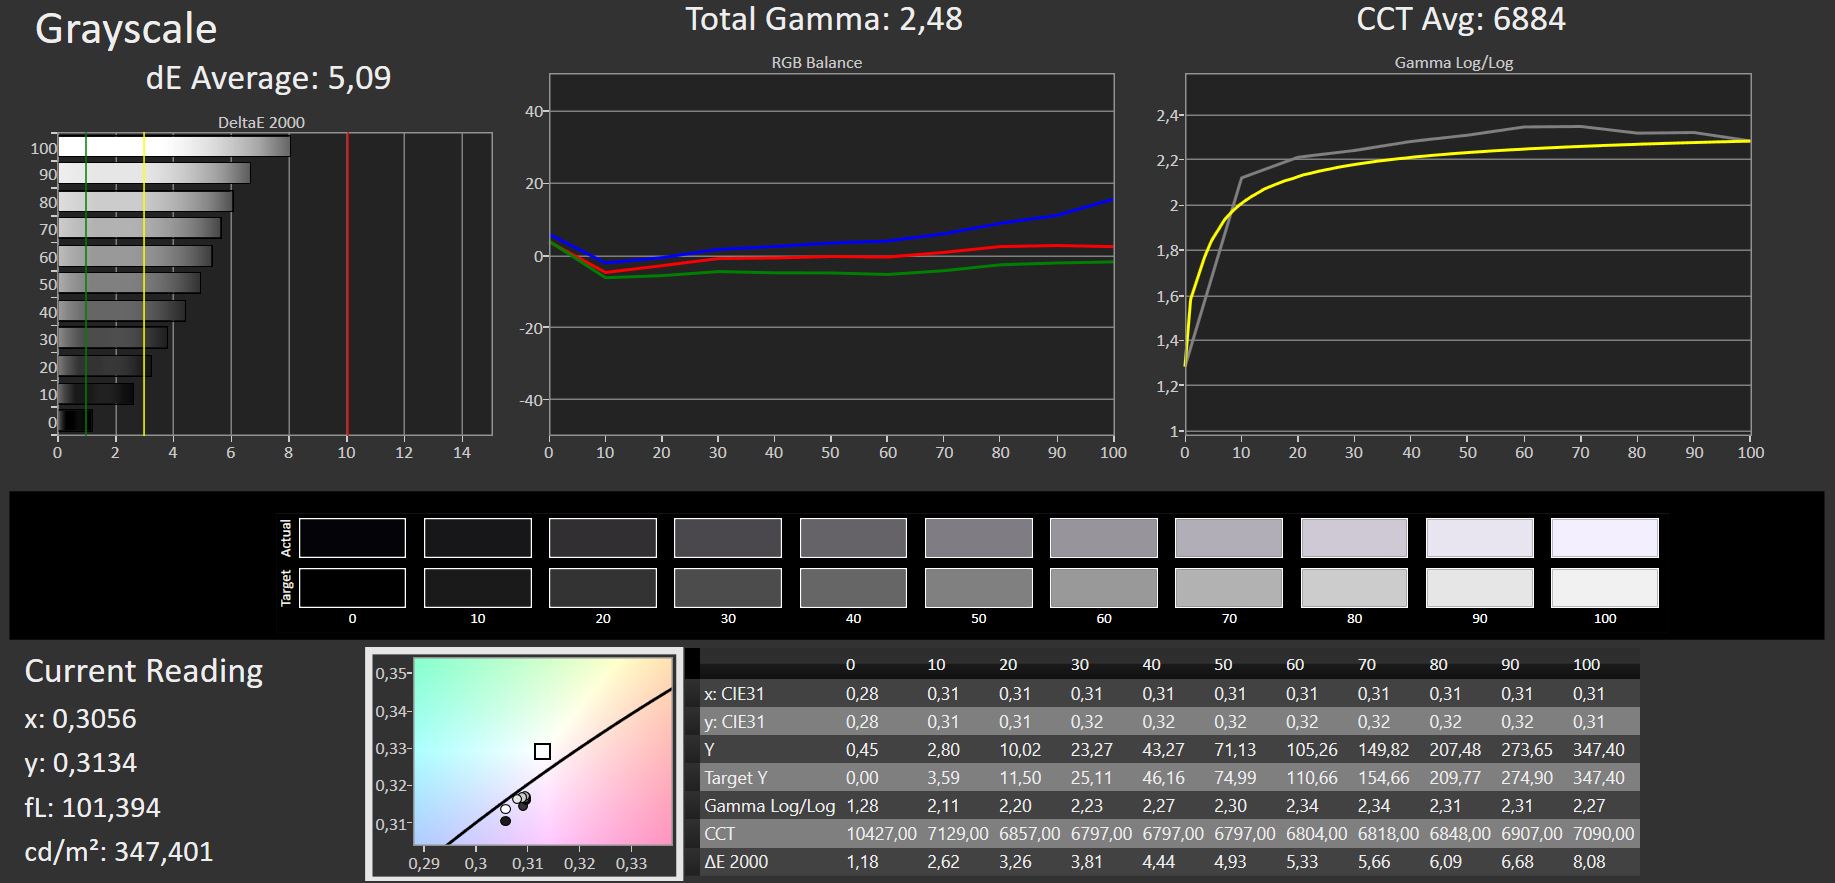
However, our model has a slightly better brightness distribution of 82%. The average brightness of just over 300 nits is decent.
Due to the relatively high black value, the contrast is not outstanding, but it's still within limits. From a subjective point of view as well, the display looks very sharp due to the high resolution, and it offers appealing colors.
The response times are appropriate for a gaming laptop. Screen bleeding is only minimally present on the right edge, and there's no PWM.
| |||||||||||||||||||||||||
Brightness Distribution: 82 %
Center on Battery: 338 cd/m²
Contrast: 758:1 (Black: 0.45 cd/m²)
ΔE ColorChecker Calman: 4.16 | ∀{0.5-29.43 Ø4.72}
calibrated: 3
ΔE Greyscale Calman: 5.09 | ∀{0.09-98 Ø4.97}
85.5% AdobeRGB 1998 (Argyll 3D)
99.9% sRGB (Argyll 3D)
97.9% Display P3 (Argyll 3D)
Gamma: 2.48
CCT: 6884 K
| Razer Blade 17 (i7-12800H, RTX 3070 Ti) BOE CQ NE173QHM-NZ1 (BOE09F9), IPS, 2560x1440, 17.3" | Razer Blade 17 RTX 3080 Ti BOE NE173QHM-NZ1, IPS, 2560x1440, 17.3" | Razer Blade 17 RTX 3070 AU Optronics B173HAN05.4, IPS, 1920x1080, 17.3" | Lenovo Legion 5 Pro 16 G7 i7 RTX 3070Ti NE160QDM-NY1, IPS, 2560x1600, 16" | MSI Vector GP66 12UGS BOE NE156FHM-NZ3, IPS, 1920x1080, 15.6" | MSI Stealth GS66 12UGS Sharp LQ156T1JW04 (SHP153C), IPS-Level, 2560x1440, 15.6" | |
|---|---|---|---|---|---|---|
| Display | 1% | -14% | -16% | -15% | -1% | |
| Display P3 Coverage (%) | 97.9 | 98.7 1% | 71.7 -27% | 68.7 -30% | 70.1 -28% | 96.4 -2% |
| sRGB Coverage (%) | 99.9 | 99.9 0% | 98.8 -1% | 97.6 -2% | 99.5 0% | 99.7 0% |
| AdobeRGB 1998 Coverage (%) | 85.5 | 86.2 1% | 73.6 -14% | 70.9 -17% | 72.1 -16% | 85.6 0% |
| Response Times | -9% | 47% | 8% | 38% | 43% | |
| Response Time Grey 50% / Grey 80% * (ms) | 15.2 ? | 17.6 ? -16% | 4.2 ? 72% | 17.6 ? -16% | 5.8 ? 62% | 6 ? 61% |
| Response Time Black / White * (ms) | 11.2 ? | 11.4 ? -2% | 8.8 ? 21% | 7.6 ? 32% | 9.6 ? 14% | 8.4 ? 25% |
| PWM Frequency (Hz) | ||||||
| Screen | 19% | 2% | 44% | 25% | 10% | |
| Brightness middle (cd/m²) | 341 | 335.9 -1% | 323.3 -5% | 502 47% | 353.1 4% | 272 -20% |
| Brightness (cd/m²) | 308 | 294 -5% | 315 2% | 491 59% | 325 6% | 253 -18% |
| Brightness Distribution (%) | 82 | 75 -9% | 91 11% | 91 11% | 85 4% | 87 6% |
| Black Level * (cd/m²) | 0.45 | 0.38 16% | 0.33 27% | 0.37 18% | 0.38 16% | 0.25 44% |
| Contrast (:1) | 758 | 884 17% | 980 29% | 1357 79% | 929 23% | 1088 44% |
| Colorchecker dE 2000 * | 4.16 | 2.82 32% | 4.59 -10% | 2.7 35% | 2.24 46% | 3.73 10% |
| Colorchecker dE 2000 max. * | 8.14 | 5.04 38% | 10.82 -33% | 4.5 45% | 5 39% | 9.43 -16% |
| Colorchecker dE 2000 calibrated * | 3 | 1.4 53% | 1.4 53% | 1.02 66% | 0.98 67% | |
| Greyscale dE 2000 * | 5.09 | 1.7 67% | 7.9 -55% | 2.7 47% | 4 21% | 6.5 -28% |
| Gamma | 2.48 89% | 2.14 103% | 2.28 96% | 2.44 90% | 2.24 98% | 2.172 101% |
| CCT | 6884 94% | 6382 102% | 5941 109% | 6326 103% | 6864 95% | 6485 100% |
| Total Average (Program / Settings) | 4% /
11% | 12% /
5% | 12% /
26% | 16% /
18% | 17% /
12% |
* ... smaller is better
Both sRGB and Display P3 are almost fully covered. AdobeRGB is also covered by about 86%. This makes the display well suited for professional image and video editors.
The display is already calibrated reasonably well out of the box. However, a new calibration reduces color deviations even more noticeably.

Display Response Times
| ↔ Response Time Black to White | ||
|---|---|---|
| 11.2 ms ... rise ↗ and fall ↘ combined | ↗ 5.8 ms rise | 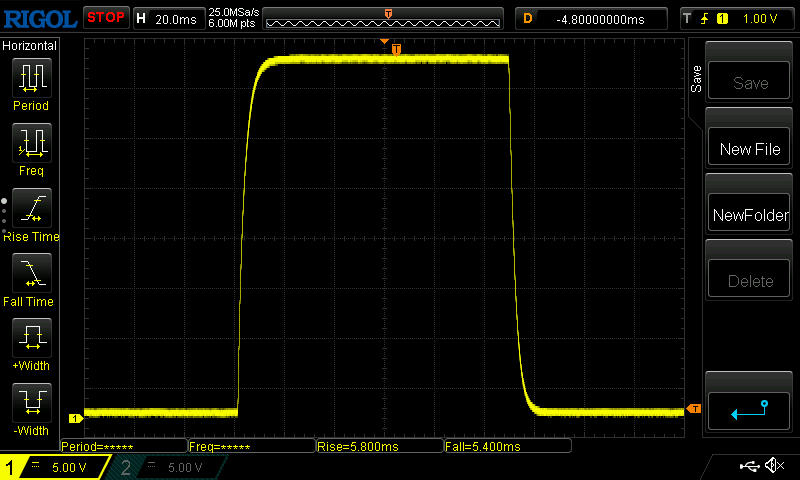 |
| ↘ 5.4 ms fall | ||
| The screen shows good response rates in our tests, but may be too slow for competitive gamers. In comparison, all tested devices range from 0.1 (minimum) to 240 (maximum) ms. » 30 % of all devices are better. This means that the measured response time is better than the average of all tested devices (19.8 ms). | ||
| ↔ Response Time 50% Grey to 80% Grey | ||
| 15.2 ms ... rise ↗ and fall ↘ combined | ↗ 7.4 ms rise | 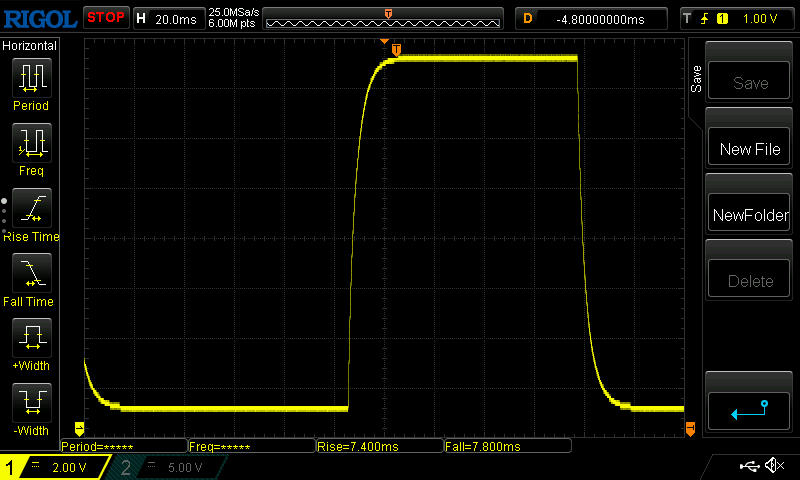 |
| ↘ 7.8 ms fall | ||
| The screen shows good response rates in our tests, but may be too slow for competitive gamers. In comparison, all tested devices range from 0.165 (minimum) to 636 (maximum) ms. » 29 % of all devices are better. This means that the measured response time is better than the average of all tested devices (31 ms). | ||
Screen Flickering / PWM (Pulse-Width Modulation)
| Screen flickering / PWM not detected | 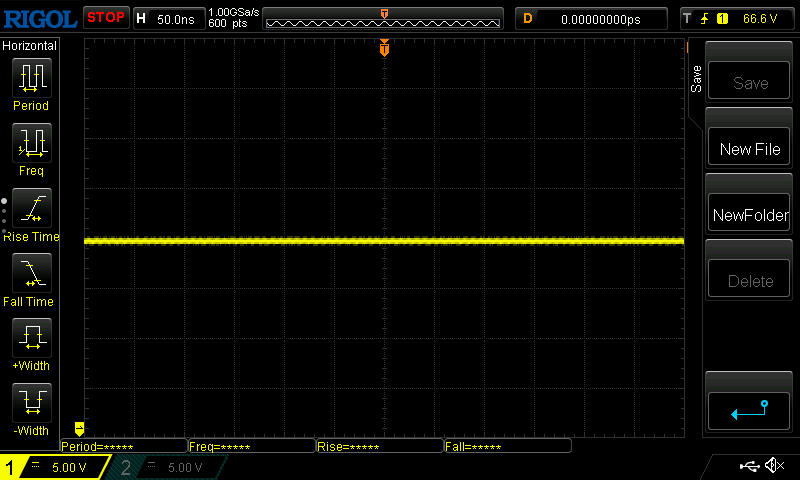 | ||
In comparison: 52 % of all tested devices do not use PWM to dim the display. If PWM was detected, an average of 7753 (minimum: 5 - maximum: 343500) Hz was measured. | |||
With a brightness of around 300 nits and the matte surface, outdoor use is possible as long as you're in the shade and are viewing the screen from a favorable angle. However, if you tilt the device or look at it from an oblique angle, the fun will soon be over.
Some brightness is lost when viewing from extreme angles, but overall, the viewing-angle stability is good as typical for IPS panels.

Performance - Still high
Thanks to its powerful components, the Razer Blade is mainly suited for gamers and content creators. We expect slightly better temperatures and noise levels from the RTX 3070 Ti than from the model with the RTX 3080 Ti. In return, there should be a slight drop in performance. Our current review sample shouldn't have any problems with the benchmarks, either.

Test conditions

For the best benchmark results, we select the custom mode in the Razer Synapse software and maximize the sliders for the CPU and GPU.
The Razer supports Advanced Optimus, and you can also manually enable the dGPU, but we won't be doing that.
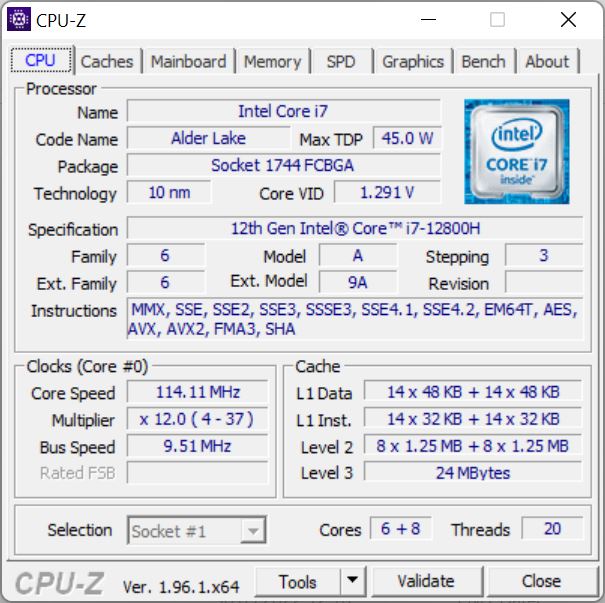
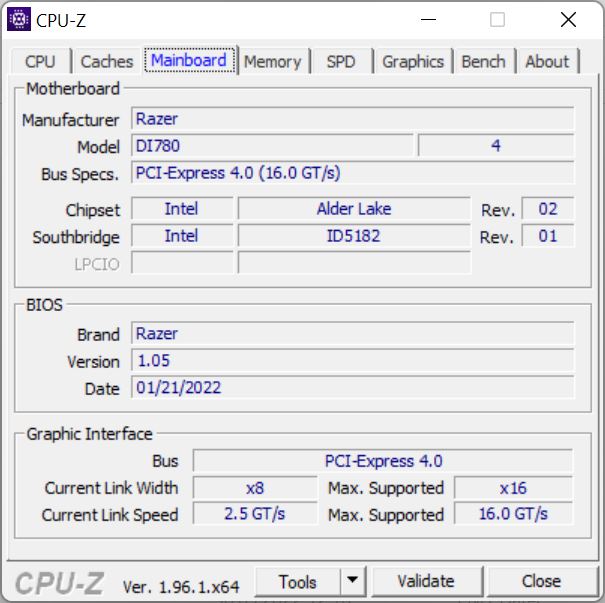
Processor

The Intel Core i7-12800H has 14 cores and a total of 20 threads. In this case, a single P-core can clock up to 4.8 GHz, while the base clock speed is between 1.8 (E-cores) and 2.4 GHz (P-cores). It should be capable of handling any task.
In the Cinebench loop, the CPU manages a TDP of around 100 watts in the first two runs. In the subsequent runs, it only reaches 85 watts for a very short time at best, after which the value drops to around 60 watts within one run. Note that this applies to the CPU on "Boost" within Razer Synapse. In the normal setting, the CPU should rather reach around 45 watts.
Overall, the Blade is slightly above the expected level. The predecessor is beaten by about 20%. But the Legion 5 in particular shows even better results. Its powerful i7-12700H even leaves models with an i9 in the dust.
The CPU only achieves a TDP of 35 watts on battery power. Accordingly, the Cinebench R15 score drops to 1,466 points, a decrease of almost 45%!
Cinebench R15 Multi endurance test
Cinebench R23: Multi Core | Single Core
Cinebench R20: CPU (Multi Core) | CPU (Single Core)
Cinebench R15: CPU Multi 64Bit | CPU Single 64Bit
Blender: v2.79 BMW27 CPU
7-Zip 18.03: 7z b 4 | 7z b 4 -mmt1
Geekbench 5.5: Multi-Core | Single-Core
HWBOT x265 Benchmark v2.2: 4k Preset
LibreOffice : 20 Documents To PDF
R Benchmark 2.5: Overall mean
| CPU Performance rating | |
| Average of class Gaming | |
| Lenovo Legion 5 Pro 16 G7 i7 RTX 3070Ti | |
| MSI Vector GP66 12UGS | |
| MSI Stealth GS66 12UGS | |
| Razer Blade 17 (i7-12800H, RTX 3070 Ti) | |
| Razer Blade 17 RTX 3080 Ti | |
| Average Intel Core i7-12800H | |
| Razer Blade 17 RTX 3070 -2! | |
| Cinebench R23 / Multi Core | |
| Average of class Gaming (10488 - 40970, n=107, last 2 years) | |
| Lenovo Legion 5 Pro 16 G7 i7 RTX 3070Ti | |
| MSI Stealth GS66 12UGS | |
| MSI Vector GP66 12UGS | |
| Razer Blade 17 (i7-12800H, RTX 3070 Ti) | |
| Razer Blade 17 RTX 3080 Ti | |
| Average Intel Core i7-12800H (9777 - 16597, n=5) | |
| Razer Blade 17 RTX 3070 | |
| Cinebench R23 / Single Core | |
| Average of class Gaming (1166 - 2356, n=107, last 2 years) | |
| MSI Vector GP66 12UGS | |
| Razer Blade 17 RTX 3080 Ti | |
| Razer Blade 17 (i7-12800H, RTX 3070 Ti) | |
| Average Intel Core i7-12800H (1796 - 1859, n=5) | |
| Lenovo Legion 5 Pro 16 G7 i7 RTX 3070Ti | |
| MSI Stealth GS66 12UGS | |
| Razer Blade 17 RTX 3070 | |
| Cinebench R20 / CPU (Multi Core) | |
| Average of class Gaming (4029 - 16108, n=106, last 2 years) | |
| Lenovo Legion 5 Pro 16 G7 i7 RTX 3070Ti | |
| MSI Stealth GS66 12UGS | |
| MSI Vector GP66 12UGS | |
| Razer Blade 17 RTX 3080 Ti | |
| Average Intel Core i7-12800H (3741 - 6433, n=5) | |
| Razer Blade 17 (i7-12800H, RTX 3070 Ti) | |
| Razer Blade 17 RTX 3070 | |
| Cinebench R20 / CPU (Single Core) | |
| Average of class Gaming (442 - 895, n=106, last 2 years) | |
| MSI Vector GP66 12UGS | |
| Razer Blade 17 RTX 3080 Ti | |
| Razer Blade 17 (i7-12800H, RTX 3070 Ti) | |
| Average Intel Core i7-12800H (690 - 714, n=5) | |
| Lenovo Legion 5 Pro 16 G7 i7 RTX 3070Ti | |
| MSI Stealth GS66 12UGS | |
| Razer Blade 17 RTX 3070 | |
| Cinebench R15 / CPU Multi 64Bit | |
| Average of class Gaming (1578 - 6271, n=105, last 2 years) | |
| Lenovo Legion 5 Pro 16 G7 i7 RTX 3070Ti | |
| MSI Stealth GS66 12UGS | |
| Razer Blade 17 (i7-12800H, RTX 3070 Ti) | |
| MSI Vector GP66 12UGS | |
| Average Intel Core i7-12800H (1566 - 2697, n=5) | |
| Razer Blade 17 RTX 3080 Ti | |
| Razer Blade 17 RTX 3070 | |
| Cinebench R15 / CPU Single 64Bit | |
| Average of class Gaming (188.8 - 343, n=106, last 2 years) | |
| MSI Vector GP66 12UGS | |
| Razer Blade 17 (i7-12800H, RTX 3070 Ti) | |
| Razer Blade 17 RTX 3080 Ti | |
| Lenovo Legion 5 Pro 16 G7 i7 RTX 3070Ti | |
| MSI Stealth GS66 12UGS | |
| Average Intel Core i7-12800H (242 - 269, n=5) | |
| Razer Blade 17 RTX 3070 | |
| Blender / v2.79 BMW27 CPU | |
| Razer Blade 17 RTX 3070 | |
| Average Intel Core i7-12800H (192 - 306, n=5) | |
| Razer Blade 17 RTX 3080 Ti | |
| Razer Blade 17 (i7-12800H, RTX 3070 Ti) | |
| MSI Vector GP66 12UGS | |
| MSI Stealth GS66 12UGS | |
| Lenovo Legion 5 Pro 16 G7 i7 RTX 3070Ti | |
| Average of class Gaming (80 - 330, n=104, last 2 years) | |
| 7-Zip 18.03 / 7z b 4 | |
| Average of class Gaming (33491 - 148086, n=105, last 2 years) | |
| Lenovo Legion 5 Pro 16 G7 i7 RTX 3070Ti | |
| MSI Stealth GS66 12UGS | |
| MSI Vector GP66 12UGS | |
| Razer Blade 17 (i7-12800H, RTX 3070 Ti) | |
| Razer Blade 17 RTX 3080 Ti | |
| Average Intel Core i7-12800H (44553 - 68930, n=5) | |
| Razer Blade 17 RTX 3070 | |
| 7-Zip 18.03 / 7z b 4 -mmt1 | |
| Average of class Gaming (4199 - 7436, n=105, last 2 years) | |
| MSI Vector GP66 12UGS | |
| Lenovo Legion 5 Pro 16 G7 i7 RTX 3070Ti | |
| Average Intel Core i7-12800H (5726 - 5976, n=5) | |
| Razer Blade 17 RTX 3080 Ti | |
| MSI Stealth GS66 12UGS | |
| Razer Blade 17 (i7-12800H, RTX 3070 Ti) | |
| Razer Blade 17 RTX 3070 | |
| Geekbench 5.5 / Multi-Core | |
| Average of class Gaming (6460 - 27010, n=105, last 2 years) | |
| MSI Stealth GS66 12UGS | |
| Lenovo Legion 5 Pro 16 G7 i7 RTX 3070Ti | |
| Razer Blade 17 RTX 3080 Ti | |
| MSI Vector GP66 12UGS | |
| Razer Blade 17 (i7-12800H, RTX 3070 Ti) | |
| Average Intel Core i7-12800H (9607 - 12940, n=5) | |
| Geekbench 5.5 / Single-Core | |
| Average of class Gaming (986 - 2474, n=105, last 2 years) | |
| MSI Vector GP66 12UGS | |
| Average Intel Core i7-12800H (1739 - 1842, n=5) | |
| Razer Blade 17 (i7-12800H, RTX 3070 Ti) | |
| Lenovo Legion 5 Pro 16 G7 i7 RTX 3070Ti | |
| Razer Blade 17 RTX 3080 Ti | |
| MSI Stealth GS66 12UGS | |
| HWBOT x265 Benchmark v2.2 / 4k Preset | |
| Average of class Gaming (11.5 - 44.3, n=105, last 2 years) | |
| Lenovo Legion 5 Pro 16 G7 i7 RTX 3070Ti | |
| MSI Vector GP66 12UGS | |
| MSI Stealth GS66 12UGS | |
| Razer Blade 17 RTX 3080 Ti | |
| Average Intel Core i7-12800H (11.7 - 19.4, n=5) | |
| Razer Blade 17 (i7-12800H, RTX 3070 Ti) | |
| Razer Blade 17 RTX 3070 | |
| LibreOffice / 20 Documents To PDF | |
| Average of class Gaming (33.2 - 88.8, n=105, last 2 years) | |
| Razer Blade 17 RTX 3080 Ti | |
| Average Intel Core i7-12800H (41.3 - 51.5, n=5) | |
| Razer Blade 17 RTX 3070 | |
| Lenovo Legion 5 Pro 16 G7 i7 RTX 3070Ti | |
| Razer Blade 17 (i7-12800H, RTX 3070 Ti) | |
| MSI Stealth GS66 12UGS | |
| MSI Vector GP66 12UGS | |
| R Benchmark 2.5 / Overall mean | |
| Razer Blade 17 RTX 3070 | |
| Razer Blade 17 RTX 3080 Ti | |
| Average Intel Core i7-12800H (0.4442 - 0.4715, n=5) | |
| Razer Blade 17 (i7-12800H, RTX 3070 Ti) | |
| Lenovo Legion 5 Pro 16 G7 i7 RTX 3070Ti | |
| MSI Stealth GS66 12UGS | |
| Average of class Gaming (0.3439 - 0.759, n=106, last 2 years) | |
| MSI Vector GP66 12UGS | |
* ... smaller is better
AIDA64: FP32 Ray-Trace | FPU Julia | CPU SHA3 | CPU Queen | FPU SinJulia | FPU Mandel | CPU AES | CPU ZLib | FP64 Ray-Trace | CPU PhotoWorxx
| Performance rating | |
| Average of class Gaming | |
| Lenovo Legion 5 Pro 16 G7 i7 RTX 3070Ti | |
| MSI Stealth GS66 12UGS | |
| MSI Vector GP66 12UGS | |
| Average Intel Core i7-12800H | |
| Razer Blade 17 RTX 3080 Ti | |
| Razer Blade 17 (i7-12800H, RTX 3070 Ti) | |
| Razer Blade 17 RTX 3070 -9! | |
| AIDA64 / FP32 Ray-Trace | |
| Average of class Gaming (10227 - 85542, n=104, last 2 years) | |
| Lenovo Legion 5 Pro 16 G7 i7 RTX 3070Ti | |
| MSI Stealth GS66 12UGS | |
| Average Intel Core i7-12800H (5839 - 15206, n=5) | |
| MSI Vector GP66 12UGS | |
| Razer Blade 17 (i7-12800H, RTX 3070 Ti) | |
| Razer Blade 17 RTX 3080 Ti | |
| AIDA64 / FPU Julia | |
| Average of class Gaming (51376 - 238426, n=104, last 2 years) | |
| Average Intel Core i7-12800H (27801 - 80002, n=5) | |
| Lenovo Legion 5 Pro 16 G7 i7 RTX 3070Ti | |
| MSI Stealth GS66 12UGS | |
| MSI Vector GP66 12UGS | |
| Razer Blade 17 (i7-12800H, RTX 3070 Ti) | |
| Razer Blade 17 RTX 3080 Ti | |
| AIDA64 / CPU SHA3 | |
| Average of class Gaming (2180 - 9817, n=104, last 2 years) | |
| Lenovo Legion 5 Pro 16 G7 i7 RTX 3070Ti | |
| MSI Stealth GS66 12UGS | |
| MSI Vector GP66 12UGS | |
| Average Intel Core i7-12800H (2013 - 3684, n=5) | |
| Razer Blade 17 (i7-12800H, RTX 3070 Ti) | |
| Razer Blade 17 RTX 3080 Ti | |
| AIDA64 / CPU Queen | |
| Average of class Gaming (49785 - 173351, n=91, last 2 years) | |
| MSI Vector GP66 12UGS | |
| Razer Blade 17 RTX 3080 Ti | |
| Lenovo Legion 5 Pro 16 G7 i7 RTX 3070Ti | |
| MSI Stealth GS66 12UGS | |
| Average Intel Core i7-12800H (85965 - 108084, n=5) | |
| Razer Blade 17 (i7-12800H, RTX 3070 Ti) | |
| AIDA64 / FPU SinJulia | |
| Average of class Gaming (4424 - 33636, n=104, last 2 years) | |
| Lenovo Legion 5 Pro 16 G7 i7 RTX 3070Ti | |
| MSI Stealth GS66 12UGS | |
| MSI Vector GP66 12UGS | |
| Razer Blade 17 (i7-12800H, RTX 3070 Ti) | |
| Razer Blade 17 RTX 3080 Ti | |
| Average Intel Core i7-12800H (7027 - 9658, n=5) | |
| AIDA64 / FPU Mandel | |
| Average of class Gaming (25115 - 128721, n=104, last 2 years) | |
| Lenovo Legion 5 Pro 16 G7 i7 RTX 3070Ti | |
| MSI Stealth GS66 12UGS | |
| Average Intel Core i7-12800H (15765 - 38179, n=5) | |
| MSI Vector GP66 12UGS | |
| Razer Blade 17 (i7-12800H, RTX 3070 Ti) | |
| Razer Blade 17 RTX 3080 Ti | |
| AIDA64 / CPU AES | |
| Average of class Gaming (39258 - 247074, n=104, last 2 years) | |
| Lenovo Legion 5 Pro 16 G7 i7 RTX 3070Ti | |
| MSI Stealth GS66 12UGS | |
| MSI Vector GP66 12UGS | |
| Average Intel Core i7-12800H (55371 - 73928, n=5) | |
| Razer Blade 17 (i7-12800H, RTX 3070 Ti) | |
| Razer Blade 17 RTX 3080 Ti | |
| AIDA64 / CPU ZLib | |
| Average of class Gaming (574 - 2531, n=104, last 2 years) | |
| Lenovo Legion 5 Pro 16 G7 i7 RTX 3070Ti | |
| MSI Vector GP66 12UGS | |
| MSI Stealth GS66 12UGS | |
| Razer Blade 17 (i7-12800H, RTX 3070 Ti) | |
| Average Intel Core i7-12800H (701 - 1047, n=5) | |
| Razer Blade 17 RTX 3080 Ti | |
| Razer Blade 17 RTX 3070 | |
| AIDA64 / FP64 Ray-Trace | |
| Average of class Gaming (5509 - 45446, n=104, last 2 years) | |
| Lenovo Legion 5 Pro 16 G7 i7 RTX 3070Ti | |
| MSI Stealth GS66 12UGS | |
| Average Intel Core i7-12800H (3257 - 8559, n=5) | |
| MSI Vector GP66 12UGS | |
| Razer Blade 17 RTX 3080 Ti | |
| Razer Blade 17 (i7-12800H, RTX 3070 Ti) | |
| AIDA64 / CPU PhotoWorxx | |
| Average of class Gaming (12271 - 89891, n=104, last 2 years) | |
| Razer Blade 17 RTX 3080 Ti | |
| MSI Stealth GS66 12UGS | |
| Average Intel Core i7-12800H (31329 - 40992, n=5) | |
| Lenovo Legion 5 Pro 16 G7 i7 RTX 3070Ti | |
| Razer Blade 17 (i7-12800H, RTX 3070 Ti) | |
| MSI Vector GP66 12UGS | |
System performance
The system performance is satisfactory, but we didn't observe a positive effect compared to the predecessor based on Tiger Lake.
CrossMark: Overall | Productivity | Creativity | Responsiveness
| PCMark 10 / Score | |
| Average of class Gaming (5828 - 11574, n=93, last 2 years) | |
| MSI Vector GP66 12UGS | |
| Razer Blade 17 RTX 3080 Ti | |
| MSI Stealth GS66 12UGS | |
| Lenovo Legion 5 Pro 16 G7 i7 RTX 3070Ti | |
| Razer Blade 17 RTX 3070 | |
| Razer Blade 17 (i7-12800H, RTX 3070 Ti) | |
| Average Intel Core i7-12800H, NVIDIA GeForce RTX 3070 Ti Laptop GPU (n=1) | |
| PCMark 10 / Essentials | |
| MSI Vector GP66 12UGS | |
| MSI Stealth GS66 12UGS | |
| Razer Blade 17 RTX 3070 | |
| Razer Blade 17 RTX 3080 Ti | |
| Average of class Gaming (8810 - 11935, n=97, last 2 years) | |
| Razer Blade 17 (i7-12800H, RTX 3070 Ti) | |
| Average Intel Core i7-12800H, NVIDIA GeForce RTX 3070 Ti Laptop GPU (n=1) | |
| Lenovo Legion 5 Pro 16 G7 i7 RTX 3070Ti | |
| PCMark 10 / Productivity | |
| Average of class Gaming (6845 - 21327, n=95, last 2 years) | |
| MSI Vector GP66 12UGS | |
| Lenovo Legion 5 Pro 16 G7 i7 RTX 3070Ti | |
| MSI Stealth GS66 12UGS | |
| Razer Blade 17 RTX 3080 Ti | |
| Razer Blade 17 RTX 3070 | |
| Razer Blade 17 (i7-12800H, RTX 3070 Ti) | |
| Average Intel Core i7-12800H, NVIDIA GeForce RTX 3070 Ti Laptop GPU (n=1) | |
| PCMark 10 / Digital Content Creation | |
| Average of class Gaming (7602 - 19657, n=95, last 2 years) | |
| MSI Vector GP66 12UGS | |
| Razer Blade 17 RTX 3080 Ti | |
| Lenovo Legion 5 Pro 16 G7 i7 RTX 3070Ti | |
| MSI Stealth GS66 12UGS | |
| Razer Blade 17 (i7-12800H, RTX 3070 Ti) | |
| Average Intel Core i7-12800H, NVIDIA GeForce RTX 3070 Ti Laptop GPU (n=1) | |
| Razer Blade 17 RTX 3070 | |
| CrossMark / Overall | |
| Average of class Gaming (1366 - 2409, n=93, last 2 years) | |
| Lenovo Legion 5 Pro 16 G7 i7 RTX 3070Ti | |
| Razer Blade 17 (i7-12800H, RTX 3070 Ti) | |
| Average Intel Core i7-12800H, NVIDIA GeForce RTX 3070 Ti Laptop GPU (n=1) | |
| CrossMark / Productivity | |
| Lenovo Legion 5 Pro 16 G7 i7 RTX 3070Ti | |
| Average of class Gaming (1386 - 2254, n=93, last 2 years) | |
| Razer Blade 17 (i7-12800H, RTX 3070 Ti) | |
| Average Intel Core i7-12800H, NVIDIA GeForce RTX 3070 Ti Laptop GPU (n=1) | |
| CrossMark / Creativity | |
| Average of class Gaming (1343 - 2729, n=93, last 2 years) | |
| Lenovo Legion 5 Pro 16 G7 i7 RTX 3070Ti | |
| Razer Blade 17 (i7-12800H, RTX 3070 Ti) | |
| Average Intel Core i7-12800H, NVIDIA GeForce RTX 3070 Ti Laptop GPU (n=1) | |
| CrossMark / Responsiveness | |
| Lenovo Legion 5 Pro 16 G7 i7 RTX 3070Ti | |
| Average of class Gaming (1226 - 2334, n=93, last 2 years) | |
| Razer Blade 17 (i7-12800H, RTX 3070 Ti) | |
| Average Intel Core i7-12800H, NVIDIA GeForce RTX 3070 Ti Laptop GPU (n=1) | |
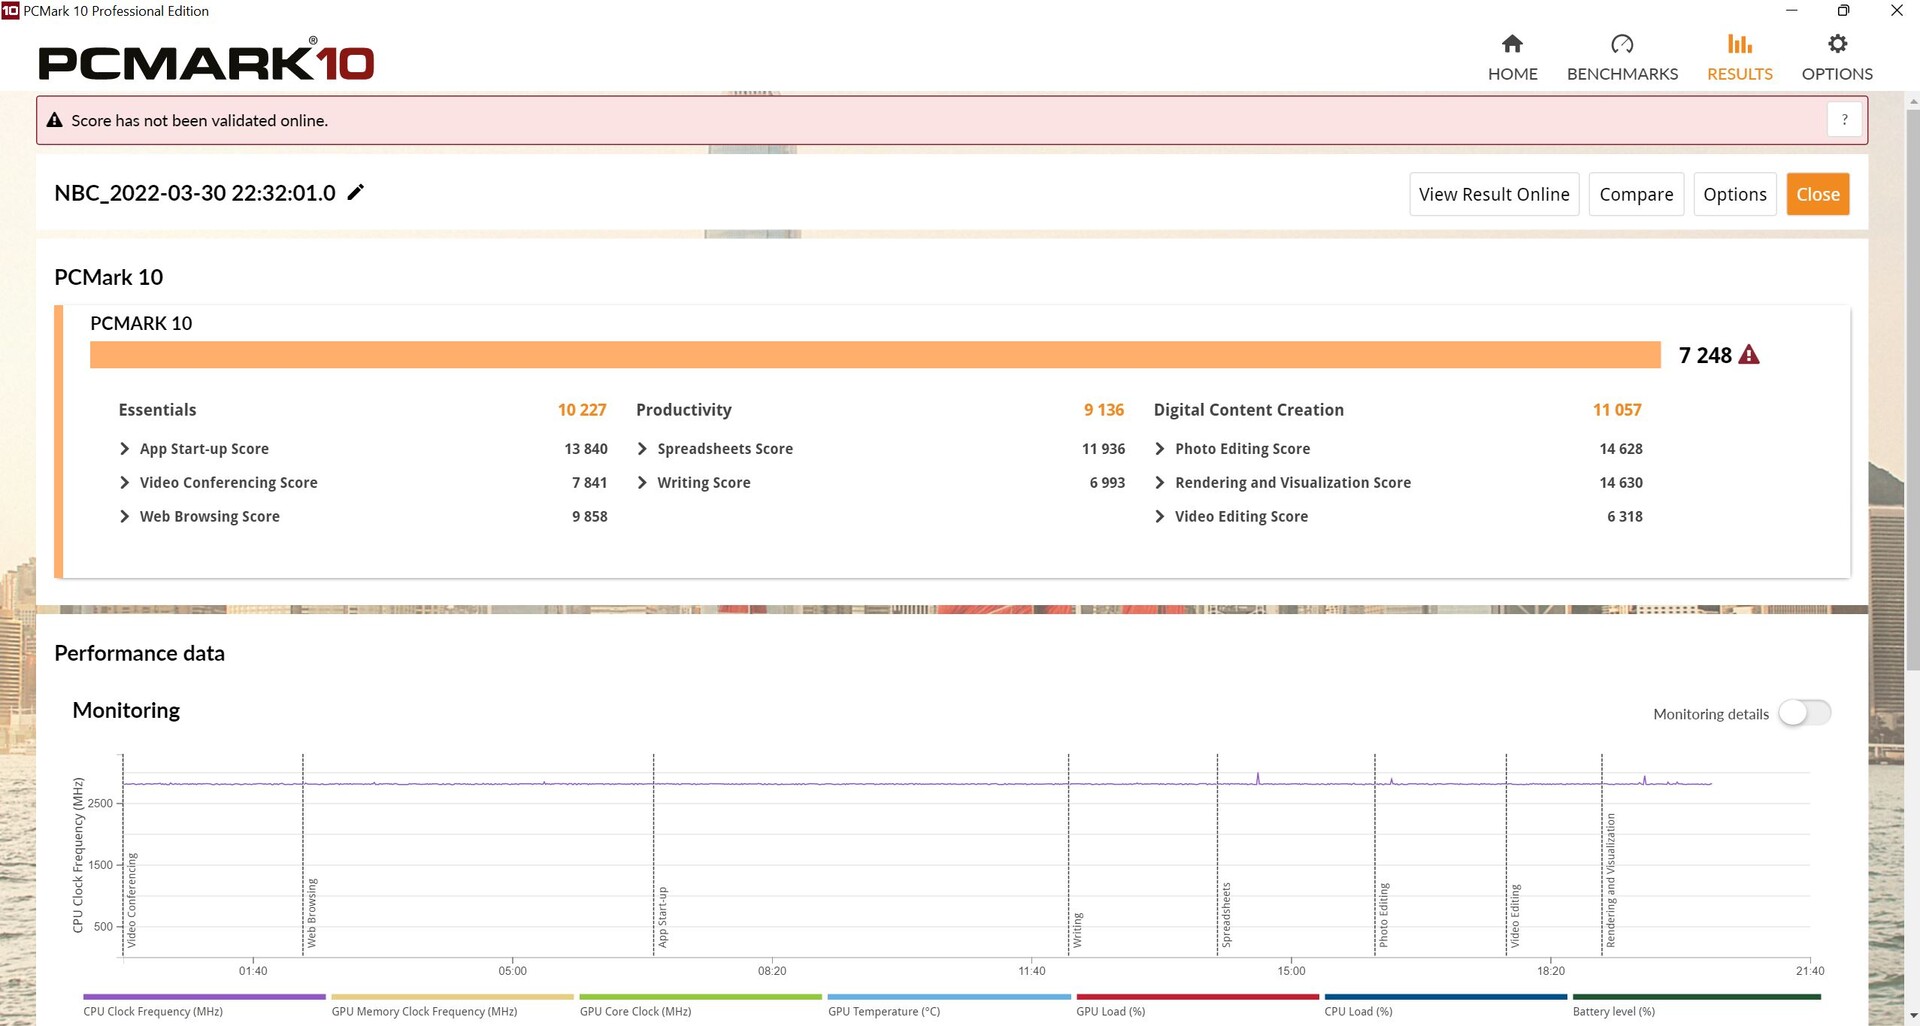
| PCMark 10 Score | 7248 points | |
Help | ||
| AIDA64 / Memory Copy | |
| Average of class Gaming (21750 - 129946, n=104, last 2 years) | |
| Razer Blade 17 RTX 3080 Ti | |
| MSI Stealth GS66 12UGS | |
| Average Intel Core i7-12800H (48643 - 62522, n=5) | |
| Lenovo Legion 5 Pro 16 G7 i7 RTX 3070Ti | |
| Razer Blade 17 (i7-12800H, RTX 3070 Ti) | |
| MSI Vector GP66 12UGS | |
| AIDA64 / Memory Read | |
| Average of class Gaming (22956 - 118858, n=104, last 2 years) | |
| Razer Blade 17 RTX 3080 Ti | |
| MSI Stealth GS66 12UGS | |
| Average Intel Core i7-12800H (56629 - 66199, n=5) | |
| Lenovo Legion 5 Pro 16 G7 i7 RTX 3070Ti | |
| Razer Blade 17 (i7-12800H, RTX 3070 Ti) | |
| MSI Vector GP66 12UGS | |
| AIDA64 / Memory Write | |
| Average of class Gaming (22297 - 135096, n=104, last 2 years) | |
| MSI Stealth GS66 12UGS | |
| Razer Blade 17 RTX 3080 Ti | |
| Average Intel Core i7-12800H (50923 - 66074, n=5) | |
| Lenovo Legion 5 Pro 16 G7 i7 RTX 3070Ti | |
| Razer Blade 17 (i7-12800H, RTX 3070 Ti) | |
| MSI Vector GP66 12UGS | |
| AIDA64 / Memory Latency | |
| Average of class Gaming (75.3 - 259, n=104, last 2 years) | |
| Lenovo Legion 5 Pro 16 G7 i7 RTX 3070Ti | |
| MSI Stealth GS66 12UGS | |
| MSI Vector GP66 12UGS | |
| Average Intel Core i7-12800H (89.3 - 95.2, n=5) | |
| Razer Blade 17 RTX 3070 | |
| Razer Blade 17 RTX 3080 Ti | |
| Razer Blade 17 (i7-12800H, RTX 3070 Ti) | |
* ... smaller is better
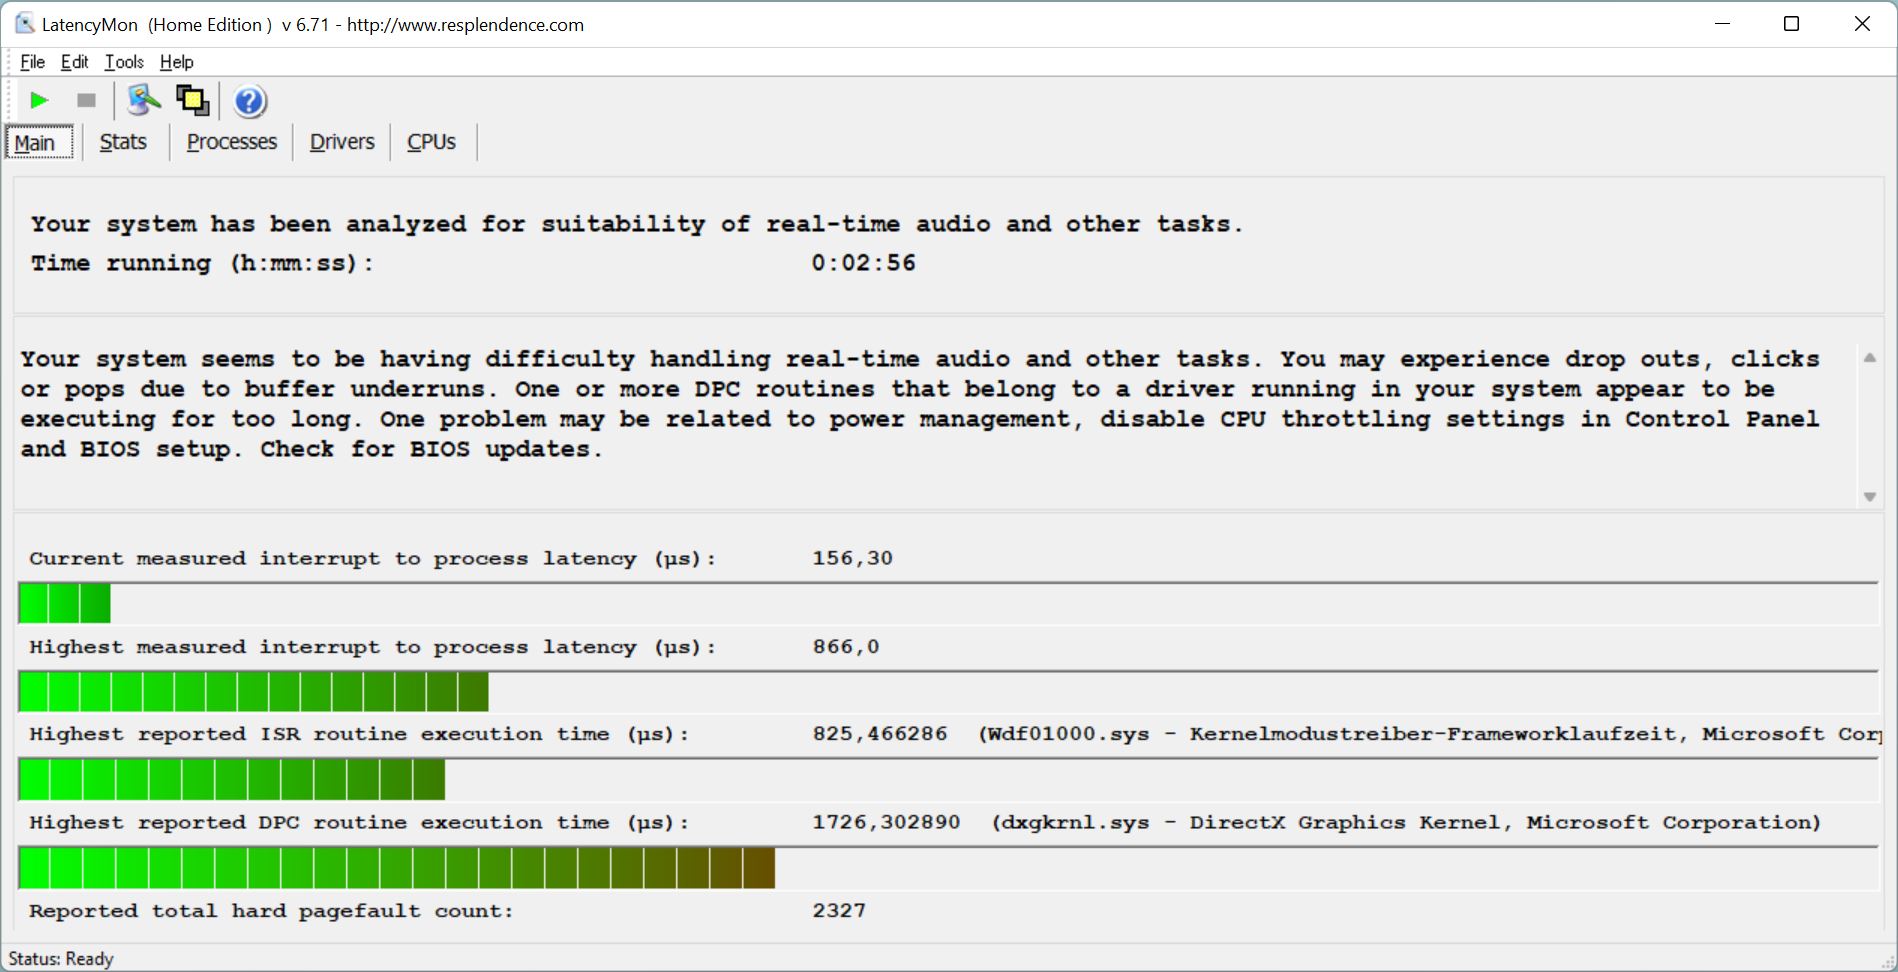
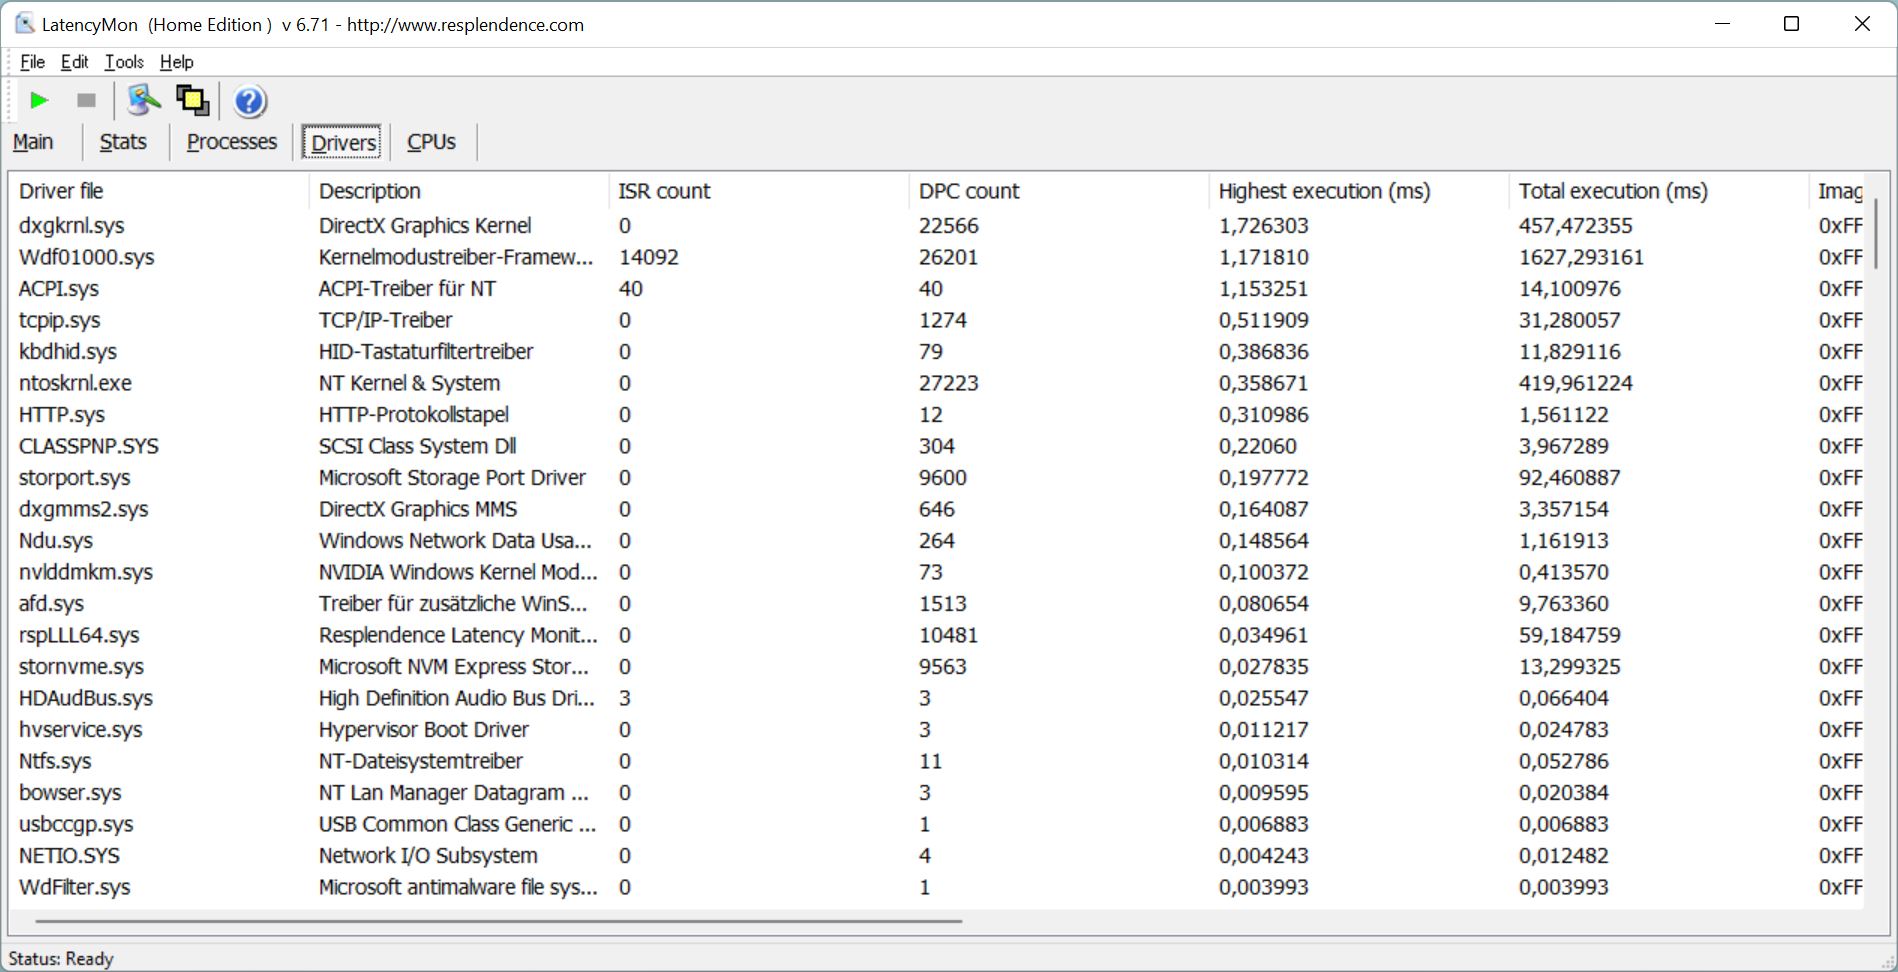
DPC latencies
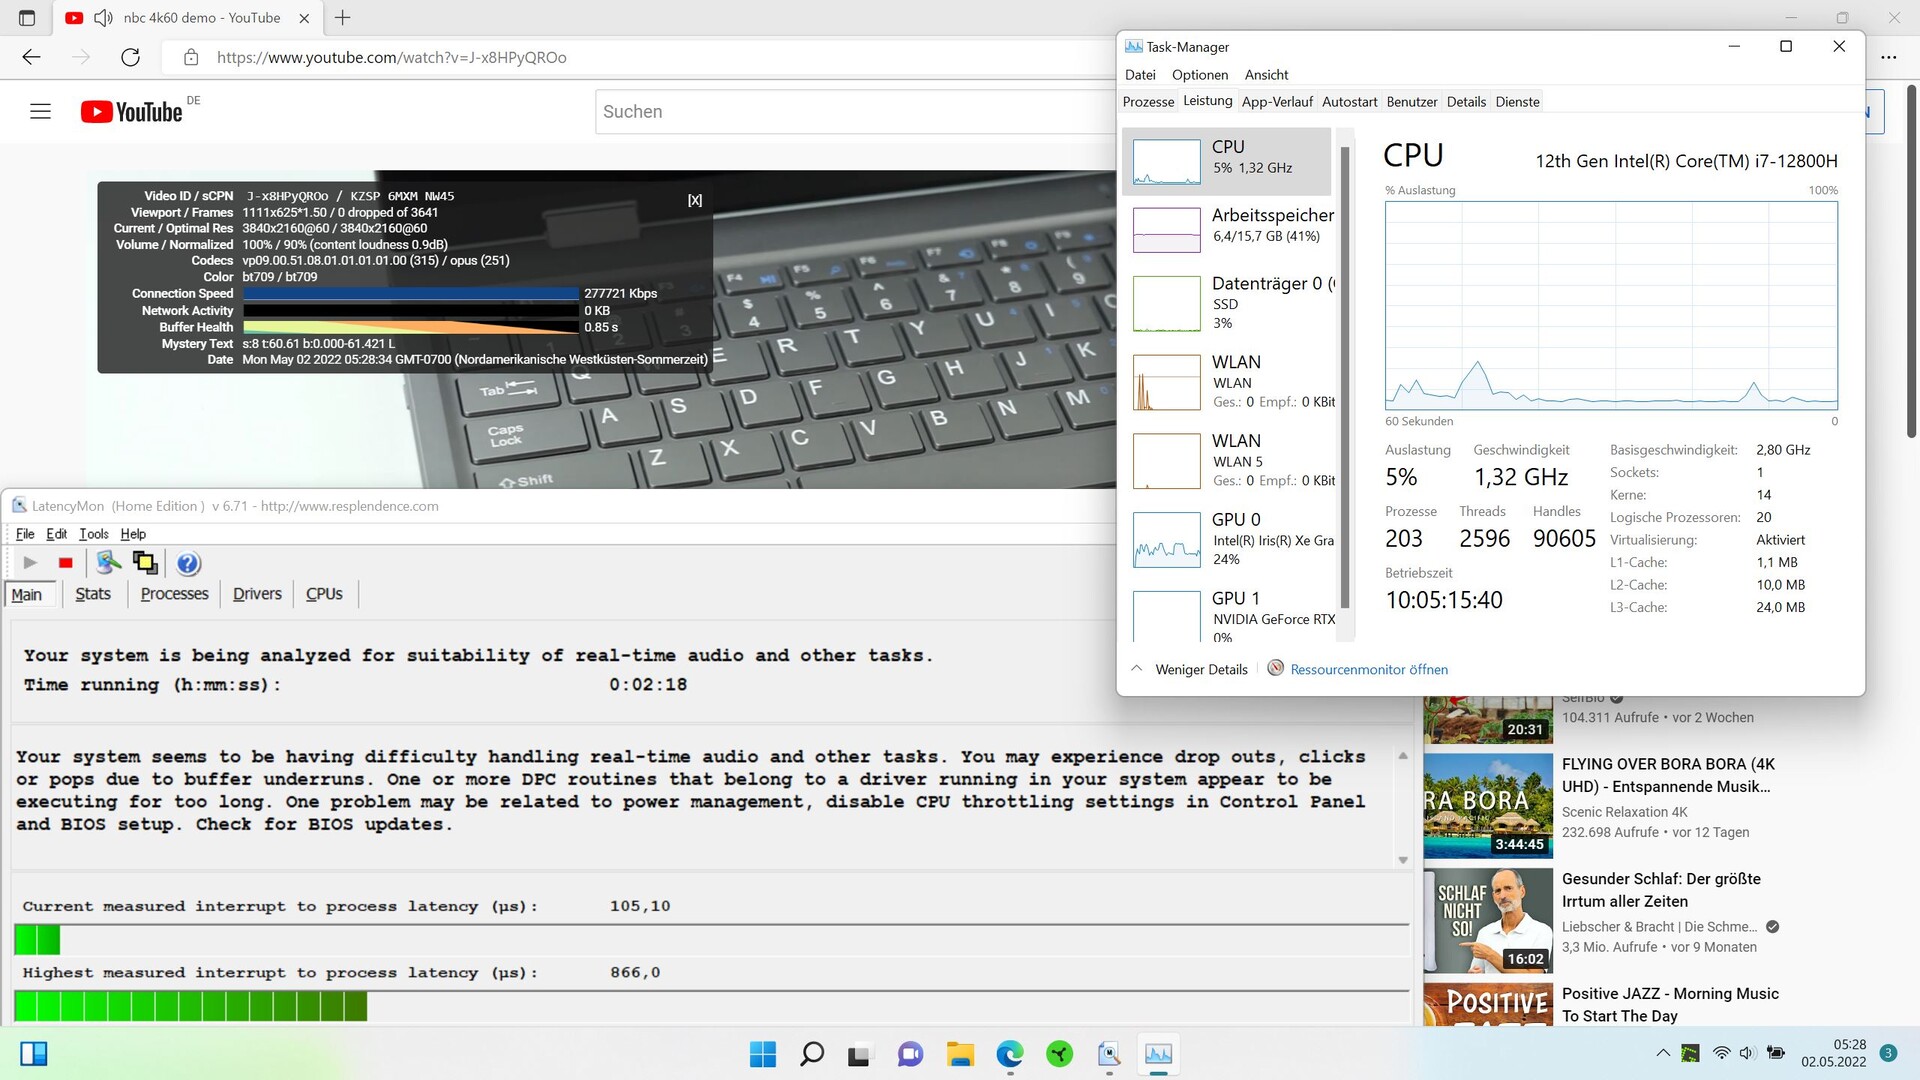
LatencyMon already registers slight latencies just by opening the Edge browser, which increase on our home page when we open multiple tabs.
The subsequent playback of our 4K/60 fps YouTube video increases the latencies further, but the video is at least rendered without dropped frames.
| DPC Latencies / LatencyMon - interrupt to process latency (max), Web, Youtube, Prime95 | |
| MSI Vector GP66 12UGS | |
| MSI Stealth GS66 12UGS | |
| Razer Blade 17 RTX 3080 Ti | |
| Razer Blade 17 (i7-12800H, RTX 3070 Ti) | |
| Lenovo Legion 5 Pro 16 G7 i7 RTX 3070Ti | |
| Razer Blade 17 RTX 3070 | |
* ... smaller is better
Storage
Razer has installed a Samsung NVMe SSD with 1 TB of storage space in our review configuration. The SSD is ranked 7th in our HDD/SSD Benchmarks article, making it one of the fastest models available.
The storage solution also achieves very good rates in comparison, but the same model is even slightly faster in the Legion. The continuous performance is beyond reproach as well.

* ... smaller is better
Continuous load read: DiskSpd Read Loop, Queue Depth 8
Graphics card
Now, we'll take a look at whether there's a gap between the built-in RTX 3070 Ti and the RTX 3080 Ti in the top configuration, and if so, we'll find out how big it is.
In the synthetic 3DMark benchmarks, the RTX 3080 Ti performs about 12% to 20% faster than the Blade with RTX 3070 Ti, which is a noticeable difference.
A new Fire Strike run on battery power reveals a performance loss of 77.5%, and the score is only 4,427 instead of 24,111 points when plugged in!


| 3DMark 11 Performance | 31308 points | |
| 3DMark Cloud Gate Standard Score | 52870 points | |
| 3DMark Fire Strike Score | 24111 points | |
| 3DMark Time Spy Score | 10868 points | |
Help | ||
Gaming performance
Needless to say, the RTX 3070 Ti is capable of running almost any game in the native resolution and at high details smoothly. For performance enthusiasts, though, the question of how many more frames you can get out of the system by buying the RTX 3080 Ti variant arises.
In The Witcher 3, the advantage of the RTX 3080 Ti is 12% in Full HD and maximum details. In Far Cry 5, the gap shrinks to 8% with the same settings. In 2K, the lead is 18%.
We measure very variable differences in Cyberpunk. While both cards are practically on par in Full HD, we only measure a bigger difference starting at 2K, where it's a considerable 22%.
Overall, the Blade 17 doesn't extract the maximum out of its RTX 3070 Ti, but the differences to the RTX 3080 Ti model are still rather small up to Full HD. However, the RTX 3080 Ti achieves a noticeable lead in the Blade's native resolution, even though most games should also run smoothly with the RTX 3070. Buying the better version will probably only be relevant when you plan to play on an external 4K display.
The Witcher 3 frame rate only drops negligibly from around 110 to 107 fps over the course of an hour.
The Witcher 3 FPS diagram
| low | med. | high | ultra | QHD | |
|---|---|---|---|---|---|
| GTA V (2015) | 182.6 | 176.8 | 164.2 | 103.8 | |
| The Witcher 3 (2015) | 339 | 296.4 | 173.4 | 111.6 | |
| Dota 2 Reborn (2015) | 173.6 | 159.3 | 150 | 141.6 | |
| Final Fantasy XV Benchmark (2018) | 158.4 | 134.3 | 103.2 | 78.5 | |
| X-Plane 11.11 (2018) | 138.6 | 117.7 | 95.8 | ||
| Far Cry 5 (2018) | 155 | 128 | 123 | 116 | 102 |
| Strange Brigade (2018) | 369 | 258 | 217 | 191.7 | |
| Cyberpunk 2077 1.6 (2022) | 117 | 113 | 105 | 104 | 49 |
Emissions - Slightly cooler
Noise emissions
The slightly lower performance makes us expect a somewhat quieter and cooler system.
The fans are usually inactive in idle usage, even when using the maximum performance settings. The Razer Blade is one of the quieter devices under load, but there are no positive differences compared to the model with the RTX 3080 Ti.
Noise level
| Idle |
| 23 / 23 / 23 dB(A) |
| Load |
| 36.92 / 50 dB(A) |
 | ||
30 dB silent 40 dB(A) audible 50 dB(A) loud |
||
min: | ||
| Razer Blade 17 (i7-12800H, RTX 3070 Ti) GeForce RTX 3070 Ti Laptop GPU, i7-12800H, Samsung PM9A1 MZVL21T0HCLR | Razer Blade 17 RTX 3080 Ti GeForce RTX 3080 Ti Laptop GPU, i7-12800H, Samsung PM9A1 MZVL21T0HCLR | Razer Blade 17 RTX 3070 GeForce RTX 3070 Laptop GPU, i7-11800H, Samsung PM9A1 MZVL21T0HCLR | Lenovo Legion 5 Pro 16 G7 i7 RTX 3070Ti GeForce RTX 3070 Ti Laptop GPU, i7-12700H, Samsung PM9A1 MZVL21T0HCLR | MSI Vector GP66 12UGS GeForce RTX 3070 Ti Laptop GPU, i9-12900H | MSI Stealth GS66 12UGS GeForce RTX 3070 Ti Laptop GPU, i7-12700H, WDC PC SN810 1TB | |
|---|---|---|---|---|---|---|
| Noise | -3% | -8% | -17% | -8% | -20% | |
| off / environment * (dB) | 23 | 23.3 -1% | 24.2 -5% | 24.6 -7% | 22.9 -0% | 24 -4% |
| Idle Minimum * (dB) | 23 | 23.3 -1% | 24.7 -7% | 28.4 -23% | 23.4 -2% | 31 -35% |
| Idle Average * (dB) | 23 | 23.3 -1% | 24.7 -7% | 28.4 -23% | 23.4 -2% | 32 -39% |
| Idle Maximum * (dB) | 23 | 26.3 -14% | 24.7 -7% | 28.4 -23% | 27.4 -19% | 35 -52% |
| Load Average * (dB) | 36.92 | 38.2 -3% | 44.3 -20% | 49.4 -34% | 36 2% | 48 -30% |
| Witcher 3 ultra * (dB) | 50 | 50.9 -2% | 56.3 -13% | 49.4 1% | 58.2 -16% | 43 14% |
| Load Maximum * (dB) | 50 | 49.1 2% | 47.7 5% | 54.7 -9% | 58 -16% | 48 4% |
* ... smaller is better
Temperature
The palm rests at least always remain cool, and the metal case conducts the waste heat particularly well to the outside. And in fact, the RTX 3070 Ti Blade does stay a bit cooler than its beefed-up counterpart, both in idle usage and under load. Hot spots of 45 °C (~113 °F) during gaming are very moderate.
(±) The maximum temperature on the upper side is 43 °C / 109 F, compared to the average of 40.4 °C / 105 F, ranging from 21.2 to 68.8 °C for the class Gaming.
(±) The bottom heats up to a maximum of 44 °C / 111 F, compared to the average of 43.2 °C / 110 F
(+) In idle usage, the average temperature for the upper side is 29.8 °C / 86 F, compared to the device average of 33.9 °C / 93 F.
(-) Playing The Witcher 3, the average temperature for the upper side is 38.3 °C / 101 F, compared to the device average of 33.9 °C / 93 F.
(+) The palmrests and touchpad are reaching skin temperature as a maximum (35 °C / 95 F) and are therefore not hot.
(-) The average temperature of the palmrest area of similar devices was 28.8 °C / 83.8 F (-6.2 °C / -11.2 F).
| Razer Blade 17 (i7-12800H, RTX 3070 Ti) Intel Core i7-12800H, NVIDIA GeForce RTX 3070 Ti Laptop GPU | Razer Blade 17 RTX 3080 Ti Intel Core i7-12800H, NVIDIA GeForce RTX 3080 Ti Laptop GPU | Razer Blade 17 RTX 3070 Intel Core i7-11800H, NVIDIA GeForce RTX 3070 Laptop GPU | Lenovo Legion 5 Pro 16 G7 i7 RTX 3070Ti Intel Core i7-12700H, NVIDIA GeForce RTX 3070 Ti Laptop GPU | MSI Vector GP66 12UGS Intel Core i9-12900H, NVIDIA GeForce RTX 3070 Ti Laptop GPU | MSI Stealth GS66 12UGS Intel Core i7-12700H, NVIDIA GeForce RTX 3070 Ti Laptop GPU | |
|---|---|---|---|---|---|---|
| Heat | -10% | -5% | -6% | -3% | -5% | |
| Maximum Upper Side * (°C) | 43 | 46 -7% | 41 5% | 45.3 -5% | 40.2 7% | 54 -26% |
| Maximum Bottom * (°C) | 44 | 46.8 -6% | 47.2 -7% | 61.2 -39% | 43.8 -0% | 59 -34% |
| Idle Upper Side * (°C) | 32 | 36.2 -13% | 33.2 -4% | 28.6 11% | 34.8 -9% | 26 19% |
| Idle Bottom * (°C) | 34 | 38.6 -14% | 39 -15% | 31.4 8% | 37 -9% | 27 21% |
* ... smaller is better
Stress test
The cores begin our stress test at around 3.2 GHz. It only takes a short time for the clock speed to settle at around 2.2 GHz, after which it remains quite stable. The temperatures reach a moderate 75 °C (~167 °C), and the maximum of 86 °C (~187 °F) is only reached for a short period of time.
The GPU's core clock fluctuates quite strongly between 1.1 and 1.8 GHz. In addition, the memory clock speed drops from 1,750 to 1,500 MHz from time to time. The GPU temperature is below 70 °C (~158 °F).
Therefore, there's still headroom for both the CPU and the GPU, and the temperatures remain at a very moderate level.


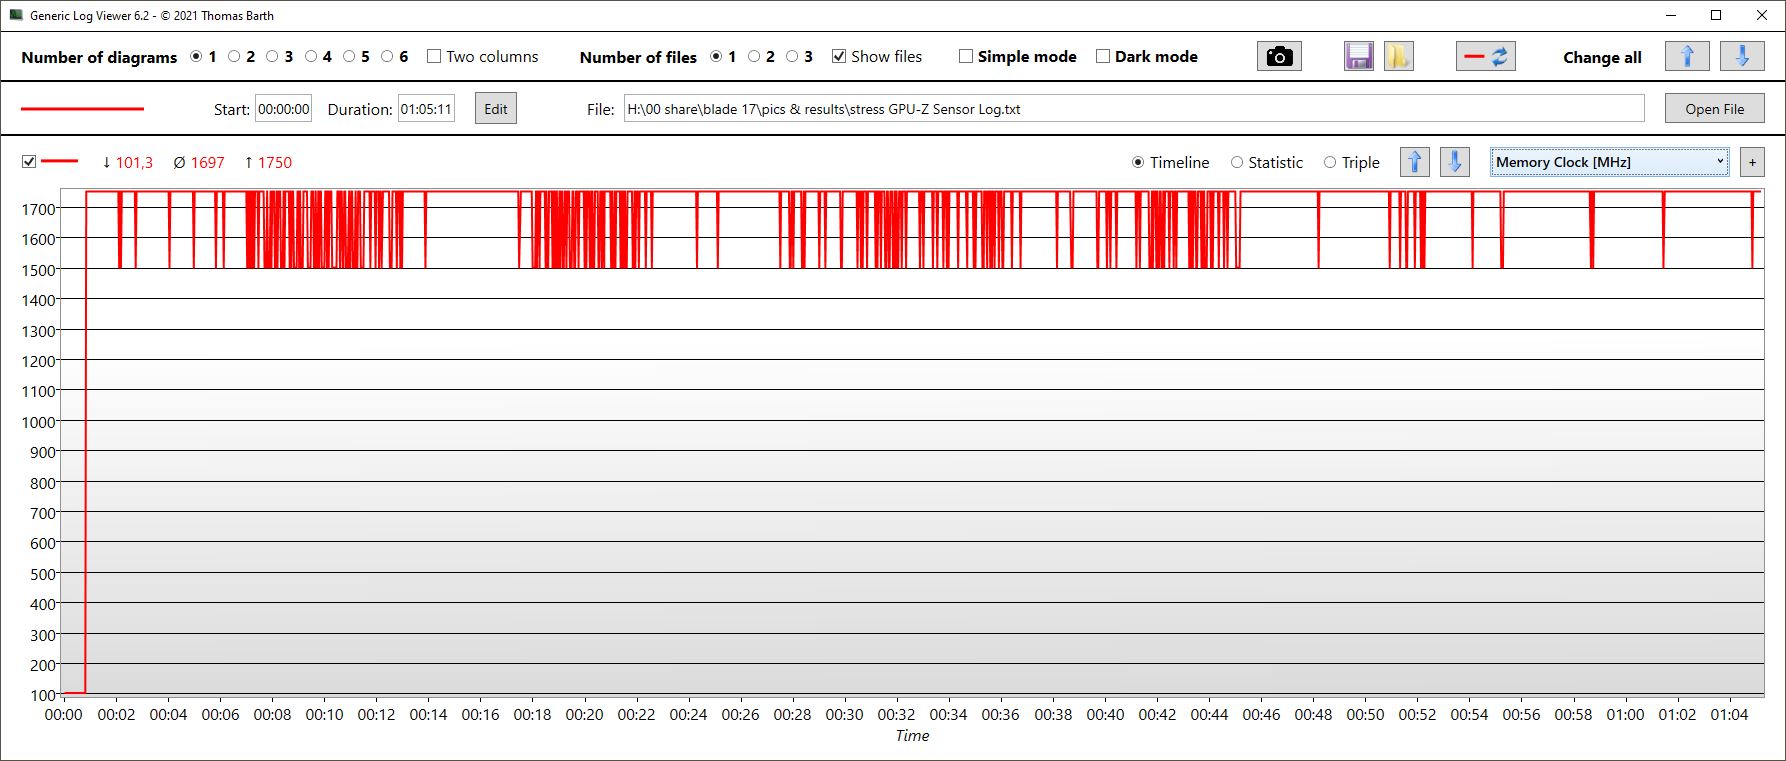
| CPU clock speed (GHz) | GPU clock speed (MHz) | Average CPU temperature (°C) | Average GPU Temperature (°C) | |
| System idle | 2.3 | 1,410 | 45 (~113 °F) | 50 (~122 °F) |
| Prime95 + FurMark stress | 2.2 | 1,482 | 74 (~165 °F) | 67 (~153 °F) |
Speakers
The Razer Blade's speakers are among the better ones in the class comparison. Although the bass has room for improvement, it's not as thin and tinny as in most other laptops. The mids and highs are very balanced, and the speakers can also get pretty loud.
Only a combined headset port in the form of an audio jack is available for the analog connection of external audio devices.
Razer Blade 17 (i7-12800H, RTX 3070 Ti) audio analysis
(+) | speakers can play relatively loud (82.67 dB)
Bass 100 - 315 Hz
(±) | reduced bass - on average 6.7% lower than median
(±) | linearity of bass is average (9.5% delta to prev. frequency)
Mids 400 - 2000 Hz
(+) | balanced mids - only 4.6% away from median
(+) | mids are linear (4% delta to prev. frequency)
Highs 2 - 16 kHz
(+) | balanced highs - only 3.1% away from median
(+) | highs are linear (6.5% delta to prev. frequency)
Overall 100 - 16.000 Hz
(+) | overall sound is linear (9.9% difference to median)
Compared to same class
» 5% of all tested devices in this class were better, 2% similar, 94% worse
» The best had a delta of 6%, average was 18%, worst was 132%
Compared to all devices tested
» 4% of all tested devices were better, 1% similar, 95% worse
» The best had a delta of 4%, average was 23%, worst was 134%
Apple MacBook Pro 16 2021 M1 Pro audio analysis
(+) | speakers can play relatively loud (84.7 dB)
Bass 100 - 315 Hz
(+) | good bass - only 3.8% away from median
(+) | bass is linear (5.2% delta to prev. frequency)
Mids 400 - 2000 Hz
(+) | balanced mids - only 1.3% away from median
(+) | mids are linear (2.1% delta to prev. frequency)
Highs 2 - 16 kHz
(+) | balanced highs - only 1.9% away from median
(+) | highs are linear (2.7% delta to prev. frequency)
Overall 100 - 16.000 Hz
(+) | overall sound is linear (4.6% difference to median)
Compared to same class
» 0% of all tested devices in this class were better, 0% similar, 100% worse
» The best had a delta of 5%, average was 17%, worst was 45%
Compared to all devices tested
» 0% of all tested devices were better, 0% similar, 100% worse
» The best had a delta of 4%, average was 23%, worst was 134%
Energy management - More frugal than the top model
Energy consumption
The GPU difference really becomes noticeable when it comes to power consumption. In all scenarios, including in idle usage, the RTX 3070 Ti configuration consumes significantly less than its RTX 3080 Ti counterpart.
When playing The Witcher 3, our review model consumes about 25 watts less, and the short-term absolute maximum consumption is roughly lower by the same amount as well. Consumption briefly soars to 248 watts in our stress test, but it's 204 watts on average.
The 280-watt power adapter, which has been particularly reduced in size by Razer, is still available in our configuration, which means that there's always enough power in reserve.
| Idle | |
| Load |
|
Key:
min: | |
| Razer Blade 17 (i7-12800H, RTX 3070 Ti) i7-12800H, GeForce RTX 3070 Ti Laptop GPU, Samsung PM9A1 MZVL21T0HCLR, IPS, 2560x1440, 17.3" | Razer Blade 17 RTX 3080 Ti i7-12800H, GeForce RTX 3080 Ti Laptop GPU, Samsung PM9A1 MZVL21T0HCLR, IPS, 2560x1440, 17.3" | Razer Blade 17 RTX 3070 i7-11800H, GeForce RTX 3070 Laptop GPU, Samsung PM9A1 MZVL21T0HCLR, IPS, 1920x1080, 17.3" | Lenovo Legion 5 Pro 16 G7 i7 RTX 3070Ti i7-12700H, GeForce RTX 3070 Ti Laptop GPU, Samsung PM9A1 MZVL21T0HCLR, IPS, 2560x1600, 16" | MSI Vector GP66 12UGS i9-12900H, GeForce RTX 3070 Ti Laptop GPU, , IPS, 1920x1080, 15.6" | MSI Stealth GS66 12UGS i7-12700H, GeForce RTX 3070 Ti Laptop GPU, WDC PC SN810 1TB, IPS-Level, 2560x1440, 15.6" | Average NVIDIA GeForce RTX 3070 Ti Laptop GPU | Average of class Gaming | |
|---|---|---|---|---|---|---|---|---|
| Power Consumption | -69% | -25% | 9% | -25% | 14% | -5% | 2% | |
| Idle Minimum * (Watt) | 14.4 | 29.8 -107% | 20.9 -45% | 8.6 40% | 17.5 -22% | 11 24% | 14.2 ? 1% | 13 ? 10% |
| Idle Average * (Watt) | 20 | 37.1 -86% | 25.1 -26% | 17.6 12% | 20.1 -1% | 16 20% | 19.9 ? 1% | 18.6 ? 7% |
| Idle Maximum * (Watt) | 21.5 | 60.8 -183% | 45 -109% | 18.5 14% | 47.3 -120% | 23 -7% | 26.2 ? -22% | 24.2 ? -13% |
| Load Average * (Watt) | 119 | 135.3 -14% | 102 14% | 110 8% | 107.3 10% | 110 8% | 125.8 ? -6% | 108.7 ? 9% |
| Witcher 3 ultra * (Watt) | 218 | 243 -11% | 189 13% | 227 -4% | 225 -3% | 151 31% | ||
| Load Maximum * (Watt) | 248 | 273.1 -10% | 234.8 5% | 294.6 -19% | 277.7 -12% | 230 7% | 248 ? -0% | 255 ? -3% |
* ... smaller is better
Energy consumption during The Witcher 3 / stress test
Energy consumption with an external monitor
Battery life
The battery hasn't been reduced in our model; Razer has equipped it with 82 Wh. However, a positive effect can only be noticed under load. When browsing the web or watching a video, only the internal GPU is active, so the battery runtimes don't differ significantly here.
Depending on the brightness setting, you can browse the web for 4 to almost 6 hours. You can plan a movie night for around the same time. It's important to change the refresh rate from 240 to 60 Hz on battery power in order to get longer runtimes. For reference: The difference in runtimes between using Wi-Fi at reduced brightness is 274 minutes at 240 Hz versus 353 minutes at 60 Hz. The indicated video value was generated at 240 Hz.
| Razer Blade 17 (i7-12800H, RTX 3070 Ti) i7-12800H, GeForce RTX 3070 Ti Laptop GPU, 82 Wh | Razer Blade 17 RTX 3080 Ti i7-12800H, GeForce RTX 3080 Ti Laptop GPU, 82 Wh | Razer Blade 17 RTX 3070 i7-11800H, GeForce RTX 3070 Laptop GPU, 70 Wh | Lenovo Legion 5 Pro 16 G7 i7 RTX 3070Ti i7-12700H, GeForce RTX 3070 Ti Laptop GPU, 80 Wh | MSI Vector GP66 12UGS i9-12900H, GeForce RTX 3070 Ti Laptop GPU, 65 Wh | MSI Stealth GS66 12UGS i7-12700H, GeForce RTX 3070 Ti Laptop GPU, 99.9 Wh | Average of class Gaming | |
|---|---|---|---|---|---|---|---|
| Battery runtime | -23% | -15% | -15% | -24% | -10% | 26% | |
| H.264 (h) | 4.9 | 6.3 29% | 8.64 ? 76% | ||||
| WiFi v1.3 (h) | 5.9 | 5.5 -7% | 5.2 -12% | 5.4 -8% | 5.7 -3% | 5.4 -8% | 7.07 ? 20% |
| Load (h) | 1.8 | 1.1 -39% | 1.5 -17% | 0.6 -67% | 1 -44% | 1.6 -11% | 1.502 ? -17% |
| Reader / Idle (h) | 8 | 6.7 | 7.9 | 7.8 | 8.71 ? |
Pros
Cons
Verdict - Cooler and more frugal
The Razer Blade is a highly recommendable gaming and productivity laptop with the RTX 3070 Ti as well. Maybe it's even more recommendable than the top configuration with the RTX 3080 Ti, since our review model remains cooler and, above all, it's much more frugal while still being able to display all games smoothly up to the native resolution.
You'll be hard pressed to find any real points of criticism for the Blade: A webcam cover would be nice, and you have to look for special keys, such as the one that controls the display brightness, using a magnifying glass when it's dark. The RTX 3070 Ti doesn't perform consistently at its best in all games, and it's outperformed by laptops with the same GPU at times. The stress test reveals that there would still be enough reserves available for an even higher 3D performance in terms of thermal throttling.
The Razer Blade 17 with the RTX 3070 Ti is a very powerful and thoroughly recommendable laptop, provided that you have the required spending capacity.
Alternatives to the 17-inch Blade in terms of quality are currently still rare. If you can go for something smaller, you should take a look at the Lenovo Legion 5 Pro 16 G7 with its 16-inch QHD display and the same GPU, since it's very good and has a slightly higher performance. However, it's also considerably thicker than the Blade. But it's also noticeably cheaper.
Price and availability
At the time of writing, you can find our review configuration on Amazon for $3,199.
Razer Blade 17 (i7-12800H, RTX 3070 Ti)
- 05/09/2022 v7 (old)
Christian Hintze
Price comparison

