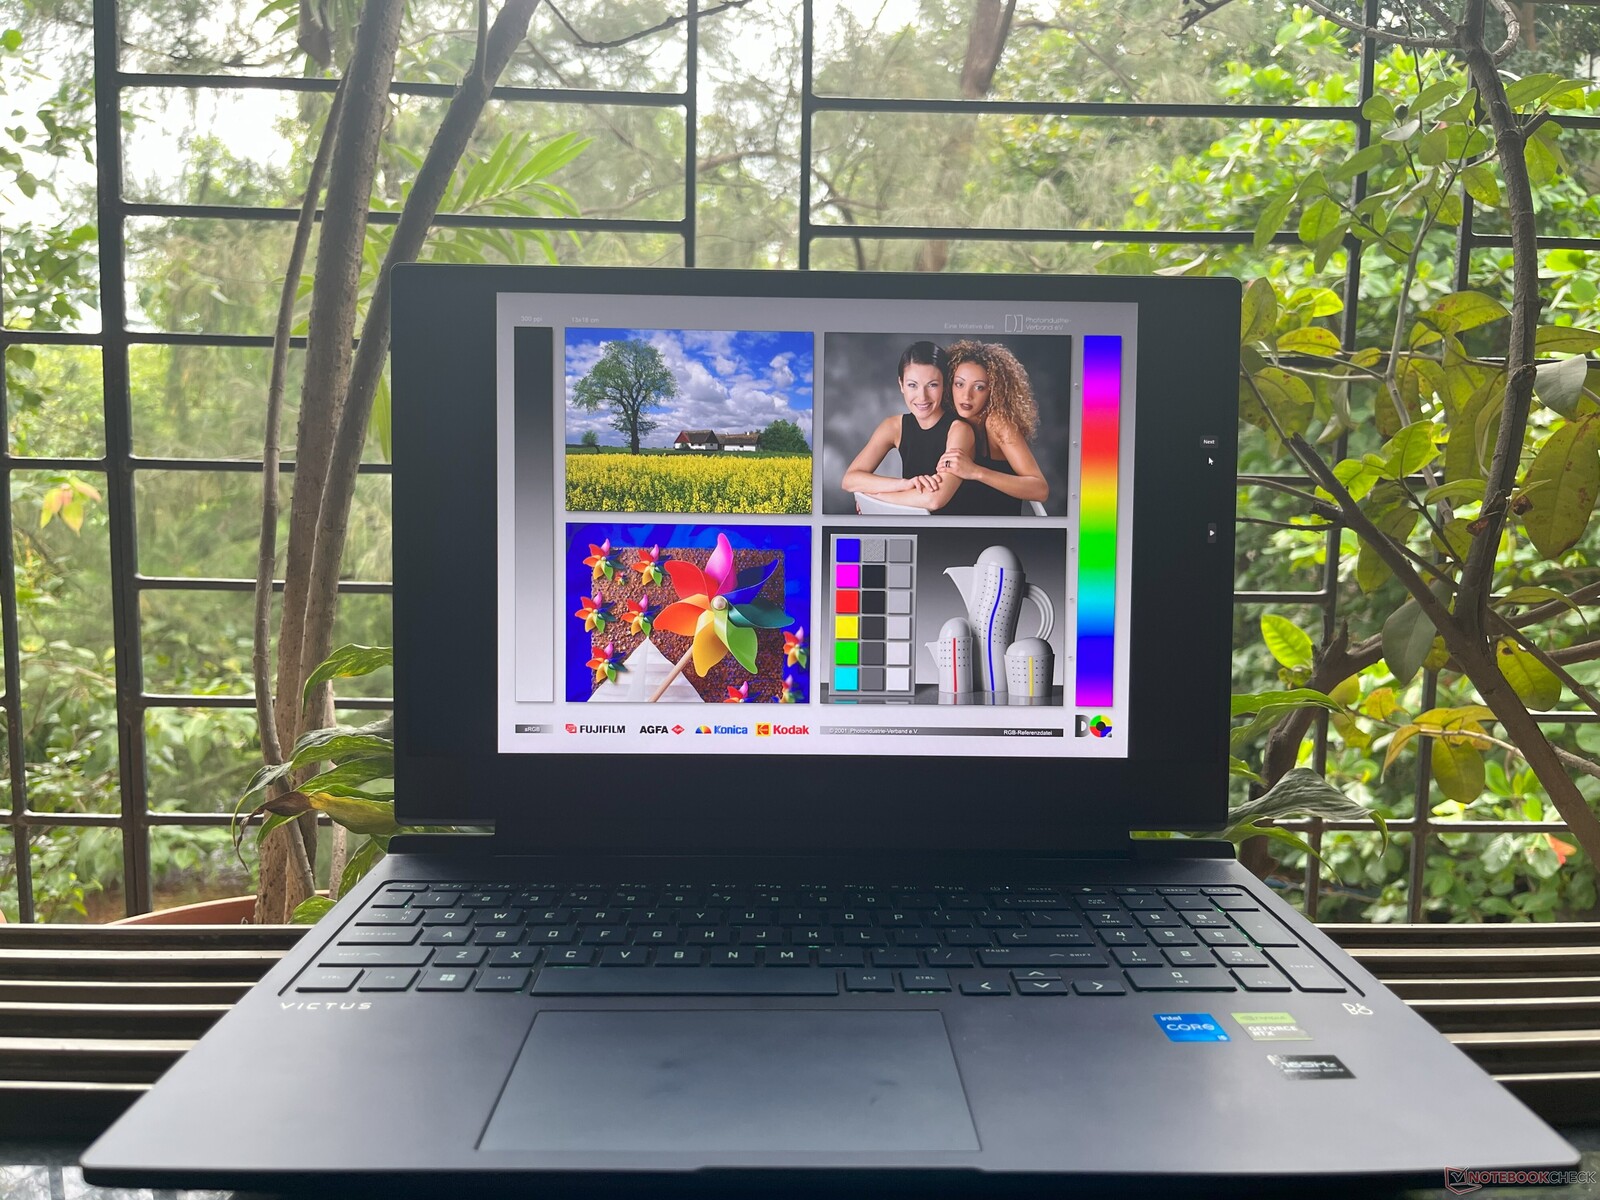
HP Victus 16 Laptop Review: A 1080p gaming powerhouse with few compromises

HP's Victus line of laptops is targeted at budget-focused audiences looking for gaming solutions. However, it still runs plenty of Omen software, effectively cementing its position in HP's repertoire of gaming laptops.
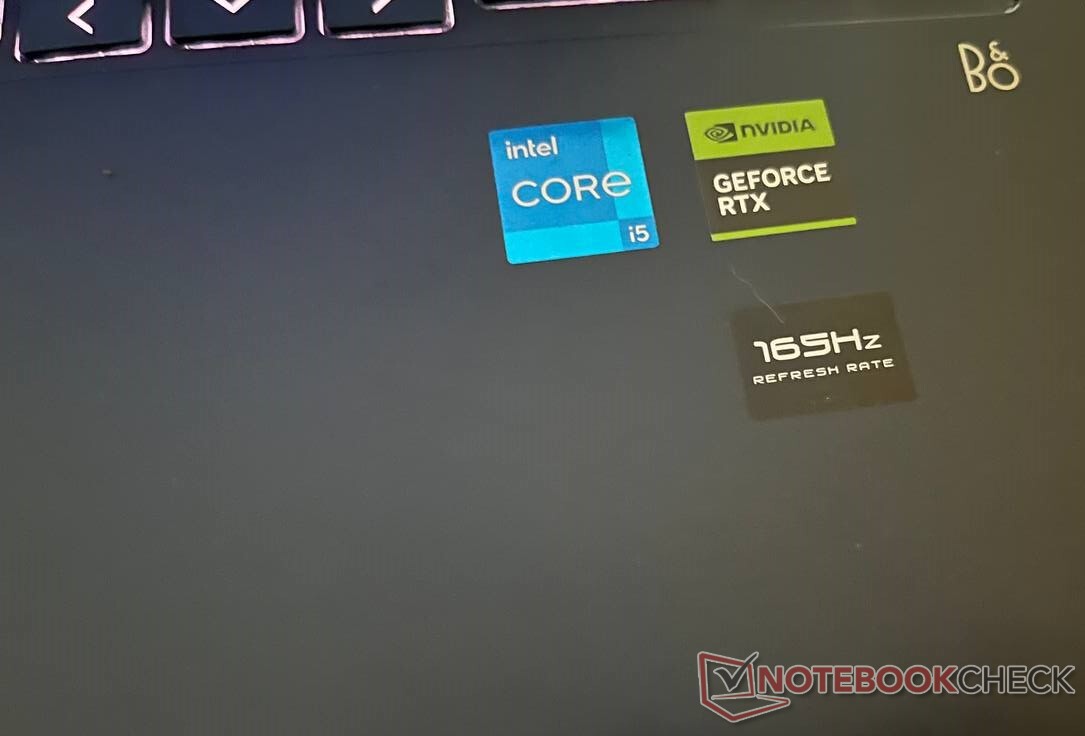
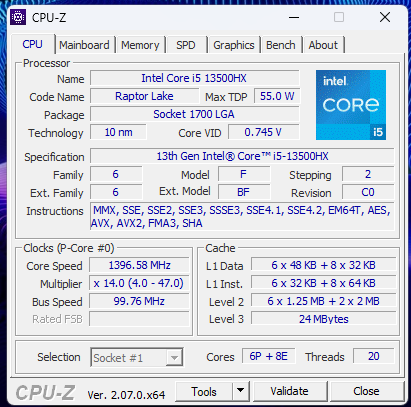
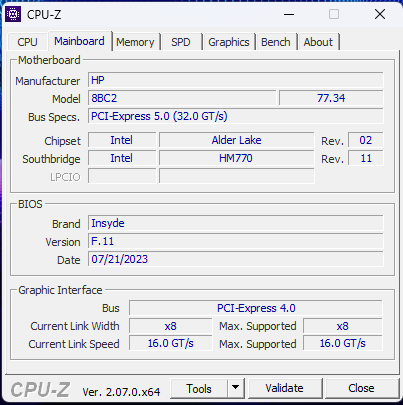
The HP Victus 16-r0076TX offers an interesting mix of mid-range hardware, an Intel Core i5-13500HX Raptor Lake-HX processor and an Nvidia GeForce RTX 4050 (Ada Lovelace) graphics card.
It is a significant improvement over its last iteration, the HP Victus 16-e0145ng, which ran an AMD Ryzen 5 5600H and Nvidia GeForce RTX 3050 Ti. However, the spec upgrade also comes with a corresponding cost increase.
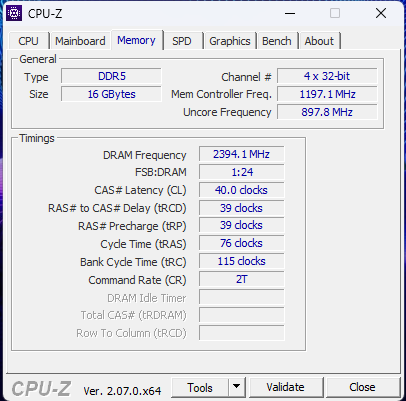
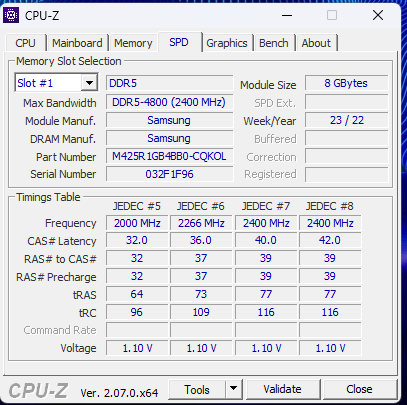
Other specs include a 16-inch FHD (1,920 x 1,080) IPS panel clocked at 165 Hz, a 512 GB NVMe SSD and 16 GB of DDR5 RAM (4,800 MT/s). It is an interesting machine that can satiate the itch of most gamers.
Potential Competitors in Comparison
Rating | Date | Model | Weight | Height | Size | Resolution | Price |
|---|---|---|---|---|---|---|---|
| 85.6 % v7 (old) | 09 / 2023 | HP Victus 16-r0076TX i5-13500HX, GeForce RTX 4050 Laptop GPU | 2.3 kg | 22.9 mm | 16.10" | 1920x1080 | |
| 86.7 % v7 (old) | 08 / 2023 | Acer Nitro 16 AN16-41-R7YE R5 7535HS, GeForce RTX 4050 Laptop GPU | 2.6 kg | 27.9 mm | 16.00" | 1920x1200 | |
| 87.3 % v7 (old) | 07 / 2023 | Acer Predator Triton 14 PT14-51 i7-13700H, GeForce RTX 4050 Laptop GPU | 1.7 kg | 19.81 mm | 14.00" | 2560x1600 | |
| 88.3 % v7 (old) | 09 / 2023 | Alienware m16 R1 Intel i7-13700HX, GeForce RTX 4060 Laptop GPU | 3 kg | 25.4 mm | 16.00" | 2560x1600 | |
| 89.5 % v7 (old) | 07 / 2023 | Acer Predator Helios 16 PH16-71-731Q i7-13700HX, GeForce RTX 4060 Laptop GPU | 2.6 kg | 26.9 mm | 16.00" | 2560x1600 | |
| 84.2 % v7 (old) | 06 / 2023 | Dell G15 5530 i7-13650HX, GeForce RTX 4060 Laptop GPU | 3 kg | 26.95 mm | 15.60" | 1920x1080 | |
| 89 % v7 (old) | 08 / 2023 | Lenovo Legion Pro 5 16ARX8 (R5 7645HX, RTX 4050) R5 7645HX, GeForce RTX 4050 Laptop GPU | 2.5 kg | 27.3 mm | 16.00" | 2560x1600 | |
| 85.7 % v7 (old) | 07 / 2023 | Lenovo LOQ 15APH8 R7 7840HS, GeForce RTX 4050 Laptop GPU | 2.5 kg | 25.2 mm | 15.60" | 1920x1080 |
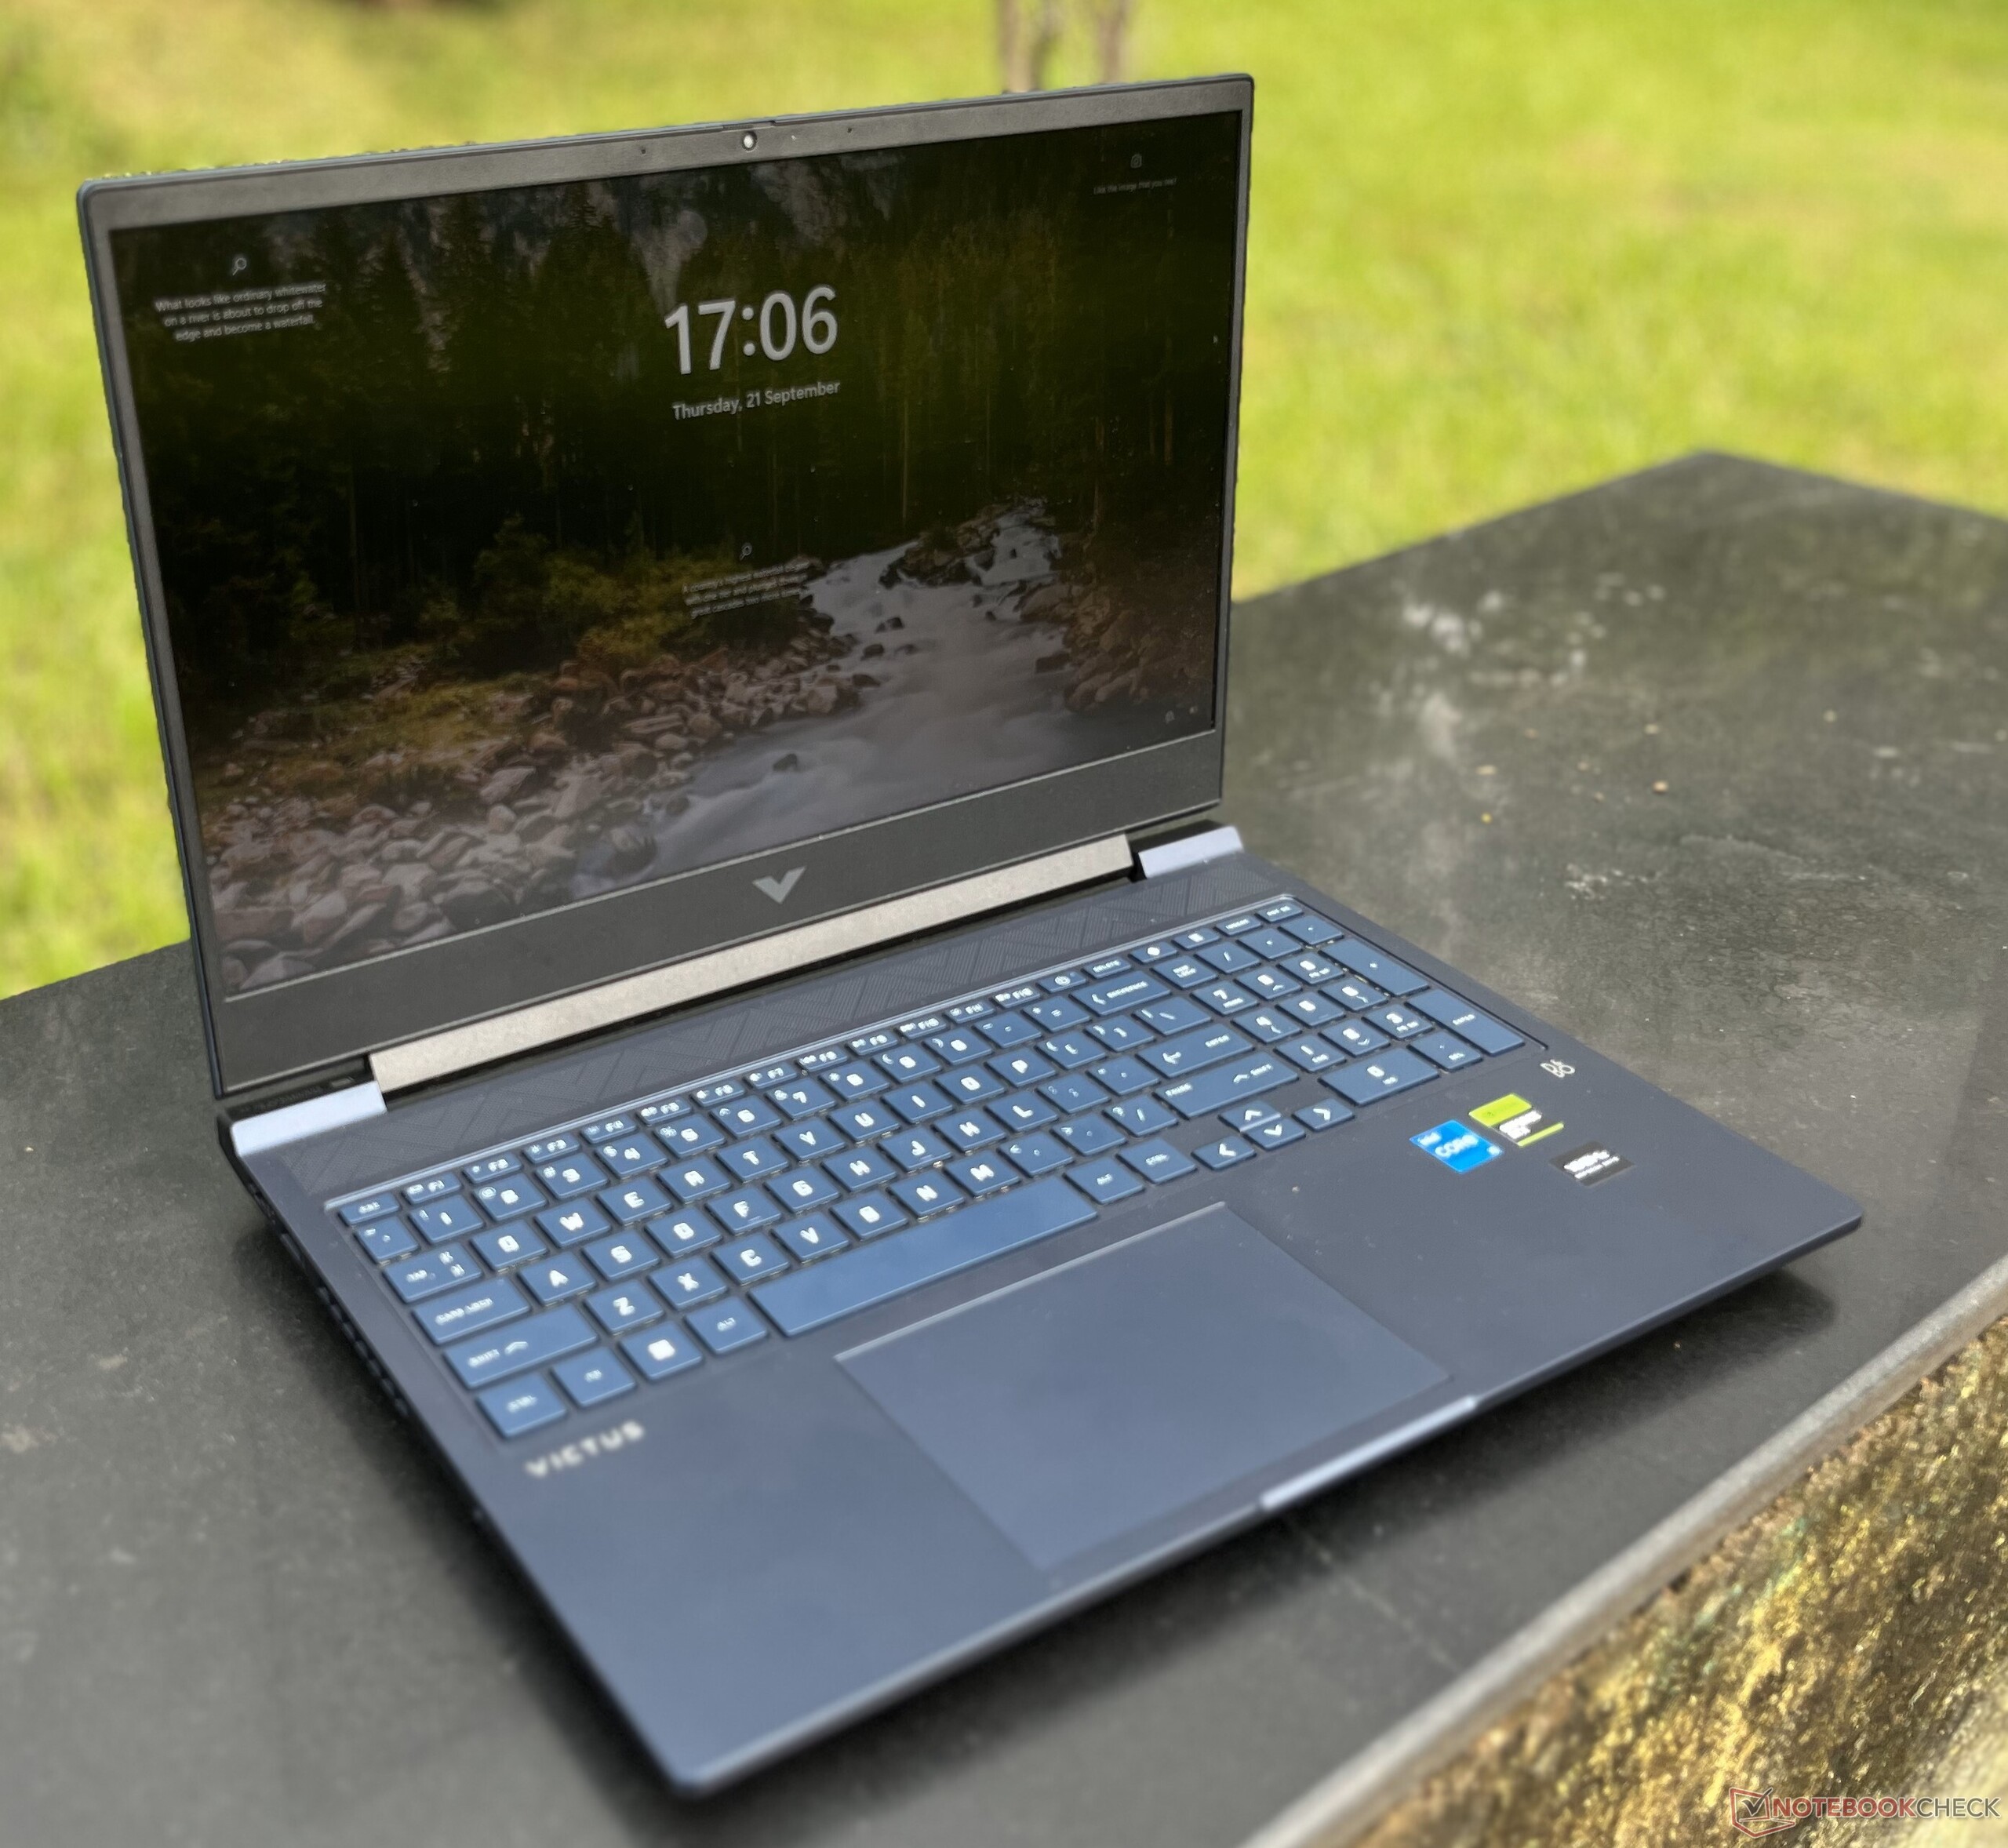
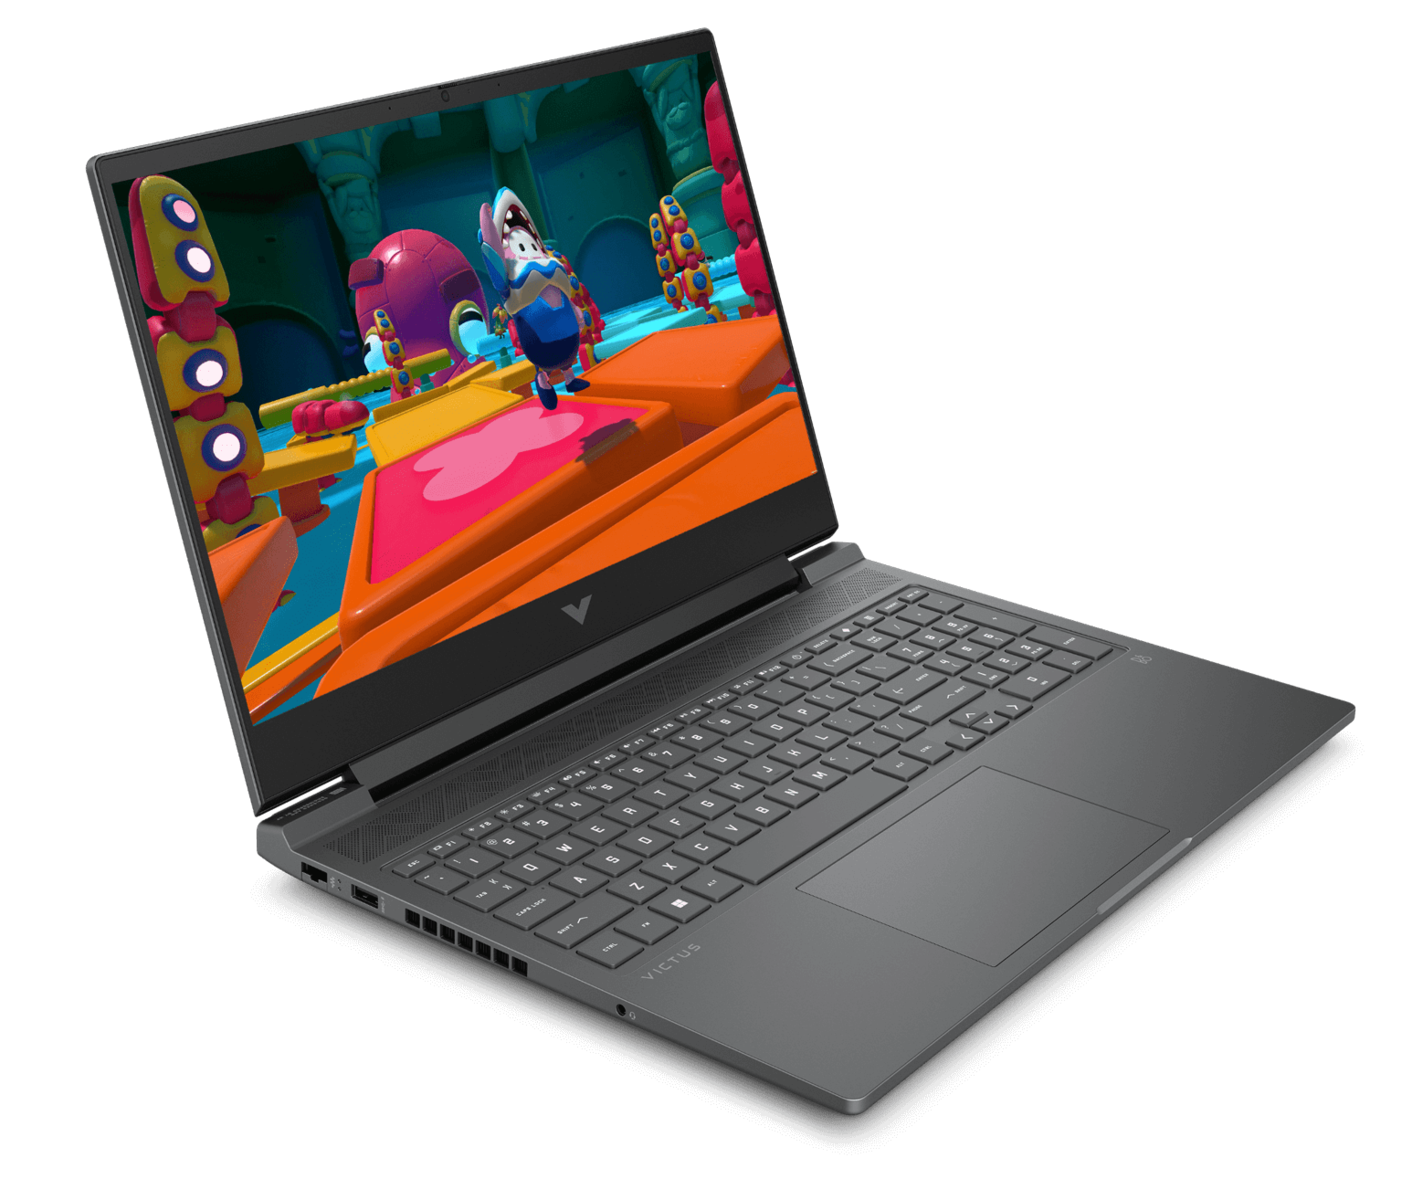
Case: Sturdy plastic body with a flimsy screen
Right out of the box, it becomes obvious that the HP Victus 16 is not very portable. Then again, gaming laptops are seldom lightweight, and at 2.3 Kg (5.05 lbs), the laptop actually falls on the lighter end of the spectrum.
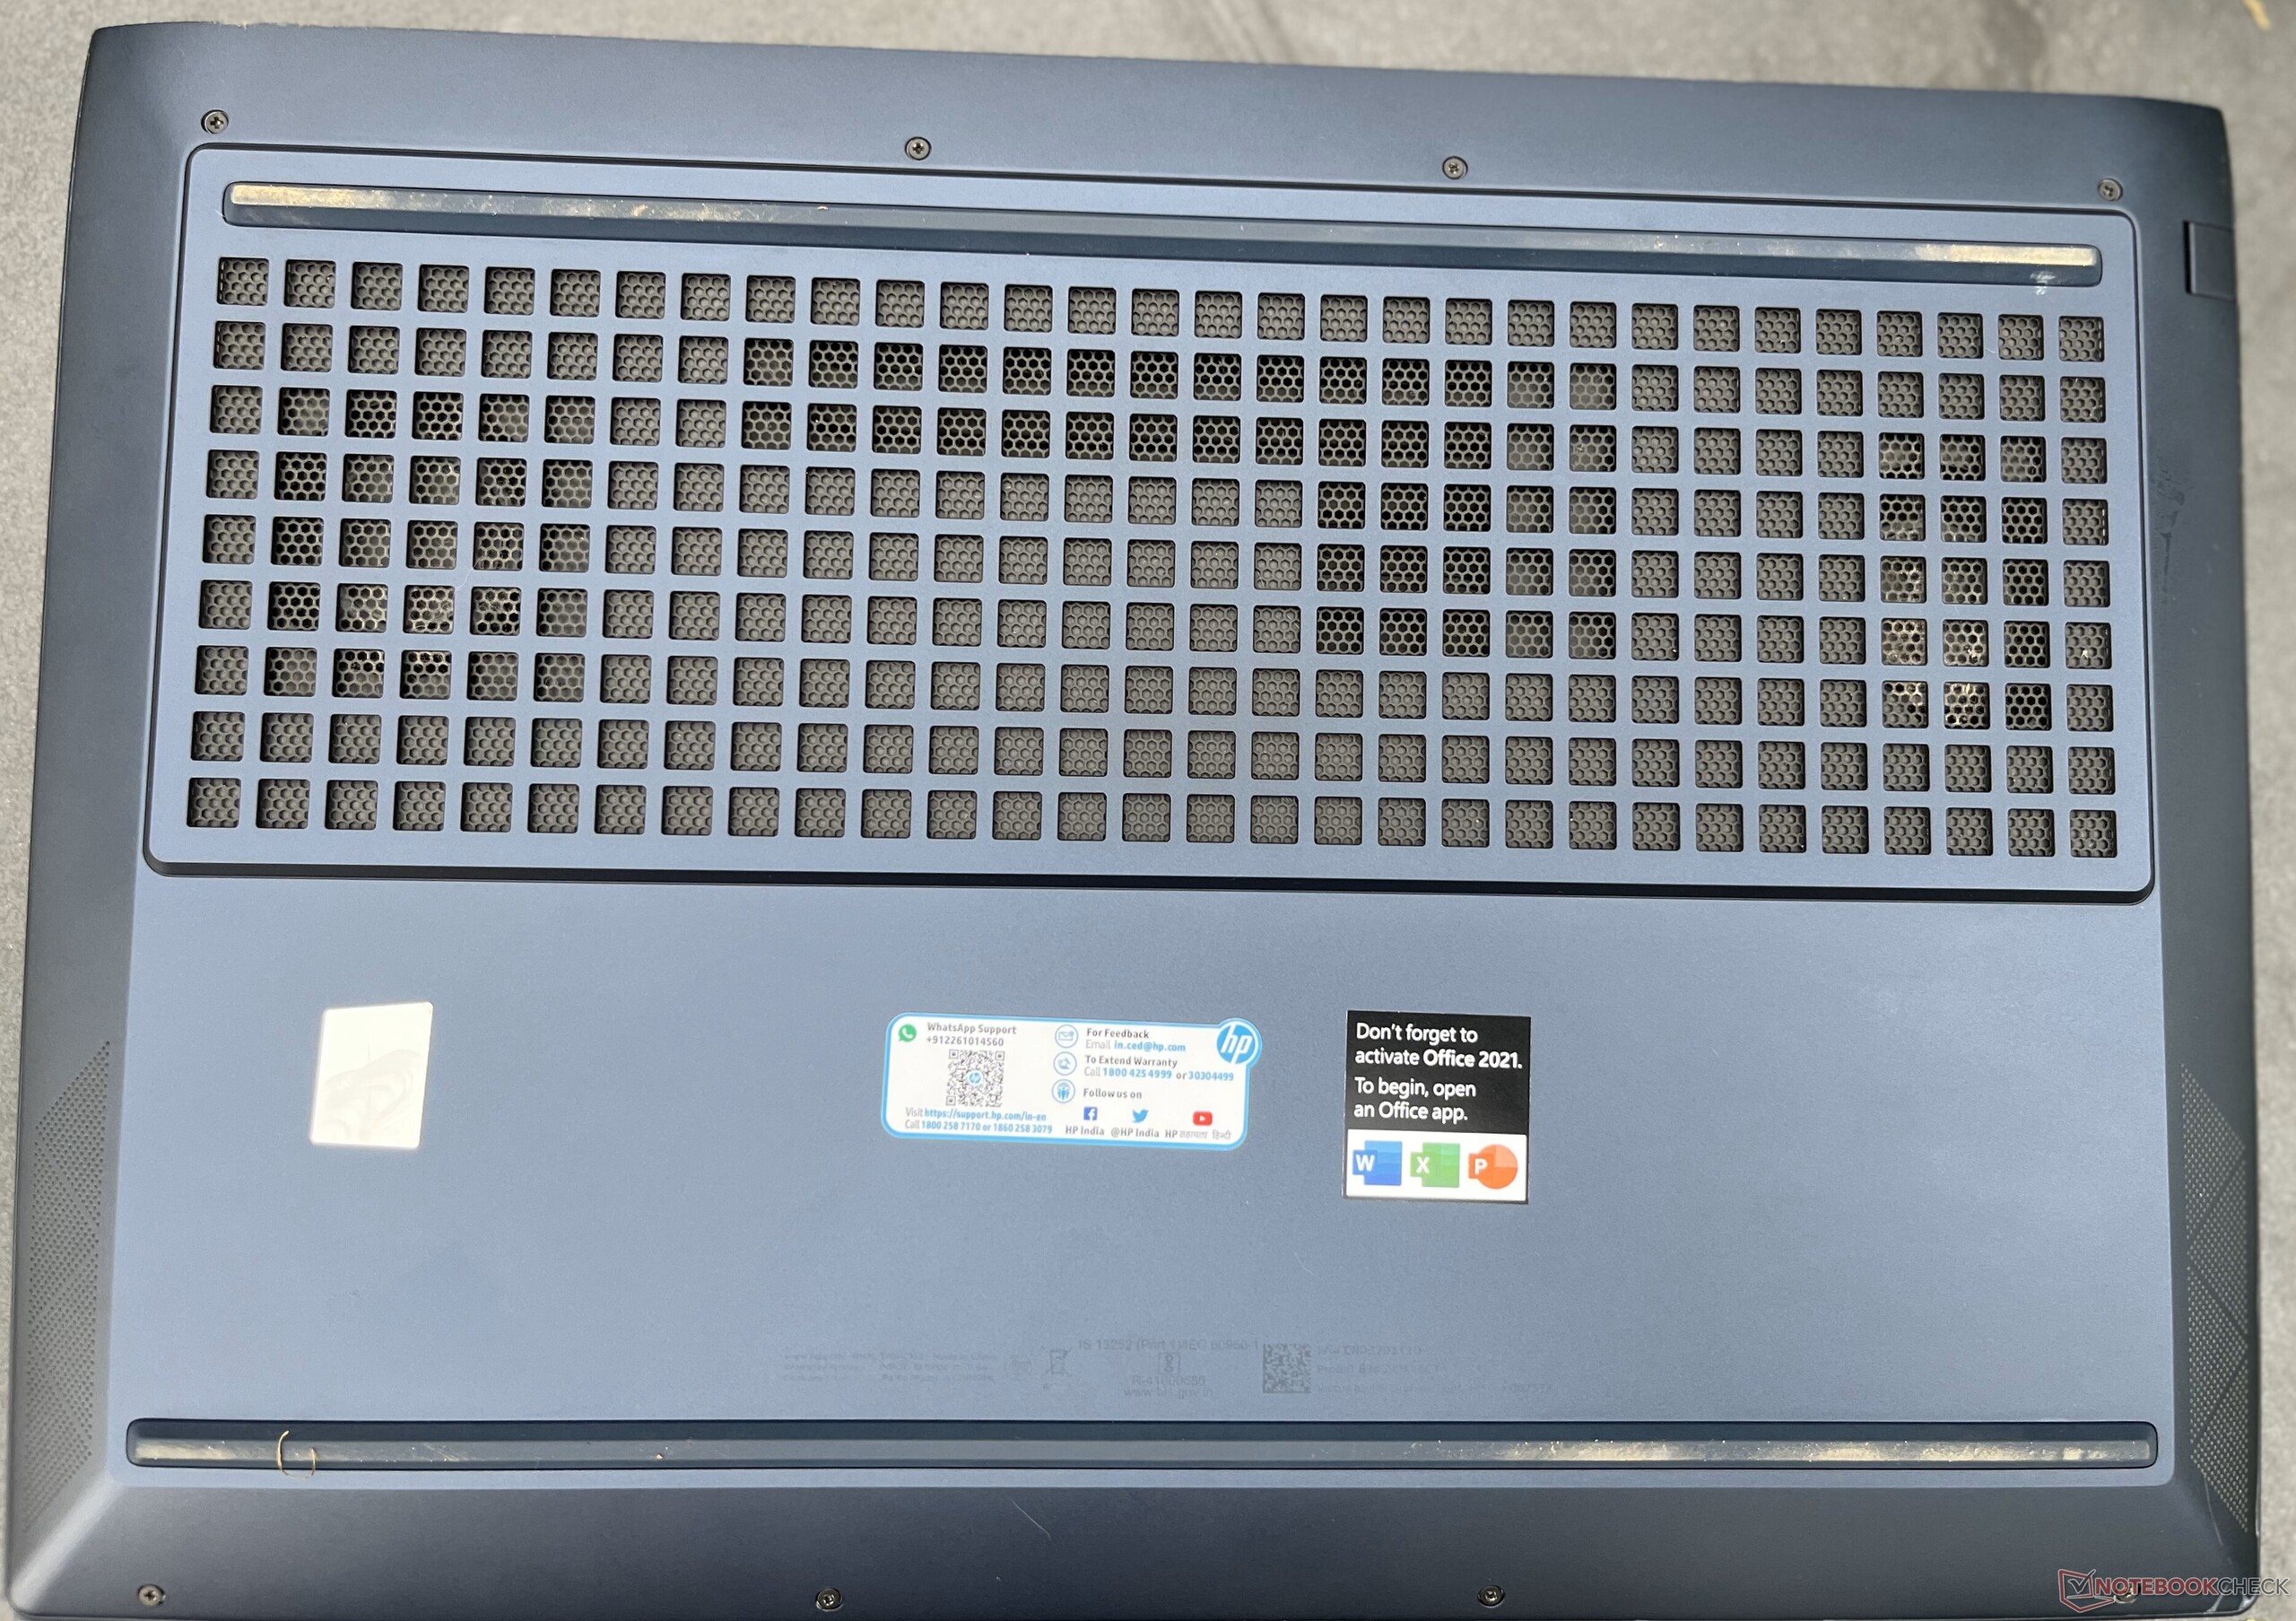
The all-black chassis doesn't have much in the way of branding, save for a "V" at the back and a standard fare of stickers at the front. HP aims to keep the laptop clean by including a dust filter on all vents.
A 16-inch screen allows HP to throw in a full keyboard (numpad included) in the Victus 16. The screen flexes a bit too much, and it would be nice if HP revised it in subsequent releases.
Connectivity: Could have done with more I/O
I/O on the HP Victus 16 is surprisingly light for a gaming laptop. On the right, one gets a USB-C port, two USB-A ports (all three rated at 5 Gbps) and a HDMI 2.1 port at one end. Next to it, there's a barrel-pin connector for the charger. The USB and HDMI ports are a bit too close for comfort, especially near the HDMI port.
On the other side, there is just one RJ-45 Ethernet jack, a USB Type-A port and a 3.5 mm audio jack. Some additional I/O at the back would have been nice. The USB-C port almost seems like an afterthought, given its poor speed.


Communication
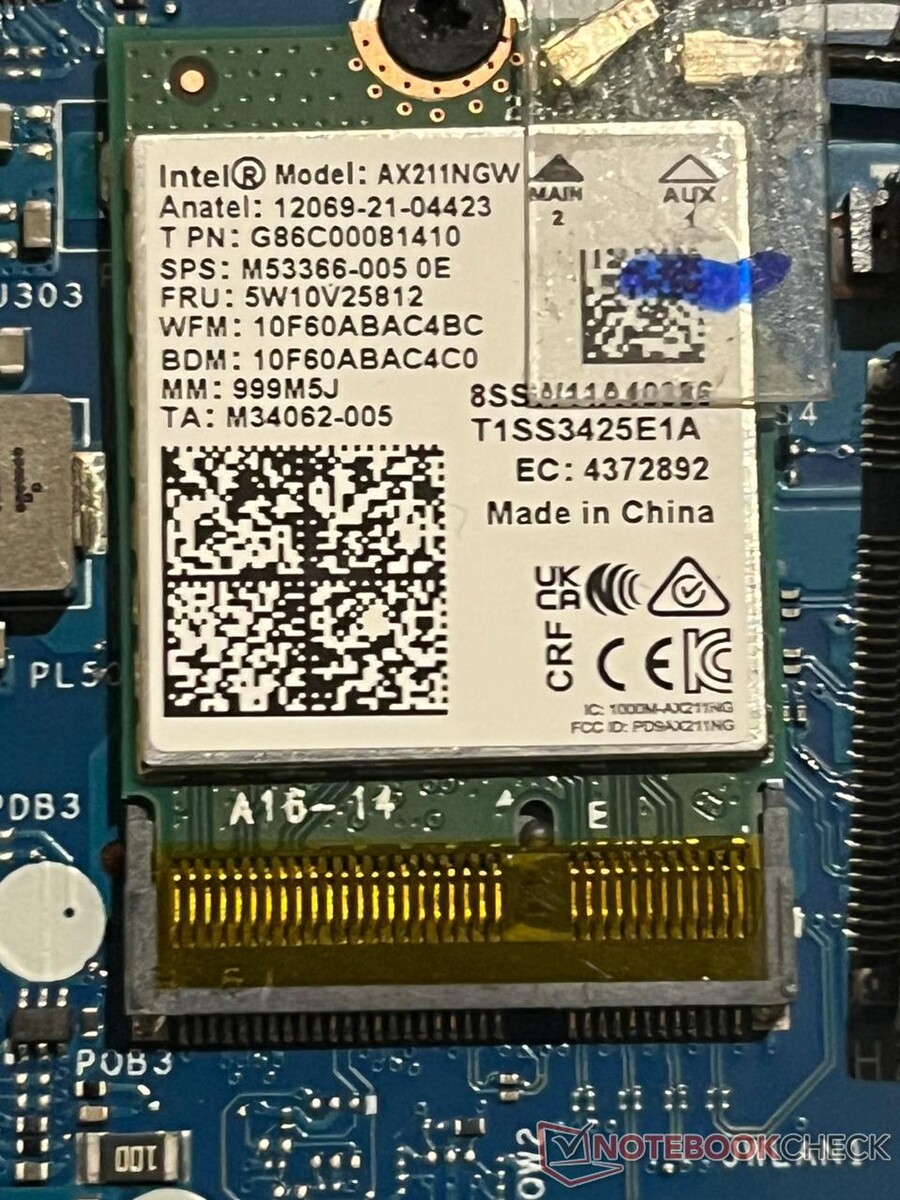
For an entry-level laptop, the HP Victus 16 has a good choice of networking options. You get Wi-Fi 6E and an Ethernet port, both of which let you transfer files at high speed.
In iPerf3, Intel's Wi-Fi 6E modem could receive data at 1,646 Mbps with our Asus ROG Rapture AXE11000 router. This is much faster than its competitors, which often lack Wi-Fi 6 functionality altogether.
| Networking / iperf3 transmit AXE11000 | |
| Lenovo Legion Pro 5 16ARX8 (R5 7645HX, RTX 4050) | |
| Dell G15 5530 | |
| HP Victus 16-r0076TX | |
| Acer Predator Triton 14 PT14-51 | |
| Acer Nitro 16 AN16-41-R7YE | |
| Acer Predator Helios 16 PH16-71-731Q | |
| Alienware m16 R1 Intel | |
| Average Intel Wi-Fi 6E AX211 (64 - 1921, n=273) | |
| Average of class Gaming (469 - 1862, n=115, last 2 years) | |
| Lenovo LOQ 15APH8 | |
| Networking / iperf3 receive AXE11000 | |
| Acer Predator Triton 14 PT14-51 | |
| Acer Nitro 16 AN16-41-R7YE | |
| Alienware m16 R1 Intel | |
| Lenovo Legion Pro 5 16ARX8 (R5 7645HX, RTX 4050) | |
| Dell G15 5530 | |
| HP Victus 16-r0076TX | |
| Acer Predator Helios 16 PH16-71-731Q | |
| Average of class Gaming (680 - 1745, n=115, last 2 years) | |
| Average Intel Wi-Fi 6E AX211 (582 - 1890, n=273) | |
| Lenovo LOQ 15APH8 | |
| Networking / iperf3 transmit AXE11000 6GHz | |
| Lenovo Legion Pro 5 16ARX8 (R5 7645HX, RTX 4050) | |
| Acer Predator Helios 16 PH16-71-731Q | |
| HP Victus 16-r0076TX | |
| Average of class Gaming (648 - 2355, n=45, last 2 years) | |
| Average Intel Wi-Fi 6E AX211 (385 - 1851, n=224) | |
| Networking / iperf3 receive AXE11000 6GHz | |
| Lenovo Legion Pro 5 16ARX8 (R5 7645HX, RTX 4050) | |
| HP Victus 16-r0076TX | |
| Average of class Gaming (975 - 1788, n=44, last 2 years) | |
| Average Intel Wi-Fi 6E AX211 (700 - 1857, n=224) | |
| Acer Predator Helios 16 PH16-71-731Q | |
Webcam
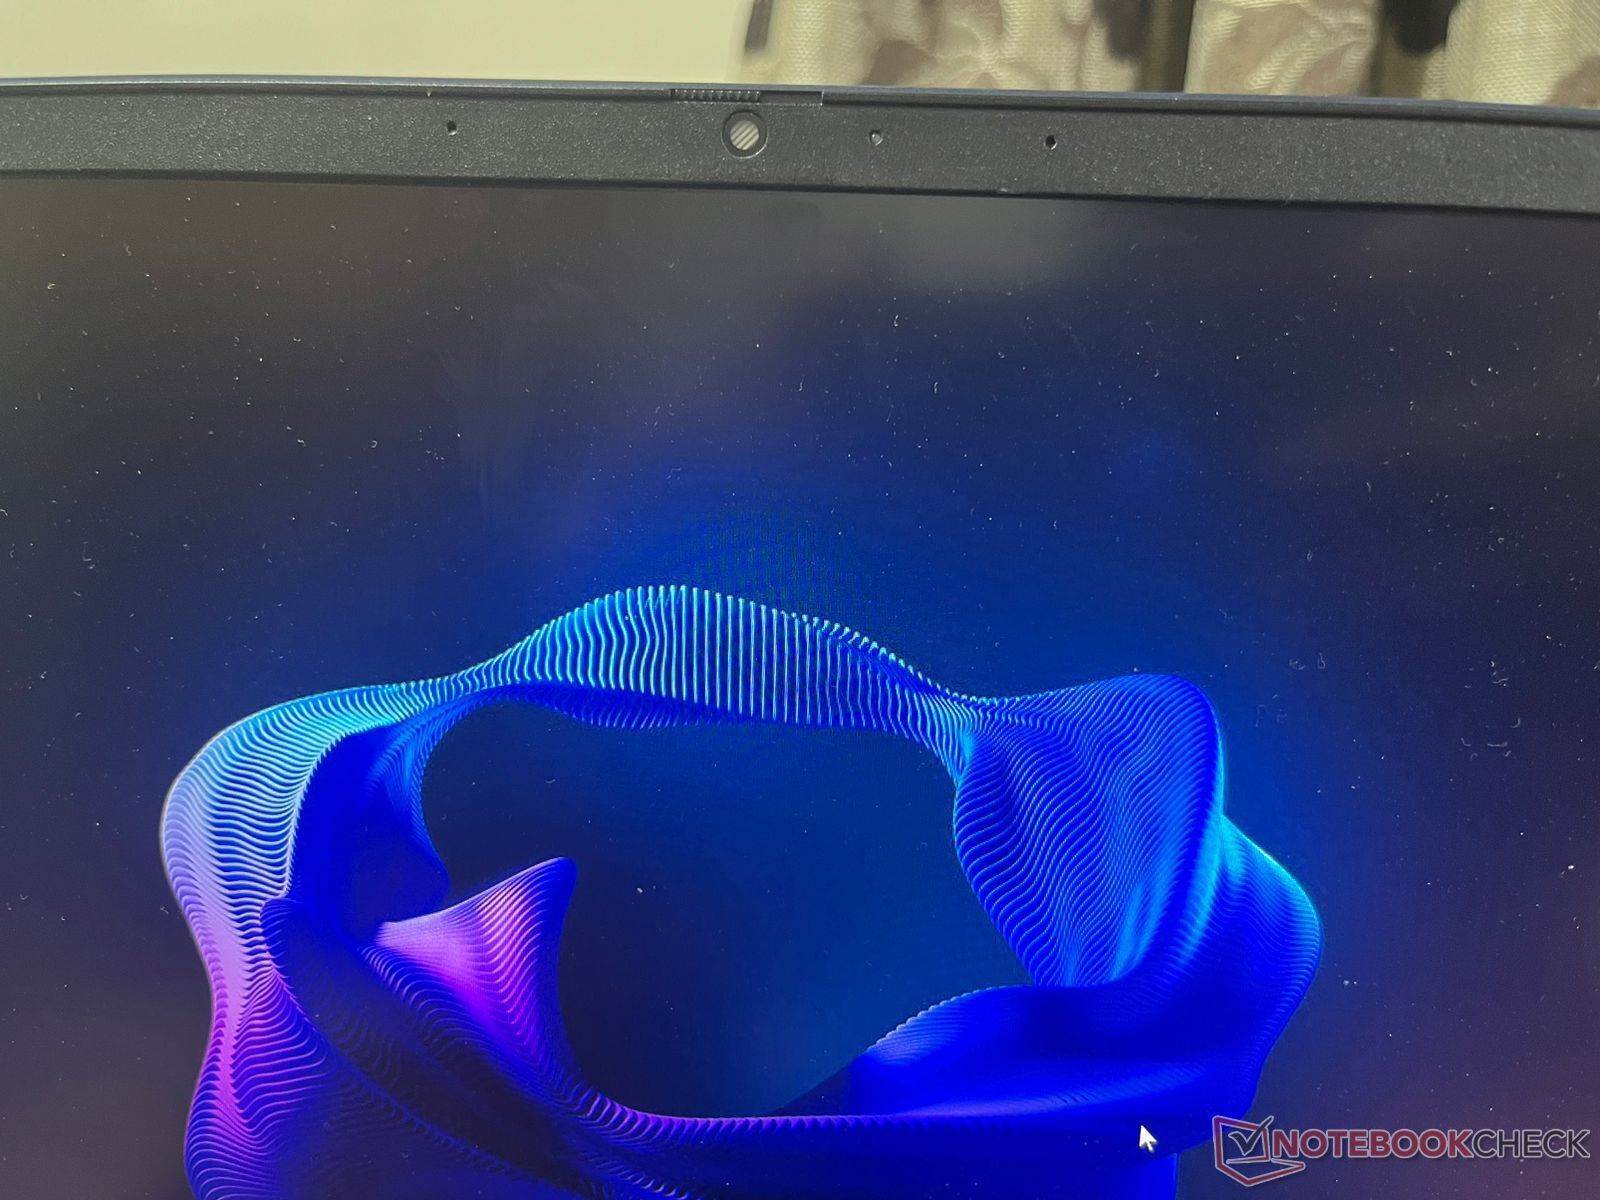
Webcams are a rarity on gaming laptops, and the fact that HP Victus 16 even includes a 1080p (~2 MP) module is nothing short of a bonus. It isn't very colour-accurate, but it should cover basic tasks such as video conferences and calls.
There's even a (hard to find) physical privacy shutter that cuts off the camera entirely. Additionally, there's a dedicated section in the Omen Gaming Hub for camera/mic enhancements using Nvidia Broadcast.


Security
Security features are completely absent on the HP Victus 16, except for a TPM module, which is required for Windows 11. There is no sign of a fingerprint sensor, Windows Hello or even a Kensington Lock slot.
Accessories and Warranty
There isn't much to speak of about the HP Victus 16's packaging. It is largely bare bones with just the laptop and a power brick. However, the latter is remarkably large, as is the case with most gaming laptops.
HP India offers a limited one-year warranty with the Victus 16. An extra ₹2,999 gets you two added years of warranty and an anti-virus plan for three years. However, the offer is valid for a limited time.
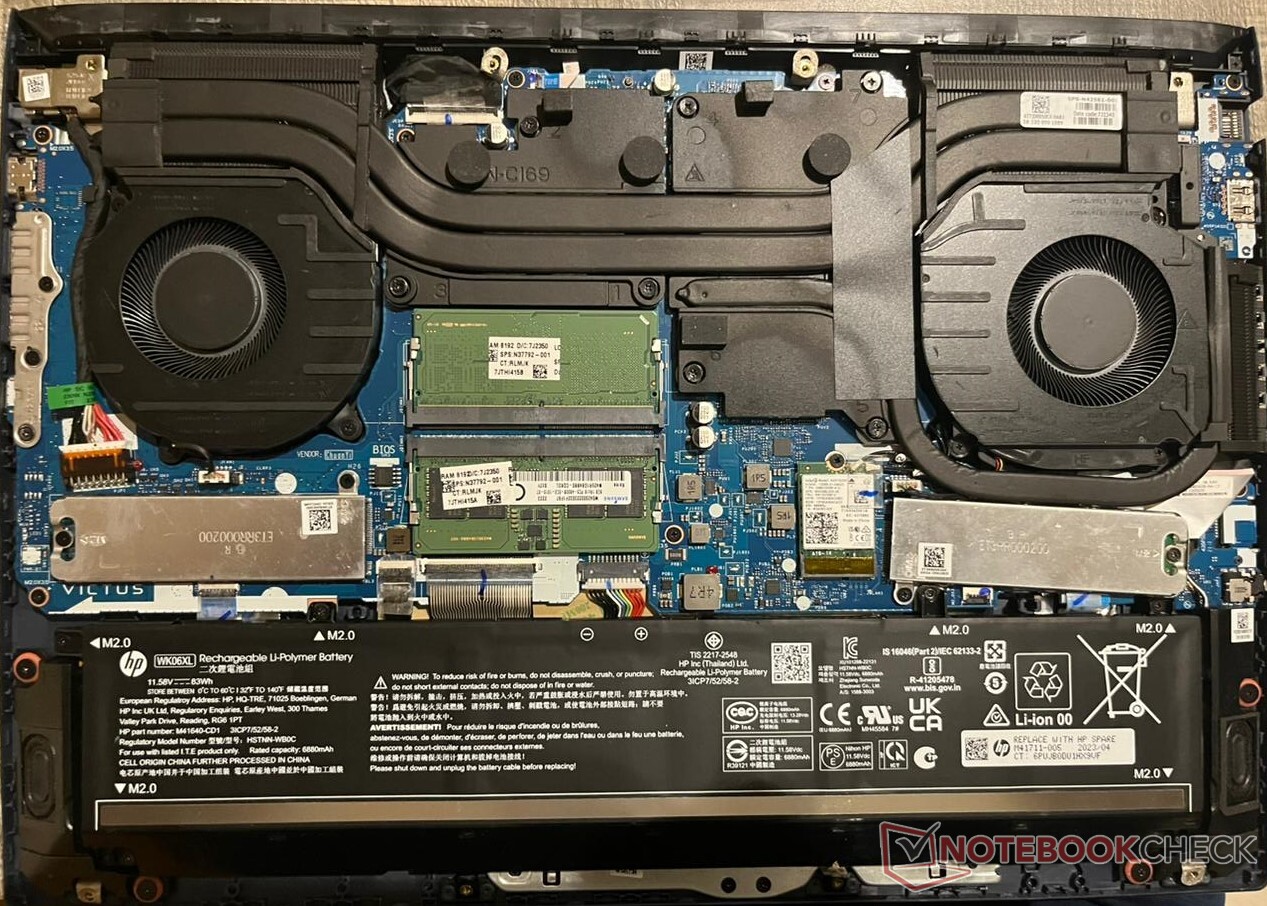
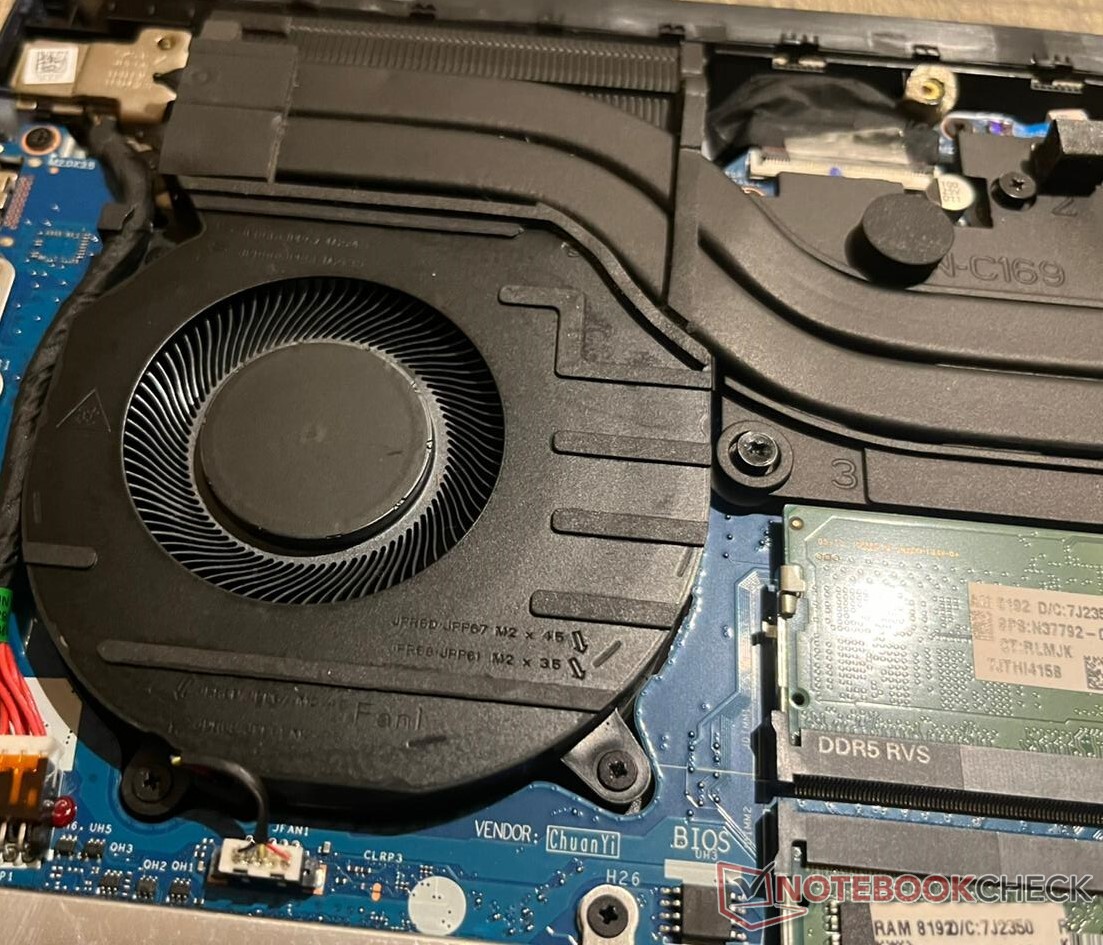
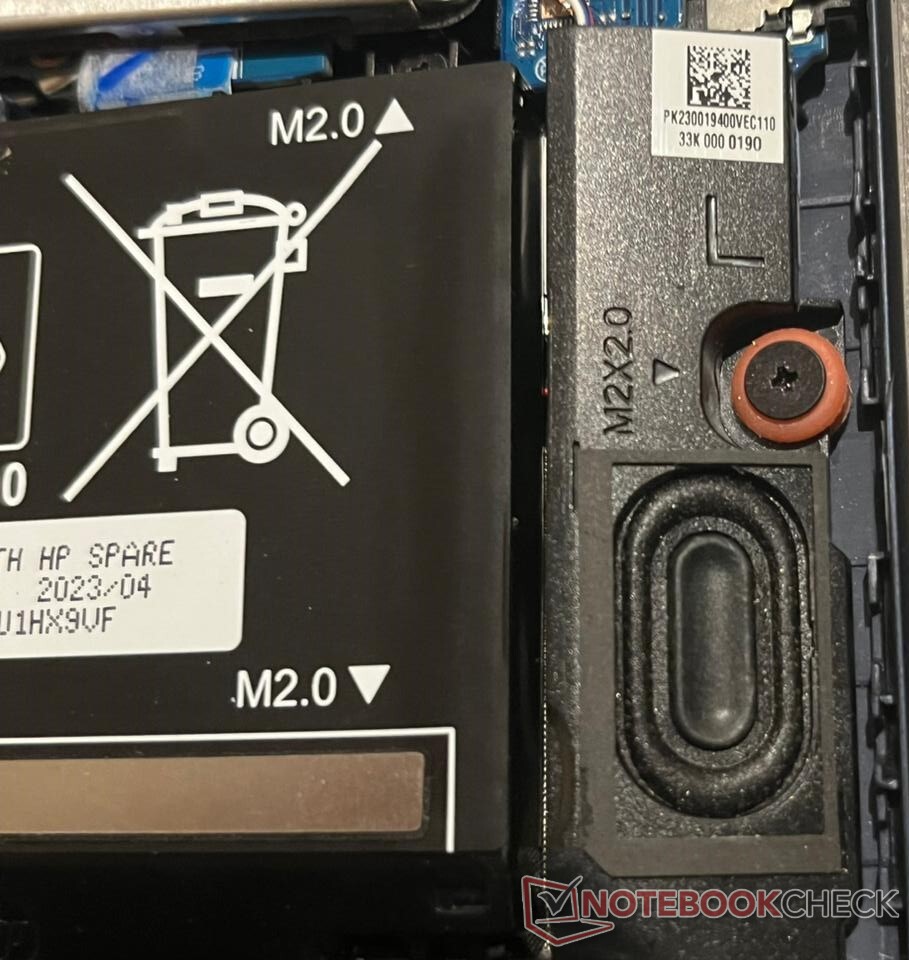
Maintenance
Getting into the HP Victus 16 is very easy. All one needs in a Philips head screwdriver, undo eight screws at the back and pry open the cover plate. The WLAN card, DDR5 RAM, and the NVMe SSD can all be replaced. The battery can be unscrewed and replaced if necessary.
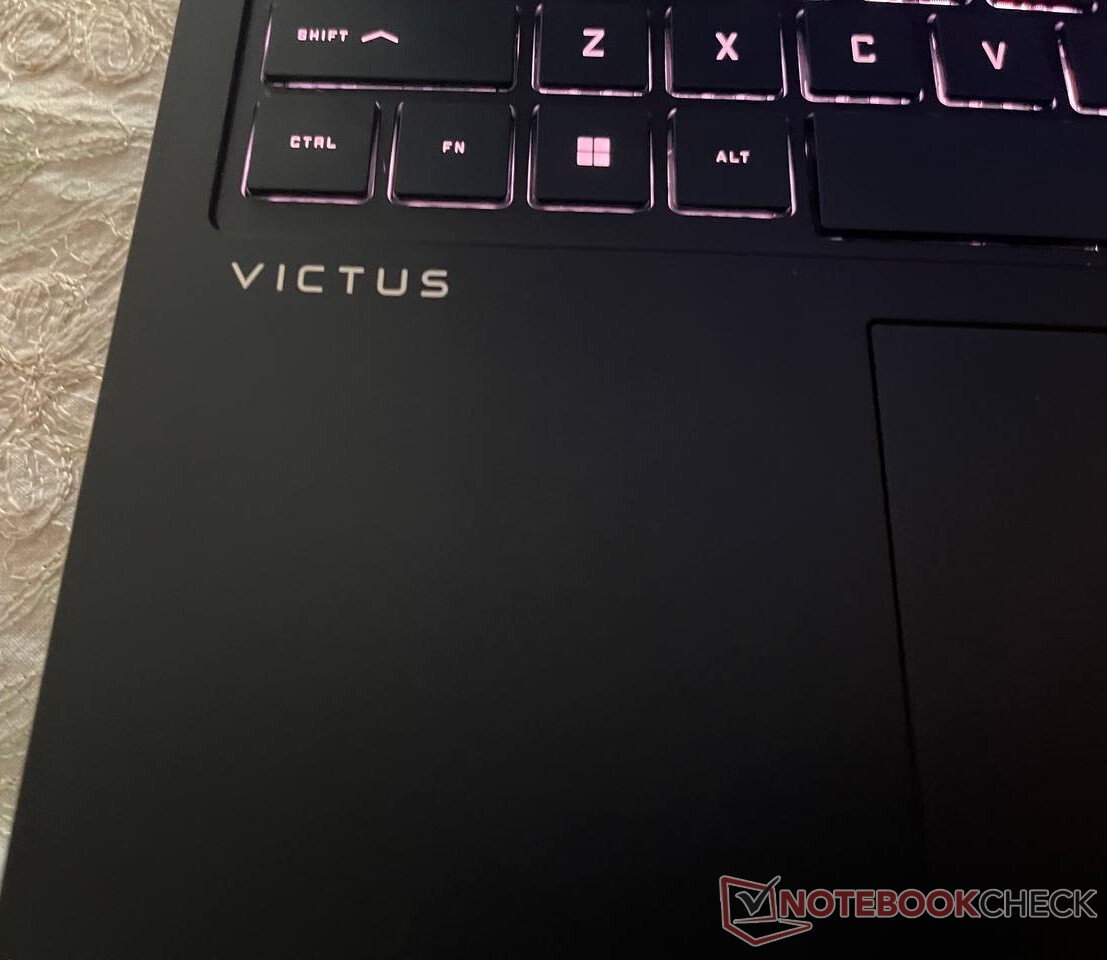
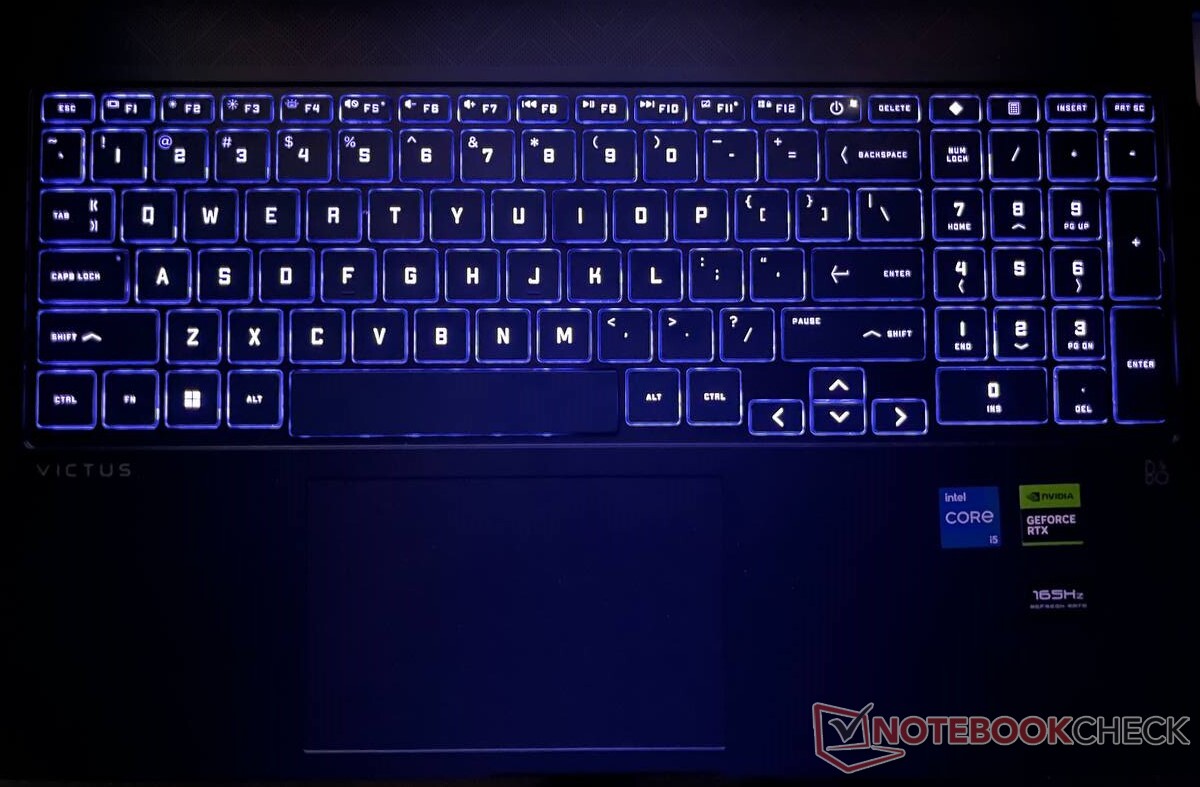
Input Devices: Decent keyboard with RGB lighting
The HP Victus 16 comes with a fully loaded keyboard and a sufficiently large trackpad. Its keys are large, and it shouldn't take long for desktop users to reprogram their muscle memory to work with the laptop. Its numpad is a welcome addition, but HP has chosen to put the power button in the worst place possible, next to the delete key. It took us a minute to find the power button the first time, and we're fairly certain we won't be the only one.
Keyboard
The keys felt a bit mushy but not too immersion-breaking. Those looking to customize keyboard lighting can do so via the Omen Lighting app.
There's a dedicated button to open the Omen Gaming Hub app and another one for the calculator.
Despite its plastic chassis, the keyboard is quite sturdy and doesn't flex much under pressure.
Touchpad
The touchpad has all Windows Precision gestures covered. However, the entire touchpad isn't clickable, with some of the top portion being rigid.
Palm rejection is on point as well, with it disregarding accidental swipes and clicks while typing. Tracking and gestures along the edges work without any issues.
Display: A 165 Hz screen with sub-par brightness
Our HP Victus 16 sample comes with a 16.1-inch FHD (1,920 x 1,080) IPS LCD panel from Chi Mei. HP offers two additional screen choices with Victus 16 SKUs, 144 Hz FHD and 240 Hz QHD (2,550 x 1,440).
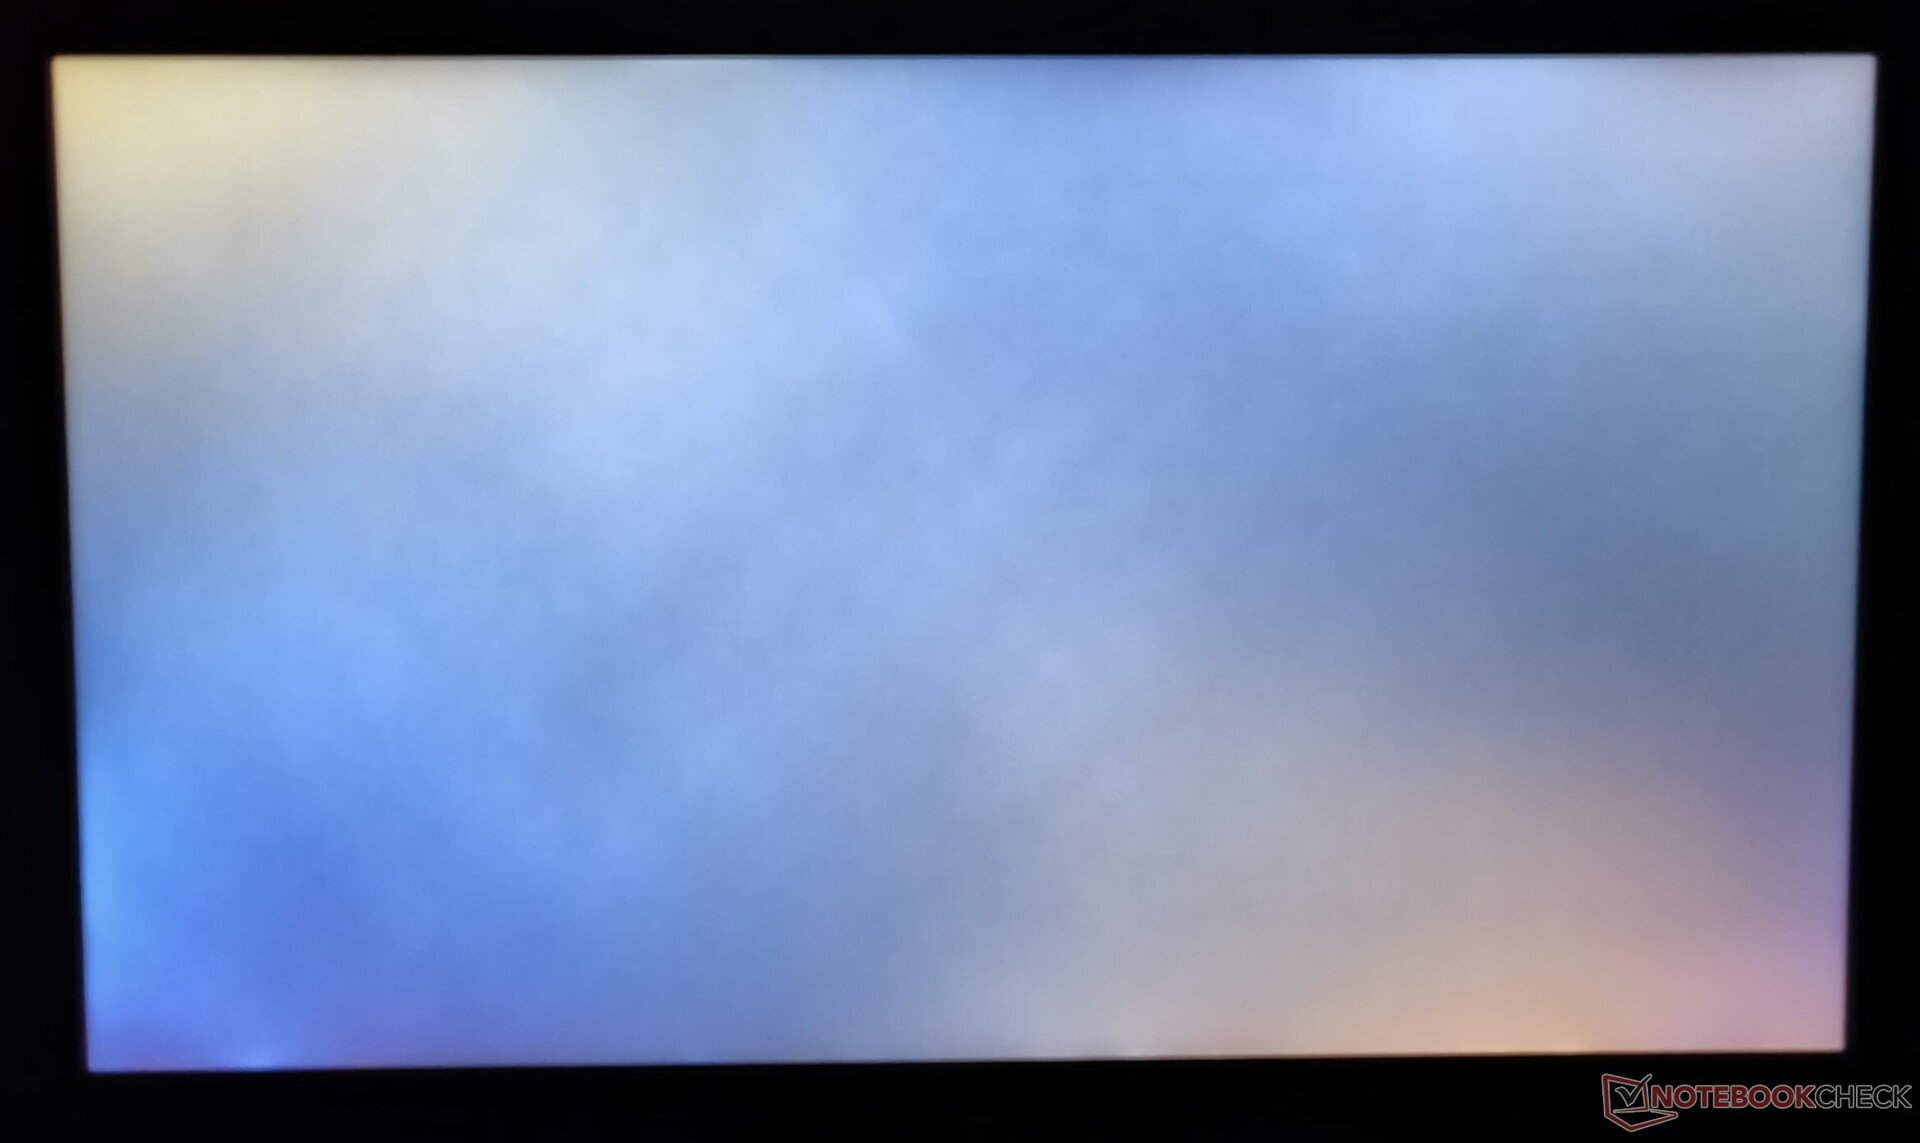
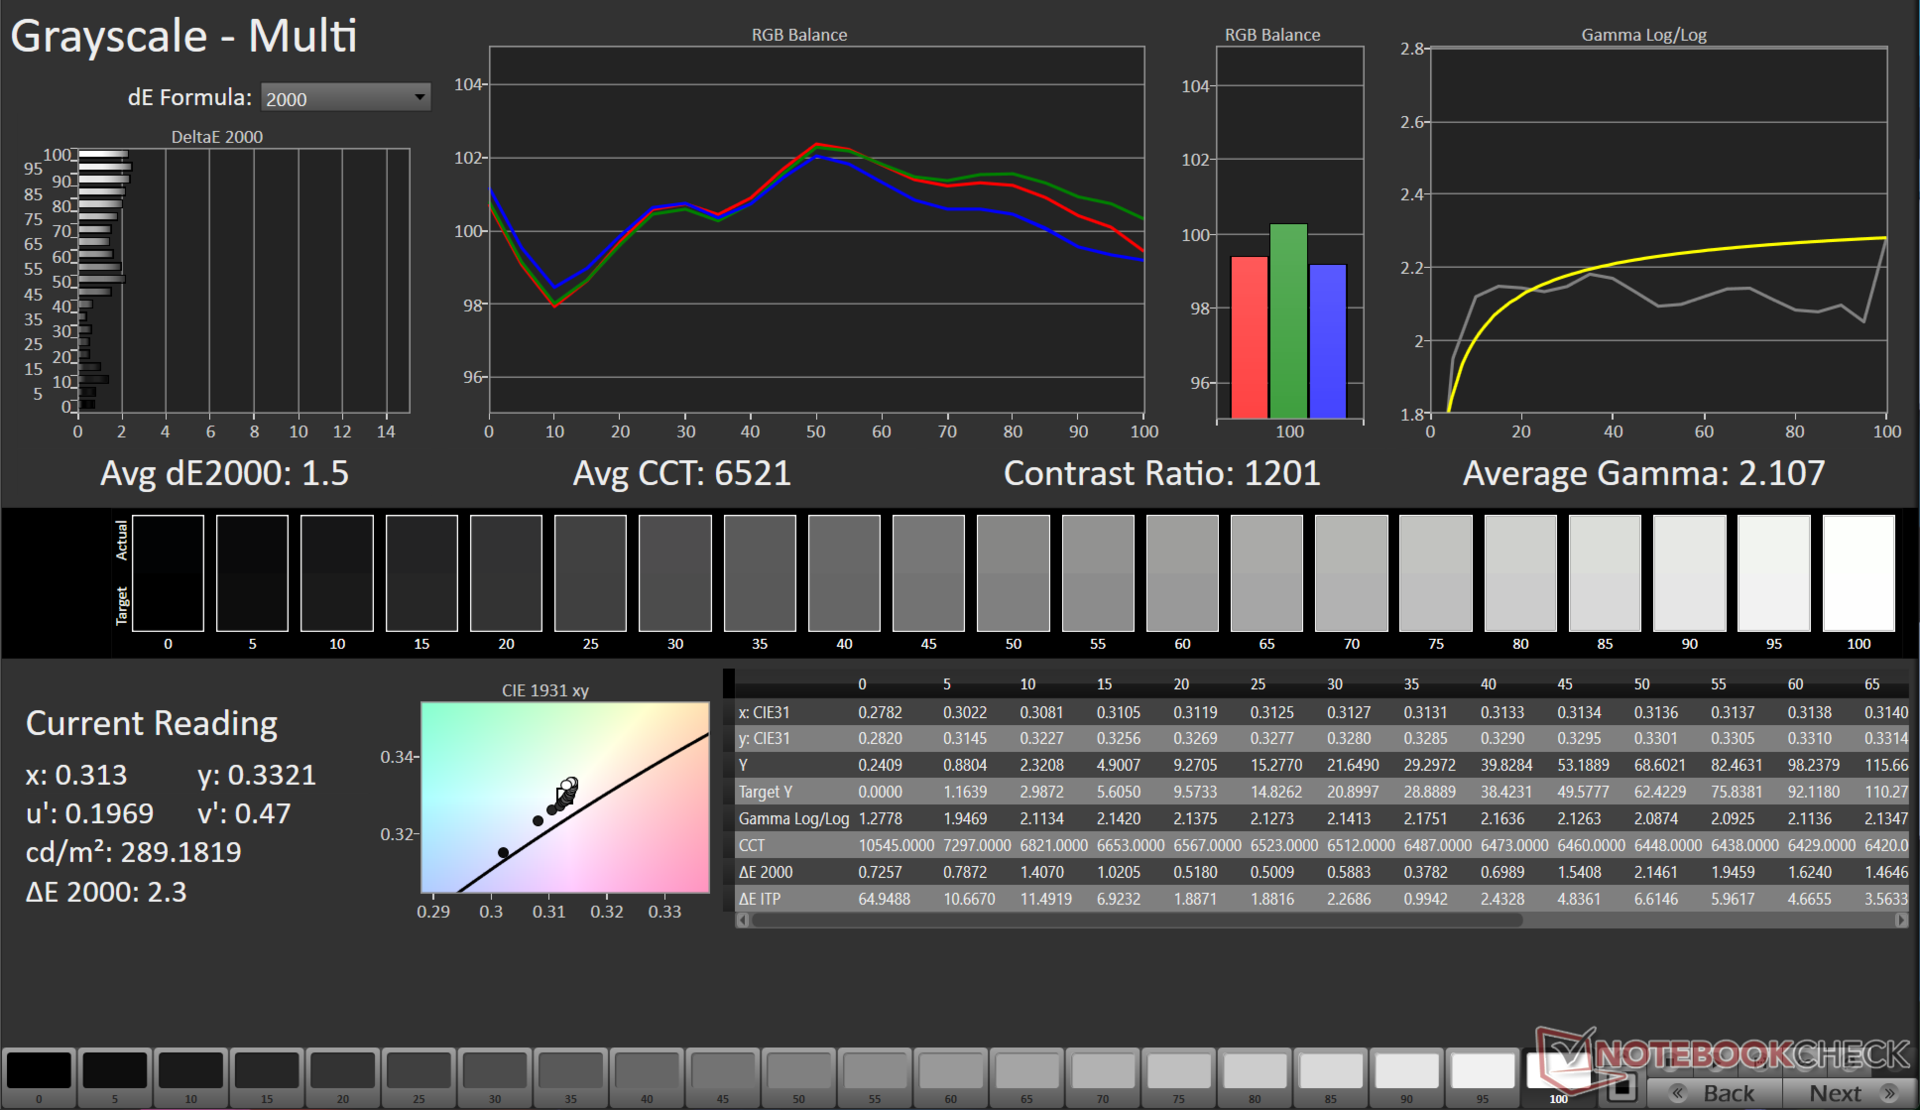
HP's website states this particular panel has a peak brightness of 300 nits. Our tests confirm the figure, but the distribution is on the lower end (82%). It is also a bit lopsided, especially towards the middle-right.
Lastly, its 1,381:1 contrast ratio sits comfortably within an acceptable range. However, the panel is afflicted by a bad case of backlight bleed, which is a recurring issue with IPS screens in general.

| |||||||||||||||||||||||||
Brightness Distribution: 82 %
Center on Battery: 287 cd/m²
Contrast: 1381:1 (Black: 0.21 cd/m²)
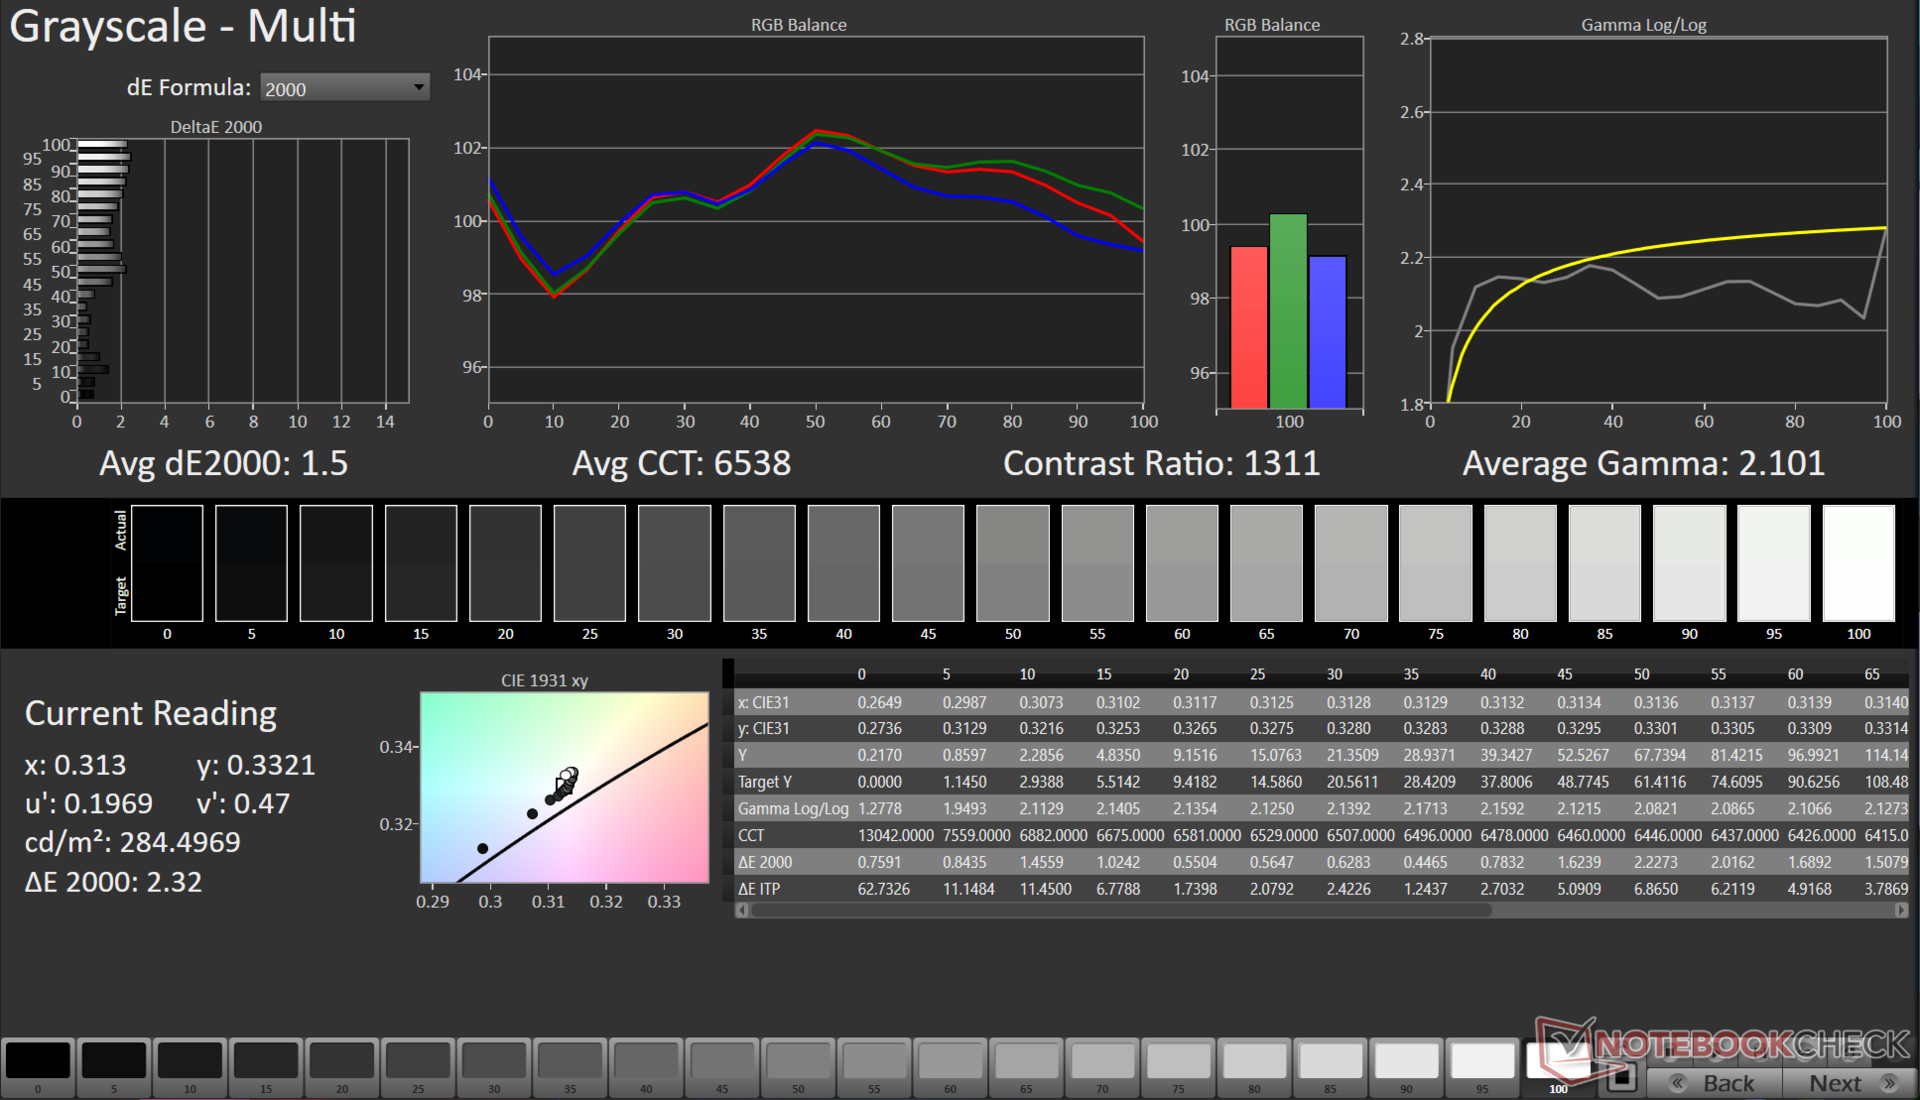
ΔE ColorChecker Calman: 1.7 | ∀{0.5-29.43 Ø4.76}
calibrated: 0.93
ΔE Greyscale Calman: 1.5 | ∀{0.09-98 Ø5}
69.7% AdobeRGB 1998 (Argyll 3D)
97.5% sRGB (Argyll 3D)
67.5% Display P3 (Argyll 3D)
Gamma: 2.1
CCT: 6538 K
| HP Victus 16-r0076TX Chi Mei CMN1629, IPS, 1920x1080, 16.1" | Acer Nitro 16 AN16-41-R7YE AU Optronics B160UAN01.Q, IPS, 1920x1200, 16" | Dell G15 5530 AUO B156HAN, IPS, 1920x1080, 15.6" | Lenovo Legion Pro 5 16ARX8 (R5 7645HX, RTX 4050) CSOT T3 MNG007DA2-2, IPS, 2560x1600, 16" | Lenovo LOQ 15APH8 BOE NJ NE156FHM-NX3, IPS, 1920x1080, 15.6" | |
|---|---|---|---|---|---|
| Display | 11% | 5% | 4% | -39% | |
| Display P3 Coverage (%) | 67.5 | 80 19% | 73.1 8% | 71.6 6% | 40.2 -40% |
| sRGB Coverage (%) | 97.5 | 99.4 2% | 98.4 1% | 99.8 2% | 60.2 -38% |
| AdobeRGB 1998 Coverage (%) | 69.7 | 77.4 11% | 74.4 7% | 72.9 5% | 41.5 -40% |
| Response Times | -25% | 38% | -31% | -407% | |
| Response Time Grey 50% / Grey 80% * (ms) | 6.18 ? | 11.2 ? -81% | 3.39 ? 45% | 12 ? -94% | 42.7 ? -591% |
| Response Time Black / White * (ms) | 7.62 ? | 5.2 ? 32% | 5.35 ? 30% | 5.2 ? 32% | 24.5 ? -222% |
| PWM Frequency (Hz) | 21620 ? | ||||
| Screen | -67% | -74% | -1% | -85% | |
| Brightness middle (cd/m²) | 290 | 415 43% | 320 10% | 543 87% | 346.2 19% |
| Brightness (cd/m²) | 275 | 380 38% | 316 15% | 516 88% | 329 20% |
| Brightness Distribution (%) | 82 | 84 2% | 94 15% | 87 6% | 81 -1% |
| Black Level * (cd/m²) | 0.21 | 0.36 -71% | 0.21 -0% | 0.58 -176% | 0.31 -48% |
| Contrast (:1) | 1381 | 1153 -17% | 1524 10% | 936 -32% | 1117 -19% |
| Colorchecker dE 2000 * | 1.7 | 4.71 -177% | 4.55 -168% | 1.35 21% | 4.19 -146% |
| Colorchecker dE 2000 max. * | 3.57 | 6.98 -96% | 9.83 -175% | 3.22 10% | 19.19 -438% |
| Colorchecker dE 2000 calibrated * | 0.93 | 2.68 -188% | 1.51 -62% | 1.31 -41% | 1.66 -78% |
| Greyscale dE 2000 * | 1.5 | 3.6 -140% | 6.2 -313% | 1.03 31% | 2.6 -73% |
| Gamma | 2.1 105% | 2.182 101% | 2.07 106% | 2.38 92% | 2.19 100% |
| CCT | 6538 99% | 7153 91% | 6479 100% | 6452 101% | 6749 96% |
| Total Average (Program / Settings) | -27% /
-45% | -10% /
-41% | -9% /
-4% | -177% /
-121% |
* ... smaller is better
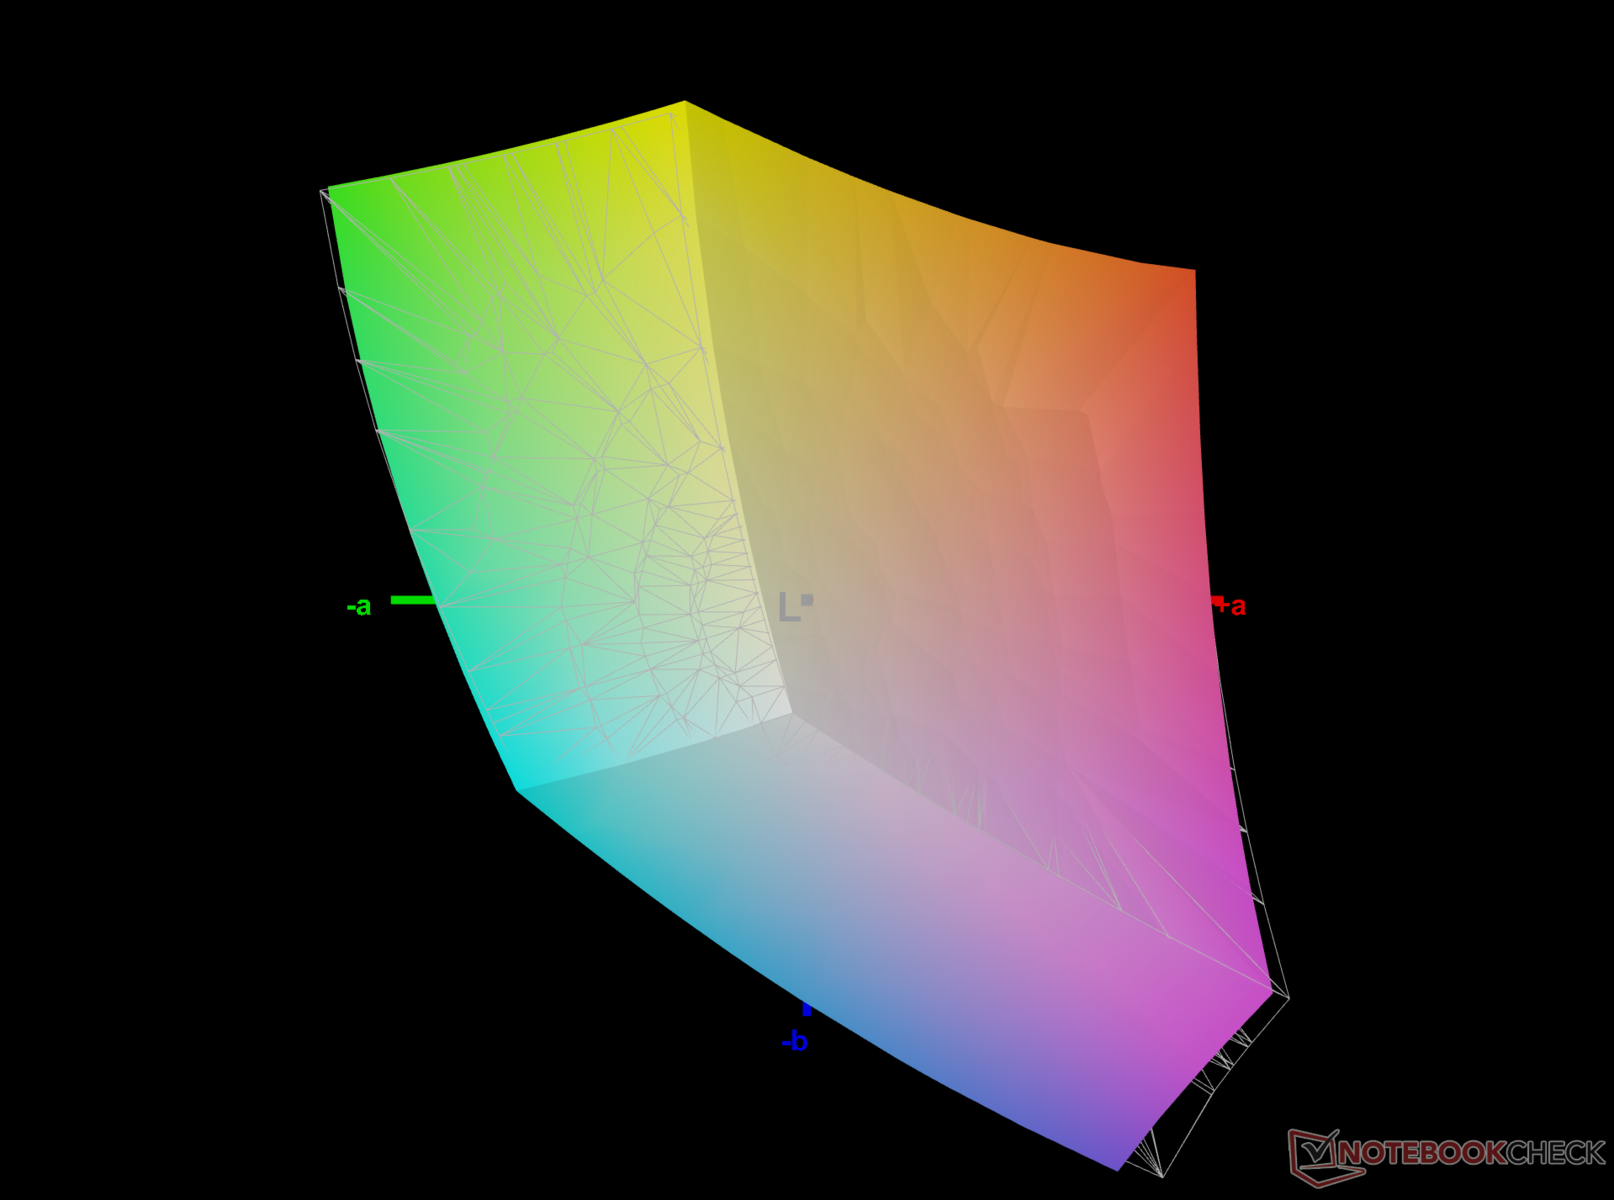
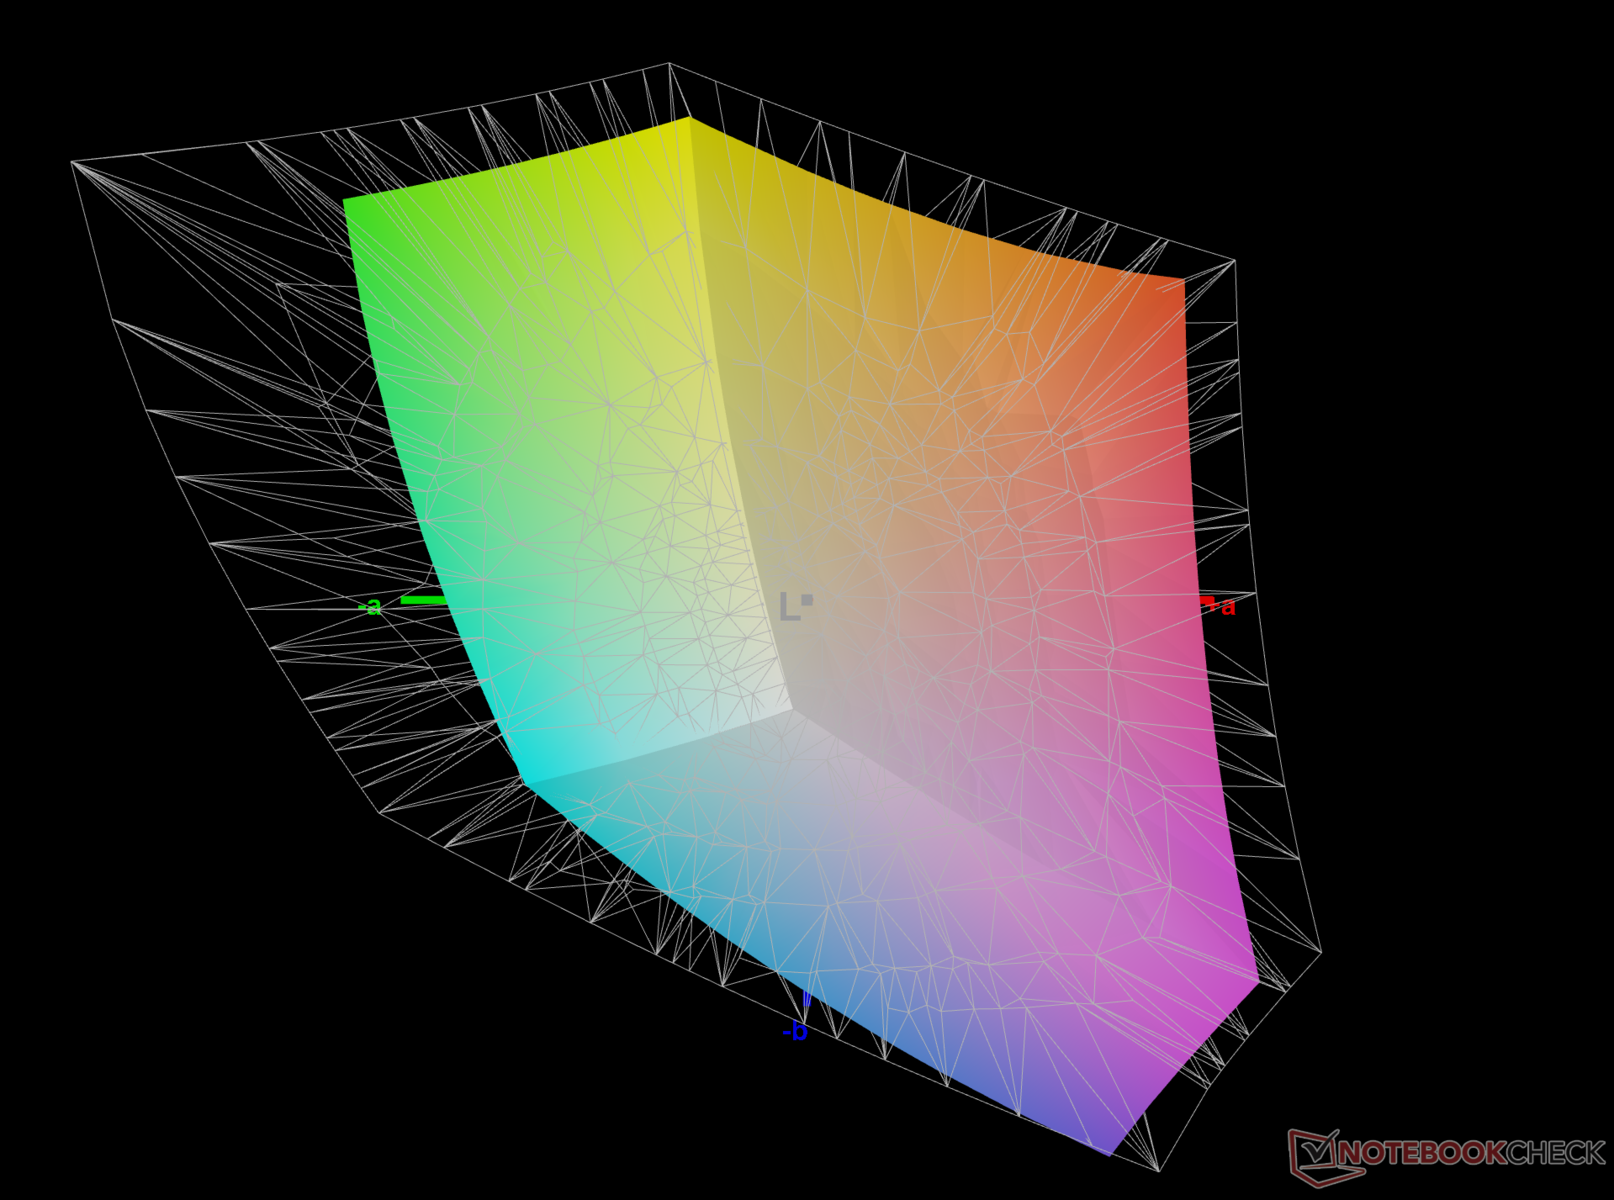
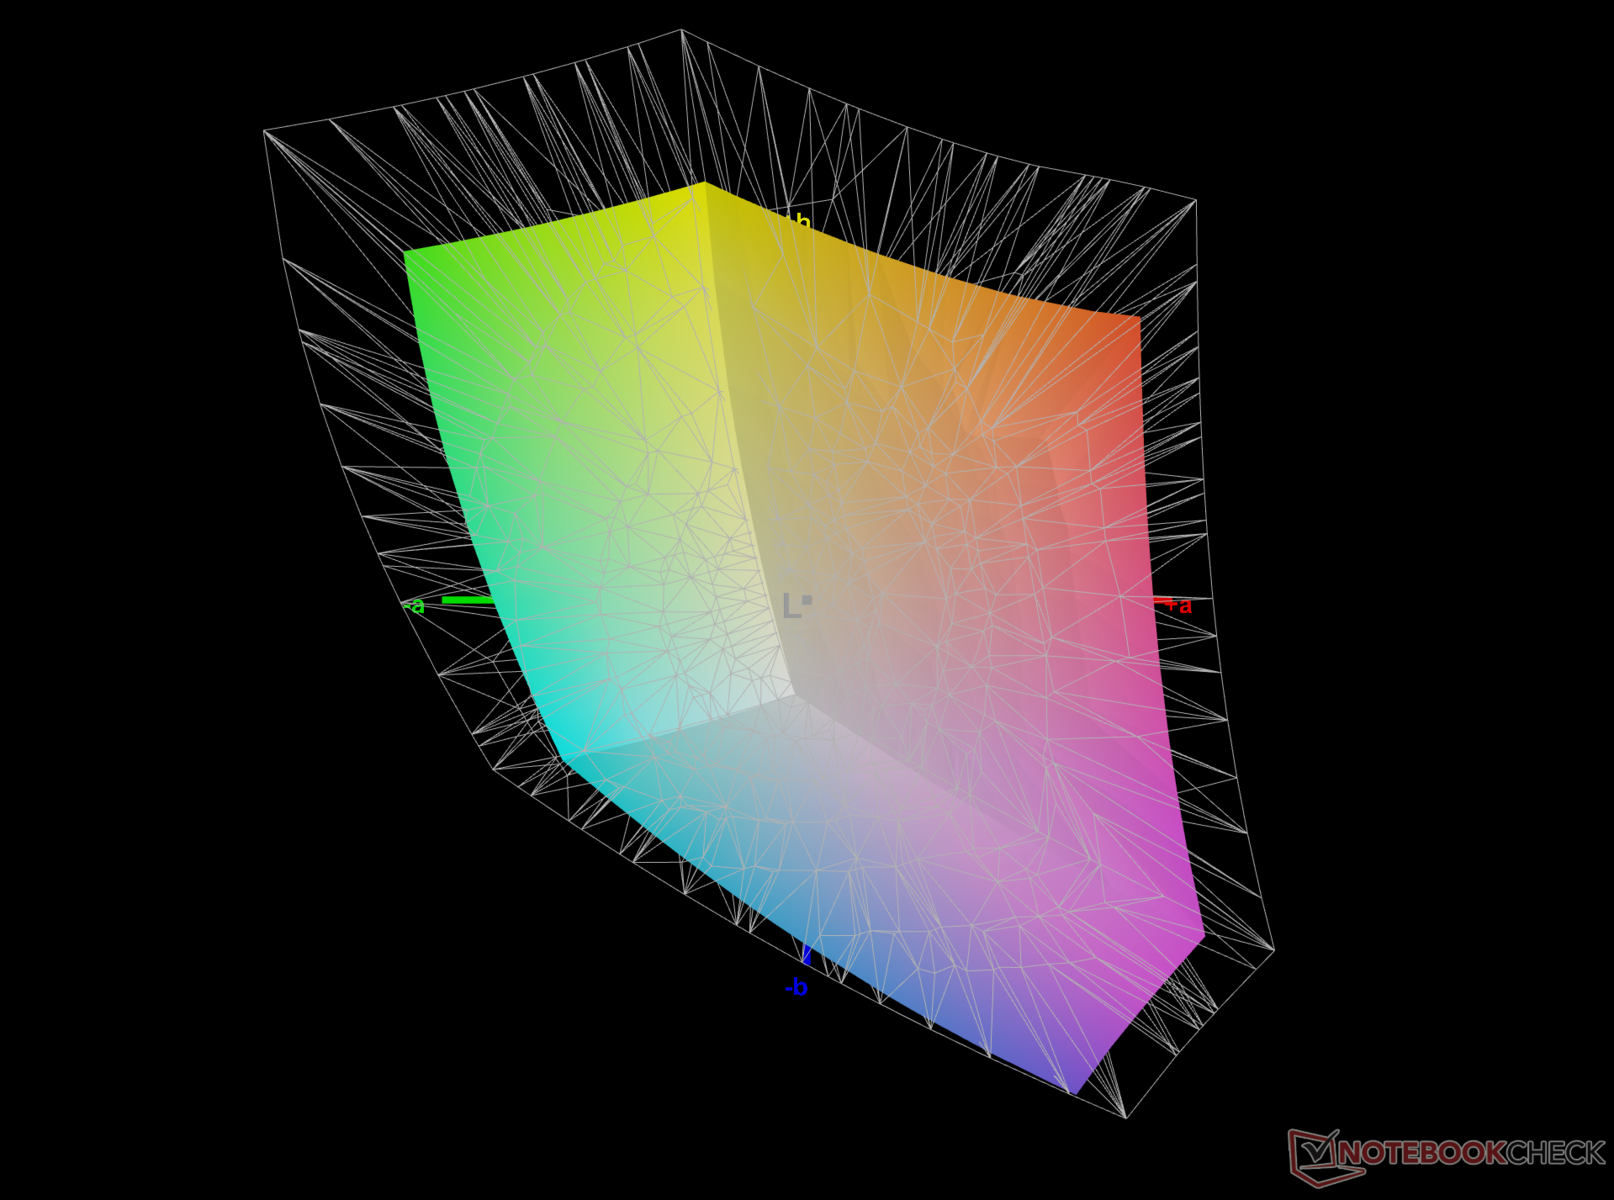
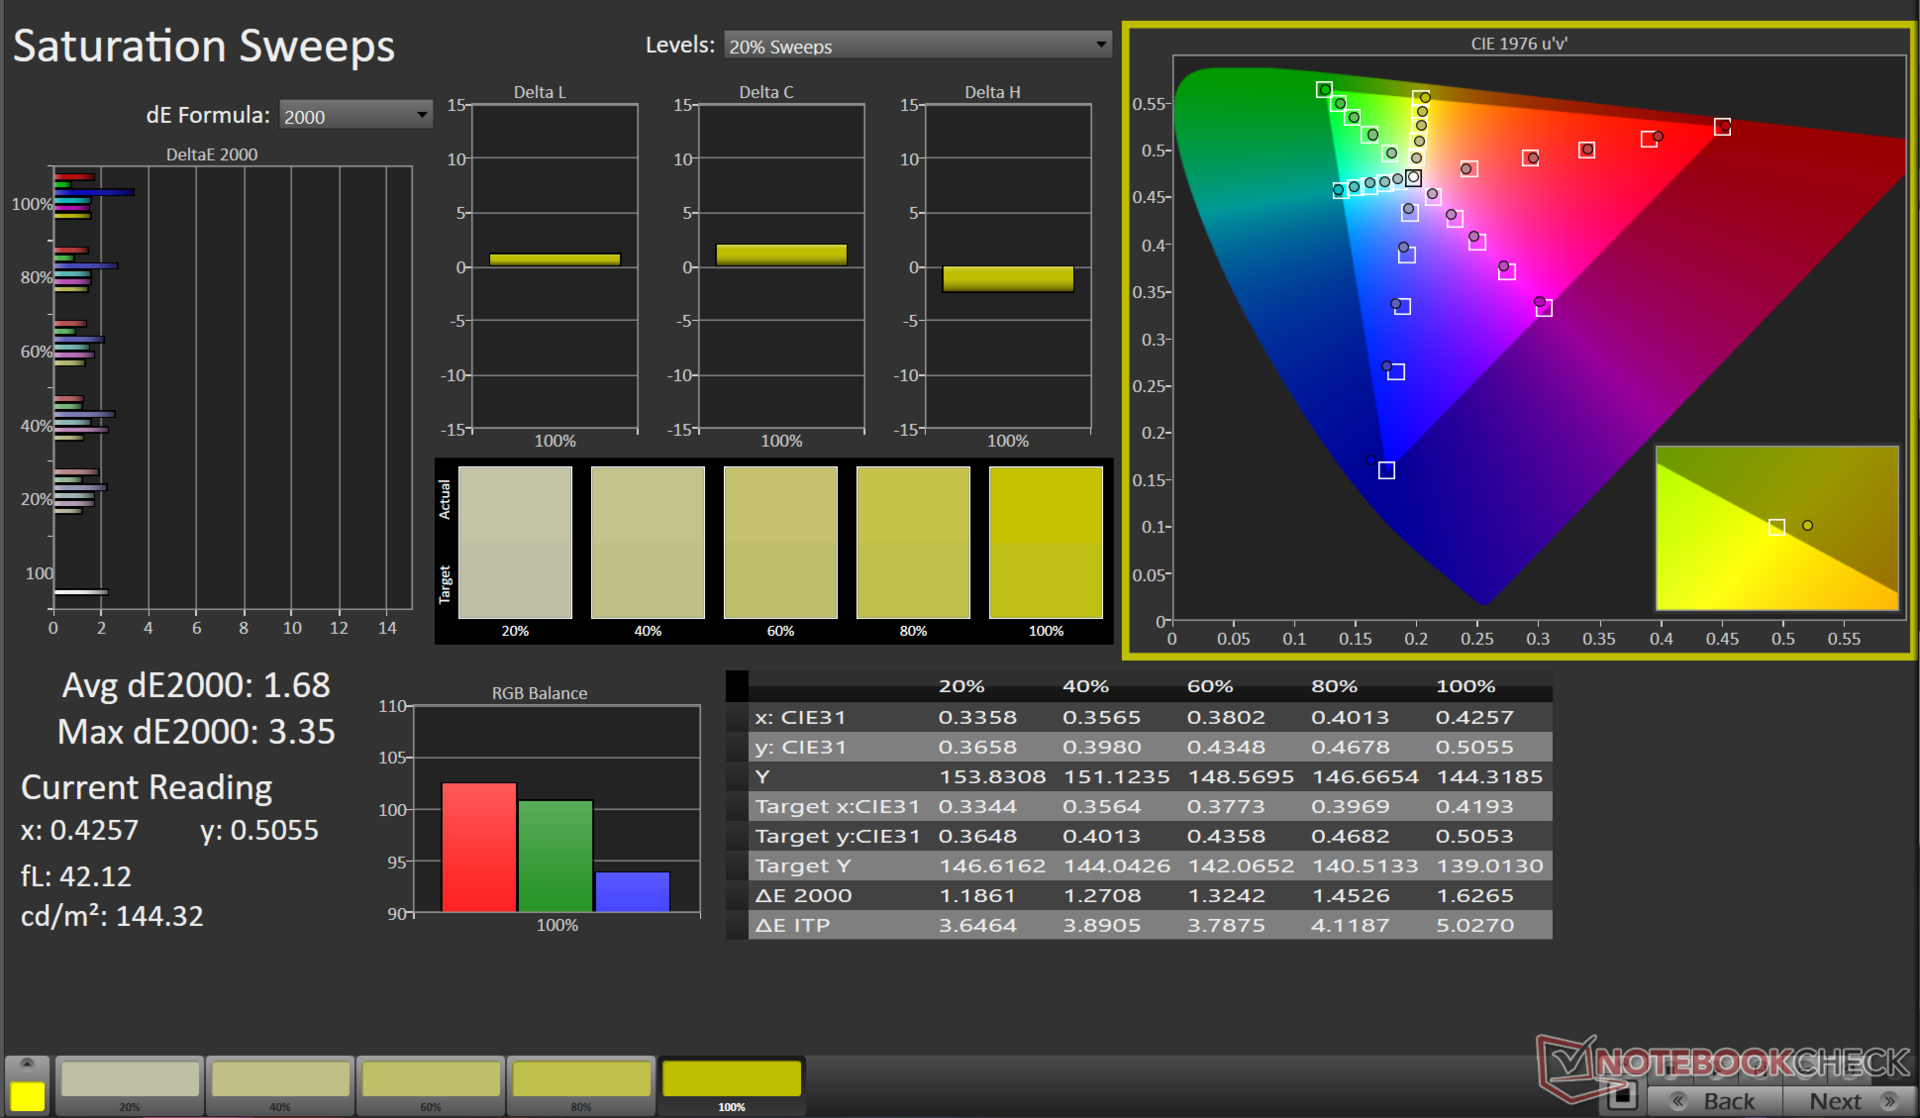
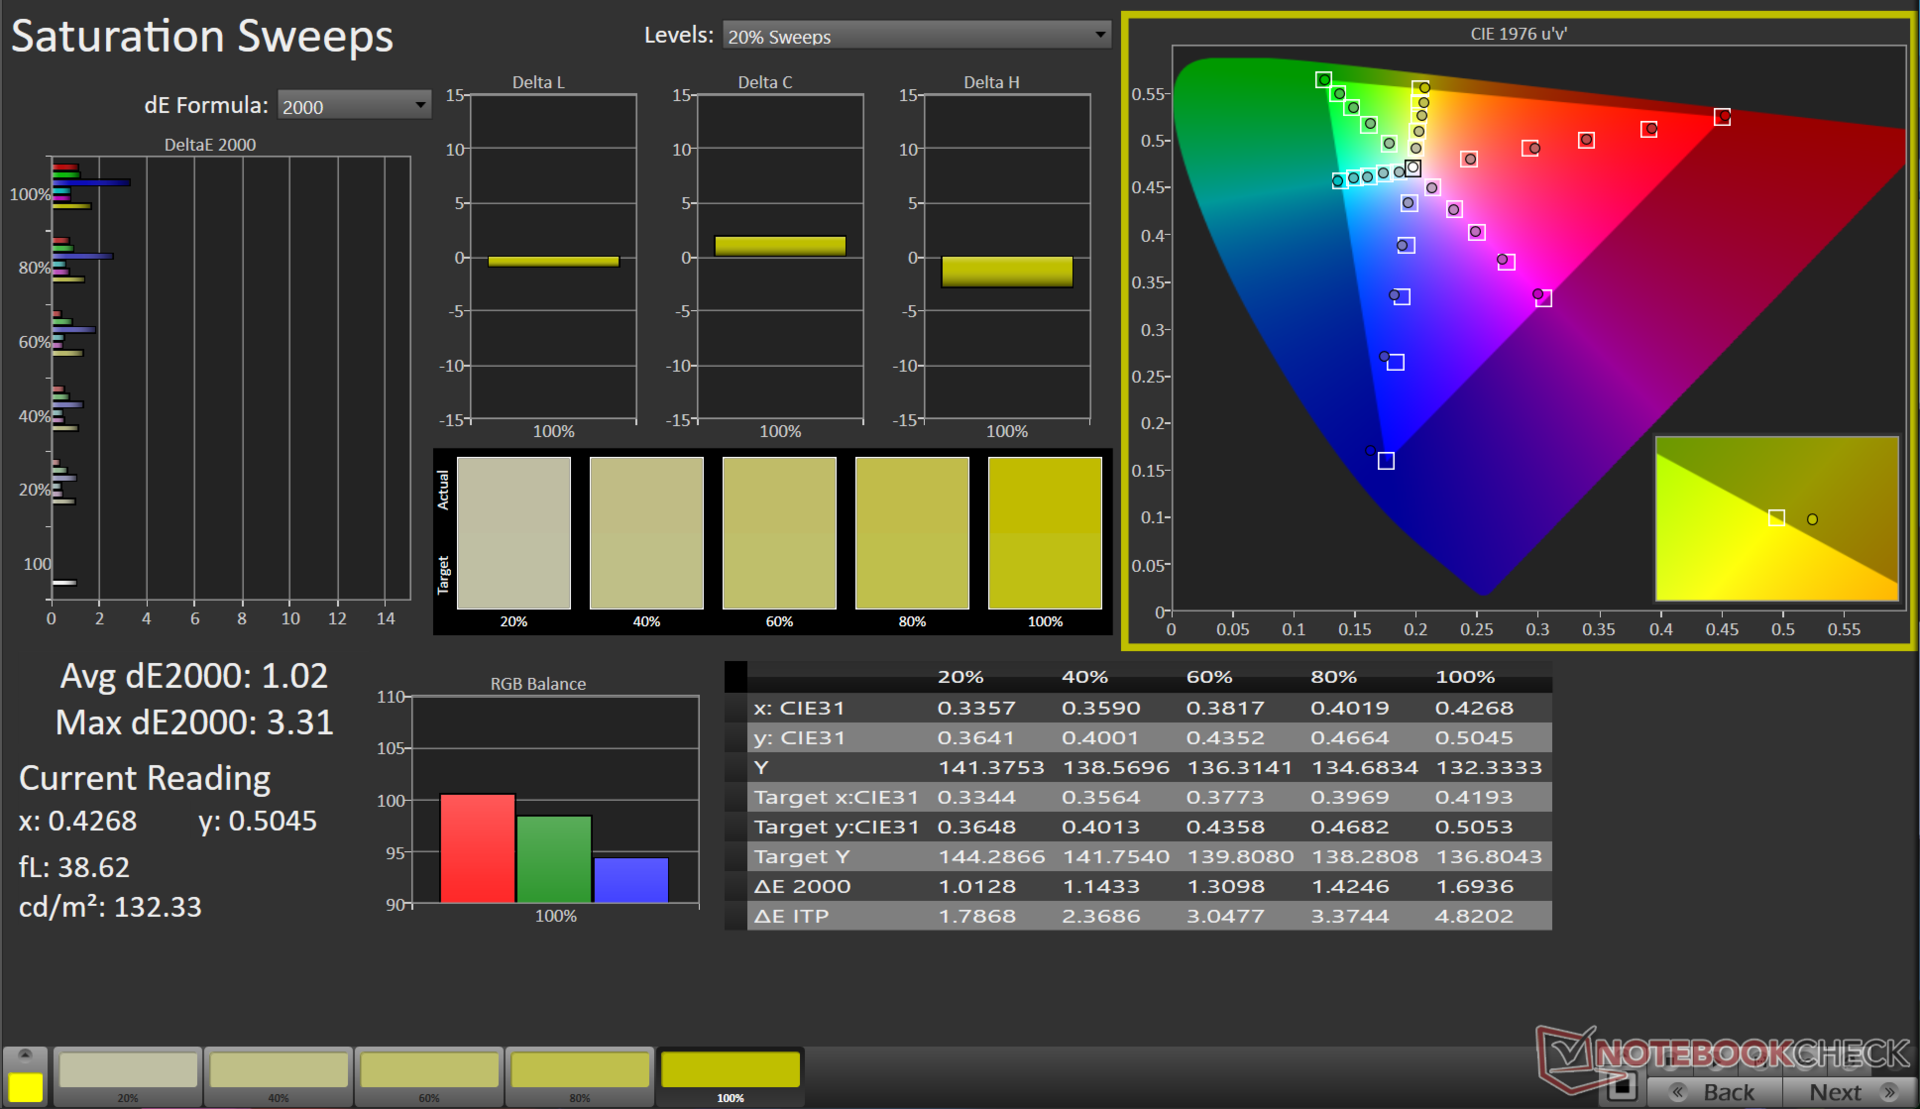
The HP Victus 16 skimps on color accuracy for a higher refresh rate experience. It covers 97.5% of the sRGB color gamut, 69.7% of Adobe RGB and 67.5% of DCI-P3. Like many displays, it has trouble reproducing different hues of blue.
Display Response Times
| ↔ Response Time Black to White | ||
|---|---|---|
| 7.62 ms ... rise ↗ and fall ↘ combined | ↗ 4.07 ms rise | 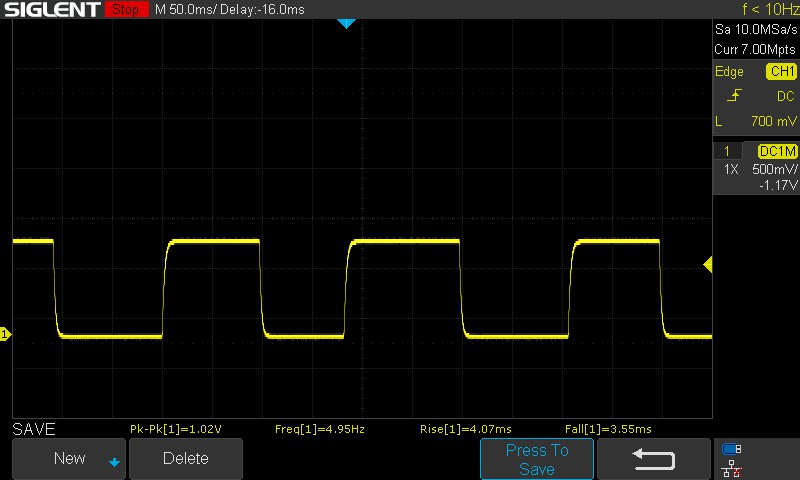 |
| ↘ 3.55 ms fall | ||
| The screen shows very fast response rates in our tests and should be very well suited for fast-paced gaming. In comparison, all tested devices range from 0.1 (minimum) to 240 (maximum) ms. » 21 % of all devices are better. This means that the measured response time is better than the average of all tested devices (20.1 ms). | ||
| ↔ Response Time 50% Grey to 80% Grey | ||
| 6.18 ms ... rise ↗ and fall ↘ combined | ↗ 3.01 ms rise | 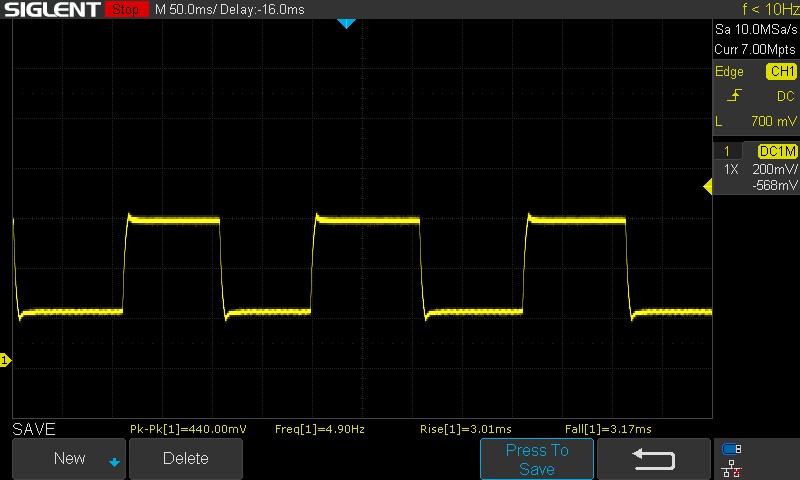 |
| ↘ 3.17 ms fall | ||
| The screen shows very fast response rates in our tests and should be very well suited for fast-paced gaming. In comparison, all tested devices range from 0.165 (minimum) to 636 (maximum) ms. » 18 % of all devices are better. This means that the measured response time is better than the average of all tested devices (31.4 ms). | ||
Screen Flickering / PWM (Pulse-Width Modulation)
| Screen flickering / PWM not detected | ≤ 100 % brightness setting | 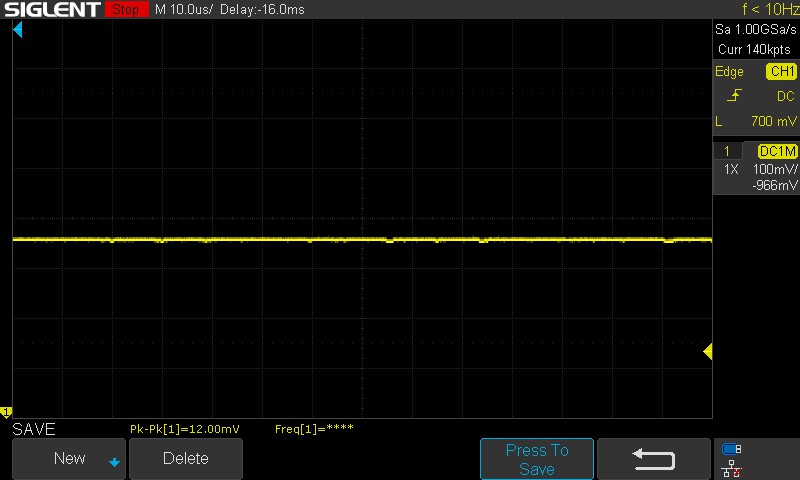 | |
In comparison: 53 % of all tested devices do not use PWM to dim the display. If PWM was detected, an average of 8013 (minimum: 5 - maximum: 343500) Hz was measured. | |||
HP's advertised response time (grey-to-grey) is 7 ms, which is confirmed by our tests, which found the value to be 6.18 ms. Similarly, black-to-white response times were at a respectable 7.62 ms.
Some work with an X-rite i1Basic Pro 3 spectrophotometer and the Calman Calibration Software from Portrait Displays yields only marginally better results, with the greyscale deviation, ColourChecker and Saturation Sweep Delta E values only improving marginally.


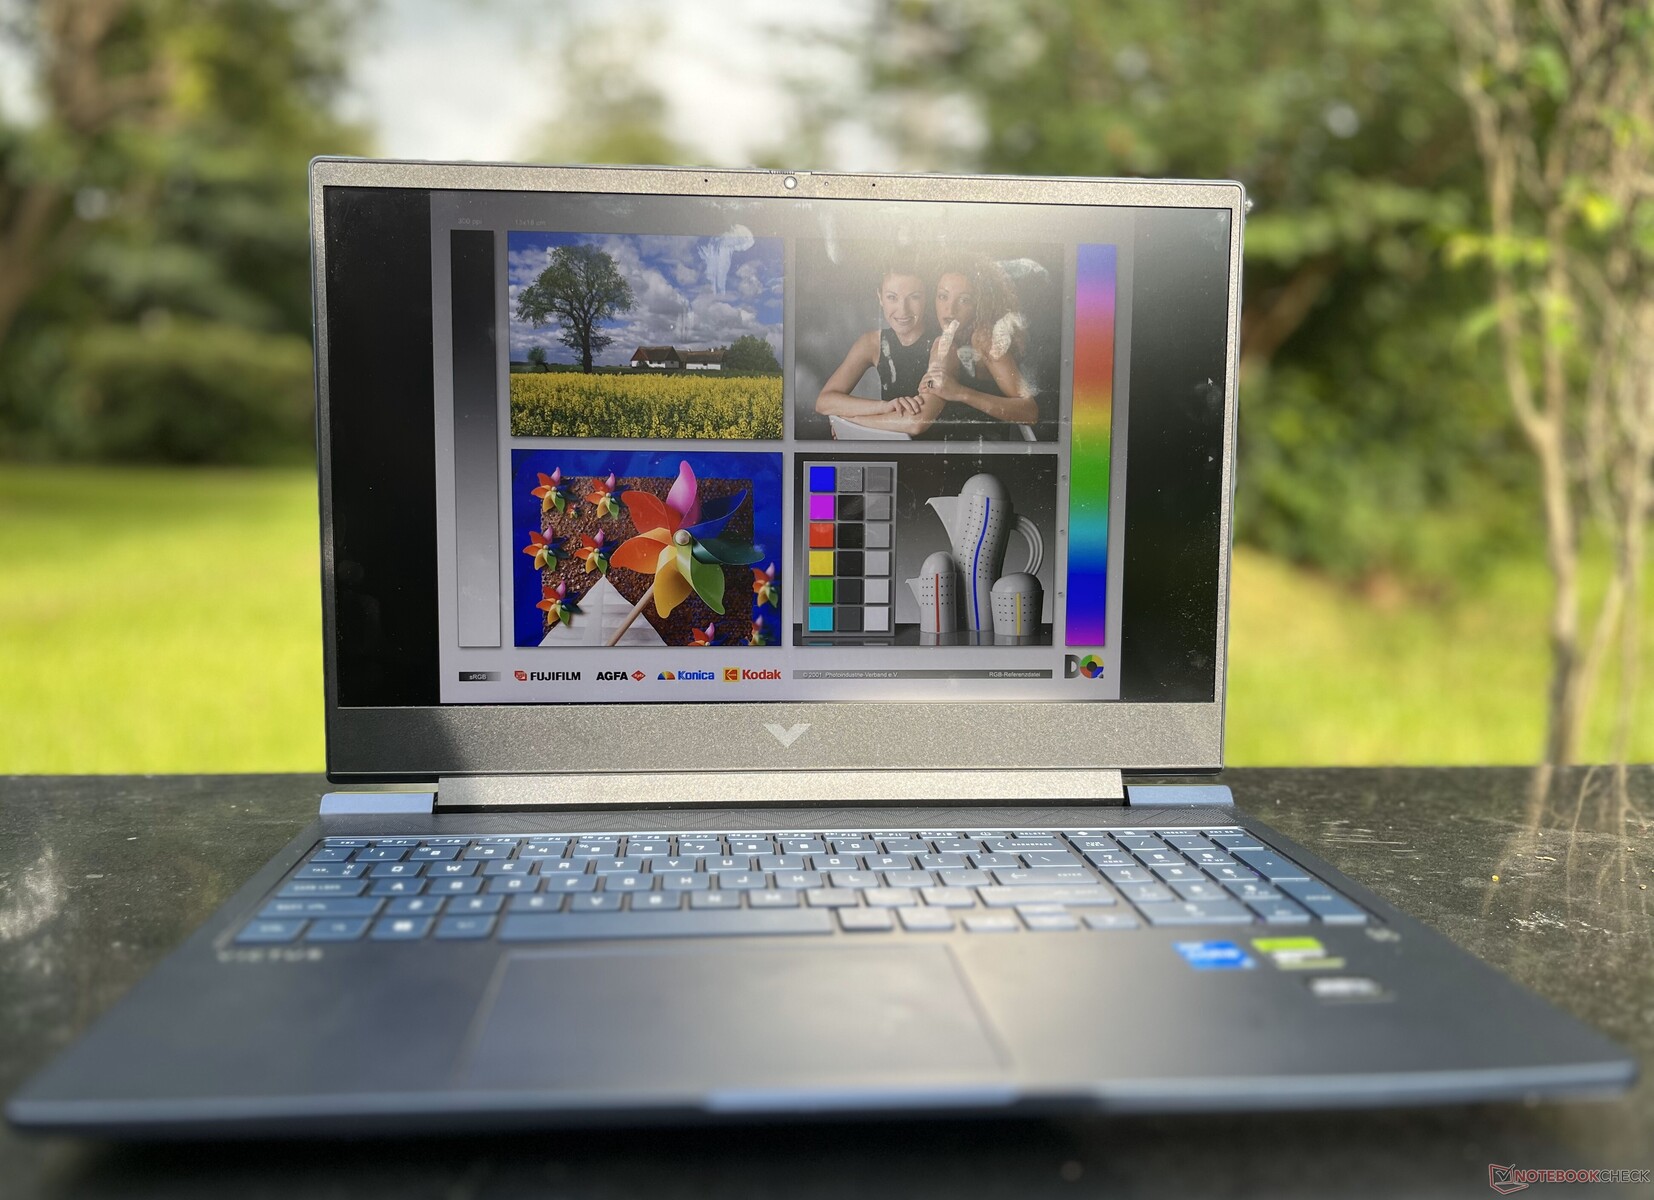
An IPS screen usually ensures decent viewing angles. However, that isn't the case with the HP Omen 16's Chi Mei panel. There is a remarkable loss in details when viewing the screen from extreme angles.
Outdoor viewing is above-average, especially for a device with just 300 nits of brightness. The loss of detail was minimal in shade and under direct sunlight. However, we'd recommend keeping the laptop indoors as it doesn't exactly scream portable.

Performance: Raptor Lake and Ada Lovelace show up big time
The HP Victus 16 is available in a few configurations. Ours is the base variant with an Intel Core i5-13500HX and Nvidia GeForce RTX 4050 Laptop GPU. One can opt for a GeForce RTX 4060 and RTX 4070 if needed.
Those looking for a more powerful CPU can go for the Core i7-13700HX variant, which can only be paired with a GeForce RTX 4070. Users looking for extra memory can also opt for a version with 32 GB of RAM and 1 TB of storage.
Testing Conditions
We picked the "Performance" plan to push the hardware to its limits. Some tests were conducted on the battery with "Eco" mode to check for performance degradation. HWInfo was unable to show the correct PL1 and PL2 information for different profiles, so we obtained these values during the Cinebench R15 loop test.
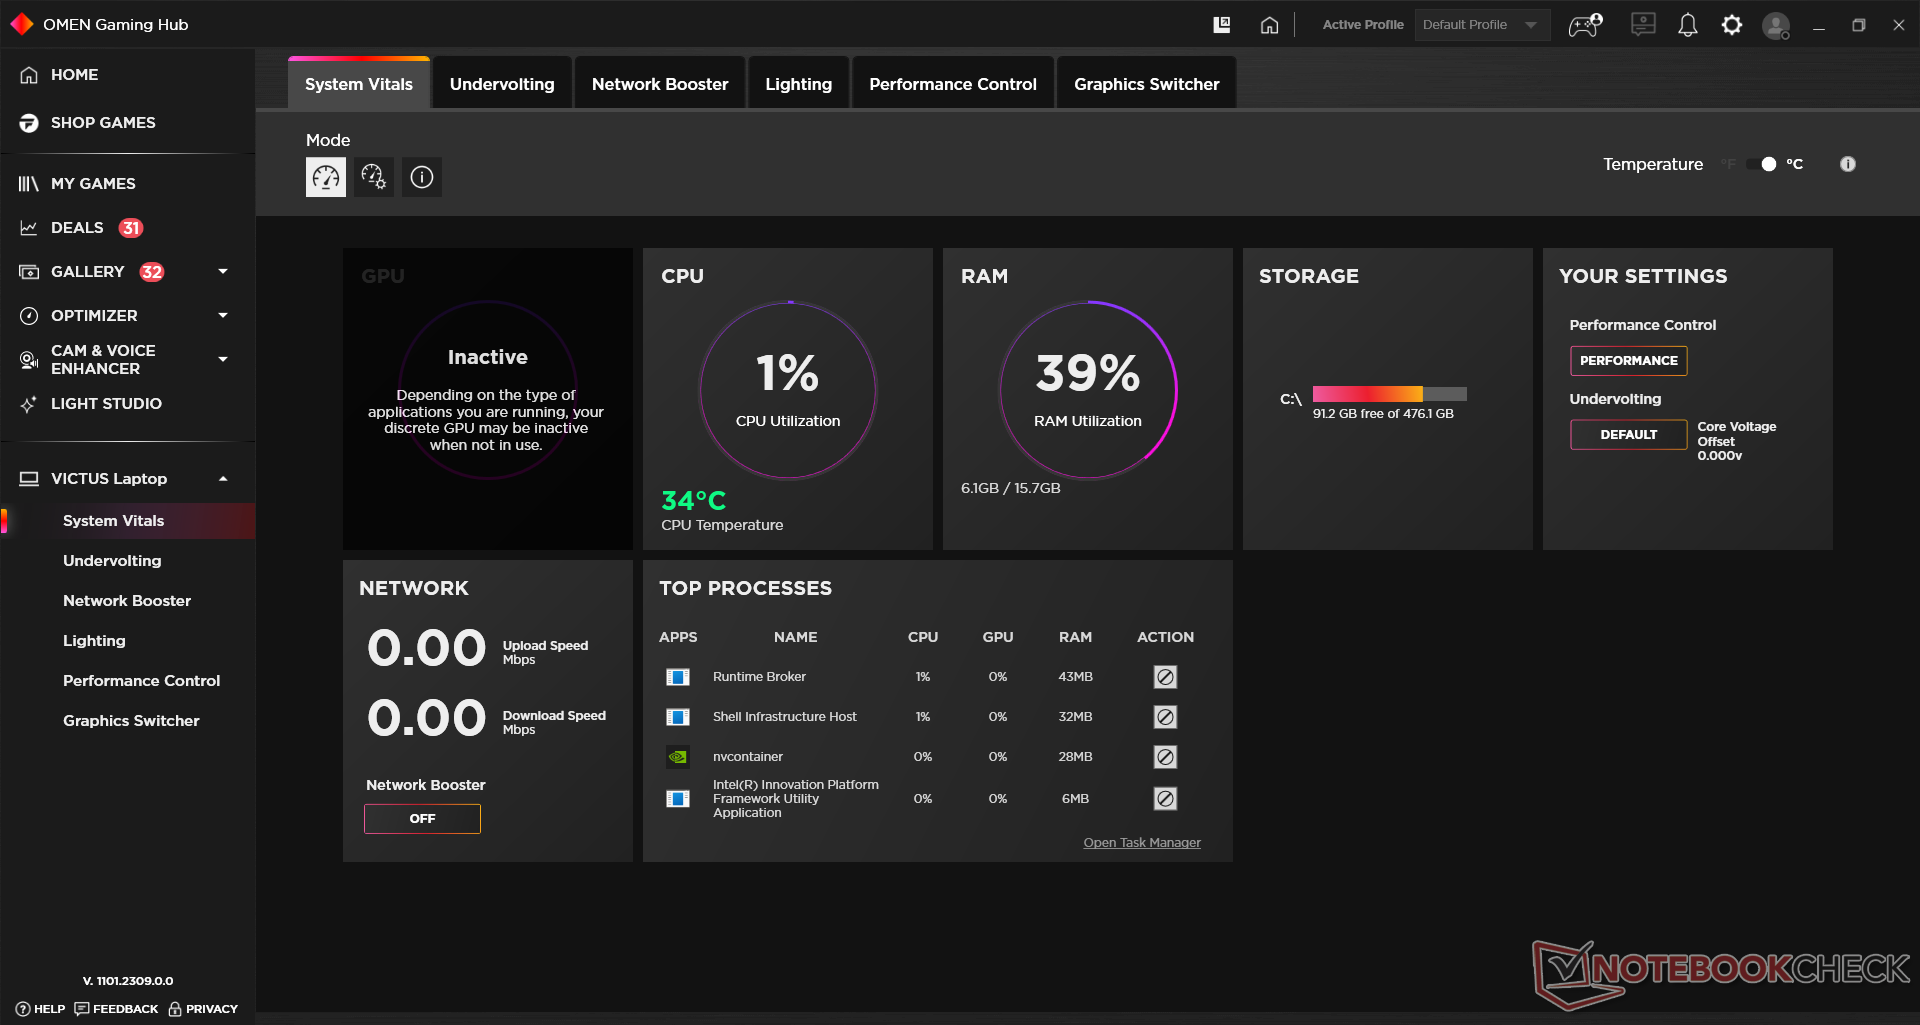
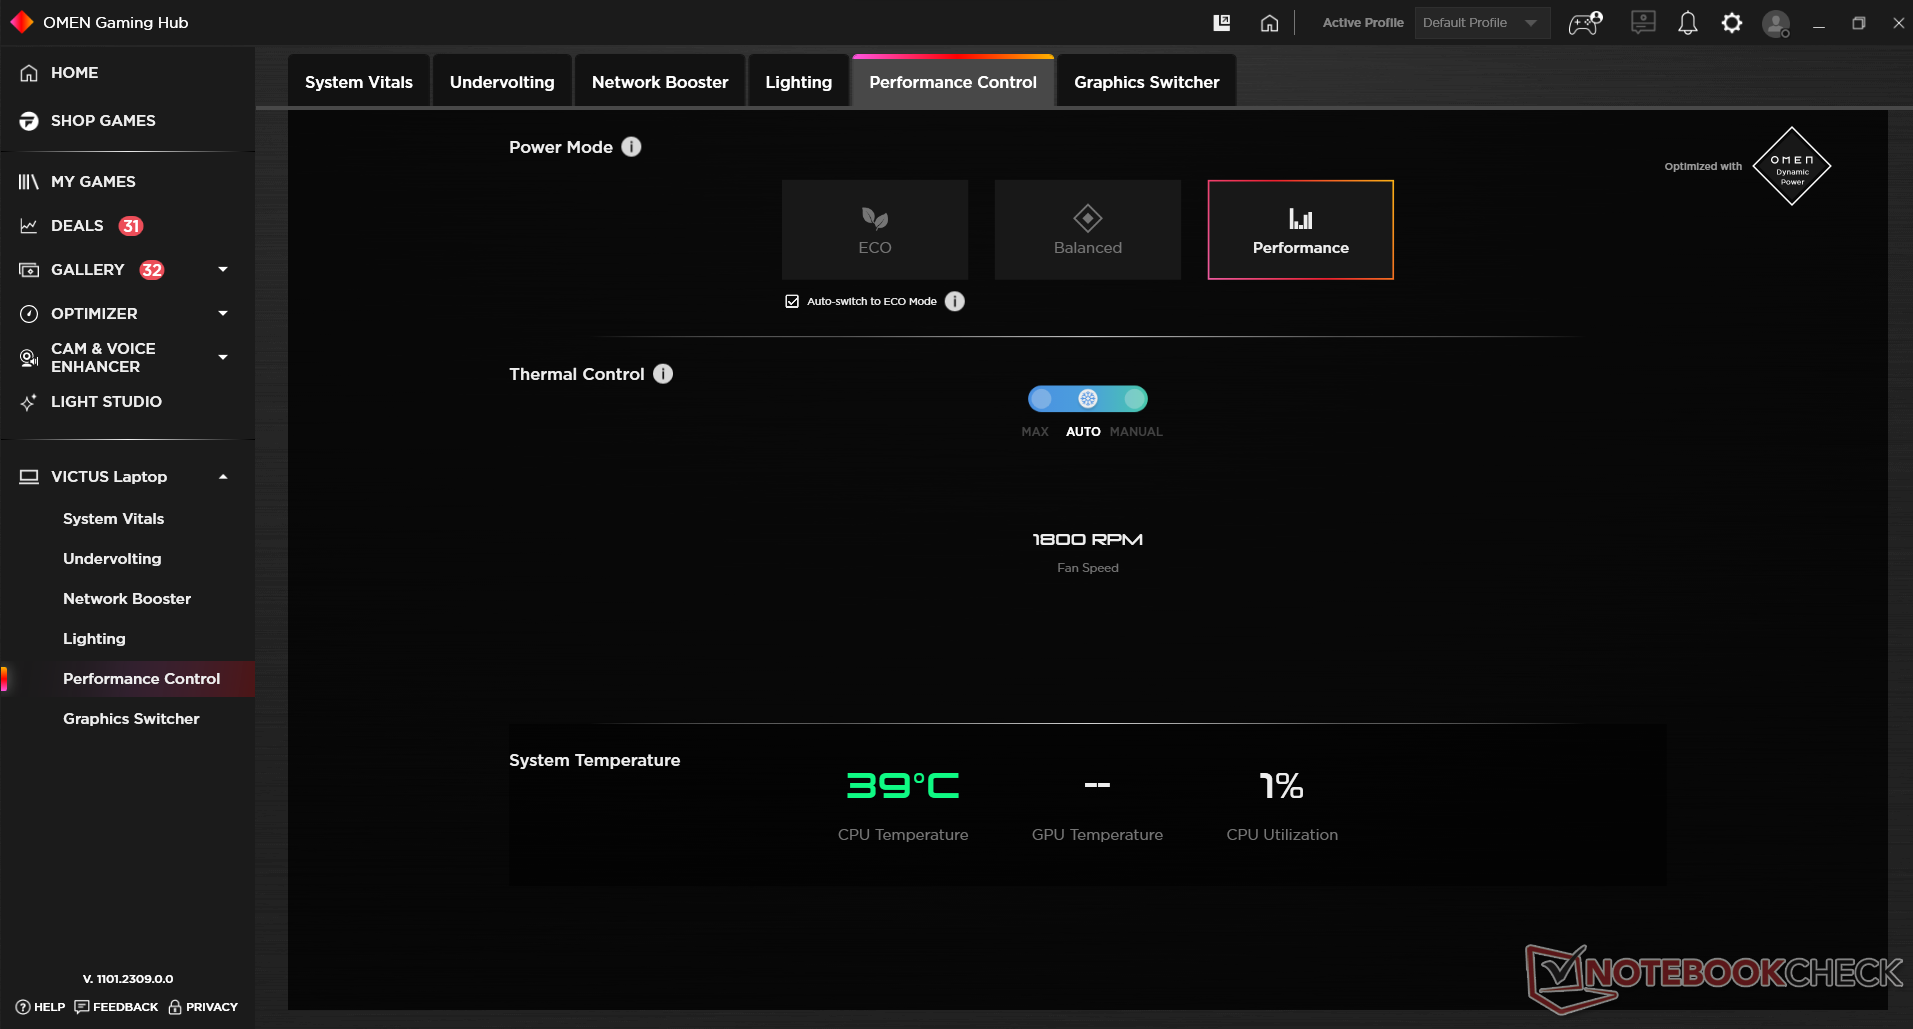
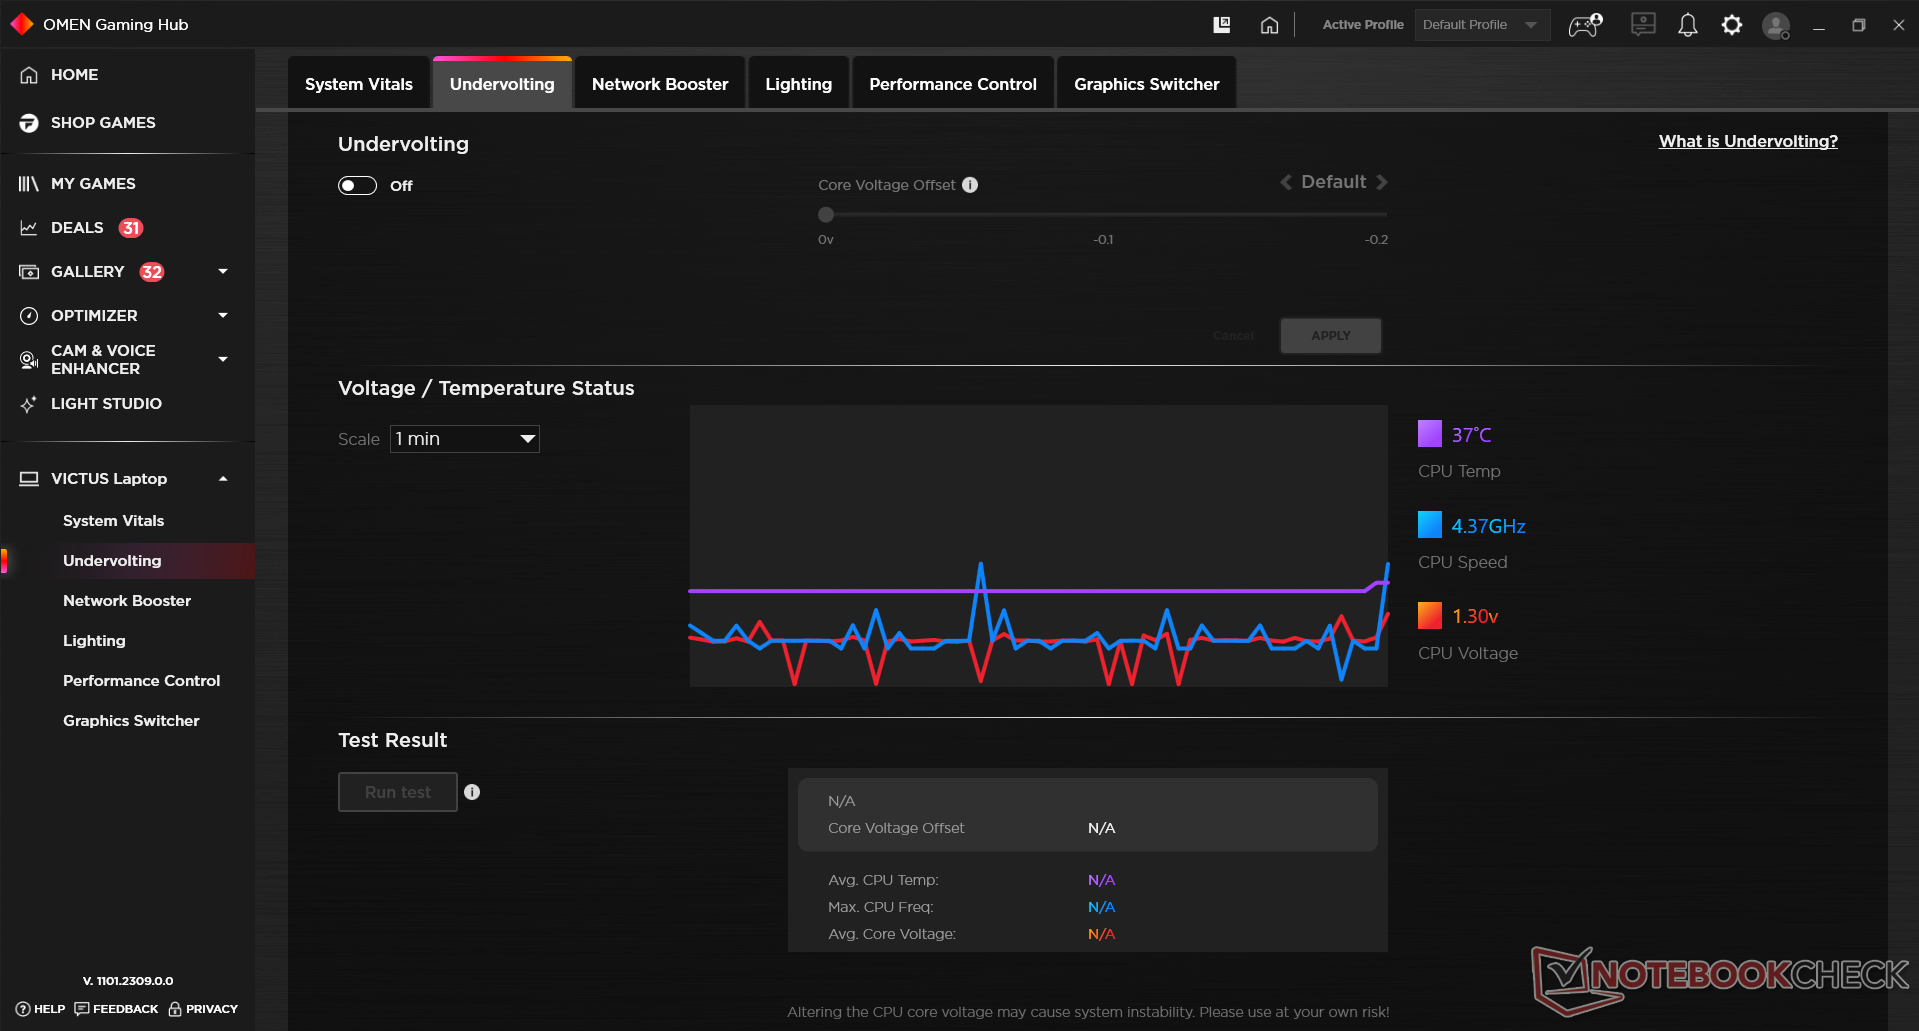
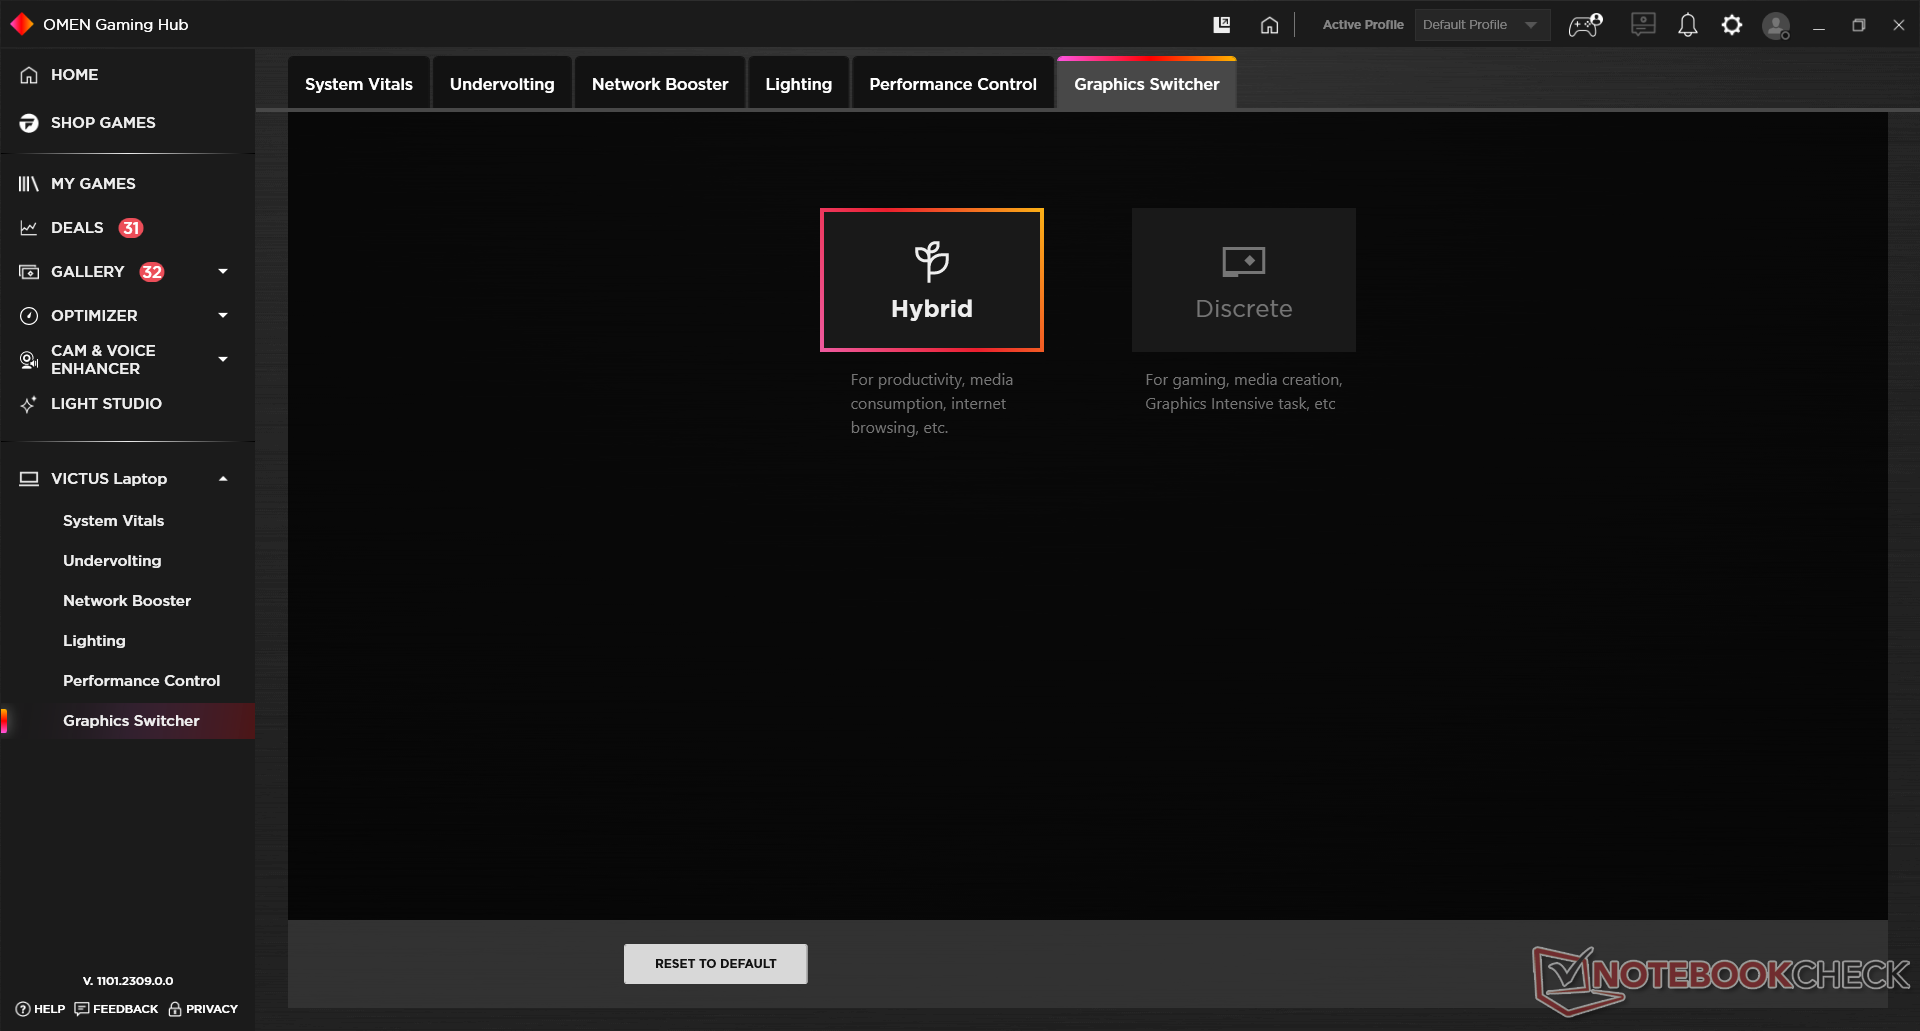
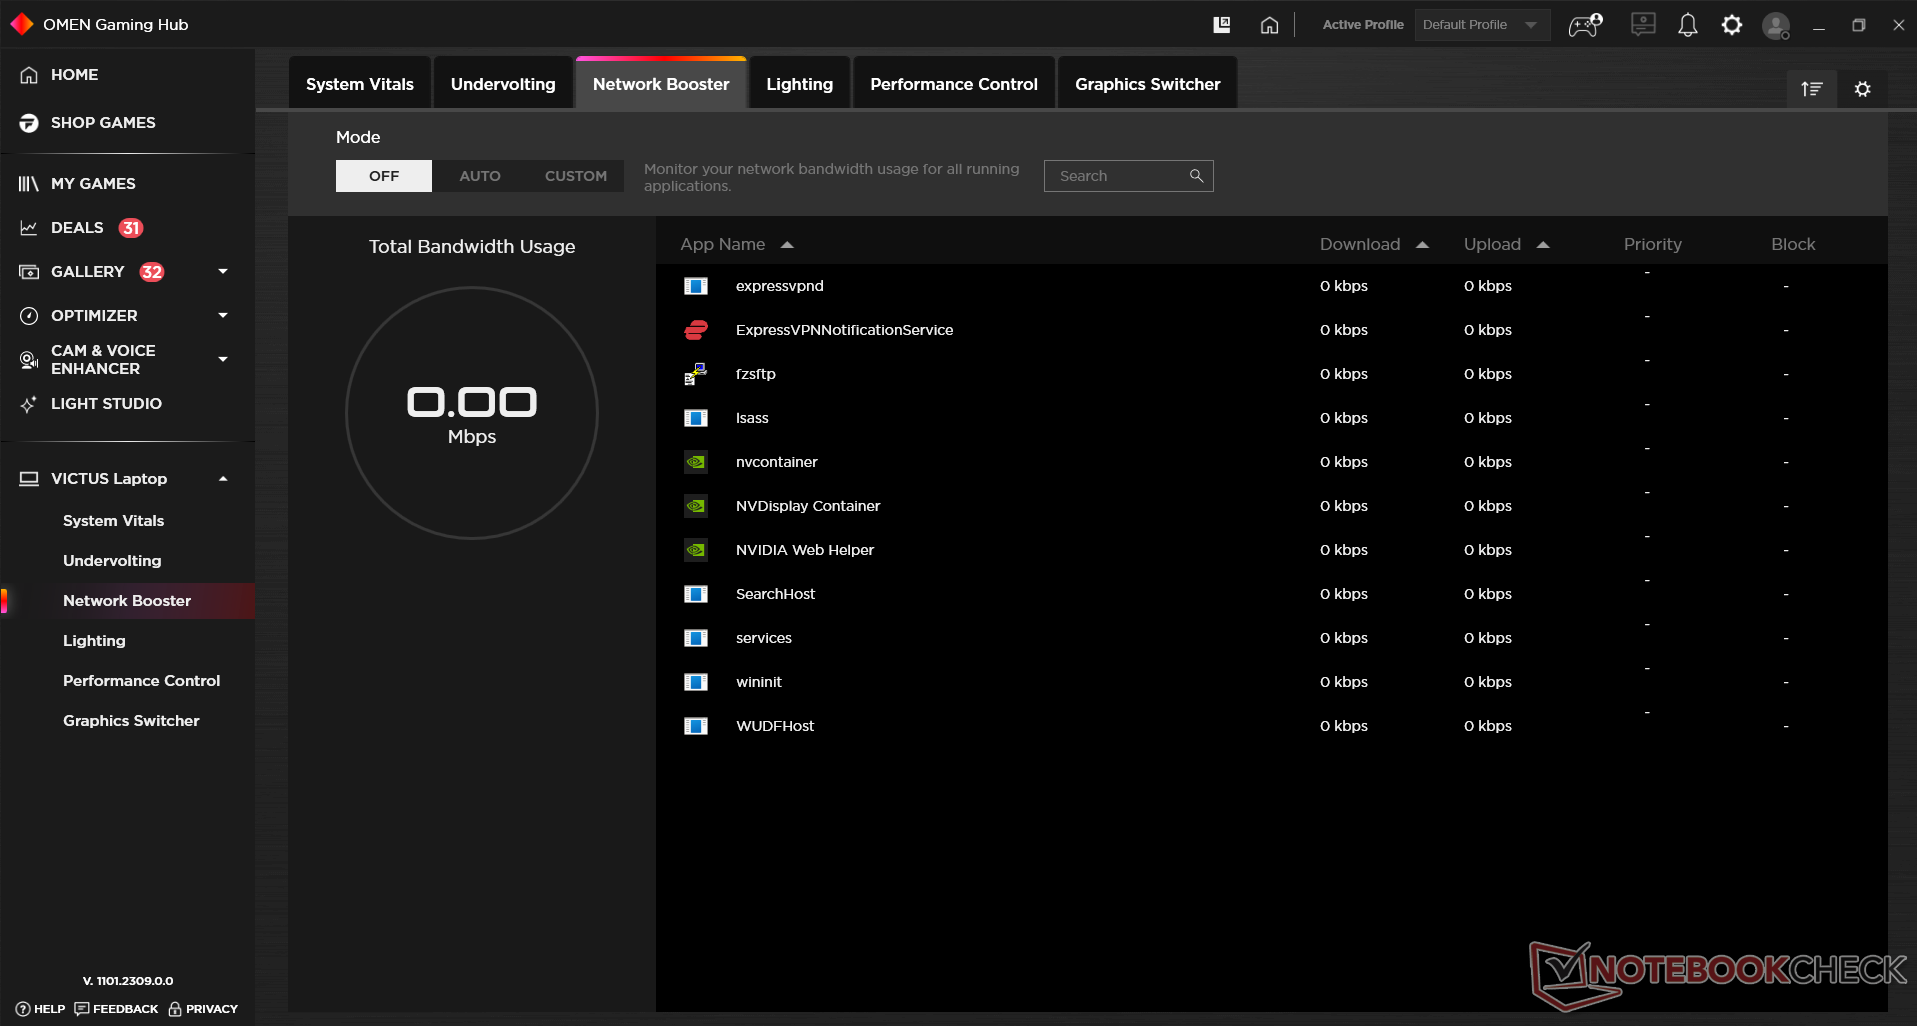
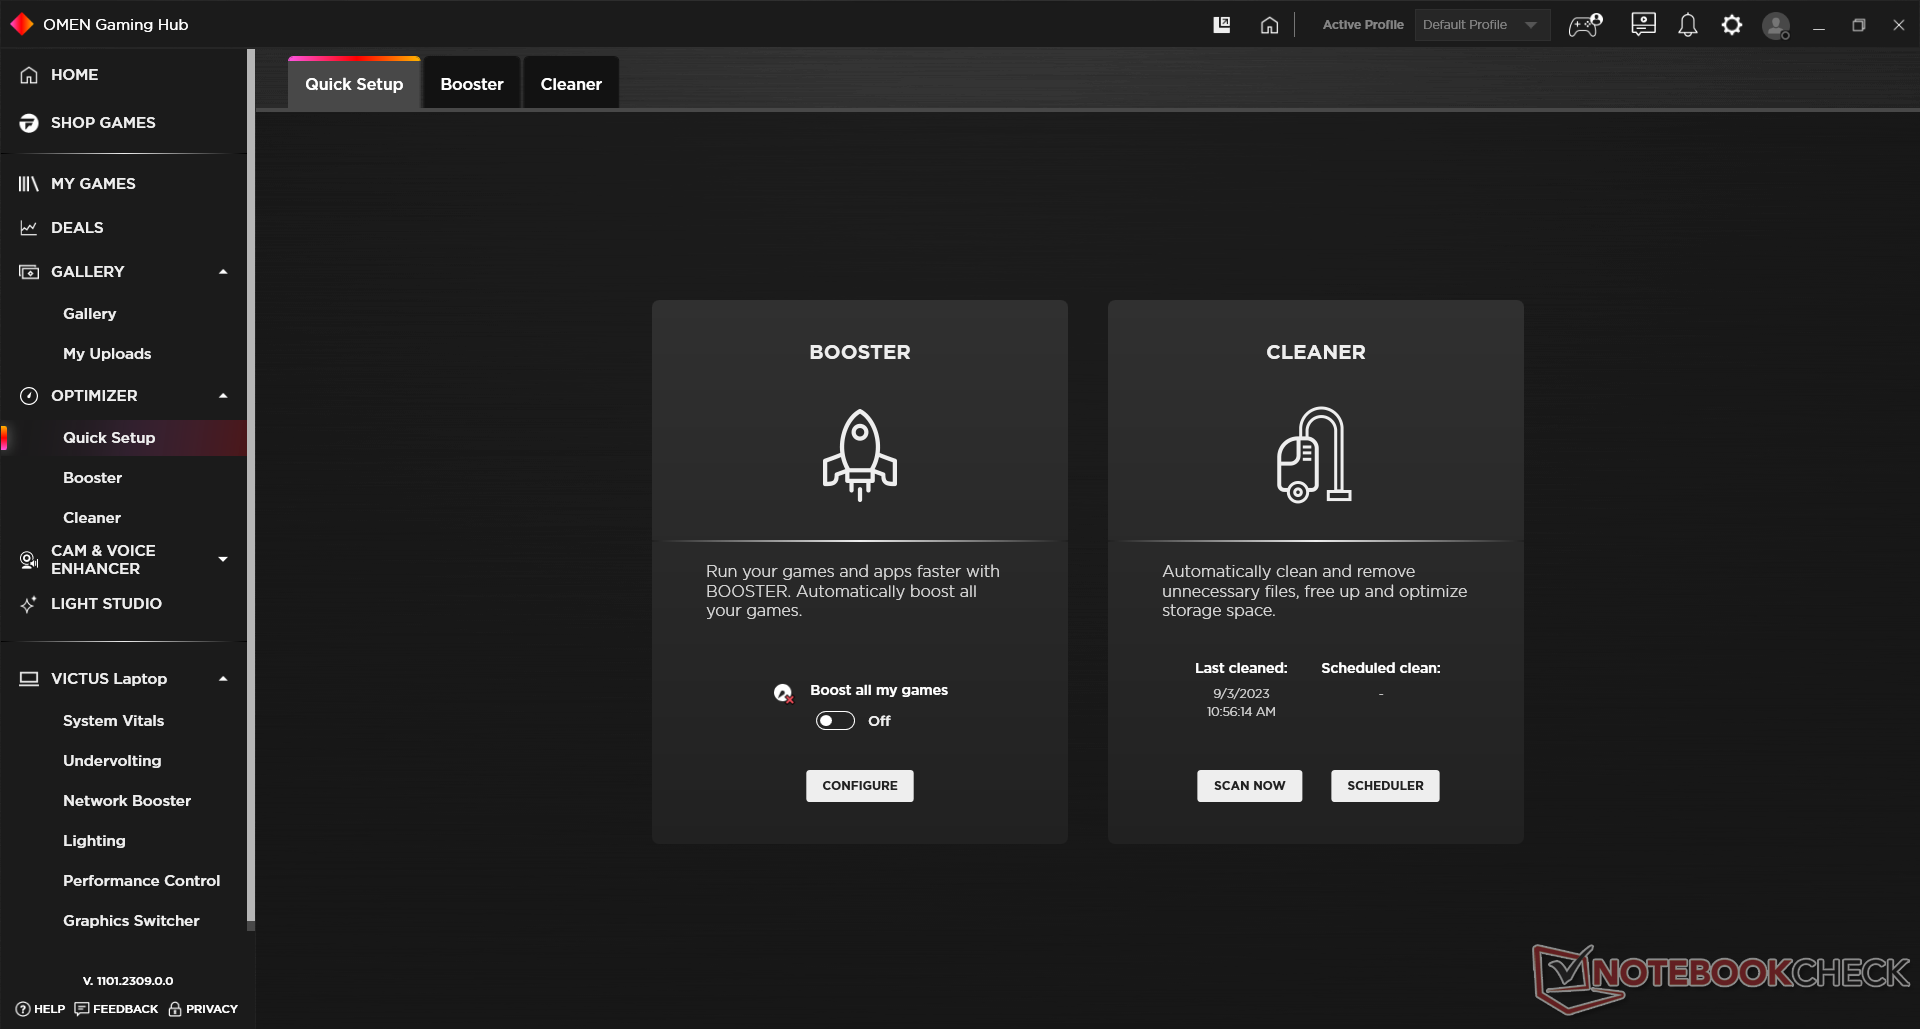
If you're interested in tinkering with your laptop, you'll find yourself spending a lot of time in the Omen Gaming Hub. It gives a birds-eye view of everything ranging from CPU temps, clocks and voltages. It even lets enthusiasts undervolt their laptops without having to navigate through the BIOS.
Then there's a "network booster" tab that prioritizes traffic towards running tasks and a "performance control" section which gives you access to the power plans mentioned above. It also lets you set custom fan curves or have it at full blast at all times.
| Profile | PL1 | PL2 | PL4 |
|---|---|---|---|
| Eco | 35 W | 46 W | 200 W |
| Balanced | 51 W | 130 W | 200 W |
| Performance | 78 W | 130 W | 200 W |
Processor
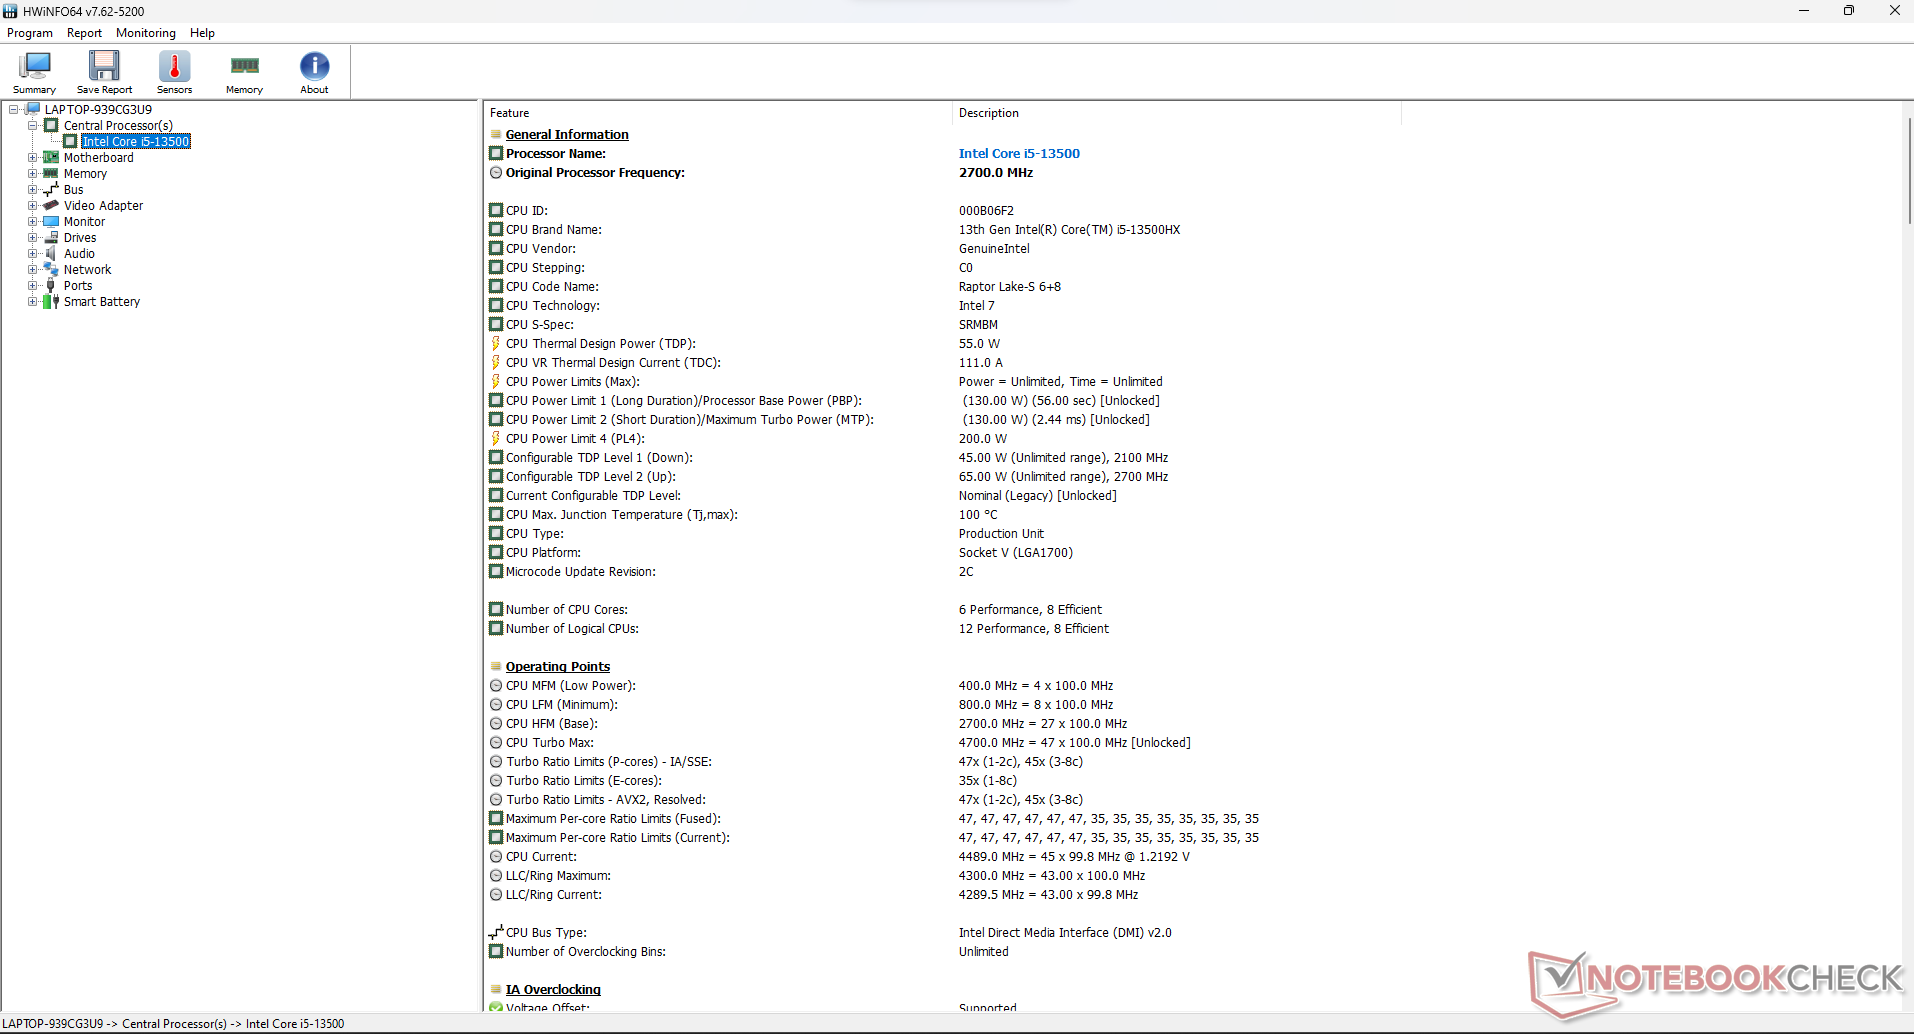
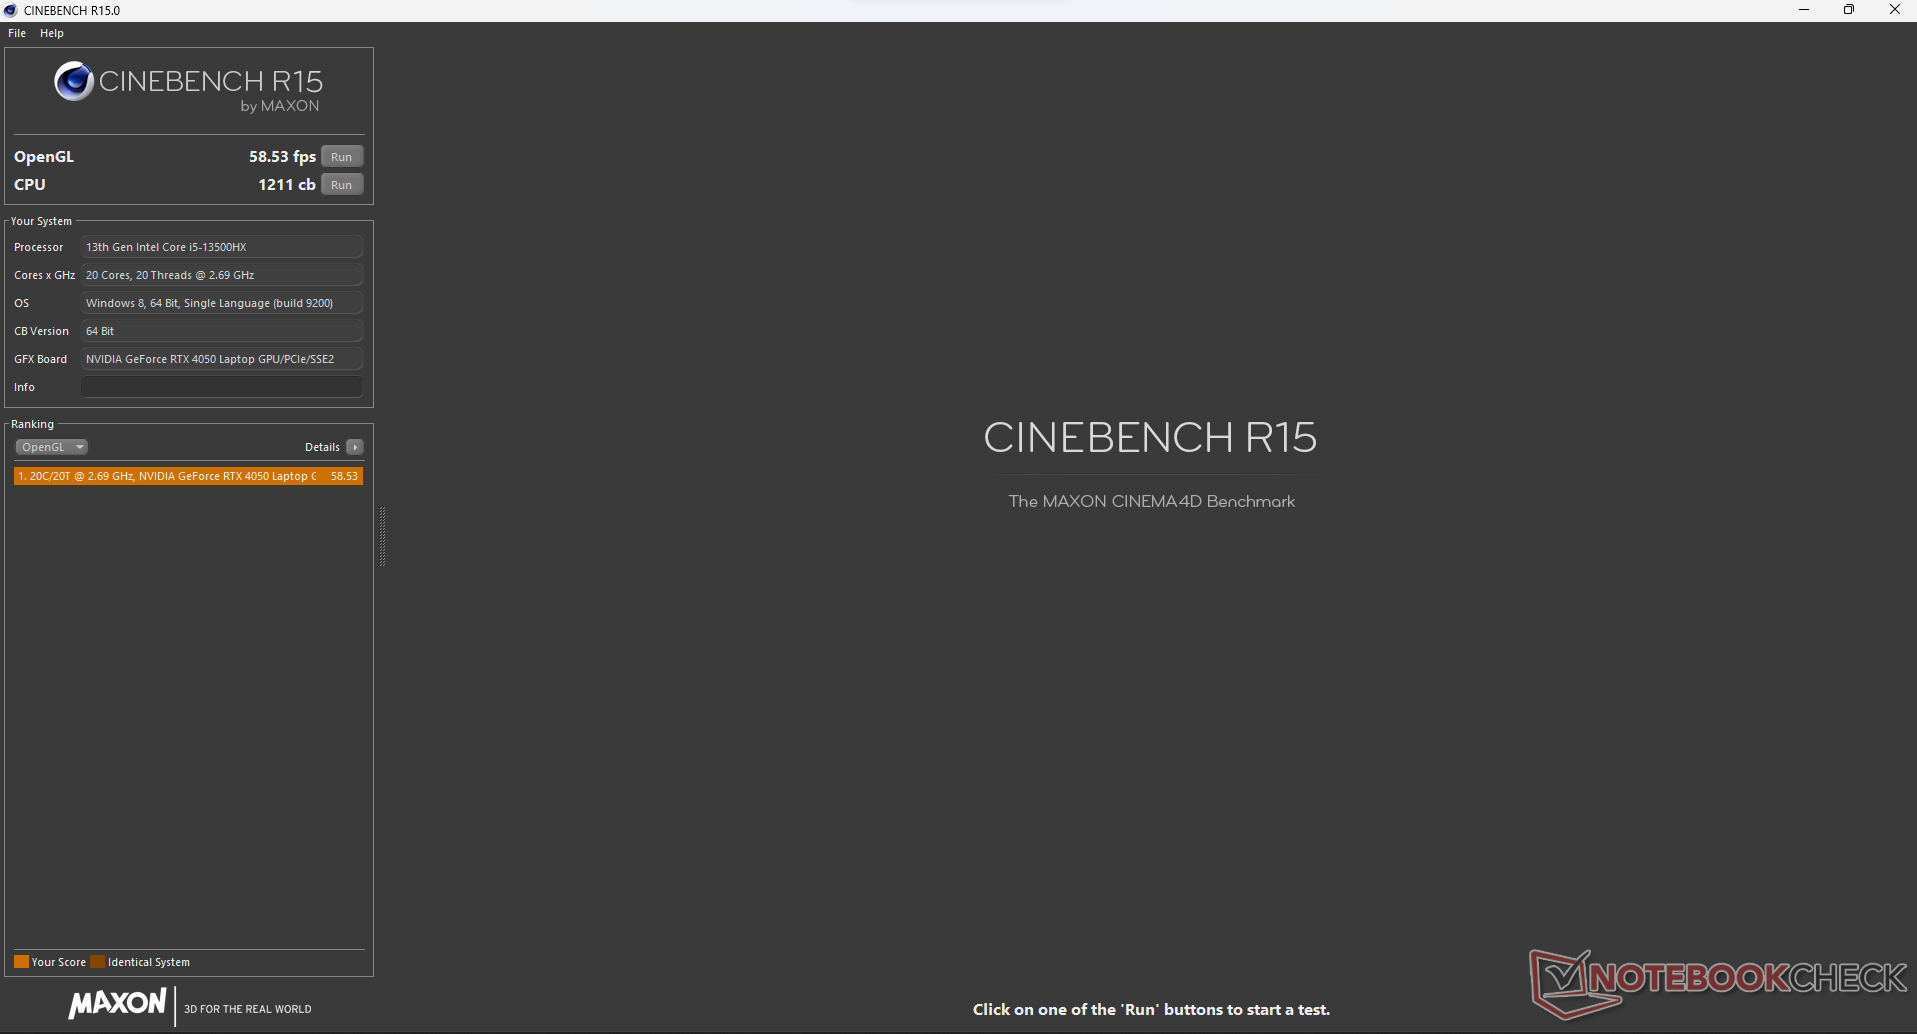
The Intel Core i5-13500HX powering our HP Victus 16 is a 14-core (6 performance plus 8 efficiency), 20-thread Raptor Lake CPU. It was launched as a part of the Raptor Lake-HX series of chips that upped the base TDP (55 Watts) against their H-branded counterparts. On top of the extra TDP headroom, it also increases the number of performance cores.
Despite being the lowest-end Raptor Lake-HX part, the Core i5-13500HX punches well above its weight class. In its PL2 state, the processor can consume up to 131 Watts of energy. However, the figure settles down at 83 Watts under sustained loads.
Gaming laptops are known to lose a lot of performance on battery, and the HP Victus 16 is no different. For example, its Cinebench R15 score drops by ~58% from 2,863 to 1,211 points when AC power is disconnected.
Cinebench R15 Multi Loop
Cinebench R23: Multi Core | Single Core
Cinebench R20: CPU (Multi Core) | CPU (Single Core)
Cinebench R15: CPU Multi 64Bit | CPU Single 64Bit
Blender: v2.79 BMW27 CPU
7-Zip 18.03: 7z b 4 | 7z b 4 -mmt1
Geekbench 5.5: Multi-Core | Single-Core
HWBOT x265 Benchmark v2.2: 4k Preset
LibreOffice : 20 Documents To PDF
R Benchmark 2.5: Overall mean
| CPU Performance rating | |
| Average of class Gaming | |
| Acer Predator Helios 16 PH16-71-731Q | |
| Alienware m16 R1 Intel | |
| HP Victus 16-r0076TX -1! | |
| Average Intel Core i5-13500HX | |
| Acer Predator Triton 14 PT14-51 | |
| Aorus 15 BSF | |
| MSI Katana 15 B12VEK | |
| Asus TUF A15 FA507 | |
| Acer Nitro 16 AN16-41-R7YE | |
| Cinebench R23 / Multi Core | |
| Average of class Gaming (9107 - 40970, n=135, last 2 years) | |
| Acer Predator Helios 16 PH16-71-731Q | |
| Alienware m16 R1 Intel | |
| Acer Predator Triton 14 PT14-51 | |
| Average Intel Core i5-13500HX (18235 - 19176, n=3) | |
| HP Victus 16-r0076TX | |
| Aorus 15 BSF | |
| MSI Katana 15 B12VEK | |
| Asus TUF A15 FA507 | |
| Acer Nitro 16 AN16-41-R7YE | |
| Cinebench R23 / Single Core | |
| Average of class Gaming (1166 - 2267, n=135, last 2 years) | |
| Alienware m16 R1 Intel | |
| Aorus 15 BSF | |
| Acer Predator Helios 16 PH16-71-731Q | |
| Average Intel Core i5-13500HX (1689 - 1772, n=2) | |
| MSI Katana 15 B12VEK | |
| HP Victus 16-r0076TX | |
| Acer Predator Triton 14 PT14-51 | |
| Asus TUF A15 FA507 | |
| Acer Nitro 16 AN16-41-R7YE | |
| Cinebench R20 / CPU (Multi Core) | |
| Average of class Gaming (3504 - 16108, n=134, last 2 years) | |
| Acer Predator Helios 16 PH16-71-731Q | |
| Alienware m16 R1 Intel | |
| Acer Predator Triton 14 PT14-51 | |
| Average Intel Core i5-13500HX (6978 - 7371, n=3) | |
| HP Victus 16-r0076TX | |
| Aorus 15 BSF | |
| MSI Katana 15 B12VEK | |
| Asus TUF A15 FA507 | |
| Acer Nitro 16 AN16-41-R7YE | |
| Cinebench R20 / CPU (Single Core) | |
| Average of class Gaming (442 - 870, n=134, last 2 years) | |
| Alienware m16 R1 Intel | |
| Aorus 15 BSF | |
| Acer Predator Helios 16 PH16-71-731Q | |
| Average Intel Core i5-13500HX (648 - 695, n=3) | |
| MSI Katana 15 B12VEK | |
| Acer Predator Triton 14 PT14-51 | |
| HP Victus 16-r0076TX | |
| Asus TUF A15 FA507 | |
| Acer Nitro 16 AN16-41-R7YE | |
| Cinebench R15 / CPU Multi 64Bit | |
| Average of class Gaming (1537 - 6271, n=135, last 2 years) | |
| Acer Predator Helios 16 PH16-71-731Q | |
| Acer Predator Helios 16 PH16-71-731Q | |
| Alienware m16 R1 Intel | |
| Acer Predator Triton 14 PT14-51 | |
| Average Intel Core i5-13500HX (2856 - 2964, n=3) | |
| HP Victus 16-r0076TX | |
| Aorus 15 BSF | |
| Asus TUF A15 FA507 | |
| MSI Katana 15 B12VEK | |
| Acer Nitro 16 AN16-41-R7YE | |
| Cinebench R15 / CPU Single 64Bit | |
| Average of class Gaming (188.8 - 343, n=134, last 2 years) | |
| Alienware m16 R1 Intel | |
| Acer Predator Helios 16 PH16-71-731Q | |
| Aorus 15 BSF | |
| Average Intel Core i5-13500HX (242 - 263, n=3) | |
| Asus TUF A15 FA507 | |
| MSI Katana 15 B12VEK | |
| Acer Predator Triton 14 PT14-51 | |
| HP Victus 16-r0076TX | |
| Acer Nitro 16 AN16-41-R7YE | |
| Blender / v2.79 BMW27 CPU | |
| Acer Nitro 16 AN16-41-R7YE | |
| MSI Katana 15 B12VEK | |
| Asus TUF A15 FA507 | |
| Aorus 15 BSF | |
| HP Victus 16-r0076TX | |
| Average Intel Core i5-13500HX (178 - 193, n=3) | |
| Acer Predator Triton 14 PT14-51 | |
| Acer Predator Helios 16 PH16-71-731Q | |
| Alienware m16 R1 Intel | |
| Average of class Gaming (80 - 335, n=131, last 2 years) | |
| 7-Zip 18.03 / 7z b 4 | |
| Average of class Gaming (33491 - 148086, n=132, last 2 years) | |
| Alienware m16 R1 Intel | |
| Acer Predator Helios 16 PH16-71-731Q | |
| Acer Predator Triton 14 PT14-51 | |
| Average Intel Core i5-13500HX (68923 - 73701, n=3) | |
| HP Victus 16-r0076TX | |
| Aorus 15 BSF | |
| Asus TUF A15 FA507 | |
| MSI Katana 15 B12VEK | |
| Acer Nitro 16 AN16-41-R7YE | |
| 7-Zip 18.03 / 7z b 4 -mmt1 | |
| Alienware m16 R1 Intel | |
| Average of class Gaming (4199 - 7508, n=132, last 2 years) | |
| Acer Predator Helios 16 PH16-71-731Q | |
| Aorus 15 BSF | |
| Asus TUF A15 FA507 | |
| Acer Nitro 16 AN16-41-R7YE | |
| Average Intel Core i5-13500HX (5377 - 5850, n=3) | |
| MSI Katana 15 B12VEK | |
| Acer Predator Triton 14 PT14-51 | |
| HP Victus 16-r0076TX | |
| Geekbench 5.5 / Multi-Core | |
| Average of class Gaming (5847 - 27010, n=132, last 2 years) | |
| Acer Predator Helios 16 PH16-71-731Q | |
| Alienware m16 R1 Intel | |
| Acer Predator Triton 14 PT14-51 | |
| Aorus 15 BSF | |
| Average Intel Core i5-13500HX (12683 - 13767, n=3) | |
| HP Victus 16-r0076TX | |
| MSI Katana 15 B12VEK | |
| Asus TUF A15 FA507 | |
| Acer Nitro 16 AN16-41-R7YE | |
| Geekbench 5.5 / Single-Core | |
| Average of class Gaming (986 - 2474, n=132, last 2 years) | |
| Acer Predator Helios 16 PH16-71-731Q | |
| Aorus 15 BSF | |
| Alienware m16 R1 Intel | |
| Average Intel Core i5-13500HX (1688 - 1779, n=3) | |
| Acer Predator Triton 14 PT14-51 | |
| HP Victus 16-r0076TX | |
| MSI Katana 15 B12VEK | |
| Asus TUF A15 FA507 | |
| Acer Nitro 16 AN16-41-R7YE | |
| HWBOT x265 Benchmark v2.2 / 4k Preset | |
| Average of class Gaming (11 - 44.3, n=132, last 2 years) | |
| Acer Predator Helios 16 PH16-71-731Q | |
| Alienware m16 R1 Intel | |
| Acer Predator Triton 14 PT14-51 | |
| Average Intel Core i5-13500HX (20.3 - 20.9, n=3) | |
| HP Victus 16-r0076TX | |
| MSI Katana 15 B12VEK | |
| Asus TUF A15 FA507 | |
| Aorus 15 BSF | |
| Acer Nitro 16 AN16-41-R7YE | |
| LibreOffice / 20 Documents To PDF | |
| Asus TUF A15 FA507 | |
| Average of class Gaming (19 - 88.8, n=132, last 2 years) | |
| Acer Predator Triton 14 PT14-51 | |
| Aorus 15 BSF | |
| MSI Katana 15 B12VEK | |
| Acer Nitro 16 AN16-41-R7YE | |
| Alienware m16 R1 Intel | |
| Average Intel Core i5-13500HX (42.5 - 45, n=2) | |
| Acer Predator Helios 16 PH16-71-731Q | |
| R Benchmark 2.5 / Overall mean | |
| Acer Nitro 16 AN16-41-R7YE | |
| Asus TUF A15 FA507 | |
| MSI Katana 15 B12VEK | |
| HP Victus 16-r0076TX | |
| Acer Predator Triton 14 PT14-51 | |
| Average Intel Core i5-13500HX (0.4512 - 0.4891, n=3) | |
| Alienware m16 R1 Intel | |
| Aorus 15 BSF | |
| Average of class Gaming (0.3439 - 0.759, n=133, last 2 years) | |
| Acer Predator Helios 16 PH16-71-731Q | |
* ... smaller is better
AIDA64: FP32 Ray-Trace | FPU Julia | CPU SHA3 | CPU Queen | FPU SinJulia | FPU Mandel | CPU AES | CPU ZLib | FP64 Ray-Trace | CPU PhotoWorxx
| Performance rating | |
| Average of class Gaming | |
| Alienware m16 R1 Intel | |
| Acer Predator Helios 16 PH16-71-731Q | |
| Acer Predator Triton 14 PT14-51 | |
| Average Intel Core i5-13500HX | |
| HP Victus 16-r0076TX | |
| Asus TUF A15 FA507 | |
| Aorus 15 BSF | |
| MSI Katana 15 B12VEK | |
| Acer Nitro 16 AN16-41-R7YE | |
| AIDA64 / FP32 Ray-Trace | |
| Average of class Gaming (10131 - 85542, n=132, last 2 years) | |
| Alienware m16 R1 Intel | |
| Acer Predator Helios 16 PH16-71-731Q | |
| Asus TUF A15 FA507 | |
| Average Intel Core i5-13500HX (15888 - 16544, n=3) | |
| Acer Predator Triton 14 PT14-51 | |
| HP Victus 16-r0076TX | |
| MSI Katana 15 B12VEK | |
| Aorus 15 BSF | |
| Acer Nitro 16 AN16-41-R7YE | |
| AIDA64 / FPU Julia | |
| Average of class Gaming (51019 - 238426, n=132, last 2 years) | |
| Alienware m16 R1 Intel | |
| Asus TUF A15 FA507 | |
| Acer Predator Helios 16 PH16-71-731Q | |
| Acer Predator Triton 14 PT14-51 | |
| HP Victus 16-r0076TX | |
| Average Intel Core i5-13500HX (80761 - 85623, n=3) | |
| Acer Nitro 16 AN16-41-R7YE | |
| MSI Katana 15 B12VEK | |
| Aorus 15 BSF | |
| AIDA64 / CPU SHA3 | |
| Average of class Gaming (2180 - 9817, n=132, last 2 years) | |
| Alienware m16 R1 Intel | |
| Acer Predator Helios 16 PH16-71-731Q | |
| Acer Predator Triton 14 PT14-51 | |
| Average Intel Core i5-13500HX (3868 - 4017, n=3) | |
| HP Victus 16-r0076TX | |
| Asus TUF A15 FA507 | |
| MSI Katana 15 B12VEK | |
| Aorus 15 BSF | |
| Acer Nitro 16 AN16-41-R7YE | |
| AIDA64 / CPU Queen | |
| Average of class Gaming (49785 - 173351, n=132, last 2 years) | |
| Alienware m16 R1 Intel | |
| Acer Predator Helios 16 PH16-71-731Q | |
| Average Intel Core i5-13500HX (105168 - 107075, n=3) | |
| Aorus 15 BSF | |
| HP Victus 16-r0076TX | |
| Asus TUF A15 FA507 | |
| Acer Predator Triton 14 PT14-51 | |
| MSI Katana 15 B12VEK | |
| Acer Nitro 16 AN16-41-R7YE | |
| AIDA64 / FPU SinJulia | |
| Average of class Gaming (4424 - 33636, n=132, last 2 years) | |
| Alienware m16 R1 Intel | |
| Acer Predator Helios 16 PH16-71-731Q | |
| Asus TUF A15 FA507 | |
| Average Intel Core i5-13500HX (10334 - 10793, n=3) | |
| Acer Predator Triton 14 PT14-51 | |
| HP Victus 16-r0076TX | |
| Acer Nitro 16 AN16-41-R7YE | |
| Aorus 15 BSF | |
| MSI Katana 15 B12VEK | |
| AIDA64 / FPU Mandel | |
| Average of class Gaming (23609 - 128721, n=132, last 2 years) | |
| Asus TUF A15 FA507 | |
| Alienware m16 R1 Intel | |
| Acer Predator Helios 16 PH16-71-731Q | |
| Acer Nitro 16 AN16-41-R7YE | |
| Average Intel Core i5-13500HX (39805 - 41418, n=3) | |
| HP Victus 16-r0076TX | |
| Acer Predator Triton 14 PT14-51 | |
| MSI Katana 15 B12VEK | |
| Aorus 15 BSF | |
| AIDA64 / CPU AES | |
| Alienware m16 R1 Intel | |
| Acer Predator Helios 16 PH16-71-731Q | |
| Acer Predator Triton 14 PT14-51 | |
| Aorus 15 BSF | |
| Average of class Gaming (39258 - 247074, n=132, last 2 years) | |
| Average Intel Core i5-13500HX (79903 - 154368, n=3) | |
| Acer Nitro 16 AN16-41-R7YE | |
| HP Victus 16-r0076TX | |
| MSI Katana 15 B12VEK | |
| Asus TUF A15 FA507 | |
| AIDA64 / CPU ZLib | |
| Average of class Gaming (574 - 2531, n=132, last 2 years) | |
| Acer Predator Helios 16 PH16-71-731Q | |
| Alienware m16 R1 Intel | |
| Acer Predator Triton 14 PT14-51 | |
| Average Intel Core i5-13500HX (1104 - 1233, n=3) | |
| HP Victus 16-r0076TX | |
| Aorus 15 BSF | |
| MSI Katana 15 B12VEK | |
| Acer Nitro 16 AN16-41-R7YE | |
| Asus TUF A15 FA507 | |
| AIDA64 / FP64 Ray-Trace | |
| Average of class Gaming (5477 - 45446, n=132, last 2 years) | |
| Alienware m16 R1 Intel | |
| Acer Predator Helios 16 PH16-71-731Q | |
| Average Intel Core i5-13500HX (8587 - 9008, n=3) | |
| Acer Predator Triton 14 PT14-51 | |
| HP Victus 16-r0076TX | |
| Asus TUF A15 FA507 | |
| MSI Katana 15 B12VEK | |
| Aorus 15 BSF | |
| Acer Nitro 16 AN16-41-R7YE | |
| AIDA64 / CPU PhotoWorxx | |
| Acer Predator Triton 14 PT14-51 | |
| Average of class Gaming (10805 - 62916, n=132, last 2 years) | |
| Average Intel Core i5-13500HX (36861 - 42683, n=3) | |
| Aorus 15 BSF | |
| MSI Katana 15 B12VEK | |
| HP Victus 16-r0076TX | |
| Alienware m16 R1 Intel | |
| Acer Predator Helios 16 PH16-71-731Q | |
| Acer Nitro 16 AN16-41-R7YE | |
| Asus TUF A15 FA507 | |
Check out our Core i5-13500HX page for more information and comparisons
System Performance
While the HP Victus 16 will do fine as a daily driver, it lags behind the competition in PCMark 10, where it scored just 6,125 points.
Its CrossMark score of 1,701 puts it ahead of the Lenovo LOQ 15 and Acer Nitro 16.
The situation is more or less the same in AIDA64, where the Raptor Lake-HX processor stays consistently ahead of its AMD counterparts.
CrossMark: Overall | Productivity | Creativity | Responsiveness
AIDA64: Memory Copy | Memory Read | Memory Write | Memory Latency
| PCMark 10 / Score | |
| Average of class Gaming (5776 - 10060, n=113, last 2 years) | |
| Lenovo Legion Pro 5 16ARX8 (R5 7645HX, RTX 4050) | |
| Acer Predator Helios 16 PH16-71-731Q | |
| Lenovo LOQ 15APH8 | |
| Acer Predator Triton 14 PT14-51 | |
| Alienware m16 R1 Intel | |
| Dell G15 5530 | |
| Acer Nitro 16 AN16-41-R7YE | |
| Average Intel Core i5-13500HX, NVIDIA GeForce RTX 4050 Laptop GPU (6125 - 6565, n=2) | |
| HP Victus 16-r0076TX | |
| PCMark 10 / Essentials | |
| Lenovo Legion Pro 5 16ARX8 (R5 7645HX, RTX 4050) | |
| Acer Predator Helios 16 PH16-71-731Q | |
| Dell G15 5530 | |
| Alienware m16 R1 Intel | |
| Average of class Gaming (8810 - 12600, n=117, last 2 years) | |
| Lenovo LOQ 15APH8 | |
| Acer Predator Triton 14 PT14-51 | |
| Average Intel Core i5-13500HX, NVIDIA GeForce RTX 4050 Laptop GPU (9625 - 10618, n=2) | |
| Acer Nitro 16 AN16-41-R7YE | |
| HP Victus 16-r0076TX | |
| PCMark 10 / Productivity | |
| Lenovo Legion Pro 5 16ARX8 (R5 7645HX, RTX 4050) | |
| Acer Predator Helios 16 PH16-71-731Q | |
| Average of class Gaming (6662 - 16716, n=115, last 2 years) | |
| Dell G15 5530 | |
| Lenovo LOQ 15APH8 | |
| Acer Predator Triton 14 PT14-51 | |
| Alienware m16 R1 Intel | |
| Average Intel Core i5-13500HX, NVIDIA GeForce RTX 4050 Laptop GPU (8471 - 9005, n=2) | |
| HP Victus 16-r0076TX | |
| Acer Nitro 16 AN16-41-R7YE | |
| PCMark 10 / Digital Content Creation | |
| Average of class Gaming (7440 - 19351, n=115, last 2 years) | |
| Lenovo LOQ 15APH8 | |
| Lenovo Legion Pro 5 16ARX8 (R5 7645HX, RTX 4050) | |
| Acer Predator Triton 14 PT14-51 | |
| Acer Nitro 16 AN16-41-R7YE | |
| Acer Predator Helios 16 PH16-71-731Q | |
| Alienware m16 R1 Intel | |
| Dell G15 5530 | |
| Average Intel Core i5-13500HX, NVIDIA GeForce RTX 4050 Laptop GPU (7649 - 8031, n=2) | |
| HP Victus 16-r0076TX | |
| CrossMark / Overall | |
| Acer Predator Helios 16 PH16-71-731Q | |
| Alienware m16 R1 Intel | |
| Average of class Gaming (1247 - 2344, n=113, last 2 years) | |
| Lenovo Legion Pro 5 16ARX8 (R5 7645HX, RTX 4050) | |
| Acer Predator Triton 14 PT14-51 | |
| Dell G15 5530 | |
| Average Intel Core i5-13500HX, NVIDIA GeForce RTX 4050 Laptop GPU (1701 - 1964, n=2) | |
| HP Victus 16-r0076TX | |
| Lenovo LOQ 15APH8 | |
| Acer Nitro 16 AN16-41-R7YE | |
| CrossMark / Productivity | |
| Acer Predator Helios 16 PH16-71-731Q | |
| Alienware m16 R1 Intel | |
| Lenovo Legion Pro 5 16ARX8 (R5 7645HX, RTX 4050) | |
| Average of class Gaming (1299 - 2211, n=113, last 2 years) | |
| Acer Predator Triton 14 PT14-51 | |
| Dell G15 5530 | |
| Average Intel Core i5-13500HX, NVIDIA GeForce RTX 4050 Laptop GPU (1585 - 1878, n=2) | |
| Lenovo LOQ 15APH8 | |
| HP Victus 16-r0076TX | |
| Acer Nitro 16 AN16-41-R7YE | |
| CrossMark / Creativity | |
| Acer Predator Helios 16 PH16-71-731Q | |
| Alienware m16 R1 Intel | |
| Average of class Gaming (1275 - 2729, n=113, last 2 years) | |
| Dell G15 5530 | |
| Lenovo Legion Pro 5 16ARX8 (R5 7645HX, RTX 4050) | |
| Acer Predator Triton 14 PT14-51 | |
| Average Intel Core i5-13500HX, NVIDIA GeForce RTX 4050 Laptop GPU (1912 - 2022, n=2) | |
| HP Victus 16-r0076TX | |
| Lenovo LOQ 15APH8 | |
| Acer Nitro 16 AN16-41-R7YE | |
| CrossMark / Responsiveness | |
| Acer Predator Helios 16 PH16-71-731Q | |
| Alienware m16 R1 Intel | |
| Lenovo Legion Pro 5 16ARX8 (R5 7645HX, RTX 4050) | |
| Average Intel Core i5-13500HX, NVIDIA GeForce RTX 4050 Laptop GPU (1478 - 2053, n=2) | |
| Acer Predator Triton 14 PT14-51 | |
| Average of class Gaming (1030 - 2330, n=113, last 2 years) | |
| Dell G15 5530 | |
| HP Victus 16-r0076TX | |
| Lenovo LOQ 15APH8 | |
| Acer Nitro 16 AN16-41-R7YE | |
| AIDA64 / Memory Copy | |
| Acer Predator Triton 14 PT14-51 | |
| Average of class Gaming (21750 - 108104, n=132, last 2 years) | |
| Dell G15 5530 | |
| Average Intel Core i5-13500HX, NVIDIA GeForce RTX 4050 Laptop GPU (56320 - 62153, n=3) | |
| Alienware m16 R1 Intel | |
| Acer Predator Helios 16 PH16-71-731Q | |
| HP Victus 16-r0076TX | |
| Acer Nitro 16 AN16-41-R7YE | |
| Lenovo Legion Pro 5 16ARX8 (R5 7645HX, RTX 4050) | |
| Lenovo LOQ 15APH8 | |
| AIDA64 / Memory Read | |
| Average of class Gaming (22956 - 104349, n=132, last 2 years) | |
| Dell G15 5530 | |
| Alienware m16 R1 Intel | |
| Acer Predator Helios 16 PH16-71-731Q | |
| Acer Predator Triton 14 PT14-51 | |
| Average Intel Core i5-13500HX, NVIDIA GeForce RTX 4050 Laptop GPU (66057 - 66667, n=3) | |
| HP Victus 16-r0076TX | |
| Acer Nitro 16 AN16-41-R7YE | |
| Lenovo Legion Pro 5 16ARX8 (R5 7645HX, RTX 4050) | |
| Lenovo LOQ 15APH8 | |
| AIDA64 / Memory Write | |
| Acer Predator Helios 16 PH16-71-731Q | |
| Acer Predator Triton 14 PT14-51 | |
| Average of class Gaming (22297 - 133486, n=132, last 2 years) | |
| Average Intel Core i5-13500HX, NVIDIA GeForce RTX 4050 Laptop GPU (56956 - 66135, n=3) | |
| Dell G15 5530 | |
| Alienware m16 R1 Intel | |
| HP Victus 16-r0076TX | |
| Acer Nitro 16 AN16-41-R7YE | |
| Lenovo Legion Pro 5 16ARX8 (R5 7645HX, RTX 4050) | |
| Lenovo LOQ 15APH8 | |
| AIDA64 / Memory Latency | |
| Average of class Gaming (75.3 - 259, n=132, last 2 years) | |
| Acer Predator Triton 14 PT14-51 | |
| HP Victus 16-r0076TX | |
| Lenovo LOQ 15APH8 | |
| Average Intel Core i5-13500HX, NVIDIA GeForce RTX 4050 Laptop GPU (87.1 - 96.8, n=3) | |
| Dell G15 5530 | |
| Alienware m16 R1 Intel | |
| Acer Nitro 16 AN16-41-R7YE | |
| Acer Predator Helios 16 PH16-71-731Q | |
| Lenovo Legion Pro 5 16ARX8 (R5 7645HX, RTX 4050) | |
* ... smaller is better
| PCMark 8 Home Score Accelerated | 4602 points | |
| PCMark 8 Work Score Accelerated | 6227 points | |
| PCMark 10 Score | 6125 points | |
Help | ||
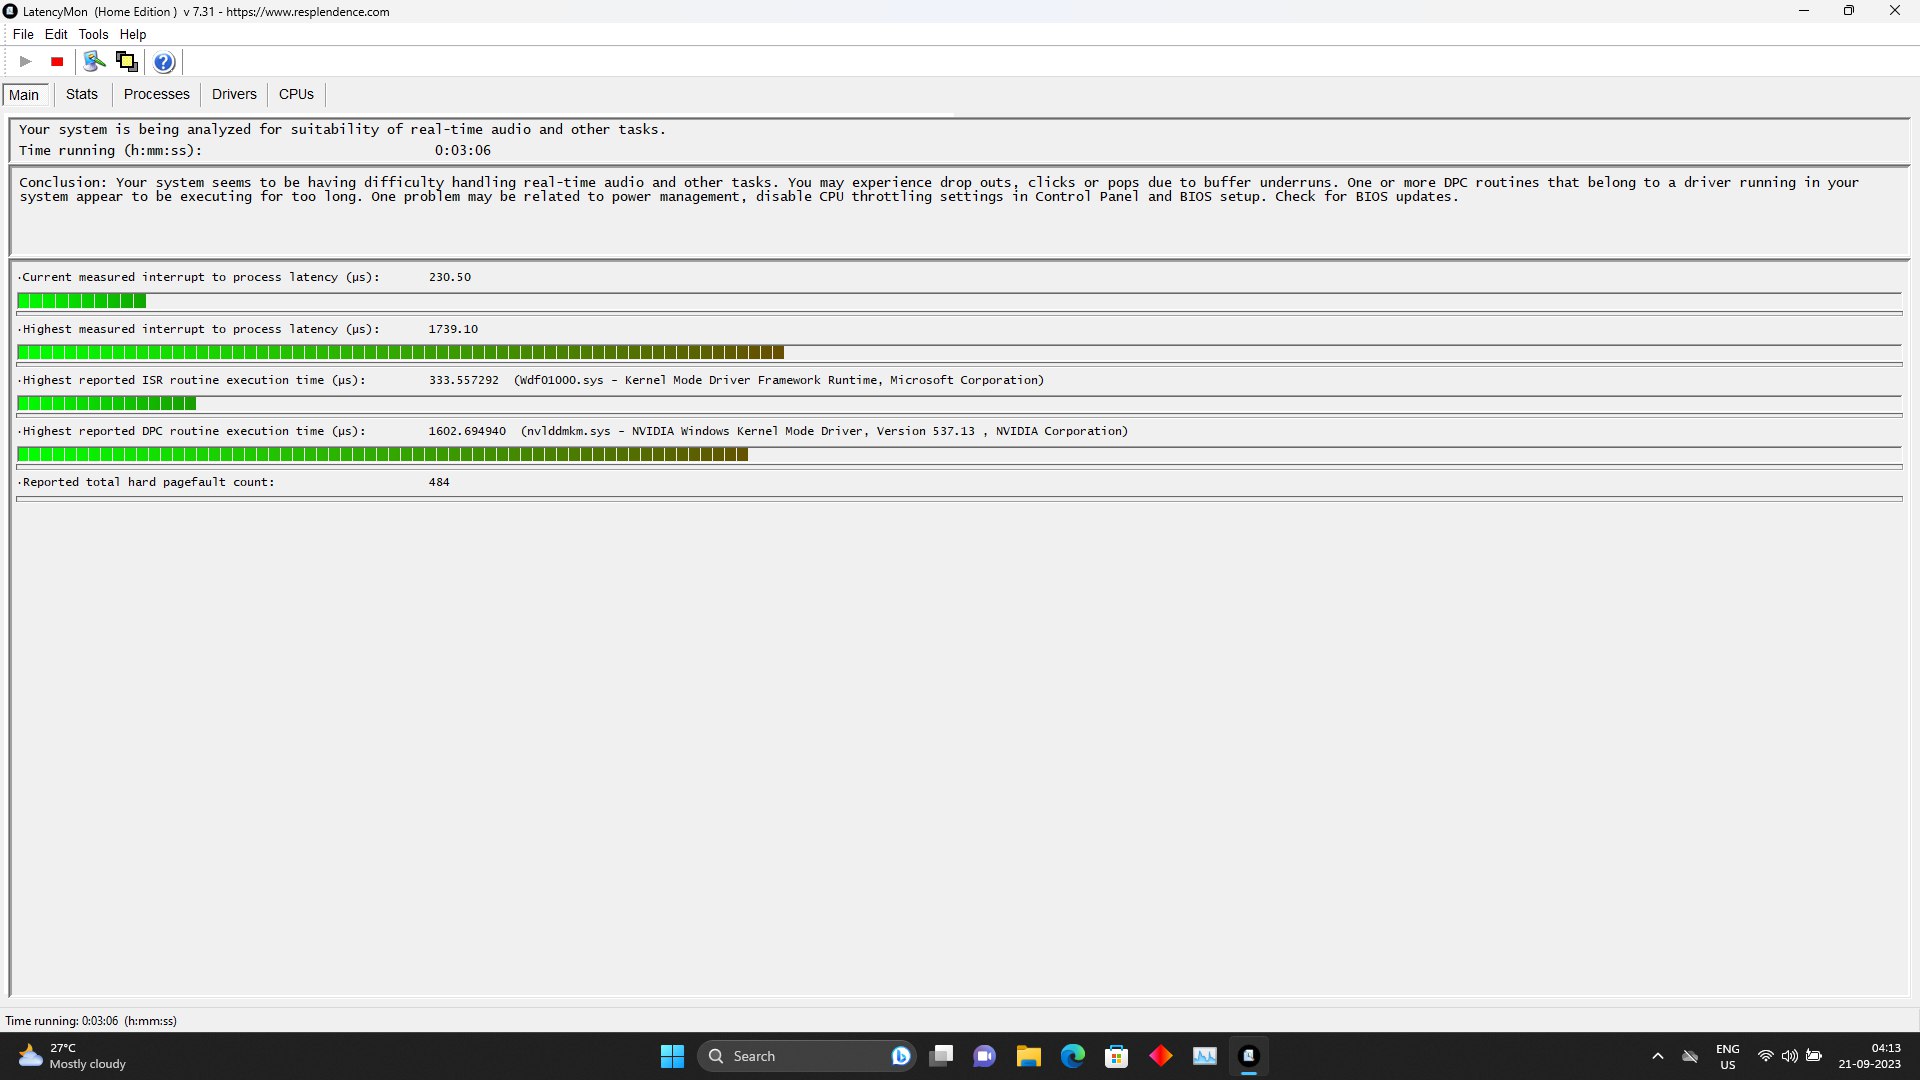
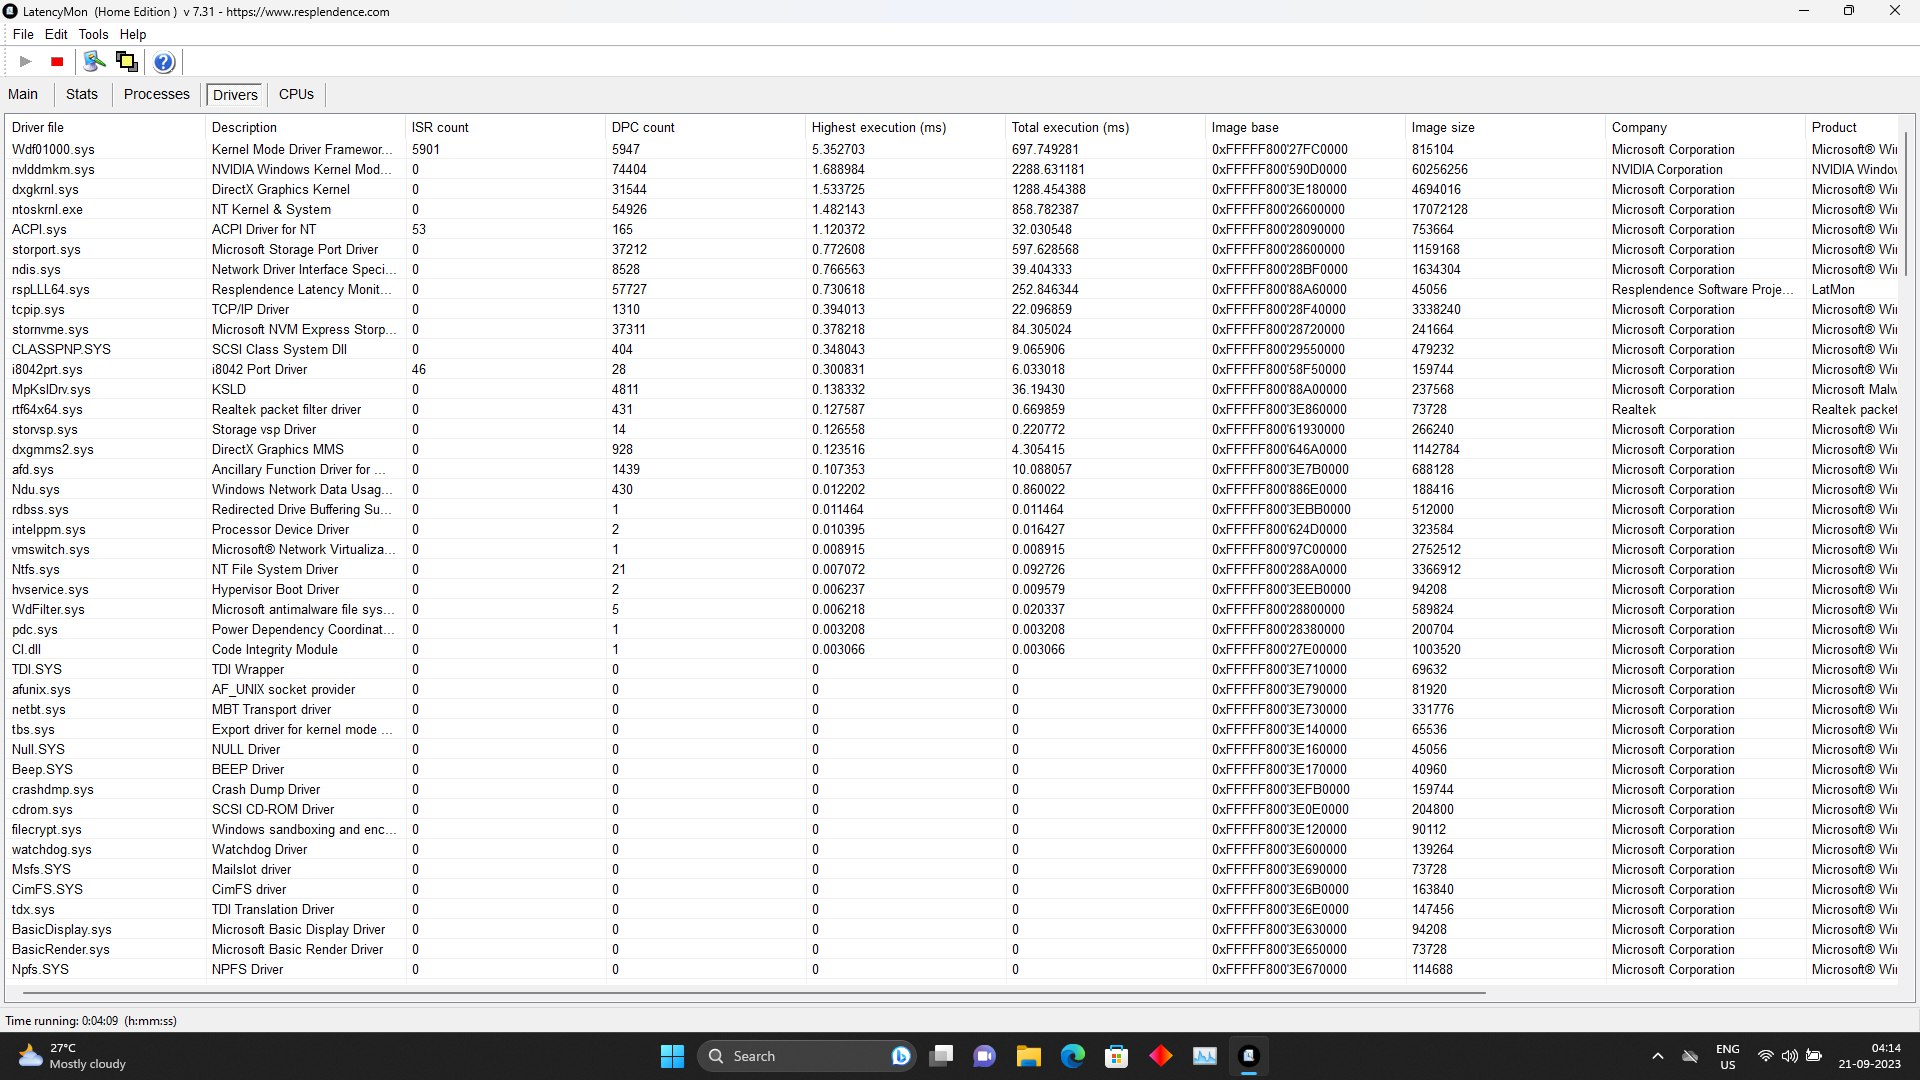
DPC Latency
High DPC latency has been an ongoing issue on desktop Ada Lovelace graphics cards since launch. The problem seems to have carried over to its laptop variants, too. A quick look at LatencyMon says the culprit is "Wdf0100.sys" (Windows Driver Framework) and "Nvlddmkm.sys" (Nvidia Windows Kernel Module), indicating a software update could solve the problem later.
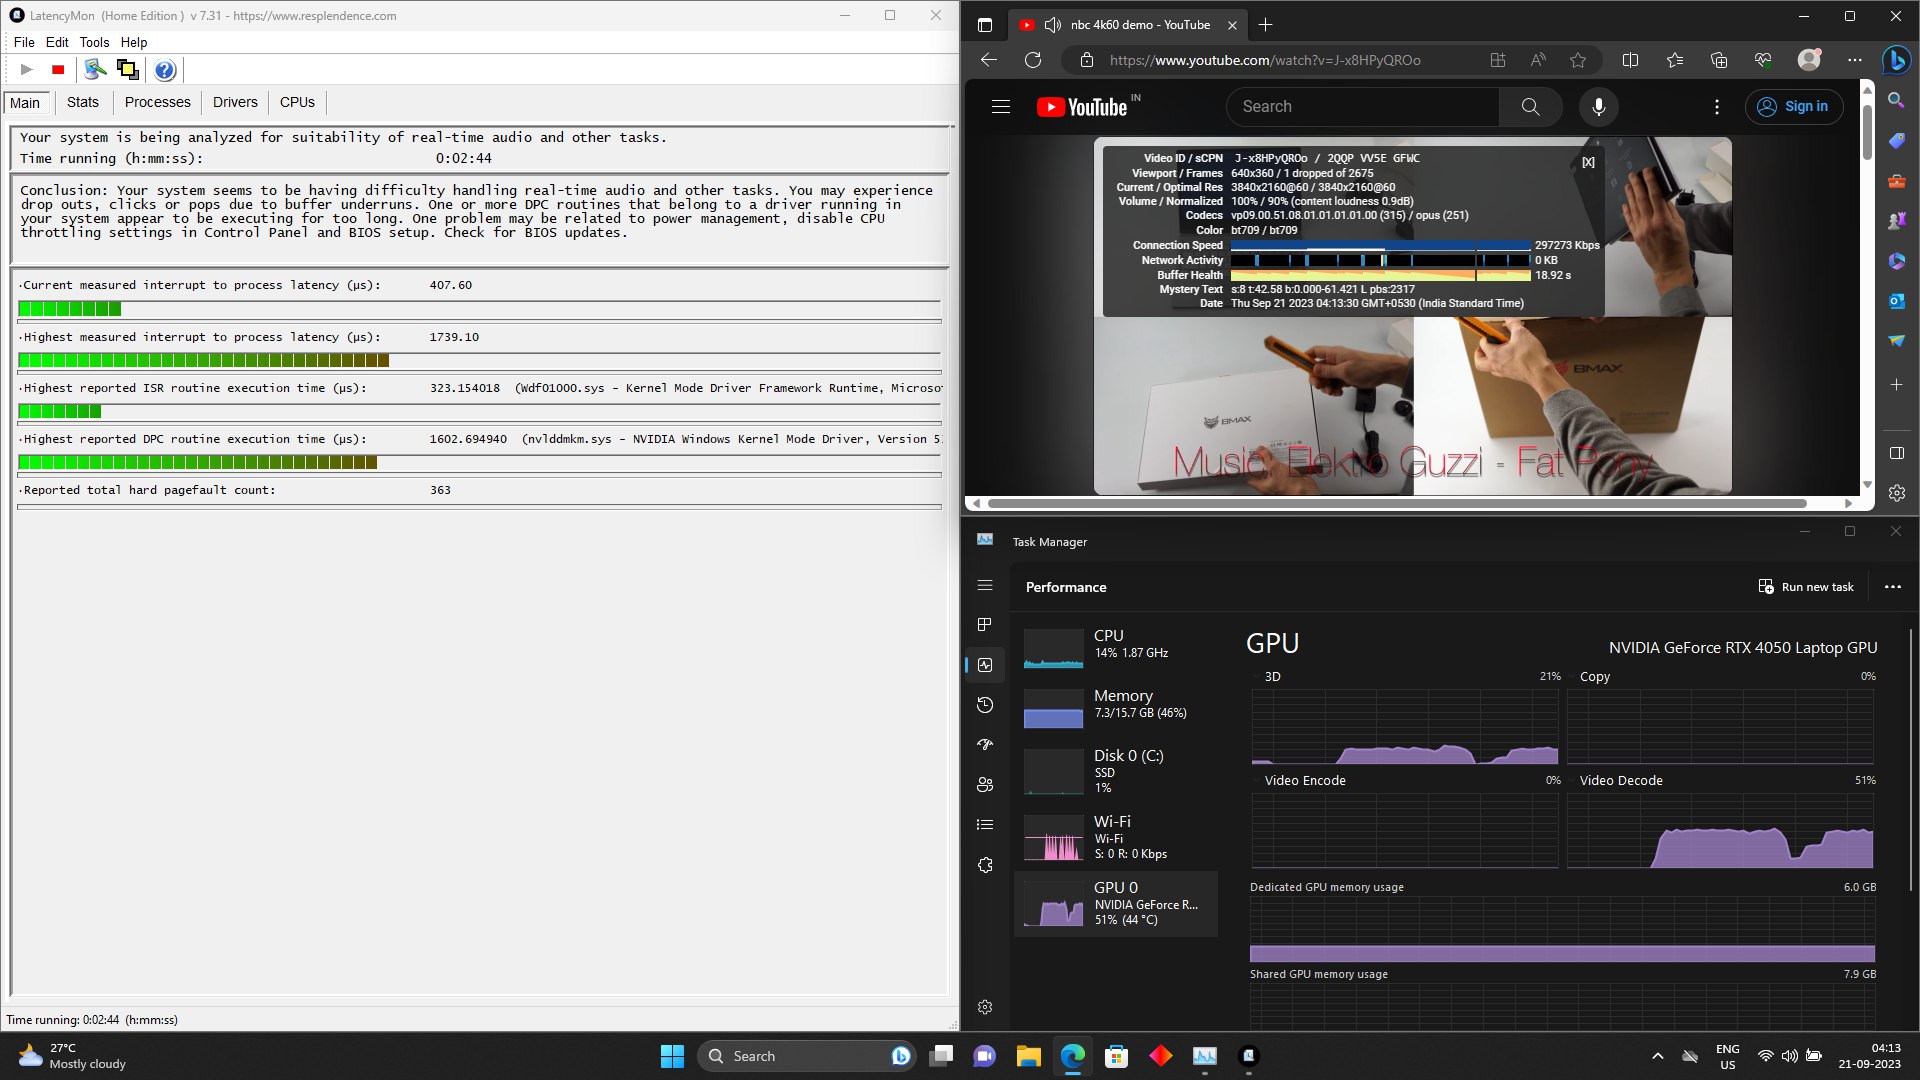
Check out Latency ranking page for more results.
| DPC Latencies / LatencyMon - interrupt to process latency (max), Web, Youtube, Prime95 | |
| Dell G15 5530 | |
| Alienware m16 R1 Intel | |
| HP Victus 16-r0076TX | |
| Acer Predator Helios 16 PH16-71-731Q | |
| Acer Predator Triton 14 PT14-51 | |
| Lenovo LOQ 15APH8 | |
| Acer Nitro 16 AN16-41-R7YE | |
| Lenovo Legion Pro 5 16ARX8 (R5 7645HX, RTX 4050) | |
* ... smaller is better
Storage Devices
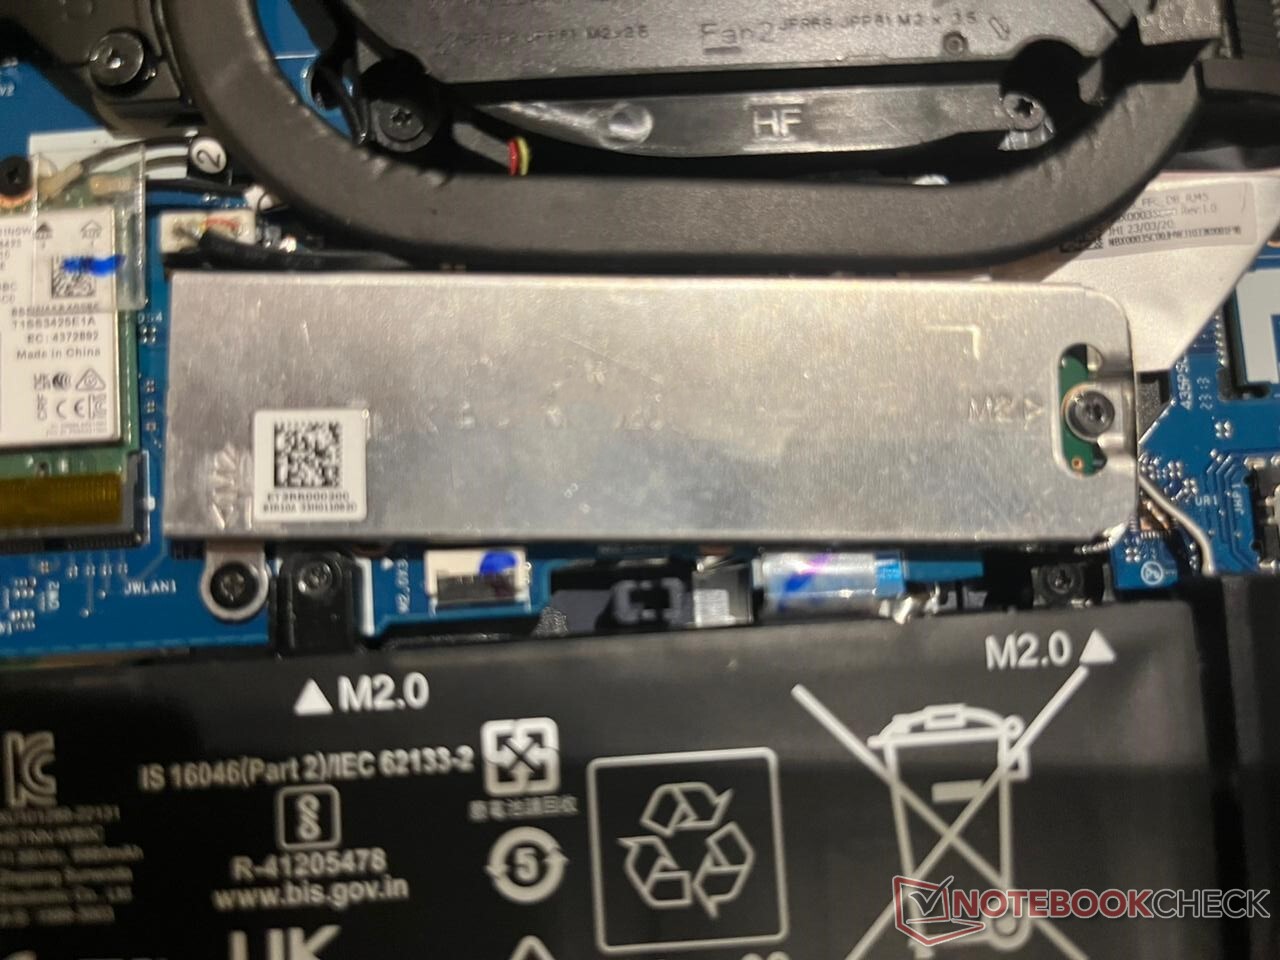
The HP Victus 16's SK Hynix PC801 NVMe SSD offers decent transfer speeds across a variety of workloads. Our tests determined it doesn't throttle even after extended use thanks to its thick metal shielding.
However, 512 GB is pitifully low in 2023, especially with bloated game sizes becoming the norm. Thankfully HP lets users install an additional drive with relative ease.

* ... smaller is better
Disk Throttling: DiskSpd Read Loop, Queue Depth 8
Read more about our HDD and SSD benchmarks.
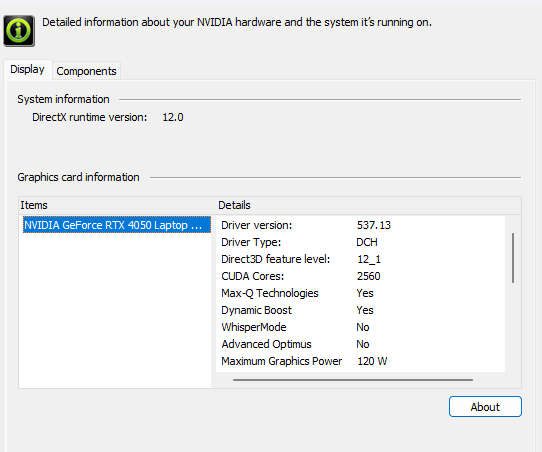
GPU Performance
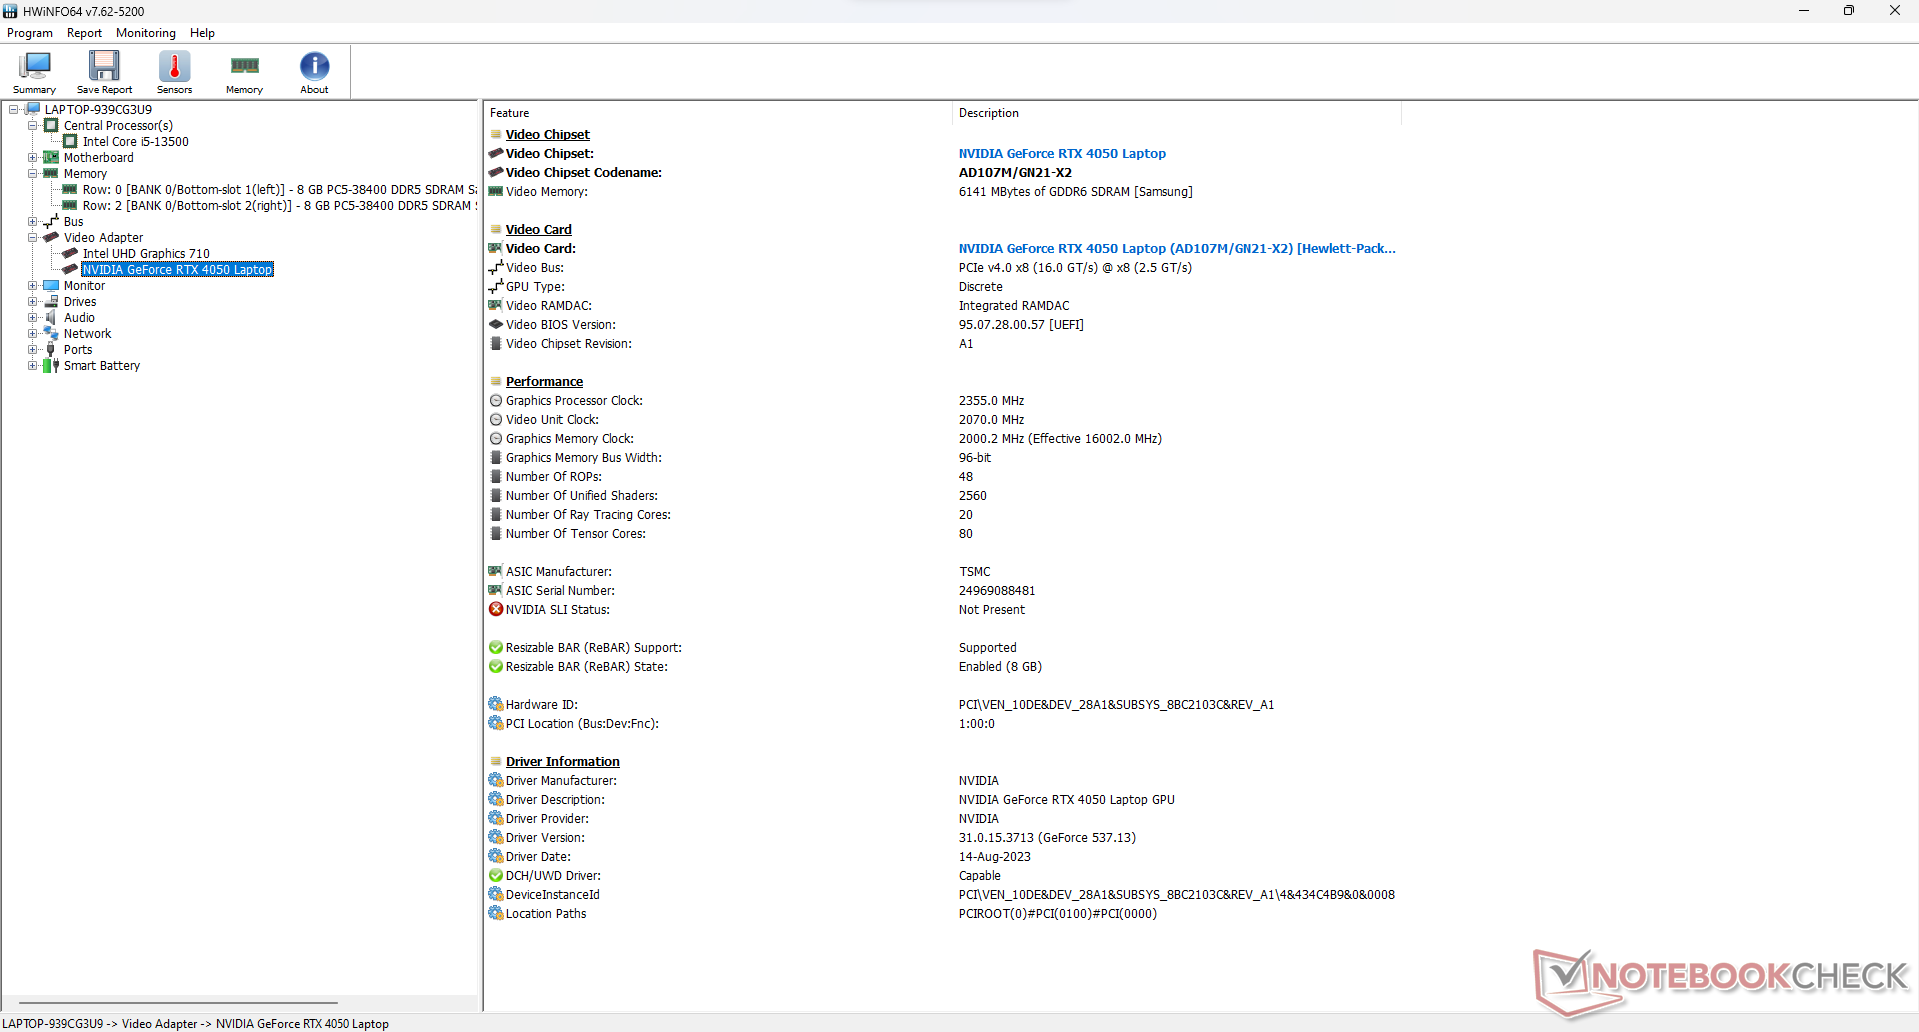
At first glance, the Nvidia GeForce RTX 4050 doesn't look like the most powerful GPU on the market. It has 6 GB of GDDR6 VRAM on a 96-bit bus, 2,560 CUDA cores and a TGP value between 35 and 115 Watts.
Some digging in Nvidia Control Panel revealed its max TGP caps out at around 100 Watts, which is respectable. Interestingly, the GeForce RTX 4050 here can "borrow" up to 20 Watts of power from the CPU.
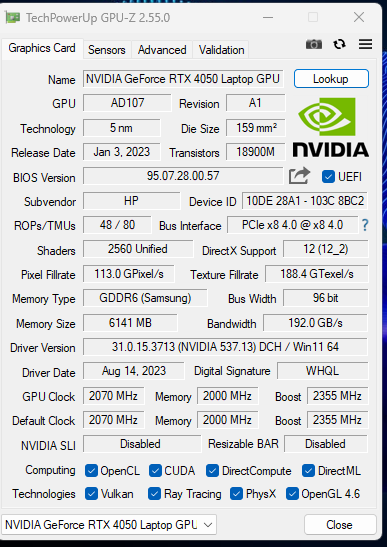
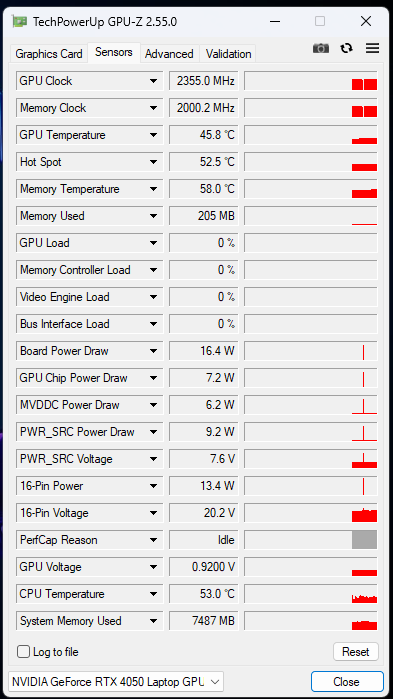
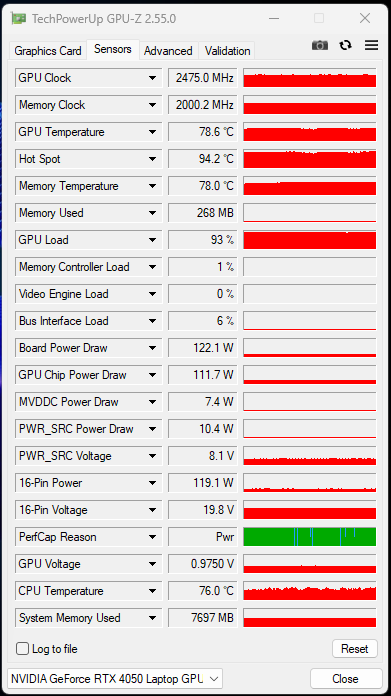
This is reflected in FurMark, where the maximum board power jumps up to 122.1 Watts under load. However, it can't stay in that state for long and settles in at a lower figure after a while.
The HP Victus 16 performs marginally better than other RTX 4050 laptops in 3DMark 11, with a score of 31,571 points. The difference is less apparent in older 3DMark tests, such as Ice Storm, Fire Strike and Time Spy.
In conclusion, the GeForce RTX 4050, despite its underwhelming spec sheet, still keeps up with the competition and makes for an impeccable entry-level graphics card.
| 3DMark 06 Standard Score | 46228 points | |
| 3DMark 11 Performance | 28214 points | |
| 3DMark Ice Storm Standard Score | 198276 points | |
| 3DMark Cloud Gate Standard Score | 61259 points | |
| 3DMark Fire Strike Score | 21070 points | |
| 3DMark Fire Strike Extreme Score | 10180 points | |
| 3DMark Time Spy Score | 9069 points | |
Help | ||
| Blender / v3.3 Classroom OPTIX/RTX | |
| Average NVIDIA GeForce RTX 4050 Laptop GPU (25 - 37, n=40) | |
| HP Victus 16-r0076TX | |
| MSI Katana 15 B12VEK | |
| Asus TUF A15 FA507 | |
| Asus TUF A15 FA507 | |
| Acer Predator Triton 14 PT14-51 | |
| Acer Nitro 16 AN16-41-R7YE | |
| Alienware m16 R1 Intel | |
| Aorus 15 BSF | |
| Acer Predator Helios 16 PH16-71-731Q | |
| Average of class Gaming (9 - 59, n=131, last 2 years) | |
| Blender / v3.3 Classroom CUDA | |
| Average NVIDIA GeForce RTX 4050 Laptop GPU (47 - 68, n=39) | |
| MSI Katana 15 B12VEK | |
| Acer Predator Triton 14 PT14-51 | |
| Asus TUF A15 FA507 | |
| Asus TUF A15 FA507 | |
| Acer Nitro 16 AN16-41-R7YE | |
| HP Victus 16-r0076TX | |
| Acer Predator Helios 16 PH16-71-731Q | |
| Alienware m16 R1 Intel | |
| Aorus 15 BSF | |
| Average of class Gaming (15 - 228, n=133, last 2 years) | |
| Blender / v3.3 Classroom CPU | |
| Acer Nitro 16 AN16-41-R7YE | |
| MSI Katana 15 B12VEK | |
| Average NVIDIA GeForce RTX 4050 Laptop GPU (243 - 907, n=40) | |
| Aorus 15 BSF | |
| Asus TUF A15 FA507 | |
| Asus TUF A15 FA507 | |
| HP Victus 16-r0076TX | |
| Acer Predator Triton 14 PT14-51 | |
| Acer Predator Helios 16 PH16-71-731Q | |
| Average of class Gaming (122 - 586, n=129, last 2 years) | |
| Alienware m16 R1 Intel | |
* ... smaller is better
Check out our Nvidia GeForce RTX 4050 benchmarks page for more information and comparisons.
Gaming Performance
The GeForce RTX 4050 is surprisingly competent at gaming, even with just 6 GB of VRAM. It could run every game we threw at it at 1080p 60 FPS, with all settings cranked up.
Cyberpunk 2077's stellar performance could be explained by Nvidia's extensive optimization of the game. E-sports titles such as DOTA 2 also run well on the laptop.
The architectural improvements brought forth by Ada Lovelace give the RTX 4050 a decent shot as a 1080p gaming machine. However, we wouldn't recommend switching on raytracing without DLSS, as it is notoriously VRAM-heavy.
| The Witcher 3 - 1920x1080 Ultra Graphics & Postprocessing (HBAO+) | |
| Average of class Gaming (80.2 - 240, n=35, last 2 years) | |
| Alienware m16 R1 Intel | |
| Dell G15 5530 | |
| Acer Predator Helios 16 PH16-71-731Q | |
| HP Victus 16-r0076TX | |
| Lenovo Legion Pro 5 16ARX8 (R5 7645HX, RTX 4050) | |
| Acer Nitro 16 AN16-41-R7YE | |
| Lenovo LOQ 15APH8 | |
| Acer Predator Triton 14 PT14-51 | |
In our sustained tests, The Witcher 3 was able to run fairly well at a minimum of 90 fps at all times. While the frame rate hovered around 100 fps in some instances, it dropped back down due to thermal throttling. In essence, the laptop can do an okay job of playing demanding games with a fairly consistent frame rate.
Witcher 3 FPS Chart
| low | med. | high | ultra | |
|---|---|---|---|---|
| The Witcher 3 (2015) | 365 | 282 | 160.2 | 94.7 |
| Dota 2 Reborn (2015) | 181.5 | 163.4 | 159 | 145 |
| Final Fantasy XV Benchmark (2018) | 190.5 | 120.3 | 84.8 | |
| X-Plane 11.11 (2018) | 157.2 | 138.8 | 106.5 | |
| Far Cry 5 (2018) | 155 | 122 | 110 | 109 |
| Strange Brigade (2018) | 355 | 213 | 171.8 | 149.3 |
| Cyberpunk 2077 1.6 (2022) | 111.2 | 85.3 | 65.5 | 71.8 |
| F1 22 (2022) | 214 | 207 | 154.4 | 54.1 |
| F1 23 (2023) | 217 | 210 | 156.2 | 60.8 |
Emissions: Runs a bit too loud and hot
System Noise
Even though HP did everything it could to cool the Victus 16, it has a hard time keeping its hardware in check. One of the first things you will notice is how loud the laptop gets under the slightest load, with the noise getting progressively louder when gaming.
Our tests determined the maximum noise output to be 55 dB(A). While it falls well below the threshold of what can be considered loud, it isn't something that can just blend into the background, not without a pair of headphones.
Noise level
| Idle |
| 23.68 / 23.68 / 23.68 dB(A) |
| Load |
| 39.44 / 55.37 dB(A) |
 | ||
30 dB silent 40 dB(A) audible 50 dB(A) loud |
||
min: | ||
| Performance mode | Idle dB(A) | Load average dB(A) | Load maximum dB(A) | The Witcher 3 1080p Ultra dB(A) |
|---|---|---|---|---|
| Eco | 23.67 | 32.50 | 40.80 | 41.03 / 84 fps |
| Balanced | 23.87 | 35.06 | 44.72 | 44.78 / 86 fps |
| Performance | 23.68 | 39.44 | 55.37 | 55.42 / 87 fps |
| HP Victus 16-r0076TX i5-13500HX, GeForce RTX 4050 Laptop GPU | Acer Nitro 16 AN16-41-R7YE R5 7535HS, GeForce RTX 4050 Laptop GPU | Acer Predator Triton 14 PT14-51 i7-13700H, GeForce RTX 4050 Laptop GPU | Alienware m16 R1 Intel i7-13700HX, GeForce RTX 4060 Laptop GPU | Acer Predator Helios 16 PH16-71-731Q i7-13700HX, GeForce RTX 4060 Laptop GPU | Dell G15 5530 i7-13650HX, GeForce RTX 4060 Laptop GPU | Lenovo Legion Pro 5 16ARX8 (R5 7645HX, RTX 4050) R5 7645HX, GeForce RTX 4050 Laptop GPU | Lenovo LOQ 15APH8 R7 7840HS, GeForce RTX 4050 Laptop GPU | |
|---|---|---|---|---|---|---|---|---|
| Noise | -1% | -7% | -9% | -3% | 3% | 5% | 0% | |
| off / environment * (dB) | 21.57 | 24 -11% | 25 -16% | 25 -16% | 24 -11% | 20.41 5% | 23 -7% | 23.1 -7% |
| Idle Minimum * (dB) | 23.68 | 25 -6% | 27 -14% | 25 -6% | 24 -1% | 26.85 -13% | 23 3% | 23.1 2% |
| Idle Average * (dB) | 23.68 | 26 -10% | 29 -22% | 26 -10% | 24 -1% | 26.85 -13% | 23 3% | 23.1 2% |
| Idle Maximum * (dB) | 23.68 | 27 -14% | 31 -31% | 27 -14% | 32.32 -36% | 26.85 -13% | 24.42 -3% | 25.2 -6% |
| Load Average * (dB) | 39.44 | 42 -6% | 42 -6% | 52 -32% | 36.66 7% | 27.65 30% | 34.94 11% | 44.3 -12% |
| Witcher 3 ultra * (dB) | 55.4 | 43 22% | 43 22% | 51 8% | 49.06 11% | 47.9 14% | 43.79 21% | 45.8 17% |
| Load Maximum * (dB) | 55.37 | 45 19% | 45 19% | 53 4% | 49.49 11% | 47.86 14% | 50 10% | 52 6% |
* ... smaller is better
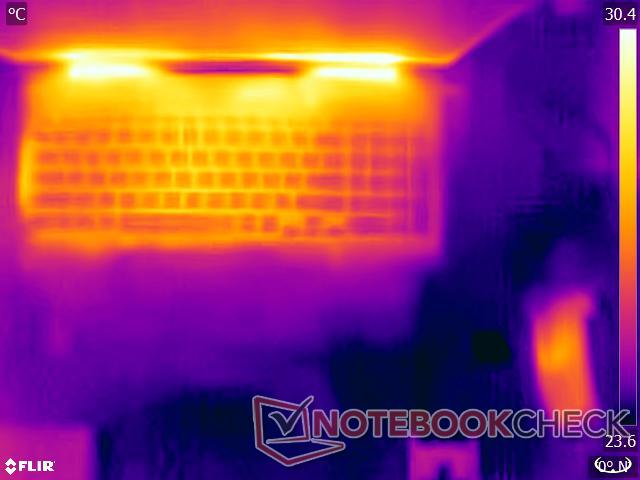
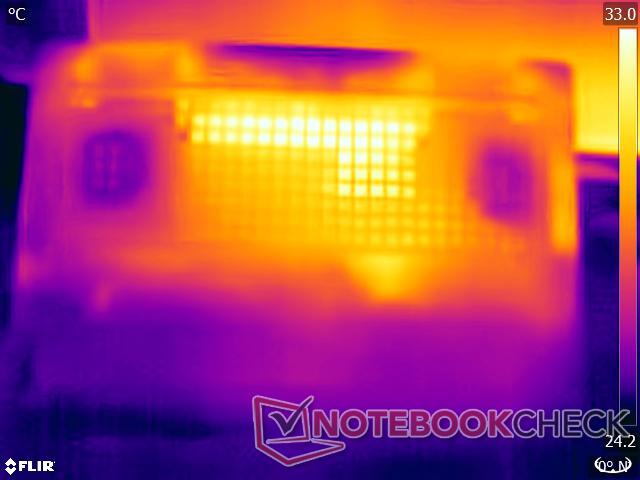
Temperature
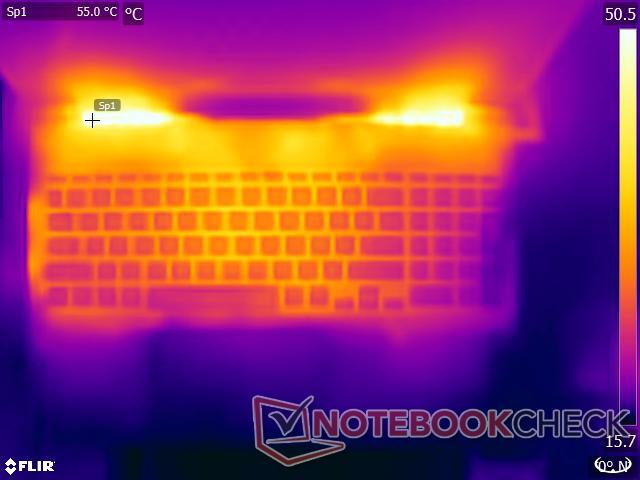
Right off the bat, the HP Victus 16 gets hot to the touch after some time gaming. Its plastic chassis does a poor job of insulating the heat generated by its power-hungry components. The keyboard, in particular, gets noticeably warmer after a few minutes of gaming.
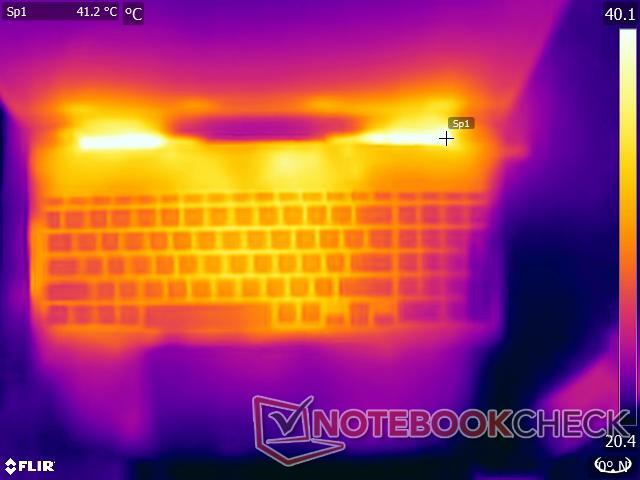
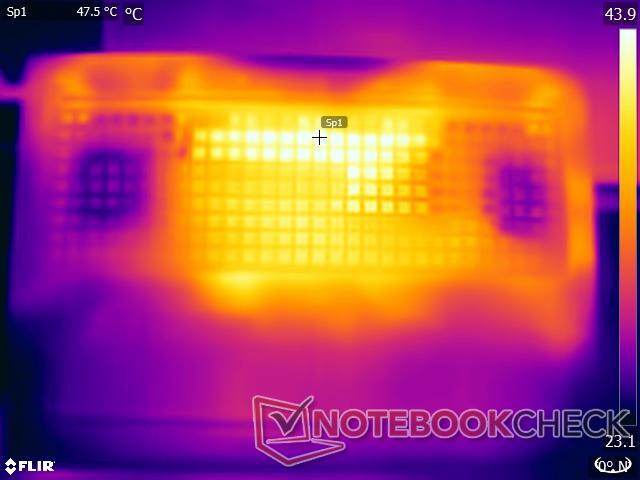
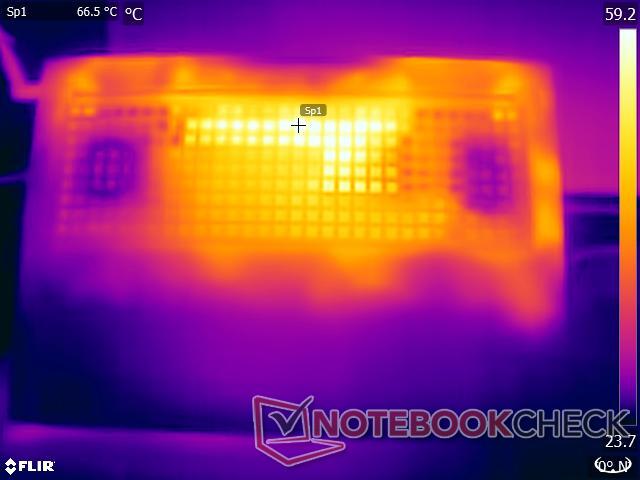
HP's design choices make it so that some of the heat gets thrown out from all directions. Our tests determined that the area directly adjacent to the vent could get as hot as 48° C under load. That is the hottest the laptop gets, with its surrounding areas hovering at 44° C and 45.8 °C.
(-) The maximum temperature on the upper side is 48 °C / 118 F, compared to the average of 40.4 °C / 105 F, ranging from 21.2 to 68.8 °C for the class Gaming.
(-) The bottom heats up to a maximum of 48 °C / 118 F, compared to the average of 43.3 °C / 110 F
(+) In idle usage, the average temperature for the upper side is 28 °C / 82 F, compared to the device average of 33.9 °C / 93 F.
(-) Playing The Witcher 3, the average temperature for the upper side is 38.7 °C / 102 F, compared to the device average of 33.9 °C / 93 F.
(+) The palmrests and touchpad are cooler than skin temperature with a maximum of 31.2 °C / 88.2 F and are therefore cool to the touch.
(-) The average temperature of the palmrest area of similar devices was 28.8 °C / 83.8 F (-2.4 °C / -4.4 F).
| HP Victus 16-r0076TX Intel Core i5-13500HX, NVIDIA GeForce RTX 4050 Laptop GPU | Acer Nitro 16 AN16-41-R7YE AMD Ryzen 5 7535HS, NVIDIA GeForce RTX 4050 Laptop GPU | Acer Predator Triton 14 PT14-51 Intel Core i7-13700H, NVIDIA GeForce RTX 4050 Laptop GPU | Alienware m16 R1 Intel Intel Core i7-13700HX, NVIDIA GeForce RTX 4060 Laptop GPU | Acer Predator Helios 16 PH16-71-731Q Intel Core i7-13700HX, NVIDIA GeForce RTX 4060 Laptop GPU | Dell G15 5530 Intel Core i7-13650HX, NVIDIA GeForce RTX 4060 Laptop GPU | Lenovo Legion Pro 5 16ARX8 (R5 7645HX, RTX 4050) AMD Ryzen 5 7645HX, NVIDIA GeForce RTX 4050 Laptop GPU | Lenovo LOQ 15APH8 AMD Ryzen 7 7840HS, NVIDIA GeForce RTX 4050 Laptop GPU | |
|---|---|---|---|---|---|---|---|---|
| Heat | -15% | -10% | -17% | -17% | -17% | -14% | 2% | |
| Maximum Upper Side * (°C) | 48 | 51 -6% | 54 -13% | 49 -2% | 41 15% | 54 -13% | 45 6% | 44.4 7% |
| Maximum Bottom * (°C) | 48 | 63 -31% | 56 -17% | 48 -0% | 66 -38% | 62.2 -30% | 54 -13% | 52 -8% |
| Idle Upper Side * (°C) | 29.6 | 34 -15% | 31 -5% | 40 -35% | 36 -22% | 33.4 -13% | 36 -22% | 28 5% |
| Idle Bottom * (°C) | 30.2 | 32 -6% | 31 -3% | 39 -29% | 37 -23% | 33.4 -11% | 38 -26% | 29.6 2% |
* ... smaller is better
Stress Test
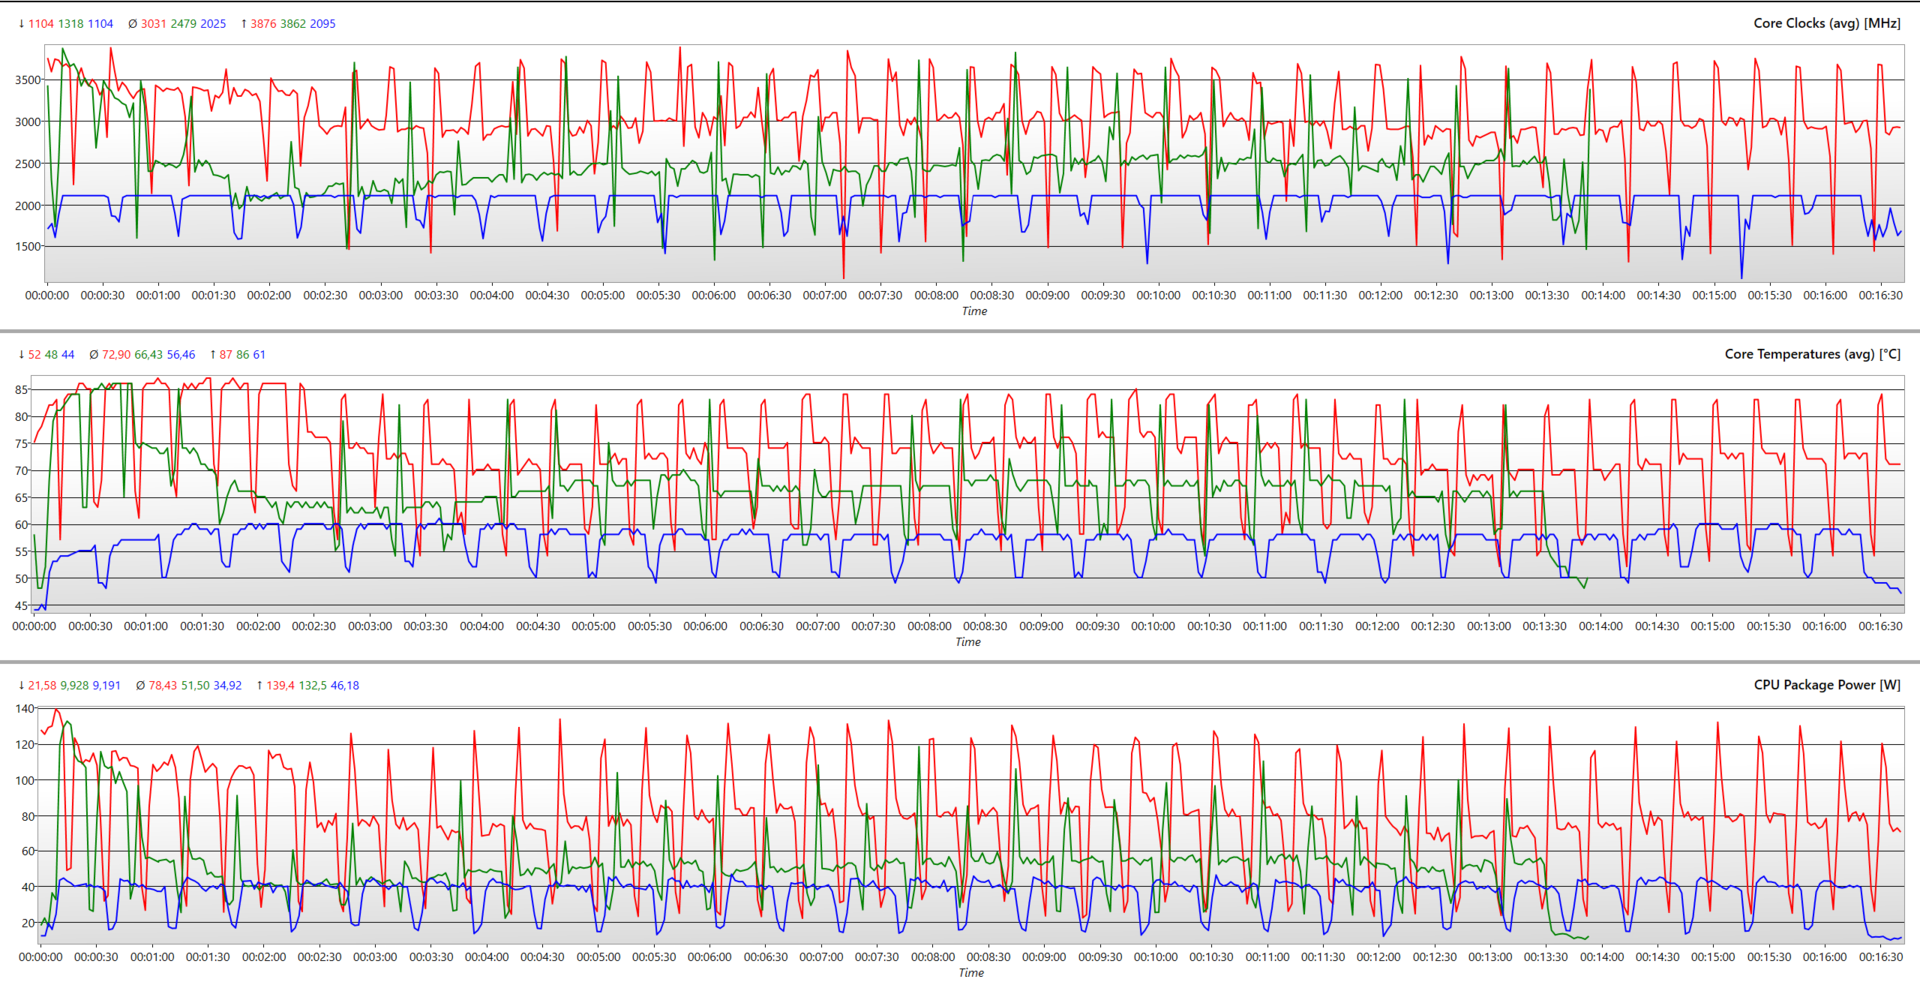
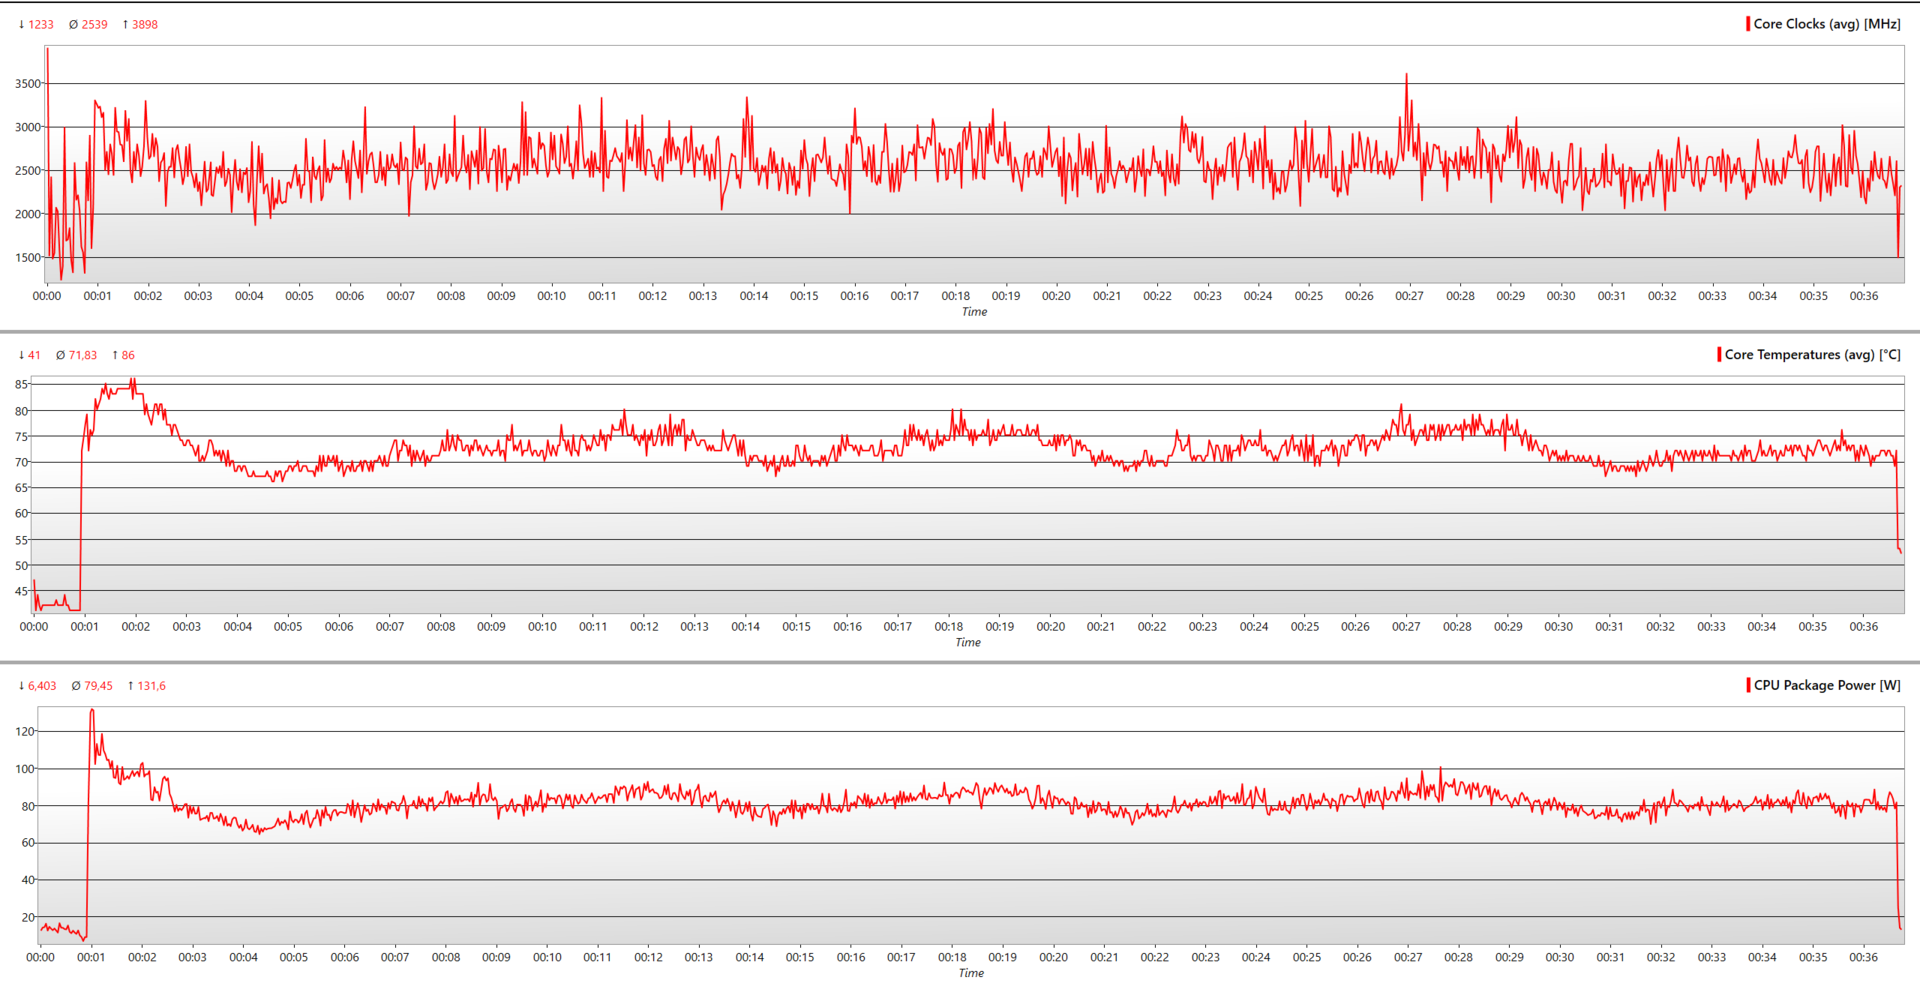
Under sustained loads, the HP Victus 16's CPU and GPU witness a noticeable dip in clock speeds. The Core i5-13500HX processor can boost up to 2.8 GHz for a while before stabilizing at around 1.69 GHz. Its temperature hovers around the 77°C region.
Similarly, the GeForce RTX 4050 tries to maintain its clocks at 2,580 MHz but ultimately settles at 2,420 MHz, which falls within Nvidia's advertised boost clocks. It runs a bit hotter than the CPU, with an average temperature of 82.5°C, thanks to the two beefy fans and heat pipes that funnel the heat away via vents.
The P-core can boost up to 4.4 GHz for a brief period, a tad lower than Intel's advertised figure of 4.7 GHz. Similarly, its E-core tops out at 3.49 GHz, a hair lower than 3.50 GHz. On average, the overall boost clock goes as high as 3.8 GHz across the board. That eventually stabilizes at around 2.53 GHz after a while.
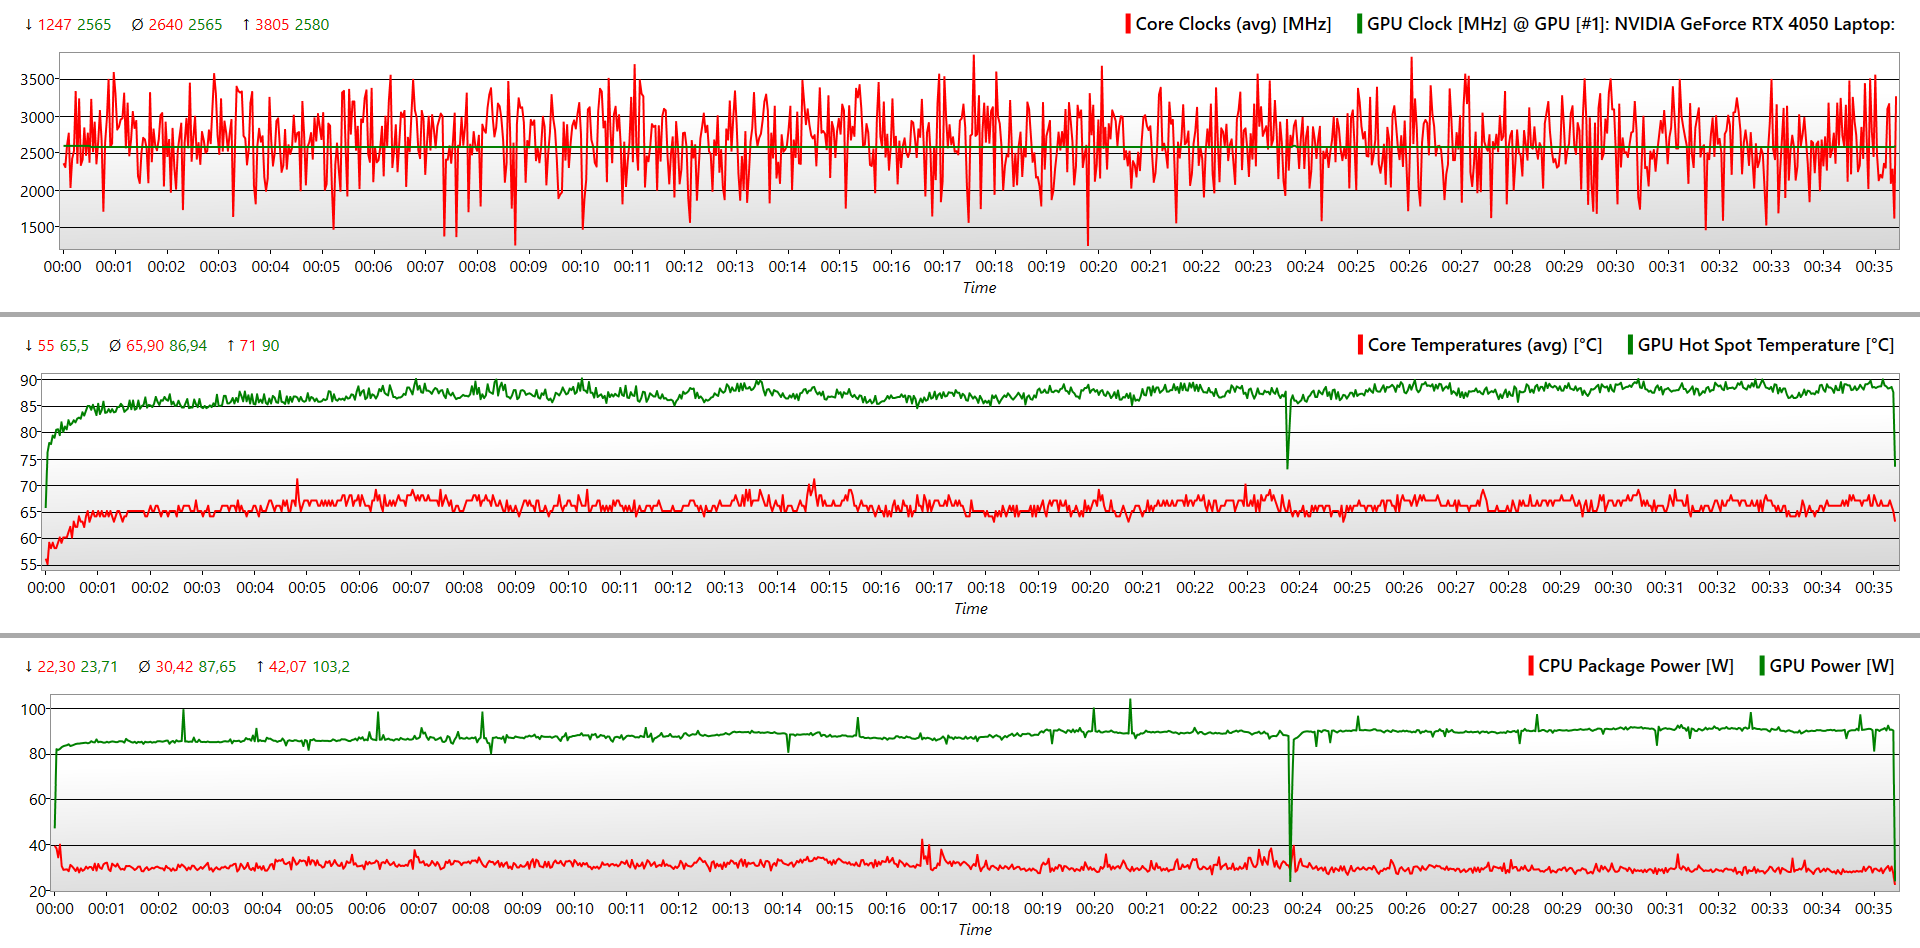

| Stress | CPU Clock (GHz) | GPU Clock (MHz) | Average CPU Temperature (°C) | Average GPU Temperature (°C) |
| System Idle | 1.755 | 700 | 41 | 45 |
| Prime95 | 2.539 | 500 | 82.5 | 63.1 |
| Prime95 + FurMark | 1.696 | 2,420 | 77.2 | 82.5 |
| The Witcher 3 1080p Ultra | 3.047 | 2,565 | 80 | 74 |
Speakers
With a maximum volume of 70.7 dB(A), they are barely louder than the fan under stressful conditions. The actual drivers themselves are minuscule and nothing to write home about.
That said, HP has put in some effort and included B&O (Bang and Olufsen) tuning. This results in respectable mids and highs, but one can't say the same about the lows. It's fine for video consumption, but the audio quality could get compromised if the fans decide to ramp up.
Alternatively, you can connect a headset/speaker via the 3.5mm audio jack or go fully wireless with Bluetooth 5.3.
HP Victus 16-r0076TX audio analysis
(-) | not very loud speakers (70.7 dB)
Bass 100 - 315 Hz
(±) | reduced bass - on average 9.7% lower than median
(±) | linearity of bass is average (7.6% delta to prev. frequency)
Mids 400 - 2000 Hz
(+) | balanced mids - only 3.2% away from median
(+) | mids are linear (2.5% delta to prev. frequency)
Highs 2 - 16 kHz
(+) | balanced highs - only 4% away from median
(+) | highs are linear (5.7% delta to prev. frequency)
Overall 100 - 16.000 Hz
(±) | linearity of overall sound is average (15.4% difference to median)
Compared to same class
» 34% of all tested devices in this class were better, 7% similar, 60% worse
» The best had a delta of 6%, average was 18%, worst was 132%
Compared to all devices tested
» 22% of all tested devices were better, 4% similar, 74% worse
» The best had a delta of 4%, average was 24%, worst was 134%
Apple MacBook Pro 16 2021 M1 Pro audio analysis
(+) | speakers can play relatively loud (84.7 dB)
Bass 100 - 315 Hz
(+) | good bass - only 3.8% away from median
(+) | bass is linear (5.2% delta to prev. frequency)
Mids 400 - 2000 Hz
(+) | balanced mids - only 1.3% away from median
(+) | mids are linear (2.1% delta to prev. frequency)
Highs 2 - 16 kHz
(+) | balanced highs - only 1.9% away from median
(+) | highs are linear (2.7% delta to prev. frequency)
Overall 100 - 16.000 Hz
(+) | overall sound is linear (4.6% difference to median)
Compared to same class
» 0% of all tested devices in this class were better, 0% similar, 100% worse
» The best had a delta of 5%, average was 17%, worst was 45%
Compared to all devices tested
» 0% of all tested devices were better, 0% similar, 100% worse
» The best had a delta of 4%, average was 24%, worst was 134%
Energy Management: Battery life could have been better
Power Consumption
The HP Victus 16's Raptor Lake-HX processor and Ada Lovelace GPU make short work of the supplied 230-watt power brick by consuming up to 237 Watts. However, the situation is a lot better on idle, with power consumption maxing out at 22.1 Watts.
That value doesn't change much on AMD's HX-branded processors found in its competitors. Interestingly, the Dell G5 15's Core i7-13700HX is a tad more efficient at idle, with an average power draw of 14.98 Watts.
| Off / Standby | |
| Idle | |
| Load |
|
Key:
min: | |
| HP Victus 16-r0076TX i5-13500HX, GeForce RTX 4050 Laptop GPU, SK hynix PC801 HFS512GEJ9X101N BF, IPS, 1920x1080, 16.1" | Acer Nitro 16 AN16-41-R7YE R5 7535HS, GeForce RTX 4050 Laptop GPU, SK hynix HFS512GEJ9X125N, IPS, 1920x1200, 16" | Acer Predator Helios 16 PH16-71-731Q i7-13700HX, GeForce RTX 4060 Laptop GPU, Micron 3400 1TB MTFDKBA1T0TFH, IPS-LED, 2560x1600, 16" | Dell G15 5530 i7-13650HX, GeForce RTX 4060 Laptop GPU, SSTC CL4-3D512-Q11, IPS, 1920x1080, 15.6" | Lenovo Legion Pro 5 16ARX8 (R5 7645HX, RTX 4050) R5 7645HX, GeForce RTX 4050 Laptop GPU, SK hynix PC801 HFS512GEJ9X115N, IPS, 2560x1600, 16" | Lenovo LOQ 15APH8 R7 7840HS, GeForce RTX 4050 Laptop GPU, Micron 2450 512GB MTFDKCD512TFK, IPS, 1920x1080, 15.6" | Average NVIDIA GeForce RTX 4050 Laptop GPU | Average of class Gaming | |
|---|---|---|---|---|---|---|---|---|
| Power Consumption | 7% | -5% | 13% | 12% | 15% | 21% | -4% | |
| Idle Minimum * (Watt) | 16.12 | 19 -18% | 15.9 1% | 8.4 48% | 13 19% | 15 7% | 9.95 ? 38% | 13.8 ? 14% |
| Idle Average * (Watt) | 20.47 | 20 2% | 20.5 -0% | 14.98 27% | 17.4 15% | 17.7 14% | 15.8 ? 23% | 19.5 ? 5% |
| Idle Maximum * (Watt) | 22.11 | 23 -4% | 20.9 5% | 15.56 30% | 21.8 1% | 21.5 3% | 20.1 ? 9% | 25.5 ? -15% |
| Load Average * (Watt) | 94.8 | 80 16% | 106 -12% | 96.8 -2% | 96.4 -2% | 73.5 22% | 88 ? 7% | 110.6 ? -17% |
| Witcher 3 ultra * (Watt) | 166.9 | 125.8 25% | 175 -5% | 186 -11% | 125 25% | 138.6 17% | ||
| Load Maximum * (Watt) | 237 | 184 22% | 276 -16% | 271.42 -15% | 204 14% | 176.5 26% | 176.3 ? 26% | 257 ? -8% |
* ... smaller is better
Power Consumption: The Witcher 3 / Stress test
Power Consumption: External monitor
Battery Life
The HP Victus 16 packs a respectable 83 Wh battery. A 99 Wh unit would have been ideal, but those are reserved for top-of-the-line SKUs.
In our Wi-Fi web surfing test with brightness set to 150 nits, we got about 8 hours and 51 minutes of battery life. Cranking up the brightness to max reduced that figure to 8 hours and 10 minutes.
Interestingly, the laptop fared worse in the Big Buck Bunny FHD H.264 test with the brightness set at 150 nits and all radios (Wi-Fi, Bluetooth) turned off. It lasted only 7 hours and 39 minutes. In an ideal scenario, that figure should have been higher.
Lastly, it gave away after just 1 hour and 31 minutes in our The Witcher 3 test with 150 nits brightness and the game running at "Ultra" settings. That figure went down to 1 hour and 11 minutes with a combined load of Prime95 and FurMark.
| HP Victus 16-r0076TX i5-13500HX, GeForce RTX 4050 Laptop GPU, 83 Wh | Alienware m16 R1 Intel i7-13700HX, GeForce RTX 4060 Laptop GPU, 86 Wh | Acer Predator Helios 16 PH16-71-731Q i7-13700HX, GeForce RTX 4060 Laptop GPU, 90 Wh | Dell G15 5530 i7-13650HX, GeForce RTX 4060 Laptop GPU, 86 Wh | Lenovo Legion Pro 5 16ARX8 (R5 7645HX, RTX 4050) R5 7645HX, GeForce RTX 4050 Laptop GPU, 80 Wh | Lenovo LOQ 15APH8 R7 7840HS, GeForce RTX 4050 Laptop GPU, 60 Wh | Average of class Gaming | |
|---|---|---|---|---|---|---|---|
| Battery runtime | -30% | -13% | -30% | -38% | -13% | -9% | |
| H.264 (h) | 7.7 | 5.6 -27% | 4.8 -38% | 6.8 -12% | 5.4 -30% | 7.93 ? 3% | |
| WiFi v1.3 (h) | 8.9 | 4.8 -46% | 5.6 -37% | 6.5 -27% | 5.6 -37% | 7.4 -17% | 6.67 ? -25% |
| Witcher 3 ultra (h) | 1.5 | 1.5 0% | 0.8 -47% | 0.8 -47% | 0.958 ? -36% | ||
| Load (h) | 1.2 | 1 -17% | 1.5 25% | 0.8 -33% | 1.1 -8% | 1.483 ? 24% | |
| Reader / Idle (h) | 6.4 | 9.8 | 9.06 ? |
Pros
Cons
Verdict: A decent 1080p gaming laptop for those on a budget
The HP Victus 16 is a decent gaming laptop, but not without its shortcomings. Despite the company's best efforts to keep thermals under control with its two fans and a labyrinth of heatsinks, we still find high thermal emissions.
Right off the bat, the Raptor Lake-HX processor pulls its weight, allowing the laptop to outperform better-specced competitors like the Lenovo Legion Pro 5 16ARX8 with the Ryzen 5 7645HX and the same GPU.
Then there's the issue of bloatware. We all like a good VPN service, but it gets annoying when ExpressVPN popups show up every few minutes. And no, the laptop doesn't come bundled with an ExpressVPN plan.
The HP Victus 16 is an ideal 1080p gaming machine for e-sports enthusiasts on a budget thanks to its powerful processor and 165 Hz screen if you can put up with its noise and thermals.
Currently, there are very few laptops on the market with entry-level Raptor Lake-HX processors. That alone gives the HP Victus 16 a significant edge over the Acer Nitro 16 AN16-41 and Lenovo LOQ 15.
Price and Availability
The HP Victus 16 can be purchased on HP India's website for ₹129,990. A cheaper variant with the same specs (Core i5-13500HX, GeForce RTX 4050, 16 GB RAM) and a lower-end 144 Hz screen can be had for ₹124,990. Alternatively, its last-gen version can be bought on Amazon India for ₹68,400. On Amazon US, a better-specced version with a QHD (2,560 x 1,440) screen, an AMD Ryzen 7 7840HS, and a GeForce RTX 4060 can be purchased for US$1,279.
HP Victus 16-r0076TX
- 09/25/2023 v7 (old)
Anil Ganti
Transparency
The selection of devices to be reviewed is made by our editorial team. The test sample was provided to the author as a loan by the manufacturer or retailer for the purpose of this review. The lender had no influence on this review, nor did the manufacturer receive a copy of this review before publication. There was no obligation to publish this review. As an independent media company, Notebookcheck is not subjected to the authority of manufacturers, retailers or publishers.
This is how Notebookcheck is testing
Every year, Notebookcheck independently reviews hundreds of laptops and smartphones using standardized procedures to ensure that all results are comparable. We have continuously developed our test methods for around 20 years and set industry standards in the process. In our test labs, high-quality measuring equipment is utilized by experienced technicians and editors. These tests involve a multi-stage validation process. Our complex rating system is based on hundreds of well-founded measurements and benchmarks, which maintains objectivity. Further information on our test methods can be found here.
Price comparison
