Asus TUF Gaming F15 FX507ZM laptop review: Peak GeForce RTX 3060 performance
Asus has refreshed its TUF Gaming F15 series for 2022 now that the Intel 12th gen CPU series is widely available. Instead of a simple CPU swap, however, the manufacturer has updated significant aspects of last year's FX506 chassis in order to create the FX507. This review will go over all the key differences between the 2021 FX506 and 2022 FX507 as well as what performance levels users can expect from the FX507.
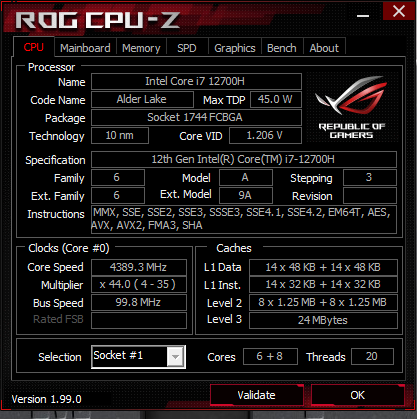
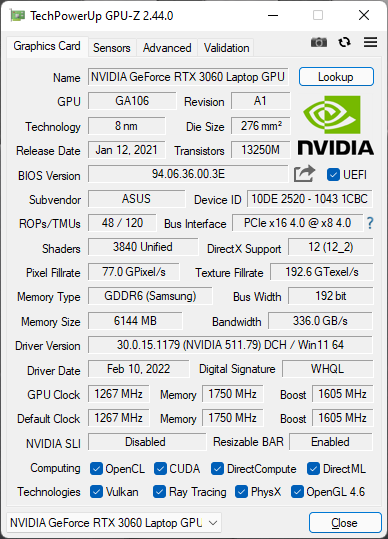
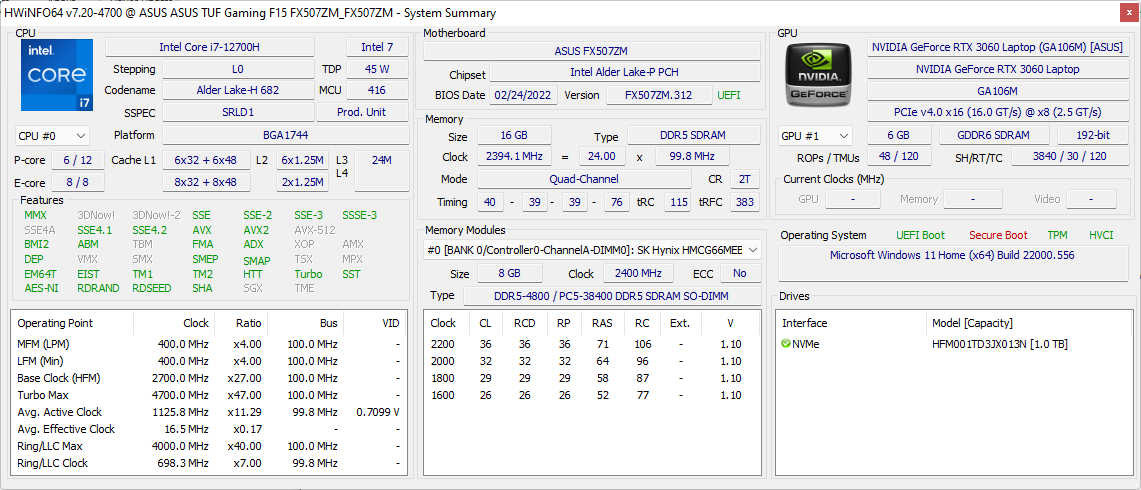
Our configuration in review comes with the Alder Lake-H Core i7-12700H CPU, GeForce RTX 3060 GPU, 300 Hz 1080p IPS panel, and 90 Wh battery for approximately $1500 USD retail. Other SKUs with slower display refresh rates, smaller 56 Wh battery, and slower CPU options may be available. Note that even though the FX507 comes with the same GeForce RTX 3060 GPU as on the older FX506, the GPU in the newer model targets a much higher TGP to squeeze out more performance (140 W vs. 95 W).
Competitors to the FX507 include other midrange 15.6-inch thin-and-light gaming laptops like the Razer Blade 15 Base Model, MSI GP66, Acer Predator Triton, or the Gigabyte Aorus 5 series.
More Asus reviews:
Potential Competitors in Comparison
Rating | Date | Model | Weight | Height | Size | Resolution | Price |
|---|---|---|---|---|---|---|---|
| 87.2 % v7 (old) | 03 / 2022 | Asus TUF Gaming F15 FX507ZM i7-12700H, GeForce RTX 3060 Laptop GPU | 2.1 kg | 24.95 mm | 15.60" | 1920x1080 | |
| 85.9 % v7 (old) | 06 / 2021 | Asus TUF Gaming F15 FX506HM i7-11800H, GeForce RTX 3060 Laptop GPU | 2.3 kg | 24.9 mm | 15.60" | 1920x1080 | |
| 82.4 % v7 (old) | 02 / 2021 | Asus TUF Dash F15 FX516PR i7-11370H, GeForce RTX 3070 Laptop GPU | 2 kg | 20 mm | 15.60" | 1920x1080 | |
| 86.3 % v7 (old) | 07 / 2021 | Asus ROG Strix Scar 15 G533QS R9 5900HX, GeForce RTX 3080 Laptop GPU | 2.3 kg | 27.2 mm | 15.60" | 2560x1440 | |
| 82.9 % v7 (old) | 09 / 2020 | Asus Zephyrus S15 GX502L i7-10875H, GeForce RTX 2070 Super Mobile | 2.1 kg | 19 mm | 15.60" | 1920x1080 | |
| 85.8 % v7 (old) | 06 / 2021 | Asus ZenBook Pro Duo UX582 LR-1BH2 i7-10870H, GeForce RTX 3070 Laptop GPU | 2.4 kg | 21.5 mm | 15.60" | 3840x2160 |
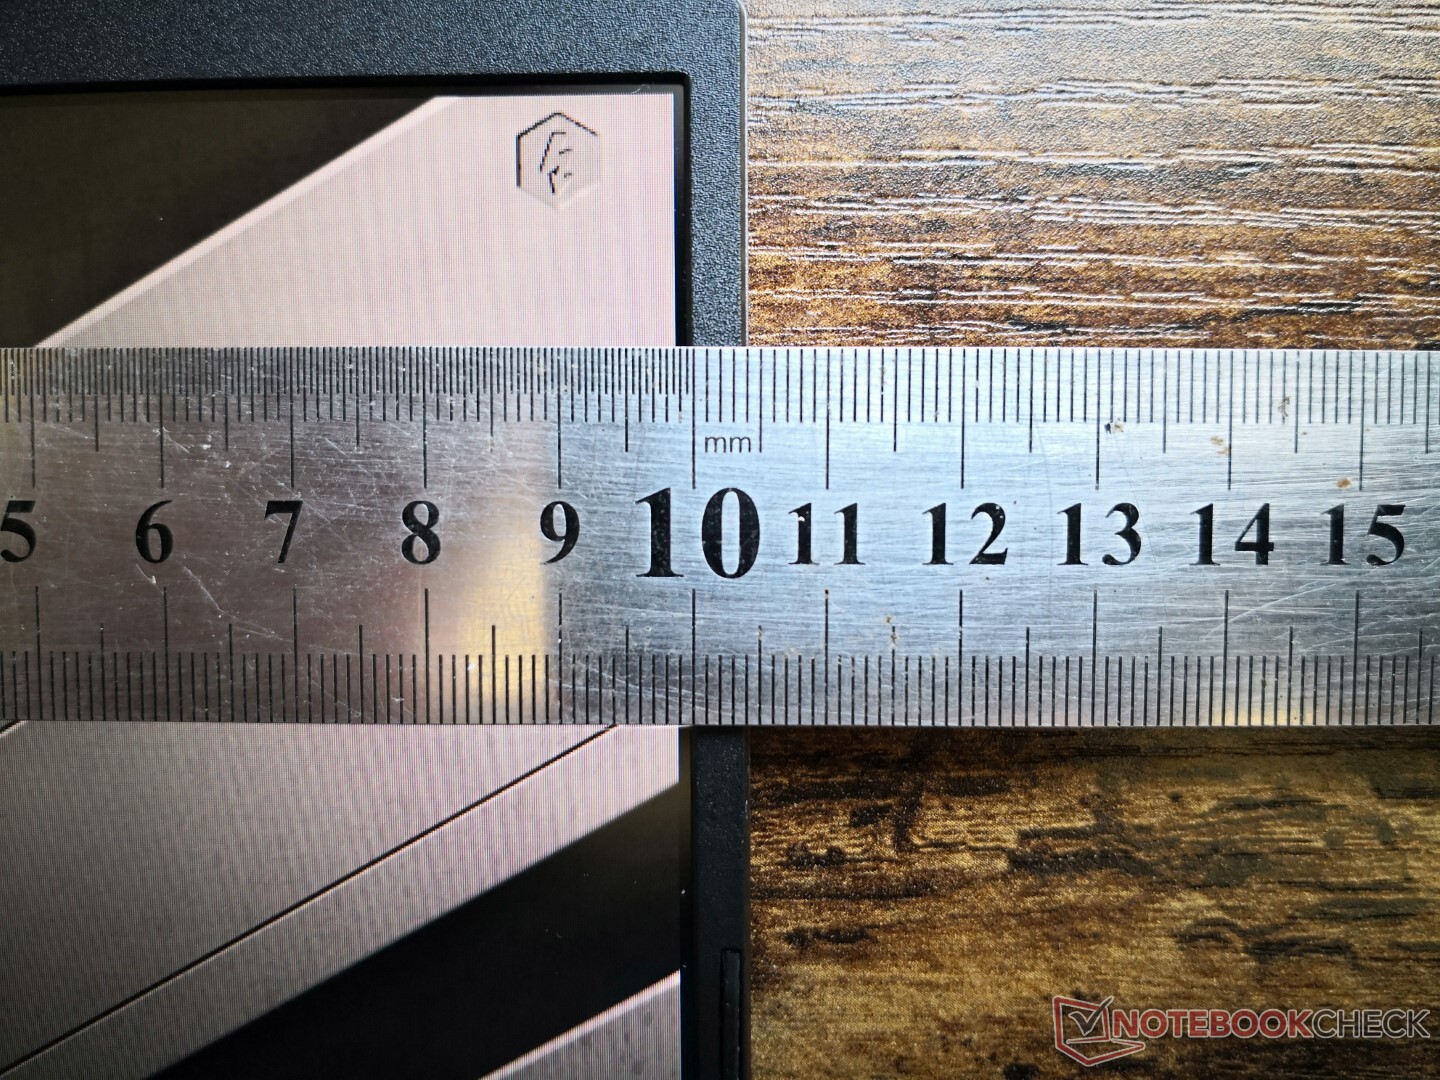
Case — Smaller and Lighter
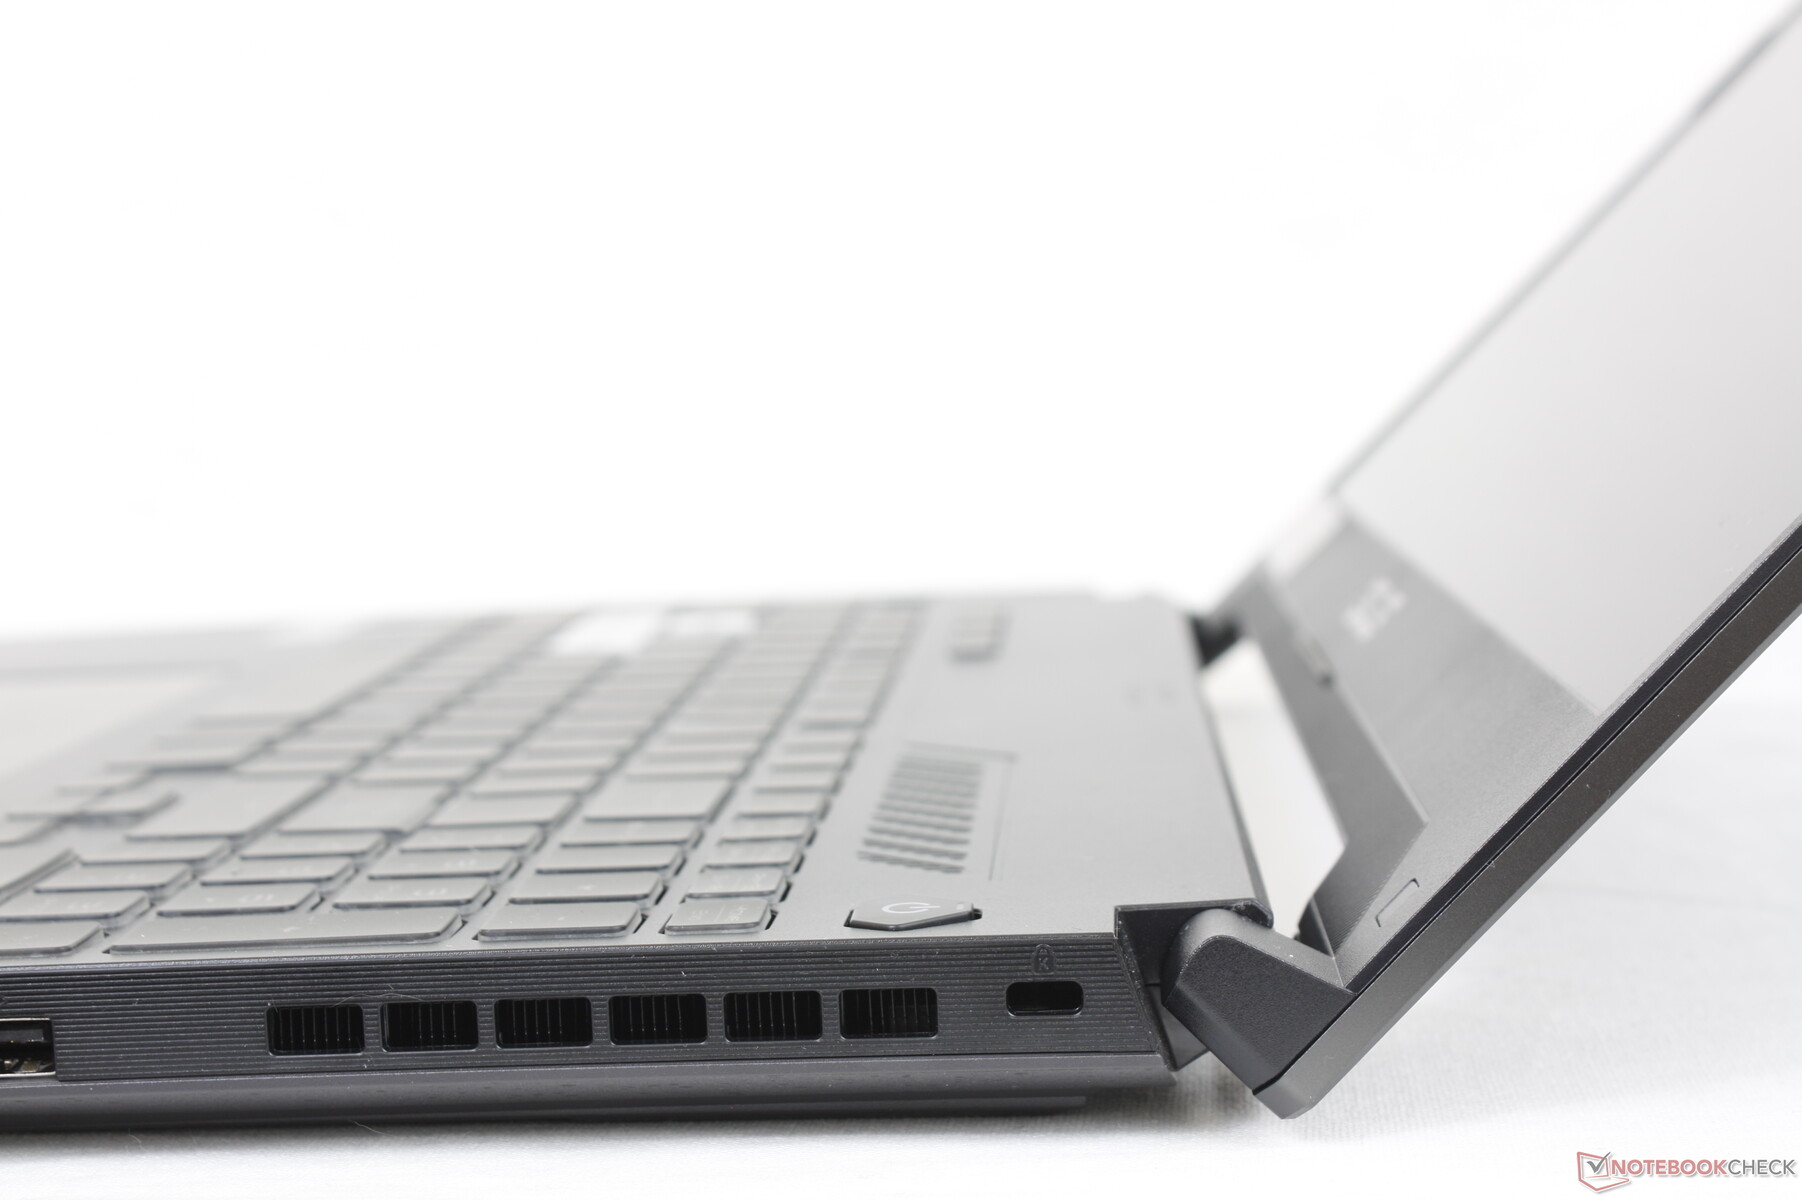
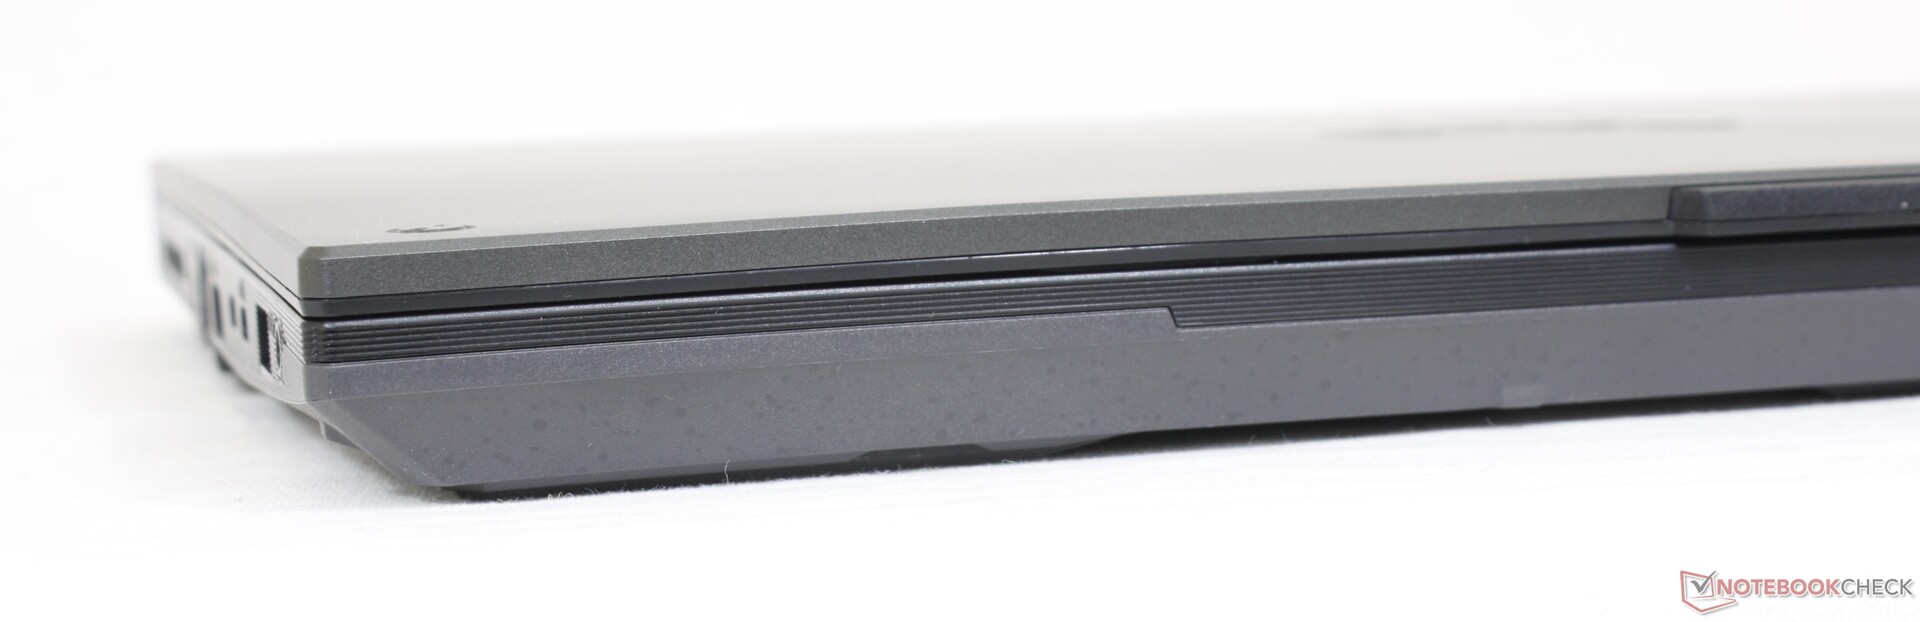
The FX507 may look identical to the FX506 at first glance, but there are actually numerous small changes. The corners, for example, are sharper than before while the faux-brushed glossy palm rests are now a flatter matte texture. Most of the bumps and alternating textures on the FX506 have been removed for a cleaner and more minimalistic look. Chassis materials appear to be otherwise the same as last year's model for a similar level of rigidity.
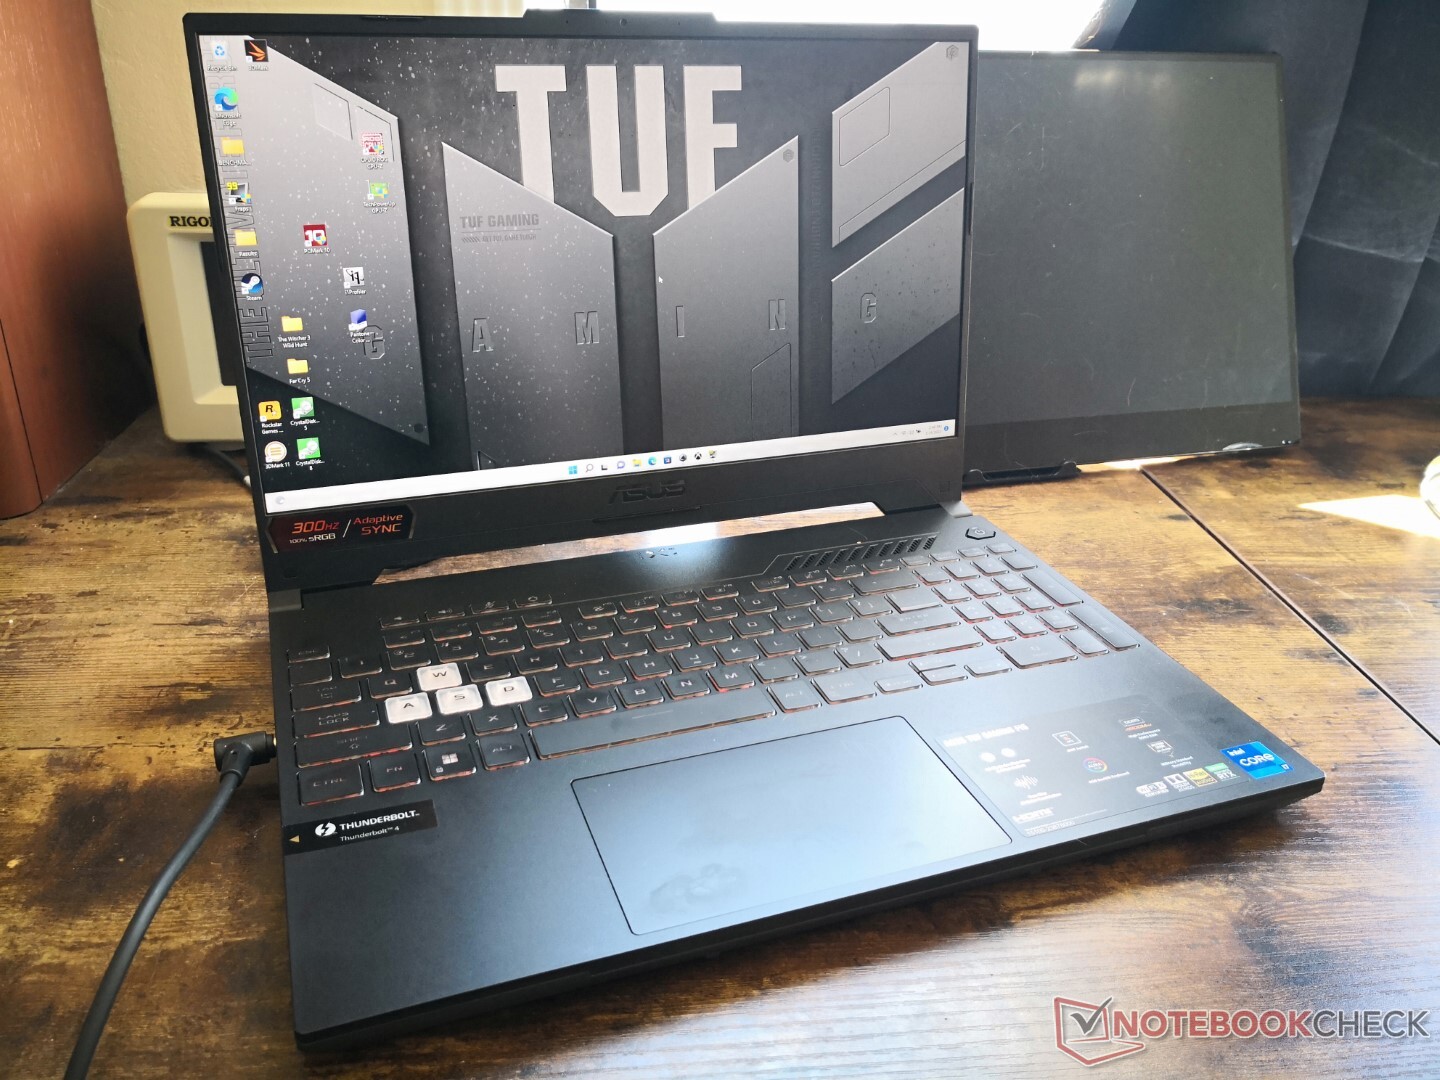
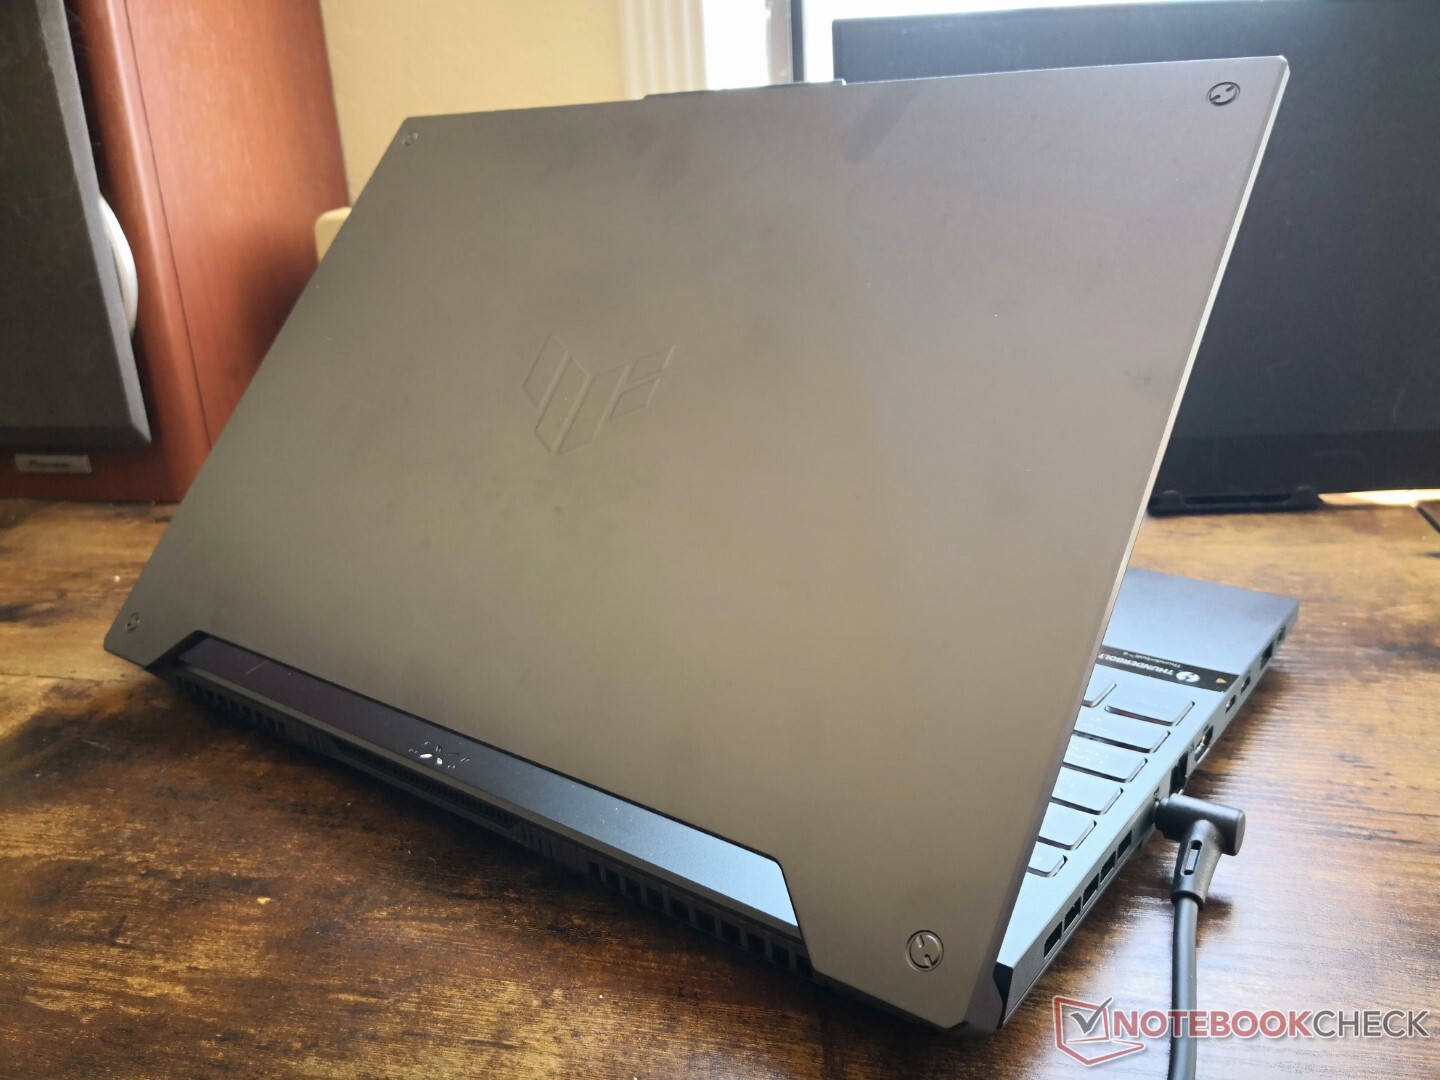
Asus has managed to cut down both the size and weight of the FX507 when compared to its FX506 predecessor. The newer model is slightly shorter (354.9 mm vs. 359.8 mm), slightly narrower (251.9 mm x 256 mm), and a fair bit lighter (2.1 kg vs. 2.3 kg) to be just as light as the thinner Zephyrus S15 design.
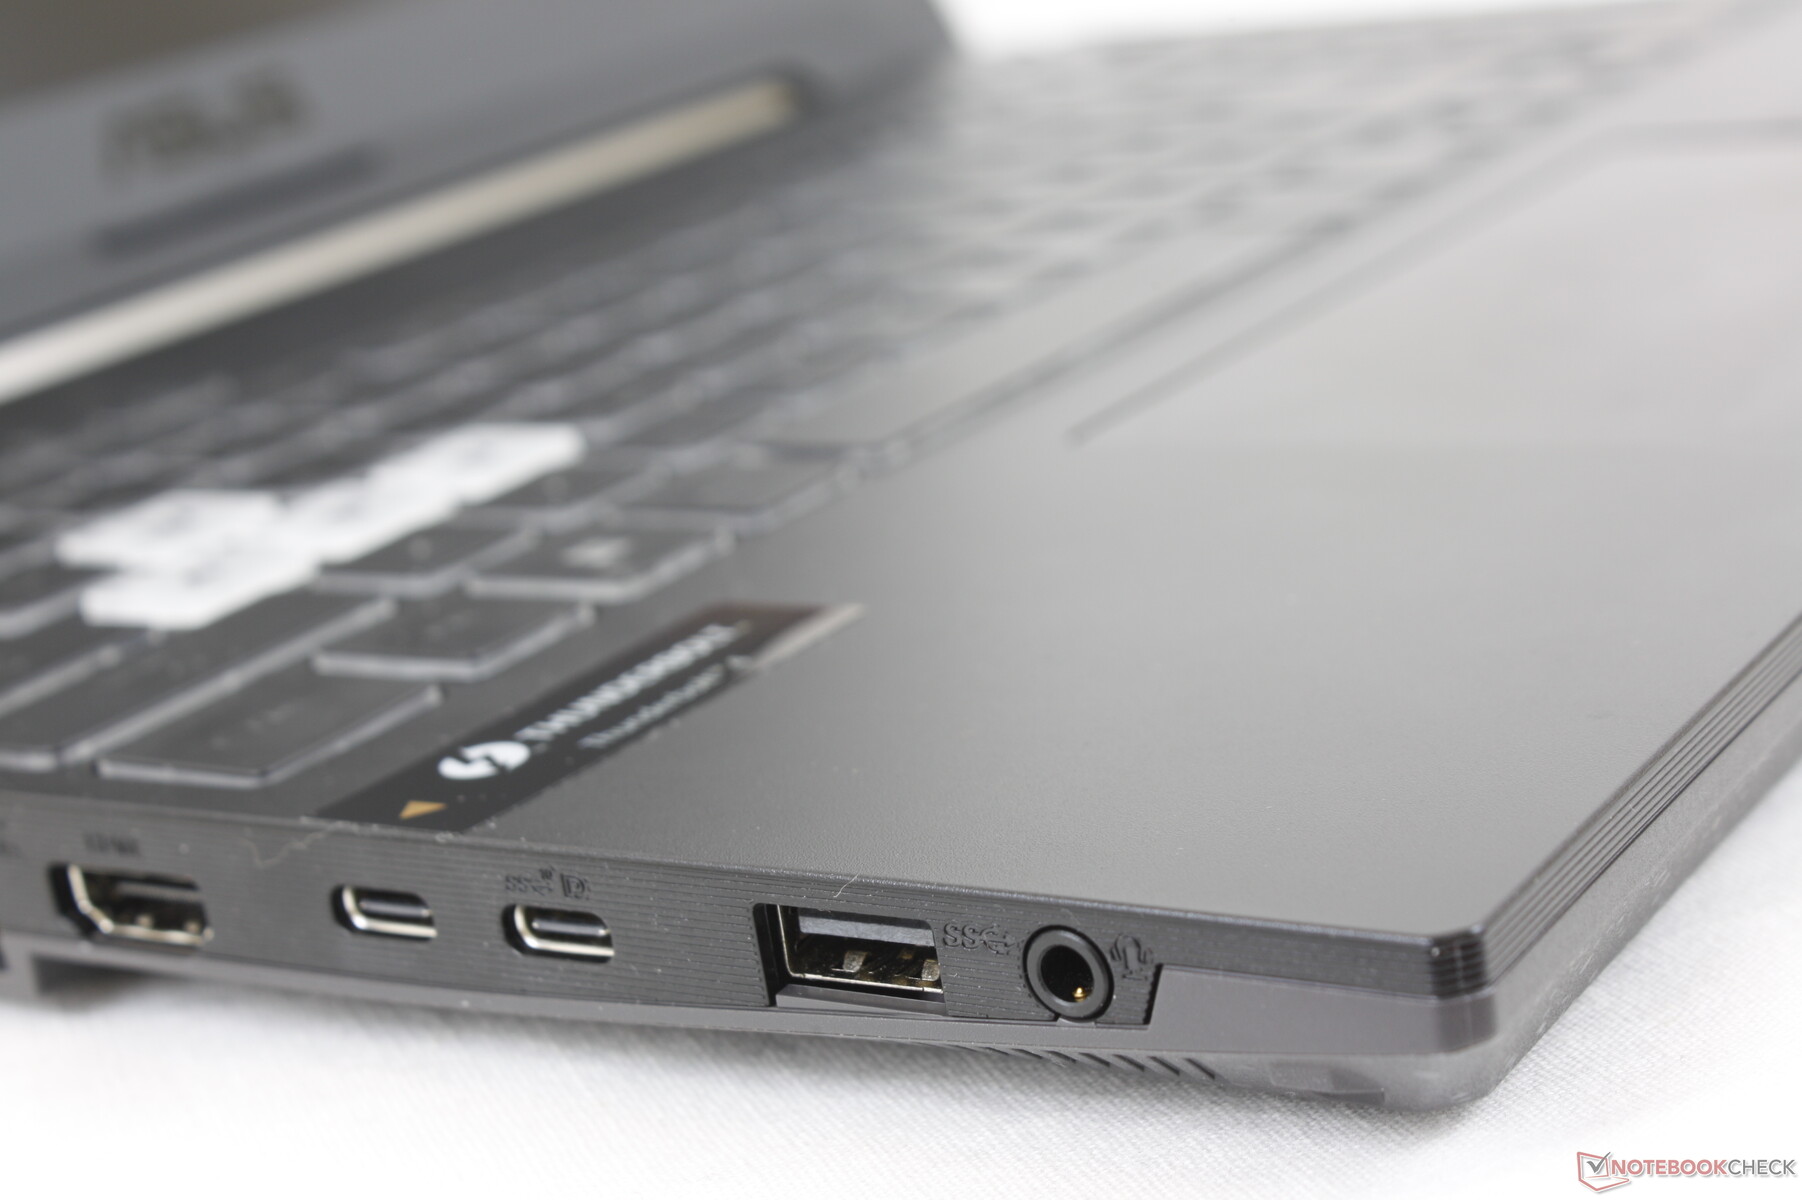
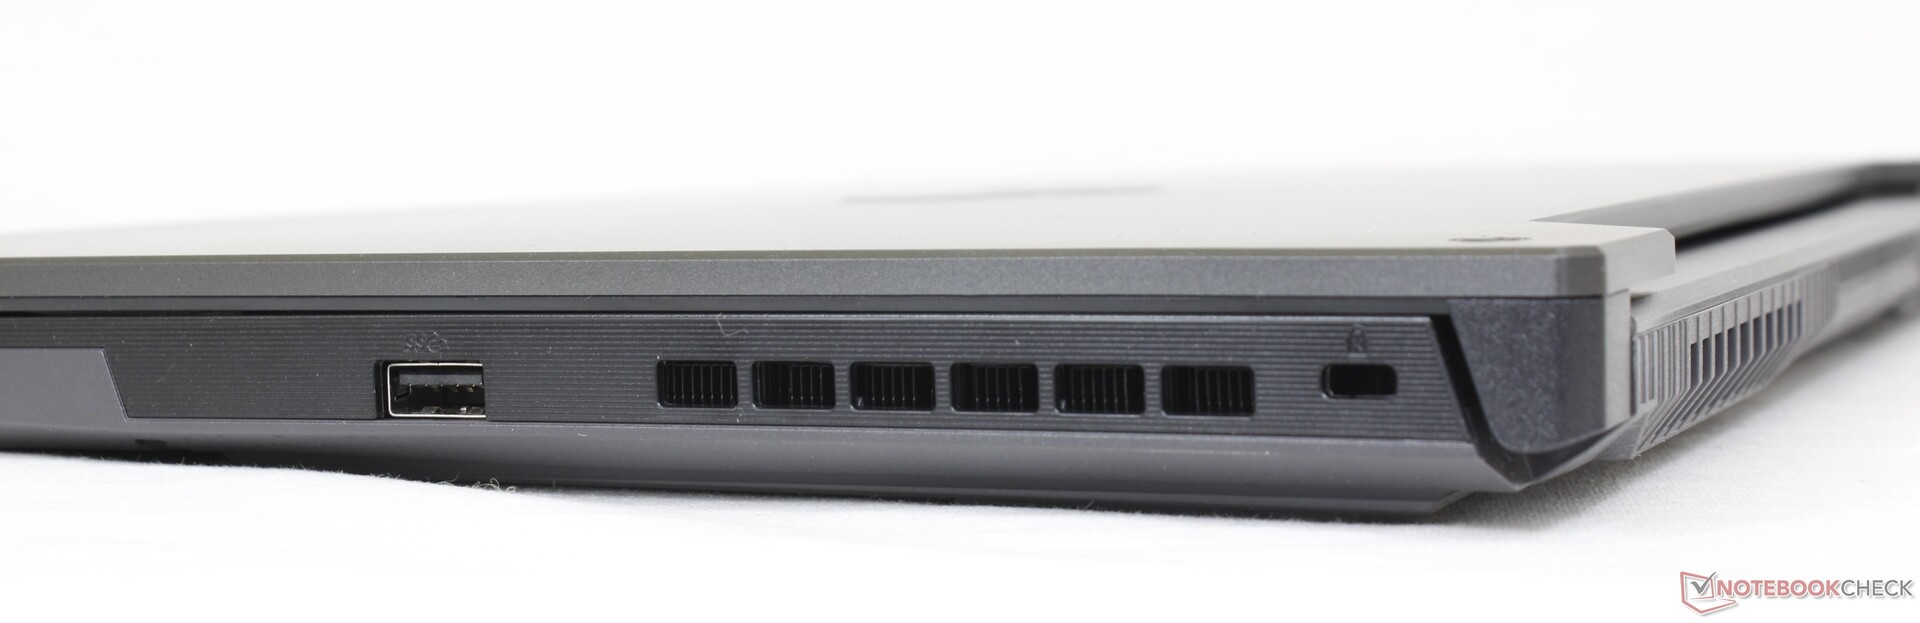
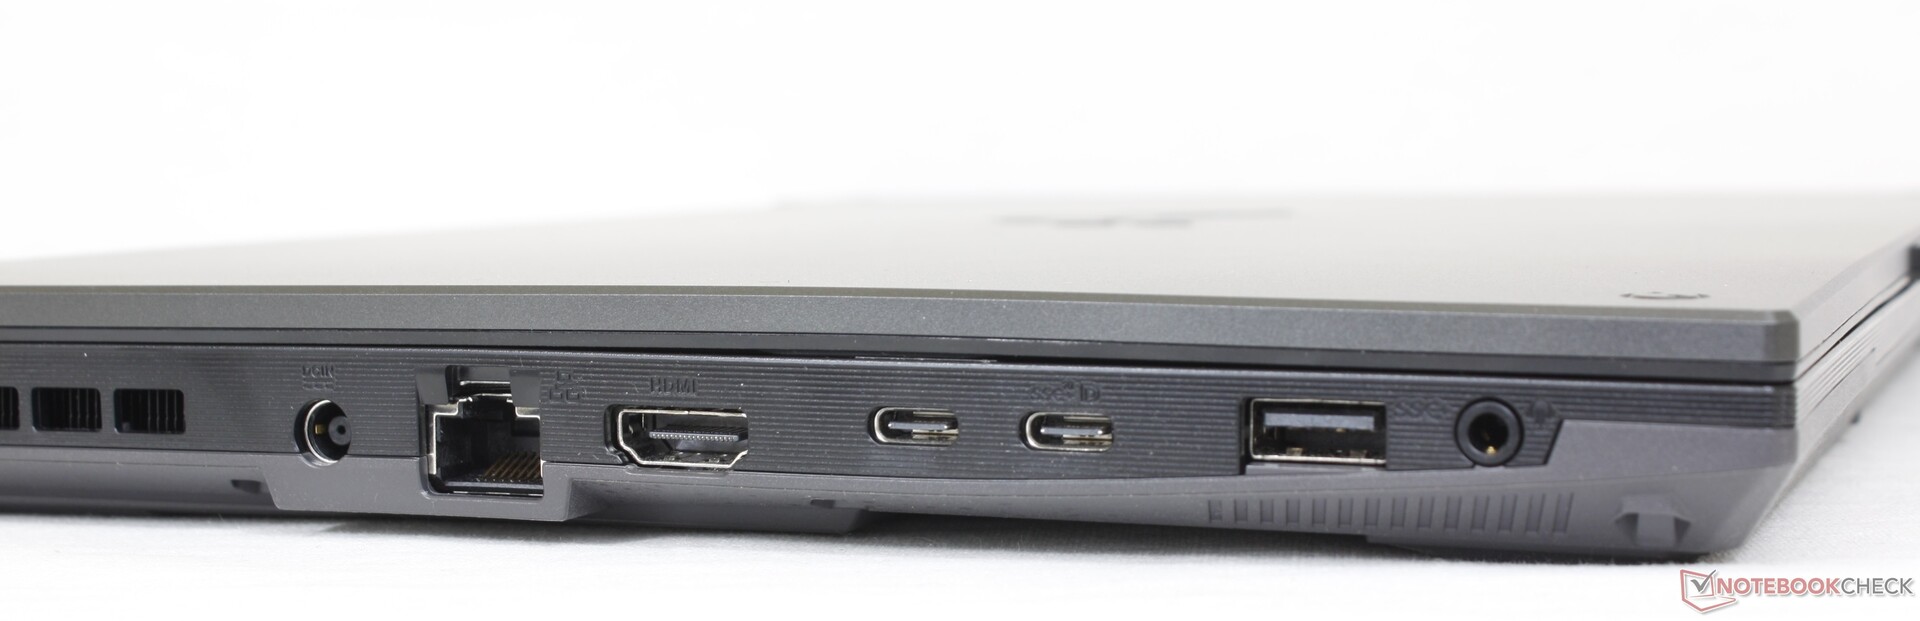
Connectivity — One More USB-C Port
Port options have changed slightly from the FX506. More specifically, the FX507 has dropped one USB-A port for a second USB-C port. All other ports are otherwise identical.
Keep in mind that the laptop must be on MSHybrid mode if connecting any Thunderbolt 4 devices. This is a limitation to all laptops running on 12th gen Alder Lake-H CPUs thus far.
Communication
Webcam
Camera quality is poor from the 720p webcam. There is no privacy shutter or Windows Hello support, either.


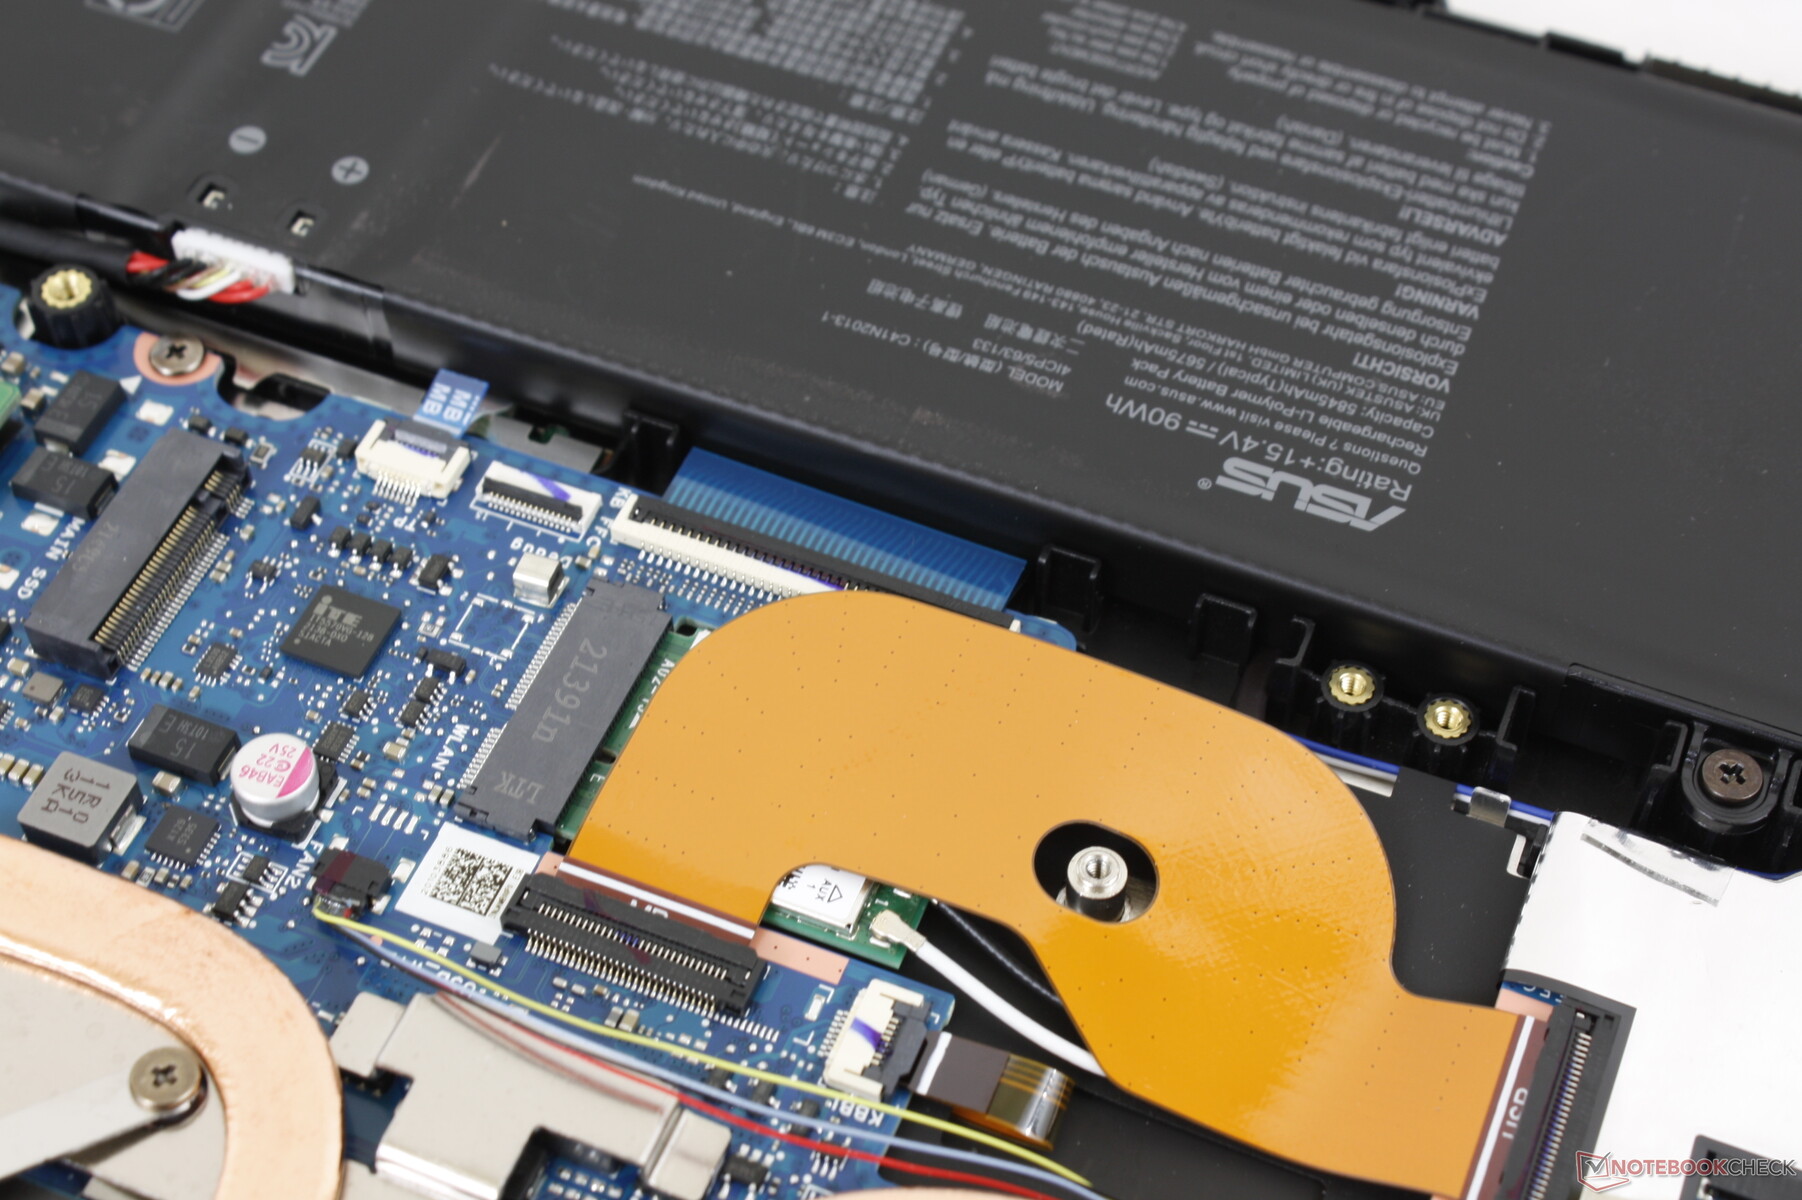
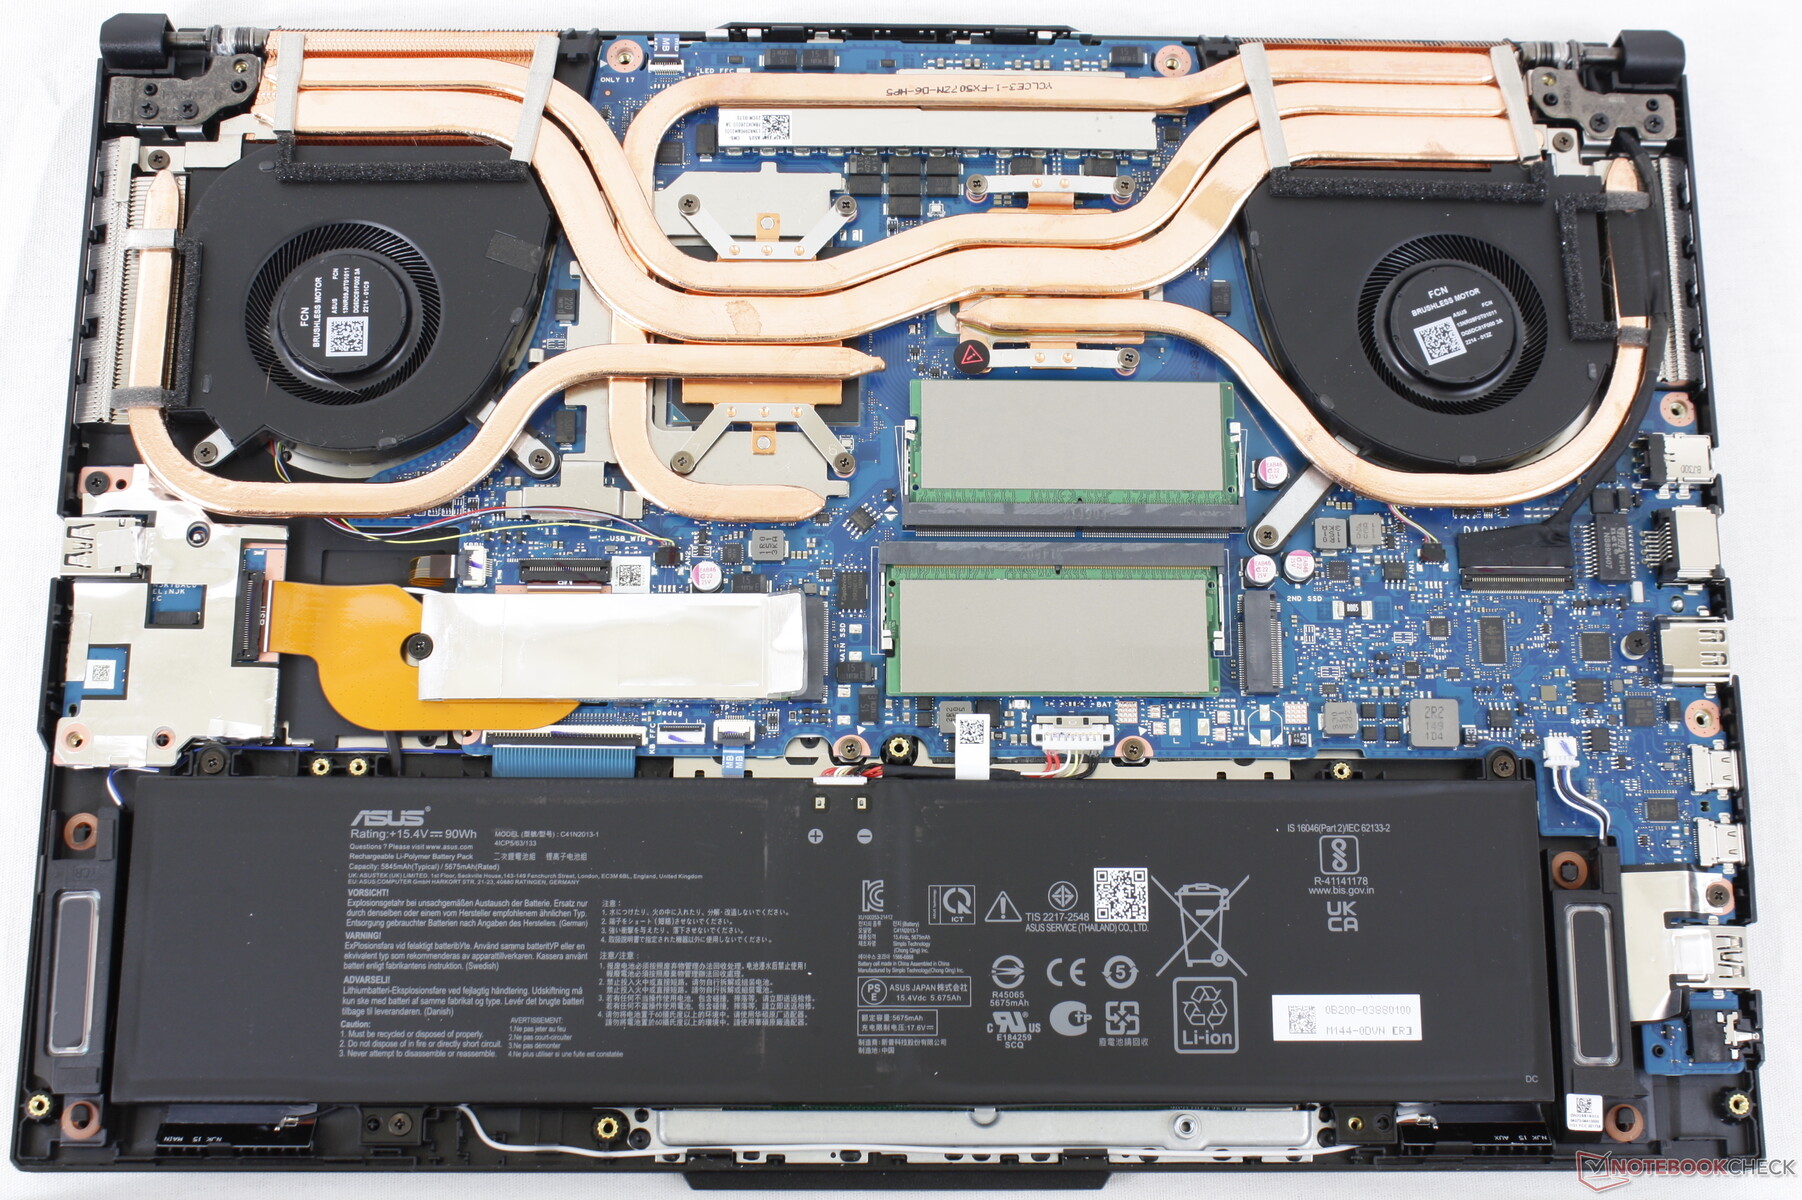
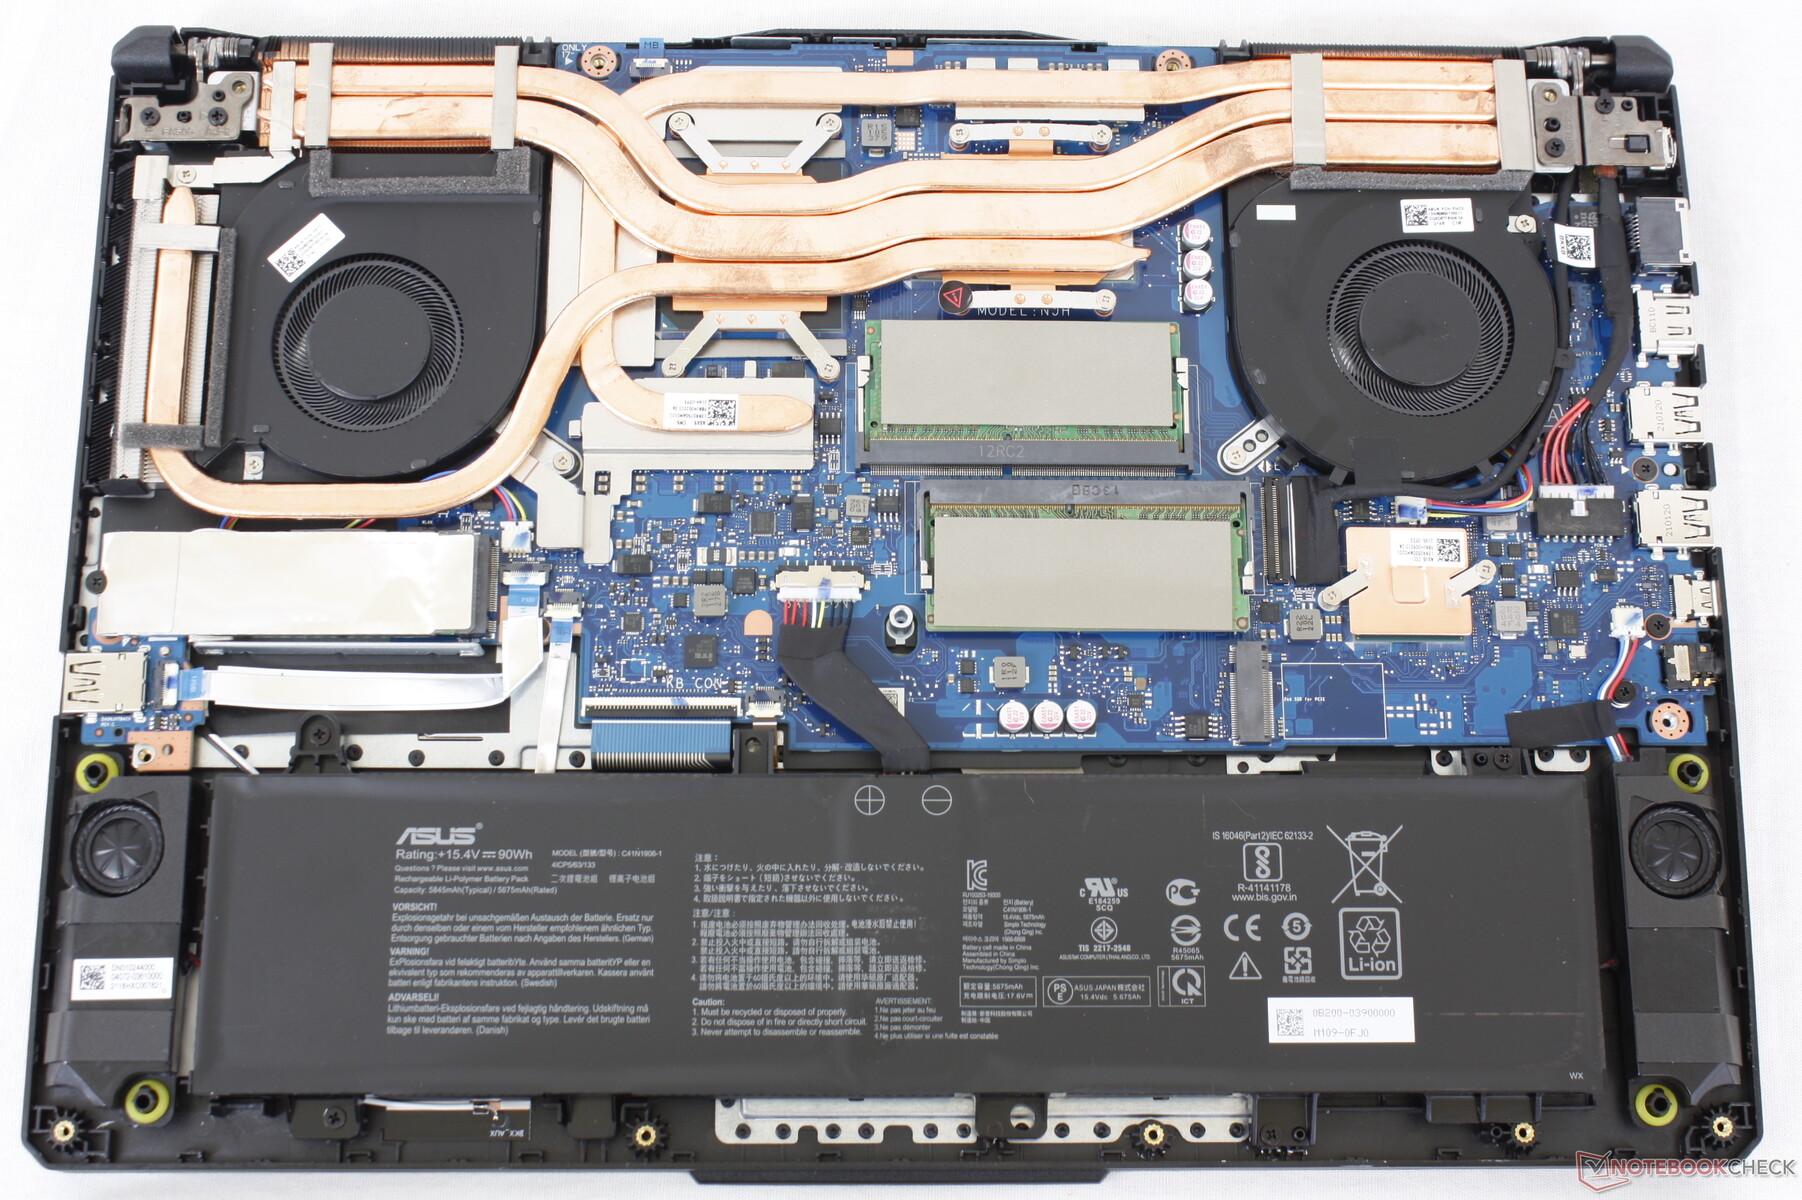
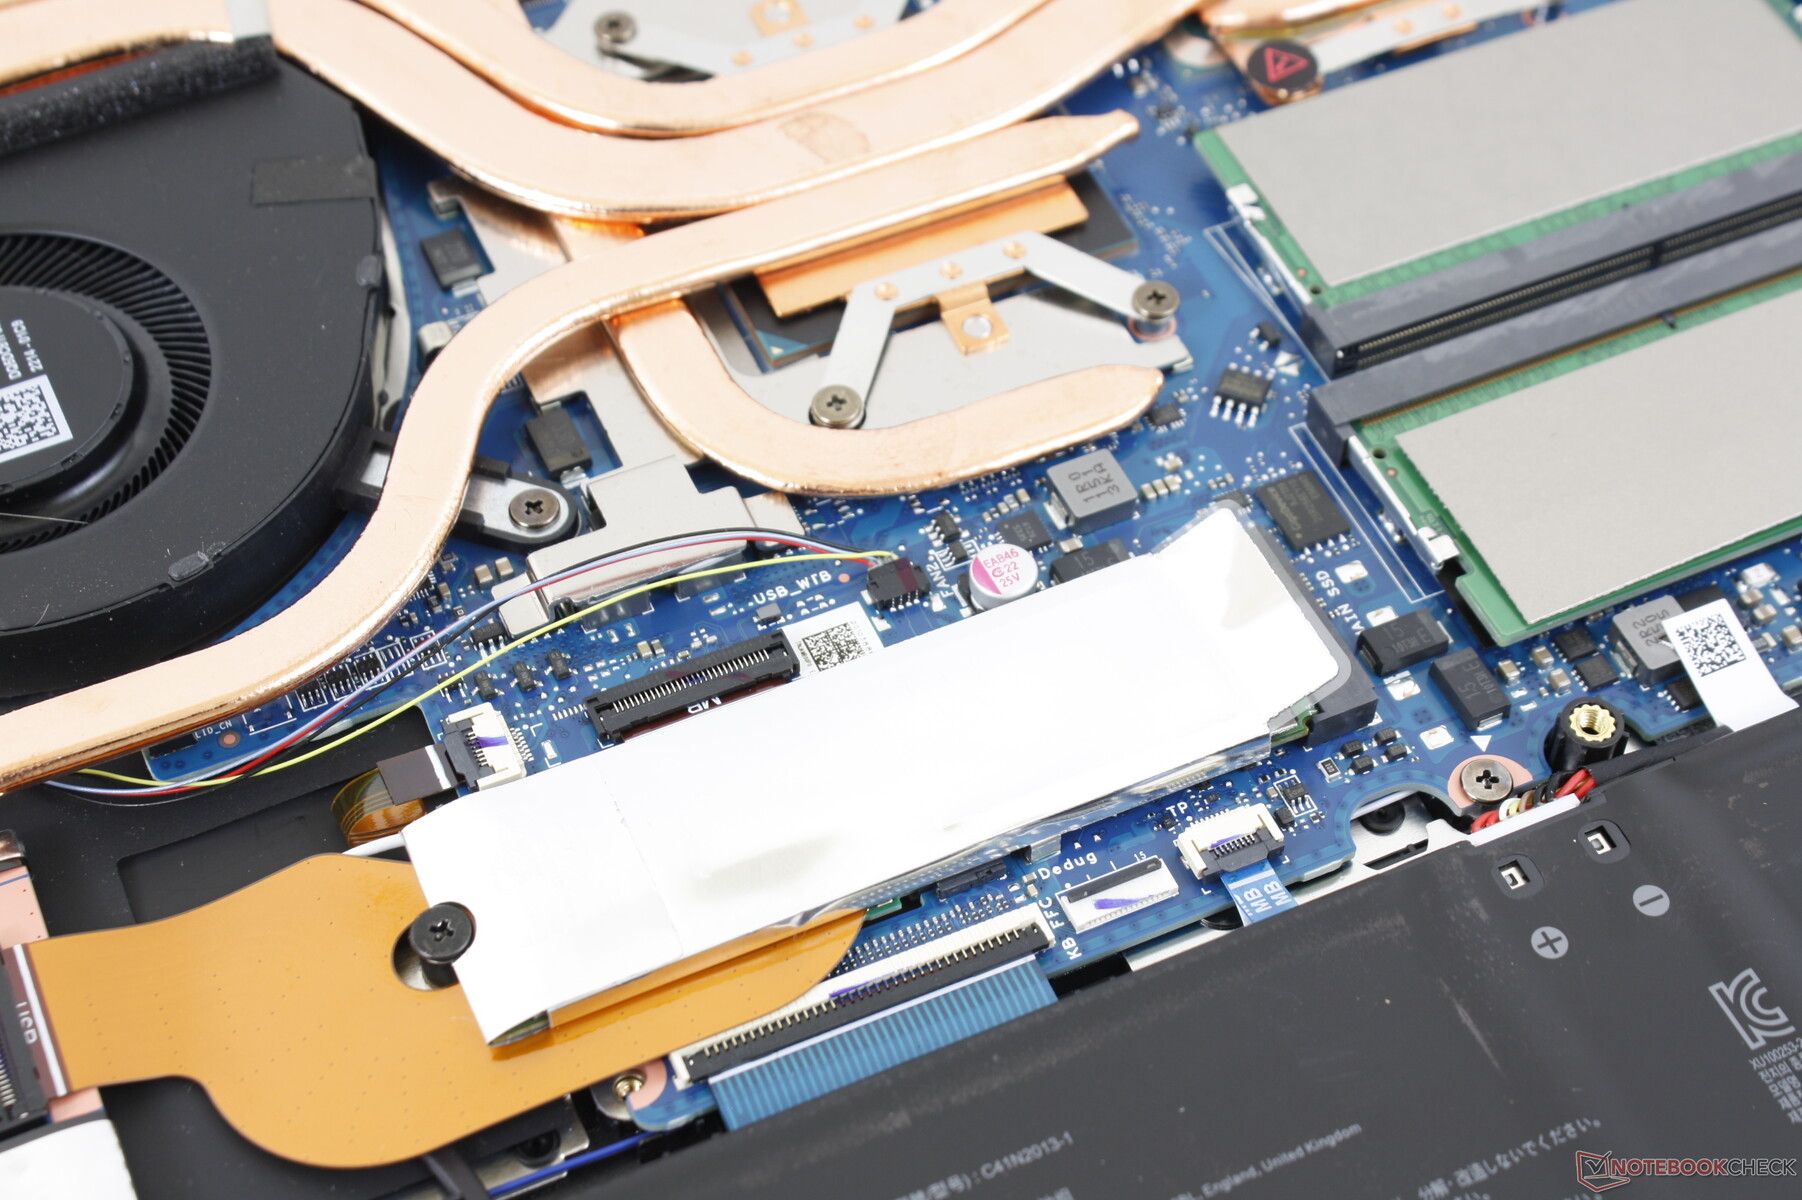
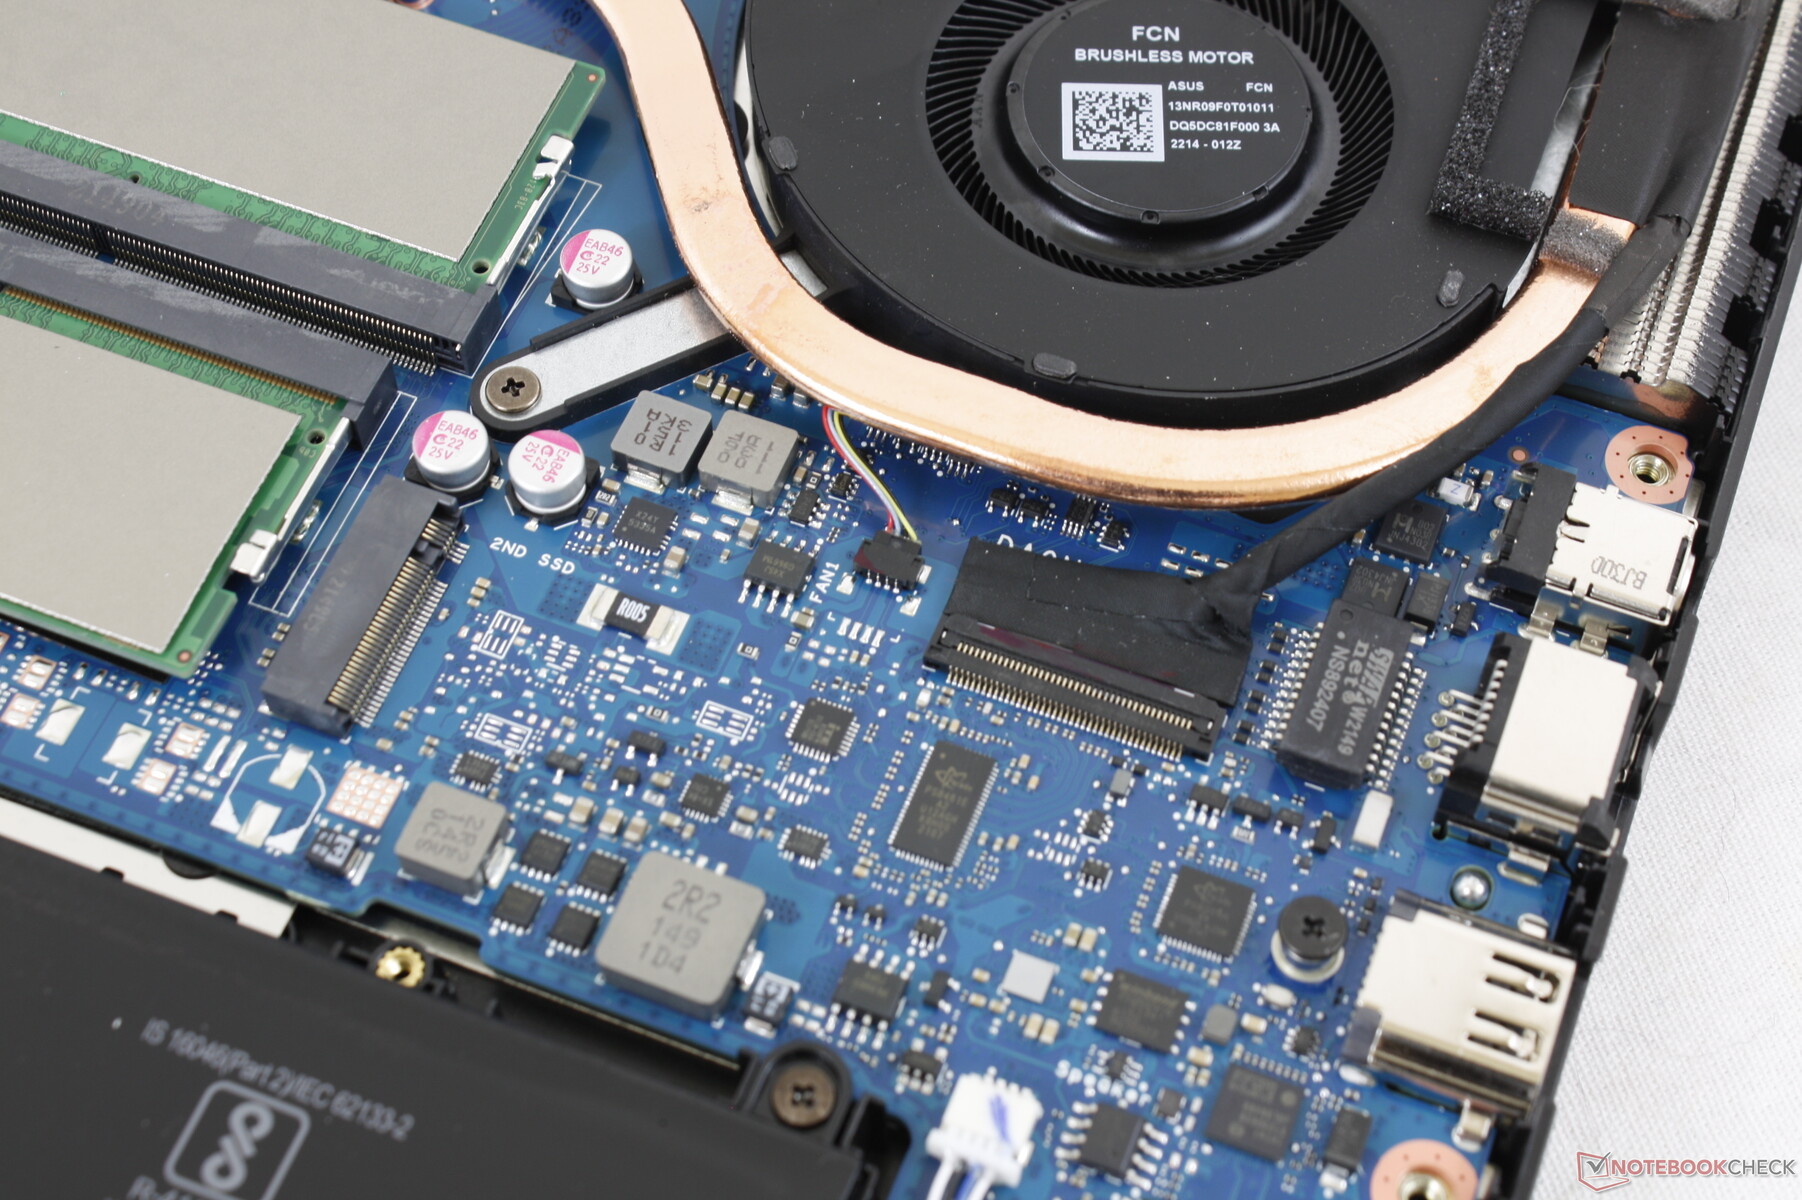
Maintenance
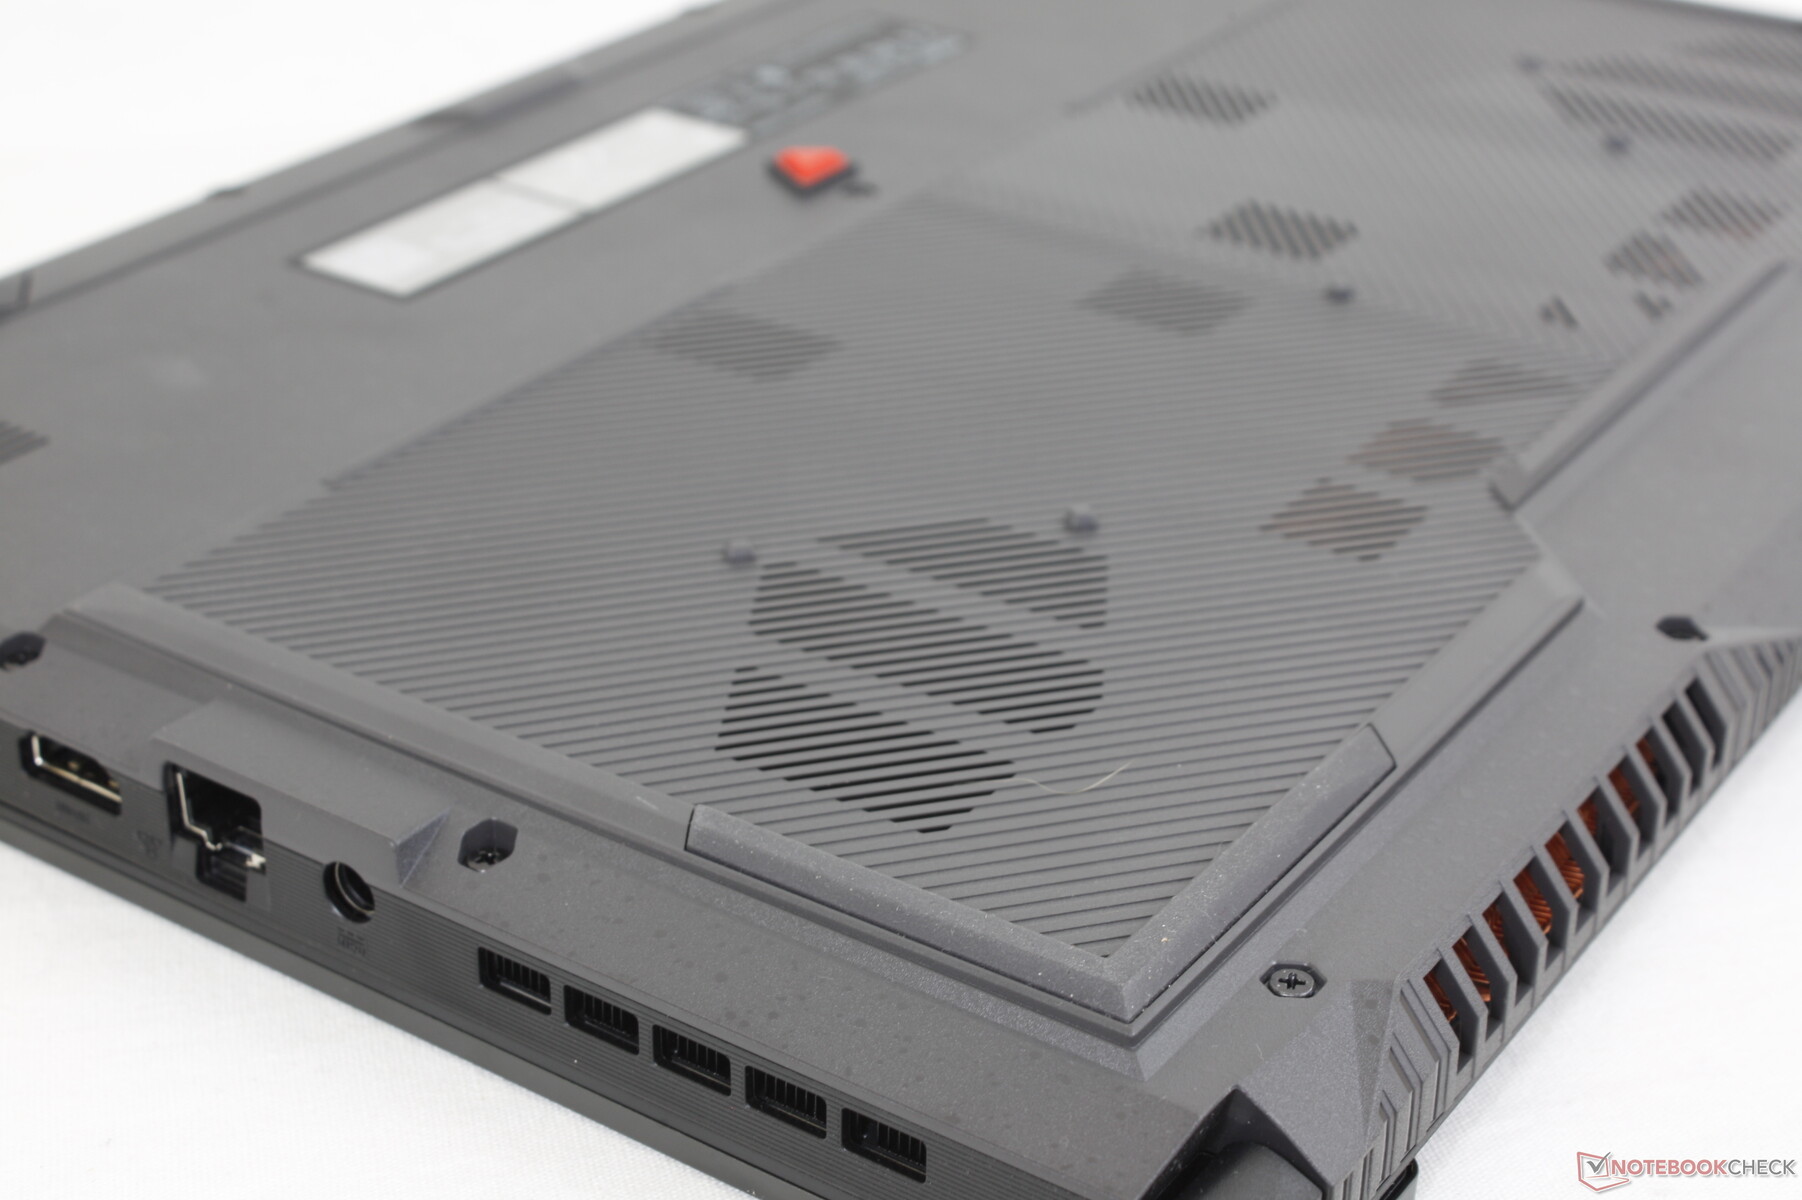
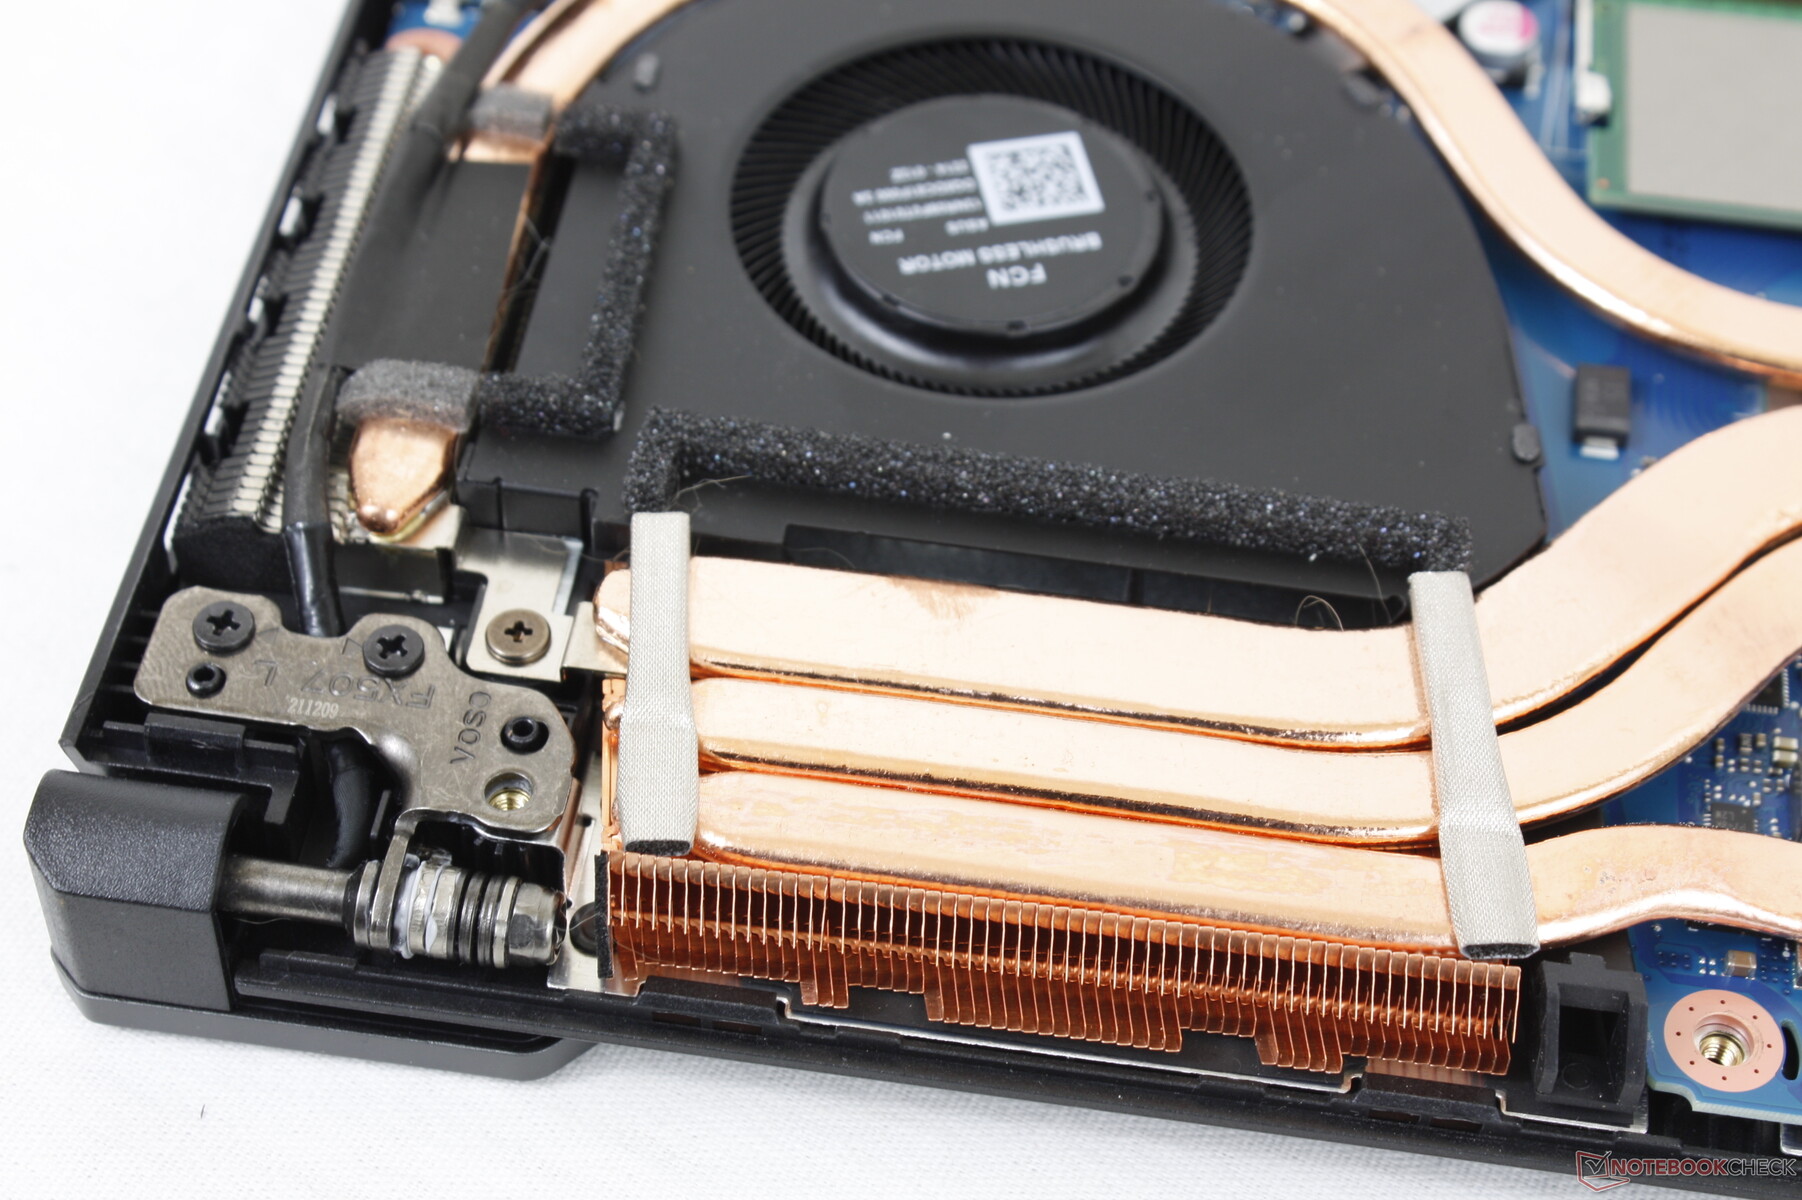
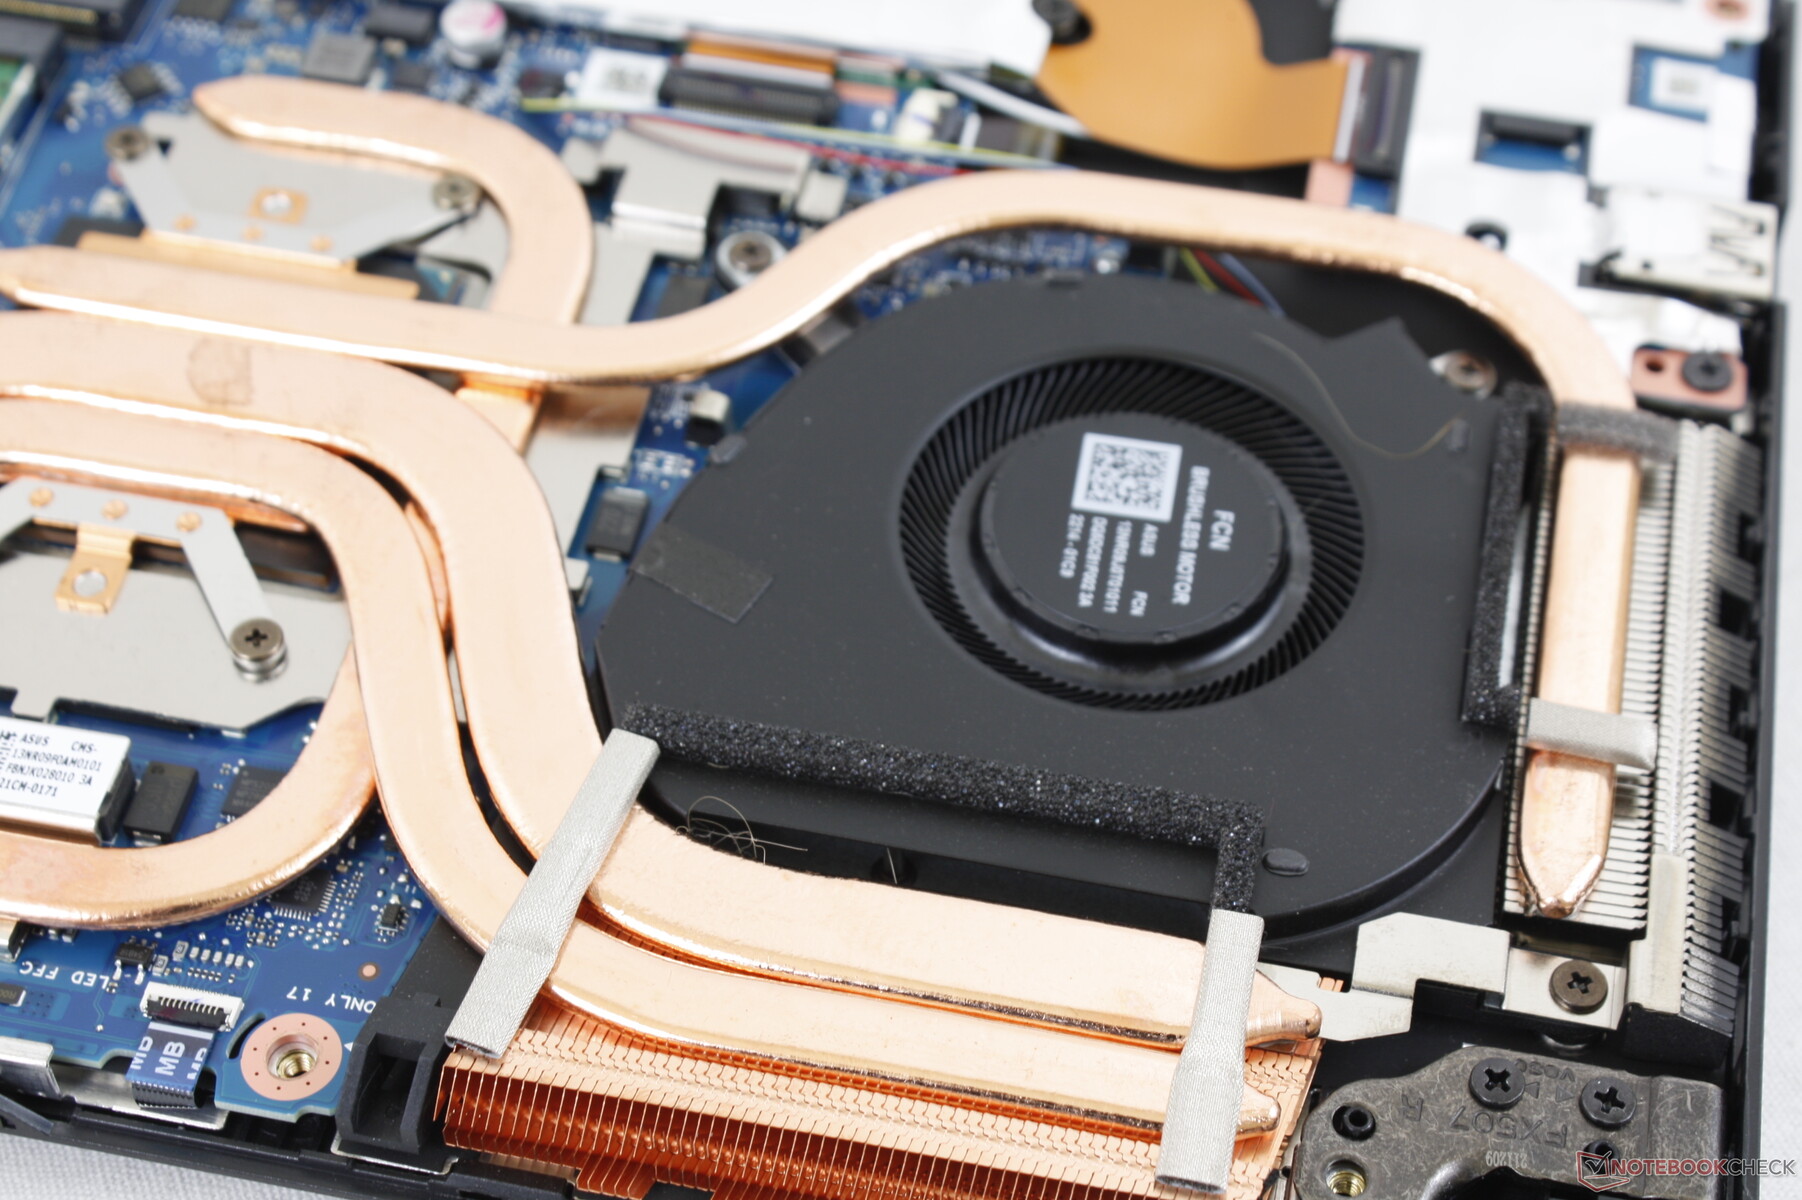
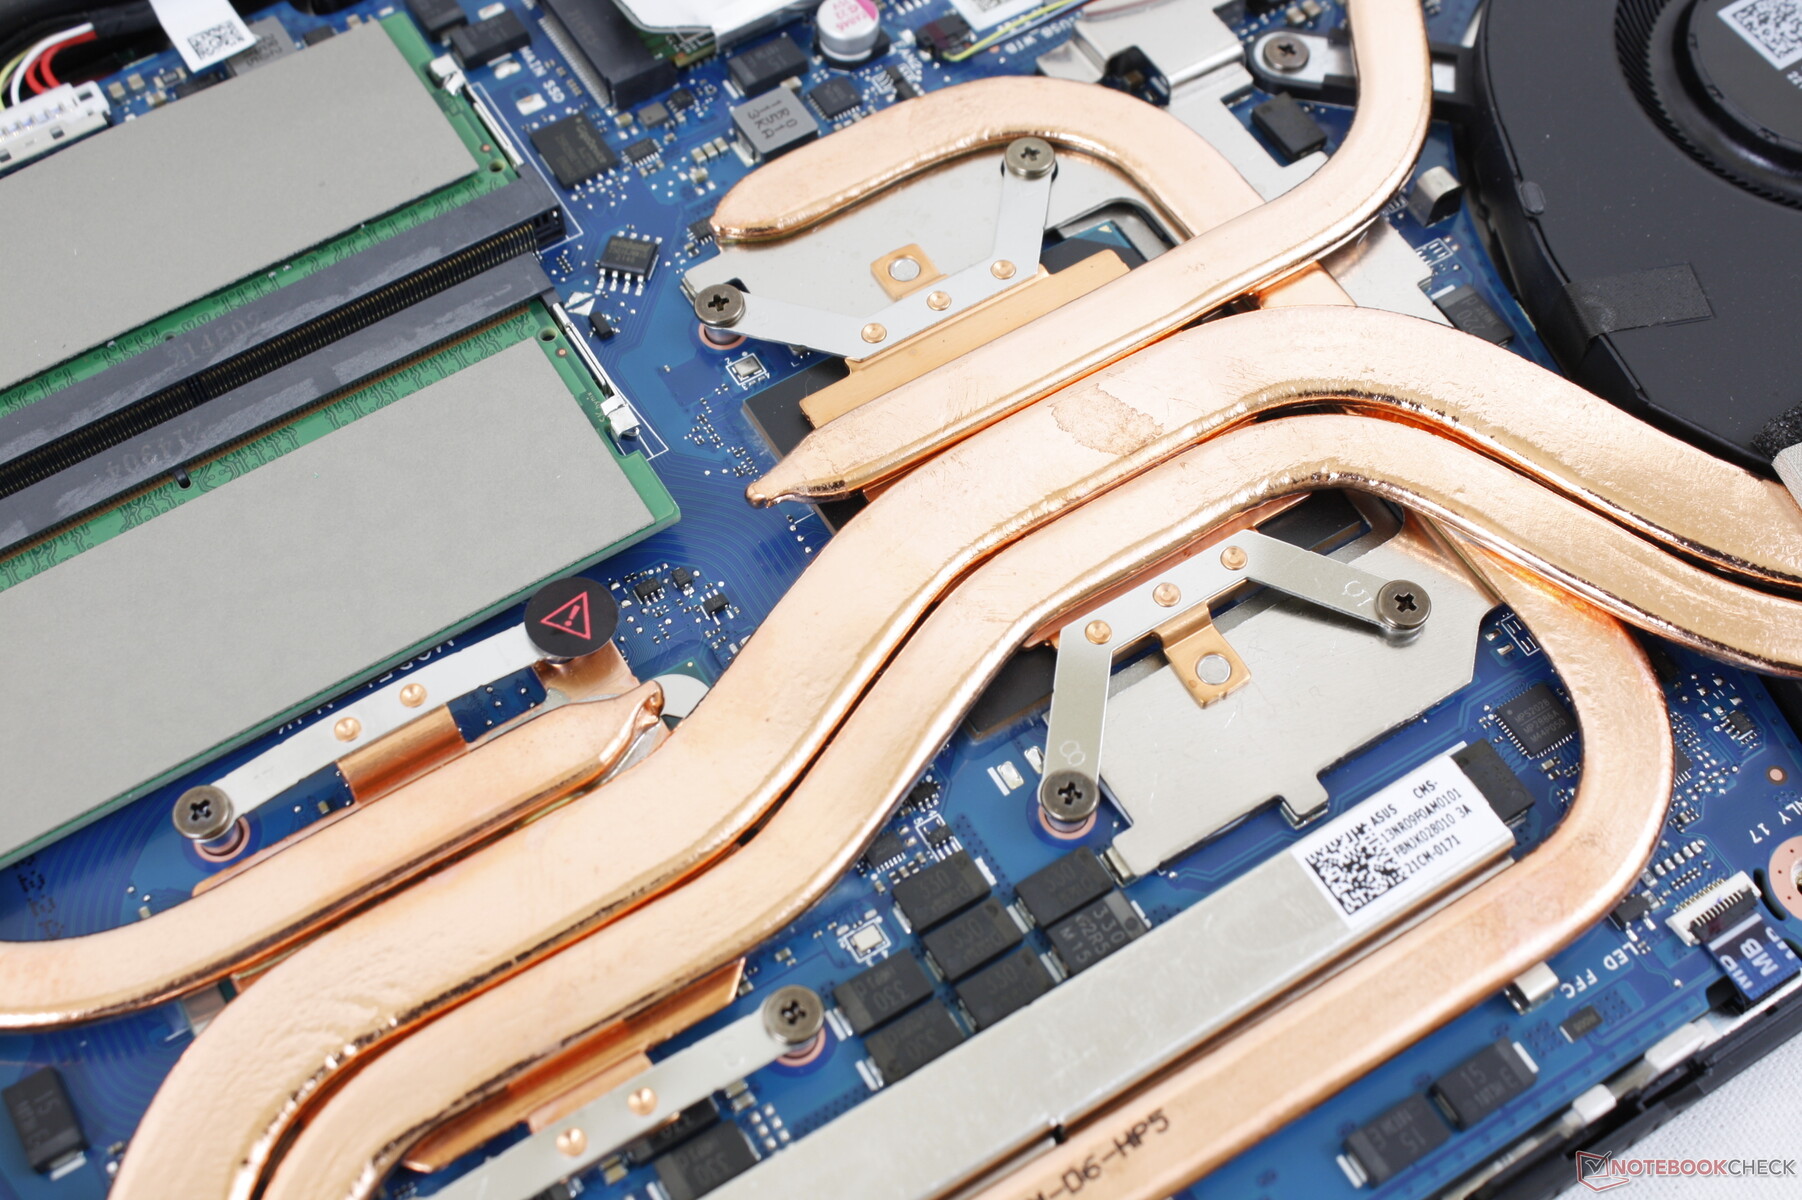
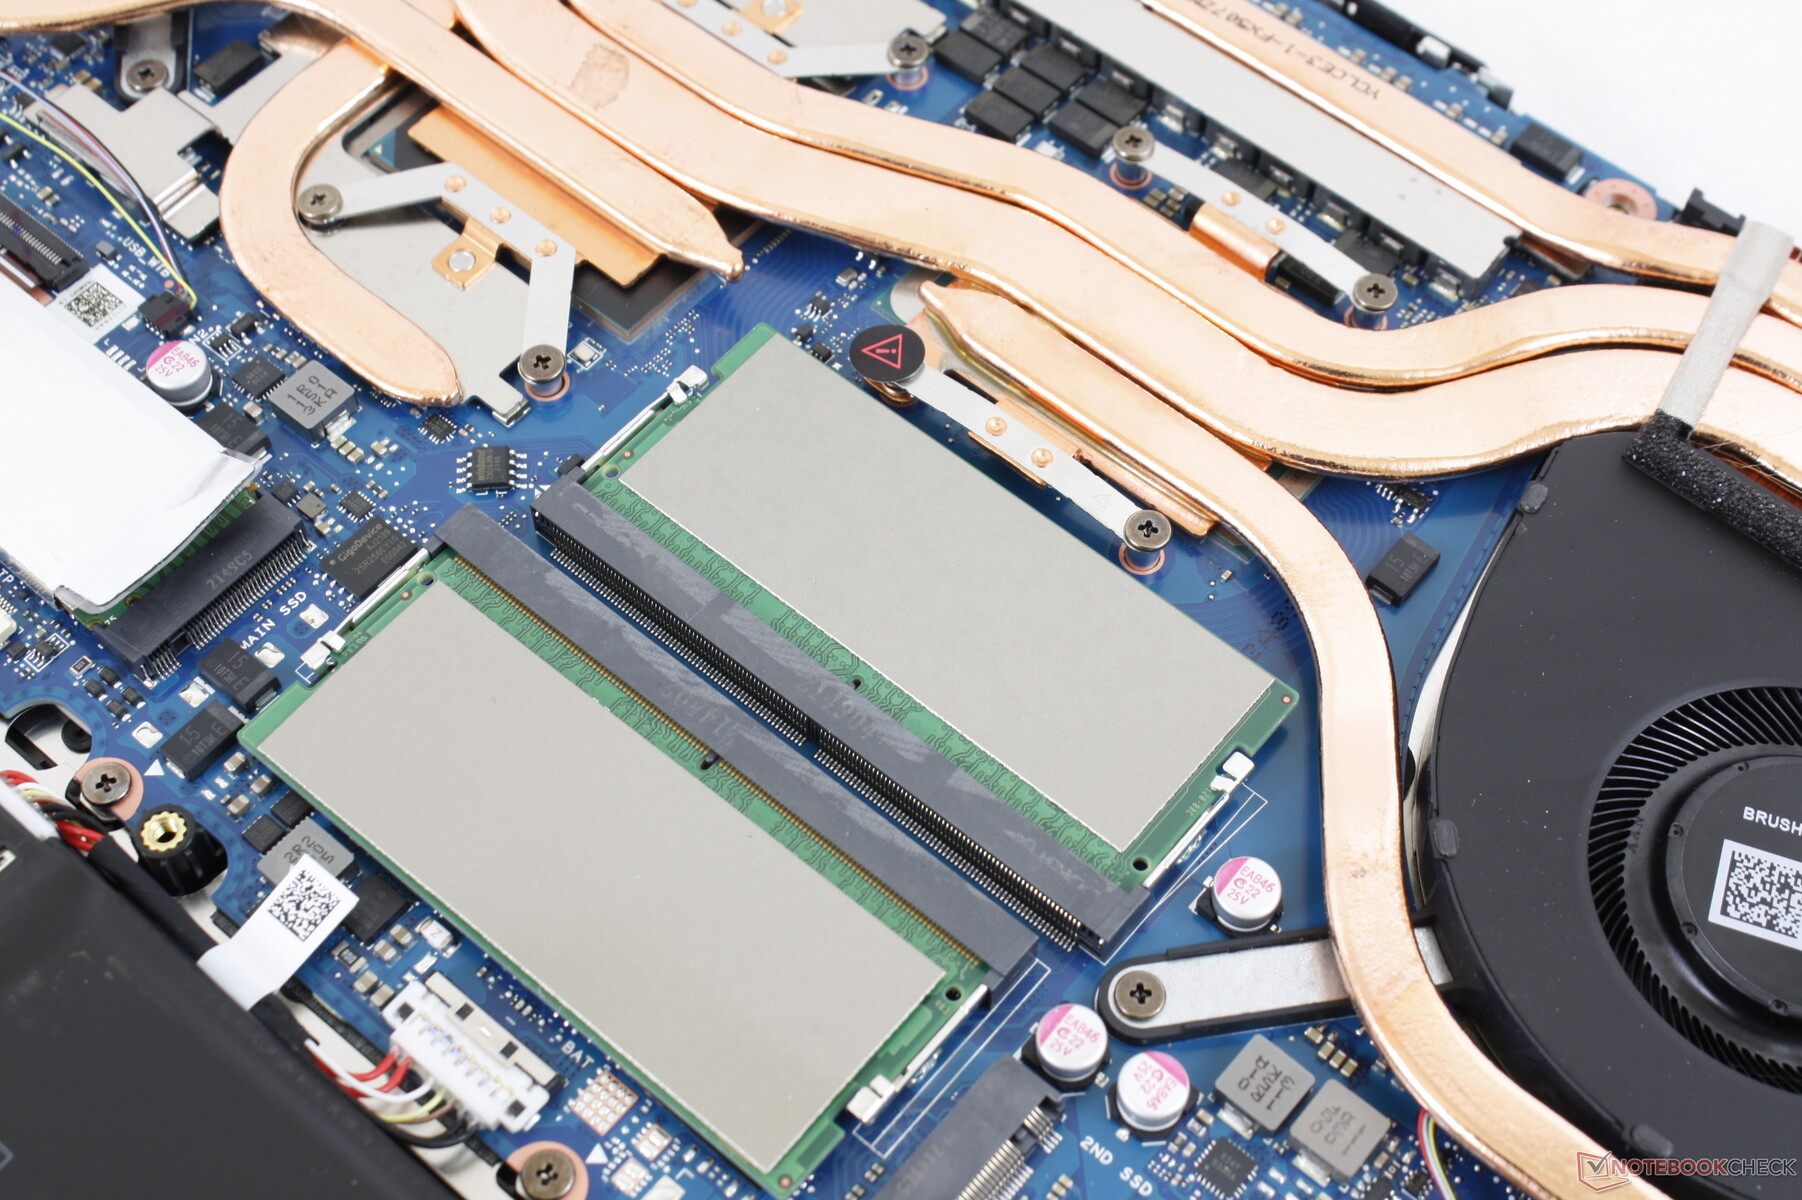
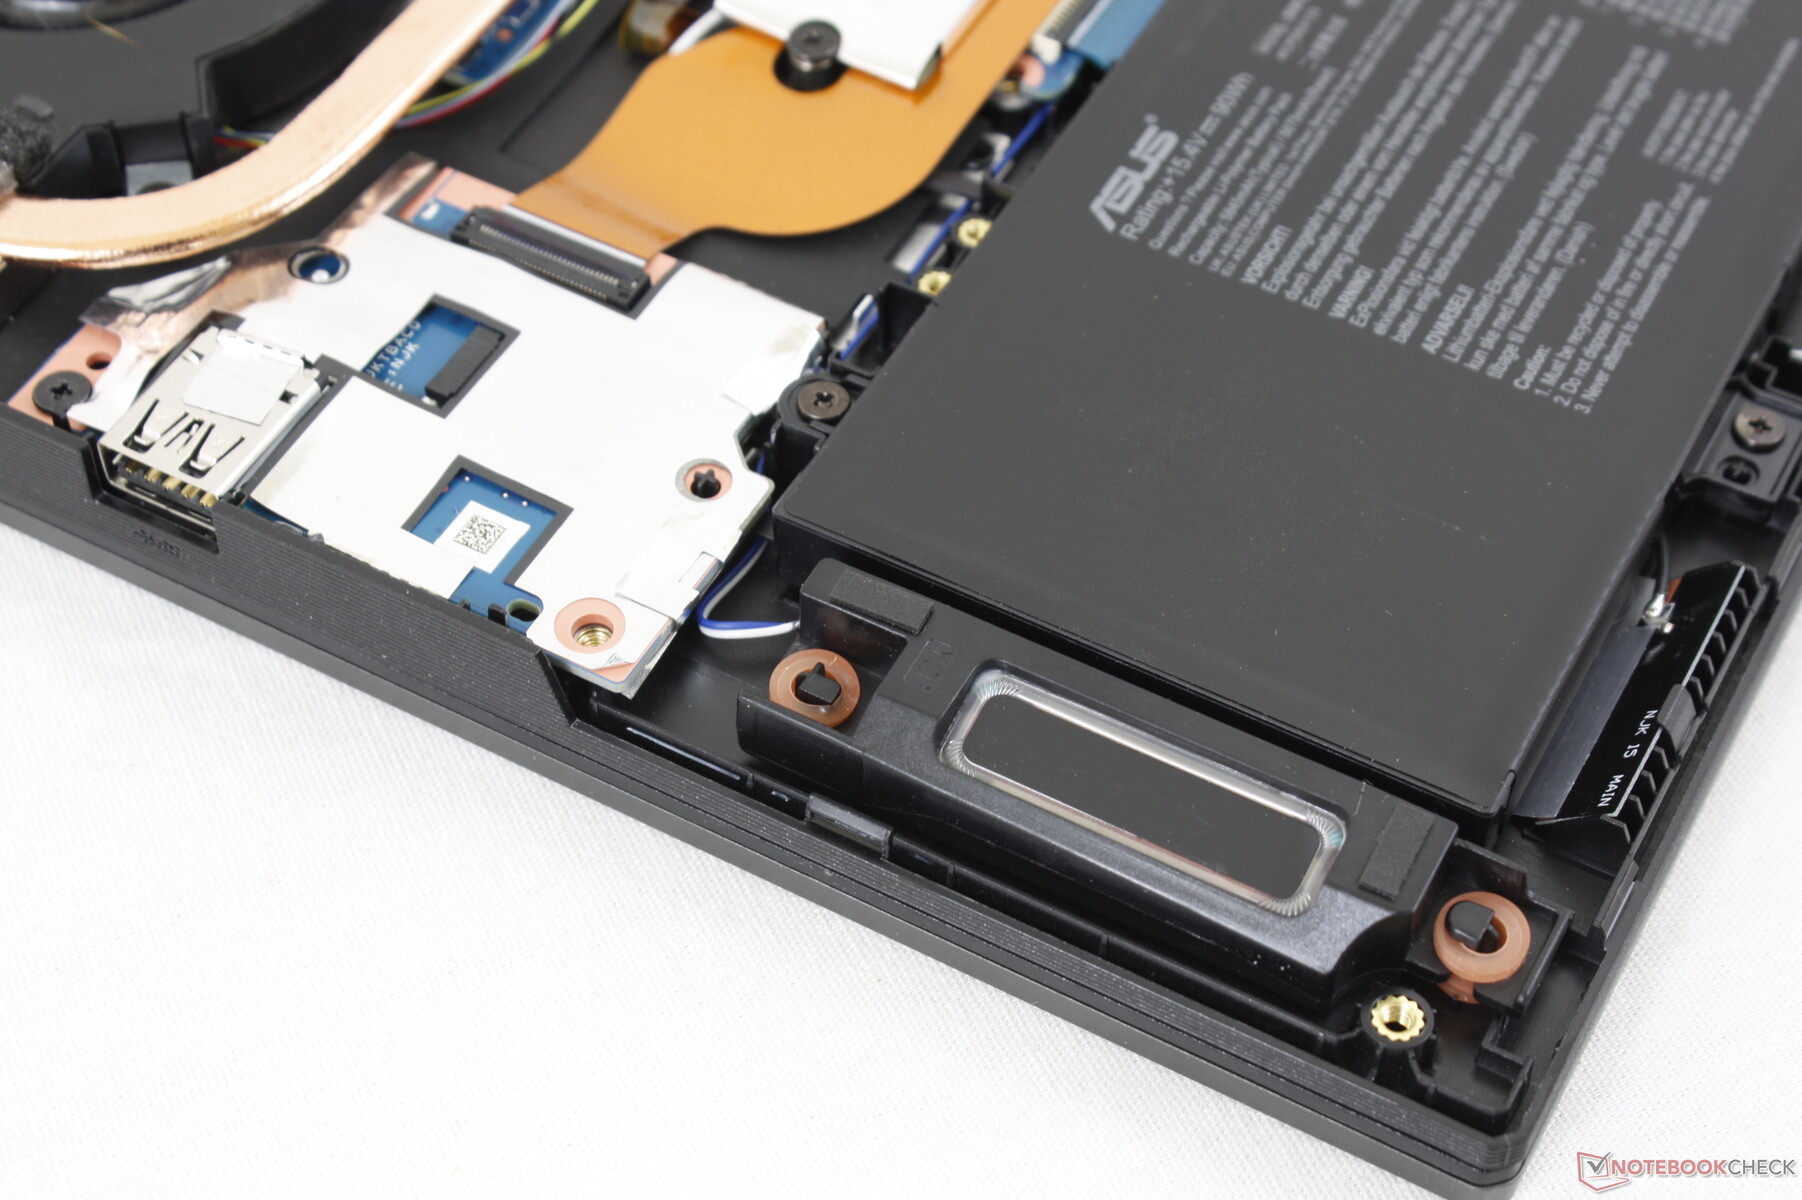
The bottom panel is relatively easy to remove with a Philips screwdriver and flat edge. The internals have been revamped as shown by the comparison images below, but the 2x SODIMM slots, 2x M.2 SSD slots, and removable WLAN module remains.
Accessories and Warranty
There are no extras in the box other than the usual AC adapter and paperwork. The typical one-year manufacturer warranty applies.
Input Devices — Different But Not Necessarily Better
Keyboard
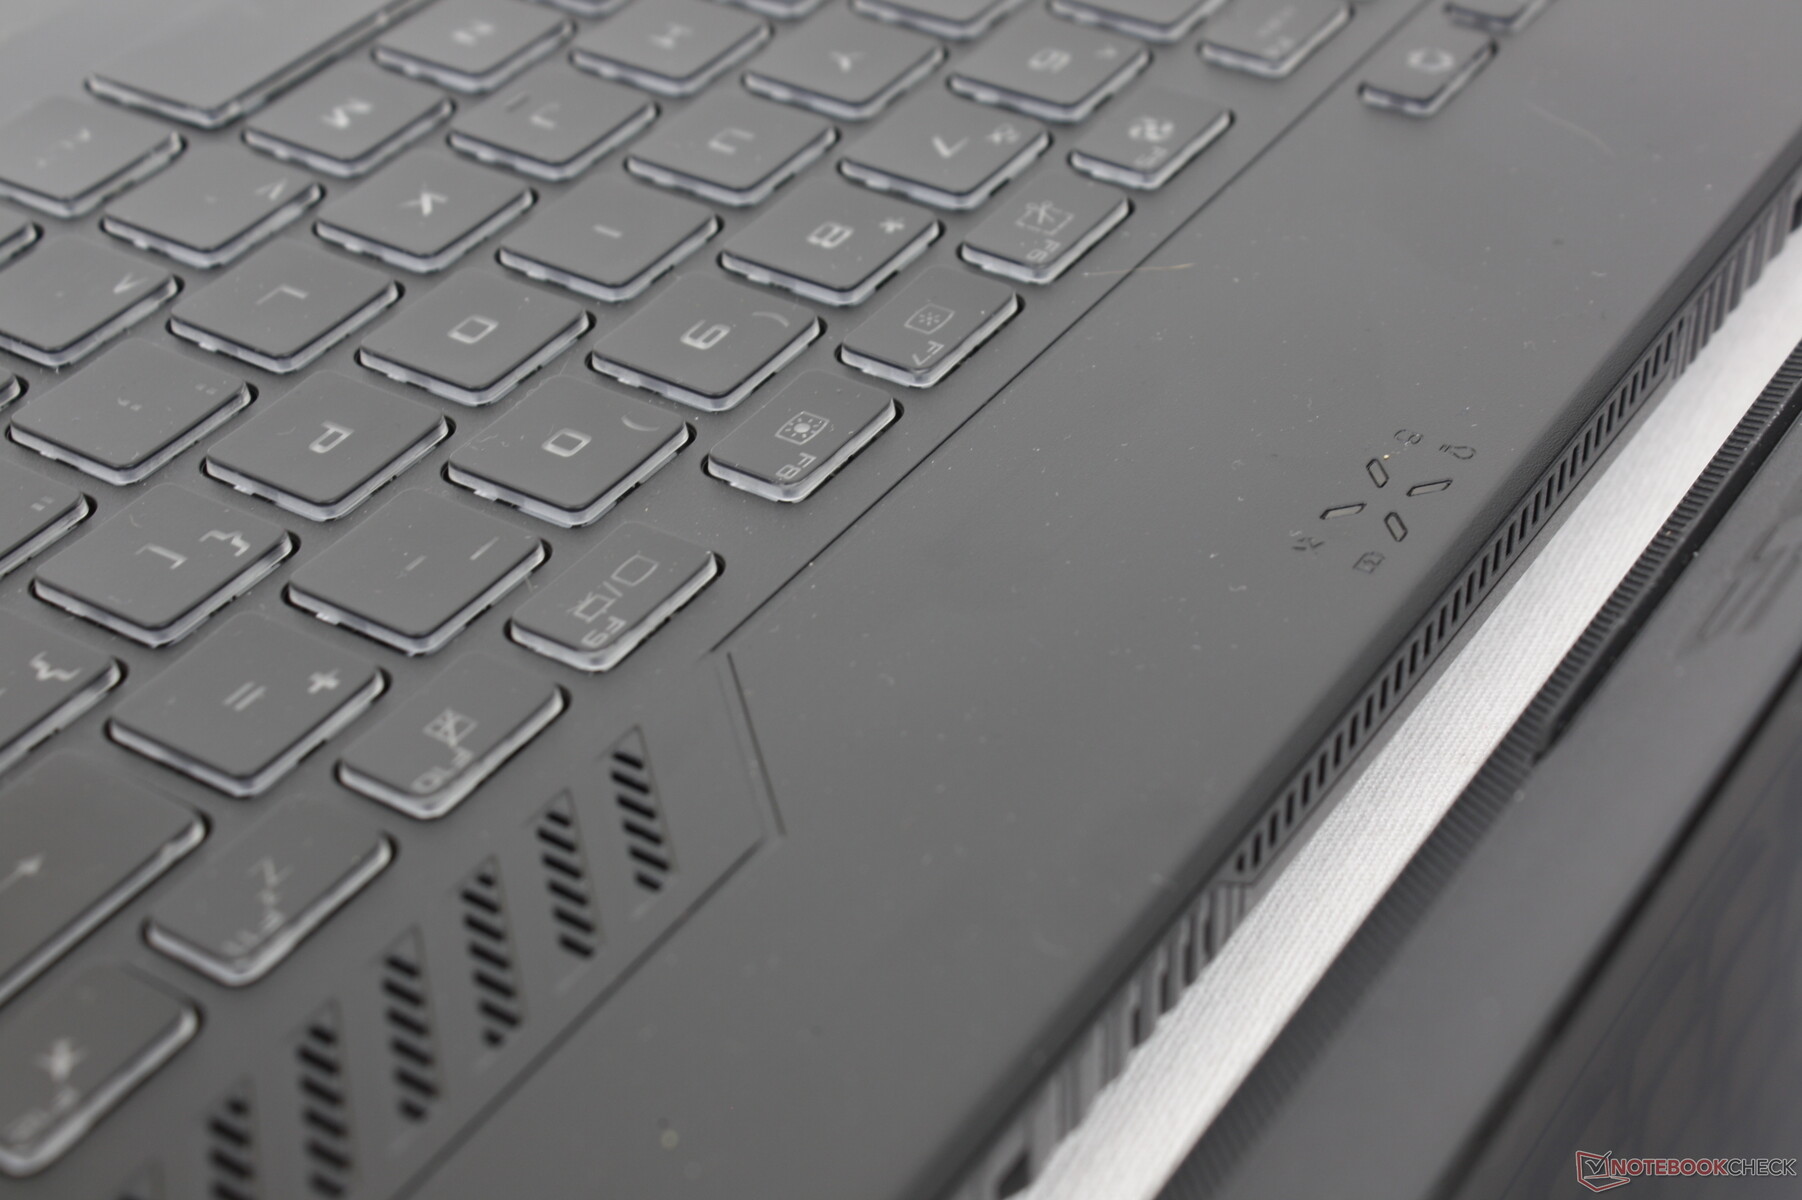
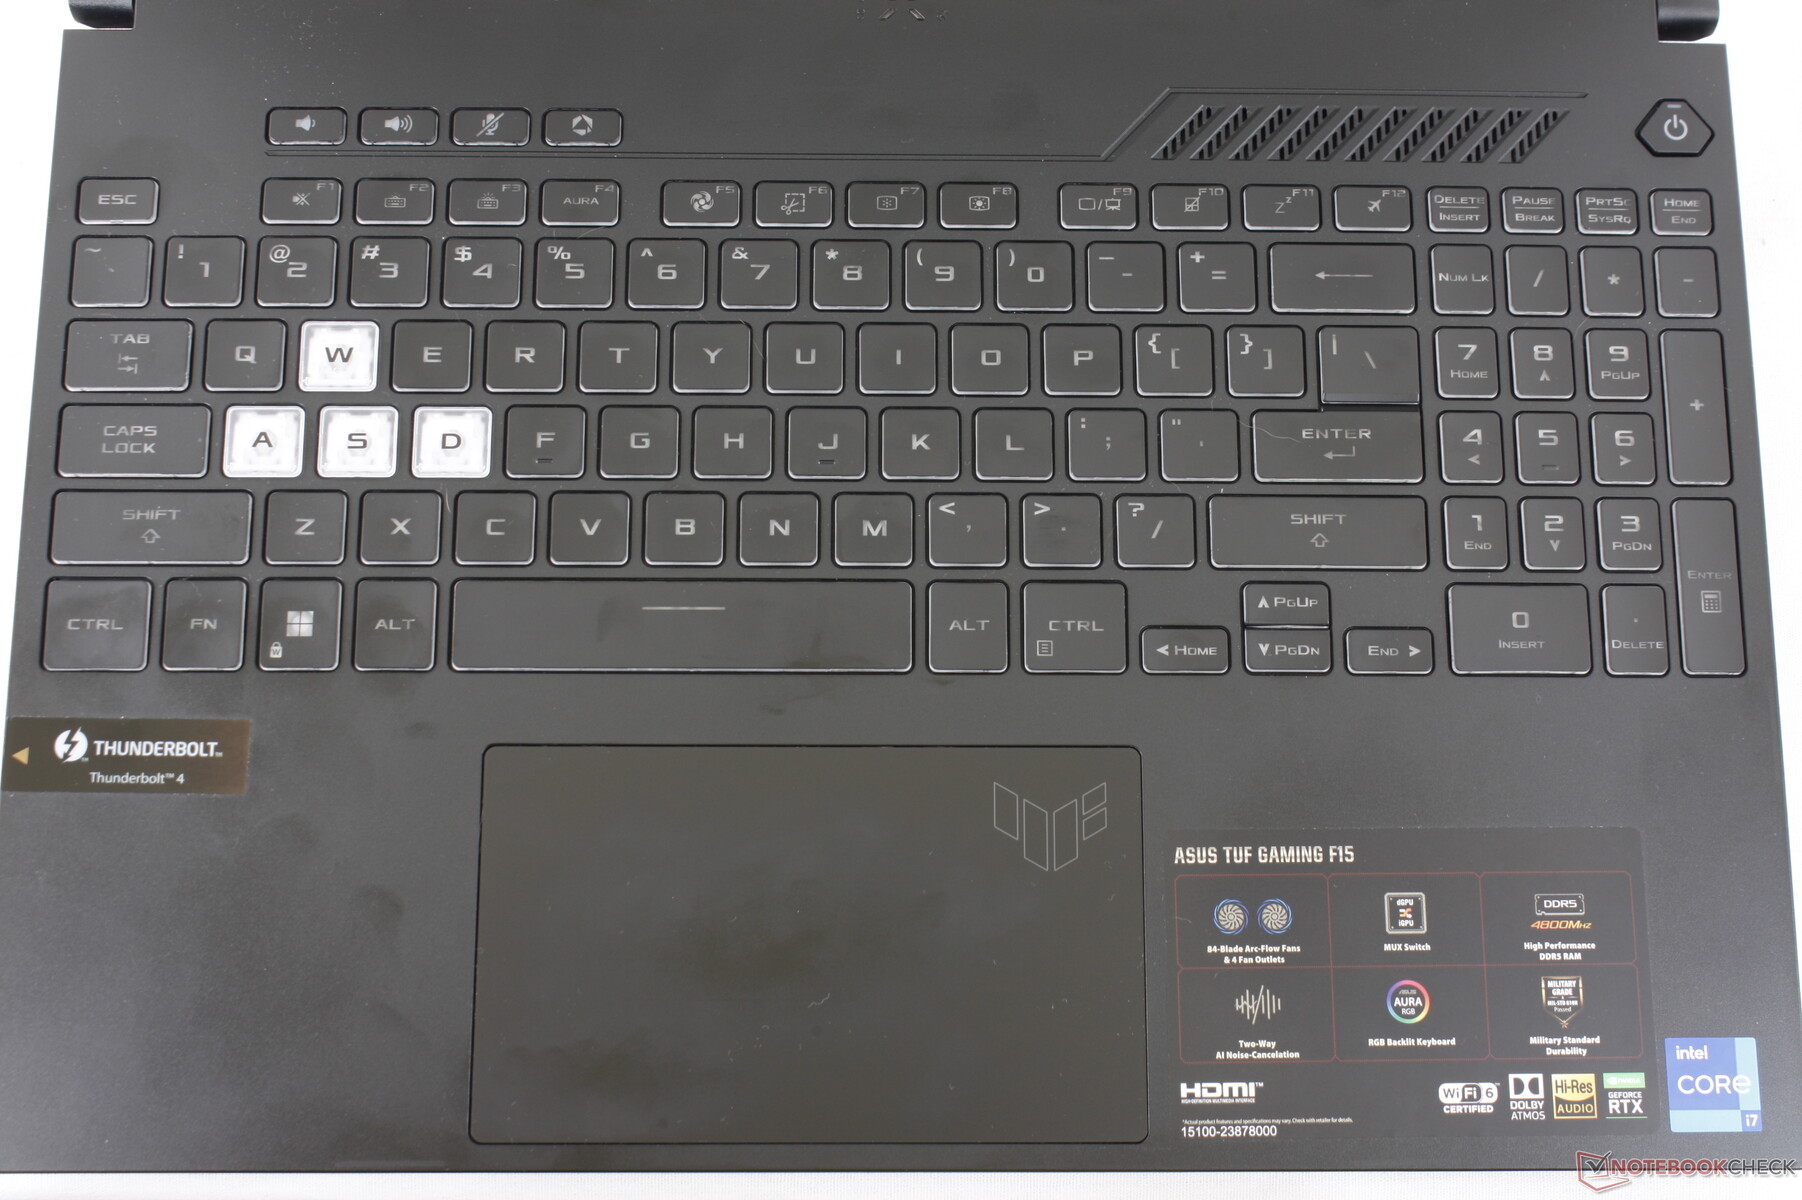
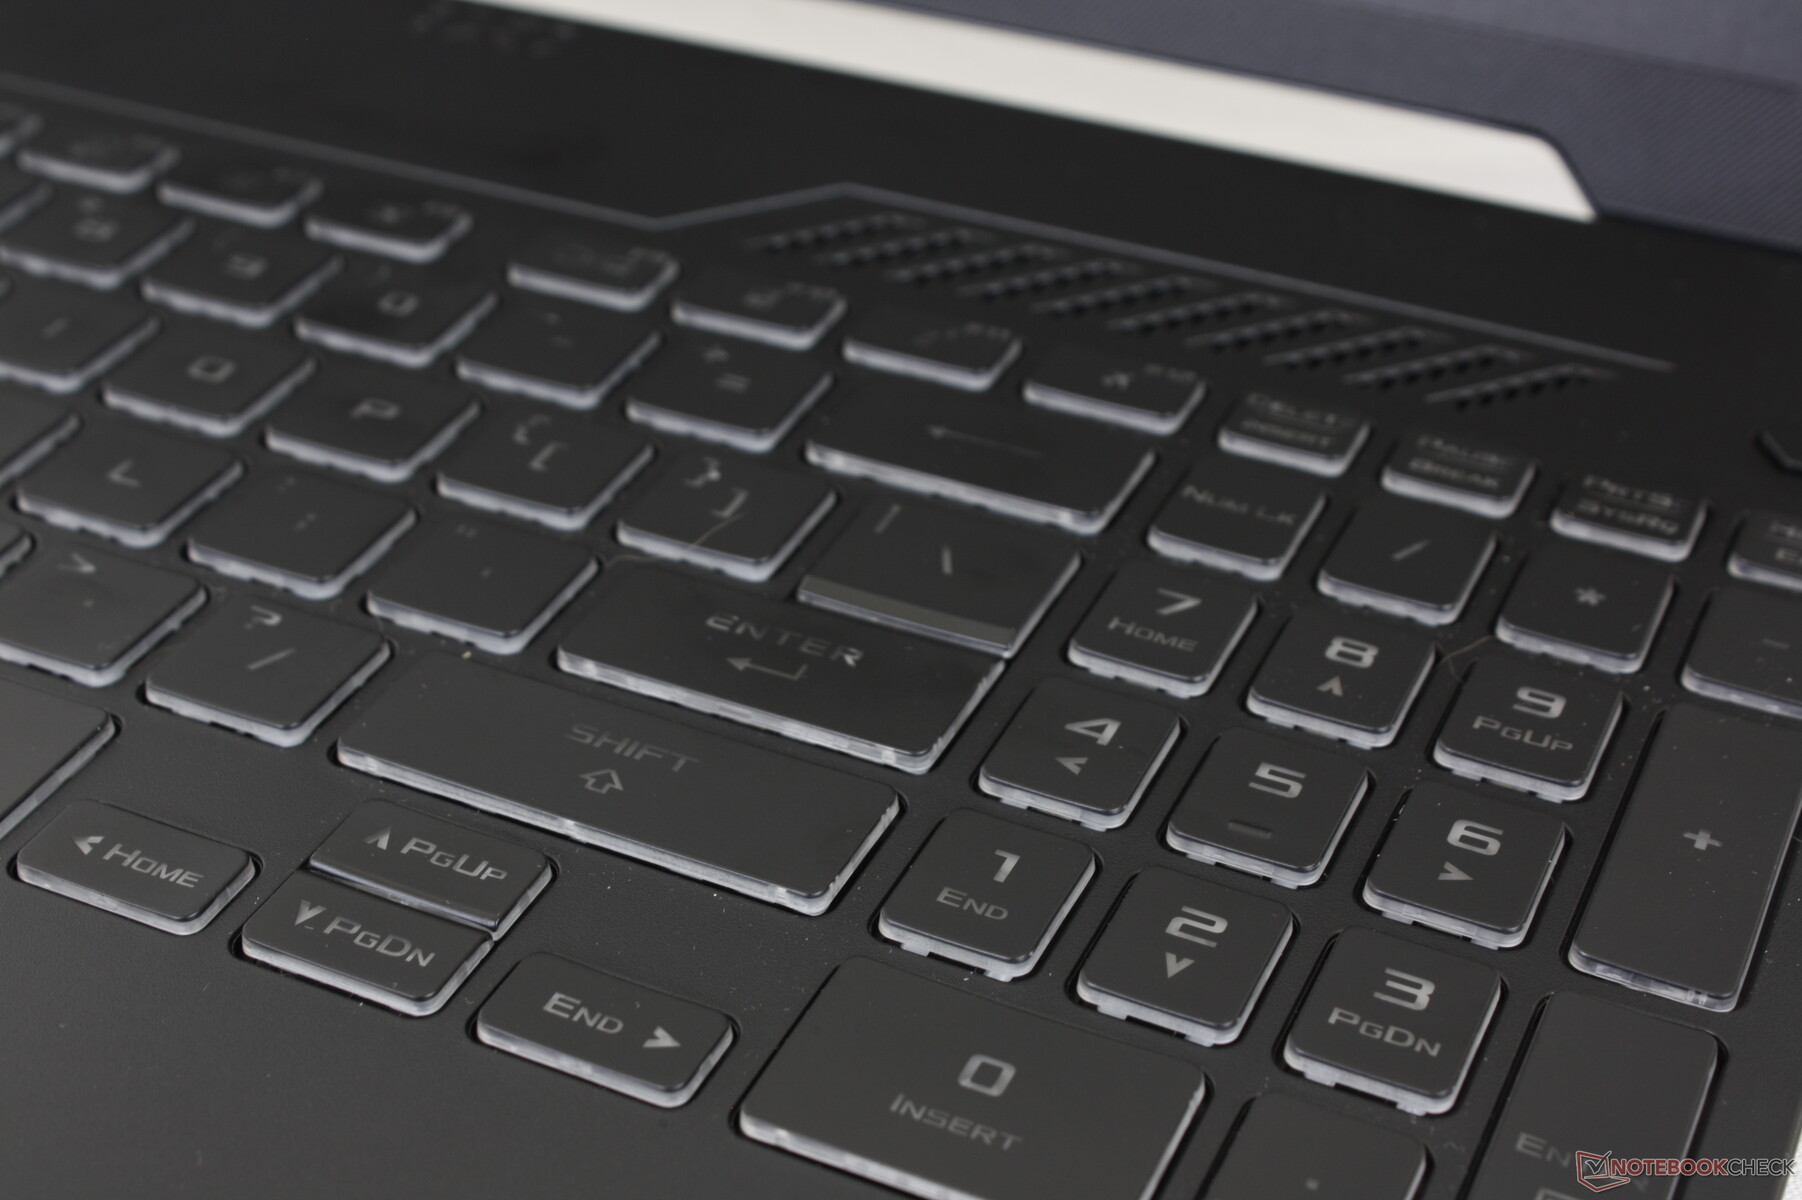
Asus has revised the keyboard layout when compared to the FX506. Some of the auxiliary keys are now in their own row near the top left while the arrow keys are now slightly longer in length. The font on each key is also darker and grayer which unfortunately makes it more difficult to read.
Both key feedback and the single-zone RGB backlight remain identical year-over-year. We find the keys to the lighter and softer side when compared to the keys on the Eurocom RX315 while being very close to the keyboards on most Zephyrus S models.
Touchpad
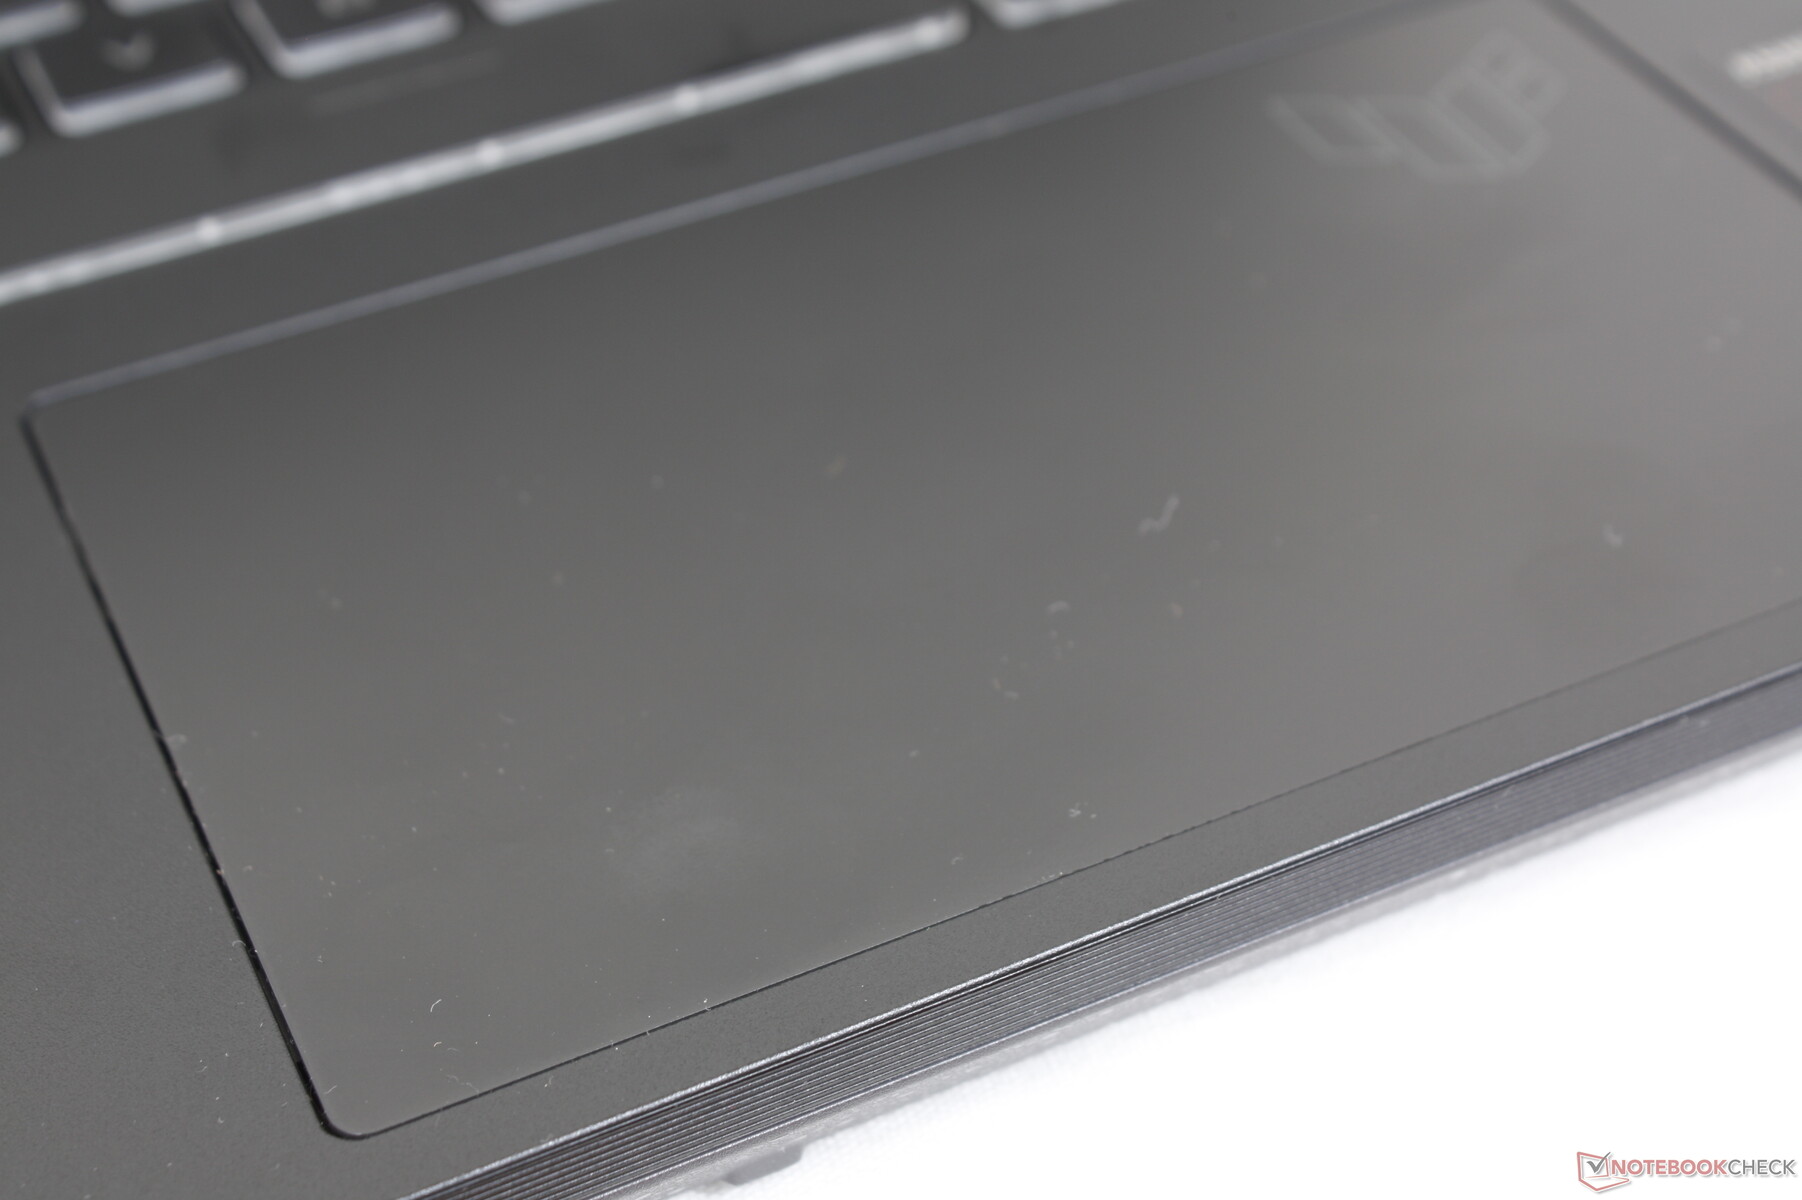
The FX507 has dropped the dedicated mouse buttons on the FX506 for a larger clickpad surface area (13 x 7.8 cm vs. 10.6 x 8.0 cm). Gliding is smooth at all speeds with very little sticking, but feedback is weak and somewhat spongy when inputting clicks. Drag-and-drag actions are therefore not as comfortable as on the older FX506.

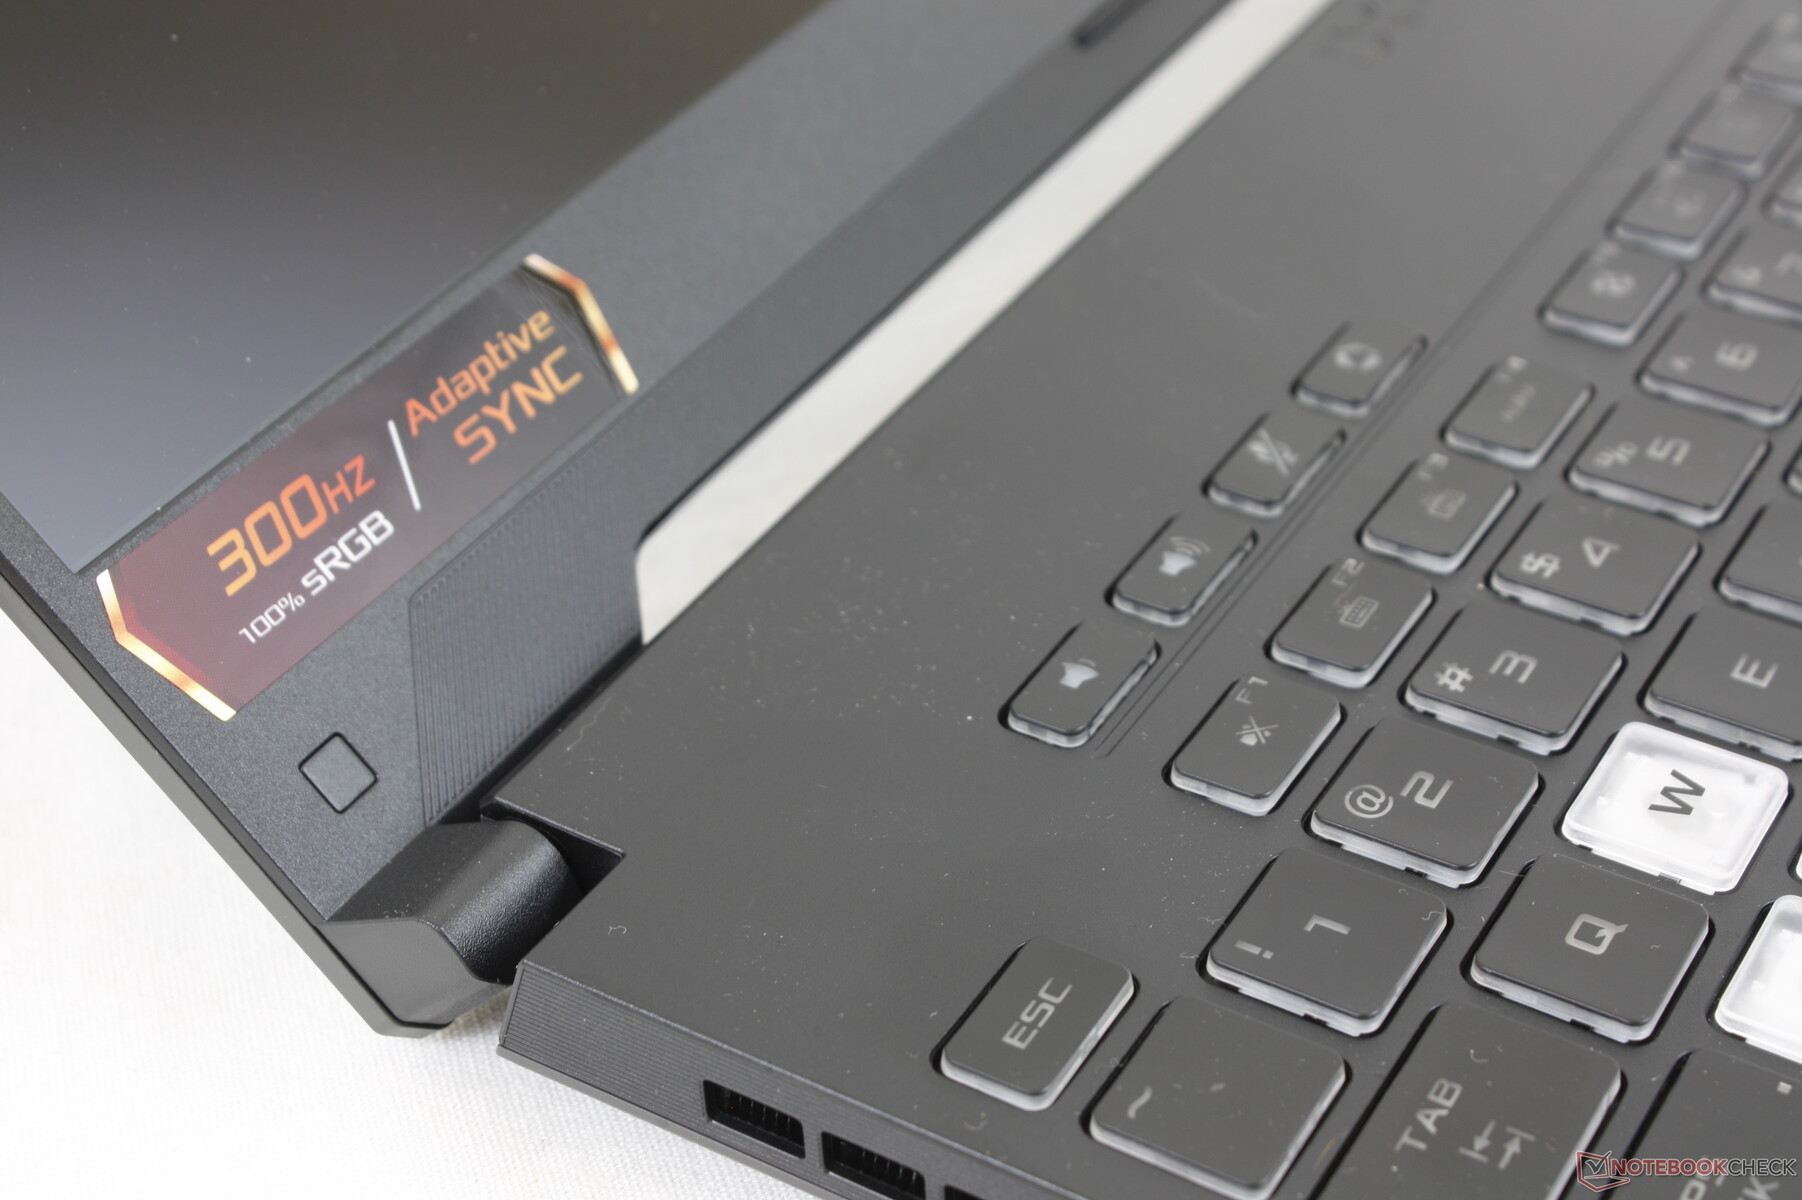
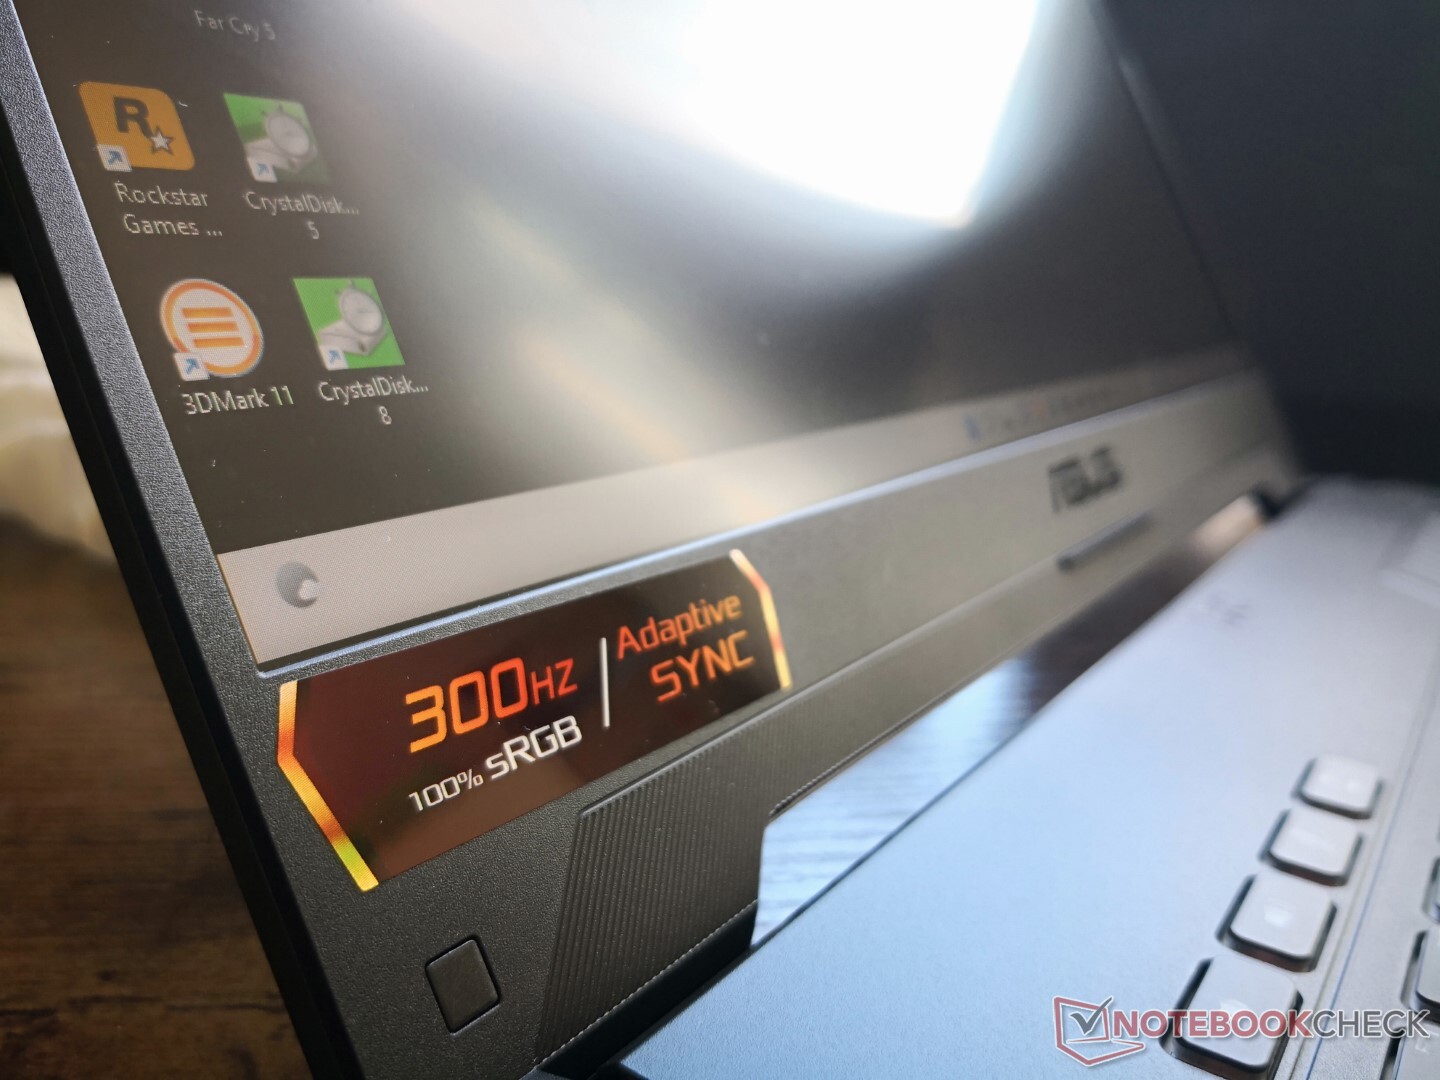
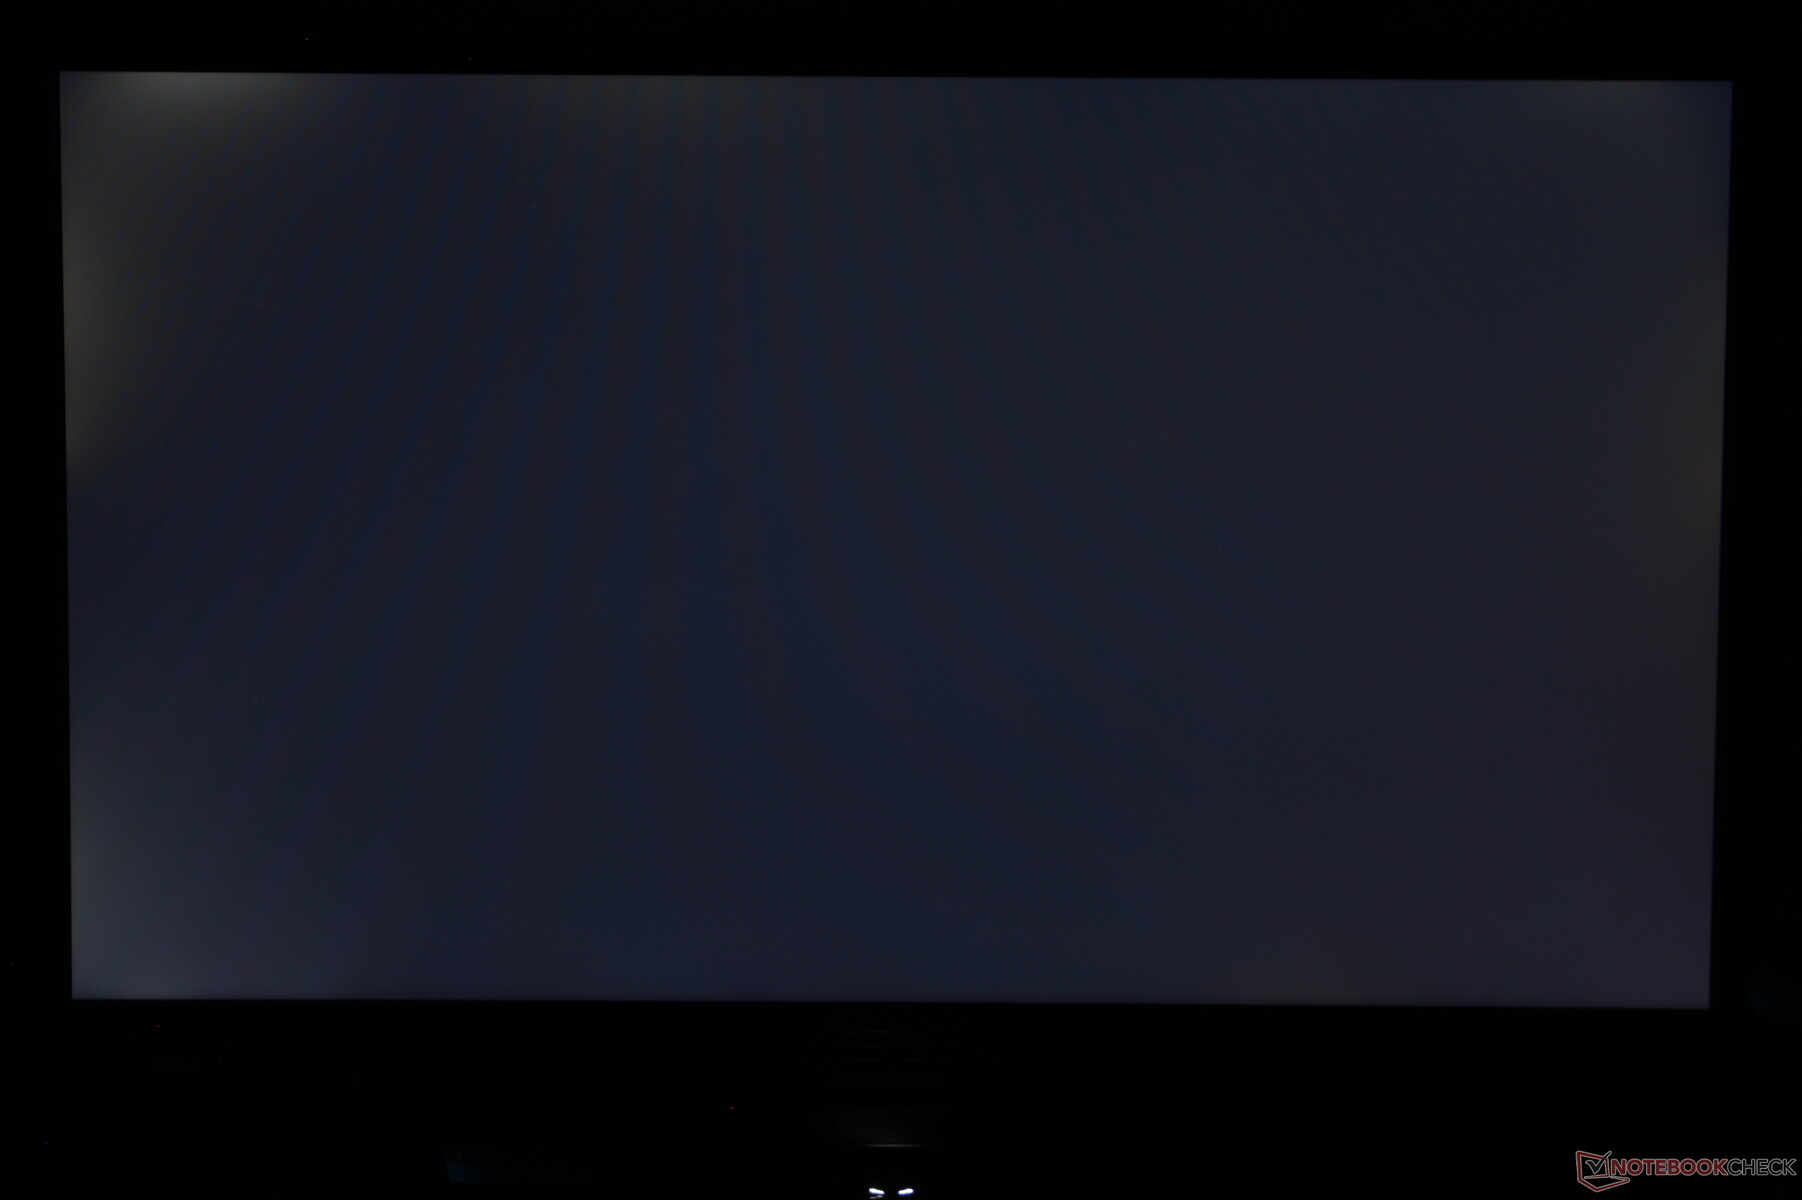
Display — 300 Hz with Adaptive Sync
Asus has upgraded the 240 Hz Sharp LQ156M1JW26 IPS panel on the older FX516PR for a faster 300 Hz Sharp TL156VDXP0101 IPS panel on the FX507. Aside from the higher refresh rate, the newer panel also provides faster gray-gray response times and a brighter backlight while maintaining roughly the same contrast ratio and gamut as on the FX516PR.
We're happy to see that Asus has dropped the horrid Chi Mei panel on the FX506 which had significantly inferior colors and response times.

| |||||||||||||||||||||||||
Brightness Distribution: 89 %
Center on Battery: 353.7 cd/m²
Contrast: 1040:1 (Black: 0.34 cd/m²)
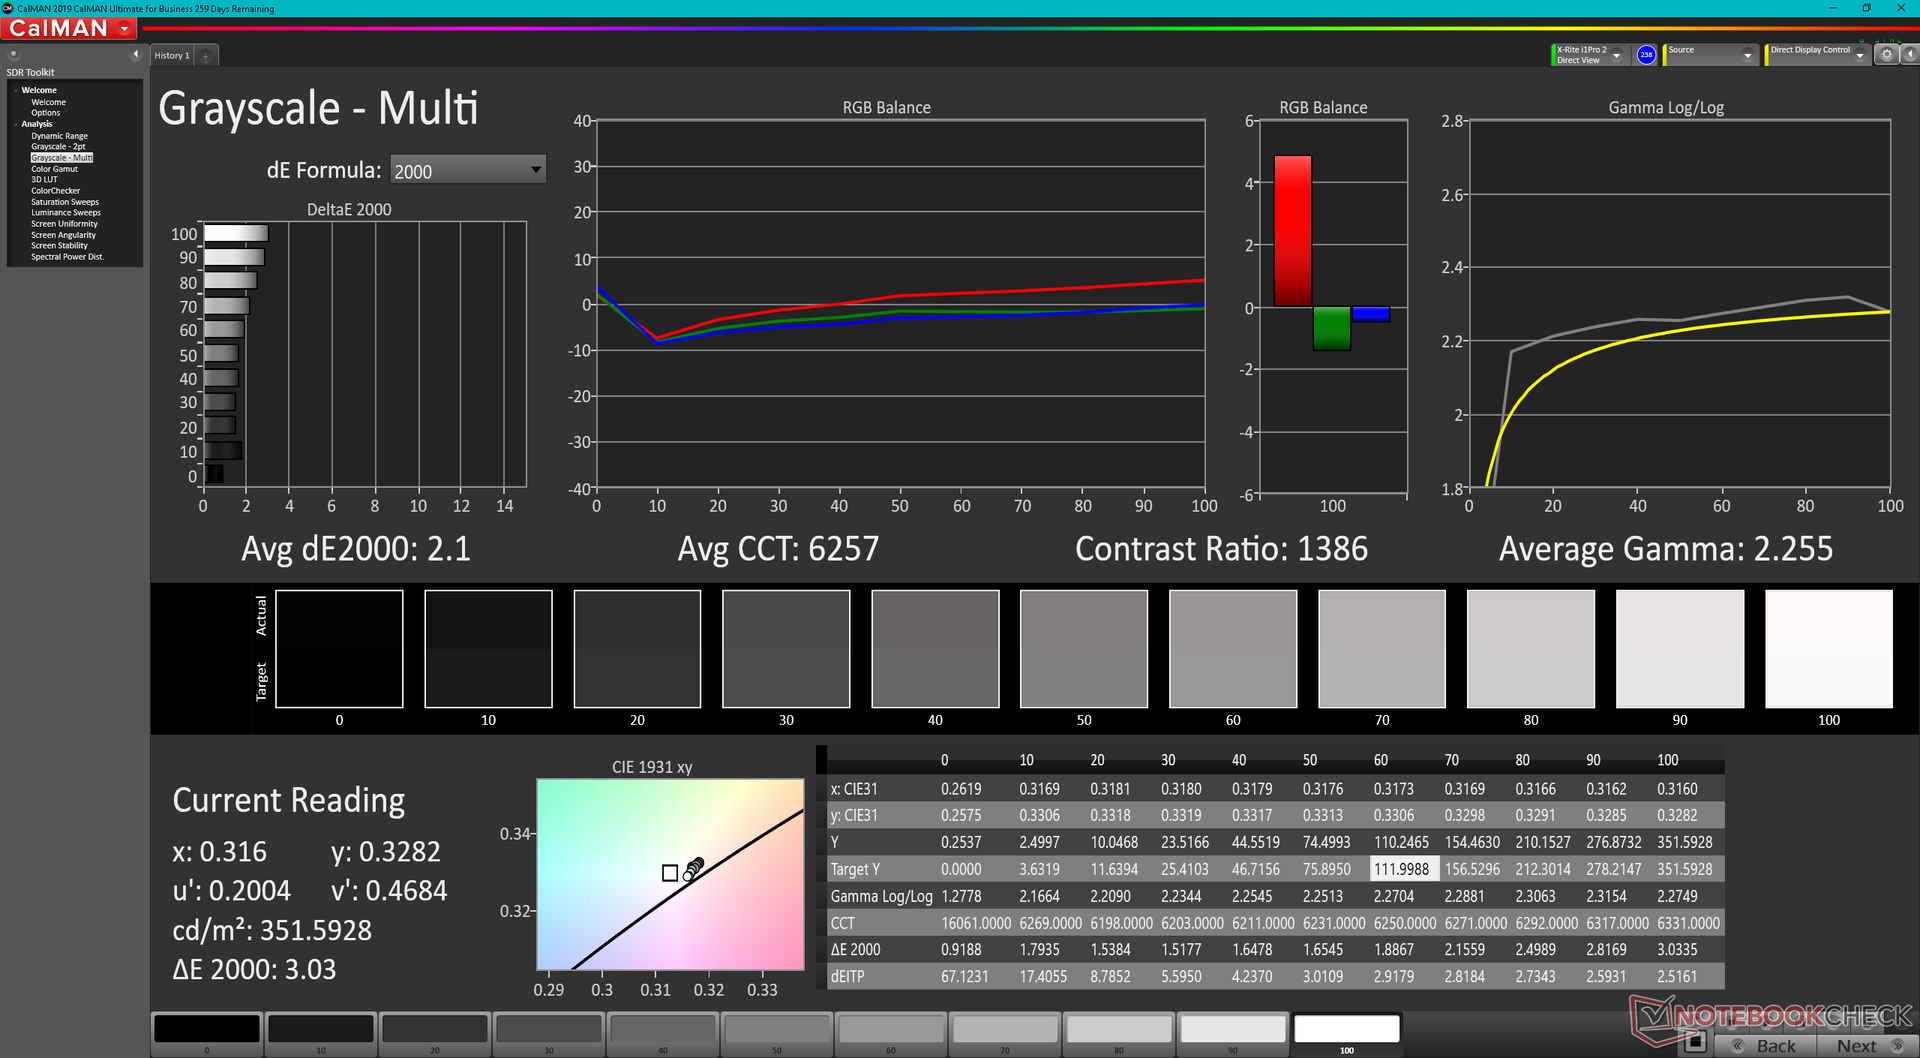
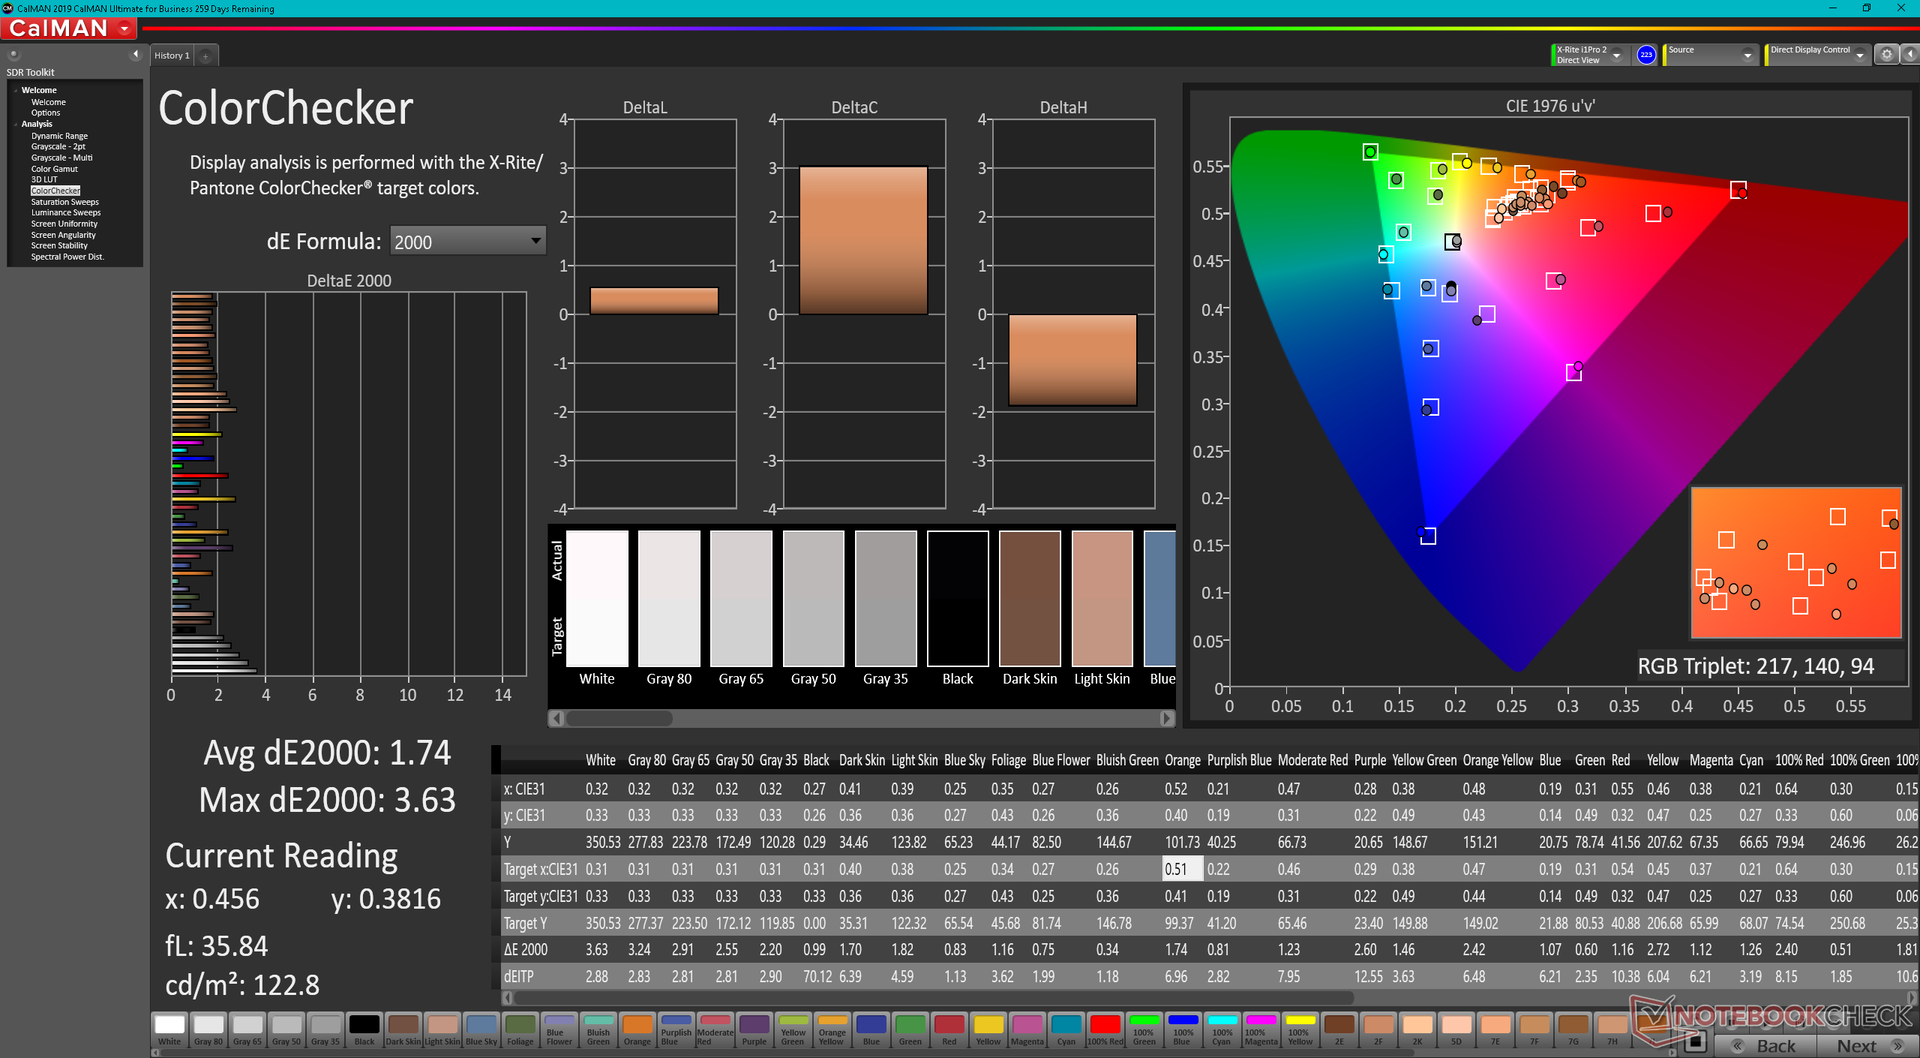
ΔE ColorChecker Calman: 1.74 | ∀{0.5-29.43 Ø4.72}
calibrated: 0.5
ΔE Greyscale Calman: 2.1 | ∀{0.09-98 Ø4.97}
68.5% AdobeRGB 1998 (Argyll 3D)
97% sRGB (Argyll 3D)
66.4% Display P3 (Argyll 3D)
Gamma: 2.3
CCT: 6257 K
| Asus TUF Gaming F15 FX507ZM TL156VDXP0101, IPS, 1920x1080, 15.6" | Asus TUF Gaming F15 FX506HM Chi Mei N156HRA-EA1, IPS, 1920x1080, 15.6" | Asus TUF Dash F15 FX516PR LQ156M1JW26 (SHP1532), IPS, 1920x1080, 15.6" | Asus ROG Strix Scar 15 G533QS BOE CQ NE156QHM-NY1, IPS, 2560x1440, 15.6" | Asus Zephyrus S15 GX502L B156HAN12.0 (AUOBC8C), IPS, 1920x1080, 15.6" | Asus ZenBook Pro Duo UX582 LR-1BH2 SDC4143, OLED + IPS, 3840x2160, 15.6" | |
|---|---|---|---|---|---|---|
| Display | -36% | 0% | 25% | 4% | 33% | |
| Display P3 Coverage (%) | 66.4 | 41.9 -37% | 66.9 1% | 97.6 47% | 69.7 5% | 99.9 50% |
| sRGB Coverage (%) | 97 | 62.9 -35% | 98.1 1% | 99.9 3% | 99.7 3% | 100 3% |
| AdobeRGB 1998 Coverage (%) | 68.5 | 43.3 -37% | 67.9 -1% | 85.3 25% | 71.1 4% | 99.7 46% |
| Response Times | -238% | -46% | -74% | -63% | 69% | |
| Response Time Grey 50% / Grey 80% * (ms) | 5.6 ? | 28.4 ? -407% | 12 ? -114% | 14 ? -150% | 14 ? -150% | 2.4 ? 57% |
| Response Time Black / White * (ms) | 12.8 ? | 21.6 ? -69% | 10 ? 22% | 12.4 ? 3% | 9.6 ? 25% | 2.4 ? 81% |
| PWM Frequency (Hz) | 23580 ? | 59.5 ? | ||||
| Screen | -144% | -27% | -70% | -29% | -87% | |
| Brightness middle (cd/m²) | 353.7 | 268.3 -24% | 286 -19% | 304.3 -14% | 283 -20% | 345 -2% |
| Brightness (cd/m²) | 340 | 257 -24% | 275 -19% | 286 -16% | 289 -15% | 332 -2% |
| Brightness Distribution (%) | 89 | 84 -6% | 91 2% | 76 -15% | 90 1% | 87 -2% |
| Black Level * (cd/m²) | 0.34 | 0.34 -0% | 0.25 26% | 0.33 3% | 0.24 29% | |
| Contrast (:1) | 1040 | 789 -24% | 1144 10% | 922 -11% | 1179 13% | |
| Colorchecker dE 2000 * | 1.74 | 5.05 -190% | 2.43 -40% | 2.76 -59% | 2.26 -30% | 3.3 -90% |
| Colorchecker dE 2000 max. * | 3.63 | 15.43 -325% | 6.33 -74% | 5.57 -53% | 5.64 -55% | 7.2 -98% |
| Colorchecker dE 2000 calibrated * | 0.5 | 3.21 -542% | 0.83 -66% | 2.38 -376% | 1.11 -122% | 2.6 -420% |
| Greyscale dE 2000 * | 2.1 | 5.5 -162% | 3.5 -67% | 4 -90% | 3.4 -62% | 2 5% |
| Gamma | 2.3 96% | 2.35 94% | 2.32 95% | 2.14 103% | 2.228 99% | 2.01 109% |
| CCT | 6257 104% | 7392 88% | 7145 91% | 6844 95% | 7249 90% | 6566 99% |
| Color Space (Percent of AdobeRGB 1998) (%) | 68 | 71 | 89.2 | |||
| Color Space (Percent of sRGB) (%) | 91 | 93 | 100 | |||
| Total Average (Program / Settings) | -139% /
-134% | -24% /
-24% | -40% /
-50% | -29% /
-27% | 5% /
-31% |
* ... smaller is better
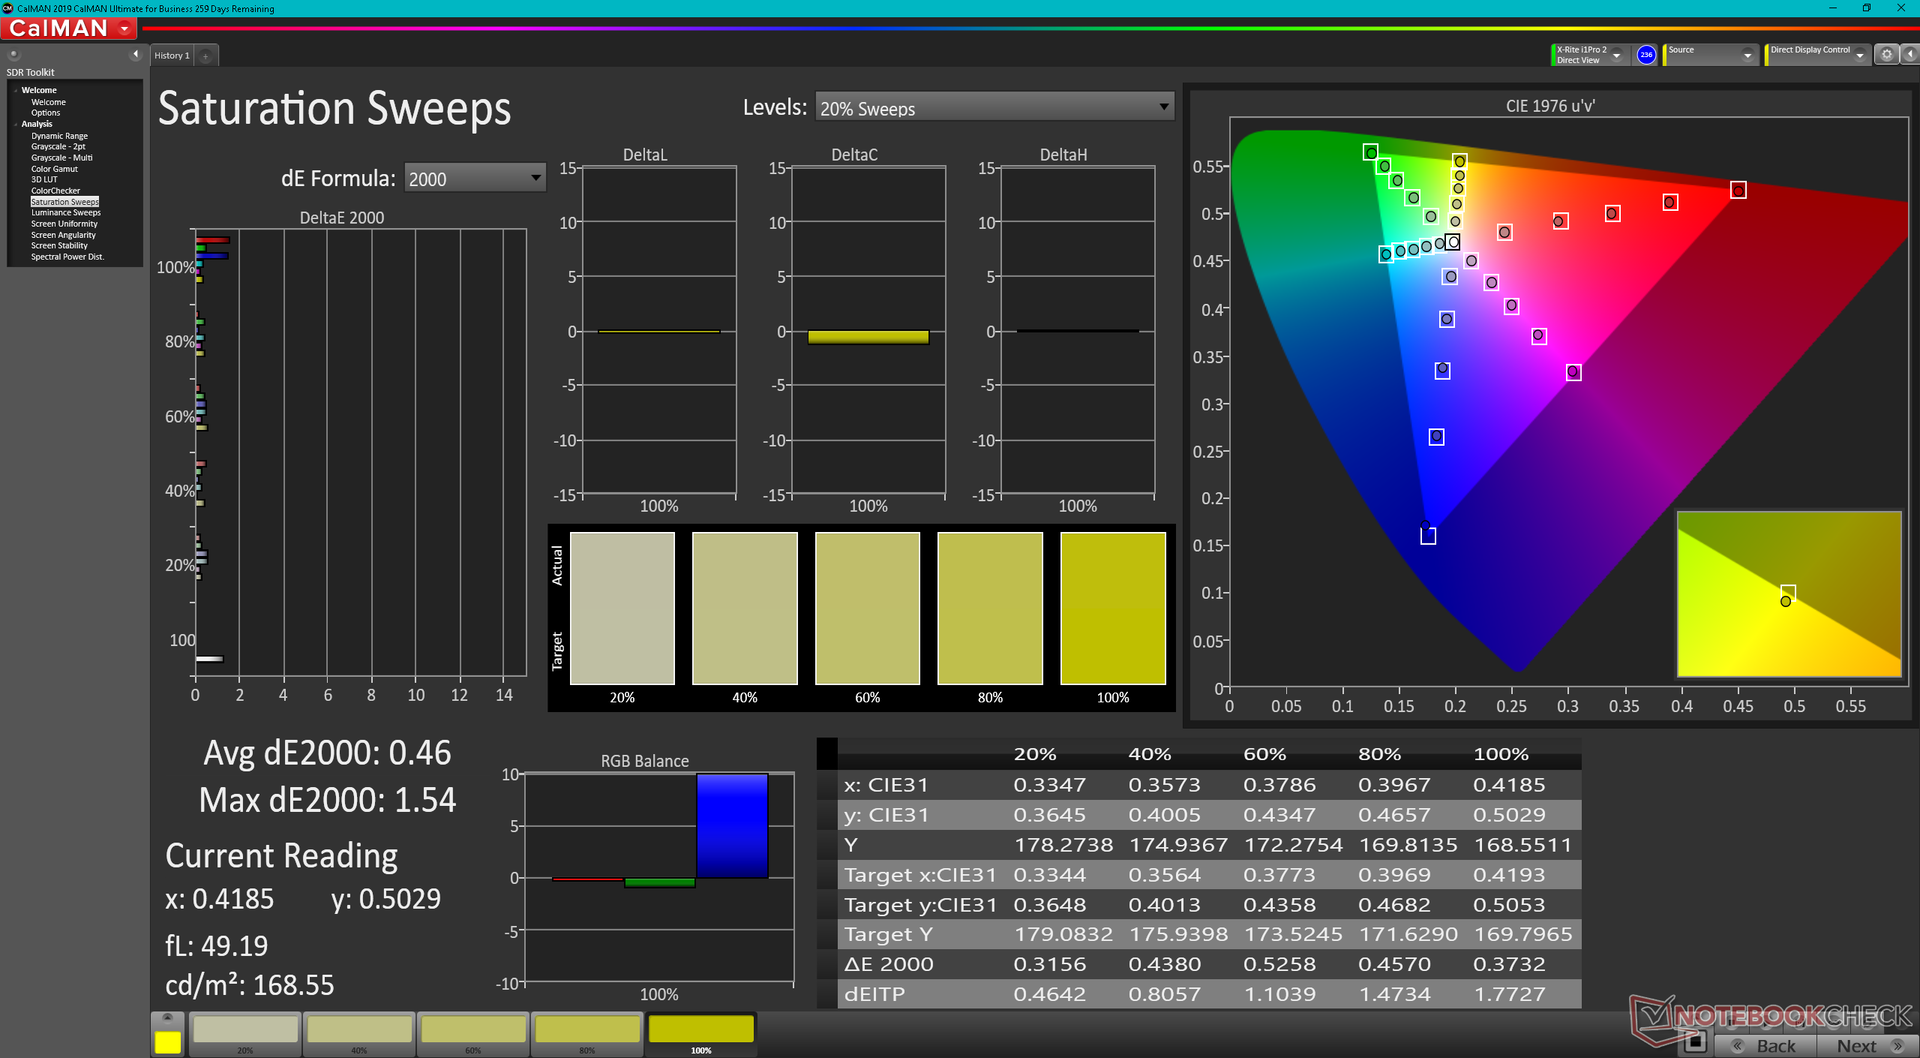
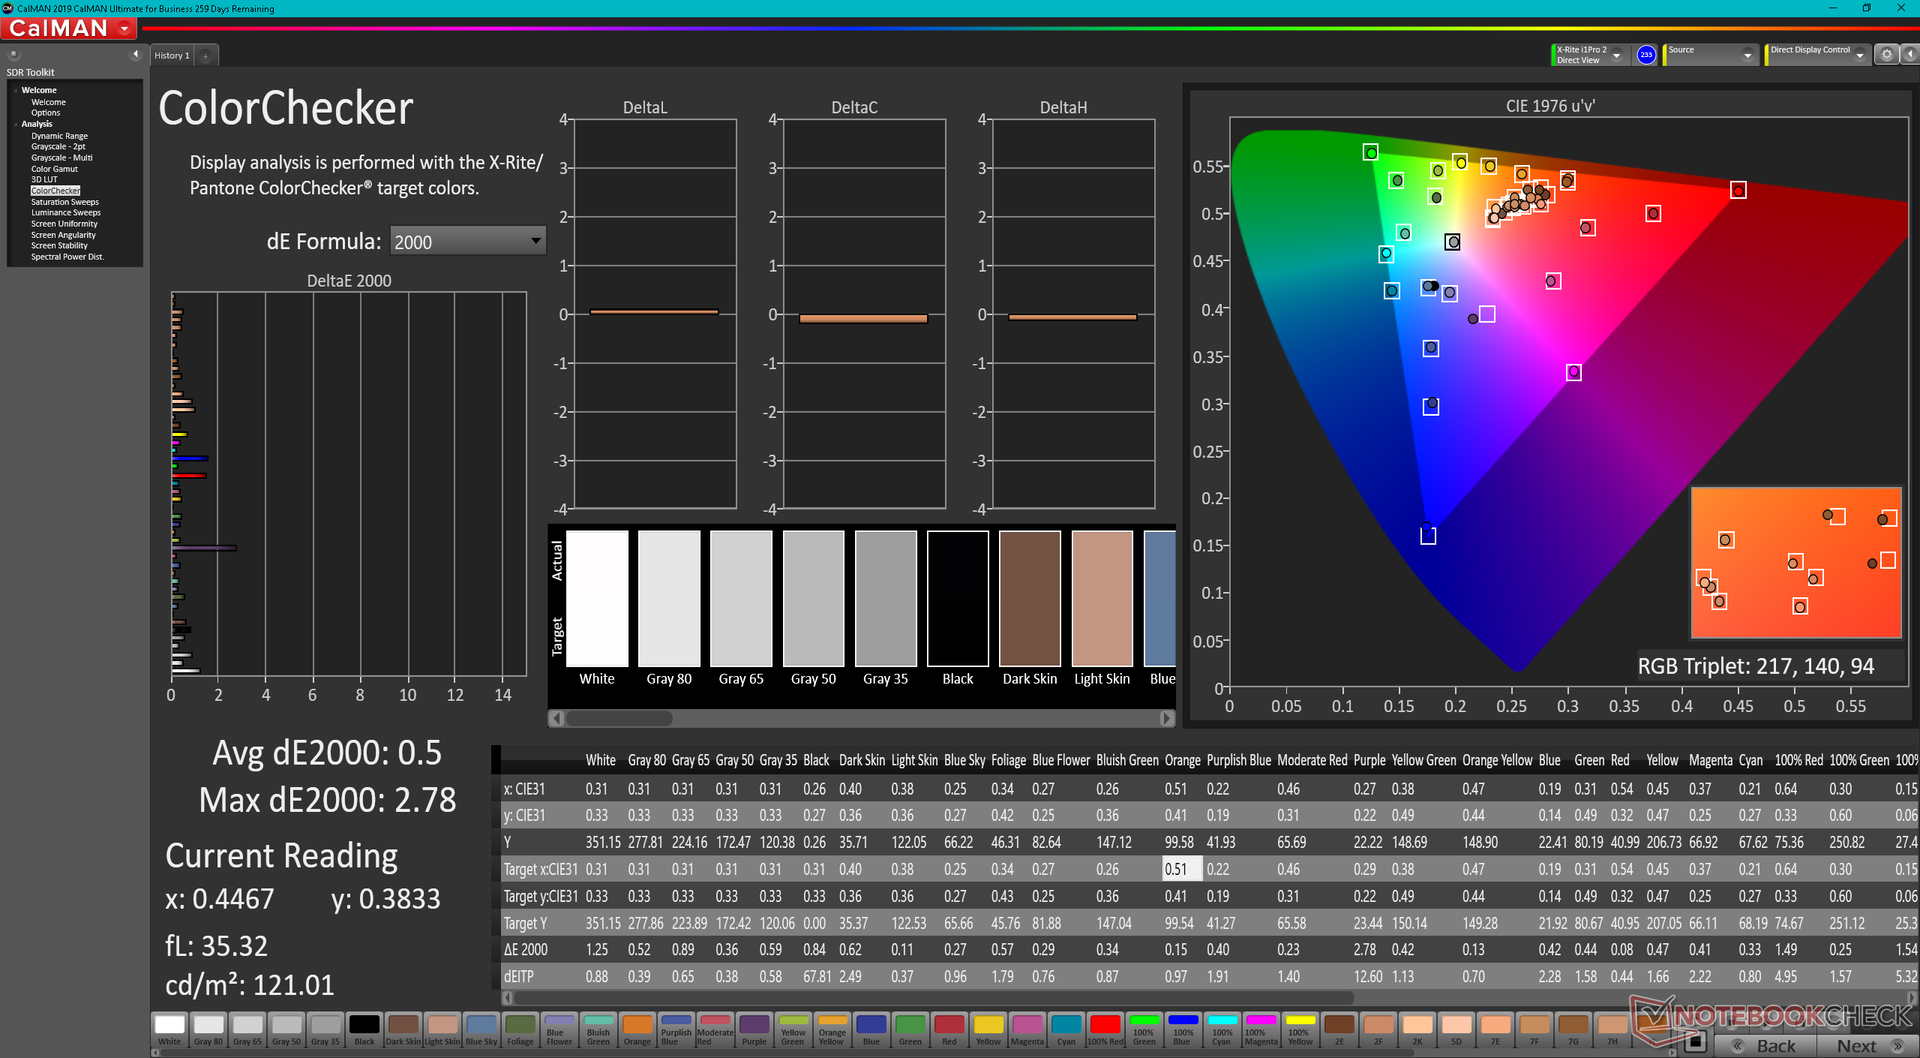
There are no significant color space changes between the FX506 and FX507. Asus does not offer any AdobeRGB or DCI-P3 coverage options for its FX507 series unlike on the Razer Blade 15 series or professional ZenBook series.
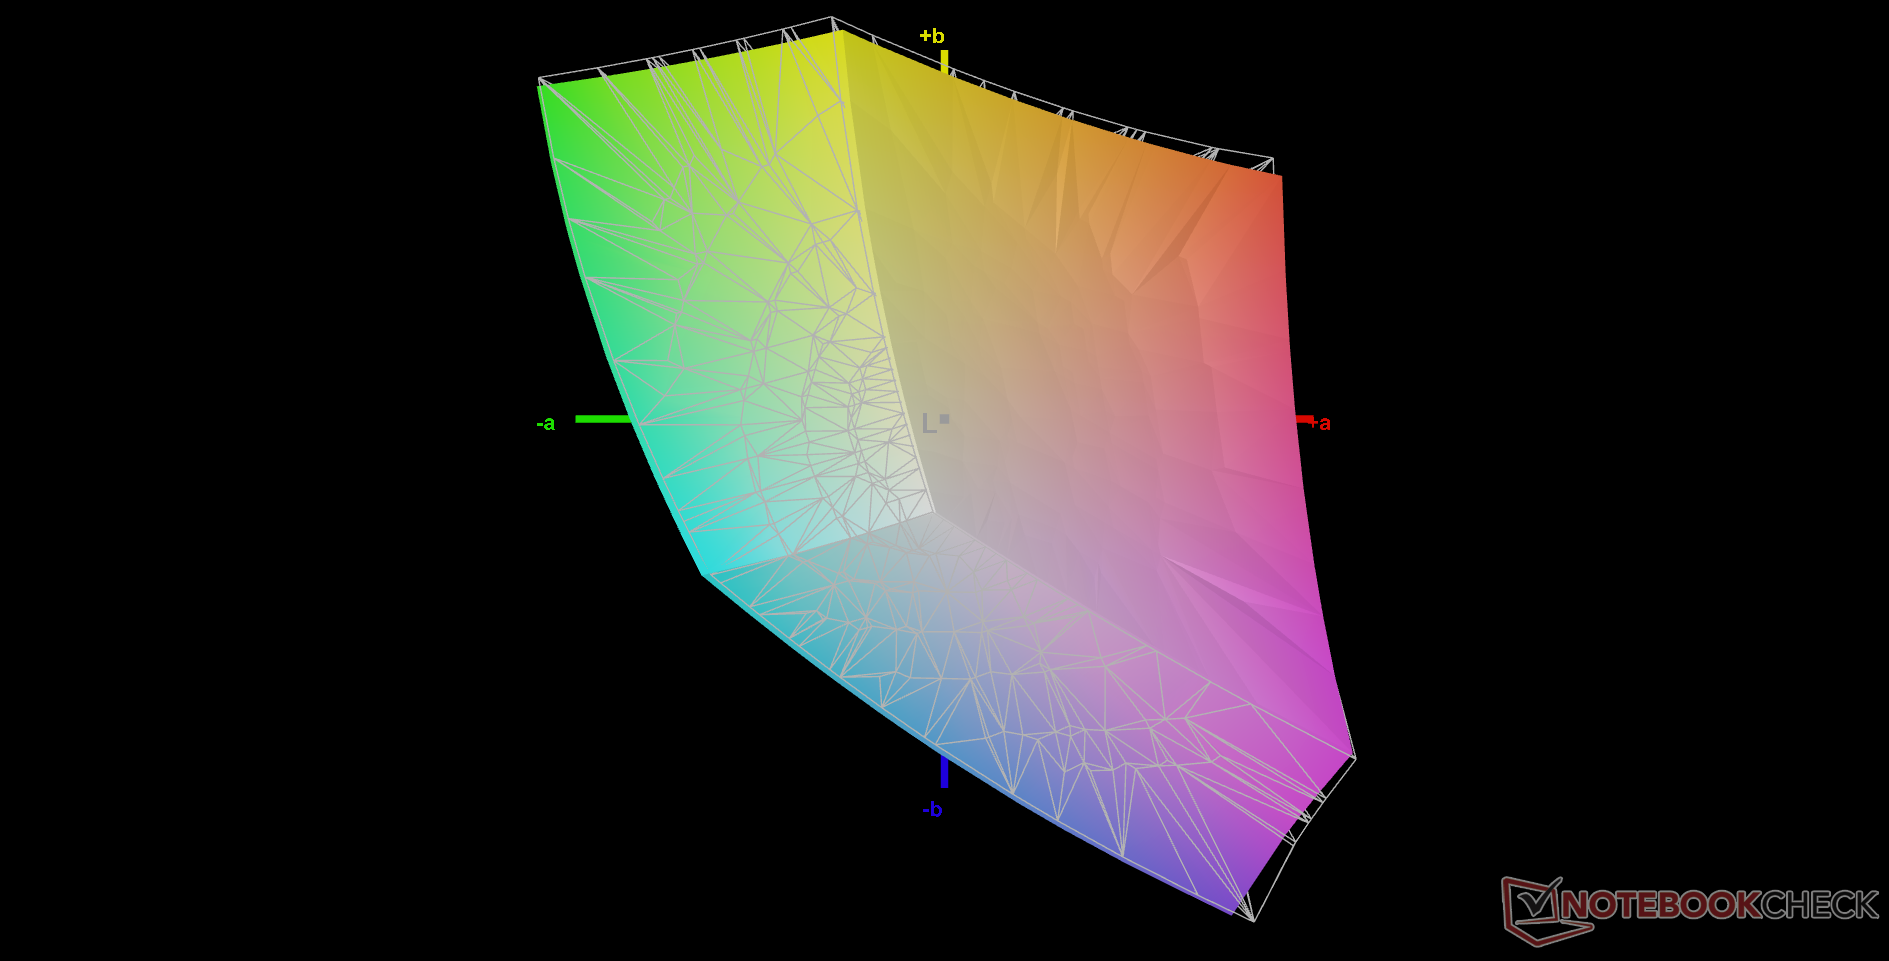
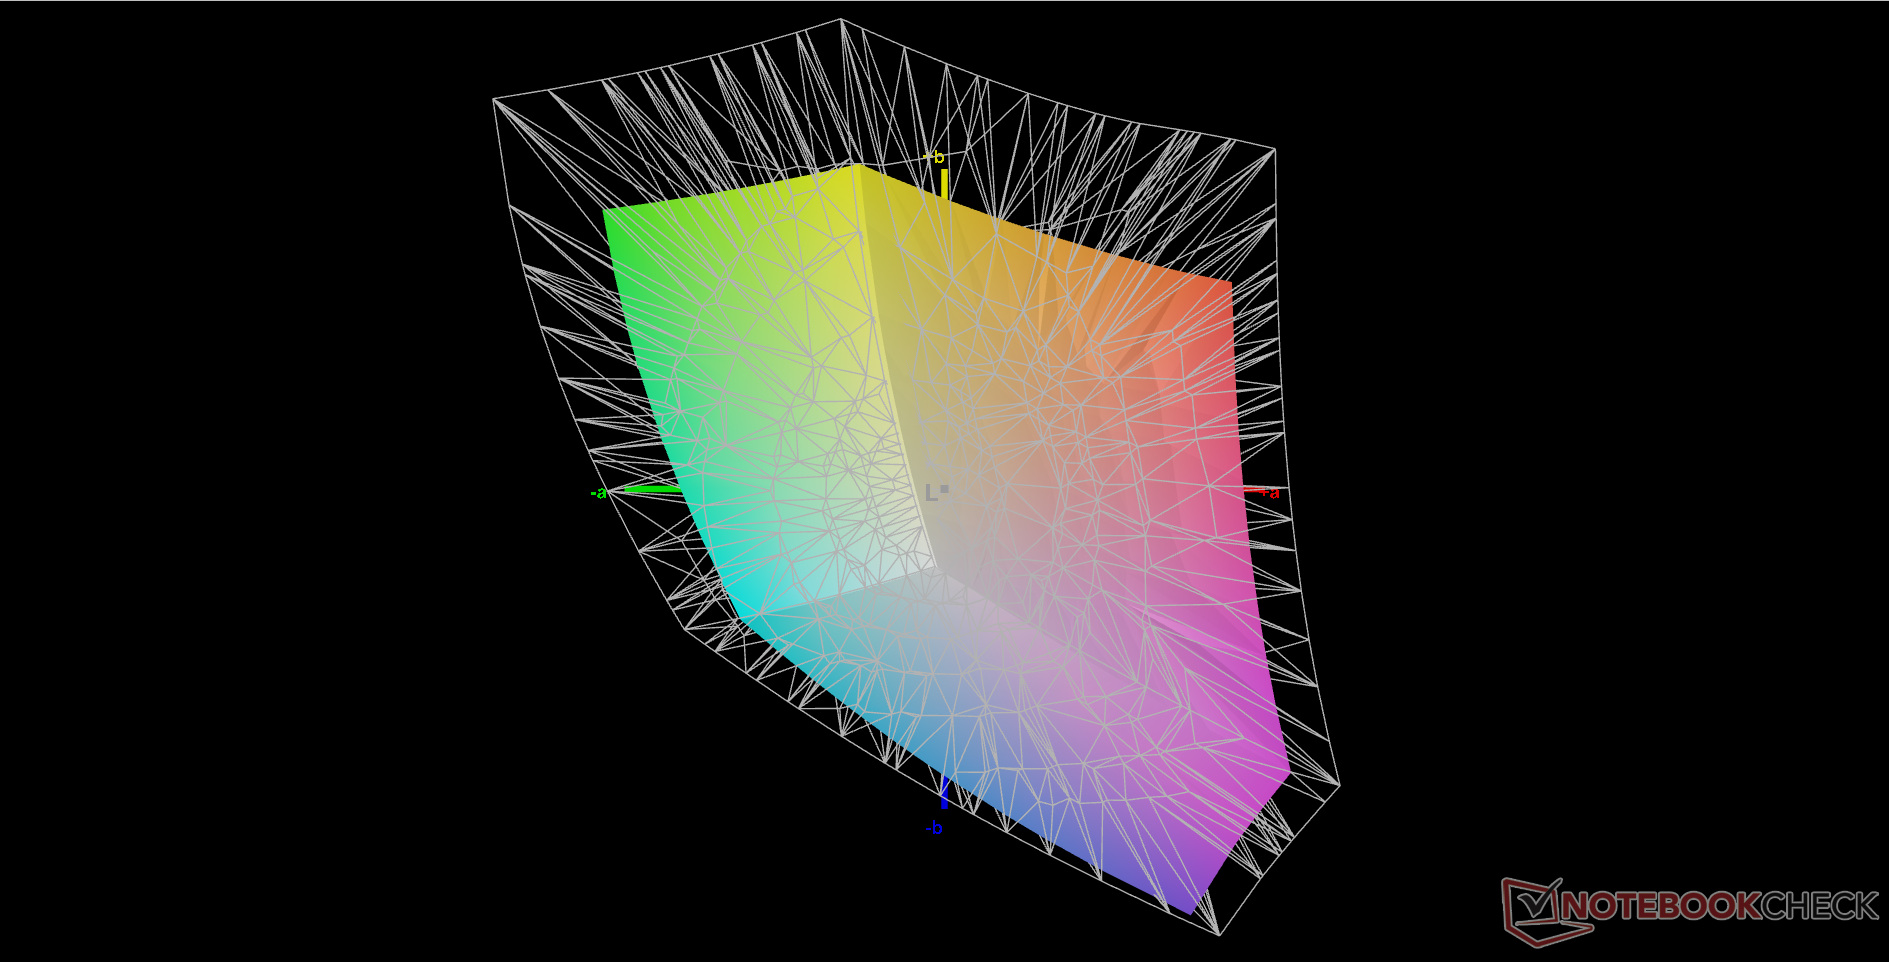
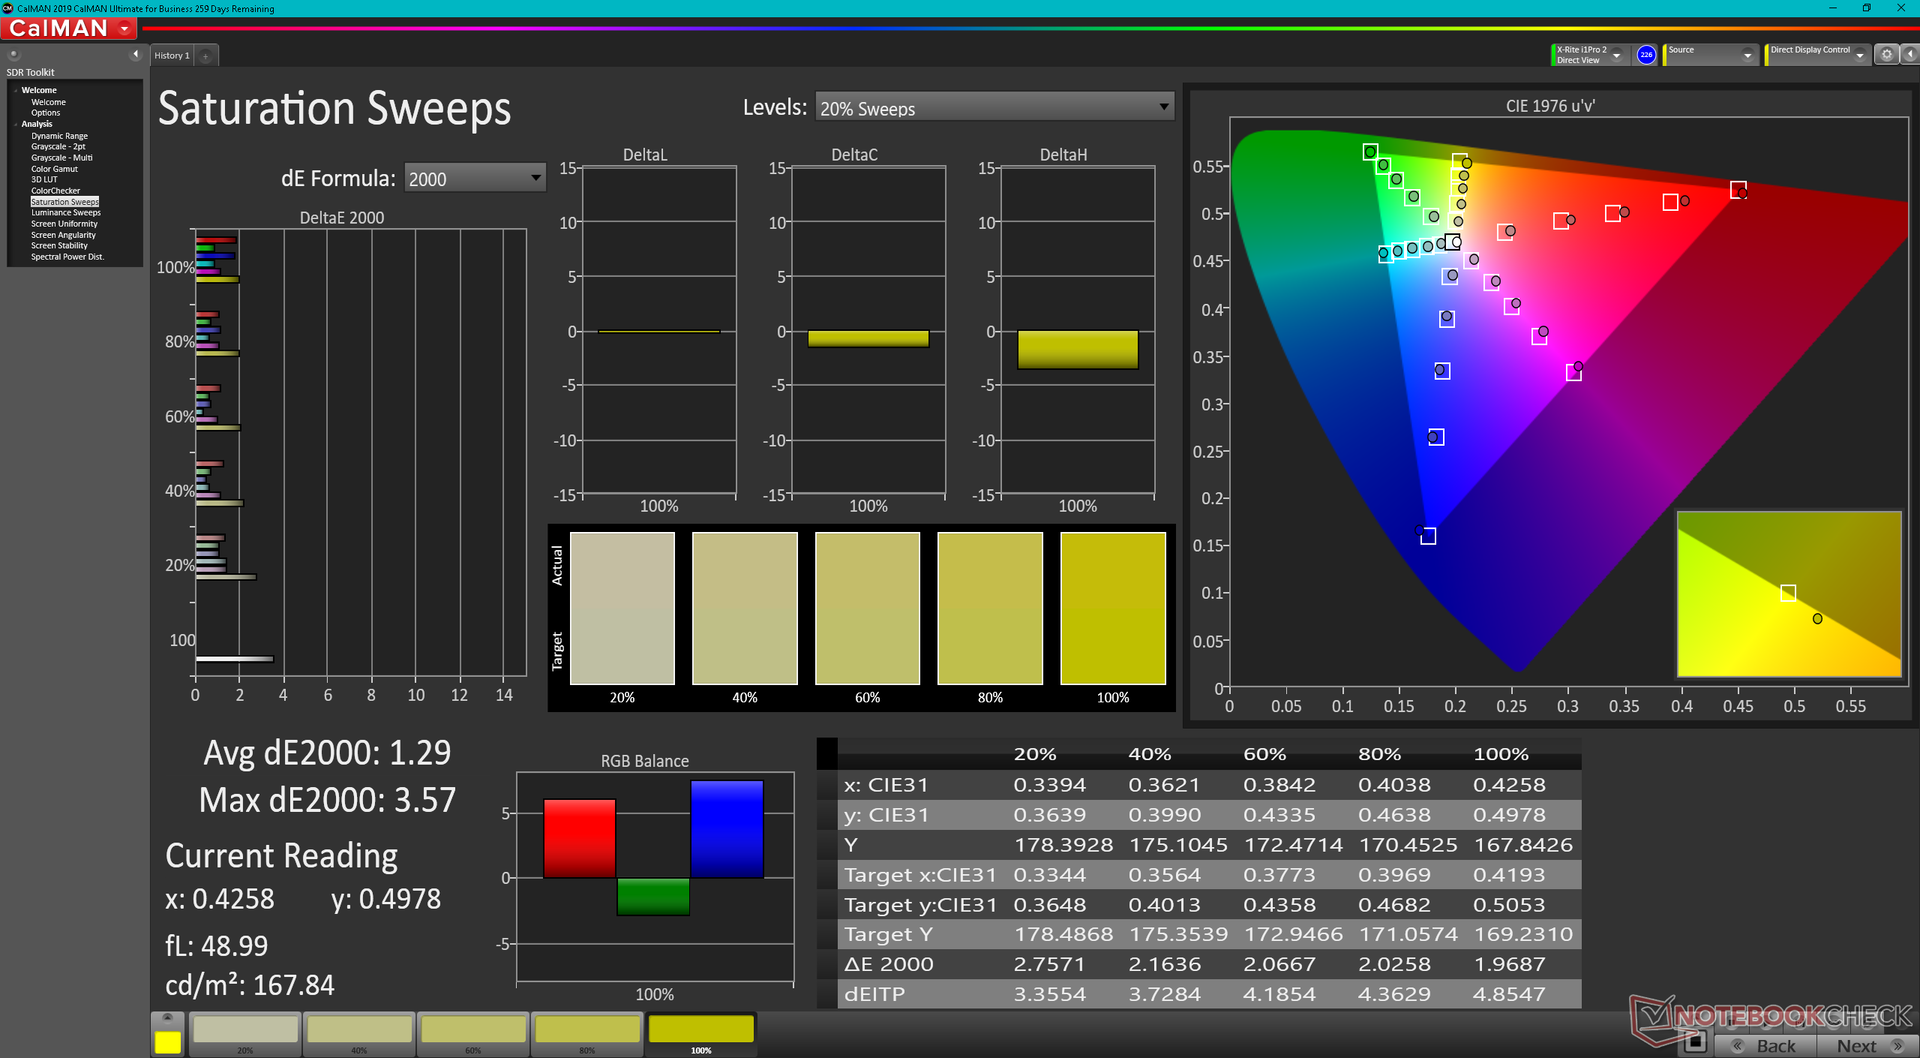
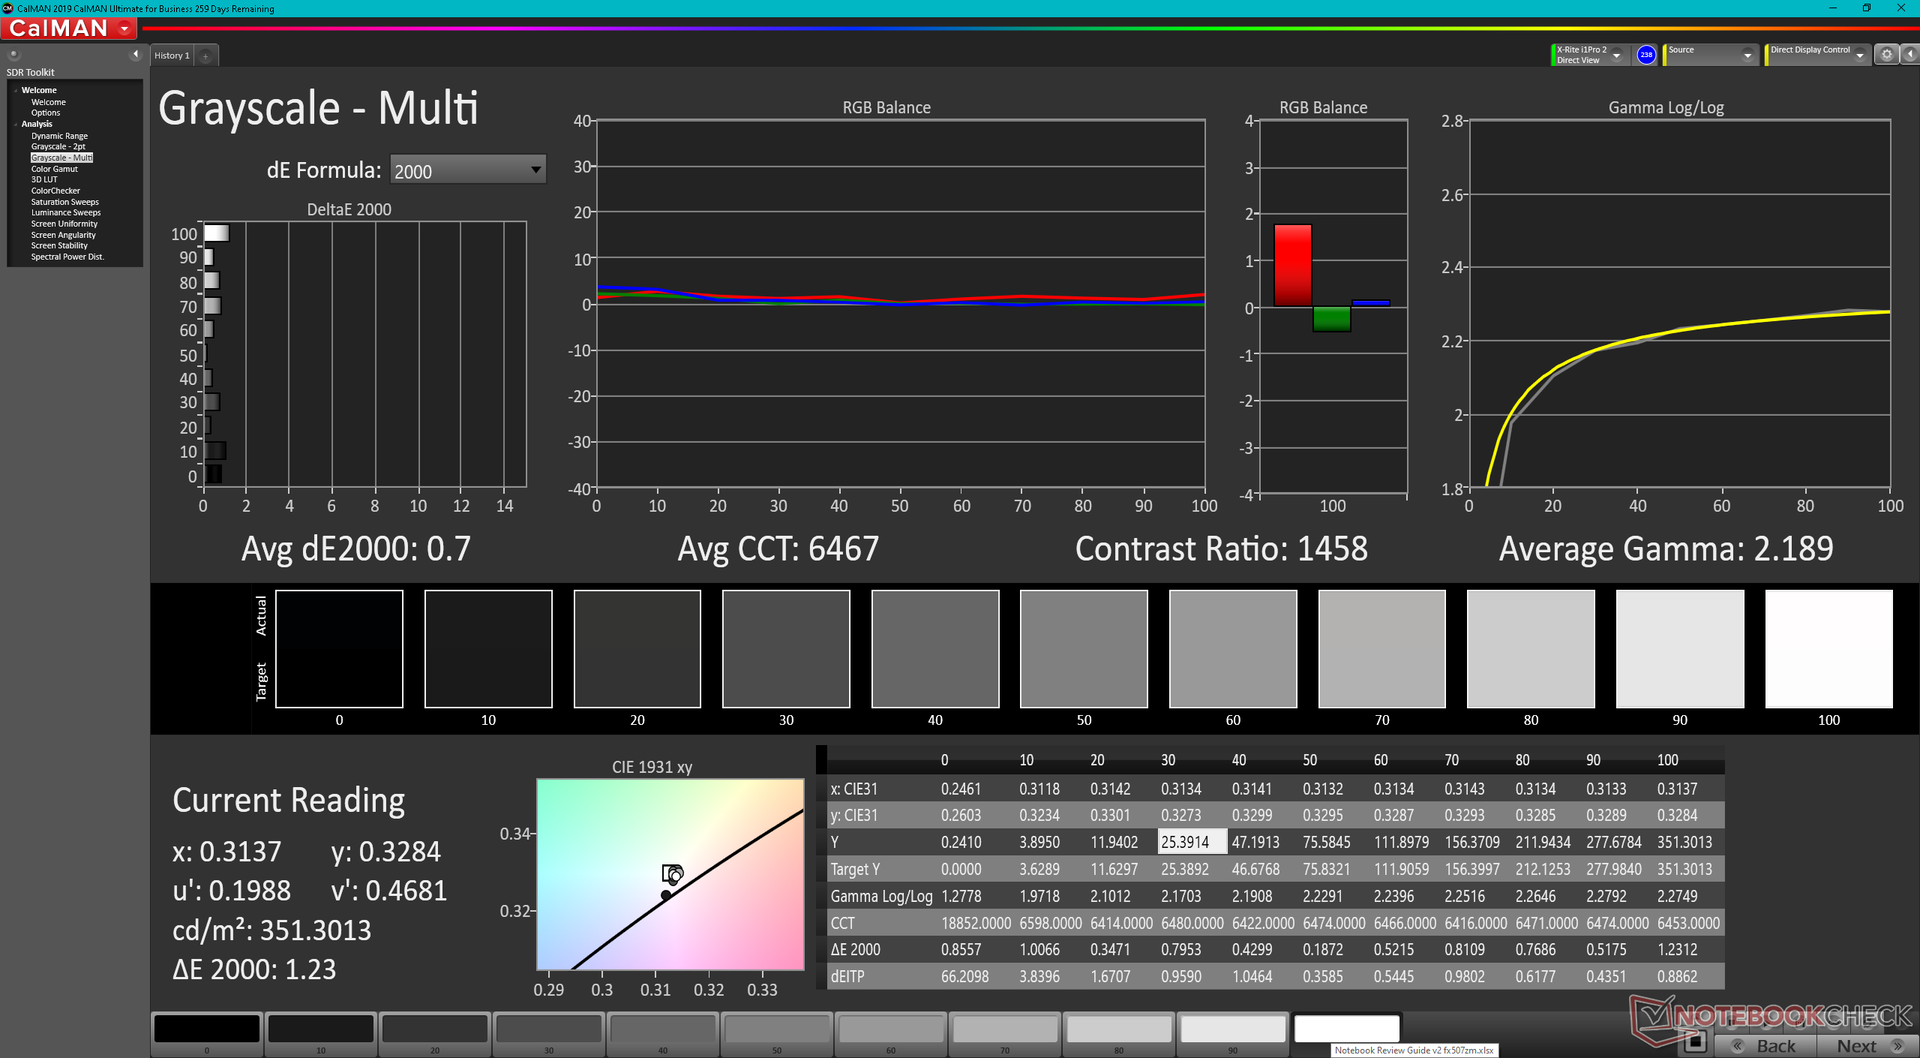
The display is well-calibrated out of the box with average grayscale and color deltaE values of only 2.1 and 1.74, respectively. Calibrating the display even further ourselves with an X-Rite colorimeter would improve deltaE even more to less than 1 each.
Display Response Times
| ↔ Response Time Black to White | ||
|---|---|---|
| 12.8 ms ... rise ↗ and fall ↘ combined | ↗ 6.8 ms rise | 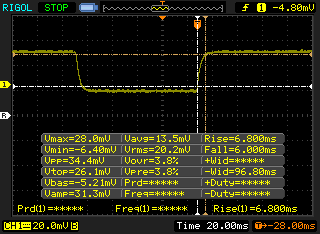 |
| ↘ 6 ms fall | ||
| The screen shows good response rates in our tests, but may be too slow for competitive gamers. In comparison, all tested devices range from 0.1 (minimum) to 240 (maximum) ms. » 33 % of all devices are better. This means that the measured response time is better than the average of all tested devices (19.8 ms). | ||
| ↔ Response Time 50% Grey to 80% Grey | ||
| 5.6 ms ... rise ↗ and fall ↘ combined | ↗ 3.2 ms rise | 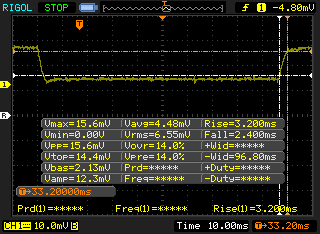 |
| ↘ 2.4 ms fall | ||
| The screen shows very fast response rates in our tests and should be very well suited for fast-paced gaming. In comparison, all tested devices range from 0.165 (minimum) to 636 (maximum) ms. » 18 % of all devices are better. This means that the measured response time is better than the average of all tested devices (31 ms). | ||
Screen Flickering / PWM (Pulse-Width Modulation)
| Screen flickering / PWM not detected | 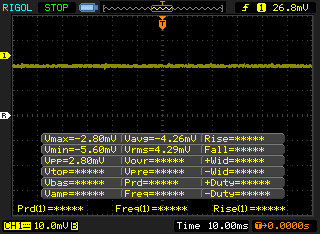 | ||
In comparison: 52 % of all tested devices do not use PWM to dim the display. If PWM was detected, an average of 7753 (minimum: 5 - maximum: 343500) Hz was measured. | |||

Performance — The Intel 12th Gen Difference
Testing Conditions
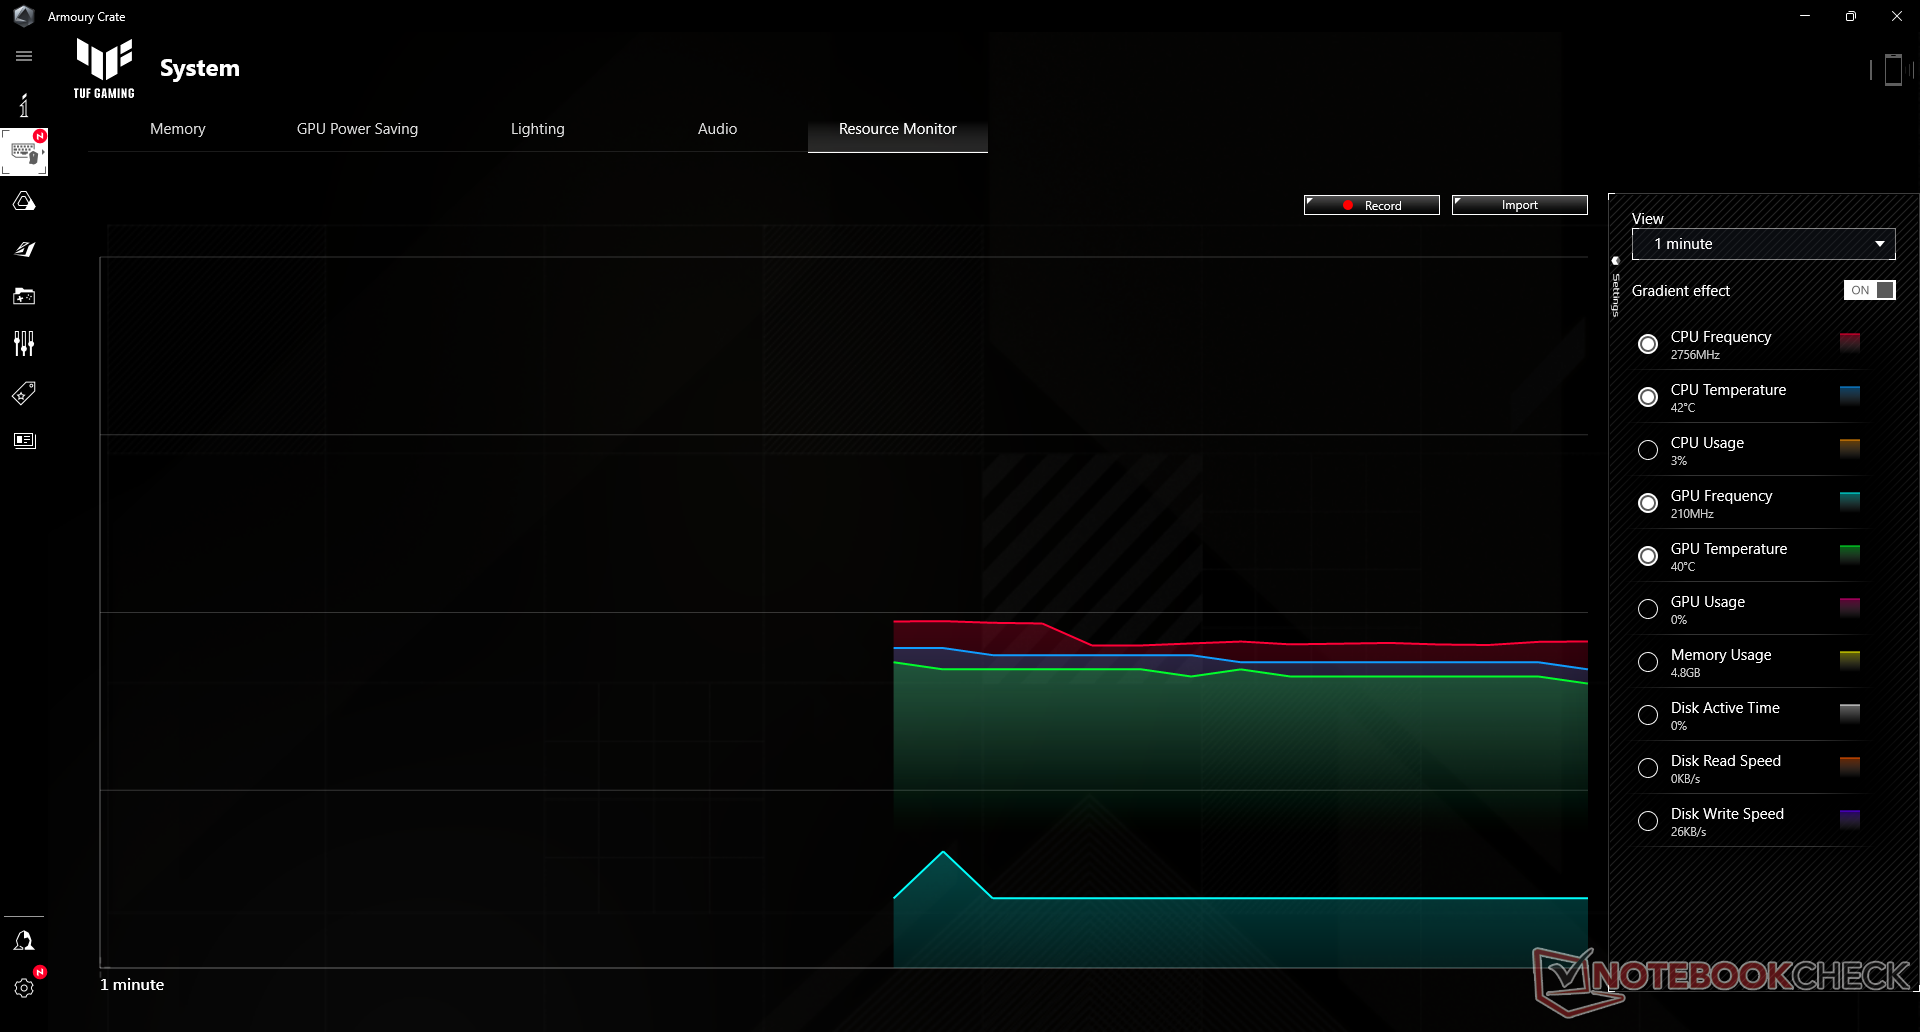
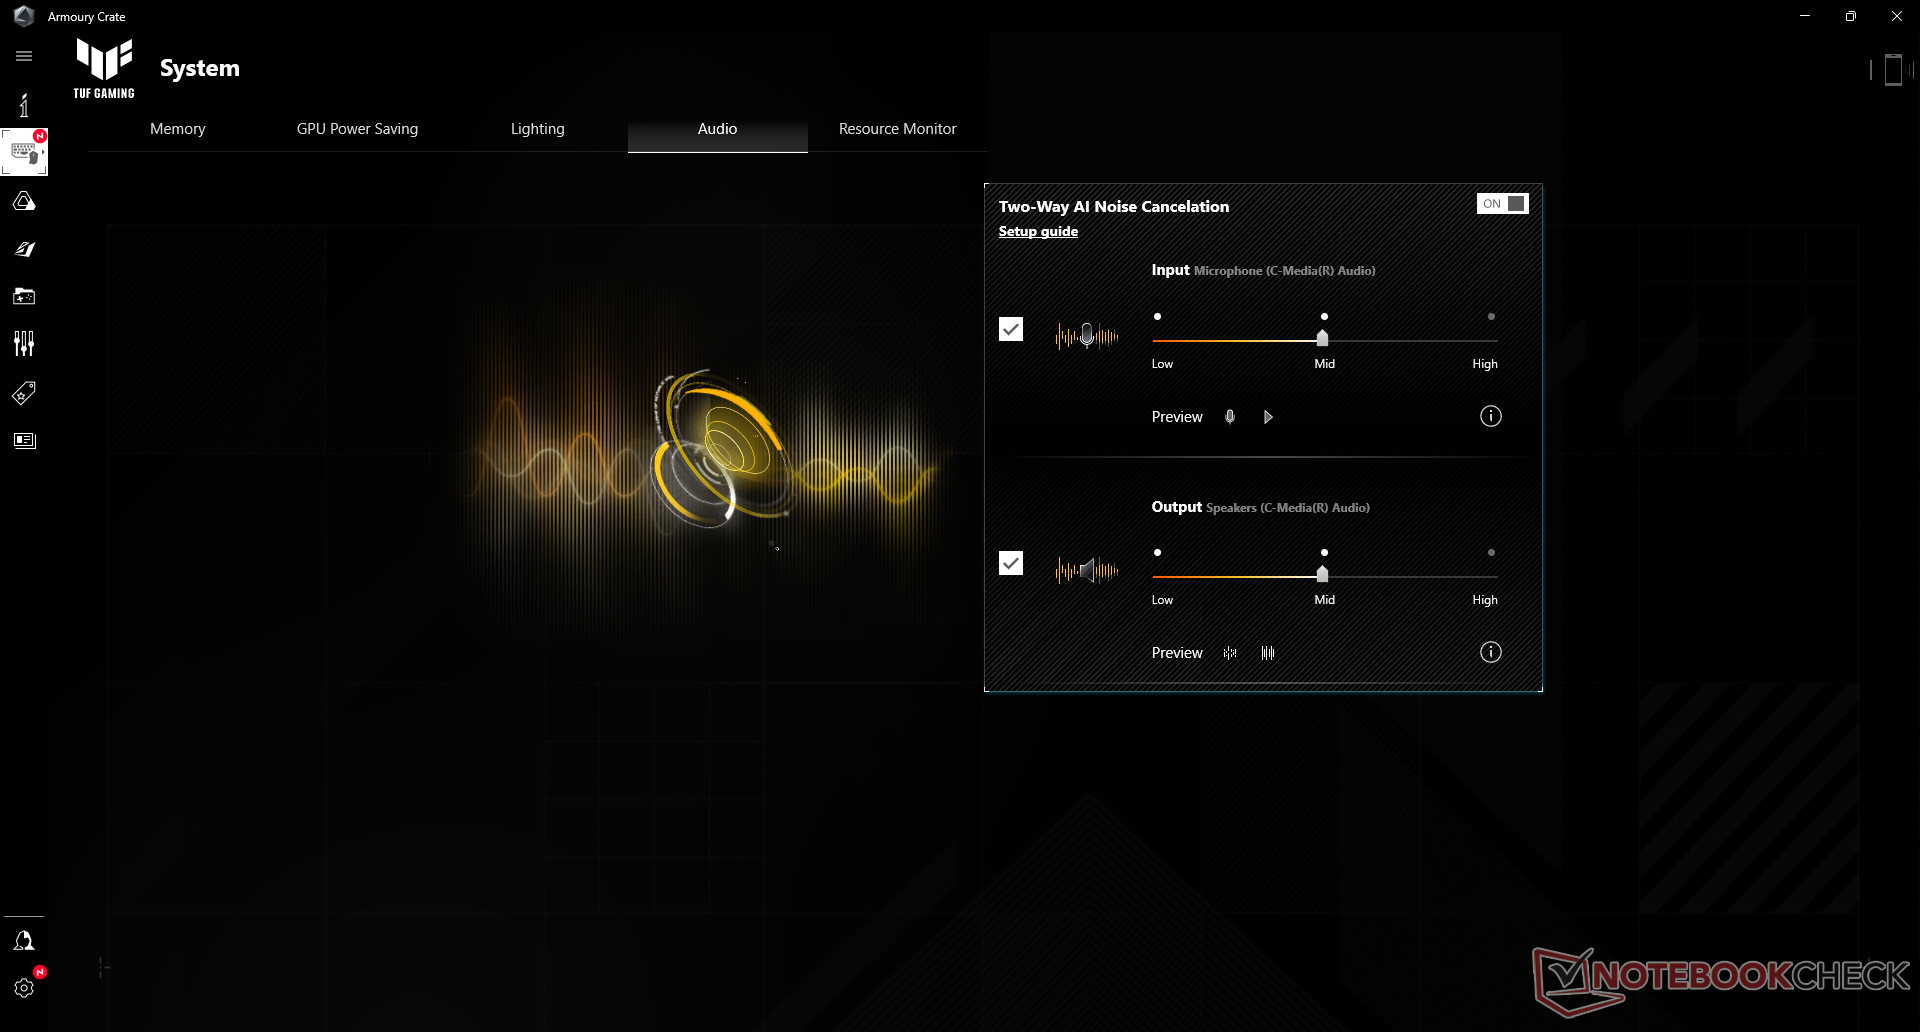
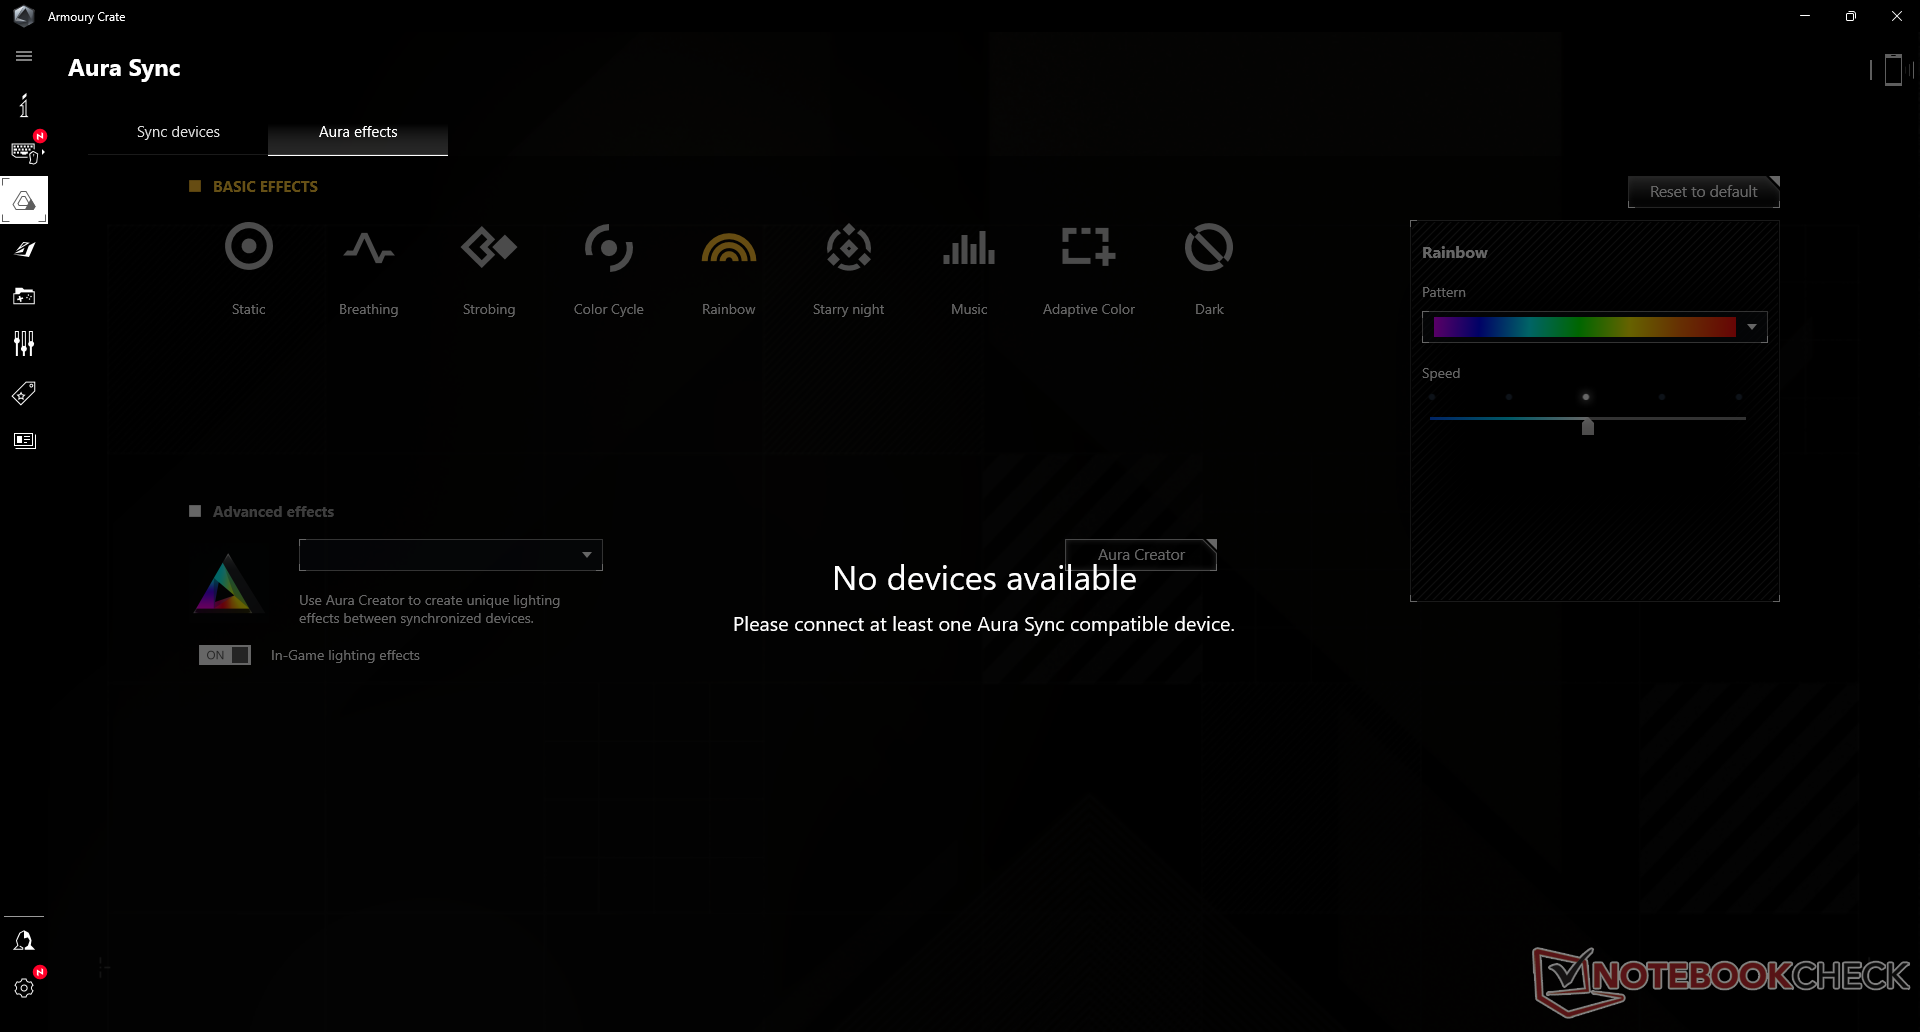
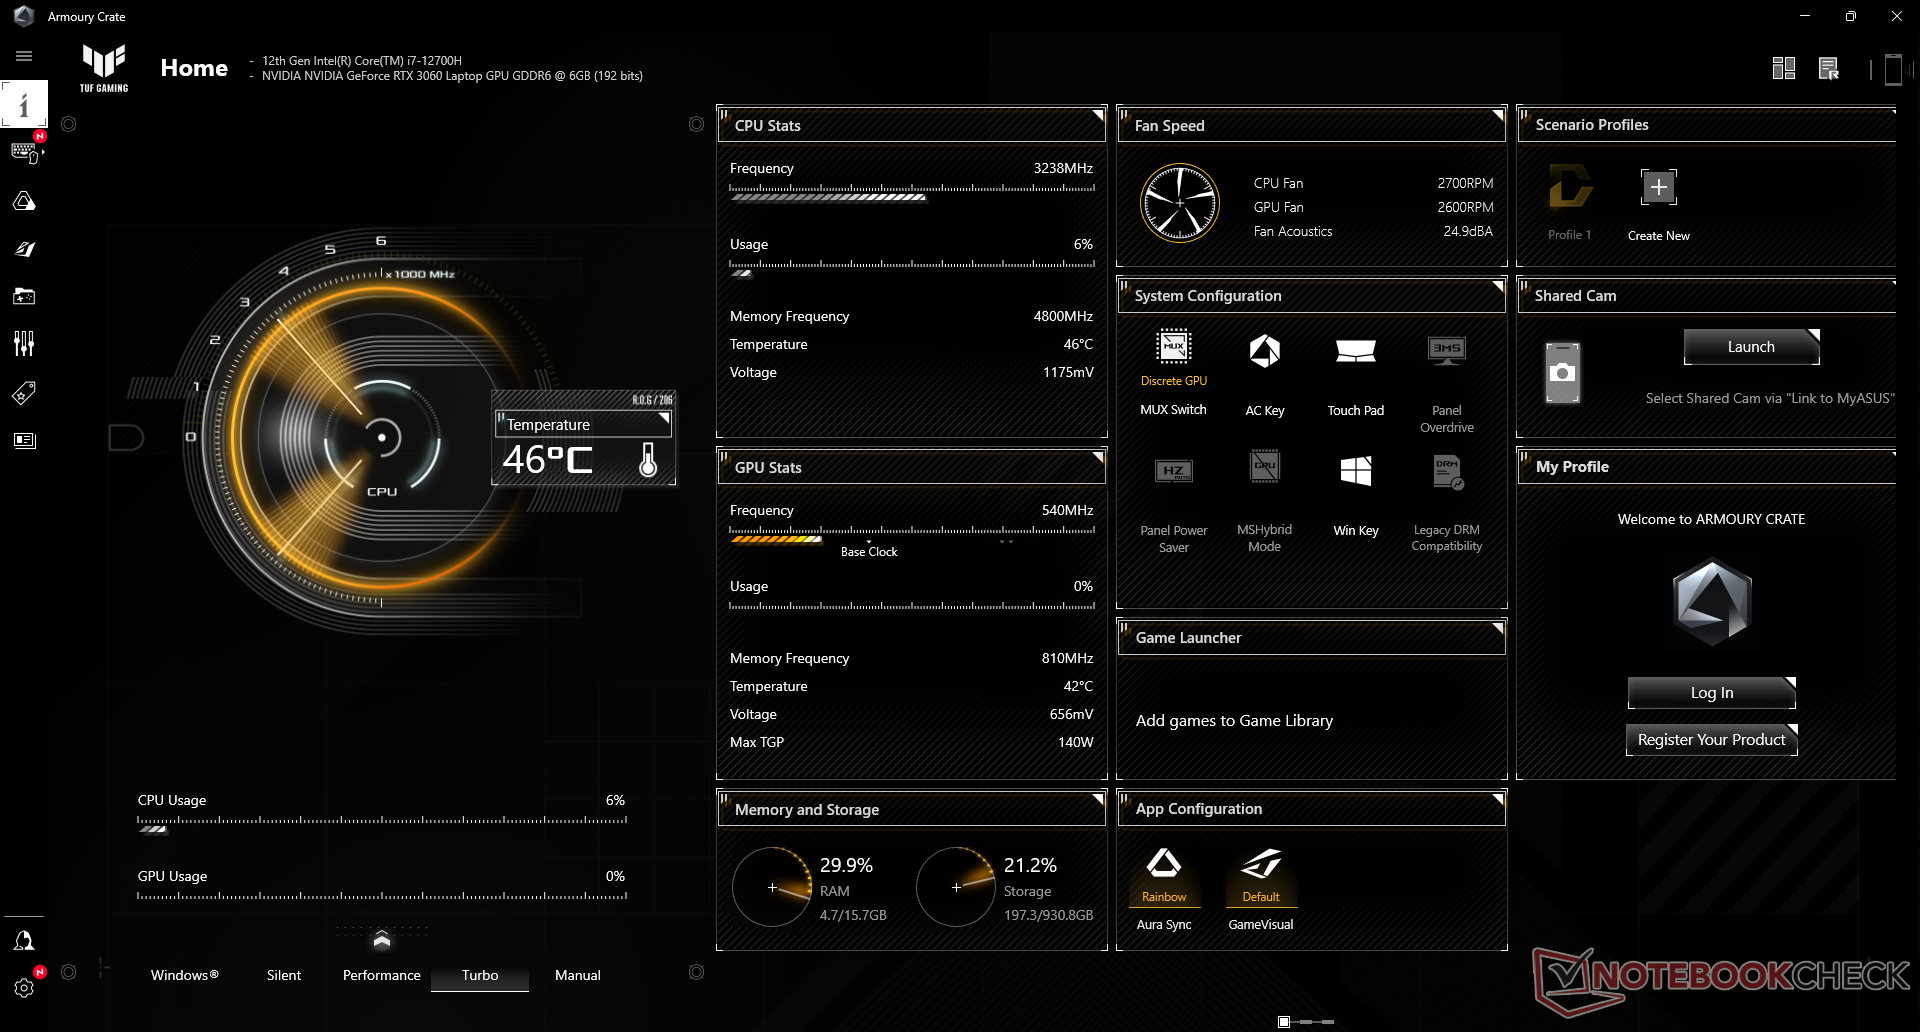
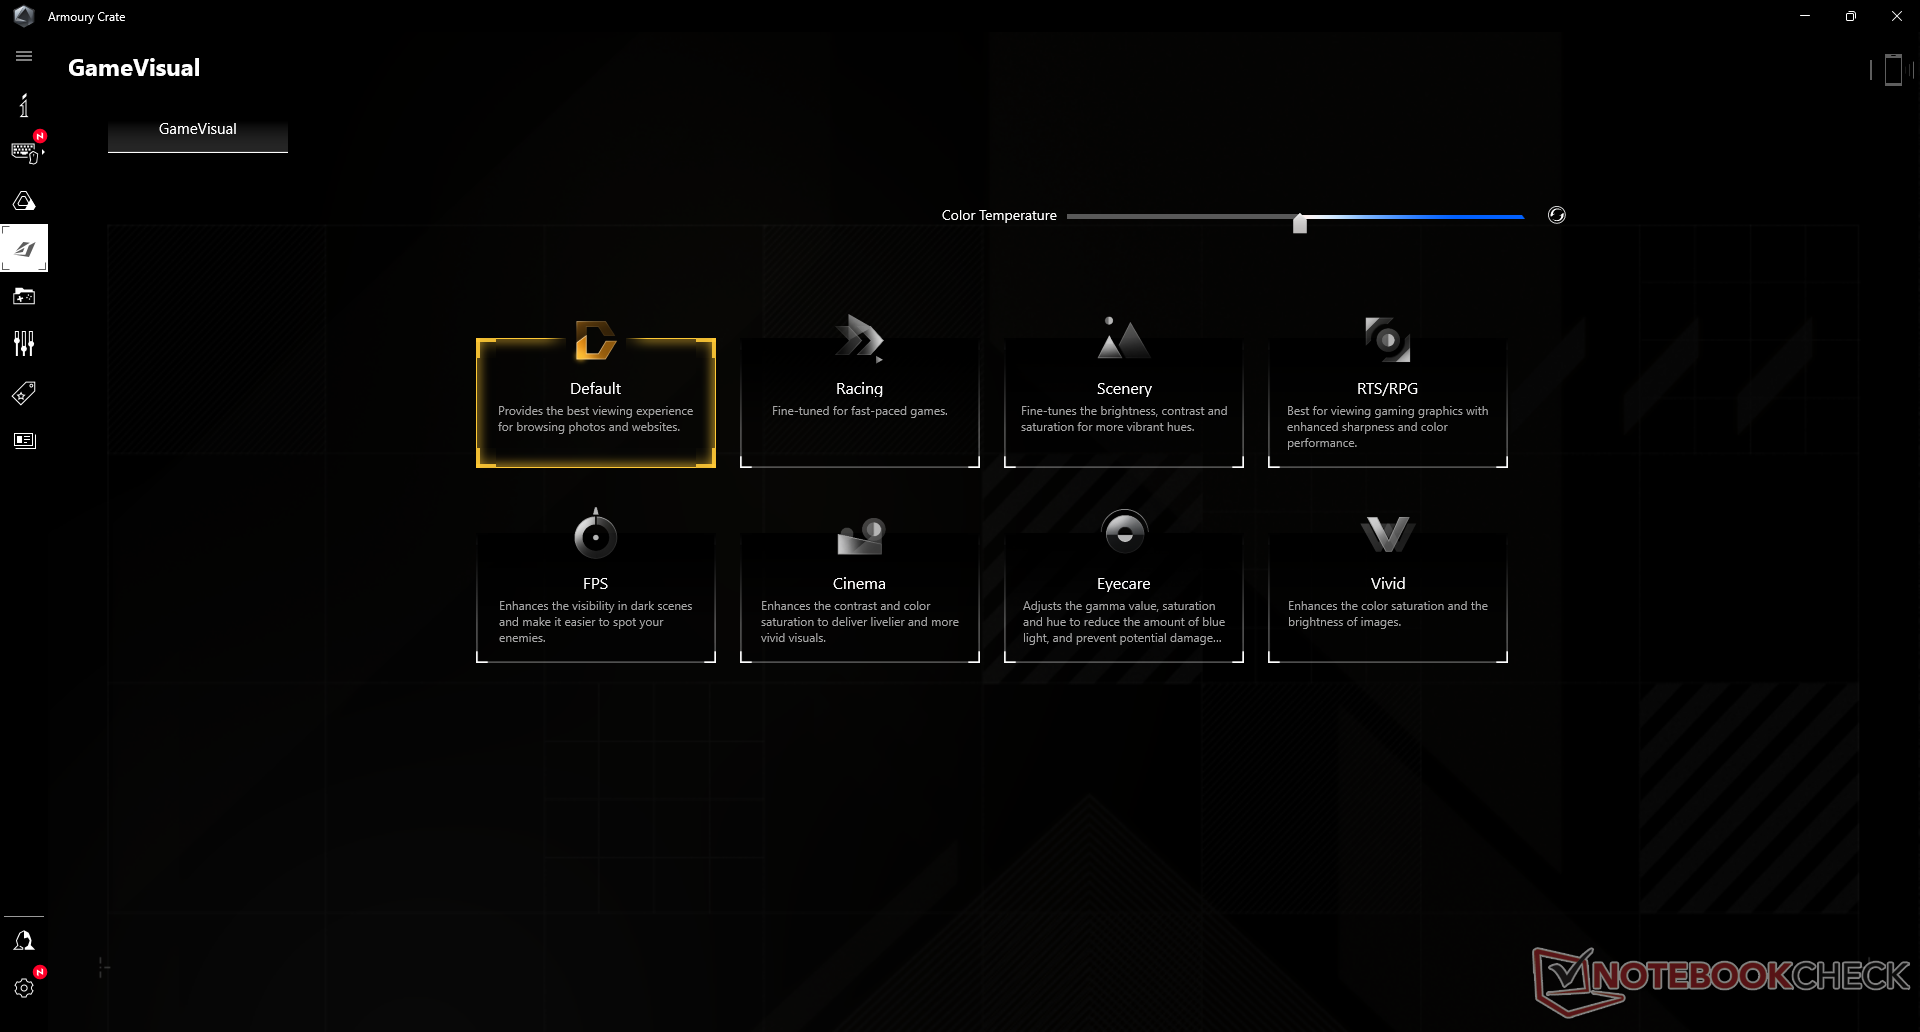
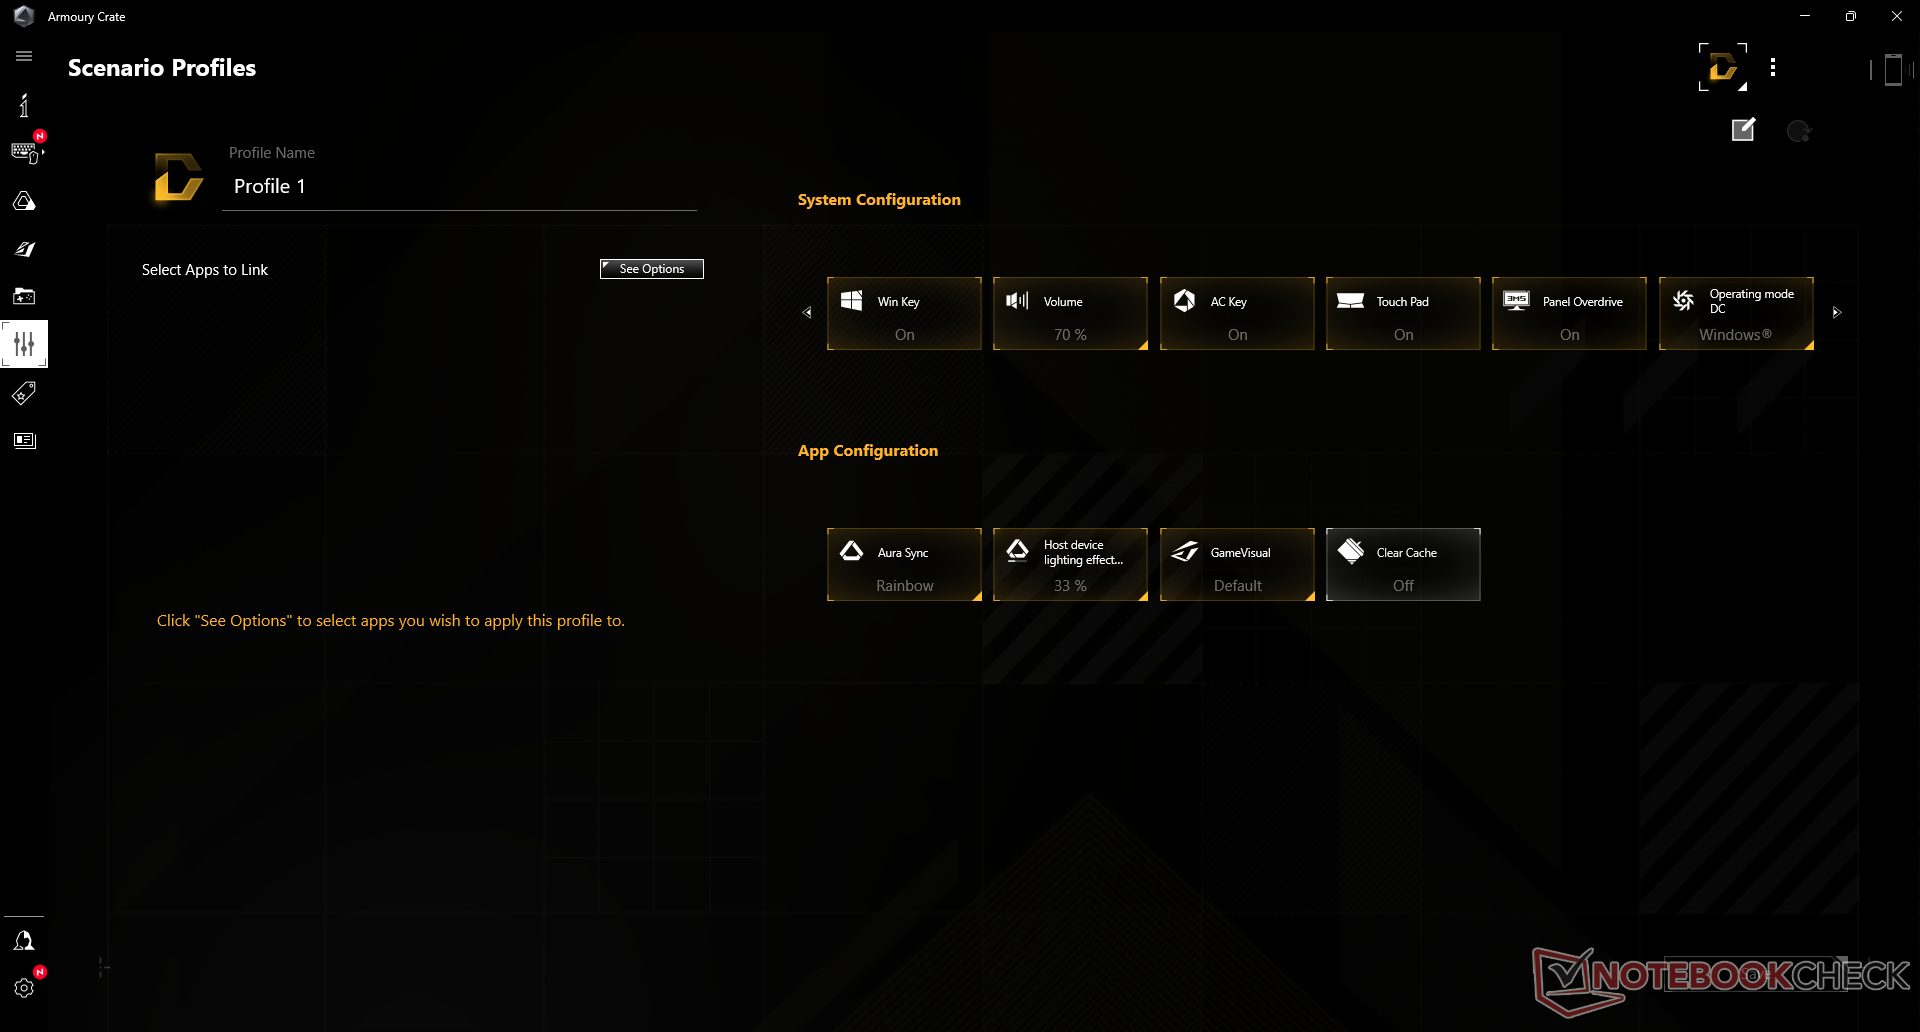
Our unit was set to Turbo mode and discrete GPU mode via the pre-installed Armoury Crate profile prior to running any performance benchmarks below. It's recommended that owners become familiar with this software as it serves as the hub for monitoring performance, toggling auxiliary features, and switching between performance profiles. Most notably, users can switch between MSHybrid or MUX graphics modes directly through the software. The previous FX506 model did not have a MUX switch.
Advanced Optimus is not supported meaning a soft reboot is required when switching between discrete or Optimus graphics. For Adaptive Sync to work on the internal display, users must run on MSHybrid mode as dGPU MUX mode does not support Adaptive Sync. G-Sync and FreeSync can be enabled on a supported external monitor regardless of GPU mode so long as it is connected via USB-C DisplayPort and not HDMI.
CPU TDP and GPU TGP targets will vary depending on the Armoury Crate power profile as detailed by the table below. Thus, owners must run the system in Turbo or Manual modes to get the most power out of the FX507.
| Power Profile | Silent | Performance | Turbo | Manual |
| Target CPU PL1 | 45 W | 70 W | 90 W | 100 W |
| Target CPU PL2 | 60 W | 105 W | 115 W | 135 W |
| Target GPU TGP | <115 W (WhisperMode 2.0 on) | 100 W + 15 W | 115 W + 25 W | 115 W + 25 W |
| Target Max TDP+TGP | 25 W + <100 W (WhisperMode 2.0 on) | 35 W + 100 W | 45 W + 115 W | 45 W + 115 W |
| Target dB(A) (Manufacturer Provided) | <35 dB(A) | 40 dB(A) | 48 dB(A) | 52 dB(A) |
Processor
CPU performance is excellent and exactly where we expect it to be relative to other laptops with the exact same CPU. When compared to the Core i7-11800H on last year's FX506, the Core i7-12700H can offer roughly 17 percent and 30 percent faster single-thread and multi-thread performance, respectively. Overall performance is essentially on par with the more expensive Core i9-12900H while being ahead of the Core i7-12800H as found on the Razer Blade 15.
Turbo Boost sustainability is good as our initial score of 2735 points would only drop by a few percentage points when running CineBench R15 xT in a loop.
Cinebench R15 Multi Loop
Cinebench R23: Multi Core | Single Core
Cinebench R15: CPU Multi 64Bit | CPU Single 64Bit
Blender: v2.79 BMW27 CPU
7-Zip 18.03: 7z b 4 | 7z b 4 -mmt1
Geekbench 5.5: Multi-Core | Single-Core
HWBOT x265 Benchmark v2.2: 4k Preset
LibreOffice : 20 Documents To PDF
R Benchmark 2.5: Overall mean
* ... smaller is better
AIDA64: FP32 Ray-Trace | FPU Julia | CPU SHA3 | CPU Queen | FPU SinJulia | FPU Mandel | CPU AES | CPU ZLib | FP64 Ray-Trace | CPU PhotoWorxx
| Performance rating | |
| Asus ROG Strix Scar 15 G533QS | |
| Average Intel Core i7-12700H | |
| Asus Zephyrus S15 GX502L | |
| Asus TUF Gaming F15 FX507ZM | |
| Asus ZenBook Pro Duo UX582 LR-1BH2 | |
| Asus TUF Dash F15 FX516PR | |
| Asus TUF Gaming F15 FX506HM -9! | |
| AIDA64 / FP32 Ray-Trace | |
| Asus ROG Strix Scar 15 G533QS | |
| Asus Zephyrus S15 GX502L | |
| Asus ZenBook Pro Duo UX582 LR-1BH2 | |
| Average Intel Core i7-12700H (2585 - 17957, n=64) | |
| Asus TUF Gaming F15 FX507ZM | |
| Asus TUF Dash F15 FX516PR | |
| AIDA64 / FPU Julia | |
| Asus ROG Strix Scar 15 G533QS | |
| Asus Zephyrus S15 GX502L | |
| Asus ZenBook Pro Duo UX582 LR-1BH2 | |
| Average Intel Core i7-12700H (12439 - 90760, n=64) | |
| Asus TUF Gaming F15 FX507ZM | |
| Asus TUF Dash F15 FX516PR | |
| AIDA64 / CPU SHA3 | |
| Asus ROG Strix Scar 15 G533QS | |
| Asus TUF Gaming F15 FX507ZM | |
| Asus Zephyrus S15 GX502L | |
| Average Intel Core i7-12700H (833 - 4242, n=64) | |
| Asus ZenBook Pro Duo UX582 LR-1BH2 | |
| Asus TUF Dash F15 FX516PR | |
| AIDA64 / CPU Queen | |
| Asus ROG Strix Scar 15 G533QS | |
| Asus TUF Gaming F15 FX507ZM | |
| Average Intel Core i7-12700H (57923 - 103202, n=63) | |
| Asus Zephyrus S15 GX502L | |
| Asus ZenBook Pro Duo UX582 LR-1BH2 | |
| Asus TUF Dash F15 FX516PR | |
| AIDA64 / FPU SinJulia | |
| Asus ROG Strix Scar 15 G533QS | |
| Asus Zephyrus S15 GX502L | |
| Asus TUF Gaming F15 FX507ZM | |
| Asus ZenBook Pro Duo UX582 LR-1BH2 | |
| Average Intel Core i7-12700H (3249 - 9939, n=64) | |
| Asus TUF Dash F15 FX516PR | |
| AIDA64 / FPU Mandel | |
| Asus ROG Strix Scar 15 G533QS | |
| Asus Zephyrus S15 GX502L | |
| Asus ZenBook Pro Duo UX582 LR-1BH2 | |
| Average Intel Core i7-12700H (7135 - 44760, n=64) | |
| Asus TUF Gaming F15 FX507ZM | |
| Asus TUF Dash F15 FX516PR | |
| AIDA64 / CPU AES | |
| Asus ROG Strix Scar 15 G533QS | |
| Average Intel Core i7-12700H (31839 - 144360, n=64) | |
| Asus TUF Dash F15 FX516PR | |
| Asus TUF Gaming F15 FX507ZM | |
| Asus Zephyrus S15 GX502L | |
| Asus ZenBook Pro Duo UX582 LR-1BH2 | |
| AIDA64 / CPU ZLib | |
| Asus TUF Gaming F15 FX507ZM | |
| Average Intel Core i7-12700H (305 - 1171, n=64) | |
| Asus ROG Strix Scar 15 G533QS | |
| Asus Zephyrus S15 GX502L | |
| Asus ZenBook Pro Duo UX582 LR-1BH2 | |
| Asus TUF Dash F15 FX516PR | |
| Asus TUF Gaming F15 FX506HM | |
| AIDA64 / FP64 Ray-Trace | |
| Asus ROG Strix Scar 15 G533QS | |
| Asus Zephyrus S15 GX502L | |
| Asus ZenBook Pro Duo UX582 LR-1BH2 | |
| Average Intel Core i7-12700H (1437 - 9692, n=64) | |
| Asus TUF Gaming F15 FX507ZM | |
| Asus TUF Dash F15 FX516PR | |
| AIDA64 / CPU PhotoWorxx | |
| Asus TUF Gaming F15 FX507ZM | |
| Average Intel Core i7-12700H (12863 - 52207, n=64) | |
| Asus ROG Strix Scar 15 G533QS | |
| Asus Zephyrus S15 GX502L | |
| Asus TUF Dash F15 FX516PR | |
| Asus ZenBook Pro Duo UX582 LR-1BH2 | |
System Performance
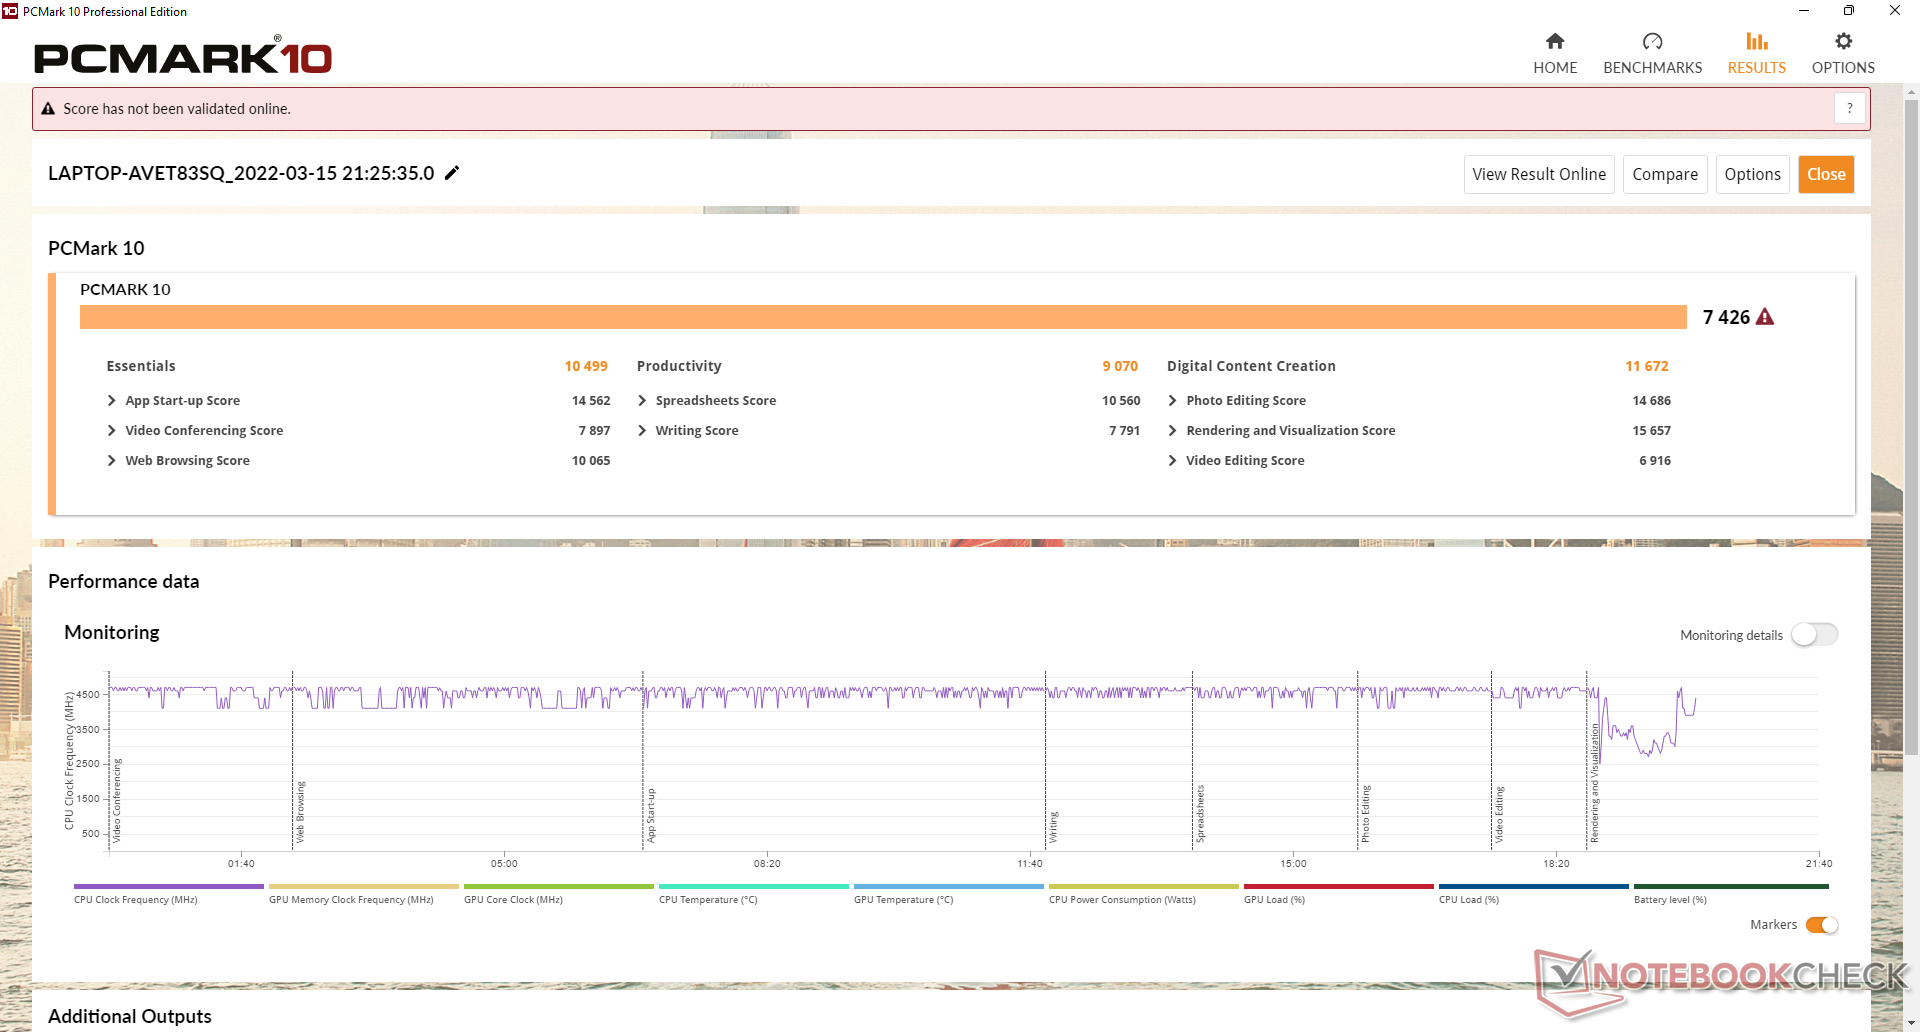
PCMark 10 results are essentially identical to the FX506 meaning that day-to-day activities won't necessarily feel any faster despite the CPU and GPU upgrades. The Digital Content Creation subtest is noticeably higher, however, likely due to the faster GPU clock rates over the older RTX 3060.
| PCMark 10 / Score | |
| Asus TUF Gaming F15 FX507ZM | |
| Average Intel Core i7-12700H, NVIDIA GeForce RTX 3060 Laptop GPU (5986 - 8156, n=12) | |
| Asus ROG Strix Scar 15 G533QS | |
| Asus TUF Gaming F15 FX506HM | |
| Asus TUF Dash F15 FX516PR | |
| Asus ZenBook Pro Duo UX582 LR-1BH2 | |
| Asus Zephyrus S15 GX502L | |
| PCMark 10 / Essentials | |
| Average Intel Core i7-12700H, NVIDIA GeForce RTX 3060 Laptop GPU (9289 - 12144, n=12) | |
| Asus TUF Gaming F15 FX506HM | |
| Asus TUF Gaming F15 FX507ZM | |
| Asus ROG Strix Scar 15 G533QS | |
| Asus Zephyrus S15 GX502L | |
| Asus TUF Dash F15 FX516PR | |
| Asus ZenBook Pro Duo UX582 LR-1BH2 | |
| PCMark 10 / Productivity | |
| Asus ROG Strix Scar 15 G533QS | |
| Asus TUF Dash F15 FX516PR | |
| Average Intel Core i7-12700H, NVIDIA GeForce RTX 3060 Laptop GPU (6161 - 10362, n=12) | |
| Asus TUF Gaming F15 FX507ZM | |
| Asus TUF Gaming F15 FX506HM | |
| Asus Zephyrus S15 GX502L | |
| Asus ZenBook Pro Duo UX582 LR-1BH2 | |
| PCMark 10 / Digital Content Creation | |
| Asus TUF Gaming F15 FX507ZM | |
| Average Intel Core i7-12700H, NVIDIA GeForce RTX 3060 Laptop GPU (8950 - 12554, n=12) | |
| Asus ROG Strix Scar 15 G533QS | |
| Asus TUF Gaming F15 FX506HM | |
| Asus ZenBook Pro Duo UX582 LR-1BH2 | |
| Asus TUF Dash F15 FX516PR | |
| Asus Zephyrus S15 GX502L | |
| PCMark 10 Score | 7426 points | |
Help | ||
| AIDA64 / Memory Copy | |
| Average Intel Core i7-12700H (25615 - 80511, n=64) | |
| Asus TUF Gaming F15 FX507ZM | |
| Asus ROG Strix Scar 15 G533QS | |
| Asus Zephyrus S15 GX502L | |
| Asus ZenBook Pro Duo UX582 LR-1BH2 | |
| Asus TUF Dash F15 FX516PR | |
| AIDA64 / Memory Read | |
| Asus TUF Gaming F15 FX507ZM | |
| Average Intel Core i7-12700H (25586 - 79442, n=64) | |
| Asus ROG Strix Scar 15 G533QS | |
| Asus Zephyrus S15 GX502L | |
| Asus ZenBook Pro Duo UX582 LR-1BH2 | |
| Asus TUF Dash F15 FX516PR | |
| AIDA64 / Memory Write | |
| Asus TUF Gaming F15 FX507ZM | |
| Average Intel Core i7-12700H (23679 - 88660, n=64) | |
| Asus ROG Strix Scar 15 G533QS | |
| Asus Zephyrus S15 GX502L | |
| Asus ZenBook Pro Duo UX582 LR-1BH2 | |
| Asus TUF Dash F15 FX516PR | |
| AIDA64 / Memory Latency | |
| Asus TUF Dash F15 FX516PR | |
| Asus ROG Strix Scar 15 G533QS | |
| Average Intel Core i7-12700H (76.2 - 133.9, n=62) | |
| Asus Zephyrus S15 GX502L | |
| Asus ZenBook Pro Duo UX582 LR-1BH2 | |
| Asus TUF Gaming F15 FX506HM | |
| Asus TUF Gaming F15 FX507ZM | |
* ... smaller is better
DPC Latency
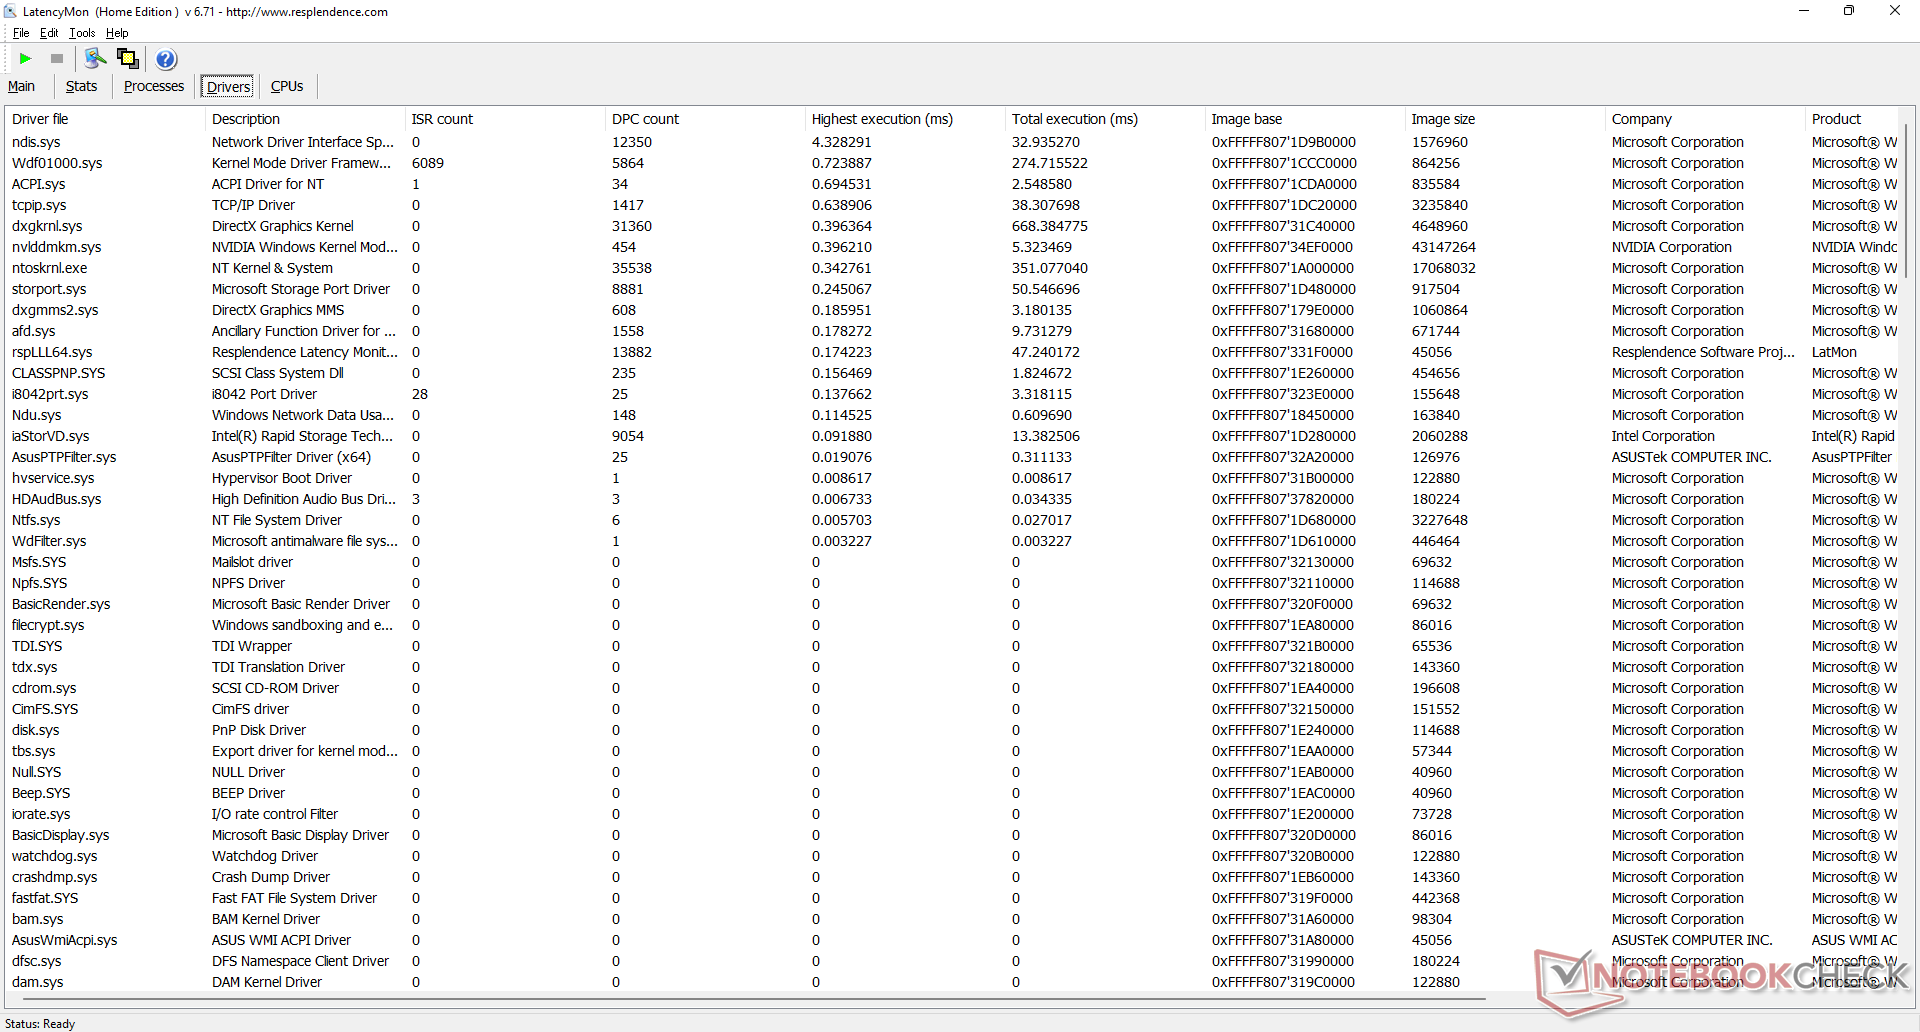
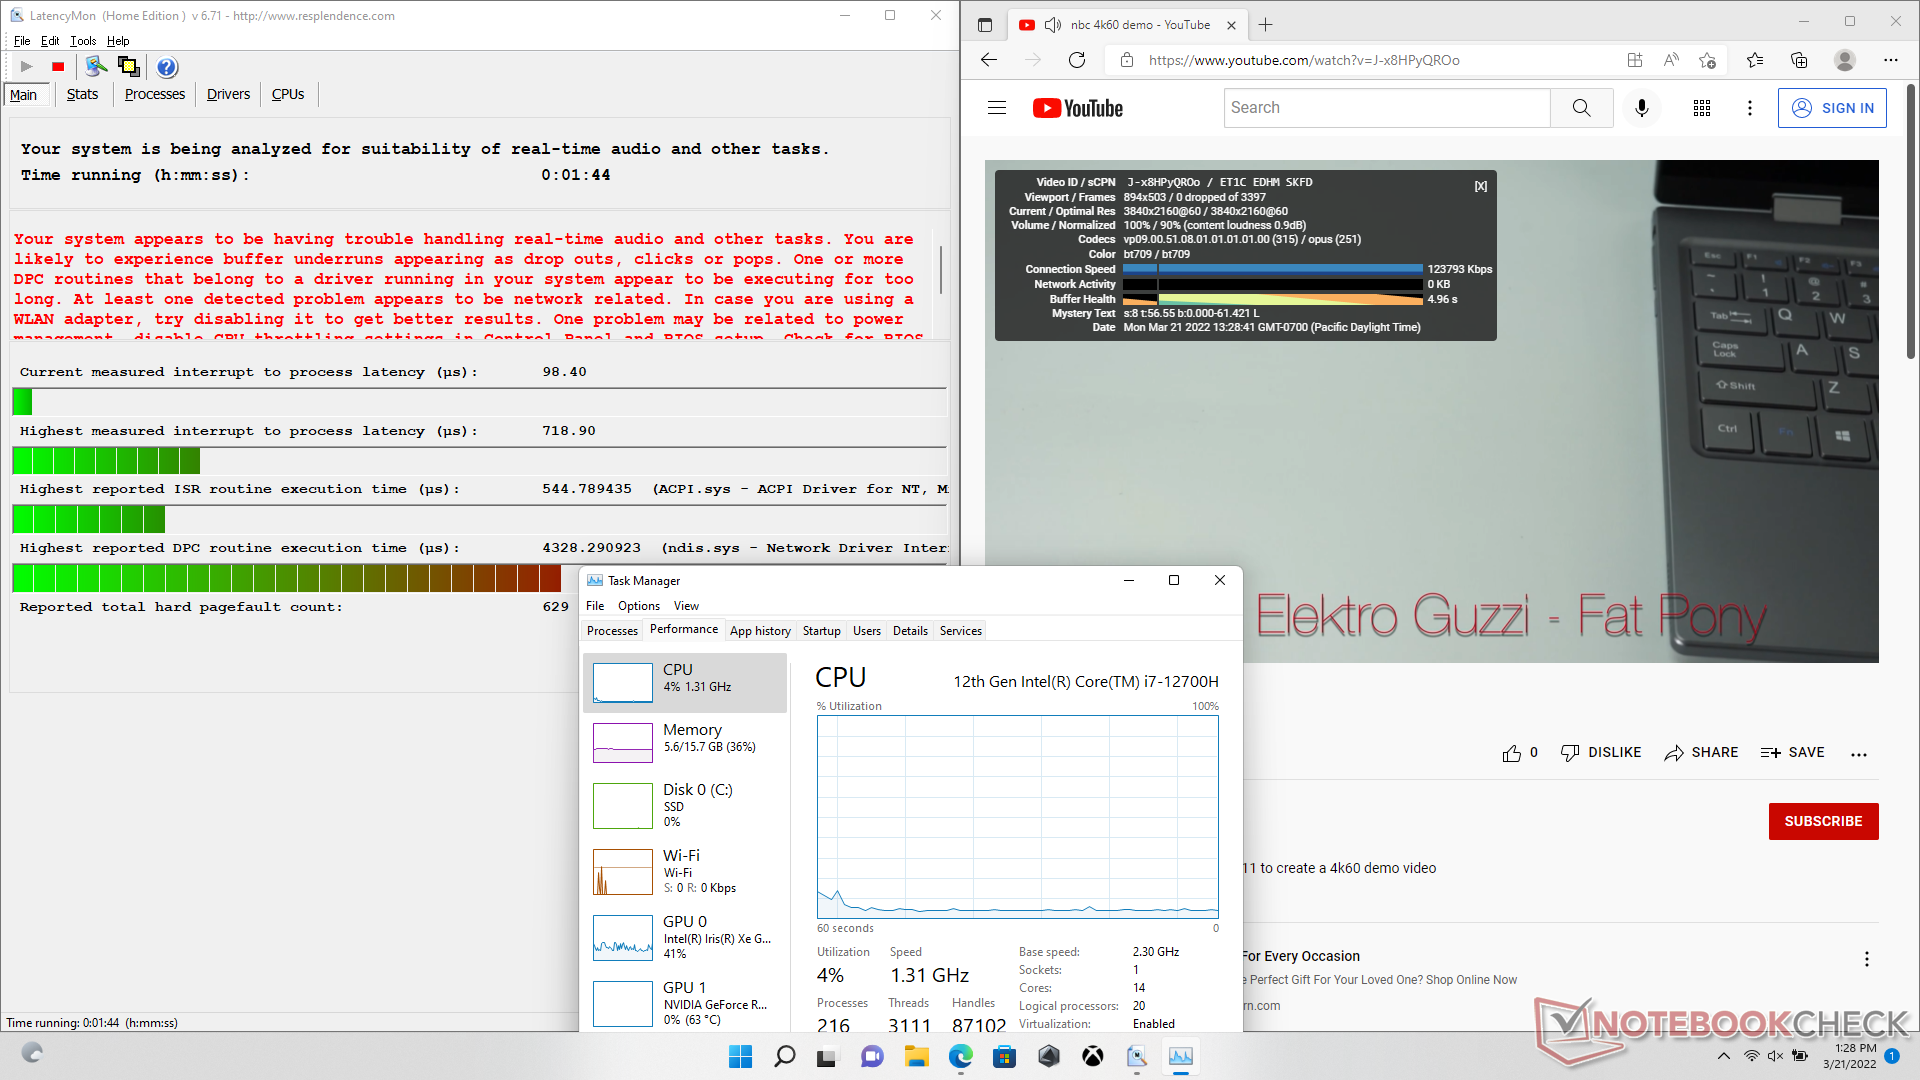
LatencyMon reveals DPC issues when opening multiple browser tabs of our homepage. 4K video playback at 60 FPS is otherwise smooth and with no dropped frames.
| DPC Latencies / LatencyMon - interrupt to process latency (max), Web, Youtube, Prime95 | |
| Asus Zephyrus S15 GX502L | |
| Asus TUF Gaming F15 FX506HM | |
| Asus ROG Strix Scar 15 G533QS | |
| Asus TUF Dash F15 FX516PR | |
| Asus ZenBook Pro Duo UX582 LR-1BH2 | |
| Asus TUF Gaming F15 FX507ZM | |
* ... smaller is better
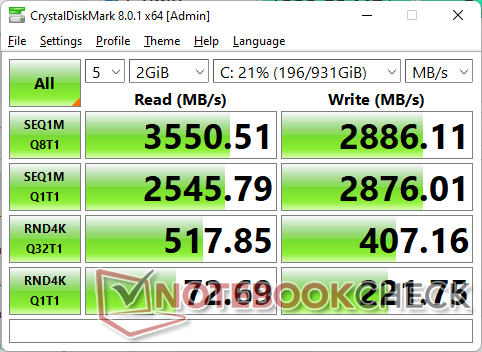
Storage Devices — Up To Two M.2 PCIe4 x4 Drives
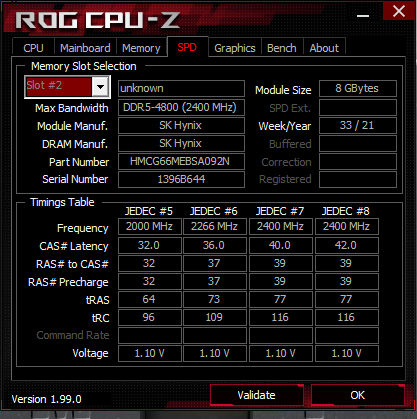
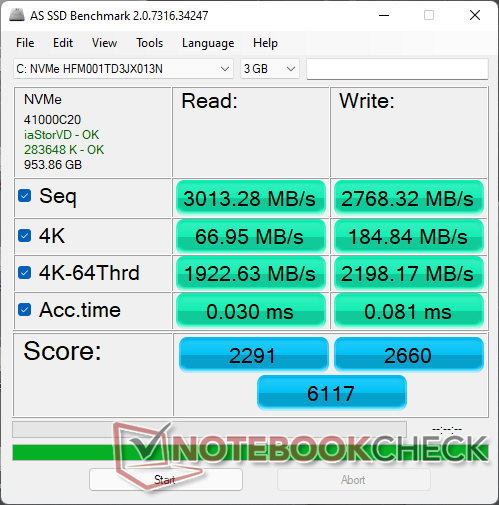
Our unit ships with the same SK Hynix HFM001TD3JX013N PCIe3 x4 NVMe SSD as on last year's model. However, do keep in mind that the FX507 supports PCIe4 x4 SSDs meaning end-users can install even faster drives if desired. Performance sustainability may be limited since there is no heat spreader atop of the two M.2 slots.

* ... smaller is better
Disk Throttling: DiskSpd Read Loop, Queue Depth 8
GPU Performance — 140 W TGP Graphics
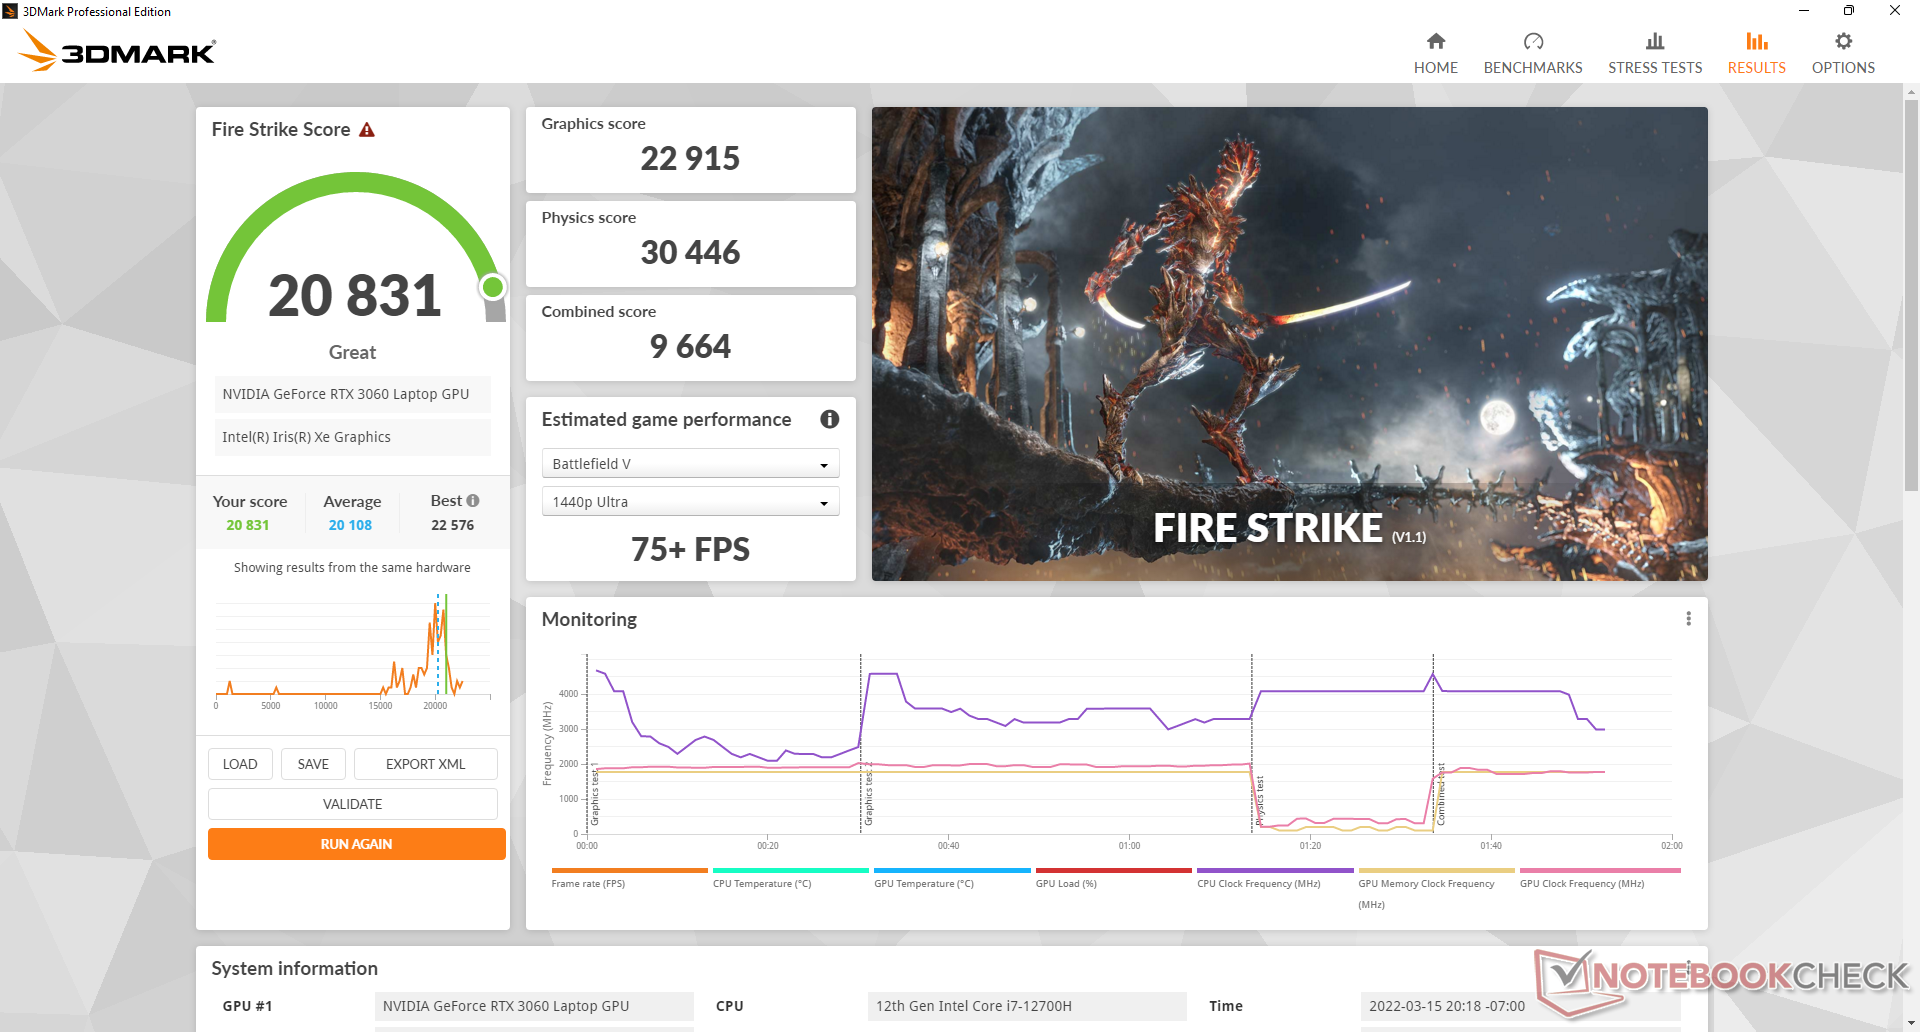
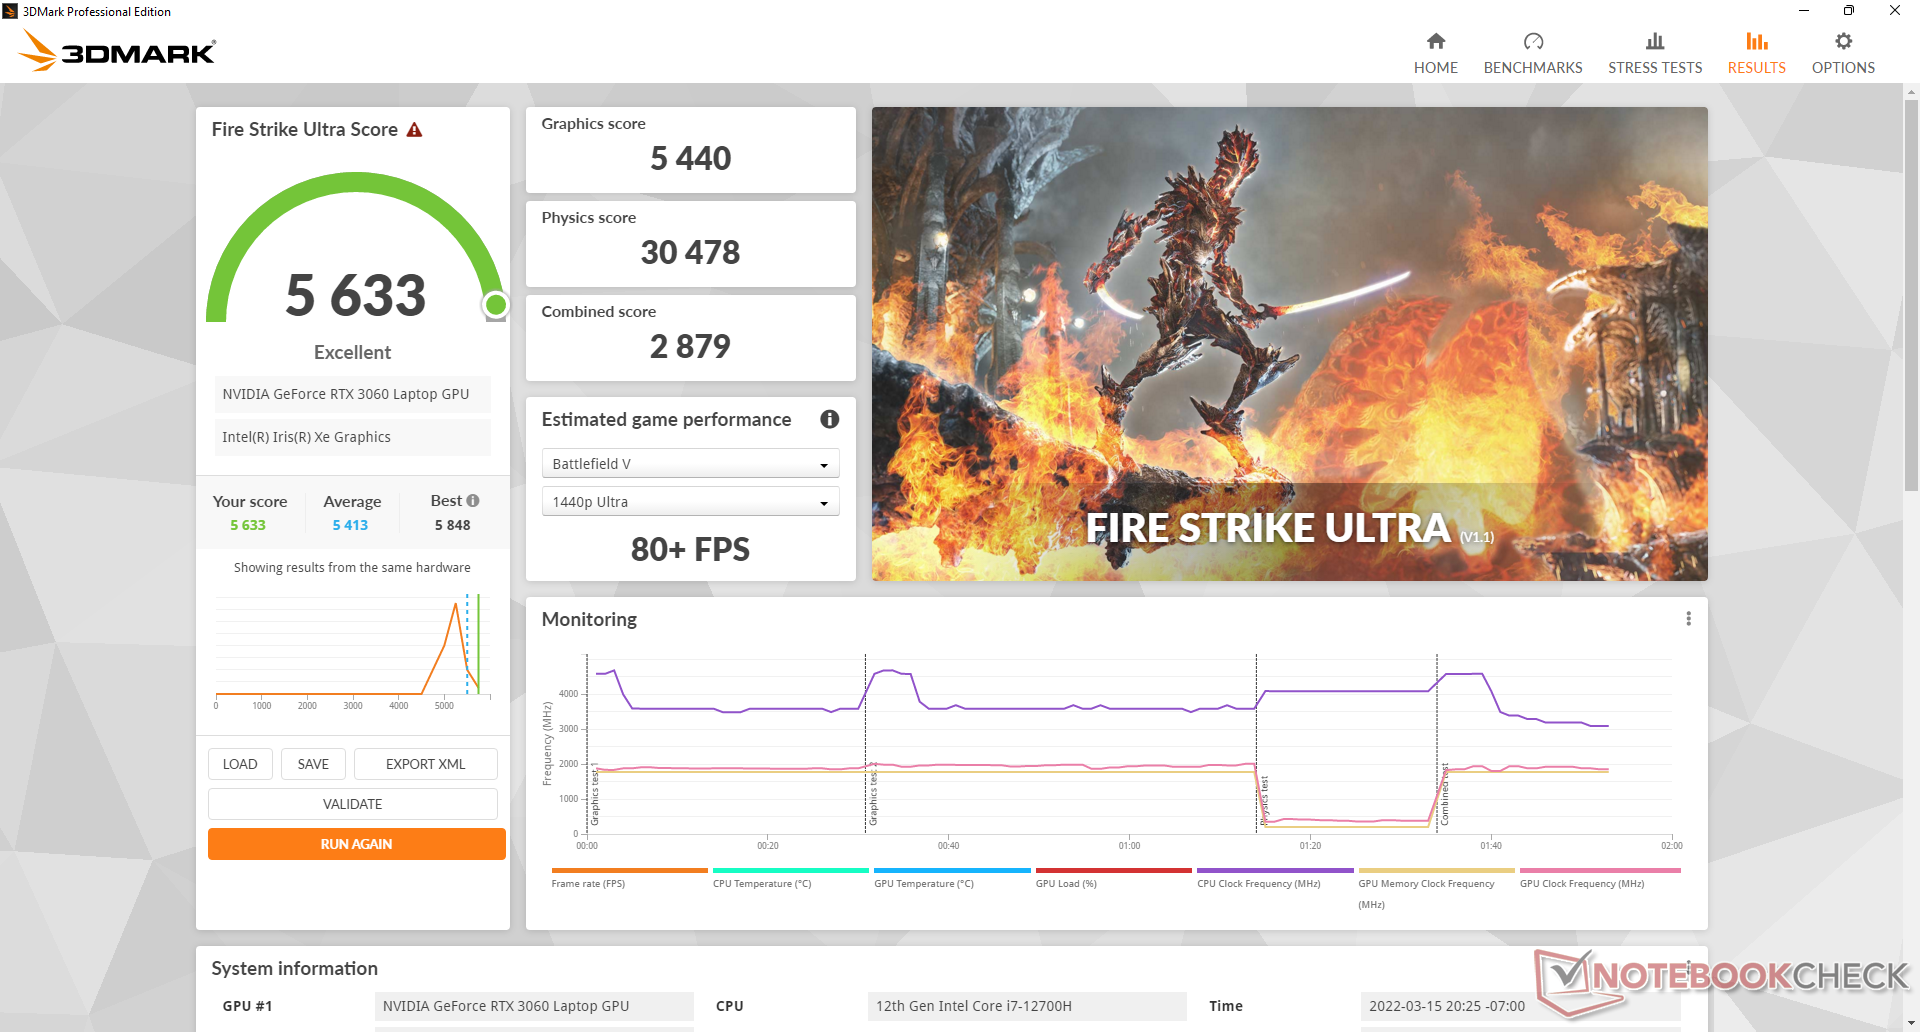
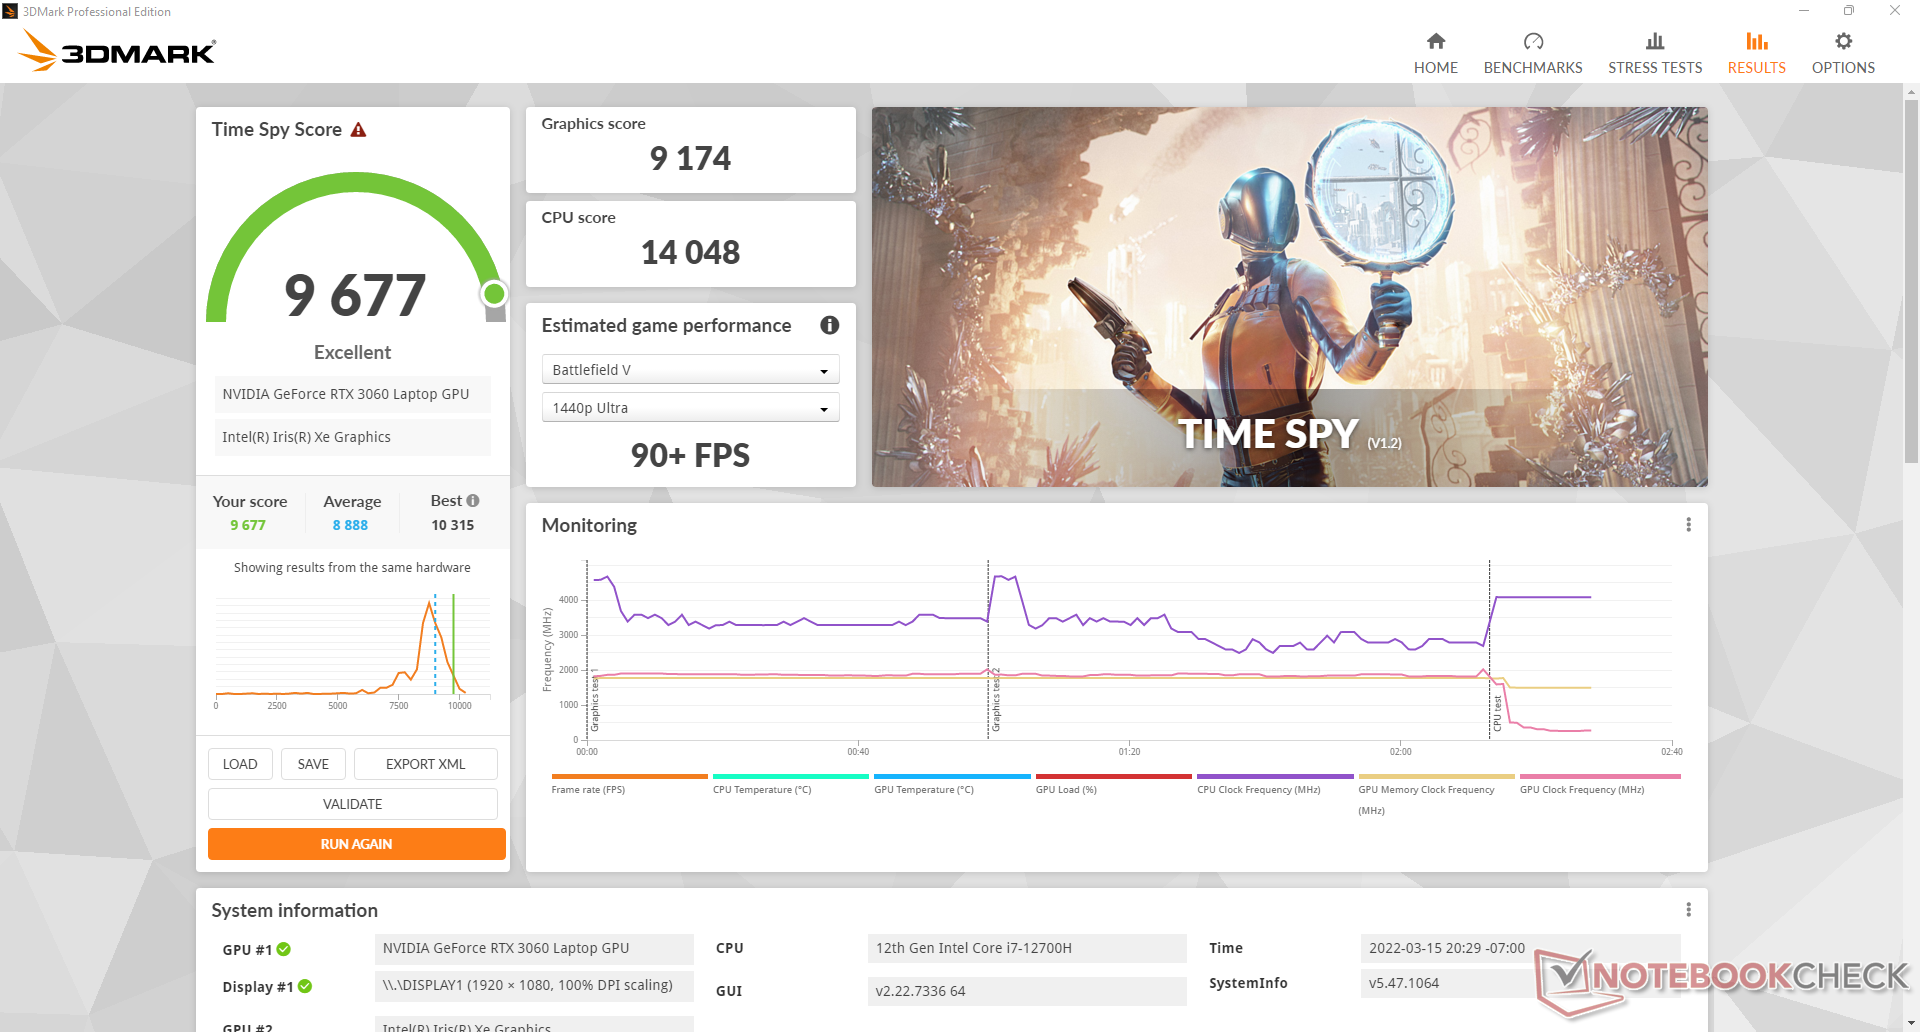
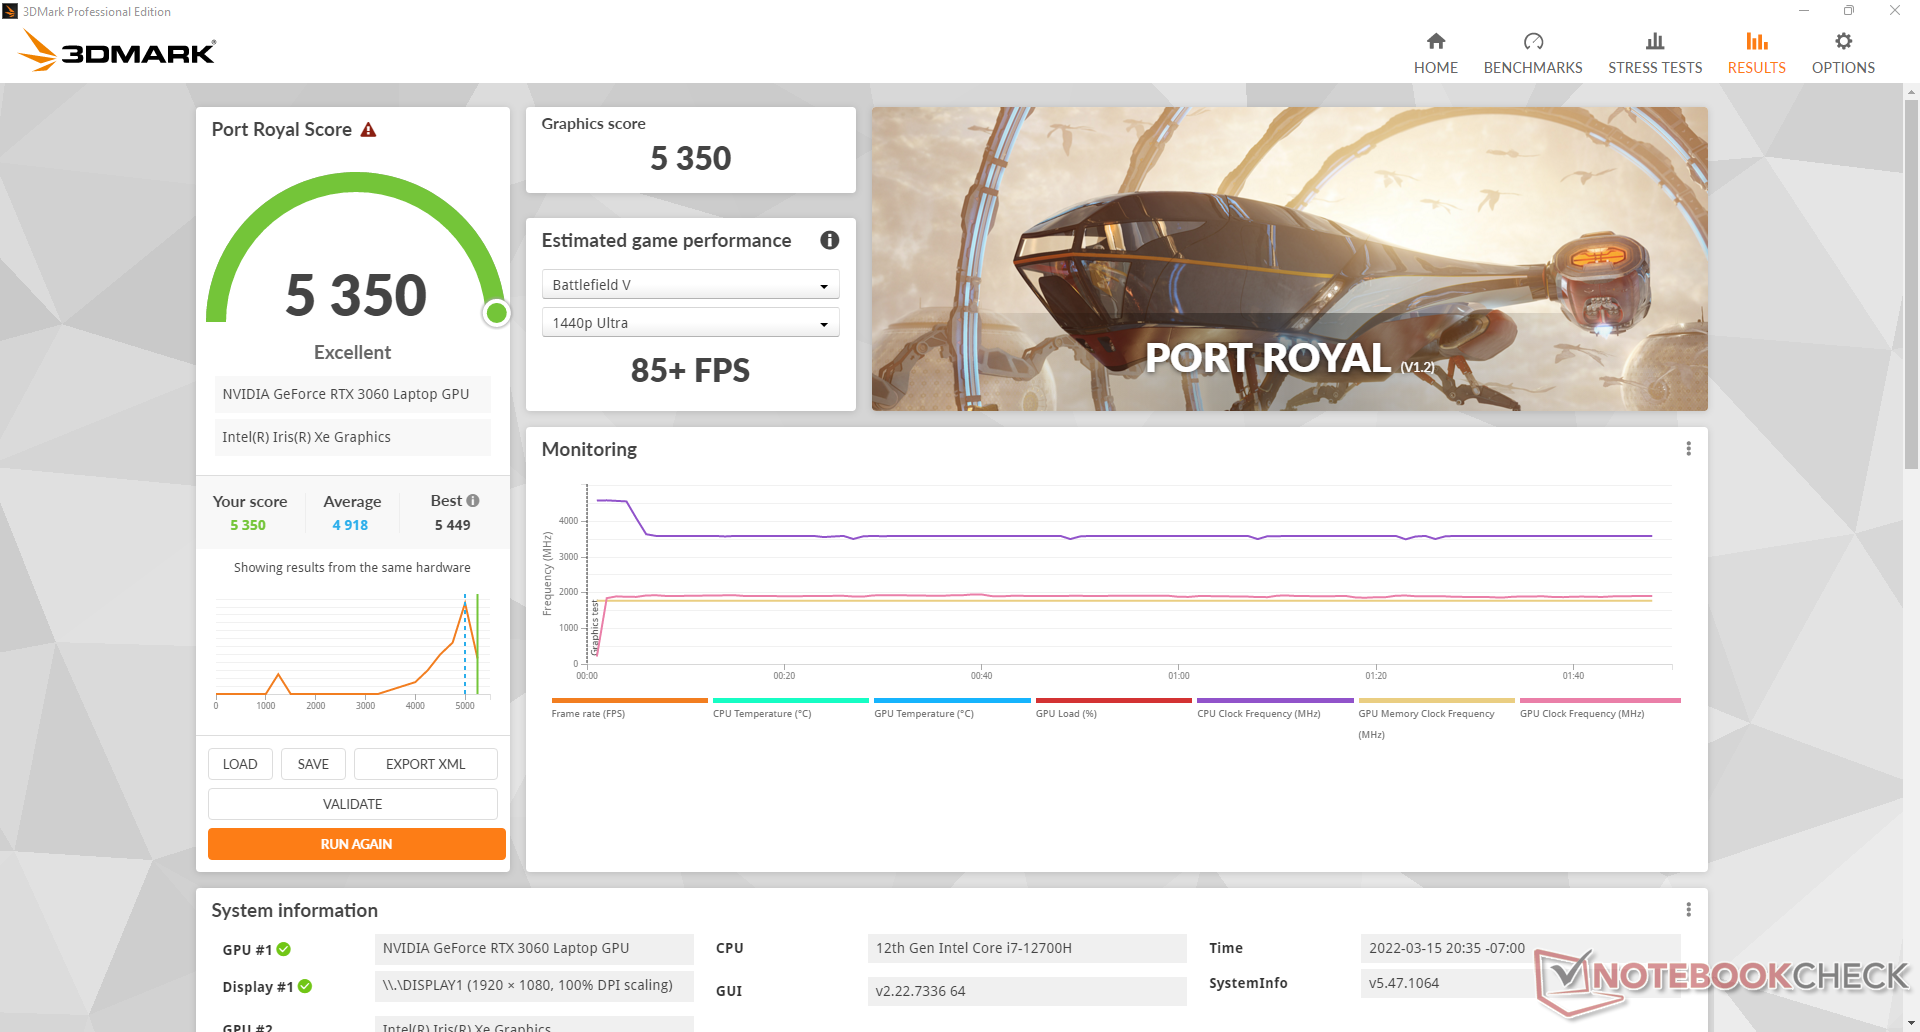
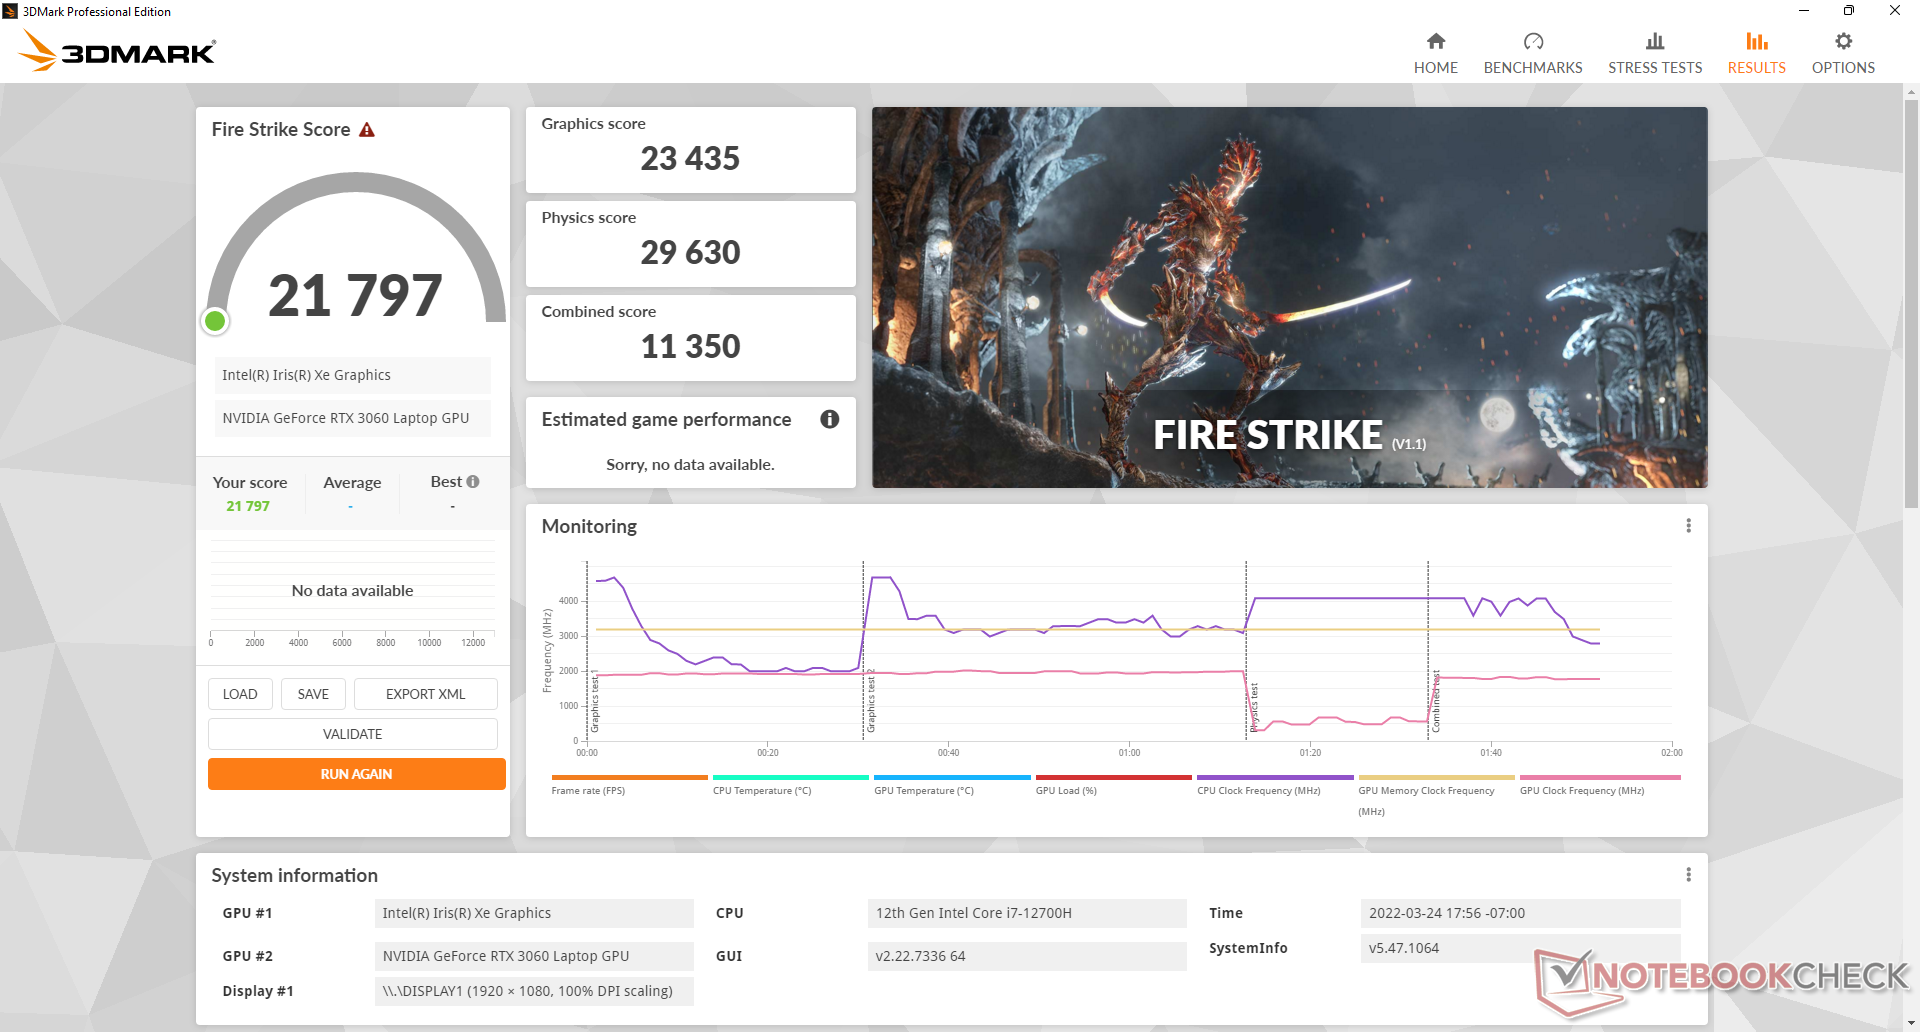
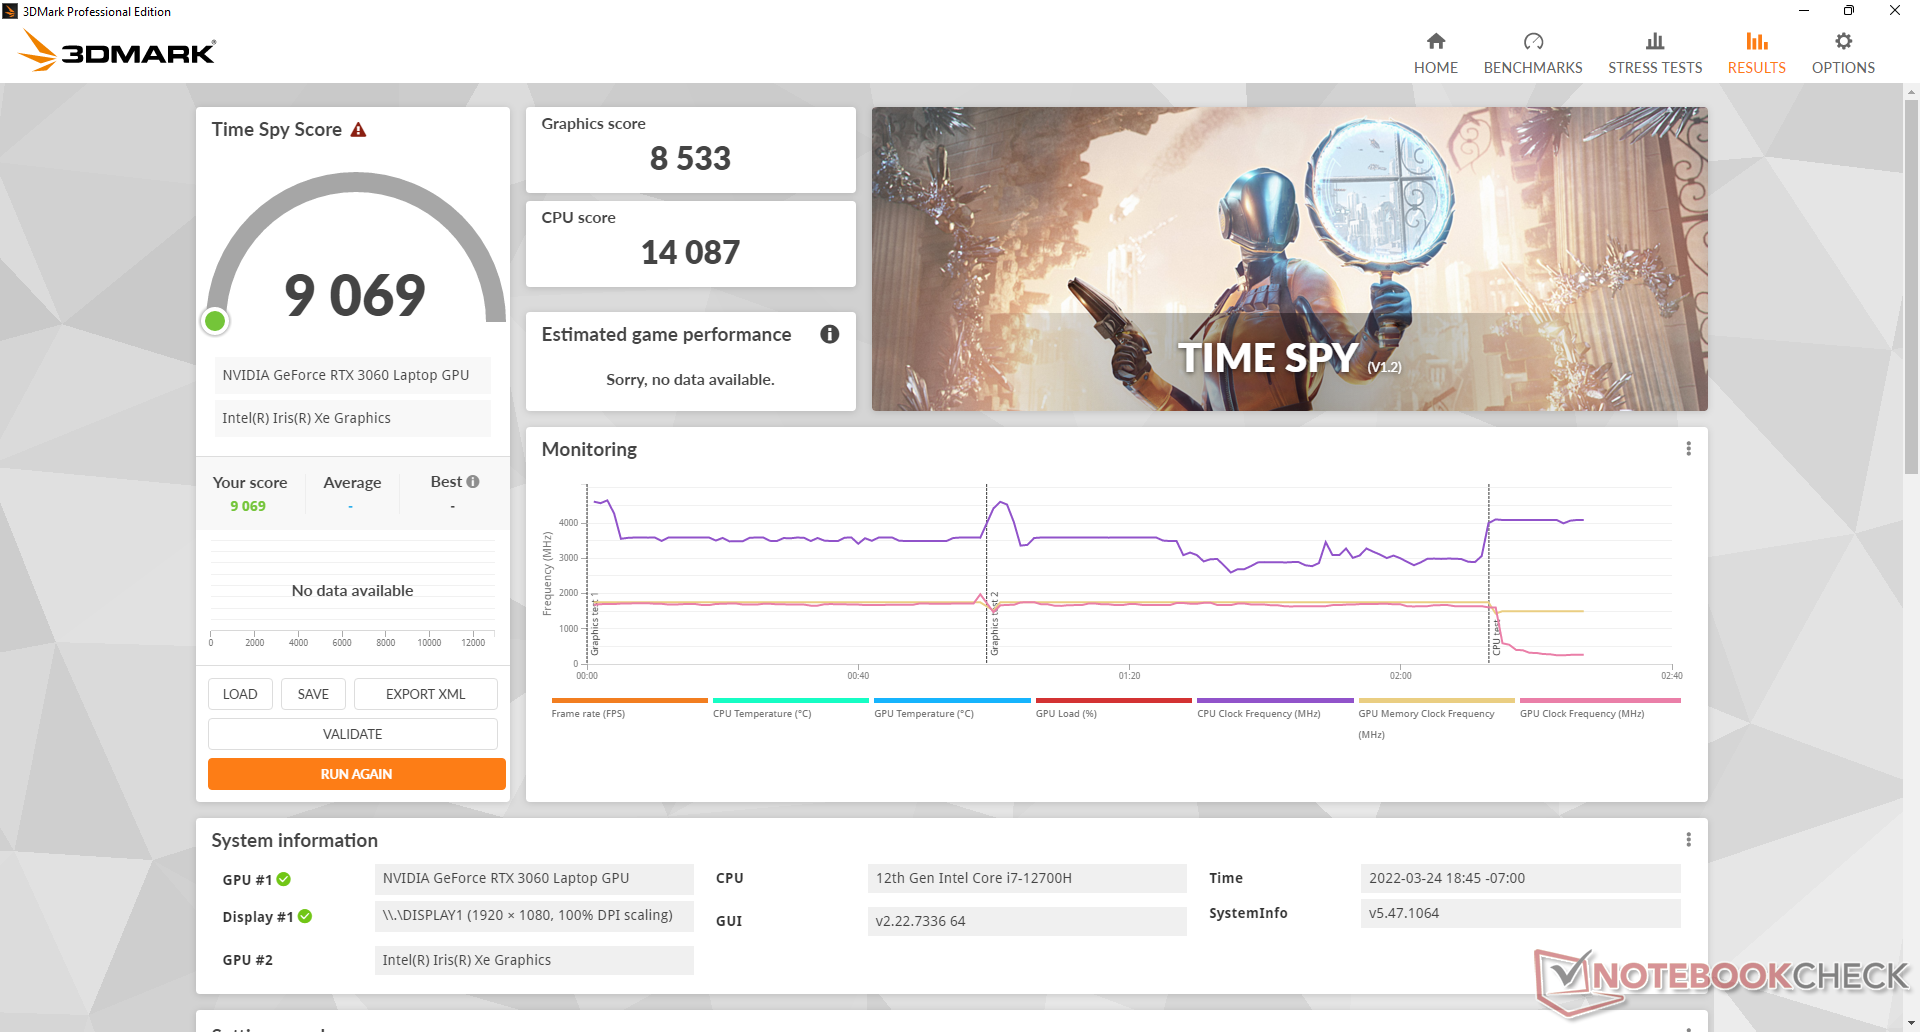
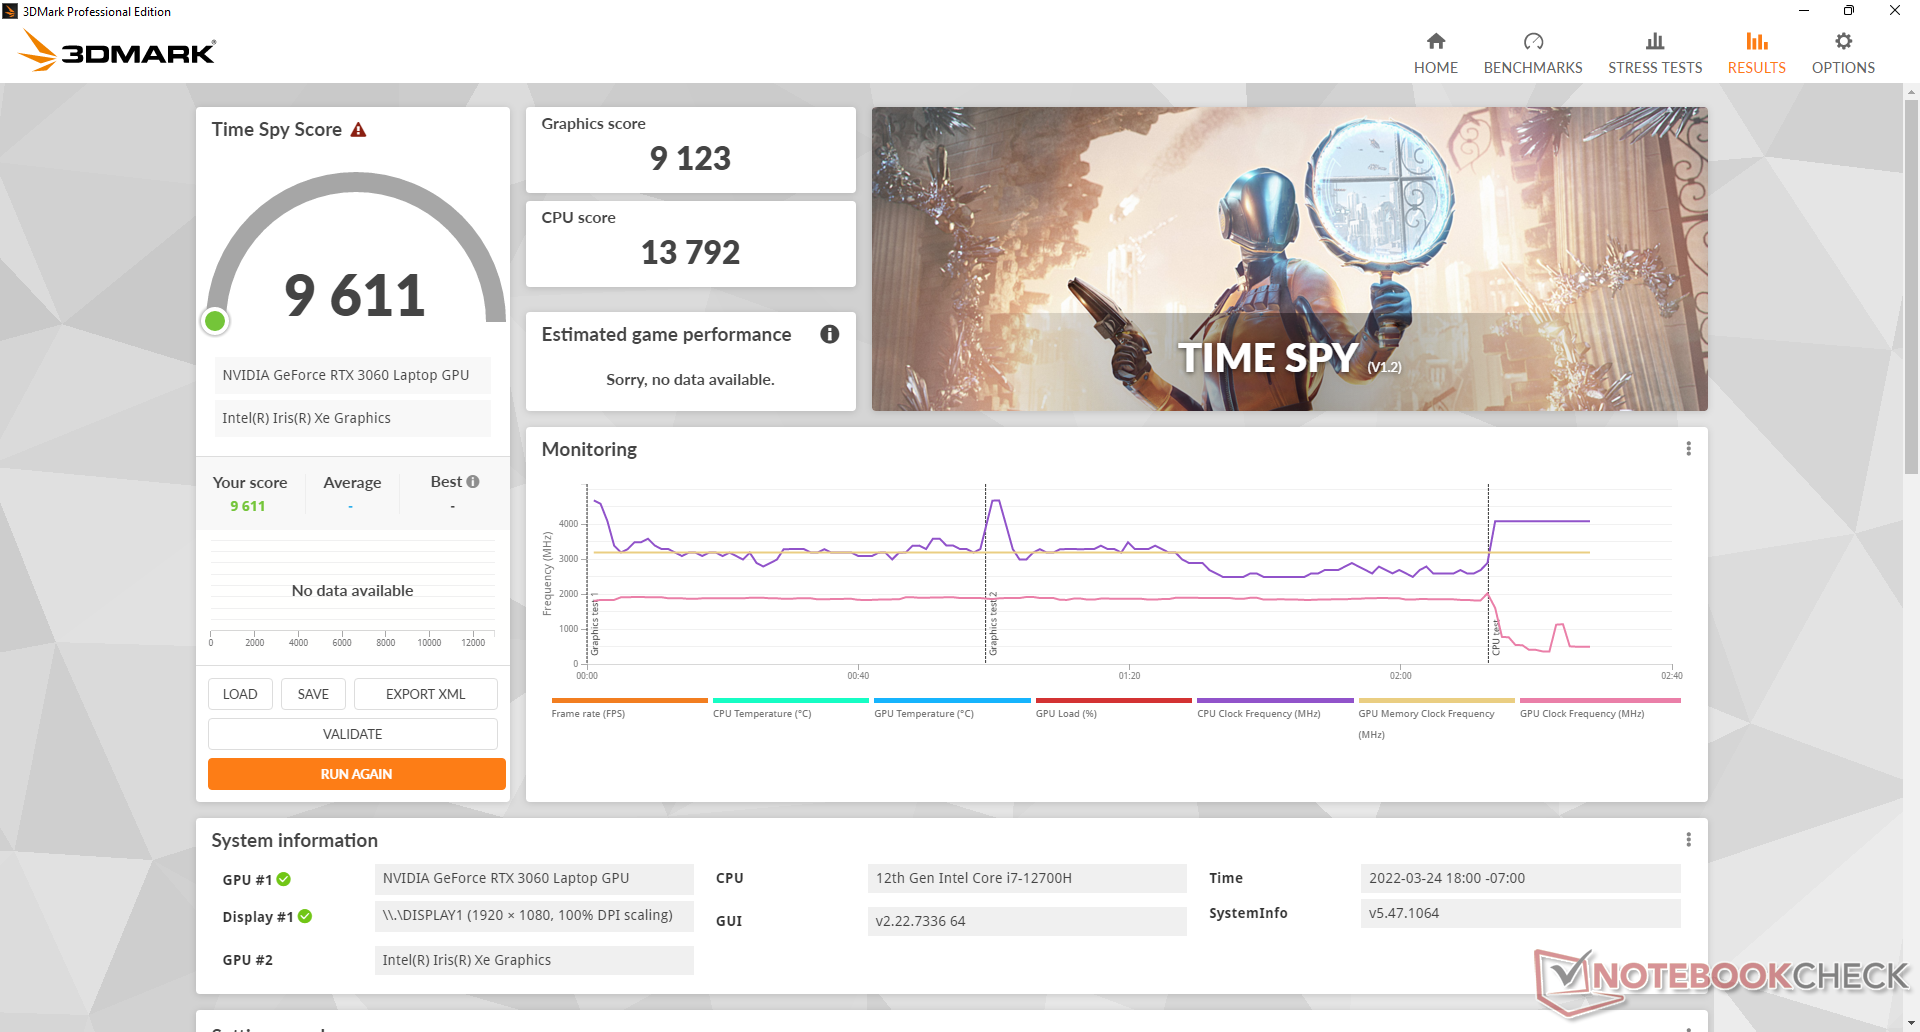
The higher GeForce RTX 3060 TGP target when compared to last year's model (140 W vs. 95 W) has naturally led to higher graphics performance. Users can expect a 10 to 20 percent performance boost over the FX506 equipped with the same RTX 3060 GPU. In fact, the FX507 is one of the fastest GeForce RTX 3060 laptops you can buy at the moment with results that are approximately 15 percent higher than the average laptop equipped with the same GPU.
Running on MSHybrid mode instead of discrete GPU mode would result in just very minor performance deficits or almost no deficit at all. 3DMark results would be nearly identical between the two modes while frame rates when gaming would be slower by just a couple of percentage points in our tests.
Running on dGPU Performance mode instead of dGPU Turbo mode would result in a 5 to 10 percent GPU performance deficit.
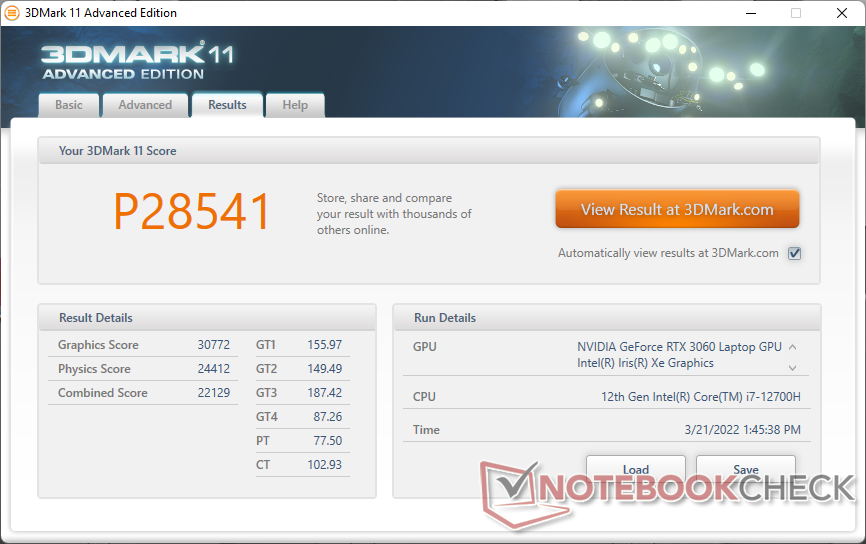

| 3DMark 11 Performance | 28541 points | |
| 3DMark Cloud Gate Standard Score | 58475 points | |
| 3DMark Fire Strike Score | 20831 points | |
| 3DMark Time Spy Score | 9677 points | |
Help | ||
Witcher 3 FPS Chart
| low | med. | high | ultra | |
|---|---|---|---|---|
| GTA V (2015) | 186 | 182 | 162 | 97.9 |
| The Witcher 3 (2015) | 395.4 | 291.8 | 186.8 | 91.5 |
| Dota 2 Reborn (2015) | 172 | 161 | 154 | 148 |
| Final Fantasy XV Benchmark (2018) | 161 | 122 | 91.9 | |
| X-Plane 11.11 (2018) | 153 | 136 | 107 | |
| Far Cry 5 (2018) | 156 | 123 | 114 | 114 |
| Strange Brigade (2018) | 345 | 232 | 185 | 160 |
Emissions
System Noise
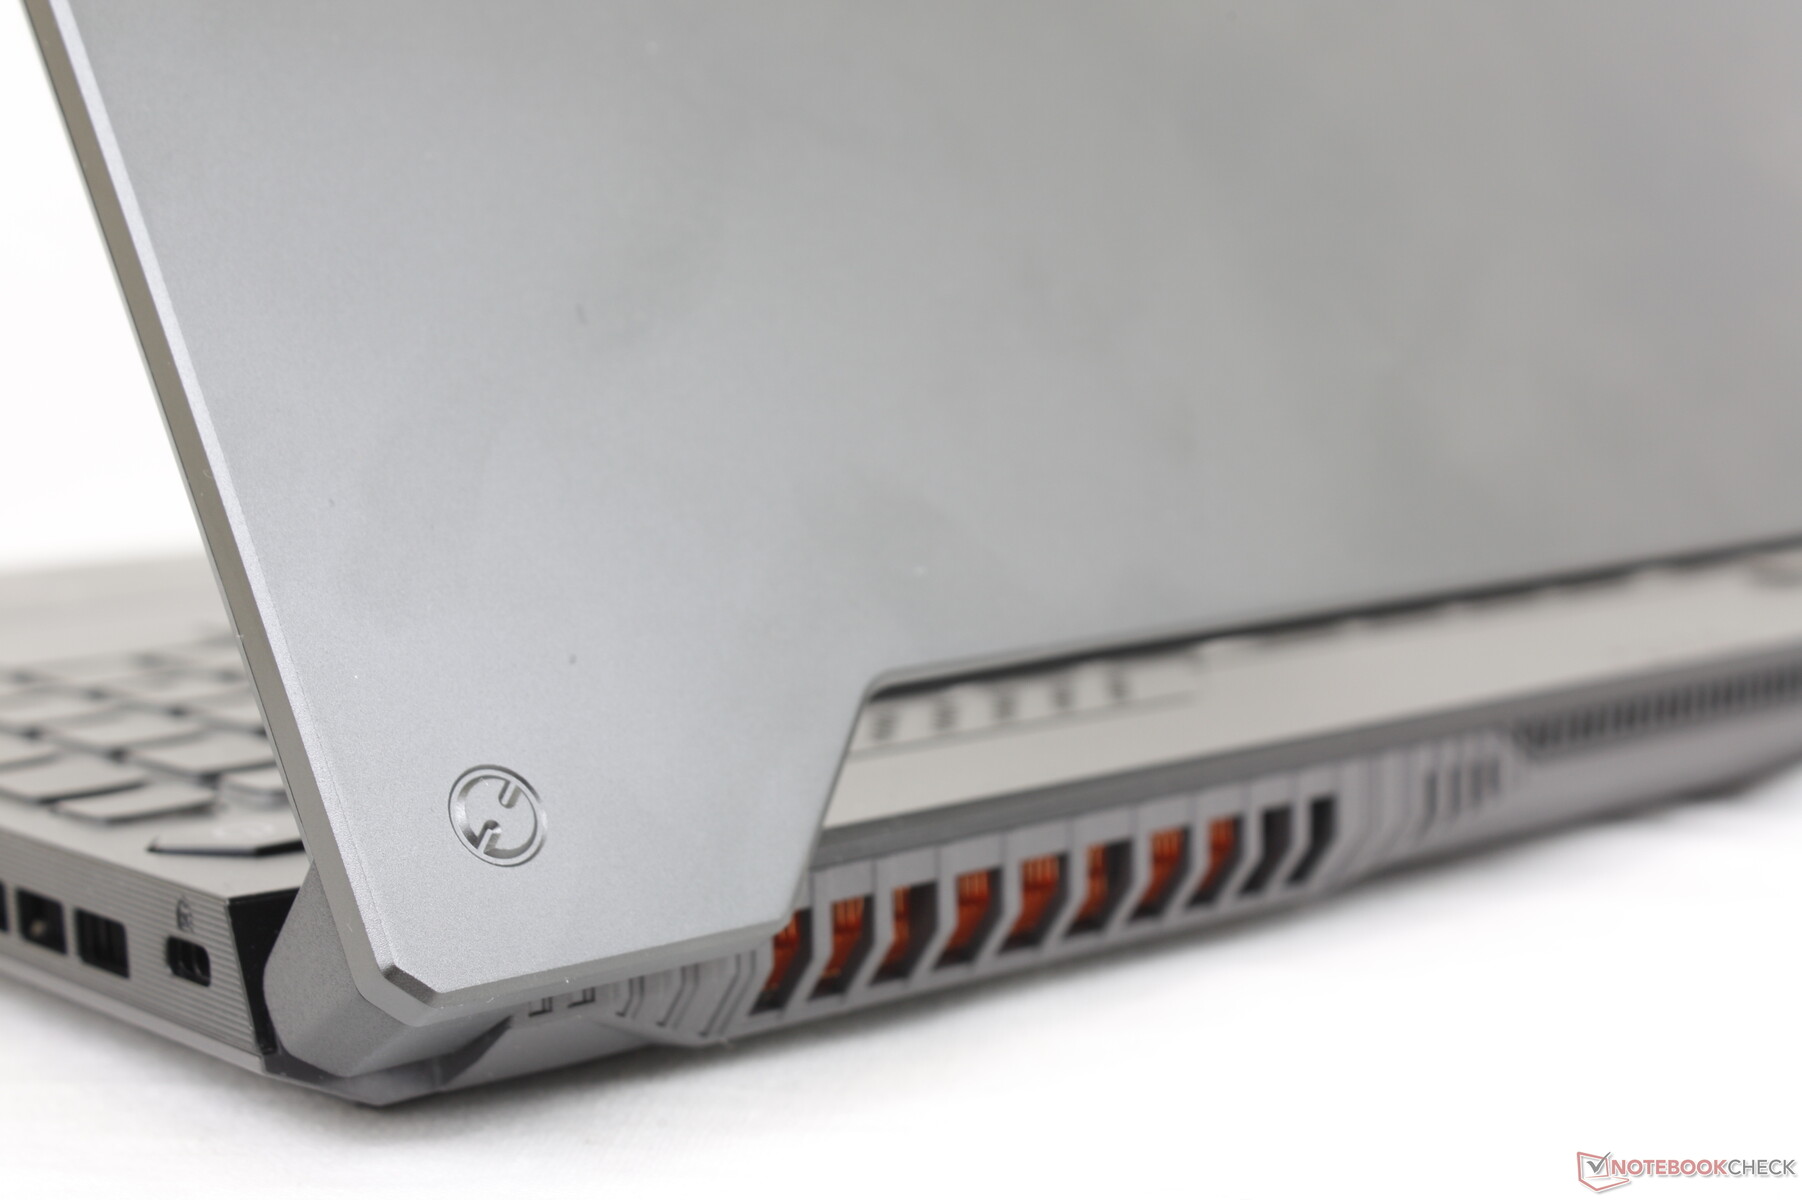
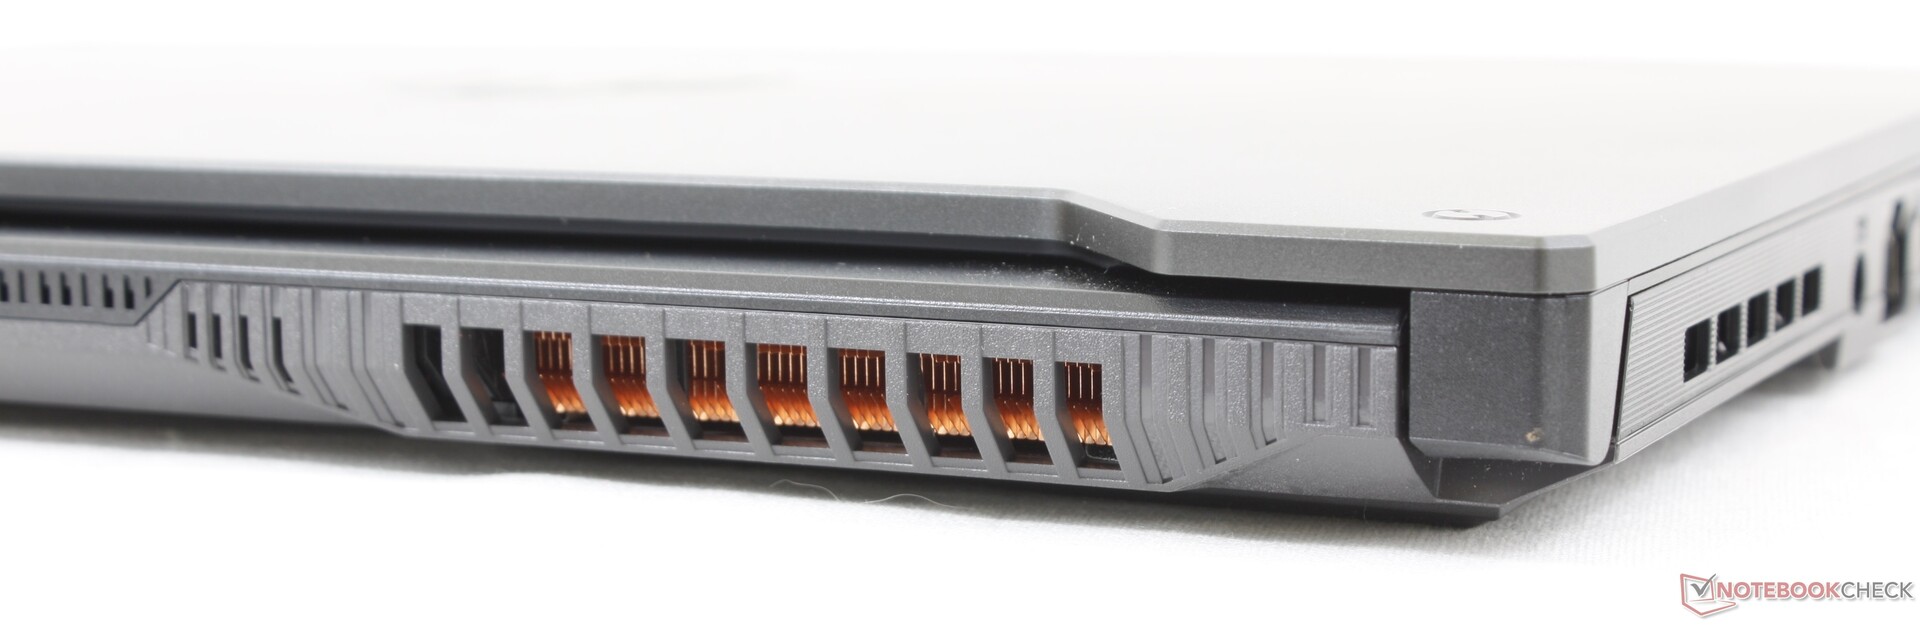
Asus has upgraded the cooling solution for the FX507 despite its lighter overall weight when compared to the FX506. Five fan modes are available via Armoury Crate: Windows, Silent, Performance, Turbo, and Manual. Windows or Silent is recommended when browsing or word processing to avoid pulsing fans.
Running Witcher 3 on Performance mode and Turbo mode would result in a fan noise of 45.8 dB(A) and 54.1 dB(A), respectively. The lower fan noise in Performance mode is significant relative to the small 5 to 10 percent decrease in graphics performance when compared to Turbo mode. Thus, users may want to consider gaming in Performance mode if fan noise is a concern.
Noise level
| Idle |
| 23.6 / 23.6 / 25.4 dB(A) |
| Load |
| 38 / 57.2 dB(A) |
 | ||
30 dB silent 40 dB(A) audible 50 dB(A) loud |
||
min: | ||
| Asus TUF Gaming F15 FX507ZM GeForce RTX 3060 Laptop GPU, i7-12700H, SK Hynix HFM001TD3JX013N | Asus TUF Gaming F15 FX506HM GeForce RTX 3060 Laptop GPU, i7-11800H, SK Hynix HFM001TD3JX013N | Asus TUF Dash F15 FX516PR GeForce RTX 3070 Laptop GPU, i7-11370H, SK Hynix HFM001TD3JX013N | Asus ROG Strix Scar 15 G533QS GeForce RTX 3080 Laptop GPU, R9 5900HX, ADATA Swordfish 2 TB | Asus Zephyrus S15 GX502L GeForce RTX 2070 Super Mobile, i7-10875H, WDC PC SN730 SDBPNTY-1T00 | Asus ZenBook Pro Duo UX582 LR-1BH2 GeForce RTX 3070 Laptop GPU, i7-10870H, Samsung PM981a MZVLB1T0HBLR | |
|---|---|---|---|---|---|---|
| Noise | 6% | -14% | -8% | -21% | -1% | |
| off / environment * (dB) | 23.2 | 24.8 -7% | 24 -3% | 25.5 -10% | 25 -8% | 24.6 -6% |
| Idle Minimum * (dB) | 23.6 | 24.6 -4% | 25 -6% | 25.5 -8% | 28 -19% | 24.6 -4% |
| Idle Average * (dB) | 23.6 | 24.9 -6% | 30 -27% | 25.5 -8% | 31 -31% | 24.6 -4% |
| Idle Maximum * (dB) | 25.4 | 24.9 2% | 35 -38% | 37.1 -46% | 36 -42% | 25.9 -2% |
| Load Average * (dB) | 38 | 27.1 29% | 53 -39% | 39.2 -3% | 56 -47% | 39.6 -4% |
| Witcher 3 ultra * (dB) | 54.1 | 46.4 14% | 48 11% | 50.5 7% | 55 -2% | 49.8 8% |
| Load Maximum * (dB) | 57.2 | 49 14% | 54 6% | 51.8 9% | 57 -0% | 54.2 5% |
* ... smaller is better
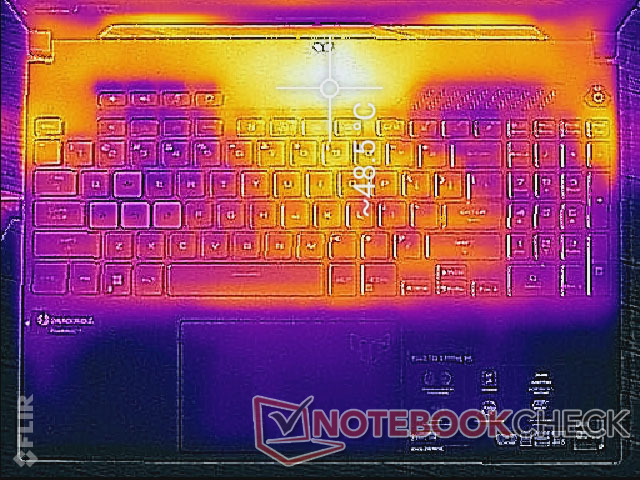
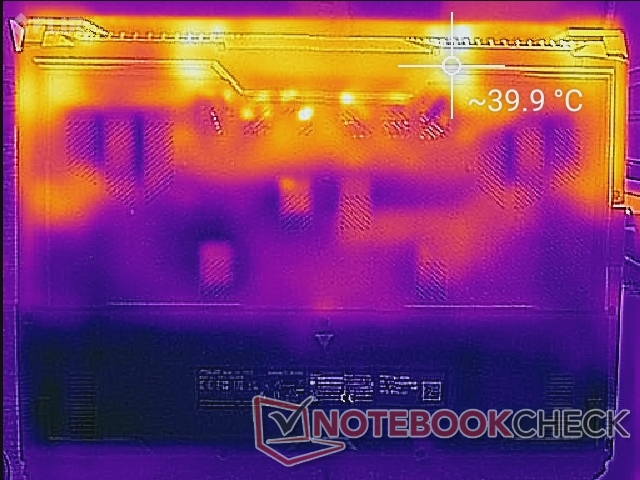
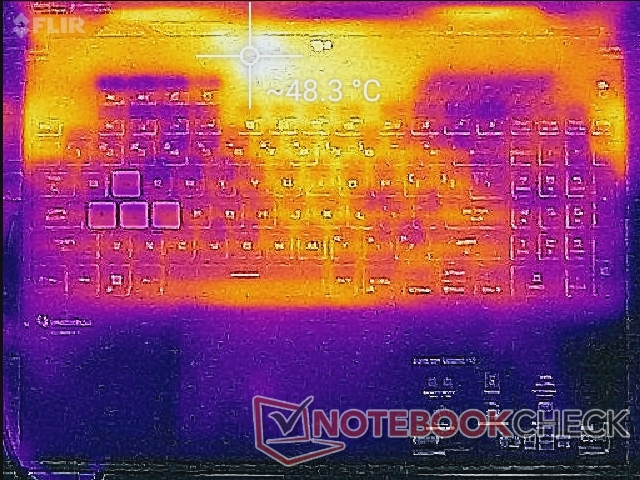
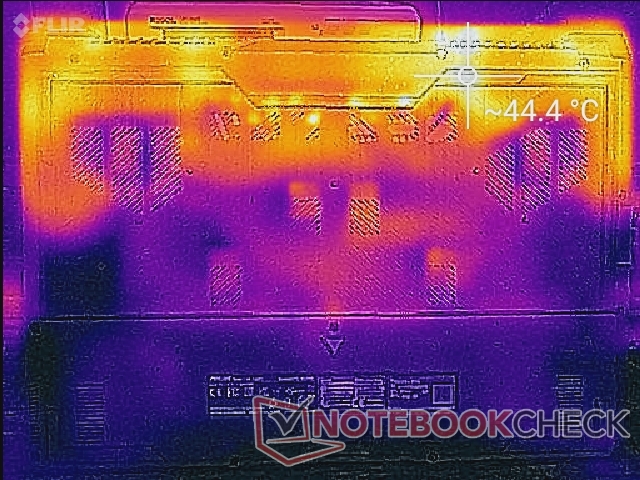
Temperature
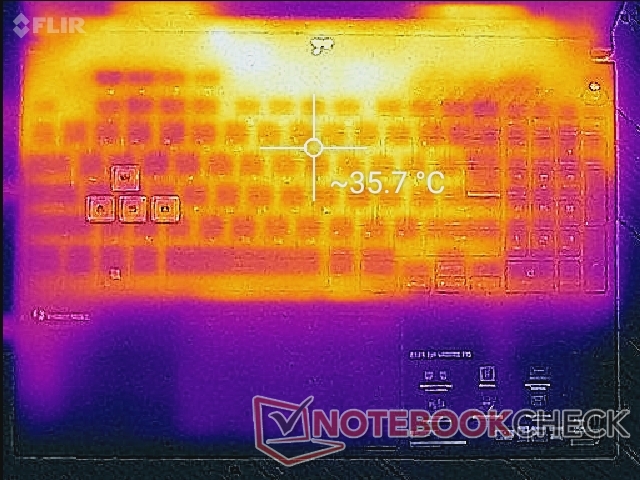
Surface temperature hot spots are warmer than what we recorded on last year's model. When running Witcher 3, for example, the top hot spot on the FX507 can be as warm as 49 C compared to only 37 C on the FX506. However, the improved cooling solution of the FX507 has moved the hot spot away from the keyboard keys to keep the palms and fingers cool no matter the onscreen load.
Surface temperatures are warmer than expected even when idling on desktop, but that is because the fans tend to idle or run at very low speeds when activity is low. We find this to be an acceptable tradeoff especially when in classrooms or when playing video or music.
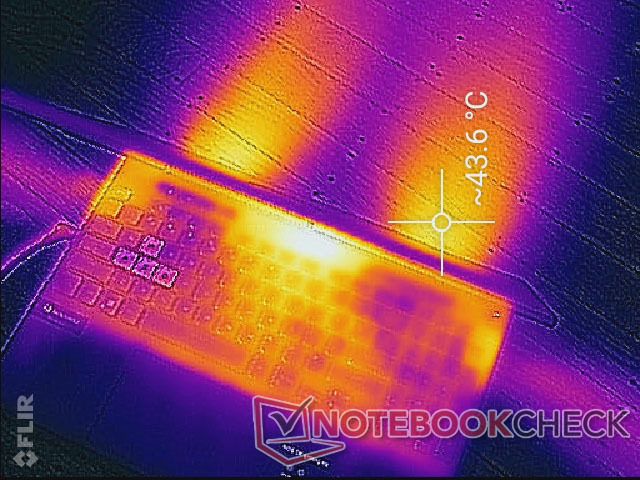
(±) The maximum temperature on the upper side is 44.4 °C / 112 F, compared to the average of 40.4 °C / 105 F, ranging from 21.2 to 68.8 °C for the class Gaming.
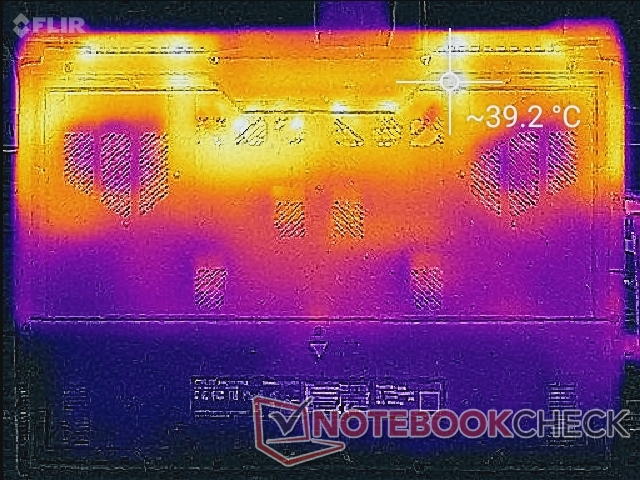
(-) The bottom heats up to a maximum of 48.8 °C / 120 F, compared to the average of 43.2 °C / 110 F
(+) In idle usage, the average temperature for the upper side is 30.2 °C / 86 F, compared to the device average of 33.9 °C / 93 F.
(+) Playing The Witcher 3, the average temperature for the upper side is 31.4 °C / 89 F, compared to the device average of 33.9 °C / 93 F.
(+) The palmrests and touchpad are cooler than skin temperature with a maximum of 28 °C / 82.4 F and are therefore cool to the touch.
(±) The average temperature of the palmrest area of similar devices was 28.8 °C / 83.8 F (+0.8 °C / 1.4 F).
| Asus TUF Gaming F15 FX507ZM Intel Core i7-12700H, NVIDIA GeForce RTX 3060 Laptop GPU | Asus TUF Gaming F15 FX506HM Intel Core i7-11800H, NVIDIA GeForce RTX 3060 Laptop GPU | Asus TUF Dash F15 FX516PR Intel Core i7-11370H, NVIDIA GeForce RTX 3070 Laptop GPU | Asus ROG Strix Scar 15 G533QS AMD Ryzen 9 5900HX, NVIDIA GeForce RTX 3080 Laptop GPU | Asus Zephyrus S15 GX502L Intel Core i7-10875H, NVIDIA GeForce RTX 2070 Super Mobile | Asus ZenBook Pro Duo UX582 LR-1BH2 Intel Core i7-10870H, NVIDIA GeForce RTX 3070 Laptop GPU | |
|---|---|---|---|---|---|---|
| Heat | 16% | 1% | 4% | 11% | 14% | |
| Maximum Upper Side * (°C) | 44.4 | 46.4 -5% | 55 -24% | 43.4 2% | 51 -15% | 47.7 -7% |
| Maximum Bottom * (°C) | 48.8 | 45.4 7% | 56 -15% | 48.2 1% | 44 10% | 53.8 -10% |
| Idle Upper Side * (°C) | 37.8 | 26 31% | 29 23% | 35.2 7% | 29 23% | 24.4 35% |
| Idle Bottom * (°C) | 39.6 | 27.4 31% | 32 19% | 37 7% | 30 24% | 24.7 38% |
* ... smaller is better
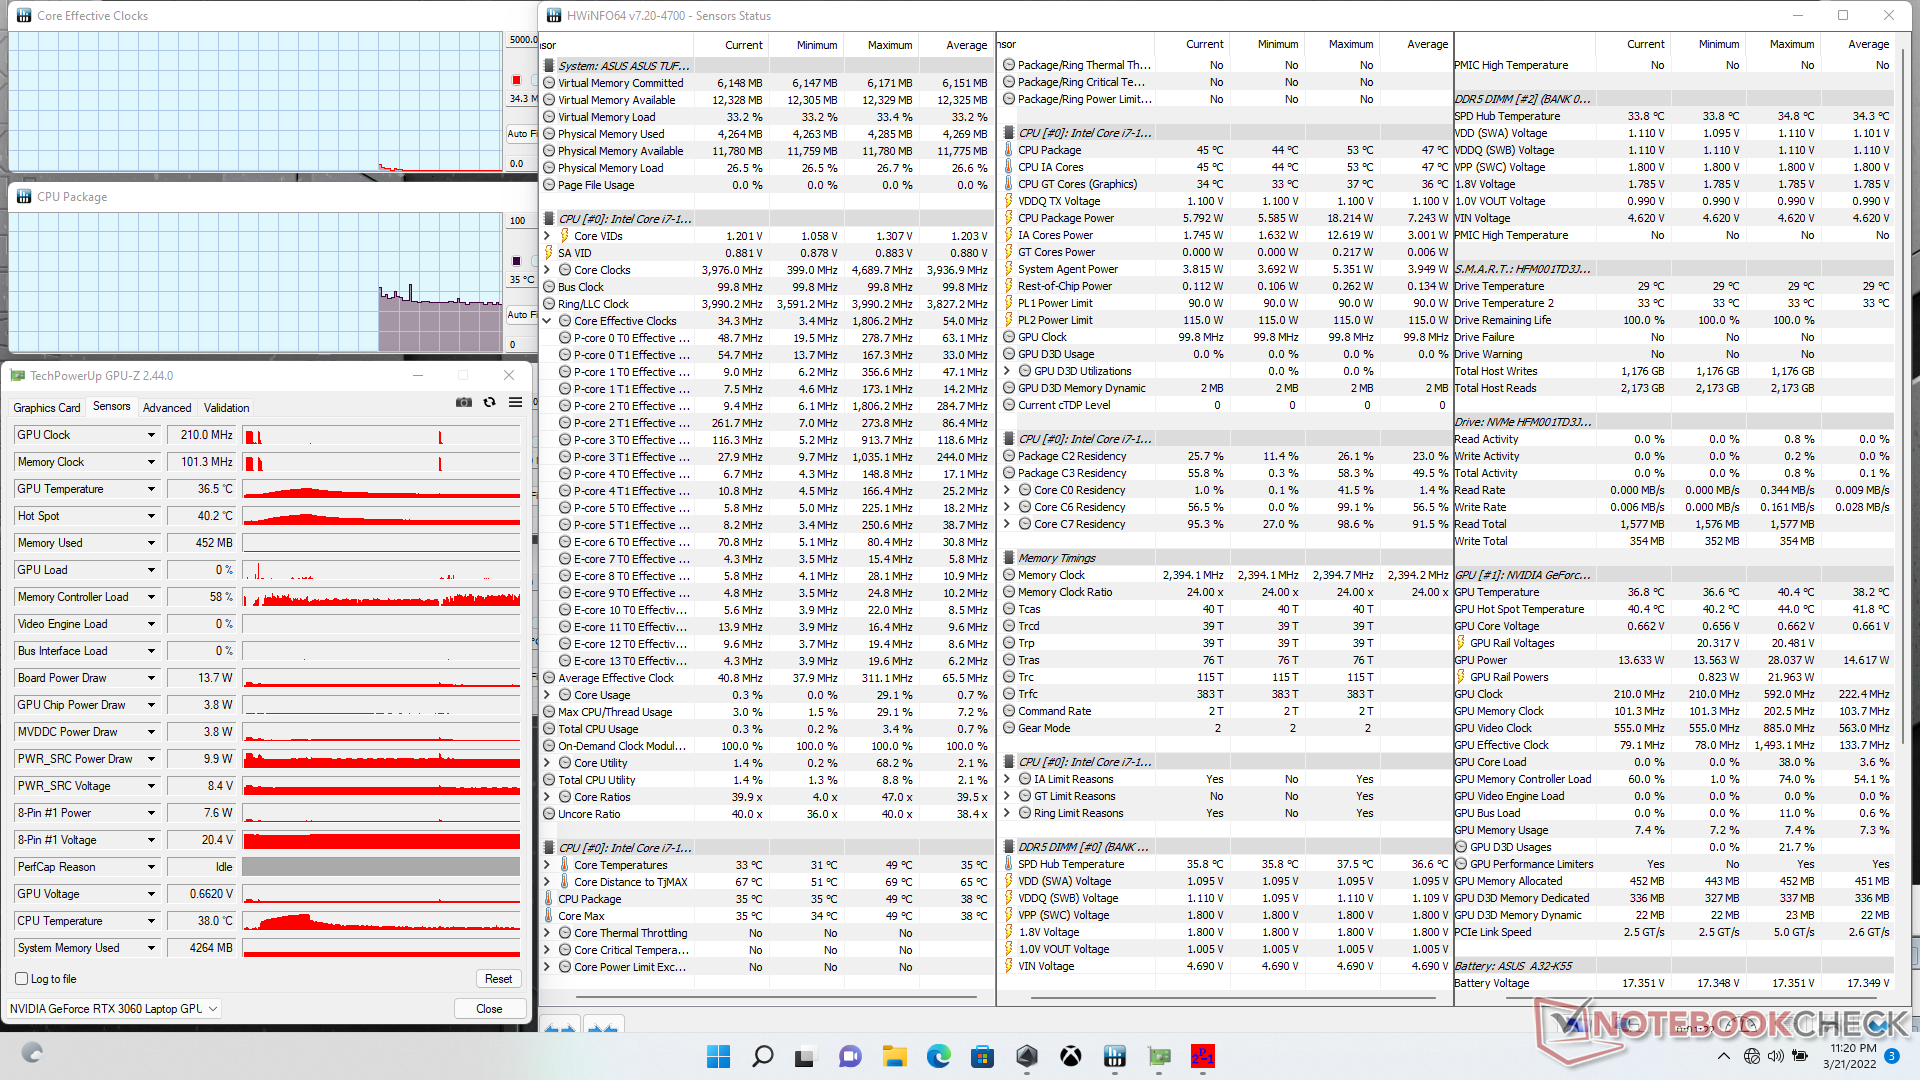
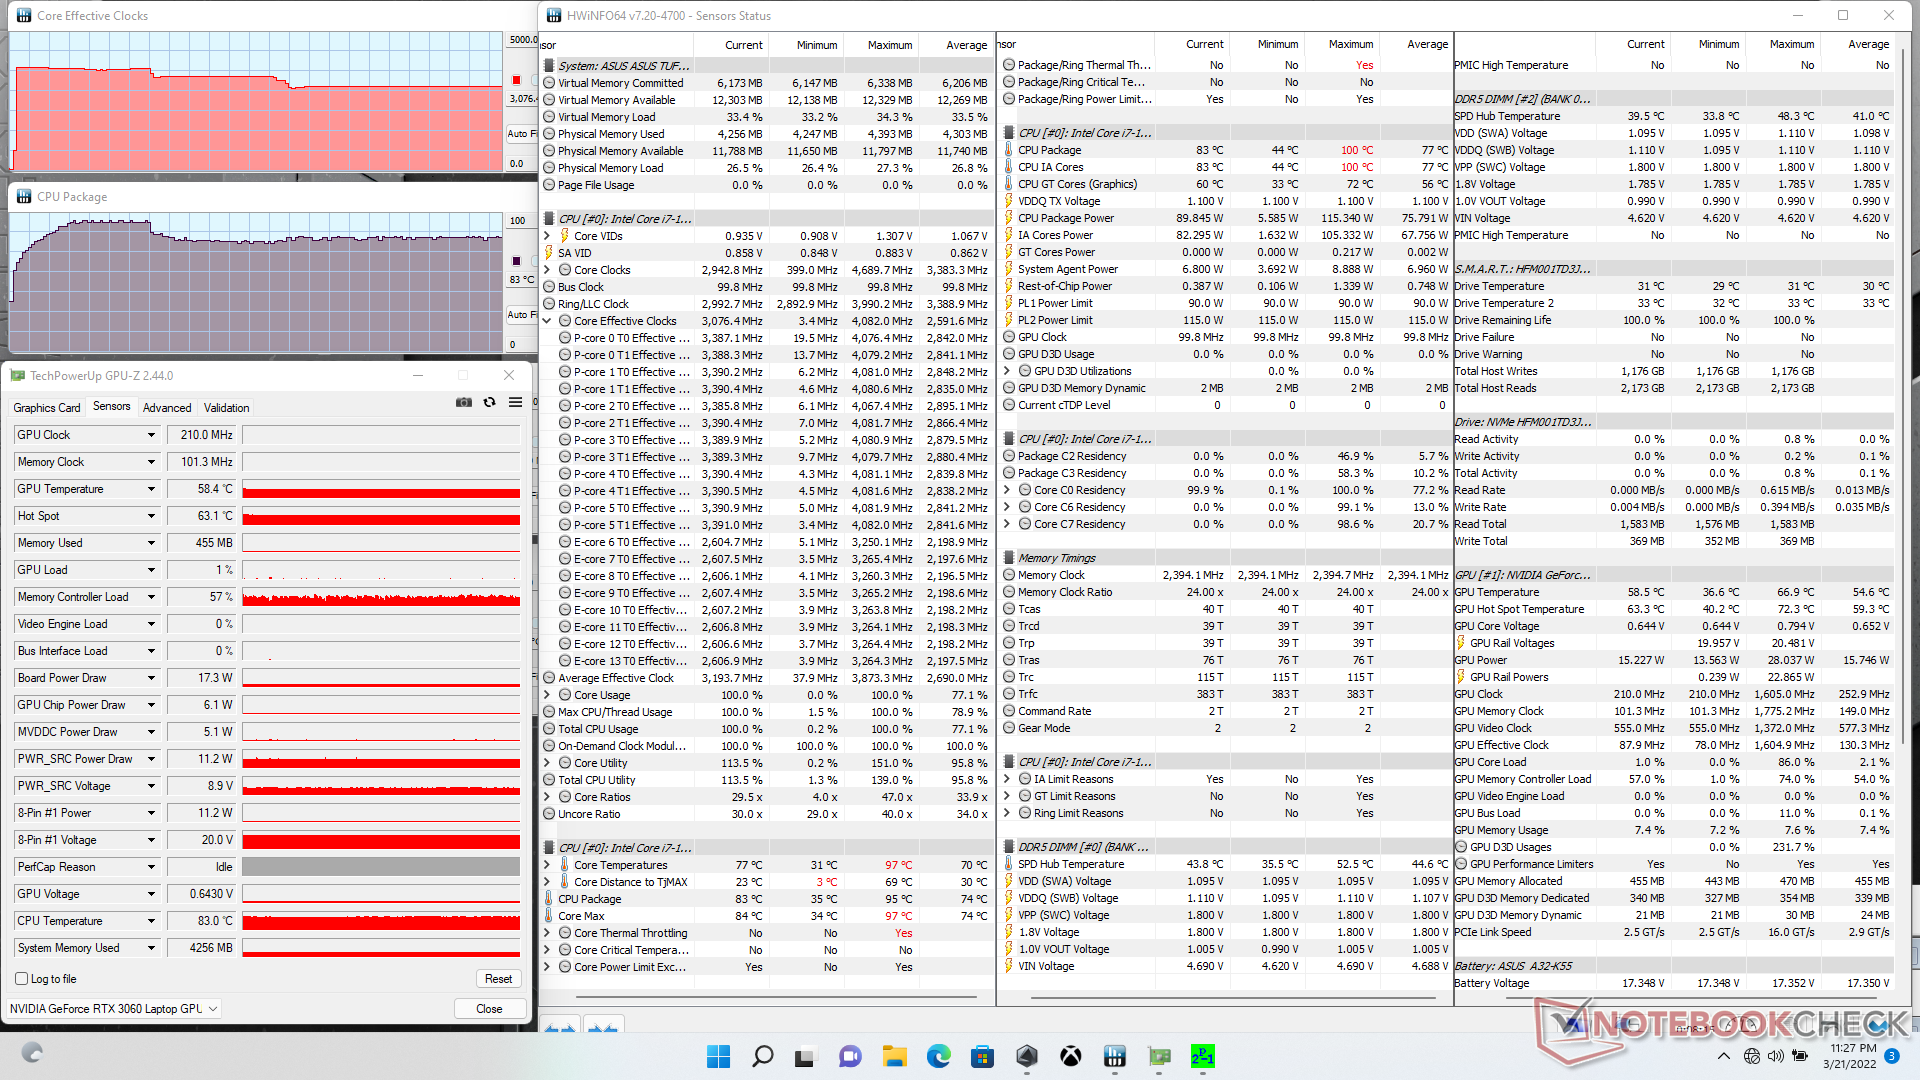
Stress Test
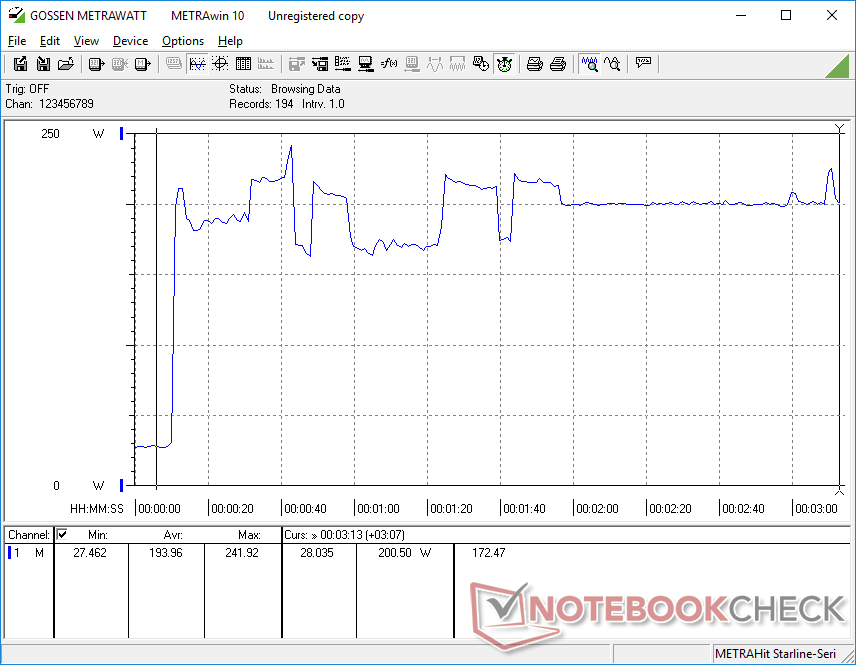
When running Prime95, the CPU would boost to 3.8 GHz for the first 100 seconds or so and at a core temperature of 95 C. Clock rates and temperature would eventually drop and stabilize at 3.1 GHz and 83 C, respectively. Package power would drop as well from 115 W to 90 W during this time according to HWiNFO.
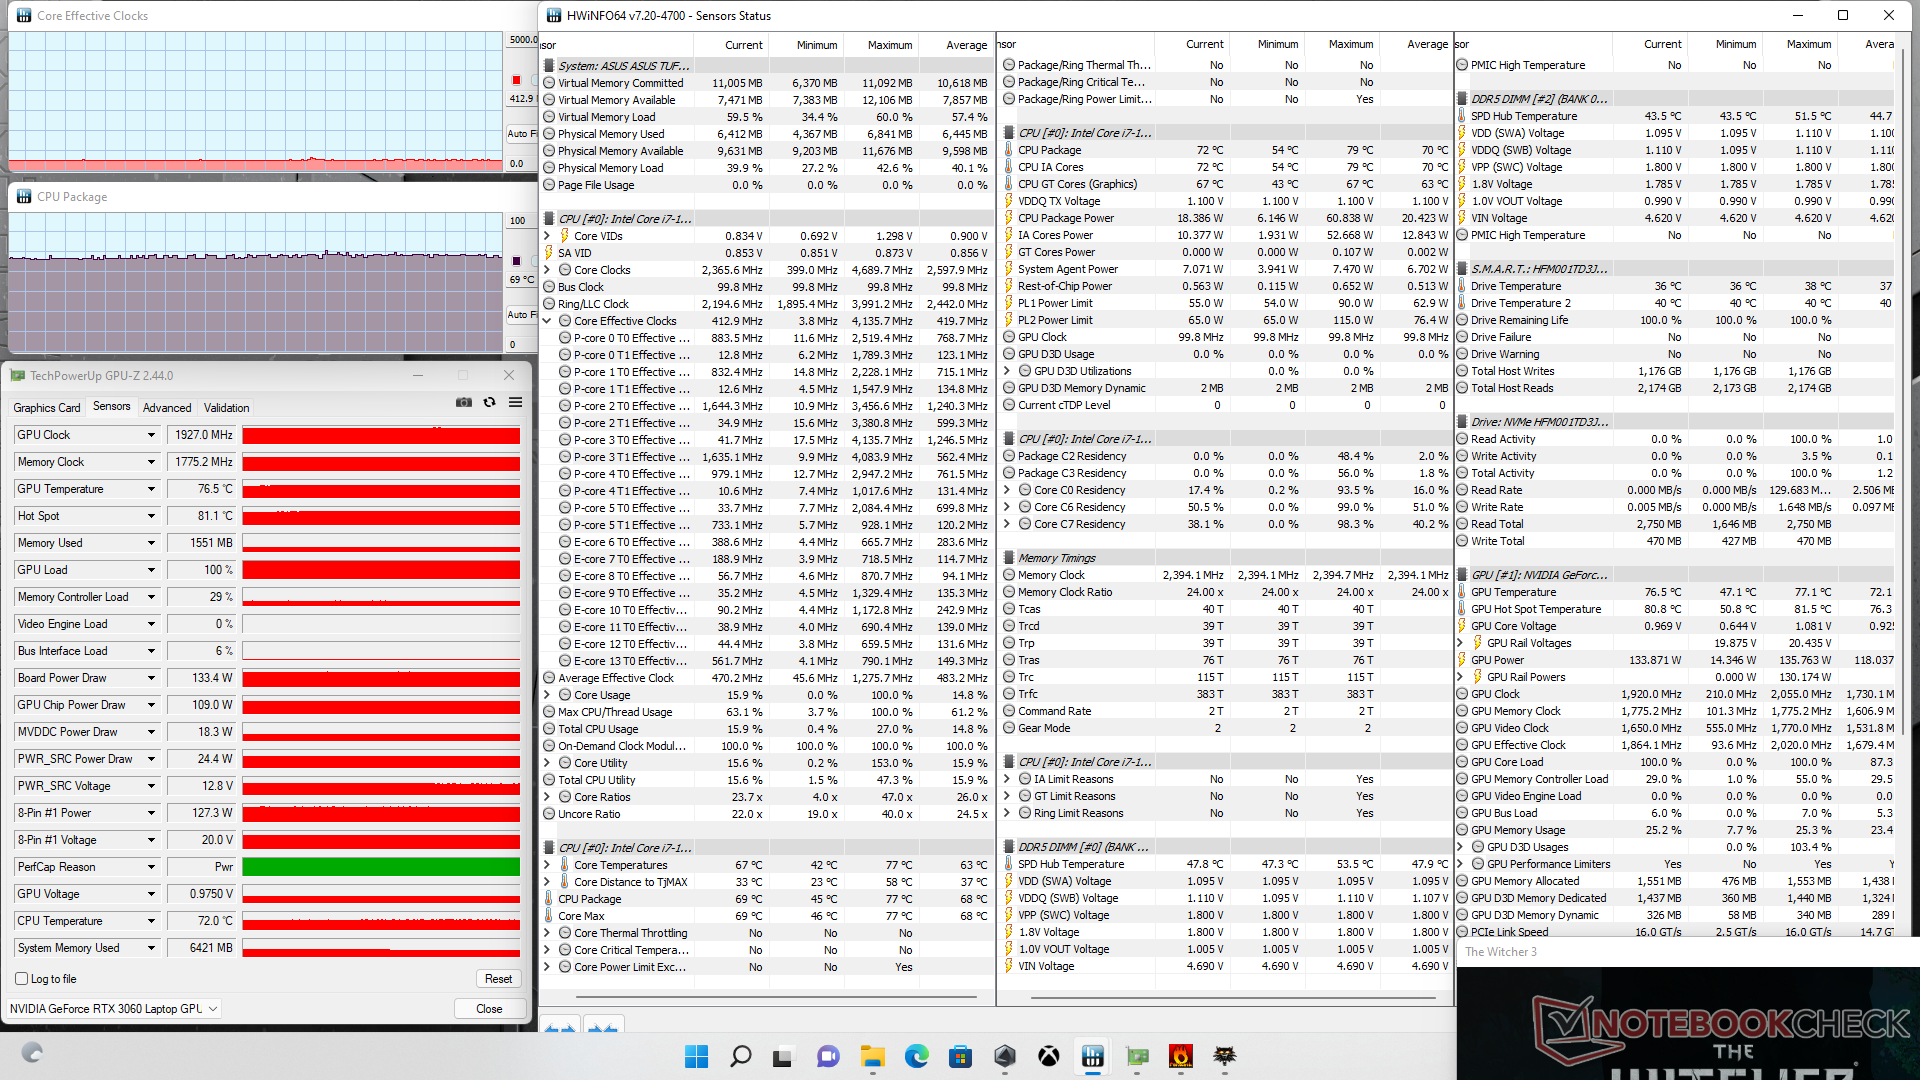
When running Witcher 3 to represent typical gaming stress, CPU and GPU temperatures would stabilize at 69 C and 77 C, respectively, with the GPU at 1927 MHz and a board power draw of 133.4 W. Running this same test on the FX506 would see warmer CPU and GPU temperatures of 75 C and 81 C, respectively, but a slower GPU clock rate of 1717 MHz and lower board power draw of 90.4 W.
Running on battery power limits performance. A Fire Strike test on batteries would return Physics and Graphics scores of 21169 and 15715 points, respectively, compared to 30446 and 22915 points when on mains.
| CPU Clock (GHz) | GPU Clock (MHz) | Average CPU Temperature (°C) | Average GPU Temperature (°C) | |
| System Idle | -- | -- | 35 | 37 |
| Prime95 Stress | 3.1 | -- | 83 | 58 |
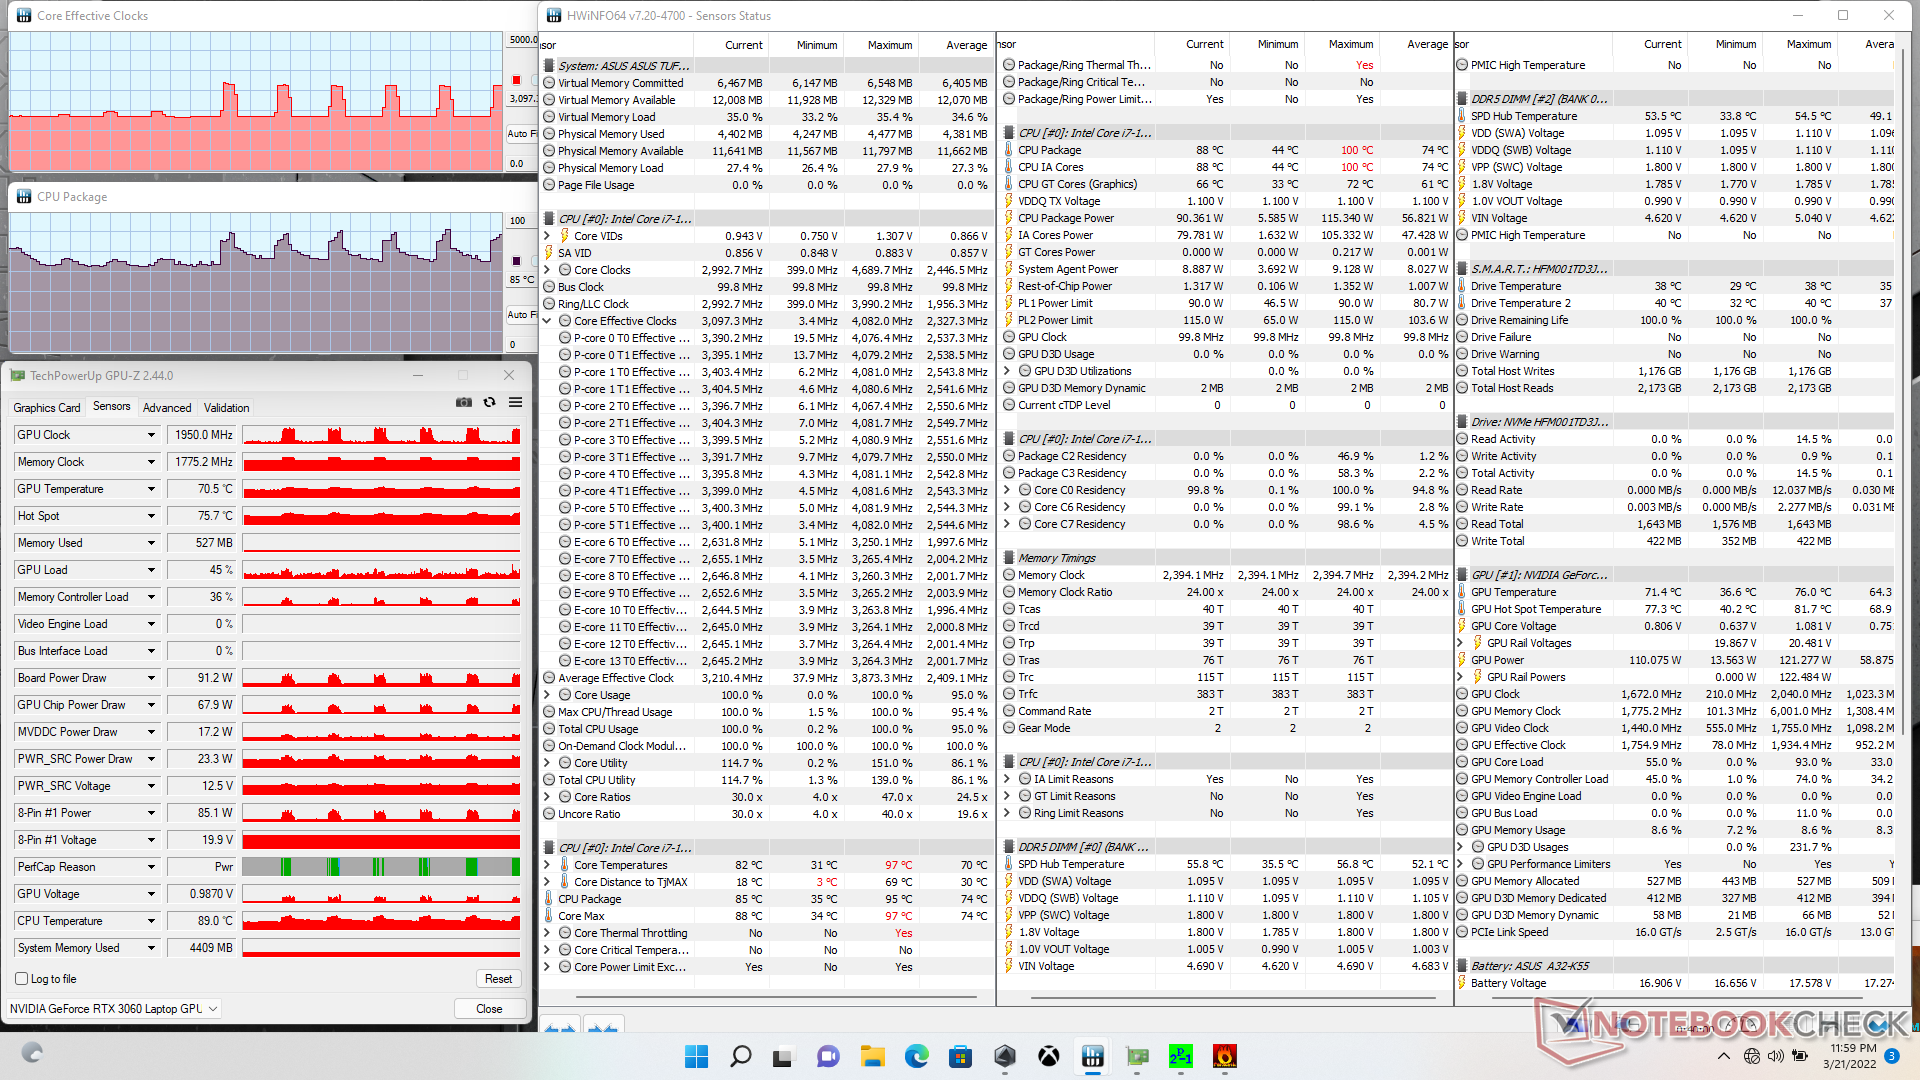
| Prime95 + FurMark Stress | 2.0 - 3.0 | 450 - 2000 | 66 - 89 | 58 - 72 |
| Witcher 3 Stress | 0.412 | 1927 | 69 | 77 |
Speakers
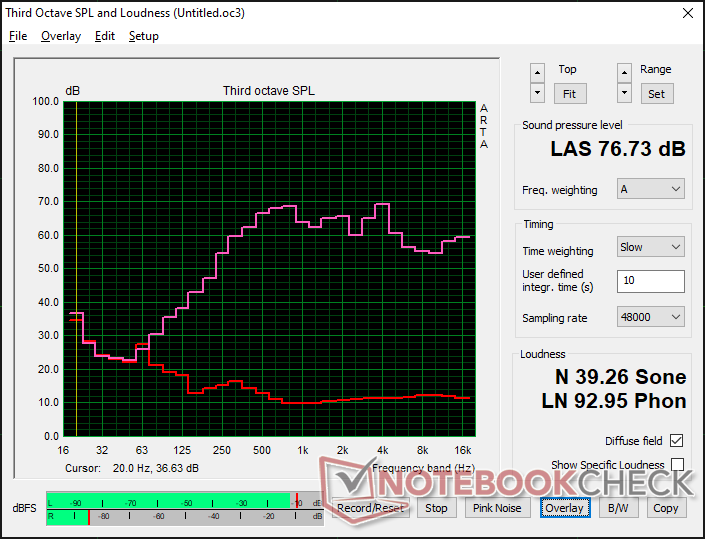
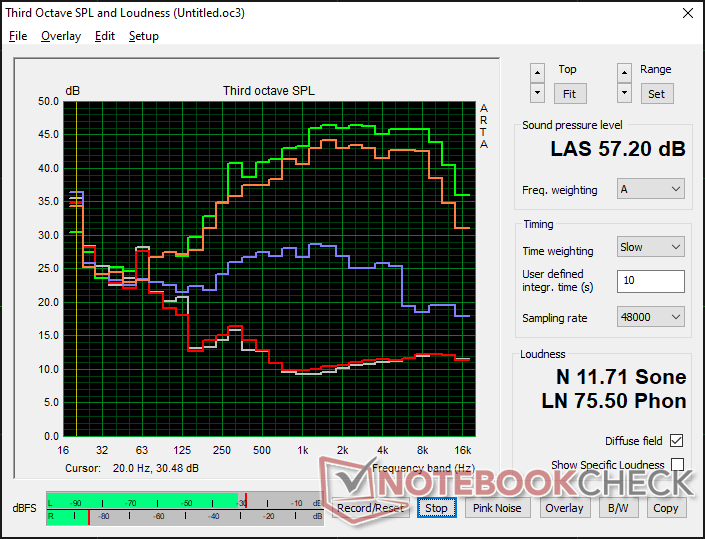
Asus TUF Gaming F15 FX507ZM audio analysis
(±) | speaker loudness is average but good (76.7 dB)
Bass 100 - 315 Hz
(±) | reduced bass - on average 13.7% lower than median
(±) | linearity of bass is average (10.1% delta to prev. frequency)
Mids 400 - 2000 Hz
(±) | higher mids - on average 5.2% higher than median
(+) | mids are linear (4.9% delta to prev. frequency)
Highs 2 - 16 kHz
(+) | balanced highs - only 4.1% away from median
(±) | linearity of highs is average (8.6% delta to prev. frequency)
Overall 100 - 16.000 Hz
(±) | linearity of overall sound is average (15.9% difference to median)
Compared to same class
» 38% of all tested devices in this class were better, 7% similar, 56% worse
» The best had a delta of 6%, average was 18%, worst was 132%
Compared to all devices tested
» 25% of all tested devices were better, 5% similar, 70% worse
» The best had a delta of 4%, average was 23%, worst was 134%
Apple MacBook Pro 16 2021 M1 Pro audio analysis
(+) | speakers can play relatively loud (84.7 dB)
Bass 100 - 315 Hz
(+) | good bass - only 3.8% away from median
(+) | bass is linear (5.2% delta to prev. frequency)
Mids 400 - 2000 Hz
(+) | balanced mids - only 1.3% away from median
(+) | mids are linear (2.1% delta to prev. frequency)
Highs 2 - 16 kHz
(+) | balanced highs - only 1.9% away from median
(+) | highs are linear (2.7% delta to prev. frequency)
Overall 100 - 16.000 Hz
(+) | overall sound is linear (4.6% difference to median)
Compared to same class
» 0% of all tested devices in this class were better, 0% similar, 100% worse
» The best had a delta of 5%, average was 17%, worst was 45%
Compared to all devices tested
» 0% of all tested devices were better, 0% similar, 100% worse
» The best had a delta of 4%, average was 23%, worst was 134%
Energy Management — More Demanding Hardware Across The Board
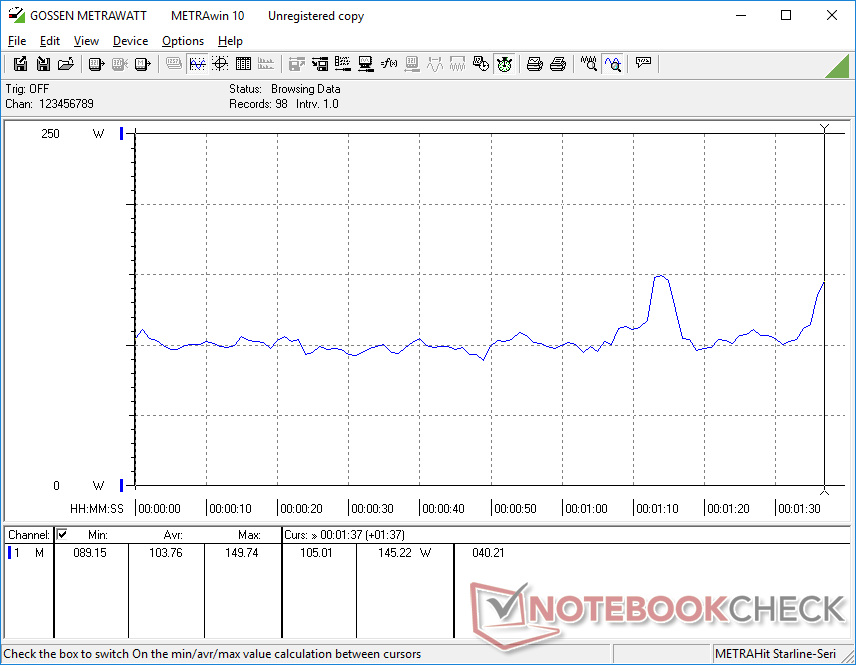
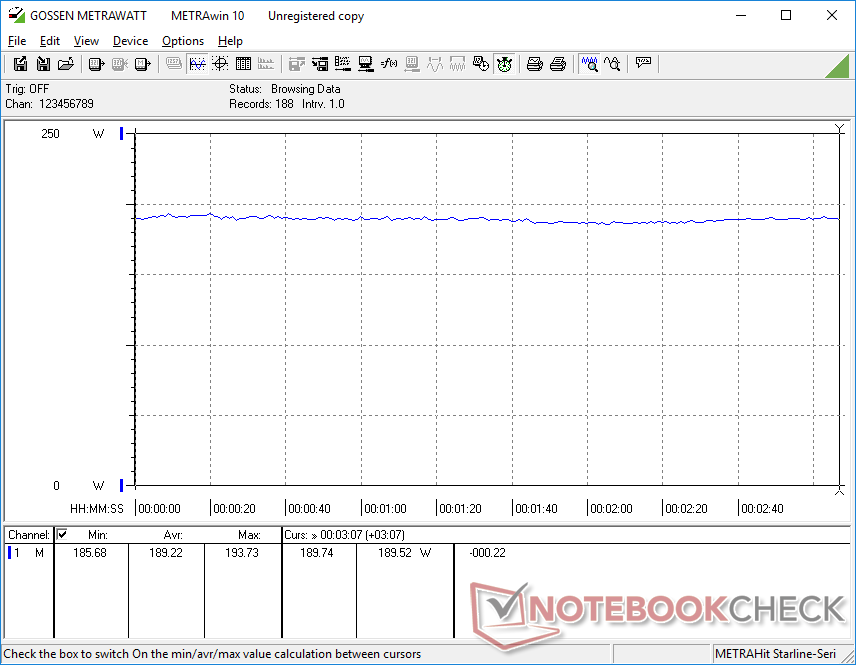
Power Consumption
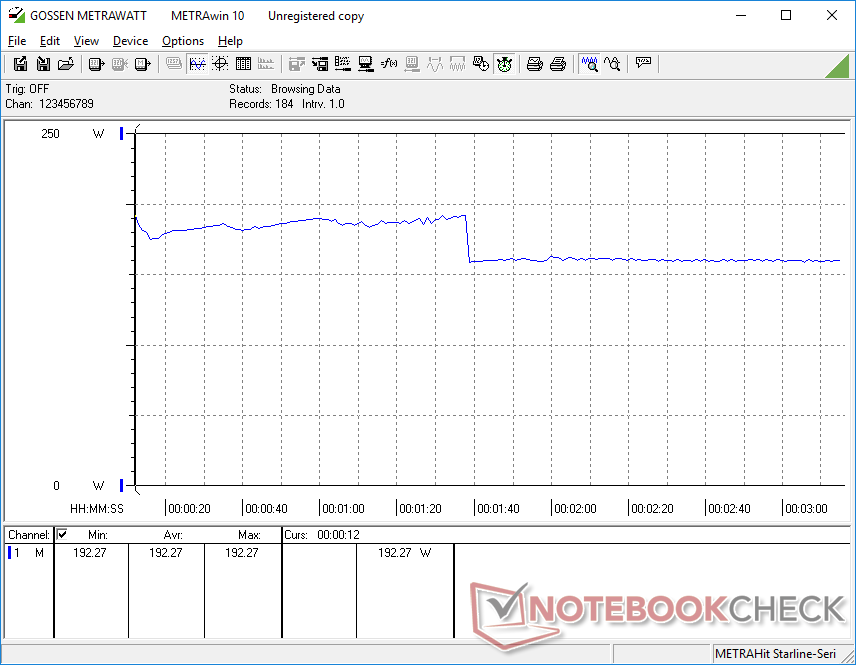
Overall consumption is higher than what was recorded on previous year's model. This is to be expected due to the higher power demands of Intel's new 12th gen CPU, the higher RTX 3060 TGP, and larger internal cooling solution of the FX507. Running Witcher 3 consumes about 20 percent more power year-over-year for a 10 to 20 percent boost in graphics performance over the 2021 Asus FX506.
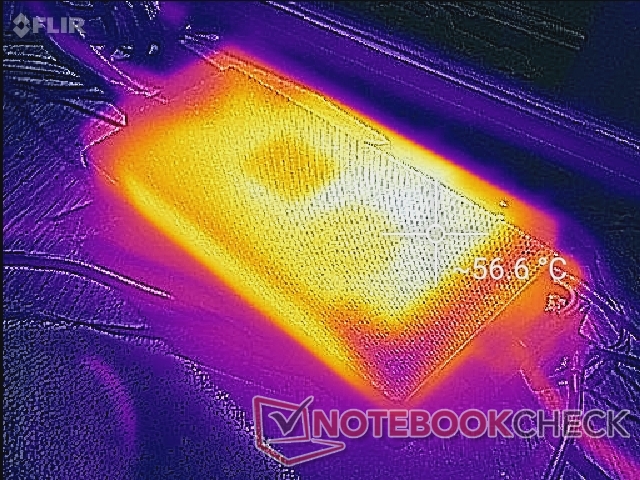
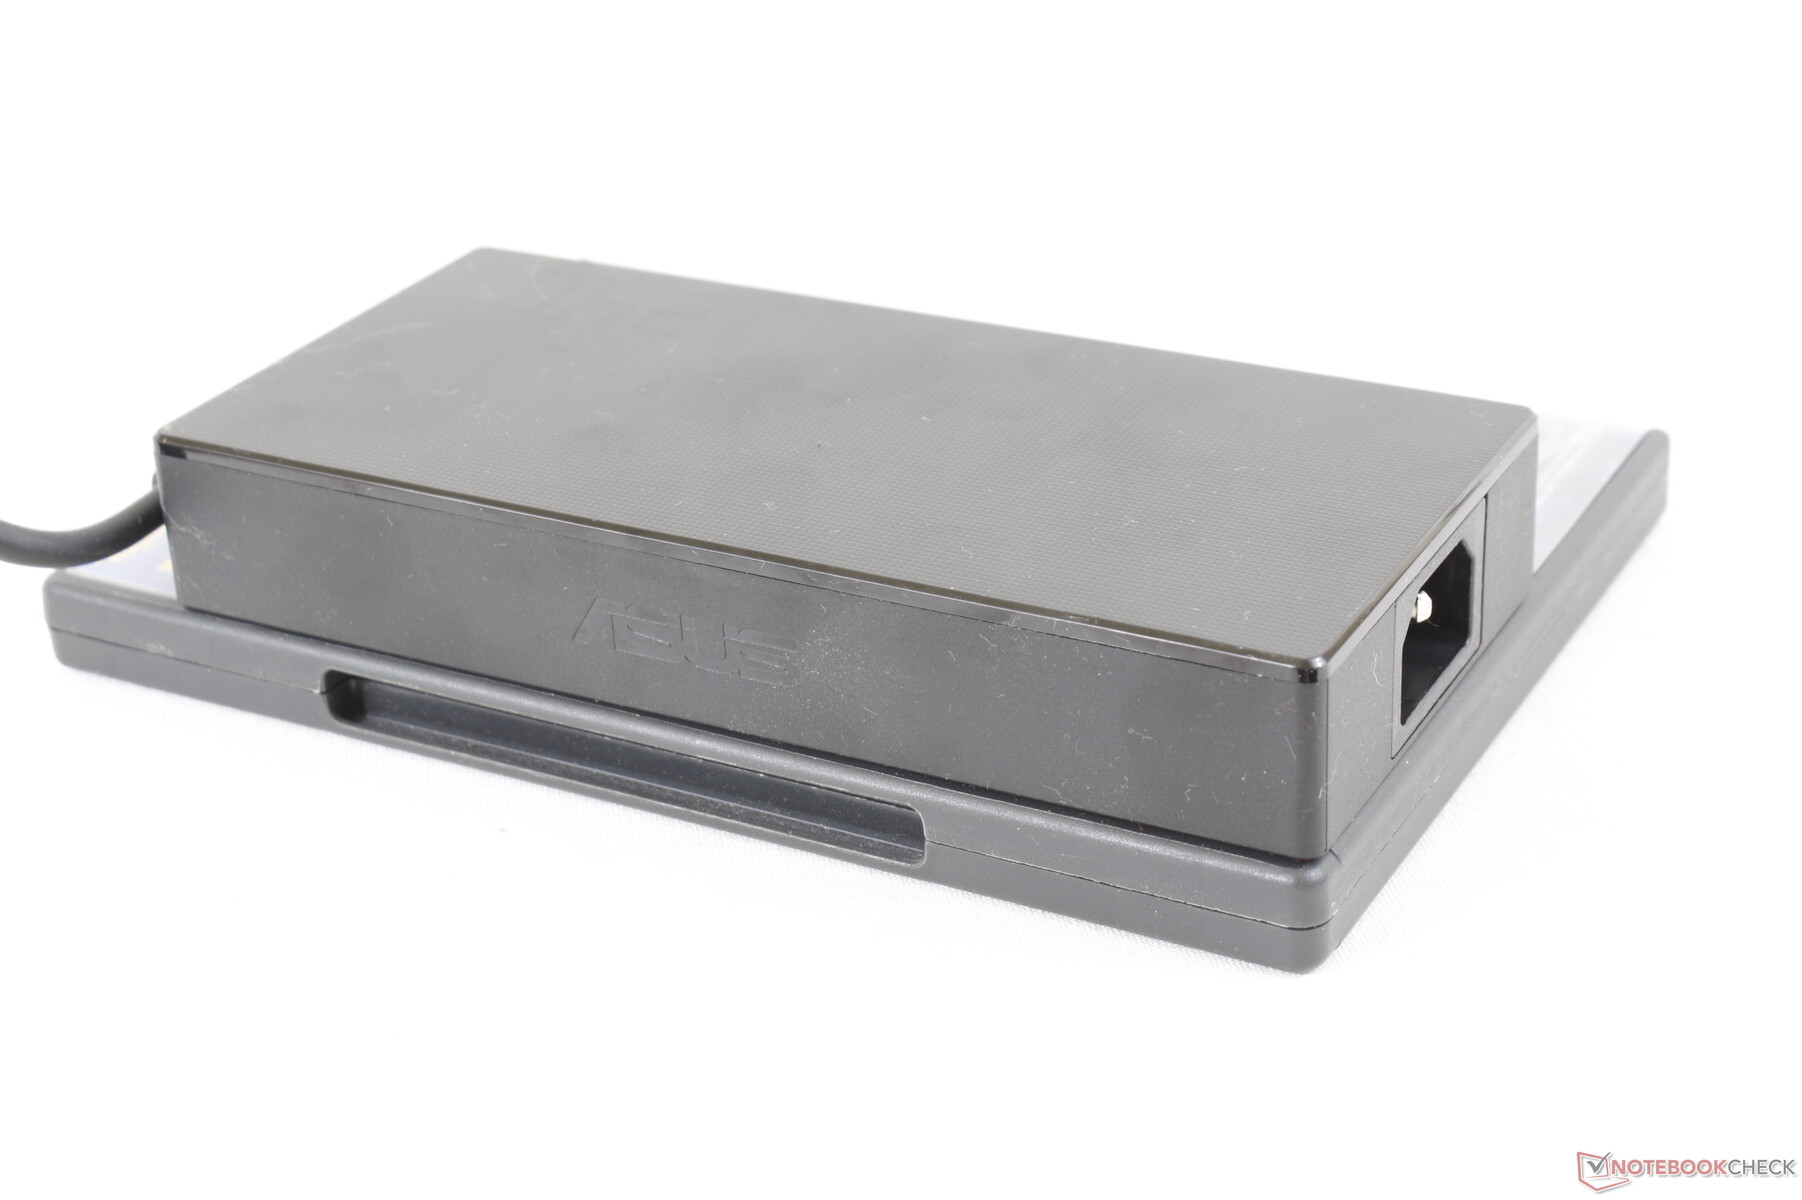
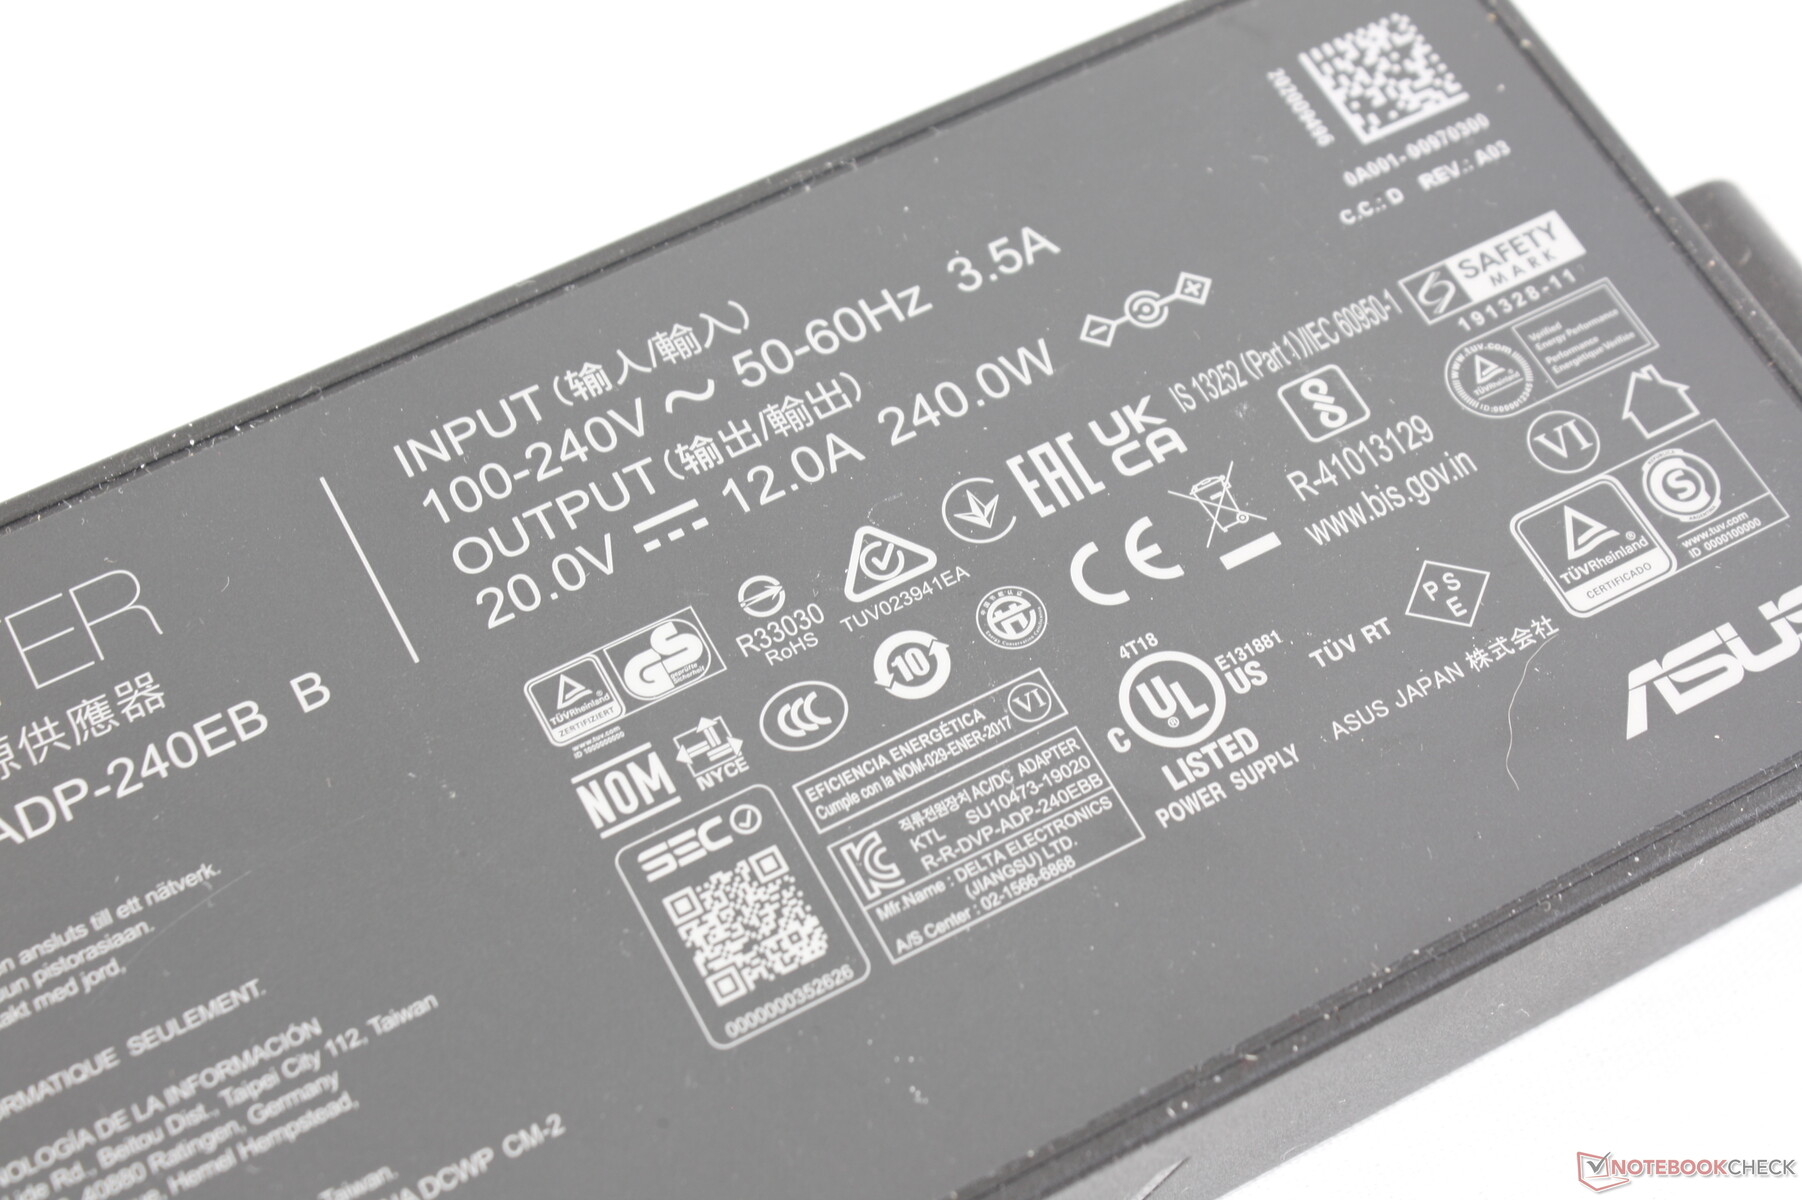
The FX507 ships with a higher-power 240 W AC adapter compared to the 200 W AC adapter that ships with the FX506 to better accommodate the more power-hungry internals. The new adapter is subsequently larger than the older adapter (~16.5 x 7.6 x 2.6 cm vs. ~15.1 x 7.2 x 2.3 cm).
| Off / Standby | |
| Idle | |
| Load |
|
Key:
min: | |
| Asus TUF Gaming F15 FX507ZM i7-12700H, GeForce RTX 3060 Laptop GPU, SK Hynix HFM001TD3JX013N, IPS, 1920x1080, 15.6" | Asus TUF Gaming F15 FX506HM i7-11800H, GeForce RTX 3060 Laptop GPU, SK Hynix HFM001TD3JX013N, IPS, 1920x1080, 15.6" | Asus TUF Dash F15 FX516PR i7-11370H, GeForce RTX 3070 Laptop GPU, SK Hynix HFM001TD3JX013N, IPS, 1920x1080, 15.6" | Asus ROG Strix Scar 15 G533QS R9 5900HX, GeForce RTX 3080 Laptop GPU, ADATA Swordfish 2 TB, IPS, 2560x1440, 15.6" | Asus Zephyrus S15 GX502L i7-10875H, GeForce RTX 2070 Super Mobile, WDC PC SN730 SDBPNTY-1T00, IPS, 1920x1080, 15.6" | Asus ZenBook Pro Duo UX582 LR-1BH2 i7-10870H, GeForce RTX 3070 Laptop GPU, Samsung PM981a MZVLB1T0HBLR, OLED + IPS, 3840x2160, 15.6" | |
|---|---|---|---|---|---|---|
| Power Consumption | -2% | 9% | -24% | -12% | -4% | |
| Idle Minimum * (Watt) | 6.3 | 9.5 -51% | 9 -43% | 11.2 -78% | 7 -11% | 9 -43% |
| Idle Average * (Watt) | 9.8 | 12.1 -23% | 11 -12% | 16.4 -67% | 13 -33% | 14 -43% |
| Idle Maximum * (Watt) | 26.5 | 22.5 15% | 16 40% | 29.4 -11% | 25 6% | 15 43% |
| Load Average * (Watt) | 103.8 | 99.5 4% | 107 -3% | 106.2 -2% | 148 -43% | 107.2 -3% |
| Witcher 3 ultra * (Watt) | 189 | 157 17% | 121 36% | 189 -0% | 175 7% | 156 17% |
| Load Maximum * (Watt) | 241.9 | 173.5 28% | 162 33% | 213.6 12% | 232 4% | 235 3% |
* ... smaller is better
Power Consumption Witcher 3 / Stresstest
Power Consumption external Monitor
Battery Life — Shorter Than Last Generation Model
WLAN runtimes are shorter than what we recorded on last year's model by several hours despite carrying the same 90 Wh capacity battery between them. We tested this twice on the Balanced power profile with MSHybrid active and achieved the same results. The shorter year-over-year WLAN runtimes are consistent with what we observed between the 2021 Razer Blade 15 and 2022 Razer Blade 15.
Charging from empty to full capacity with the included AC adapter takes about 90 minutes. Unfortunately, this model does not support USB-C charging unlike on the Razer Blade series or the MSI GS series.
| Asus TUF Gaming F15 FX507ZM i7-12700H, GeForce RTX 3060 Laptop GPU, 90 Wh | Asus TUF Gaming F15 FX506HM i7-11800H, GeForce RTX 3060 Laptop GPU, 90 Wh | Asus TUF Dash F15 FX516PR i7-11370H, GeForce RTX 3070 Laptop GPU, 76 Wh | Asus ROG Strix Scar 15 G533QS R9 5900HX, GeForce RTX 3080 Laptop GPU, 90 Wh | Asus Zephyrus S15 GX502L i7-10875H, GeForce RTX 2070 Super Mobile, 76 Wh | Asus ZenBook Pro Duo UX582 LR-1BH2 i7-10870H, GeForce RTX 3070 Laptop GPU, 92 Wh | |
|---|---|---|---|---|---|---|
| Battery runtime | 39% | 46% | 16% | -15% | 36% | |
| Reader / Idle (h) | 15.8 | 11 -30% | 16 1% | 11.1 -30% | 8.7 -45% | |
| WiFi v1.3 (h) | 4.8 | 7.9 65% | 9.1 90% | 7.3 52% | 3 -37% | 7.4 54% |
| Load (h) | 1.1 | 2 82% | 1.4 27% | 1.5 36% | 1.3 18% | |
| H.264 (h) | 8.2 |
Pros
Cons
Verdict — 140 W GeForce RTX 3060 Graphics
Aside from all the chassis updates, the FX507 is most notable for its much higher TGP target of 140 W compared to only 95 W on the FX506. PC makers everywhere are using the same GeForce GPUs this year since Nvidia has yet to launch the successor to the mobile RTX 3000 series. Thus, in order to offer better graphics performance from the same GPU, the FX507 must consume more power than the FX506. The result is a GeForce RTX 3060 laptop is faster than most other laptops currently available equipped with the same GPU.
To alleviate some of the consequences of a more power-hungry system, Asus has upgraded the cooling solution to keep temperatures and fan noise in check. The FX507 is subsequently not significantly warmer or louder than its predecessor despite its overall lighter weight.
The more demanding processors of the FX507 has directly impacted battery life and the size of the AC adapter. Don't expect runtimes to be longer than on the FX506 under most conditions and be prepared to carry around an even larger AC adapter than before. It's unfortunate that the system cannot be recharged via third-party USB-C adapters.
The changes to the keyboard and clickpad are a mixed bag considering that the dark gray font contrasts poorly with the dark keycaps. Drag-and-drop actions are easier on the last generation model because of its dedicated mouse buttons.
Price and Availability
The Asus TUF Gaming F15 FX507ZM as reviewed is now available on Amazon for $1750 USD.
Asus TUF Gaming F15 FX507ZM
- 03/26/2022 v7 (old)
Allen Ngo
Price comparison
