Schenker XMG Neo 15 gaming laptop in review - RTX 3080 with 165W TGP ensures high scores
The brand-new Schenker XMG Neo 15 M21 is one of the first laptops in the manufacturer's lineup that is also equipped with a Tiger Lake H processor in addition to the 16 GB RTX-3080. Unlike models from larger manufacturers, there are numerous pro features on this 15-inch laptop, such as CPU undervolting and manual configuration of power limits and the working memory.
As an Intel-based laptop, the Neo 15 M21 supports Thunderbolt 4, but it also has to compete with AMD Ryzen rivals that have a lot going for them in terms of CPU performance and energy efficiency. The Neo 15 is also available in an AMD version. Compared to the predecessor, the XMG Neo 15 (Comet Lake), our review sample should be able to offer much more performance thanks to the new CPU and GPU generation.
Possible competitors in comparison
Rating | Date | Model | Weight | Height | Size | Resolution | Price |
|---|---|---|---|---|---|---|---|
| 87 % v7 (old) | 06 / 2021 | Schenker XMG Neo 15 Tiger Lake i7-11800H, GeForce RTX 3080 Laptop GPU | 2.2 kg | 26 mm | 15.60" | 2560x1440 | |
| 86.4 % v7 (old) | 06 / 2021 | Aorus 15P YD i7-11800H, GeForce RTX 3080 Laptop GPU | 2.2 kg | 27 mm | 15.60" | 1920x1080 | |
| 85 % v7 (old) | 02 / 2021 | Asus ROG Strix G15 G513QR R9 5900HX, GeForce RTX 3070 Laptop GPU | 2.3 kg | 27.2 mm | 15.60" | 1920x1080 | |
| 85.9 % v7 (old) | 11 / 2020 | Schenker XMG Neo 15 Comet Lake i7-10875H, GeForce RTX 2070 Super Mobile | 2.2 kg | 23 mm | 15.60" | 1920x1080 | |
| 86.1 % v7 (old) | 06 / 2021 | Alienware m15 R4 RTX 3080 i9-10980HK, GeForce RTX 3080 Laptop GPU | 2.4 kg | 20 mm | 15.60" | 1920x1080 | |
| 87.5 % v7 (old) | 05 / 2021 | Razer Blade 15 Advanced Model Early 2021 i7-10875H, GeForce RTX 3080 Laptop GPU | 2 kg | 16.99 mm | 15.60" | 1920x1080 |
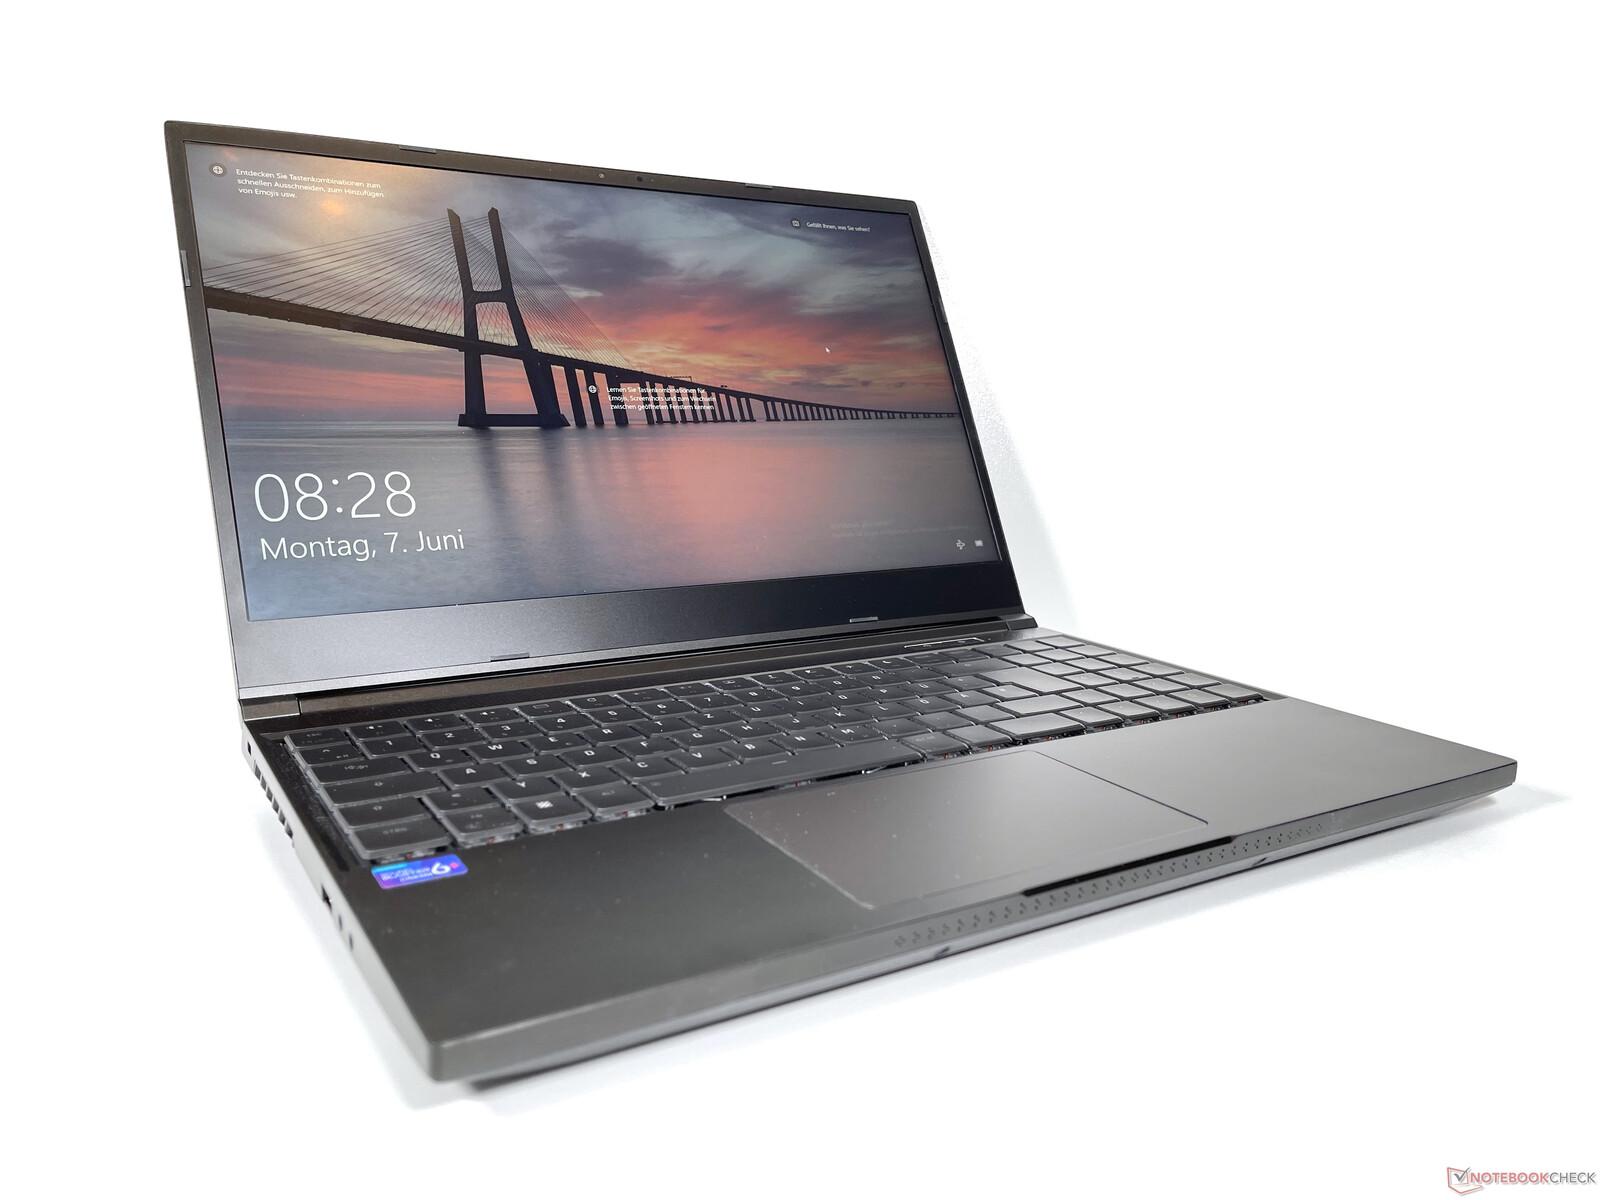
Case - Industrial inspiration
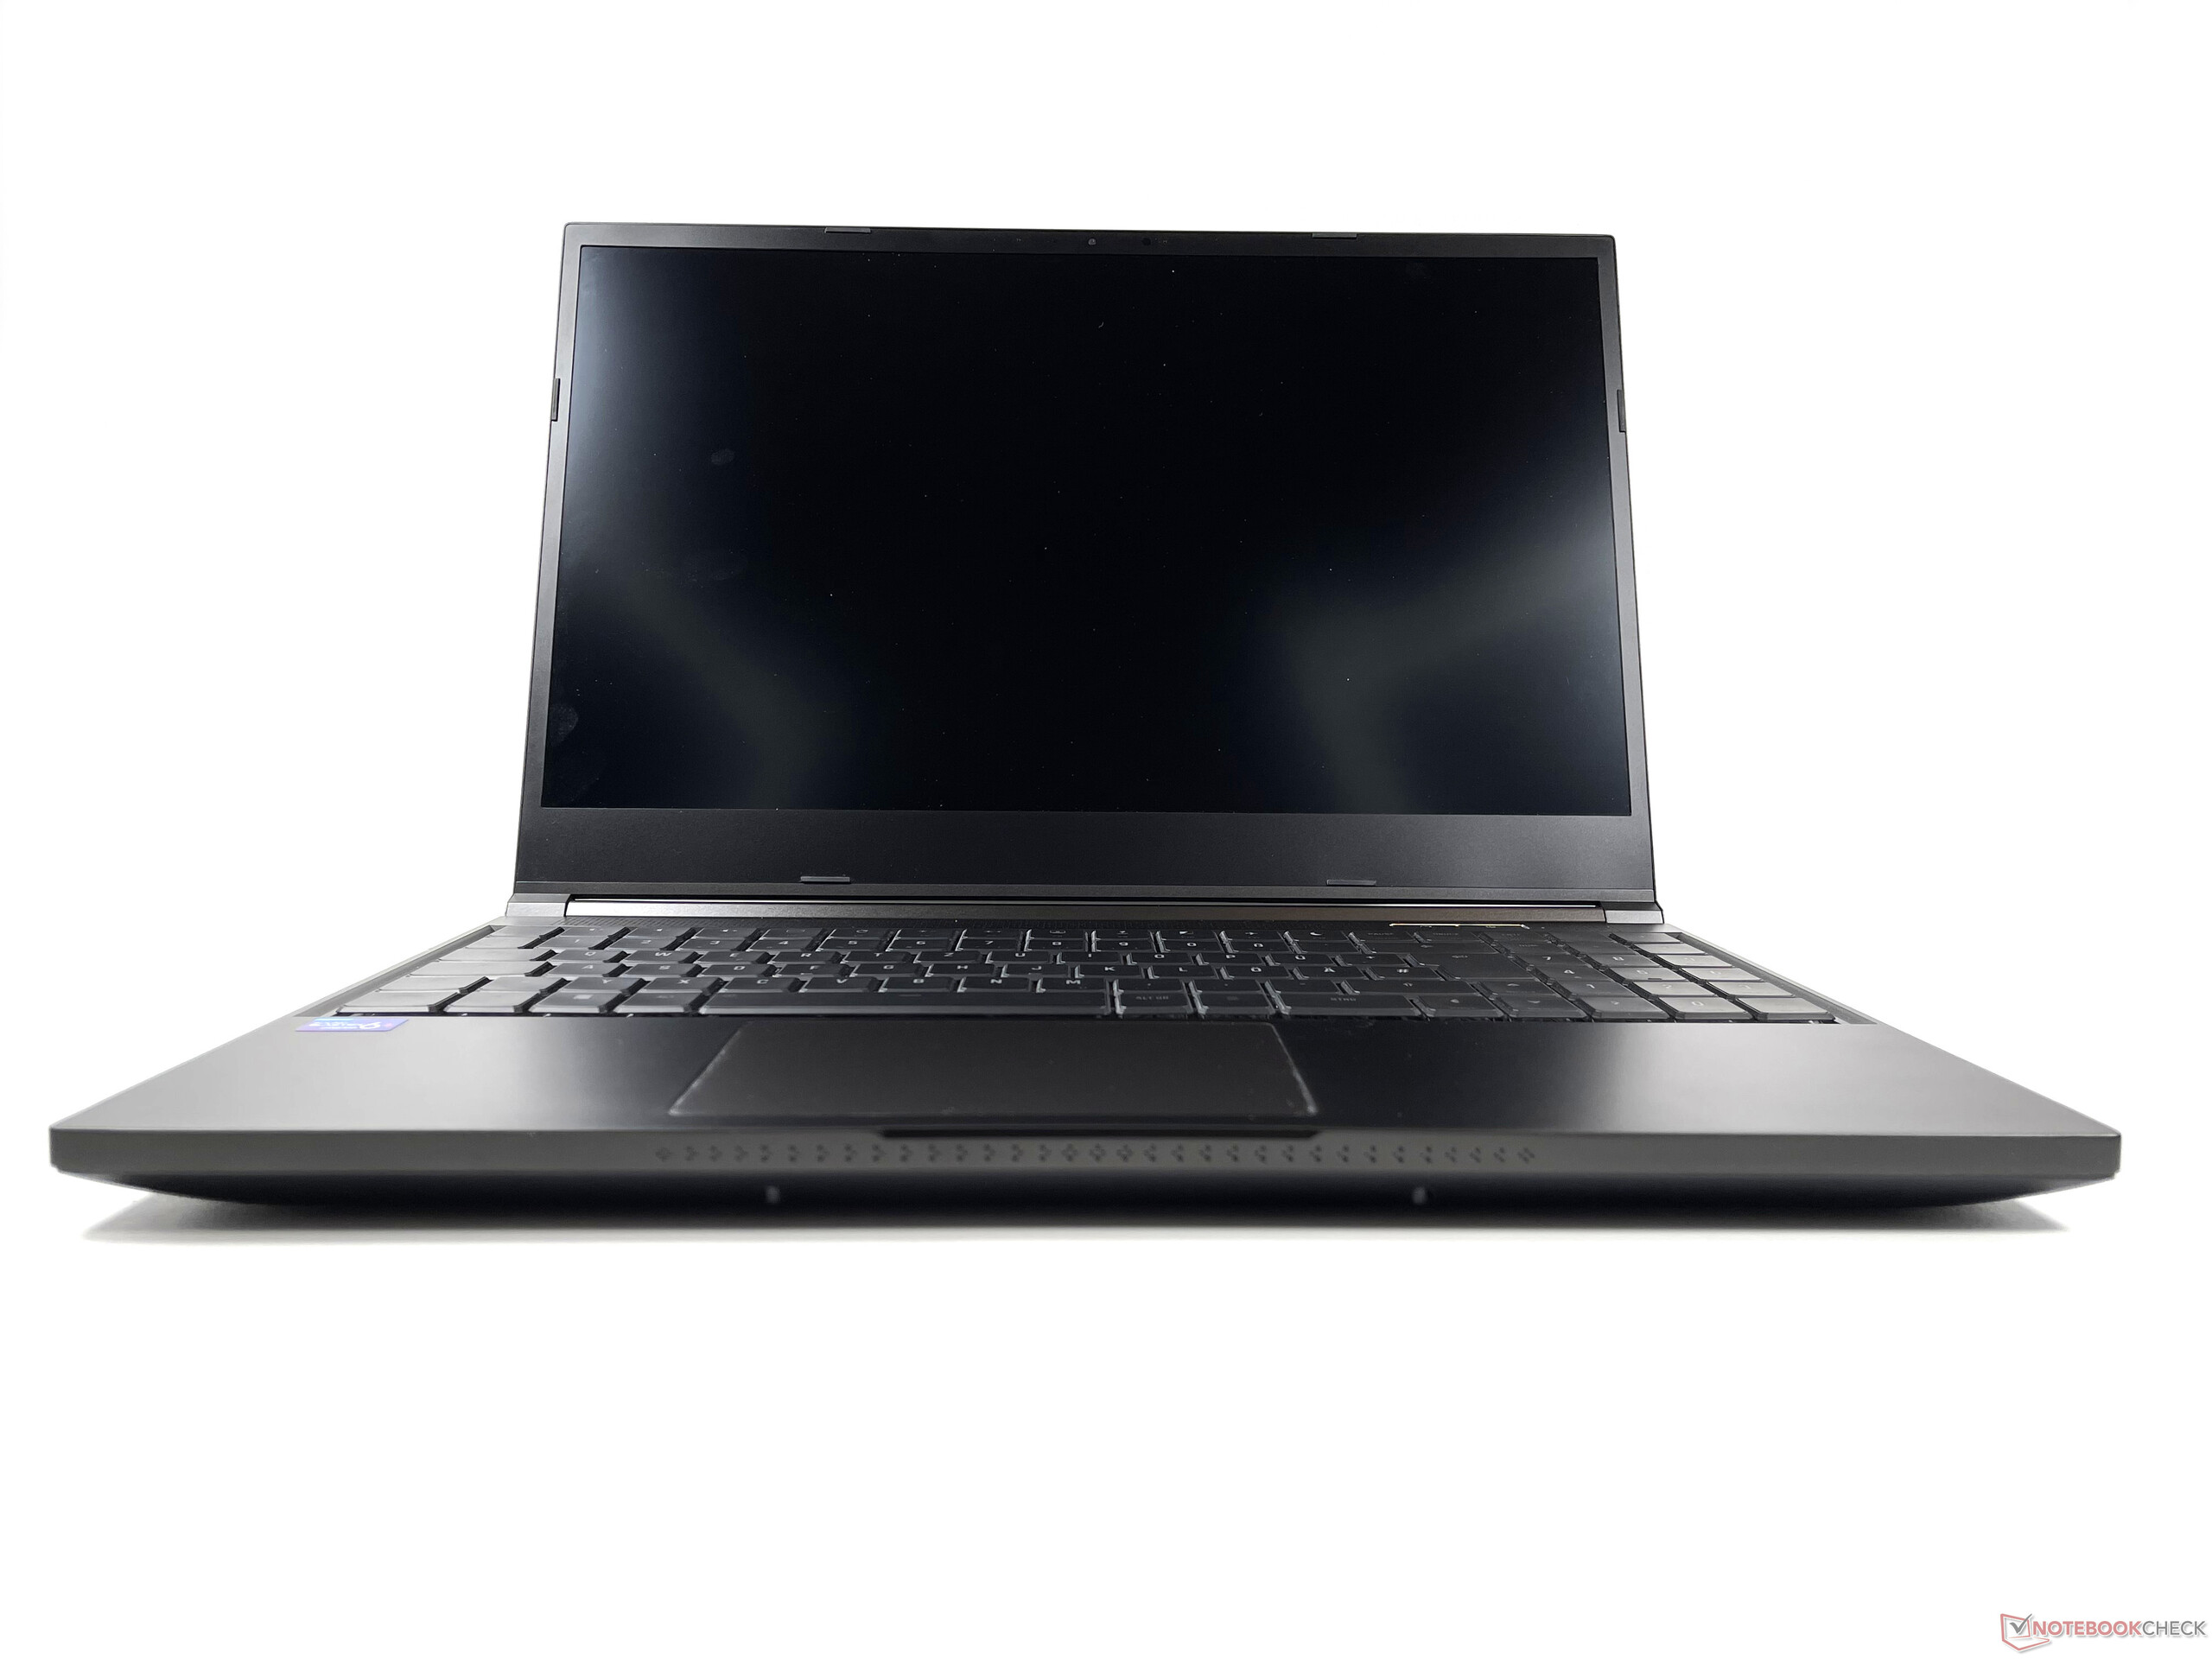
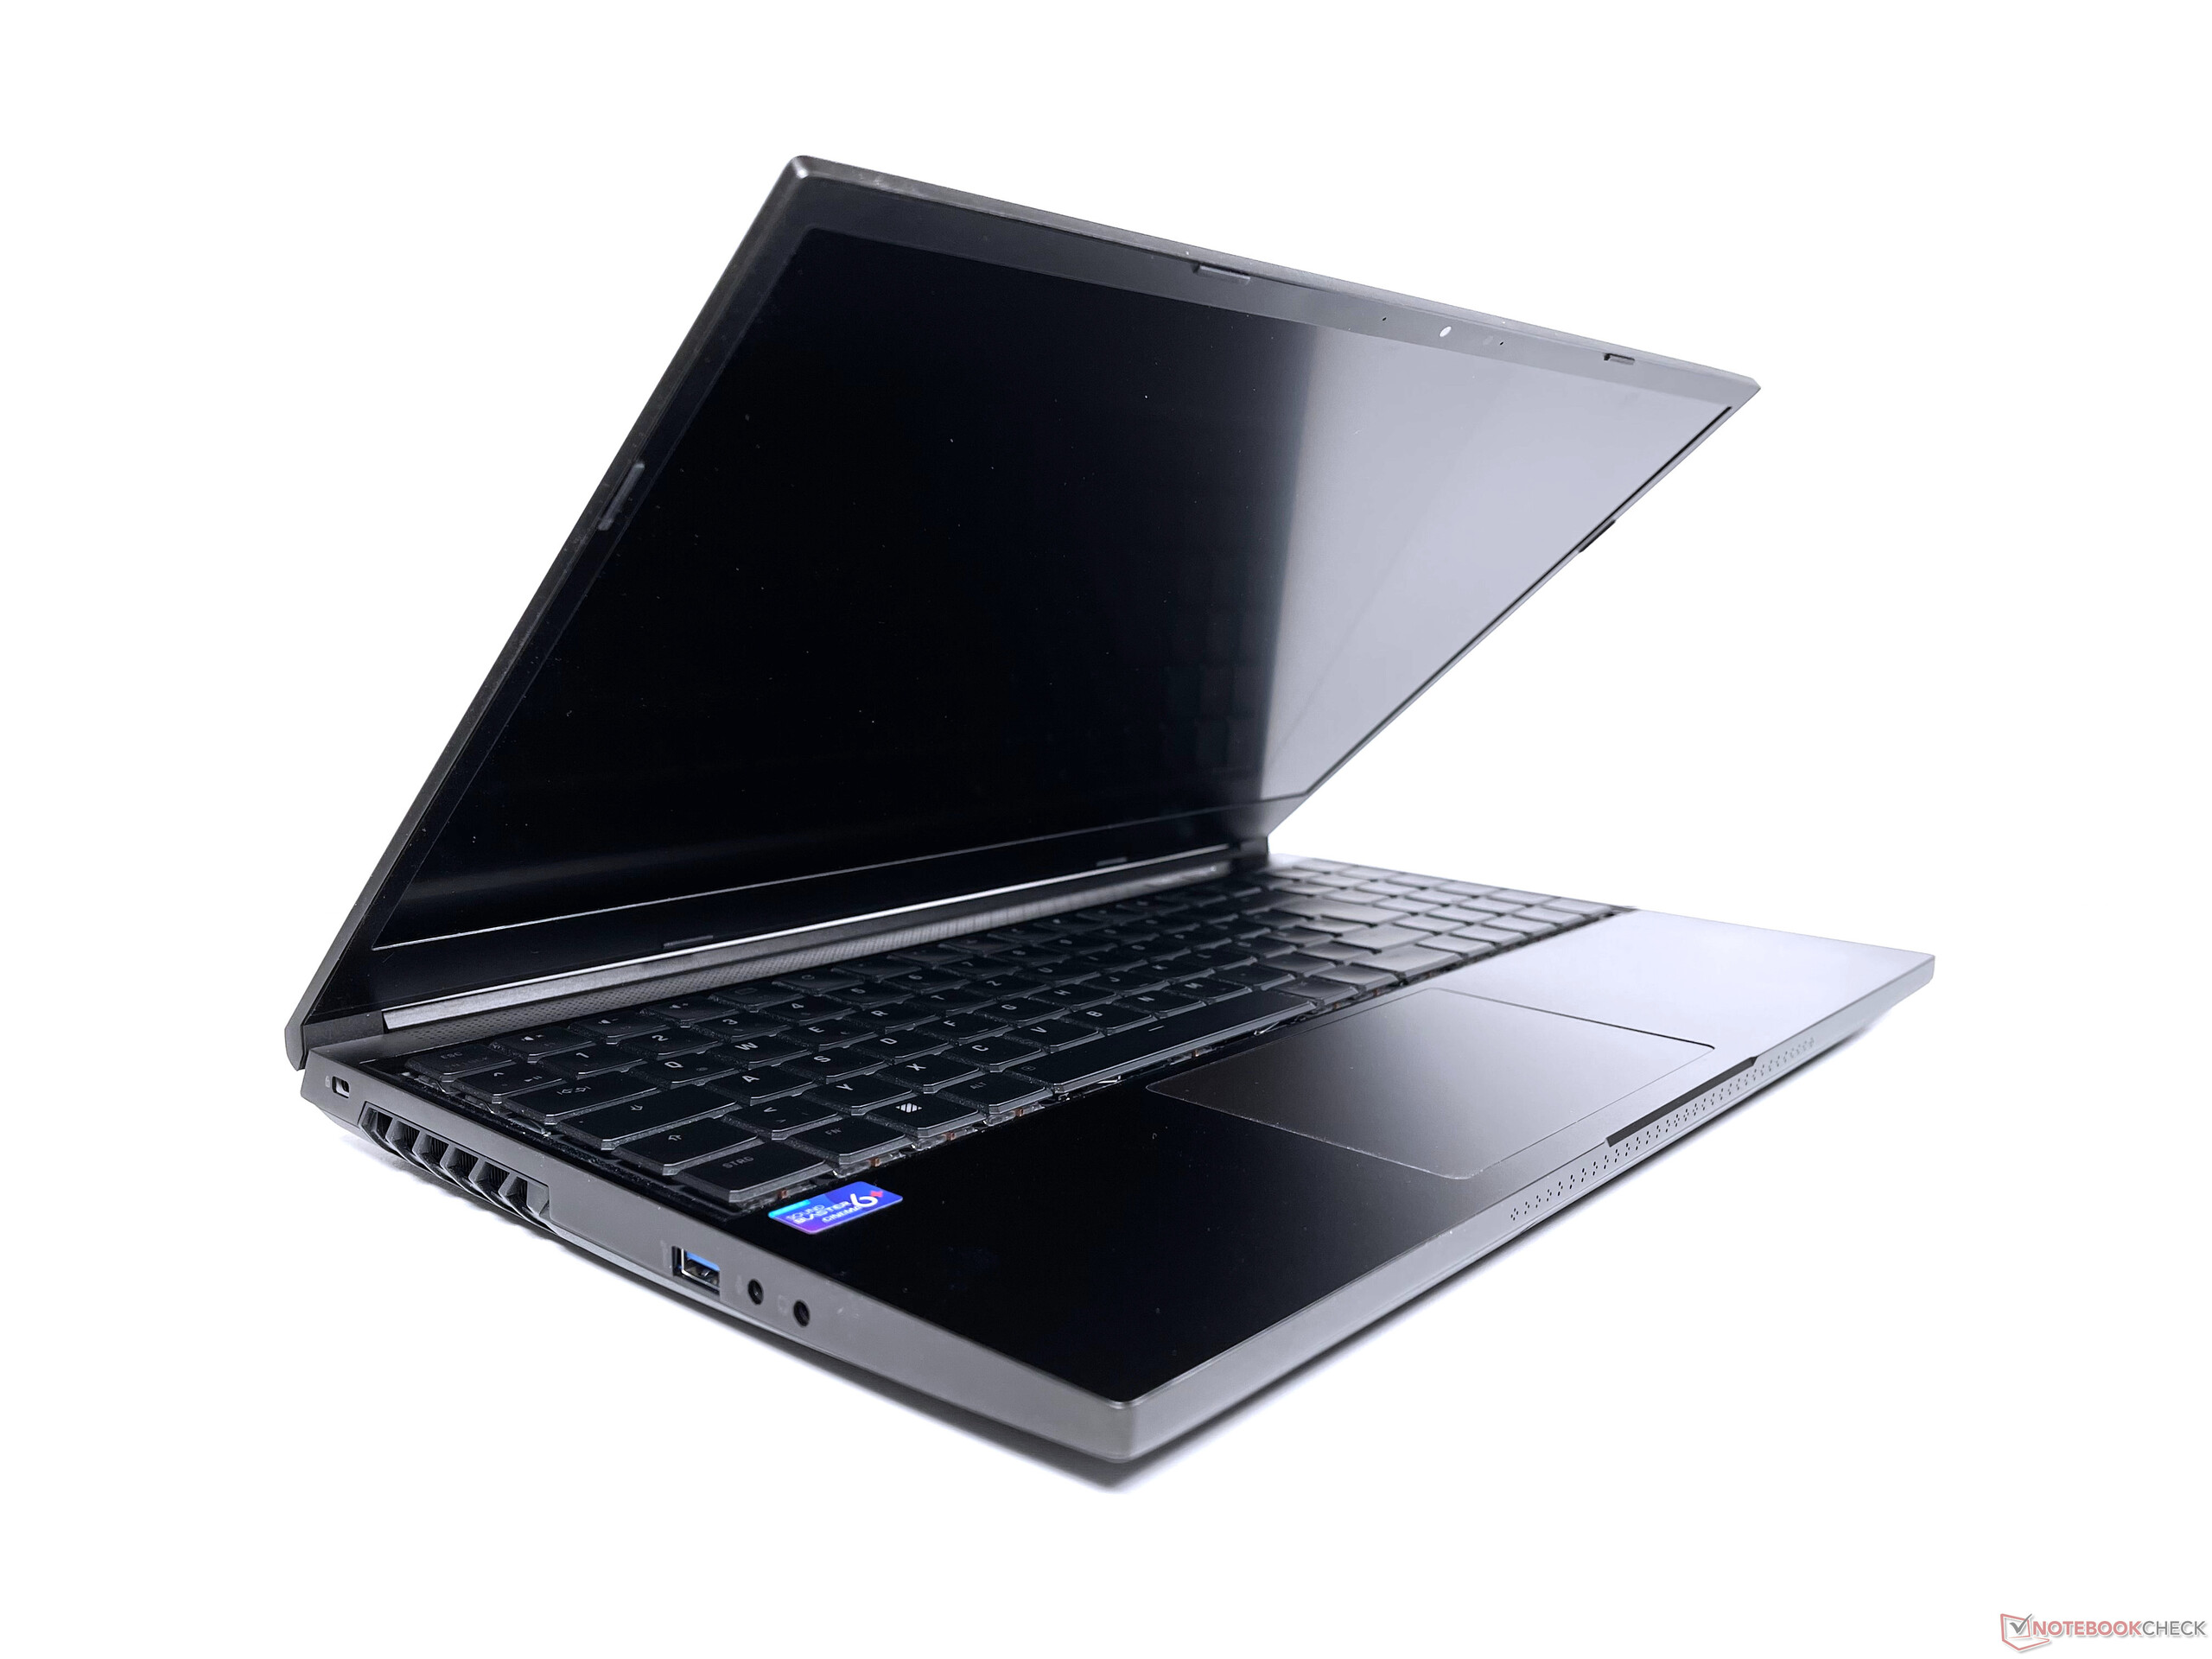
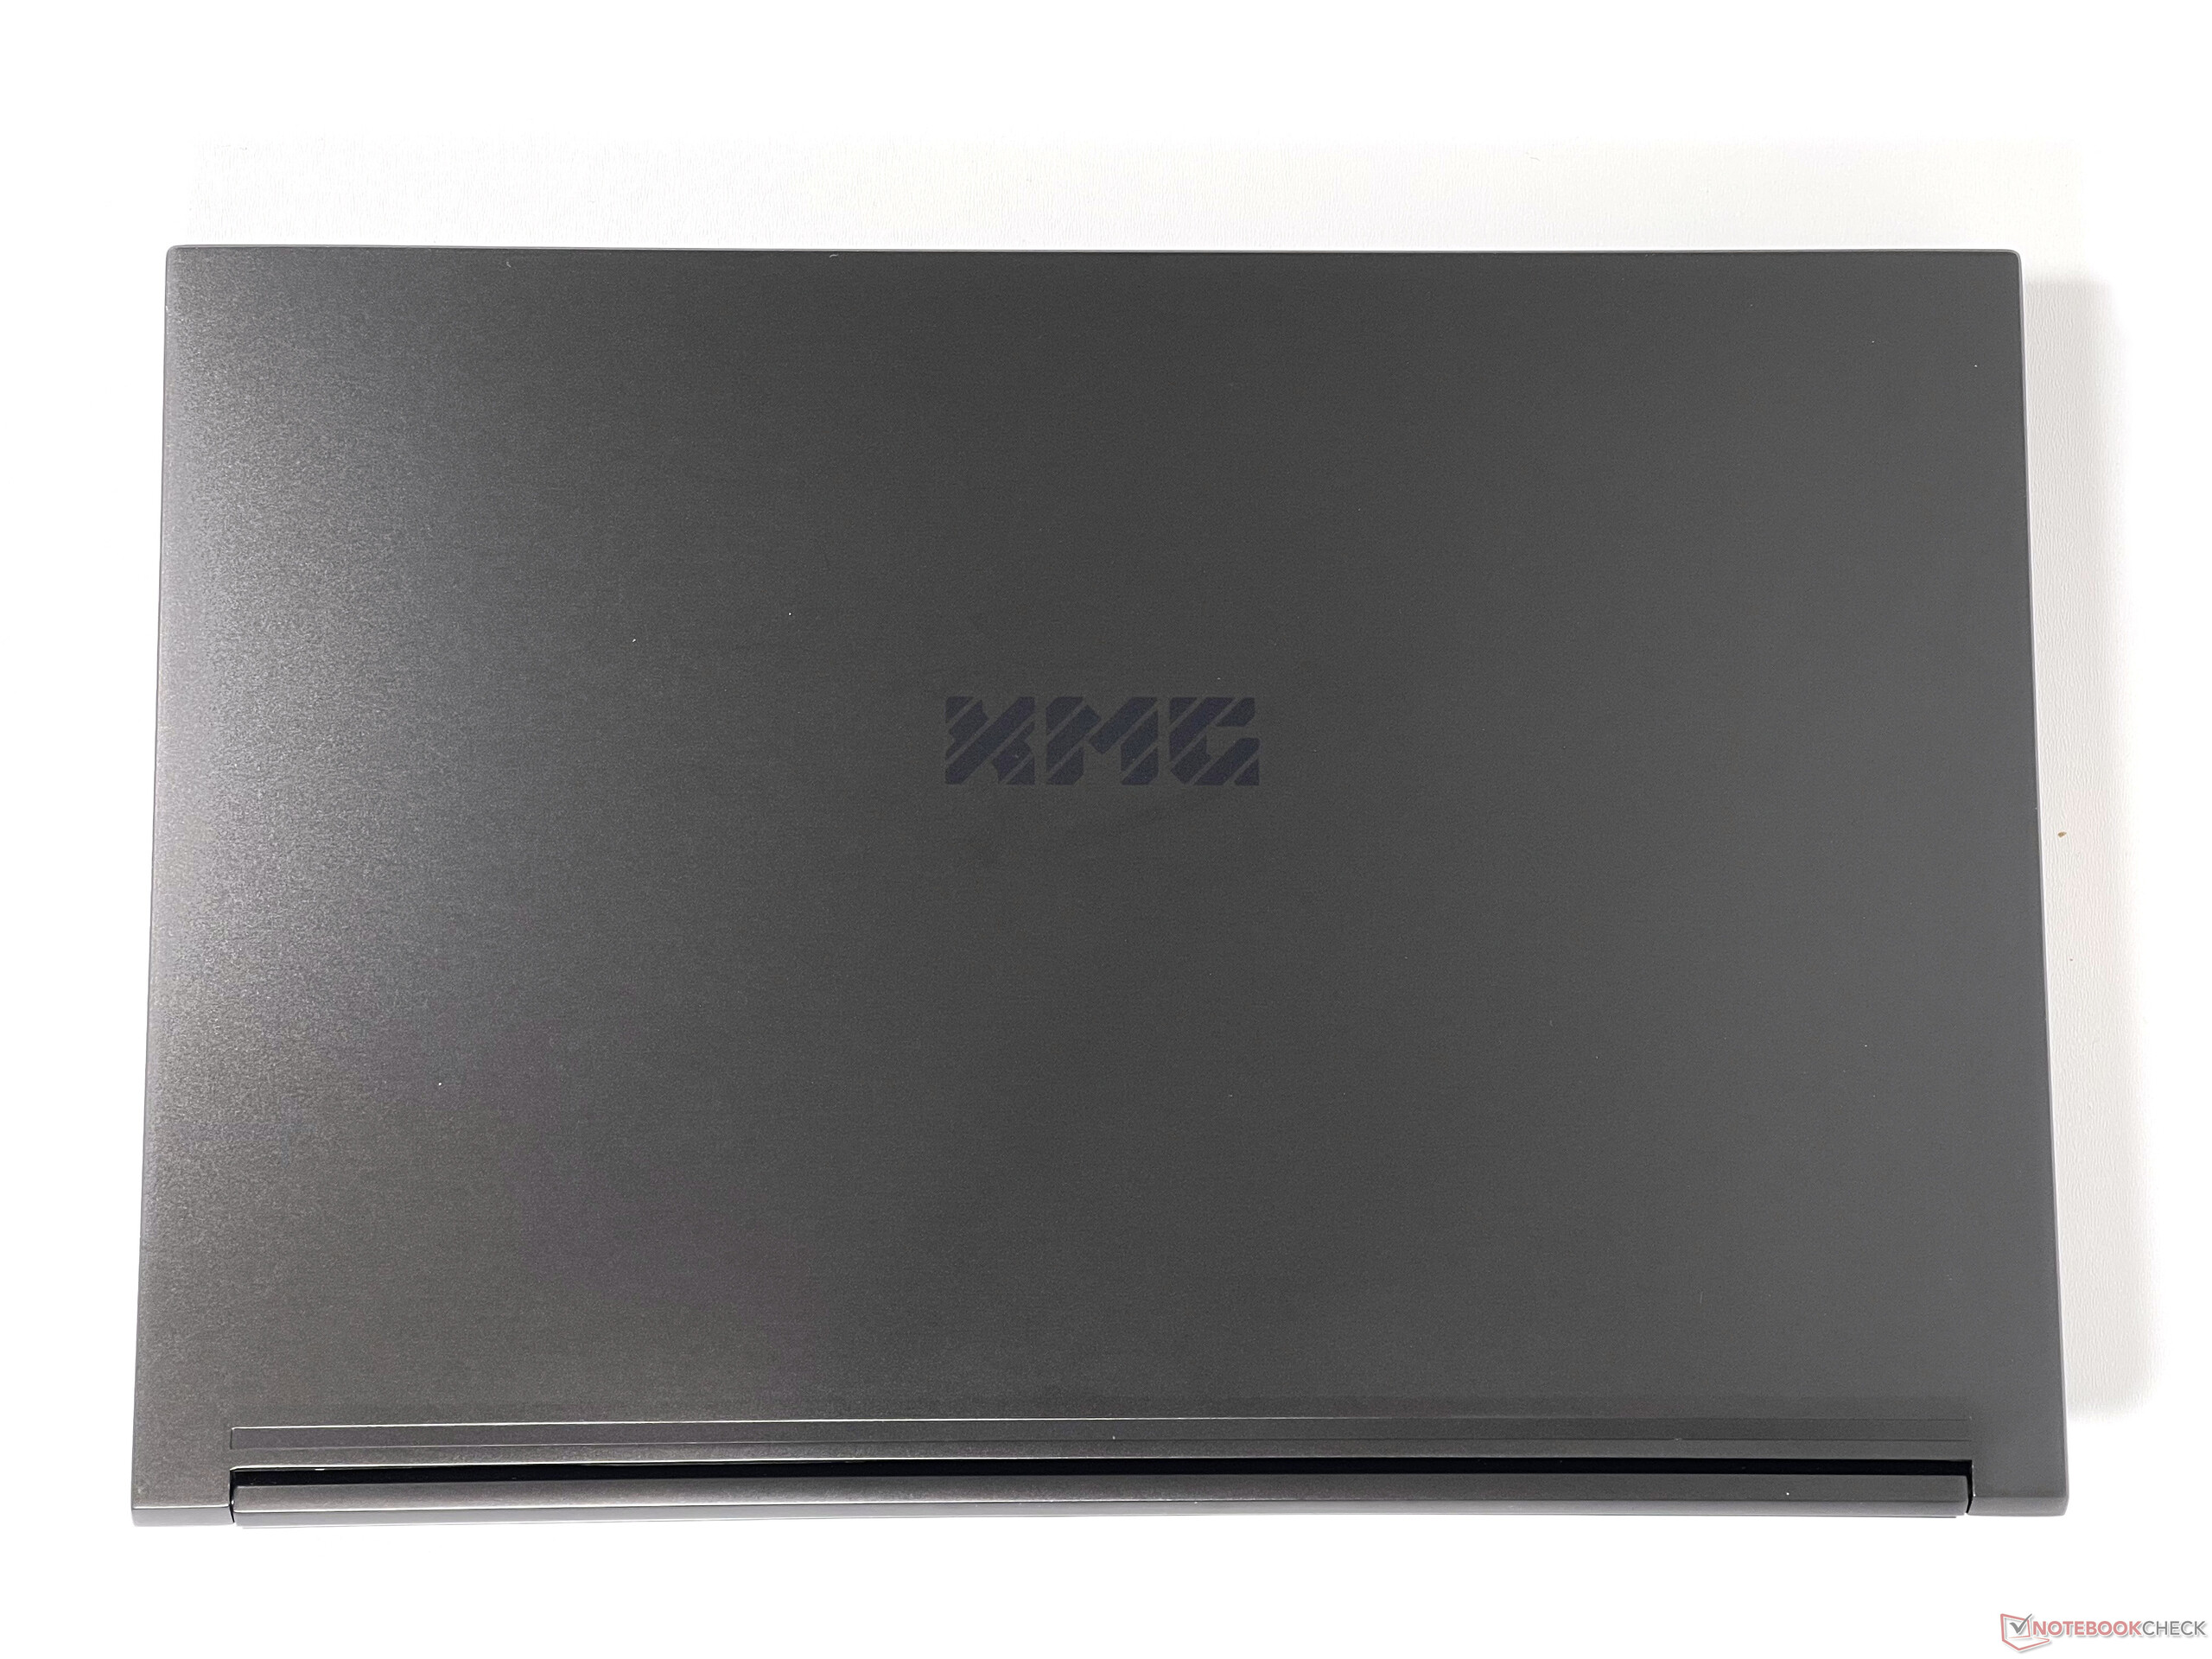
Apart from the plastic base plate, the casing is mostly made of matte black aluminum with a relatively smooth surface texture. The material is very susceptible to fingerprints, but they can be quickly removed with a cloth. The construction gives an extremely stable impression and almost does not yield under pressure and in the torsion test. The workmanship also offers no reason for criticism and thanks to the subtle design, the laptop also fits into a professional environment. The laptop can be opened with one hand, but there is no notch on the front that would make this easier.
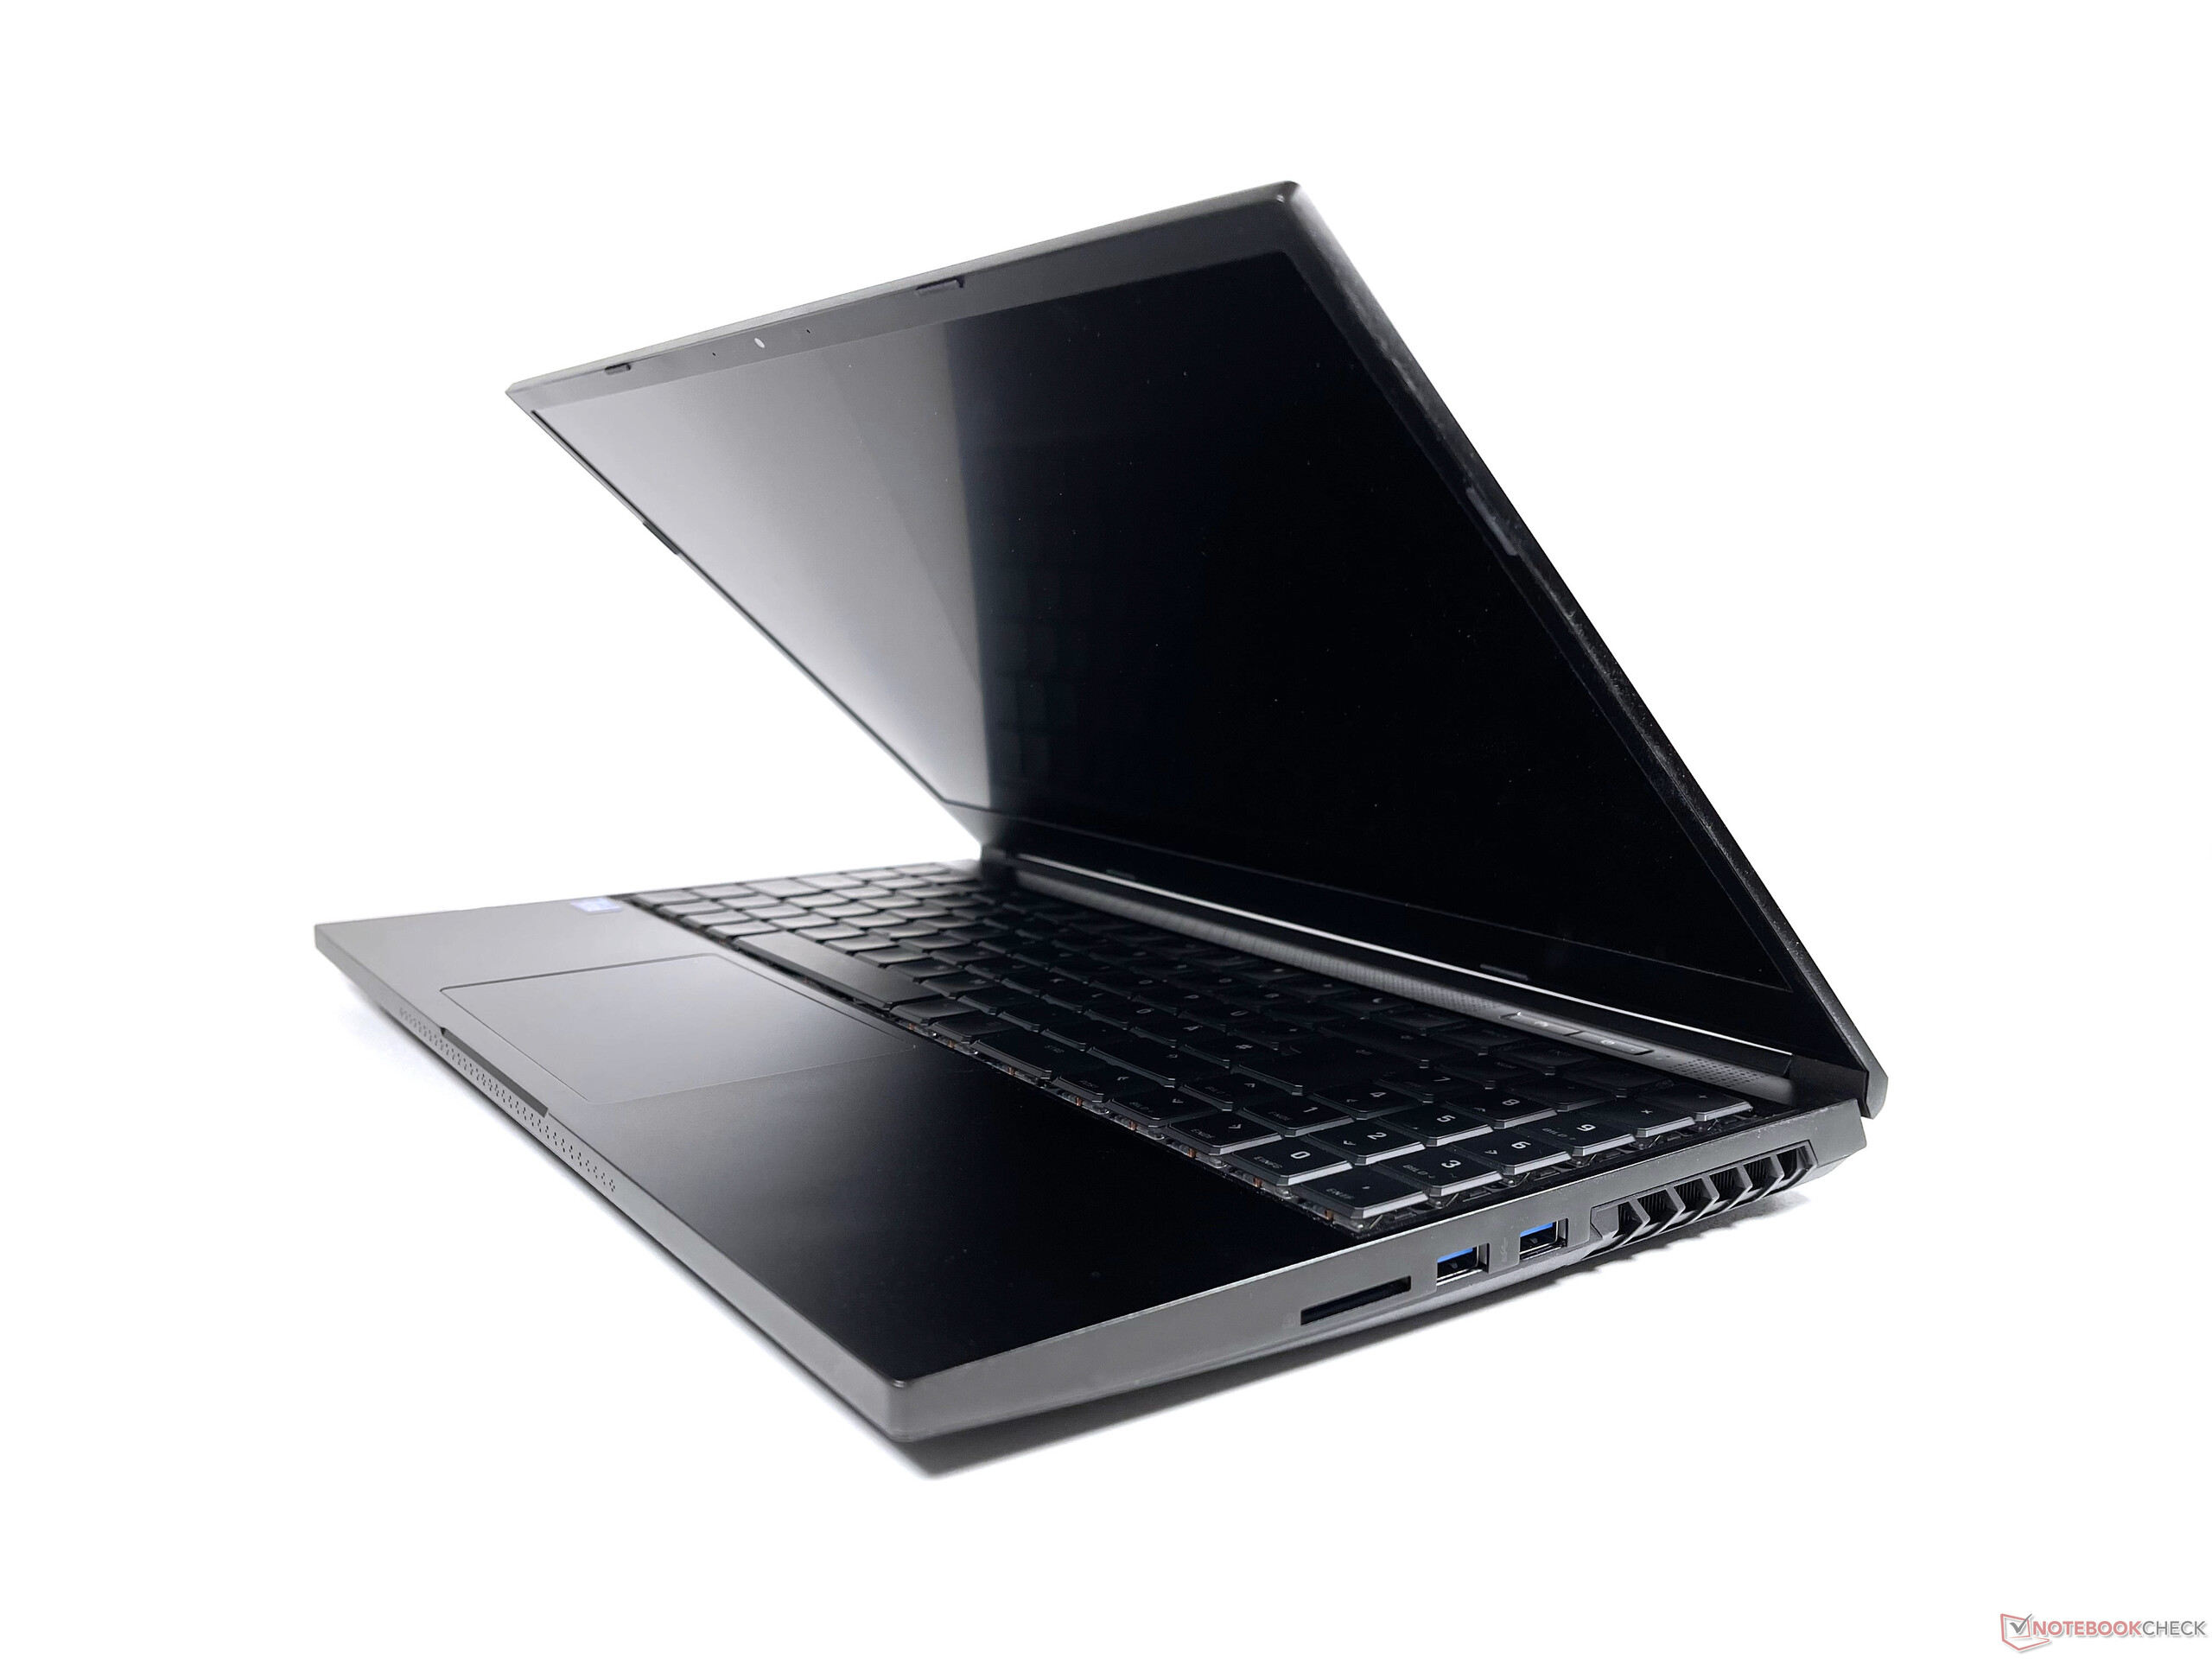
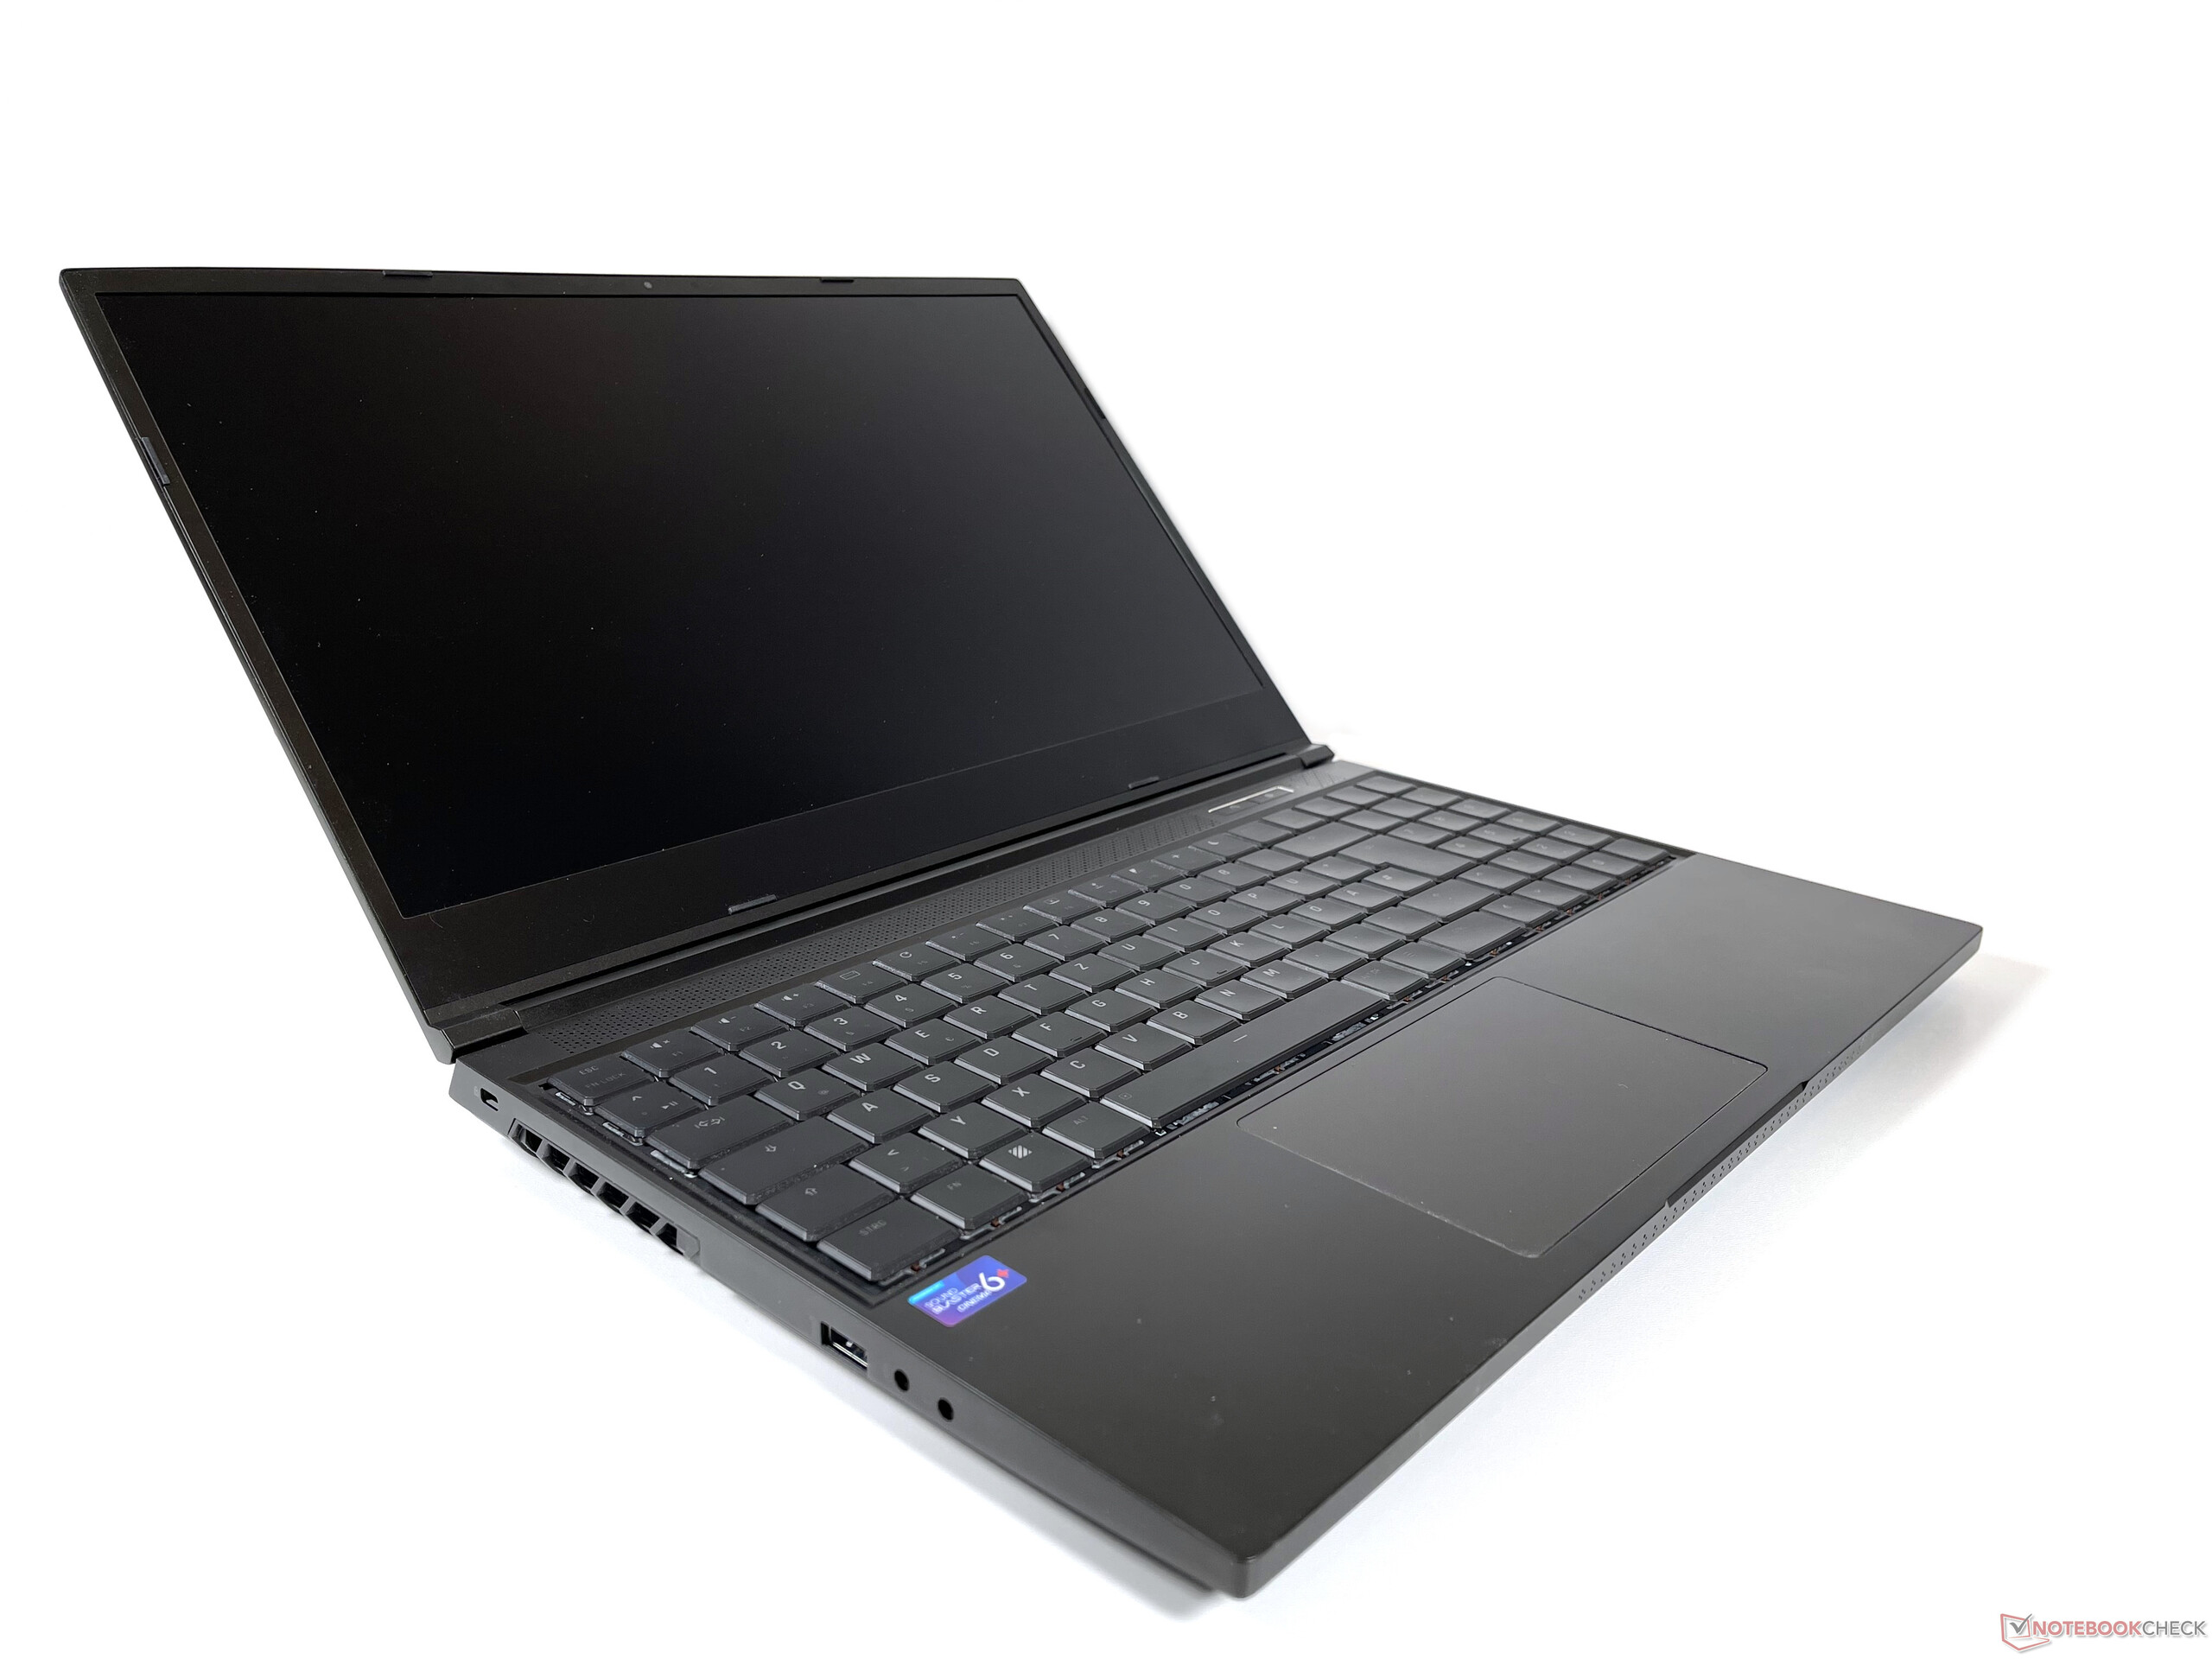
With a thickness of 26 mm, the Neo 15 M21 is not one of the thinnest 15-inchers, but the footprint is quite compact. The weight of 2.2 kg (~4.85 lb) is in the midfield.
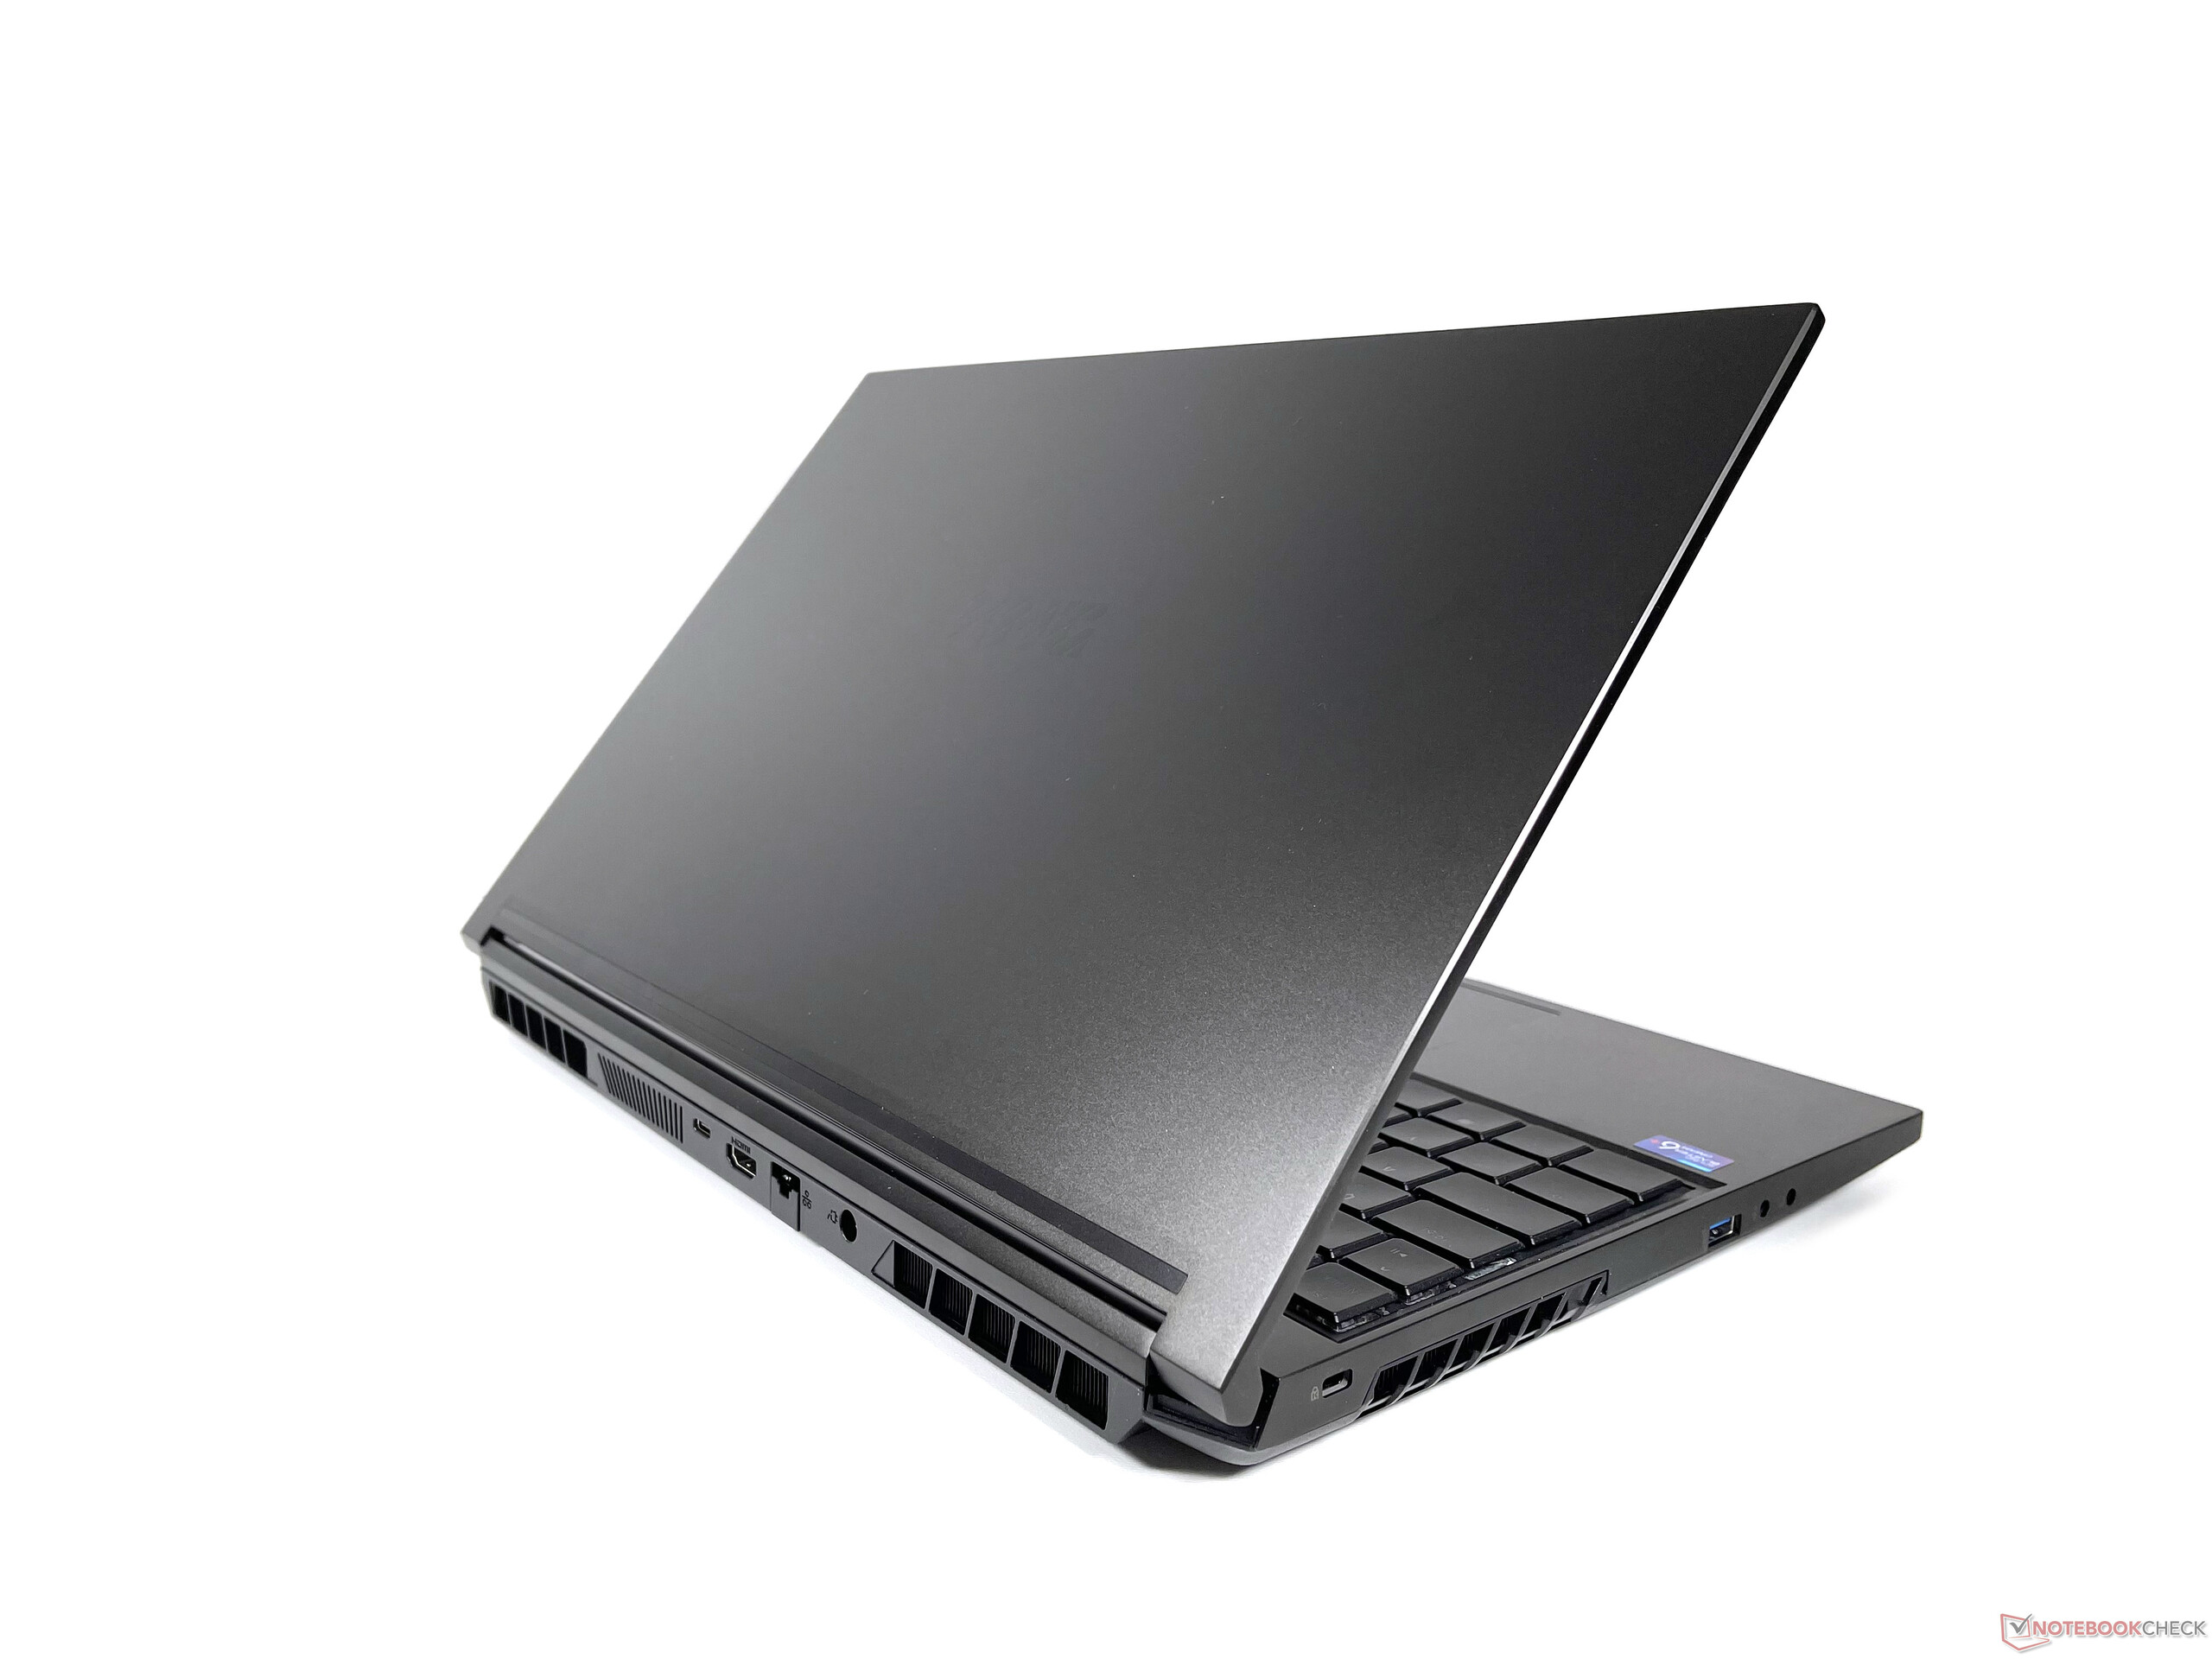
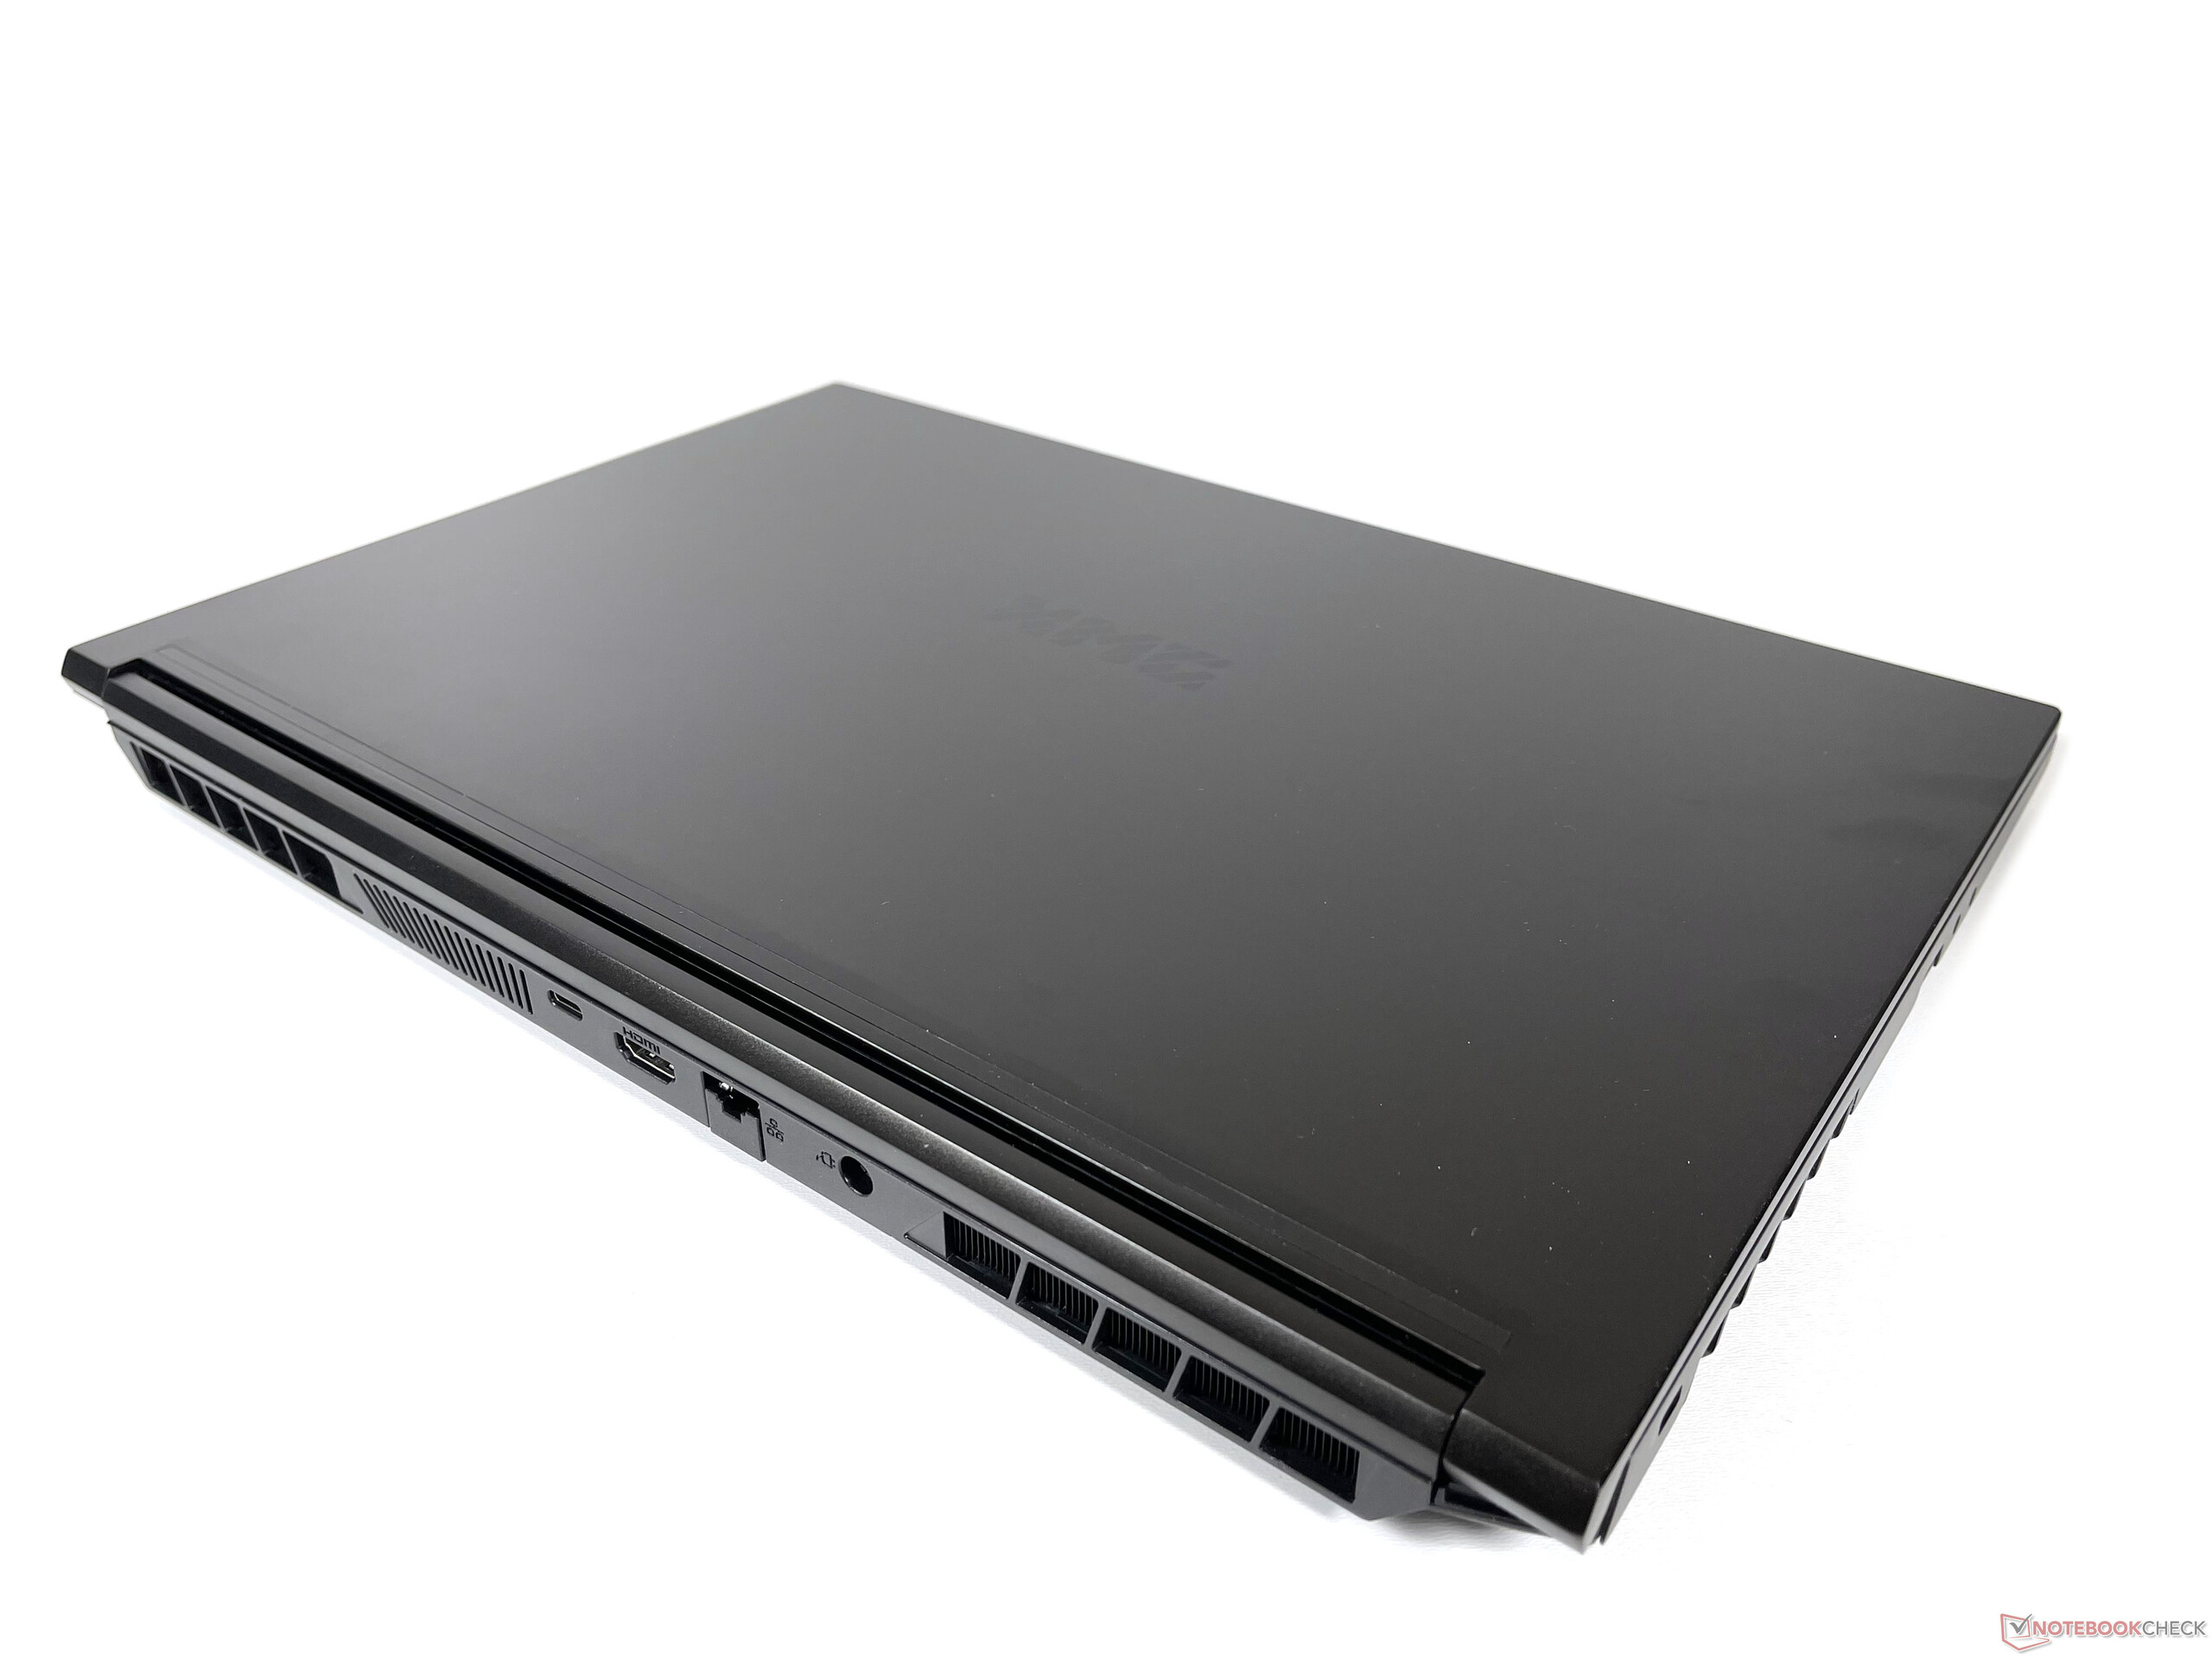
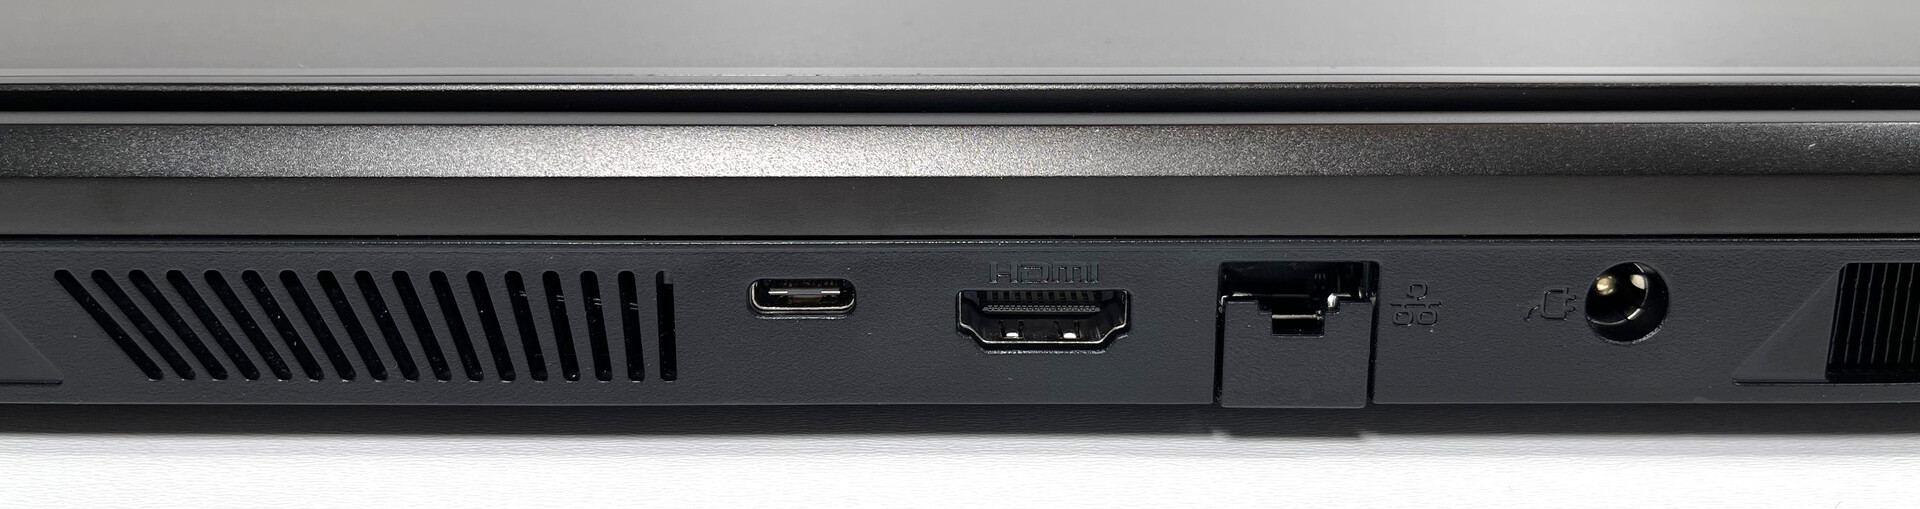
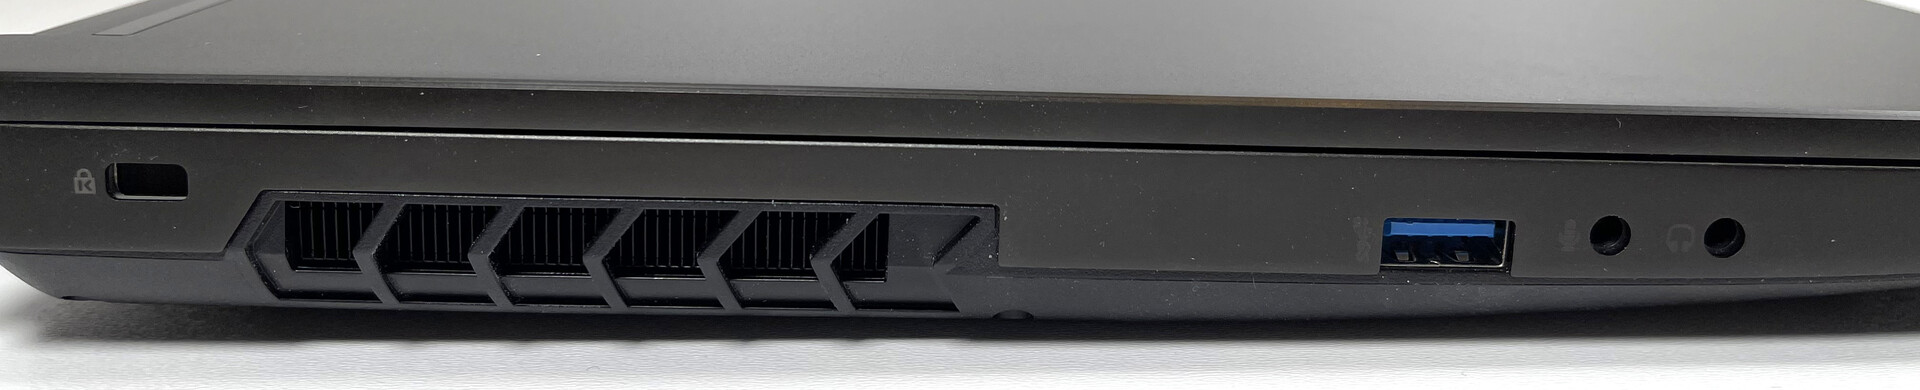
Equipment - Thunderbolt 4 and HDMI 2.1
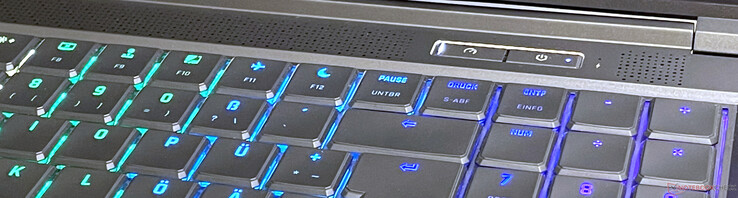
The highlights of the connectivity include the Thunderbolt 4 port, which cannot be used for charging here, an HDMI 2.1 port and a 2.5 Gb/s LAN port. In contrast to the desktop versions, mobile RTX-3000 GPUs do not necessarily support the latest HDMI standard and the associated HDCP 2.3 encryption. The ports are distributed on three sides. Placing two USB-A ports on the right side is an unusual decision, especially for a gaming laptop, since connected devices would take up space that would otherwise be available for mouse movements. At the same time, this fact may make the Neo 15 more attractive to left-handed users. A relatively unusual advantage is the separate microphone and headphone ports.
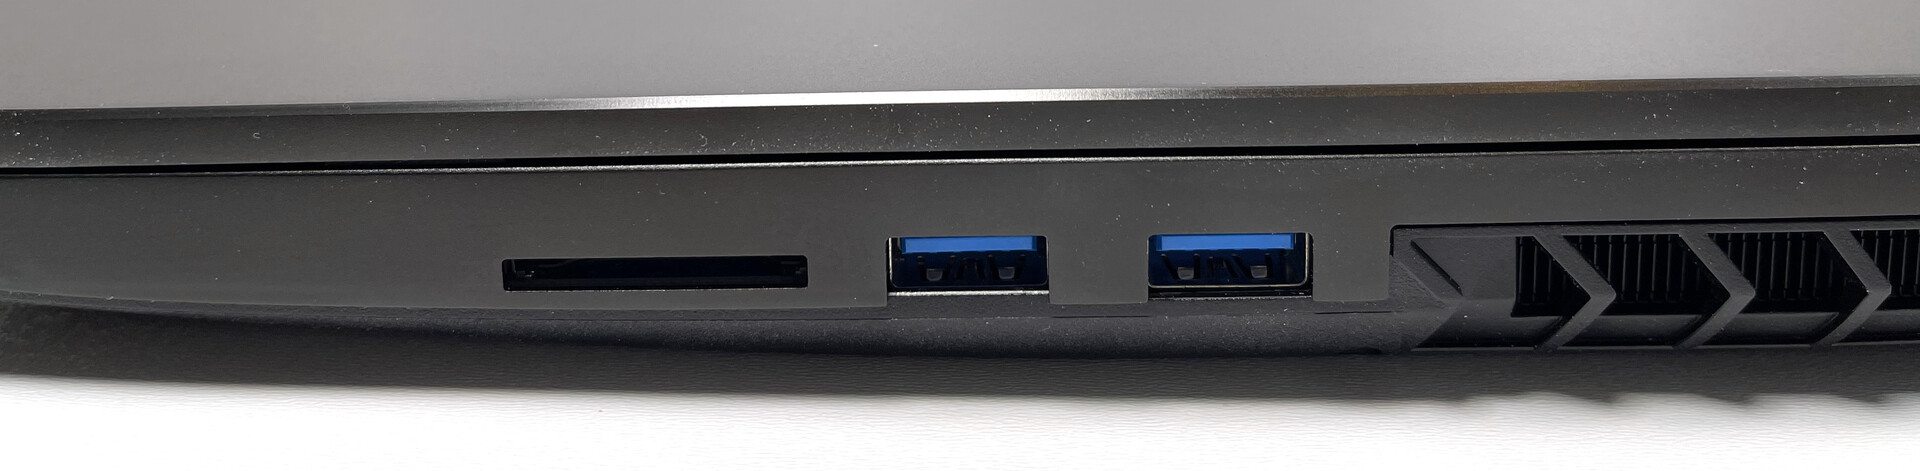
SD card reader
The performance of the SD card reader in combination with our reference card AV Pro microSD 128 GB V60 is comparable to that of the Predecessor, almost identical. Since the Aorus 15P YD achieves about twice as high transfer speeds and the Razer Blade 15 pro model achieves a lead of 153% in the JPG copy test, the installed card reader is rather one of the slower models. However, it supports normal-sized SD cards.
| SD Card Reader | |
| average JPG Copy Test (av. of 3 runs) | |
| Razer Blade 15 Advanced Model Early 2021 (AV PRO microSD 128 GB V60) | |
| Aorus 15P YD (AV PRO microSD 128 GB V60) | |
| Alienware m15 R4 RTX 3080 (AV PRO microSD 128 GB V60) | |
| Average of class Gaming (20.9 - 210, n=55, last 2 years) | |
| Schenker XMG Neo 15 Tiger Lake (AV PRO microSD 128 GB V60) | |
| maximum AS SSD Seq Read Test (1GB) | |
| Alienware m15 R4 RTX 3080 (AV PRO microSD 128 GB V60) | |
| Razer Blade 15 Advanced Model Early 2021 (AV PRO microSD 128 GB V60) | |
| Aorus 15P YD (AV PRO microSD 128 GB V60) | |
| Average of class Gaming (25.5 - 261, n=52, last 2 years) | |
| Schenker XMG Neo 15 Tiger Lake (AV PRO microSD 128 GB V60) | |
Communication
Intel's WLAN module AX201 offers WLAN 6 and Bluetooth 5 support. In the WLAN test, it achieves peak values for both reception and transmission in comparison, which are between 30 and 40% higher than the average values of the AX201. Although it is already equipped with the WLAN-6E chip AX210, the successor of the AX201, the Razer Blade 15 pro model cannot keep up here.
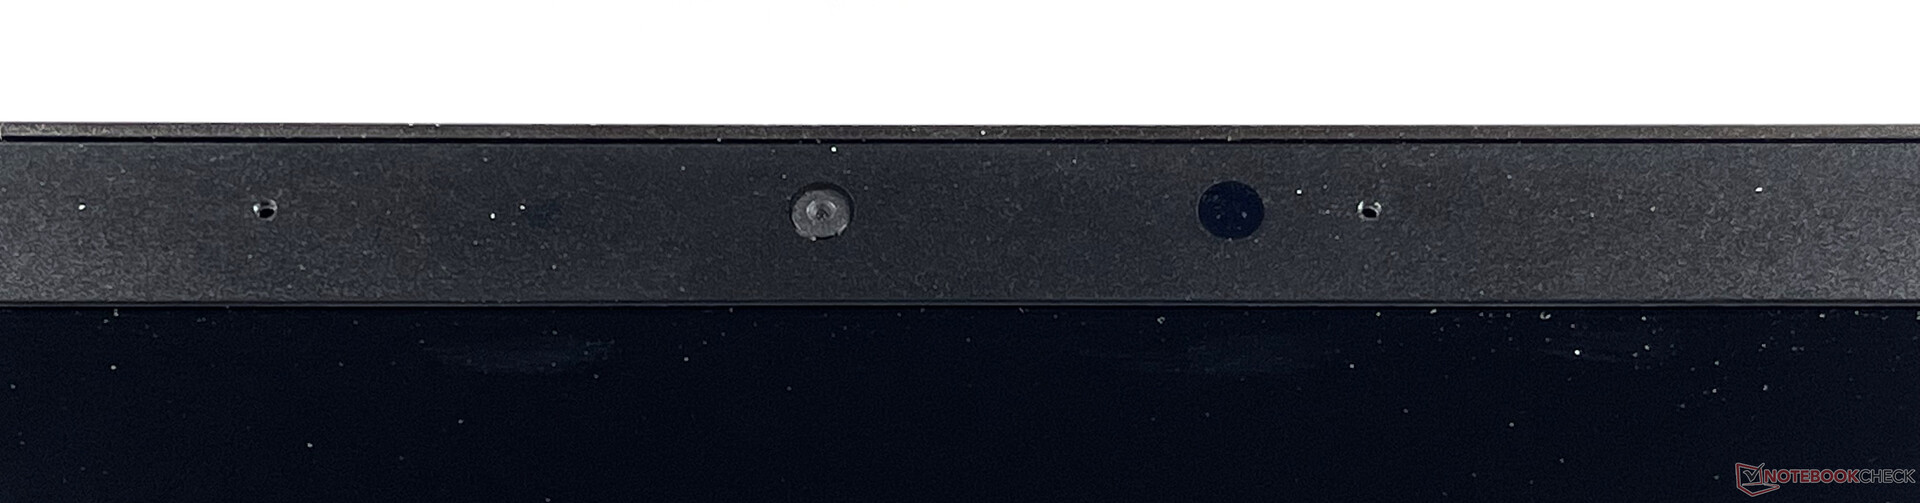
Webcam


Security
The Neo 15 comes with TPM 2.0 and a Kensington Lock as security features.
Accessories
In addition to the laptop itself and the charger, the scope of delivery includes a manual and a driver CD or a driver USB stick. In the online shop of the manufacturer, for example, replacement batteries and power supplies can be purchased.
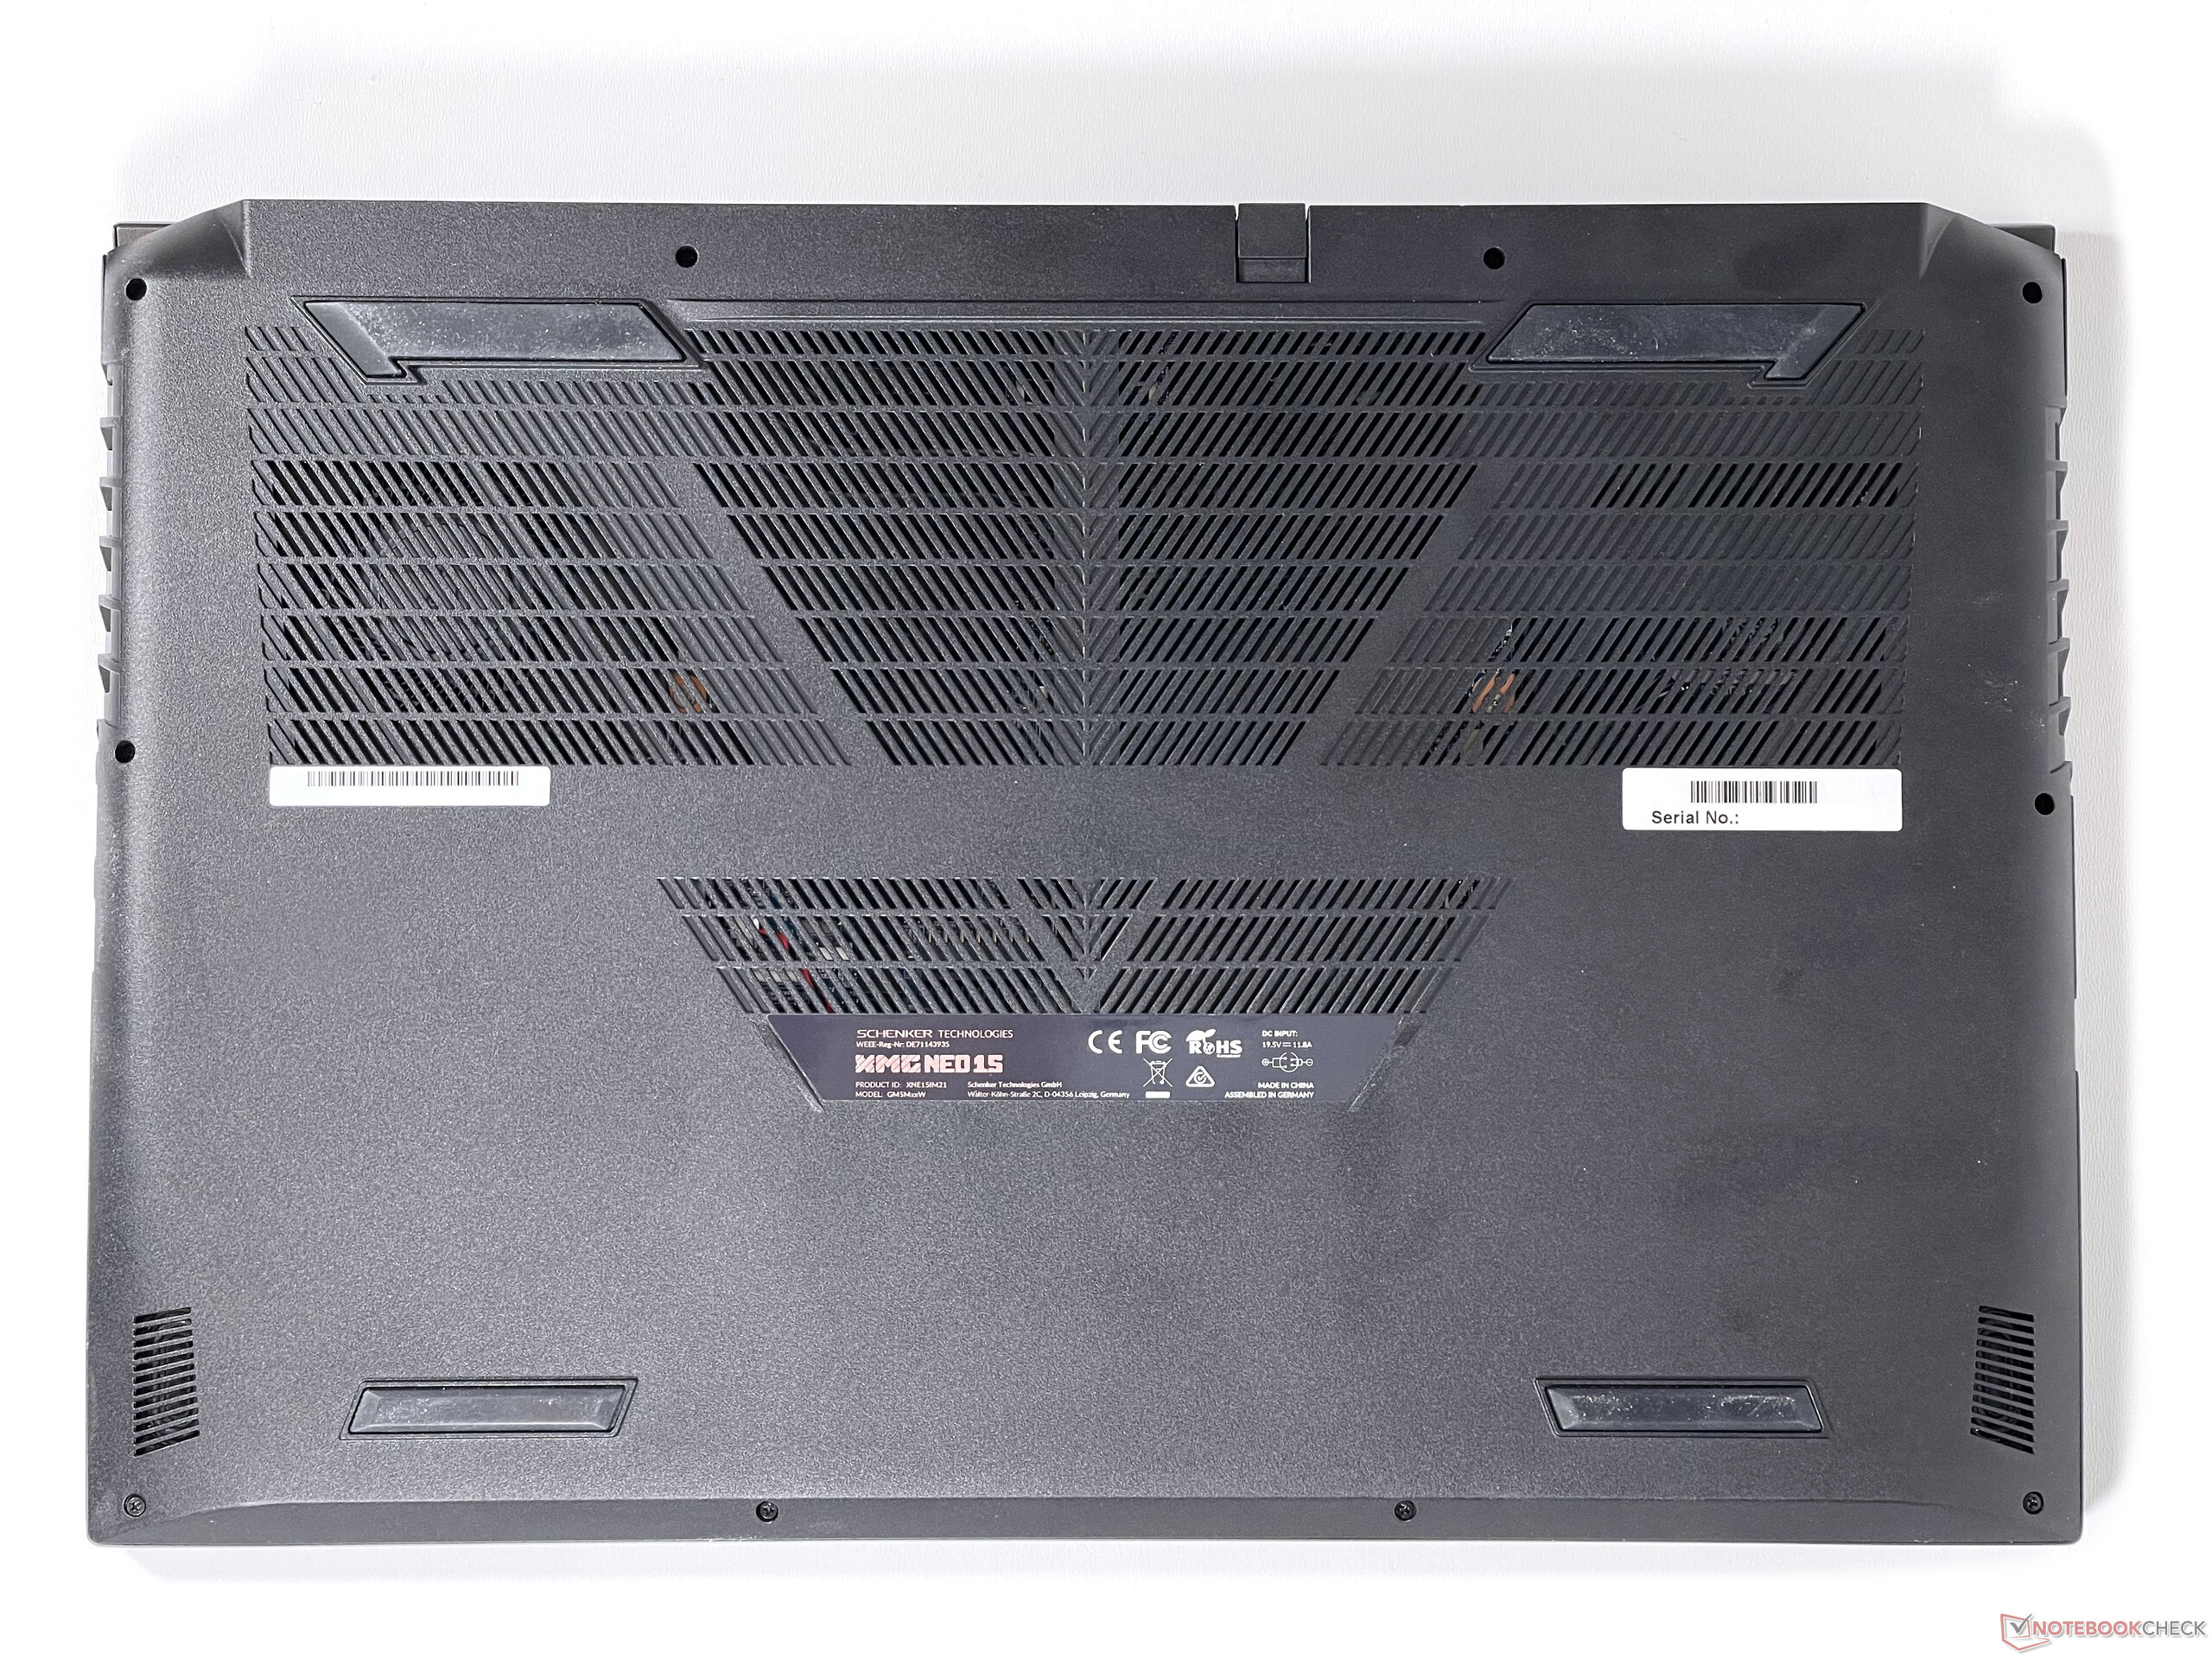
Maintenance
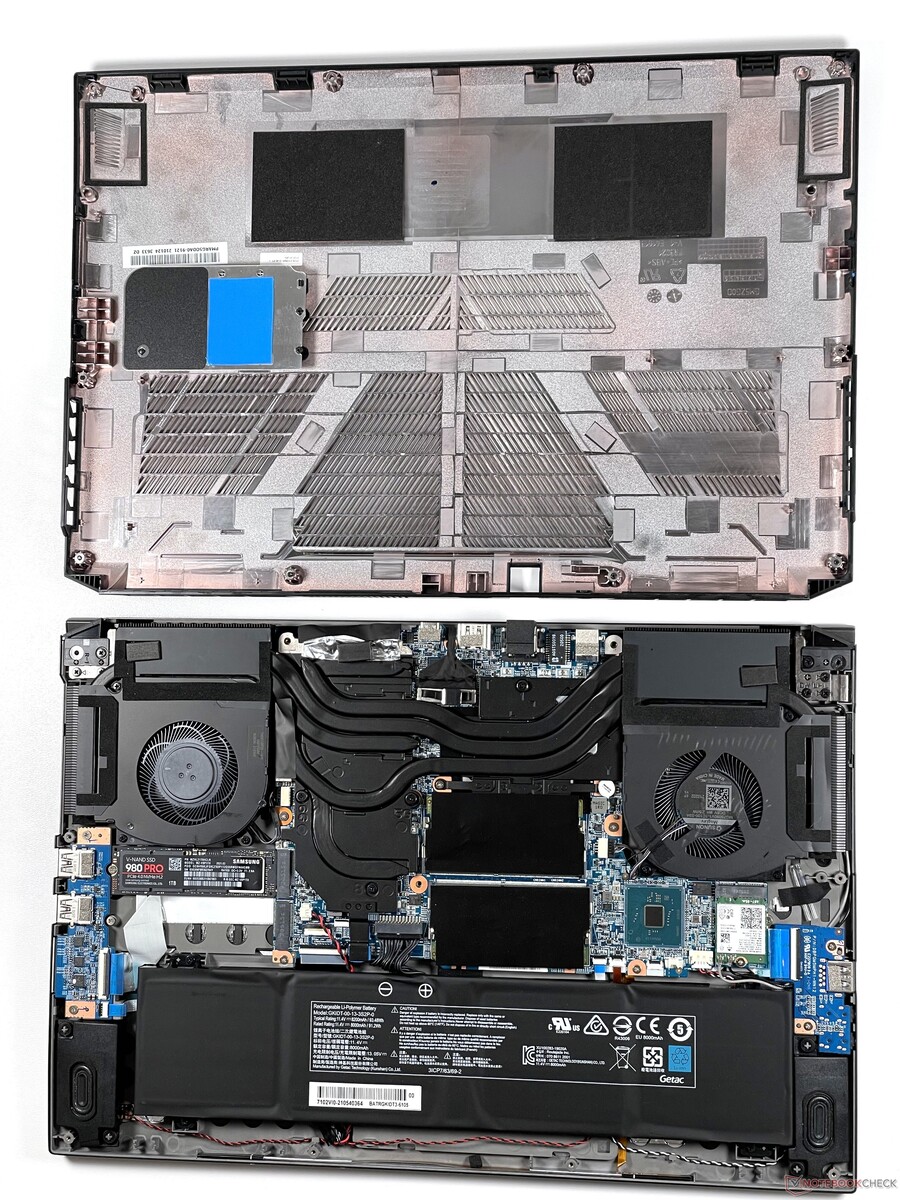
After loosening 10 cross screws, the base plate, which is equipped with a cooler for the M.2 SSDs as seen in the picture, can be removed easily. This is much easier here than with many competitors, where additional plastic clips require a higher degree of caution. Inside, you have direct access to the SSDs, the WLAN module, the battery and the RAM modules.
Warranty
The warranty period is 2 years. Once the configuration page has been enabled, it should be possible to extend the warranty up to 3 years with optional quick repair service.
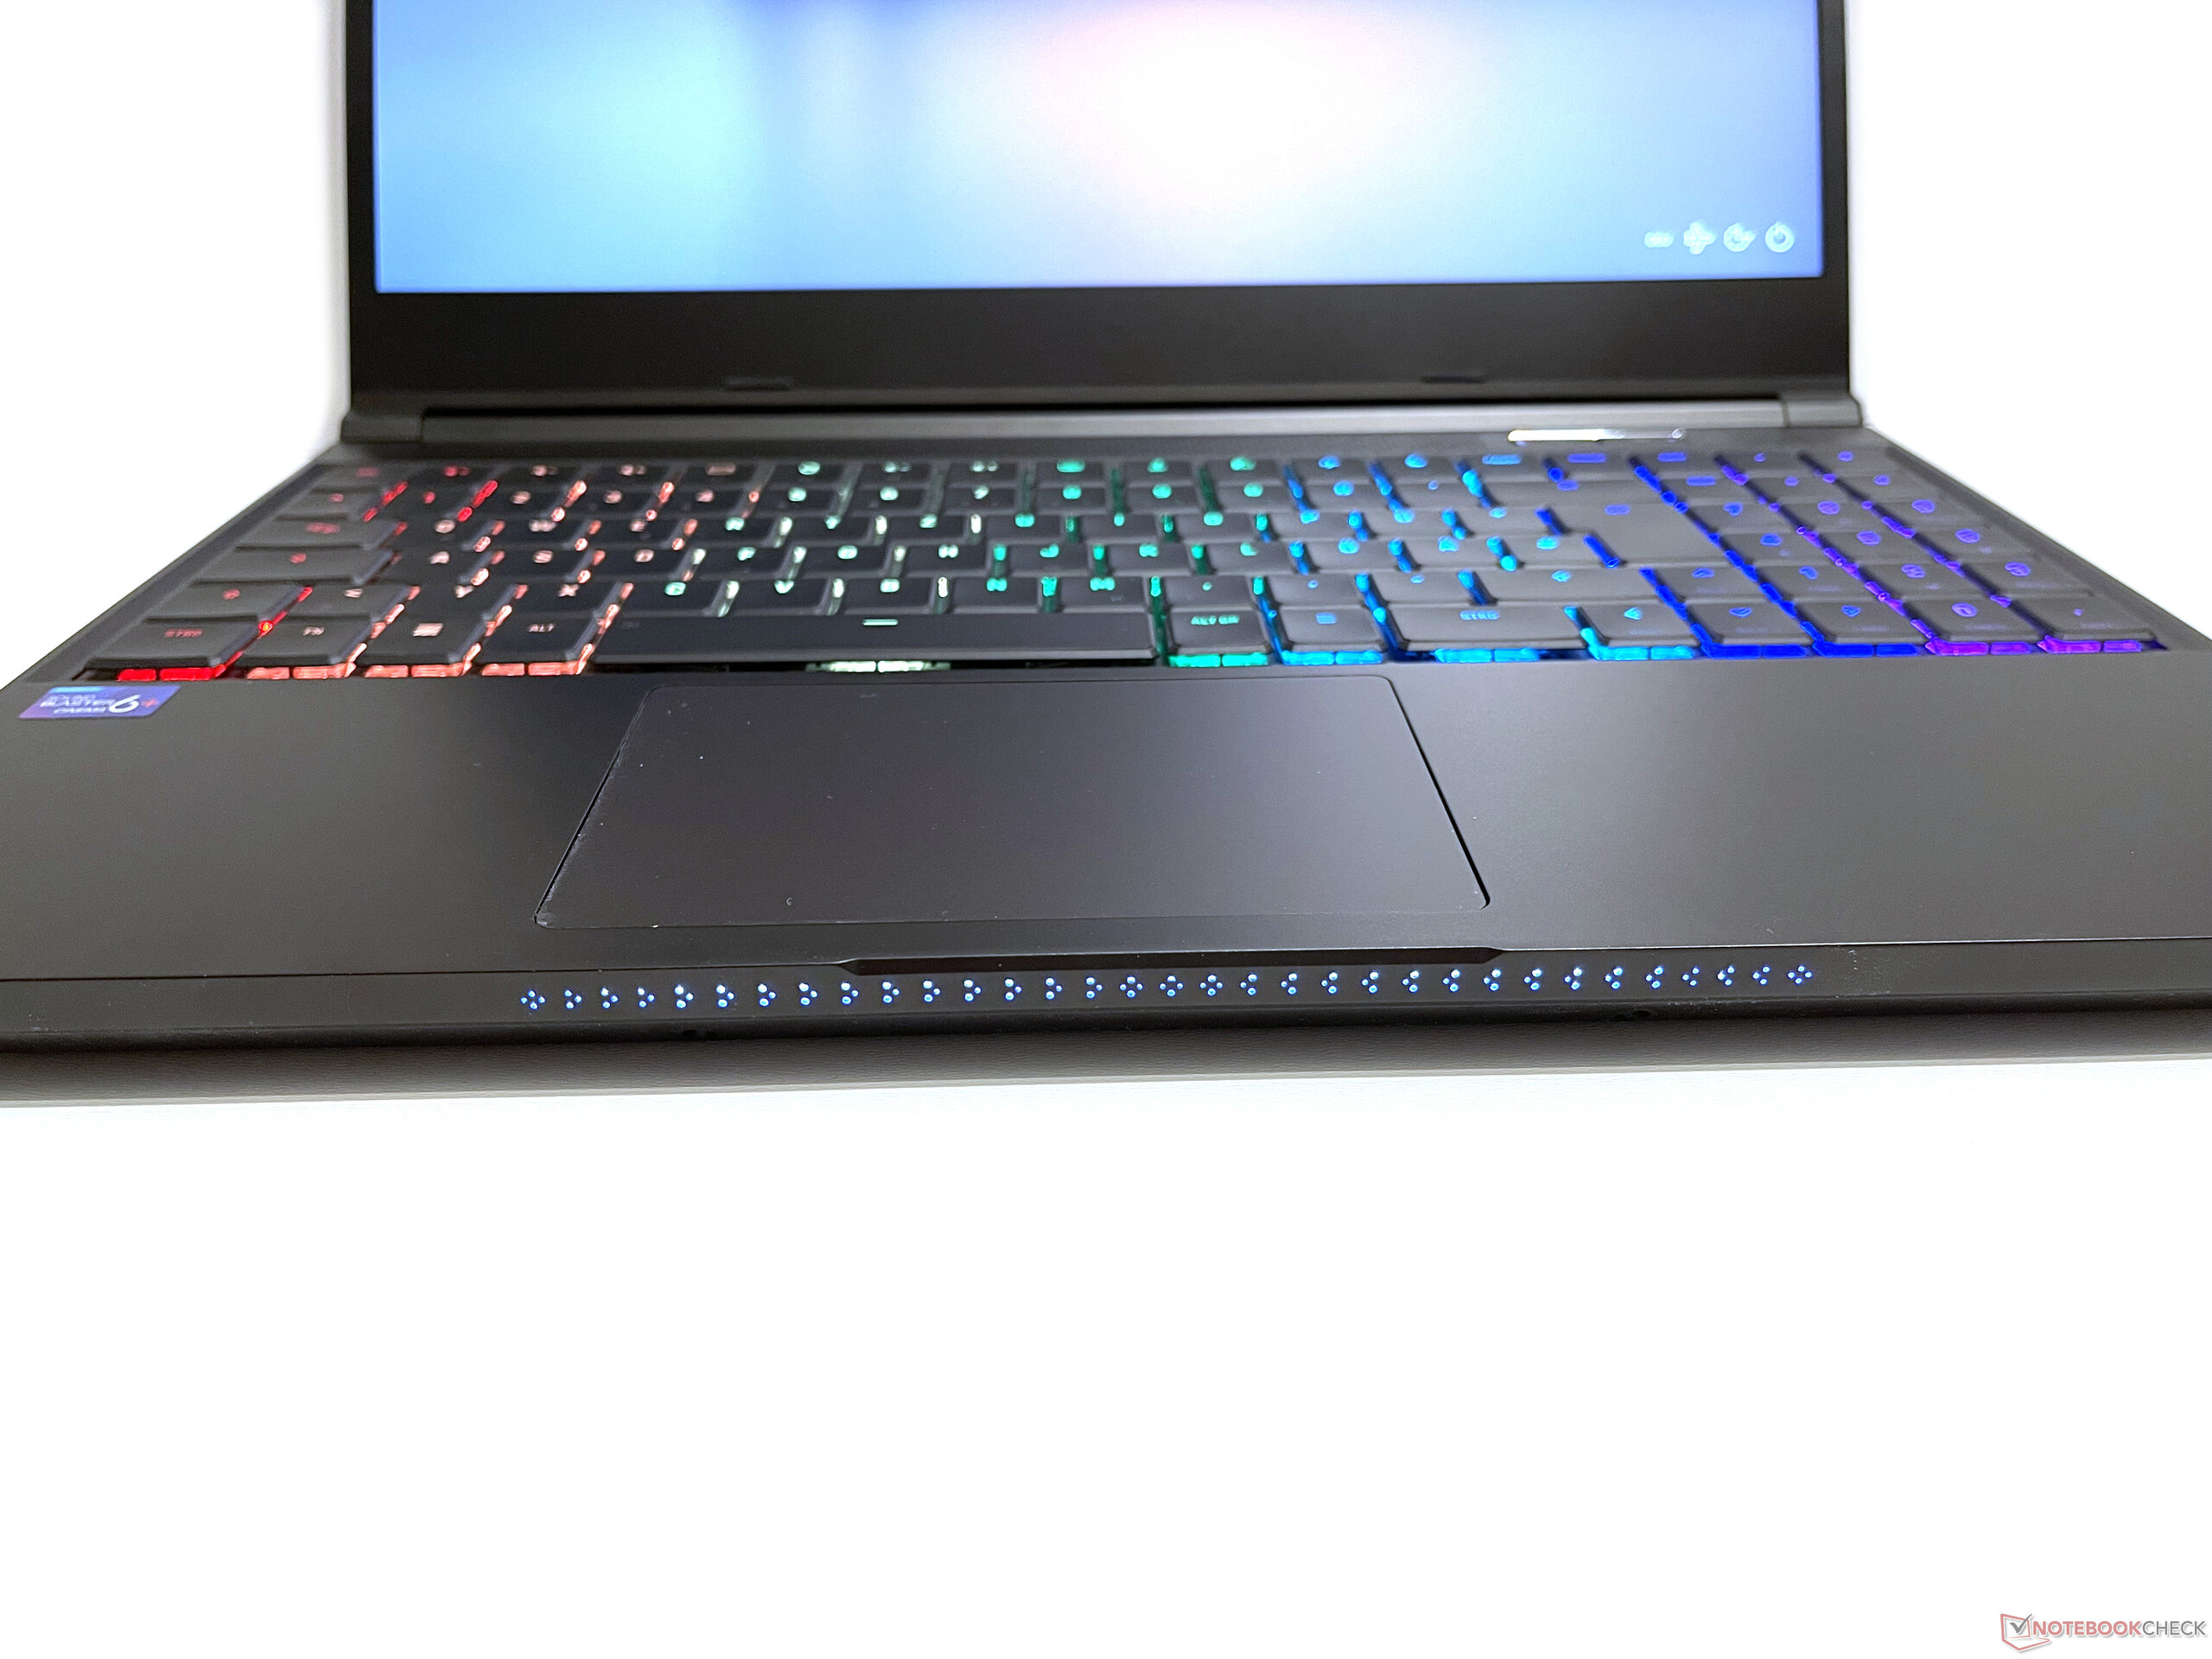
Input devices - Mechanical keyboard leaves a lot to be desired
Keyboard
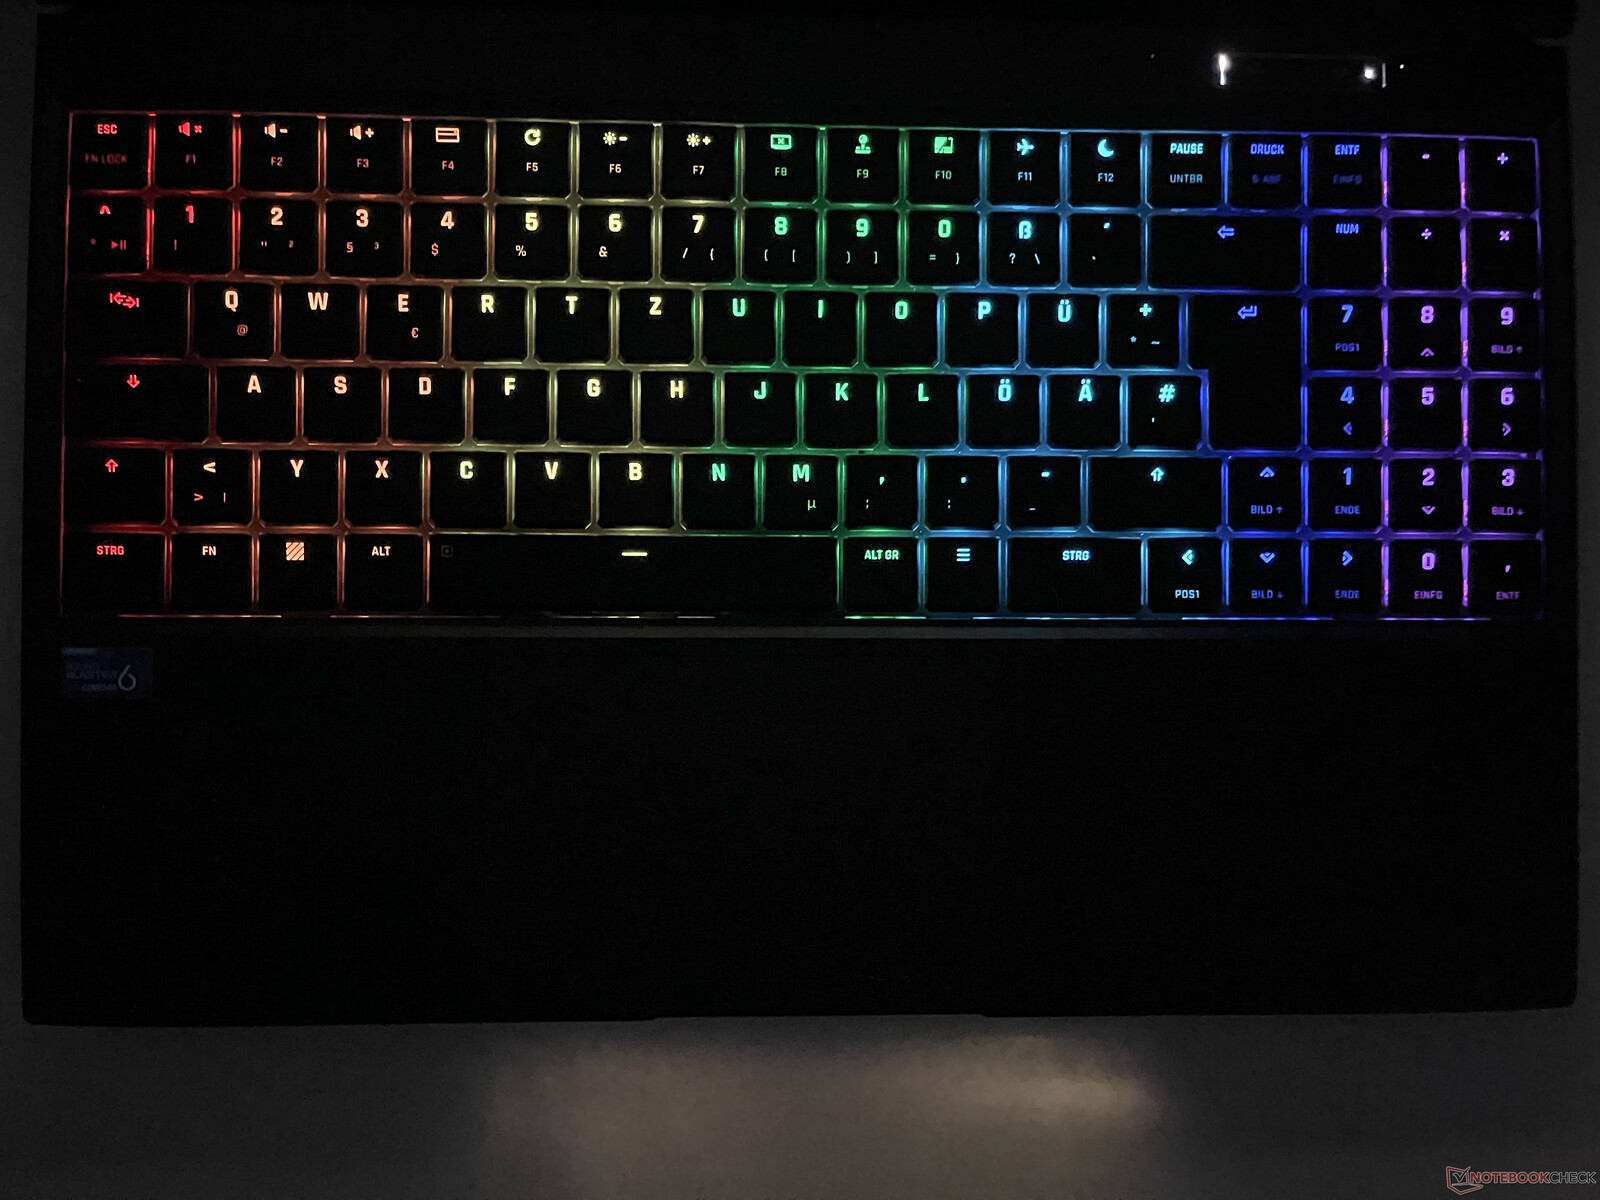
The chiclet keyboard with numeric keypad relies on optomechanical keys with tactile switches that have a key drop of 2 mm and a travel of 1 mm. The key layout makes optimum use of the available space, creates a tidy impression and yet does not have to resort to half-height arrow or numeric keypad keys. An RGB key illumination is also available and comes up with various effects as well as 4 brightness levels. Since the keyboard offers a low resistance, it seems quite soft and not particularly high-quality despite its mechanical nature. It is questionable whether the use of a mechanical model was worthwhile here at all, because the conventional keyboards of many laptops are also better suited for writing longer texts in particular. The keys acknowledge a release with audible typing noises, but are especially quieter than a "clicky" model. The keyboard base is very rigid and hardly yields under pressure even in the center.
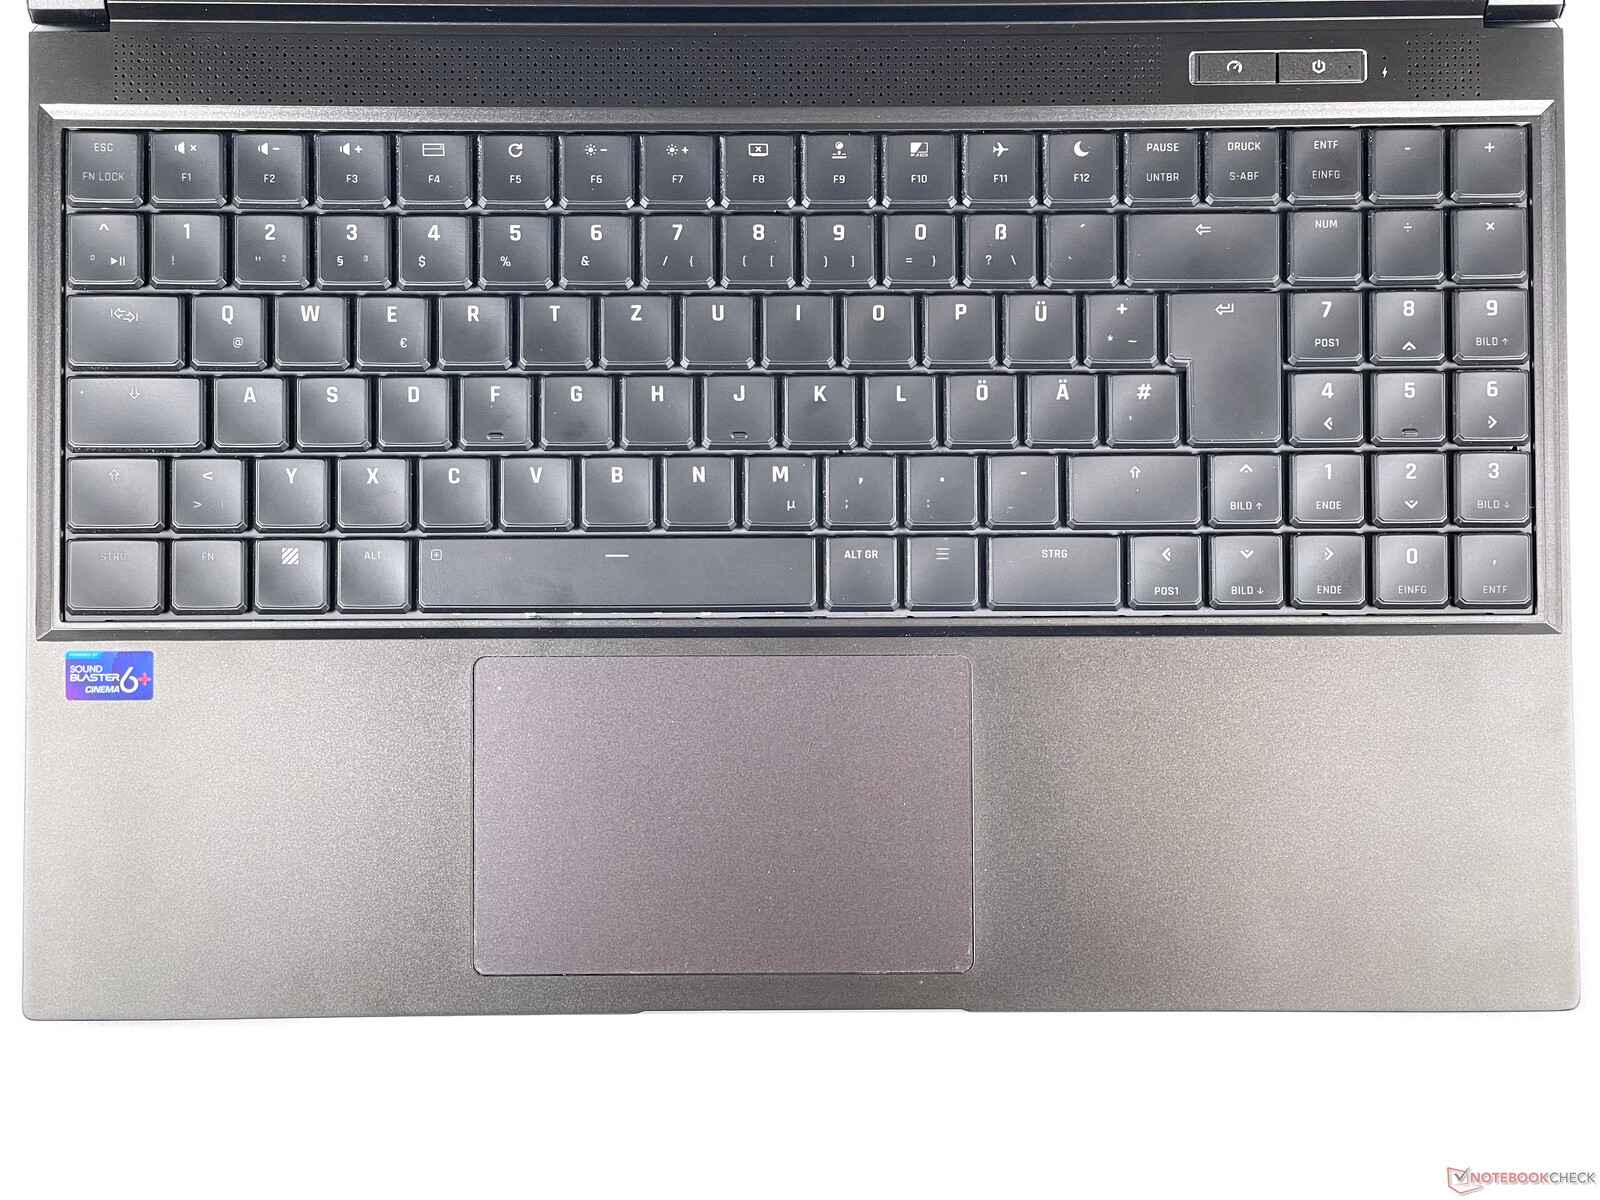
Touchpad
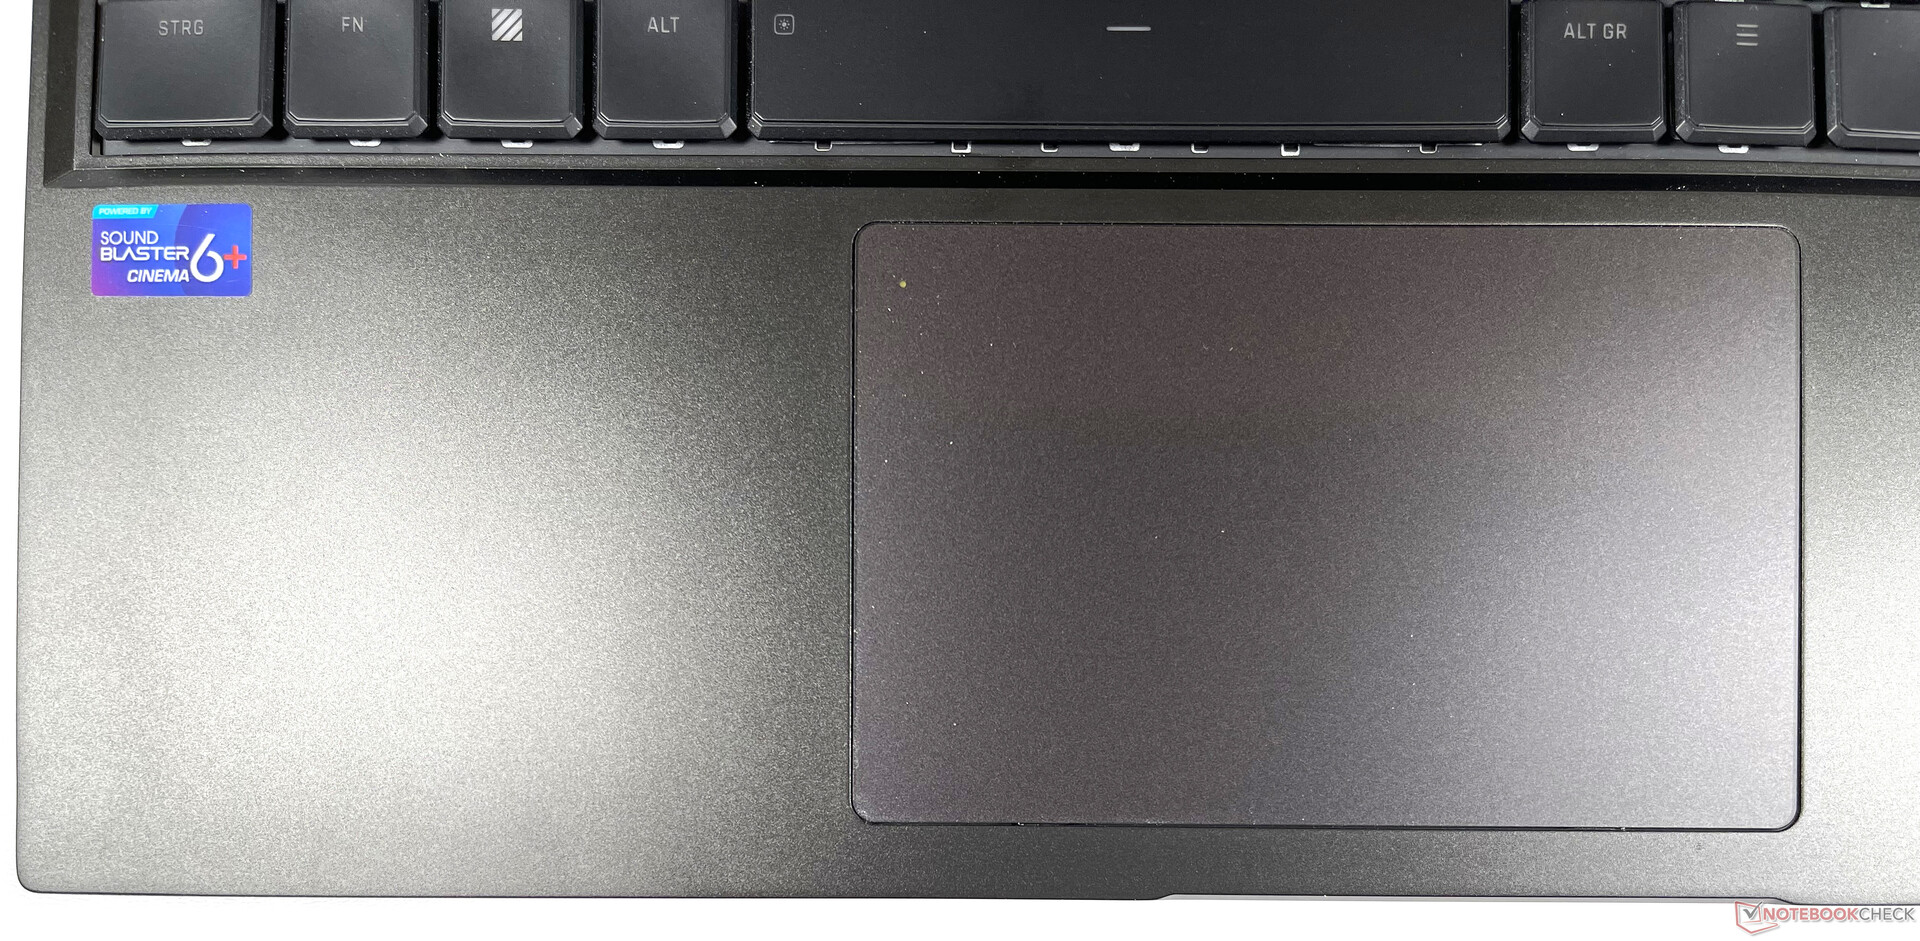
The glass touchpad bears the Microsoft Precision designation and has an extremely smooth, medium-sized surface (~11.6 x 7.4 cm/~4.6 x 2.9 in). Tapping on the lower half produces a slight rattling noise under certain circumstances. However, the touchpad is fine for occasional use and many gamers will probably connect an external mouse most of the time anyway. Standard gestures and mouse cursor control work well, but the touchpad does not quite respond to inputs up to the upper limit.
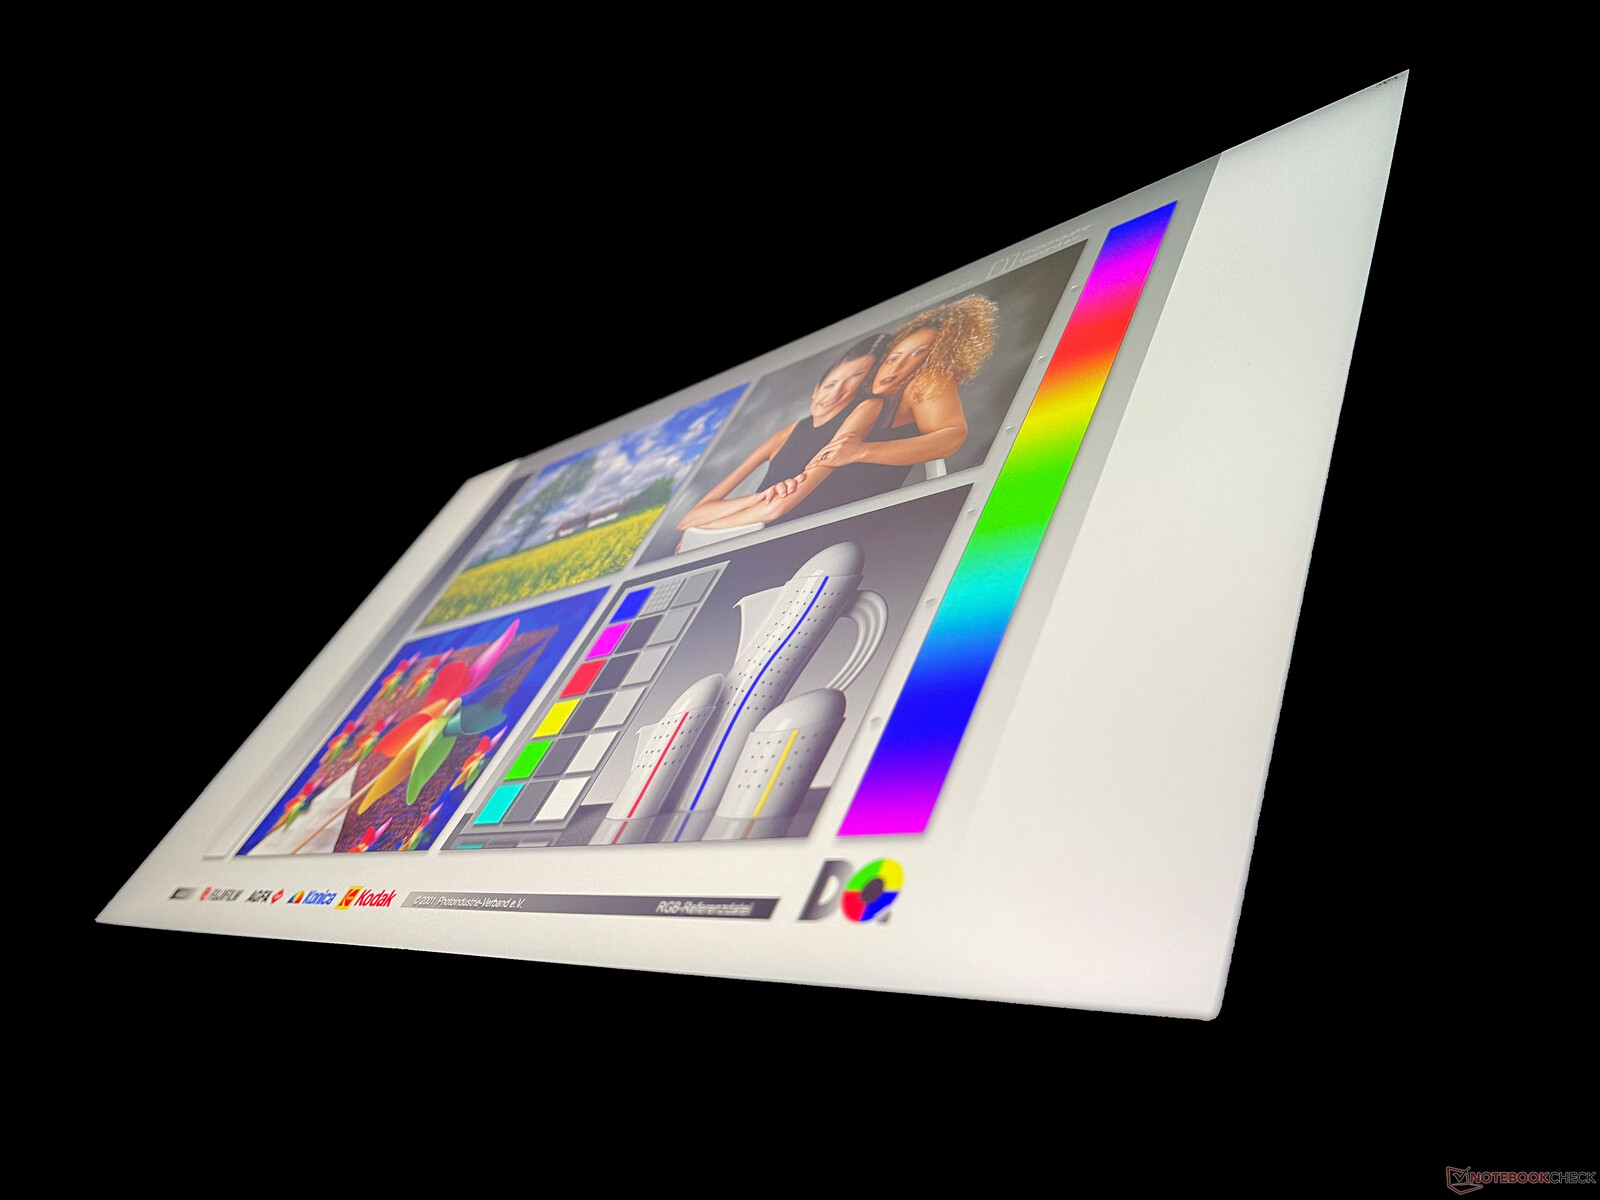
Display - High-resolution WQHD display with 165 Hz and good contrast
For the display, the manufacturer relies on a matte IPS display from BOE with a native WQHD resolution (2560 x 1440 pixels) and a refresh rate of 165 Hz. The display is fixed in all configurations and is currently a very popular compromise between image and motion sharpness. Especially since this is a 15-inch display where the extra pixels do not significantly improve the perceived sharpness, a 1080p 300Hz or a 1080p 360Hz display option would have been an interesting alternative for competitive shooters. Most competitors also offer these at least as an option.
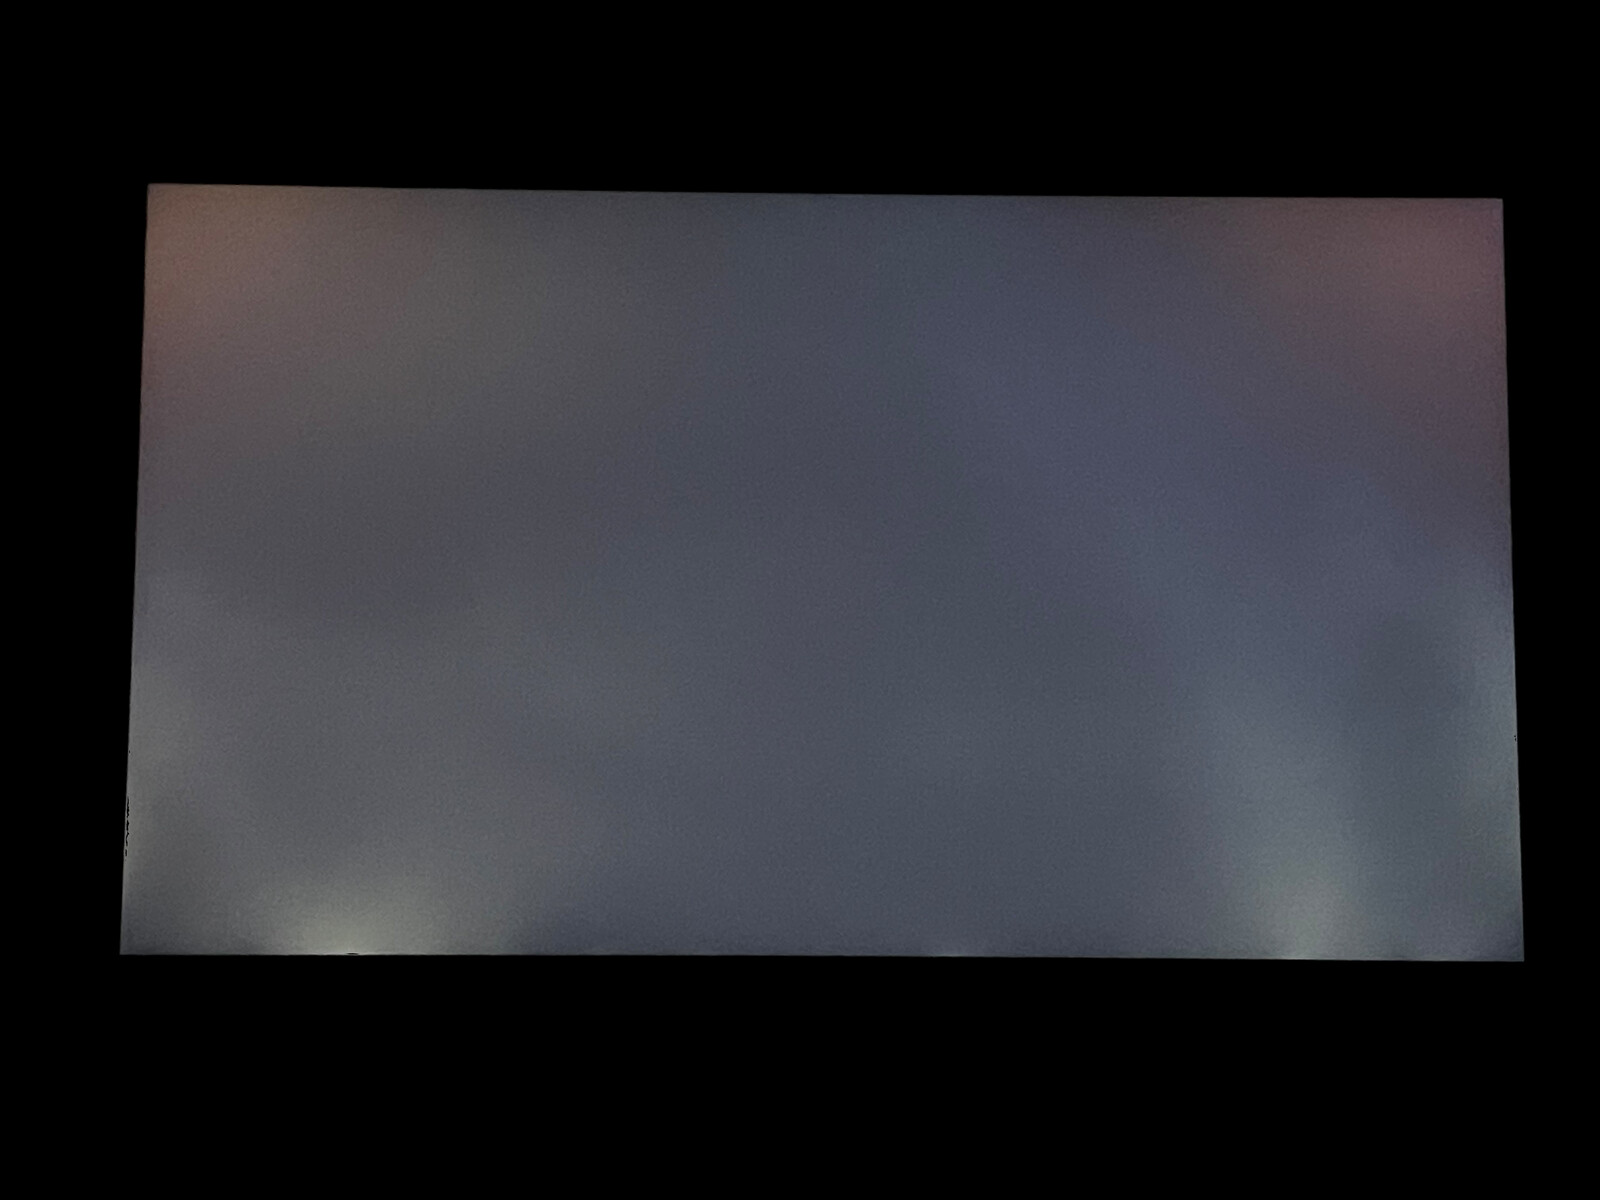
The average brightness of 307 cd/m² that we measured falls short of the manufacturer's specification of 350 cd/m², but is on the usual level in the class comparison and the brightness distribution turns out relatively good with 91%. Fortunately, PWM is not used.
| |||||||||||||||||||||||||
Brightness Distribution: 91 %
Center on Battery: 324 cd/m²
Contrast: 1200:1 (Black: 0.27 cd/m²)
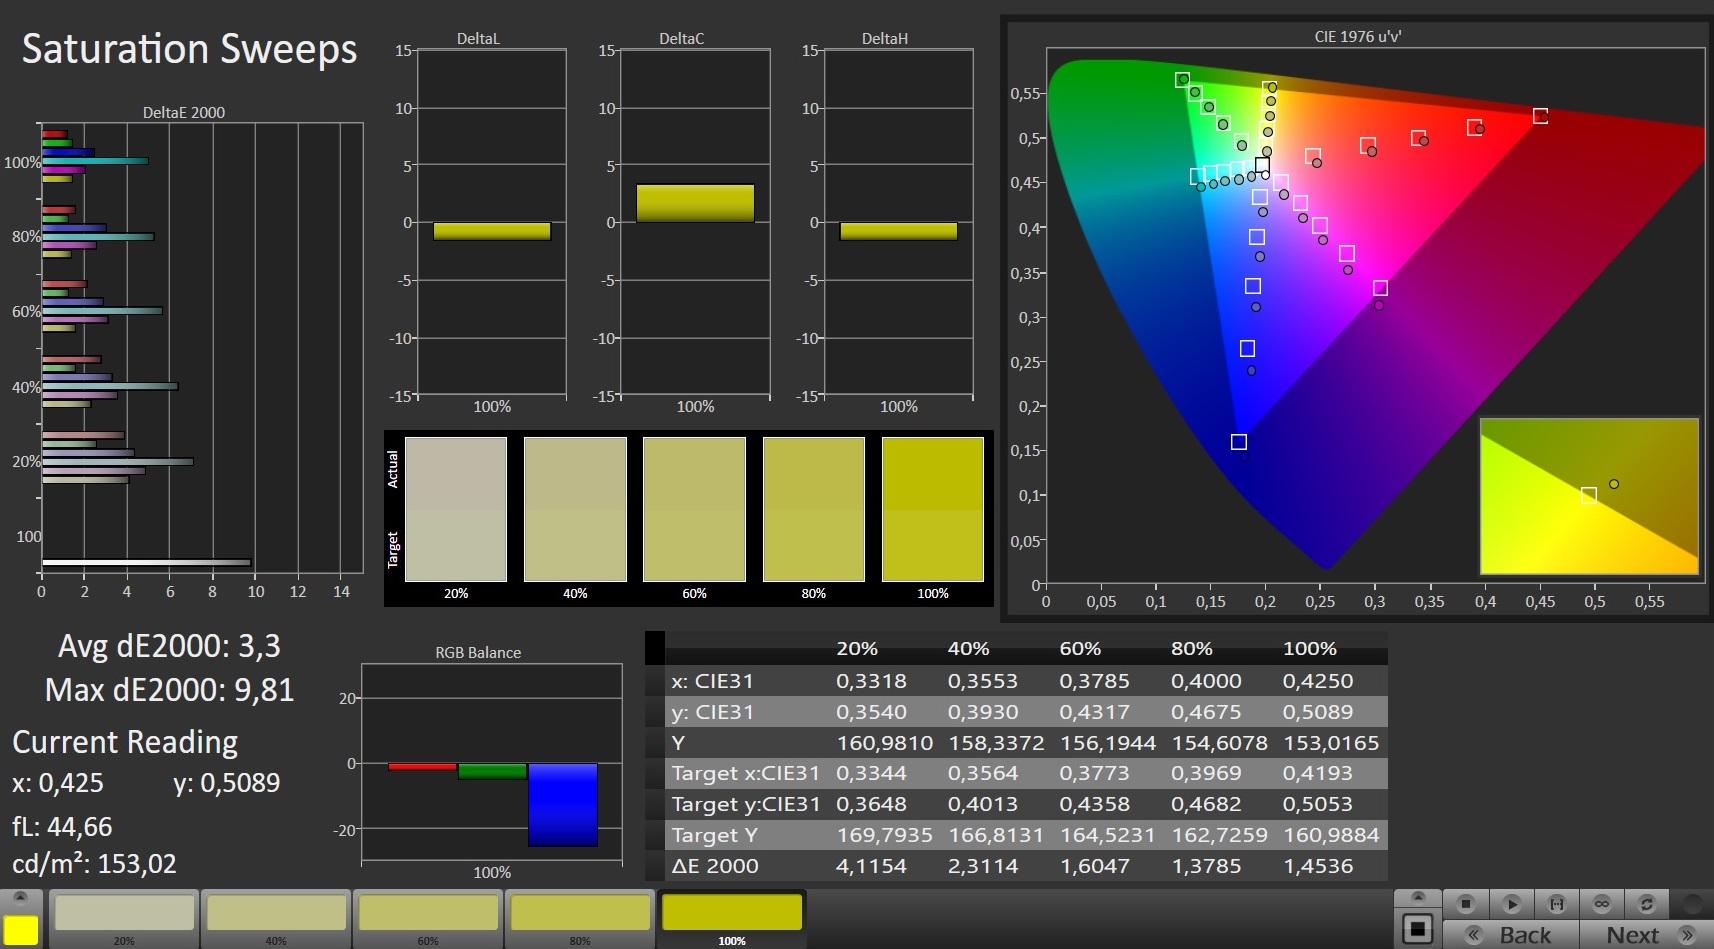
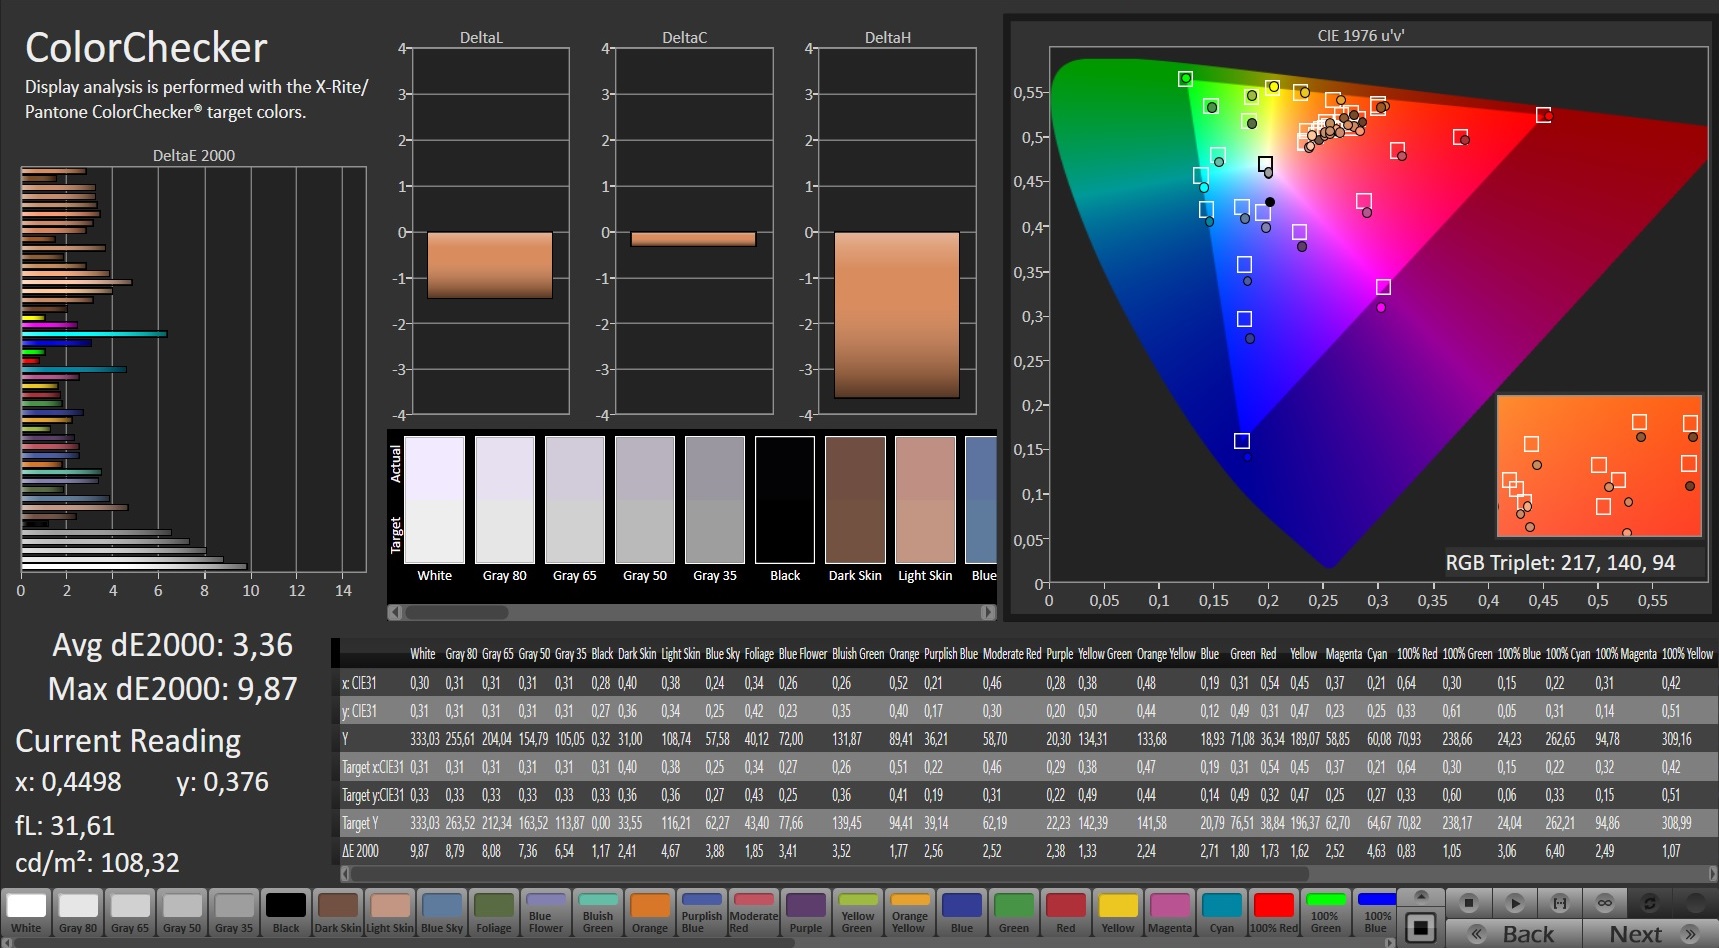
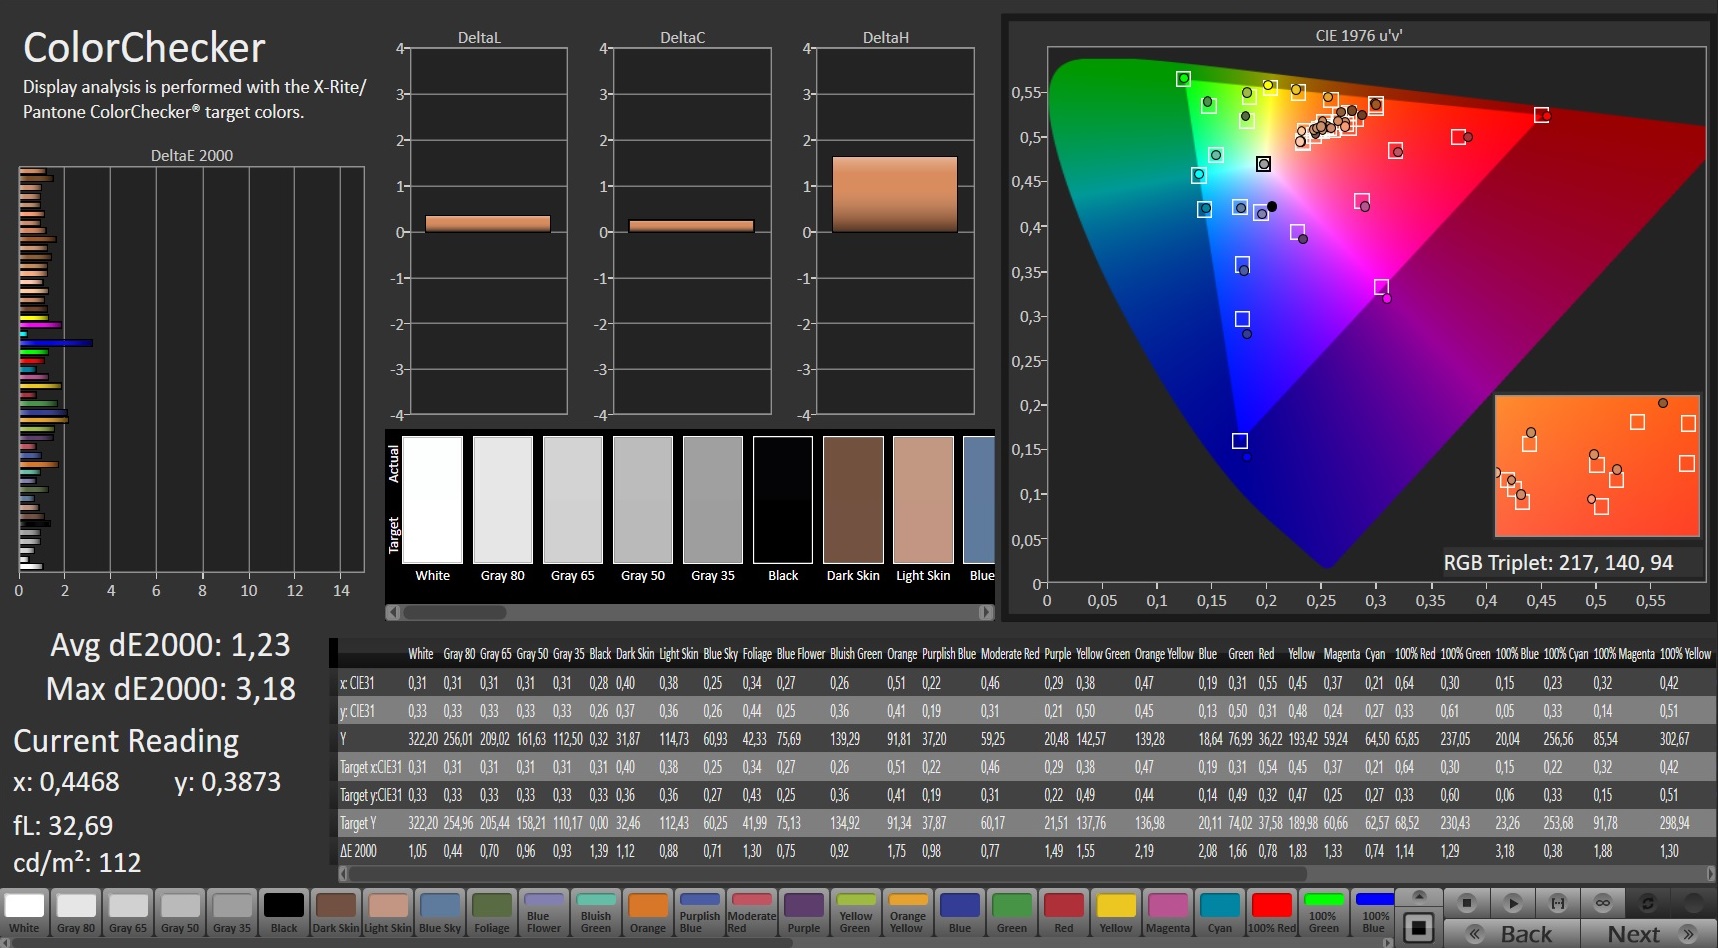
ΔE ColorChecker Calman: 3.36 | ∀{0.5-29.43 Ø4.73}
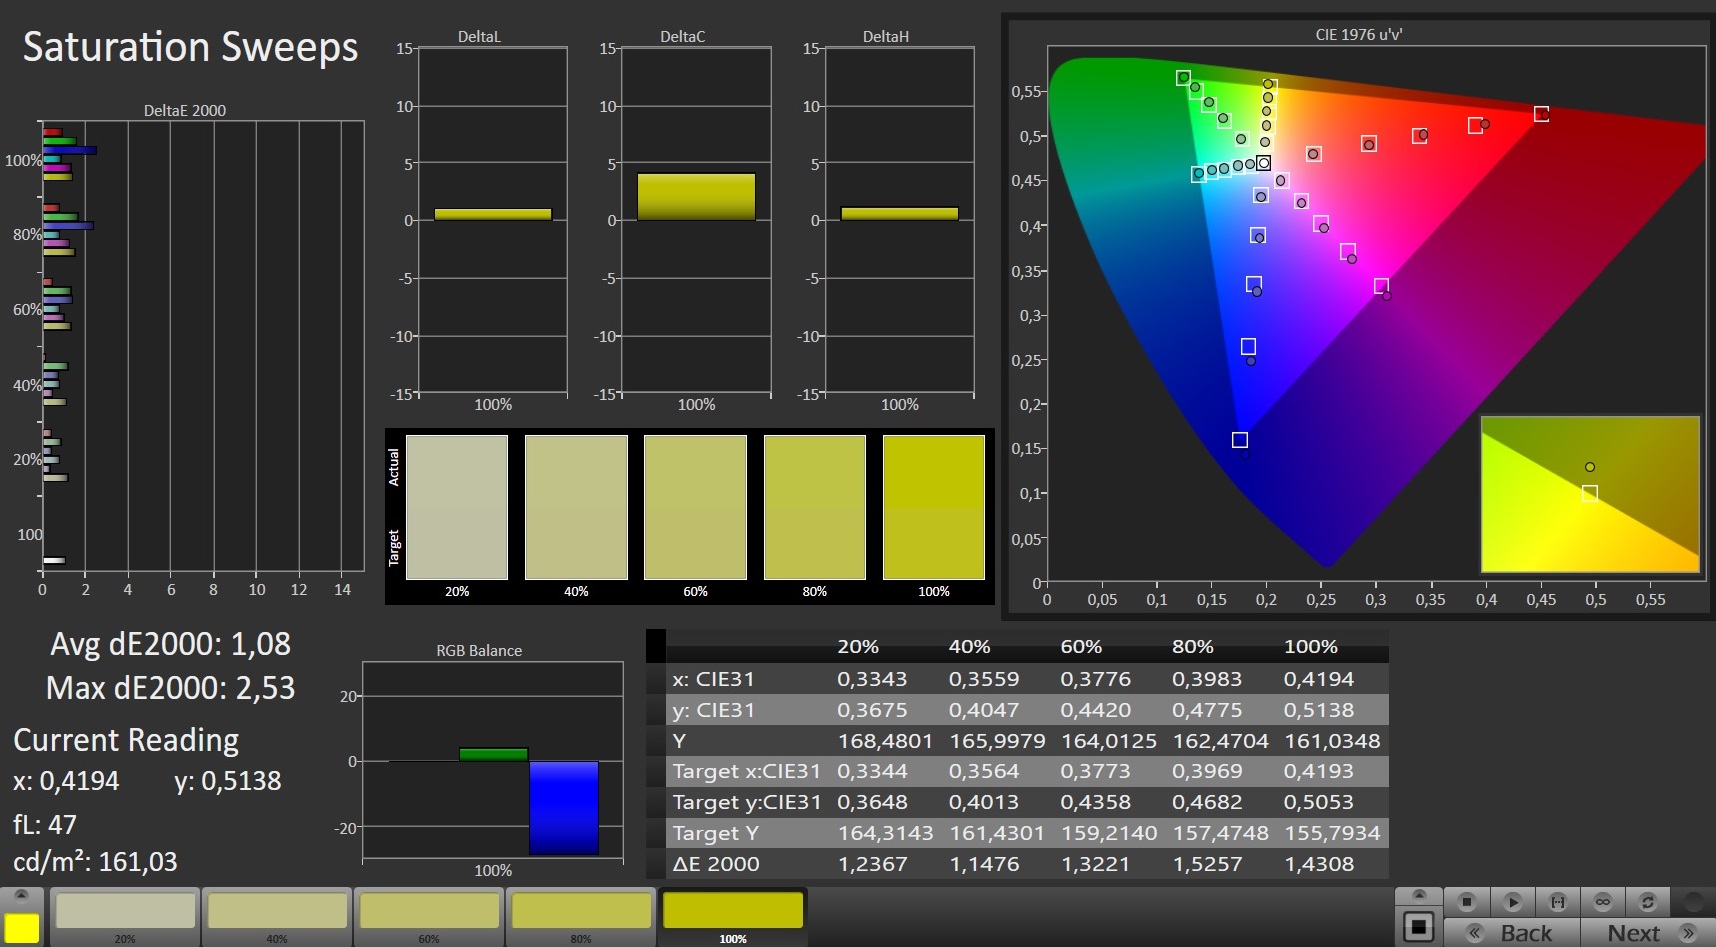
calibrated: 1.23
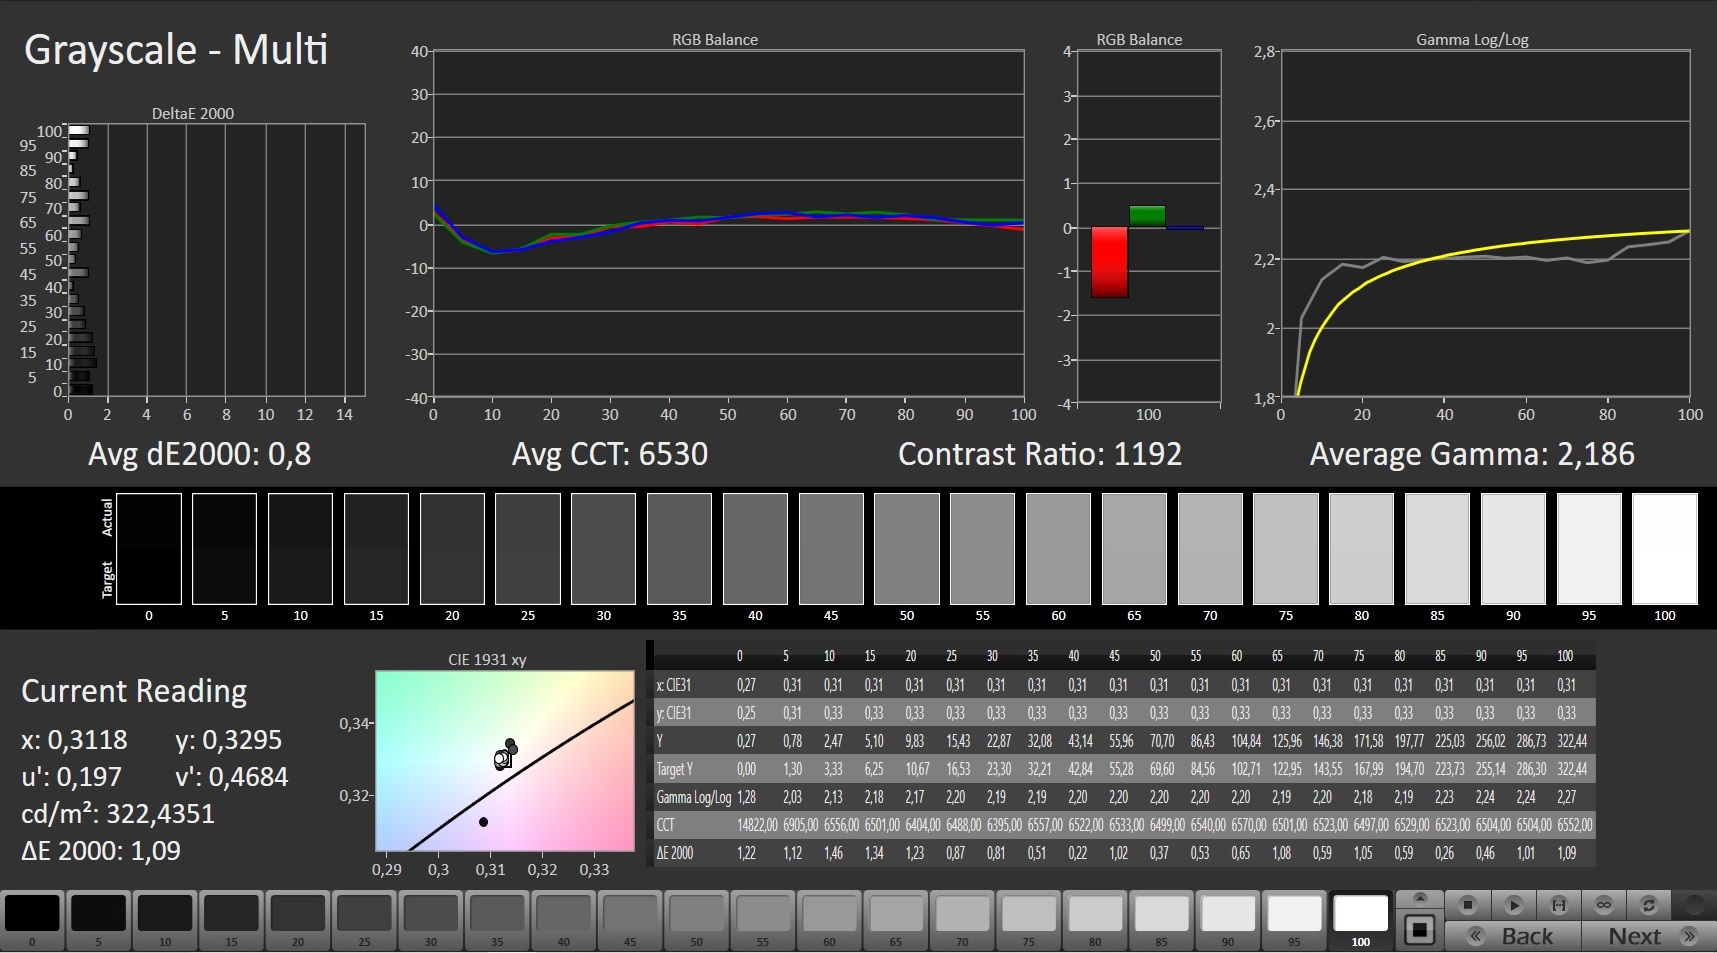
ΔE Greyscale Calman: 5.8 | ∀{0.09-98 Ø4.97}
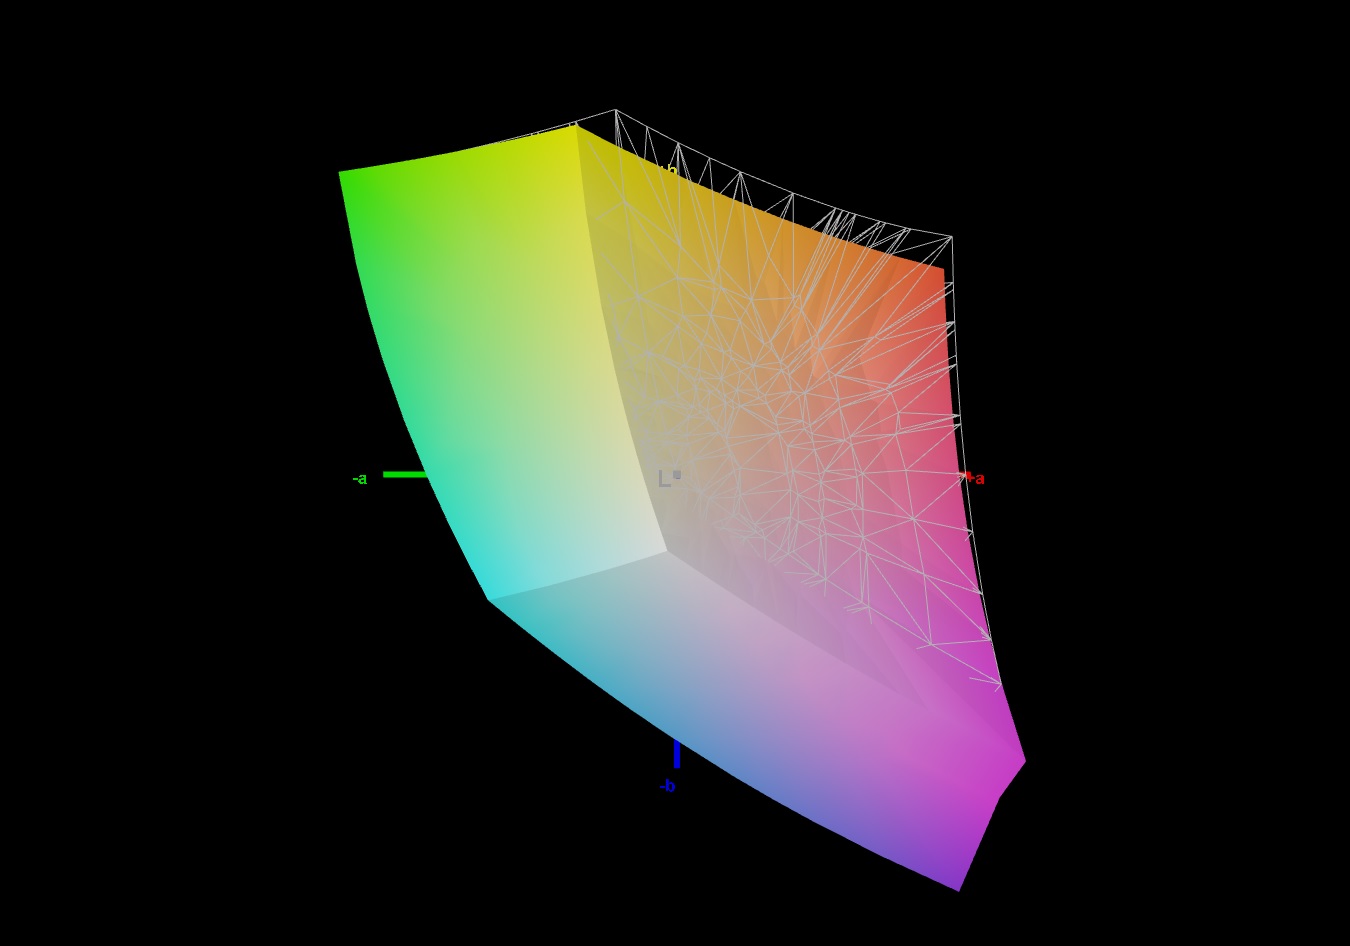
93% sRGB (Argyll 1.6.3 3D)
69% AdobeRGB 1998 (Argyll 1.6.3 3D)
69.3% AdobeRGB 1998 (Argyll 3D)
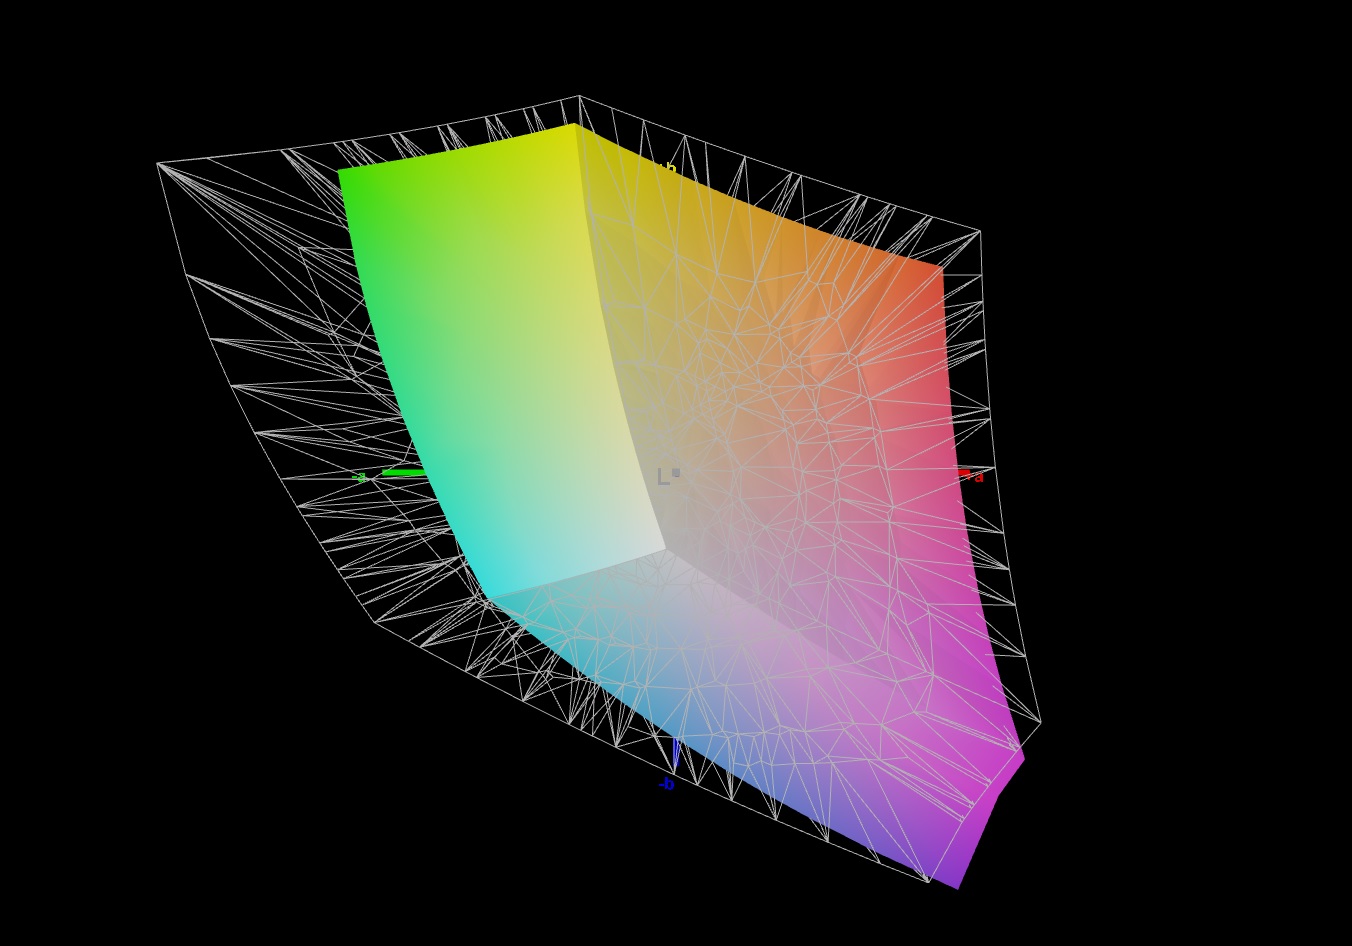
98.6% sRGB (Argyll 3D)
68.6% Display P3 (Argyll 3D)
Gamma: 2.311
CCT: 7087 K
| Schenker XMG Neo 15 Tiger Lake BOE CQ NE156QHM-NY2, IPS, 2560x1440, 15.6" | Aorus 15P YD BOE09B9, IPS, 1920x1080, 15.6" | Asus ROG Strix G15 G513QR LQ156M1JW25, IPS, 1920x1080, 15.6" | Schenker XMG Neo 15 Comet Lake IPS, 1920x1080, 15.6" | Alienware m15 R4 RTX 3080 LG Philips LGD066E (156WFG), IPS, 1920x1080, 15.6" | Razer Blade 15 Advanced Model Early 2021 TL156VDXP02-0, IPS, 1920x1080, 15.6" | |
|---|---|---|---|---|---|---|
| Display | 2% | -2% | 0% | 2% | -3% | |
| Display P3 Coverage (%) | 68.6 | 70.2 2% | 67.7 -1% | 69.5 1% 67.9 -1% | 70.1 2% | 65.9 -4% |
| sRGB Coverage (%) | 98.6 | 98.5 0% | 94.3 -4% | 99.2 1% 98.7 0% | 99.8 1% | 96.4 -2% |
| AdobeRGB 1998 Coverage (%) | 69.3 | 72.4 4% | 68.2 -2% | 70.7 2% 68.8 -1% | 71.5 3% | 68 -2% |
| Response Times | 16% | 36% | 9% | 36% | 7% | |
| Response Time Grey 50% / Grey 80% * (ms) | 16 ? | 14 ? 12% | 8.2 ? 49% | 15.2 ? 5% | 7.6 ? 52% | 16 ? -0% |
| Response Time Black / White * (ms) | 12 ? | 9.6 ? 20% | 9.2 ? 23% | 10.4 ? 13% | 9.6 ? 20% | 10.4 ? 13% |
| PWM Frequency (Hz) | 23580 ? | |||||
| Screen | -1% | 6% | 5% | 17% | 23% | |
| Brightness middle (cd/m²) | 324 | 337 4% | 308 -5% | 308 -5% | 347 7% | 338 4% |
| Brightness (cd/m²) | 307 | 316 3% | 288 -6% | 284 -7% | 318 4% | 334 9% |
| Brightness Distribution (%) | 91 | 85 -7% | 86 -5% | 87 -4% | 86 -5% | 94 3% |
| Black Level * (cd/m²) | 0.27 | 0.31 -15% | 0.23 15% | 0.32 -19% | 0.31 -15% | 0.24 11% |
| Contrast (:1) | 1200 | 1087 -9% | 1339 12% | 963 -20% | 1119 -7% | 1408 17% |
| Colorchecker dE 2000 * | 3.36 | 3.87 -15% | 3.28 2% | 2.45 27% | 1.68 50% | 1.39 59% |
| Colorchecker dE 2000 max. * | 9.87 | 8.09 18% | 8.51 14% | 7.74 22% | 3.03 69% | 3.31 66% |
| Colorchecker dE 2000 calibrated * | 1.23 | 1.15 7% | 0.83 33% | 0.83 33% | 1.08 12% | 0.97 21% |
| Greyscale dE 2000 * | 5.8 | 6.1 -5% | 5 14% | 3.9 33% | 1.8 69% | 1.6 72% |
| Gamma | 2.311 95% | 2.132 103% | 2.057 107% | 2.211 100% | 2.262 97% | 2.291 96% |
| CCT | 7087 92% | 6891 94% | 7393 88% | 7434 87% | 6592 99% | 6626 98% |
| Color Space (Percent of AdobeRGB 1998) (%) | 69 | 72 4% | 68 -1% | 69 0% | 71 3% | 68 -1% |
| Color Space (Percent of sRGB) (%) | 93 | 94 1% | 90 -3% | 91 -2% | 94 1% | 89 -4% |
| Total Average (Program / Settings) | 6% /
2% | 13% /
8% | 5% /
4% | 18% /
17% | 9% /
16% |
* ... smaller is better
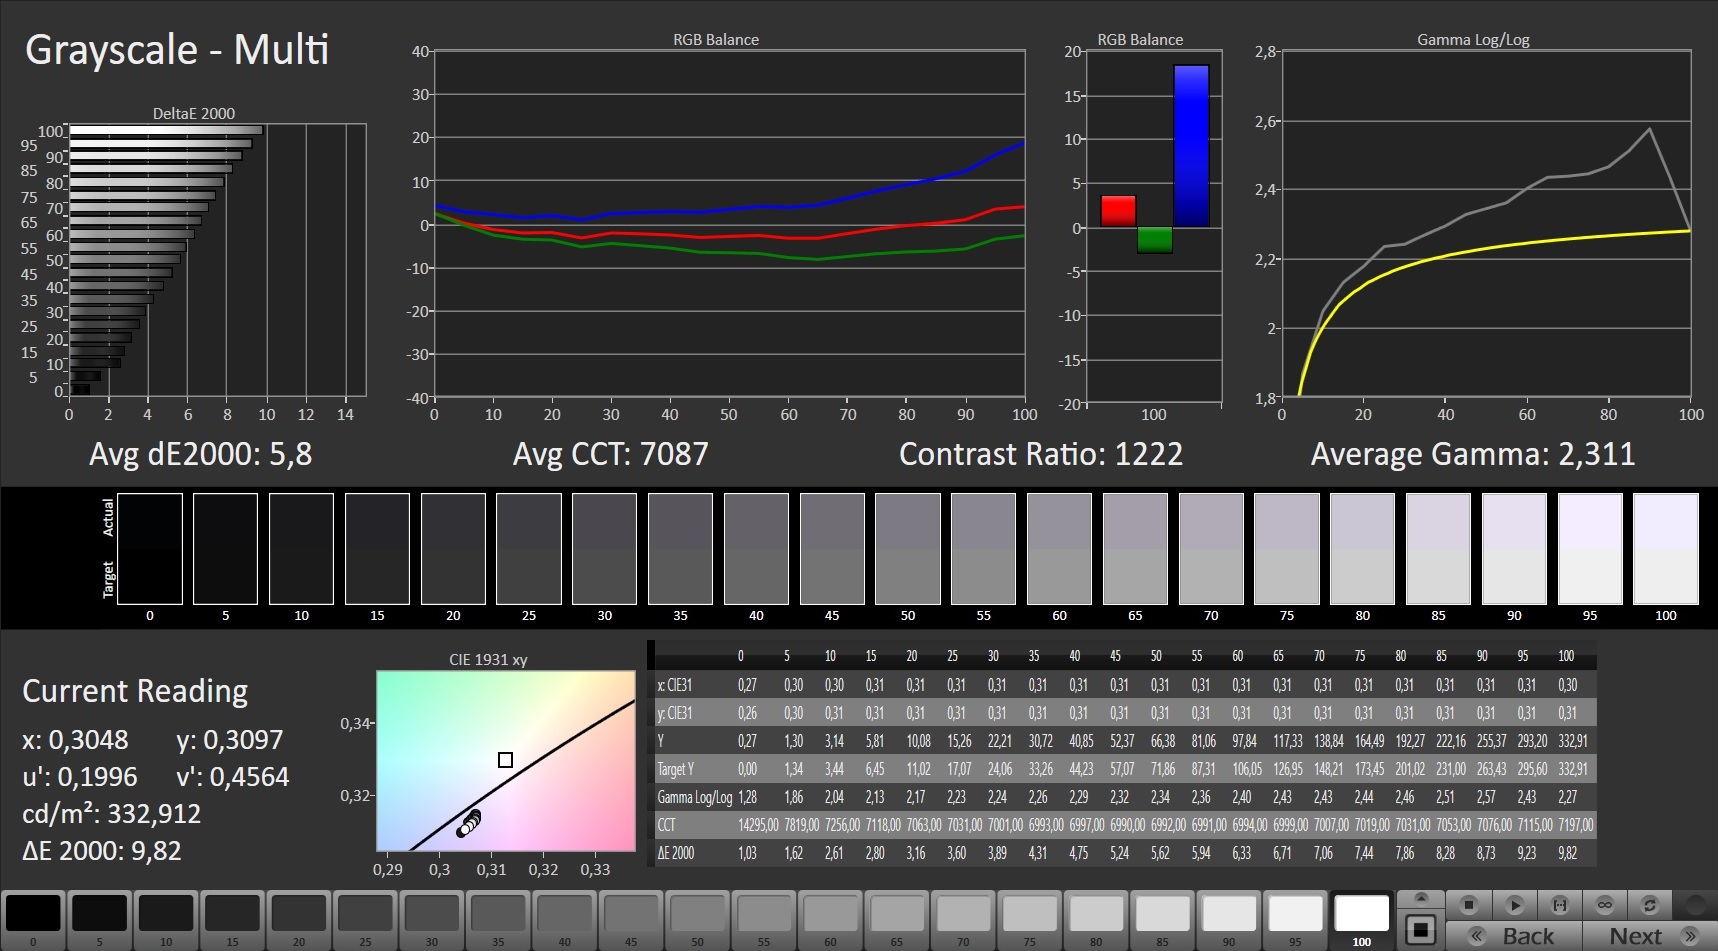
The black value of 0.27 is an average value in comparison, which earns the display a good contrast ratio of 1200:1. The Asus ROG Strix G15 and the Razer Blade 15 pro model have a small lead in this respect with 1,339:1 and 1,408:1, respectively. The color space coverage of 98.55% of the sRGB, 69.26% of the AdobeRGB, and 68.55% of the DCI-P3 color space is about the same as the competition. Thus, the display is not better suited for professional image editing than the Full HD screens of the rivals.
The display is relatively legible outdoors thanks to the matte IPS panel, but it is not bright enough to reliably compensate for reflections in direct sunlight.
Display Response Times
| ↔ Response Time Black to White | ||
|---|---|---|
| 12 ms ... rise ↗ and fall ↘ combined | ↗ 6 ms rise | 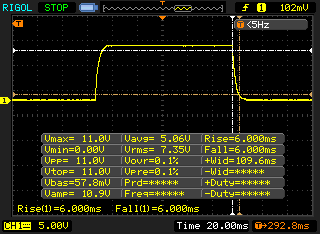 |
| ↘ 6 ms fall | ||
| The screen shows good response rates in our tests, but may be too slow for competitive gamers. In comparison, all tested devices range from 0.1 (minimum) to 240 (maximum) ms. » 31 % of all devices are better. This means that the measured response time is better than the average of all tested devices (19.9 ms). | ||
| ↔ Response Time 50% Grey to 80% Grey | ||
| 16 ms ... rise ↗ and fall ↘ combined | ↗ 8.4 ms rise | 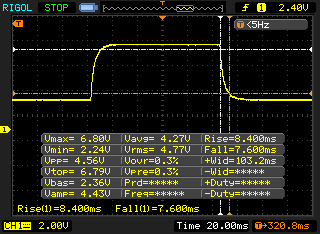 |
| ↘ 7.6 ms fall | ||
| The screen shows good response rates in our tests, but may be too slow for competitive gamers. In comparison, all tested devices range from 0.165 (minimum) to 636 (maximum) ms. » 30 % of all devices are better. This means that the measured response time is better than the average of all tested devices (31.1 ms). | ||
Screen Flickering / PWM (Pulse-Width Modulation)
| Screen flickering / PWM not detected | 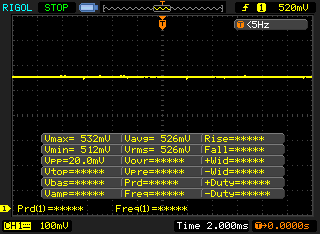 | ||
In comparison: 52 % of all tested devices do not use PWM to dim the display. If PWM was detected, an average of 7798 (minimum: 5 - maximum: 343500) Hz was measured. | |||
As expected, the viewing angles of the IPS panel are very good and even when viewing from very steep angles, the colors and perceived brightness are almost not distorted.
Performance - Tiger-Lake CPU with amazing performance
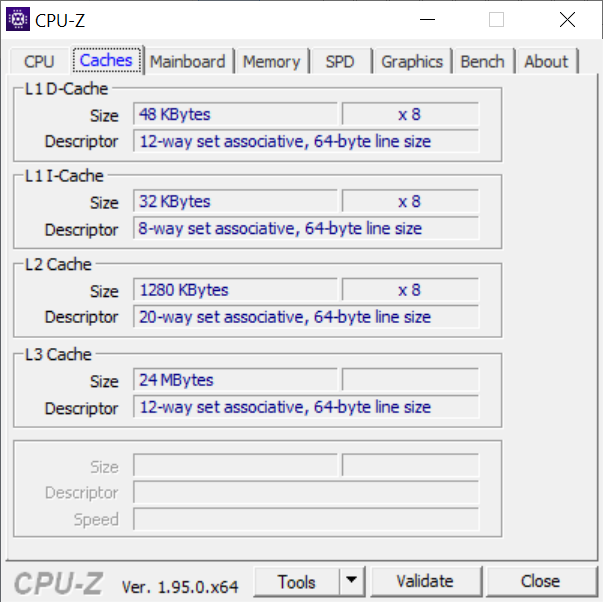
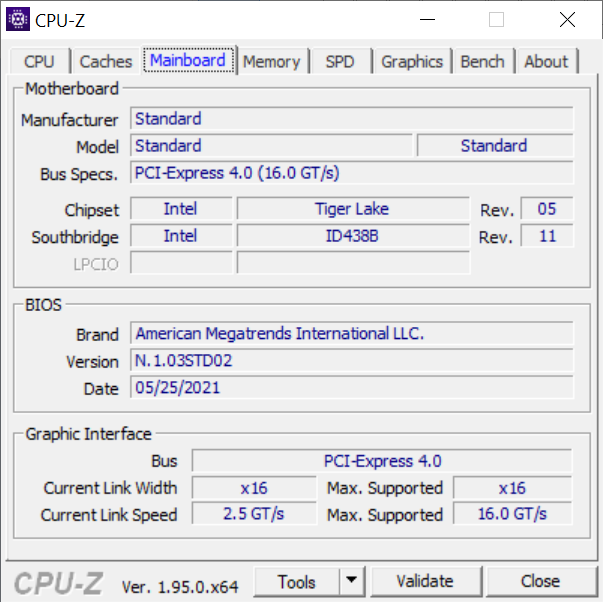
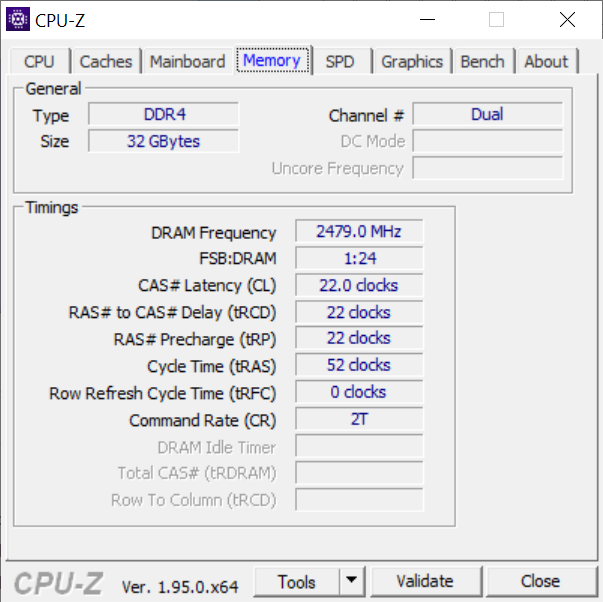
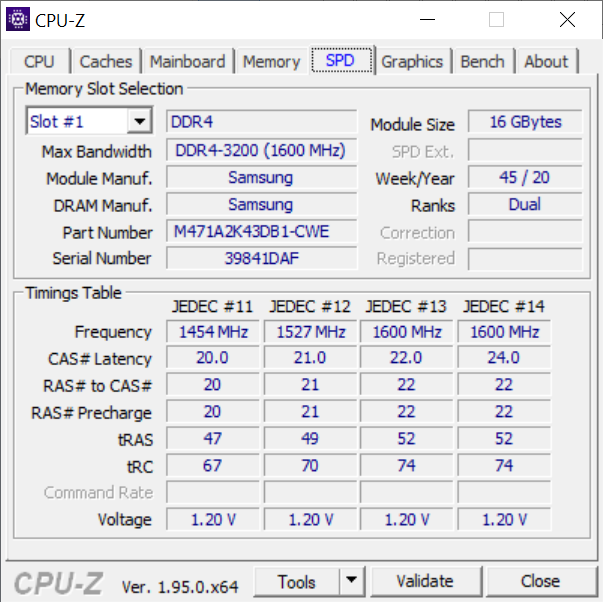
Our test device is the Intel version of the XMG Neo 15, which accordingly comes with an Intel Core i7-11800H. In addition, there are two DDR4 3200 MHz RAM modules with a capacity of up to 64 GB (here: 2x 16 GB), a mobile Nvidia GeForce RTX 3080 and a 1 TB NVMe SSD. While the Core-i7-11800H CPU is used in all configurations, we assume that other storage solutions for the two M.2-2280 PCIe slots (1x PCIe 3.0 x4, 1x PCIe 4.0 x4) will be available in the configurator later. Thus, the Schenker XMG Neo 15 is well equipped for demanding scenarios like gaming.
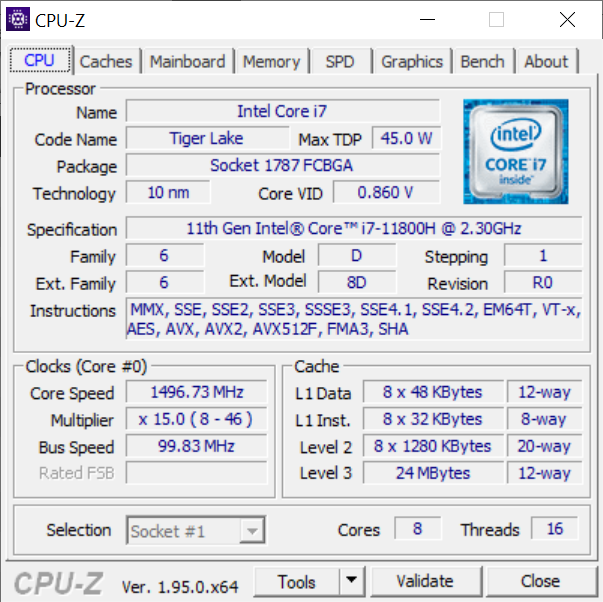
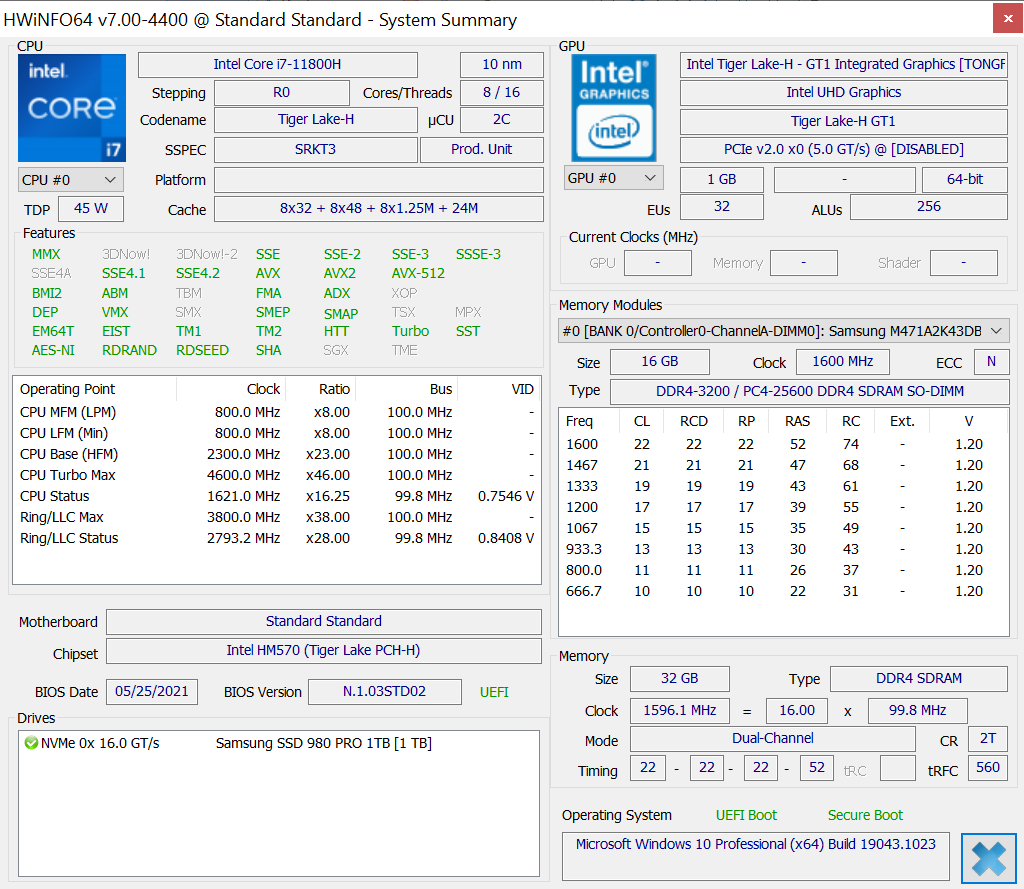
Processor
The manufacturer relies on the Intel Core i7-11800H, an 8-core CPU with 16 threads, whose power consumption can be freely set from 10-120 W via the pre-installed Control Center software. Since the Tiger Lake H CPU is manufactured in a 10 nm process, it is faster and more efficient than the processors from Intel's 10th processor generation. In the Cinebench R15 loop test, the CPU goes head-to-head with the AMD Ryzen 9 5900HX, which it can even win in the end with a narrow lead of about 5%. Although there are laptops that achieve slightly better results with the Ryzen 9 5900HX than the Asus ROG Strix G15, this is an impressive result, which shows that the Intel model can definitely stand up to the AMD competition. The XMG Neo 15 also achieves mostly top scores in the application benchmarks.
In battery mode, the CPU performance in the Cinebench R15 multi-thread test is on average about 50% lower than in mains operation.
* ... smaller is better
System performance
Our test device and the new Aorus 15P YD, which is equipped with the same Tiger Lake processor, also perform very well in the system performance benchmarks. On the other hand, the Alienware m15 R4 wins the PCMark Productivity Test. In practice, the work speed is very high and programs start almost immediately.
| PCMark 8 Home Score Accelerated v2 | 5640 points | |
| PCMark 8 Work Score Accelerated v2 | 6201 points | |
| PCMark 10 Score | 7190 points | |
Help | ||
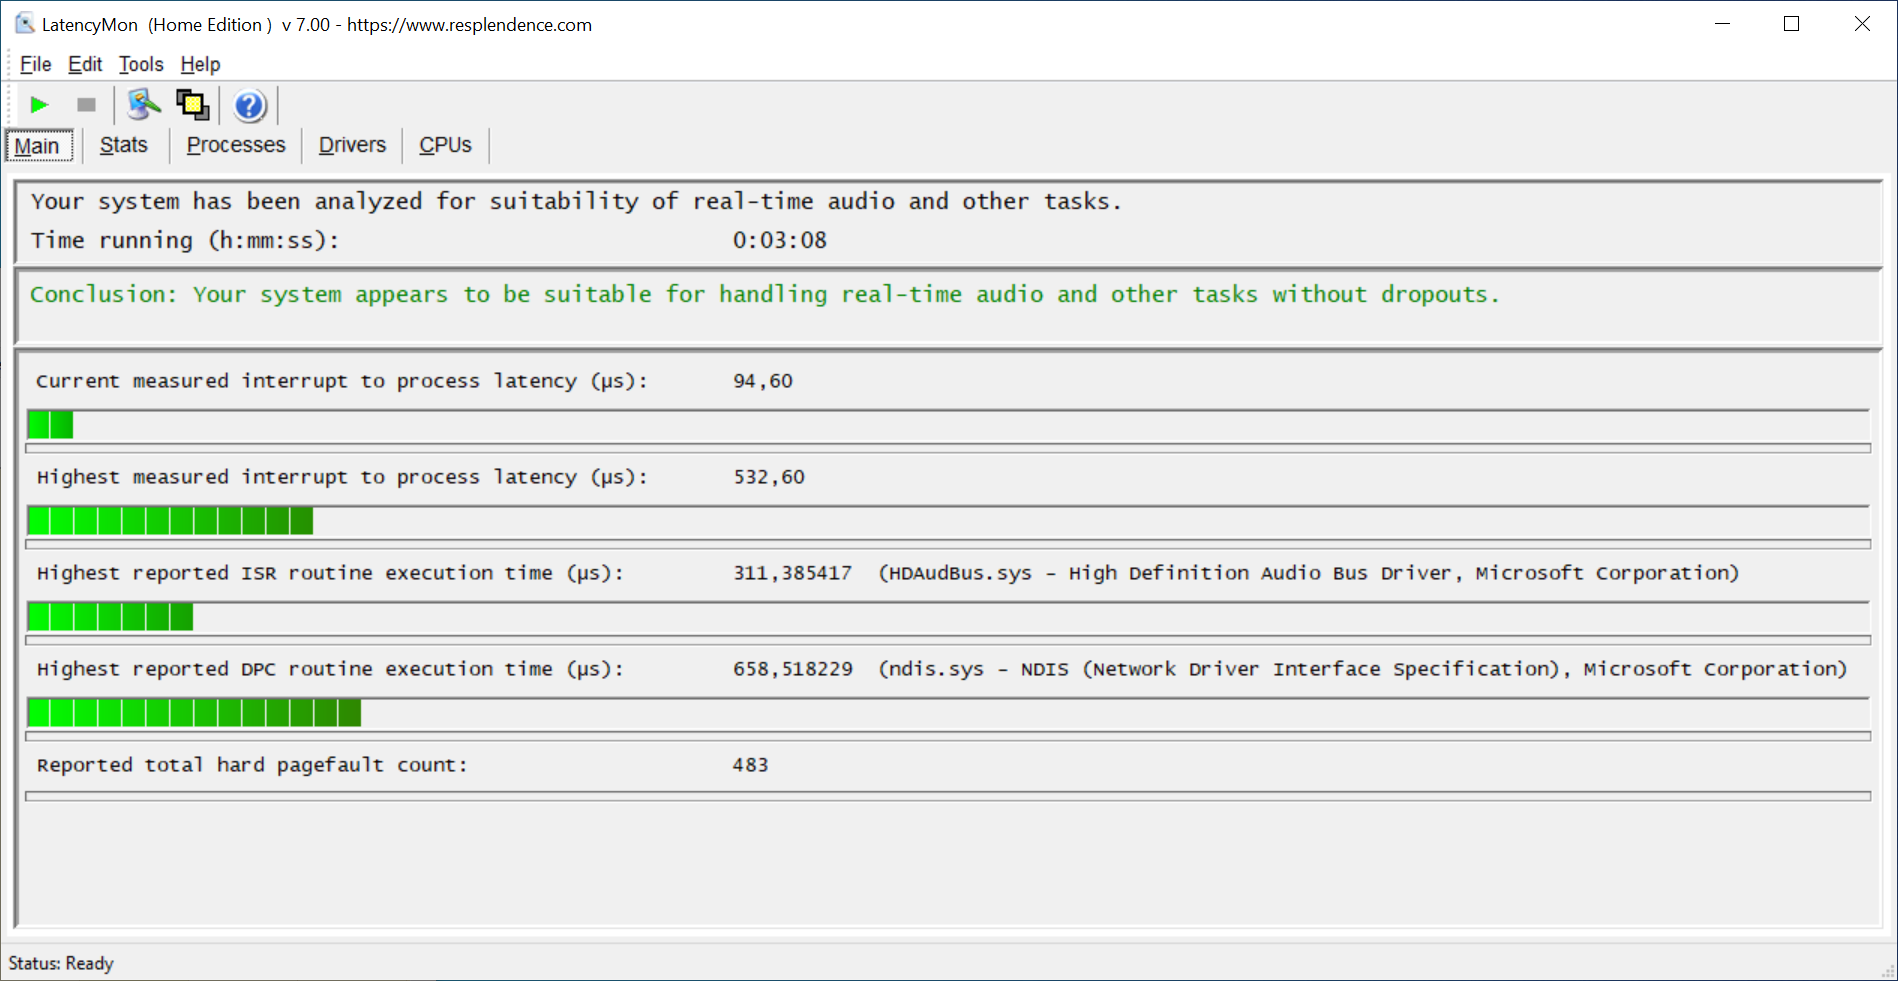
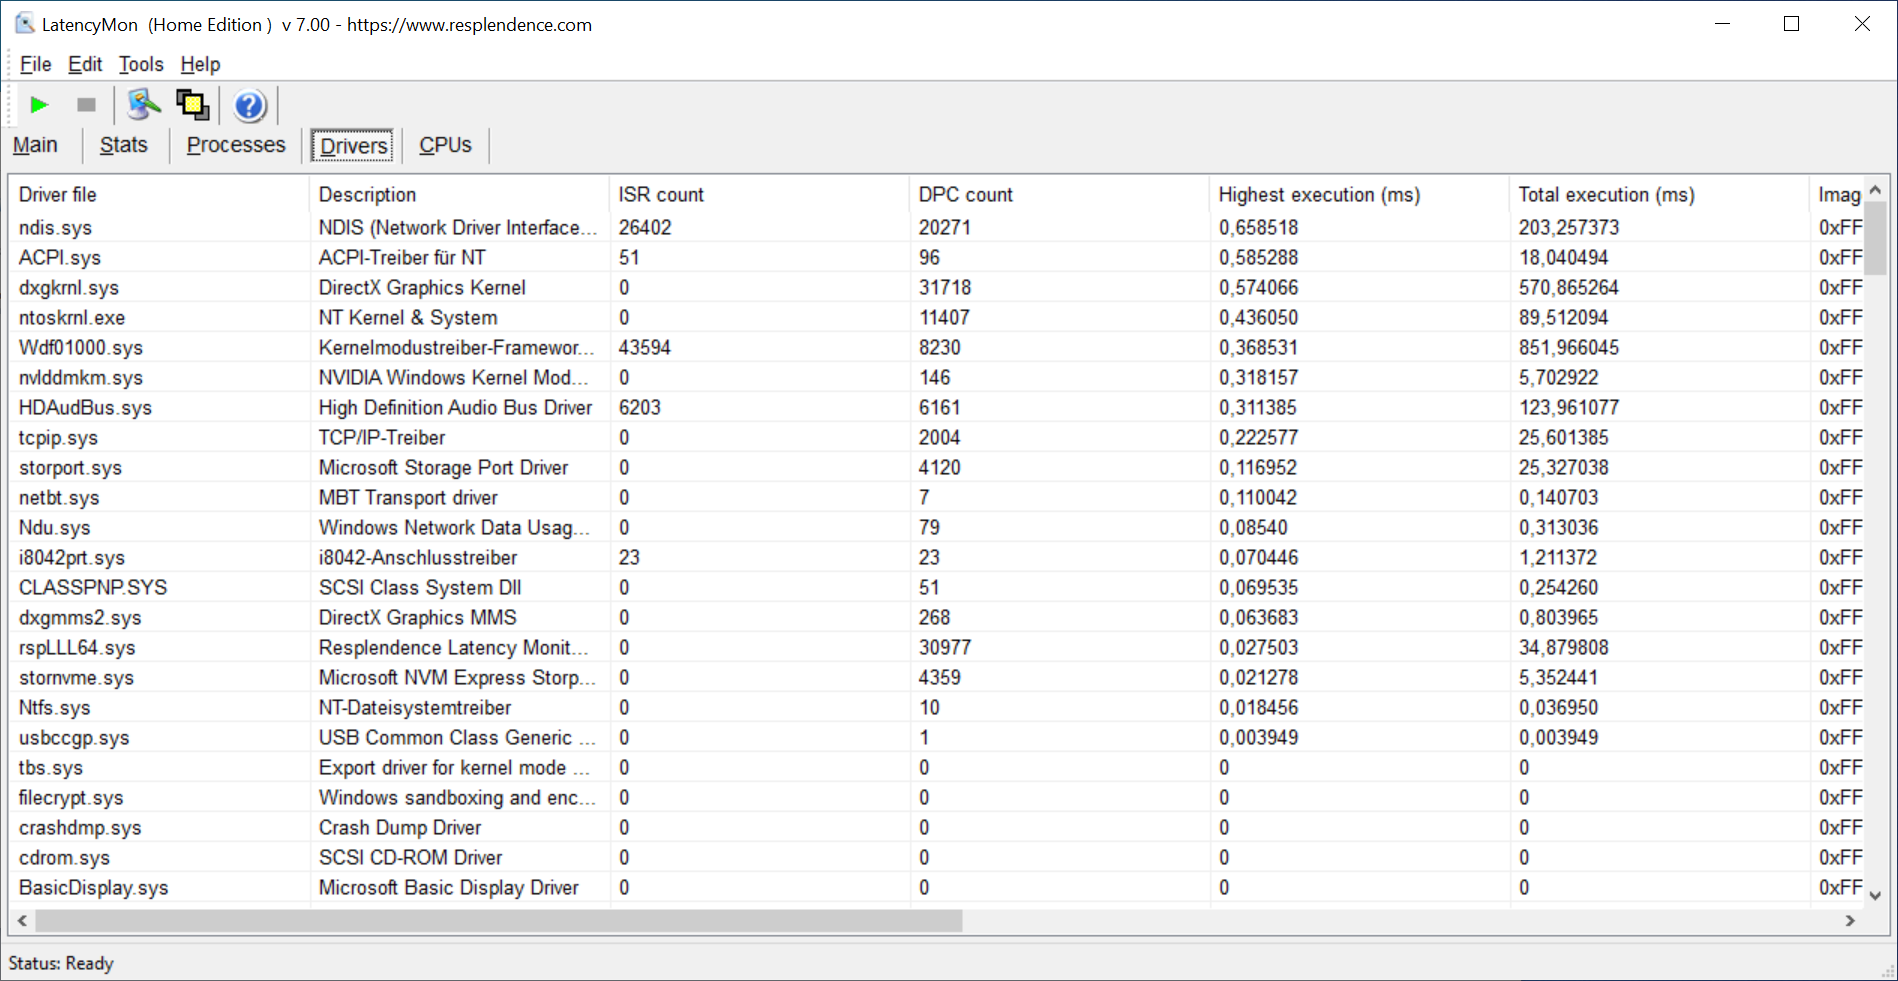
DPC latencies
Since LatencyMon measures low DPC latencies in our standardized test, the laptop should also be suitable for editing video and audio files in real time ex-works.
| DPC Latencies / LatencyMon - interrupt to process latency (max), Web, Youtube, Prime95 | |
| Aorus 15P YD | |
| Alienware m15 R4 RTX 3080 | |
| Schenker XMG Neo 15 Comet Lake | |
| Razer Blade 15 Advanced Model Early 2021 | |
| Schenker XMG Neo 15 Tiger Lake | |
| Asus ROG Strix G15 G513QR | |
* ... smaller is better
Mass storage
Our model uses the Samsung 980 Pro NVMe SSD as the system drive. This is a very powerful PCIe 4.0 drive that achieves excellent results overall in the test. Apart from the Samsung PM9A1 in the Aorus 15P YD, which also already uses PCIe 4.0, our test device beats all other comparison devices with a mostly clear lead. However, the transfer rates of the two other laptops we tested with the 1 TB version of the 980 Pro are on average about 15% higher.
More information and benchmark comparisons can be found in our Hard disk and SSD table.
| Schenker XMG Neo 15 Tiger Lake Samsung SSD 980 Pro 1TB MZ-V8P1T0BW | Aorus 15P YD Samsung PM9A1 MZVL21T0HCLR | Asus ROG Strix G15 G513QR SK Hynix HFM001TD3JX013N | Schenker XMG Neo 15 Comet Lake Samsung SSD 970 EVO Plus 1TB | Alienware m15 R4 RTX 3080 2x WDC PC SN730 SDBPNTY-512G (RAID 0) | Razer Blade 15 Advanced Model Early 2021 Samsung PM981a MZVLB1T0HBLR | Average Samsung SSD 980 Pro 1TB MZ-V8P1T0BW | |
|---|---|---|---|---|---|---|---|
| CrystalDiskMark 5.2 / 6 | 27% | -12% | -27% | -30% | 25% | ||
| Write 4K (MB/s) | 162.7 | 230.4 42% | 182.6 12% | 114.2 -30% | 138 -15% | 220 ? 35% | |
| Read 4K (MB/s) | 79 | 91.8 16% | 53.5 -32% | 43.77 -45% | 47.41 -40% | 85.1 ? 8% | |
| Write Seq (MB/s) | 2865 | 4301 50% | 3035 6% | 1922 -33% | 3911 ? 37% | ||
| Read Seq (MB/s) | 3411 | 4474 31% | 2520 -26% | 1673 -51% | 3999 ? 17% | ||
| Write 4K Q32T1 (MB/s) | 522 | 656 26% | 524 0% | 464.5 -11% | 445.5 -15% | 551 ? 6% | |
| Read 4K Q32T1 (MB/s) | 508 | 722 42% | 617 21% | 546 7% | 534 5% | 977 ? 92% | |
| Write Seq Q32T1 (MB/s) | 4765 | 5198 9% | 3316 -30% | 3233 -32% | 2976 -38% | 4932 ? 4% | |
| Read Seq Q32T1 (MB/s) | 7083 | 7065 0% | 3548 -50% | 3473 -51% | 3232 -54% | 6842 ? -3% | |
| Write 4K Q8T8 (MB/s) | 1375 | 1390 ? | |||||
| Read 4K Q8T8 (MB/s) | 1447 | 2134 ? | |||||
| AS SSD | 23% | -30% | -4% | -28% | -26% | 8% | |
| Seq Read (MB/s) | 4830 | 5376 11% | 2881 -40% | 2970 -39% | 2888 -40% | 2112 -56% | 4838 ? 0% |
| Seq Write (MB/s) | 2032 | 3669 81% | 1570 -23% | 2559 26% | 2786 37% | 2024 0% | 3490 ? 72% |
| 4K Read (MB/s) | 62.3 | 56.5 -9% | 52.4 -16% | 56.6 -9% | 41.98 -33% | 46.53 -25% | 72 ? 16% |
| 4K Write (MB/s) | 146.4 | 157.7 8% | 124 -15% | 145 -1% | 108 -26% | 89.7 -39% | 188.8 ? 29% |
| 4K-64 Read (MB/s) | 1305 | 2720 108% | 1334 2% | 1938 49% | 1396 7% | 1747 34% | 2234 ? 71% |
| 4K-64 Write (MB/s) | 3708 | 3366 -9% | 2189 -41% | 2307 -38% | 1234 -67% | 1962 -47% | 2622 ? -29% |
| Access Time Read * (ms) | 0.029 | 0.04 -38% | 0.055 -90% | 0.035 -21% | 0.056 -93% | 0.052 -79% | 0.04075 ? -41% |
| Access Time Write * (ms) | 0.027 | 0.027 -0% | 0.03 -11% | 0.025 7% | 0.035 -30% | 0.04 -48% | 0.03363 ? -25% |
| Score Read (Points) | 1850 | 3314 79% | 1675 -9% | 2291 24% | 1727 -7% | 2004 8% | 2811 ? 52% |
| Score Write (Points) | 4058 | 3890 -4% | 2470 -39% | 2708 -33% | 1621 -60% | 2254 -44% | 3159 ? -22% |
| Score Total (Points) | 6724 | 8804 31% | 4943 -26% | 6152 -9% | 4227 -37% | 5280 -21% | 7334 ? 9% |
| Copy ISO MB/s (MB/s) | 1709 | 1277 -25% | 1868 9% | 2128 25% | 2688 ? 57% | ||
| Copy Program MB/s (MB/s) | 1250 | 575 -54% | 812 -35% | 707 -43% | 568 ? -55% | ||
| Copy Game MB/s (MB/s) | 1909 | 1272 -33% | 1596 -16% | 1471 -23% | 1346 ? -29% | ||
| Total Average (Program / Settings) | 25% /
25% | -30% /
-30% | -8% /
-8% | -28% /
-28% | -28% /
-27% | 17% /
14% |
* ... smaller is better

Continuous reading: DiskSpd Read Loop, Queue Depth 8
Graphics card
The Schenker XMG Neo 15 comes with the mobile Nvidia GeForce RTX 3080 with 16 GB of video memory. Its TDP can be set to 120-165 watts via the Control Center software. Alternatively, the Neo 15 can also be configured with an RTX 3060 (130 W) or an RTX 3070 (140 W). The RTX 3080 shows off its enormous performance with numerous top scores in our review unit and only does not take first place in the older Cloud Gate benchmark. The advantage probably partly stems from the directly adjustable TDP of the GPU, but it also shows that the cooling solution is up to the task. The graphics performance is severely limited in battery mode and the manual consumption settings are not available then, either.
| 3DMark 11 Performance | 32208 points | |
| 3DMark Cloud Gate Standard Score | 48208 points | |
| 3DMark Fire Strike Score | 24691 points | |
| 3DMark Time Spy Score | 11735 points | |
Help | ||
Gaming performance
Analogous to the synthetic performance, the gaming performance is also extremely high. Nevertheless, the Alienware m15 R4 still manages to outperform our test device on some graphics settings. Overall, the GPU performance is high enough to smoothly render even the latest games in the native WQHD resolution with high or maximum details. The mobile RTX 3080 does not seem to be significantly limited in its performance by the 15-inch format and unfolds its performance in practice without any problems.
Looking at the Witcher 3 frame rate history reveals an interesting parallel to that of the Neo 15 Comet Lake: Both Schenker laptops show a very constant frame rate history that is not characterized by small drops like many competitors. Presumably, there is little to no background activity here and certain automatic energy-saving measures are overridden by the manual performance profile.
| low | med. | high | ultra | QHD | |
|---|---|---|---|---|---|
| GTA V (2015) | 186 | 180 | 172 | 109 | |
| The Witcher 3 (2015) | 427 | 311 | 198 | 108 | |
| Dota 2 Reborn (2015) | 182 | 165 | 154 | 146 | |
| Final Fantasy XV Benchmark (2018) | 196 | 139 | 105 | 80.6 | |
| X-Plane 11.11 (2018) | 117 | 104 | 82.8 | ||
| Far Cry 5 (2018) | 170 | 132 | 127 | 120 | 107 |
| Strange Brigade (2018) | 480 | 268 | 221 | 197 | |
| Cyberpunk 2077 1.0 (2020) | 139 | 99.9 | 84.4 | 73.6 | 49.7 |
Emissions - Fan confronted with a lot of waste heat
Noise emissions
When idling and in everyday use, the laptop remains quite quiet and the fans are barely audible. However, this changes drastically under load, as the fans then become relatively loud. Therefore, it is advisable to use headphones in gaming mode to cover up the background noise. Although the fans are far from whistling, the fan noise cannot necessarily be described as a subtle, deep hiss either. However, such a compact and yet powerful laptop is inevitably accompanied by a certain noise level. Unfortunately, clearly audible coil whine also occurs in games in our test device.
Noise level
| Idle |
| 27 / 30 / 32 dB(A) |
| Load |
| 46 / 55 dB(A) |
 | ||
30 dB silent 40 dB(A) audible 50 dB(A) loud |
||
min: | ||
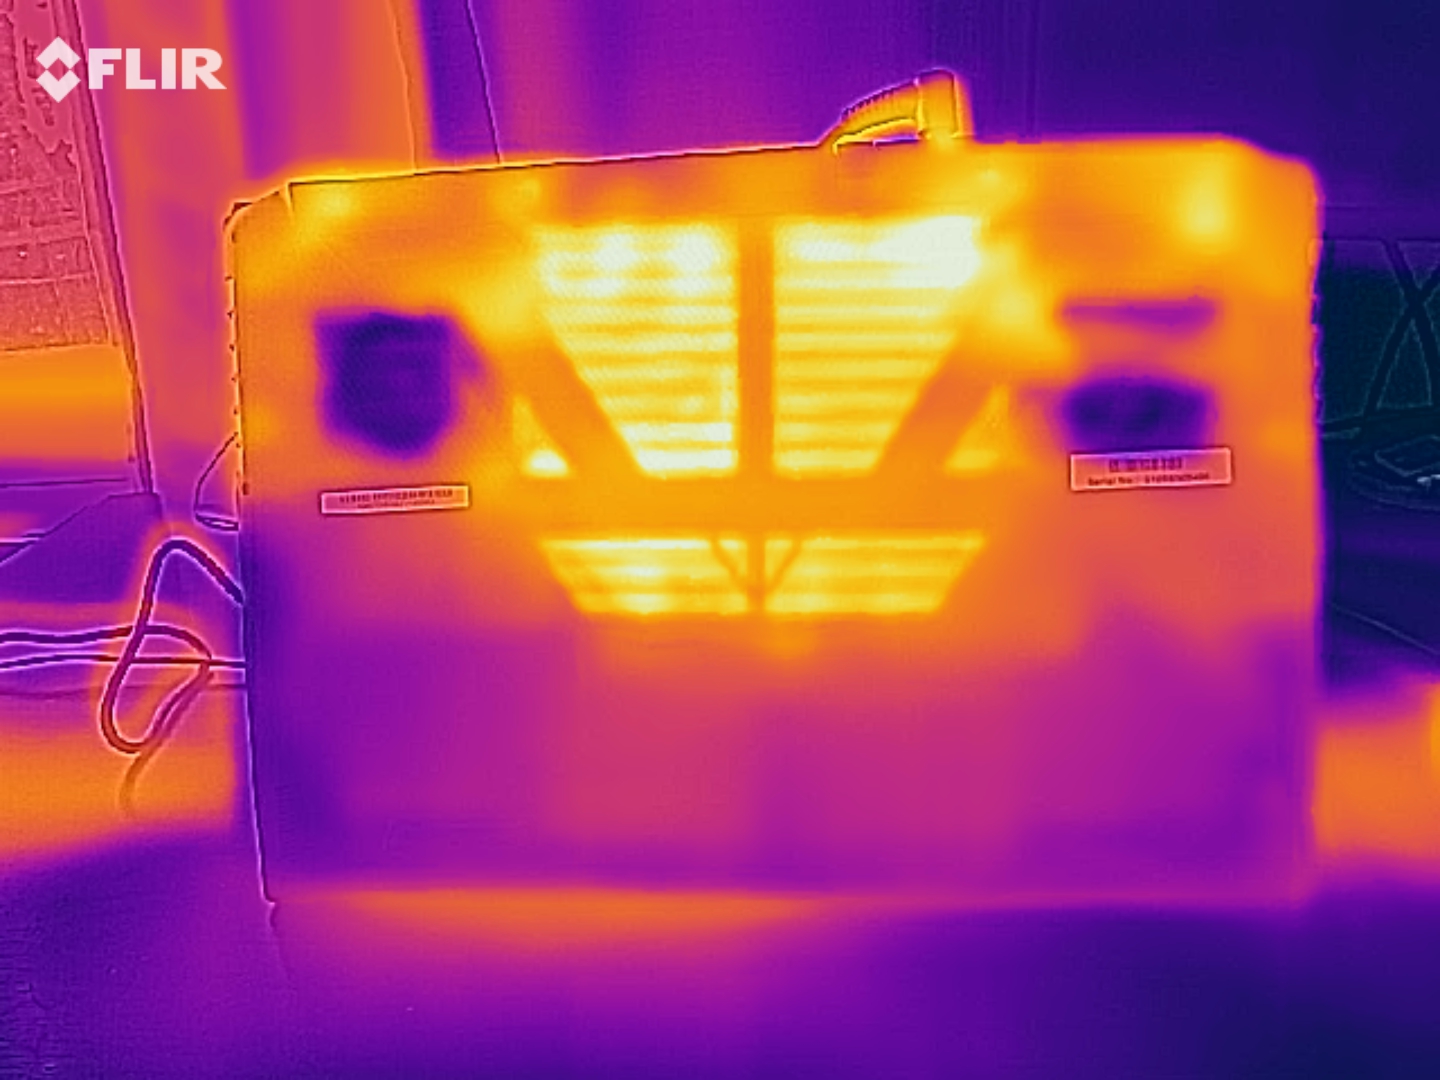
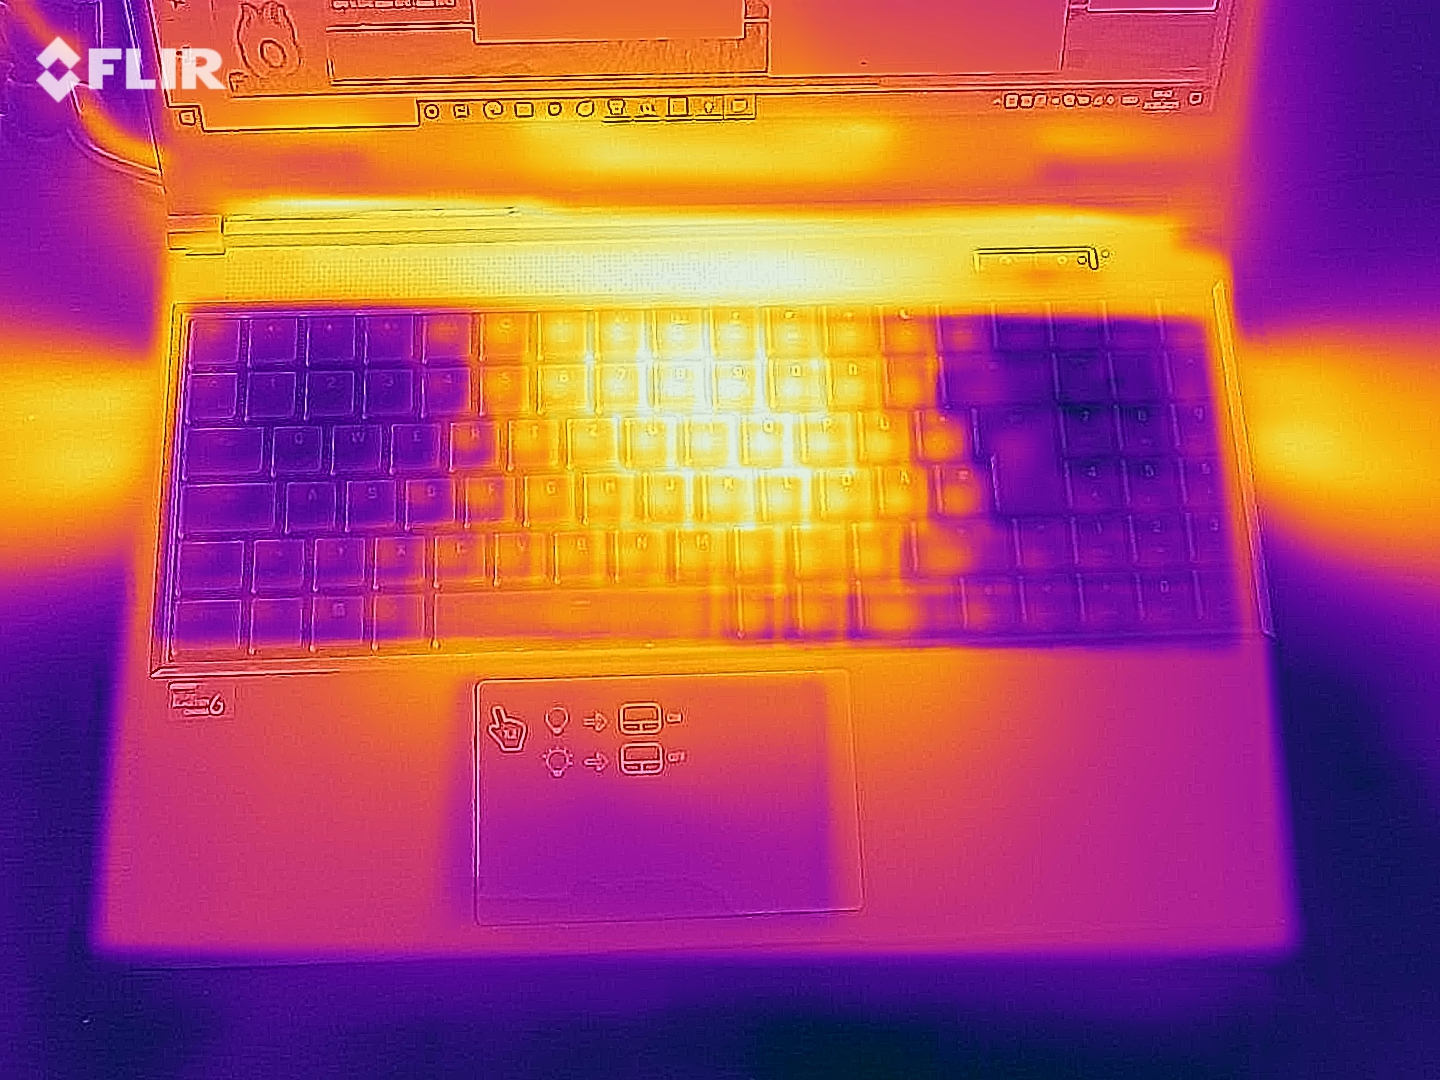
Temperature
The Schenker XMG Neo 15 stays relatively cool in idle, but the airflow at the vents is still warm to the touch. In the stress test, it gets very warm with a maximum of 50 °C (122 °F) on the bottom, but the top stays relatively cool with a maximum of 39 °C (102.2 °F). These peak temperatures increase by 2 °C (3.6 °F) each when playing The Witcher 3. The palm rests also stay relatively cool with a maximum of 33 °C (91.4 °F).
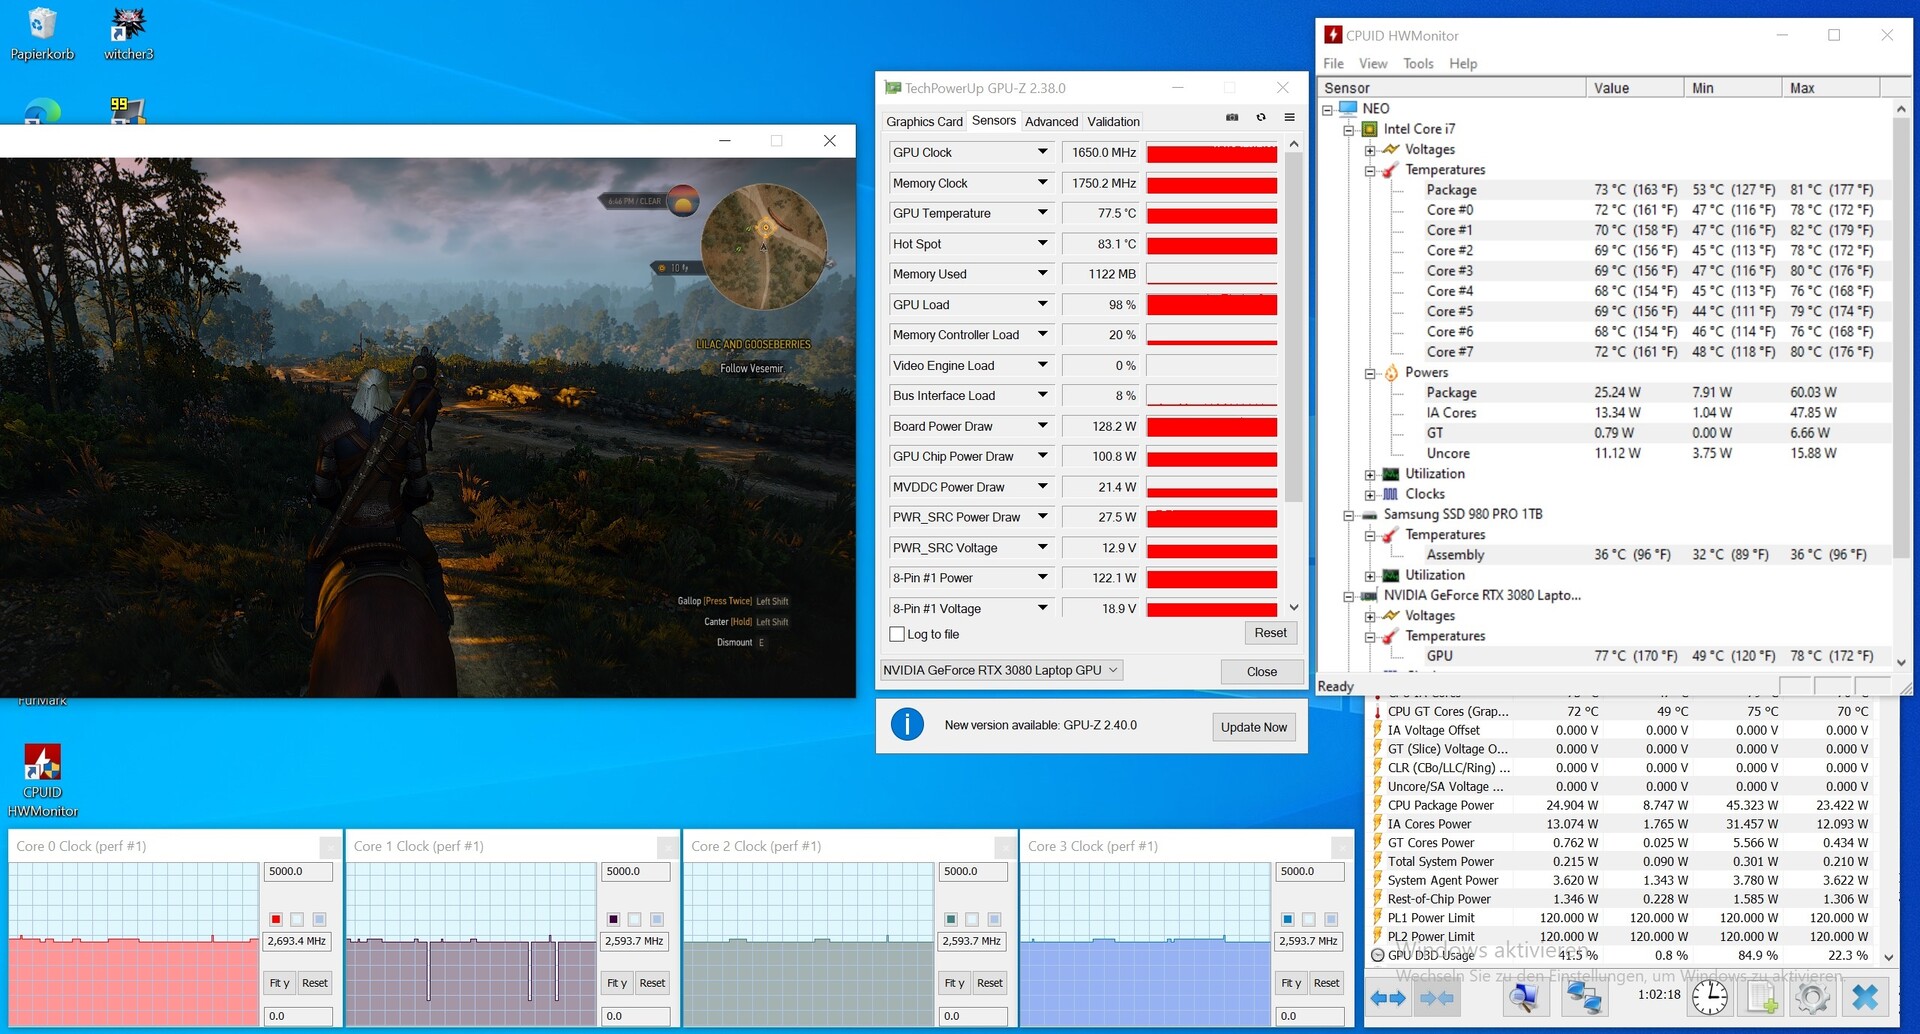
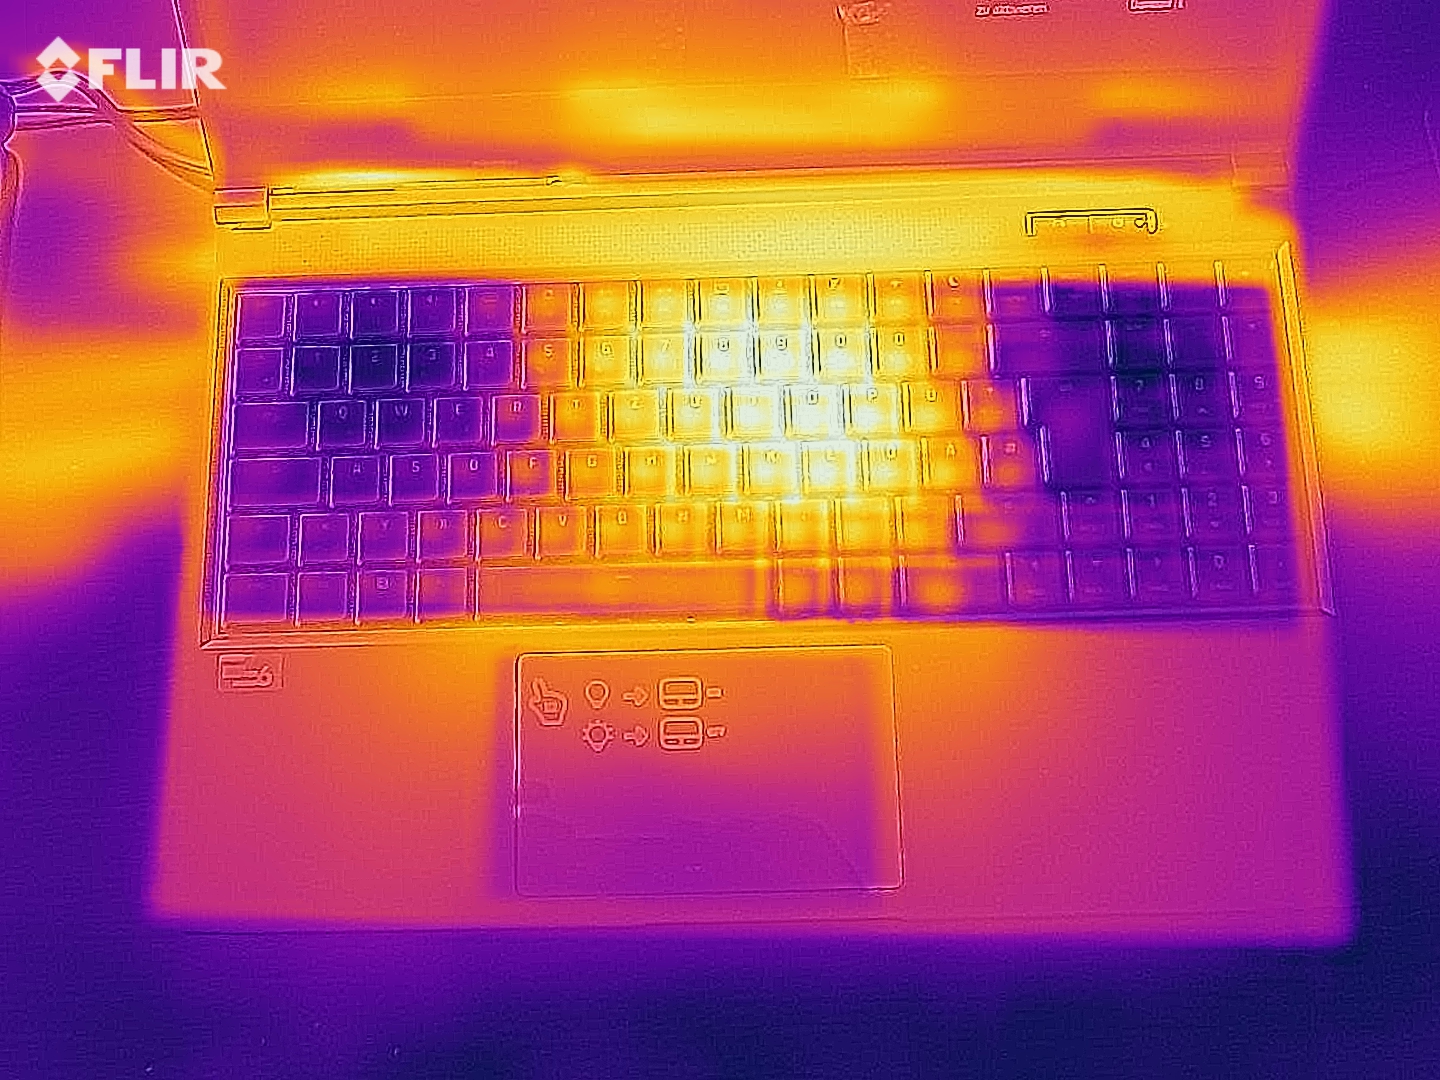
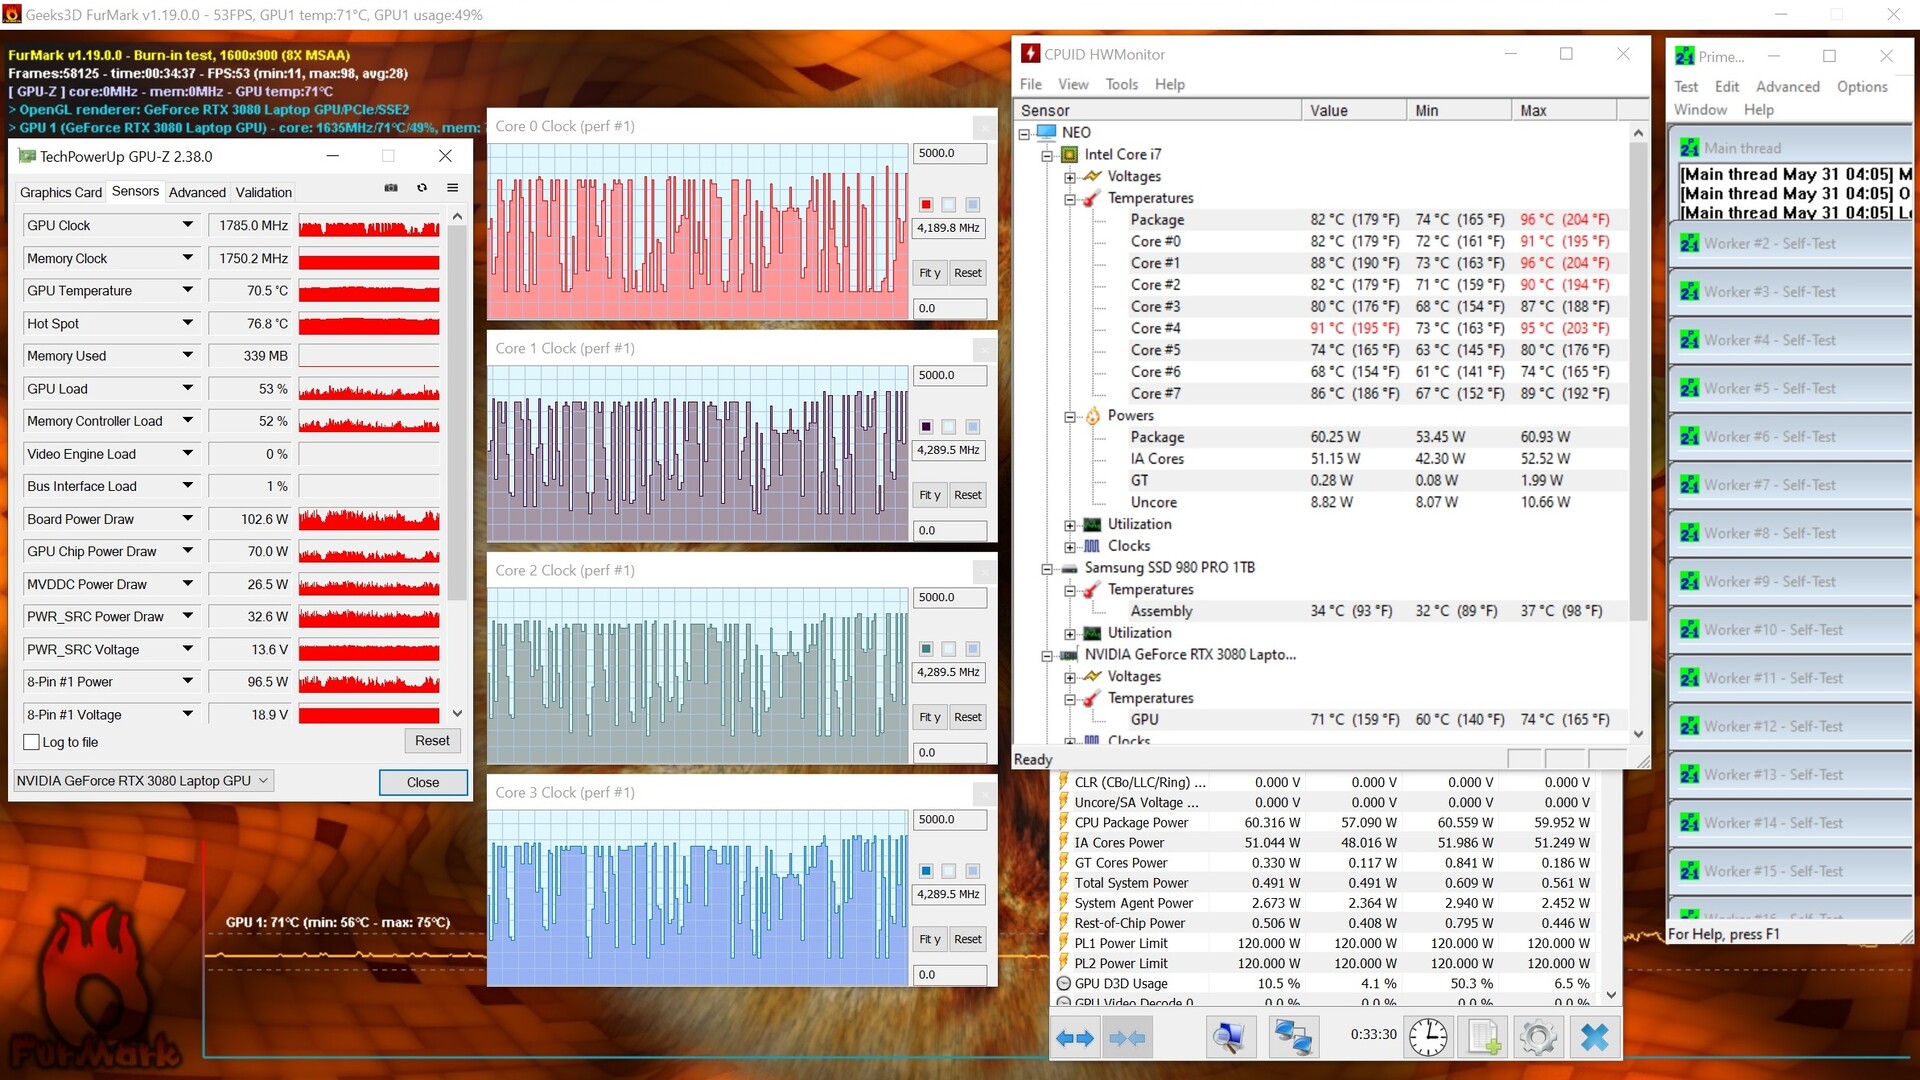
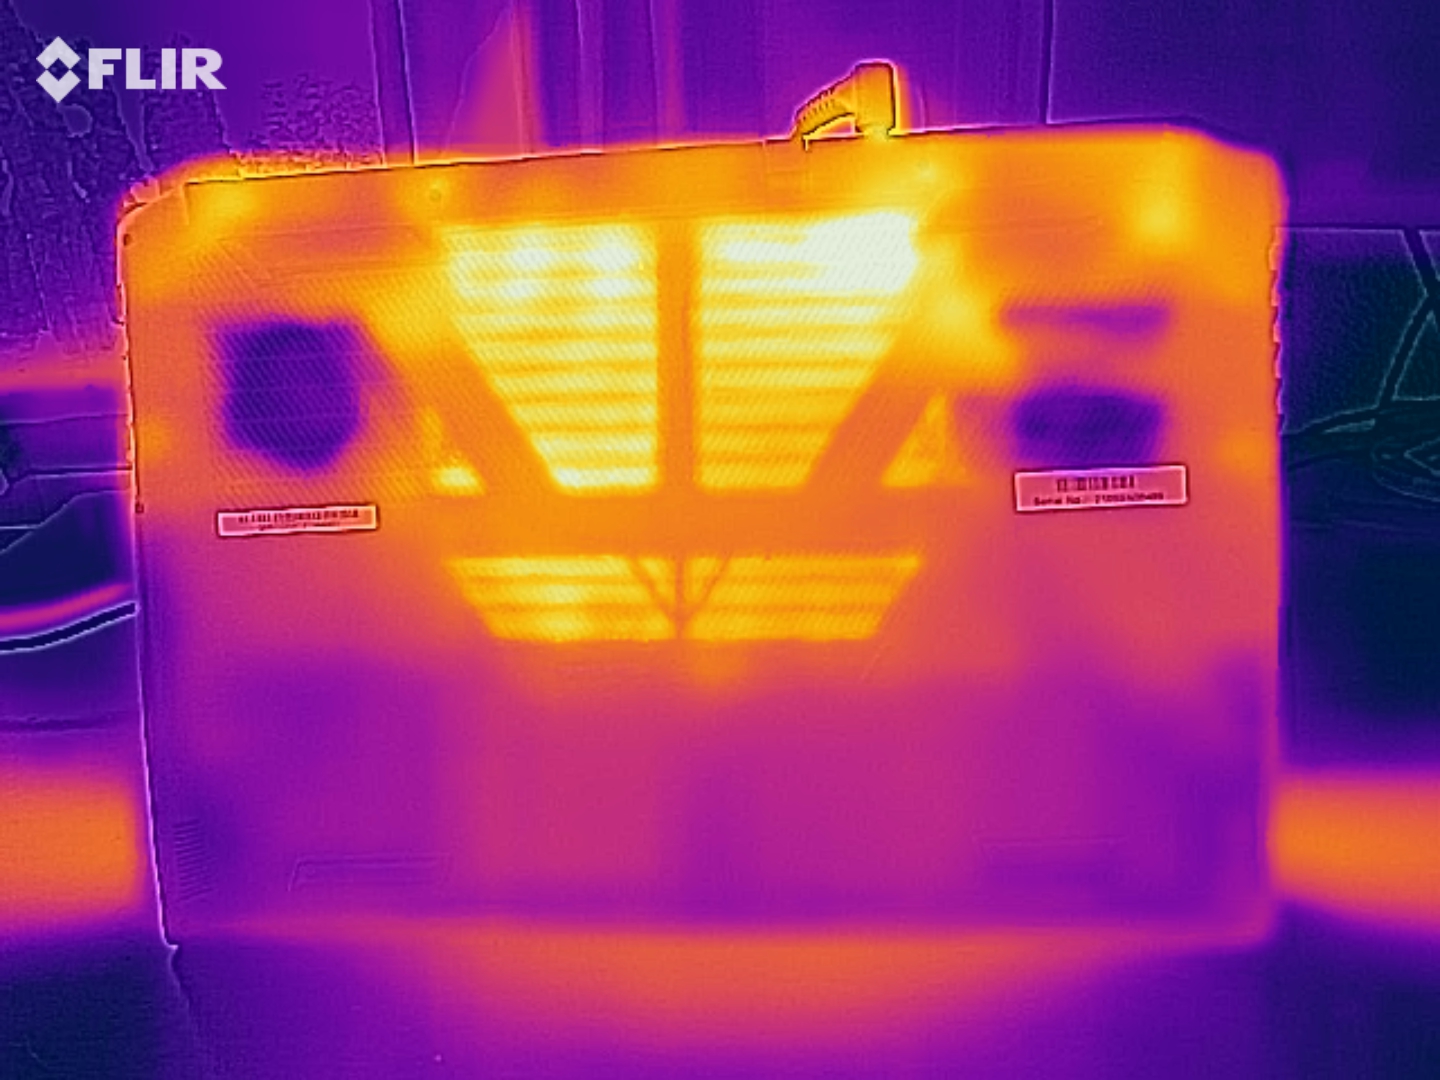
In the stress test, the CPU and GPU clocks are around 4.3 GHz with large drops and 1,785 MHz with smaller dips, respectively, after more than half an hour, as can be seen in the screenshot.
(+) The maximum temperature on the upper side is 39 °C / 102 F, compared to the average of 40.4 °C / 105 F, ranging from 21.2 to 68.8 °C for the class Gaming.
(-) The bottom heats up to a maximum of 50 °C / 122 F, compared to the average of 43.2 °C / 110 F
(±) In idle usage, the average temperature for the upper side is 32 °C / 90 F, compared to the device average of 33.9 °C / 93 F.
(±) Playing The Witcher 3, the average temperature for the upper side is 35.6 °C / 96 F, compared to the device average of 33.9 °C / 93 F.
(+) The palmrests and touchpad are reaching skin temperature as a maximum (33 °C / 91.4 F) and are therefore not hot.
(-) The average temperature of the palmrest area of similar devices was 28.8 °C / 83.8 F (-4.2 °C / -7.6 F).
Speaker
There are no big surprises in the speakers. Bass is lacking and the overall sound leaves much to be desired. The quality is sufficient for calls via VoIP programs. Fortunately, external audio devices can be connected via the Bluetooth or USB jack.
Schenker XMG Neo 15 Tiger Lake audio analysis
(±) | speaker loudness is average but good (79 dB)
Bass 100 - 315 Hz
(-) | nearly no bass - on average 22.6% lower than median
(±) | linearity of bass is average (9.5% delta to prev. frequency)
Mids 400 - 2000 Hz
(+) | balanced mids - only 4.7% away from median
(±) | linearity of mids is average (9.1% delta to prev. frequency)
Highs 2 - 16 kHz
(+) | balanced highs - only 4.1% away from median
(+) | highs are linear (5.3% delta to prev. frequency)
Overall 100 - 16.000 Hz
(±) | linearity of overall sound is average (19.4% difference to median)
Compared to same class
» 67% of all tested devices in this class were better, 7% similar, 26% worse
» The best had a delta of 6%, average was 18%, worst was 132%
Compared to all devices tested
» 48% of all tested devices were better, 7% similar, 45% worse
» The best had a delta of 4%, average was 24%, worst was 134%
Aorus 15P YD audio analysis
(+) | speakers can play relatively loud (85 dB)
Bass 100 - 315 Hz
(-) | nearly no bass - on average 23.5% lower than median
(±) | linearity of bass is average (12.8% delta to prev. frequency)
Mids 400 - 2000 Hz
(±) | higher mids - on average 6.2% higher than median
(+) | mids are linear (4% delta to prev. frequency)
Highs 2 - 16 kHz
(+) | balanced highs - only 1.9% away from median
(+) | highs are linear (4.6% delta to prev. frequency)
Overall 100 - 16.000 Hz
(±) | linearity of overall sound is average (17.1% difference to median)
Compared to same class
» 46% of all tested devices in this class were better, 12% similar, 43% worse
» The best had a delta of 6%, average was 18%, worst was 132%
Compared to all devices tested
» 31% of all tested devices were better, 8% similar, 61% worse
» The best had a delta of 4%, average was 24%, worst was 134%
Power management - Gaming laptop runtimes
Energy consumption
An average of 17 watts is consumed while idling on the desktop. This does not make the Neo 15 one of the most energy-efficient laptops, but it is still very low compared to the average 40 watts of the Alienware m15 R4. This is especially true considering the comparatively high resolution of our test device. At its peak, the consumption is 230 watts, which is exactly the rated power of the included power adapter.
| Off / Standby | |
| Idle | |
| Load |
|
Key:
min: | |
| Schenker XMG Neo 15 Tiger Lake i7-11800H, GeForce RTX 3080 Laptop GPU | Aorus 15P YD i7-11800H, GeForce RTX 3080 Laptop GPU | Asus ROG Strix G15 G513QR R9 5900HX, GeForce RTX 3070 Laptop GPU | Schenker XMG Neo 15 Comet Lake i7-10875H, GeForce RTX 2070 Super Mobile | Alienware m15 R4 RTX 3080 i9-10980HK, GeForce RTX 3080 Laptop GPU | Razer Blade 15 Advanced Model Early 2021 i7-10875H, GeForce RTX 3080 Laptop GPU | Average of class Gaming | |
|---|---|---|---|---|---|---|---|
| Power Consumption | -30% | 7% | -13% | -75% | 15% | -6% | |
| Idle Minimum * (Watt) | 15 | 23 -53% | 4 73% | 17 -13% | 37 -147% | 13 13% | 13.3 ? 11% |
| Idle Average * (Watt) | 17 | 25 -47% | 9 47% | 19 -12% | 40 -135% | 15 12% | 19 ? -12% |
| Idle Maximum * (Watt) | 22 | 35 -59% | 36 -64% | 29 -32% | 53 -141% | 22 -0% | 24.5 ? -11% |
| Load Average * (Watt) | 101 | 101 -0% | 130 -29% | 120 -19% | 121 -20% | 98 3% | 108.1 ? -7% |
| Witcher 3 ultra * (Watt) | 195 | 190 3% | 174 11% | 186 5% | 193 1% | 126 35% | |
| Load Maximum * (Watt) | 230 | 280 -22% | 227 1% | 250 -9% | 246 -7% | 165 28% | 254 ? -10% |
* ... smaller is better
Battery life
In our real-world WLAN test (150 cd/m², web browsing script), the Neo 15 achieves a relatively low runtime of 5:38 hours. The predecessor lasts almost 2 hours longer in this test. The Razer Blade 15 pro model also scores better here, whereas the 5:36 h achieved in the video test (Big Buck Bunny h264, 150 cd/m², energy-saving mode) is a slightly worse result than the 5:52 h of our test device. In the load test, the latter takes first place with a runtime of 2:41 h. The battery capacity of 93 Wh is relatively large.
| Schenker XMG Neo 15 Tiger Lake i7-11800H, GeForce RTX 3080 Laptop GPU, 93 Wh | Aorus 15P YD i7-11800H, GeForce RTX 3080 Laptop GPU, 99 Wh | Asus ROG Strix G15 G513QR R9 5900HX, GeForce RTX 3070 Laptop GPU, 90 Wh | Schenker XMG Neo 15 Comet Lake i7-10875H, GeForce RTX 2070 Super Mobile, 93 Wh | Alienware m15 R4 RTX 3080 i9-10980HK, GeForce RTX 3080 Laptop GPU, 86 Wh | Razer Blade 15 Advanced Model Early 2021 i7-10875H, GeForce RTX 3080 Laptop GPU, 80 Wh | Average of class Gaming | |
|---|---|---|---|---|---|---|---|
| Battery runtime | -14% | 41% | 34% | -69% | 29% | 6% | |
| H.264 (h) | 5.9 | 13.5 129% | 1.9 -68% | 8.9 51% | 8.26 ? 40% | ||
| WiFi v1.3 (h) | 5.6 | 5.3 -5% | 7.4 32% | 7.5 34% | 1.8 -68% | 9 61% | 7.01 ? 25% |
| Load (h) | 2.7 | 2.1 -22% | 1.7 -37% | 0.8 -70% | 2 -26% | 1.47 ? -46% | |
| Reader / Idle (h) | 7.5 | 14.4 | 8.71 ? | ||||
| Witcher 3 ultra (h) | 0.8 |
Pros
Cons
Verdict - Powerful gaming laptop with stable metal construction
The Schenker XMG Neo 15 is characterized by a high-quality yet subtle build, which skillfully disguises the laptop's enormous performance potential. The case is rigid and appears robust, but you have to do without a notch for easier opening or optical gimmicks here. The input devices are okay, but you should not expect too much from the mechanical keyboard. On the other hand, we liked the display, which convinced us with its good contrast and high refresh rate.
However, it quickly becomes clear that the laptop's real focus is on performance. Both the CPU and the GPU achieve very good results in the synthetic benchmarks and in games. It was particularly surprising that the Tiger Lake Core i7-11800H CPU could keep up with or even surpass many AMD rivals in the CPU tests. Together with the built-in Thunderbolt 4 port, which is currently reserved for the Intel platform, this makes the Intel version look particularly good. Also worth mentioning are the built-in SD card reader and the extraordinarily good results in the WLAN test.
The Schenker XMG Neo 15 offers an excellent performance in a small format and lets users decide about considerably more parameters than other laptops, but the comfort comes up short in some places.
The high level of performance in such a compact format naturally requires a good cooling solution. This is where the downsides of the Neo 15 reveal themselves, because although loud fans are not uncommon in this device class, our model is not spared from coil whine either. On the other hand, maintenance is particularly easy because all components are accessible and there are no pitfalls during disassembly. Apart from the noise, the Neo 15 is a densely packed powerhouse that offers uncompromising performance in a 15-inch format. Also, good alternatives are the Alienware m15 R4, which offers similar performance, and the Razer Blade 15, which is not quite as fast, but achieves longer battery runtimes and comes in a slimmer case.
Price and availability
The base version of the Schenker XMG Neo 15 M21 with a mobile RTX 3060 and a bit less RAM and storage is currently listed on bestware.com (official store of the manufacturer) for 1,799 Euros (~$2143) with a planned delivery date from the end of June. Our configuration is expected to cost 2,838 Euros (~$3381) without the operating system.
Schenker XMG Neo 15 Tiger Lake
- 06/14/2021 v7 (old)
Marius Schell
Price comparison

