Schenker XMG Neo 15 with XMG Oasis in review: RTX 3080 Ti without thermal limits
In February of this year, we were able to get our hands on one of the pre-production models of the XMG Neo 15 (together with the XMG Oasis) and gather initial benchmark results. Now both the Neo 15 and the external Oasis liquid cooling unit are ready for production and it's time for a proper and thorough test.
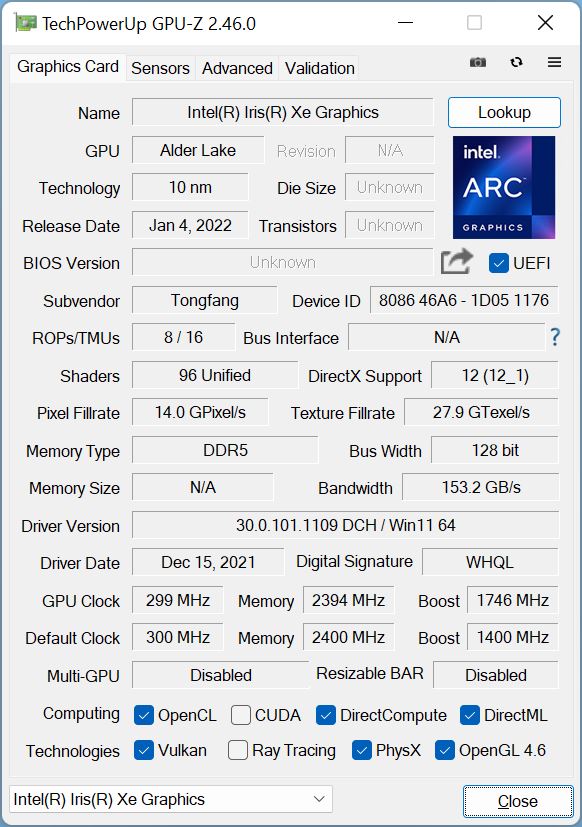
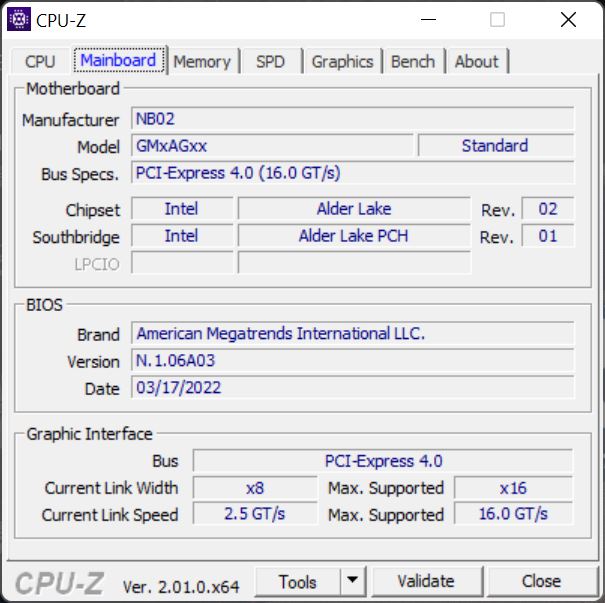
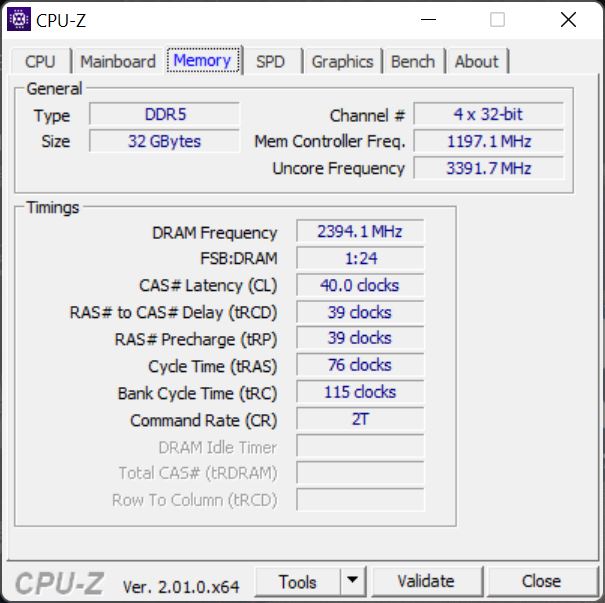
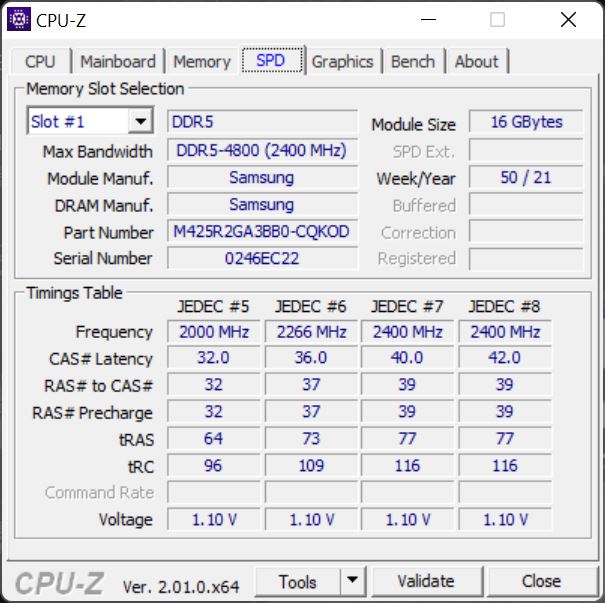
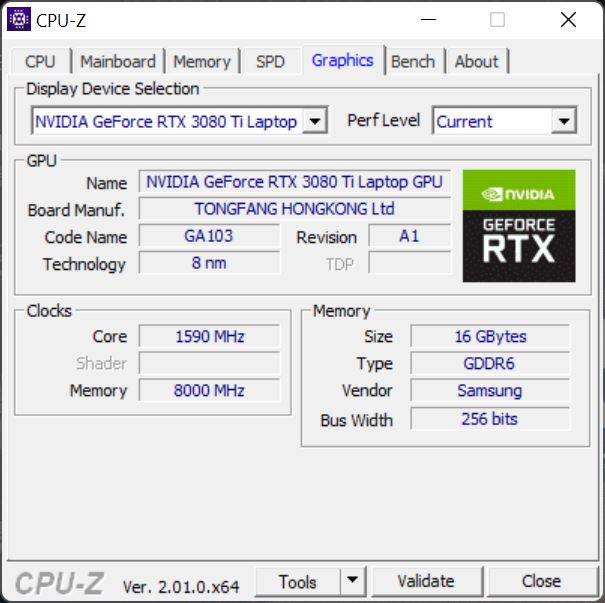
Our review sample combines an i7-12700H with an RTX 3080 Ti in a 15.6-inch chassis. Added to this is 32 GB of DDR5 and a QHD display with almost complete sRGB coverage. The case comes from Tongfang/Uniwill with the designation GM5AG8W.

The external XMG Oasis liquid cooling unit can be purchased separately for EUR 199 (~US$ 199) and is supposed to increase performance as well as reduce noise and temperature.
We take a look at both the laptop and the Oasis, and compare the Neo 15 with and without liquid cooling in our benchmarks. For external comparison, we use other laptops with an RTX 3080 Ti alongside the predecessor. These include the Razer Blade 15, but also the Asus ROG Zephyrus Duo 16, the Gigabyte Aero 16 YE5 and the Alienware x17 R2 due to the lack of other 15-inch laptops with an RTX 3080 Ti.
Possible Competitors in Comparison
Rating | Date | Model | Weight | Height | Size | Resolution | Price |
|---|---|---|---|---|---|---|---|
| 88.4 % v7 (old) | 07 / 2022 | Schenker XMG Neo 15 (i7-12700H, RTX 3080 Ti) i7-12700H, GeForce RTX 3080 Ti Laptop GPU | 2.3 kg | 26.6 mm | 15.60" | 2560x1440 | |
| 87 % v7 (old) | 06 / 2021 | Schenker XMG Neo 15 Tiger Lake i7-11800H, GeForce RTX 3080 Laptop GPU | 2.2 kg | 26 mm | 15.60" | 2560x1440 | |
| 89.1 % v7 (old) | 03 / 2022 | Razer Blade 15 2022 i7-12800H, GeForce RTX 3080 Ti Laptop GPU | 2.1 kg | 16.99 mm | 15.60" | 2560x1440 | |
| 88.2 % v7 (old) | 05 / 2022 | Asus ROG Zephyrus Duo 16 GX650RX R9 6900HX, GeForce RTX 3080 Ti Laptop GPU | 2.6 kg | 20.5 mm | 16.00" | 3840x2400 | |
| 84.7 % v7 (old) | 03 / 2022 | Gigabyte Aero 16 YE5 i9-12900HK, GeForce RTX 3080 Ti Laptop GPU | 2.3 kg | 22.4 mm | 16.00" | 3840x2400 | |
| 89.2 % v7 (old) | 05 / 2022 | Alienware x17 R2 P48E i9-12900HK, GeForce RTX 3080 Ti Laptop GPU | 3.1 kg | 20.9 mm | 17.30" | 1920x1080 |
Case: Metal above, plastic below
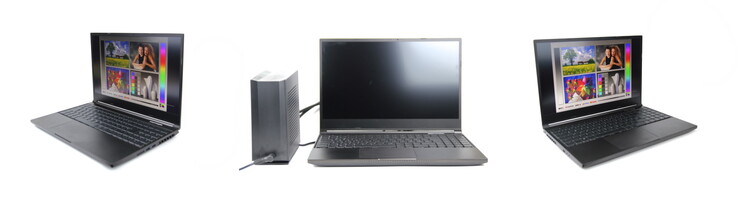
XMG Neo 15
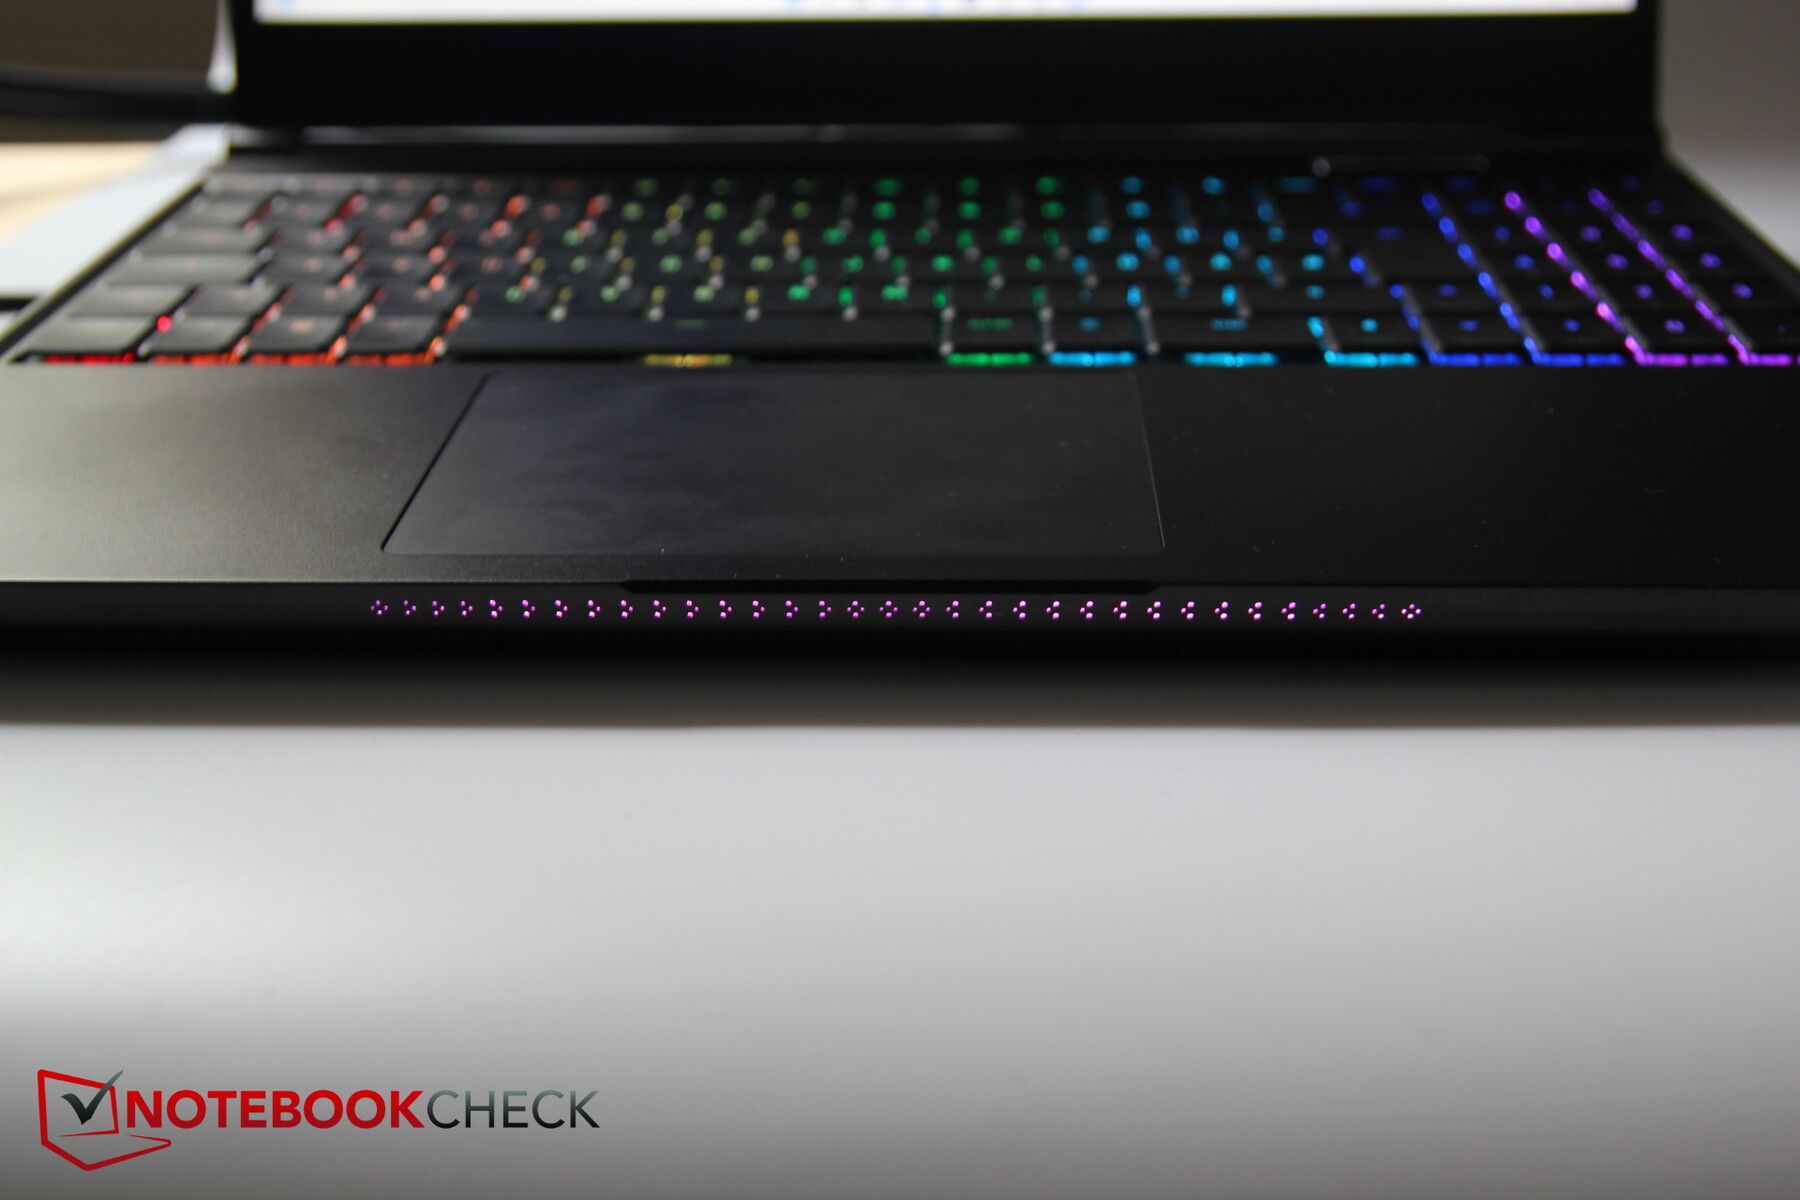
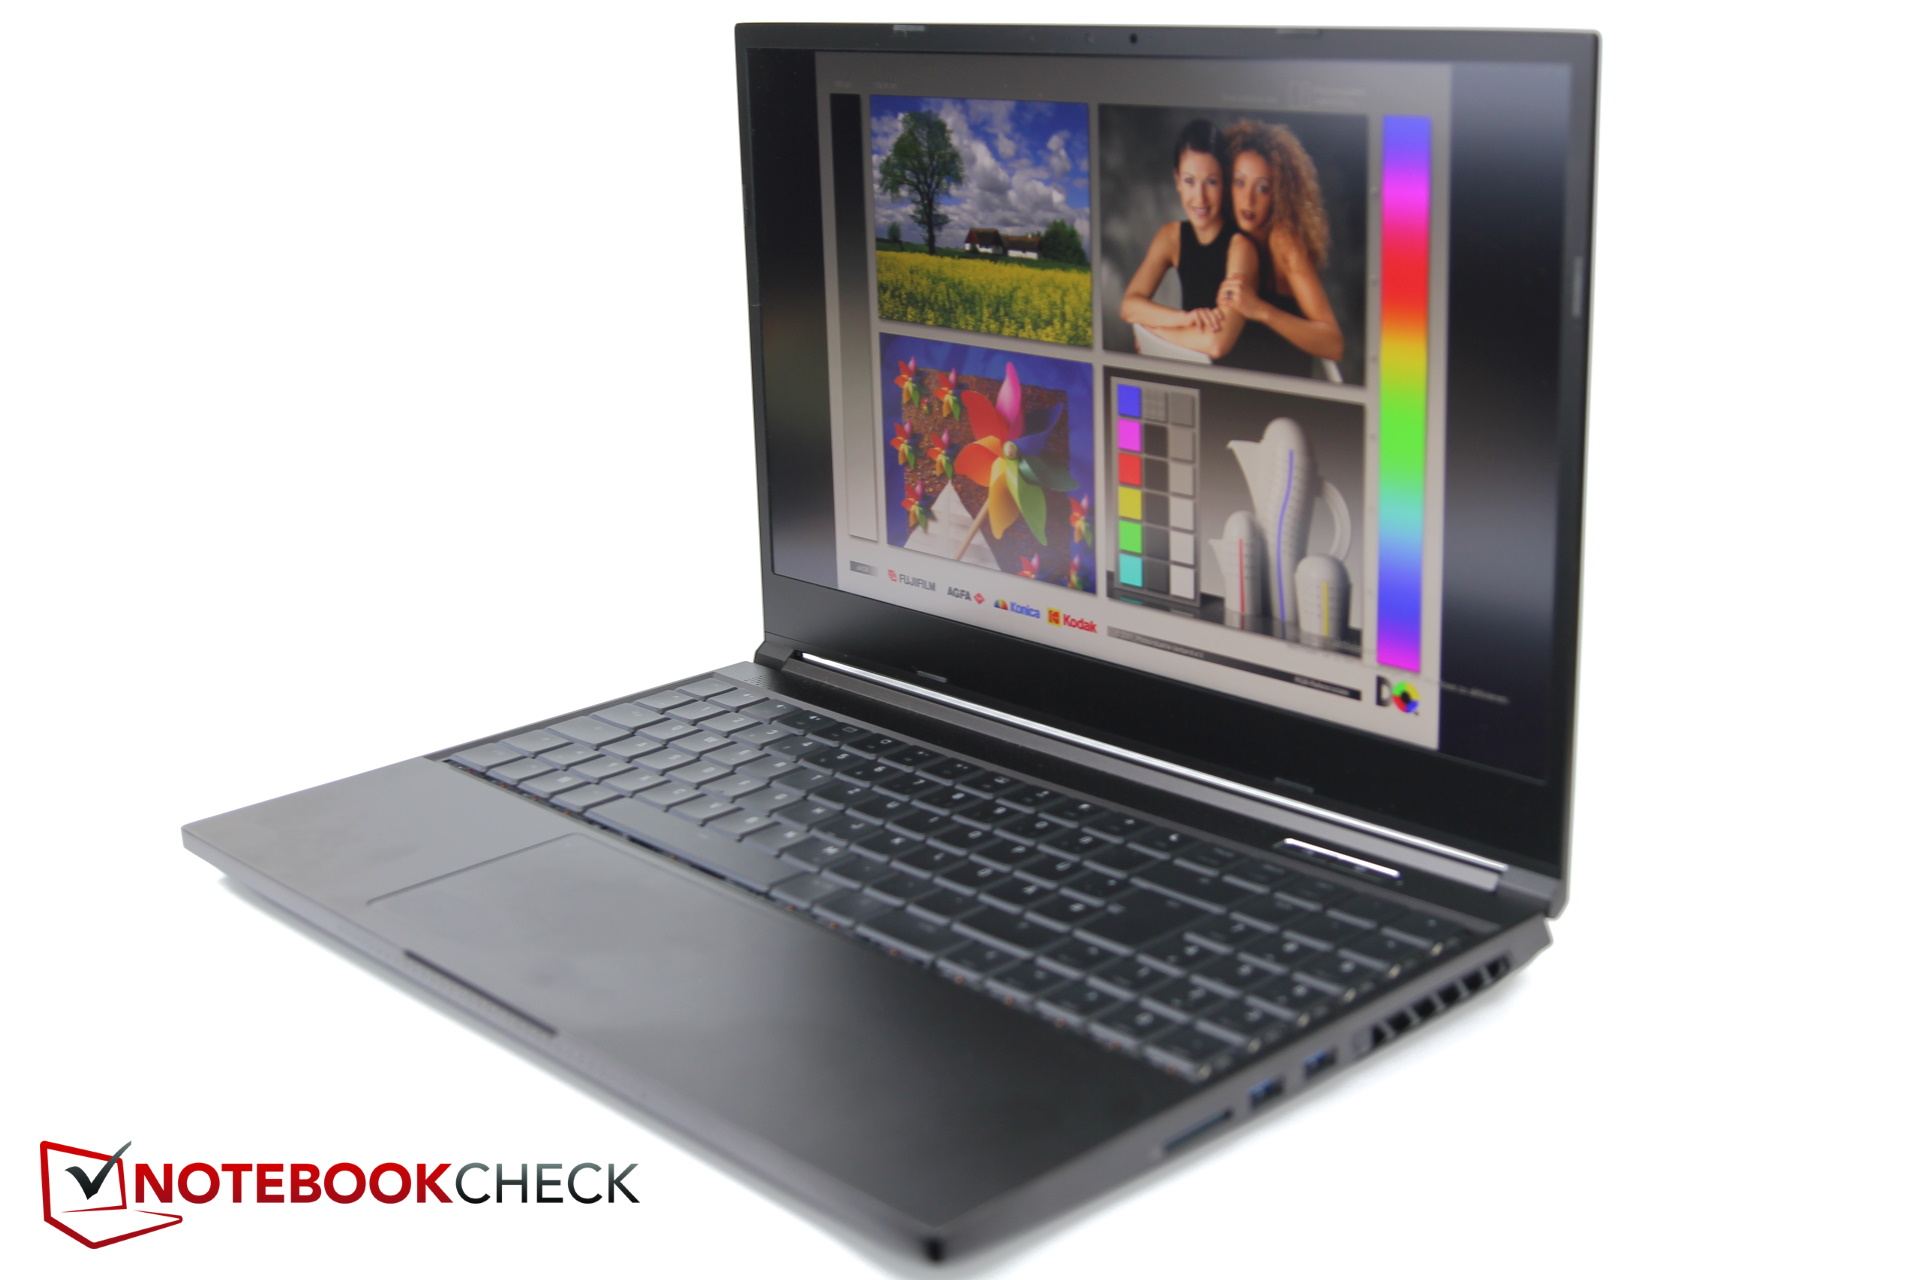
For a gamer, the Neo comes across as rather plain. Apart from the keyboard, there are no flashing RGB elements, and even the otherwise obligatory colorful spec stickers are "missing" from the palm rest. The matte black design is functionally simple and unobtrusive, and pleasing exactly for these reasons. Even professionals don't have to be embarrassed about having the Neo on their office desk. However, there is a kind of bar with a lattice structure at the front, which also allows the keyboard backlighting to shine through, but not too obtrusively.
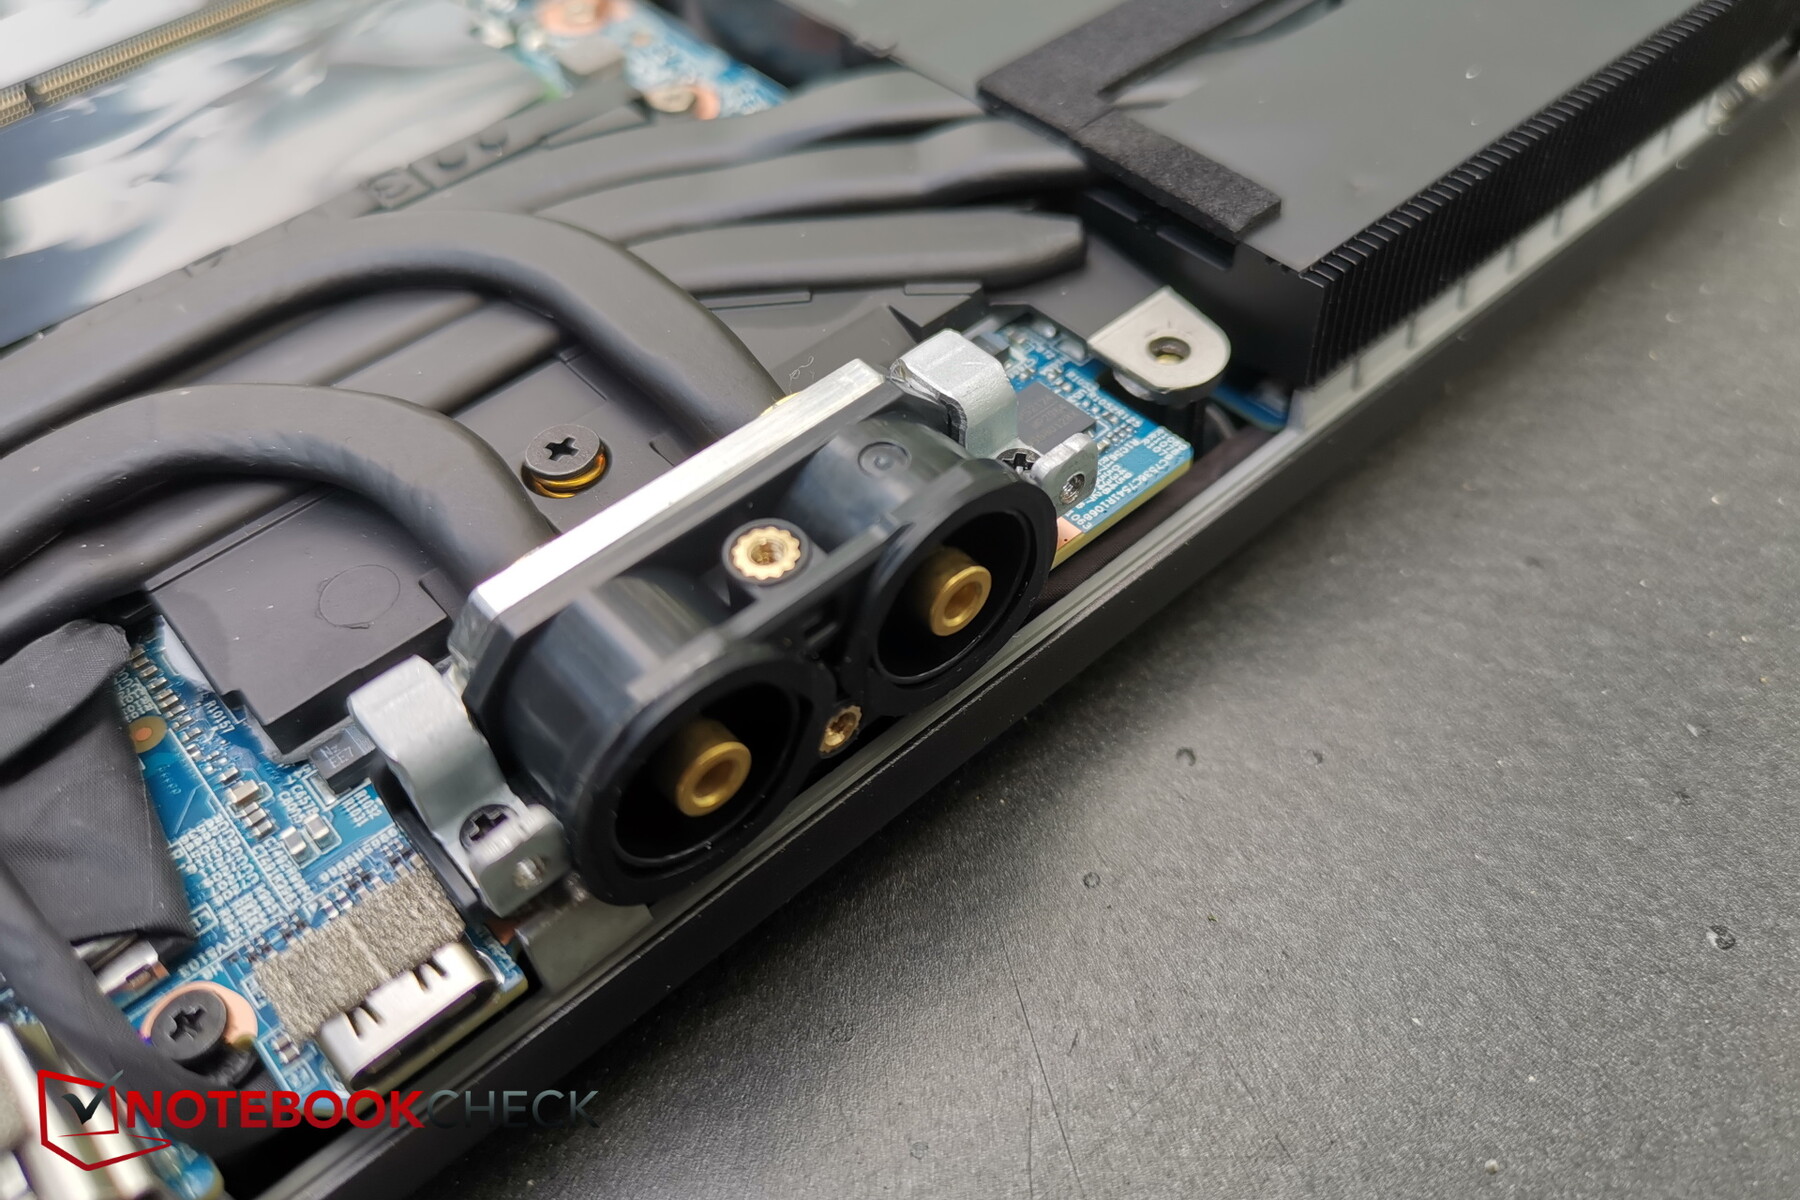
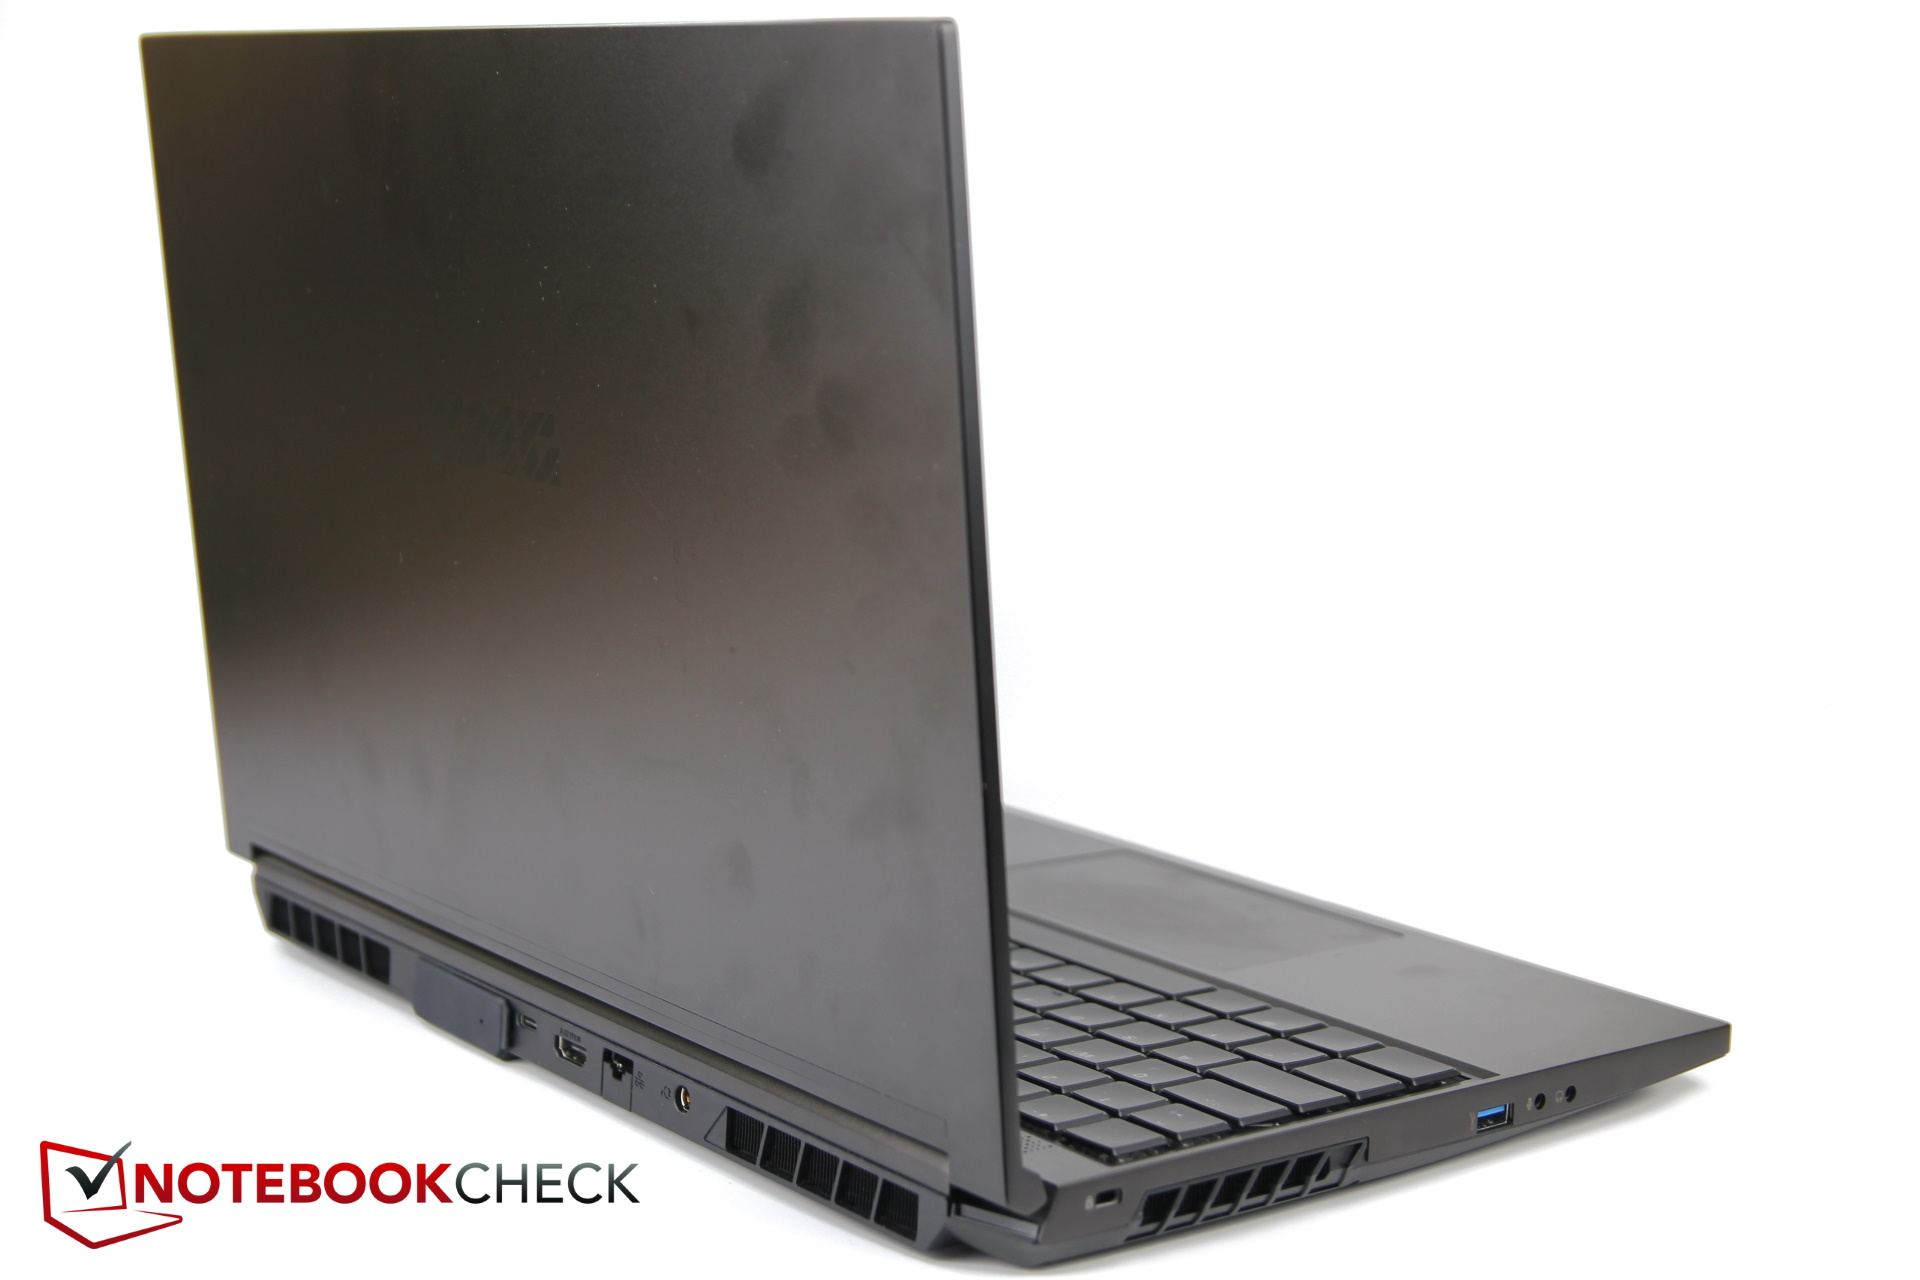
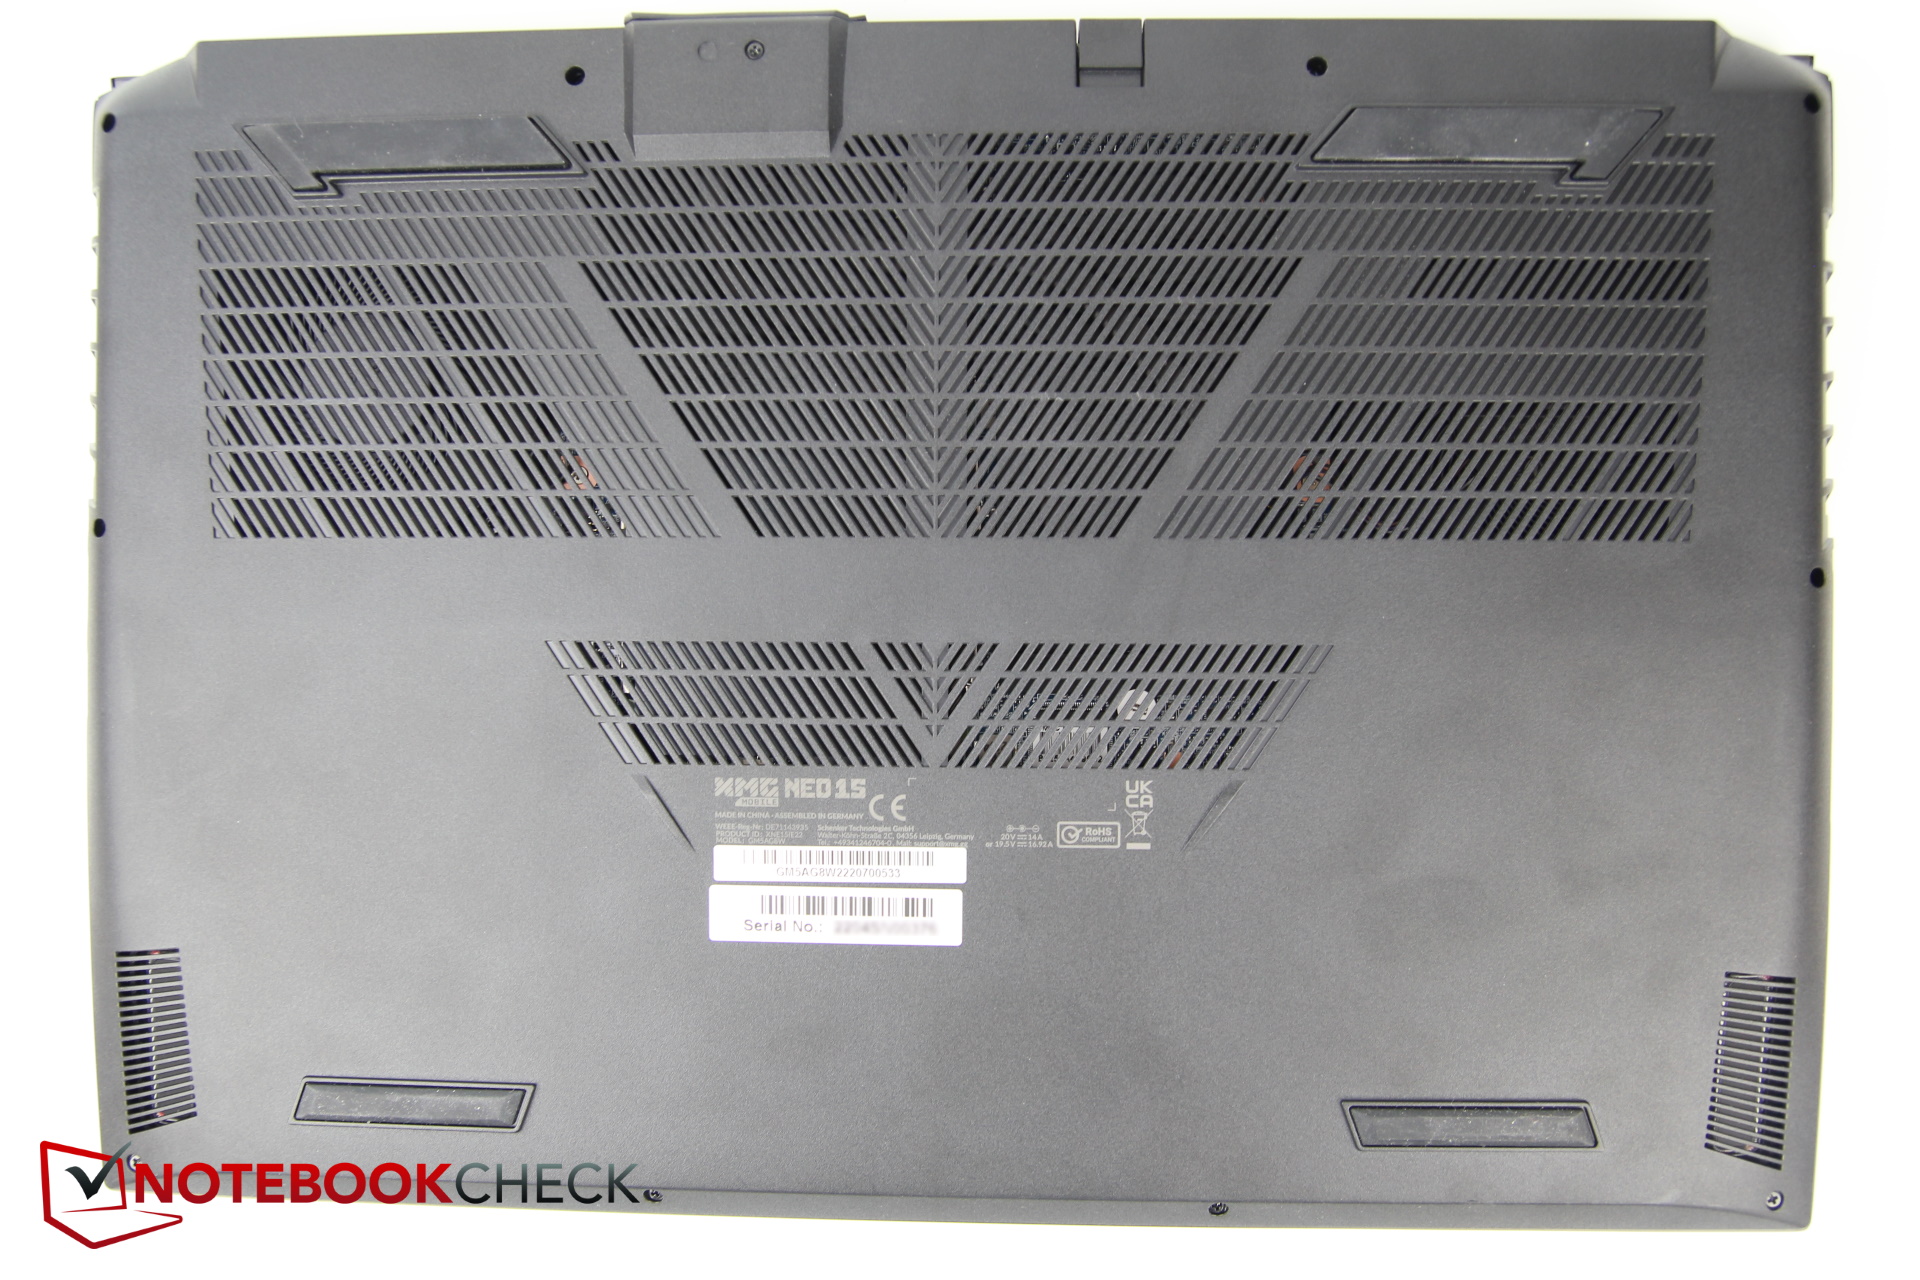
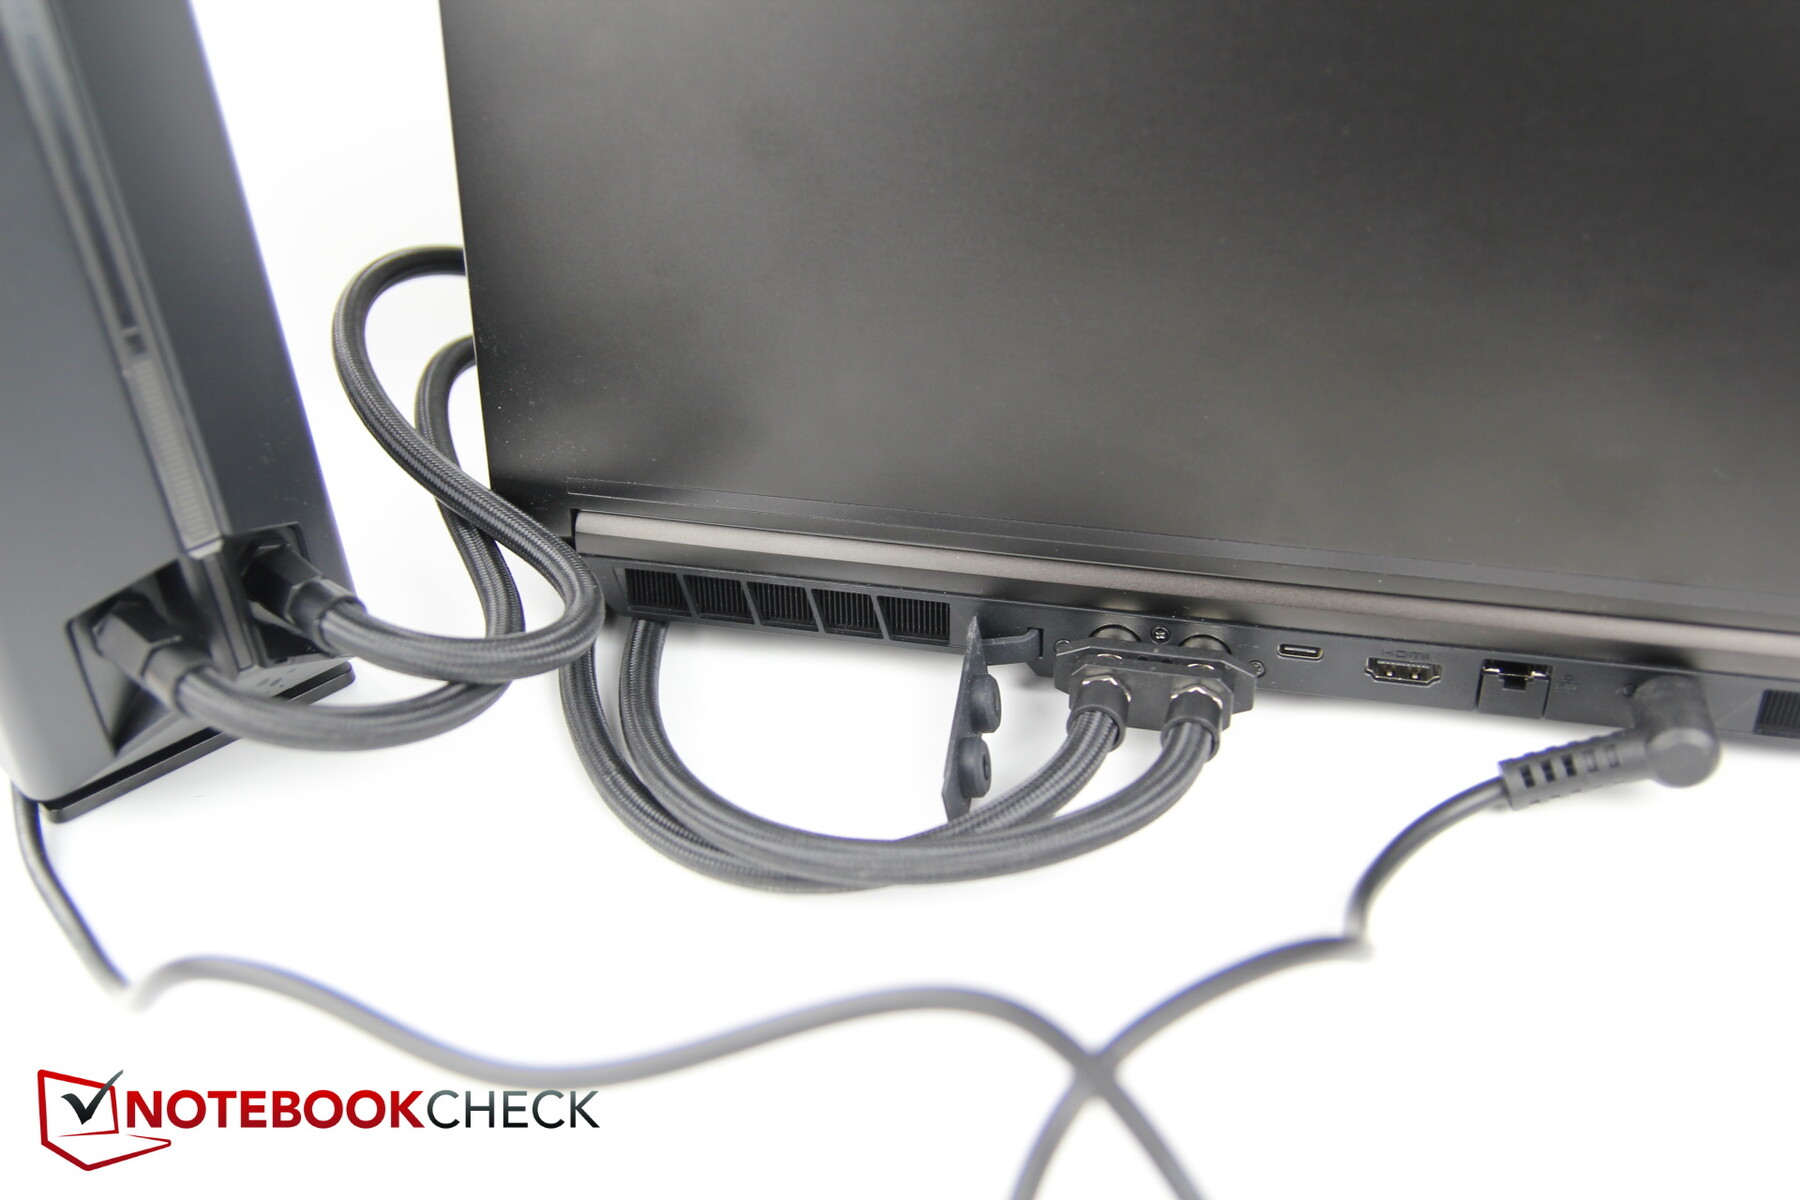
Upon initial examination of the NEO, an clearly noticeable feature is the two gold-colored pipe ports for the liquid cooling at the back, protected by a rubber cap.
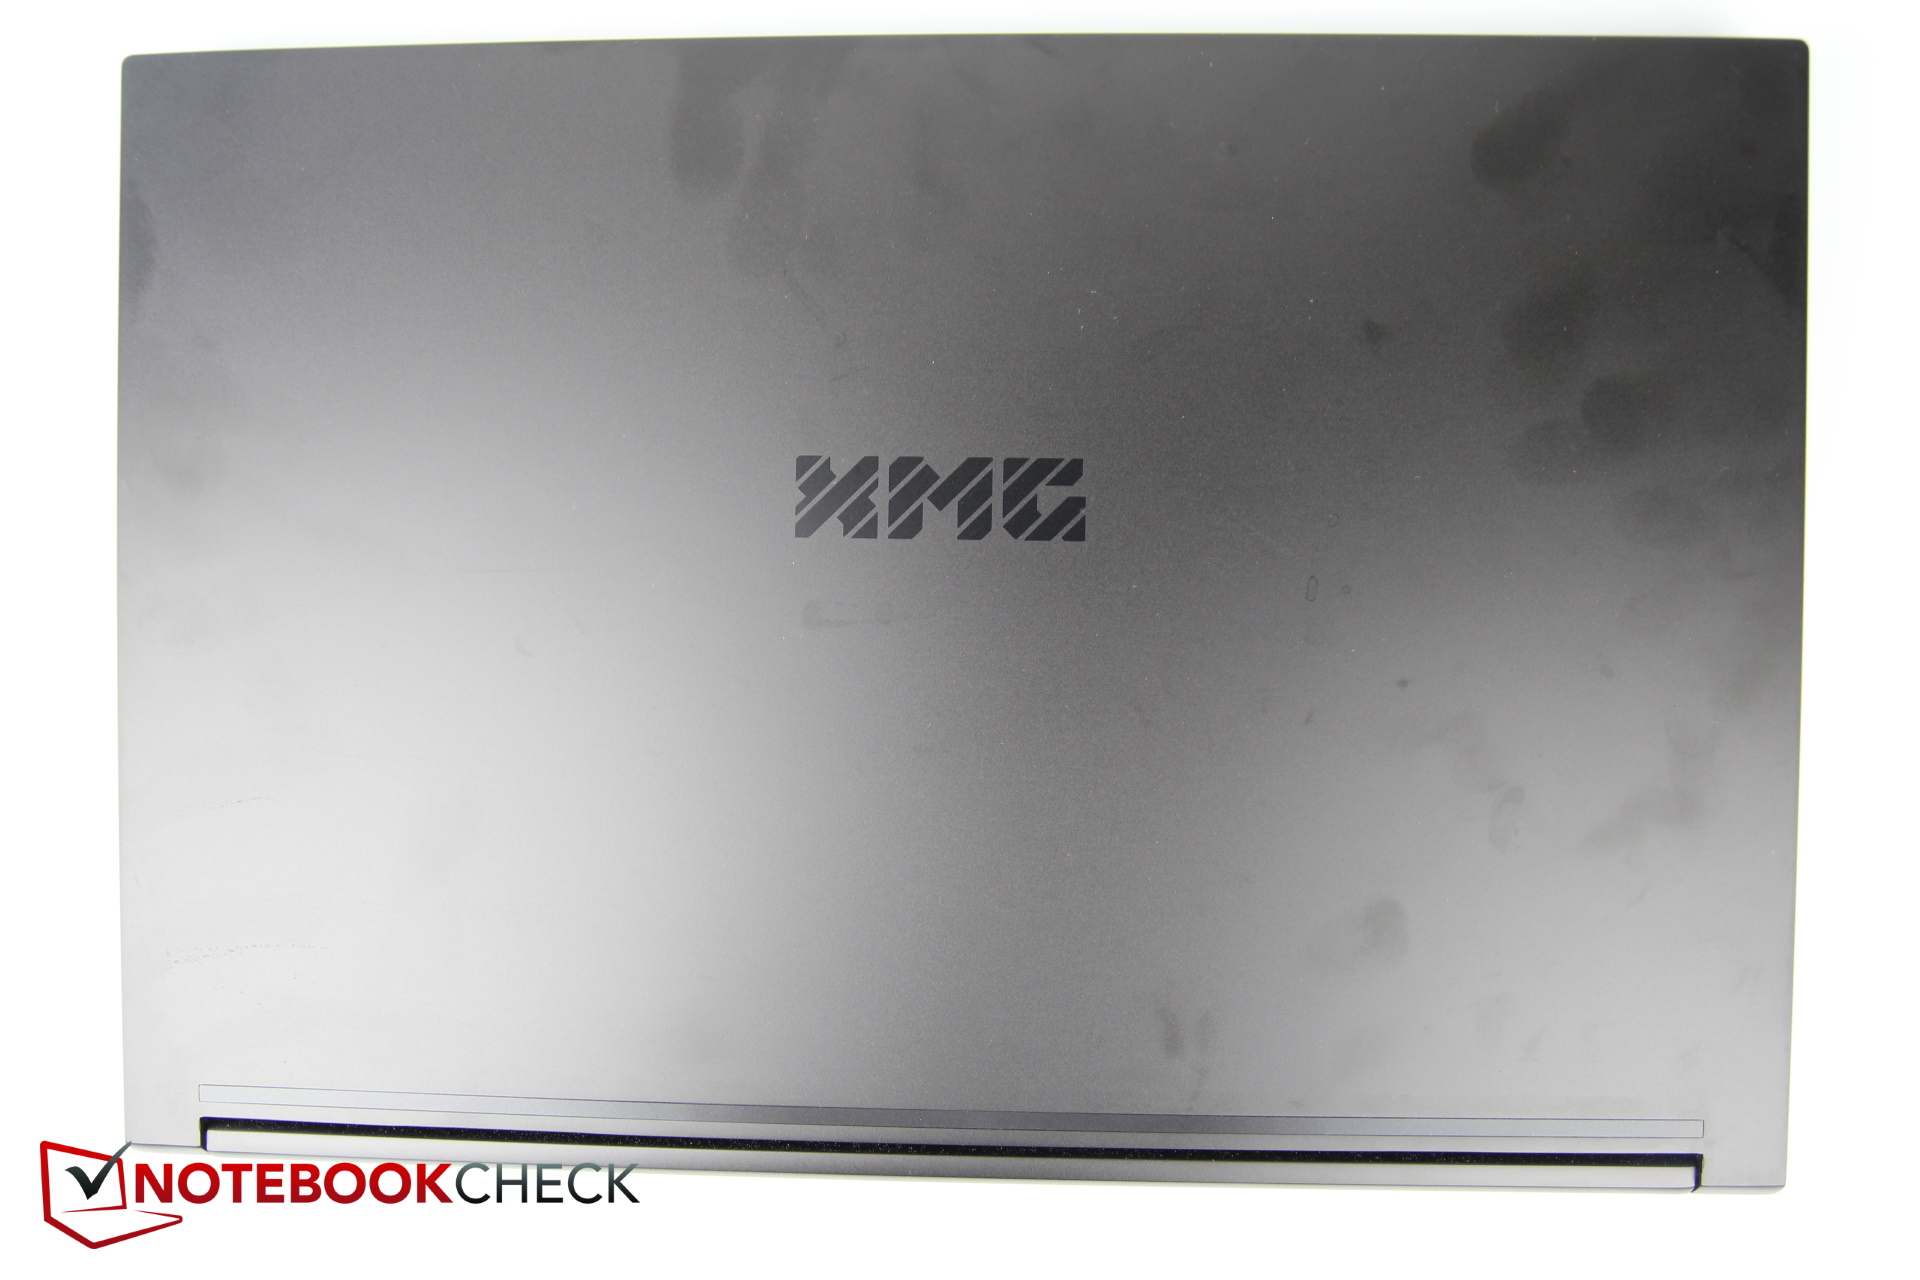
The display lid and the topside of the baseplate are made of metal, while the underside is made of plastic. The base is very stable and does not make any cracking or creaking sounds when subject to torsion. This also applies to the display lid, but this is naturally easier to bend. The hinges could perhaps be a little tighter, but they are solid.
The metal surface is sensitive to fingerprints and grease stains. The build quality is very good; we did not discover any unusual or uneven gaps.
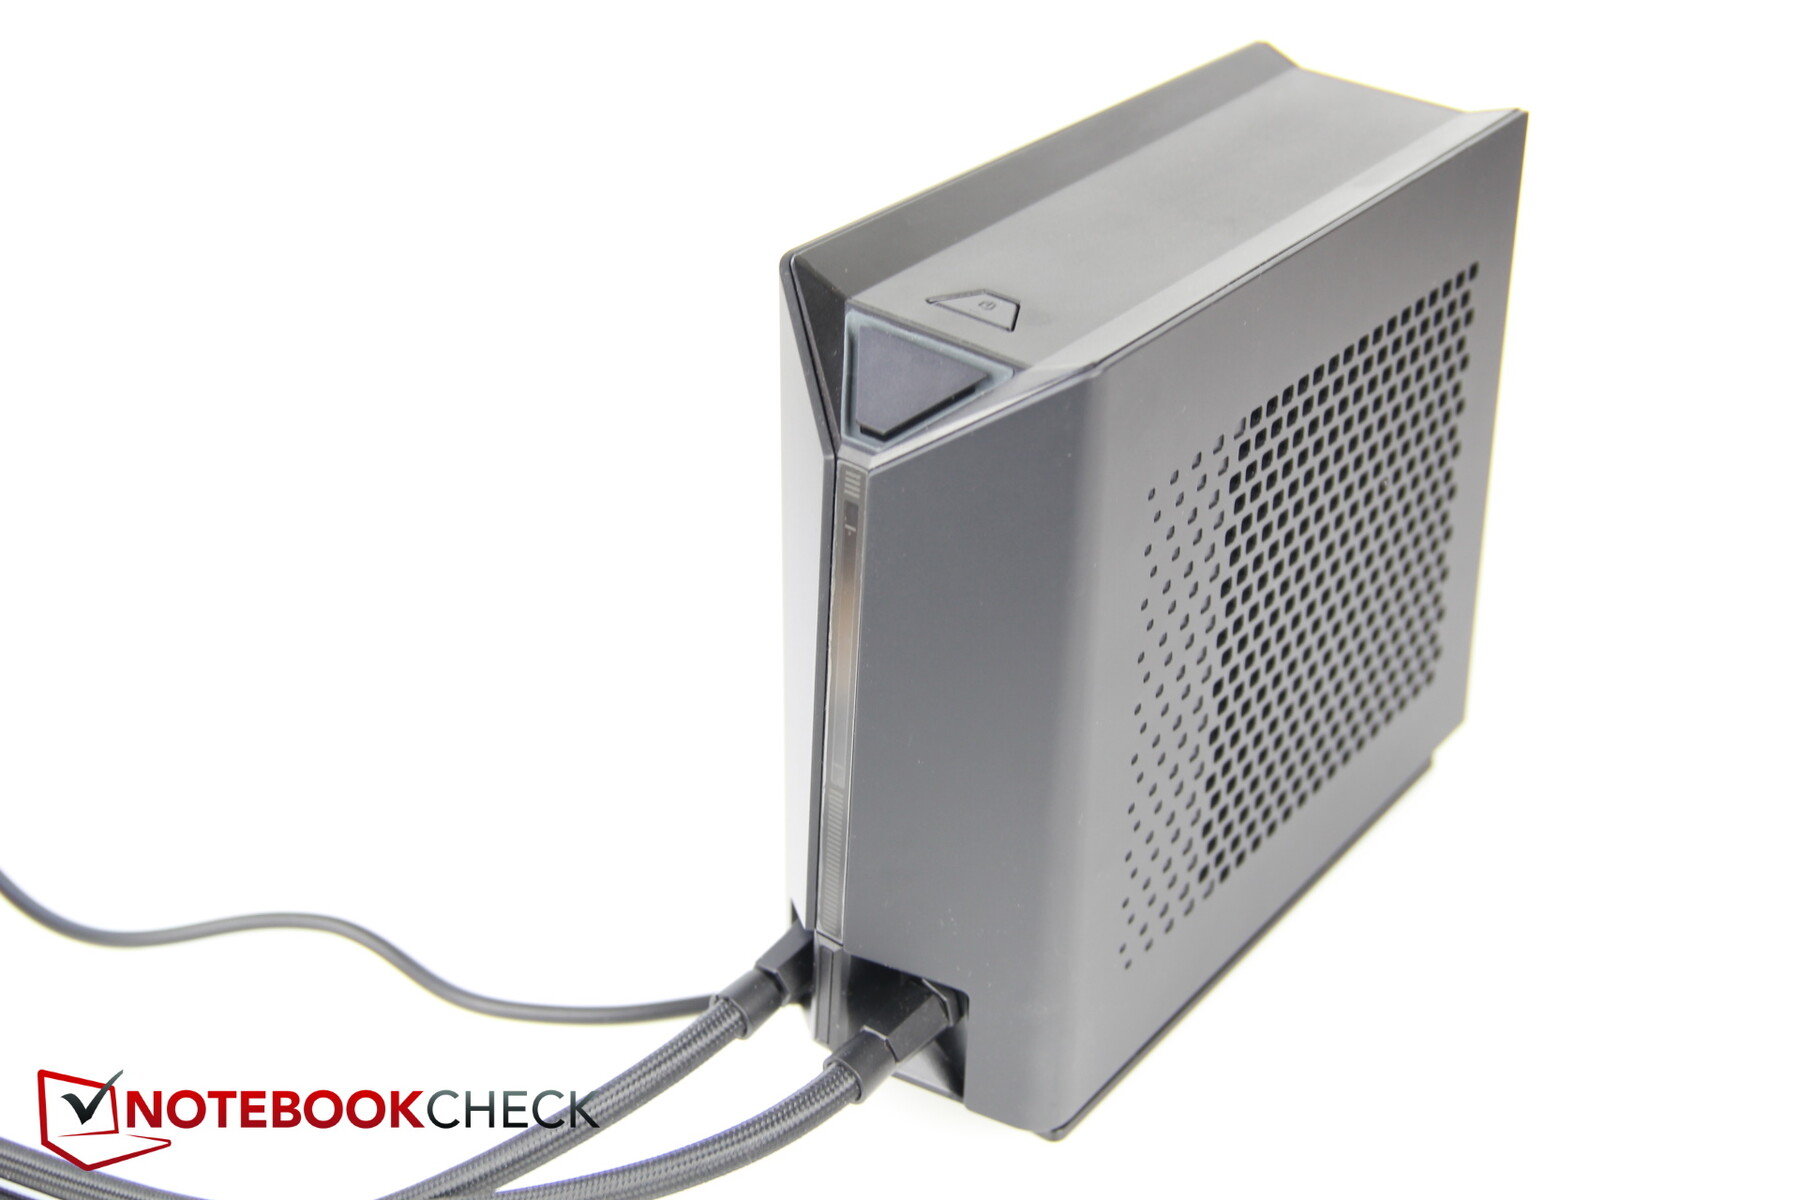
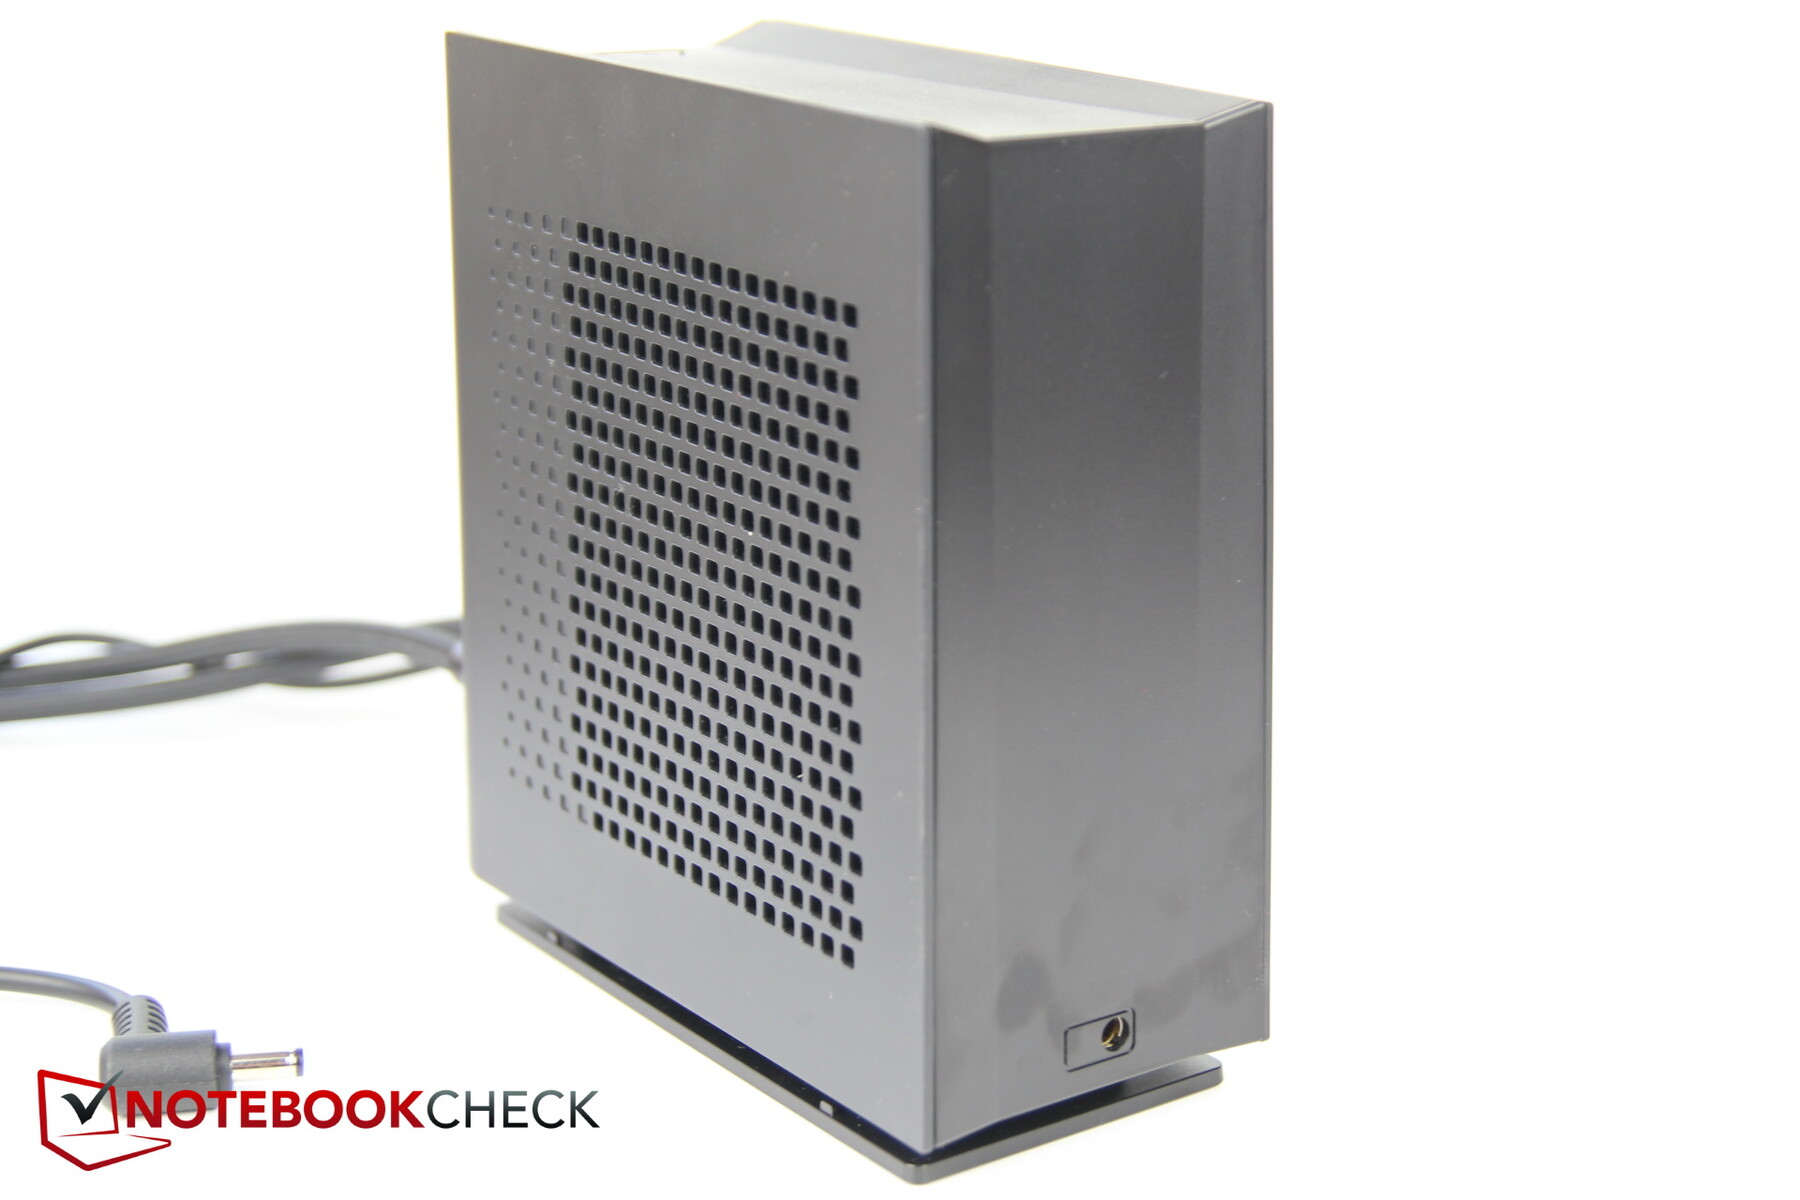
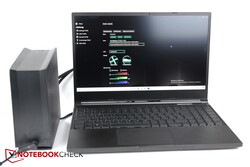
XMG Oasis
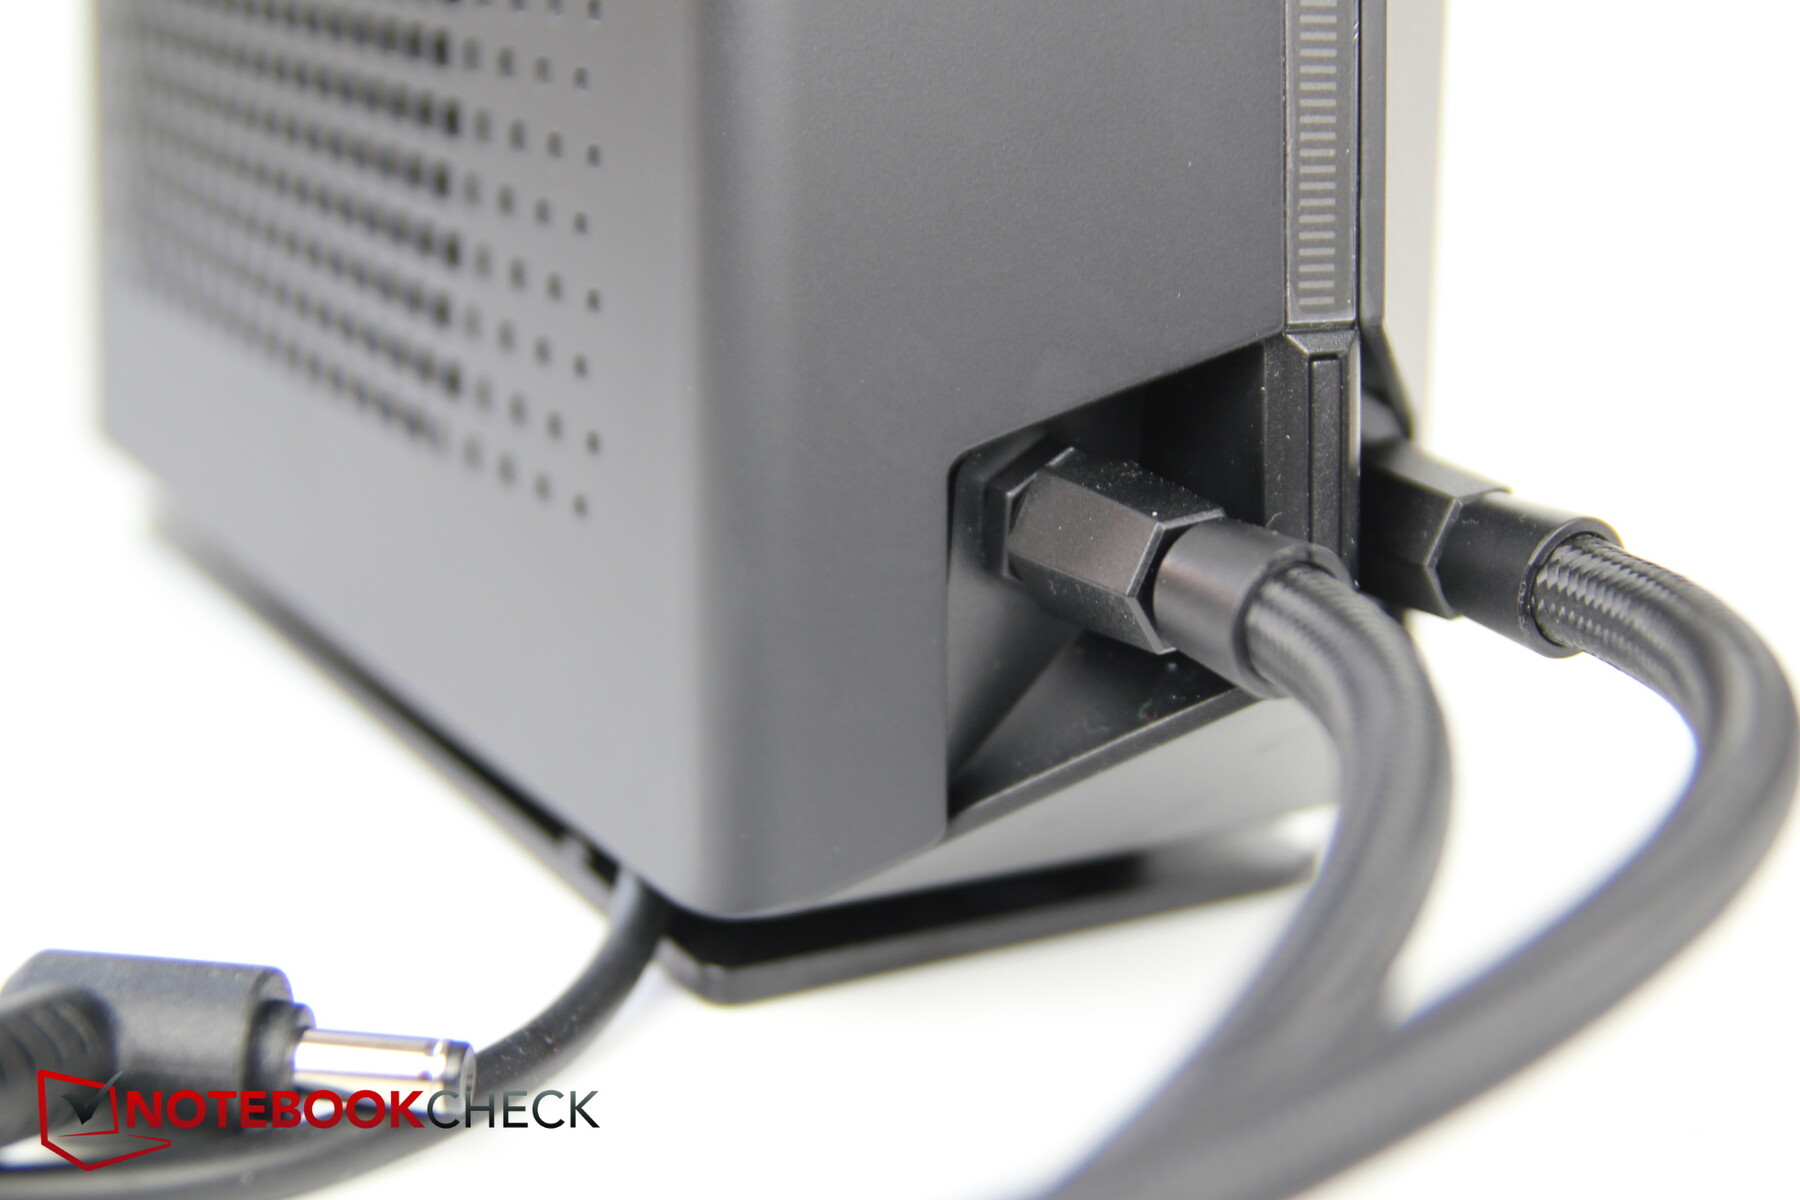
The external liquid cooling unit comes in the form of a black plastic case. Coolant or distilled water is poured in at the top. The two hose connections are at the bottom on one side and the power connection on the opposite side. This is where the Neo's power supply is connected, a short cable from the Oasis then goes into the Neo's power slot as a power feeder.
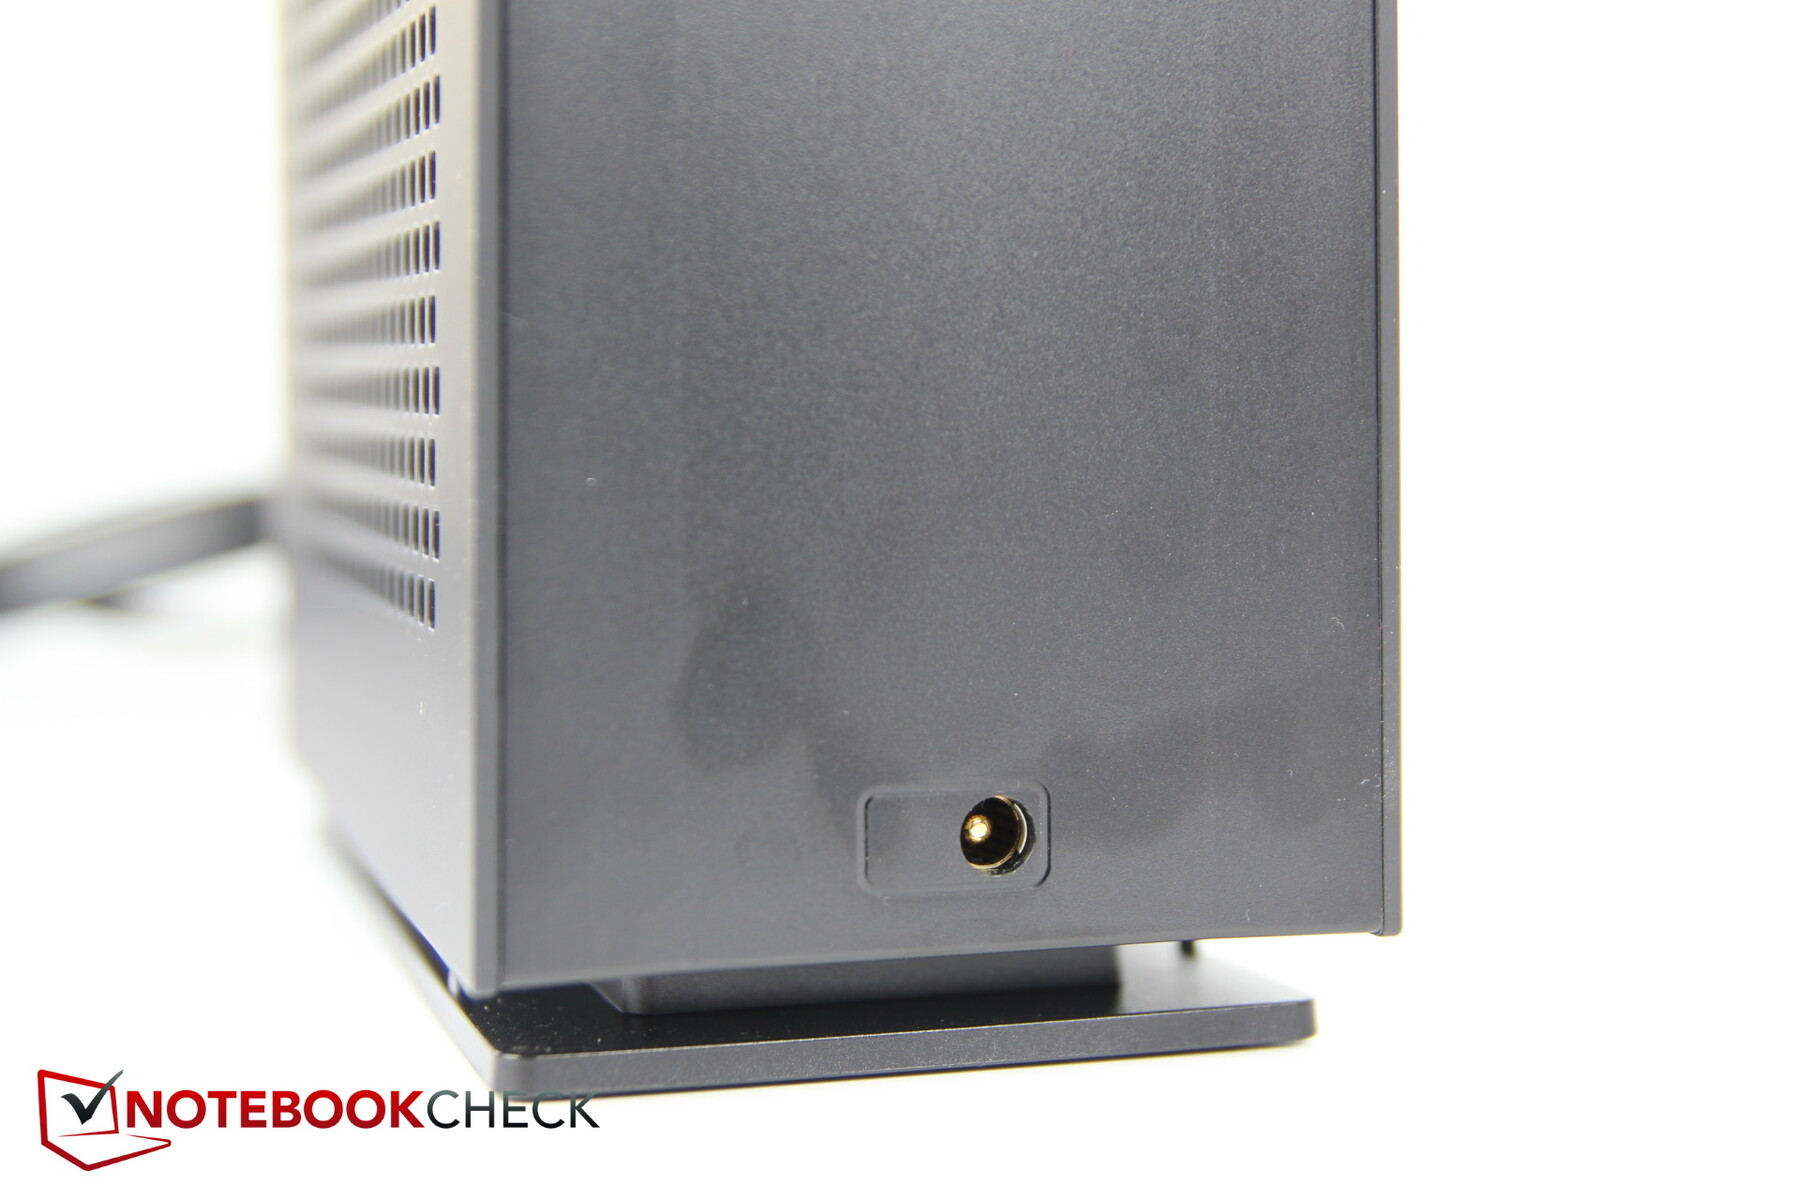
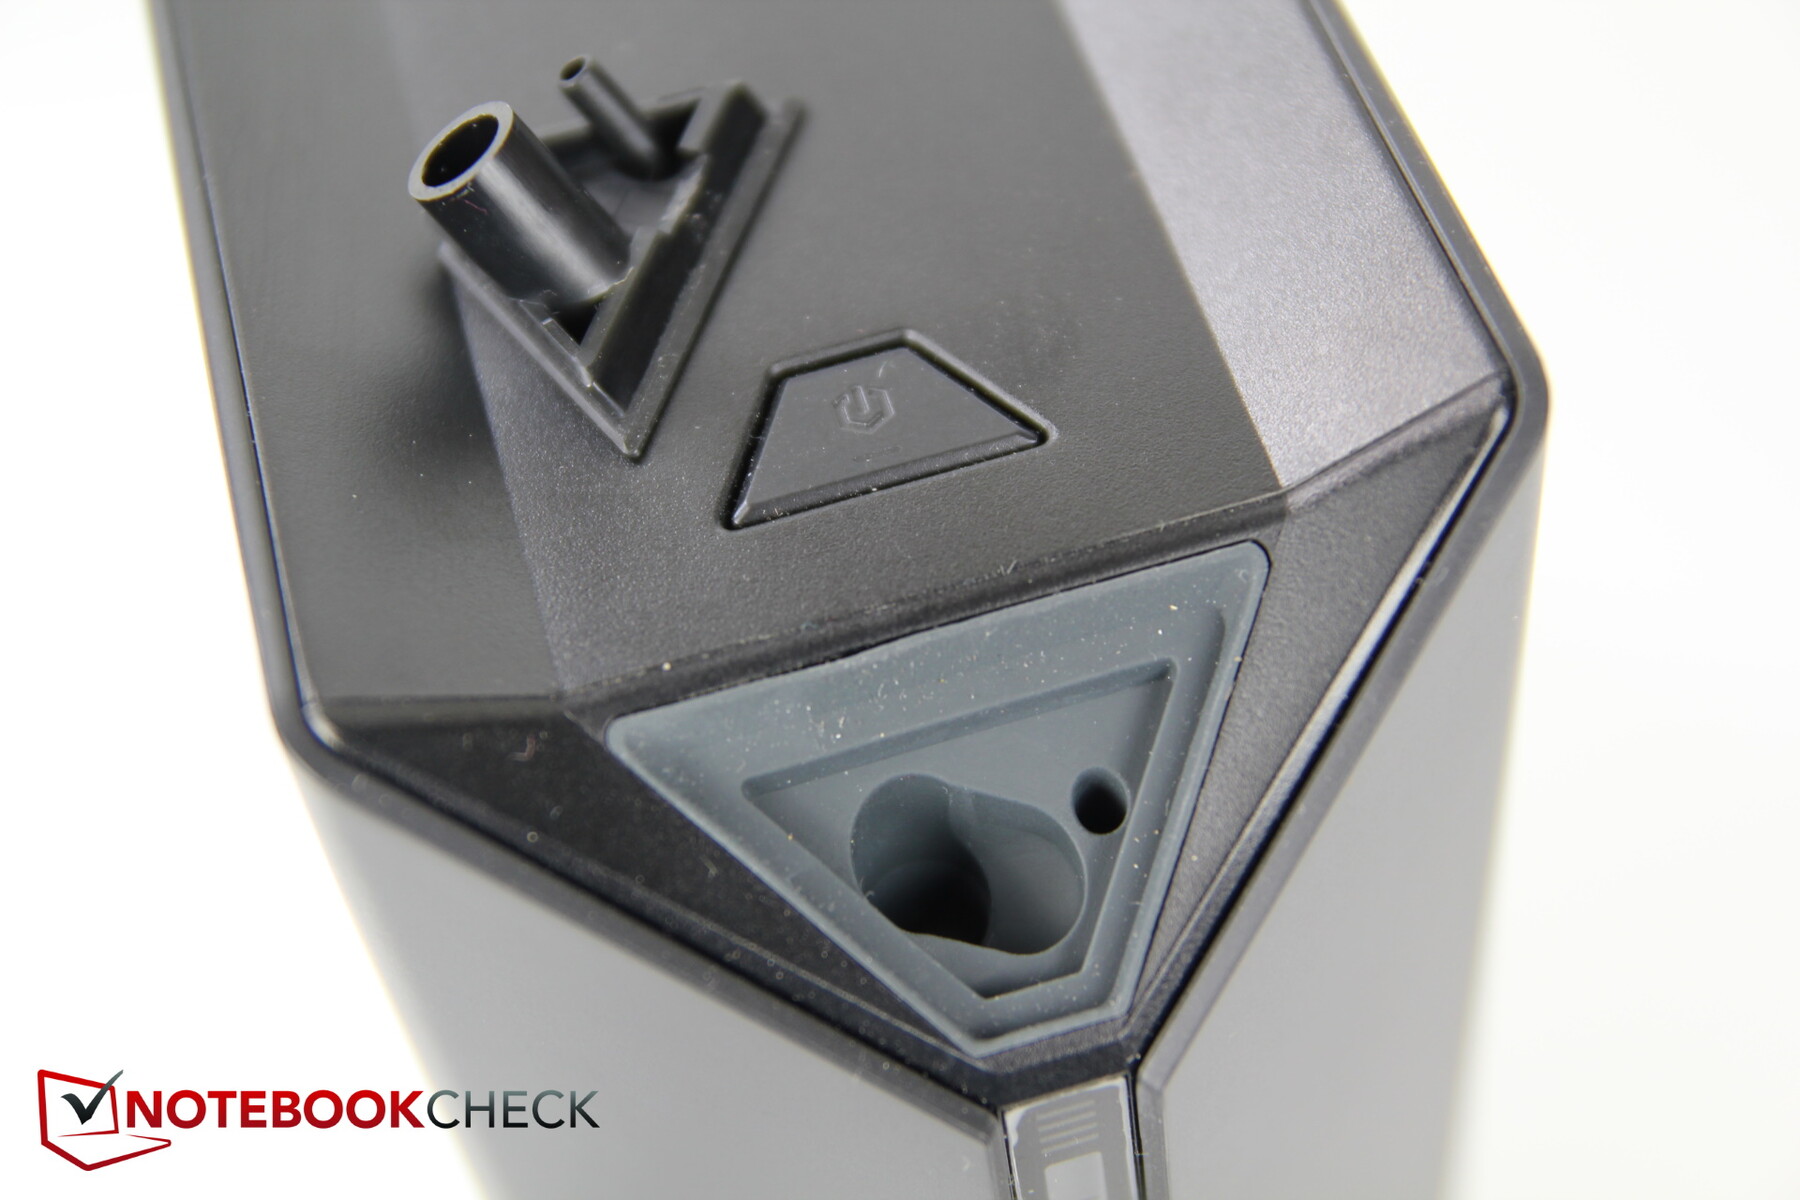
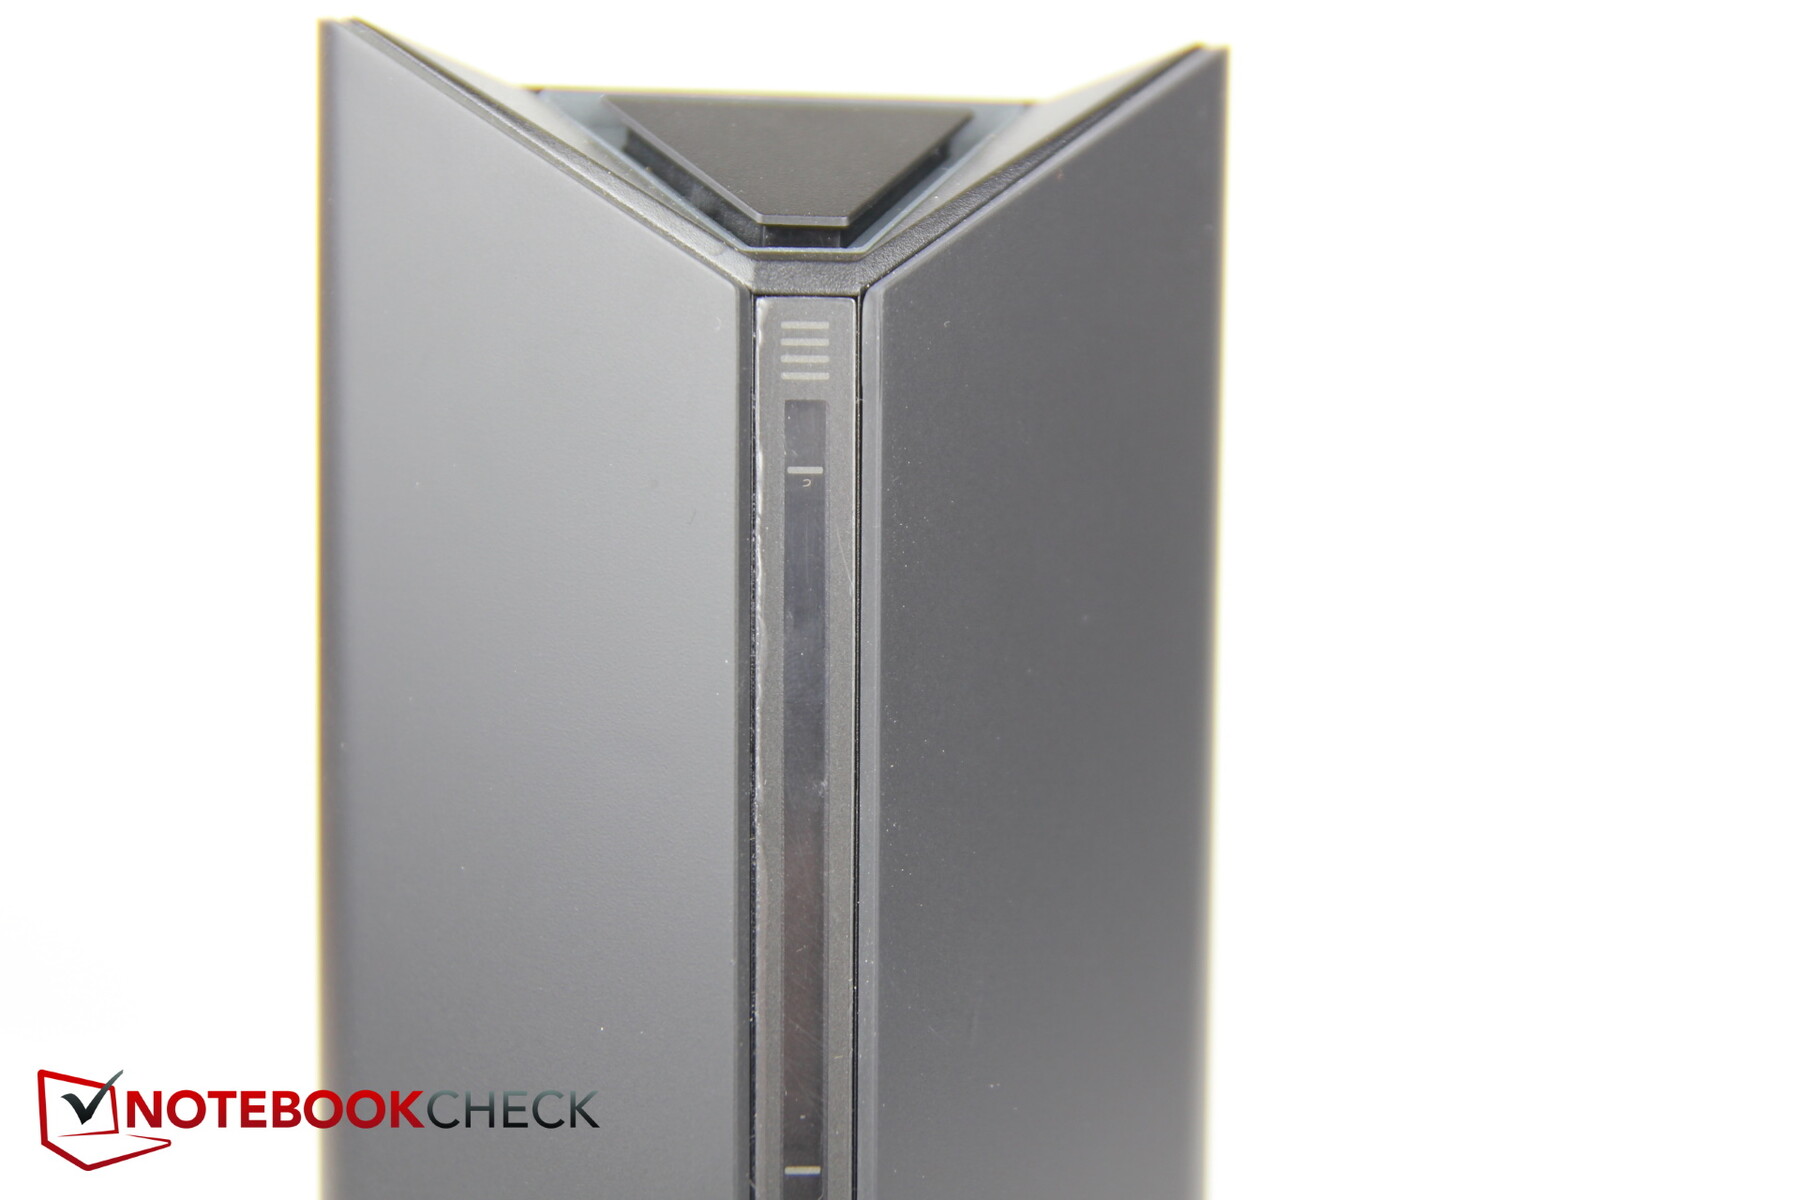
The case is about 18 cm high, at least just as long, and about 7.5 cm wide. At the top is the fill hole, which is secured by a small plastic cover that is inserted into a rubber cap to prevent leakage.
At the front there is a narrow, transparent viewing column where you can read the fill level. Unfortunately, this is hardly visible, at least when using distilled water. A colored "ball" that is pushed up by the water or something similar would be helpful here.
After connecting the Oasis to the Neo, you fill Oasis with distilled water. When the two devices are connected, some of the water is pumped into the cooling circuit of the Neo and so a little more water has to be added again. Afterwards the water level should remain constant and no more refills are needed as long as you don't drain the water out of the Neo (in order to use it as a mobile laptop without the Oasis, for example). How coolant is used is thus based on your own laptop use. Mobile users will often have to drain the coolant and refill it. In stationary use, the Oasis almost never needs to be refilled, since the coolant has nowhere else to go.
Size Comparison
Because comparison with 16- and 17-inch models makes little sense, we use other 15-inch gamers here, also with a different GPU.
Nothing has changed compared to the predecessor. The Razer Blade 15 is slightly smaller and significantly thinner than the Neo, but the other competitors tend to be slightly larger. Overall, the Neo 15 is not overly noticeable compared to the competition in terms of weight or dimension.
Equipment: Thunderbolt, FHD webcam and liquid cooling port
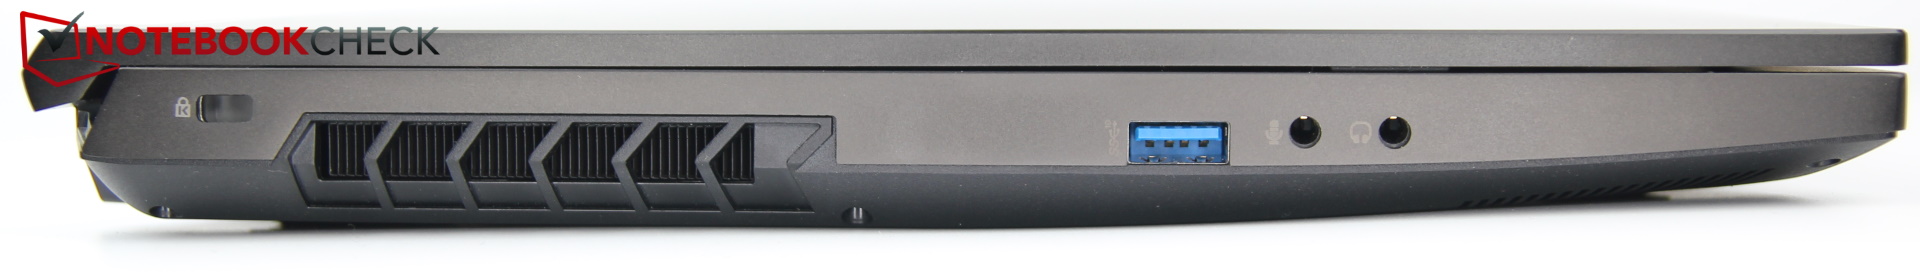
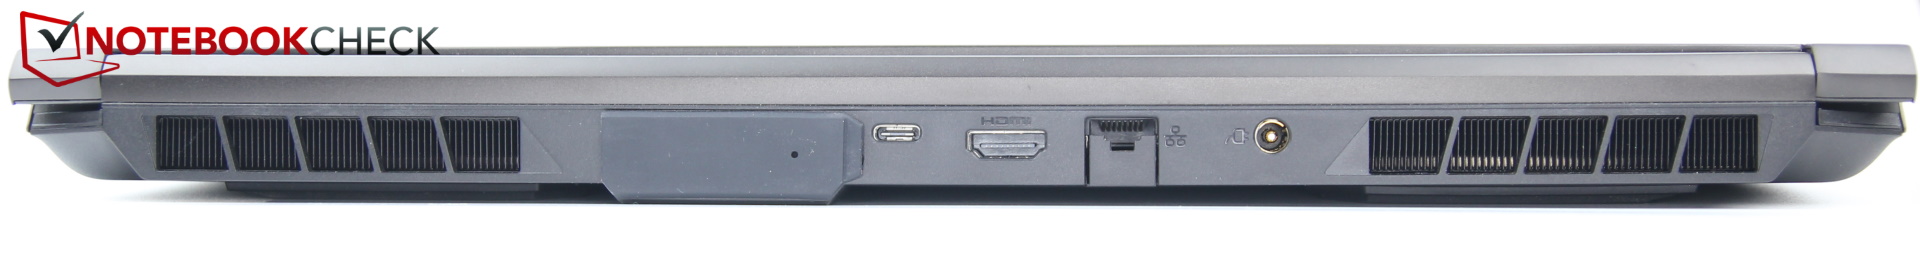
The Neo 15 has a total of four USB ports, three of them type A and one type C, which is also a Thunderbolt port. The latter supports DisplayPort, but is unfortunately not VR-capable due to the connection to the iGPU, and PowerDelivery is not supported. Of the three USB-A ports, only the one on the left is capable of 10 Gbit/s, the two on the right only 5 Gbit/s (USB 3.2 Gen1 corresponds to USB 3.0).
The two separate audio ports are also a nice feature. But the special feature is certainly is the external liquid cooling port, which is at the back.
The ports are distributed over three sides, and most of them are at the back. The cable from the beefy 280 W power adapter to the laptop is a bit short for our taste.
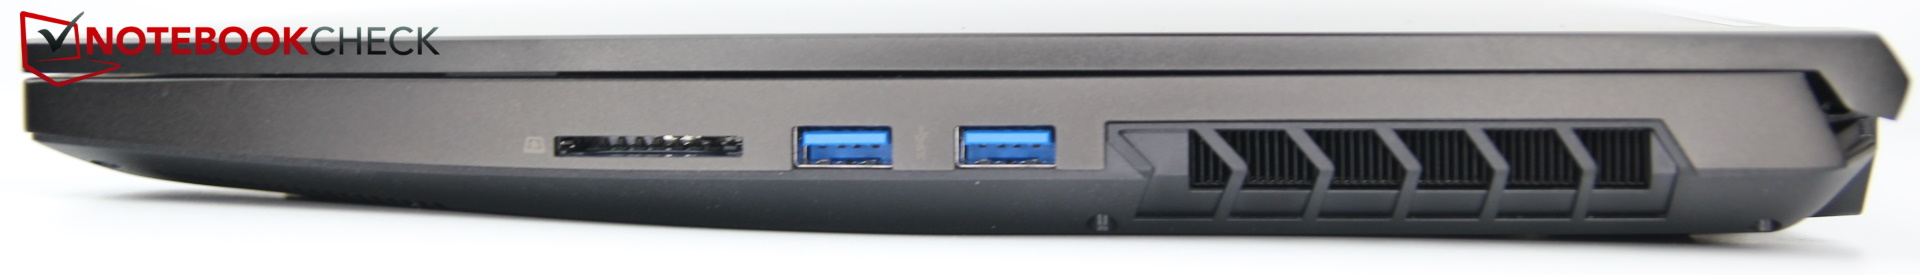
SD Card Reader
The SD reader is on the right side and leaves SD cards that are only inserted and not properly locked in half sticking out. While the transfer rates are more functional than fast, at least there is a card reader.
| SD Card Reader | |
| average JPG Copy Test (av. of 3 runs) | |
| Alienware x17 R2 P48E (AV Pro V60) | |
| Razer Blade 15 2022 (Toshiba Exceria Pro SDXC 64 GB UHS-II) | |
| Asus ROG Zephyrus Duo 16 GX650RX (AV PRO microSD 128 GB V60) | |
| Average of class Gaming (20.9 - 210, n=54, last 2 years) | |
| Schenker XMG Neo 15 (i7-12700H, RTX 3080 Ti) | |
| Schenker XMG Neo 15 Tiger Lake (AV PRO microSD 128 GB V60) | |
| maximum AS SSD Seq Read Test (1GB) | |
| Alienware x17 R2 P48E (AV Pro V60) | |
| Asus ROG Zephyrus Duo 16 GX650RX (AV PRO microSD 128 GB V60) | |
| Razer Blade 15 2022 (Toshiba Exceria Pro SDXC 64 GB UHS-II) | |
| Average of class Gaming (25.5 - 261, n=51, last 2 years) | |
| Schenker XMG Neo 15 Tiger Lake (AV PRO microSD 128 GB V60) | |
| Schenker XMG Neo 15 (i7-12700H, RTX 3080 Ti) | |
Communication
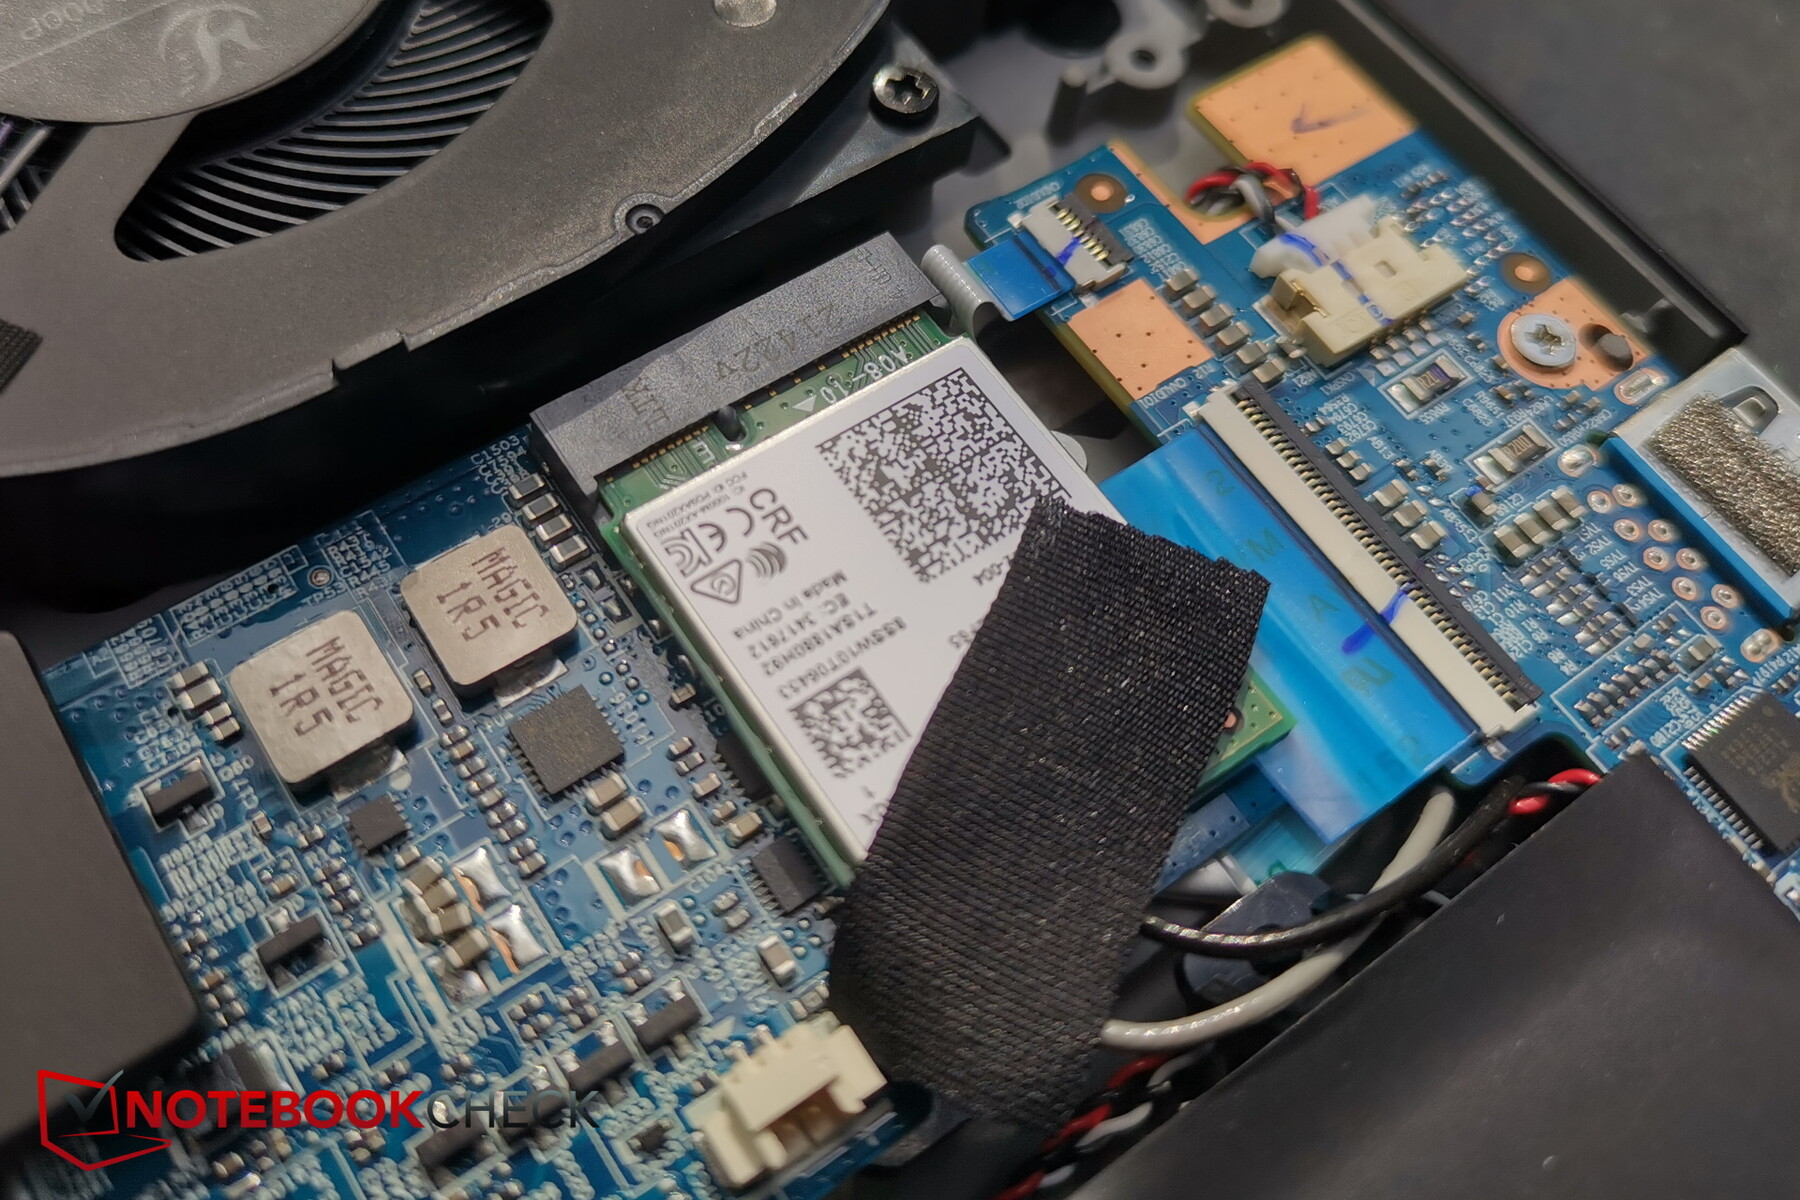
The installed Intel AX201 module offers fast transmission rates in the 2.4 and 5 GHz range, but is not yet capable of using the new 6 GHz Wifi 6E network. Under testing, the device repeatedly had problems finding the 5 GHz network of our reference router, which often failed to appear in the list of available Wi-Fi connections.
Upon detection, the connection was stable and also pleasingly fast at approximately 1,600 Mbit/s.
Webcam
Schenker makes use of a 1080p webcam. A fundamentally welcome feature, but the quality is rather mediocre despite FullHD resolution, and color deviations are quite high.

 GeForce RTX 3080 Ti Laptop GPU, i7-12700H, Samsung SSD 980 Pro 1TB MZ-V8P1T0BW")
 GeForce RTX 3080 Ti Laptop GPU, i7-12700H, Samsung SSD 980 Pro 1TB MZ-V8P1T0BW")
Security
A Kensington port is available, as is TPM. However, the Neo does not offer features such as a fingerprint sensor, IR camera or similar.
Accessories & Warranty
In addition to the usual documentation, the Neo comes with a typical Schenker USB stick with drivers - practical. A large mouse pad is also included.
The warranty in Germany is 24 months, which includes pickup and return service. This may differ in other countries and regions, so be sure to check with your supplier before purchasing.
Maintenance
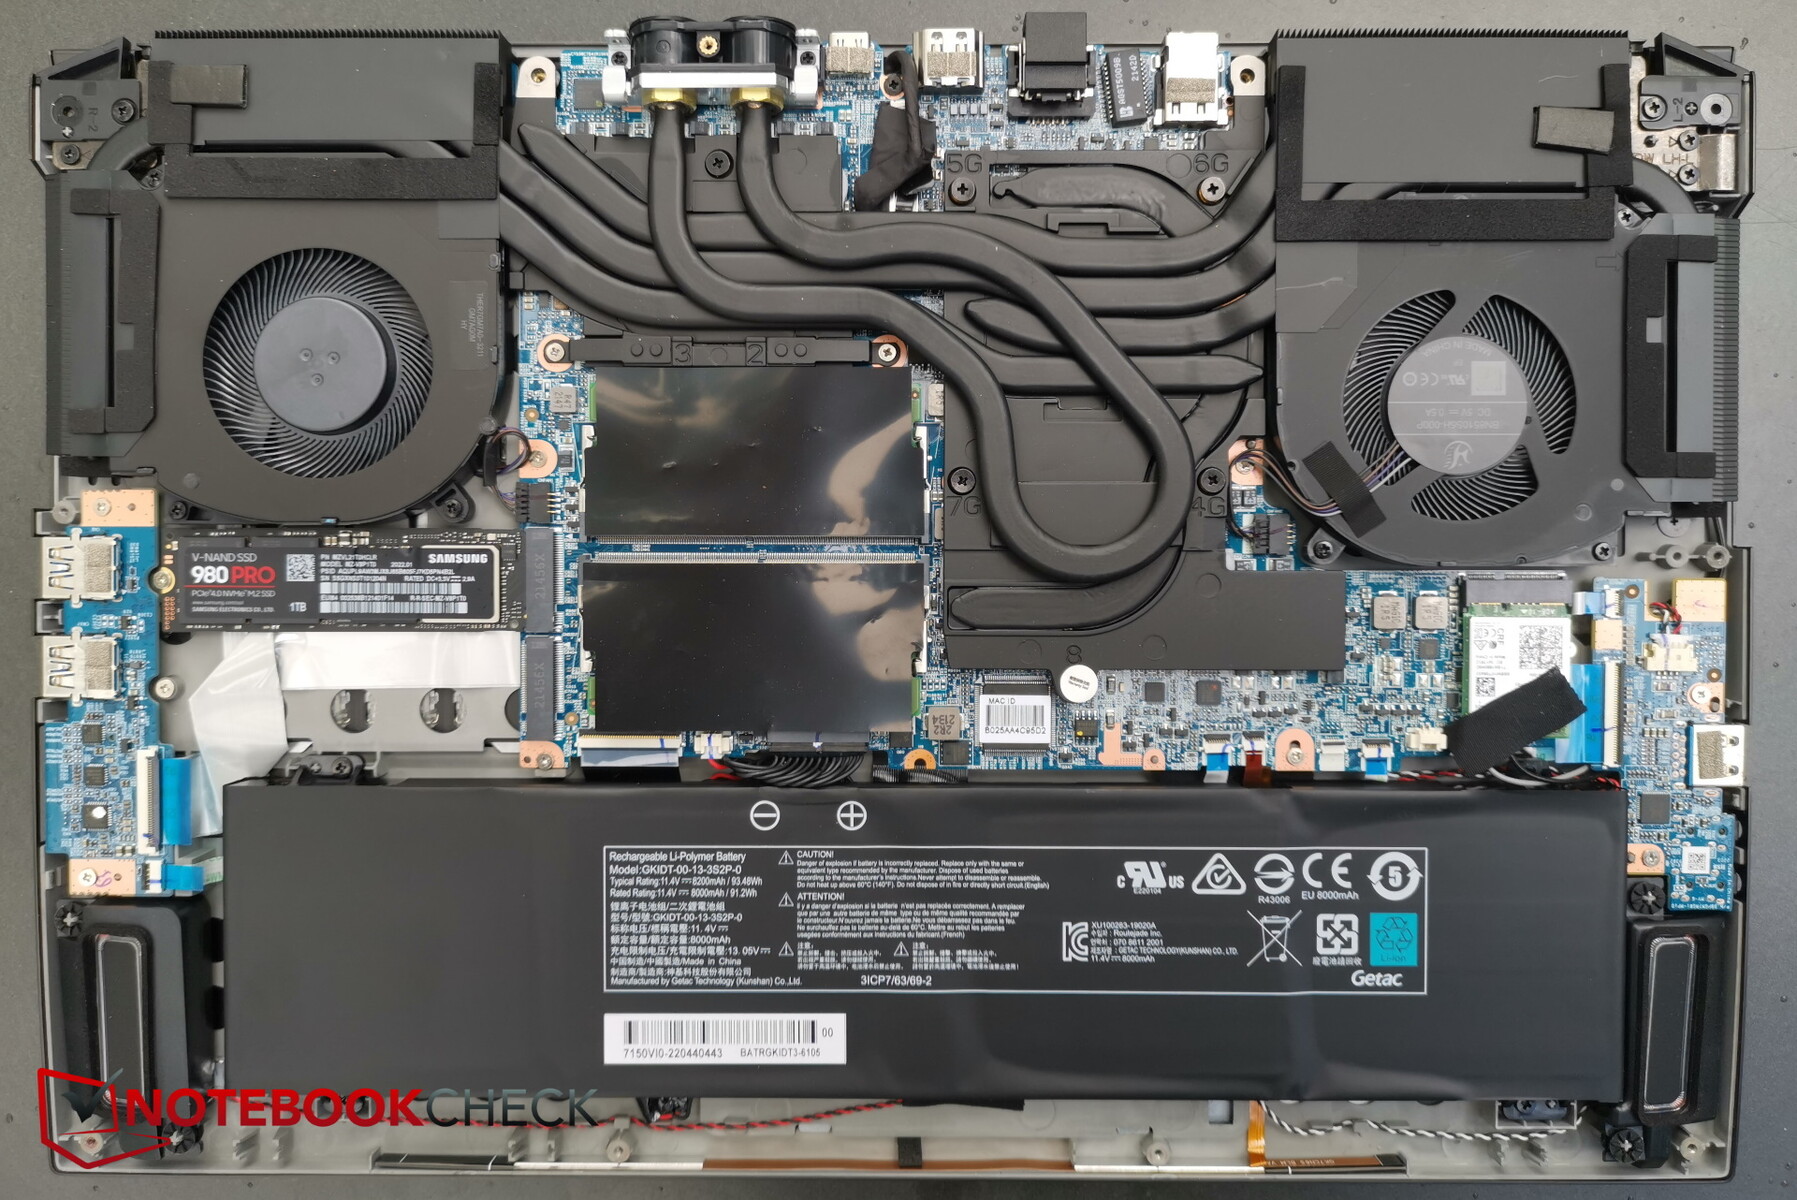
A total of 14 Phillips screws have to be removed in order to access the interior. Fortunately all have the same length, including the three at the liquid cooling port. Afterwards the underside can be levered off quite easily by hand, preferably from the lateral rear.
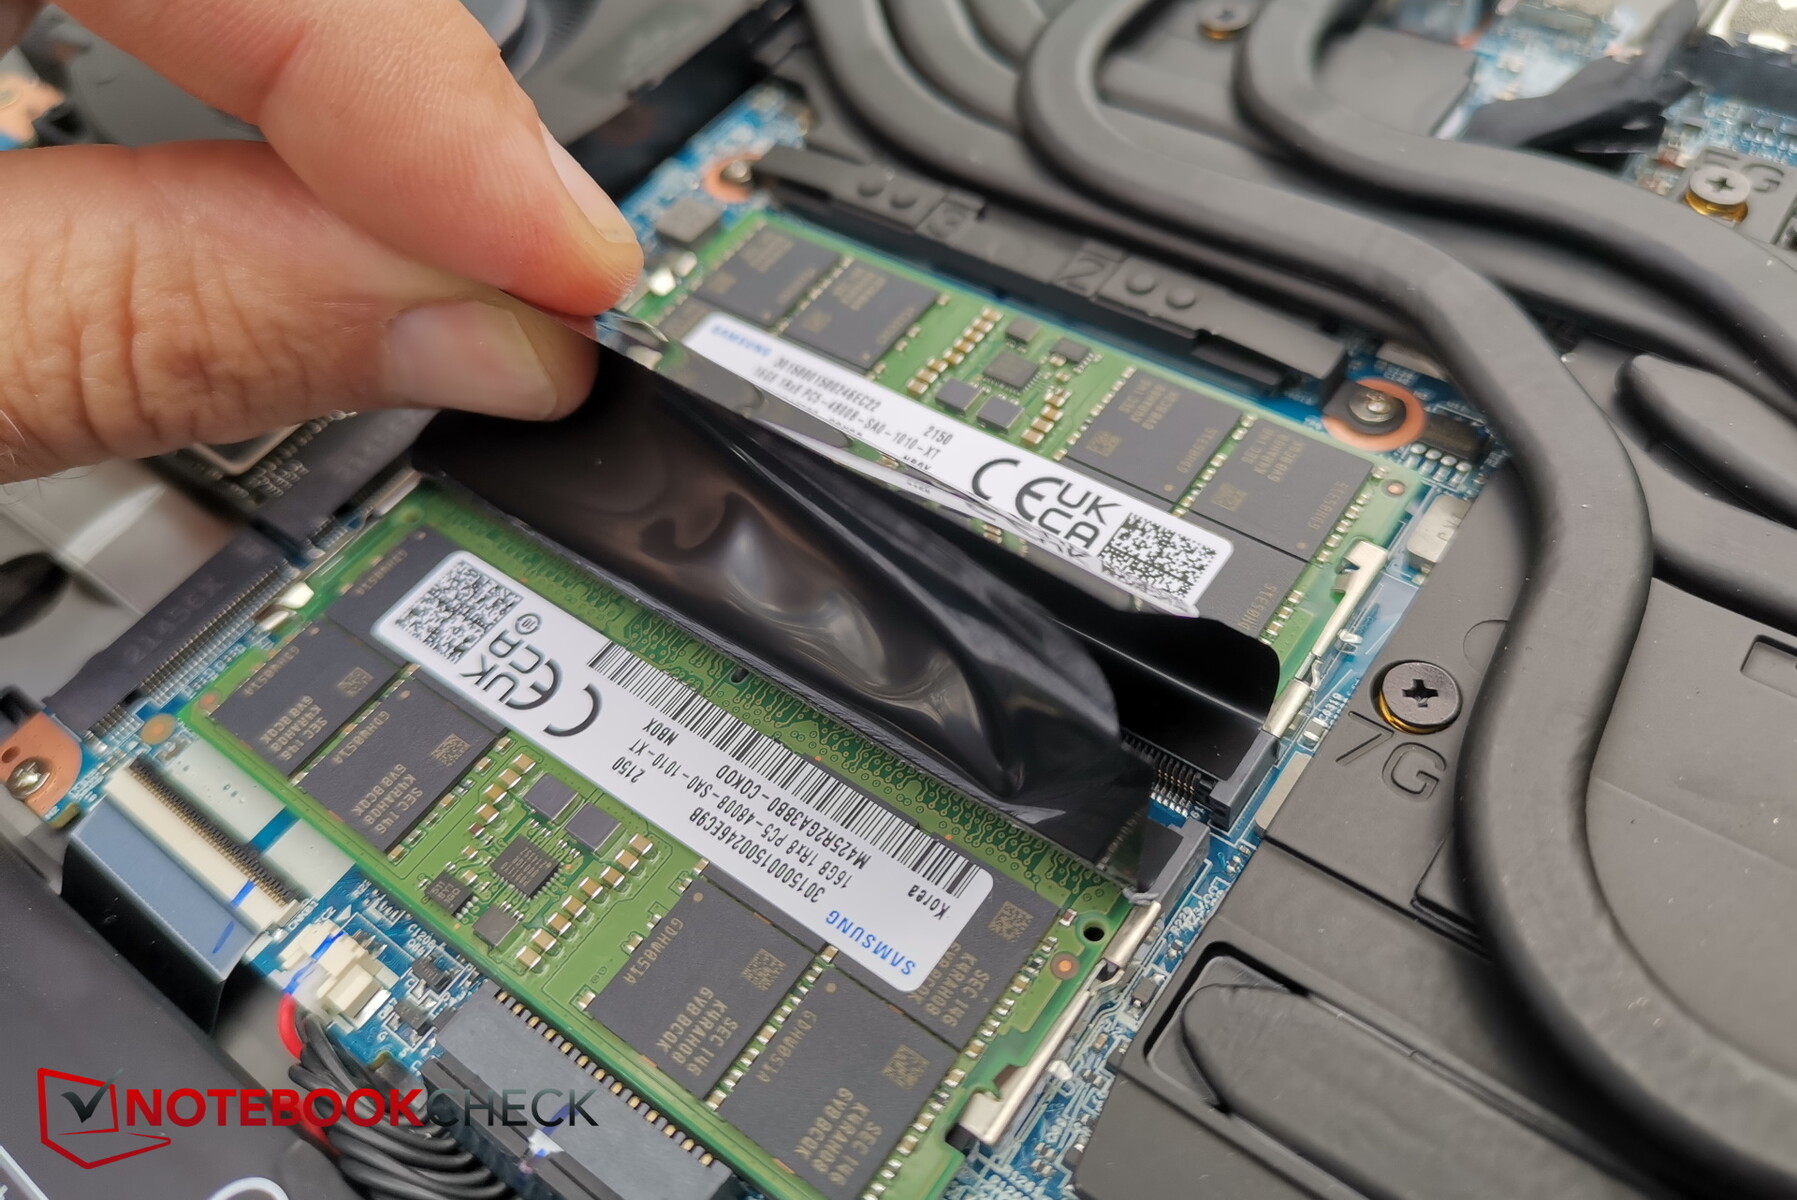
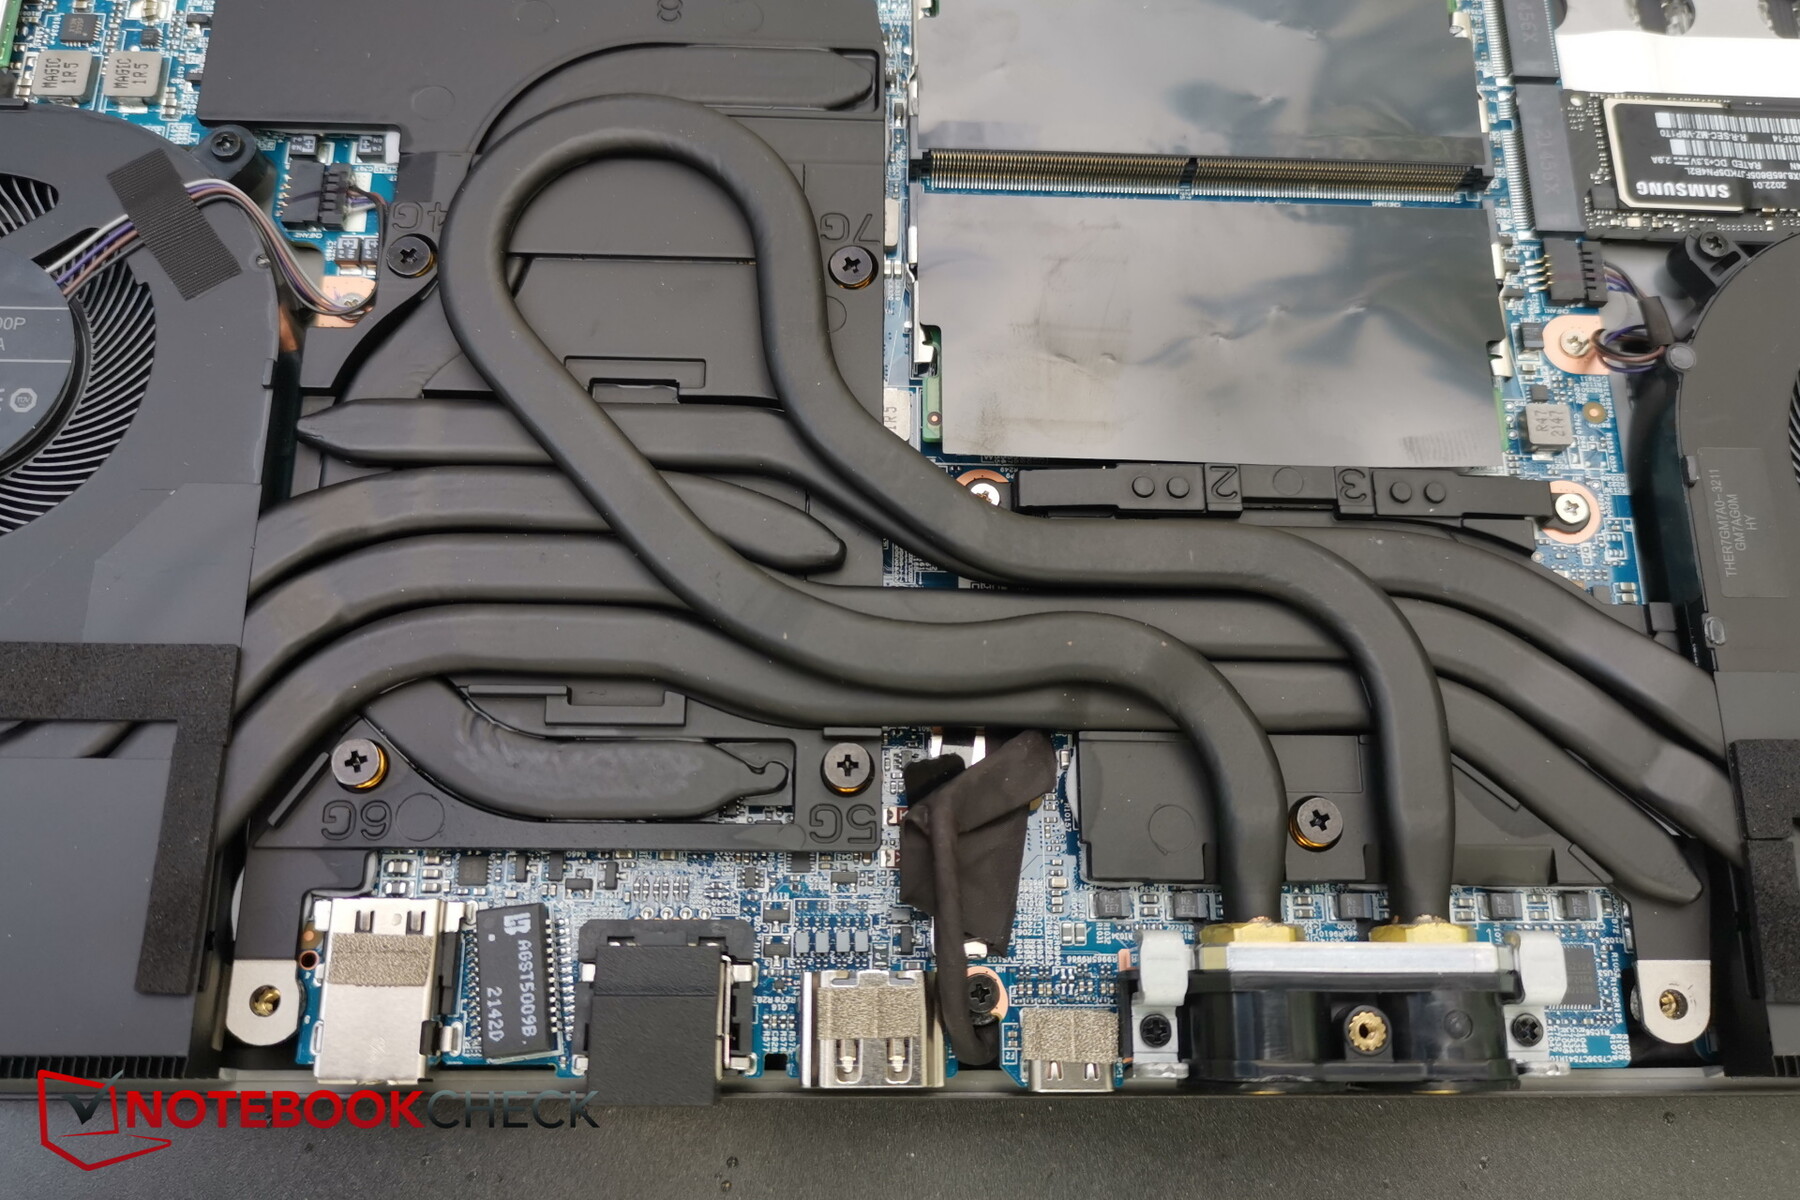
Once inside, you have access to the RAM, the SSD (incl. second M.2 slot), the fans, battery, the liquid cooling circuit and the replaceable Wifi module.
Input devices: Optomechanical keyboard
Keyboard
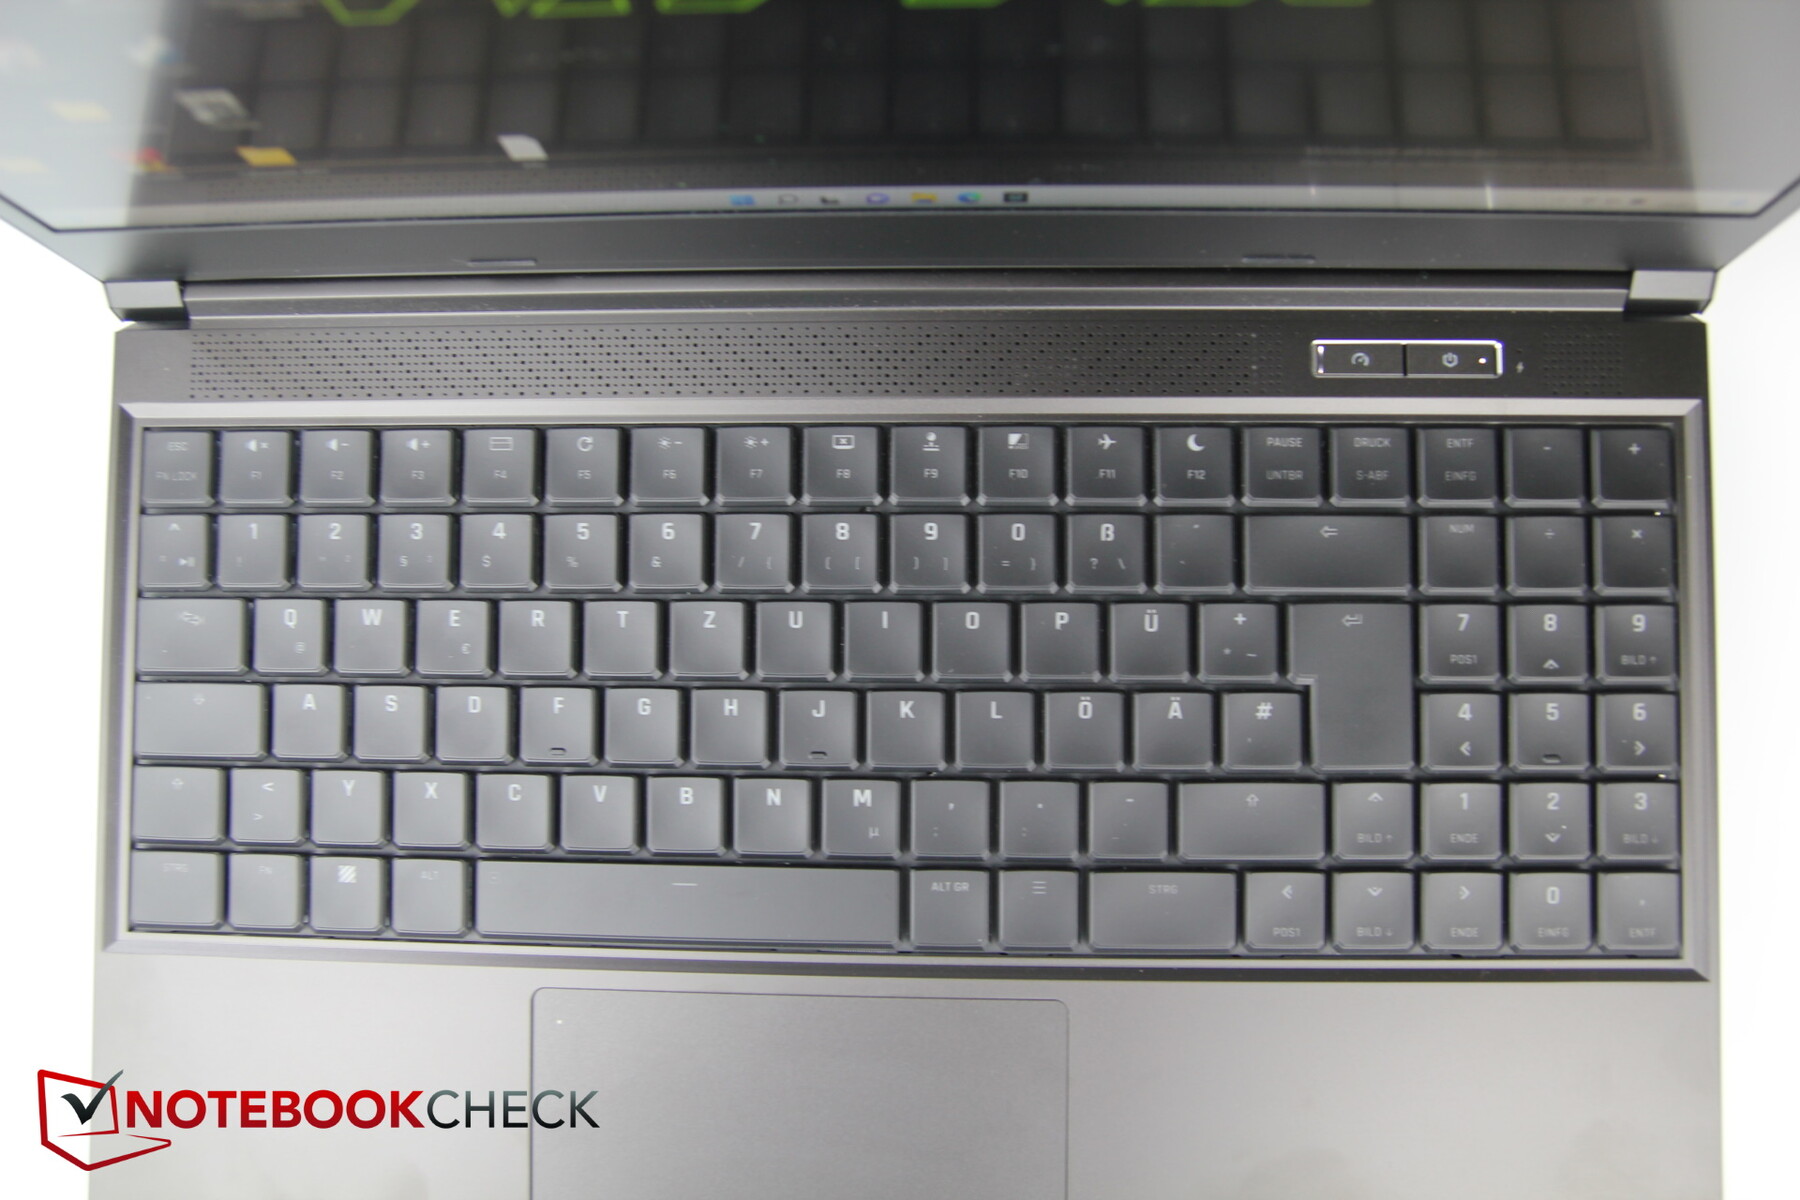
The keyboard takes up the entire space of the 15-inch base, at least in terms of width. This makes for a successful normal-sized keyboard design with good spacing between keys as well as a numpad on the right. The extremely tidy layout is pleasing: even the arrow keys are of a decent size and everything seems to be exactly in the right place.
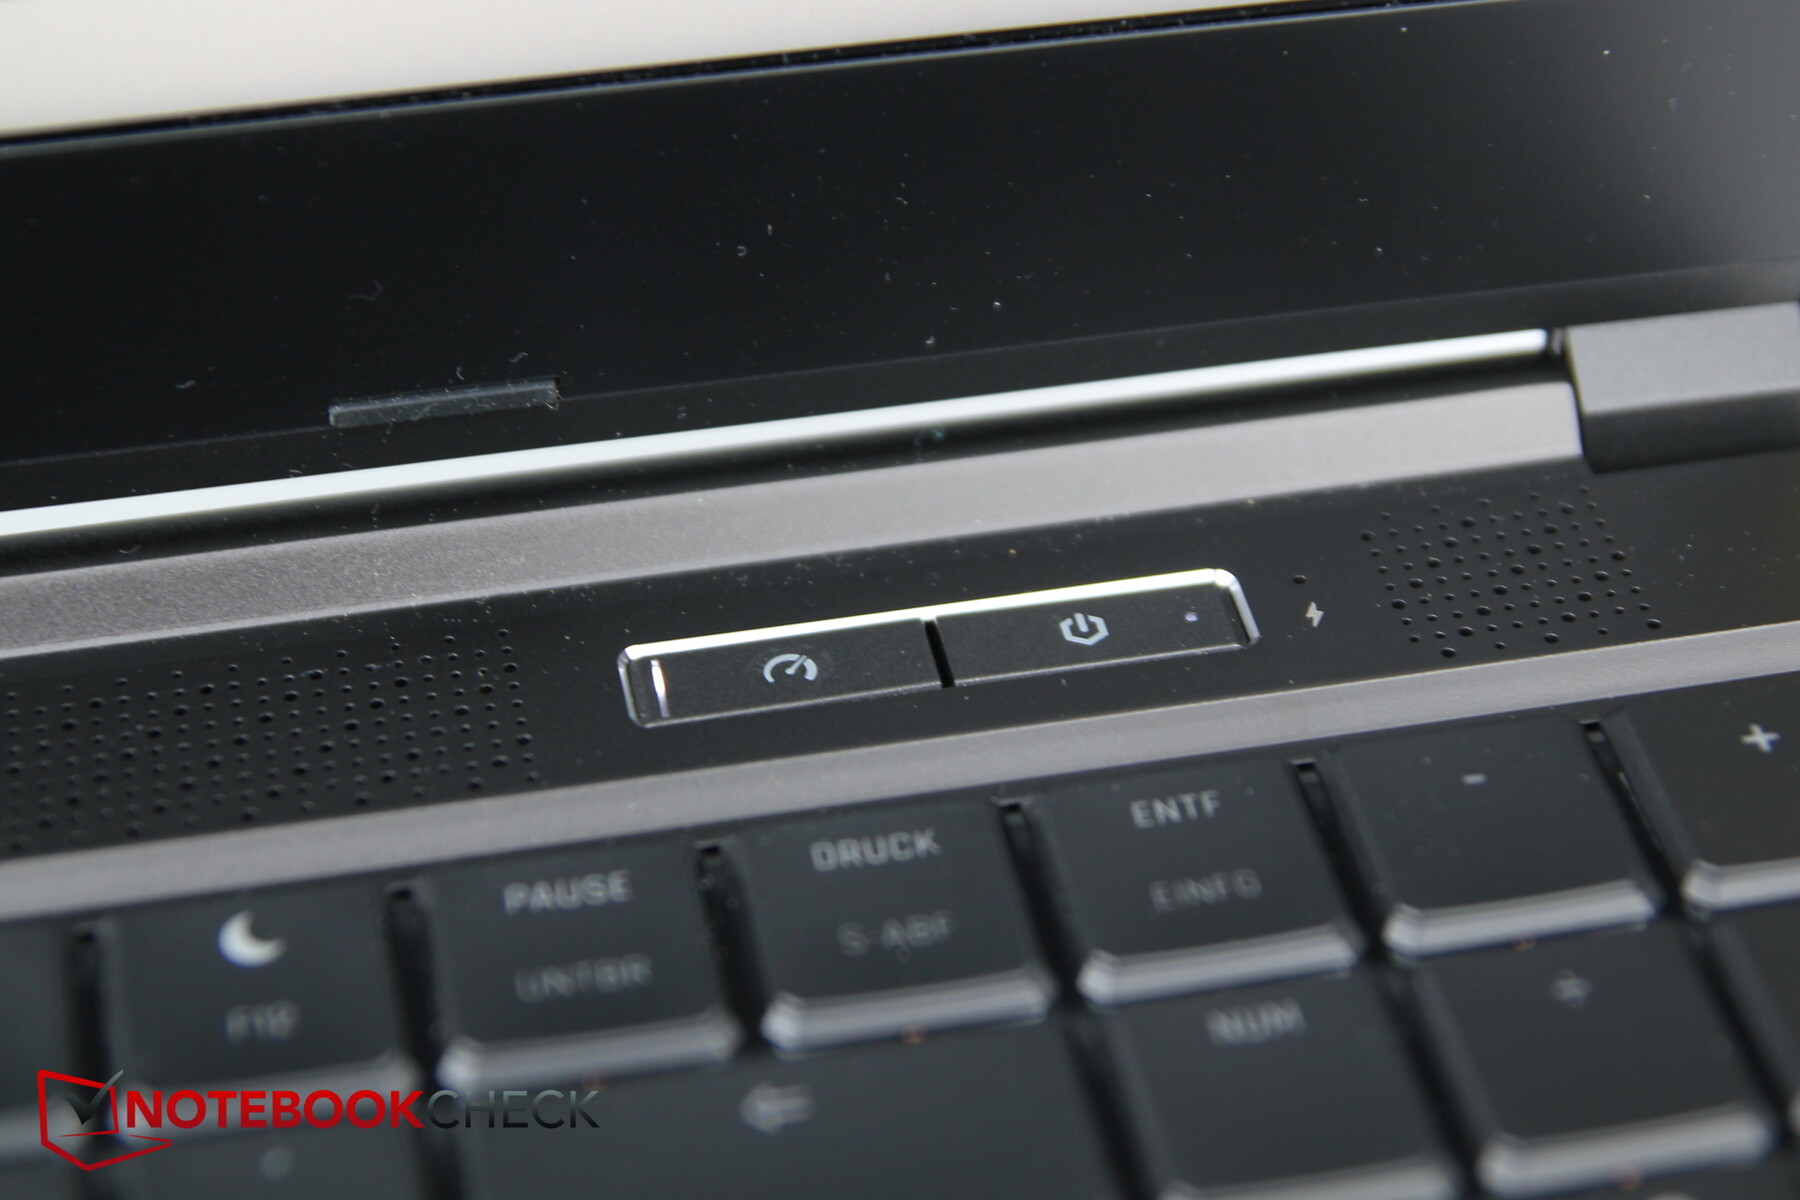
The power button is designed as an extra key above the keyboard and next to it is another key that switches through the performance modes. Oddly, the "End" key is located as a secondary function on the right arrow key, as well as directly above it on the "1" of the numpad, so the two are directly on top of each other. It took us a while to find the key for the keyboard lighting, for which the symbol is tiny and is on the upper left corner of the space bar.
The lettering is relatively small overall, but mainly kept in a dark tone, which means that it is sometimes unrecognizable during the day in suboptimal lighting conditions - brighter and/or larger lettering would be helpful here.
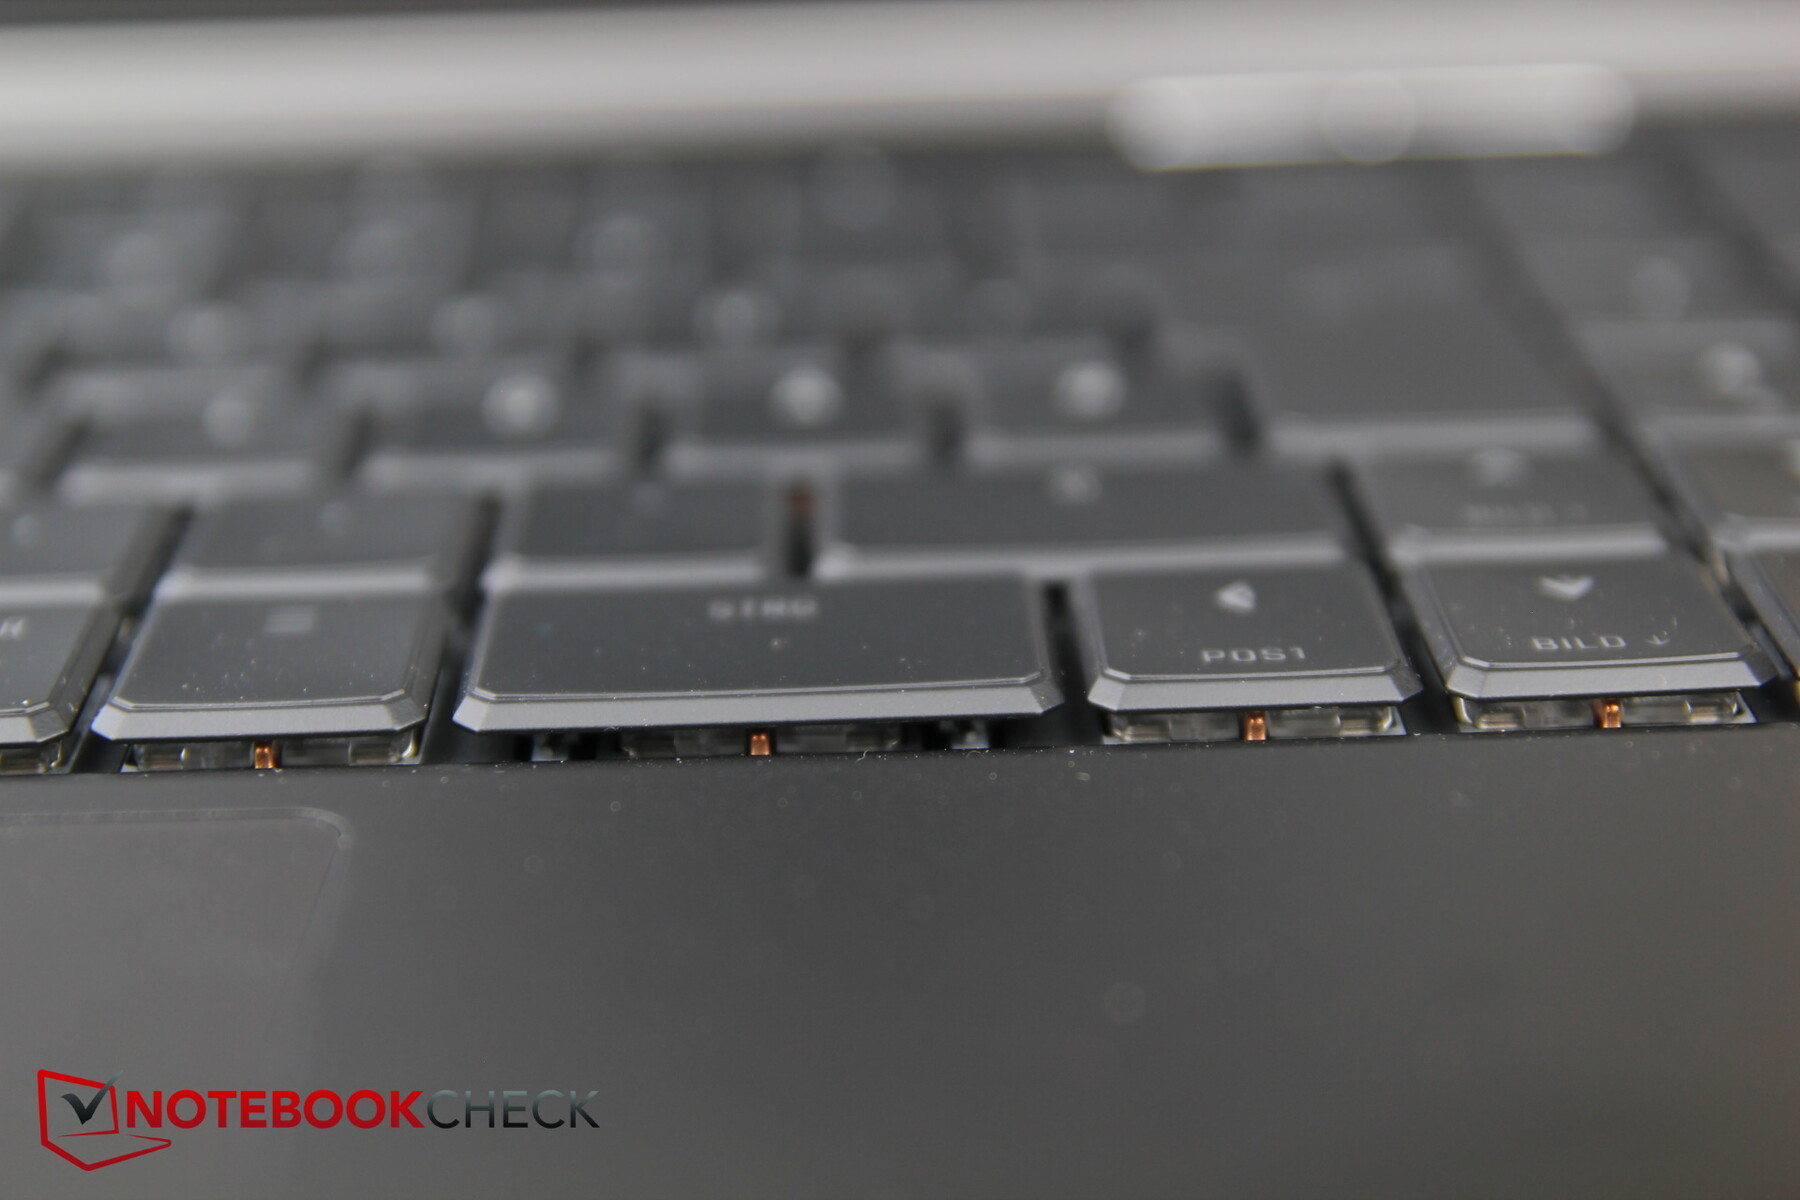
The optomechanical keys have a good typing feel, the travel is 2 mm and the feedback is pleasant. Typing noise is only slightly higher than on "normal" keyboards, but significantly lower than on purely mechanical keyboards. The keycaps are very thin. You can see under the caps and thus catch glimpses of the underlying mechanics.
Each key can also be individually illuminated, and any special functions of a key are also dimly illuminated.
Touchpad
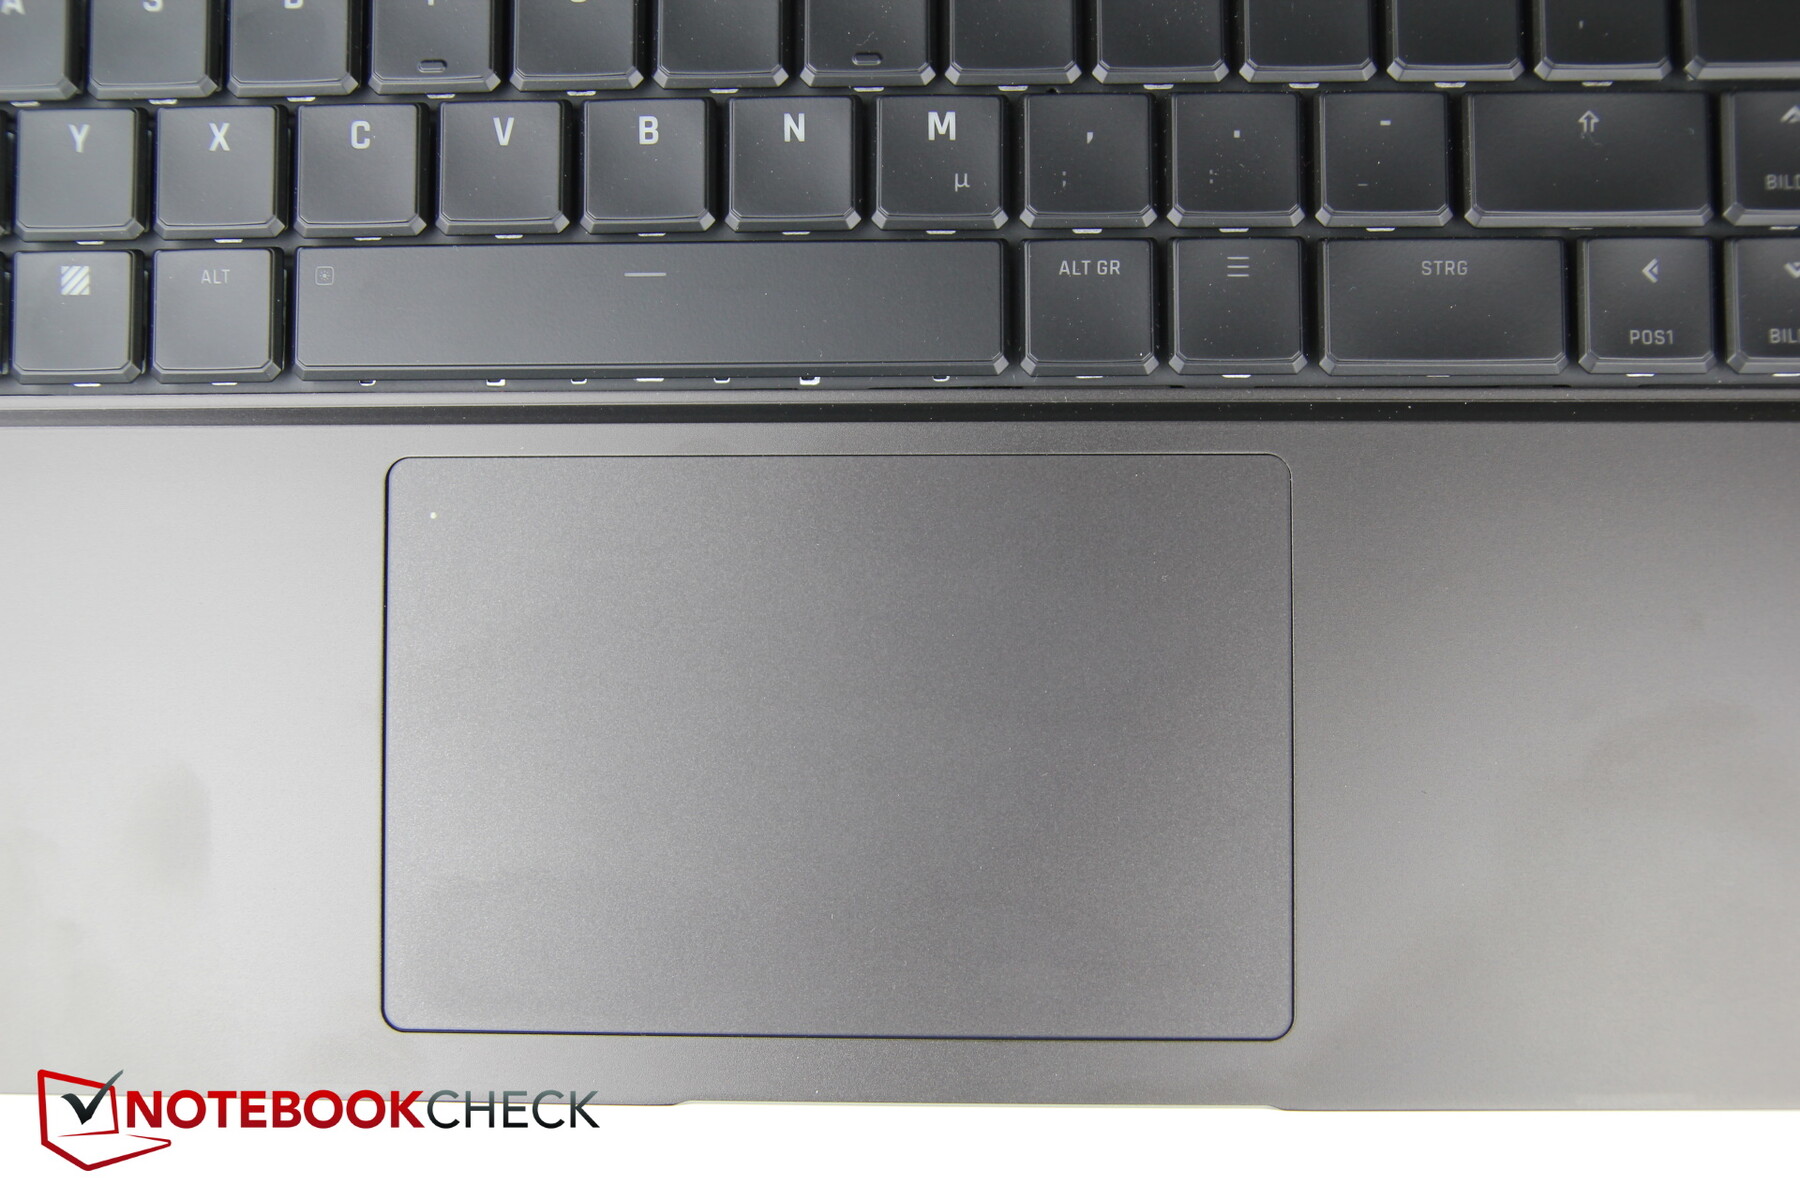
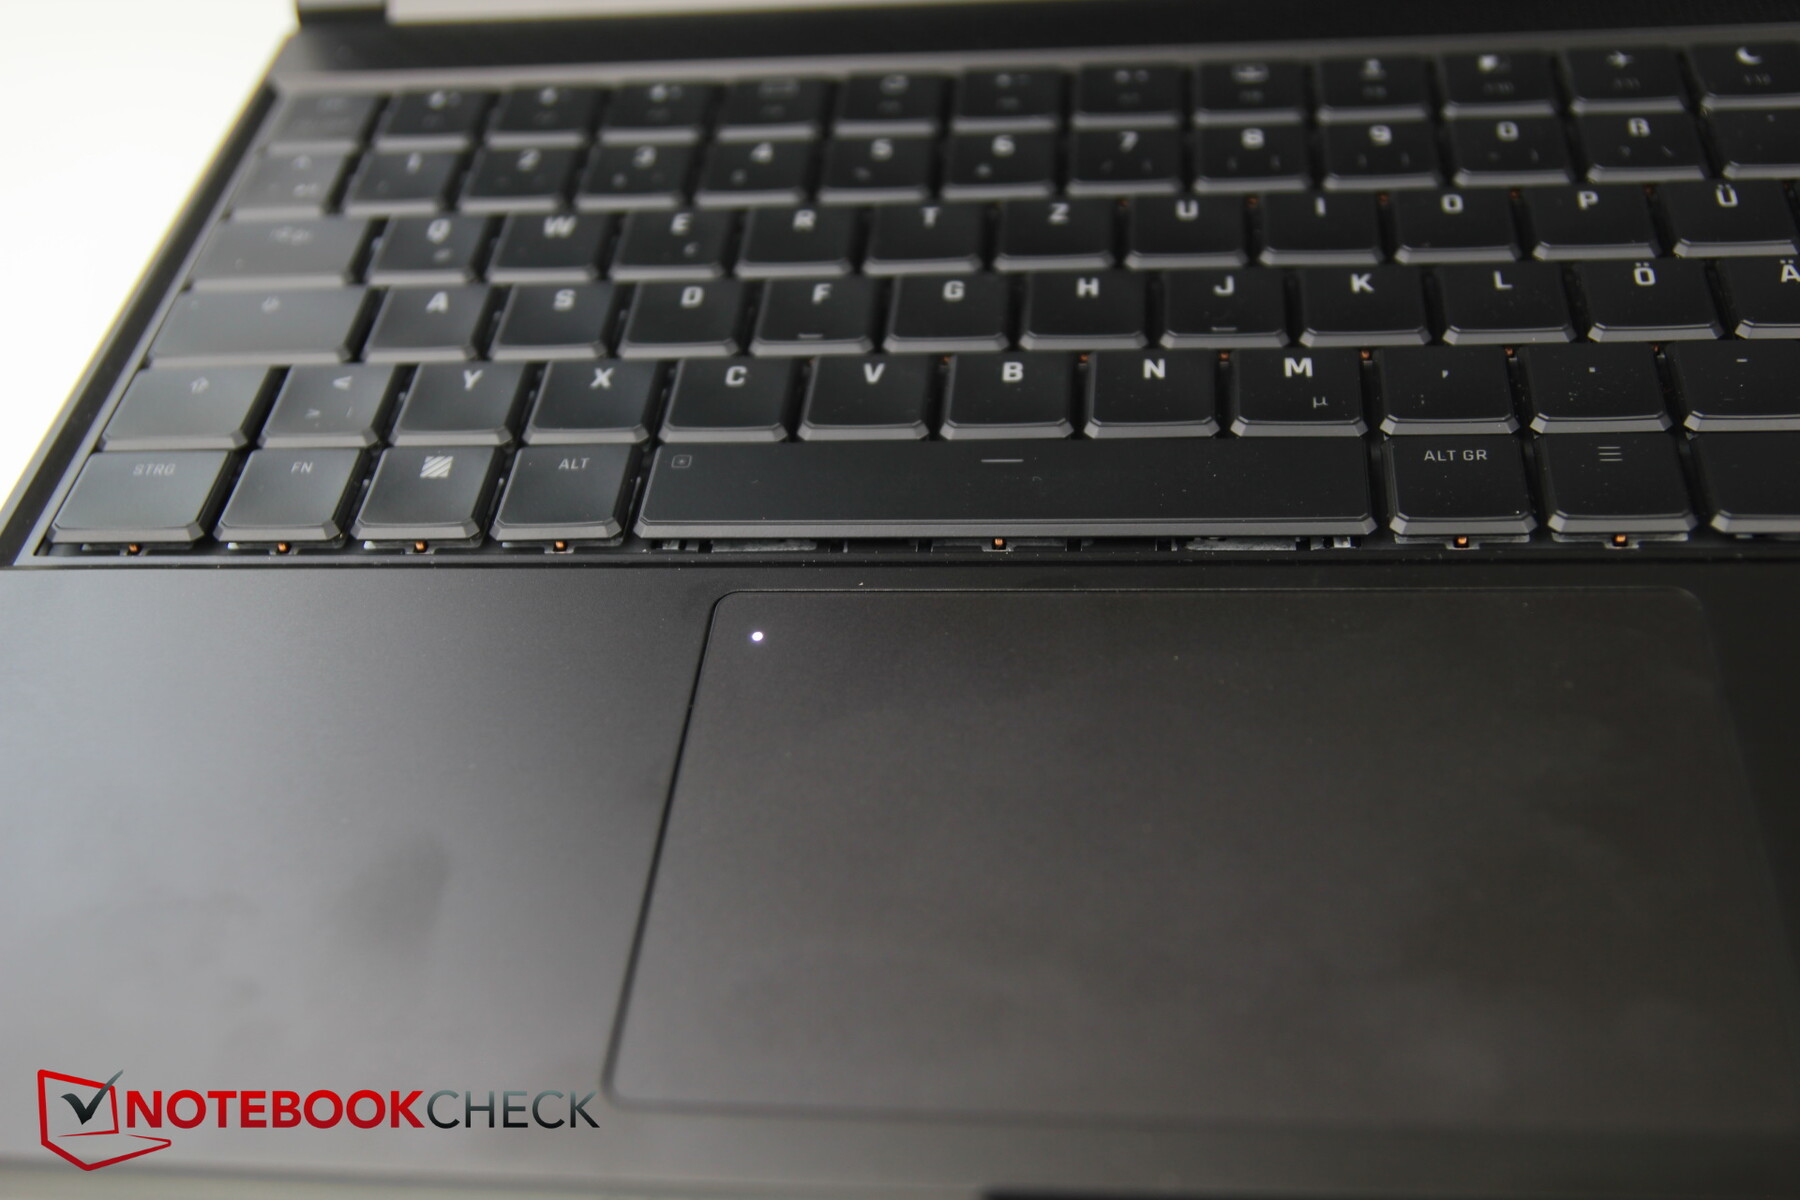
The touchpad measures around 11.6 x 7.4 cm, so it is quite large. A white mini-LED in the upper left corner indicates whether it is (de-)activated. The surface is very smooth and does not cause stutters even during slow movements.
Schenker relies on integrated keys, which want to be pressed quite firmly, give clear feedback, are moderately loud, but sometimes simply do not execute the desired function. Occasionally, several clicks in a row did not work, but a subsequent click via a finger tap on the pad did.
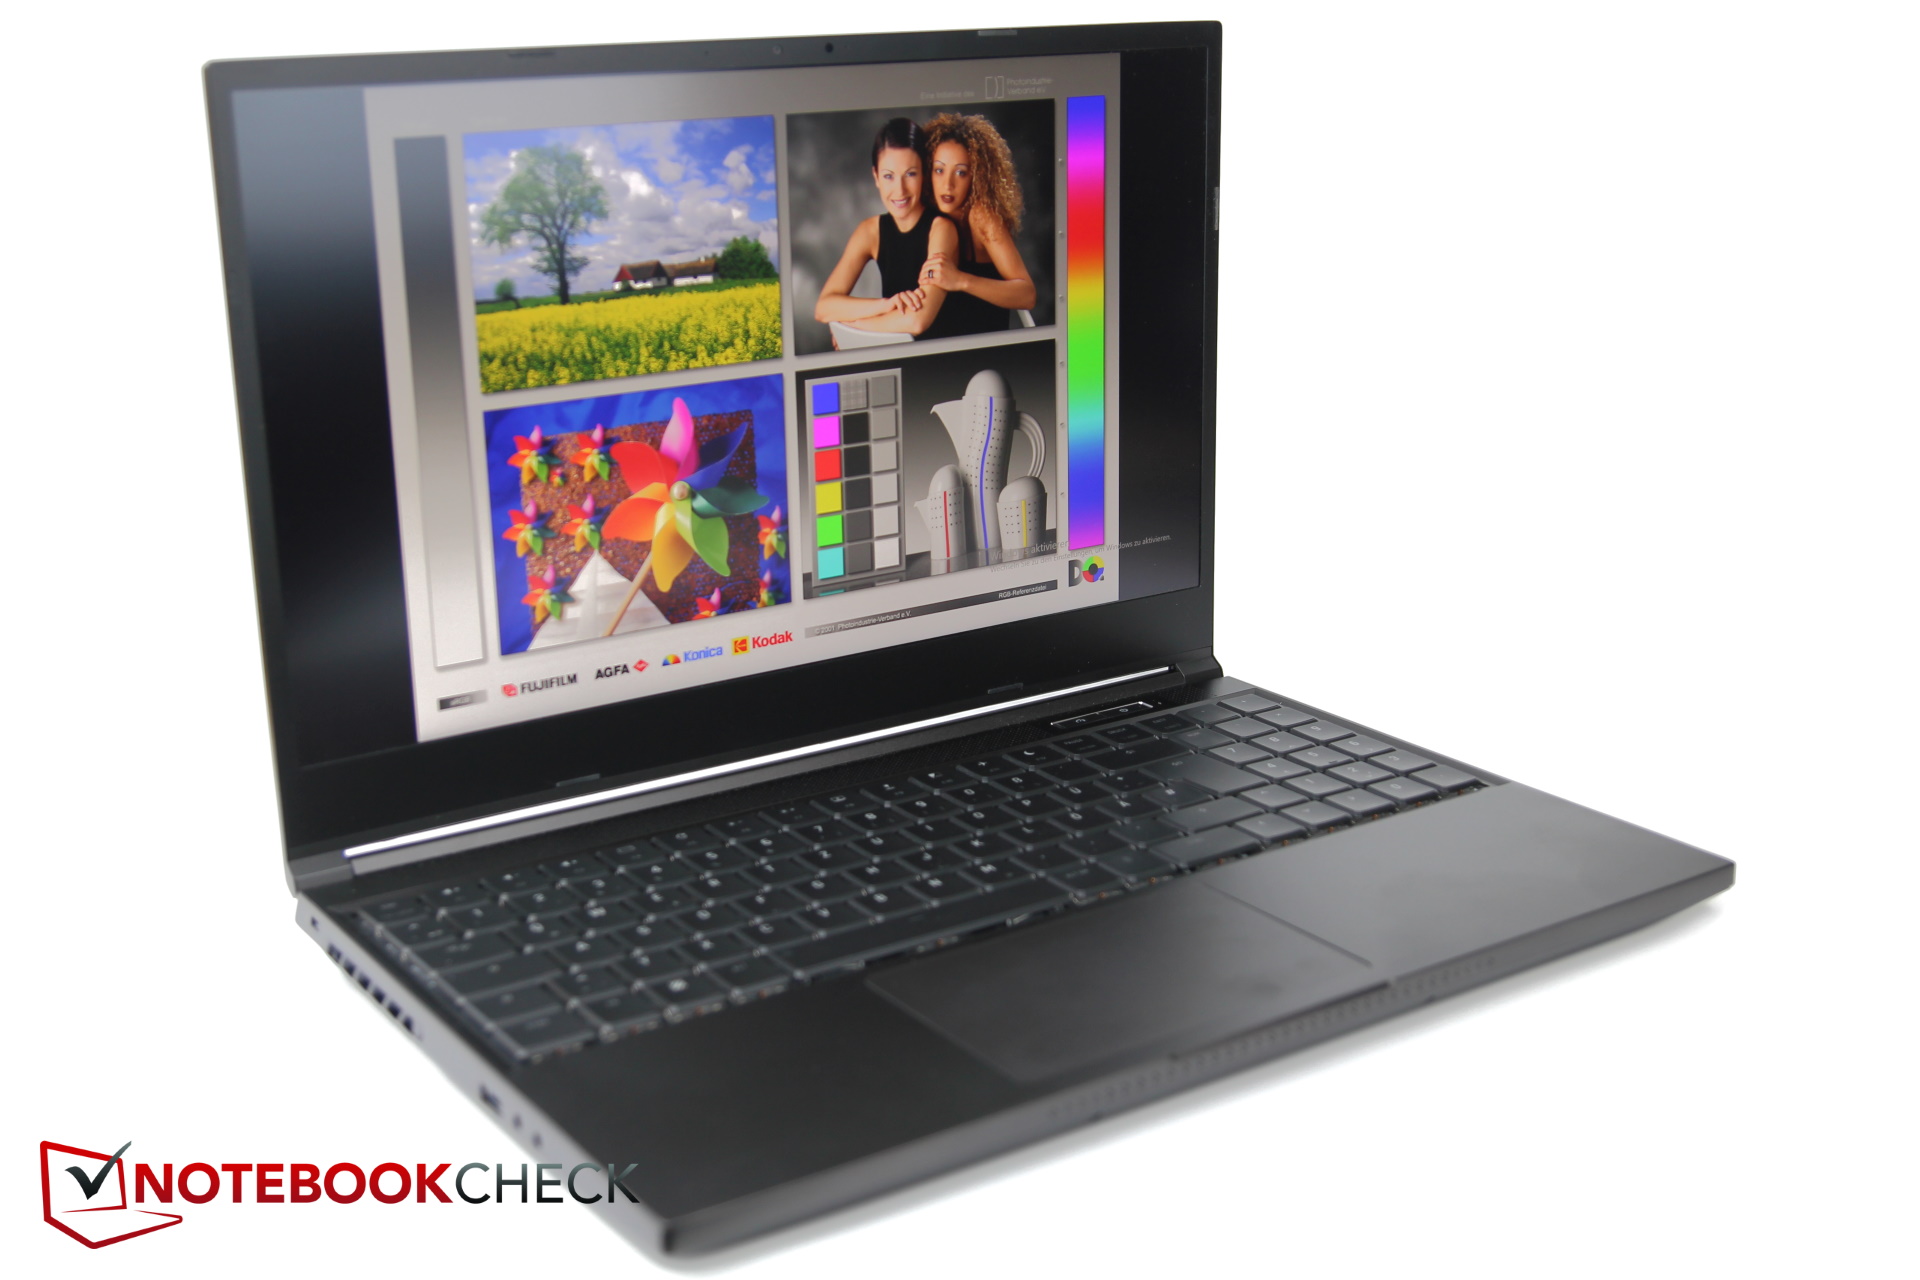
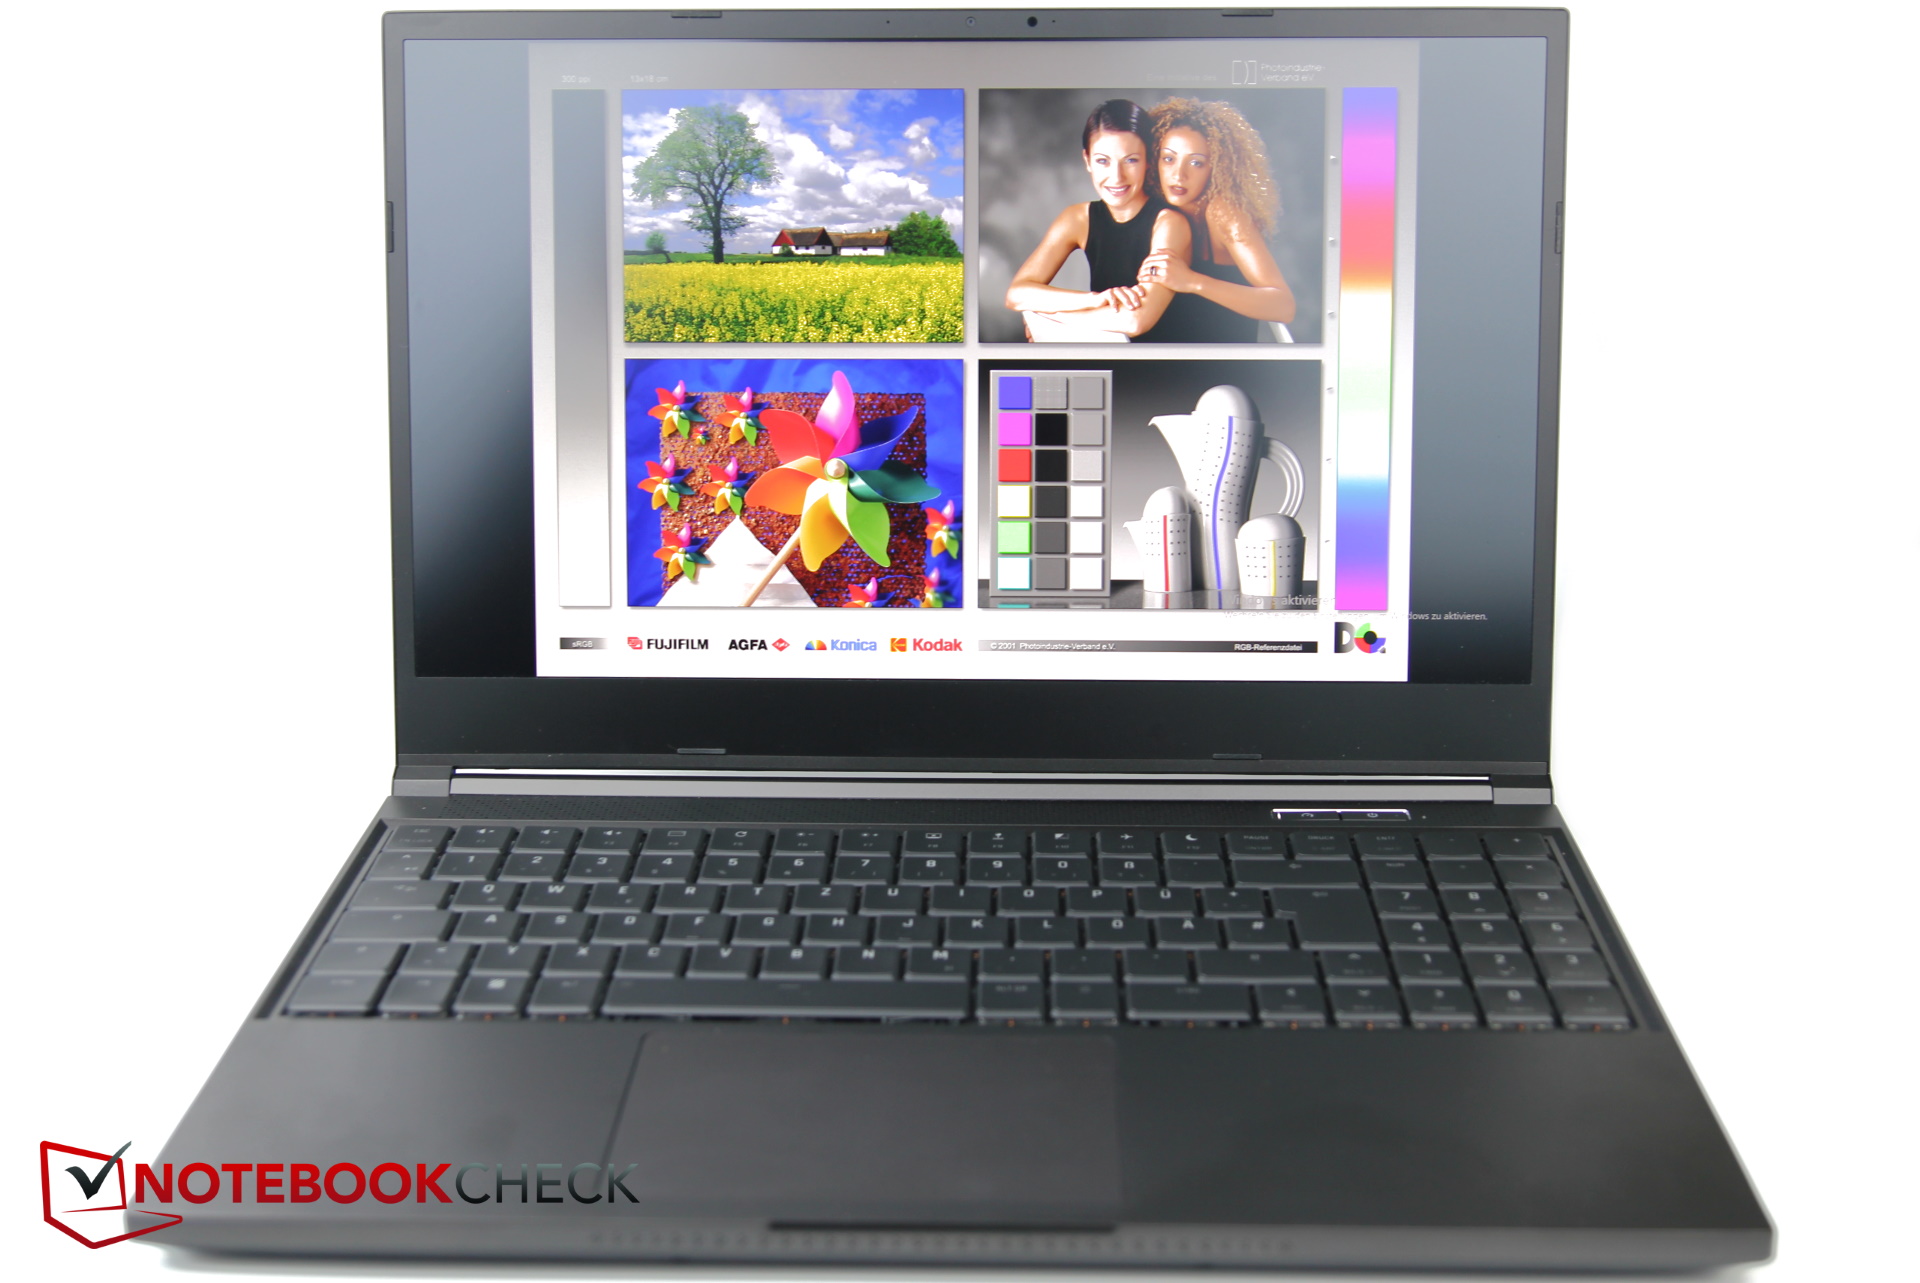
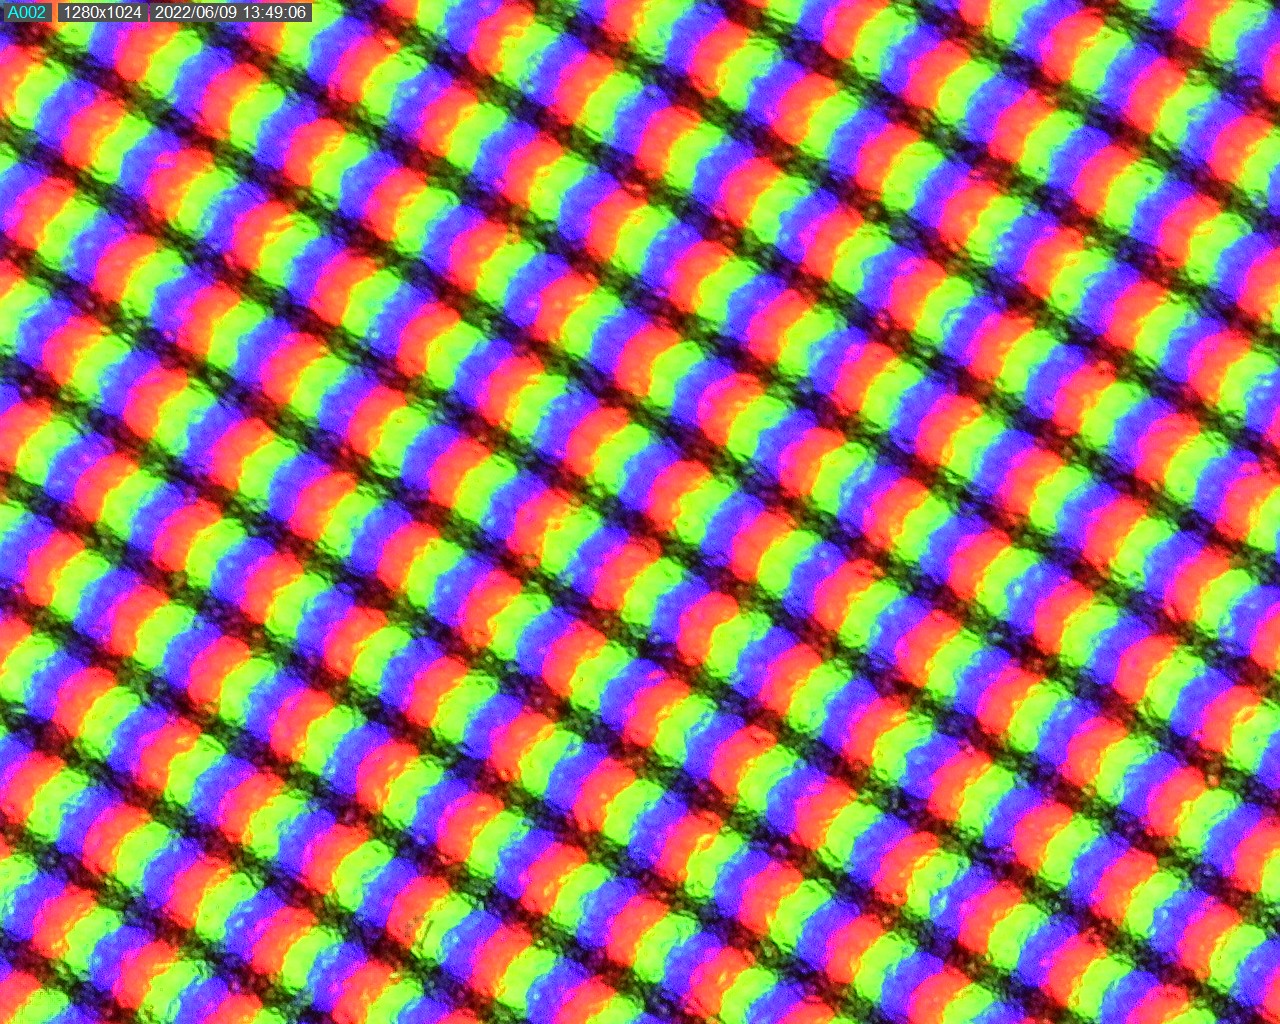
Display: QHD at 240 Hz and complete sRGB coverage
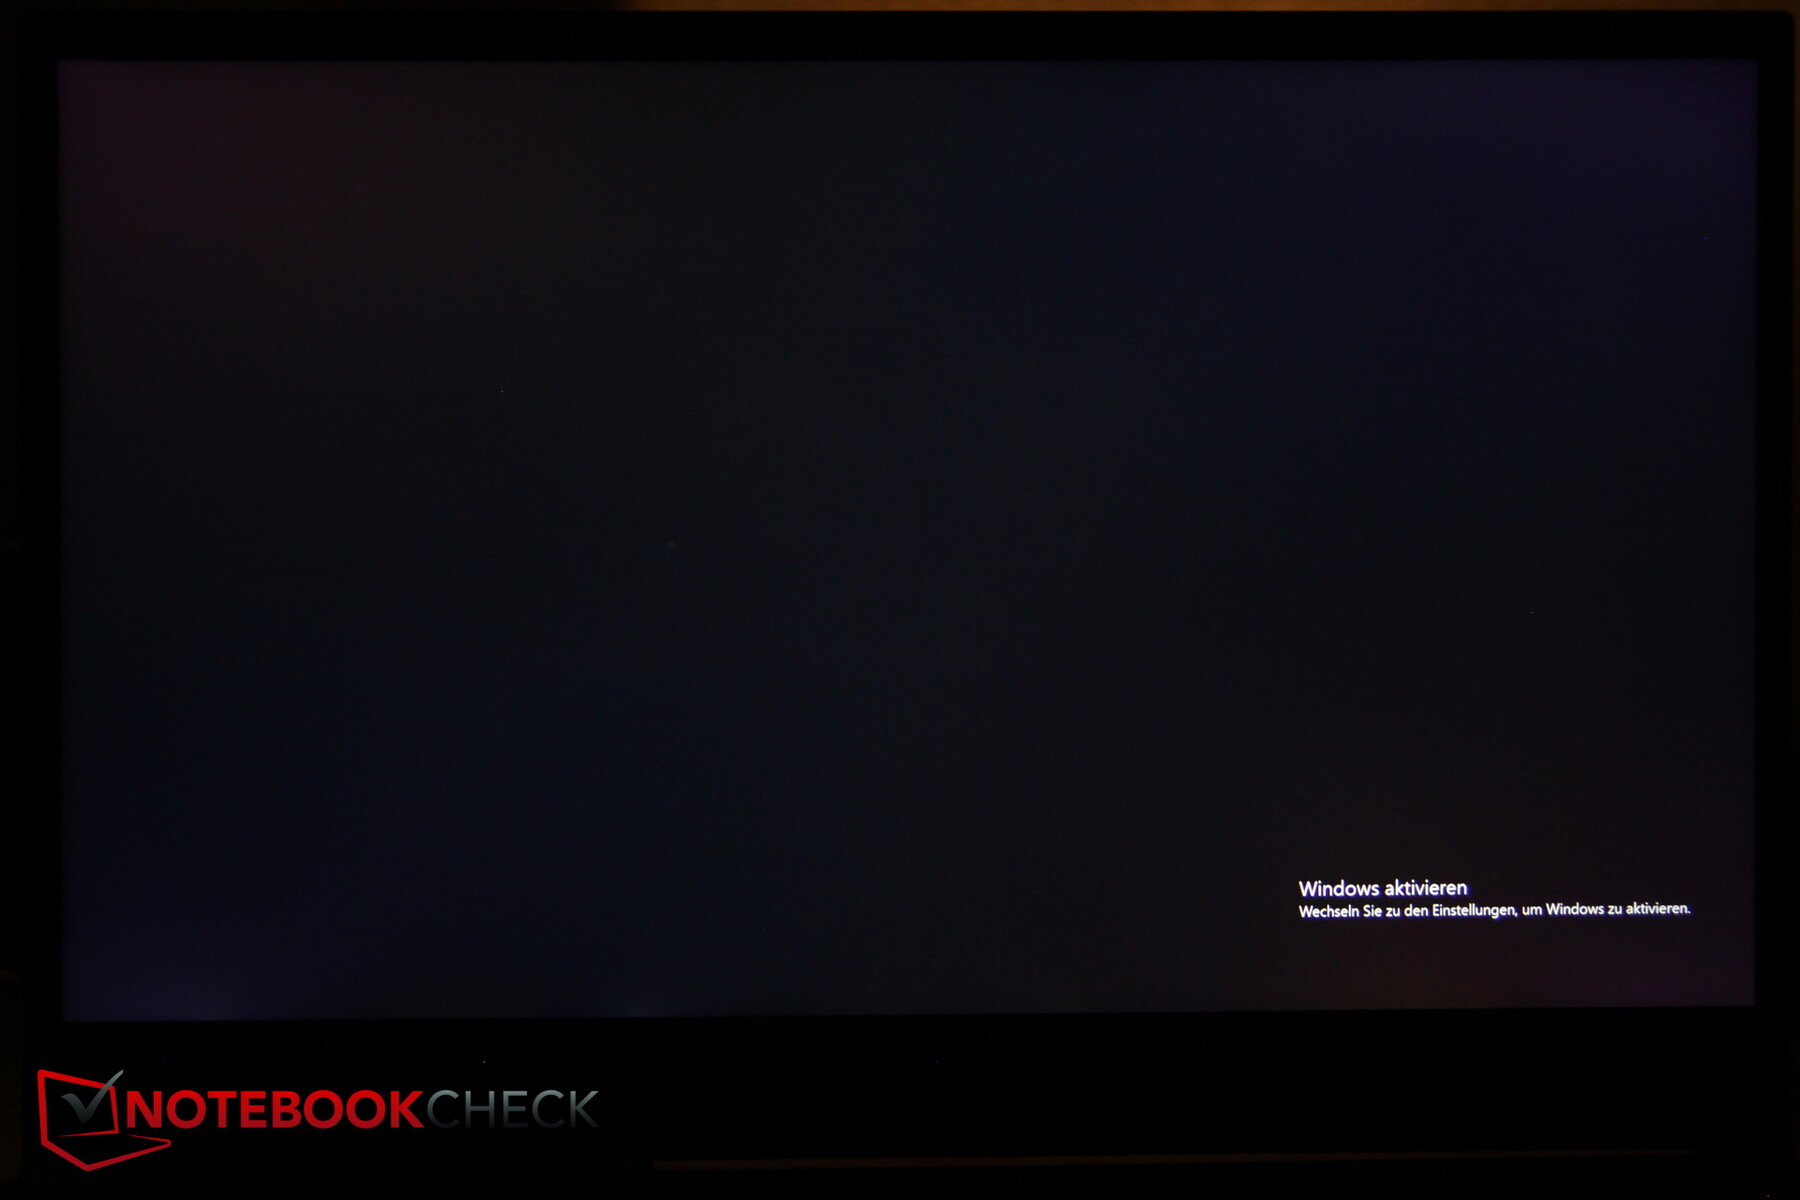
A matte QHD IPS panel from BOE with a refresh rate of 240 Hz is installed. The panel brightness is over 300 nits, but the distribution could be better, especially towards the lower left corner where the brightness decreases more strongly. Black level and contrast are average.
Screen bleeding is only minimally visible in the lower corners, and PWM is not used for brightness control. The response times are satisfactory at around 10 ms.
| |||||||||||||||||||||||||
Brightness Distribution: 81 %
Center on Battery: 365 cd/m²
Contrast: 1141:1 (Black: 0.32 cd/m²)
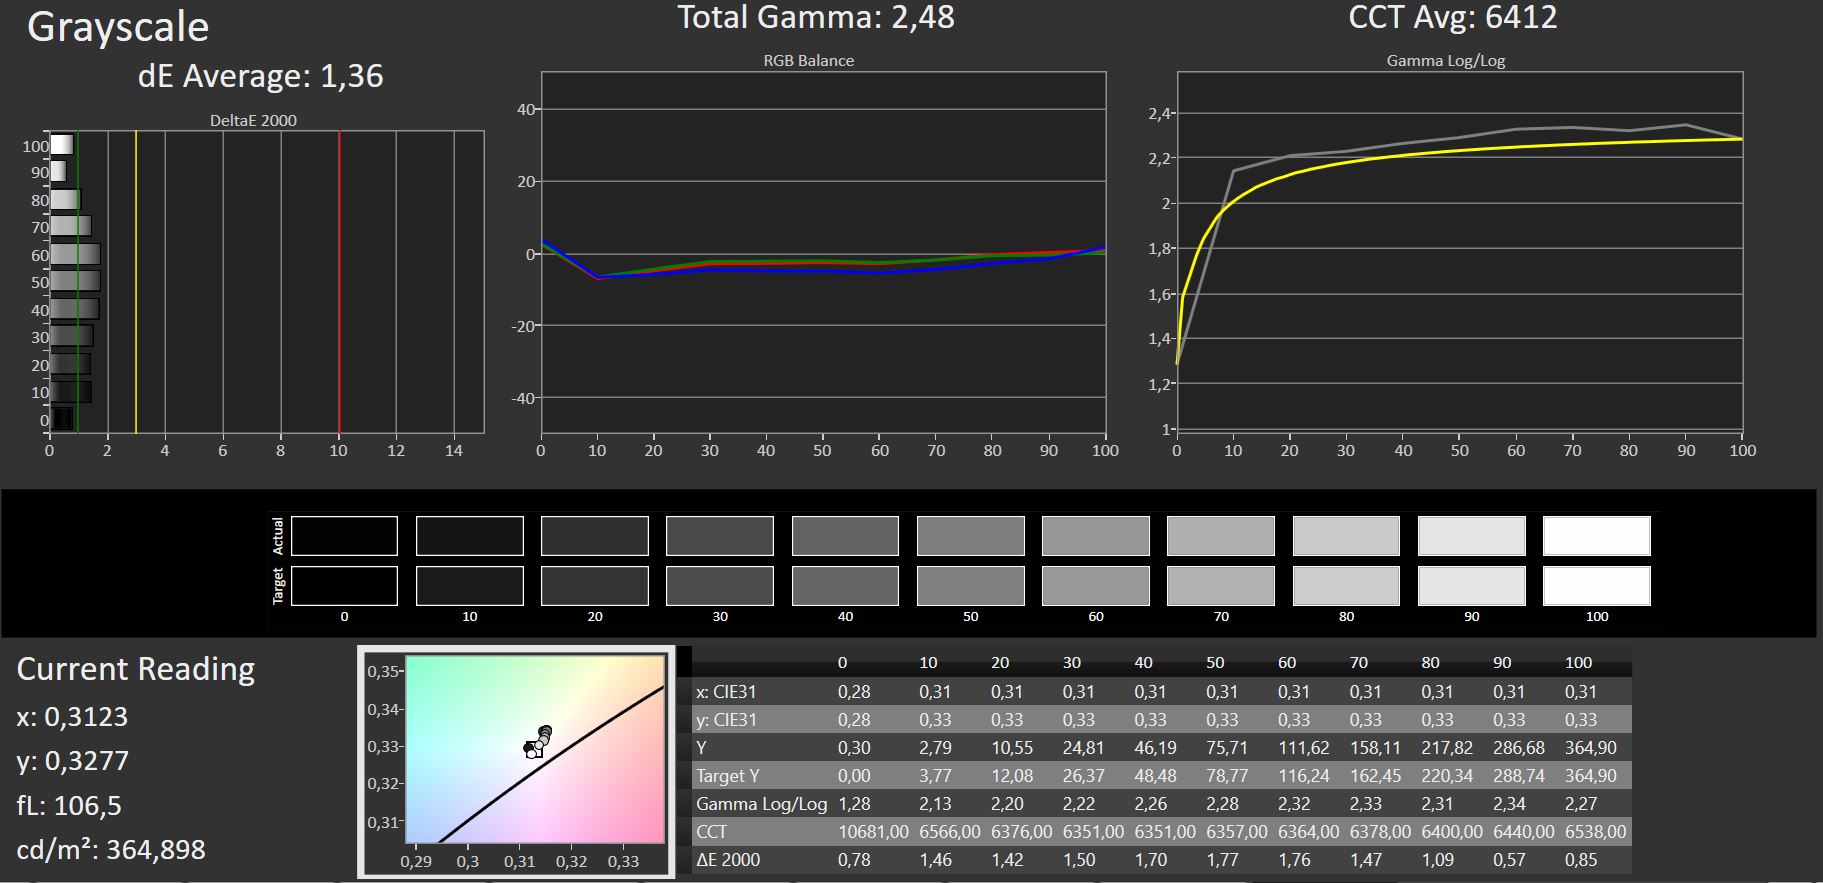
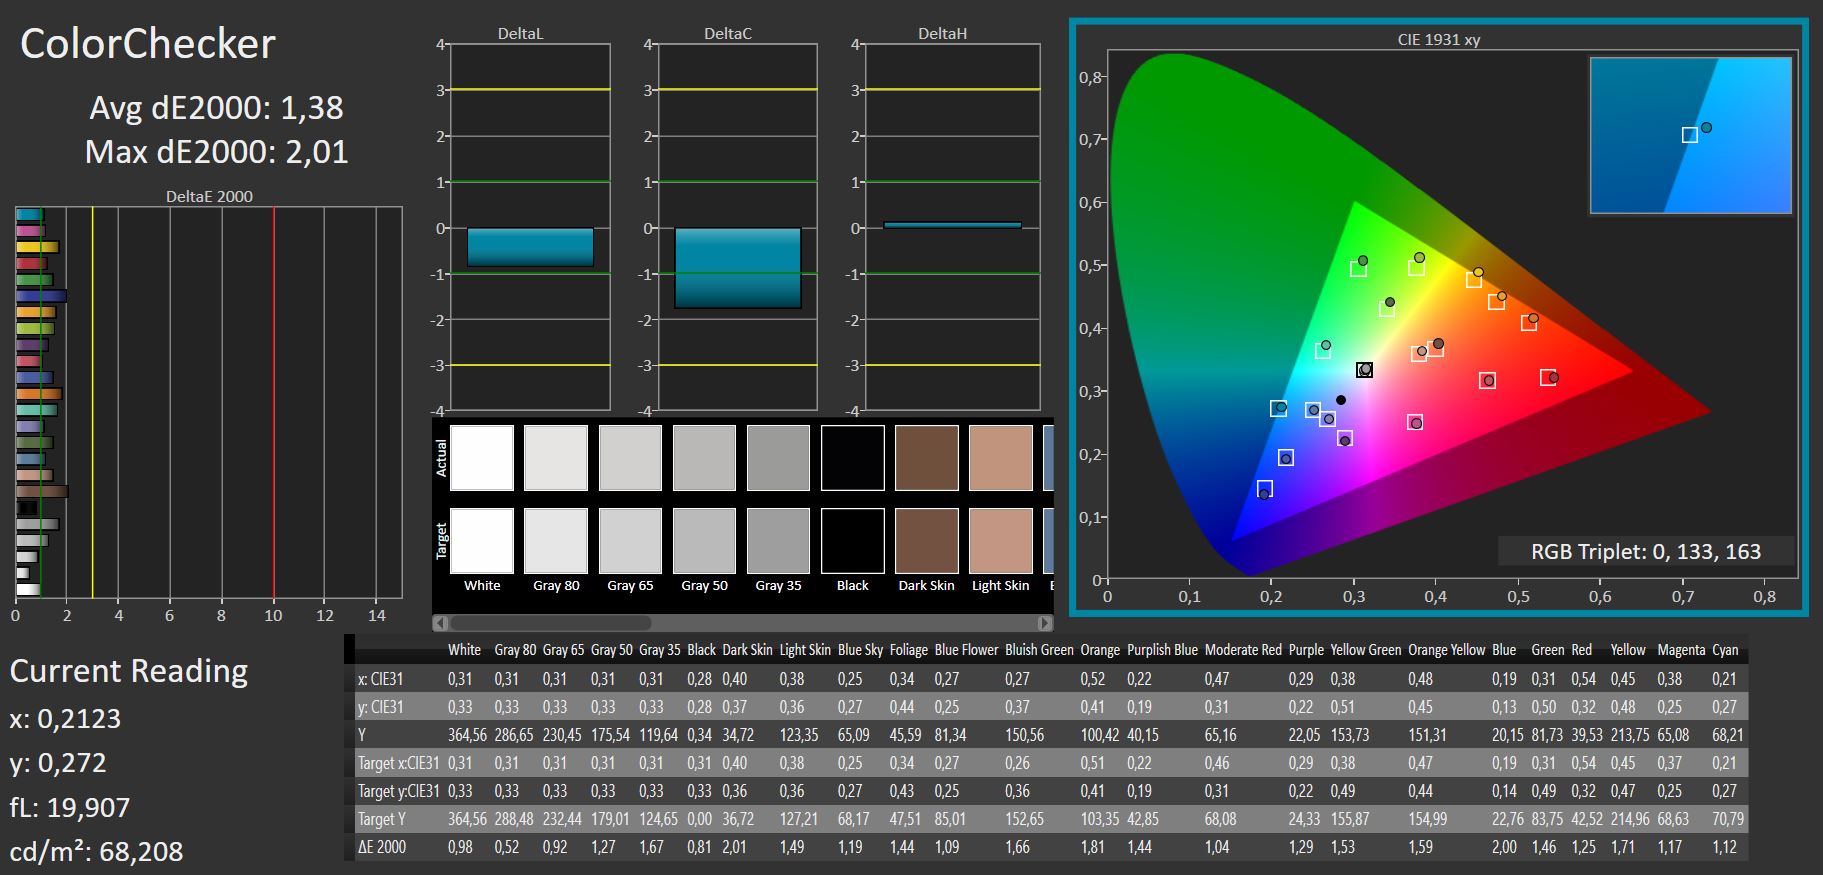
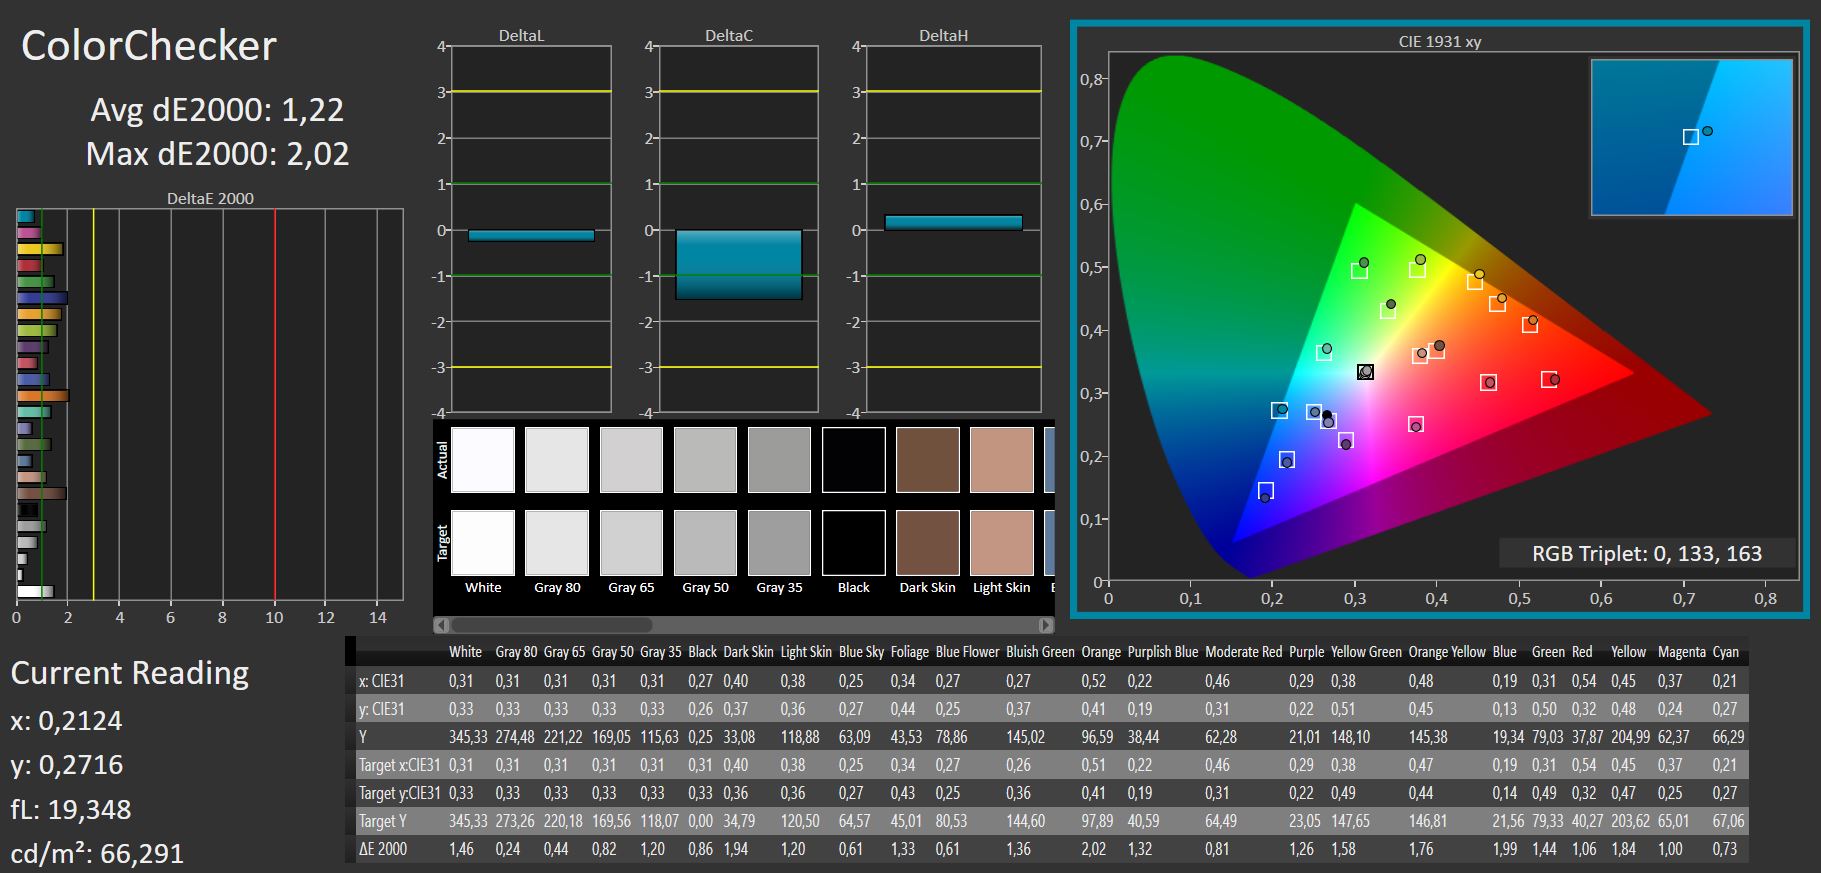
ΔE ColorChecker Calman: 1.38 | ∀{0.5-29.43 Ø4.71}
calibrated: 1.22
ΔE Greyscale Calman: 1.36 | ∀{0.09-98 Ø4.96}
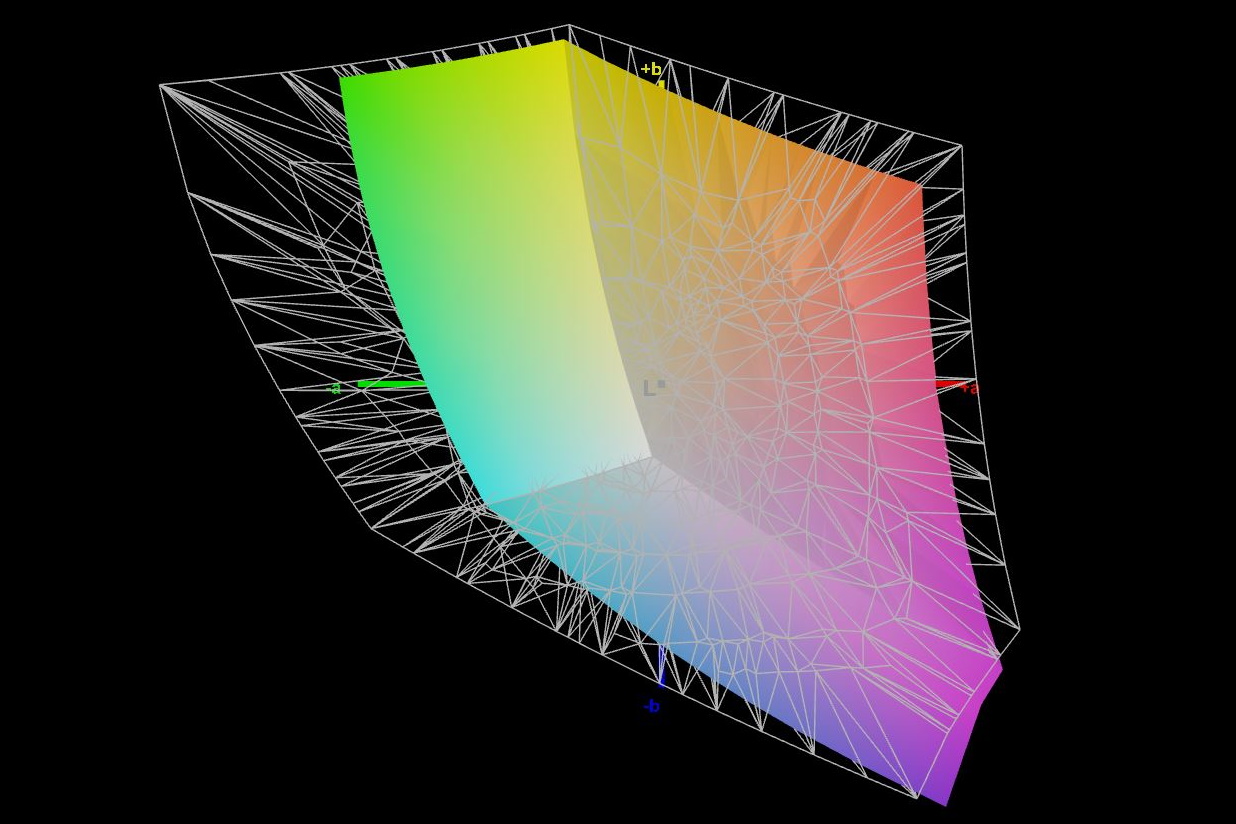
69.4% AdobeRGB 1998 (Argyll 3D)
97.2% sRGB (Argyll 3D)
68.2% Display P3 (Argyll 3D)
Gamma: 2.48
CCT: 6412 K
| Schenker XMG Neo 15 (i7-12700H, RTX 3080 Ti) BOE0A67, IPS, 2560x1440, 15.6" | Schenker XMG Neo 15 Tiger Lake BOE CQ NE156QHM-NY2, IPS, 2560x1440, 15.6" | Razer Blade 15 2022 Sharp LQ156T1JW03, IPS, 2560x1440, 15.6" | Asus ROG Zephyrus Duo 16 GX650RX BOE NE160QAM-NX1, IPS-Level, 3840x2400, 16" | Gigabyte Aero 16 YE5 Samsung SDC416B, AMOLED, 3840x2400, 16" | Alienware x17 R2 P48E AU Optronics B173HAN, IPS, 1920x1080, 17.3" | |
|---|---|---|---|---|---|---|
| Display | 1% | 24% | 24% | 11% | ||
| Display P3 Coverage (%) | 68.2 | 68.6 1% | 99.1 45% | 98 44% | 79.2 16% | |
| sRGB Coverage (%) | 97.2 | 98.6 1% | 99.9 3% | 99.9 3% | 99.8 3% | |
| AdobeRGB 1998 Coverage (%) | 69.4 | 69.3 0% | 86.8 25% | 86.3 24% | 79.6 15% | |
| Response Times | -33% | -24% | 9% | 79% | -3% | |
| Response Time Grey 50% / Grey 80% * (ms) | 12.4 ? | 16 ? -29% | 14.4 ? -16% | 14.6 ? -18% | 2.4 ? 81% | 12.4 ? -0% |
| Response Time Black / White * (ms) | 8.8 ? | 12 ? -36% | 11.6 ? -32% | 5.6 ? 36% | 2 ? 77% | 9.2 ? -5% |
| PWM Frequency (Hz) | 60 ? | |||||
| Screen | -94% | -39% | -72% | 388% | -69% | |
| Brightness middle (cd/m²) | 365 | 324 -11% | 286 -22% | 459 26% | 368 1% | 365.4 0% |
| Brightness (cd/m²) | 335 | 307 -8% | 271 -19% | 434 30% | 368 10% | 344 3% |
| Brightness Distribution (%) | 81 | 91 12% | 89 10% | 88 9% | 93 15% | 85 5% |
| Black Level * (cd/m²) | 0.32 | 0.27 16% | 0.25 22% | 0.44 -38% | 0.01 97% | 0.29 9% |
| Contrast (:1) | 1141 | 1200 5% | 1144 0% | 1043 -9% | 36800 3125% | 1260 10% |
| Colorchecker dE 2000 * | 1.38 | 3.36 -143% | 2.74 -99% | 2.97 -115% | 2.33 -69% | 3.17 -130% |
| Colorchecker dE 2000 max. * | 2.01 | 9.87 -391% | 5.21 -159% | 8.13 -304% | 4.34 -116% | 7.69 -283% |
| Colorchecker dE 2000 calibrated * | 1.22 | 1.23 -1% | 2.52 -107% | 1.03 16% | 0.51 58% | |
| Greyscale dE 2000 * | 1.36 | 5.8 -326% | 1.1 19% | 4.9 -260% | 0.8 41% | 5.3 -290% |
| Gamma | 2.48 89% | 2.311 95% | 2.2 100% | 2.235 98% | 2.119 104% | 2.18 101% |
| CCT | 6412 101% | 7087 92% | 6408 101% | 6775 96% | 6569 99% | 5879 111% |
| Color Space (Percent of AdobeRGB 1998) (%) | 69 | |||||
| Color Space (Percent of sRGB) (%) | 93 | |||||
| Total Average (Program / Settings) | -42% /
-65% | -13% /
-24% | -13% /
-40% | 234% /
326% | -20% /
-42% |
* ... smaller is better
AdobeRGB and DisplayP3 are each covered at just under 70 percent, while sRGB is almost completely covered at 97 percent. The Razer Blade, for example, is clearly better here, since its panel also covers DisplayP3 almost completely.

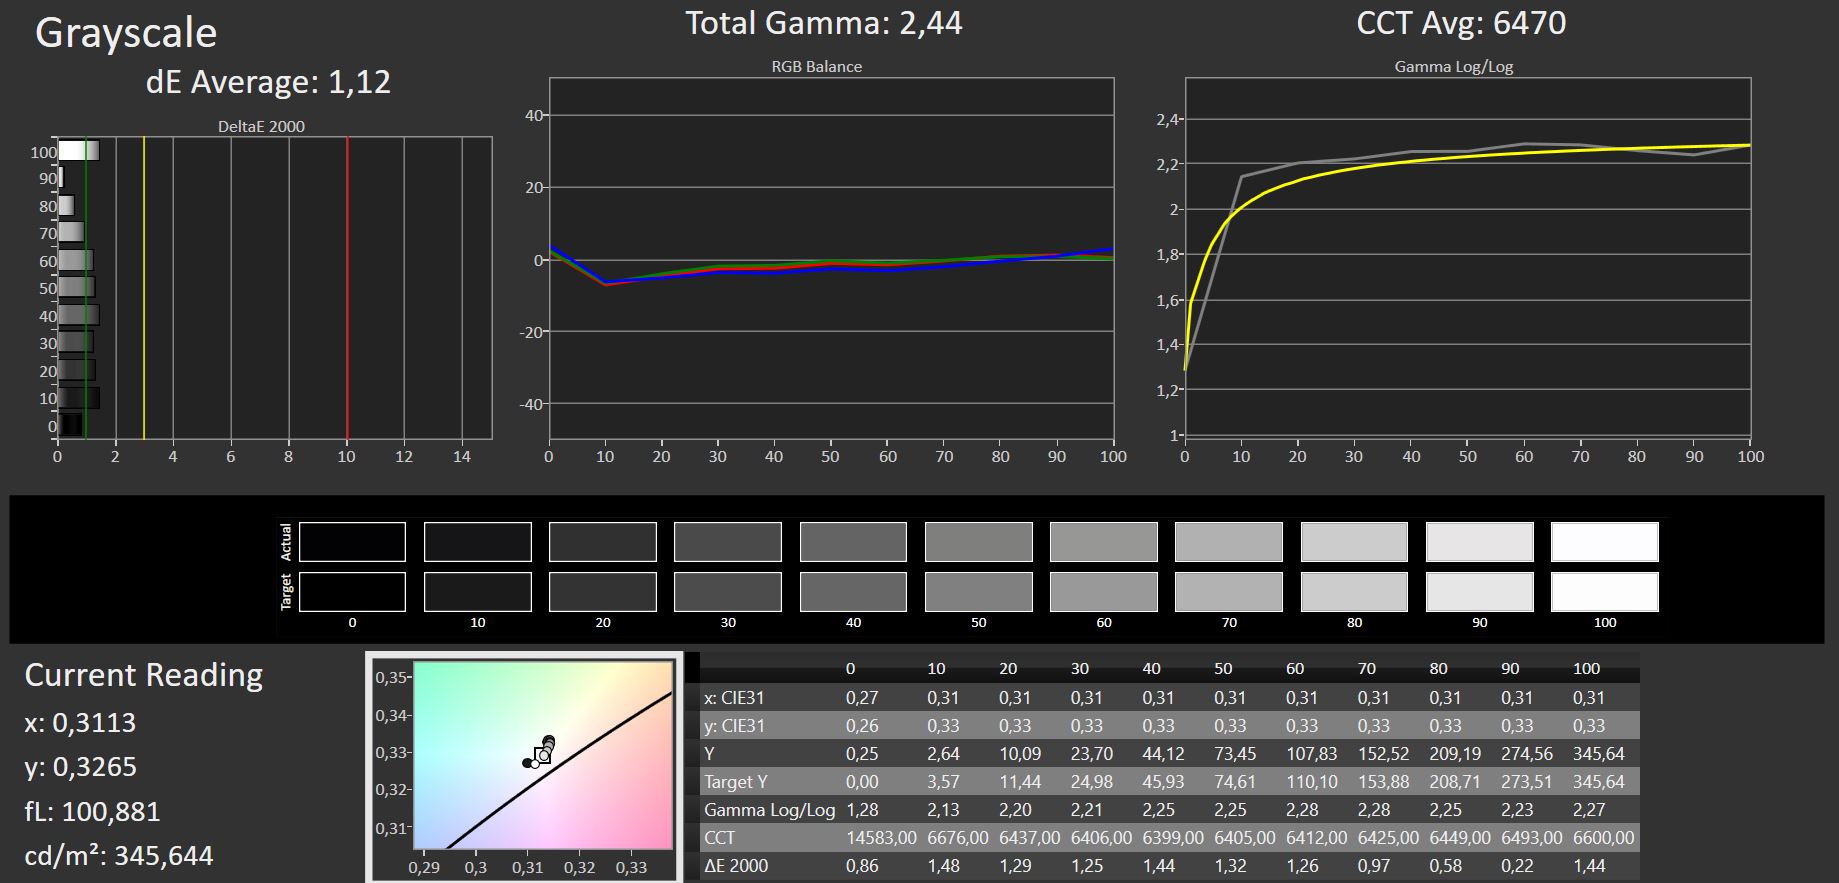
The display is already quite well calibrated ex works, and manual calibration again lowers the already low DeltaE values somewhat. Our ICC profile can be downloaded above.

Display Response Times
| ↔ Response Time Black to White | ||
|---|---|---|
| 8.8 ms ... rise ↗ and fall ↘ combined | ↗ 4.6 ms rise | 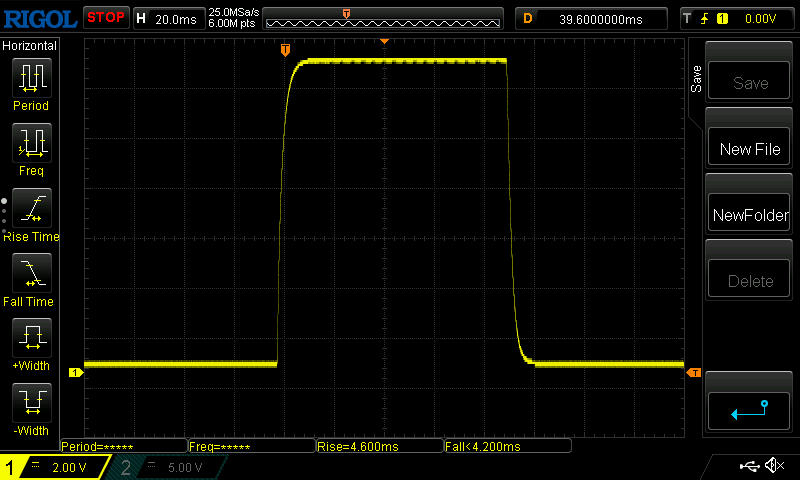 |
| ↘ 4.2 ms fall | ||
| The screen shows fast response rates in our tests and should be suited for gaming. In comparison, all tested devices range from 0.1 (minimum) to 240 (maximum) ms. » 25 % of all devices are better. This means that the measured response time is better than the average of all tested devices (19.8 ms). | ||
| ↔ Response Time 50% Grey to 80% Grey | ||
| 12.4 ms ... rise ↗ and fall ↘ combined | ↗ 5.8 ms rise | 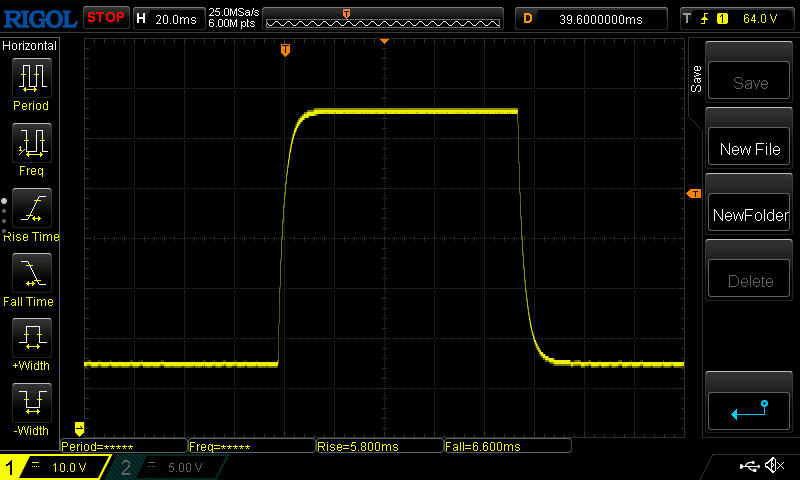 |
| ↘ 6.6 ms fall | ||
| The screen shows good response rates in our tests, but may be too slow for competitive gamers. In comparison, all tested devices range from 0.165 (minimum) to 636 (maximum) ms. » 26 % of all devices are better. This means that the measured response time is better than the average of all tested devices (31 ms). | ||
Screen Flickering / PWM (Pulse-Width Modulation)
| Screen flickering / PWM not detected | 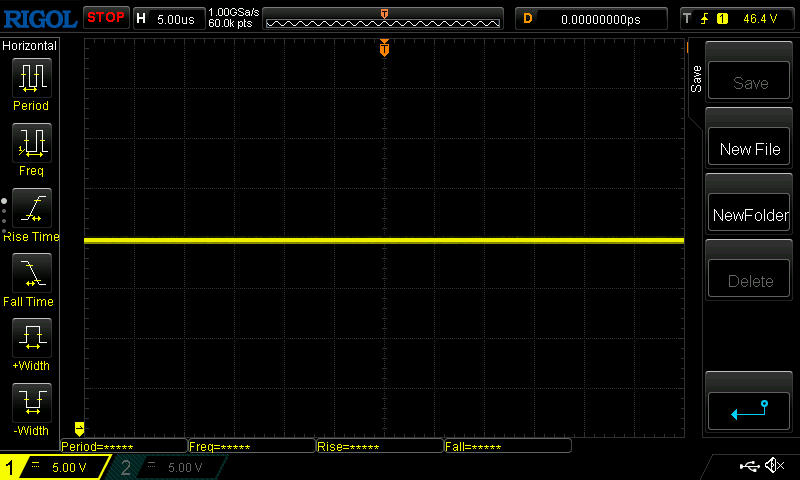 | ||
In comparison: 52 % of all tested devices do not use PWM to dim the display. If PWM was detected, an average of 7747 (minimum: 5 - maximum: 343500) Hz was measured. | |||
The matte surface, the decent brightness and the solid contrast ratio ensure good visibility of screen content outdoors, at least in the shade. Visibility is rather poor in the sun.

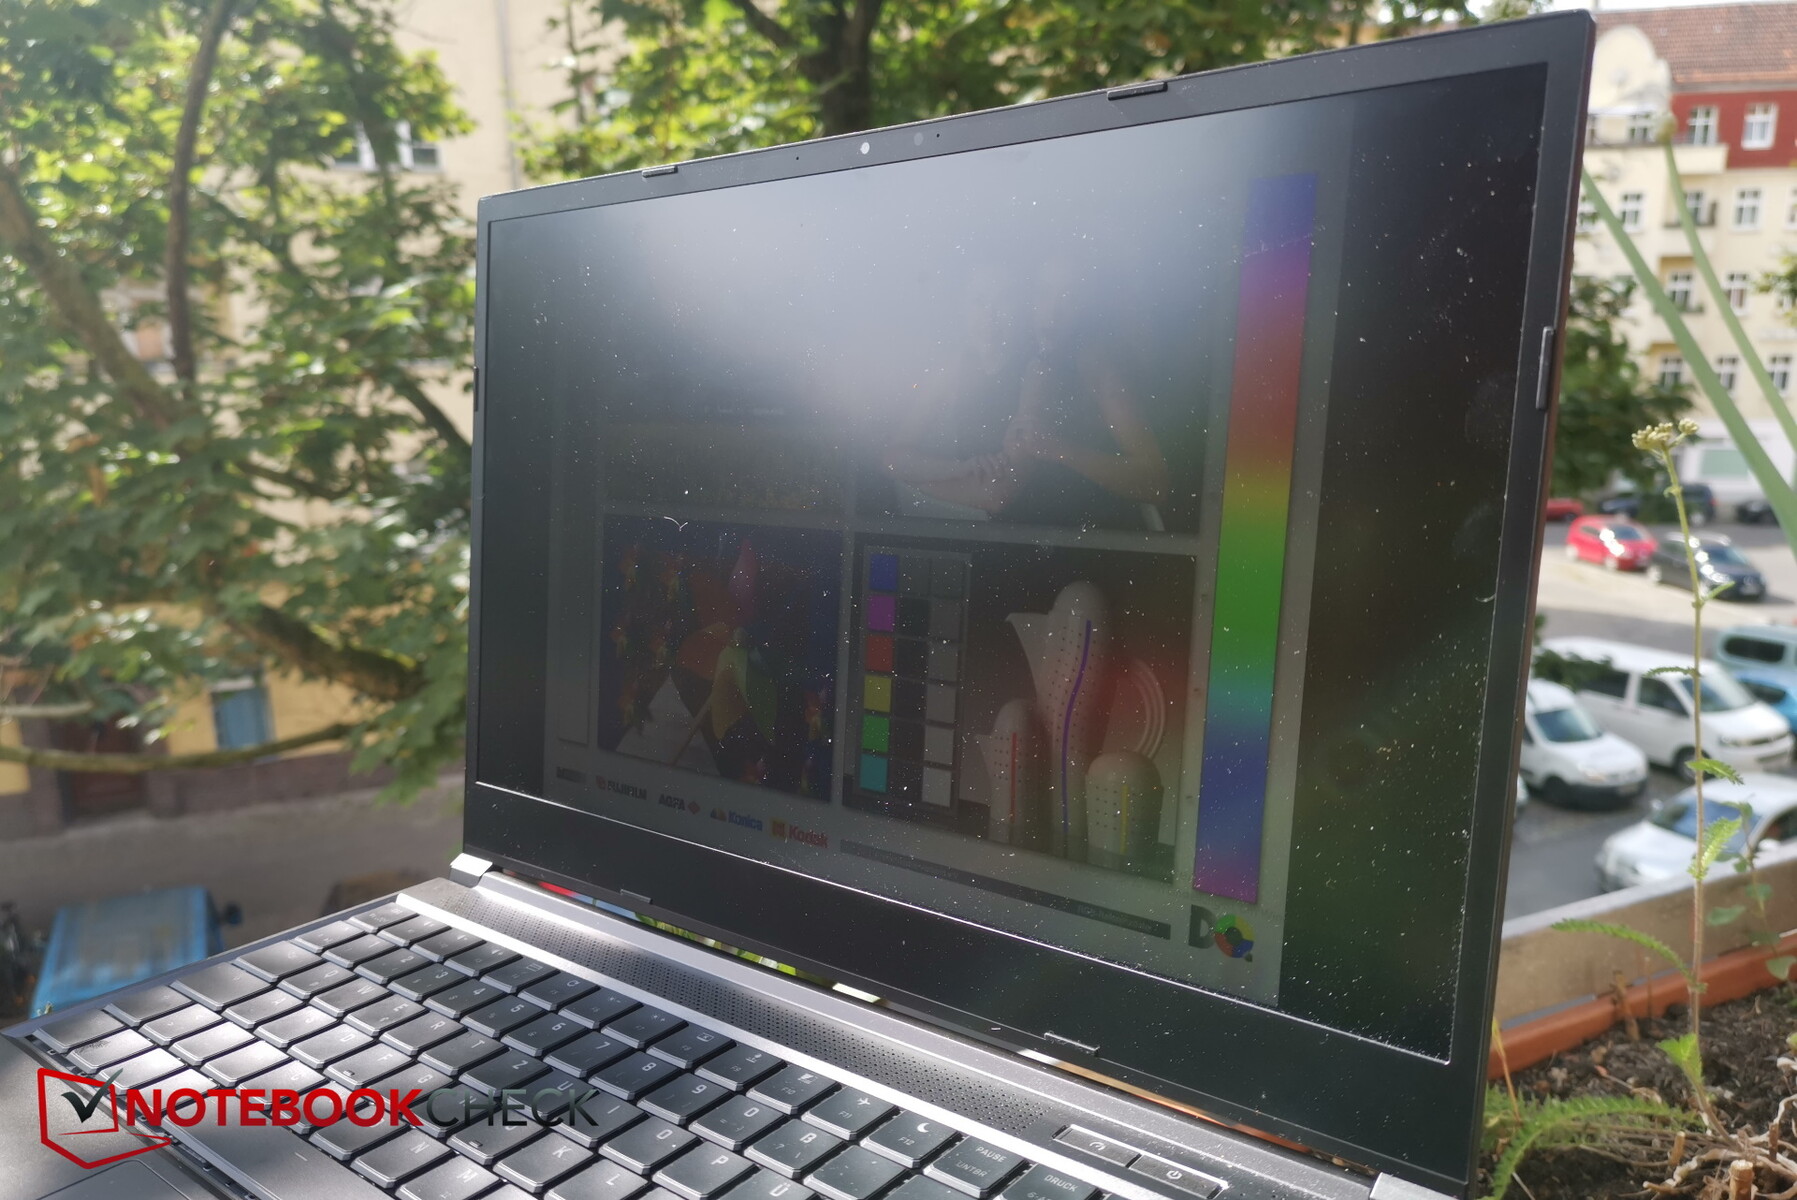
All content remains very visible even when not viewed directly. Brightness only suffers under extreme viewing angles.

Performance: RTX 3080 Ti and i7-12700H
The Neo 15 is also available with the theoretically faster CPU i9-12900H. But the combination of i7-12700H and RTX 3080 Ti is also a solid combination for gamers and should be able to run all games smoothly. If it were not for the suboptimal color space coverage, the Neo would be an interesting choice for demanding tasks in editing or content creation owing to its sleek design and the option of quiet liquid cooling.
In addition to the CPU, users can also choose the GPU and opt for an RTX 3070 Ti as an alternative.
Testing Conditions
Our tests are more comprehensive than usual because we are reviewing two devices at the same time, namely the Neo 15 on the one hand and the Neo 15 with Oasis on the other, which should produce different (clearer) benchmark and emission results.
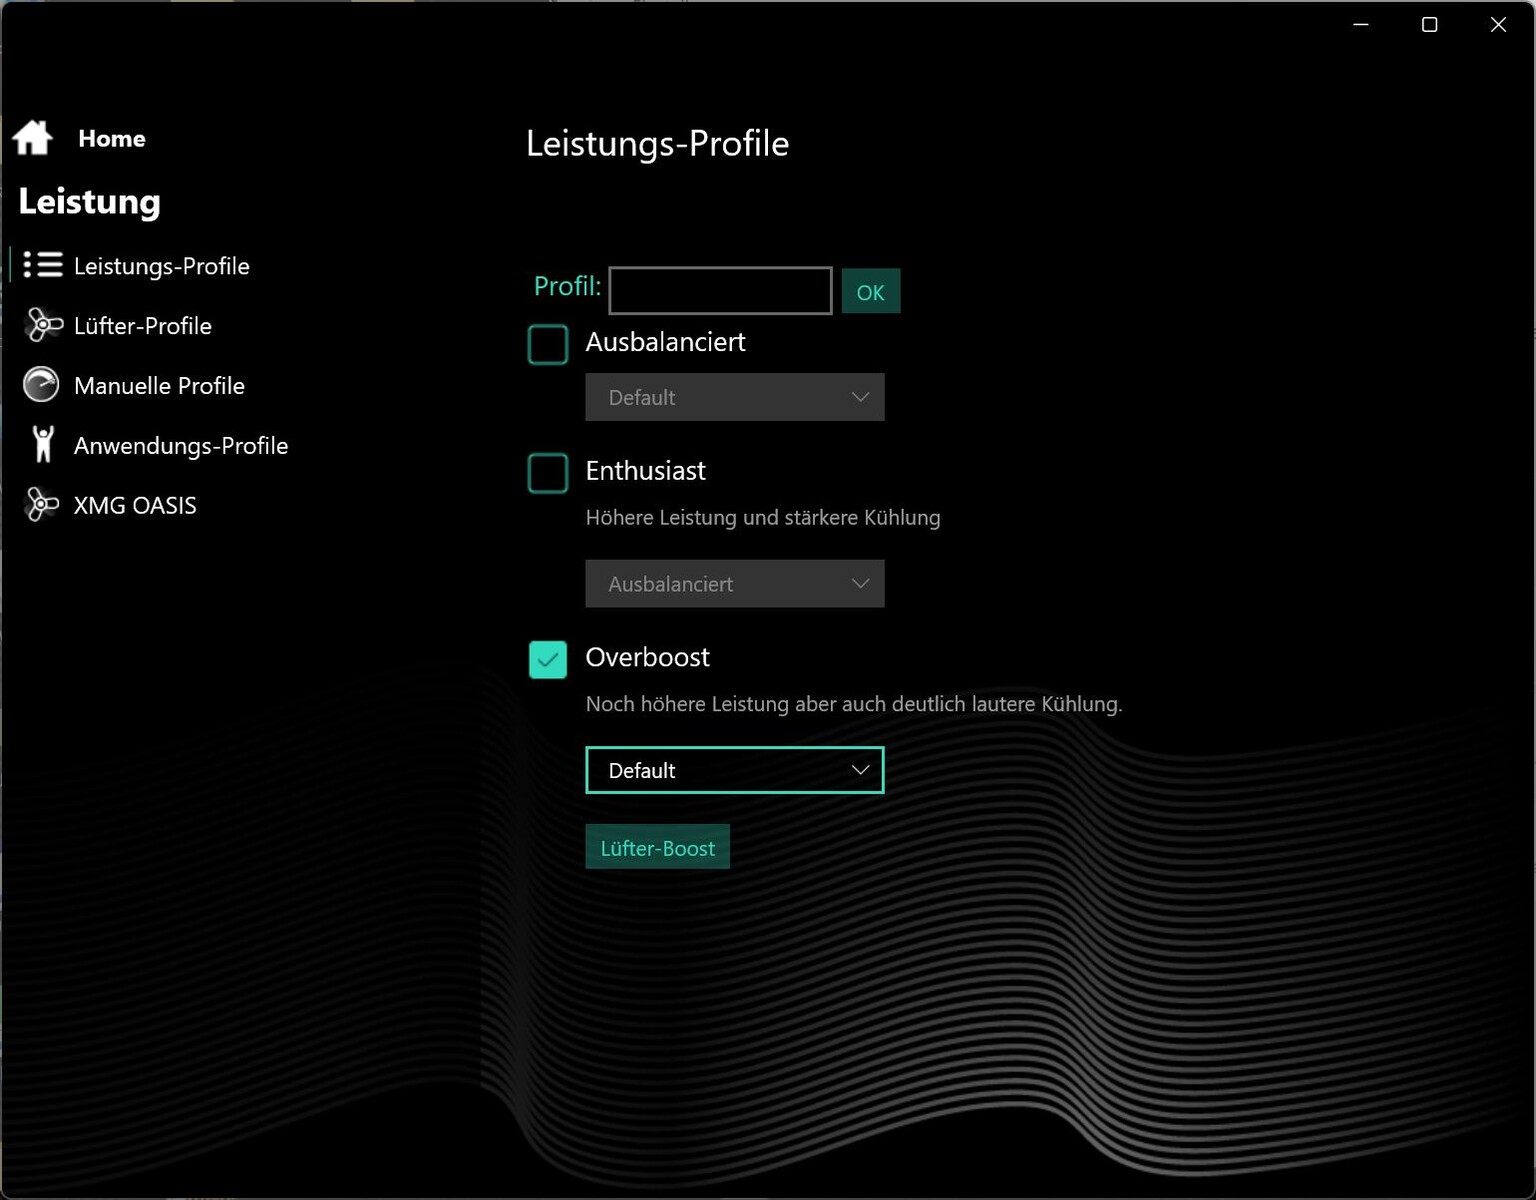
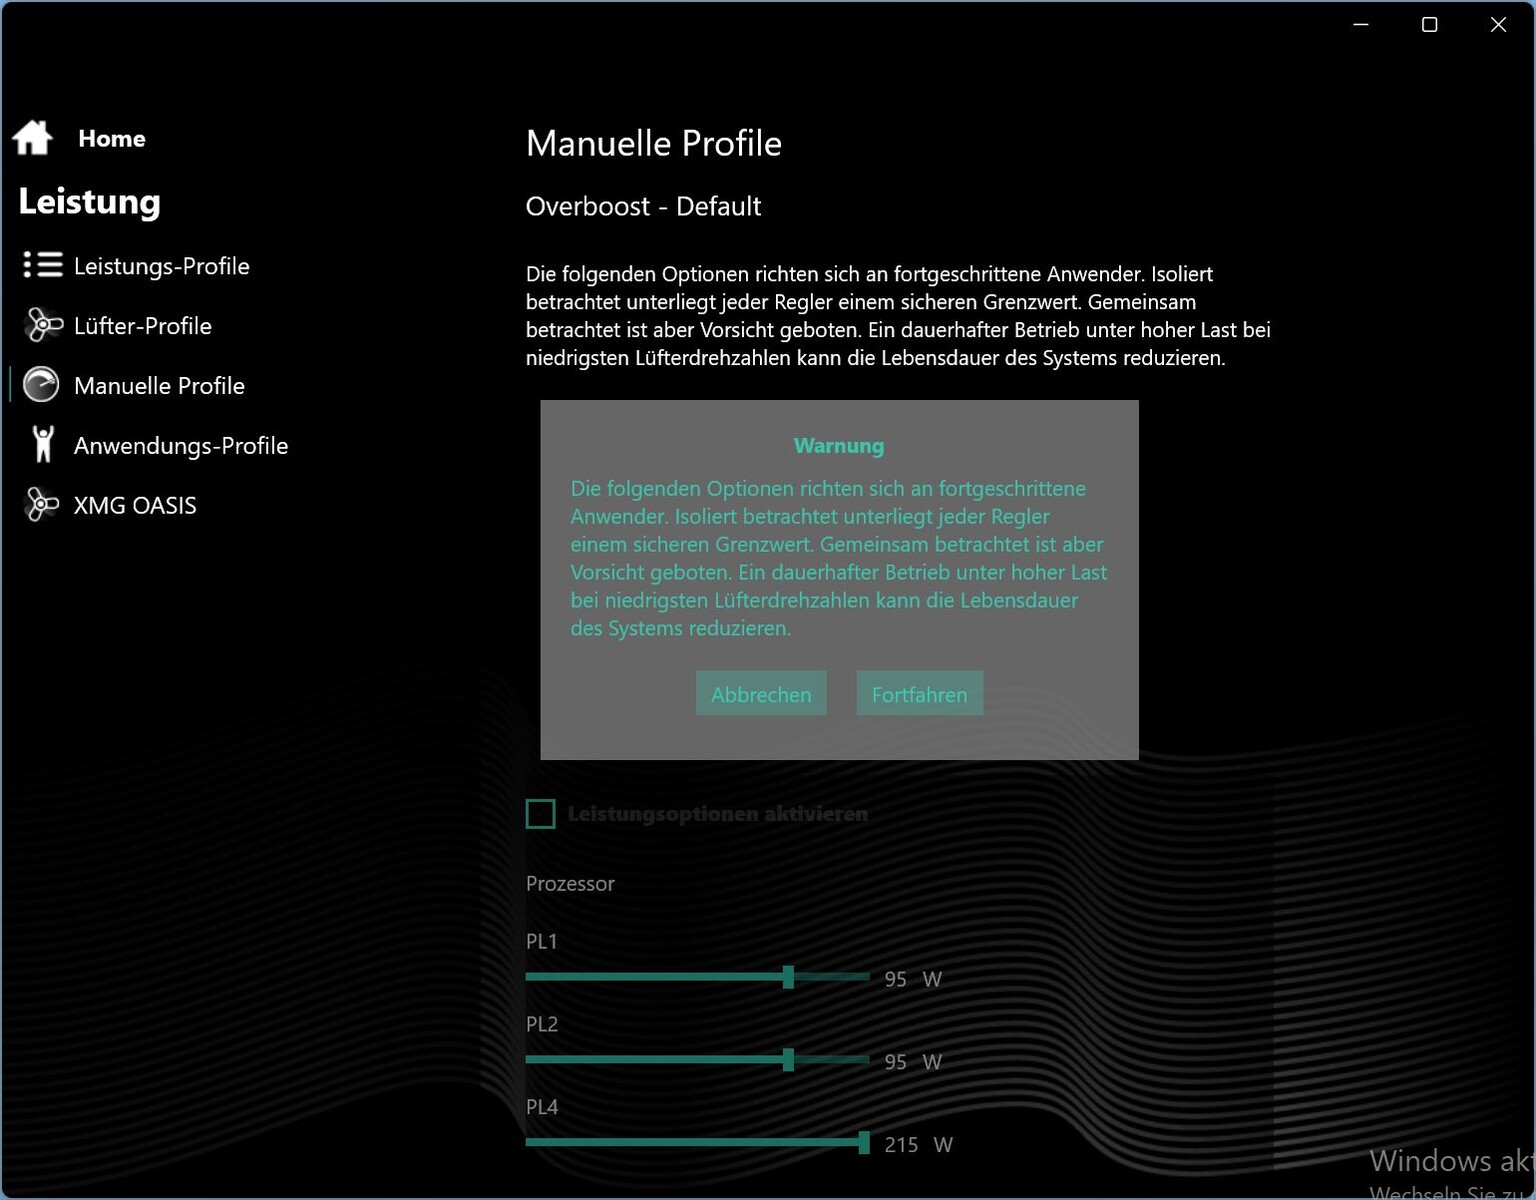
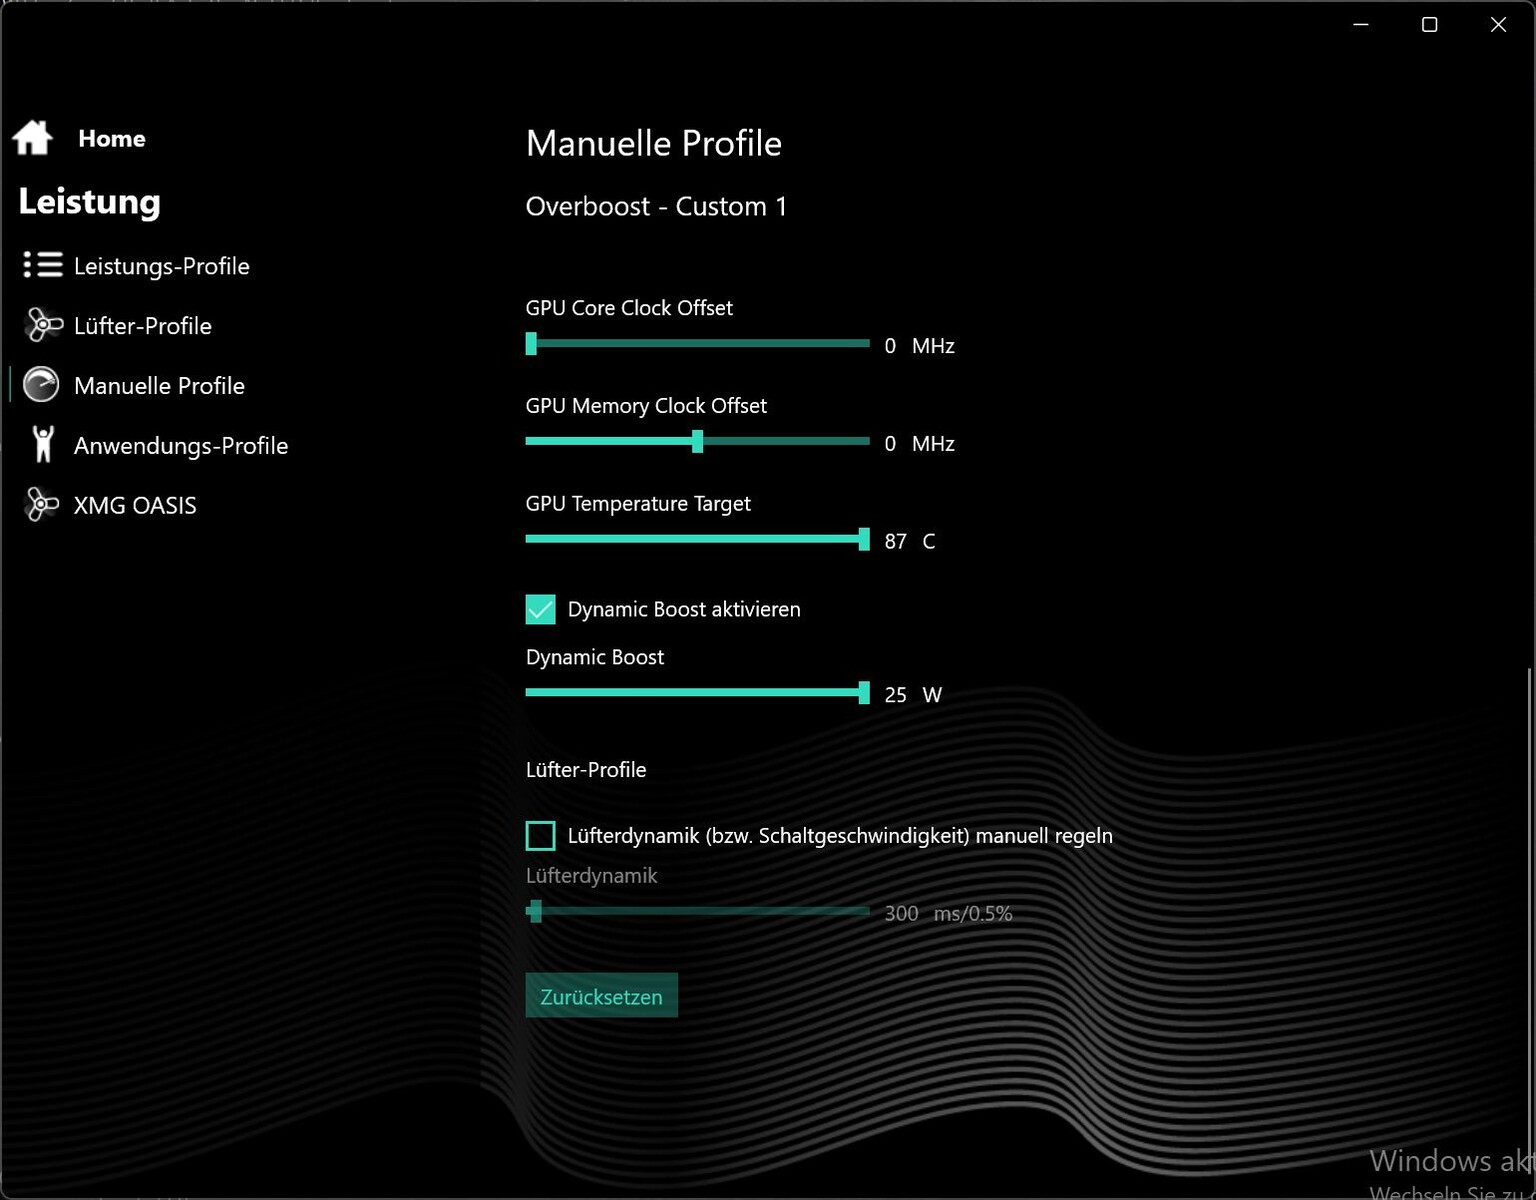
We adjusted our settings in the XMG Control Center. Here you have the choice between three performance modes: Balanced, Enthusiast, Overboost. For the best scores, we chose Overboost, but left it in its default setting. However, the RTX 3080 Ti "only" gets 5 W in Dynamic Boost here. For the full 25 W Dynamic Boost, you can set the values to maximum in the manual settings, which we do occasionally (and also indicate for readers).
We also left the XMG Oasis in normal mode (Balanced), but there are also two quieter modes where it is less active and less likely to fire up.
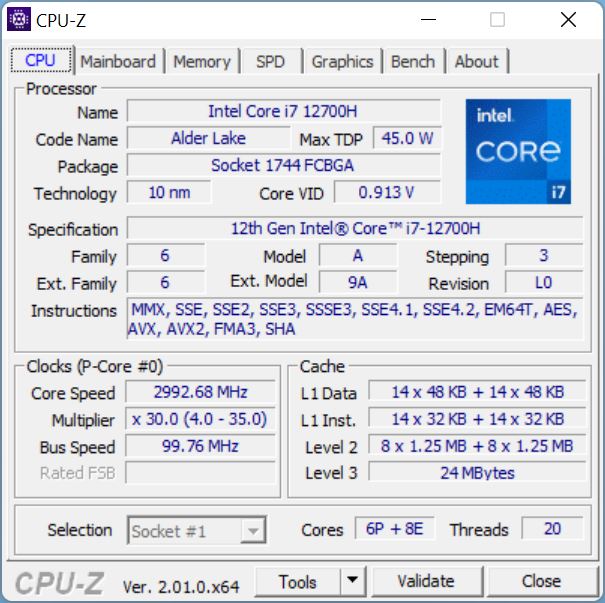
Processor
The Core i7-12700H is one of the standard CPUs for gaming laptops. With 14 cores and 20 threads, it should be able to handle all current tasks, even though there is a faster alternative in the form of the i9-12900H.
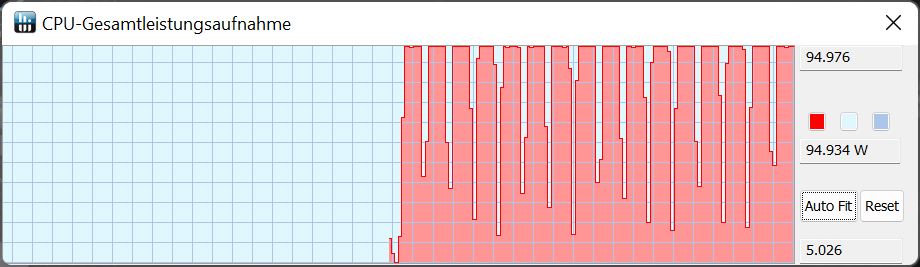
In the Cinebench R15 loop, the i7-12700H consistently performs at a very high level. It also performs on par with the i9-12900H in the Aero 16 in the multi-thread benchmark, making it 5 to 10 percent faster than the average laptop with this CPU in our database. The TDP is quite constant at 95 W in test runs.
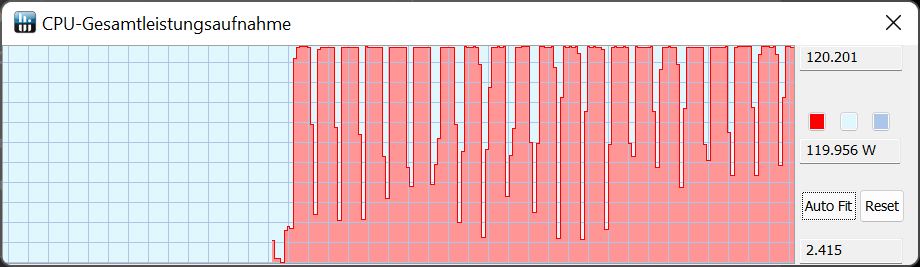
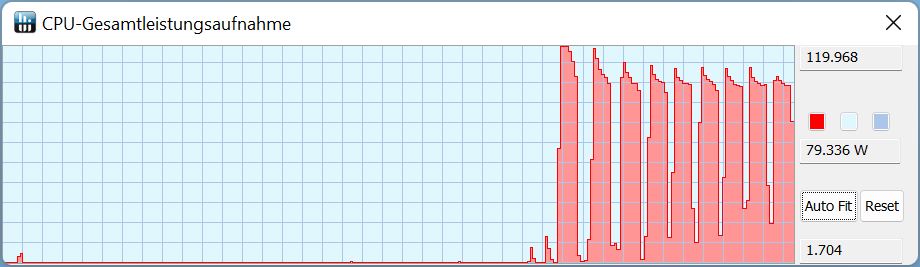
If you manually maximize the CPU limits in the Control Center, 120 W is reached in the Cinebench loop and the score is even higher (max. 2,815 instead of 2,711 points). However, despite liquid cooling, the Neo's fans rev up much more than at the 95 W performance peak. Without the Oasis, however, the Neo briefly reaches 119 W at the beginning, which then drops to 103 W before easing to 98 W in the course of testing.
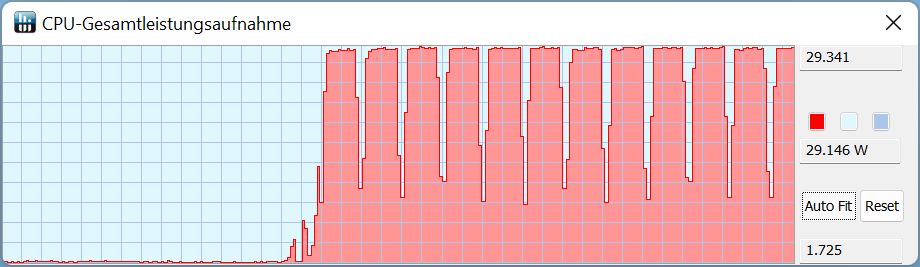
In battery mode, the Cinebench R15 multi-thread performance decreases. Instead of 95 W, only 29 W is available, and the score drops accordingly from around 2700 to only 1600 points.
Cinebench R15 Multi Sustained Load
Cinebench R23: Multi Core | Single Core
Cinebench R20: CPU (Multi Core) | CPU (Single Core)
Cinebench R15: CPU Multi 64Bit | CPU Single 64Bit
Blender: v2.79 BMW27 CPU
7-Zip 18.03: 7z b 4 | 7z b 4 -mmt1
Geekbench 5.5: Multi-Core | Single-Core
HWBOT x265 Benchmark v2.2: 4k Preset
LibreOffice : 20 Documents To PDF
R Benchmark 2.5: Overall mean
| CPU Performance rating | |
| Average of class Gaming | |
| Gigabyte Aero 16 YE5 | |
| Schenker XMG Neo 15 with XMG Oasis | |
| Schenker XMG Neo 15 (i7-12700H, RTX 3080 Ti) | |
| Average Intel Core i7-12700H | |
| Razer Blade 15 2022 | |
| Asus ROG Zephyrus Duo 16 GX650RX | |
| Schenker XMG Neo 15 Tiger Lake | |
| Cinebench R23 / Multi Core | |
| Average of class Gaming (10488 - 42661, n=107, last 2 years) | |
| Gigabyte Aero 16 YE5 | |
| Schenker XMG Neo 15 with XMG Oasis | |
| Schenker XMG Neo 15 (i7-12700H, RTX 3080 Ti) | |
| Average Intel Core i7-12700H (4032 - 19330, n=64) | |
| Razer Blade 15 2022 | |
| Schenker XMG Neo 15 Tiger Lake | |
| Asus ROG Zephyrus Duo 16 GX650RX | |
| Cinebench R23 / Single Core | |
| Average of class Gaming (1166 - 2415, n=107, last 2 years) | |
| Gigabyte Aero 16 YE5 | |
| Schenker XMG Neo 15 (i7-12700H, RTX 3080 Ti) | |
| Schenker XMG Neo 15 with XMG Oasis | |
| Razer Blade 15 2022 | |
| Average Intel Core i7-12700H (778 - 1826, n=63) | |
| Asus ROG Zephyrus Duo 16 GX650RX | |
| Schenker XMG Neo 15 Tiger Lake | |
| Cinebench R20 / CPU (Multi Core) | |
| Average of class Gaming (4029 - 16433, n=106, last 2 years) | |
| Gigabyte Aero 16 YE5 | |
| Schenker XMG Neo 15 with XMG Oasis | |
| Schenker XMG Neo 15 (i7-12700H, RTX 3080 Ti) | |
| Average Intel Core i7-12700H (1576 - 7407, n=64) | |
| Razer Blade 15 2022 | |
| Asus ROG Zephyrus Duo 16 GX650RX | |
| Schenker XMG Neo 15 Tiger Lake | |
| Cinebench R20 / CPU (Single Core) | |
| Average of class Gaming (442 - 913, n=106, last 2 years) | |
| Schenker XMG Neo 15 with XMG Oasis | |
| Razer Blade 15 2022 | |
| Schenker XMG Neo 15 (i7-12700H, RTX 3080 Ti) | |
| Gigabyte Aero 16 YE5 | |
| Average Intel Core i7-12700H (300 - 704, n=64) | |
| Asus ROG Zephyrus Duo 16 GX650RX | |
| Schenker XMG Neo 15 Tiger Lake | |
| Cinebench R15 / CPU Multi 64Bit | |
| Average of class Gaming (1578 - 6330, n=105, last 2 years) | |
| Gigabyte Aero 16 YE5 | |
| Schenker XMG Neo 15 with XMG Oasis | |
| Schenker XMG Neo 15 (i7-12700H, RTX 3080 Ti) | |
| Average Intel Core i7-12700H (1379 - 2916, n=70) | |
| Asus ROG Zephyrus Duo 16 GX650RX | |
| Razer Blade 15 2022 | |
| Schenker XMG Neo 15 Tiger Lake | |
| Cinebench R15 / CPU Single 64Bit | |
| Average of class Gaming (188.8 - 350, n=106, last 2 years) | |
| Gigabyte Aero 16 YE5 | |
| Schenker XMG Neo 15 (i7-12700H, RTX 3080 Ti) | |
| Schenker XMG Neo 15 with XMG Oasis | |
| Razer Blade 15 2022 | |
| Average Intel Core i7-12700H (113 - 263, n=65) | |
| Asus ROG Zephyrus Duo 16 GX650RX | |
| Schenker XMG Neo 15 Tiger Lake | |
| Blender / v2.79 BMW27 CPU | |
| Razer Blade 15 2022 | |
| Average Intel Core i7-12700H (168 - 732, n=63) | |
| Asus ROG Zephyrus Duo 16 GX650RX | |
| Schenker XMG Neo 15 Tiger Lake | |
| Gigabyte Aero 16 YE5 | |
| Schenker XMG Neo 15 (i7-12700H, RTX 3080 Ti) | |
| Schenker XMG Neo 15 with XMG Oasis | |
| Average of class Gaming (79 - 330, n=104, last 2 years) | |
| 7-Zip 18.03 / 7z b 4 | |
| Average of class Gaming (33491 - 148086, n=105, last 2 years) | |
| Schenker XMG Neo 15 with XMG Oasis | |
| Schenker XMG Neo 15 (i7-12700H, RTX 3080 Ti) | |
| Gigabyte Aero 16 YE5 | |
| Asus ROG Zephyrus Duo 16 GX650RX | |
| Razer Blade 15 2022 | |
| Average Intel Core i7-12700H (22844 - 73067, n=63) | |
| Schenker XMG Neo 15 Tiger Lake | |
| 7-Zip 18.03 / 7z b 4 -mmt1 | |
| Average of class Gaming (4199 - 7436, n=105, last 2 years) | |
| Gigabyte Aero 16 YE5 | |
| Schenker XMG Neo 15 (i7-12700H, RTX 3080 Ti) | |
| Schenker XMG Neo 15 with XMG Oasis | |
| Asus ROG Zephyrus Duo 16 GX650RX | |
| Razer Blade 15 2022 | |
| Schenker XMG Neo 15 Tiger Lake | |
| Average Intel Core i7-12700H (2743 - 5972, n=63) | |
| Geekbench 5.5 / Multi-Core | |
| Average of class Gaming (6460 - 28263, n=105, last 2 years) | |
| Gigabyte Aero 16 YE5 | |
| Schenker XMG Neo 15 with XMG Oasis | |
| Schenker XMG Neo 15 (i7-12700H, RTX 3080 Ti) | |
| Razer Blade 15 2022 | |
| Average Intel Core i7-12700H (5144 - 13745, n=64) | |
| Asus ROG Zephyrus Duo 16 GX650RX | |
| Schenker XMG Neo 15 Tiger Lake | |
| Geekbench 5.5 / Single-Core | |
| Average of class Gaming (986 - 2474, n=105, last 2 years) | |
| Gigabyte Aero 16 YE5 | |
| Schenker XMG Neo 15 with XMG Oasis | |
| Razer Blade 15 2022 | |
| Schenker XMG Neo 15 (i7-12700H, RTX 3080 Ti) | |
| Average Intel Core i7-12700H (803 - 1851, n=64) | |
| Schenker XMG Neo 15 Tiger Lake | |
| Asus ROG Zephyrus Duo 16 GX650RX | |
| HWBOT x265 Benchmark v2.2 / 4k Preset | |
| Average of class Gaming (11.5 - 44.4, n=105, last 2 years) | |
| Schenker XMG Neo 15 with XMG Oasis | |
| Schenker XMG Neo 15 (i7-12700H, RTX 3080 Ti) | |
| Gigabyte Aero 16 YE5 | |
| Asus ROG Zephyrus Duo 16 GX650RX | |
| Schenker XMG Neo 15 Tiger Lake | |
| Razer Blade 15 2022 | |
| Average Intel Core i7-12700H (4.67 - 21.8, n=64) | |
| LibreOffice / 20 Documents To PDF | |
| Razer Blade 15 2022 | |
| Average of class Gaming (33.2 - 88.8, n=105, last 2 years) | |
| Schenker XMG Neo 15 (i7-12700H, RTX 3080 Ti) | |
| Schenker XMG Neo 15 Tiger Lake | |
| Average Intel Core i7-12700H (34.2 - 95.3, n=63) | |
| Asus ROG Zephyrus Duo 16 GX650RX | |
| Schenker XMG Neo 15 with XMG Oasis | |
| Gigabyte Aero 16 YE5 | |
| R Benchmark 2.5 / Overall mean | |
| Schenker XMG Neo 15 Tiger Lake | |
| Asus ROG Zephyrus Duo 16 GX650RX | |
| Average Intel Core i7-12700H (0.4441 - 1.052, n=63) | |
| Razer Blade 15 2022 | |
| Schenker XMG Neo 15 (i7-12700H, RTX 3080 Ti) | |
| Schenker XMG Neo 15 with XMG Oasis | |
| Average of class Gaming (0.3439 - 0.759, n=106, last 2 years) | |
| Gigabyte Aero 16 YE5 | |
* ... smaller is better
AIDA64: FP32 Ray-Trace | FPU Julia | CPU SHA3 | CPU Queen | FPU SinJulia | FPU Mandel | CPU AES | CPU ZLib | FP64 Ray-Trace | CPU PhotoWorxx
| Performance rating | |
| Average of class Gaming | |
| Asus ROG Zephyrus Duo 16 GX650RX | |
| Alienware x17 R2 P48E | |
| Schenker XMG Neo 15 with XMG Oasis | |
| Schenker XMG Neo 15 (i7-12700H, RTX 3080 Ti) | |
| Average Intel Core i7-12700H | |
| Gigabyte Aero 16 YE5 | |
| Razer Blade 15 2022 | |
| Schenker XMG Neo 15 Tiger Lake -9! | |
| AIDA64 / FP32 Ray-Trace | |
| Average of class Gaming (10227 - 85542, n=105, last 2 years) | |
| Asus ROG Zephyrus Duo 16 GX650RX | |
| Average Intel Core i7-12700H (2585 - 17957, n=64) | |
| Alienware x17 R2 P48E | |
| Schenker XMG Neo 15 with XMG Oasis | |
| Schenker XMG Neo 15 (i7-12700H, RTX 3080 Ti) | |
| Gigabyte Aero 16 YE5 | |
| Razer Blade 15 2022 | |
| AIDA64 / FPU Julia | |
| Average of class Gaming (51376 - 238426, n=105, last 2 years) | |
| Asus ROG Zephyrus Duo 16 GX650RX | |
| Average Intel Core i7-12700H (12439 - 90760, n=64) | |
| Alienware x17 R2 P48E | |
| Schenker XMG Neo 15 (i7-12700H, RTX 3080 Ti) | |
| Schenker XMG Neo 15 with XMG Oasis | |
| Gigabyte Aero 16 YE5 | |
| Razer Blade 15 2022 | |
| AIDA64 / CPU SHA3 | |
| Average of class Gaming (2180 - 10115, n=105, last 2 years) | |
| Asus ROG Zephyrus Duo 16 GX650RX | |
| Alienware x17 R2 P48E | |
| Schenker XMG Neo 15 (i7-12700H, RTX 3080 Ti) | |
| Schenker XMG Neo 15 with XMG Oasis | |
| Average Intel Core i7-12700H (833 - 4242, n=64) | |
| Gigabyte Aero 16 YE5 | |
| Razer Blade 15 2022 | |
| AIDA64 / CPU Queen | |
| Average of class Gaming (49785 - 173351, n=90, last 2 years) | |
| Alienware x17 R2 P48E | |
| Gigabyte Aero 16 YE5 | |
| Asus ROG Zephyrus Duo 16 GX650RX | |
| Schenker XMG Neo 15 with XMG Oasis | |
| Schenker XMG Neo 15 (i7-12700H, RTX 3080 Ti) | |
| Average Intel Core i7-12700H (57923 - 103202, n=63) | |
| Razer Blade 15 2022 | |
| AIDA64 / FPU SinJulia | |
| Average of class Gaming (4424 - 33636, n=105, last 2 years) | |
| Asus ROG Zephyrus Duo 16 GX650RX | |
| Alienware x17 R2 P48E | |
| Schenker XMG Neo 15 with XMG Oasis | |
| Schenker XMG Neo 15 (i7-12700H, RTX 3080 Ti) | |
| Gigabyte Aero 16 YE5 | |
| Razer Blade 15 2022 | |
| Average Intel Core i7-12700H (3249 - 9939, n=64) | |
| AIDA64 / FPU Mandel | |
| Average of class Gaming (25115 - 128721, n=105, last 2 years) | |
| Asus ROG Zephyrus Duo 16 GX650RX | |
| Average Intel Core i7-12700H (7135 - 44760, n=64) | |
| Alienware x17 R2 P48E | |
| Schenker XMG Neo 15 with XMG Oasis | |
| Schenker XMG Neo 15 (i7-12700H, RTX 3080 Ti) | |
| Gigabyte Aero 16 YE5 | |
| Razer Blade 15 2022 | |
| AIDA64 / CPU AES | |
| Asus ROG Zephyrus Duo 16 GX650RX | |
| Average of class Gaming (39258 - 247074, n=105, last 2 years) | |
| Alienware x17 R2 P48E | |
| Gigabyte Aero 16 YE5 | |
| Average Intel Core i7-12700H (31839 - 144360, n=64) | |
| Schenker XMG Neo 15 with XMG Oasis | |
| Schenker XMG Neo 15 (i7-12700H, RTX 3080 Ti) | |
| Razer Blade 15 2022 | |
| AIDA64 / CPU ZLib | |
| Average of class Gaming (574 - 2531, n=105, last 2 years) | |
| Alienware x17 R2 P48E | |
| Schenker XMG Neo 15 with XMG Oasis | |
| Schenker XMG Neo 15 (i7-12700H, RTX 3080 Ti) | |
| Gigabyte Aero 16 YE5 | |
| Average Intel Core i7-12700H (305 - 1171, n=64) | |
| Razer Blade 15 2022 | |
| Asus ROG Zephyrus Duo 16 GX650RX | |
| Schenker XMG Neo 15 Tiger Lake | |
| AIDA64 / FP64 Ray-Trace | |
| Average of class Gaming (5509 - 45446, n=105, last 2 years) | |
| Asus ROG Zephyrus Duo 16 GX650RX | |
| Average Intel Core i7-12700H (1437 - 9692, n=64) | |
| Alienware x17 R2 P48E | |
| Schenker XMG Neo 15 with XMG Oasis | |
| Schenker XMG Neo 15 (i7-12700H, RTX 3080 Ti) | |
| Gigabyte Aero 16 YE5 | |
| Razer Blade 15 2022 | |
| AIDA64 / CPU PhotoWorxx | |
| Average of class Gaming (12271 - 89891, n=105, last 2 years) | |
| Razer Blade 15 2022 | |
| Schenker XMG Neo 15 with XMG Oasis | |
| Schenker XMG Neo 15 (i7-12700H, RTX 3080 Ti) | |
| Gigabyte Aero 16 YE5 | |
| Alienware x17 R2 P48E | |
| Average Intel Core i7-12700H (12863 - 52207, n=64) | |
| Asus ROG Zephyrus Duo 16 GX650RX | |
System Performance
In PCMark 10, our Neo 15 is on par with the Razer Blade 15 and the Aero 16. Only the Alienware x17 is somewhat ahead. The XMG Oasis thus does not confer any performance-related advantages.

CrossMark: Overall | Productivity | Creativity | Responsiveness
| PCMark 10 / Score | |
| Average of class Gaming (5828 - 12414, n=93, last 2 years) | |
| Alienware x17 R2 P48E | |
| Gigabyte Aero 16 YE5 | |
| Razer Blade 15 2022 | |
| Schenker XMG Neo 15 (i7-12700H, RTX 3080 Ti) | |
| Average Intel Core i7-12700H, NVIDIA GeForce RTX 3080 Ti Laptop GPU (6868 - 7638, n=7) | |
| Schenker XMG Neo 15 with XMG Oasis | |
| Schenker XMG Neo 15 Tiger Lake | |
| Asus ROG Zephyrus Duo 16 GX650RX | |
| PCMark 10 / Essentials | |
| Alienware x17 R2 P48E | |
| Gigabyte Aero 16 YE5 | |
| Razer Blade 15 2022 | |
| Average of class Gaming (8810 - 11935, n=97, last 2 years) | |
| Schenker XMG Neo 15 (i7-12700H, RTX 3080 Ti) | |
| Average Intel Core i7-12700H, NVIDIA GeForce RTX 3080 Ti Laptop GPU (9987 - 11318, n=7) | |
| Schenker XMG Neo 15 Tiger Lake | |
| Schenker XMG Neo 15 with XMG Oasis | |
| Asus ROG Zephyrus Duo 16 GX650RX | |
| PCMark 10 / Productivity | |
| Average of class Gaming (6845 - 25323, n=95, last 2 years) | |
| Alienware x17 R2 P48E | |
| Gigabyte Aero 16 YE5 | |
| Razer Blade 15 2022 | |
| Average Intel Core i7-12700H, NVIDIA GeForce RTX 3080 Ti Laptop GPU (8944 - 10726, n=7) | |
| Schenker XMG Neo 15 with XMG Oasis | |
| Schenker XMG Neo 15 (i7-12700H, RTX 3080 Ti) | |
| Schenker XMG Neo 15 Tiger Lake | |
| Asus ROG Zephyrus Duo 16 GX650RX | |
| PCMark 10 / Digital Content Creation | |
| Average of class Gaming (7602 - 19954, n=95, last 2 years) | |
| Alienware x17 R2 P48E | |
| Schenker XMG Neo 15 (i7-12700H, RTX 3080 Ti) | |
| Razer Blade 15 2022 | |
| Gigabyte Aero 16 YE5 | |
| Schenker XMG Neo 15 with XMG Oasis | |
| Average Intel Core i7-12700H, NVIDIA GeForce RTX 3080 Ti Laptop GPU (8956 - 12249, n=7) | |
| Schenker XMG Neo 15 Tiger Lake | |
| Asus ROG Zephyrus Duo 16 GX650RX | |
| CrossMark / Overall | |
| Gigabyte Aero 16 YE5 | |
| Average of class Gaming (1366 - 2409, n=94, last 2 years) | |
| Alienware x17 R2 P48E | |
| Average Intel Core i7-12700H, NVIDIA GeForce RTX 3080 Ti Laptop GPU (1761 - 1861, n=4) | |
| Schenker XMG Neo 15 (i7-12700H, RTX 3080 Ti) | |
| Schenker XMG Neo 15 with XMG Oasis | |
| Asus ROG Zephyrus Duo 16 GX650RX | |
| CrossMark / Productivity | |
| Gigabyte Aero 16 YE5 | |
| Average of class Gaming (1386 - 2254, n=94, last 2 years) | |
| Alienware x17 R2 P48E | |
| Average Intel Core i7-12700H, NVIDIA GeForce RTX 3080 Ti Laptop GPU (1645 - 1800, n=4) | |
| Asus ROG Zephyrus Duo 16 GX650RX | |
| Schenker XMG Neo 15 (i7-12700H, RTX 3080 Ti) | |
| Schenker XMG Neo 15 with XMG Oasis | |
| CrossMark / Creativity | |
| Average of class Gaming (1343 - 2786, n=94, last 2 years) | |
| Gigabyte Aero 16 YE5 | |
| Alienware x17 R2 P48E | |
| Schenker XMG Neo 15 (i7-12700H, RTX 3080 Ti) | |
| Schenker XMG Neo 15 with XMG Oasis | |
| Average Intel Core i7-12700H, NVIDIA GeForce RTX 3080 Ti Laptop GPU (1936 - 2041, n=4) | |
| Asus ROG Zephyrus Duo 16 GX650RX | |
| CrossMark / Responsiveness | |
| Gigabyte Aero 16 YE5 | |
| Asus ROG Zephyrus Duo 16 GX650RX | |
| Average of class Gaming (1226 - 2334, n=94, last 2 years) | |
| Alienware x17 R2 P48E | |
| Average Intel Core i7-12700H, NVIDIA GeForce RTX 3080 Ti Laptop GPU (1461 - 1868, n=4) | |
| Schenker XMG Neo 15 (i7-12700H, RTX 3080 Ti) | |
| Schenker XMG Neo 15 with XMG Oasis | |
| PCMark 10 Score | 7579 points | |
Help | ||
| AIDA64 / Memory Copy | |
| Average of class Gaming (21750 - 129946, n=105, last 2 years) | |
| Schenker XMG Neo 15 (i7-12700H, RTX 3080 Ti) | |
| Schenker XMG Neo 15 with XMG Oasis | |
| Razer Blade 15 2022 | |
| Gigabyte Aero 16 YE5 | |
| Alienware x17 R2 P48E | |
| Average Intel Core i7-12700H (25615 - 80511, n=64) | |
| Asus ROG Zephyrus Duo 16 GX650RX | |
| AIDA64 / Memory Read | |
| Average of class Gaming (22956 - 118858, n=105, last 2 years) | |
| Schenker XMG Neo 15 with XMG Oasis | |
| Schenker XMG Neo 15 (i7-12700H, RTX 3080 Ti) | |
| Razer Blade 15 2022 | |
| Gigabyte Aero 16 YE5 | |
| Alienware x17 R2 P48E | |
| Average Intel Core i7-12700H (25586 - 79442, n=64) | |
| Asus ROG Zephyrus Duo 16 GX650RX | |
| AIDA64 / Memory Write | |
| Average of class Gaming (22297 - 135096, n=105, last 2 years) | |
| Razer Blade 15 2022 | |
| Schenker XMG Neo 15 with XMG Oasis | |
| Schenker XMG Neo 15 (i7-12700H, RTX 3080 Ti) | |
| Gigabyte Aero 16 YE5 | |
| Asus ROG Zephyrus Duo 16 GX650RX | |
| Average Intel Core i7-12700H (23679 - 88660, n=64) | |
| Alienware x17 R2 P48E | |
| AIDA64 / Memory Latency | |
| Average of class Gaming (75.3 - 259, n=105, last 2 years) | |
| Alienware x17 R2 P48E | |
| Asus ROG Zephyrus Duo 16 GX650RX | |
| Gigabyte Aero 16 YE5 | |
| Average Intel Core i7-12700H (76.2 - 133.9, n=62) | |
| Schenker XMG Neo 15 Tiger Lake | |
| Razer Blade 15 2022 | |
| Schenker XMG Neo 15 with XMG Oasis | |
* ... smaller is better
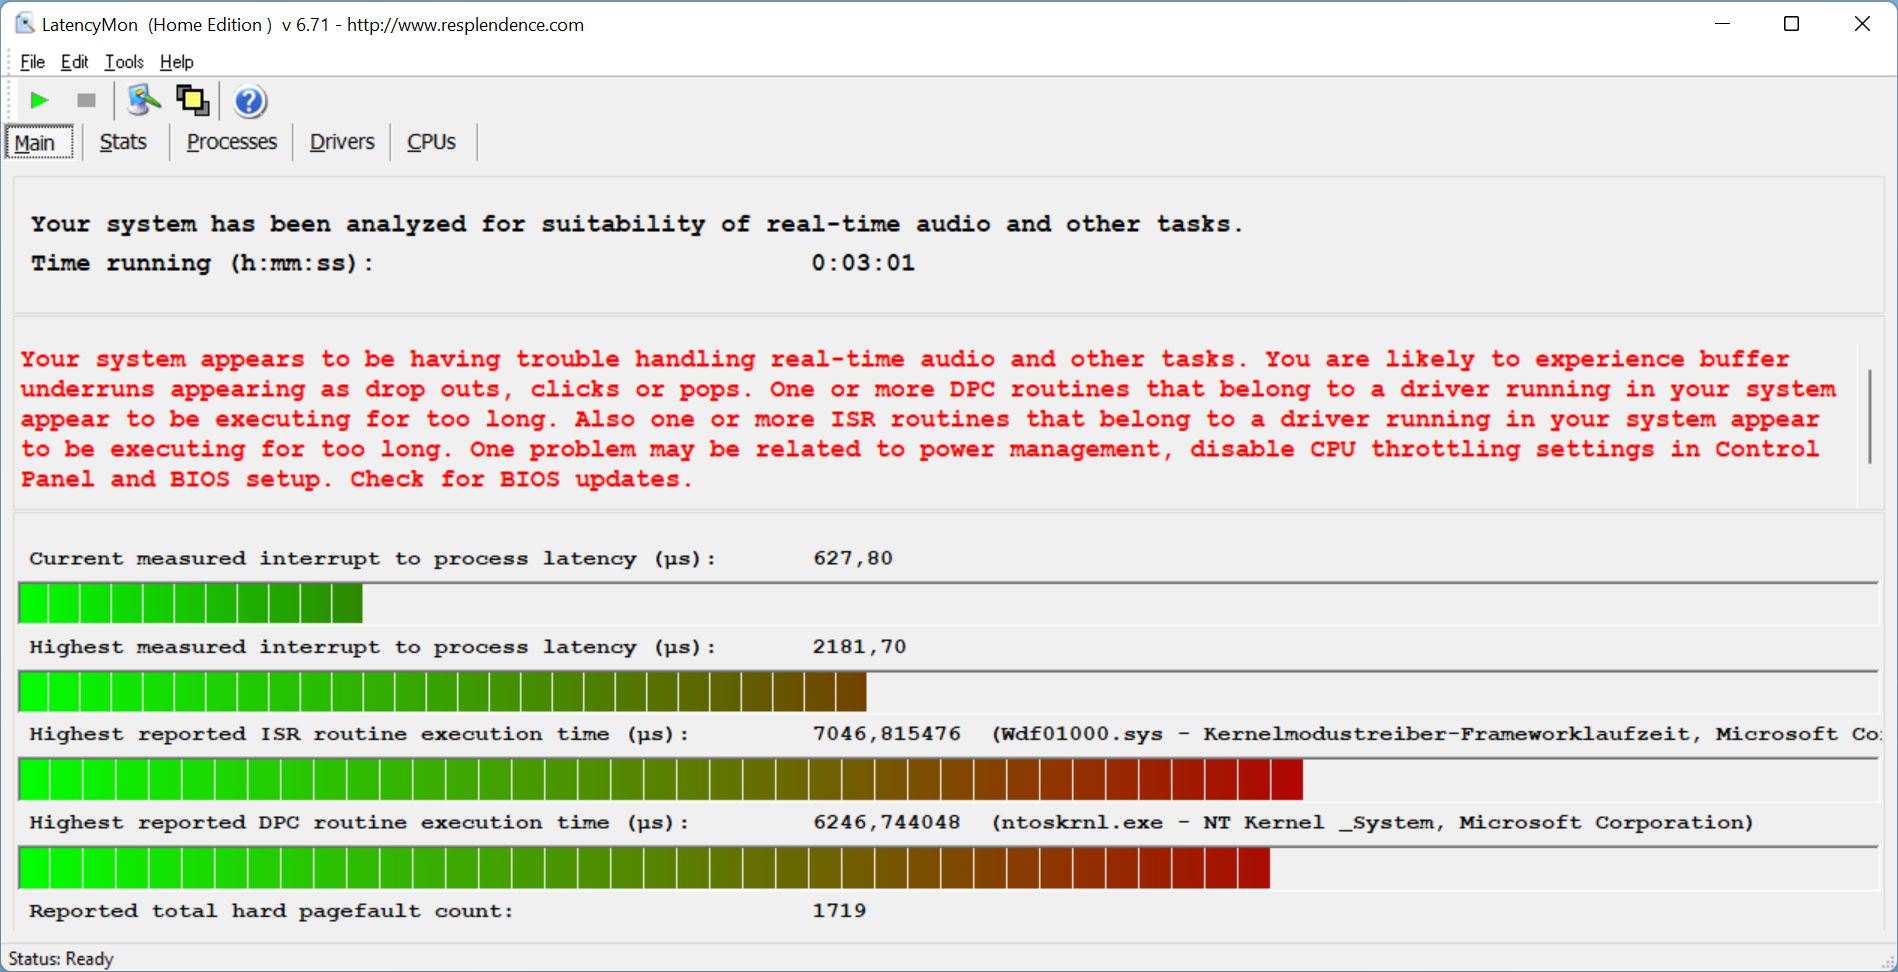
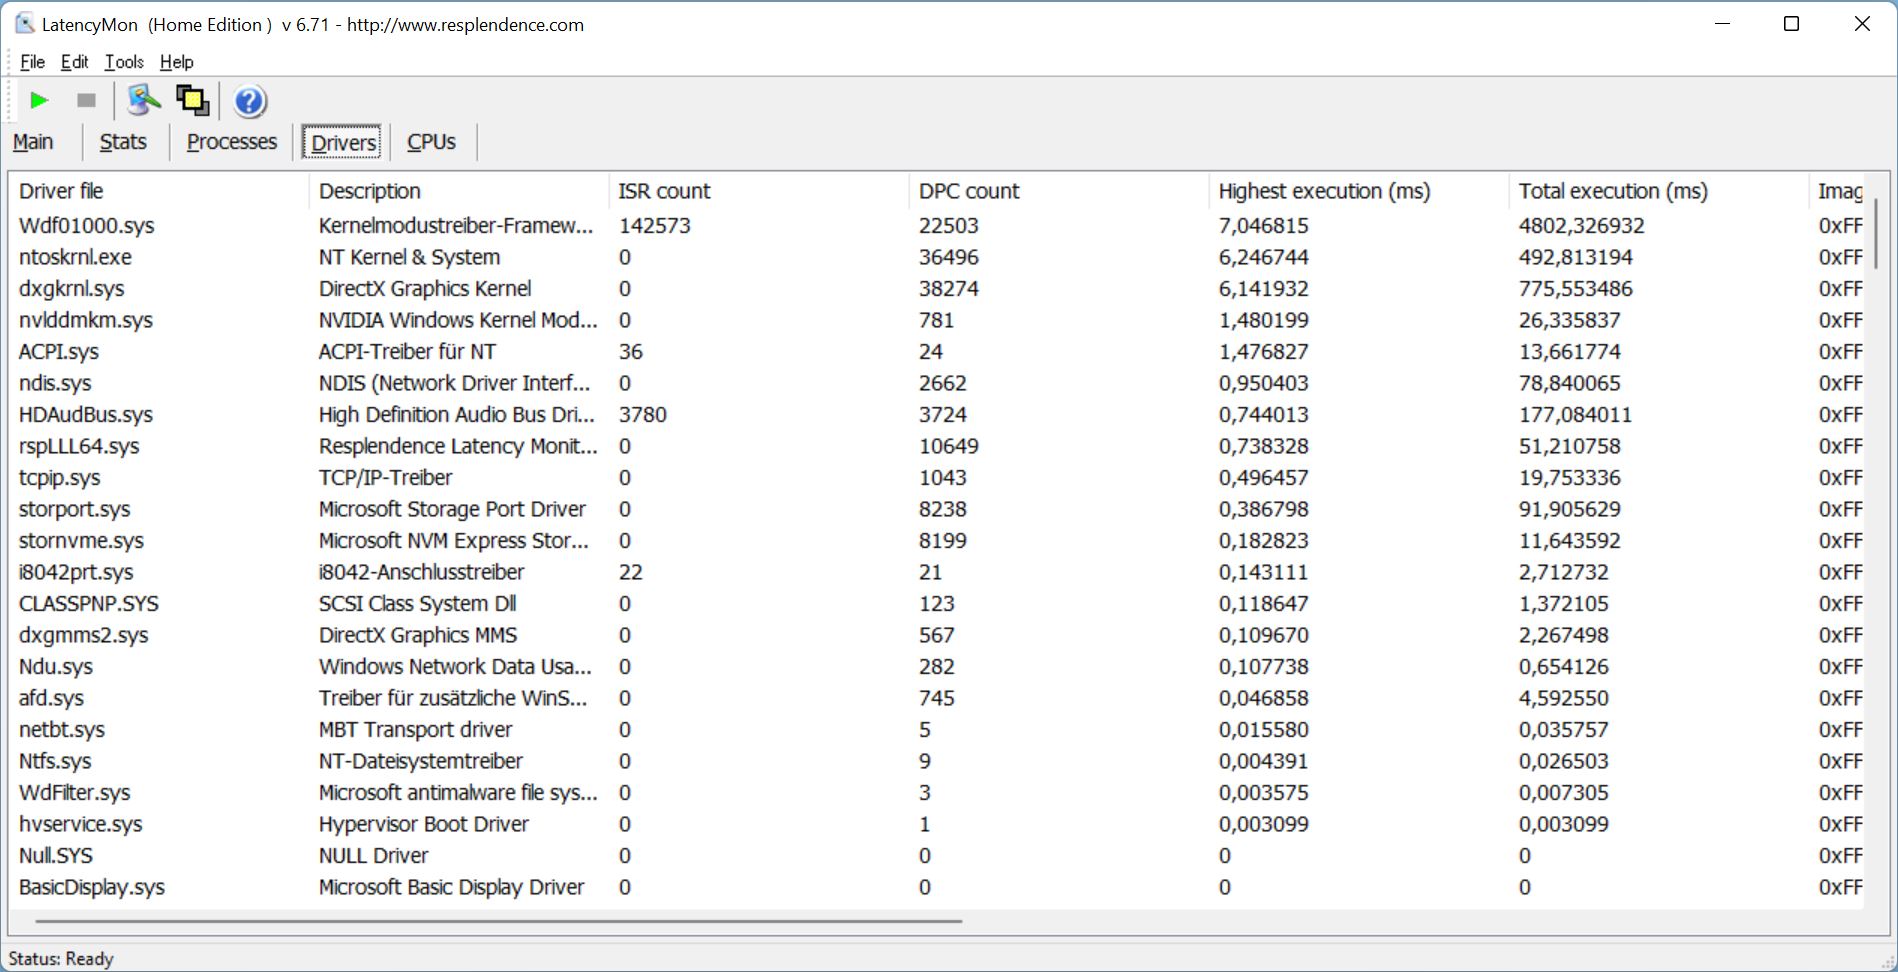
DPC Latency
LatencyMon displays latencies as soon as it is opened, which increase upon opening multiple tabs. The playback of our 4K/60 fps YouTube video increases the latency value even further, but only one dropped frame is the result. Overall, the latency is clearly too high, also in comparison with other devices.

| DPC Latencies / LatencyMon - interrupt to process latency (max), Web, Youtube, Prime95 | |
| Schenker XMG Neo 15 (i7-12700H, RTX 3080 Ti) | |
| Razer Blade 15 2022 | |
| Alienware x17 R2 P48E | |
| Gigabyte Aero 16 YE5 | |
| Schenker XMG Neo 15 Tiger Lake | |
| Asus ROG Zephyrus Duo 16 GX650RX | |
* ... smaller is better
Storage Devices
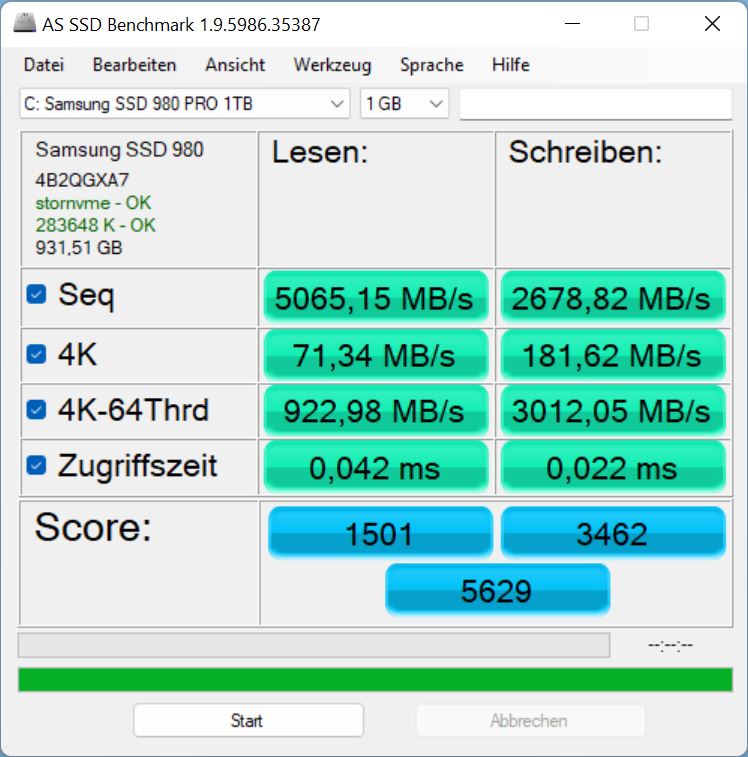
Schenker installs the well-known Samsung SSD 980 Pro with 1 TB, which ranks 11th in our SSD/HDD ranking and is very fast.
In the Neo, its performance is consistent over time, but its read performance in particular falls behind the average model in our database. It is also slower than the same model in the predecessor.

* ... smaller is better
Sustained Read Performance: DiskSpd Read Loop, Queue Depth 8
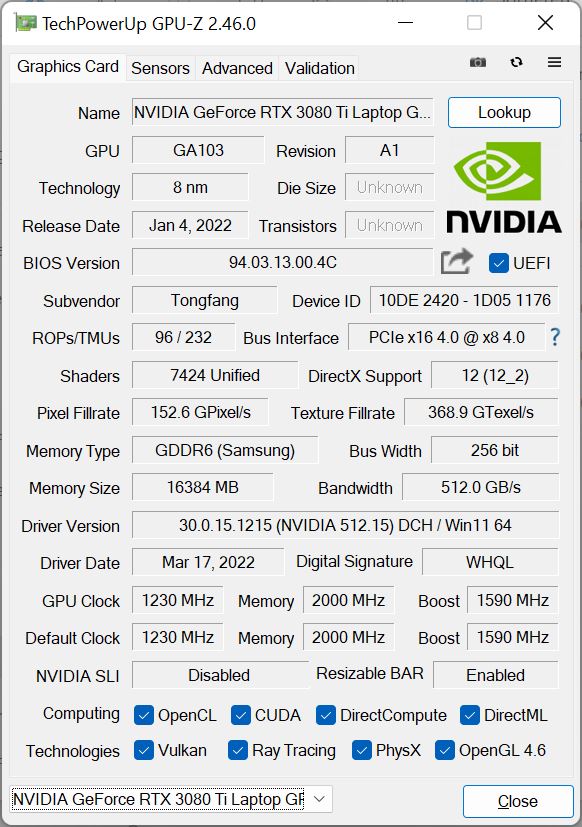
Graphics Card
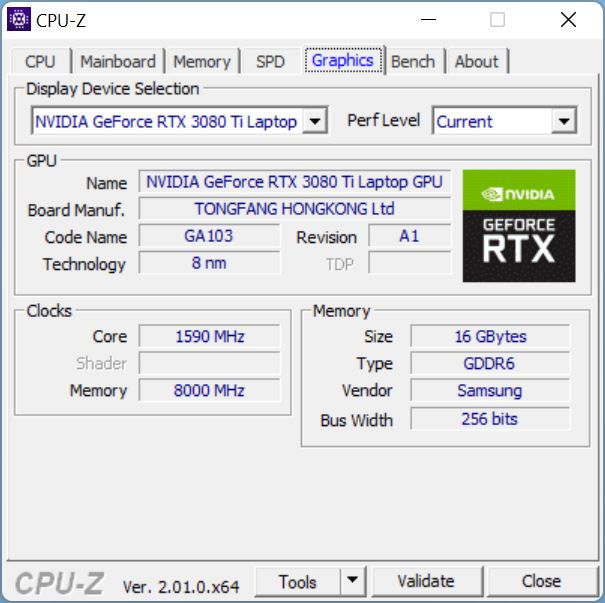
In order to utilize the full potential of the XMG Oasis, Schenker deploys the RTX 3080 Ti. This is currently the most powerful graphics card for laptops, which is supposed to ensure a smooth frame rate in games at 4K and higher.
The Neo 15 with Oasis is always ahead of the Neo 15 without Oasis in 3DMarks, but only by a few percentage points in the low single-digit range. Although the Neo with and without Oasis are always ahead of the selected competitors, the predecessor with its RTX 3080 is hardly any worse.
3D performance drops dramatically in battery mode. A further Fire Strike run only yields 2,643 points instead of around 31,000!


| 3DMark Performance rating - Percent | |
| Average of class Gaming | |
| Schenker XMG Neo 15 with XMG Oasis | |
| Schenker XMG Neo 15 Tiger Lake | |
| Schenker XMG Neo 15 (i7-12700H, RTX 3080 Ti) | |
| Average NVIDIA GeForce RTX 3080 Ti Laptop GPU | |
| Asus ROG Zephyrus Duo 16 GX650RX | |
| Razer Blade 15 2022 | |
| Gigabyte Aero 16 YE5 | |
| 3DMark 11 - 1280x720 Performance GPU | |
| Average of class Gaming (21841 - 80022, n=104, last 2 years) | |
| Schenker XMG Neo 15 with XMG Oasis | |
| Schenker XMG Neo 15 Tiger Lake | |
| Schenker XMG Neo 15 (i7-12700H, RTX 3080 Ti) | |
| Asus ROG Zephyrus Duo 16 GX650RX | |
| Average NVIDIA GeForce RTX 3080 Ti Laptop GPU (13920 - 45841, n=45) | |
| Razer Blade 15 2022 | |
| Gigabyte Aero 16 YE5 | |
| 3DMark | |
| 1920x1080 Fire Strike Graphics | |
| Average of class Gaming (12242 - 62849, n=115, last 2 years) | |
| Schenker XMG Neo 15 with XMG Oasis | |
| Schenker XMG Neo 15 Tiger Lake | |
| Schenker XMG Neo 15 (i7-12700H, RTX 3080 Ti) | |
| Average NVIDIA GeForce RTX 3080 Ti Laptop GPU (6928 - 34439, n=43) | |
| Razer Blade 15 2022 | |
| Asus ROG Zephyrus Duo 16 GX650RX | |
| Gigabyte Aero 16 YE5 | |
| 2560x1440 Time Spy Graphics | |
| Average of class Gaming (5012 - 26212, n=115, last 2 years) | |
| Schenker XMG Neo 15 with XMG Oasis | |
| Schenker XMG Neo 15 (i7-12700H, RTX 3080 Ti) | |
| Schenker XMG Neo 15 Tiger Lake | |
| Average NVIDIA GeForce RTX 3080 Ti Laptop GPU (4921 - 13835, n=43) | |
| Asus ROG Zephyrus Duo 16 GX650RX | |
| Razer Blade 15 2022 | |
| Gigabyte Aero 16 YE5 | |
| 3DMark 11 Performance | 34407 points | |
| 3DMark Cloud Gate Standard Score | 65137 points | |
| 3DMark Fire Strike Score | 27169 points | |
| 3DMark Time Spy Score | 12294 points | |
Help | ||
Gaming Performance
In gaming, the advantage of liquid cooling depends on the chosen game. There is no measurable fps advantage with Oasis (standard Overboost) in Witcher 3 or Far Cry 5, but there is in Cyberpoint, where the advantage is at least 8 percent. But overall, the advantages are negligible, since the RTX 3080 Ti in the Neo 15 still has enough power for ray tracing effects (Cyberpunk) in FullHD without Oasis.
We measured Dying Light 2 with maximized Overboost values. Here the Neo is always around 8% faster with Oasis than without, similar to Cyberpunk 2077. However, even the RTX 3080 Ti is not strong enough for high ray tracing effects in native resolution, only achieving an average of 25 fps.
| Cyberpunk 2077 1.6 | |
| 1920x1080 High Preset | |
| Alienware x17 R2 P48E | |
| Schenker XMG Neo 15 with XMG Oasis | |
| Average NVIDIA GeForce RTX 3080 Ti Laptop GPU (64 - 145.6, n=14) | |
| Schenker XMG Neo 15 (i7-12700H, RTX 3080 Ti) | |
| Asus ROG Zephyrus Duo 16 GX650RX | |
| Gigabyte Aero 16 YE5 | |
| 1920x1080 Ultra Preset | |
| Alienware x17 R2 P48E | |
| Asus ROG Zephyrus Duo 16 GX650RX | |
| Average NVIDIA GeForce RTX 3080 Ti Laptop GPU (54 - 144.1, n=16) | |
| Schenker XMG Neo 15 with XMG Oasis | |
| Schenker XMG Neo 15 (i7-12700H, RTX 3080 Ti) | |
| Gigabyte Aero 16 YE5 | |
| 2560x1440 Ultra Preset | |
| Schenker XMG Neo 15 with XMG Oasis | |
| Average NVIDIA GeForce RTX 3080 Ti Laptop GPU (36 - 69.6, n=13) | |
| Asus ROG Zephyrus Duo 16 GX650RX | |
| Schenker XMG Neo 15 (i7-12700H, RTX 3080 Ti) | |
| Gigabyte Aero 16 YE5 | |
| 1920x1080 Ray Tracing Ultra Preset (DLSS off) | |
| Gigabyte Aero 16 YE5 | |
| Average NVIDIA GeForce RTX 3080 Ti Laptop GPU (39.2 - 49.9, n=7) | |
| Schenker XMG Neo 15 with XMG Oasis | |
| Asus ROG Zephyrus Duo 16 GX650RX | |
| Schenker XMG Neo 15 (i7-12700H, RTX 3080 Ti) | |
| Far Cry 5 | |
| 1920x1080 High Preset AA:T | |
| Razer Blade 15 2022 | |
| Schenker XMG Neo 15 (i7-12700H, RTX 3080 Ti) | |
| Average NVIDIA GeForce RTX 3080 Ti Laptop GPU (118 - 167, n=22) | |
| Schenker XMG Neo 15 with XMG Oasis | |
| Gigabyte Aero 16 YE5 | |
| Schenker XMG Neo 15 Tiger Lake | |
| Average of class Gaming (82 - 163, n=6, last 2 years) | |
| Asus ROG Zephyrus Duo 16 GX650RX | |
| 1920x1080 Ultra Preset AA:T | |
| Razer Blade 15 2022 | |
| Schenker XMG Neo 15 with XMG Oasis | |
| Average NVIDIA GeForce RTX 3080 Ti Laptop GPU (111 - 162, n=24) | |
| Schenker XMG Neo 15 (i7-12700H, RTX 3080 Ti) | |
| Gigabyte Aero 16 YE5 | |
| Schenker XMG Neo 15 Tiger Lake | |
| Average of class Gaming (70 - 151, n=6, last 2 years) | |
| Asus ROG Zephyrus Duo 16 GX650RX | |
| 2560x1440 Ultra Preset AA:T | |
| Schenker XMG Neo 15 with XMG Oasis | |
| Average of class Gaming (93 - 149, n=5, last 2 years) | |
| Schenker XMG Neo 15 (i7-12700H, RTX 3080 Ti) | |
| Average NVIDIA GeForce RTX 3080 Ti Laptop GPU (86 - 134, n=20) | |
| Schenker XMG Neo 15 Tiger Lake | |
| Razer Blade 15 2022 | |
| Asus ROG Zephyrus Duo 16 GX650RX | |
| Gigabyte Aero 16 YE5 | |
| Dota 2 Reborn | |
| 1920x1080 high (2/3) | |
| Gigabyte Aero 16 YE5 | |
| Alienware x17 R2 P48E | |
| Average of class Gaming (82.8 - 275, n=106, last 2 years) | |
| Razer Blade 15 2022 | |
| Schenker XMG Neo 15 (i7-12700H, RTX 3080 Ti) | |
| Schenker XMG Neo 15 with XMG Oasis | |
| Schenker XMG Neo 15 Tiger Lake | |
| Average NVIDIA GeForce RTX 3080 Ti Laptop GPU (29.9 - 180.8, n=45) | |
| Asus ROG Zephyrus Duo 16 GX650RX | |
| 1920x1080 ultra (3/3) best looking | |
| Gigabyte Aero 16 YE5 | |
| Alienware x17 R2 P48E | |
| Razer Blade 15 2022 | |
| Average of class Gaming (84.8 - 248, n=107, last 2 years) | |
| Schenker XMG Neo 15 (i7-12700H, RTX 3080 Ti) | |
| Schenker XMG Neo 15 with XMG Oasis | |
| Schenker XMG Neo 15 Tiger Lake | |
| Average NVIDIA GeForce RTX 3080 Ti Laptop GPU (29.9 - 170.5, n=45) | |
| Asus ROG Zephyrus Duo 16 GX650RX | |
| Dying Light 2 | |
| 1920x1080 Medium Quality | |
| Schenker XMG Neo 15 with XMG Oasis | |
| Schenker XMG Neo 15 (i7-12700H, RTX 3080 Ti) | |
| Average NVIDIA GeForce RTX 3080 Ti Laptop GPU (79 - 103, n=5) | |
| Asus ROG Zephyrus Duo 16 GX650RX | |
| Gigabyte Aero 16 YE5 | |
| 1920x1080 High Quality | |
| Schenker XMG Neo 15 with XMG Oasis | |
| Schenker XMG Neo 15 (i7-12700H, RTX 3080 Ti) | |
| Average NVIDIA GeForce RTX 3080 Ti Laptop GPU (69.2 - 88.4, n=5) | |
| Asus ROG Zephyrus Duo 16 GX650RX | |
| Gigabyte Aero 16 YE5 | |
| 2560x1440 High Quality | |
| Schenker XMG Neo 15 with XMG Oasis | |
| Schenker XMG Neo 15 (i7-12700H, RTX 3080 Ti) | |
| Average NVIDIA GeForce RTX 3080 Ti Laptop GPU (49.6 - 64, n=5) | |
| Asus ROG Zephyrus Duo 16 GX650RX | |
| Gigabyte Aero 16 YE5 | |
| 1920x1080 High Quality Raytracing | |
| Schenker XMG Neo 15 with XMG Oasis | |
| Schenker XMG Neo 15 (i7-12700H, RTX 3080 Ti) | |
| Asus ROG Zephyrus Duo 16 GX650RX | |
| Average NVIDIA GeForce RTX 3080 Ti Laptop GPU (33.4 - 42.3, n=5) | |
| Gigabyte Aero 16 YE5 | |
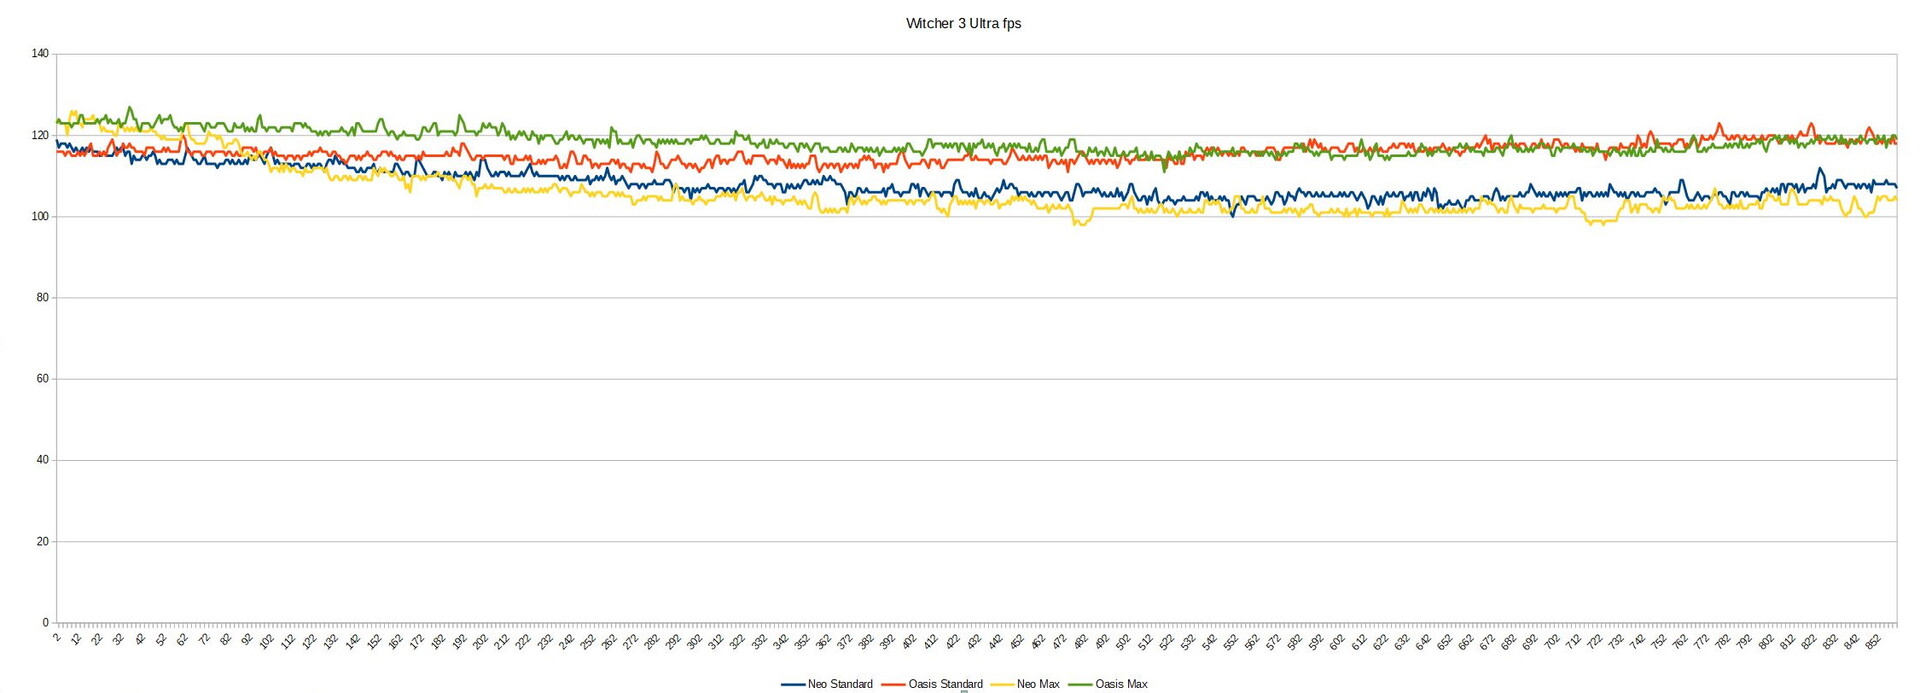
The frame rate under Witcher 3 Ultra remains very constant over an hour.
The fps differences with and without Oasis are rather small in all scenarios, but there is a pattern. For example, if you maximize all values in Neo (without Oasis), the performance output is also maximized. However, this quickly decreases and sometimes even falls below the Neo's fps in standard Overboost due to the strong thermal demands.
With Oasis, the situation is different: Here the performance output of the standard Overboost is on par with the Neo (without Oasis), but it does not drop over time, but rather increases. Therefore, the fps is always a little higher with Oasis.
Although the Witcher frame rate differs only slightly without Oasis, the liquid cooling system confers a lot of advantages internally. The CPU core temperature drops from an average of 86 °C to just 60 °C! However, this does not result in significantly higher clock rates, since the thermal throttling does not come into effect all the time.
The GPU gives a similar story: temperatures drop from 86 °C to only 59 °C, but the GPU core clock is only around 200 MHz higher. Even with maximized offset values, the picture is the same.
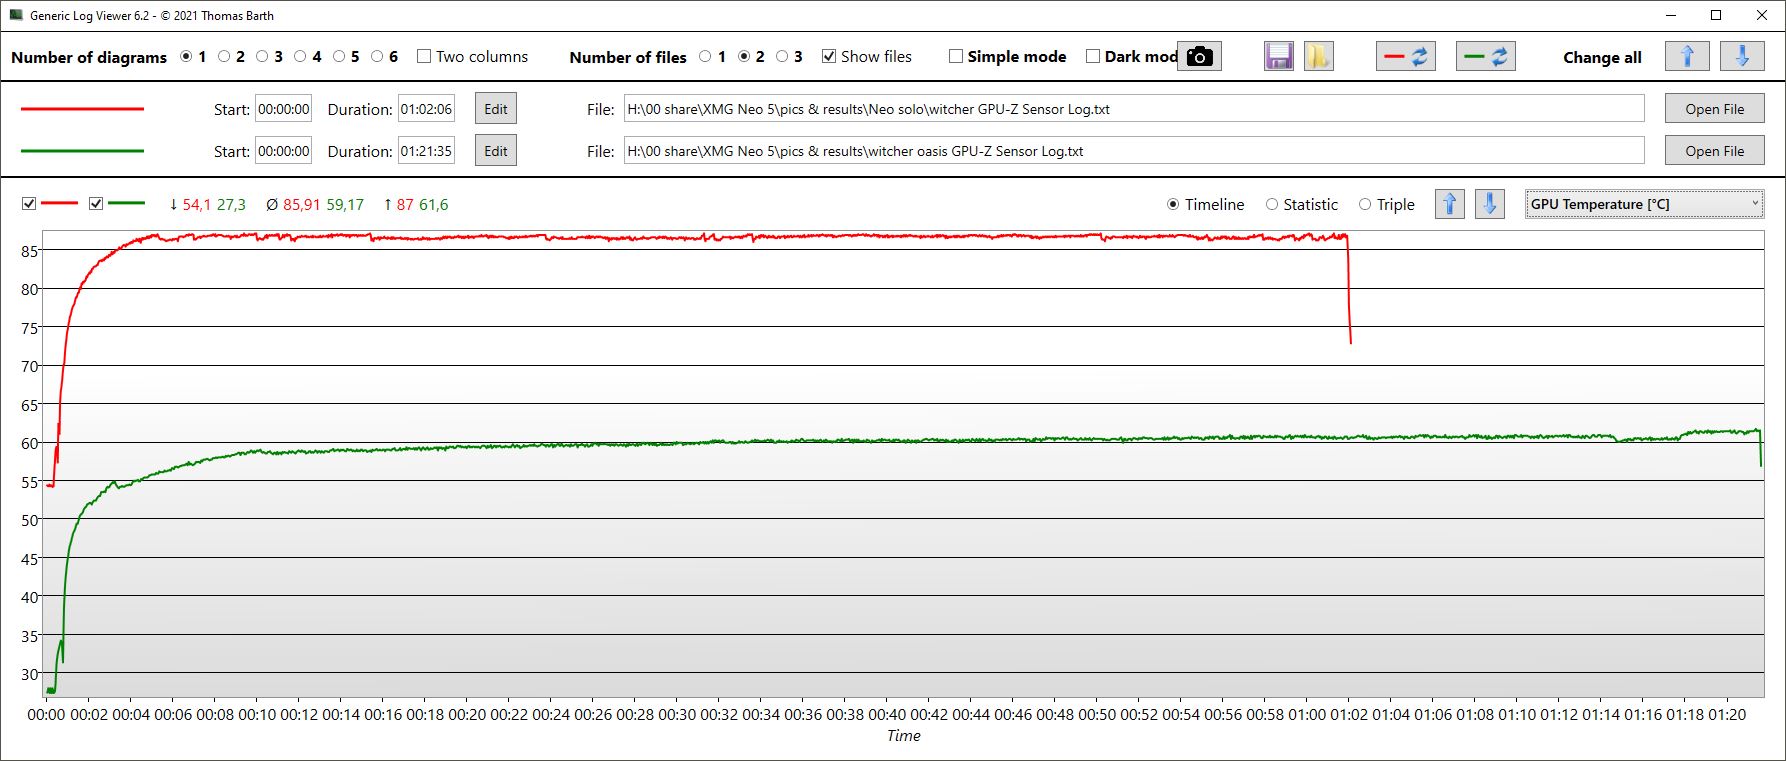
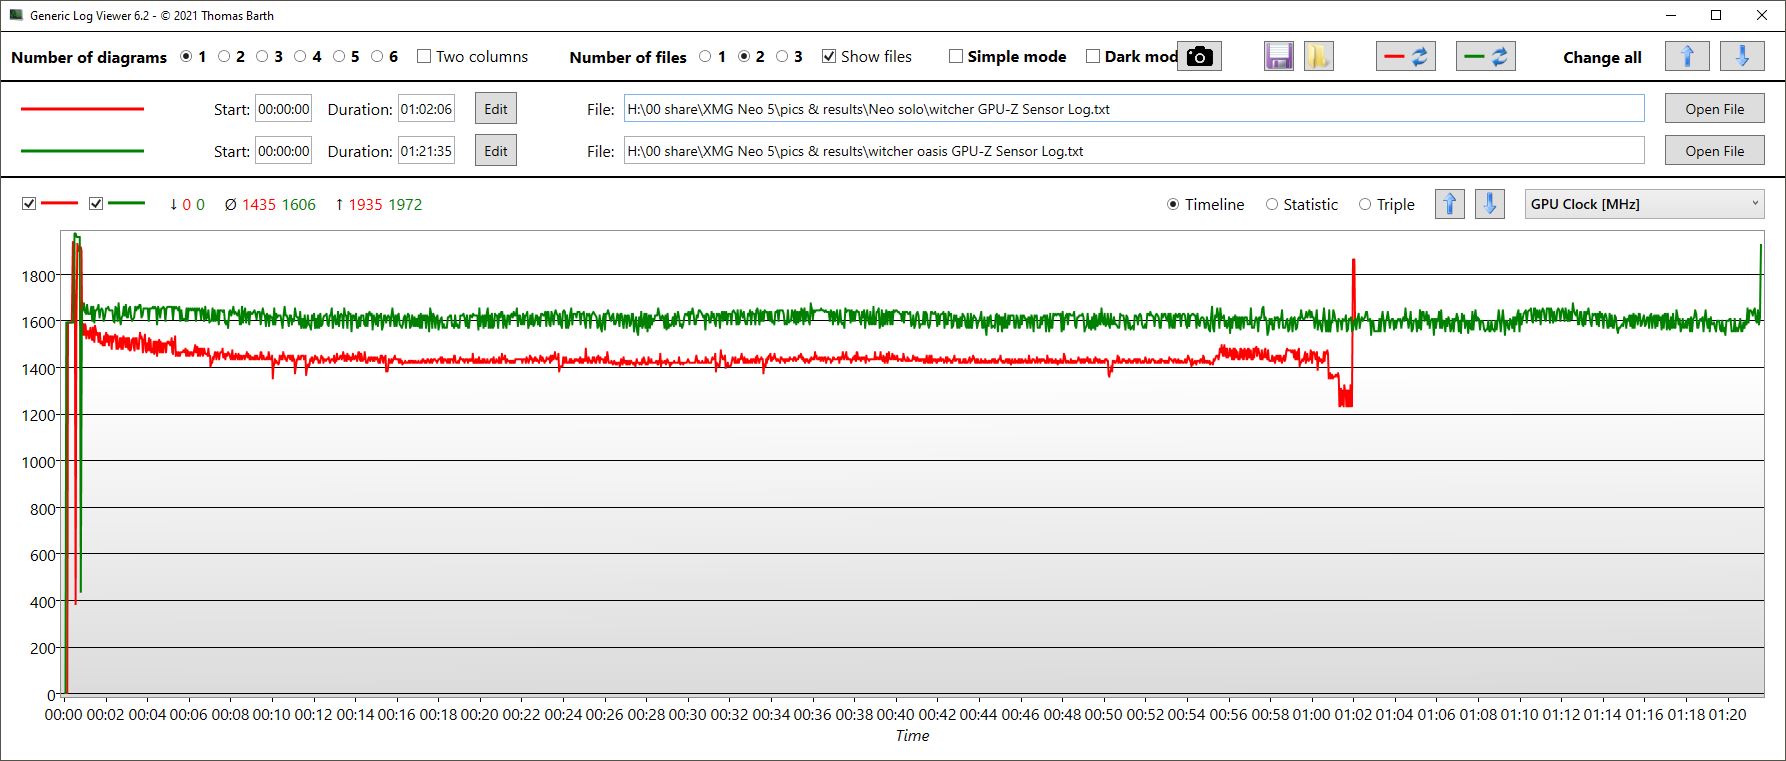
Interestingly, maximizing the offset values does not result in any fps gains, at least in Witcher 3. The card heats up a little more, but does not consume more energy than in standard Overboost without maxed offset values. The CPU shows the same effect. It is possible that the maximized settings are not correctly implemented by the control software - there is still a confirmed bug in the current version that prevents the simultaneous activation of the performance values and the Dynamic Boost (visually, at least), but the maximization should still be active.


| low | med. | high | ultra | QHD | |
|---|---|---|---|---|---|
| GTA V (2015) | 186 | 182.4 | 177.7 | 123.1 | 110.8 |
| The Witcher 3 (2015) | 407 | 341 | 242.8 | 127.8 | |
| Dota 2 Reborn (2015) | 177.8 | 165 | 155.9 | 149.9 | |
| Final Fantasy XV Benchmark (2018) | 203 | 158.5 | 116.4 | 87.8 | |
| X-Plane 11.11 (2018) | 140.3 | 122.4 | 99.4 | ||
| Far Cry 5 (2018) | 152 | 142 | 132 | 116 | |
| Strange Brigade (2018) | 474 | 285 | 225 | 201 | 146 |
| Dying Light 2 (2022) | 139 | 96 | 83 | 60 | |
| Cyberpunk 2077 1.6 (2022) | 138.35 | 134.17 | 100.93 | 83.23 | 53.37 |
Emissions: Loud and hot without Oasis
System Noise
In terms of noise, the system certainly benefits from liquid cooling. While the fans of the Neo 15 (without Oasis) rev up quite a bit during gaming, they remain at a much quieter level with the Oasis. Of course, the Oasis itself is not silent either, especially in "Balanced" mode when the large single fan of the Oasis constantly hums at around 44 dB (microphone at a distance of 15 cm). On the other hand, this is considerably quieter than the fans of the Neo without Oasis.
In "Very Quiet" mode, however, the Oasis emits a high-pitched, unpleasant whirring noise that is not audible in the other two modes. This makes "Quiet" mode the more preferable option in terms of noise reduction. The fan definitely needs to be optimized here so that Very Quiet lives up to its name.
The hose connections from the Oasis to the Neo are approximately 57 cm long. This gives you a certain but limited flexibility. You could shift the Oasis further backwards, while putting it under the desk poses some problems. But the perceived volume of the Oasis itself can still be reduced somewhat by changing the position.

At this point, a small point of criticism of Schenker's labelling policy for the Oasis fan modes arises: Balanced mode is the highest possible mode, so the integrated fan becomes loudest here. As mentioned above, there are three modes in total: Very Quiet, Quiet and Balanced. It would have been more honest to name the modes Quiet, Balanced and Performance, for what is the highest possible mode with the highest levels of noise supposed to balance out? Perhaps sometime soon, the fan modes will be called Quiet, Very Quiet and Extremely Quiet?
In contrast, the Neo itself also has three fan modes, which form the other extreme in terms of labeling: Balanced, Enthusiast and Overboost. So everything here is designed for performance. Even in Balanced mode, the fans frequently start up when the laptop is idle. Although they spin relatively quietly, we would have liked a silent mode for office use. Therefore it was difficult to measure the noise levels of the XMG Oasis since the Neo's fans were also almost always active, even if only quietly.
When idle and under low load, the Oasis is less useful, sometimes even useless due to the electronic noise in Very Quiet mode and the low noise levels of the Neo 15. On the other hand, the combination leads to noticeable noise reduction during gaming and heavy loads. However, the Razer Blade, which does not have liquid cooling, also only emits moderate levels of noise under load. Without Oasis, the Neo 15 is the loudest device under heavy load in direct comparison with competing devices.
Noise level
| Idle |
| 23 / 26.39 / 26.39 dB(A) |
| Load |
| 45.52 / 55.89 dB(A) |
 | ||
30 dB silent 40 dB(A) audible 50 dB(A) loud |
||
min: | ||
| Schenker XMG Neo 15 (i7-12700H, RTX 3080 Ti) GeForce RTX 3080 Ti Laptop GPU, i7-12700H, Samsung SSD 980 Pro 1TB MZ-V8P1T0BW | Schenker XMG Neo 15 with XMG Oasis GeForce RTX 3080 Ti Laptop GPU, i7-12700H, Samsung SSD 980 Pro 1TB MZ-V8P1T0BW | Schenker XMG Neo 15 Tiger Lake GeForce RTX 3080 Laptop GPU, i7-11800H, Samsung SSD 980 Pro 1TB MZ-V8P1T0BW | Razer Blade 15 2022 GeForce RTX 3080 Ti Laptop GPU, i7-12800H, SSSTC CA6-8D1024 | Asus ROG Zephyrus Duo 16 GX650RX GeForce RTX 3080 Ti Laptop GPU, R9 6900HX, 2x Samsung SSD 980 Pro 2TB MZ-V8P2T0 (RAID 0) | Gigabyte Aero 16 YE5 GeForce RTX 3080 Ti Laptop GPU, i9-12900HK, Phison ESR01TBMFCT | Alienware x17 R2 P48E GeForce RTX 3080 Ti Laptop GPU, i9-12900HK, 2x Samsung PM9A1 1TB (RAID 0) | |
|---|---|---|---|---|---|---|---|
| Noise | -25% | -8% | -0% | -0% | -9% | 10% | |
| off / environment * (dB) | 23 | 23 -0% | 25 -9% | 25.4 -10% | 26 -13% | 25 -9% | 22.7 1% |
| Idle Minimum * (dB) | 23 | 40.84 -78% | 27 -17% | 26.2 -14% | 26 -13% | 30 -30% | 23.1 -0% |
| Idle Average * (dB) | 26.39 | 41.4 -57% | 30 -14% | 26.2 1% | 27 -2% | 32 -21% | 23.1 12% |
| Idle Maximum * (dB) | 26.39 | 44.33 -68% | 32 -21% | 28.4 -8% | 29 -10% | 33 -25% | 23.1 12% |
| Load Average * (dB) | 45.52 | 44.33 3% | 46 -1% | 44.7 2% | 41 10% | 45 1% | 31.9 30% |
| Witcher 3 ultra * (dB) | 55.89 | 46.25 17% | 52 7% | 44.7 20% | 48 14% | 50 11% | 52.5 6% |
| Load Maximum * (dB) | 55.89 | 51.26 8% | 55 2% | 51.9 7% | 50 11% | 52 7% | 52.5 6% |
* ... smaller is better
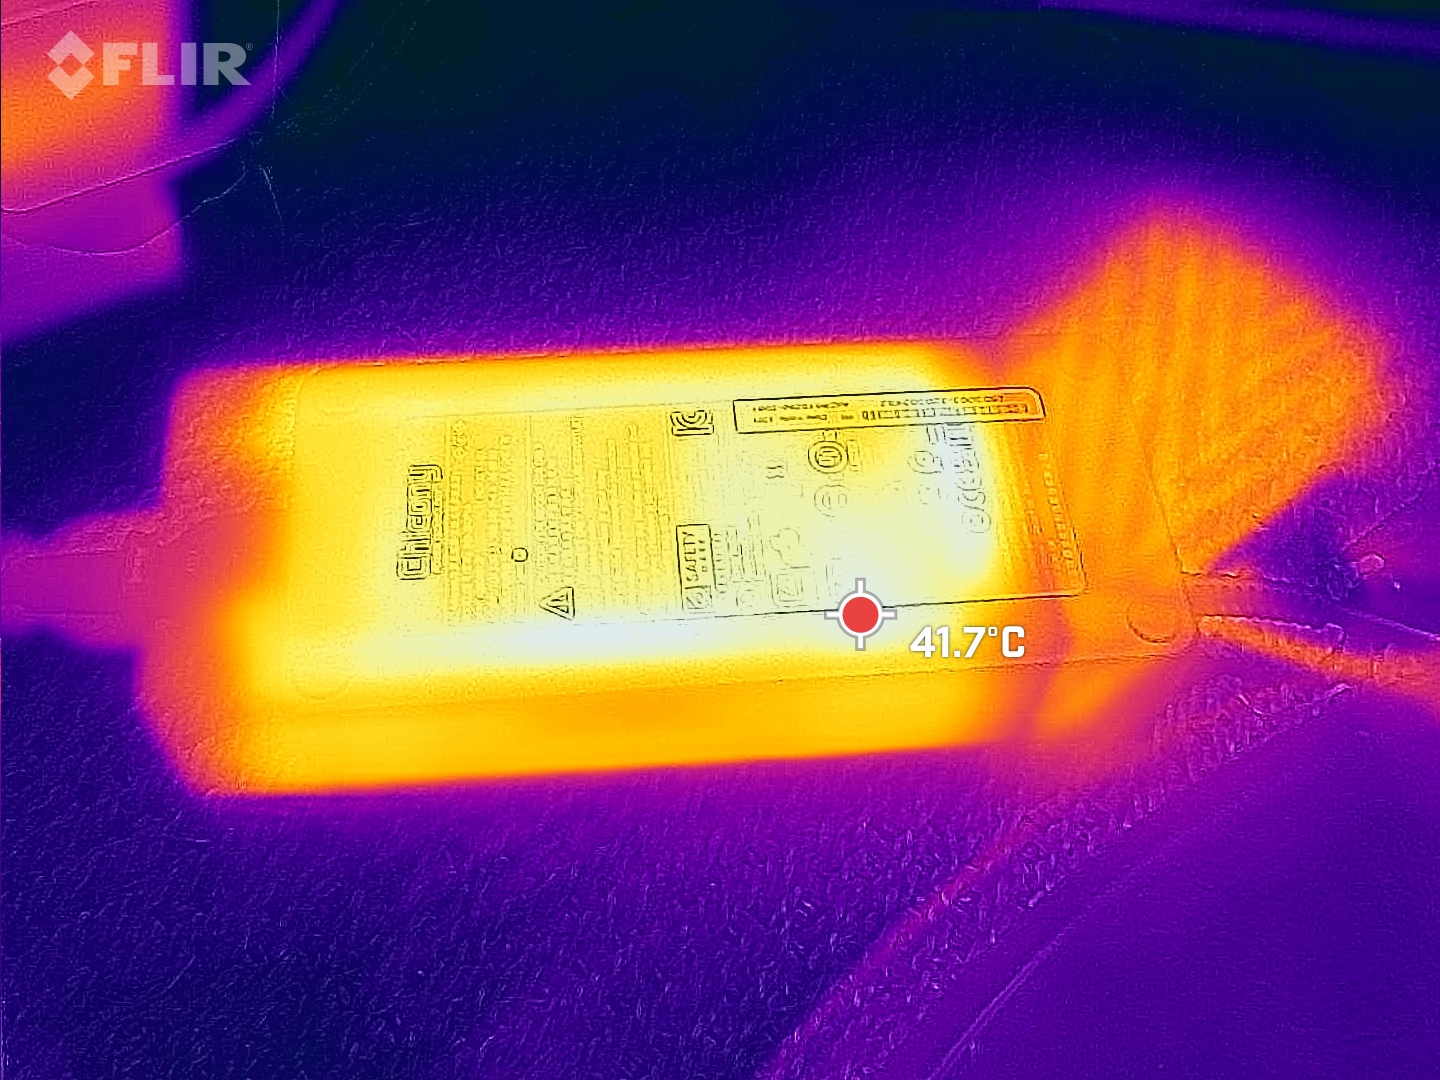
Temperature
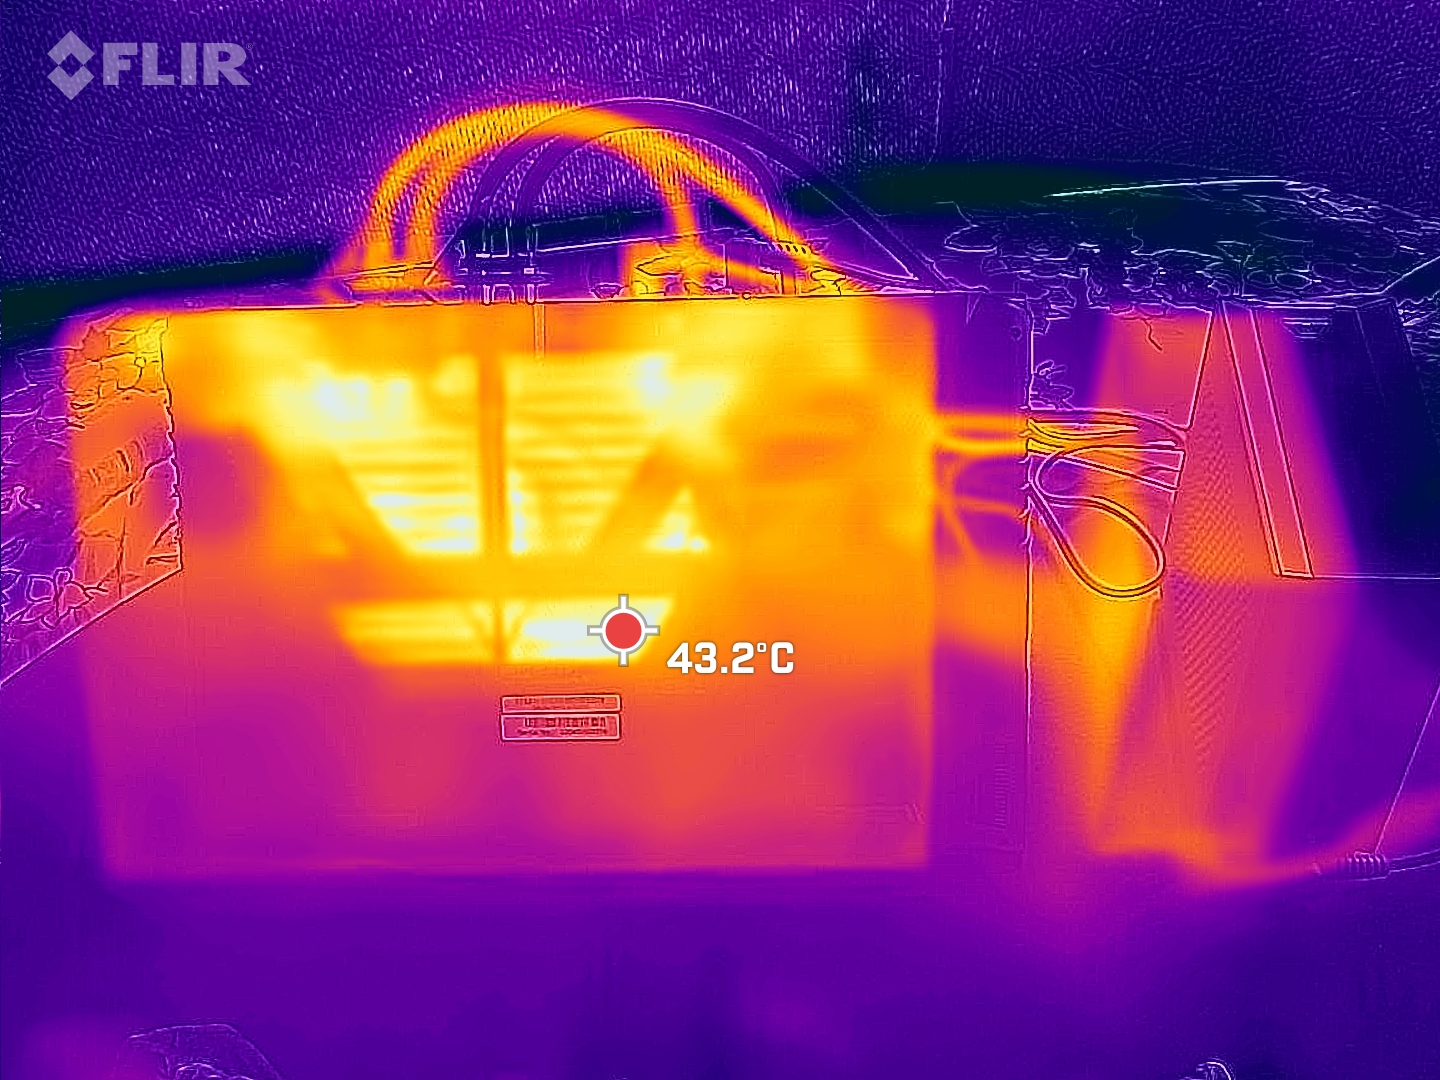
Under heavy load, surface temperatures also drop thanks to the Oasis, especially on the bottom from a maximum of 56 to 49 °C.
There is also a significant temperature reduction when idling, but this was recorded in Balanced mode, which is unlikely to be used for idling due to the high noise levels.
The Oasis does not have the strongest impact on surface temperatures, but rather on core and hardware temperatures, as can be seen in the following section under "Stress Test".
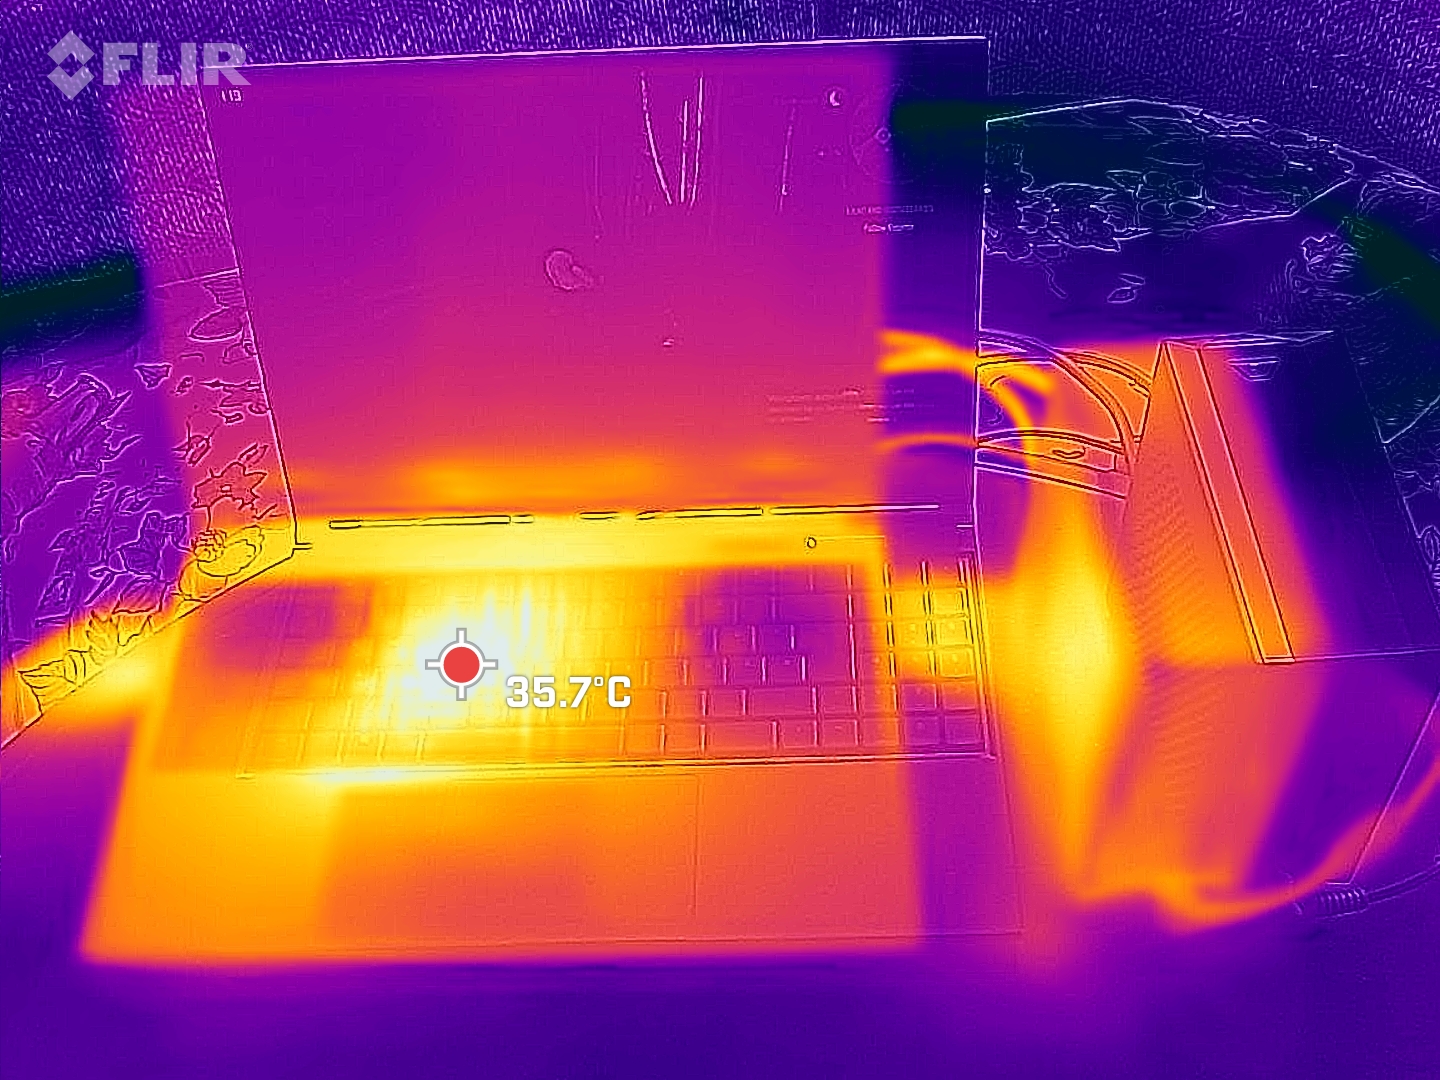
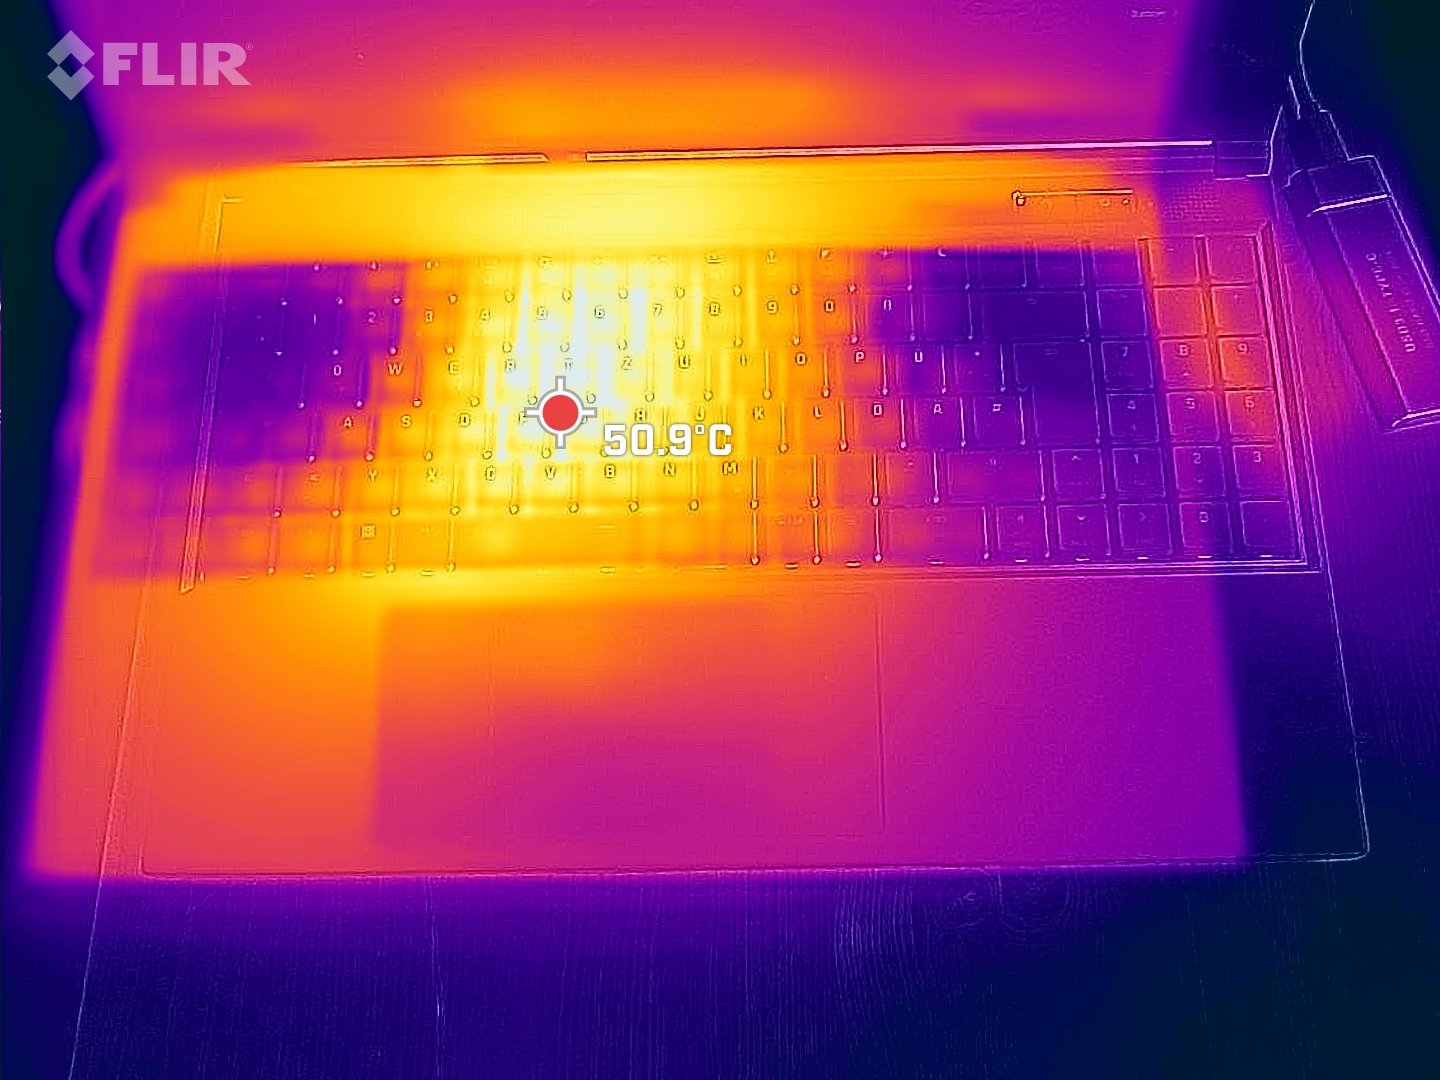
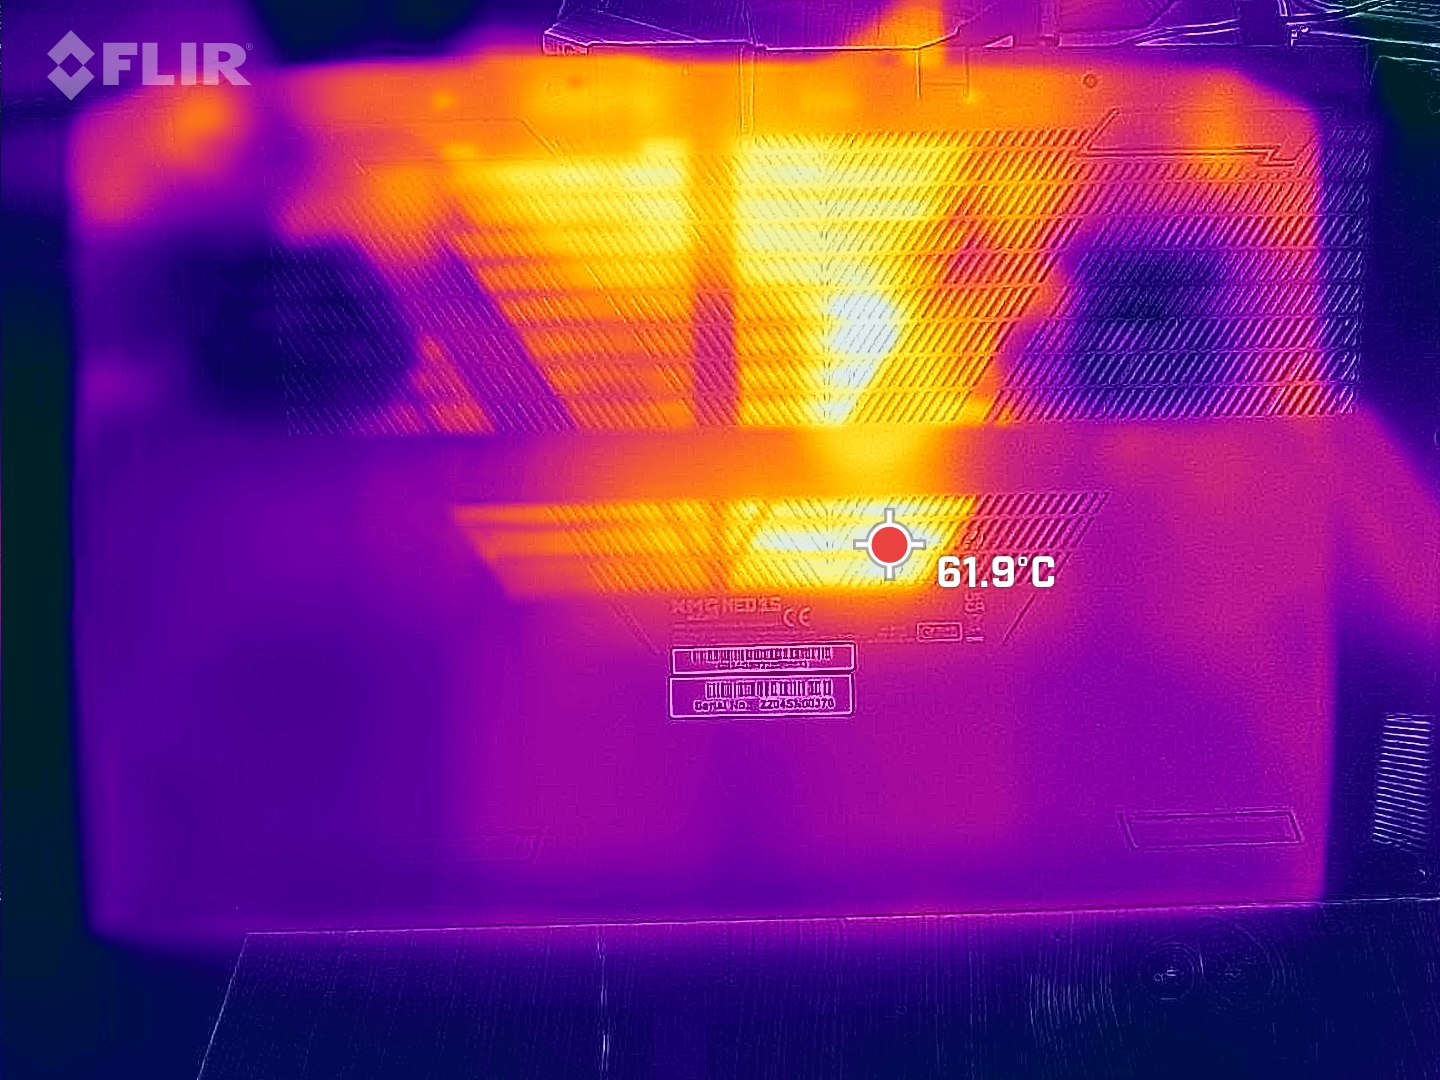
(±) The maximum temperature on the upper side is 44 °C / 111 F, compared to the average of 40.4 °C / 105 F, ranging from 21.2 to 68.8 °C for the class Gaming.
(-) The bottom heats up to a maximum of 56 °C / 133 F, compared to the average of 43.2 °C / 110 F
(±) In idle usage, the average temperature for the upper side is 33.9 °C / 93 F, compared to the device average of 33.9 °C / 93 F.
(-) Playing The Witcher 3, the average temperature for the upper side is 39.8 °C / 104 F, compared to the device average of 33.9 °C / 93 F.
(±) The palmrests and touchpad can get very hot to the touch with a maximum of 37 °C / 98.6 F.
(-) The average temperature of the palmrest area of similar devices was 28.8 °C / 83.8 F (-8.2 °C / -14.8 F).
| Schenker XMG Neo 15 (i7-12700H, RTX 3080 Ti) Intel Core i7-12700H, NVIDIA GeForce RTX 3080 Ti Laptop GPU | Schenker XMG Neo 15 with XMG Oasis Intel Core i7-12700H, NVIDIA GeForce RTX 3080 Ti Laptop GPU | Schenker XMG Neo 15 Tiger Lake Intel Core i7-11800H, NVIDIA GeForce RTX 3080 Laptop GPU | Razer Blade 15 2022 Intel Core i7-12800H, NVIDIA GeForce RTX 3080 Ti Laptop GPU | Asus ROG Zephyrus Duo 16 GX650RX AMD Ryzen 9 6900HX, NVIDIA GeForce RTX 3080 Ti Laptop GPU | Gigabyte Aero 16 YE5 Intel Core i9-12900HK, NVIDIA GeForce RTX 3080 Ti Laptop GPU | Alienware x17 R2 P48E Intel Core i9-12900HK, NVIDIA GeForce RTX 3080 Ti Laptop GPU | |
|---|---|---|---|---|---|---|---|
| Heat | 15% | 11% | 3% | 11% | 6% | 14% | |
| Maximum Upper Side * (°C) | 44 | 44 -0% | 39 11% | 50 -14% | 45 -2% | 49 -11% | 49.6 -13% |
| Maximum Bottom * (°C) | 56 | 49 12% | 50 11% | 47 16% | 50 11% | 55 2% | 42.4 24% |
| Idle Upper Side * (°C) | 38 | 30 21% | 34 11% | 37.4 2% | 33 13% | 33 13% | 29.2 23% |
| Idle Bottom * (°C) | 41 | 30 27% | 37 10% | 38.4 6% | 33 20% | 33 20% | 32 22% |
* ... smaller is better
Stress Test
And this is where the XMG Oasis finally makes a markedly positive contribution. Since the average CPU core temperature of the Neo 15 is just under 90 °C, Oasis pushes this value down by over 10 °C to just 79 °C. This is also noticeable in the power consumption because thermal limits are absent in the presence of Oasis. The system can thus always make use of the full 95 W (standard Overboost mode) or more (Overboost
max), whereas the Neo alone cannot maintain the 95 W and so falls to an average of 79 W due to thermal limitations.
Accordingly, the CPU clock rates are higher, namely about 300 MHz higher with Oasis than without it. So, thanks to the Oasis, you can experiment with the manual offset values or even maximize them free of worry.
The results of the graphics card are analogous: Instead of 67 °C, the GPU only warms up to 58 °C under Oasis, while the clock rates almost double from 800 to 1,600 MHz! Even the memory clock is almost 500 MHz higher and the chip is able to consume more energy.


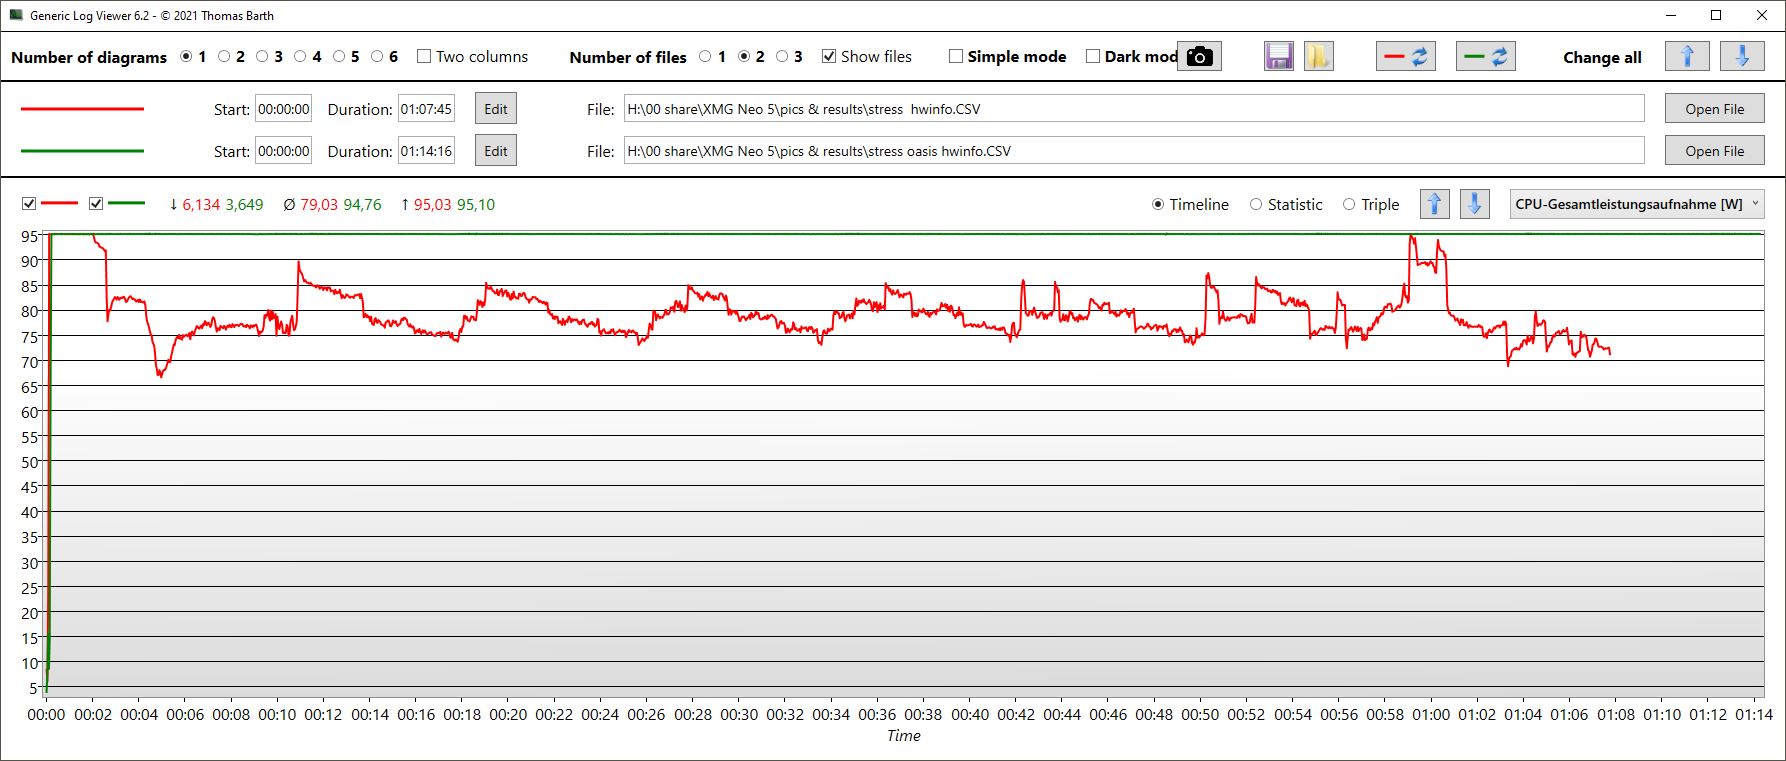


| with / without Oasis | CPU Clock (GHz) | GPU Clock (MHz) | Average CPU Temperature (°C) | Average GPU Temperature (°C) |
| Prime95 + FurMark Stress | 3,3 / 3,6 | 815 / 1.625 | 90 / 79 | 67 / 58 |
| Witcher 3 Stress | 3,2 | 1.435 / 1.602 | 86 / 60 | 86 / 59 |
Speakers
Despite slightly larger speakers compared to the predecessor, the Neo plays at a rather mediocre volume and still offers too little bass. The mids are also somewhat too high. Only the highs are quite balanced.
The Neo offers two jack ports for connecting analog audio devices, namely separate ones for headphones and microphones.
Schenker XMG Neo 15 (i7-12700H, RTX 3080 Ti) audio analysis
(±) | speaker loudness is average but good (78.58 dB)
Bass 100 - 315 Hz
(-) | nearly no bass - on average 17.9% lower than median
(±) | linearity of bass is average (8% delta to prev. frequency)
Mids 400 - 2000 Hz
(±) | higher mids - on average 7% higher than median
(±) | linearity of mids is average (9% delta to prev. frequency)
Highs 2 - 16 kHz
(+) | balanced highs - only 3.7% away from median
(±) | linearity of highs is average (8.5% delta to prev. frequency)
Overall 100 - 16.000 Hz
(±) | linearity of overall sound is average (19.8% difference to median)
Compared to same class
» 70% of all tested devices in this class were better, 6% similar, 24% worse
» The best had a delta of 6%, average was 18%, worst was 132%
Compared to all devices tested
» 50% of all tested devices were better, 7% similar, 42% worse
» The best had a delta of 4%, average was 23%, worst was 134%
Razer Blade 15 2022 audio analysis
(+) | speakers can play relatively loud (90.9 dB)
Bass 100 - 315 Hz
(-) | nearly no bass - on average 21% lower than median
(±) | linearity of bass is average (9.7% delta to prev. frequency)
Mids 400 - 2000 Hz
(+) | balanced mids - only 3.9% away from median
(+) | mids are linear (3.9% delta to prev. frequency)
Highs 2 - 16 kHz
(+) | balanced highs - only 4.2% away from median
(±) | linearity of highs is average (7.8% delta to prev. frequency)
Overall 100 - 16.000 Hz
(±) | linearity of overall sound is average (15.7% difference to median)
Compared to same class
» 37% of all tested devices in this class were better, 7% similar, 57% worse
» The best had a delta of 6%, average was 18%, worst was 132%
Compared to all devices tested
» 24% of all tested devices were better, 5% similar, 71% worse
» The best had a delta of 4%, average was 23%, worst was 134%
Energy Management: High performance equals high consumption
Power Consumption
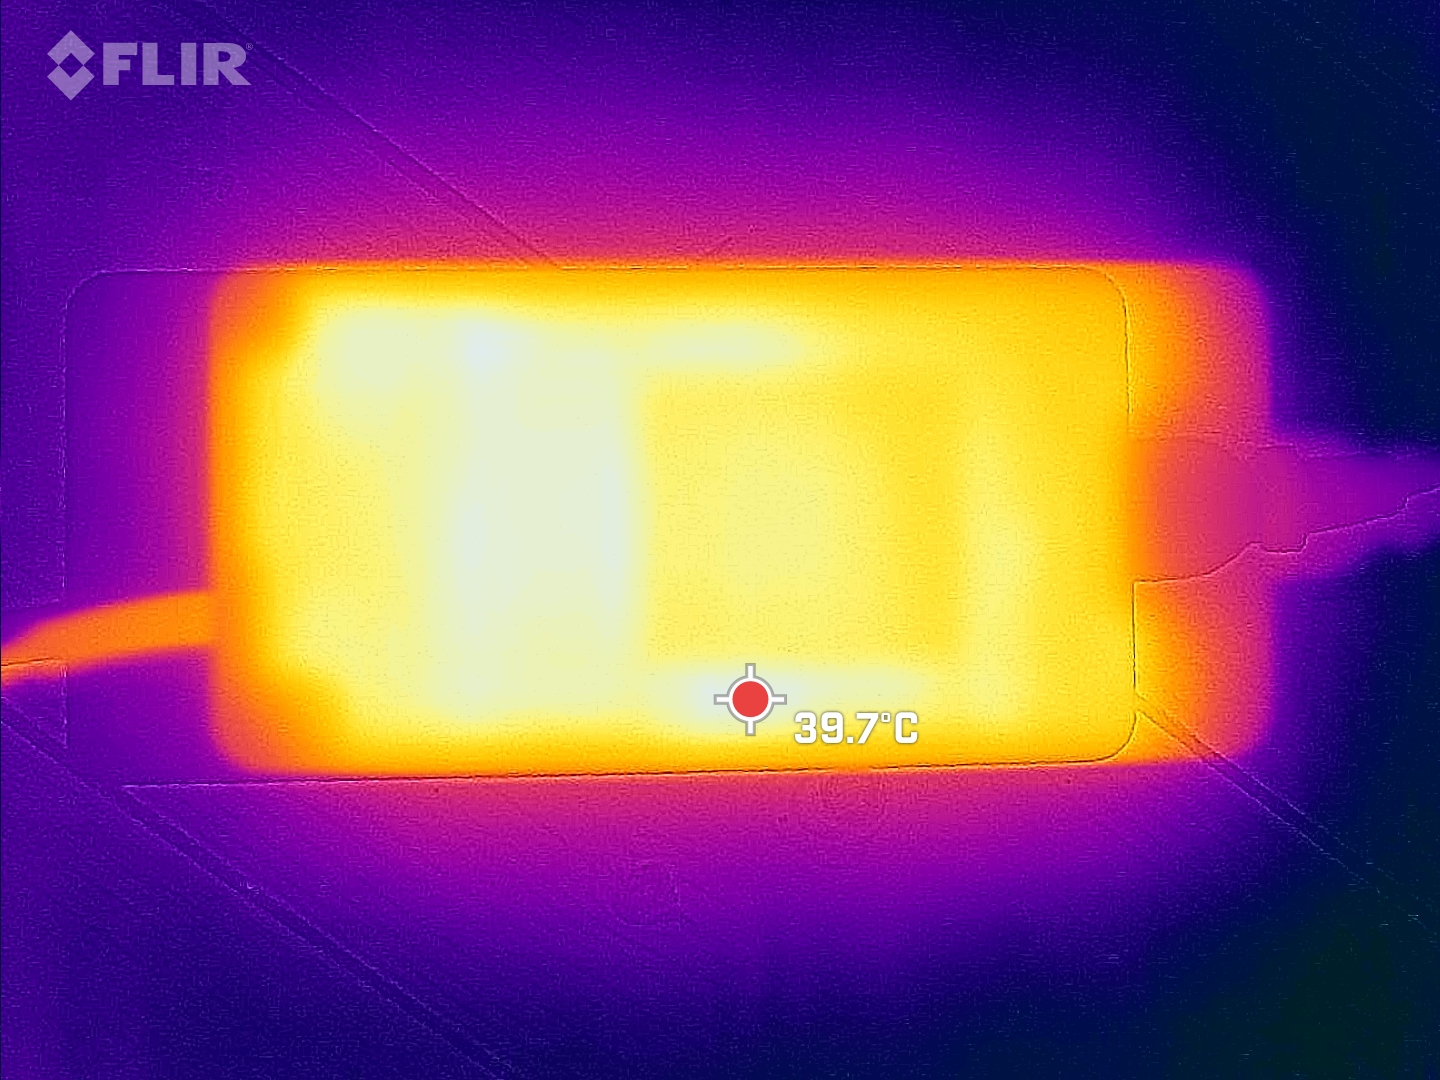
The power consumption of the Neo is quite low when idle, but higher than that of many competitors under load. Only the Alienware consumes more. We measured short-term load peaks of around 300 W, but gaming consumed 234 W on average. The huge (approx. 18 x 8.5 x 3.5 cm) 280 W power supply should therefore always have sufficient reserves. A 330 W power supply for extreme users is also planned.
Power consumption of the Oasis varies between 4 and 9 watts. We measured an average of 6.6 W in Balanced mode.
| Idle | |
| Load |
|
Key:
min: | |
| Schenker XMG Neo 15 (i7-12700H, RTX 3080 Ti) i7-12700H, GeForce RTX 3080 Ti Laptop GPU, Samsung SSD 980 Pro 1TB MZ-V8P1T0BW, IPS, 2560x1440, 15.6" | Schenker XMG Neo 15 Tiger Lake i7-11800H, GeForce RTX 3080 Laptop GPU, Samsung SSD 980 Pro 1TB MZ-V8P1T0BW, IPS, 2560x1440, 15.6" | Razer Blade 15 2022 i7-12800H, GeForce RTX 3080 Ti Laptop GPU, SSSTC CA6-8D1024, IPS, 2560x1440, 15.6" | Asus ROG Zephyrus Duo 16 GX650RX R9 6900HX, GeForce RTX 3080 Ti Laptop GPU, 2x Samsung SSD 980 Pro 2TB MZ-V8P2T0 (RAID 0), IPS-Level, 3840x2400, 16" | Gigabyte Aero 16 YE5 i9-12900HK, GeForce RTX 3080 Ti Laptop GPU, Phison ESR01TBMFCT, AMOLED, 3840x2400, 16" | Alienware x17 R2 P48E i9-12900HK, GeForce RTX 3080 Ti Laptop GPU, 2x Samsung PM9A1 1TB (RAID 0), IPS, 1920x1080, 17.3" | Average NVIDIA GeForce RTX 3080 Ti Laptop GPU | Average of class Gaming | |
|---|---|---|---|---|---|---|---|---|
| Power Consumption | 7% | -46% | -14% | -34% | -62% | -21% | -0% | |
| Idle Minimum * (Watt) | 15 | 15 -0% | 33.2 -121% | 19 -27% | 26 -73% | 24.1 -61% | 17.2 ? -15% | 13 ? 13% |
| Idle Average * (Watt) | 18 | 17 6% | 36.4 -102% | 24 -33% | 30 -67% | 28.5 -58% | 23.3 ? -29% | 18.7 ? -4% |
| Idle Maximum * (Watt) | 18 | 22 -22% | 37.6 -109% | 31 -72% | 37 -106% | 60 -233% | 30.8 ? -71% | 24.3 ? -35% |
| Load Average * (Watt) | 123 | 101 18% | 116.7 5% | 104 15% | 127 -3% | 128.7 -5% | 121.2 ? 1% | 110.2 ? 10% |
| Witcher 3 ultra * (Watt) | 234 | 195 17% | 172 26% | 186.5 20% | 176 25% | 254 -9% | ||
| Load Maximum * (Watt) | 301 | 230 24% | 228.6 24% | 256 15% | 236 22% | 323 -7% | 276 ? 8% | 258 ? 14% |
* ... smaller is better
Power consumption Witcher 3 / Stress test
Power consumption with external monitor
Battery Life
A 93 Wh battery is around the same size as offered by competing devices. Reducing the refresh rate from 240 Hz to 60 Hz is important for long and reasonable runtimes.
A movie night can be planned for a whole seven hours at reduced brightness, or just over 3 hours at 240 Hz. Simple web surfing also lasts between 6 and 7 hours, depending on the brightness.
In battery mode, the Oasis is not active because it draws its power from the mains plug and cannot be reversed-powered by the Neo.
| Schenker XMG Neo 15 (i7-12700H, RTX 3080 Ti) i7-12700H, GeForce RTX 3080 Ti Laptop GPU, 93 Wh | Schenker XMG Neo 15 Tiger Lake i7-11800H, GeForce RTX 3080 Laptop GPU, 93 Wh | Razer Blade 15 2022 i7-12800H, GeForce RTX 3080 Ti Laptop GPU, 80 Wh | Asus ROG Zephyrus Duo 16 GX650RX R9 6900HX, GeForce RTX 3080 Ti Laptop GPU, 90 Wh | Gigabyte Aero 16 YE5 i9-12900HK, GeForce RTX 3080 Ti Laptop GPU, 99 Wh | Alienware x17 R2 P48E i9-12900HK, GeForce RTX 3080 Ti Laptop GPU, 87 Wh | Average of class Gaming | |
|---|---|---|---|---|---|---|---|
| Battery runtime | 12% | -36% | -0% | -1% | -61% | 5% | |
| H.264 (h) | 7.1 | 5.9 -17% | 9.3 31% | 7.5 6% | 8.64 ? 22% | ||
| WiFi v1.3 (h) | 7.7 | 5.6 -27% | 4.9 -36% | 7.8 1% | 6.4 -17% | 2 -74% | 7.11 ? -8% |
| Load (h) | 1.5 | 2.7 80% | 1 -33% | 1.6 7% | 0.8 -47% | 1.502 ? 0% | |
| Reader / Idle (h) | 12.5 | 8.9 | 3.9 | 8.71 ? |
Pros
Cons
Verdict: Oasis a blessing for gamers?
The review rating displayed here refers to the XMG Neo 15 without liquid cooling, which has to be purchased separately as an accessory.
Raw performance aside, we also liked the keyboard, the design, the build and, barring some drawbacks, the display. Of course, the 15-inch form factor has thermal limits that restrict performance, but the limitations are very mild. In return, however, the Neo also becomes very loud and warm.
Using the Oasis liquid cooling system, the temperatures and thus the thermal load on the hardware drop dramatically. Performance benefits are only minimal, since the Neo already has few limitations on its own. Users have to max out all performance values to reach the thermal limit and to benefit from the Oasis in terms of performance.
That said, the Oasis does bring advantages in other areas: the volume decreases noticeably during gaming and temperatures drop even more. This can only be conducive to the longevity of the components. Although the liquid cooling system is not intended for mobile use, it brings clear advantages in stationary use.
Accordingly, the rating of the Neo would be somewhat higher with Oasis. But in a way, Oasis simply conceals the weaknesses of the Neo 15, which is the loudest and hottest device in its field in the absence of liquid cooling. The performance values, meanwhile, are beyond criticism.
The XMG Neo 15 is an extremely powerful gamer with many manual options, but it also gets very loud and hot. Together with XMG Oasis, these drawbacks are mitigated, even if there is still potential for optimization.
The Razer Blade 15, for example, operates much more quietly than the Neo 15 even without water cooling, but does not have the same level of brute performance.
Price and Availability
The Neo 15 (E22) can be configured and ordered via Schenker's own homepage bestware.com. Our review unit version cost around EUR 3,400 Euros, and a Windows 11 Home license is optional for around EUR 40.
XMG Oasis can be ordered directly in the configurator for EUR 199. Strangely, Oasis can be ordered in a double pack, which hopefully is not indicative of a short life, because you can of course only connect one Oasis to a Neo at a time.
Schenker XMG Neo 15 (i7-12700H, RTX 3080 Ti)
- 07/06/2022 v7 (old)
Christian Hintze
Price comparison

