Schenker XMG Neo 15 gaming laptop review: Ryzen 6000 with liquid cooling ports
The Intel-based Neo 15 that we reviewed back in July was an unusual laptop that features a connection for the optional OASIS cooling system (sold separately for around 199 Euro, or US$198), which we also tested at the same time.
XMG has now launched a new Neo 15 model equipped with the latest AMD Ryzen processor. The switch to an AMD CPU has also brought about some other changes in port selection and such.
So how well does the AMD-based Neo perform compared with the Intel-based model? In this review, we are going to test out a variant with the slightly more affordable RTX 3070 Ti (which still costs 2,850 Euro, or US$2,826) and take a look at what the hardware changes mean for the laptop's performance and emissions.
Besides just comparing the AMD- and Intel-based Neo 15s, we will be pitting the review model against other gaming laptops with an RTX 3070 Ti, such as the MSI Raider GE67, Asus ROG Strix Scar 15, Acer Nitro 5 and MSI Stealth GS66.
Comparison with possible competitors
Rating | Date | Model | Weight | Height | Size | Resolution | Price |
|---|---|---|---|---|---|---|---|
| 88 % v7 (old) | 11 / 2022 | Schenker XMG Neo 15 (Ryzen 9 6900HX, RTX 3070 Ti) R9 6900HX, GeForce RTX 3070 Ti Laptop GPU | 2.3 kg | 26.6 mm | 15.60" | 2560x1440 | |
| 88.4 % v7 (old) | 07 / 2022 | Schenker XMG Neo 15 (i7-12700H, RTX 3080 Ti) i7-12700H, GeForce RTX 3080 Ti Laptop GPU | 2.3 kg | 26.6 mm | 15.60" | 2560x1440 | |
| 87.7 % v7 (old) | 07 / 2022 | MSI GE67 HX 12UGS i7-12800HX, GeForce RTX 3070 Ti Laptop GPU | 2.5 kg | 23.4 mm | 15.60" | 1920x1080 | |
| 86.3 % v7 (old) | 05 / 2022 | Asus ROG Strix Scar 15 G533ZW-LN106WS i9-12900H, GeForce RTX 3070 Ti Laptop GPU | 2.3 kg | 27.2 mm | 15.60" | 2560x1440 | |
| 84 % v7 (old) | 06 / 2022 | Acer Nitro 5 AN515-58-72QR i7-12700H, GeForce RTX 3070 Ti Laptop GPU | 2.5 kg | 26.8 mm | 15.60" | 2560x1440 | |
| 84.5 % v7 (old) | 02 / 2022 | MSI Stealth GS66 12UGS i7-12700H, GeForce RTX 3070 Ti Laptop GPU | 2.2 kg | 19.8 mm | 15.60" | 2560x1440 |
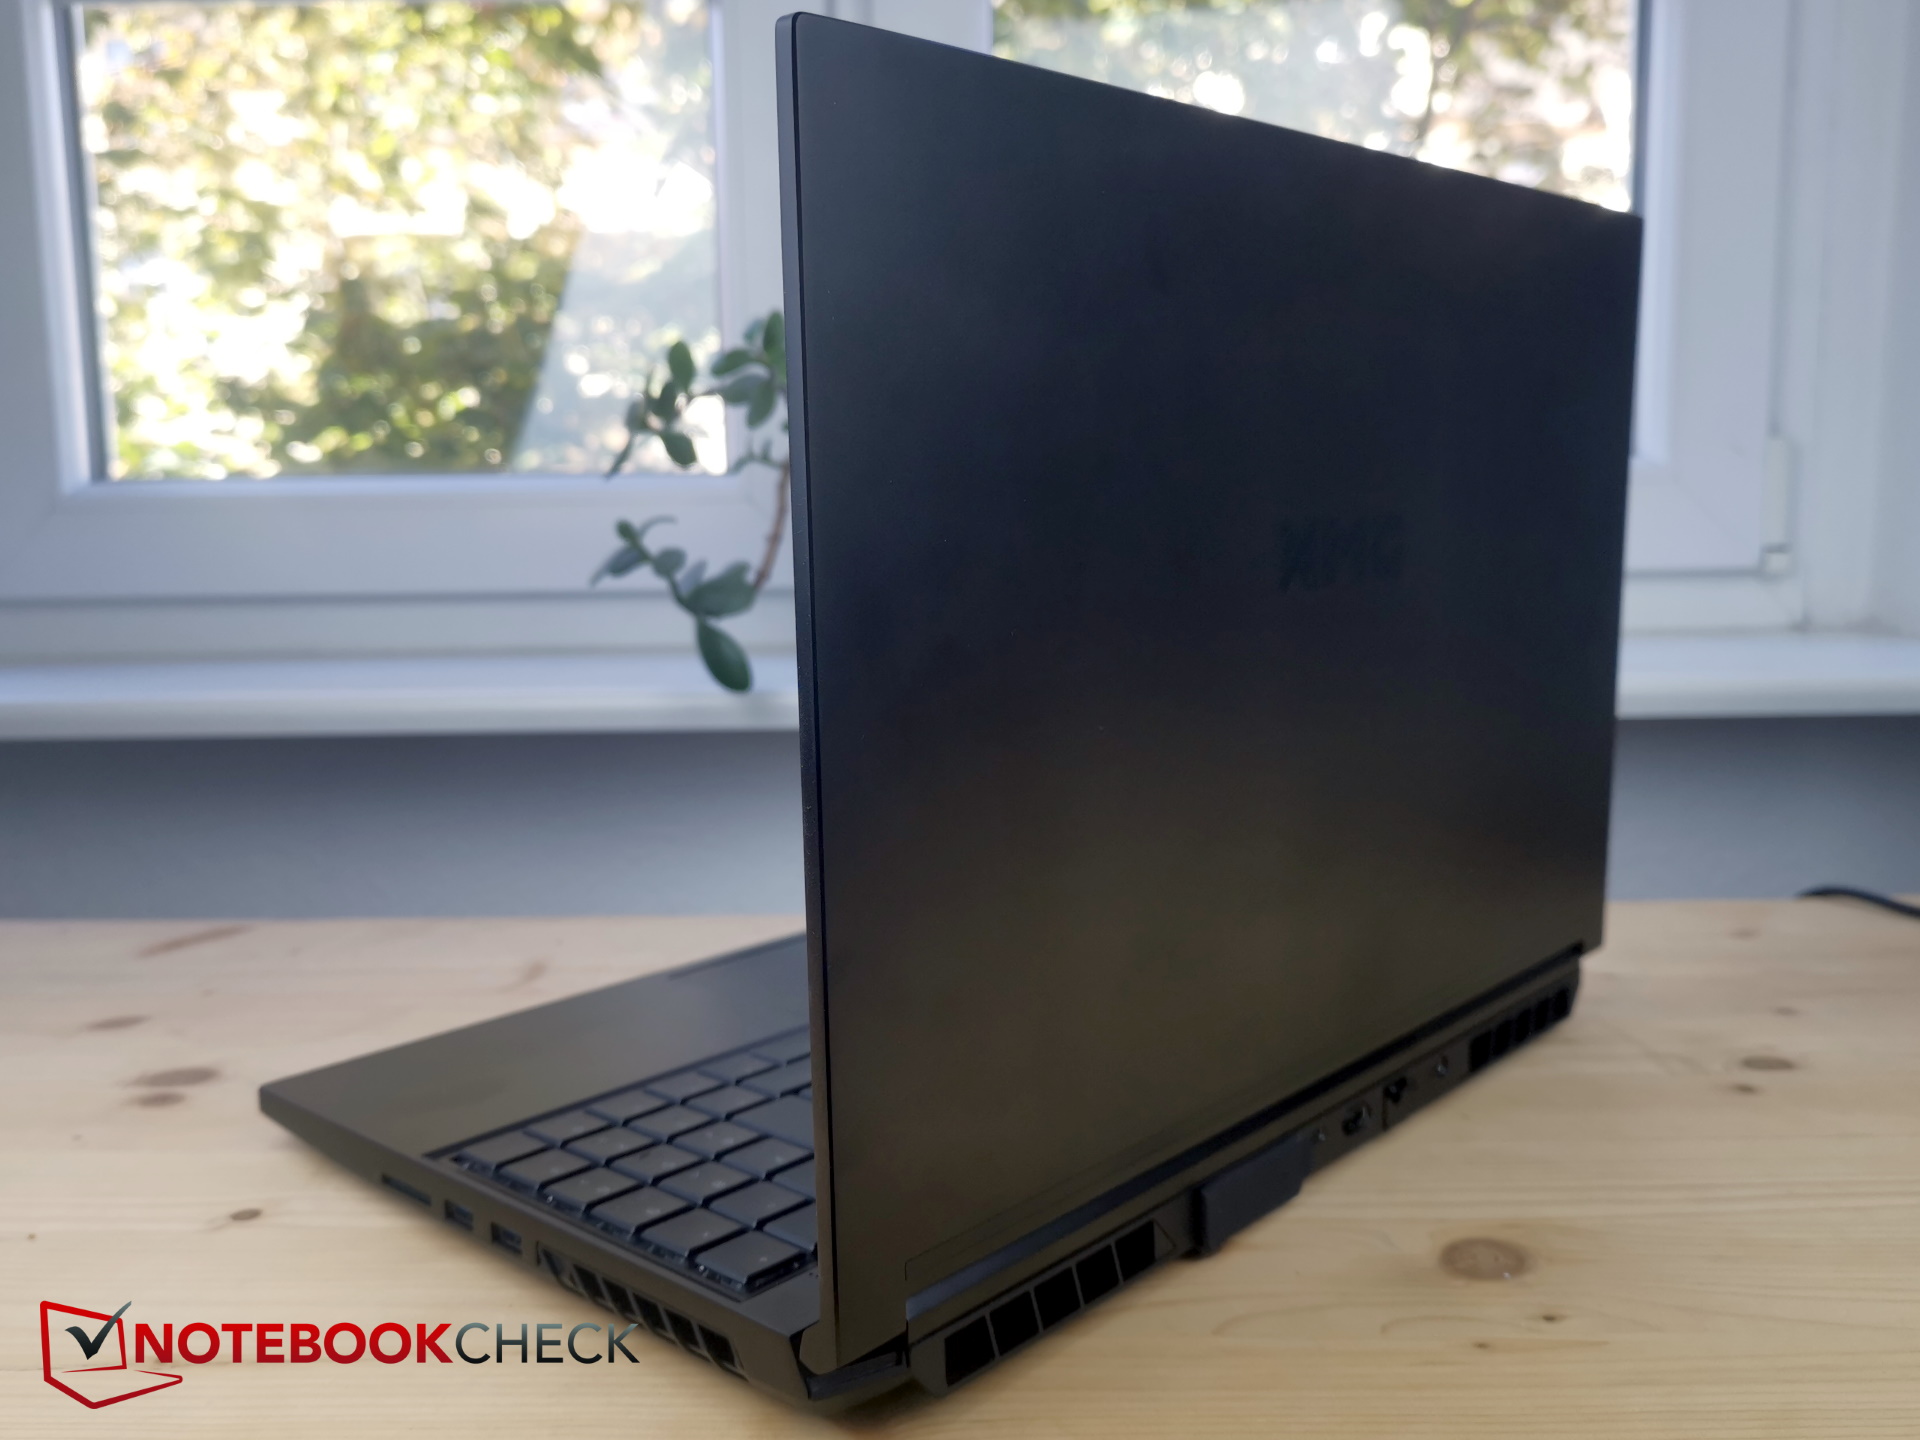
Case - sturdy keyboard deck, (overly) soft lower case
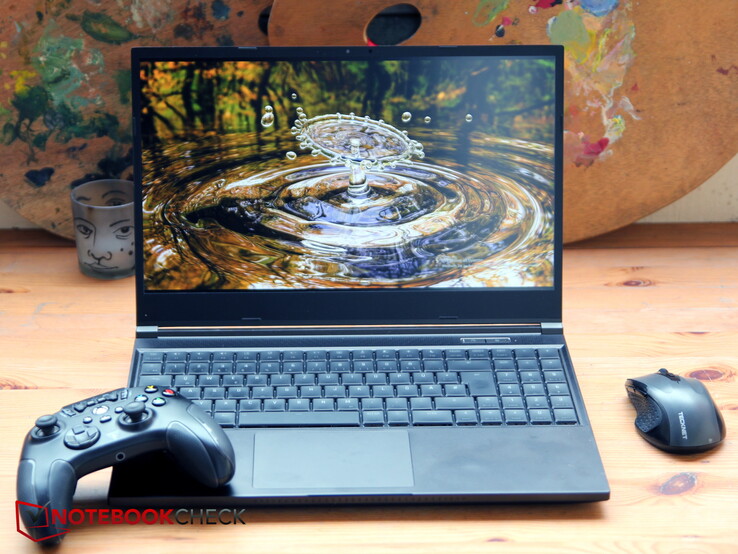
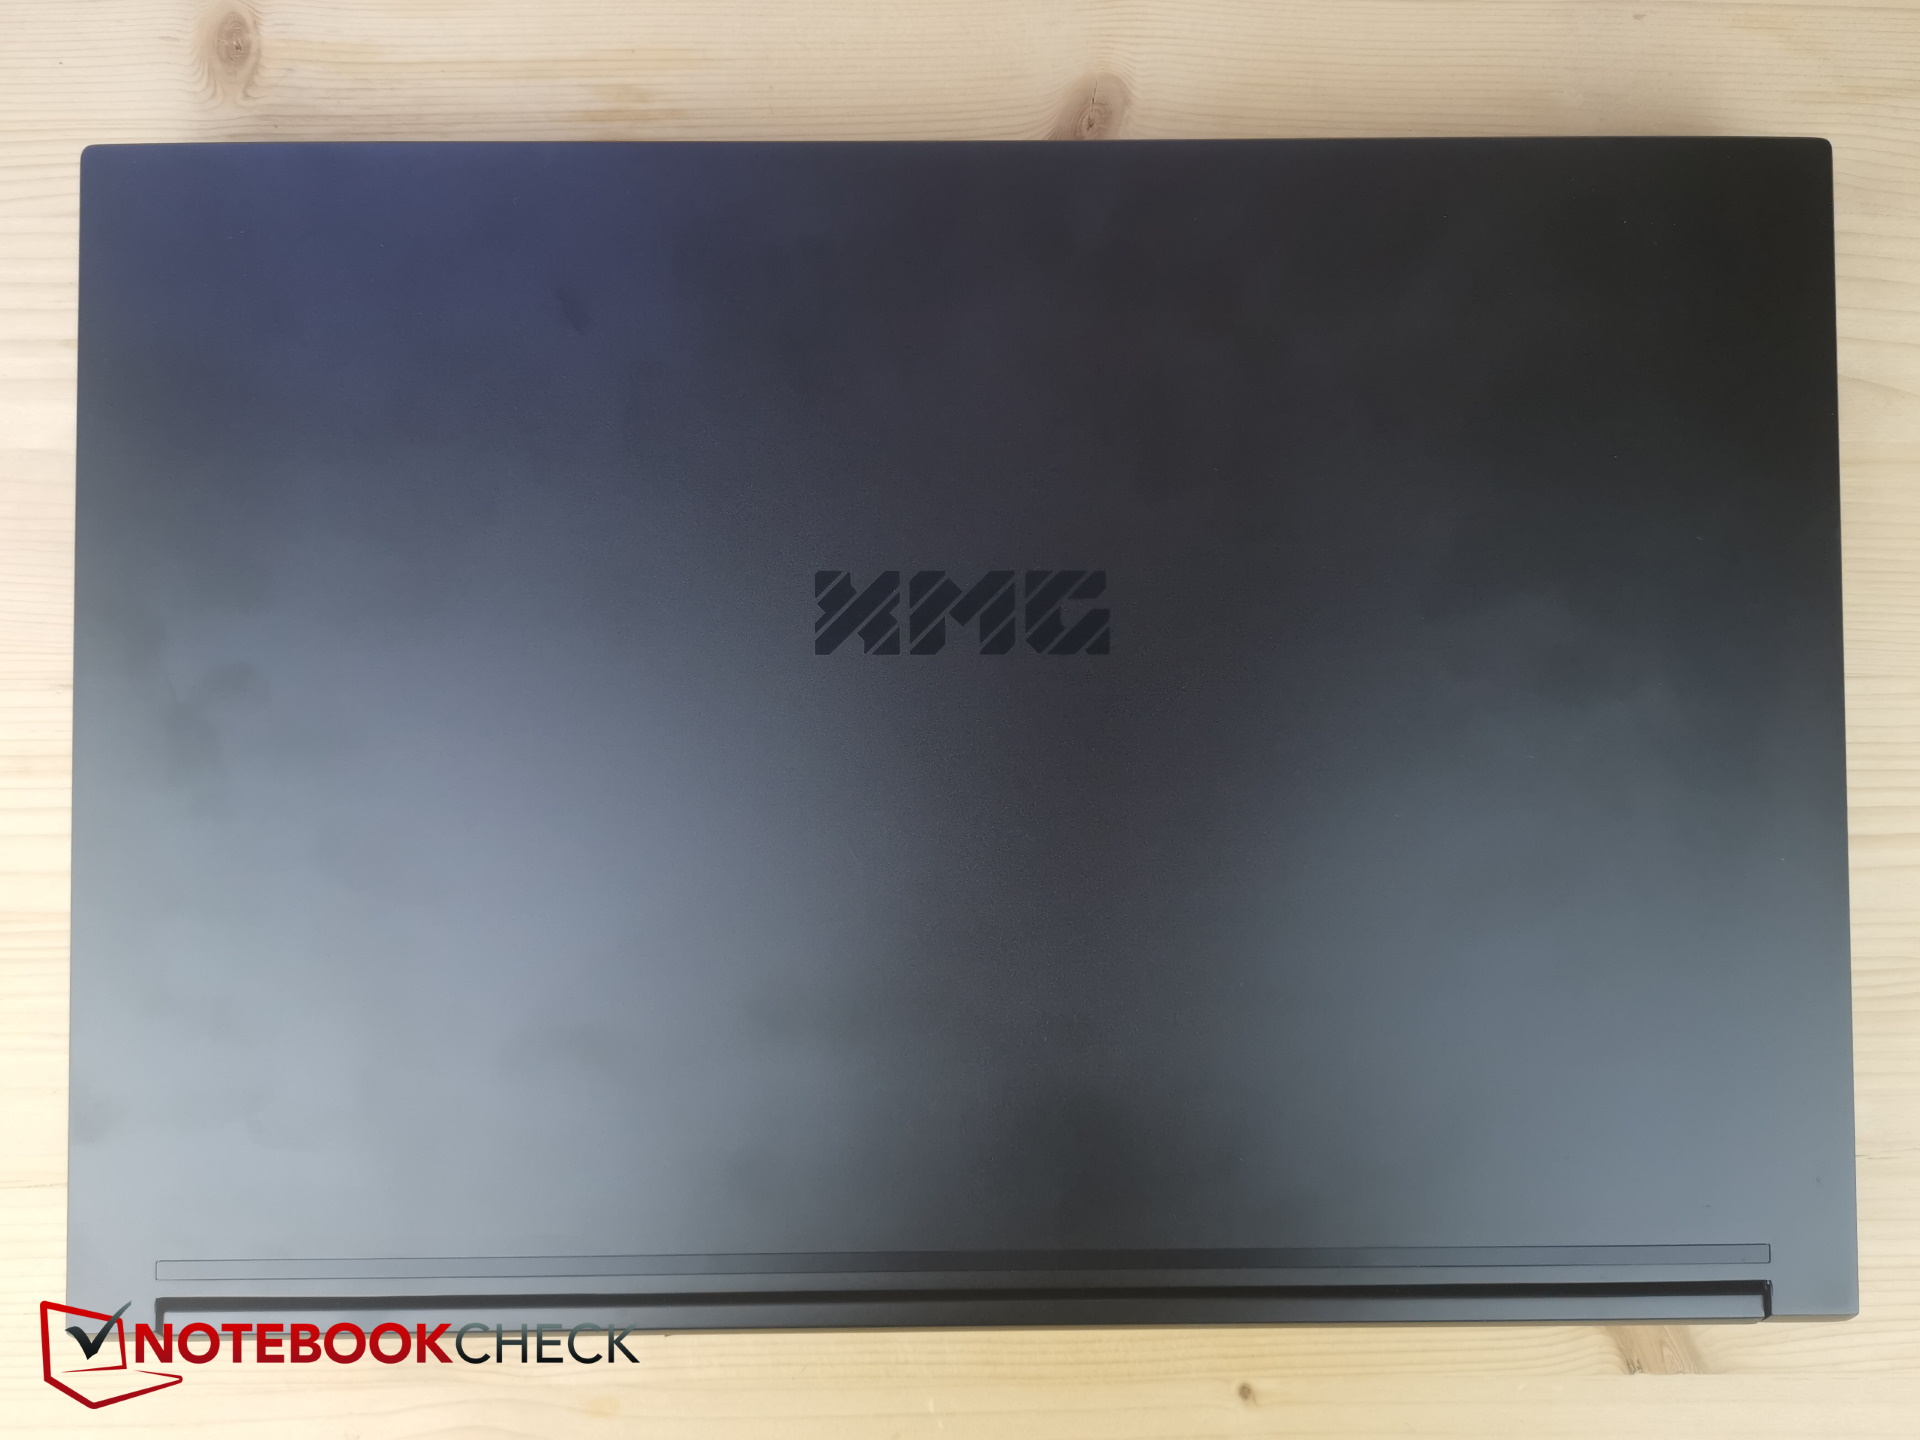
For a gaming laptop, the Neo 15 doesn't have an overly flashy design. For the most part, its colour scheme ranges from a plain dark grey to black. The display lid and base section are made of metal, whilst the bottom and bezel are made of a soft plastic. There is an XMG logo in the centre of the lid. The dotted LED bar on the front does sprinkle the device with a certain gaming aesthetic.
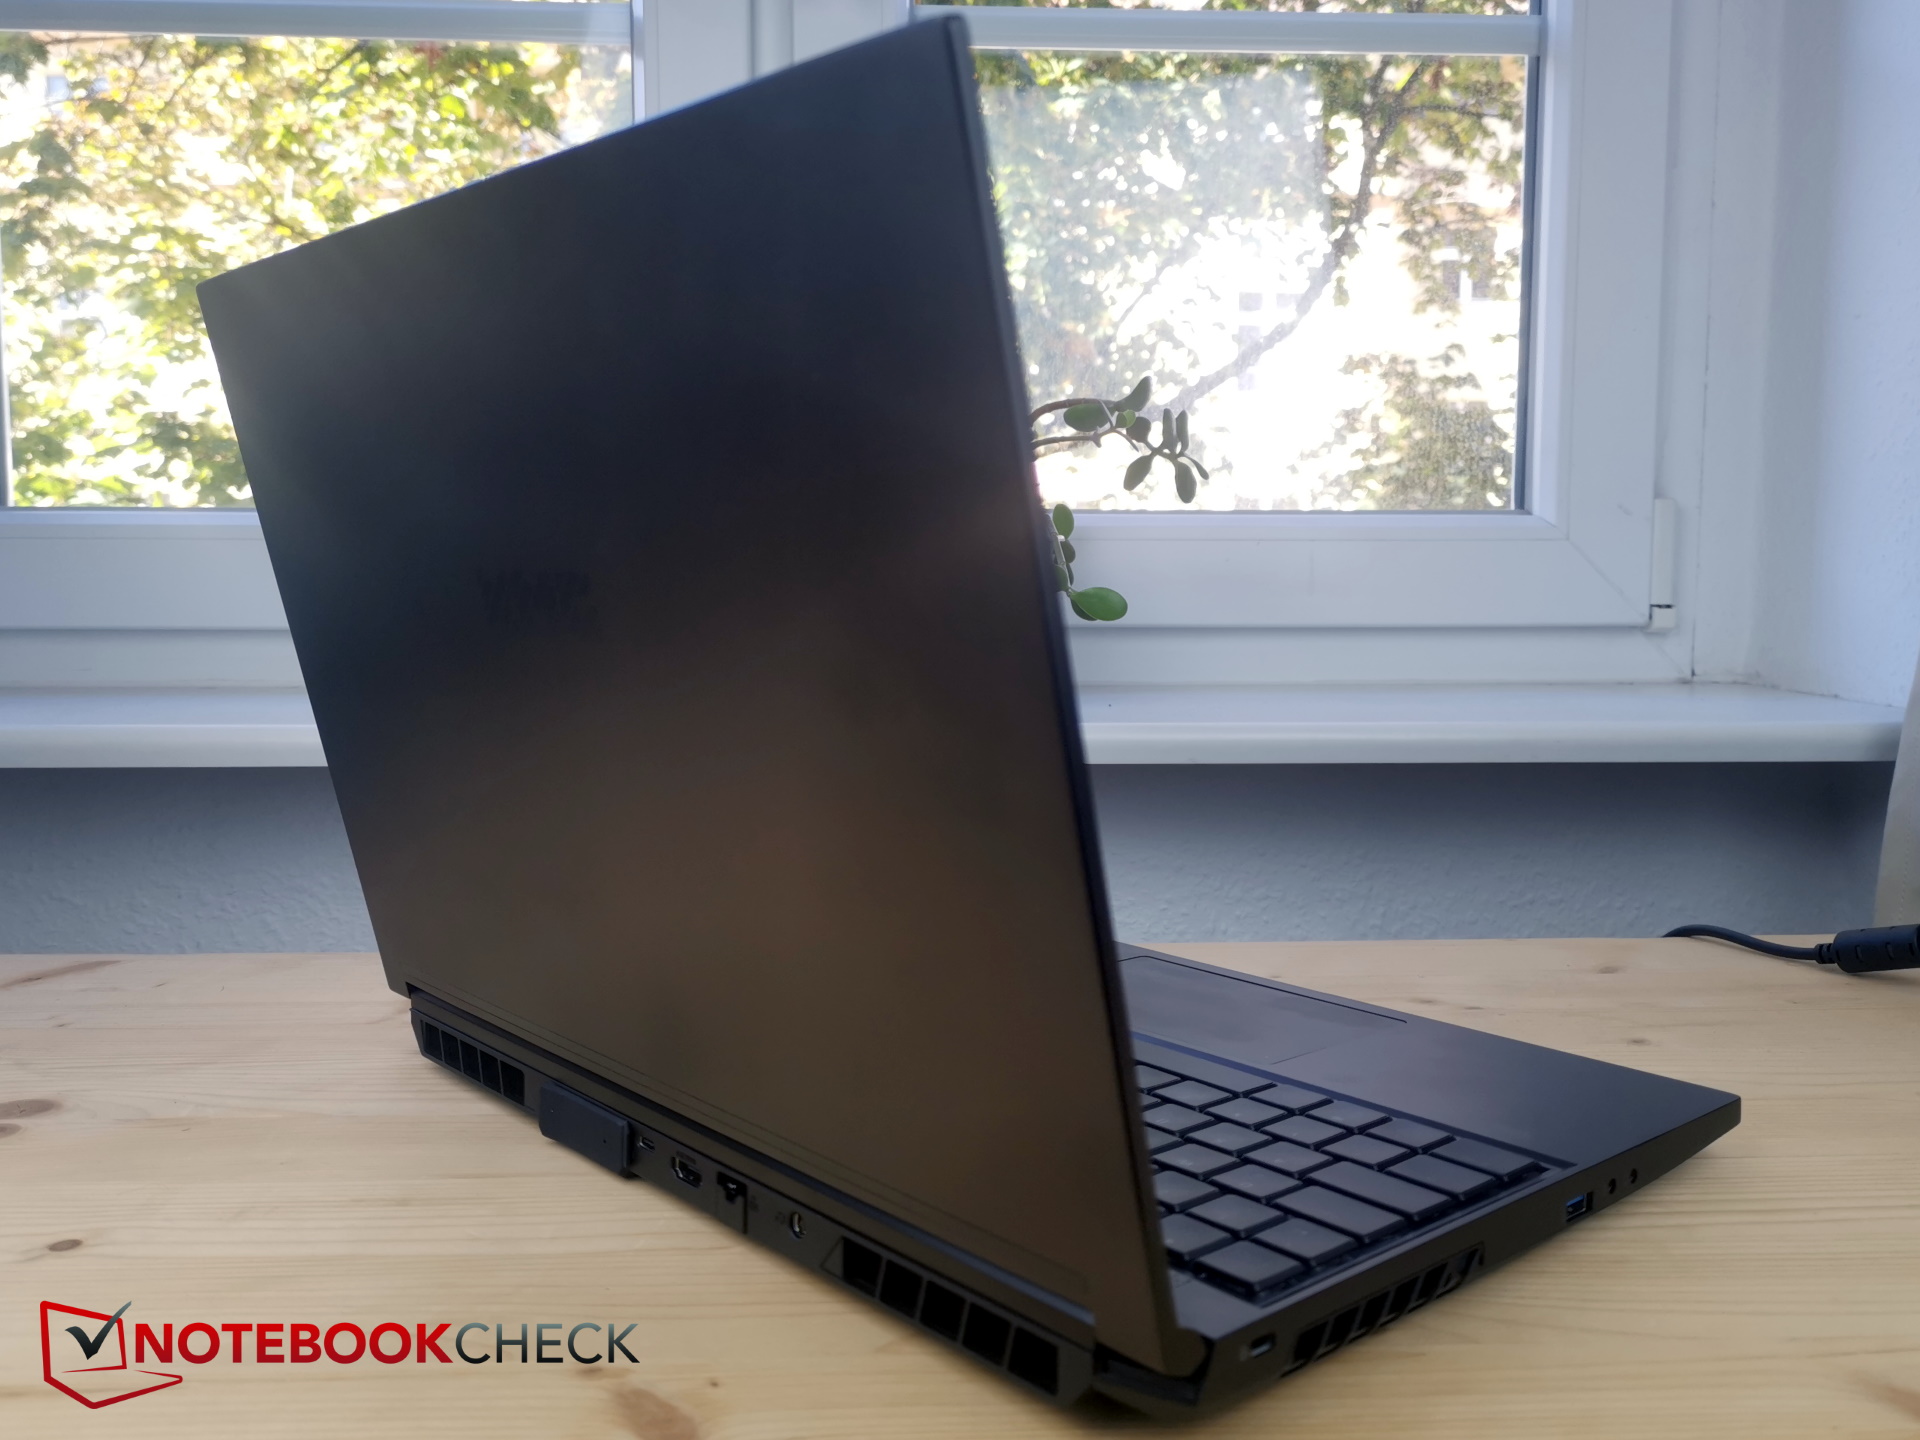
Thanks to the use of metal, the Neo 15 feels very solid, especially in the base section. The laptop exhibits hardly any flex and doesn't make any creaking noises when twisted or bent. Naturally, the lid is going to be somewhat less stiff. That said, the display can endure some twisting without being affected. One drawback, however, is that fingerprints can accumulate on the matt surface.
Unfortunately, the plastic lower case is so soft that this may happen: if you hold the device at the "wrong" place (i.e. the area around the air vent at the bottom right) using just one hand, this spot may get pushed in so far that it touches the spinning fans.
Other than that, the Neo 15 has excellent fit and finish, feels very compact and robust, and is equipped with hinges that are firm enough but not too stiff.
At 26.6 mm (1.05") thick, the Neo isn't trying to compete with the slim Razer Blade 15. But it feels slightly thinner than it really is thanks to its compact design. Most of the competitors have roughly the same thickness; only the MSI Stealth is considerably slimmer.
The laptop's compactness is also reflected in its dimensions – none of the other laptops take up as little depth as the Neo 15. In terms of weight, the Neo is squarely in the middle of the comparison group. Only the Stealth is about 100 g (0.22 lb) lighter, while both the Nitro and MSI GE67 weigh around 200 g (0.44 lb) more.
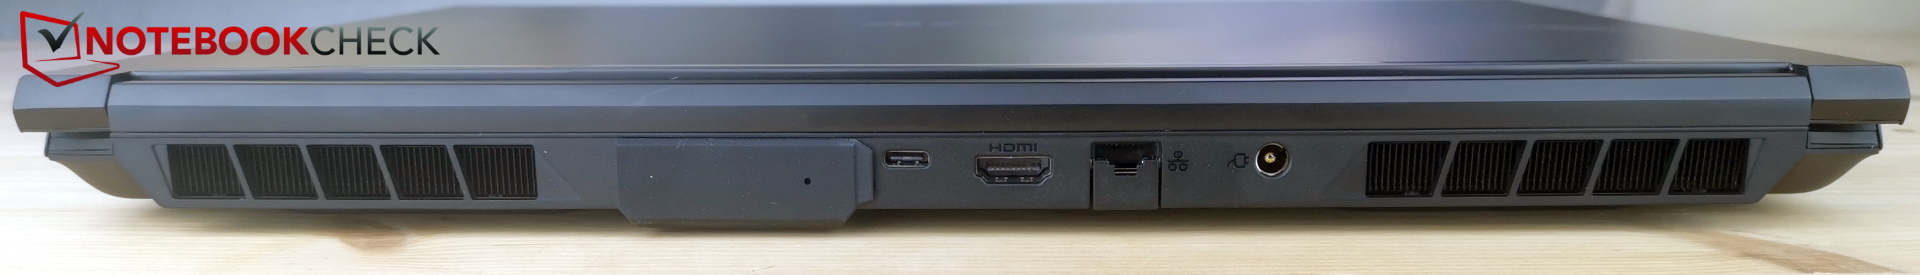
Specifications - No Thunderbolt, slow USB-C port
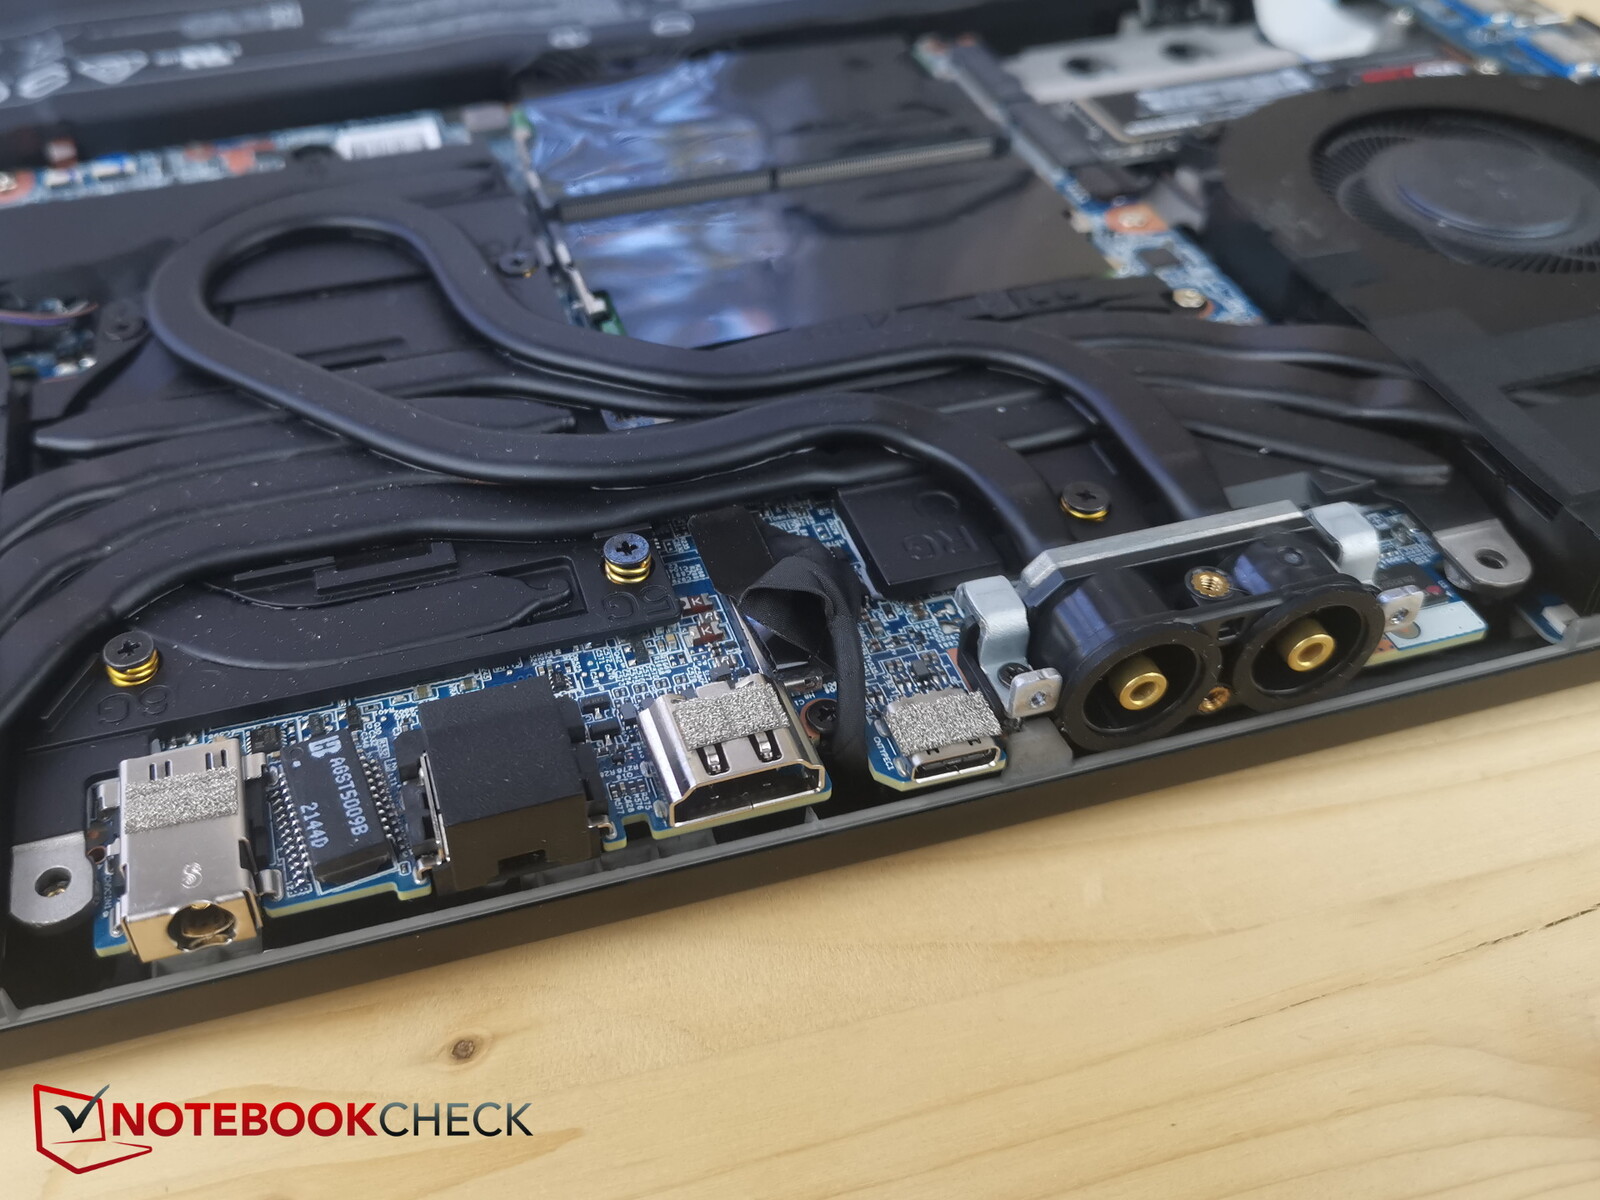
Unfortunately, the USB-C port on the AMD-based Neo 15 is different from the one on the Intel model. On the AMD version, not only are you not getting Thunderbolt, but the USB-C port is only of type 3.2 Gen2x1 instead of Gen2x2. Power Delivery is likewise not supported.
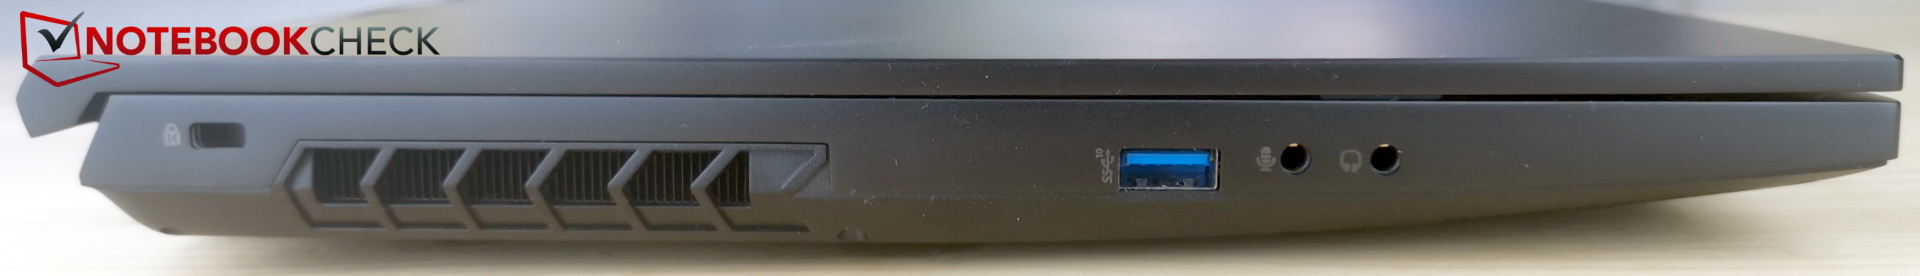
On a positive note, the laptop features two separate audio jacks (microphone + headphones), and the ports are well arranged on the left, right and back. The water connection for XMG OASIS is also located on the rear.
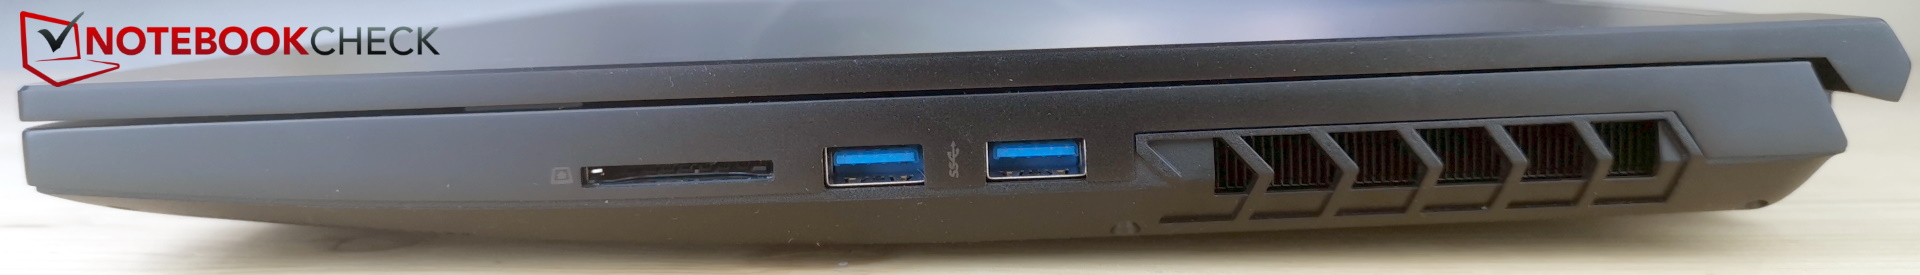
SD card reader
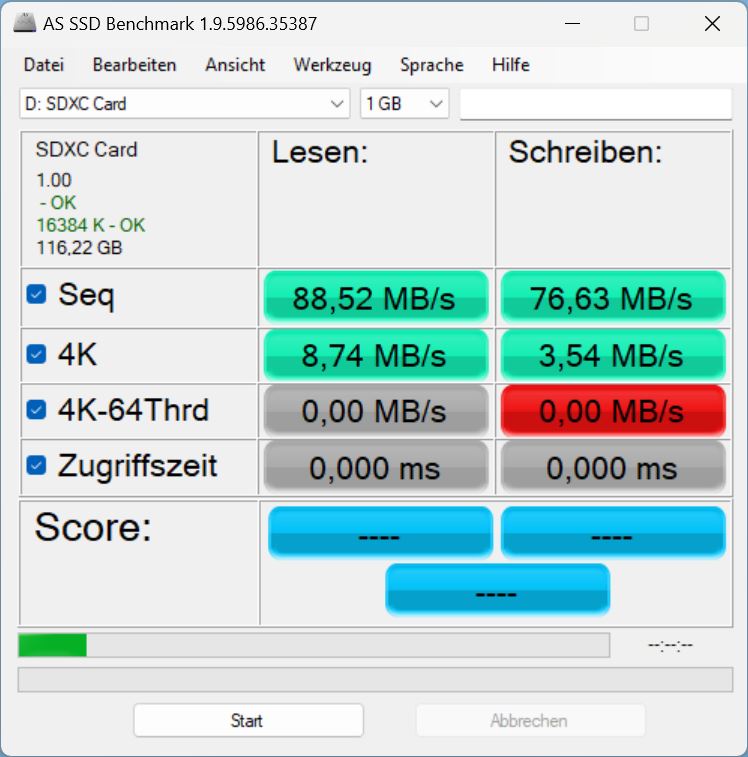
The card reader accepts regular SD cards. When you insert an SD card, around half of the card will stick out of the slot because it doesn't have a locking mechanism.
The card reader's transfer speeds are more or less on the lower end of the spectrum.
| SD Card Reader | |
| average JPG Copy Test (av. of 3 runs) | |
| Average of class Gaming (20.9 - 210, n=55, last 2 years) | |
| Schenker XMG Neo 15 (i7-12700H, RTX 3080 Ti) | |
| MSI GE67 HX 12UGS (Toshiba Exceria Pro SDXC 64 GB UHS-II) | |
| Schenker XMG Neo 15 (Ryzen 9 6900HX, RTX 3070 Ti) | |
| maximum AS SSD Seq Read Test (1GB) | |
| Average of class Gaming (25.5 - 261, n=52, last 2 years) | |
| Schenker XMG Neo 15 (Ryzen 9 6900HX, RTX 3070 Ti) | |
| Schenker XMG Neo 15 (i7-12700H, RTX 3080 Ti) | |
| MSI GE67 HX 12UGS (Toshiba Exceria Pro SDXC 64 GB UHS-II) | |
Connectivity
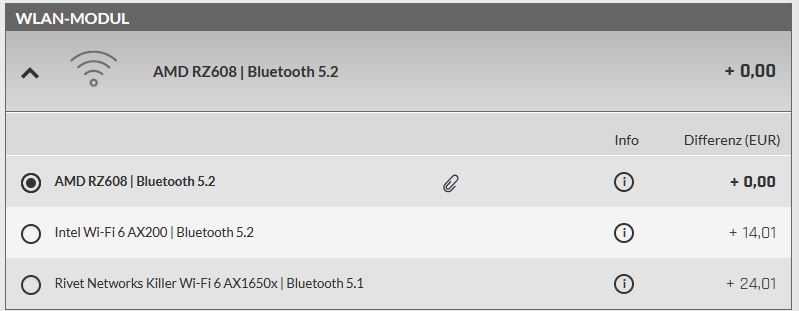
The Neo comes with an Intel AX200 wireless module. Whilst this wireless card supports Wi-Fi 6, it still doesn't work with the 6 GHz frequency band. It delivers good and stable transfer rates, but the other Wi-Fi modules in the comparison are marginally faster.
Webcam
The good: the Neo 15 is fitted with a Full HD webcam. The not-so-good: image quality is worse than what some 720p models are capable of (see photo below).


 GeForce RTX 3070 Ti Laptop GPU, R9 6900HX, Samsung SSD 980 Pro 1TB MZ-V8P1T0BW")
 GeForce RTX 3070 Ti Laptop GPU, R9 6900HX, Samsung SSD 980 Pro 1TB MZ-V8P1T0BW")
Security
There is no fingerprint sensor on the Neo 15, but TPM 2.0 and a Kensington slot are on board.
Accessories & warranty
Unlike many other manufacturers, Schenker is known for not scrimping on accessories. For instance, a large mousepad and a USB flash drive containing drivers are included in the box.
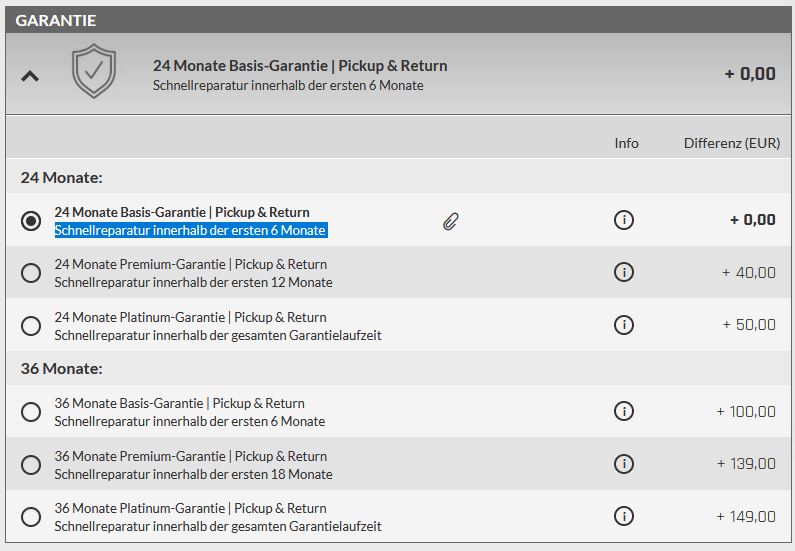
The company provides a 24-month warranty that includes pickup and return service as well as quick repair within the first six months of purchase.
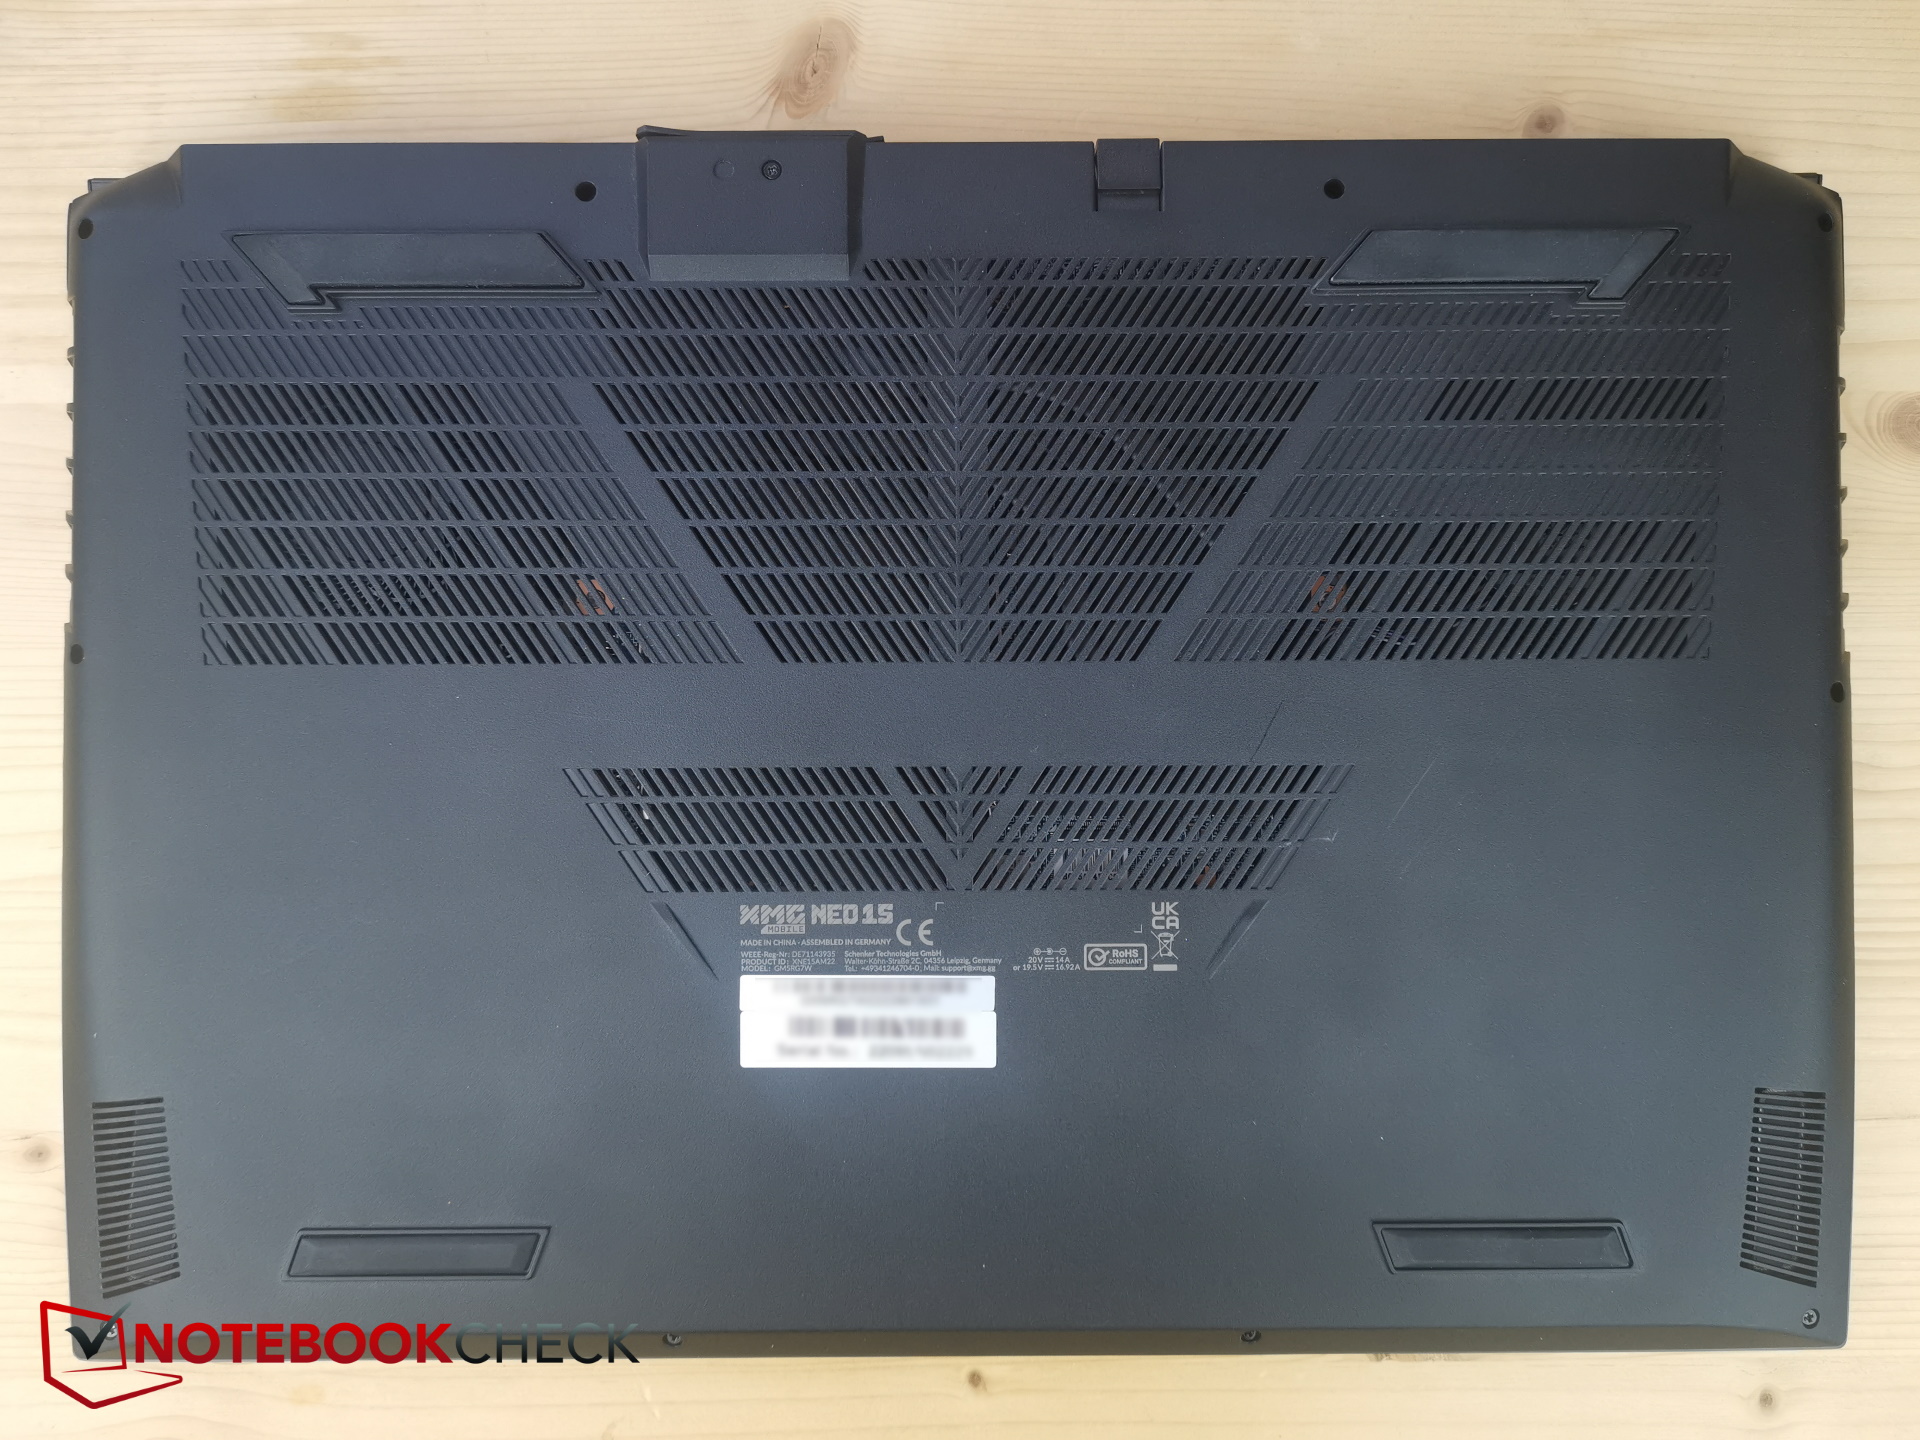
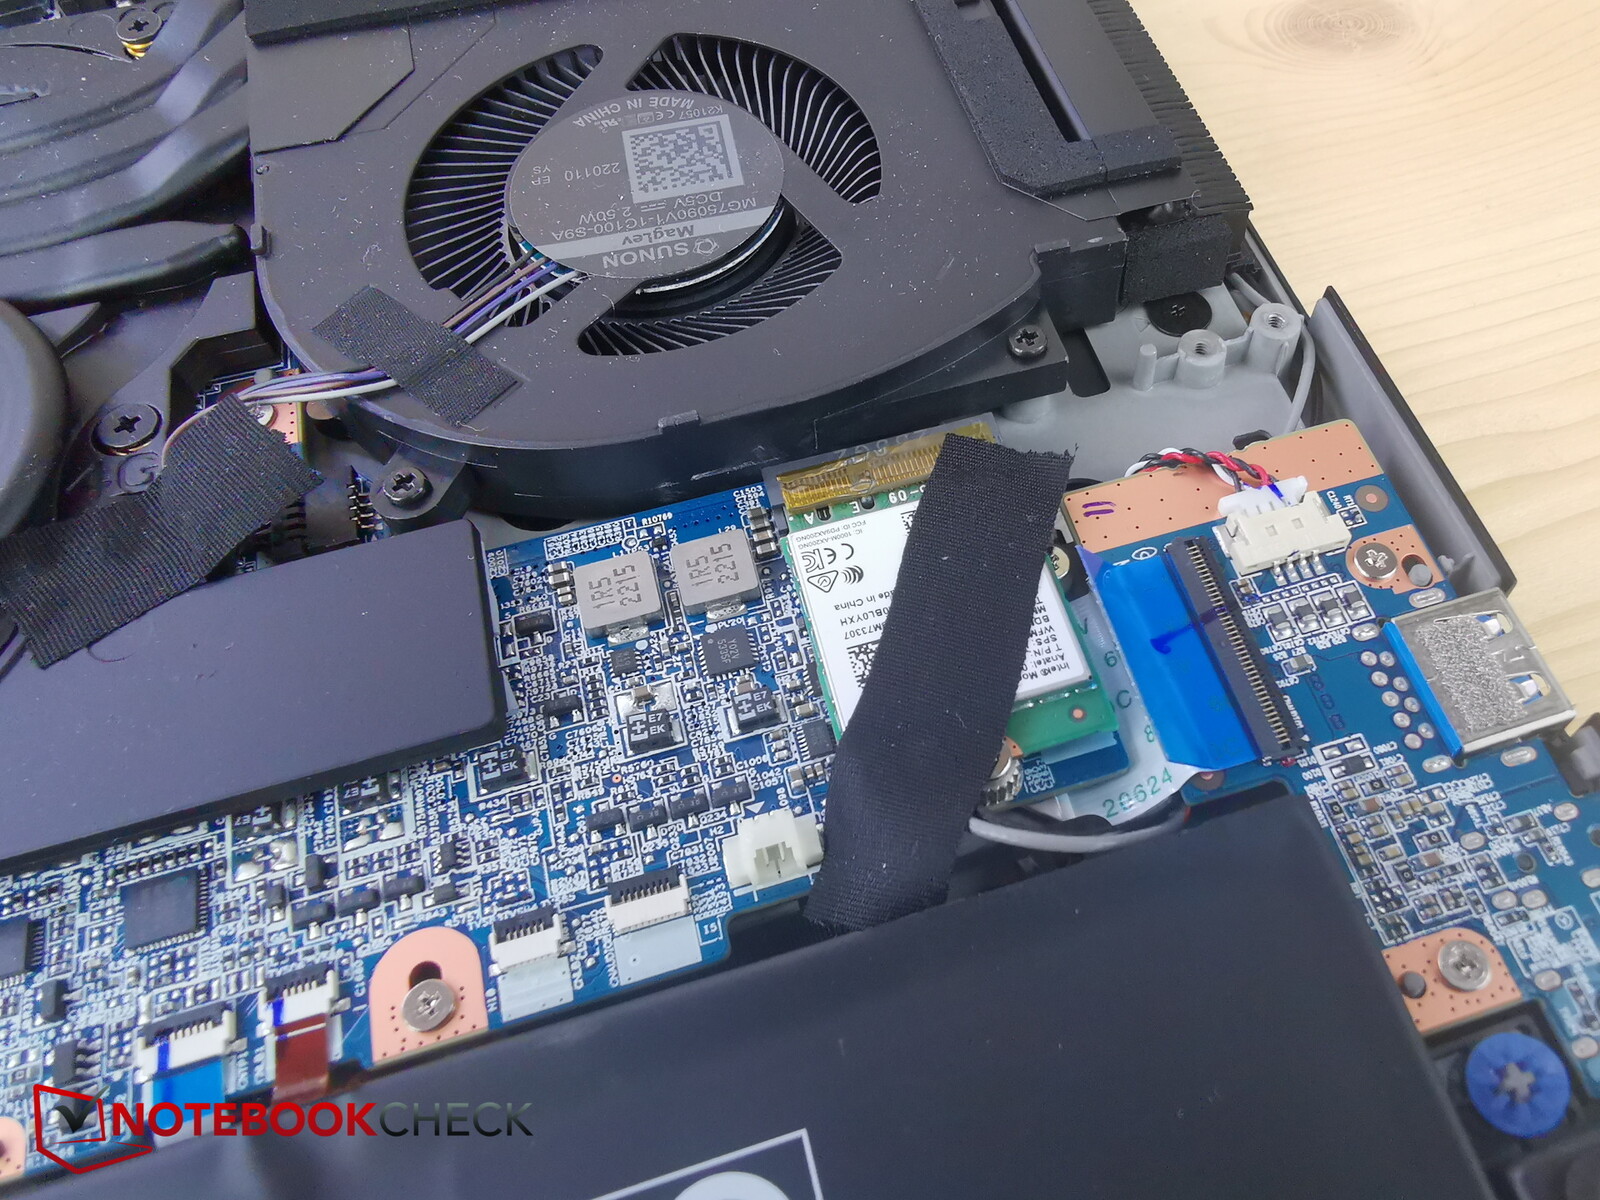
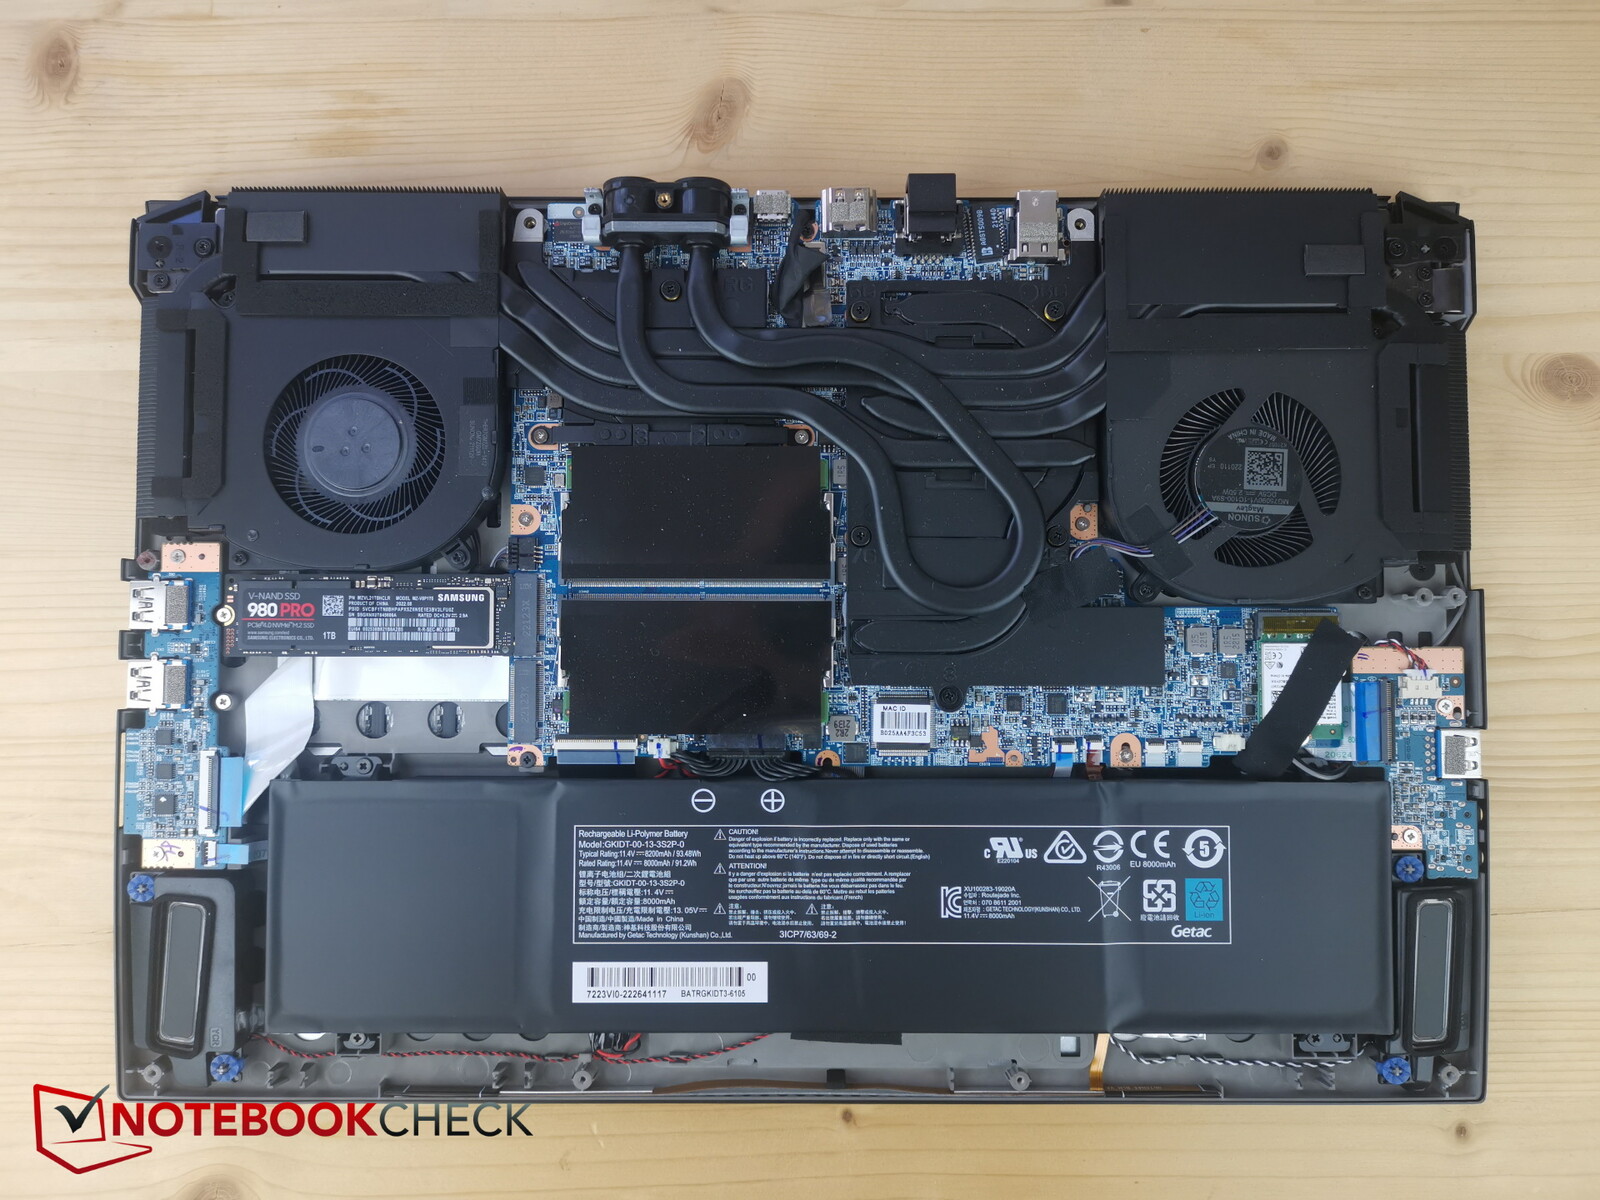
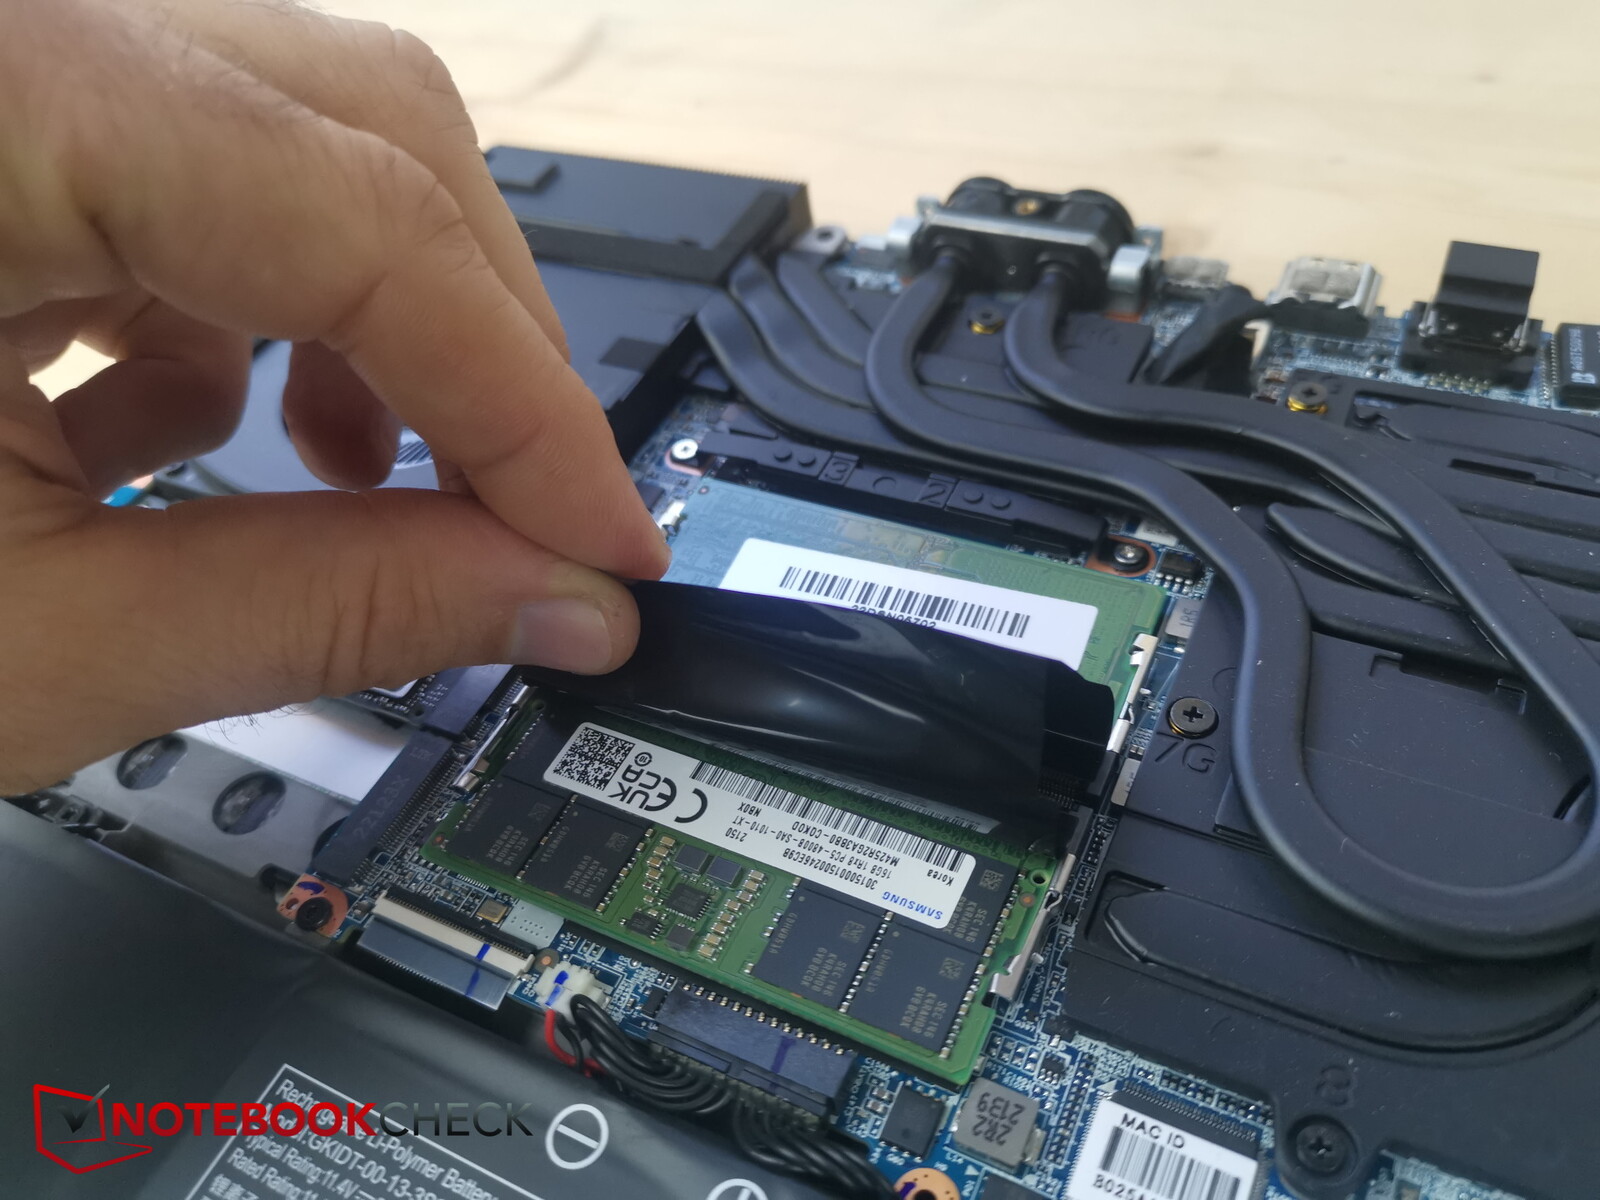
Maintenance
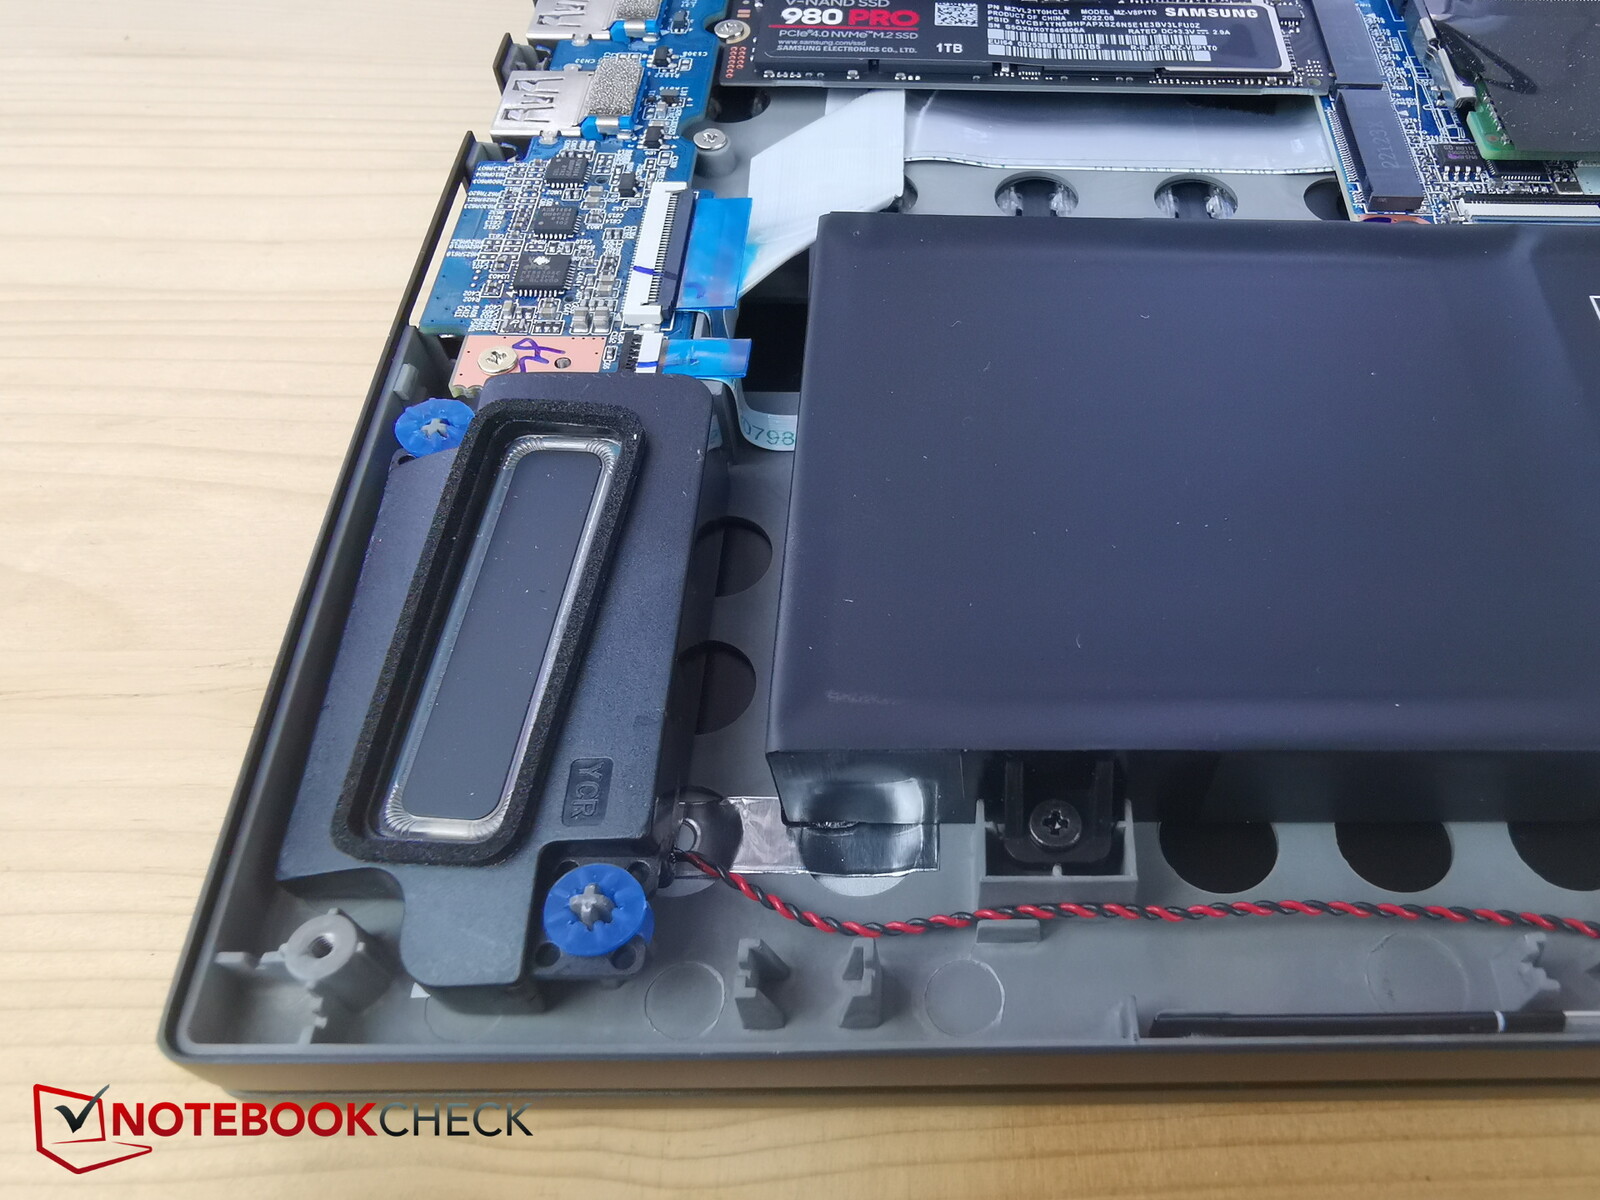
The plastic bottom is secured in place by a total of 14 Phillips-head screws, four of which are on the liquid cooling ports. It is very easy to lift up the bottom panel when you start from the back. Once the laptop chassis is opened, you will have access to the two M.2 SSD slots, the fans, the battery, the Wi-Fi module and the two RAM slots.
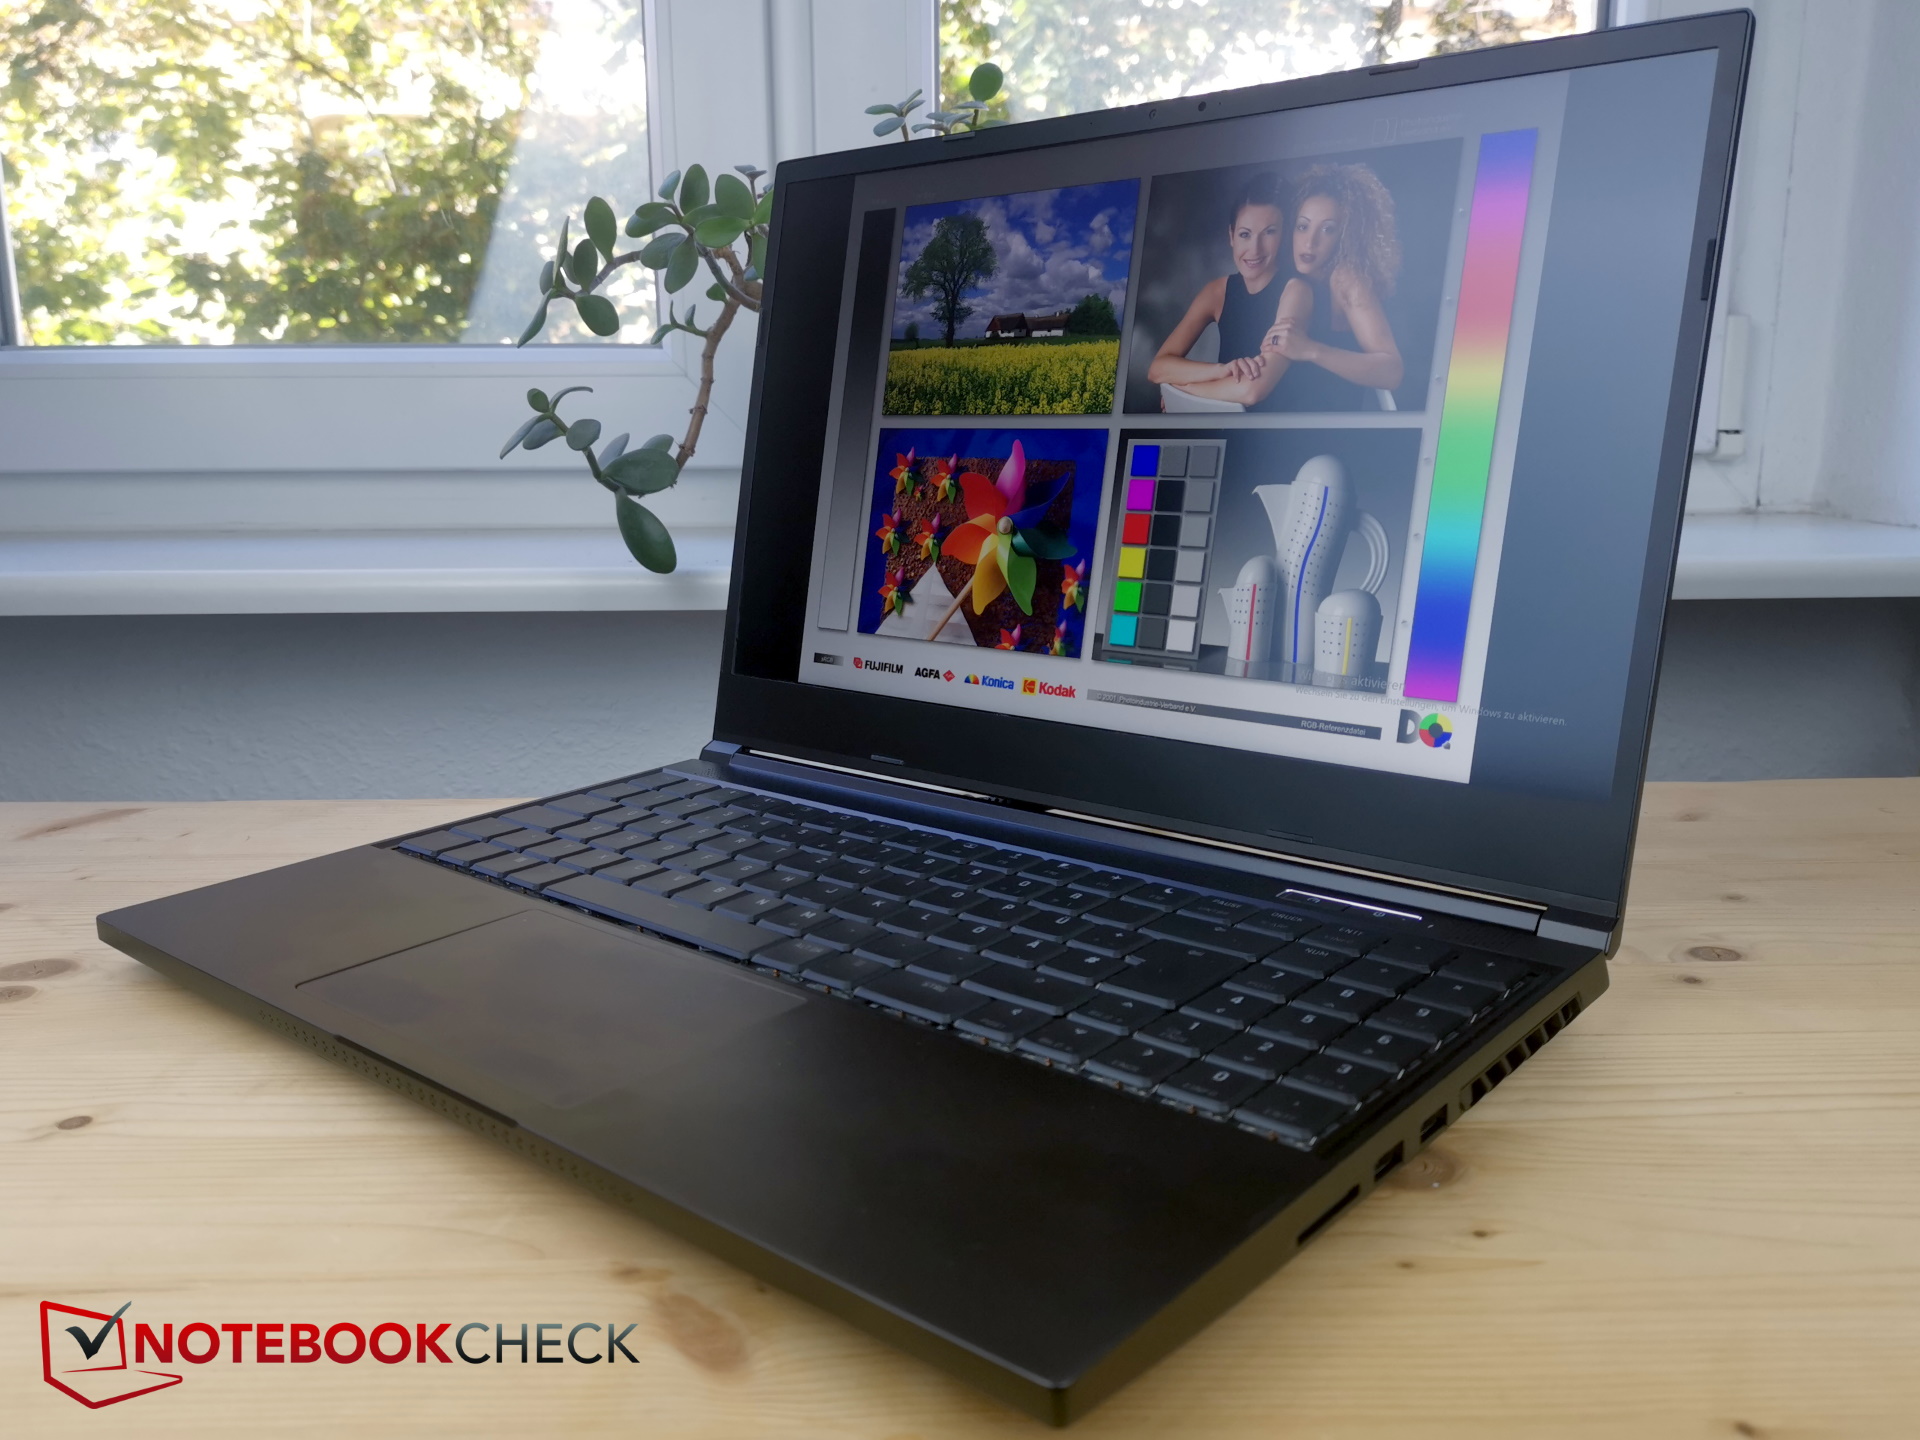
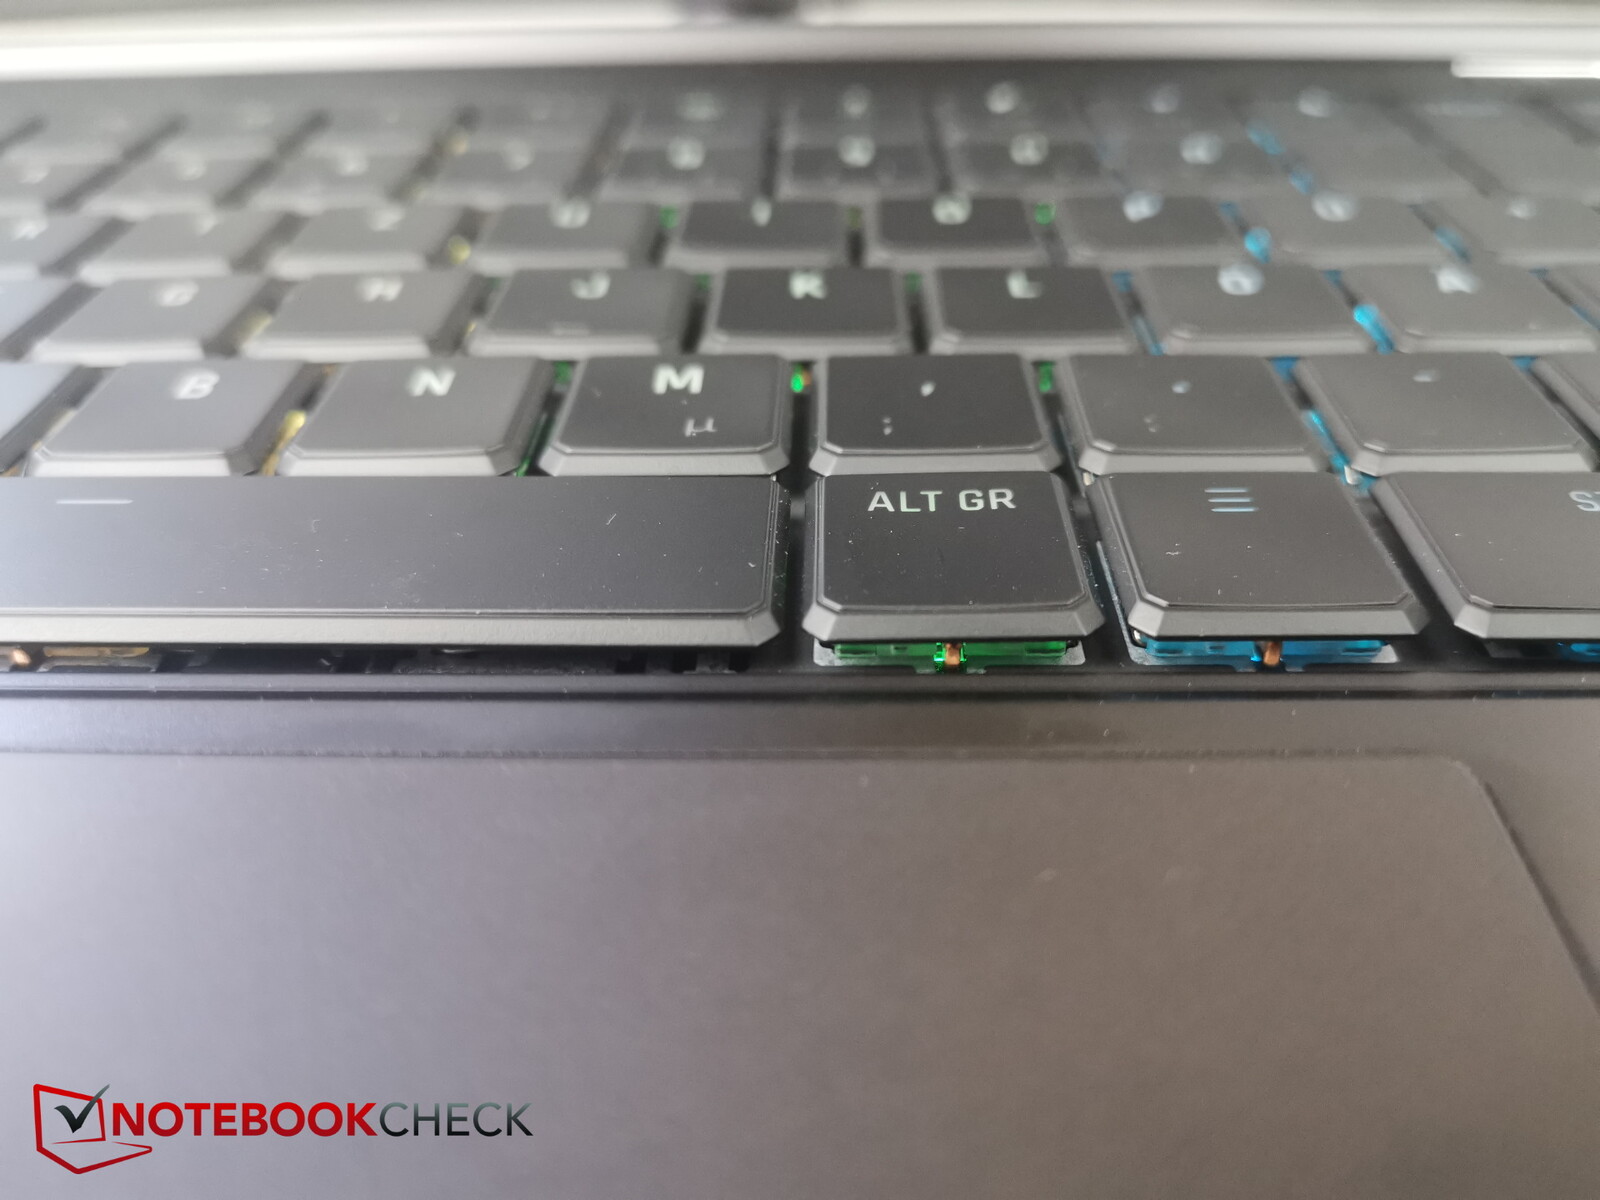
Input devices - Opto-mechanical switches
Keyboard
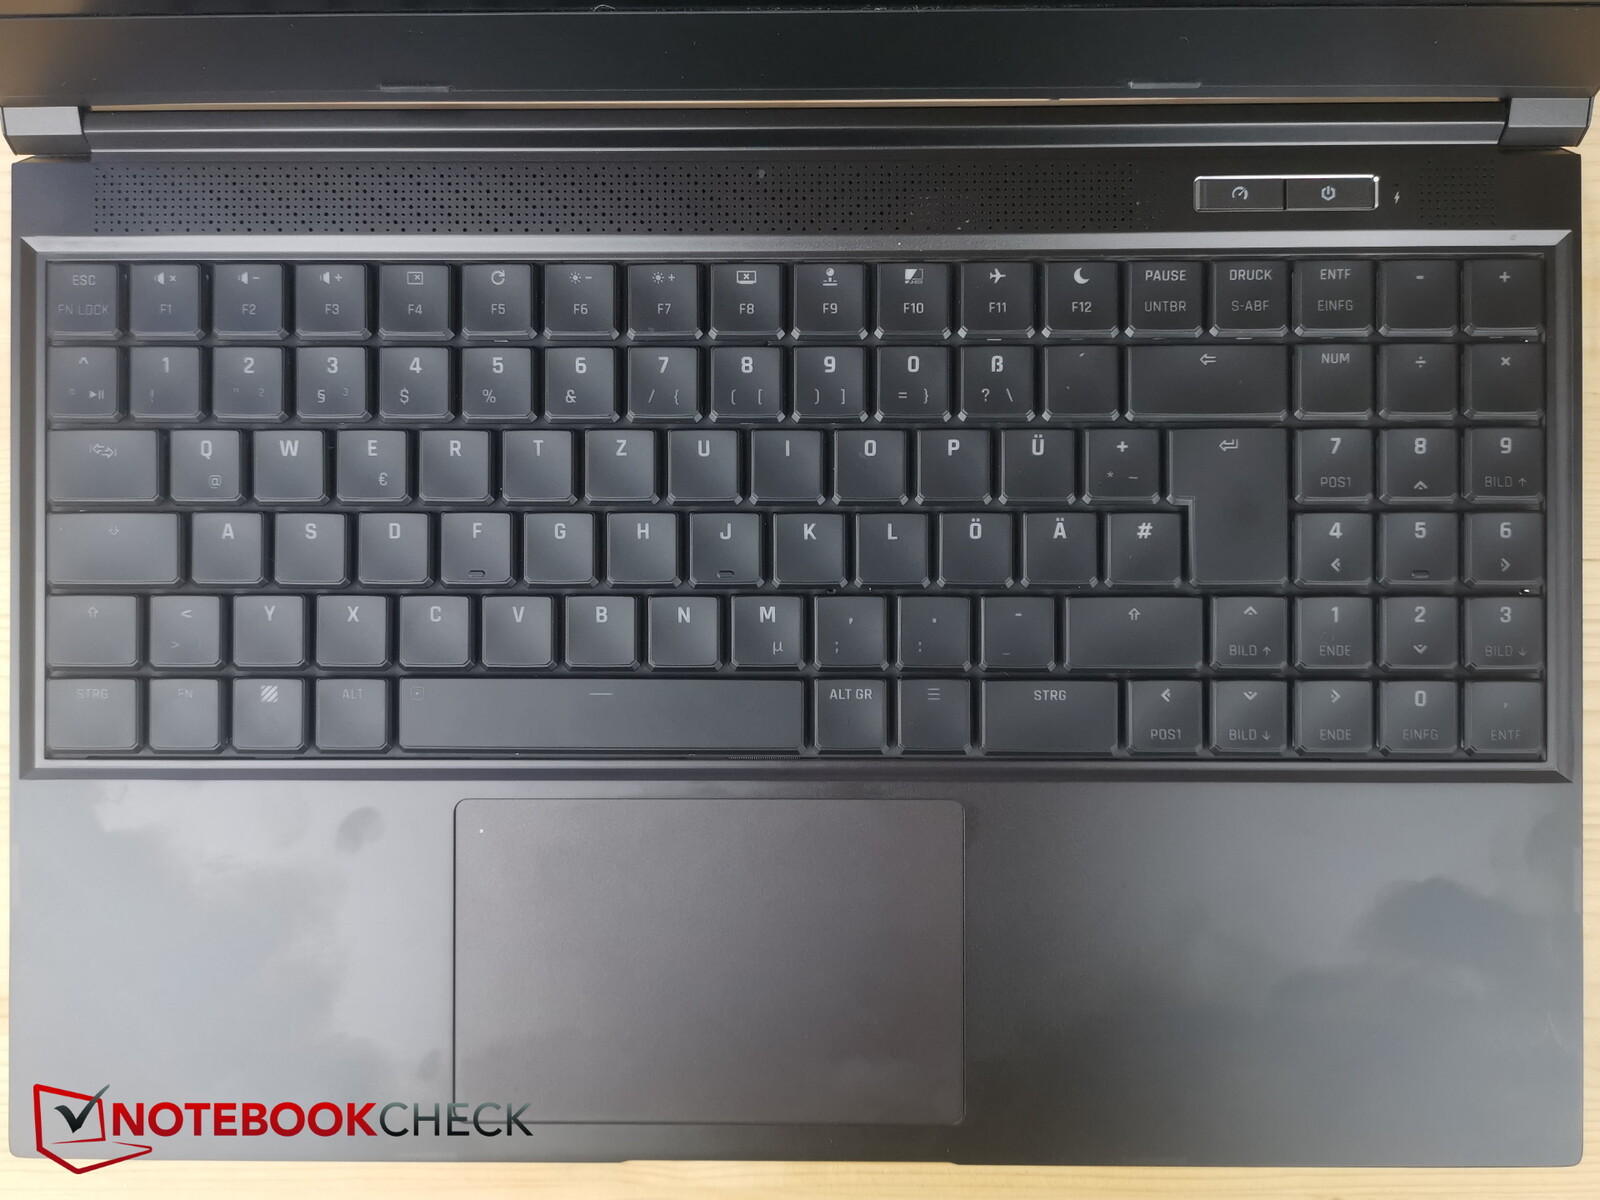
The opto-mechanical keyboard occupies almost the entire width of the 15-inch laptop. This is large enough to accommodate full-size keys and even a number pad of the same size next to them. There isn't much space between the keys, but this is not an issue considering how large they are.
The keyboard has a very neat layout – everything fits inside a rectangle without any notches or similar. On the one hand, this means none of the keys stick out or are isolated from other keys, and the user only need to rely on the legends and their own experience to navigate the keyboard. On the other hand, everything is right where it belongs.
The keyboard on the Neo is also fairly comfortable to type on owing to its moderate key travel and clear feedback, thus enabling fast typing. The typing sound is a little "clattery", but it is not too bad. The laptop also features per-key RGB lighting for use in dark environments.
Touchpad
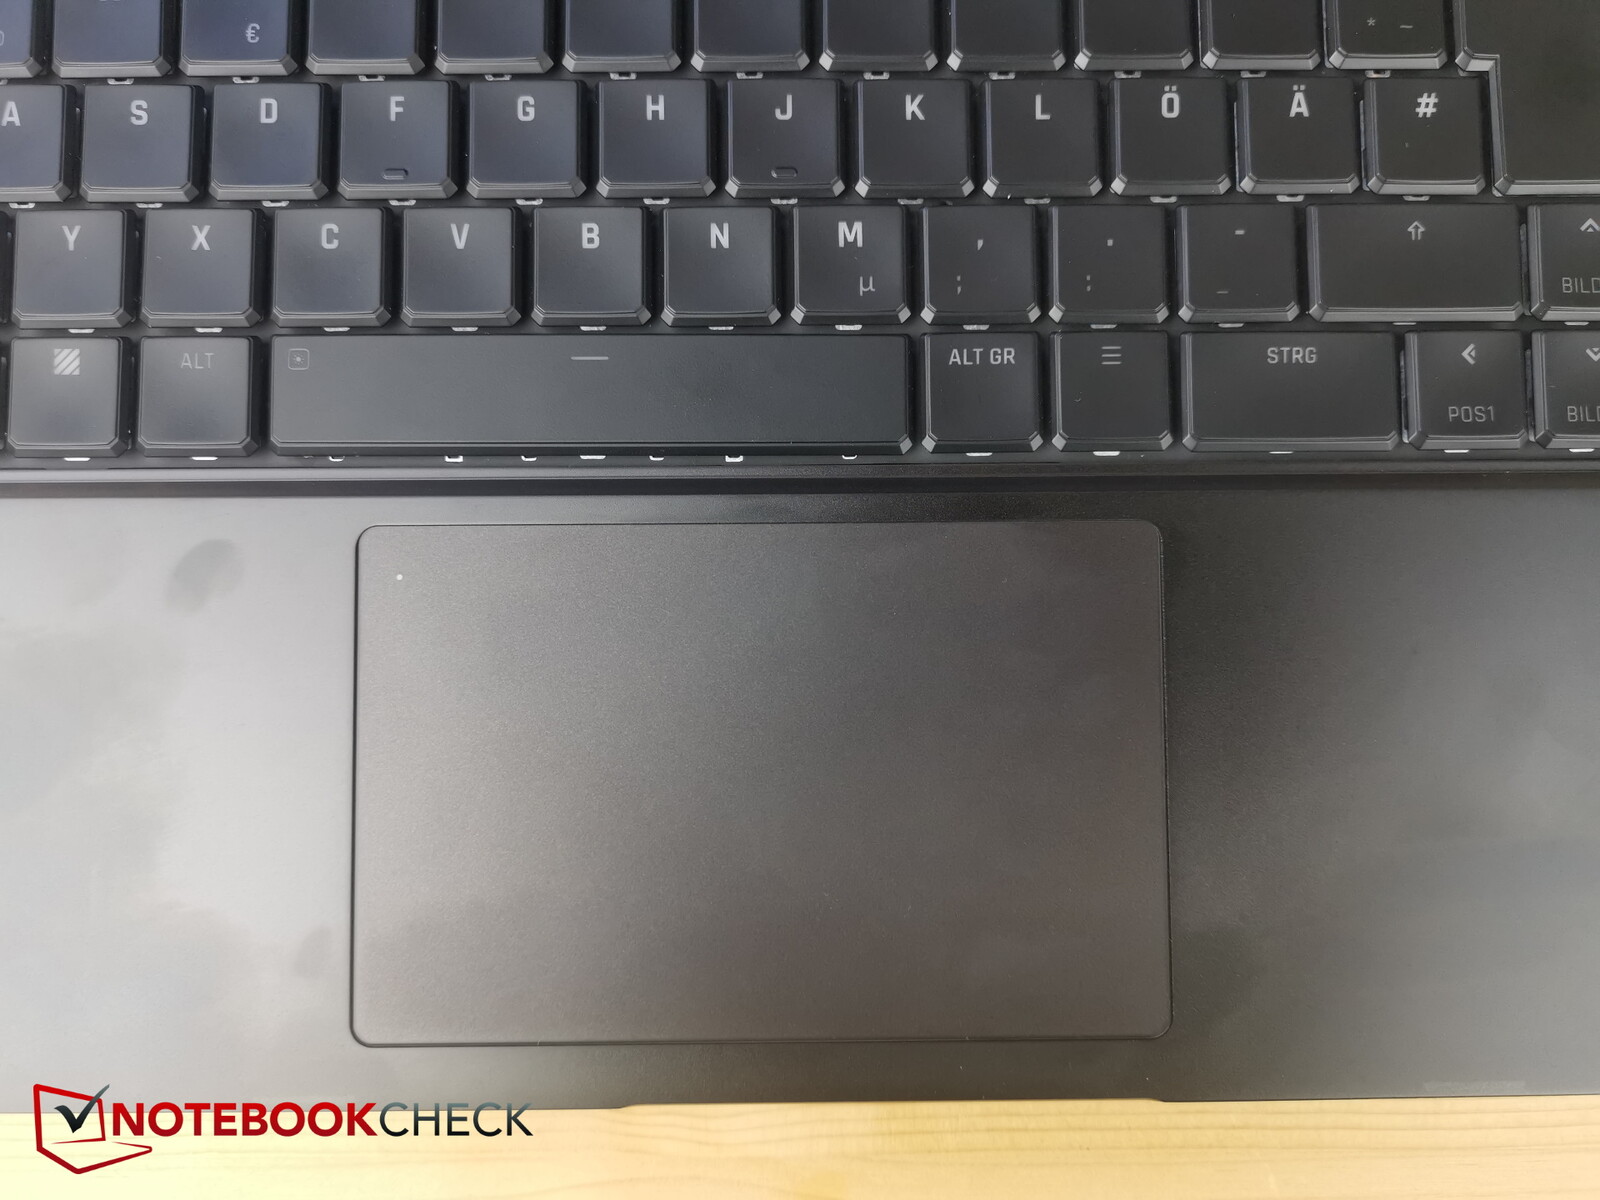
The touchpad is of a good size (approx. 11.6 x 7.4 cm, or 4.6 x 2.9") and has a smooth surface, meaning you won't experience stuttering even when sliding your finger slowly across the touchpad. There is a tiny LED at the top left-hand corner that indicates whether the touchpad is enabled or not.
The integrated click buttons are slightly stiffer than what we would find comfortable, but they provide distinctive feedback and a clear click sound.
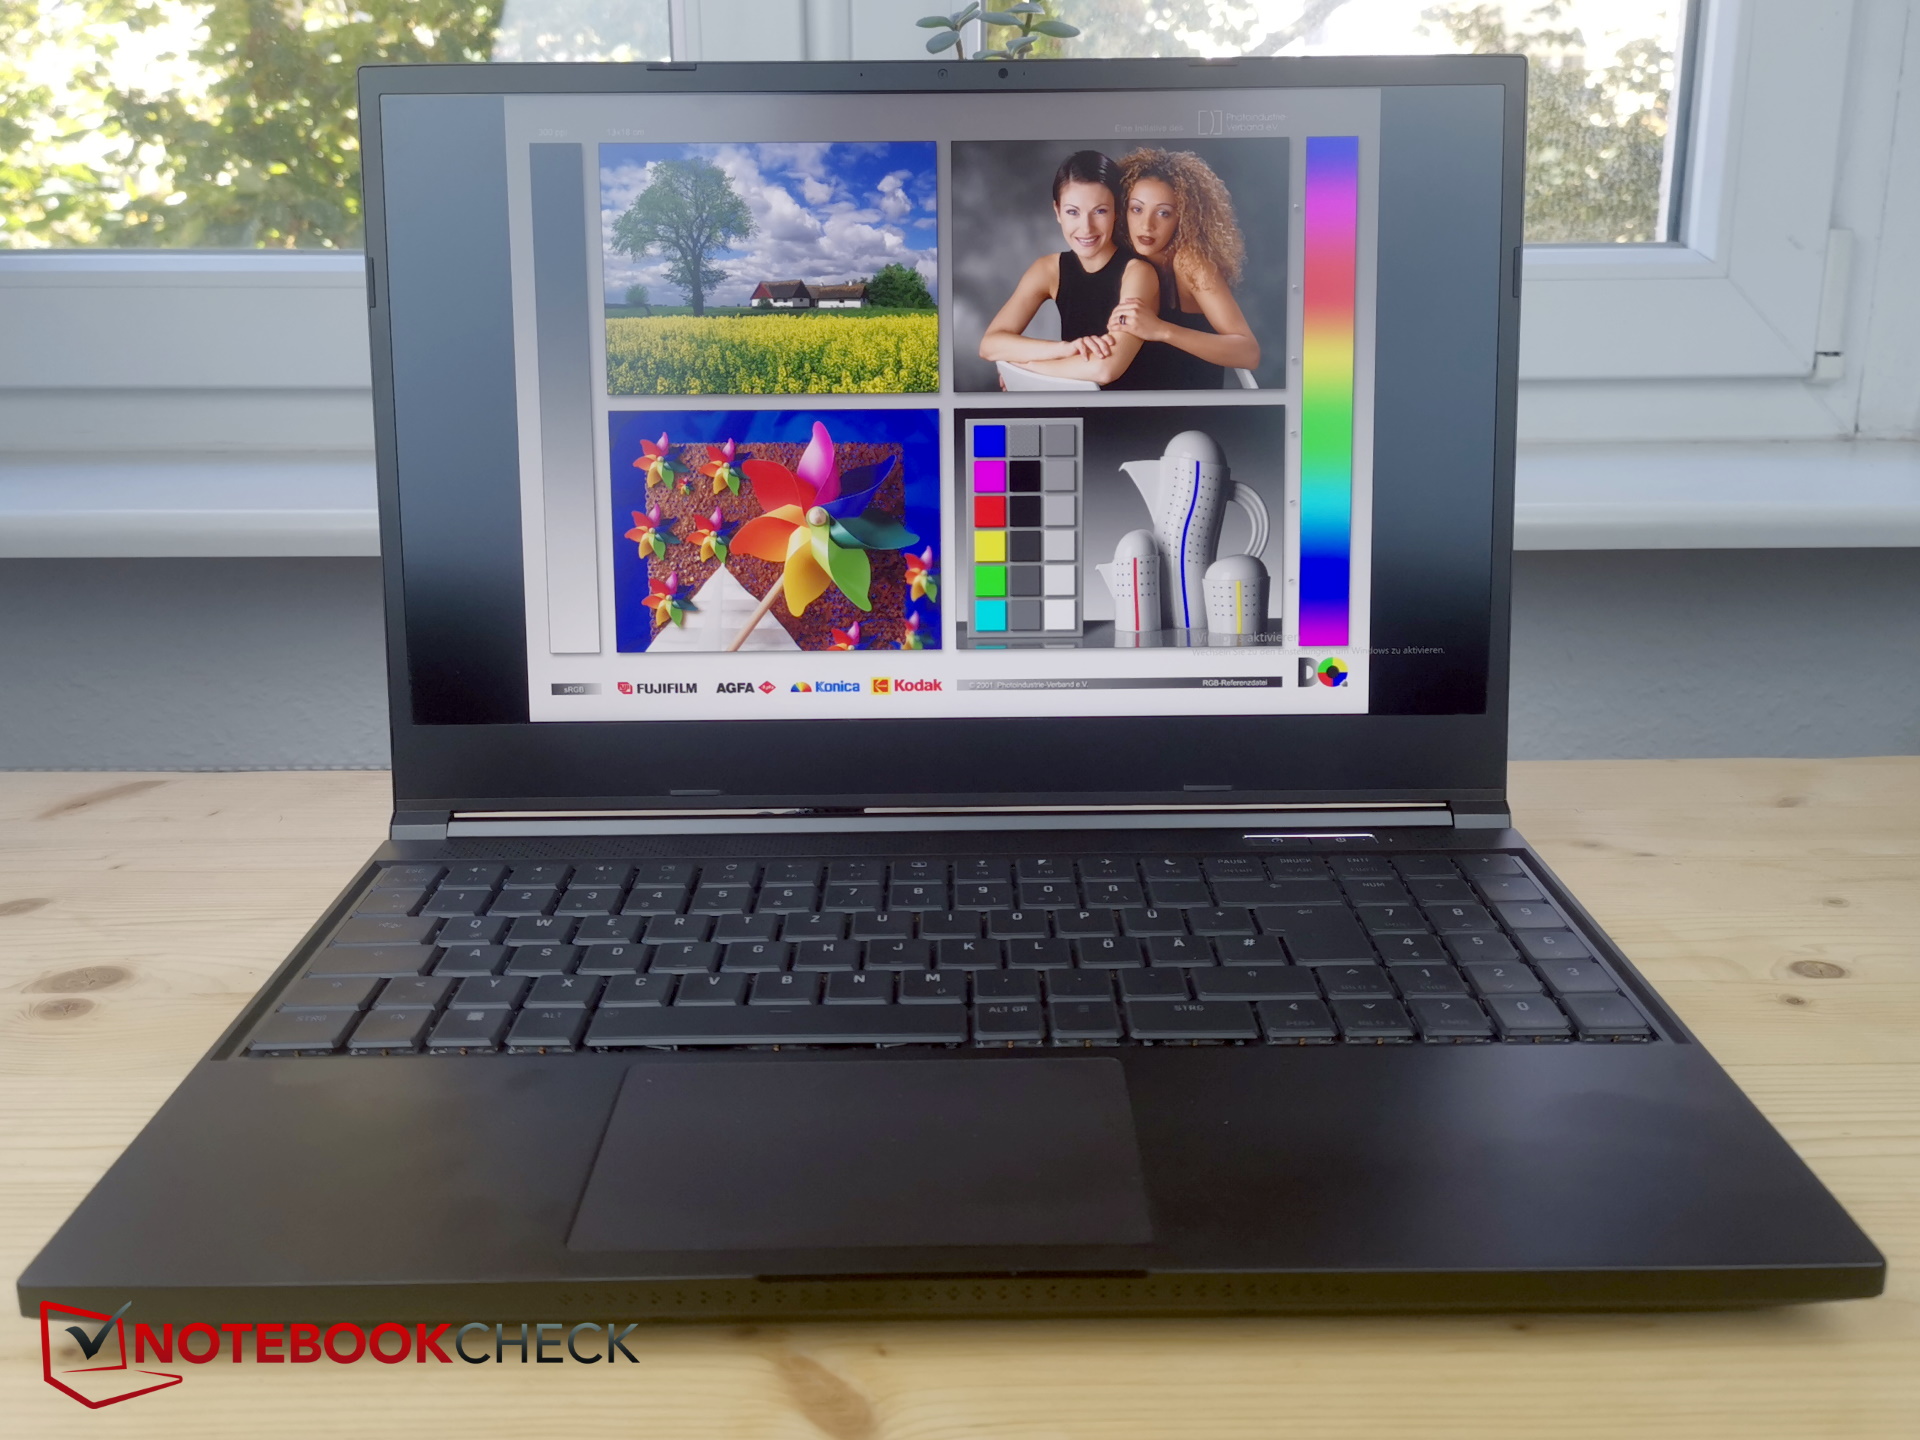
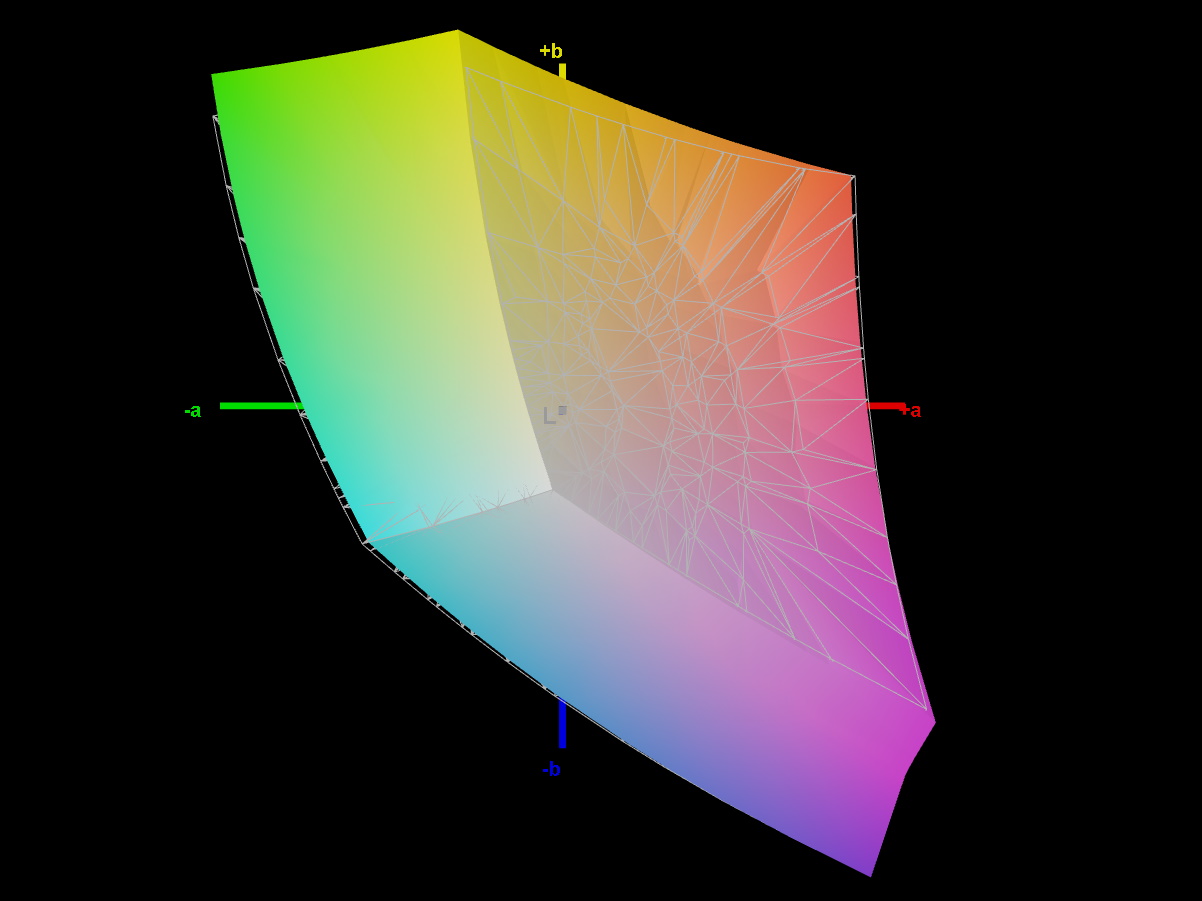
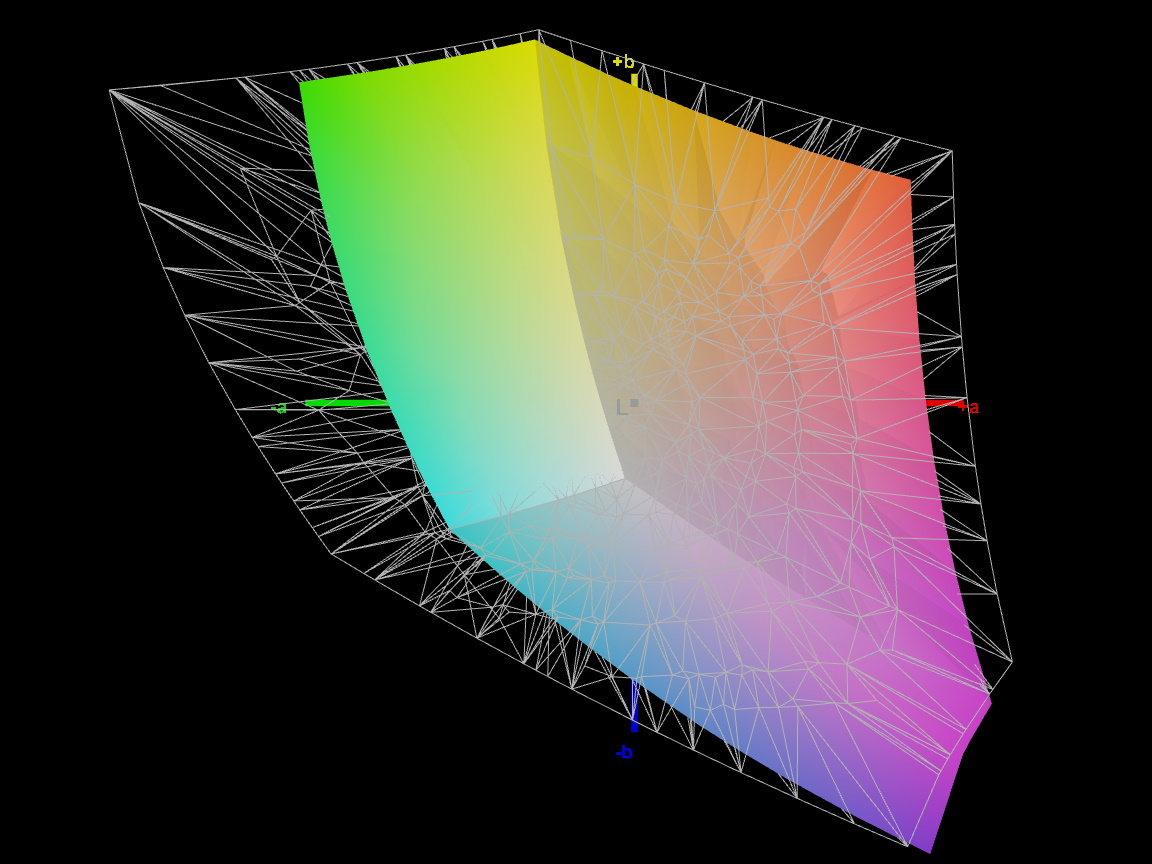
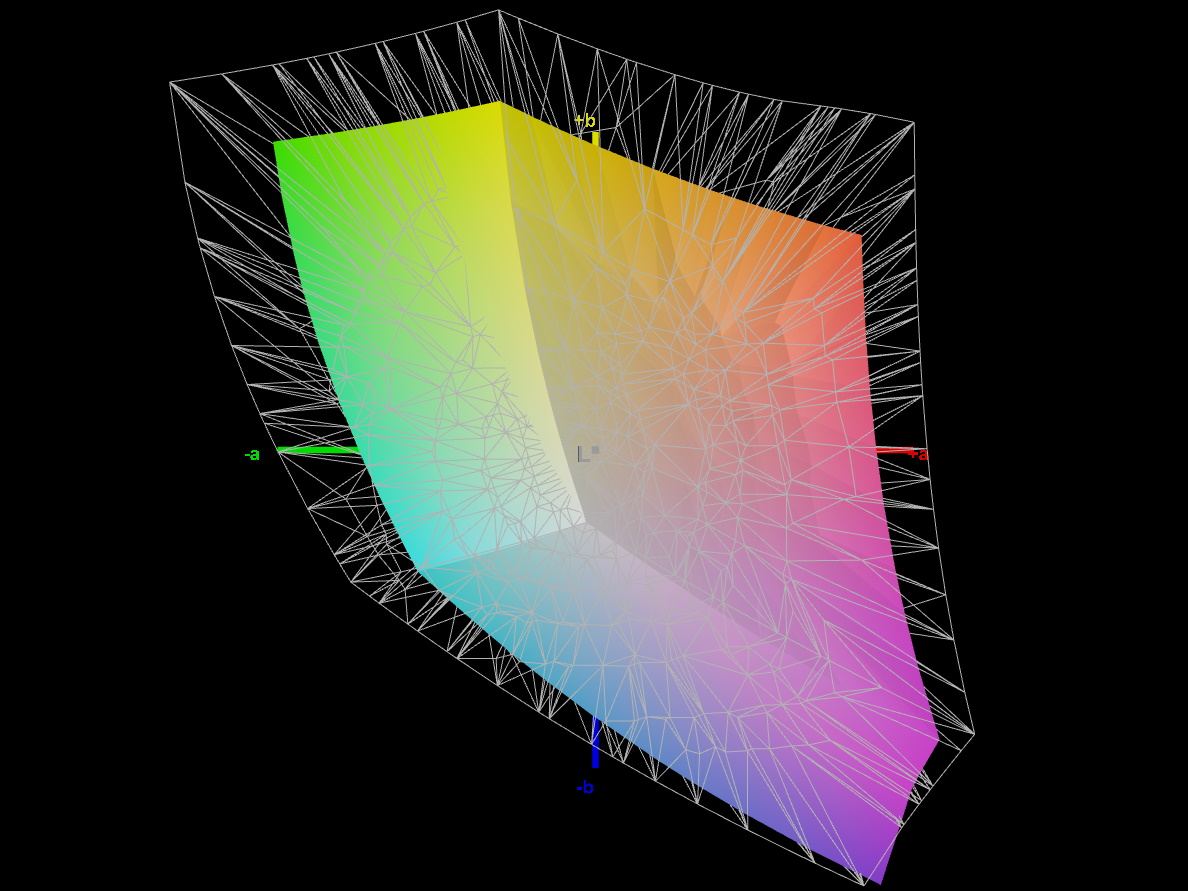
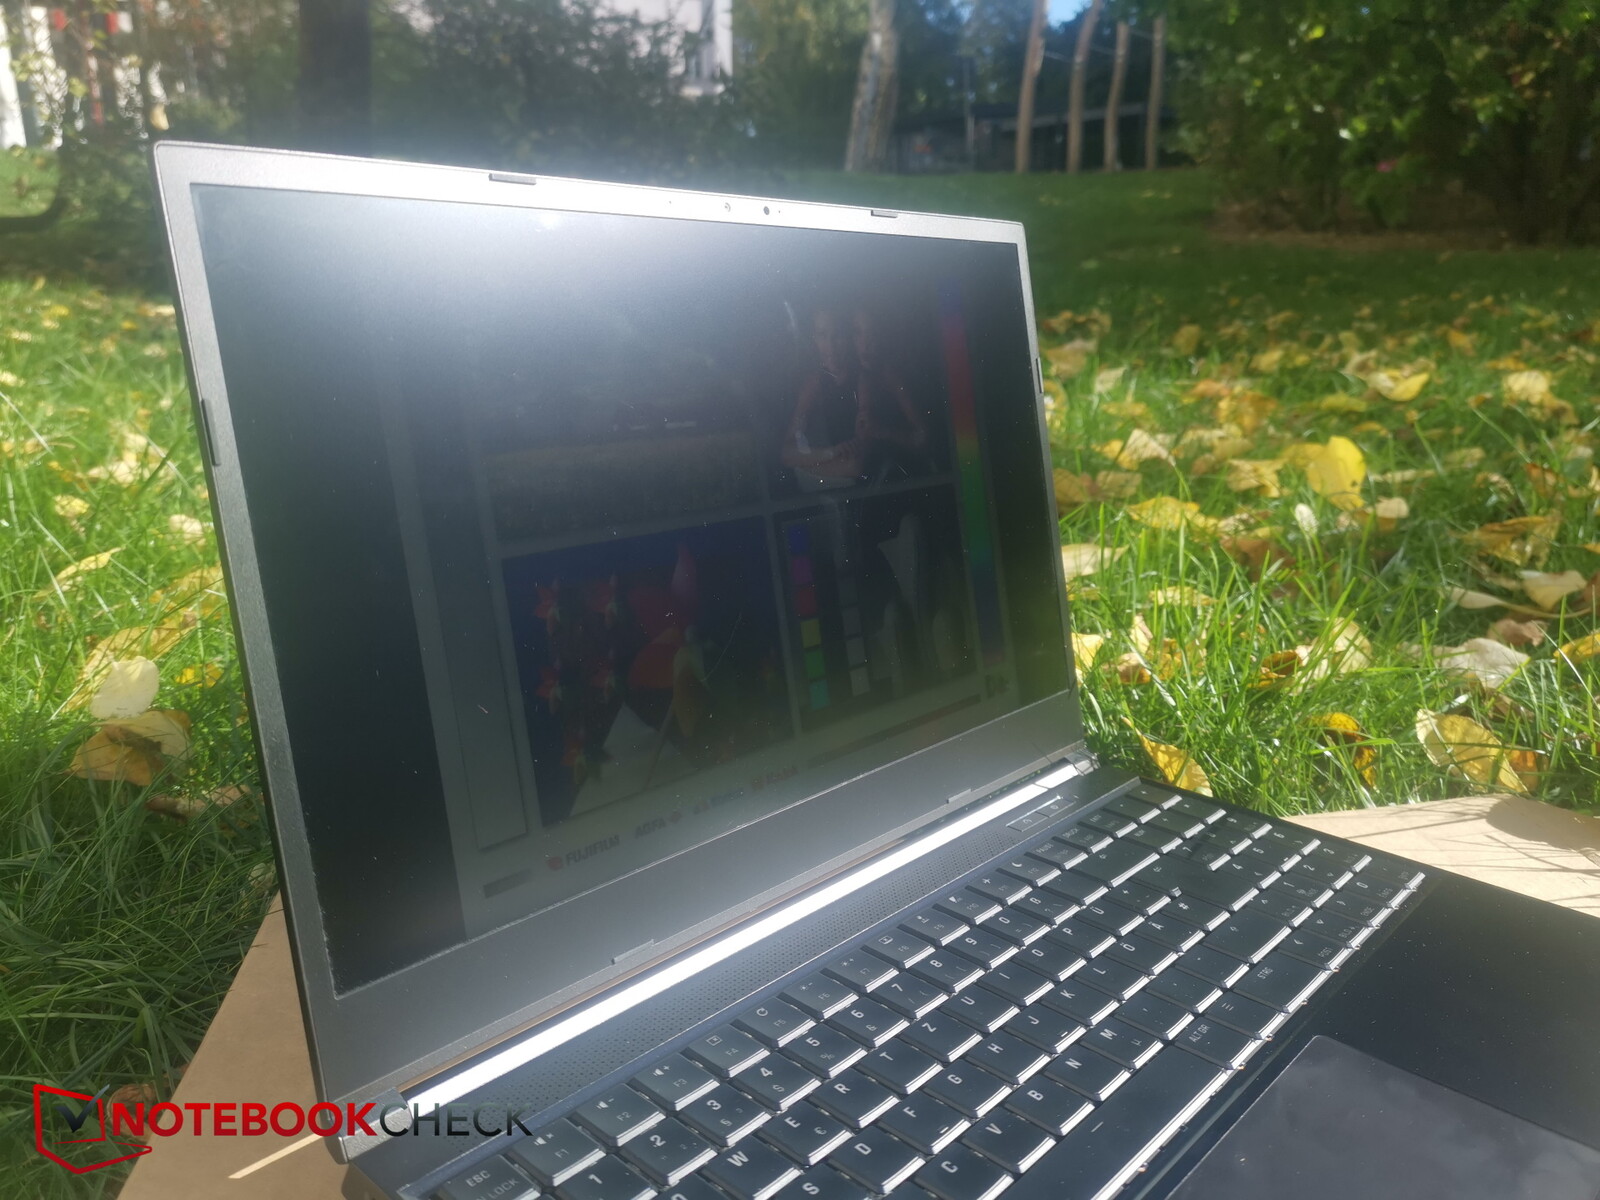
Display - 240Hz QHD display with full sRGB coverage
Schenker uses the same 16:9 QHD IPS panel with a resolution of 2,560 x 1,440 on all the models. The display has a peak brightness of 350 nits, which is a relatively good level that puts the Neo 15 ahead of both the MSI Stealth and Acer Nitro.
However, its brightness distribution of just 82 per cent is somewhat below average. In particular, screen brightness is significantly lower along the bottom of the screen.
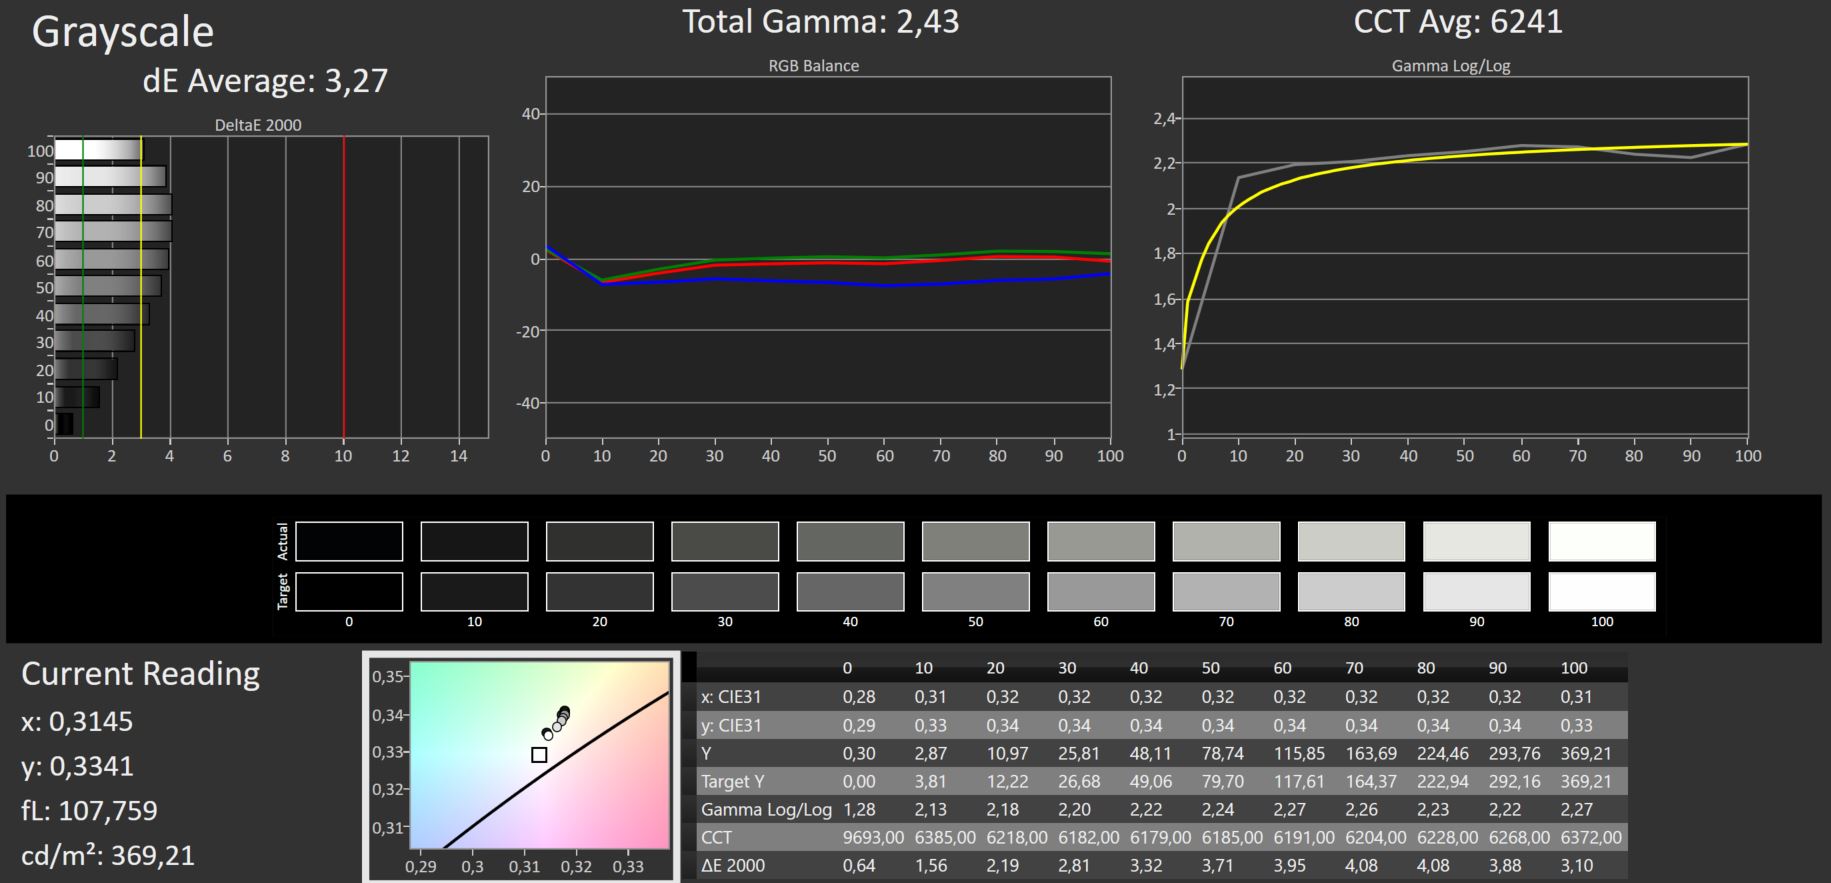
The black level and contrast are both great for a laptop of this class. The display also has good response time and doesn't use PWM.

| |||||||||||||||||||||||||
Brightness Distribution: 82 %
Center on Battery: 367 cd/m²
Contrast: 1321:1 (Black: 0.28 cd/m²)
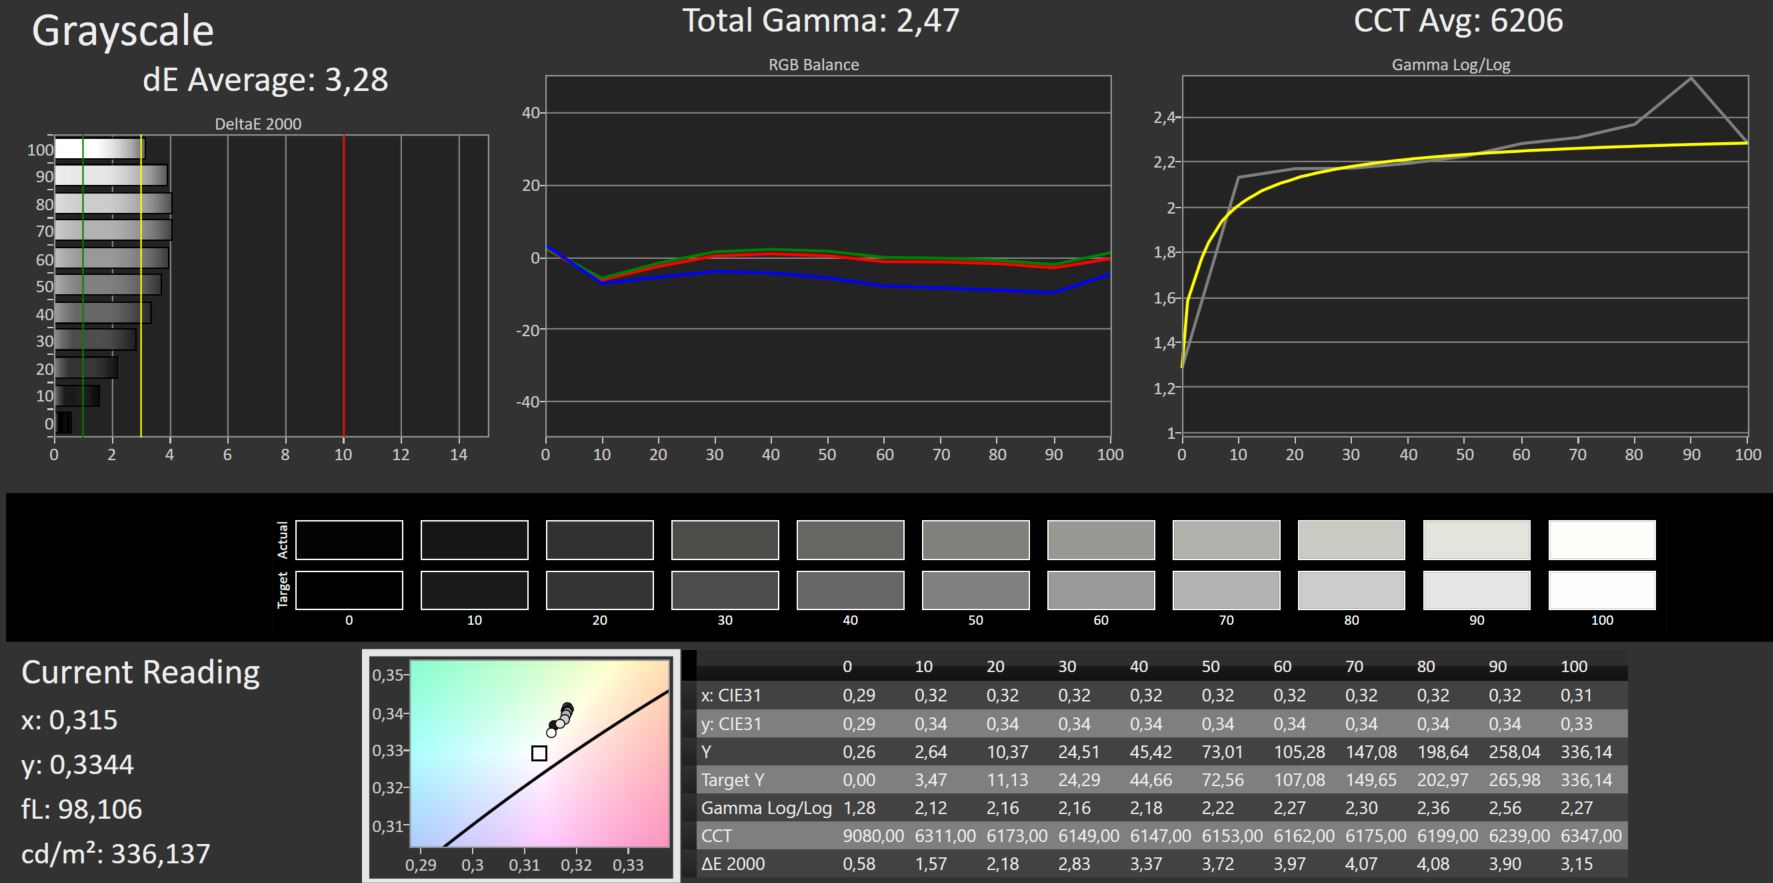
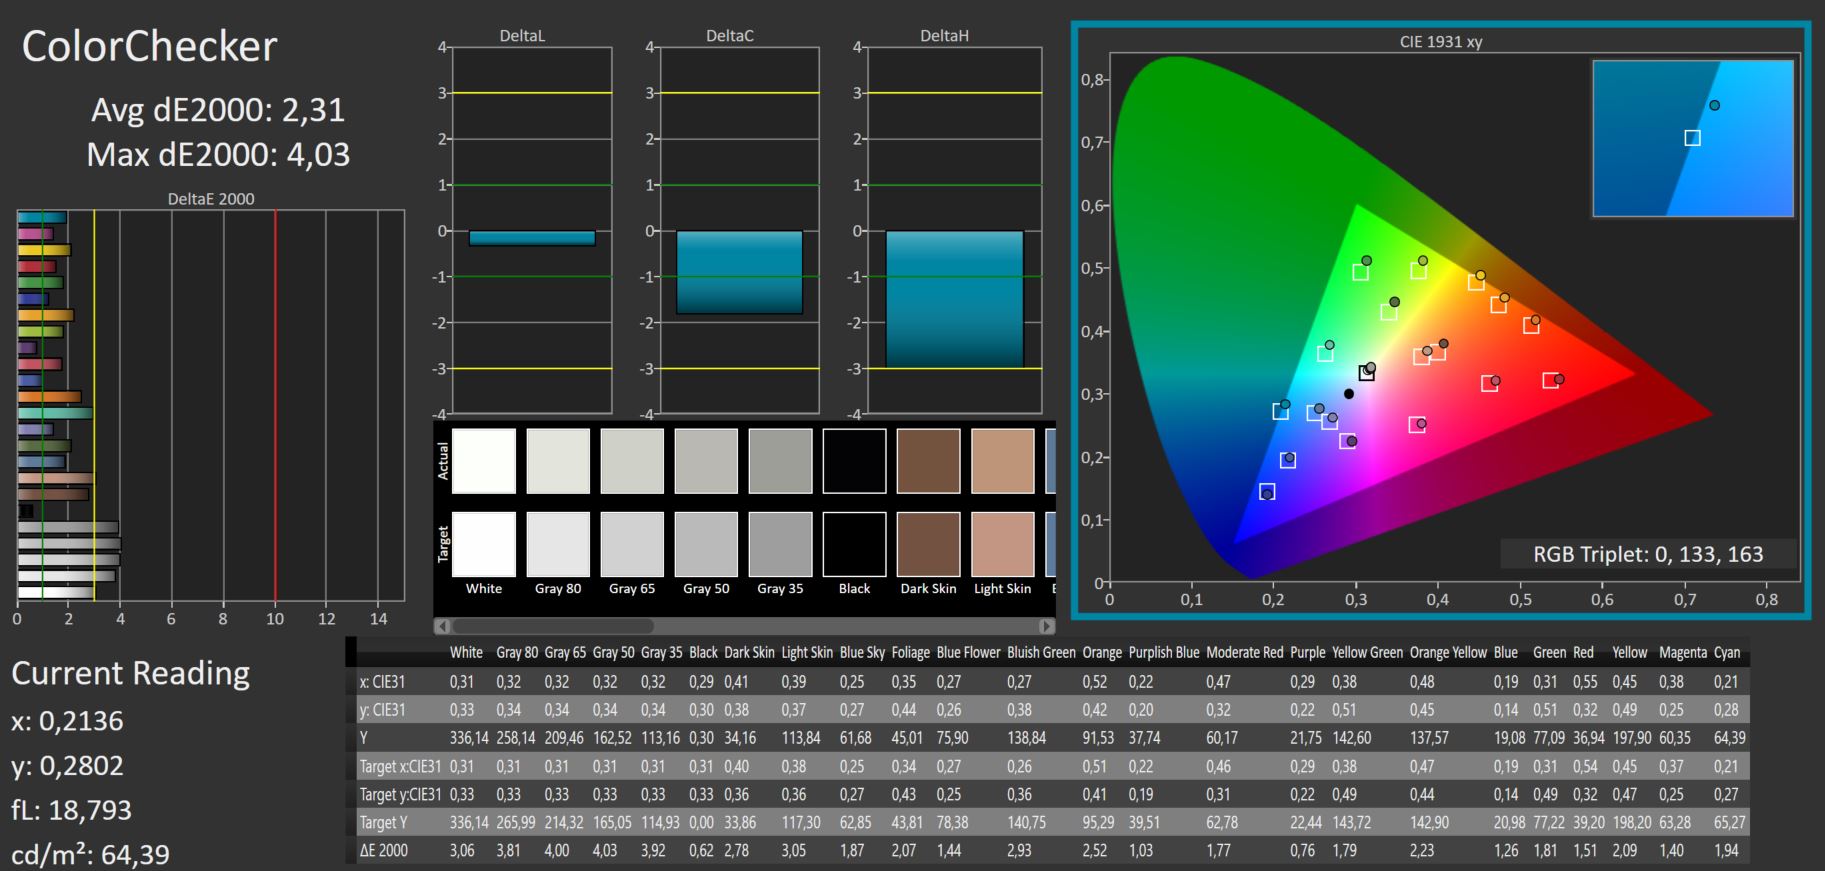
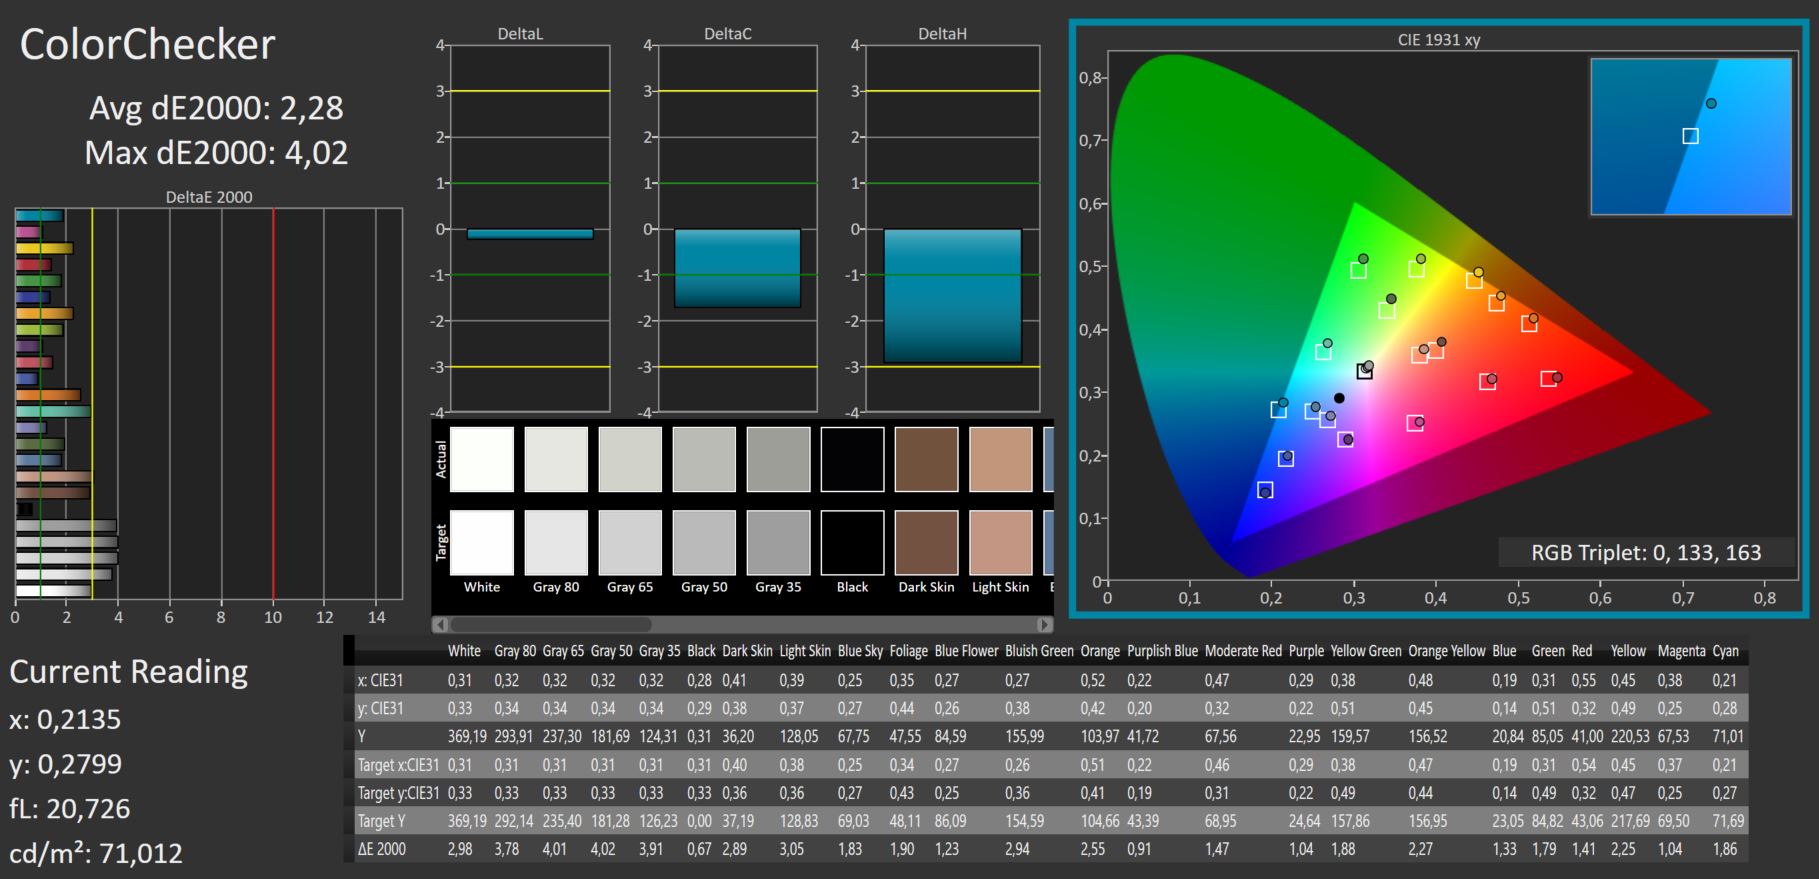
ΔE ColorChecker Calman: 2.31 | ∀{0.5-29.43 Ø4.73}
ΔE Greyscale Calman: 3.28 | ∀{0.09-98 Ø4.97}
70.4% AdobeRGB 1998 (Argyll 3D)
97.7% sRGB (Argyll 3D)
68.9% Display P3 (Argyll 3D)
Gamma: 2.47
CCT: 6206 K
| Schenker XMG Neo 15 (Ryzen 9 6900HX, RTX 3070 Ti) BOE0A67, IPS, 2560x1440, 15.6" | Schenker XMG Neo 15 (i7-12700H, RTX 3080 Ti) BOE0A67, IPS, 2560x1440, 15.6" | MSI GE67 HX 12UGS Samsung ATNA562P02-0, OLED, 1920x1080, 15.6" | Asus ROG Strix Scar 15 G533ZW-LN106WS BOE CQ NE156QHM-NZ2, IPS-level, 2560x1440, 15.6" | Acer Nitro 5 AN515-58-72QR Chi Mei N156KME-GNA, IPS, 2560x1440, 15.6" | MSI Stealth GS66 12UGS Sharp LQ156T1JW04 (SHP153C), IPS-Level, 2560x1440, 15.6" | |
|---|---|---|---|---|---|---|
| Display | -1% | 1% | 21% | 21% | 21% | |
| Display P3 Coverage (%) | 68.9 | 68.2 -1% | 71.7 4% | 96.2 40% | 95.6 39% | 96.4 40% |
| sRGB Coverage (%) | 97.7 | 97.2 -1% | 89.7 -8% | 99.9 2% | 99.8 2% | 99.7 2% |
| AdobeRGB 1998 Coverage (%) | 70.4 | 69.4 -1% | 75.2 7% | 84.5 20% | 85.2 21% | 85.6 22% |
| Response Times | 0% | 97% | 39% | -22% | 29% | |
| Response Time Grey 50% / Grey 80% * (ms) | 12.4 ? | 12.4 ? -0% | 0.25 ? 98% | 7.86 ? 37% 4.21 ? 66% | 15.7 ? -27% | 6 ? 52% |
| Response Time Black / White * (ms) | 8.8 ? | 8.8 ? -0% | 0.4 ? 95% | 7.5 ? 15% | 10.2 ? -16% | 8.4 ? 5% |
| PWM Frequency (Hz) | 480.4 ? | |||||
| Screen | 15% | -30% | -35% | -30% | -43% | |
| Brightness middle (cd/m²) | 370 | 365 -1% | 356.1 -4% | 346 -6% | 332 -10% | 272 -26% |
| Brightness (cd/m²) | 343 | 335 -2% | 358 4% | 329 -4% | 303 -12% | 253 -26% |
| Brightness Distribution (%) | 82 | 81 -1% | 99 21% | 91 11% | 86 5% | 87 6% |
| Black Level * (cd/m²) | 0.28 | 0.32 -14% | 0.59 -111% | 0.29 -4% | 0.25 11% | |
| Contrast (:1) | 1321 | 1141 -14% | 586 -56% | 1145 -13% | 1088 -18% | |
| Colorchecker dE 2000 * | 2.31 | 1.38 40% | 4.83 -109% | 3.06 -32% | 3.61 -56% | 3.73 -61% |
| Colorchecker dE 2000 max. * | 4.03 | 2.01 50% | 7.94 -97% | 5.81 -44% | 7.71 -91% | 9.43 -134% |
| Greyscale dE 2000 * | 3.28 | 1.36 59% | 3.1 5% | 5.2 -59% | 6.5 -98% | |
| Gamma | 2.47 89% | 2.48 89% | 2.2 100% | 2.12 104% | 2.155 102% | 2.172 101% |
| CCT | 6206 105% | 6412 101% | 5938 109% | 7021 93% | 6724 97% | 6485 100% |
| Colorchecker dE 2000 calibrated * | 1.22 | 2.57 | 0.59 | 0.98 | ||
| Total Average (Program / Settings) | 5% /
9% | 23% /
1% | 8% /
-5% | -10% /
-17% | 2% /
-17% |
* ... smaller is better
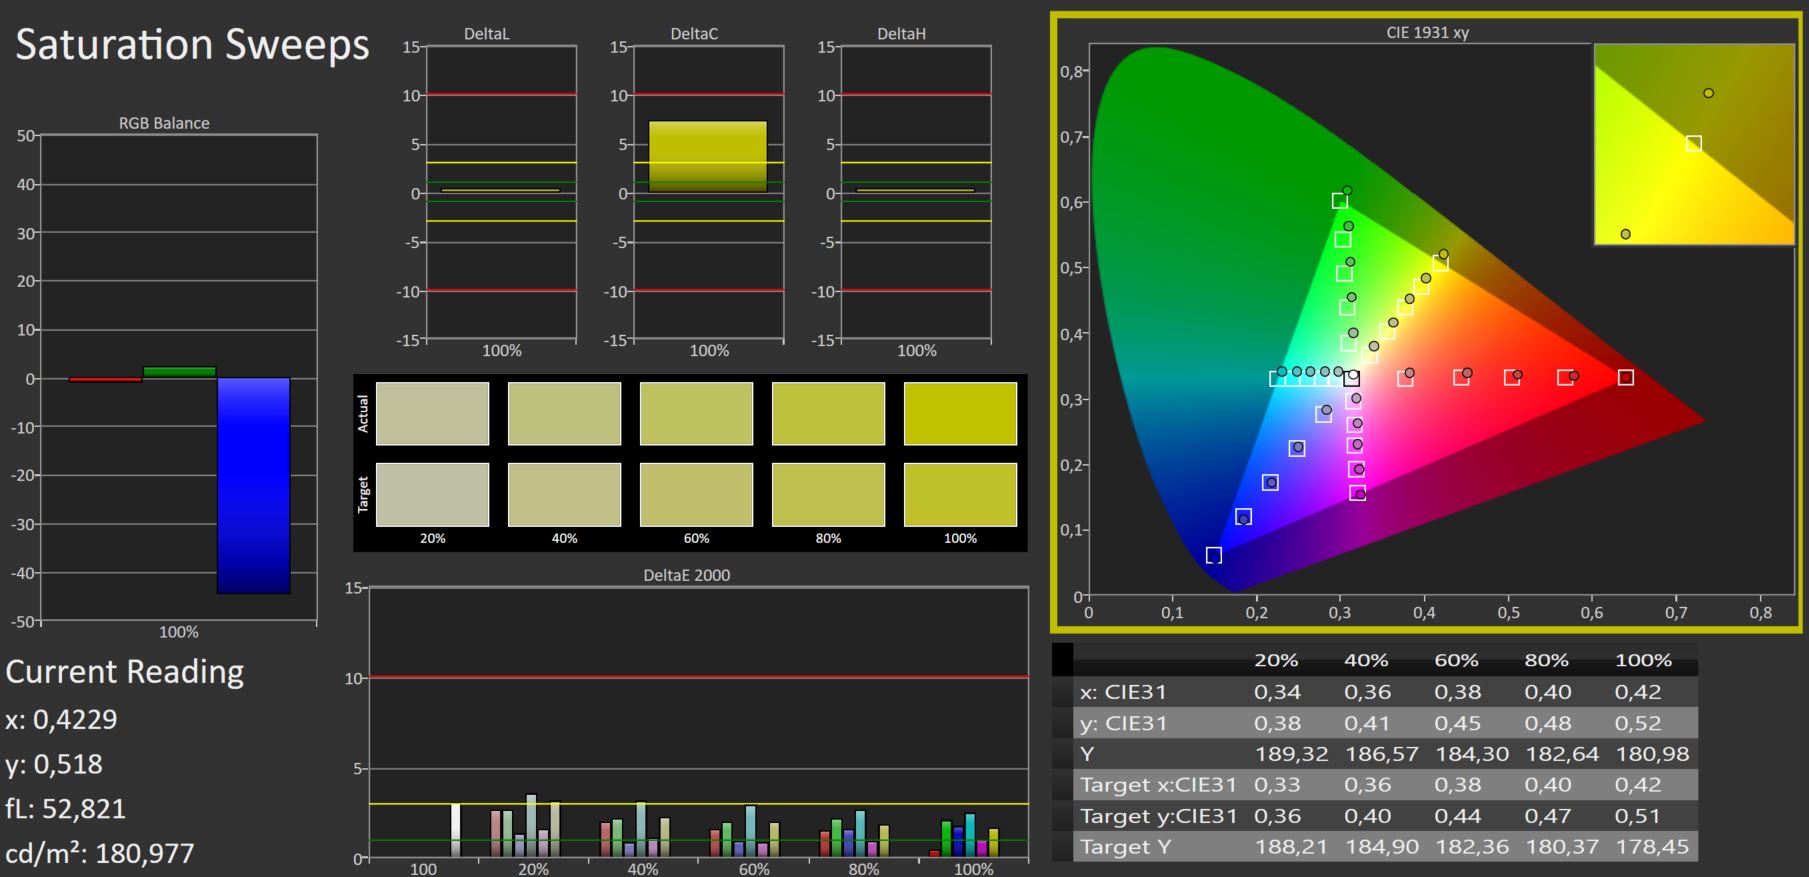
The screen is not really suitable for professional photo and video editing. Whilst the display has full sRGB coverage, it only managed to cover roughly 70 per cent of the AdobeRGB and DisplayP3 colour space.
The display is already quite well calibrated right out of the box. Despite the Delta E values not being especially low, there wasn't any improvement even after we manually calibrated the screen ourselves.
Display Response Times
| ↔ Response Time Black to White | ||
|---|---|---|
| 8.8 ms ... rise ↗ and fall ↘ combined | ↗ 4.6 ms rise | 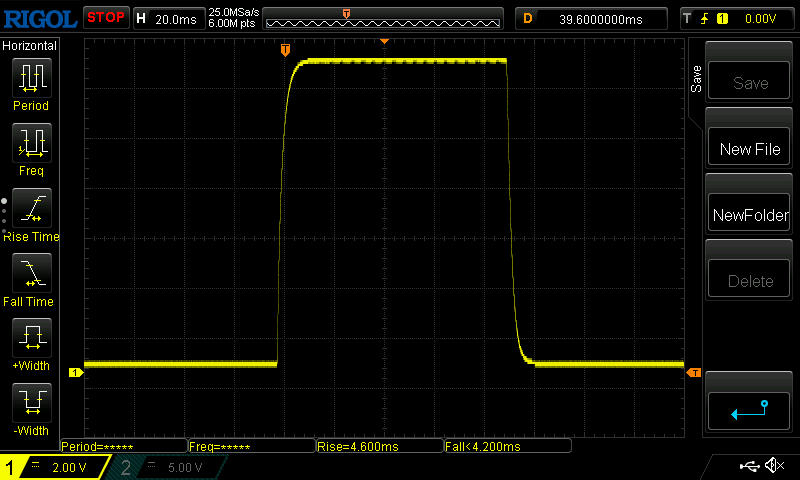 |
| ↘ 4.2 ms fall | ||
| The screen shows fast response rates in our tests and should be suited for gaming. In comparison, all tested devices range from 0.1 (minimum) to 240 (maximum) ms. » 24 % of all devices are better. This means that the measured response time is better than the average of all tested devices (19.9 ms). | ||
| ↔ Response Time 50% Grey to 80% Grey | ||
| 12.4 ms ... rise ↗ and fall ↘ combined | ↗ 5.8 ms rise | 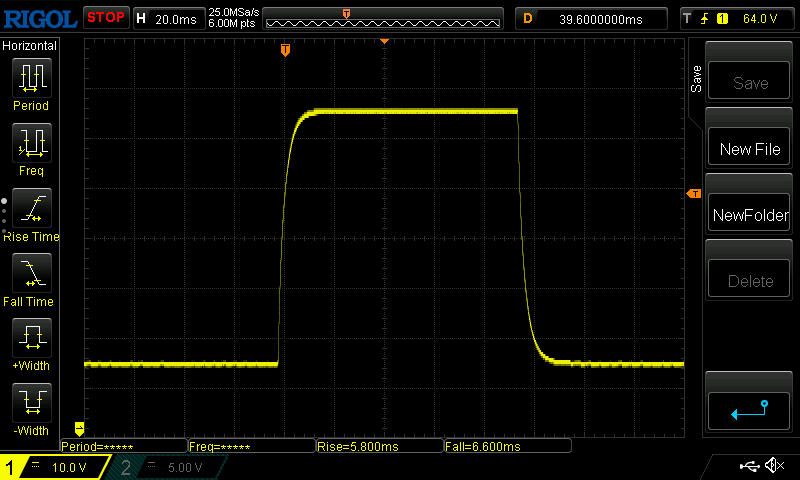 |
| ↘ 6.6 ms fall | ||
| The screen shows good response rates in our tests, but may be too slow for competitive gamers. In comparison, all tested devices range from 0.165 (minimum) to 636 (maximum) ms. » 26 % of all devices are better. This means that the measured response time is better than the average of all tested devices (31.1 ms). | ||
Screen Flickering / PWM (Pulse-Width Modulation)
| Screen flickering / PWM not detected | 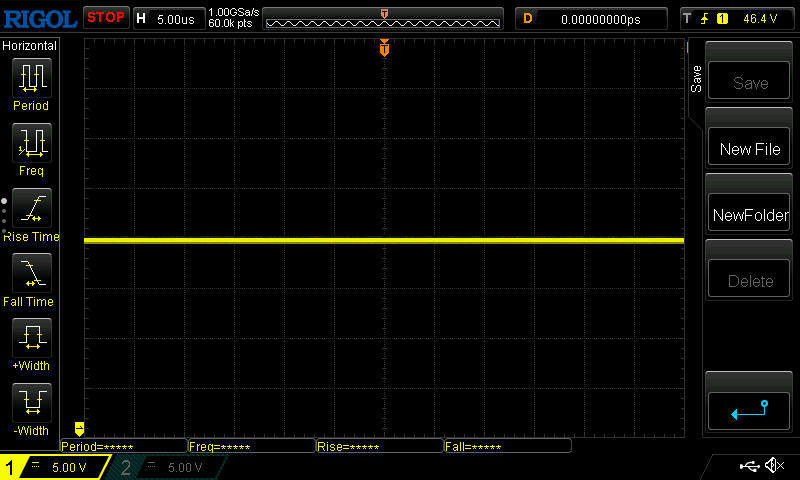 | ||
In comparison: 52 % of all tested devices do not use PWM to dim the display. If PWM was detected, an average of 7798 (minimum: 5 - maximum: 343500) Hz was measured. | |||
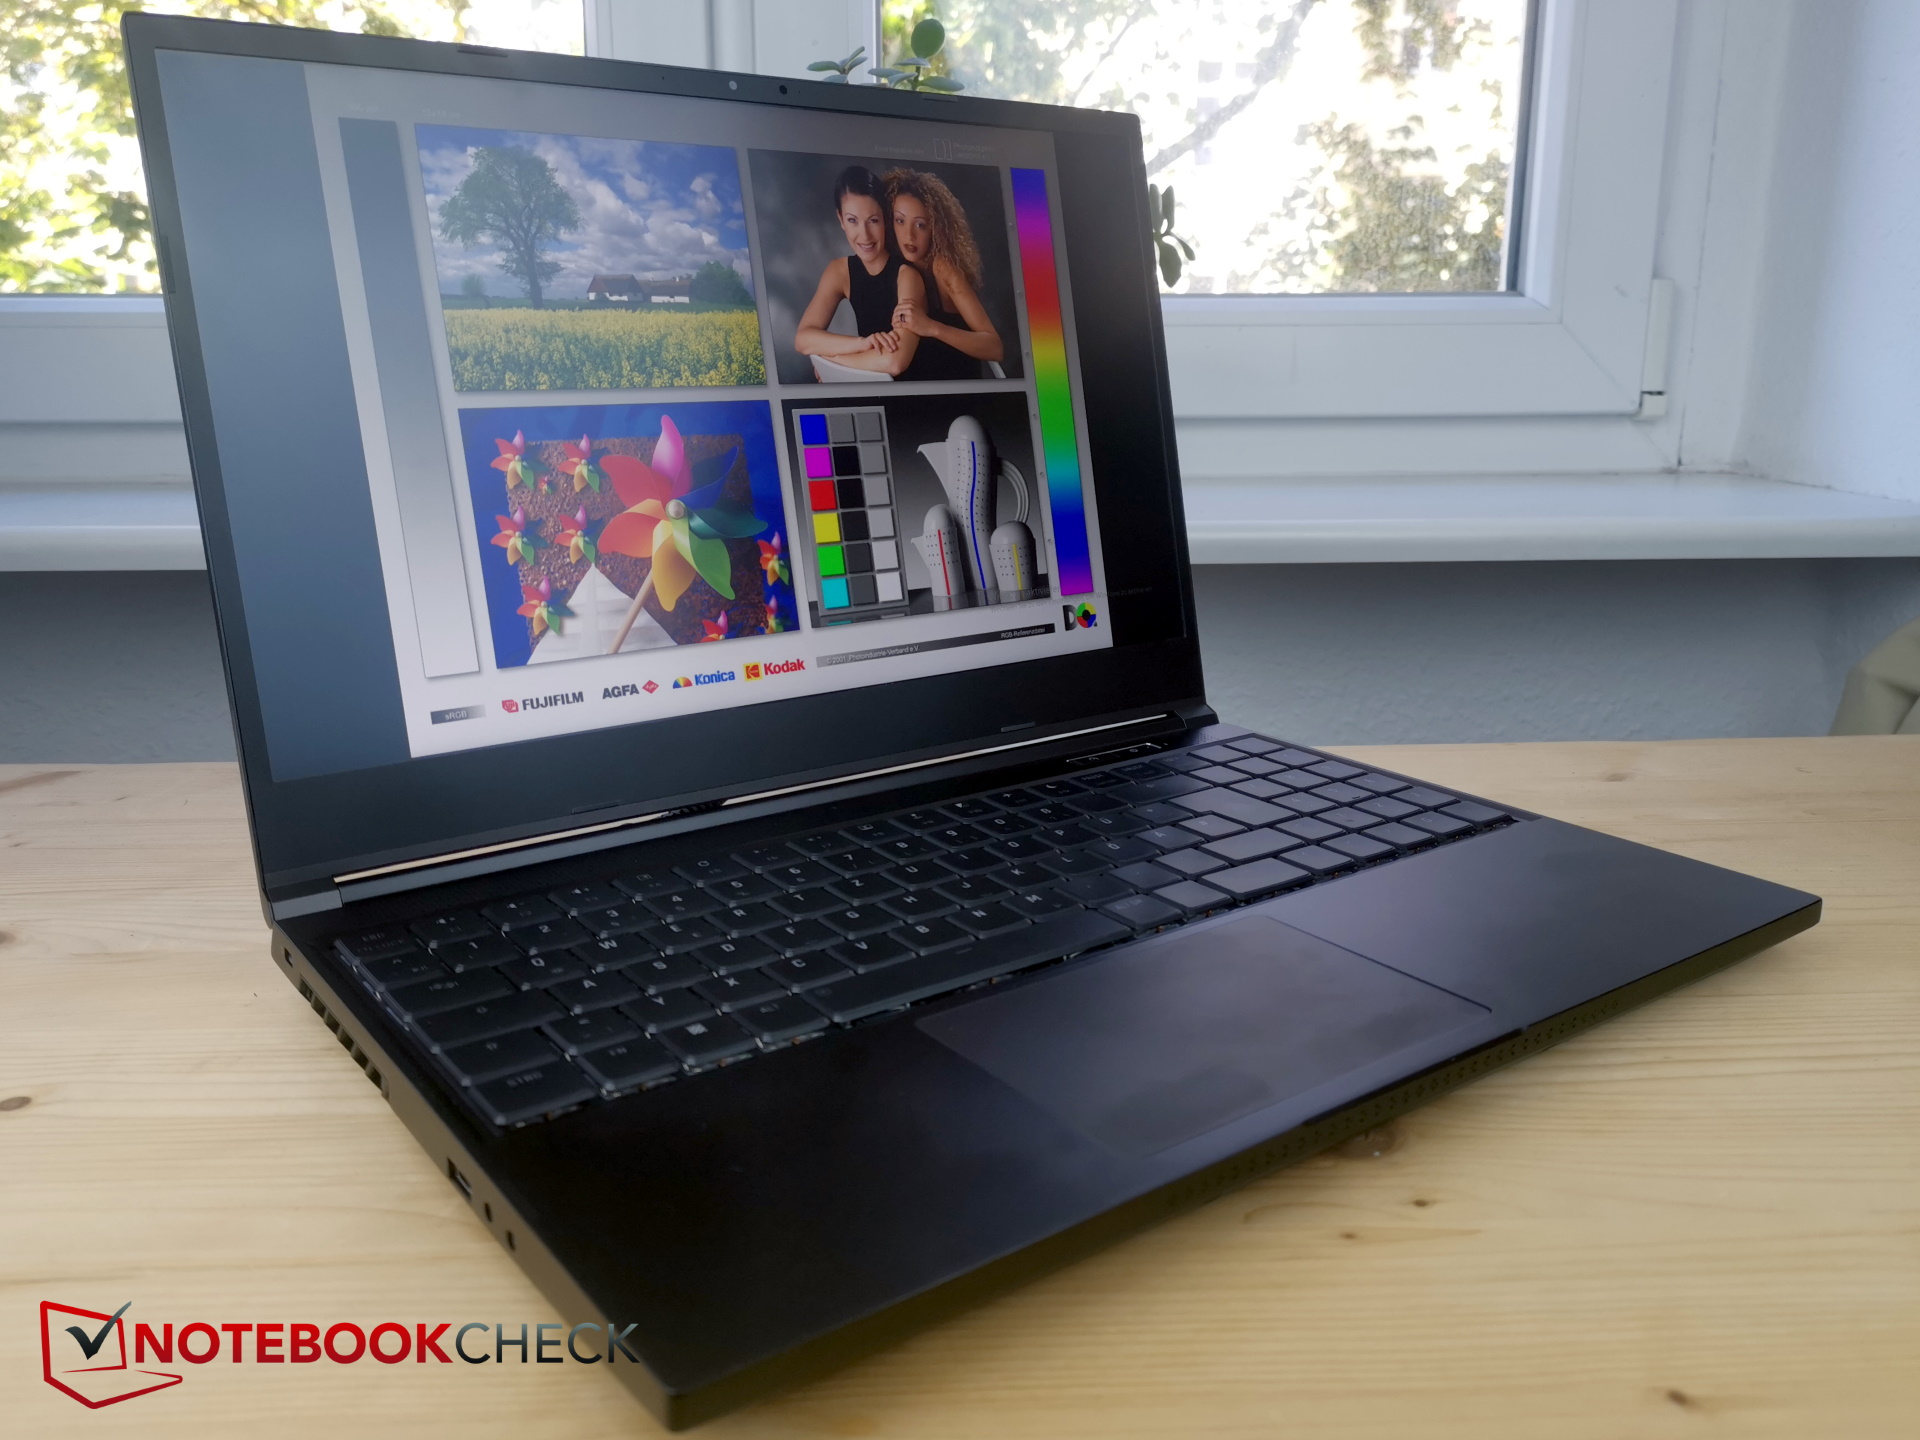
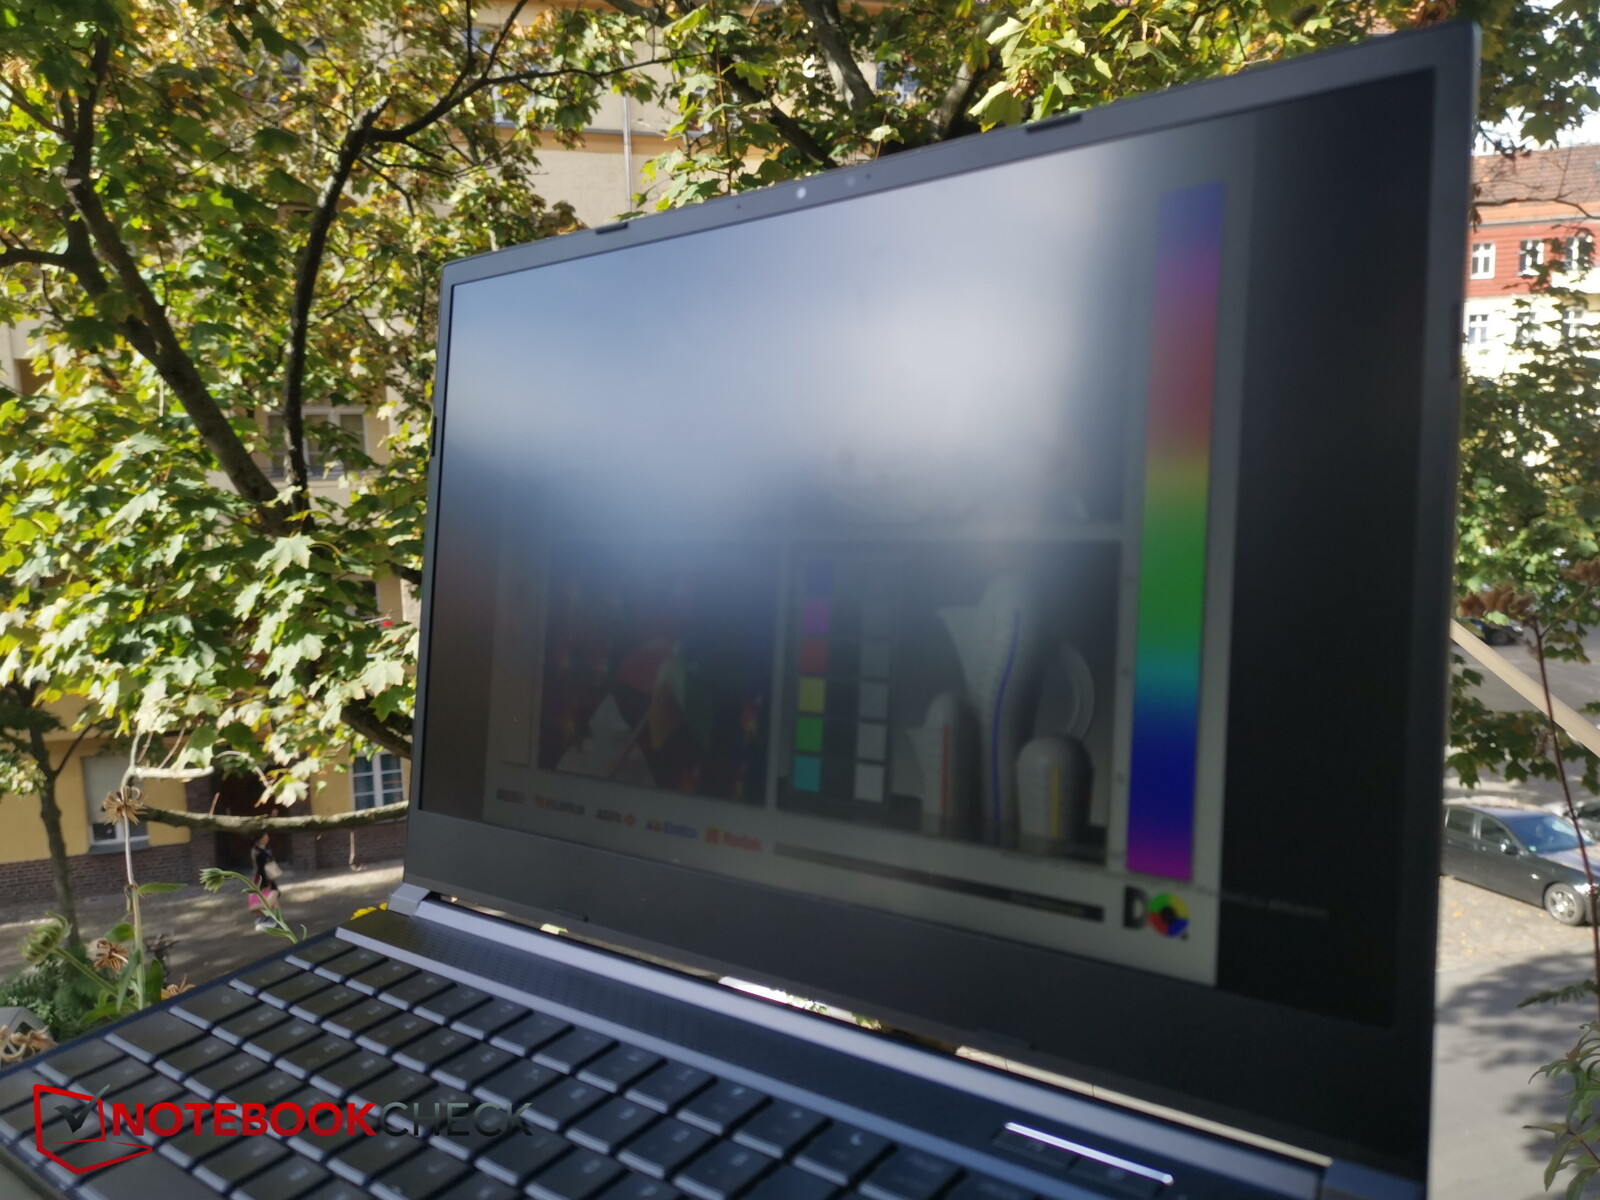
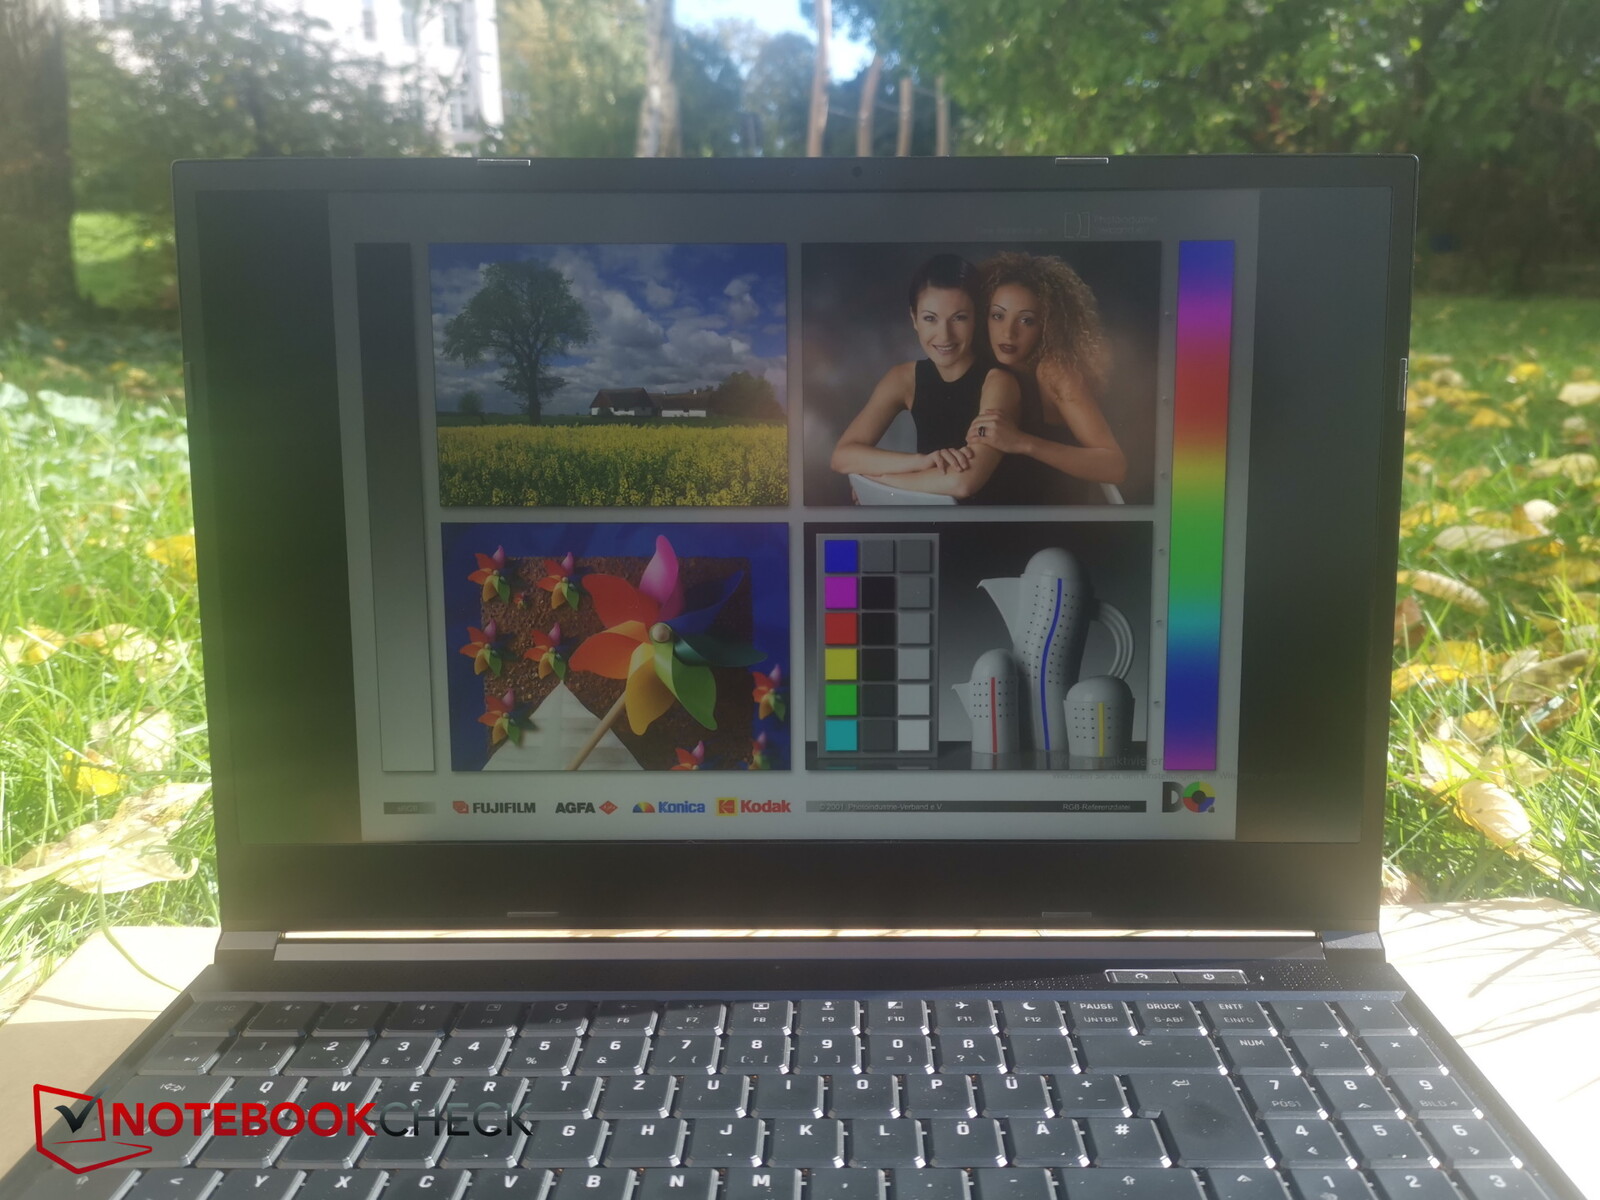
When using the device outdoors, you should look for a shady spot and make sure you are viewing the display straight on. This is because the screen content is very difficult to read when viewed at an angle or in direct sunlight.


Performance - AMD and Intel almost on par with each other
You'll find many different ways to configure the Neo 15 M22 on bestware's website. But it always come with the same panel and AMD processor. Those who want an Intel CPU instead can look at the Neo 15 E22.
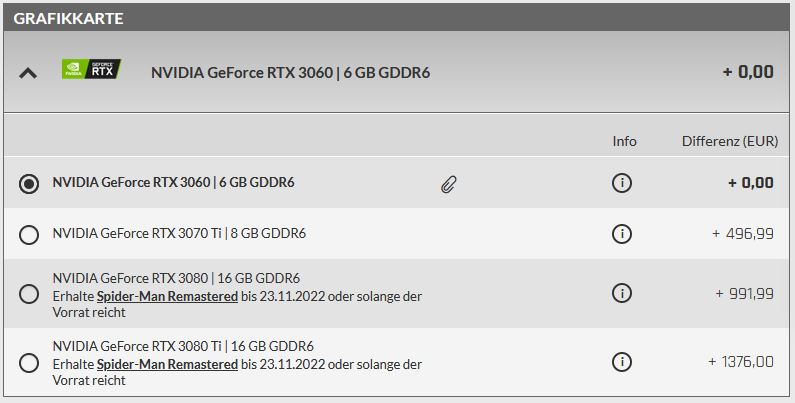
The RTX 3070 Ti in our review unit adds around 497 Euro (US$494) to the purchase price compared with the lowest-end GPU option (RTX 3060). It will set you back a cool 1,376 Euro (US$1,368) to upgrade from an RTX 3060 to RTX 3080 Ti.
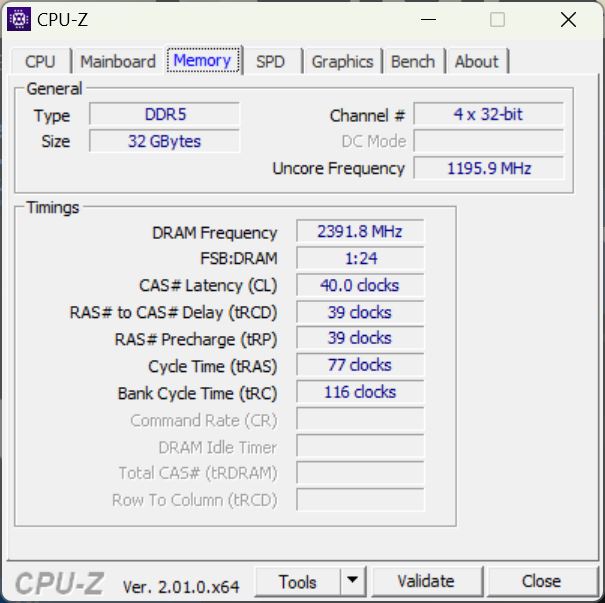
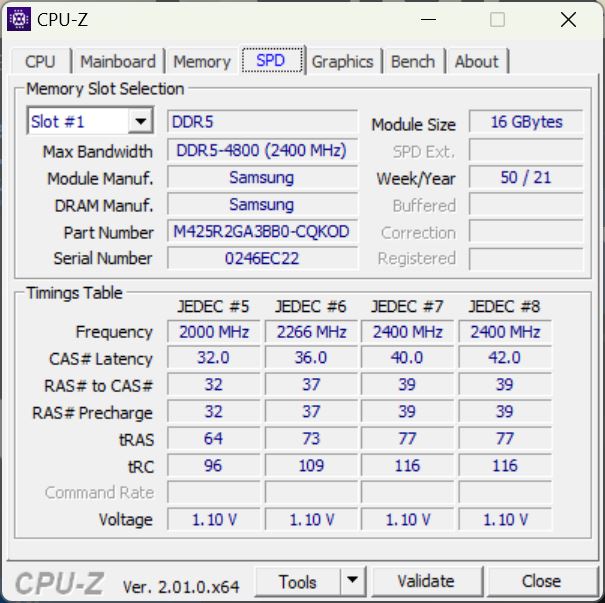
Many other components, such as the SSD, DDR5 RAM and Wi-Fi module, are likewise upgradable.
Test conditions
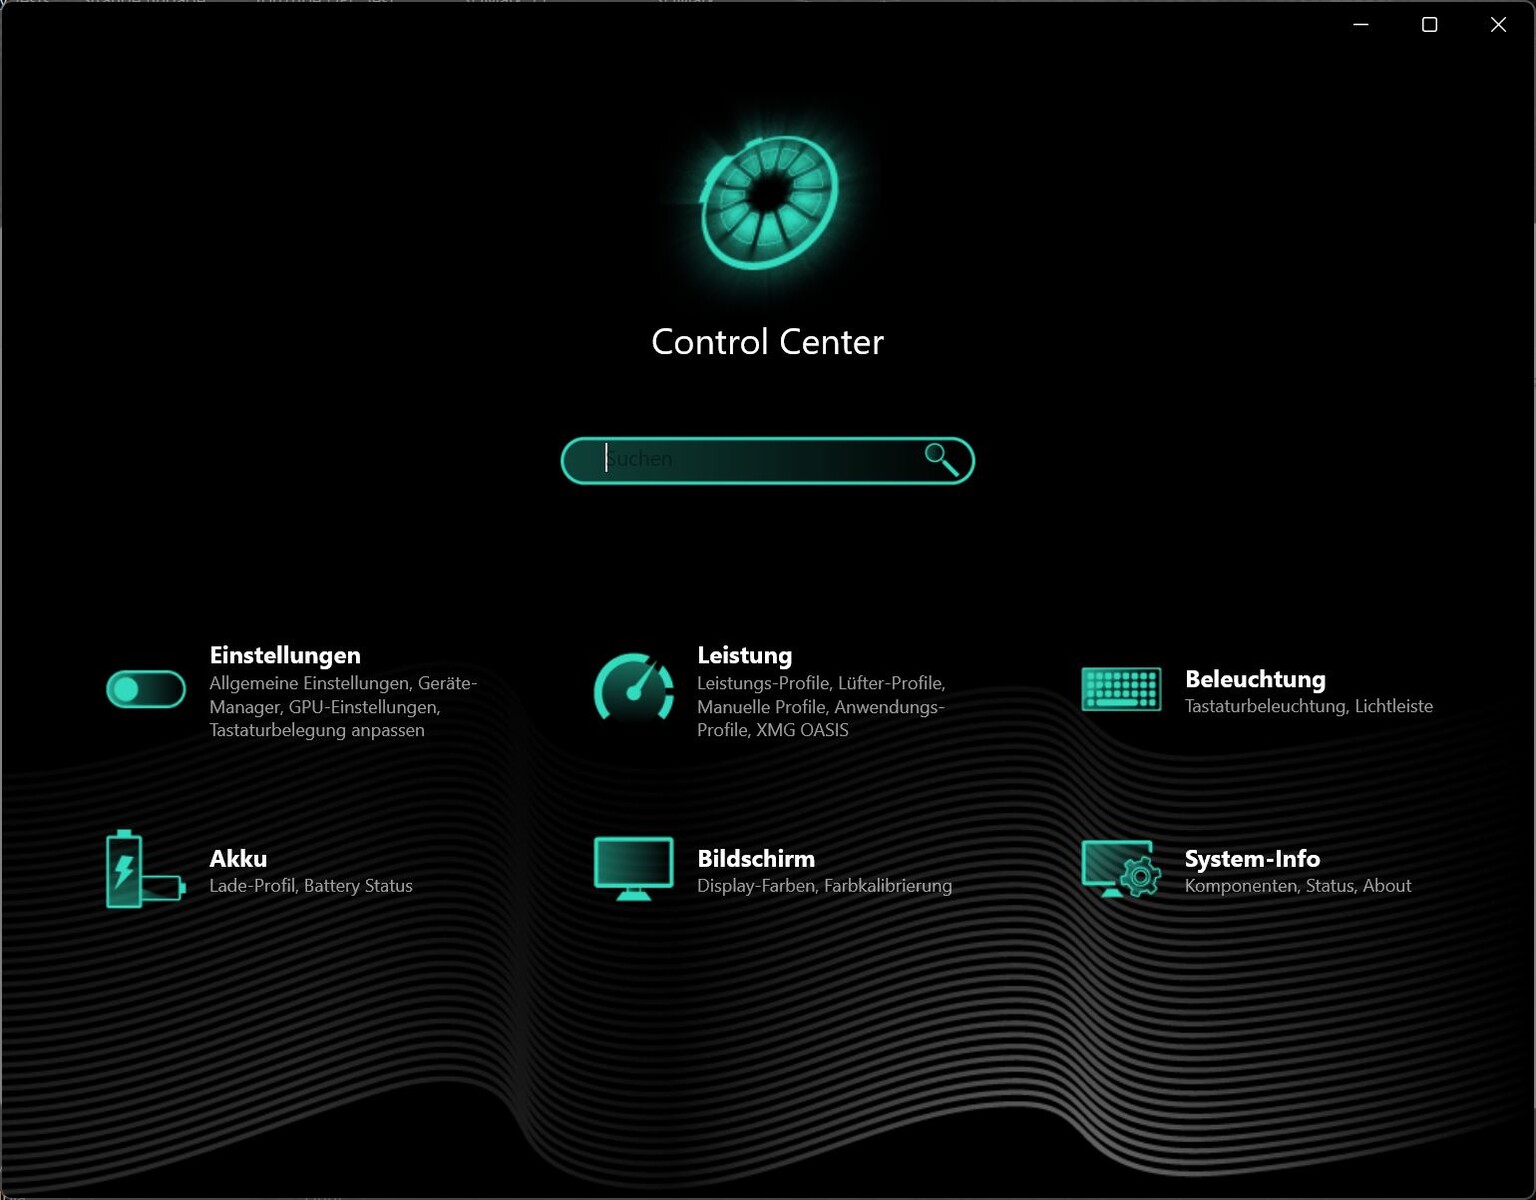
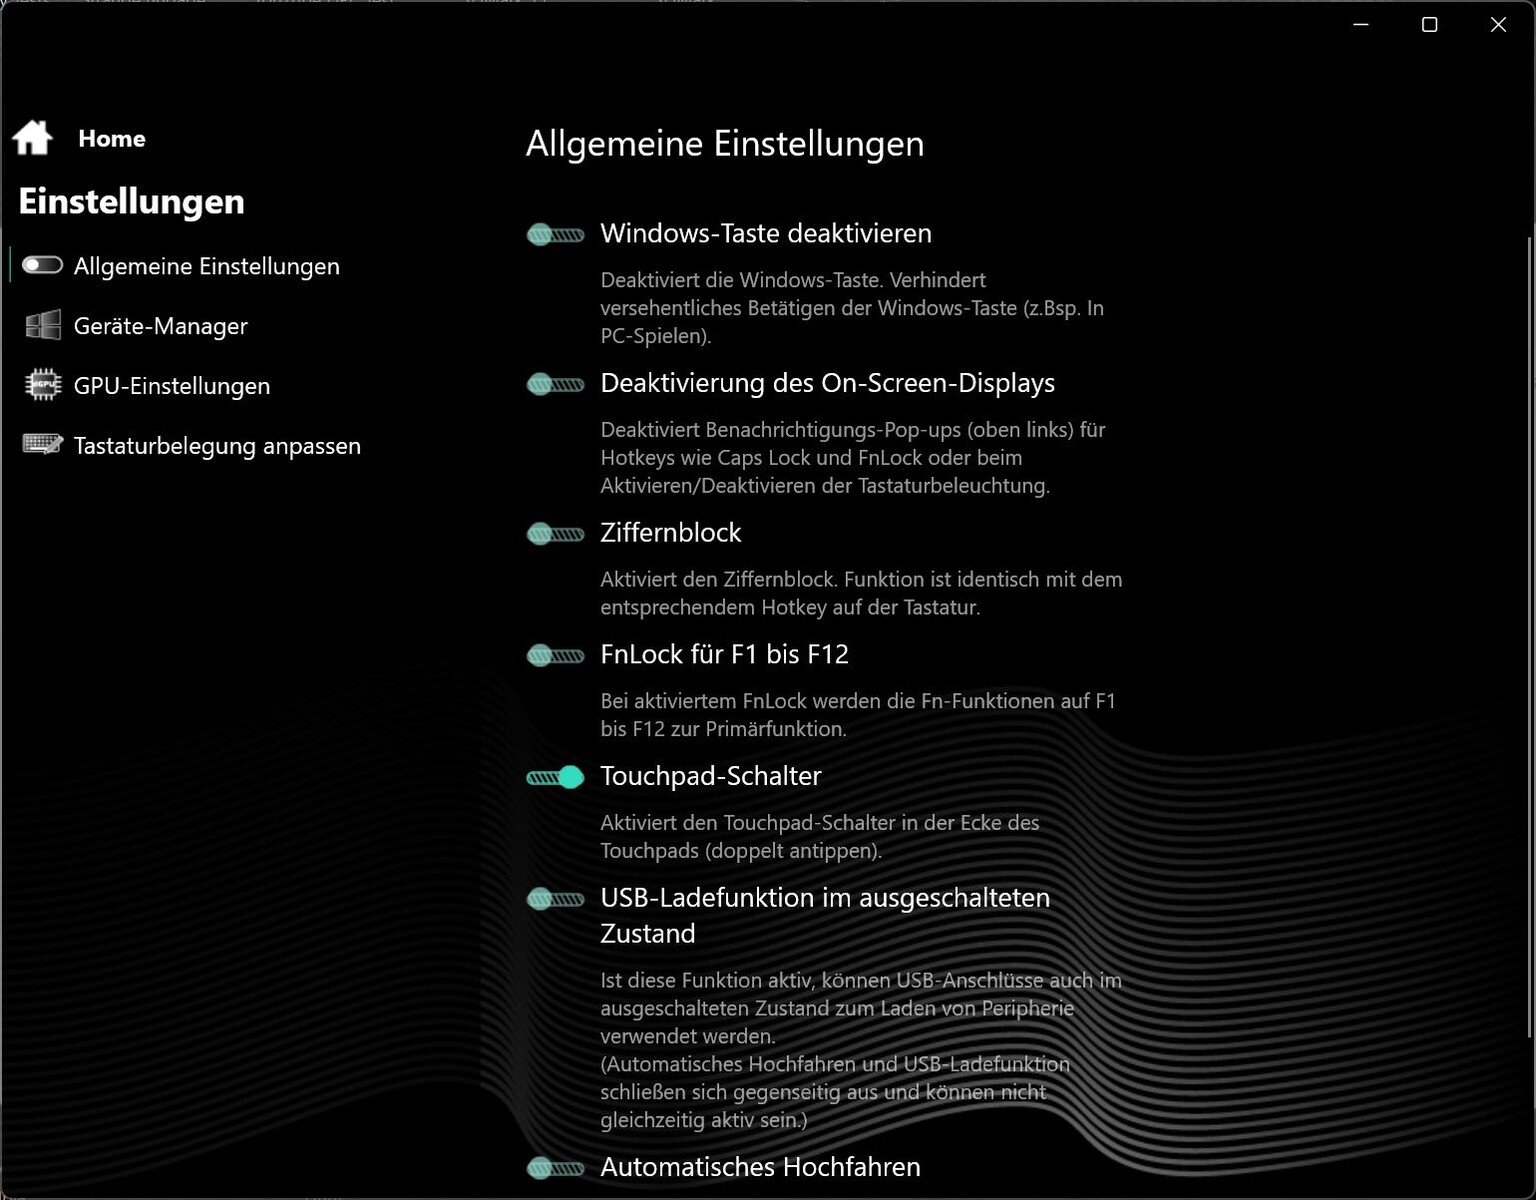
The Control Center software offers a few performance profiles (Balanced, Enthusiast and Overboost). We selected the most powerful mode (Overboost) to give us the best benchmark results, despite the fact that Schenker recommends the middle option, which is designed to be the best compromise between performance and noise levels.
Furthermore, the software allows users to manually adjust various parameters (e.g. Dynamic Boost) as well as offset values. We would nonetheless like to see a silent mode added to the options.

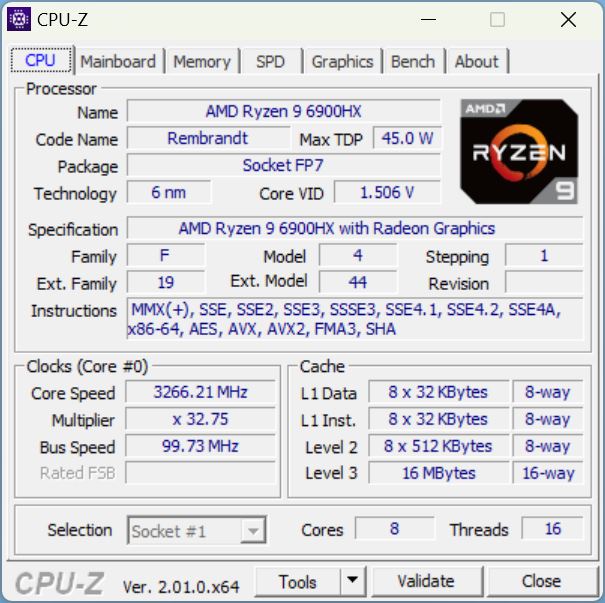
Processor

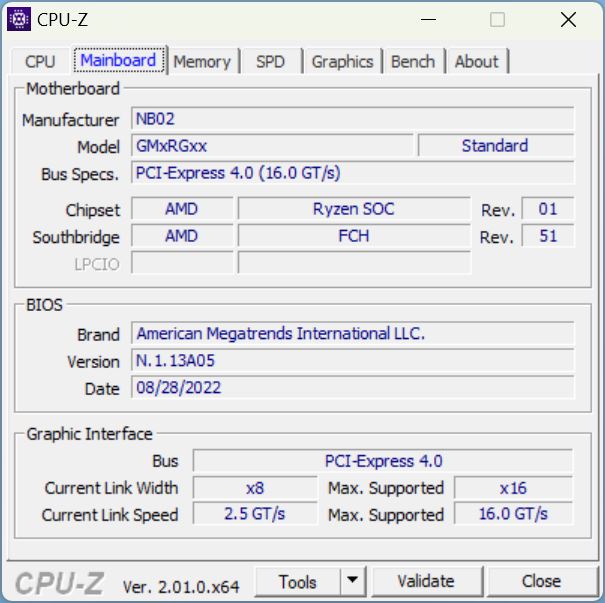
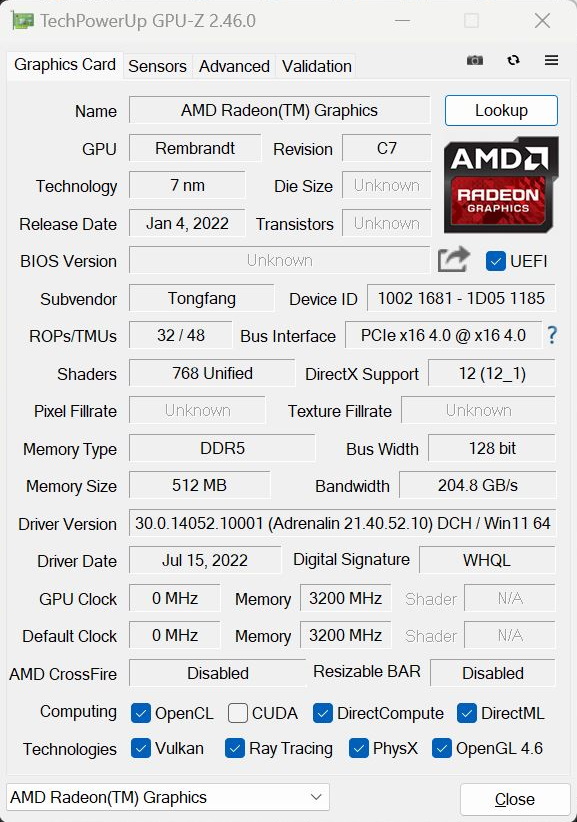
Unlike the Neo 15 E22, which features a Core i7-12700H, the Neo M22 is powered by an AMD Ryzen 9 6900HX. The Zen 3+ CPU has eight cores that can operate at up to 4.9 GHz and run 16 threads concurrently. The processor also houses a Radeon 680M integrated GPU.
When running Cinebench continuously in a loop, the Ryzen CPU delivered its usual consistent performance without any dips after the first few runs. However, the Core i7-12700H in the Intel-based Neo 15 is slightly faster. And this is naturally also true for the Core i9-12900H in the ROG Strix or even the Core i7-12800HX in the MSI GE67.
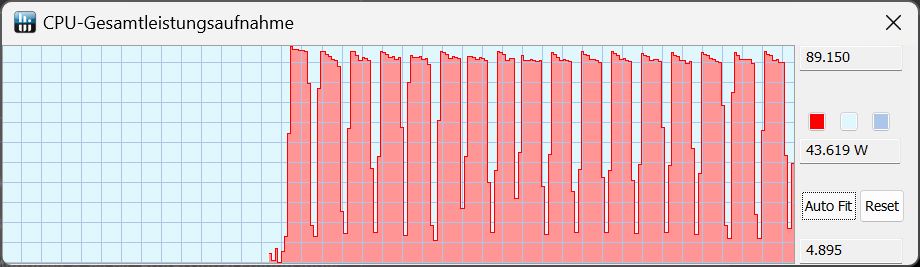
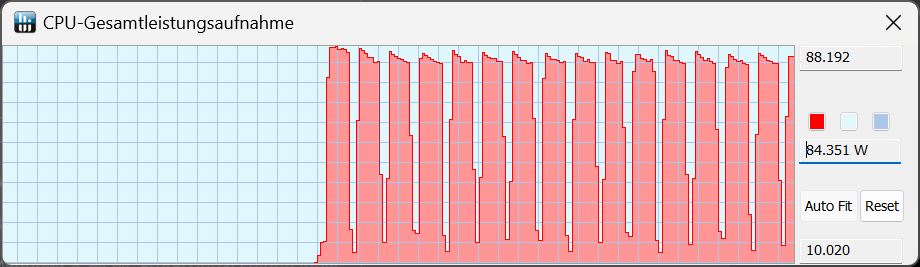
The TDP always remained under 90 watts. In Enthusiast mode, power usage decreased slightly to about 85 watts.
In contrast, there was a drop in performance when the laptop was on battery power, with the TDP to reducing to "just" 50 watts.
Cinebench R15 Multi Sustained Load
Cinebench R23: Multi Core | Single Core
Cinebench R20: CPU (Multi Core) | CPU (Single Core)
Cinebench R15: CPU Multi 64Bit | CPU Single 64Bit
Blender: v2.79 BMW27 CPU
7-Zip 18.03: 7z b 4 | 7z b 4 -mmt1
Geekbench 5.5: Multi-Core | Single-Core
HWBOT x265 Benchmark v2.2: 4k Preset
LibreOffice : 20 Documents To PDF
R Benchmark 2.5: Overall mean
| CPU Performance rating | |
| Average of class Gaming | |
| MSI GE67 HX 12UGS | |
| Asus ROG Strix Scar 15 G533ZW-LN106WS | |
| MSI Stealth GS66 12UGS | |
| Schenker XMG Neo 15 (i7-12700H, RTX 3080 Ti) | |
| Acer Nitro 5 AN515-58-72QR | |
| Schenker XMG Neo 15 (Ryzen 9 6900HX, RTX 3070 Ti) | |
| Average AMD Ryzen 9 6900HX | |
| Cinebench R23 / Multi Core | |
| Average of class Gaming (10488 - 40970, n=113, last 2 years) | |
| MSI GE67 HX 12UGS | |
| Asus ROG Strix Scar 15 G533ZW-LN106WS | |
| MSI Stealth GS66 12UGS | |
| Schenker XMG Neo 15 (i7-12700H, RTX 3080 Ti) | |
| Acer Nitro 5 AN515-58-72QR | |
| Schenker XMG Neo 15 (Ryzen 9 6900HX, RTX 3070 Ti) | |
| Average AMD Ryzen 9 6900HX (9709 - 15100, n=19) | |
| Cinebench R23 / Single Core | |
| Average of class Gaming (1166 - 2356, n=113, last 2 years) | |
| Asus ROG Strix Scar 15 G533ZW-LN106WS | |
| Acer Nitro 5 AN515-58-72QR | |
| MSI GE67 HX 12UGS | |
| Schenker XMG Neo 15 (i7-12700H, RTX 3080 Ti) | |
| MSI Stealth GS66 12UGS | |
| Schenker XMG Neo 15 (Ryzen 9 6900HX, RTX 3070 Ti) | |
| Average AMD Ryzen 9 6900HX (1516 - 1616, n=19) | |
| Cinebench R20 / CPU (Multi Core) | |
| Average of class Gaming (4029 - 16108, n=112, last 2 years) | |
| MSI GE67 HX 12UGS | |
| Asus ROG Strix Scar 15 G533ZW-LN106WS | |
| Schenker XMG Neo 15 (i7-12700H, RTX 3080 Ti) | |
| MSI Stealth GS66 12UGS | |
| Acer Nitro 5 AN515-58-72QR | |
| Schenker XMG Neo 15 (Ryzen 9 6900HX, RTX 3070 Ti) | |
| Average AMD Ryzen 9 6900HX (3742 - 5813, n=19) | |
| Cinebench R20 / CPU (Single Core) | |
| Average of class Gaming (442 - 895, n=112, last 2 years) | |
| Asus ROG Strix Scar 15 G533ZW-LN106WS | |
| Acer Nitro 5 AN515-58-72QR | |
| MSI Stealth GS66 12UGS | |
| Schenker XMG Neo 15 (i7-12700H, RTX 3080 Ti) | |
| MSI GE67 HX 12UGS | |
| Schenker XMG Neo 15 (Ryzen 9 6900HX, RTX 3070 Ti) | |
| Average AMD Ryzen 9 6900HX (595 - 631, n=19) | |
| Cinebench R15 / CPU Multi 64Bit | |
| Average of class Gaming (1578 - 6271, n=113, last 2 years) | |
| MSI GE67 HX 12UGS | |
| Asus ROG Strix Scar 15 G533ZW-LN106WS | |
| MSI Stealth GS66 12UGS | |
| Acer Nitro 5 AN515-58-72QR | |
| Schenker XMG Neo 15 (i7-12700H, RTX 3080 Ti) | |
| Schenker XMG Neo 15 (Ryzen 9 6900HX, RTX 3070 Ti) | |
| Average AMD Ryzen 9 6900HX (1588 - 2411, n=19) | |
| Cinebench R15 / CPU Single 64Bit | |
| Average of class Gaming (188.8 - 343, n=112, last 2 years) | |
| Asus ROG Strix Scar 15 G533ZW-LN106WS | |
| Acer Nitro 5 AN515-58-72QR | |
| Schenker XMG Neo 15 (i7-12700H, RTX 3080 Ti) | |
| MSI Stealth GS66 12UGS | |
| MSI GE67 HX 12UGS | |
| Schenker XMG Neo 15 (Ryzen 9 6900HX, RTX 3070 Ti) | |
| Average AMD Ryzen 9 6900HX (241 - 261, n=19) | |
| Blender / v2.79 BMW27 CPU | |
| Average AMD Ryzen 9 6900HX (212 - 357, n=21) | |
| Schenker XMG Neo 15 (Ryzen 9 6900HX, RTX 3070 Ti) | |
| Acer Nitro 5 AN515-58-72QR | |
| MSI Stealth GS66 12UGS | |
| Schenker XMG Neo 15 (i7-12700H, RTX 3080 Ti) | |
| Asus ROG Strix Scar 15 G533ZW-LN106WS | |
| Average of class Gaming (80 - 330, n=110, last 2 years) | |
| MSI GE67 HX 12UGS | |
| 7-Zip 18.03 / 7z b 4 | |
| Average of class Gaming (33491 - 148086, n=111, last 2 years) | |
| MSI GE67 HX 12UGS | |
| Schenker XMG Neo 15 (i7-12700H, RTX 3080 Ti) | |
| MSI Stealth GS66 12UGS | |
| Asus ROG Strix Scar 15 G533ZW-LN106WS | |
| Schenker XMG Neo 15 (Ryzen 9 6900HX, RTX 3070 Ti) | |
| Average AMD Ryzen 9 6900HX (49526 - 65336, n=20) | |
| Acer Nitro 5 AN515-58-72QR | |
| 7-Zip 18.03 / 7z b 4 -mmt1 | |
| Average of class Gaming (4199 - 7436, n=111, last 2 years) | |
| Asus ROG Strix Scar 15 G533ZW-LN106WS | |
| Schenker XMG Neo 15 (i7-12700H, RTX 3080 Ti) | |
| Schenker XMG Neo 15 (Ryzen 9 6900HX, RTX 3070 Ti) | |
| Acer Nitro 5 AN515-58-72QR | |
| MSI Stealth GS66 12UGS | |
| Average AMD Ryzen 9 6900HX (5090 - 6070, n=20) | |
| MSI GE67 HX 12UGS | |
| Geekbench 5.5 / Multi-Core | |
| Average of class Gaming (6460 - 27010, n=111, last 2 years) | |
| MSI GE67 HX 12UGS | |
| Asus ROG Strix Scar 15 G533ZW-LN106WS | |
| Schenker XMG Neo 15 (i7-12700H, RTX 3080 Ti) | |
| MSI Stealth GS66 12UGS | |
| Schenker XMG Neo 15 (Ryzen 9 6900HX, RTX 3070 Ti) | |
| Acer Nitro 5 AN515-58-72QR | |
| Average AMD Ryzen 9 6900HX (8313 - 10490, n=21) | |
| Geekbench 5.5 / Single-Core | |
| Average of class Gaming (986 - 2474, n=111, last 2 years) | |
| Asus ROG Strix Scar 15 G533ZW-LN106WS | |
| Acer Nitro 5 AN515-58-72QR | |
| MSI GE67 HX 12UGS | |
| Schenker XMG Neo 15 (i7-12700H, RTX 3080 Ti) | |
| MSI Stealth GS66 12UGS | |
| Schenker XMG Neo 15 (Ryzen 9 6900HX, RTX 3070 Ti) | |
| Average AMD Ryzen 9 6900HX (1523 - 1652, n=21) | |
| HWBOT x265 Benchmark v2.2 / 4k Preset | |
| Average of class Gaming (11.5 - 44.3, n=111, last 2 years) | |
| MSI GE67 HX 12UGS | |
| Asus ROG Strix Scar 15 G533ZW-LN106WS | |
| Schenker XMG Neo 15 (i7-12700H, RTX 3080 Ti) | |
| MSI Stealth GS66 12UGS | |
| Acer Nitro 5 AN515-58-72QR | |
| Schenker XMG Neo 15 (Ryzen 9 6900HX, RTX 3070 Ti) | |
| Average AMD Ryzen 9 6900HX (12.6 - 18.7, n=20) | |
| LibreOffice / 20 Documents To PDF | |
| Schenker XMG Neo 15 (Ryzen 9 6900HX, RTX 3070 Ti) | |
| Average AMD Ryzen 9 6900HX (44.8 - 81.7, n=20) | |
| Average of class Gaming (19 - 88.8, n=111, last 2 years) | |
| Schenker XMG Neo 15 (i7-12700H, RTX 3080 Ti) | |
| MSI GE67 HX 12UGS | |
| Acer Nitro 5 AN515-58-72QR | |
| MSI Stealth GS66 12UGS | |
| Asus ROG Strix Scar 15 G533ZW-LN106WS | |
| R Benchmark 2.5 / Overall mean | |
| Schenker XMG Neo 15 (Ryzen 9 6900HX, RTX 3070 Ti) | |
| Average AMD Ryzen 9 6900HX (0.4627 - 0.4974, n=20) | |
| MSI GE67 HX 12UGS | |
| Schenker XMG Neo 15 (i7-12700H, RTX 3080 Ti) | |
| Acer Nitro 5 AN515-58-72QR | |
| MSI Stealth GS66 12UGS | |
| Asus ROG Strix Scar 15 G533ZW-LN106WS | |
| Average of class Gaming (0.3439 - 0.759, n=112, last 2 years) | |
* ... smaller is better
AIDA64: FP32 Ray-Trace | FPU Julia | CPU SHA3 | CPU Queen | FPU SinJulia | FPU Mandel | CPU AES | CPU ZLib | FP64 Ray-Trace | CPU PhotoWorxx
| Performance rating | |
| Average of class Gaming | |
| Average AMD Ryzen 9 6900HX | |
| Schenker XMG Neo 15 (Ryzen 9 6900HX, RTX 3070 Ti) | |
| MSI GE67 HX 12UGS | |
| Asus ROG Strix Scar 15 G533ZW-LN106WS | |
| MSI Stealth GS66 12UGS | |
| Schenker XMG Neo 15 (i7-12700H, RTX 3080 Ti) | |
| Acer Nitro 5 AN515-58-72QR | |
| AIDA64 / FP32 Ray-Trace | |
| Average of class Gaming (10227 - 85542, n=110, last 2 years) | |
| Schenker XMG Neo 15 (Ryzen 9 6900HX, RTX 3070 Ti) | |
| Average AMD Ryzen 9 6900HX (10950 - 17963, n=20) | |
| MSI GE67 HX 12UGS | |
| Asus ROG Strix Scar 15 G533ZW-LN106WS | |
| Schenker XMG Neo 15 (i7-12700H, RTX 3080 Ti) | |
| MSI Stealth GS66 12UGS | |
| Acer Nitro 5 AN515-58-72QR | |
| AIDA64 / FPU Julia | |
| Average of class Gaming (51376 - 238426, n=110, last 2 years) | |
| Schenker XMG Neo 15 (Ryzen 9 6900HX, RTX 3070 Ti) | |
| Average AMD Ryzen 9 6900HX (71414 - 110797, n=20) | |
| MSI GE67 HX 12UGS | |
| Asus ROG Strix Scar 15 G533ZW-LN106WS | |
| Schenker XMG Neo 15 (i7-12700H, RTX 3080 Ti) | |
| MSI Stealth GS66 12UGS | |
| Acer Nitro 5 AN515-58-72QR | |
| AIDA64 / CPU SHA3 | |
| Average of class Gaming (2180 - 9817, n=110, last 2 years) | |
| MSI GE67 HX 12UGS | |
| Schenker XMG Neo 15 (Ryzen 9 6900HX, RTX 3070 Ti) | |
| Asus ROG Strix Scar 15 G533ZW-LN106WS | |
| Average AMD Ryzen 9 6900HX (2471 - 3804, n=20) | |
| Schenker XMG Neo 15 (i7-12700H, RTX 3080 Ti) | |
| MSI Stealth GS66 12UGS | |
| Acer Nitro 5 AN515-58-72QR | |
| AIDA64 / CPU Queen | |
| Average of class Gaming (49785 - 173351, n=101, last 2 years) | |
| Schenker XMG Neo 15 (Ryzen 9 6900HX, RTX 3070 Ti) | |
| Asus ROG Strix Scar 15 G533ZW-LN106WS | |
| Average AMD Ryzen 9 6900HX (84185 - 107544, n=20) | |
| Acer Nitro 5 AN515-58-72QR | |
| Schenker XMG Neo 15 (i7-12700H, RTX 3080 Ti) | |
| MSI Stealth GS66 12UGS | |
| MSI GE67 HX 12UGS | |
| AIDA64 / FPU SinJulia | |
| Average of class Gaming (4424 - 33636, n=110, last 2 years) | |
| Schenker XMG Neo 15 (Ryzen 9 6900HX, RTX 3070 Ti) | |
| Average AMD Ryzen 9 6900HX (10970 - 13205, n=20) | |
| MSI GE67 HX 12UGS | |
| Asus ROG Strix Scar 15 G533ZW-LN106WS | |
| Schenker XMG Neo 15 (i7-12700H, RTX 3080 Ti) | |
| Acer Nitro 5 AN515-58-72QR | |
| MSI Stealth GS66 12UGS | |
| AIDA64 / FPU Mandel | |
| Average of class Gaming (25115 - 128721, n=110, last 2 years) | |
| Schenker XMG Neo 15 (Ryzen 9 6900HX, RTX 3070 Ti) | |
| Average AMD Ryzen 9 6900HX (39164 - 61370, n=20) | |
| MSI GE67 HX 12UGS | |
| Asus ROG Strix Scar 15 G533ZW-LN106WS | |
| Schenker XMG Neo 15 (i7-12700H, RTX 3080 Ti) | |
| MSI Stealth GS66 12UGS | |
| Acer Nitro 5 AN515-58-72QR | |
| AIDA64 / CPU AES | |
| MSI GE67 HX 12UGS | |
| Average AMD Ryzen 9 6900HX (54613 - 142360, n=20) | |
| Average of class Gaming (39258 - 247074, n=110, last 2 years) | |
| Asus ROG Strix Scar 15 G533ZW-LN106WS | |
| MSI Stealth GS66 12UGS | |
| Schenker XMG Neo 15 (Ryzen 9 6900HX, RTX 3070 Ti) | |
| Schenker XMG Neo 15 (i7-12700H, RTX 3080 Ti) | |
| Acer Nitro 5 AN515-58-72QR | |
| AIDA64 / CPU ZLib | |
| Average of class Gaming (574 - 2531, n=110, last 2 years) | |
| MSI GE67 HX 12UGS | |
| Asus ROG Strix Scar 15 G533ZW-LN106WS | |
| Schenker XMG Neo 15 (i7-12700H, RTX 3080 Ti) | |
| Acer Nitro 5 AN515-58-72QR | |
| MSI Stealth GS66 12UGS | |
| Average AMD Ryzen 9 6900HX (578 - 911, n=20) | |
| Schenker XMG Neo 15 (Ryzen 9 6900HX, RTX 3070 Ti) | |
| AIDA64 / FP64 Ray-Trace | |
| Average of class Gaming (5509 - 45446, n=110, last 2 years) | |
| Schenker XMG Neo 15 (Ryzen 9 6900HX, RTX 3070 Ti) | |
| Average AMD Ryzen 9 6900HX (5798 - 9540, n=20) | |
| MSI GE67 HX 12UGS | |
| Asus ROG Strix Scar 15 G533ZW-LN106WS | |
| Schenker XMG Neo 15 (i7-12700H, RTX 3080 Ti) | |
| MSI Stealth GS66 12UGS | |
| Acer Nitro 5 AN515-58-72QR | |
| AIDA64 / CPU PhotoWorxx | |
| Average of class Gaming (12271 - 89891, n=110, last 2 years) | |
| Schenker XMG Neo 15 (i7-12700H, RTX 3080 Ti) | |
| MSI Stealth GS66 12UGS | |
| Asus ROG Strix Scar 15 G533ZW-LN106WS | |
| MSI GE67 HX 12UGS | |
| Schenker XMG Neo 15 (Ryzen 9 6900HX, RTX 3070 Ti) | |
| Average AMD Ryzen 9 6900HX (26873 - 30604, n=20) | |
| Acer Nitro 5 AN515-58-72QR | |
System performance
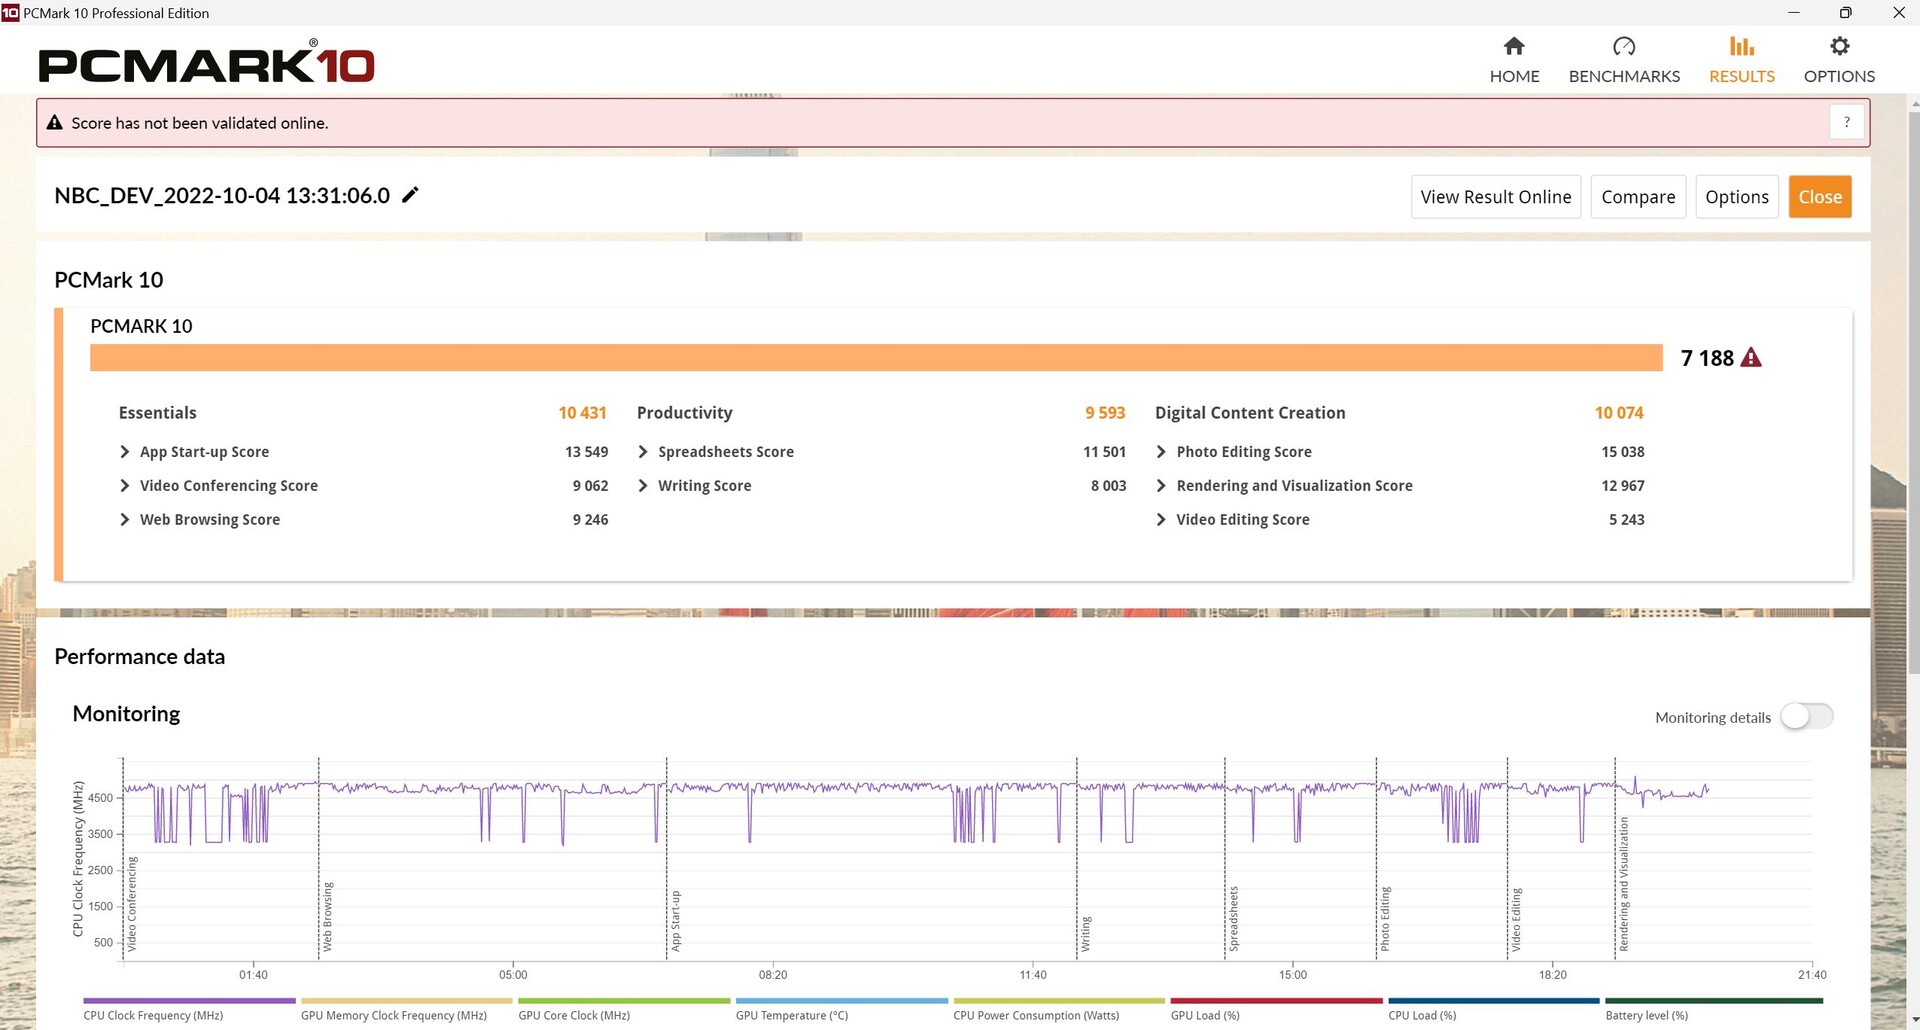
In PCMark 10, the Neo 15 delivered results that are more or less in line with our expectations. However, apart from the faltering Acer Nitro 5, all of the other competitors were faster, especially the MSI Raider GE67 and Asus ROG Strix.
CrossMark: Overall | Productivity | Creativity | Responsiveness
| PCMark 10 / Score | |
| Average of class Gaming (5828 - 11574, n=96, last 2 years) | |
| MSI GE67 HX 12UGS | |
| Asus ROG Strix Scar 15 G533ZW-LN106WS | |
| MSI Stealth GS66 12UGS | |
| Schenker XMG Neo 15 (i7-12700H, RTX 3080 Ti) | |
| Average AMD Ryzen 9 6900HX, NVIDIA GeForce RTX 3070 Ti Laptop GPU (7161 - 7332, n=3) | |
| Schenker XMG Neo 15 (Ryzen 9 6900HX, RTX 3070 Ti) | |
| Acer Nitro 5 AN515-58-72QR | |
| PCMark 10 / Essentials | |
| MSI GE67 HX 12UGS | |
| MSI Stealth GS66 12UGS | |
| Asus ROG Strix Scar 15 G533ZW-LN106WS | |
| Average AMD Ryzen 9 6900HX, NVIDIA GeForce RTX 3070 Ti Laptop GPU (10431 - 10934, n=3) | |
| Average of class Gaming (8810 - 12600, n=100, last 2 years) | |
| Schenker XMG Neo 15 (i7-12700H, RTX 3080 Ti) | |
| Schenker XMG Neo 15 (Ryzen 9 6900HX, RTX 3070 Ti) | |
| Acer Nitro 5 AN515-58-72QR | |
| PCMark 10 / Productivity | |
| Average of class Gaming (6845 - 18766, n=98, last 2 years) | |
| Asus ROG Strix Scar 15 G533ZW-LN106WS | |
| MSI GE67 HX 12UGS | |
| Schenker XMG Neo 15 (Ryzen 9 6900HX, RTX 3070 Ti) | |
| Average AMD Ryzen 9 6900HX, NVIDIA GeForce RTX 3070 Ti Laptop GPU (9043 - 9960, n=3) | |
| MSI Stealth GS66 12UGS | |
| Schenker XMG Neo 15 (i7-12700H, RTX 3080 Ti) | |
| Acer Nitro 5 AN515-58-72QR | |
| PCMark 10 / Digital Content Creation | |
| Average of class Gaming (7602 - 19657, n=98, last 2 years) | |
| MSI GE67 HX 12UGS | |
| Schenker XMG Neo 15 (i7-12700H, RTX 3080 Ti) | |
| Asus ROG Strix Scar 15 G533ZW-LN106WS | |
| MSI Stealth GS66 12UGS | |
| Acer Nitro 5 AN515-58-72QR | |
| Average AMD Ryzen 9 6900HX, NVIDIA GeForce RTX 3070 Ti Laptop GPU (9351 - 10817, n=3) | |
| Schenker XMG Neo 15 (Ryzen 9 6900HX, RTX 3070 Ti) | |
| CrossMark / Overall | |
| Asus ROG Strix Scar 15 G533ZW-LN106WS | |
| Average of class Gaming (1366 - 2409, n=98, last 2 years) | |
| MSI GE67 HX 12UGS | |
| Schenker XMG Neo 15 (i7-12700H, RTX 3080 Ti) | |
| Acer Nitro 5 AN515-58-72QR | |
| Average AMD Ryzen 9 6900HX, NVIDIA GeForce RTX 3070 Ti Laptop GPU (1624 - 1743, n=2) | |
| Schenker XMG Neo 15 (Ryzen 9 6900HX, RTX 3070 Ti) | |
| CrossMark / Productivity | |
| Asus ROG Strix Scar 15 G533ZW-LN106WS | |
| MSI GE67 HX 12UGS | |
| Average of class Gaming (1386 - 2254, n=98, last 2 years) | |
| Acer Nitro 5 AN515-58-72QR | |
| Schenker XMG Neo 15 (i7-12700H, RTX 3080 Ti) | |
| Average AMD Ryzen 9 6900HX, NVIDIA GeForce RTX 3070 Ti Laptop GPU (1591 - 1722, n=2) | |
| Schenker XMG Neo 15 (Ryzen 9 6900HX, RTX 3070 Ti) | |
| CrossMark / Creativity | |
| Average of class Gaming (1343 - 2729, n=98, last 2 years) | |
| Asus ROG Strix Scar 15 G533ZW-LN106WS | |
| MSI GE67 HX 12UGS | |
| Schenker XMG Neo 15 (i7-12700H, RTX 3080 Ti) | |
| Acer Nitro 5 AN515-58-72QR | |
| Average AMD Ryzen 9 6900HX, NVIDIA GeForce RTX 3070 Ti Laptop GPU (1749 - 1809, n=2) | |
| Schenker XMG Neo 15 (Ryzen 9 6900HX, RTX 3070 Ti) | |
| CrossMark / Responsiveness | |
| Asus ROG Strix Scar 15 G533ZW-LN106WS | |
| MSI GE67 HX 12UGS | |
| Average of class Gaming (1226 - 2334, n=98, last 2 years) | |
| Acer Nitro 5 AN515-58-72QR | |
| Schenker XMG Neo 15 (i7-12700H, RTX 3080 Ti) | |
| Average AMD Ryzen 9 6900HX, NVIDIA GeForce RTX 3070 Ti Laptop GPU (1382 - 1615, n=2) | |
| Schenker XMG Neo 15 (Ryzen 9 6900HX, RTX 3070 Ti) | |
| PCMark 10 Score | 7188 points | |
Help | ||
| AIDA64 / Memory Copy | |
| Average of class Gaming (21750 - 129946, n=110, last 2 years) | |
| Schenker XMG Neo 15 (i7-12700H, RTX 3080 Ti) | |
| MSI Stealth GS66 12UGS | |
| Asus ROG Strix Scar 15 G533ZW-LN106WS | |
| Average AMD Ryzen 9 6900HX (47938 - 53345, n=20) | |
| Schenker XMG Neo 15 (Ryzen 9 6900HX, RTX 3070 Ti) | |
| MSI GE67 HX 12UGS | |
| Acer Nitro 5 AN515-58-72QR | |
| AIDA64 / Memory Read | |
| Average of class Gaming (22956 - 118858, n=110, last 2 years) | |
| Schenker XMG Neo 15 (i7-12700H, RTX 3080 Ti) | |
| MSI Stealth GS66 12UGS | |
| Asus ROG Strix Scar 15 G533ZW-LN106WS | |
| MSI GE67 HX 12UGS | |
| Schenker XMG Neo 15 (Ryzen 9 6900HX, RTX 3070 Ti) | |
| Average AMD Ryzen 9 6900HX (43892 - 53321, n=20) | |
| Acer Nitro 5 AN515-58-72QR | |
| AIDA64 / Memory Write | |
| Average of class Gaming (22297 - 135096, n=110, last 2 years) | |
| MSI Stealth GS66 12UGS | |
| Schenker XMG Neo 15 (i7-12700H, RTX 3080 Ti) | |
| Asus ROG Strix Scar 15 G533ZW-LN106WS | |
| MSI GE67 HX 12UGS | |
| Schenker XMG Neo 15 (Ryzen 9 6900HX, RTX 3070 Ti) | |
| Average AMD Ryzen 9 6900HX (51085 - 57202, n=20) | |
| Acer Nitro 5 AN515-58-72QR | |
| AIDA64 / Memory Latency | |
| Average of class Gaming (75.3 - 259, n=110, last 2 years) | |
| Asus ROG Strix Scar 15 G533ZW-LN106WS | |
| MSI GE67 HX 12UGS | |
| MSI Stealth GS66 12UGS | |
| Schenker XMG Neo 15 (Ryzen 9 6900HX, RTX 3070 Ti) | |
| Average AMD Ryzen 9 6900HX (80.7 - 120.6, n=20) | |
| Acer Nitro 5 AN515-58-72QR | |
| Acer Nitro 5 AN515-58-72QR | |
* ... smaller is better
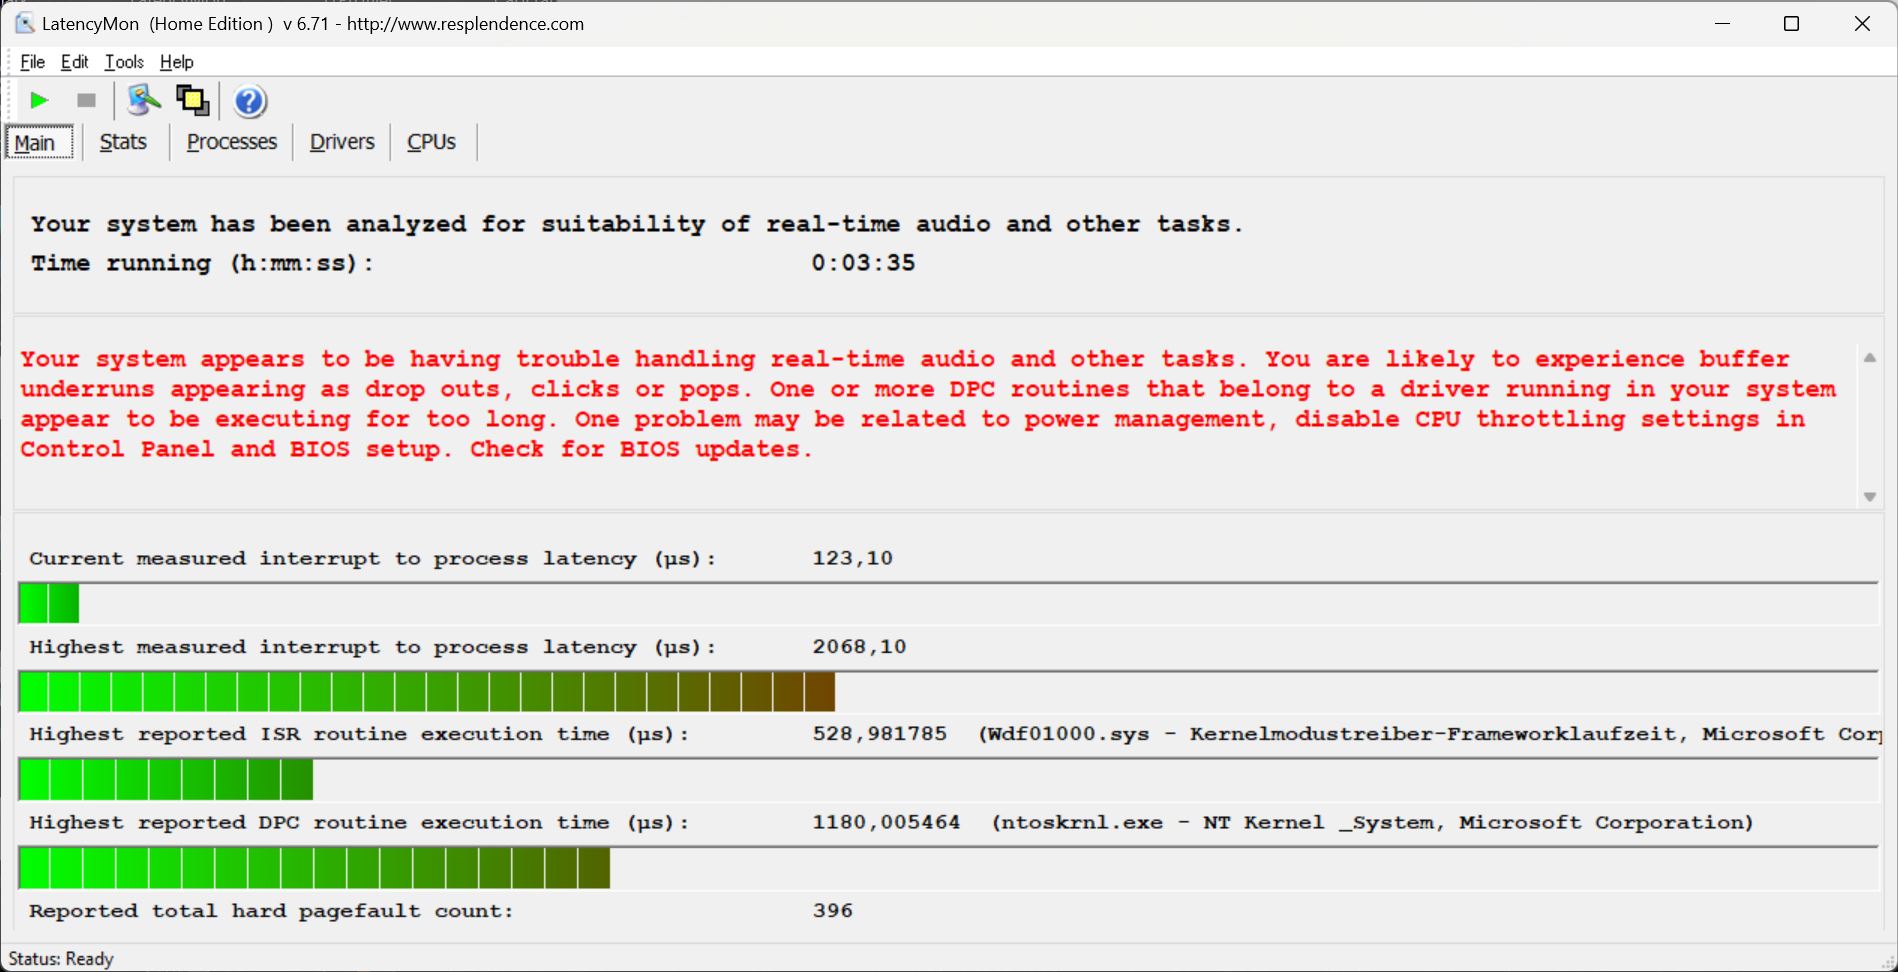
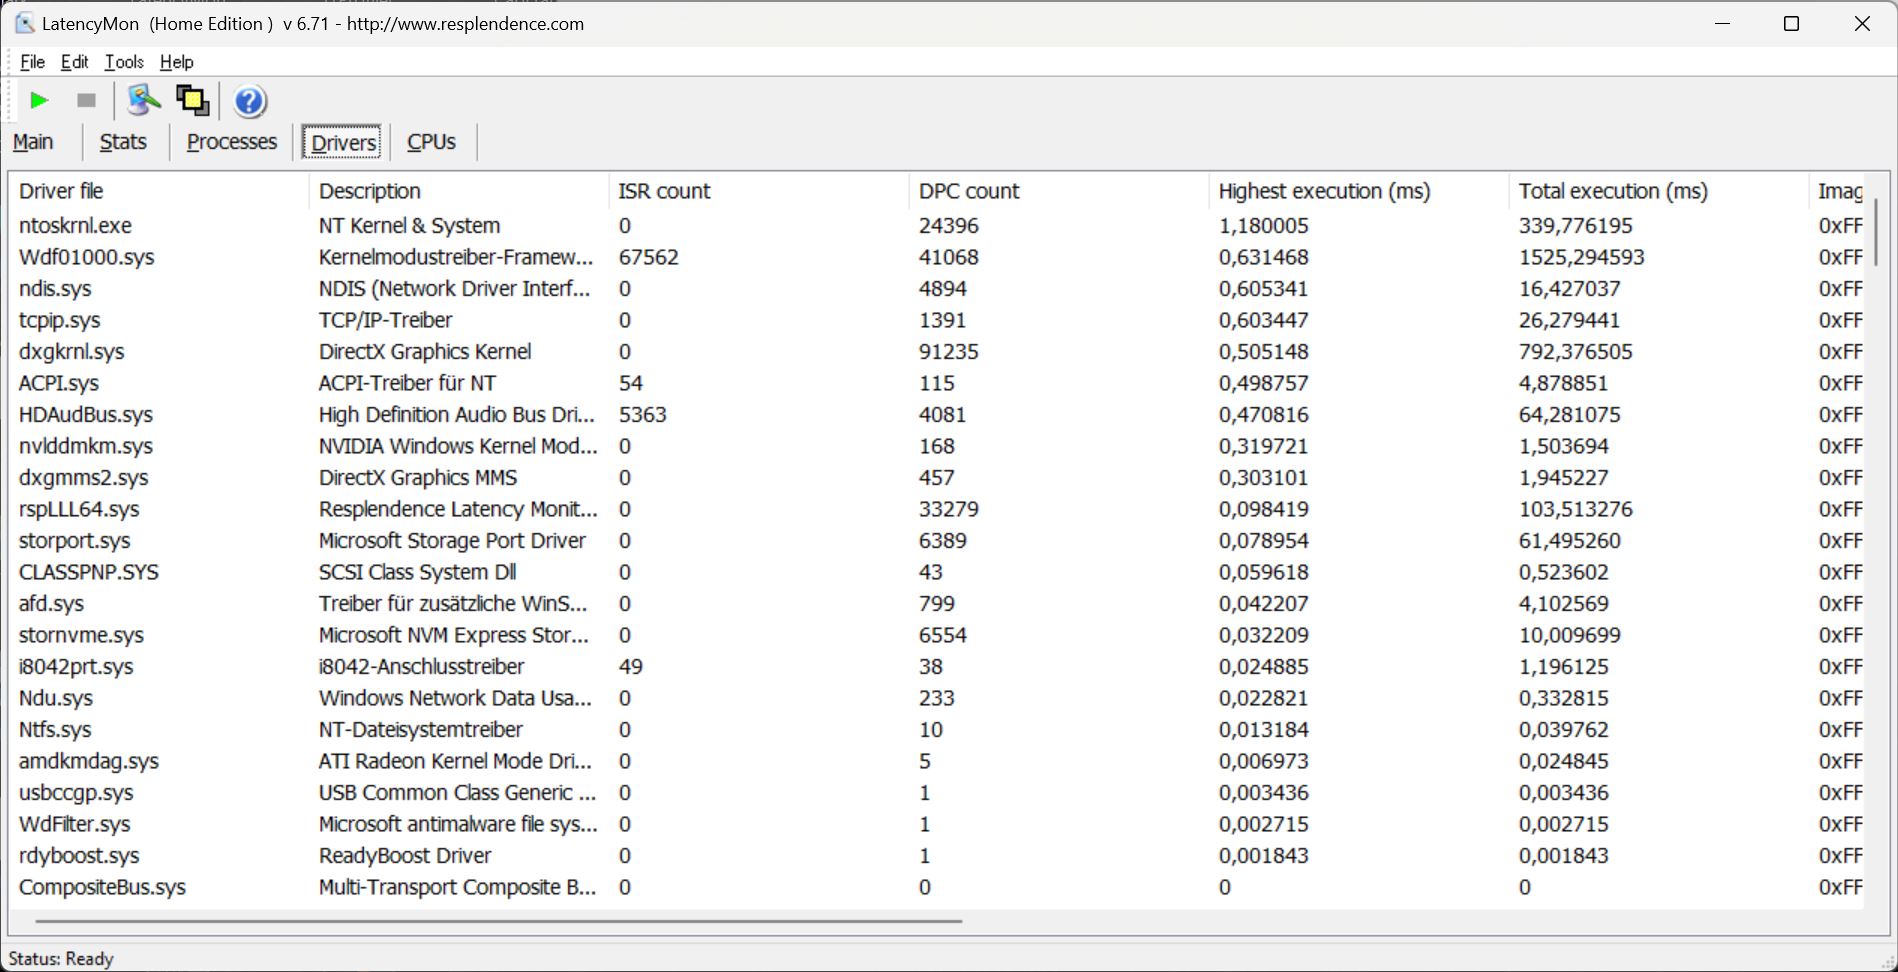
DPC latency
We encountered the first DPC issues after opening several browser tabs to our home page. The latency increased during playback of our 4K YouTube videos at 60 FPS. Kernel drivers are suspected to be the main cause of this problem.
But at least there weren't any dropped frames and the CPU/GPU usage is very low during playback of the test video.

| DPC Latencies / LatencyMon - interrupt to process latency (max), Web, Youtube, Prime95 | |
| Schenker XMG Neo 15 (i7-12700H, RTX 3080 Ti) | |
| MSI Stealth GS66 12UGS | |
| Schenker XMG Neo 15 (Ryzen 9 6900HX, RTX 3070 Ti) | |
| MSI GE67 HX 12UGS | |
| Asus ROG Strix Scar 15 G533ZW-LN106WS | |
| Acer Nitro 5 AN515-58-72QR | |
* ... smaller is better
Mass storage
The Neo 15 can be configured with countless SSD options. Our review unit features a 1 TB Samsung 980 Pro SSD, which is currently ranked 12th on our SSD/HDD benchmark list. The drive is able to maintain its great performance even over a prolonged period.

* ... smaller is better
Sustained Load Read: DiskSpd Read Loop, Queue Depth 8
Graphics card

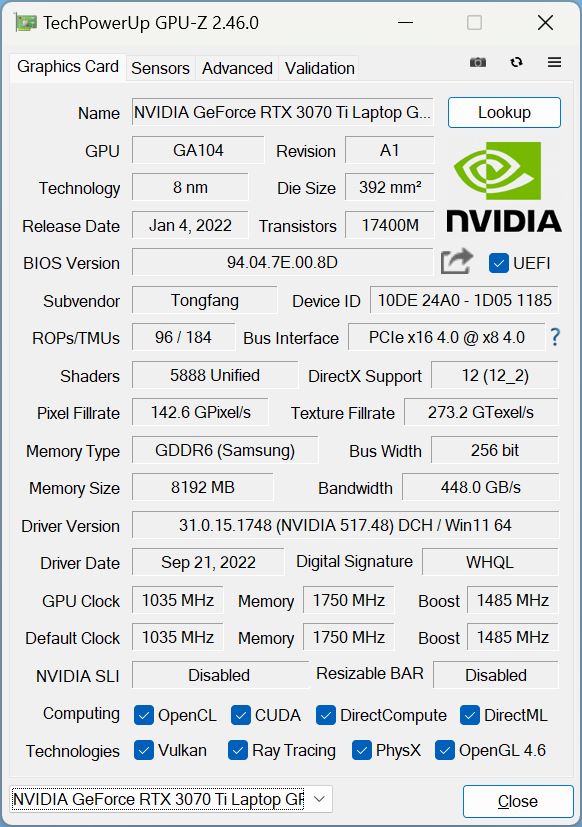
Our review unit has a GeForce RTX 3070 Ti with a TGP target of 150 watts including Dynamic Boost. These values can be manually adjusted in the Control Center. Alternatively, you can get the Neo 15 with various GPUs ranging from an RTX 3060 to RTX 3080 Ti.
Just as we had expected, the GPU in the review unit scored 5 to 10 per cent better than an average RTX 3070 Ti. The MSI GE67 is the only device in the comparison that is significantly faster. Although the Strix Scar often scored better than the Neo, the performance differentials are mostly negligible at roughly just 2 per cent.
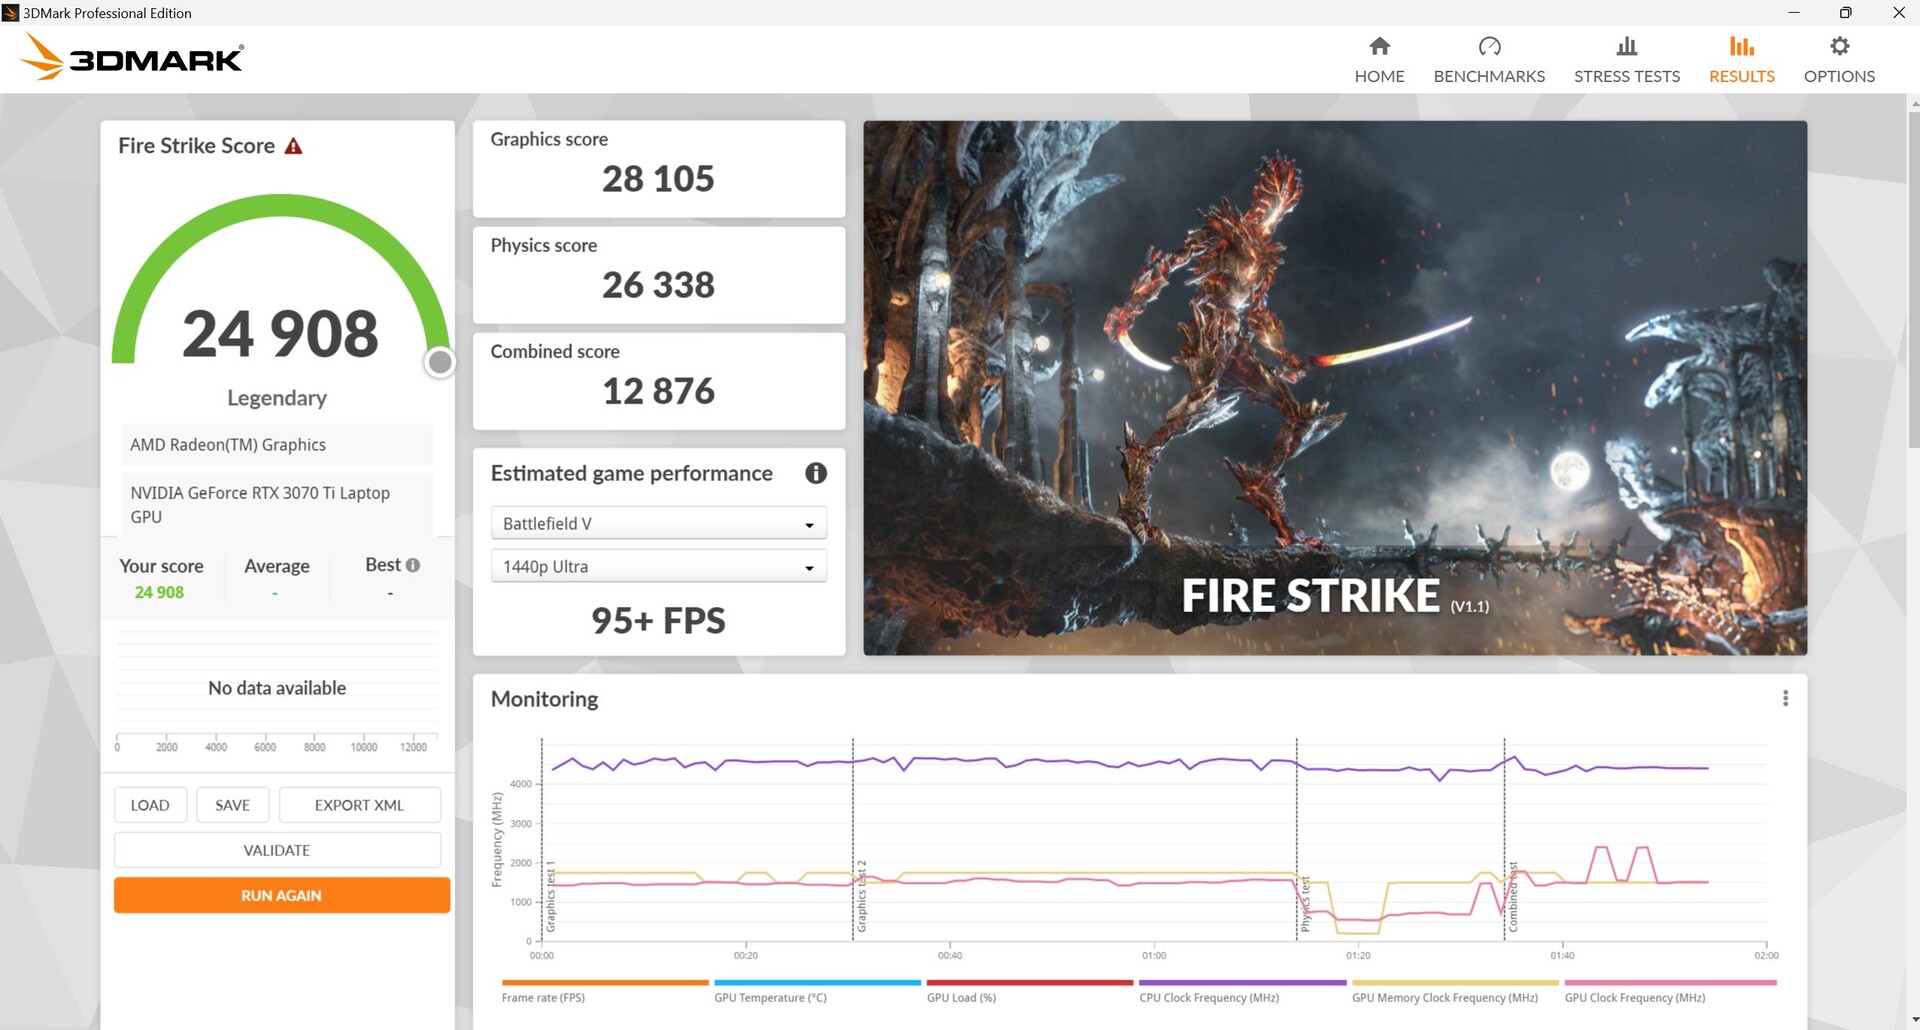
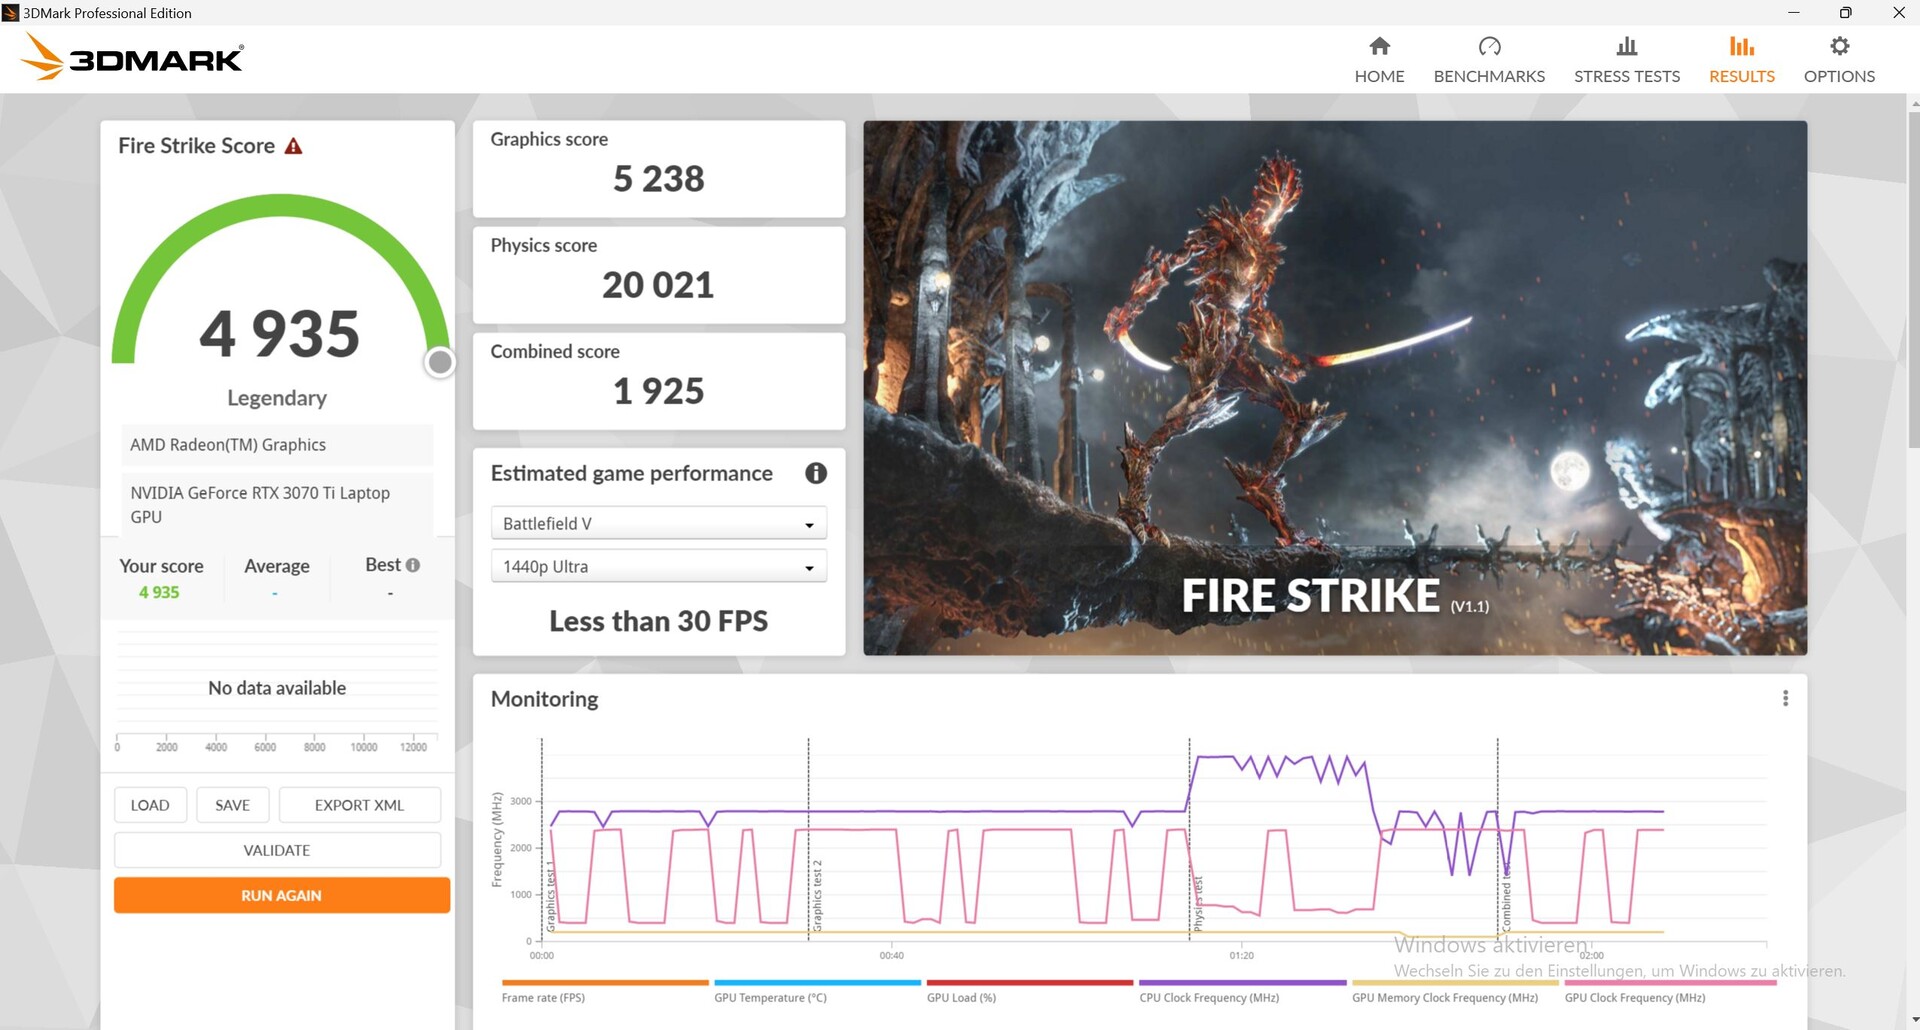
The Neo 15 loses a massive amount of 3D performance when running on battery. For instance, when we unplugged the laptop and ran Fire Strike again, the physics and graphics score were only 20,021 and 5,238 respectively, instead of the 26,338 and 28,105 obtained when the Neo was connected to the mains.
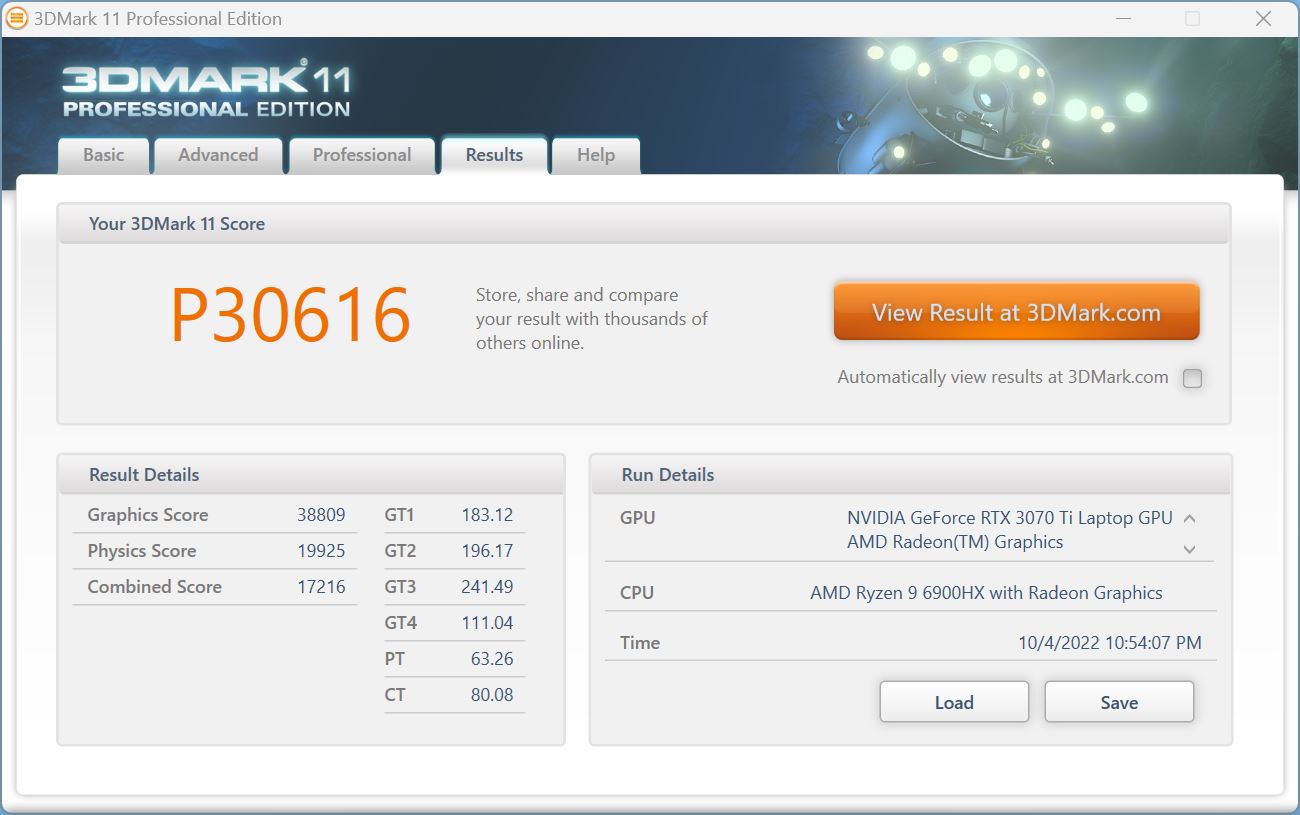
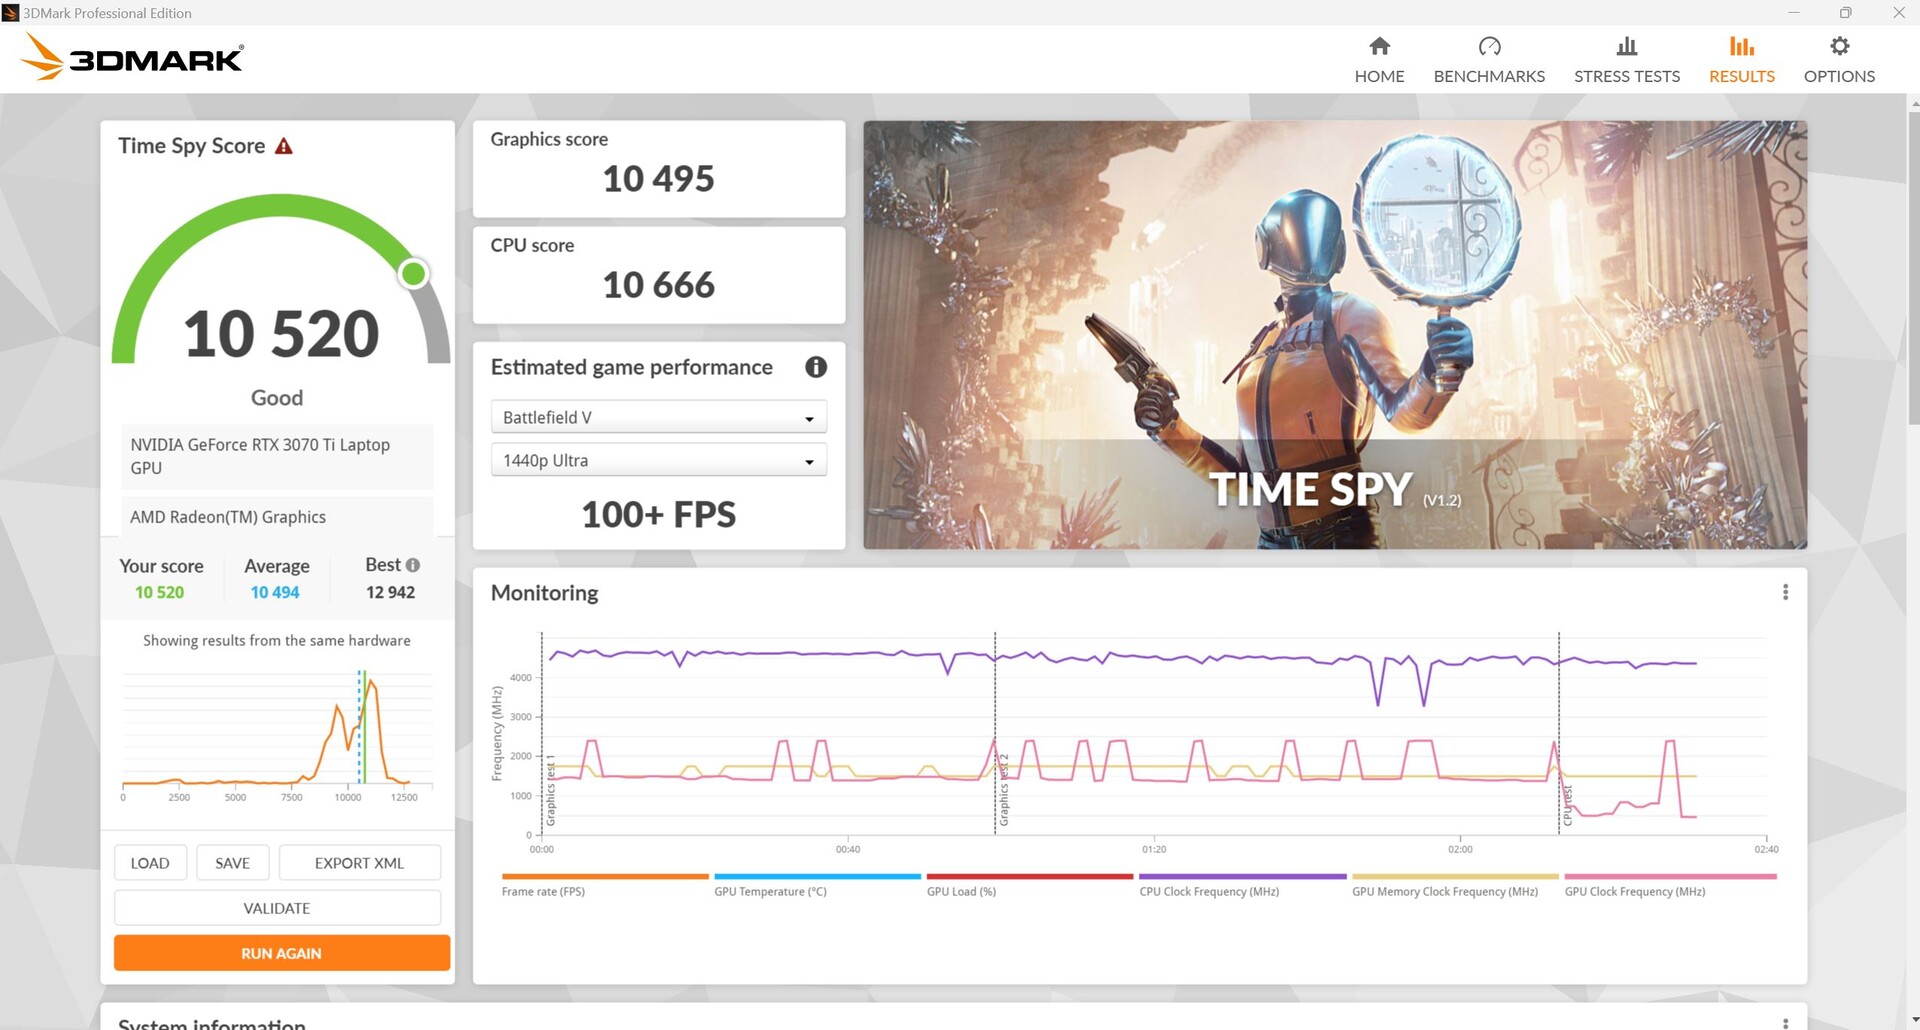

| 3DMark 11 Performance | 30616 points | |
| 3DMark Cloud Gate Standard Score | 57616 points | |
| 3DMark Fire Strike Score | 24908 points | |
| 3DMark Time Spy Score | 10520 points | |
Help | ||
* ... smaller is better
Gaming performance
The Neo 15 is essentially able to run all of the games tested smoothly, even at QHD resolution and max settings. The laptop only starts having some trouble when ray-tracing settings are set to high in games such as Dying Light 2 (35 FPS).
In the comparison, the gaming test results paint a similar picture to those from 3DMark: The GPU in the Neo largely (but not always) performed better than an average RTX 3070 Ti. That said, the Asus ROG Strix Scar and particularly the MSI GE67 were faster than the Neo.
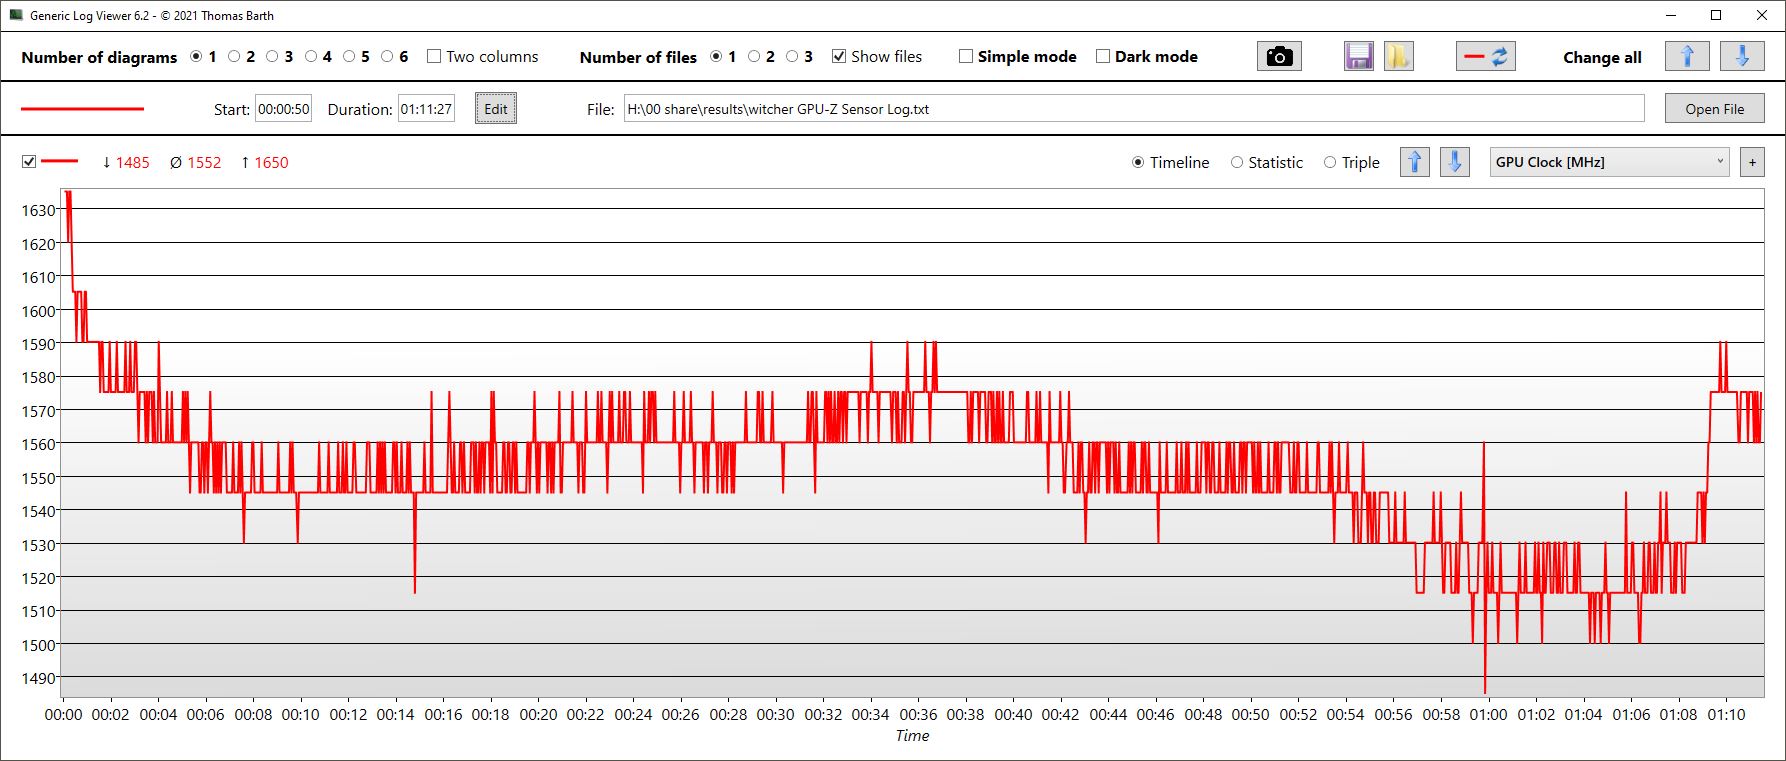
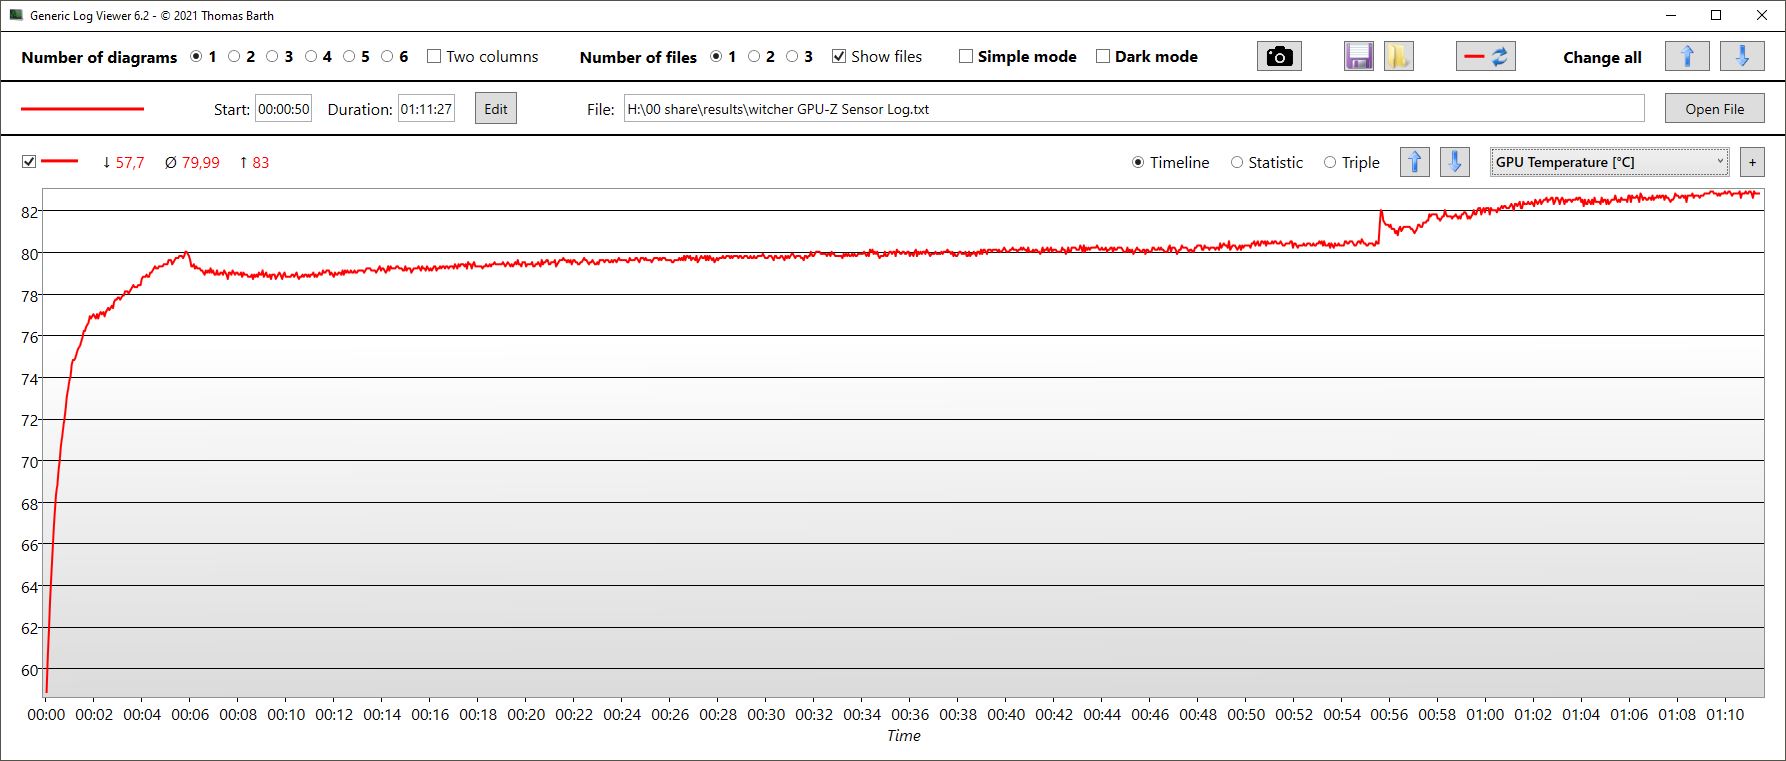
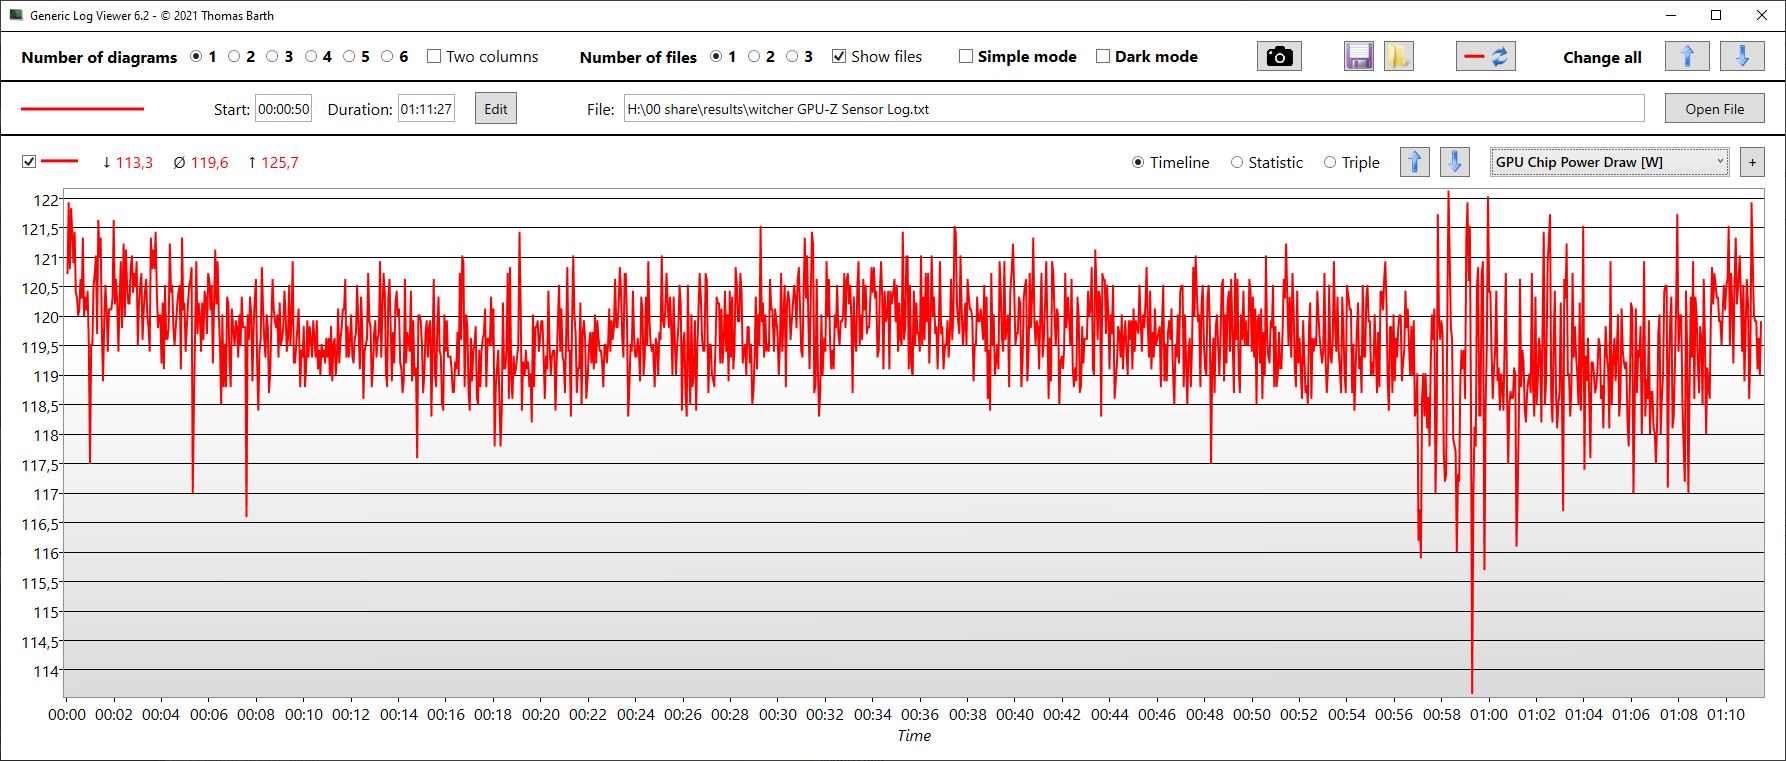
In the Witcher 3, frame rates were mostly stable. But we noticed that the GPU temperature (recorded in parallel) continued to increase over the test duration and didn't really stabilise. This indicates that the GPU may start experiencing thermal throttling after running demanding games for a long time, though this didn't happen during the one-hour test. The GPU power usage was 120 watts on average.
In the comparison, even the Intel-based Neo with an RTX 3080 Ti wasn't substantially faster with the same settings. Generally speaking, the extremely expensive GPU in the Intel-based Neo hardly justifies its high price with the performance gains it provides. Depending on the game and settings, it only had a lead of about 1 to 25 per cent.
Witcher 3 FPS chart
| low | med. | high | ultra | QHD | |
|---|---|---|---|---|---|
| GTA V (2015) | 176.6 | 170.3 | 156.2 | 97.6 | 93 |
| The Witcher 3 (2015) | 195 | 110 | |||
| Dota 2 Reborn (2015) | 135.9 | 123.1 | 116.3 | 114.1 | |
| X-Plane 11.11 (2018) | 109.5 | 94.9 | 77.6 | ||
| Far Cry 5 (2018) | 119 | 110 | 102 | ||
| Strange Brigade (2018) | 305 | 224 | 206 | 189 | 143 |
| Dying Light 2 (2022) | 82.5 | 59 |
Emissions - Cooler than the Intel Neo at idle
Noise emissions
Although the laptop doesn't have a silent mode, the fans inside are often not spinning at idle. It is interesting that, despite having a weaker GPU, the AMD-based Neo doesn't stay as quiet under load as its Intel-based counterpart. Amongst the competitors, only the Acer Nitro 5 is slightly quieter. But then again, it is also less performant than the Neo.
When the fans are inactive, there is a soft but high-pitched beeping noise coming from the chassis. Whilst this noise is not audible when the fans are running, it is still annoying in a quiet environment.
Noise level
| Idle |
| 23 / 25.82 / 27.3 dB(A) |
| Load |
| 42.7 / 56 dB(A) |
 | ||
30 dB silent 40 dB(A) audible 50 dB(A) loud |
||
min: | ||
| Schenker XMG Neo 15 (Ryzen 9 6900HX, RTX 3070 Ti) GeForce RTX 3070 Ti Laptop GPU, R9 6900HX, Samsung SSD 980 Pro 1TB MZ-V8P1T0BW | Schenker XMG Neo 15 (i7-12700H, RTX 3080 Ti) GeForce RTX 3080 Ti Laptop GPU, i7-12700H, Samsung SSD 980 Pro 1TB MZ-V8P1T0BW | MSI GE67 HX 12UGS GeForce RTX 3070 Ti Laptop GPU, i7-12800HX, Samsung PM9A1 MZVL21T0HCLR | Asus ROG Strix Scar 15 G533ZW-LN106WS GeForce RTX 3070 Ti Laptop GPU, i9-12900H, Samsung PM9A1 MZVL22T0HBLB | Acer Nitro 5 AN515-58-72QR GeForce RTX 3070 Ti Laptop GPU, i7-12700H, Samsung PM9A1 MZVL21T0HCLR | MSI Stealth GS66 12UGS GeForce RTX 3070 Ti Laptop GPU, i7-12700H, WDC PC SN810 1TB | |
|---|---|---|---|---|---|---|
| Noise | -1% | 3% | -30% | -8% | -9% | |
| off / environment * (dB) | 23 | 23 -0% | 22.7 1% | 26.86 -17% | 26 -13% | 24 -4% |
| Idle Minimum * (dB) | 23 | 23 -0% | 22.9 -0% | 39.07 -70% | 26 -13% | 31 -35% |
| Idle Average * (dB) | 25.82 | 26.39 -2% | 22.9 11% | 39.07 -51% | 29 -12% | 32 -24% |
| Idle Maximum * (dB) | 27.3 | 26.39 3% | 22.9 16% | 39.07 -43% | 33 -21% | 35 -28% |
| Load Average * (dB) | 42.7 | 45.52 -7% | 44.4 -4% | 53.34 -25% | 47 -10% | 48 -12% |
| Witcher 3 ultra * (dB) | 56 | 55.89 -0% | 55.7 1% | 56.6 -1% | 53 5% | 43 23% |
| Load Maximum * (dB) | 56 | 55.89 -0% | 57.4 -2% | 56.6 -1% | 53 5% | 48 14% |
* ... smaller is better
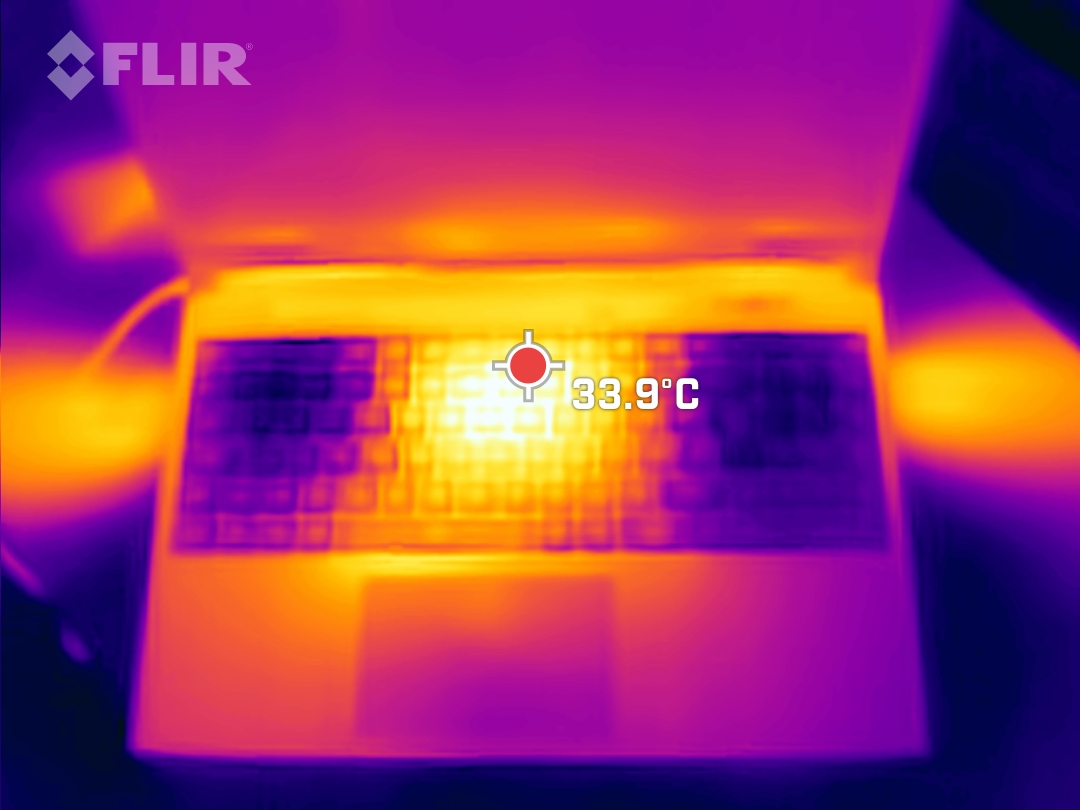
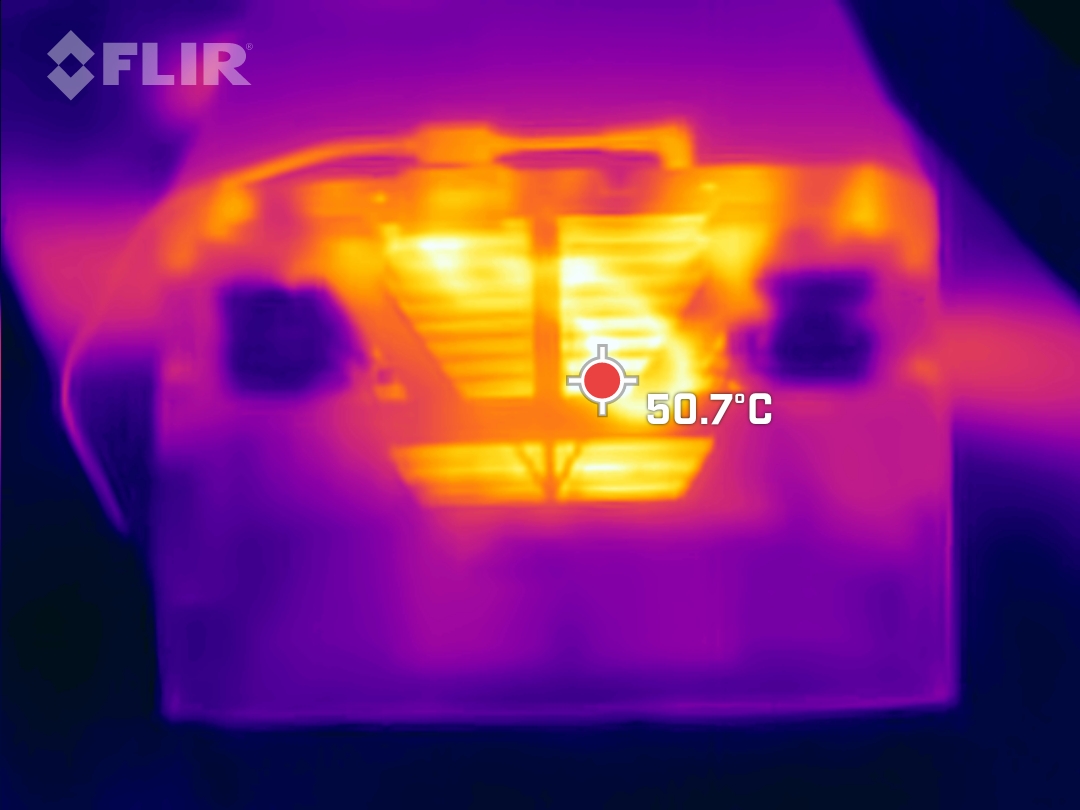
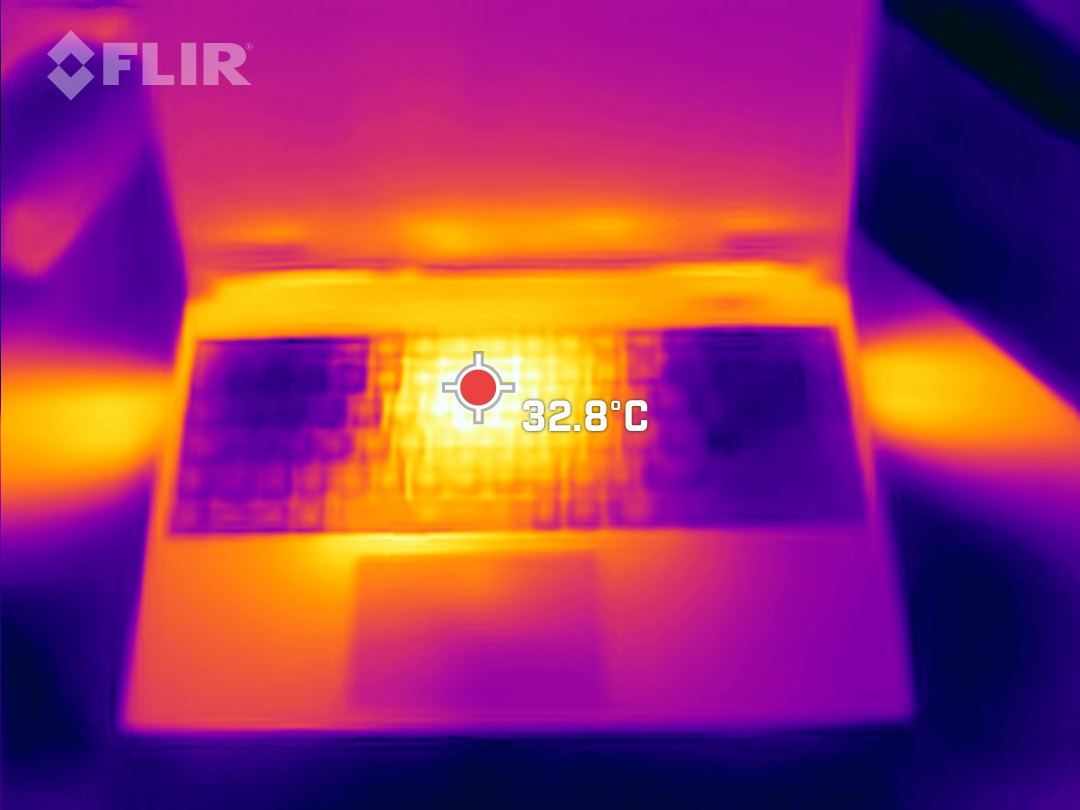
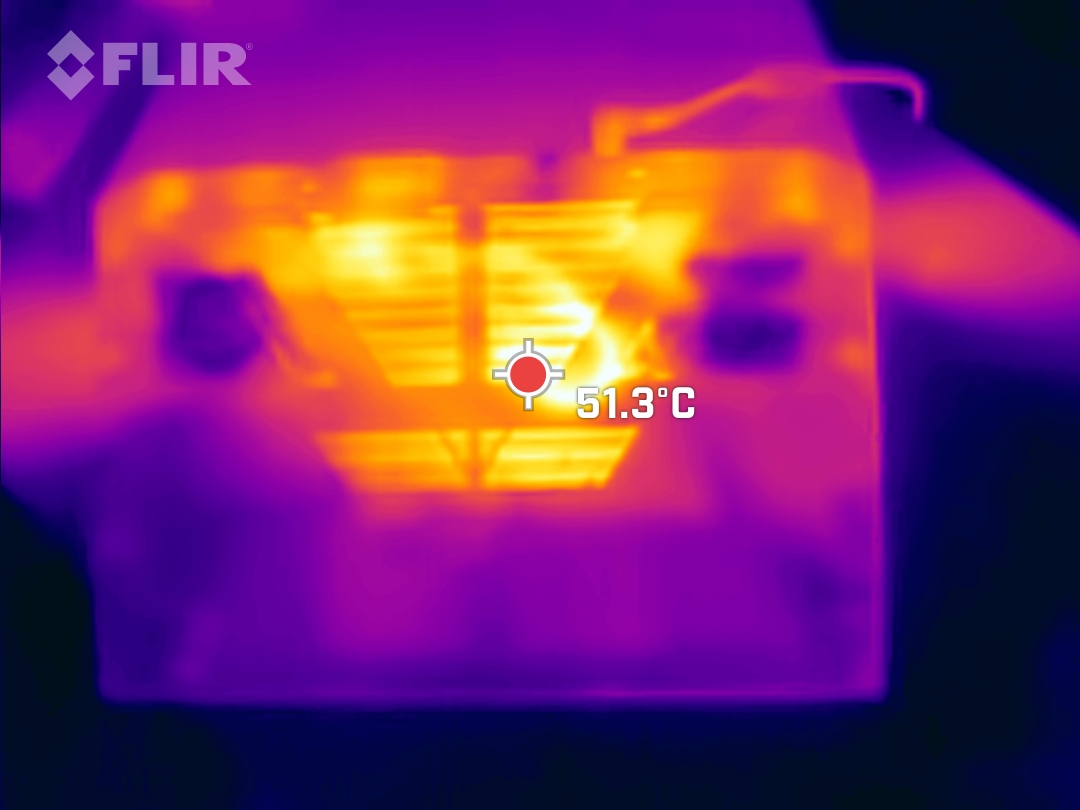
Temperature
At idle, case temperatures remain more comfortable than on the Intel-based Neo with RTX 3080 Ti. However, this advantage pretty much disappears under load. The other devices in the comparison group can get about as warm as the Neo. But of all things, it is the highly performant but slightly more bulky MSI GE67 that runs cooler than the other gaming laptops.
The palm rests don't ever become unpleasantly warm, and the same goes for the WASD keys. The heat is mostly concentrated in the middle and in the area close to the display. The thin, plastic bottom panel has many air vents, causing it to be considerably warmer than the keyboard deck.
(±) The maximum temperature on the upper side is 41 °C / 106 F, compared to the average of 40.4 °C / 105 F, ranging from 21.2 to 68.8 °C for the class Gaming.
(-) The bottom heats up to a maximum of 57 °C / 135 F, compared to the average of 43.2 °C / 110 F
(+) In idle usage, the average temperature for the upper side is 27.1 °C / 81 F, compared to the device average of 33.9 °C / 93 F.
(±) Playing The Witcher 3, the average temperature for the upper side is 33.3 °C / 92 F, compared to the device average of 33.9 °C / 93 F.
(+) The palmrests and touchpad are cooler than skin temperature with a maximum of 31 °C / 87.8 F and are therefore cool to the touch.
(-) The average temperature of the palmrest area of similar devices was 28.8 °C / 83.8 F (-2.2 °C / -4 F).
| Schenker XMG Neo 15 (Ryzen 9 6900HX, RTX 3070 Ti) AMD Ryzen 9 6900HX, NVIDIA GeForce RTX 3070 Ti Laptop GPU | Schenker XMG Neo 15 (i7-12700H, RTX 3080 Ti) Intel Core i7-12700H, NVIDIA GeForce RTX 3080 Ti Laptop GPU | MSI GE67 HX 12UGS Intel Core i7-12800HX, NVIDIA GeForce RTX 3070 Ti Laptop GPU | Asus ROG Strix Scar 15 G533ZW-LN106WS Intel Core i9-12900H, NVIDIA GeForce RTX 3070 Ti Laptop GPU | Acer Nitro 5 AN515-58-72QR Intel Core i7-12700H, NVIDIA GeForce RTX 3070 Ti Laptop GPU | MSI Stealth GS66 12UGS Intel Core i7-12700H, NVIDIA GeForce RTX 3070 Ti Laptop GPU | |
|---|---|---|---|---|---|---|
| Heat | -20% | 11% | -14% | -9% | -5% | |
| Maximum Upper Side * (°C) | 41 | 44 -7% | 34.4 16% | 42.6 -4% | 48 -17% | 54 -32% |
| Maximum Bottom * (°C) | 57 | 56 2% | 42 26% | 50.2 12% | 51 11% | 59 -4% |
| Idle Upper Side * (°C) | 28 | 38 -36% | 24 14% | 36.2 -29% | 34 -21% | 26 7% |
| Idle Bottom * (°C) | 30 | 41 -37% | 33.2 -11% | 40.2 -34% | 33 -10% | 27 10% |
* ... smaller is better
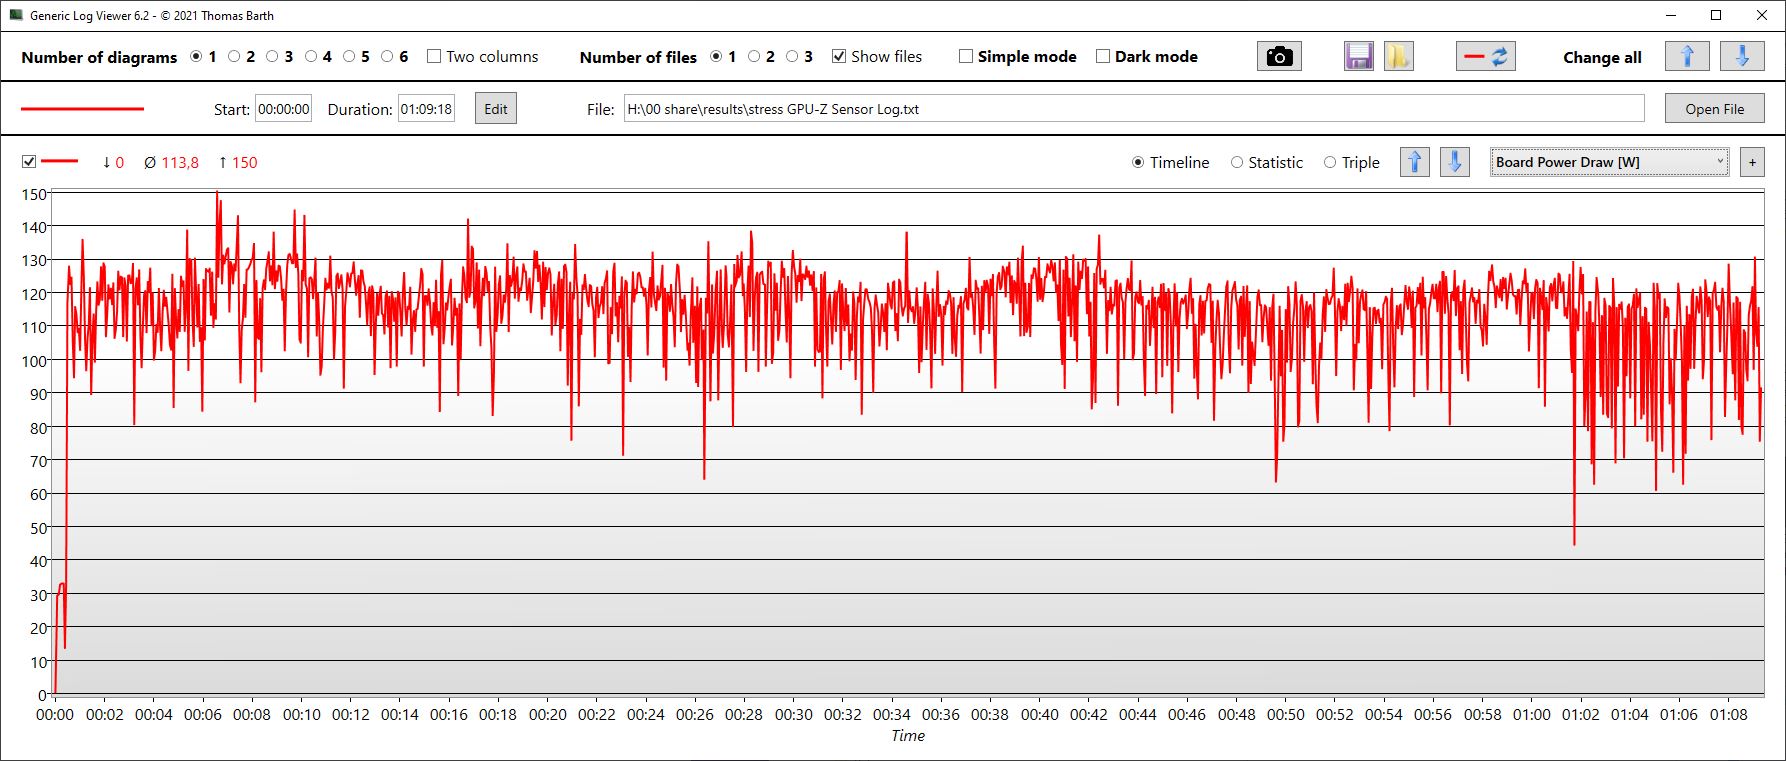
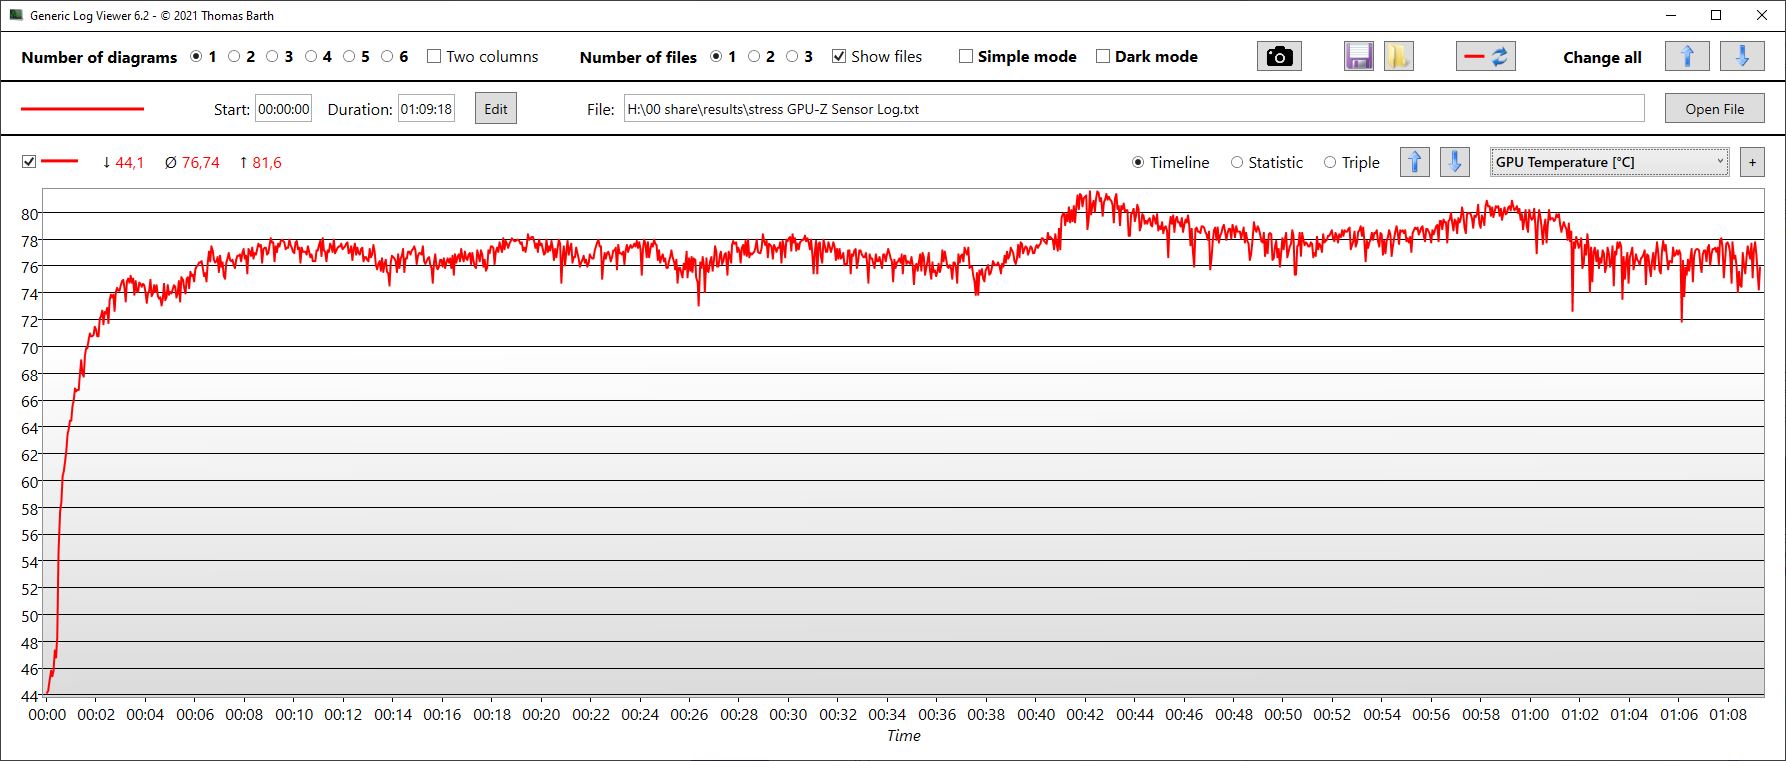
Stress test
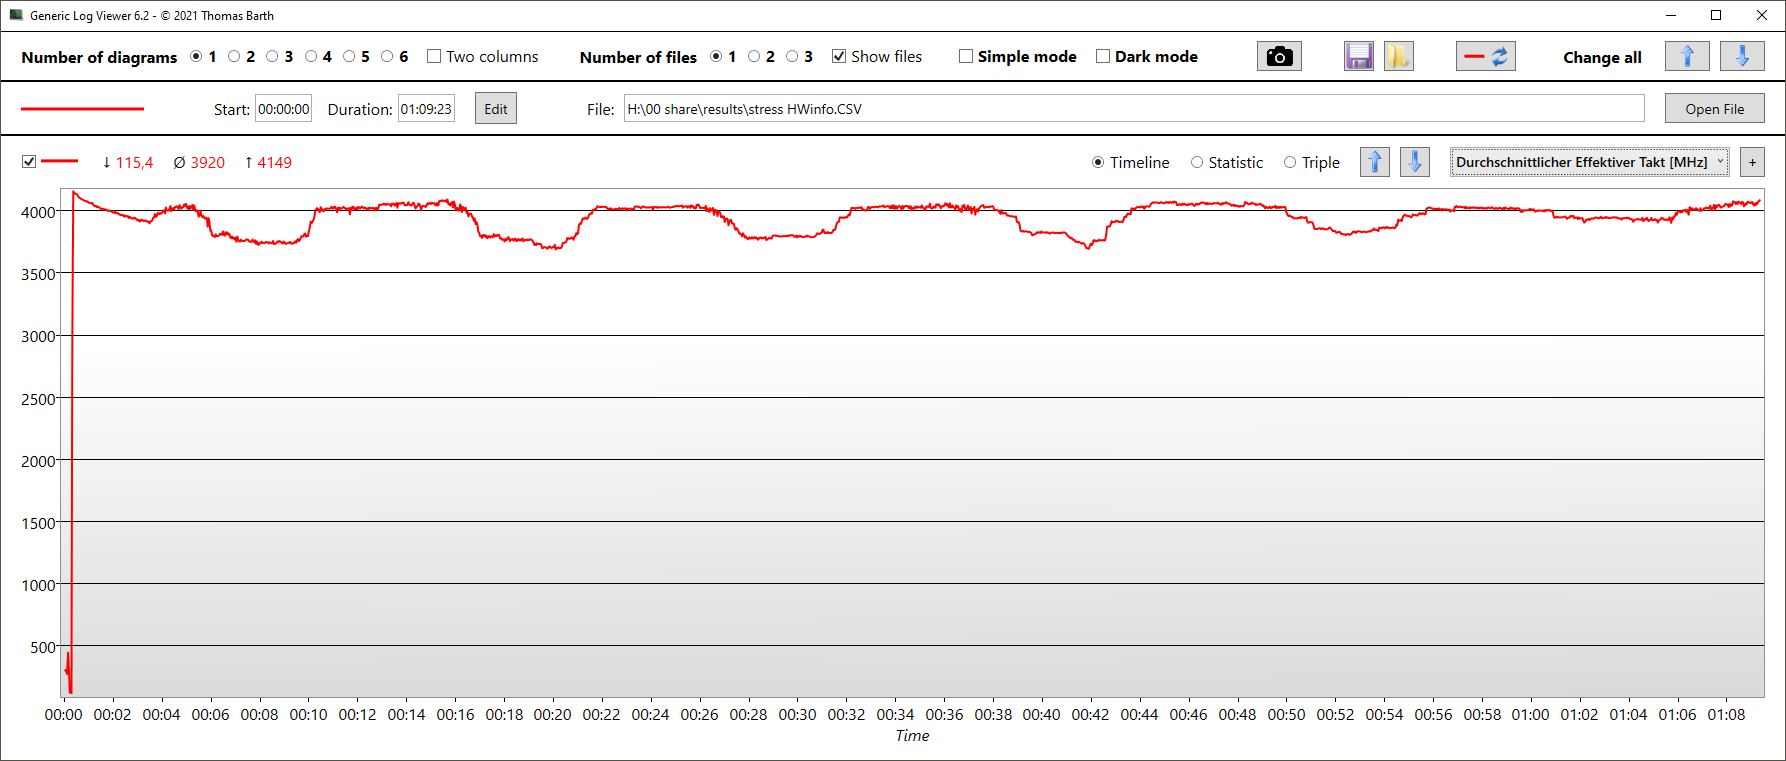
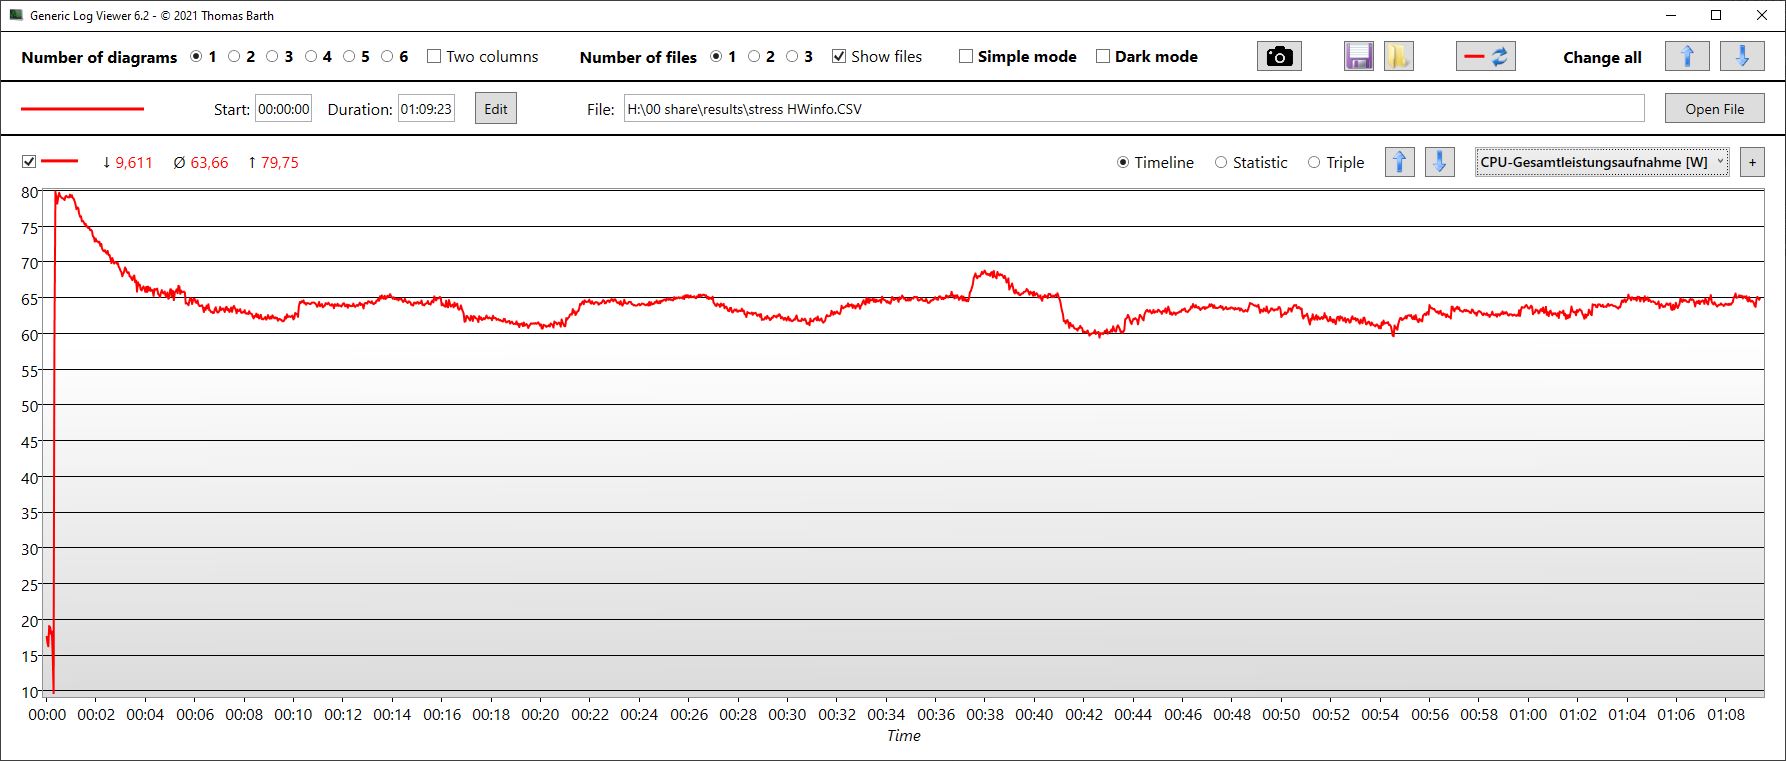
Unlike with many Intel-based systems, the Neo's CPU clock speed managed to stay fairly stable during our one-hour stress test. The cores started the test at 4.1 GHz and didn't go below 3.9 GHz. They also managed to occasionally approach the initial value. Core temperatures stayed at a constant 95°C (203°F), and power usage was 64 watts on average.
The GPU values fluctuated more by comparison. After initially running at 1.7 GHz, the GPU sometimes dipped down to 1 GHz before returning to the initial clock speed. VRAM speed was constant during the test. GPU temperatures stabilised at around 78°C (172°F), while power consumption rarely hit the 150-watt power target, averaging at roughly 114 watts.
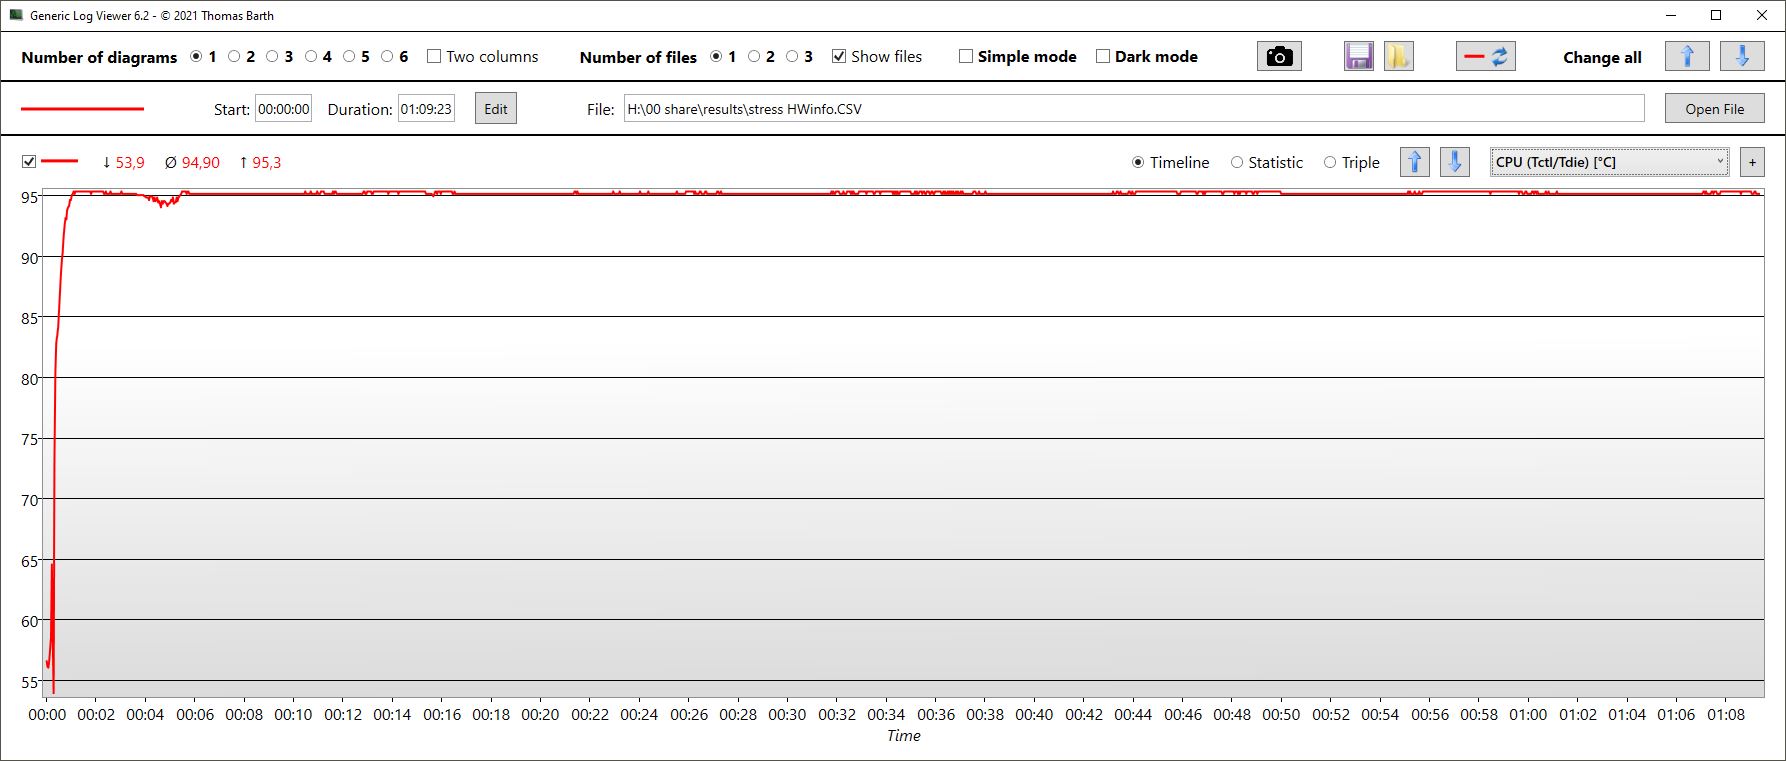

| CPU Clock (GHz) | GPU Clock (MHz) | Average CPU Temperature (°C) | Average GPU Temperature (°C) | |
| System Idle | -- | -- | 55 | 44 |
| Prime95 + FurMark Stress | 3.9 | 1,522 | 95 | 77 |
| Witcher 3 Stress | 3.1 | 1,550 | 67 | 83 |
Speakers
Schenker XMG Neo 15 (Ryzen 9 6900HX, RTX 3070 Ti) audio analysis
(±) | speaker loudness is average but good (78.26 dB)
Bass 100 - 315 Hz
(-) | nearly no bass - on average 19.2% lower than median
(±) | linearity of bass is average (8.2% delta to prev. frequency)
Mids 400 - 2000 Hz
(±) | higher mids - on average 6.6% higher than median
(±) | linearity of mids is average (9.9% delta to prev. frequency)
Highs 2 - 16 kHz
(+) | balanced highs - only 2.8% away from median
(+) | highs are linear (6% delta to prev. frequency)
Overall 100 - 16.000 Hz
(±) | linearity of overall sound is average (19.1% difference to median)
Compared to same class
» 64% of all tested devices in this class were better, 7% similar, 28% worse
» The best had a delta of 6%, average was 18%, worst was 132%
Compared to all devices tested
» 46% of all tested devices were better, 7% similar, 47% worse
» The best had a delta of 4%, average was 24%, worst was 134%
Asus ROG Strix Scar 15 G533ZW-LN106WS audio analysis
(±) | speaker loudness is average but good (80.5 dB)
Bass 100 - 315 Hz
(+) | good bass - only 3.7% away from median
(+) | bass is linear (5.5% delta to prev. frequency)
Mids 400 - 2000 Hz
(±) | higher mids - on average 7.1% higher than median
(+) | mids are linear (3.1% delta to prev. frequency)
Highs 2 - 16 kHz
(+) | balanced highs - only 3.3% away from median
(+) | highs are linear (5.9% delta to prev. frequency)
Overall 100 - 16.000 Hz
(+) | overall sound is linear (12.2% difference to median)
Compared to same class
» 13% of all tested devices in this class were better, 4% similar, 83% worse
» The best had a delta of 6%, average was 18%, worst was 132%
Compared to all devices tested
» 10% of all tested devices were better, 2% similar, 88% worse
» The best had a delta of 4%, average was 24%, worst was 134%
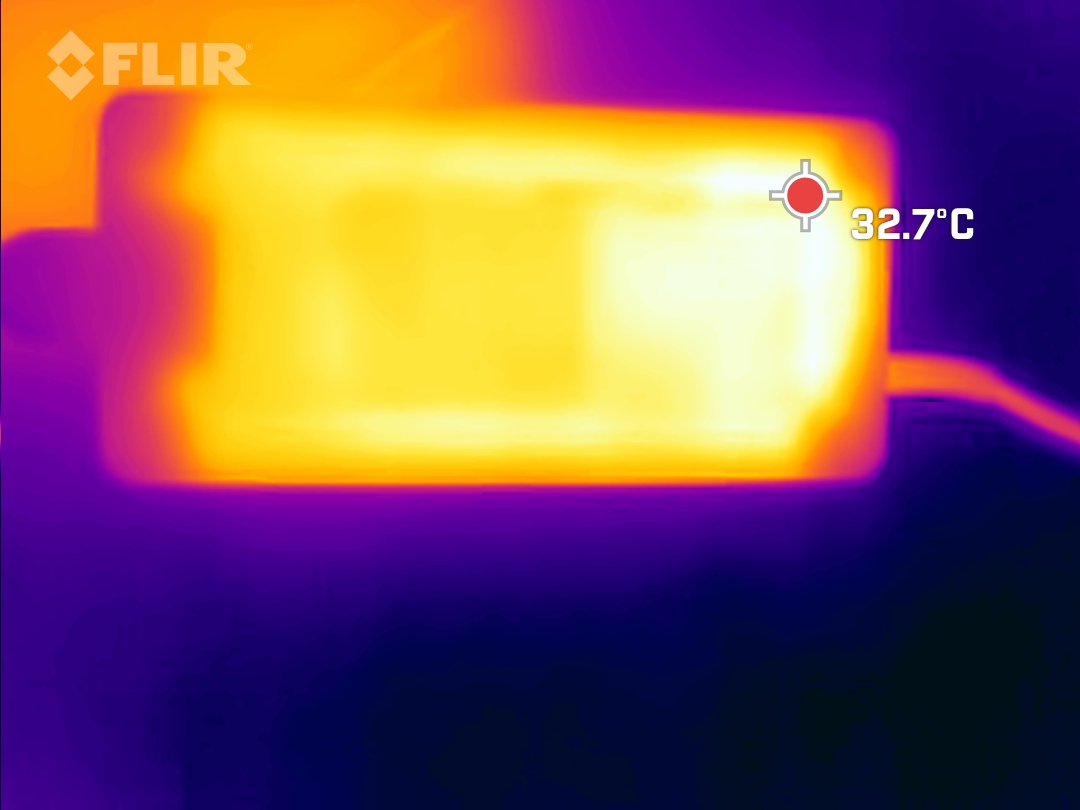
Power management - XMG Neo 15 has great battery life
Power consumption
The laptop uses between 13 and 20 watts of power at idle, depending on the performance profile selected and display brightness. This is at best an average results in our comparison.
When running the Witcher 3, the system drew about 200 watts of power – a fraction more than the slightly faster Asus ROG Strix.
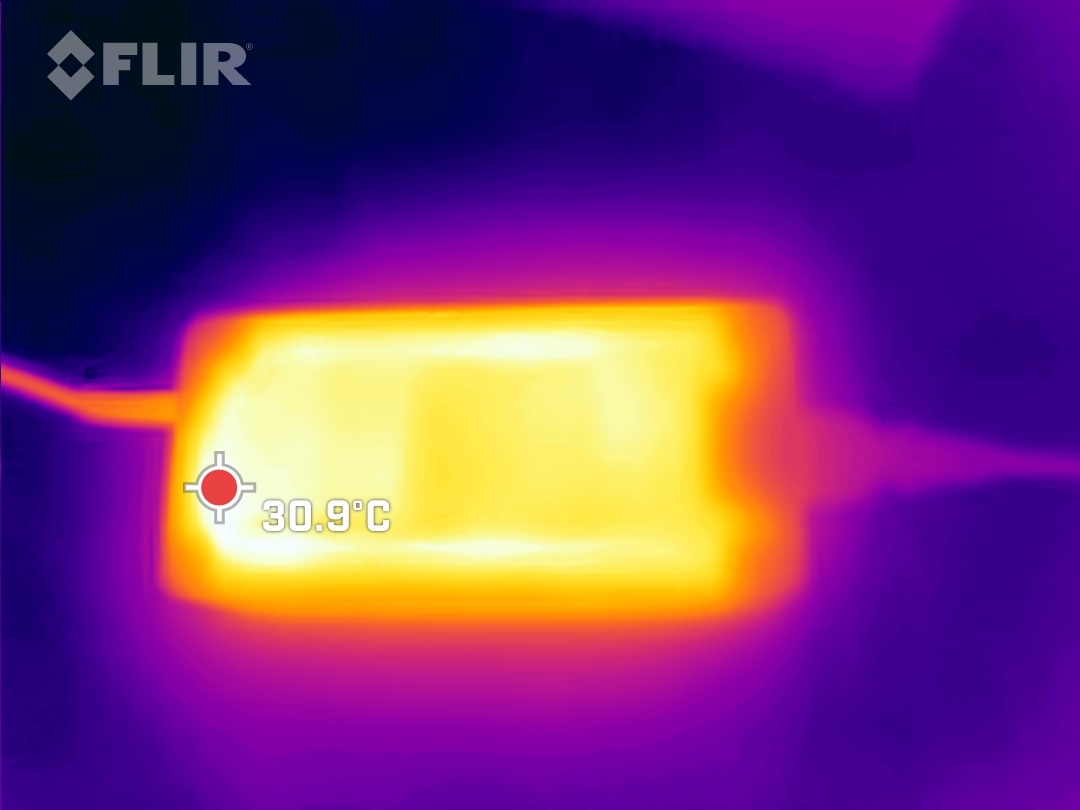
During the stress test, we measured a temporary peak power usage of 260 watts. The chunky 280-watt charger can easily handle the laptop's power requirements, especially considering the power draw stabilised at 210 watts over the course of the stress test.
| Off / Standby | |
| Idle | |
| Load |
|
Key:
min: | |
| Schenker XMG Neo 15 (Ryzen 9 6900HX, RTX 3070 Ti) R9 6900HX, GeForce RTX 3070 Ti Laptop GPU, Samsung SSD 980 Pro 1TB MZ-V8P1T0BW, IPS, 2560x1440, 15.6" | Schenker XMG Neo 15 (i7-12700H, RTX 3080 Ti) i7-12700H, GeForce RTX 3080 Ti Laptop GPU, Samsung SSD 980 Pro 1TB MZ-V8P1T0BW, IPS, 2560x1440, 15.6" | MSI GE67 HX 12UGS i7-12800HX, GeForce RTX 3070 Ti Laptop GPU, Samsung PM9A1 MZVL21T0HCLR, OLED, 1920x1080, 15.6" | Asus ROG Strix Scar 15 G533ZW-LN106WS i9-12900H, GeForce RTX 3070 Ti Laptop GPU, Samsung PM9A1 MZVL22T0HBLB, IPS-level, 2560x1440, 15.6" | Acer Nitro 5 AN515-58-72QR i7-12700H, GeForce RTX 3070 Ti Laptop GPU, Samsung PM9A1 MZVL21T0HCLR, IPS, 2560x1440, 15.6" | MSI Stealth GS66 12UGS i7-12700H, GeForce RTX 3070 Ti Laptop GPU, WDC PC SN810 1TB, IPS-Level, 2560x1440, 15.6" | Average NVIDIA GeForce RTX 3070 Ti Laptop GPU | Average of class Gaming | |
|---|---|---|---|---|---|---|---|---|
| Power Consumption | -14% | -20% | 5% | 3% | 3% | -19% | -11% | |
| Idle Minimum * (Watt) | 13 | 15 -15% | 16.1 -24% | 7.56 42% | 7 46% | 11 15% | 14.2 ? -9% | 13.3 ? -2% |
| Idle Average * (Watt) | 17 | 18 -6% | 17.1 -1% | 13.5 21% | 15 12% | 16 6% | 19.9 ? -17% | 19 ? -12% |
| Idle Maximum * (Watt) | 20 | 18 10% | 26.6 -33% | 16.87 16% | 24 -20% | 23 -15% | 26.2 ? -31% | 24.5 ? -23% |
| Load Average * (Watt) | 89 | 123 -38% | 116.3 -31% | 128.9 -45% | 124 -39% | 110 -24% | 125.8 ? -41% | 108.1 ? -21% |
| Witcher 3 ultra * (Watt) | 200 | 234 -17% | 237 -19% | 196.2 2% | 195.1 2% | 151 24% | ||
| Load Maximum * (Watt) | 260 | 301 -16% | 291.1 -12% | 274.86 -6% | 220 15% | 230 12% | 248 ? 5% | 254 ? 2% |
* ... smaller is better
Power Consumption Witcher 3 / Stress test
Power Consumption with External Monitor
Battery life
Schenker has given the laptop a 96Wh battery. Apart from the Acer Nitro, all the devices in the comparison have similarly large batteries.
The XMG Neo 15 delivers excellent battery life relative to the competition. It seems Schenker has done a good job fine-tuning the power modes.
In any case, with screen brightness turned down, the laptop provided us with almost 11 hours of web browsing and video playback. Even at max screen brightness, we still managed to surf the Internet for 8.5 hours over Wi-Fi.
| Schenker XMG Neo 15 (Ryzen 9 6900HX, RTX 3070 Ti) R9 6900HX, GeForce RTX 3070 Ti Laptop GPU, 93 Wh | Schenker XMG Neo 15 (i7-12700H, RTX 3080 Ti) i7-12700H, GeForce RTX 3080 Ti Laptop GPU, 93 Wh | MSI GE67 HX 12UGS i7-12800HX, GeForce RTX 3070 Ti Laptop GPU, 99.9 Wh | Asus ROG Strix Scar 15 G533ZW-LN106WS i9-12900H, GeForce RTX 3070 Ti Laptop GPU, 90 Wh | Acer Nitro 5 AN515-58-72QR i7-12700H, GeForce RTX 3070 Ti Laptop GPU, 57.5 Wh | MSI Stealth GS66 12UGS i7-12700H, GeForce RTX 3070 Ti Laptop GPU, 99.9 Wh | Average of class Gaming | |
|---|---|---|---|---|---|---|---|
| Battery runtime | -23% | -9% | -29% | -48% | -25% | -22% | |
| H.264 (h) | 10.7 | 7.1 -34% | 8.5 -21% | 4.7 -56% | 8.26 ? -23% | ||
| WiFi v1.3 (h) | 10.9 | 7.7 -29% | 5.6 -49% | 8.4 -23% | 3.9 -64% | 5.4 -50% | 7.01 ? -36% |
| Load (h) | 1.6 | 1.5 -6% | 2.1 31% | 0.9 -44% | 1.2 -25% | 1.6 0% | 1.47 ? -8% |
| Reader / Idle (h) | 8.4 | 5.7 | 7.8 | 8.71 ? | |||
| Witcher 3 ultra (h) | 1.2 |
Pros
Cons
Verdict - Intel or AMD? It's a matter of preference.

The Neo 15 is a great gaming laptop even with an AMD processor. At idle, the AMD-based Neo runs much cooler and has a longer battery life than its Intel-based counterpart. On the flip side, it has marginally lower CPU performance and lacks Thunderbolt support. Consumers need to decide what is more important to them.
The laptop's gaming performance is in the upper mid-tier, but can be further improved using the wide range of manual settings available.
We are impressed by the superb battery life but are slightly torn in some aspects. We like the robust metal materials used on the display and on the keyboard deck, but the lower case is too soft for our liking. The device has a Full HD webcam, but it delivers such poor image quality that many 720p models are simply able to do better. There is still a bit of room for improvement here. That said, this is a relatively minor criticism.
The XMG Neo 15 with AMD Ryzen is a performant gaming laptop without any major downsides that has a connection for optional external water cooling. Nonetheless, some of the many great ideas on the laptop can still use some refinement.
If you are looking for alternatives, we particularly recommend the MSI GE6 HX 12UGS, which is ahead in almost all performance tests and yet isn't any much worse in terms of emissions. You can also check out the Asus ROG Strix Scar, a laptop that is neck and neck with the Neo 15.
Price and availability
The Neo 15 can be configured in many ways on XMG's own online shop (bestware.com). Our review model costs 2,877 Euro (US$2,850) from the website. You can save almost 500 Euro (US$495) by opting for an RTX 3060 instead of RTX 3070 Ti! If you look around comparison websites, you may sometime also find the laptop going for slightly less.
Schenker XMG Neo 15 (Ryzen 9 6900HX, RTX 3070 Ti)
- 10/26/2022 v7 (old)
Christian Hintze
Price comparison

