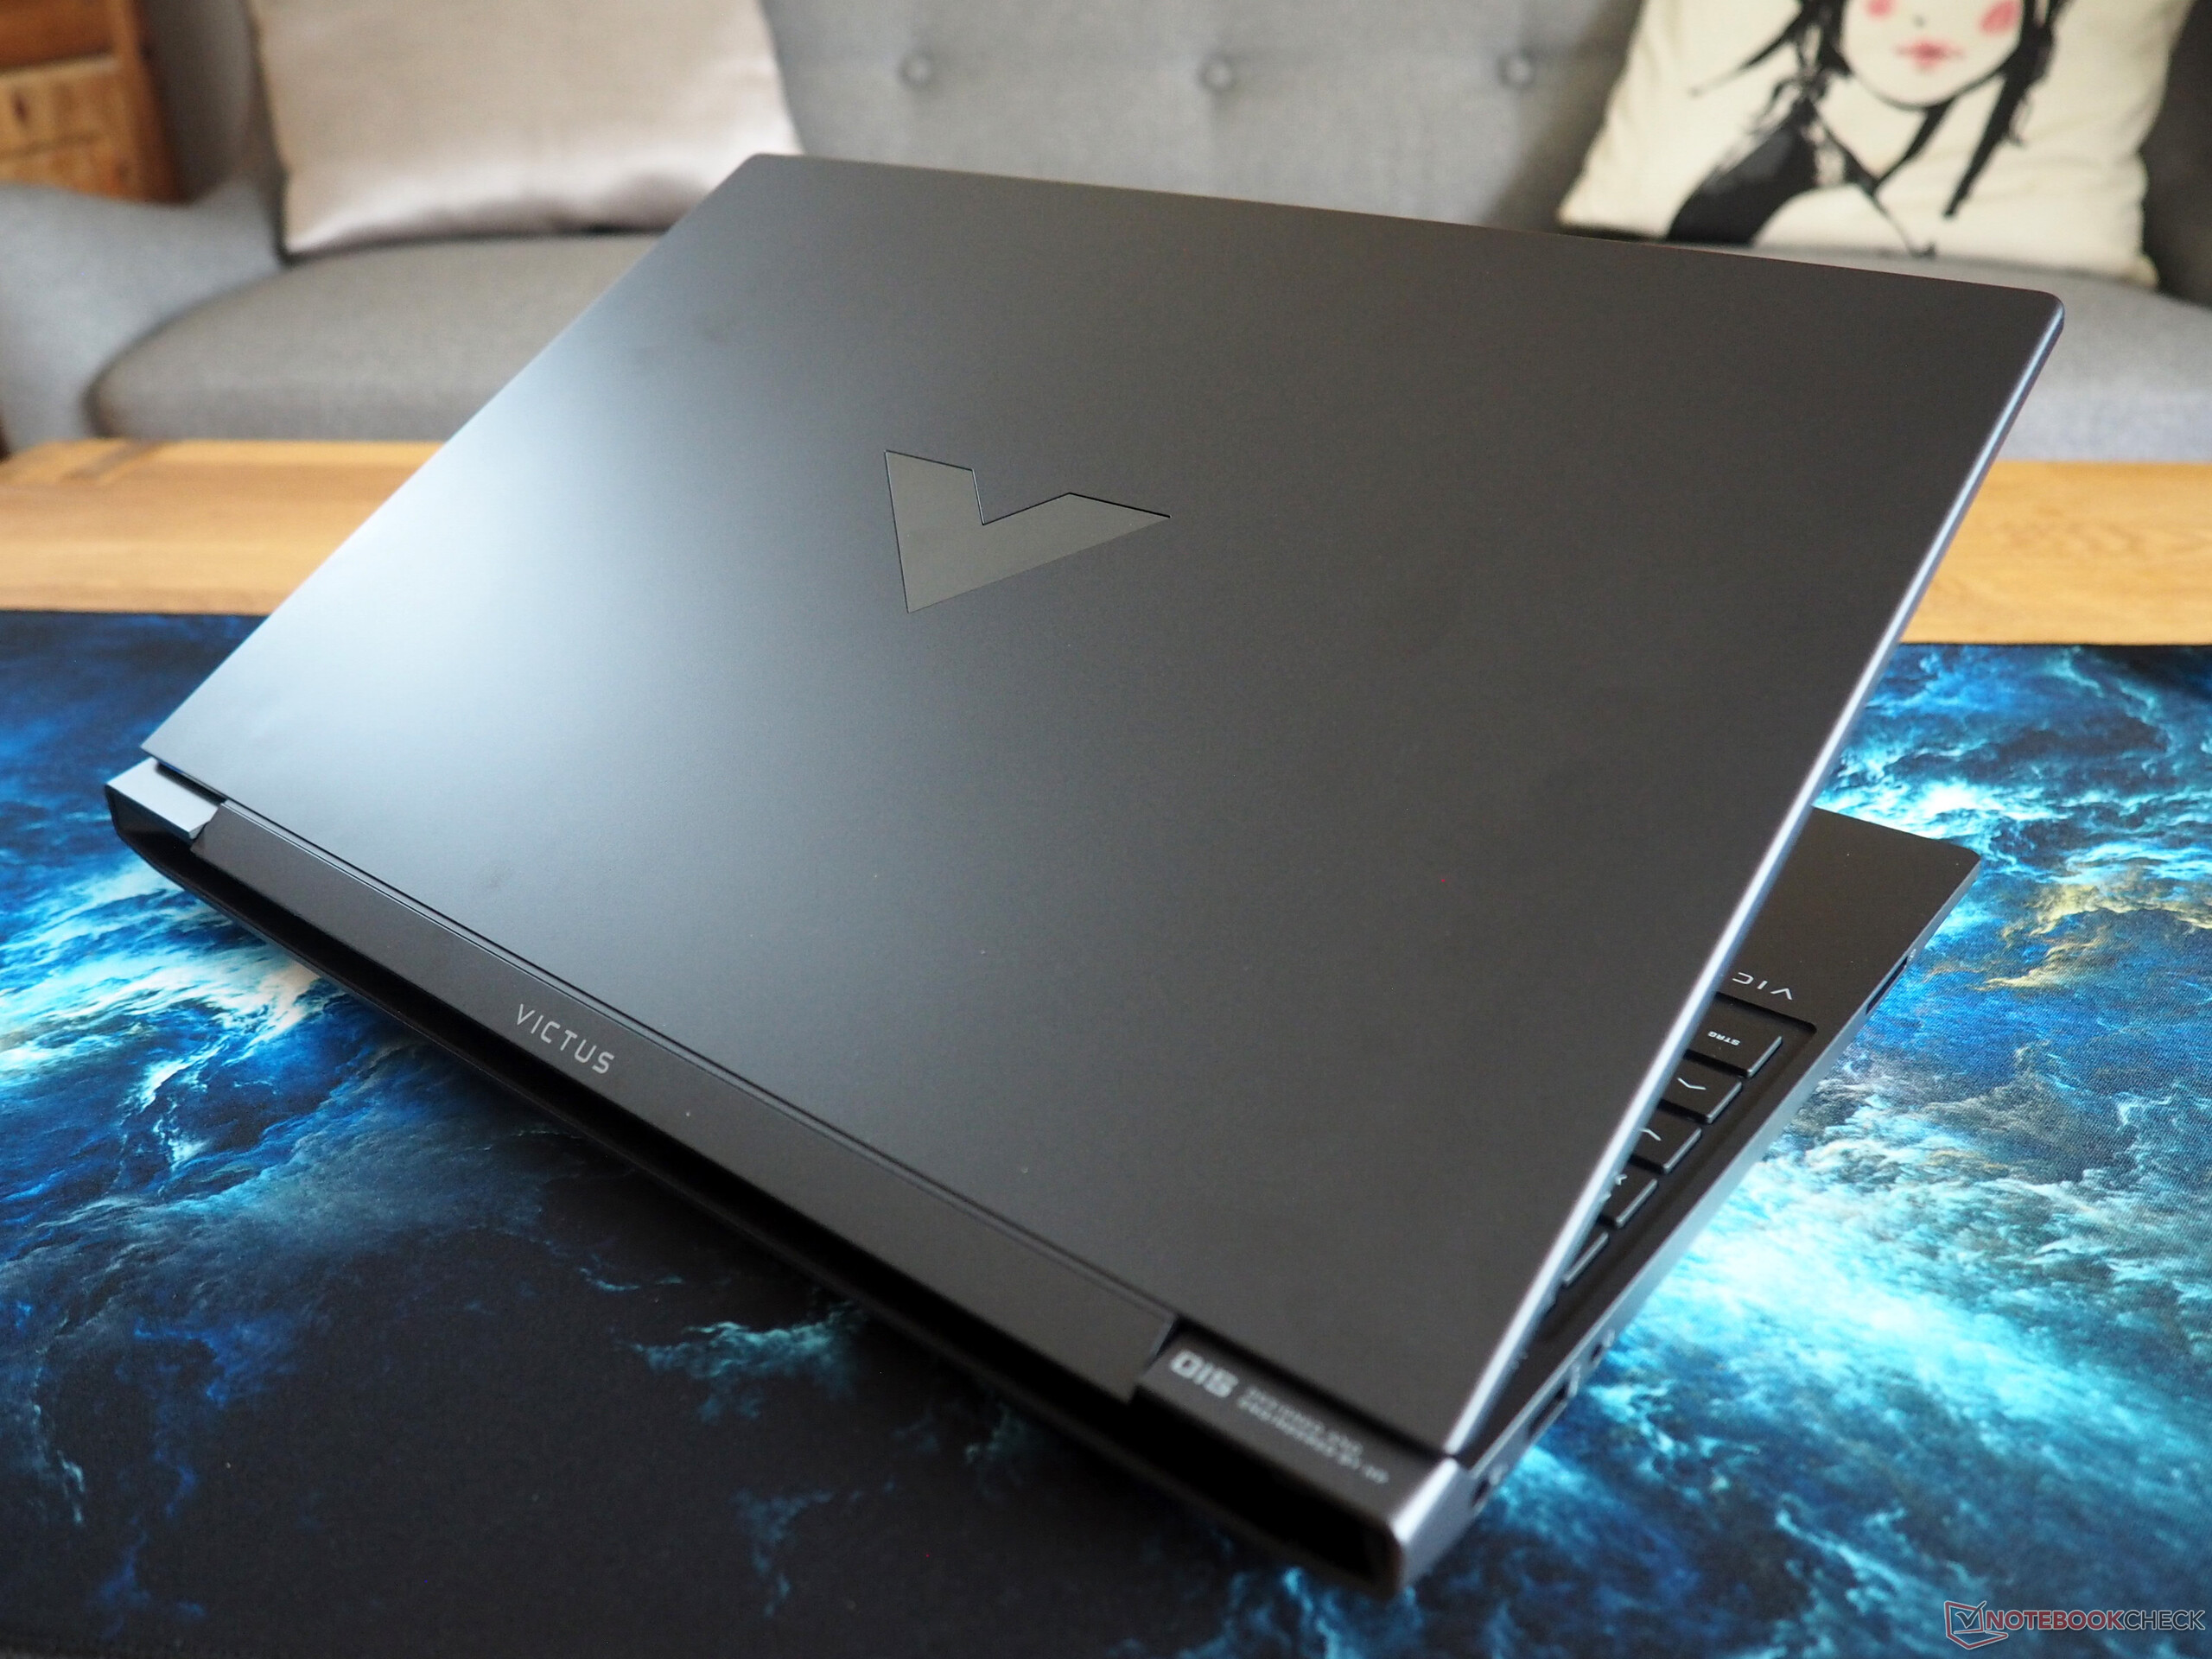
HP Victus 15 gaming laptop with Raptor Lake and Ada Lovelace in review

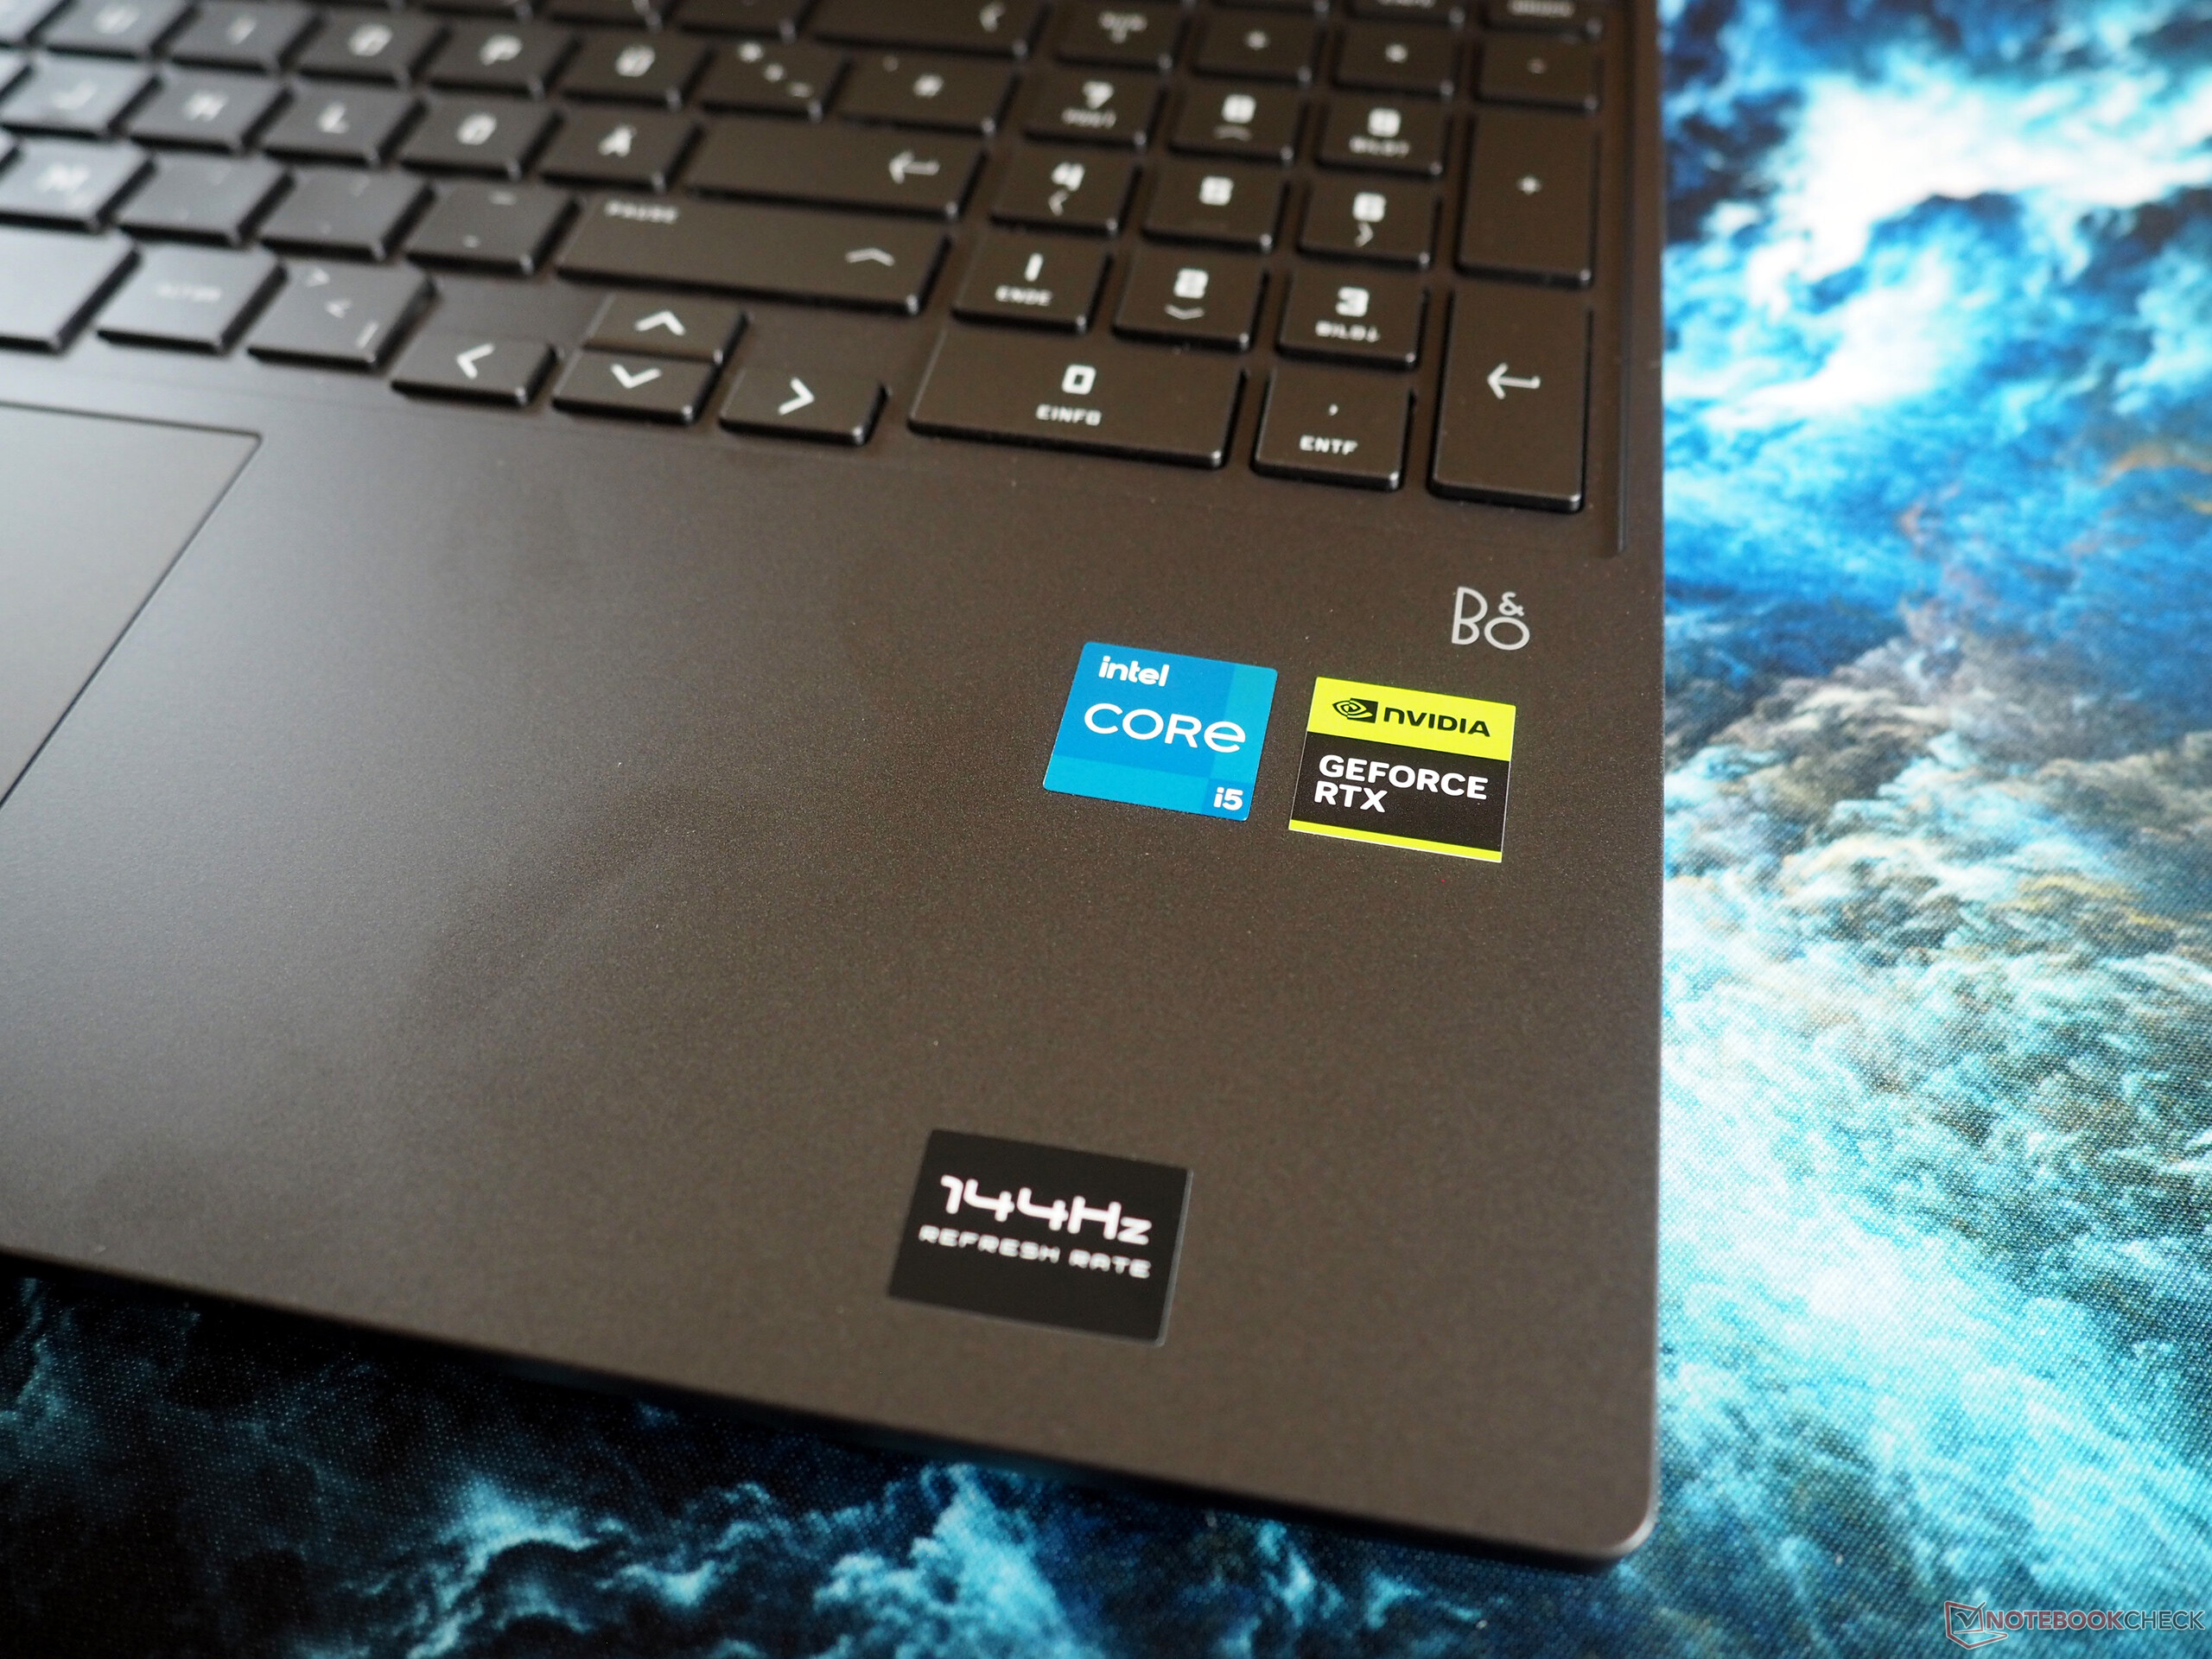
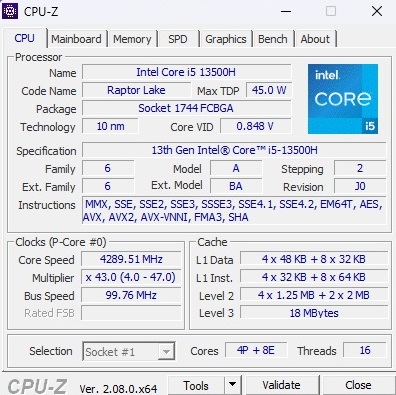
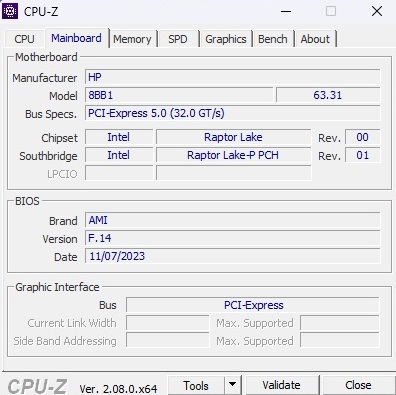
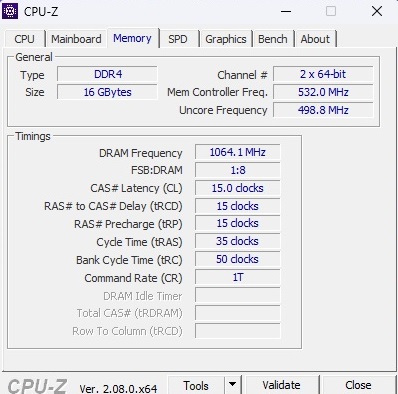
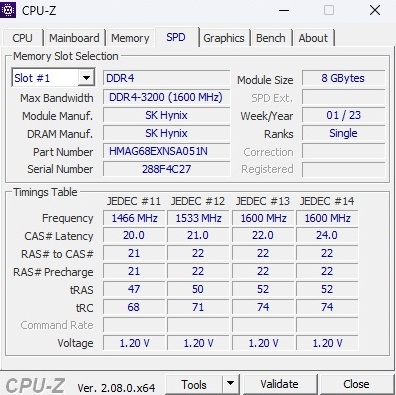
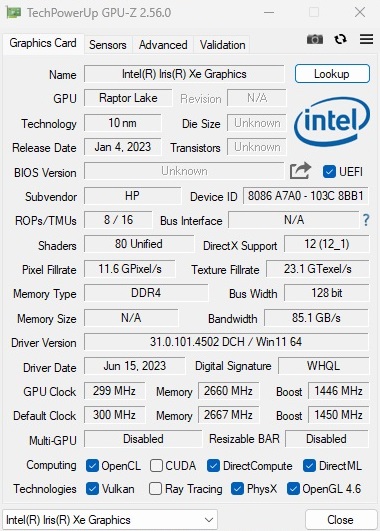
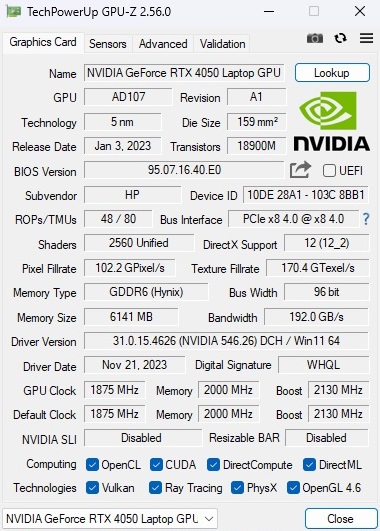
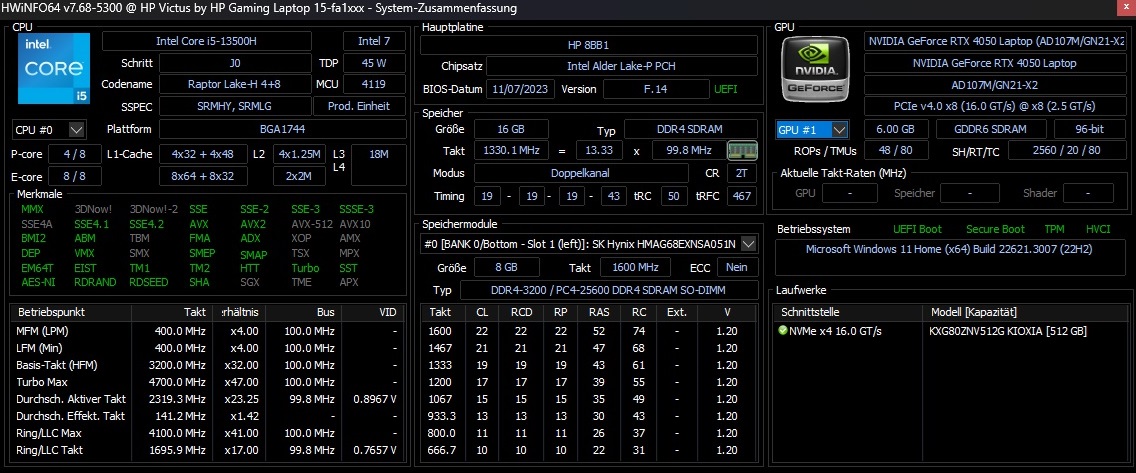
While premium laptops continue to become more expensive each year, the budget segment in 2024 offers a plethora of exciting products. Such an example is the Victus 15-fa1057ng, available for less than $1000. Setting itself apart from many competitors, it features a GeForce RTX 4050 with 6 GB GDDR6 VRAM. Complementing this is a Core i5-13500H processor (12 cores, 16 threads), 16 GB DDR4-3,200 RAM (2x 8 GB SO-DIMM), and a 512 GB PCIe-based M.2 SSD. Handling visual output is a matte 144 Hz Full HD IPS display, although it's specified with 250 nits and 45% NTSC – values we consider outdated, even for the budget sector. The package is completed with Windows 11 Home as the operating system (cheaper versions with FreeDOS are also available).
The rivals of the Victus 15 include other gaming laptops equipped with the RTX 4050 and the latest CPUs, such as the Dell G15 5530, the Acer Nitro V 15 ANV15-51 or the Asus TUF A15 FA507, all of which are listed in the tables for comparison.
As the case is mostly identical to the predecessor featuring the Core i7-12700H and GeForce RTX 3050 Ti ist, this article will include a brief explanation of the casing, features, and input device categories.
Possible competitors compared
Rating | Date | Model | Weight | Height | Size | Resolution | Price |
|---|---|---|---|---|---|---|---|
| 84 % v7 (old) | 02 / 2024 | HP Victus 15-fa1057ng i5-13500H, GeForce RTX 4050 Laptop GPU | 2.3 kg | 24 mm | 15.60" | 1920x1080 | |
| 81 % v7 (old) | 12 / 2022 | HP Victus 15 fa0020nr i7-12700H, GeForce RTX 3050 Ti Laptop GPU | 2.3 kg | 23.6 mm | 15.60" | 1920x1080 | |
| 84.7 % v7 (old) | 01 / 2024 | Dell G15 5530, i5-13450HX RTX 4050 i5-13450HX, GeForce RTX 4050 Laptop GPU | 2.7 kg | 27 mm | 15.60" | 1920x1080 | |
| 82.8 % v7 (old) | 01 / 2024 | Acer Nitro V 15 ANV15-51-582S i5-13420H, GeForce RTX 4050 Laptop GPU | 2.1 kg | 23.5 mm | 15.60" | 1920x1080 | |
| 86.3 % v7 (old) | 06 / 2023 | Asus TUF A15 FA507 R7 7735HS, GeForce RTX 4050 Laptop GPU | 2.2 kg | 24.9 mm | 15.60" | 1920x1080 |
Case
Customers receive a robust plastic enclosure, as is common in this price category, although it may exhibit some rattling in certain areas and lacks the premium sound and feel. A redesign or optimization might be beneficial for the slightly shaky hinges. Overall stability is similar. Most notably, when applying more pressure, the palm rest might bow substantially. The Victus 15 has a beautiful aesthetic that combines subtle and fun design features. The dimensions and weight are within average range, although not particularly noteworthy when compared to the competitors.

Connectivity
The range of connectivity elicits varied reactions. While the absence of a card reader is notable, HP compromises on contemporary USB ports. The available USB ports (2x Type-A, 1x Type-C incl. DisplayPort) are limited to 5 Gbit/s. Fortunately, the HDMI port is specified as version 2.1 by the producer. Additionally, an audio socket and an RJ45 port (limited to 1 Gbit LAN instead of 2.5) are present. With most of the connections situated in the rear half of the case, there is no difficulty in using the mouse.
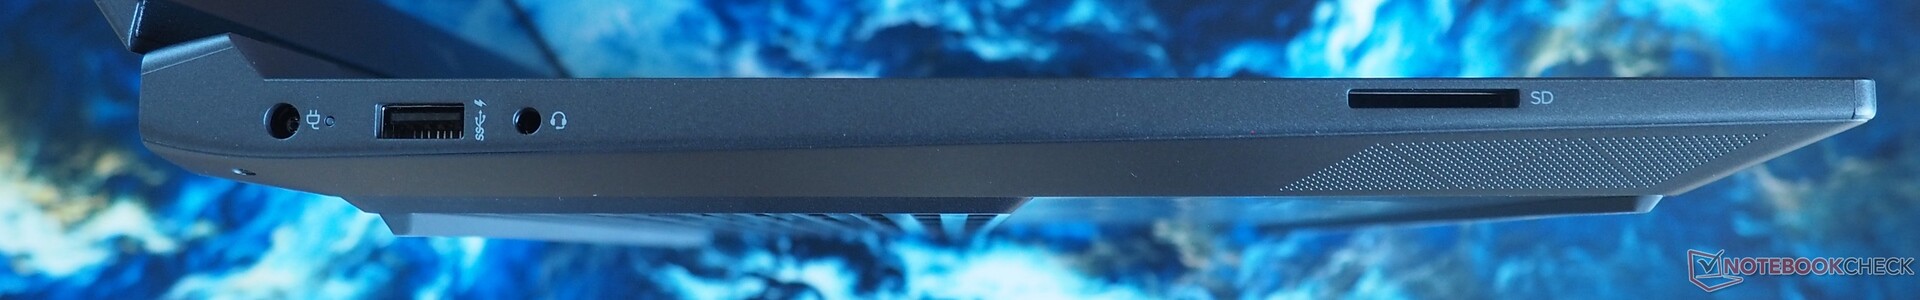

SD Card Reader
The card reader's speed falls within the mid-range. We recorded a reliable 80 MB/s when transferring multiple jpg images.
| SD Card Reader - average JPG Copy Test (av. of 3 runs) | |
| Average of class Gaming (20.9 - 210, n=54, last 2 years) | |
| HP Victus 15-fa1057ng (AV PRO microSD 128 GB V60) | |
| HP Victus 15 fa0020nr (Toshiba Exceria Pro SDXC 64 GB UHS-II) | |
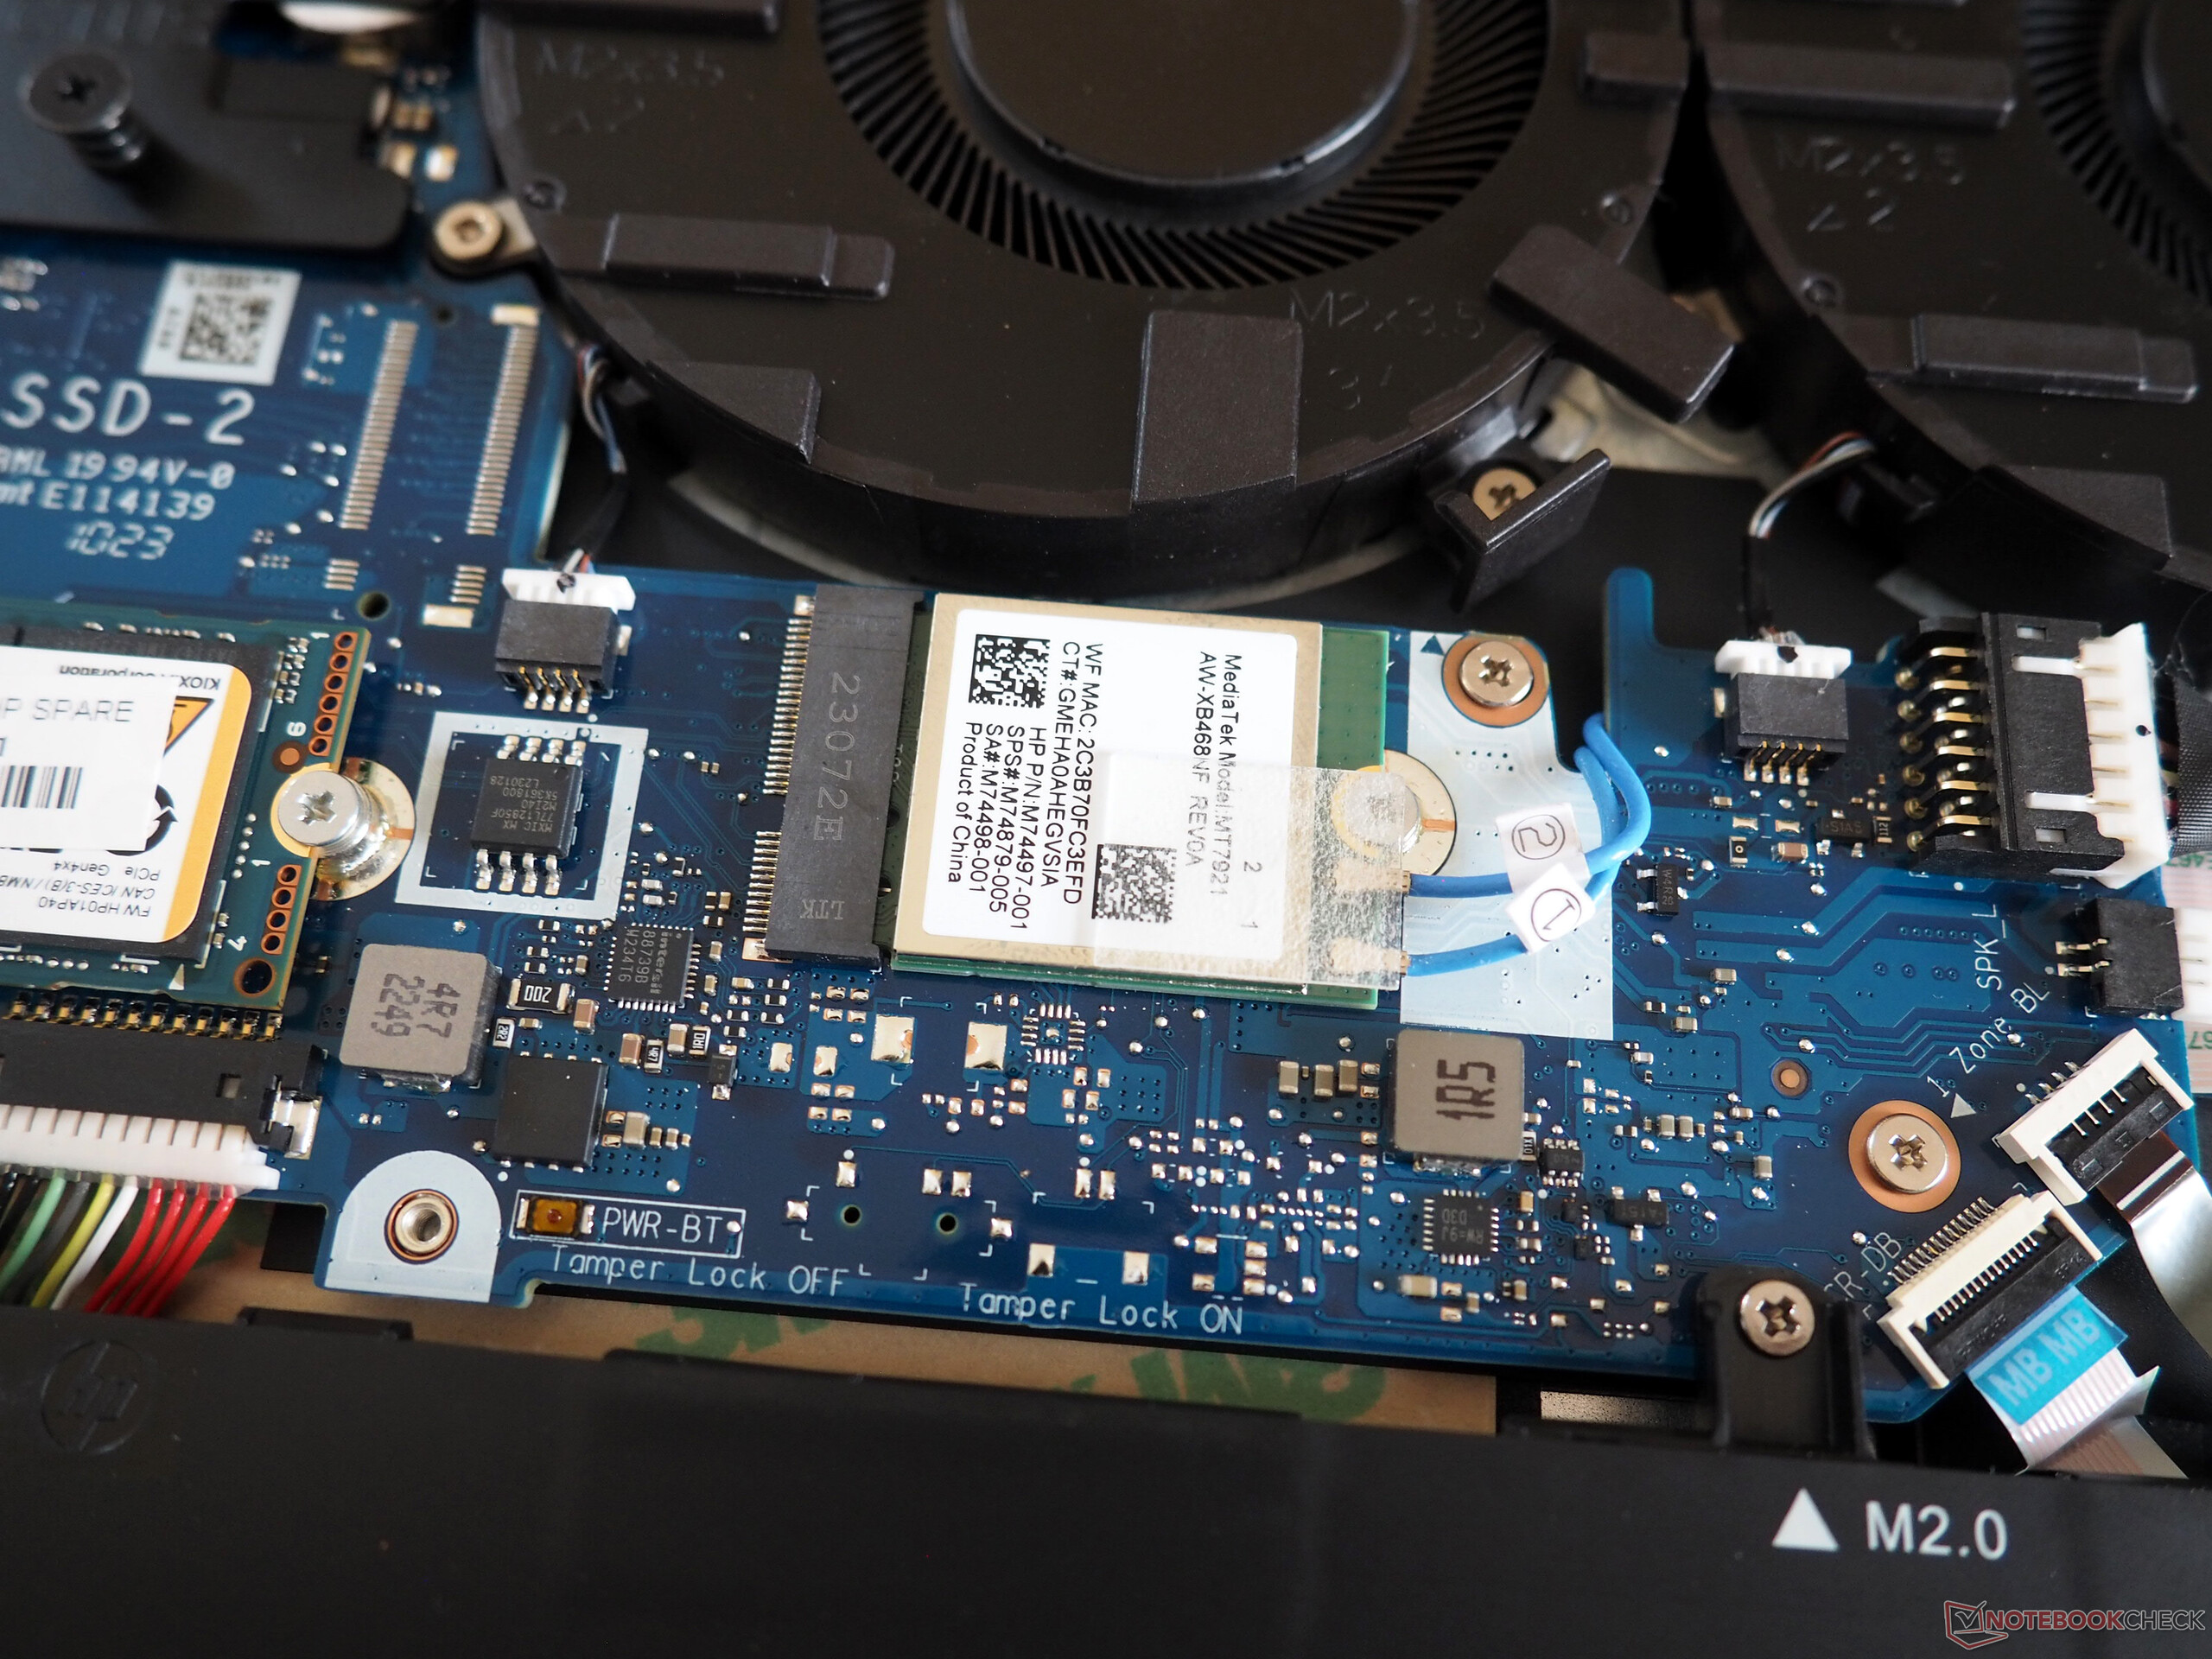
Communication
The Wi-Fi performance is somewhat lacking. During our range test, 3.28 feet distance to the reference router, the integrated MediaTek module ranked last in the comparison field.
Webcam
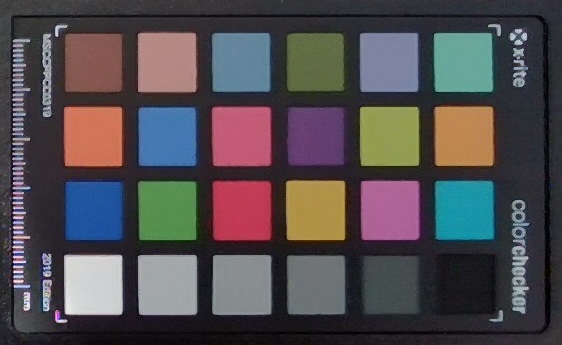
The performance of the 720p webcam is not exceptional, leaving room for improvement, particularly in terms of image sharpness.


Accessories
The laptop comes with a few information booklets and a not-too-bulky 200-watt power supply unit.
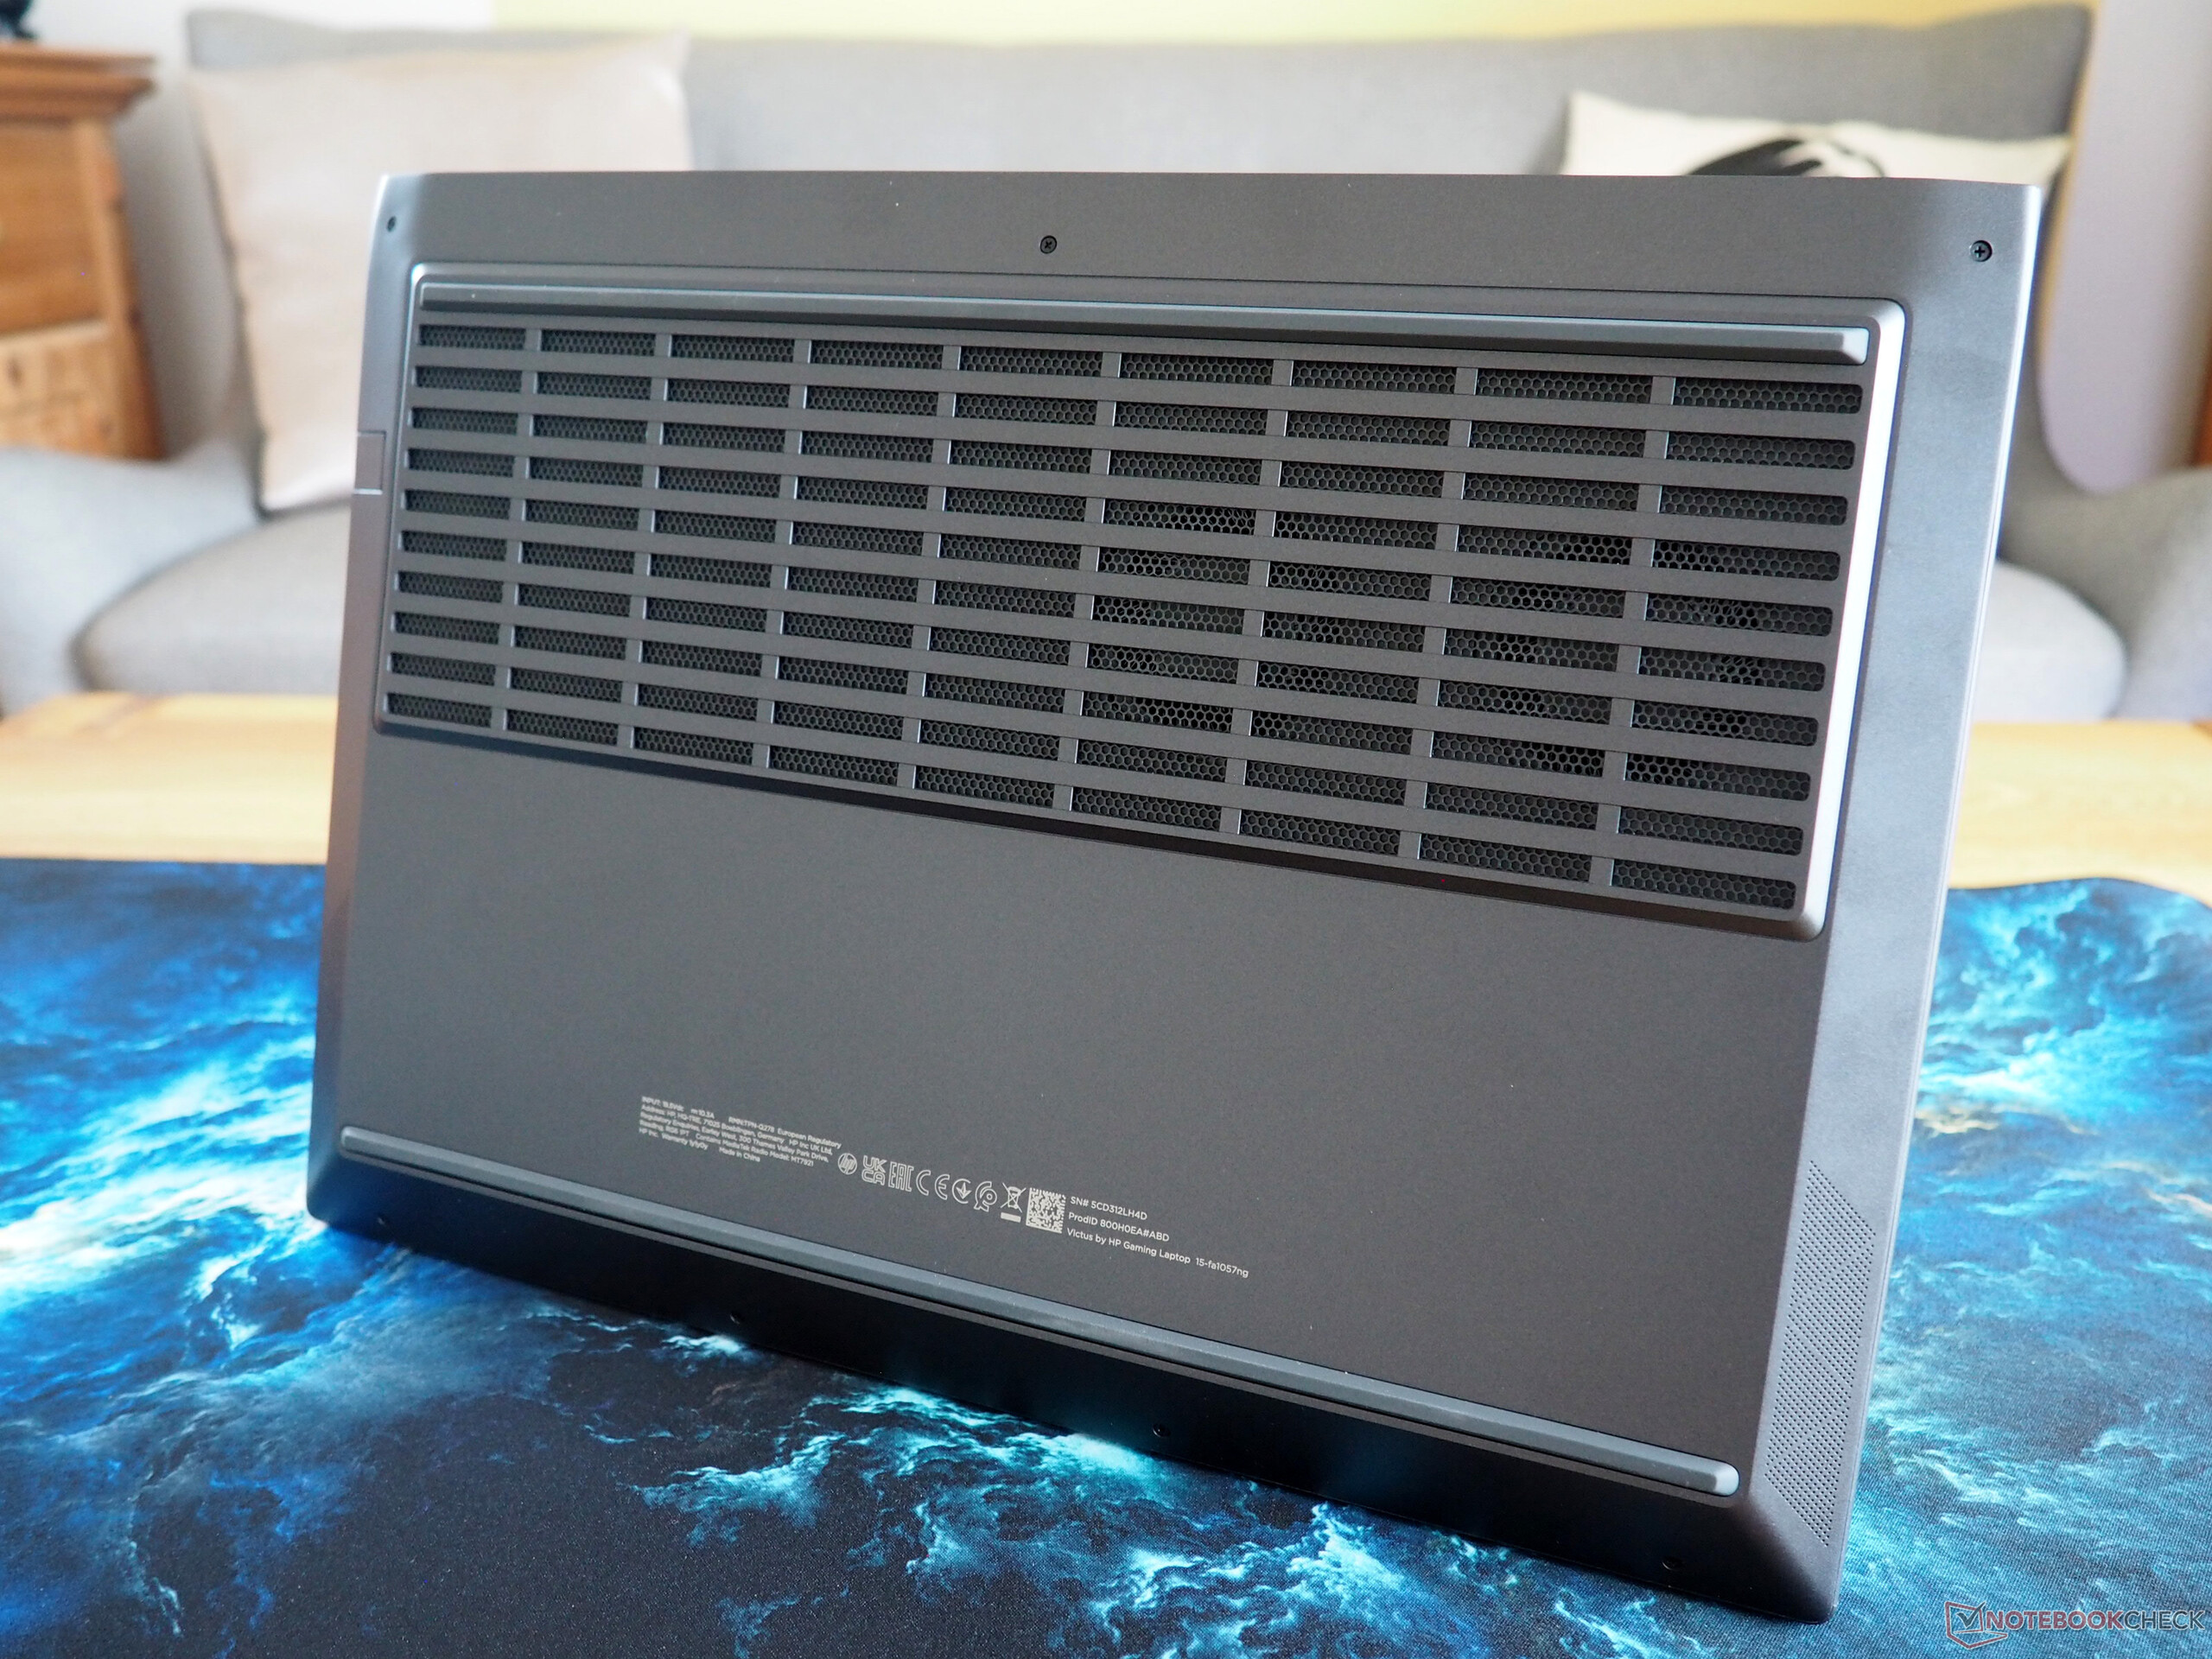
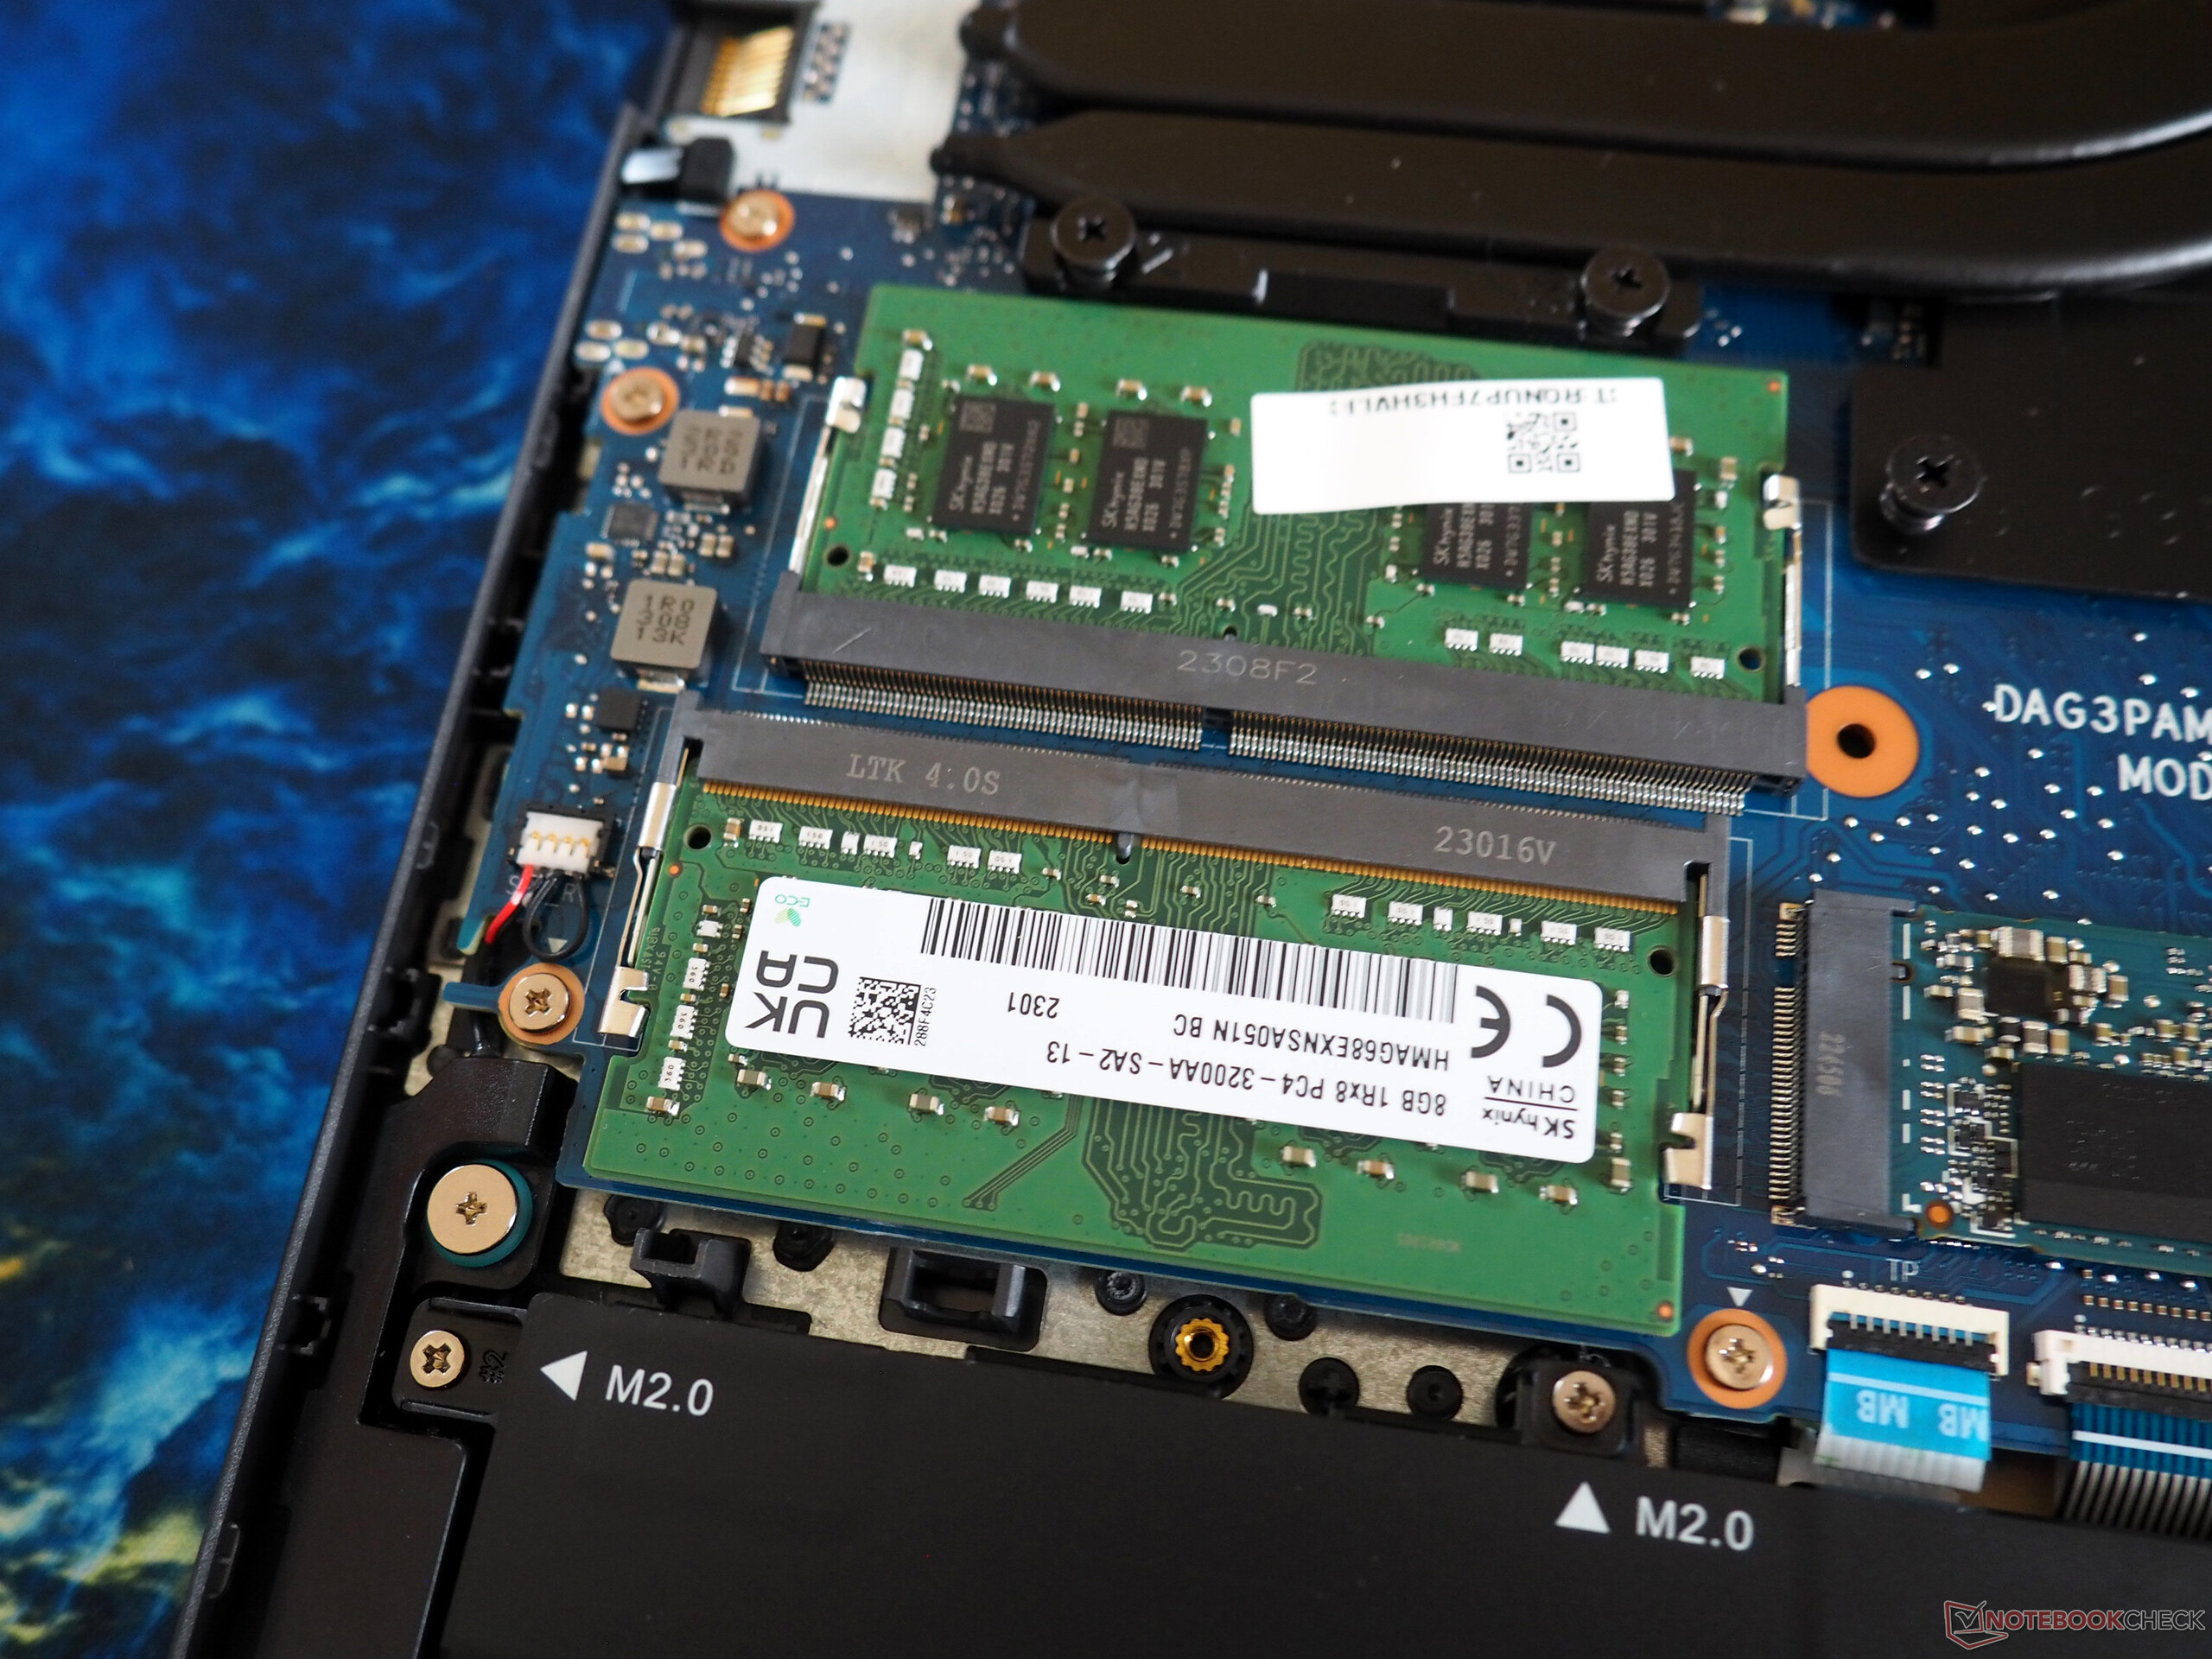
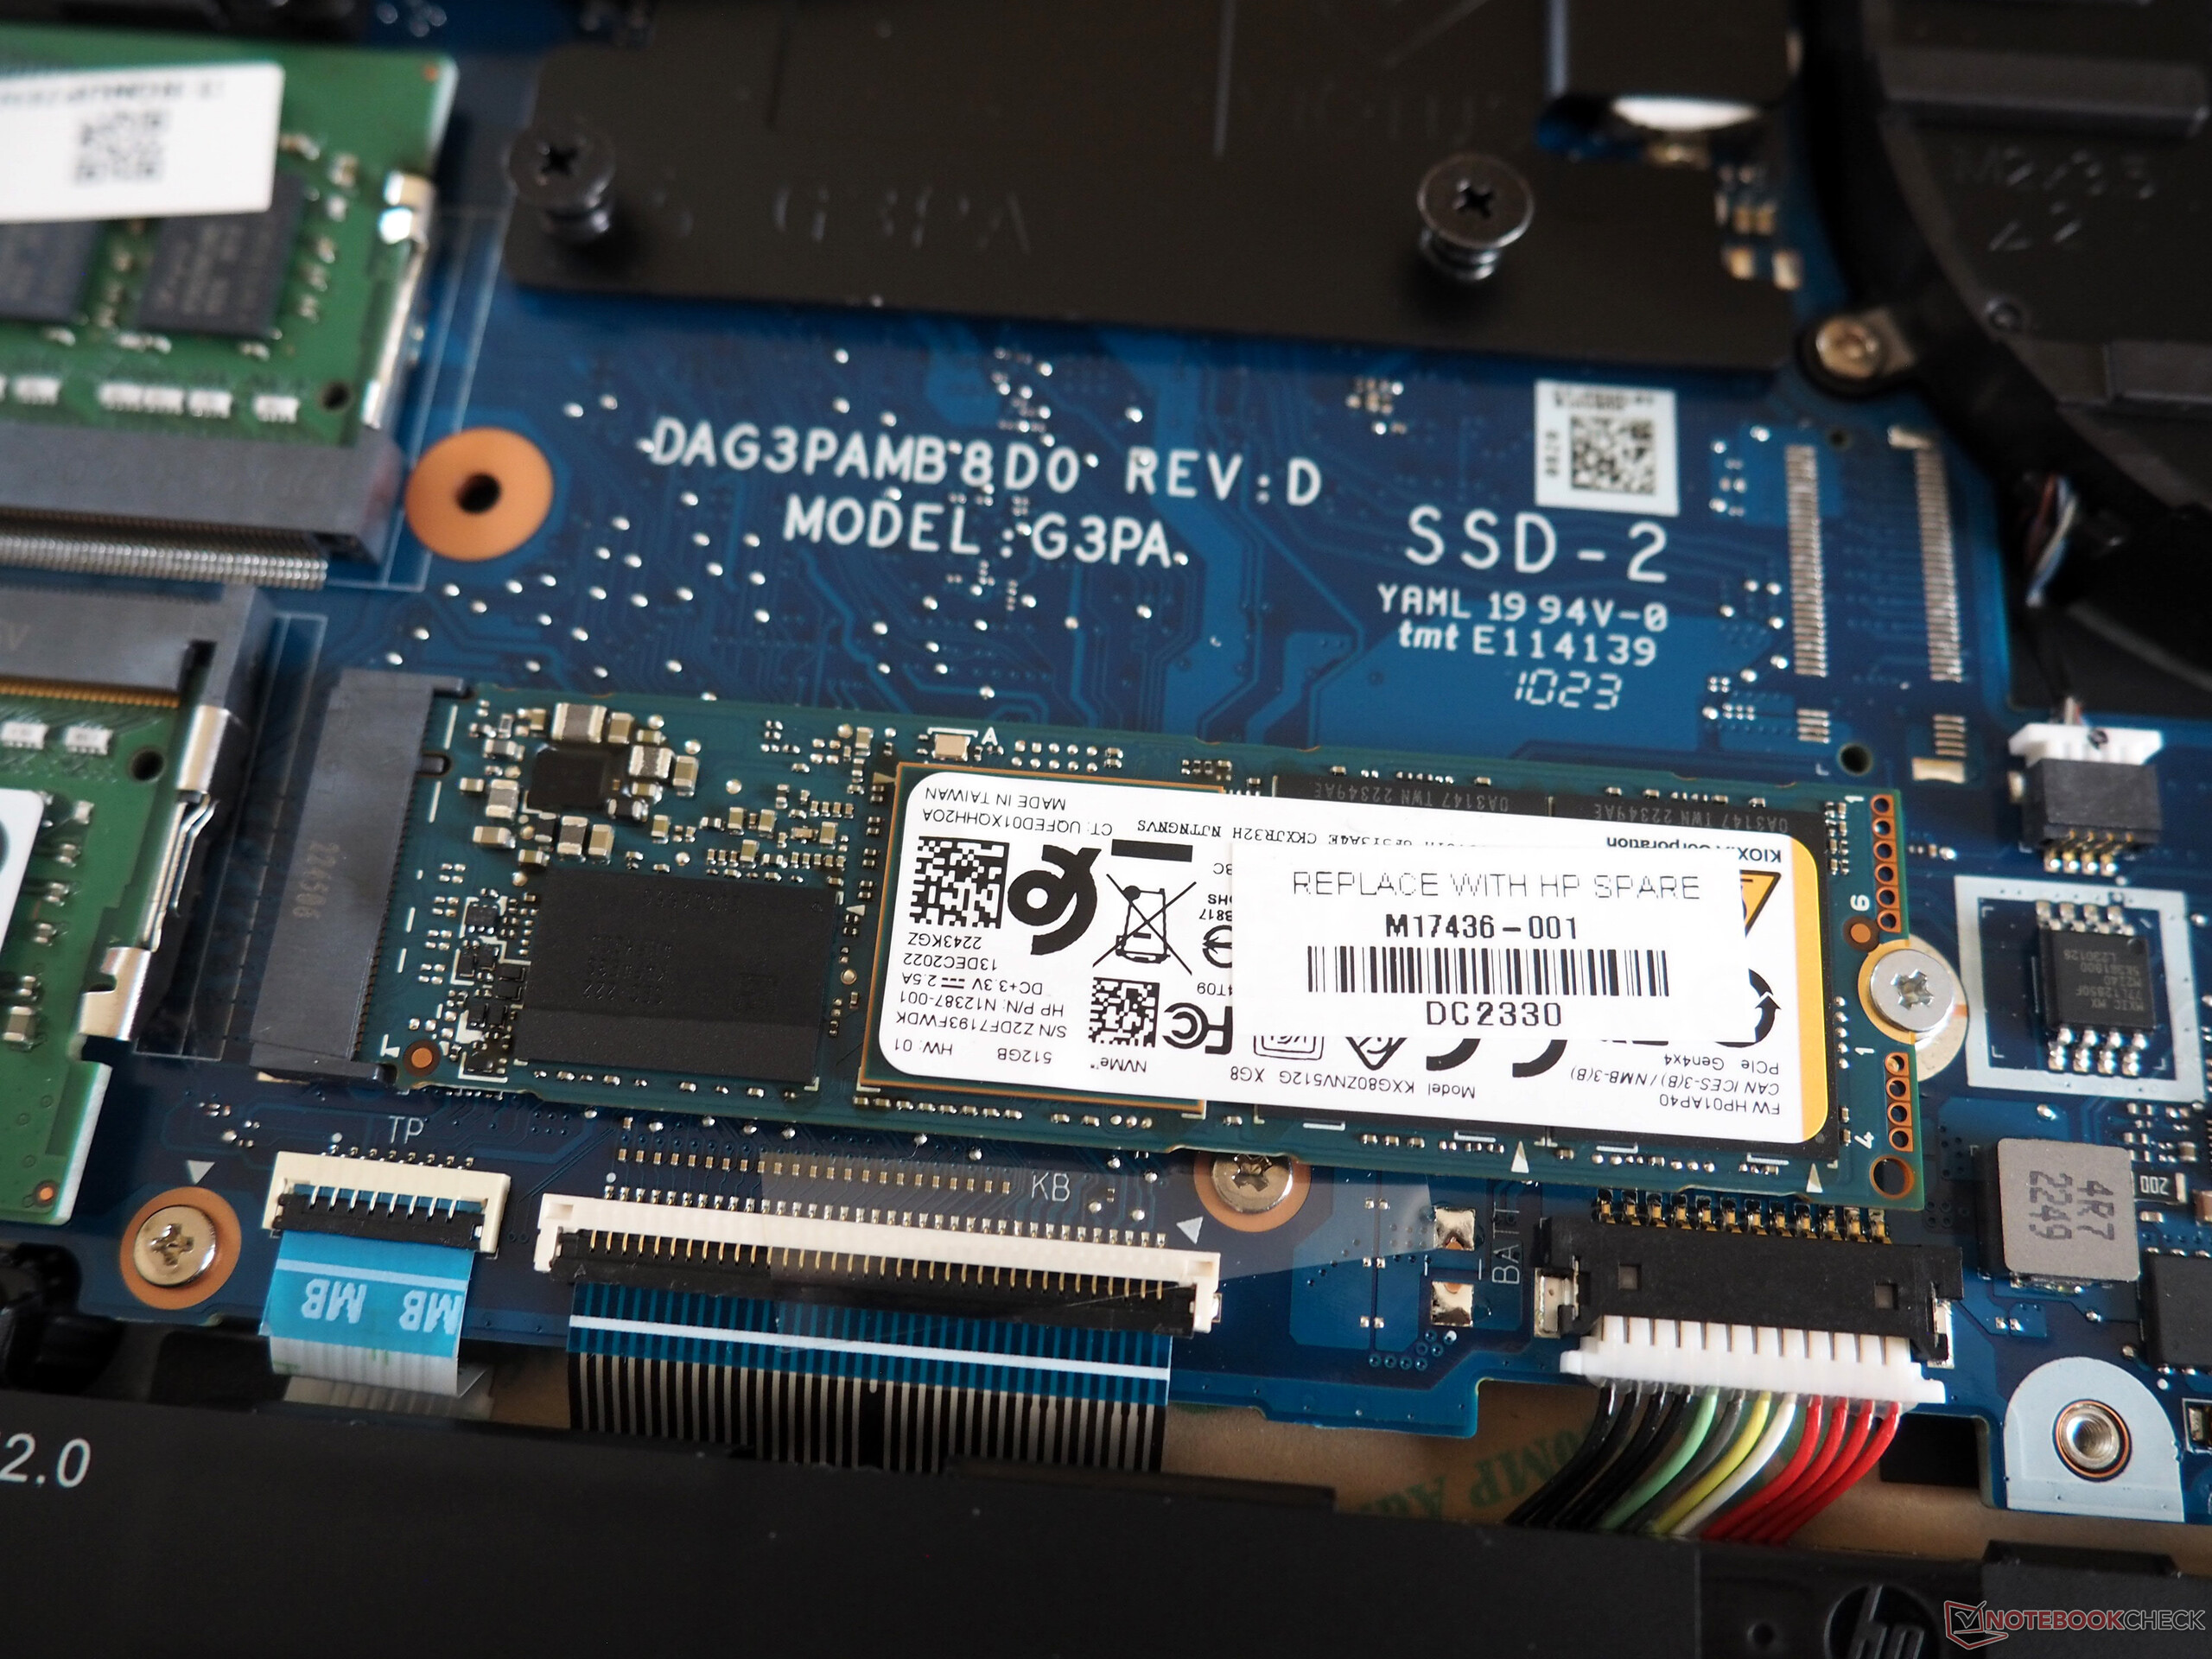
Maintenance
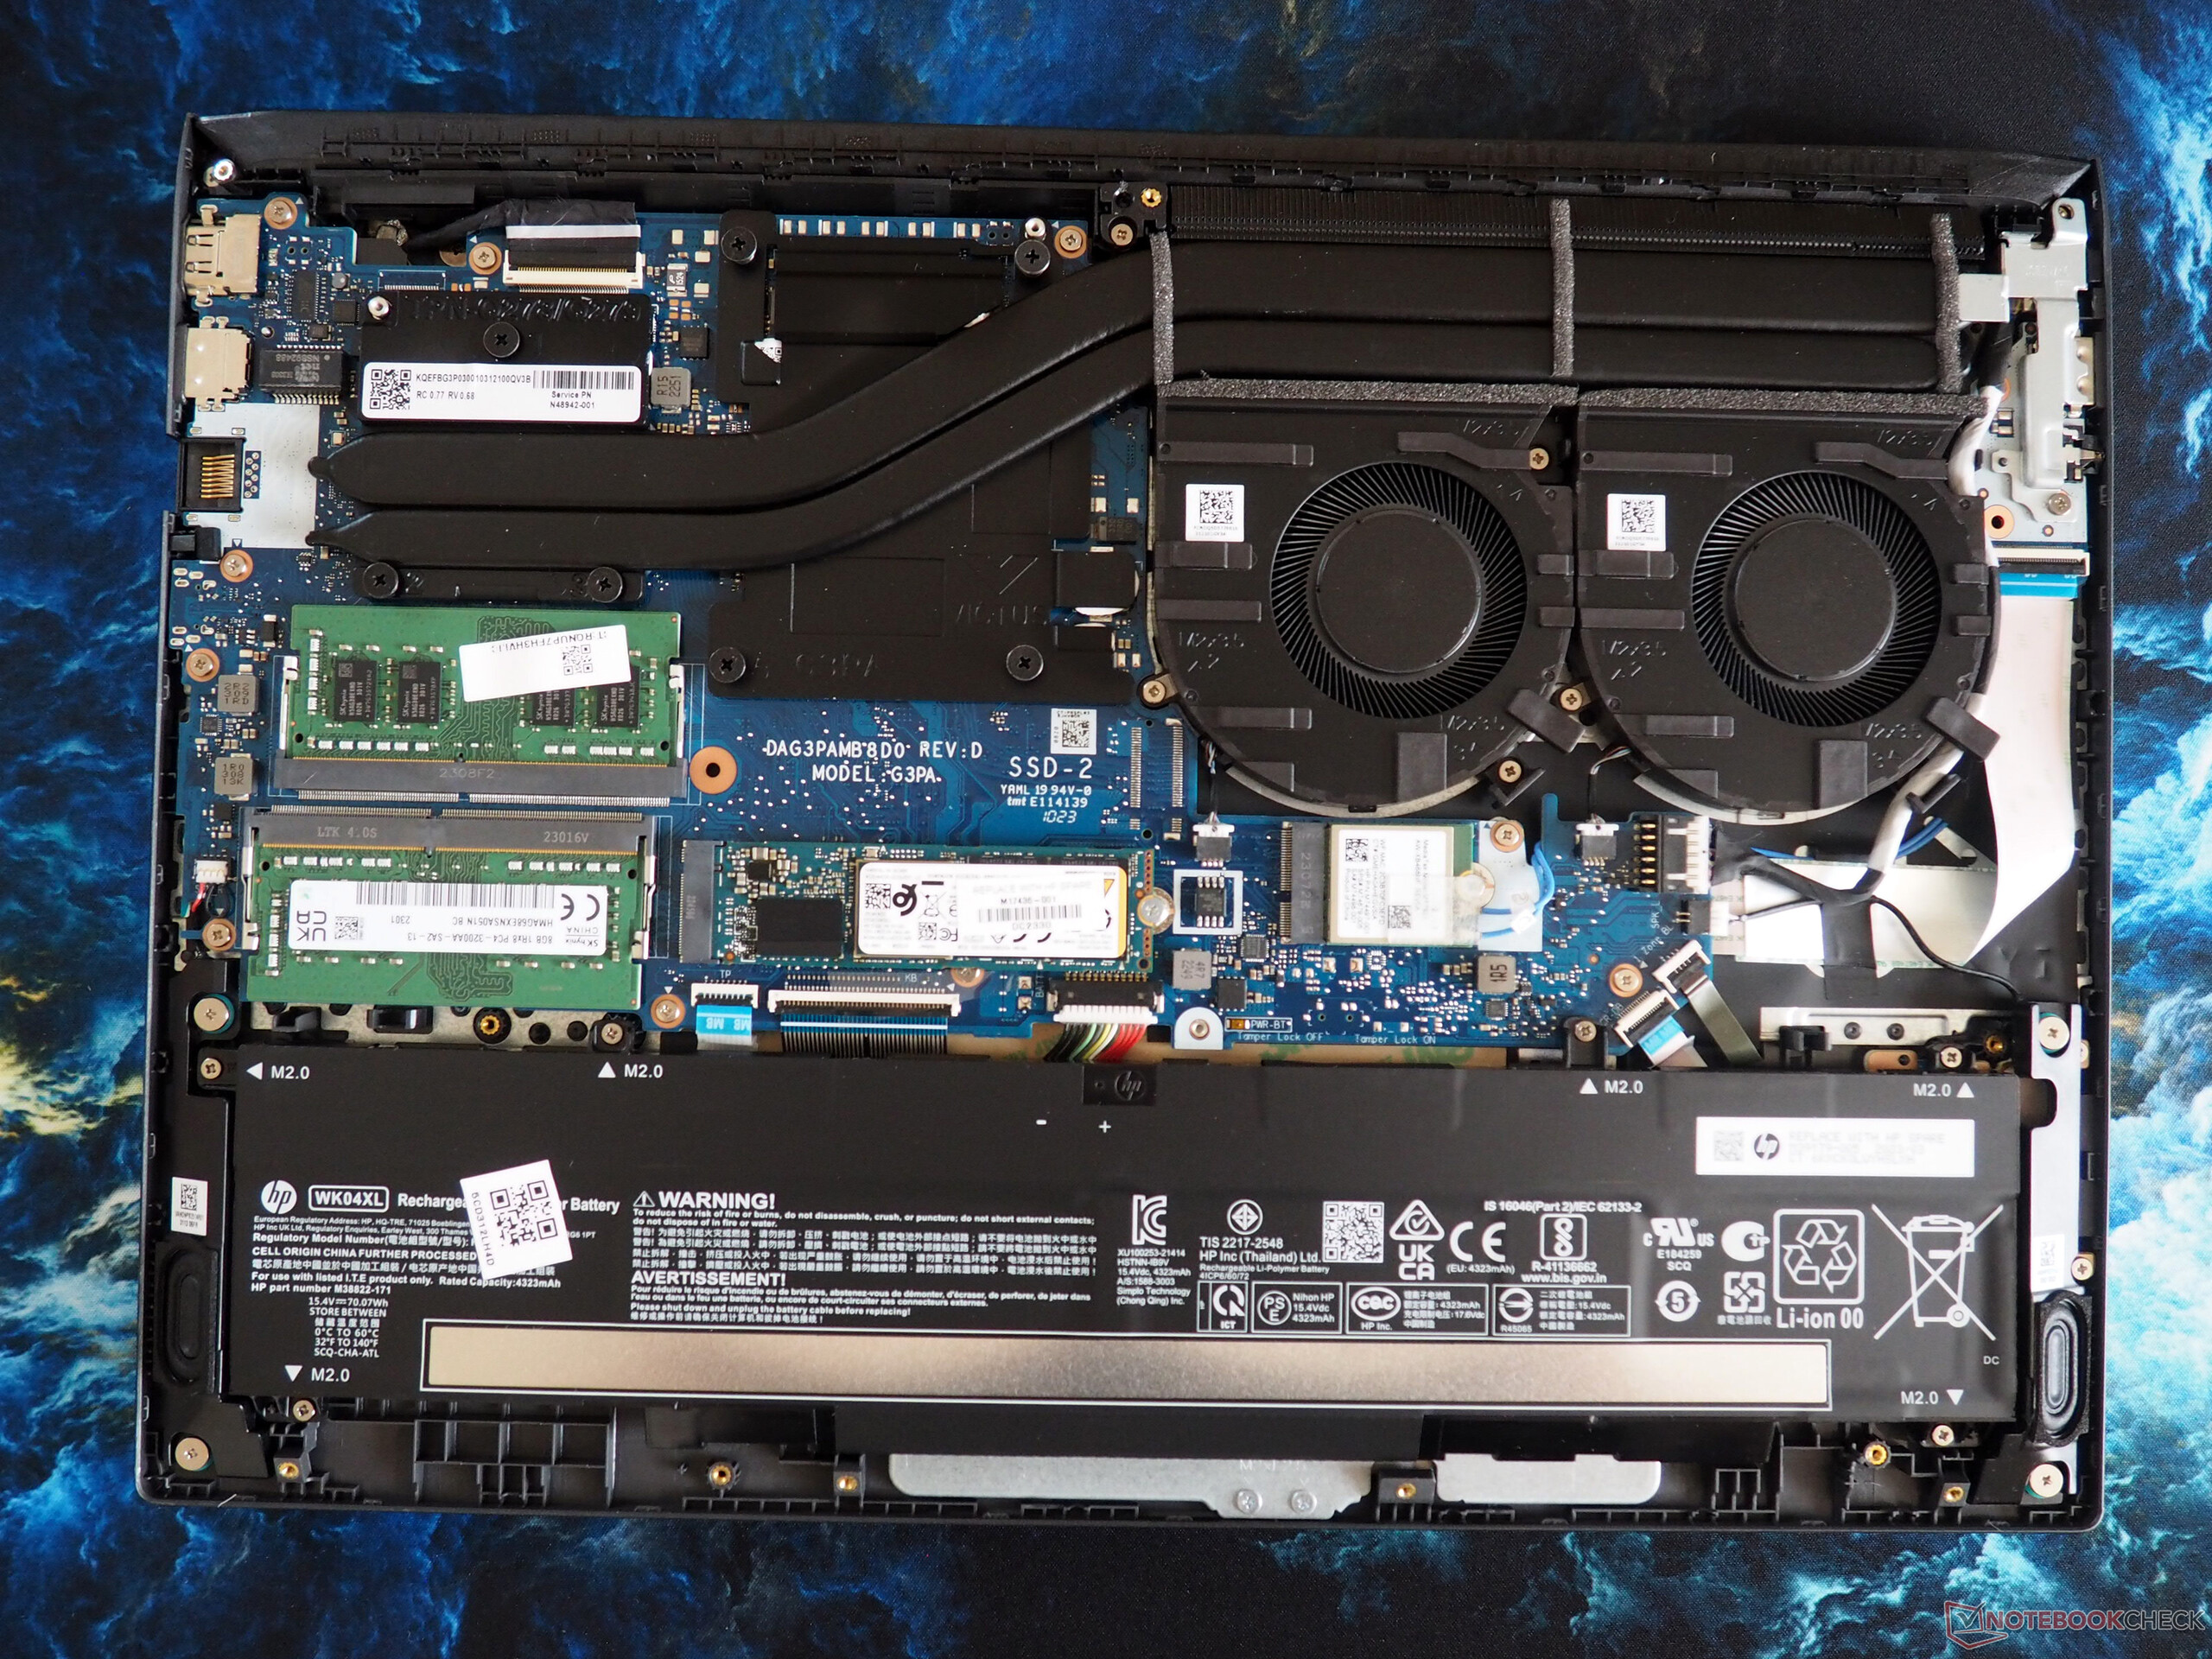
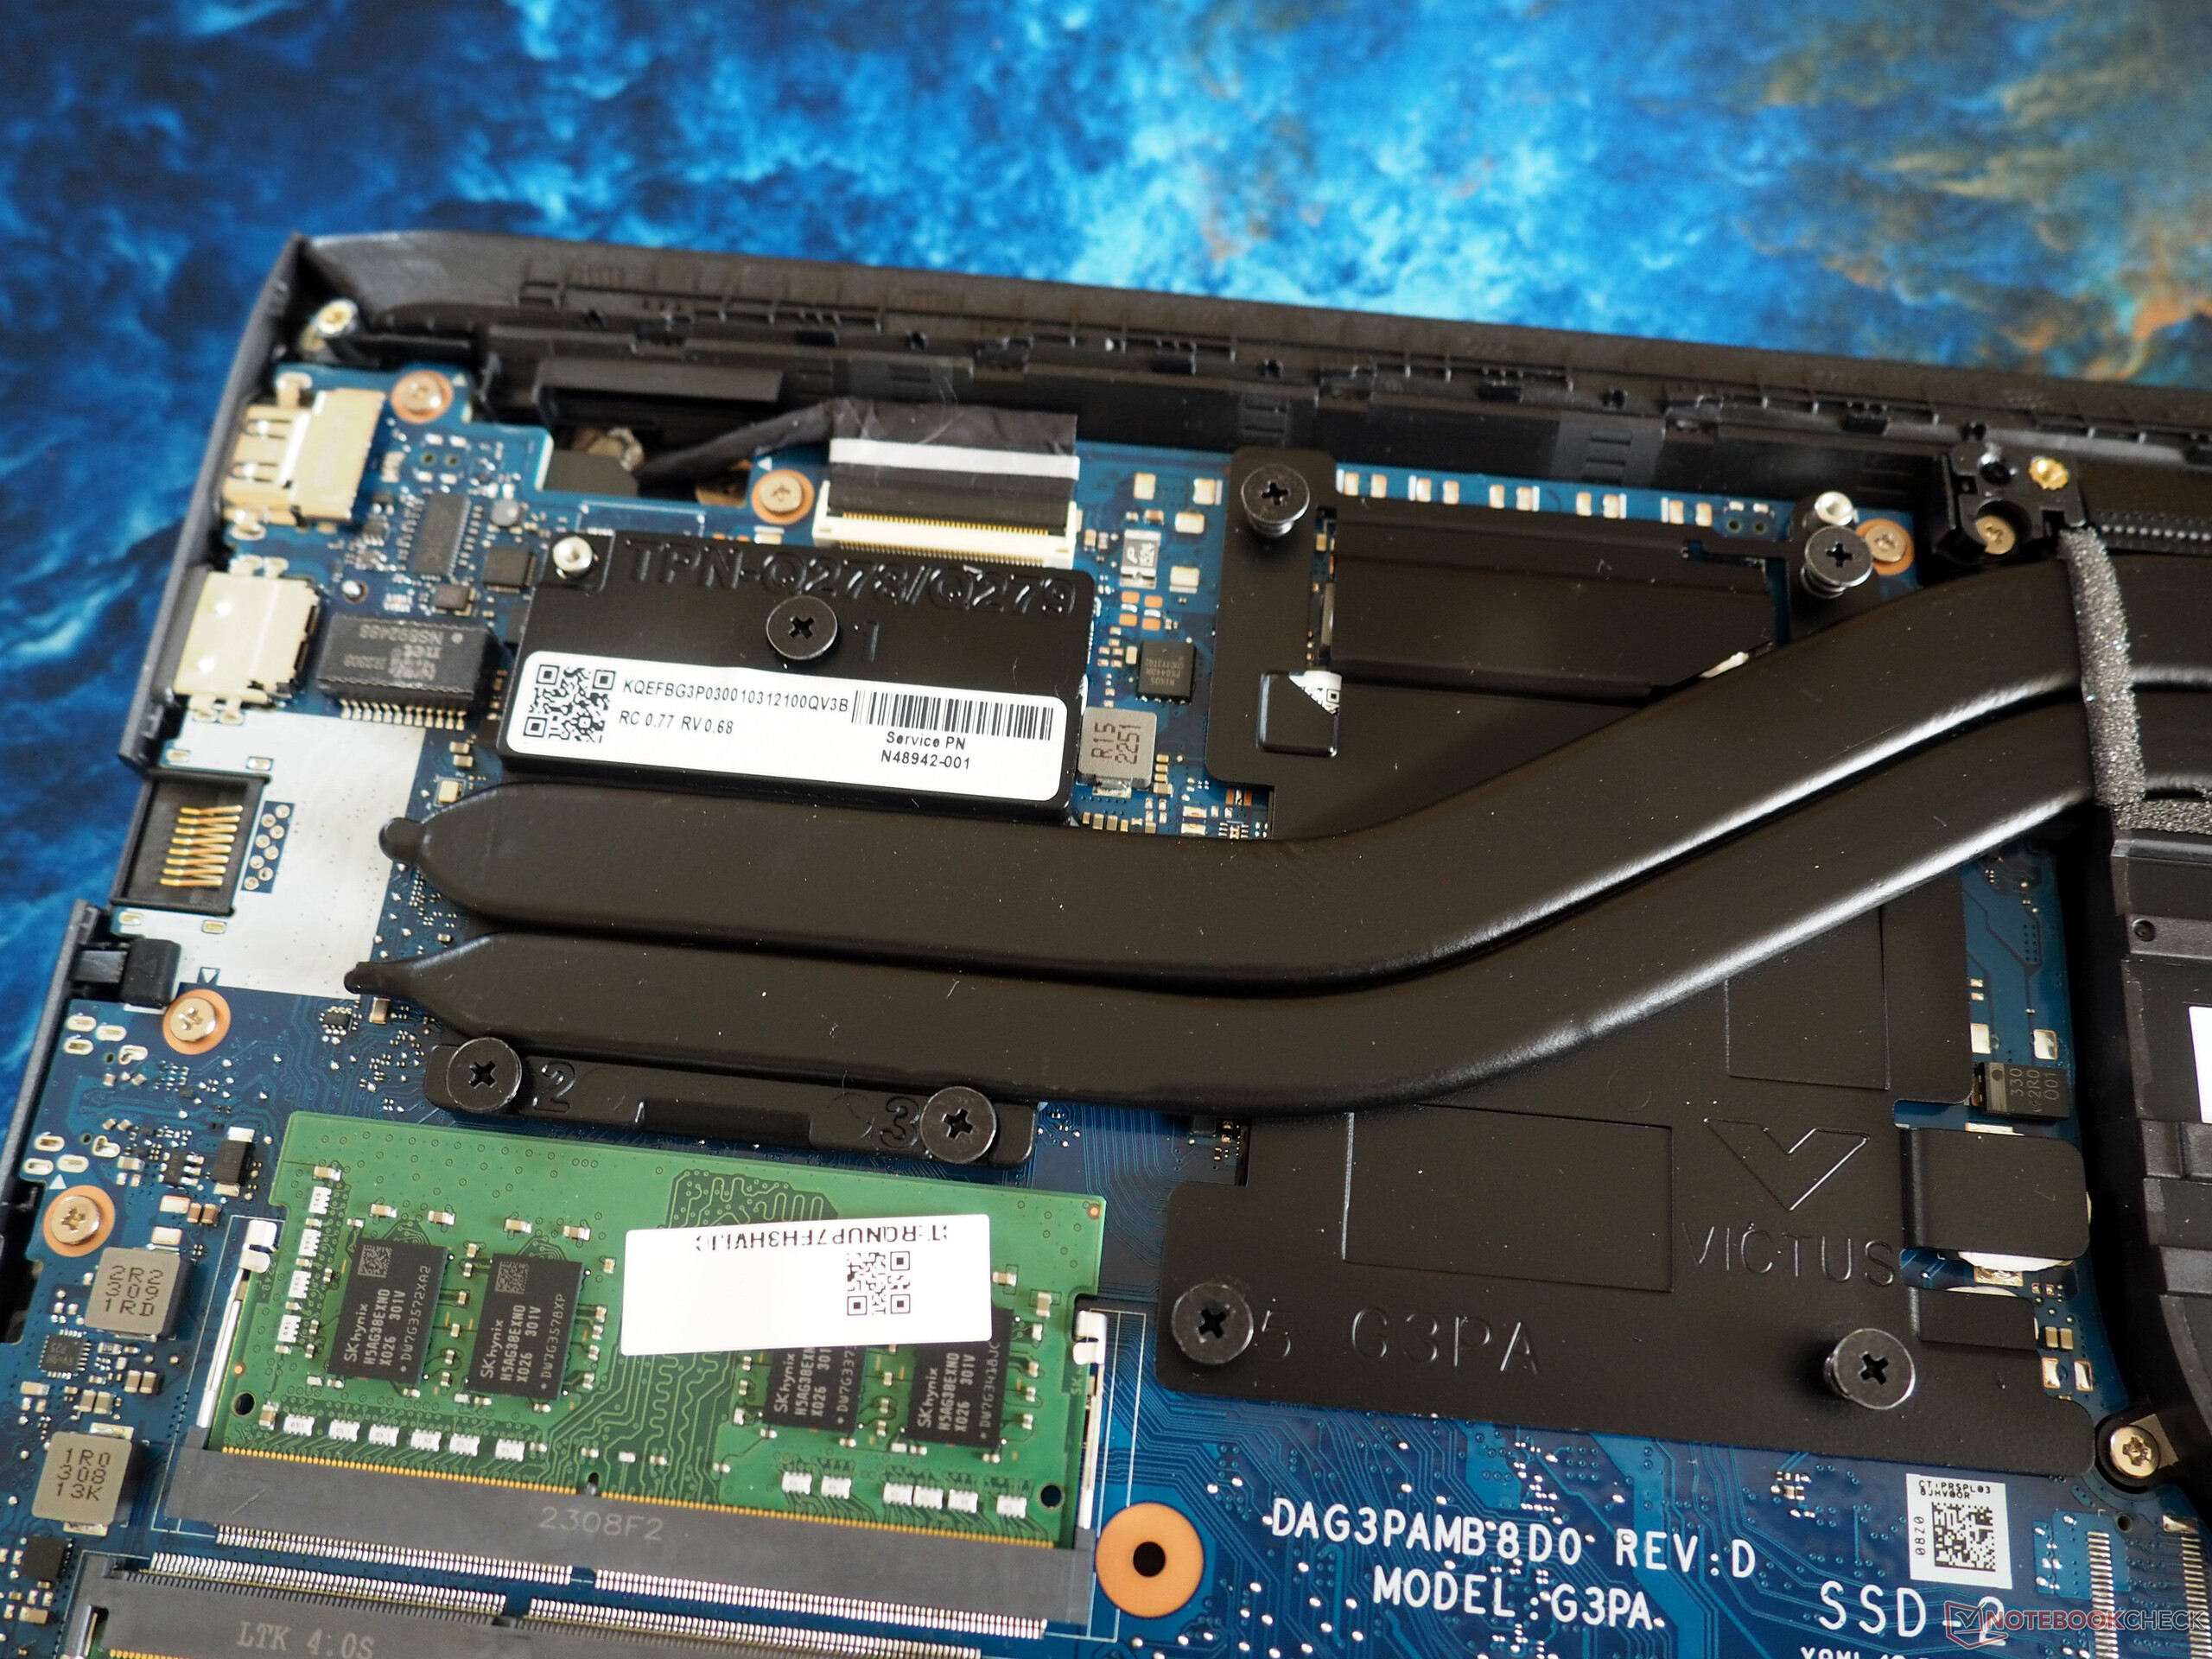
Some caution is needed during maintenance. While the Phillips screws on the base plate can be removed relatively quickly, loosening the retaining clips proves to be somewhat challenging, even with a suitable tool. The pictures show the interior of the casing, and that all essential components are accessible.

Warranty
The warranty only covers 12 months.
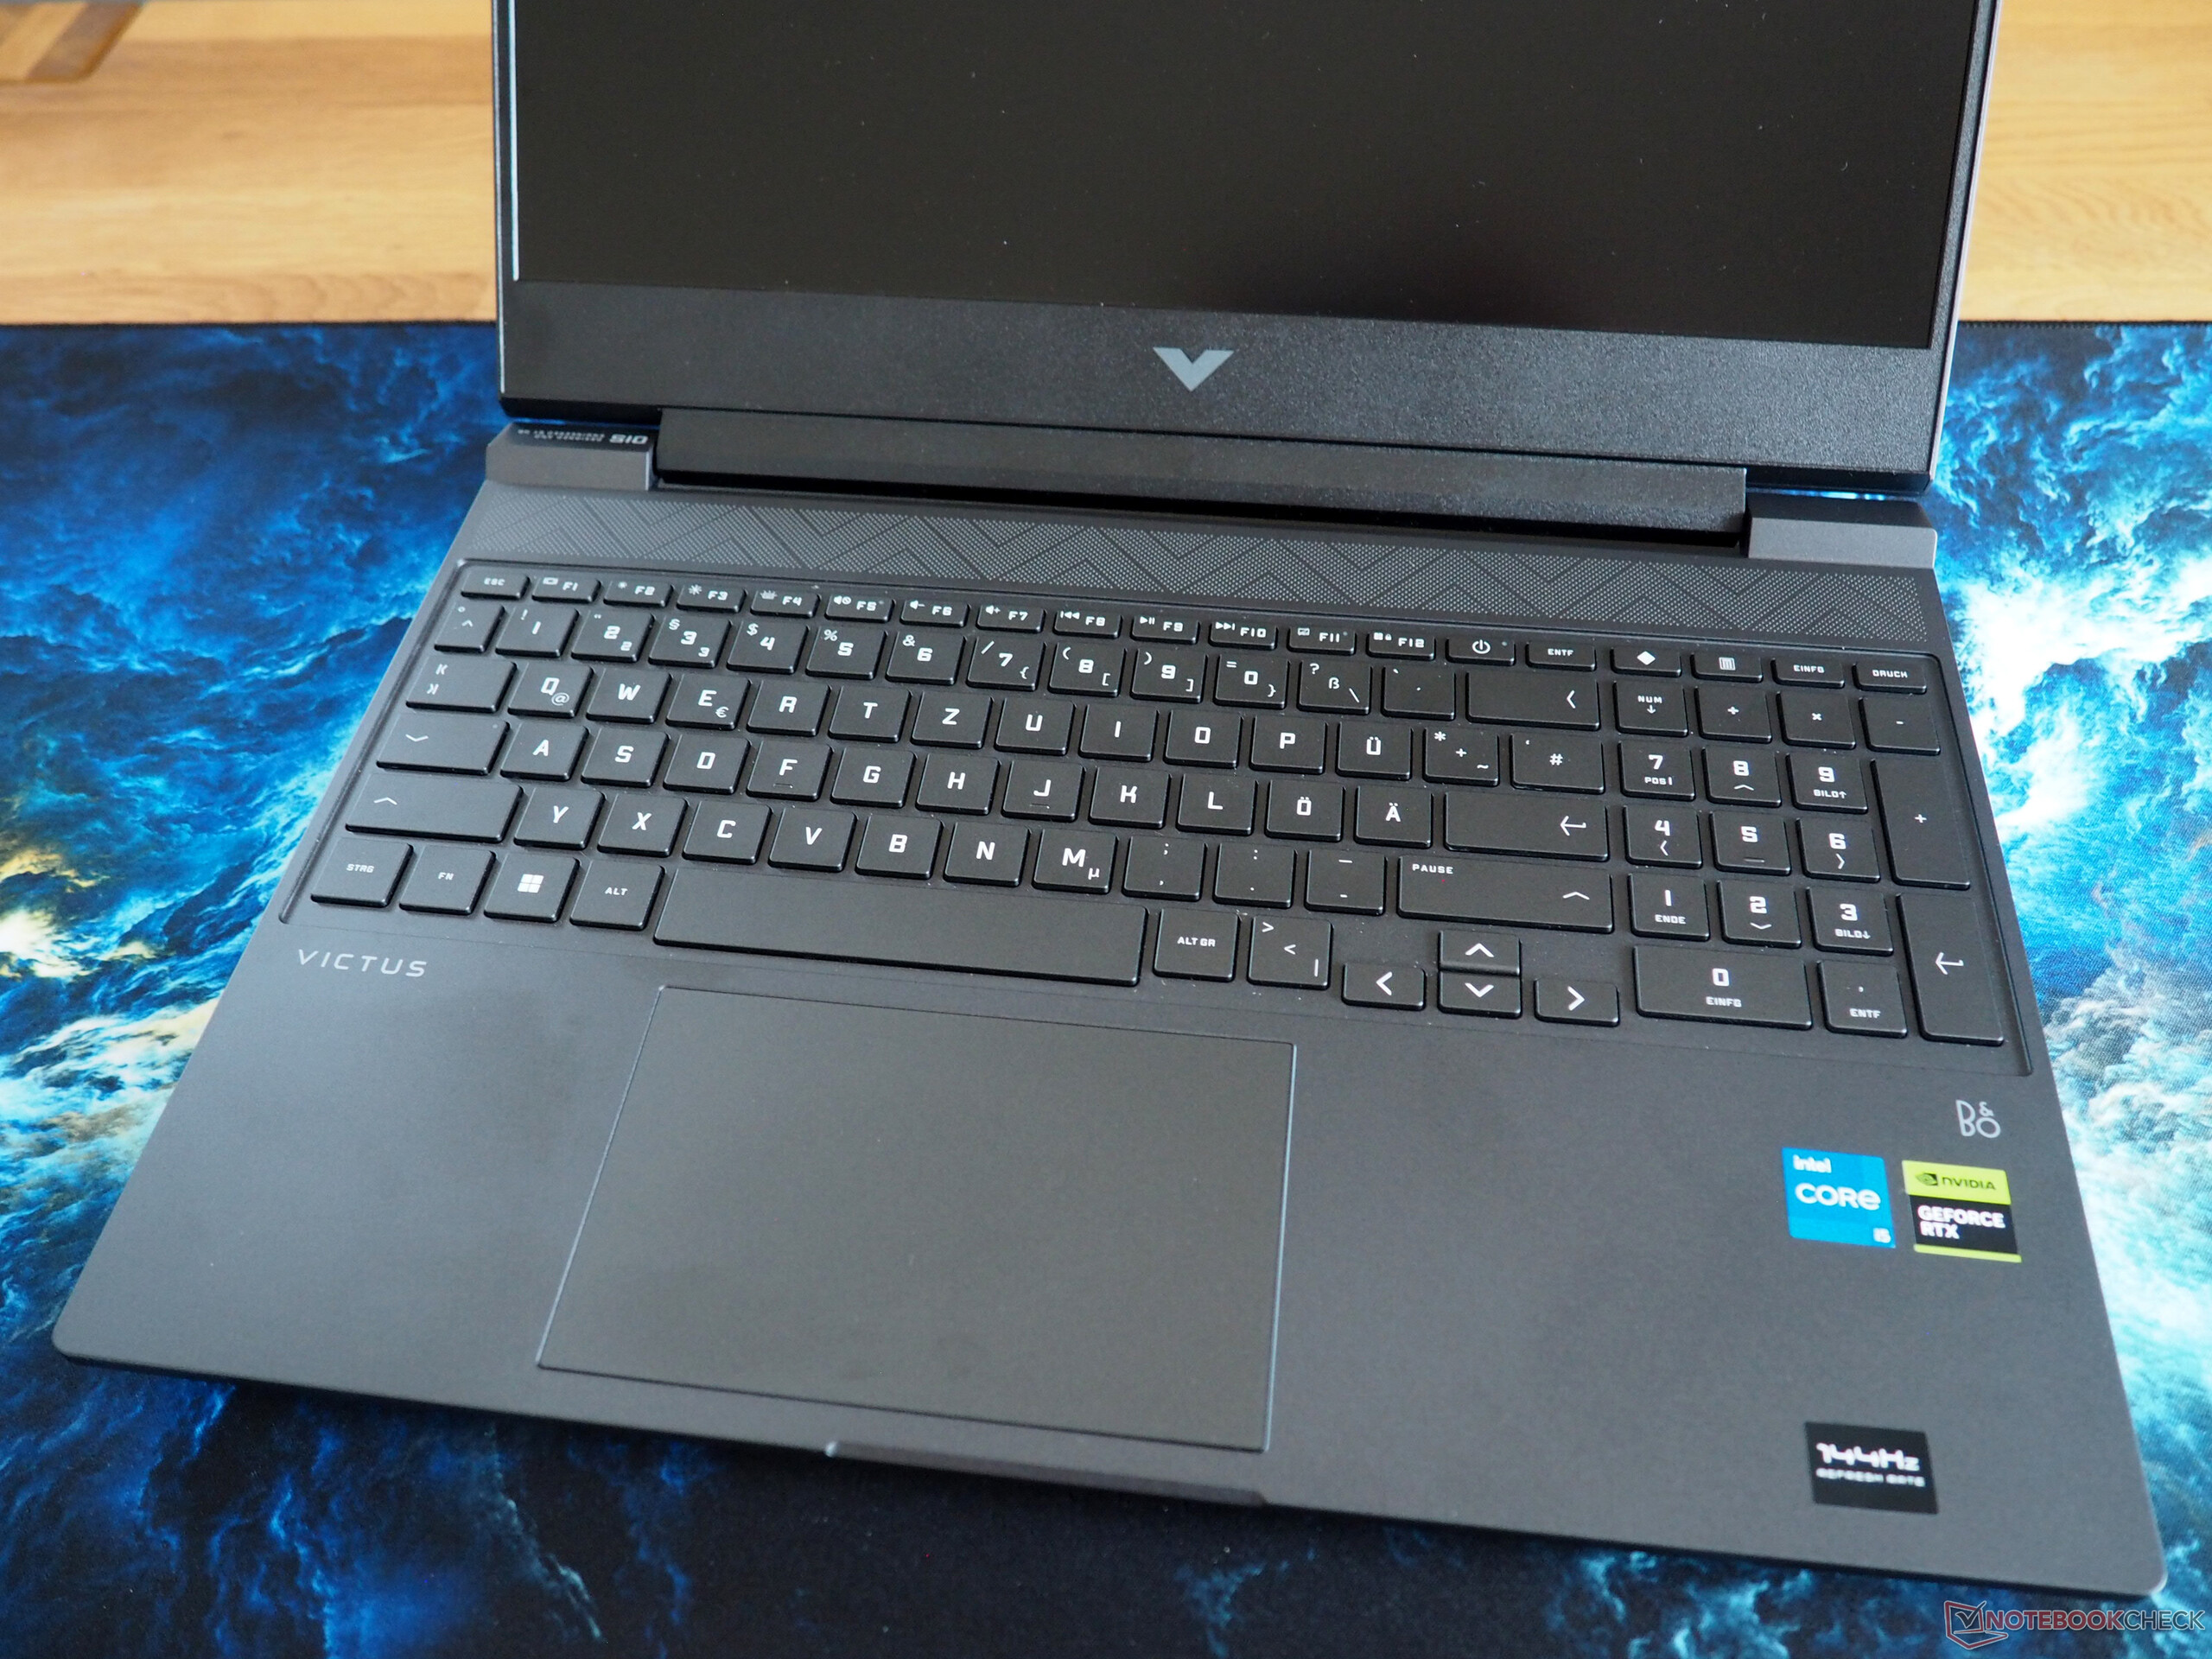
Input devices
Keyboard
In terms of the keyboard, the layout requires some adaptation. The compact directional arrows and the unconventional arrangement of the F-row (power button not on the outer edge, Ins and Del not adjacent, etc.) may also raise some eyebrows. Nevertheless, the keyboard provides a satisfactory typing experience. The white illumination has only two settings: on or off, without adjustable brightness levels.
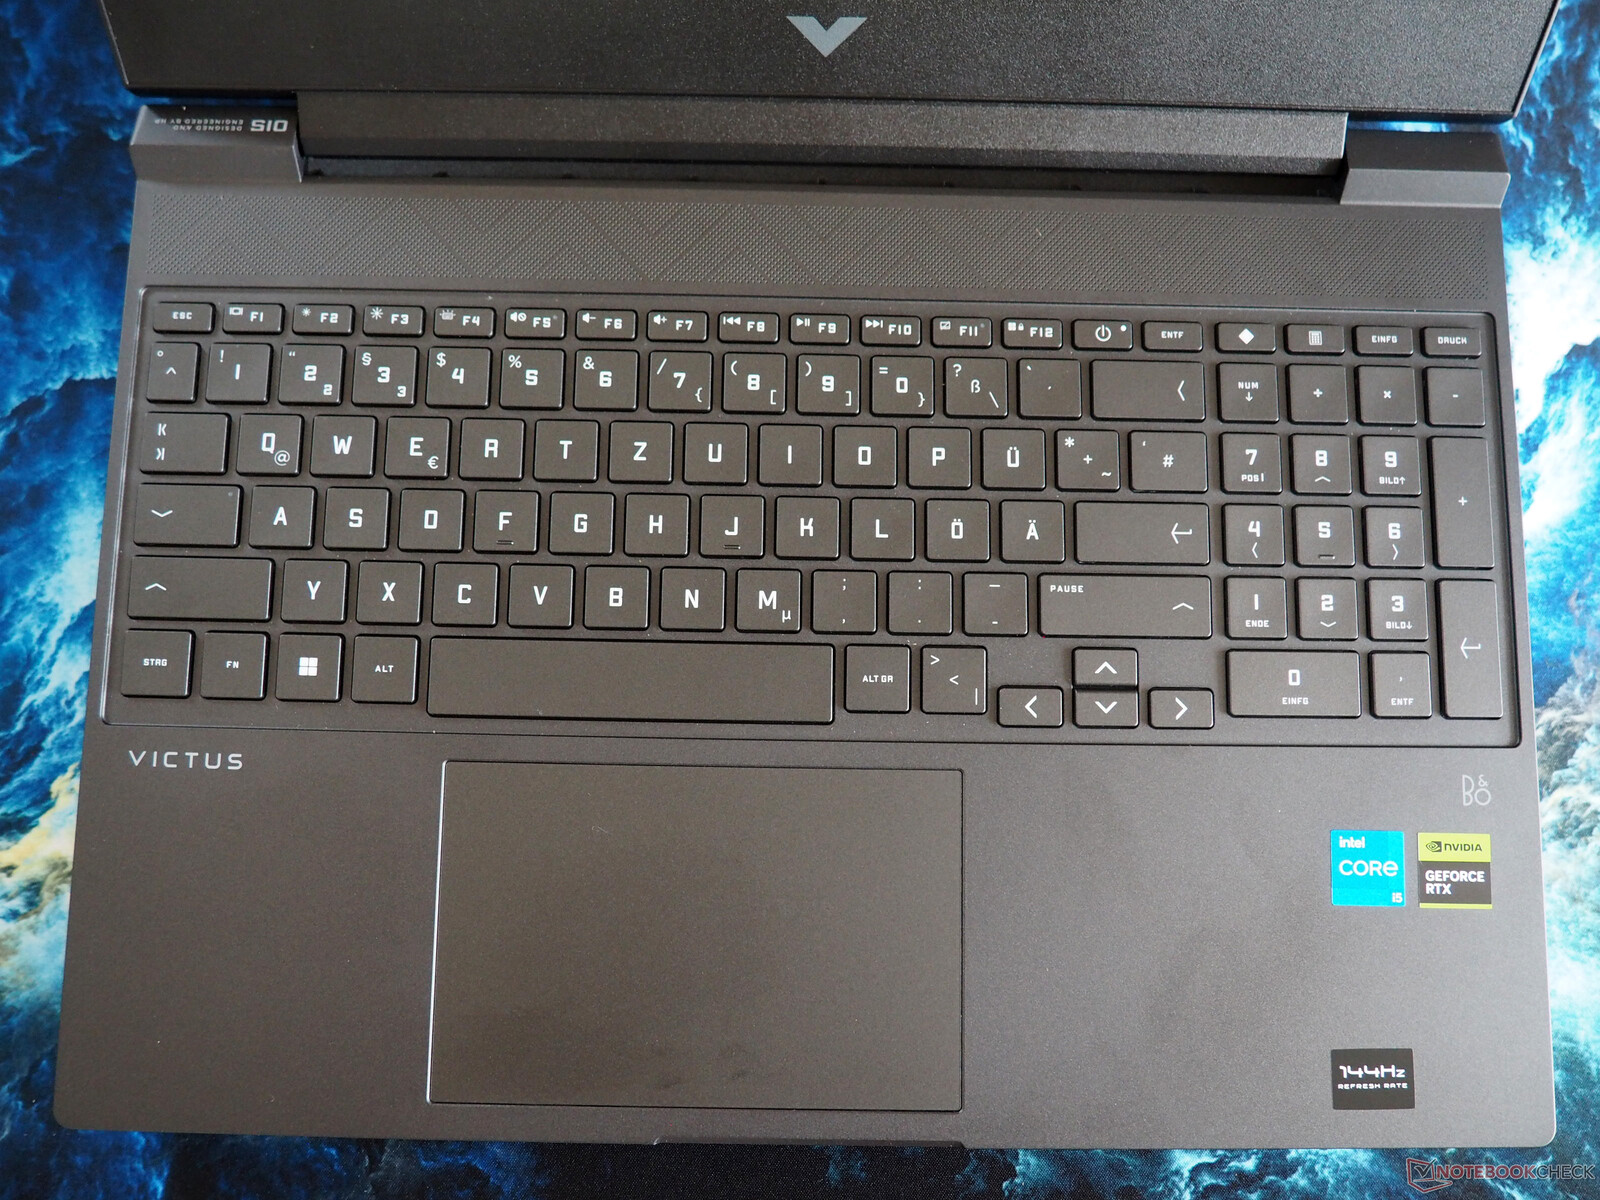
Touchpad
The quality of the touchpad aligns with that of the competition. The gliding properties and functionality of the click surfaces are neither poor nor exceptionally good. There were no noticeable issues with gesture support. The size is decent at approximately 4.92 x 3.15 inches.
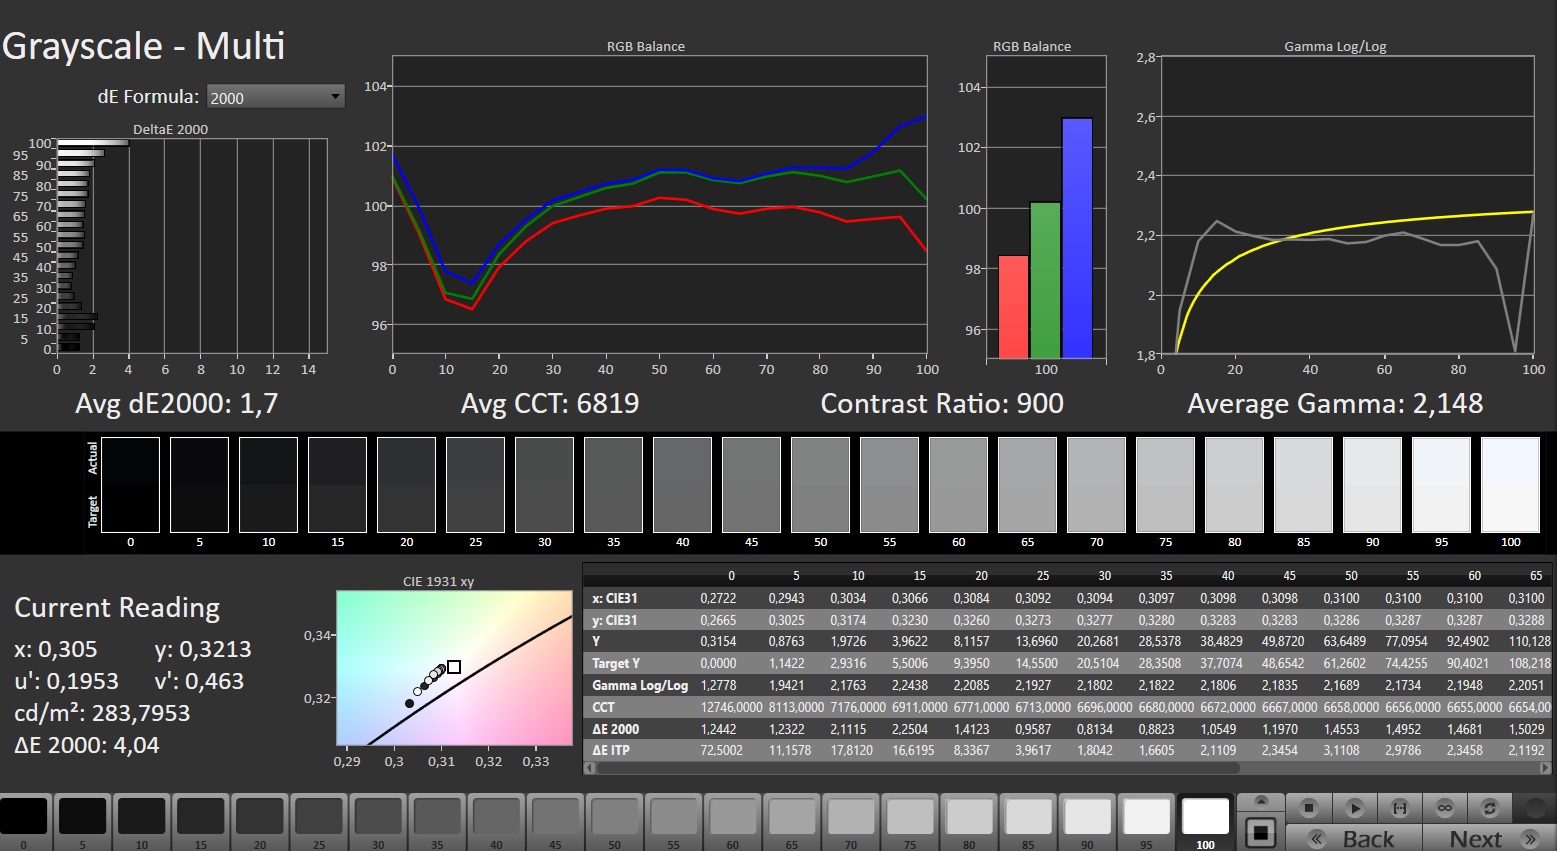
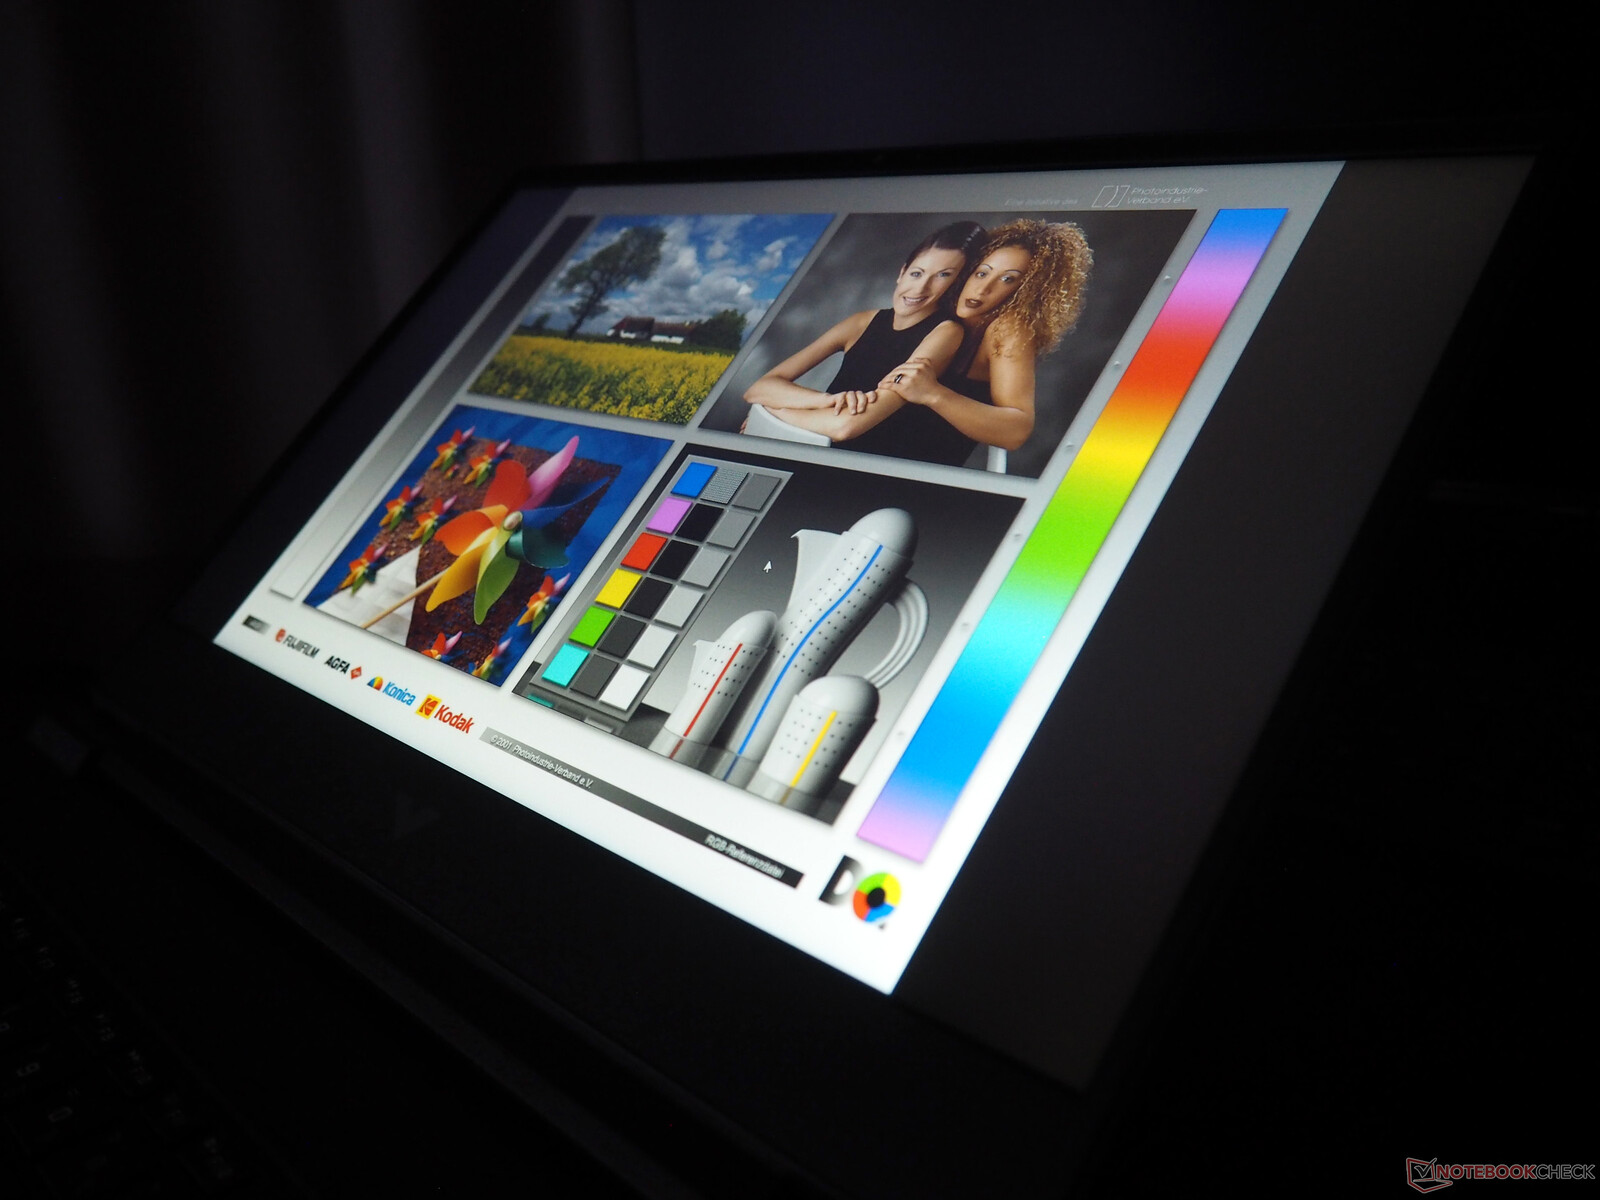
Display
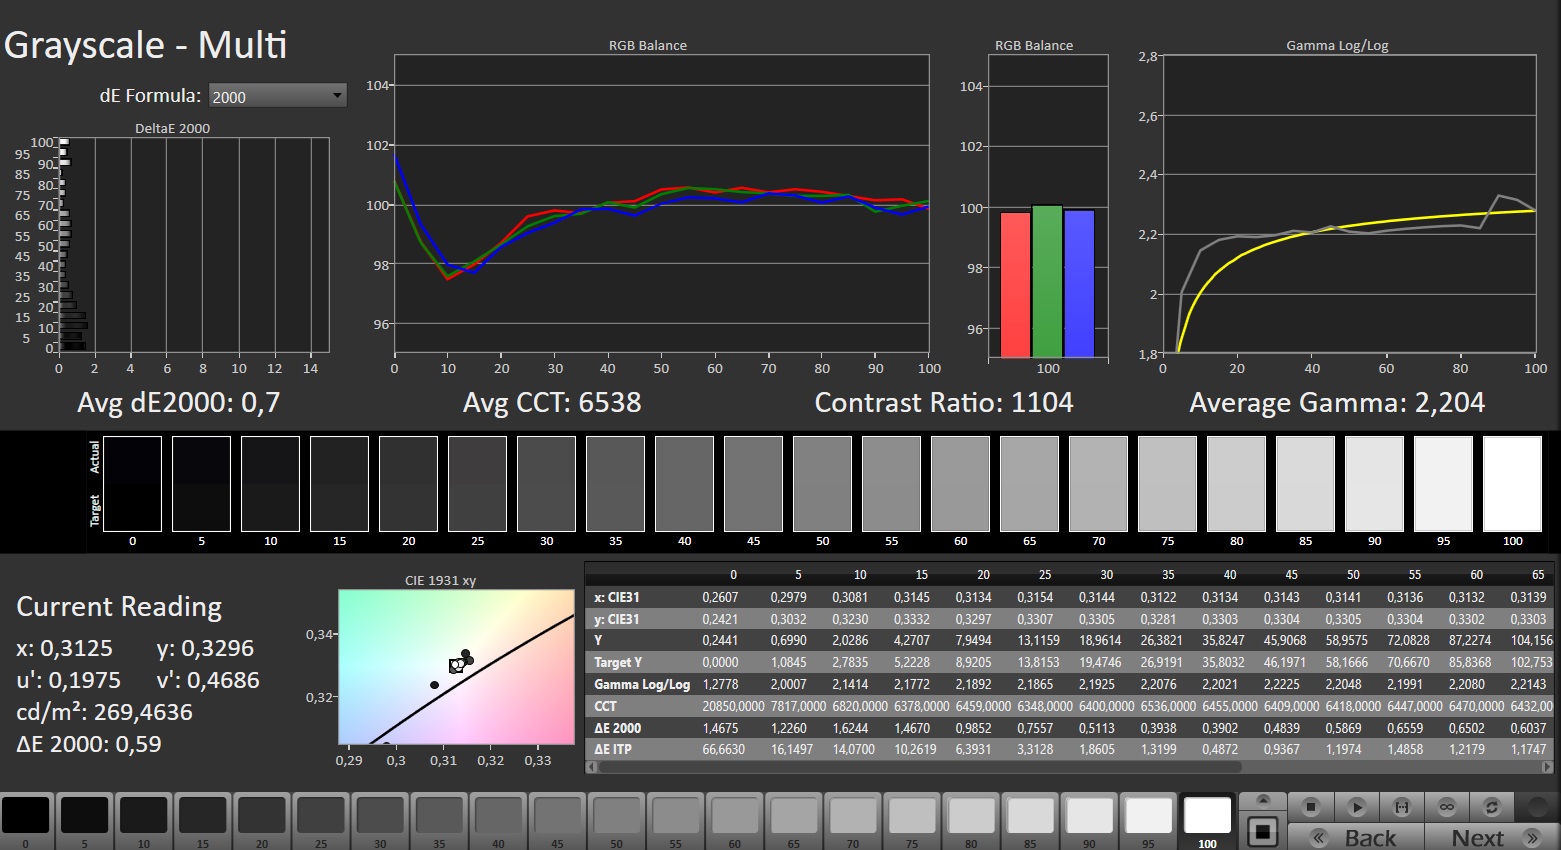
The subpar display proves to be the most significant drawback. While the black level (0.28 cd/m²) and contrast (975:1) are still decent, the luminosity leaves much to be desired. An average of 249 cd/m² can be problematic even indoors. The Victus 15 is entirely unsuitable for outdoor use.
| |||||||||||||||||||||||||
Brightness Distribution: 84 %
Center on Battery: 273 cd/m²
Contrast: 975:1 (Black: 0.28 cd/m²)
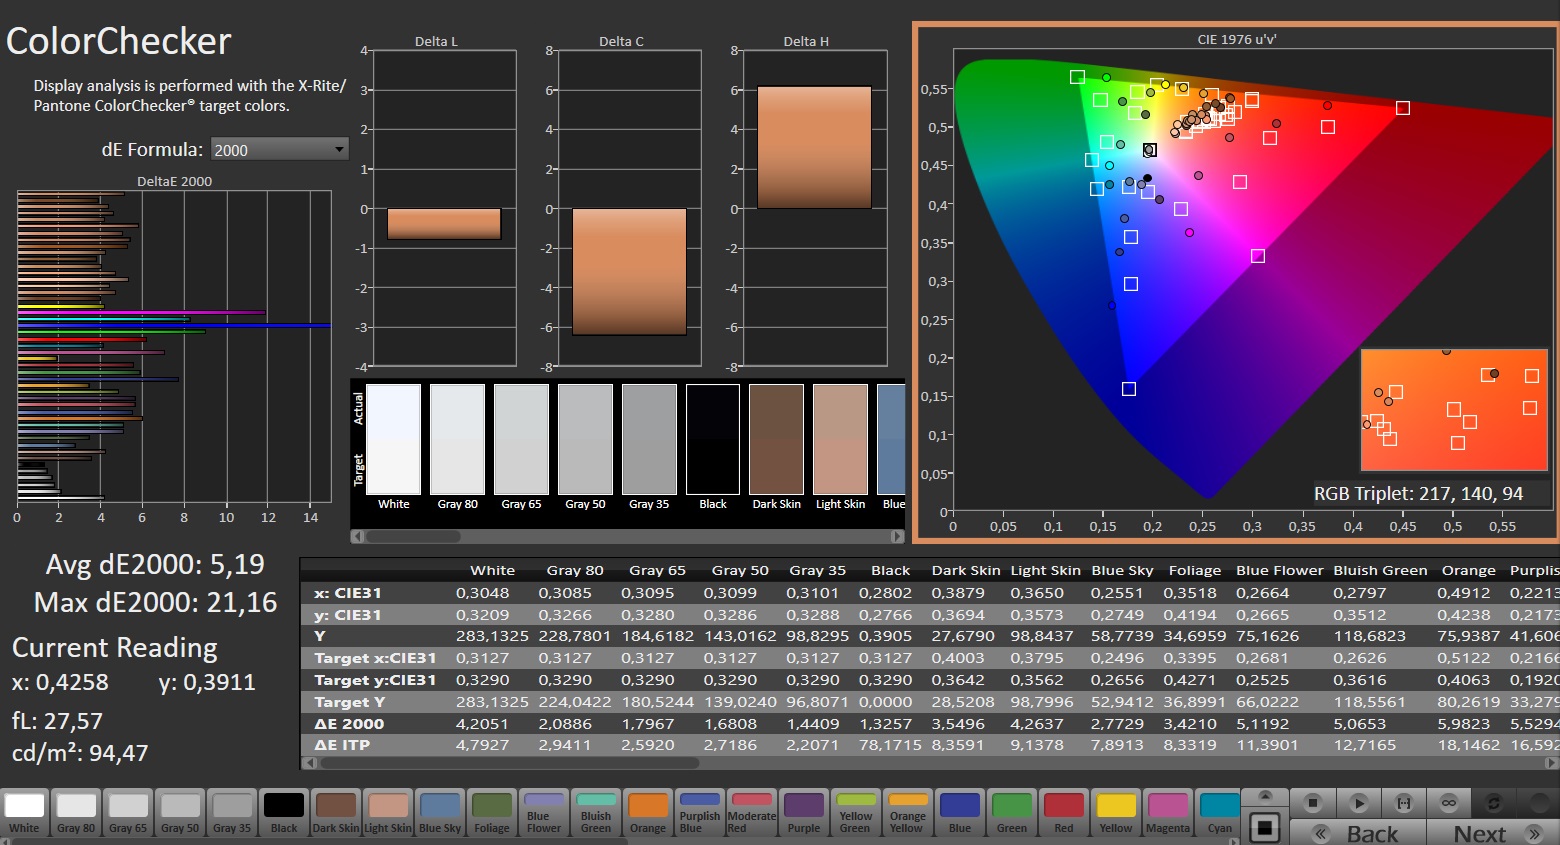
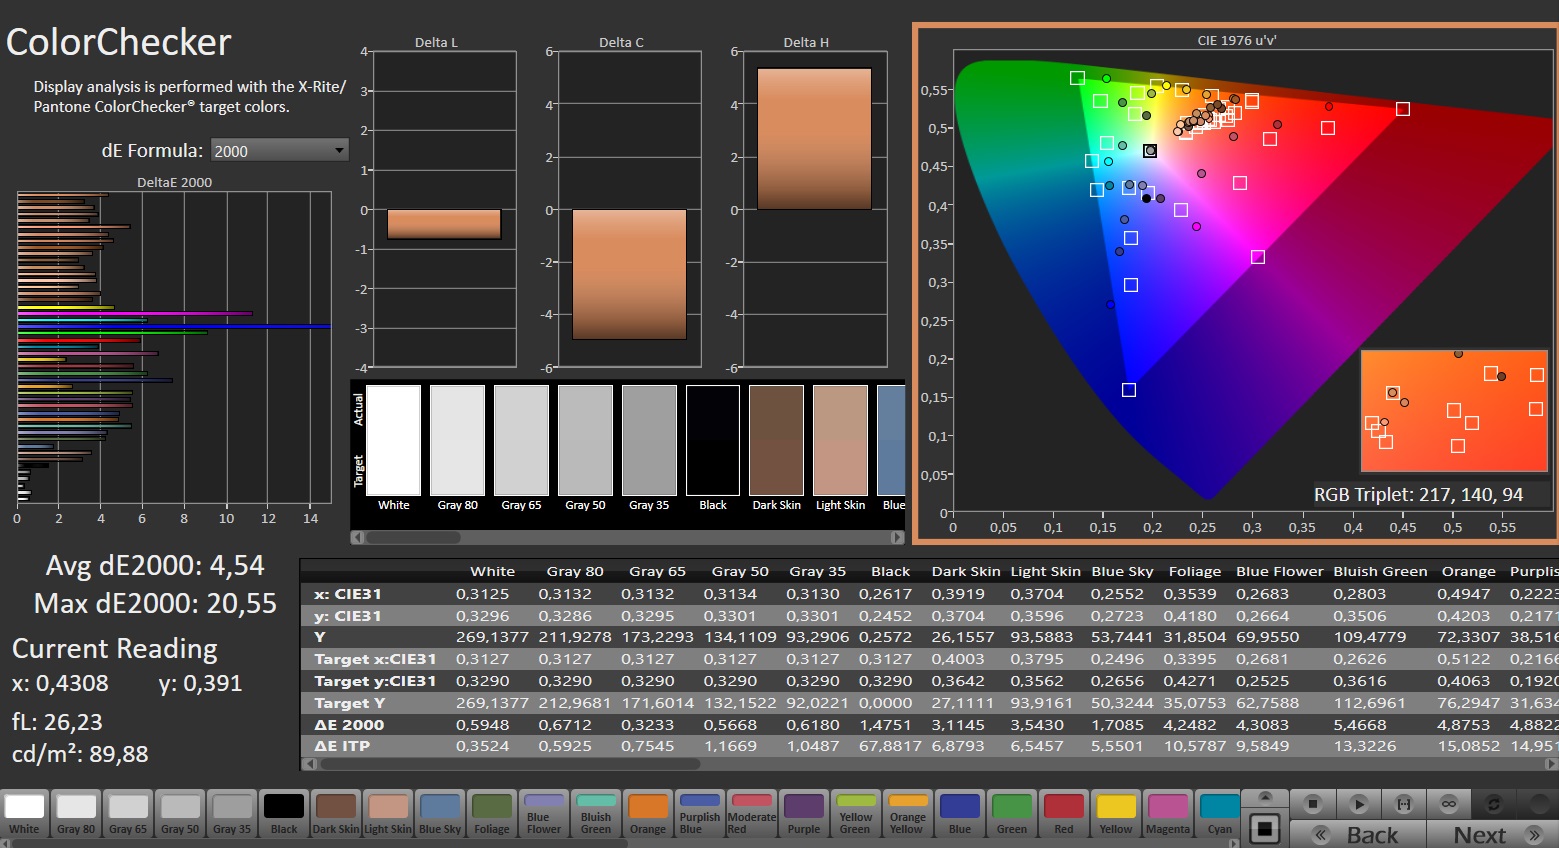
ΔE ColorChecker Calman: 5.19 | ∀{0.5-29.43 Ø4.73}
calibrated: 4.54
ΔE Greyscale Calman: 1.7 | ∀{0.09-98 Ø4.97}
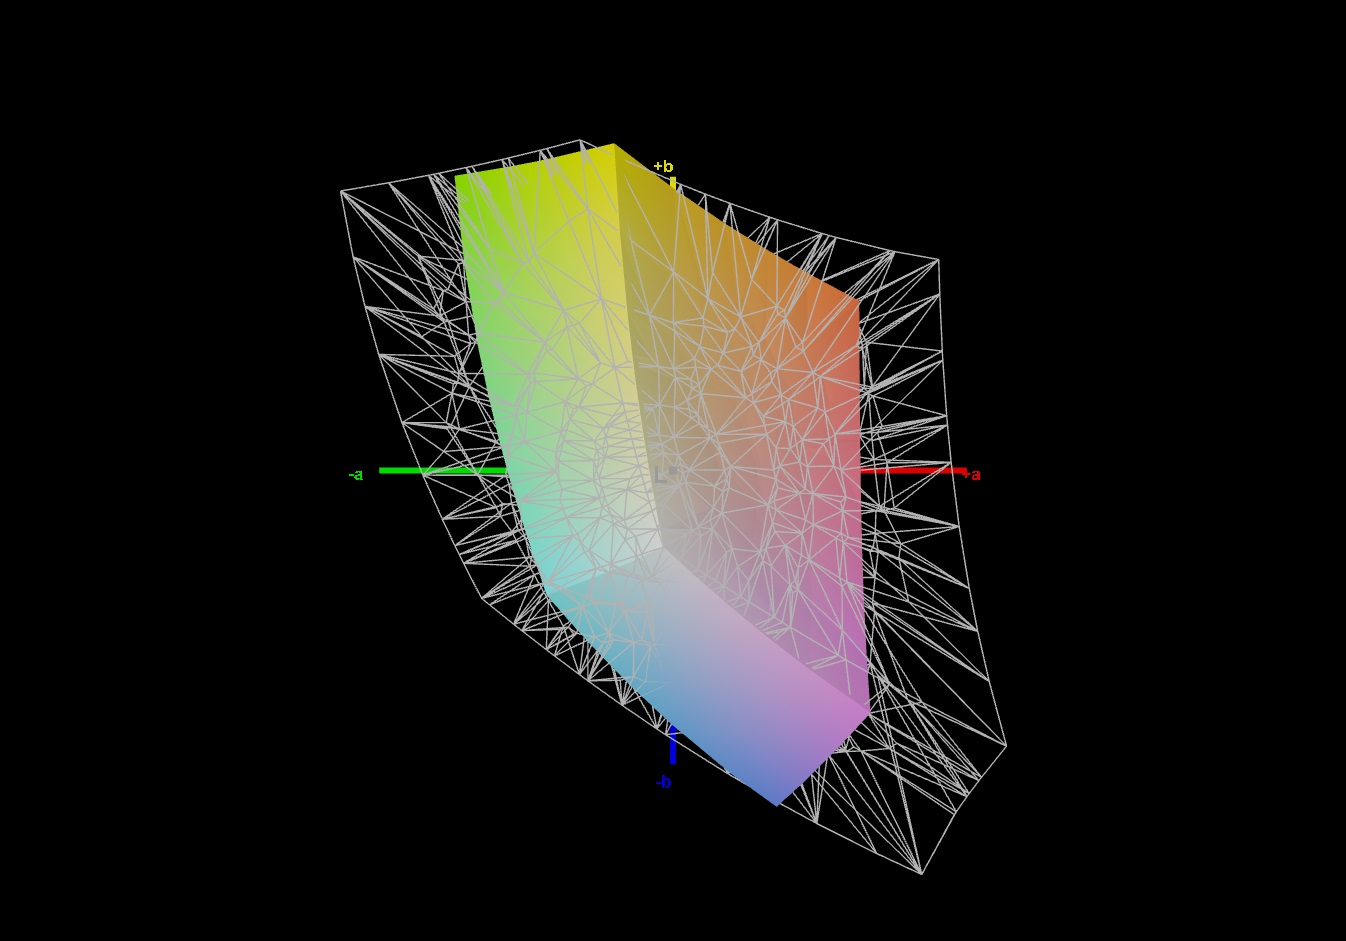
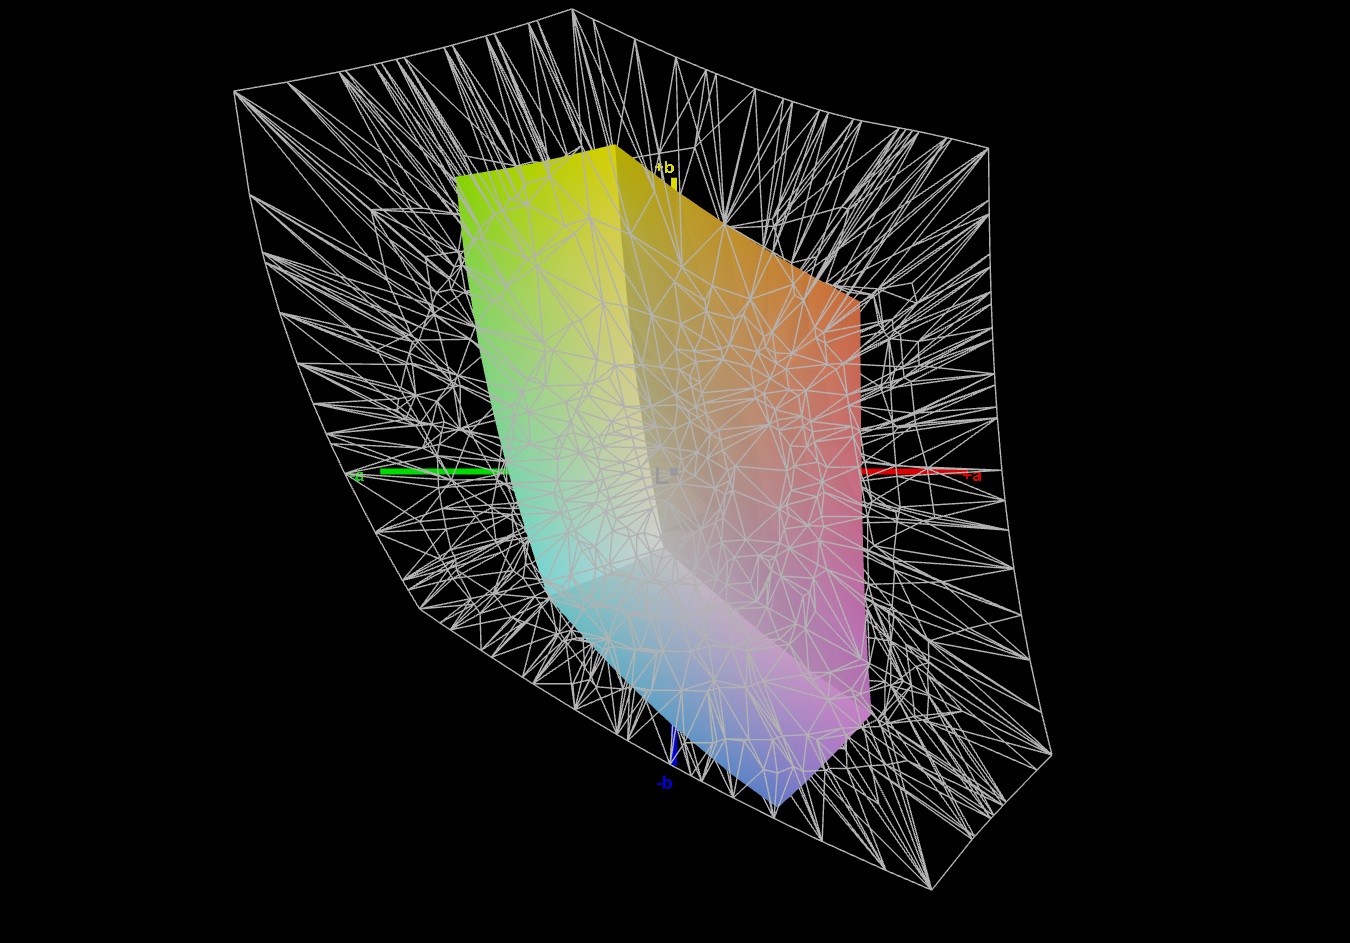
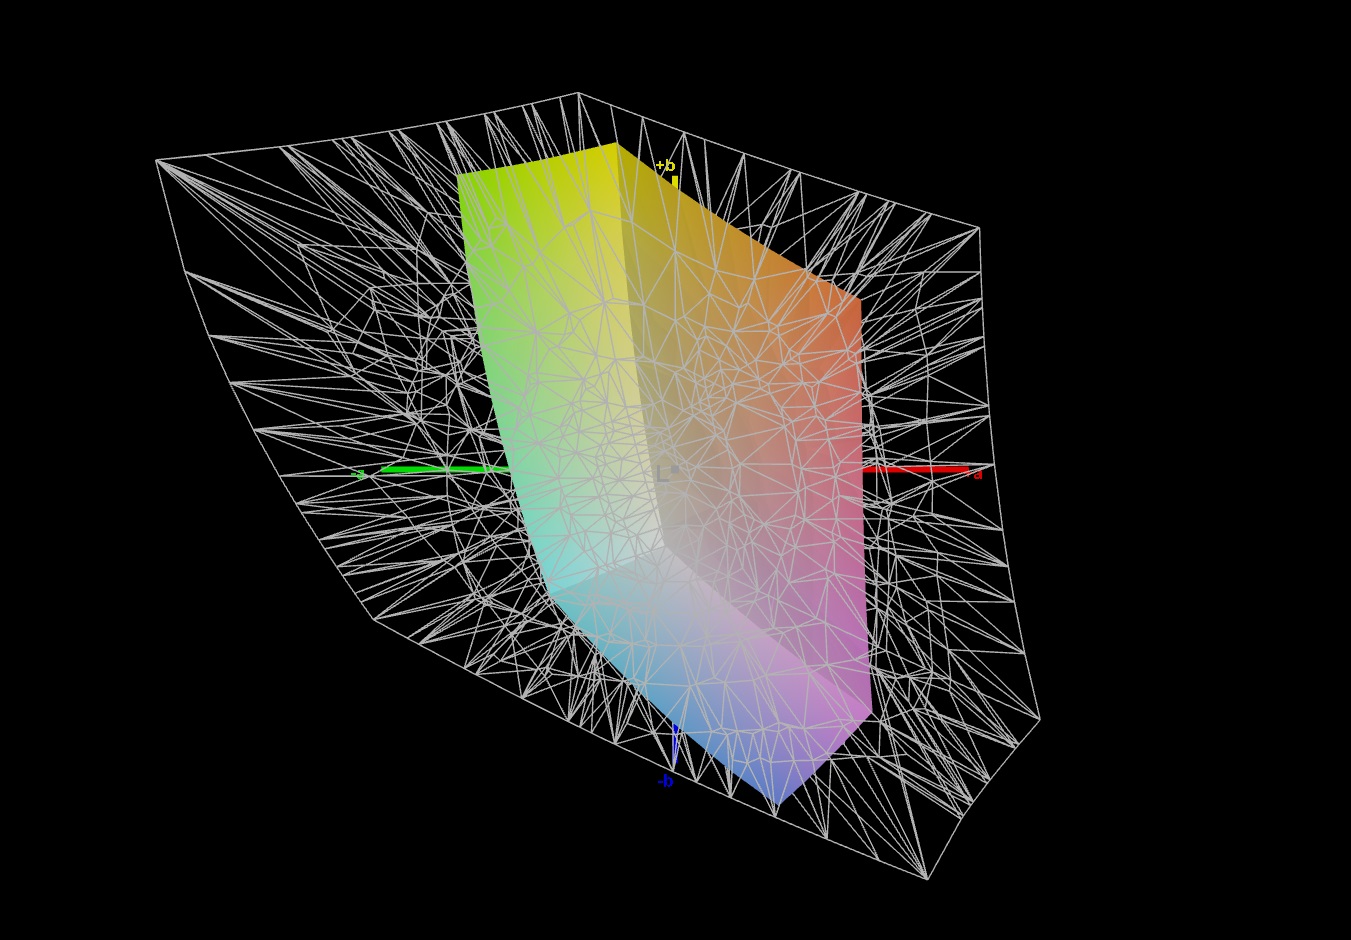
40.5% AdobeRGB 1998 (Argyll 3D)
57.9% sRGB (Argyll 3D)
39.2% Display P3 (Argyll 3D)
Gamma: 2.148
CCT: 6819 K
| HP Victus 15-fa1057ng BOE094D, IPS, 1920x1080, 15.6" | HP Victus 15 fa0020nr CMN1521, IPS, 1920x1080, 15.6" | Dell G15 5530, i5-13450HX RTX 4050 BOEhydis NV15NY9 (Dell 18PJX), IPS, 1920x1080, 15.6" | Acer Nitro V 15 ANV15-51-582S LG LP156WFJ-SPB4 (LGD0742), IPS, 1920x1080, 15.6" | Asus TUF A15 FA507 N156HMA-GA1, IPS, 1920x1080, 15.6" | |
|---|---|---|---|---|---|
| Display | 7% | 76% | 3% | 66% | |
| Display P3 Coverage (%) | 39.2 | 42 7% | 71.1 81% | 40 2% | 64.9 66% |
| sRGB Coverage (%) | 57.9 | 62.7 8% | 99.3 72% | 60 4% | 96.5 67% |
| AdobeRGB 1998 Coverage (%) | 40.5 | 43.4 7% | 71.4 76% | 41.4 2% | 66.6 64% |
| Response Times | -58% | 62% | -51% | -28% | |
| Response Time Grey 50% / Grey 80% * (ms) | 23.8 ? | 35.2 ? -48% | 8.5 ? 64% | 34.2 ? -44% | 30.4 ? -28% |
| Response Time Black / White * (ms) | 16.3 ? | 27.2 ? -67% | 6.7 ? 59% | 25.8 ? -58% | 20.8 ? -28% |
| PWM Frequency (Hz) | |||||
| Screen | 8% | 13% | -17% | 34% | |
| Brightness middle (cd/m²) | 273 | 284.3 4% | 389 42% | 292 7% | 288 5% |
| Brightness (cd/m²) | 249 | 262 5% | 374 50% | 263 6% | 271 9% |
| Brightness Distribution (%) | 84 | 87 4% | 89 6% | 80 -5% | 91 8% |
| Black Level * (cd/m²) | 0.28 | 0.17 39% | 0.35 -25% | 0.25 11% | 0.17 39% |
| Contrast (:1) | 975 | 1672 71% | 1111 14% | 1168 20% | 1694 74% |
| Colorchecker dE 2000 * | 5.19 | 4.52 13% | 3.08 41% | 7.15 -38% | 1.9 63% |
| Colorchecker dE 2000 max. * | 21.16 | 18.67 12% | 5.44 74% | 15.51 27% | 3.3 84% |
| Colorchecker dE 2000 calibrated * | 4.54 | 1.55 66% | 1.17 74% | 4.13 9% | 0.9 80% |
| Greyscale dE 2000 * | 1.7 | 4.1 -141% | 4.4 -159% | 4.9 -188% | 2.7 -59% |
| Gamma | 2.148 102% | 2.3 96% | 2.409 91% | 2.014 109% | 2.32 95% |
| CCT | 6819 95% | 6529 100% | 6350 102% | 7178 91% | 6535 99% |
| Total Average (Program / Settings) | -14% /
-1% | 50% /
34% | -22% /
-18% | 24% /
32% |
* ... smaller is better
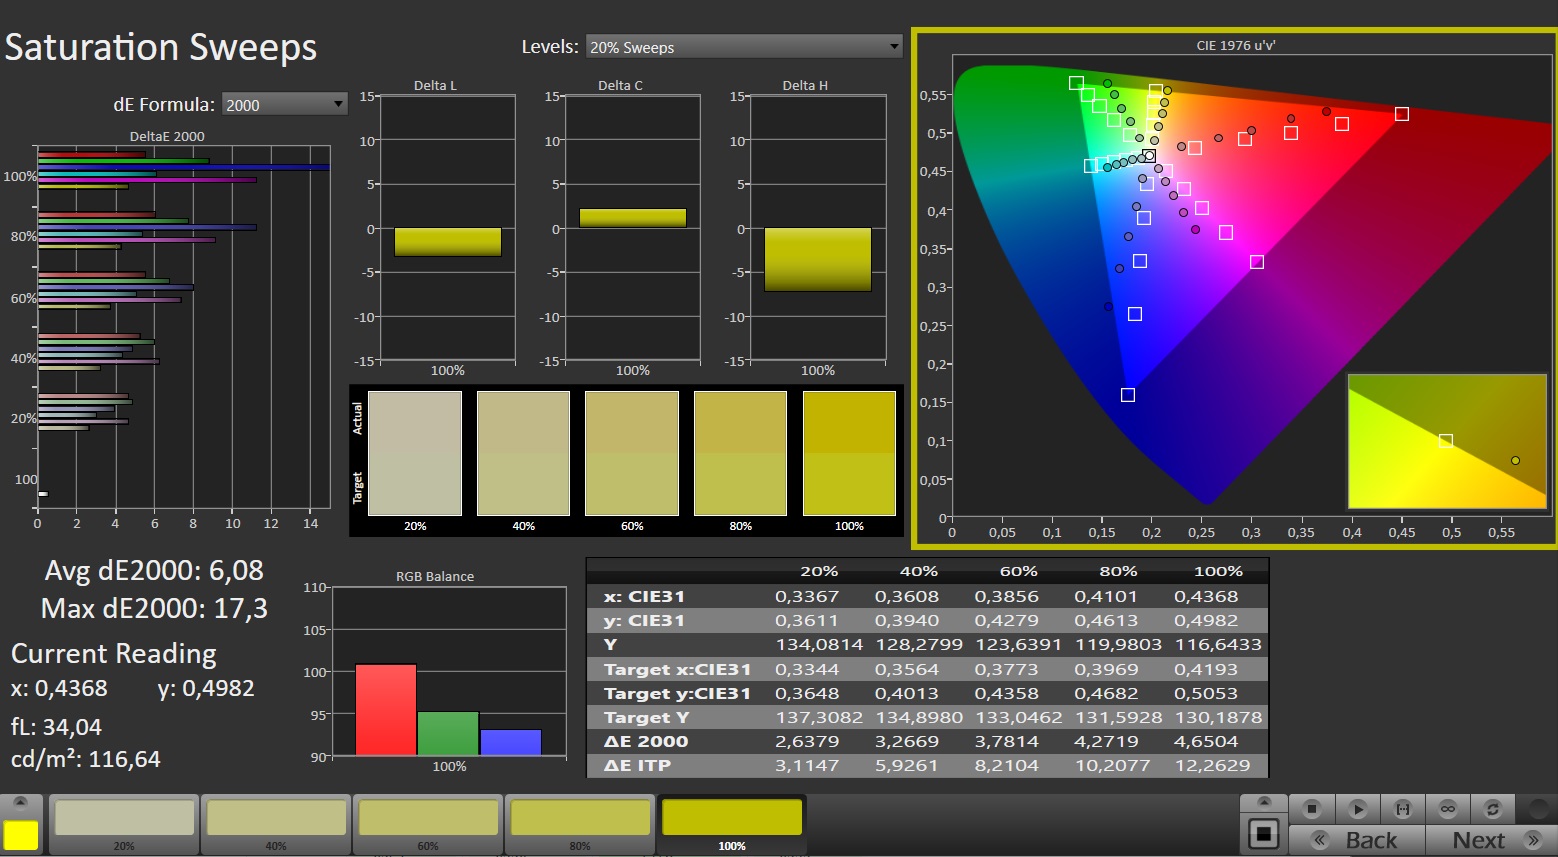
The 15 inch device faces substantial criticism regarding the color space. With 58% sRGB, the outcome is a rather lackluster picture, limiting the visual appeal of films, pictures, and games. Some competitors, like the Dell G15 or the Asus TUF A15, perform significantly better in this aspect.
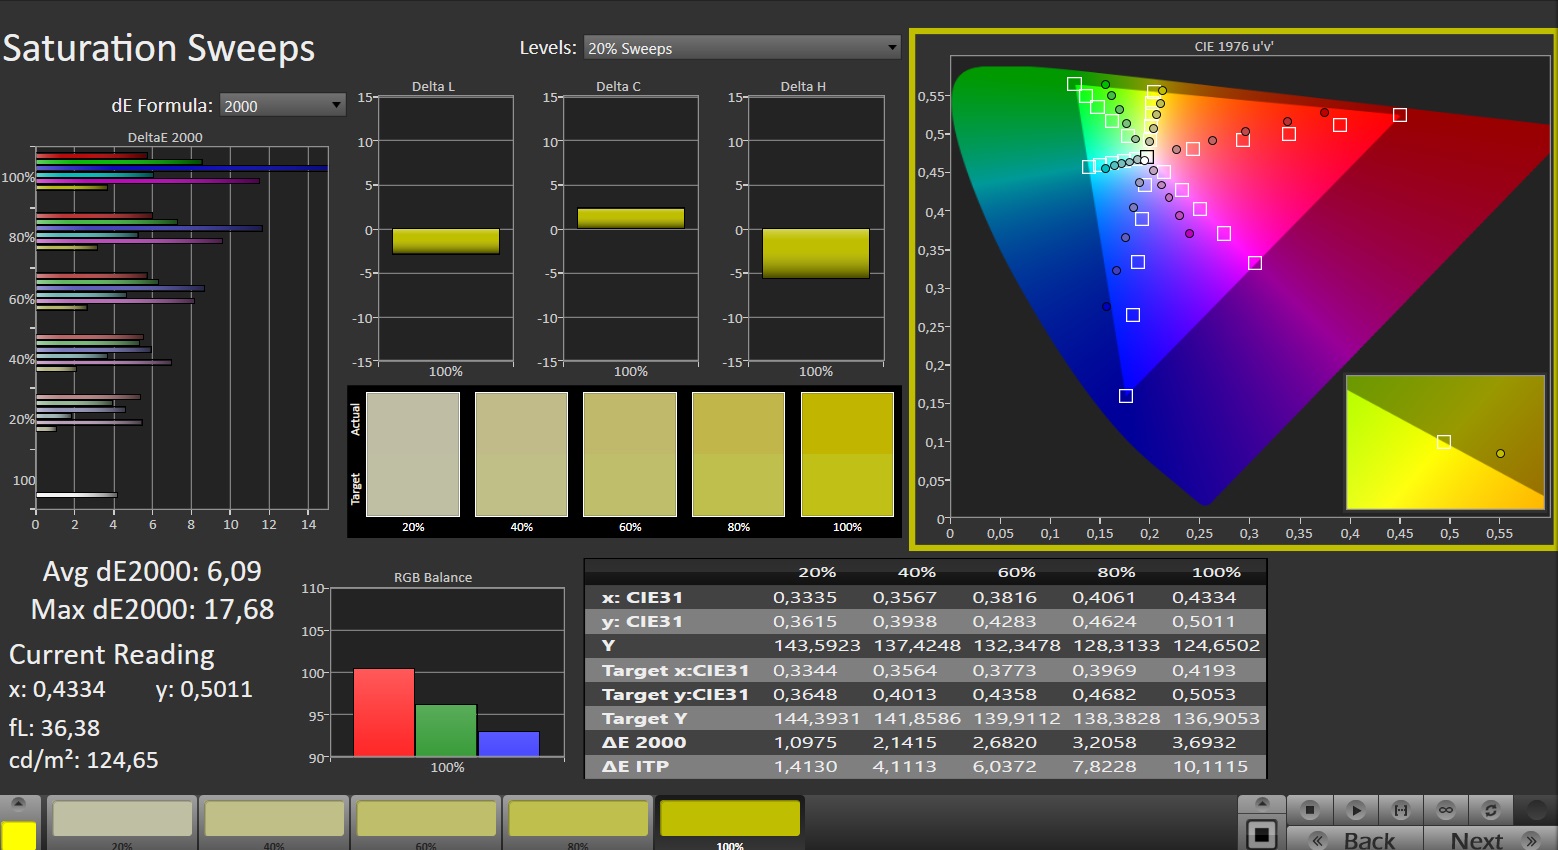
Meanwhile, the viewing angle stability and response time adhere to the typical IPS standard.

Display Response Times
| ↔ Response Time Black to White | ||
|---|---|---|
| 16.3 ms ... rise ↗ and fall ↘ combined | ↗ 7.6 ms rise | 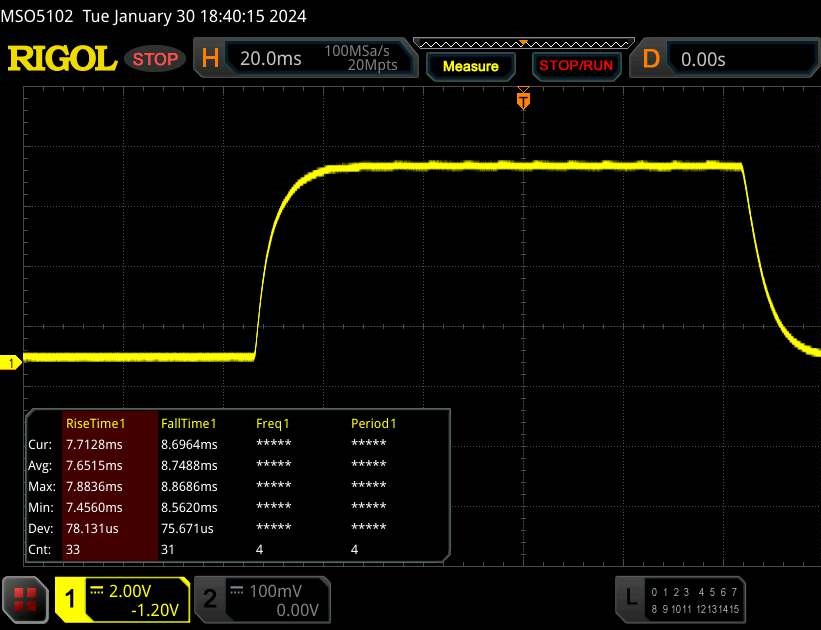 |
| ↘ 8.7 ms fall | ||
| The screen shows good response rates in our tests, but may be too slow for competitive gamers. In comparison, all tested devices range from 0.1 (minimum) to 240 (maximum) ms. » 38 % of all devices are better. This means that the measured response time is better than the average of all tested devices (19.9 ms). | ||
| ↔ Response Time 50% Grey to 80% Grey | ||
| 23.8 ms ... rise ↗ and fall ↘ combined | ↗ 11.1 ms rise | 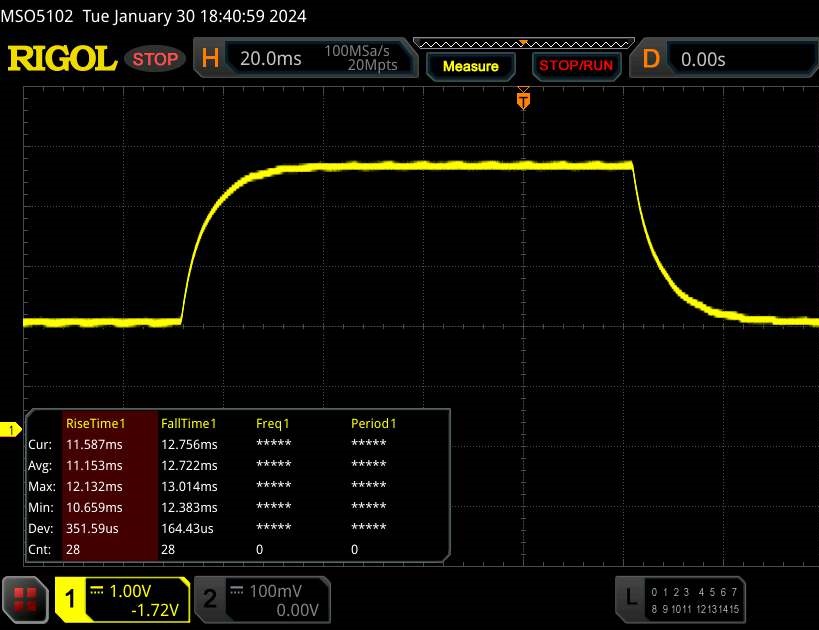 |
| ↘ 12.7 ms fall | ||
| The screen shows good response rates in our tests, but may be too slow for competitive gamers. In comparison, all tested devices range from 0.165 (minimum) to 636 (maximum) ms. » 34 % of all devices are better. This means that the measured response time is better than the average of all tested devices (31.1 ms). | ||
Screen Flickering / PWM (Pulse-Width Modulation)
| Screen flickering / PWM not detected | 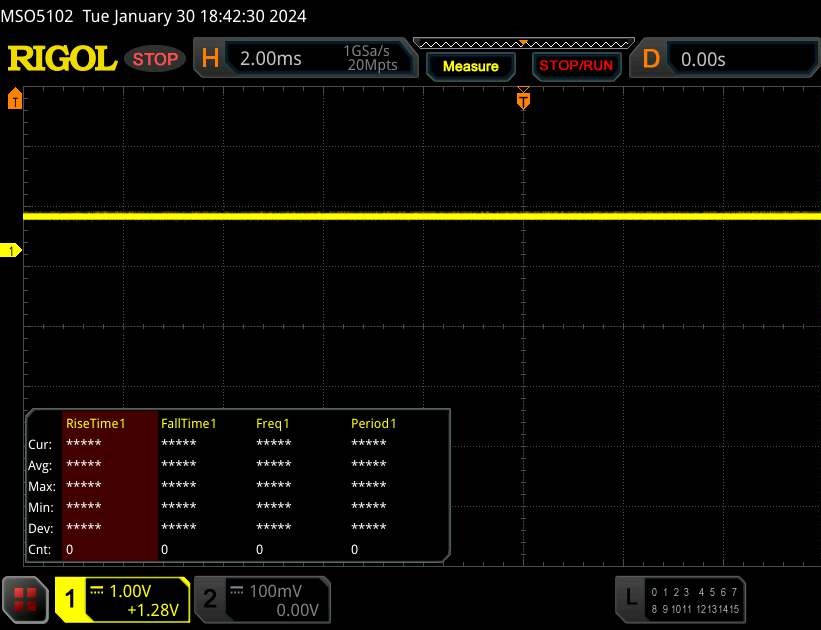 | ||
In comparison: 52 % of all tested devices do not use PWM to dim the display. If PWM was detected, an average of 7791 (minimum: 5 - maximum: 343500) Hz was measured. | |||
Performance
In this configuration, the Victus 15 is clearly a mid-range notebook. While 16 GB of RAM is currently sufficient for gaming, the only 512 GB SSD can quickly become cramped, especially as the 15 inch model does not offer a second M.2 slot.
Testing conditions
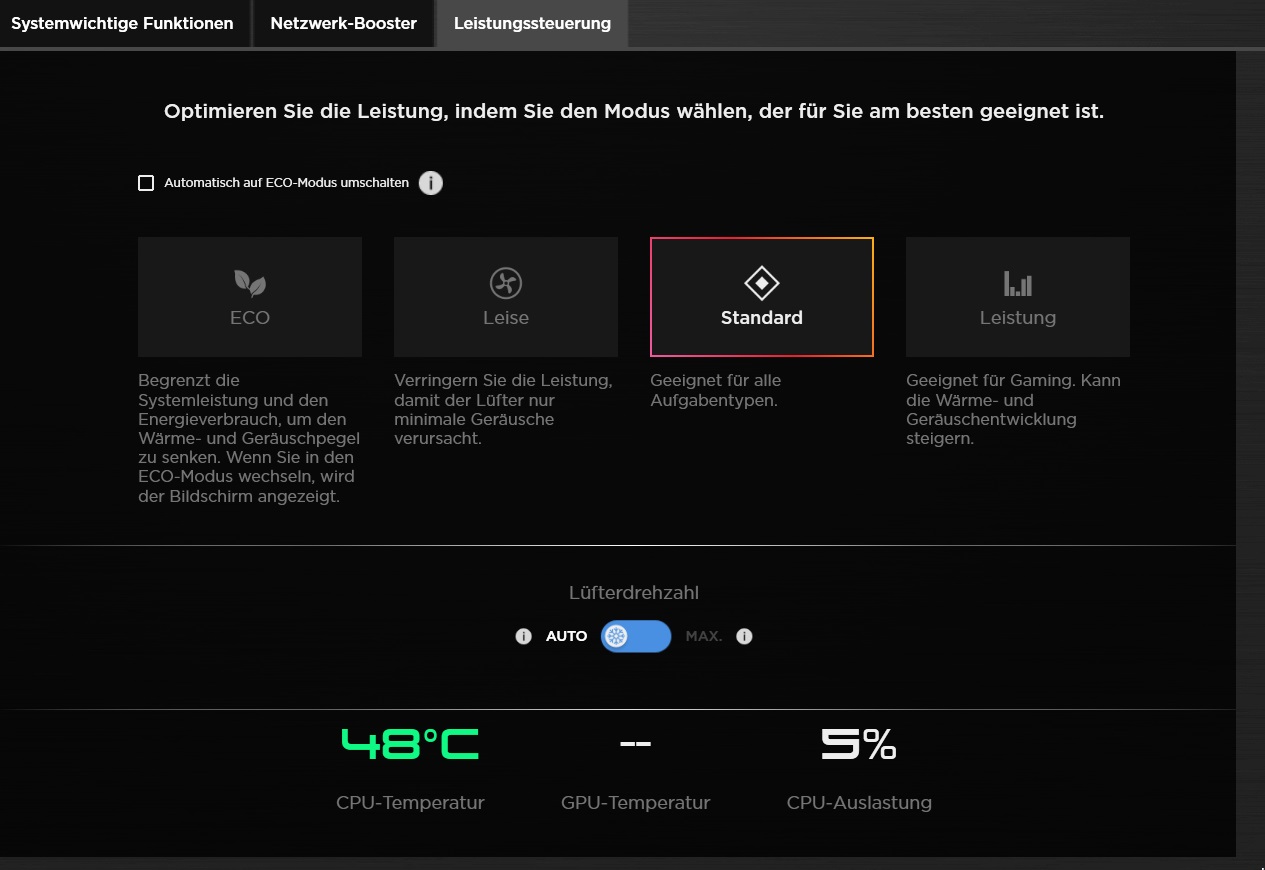
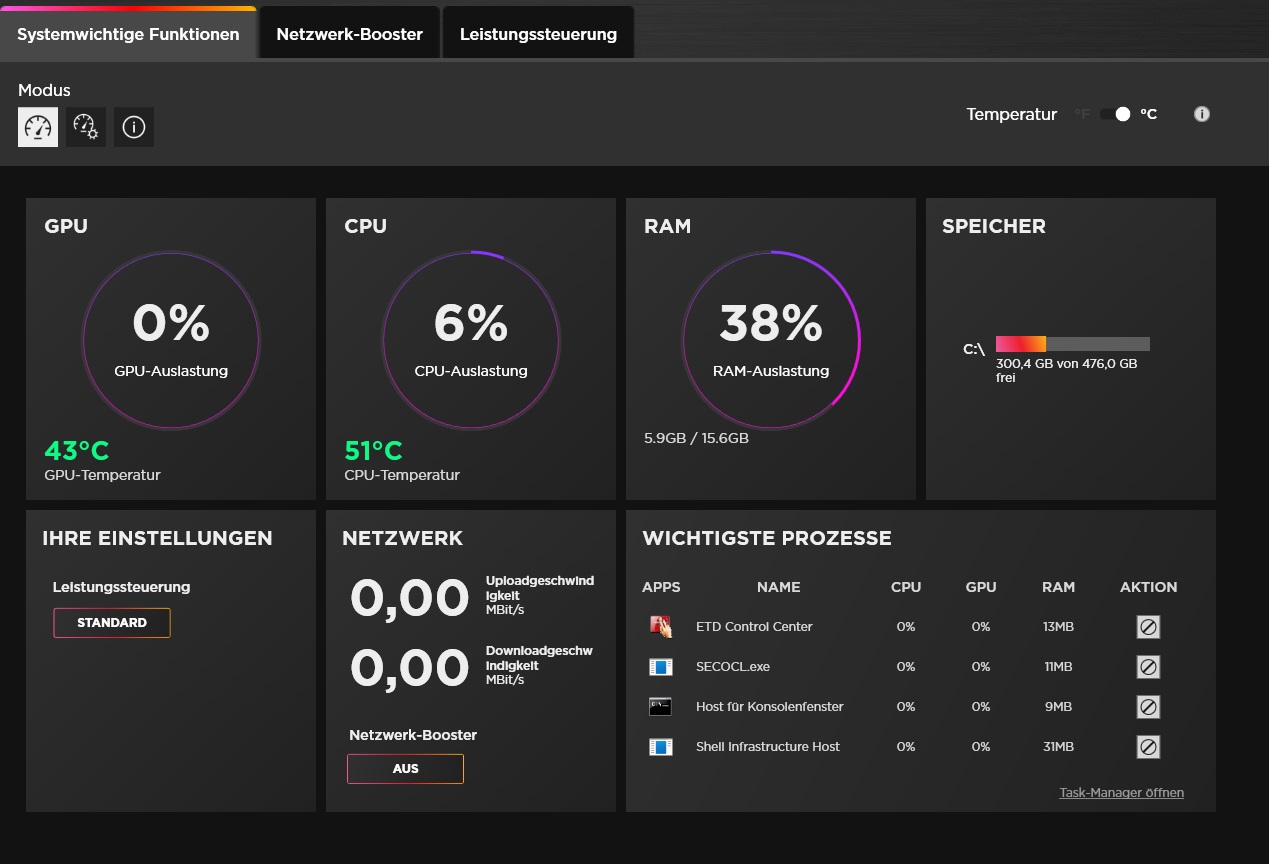
The Omen Gaming Hub enables users to influence the system behavior. The various power control modes not only affect the volume but also the performance (see table). Our tests were all conducted in the "Standard" mode, as the frame rate gain under "Performance" is, as is often the case, disproportionate to the increase in noise. Interestingly, the "Quiet" mode consistently resulted in higher noise emissions than "Standard" on the test device despite lower FPS figures.
| Witcher 3 (FHD/Ultra) | Eco | Quiet | Standard | Performance |
| Noise | 36 dB(A) | 46 dB(A) | 42 dB(A) | 48 dB(A) |
| Performance | 60 fps lock | 54 fps | 78 fps | 80 fps |
Processor
The Core i5-13500H is part of Intel's Raptor Lake generation, featuring four performance cores with Hyper-Threading and eight efficiency cores without HT. Its speed in the benchmark results is in between the Acer Nitro V 15's Core i5-13420H and the Dell G15's Core i5-13450HX. The Ryzen 7 7735HS is roughly on par initially, but the Core i5 loses more points and exhibits less consistent performance in the loop test. Comparing it to the predecessor is somewhat unfair, as the Core i7 of the old Victus belongs more to the high-end range.
Cinebench R15 Multi continuous test
| CPU Performance rating - Percent | |
| Average of class Gaming | |
| Dell G15 5530, i5-13450HX RTX 4050 | |
| Average Intel Core i5-13500H | |
| HP Victus 15 fa0020nr -2! | |
| Asus TUF A15 FA507 -2! | |
| Acer Nitro V 15 ANV15-51-582S | |
| HP Victus 15-fa1057ng -4! | |
* ... smaller is better
AIDA64: FP32 Ray-Trace | FPU Julia | CPU SHA3 | CPU Queen | FPU SinJulia | FPU Mandel | CPU AES | CPU ZLib | FP64 Ray-Trace | CPU PhotoWorxx
| Performance rating | |
| Average of class Gaming | |
| Asus TUF A15 FA507 | |
| Dell G15 5530, i5-13450HX RTX 4050 | |
| Average Intel Core i5-13500H | |
| HP Victus 15 fa0020nr | |
| HP Victus 15-fa1057ng | |
| Acer Nitro V 15 ANV15-51-582S | |
| AIDA64 / FP32 Ray-Trace | |
| Average of class Gaming (10227 - 85542, n=107, last 2 years) | |
| Dell G15 5530, i5-13450HX RTX 4050 | |
| Asus TUF A15 FA507 | |
| Average Intel Core i5-13500H (11081 - 15390, n=6) | |
| HP Victus 15 fa0020nr | |
| HP Victus 15-fa1057ng | |
| Acer Nitro V 15 ANV15-51-582S | |
| AIDA64 / FPU Julia | |
| Average of class Gaming (51376 - 238426, n=107, last 2 years) | |
| Asus TUF A15 FA507 | |
| Dell G15 5530, i5-13450HX RTX 4050 | |
| Average Intel Core i5-13500H (56813 - 74251, n=6) | |
| HP Victus 15 fa0020nr | |
| Acer Nitro V 15 ANV15-51-582S | |
| HP Victus 15-fa1057ng | |
| AIDA64 / CPU SHA3 | |
| Average of class Gaming (2180 - 9817, n=107, last 2 years) | |
| Dell G15 5530, i5-13450HX RTX 4050 | |
| Asus TUF A15 FA507 | |
| Average Intel Core i5-13500H (2621 - 3623, n=6) | |
| HP Victus 15 fa0020nr | |
| Acer Nitro V 15 ANV15-51-582S | |
| HP Victus 15-fa1057ng | |
| AIDA64 / CPU Queen | |
| Average of class Gaming (49785 - 173351, n=98, last 2 years) | |
| Asus TUF A15 FA507 | |
| HP Victus 15 fa0020nr | |
| Dell G15 5530, i5-13450HX RTX 4050 | |
| Average Intel Core i5-13500H (77835 - 85727, n=6) | |
| HP Victus 15-fa1057ng | |
| Acer Nitro V 15 ANV15-51-582S | |
| AIDA64 / FPU SinJulia | |
| Average of class Gaming (4424 - 33636, n=107, last 2 years) | |
| Asus TUF A15 FA507 | |
| Dell G15 5530, i5-13450HX RTX 4050 | |
| HP Victus 15 fa0020nr | |
| Average Intel Core i5-13500H (7249 - 8086, n=6) | |
| HP Victus 15-fa1057ng | |
| Acer Nitro V 15 ANV15-51-582S | |
| AIDA64 / FPU Mandel | |
| Average of class Gaming (25115 - 128721, n=107, last 2 years) | |
| Asus TUF A15 FA507 | |
| Dell G15 5530, i5-13450HX RTX 4050 | |
| Average Intel Core i5-13500H (27820 - 38336, n=6) | |
| HP Victus 15 fa0020nr | |
| HP Victus 15-fa1057ng | |
| Acer Nitro V 15 ANV15-51-582S | |
| AIDA64 / CPU AES | |
| Average of class Gaming (39258 - 247074, n=107, last 2 years) | |
| Acer Nitro V 15 ANV15-51-582S | |
| Average Intel Core i5-13500H (62657 - 120493, n=6) | |
| Dell G15 5530, i5-13450HX RTX 4050 | |
| Asus TUF A15 FA507 | |
| HP Victus 15-fa1057ng | |
| HP Victus 15 fa0020nr | |
| AIDA64 / CPU ZLib | |
| Average of class Gaming (574 - 2531, n=107, last 2 years) | |
| Dell G15 5530, i5-13450HX RTX 4050 | |
| HP Victus 15-fa1057ng | |
| Average Intel Core i5-13500H (782 - 992, n=6) | |
| HP Victus 15 fa0020nr | |
| Acer Nitro V 15 ANV15-51-582S | |
| Asus TUF A15 FA507 | |
| AIDA64 / FP64 Ray-Trace | |
| Average of class Gaming (5509 - 45446, n=107, last 2 years) | |
| Dell G15 5530, i5-13450HX RTX 4050 | |
| Asus TUF A15 FA507 | |
| Average Intel Core i5-13500H (5955 - 8495, n=6) | |
| HP Victus 15 fa0020nr | |
| HP Victus 15-fa1057ng | |
| Acer Nitro V 15 ANV15-51-582S | |
| AIDA64 / CPU PhotoWorxx | |
| Average of class Gaming (12271 - 89891, n=107, last 2 years) | |
| Dell G15 5530, i5-13450HX RTX 4050 | |
| Average Intel Core i5-13500H (20212 - 37618, n=6) | |
| Asus TUF A15 FA507 | |
| HP Victus 15-fa1057ng | |
| Acer Nitro V 15 ANV15-51-582S | |
| HP Victus 15 fa0020nr | |
System Performance
When it comes to system performance, the competitors hardly have anything in common. The overall PCMark 10 score is very similar in all cases, with more noticeable differences in RAM speed.
CrossMark: Overall | Productivity | Creativity | Responsiveness
WebXPRT 3: Overall
WebXPRT 4: Overall
Mozilla Kraken 1.1: Total
| PCMark 10 / Score | |
| Average of class Gaming (5828 - 11574, n=94, last 2 years) | |
| Asus TUF A15 FA507 | |
| Average Intel Core i5-13500H, NVIDIA GeForce RTX 4050 Laptop GPU (6812 - 7228, n=2) | |
| Dell G15 5530, i5-13450HX RTX 4050 | |
| HP Victus 15 fa0020nr | |
| HP Victus 15-fa1057ng | |
| Acer Nitro V 15 ANV15-51-582S | |
| PCMark 10 / Essentials | |
| Average of class Gaming (8810 - 12600, n=98, last 2 years) | |
| Asus TUF A15 FA507 | |
| HP Victus 15 fa0020nr | |
| Average Intel Core i5-13500H, NVIDIA GeForce RTX 4050 Laptop GPU (9521 - 10019, n=2) | |
| Dell G15 5530, i5-13450HX RTX 4050 | |
| HP Victus 15-fa1057ng | |
| Acer Nitro V 15 ANV15-51-582S | |
| PCMark 10 / Productivity | |
| Average of class Gaming (6845 - 18766, n=96, last 2 years) | |
| Asus TUF A15 FA507 | |
| HP Victus 15 fa0020nr | |
| Average Intel Core i5-13500H, NVIDIA GeForce RTX 4050 Laptop GPU (8890 - 8968, n=2) | |
| HP Victus 15-fa1057ng | |
| Dell G15 5530, i5-13450HX RTX 4050 | |
| Acer Nitro V 15 ANV15-51-582S | |
| PCMark 10 / Digital Content Creation | |
| Average of class Gaming (7602 - 19657, n=96, last 2 years) | |
| Average Intel Core i5-13500H, NVIDIA GeForce RTX 4050 Laptop GPU (10134 - 11405, n=2) | |
| Dell G15 5530, i5-13450HX RTX 4050 | |
| Asus TUF A15 FA507 | |
| HP Victus 15-fa1057ng | |
| HP Victus 15 fa0020nr | |
| Acer Nitro V 15 ANV15-51-582S | |
| CrossMark / Overall | |
| Average of class Gaming (1366 - 2409, n=96, last 2 years) | |
| Average Intel Core i5-13500H, NVIDIA GeForce RTX 4050 Laptop GPU (n=1) | |
| HP Victus 15 fa0020nr | |
| Asus TUF A15 FA507 | |
| CrossMark / Productivity | |
| Average of class Gaming (1386 - 2254, n=96, last 2 years) | |
| Average Intel Core i5-13500H, NVIDIA GeForce RTX 4050 Laptop GPU (n=1) | |
| HP Victus 15 fa0020nr | |
| Asus TUF A15 FA507 | |
| CrossMark / Creativity | |
| Average of class Gaming (1343 - 2729, n=96, last 2 years) | |
| Average Intel Core i5-13500H, NVIDIA GeForce RTX 4050 Laptop GPU (n=1) | |
| HP Victus 15 fa0020nr | |
| Asus TUF A15 FA507 | |
| CrossMark / Responsiveness | |
| Average Intel Core i5-13500H, NVIDIA GeForce RTX 4050 Laptop GPU (n=1) | |
| Average of class Gaming (1226 - 2334, n=96, last 2 years) | |
| HP Victus 15 fa0020nr | |
| Asus TUF A15 FA507 | |
| WebXPRT 3 / Overall | |
| Average of class Gaming (242 - 532, n=99, last 2 years) | |
| HP Victus 15 fa0020nr | |
| Asus TUF A15 FA507 | |
| Dell G15 5530, i5-13450HX RTX 4050 | |
| Dell G15 5530, i5-13450HX RTX 4050 | |
| HP Victus 15-fa1057ng | |
| Average Intel Core i5-13500H, NVIDIA GeForce RTX 4050 Laptop GPU (267 - 267, n=2) | |
| Acer Nitro V 15 ANV15-51-582S | |
| WebXPRT 4 / Overall | |
| Average of class Gaming (176.4 - 354, n=99, last 2 years) | |
| HP Victus 15 fa0020nr | |
| Acer Nitro V 15 ANV15-51-582S | |
| Average Intel Core i5-13500H, NVIDIA GeForce RTX 4050 Laptop GPU (n=1) | |
| Asus TUF A15 FA507 | |
| Mozilla Kraken 1.1 / Total | |
| Asus TUF A15 FA507 | |
| Acer Nitro V 15 ANV15-51-582S | |
| HP Victus 15-fa1057ng | |
| Average Intel Core i5-13500H, NVIDIA GeForce RTX 4050 Laptop GPU (530 - 545, n=2) | |
| HP Victus 15 fa0020nr | |
| Dell G15 5530, i5-13450HX RTX 4050 | |
| Dell G15 5530, i5-13450HX RTX 4050 | |
| Average of class Gaming (391 - 590, n=104, last 2 years) | |
* ... smaller is better
| PCMark 10 Score | 6812 points | |
Help | ||
| AIDA64 / Memory Copy | |
| Average of class Gaming (21750 - 129946, n=107, last 2 years) | |
| Dell G15 5530, i5-13450HX RTX 4050 | |
| Average Intel Core i5-13500H (36916 - 57830, n=6) | |
| Asus TUF A15 FA507 | |
| HP Victus 15-fa1057ng | |
| HP Victus 15 fa0020nr | |
| Acer Nitro V 15 ANV15-51-582S | |
| AIDA64 / Memory Read | |
| Average of class Gaming (22956 - 118858, n=107, last 2 years) | |
| Dell G15 5530, i5-13450HX RTX 4050 | |
| Average Intel Core i5-13500H (41676 - 65633, n=6) | |
| Asus TUF A15 FA507 | |
| HP Victus 15 fa0020nr | |
| HP Victus 15-fa1057ng | |
| Acer Nitro V 15 ANV15-51-582S | |
| AIDA64 / Memory Write | |
| Average of class Gaming (22297 - 135096, n=107, last 2 years) | |
| Dell G15 5530, i5-13450HX RTX 4050 | |
| Asus TUF A15 FA507 | |
| Average Intel Core i5-13500H (36826 - 60523, n=6) | |
| HP Victus 15-fa1057ng | |
| HP Victus 15 fa0020nr | |
| Acer Nitro V 15 ANV15-51-582S | |
| AIDA64 / Memory Latency | |
| Average of class Gaming (75.3 - 259, n=107, last 2 years) | |
| Dell G15 5530, i5-13450HX RTX 4050 | |
| Average Intel Core i5-13500H (86.2 - 96.1, n=6) | |
| Acer Nitro V 15 ANV15-51-582S | |
| HP Victus 15-fa1057ng | |
| Asus TUF A15 FA507 | |
| HP Victus 15 fa0020nr | |
* ... smaller is better
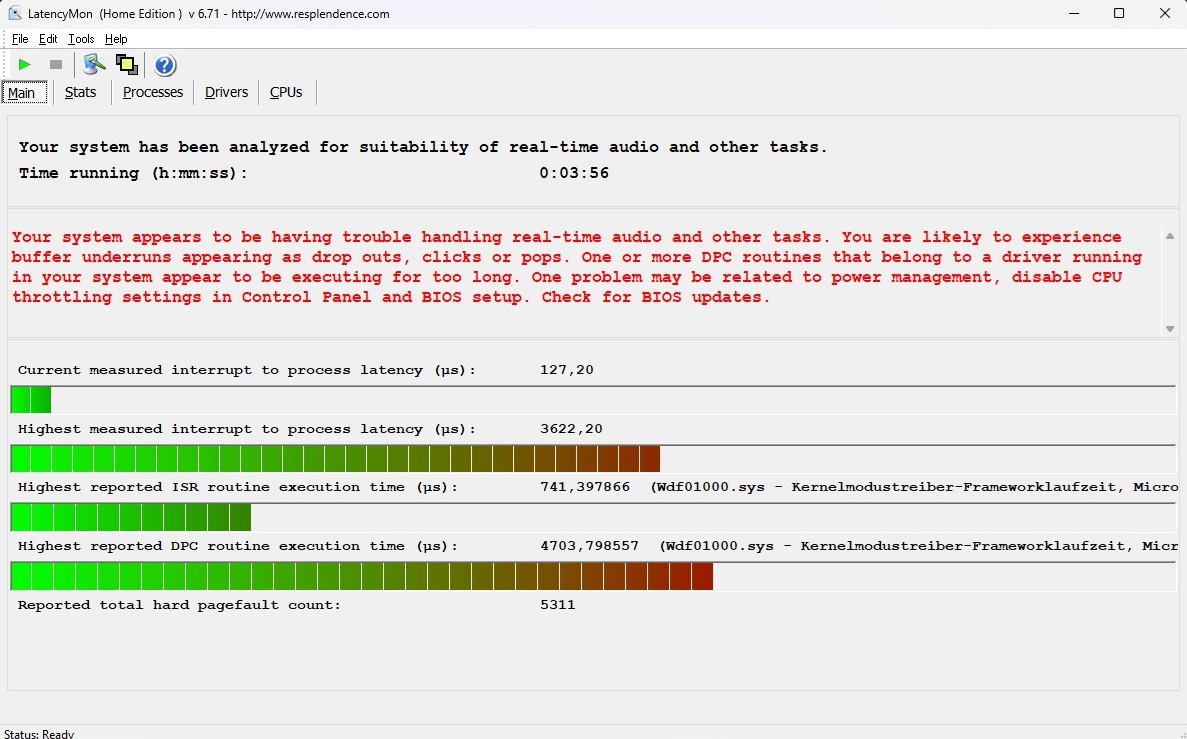
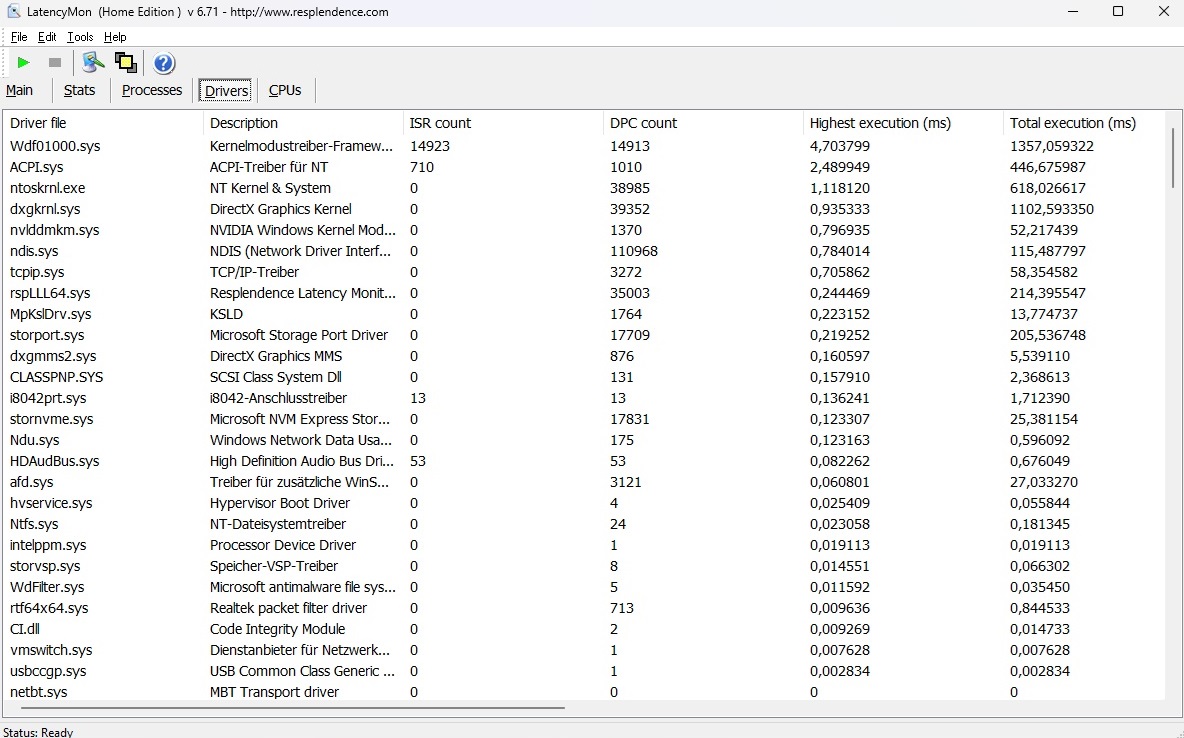
DPC latency
If you intend to use the system for real-time audio and video editing, you may want to consider alternatives. According to the LatencyMon tool, latencies in the factory state are quite modest, which could lead to issues with certain tasks.
| DPC Latencies / LatencyMon - interrupt to process latency (max), Web, Youtube, Prime95 | |
| HP Victus 15-fa1057ng | |
| Dell G15 5530, i5-13450HX RTX 4050 | |
| HP Victus 15 fa0020nr | |
| Acer Nitro V 15 ANV15-51-582S | |
* ... smaller is better
Storage devices
The SSD cooling is also suboptimal. While the Kioxia drive installed initially delivers commendable results in the first few runs, it experiences significant throttling over time, as demonstrated in our loop test.

* ... smaller is better
Reading continuous performance: DiskSpd Read Loop, Queue Depth 8
Graphics card
The performance of present Nvidia graphics cards is highly dependent on the chosen TDP. HP has chosen 75 watts (including Dynamic Boost) for the Victus 15, which is relatively low for the RTX 4050 but is only reflected to a limited extent in many benchmarks. Overall, the 3D performance aligns with the average for this graphics card. The future-proofing of the RTX 4050 is not too promising, as 6 GB VRAM and a 96-bit interface can already become limiting factors in demanding titles.
| 3DMark 11 Performance | 25418 points | |
| 3DMark Ice Storm Standard Score | 189586 points | |
| 3DMark Cloud Gate Standard Score | 55024 points | |
| 3DMark Fire Strike Score | 19211 points | |
| 3DMark Time Spy Score | 8149 points | |
Help | ||
* ... smaller is better
Gaming Performance
Nevertheless, the Victus 15 is fast enough to smoothly run most current games at the native resolution of 1,920 x 1,080 with high to maximum settings. It only faces challenges in individual cases such as Enshrouded. The fact that the RTX 4050 operates with a maximum TDP of 75 watts does not have any noticeable effects compared to laptops with a higher TGP, similar to the synthetic tests.
| The Witcher 3 - 1920x1080 Ultra Graphics & Postprocessing (HBAO+) | |
| Average of class Gaming (95 - 240, n=8, last 2 years) | |
| Dell G15 5530, i5-13450HX RTX 4050 | |
| Asus TUF A15 FA507 | |
| Acer Nitro V 15 ANV15-51-582S | |
| HP Victus 15-fa1057ng | |
| Average NVIDIA GeForce RTX 4050 Laptop GPU (18.5 - 94.7, n=40) | |
| HP Victus 15 fa0020nr | |
| Enshrouded - 1920x1080 Max. Quality AA:FX | |
| Medion Erazer Scout E20 | |
| Average NVIDIA GeForce RTX 4050 Laptop GPU (37.3 - 37.7, n=2) | |
| HP Victus 15-fa1057ng | |
| Average of class Gaming (n=1last 2 years) | |
| Palworld - 1920x1080 Epic Preset AA:TSR | |
| Medion Erazer Scout E20 | |
| Average NVIDIA GeForce RTX 4050 Laptop GPU (71.9 - 74.9, n=2) | |
| HP Victus 15-fa1057ng | |
| Average of class Gaming (n=1last 2 years) | |
| Prince of Persia The Lost Crown - 1920x1080 Ultra Preset AA:SM | |
| Medion Erazer Scout E20 | |
| Average NVIDIA GeForce RTX 4050 Laptop GPU (349 - 353, n=2) | |
| HP Victus 15-fa1057ng | |
| Average of class Gaming (321 - 357, n=6, last 2 years) | |
We tested how the 3D performance behaves over a longer period of time, specifically 60 minutes with the role-playing game The Witcher 3 (FHD/Ultra). The frame rate remained fairly stable over the long term.
Witcher 3 FPS diagram
| low | med. | high | ultra | |
|---|---|---|---|---|
| GTA V (2015) | 172.4 | 160.7 | 89.1 | |
| The Witcher 3 (2015) | 78 | |||
| Dota 2 Reborn (2015) | 159.7 | 141.1 | 130.7 | 122.5 |
| Final Fantasy XV Benchmark (2018) | 105.1 | 80.3 | ||
| X-Plane 11.11 (2018) | 113 | 101.1 | 81.5 | |
| Strange Brigade (2018) | 197.1 | 159 | 139.1 | |
| Prince of Persia The Lost Crown (2024) | 352 | 350 | 349 | |
| Palworld (2024) | 93.3 | 72.5 | 71.9 | |
| Enshrouded (2024) | 45.8 | 45.1 | 37.3 |
Emissions
System noise
We would describe the noise development as expected. At 29-31 dB (idle) and 40-48 dB (load), the 15 inch laptop is neither very quiet nor very loud in "Standard" mode, but reaches a medium level that should be acceptable for most buyers even without a headset.
Noise level
| Idle |
| 29 / 30 / 31 dB(A) |
| Load |
| 40 / 48 dB(A) |
 | ||
30 dB silent 40 dB(A) audible 50 dB(A) loud |
||
min: | ||
| HP Victus 15-fa1057ng GeForce RTX 4050 Laptop GPU, i5-13500H | HP Victus 15 fa0020nr GeForce RTX 3050 Ti Laptop GPU, i7-12700H | Dell G15 5530, i5-13450HX RTX 4050 GeForce RTX 4050 Laptop GPU, i5-13450HX | Acer Nitro V 15 ANV15-51-582S GeForce RTX 4050 Laptop GPU, i5-13420H | Asus TUF A15 FA507 GeForce RTX 4050 Laptop GPU, R7 7735HS | |
|---|---|---|---|---|---|
| Noise | 7% | 4% | -4% | 15% | |
| off / environment * (dB) | 25 | 24.8 1% | 25 -0% | 25 -0% | 23.3 7% |
| Idle Minimum * (dB) | 29 | 26.2 10% | 25 14% | 25 14% | 23.3 20% |
| Idle Average * (dB) | 30 | 29.2 3% | 26 13% | 29 3% | 23.3 22% |
| Idle Maximum * (dB) | 31 | 29.4 5% | 30 3% | 30 3% | 23.3 25% |
| Load Average * (dB) | 40 | 29.9 25% | 38 5% | 49 -23% | 29.6 26% |
| Witcher 3 ultra * (dB) | 42 | 41.1 2% | 44 -5% | 49 -17% | 43 -2% |
| Load Maximum * (dB) | 48 | 45.5 5% | 50 -4% | 51 -6% | 43 10% |
* ... smaller is better
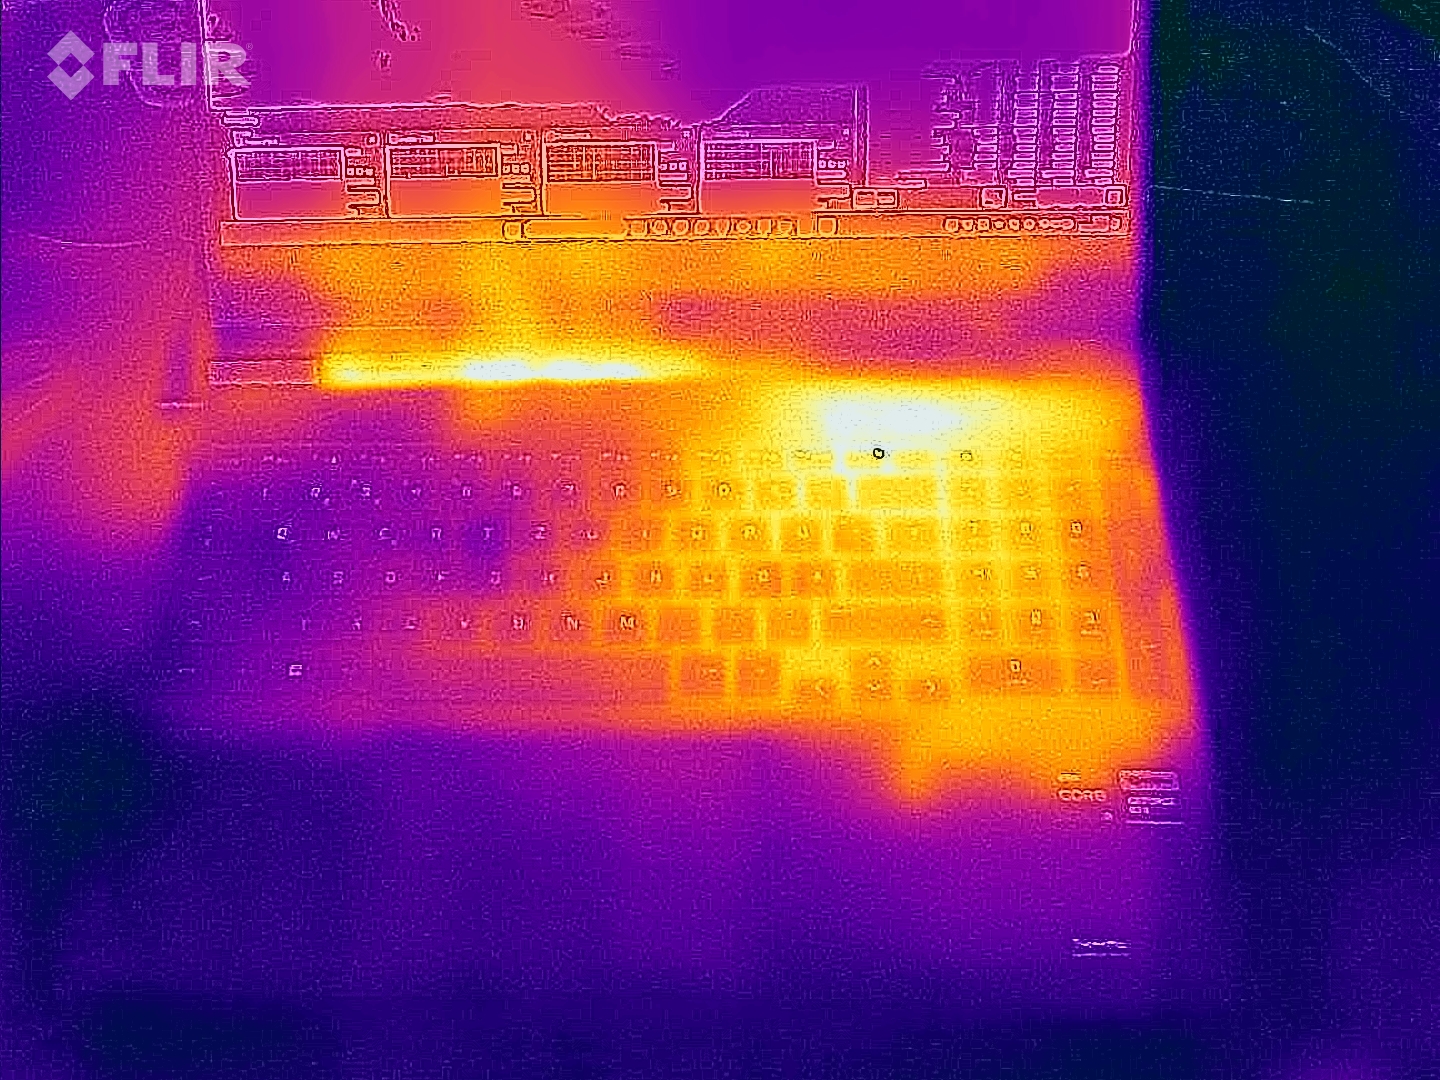
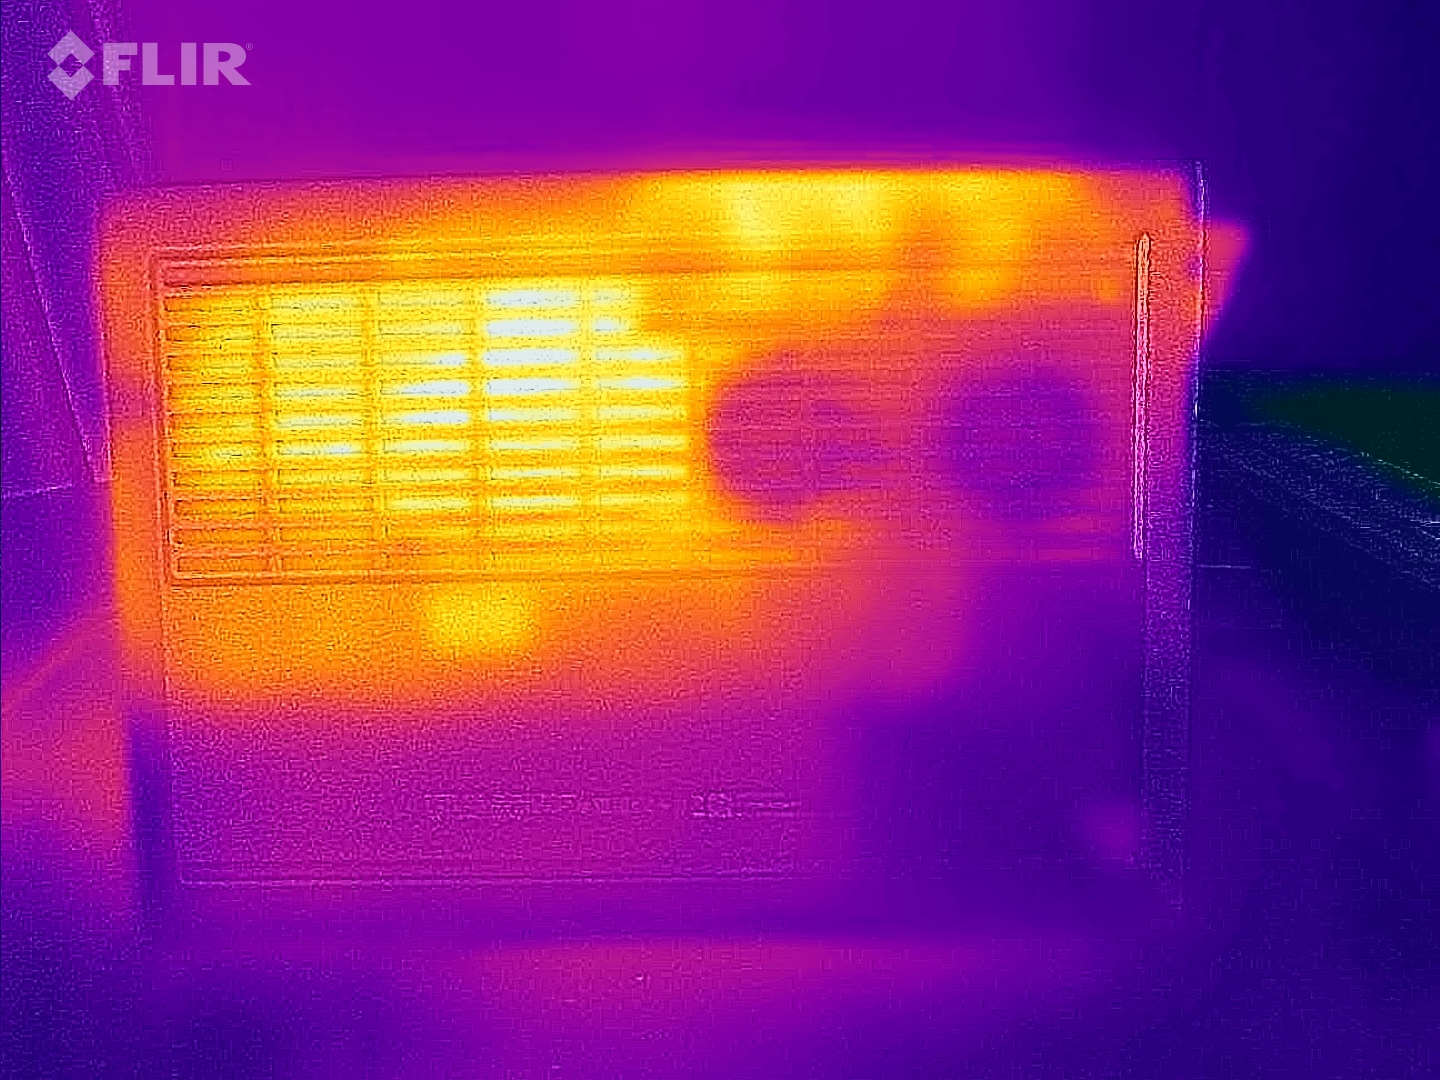
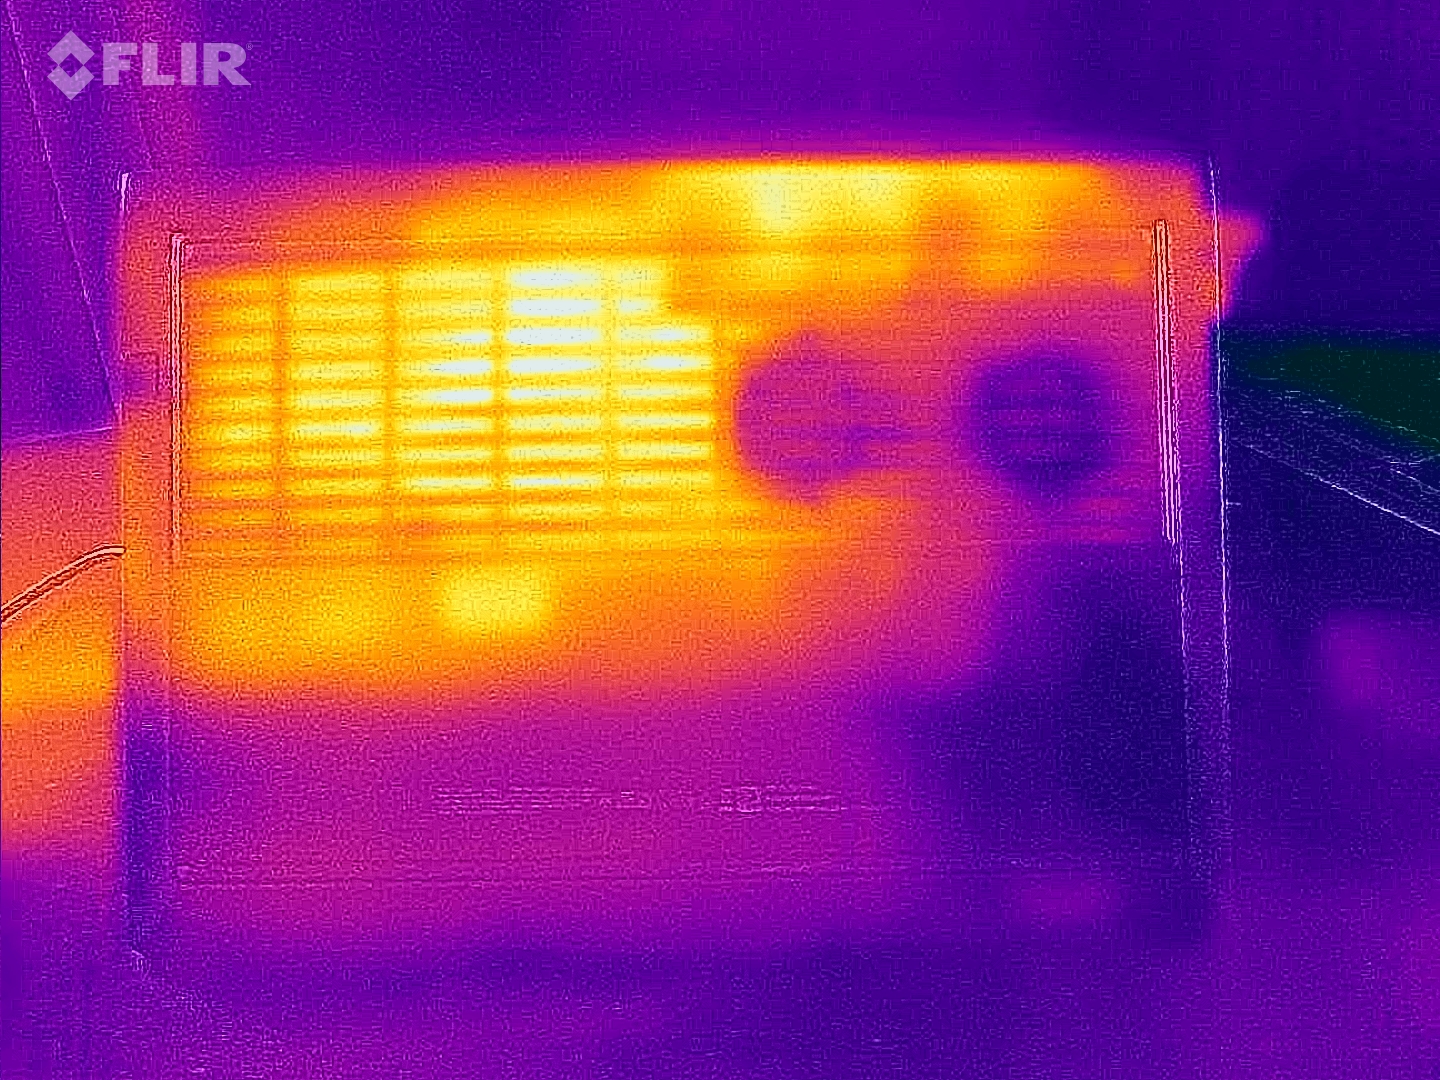
Temperature
The case temperatures are surprisingly low. Even after an hour of stress testing with the Furmark and Prime95 tools, the case only reaches a temperature of 107.6 °F. This means that the Victus 15 can easily be placed on the lap while gaming. The competition gets noticeably warmer in some cases.
(±) The maximum temperature on the upper side is 42 °C / 108 F, compared to the average of 40.4 °C / 105 F, ranging from 21.2 to 68.8 °C for the class Gaming.
(±) The bottom heats up to a maximum of 42 °C / 108 F, compared to the average of 43.2 °C / 110 F
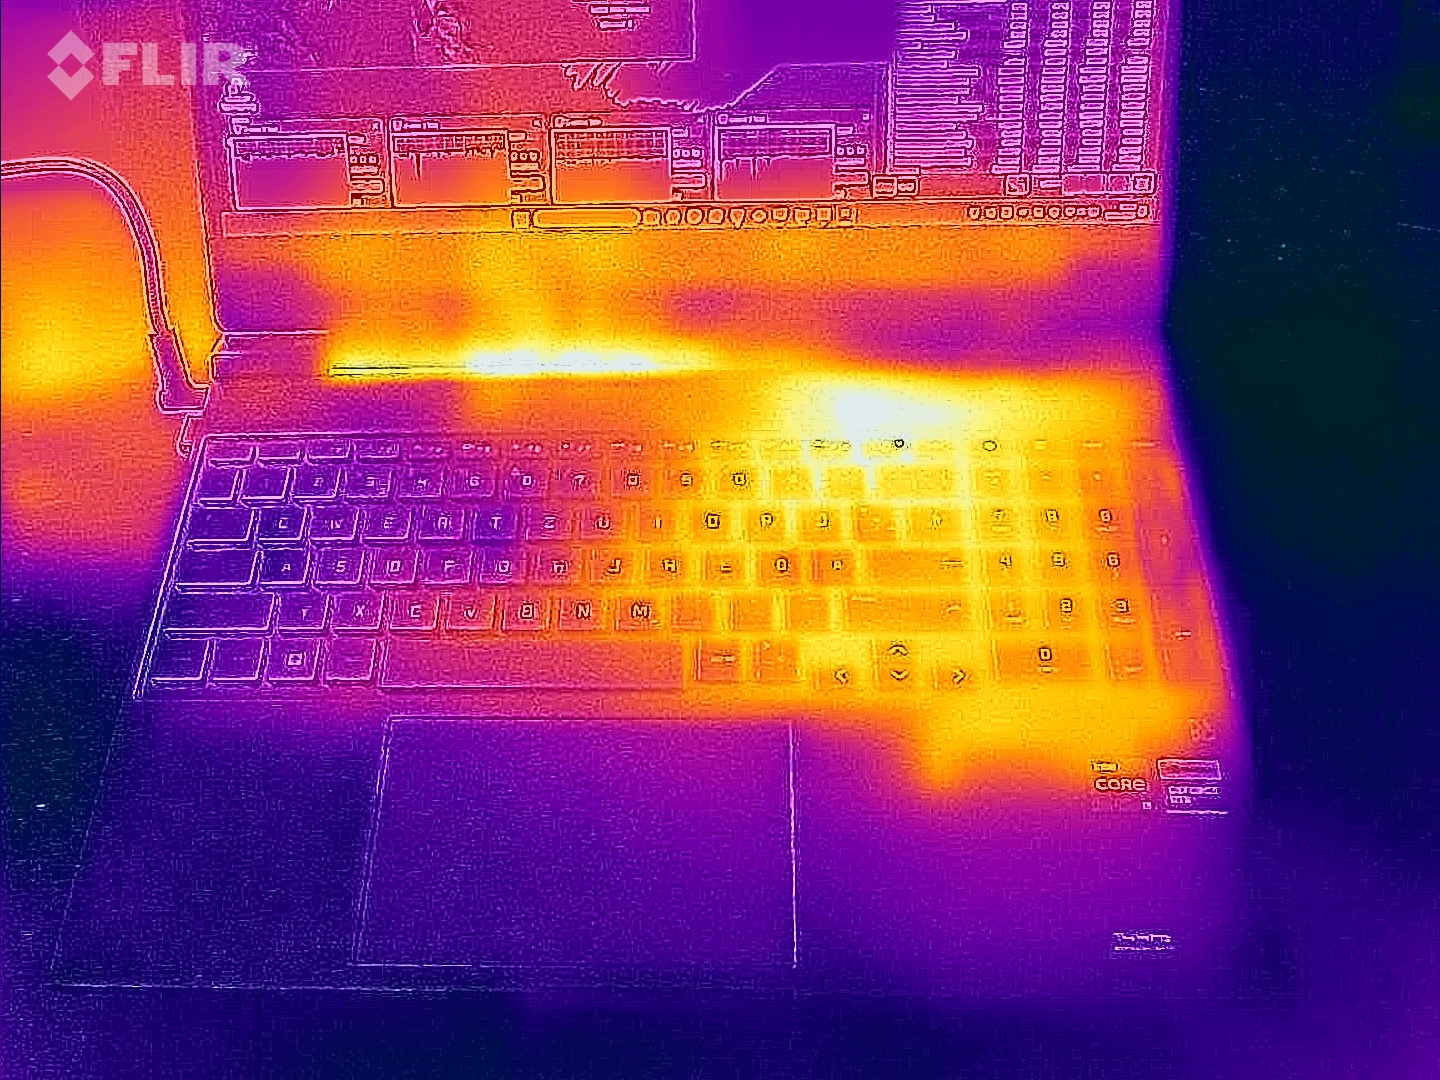
(+) In idle usage, the average temperature for the upper side is 23.6 °C / 74 F, compared to the device average of 33.9 °C / 93 F.
(±) Playing The Witcher 3, the average temperature for the upper side is 33.8 °C / 93 F, compared to the device average of 33.9 °C / 93 F.
(+) The palmrests and touchpad are reaching skin temperature as a maximum (33 °C / 91.4 F) and are therefore not hot.
(-) The average temperature of the palmrest area of similar devices was 28.8 °C / 83.8 F (-4.2 °C / -7.6 F).
| HP Victus 15-fa1057ng GeForce RTX 4050 Laptop GPU, i5-13500H | HP Victus 15 fa0020nr GeForce RTX 3050 Ti Laptop GPU, i7-12700H | Dell G15 5530, i5-13450HX RTX 4050 GeForce RTX 4050 Laptop GPU, i5-13450HX | Acer Nitro V 15 ANV15-51-582S GeForce RTX 4050 Laptop GPU, i5-13420H | Asus TUF A15 FA507 GeForce RTX 4050 Laptop GPU, R7 7735HS | |
|---|---|---|---|---|---|
| Heat | 10% | -30% | -14% | -13% | |
| Maximum Upper Side * (°C) | 42 | 37.2 11% | 58 -38% | 46 -10% | 48.9 -16% |
| Maximum Bottom * (°C) | 42 | 35.4 16% | 57 -36% | 48 -14% | 44.6 -6% |
| Idle Upper Side * (°C) | 24 | 22.4 7% | 30 -25% | 27 -13% | 27.1 -13% |
| Idle Bottom * (°C) | 24 | 22.6 6% | 29 -21% | 28 -17% | 27.5 -15% |
* ... smaller is better
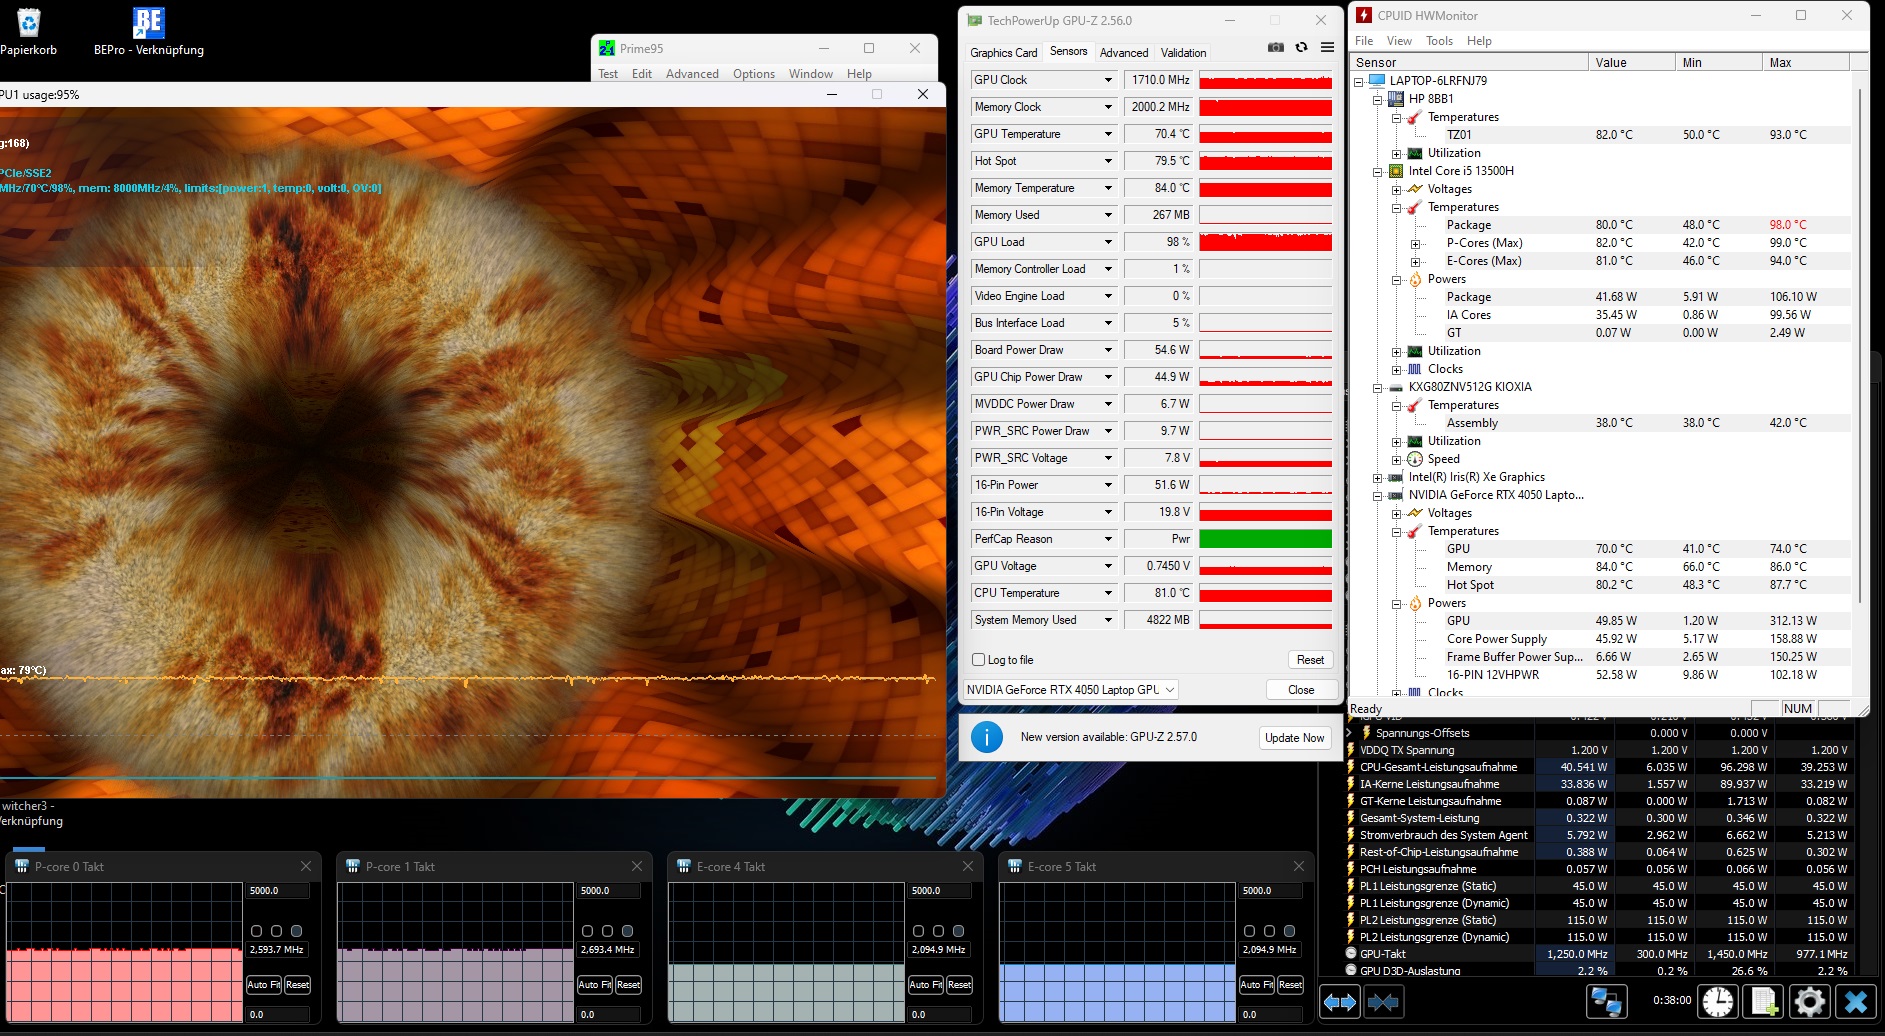
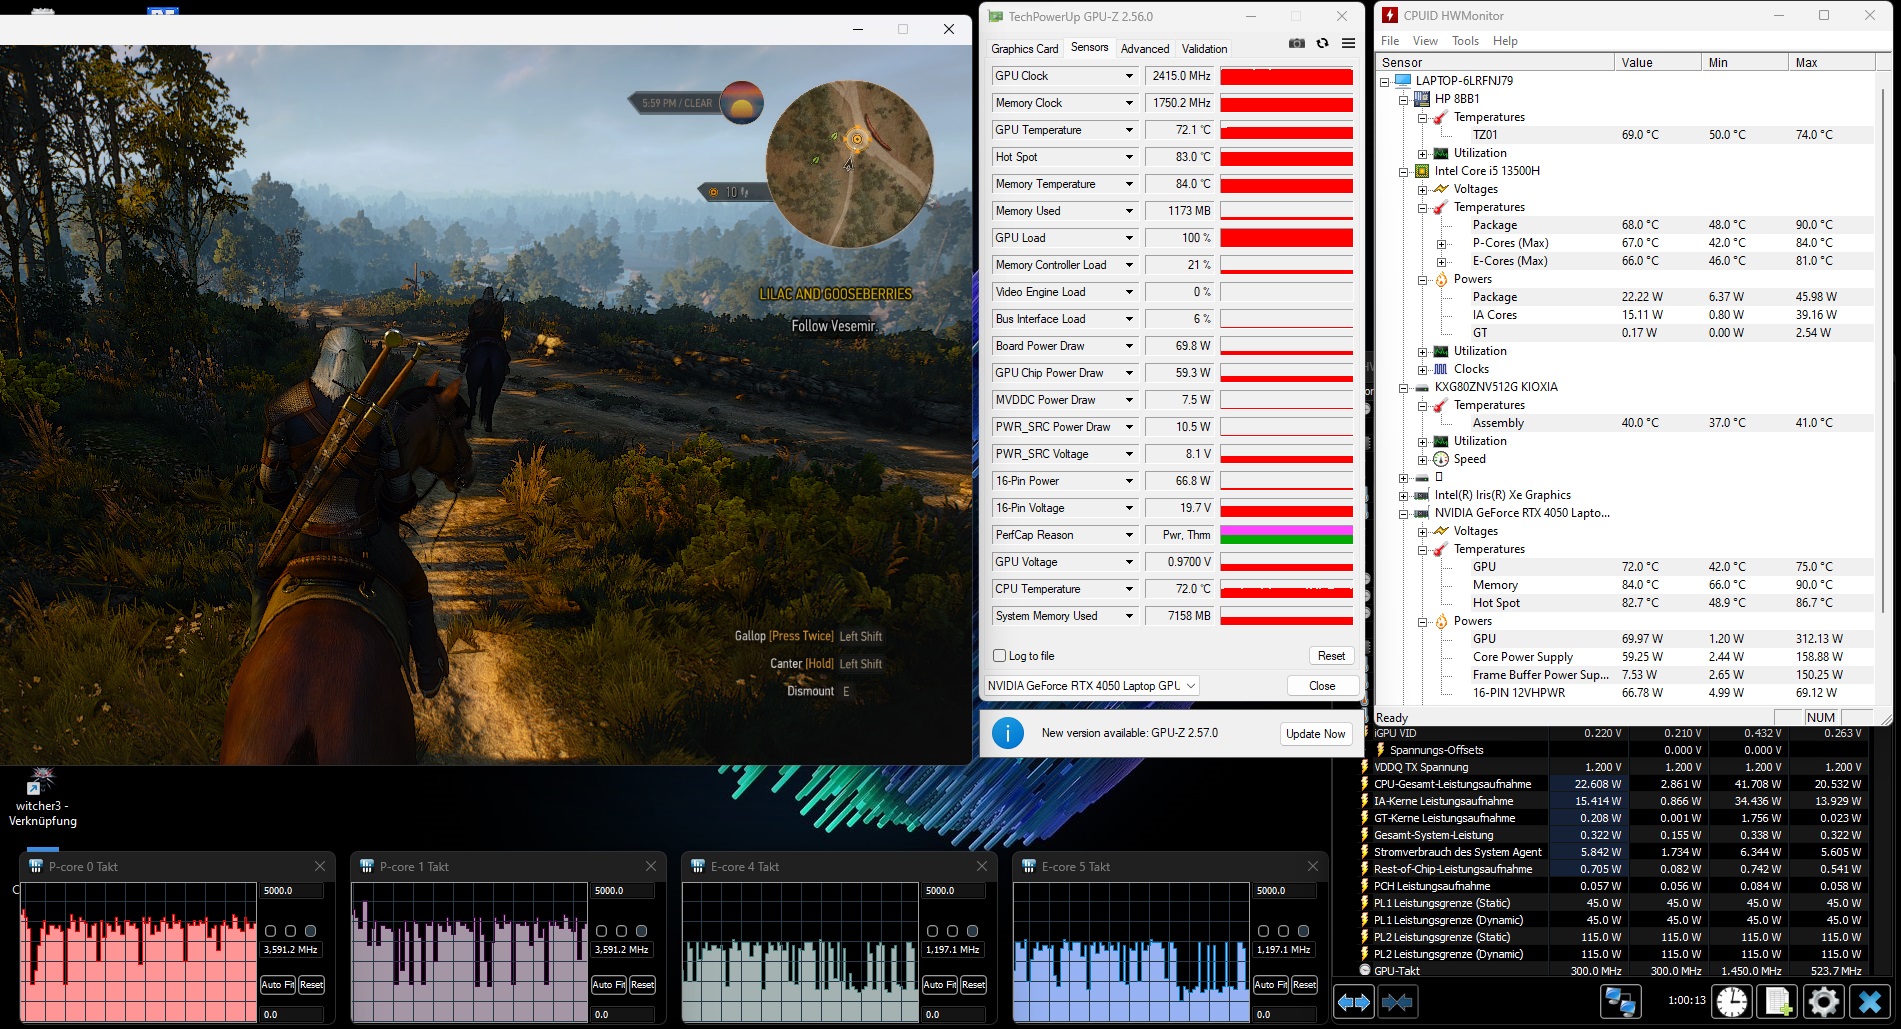
Stress test
The components provided no unwelcome surprises. Following an extended period of full load, the CPU stabilized at approximately 176 °F, while the GPU maintained an average of 158 °F, which is also entirely acceptable for this scenario.
Speakers
If possible, a headset or external speakers should be connected for media enjoyment. The Victus 15's 2.0 audio system only achieved a mediocre score in the audio analysis, with noticeable deficiencies in bass reproduction and maximum volume.
HP Victus 15-fa1057ng audio analysis
(±) | speaker loudness is average but good (79 dB)
Bass 100 - 315 Hz
(-) | nearly no bass - on average 26.2% lower than median
(±) | linearity of bass is average (12.8% delta to prev. frequency)
Mids 400 - 2000 Hz
(+) | balanced mids - only 1.7% away from median
(+) | mids are linear (4.1% delta to prev. frequency)
Highs 2 - 16 kHz
(+) | balanced highs - only 3% away from median
(+) | highs are linear (3.7% delta to prev. frequency)
Overall 100 - 16.000 Hz
(±) | linearity of overall sound is average (18.4% difference to median)
Compared to same class
» 59% of all tested devices in this class were better, 9% similar, 33% worse
» The best had a delta of 6%, average was 18%, worst was 132%
Compared to all devices tested
» 41% of all tested devices were better, 8% similar, 52% worse
» The best had a delta of 4%, average was 24%, worst was 134%
HP Victus 15 fa0020nr audio analysis
(±) | speaker loudness is average but good (81 dB)
Bass 100 - 315 Hz
(-) | nearly no bass - on average 24.6% lower than median
(±) | linearity of bass is average (12.8% delta to prev. frequency)
Mids 400 - 2000 Hz
(+) | balanced mids - only 2.5% away from median
(+) | mids are linear (3.4% delta to prev. frequency)
Highs 2 - 16 kHz
(+) | balanced highs - only 3.7% away from median
(+) | highs are linear (4.9% delta to prev. frequency)
Overall 100 - 16.000 Hz
(±) | linearity of overall sound is average (19.7% difference to median)
Compared to same class
» 69% of all tested devices in this class were better, 6% similar, 25% worse
» The best had a delta of 6%, average was 18%, worst was 132%
Compared to all devices tested
» 50% of all tested devices were better, 7% similar, 43% worse
» The best had a delta of 4%, average was 24%, worst was 134%
Energy management
Power consumption
The moderate power consumption is appreciated. Considering the available performance, the 5–9 watt idle and 72–176 watt load consumption are reasonable. The power supply unit is adequately sized.
| Off / Standby | |
| Idle | |
| Load |
|
Key:
min: | |
| HP Victus 15-fa1057ng i5-13500H, GeForce RTX 4050 Laptop GPU | HP Victus 15 fa0020nr i7-12700H, GeForce RTX 3050 Ti Laptop GPU | Dell G15 5530, i5-13450HX RTX 4050 i5-13450HX, GeForce RTX 4050 Laptop GPU | Acer Nitro V 15 ANV15-51-582S i5-13420H, GeForce RTX 4050 Laptop GPU | Asus TUF A15 FA507 R7 7735HS, GeForce RTX 4050 Laptop GPU | Average of class Gaming | |
|---|---|---|---|---|---|---|
| Power Consumption | -18% | -21% | 9% | -14% | -76% | |
| Idle Minimum * (Watt) | 5 | 5.1 -2% | 2 60% | 7 -40% | 8 -60% | 13.2 ? -164% |
| Idle Average * (Watt) | 9 | 15.1 -68% | 12 -33% | 8 11% | 12.1 -34% | 18.9 ? -110% |
| Idle Maximum * (Watt) | 22 | 18.9 14% | 27 -23% | 11 50% | 12.5 43% | 24.3 ? -10% |
| Load Average * (Watt) | 72 | 114.5 -59% | 100 -39% | 76 -6% | 74.9 -4% | 108.3 ? -50% |
| Witcher 3 ultra * (Watt) | 113 | 113.9 -1% | 161.9 -43% | 98.2 13% | 136.6 -21% | |
| Load Maximum * (Watt) | 176 | 165.8 6% | 262 -49% | 136 23% | 185 -5% | 254 ? -44% |
* ... smaller is better
Power consumption Witcher 3 / stress test
Power consumption with external monitor
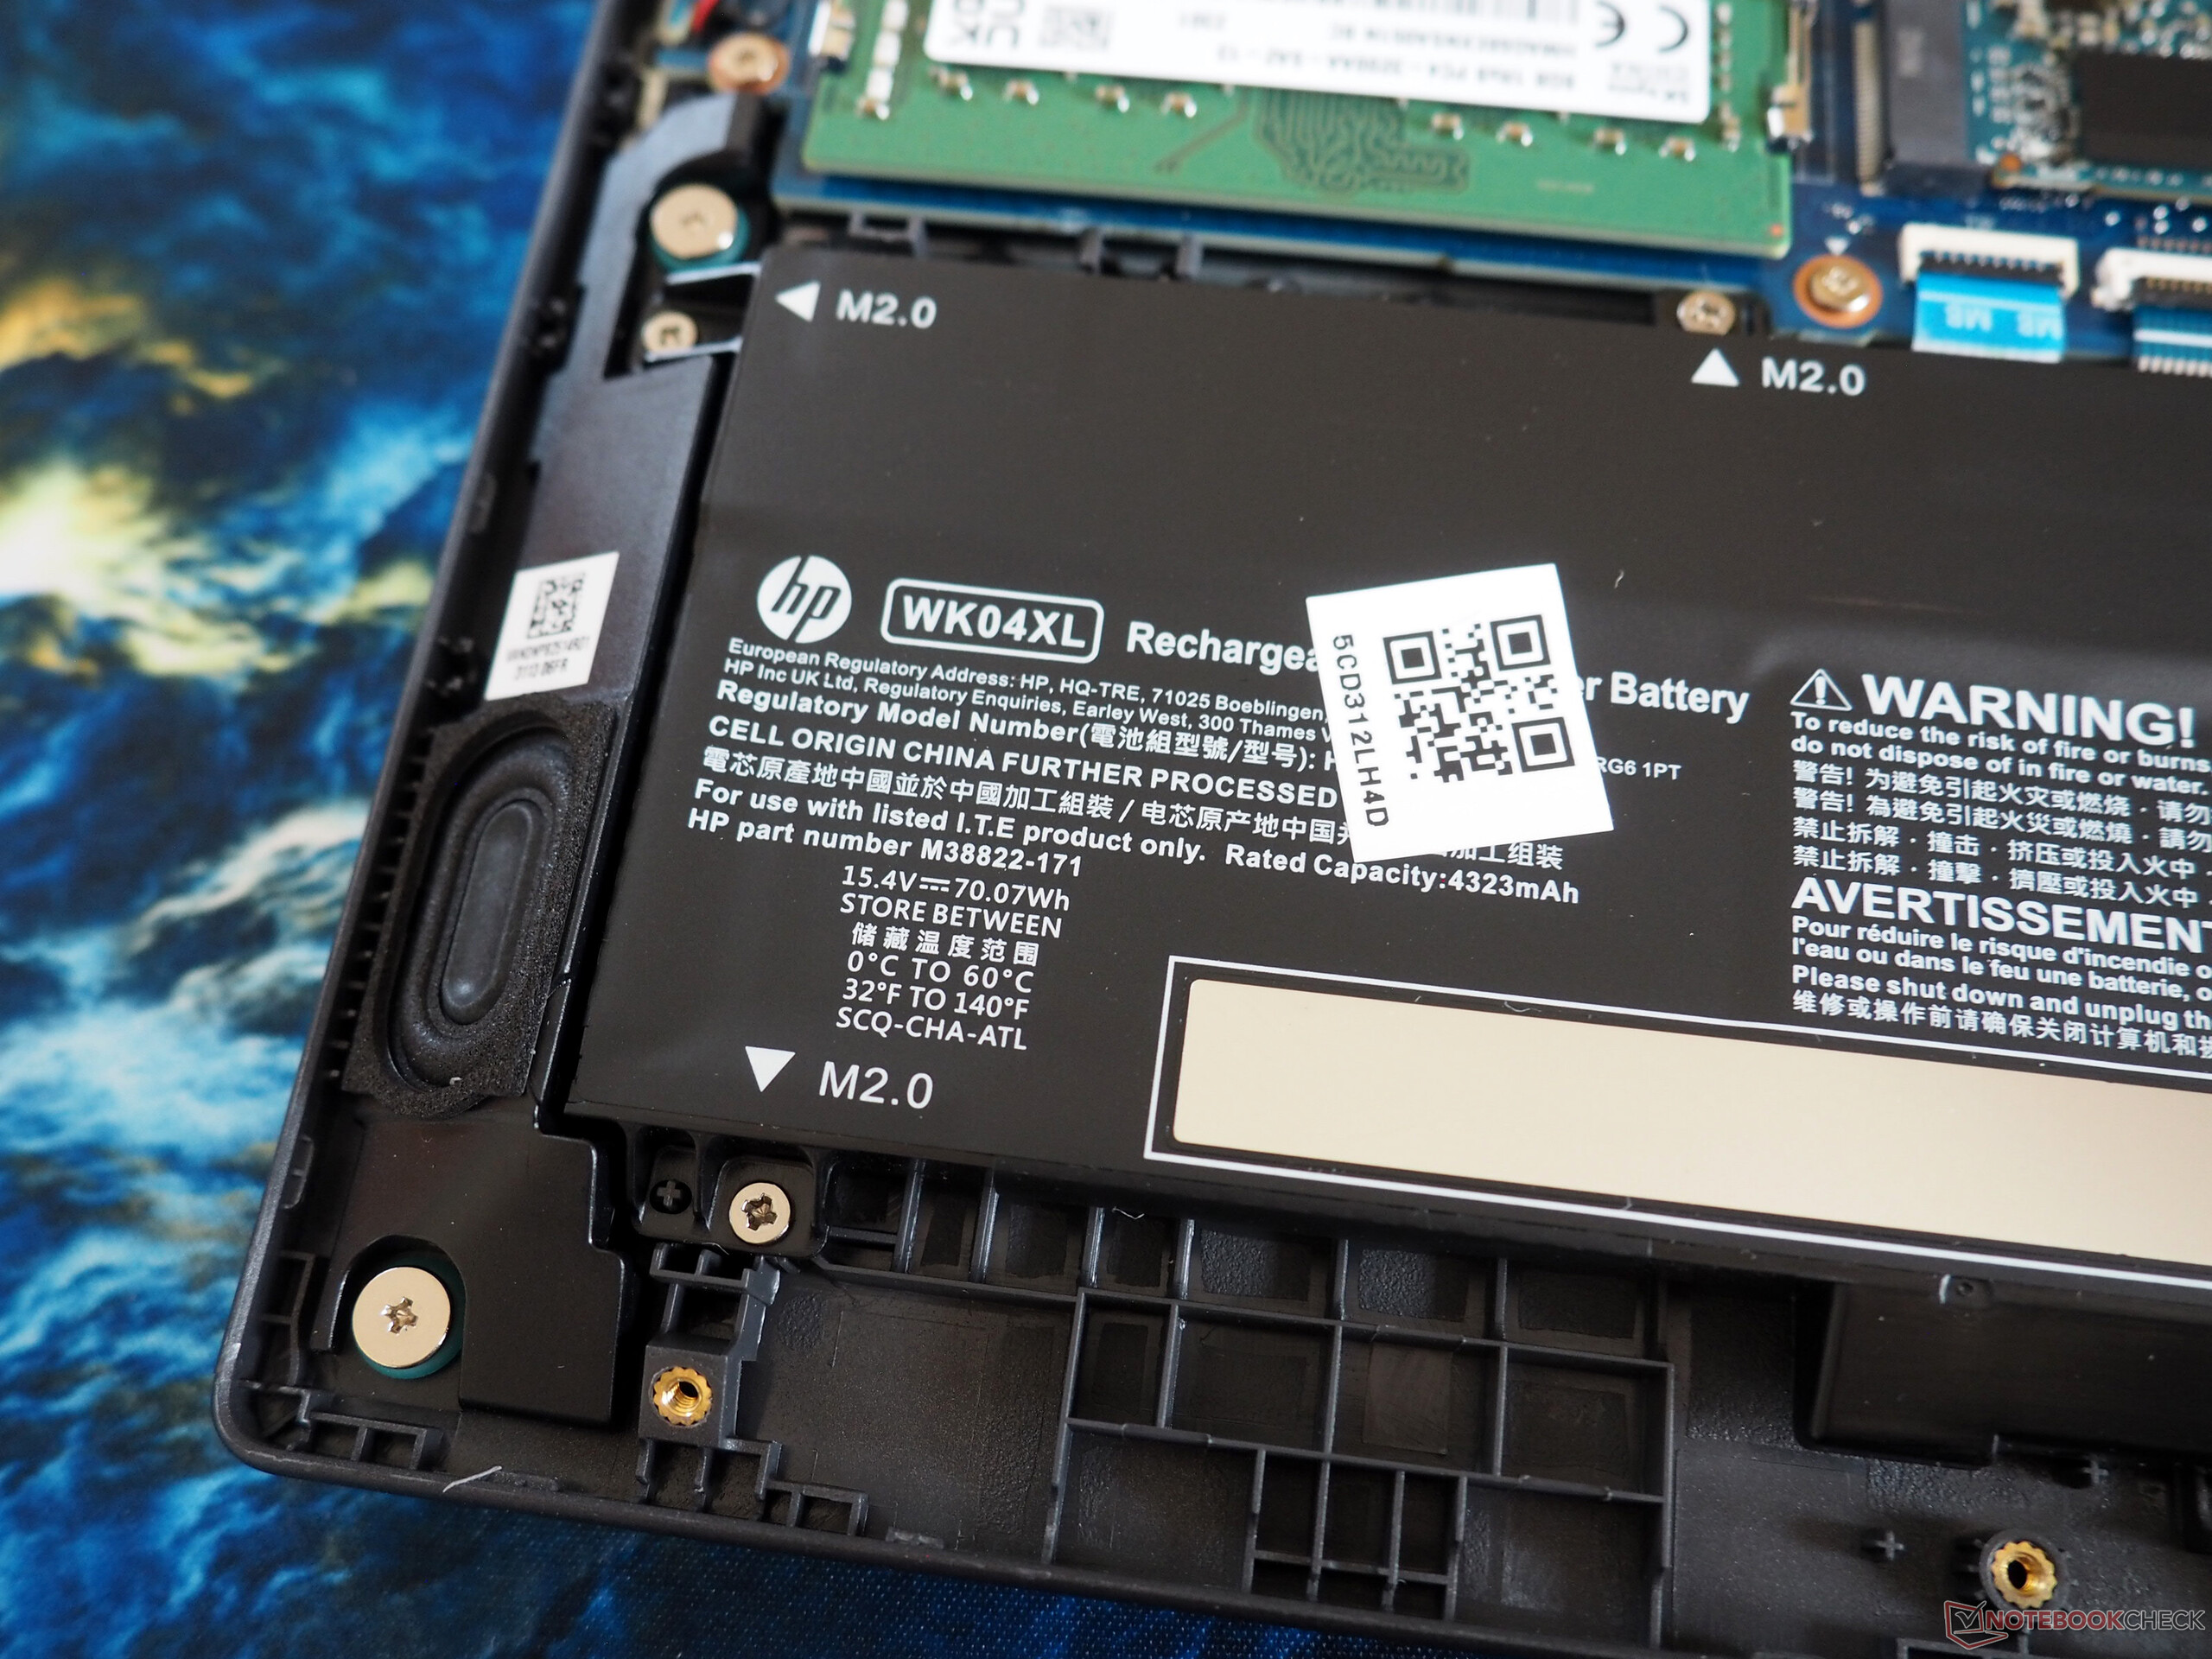
Runtimes
The 15 inch laptop doesn't have to hide behind the competition in terms of runtimes either - on the contrary. The HP offshoot lasted around 7.5 hours in our WLAN test with the brightness reduced to 150 cd/m² - a good result for a gaming notebook. The values of the predecessor are probably significantly worse due to a bug.
| HP Victus 15-fa1057ng i5-13500H, GeForce RTX 4050 Laptop GPU, 70 Wh | HP Victus 15 fa0020nr i7-12700H, GeForce RTX 3050 Ti Laptop GPU, 70 Wh | Dell G15 5530, i5-13450HX RTX 4050 i5-13450HX, GeForce RTX 4050 Laptop GPU, 86 Wh | Acer Nitro V 15 ANV15-51-582S i5-13420H, GeForce RTX 4050 Laptop GPU, 57 Wh | Asus TUF A15 FA507 R7 7735HS, GeForce RTX 4050 Laptop GPU, 90 Wh | Average of class Gaming | |
|---|---|---|---|---|---|---|
| Battery runtime | -72% | -5% | 25% | 56% | -6% | |
| WiFi v1.3 (h) | 7.5 | 2.1 -72% | 7.1 -5% | 9.4 25% | 11.7 56% | 7.04 ? -6% |
| Reader / Idle (h) | 2.6 | 21.5 | 8.71 ? | |||
| Load (h) | 1.1 | 1.7 | 1 | 1.47 ? | ||
| H.264 (h) | 12.5 | 8.26 ? |
Pros
Cons
Verdict
The Victus 15-fa1057ng emerges as a typical budget gaming notebook, catering to price-conscious gamers.
The plastic casing, though not exuding high-quality craftsmanship, reliably performs its function, as do the input devices. The hardware aligns well with the Full HD resolution, providing a decent gaming experience for most titles, even though the 144 Hz display is not fully exploited. Emissions from the Core i5-13500H and GeForce RTX 4050 remain manageable.
One advantage is the significantly extended battery life.
However, users must accept a display with limited color accuracy and brightness. For those prioritizing image quality, alternatives like the Dell G15 5530 or Asus TUF A15 FA507 in a similar price range may be worth considering. Consequently, an improved display quality would be a significant enhancement for the successor.
Price and availability
The HP Victus 15 equipped with the Core i5-13500H, is available for approximately $690 from various online retailers (e.g., Amazon).
HP Victus 15-fa1057ng
- 01/31/2024 v7 (old)
Florian Glaser
Transparency
The selection of devices to be reviewed is made by our editorial team. The test sample was provided to the author as a loan by the manufacturer or retailer for the purpose of this review. The lender had no influence on this review, nor did the manufacturer receive a copy of this review before publication. There was no obligation to publish this review. As an independent media company, Notebookcheck is not subjected to the authority of manufacturers, retailers or publishers.
This is how Notebookcheck is testing
Every year, Notebookcheck independently reviews hundreds of laptops and smartphones using standardized procedures to ensure that all results are comparable. We have continuously developed our test methods for around 20 years and set industry standards in the process. In our test labs, high-quality measuring equipment is utilized by experienced technicians and editors. These tests involve a multi-stage validation process. Our complex rating system is based on hundreds of well-founded measurements and benchmarks, which maintains objectivity. Further information on our test methods can be found here.
Price comparison

