HP Omen 15: Gaming laptop with good battery life

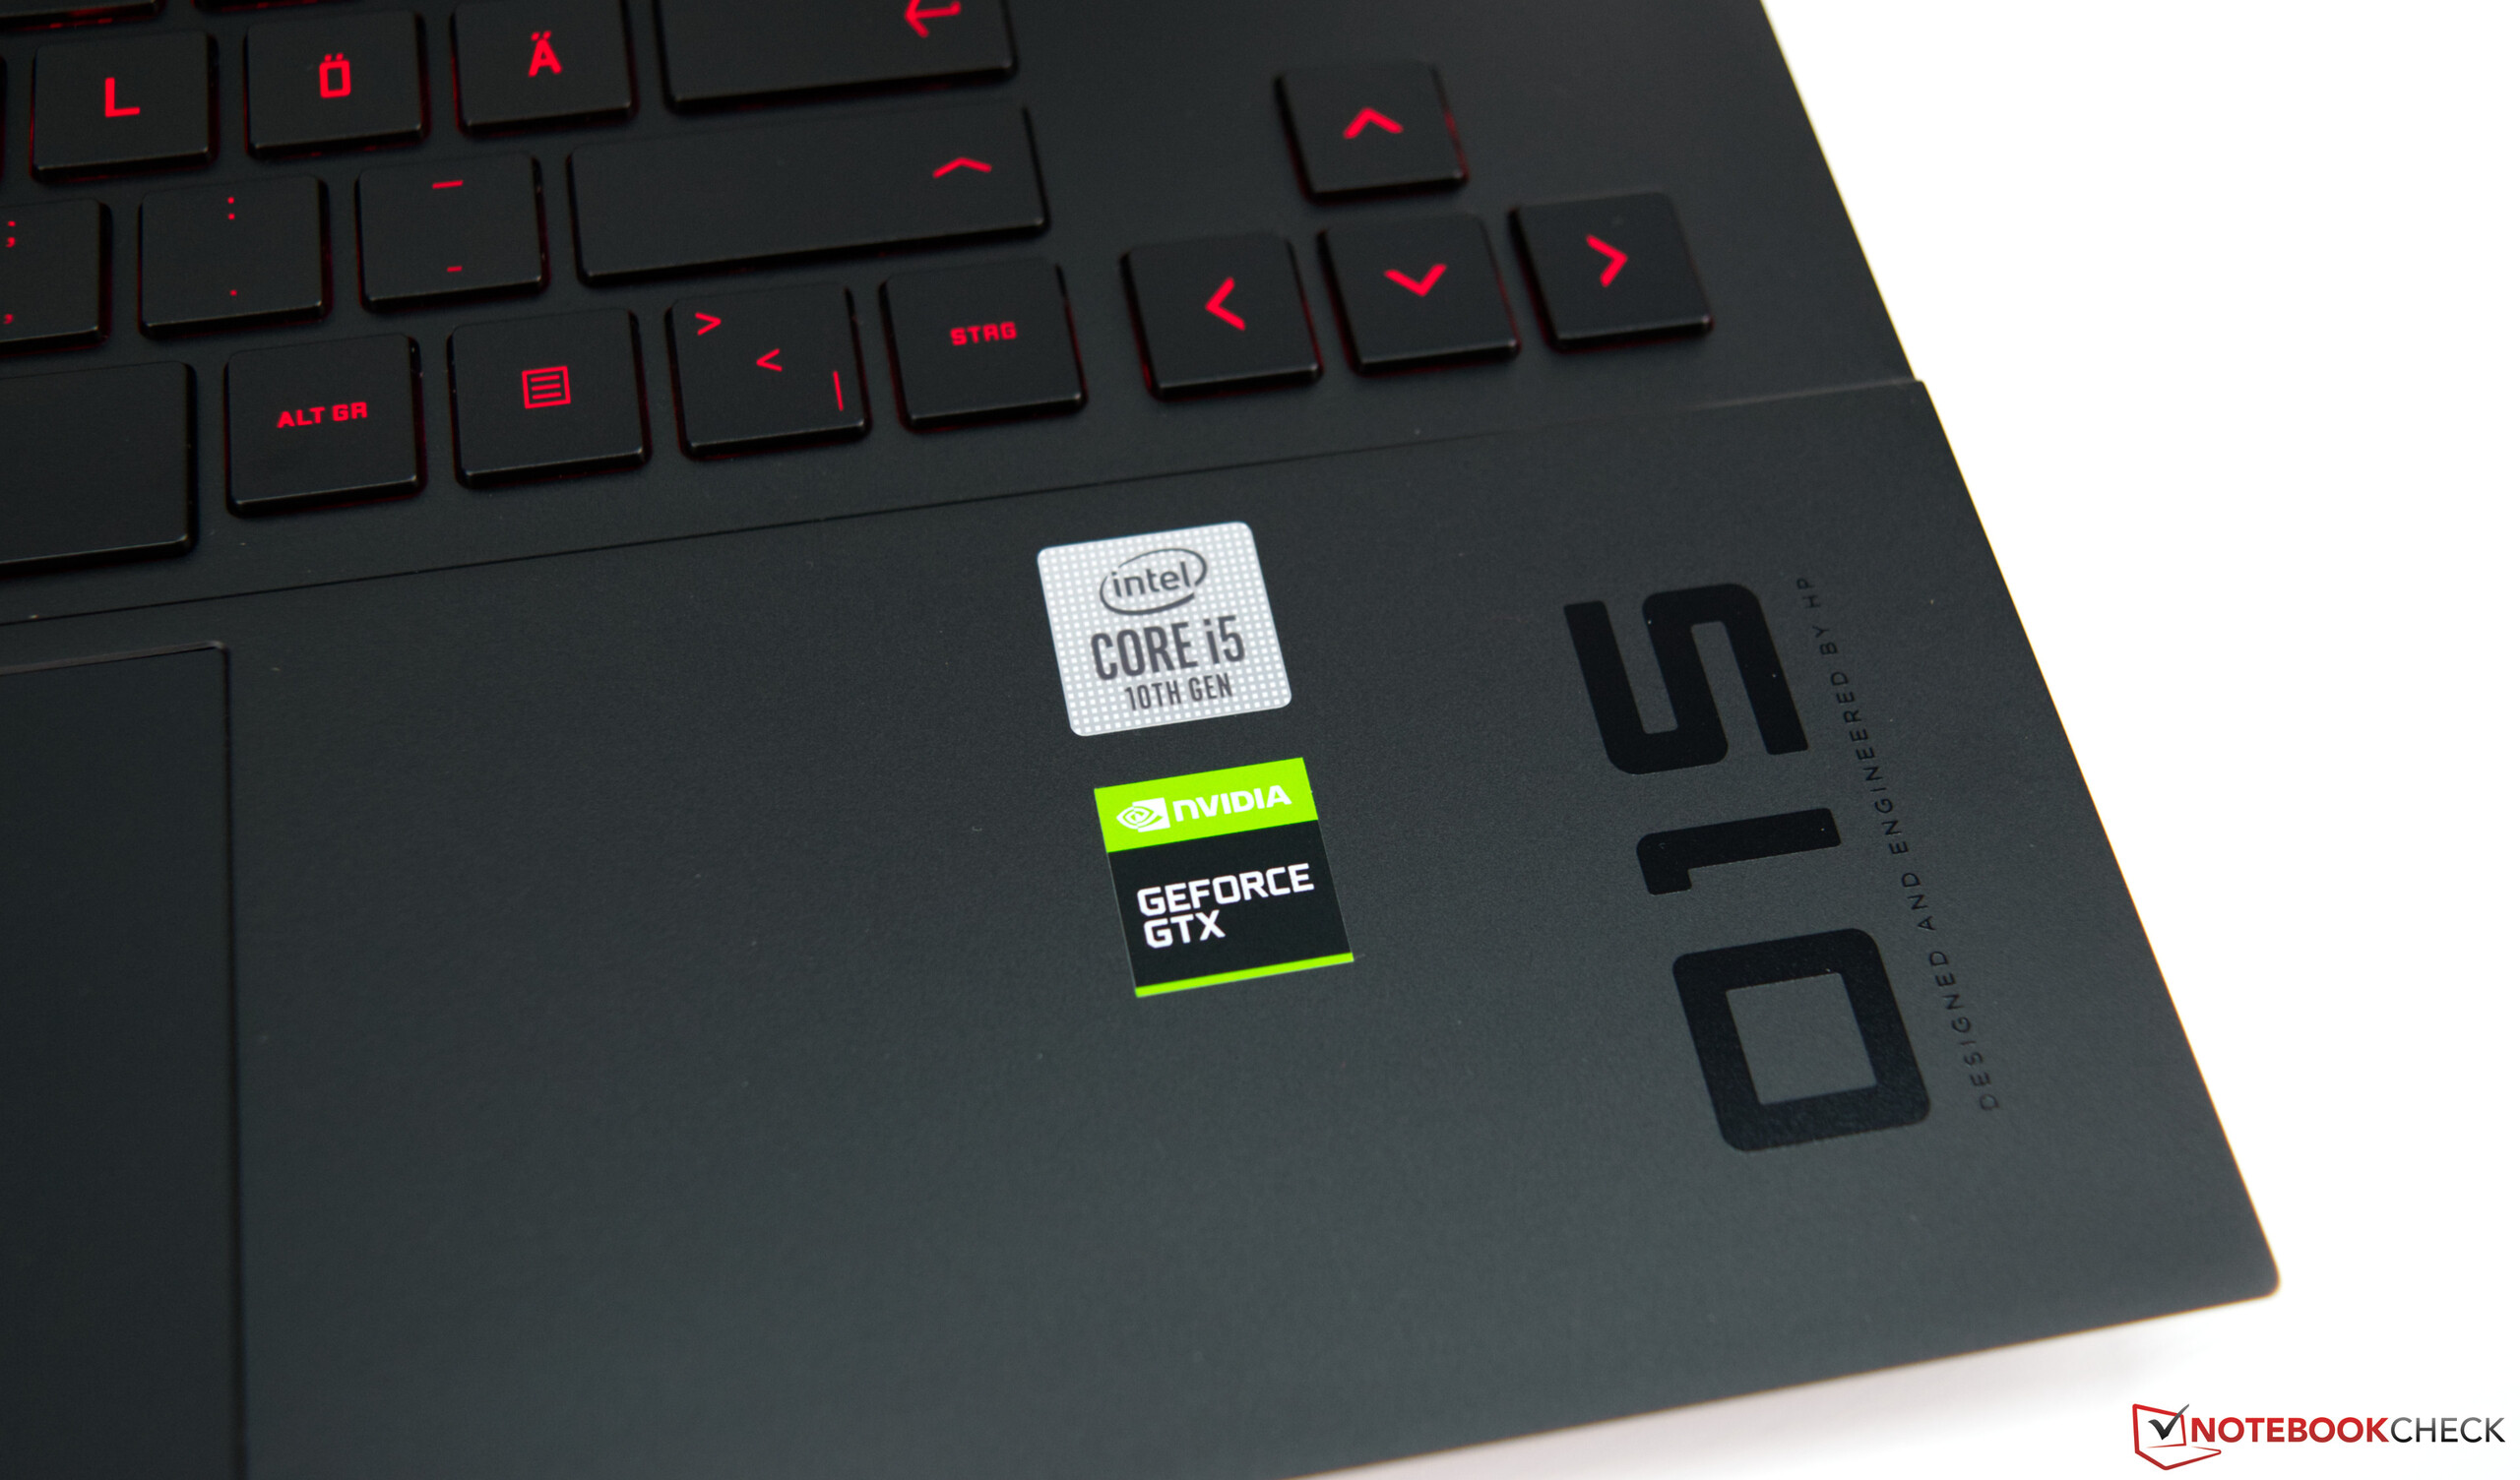
The HP Omen laptops are primarily aimed at gamers who are exclusively focused on performance. Furthermore, the Omen series is also available outside the high-priced range. HP shows this exactly with the Omen 15, which costs almost 1,250 Euros (~$1,480) in our configuration. In this case, an Intel Core i5-10300H serves as the processor, and Nvidia's GeForce GTX 1660 Ti is used as the graphics card. Those who prefer AMD can also get the Omen 15 with a Ryzen 5 4600H. There's no significant difference in price compared to our test sample with the Intel SoC. Both have 16 GB of RAM and are equipped with 512 GB of SSD storage space.
But if you need more power, you can also get the Omen 15 with a Core i7-10750H CPU and a GeForce RTX 2070 Max-Q GPU. However, this will set you back at least 600 Euros (~$711) more. A mid-range option is also available with the GeForce RTX 2060 and the Intel Core i5-10300H. Here, the price is about 1,370 Euros (~$1,622) at the time of testing.
In terms of the comparison devices for this review, we have limited ourselves to current 15.6-inch devices that are somewhat at the same price level. You can find an overview under the HP Omen 15 specifications.
Rating | Date | Model | Weight | Height | Size | Resolution | Price |
|---|---|---|---|---|---|---|---|
| 82.1 % v7 (old) | 09 / 2020 | HP Omen 15-ek0456ng i5-10300H, GeForce GTX 1660 Ti Mobile | 2.1 kg | 32 mm | 15.60" | 1920x1080 | |
| 81.2 % v7 (old) | 09 / 2020 | Asus ROG Zephyrus G15 GA502IU-ES76 R7 4800HS, GeForce GTX 1660 Ti Max-Q | 2.1 kg | 19.9 mm | 15.60" | 1920x1080 | |
| 81.3 % v7 (old) | 02 / 2020 | Schenker XMG Core 15 GK5CP6V i7-9750H, GeForce GTX 1660 Ti Mobile | 2 kg | 26 mm | 15.60" | 1920x1080 | |
| 81.2 % v7 (old) | 08 / 2020 | Nexoc GH5 515IG i5-10300H, GeForce GTX 1650 Mobile | 2.1 kg | 24.9 mm | 15.60" | 1920x1080 | |
| 79.5 % v7 (old) | 07 / 2020 | MSI Bravo 15 A4DCR R7 4800H, Radeon RX 5300M | 2 kg | 22 mm | 15.60" | 1920x1080 | |
| 81.5 % v7 (old) | 07 / 2019 | HP Omen 15-dc1020ng i5-9300H, GeForce GTX 1650 Mobile | 2.3 kg | 25 mm | 15.60" | 1920x1080 |
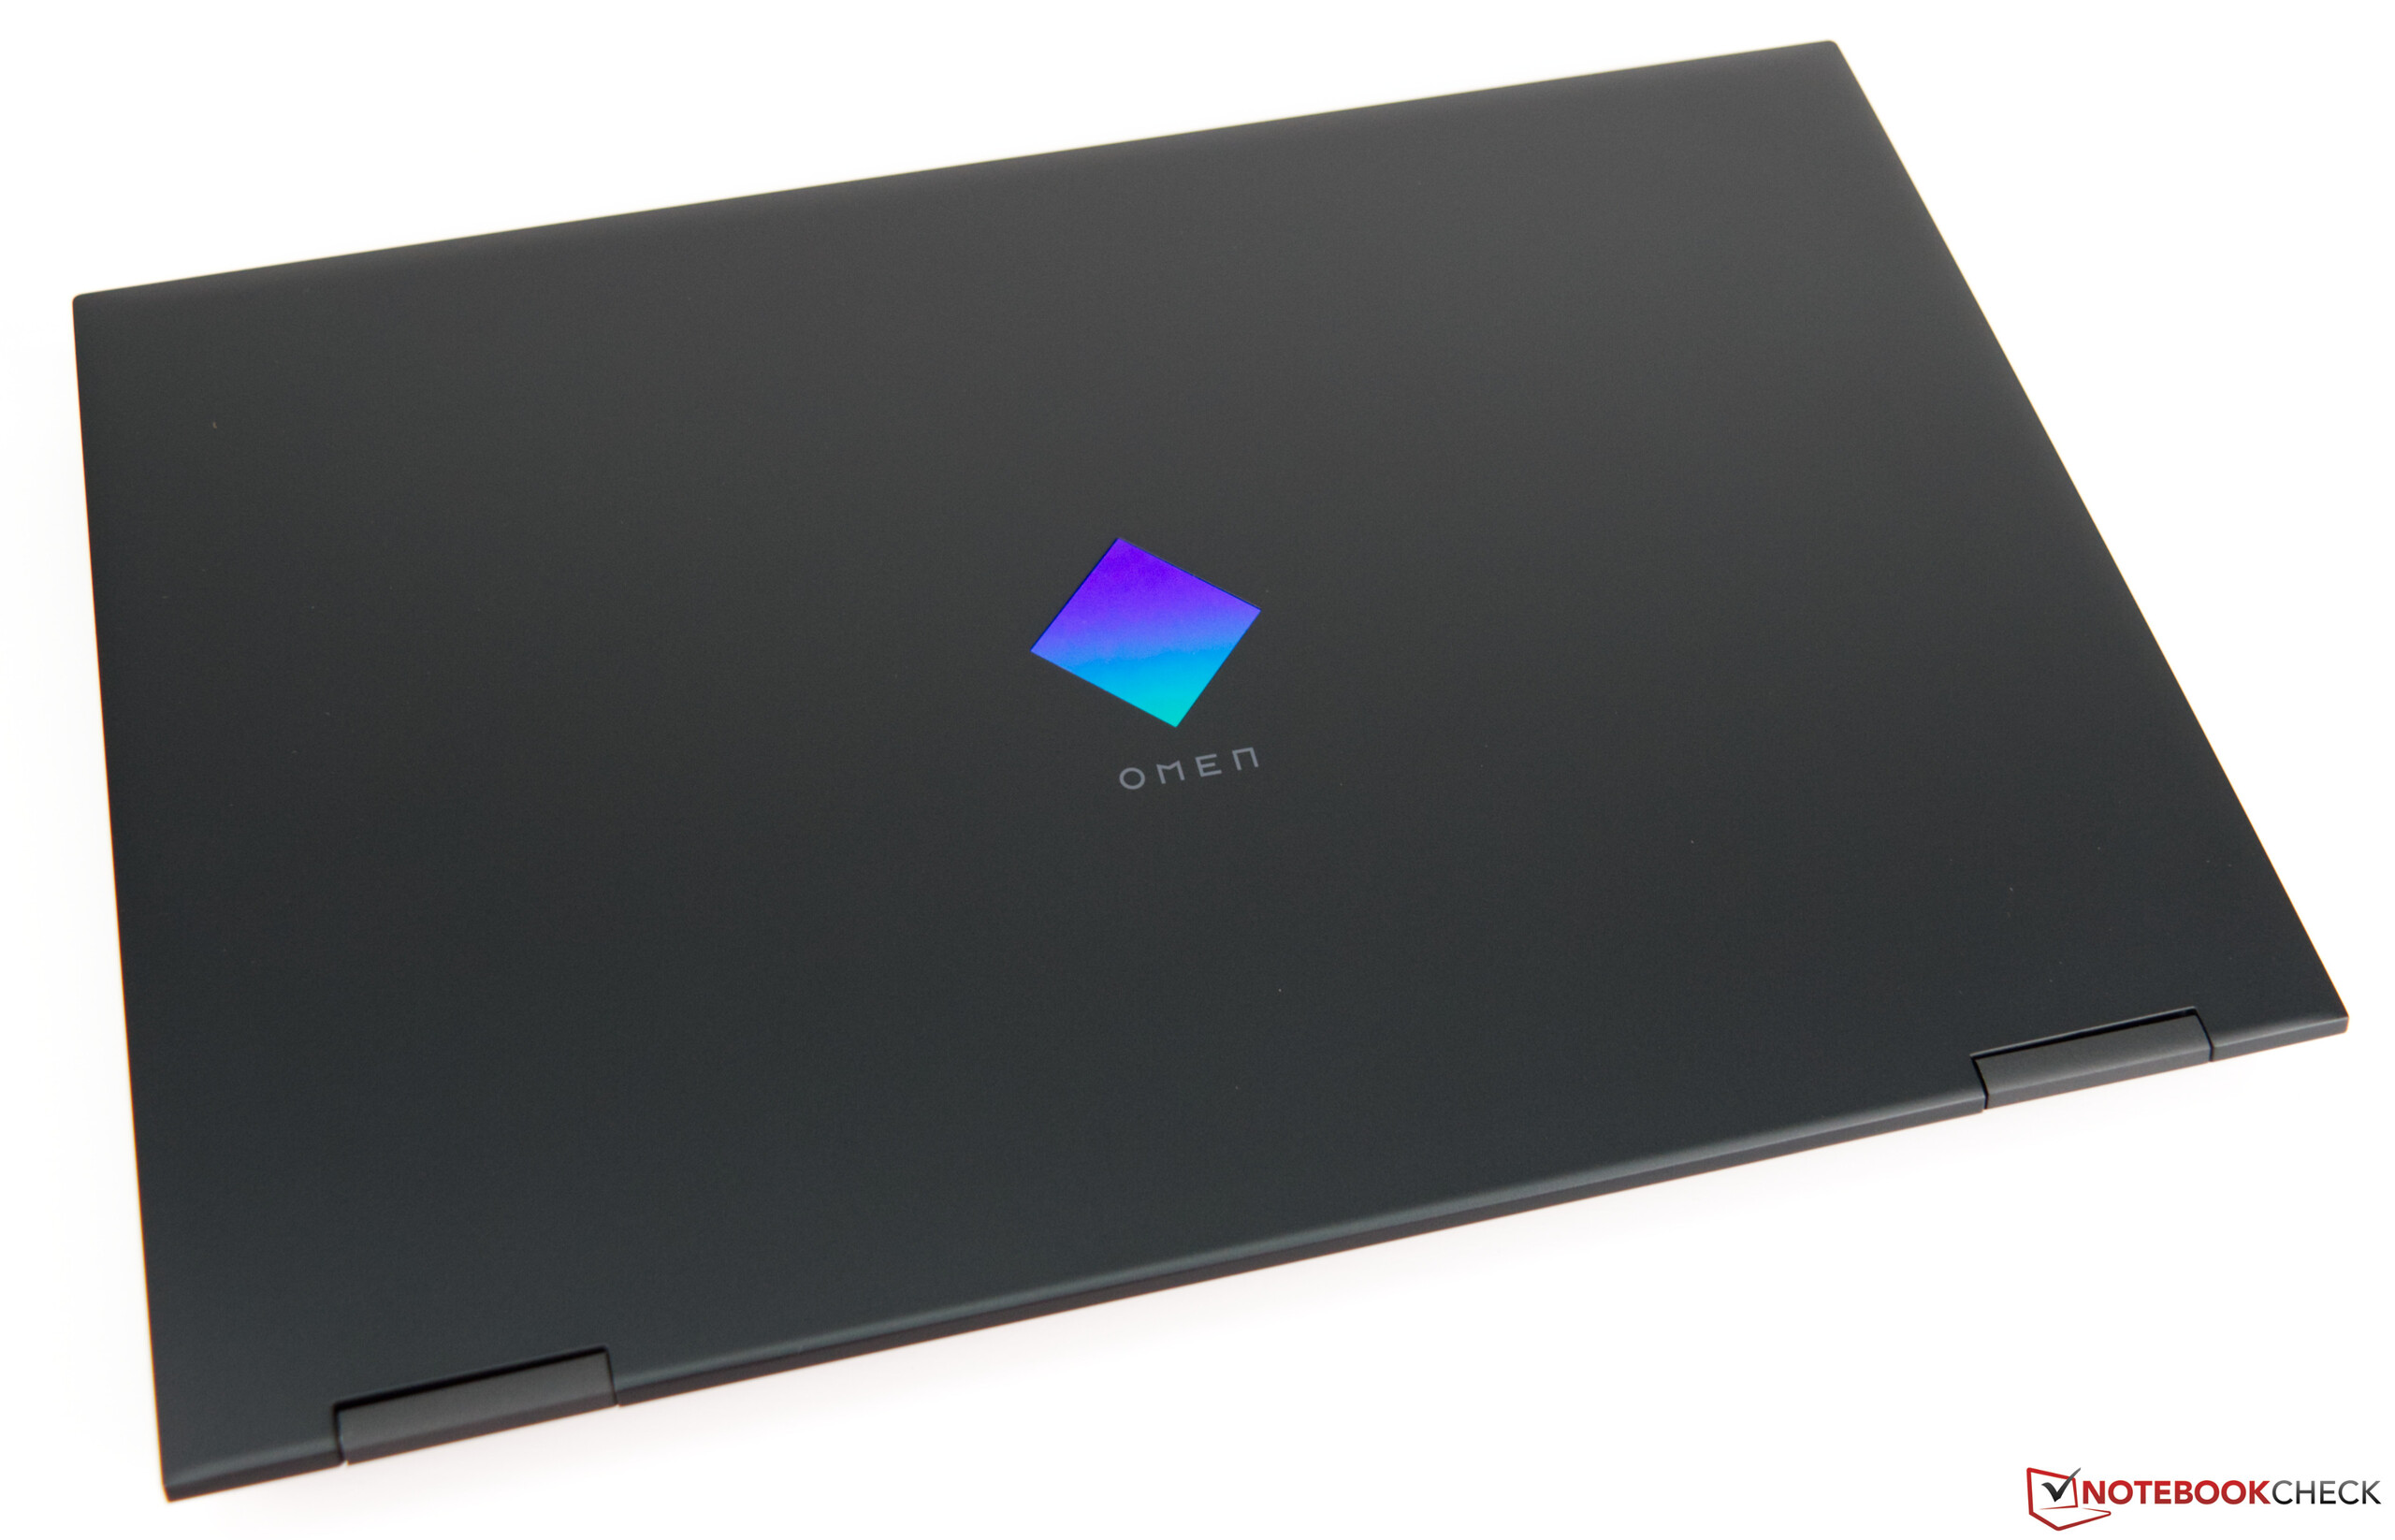
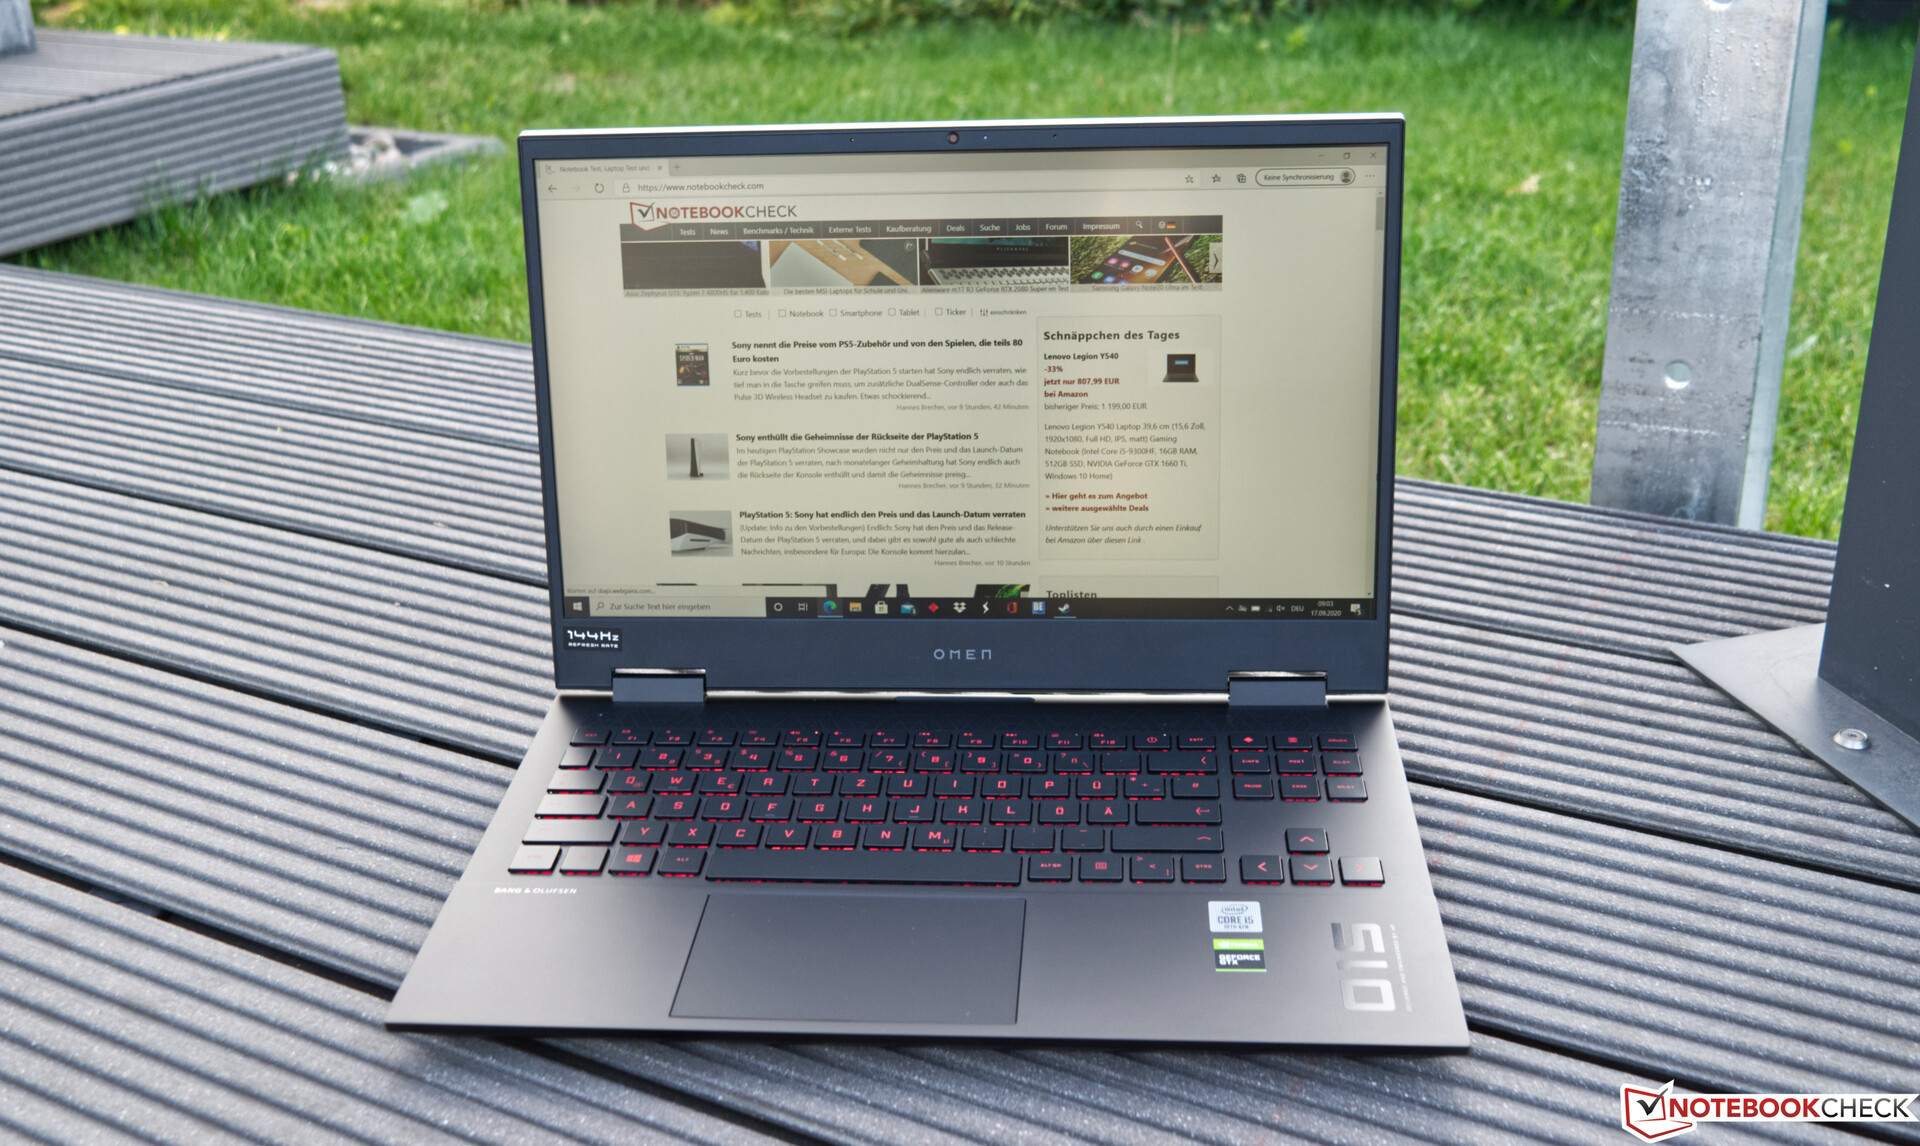
Case - Plastic with flaws
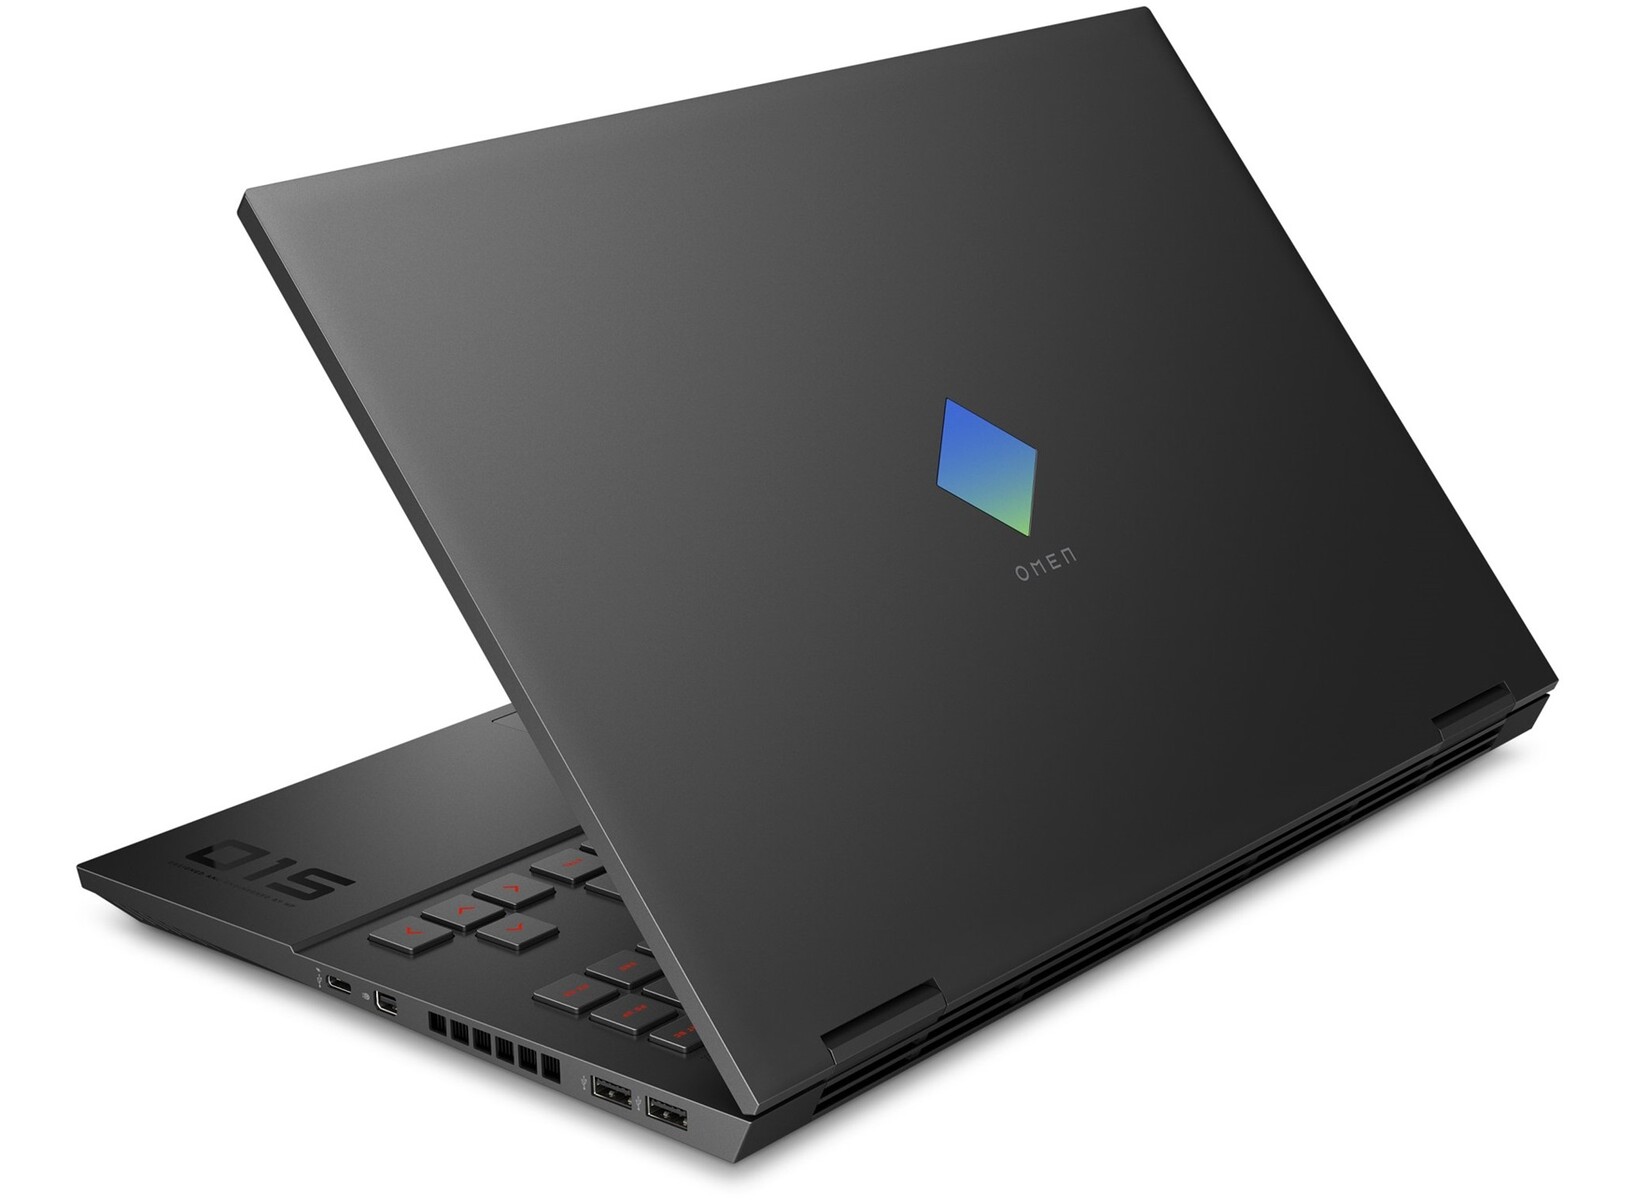
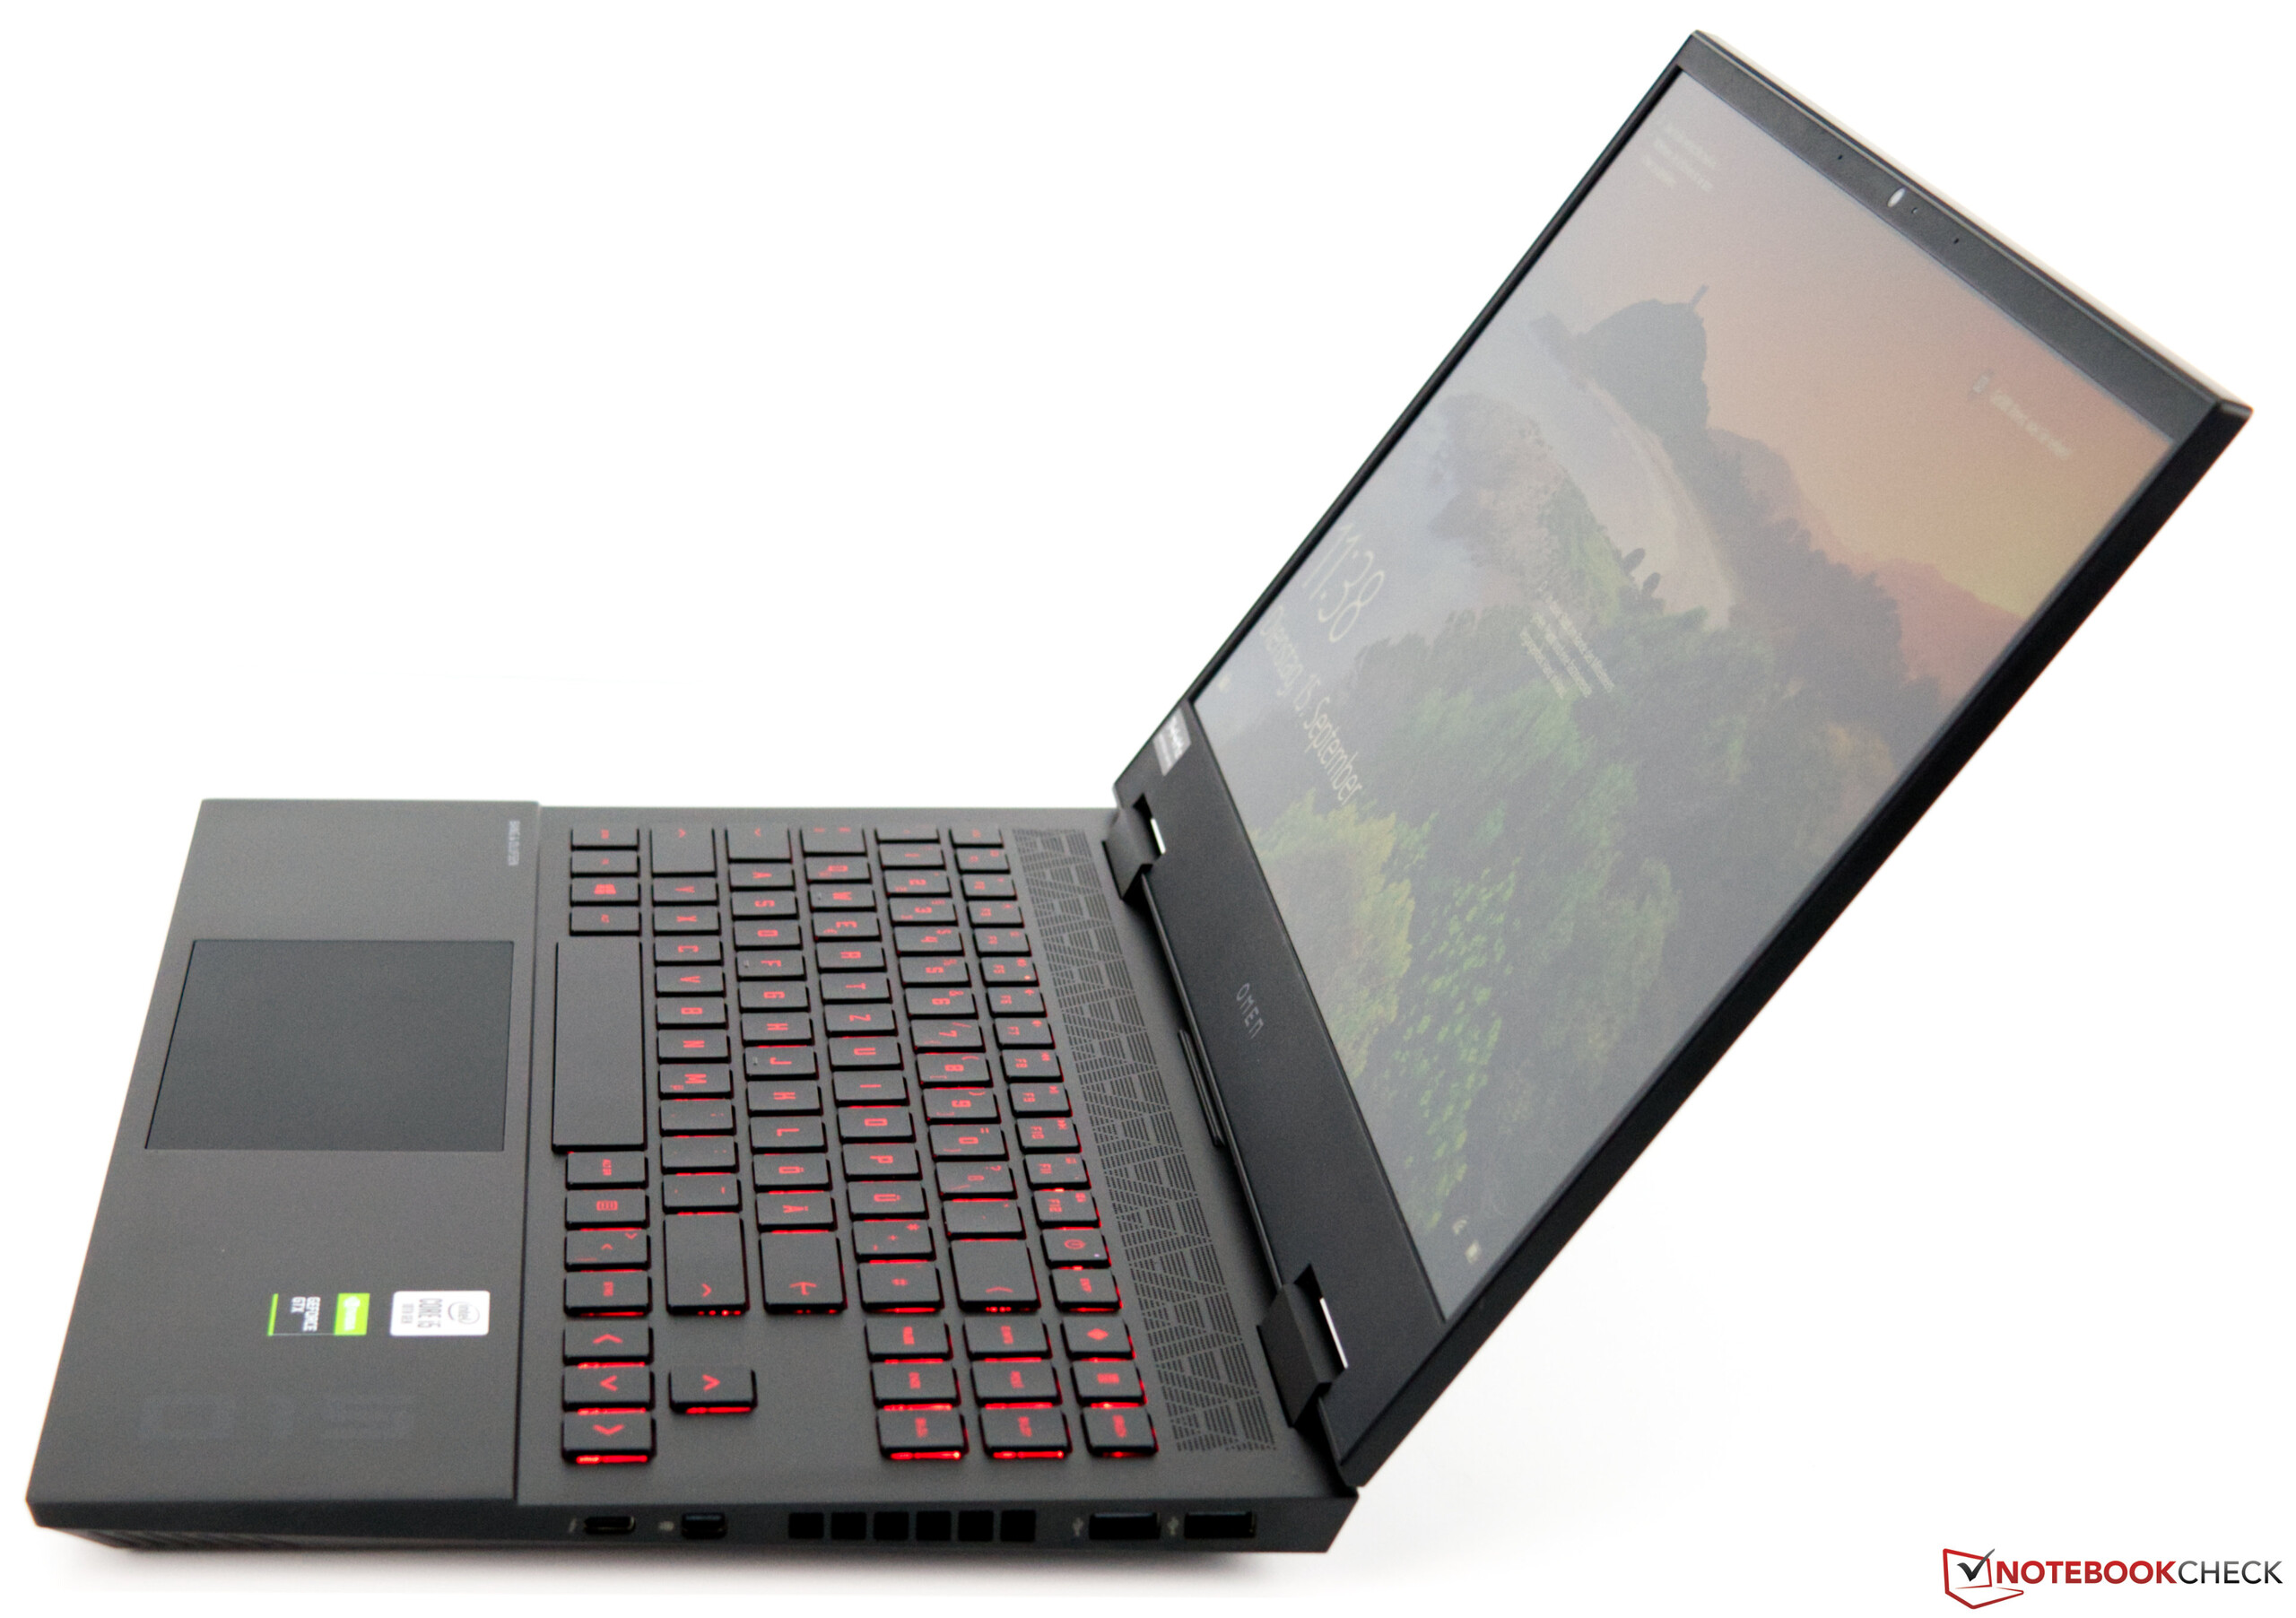
The case is made of plastic and is completely black. At first glance, the matte surface looks attractive, but when you start to use the device, it quickly becomes clear that fingerprints are literally attracted to it. The stability is good, although the lid and base unit can be twisted easily and produce a quiet creaking sound. However, exerting targeted pressure doesn't affect the panel, so that no changes in color are visible on it. Moreover, the hinges are smooth, and the lid can be opened with one hand. This results in slight wobbling, but we only saw this happen for a short time. At 180 degrees, the aperture angle is very wide and much larger than with comparable devices.
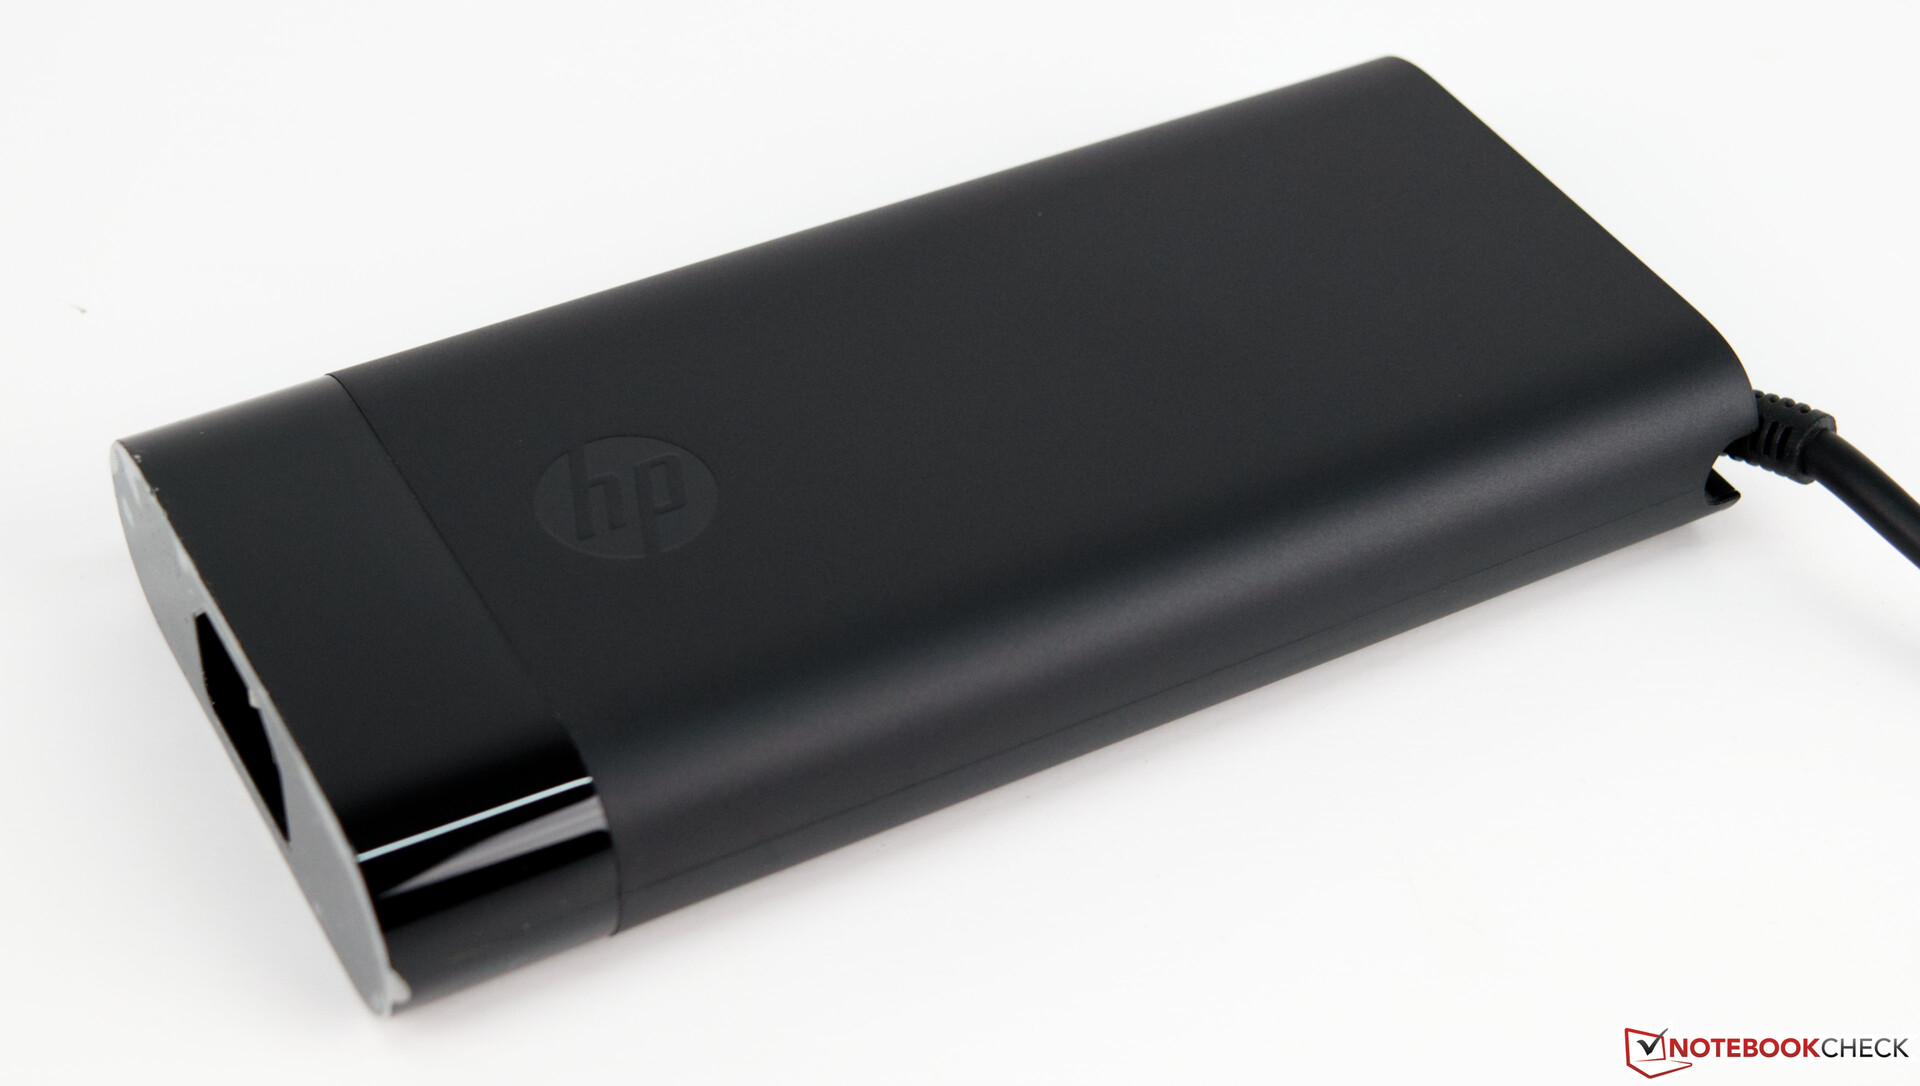
The HP Omen 15 is a 15.6-inch laptop and thus just as large as its competitors. The footprint's dimensions are only visibly smaller when comparing the laptop to the older Omen 15. With its 2.1 kilograms, our Omen 15 is also in the same league as its opponents. Weighing 2.4 kilograms, the Omen 15-dc was significantly heavier at its time. You have to take another 650 grams into account when it comes to the power adapter.
Connectivity - Armed for the future
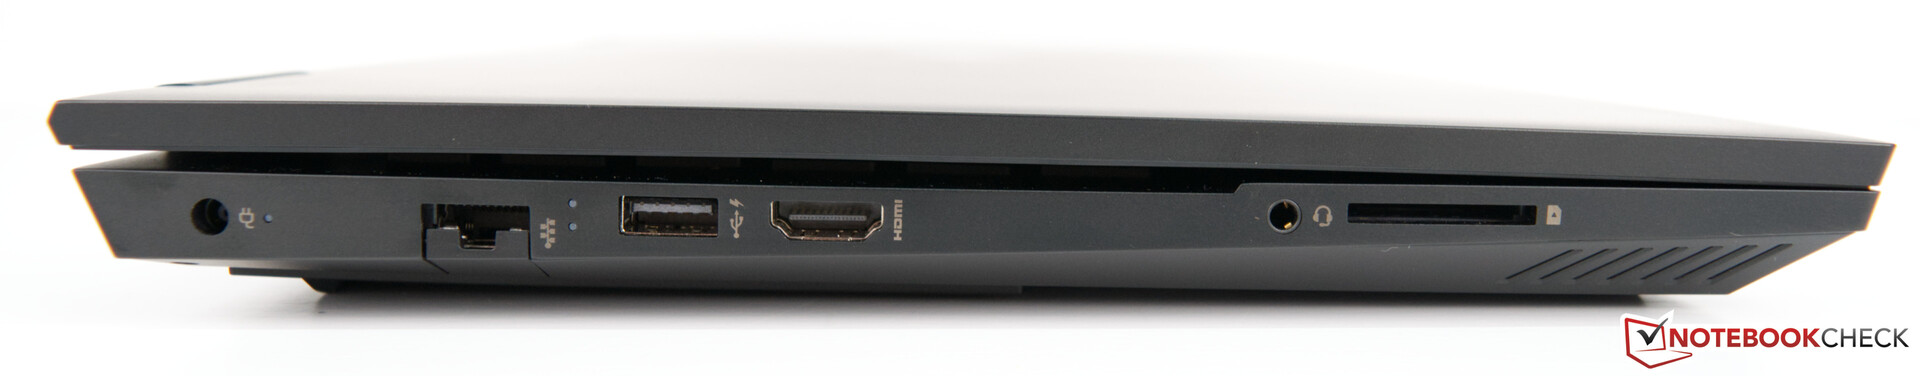
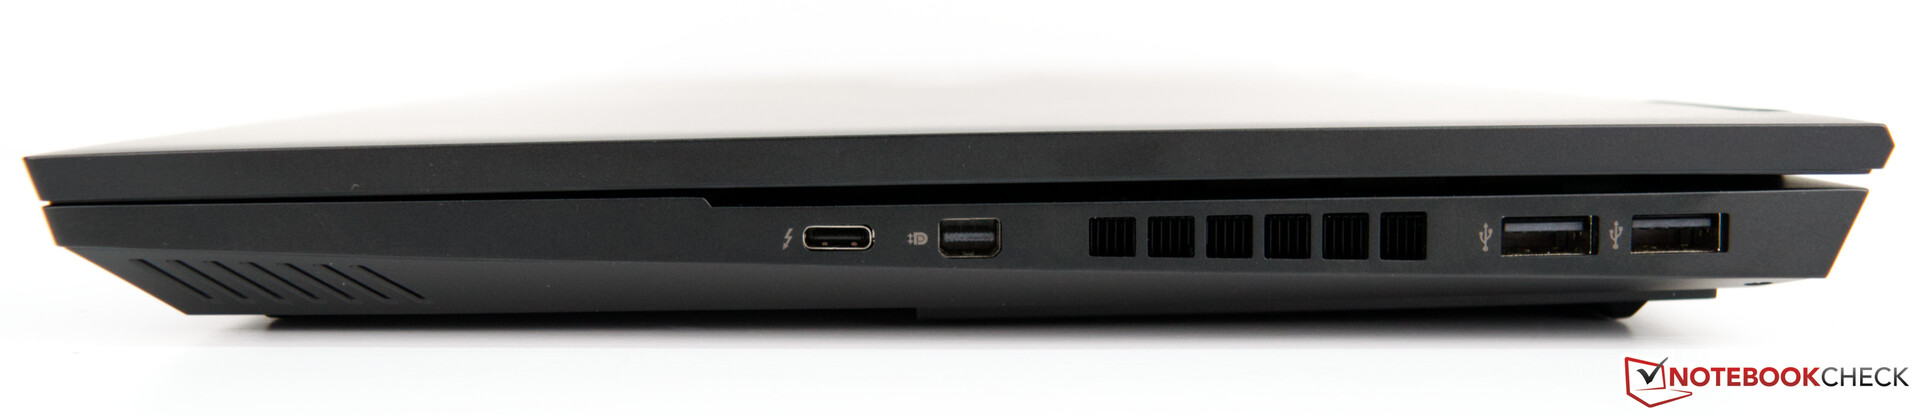
In terms of the port configuration, the HP Omen 15 offers a solid foundation with a few small extras. For example, the Mini DisplayPort, which is no longer frequently found, and a USB-C port with Thunderbolt 3 support should be mentioned as extras. There are also three conventional USB Type-A ports, and they all offer USB 3 speeds. Furthermore, the Omen 15 also offers HDMI 2.0b for the connection of external displays. Gigabit LAN is available as well, and users have to limit the distribution of the ports to the two edges. However, since the ports are located far at the rear, there are no problems when using a mouse next to the device.
SD card reader
The HP Omen 15 is equipped with an SD card reader that works at USB 3.0 speeds. This is also confirmed by our measurements, which we performed with our reference memory card (the 64 GB Toshiba Exceria Pro UHS-II SDXC).
| SD Card Reader | |
| average JPG Copy Test (av. of 3 runs) | |
| Average of class Gaming (20.9 - 210, n=54, last 2 years) | |
| Nexoc GH5 515IG (Toshiba Exceria Pro SDXC 64 GB UHS-II) | |
| HP Omen 15-dc1020ng (Toshiba Exceria Pro SDXC 64 GB UHS-II) | |
| HP Omen 15-ek0456ng (Toshiba Exceria Pro SDXC 64 GB UHS-II) | |
| Schenker XMG Core 15 GK5CP6V (Toshiba Exceria Pro SDXC 64 GB UHS-II) | |
| maximum AS SSD Seq Read Test (1GB) | |
| Average of class Gaming (25.5 - 261, n=51, last 2 years) | |
| HP Omen 15-dc1020ng (Toshiba Exceria Pro SDXC 64 GB UHS-II) | |
| Nexoc GH5 515IG (Toshiba Exceria Pro SDXC 64 GB UHS-II) | |
| HP Omen 15-ek0456ng (Toshiba Exceria Pro SDXC 64 GB UHS-II) | |
| Schenker XMG Core 15 GK5CP6V (Toshiba Exceria Pro SDXC 64 GB UHS-II) | |
Communication
The built-in WLAN chip offers Wi-Fi 6 and thus the latest standard including Bluetooth 5, but the HP Omen 15 couldn't quite implement the advantages of the faster Wi-Fi 6 in the test. The speeds for sending and receiving data are partly clearly behind the average that we have measured so far with the Intel Wi-Fi 6 AX201 module. Alternatively, however, transfer rates of up to 1 Gb/s can be achieved via the RJ45 port.
Webcam
The integrated webcam (0.9 MP) delivers a maximum resolution of 1280x720 pixels and has to cope with significant color deviations. The measured Delta E value is 15.48. A value smaller than 3 is, therefore, a long way off.


Accessories
Apart from the obligatory safety information and the warranty brochure, there are no other accessories when purchasing the HP Omen 15.
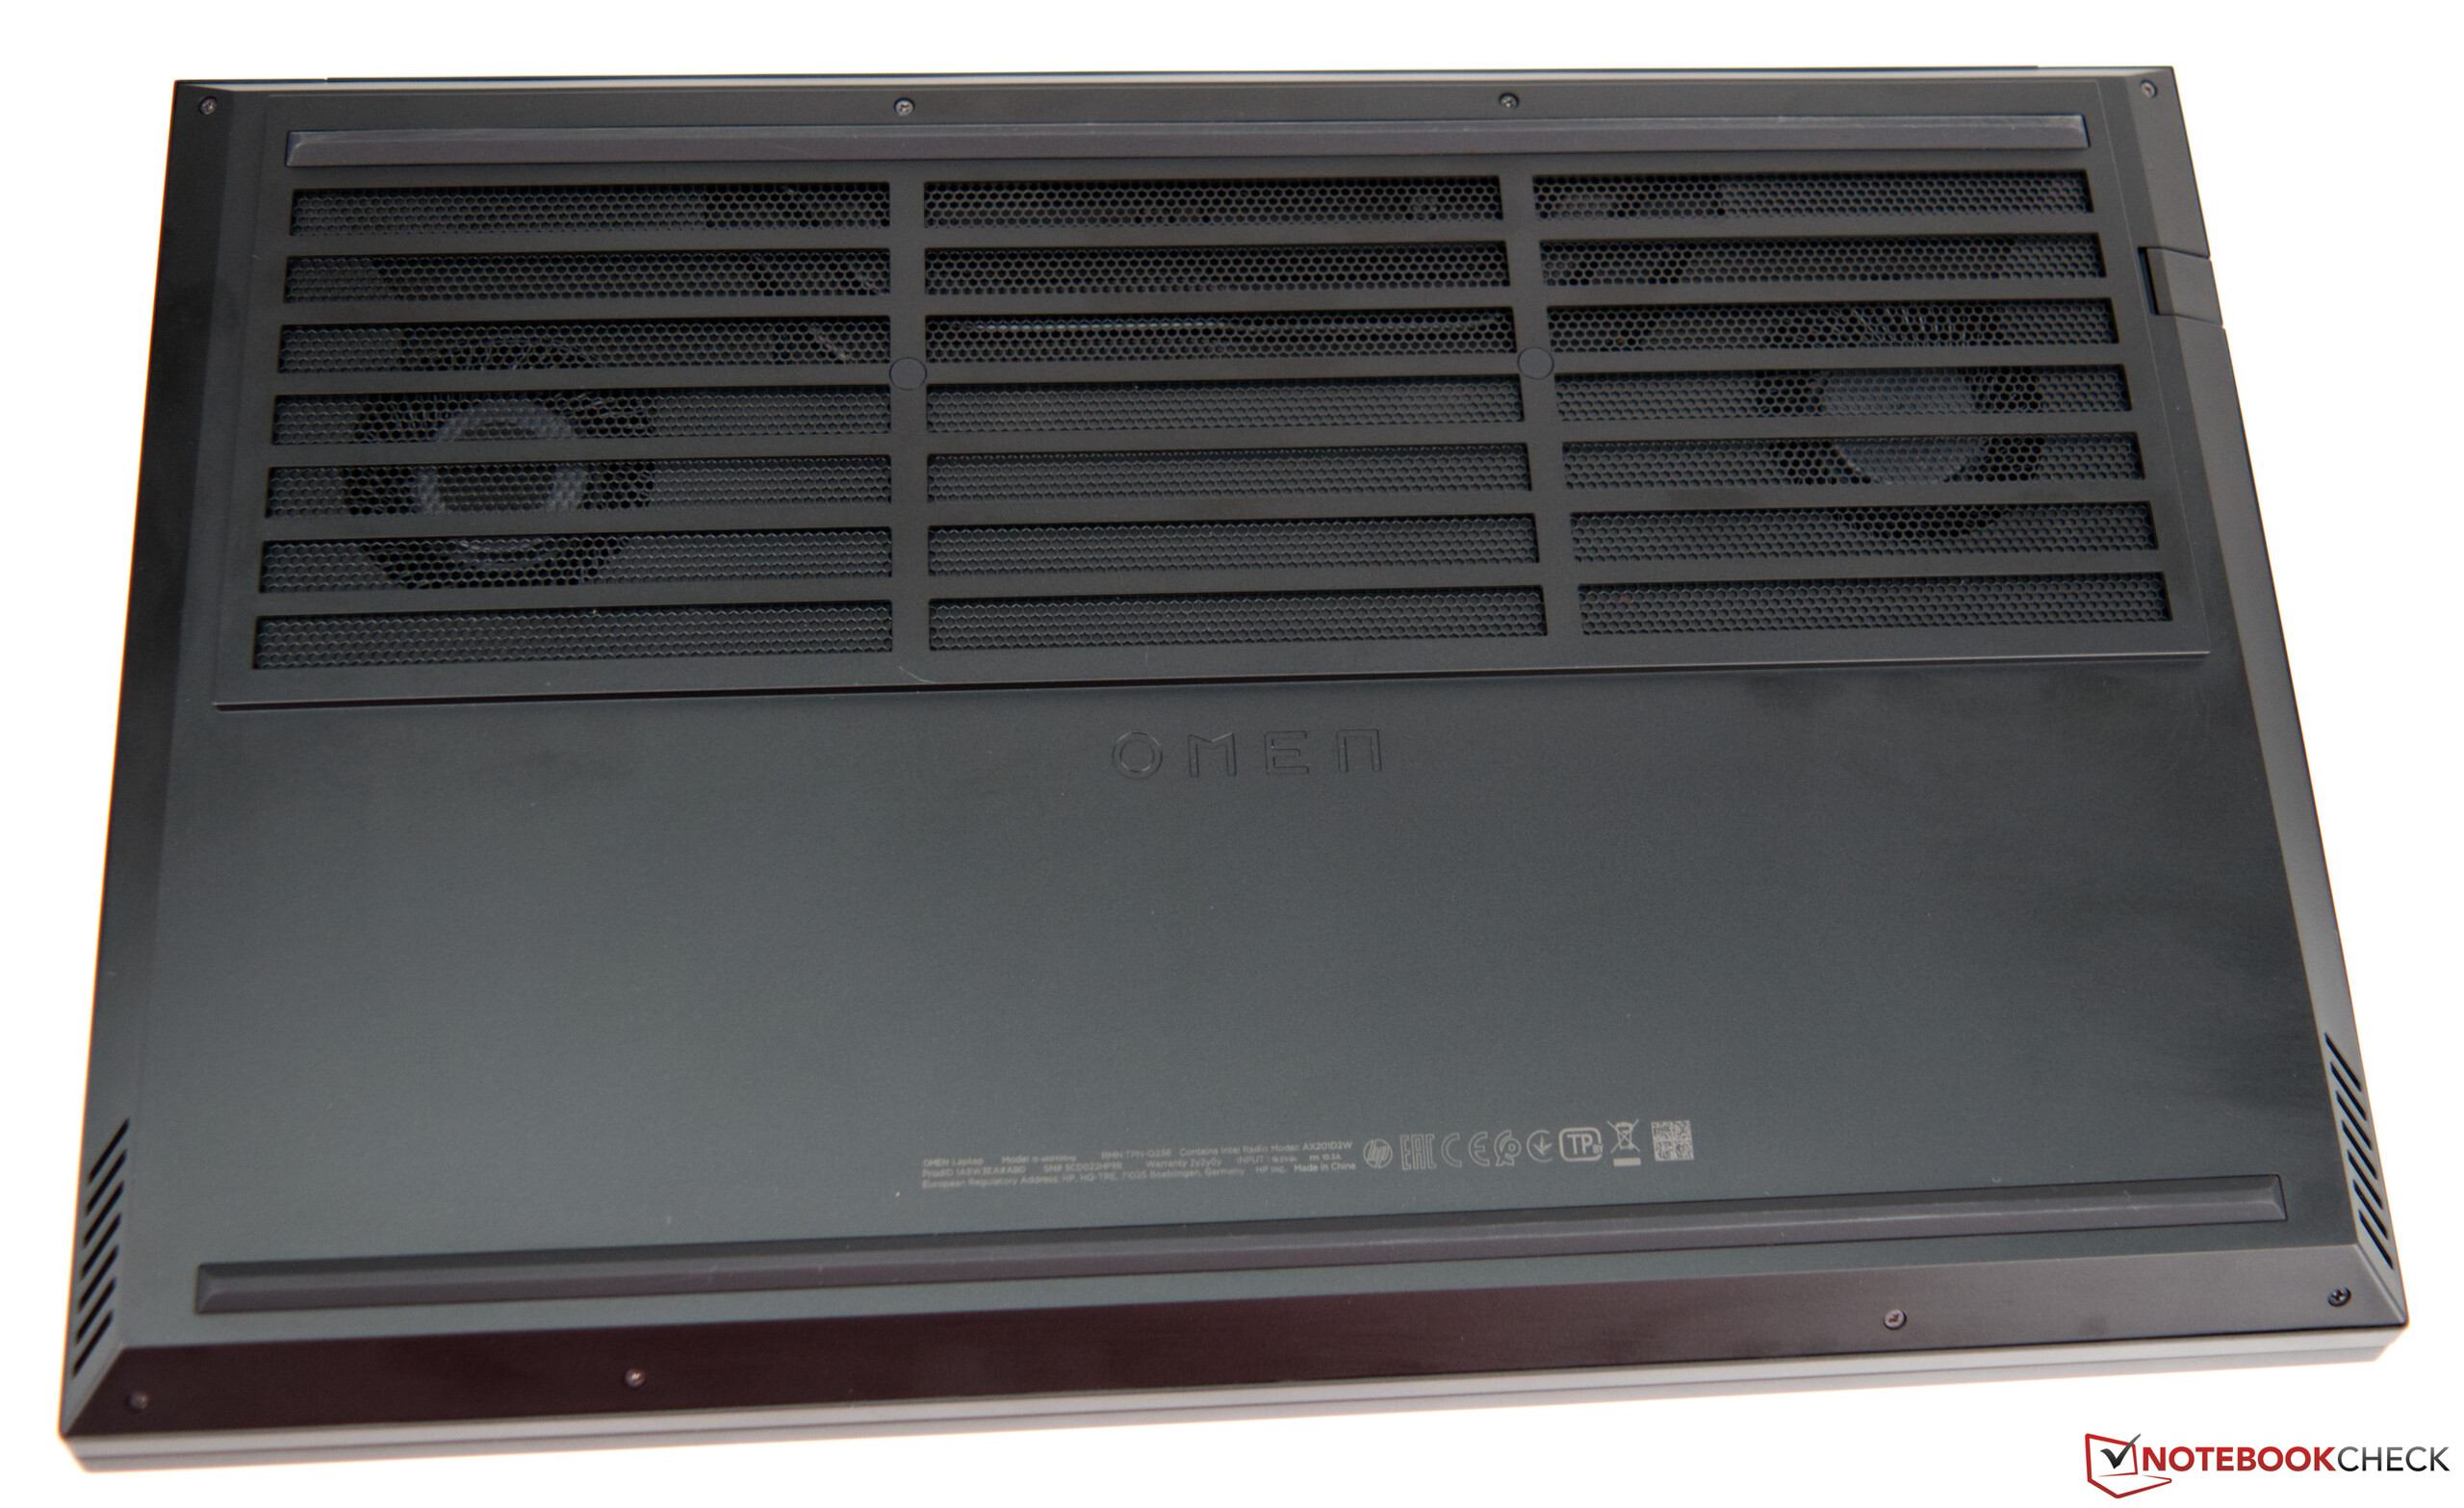
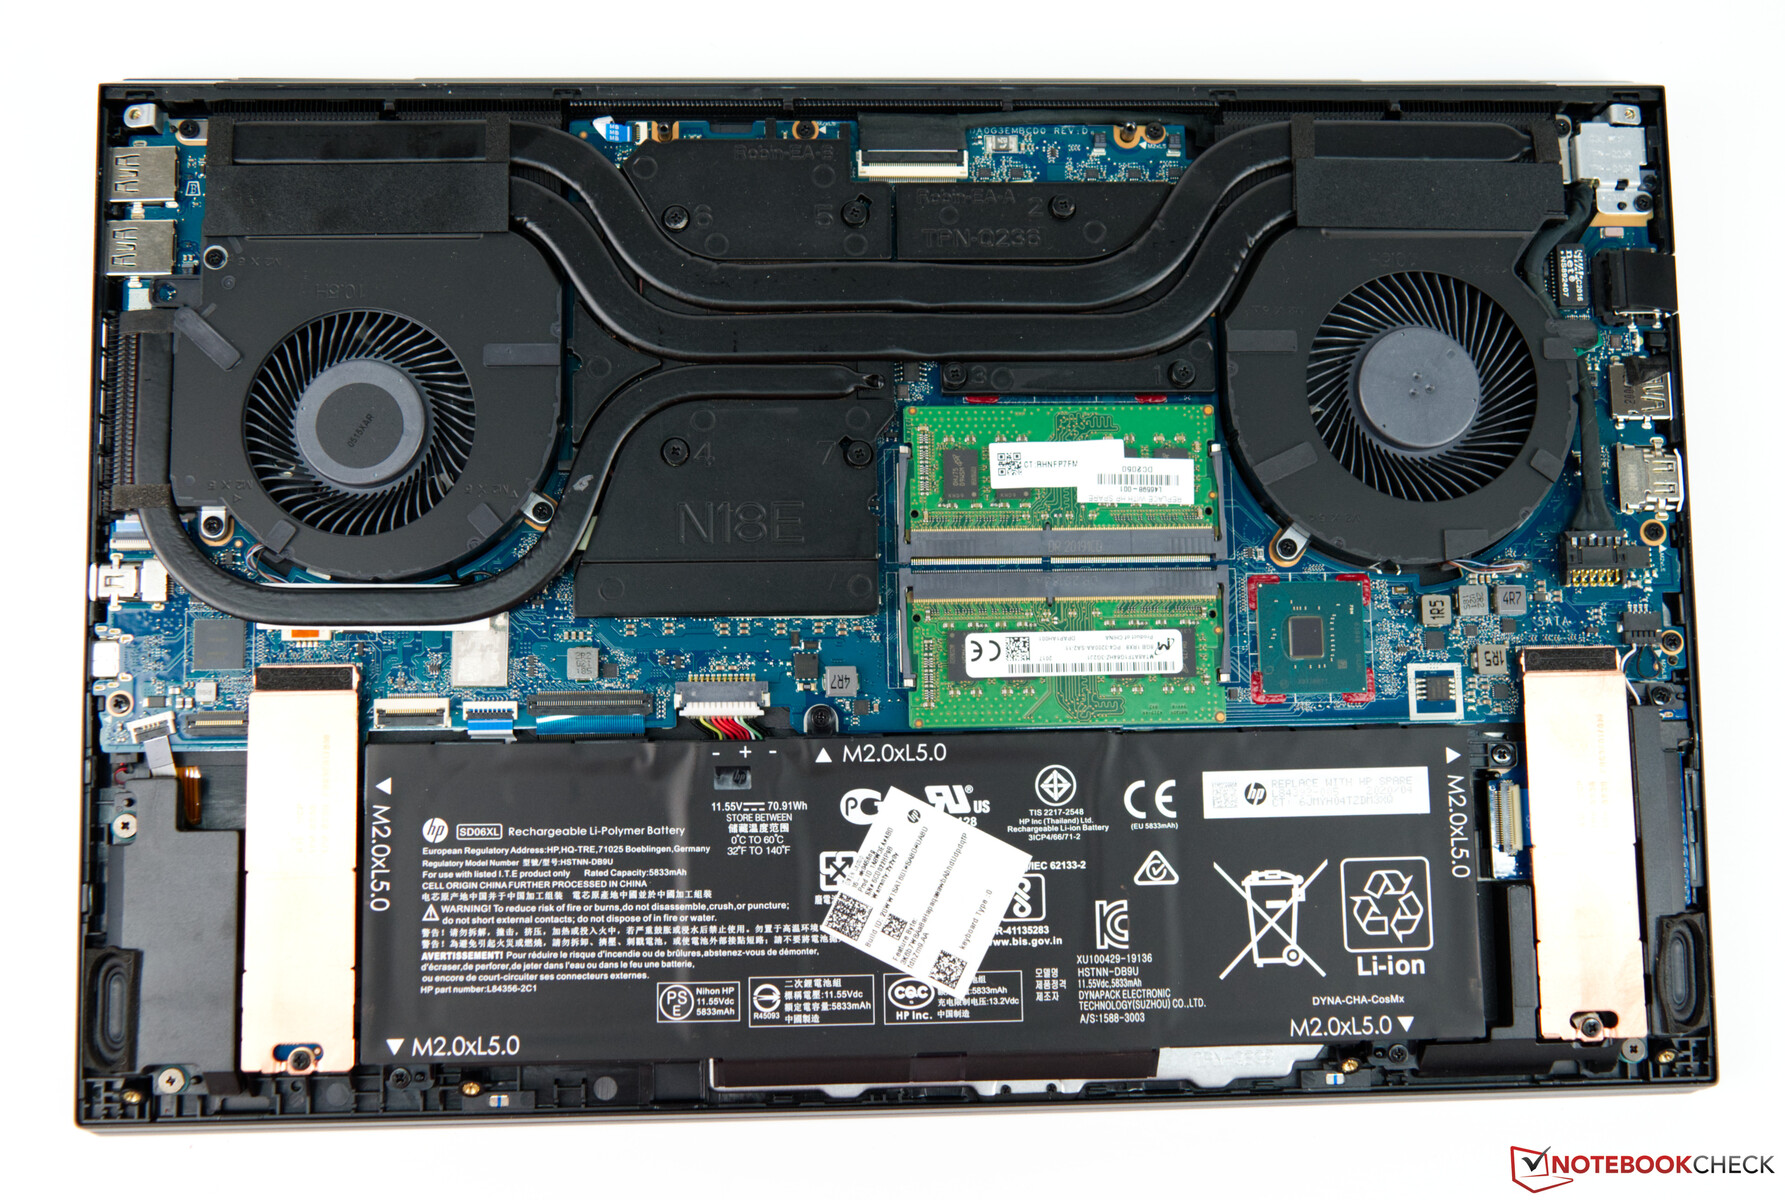
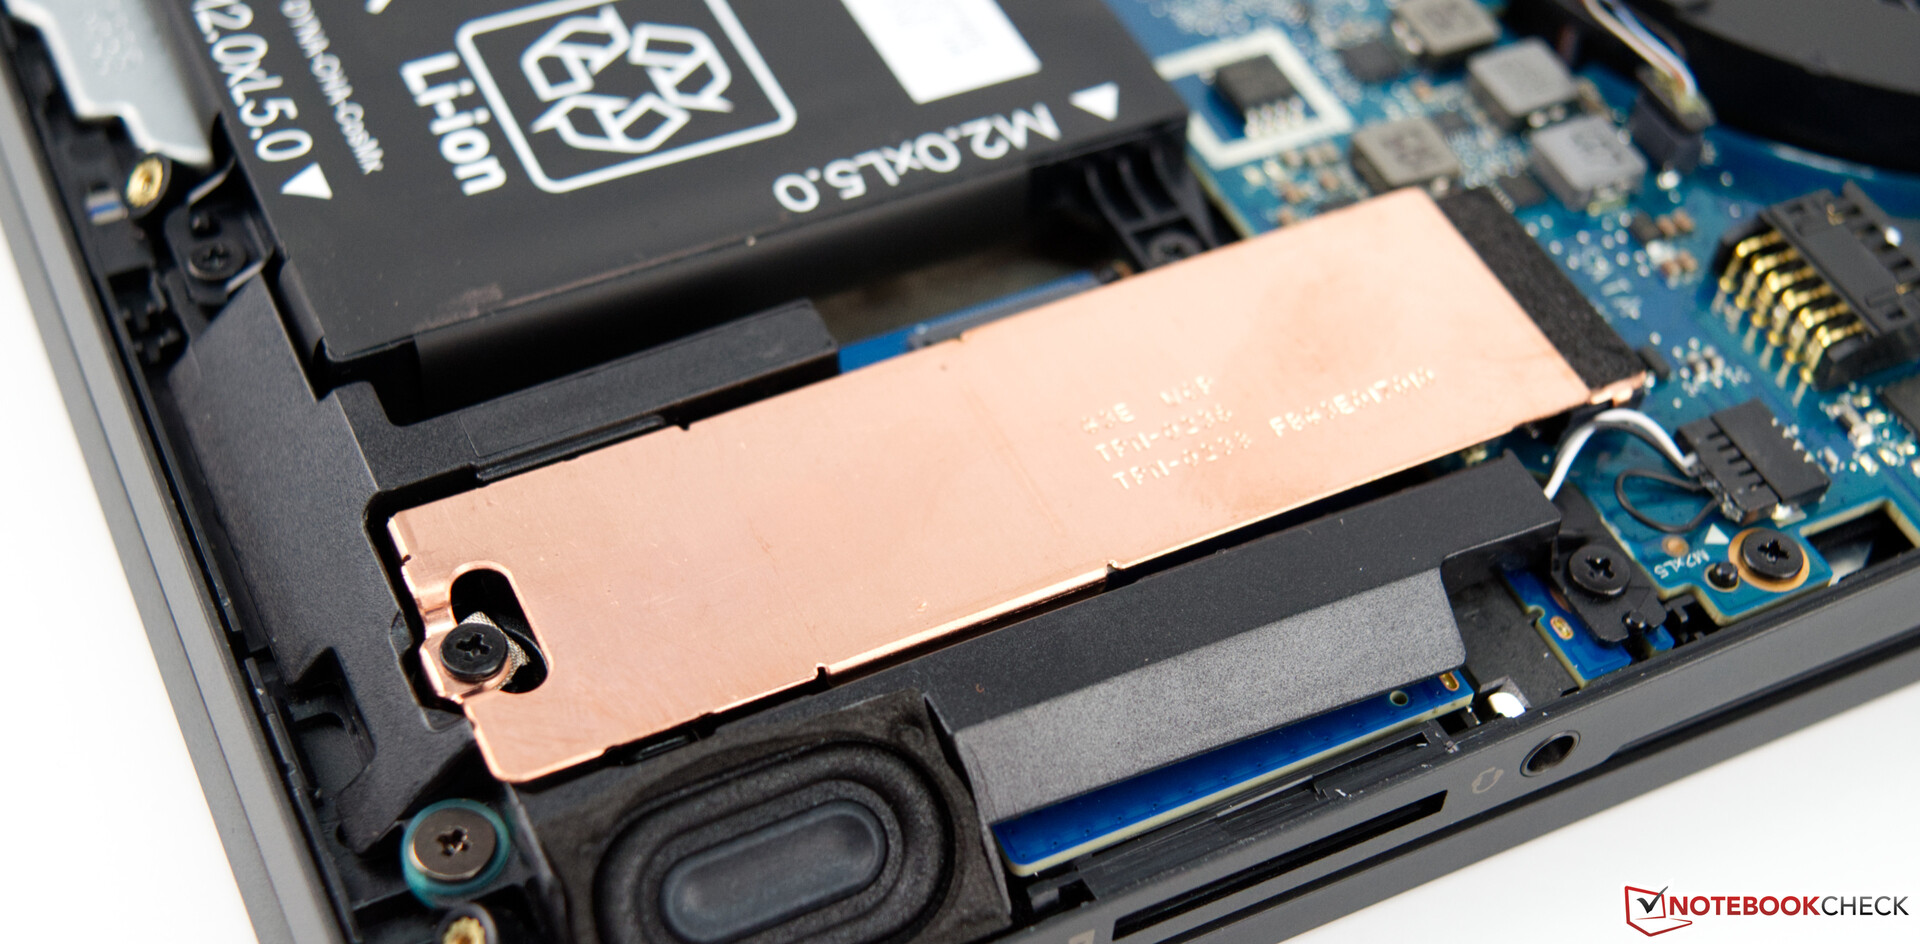
Maintenance
Unfortunately, the HP Omen 15 doesn't offer a maintenance hatch. That's not too bad because the bottom cover of the base unit can be removed without problems. You only need to loosen eight screws to detach the cover. The RAM modules as well as the two M.2 slots for the storage devices are hidden under the base cover. The two fans can also be easily cleaned this way.
Warranty
When purchasing the HP Omen 15, the manufacturer only grants a 24-month warranty on the device. This can be extended to up to 36 months on HP's online store (HP Care Pack). A one-time fee of about 128 Euros (~$152) is charged for this.
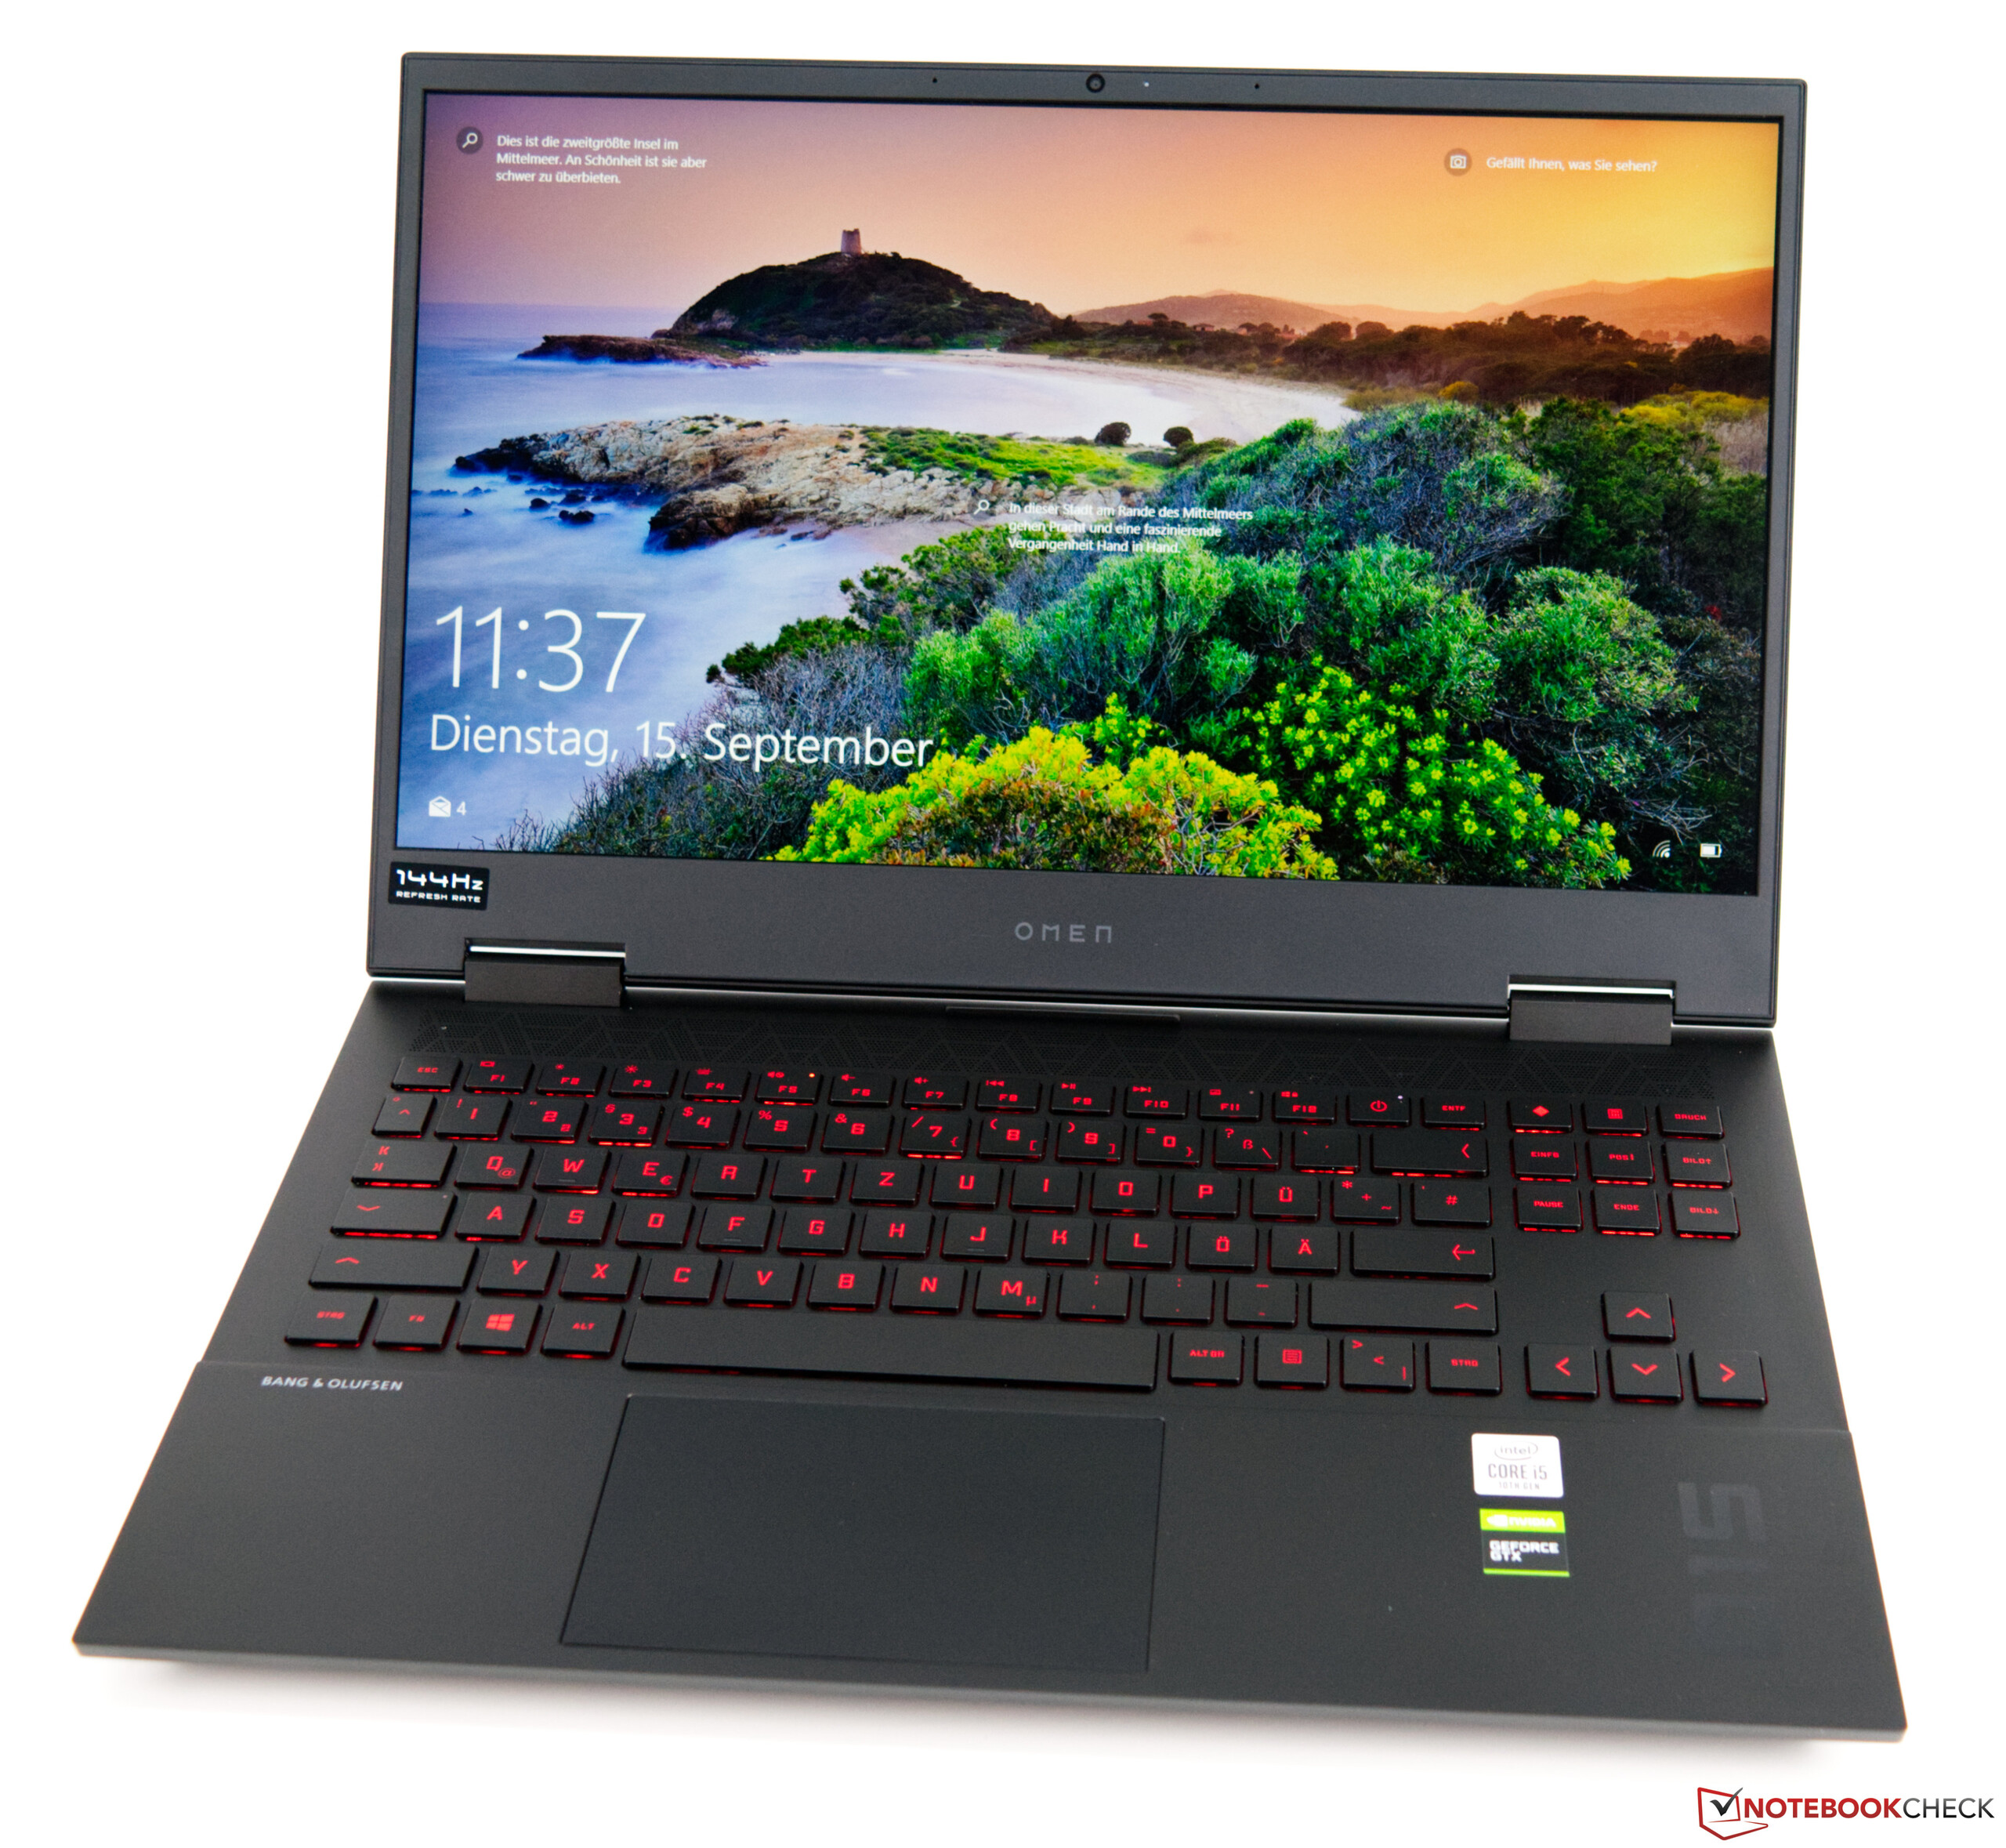
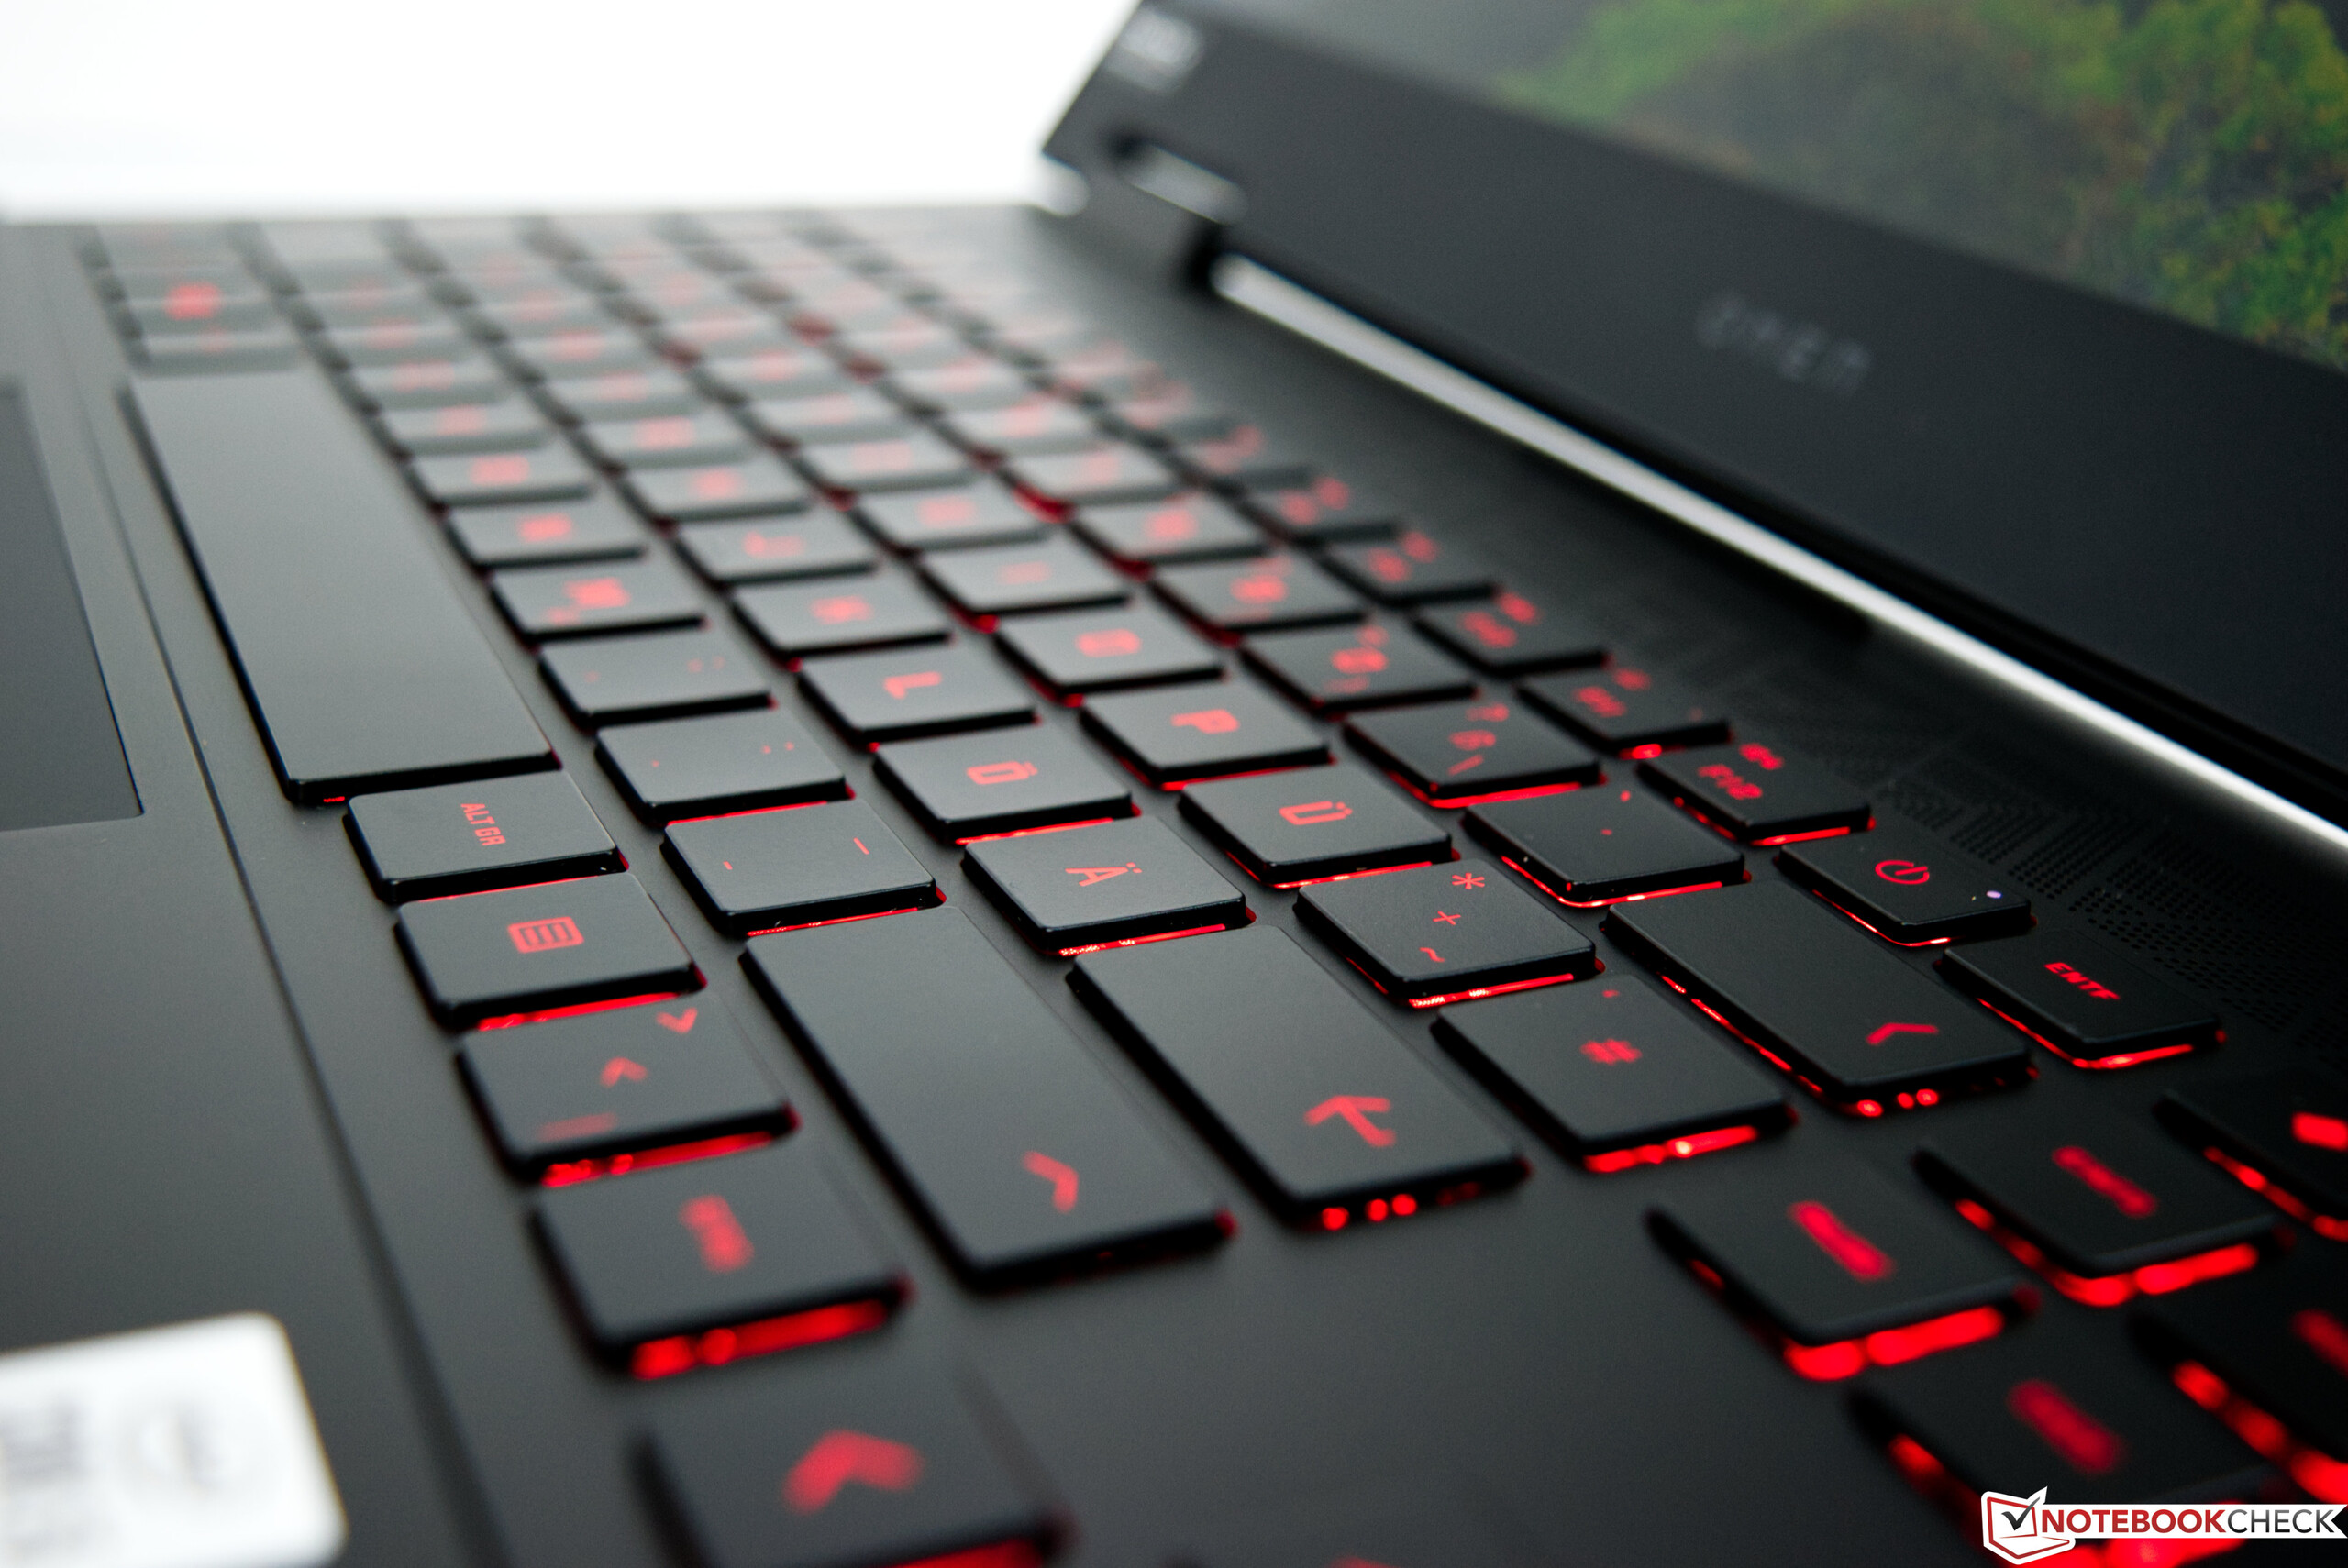
Input devices - With red keyboard lighting
Keyboard and touchpad
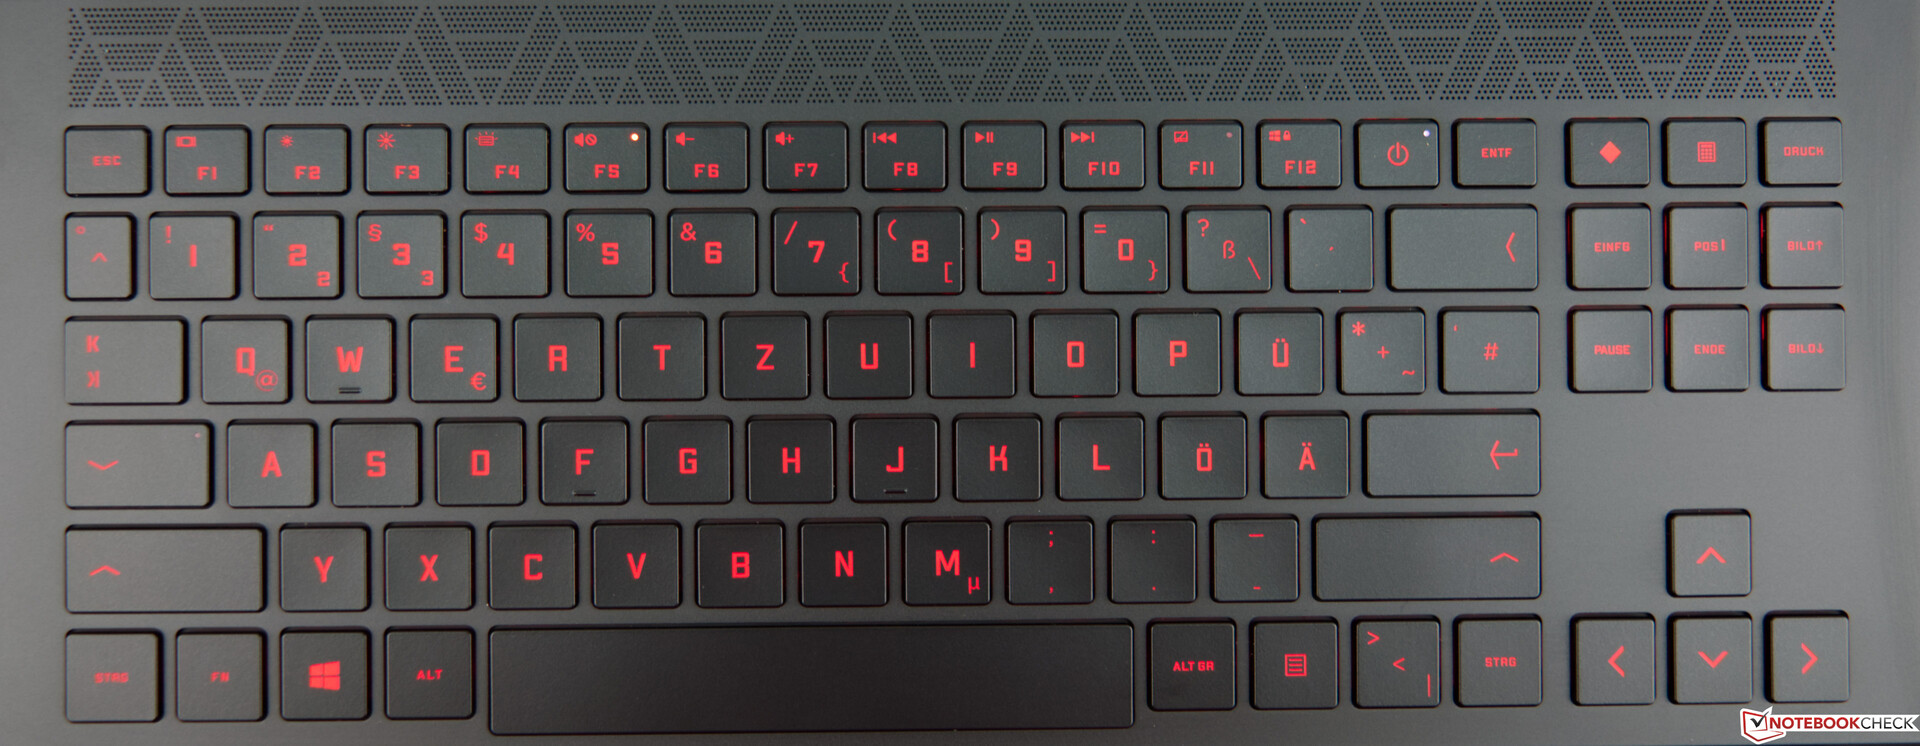
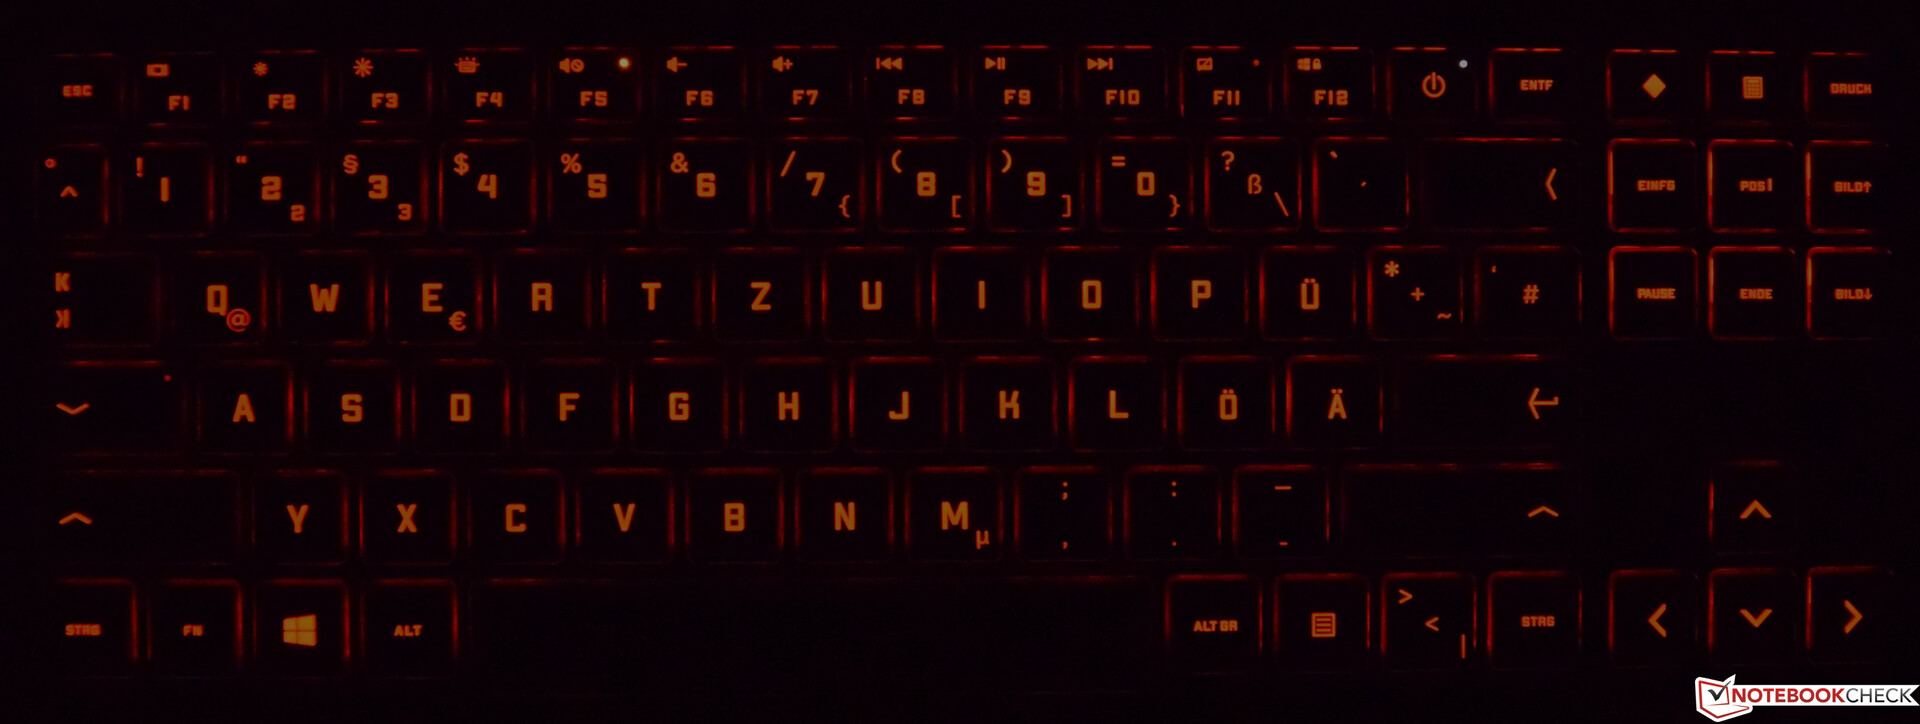
The built-in chiclet keyboard offers a pleasant typing experience, although the pressure point could have been a bit firmer. Fortunately, the stroke isn't excessively cushioned, which prevents typing from feeling mushy. A number pad has been omitted, leaving more space for the remaining keys. At 15 x 15 millimeters, the keys have a pleasant size. HP has provided the keyboard of the Omen 15 with a red backlight that can also be optionally deactivated. Unfortunately, there's no dimming function.
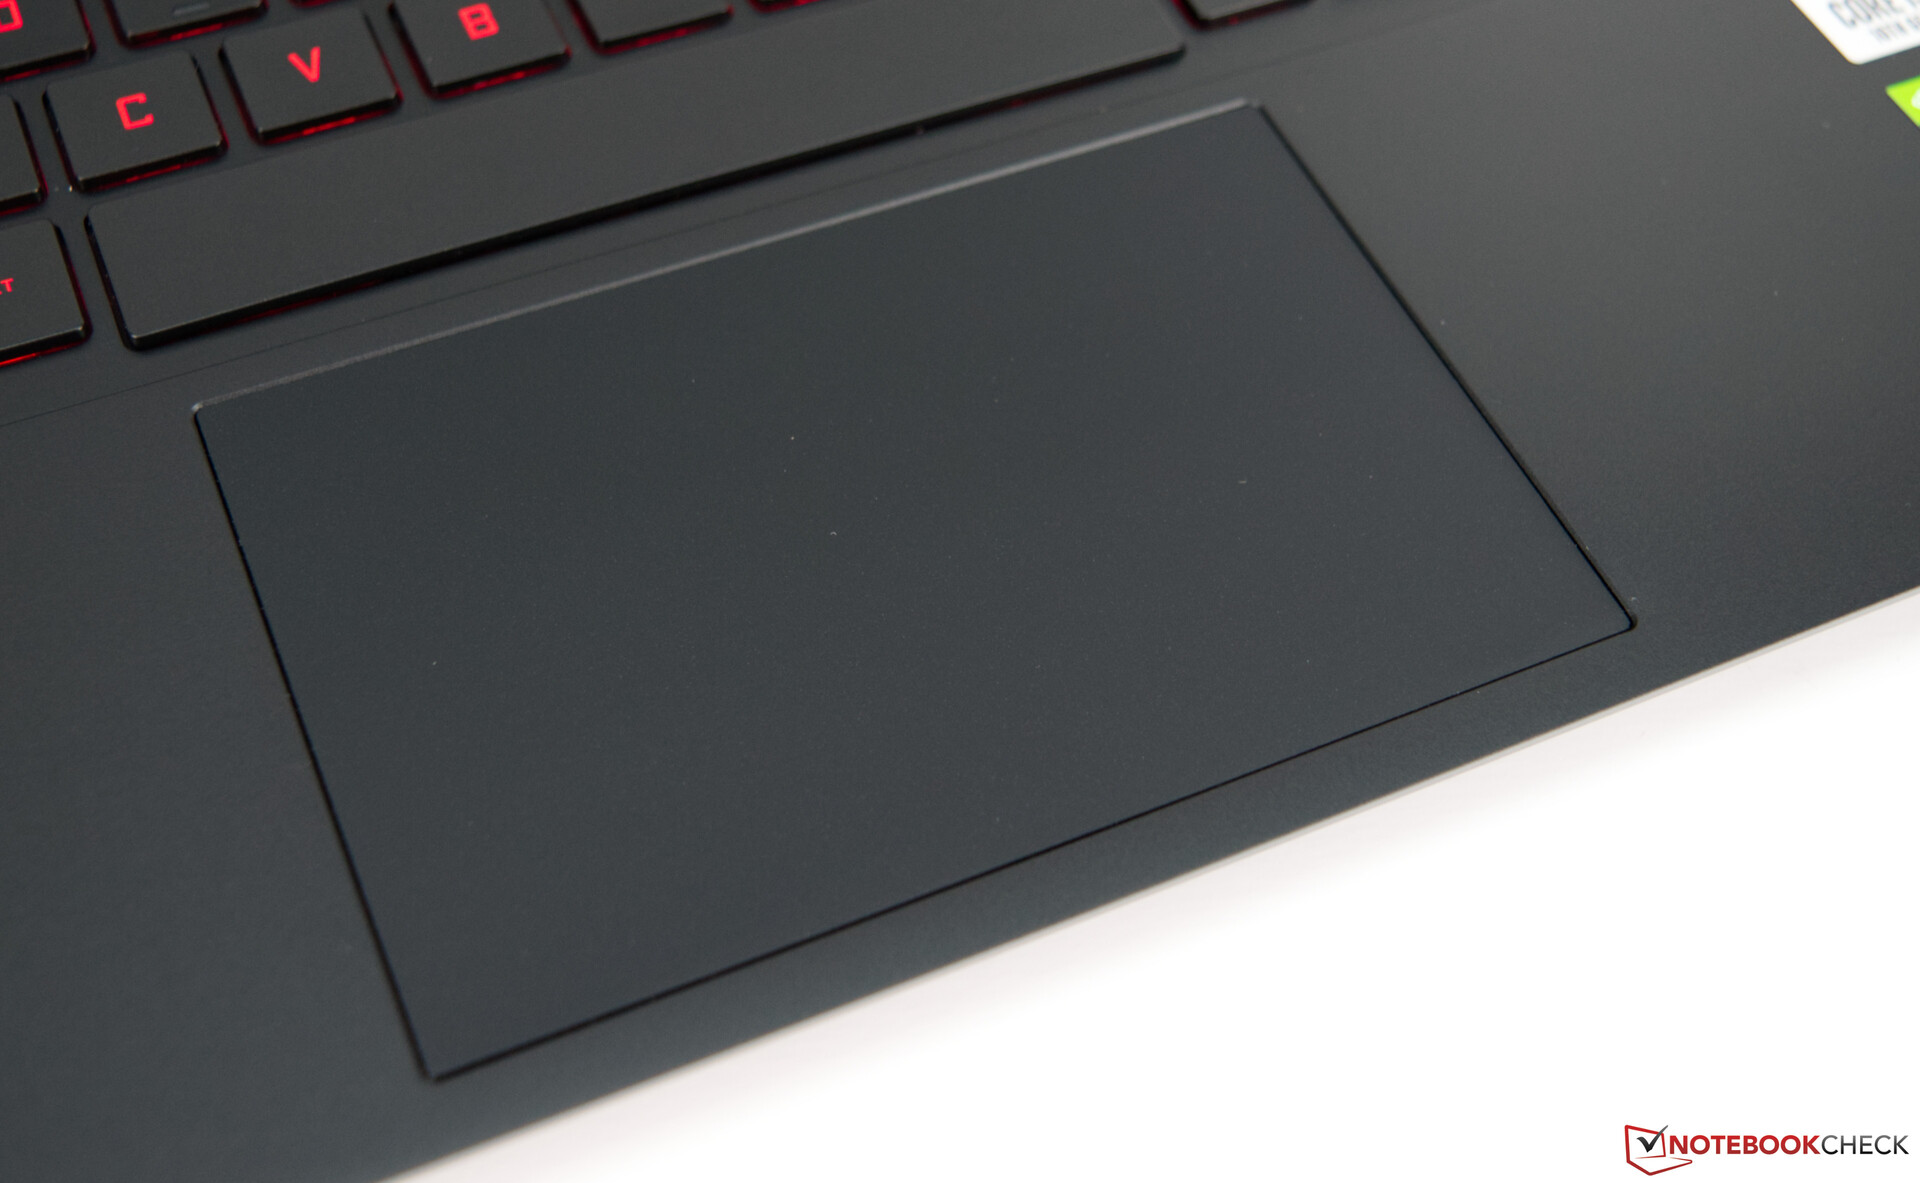
HP has installed a generous ClickPad in the Omen 15, which makes very good use of the area between the palms rests. At 11.5 x 7.5 centimeters, it's just as large as in the HP Pavilion Gaming 16. In terms of visuals, the input area fits well with the overall package of the base unit; it also lets the fingers glide smoothly on it. However, there are some minor problems in the area of the corners when it comes to accuracy. This wasn't an issue in everyday use, though, since the input surface is large enough. "Big enough" is also the keyword here because the ClickPad is really good for multi-touch gestures. The two input keys at the bottom are very quiet when pressed. They often attract attention with a clearly audible click.
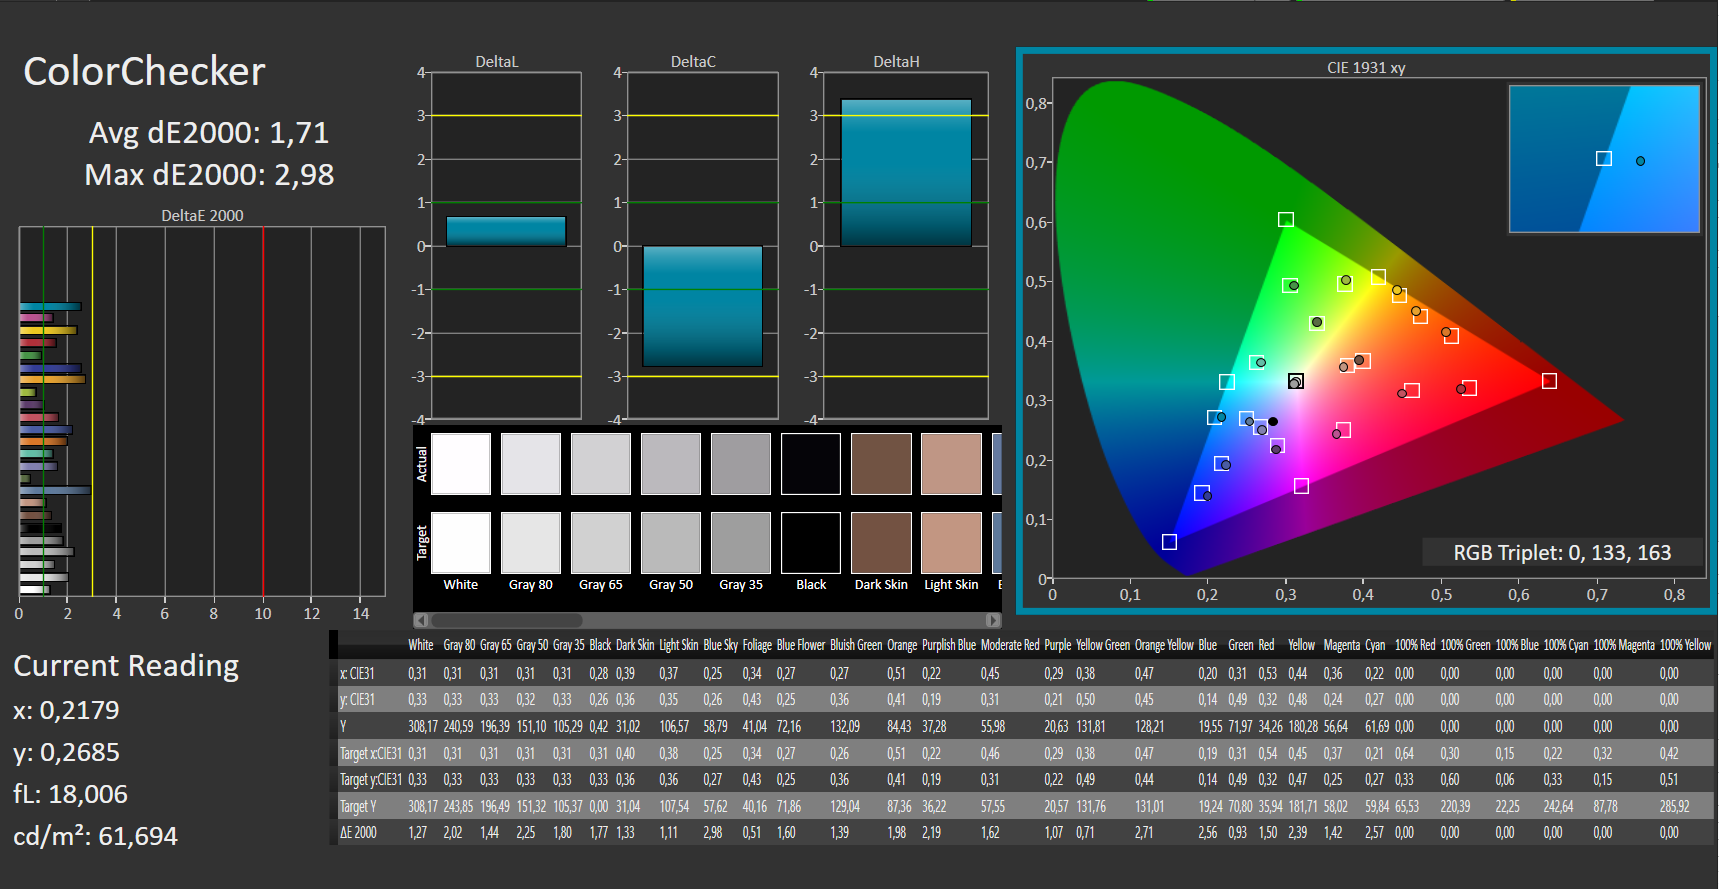
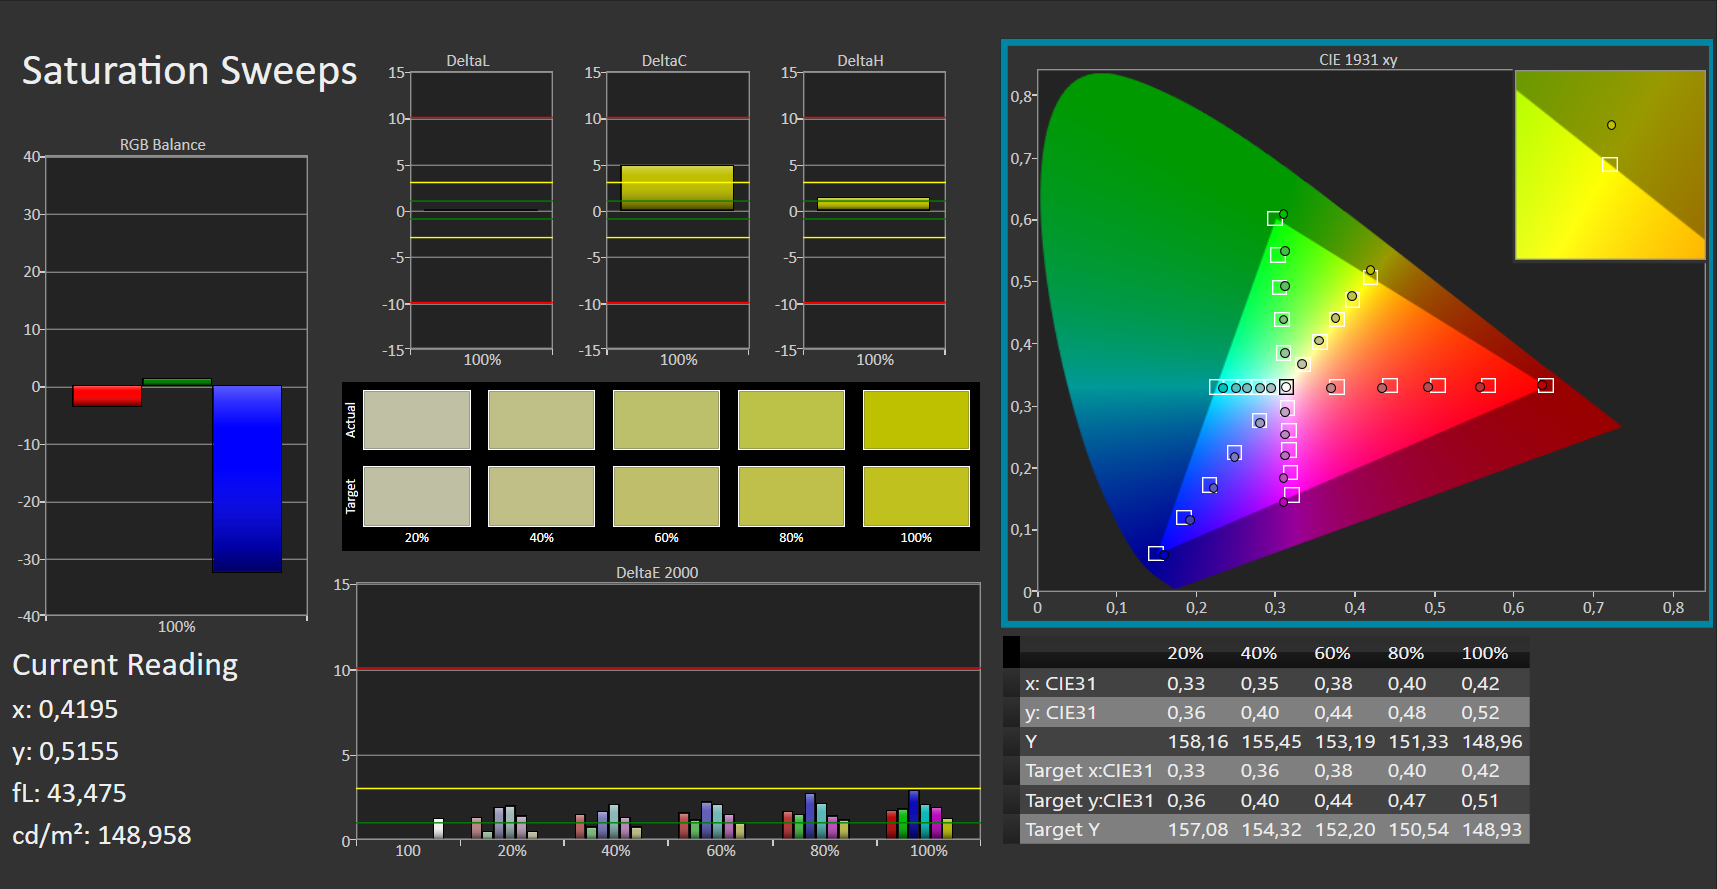
Display - Good color accuracy and 144 Hz


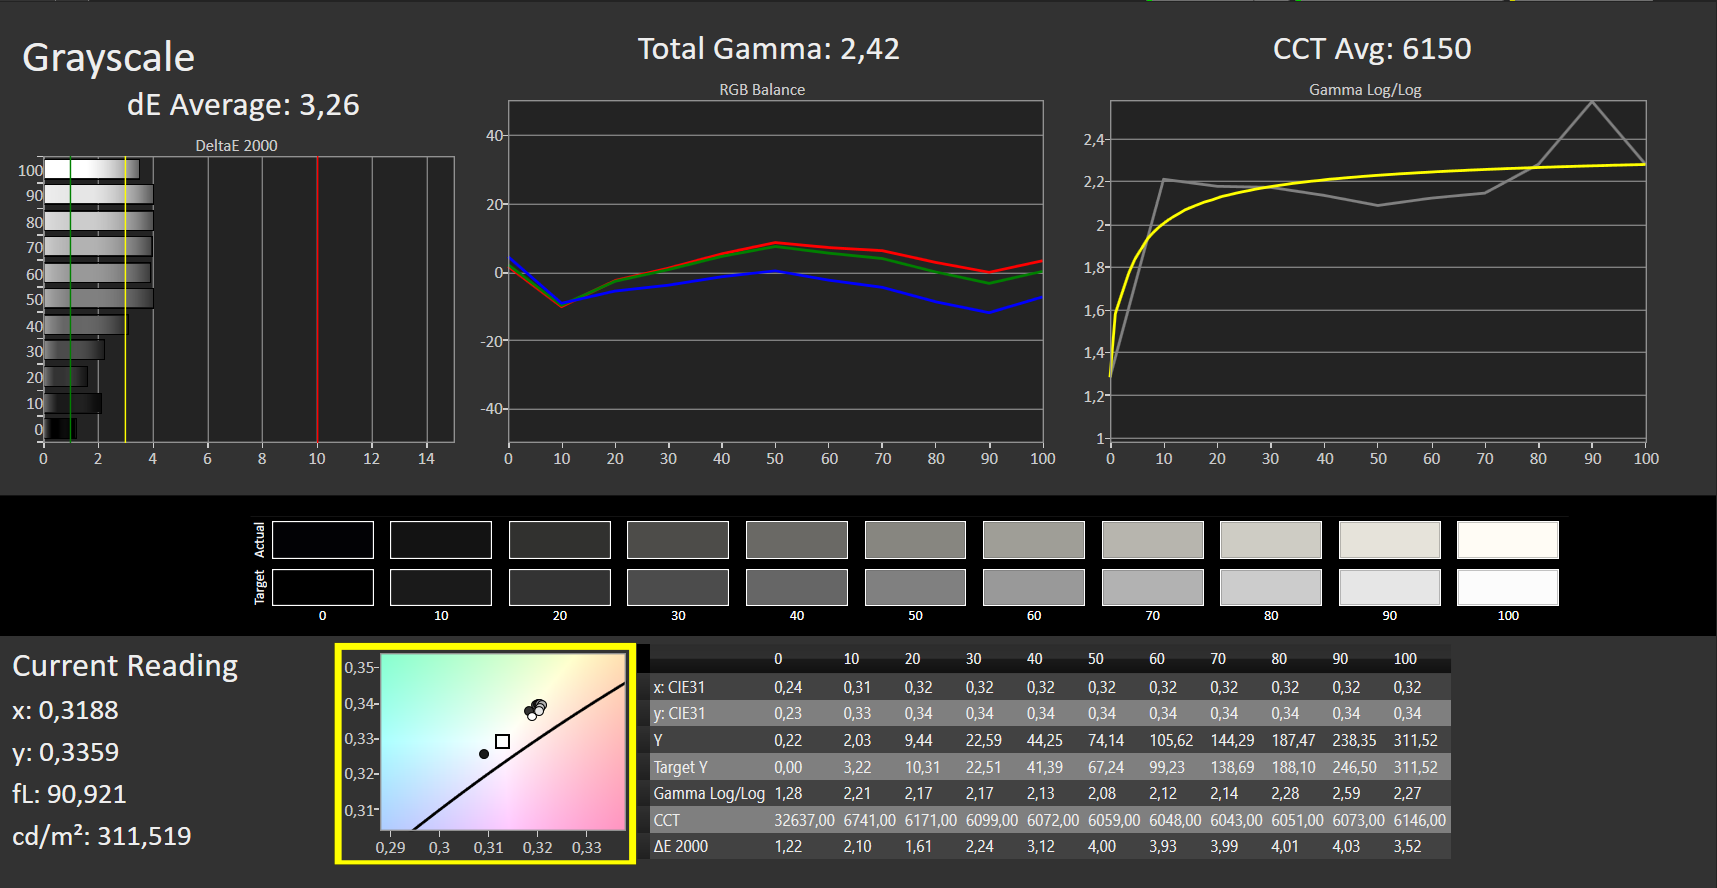
The built-in display goes well with the device and the requirements. The 15.6-inch panel offers Full HD and thus reaches a pixel density of 141 ppi. Unfortunately, our test device only reaches the 300 nits specified in the technical data in the middle and in the upper corners. On average, the display brightness is 293 cd/m², which is very close to the specified value, though. At 87%, the brightness distribution is about on par with the competition.
The high contrast value is the result of the brightness and the low black level. The Omen 15 can clearly set itself apart from the competition here. The response times are not the best values but are sufficient for most gamers. In addition, the laptop's gaming nature is underlined once again with the 144 Hz refresh rate. There are no restrictions due to clouding in our device. We also couldn't detect PWM, which has a positive effect on the overall result.
| |||||||||||||||||||||||||
Brightness Distribution: 87 %
Center on Battery: 269 cd/m²
Contrast: 1427:1 (Black: 0.22 cd/m²)
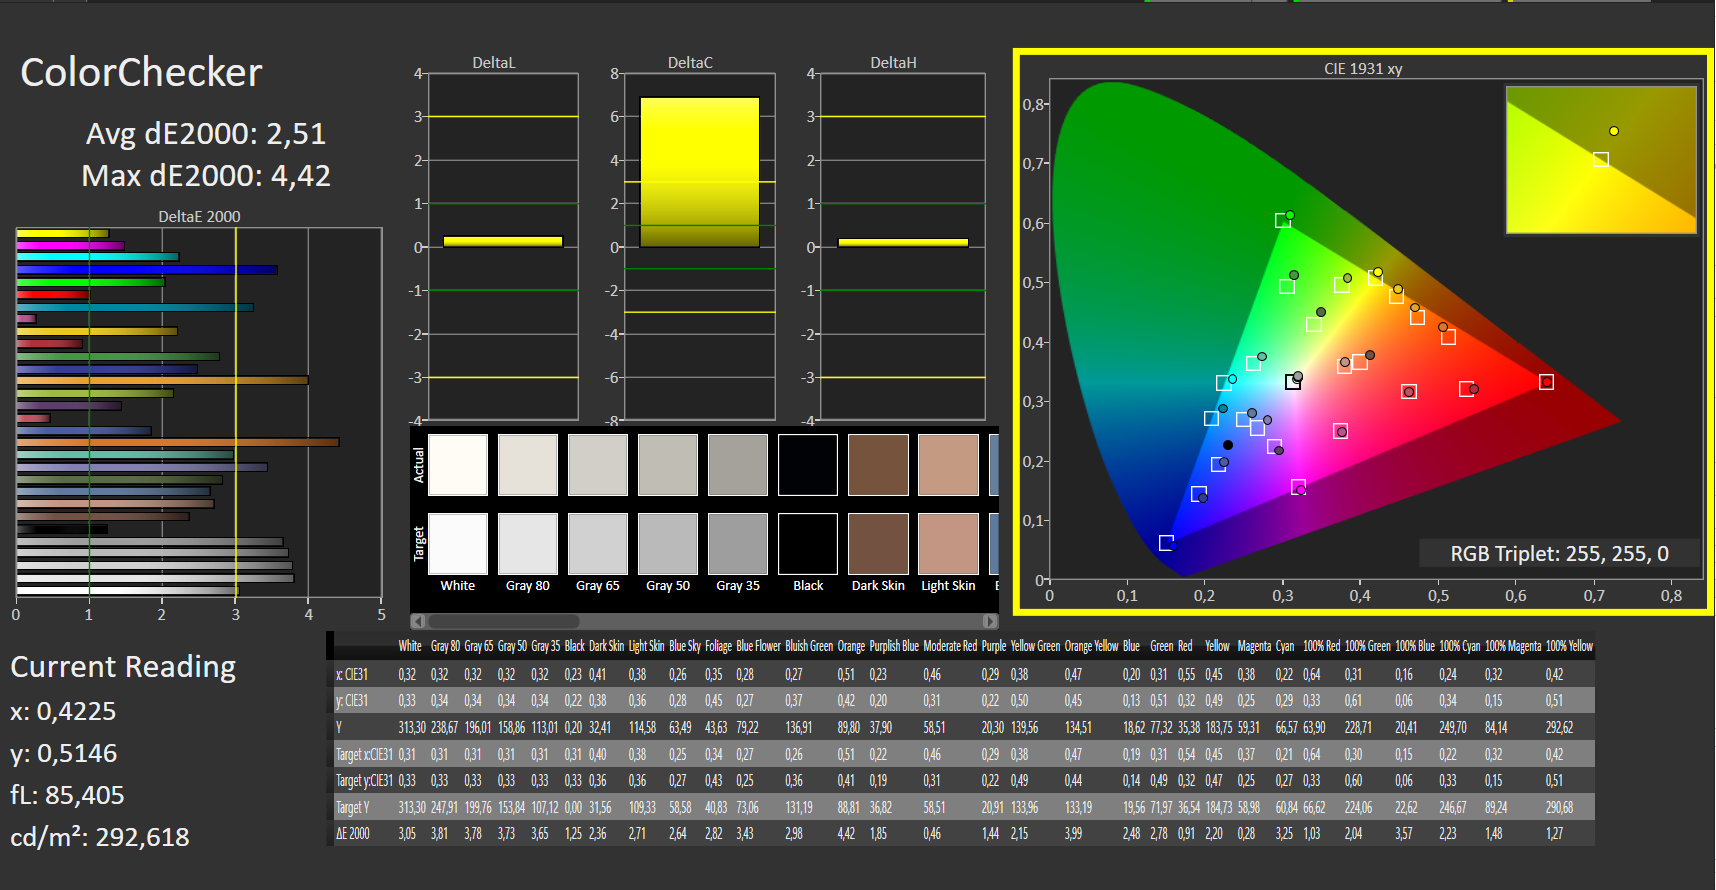
ΔE ColorChecker Calman: 2.51 | ∀{0.5-29.43 Ø4.71}
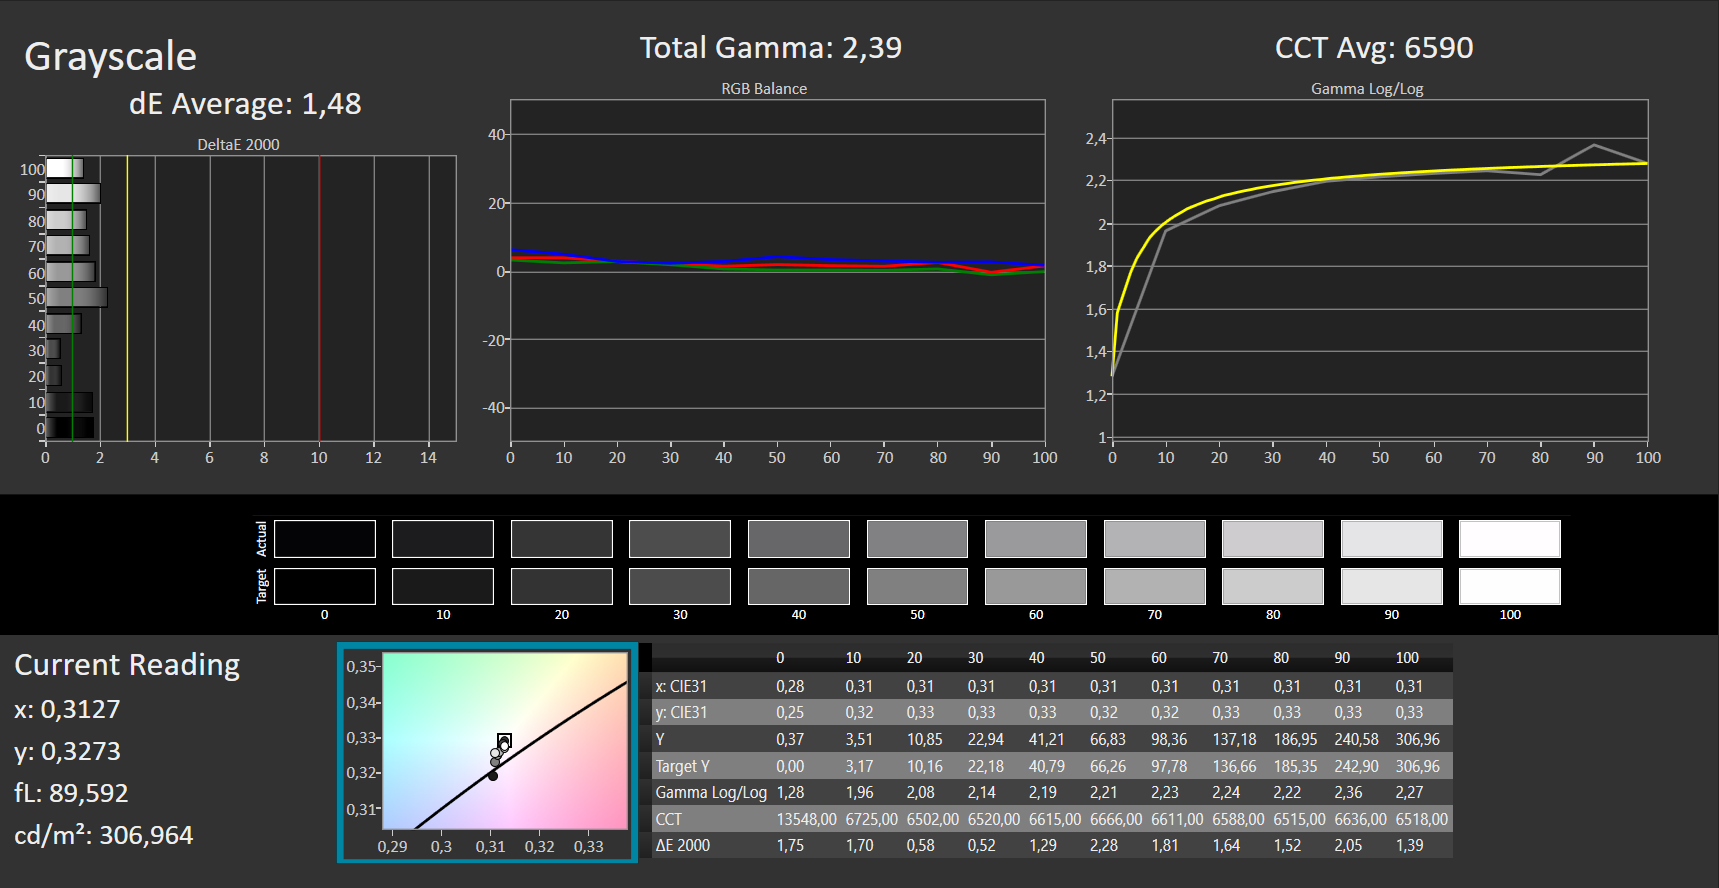
calibrated: 1.71
ΔE Greyscale Calman: 3.26 | ∀{0.09-98 Ø4.96}
Gamma: 2.42
CCT: 6150 K
| HP Omen 15-ek0456ng LGD05FE, IPS, 1920x1080, 15.6" | Asus ROG Zephyrus G15 GA502IU-ES76 Panda LM156LF-2F01, IPS, 1920x1080, 15.6" | Schenker XMG Core 15 GK5CP6V BOEhydis NV156FHM-N4G (BOE084D), IPS, 1920x1080, 15.6" | Nexoc GH5 515IG LG Philips LP156WFC-SPD1, IPS, 1920x1080, 15.6" | MSI Bravo 15 A4DCR AU Optronics B156HAN08.0 (AUO80ED), IPS-Level, 1920x1080, 15.6" | HP Omen 15-dc1020ng LGD05CE, IPS, 1920x1080, 15.6" | |
|---|---|---|---|---|---|---|
| Display | ||||||
| Display P3 Coverage (%) | 38.9 | 63.3 | 37.91 | 62 | 38.37 | |
| sRGB Coverage (%) | 58.5 | 91.2 | 57 | 86.8 | 57.6 | |
| AdobeRGB 1998 Coverage (%) | 40.22 | 65 | 39.19 | 62.7 | 39.69 | |
| Response Times | -89% | 27% | -117% | 6% | -152% | |
| Response Time Grey 50% / Grey 80% * (ms) | 17 ? | 24.4 ? -44% | 8.8 ? 48% | 34.8 ? -105% | 16 ? 6% | 40 ? -135% |
| Response Time Black / White * (ms) | 11 ? | 25.6 ? -133% | 10.4 ? 5% | 25.2 ? -129% | 10.4 ? 5% | 29.6 ? -169% |
| PWM Frequency (Hz) | ||||||
| Screen | -73% | -17% | -34% | -39% | -78% | |
| Brightness middle (cd/m²) | 314 | 255.9 -19% | 324 3% | 261 -17% | 311 -1% | 251 -20% |
| Brightness (cd/m²) | 293 | 246 -16% | 296 1% | 254 -13% | 313 7% | 232 -21% |
| Brightness Distribution (%) | 87 | 89 2% | 88 1% | 93 7% | 88 1% | 76 -13% |
| Black Level * (cd/m²) | 0.22 | 0.22 -0% | 0.27 -23% | 0.23 -5% | 0.43 -95% | 0.17 23% |
| Contrast (:1) | 1427 | 1163 -19% | 1200 -16% | 1135 -20% | 723 -49% | 1476 3% |
| Colorchecker dE 2000 * | 2.51 | 5.15 -105% | 4.07 -62% | 4.71 -88% | 4.5 -79% | 6.2 -147% |
| Colorchecker dE 2000 max. * | 4.42 | 17.11 -287% | 6.39 -45% | 7.6 -72% | 7.97 -80% | 18.6 -321% |
| Colorchecker dE 2000 calibrated * | 1.71 | 4.83 -182% | 1.49 13% | 3.67 -115% | 2.65 -55% | 4.8 -181% |
| Greyscale dE 2000 * | 3.26 | 4.2 -29% | 4.01 -23% | 2.76 15% | 3.3 -1% | 4.2 -29% |
| Gamma | 2.42 91% | 2.16 102% | 2.6 85% | 2.42 91% | 2.129 103% | 2.32 95% |
| CCT | 6150 106% | 7500 87% | 7350 88% | 7090 92% | 7227 90% | 7454 87% |
| Color Space (Percent of AdobeRGB 1998) (%) | 36.9 | 59 | 36 | 63 | 36.5 | |
| Color Space (Percent of sRGB) (%) | 58 | 91 | 56 | 86 | 57.4 | |
| Total Average (Program / Settings) | -81% /
-76% | 5% /
-9% | -76% /
-49% | -17% /
-31% | -115% /
-92% |
* ... smaller is better
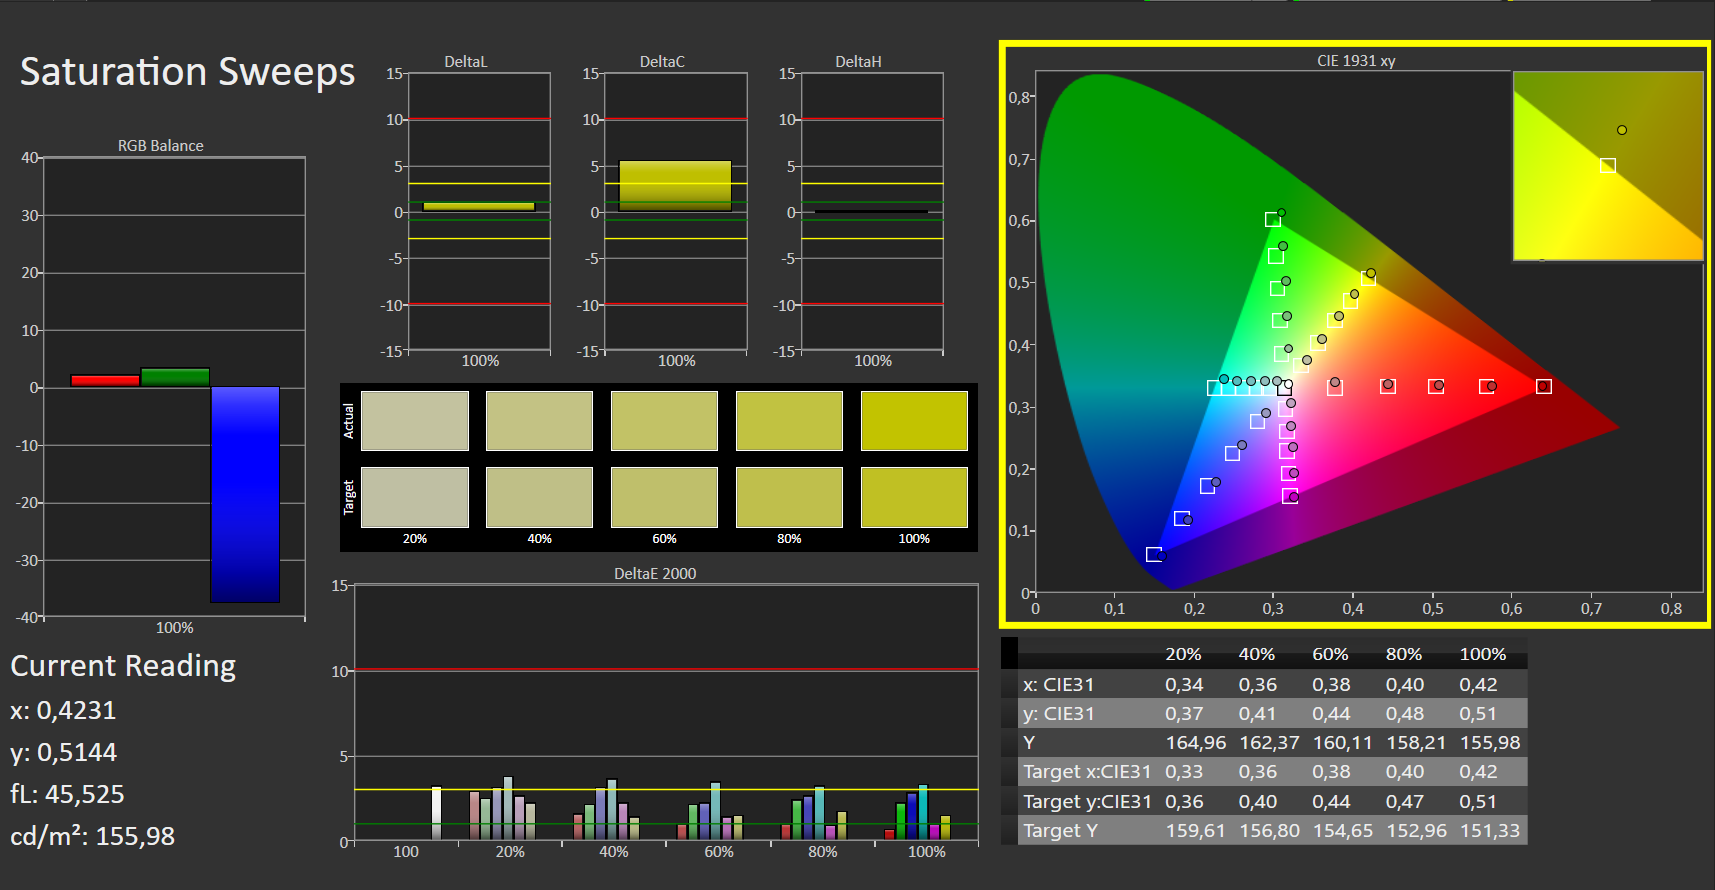
Out of the box, the measured Delta E 2000 color deviations are only slightly increased compared to the sRGB color space, indicating that HP delivers the Omen 15 with a precalibrated panel. But there is still some potential in the display as our manual calibration shows. We were able to improve the values both in terms of colors and grayscales.
Display Response Times
| ↔ Response Time Black to White | ||
|---|---|---|
| 11 ms ... rise ↗ and fall ↘ combined | ↗ 7 ms rise | 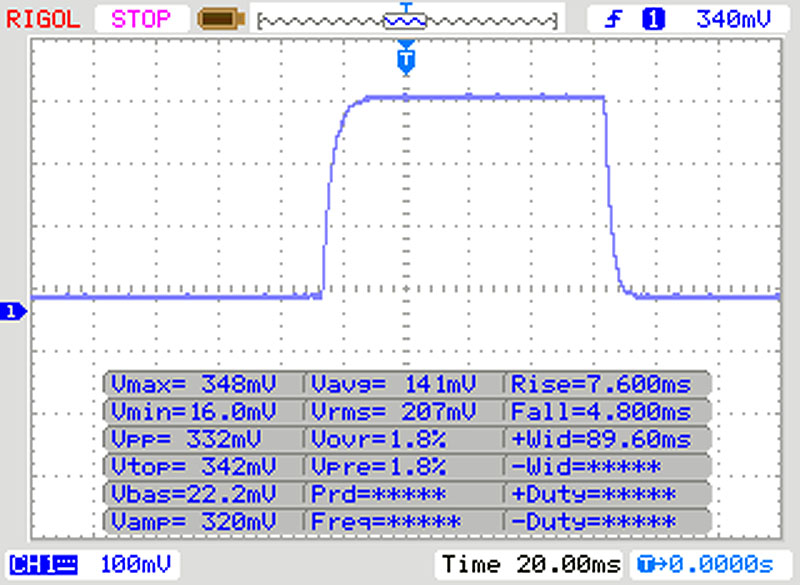 |
| ↘ 4 ms fall | ||
| The screen shows good response rates in our tests, but may be too slow for competitive gamers. In comparison, all tested devices range from 0.1 (minimum) to 240 (maximum) ms. » 30 % of all devices are better. This means that the measured response time is better than the average of all tested devices (19.8 ms). | ||
| ↔ Response Time 50% Grey to 80% Grey | ||
| 17 ms ... rise ↗ and fall ↘ combined | ↗ 9 ms rise | 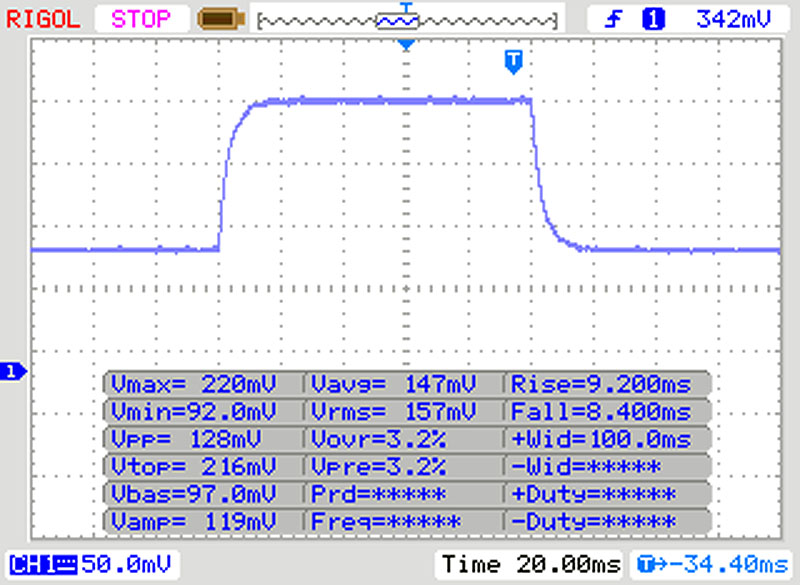 |
| ↘ 8 ms fall | ||
| The screen shows good response rates in our tests, but may be too slow for competitive gamers. In comparison, all tested devices range from 0.165 (minimum) to 636 (maximum) ms. » 31 % of all devices are better. This means that the measured response time is better than the average of all tested devices (31 ms). | ||
Screen Flickering / PWM (Pulse-Width Modulation)
| Screen flickering / PWM not detected | 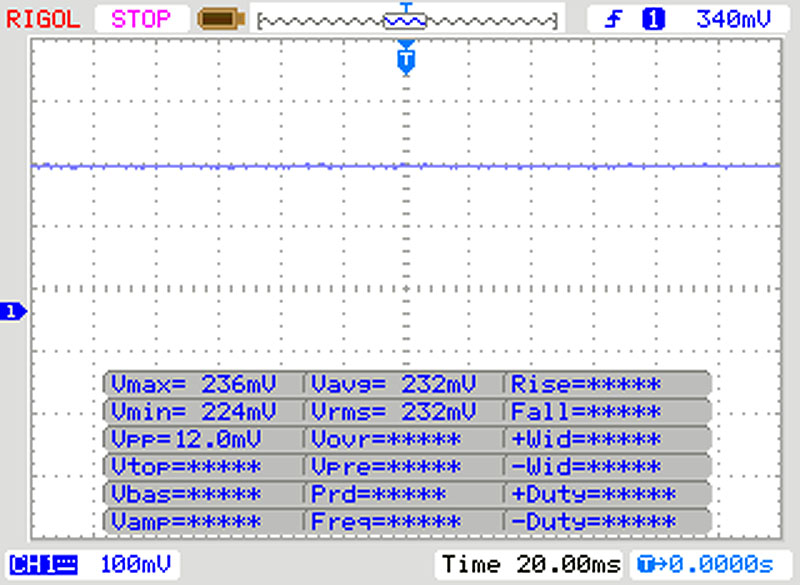 | ||
In comparison: 52 % of all tested devices do not use PWM to dim the display. If PWM was detected, an average of 7754 (minimum: 5 - maximum: 343500) Hz was measured. | |||
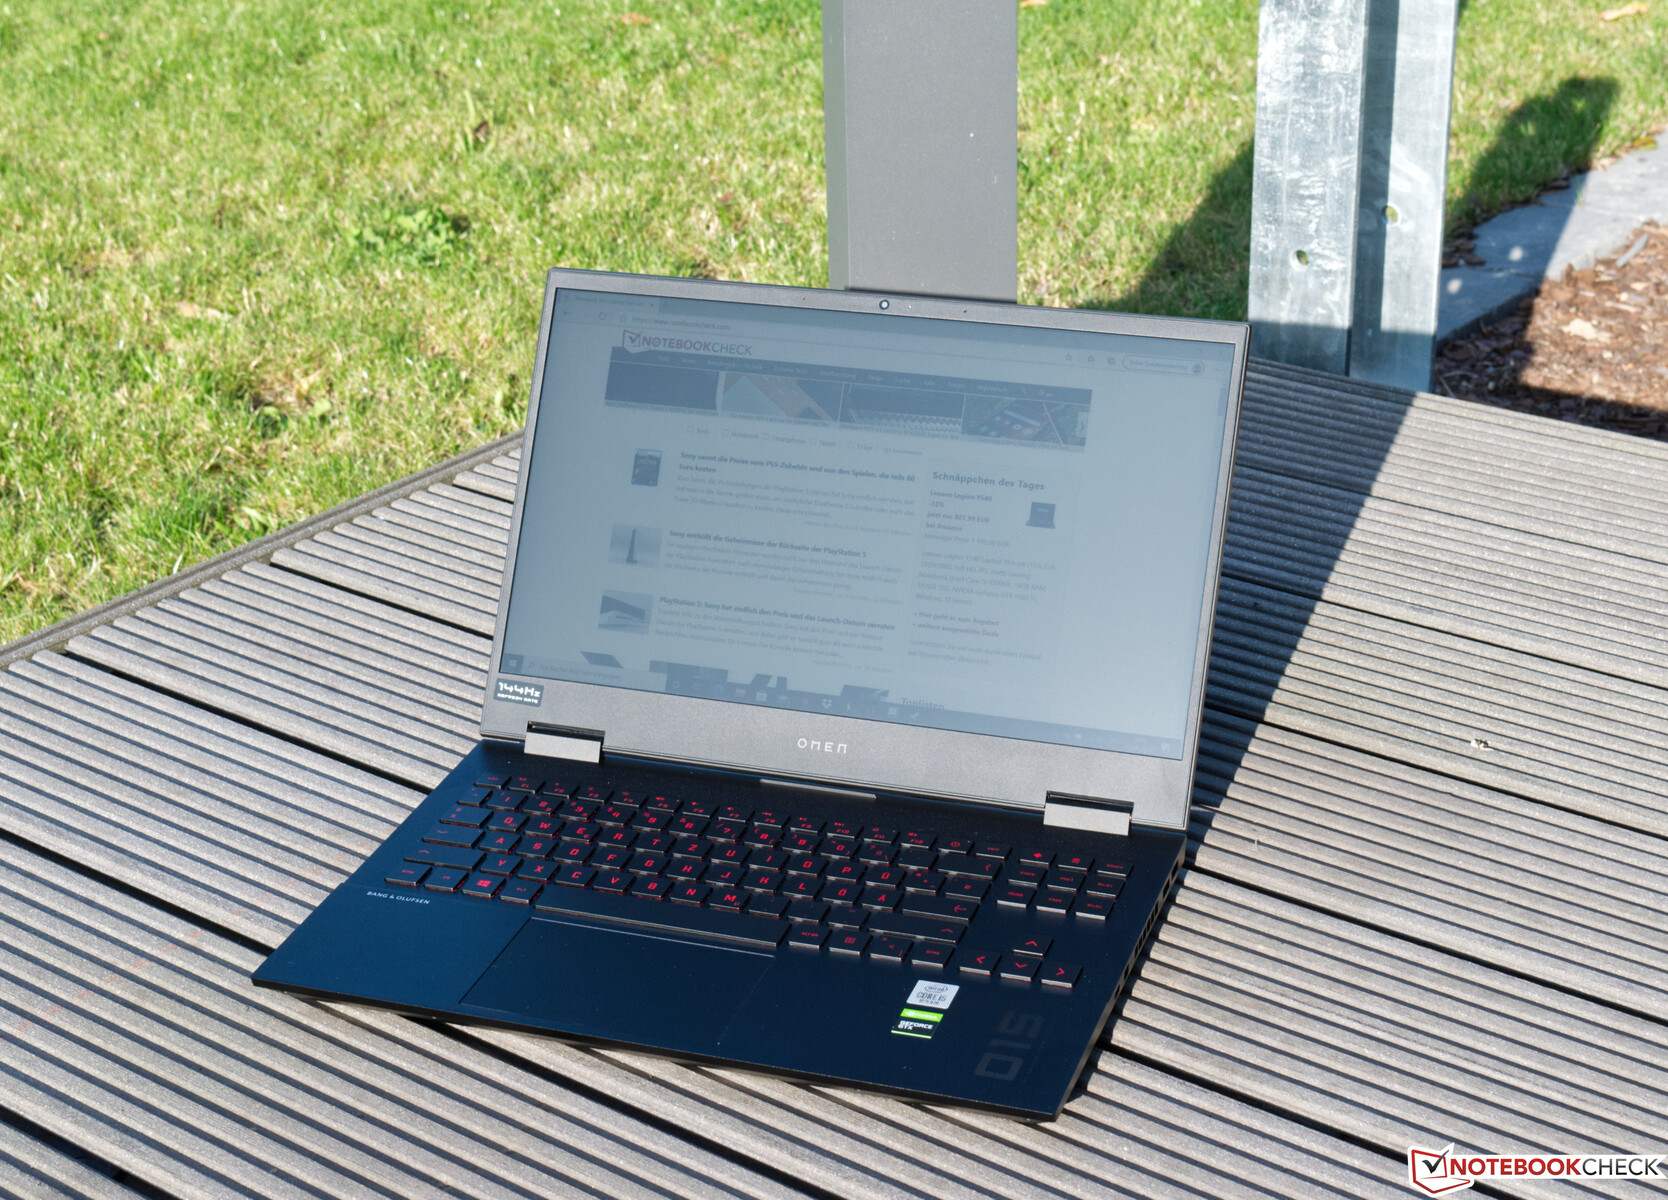
The built-in IPS panel can fully display its advantages during the viewing-angle test. Color changes only occur in extreme situations like with the four corner images, for example. If you want to sit on the terrace with the device, you should rather find a place in the shade. However, working in the sunshine is still not impossible if you can prevent direct sunlight.

Performance - Fast enough for Full HD
The Intel Core i5-10300H together with the Nvidia GeForce GTX 1660 Ti offers a solid foundation for Full HD gaming. The 16 GB of RAM and the 512 GB SSD are enough, and if necessary, storage can be quickly expanded with a second M.2 module.
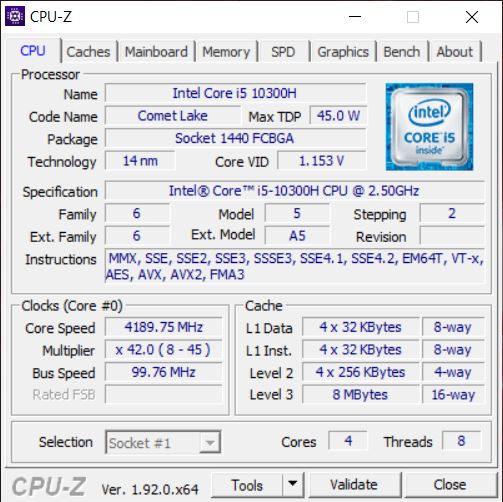


Processor
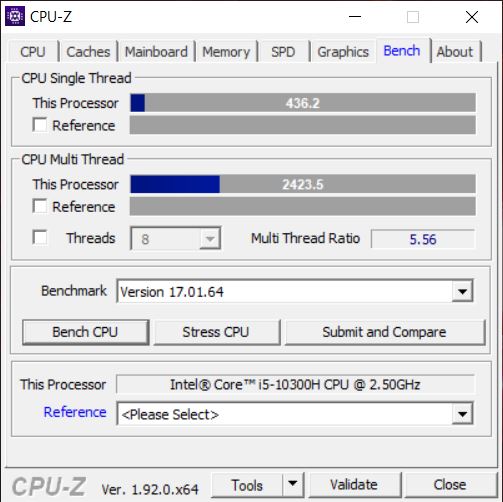
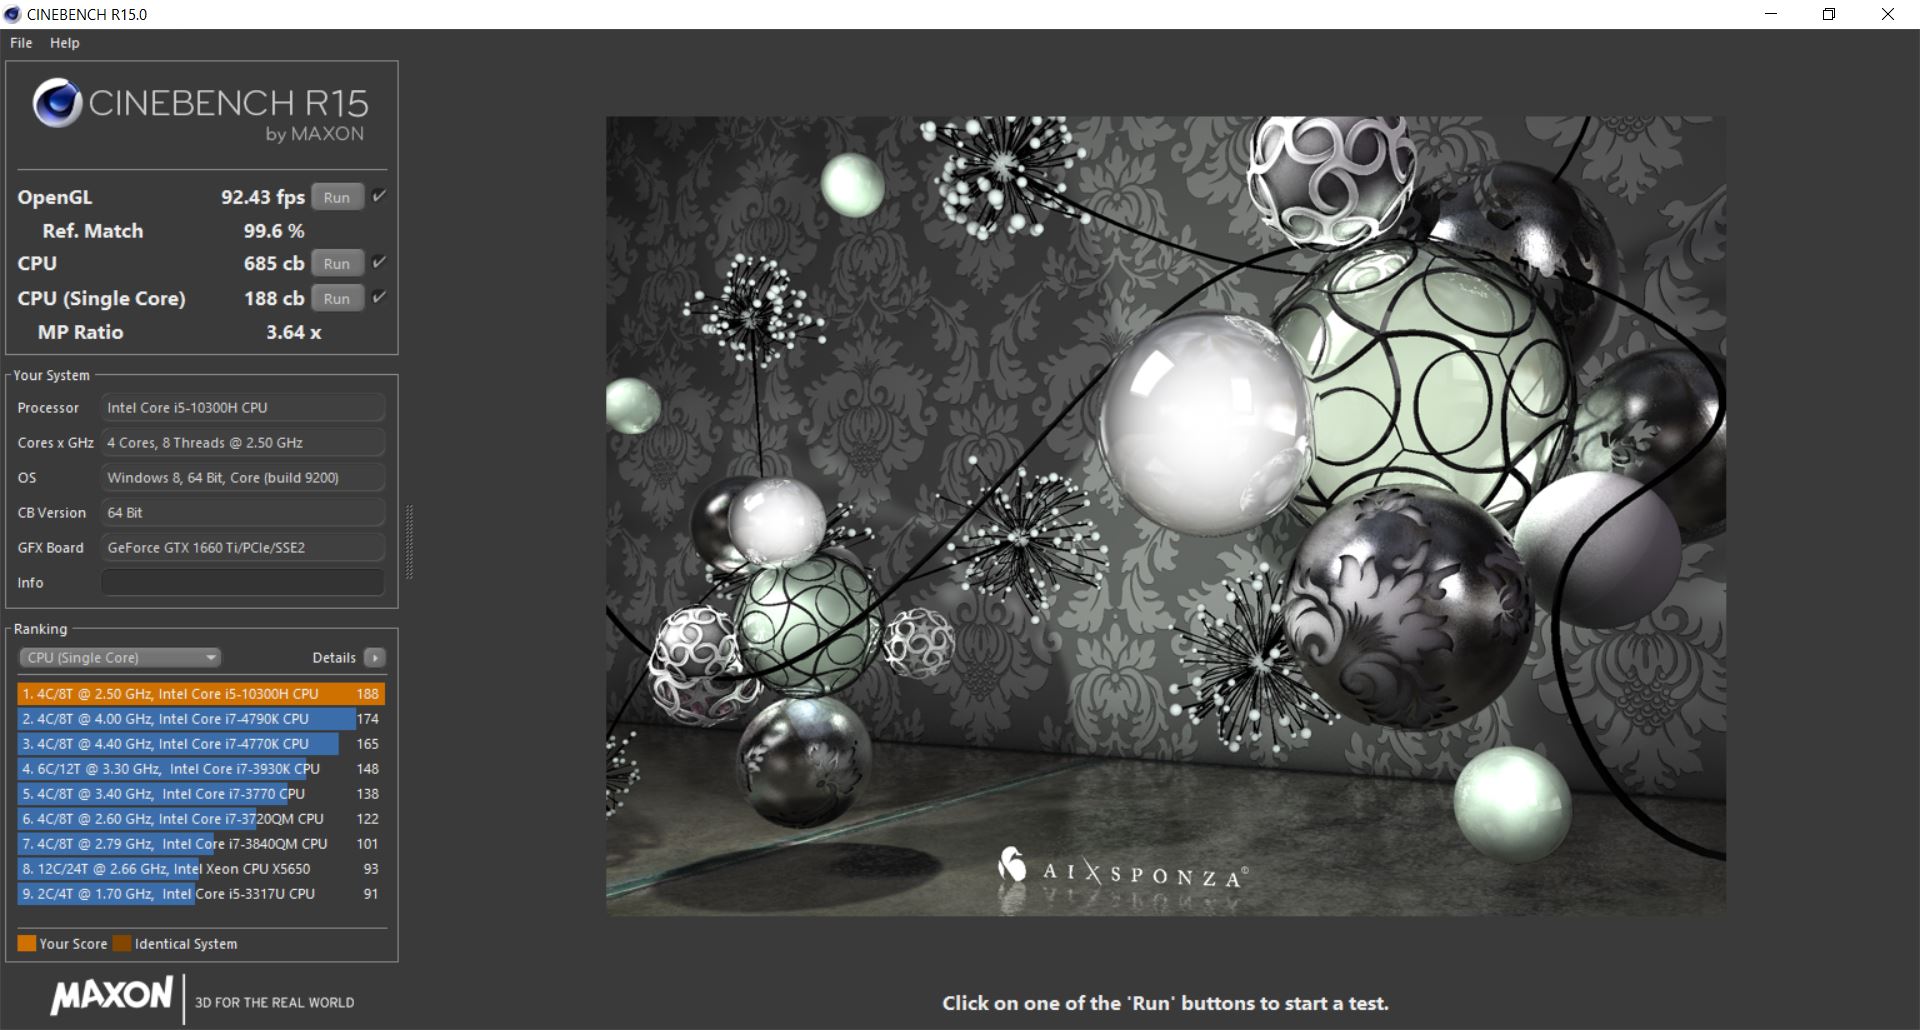
The Intel Core i5-10300H offers four cores and Hyper-Threading. The SoC operates at a base clock speed of 2.5 GHz and can reach up to 4.5 GHz on one core via Turbo. Nevertheless, the clock-rate limit when using all cores is 4.2 GHz. In the test, the Core i5-10300H has to admit defeat to the AMD Ryzen 7 4800H found in the MSI Bravo 15. The Core i5-10300H can still keep up in the single-thread tests, but the quad-core processor is clearly inferior to the octa-core SoC in the multithread tests.
Our HP Omen 15 can convince with a consistent performance in the Cinebench R15 multi-loop. Even after some time, the performance of the i5-10300H doesn't decrease, which is very often the case with other devices. After 50 runs, we register an average score of 897 points. This means that the Omen 15 is slightly faster than the Nexoc GH15 with the same SoC.
For further comparisons and benchmarks, please refer to our CPU comparison table.
Cinebench R15: CPU Single 64Bit | CPU Multi 64Bit
Blender: v2.79 BMW27 CPU
7-Zip 18.03: 7z b 4 -mmt1 | 7z b 4
Geekbench 5.5: Single-Core | Multi-Core
HWBOT x265 Benchmark v2.2: 4k Preset
LibreOffice : 20 Documents To PDF
R Benchmark 2.5: Overall mean
| Cinebench R20 / CPU (Single Core) | |
| Average of class Gaming (442 - 913, n=106, last 2 years) | |
| Asus ROG Zephyrus G15 GA502IU-ES76 | |
| MSI Bravo 15 A4DCR | |
| Nexoc GH5 515IG | |
| HP Omen 15-ek0456ng | |
| Schenker XMG Core 15 GK5CP6V | |
| Average Intel Core i5-10300H (312 - 470, n=15) | |
| HP Omen 15-dc1020ng | |
| Cinebench R20 / CPU (Multi Core) | |
| Average of class Gaming (4029 - 16433, n=106, last 2 years) | |
| MSI Bravo 15 A4DCR | |
| Asus ROG Zephyrus G15 GA502IU-ES76 | |
| HP Omen 15-ek0456ng | |
| Schenker XMG Core 15 GK5CP6V | |
| Average Intel Core i5-10300H (1397 - 2240, n=15) | |
| Nexoc GH5 515IG | |
| HP Omen 15-dc1020ng | |
| Cinebench R15 / CPU Single 64Bit | |
| Average of class Gaming (188.8 - 350, n=106, last 2 years) | |
| Schenker XMG Core 15 GK5CP6V | |
| HP Omen 15-ek0456ng | |
| MSI Bravo 15 A4DCR | |
| Nexoc GH5 515IG | |
| Asus ROG Zephyrus G15 GA502IU-ES76 | |
| Average Intel Core i5-10300H (108 - 194, n=17) | |
| HP Omen 15-dc1020ng | |
| Cinebench R15 / CPU Multi 64Bit | |
| Average of class Gaming (1578 - 6330, n=105, last 2 years) | |
| MSI Bravo 15 A4DCR | |
| Asus ROG Zephyrus G15 GA502IU-ES76 | |
| Schenker XMG Core 15 GK5CP6V | |
| HP Omen 15-ek0456ng | |
| Nexoc GH5 515IG | |
| Average Intel Core i5-10300H (536 - 921, n=17) | |
| HP Omen 15-dc1020ng | |
| Blender / v2.79 BMW27 CPU | |
| HP Omen 15-dc1020ng | |
| Nexoc GH5 515IG | |
| Average Intel Core i5-10300H (479 - 555, n=14) | |
| HP Omen 15-ek0456ng | |
| Schenker XMG Core 15 GK5CP6V | |
| MSI Bravo 15 A4DCR | |
| Asus ROG Zephyrus G15 GA502IU-ES76 | |
| Average of class Gaming (79 - 330, n=104, last 2 years) | |
| 7-Zip 18.03 / 7z b 4 -mmt1 | |
| Average of class Gaming (4199 - 7436, n=105, last 2 years) | |
| HP Omen 15-ek0456ng | |
| Nexoc GH5 515IG | |
| Schenker XMG Core 15 GK5CP6V | |
| Average Intel Core i5-10300H (2945 - 4956, n=14) | |
| Asus ROG Zephyrus G15 GA502IU-ES76 | |
| HP Omen 15-dc1020ng | |
| MSI Bravo 15 A4DCR | |
| 7-Zip 18.03 / 7z b 4 | |
| Average of class Gaming (33491 - 148086, n=105, last 2 years) | |
| Asus ROG Zephyrus G15 GA502IU-ES76 | |
| MSI Bravo 15 A4DCR | |
| Schenker XMG Core 15 GK5CP6V | |
| HP Omen 15-ek0456ng | |
| Average Intel Core i5-10300H (15146 - 24841, n=14) | |
| Nexoc GH5 515IG | |
| HP Omen 15-dc1020ng | |
| Geekbench 5.5 / Single-Core | |
| Average of class Gaming (986 - 2474, n=105, last 2 years) | |
| HP Omen 15-ek0456ng | |
| HP Omen 15-ek0456ng | |
| Nexoc GH5 515IG | |
| Asus ROG Zephyrus G15 GA502IU-ES76 | |
| Average Intel Core i5-10300H (703 - 1241, n=16) | |
| Schenker XMG Core 15 GK5CP6V | |
| MSI Bravo 15 A4DCR | |
| Geekbench 5.5 / Multi-Core | |
| Average of class Gaming (6460 - 28263, n=105, last 2 years) | |
| Asus ROG Zephyrus G15 GA502IU-ES76 | |
| MSI Bravo 15 A4DCR | |
| Schenker XMG Core 15 GK5CP6V | |
| Nexoc GH5 515IG | |
| HP Omen 15-ek0456ng | |
| HP Omen 15-ek0456ng | |
| Average Intel Core i5-10300H (2783 - 4728, n=16) | |
| HWBOT x265 Benchmark v2.2 / 4k Preset | |
| Average of class Gaming (11.5 - 44.4, n=105, last 2 years) | |
| Asus ROG Zephyrus G15 GA502IU-ES76 | |
| MSI Bravo 15 A4DCR | |
| Schenker XMG Core 15 GK5CP6V | |
| HP Omen 15-ek0456ng | |
| Average Intel Core i5-10300H (6.13 - 7.78, n=14) | |
| Nexoc GH5 515IG | |
| HP Omen 15-dc1020ng | |
| LibreOffice / 20 Documents To PDF | |
| MSI Bravo 15 A4DCR | |
| Average Intel Core i5-10300H (23.9 - 94, n=14) | |
| Nexoc GH5 515IG | |
| Asus ROG Zephyrus G15 GA502IU-ES76 | |
| Average of class Gaming (33.2 - 88.8, n=105, last 2 years) | |
| HP Omen 15-ek0456ng | |
| R Benchmark 2.5 / Overall mean | |
| Average Intel Core i5-10300H (0.625 - 1.088, n=14) | |
| Schenker XMG Core 15 GK5CP6V | |
| HP Omen 15-ek0456ng | |
| Nexoc GH5 515IG | |
| MSI Bravo 15 A4DCR | |
| Asus ROG Zephyrus G15 GA502IU-ES76 | |
| Average of class Gaming (0.3439 - 0.759, n=106, last 2 years) | |
* ... smaller is better
System performance
The PCMark 10 results of our test sample are good, and in comparison to the competition, even significantly better. As a result, the HP Omen 15 doesn't need to hide here, because in everyday use, the good performance was always convincing and getting work done fast was always possible with the device.
| PCMark 8 Home Score Accelerated v2 | 4853 points | |
| PCMark 8 Creative Score Accelerated v2 | 7696 points | |
| PCMark 8 Work Score Accelerated v2 | 5507 points | |
| PCMark 10 Score | 5127 points | |
Help | ||
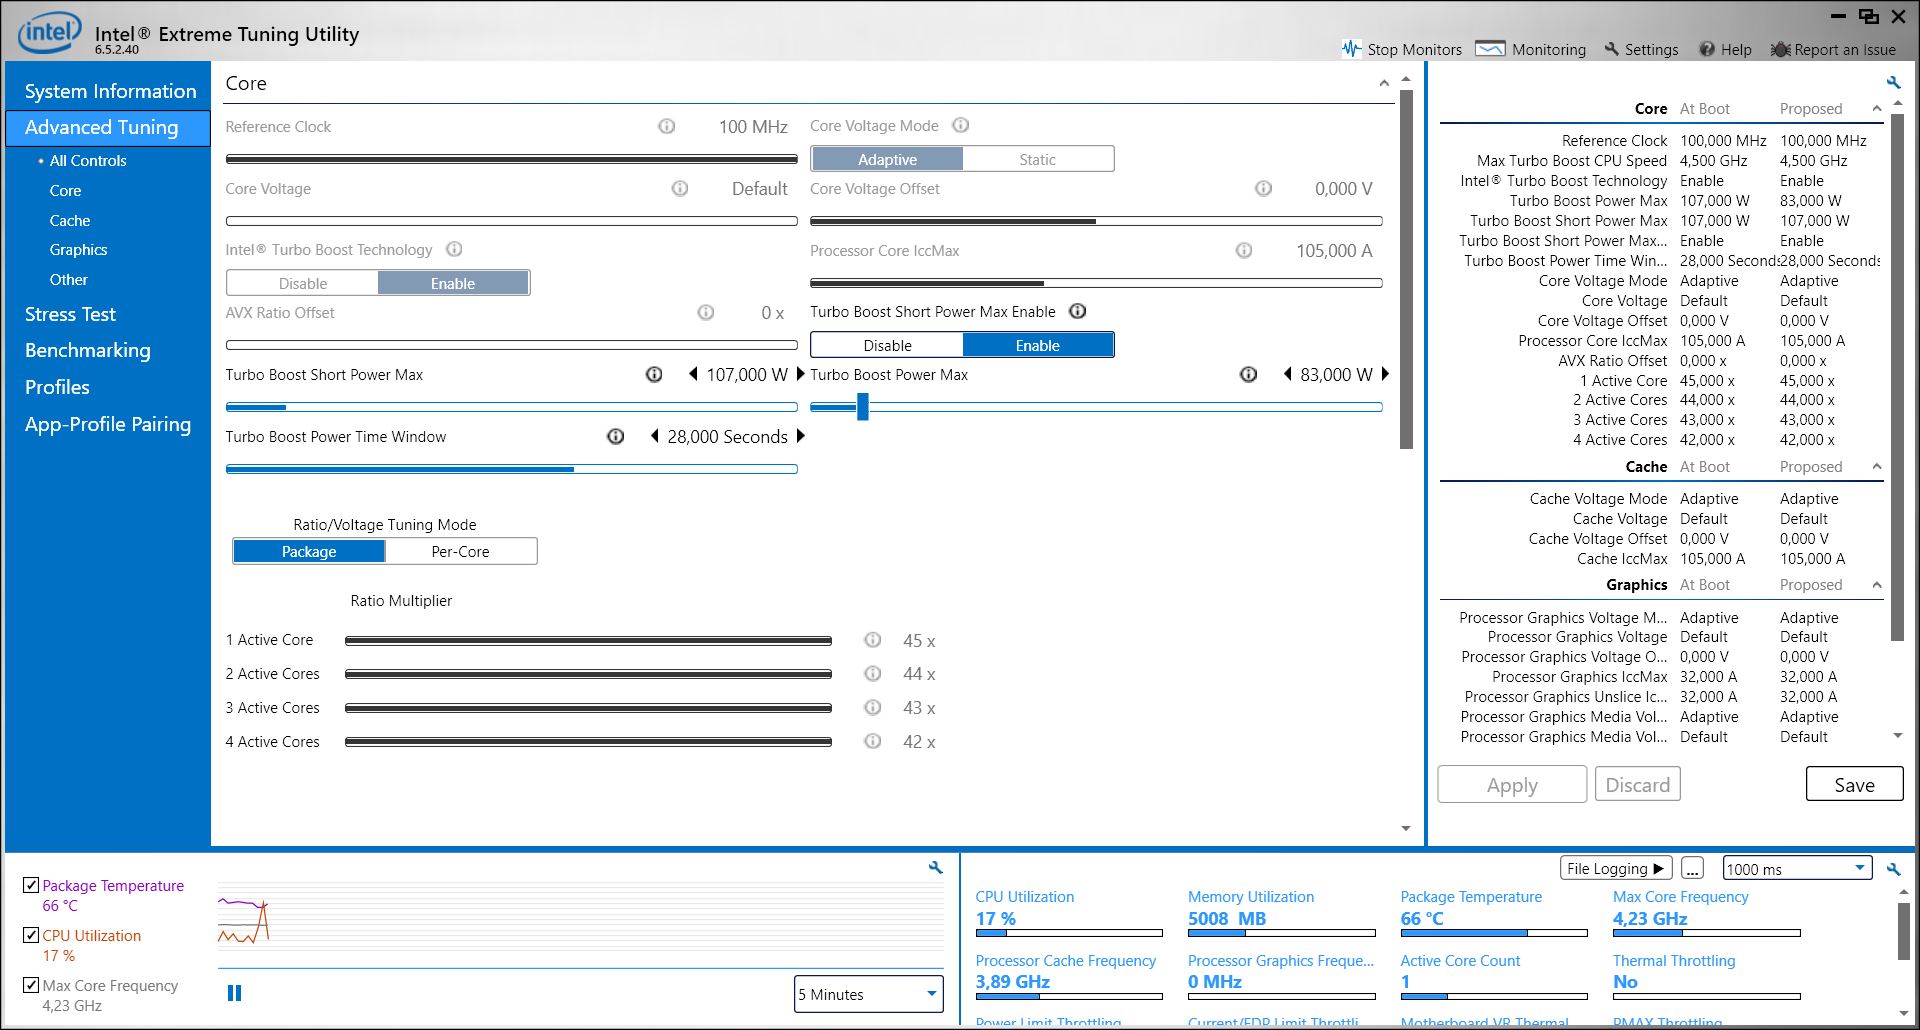
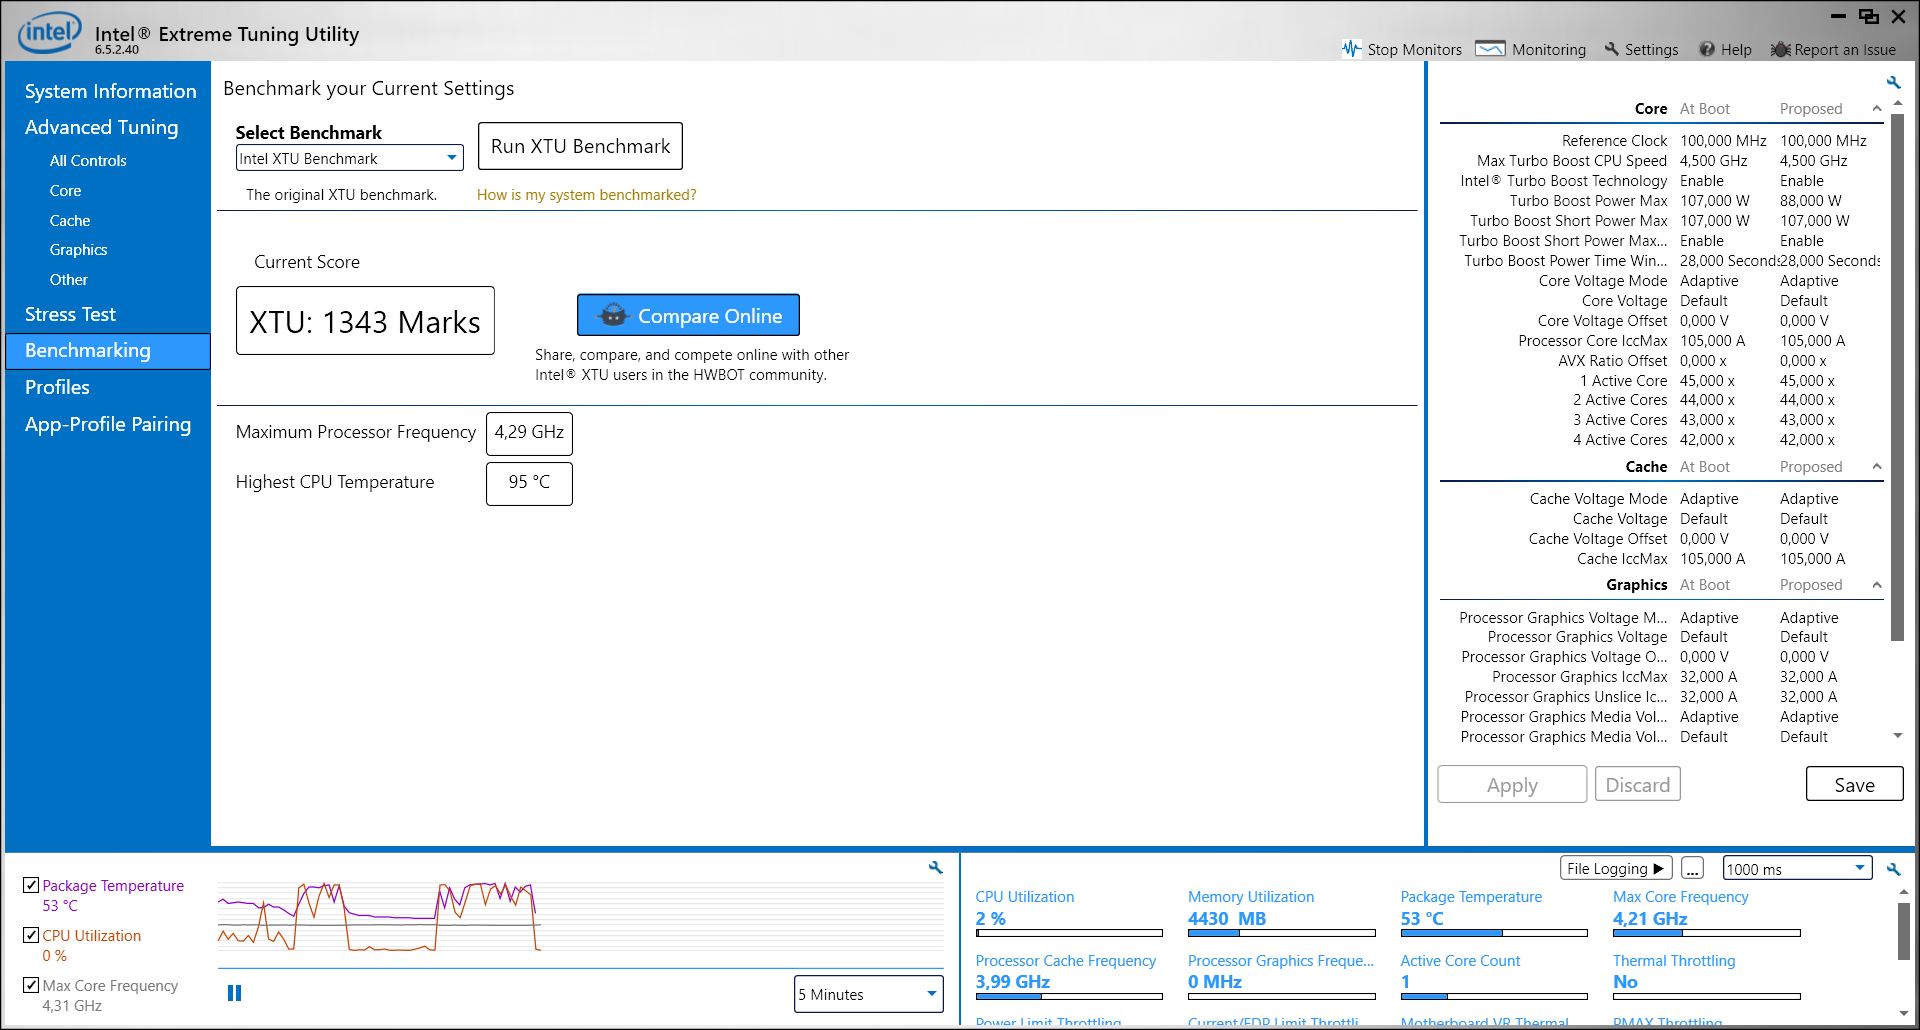
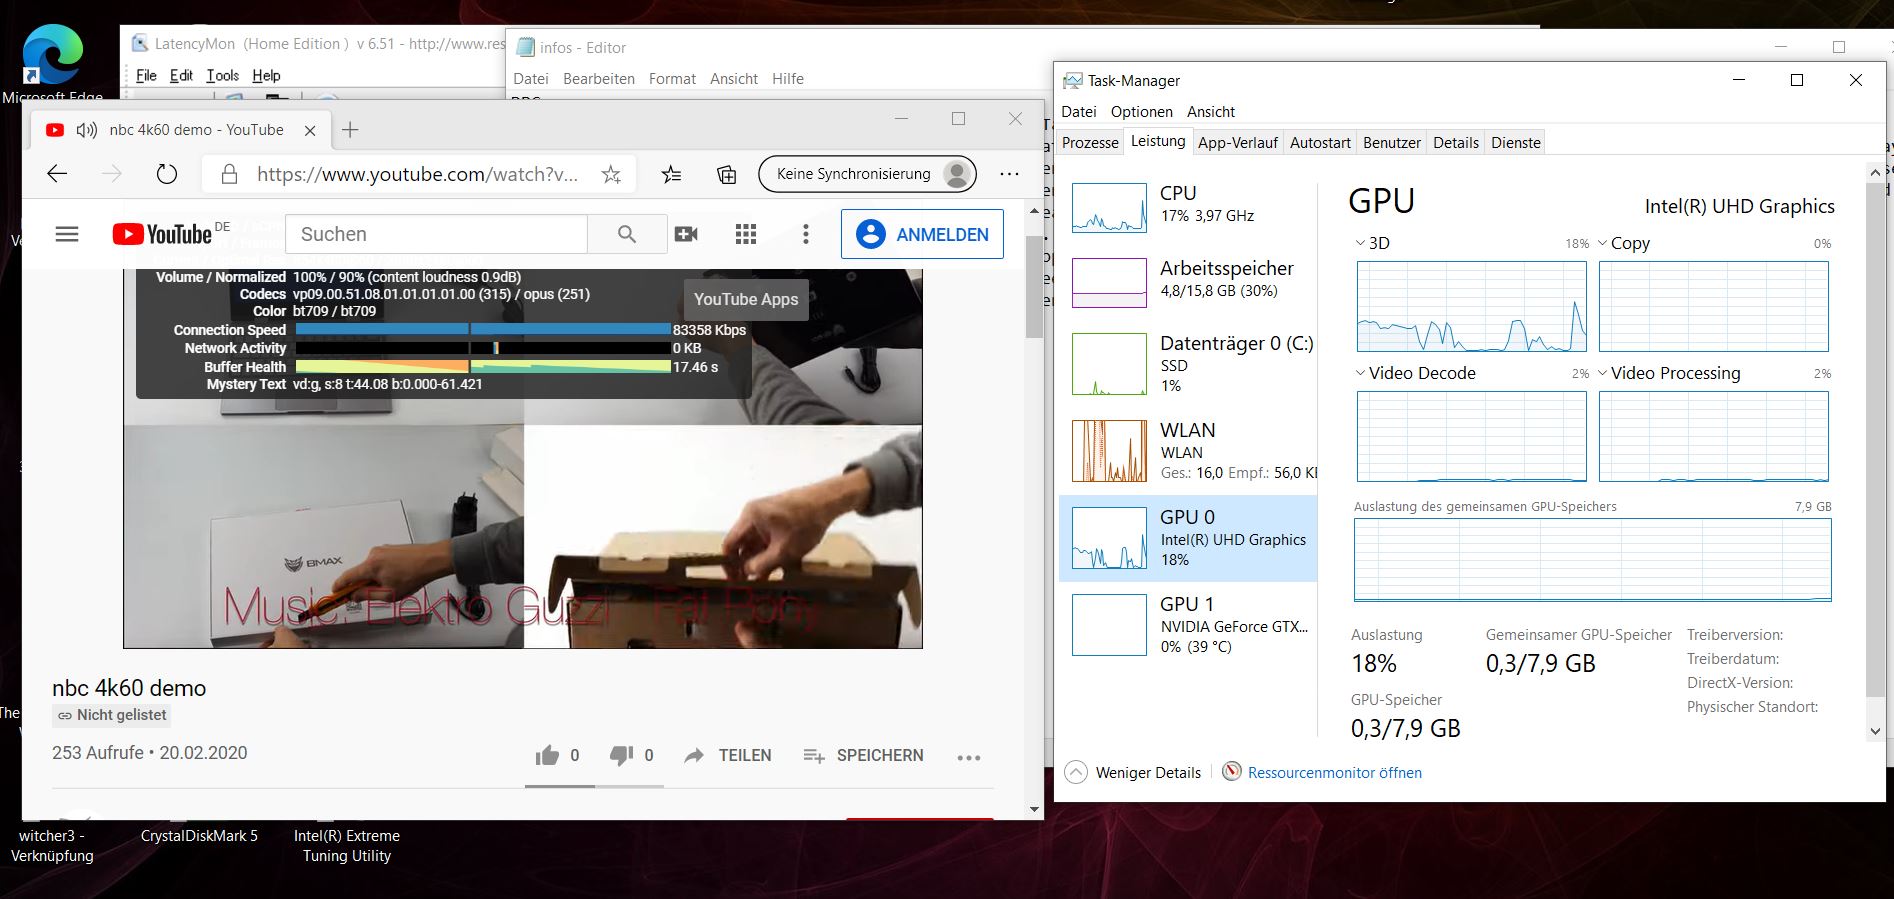
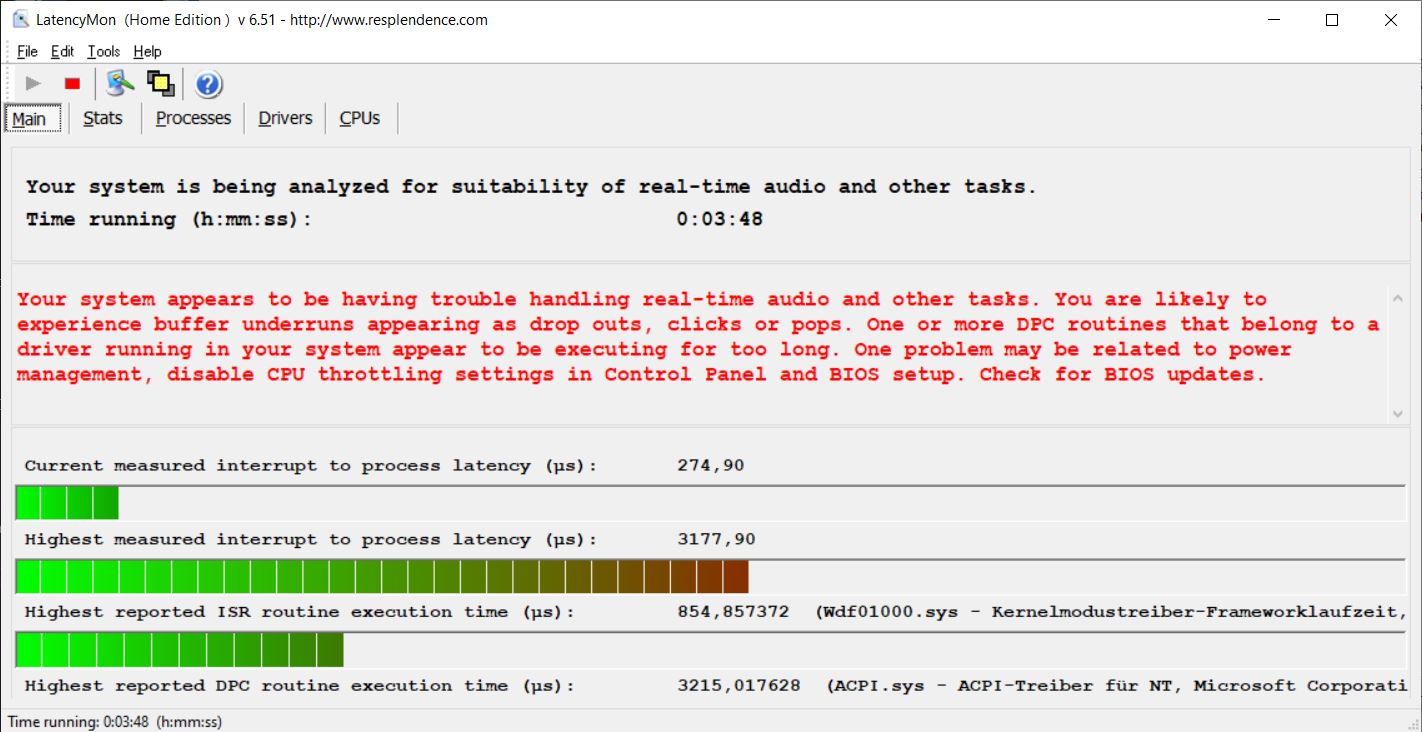
DPC latencies
LatencyMon shows small problems with increased DPC latencies when opening multiple browser tabs in Edge. When playing 4K video material, there are no further increased DPC latencies. These rose significantly only after we started Prime95. Moreover, the iGPU load when playing the 4K YouTube video was almost 25%.

| DPC Latencies / LatencyMon - interrupt to process latency (max), Web, Youtube, Prime95 | |
| HP Omen 15-ek0456ng | |
* ... smaller is better
Storage
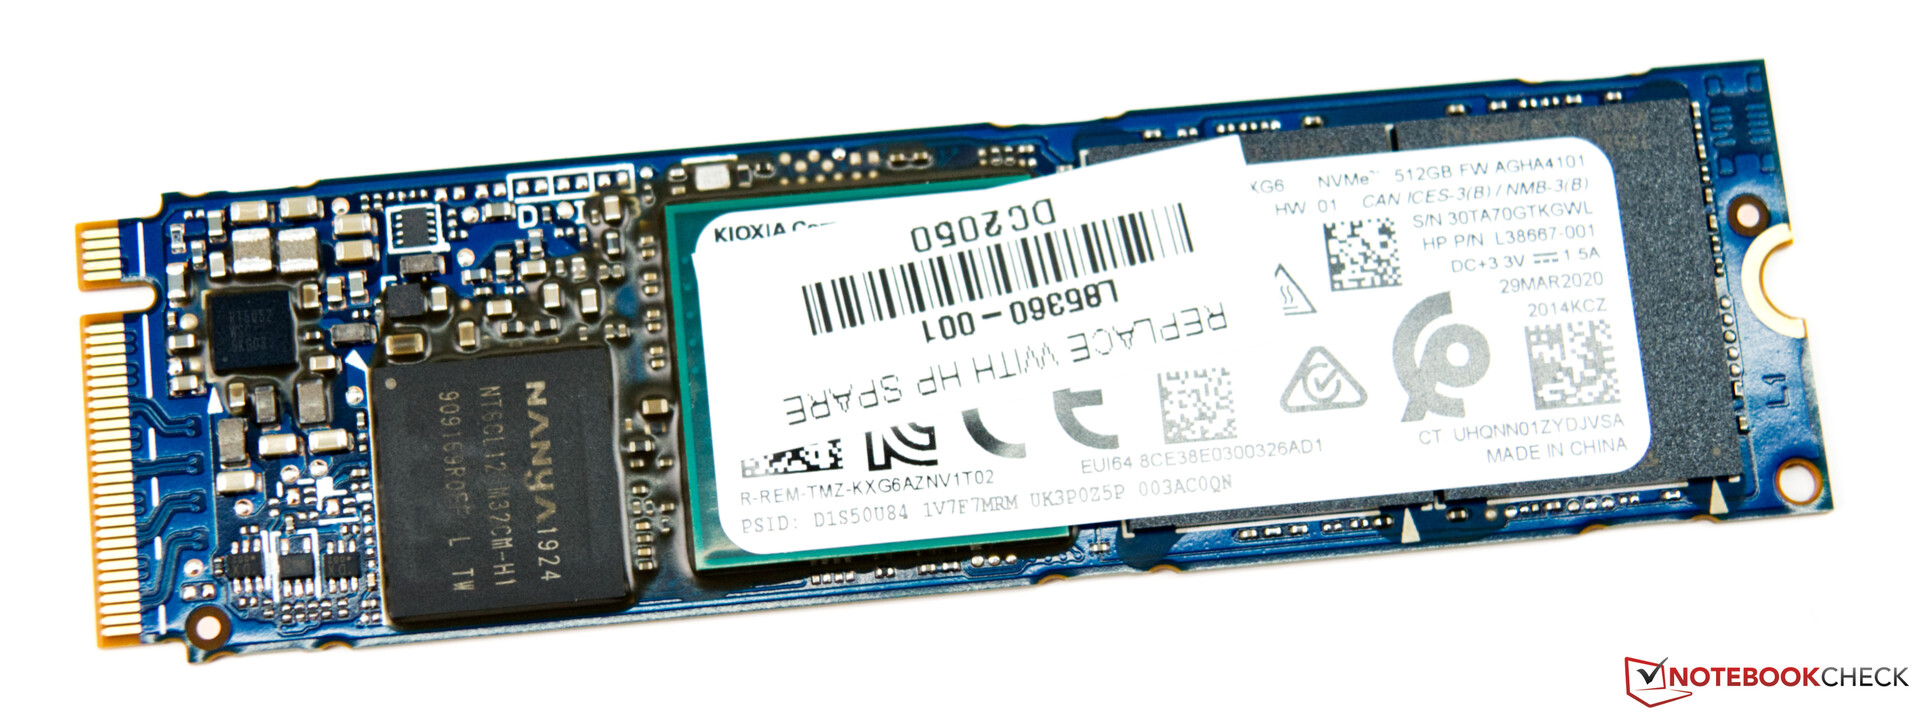
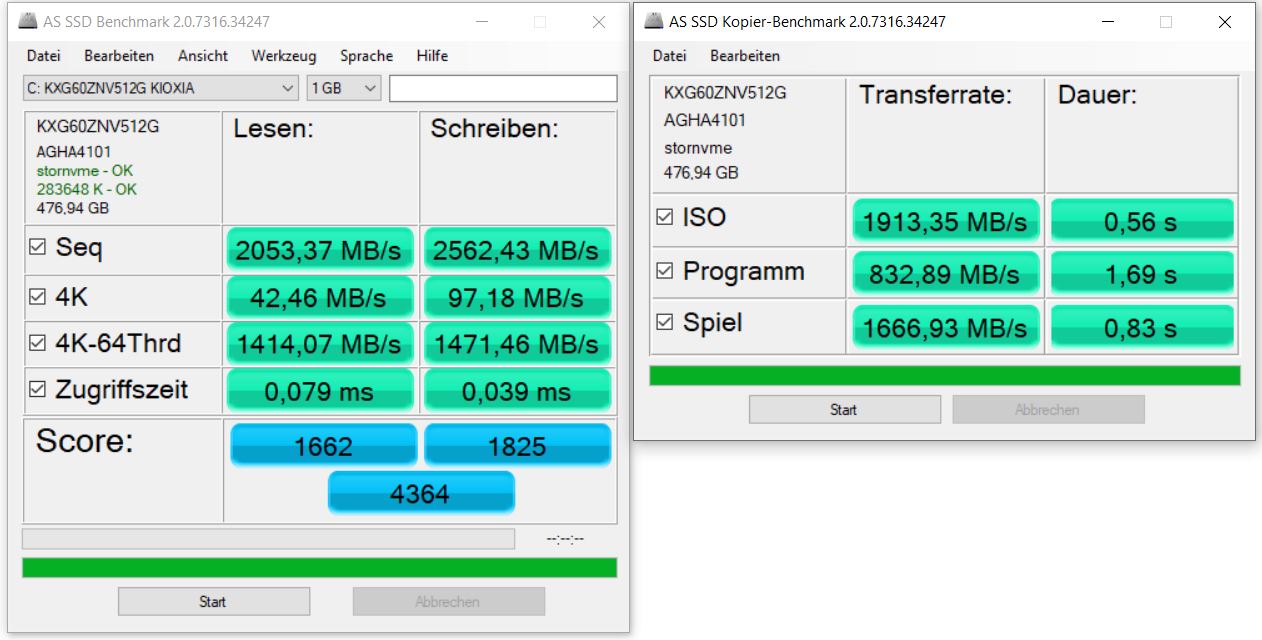
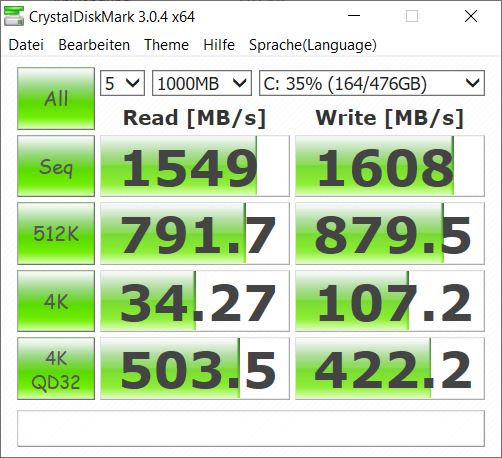
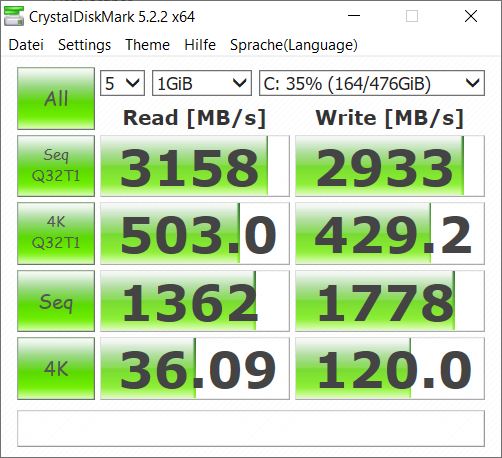
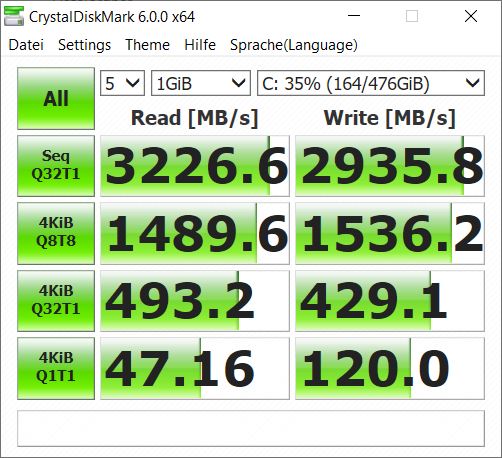
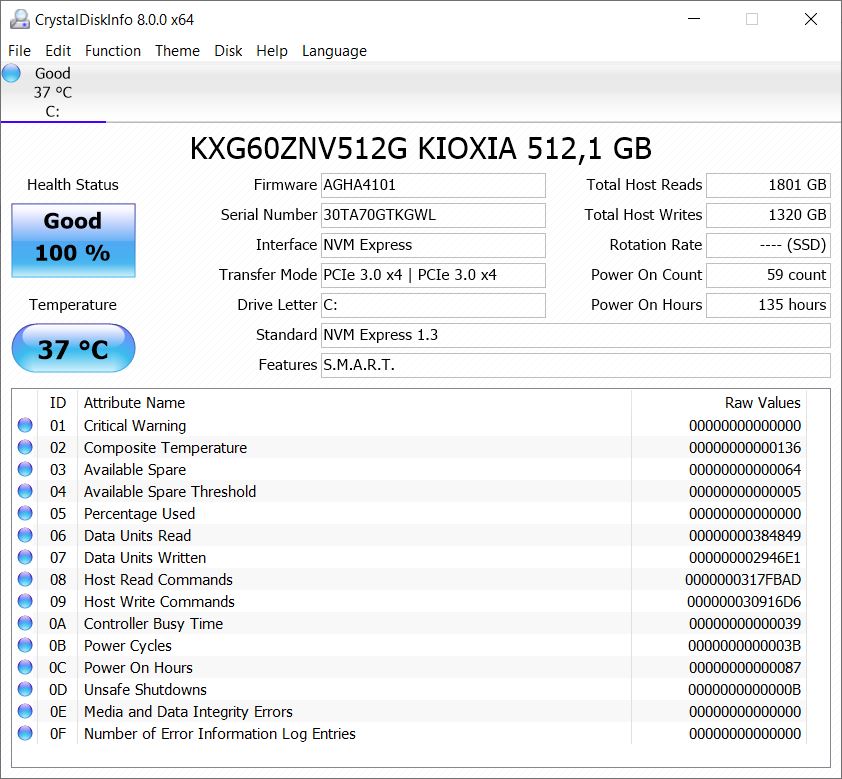
An NVMe SSD (M.2 2280) from Toshiba with a storage capacity of 512 GB serves as the system drive. The transfer rates of the SSD are excellent. Nevertheless, the laptop still offers a second M.2 2280 slot that can be occupied with an NVMe or SATA SSD. Moreover, we couldn't detect any performance drops in the transfer speeds under continuous load. Other configurations of the Omen 15 come with a 1 TB SSD out of the box. If you want to store many games, you should rather consider this device.
You can find further comparisons and benchmarks in our comparison table.
| HP Omen 15-ek0456ng Toshiba XG6 KXG60ZNV512G | Asus ROG Zephyrus G15 GA502IU-ES76 Intel SSD 660p 1TB SSDPEKNW010T8 | Schenker XMG Core 15 GK5CP6V Samsung SSD 970 EVO Plus 500GB | Nexoc GH5 515IG Samsung SSD 860 Evo 512GB | MSI Bravo 15 A4DCR Samsung PM981a MZVLB1T0HBLR | HP Omen 15-dc1020ng WDC PC SN720 SDAQNTW-512G | Average Toshiba XG6 KXG60ZNV512G | |
|---|---|---|---|---|---|---|---|
| CrystalDiskMark 5.2 / 6 | 10% | -3% | -46% | 21% | 3% | -10% | |
| Write 4K (MB/s) | 120 | 189.6 58% | 102 -15% | 89.6 -25% | 118.3 -1% | 112.1 -7% | 112.8 ? -6% |
| Read 4K (MB/s) | 36.09 | 61.7 71% | 41.39 15% | 40.88 13% | 43.73 21% | 42.01 16% | 42.7 ? 18% |
| Write Seq (MB/s) | 1778 | 1730 -3% | 1649 -7% | 518 -71% | 2854 61% | 1964 10% | 1489 ? -16% |
| Read Seq (MB/s) | 1362 | 1620 19% | 1367 0% | 539 -60% | 2302 69% | 2065 52% | 1771 ? 30% |
| Write 4K Q32T1 (MB/s) | 429.1 | 474.2 11% | 379 -12% | 304 -29% | 418.5 -2% | 318.2 -26% | 345 ? -20% |
| Read 4K Q32T1 (MB/s) | 493.2 | 528 7% | 401.2 -19% | 329 -33% | 517 5% | 406.7 -18% | 359 ? -27% |
| Write Seq Q32T1 (MB/s) | 2936 | 1795 -39% | 3276 12% | 529 -82% | 3008 2% | 2534 -14% | 2257 ? -23% |
| Read Seq Q32T1 (MB/s) | 3227 | 1880 -42% | 3417 6% | 561 -83% | 3568 11% | 3438 7% | 2926 ? -9% |
| Write 4K Q8T8 (MB/s) | 1536 | 1080 ? -30% | |||||
| Read 4K Q8T8 (MB/s) | 1490 | 1232 ? -17% | |||||
| AS SSD | -37% | 19% | -54% | 30% | -4% | -16% | |
| Seq Read (MB/s) | 2053 | 1197 -42% | 2261 10% | 524 -74% | 2730 33% | 2955 44% | 2456 ? 20% |
| Seq Write (MB/s) | 2562 | 1637 -36% | 2393 -7% | 495 -81% | 2513 -2% | 2440 -5% | 1493 ? -42% |
| 4K Read (MB/s) | 42.46 | 56.3 33% | 54.6 29% | 38.93 -8% | 61.4 45% | 40.56 -4% | 44.1 ? 4% |
| 4K Write (MB/s) | 97.2 | 159 64% | 118.4 22% | 87.3 -10% | 156.1 61% | 118.6 22% | 119.3 ? 23% |
| 4K-64 Read (MB/s) | 1414 | 583 -59% | 1376 -3% | 380 -73% | 1780 26% | 1283 -9% | 980 ? -31% |
| 4K-64 Write (MB/s) | 1471 | 838 -43% | 2299 56% | 335.7 -77% | 1920 31% | 1538 5% | 1180 ? -20% |
| Access Time Read * (ms) | 0.079 | 0.062 22% | 0.07 11% | 0.073 8% | 0.063 20% | 0.084 -6% | 0.08057 ? -2% |
| Access Time Write * (ms) | 0.039 | 0.128 -228% | 0.031 21% | 0.039 -0% | 0.025 36% | 0.032 18% | 0.055 ? -41% |
| Score Read (Points) | 1662 | 759 -54% | 1657 0% | 471 -72% | 2114 27% | 1619 -3% | 1269 ? -24% |
| Score Write (Points) | 1825 | 1160 -36% | 2657 46% | 472 -74% | 2327 28% | 1901 4% | 1449 ? -21% |
| Score Total (Points) | 4364 | 2350 -46% | 5175 19% | 1198 -73% | 5518 26% | 4323 -1% | 3326 ? -24% |
| Copy ISO MB/s (MB/s) | 1913 | 1376 -28% | 500 -74% | 1418 -26% | 1894 ? -1% | ||
| Copy Program MB/s (MB/s) | 833 | 568 -32% | 283.8 -66% | 392.5 -53% | 552 ? -34% | ||
| Copy Game MB/s (MB/s) | 1667 | 1180 -29% | 319.6 -81% | 907 -46% | 1187 ? -29% | ||
| Total Average (Program / Settings) | -14% /
-20% | 8% /
10% | -50% /
-51% | 26% /
26% | -1% /
-2% | -13% /
-13% |
* ... smaller is better

Continuous load read: DiskSpd Read Loop, Queue Depth 8
Graphics card
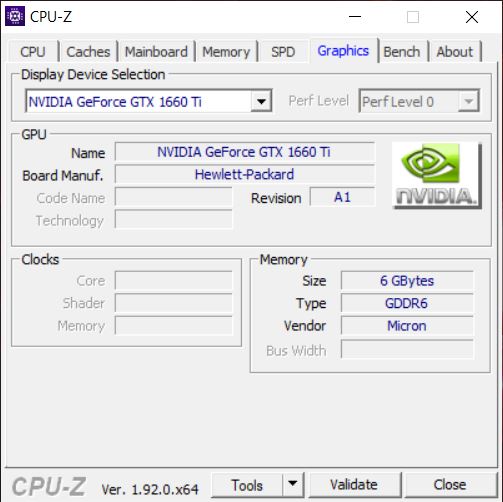
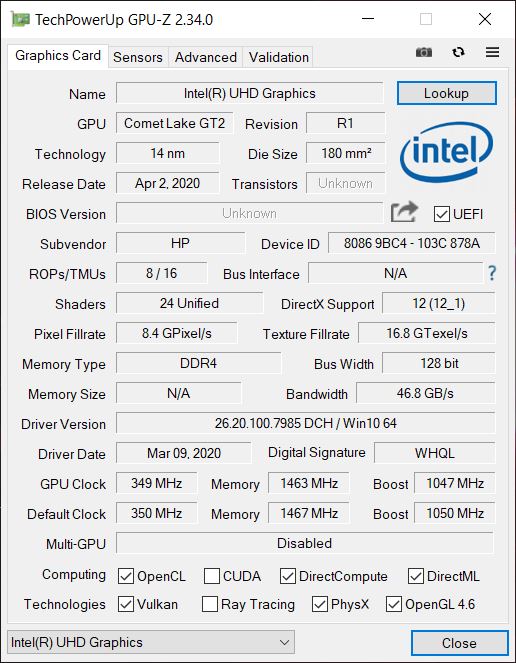
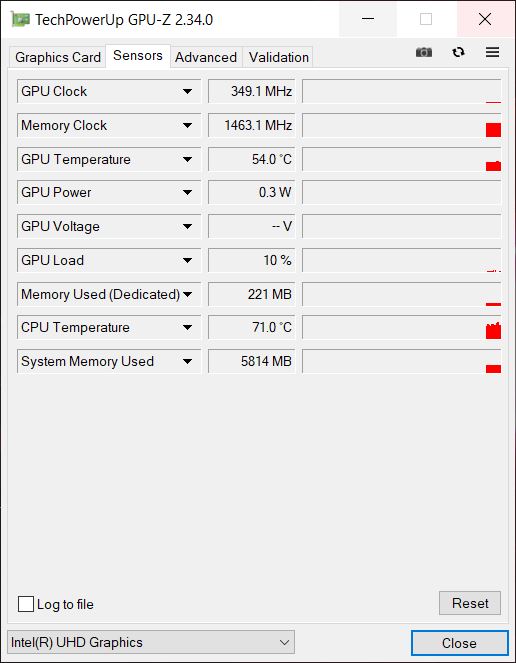
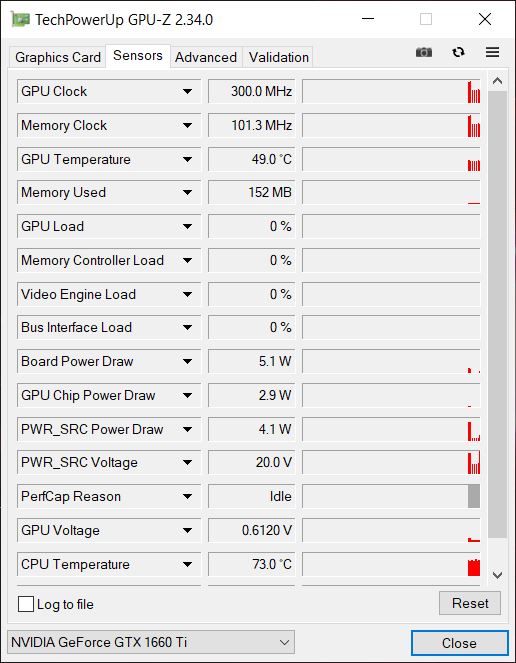
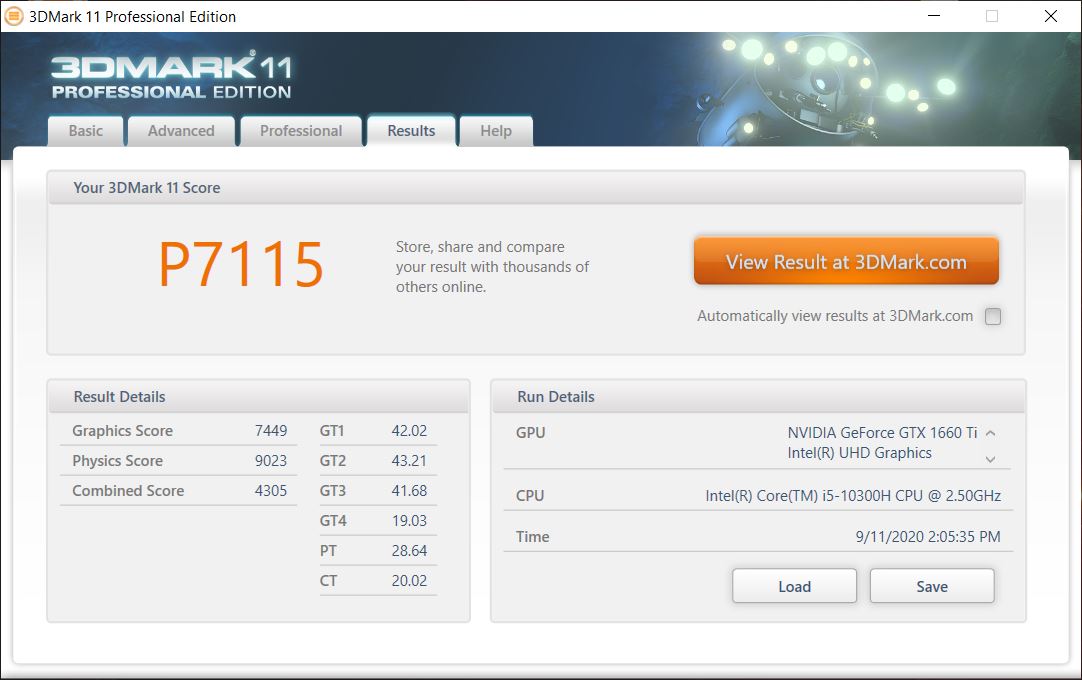
The HP Omen 15 is equipped with an Nvidia GeForce GTX 1660 Ti GPU that is responsible for 3D rendering. Thanks to Nvidia Optimus, it's possible to switch to the integrated Intel UHD Graphics 630 GPU in 2D usage to save energy. As a dedicated graphics card, the GeForce GTX 1660 Ti has its own VRAM consisting of 6 GB of GDDR6 memory. The HP Omen 15 can assert itself very well against the competition and even achieve the best values in some cases.
You can find further comparisons and benchmarks in our GPU comparison table.
| 3DMark 11 Performance | 16523 points | |
| 3DMark Ice Storm Standard Score | 119496 points | |
| 3DMark Cloud Gate Standard Score | 31686 points | |
| 3DMark Fire Strike Score | 12767 points | |
| 3DMark Fire Strike Extreme Score | 6478 points | |
| 3DMark Time Spy Score | 4946 points | |
Help | ||
Gaming performance
When it comes to gaming performance, the GeForce GTX 1660 Ti delivers solid results, which are in line with our averages. Users who need more performance should look for a device with a GeForce RTX 2060 or GeForce RTX 2070. Both configurations are offered for the Omen 15. However, the latest games can also be played in the native resolution with our test device's configuration.
Long gaming sessions aren't accompanied by a declining gaming performance as our The Witcher 3 stress test shows here.
| low | med. | high | ultra | |
|---|---|---|---|---|
| BioShock Infinite (2013) | 309.5 | 277.4 | 258.1 | 137 |
| GTA V (2015) | 164 | 133 | 71.8 | |
| The Witcher 3 (2015) | 256 | 179 | 104 | 54.2 |
| Dota 2 Reborn (2015) | 143.5 | 126.8 | 119 | 113.6 |
| Rise of the Tomb Raider (2016) | 232 | 166 | 97.8 | 87.4 |
| Final Fantasy XV Benchmark (2018) | 133 | 81.4 | 59.9 | |
| X-Plane 11.11 (2018) | 85.7 | 77.8 | 67.1 | |
| Far Cry 5 (2018) | 124 | 97 | 90 | 85 |
| Strange Brigade (2018) | 292 | 144 | 114 | 97.4 |
| Far Cry New Dawn (2019) | 106 | 88 | 85 | 76 |
| Metro Exodus (2019) | 129 | 72.5 | 54.9 | 43.1 |
Emissions
Noise emissions
Gaming laptops often have a bad reputation when it comes to their volume. The HP Omen 15 is relatively quiet in idle usage, but at 32.4 dB(A), a constant low noise is present. The Omen 15 does not offer a fan-stop mode. Under load, however, the two fans turn up quite a bit and produce a clearly audible sound pressure level. We measure a maximum value of 51.9 dB(A). The relatively high-frequency fan noise makes the volume seem even slightly louder.
Noise level
| Idle |
| 32.4 / 32.4 / 32.4 dB(A) |
| Load |
| 32.5 / 51.9 dB(A) |
 | ||
30 dB silent 40 dB(A) audible 50 dB(A) loud |
||
min: | ||
Temperature
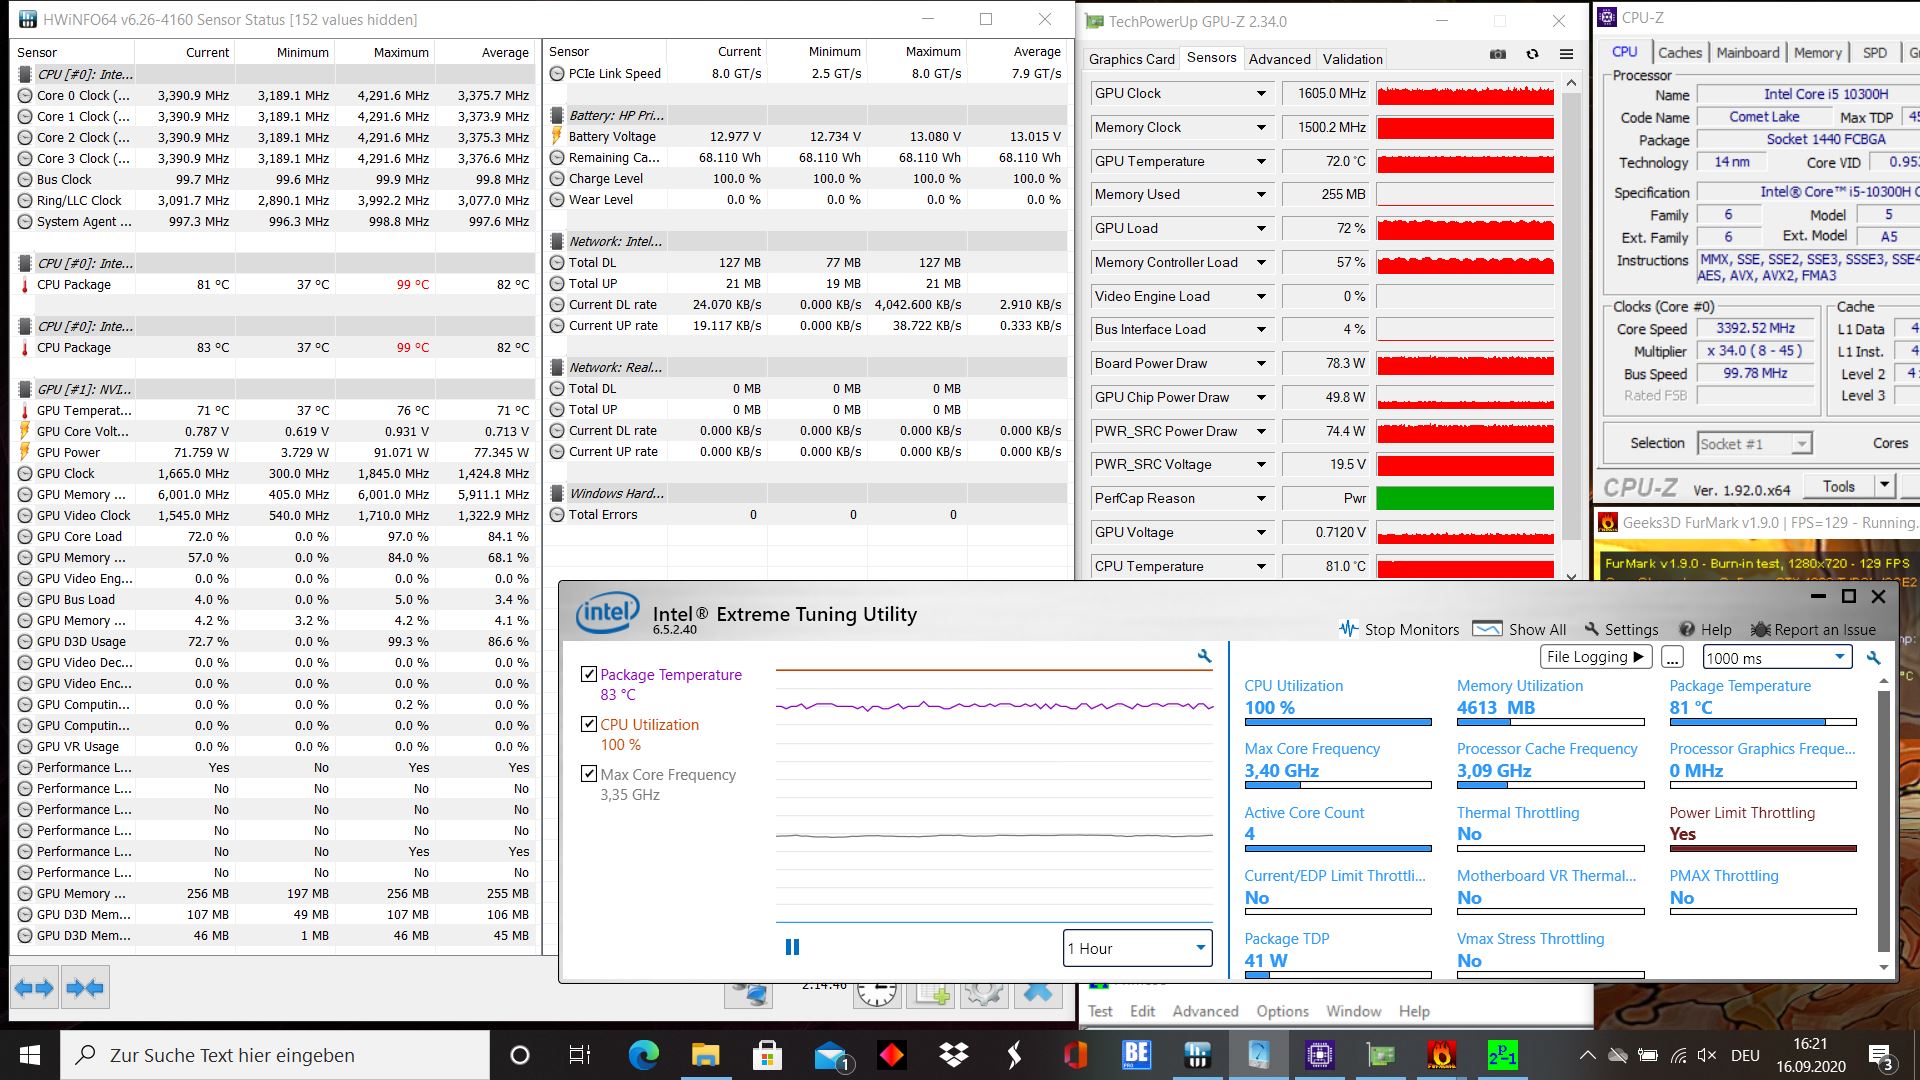
The relatively slim design ensures that cooling under load is properly required to transport the heat generated out of the case. However, the 50-°C mark (~122 °F) is not exceeded since the warmest point at the bottom only reaches 48.4 °C (~119 °F). The remaining areas stay considerably cooler. You should still refrain from extended gaming sessions with the device on your lap, though, so that the cooling on the bottom isn't covered.
We checked the temperatures of the CPU and GPU during the stress test and found that the SoC heats up to 99 °C (~210 °F). Consequently, the SoC is scratching the thermal limit that the manufacturer's specifications allow. However, you shouldn't expect any failures here because the speed gets throttled before. At least the Core i5-10300H ran at an average of 3.37 GHz in this extreme scenario. Moreover, the GPU's measured temperature was 72 °C (~162 °F). The GPU clock frequency was also consistently above the base clock speed here.
(±) The maximum temperature on the upper side is 40.2 °C / 104 F, compared to the average of 40.4 °C / 105 F, ranging from 21.2 to 68.8 °C for the class Gaming.
(-) The bottom heats up to a maximum of 48.4 °C / 119 F, compared to the average of 43.2 °C / 110 F
(+) In idle usage, the average temperature for the upper side is 24.8 °C / 77 F, compared to the device average of 33.9 °C / 93 F.
(±) Playing The Witcher 3, the average temperature for the upper side is 32 °C / 90 F, compared to the device average of 33.9 °C / 93 F.
(+) The palmrests and touchpad are cooler than skin temperature with a maximum of 29.9 °C / 85.8 F and are therefore cool to the touch.
(±) The average temperature of the palmrest area of similar devices was 28.8 °C / 83.8 F (-1.1 °C / -2 F).
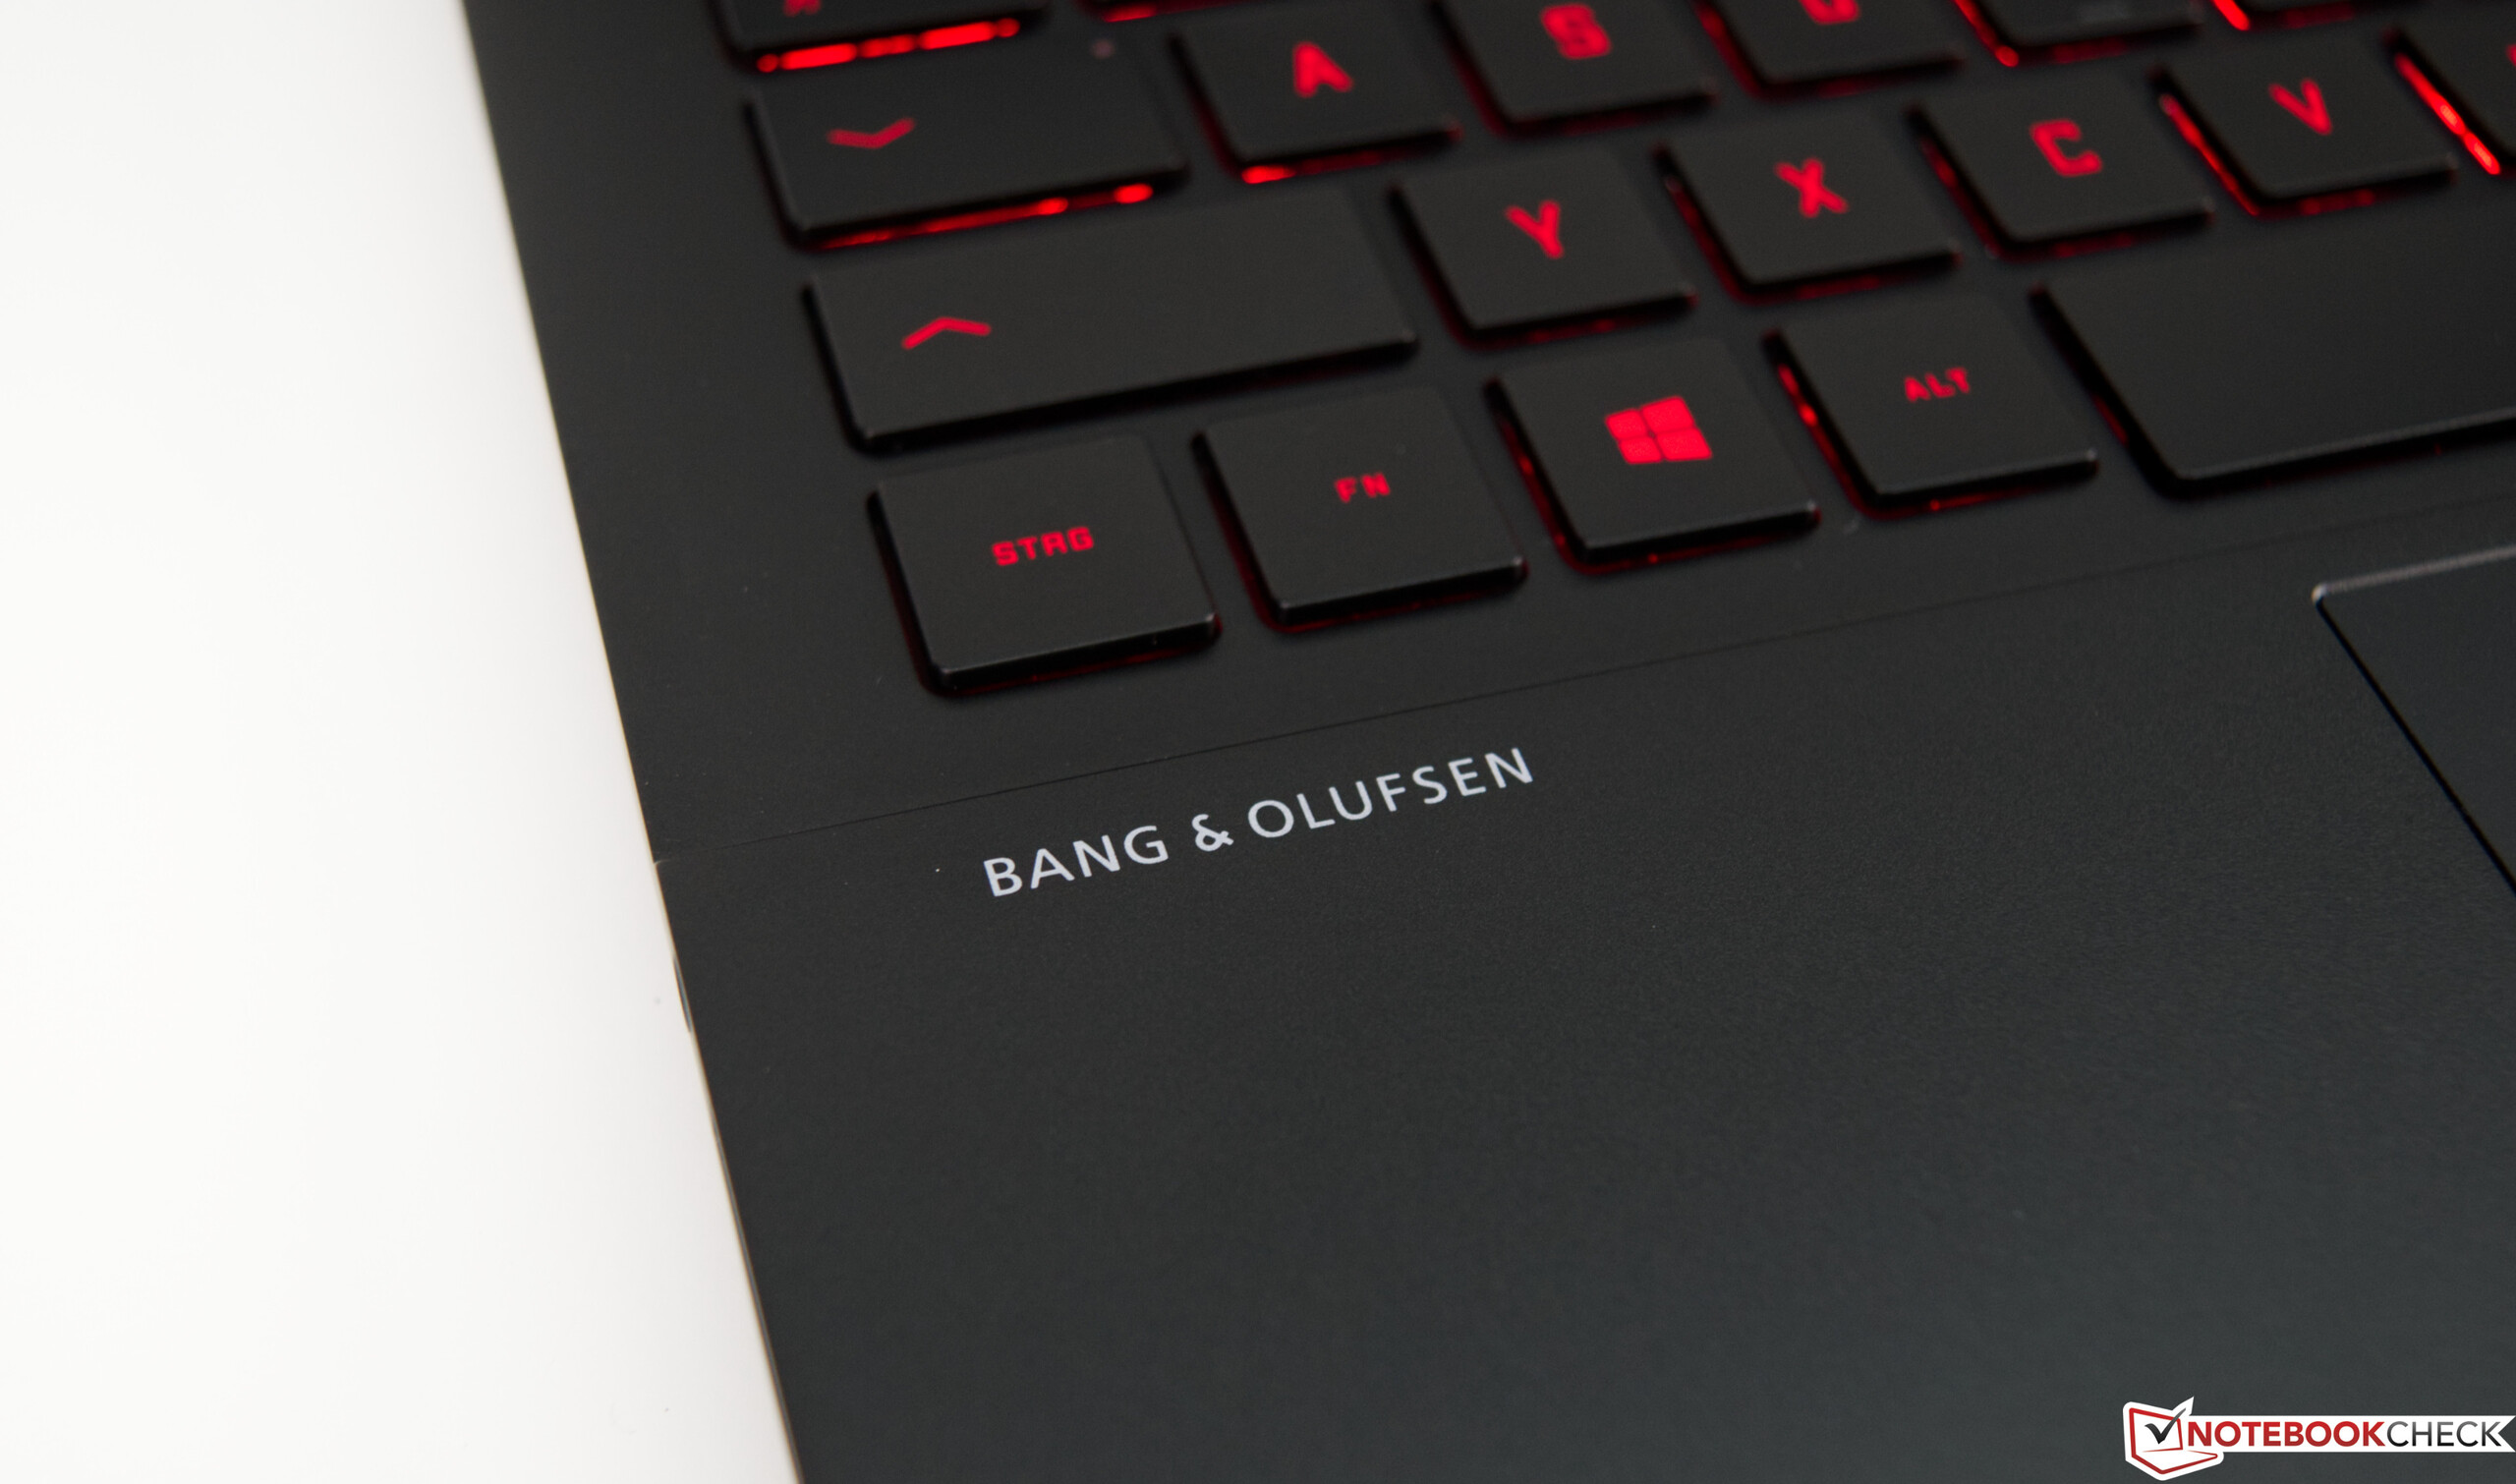
Speakers
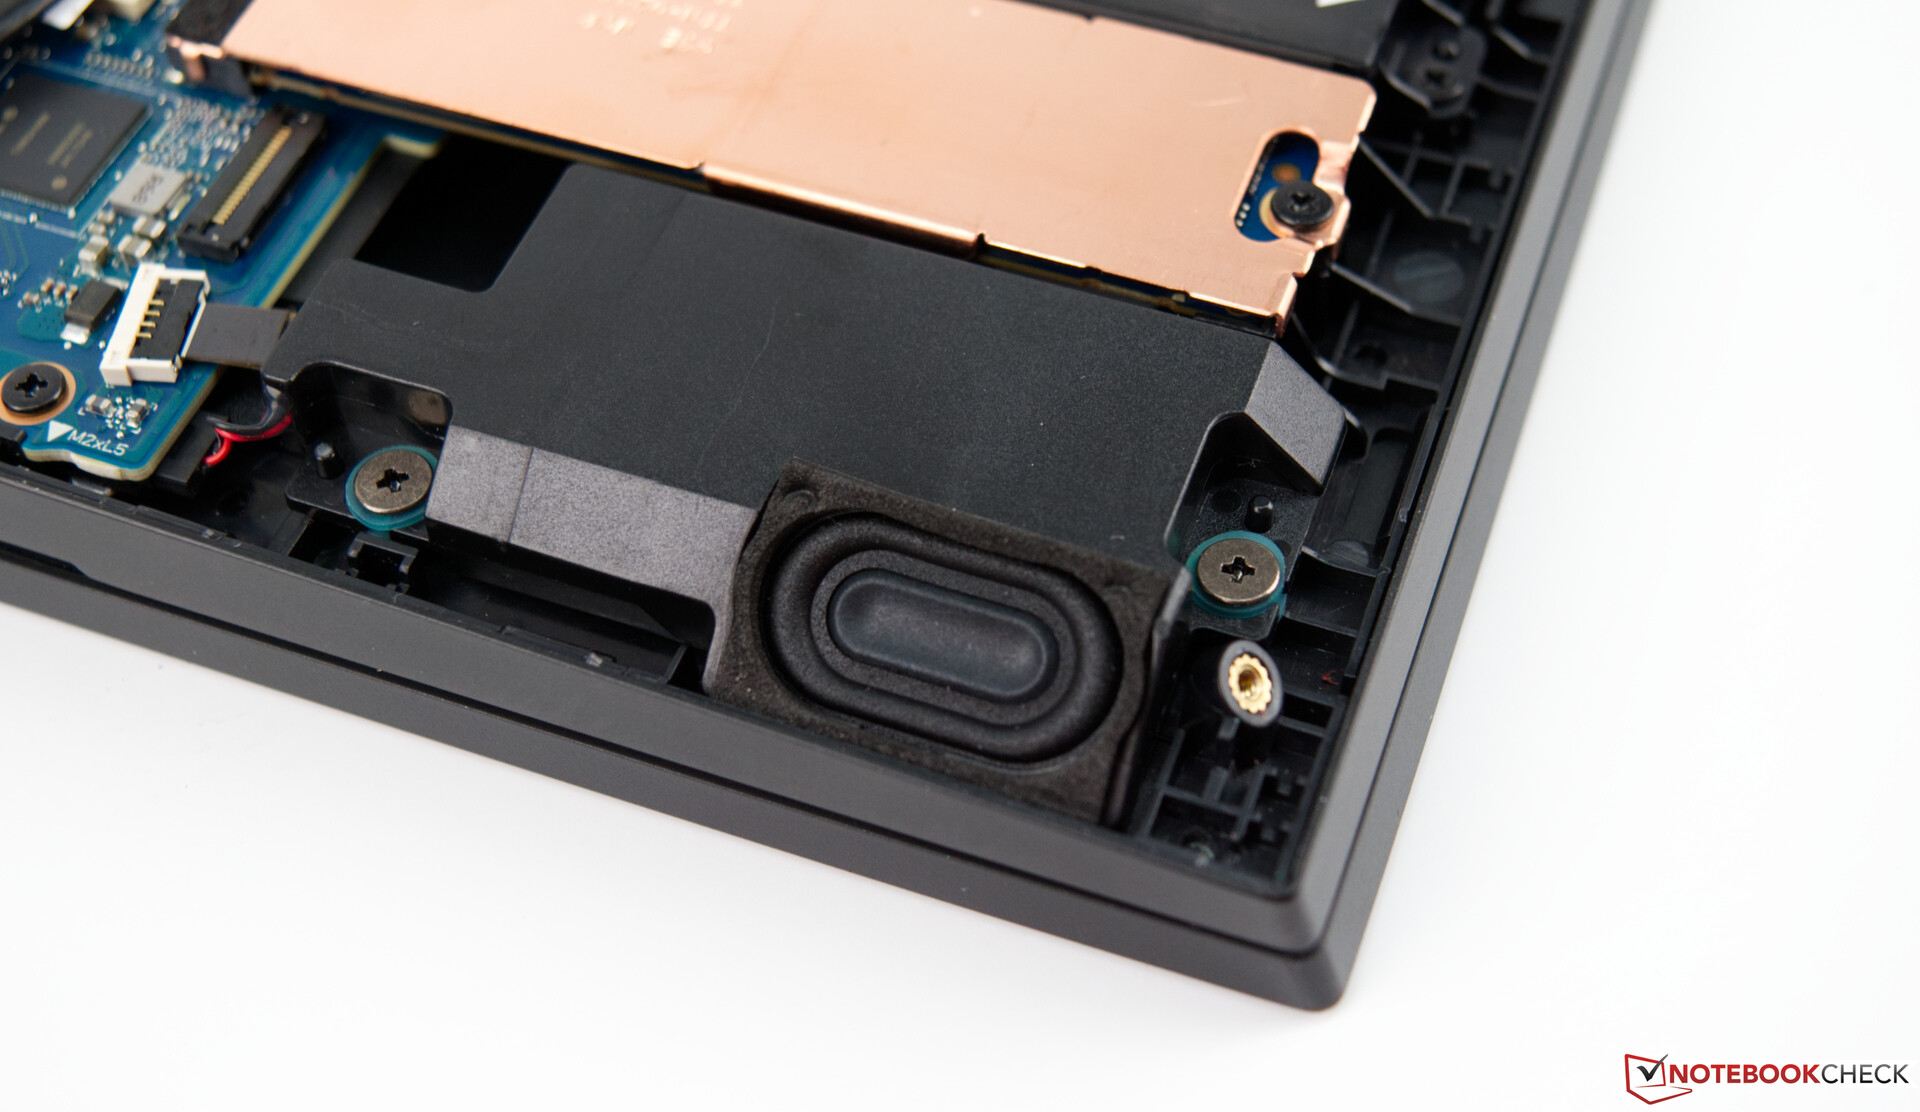
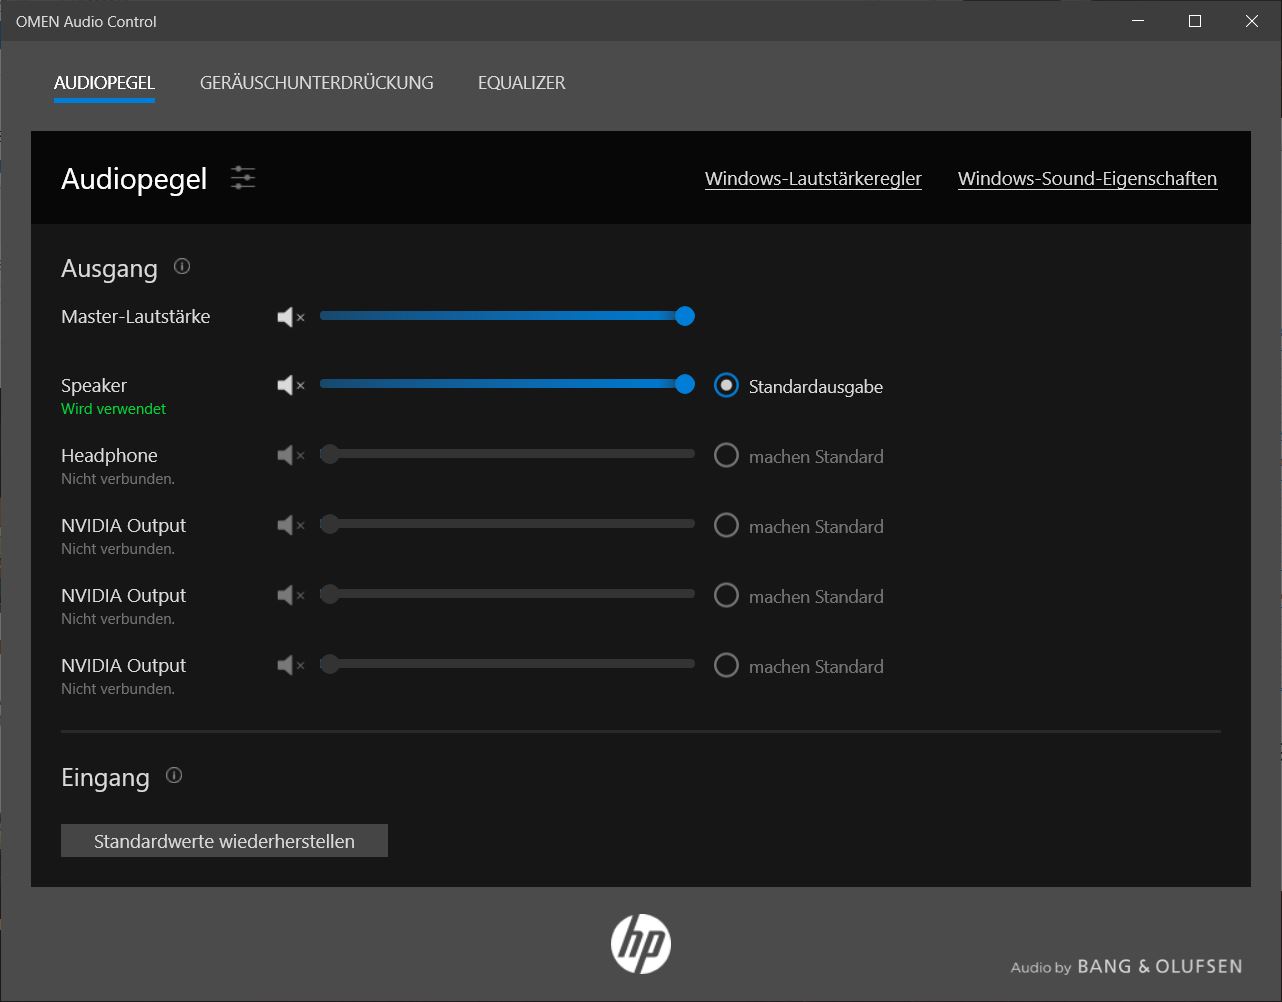
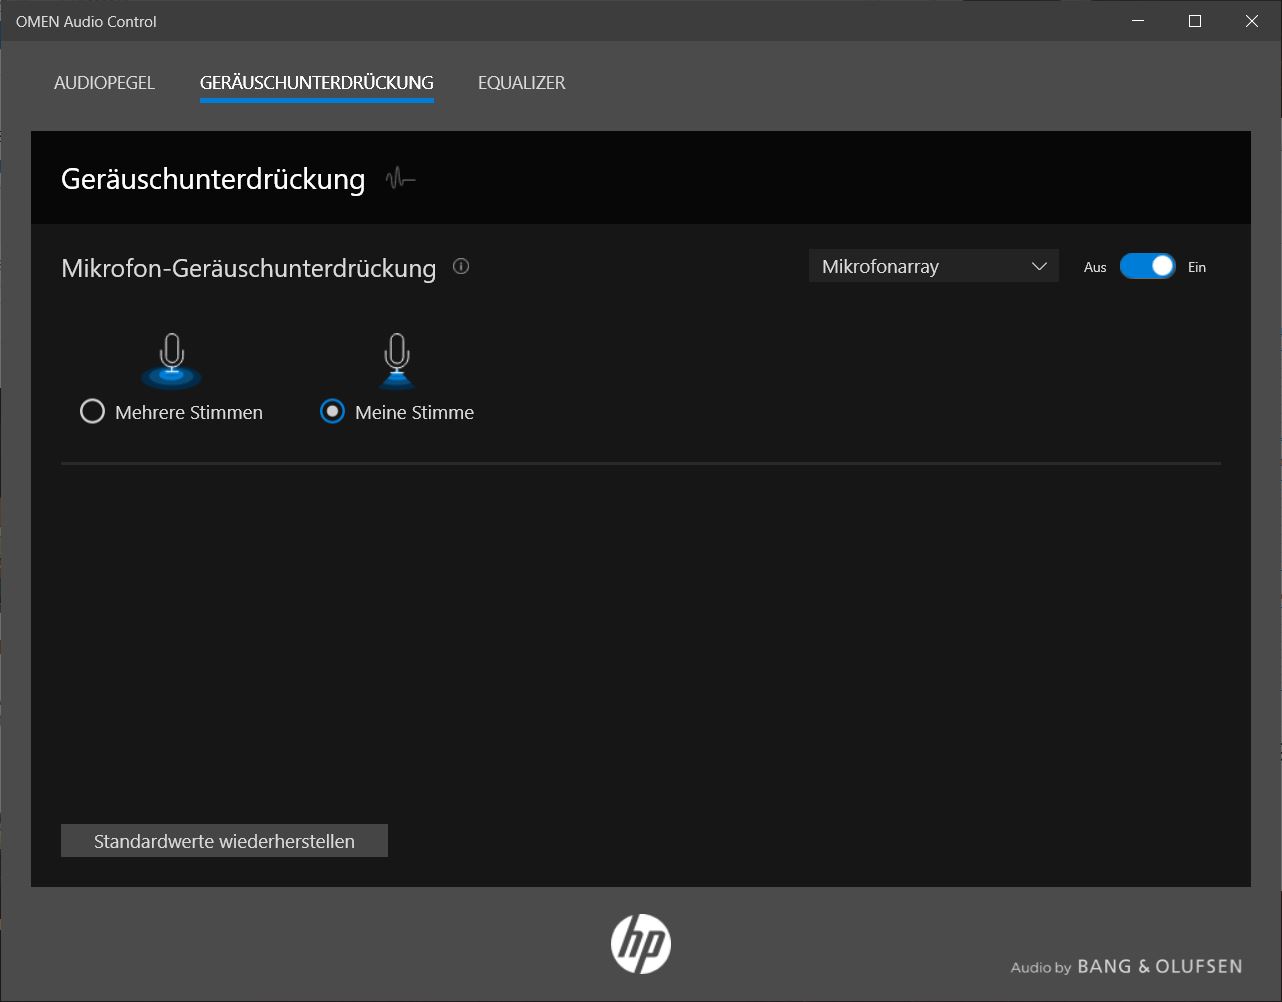
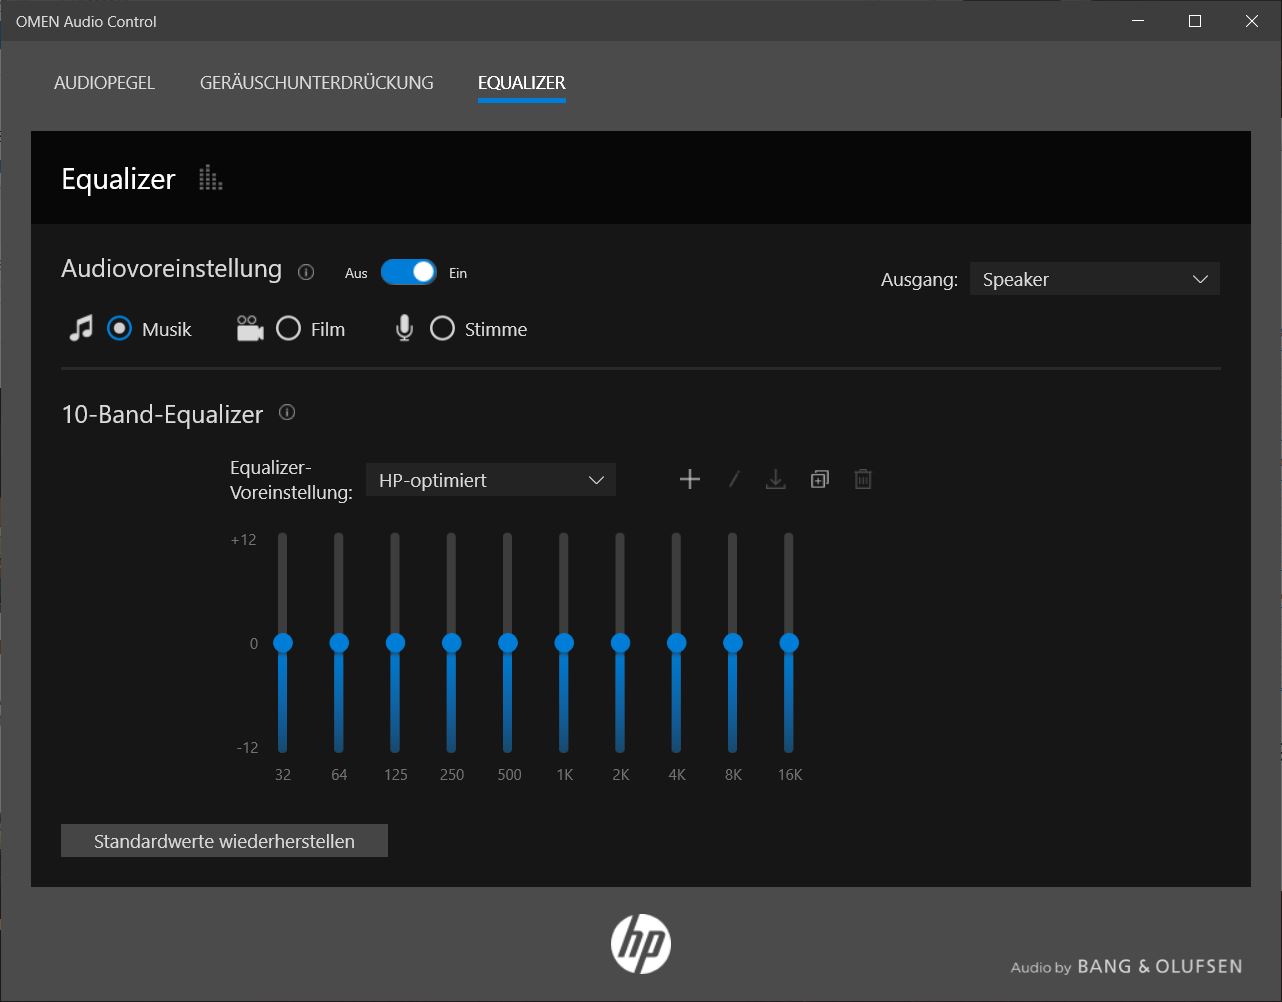
The Bang & Olufsen sound system is located under the palm rests and needs to be reflected off the table. Consequently, using the laptop on soft surfaces can lead to a considerably muffled sound quality. The two membranes lack bass due to their size. However, the bass isn't completely suppressed, so that it can be partially identified. Music and speech are very easy to understand. With the included Bang & Olufsen software, you choose between various sound-quality options.
There was no background noise or distortion at maximum volume. However, we recommend the use of a headset for a perfect sound experience. In addition, the 3.5 mm audio jack worked without any issues in our device.
HP Omen 15-ek0456ng audio analysis
(-) | not very loud speakers (58.1 dB)
Bass 100 - 315 Hz
(-) | nearly no bass - on average 17.3% lower than median
(±) | linearity of bass is average (13% delta to prev. frequency)
Mids 400 - 2000 Hz
(+) | balanced mids - only 3.4% away from median
(±) | linearity of mids is average (9.7% delta to prev. frequency)
Highs 2 - 16 kHz
(+) | balanced highs - only 3.2% away from median
(+) | highs are linear (5.4% delta to prev. frequency)
Overall 100 - 16.000 Hz
(±) | linearity of overall sound is average (22% difference to median)
Compared to same class
» 79% of all tested devices in this class were better, 6% similar, 15% worse
» The best had a delta of 6%, average was 18%, worst was 132%
Compared to all devices tested
» 64% of all tested devices were better, 6% similar, 30% worse
» The best had a delta of 4%, average was 23%, worst was 134%
Asus ROG Zephyrus G15 GA502IU-ES76 audio analysis
(±) | speaker loudness is average but good (81 dB)
Bass 100 - 315 Hz
(±) | reduced bass - on average 5.9% lower than median
(±) | linearity of bass is average (11.4% delta to prev. frequency)
Mids 400 - 2000 Hz
(+) | balanced mids - only 2.2% away from median
(+) | mids are linear (4% delta to prev. frequency)
Highs 2 - 16 kHz
(±) | higher highs - on average 6.5% higher than median
(+) | highs are linear (6.5% delta to prev. frequency)
Overall 100 - 16.000 Hz
(+) | overall sound is linear (13.1% difference to median)
Compared to same class
» 18% of all tested devices in this class were better, 4% similar, 78% worse
» The best had a delta of 6%, average was 18%, worst was 132%
Compared to all devices tested
» 13% of all tested devices were better, 3% similar, 84% worse
» The best had a delta of 4%, average was 23%, worst was 134%
Energy management
Energy consumption
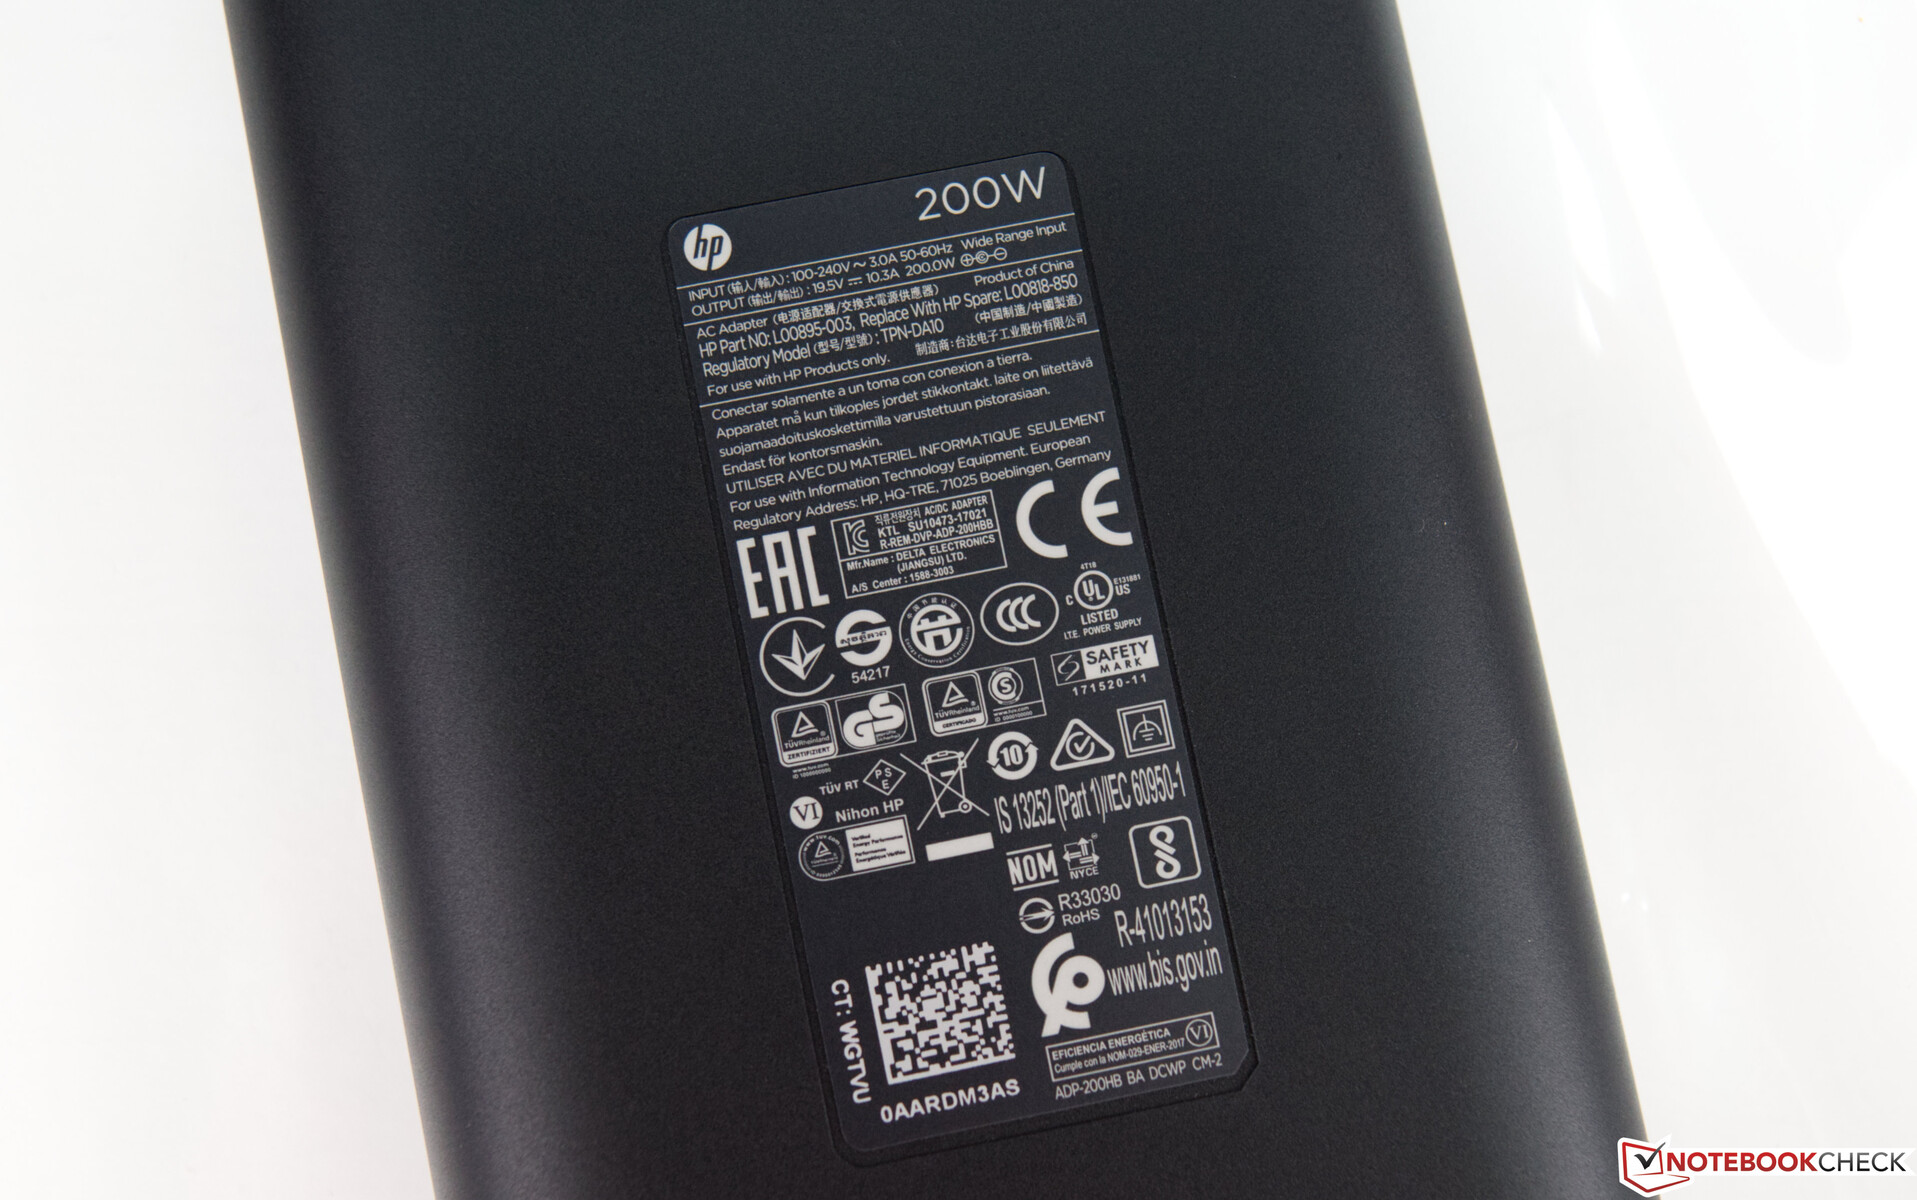
The power consumption of the HP Omen 15 is worse compared to the competition. The device simply requires too much energy in idle usage and is the clear loser. But the laptop is also power-hungry under load and needs up to 194 watts in peaks. When playing games, the Omen 15 needs 142 watts on average, which is a bit less, but compared to the competition with the same CPU and GPU configuration, it gets the short end of the stick. The compact power adapter has an output of up to 200 watts and can prevent the battery from discharging during the stress test.
| Off / Standby | |
| Idle | |
| Load |
|
Key:
min: | |
| HP Omen 15-ek0456ng i5-10300H, GeForce GTX 1660 Ti Mobile, Toshiba XG6 KXG60ZNV512G, IPS, 1920x1080, 15.6" | Asus ROG Zephyrus G15 GA502IU-ES76 R7 4800HS, GeForce GTX 1660 Ti Max-Q, Intel SSD 660p 1TB SSDPEKNW010T8, IPS, 1920x1080, 15.6" | Schenker XMG Core 15 GK5CP6V i7-9750H, GeForce GTX 1660 Ti Mobile, Samsung SSD 970 EVO Plus 500GB, IPS, 1920x1080, 15.6" | Nexoc GH5 515IG i5-10300H, GeForce GTX 1650 Mobile, Samsung SSD 860 Evo 512GB, IPS, 1920x1080, 15.6" | MSI Bravo 15 A4DCR R7 4800H, Radeon RX 5300M, Samsung PM981a MZVLB1T0HBLR, IPS-Level, 1920x1080, 15.6" | HP Omen 15-dc1020ng i5-9300H, GeForce GTX 1650 Mobile, WDC PC SN720 SDAQNTW-512G, IPS, 1920x1080, 15.6" | Average NVIDIA GeForce GTX 1660 Ti Mobile | Average of class Gaming | |
|---|---|---|---|---|---|---|---|---|
| Power Consumption | 38% | 7% | 33% | 1% | 35% | -22% | -35% | |
| Idle Minimum * (Watt) | 9.2 | 5.1 45% | 9 2% | 3 67% | 11 -20% | 4.04 56% | 12.4 ? -35% | 13 ? -41% |
| Idle Average * (Watt) | 14.6 | 8.4 42% | 12 18% | 7 52% | 14 4% | 7.2 51% | 18 ? -23% | 19 ? -30% |
| Idle Maximum * (Watt) | 18.1 | 9.1 50% | 18 1% | 16 12% | 25 -38% | 11.4 37% | 25.3 ? -40% | 24.6 ? -36% |
| Load Average * (Watt) | 84 | 55.1 34% | 86 -2% | 85 -1% | 72 14% | 80.8 4% | 93.5 ? -11% | 110.7 ? -32% |
| Witcher 3 ultra * (Watt) | 142 | 97.5 31% | 126 11% | 86 39% | 100 30% | 93.6 34% | ||
| Load Maximum * (Watt) | 194 | 140.2 28% | 173 11% | 134 31% | 163 16% | 144.5 26% | 191.9 ? 1% | 259 ? -34% |
* ... smaller is better
Battery life
The HP Omen 15 is equipped with a large 71 Wh battery, which the device also needs, because the high energy demand in idle usage and under medium load must be compensated for. The comparison shows that HP's Omen 15 can score points with longer battery life despite its poor performance in terms of energy consumption. However, the advantage in the WLAN test is sometimes very small. Nevertheless, the Omen 15 could be used for a good 6.5 hours before the battery had to be recharged. By the way, the large battery's charging time is pleasingly short at two hours.
If you want to use the device for gaming on the go, you should know that both the CPU and GPU performance are somewhat throttled on battery power.
| HP Omen 15-ek0456ng i5-10300H, GeForce GTX 1660 Ti Mobile, 70.91 Wh | Asus ROG Zephyrus G15 GA502IU-ES76 R7 4800HS, GeForce GTX 1660 Ti Max-Q, 76 Wh | Schenker XMG Core 15 GK5CP6V i7-9750H, GeForce GTX 1660 Ti Mobile, 46 Wh | Nexoc GH5 515IG i5-10300H, GeForce GTX 1650 Mobile, 48.96 Wh | MSI Bravo 15 A4DCR R7 4800H, Radeon RX 5300M, 51 Wh | HP Omen 15-dc1020ng i5-9300H, GeForce GTX 1650 Mobile, 52.5 Wh | Average of class Gaming | |
|---|---|---|---|---|---|---|---|
| Battery runtime | -15% | -51% | -1% | -39% | 8% | -1% | |
| Reader / Idle (h) | 11.7 | 7.1 -39% | 6.1 -48% | 14.9 27% | 7 -40% | 15.9 36% | 8.27 ? -29% |
| H.264 (h) | 6.4 | 6.5 2% | 8 25% | 8.32 ? 30% | |||
| WiFi v1.3 (h) | 6.5 | 5.3 -18% | 3.6 -45% | 6.4 -2% | 4.5 -31% | 6.4 -2% | 7.11 ? 9% |
| Load (h) | 1.7 | 1.9 12% | 0.7 -59% | 1.2 -29% | 0.9 -47% | 1.2 -29% | 1.502 ? -12% |
| Witcher 3 ultra (h) | 1 |


Pros
Cons
Verdict - Slight deductions in style points
The HP Omen 15 is a good gaming laptop that doesn't put a huge dent in your wallet. And nonetheless, the device offers great performance with which you can play even the most modern titles. Our sample device costs nearly 1,250 Euros (~$1,480) at the time of testing. The Core i5-10300H offers only four cores compared to the competition, but it can still keep up well when it comes to pure gaming performance. In a direct comparison of CPU performance, the Core i5-10300H has to give way to the hexa-core and octa-core processors. Together with the GeForce GTX 1660 Ti, gaming with the laptop is really fun, which is also due to the great display. At about 300 nits, it's not extremely bright, but it's sufficient for the intended use. In addition, the almost very good color-space deviations provide a good rating in the end. On the other hand, you can certainly criticize the built-in storage device, because 512 GB is not the best nowadays. Fortunately, a second M.2 module can be used to expand the storage space. This is also done quickly because the bottom cover can be removed without much effort.
The HP Omen 15 is a good gaming laptop with a good port configuration and good battery life.
When it comes to volume, however, users have to live with permanent ventilation, which is always audible even in idle usage. Unfortunately, you can also tell by looking at the case that this is a budget device. However, we want to praise the multiple connections once again; the inclusion of a Thunderbolt 3 port results in the Omen 15 also being future-proof. This applies to the latest Wi-Fi 6 standard as well, which couldn't deliver its full performance in the test, though.
HP Omen 15-ek0456ng
- 09/18/2020 v7 (old)
Sebastian Bade
Price comparison

