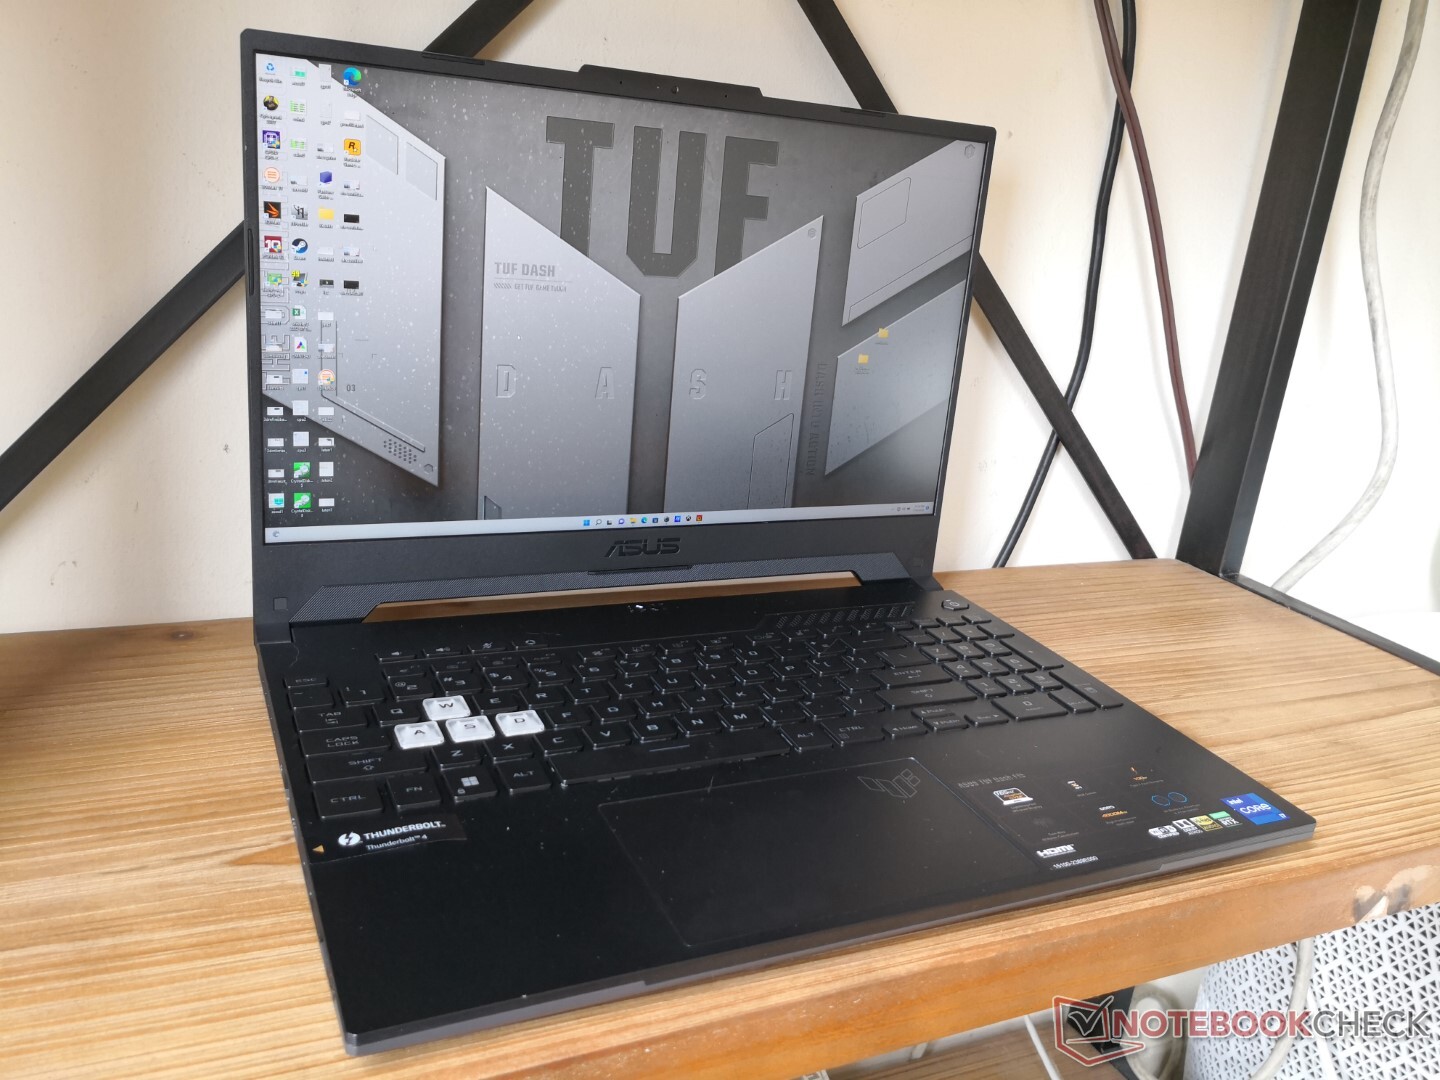
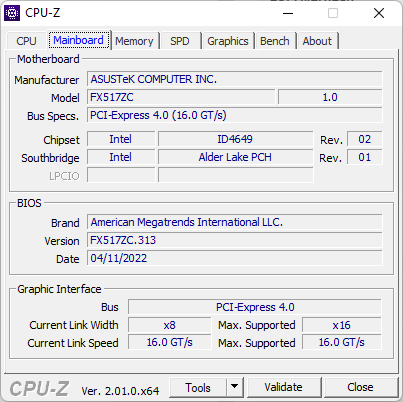
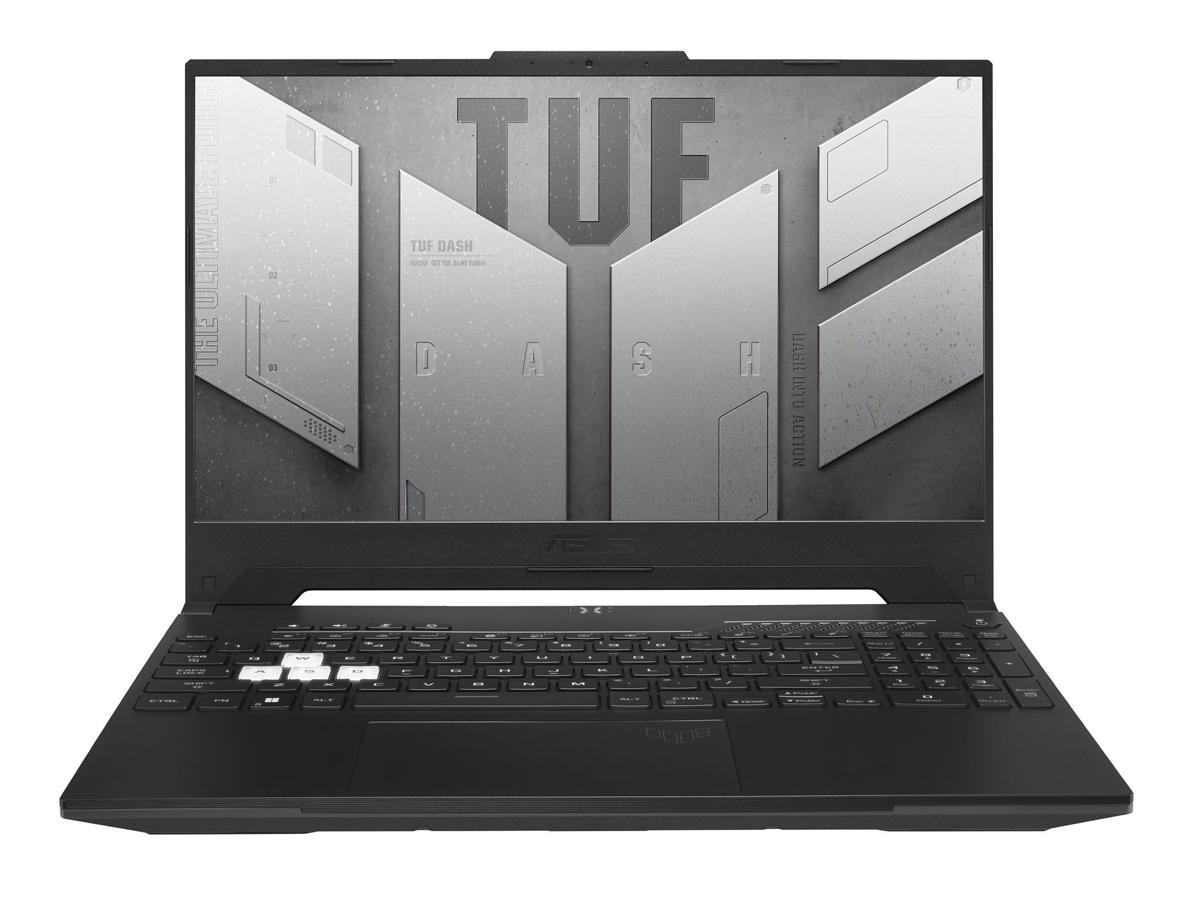
Asus TUF Dash F15 FX517ZC laptop review: 1440p, 165 Hz, And Full P3 Colors For Under $1000

Unlike the flagship Asus ROG series, the Asus TUF series is home to midrange gaming laptops that typically omit luxurious features like RGB lights or Asus Keystone in favor of more affordable prices. The TUF Dash F15 FX517 series in particular can be configured with a budget GeForce RTX 3050 option (FX517ZC) all the way to the RTX 3070 (FX517ZR). This review focuses on the RTX 3050 option.
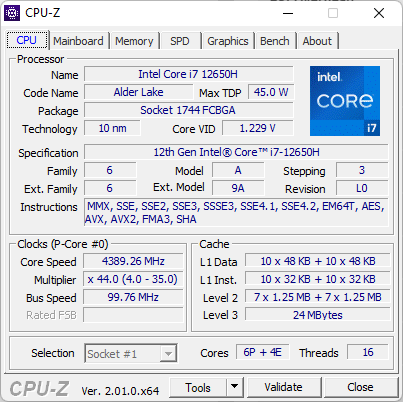
We recommend checking out our existing review on the RTX 3070 configuration as it shares the same 1440p 165 Hz display, Core i7-12650H CPU, and essentially the same physical features as the RTX 3050 configuration. Competitors in this space include other affordable gaming laptops retailing for $1000 USD or less like the Dell G15 5510, MSI Bravo 15, Lenovo IdeaPad Gaming 3 15, or the Gigabyte G5.
More Asus reviews:
Potential Competitors in Comparison
Rating | Date | Model | Weight | Height | Size | Resolution | Price |
|---|---|---|---|---|---|---|---|
| 84.9 % v7 (old) | 08 / 2022 | Asus TUF Dash F15 FX517ZC i7-12650H, GeForce RTX 3050 4GB Laptop GPU | 1.9 kg | 20.7 mm | 15.60" | 2560x1440 | |
| 85.8 % v7 (old) | 07 / 2022 | Asus TUF Dash F15 FX517ZR i7-12650H, GeForce RTX 3070 Laptop GPU | 2 kg | 20.7 mm | 15.60" | 2560x1440 | |
| 81 % v7 (old) | 06 / 2022 | Dell G15 5510 i5-10500H, GeForce RTX 3050 4GB Laptop GPU | 2.5 kg | 23 mm | 15.60" | 1920x1080 | |
| 78.2 % v7 (old) | 04 / 2022 | MSI Bravo 15 B5DD-010US R5 5600H, Radeon RX 5500M | 2.3 kg | 24.95 mm | 15.60" | 1920x1080 | |
| 79.7 % v7 (old) | 03 / 2022 | Lenovo Ideapad Gaming 3 15IHU-82K1002RGE i5-11300H, GeForce RTX 3050 Ti Laptop GPU | 2 kg | 24.2 mm | 15.60" | 1920x1080 | |
| 81.7 % v7 (old) | 11 / 2021 | Gigabyte G5 GD i5-11400H, GeForce RTX 3050 4GB Laptop GPU | 2.1 kg | 31.6 mm | 15.60" | 1920x1080 |
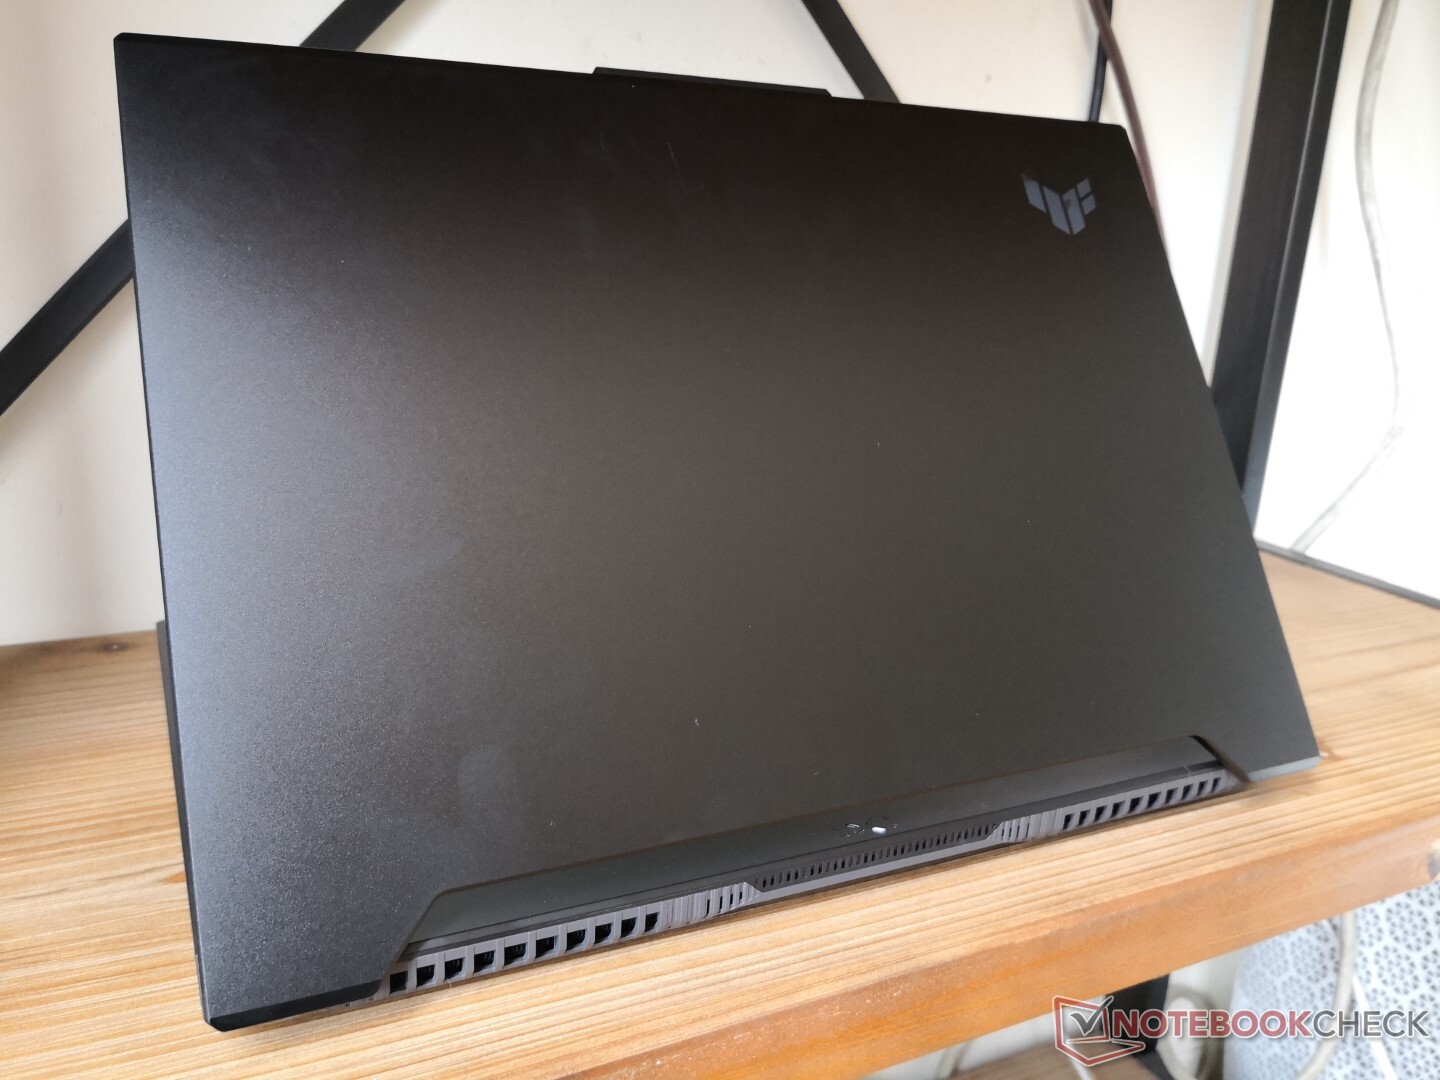
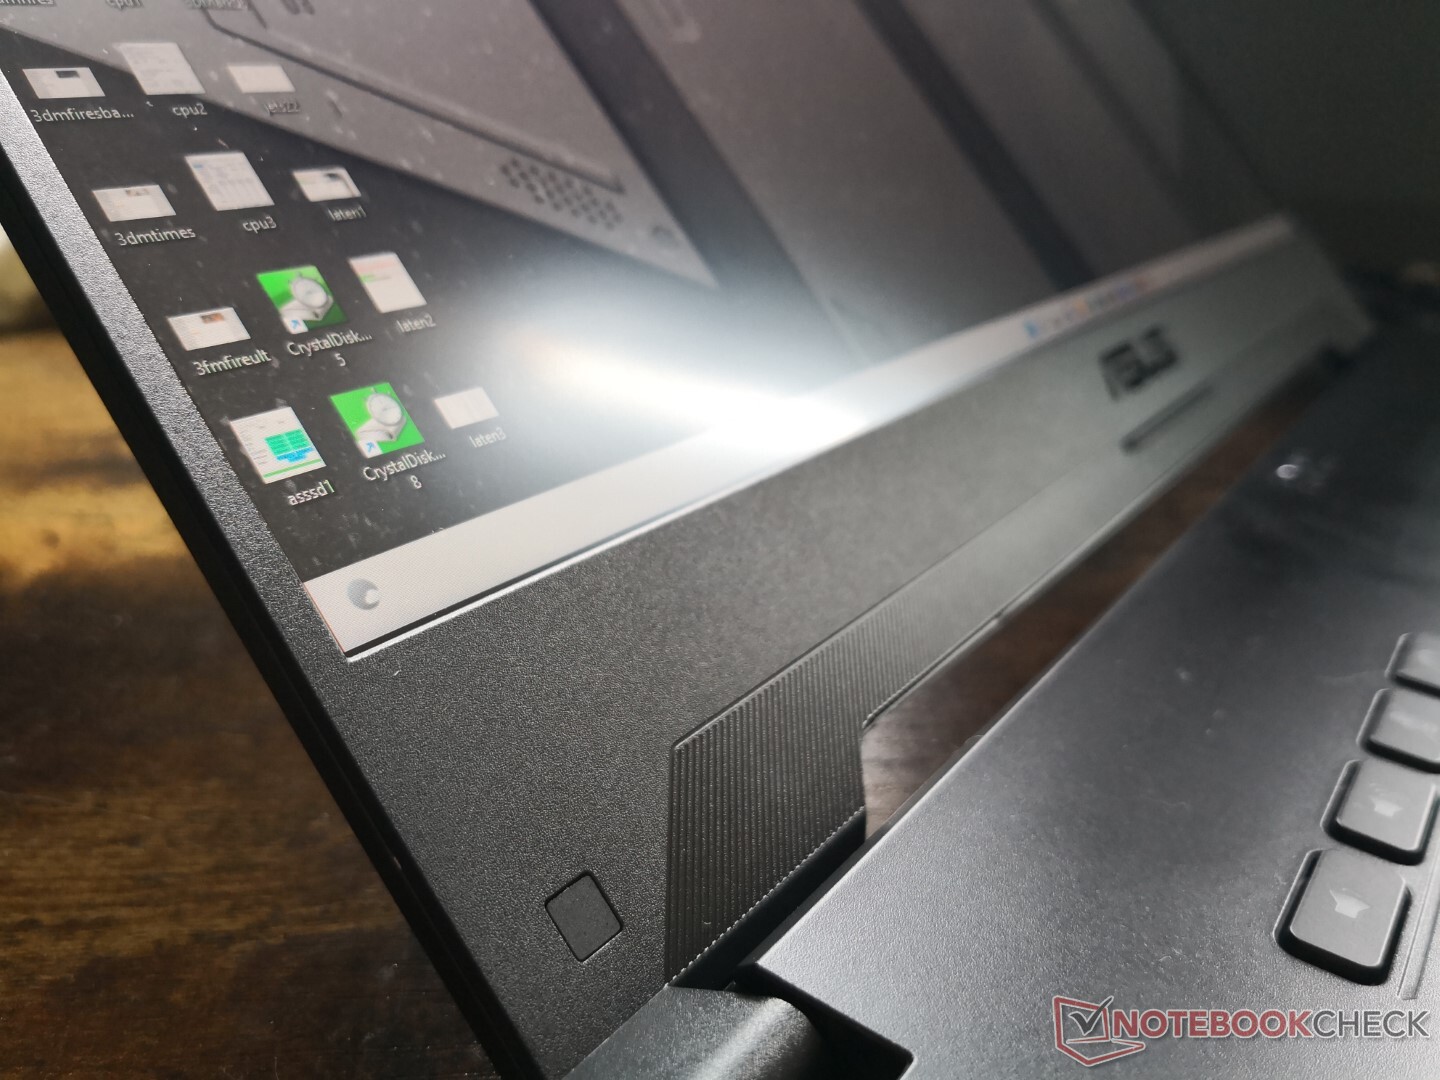
Case
Connectivity
It's important to note that while there are two USB-C ports, only the one closest to the front edge supports USB-C charging. Both are otherwise capable of DisplayPort-over-USB.
Communication
The model ships without Wi-Fi 6E support likely to save on costs. Performance is nonetheless sufficient and stable enough for the target audience of budget gamers.
| Networking | |
| iperf3 transmit AX12 | |
| Gigabyte G5 GD | |
| Lenovo Ideapad Gaming 3 15IHU-82K1002RGE | |
| MSI Bravo 15 B5DD-010US | |
| iperf3 receive AX12 | |
| Lenovo Ideapad Gaming 3 15IHU-82K1002RGE | |
| Gigabyte G5 GD | |
| MSI Bravo 15 B5DD-010US | |
| iperf3 receive AXE11000 | |
| Dell G15 5510 | |
| Asus TUF Dash F15 FX517ZR | |
| Asus TUF Dash F15 FX517ZC | |
| iperf3 transmit AXE11000 | |
| Asus TUF Dash F15 FX517ZR | |
| Asus TUF Dash F15 FX517ZC | |
Webcam
The integrated webcam is the standard 1 MP with no privacy shutter or IR features.


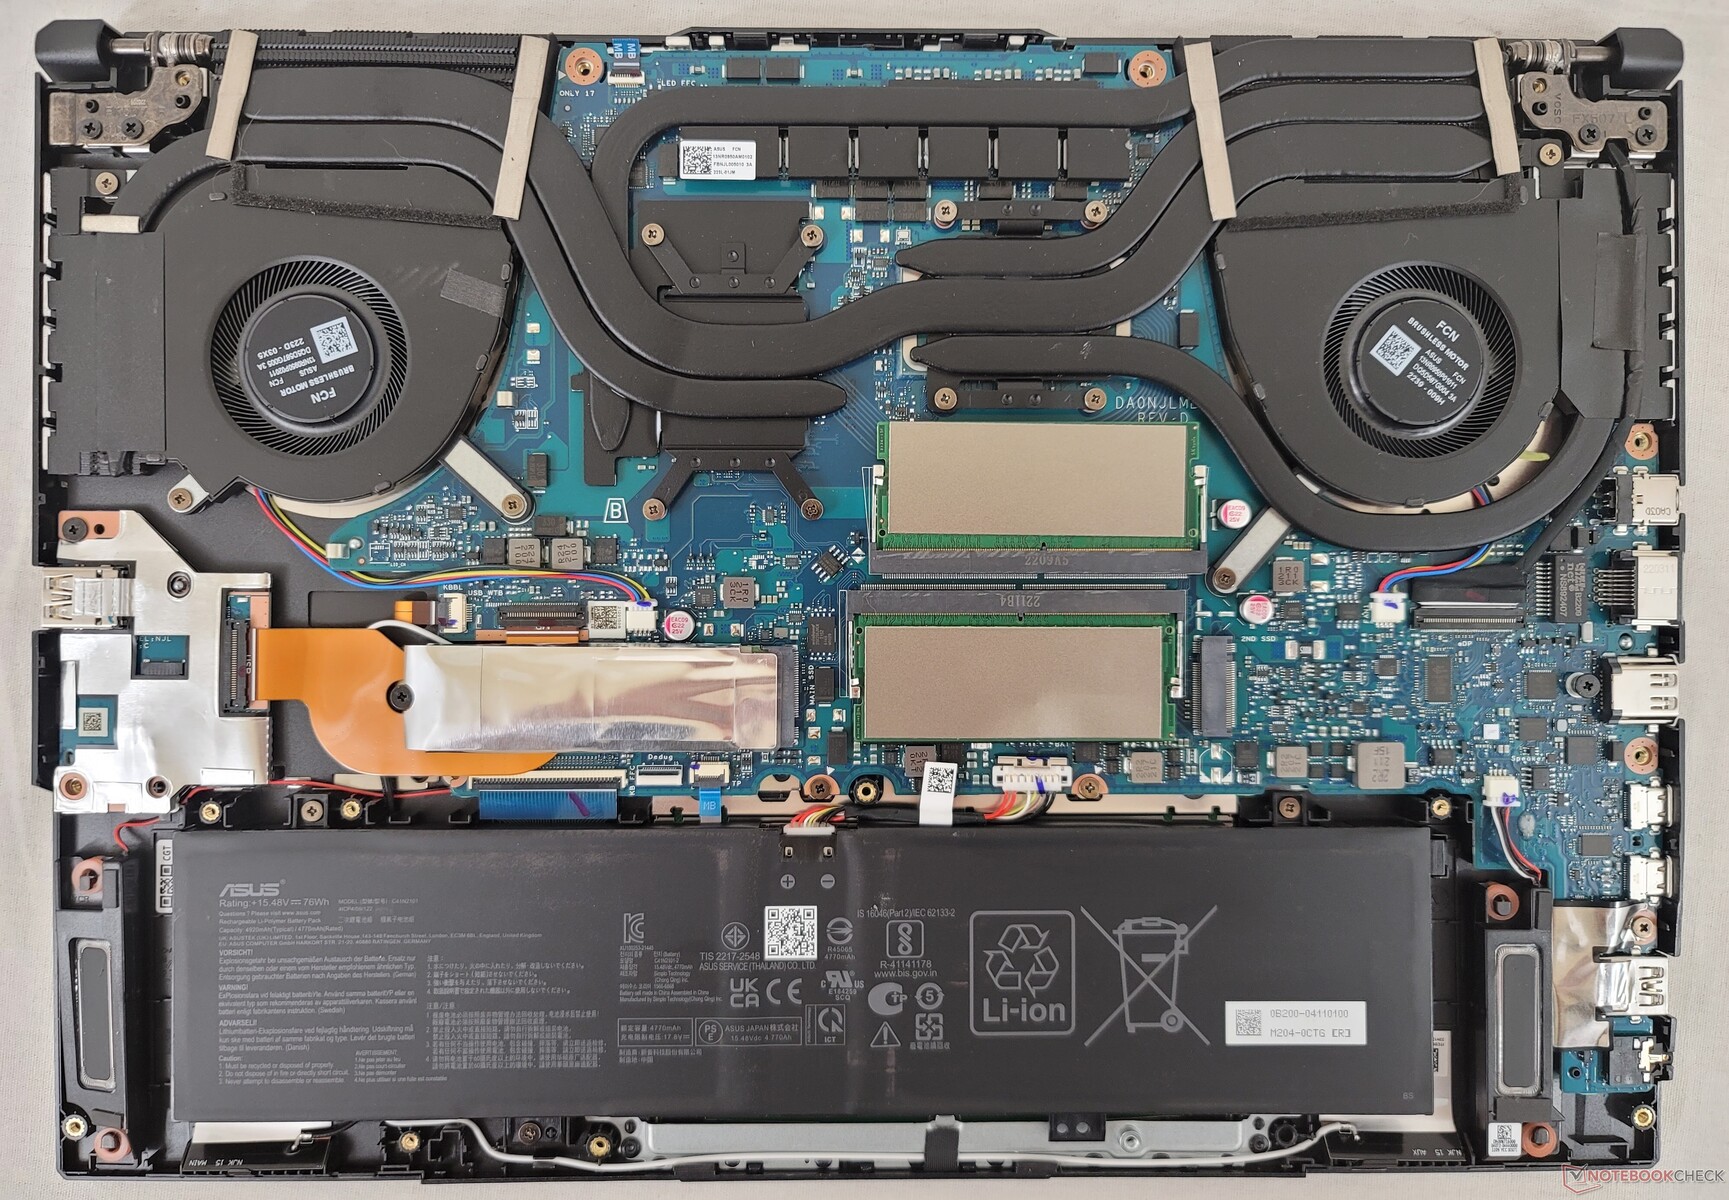
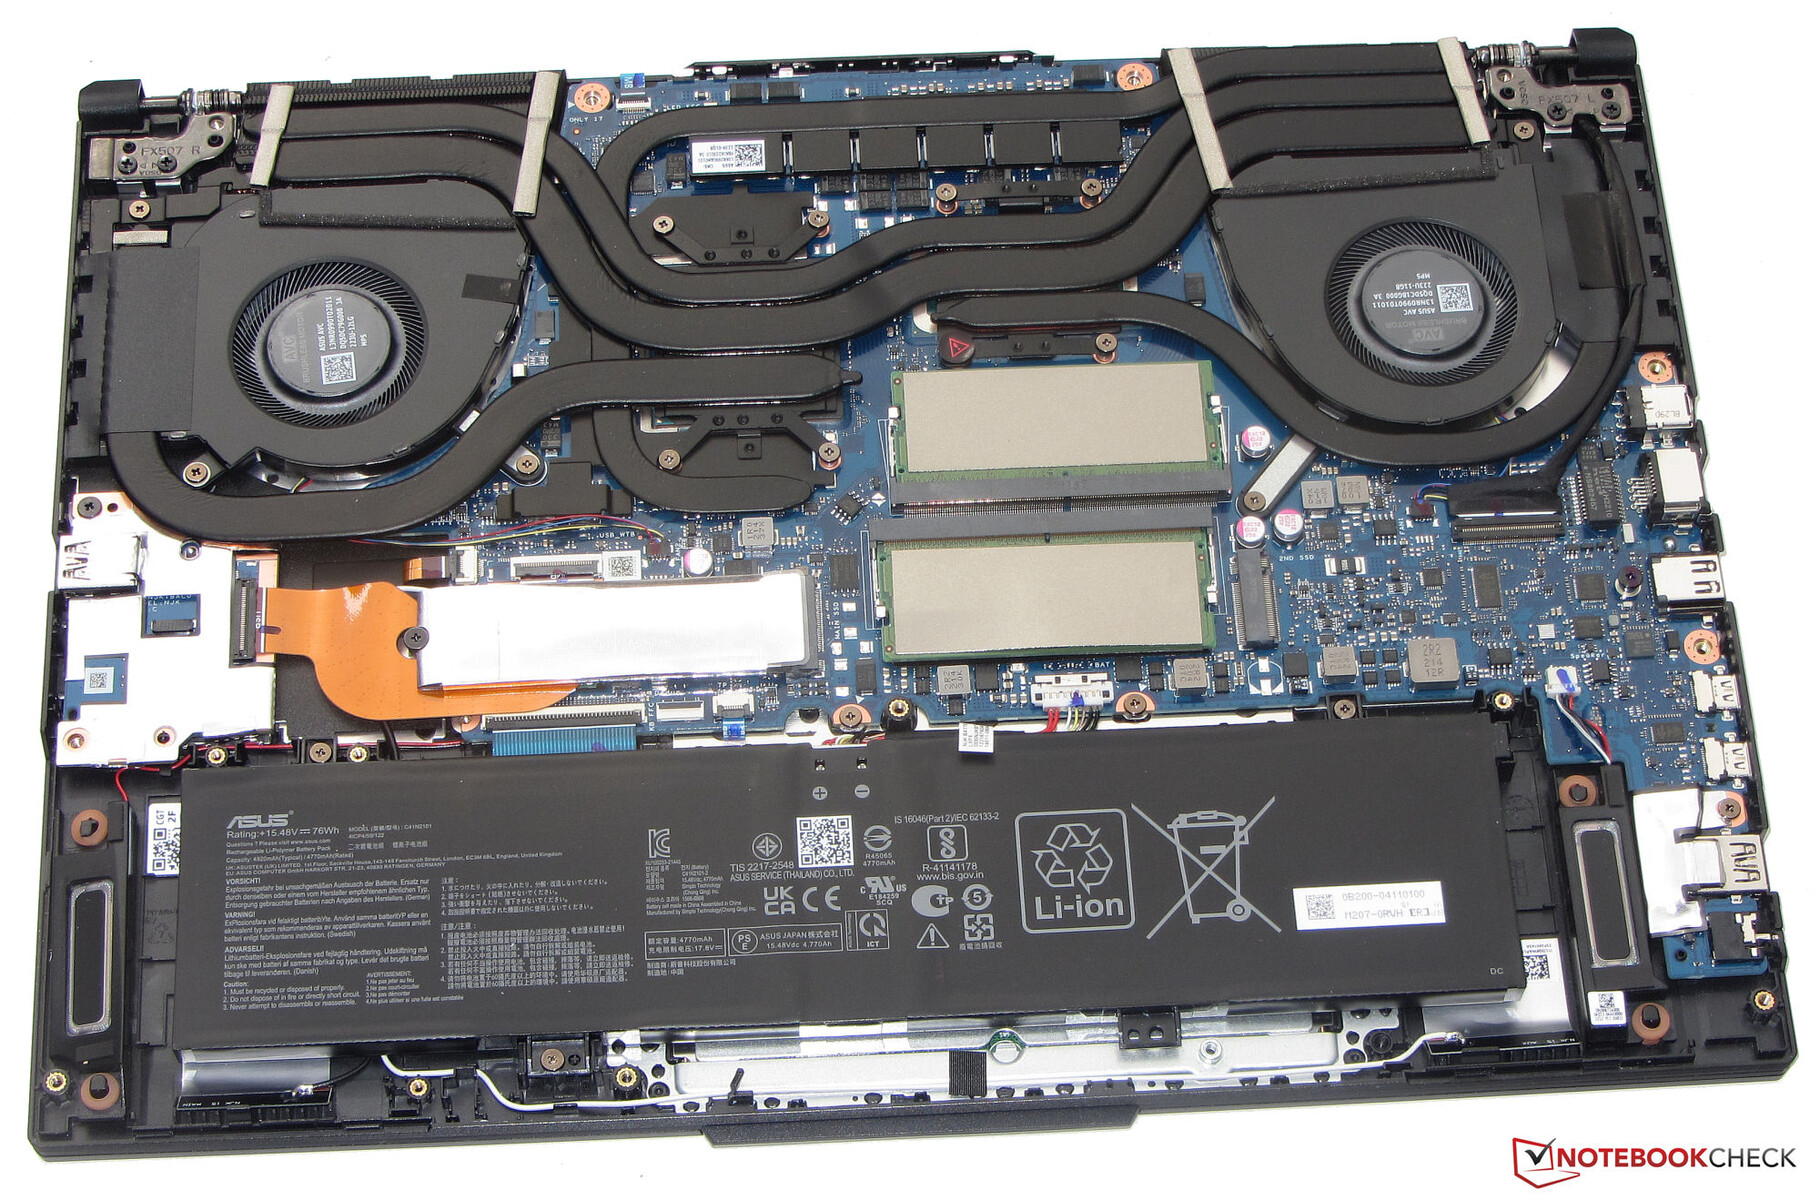
Maintenance
The bottom panel can be removed very easily with just a Philips screwdriver to reveal 2x M.2 storage bays, 2x SODIMM slots, and the WLAN module tucked underneath the primary M.2 SSD. When compared to the FX517ZR, our FX517ZC utilizes fewer copper heat pipes over the GPU as shown below for a slightly lighter weight.
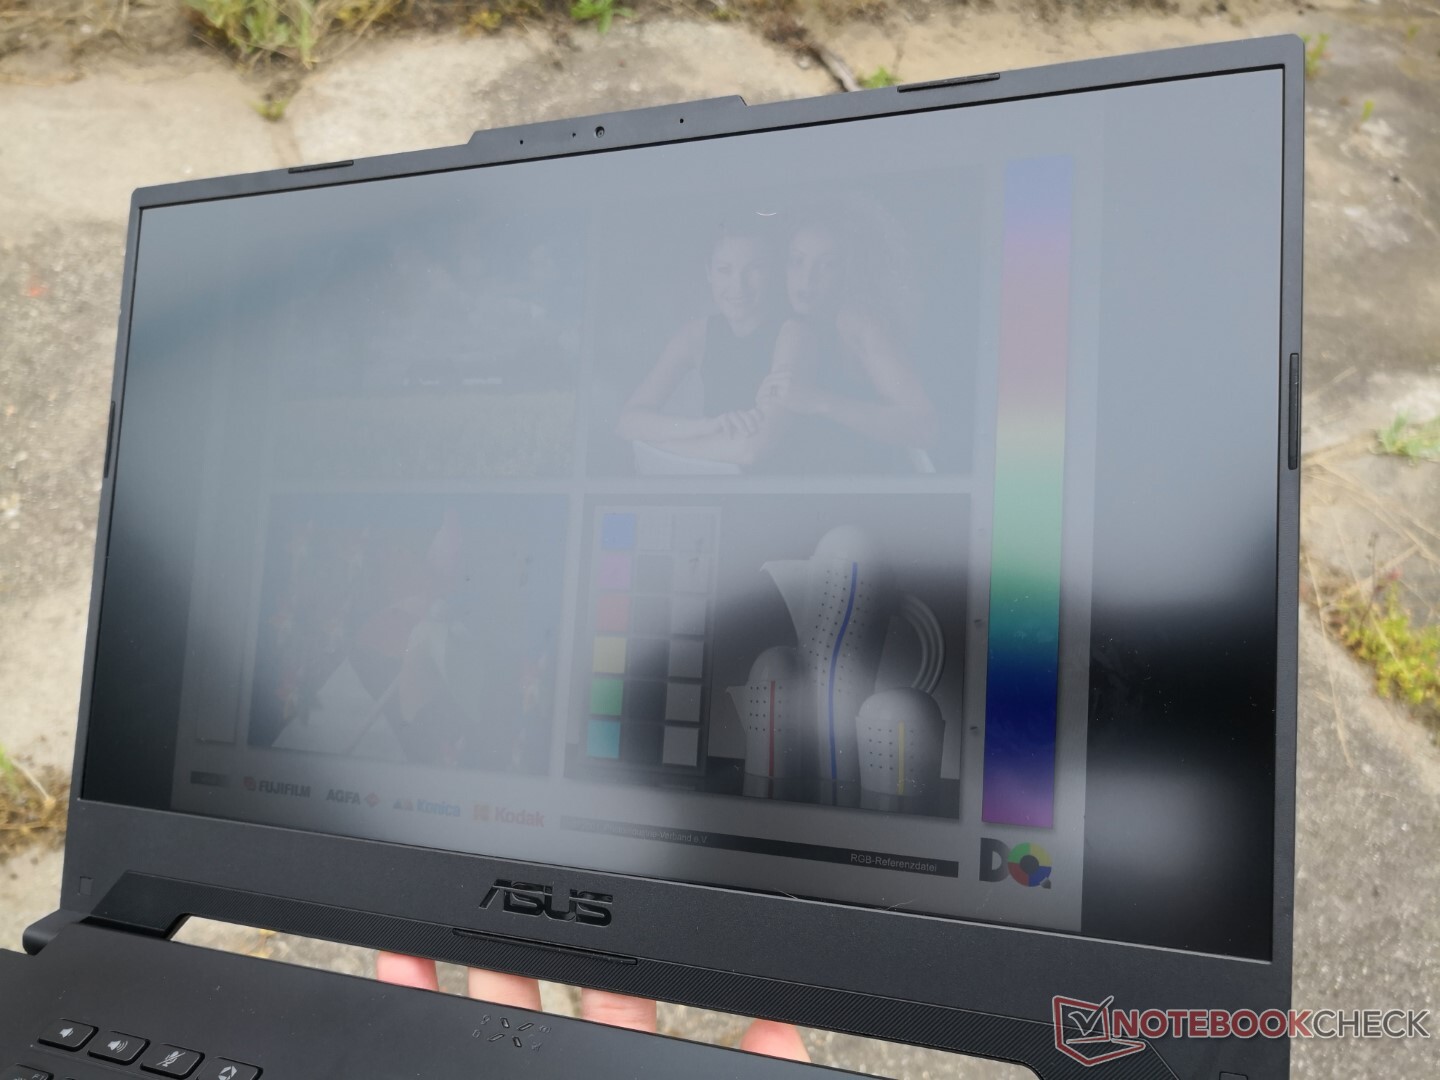
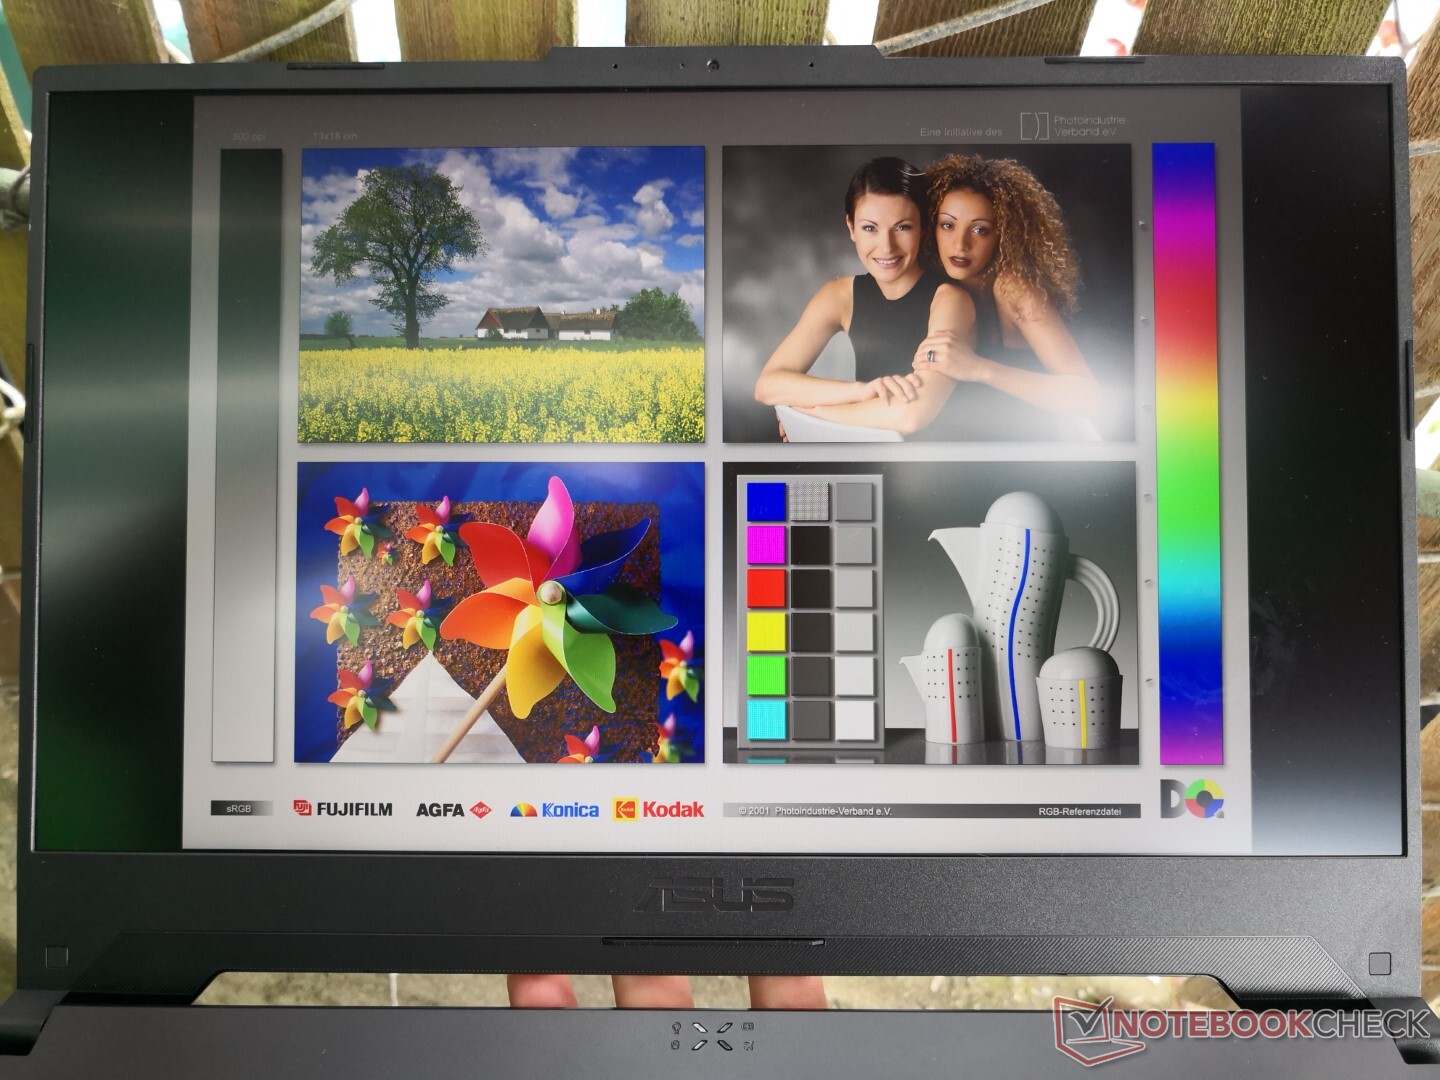
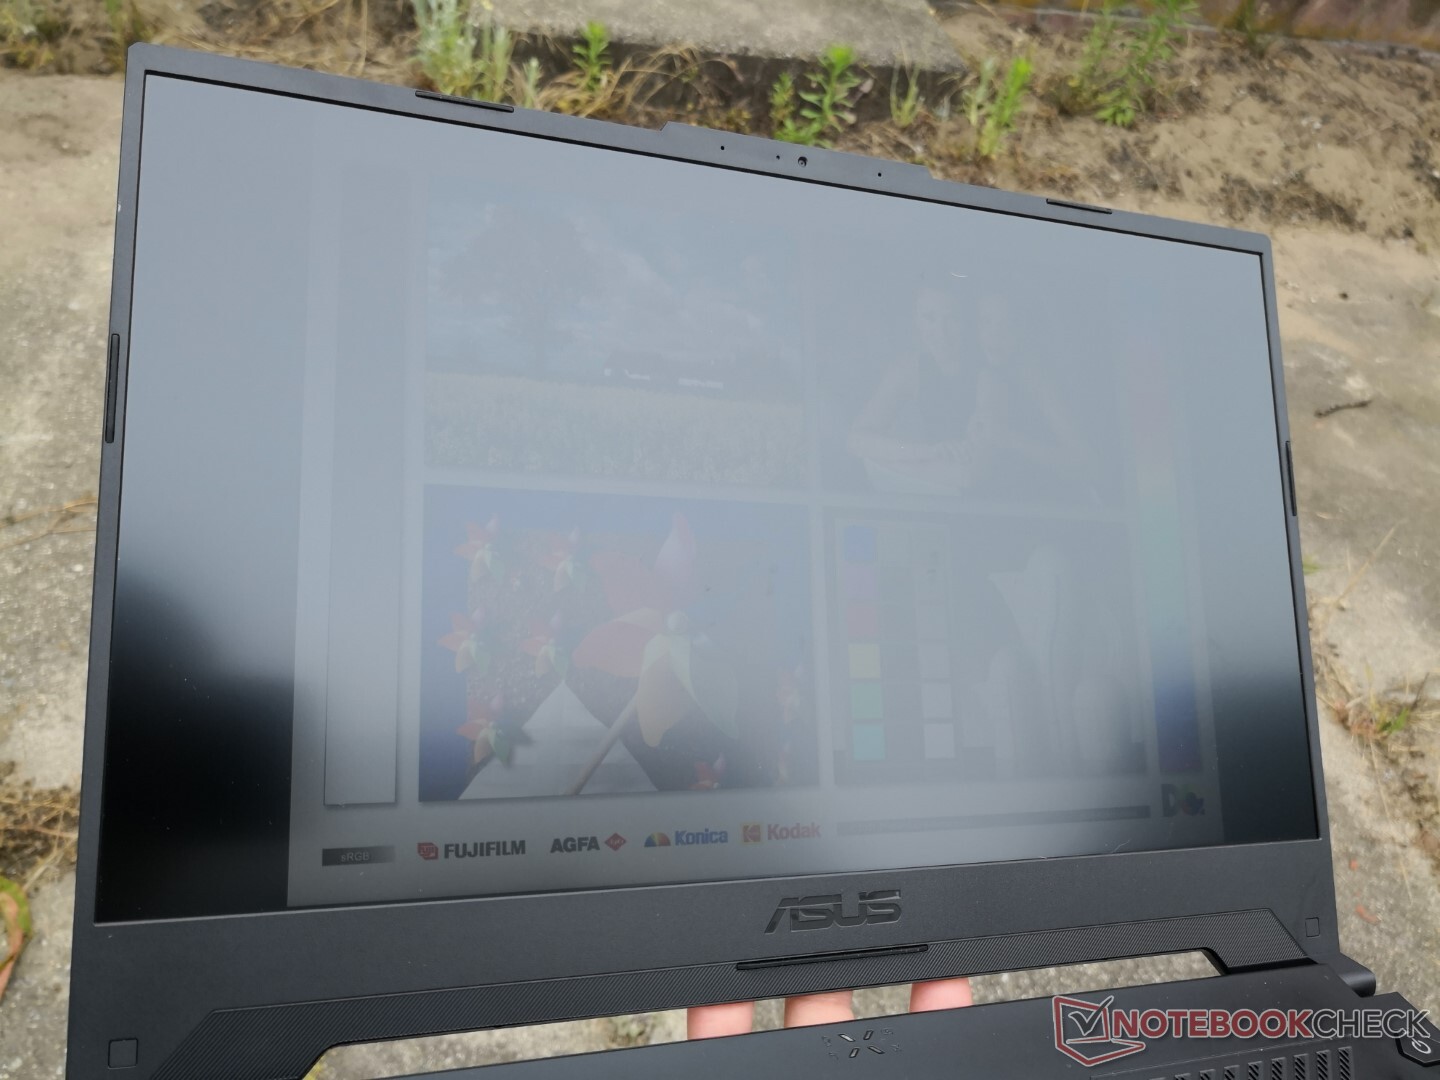
Display


| |||||||||||||||||||||||||
Brightness Distribution: 88 %
Center on Battery: 354.2 cd/m²
Contrast: 1107:1 (Black: 0.32 cd/m²)
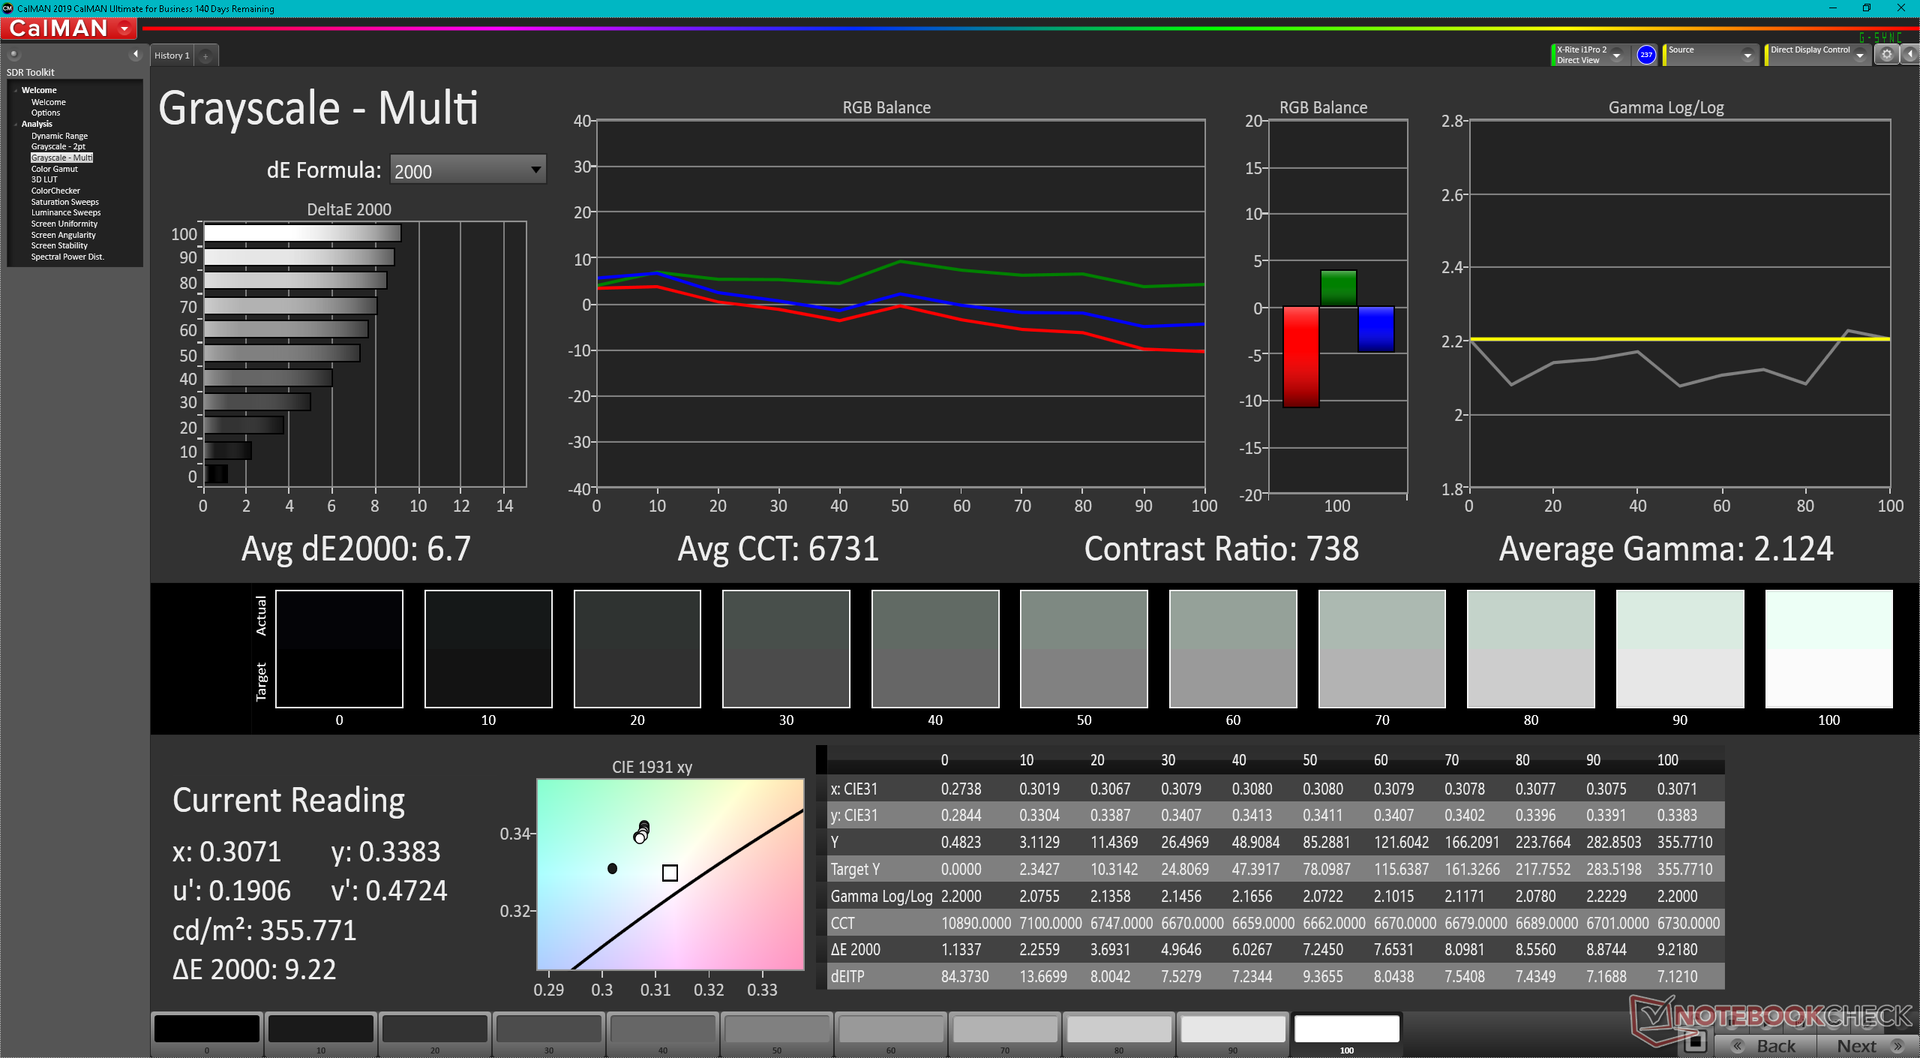
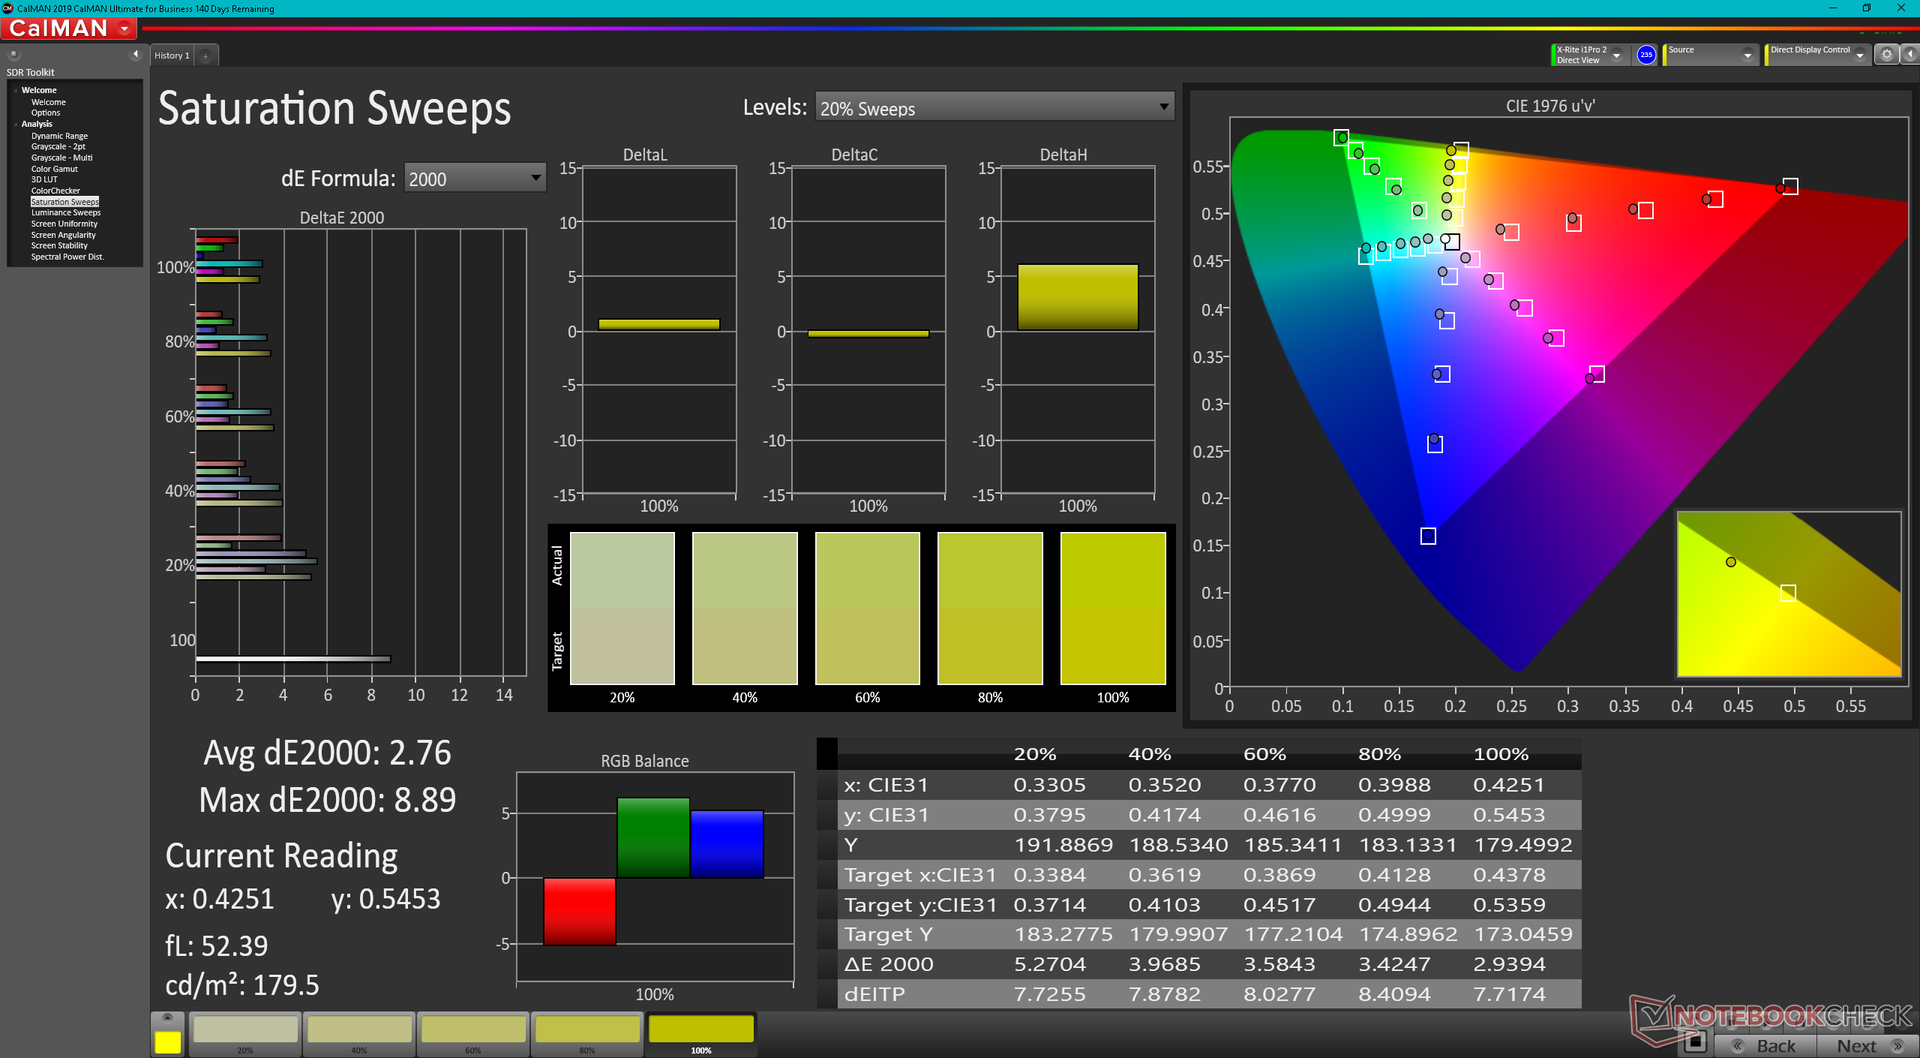
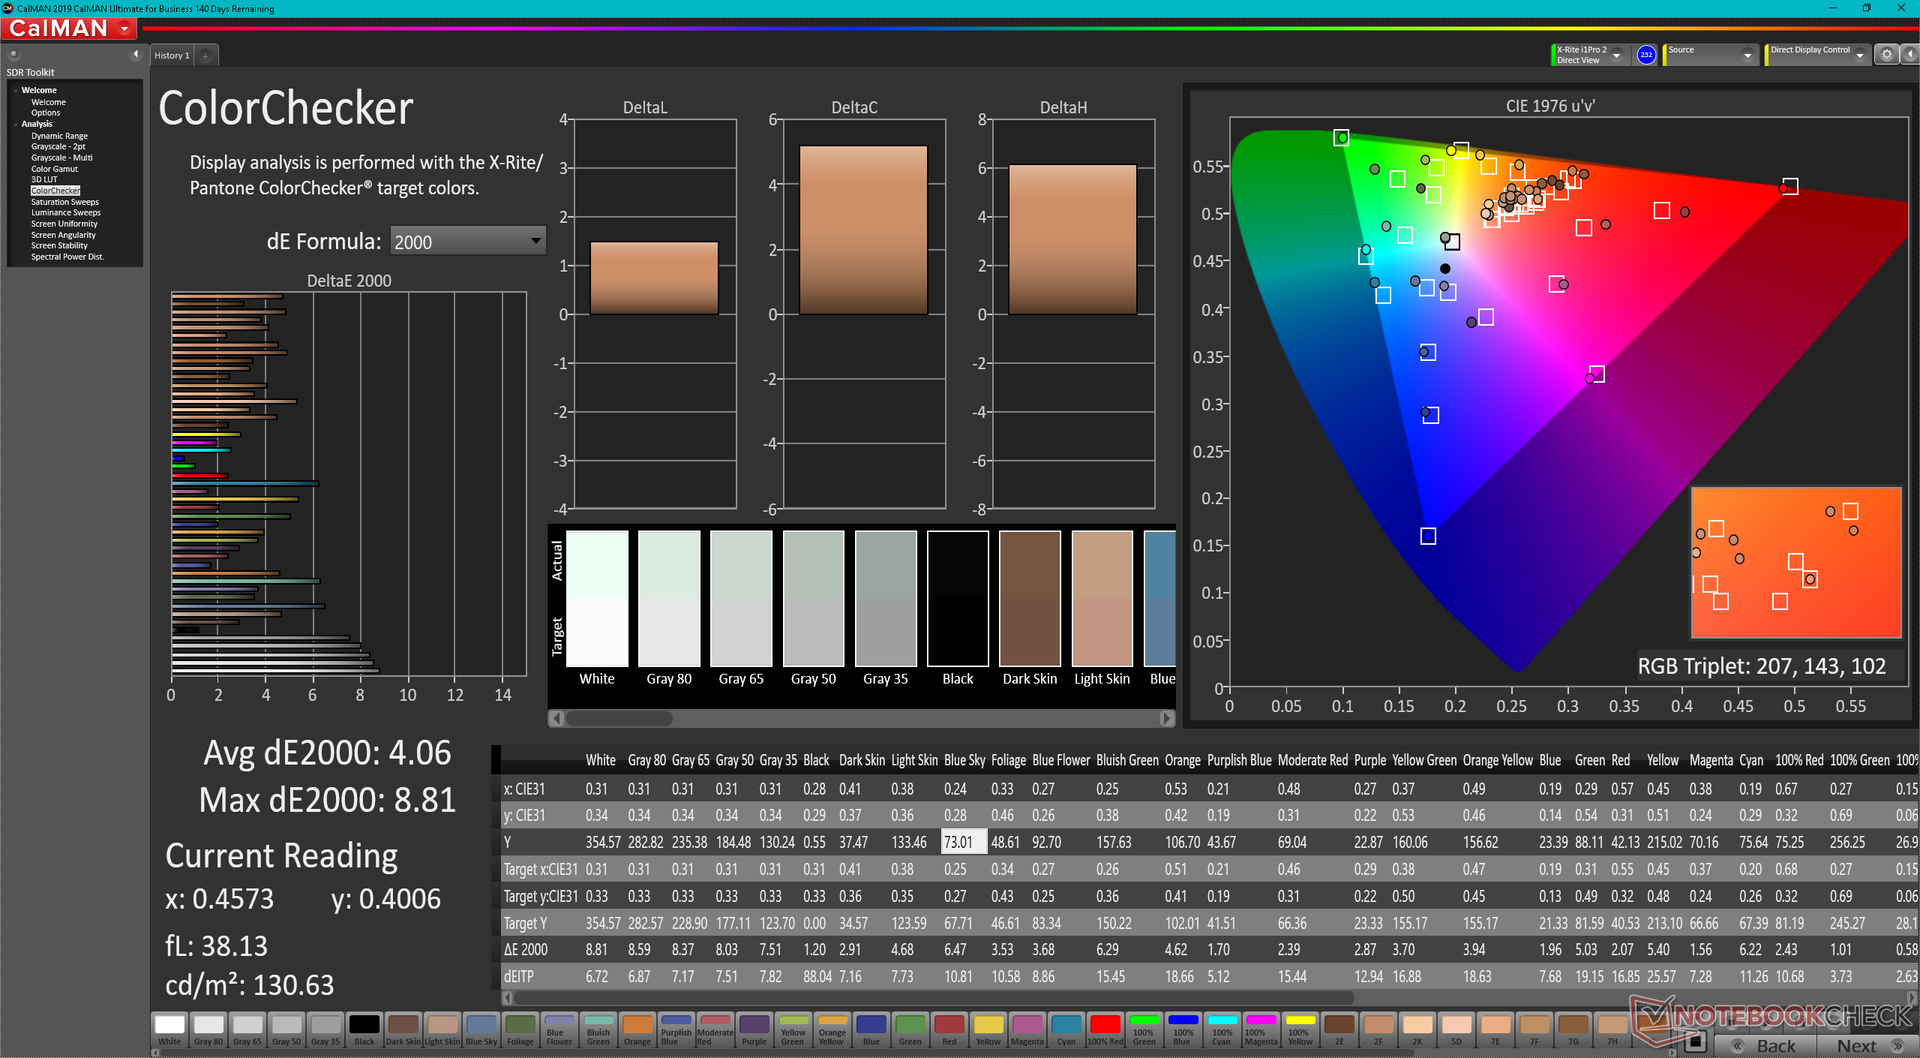
ΔE ColorChecker Calman: 4.06 | ∀{0.5-29.43 Ø4.72}
ΔE Greyscale Calman: 6.7 | ∀{0.09-98 Ø4.97}
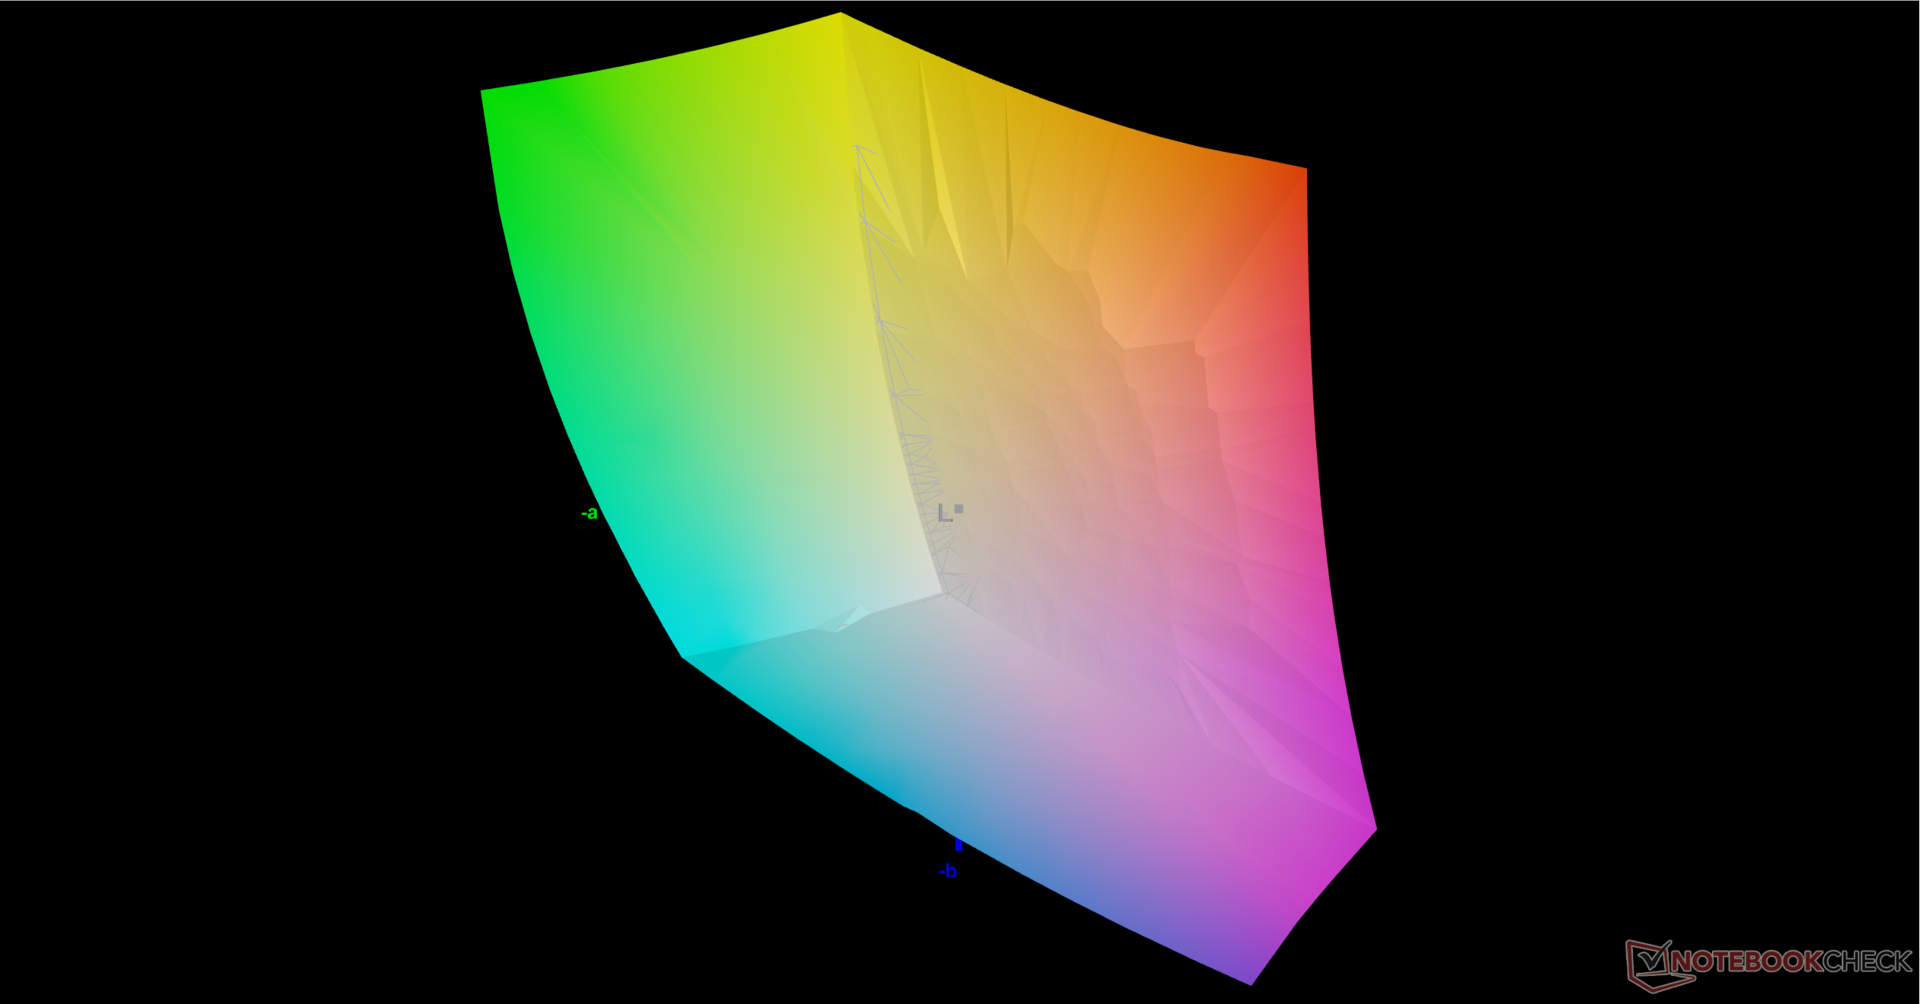
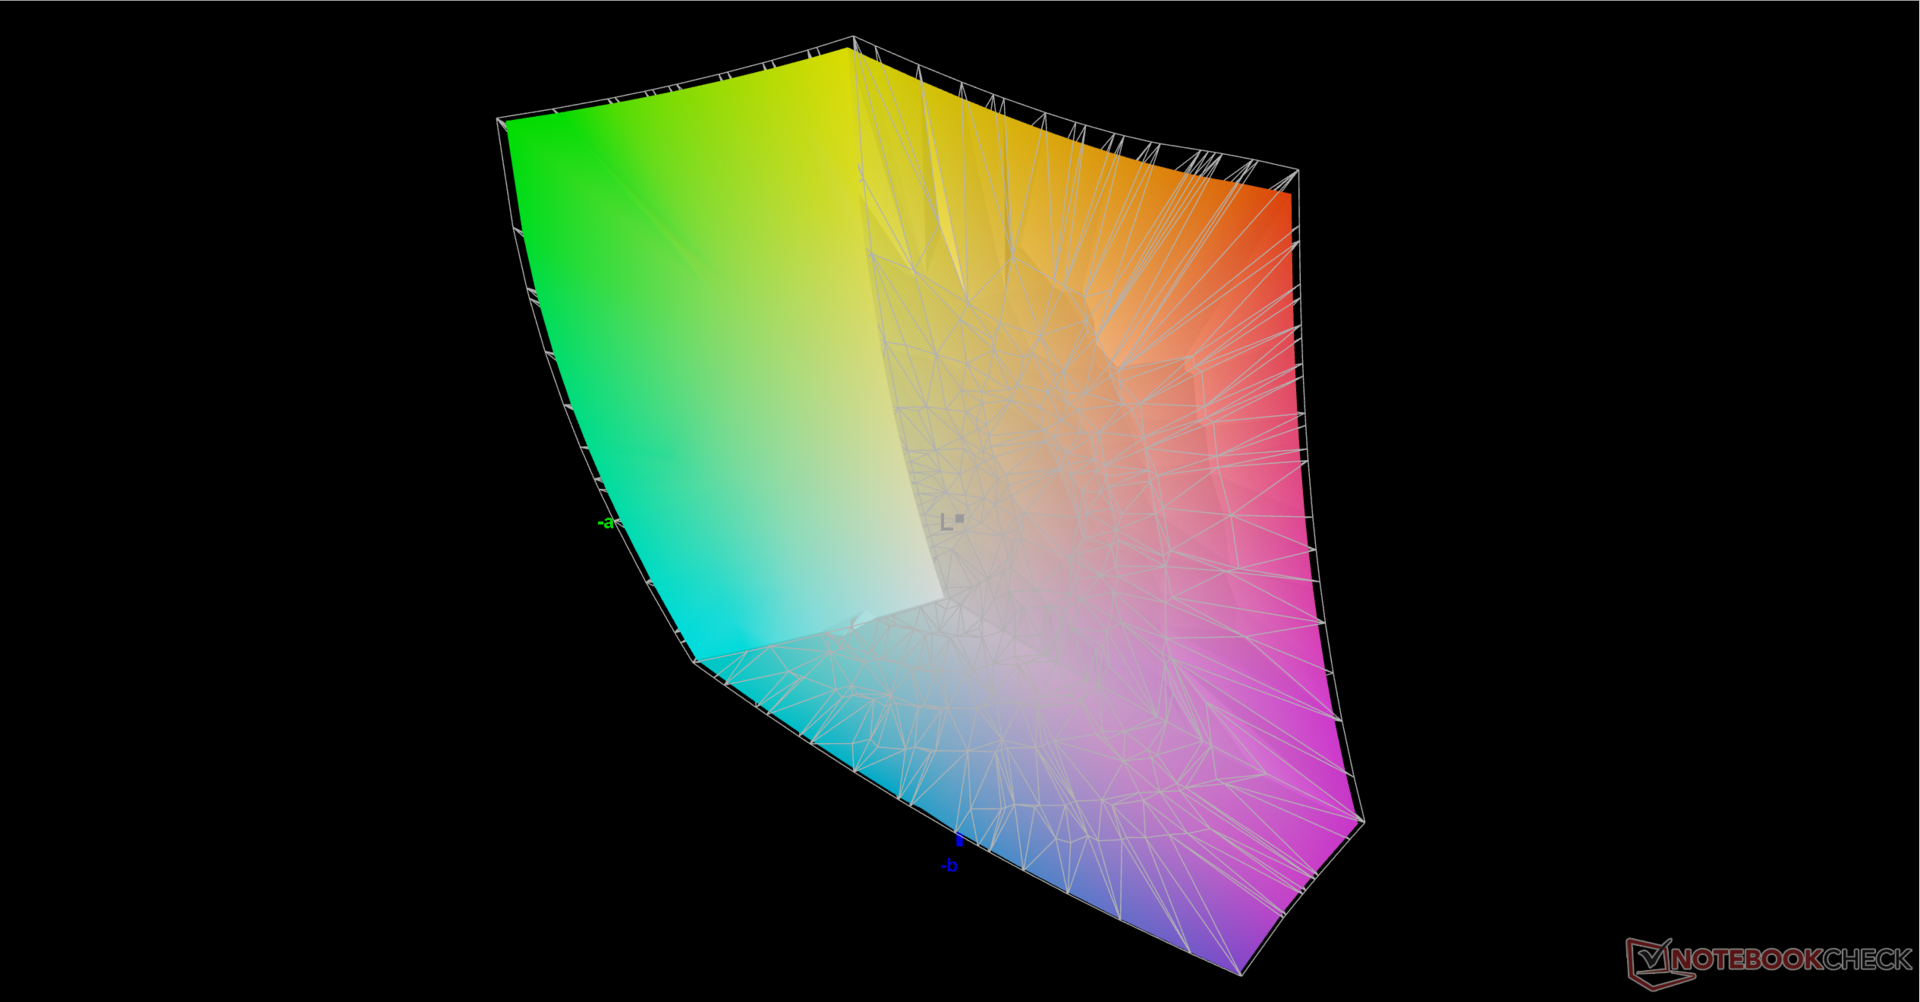
85.1% AdobeRGB 1998 (Argyll 3D)
99.9% sRGB (Argyll 3D)
95.8% Display P3 (Argyll 3D)
Gamma: 2.12
CCT: 6731 K
| Asus TUF Dash F15 FX517ZC BOE CQ NE156QHM-NY1, IPS, 2560x1440, 15.6" | Asus TUF Dash F15 FX517ZR BOE CQ NE156QHM-NY1, IPS, 2560x1440, 15.6" | Dell G15 5510 YMHWH_156HRA (CMN1522), IPS, 1920x1080, 15.6" | MSI Bravo 15 B5DD-010US Chi Mei N156HRA-EA1, IPS, 1920x1080, 15.6" | Lenovo Ideapad Gaming 3 15IHU-82K1002RGE LEN156FHD, IPS, 1920x1080, 15.6" | Gigabyte G5 GD Chi Mei N156HRA-EA1, IPS, 1920x1080, 15.6" | |
|---|---|---|---|---|---|---|
| Display | 1% | -48% | -47% | -50% | -48% | |
| Display P3 Coverage (%) | 95.8 | 98.4 3% | 41.6 -57% | 42.1 -56% | 39.7 -59% | 41.8 -56% |
| sRGB Coverage (%) | 99.9 | 99.9 0% | 62.2 -38% | 62.8 -37% | 59.6 -40% | 62.3 -38% |
| AdobeRGB 1998 Coverage (%) | 85.1 | 85.9 1% | 43 -49% | 43.6 -49% | 41.1 -52% | 43.2 -49% |
| Response Times | 22% | -198% | -162% | -345% | -217% | |
| Response Time Grey 50% / Grey 80% * (ms) | 8.4 ? | 5.6 ? 33% | 33.3 ? -296% | 25.6 ? -205% | 46.4 ? -452% | 34.4 ? -310% |
| Response Time Black / White * (ms) | 10.4 ? | 9.4 ? 10% | 20.7 ? -99% | 22.8 ? -119% | 35.2 ? -238% | 23.2 ? -123% |
| PWM Frequency (Hz) | ||||||
| Screen | 17% | -5% | -25% | -15% | -5% | |
| Brightness middle (cd/m²) | 354.2 | 286 -19% | 288 -19% | 265.1 -25% | 307 -13% | 261 -26% |
| Brightness (cd/m²) | 330 | 266 -19% | 264 -20% | 245 -26% | 292 -12% | 246 -25% |
| Brightness Distribution (%) | 88 | 87 -1% | 88 0% | 87 -1% | 88 0% | 87 -1% |
| Black Level * (cd/m²) | 0.32 | 0.25 22% | 0.24 25% | 0.35 -9% | 0.21 34% | 0.19 41% |
| Contrast (:1) | 1107 | 1144 3% | 1200 8% | 757 -32% | 1462 32% | 1374 24% |
| Colorchecker dE 2000 * | 4.06 | 2.14 47% | 3.67 10% | 4.68 -15% | 5.9 -45% | 3.9 4% |
| Colorchecker dE 2000 max. * | 8.81 | 5.22 41% | 18.12 -106% | 19.96 -127% | 21.6 -145% | 19.26 -119% |
| Greyscale dE 2000 * | 6.7 | 2.8 58% | 2.6 61% | 4.5 33% | 4.9 27% | 2.7 60% |
| Gamma | 2.12 104% | 2.23 99% | 2.187 101% | 2.22 99% | 2.26 97% | 2.248 98% |
| CCT | 6731 97% | 7092 92% | 6971 93% | 6632 98% | 6504 100% | 6828 95% |
| Colorchecker dE 2000 calibrated * | 0.67 | 3.22 | 3.7 | 4.8 | 3.24 | |
| Total Average (Program / Settings) | 13% /
14% | -84% /
-45% | -78% /
-51% | -137% /
-74% | -90% /
-48% |
* ... smaller is better
Display Response Times
| ↔ Response Time Black to White | ||
|---|---|---|
| 10.4 ms ... rise ↗ and fall ↘ combined | ↗ 6.4 ms rise | 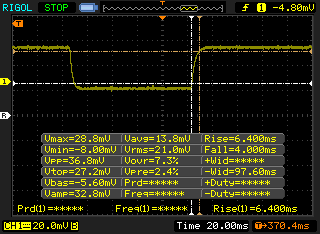 |
| ↘ 4 ms fall | ||
| The screen shows good response rates in our tests, but may be too slow for competitive gamers. In comparison, all tested devices range from 0.1 (minimum) to 240 (maximum) ms. » 28 % of all devices are better. This means that the measured response time is better than the average of all tested devices (19.8 ms). | ||
| ↔ Response Time 50% Grey to 80% Grey | ||
| 8.4 ms ... rise ↗ and fall ↘ combined | ↗ 4.4 ms rise | 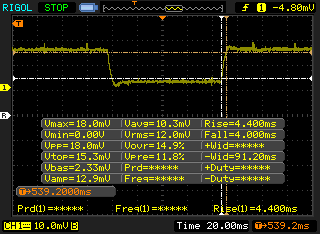 |
| ↘ 4 ms fall | ||
| The screen shows fast response rates in our tests and should be suited for gaming. In comparison, all tested devices range from 0.165 (minimum) to 636 (maximum) ms. » 22 % of all devices are better. This means that the measured response time is better than the average of all tested devices (31 ms). | ||
Screen Flickering / PWM (Pulse-Width Modulation)
| Screen flickering / PWM not detected | 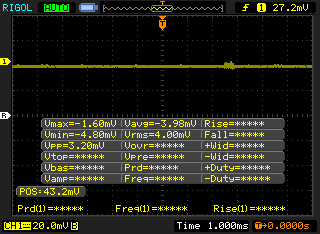 | ||
In comparison: 52 % of all tested devices do not use PWM to dim the display. If PWM was detected, an average of 7747 (minimum: 5 - maximum: 343500) Hz was measured. | |||

Performance
Testing Conditions
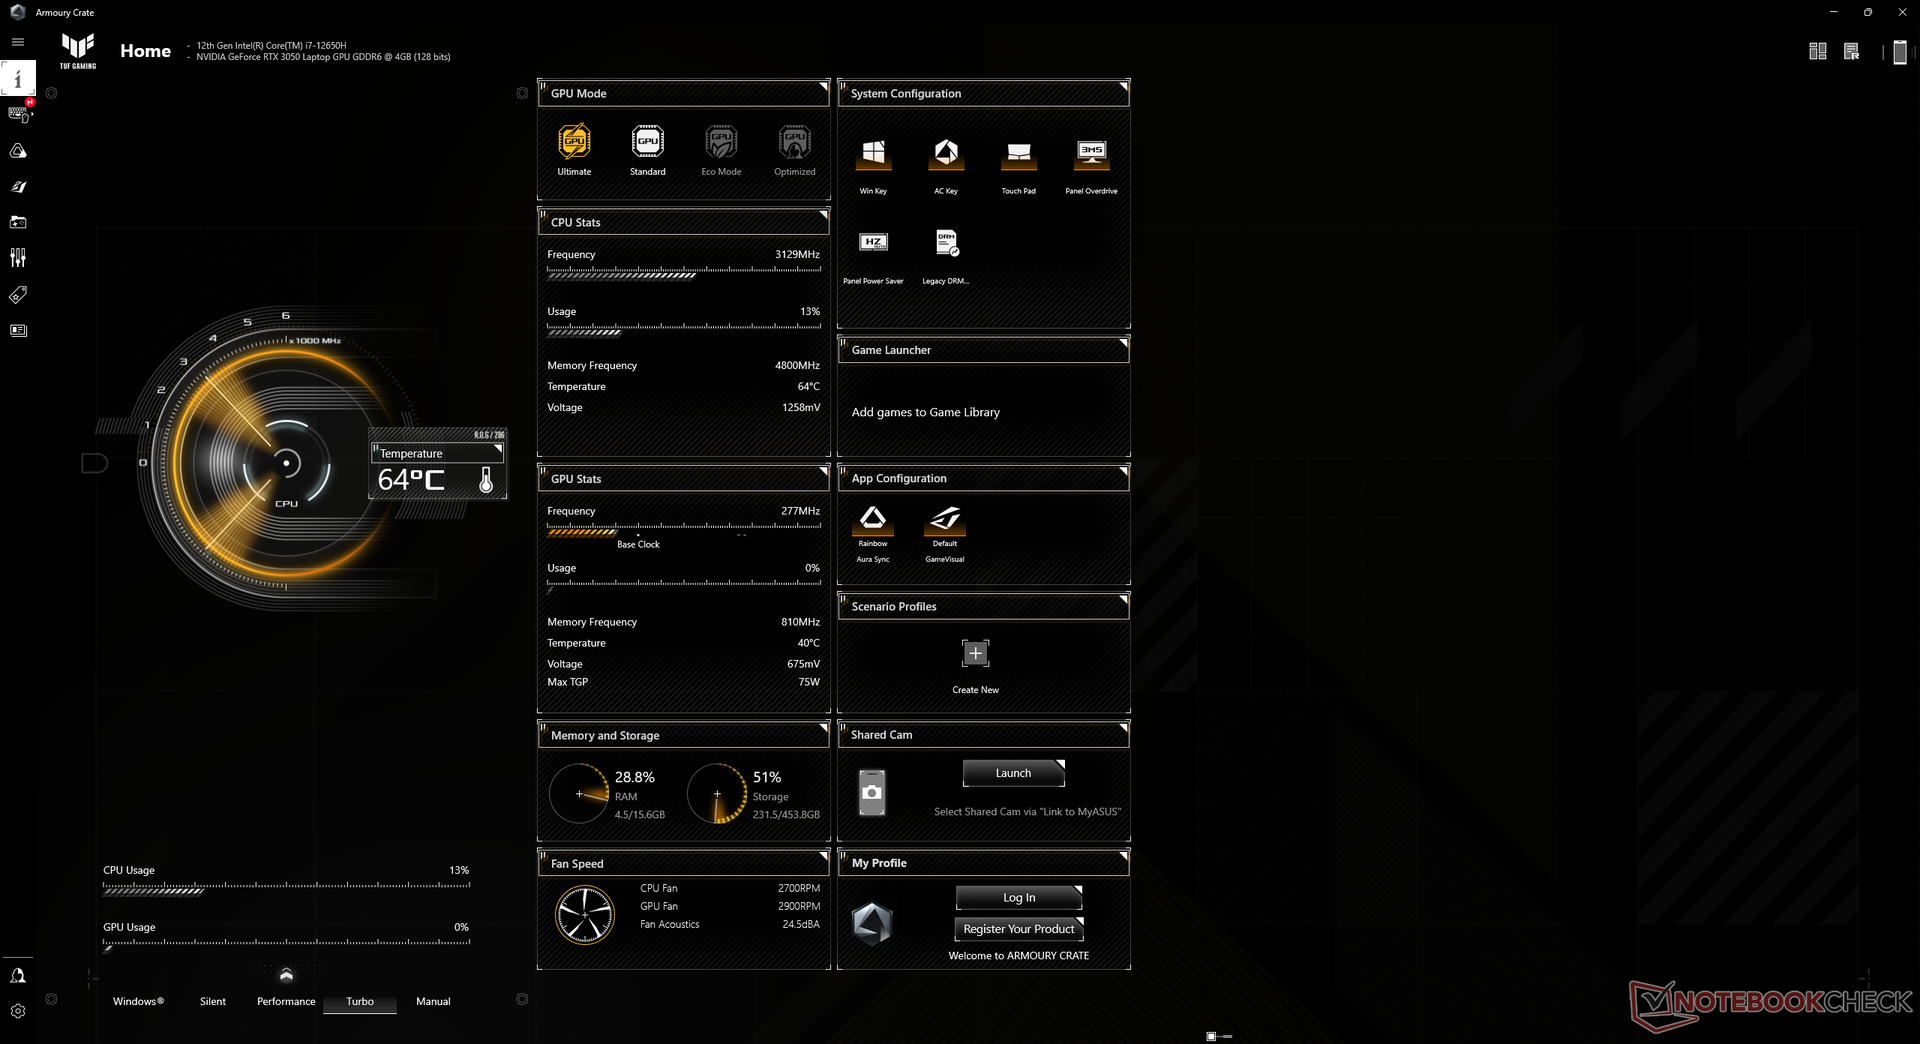
We set our unit to Turbo and discrete GPU modes prior to running any performance benchmarks below. The system utilizes MSHybrid/MUX for graphics switching which users can toggle via the Armoury Crate software. It's highly recommended that owners become familiar with Armoury Crate as it serves as the command center for the system. The model even has a handy dedicated key on the keyboard for launching the app.

Processor
Overall CPU performance is most similar to the Core i7-11800H in multi-threaded applications while being about 15 to 20 percent faster in single-threaded applications.
Cinebench R15 Multi Loop
Cinebench R23: Multi Core | Single Core
Cinebench R15: CPU Multi 64Bit | CPU Single 64Bit
Blender: v2.79 BMW27 CPU
7-Zip 18.03: 7z b 4 | 7z b 4 -mmt1
Geekbench 5.5: Multi-Core | Single-Core
HWBOT x265 Benchmark v2.2: 4k Preset
LibreOffice : 20 Documents To PDF
R Benchmark 2.5: Overall mean
| Cinebench R20 / CPU (Multi Core) | |
| MSI GE67 HX 12UGS | |
| MSI Vector GP66 12UGS | |
| Acer Nitro 5 AN515-58-72QR | |
| MSI Raider GE66 12UHS | |
| Gigabyte A5 X1 | |
| MSI GP66 Leopard 11UH-028 | |
| Asus TUF Dash F15 FX517ZC | |
| Dell G15 5515 | |
| Average Intel Core i7-12650H (2106 - 6009, n=14) | |
| MSI GS66 Stealth 10UG | |
| MSI Bravo 15 B5DD-010US | |
| Gigabyte G5 GD | |
| Cinebench R20 / CPU (Single Core) | |
| MSI Vector GP66 12UGS | |
| MSI Raider GE66 12UHS | |
| Acer Nitro 5 AN515-58-72QR | |
| Asus TUF Dash F15 FX517ZC | |
| MSI GE67 HX 12UGS | |
| Average Intel Core i7-12650H (552 - 696, n=14) | |
| MSI GP66 Leopard 11UH-028 | |
| Gigabyte A5 X1 | |
| Gigabyte G5 GD | |
| Dell G15 5515 | |
| MSI Bravo 15 B5DD-010US | |
| MSI GS66 Stealth 10UG | |
| Cinebench R15 / CPU Multi 64Bit | |
| MSI GE67 HX 12UGS | |
| Acer Nitro 5 AN515-58-72QR | |
| MSI Raider GE66 12UHS | |
| MSI Vector GP66 12UGS | |
| Gigabyte A5 X1 | |
| MSI GP66 Leopard 11UH-028 | |
| Dell G15 5515 | |
| Asus TUF Dash F15 FX517ZC | |
| Average Intel Core i7-12650H (753 - 2253, n=14) | |
| MSI GS66 Stealth 10UG | |
| Gigabyte G5 GD | |
| MSI Bravo 15 B5DD-010US | |
| Cinebench R15 / CPU Single 64Bit | |
| MSI Vector GP66 12UGS | |
| MSI Raider GE66 12UHS | |
| Acer Nitro 5 AN515-58-72QR | |
| MSI GE67 HX 12UGS | |
| Asus TUF Dash F15 FX517ZC | |
| Average Intel Core i7-12650H (206 - 261, n=14) | |
| Gigabyte A5 X1 | |
| Dell G15 5515 | |
| MSI GP66 Leopard 11UH-028 | |
| MSI Bravo 15 B5DD-010US | |
| Gigabyte G5 GD | |
| MSI GS66 Stealth 10UG | |
| HWBOT x265 Benchmark v2.2 / 4k Preset | |
| MSI GE67 HX 12UGS | |
| MSI Vector GP66 12UGS | |
| MSI Raider GE66 12UHS | |
| Acer Nitro 5 AN515-58-72QR | |
| Gigabyte A5 X1 | |
| MSI GP66 Leopard 11UH-028 | |
| Dell G15 5515 | |
| Asus TUF Dash F15 FX517ZC | |
| Average Intel Core i7-12650H (6.62 - 17.4, n=16) | |
| MSI GS66 Stealth 10UG | |
| MSI Bravo 15 B5DD-010US | |
| Gigabyte G5 GD | |
| LibreOffice / 20 Documents To PDF | |
| Dell G15 5515 | |
| Gigabyte A5 X1 | |
| MSI Bravo 15 B5DD-010US | |
| Asus TUF Dash F15 FX517ZC | |
| MSI GP66 Leopard 11UH-028 | |
| MSI GS66 Stealth 10UG | |
| Average Intel Core i7-12650H (35.1 - 58.5, n=14) | |
| Gigabyte G5 GD | |
| MSI GE67 HX 12UGS | |
| Acer Nitro 5 AN515-58-72QR | |
| MSI Vector GP66 12UGS | |
| MSI Raider GE66 12UHS | |
| R Benchmark 2.5 / Overall mean | |
| MSI GS66 Stealth 10UG | |
| Gigabyte G5 GD | |
| MSI GP66 Leopard 11UH-028 | |
| MSI Bravo 15 B5DD-010US | |
| Dell G15 5515 | |
| Gigabyte A5 X1 | |
| Asus TUF Dash F15 FX517ZC | |
| Average Intel Core i7-12650H (0.4584 - 0.515, n=14) | |
| MSI GE67 HX 12UGS | |
| Acer Nitro 5 AN515-58-72QR | |
| MSI Raider GE66 12UHS | |
| MSI Vector GP66 12UGS | |
* ... smaller is better
AIDA64: FP32 Ray-Trace | FPU Julia | CPU SHA3 | CPU Queen | FPU SinJulia | FPU Mandel | CPU AES | CPU ZLib | FP64 Ray-Trace | CPU PhotoWorxx
| Performance rating | |
| Asus TUF Dash F15 FX517ZR | |
| MSI Bravo 15 B5DD-010US | |
| Average Intel Core i7-12650H | |
| Gigabyte G5 GD | |
| Dell G15 5510 | |
| Asus TUF Dash F15 FX517ZC | |
| Lenovo Ideapad Gaming 3 15IHU-82K1002RGE | |
| AIDA64 / FP32 Ray-Trace | |
| Asus TUF Dash F15 FX517ZR | |
| Average Intel Core i7-12650H (5422 - 15620, n=14) | |
| MSI Bravo 15 B5DD-010US | |
| Gigabyte G5 GD | |
| Dell G15 5510 | |
| Lenovo Ideapad Gaming 3 15IHU-82K1002RGE | |
| Asus TUF Dash F15 FX517ZC | |
| AIDA64 / FPU Julia | |
| Asus TUF Dash F15 FX517ZR | |
| MSI Bravo 15 B5DD-010US | |
| Average Intel Core i7-12650H (26386 - 76434, n=14) | |
| Dell G15 5510 | |
| Gigabyte G5 GD | |
| Lenovo Ideapad Gaming 3 15IHU-82K1002RGE | |
| Asus TUF Dash F15 FX517ZC | |
| AIDA64 / CPU SHA3 | |
| Asus TUF Dash F15 FX517ZR | |
| Gigabyte G5 GD | |
| Average Intel Core i7-12650H (1479 - 3244, n=14) | |
| MSI Bravo 15 B5DD-010US | |
| Lenovo Ideapad Gaming 3 15IHU-82K1002RGE | |
| Dell G15 5510 | |
| Asus TUF Dash F15 FX517ZC | |
| AIDA64 / CPU Queen | |
| Asus TUF Dash F15 FX517ZR | |
| Average Intel Core i7-12650H (59278 - 89537, n=14) | |
| MSI Bravo 15 B5DD-010US | |
| Asus TUF Dash F15 FX517ZC | |
| Dell G15 5510 | |
| Gigabyte G5 GD | |
| Lenovo Ideapad Gaming 3 15IHU-82K1002RGE | |
| AIDA64 / FPU SinJulia | |
| MSI Bravo 15 B5DD-010US | |
| Asus TUF Dash F15 FX517ZR | |
| Dell G15 5510 | |
| Average Intel Core i7-12650H (4690 - 8726, n=14) | |
| Gigabyte G5 GD | |
| Asus TUF Dash F15 FX517ZC | |
| Lenovo Ideapad Gaming 3 15IHU-82K1002RGE | |
| AIDA64 / FPU Mandel | |
| MSI Bravo 15 B5DD-010US | |
| Asus TUF Dash F15 FX517ZR | |
| Average Intel Core i7-12650H (15001 - 37738, n=14) | |
| Gigabyte G5 GD | |
| Dell G15 5510 | |
| Lenovo Ideapad Gaming 3 15IHU-82K1002RGE | |
| Asus TUF Dash F15 FX517ZC | |
| AIDA64 / CPU AES | |
| Gigabyte G5 GD | |
| MSI Bravo 15 B5DD-010US | |
| Lenovo Ideapad Gaming 3 15IHU-82K1002RGE | |
| Asus TUF Dash F15 FX517ZR | |
| Average Intel Core i7-12650H (32702 - 92530, n=14) | |
| Asus TUF Dash F15 FX517ZC | |
| Dell G15 5510 | |
| AIDA64 / CPU ZLib | |
| Asus TUF Dash F15 FX517ZR | |
| Average Intel Core i7-12650H (443 - 891, n=14) | |
| Asus TUF Dash F15 FX517ZC | |
| MSI Bravo 15 B5DD-010US | |
| Gigabyte G5 GD | |
| Dell G15 5510 | |
| Lenovo Ideapad Gaming 3 15IHU-82K1002RGE | |
| AIDA64 / FP64 Ray-Trace | |
| Asus TUF Dash F15 FX517ZR | |
| Average Intel Core i7-12650H (3096 - 8448, n=14) | |
| Gigabyte G5 GD | |
| MSI Bravo 15 B5DD-010US | |
| Dell G15 5510 | |
| Lenovo Ideapad Gaming 3 15IHU-82K1002RGE | |
| Asus TUF Dash F15 FX517ZC | |
| AIDA64 / CPU PhotoWorxx | |
| Asus TUF Dash F15 FX517ZR | |
| Average Intel Core i7-12650H (22046 - 44164, n=14) | |
| Asus TUF Dash F15 FX517ZC | |
| Gigabyte G5 GD | |
| MSI Bravo 15 B5DD-010US | |
| Dell G15 5510 | |
| Lenovo Ideapad Gaming 3 15IHU-82K1002RGE | |
System Performance
CrossMark: Overall | Productivity | Creativity | Responsiveness
| PCMark 10 / Score | |
| Asus TUF Dash F15 FX517ZC | |
| Average Intel Core i7-12650H, NVIDIA GeForce RTX 3050 4GB Laptop GPU (n=1) | |
| Asus TUF Dash F15 FX517ZR | |
| MSI Bravo 15 B5DD-010US | |
| Gigabyte G5 GD | |
| Lenovo Ideapad Gaming 3 15IHU-82K1002RGE | |
| Dell G15 5510 | |
| PCMark 10 / Essentials | |
| Asus TUF Dash F15 FX517ZC | |
| Average Intel Core i7-12650H, NVIDIA GeForce RTX 3050 4GB Laptop GPU (n=1) | |
| Asus TUF Dash F15 FX517ZR | |
| MSI Bravo 15 B5DD-010US | |
| Gigabyte G5 GD | |
| Lenovo Ideapad Gaming 3 15IHU-82K1002RGE | |
| Dell G15 5510 | |
| PCMark 10 / Productivity | |
| Asus TUF Dash F15 FX517ZR | |
| Asus TUF Dash F15 FX517ZC | |
| Average Intel Core i7-12650H, NVIDIA GeForce RTX 3050 4GB Laptop GPU (n=1) | |
| Lenovo Ideapad Gaming 3 15IHU-82K1002RGE | |
| MSI Bravo 15 B5DD-010US | |
| Gigabyte G5 GD | |
| Dell G15 5510 | |
| PCMark 10 / Digital Content Creation | |
| Asus TUF Dash F15 FX517ZC | |
| Average Intel Core i7-12650H, NVIDIA GeForce RTX 3050 4GB Laptop GPU (n=1) | |
| Asus TUF Dash F15 FX517ZR | |
| MSI Bravo 15 B5DD-010US | |
| Gigabyte G5 GD | |
| Dell G15 5510 | |
| Lenovo Ideapad Gaming 3 15IHU-82K1002RGE | |
| CrossMark / Overall | |
| Asus TUF Dash F15 FX517ZR | |
| Asus TUF Dash F15 FX517ZC | |
| Average Intel Core i7-12650H, NVIDIA GeForce RTX 3050 4GB Laptop GPU (n=1) | |
| Lenovo Ideapad Gaming 3 15IHU-82K1002RGE | |
| CrossMark / Productivity | |
| Asus TUF Dash F15 FX517ZC | |
| Average Intel Core i7-12650H, NVIDIA GeForce RTX 3050 4GB Laptop GPU (n=1) | |
| Asus TUF Dash F15 FX517ZR | |
| Lenovo Ideapad Gaming 3 15IHU-82K1002RGE | |
| CrossMark / Creativity | |
| Asus TUF Dash F15 FX517ZR | |
| Asus TUF Dash F15 FX517ZC | |
| Average Intel Core i7-12650H, NVIDIA GeForce RTX 3050 4GB Laptop GPU (n=1) | |
| Lenovo Ideapad Gaming 3 15IHU-82K1002RGE | |
| CrossMark / Responsiveness | |
| Asus TUF Dash F15 FX517ZC | |
| Average Intel Core i7-12650H, NVIDIA GeForce RTX 3050 4GB Laptop GPU (n=1) | |
| Asus TUF Dash F15 FX517ZR | |
| Lenovo Ideapad Gaming 3 15IHU-82K1002RGE | |
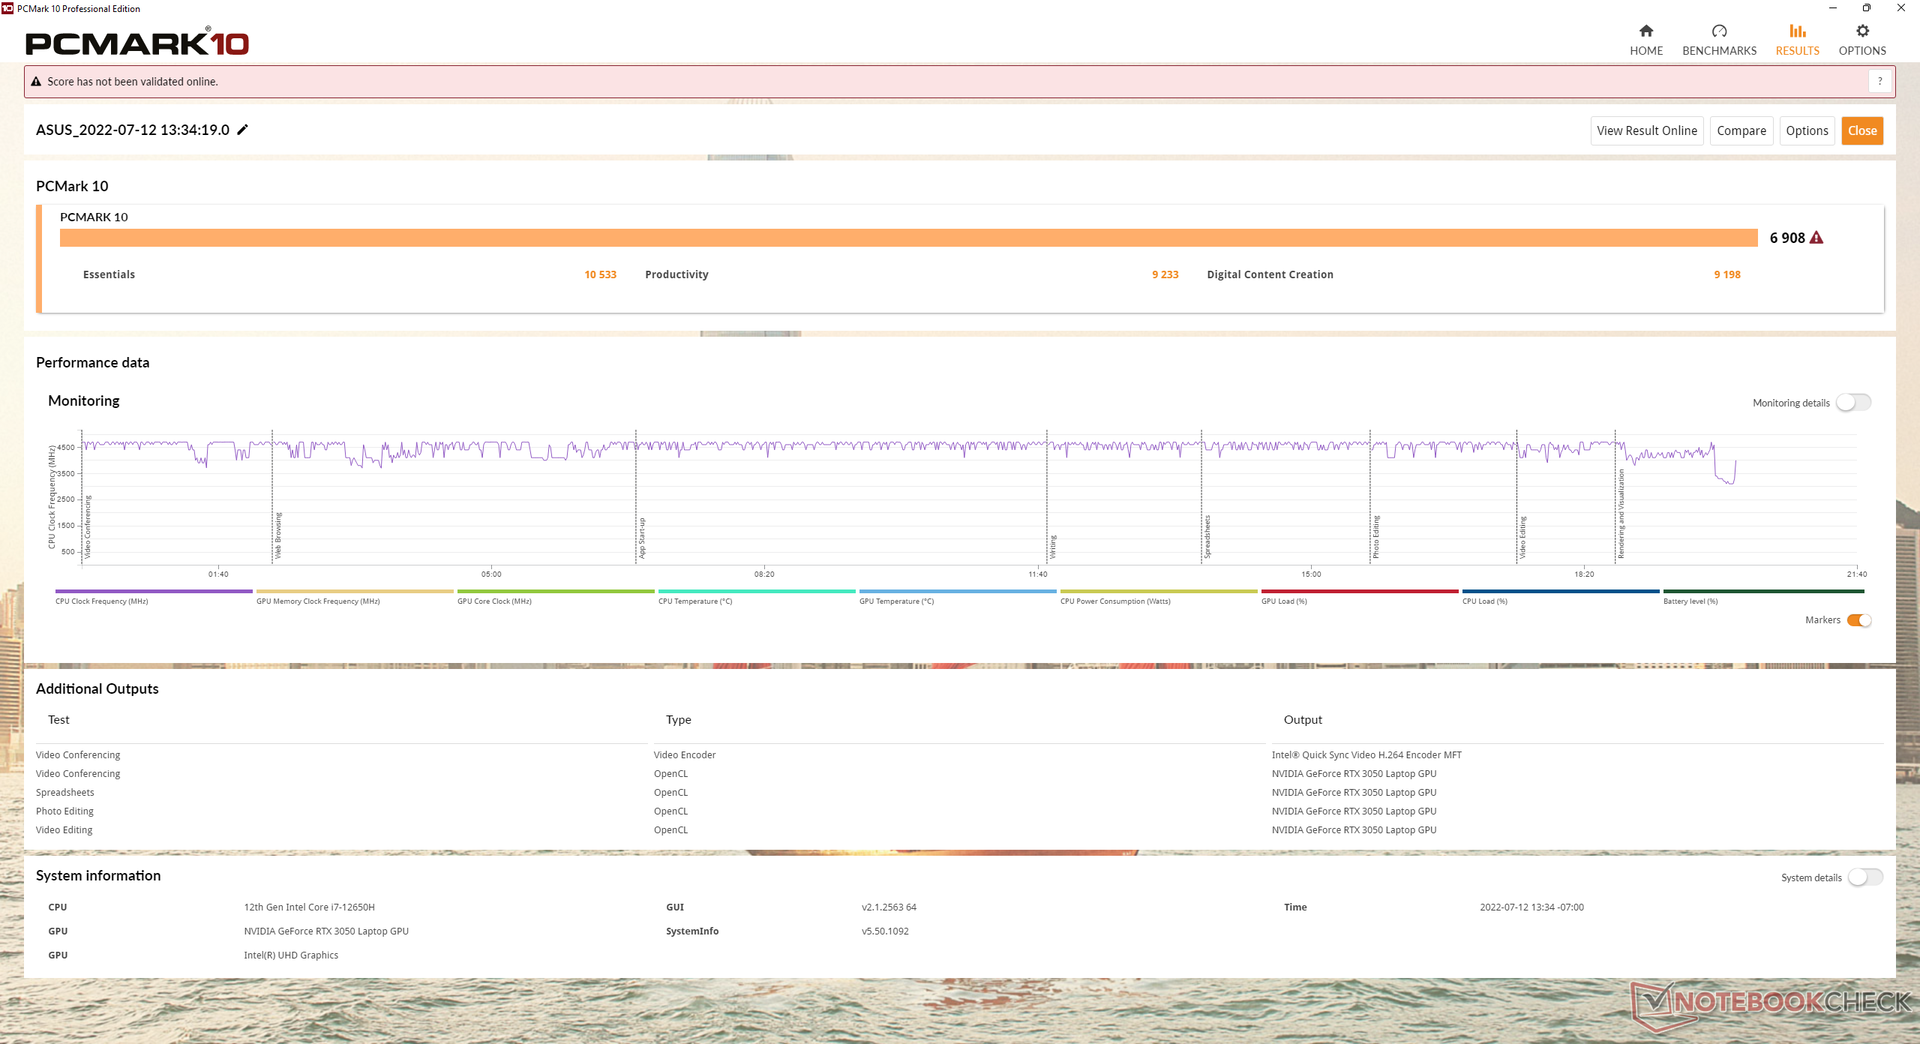
| PCMark 10 Score | 6908 points | |
Help | ||
| AIDA64 / Memory Copy | |
| Asus TUF Dash F15 FX517ZR | |
| Average Intel Core i7-12650H (43261 - 69735, n=14) | |
| Asus TUF Dash F15 FX517ZC | |
| Gigabyte G5 GD | |
| MSI Bravo 15 B5DD-010US | |
| Dell G15 5510 | |
| Lenovo Ideapad Gaming 3 15IHU-82K1002RGE | |
| AIDA64 / Memory Read | |
| Asus TUF Dash F15 FX517ZR | |
| Average Intel Core i7-12650H (47313 - 67412, n=14) | |
| Asus TUF Dash F15 FX517ZC | |
| Gigabyte G5 GD | |
| MSI Bravo 15 B5DD-010US | |
| Dell G15 5510 | |
| Lenovo Ideapad Gaming 3 15IHU-82K1002RGE | |
| AIDA64 / Memory Write | |
| Asus TUF Dash F15 FX517ZR | |
| Average Intel Core i7-12650H (45617 - 59361, n=14) | |
| Asus TUF Dash F15 FX517ZC | |
| Gigabyte G5 GD | |
| Dell G15 5510 | |
| MSI Bravo 15 B5DD-010US | |
| Lenovo Ideapad Gaming 3 15IHU-82K1002RGE | |
| AIDA64 / Memory Latency | |
| Asus TUF Dash F15 FX517ZR | |
| Gigabyte G5 GD | |
| Lenovo Ideapad Gaming 3 15IHU-82K1002RGE | |
| Average Intel Core i7-12650H (71.6 - 103.9, n=14) | |
| Dell G15 5510 | |
| MSI Bravo 15 B5DD-010US | |
| Asus TUF Dash F15 FX517ZC | |
* ... smaller is better
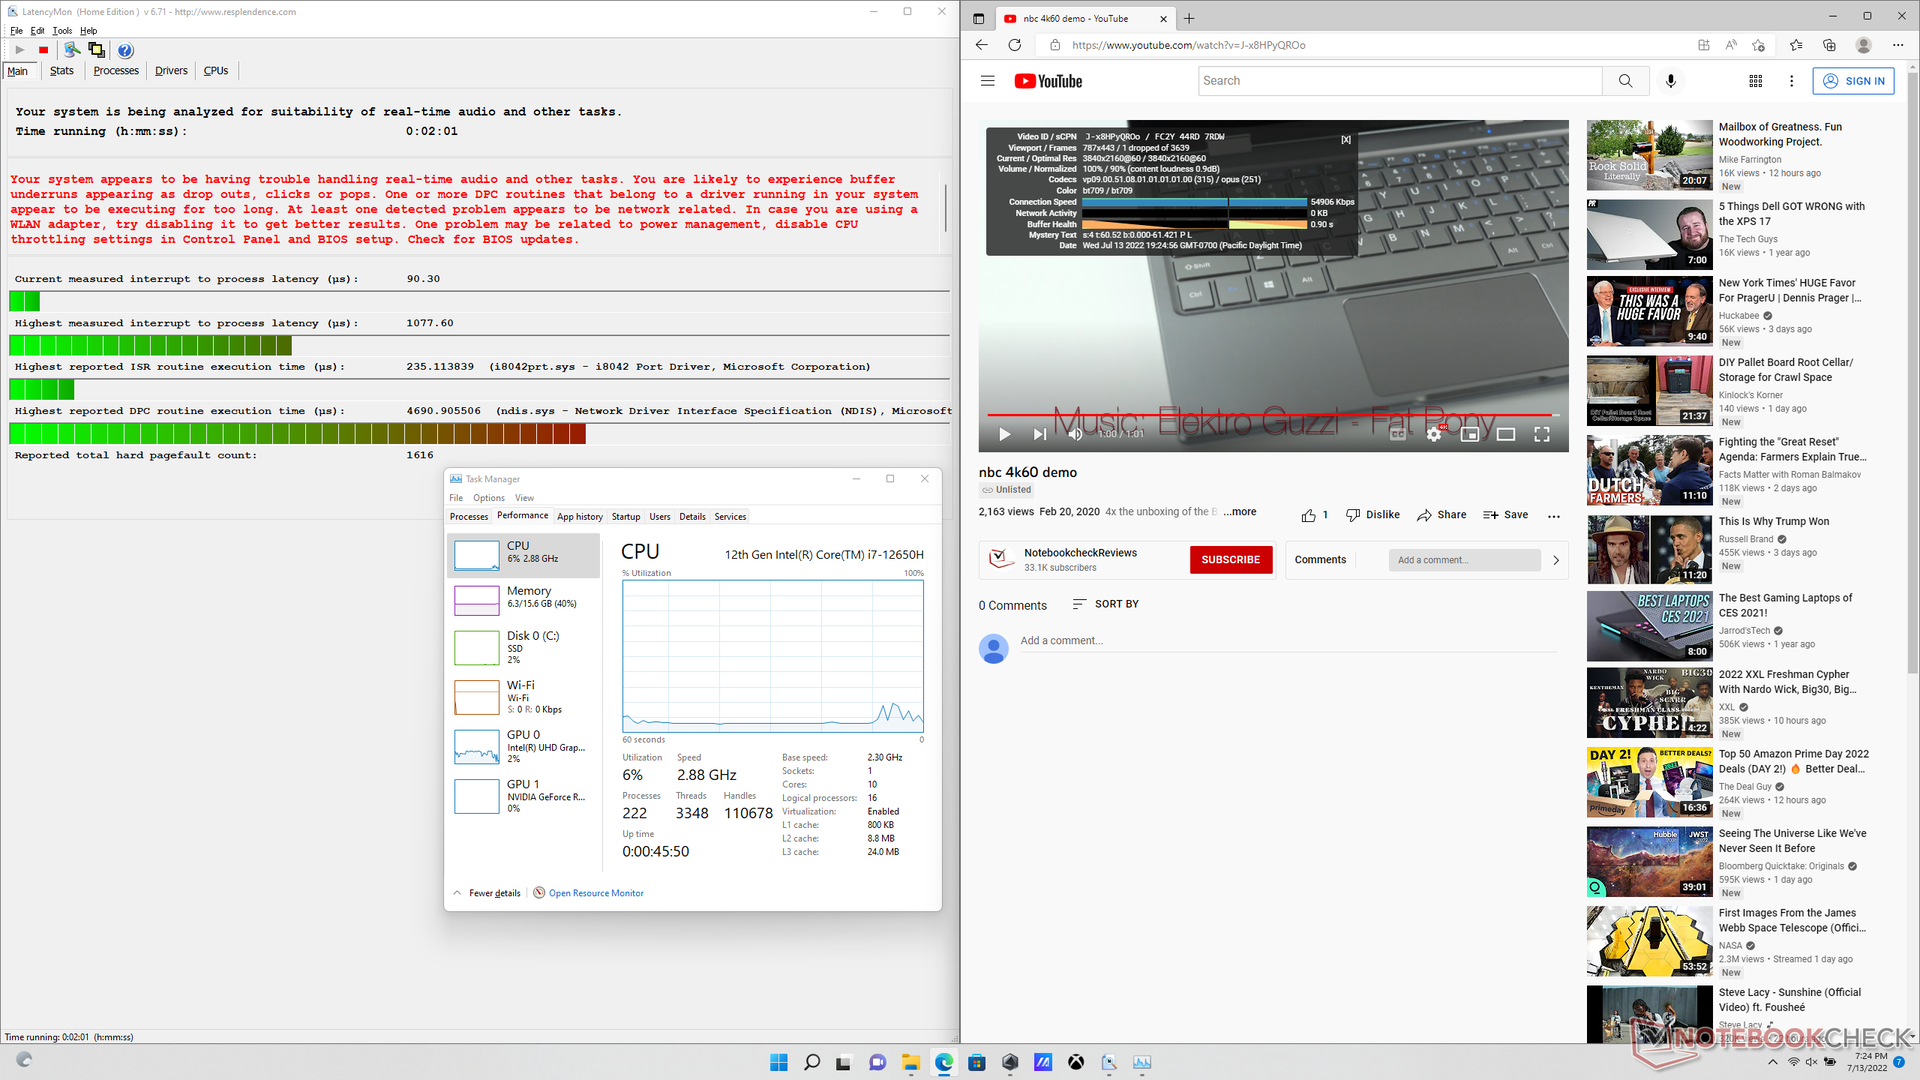
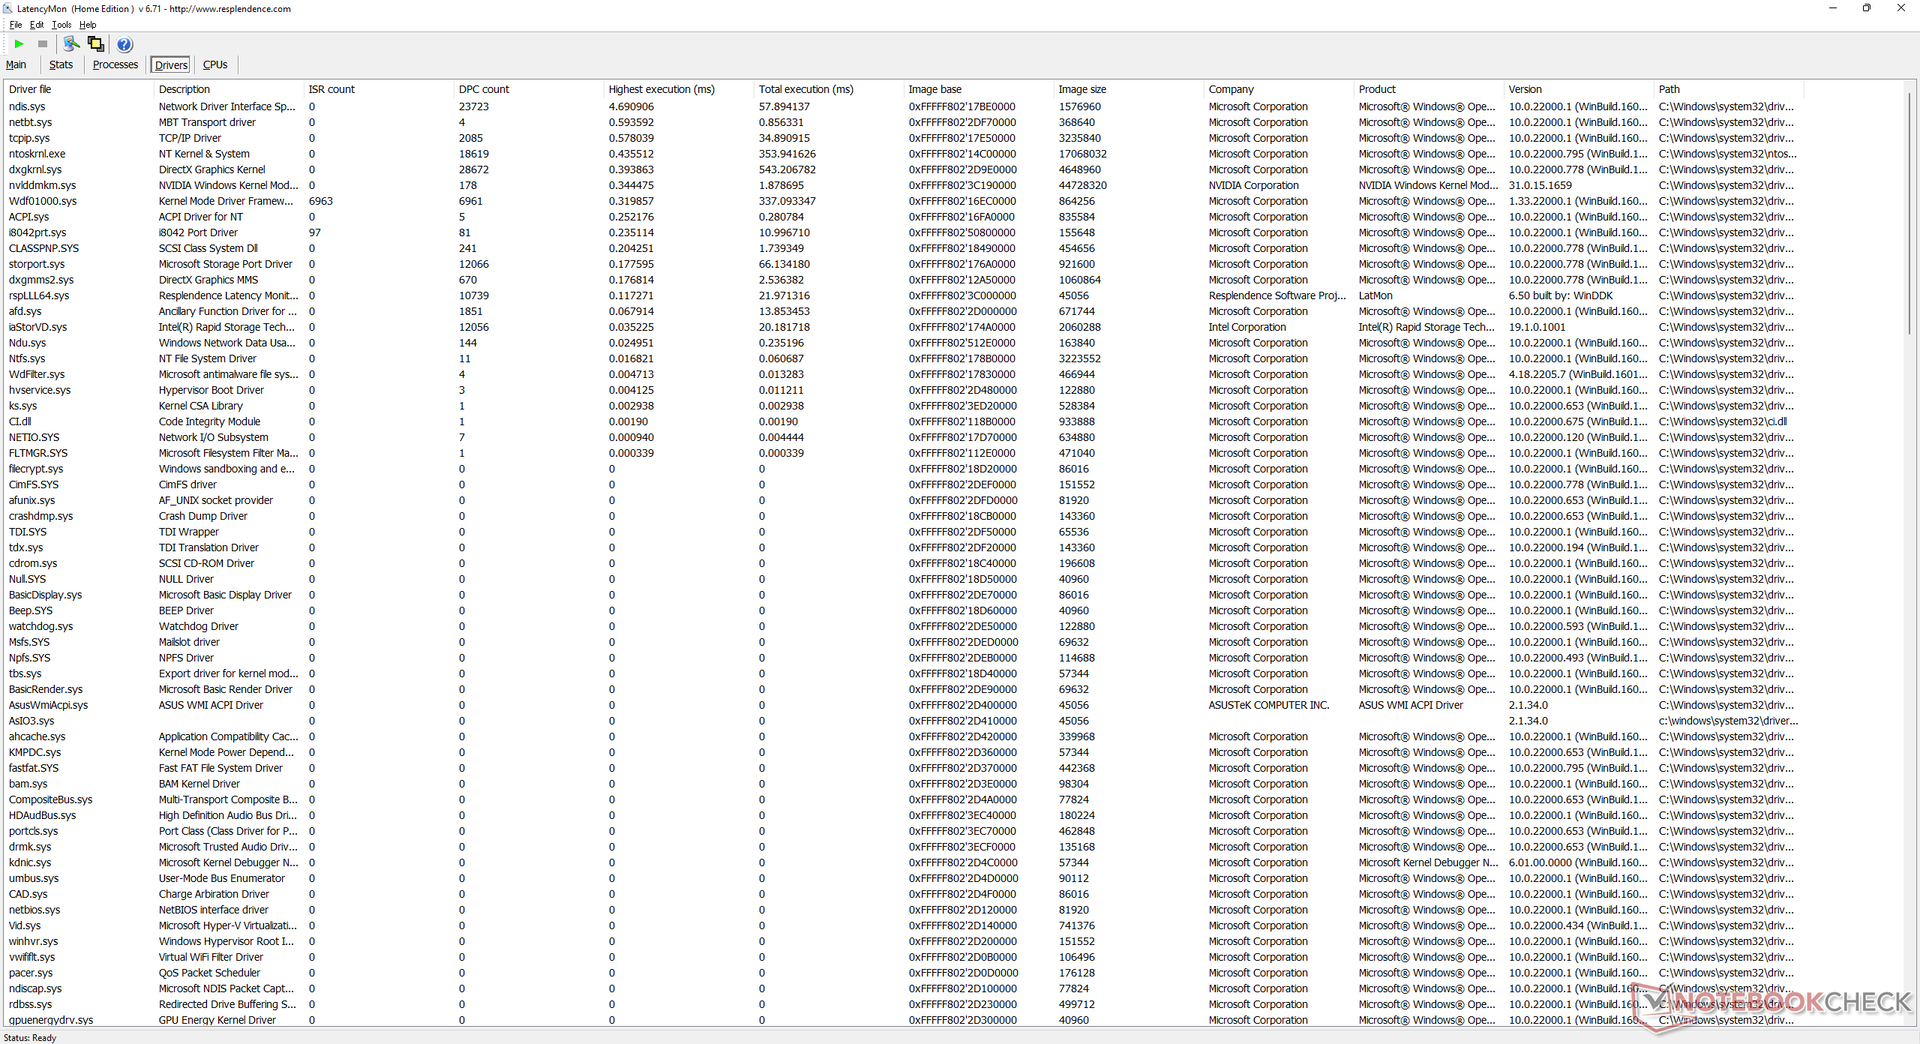
DPC Latency
We experienced DPC issues when opening multiple browser tabs on our homepage. 4K video playback at 60 FPS is otherwise perfect with just a single dropped frame during our minute-long video.
| DPC Latencies / LatencyMon - interrupt to process latency (max), Web, Youtube, Prime95 | |
| Dell G15 5510 | |
| MSI Bravo 15 B5DD-010US | |
| Asus TUF Dash F15 FX517ZC | |
| Lenovo Ideapad Gaming 3 15IHU-82K1002RGE | |
| Asus TUF Dash F15 FX517ZR | |
| Gigabyte G5 GD | |
* ... smaller is better
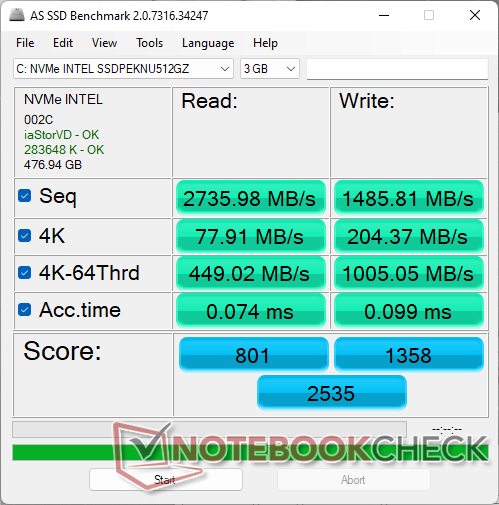
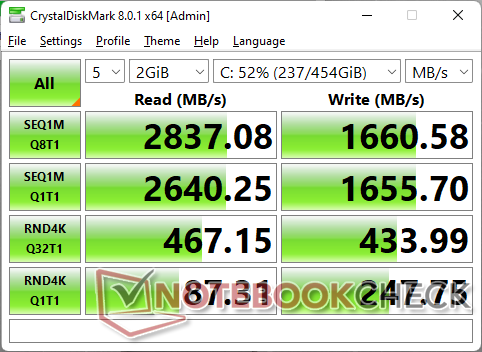
Storage Devices — Supports Up To 2x M.2 SSDs
Our test unit ships with a midrange Intel 670p SSD for a sustained sequential read rate of about 2300 MB/s. The system can support up to two internal M.2 2280 SSDs simultaneously.

| Drive Performance rating - Percent | |
| Gigabyte G5 GD | |
| Asus TUF Dash F15 FX517ZR | |
| Dell G15 5510 | |
| Asus TUF Dash F15 FX517ZC | |
| Lenovo Ideapad Gaming 3 15IHU-82K1002RGE | |
| MSI Bravo 15 B5DD-010US | |
* ... smaller is better
Disk Throttling: DiskSpd Read Loop, Queue Depth 8
GPU Performance
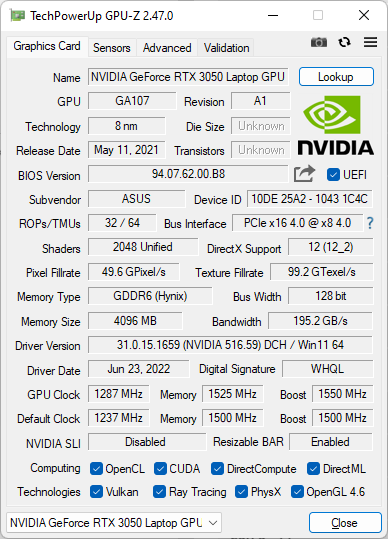
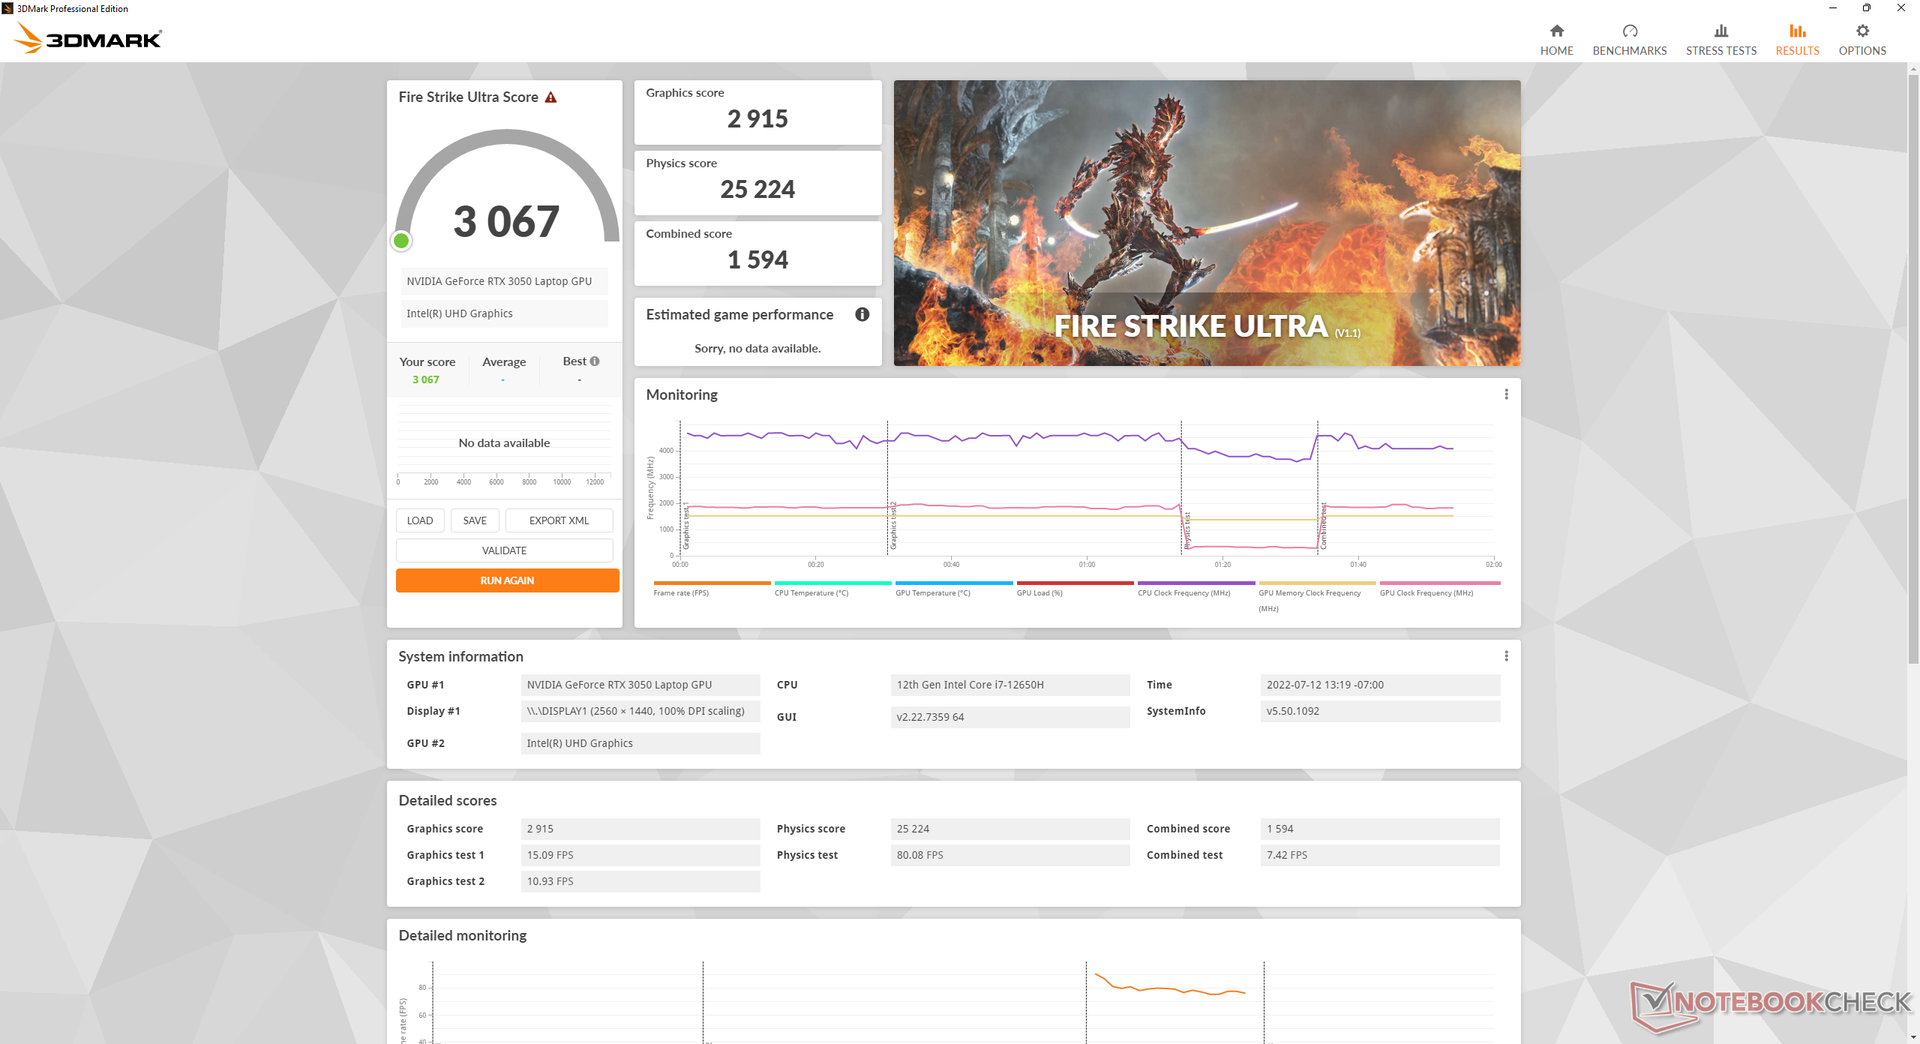
Our 75 W GeForce RTX 3050 is performing roughly 40 percent slower than the 105 W GeForce RTX 3070 in the FX517ZR. The difference becomes more pronounced when running GPU-heavy titles like Cyberpunk 2077 where our RTX 3050 can be almost 50 percent behind. Laptop gamers still running on the older RTX 2060 aren't missing much as the Turing GPU is faster than the RTX 3050 by about 25 percent.
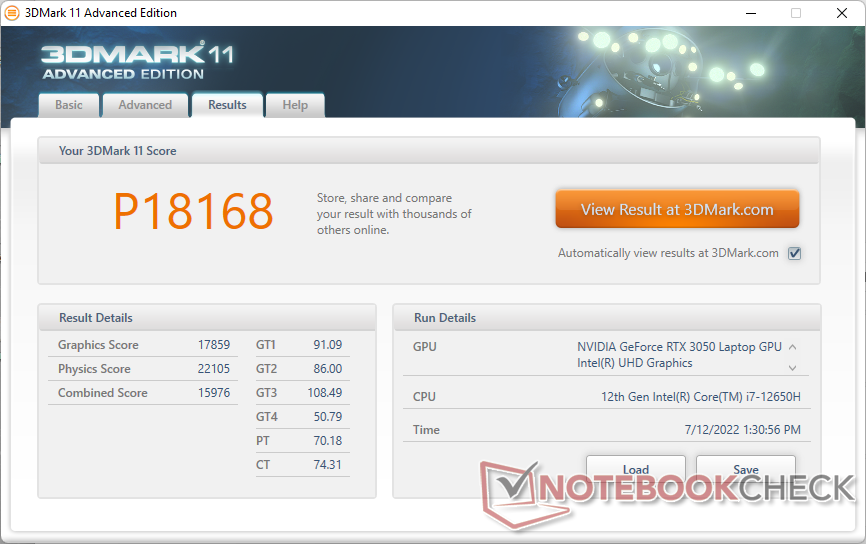
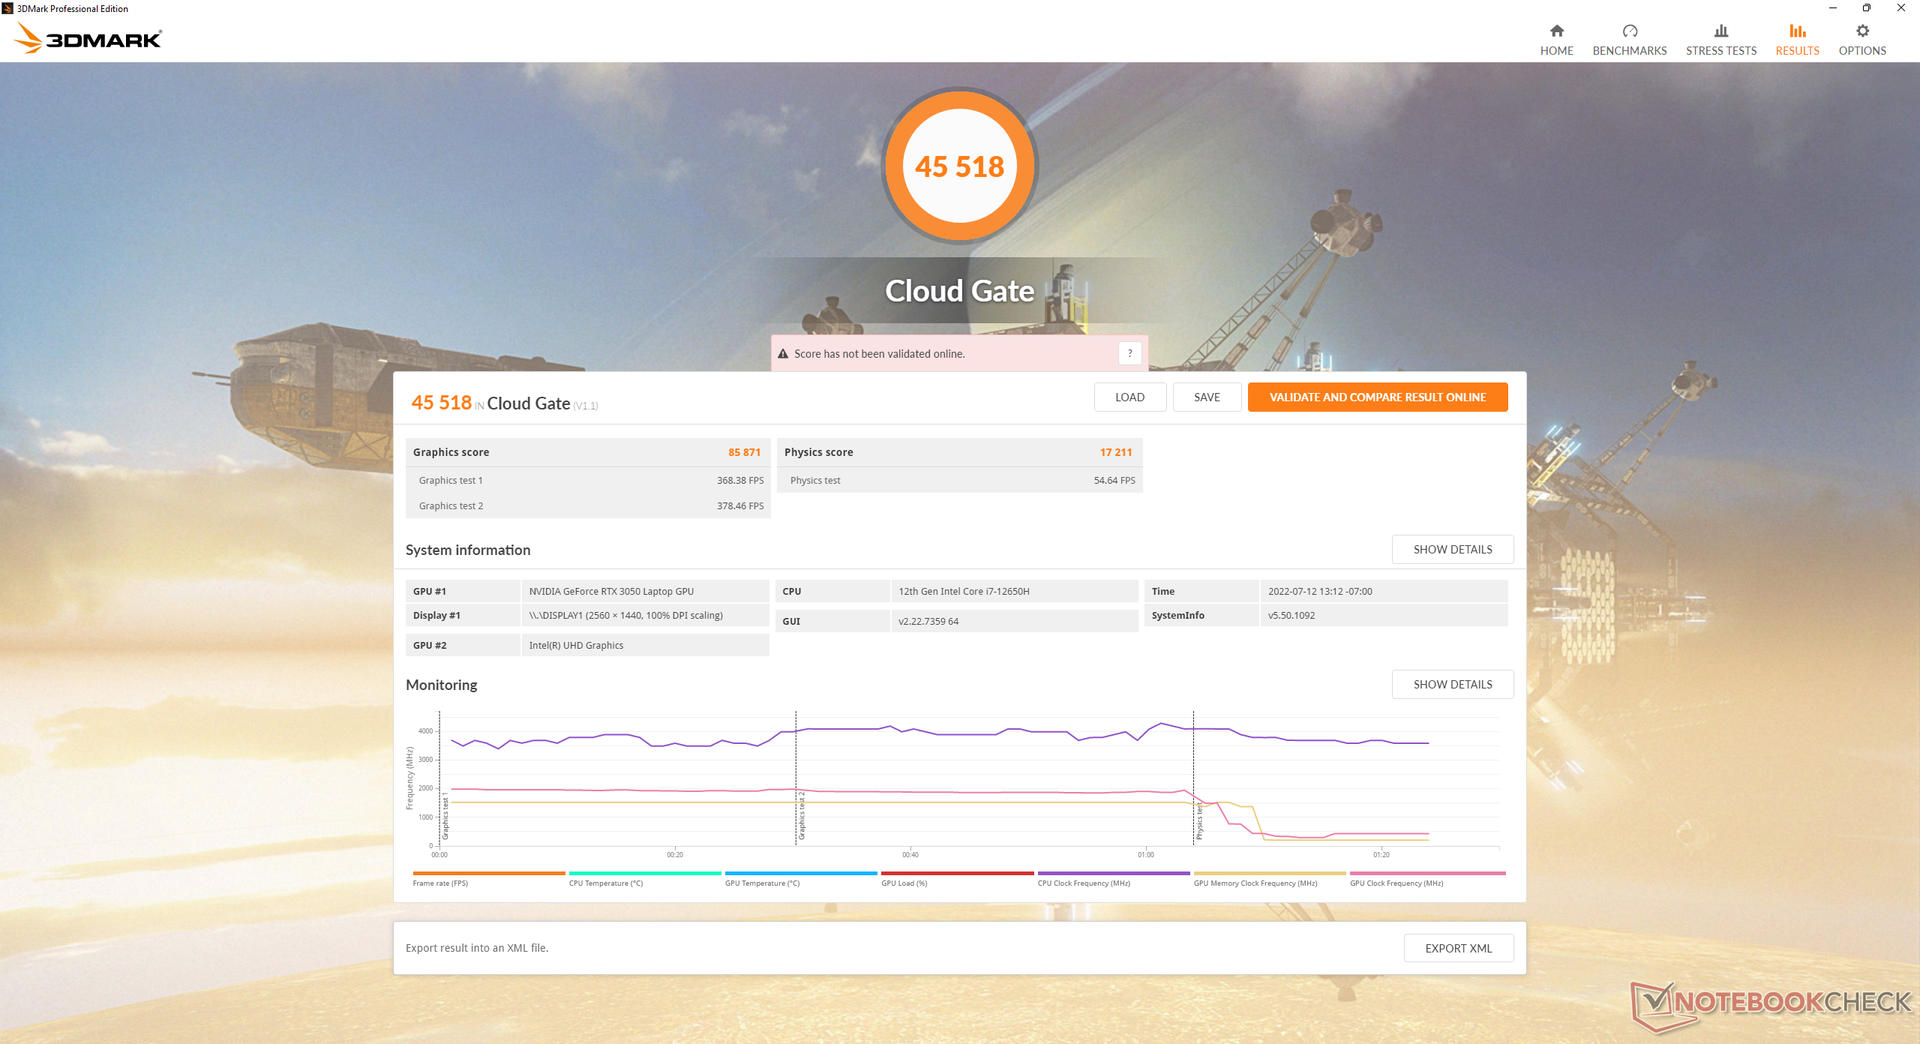
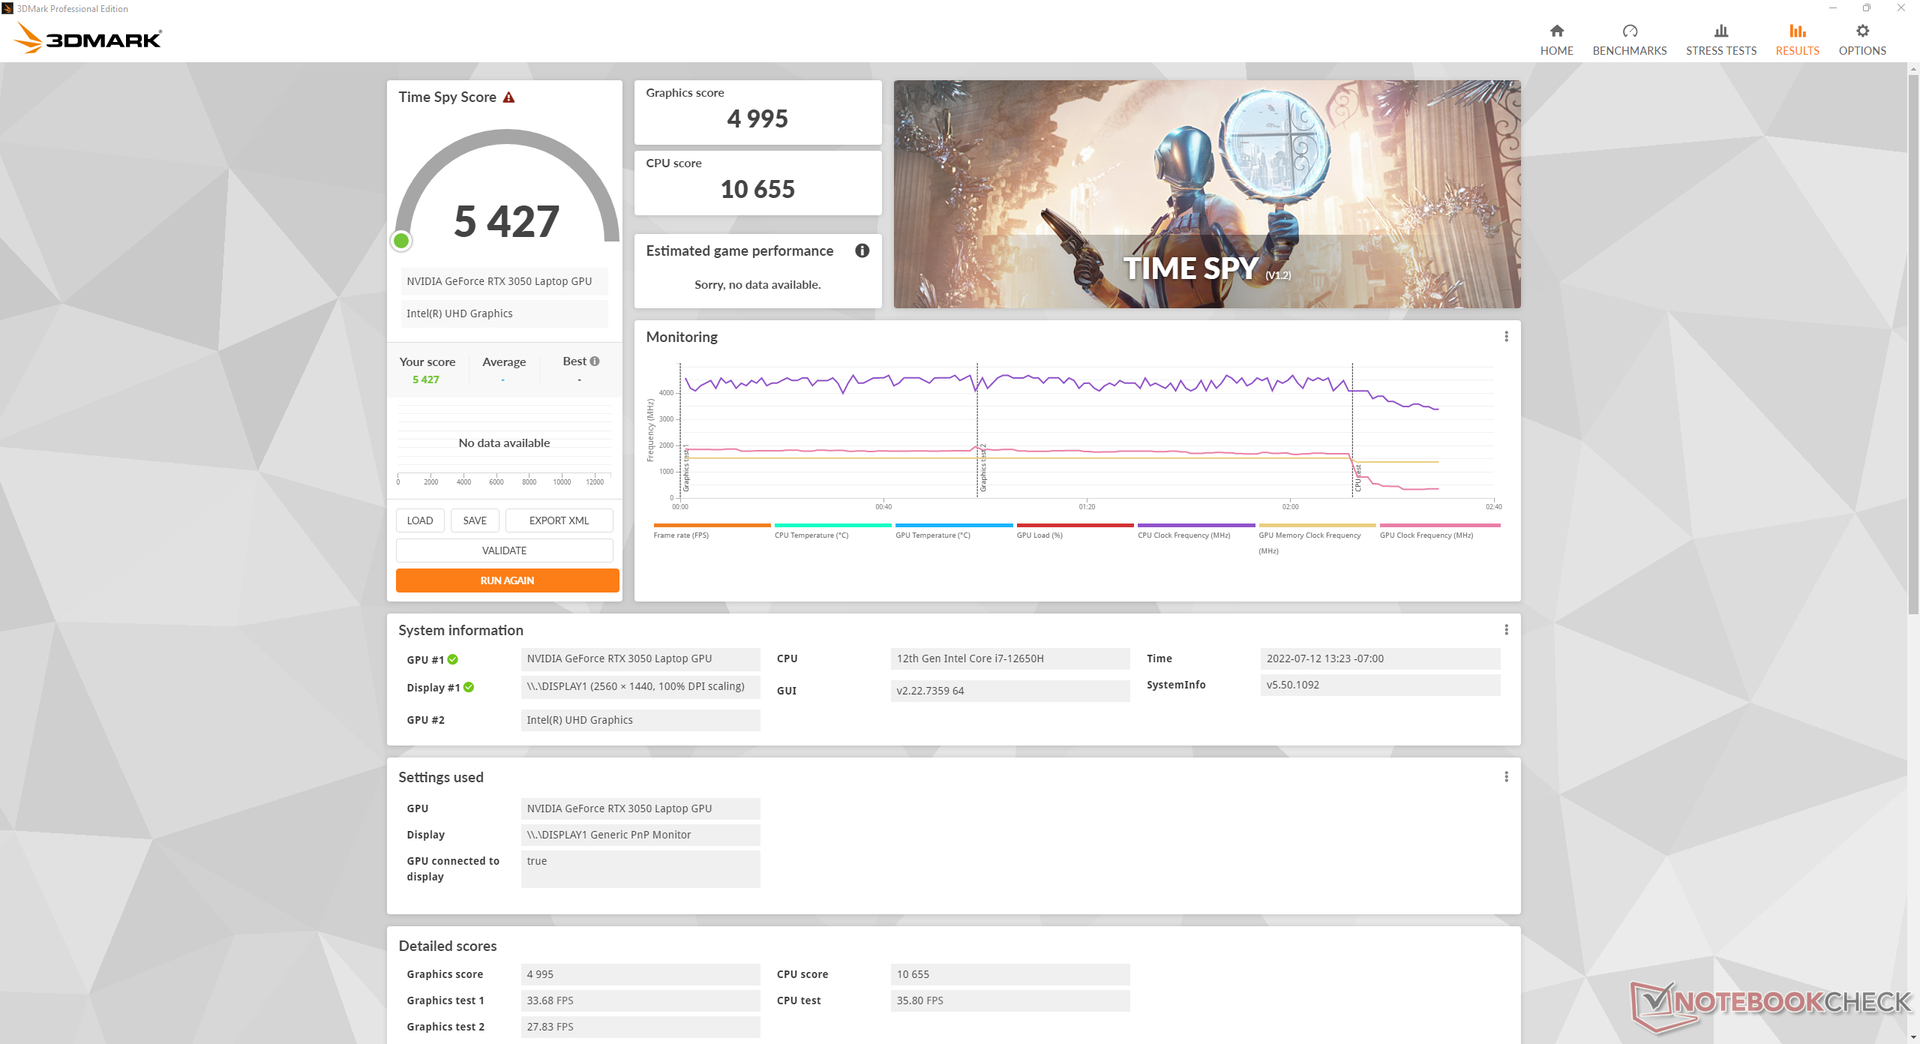
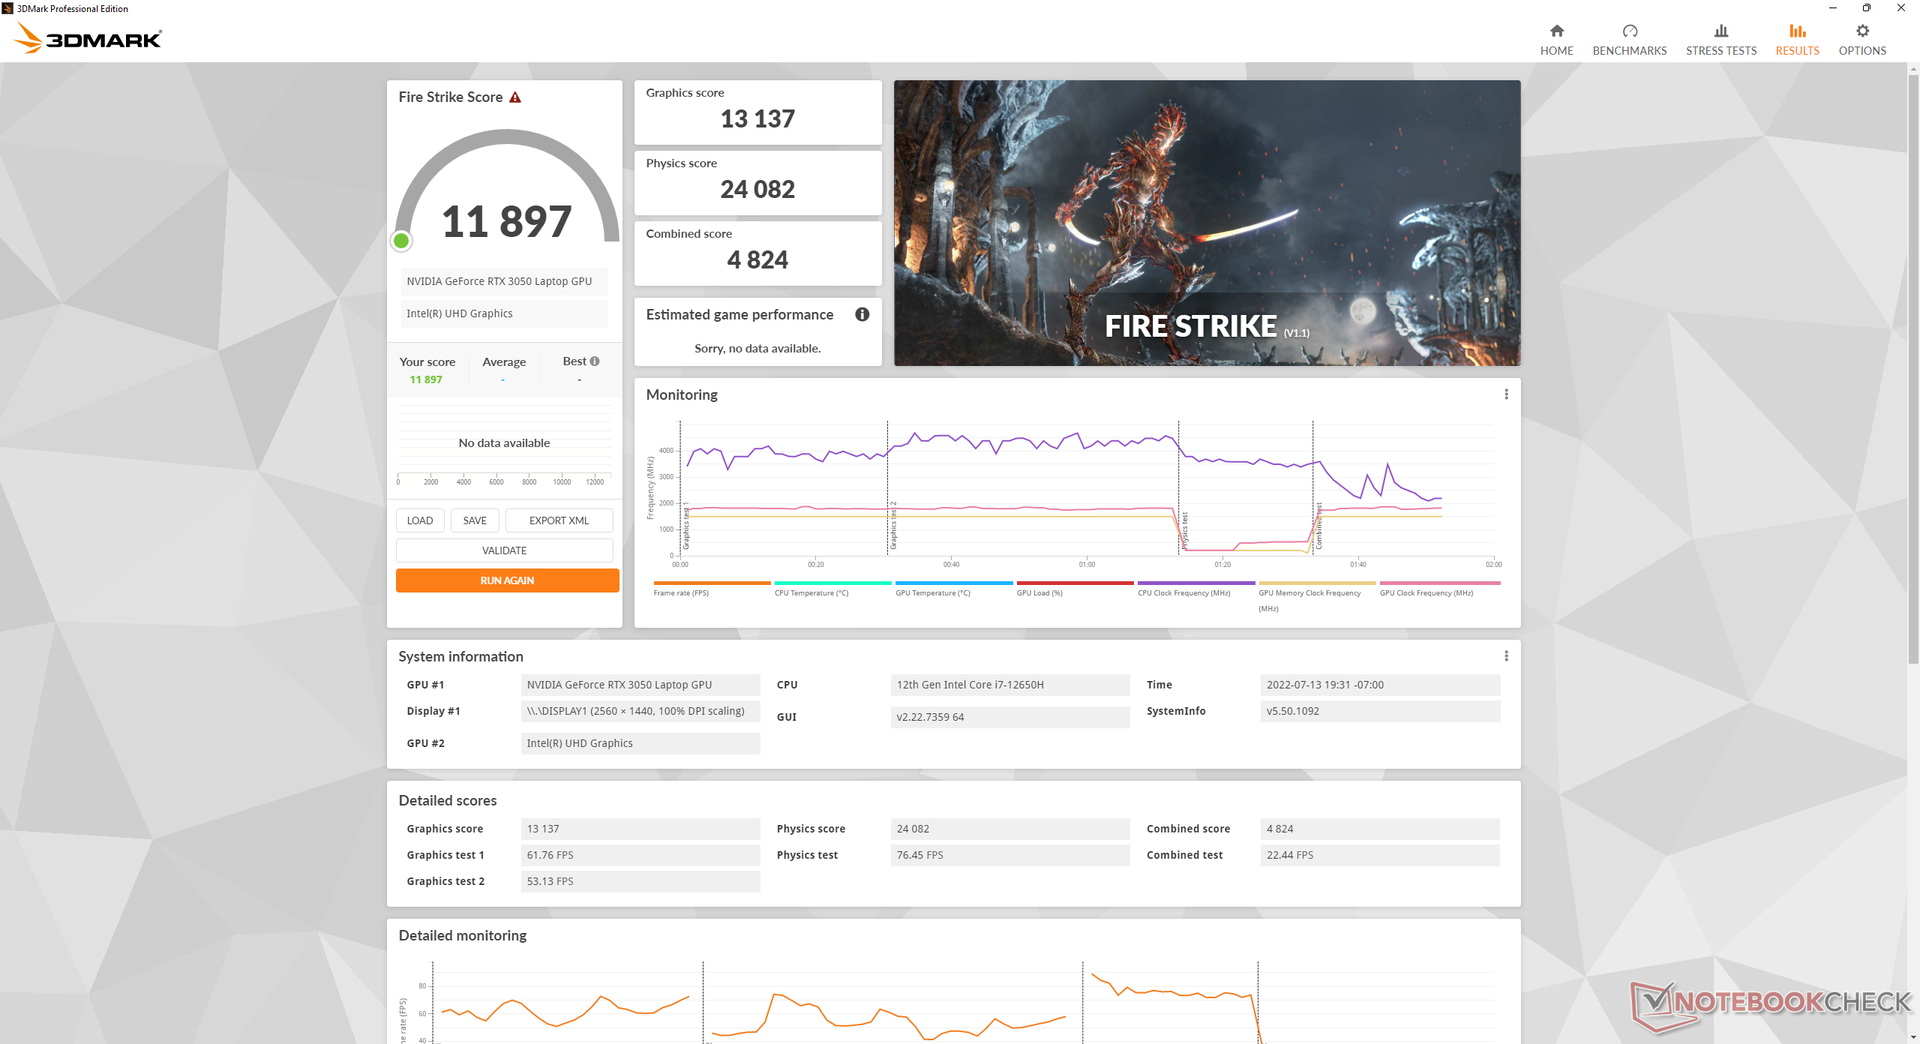
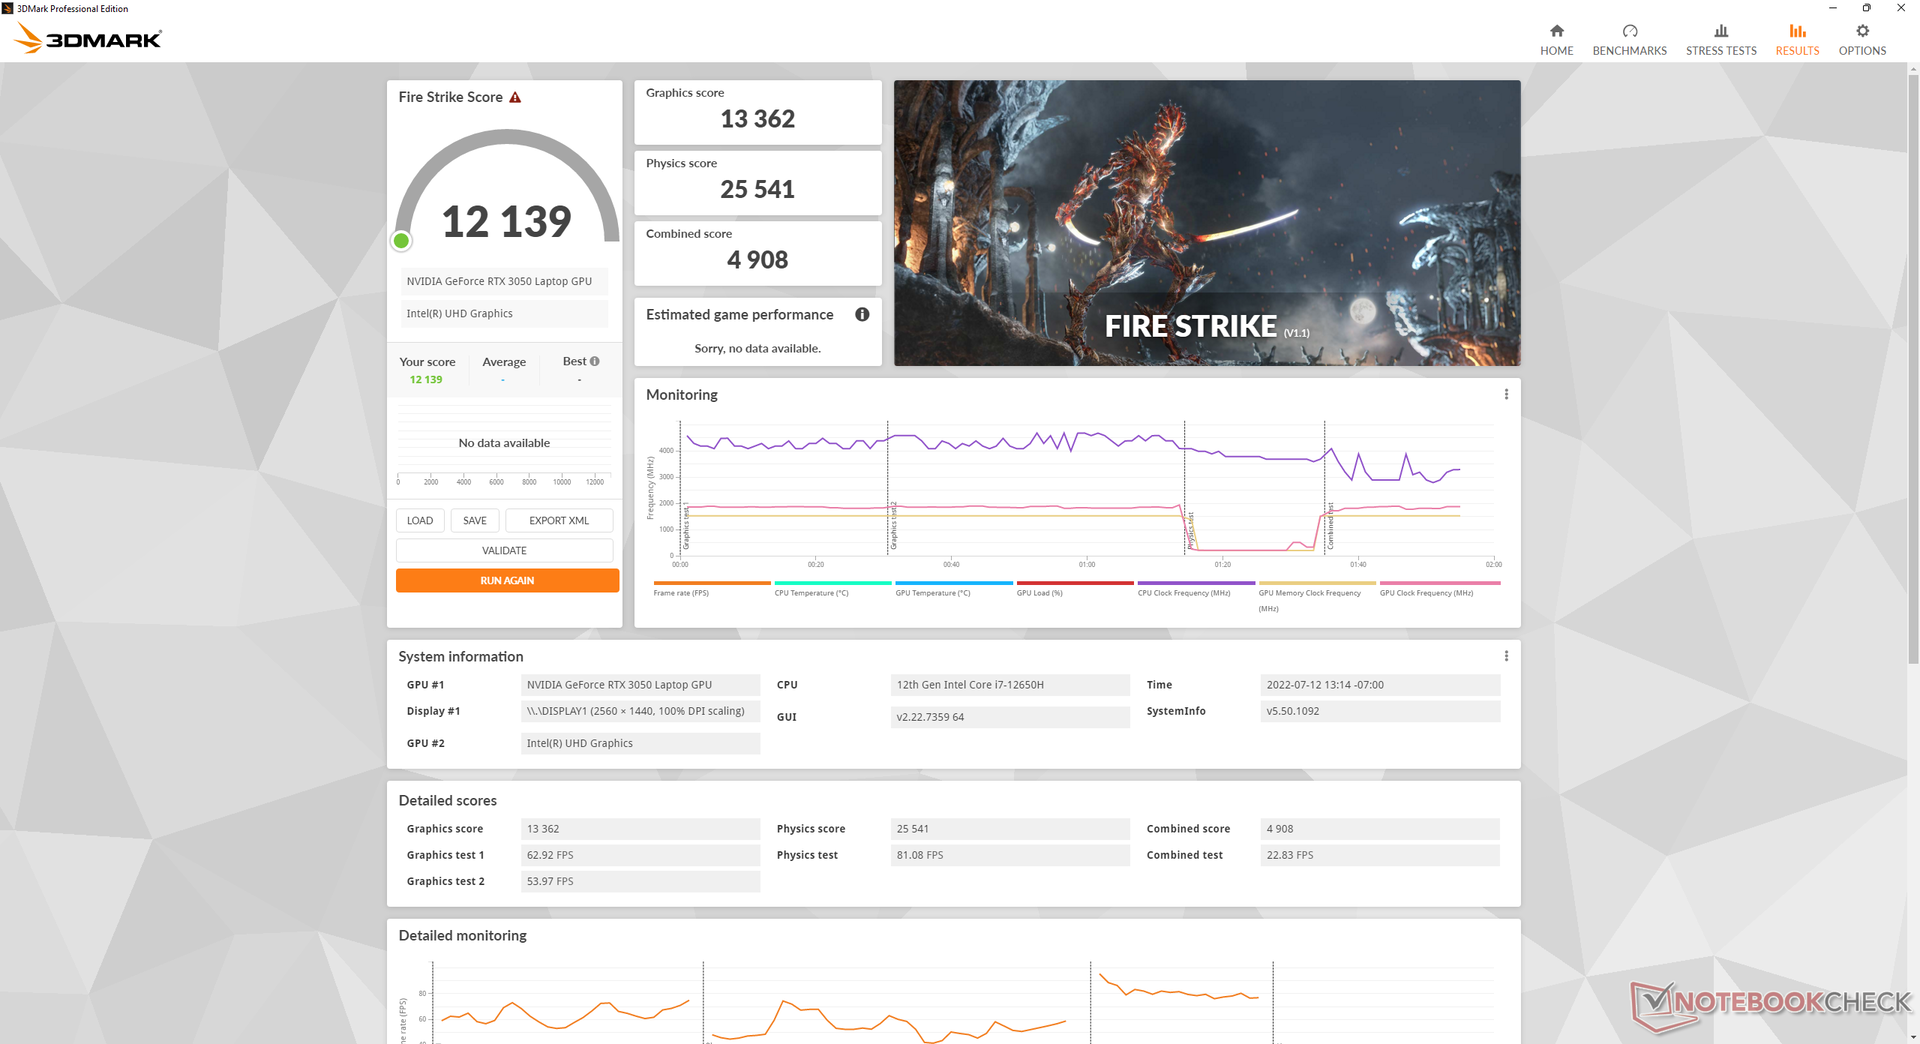
| 3DMark 11 Performance | 18168 points | |
| 3DMark Cloud Gate Standard Score | 45518 points | |
| 3DMark Fire Strike Score | 12139 points | |
| 3DMark Time Spy Score | 5427 points | |
Help | ||
Witcher 3 FPS Chart
| low | med. | high | ultra | |
|---|---|---|---|---|
| GTA V (2015) | 184 | 179 | 148.2 | 70.9 |
| The Witcher 3 (2015) | 282.1 | 171.6 | 98.7 | 51.9 |
| Dota 2 Reborn (2015) | 176.5 | 163.2 | 156.3 | 147.7 |
| Final Fantasy XV Benchmark (2018) | 143.4 | 74 | 51 | |
| X-Plane 11.11 (2018) | 148.1 | 129.9 | 103.1 | |
| Strange Brigade (2018) | 320 | 135.8 | 108.1 | 90.8 |
| Cyberpunk 2077 1.6 (2022) | 77.9 | 62.1 | 44 | 36.1 |
Emissions
System Noise — Over 50 dB(A) When Gaming
Fan noise is highly dependent on the Armoury Crate power profile settings: Windows, Silent, Balanced, Turbo, and Manual. We highly recommend Silent mode if simply web browsing or streaming as the internal fans can otherwise be quite loud. If on Balanced mode, for example, the fan would frequently pulse to 32 dB(A) against a silent background of 24 dB(A) just from web browsing.
Fan noise would stabilize at 48.7 dB(A) and 53.4 dB(A) when gaming on Balanced mode and Turbo mode, respectively. Our Stress Test section below shows that higher TDP and TGP are only accessible on Turbo mode meaning users must endure the louder fans if they wish to extract the full performance of the laptop. The 50+ dB(A) range is higher than on most other gaming laptops including the Dell G15 5510 or Lenovo Ideapad Gaming 3 15 each with the same RTX 3050 GPU.
Noise level
| Idle |
| 24 / 24 / 32.3 dB(A) |
| Load |
| 43.7 / 53.6 dB(A) |
 | ||
30 dB silent 40 dB(A) audible 50 dB(A) loud |
||
min: | ||
| Asus TUF Dash F15 FX517ZC GeForce RTX 3050 4GB Laptop GPU, i7-12650H, Intel SSD 670p SSDPEKNU512GZ | Asus TUF Dash F15 FX517ZR GeForce RTX 3070 Laptop GPU, i7-12650H, Samsung PM991a MZVLQ1T0HBLB | Dell G15 5510 GeForce RTX 3050 4GB Laptop GPU, i5-10500H, SK Hynix BC711 HFM512GD3HX015N | MSI Bravo 15 B5DD-010US Radeon RX 5500M, R5 5600H, Kingston OM8PCP3512F-AB | Lenovo Ideapad Gaming 3 15IHU-82K1002RGE GeForce RTX 3050 Ti Laptop GPU, i5-11300H, Micron 2210 MTFDHBA512QFD | Gigabyte G5 GD GeForce RTX 3050 4GB Laptop GPU, i5-11400H, ESR512GTLG-E6GBTNB4 | |
|---|---|---|---|---|---|---|
| Noise | -6% | -1% | -2% | 4% | -9% | |
| off / environment * (dB) | 23.9 | 26 -9% | 26 -9% | 24.5 -3% | 23.9 -0% | 24 -0% |
| Idle Minimum * (dB) | 24 | 26 -8% | 26 -8% | 24.5 -2% | 23.9 -0% | 29 -21% |
| Idle Average * (dB) | 24 | 32 -33% | 27 -13% | 32.8 -37% | 26.8 -12% | 30 -25% |
| Idle Maximum * (dB) | 32.3 | 33 -2% | 33 -2% | 32.8 -2% | 26.8 17% | 32 1% |
| Load Average * (dB) | 43.7 | 48 -10% | 45 -3% | 34.5 21% | 43.5 -0% | 53 -21% |
| Witcher 3 ultra * (dB) | 53.4 | 47 12% | 45 16% | 42.5 20% | 43.5 19% | 52 3% |
| Load Maximum * (dB) | 53.6 | 49 9% | 47 12% | 58.5 -9% | 53.1 1% | 54 -1% |
* ... smaller is better
Temperature
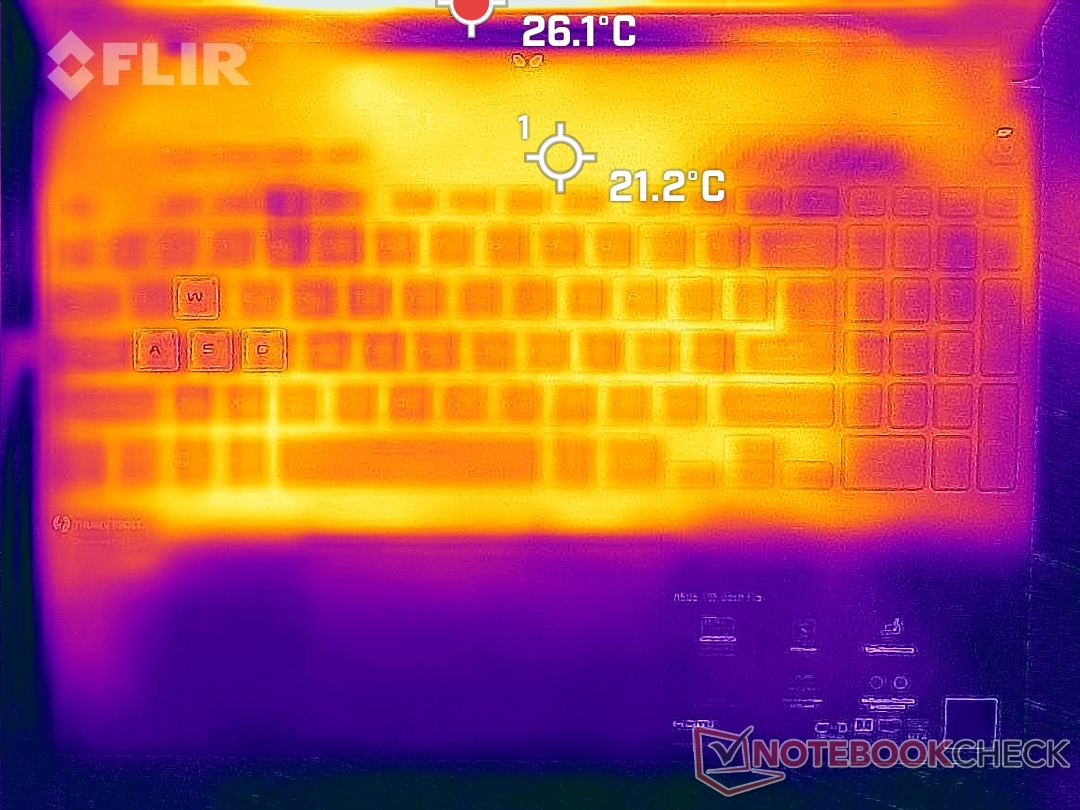
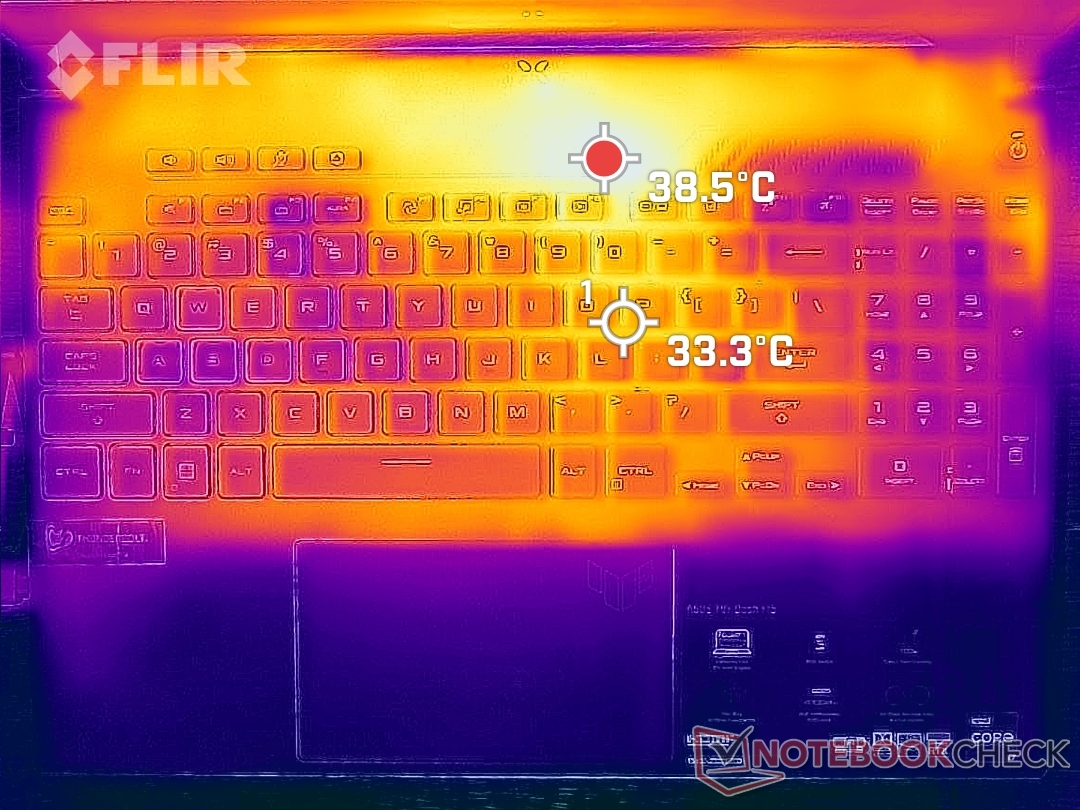
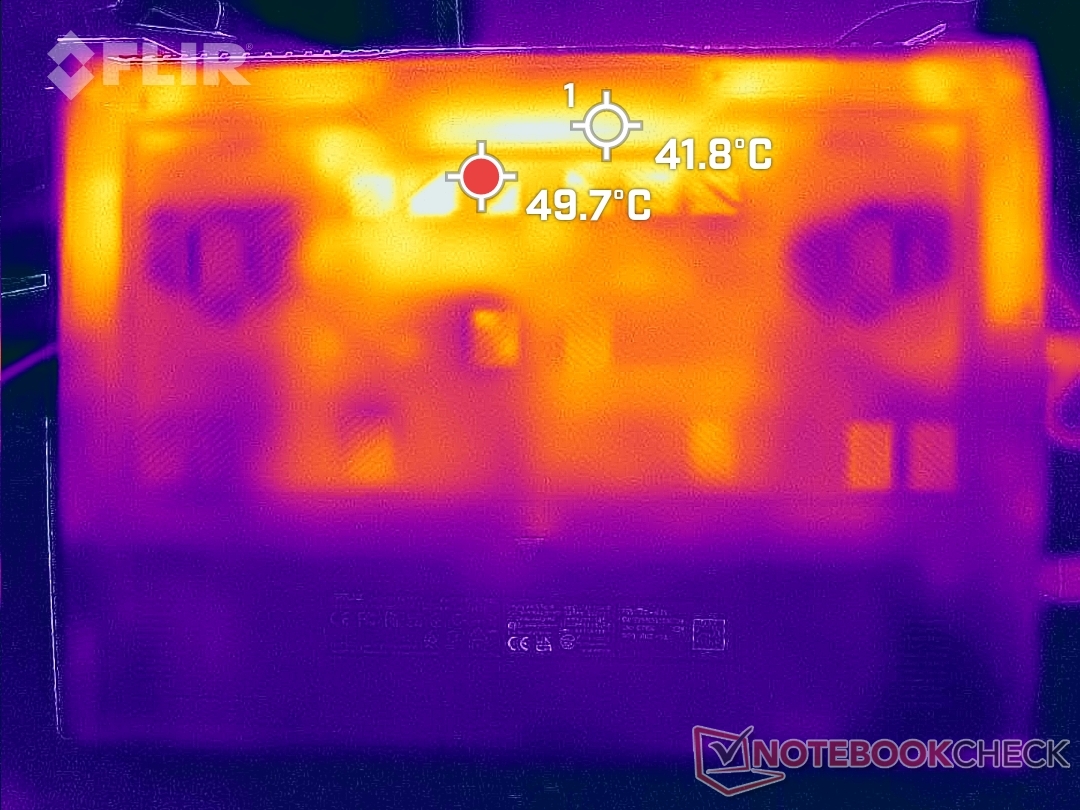
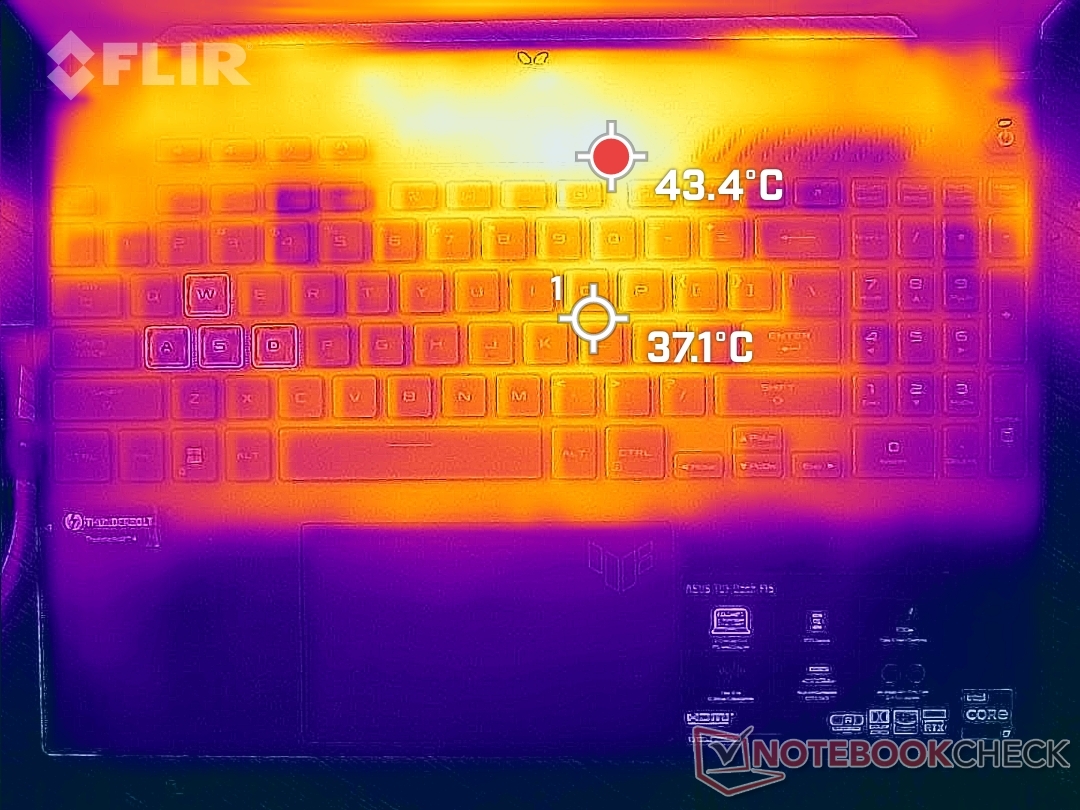
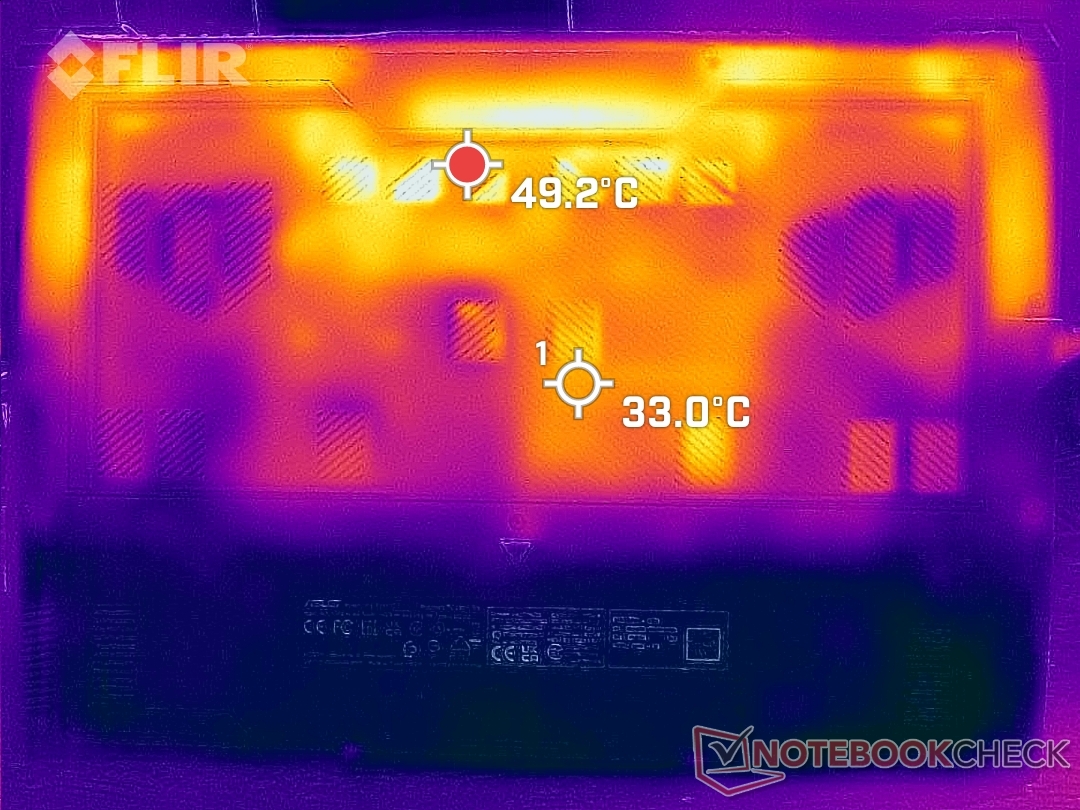
Surface temperatures can reach 33 C to 37 C on the keyboard center when gaming which is cooler than what we observed on the Acer Swift X 16 equipped with the same RTX 3050 GPU by more than a few degrees. The hot spot on the Asus can reach 43 C or higher, but this area is thankfully above the first row of keyboard keys as shown by the temperature maps below where users are unlikely to touch when gaming.
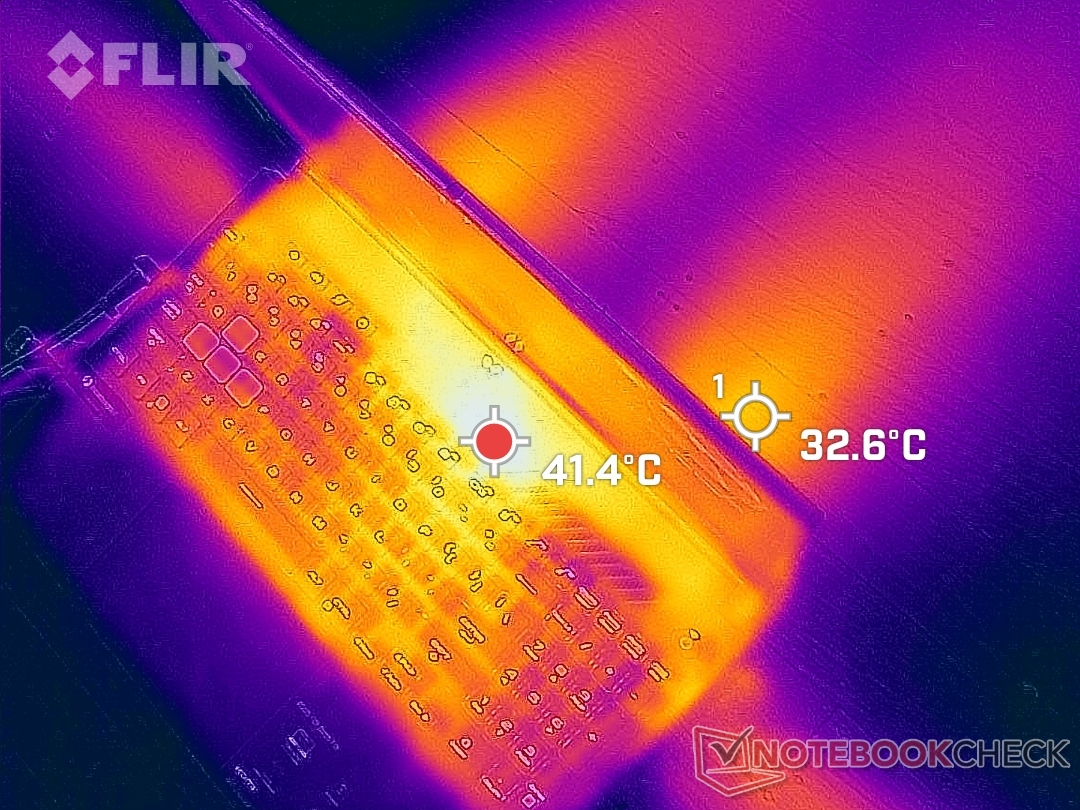
(±) The maximum temperature on the upper side is 43.4 °C / 110 F, compared to the average of 40.4 °C / 105 F, ranging from 21.2 to 68.8 °C for the class Gaming.
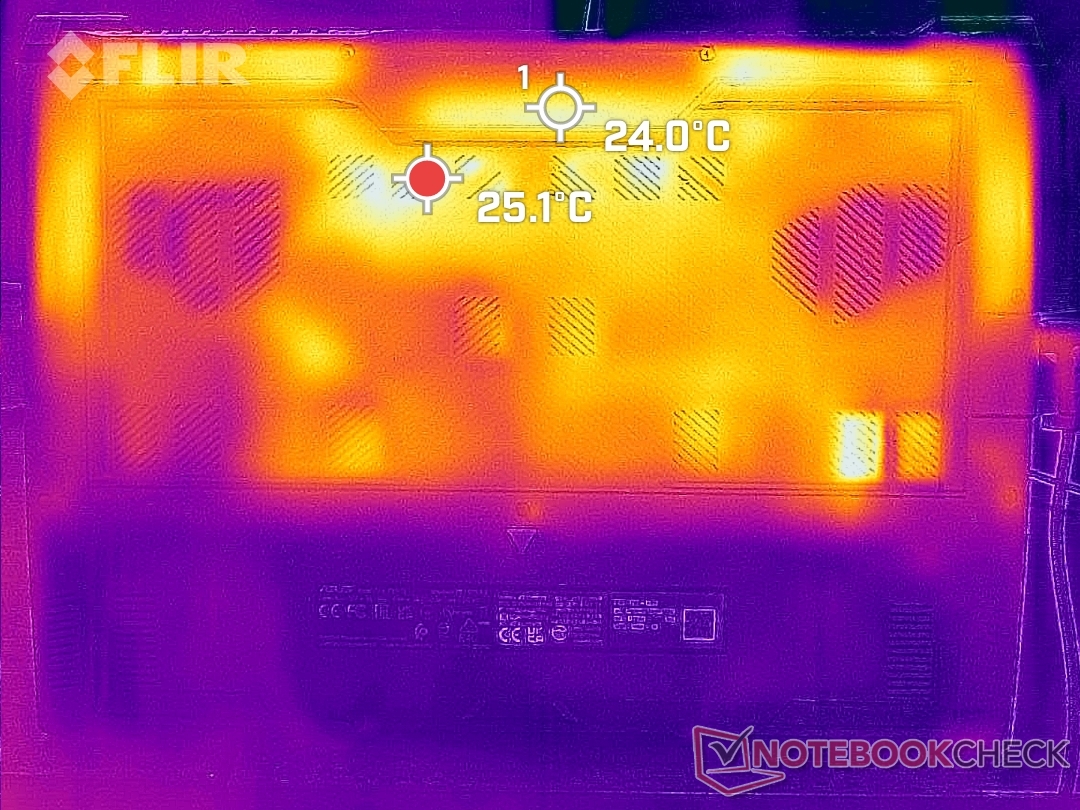
(±) The bottom heats up to a maximum of 44.4 °C / 112 F, compared to the average of 43.2 °C / 110 F
(+) In idle usage, the average temperature for the upper side is 19.2 °C / 67 F, compared to the device average of 33.9 °C / 93 F.
(+) Playing The Witcher 3, the average temperature for the upper side is 26.3 °C / 79 F, compared to the device average of 33.9 °C / 93 F.
(+) The palmrests and touchpad are cooler than skin temperature with a maximum of 19.4 °C / 66.9 F and are therefore cool to the touch.
(+) The average temperature of the palmrest area of similar devices was 28.8 °C / 83.8 F (+9.4 °C / 16.9 F).
| Asus TUF Dash F15 FX517ZC Intel Core i7-12650H, NVIDIA GeForce RTX 3050 4GB Laptop GPU | Asus TUF Dash F15 FX517ZR Intel Core i7-12650H, NVIDIA GeForce RTX 3070 Laptop GPU | Dell G15 5510 Intel Core i5-10500H, NVIDIA GeForce RTX 3050 4GB Laptop GPU | MSI Bravo 15 B5DD-010US AMD Ryzen 5 5600H, AMD Radeon RX 5500M | Lenovo Ideapad Gaming 3 15IHU-82K1002RGE Intel Core i5-11300H, NVIDIA GeForce RTX 3050 Ti Laptop GPU | Gigabyte G5 GD Intel Core i5-11400H, NVIDIA GeForce RTX 3050 4GB Laptop GPU | |
|---|---|---|---|---|---|---|
| Heat | -36% | -15% | -32% | -10% | -20% | |
| Maximum Upper Side * (°C) | 43.4 | 52 -20% | 52 -20% | 52.2 -20% | 43.2 -0% | 45 -4% |
| Maximum Bottom * (°C) | 44.4 | 52 -17% | 49 -10% | 48.6 -9% | 47.9 -8% | 50 -13% |
| Idle Upper Side * (°C) | 21.2 | 33 -56% | 26 -23% | 38 -79% | 24.9 -17% | 28 -32% |
| Idle Bottom * (°C) | 24 | 36 -50% | 26 -8% | 28.4 -18% | 27 -13% | 31 -29% |
* ... smaller is better
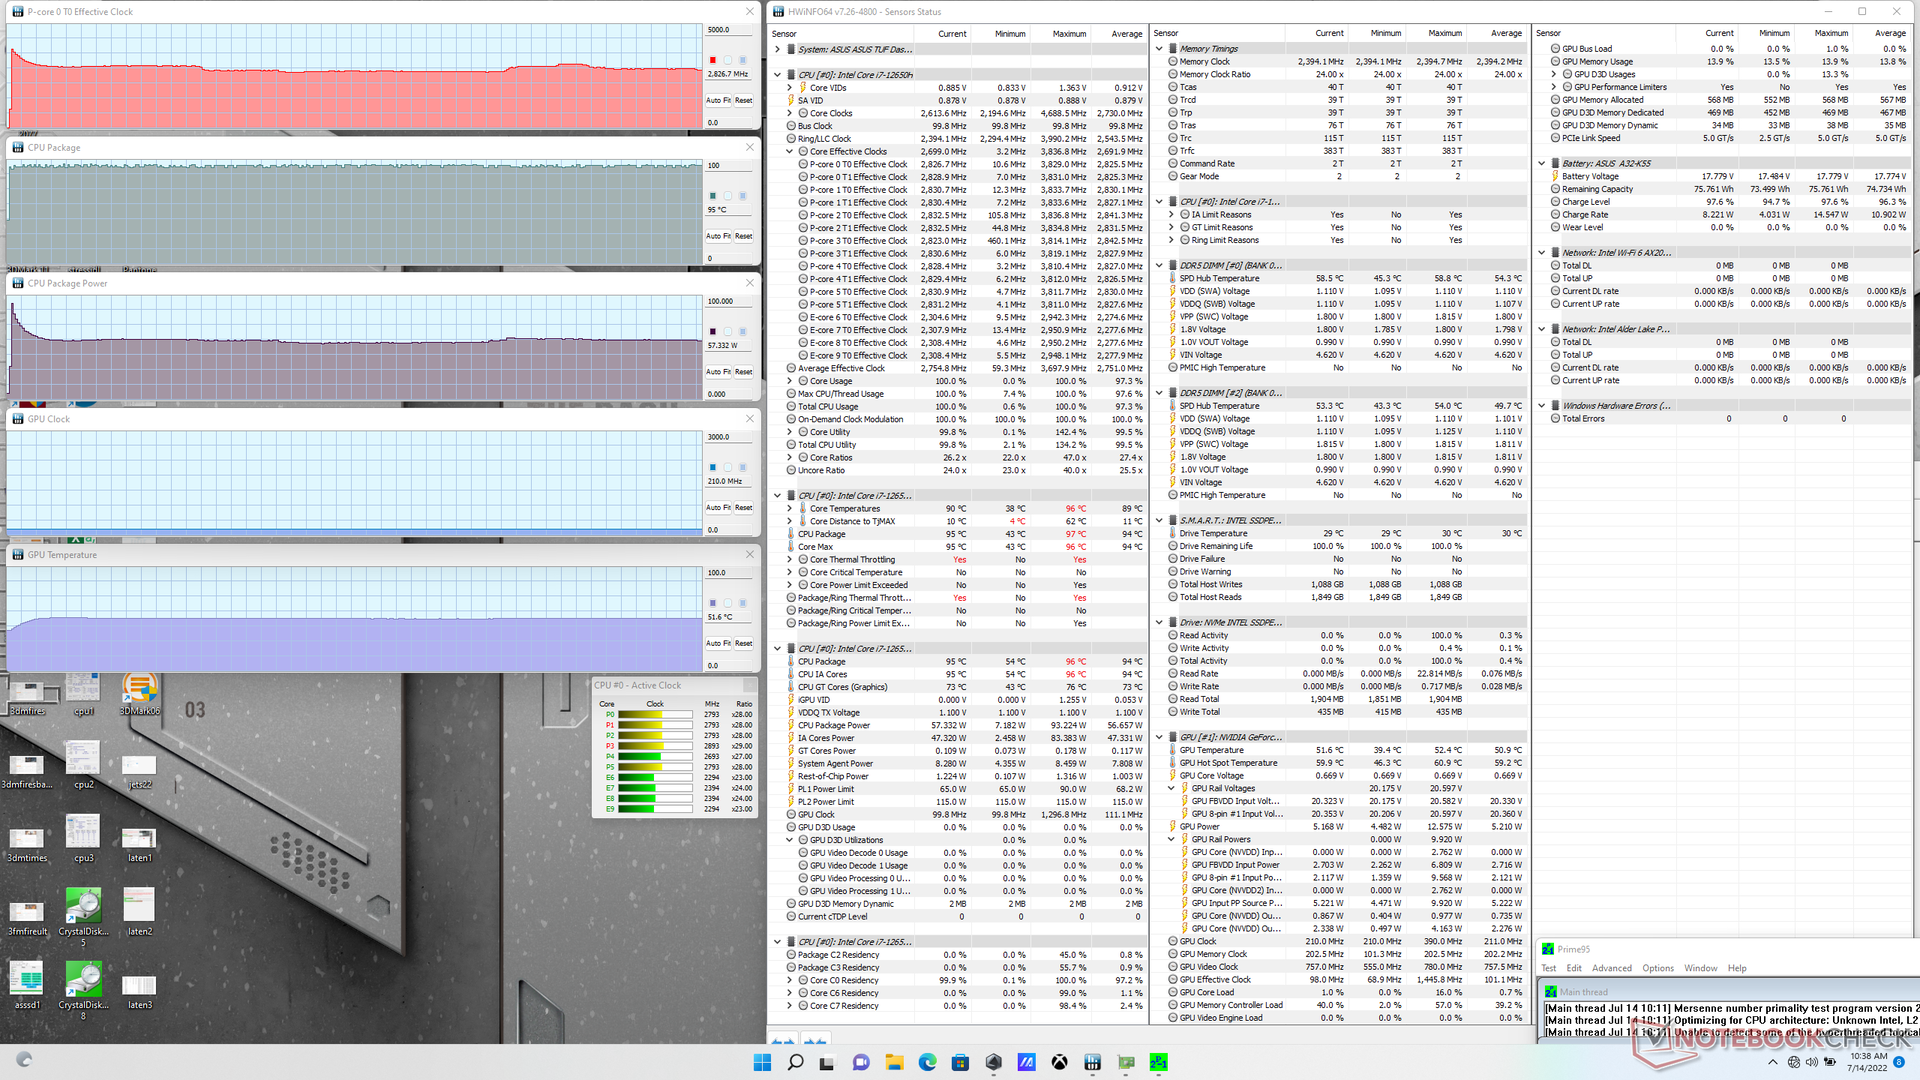
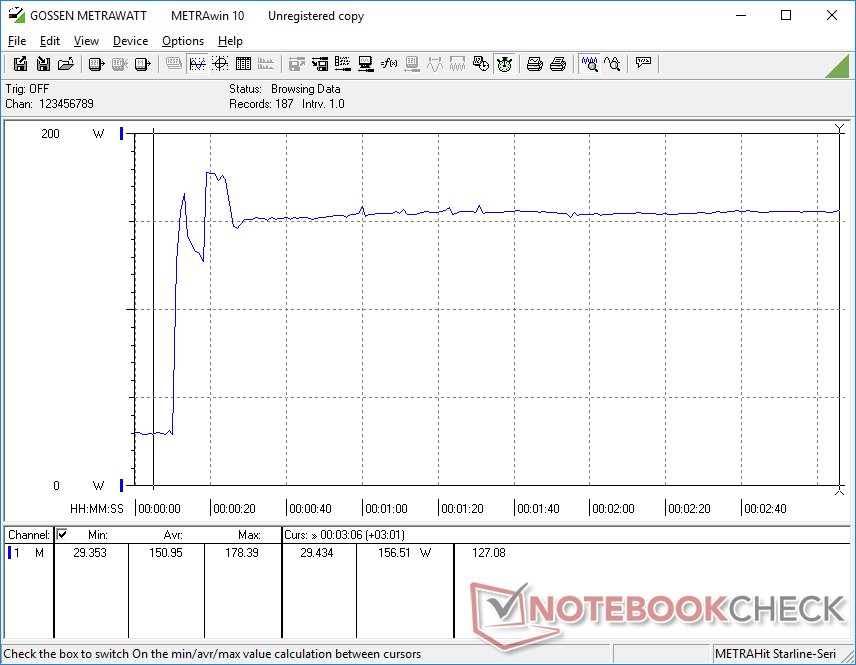
Stress Test
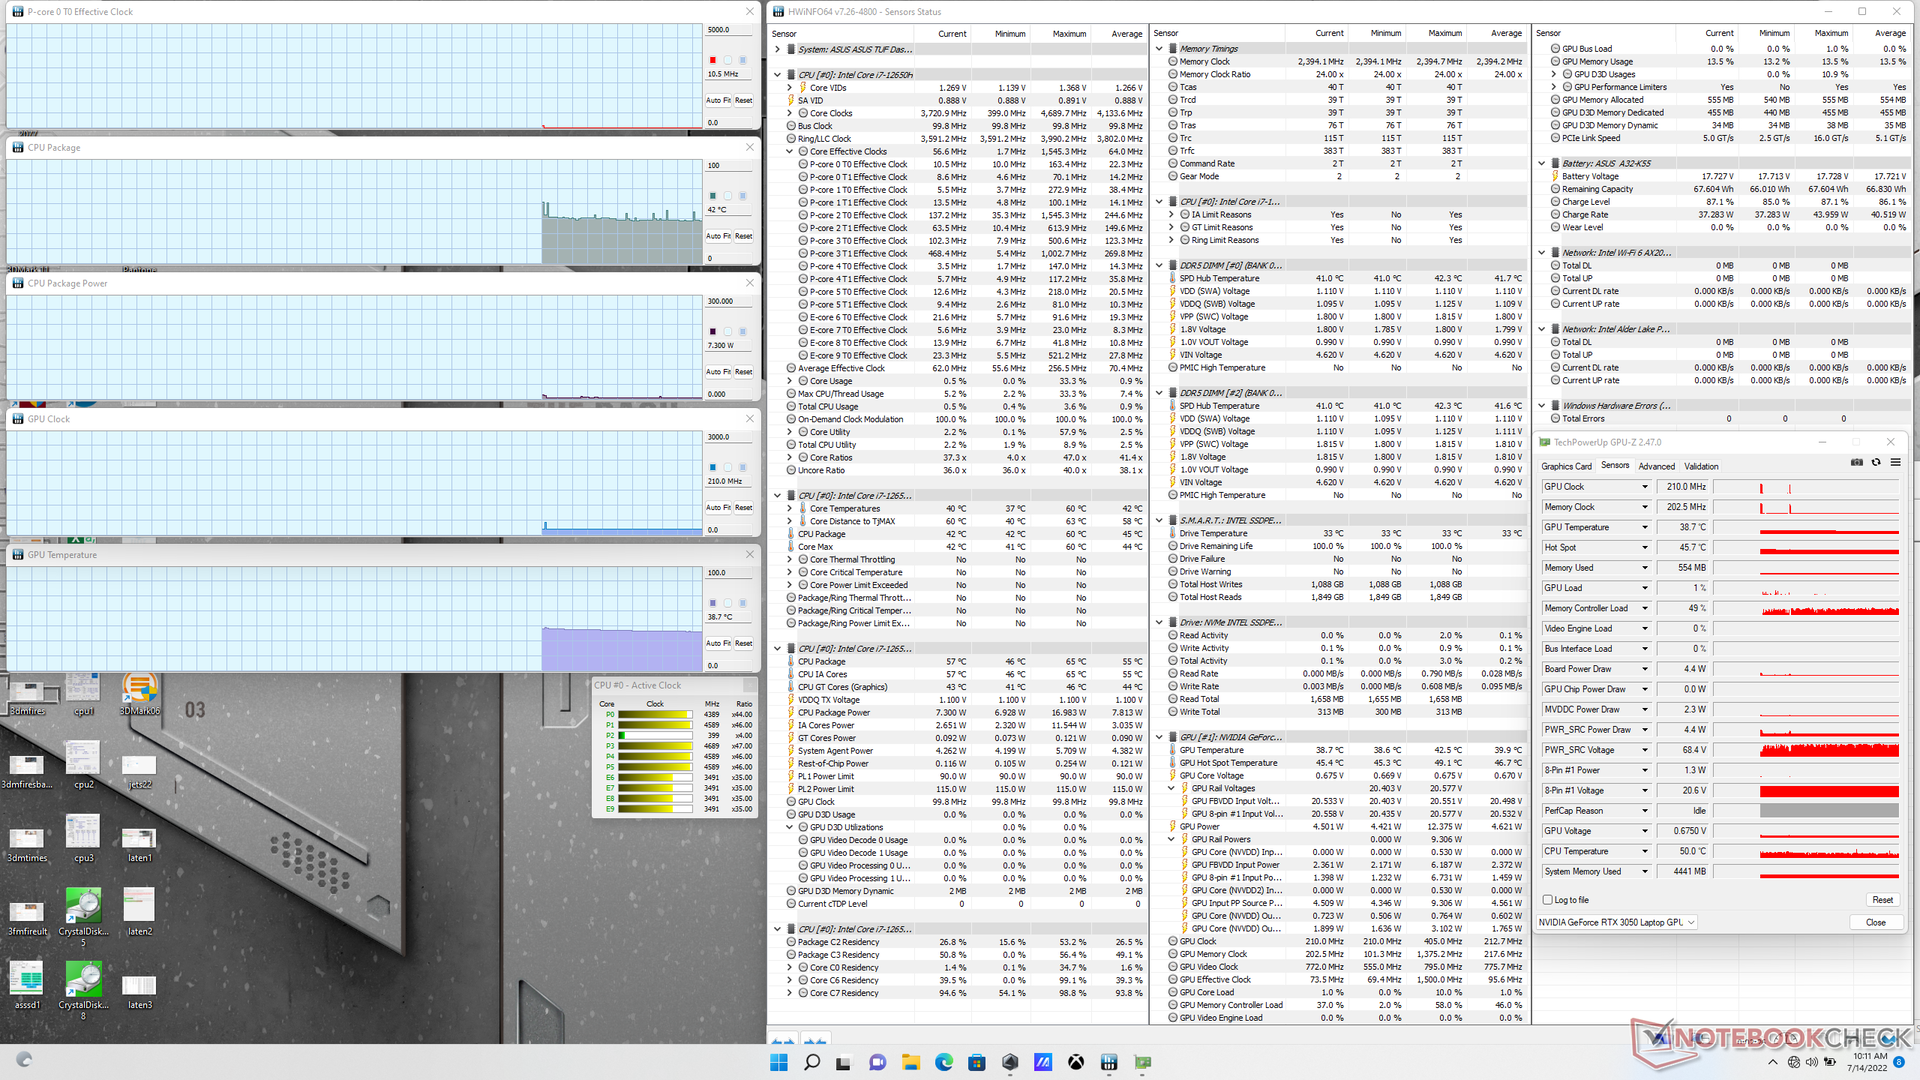
CPU clock rates, core temperature, and package power draw would spike to 3.7 GHz, 95 C, and 93 W, respectively, when initiating Prime95 stress. However, clock rates would immediately begin falling before eventually stabilizing at 2.9 GHz and a package power draw of 57 W in order to prevent core temperatures from reaching any higher. It's clear that the cooling solution is a limiting factor to higher CPU performance.
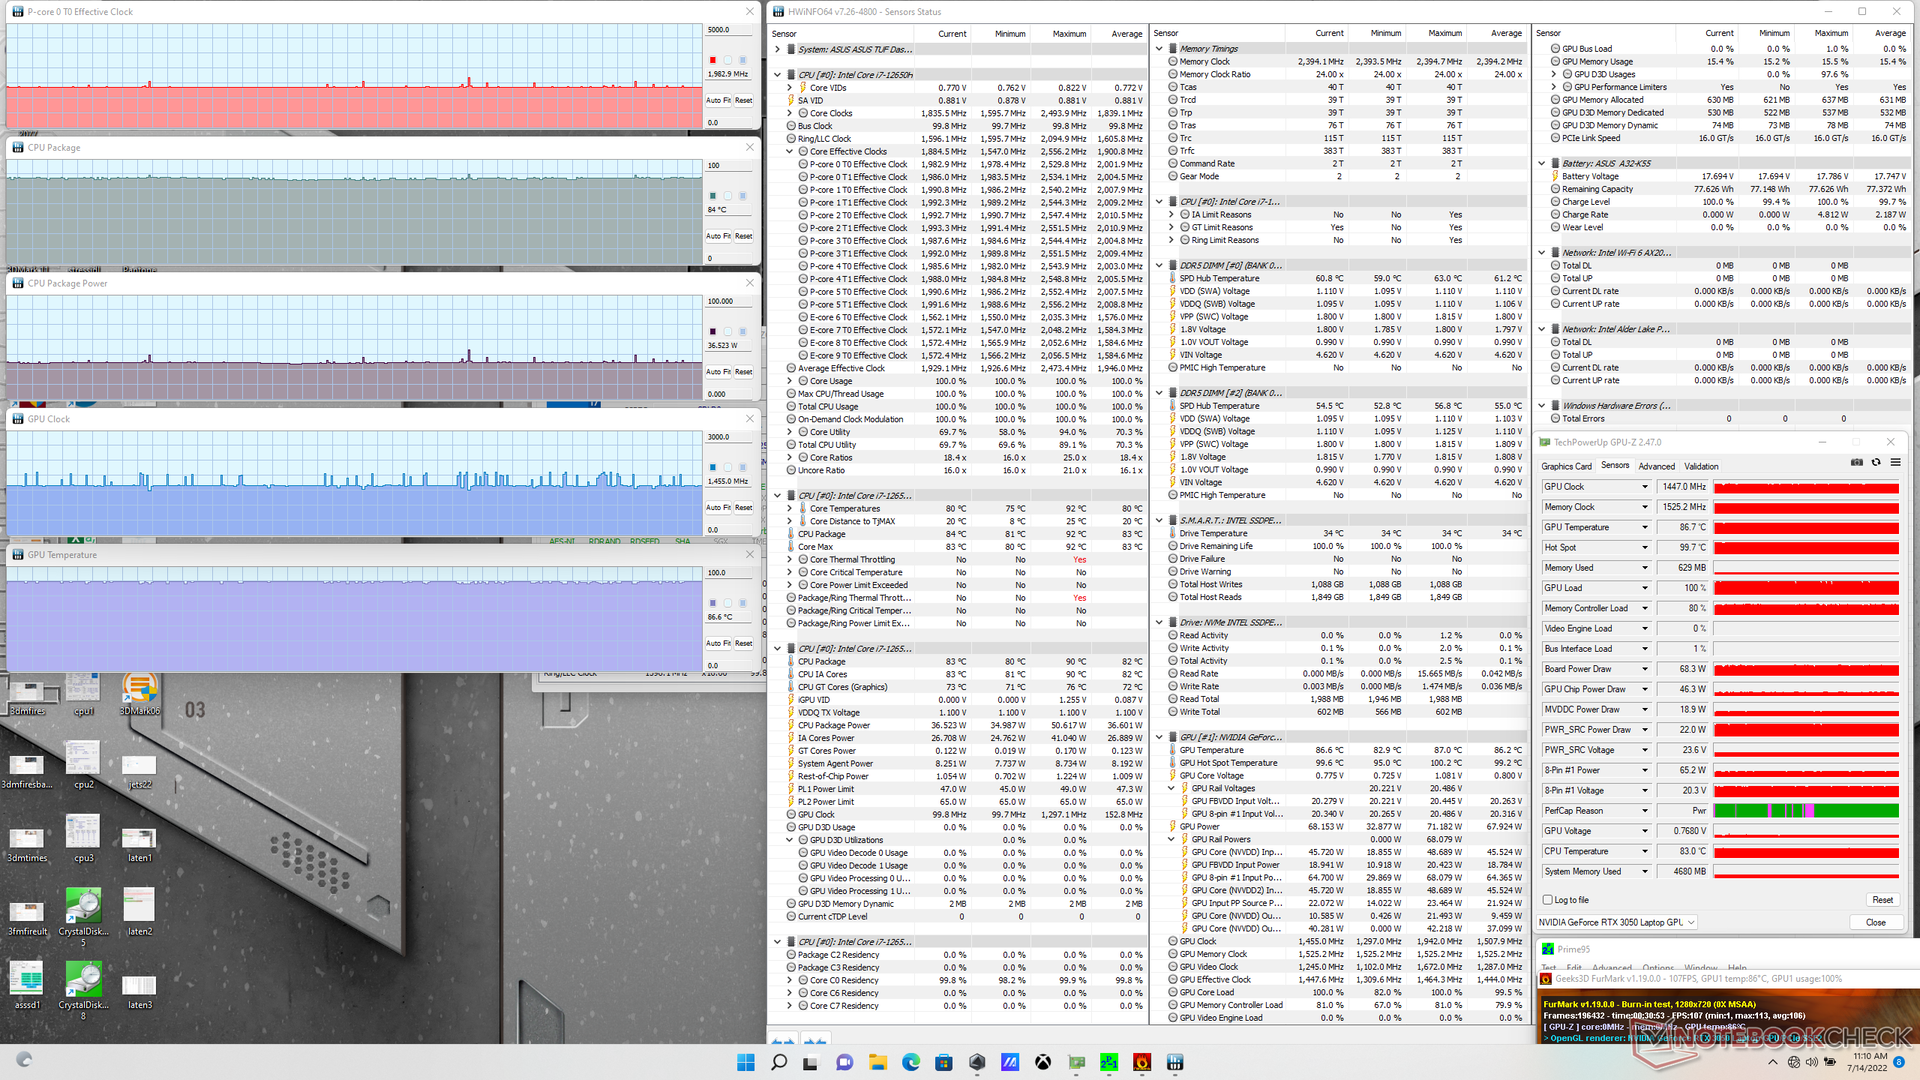
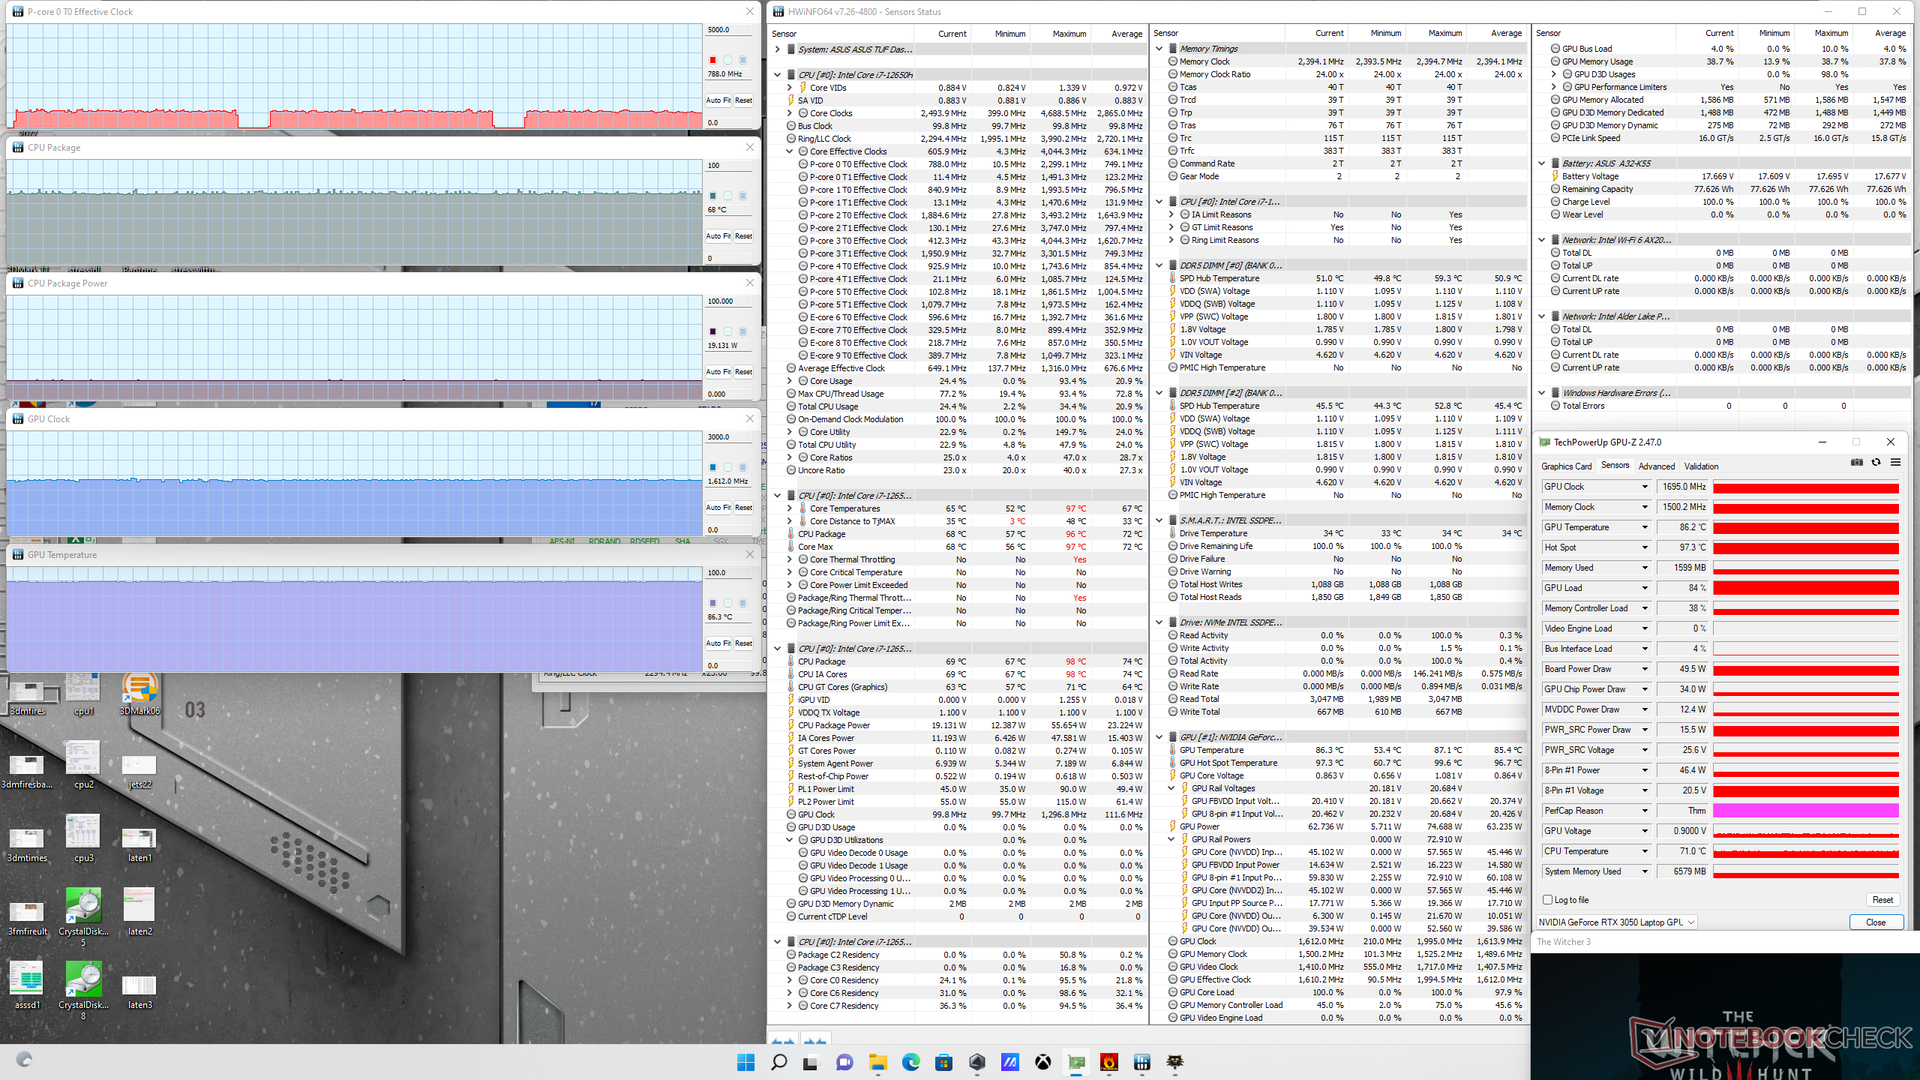
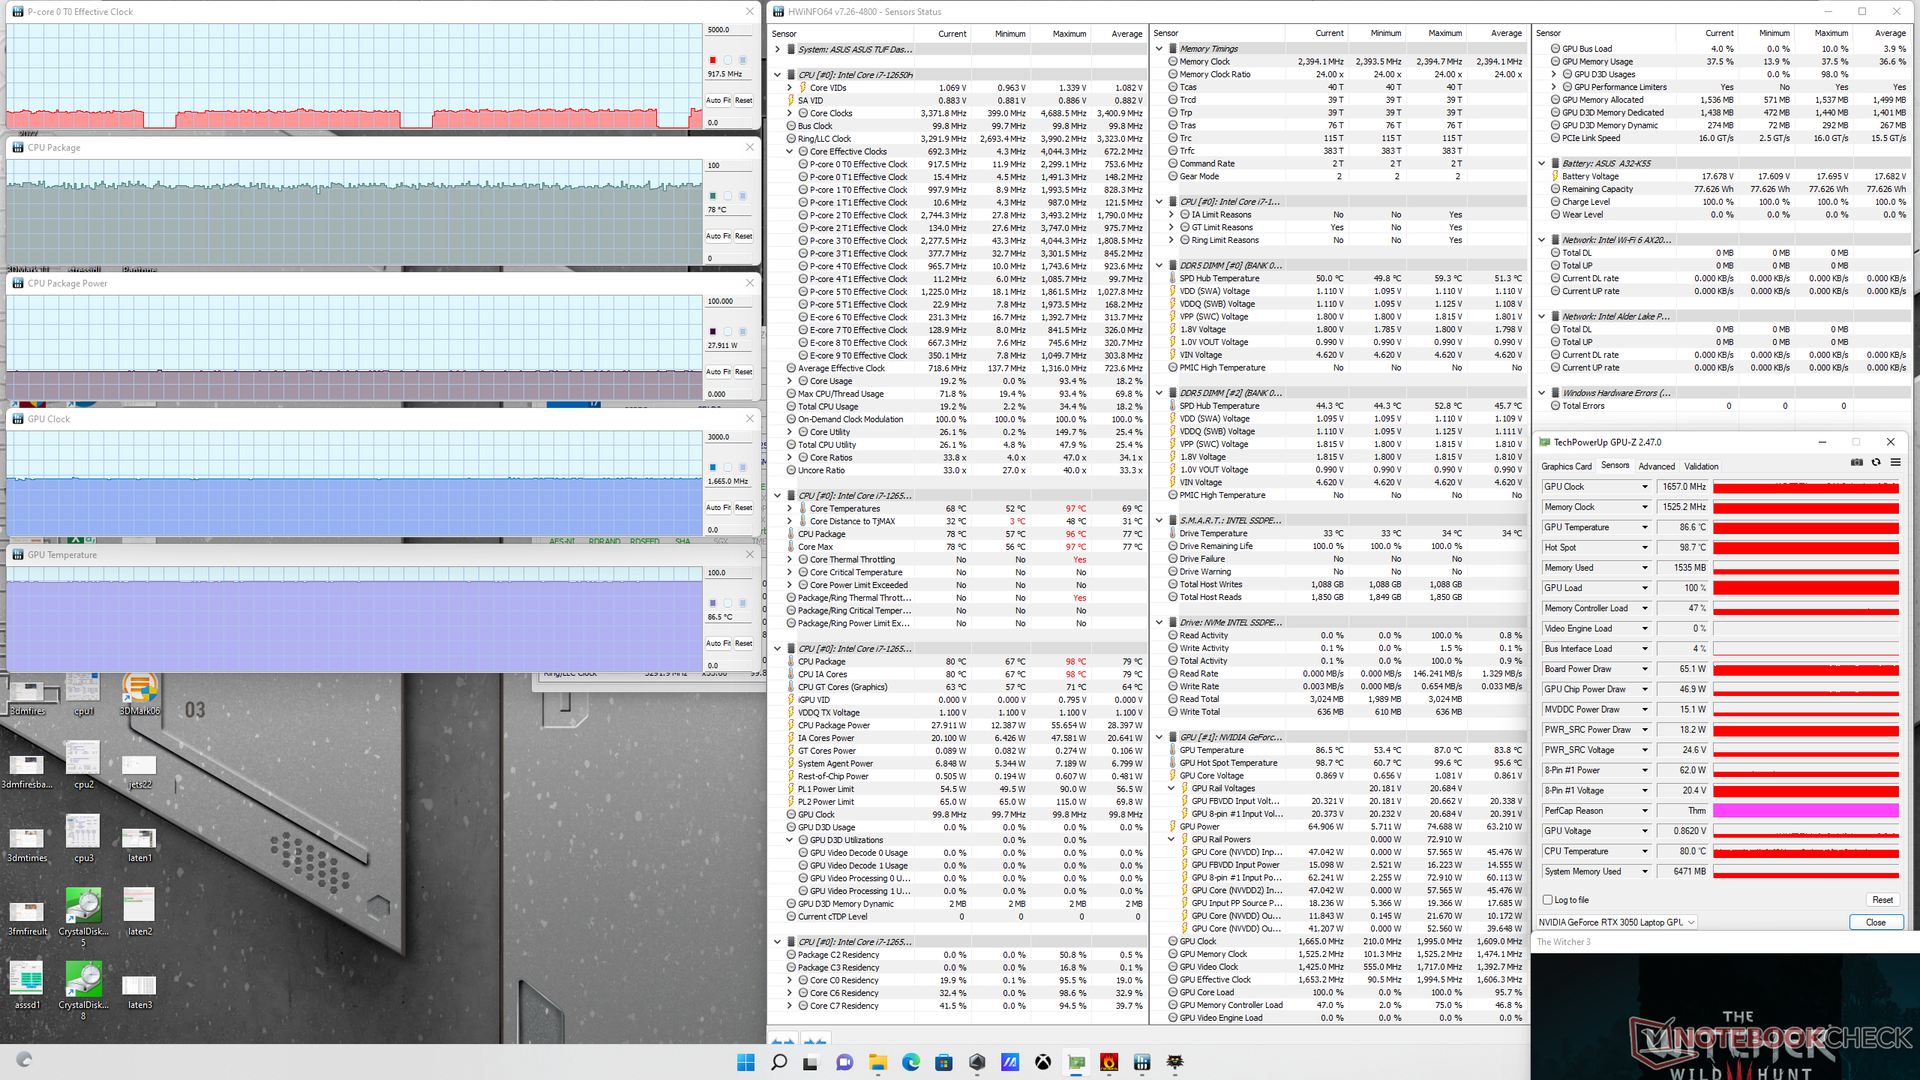
GPU clock, memory clock, and core temperature would stabilize at 1612 MHz, 1500 MHz, and 86 C, respectively, when running Witcher 3 on the Balanced power profile. GPU clock and memory clock would increase just slightly if running on Turbo mode, but GPU temperature would remain the same as fan noise is higher on Turbo mode as noted above to compensate for the higher clocks. Note that both GPU and CPU package power draw would increase from 50 W to 65 W and 19 W to 28 W, respectively, when running Witcher 3 on Turbo mode.
GPU temperature when gaming is just as warm as on the FX517ZR even though our GPU is much slower.
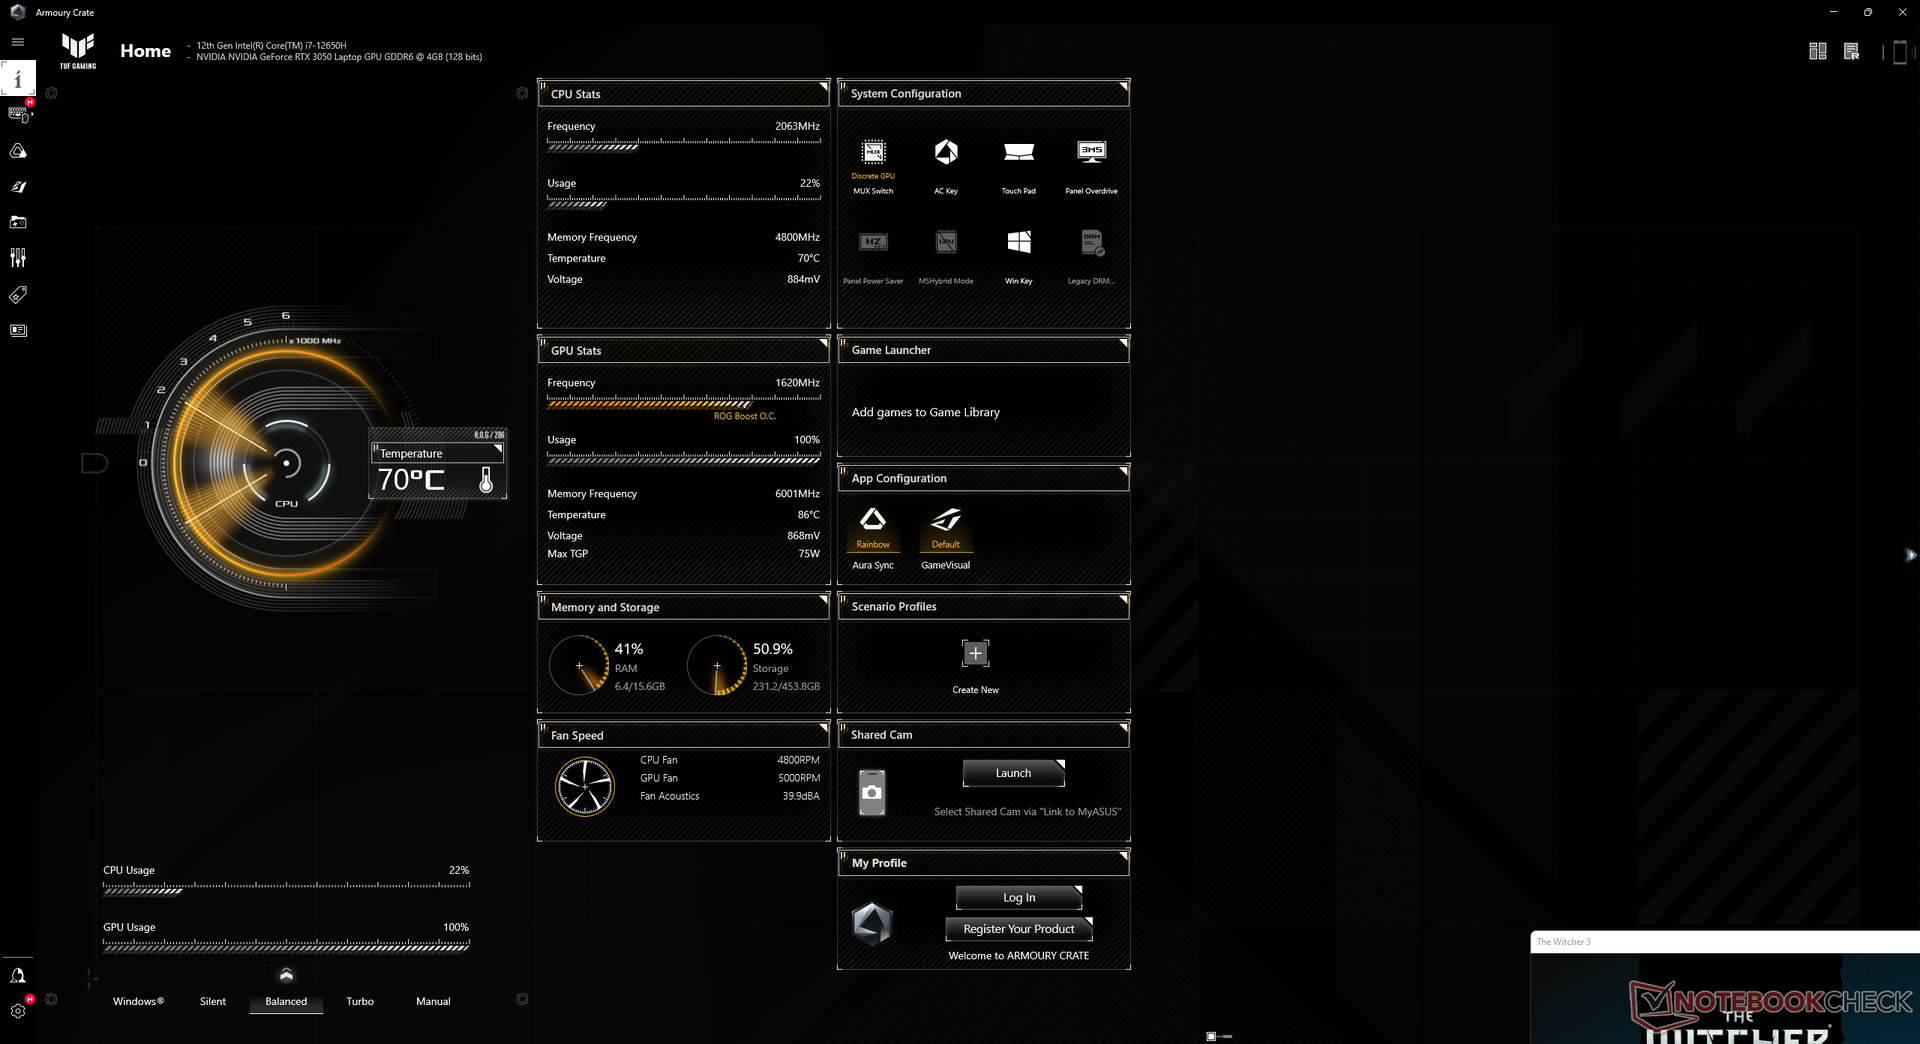
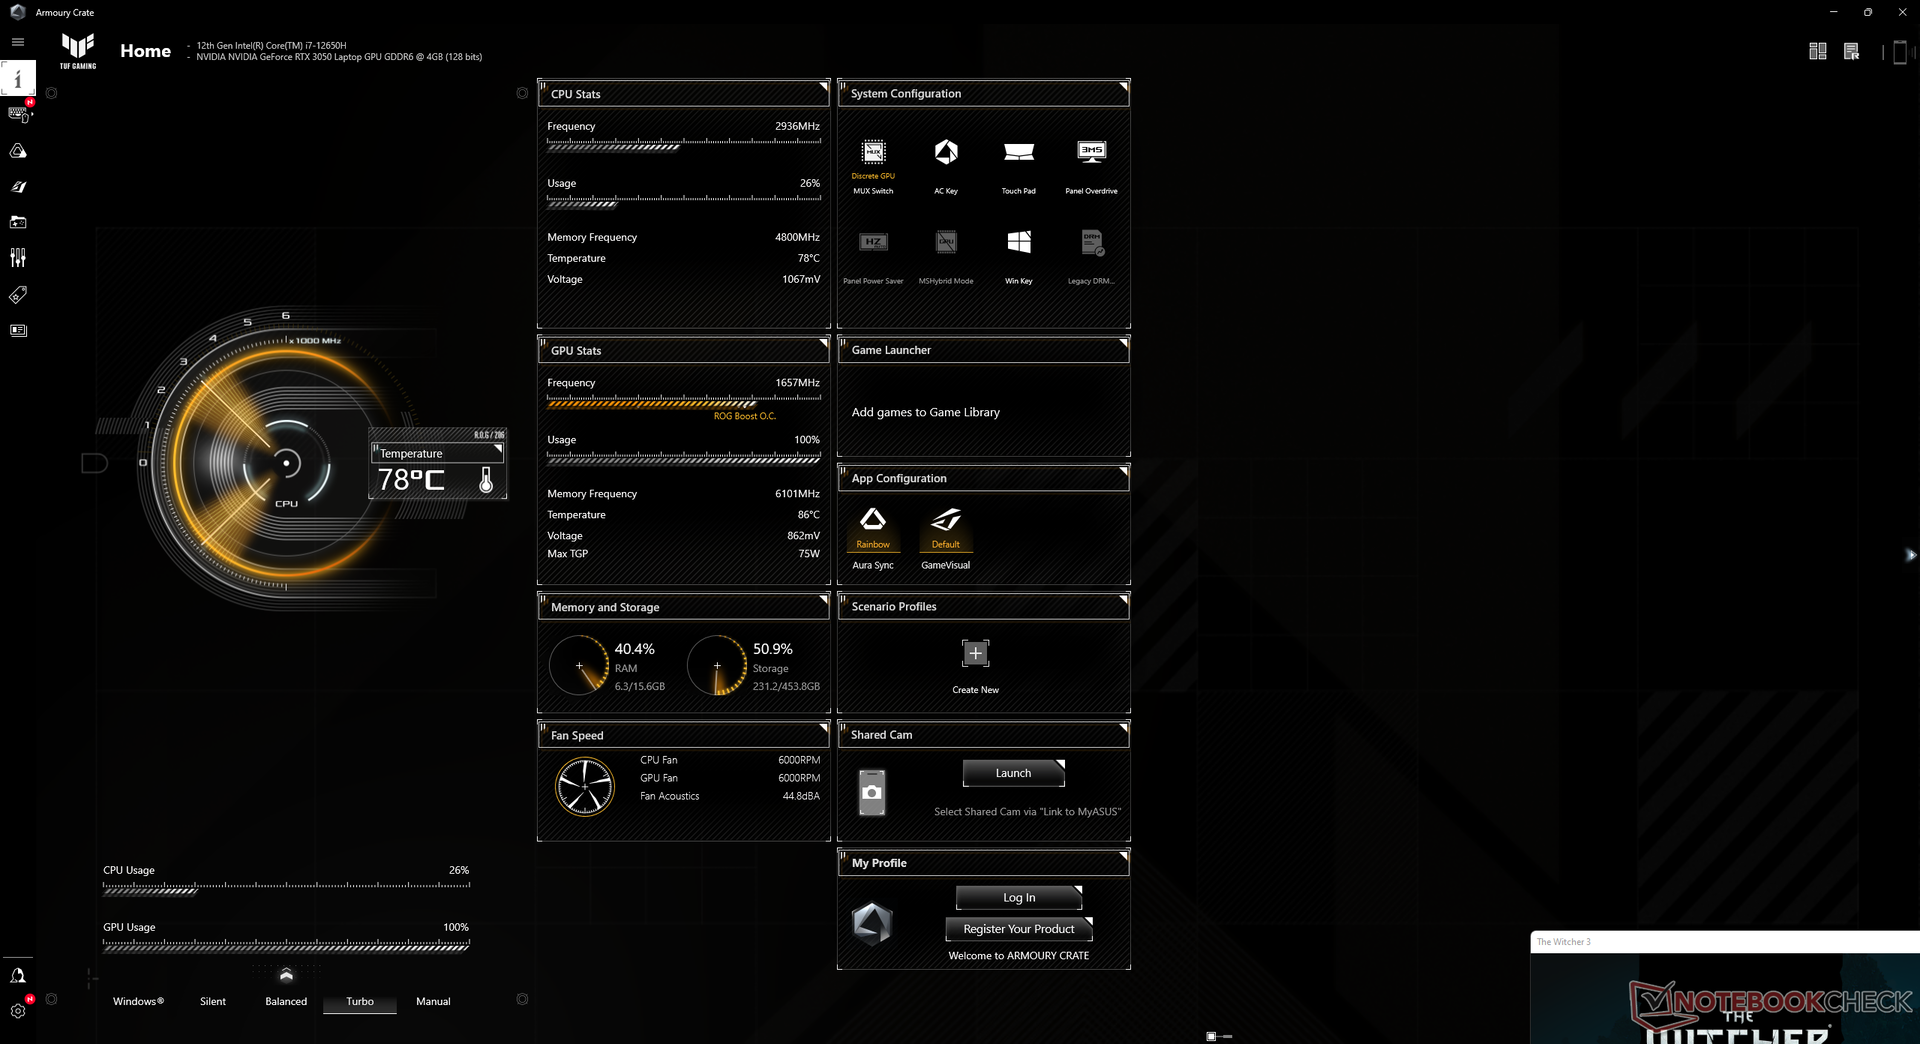
| CPU Clock (GHz) | GPU Clock (MHz) | Average CPU Temperature (°C) | Average GPU Temperature (°C) | |
| System Idle | -- | -- | 42 | 39 |
| Prime95 Stress | ~2.9 | -- | 95 | 52 |
| Prime95 + FurMark Stress | 2.0 | 1455 | 84 | 87 |
| Witcher 3 Stress (Balanced mode) | ~0.8 | 1612 | 68 | 86 |
| Witcher 3 Stress (Turbo mode) | ~0.9 | 1665 | 78 | 86 |
Speakers
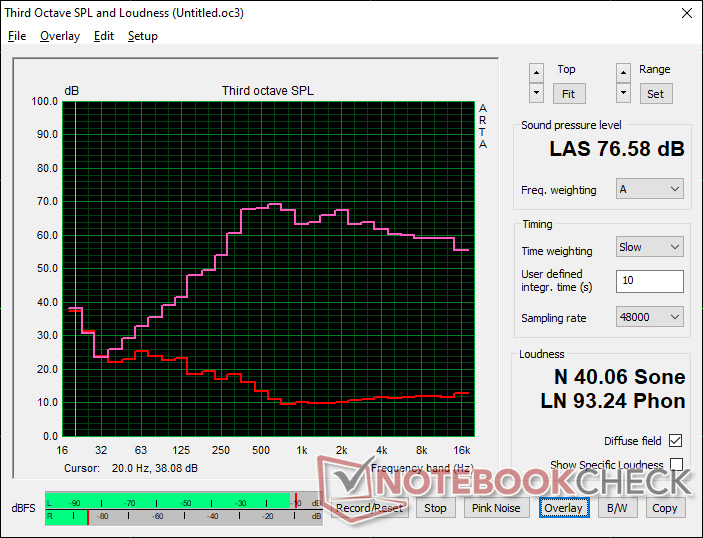
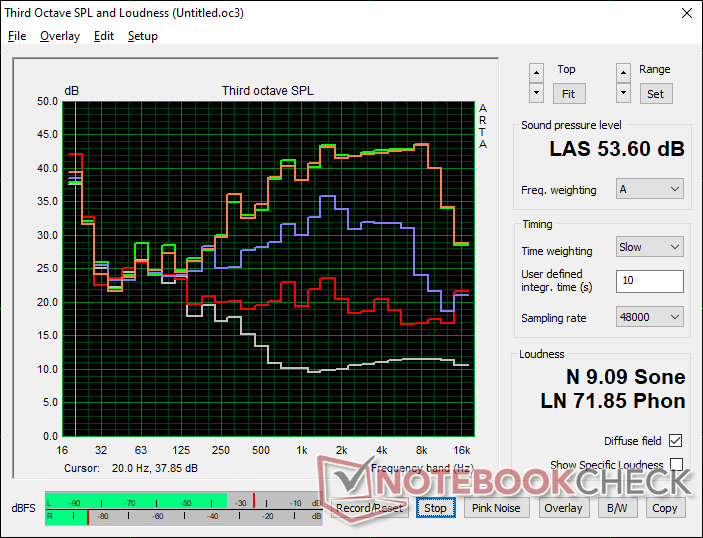
Asus TUF Dash F15 FX517ZC audio analysis
(±) | speaker loudness is average but good (76.6 dB)
Bass 100 - 315 Hz
(±) | reduced bass - on average 11.8% lower than median
(±) | linearity of bass is average (8.6% delta to prev. frequency)
Mids 400 - 2000 Hz
(±) | higher mids - on average 6.1% higher than median
(+) | mids are linear (4.9% delta to prev. frequency)
Highs 2 - 16 kHz
(+) | balanced highs - only 1.6% away from median
(+) | highs are linear (2.8% delta to prev. frequency)
Overall 100 - 16.000 Hz
(+) | overall sound is linear (14.2% difference to median)
Compared to same class
» 25% of all tested devices in this class were better, 7% similar, 68% worse
» The best had a delta of 6%, average was 18%, worst was 132%
Compared to all devices tested
» 17% of all tested devices were better, 4% similar, 79% worse
» The best had a delta of 4%, average was 23%, worst was 134%
Apple MacBook Pro 16 2021 M1 Pro audio analysis
(+) | speakers can play relatively loud (84.7 dB)
Bass 100 - 315 Hz
(+) | good bass - only 3.8% away from median
(+) | bass is linear (5.2% delta to prev. frequency)
Mids 400 - 2000 Hz
(+) | balanced mids - only 1.3% away from median
(+) | mids are linear (2.1% delta to prev. frequency)
Highs 2 - 16 kHz
(+) | balanced highs - only 1.9% away from median
(+) | highs are linear (2.7% delta to prev. frequency)
Overall 100 - 16.000 Hz
(+) | overall sound is linear (4.6% difference to median)
Compared to same class
» 0% of all tested devices in this class were better, 0% similar, 100% worse
» The best had a delta of 5%, average was 17%, worst was 45%
Compared to all devices tested
» 0% of all tested devices were better, 0% similar, 100% worse
» The best had a delta of 4%, average was 23%, worst was 134%
Energy Management — Still Power-Hungry
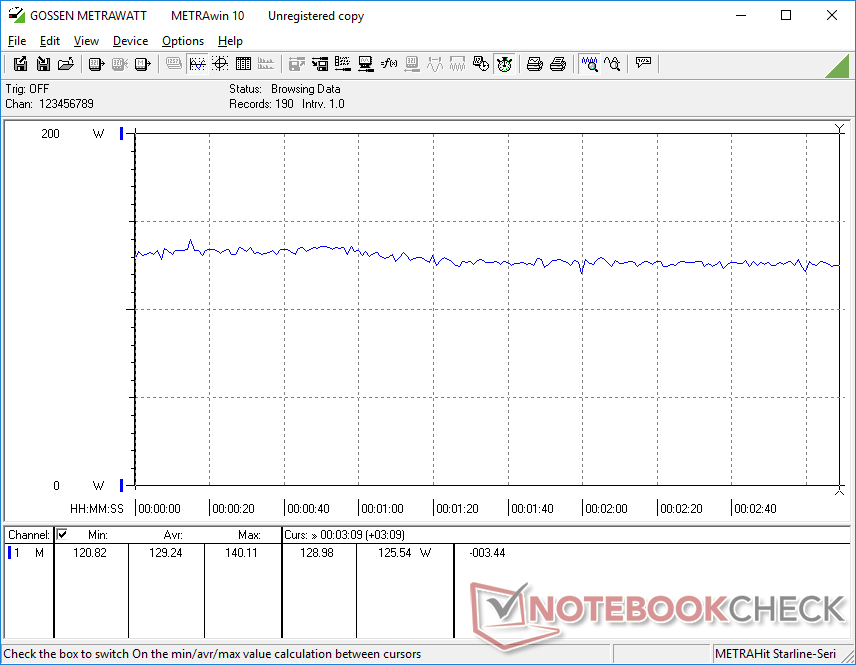
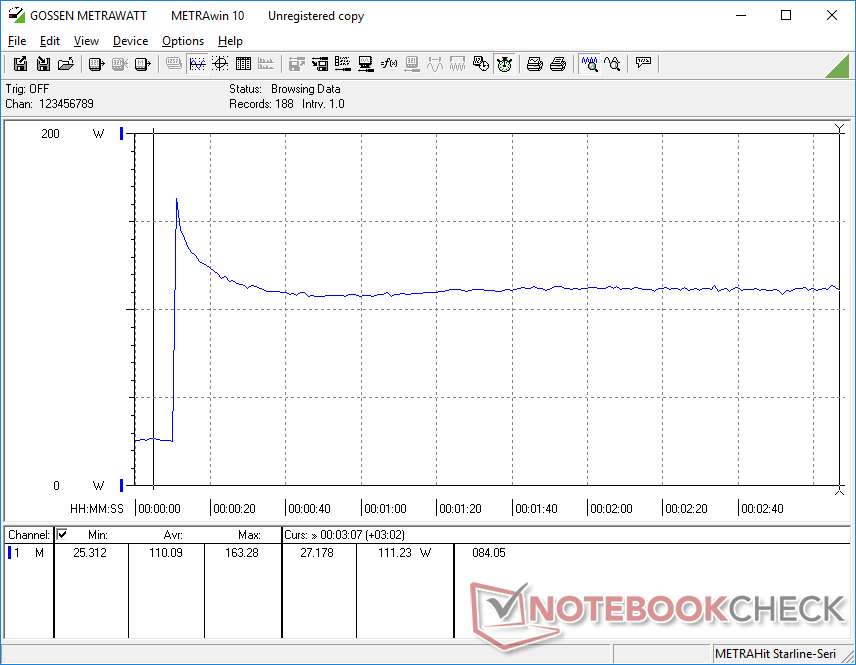
Power Consumption
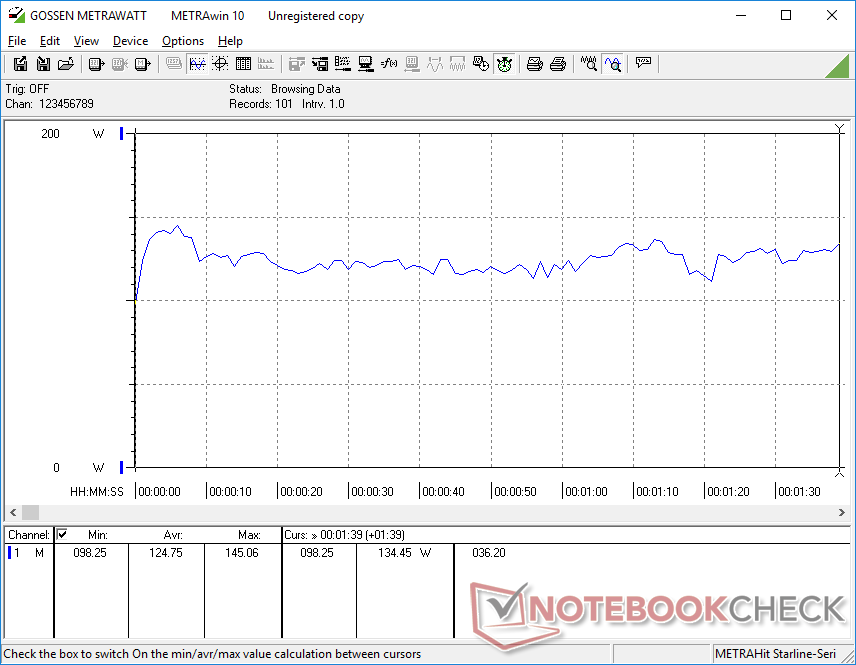
If the RTX 3050 is 40 percent slower than the RTX 3070, does that mean we can expect power consumption to be 40 percent lower as well? Unfortunately, our FX517ZC would demand just 7 percent less than the FX517ZR when running the same games at the same graphical settings.
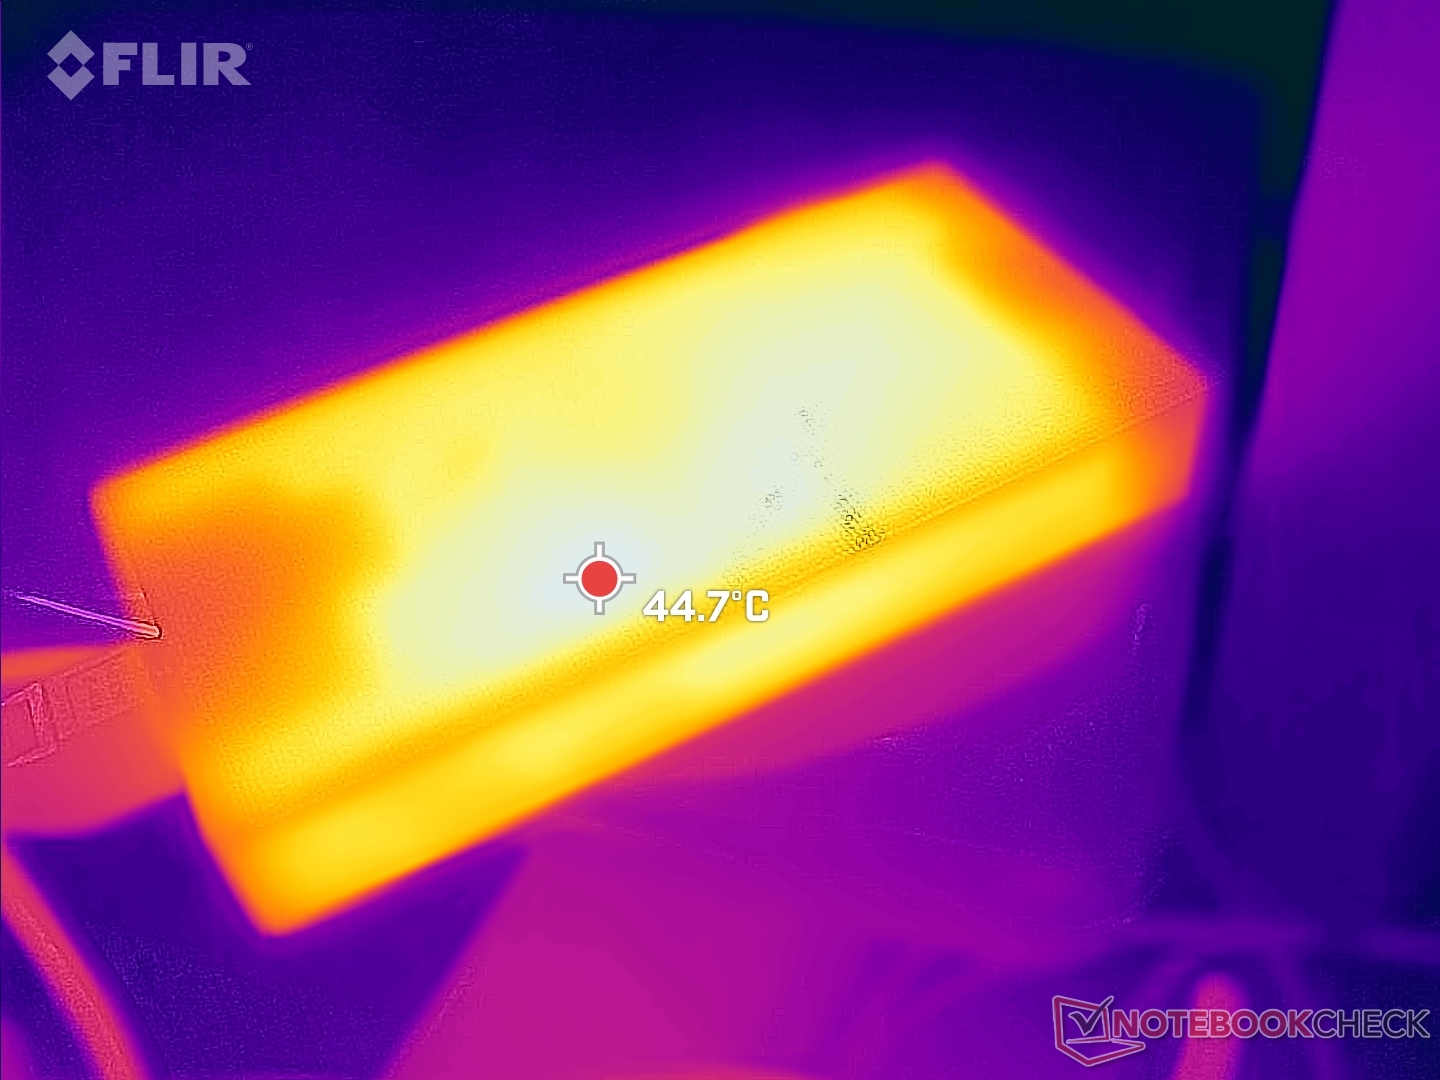
Note that the FX517ZC ships with a 180 W AC adapter (~15 x 7.2 x 2.3 cm) whereas the FX517ZR ships with a slightly larger 200 W adapter.
| Off / Standby | |
| Idle | |
| Load |
|
Key:
min: | |
| Asus TUF Dash F15 FX517ZC i7-12650H, GeForce RTX 3050 4GB Laptop GPU, Intel SSD 670p SSDPEKNU512GZ, IPS, 2560x1440, 15.6" | Asus TUF Dash F15 FX517ZR i7-12650H, GeForce RTX 3070 Laptop GPU, Samsung PM991a MZVLQ1T0HBLB, IPS, 2560x1440, 15.6" | Dell G15 5510 i5-10500H, GeForce RTX 3050 4GB Laptop GPU, SK Hynix BC711 HFM512GD3HX015N, IPS, 1920x1080, 15.6" | MSI Bravo 15 B5DD-010US R5 5600H, Radeon RX 5500M, Kingston OM8PCP3512F-AB, IPS, 1920x1080, 15.6" | Lenovo Ideapad Gaming 3 15IHU-82K1002RGE i5-11300H, GeForce RTX 3050 Ti Laptop GPU, Micron 2210 MTFDHBA512QFD, IPS, 1920x1080, 15.6" | Gigabyte G5 GD i5-11400H, GeForce RTX 3050 4GB Laptop GPU, ESR512GTLG-E6GBTNB4, IPS, 1920x1080, 15.6" | |
|---|---|---|---|---|---|---|
| Power Consumption | 4% | 28% | 33% | 35% | 6% | |
| Idle Minimum * (Watt) | 9.2 | 10 -9% | 3 67% | 6.6 28% | 4.9 47% | 13 -41% |
| Idle Average * (Watt) | 15.9 | 14 12% | 8 50% | 9.8 38% | 8.3 48% | 15 6% |
| Idle Maximum * (Watt) | 29.5 | 20 32% | 13 56% | 10.8 63% | 8.9 70% | 20 32% |
| Load Average * (Watt) | 124.8 | 122 2% | 103 17% | 70.5 44% | 81 35% | 102 18% |
| Witcher 3 ultra * (Watt) | 129.2 | 138.6 -7% | 139.5 -8% | 103.2 20% | 119 8% | 124 4% |
| Load Maximum * (Watt) | 178.4 | 189 -6% | 204 -14% | 175 2% | 172 4% | 148 17% |
* ... smaller is better
Power Consumption Witcher 3 / Stresstest
Power Consumption external Monitor
Battery Life — Not That Long
Battery life is shorter than expected, but we expect it to be a bug. When set to the Balanced power profile with the integrated GPU active via MSHybrid, we're only able to record a runtime of just 4 hours compared to 7 hours on the FX517ZR. Results would not improve even after repeating the test.
| Asus TUF Dash F15 FX517ZC i7-12650H, GeForce RTX 3050 4GB Laptop GPU, 76 Wh | Asus TUF Dash F15 FX517ZR i7-12650H, GeForce RTX 3070 Laptop GPU, 76 Wh | Dell G15 5510 i5-10500H, GeForce RTX 3050 4GB Laptop GPU, 56 Wh | MSI Bravo 15 B5DD-010US R5 5600H, Radeon RX 5500M, 53 Wh | Lenovo Ideapad Gaming 3 15IHU-82K1002RGE i5-11300H, GeForce RTX 3050 Ti Laptop GPU, 45 Wh | Gigabyte G5 GD i5-11400H, GeForce RTX 3050 4GB Laptop GPU, 41 Wh | |
|---|---|---|---|---|---|---|
| Battery runtime | 75% | 50% | 58% | 65% | -22% | |
| WiFi v1.3 (h) | 4 | 7 75% | 6 50% | 6.3 58% | 6.6 65% | 3.1 -22% |
| Reader / Idle (h) | 10.8 | 11.3 | 9.2 | 5.7 | ||
| H.264 (h) | 5.8 | 7.7 | 3.6 | |||
| Load (h) | 2.3 | 1 | 1 | 1.1 | 1.1 |
Pros
Cons
Verdict — Entry-Level Price With Excellent High-Level Display
Aside from the obvious price savings, one may prefer entry-level gaming laptops for their quieter fans, cooler temperatures, longer battery life, and lower power consumption when compared to more powerful higher-end options. Thus, we expected the Asus TUF Dash F15 FX517ZC and its RTX 3050 to be quieter, cooler, longer-lasting, and less demanding than its TUF Dash F15 FX517ZR RTX 3070 counterpart. The reality is that any differences between the FX517ZC and FX517ZR in terms of temperature, power consumption, and noise are unfortunately minor relative to the very wide GPU performance gap between them. In other words, if you were hoping for the FX517ZC to be noticeably quieter, cooler, and longer-lasting than its higher-end configurations, then you may be disappointed.
The Asus TUF Dash F15 FX517ZC comes with a better 1440p165 IPS display than expected for its price range. Power consumption, fan noise, and battery life, however, aren't any better than faster higher-end models.
For an entry-level gaming laptop, however, the FX517ZC is still pretty good as it doesn't skimp on the display, RAM, or CPU which many other gaming laptops tend to do in the $1000 and under range. The 1440p panel offers full P3 coverage, fast response times, adaptive sync, and 165 Hz which is a rarity on a budget system. The 12th gen Core i7-12650H CPU, while not all that different form the 11th gen Core i7-11800H, pairs well with the affordable RTX 3050 GPU in this case.
Price and Availability
The Asus TUF Dash F15 FX517 series is now widely available online. However, our specific RTX 3050 SKU is uncommon. Users will find the RTX 3050 Ti, RTX 3060, and RTX 3070 configurations more readily available as of this writing. The RTX 3060 configuration can be found on Amazon for $1070 USD while the RTX 3050 Ti can be found on Best Buy for $1200.
Asus TUF Dash F15 FX517ZC
- 08/08/2022 v7 (old)
Allen Ngo
Price comparison
