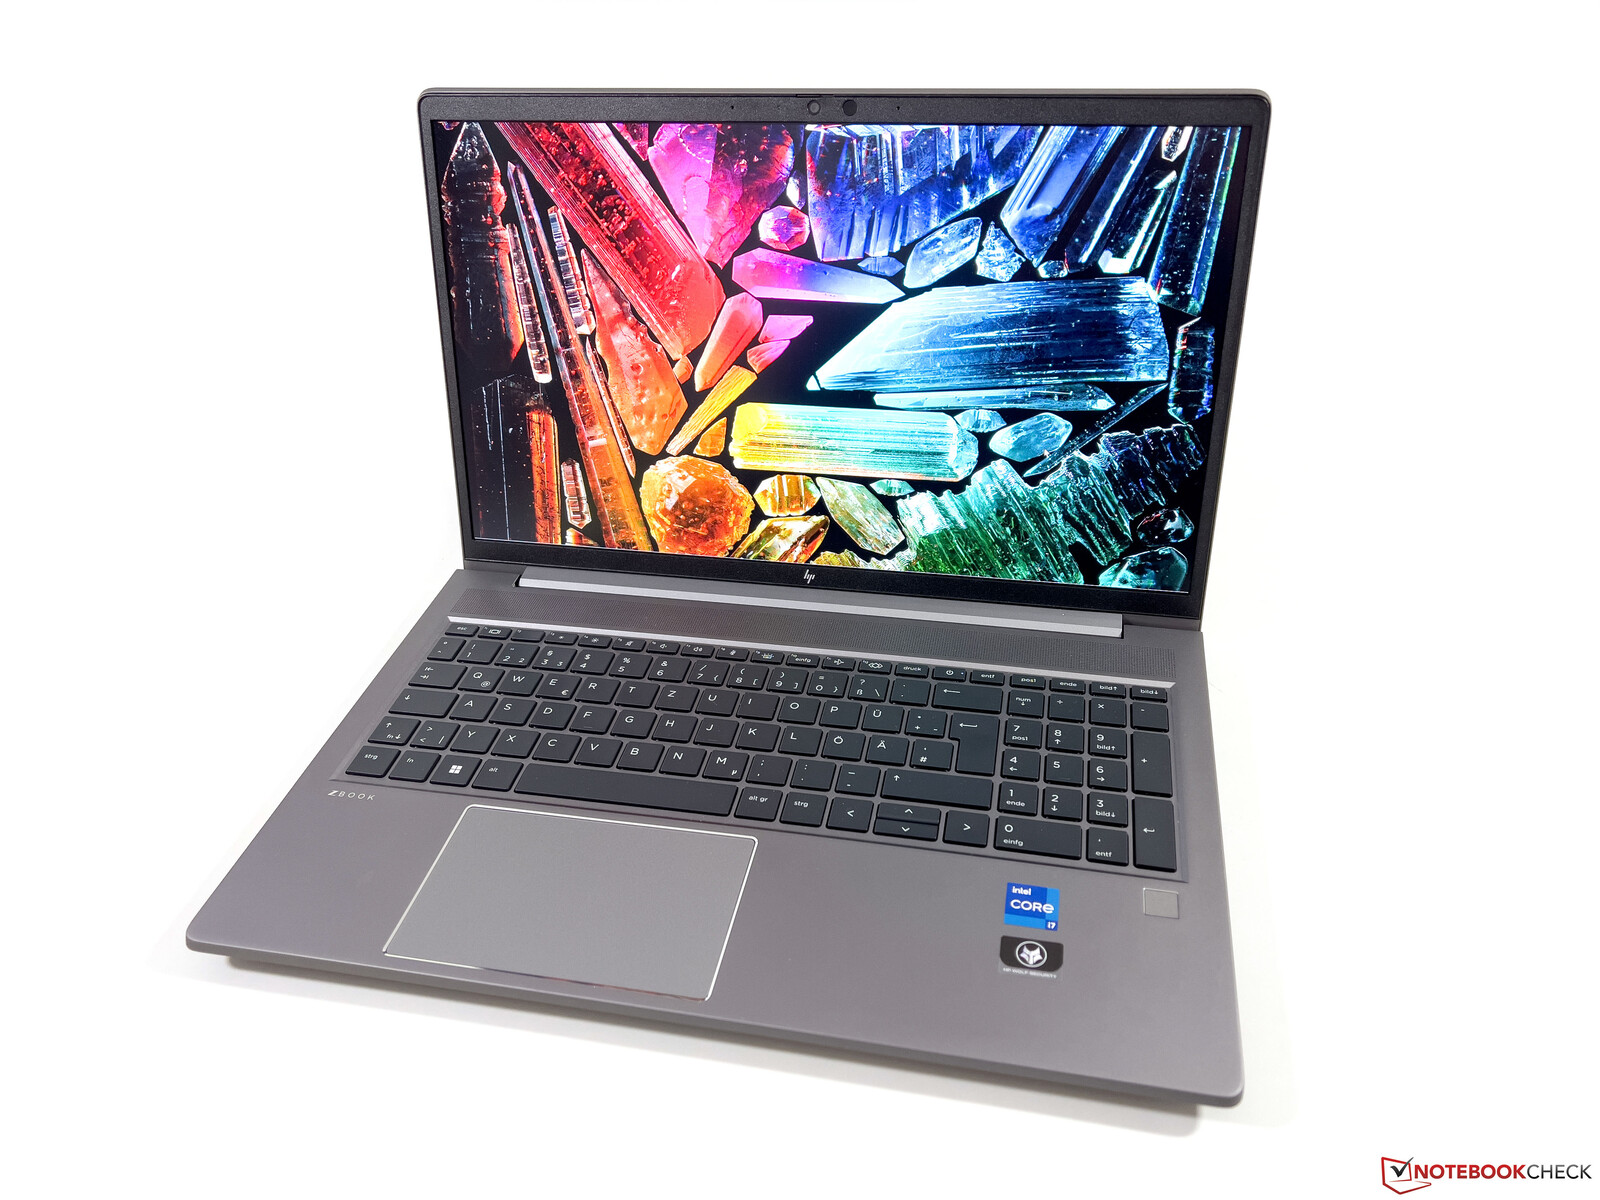
HP ZBook Power 15 G9 laptop review - Mobile workstation with a matte 4K display
HP offers various mobile workstation model series, starting with the thin ZBook Firefly entry-level devices, followed by the ZBook Studio, the ZBook Fury high-end models, and the ZBook Power, which is supposed to represent a good combination of price and performance. While the case is not particularly slim, this also brings with it a sufficient number of ports. We test the ZBook Power 15 G9 6B8C4EA version for around 2,800 Euros (~$2981), which is very well equipped with a Core i7-12700H, the RTX A2000, 32 GB of RAM, a 1-TB SSD, and a matte 4K display. Compared to the ZBook Power 15 G8 predecessor (here in our test), there are no changes in the case and input devices, so we will keep those sections short here, focusing instead on the performance sections.
Possible Competitors in Comparison
Rating | Date | Model | Weight | Height | Size | Resolution | Price |
|---|---|---|---|---|---|---|---|
| 87.4 % v7 (old) | 01 / 2023 | HP ZBook Power 15 G9 6B8C4EA i7-12700H, RTX A2000 Laptop GPU | 2 kg | 22.8 mm | 15.60" | 3840x2160 | |
| 90.1 % v7 (old) | 11 / 2022 | HP ZBook Studio 16 G9 62U04EA i7-12800H, RTX A2000 Laptop GPU | 1.8 kg | 19 mm | 16.00" | 3840x2400 | |
| 88.3 % v7 (old) | 10 / 2021 | Dell Precision 5000 5560 i7-11850H, RTX A2000 Laptop GPU | 2 kg | 18 mm | 15.60" | 3840x2400 | |
| 86.2 % v7 (old) | 06 / 2022 | Lenovo ThinkPad P15v G2 21A9000XGE i7-11800H, T1200 Laptop GPU | 2.3 kg | 22.7 mm | 15.60" | 1920x1080 | |
| 87.7 % v7 (old) | 07 / 2022 | HP ZBook Power 15 G8 313S5EA i7-11800H, T600 Laptop GPU | 2 kg | 22.8 mm | 15.60" | 1920x1080 |
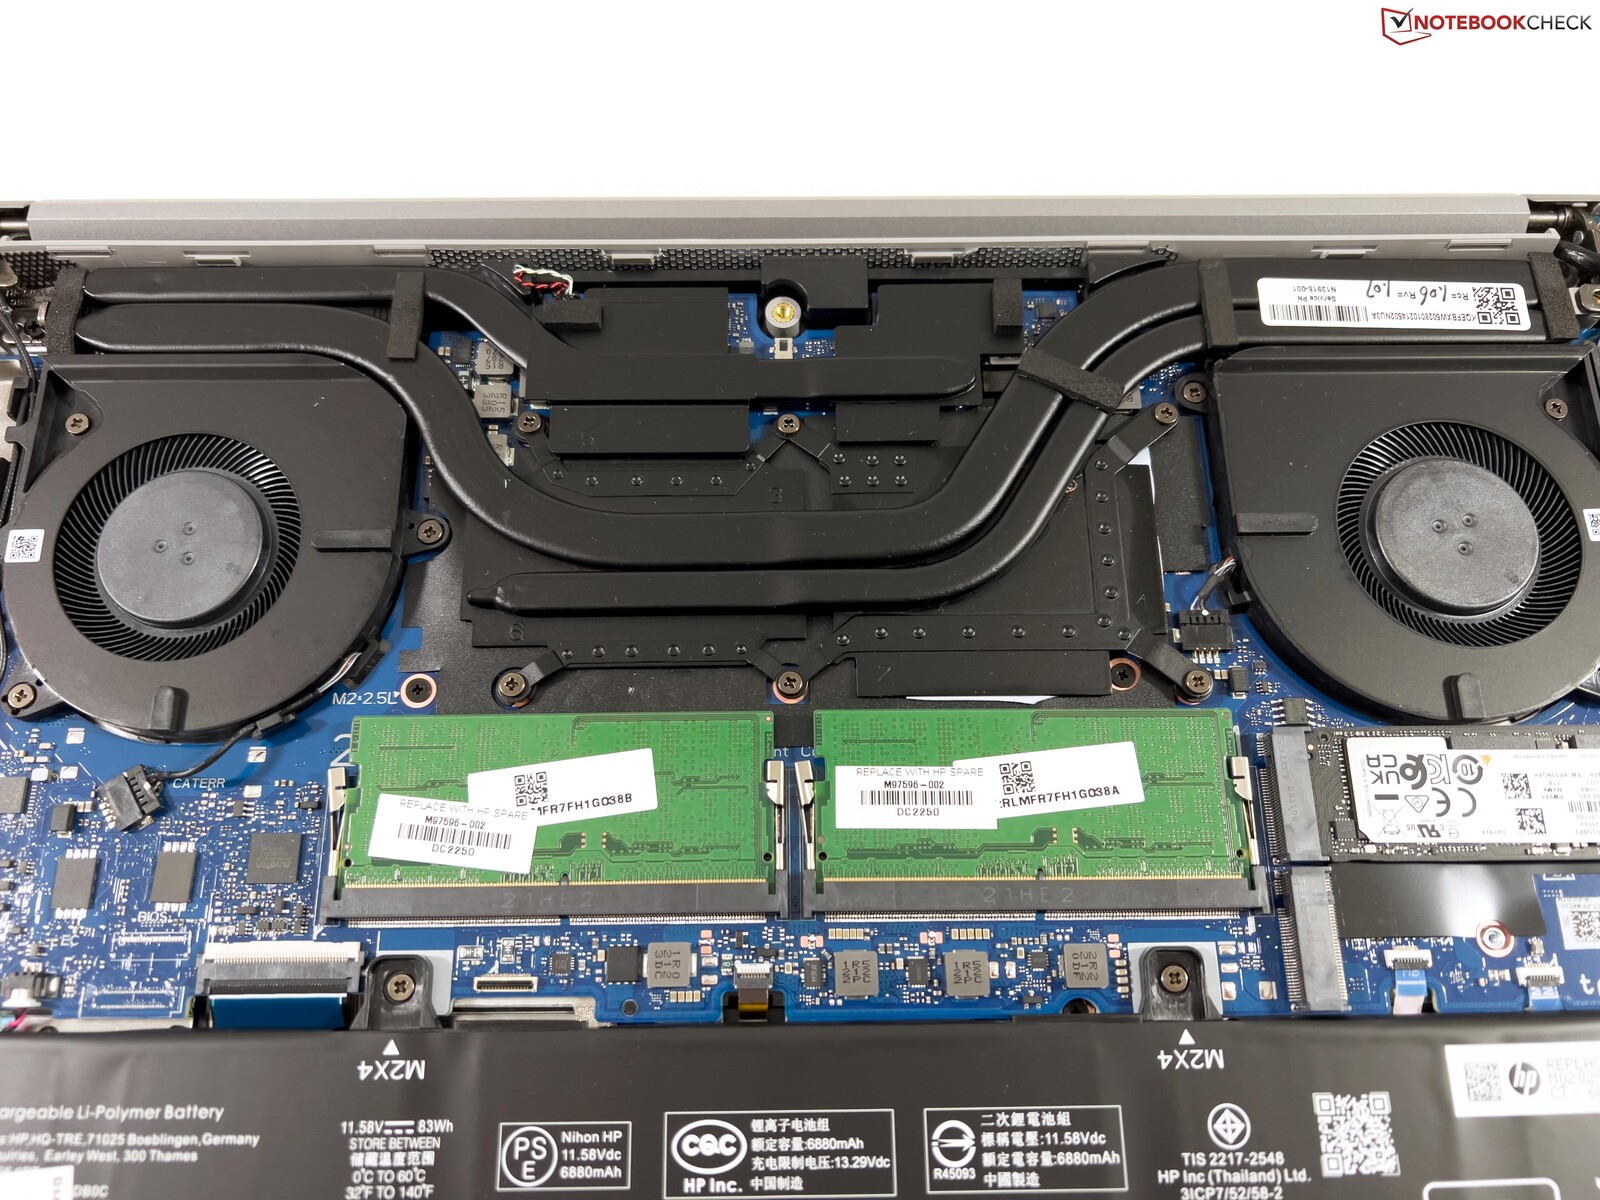
Case and Equipment
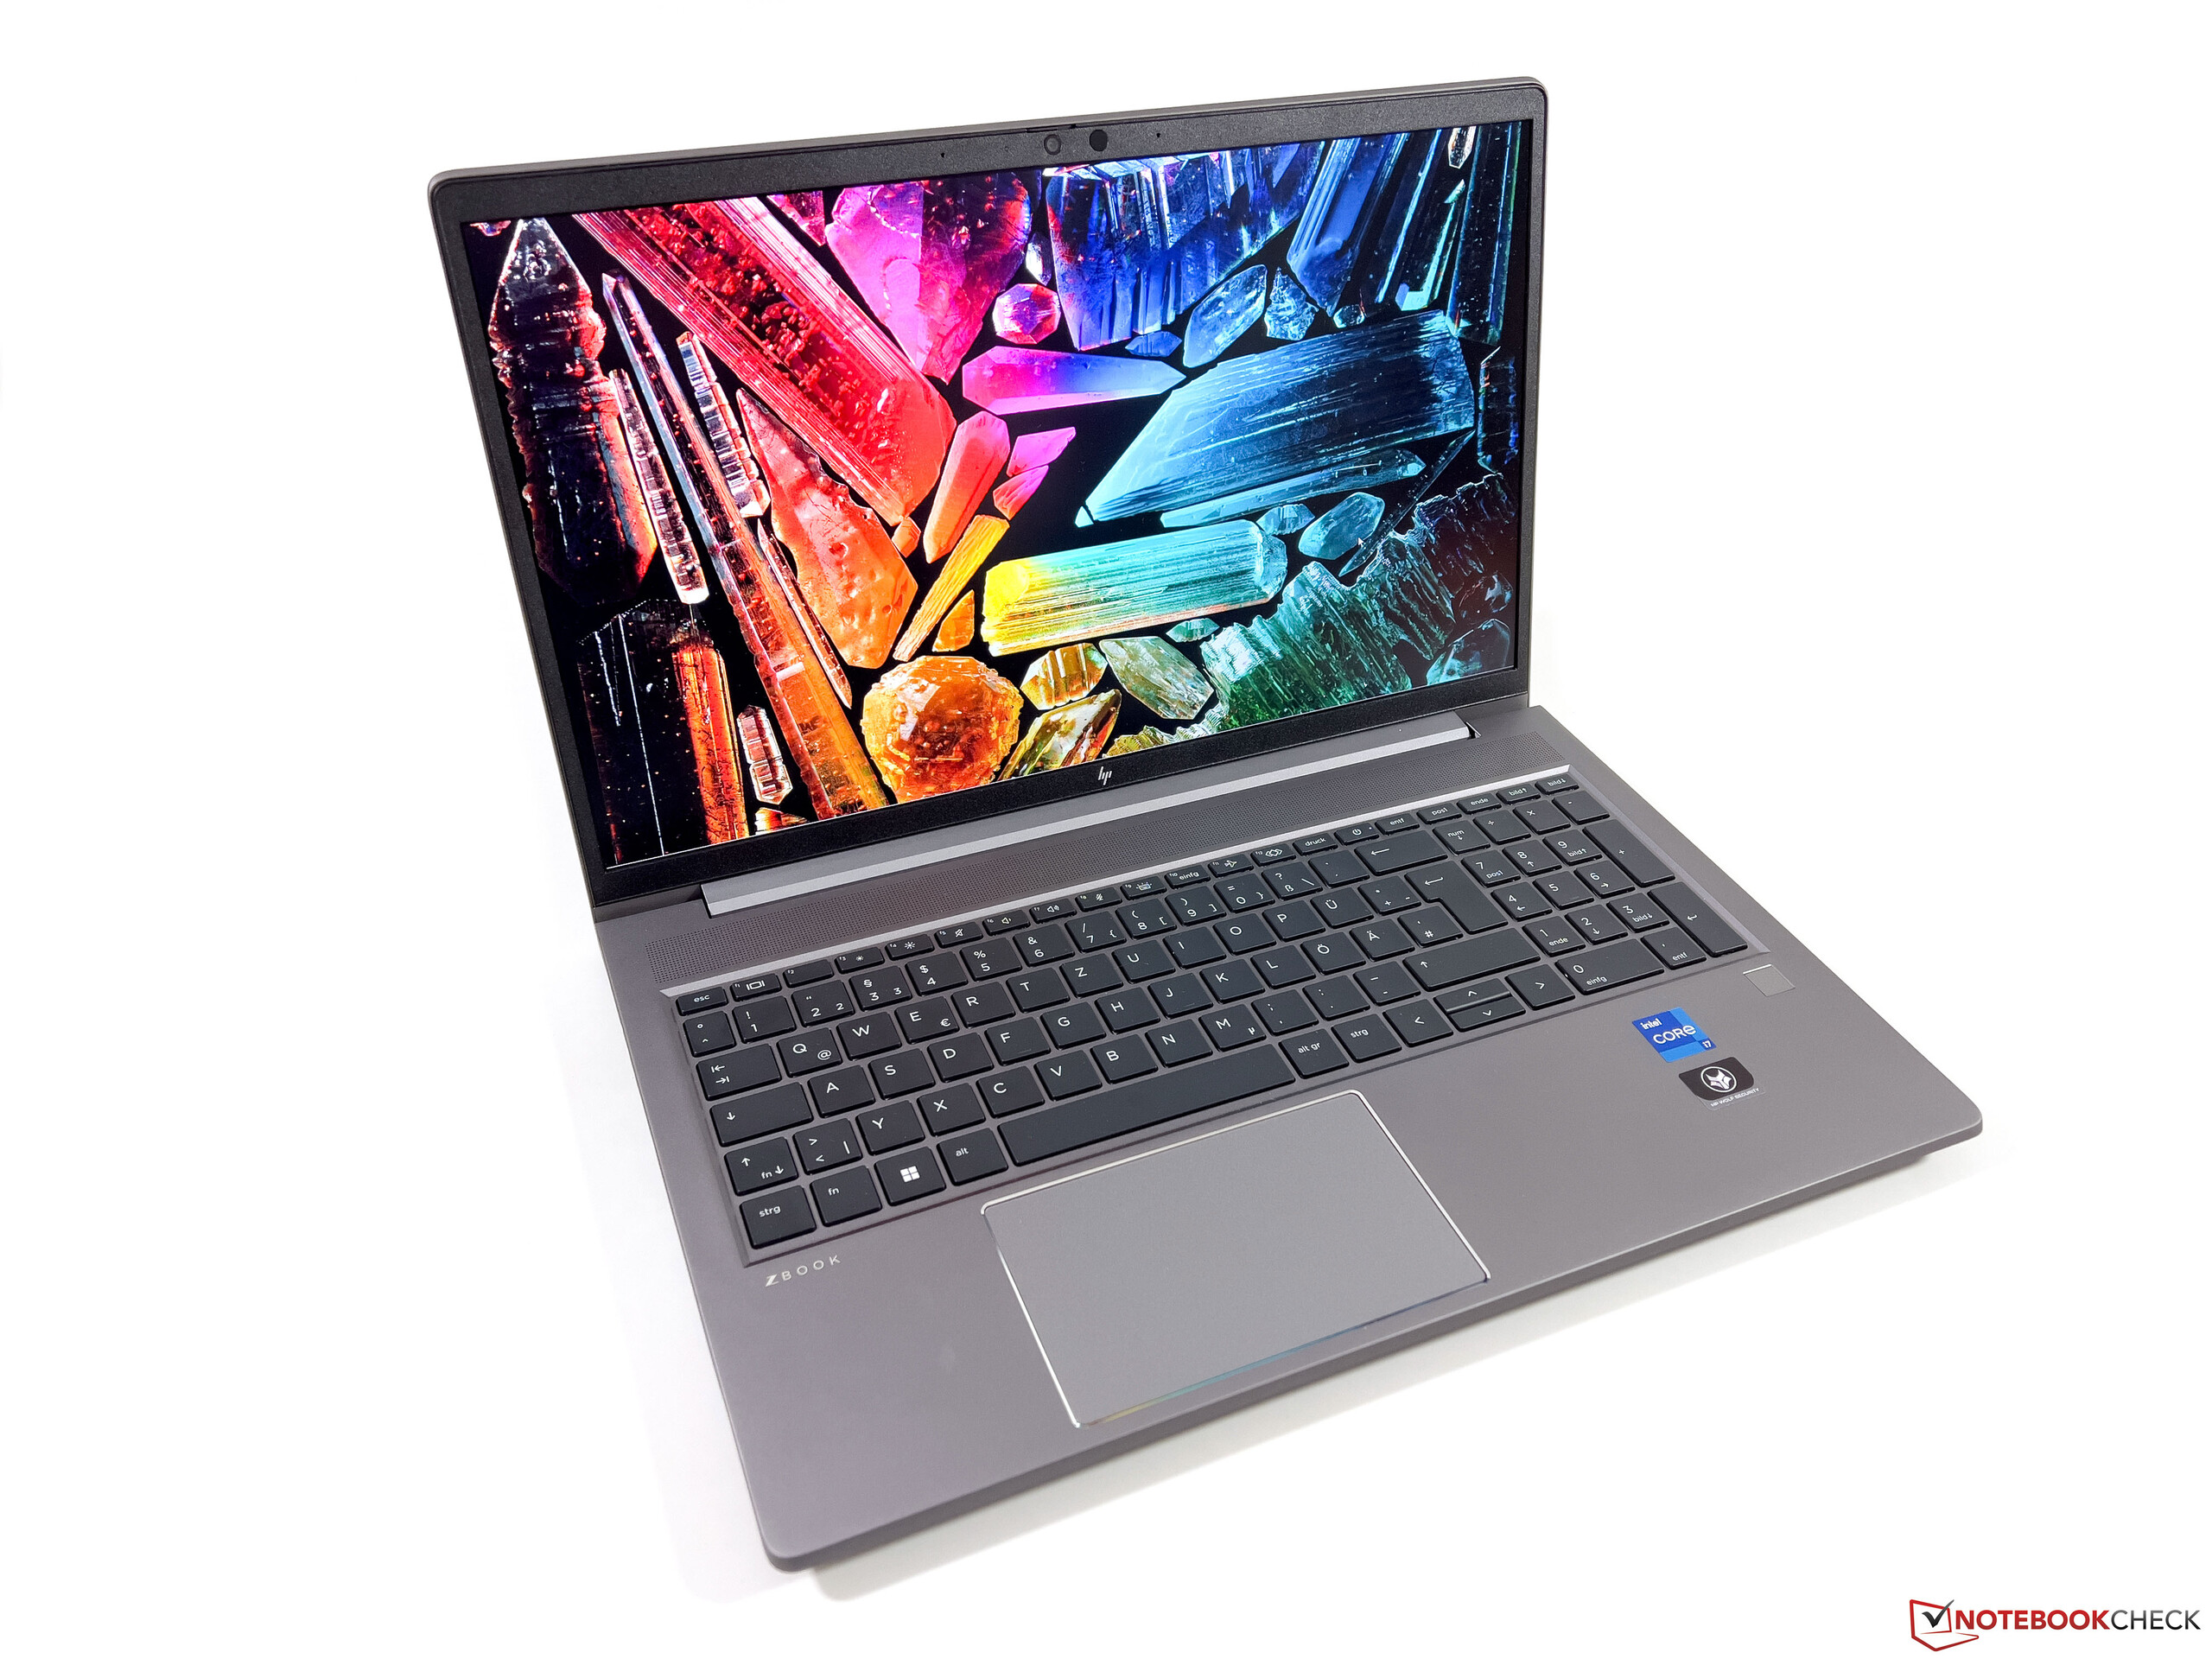
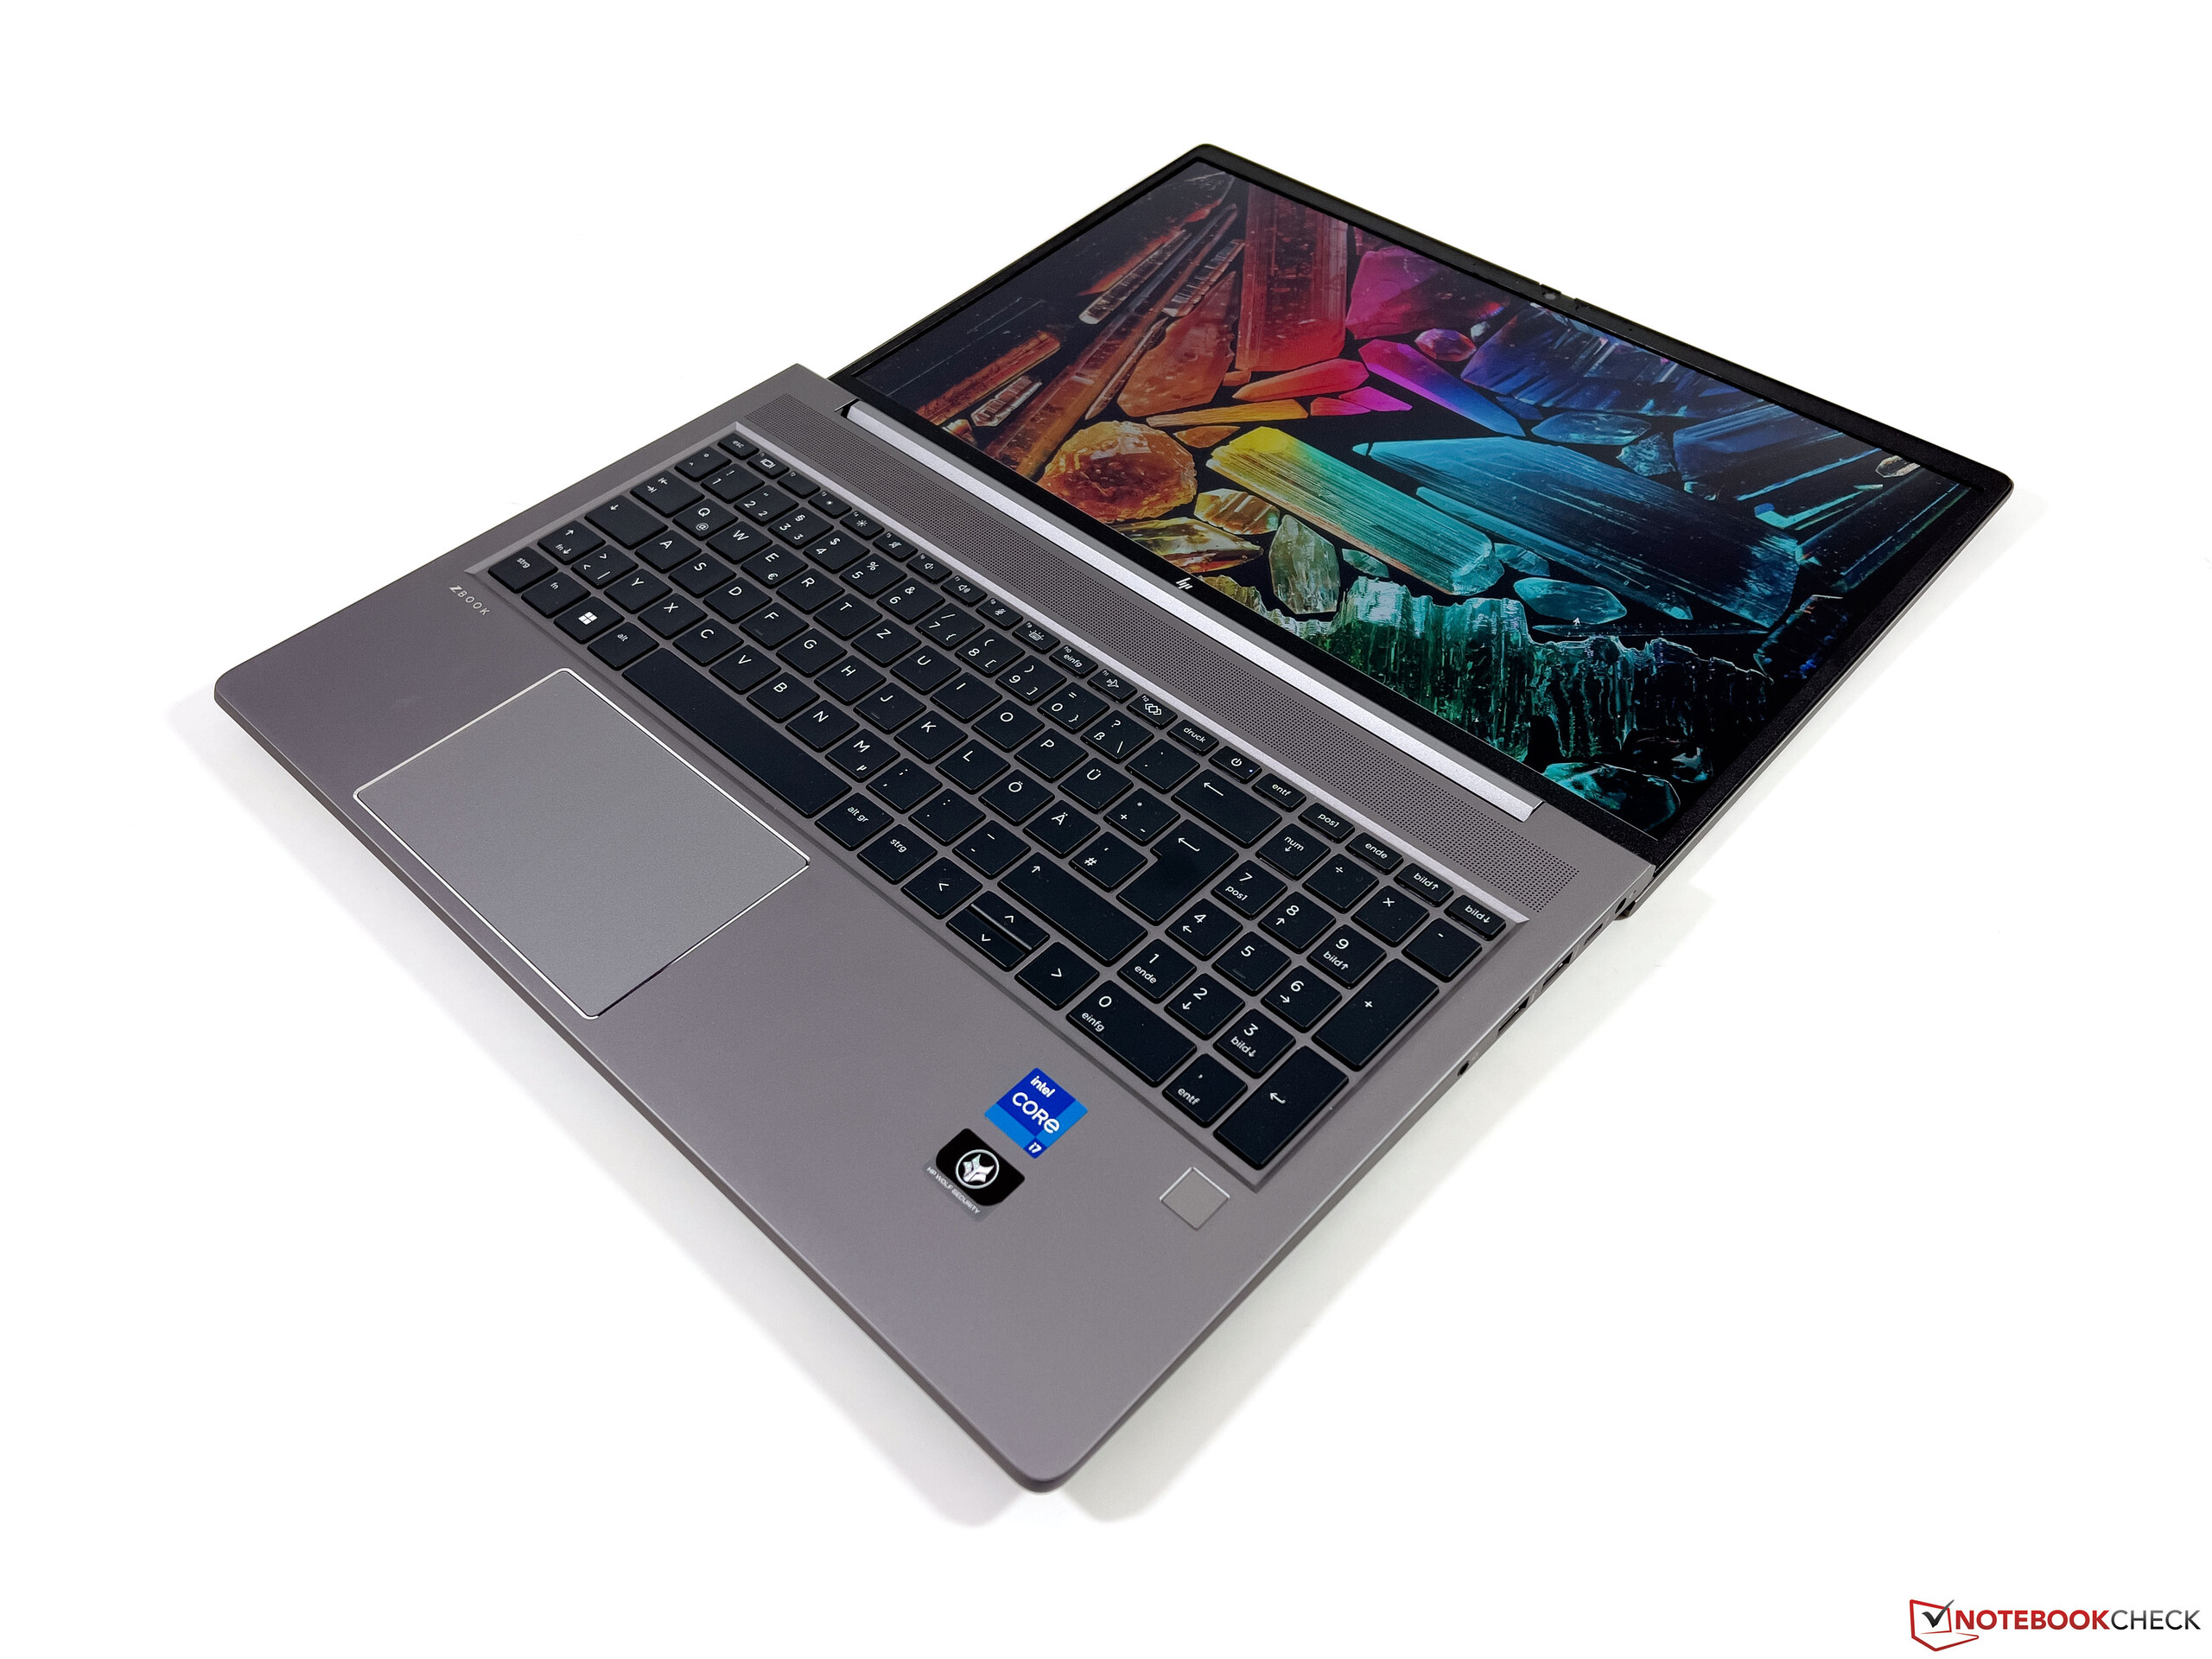
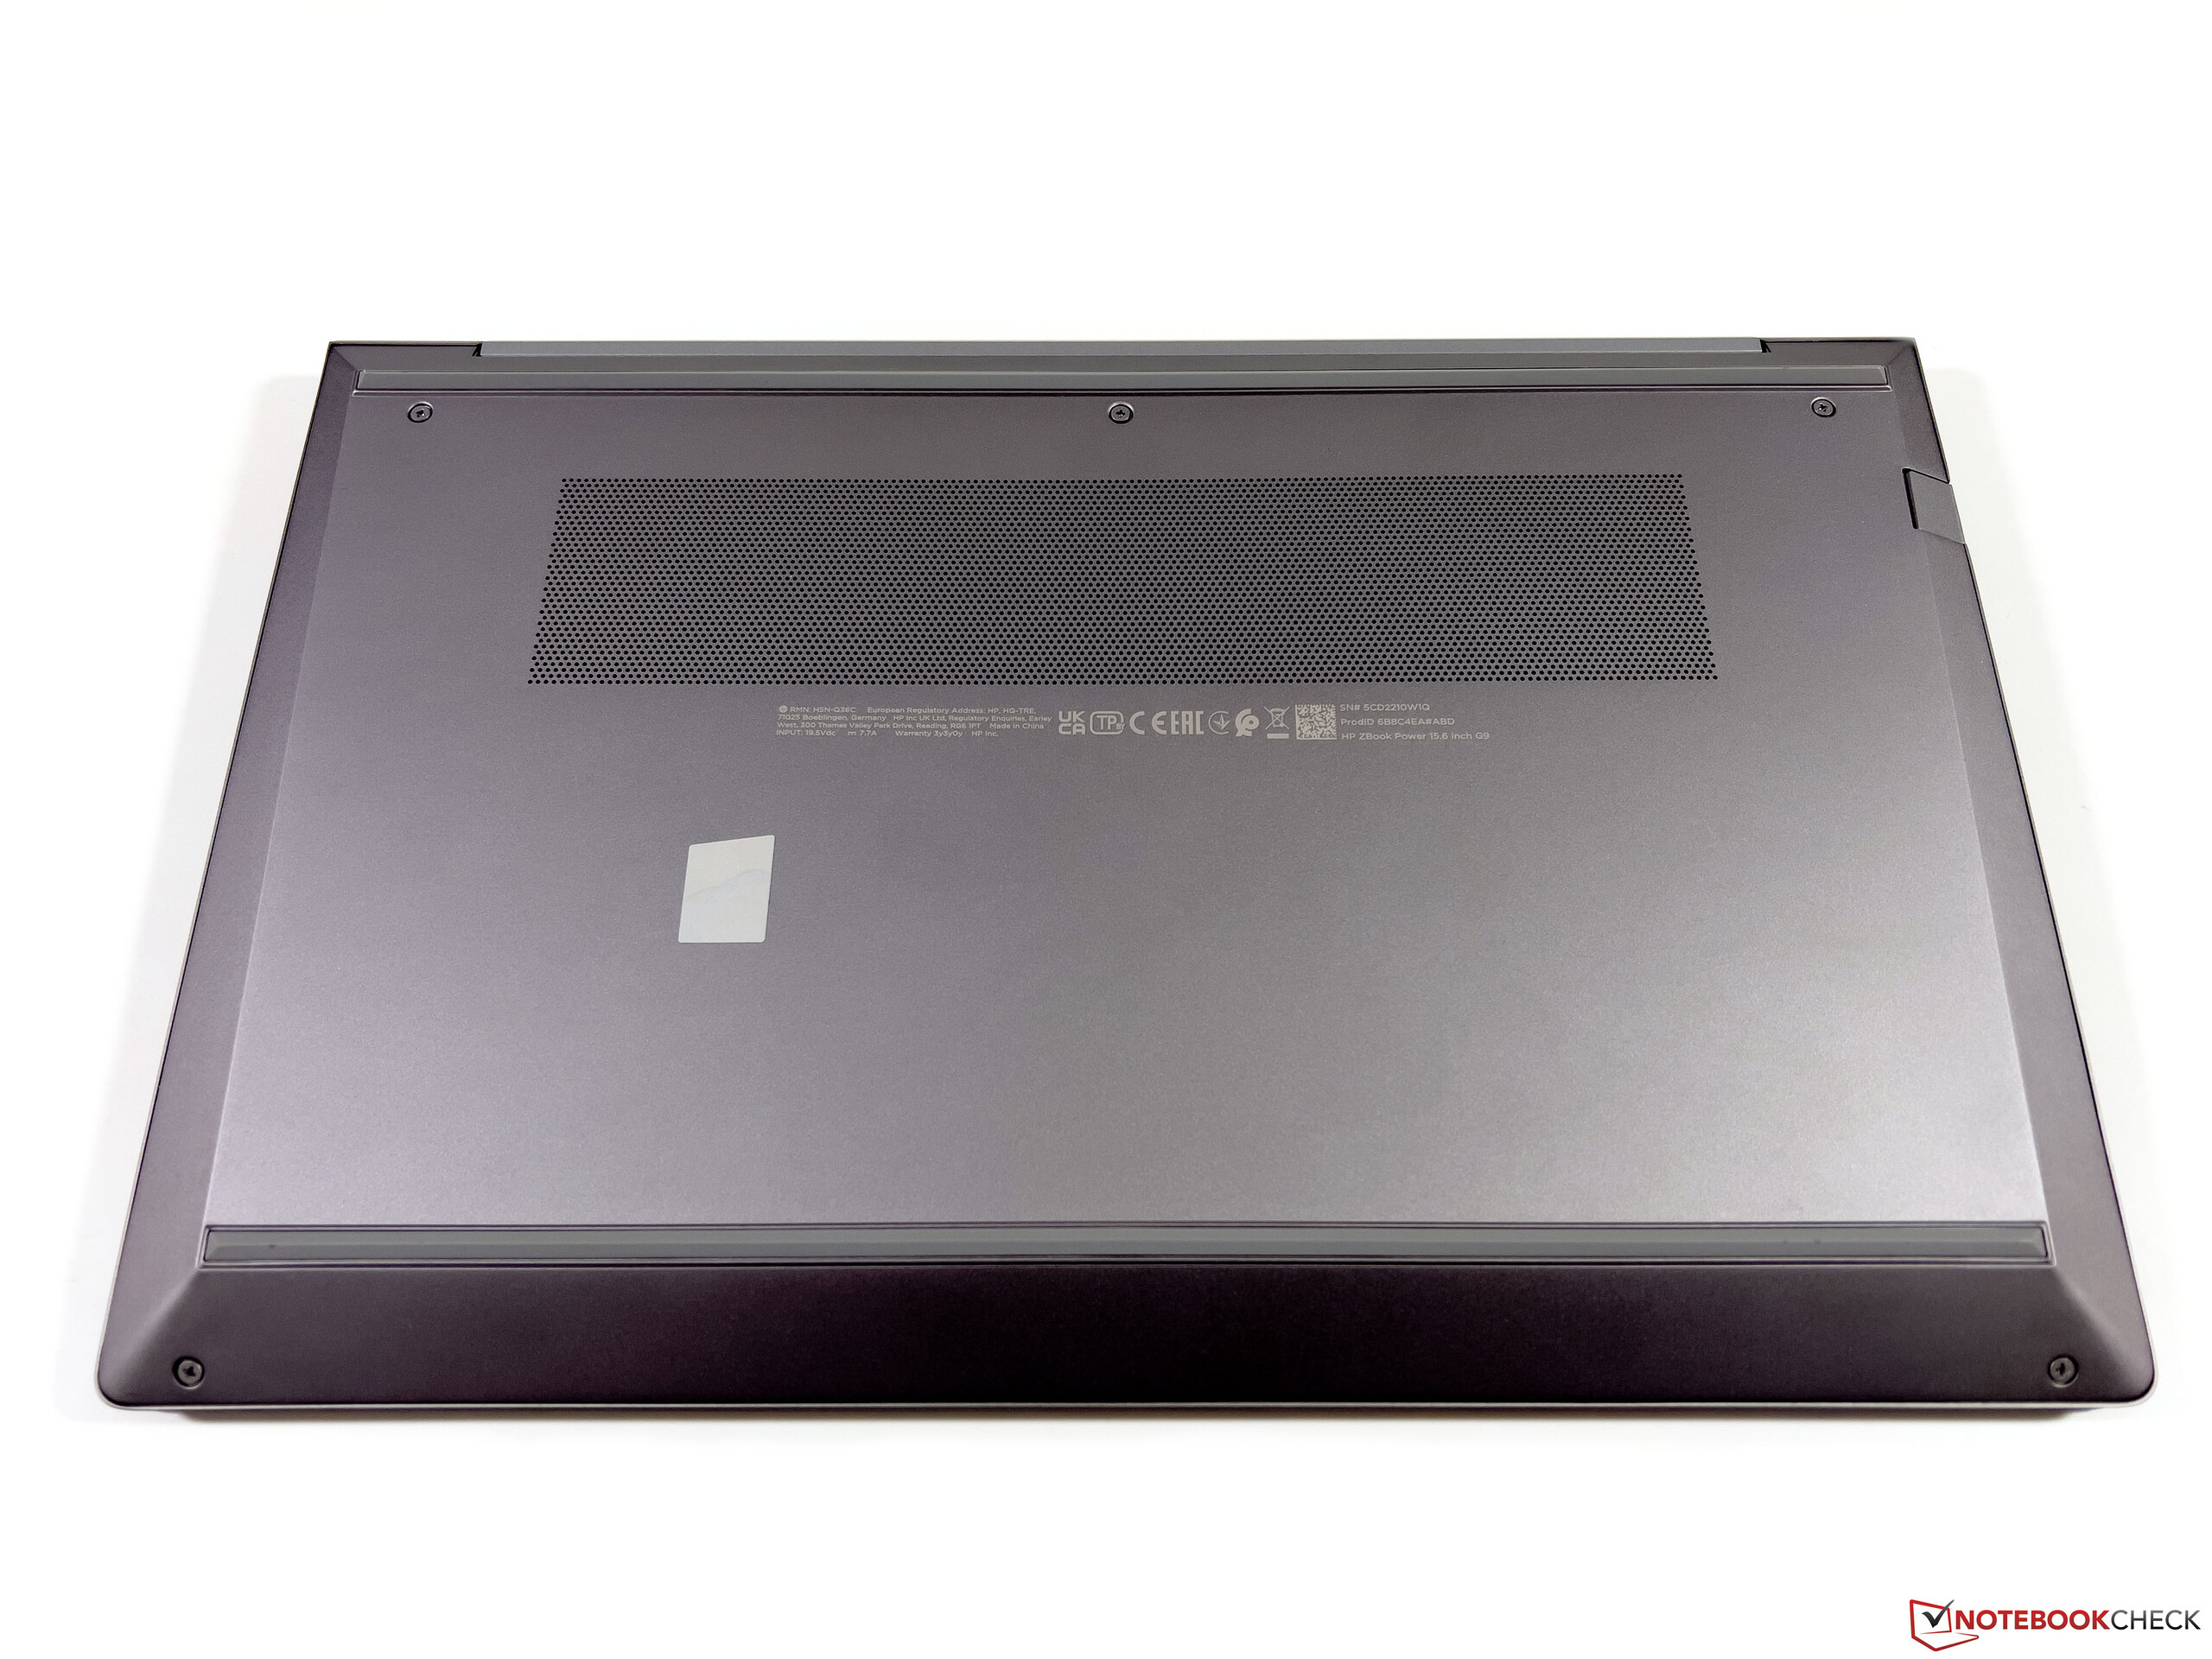
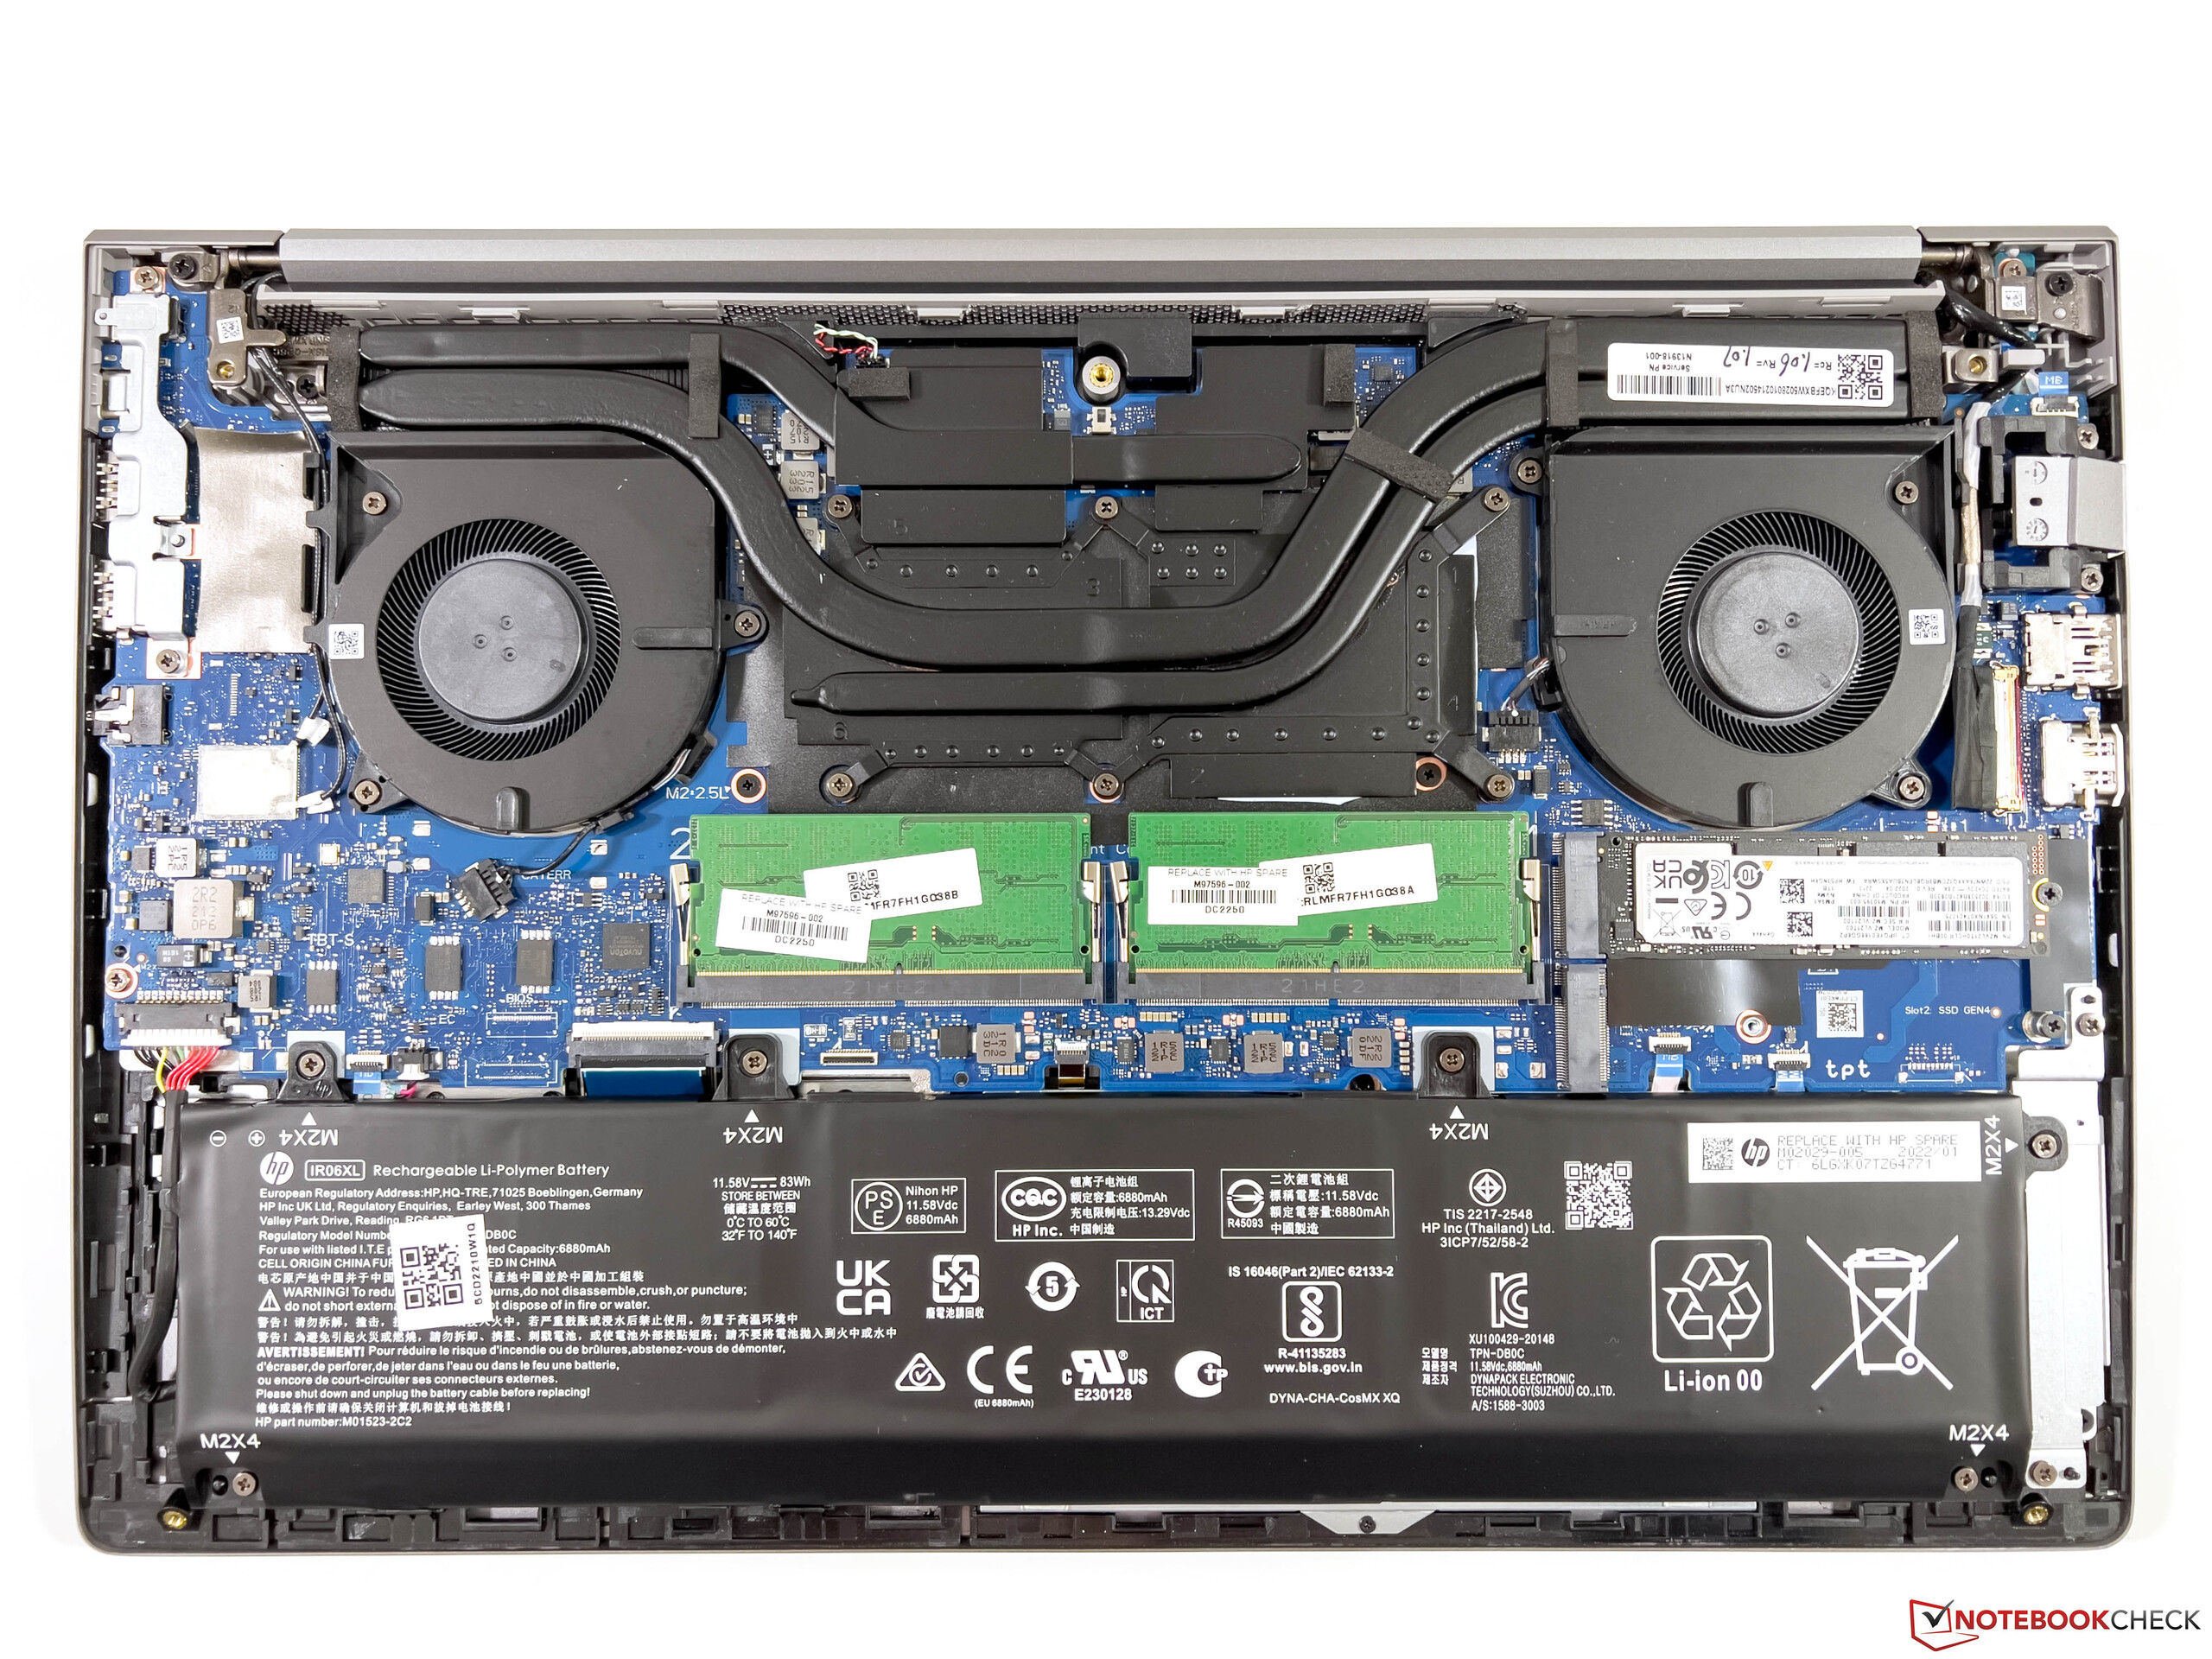
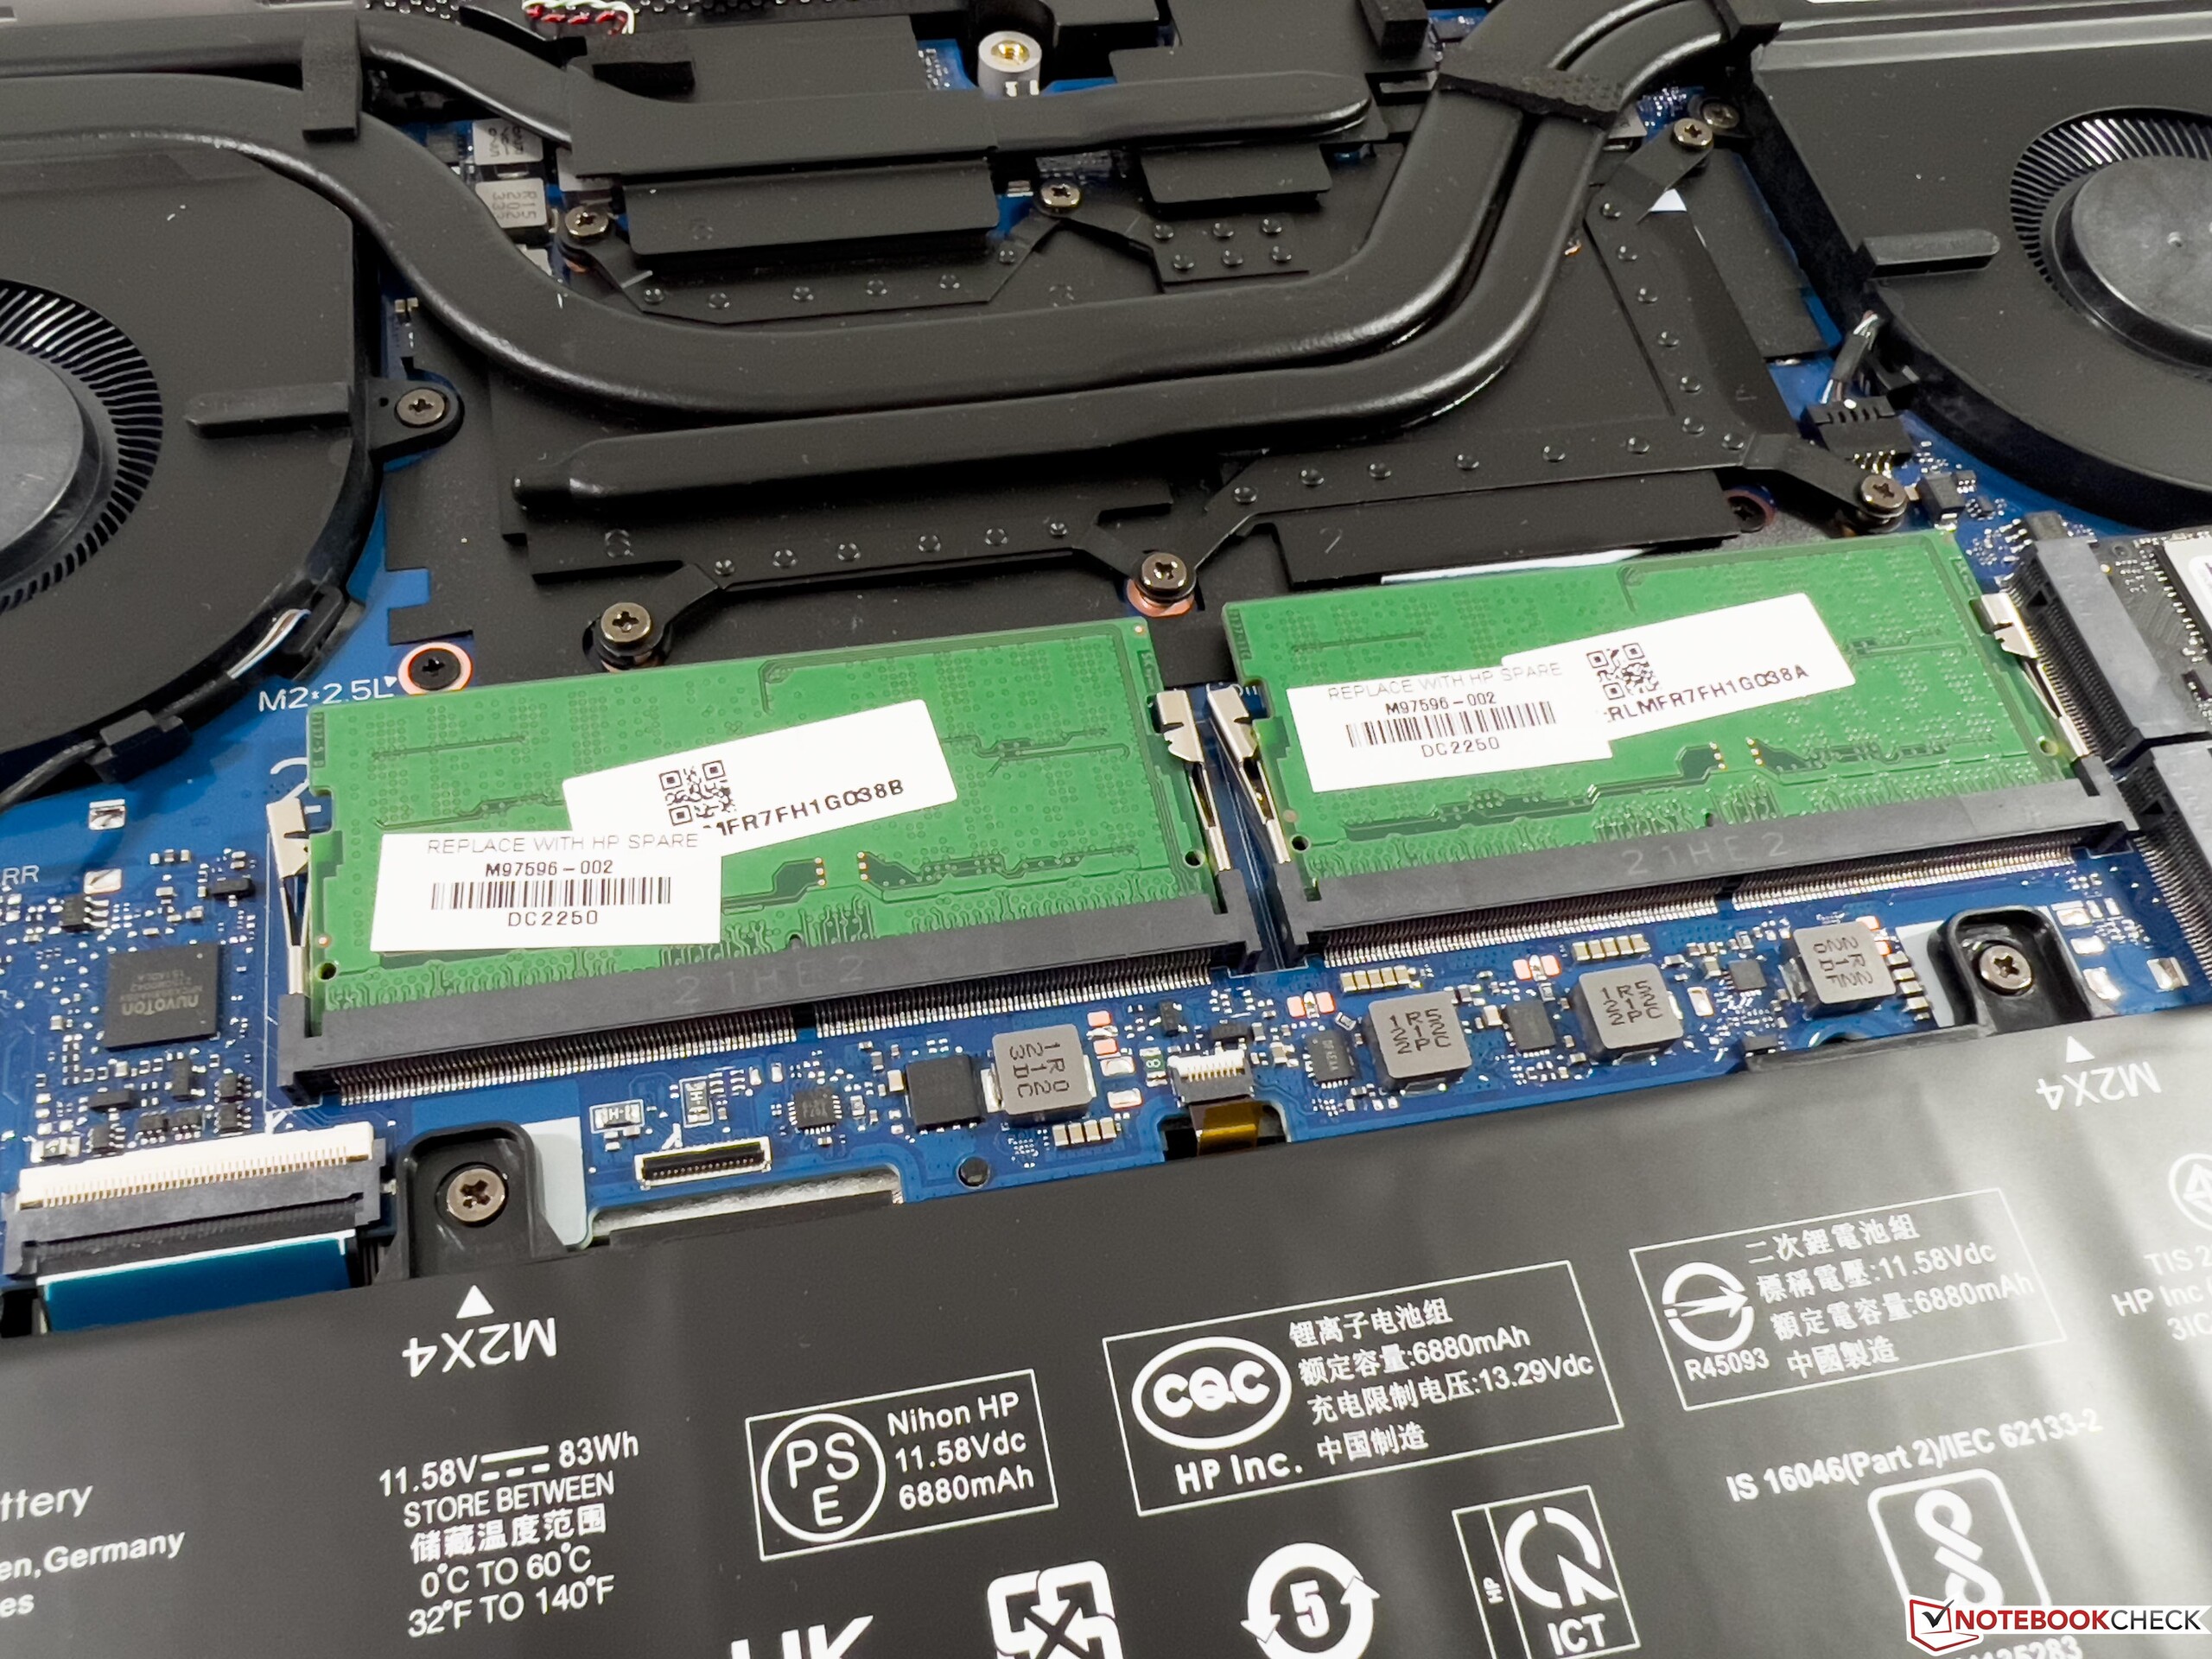
The aluminum case remains unchanged from the previous G8 model. While the quality is good overall, the stability doesn't quite reach that of the more expensive workstation models such as the ZBook Studio or ZBook Fury. In addition, the display wobbles slightly after changing the opening angle. Visually, the ZBook Power 15 G9 looks modest and unremarkable with its darker gray color. The bottom of the case is only screwed in and can be removed easily. Besides the working memory, you can also access the two M.2 SSD slots, but the WLAN module is soldered in.
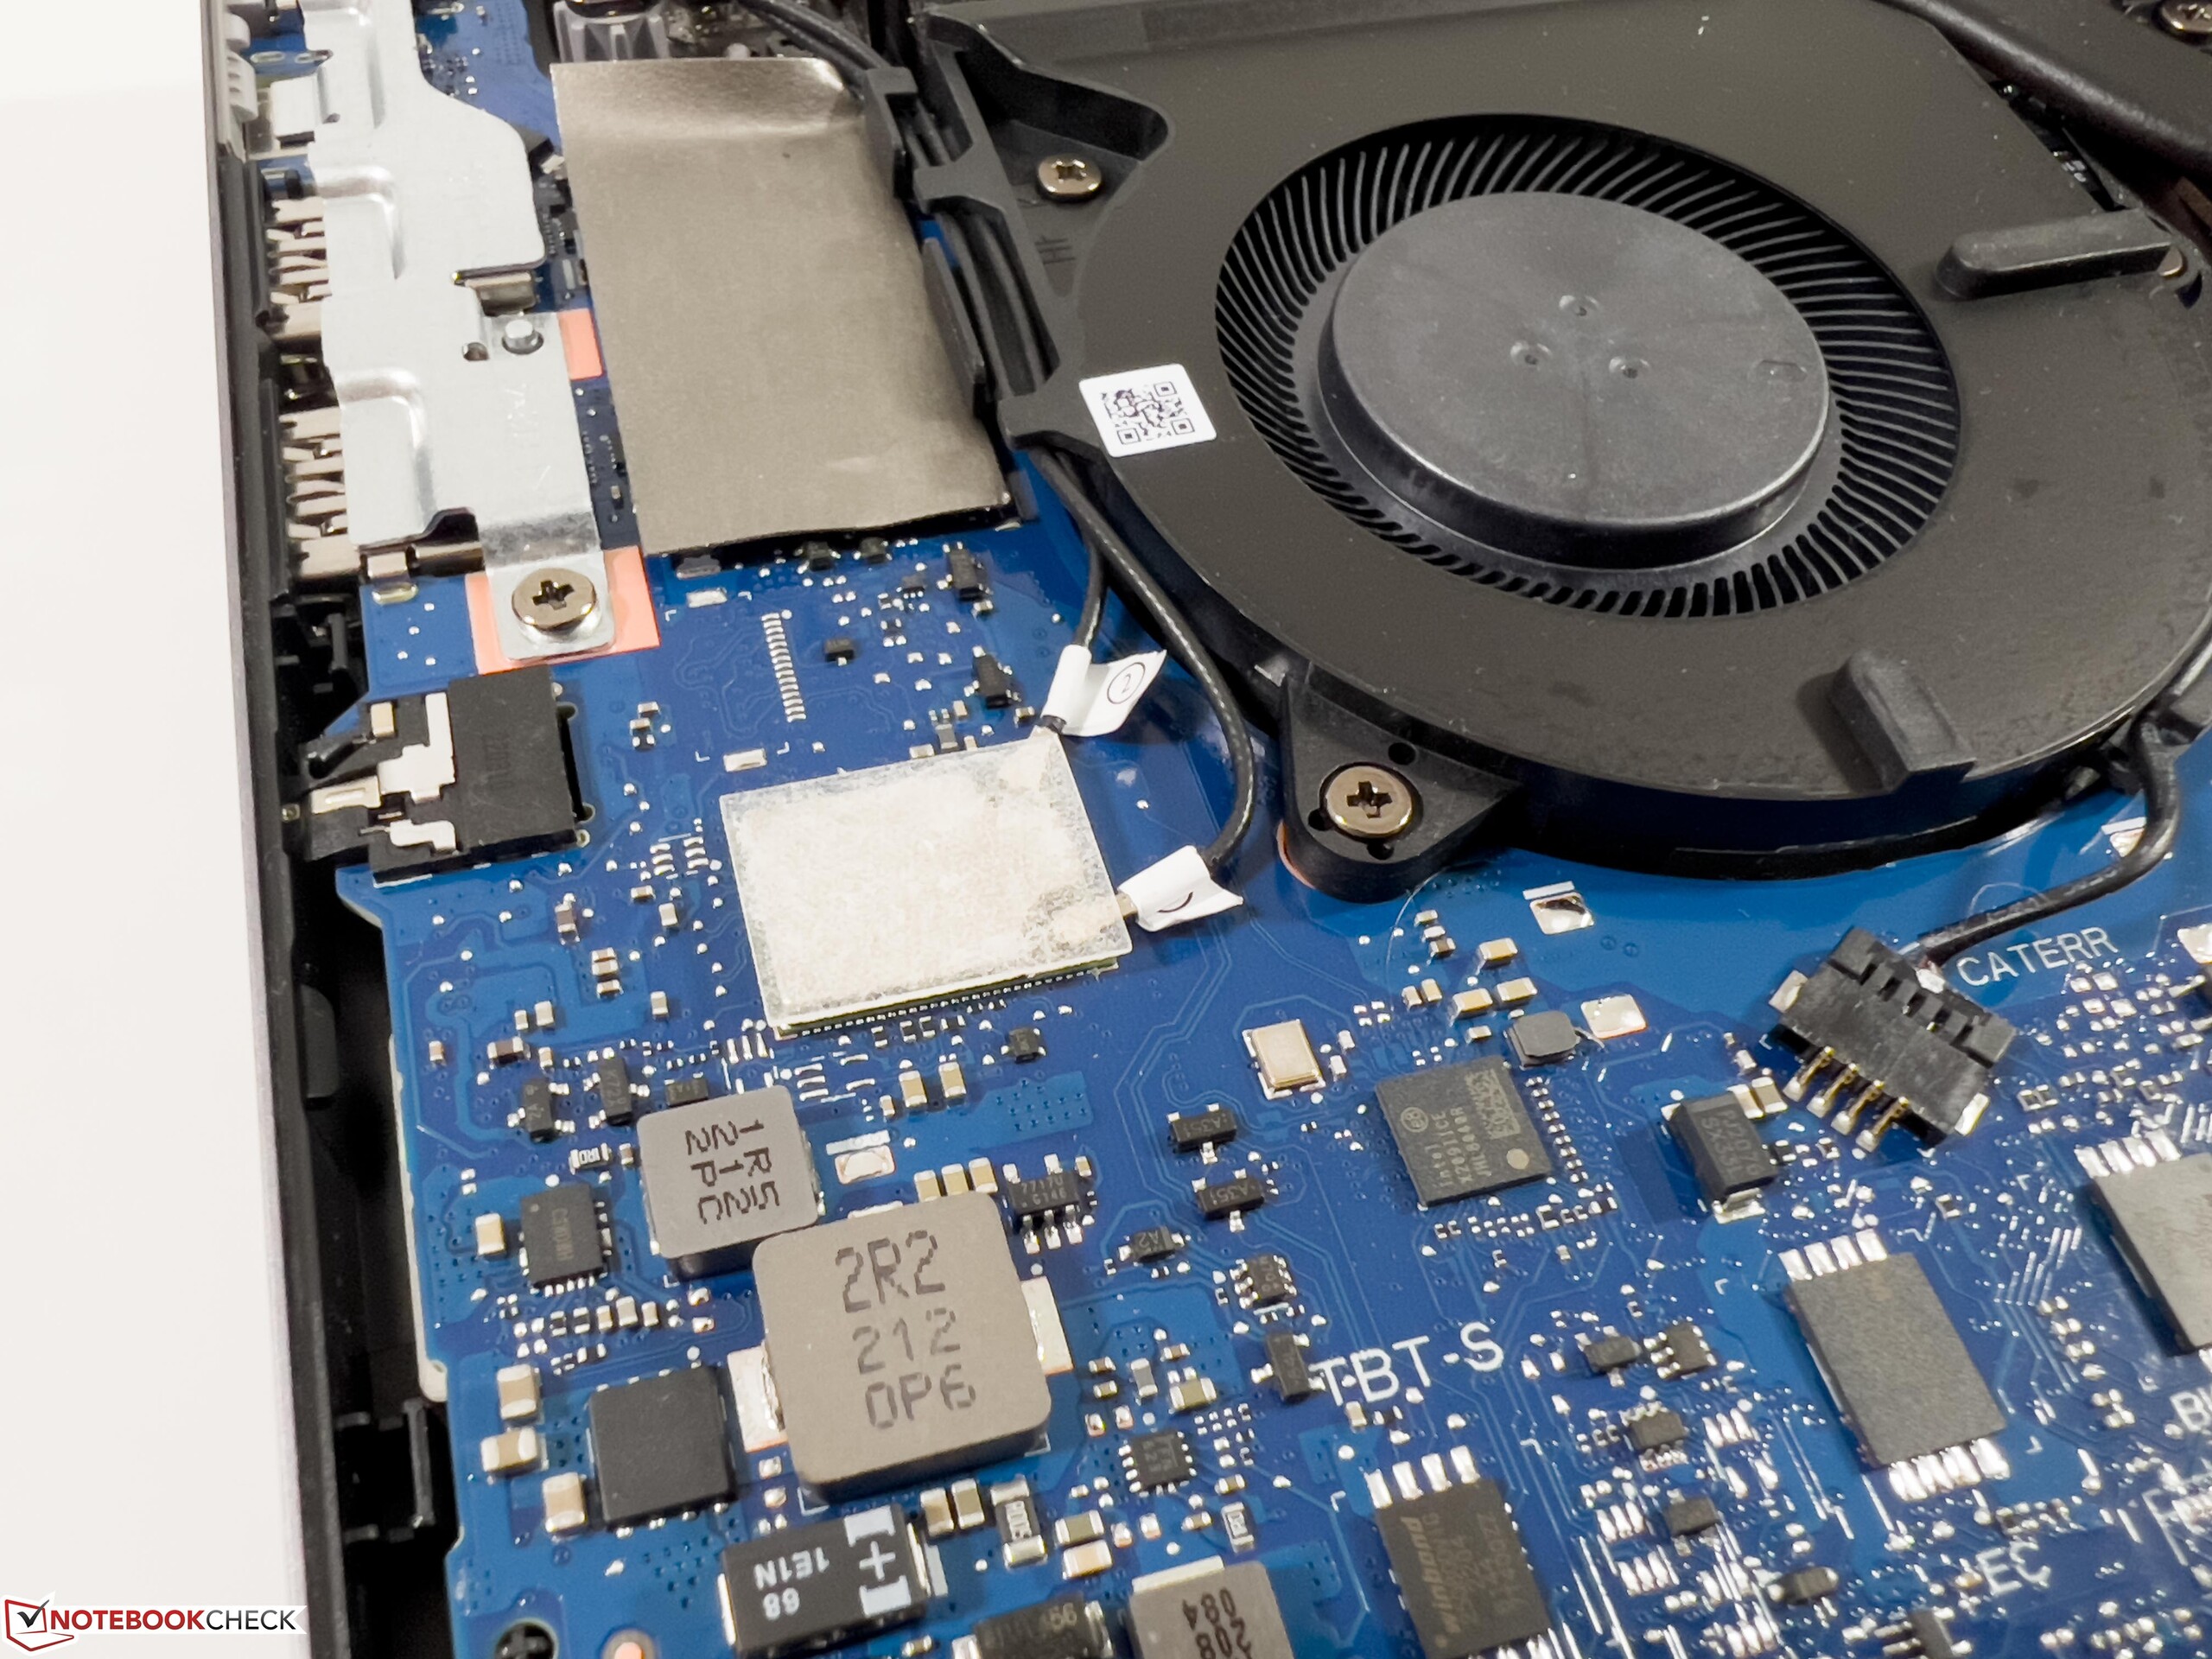
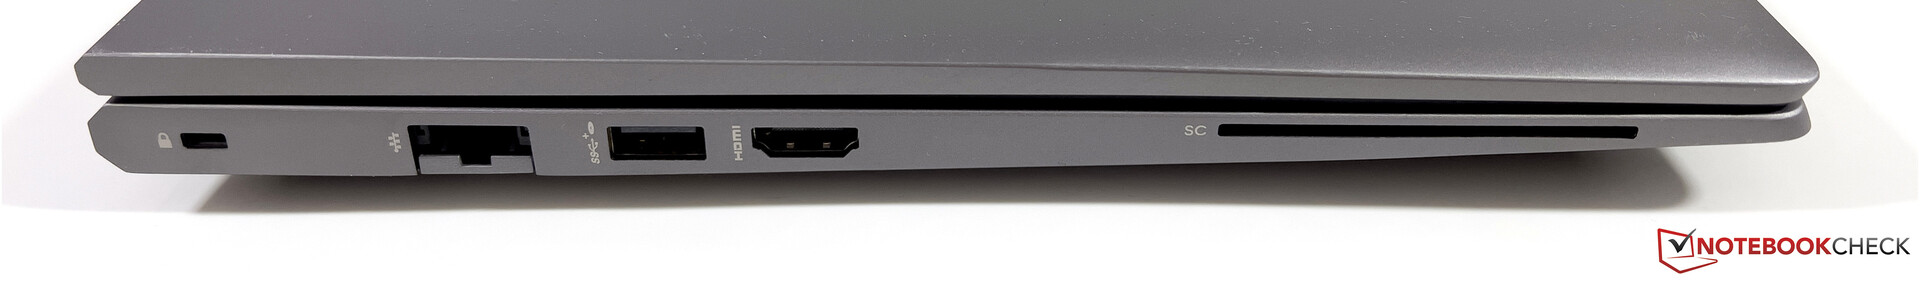
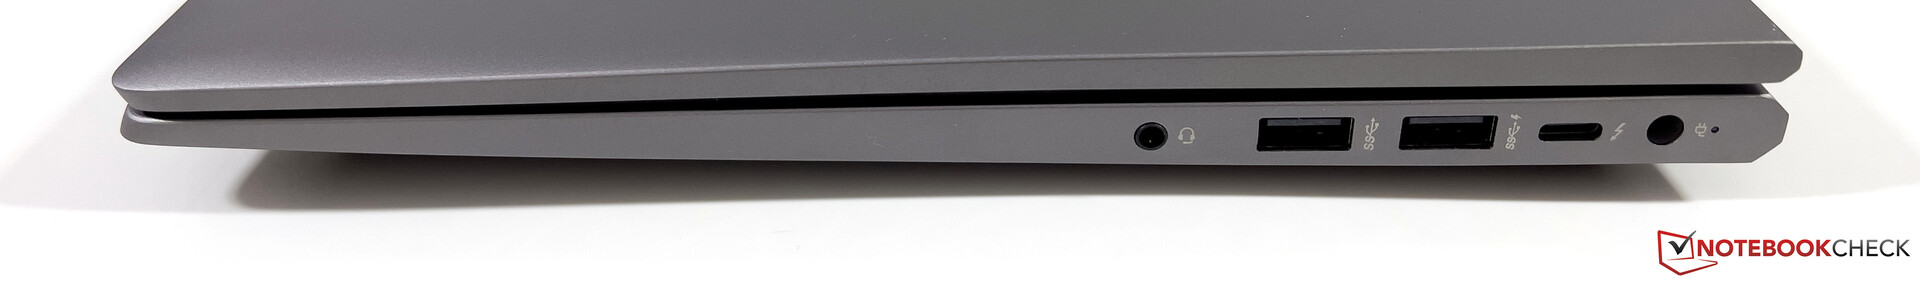
In terms of the connection equipment, there continues to be a number of USB-A ports as well as USB-C with Thunderbolt 4, Ethernet, and an HDMI port. However, it lacks a card reader. The WLAN module was upgraded, and the AX211 card from Intel now also supports the Wi-Fi 6E standard. We are able to connect to the 6-GHz network from our Asus reference router without any problems. The transfer rates we measure are very high and also stabile. An LTE/5G module is not available for the ZBook Power.
As the webcam, there continues to be a 720p sensor including an IR camera for face recognition. The webcam does its job, but the image quality is not very good even in good light conditions.
| Networking | |
| HP ZBook Power 15 G9 6B8C4EA | |
| iperf3 receive AXE11000 6GHz | |
| iperf3 transmit AXE11000 6GHz | |
| HP ZBook Studio 16 G9 62U04EA | |
| iperf3 receive AXE11000 6GHz | |
| iperf3 transmit AXE11000 6GHz | |
| Dell Precision 5000 5560 | |
| iperf3 transmit AX12 | |
| iperf3 receive AX12 | |
| Lenovo ThinkPad P15v G2 21A9000XGE | |
| iperf3 transmit AX12 | |
| iperf3 receive AX12 | |
| HP ZBook Power 15 G8 313S5EA | |
| iperf3 transmit AX12 | |
| iperf3 receive AX12 | |


Input Devices - ZBook Power with a good keyboard
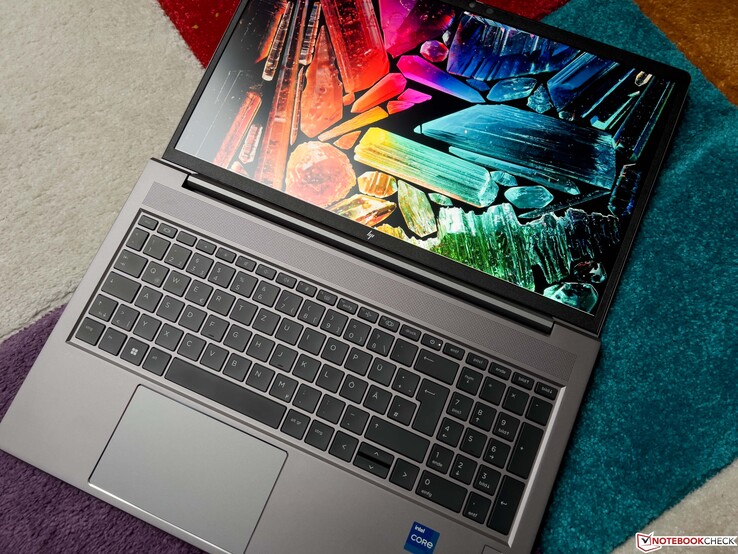
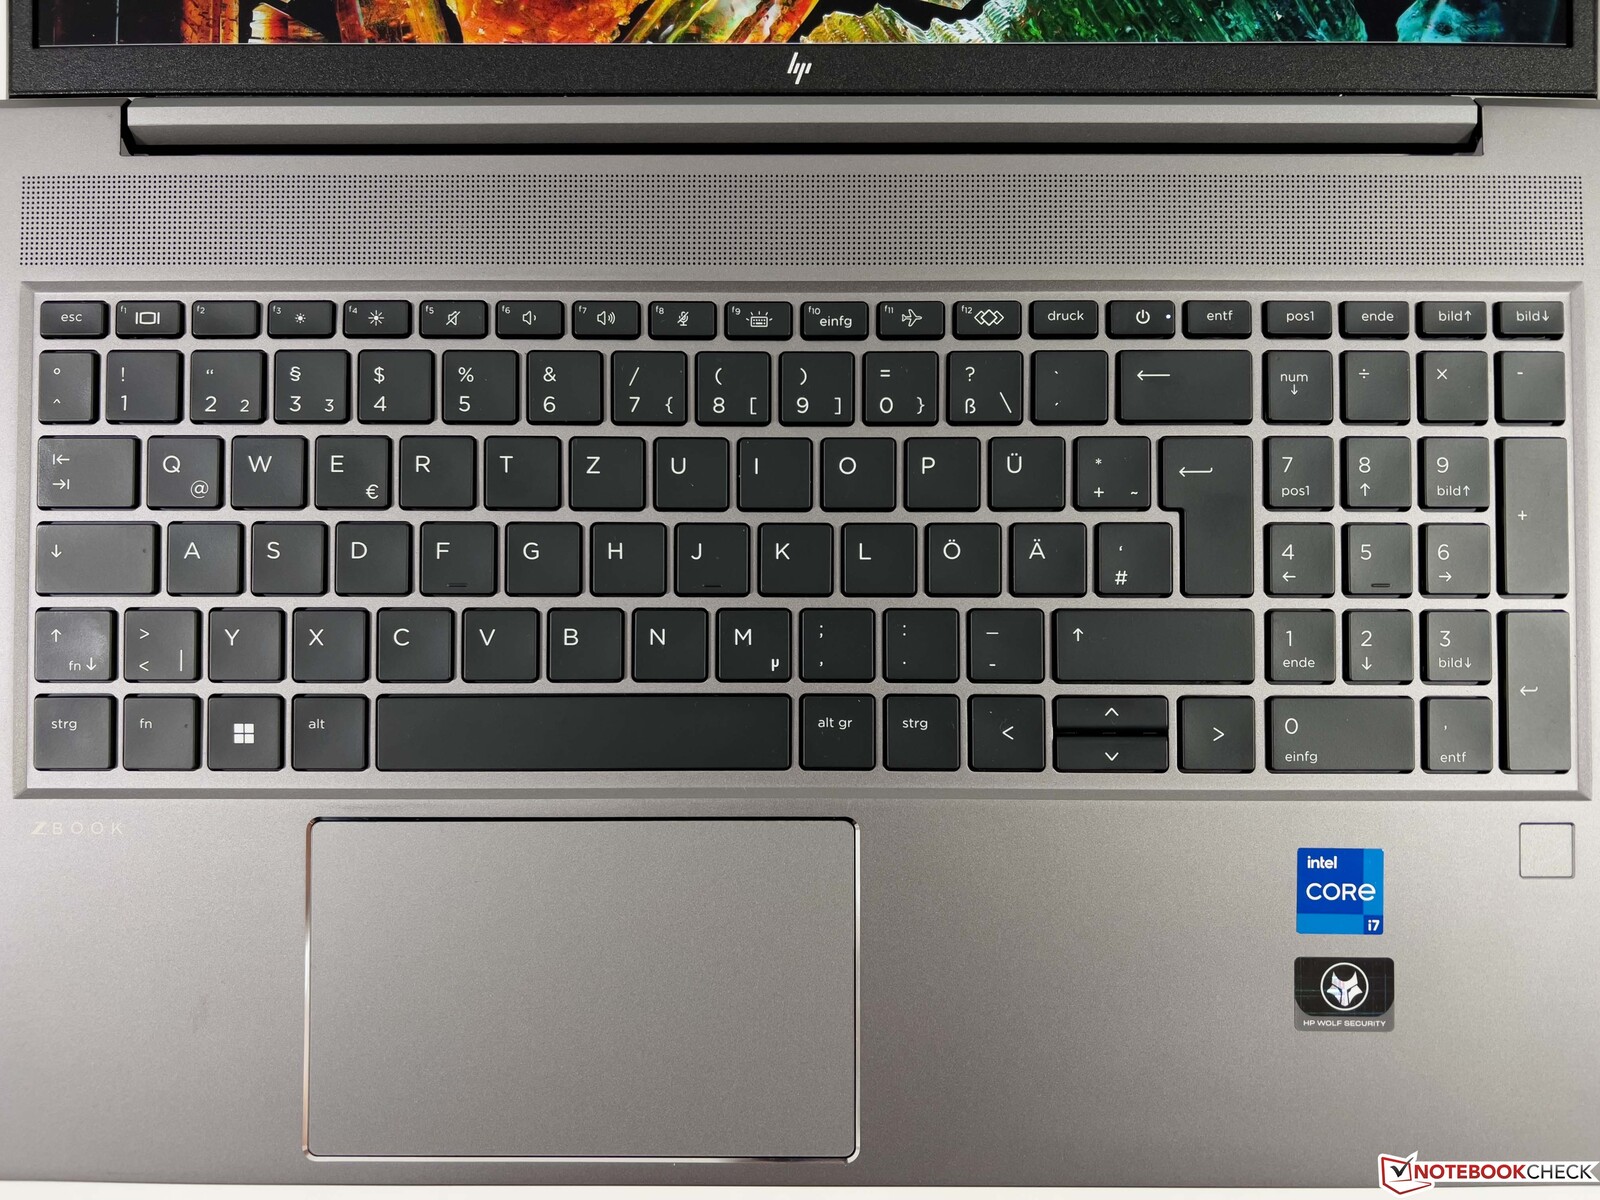
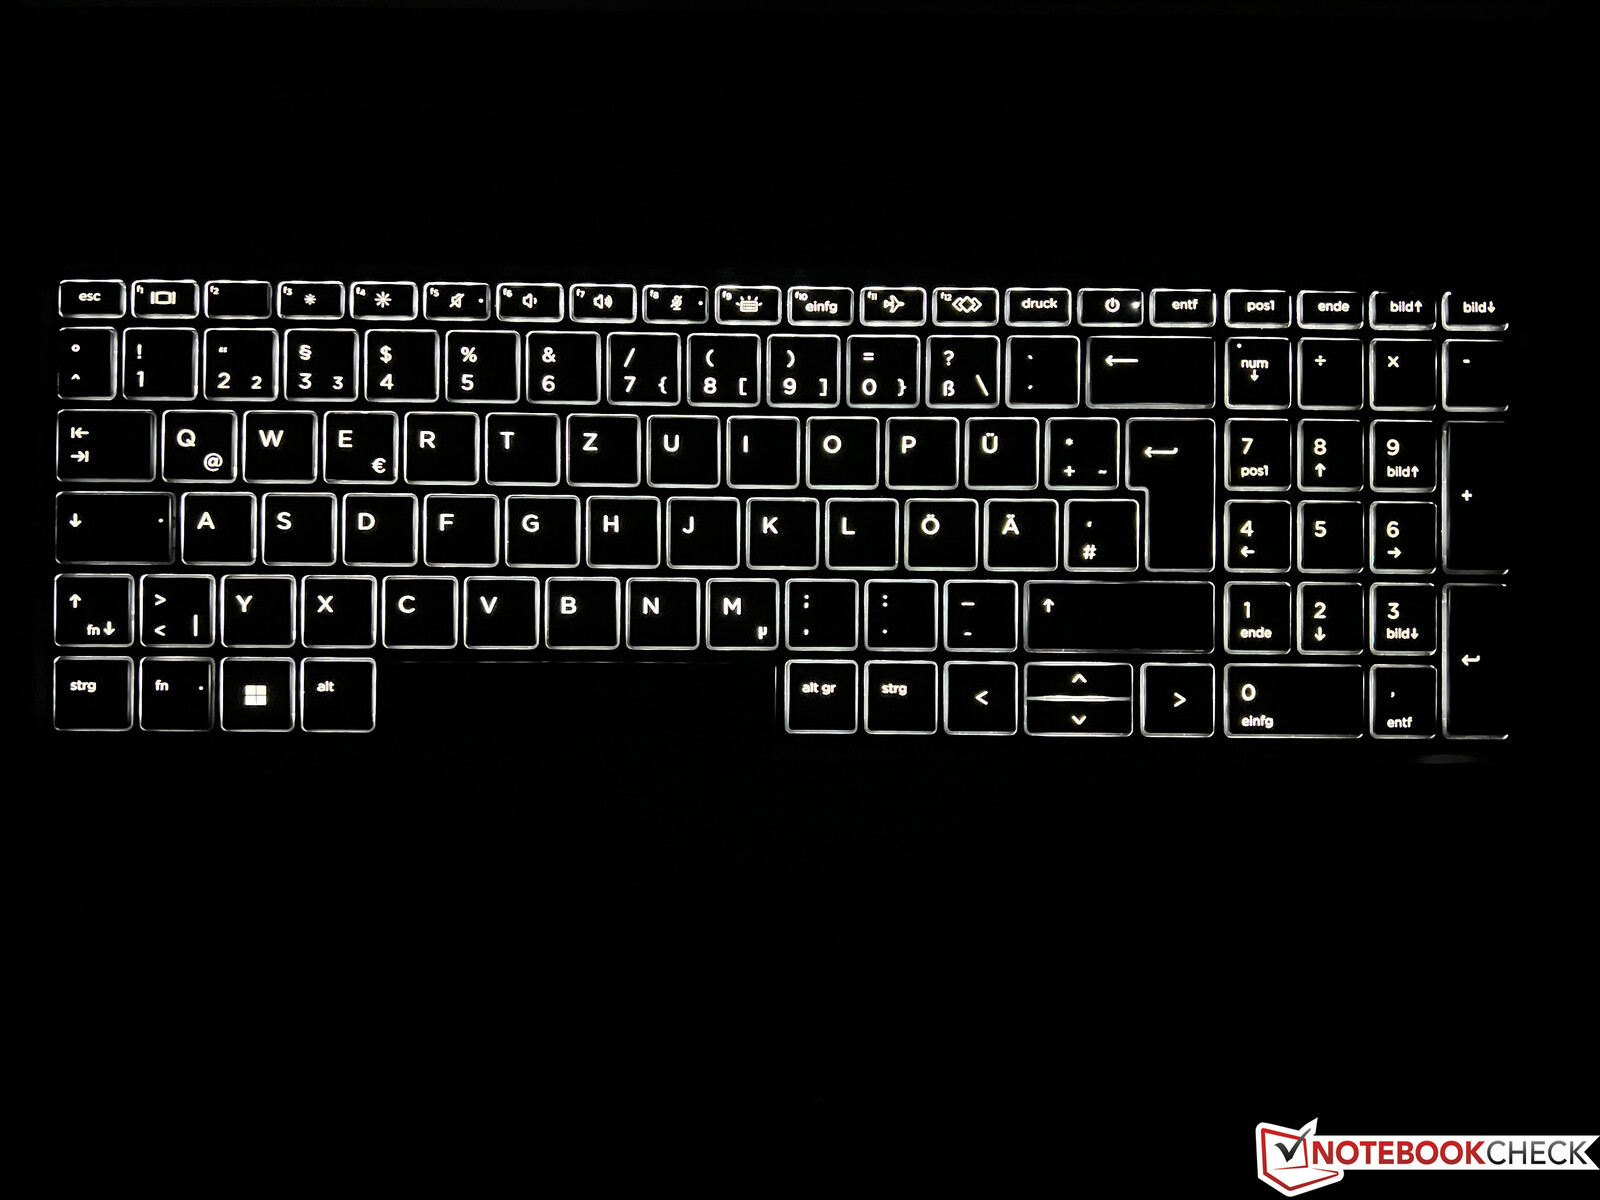
Compared to the ZBook Power 15 G8, there are also no changes in the input devices. The keyboard with background illumination offers a very good typing experience, and there is a dedicated number block on the right side. In terms of the layout, you have to get used to the slightly smaller arrow keys and the Power button in the top key row. The fingerprint scanner is placed on the right, below the keyboard. In our test, the ClickPad works reliably, but the clicking sound is a bit loud.
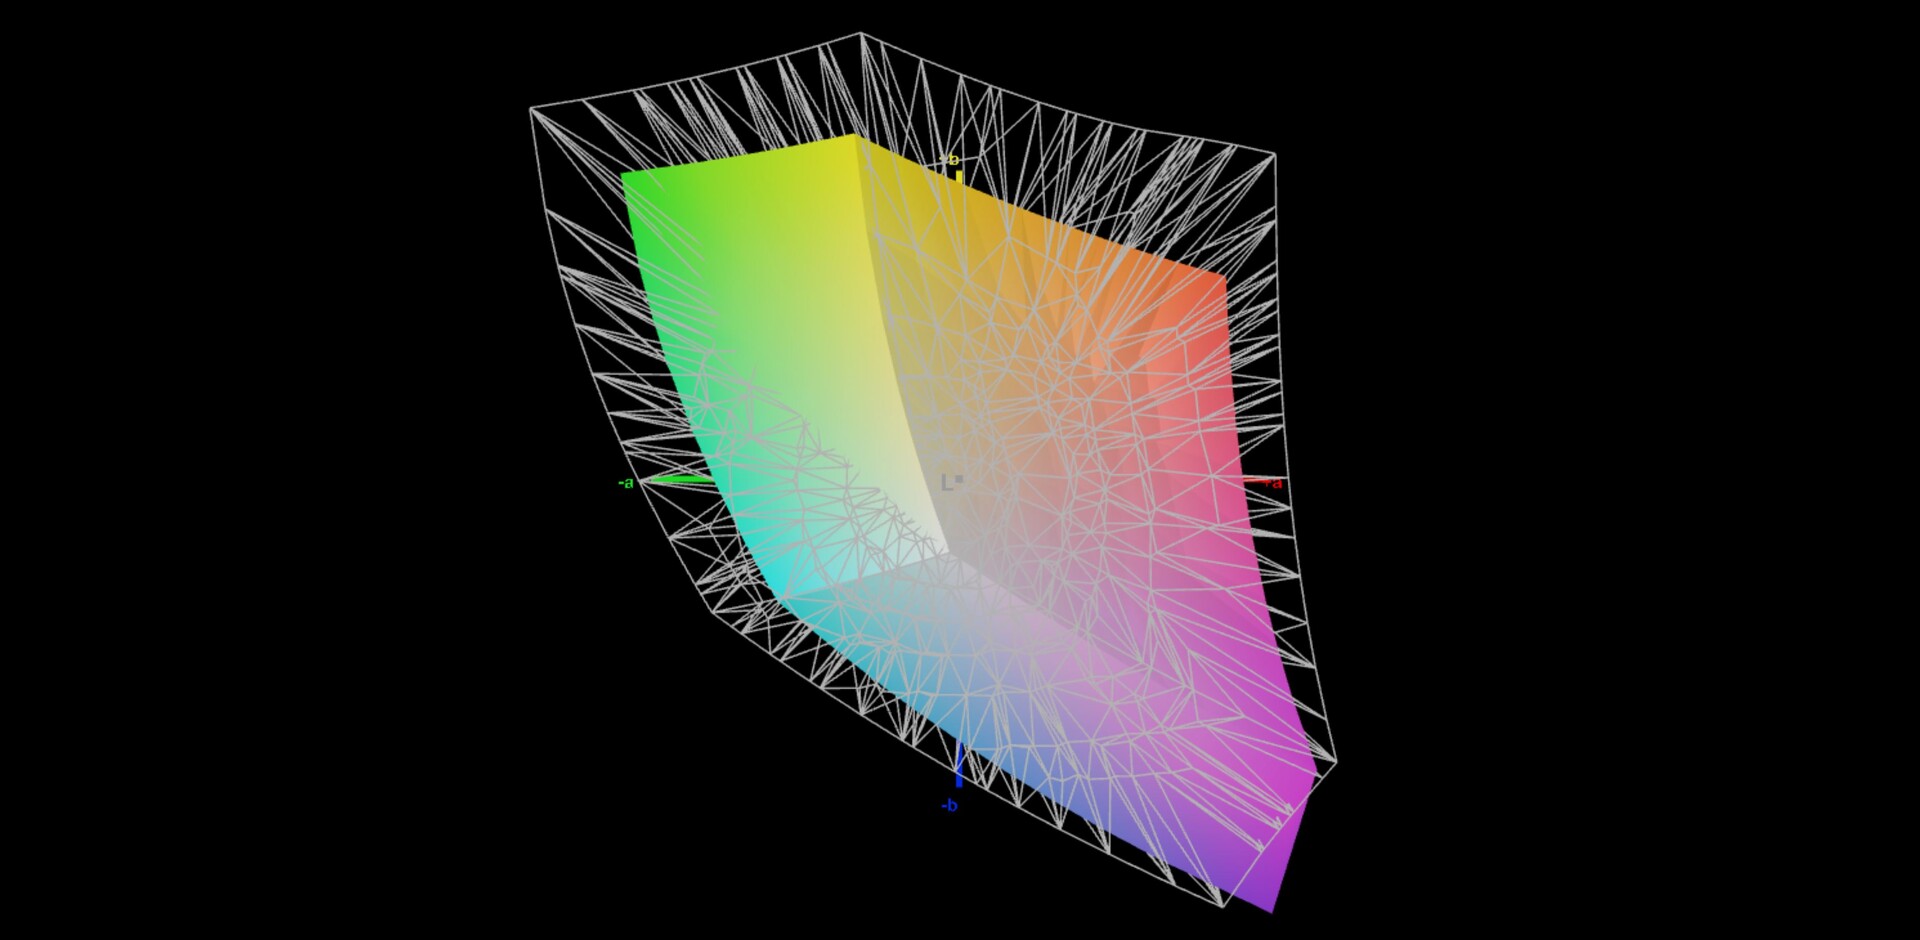
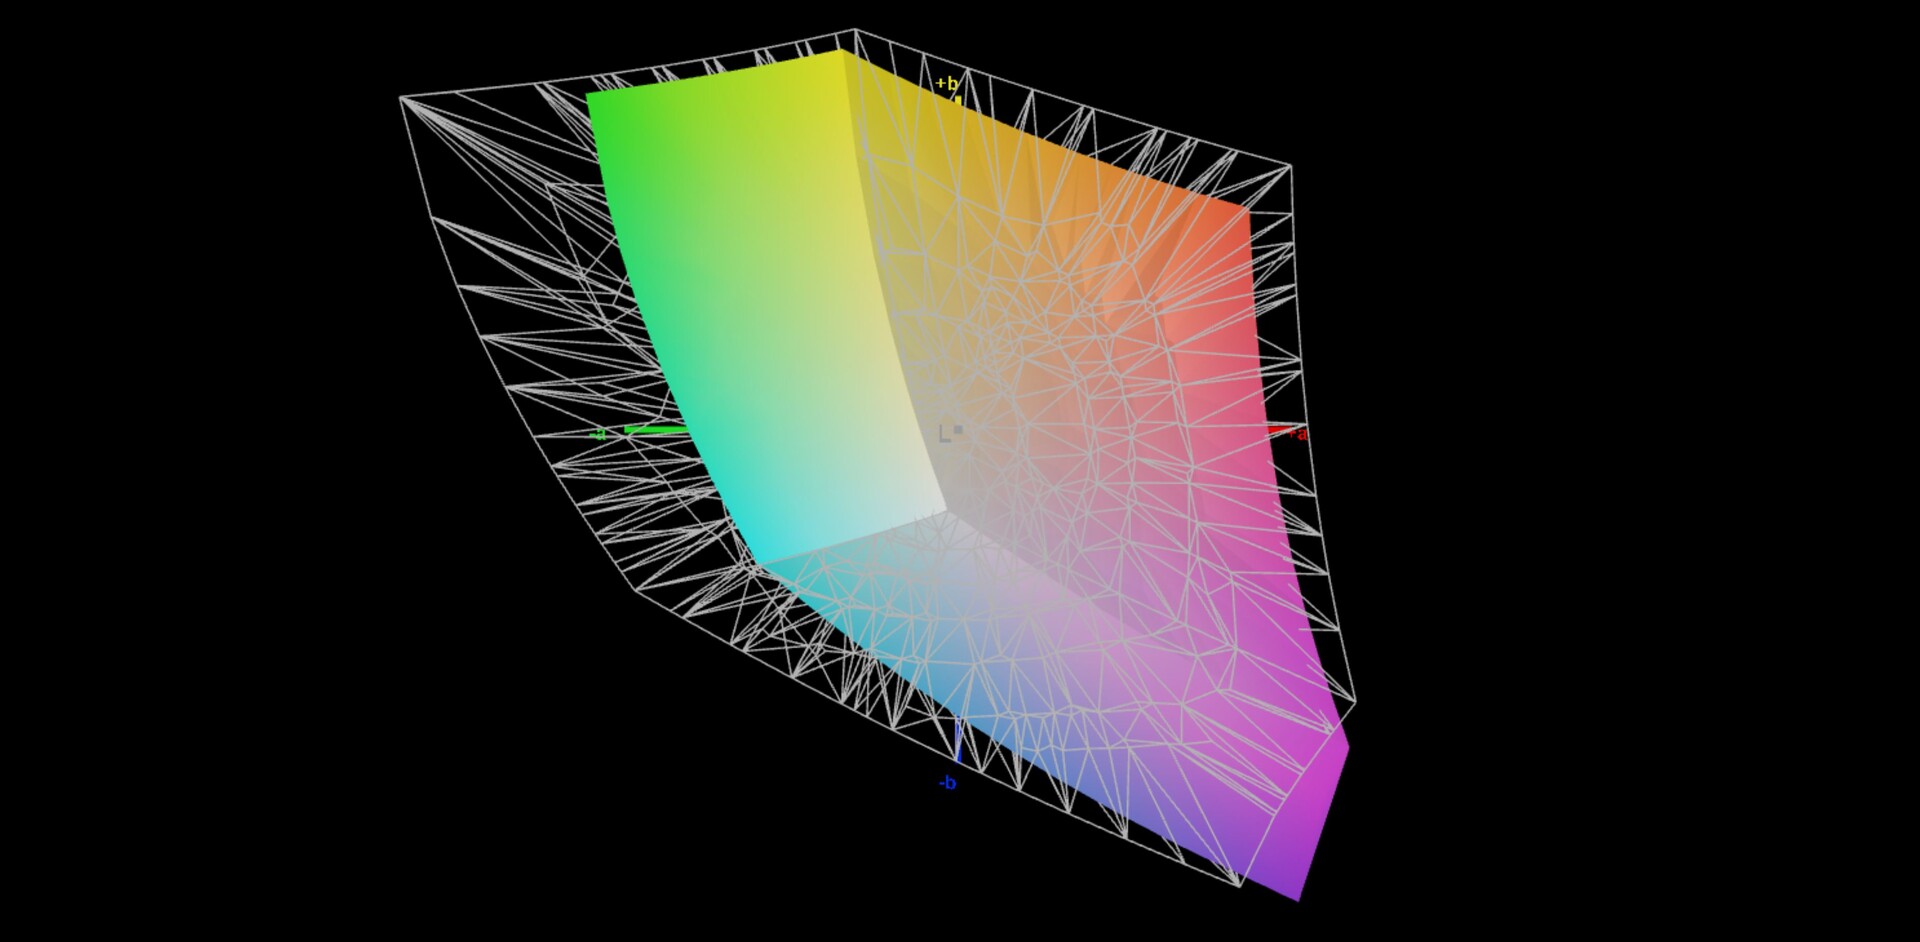
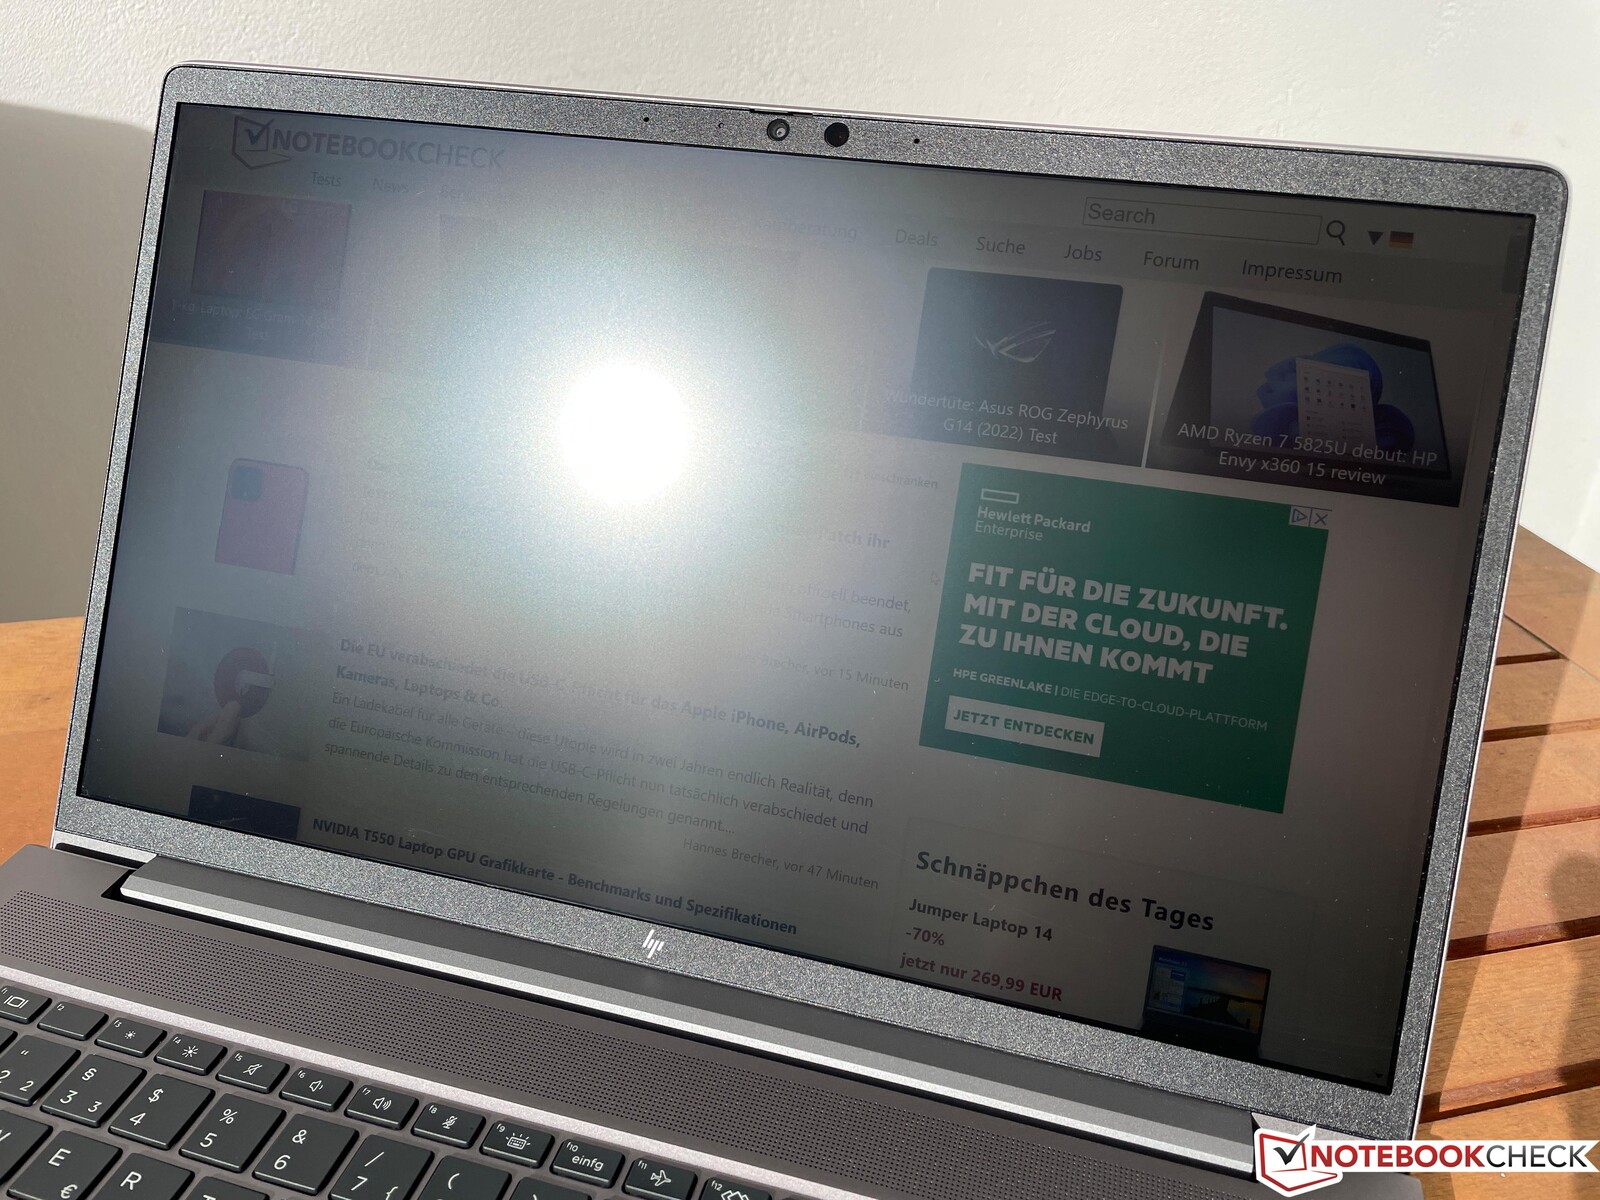
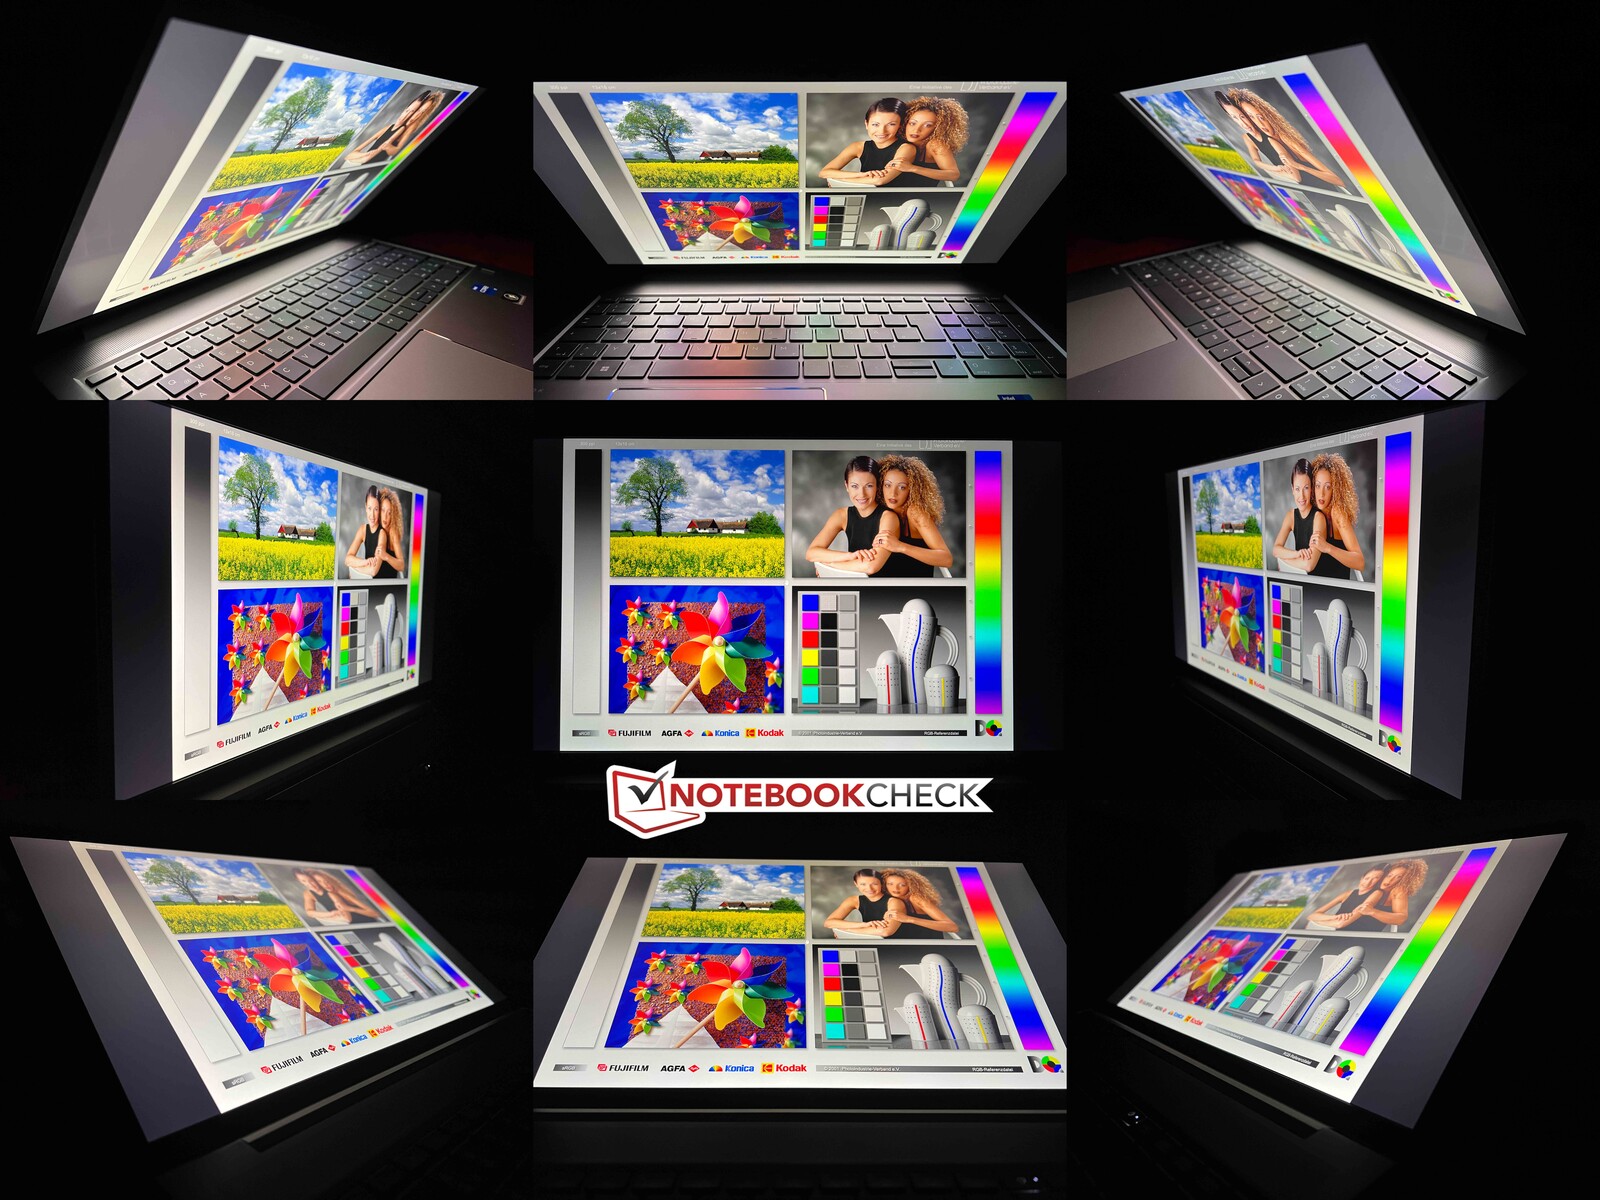
Display - 4K IPS with 100% sRGB coverage
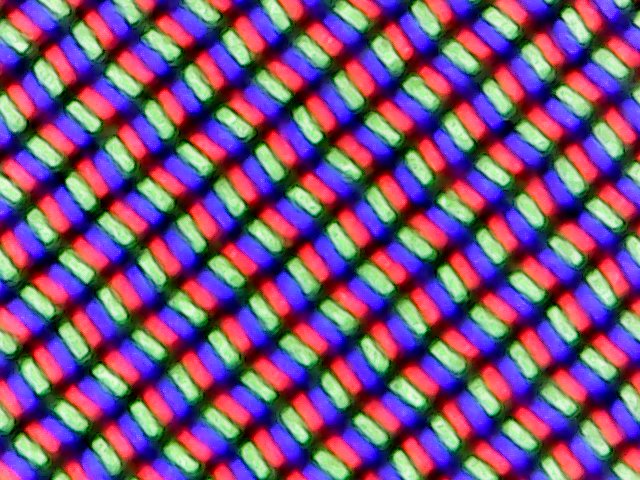
We already tested the regular Full HD panel with the predecessor, and our current test configuration of the ZBook Power G9 is equipped with the optional low power 4K IPS display. As in the predecessor, this still has the 16:9 format (3,840 x 2,160 pixels). Subjectively, the LG-Philips panel produces a good image quality, but bright contents appear slightly grainy on the matte display surface. In addition, the response times are not particularly fast, and we also see some clear ghosting effects in practice, for example in the mouse pointer.
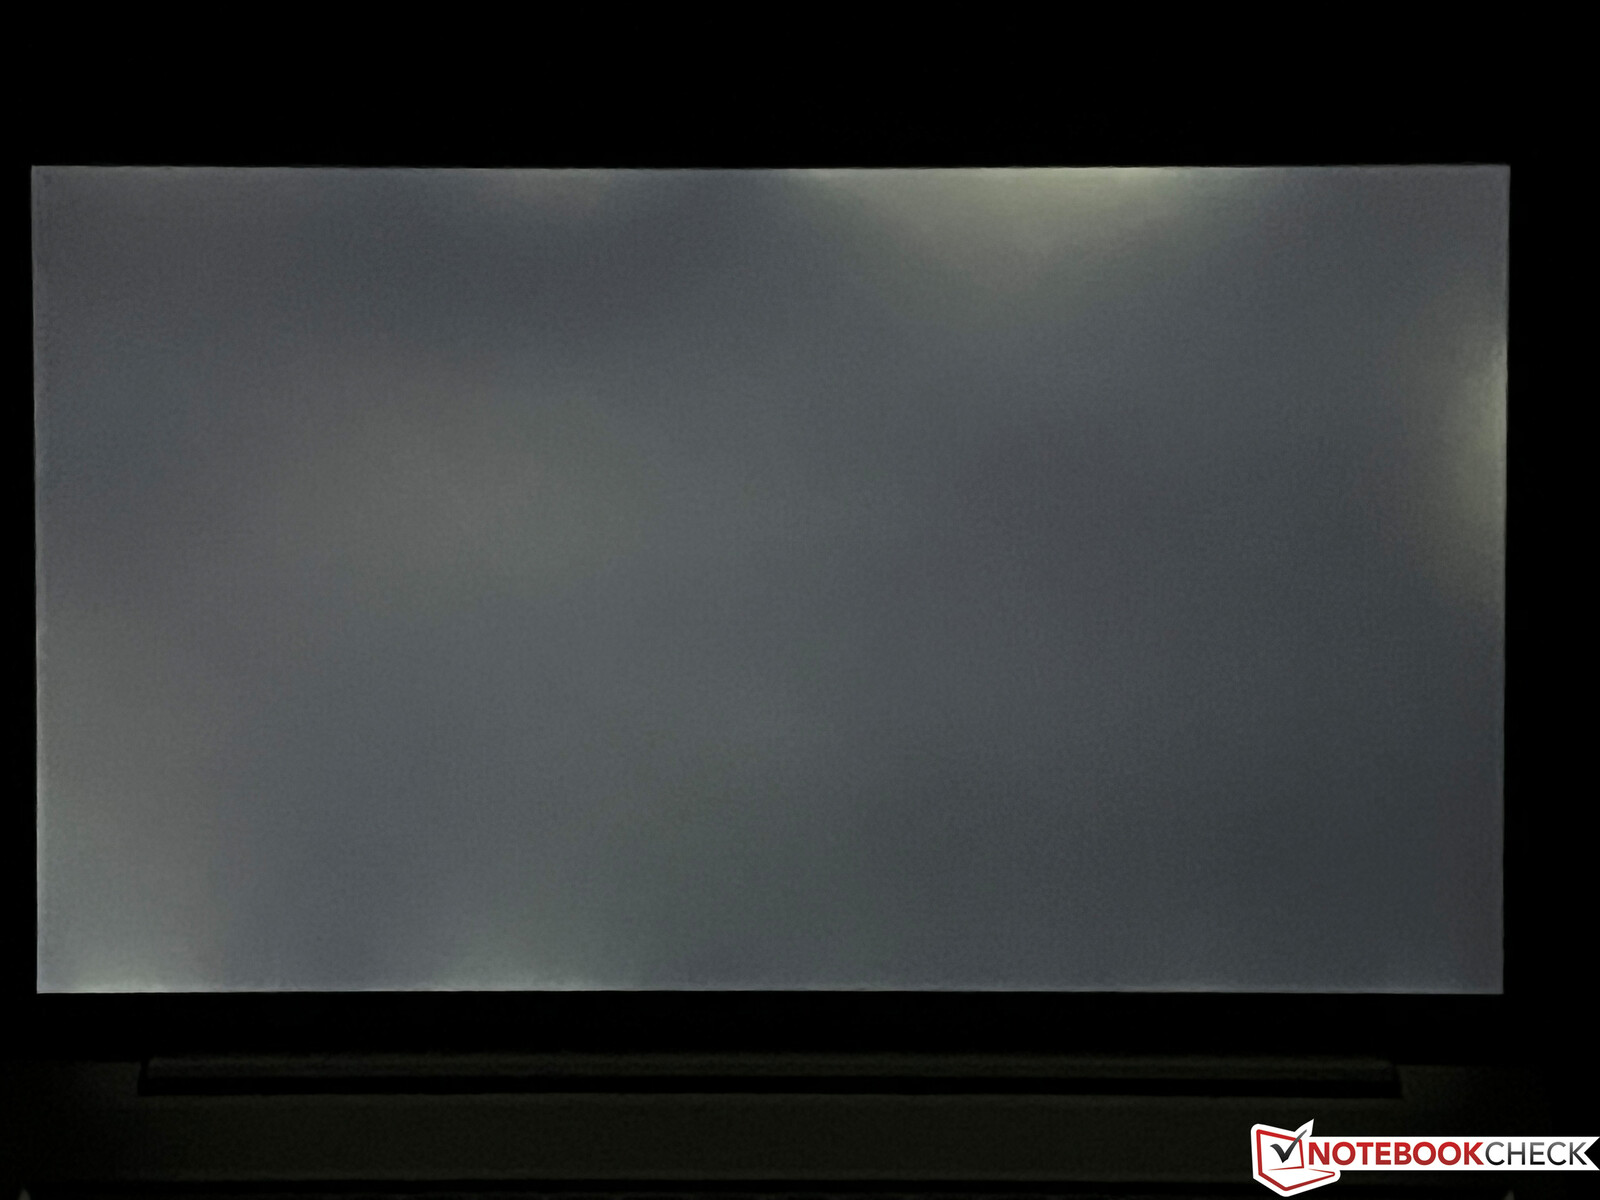
HP advertises a brightness of 400 cd/m², and our test unit also achieves this in the top range. At the same time, the black value is very low at 0.15, leading to a very good contrast ratio of more than 2,500:1. At full brightness and with a dark background, there are some noticeable light halos. PWM is not used.
| |||||||||||||||||||||||||
Brightness Distribution: 88 %
Center on Battery: 391 cd/m²
Contrast: 2613:1 (Black: 0.15 cd/m²)
ΔE ColorChecker Calman: 3.2 | ∀{0.5-29.43 Ø4.72}
calibrated: 1.2
ΔE Greyscale Calman: 4.9 | ∀{0.09-98 Ø4.97}
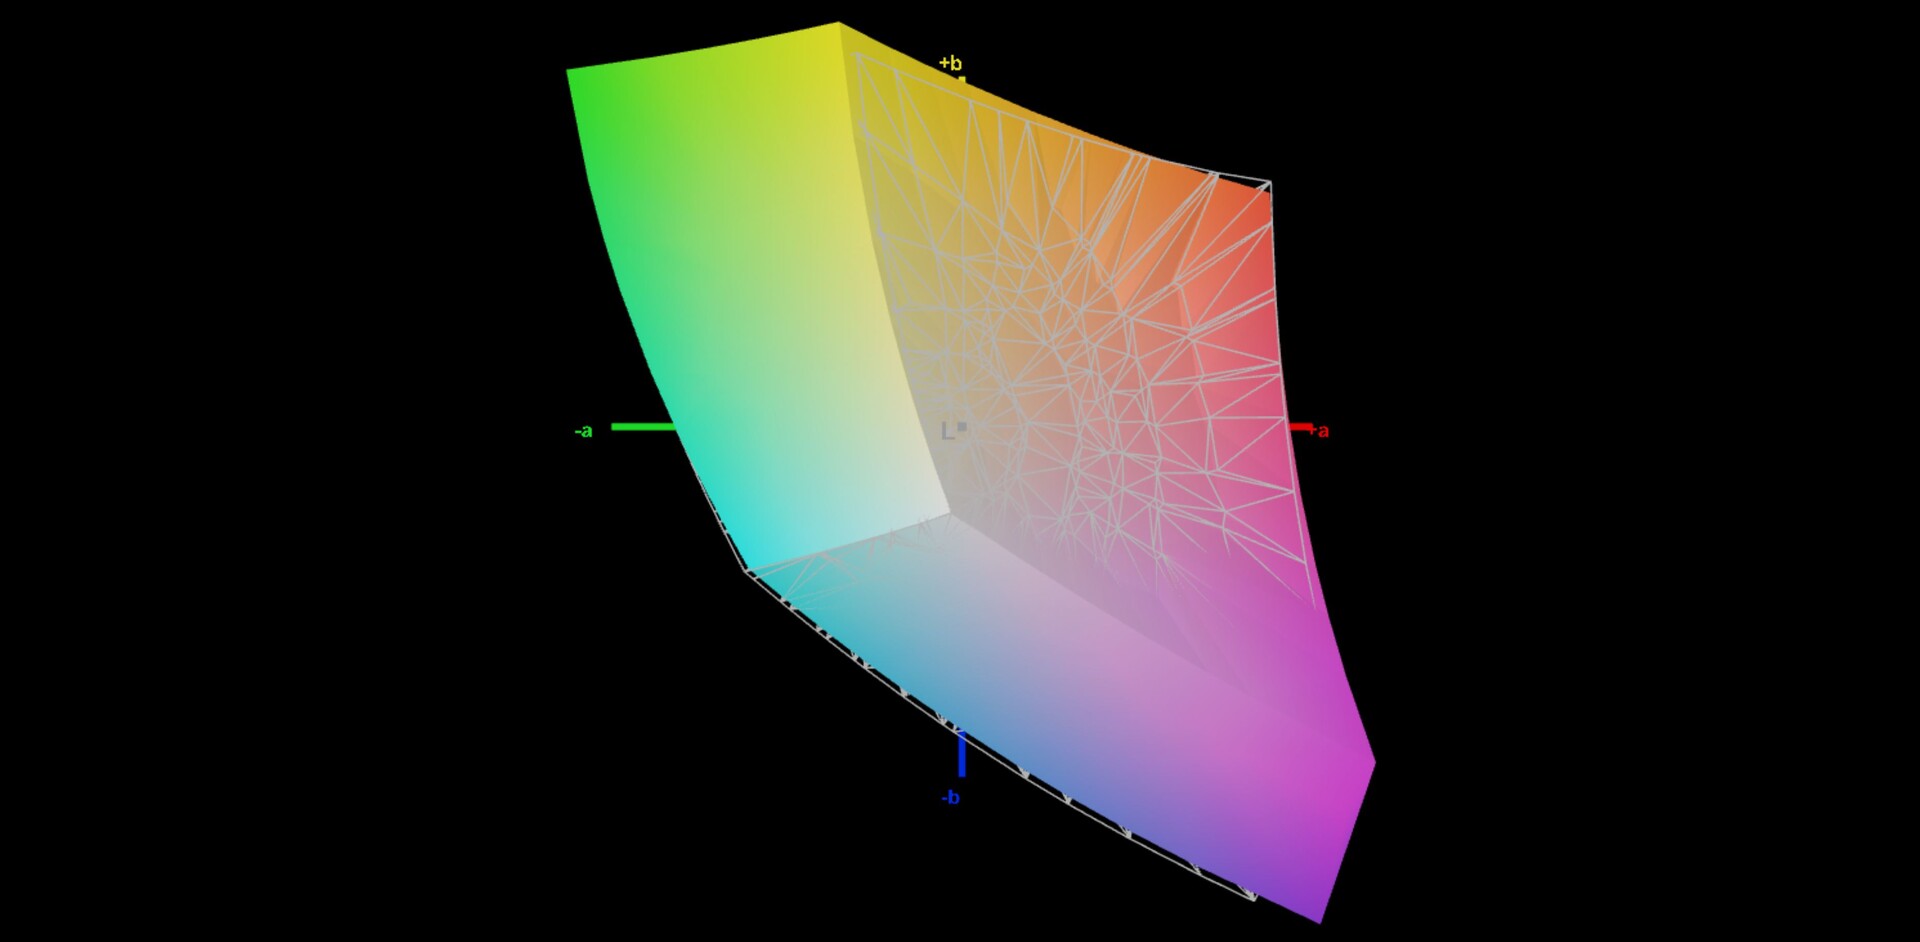
69.6% AdobeRGB 1998 (Argyll 3D)
97.7% sRGB (Argyll 3D)
69.1% Display P3 (Argyll 3D)
Gamma: 2.13
CCT: 5982 K
| HP ZBook Power 15 G9 6B8C4EA LGD073F, IPS, 3840x2160, 15.6" | HP ZBook Studio 16 G9 62U04EA BOE0A52, IPS, 3840x2400, 16" | Dell Precision 5000 5560 Sharp LQ156R1, IPS, 3840x2400, 15.6" | Lenovo ThinkPad P15v G2 21A9000XGE N156HCA-EAC, IPS LED, 1920x1080, 15.6" | HP ZBook Power 15 G8 313S5EA AUOA08B, IPS LED, 1920x1080, 15.6" | |
|---|---|---|---|---|---|
| Display | 22% | 28% | -35% | 2% | |
| Display P3 Coverage (%) | 69.1 | 97.5 41% | 94.9 37% | 43.7 -37% | 70.5 2% |
| sRGB Coverage (%) | 97.7 | 99.9 2% | 100 2% | 65.1 -33% | 99 1% |
| AdobeRGB 1998 Coverage (%) | 69.6 | 86.3 24% | 100 44% | 45.3 -35% | 71.3 2% |
| Response Times | 73% | -5% | -2% | -33% | |
| Response Time Grey 50% / Grey 80% * (ms) | 45.8 ? | 15.3 ? 67% | 47.2 ? -3% | 48 ? -5% | 61 -33% |
| Response Time Black / White * (ms) | 28.6 ? | 6.1 ? 79% | 30.4 ? -6% | 28 ? 2% | 38 ? -33% |
| PWM Frequency (Hz) | |||||
| Screen | 6% | -21% | -87% | 3% | |
| Brightness middle (cd/m²) | 392 | 554 41% | 501.5 28% | 305 -22% | 393 0% |
| Brightness (cd/m²) | 388 | 516 33% | 467 20% | 281 -28% | 385 -1% |
| Brightness Distribution (%) | 88 | 84 -5% | 83 -6% | 88 0% | 78 -11% |
| Black Level * (cd/m²) | 0.15 | 0.47 -213% | 0.44 -193% | 0.32 -113% | 0.25 -67% |
| Contrast (:1) | 2613 | 1179 -55% | 1140 -56% | 953 -64% | 1572 -40% |
| Colorchecker dE 2000 * | 3.2 | 1 69% | 4.73 -48% | 5.9 -84% | 1.5 53% |
| Colorchecker dE 2000 max. * | 7 | 2.4 66% | 8.45 -21% | 20.1 -187% | 4.3 39% |
| Colorchecker dE 2000 calibrated * | 1.2 | 0.6 50% | 0.51 57% | 4.5 -275% | 1.4 -17% |
| Greyscale dE 2000 * | 4.9 | 1.6 67% | 3.6 27% | 5.3 -8% | 1.3 73% |
| Gamma | 2.13 103% | 2.29 96% | 2.08 106% | 2.1 105% | 2.26 97% |
| CCT | 5982 109% | 6458 101% | 6447 101% | 6307 103% | 6435 101% |
| Total Average (Program / Settings) | 34% /
19% | 1% /
-8% | -41% /
-64% | -9% /
-2% |
* ... smaller is better
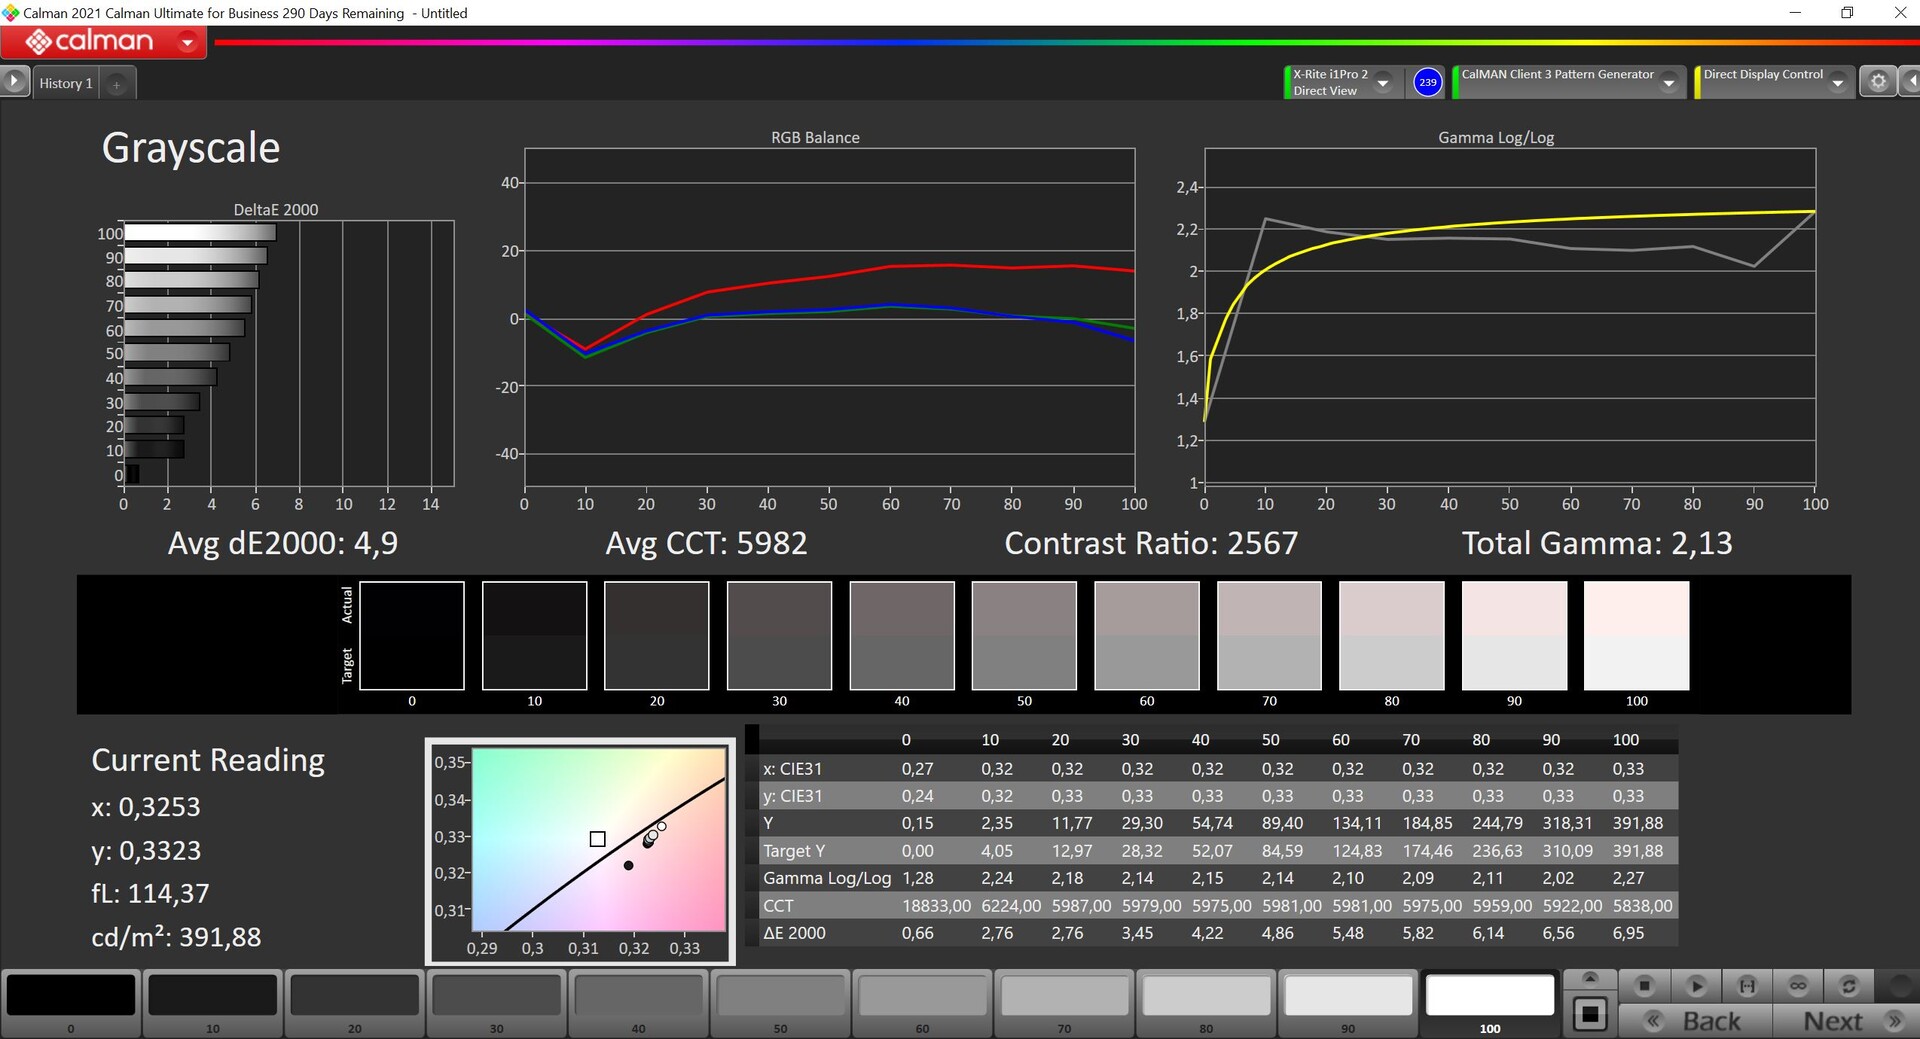
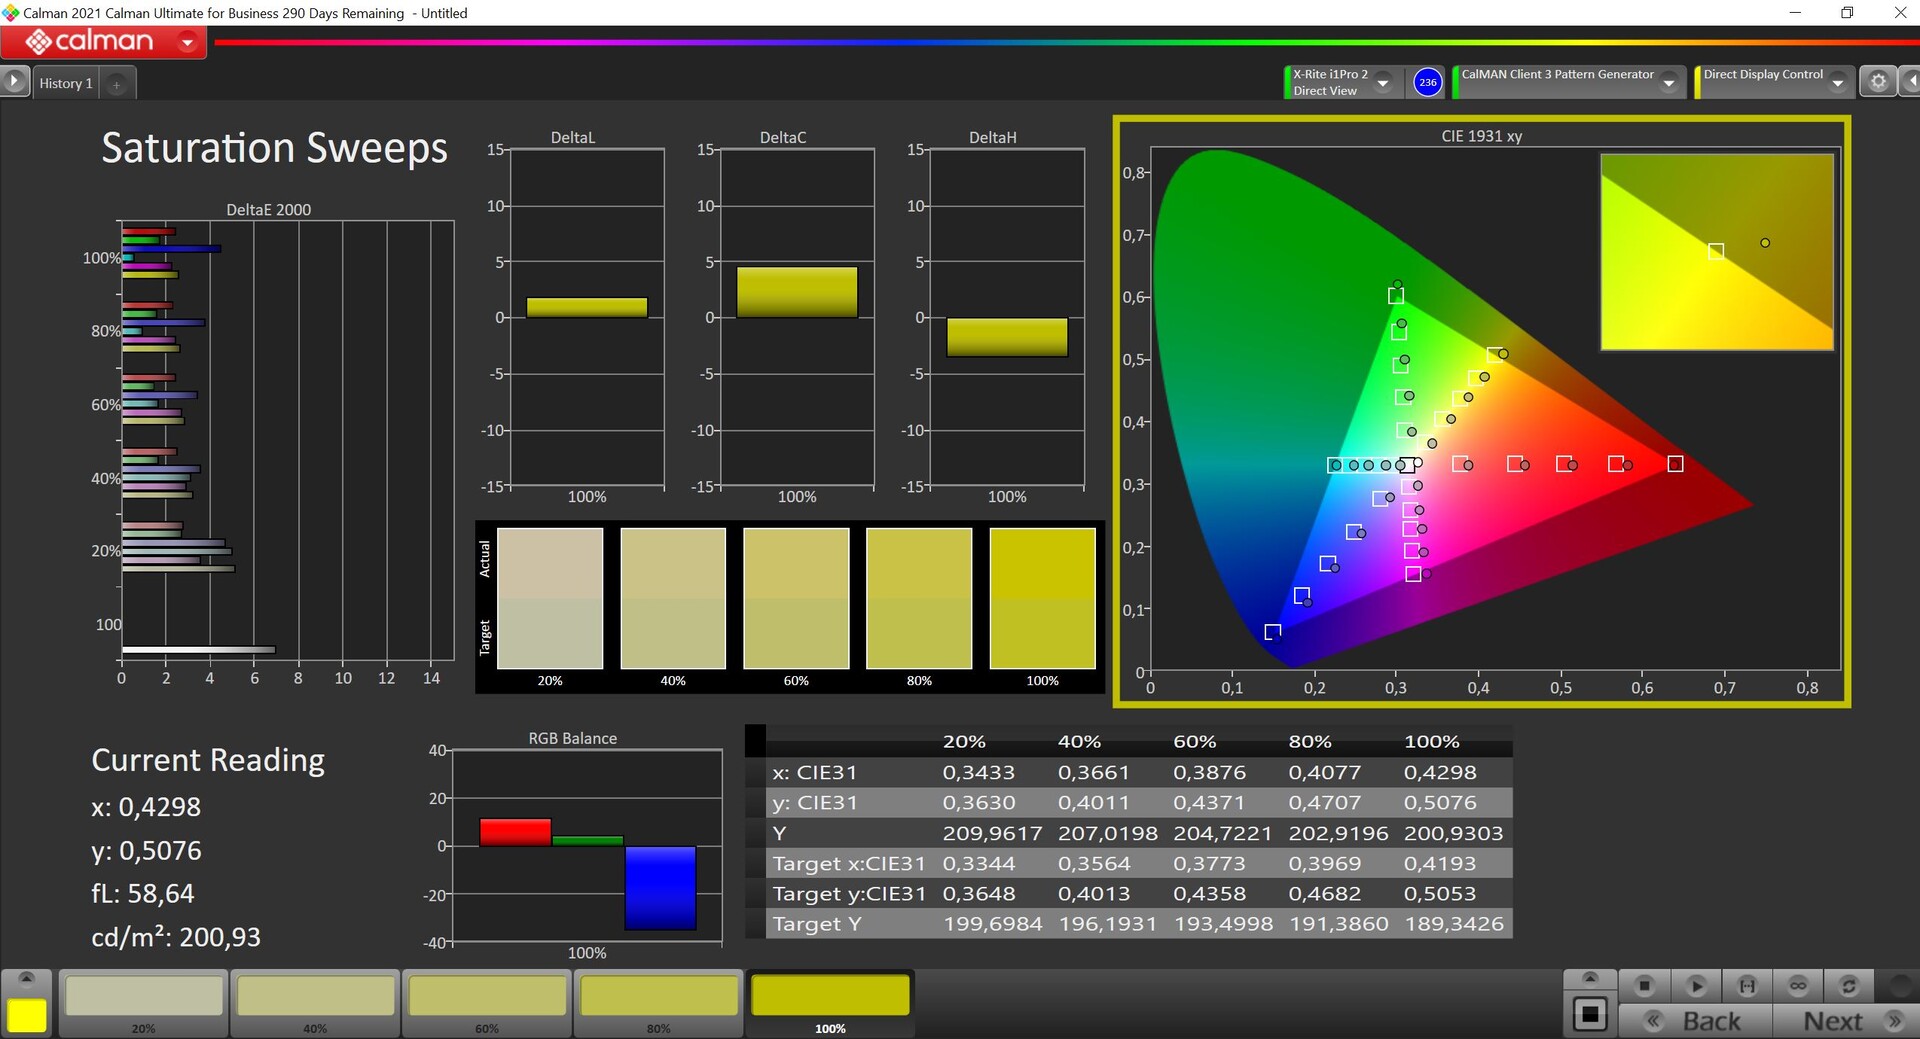
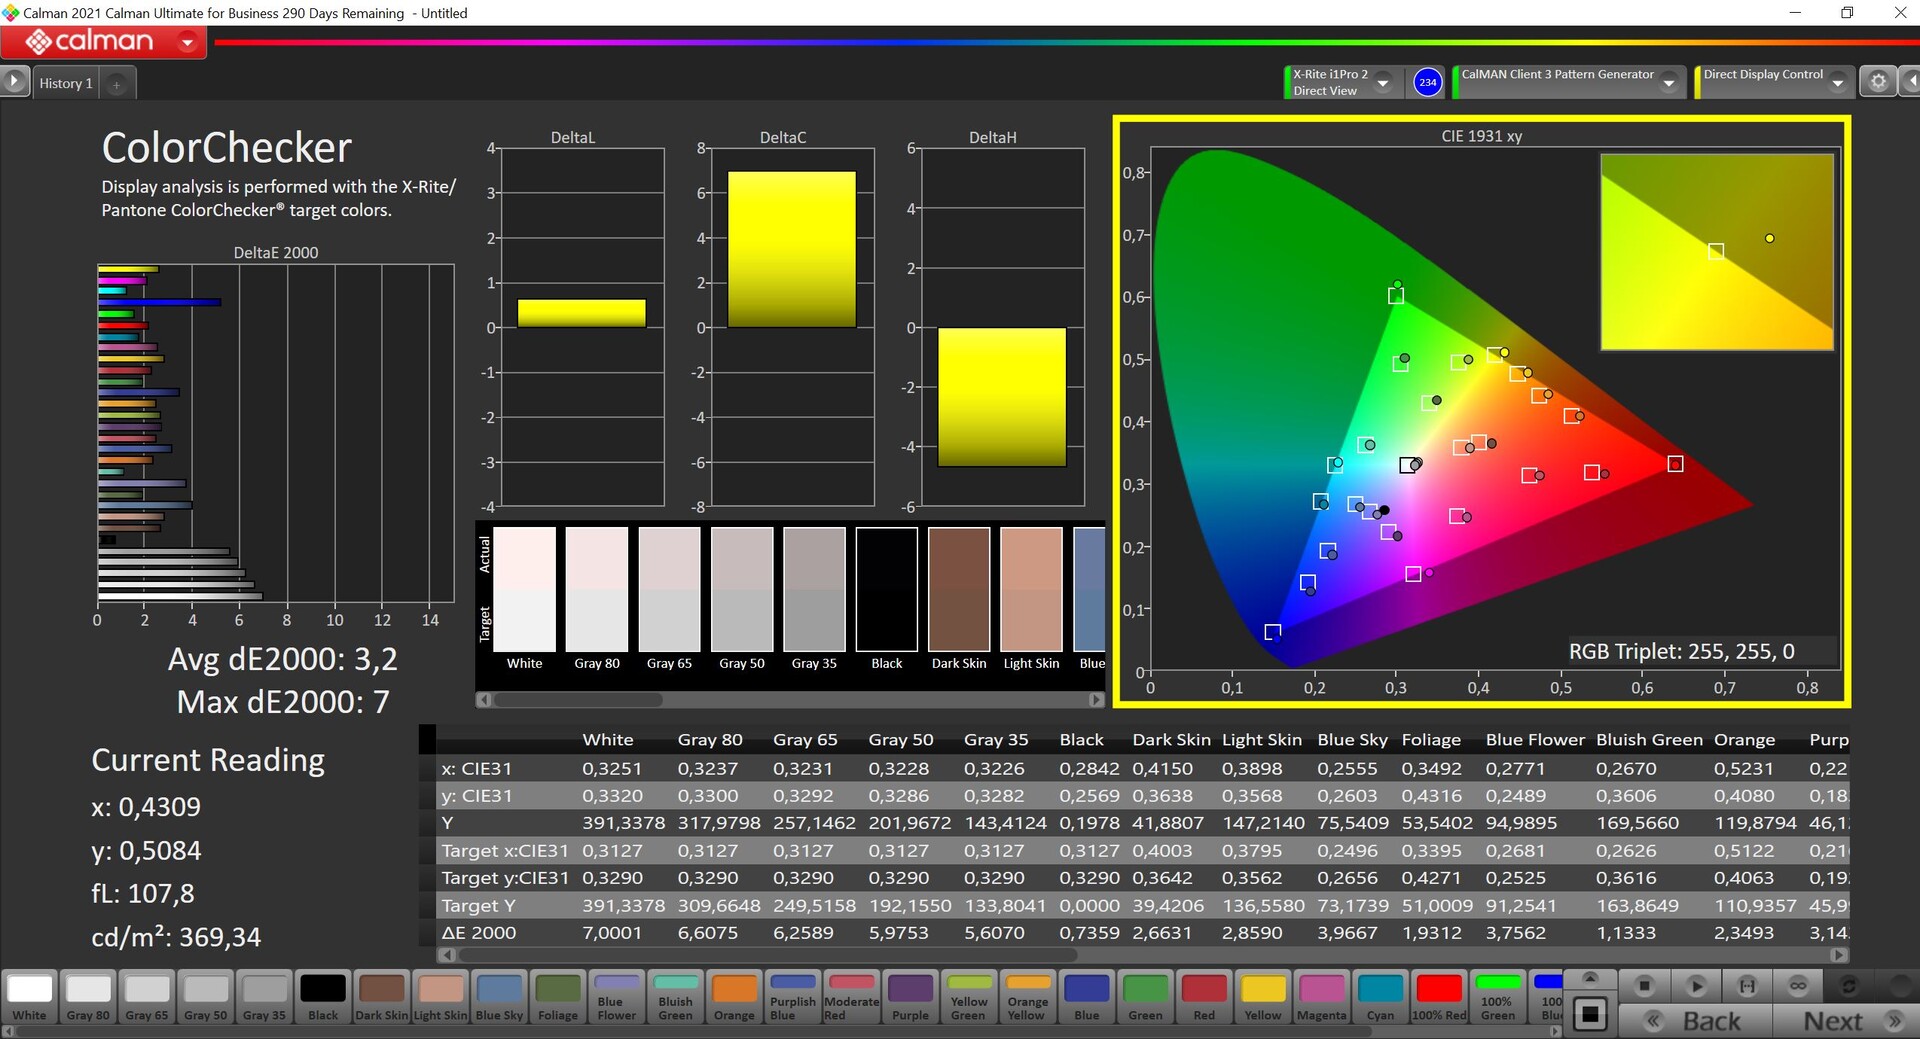
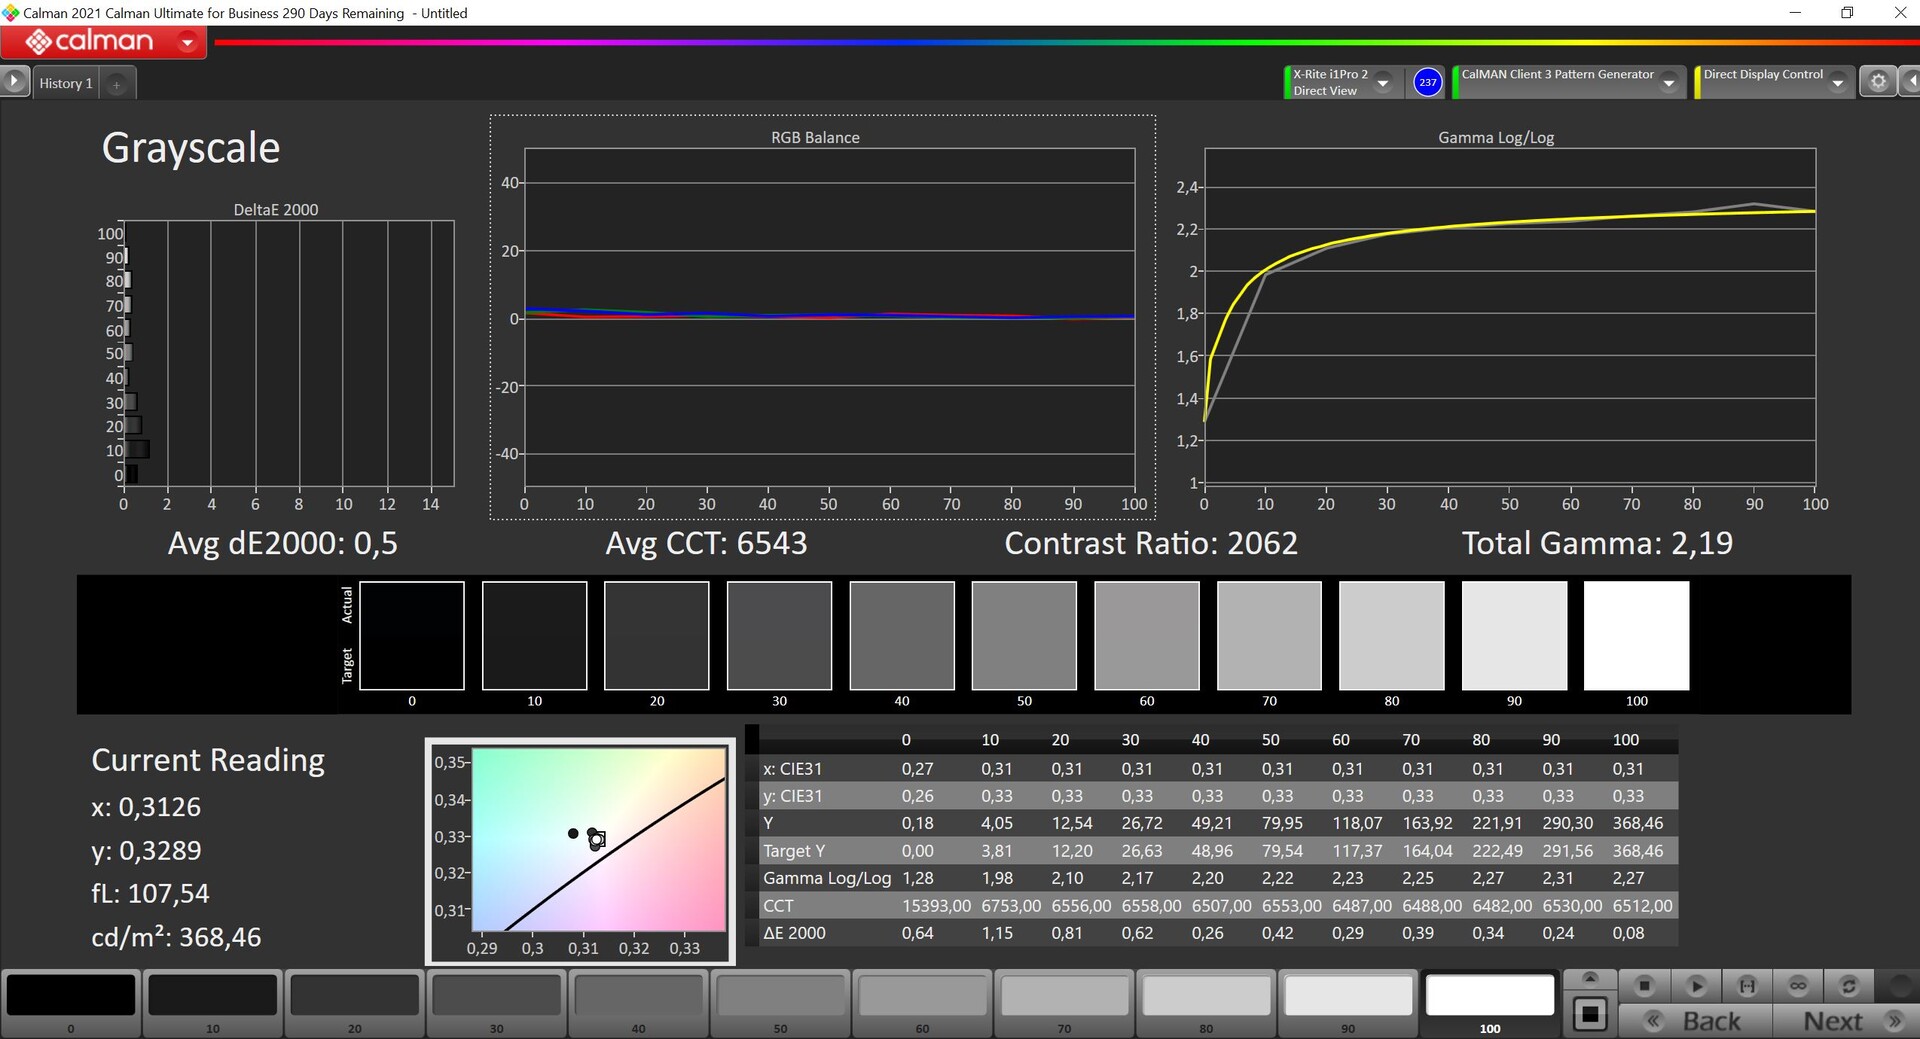
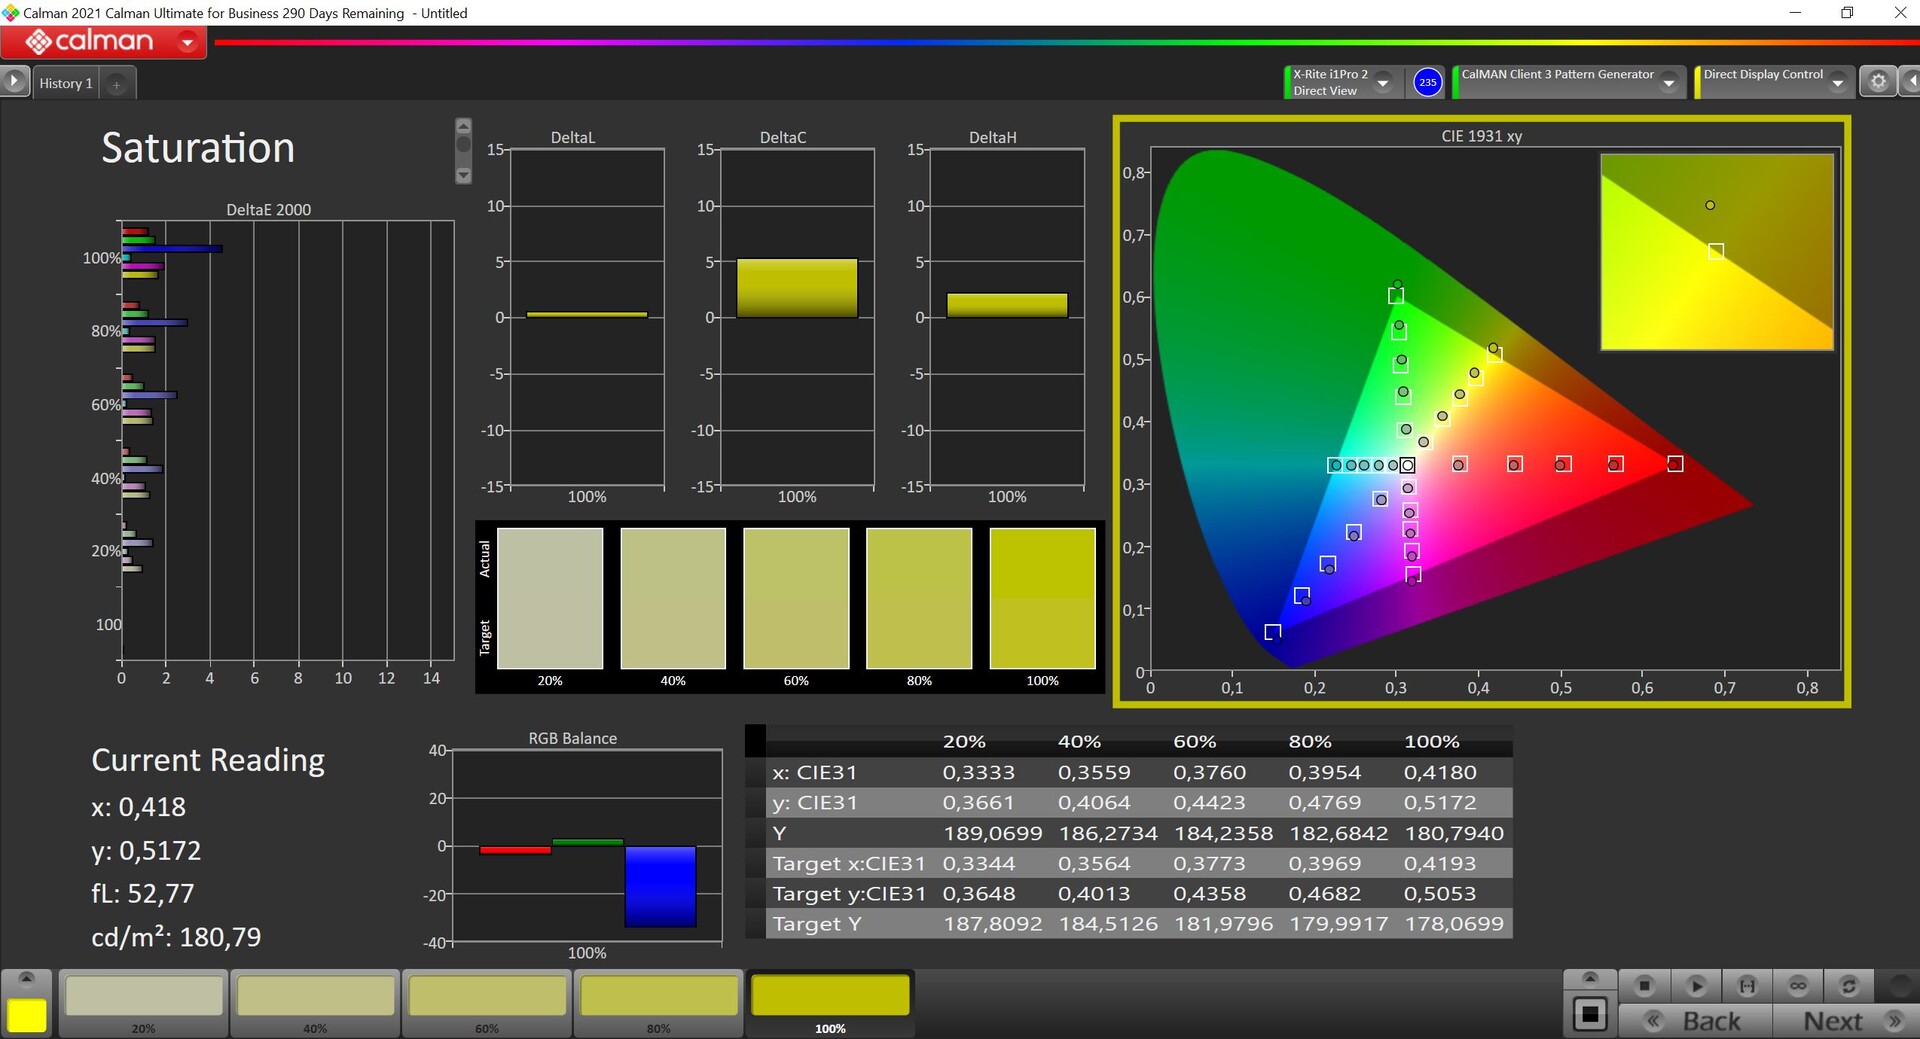

We measure the panel with the professional CalMAN software. There is a clearly visible red tint in the state of delivery, and the color temperature is also too warm. This is unfortunate, since we are able to significantly improve the display with our own calibration (color profile available for free download from the link above), which leads to excellent results particularly in the grayscale and completely gets rid of the color tint. The color deviations compared to the reference sRGB color space (which is covered fully) are also slightly lower, leaving only 100% blue as an outlier. However, the calibrated panel is still suitable for image processing.
Display Response Times
| ↔ Response Time Black to White | ||
|---|---|---|
| 28.6 ms ... rise ↗ and fall ↘ combined | ↗ 14.5 ms rise | 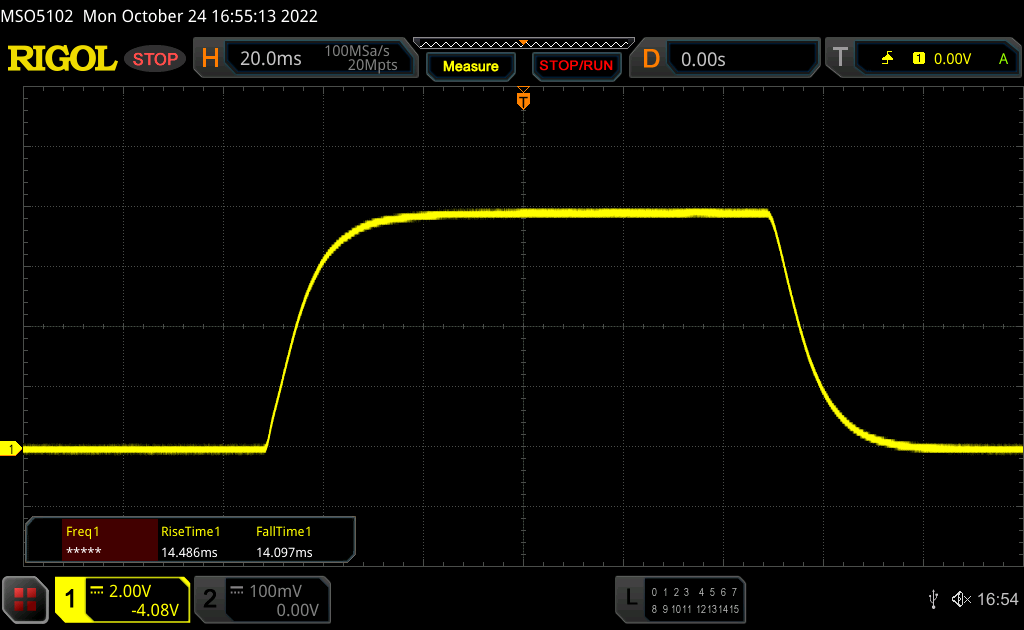 |
| ↘ 14.1 ms fall | ||
| The screen shows relatively slow response rates in our tests and may be too slow for gamers. In comparison, all tested devices range from 0.1 (minimum) to 240 (maximum) ms. » 76 % of all devices are better. This means that the measured response time is worse than the average of all tested devices (19.8 ms). | ||
| ↔ Response Time 50% Grey to 80% Grey | ||
| 45.8 ms ... rise ↗ and fall ↘ combined | ↗ 21.2 ms rise | 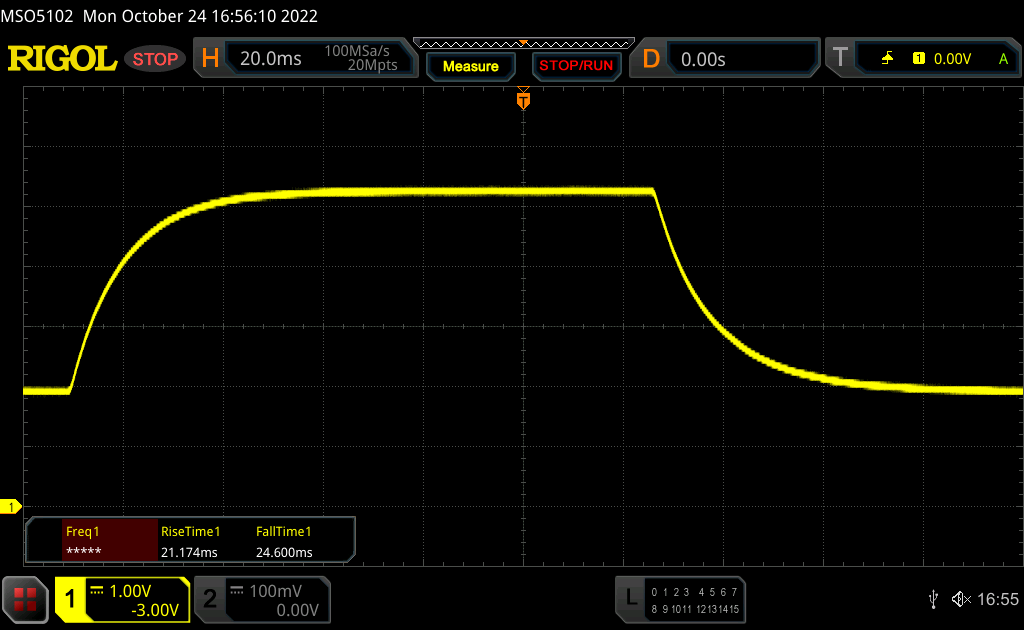 |
| ↘ 24.6 ms fall | ||
| The screen shows slow response rates in our tests and will be unsatisfactory for gamers. In comparison, all tested devices range from 0.165 (minimum) to 636 (maximum) ms. » 79 % of all devices are better. This means that the measured response time is worse than the average of all tested devices (31 ms). | ||
Screen Flickering / PWM (Pulse-Width Modulation)
| Screen flickering / PWM not detected |  | ||
In comparison: 52 % of all tested devices do not use PWM to dim the display. If PWM was detected, an average of 7763 (minimum: 5 - maximum: 343500) Hz was measured. | |||
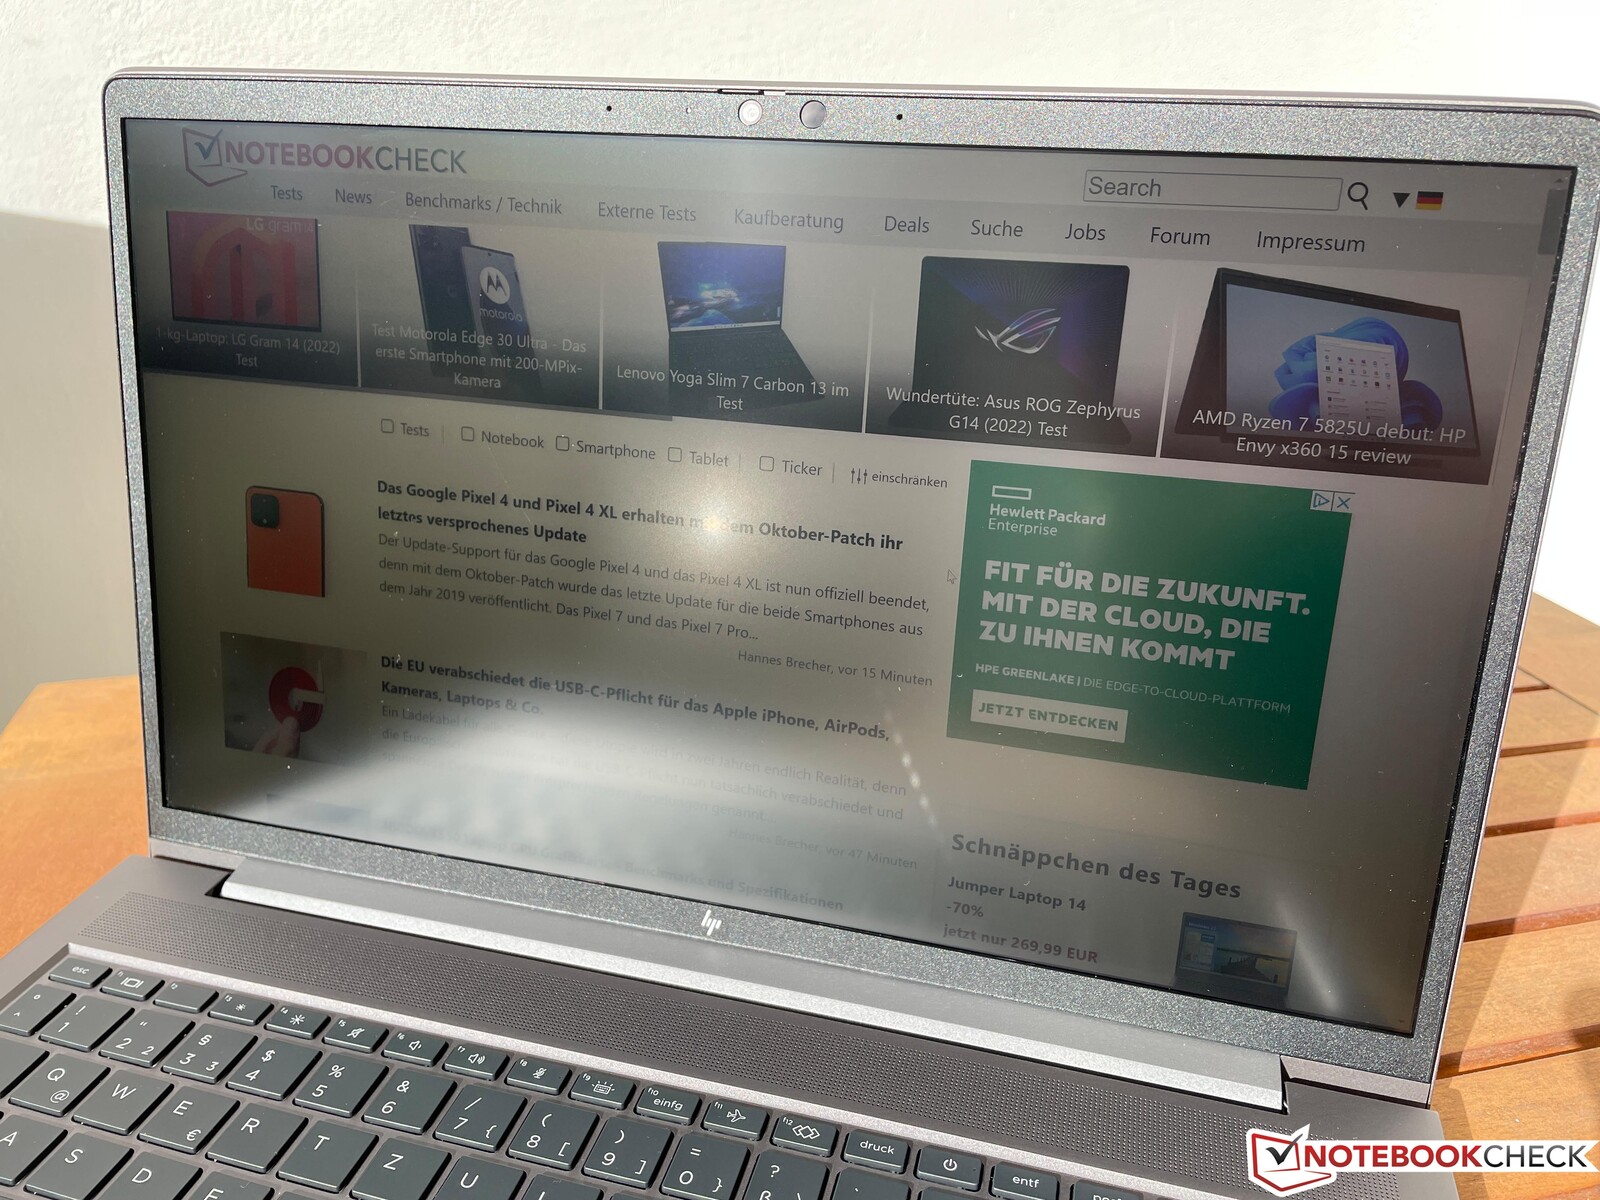
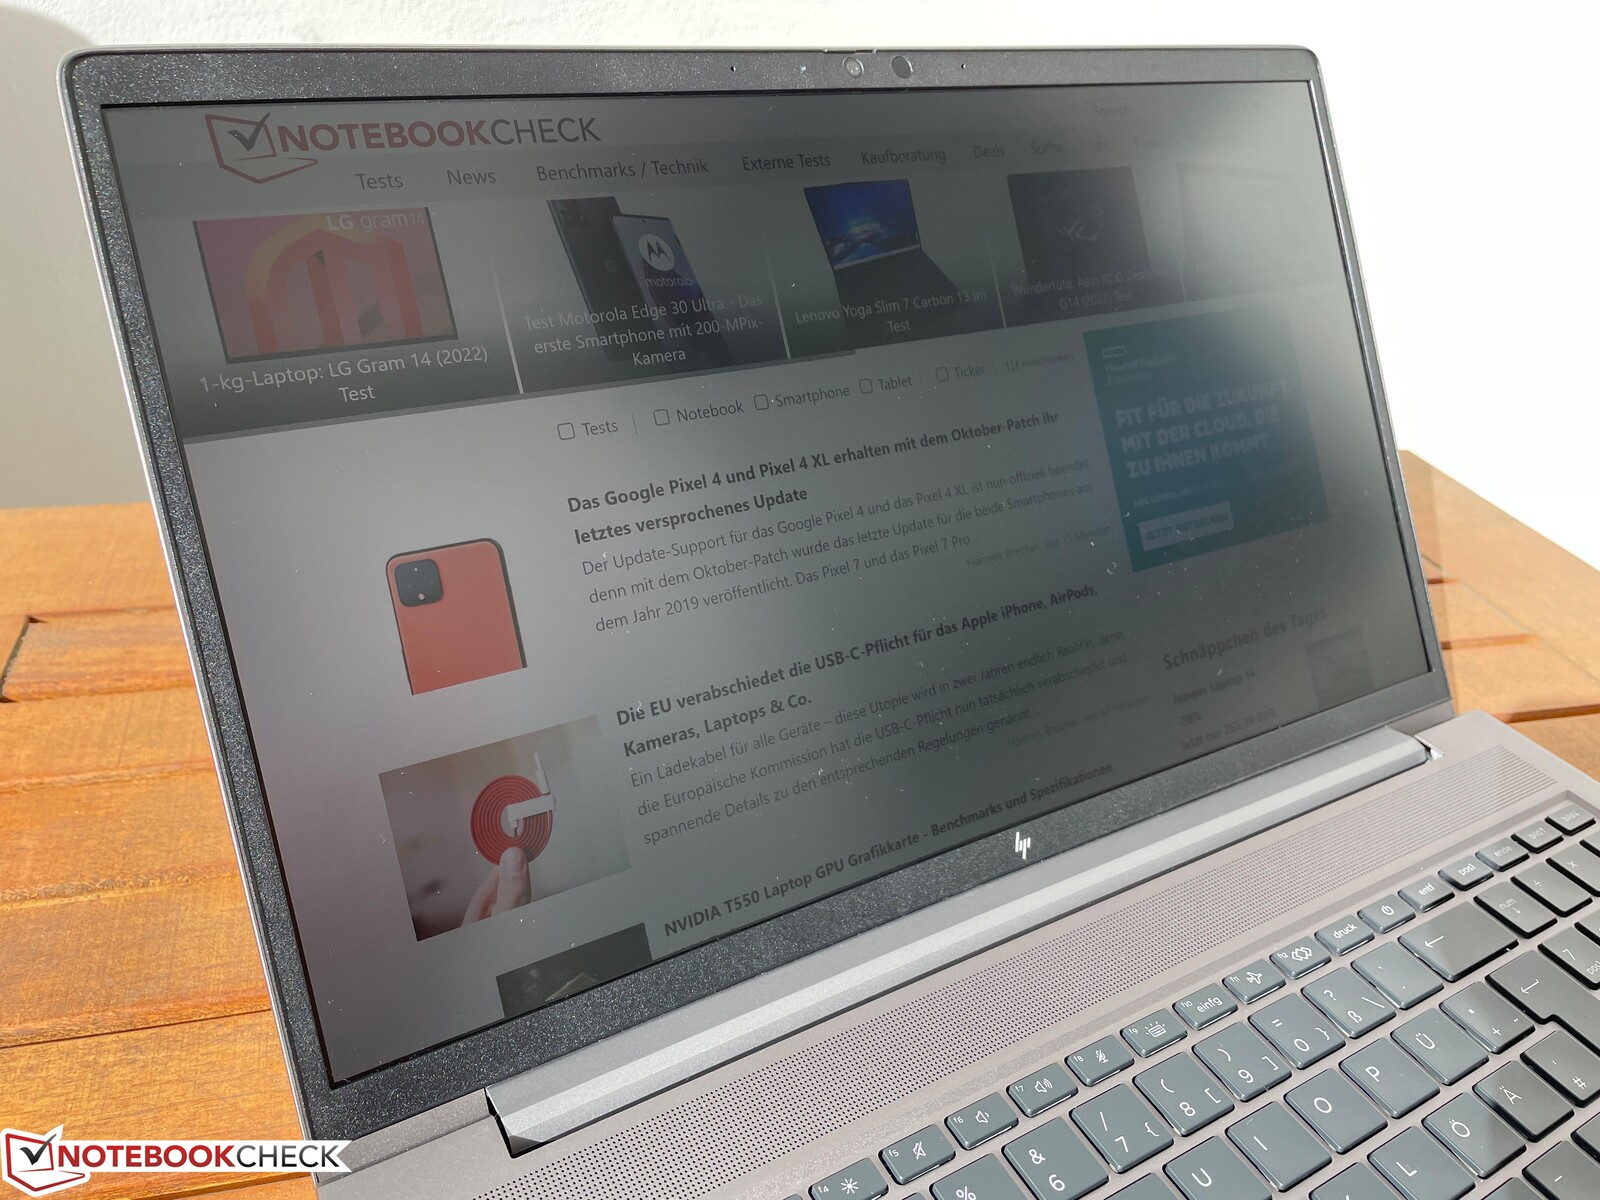
Outdoors, the display benefits from the matte surface, and as long as you avoid direct reflections of light sources, you can still easily recognize the display contents even on bright days. The viewing angle stability of the IPS panel is very good.
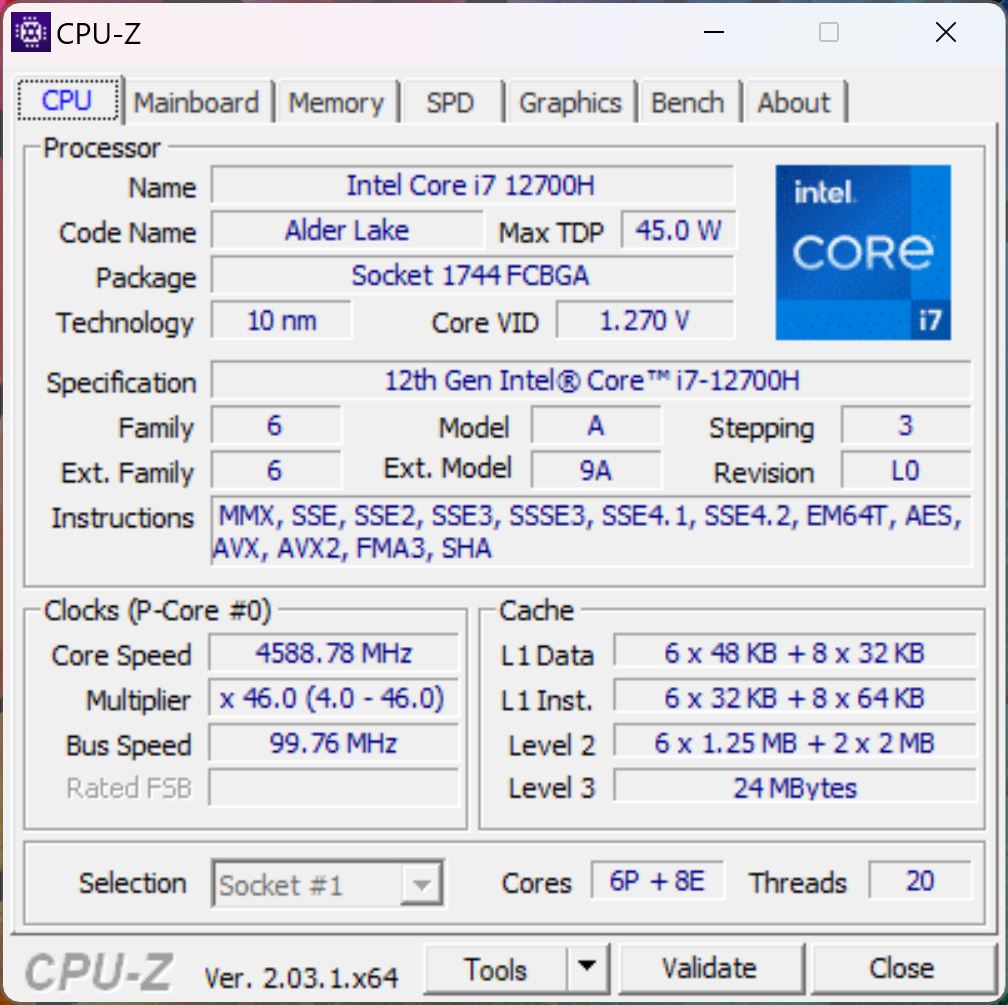
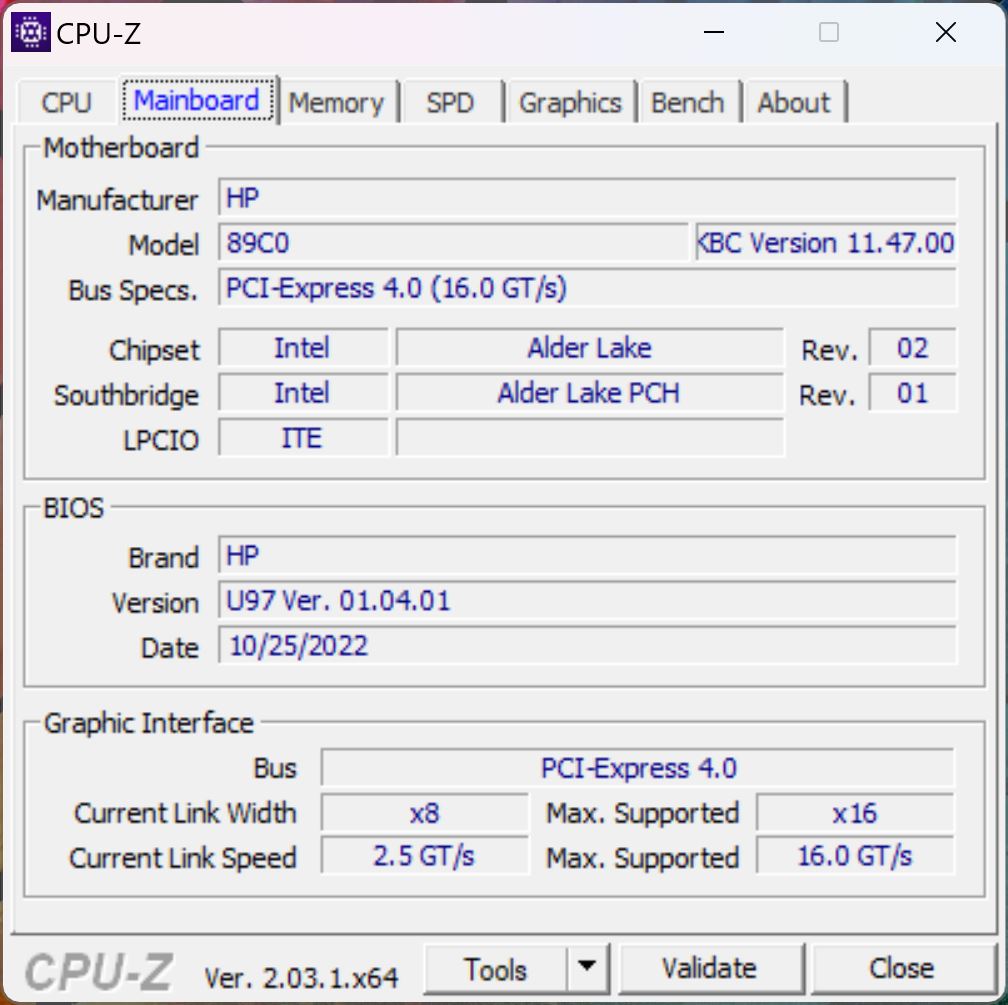
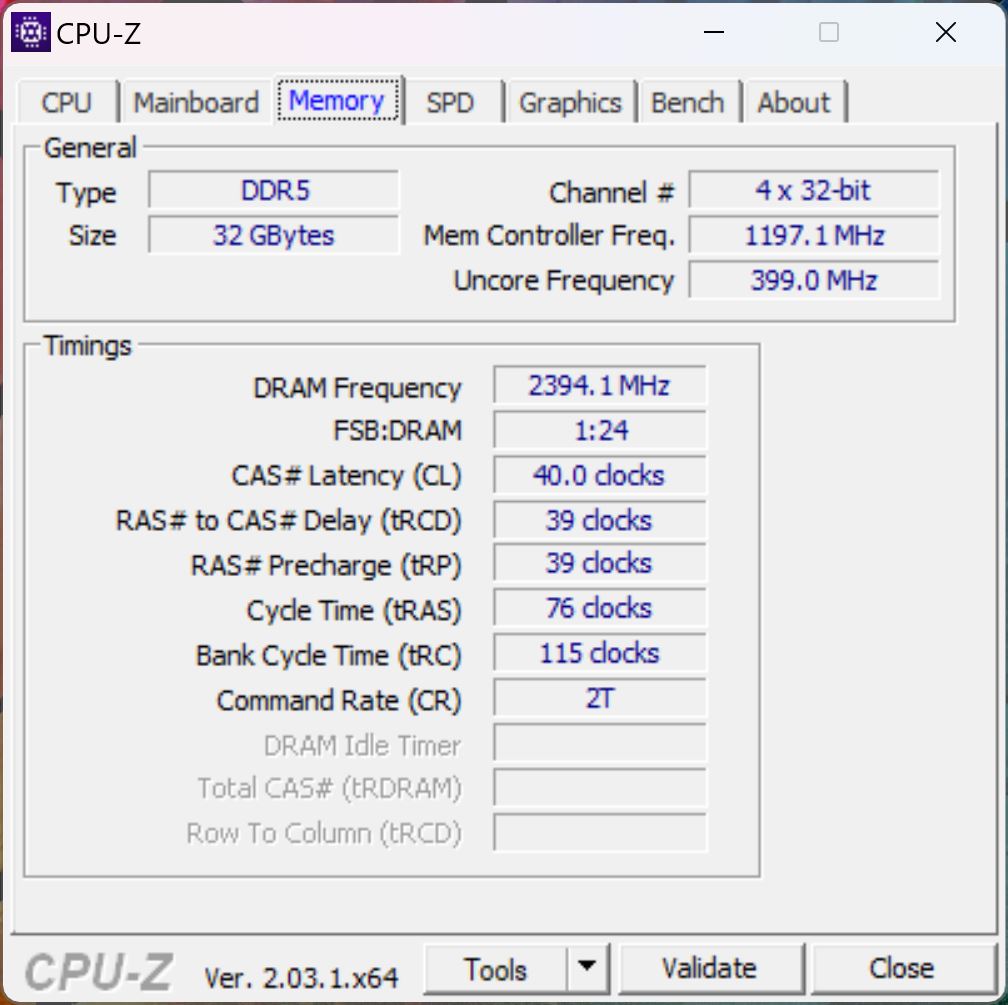
Performance - ZBook with Intel Alder Lake
Test Conditions
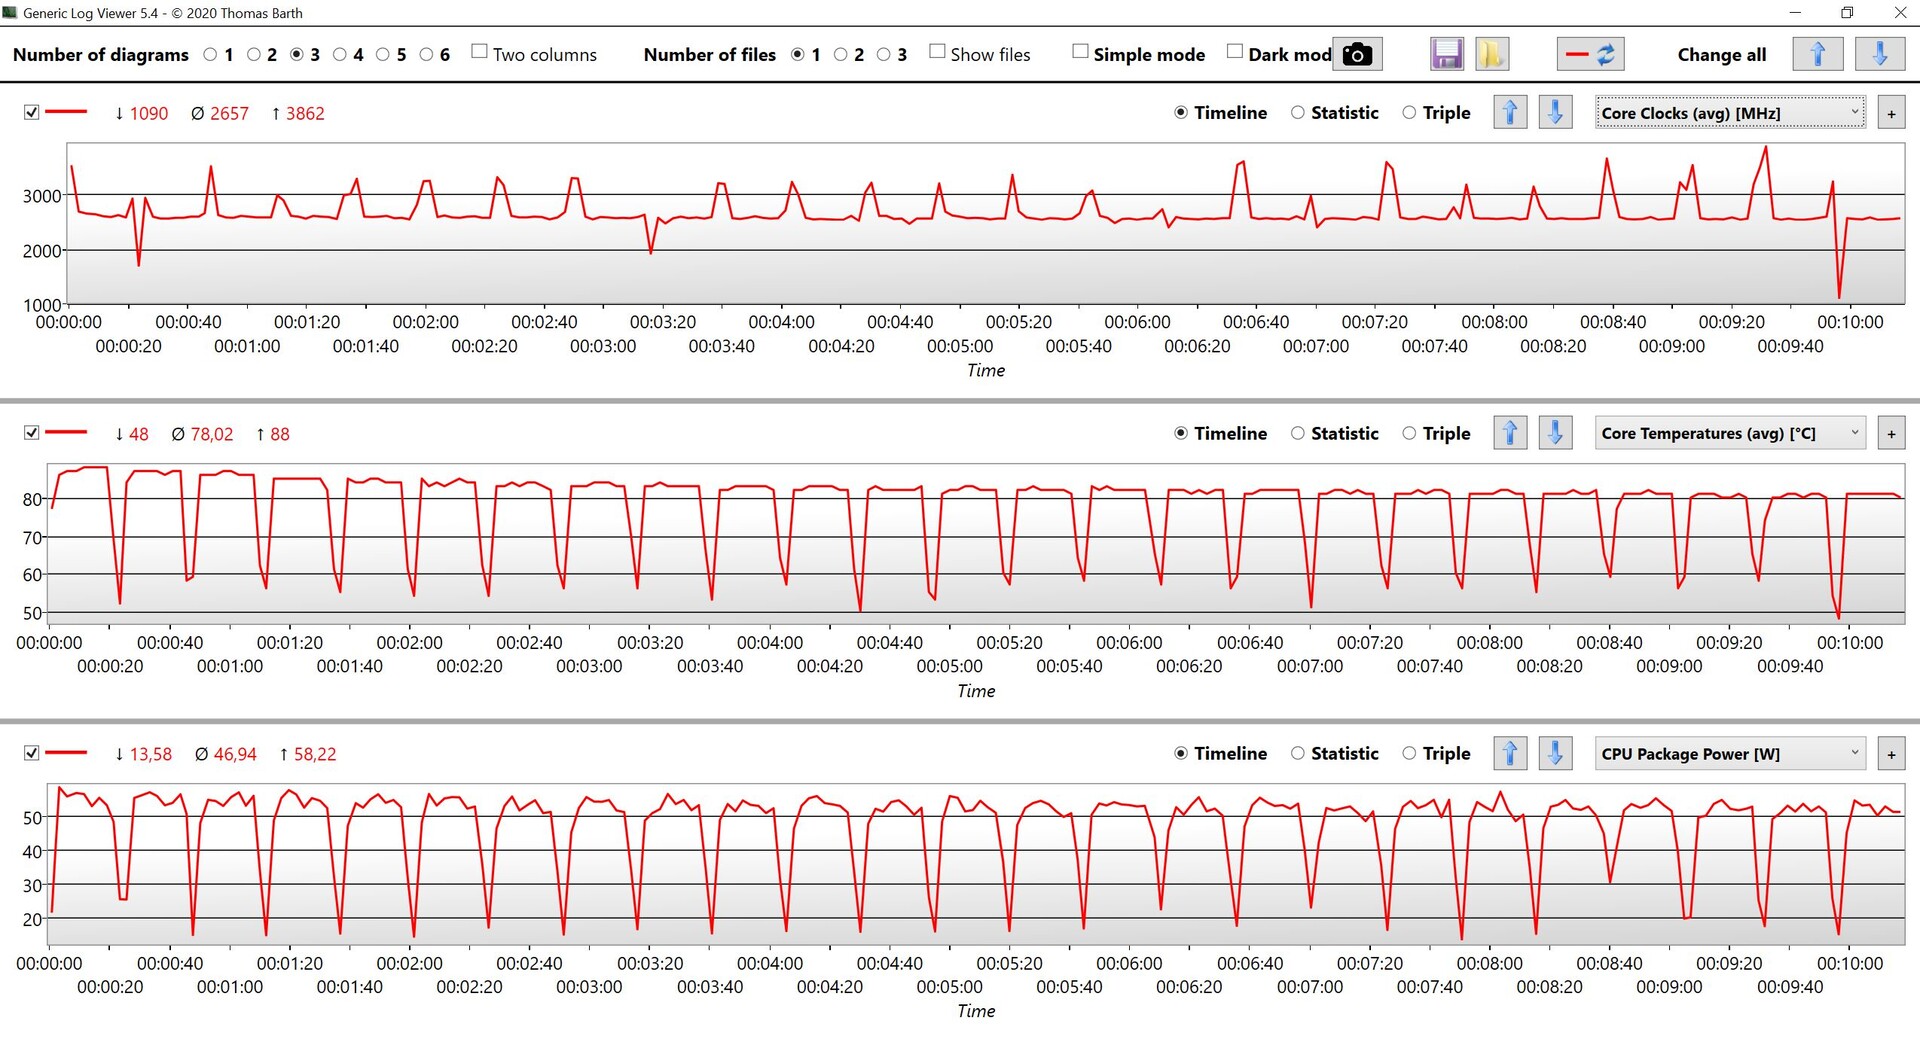
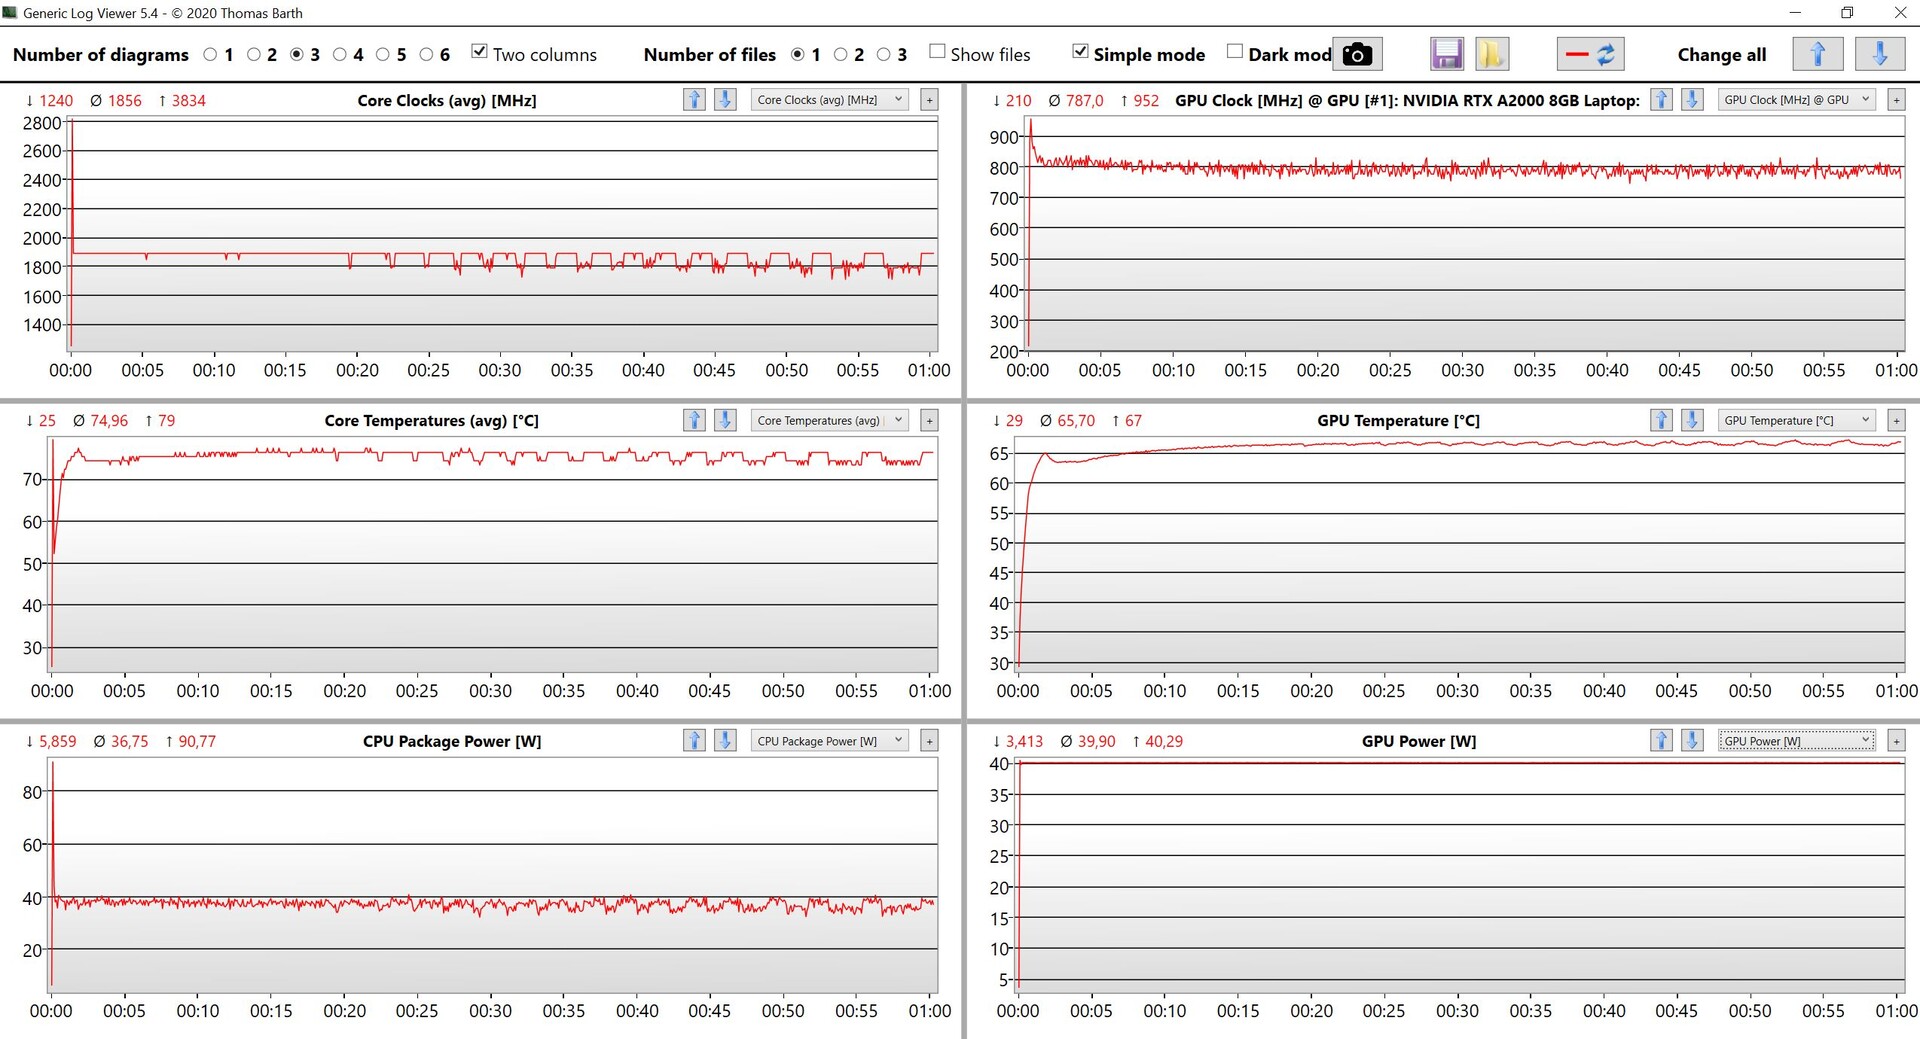
HP doesn't offer any additional power configuration options. During the test, we are able to observe some strongly varying performance values. While the situation is improved slightly with some BIOS updates, it still isn't completely stable. With 105/75 watts, the TDP values are basically configured high, but the processor is only able to use up to 90 watts at most for one second once a while, before it quickly levels out at around 55 watts. At times, the processor even starts out with this value (with previous BIOS versions, it was even less than 40 watts).
Processor
The Core i7-12700H comes from Intel's current Alder Lake generation, combining 6 fast Performance cores with 8 Efficiency cores. The single-core performance is very good and about 15-20% faster than that of the predecessor with the Core i7-11800H. However, in the multicore benchmarks the performance is slightly disappointing considering the large case, with a lot of potential remaining unused. For example, the ZBook Studio 16 G9 with the same processor is about 20% faster in the multicore tests. We also try to raise the TDP values manually, but the cooling is unable to handle more than 60-65 watts, since the CPU temperatures will then increase to more than 95 °C (203 °F).
In battery operation, the power consumption of the CPU is limited to 30 watts. This has no influence on the single-core performance, but results in a performance deficit of around 30% in the multicore tests (9,926 points CB R23 Multi). You can find additional CPU benchmarks in our technical section.
Cinebench R15 Multi Constant Load Test
Cinebench R23: Multi Core | Single Core
Cinebench R20: CPU (Multi Core) | CPU (Single Core)
Cinebench R15: CPU Multi 64Bit | CPU Single 64Bit
Blender: v2.79 BMW27 CPU
7-Zip 18.03: 7z b 4 | 7z b 4 -mmt1
Geekbench 5.5: Multi-Core | Single-Core
HWBOT x265 Benchmark v2.2: 4k Preset
LibreOffice : 20 Documents To PDF
R Benchmark 2.5: Overall mean
| CPU Performance rating | |
| Average of class Workstation | |
| HP ZBook Studio 16 G9 62U04EA | |
| Average Intel Core i7-12700H | |
| HP ZBook Power 15 G9 6B8C4EA | |
| HP ZBook Power 15 G8 313S5EA | |
| Dell Precision 5000 5560 -2! | |
| Lenovo ThinkPad P15v G2 21A9000XGE -1! | |
| Cinebench R23 / Multi Core | |
| Average of class Workstation (14621 - 38520, n=24, last 2 years) | |
| HP ZBook Studio 16 G9 62U04EA | |
| Average Intel Core i7-12700H (4032 - 19330, n=64) | |
| HP ZBook Power 15 G9 6B8C4EA | |
| HP ZBook Power 15 G8 313S5EA | |
| Lenovo ThinkPad P15v G2 21A9000XGE | |
| Dell Precision 5000 5560 | |
| Cinebench R23 / Single Core | |
| Average of class Workstation (1712 - 2228, n=24, last 2 years) | |
| HP ZBook Studio 16 G9 62U04EA | |
| HP ZBook Power 15 G9 6B8C4EA | |
| Average Intel Core i7-12700H (778 - 1826, n=63) | |
| HP ZBook Power 15 G8 313S5EA | |
| Dell Precision 5000 5560 | |
| Cinebench R20 / CPU (Multi Core) | |
| Average of class Workstation (5760 - 15043, n=24, last 2 years) | |
| HP ZBook Studio 16 G9 62U04EA | |
| Average Intel Core i7-12700H (1576 - 7407, n=64) | |
| HP ZBook Power 15 G9 6B8C4EA | |
| HP ZBook Power 15 G8 313S5EA | |
| Dell Precision 5000 5560 | |
| Lenovo ThinkPad P15v G2 21A9000XGE | |
| Cinebench R20 / CPU (Single Core) | |
| Average of class Workstation (671 - 857, n=24, last 2 years) | |
| HP ZBook Studio 16 G9 62U04EA | |
| HP ZBook Power 15 G9 6B8C4EA | |
| Average Intel Core i7-12700H (300 - 704, n=64) | |
| HP ZBook Power 15 G8 313S5EA | |
| Dell Precision 5000 5560 | |
| Lenovo ThinkPad P15v G2 21A9000XGE | |
| Cinebench R15 / CPU Multi 64Bit | |
| Average of class Workstation (2489 - 5810, n=24, last 2 years) | |
| HP ZBook Studio 16 G9 62U04EA | |
| Average Intel Core i7-12700H (1379 - 2916, n=70) | |
| HP ZBook Power 15 G8 313S5EA | |
| HP ZBook Power 15 G8 313S5EA | |
| HP ZBook Power 15 G9 6B8C4EA | |
| Lenovo ThinkPad P15v G2 21A9000XGE | |
| Dell Precision 5000 5560 | |
| Cinebench R15 / CPU Single 64Bit | |
| Average of class Workstation (191.4 - 328, n=24, last 2 years) | |
| HP ZBook Studio 16 G9 62U04EA | |
| Average Intel Core i7-12700H (113 - 263, n=65) | |
| HP ZBook Power 15 G9 6B8C4EA | |
| Dell Precision 5000 5560 | |
| HP ZBook Power 15 G8 313S5EA | |
| Lenovo ThinkPad P15v G2 21A9000XGE | |
| Blender / v2.79 BMW27 CPU | |
| Lenovo ThinkPad P15v G2 21A9000XGE | |
| Dell Precision 5000 5560 | |
| HP ZBook Power 15 G8 313S5EA | |
| HP ZBook Power 15 G9 6B8C4EA | |
| Average Intel Core i7-12700H (168 - 732, n=63) | |
| HP ZBook Studio 16 G9 62U04EA | |
| Average of class Workstation (91 - 222, n=24, last 2 years) | |
| 7-Zip 18.03 / 7z b 4 | |
| Average of class Workstation (60489 - 116969, n=24, last 2 years) | |
| HP ZBook Studio 16 G9 62U04EA | |
| Average Intel Core i7-12700H (22844 - 73067, n=63) | |
| HP ZBook Power 15 G9 6B8C4EA | |
| HP ZBook Power 15 G8 313S5EA | |
| Dell Precision 5000 5560 | |
| Lenovo ThinkPad P15v G2 21A9000XGE | |
| 7-Zip 18.03 / 7z b 4 -mmt1 | |
| Average of class Workstation (5126 - 6960, n=24, last 2 years) | |
| HP ZBook Studio 16 G9 62U04EA | |
| HP ZBook Power 15 G9 6B8C4EA | |
| Dell Precision 5000 5560 | |
| HP ZBook Power 15 G8 313S5EA | |
| Average Intel Core i7-12700H (2743 - 5972, n=63) | |
| Lenovo ThinkPad P15v G2 21A9000XGE | |
| Geekbench 5.5 / Multi-Core | |
| Average of class Workstation (11542 - 25554, n=24, last 2 years) | |
| HP ZBook Studio 16 G9 62U04EA | |
| HP ZBook Power 15 G9 6B8C4EA | |
| Average Intel Core i7-12700H (5144 - 13745, n=64) | |
| HP ZBook Power 15 G8 313S5EA | |
| Lenovo ThinkPad P15v G2 21A9000XGE | |
| Geekbench 5.5 / Single-Core | |
| Average of class Workstation (1783 - 2183, n=24, last 2 years) | |
| HP ZBook Studio 16 G9 62U04EA | |
| Average Intel Core i7-12700H (803 - 1851, n=64) | |
| HP ZBook Power 15 G9 6B8C4EA | |
| HP ZBook Power 15 G8 313S5EA | |
| Lenovo ThinkPad P15v G2 21A9000XGE | |
| HWBOT x265 Benchmark v2.2 / 4k Preset | |
| Average of class Workstation (17.8 - 40.5, n=24, last 2 years) | |
| HP ZBook Studio 16 G9 62U04EA | |
| Average Intel Core i7-12700H (4.67 - 21.8, n=64) | |
| HP ZBook Power 15 G9 6B8C4EA | |
| HP ZBook Power 15 G8 313S5EA | |
| Dell Precision 5000 5560 | |
| Lenovo ThinkPad P15v G2 21A9000XGE | |
| LibreOffice / 20 Documents To PDF | |
| Lenovo ThinkPad P15v G2 21A9000XGE | |
| Dell Precision 5000 5560 | |
| Average of class Workstation (37.1 - 74.7, n=24, last 2 years) | |
| Average Intel Core i7-12700H (34.2 - 95.3, n=63) | |
| HP ZBook Power 15 G9 6B8C4EA | |
| HP ZBook Studio 16 G9 62U04EA | |
| HP ZBook Power 15 G8 313S5EA | |
| R Benchmark 2.5 / Overall mean | |
| HP ZBook Power 15 G8 313S5EA | |
| Lenovo ThinkPad P15v G2 21A9000XGE | |
| Dell Precision 5000 5560 | |
| HP ZBook Power 15 G9 6B8C4EA | |
| Average Intel Core i7-12700H (0.4441 - 1.052, n=63) | |
| HP ZBook Studio 16 G9 62U04EA | |
| Average of class Workstation (0.3825 - 0.603, n=24, last 2 years) | |
* ... smaller is better
AIDA64: FP32 Ray-Trace | FPU Julia | CPU SHA3 | CPU Queen | FPU SinJulia | FPU Mandel | CPU AES | CPU ZLib | FP64 Ray-Trace | CPU PhotoWorxx
| Performance rating | |
| Average of class Workstation | |
| HP ZBook Studio 16 G9 62U04EA | |
| HP ZBook Power 15 G9 6B8C4EA | |
| HP ZBook Power 15 G8 313S5EA | |
| Average Intel Core i7-12700H | |
| Lenovo ThinkPad P15v G2 21A9000XGE | |
| Dell Precision 5000 5560 -9! | |
| AIDA64 / FP32 Ray-Trace | |
| Average of class Workstation (15143 - 61611, n=24, last 2 years) | |
| HP ZBook Studio 16 G9 62U04EA | |
| HP ZBook Power 15 G8 313S5EA | |
| HP ZBook Power 15 G9 6B8C4EA | |
| Lenovo ThinkPad P15v G2 21A9000XGE | |
| Average Intel Core i7-12700H (2585 - 17957, n=64) | |
| AIDA64 / FPU Julia | |
| Average of class Workstation (81575 - 186971, n=24, last 2 years) | |
| HP ZBook Studio 16 G9 62U04EA | |
| HP ZBook Power 15 G9 6B8C4EA | |
| HP ZBook Power 15 G8 313S5EA | |
| Average Intel Core i7-12700H (12439 - 90760, n=64) | |
| Lenovo ThinkPad P15v G2 21A9000XGE | |
| AIDA64 / CPU SHA3 | |
| Average of class Workstation (3833 - 8975, n=24, last 2 years) | |
| HP ZBook Power 15 G8 313S5EA | |
| HP ZBook Studio 16 G9 62U04EA | |
| Lenovo ThinkPad P15v G2 21A9000XGE | |
| HP ZBook Power 15 G9 6B8C4EA | |
| Average Intel Core i7-12700H (833 - 4242, n=64) | |
| AIDA64 / CPU Queen | |
| HP ZBook Studio 16 G9 62U04EA | |
| Average of class Workstation (60778 - 144411, n=24, last 2 years) | |
| HP ZBook Power 15 G9 6B8C4EA | |
| Average Intel Core i7-12700H (57923 - 103202, n=63) | |
| HP ZBook Power 15 G8 313S5EA | |
| Lenovo ThinkPad P15v G2 21A9000XGE | |
| AIDA64 / FPU SinJulia | |
| Average of class Workstation (8165 - 29343, n=24, last 2 years) | |
| HP ZBook Power 15 G8 313S5EA | |
| HP ZBook Studio 16 G9 62U04EA | |
| Average Intel Core i7-12700H (3249 - 9939, n=64) | |
| Lenovo ThinkPad P15v G2 21A9000XGE | |
| HP ZBook Power 15 G9 6B8C4EA | |
| AIDA64 / FPU Mandel | |
| Average of class Workstation (40055 - 98153, n=24, last 2 years) | |
| HP ZBook Studio 16 G9 62U04EA | |
| HP ZBook Power 15 G8 313S5EA | |
| HP ZBook Power 15 G9 6B8C4EA | |
| Lenovo ThinkPad P15v G2 21A9000XGE | |
| Average Intel Core i7-12700H (7135 - 44760, n=64) | |
| AIDA64 / CPU AES | |
| Average of class Workstation (73133 - 187841, n=24, last 2 years) | |
| Average Intel Core i7-12700H (31839 - 144360, n=64) | |
| HP ZBook Power 15 G8 313S5EA | |
| Lenovo ThinkPad P15v G2 21A9000XGE | |
| HP ZBook Studio 16 G9 62U04EA | |
| HP ZBook Power 15 G9 6B8C4EA | |
| AIDA64 / CPU ZLib | |
| Average of class Workstation (929 - 2148, n=24, last 2 years) | |
| HP ZBook Studio 16 G9 62U04EA | |
| Average Intel Core i7-12700H (305 - 1171, n=64) | |
| HP ZBook Power 15 G9 6B8C4EA | |
| HP ZBook Power 15 G8 313S5EA | |
| Lenovo ThinkPad P15v G2 21A9000XGE | |
| Dell Precision 5000 5560 | |
| AIDA64 / FP64 Ray-Trace | |
| Average of class Workstation (7813 - 32891, n=24, last 2 years) | |
| HP ZBook Studio 16 G9 62U04EA | |
| HP ZBook Power 15 G8 313S5EA | |
| HP ZBook Power 15 G9 6B8C4EA | |
| Lenovo ThinkPad P15v G2 21A9000XGE | |
| Average Intel Core i7-12700H (1437 - 9692, n=64) | |
| AIDA64 / CPU PhotoWorxx | |
| Average of class Workstation (37151 - 93684, n=24, last 2 years) | |
| HP ZBook Power 15 G9 6B8C4EA | |
| HP ZBook Studio 16 G9 62U04EA | |
| Average Intel Core i7-12700H (12863 - 52207, n=64) | |
| HP ZBook Power 15 G8 313S5EA | |
| Lenovo ThinkPad P15v G2 21A9000XGE | |
System Performance
The ZBook Power 15 G9 is a very responsive device, and we did not encounter any problems during our testing. The synthetic benchmark results are also very good and confirm our subjective impression of the performance.
CrossMark: Overall | Productivity | Creativity | Responsiveness
| PCMark 10 / Score | |
| Average of class Workstation (6563 - 10409, n=20, last 2 years) | |
| Dell Precision 5000 5560 | |
| HP ZBook Studio 16 G9 62U04EA | |
| HP ZBook Power 15 G9 6B8C4EA | |
| Average Intel Core i7-12700H, NVIDIA RTX A2000 Laptop GPU (n=1) | |
| Lenovo ThinkPad P15v G2 21A9000XGE | |
| HP ZBook Power 15 G8 313S5EA | |
| PCMark 10 / Essentials | |
| Dell Precision 5000 5560 | |
| Average of class Workstation (9622 - 11157, n=20, last 2 years) | |
| HP ZBook Power 15 G9 6B8C4EA | |
| Average Intel Core i7-12700H, NVIDIA RTX A2000 Laptop GPU (n=1) | |
| Lenovo ThinkPad P15v G2 21A9000XGE | |
| HP ZBook Studio 16 G9 62U04EA | |
| HP ZBook Power 15 G8 313S5EA | |
| PCMark 10 / Productivity | |
| Average of class Workstation (8789 - 20616, n=20, last 2 years) | |
| Dell Precision 5000 5560 | |
| Lenovo ThinkPad P15v G2 21A9000XGE | |
| HP ZBook Studio 16 G9 62U04EA | |
| HP ZBook Power 15 G9 6B8C4EA | |
| Average Intel Core i7-12700H, NVIDIA RTX A2000 Laptop GPU (n=1) | |
| HP ZBook Power 15 G8 313S5EA | |
| PCMark 10 / Digital Content Creation | |
| Average of class Workstation (8108 - 15631, n=20, last 2 years) | |
| HP ZBook Studio 16 G9 62U04EA | |
| HP ZBook Power 15 G9 6B8C4EA | |
| Average Intel Core i7-12700H, NVIDIA RTX A2000 Laptop GPU (n=1) | |
| Dell Precision 5000 5560 | |
| Lenovo ThinkPad P15v G2 21A9000XGE | |
| HP ZBook Power 15 G8 313S5EA | |
| CrossMark / Overall | |
| Average of class Workstation (1307 - 2267, n=23, last 2 years) | |
| HP ZBook Studio 16 G9 62U04EA | |
| HP ZBook Power 15 G9 6B8C4EA | |
| Average Intel Core i7-12700H, NVIDIA RTX A2000 Laptop GPU (n=1) | |
| HP ZBook Power 15 G8 313S5EA | |
| Lenovo ThinkPad P15v G2 21A9000XGE | |
| CrossMark / Productivity | |
| Average of class Workstation (1130 - 2122, n=23, last 2 years) | |
| HP ZBook Studio 16 G9 62U04EA | |
| HP ZBook Power 15 G9 6B8C4EA | |
| Average Intel Core i7-12700H, NVIDIA RTX A2000 Laptop GPU (n=1) | |
| HP ZBook Power 15 G8 313S5EA | |
| Lenovo ThinkPad P15v G2 21A9000XGE | |
| CrossMark / Creativity | |
| Average of class Workstation (1657 - 2725, n=23, last 2 years) | |
| HP ZBook Studio 16 G9 62U04EA | |
| HP ZBook Power 15 G9 6B8C4EA | |
| Average Intel Core i7-12700H, NVIDIA RTX A2000 Laptop GPU (n=1) | |
| HP ZBook Power 15 G8 313S5EA | |
| Lenovo ThinkPad P15v G2 21A9000XGE | |
| CrossMark / Responsiveness | |
| Average of class Workstation (993 - 2096, n=23, last 2 years) | |
| HP ZBook Studio 16 G9 62U04EA | |
| HP ZBook Power 15 G9 6B8C4EA | |
| Average Intel Core i7-12700H, NVIDIA RTX A2000 Laptop GPU (n=1) | |
| HP ZBook Power 15 G8 313S5EA | |
| Lenovo ThinkPad P15v G2 21A9000XGE | |
| PCMark 10 Score | 6232 points | |
Help | ||
| AIDA64 / Memory Copy | |
| Average of class Workstation (56003 - 164795, n=24, last 2 years) | |
| HP ZBook Power 15 G9 6B8C4EA | |
| HP ZBook Studio 16 G9 62U04EA | |
| Average Intel Core i7-12700H (25615 - 80511, n=64) | |
| HP ZBook Power 15 G8 313S5EA | |
| Lenovo ThinkPad P15v G2 21A9000XGE | |
| AIDA64 / Memory Read | |
| Average of class Workstation (55795 - 121563, n=24, last 2 years) | |
| HP ZBook Power 15 G9 6B8C4EA | |
| HP ZBook Studio 16 G9 62U04EA | |
| Average Intel Core i7-12700H (25586 - 79442, n=64) | |
| HP ZBook Power 15 G8 313S5EA | |
| Lenovo ThinkPad P15v G2 21A9000XGE | |
| AIDA64 / Memory Write | |
| Average of class Workstation (55663 - 214520, n=24, last 2 years) | |
| HP ZBook Power 15 G9 6B8C4EA | |
| HP ZBook Studio 16 G9 62U04EA | |
| Average Intel Core i7-12700H (23679 - 88660, n=64) | |
| HP ZBook Power 15 G8 313S5EA | |
| Lenovo ThinkPad P15v G2 21A9000XGE | |
| AIDA64 / Memory Latency | |
| Average of class Workstation (84.5 - 165.2, n=24, last 2 years) | |
| Lenovo ThinkPad P15v G2 21A9000XGE | |
| HP ZBook Power 15 G9 6B8C4EA | |
| HP ZBook Studio 16 G9 62U04EA | |
| Average Intel Core i7-12700H (76.2 - 133.9, n=62) | |
| HP ZBook Power 15 G8 313S5EA | |
* ... smaller is better
DPC Latencies
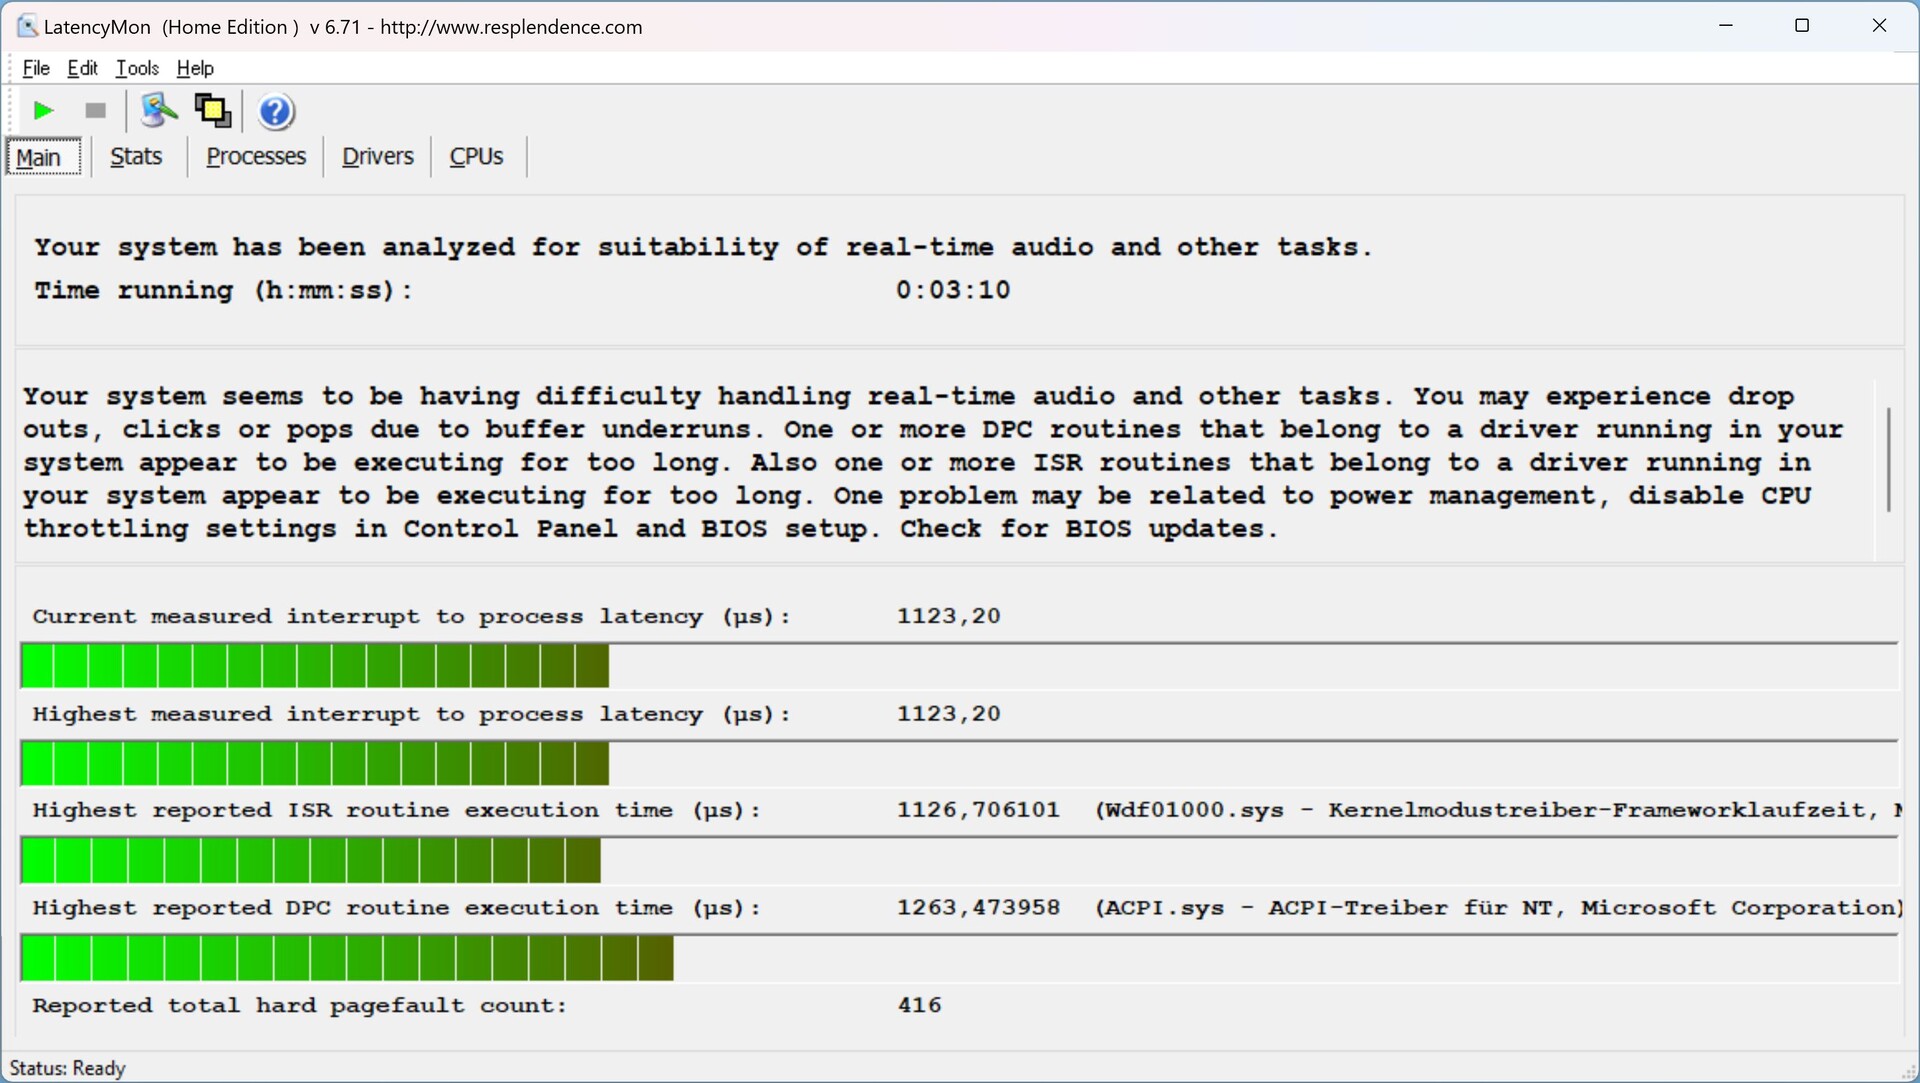
In our standardized latency test (surfing the Internet, 4K YouTube video reproduction, CPU load), there are some slight limitations. As a result, the device with the current BIOS version is not optimally suited for using real-time audio applications.
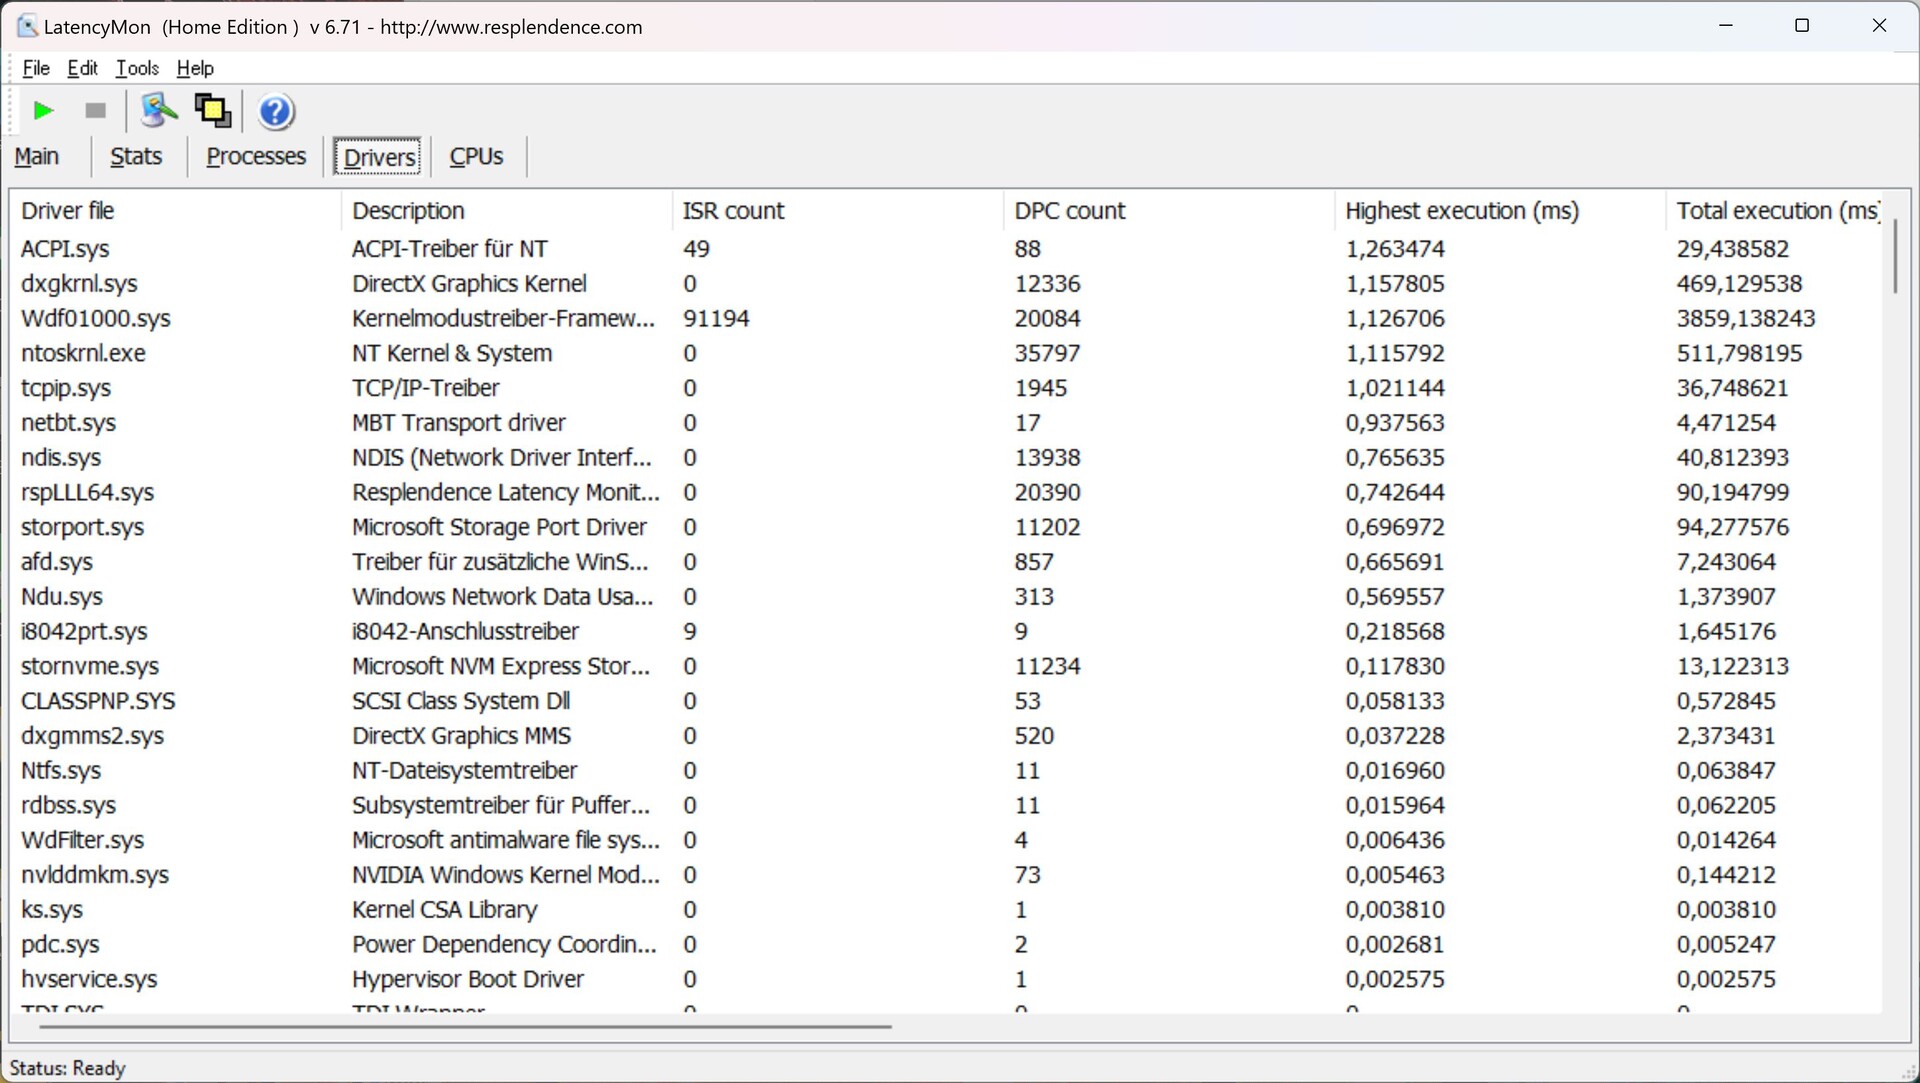
| DPC Latencies / LatencyMon - interrupt to process latency (max), Web, Youtube, Prime95 | |
| Lenovo ThinkPad P15v G2 21A9000XGE | |
| HP ZBook Studio 16 G9 62U04EA | |
| HP ZBook Power 15 G9 6B8C4EA | |
| Dell Precision 5000 5560 | |
| HP ZBook Power 15 G8 313S5EA | |
* ... smaller is better
Storage Solution
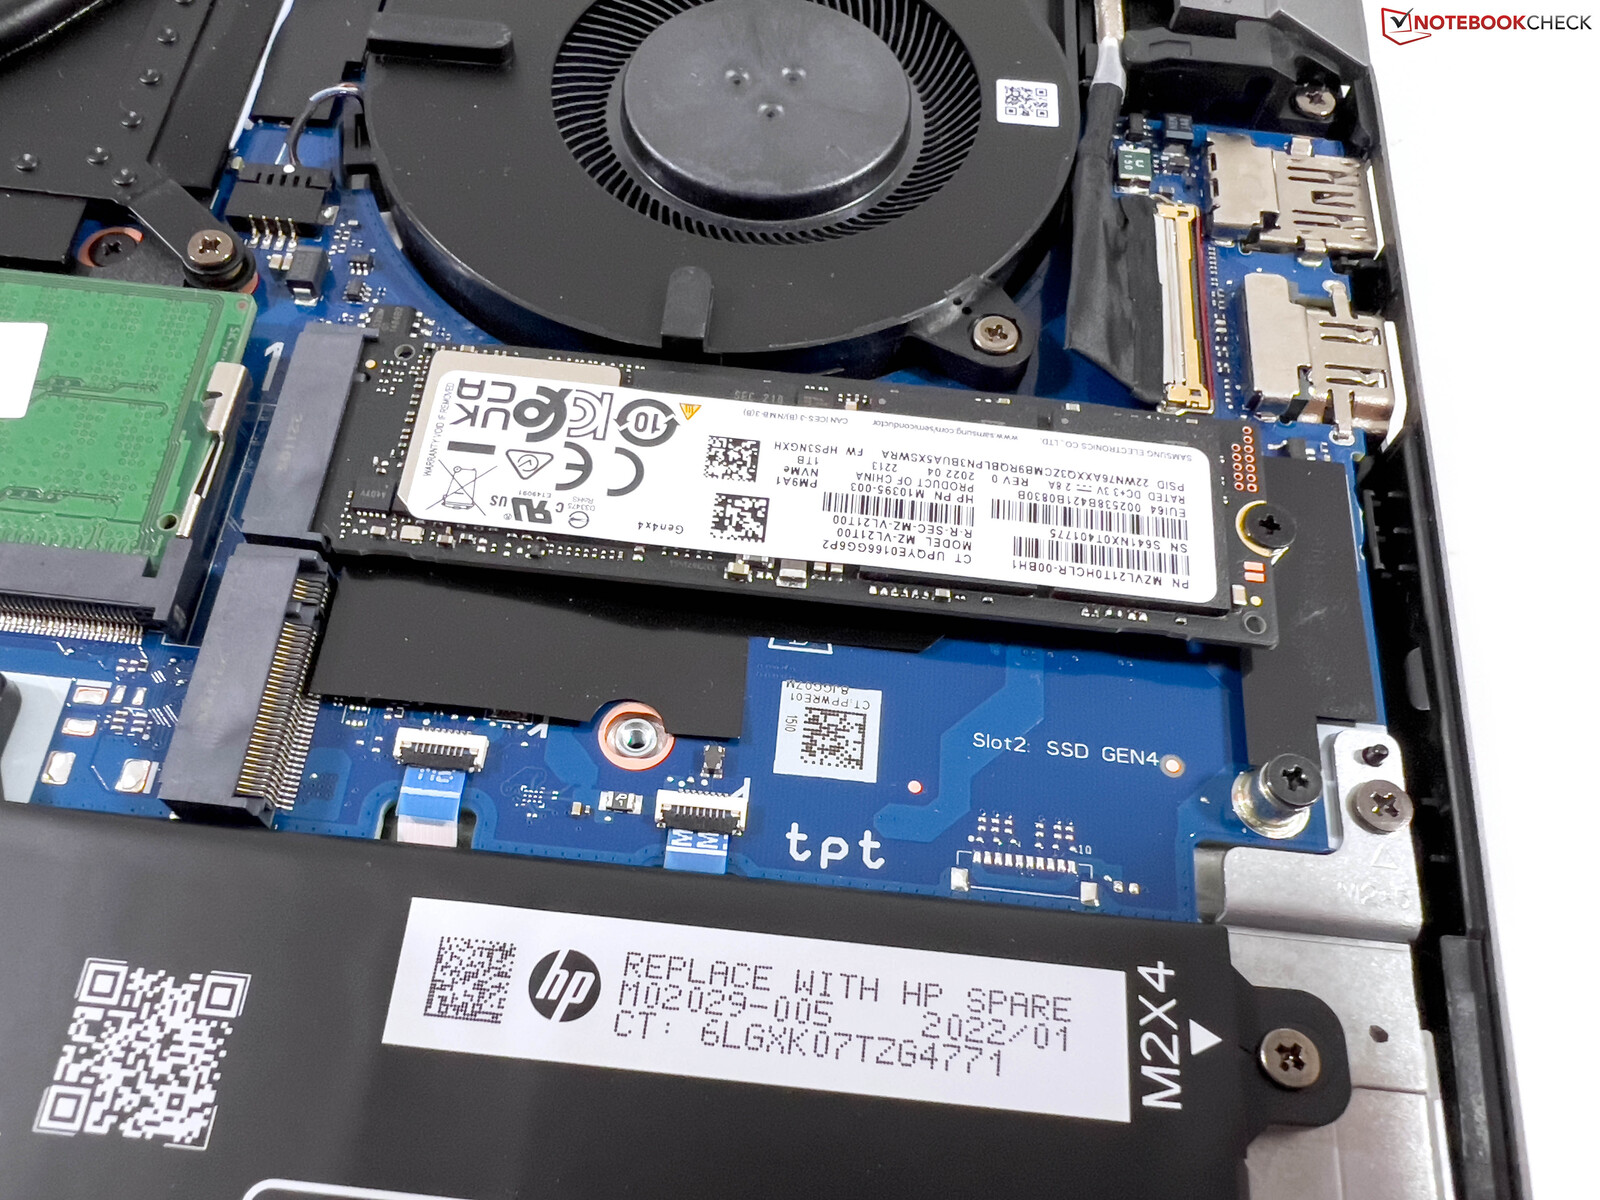
The ZBook Power 15 G9 offers two fast PCIe 4.0 slots for M.2 SSDs. Our test unit uses a large, 1-TB PM9A1 from Samsung (OEM version of the 980 Pro). After turning it on for the first time, 890 GB of this are available to the user. The transfer rates of the SSD are excellent, and the performance also remains almost completely stable even after longer load. You can find additional SSD benchmarks here.

* ... smaller is better
Disk Throttling: DiskSpd Read Loop, Queue Depth 8
Graphics Card
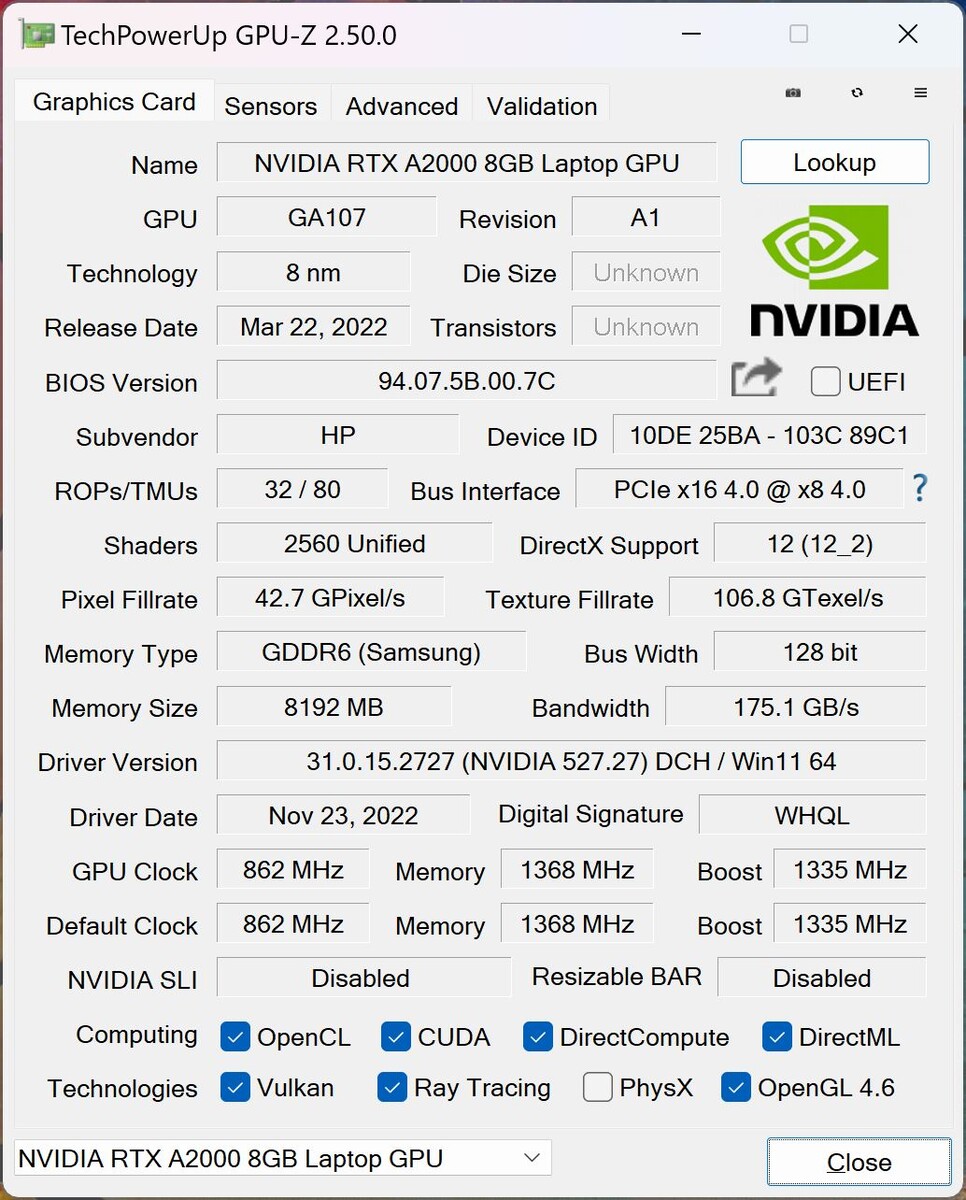
The Nvidia RTX A2000 is the fastest GPU that HP offers for the ZBook Power 15 G9. This is the updated version with 8 GB of GDDR6-VRAM. However, the GPU is only allowed to consume a maximum of 45 watts (including 5 watts Dynamic Boost), which makes it one of the slowest versions. In our benchmarks, the GPU therefore also drops below the average of the results that we measured for the RTX A2000 so far. The gaming performance is comparable to that of the GeForce RTX 3050 Ti consumer GPU, but thanks to the certified drivers, the performance in professional applications can also turn out significantly better.
Under constant load, the GPU performance remains completely stabile. As already in the processor, the power consumption of the graphics card in battery operation is also limited to 30 watts, leading to a performance reduction of almost 25% (3,589 points Time Spy Graphics). You can find additional GPU benchmarks here.
| 3DMark 11 Performance | 16503 points | |
| 3DMark Fire Strike Score | 11074 points | |
| 3DMark Time Spy Score | 5106 points | |
Help | ||
| Blender / v3.3 Classroom OPTIX/RTX | |
| HP ZBook Studio 16 G9 62U04EA | |
| HP ZBook Power 15 G9 6B8C4EA | |
| Average NVIDIA RTX A2000 Laptop GPU (42 - 54, n=7) | |
| Average of class Workstation (10 - 43, n=18, last 2 years) | |
| Blender / v3.3 Classroom CUDA | |
| HP ZBook Studio 16 G9 62U04EA | |
| HP ZBook Power 15 G9 6B8C4EA | |
| Average NVIDIA RTX A2000 Laptop GPU (78 - 98, n=7) | |
| Average of class Workstation (16 - 74, n=18, last 2 years) | |
| Blender / v3.3 Classroom CPU | |
| HP ZBook Power 15 G9 6B8C4EA | |
| Average NVIDIA RTX A2000 Laptop GPU (312 - 414, n=7) | |
| HP ZBook Studio 16 G9 62U04EA | |
| Average of class Workstation (148 - 364, n=24, last 2 years) | |
* ... smaller is better
| The Witcher 3 - 1920x1080 Ultra Graphics & Postprocessing (HBAO+) | |
| Average of class Workstation (51 - 91.7, n=2, last 2 years) | |
| Dell Precision 5000 5560 | |
| HP ZBook Studio 16 G9 62U04EA | |
| HP ZBook Power 15 G9 6B8C4EA | |
| Lenovo ThinkPad P15v G2 21A9000XGE | |
| HP ZBook Power 15 G8 313S5EA | |
| GTA V - 1920x1080 Highest AA:4xMSAA + FX AF:16x | |
| Average of class Workstation (18.1 - 156.1, n=24, last 2 years) | |
| HP ZBook Studio 16 G9 62U04EA | |
| HP ZBook Power 15 G9 6B8C4EA | |
| Dell Precision 5000 5560 | |
| Lenovo ThinkPad P15v G2 21A9000XGE | |
| HP ZBook Power 15 G8 313S5EA | |
| Final Fantasy XV Benchmark - 1920x1080 High Quality | |
| Average of class Workstation (26.4 - 197.6, n=24, last 2 years) | |
| HP ZBook Studio 16 G9 62U04EA | |
| HP ZBook Power 15 G9 6B8C4EA | |
| Dell Precision 5000 5560 | |
| Lenovo ThinkPad P15v G2 21A9000XGE | |
| HP ZBook Power 15 G8 313S5EA | |
| Strange Brigade - 1920x1080 ultra AA:ultra AF:16 | |
| Average of class Workstation (91 - 418, n=18, last 2 years) | |
| HP ZBook Studio 16 G9 62U04EA | |
| HP ZBook Power 15 G9 6B8C4EA | |
| Lenovo ThinkPad P15v G2 21A9000XGE | |
| HP ZBook Power 15 G8 313S5EA | |
| Dota 2 Reborn - 1920x1080 ultra (3/3) best looking | |
| HP ZBook Studio 16 G9 62U04EA | |
| Average of class Workstation (50.7 - 178.4, n=24, last 2 years) | |
| Dell Precision 5000 5560 | |
| HP ZBook Power 15 G9 6B8C4EA | |
| HP ZBook Power 15 G8 313S5EA | |
| Lenovo ThinkPad P15v G2 21A9000XGE | |
The Witcher 3 FPS Chart
| low | med. | high | ultra | QHD | 4K | |
|---|---|---|---|---|---|---|
| GTA V (2015) | 182.9 | 177.1 | 134.7 | 65.4 | 47.3 | 45 |
| The Witcher 3 (2015) | 264 | 171 | 45 | 44.5 | ||
| Dota 2 Reborn (2015) | 179.3 | 133.5 | 126.1 | 118.6 | 68.9 | |
| Final Fantasy XV Benchmark (2018) | 121.9 | 68.2 | 48.6 | 34.9 | 20.6 | |
| X-Plane 11.11 (2018) | 122.6 | 103.6 | 87.6 | 73.1 | ||
| Strange Brigade (2018) | 266 | 126 | 100 | 86 | 36 | |
| F1 2021 (2021) | 287 | 153.1 | 124.4 | 62.7 | 44.4 | 23.9 |
| F1 22 (2022) | 147.1 | 137.9 | 100.6 | 30.8 | 19.1 | 9.05 |
Emissions and Power Management
Noise Level
Usually, the two fans of the ZBook Power 15 G9 often remain deactivated during simple tasks. Only when you put the processor or dedicated graphics card under load do the fans turn on quickly, usually producing a noise level between 42 and 45 dB(A), with the speed of the fans not always remaining stabile but fluctuating sometimes. During the stress test with maximum load for the two components, we measure a maximum of 47.9 dB(A). With this, the current G9 generation remains slightly quieter than the predecessor. There are no other electronic noises.
Noise level
| Idle |
| 23.8 / 23.8 / 23.8 dB(A) |
| Load |
| 42.9 / 47.9 dB(A) |
 | ||
30 dB silent 40 dB(A) audible 50 dB(A) loud |
||
min: | ||
| HP ZBook Power 15 G9 6B8C4EA RTX A2000 Laptop GPU, i7-12700H, Samsung PM9A1 MZVL21T0HCLR | HP ZBook Studio 16 G9 62U04EA RTX A2000 Laptop GPU, i7-12800H, Micron 3400 1TB MTFDKBA1T0TFH | Dell Precision 5000 5560 RTX A2000 Laptop GPU, i7-11850H, Samsung PM9A1 MZVL22T0HBLB | Lenovo ThinkPad P15v G2 21A9000XGE T1200 Laptop GPU, i7-11800H, Toshiba XG6 KXG6AZNV512G | HP ZBook Power 15 G8 313S5EA T600 Laptop GPU, i7-11800H, Samsung PM9A1 MZVL2512HCJQ | |
|---|---|---|---|---|---|
| Noise | -4% | 10% | 2% | -8% | |
| off / environment * (dB) | 23.8 | 24 -1% | 23.4 2% | 25.21 -6% | 25.54 -7% |
| Idle Minimum * (dB) | 23.8 | 24 -1% | 23.6 1% | 25.21 -6% | 25.54 -7% |
| Idle Average * (dB) | 23.8 | 27.7 -16% | 23.6 1% | 25.21 -6% | 25.54 -7% |
| Idle Maximum * (dB) | 23.8 | 27.7 -16% | 23.6 1% | 25.21 -6% | 25.54 -7% |
| Load Average * (dB) | 42.9 | 39.8 7% | 25.8 40% | 39.09 9% | 48.85 -14% |
| Witcher 3 ultra * (dB) | 44.5 | 44.3 -0% | 40.1 10% | 36.6 18% | 46.58 -5% |
| Load Maximum * (dB) | 47.9 | 47.7 -0% | 41.4 14% | 43.53 9% | 50.98 -6% |
* ... smaller is better
Temperatures
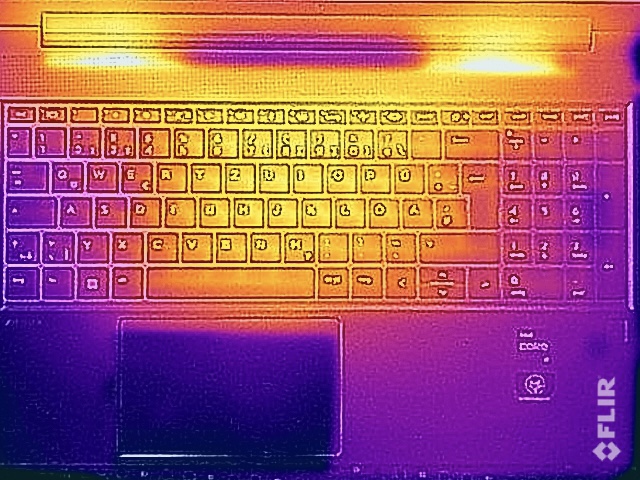
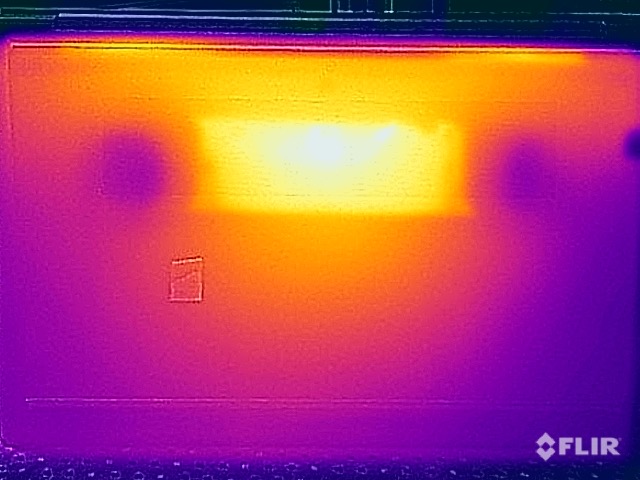
The surface temperatures of the mobile workstation usually remain very low in everyday operation, giving no reason for concern at all, even under load. At 48 °C (118 °F), the only hotspot is at the bottom in the central area toward the back, but due to its position, you can still place the device on your lap. However, the top of the base unit, including the keyboard, remains significantly cooler at a maximum of 40 °C (104°F).
During the stress test, the processor levels out at 35-39 watts after a brief peak of 90 watts, while the graphics card remains stable at 40 watts. After the stress test, the performance is not reduced. In battery operation, the values drop slightly, with the CPU still being allowed to consume 25 watts and the GPU, 30 watts under combined load.
(±) The maximum temperature on the upper side is 40.3 °C / 105 F, compared to the average of 38.2 °C / 101 F, ranging from 22.2 to 69.8 °C for the class Workstation.
(-) The bottom heats up to a maximum of 48.3 °C / 119 F, compared to the average of 41.1 °C / 106 F
(+) In idle usage, the average temperature for the upper side is 23.1 °C / 74 F, compared to the device average of 32 °C / 90 F.
(±) Playing The Witcher 3, the average temperature for the upper side is 33.5 °C / 92 F, compared to the device average of 32 °C / 90 F.
(+) The palmrests and touchpad are cooler than skin temperature with a maximum of 28.6 °C / 83.5 F and are therefore cool to the touch.
(±) The average temperature of the palmrest area of similar devices was 27.8 °C / 82 F (-0.8 °C / -1.5 F).
| HP ZBook Power 15 G9 6B8C4EA Intel Core i7-12700H, NVIDIA RTX A2000 Laptop GPU | HP ZBook Studio 16 G9 62U04EA Intel Core i7-12800H, NVIDIA RTX A2000 Laptop GPU | Dell Precision 5000 5560 Intel Core i7-11850H, NVIDIA RTX A2000 Laptop GPU | Lenovo ThinkPad P15v G2 21A9000XGE Intel Core i7-11800H, NVIDIA T1200 Laptop GPU | HP ZBook Power 15 G8 313S5EA Intel Core i7-11800H, NVIDIA T600 Laptop GPU | |
|---|---|---|---|---|---|
| Heat | -14% | -26% | -18% | 2% | |
| Maximum Upper Side * (°C) | 40.3 | 38.7 4% | 48.2 -20% | 53.8 -33% | 41.4 -3% |
| Maximum Bottom * (°C) | 48.3 | 53.4 -11% | 42.6 12% | 52.1 -8% | 41.5 14% |
| Idle Upper Side * (°C) | 23.7 | 27.3 -15% | 34.8 -47% | 27.6 -16% | 23.8 -0% |
| Idle Bottom * (°C) | 23.8 | 31.6 -33% | 35.2 -48% | 27.7 -16% | 25 -5% |
* ... smaller is better
Speakers
The two stereo speakers represent one of the weaknesses of the mobile workstation, since their sound is very thin and hardly convincing. While they do their job during video conferences or voice calls, we would definitely recommend using headphones or external speakers for the reproduction of music or movies.
HP ZBook Power 15 G9 6B8C4EA audio analysis
(±) | speaker loudness is average but good (77.9 dB)
Bass 100 - 315 Hz
(-) | nearly no bass - on average 28.5% lower than median
(±) | linearity of bass is average (9.4% delta to prev. frequency)
Mids 400 - 2000 Hz
(+) | balanced mids - only 3.9% away from median
(+) | mids are linear (5.1% delta to prev. frequency)
Highs 2 - 16 kHz
(±) | higher highs - on average 5.1% higher than median
(+) | highs are linear (4.1% delta to prev. frequency)
Overall 100 - 16.000 Hz
(±) | linearity of overall sound is average (22.9% difference to median)
Compared to same class
» 82% of all tested devices in this class were better, 3% similar, 15% worse
» The best had a delta of 7%, average was 17%, worst was 35%
Compared to all devices tested
» 68% of all tested devices were better, 6% similar, 26% worse
» The best had a delta of 4%, average was 24%, worst was 134%
Dell Precision 5000 5560 audio analysis
(±) | speaker loudness is average but good (75.2 dB)
Bass 100 - 315 Hz
(±) | reduced bass - on average 9.8% lower than median
(±) | linearity of bass is average (8.8% delta to prev. frequency)
Mids 400 - 2000 Hz
(±) | higher mids - on average 5.7% higher than median
(+) | mids are linear (3.7% delta to prev. frequency)
Highs 2 - 16 kHz
(+) | balanced highs - only 2.7% away from median
(+) | highs are linear (6.4% delta to prev. frequency)
Overall 100 - 16.000 Hz
(+) | overall sound is linear (14.8% difference to median)
Compared to same class
» 33% of all tested devices in this class were better, 6% similar, 61% worse
» The best had a delta of 7%, average was 17%, worst was 35%
Compared to all devices tested
» 20% of all tested devices were better, 4% similar, 76% worse
» The best had a delta of 4%, average was 24%, worst was 134%
Power Consumption
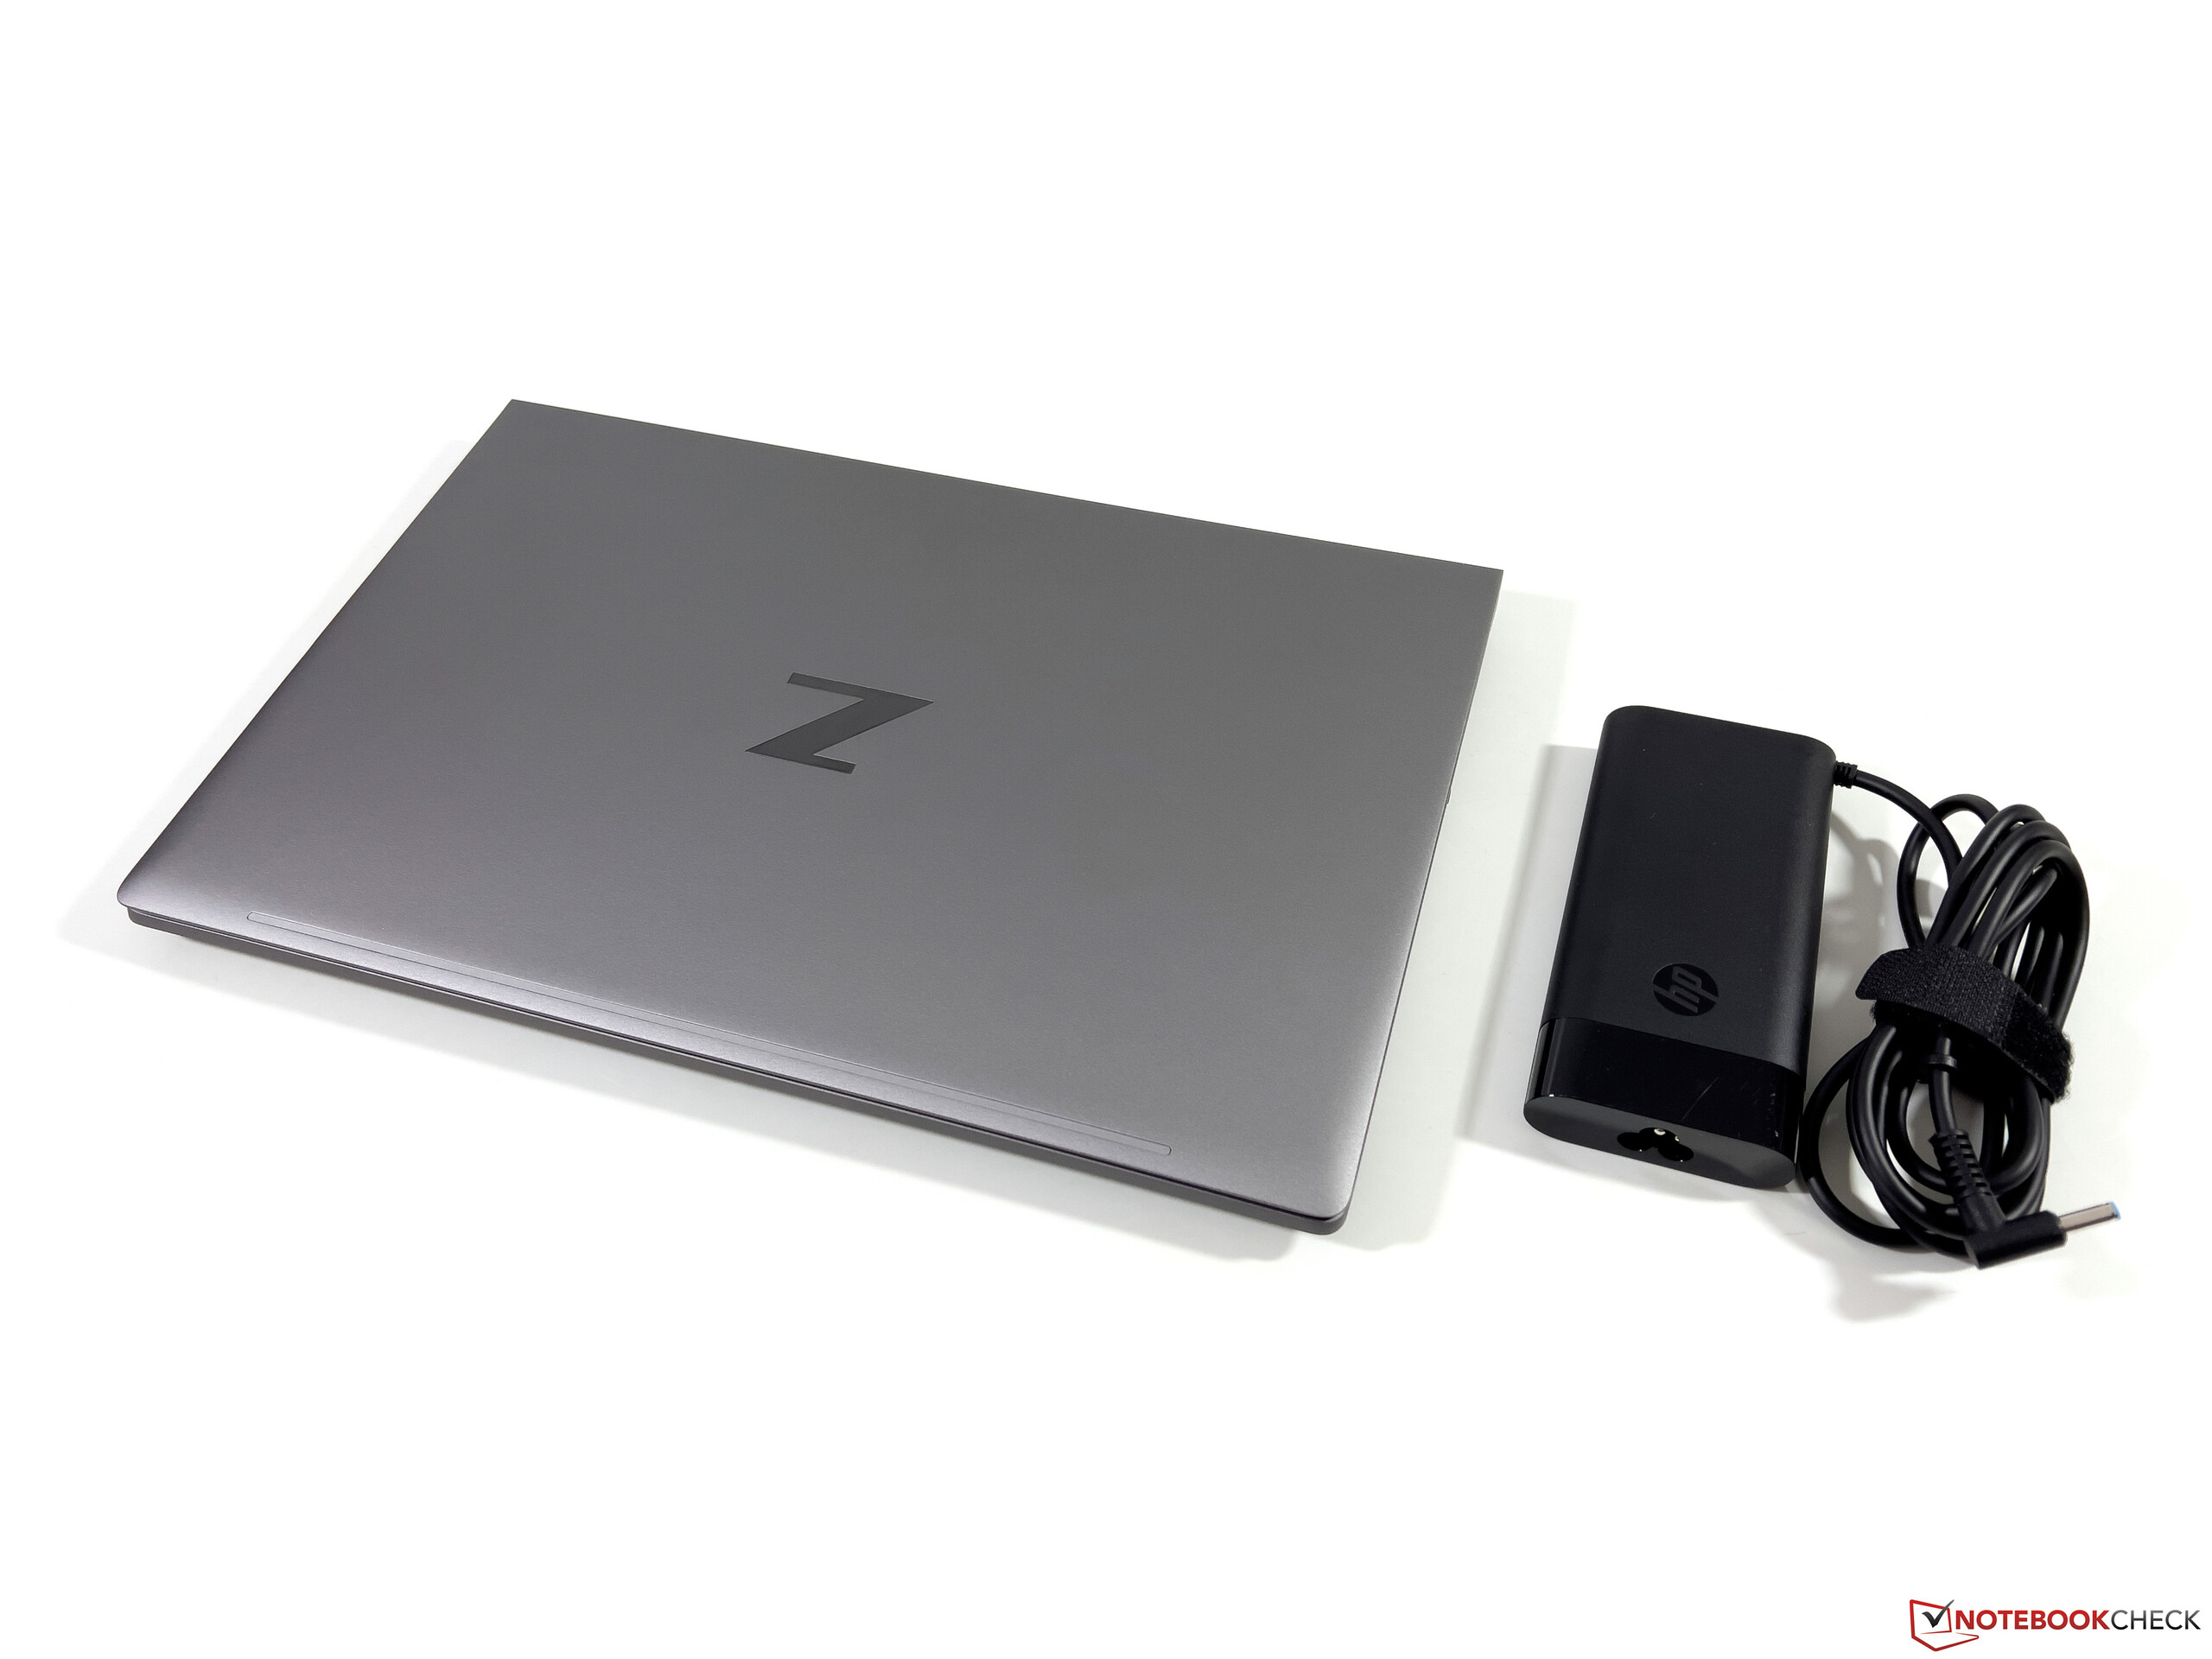
Despite the 4K display, the ZBook Power 15 G9 is a very efficient device with a maximum of 8.5 watts during idle operation. Under load, you can expect about 85-100 watts, and after a short consumption peak of 139 watts, it also levels out in that range after several minutes during the stress test. The included 150-watt power supply is therefore completely sufficient.
| Off / Standby | |
| Idle | |
| Load |
|
Key:
min: | |
Power Consumption The Witcher 3 / Stress Test
Power Consumption With External Monitor
Battery Life
The large 83-Wh battery remains unchanged, allowing for a good battery life, even if the predecessor with a Full HD panel still lasted longer. Considering the 4K panel, with around 10 hours in our WLAN test at 150 cd/m² (corresponding to 65% of the maximum brightness in our test unit) and still 9 hours at maximum brightness, the results are very good. The low-power display becomes definitely noticeable here.
I takes about 2.5 hours to completely recharge the device when it is turned on, with 50% of that already being available after 34 minutes, and 80% after 70 minutes.
Pros
Cons
Verdict - The HP ZBook Power 15 G9 would benefit from more powerful cooling
The ZBook Power 15 G9 is an entry-level workstation, targeting users who need a reliable performance and professional graphics cards. Aside from the processor, our test configuration already corresponds to the maximum configuration with the 4K display, the Nvidia RTX A2000, and abundant storage, which of course also drives up the price. Like its predecessor, the ZBook Power G9 also offers a solid performance in many areas. But particularly in the CPU performance, the results again are not always constant. The situation has slightly stabilized with some BIOS updates, but the workstation is still unable to make full use of the real potential of the Core i7-12700H.
Particularly in terms of the performance development, the ZBook Power 15 G9 is unable to reach top values, but thanks to some BIOS updates, the CPU performance has stabilized to a large extent. After a calibration, the low power 4K display offers a good image quality and allows for a long battery life.
However, to be fair we also have to mention that the entry-level workstations from the competitors, such as the Lenovo ThinkPad P15v or Dell Precision 5560 don't deliver much more performance either, with the three models performing at eye level overall. The 4K panel is basically a very good choice, since it runs very efficiently without driving up the power consumption, but you should calibrate it if possible.
Price and Availability
The ZBook Power 15 G9 is currently available directly from HP starting from about $1455, and some configurations are also available from Amazon, for example.
HP ZBook Power 15 G9 6B8C4EA
- 01/05/2023 v7 (old)
Andreas Osthoff
Price comparison

