Asus Vivobook Pro 16X Laptop in review: Asus system with a top-of-the-line OLED Display

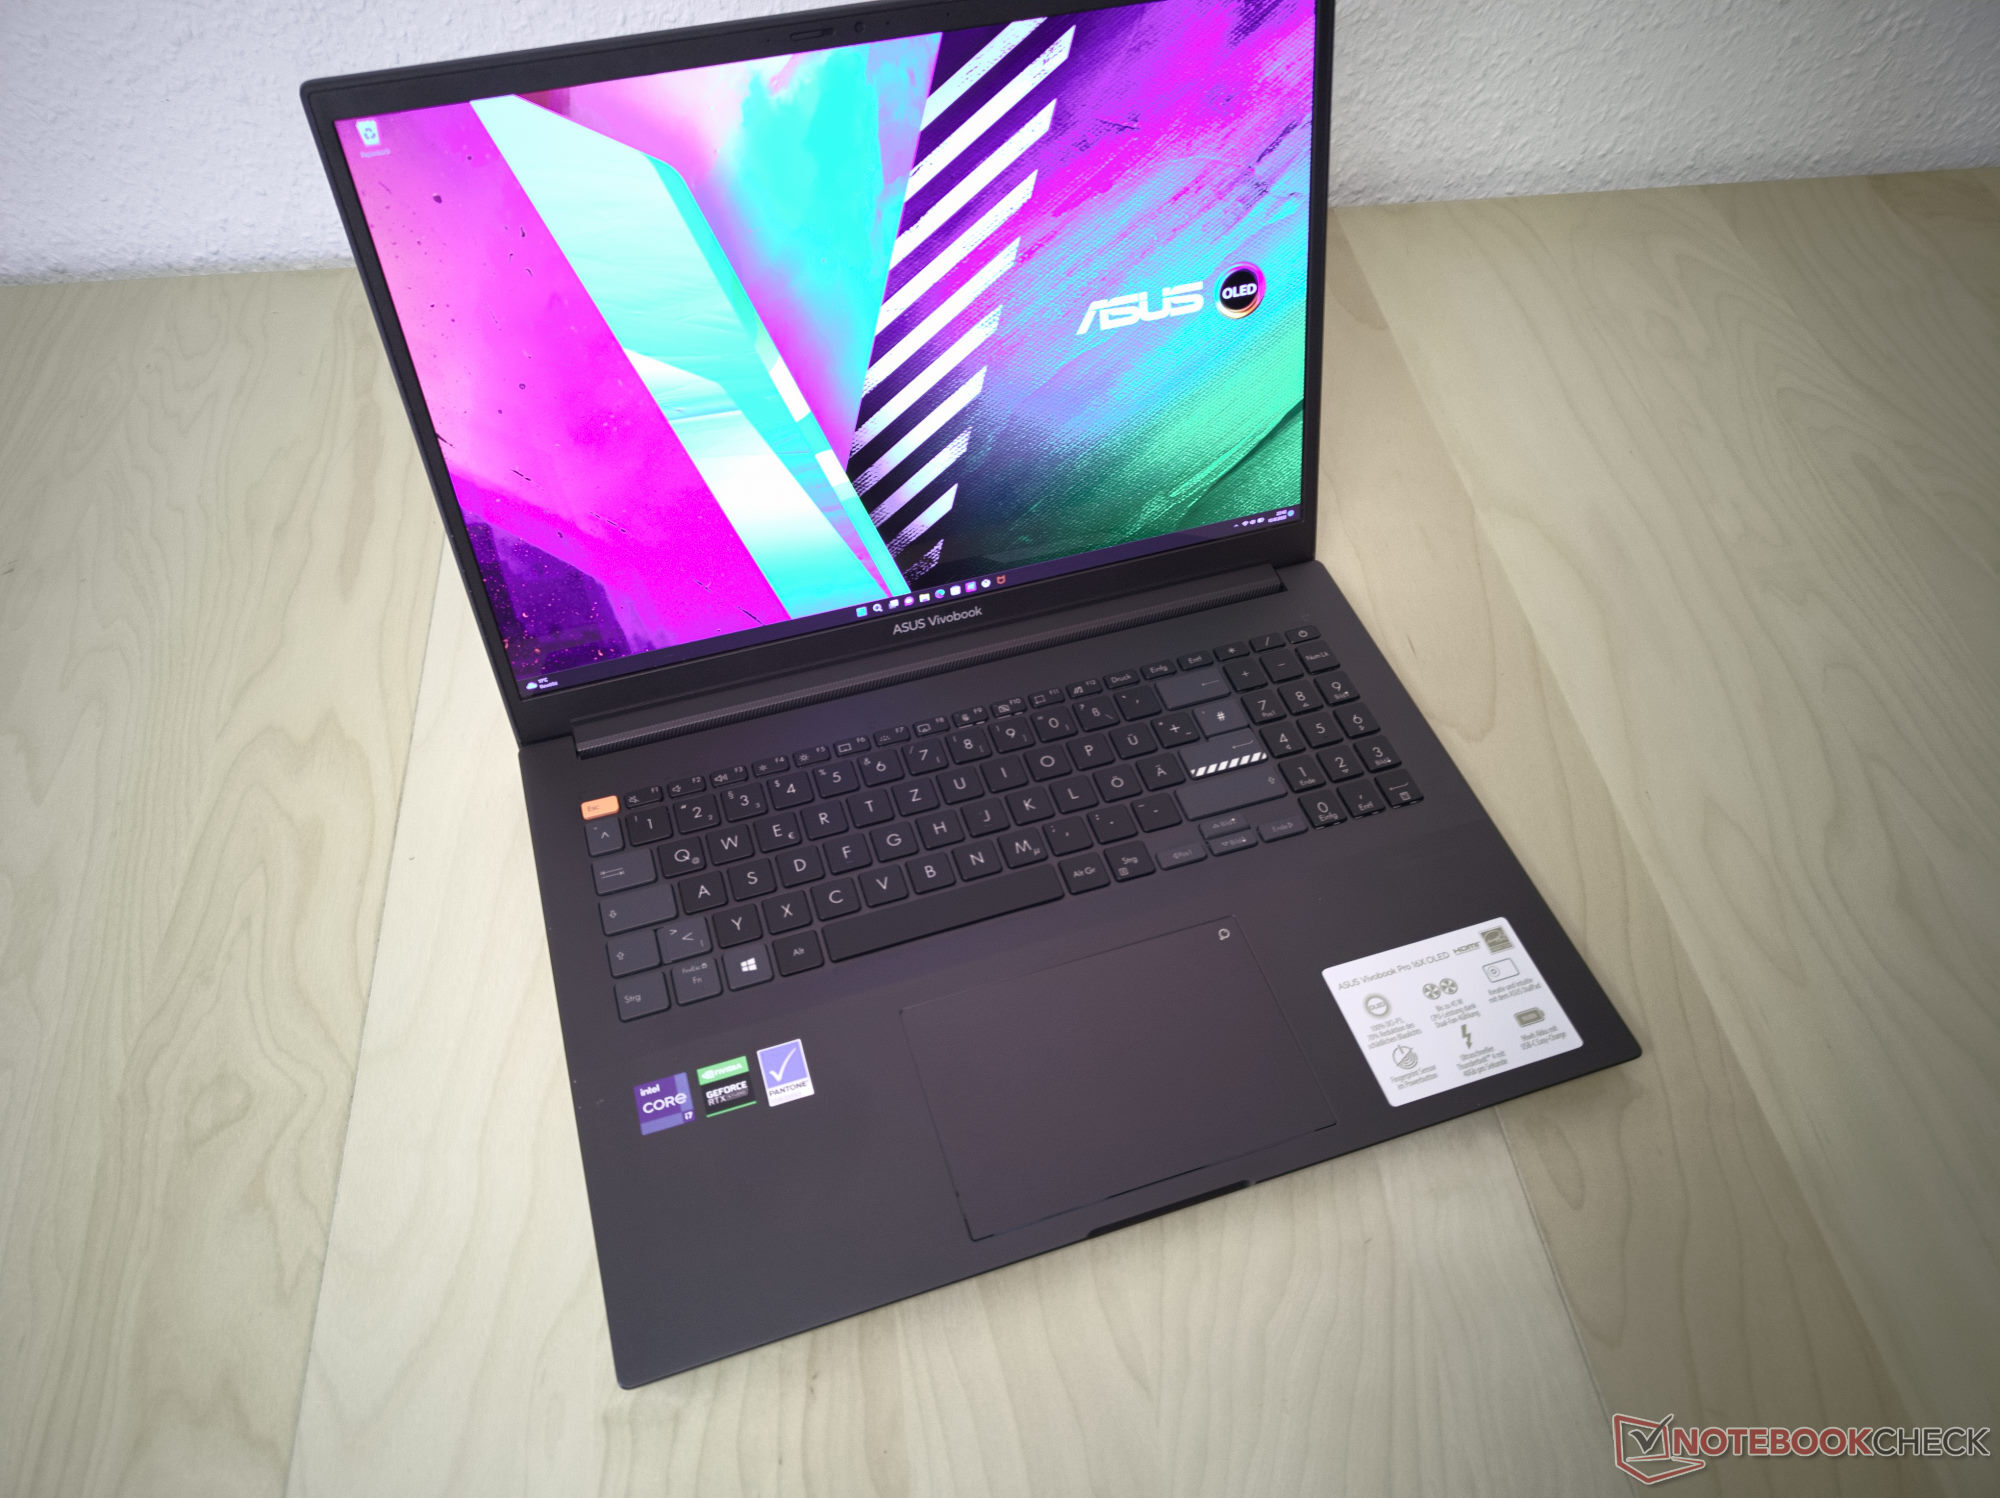
Considering its features, the Asus Vivobook Pro 16X appears to be aimed at creators. It is equipped with an excellent 16:10 OLED display and achieves good results in various benchmarks. This is accomplished with an Intel Core i7-11370H from the last generation and an Nvidia GeForce RTX 3050. Alternatively, the Vivobook Pro 16X is also available in numerous other configurations, which include the latest AMD or Intel processors and several Nvidia GPU options.
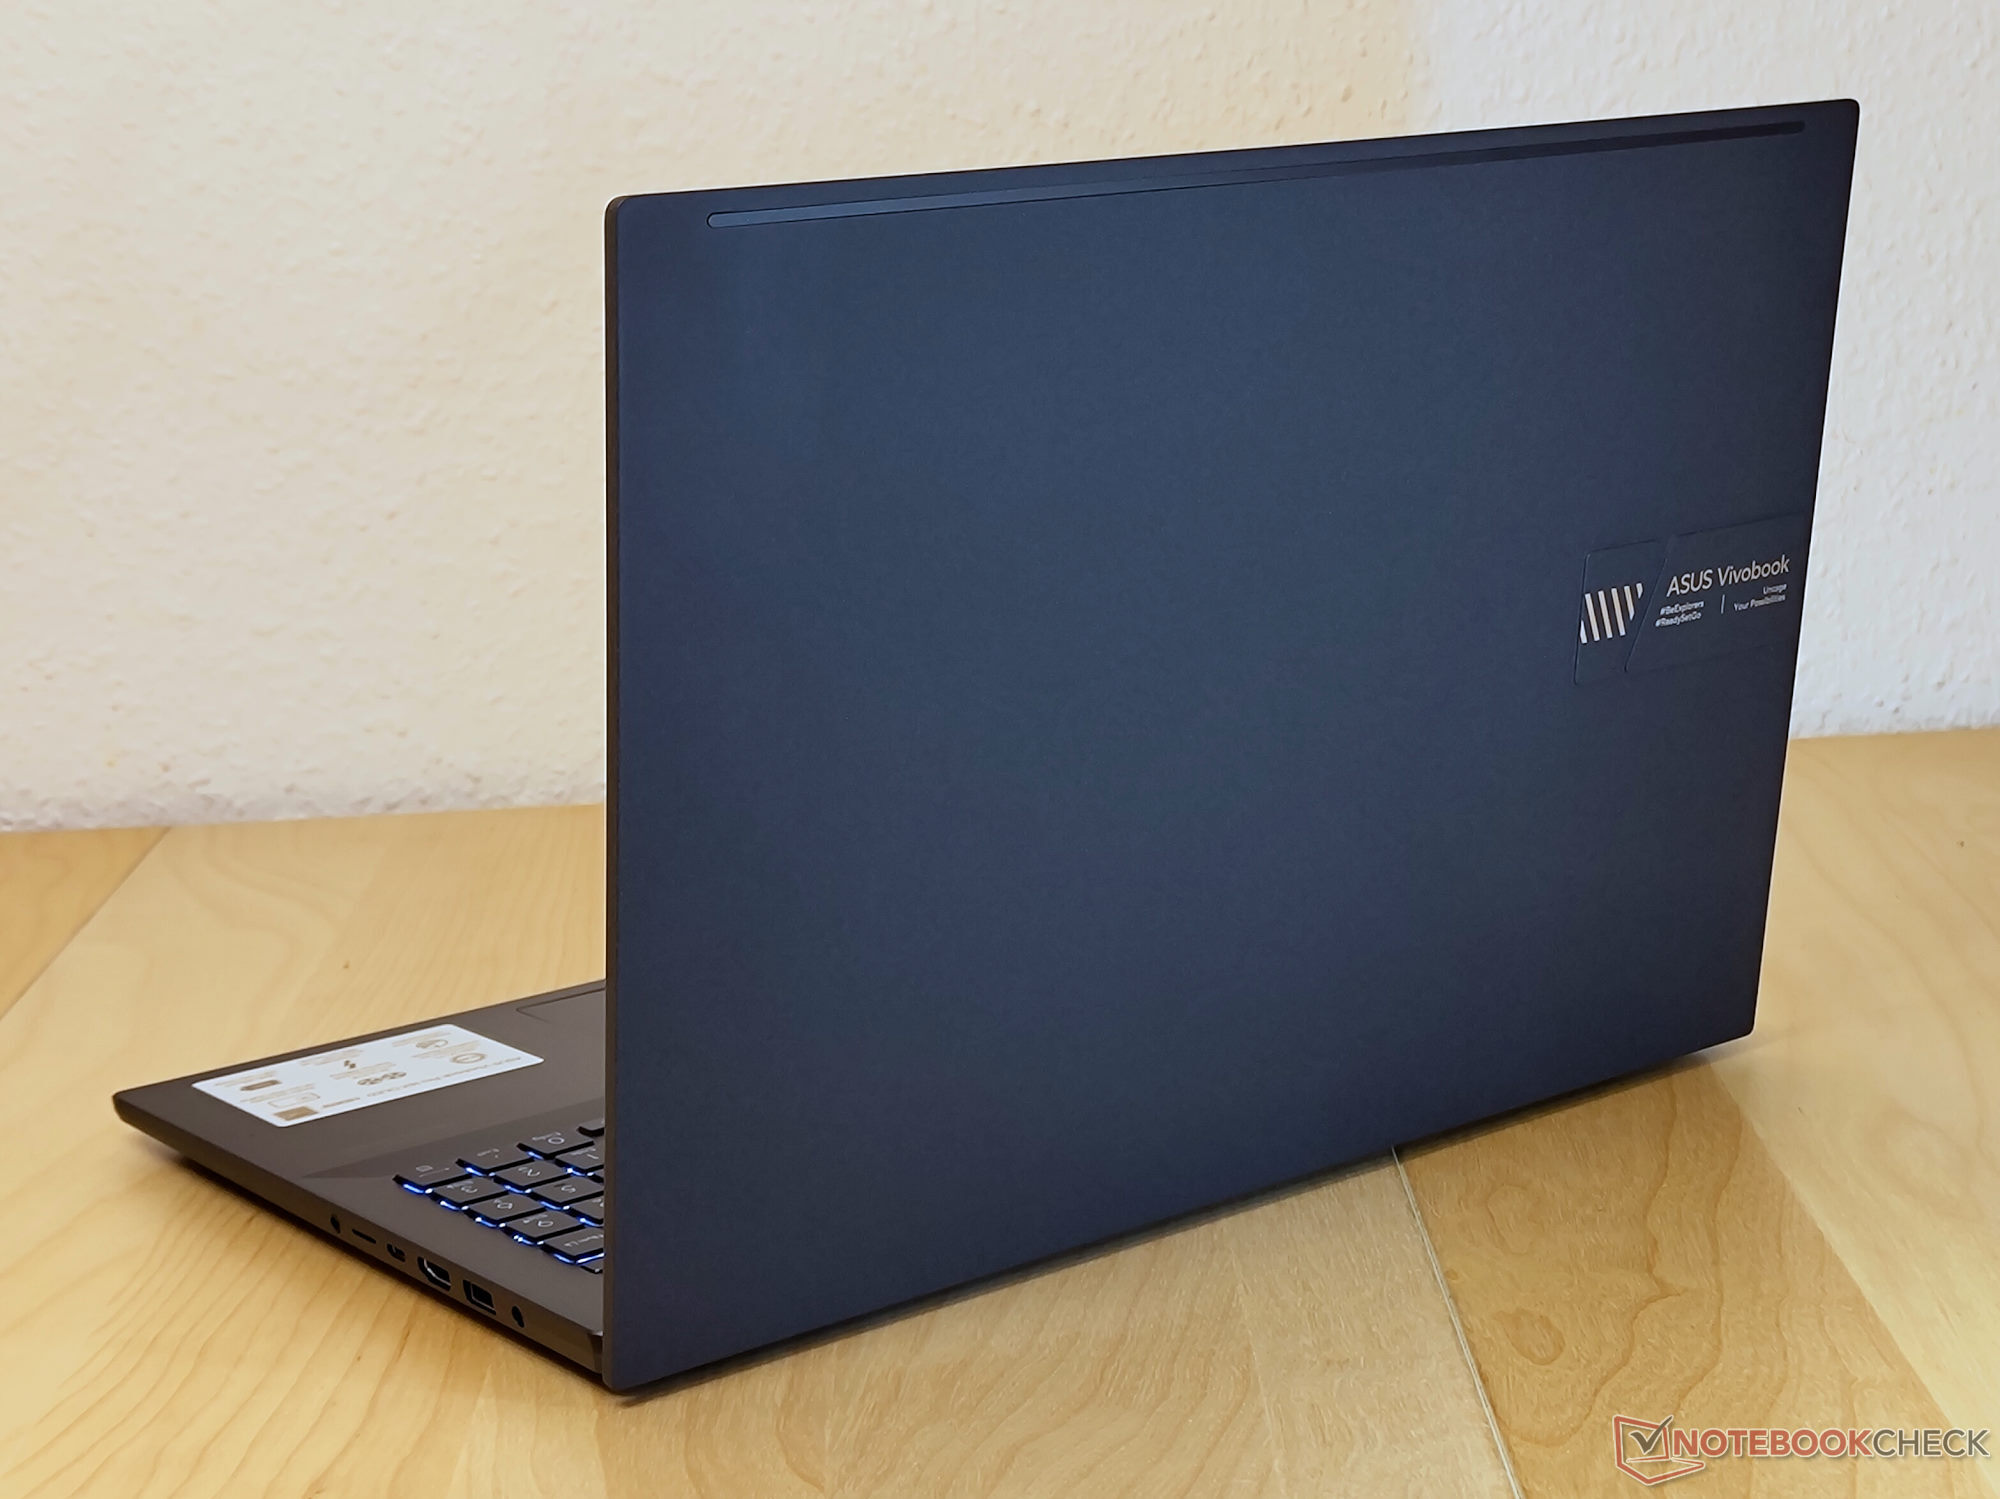
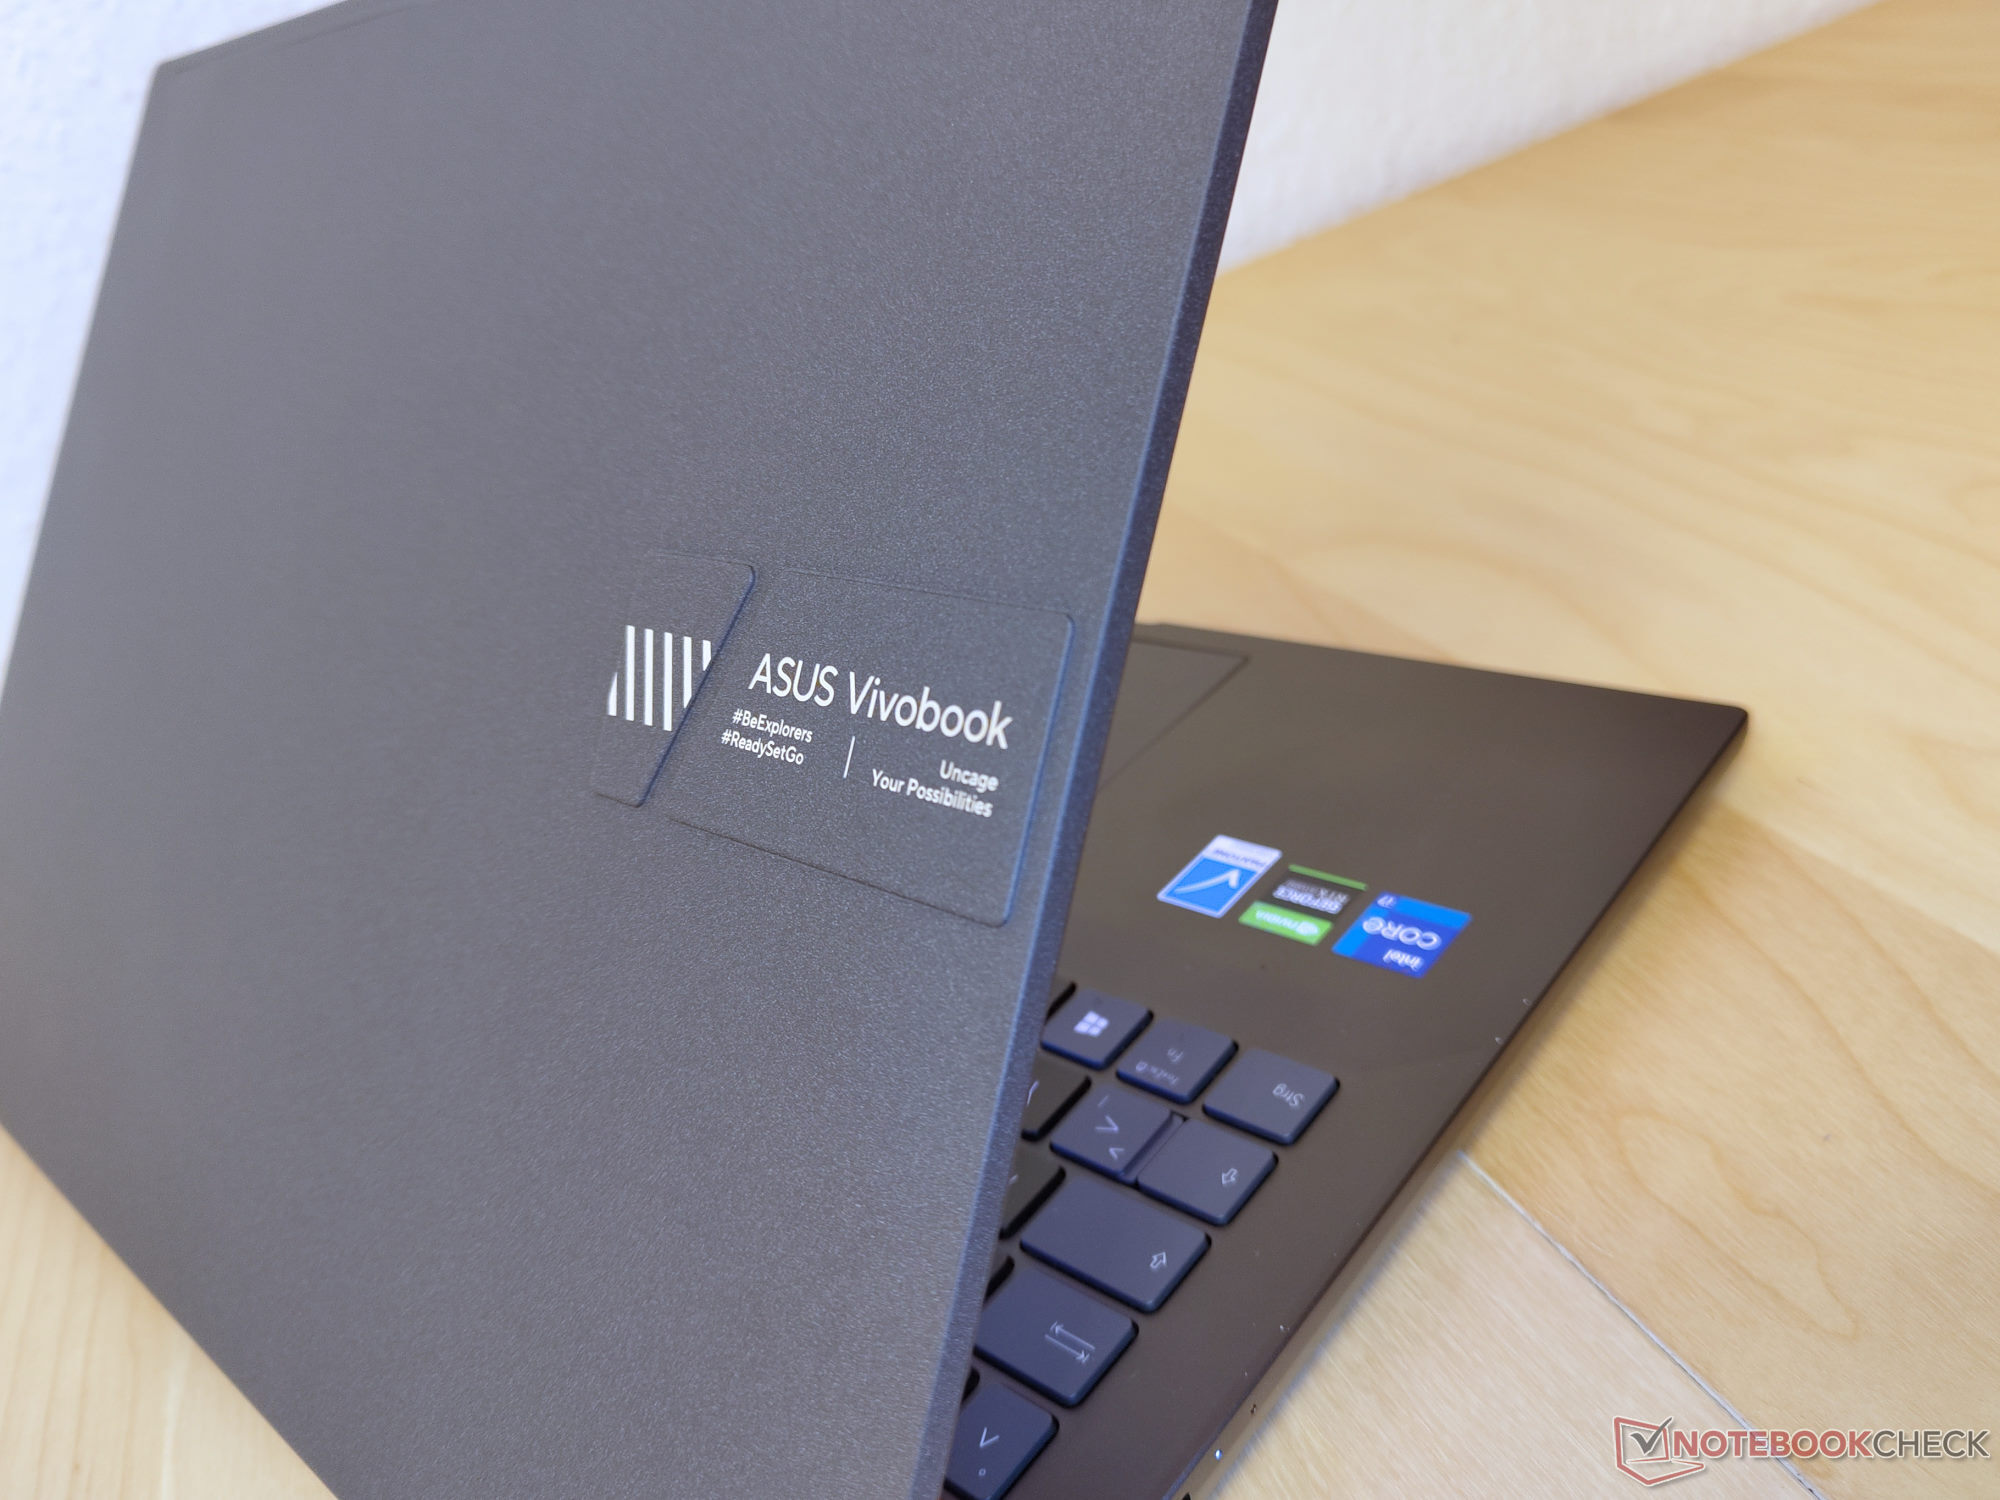
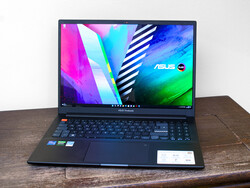
The visual presentation of the laptop benefits from the generous use of aluminum. Thanks to its weave finish, the lid is particularly resistant to scratching and grease.
Since the multimedia laptop is equipped with powerful components, we selected laptops from various categories for our comparison. For example, both the cheaper Dell Inspiron 16 Plus 7610 and the significantly more expensive ThinkPad X1 Extreme G4 are very similar in terms of the features. Regardless, the Vivobook is able to set itself apart from the competition due to its excellent OLED display.
Potential Competitors in Comparison
Rating | Date | Model | Weight | Height | Size | Resolution | Price |
|---|---|---|---|---|---|---|---|
| 83.7 % v7 (old) | 11 / 2022 | Asus VivoBook Pro 16X OLED N7600PC-L2026X i7-11370H, GeForce RTX 3050 4GB Laptop GPU | 2 kg | 18.9 mm | 16.00" | 3840x2400 | |
| 84.2 % v7 (old) | 10 / 2022 | MSI Summit E16 Flip A12UDT-031 i7-1280P, GeForce RTX 3050 Ti Laptop GPU | 1.9 kg | 16.85 mm | 16.00" | 2560x1600 | |
| 89 % v7 (old) | 03 / 2022 | Microsoft Surface Laptop Studio i7 RTX 3050 Ti i7-11370H, GeForce RTX 3050 Ti Laptop GPU | 1.8 kg | 19 mm | 14.40" | 2400x1600 | |
| 86.7 % v7 (old) | 08 / 2021 | Dell Inspiron 16 Plus 7610 i7-11800H, GeForce RTX 3050 4GB Laptop GPU | 2 kg | 18.99 mm | 16.00" | 3072x1920 | |
| 89 % v7 (old) | 11 / 2021 | Lenovo ThinkPad X1 Extreme G4-20Y5CTO1WW (3050 Ti) i7-11800H, GeForce RTX 3050 Ti Laptop GPU | 2 kg | 18.2 mm | 16.00" | 3840x2400 | |
| 83.2 % v7 (old) | 09 / 2021 | Schenker XMG Focus 15 i7-11800H, GeForce RTX 3050 Ti Laptop GPU | 1.9 kg | 22 mm | 15.60" | 1920x1080 |
Case - Aluminum Top, Bottom, and Center
Although this may not be apparent at first glance, almost the entire chassis of the Vivobook 16X consists of aluminum. The base unit was painted in anthracite, while a dark gray coating covers the lid. The latter is matte, very robust, and does not attract grease. Asus markets this as weave coating. Depending on the angle at which light hits the surface, it can appear very smooth or very rough. There is a characteristic Asus logo in a seperated area on the back of the lid. The design of the multimedia laptop is relatively straightforward otherwise.
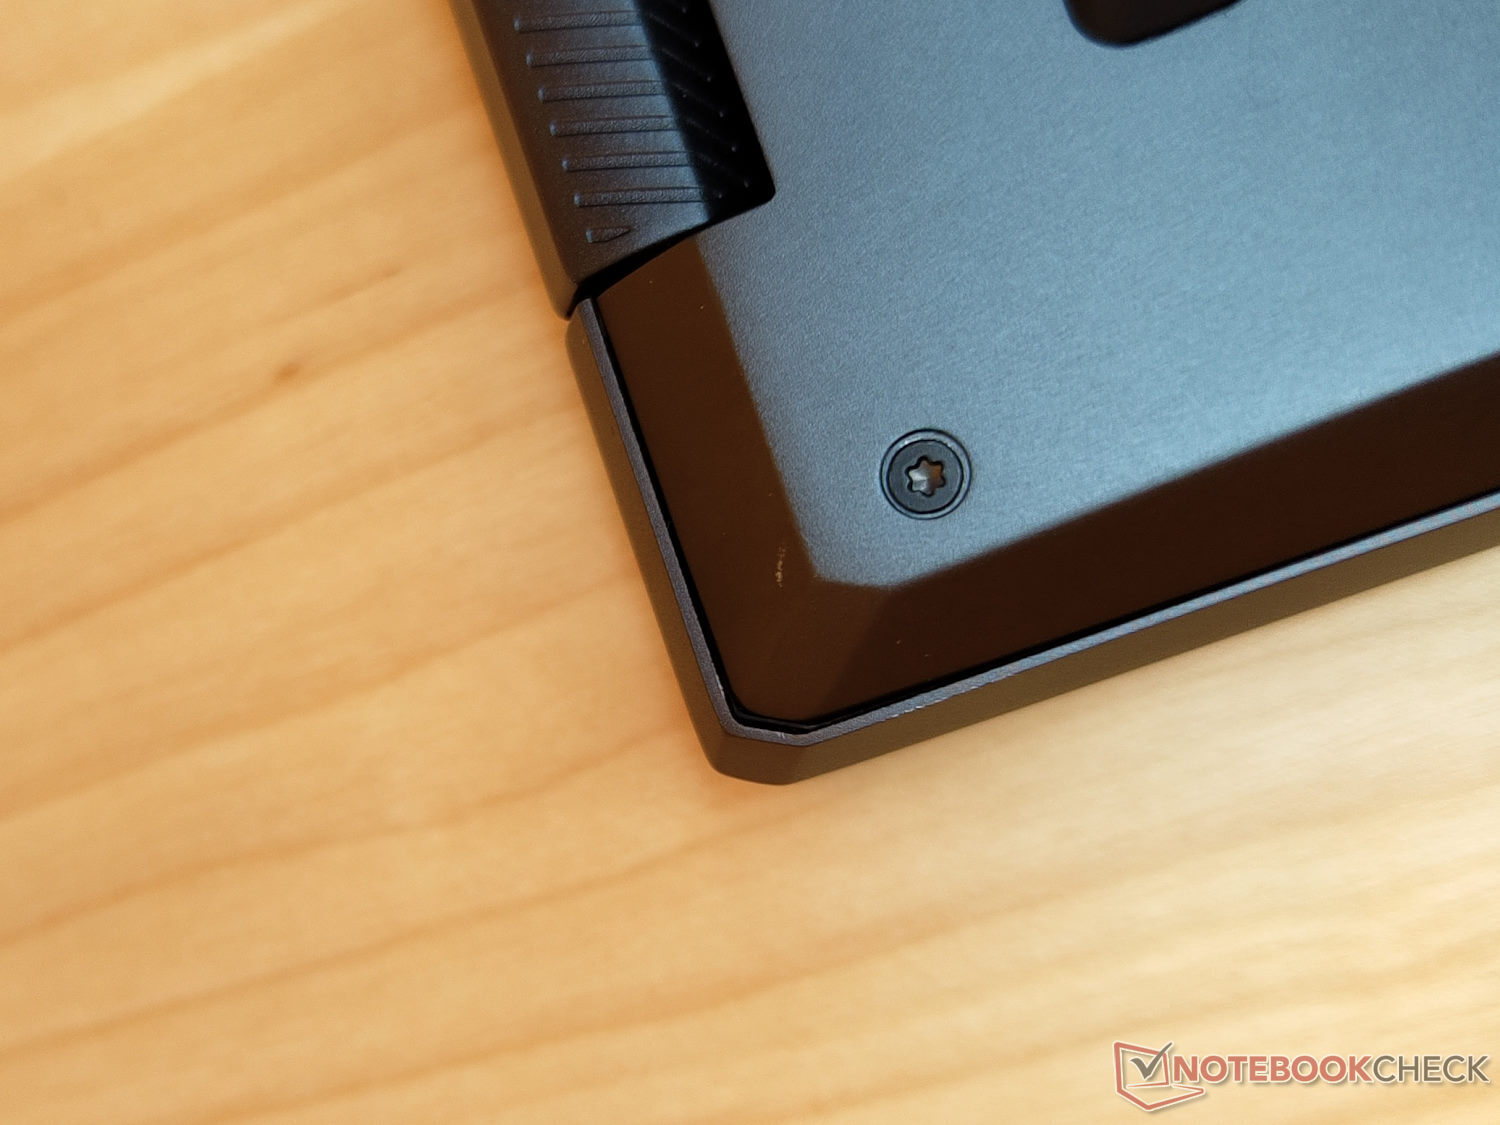
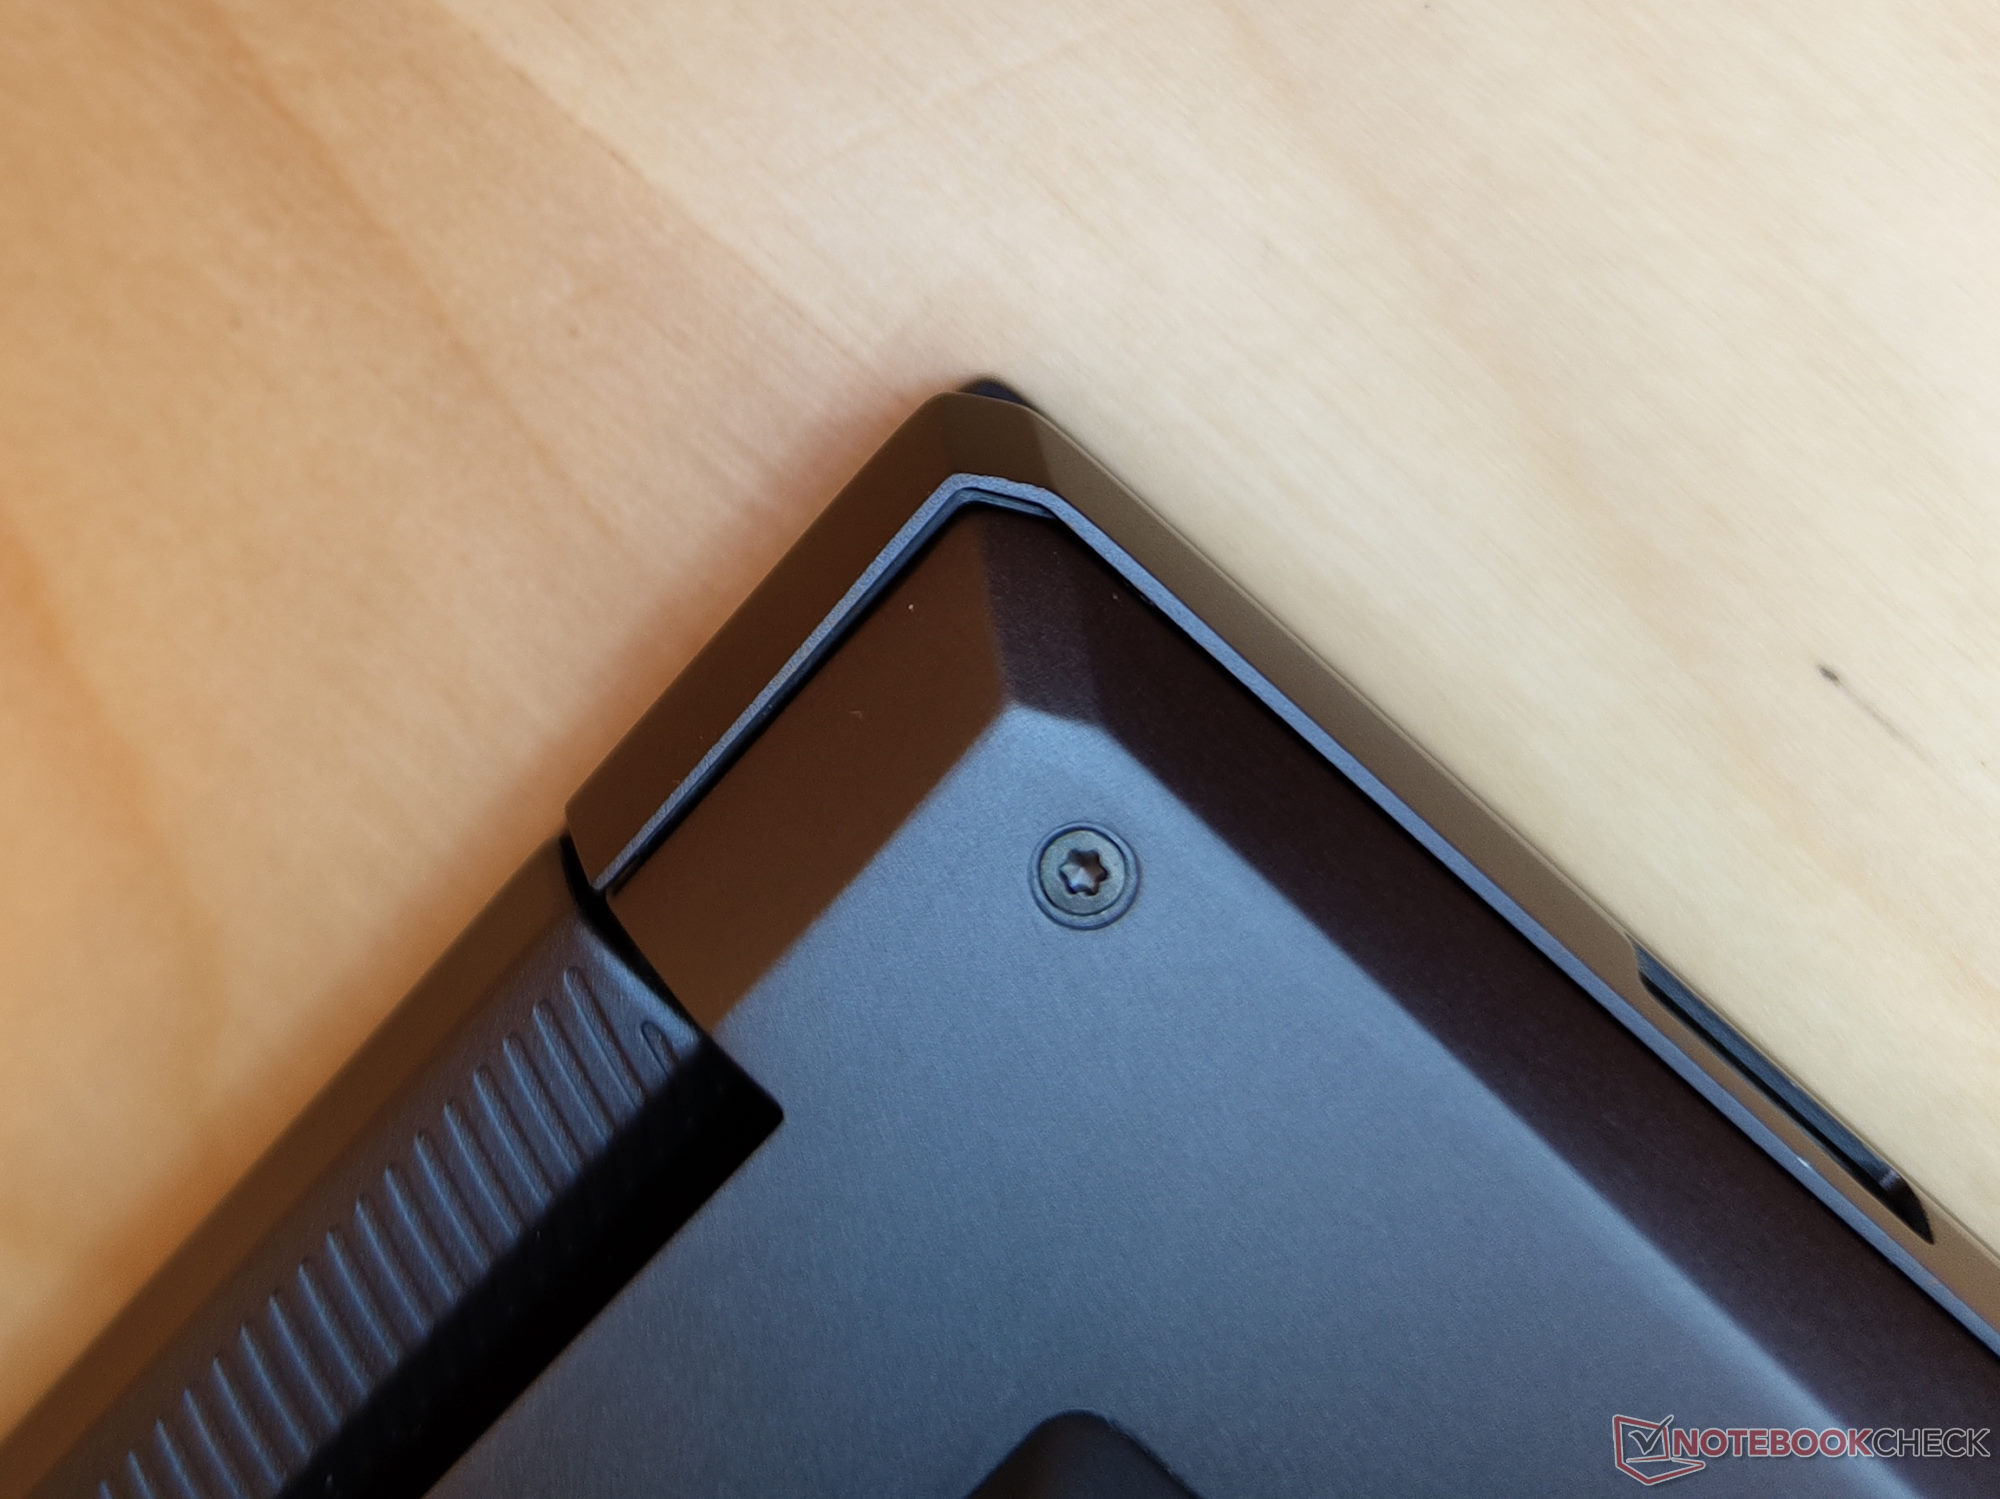
The rigidity of the 16-inch system noticeably benefits from the generous use of metal. We were unable to meaningfully twist the base unit of the laptop from the corners. While the same does not quite hold true for the display, we at least did not notice any creaking. Although the lid can be opened up to a maximum angle of around 130 degrees with one hand, there is no major teetering. Unfortunately, the clearances are not perfectly even in several places. In the bottom left corner of the clickpad, there is a gap that exposes the internals of the case. Similarly, there are multiple spots with uneven clearances on the bottom. Our image gallery shows a few examples of the gaps we found. This begs the question whether the larger gaps are meant to compensate greater thermal expansion or if the manufacturing tolerances are simply too large.
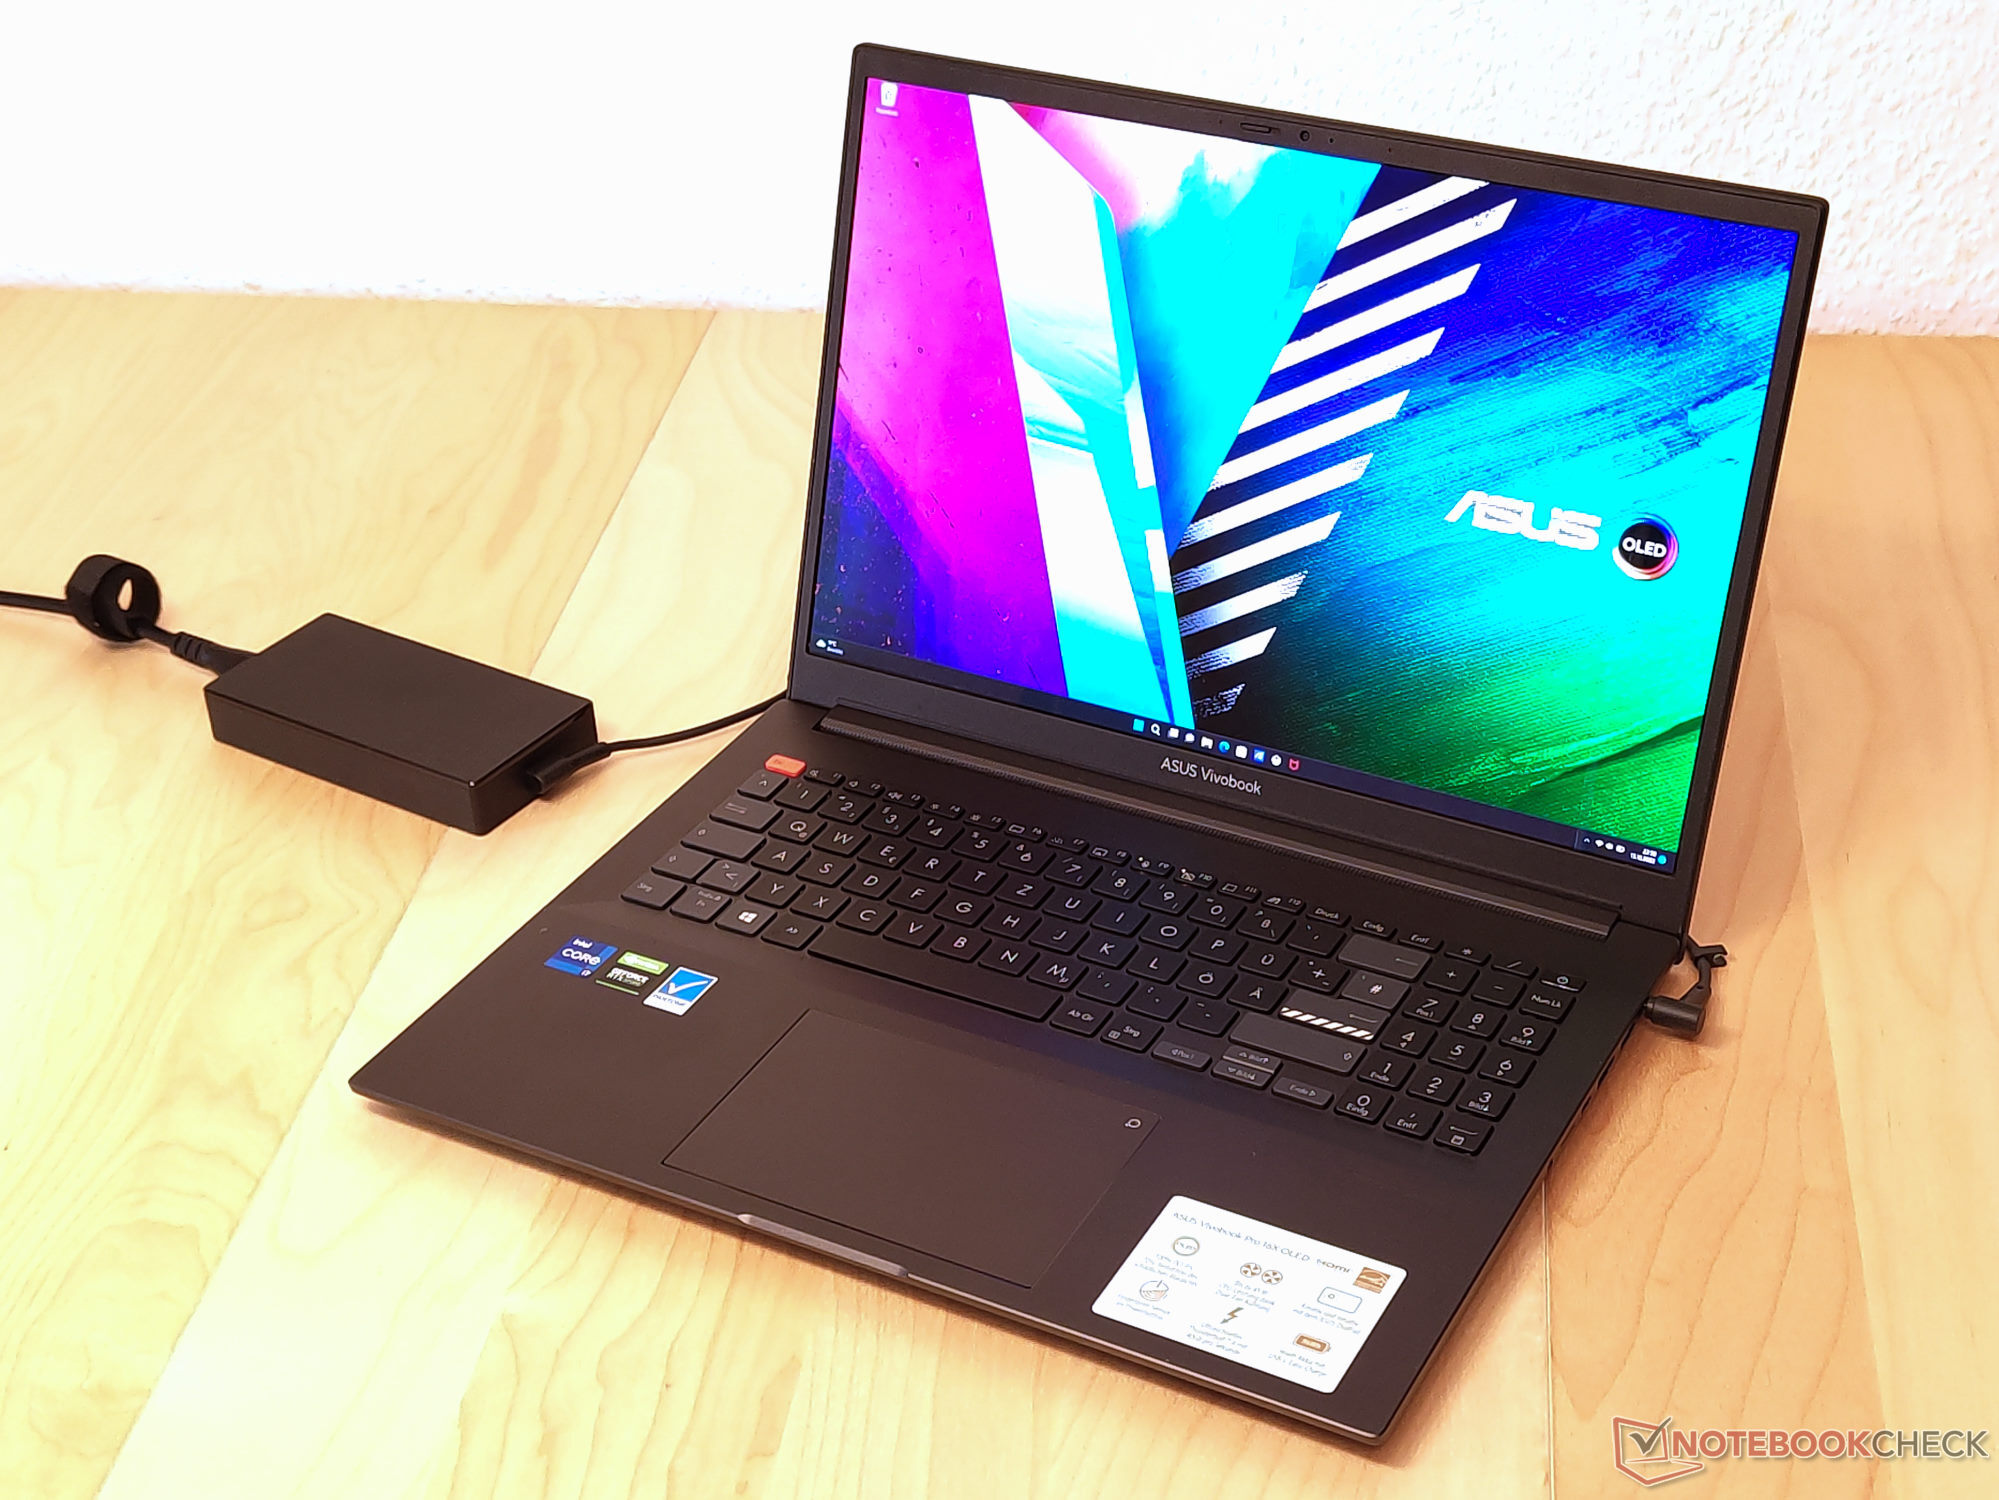
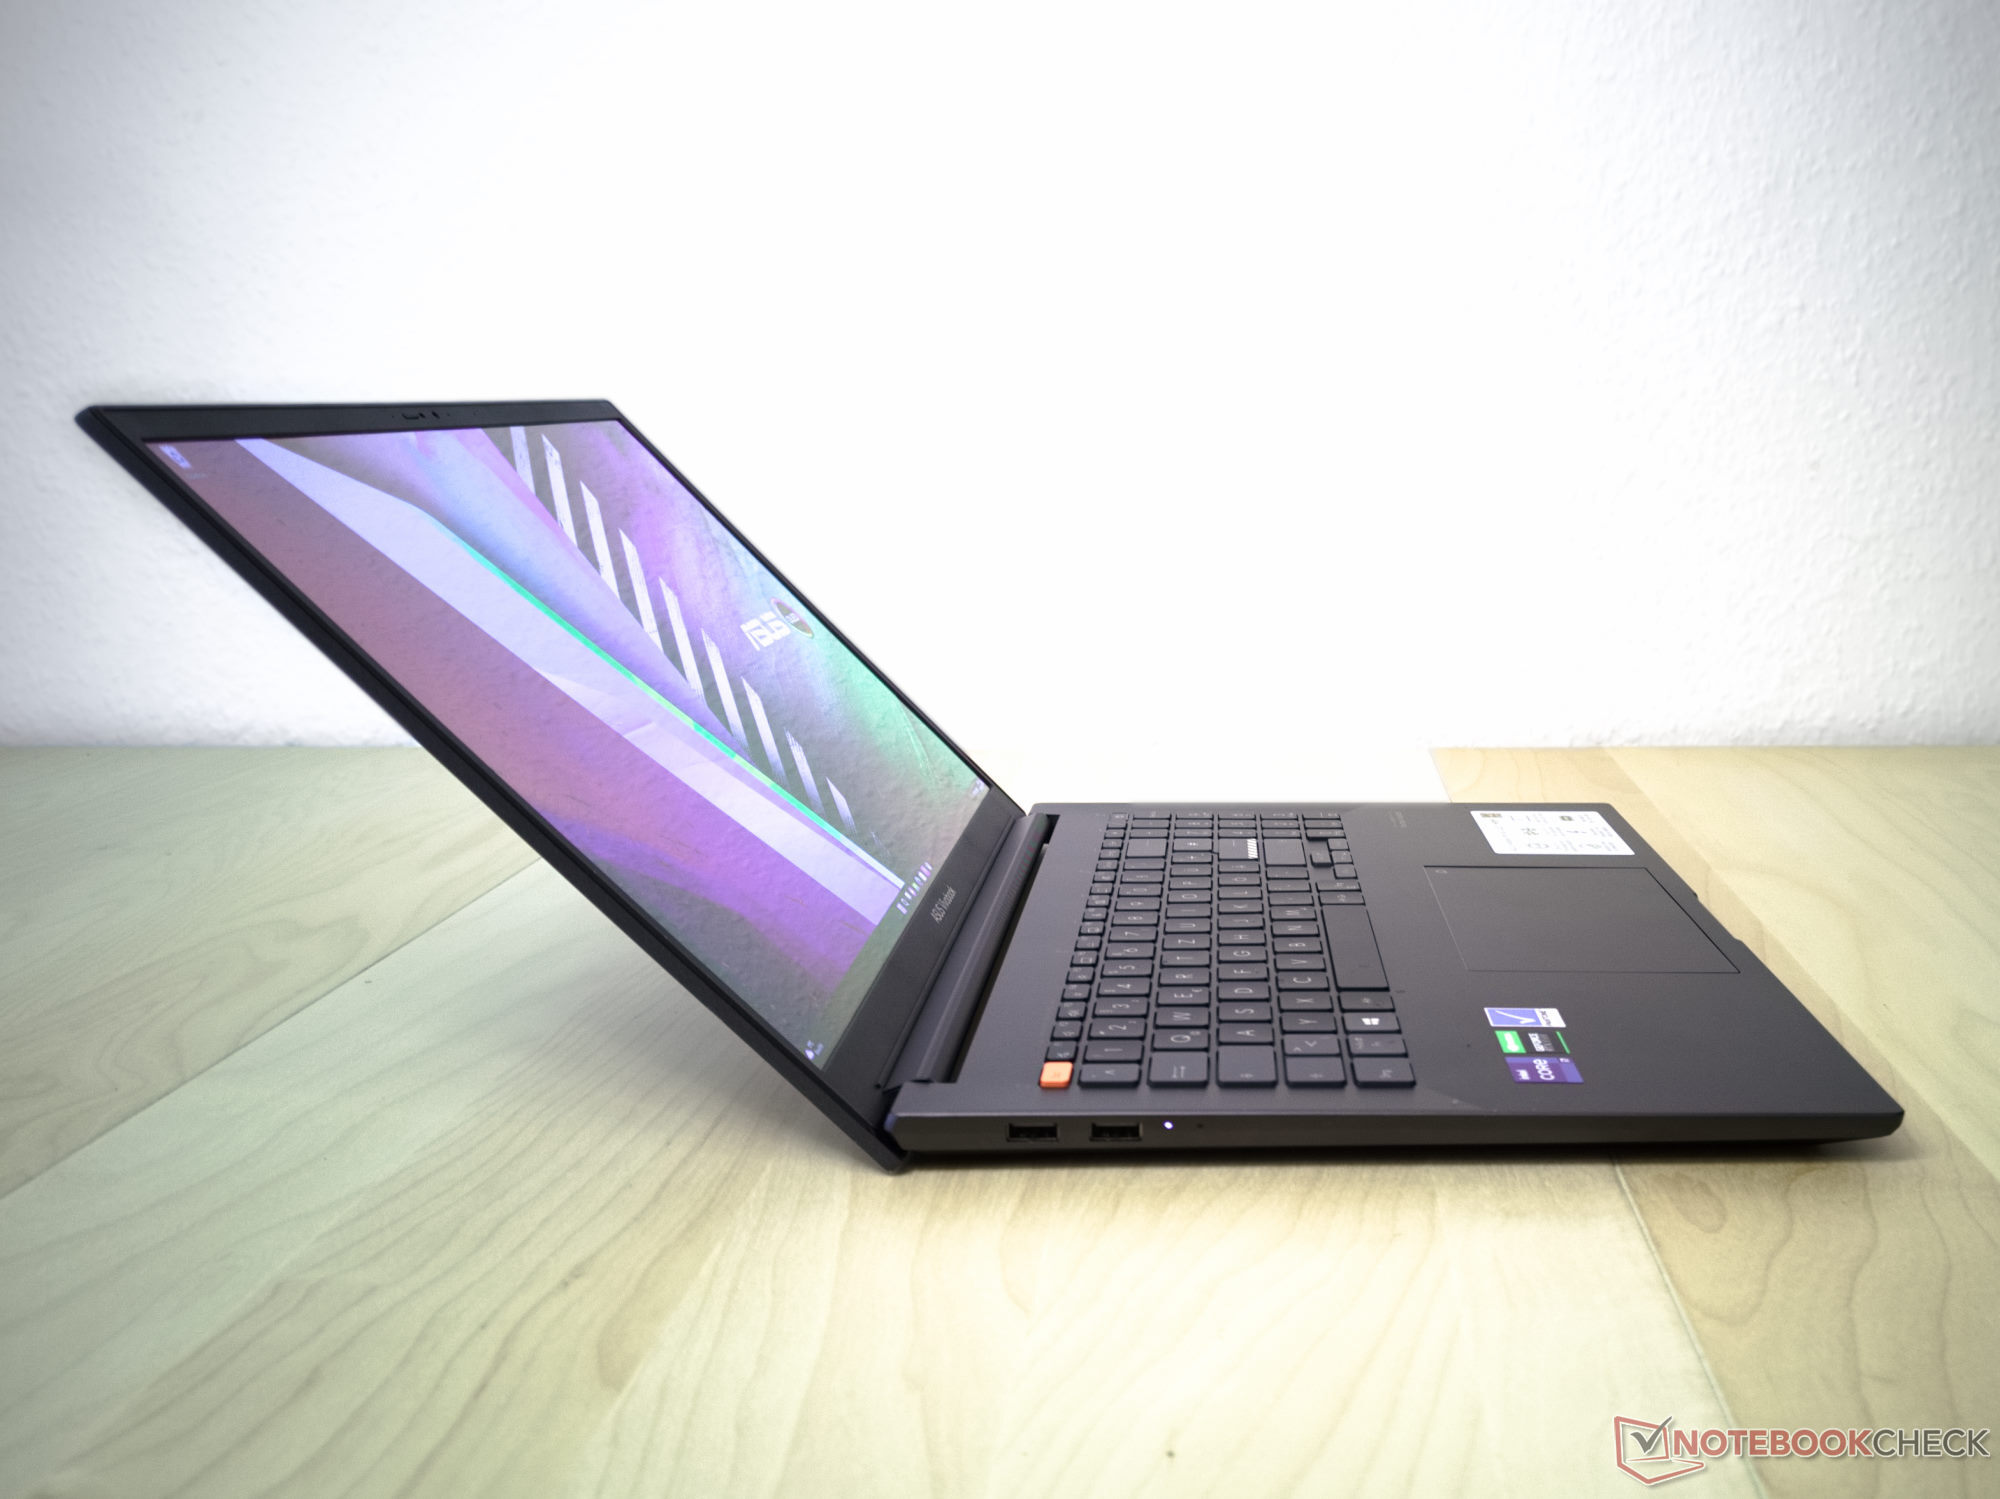
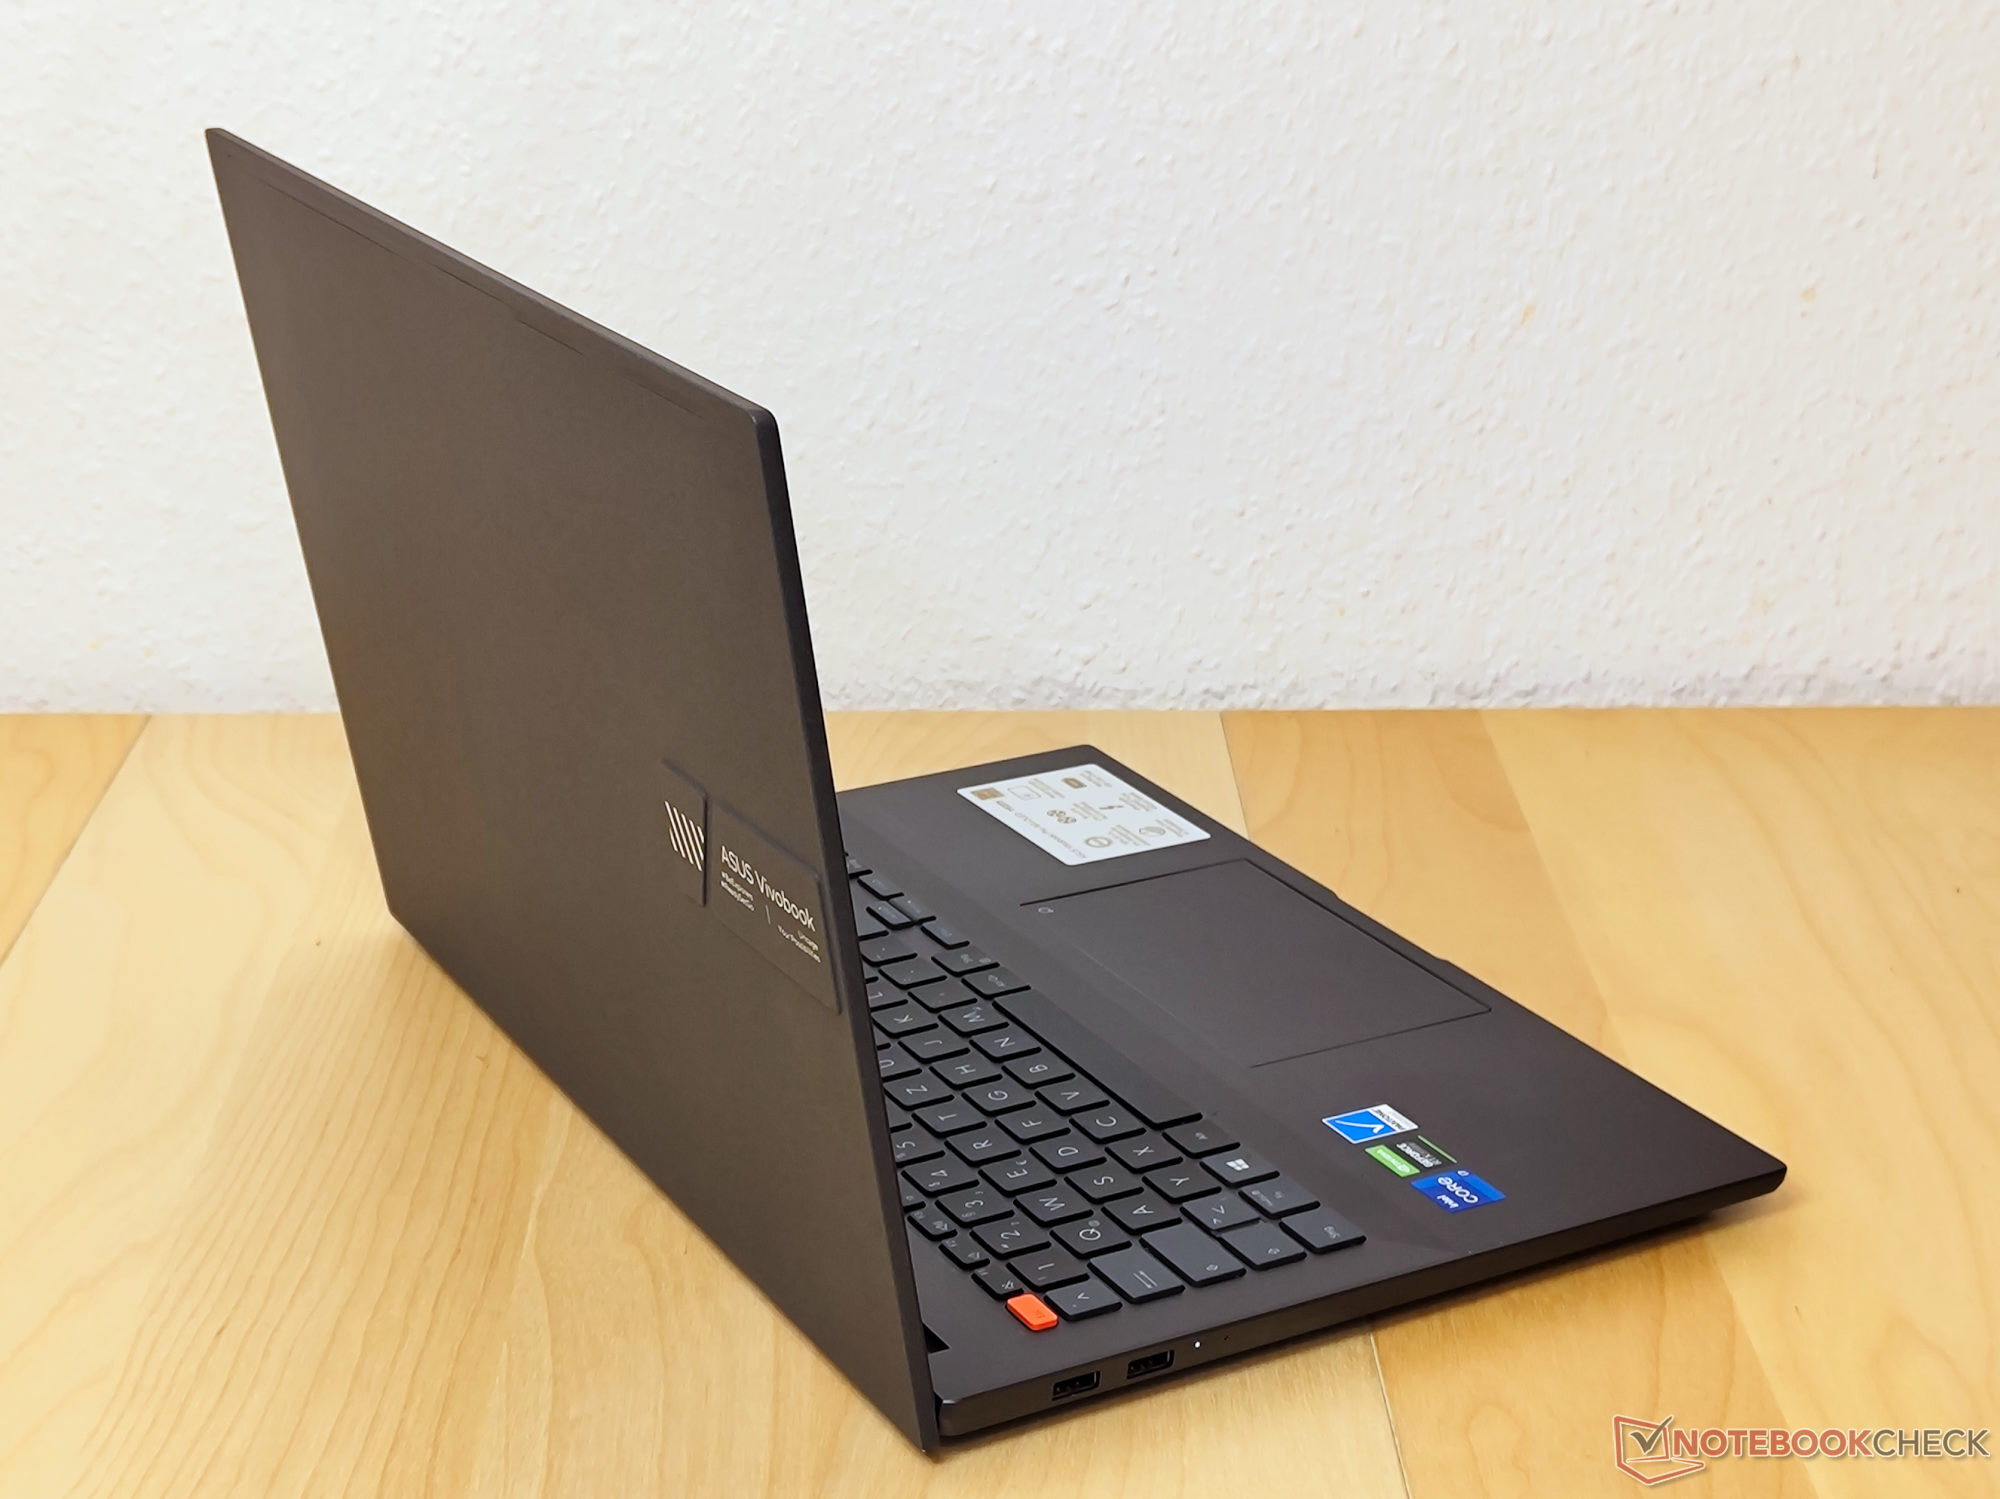
Due to the fairly slim bezels, the Vivobook 16X OLED tends to be slightly smaller than other 16-inch laptops despite being a 16-inch device itself. Additionally, it is fairly thin when taking the dedicated GPU and the powerful CPU into account. By contrast, the weight is fairly high. At 1969 g (~4.34 lb), it can hardly be described as lightweight. Combined with the additional 446 g (~0.98 lb) for the AC adapter and its cable, the Vivobook 16X comes in at 2.4 kg (~5.29 lb) in total.
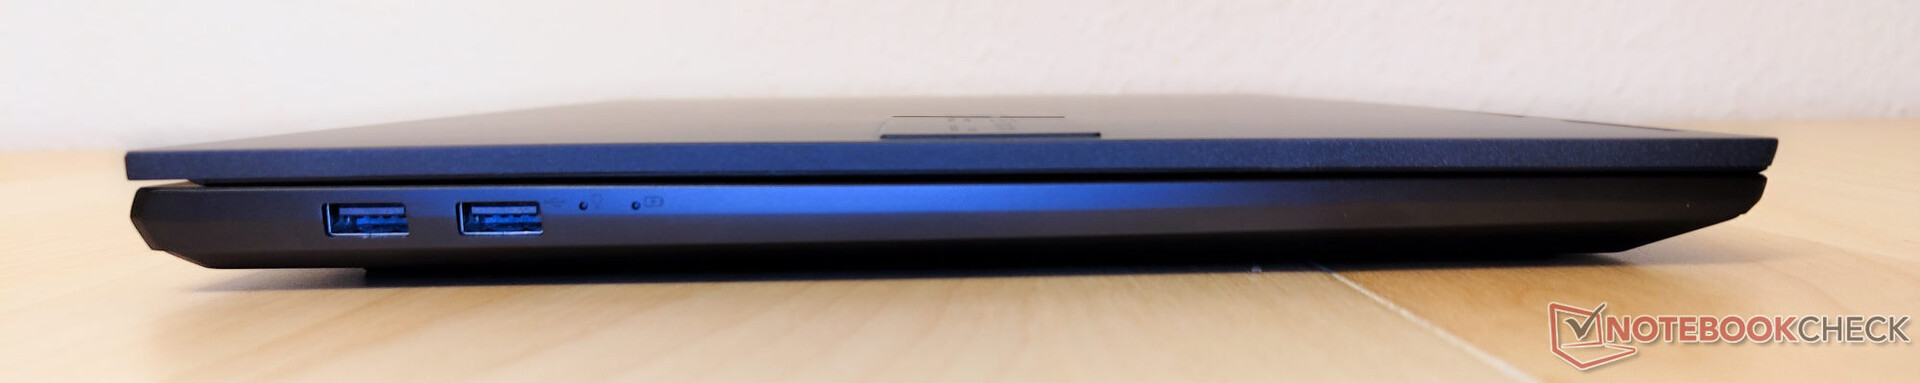
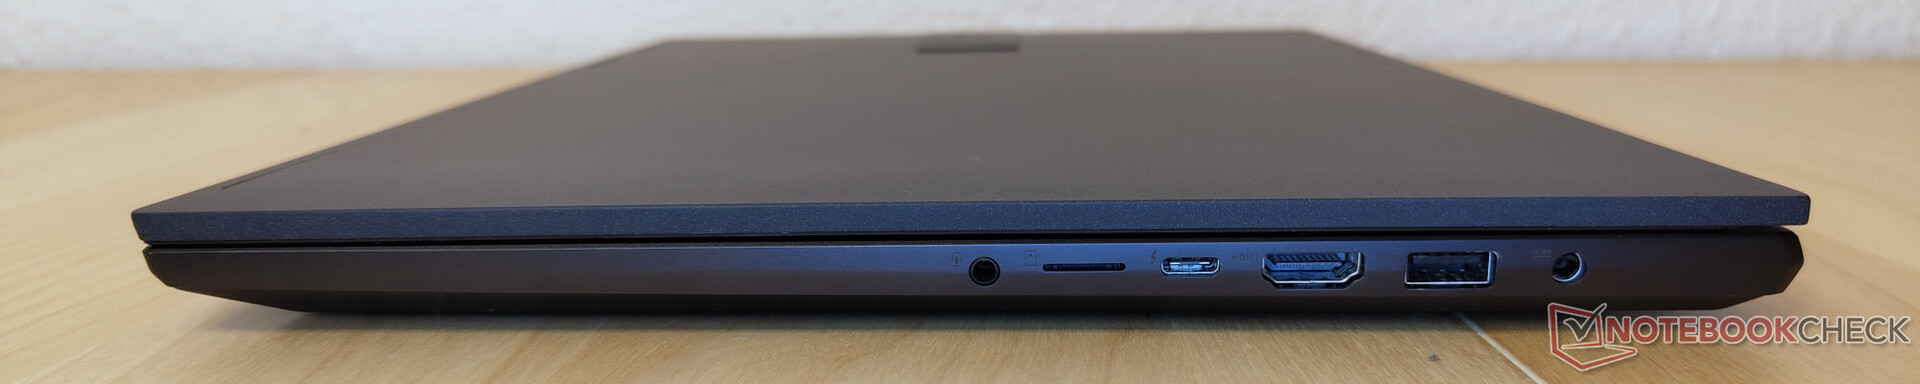
Connectivity - USB-C with Thunderbolt 4 on the Right, USB 2.0 on the Left
Thanks to USB type-C with Thunderbolt 4 and Power Delivery as well as 3x USB type-A and HDMI 2.1, users get a lot of flexibility in terms of accessories. This makes the slow microSD card reader a downright unfortuante choice. For a device aimed at content creators, a fullsize SD card reader with decent transfer speeds could have been a better fit. The two USB type-A ports on the left only support USB 2.0. Most of the usable ports are located on the right. For right-handed users who wish to use an external mouse, this can be a slight inconvenience.
SD Card Reader
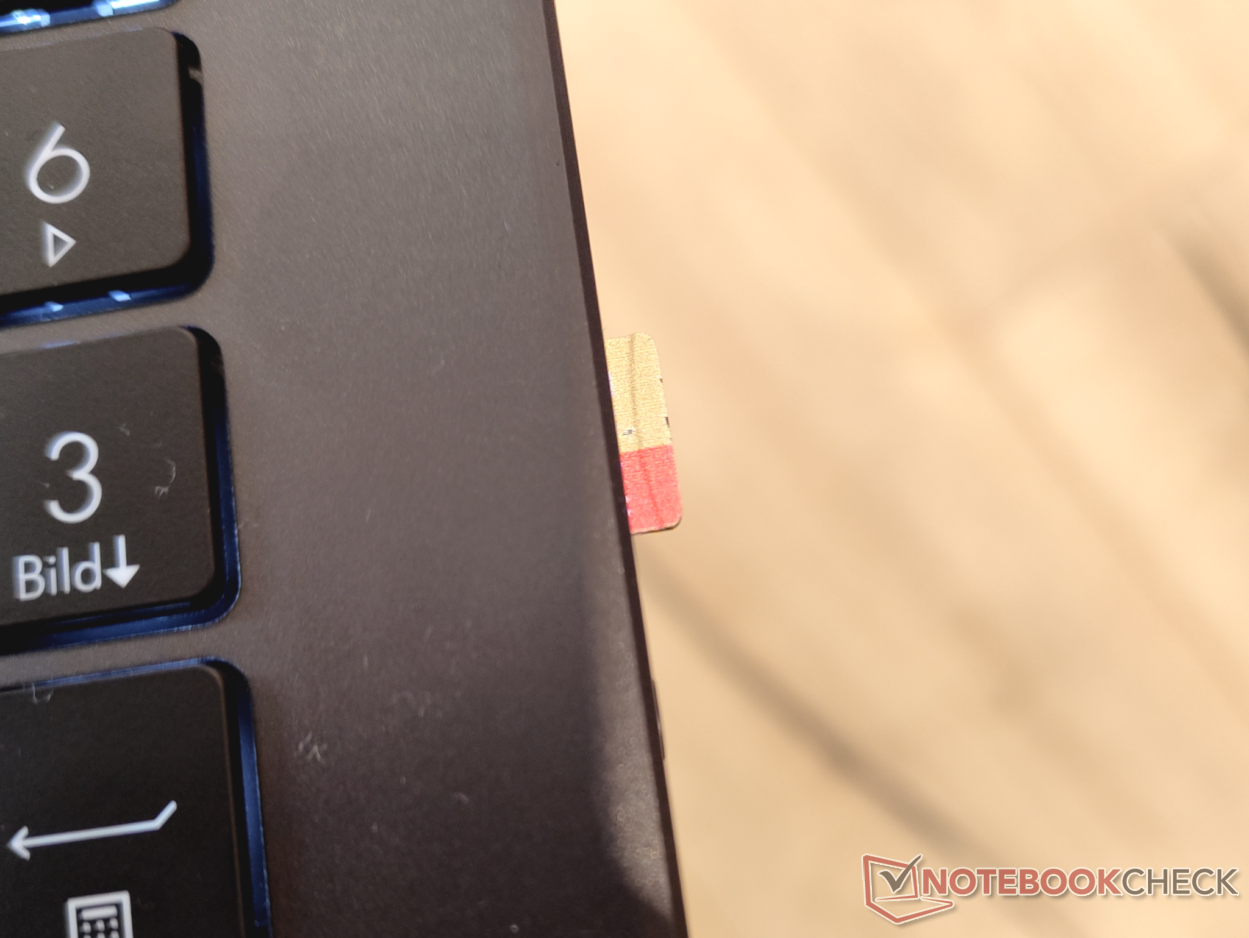
The SD card reader is not one of the Vivobook's strengths. Since it is only connected via USB 2.0, it cannot reach good speeds even with our reference AV PRO microSD 128 GB V60 card. The fact that not even microSD cards can be inserted fully, is also somewhat disappointing.
| SD Card Reader | |
| average JPG Copy Test (av. of 3 runs) | |
| MSI Summit E16 Flip A12UDT-031 (AV Pro SD microSD 128 GB V60) | |
| Lenovo ThinkPad X1 Extreme G4-20Y5CTO1WW (3050 Ti) (AV Pro V60) | |
| Average of class Multimedia (23 - 531, n=41, last 2 years) | |
| Schenker XMG Focus 15 (AV PRO microSD 128 GB V60) | |
| Asus VivoBook Pro 16X OLED N7600PC-L2026X | |
| Dell Inspiron 16 Plus 7610 (AV PRO microSD 128 GB V60) | |
| maximum AS SSD Seq Read Test (1GB) | |
| Average of class Multimedia (37.3 - 1455, n=40, last 2 years) | |
| Lenovo ThinkPad X1 Extreme G4-20Y5CTO1WW (3050 Ti) (AV Pro V60) | |
| MSI Summit E16 Flip A12UDT-031 (AV Pro SD microSD 128 GB V60) | |
| Schenker XMG Focus 15 (AV PRO microSD 128 GB V60) | |
| Asus VivoBook Pro 16X OLED N7600PC-L2026X | |
| Dell Inspiron 16 Plus 7610 (AV PRO microSD 128 GB V60) | |
Communication
A metal chassis often complicates the placement of the Wi-Fi antennas for the manufacturer. This also appears to be the case on the Asus Vivobook 16X, since around 700 Mb/s for up- and downloads are below what we expect from Wi-Fi 6 and also subpar in our comparison.
Webcam
Asus uses a 0.9-MP webcam, which is a common choice for consumer laptops. Unfortunately, its quality is similarly poor as a result. As the Lenovo Thinkbook 14 G4 and 15 G4 have shown recently, there is room for improvements.


")
")
Security
A fingerprint sensor is integrated into the power button. Other security features are limited to the Intel Core i7's TPM 2.0 and other software solutions.
Accessories
The package of the Vivobook 16X OLED only includes the essentials. The AC adapter, paperwork, and laptop are packaged with small amounts of plastic.
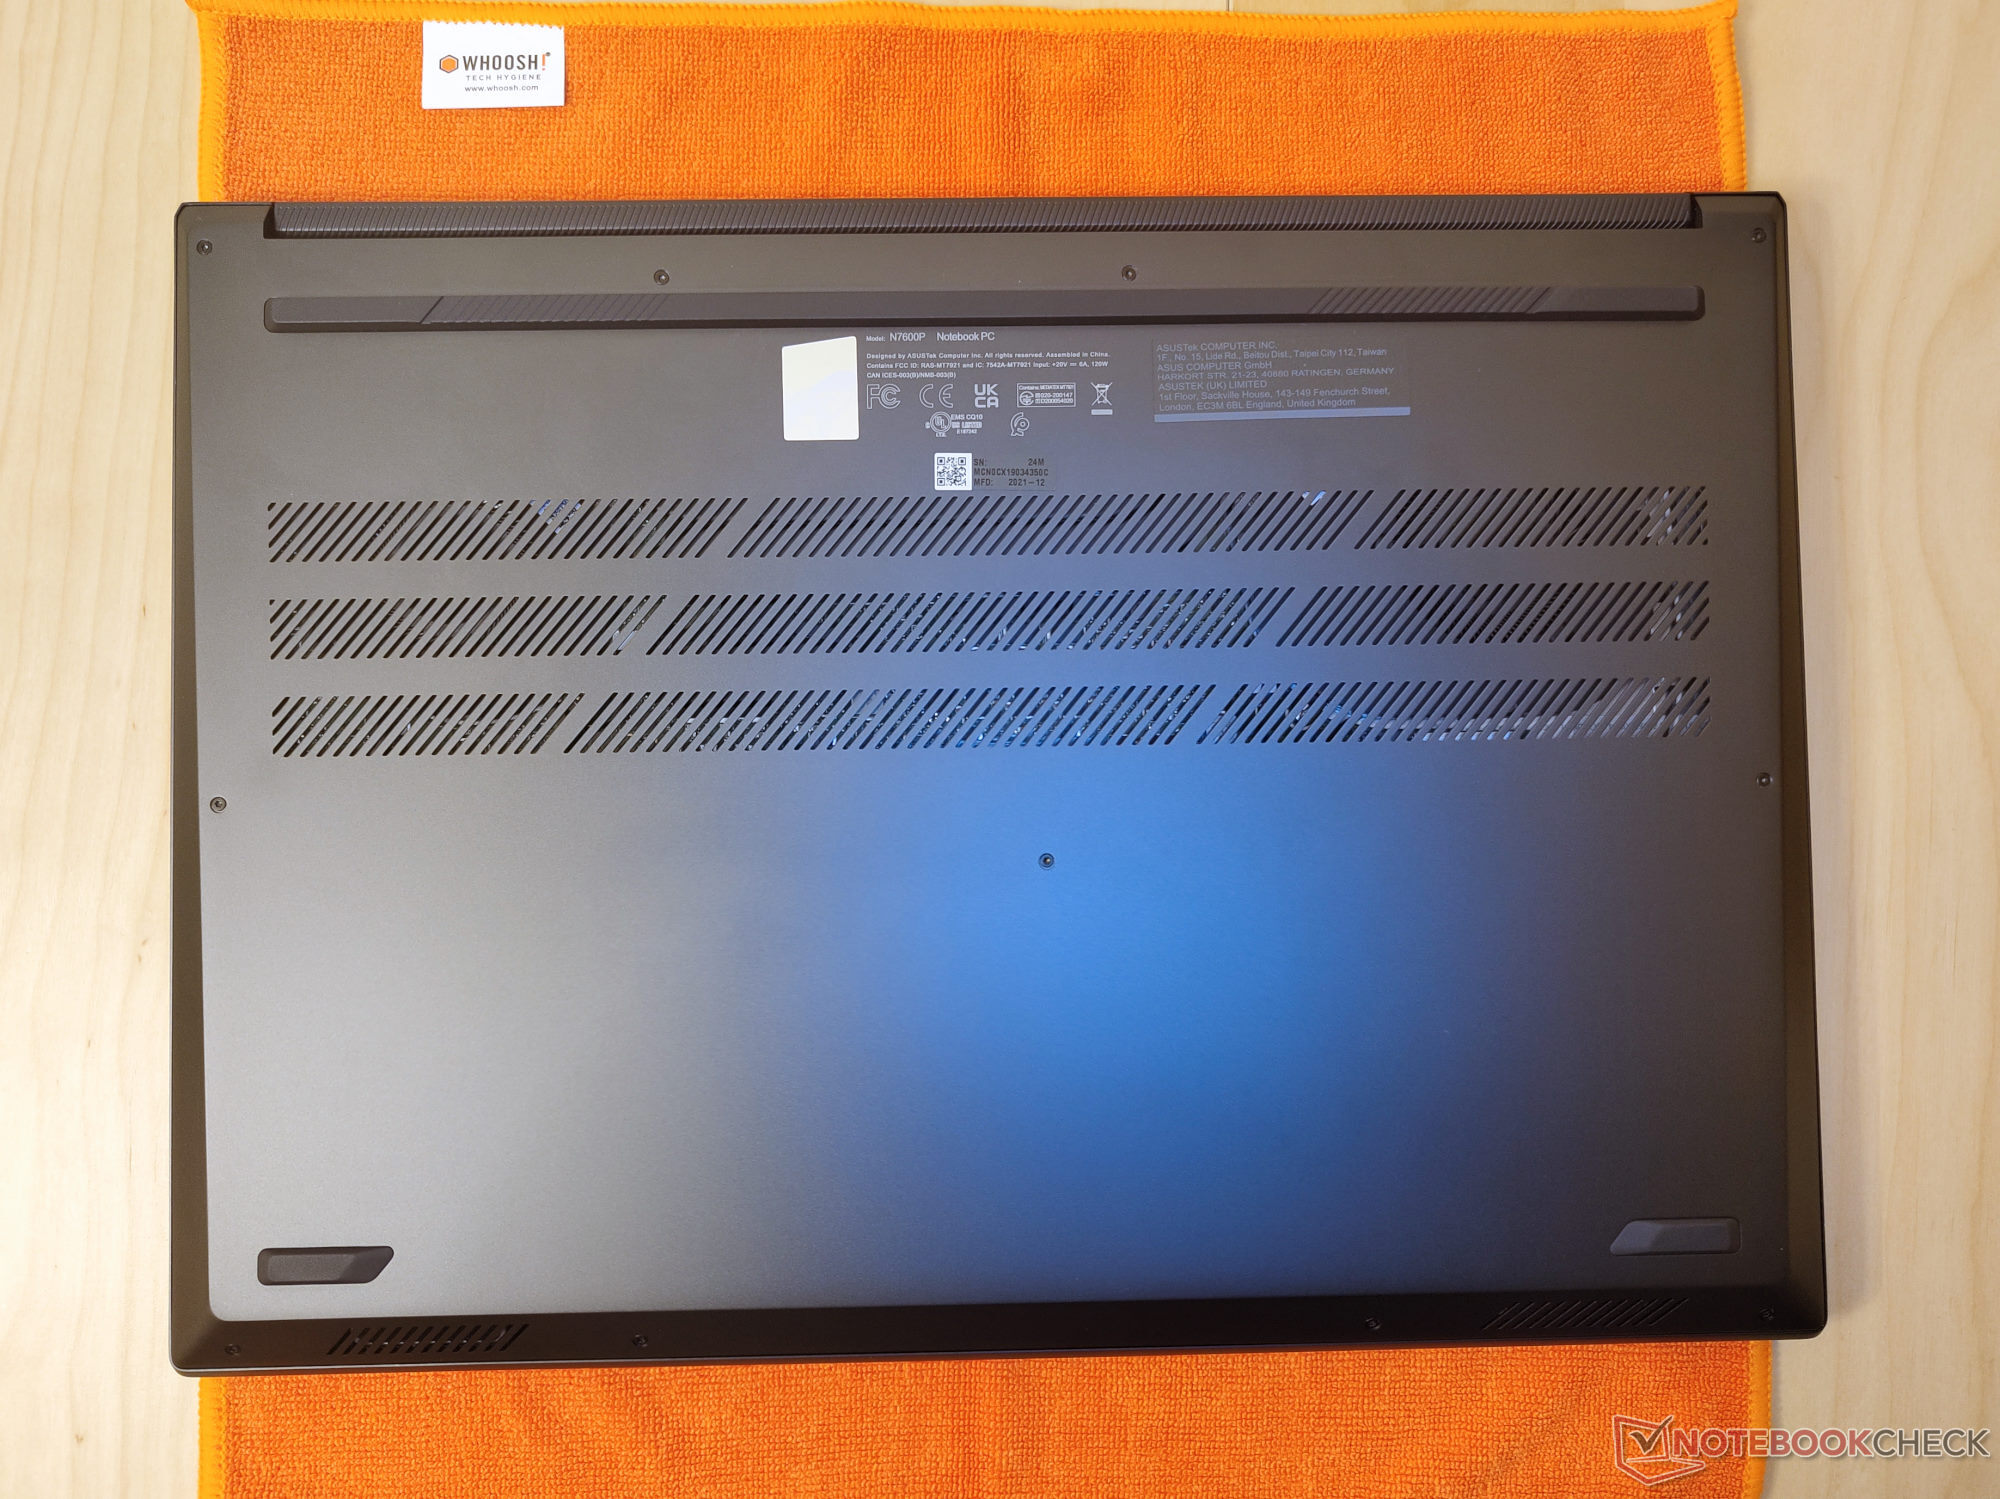
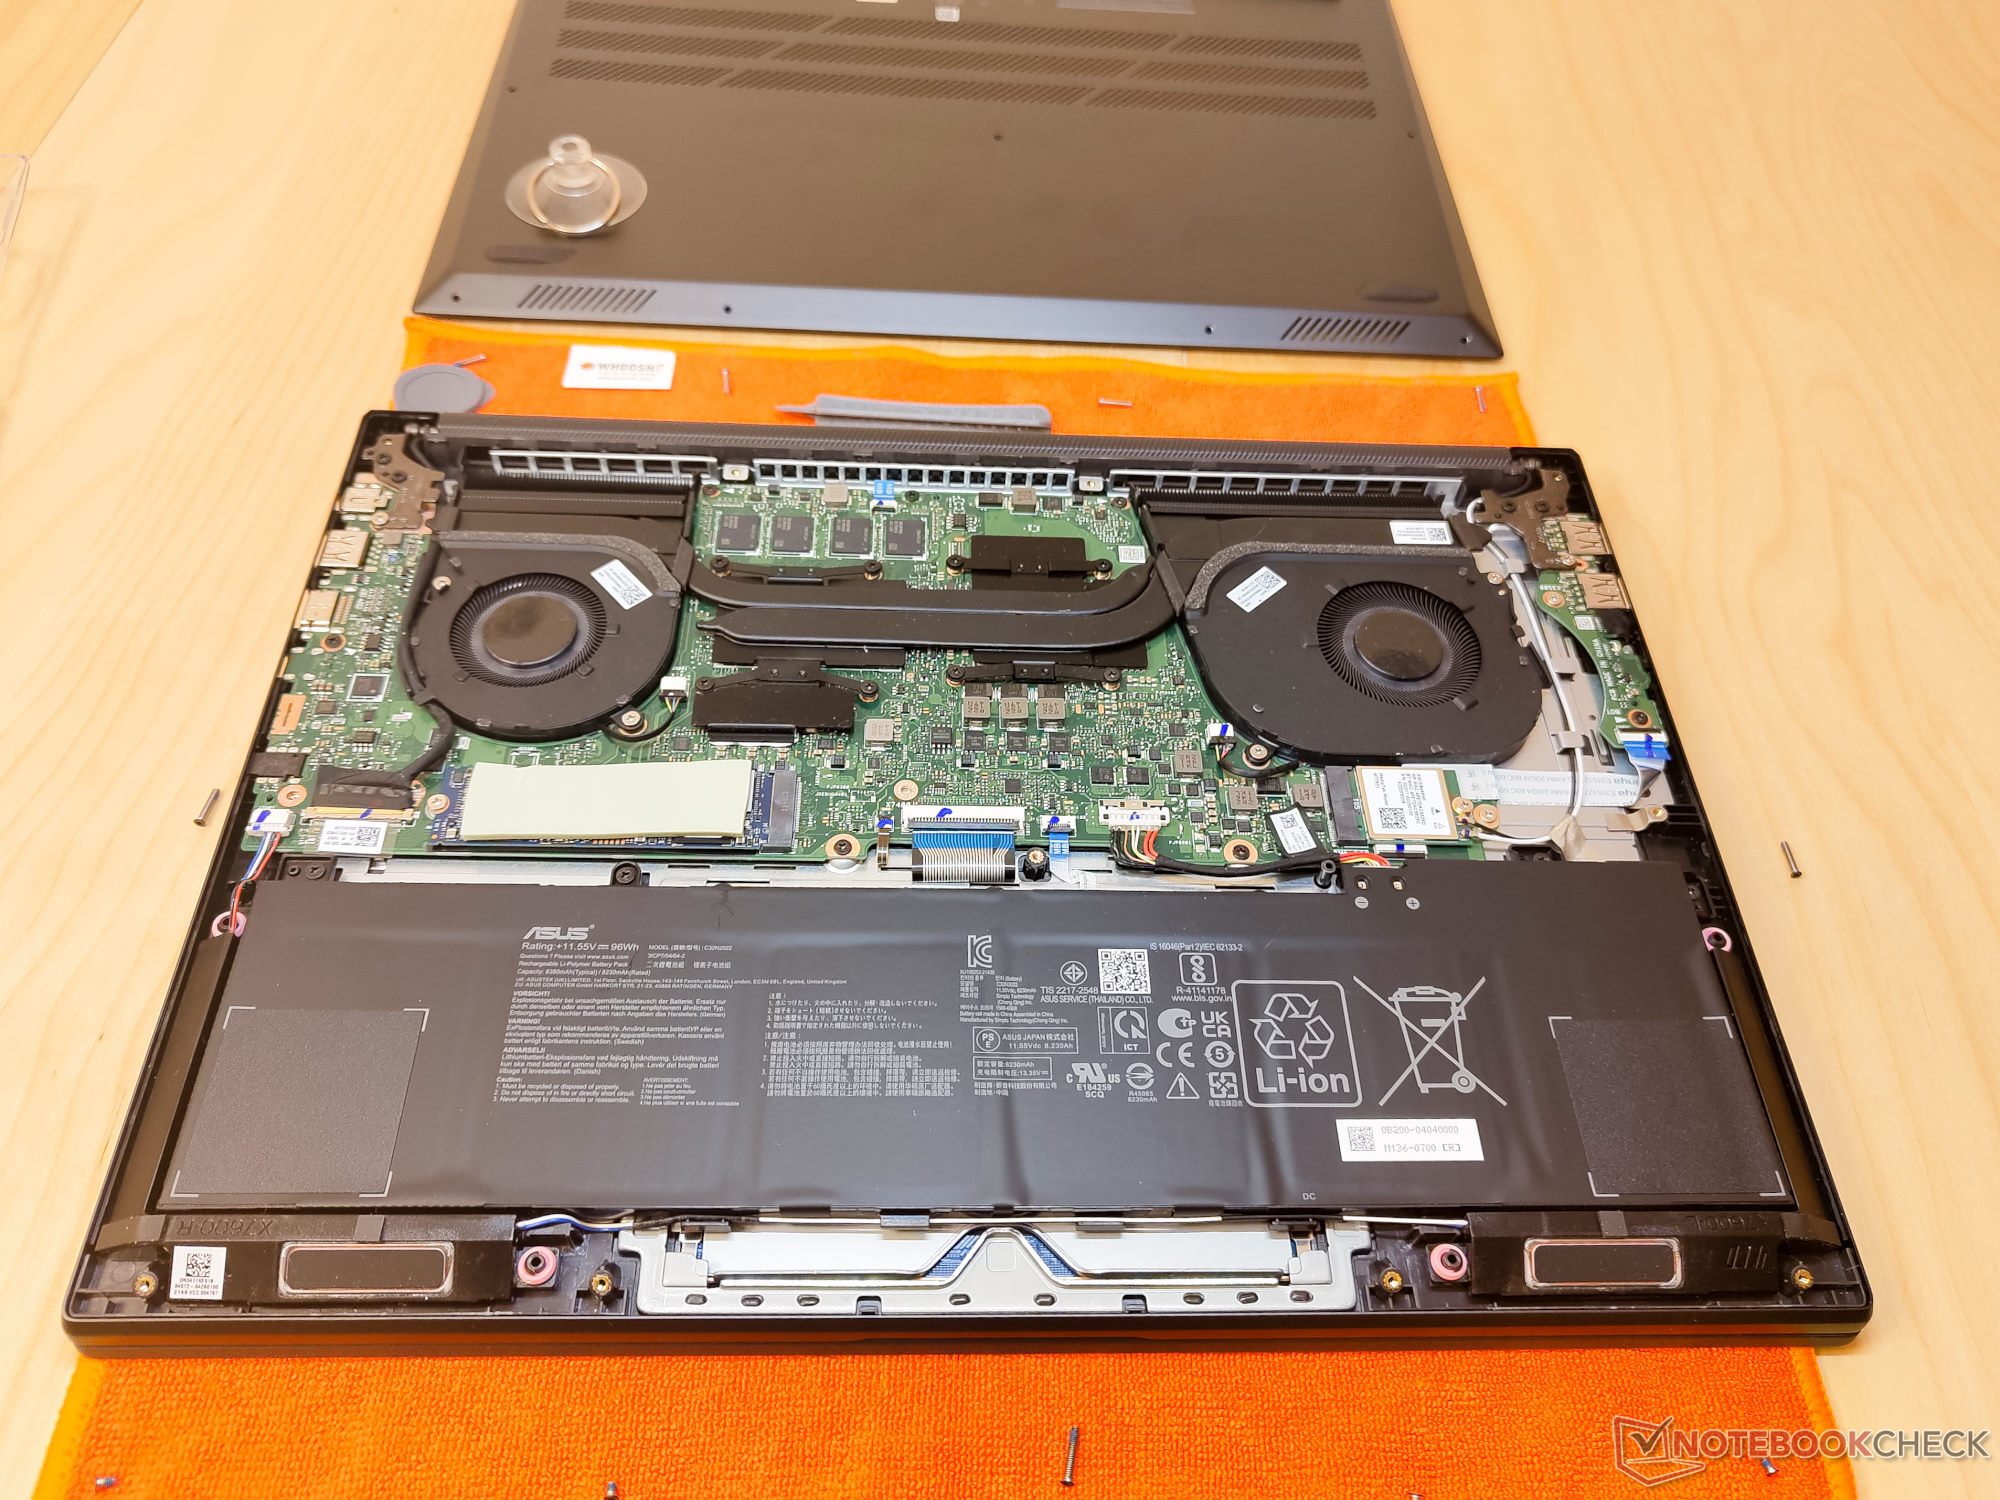
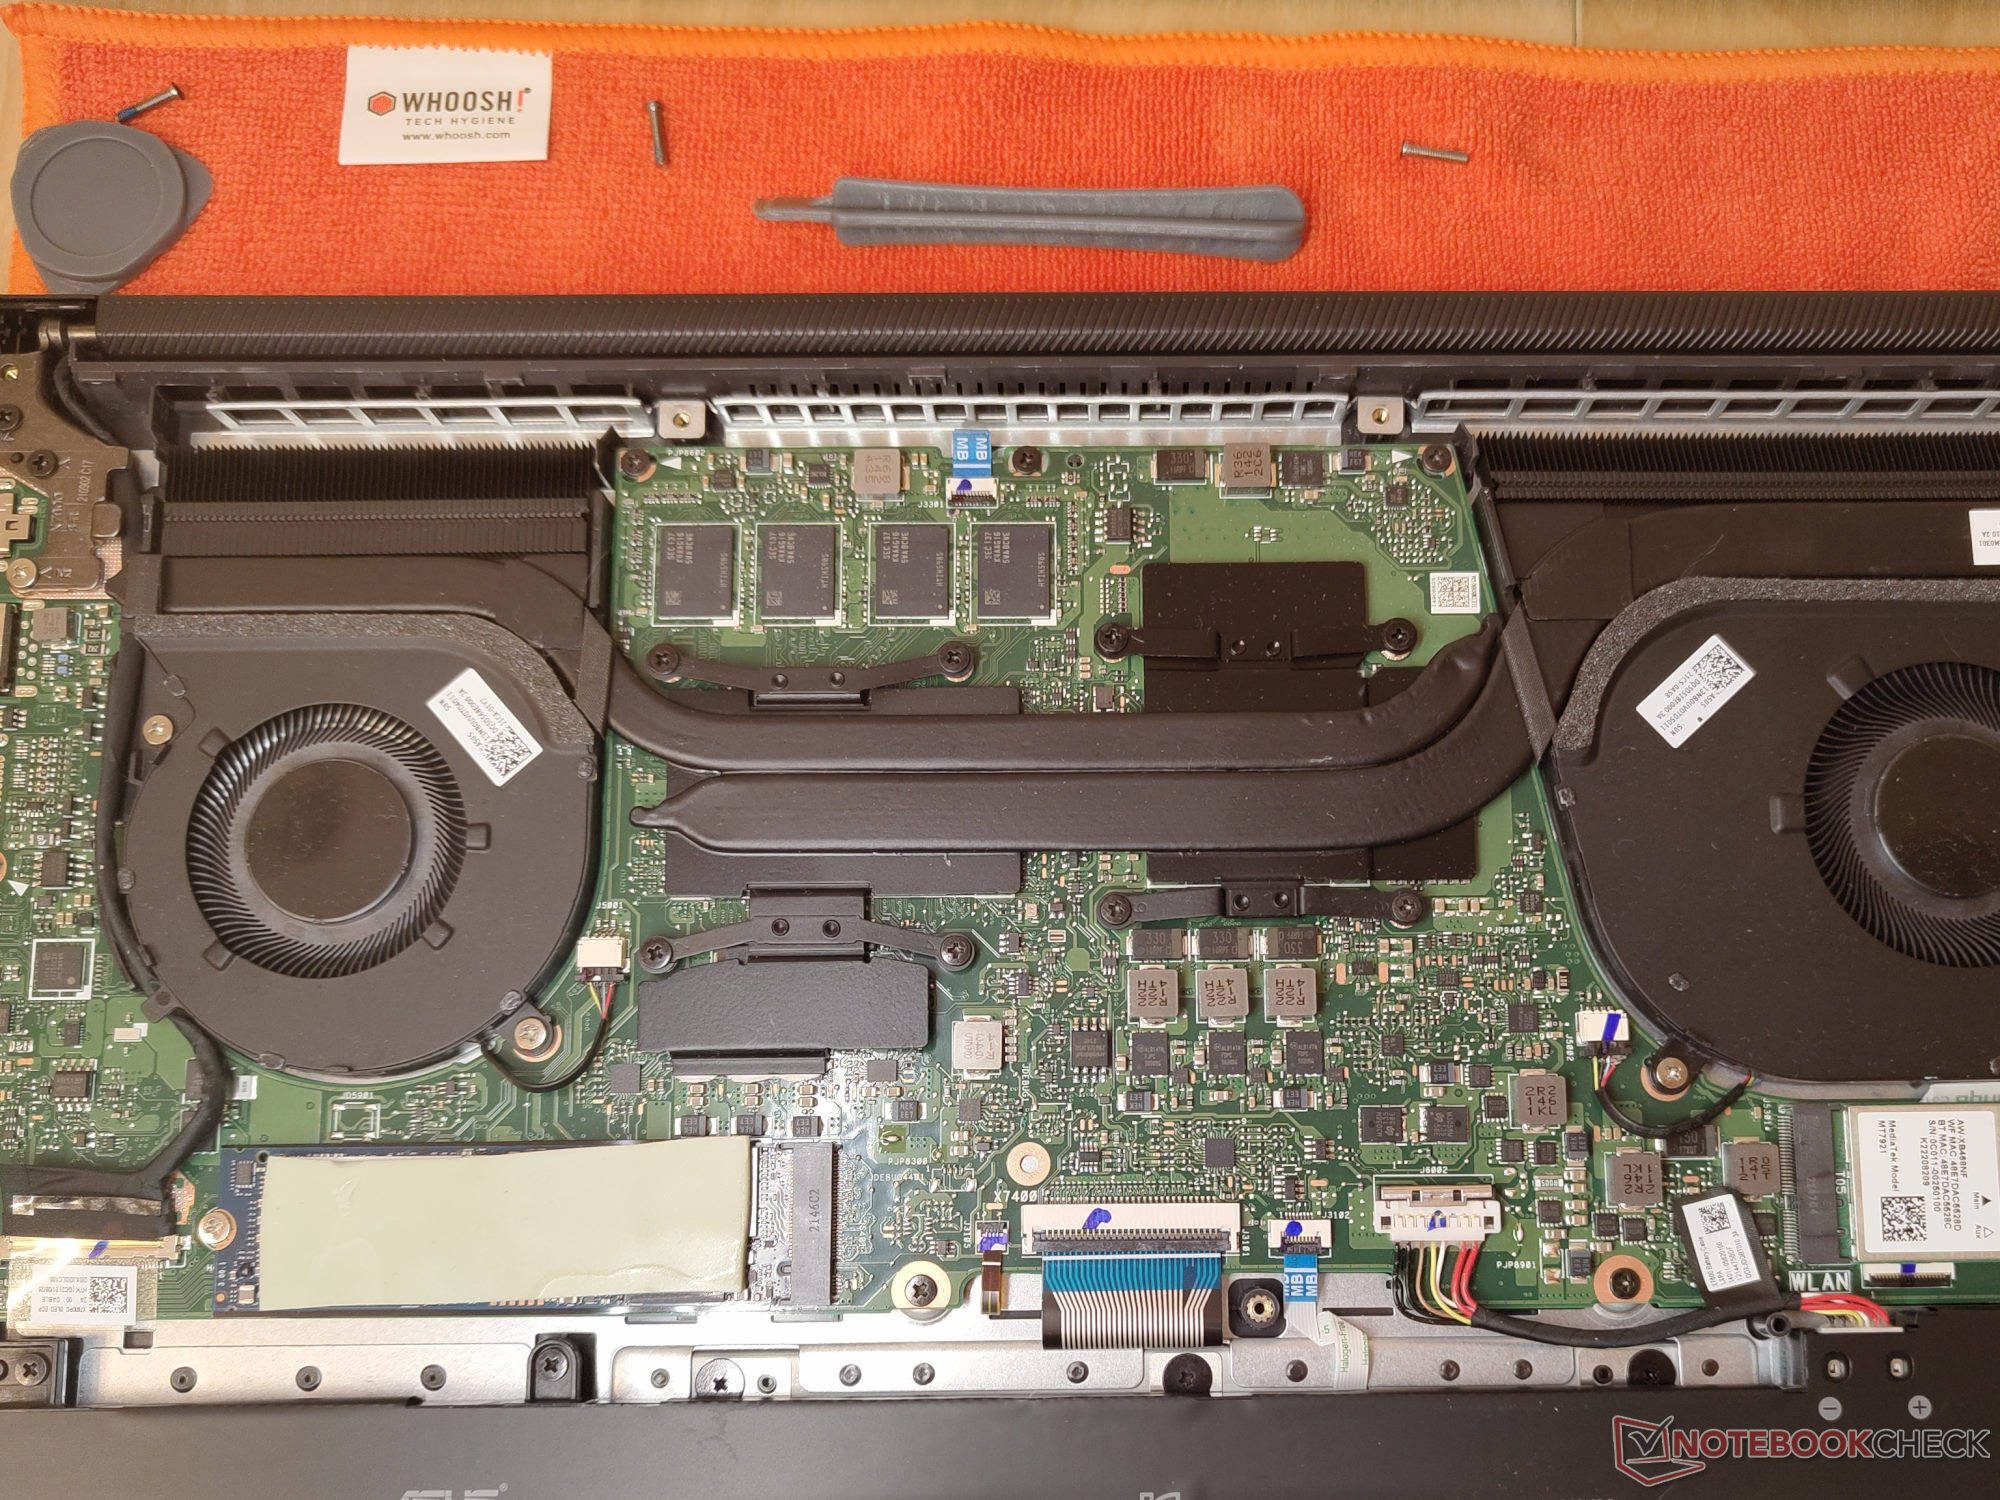
Maintenance
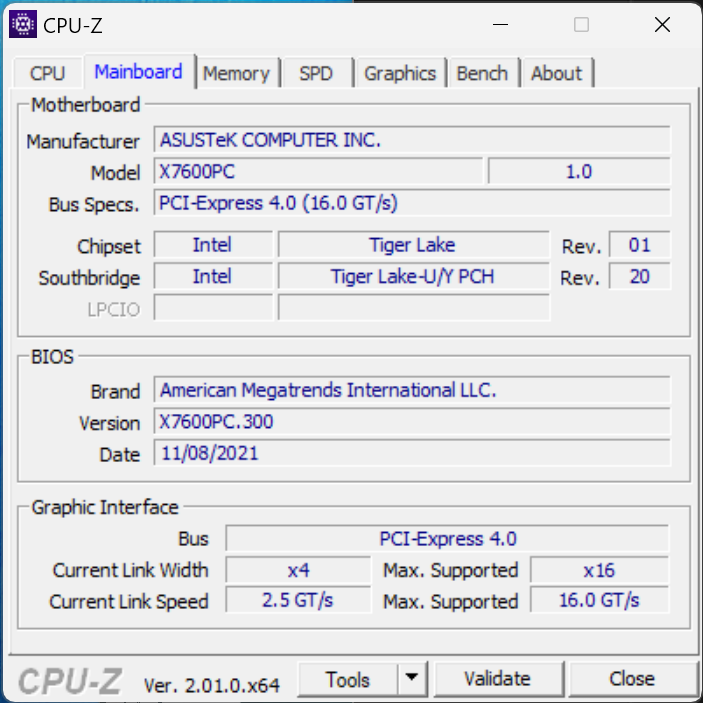
The base unit is secured by 11 TX5 screws. After loosening them, the bottom still cannot be removed easily. Here, we recommend a suction cup and a plastic spudger to carefully dislodge the cover. 16 GB of RAM is soldered to the mainboard and thus cannot be upgraded. Easy upgrades are instead limited to the Wi-Fi module and the M.2 SSD. There are no other upgradeable parts on the Vivobook.
Warranty
The Vivobook Pro 16X comes with a standard one-year limited warranty when purchased in the US.
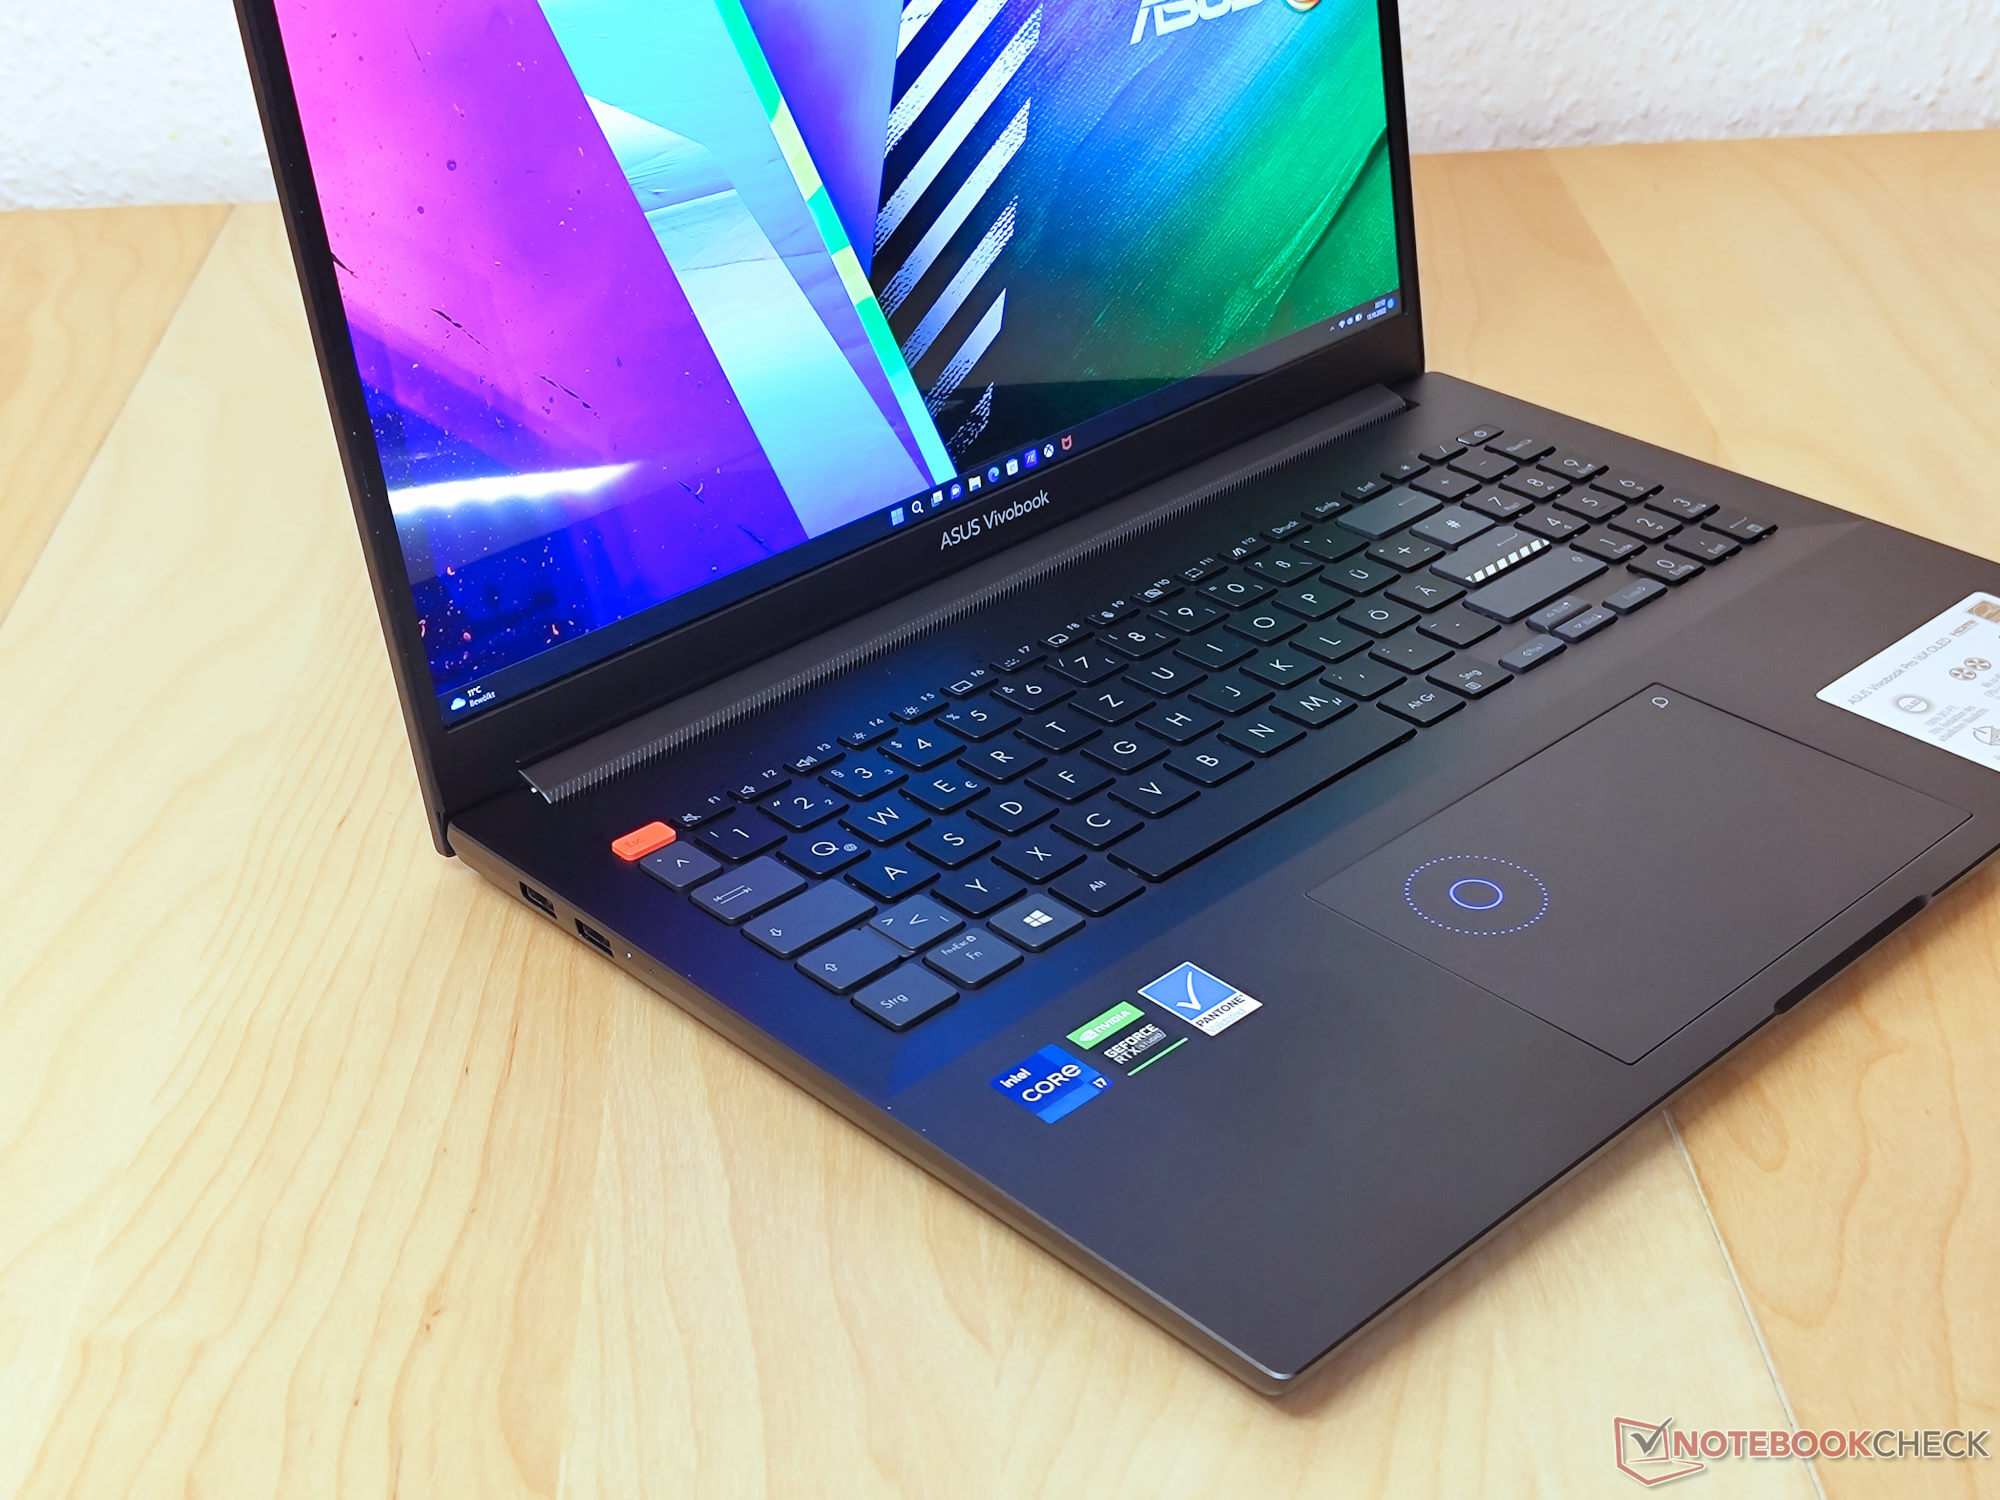
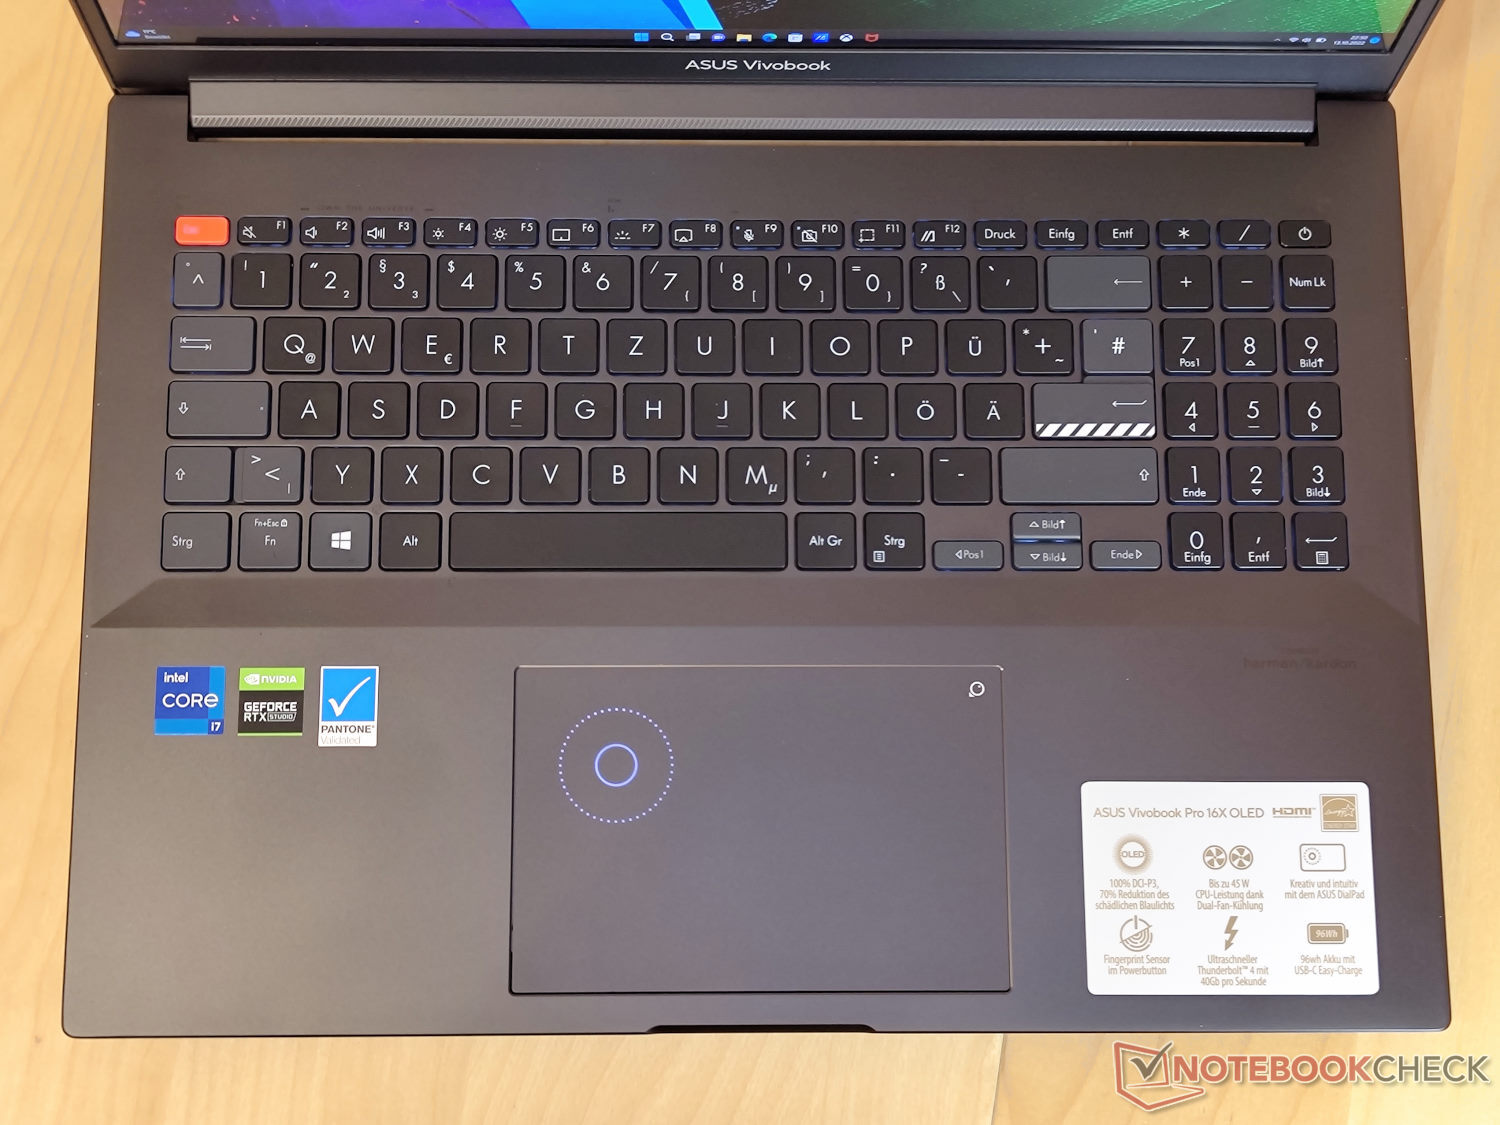
Input Devices - Asus Dail and a Fullsize Keyboard
Keyboard
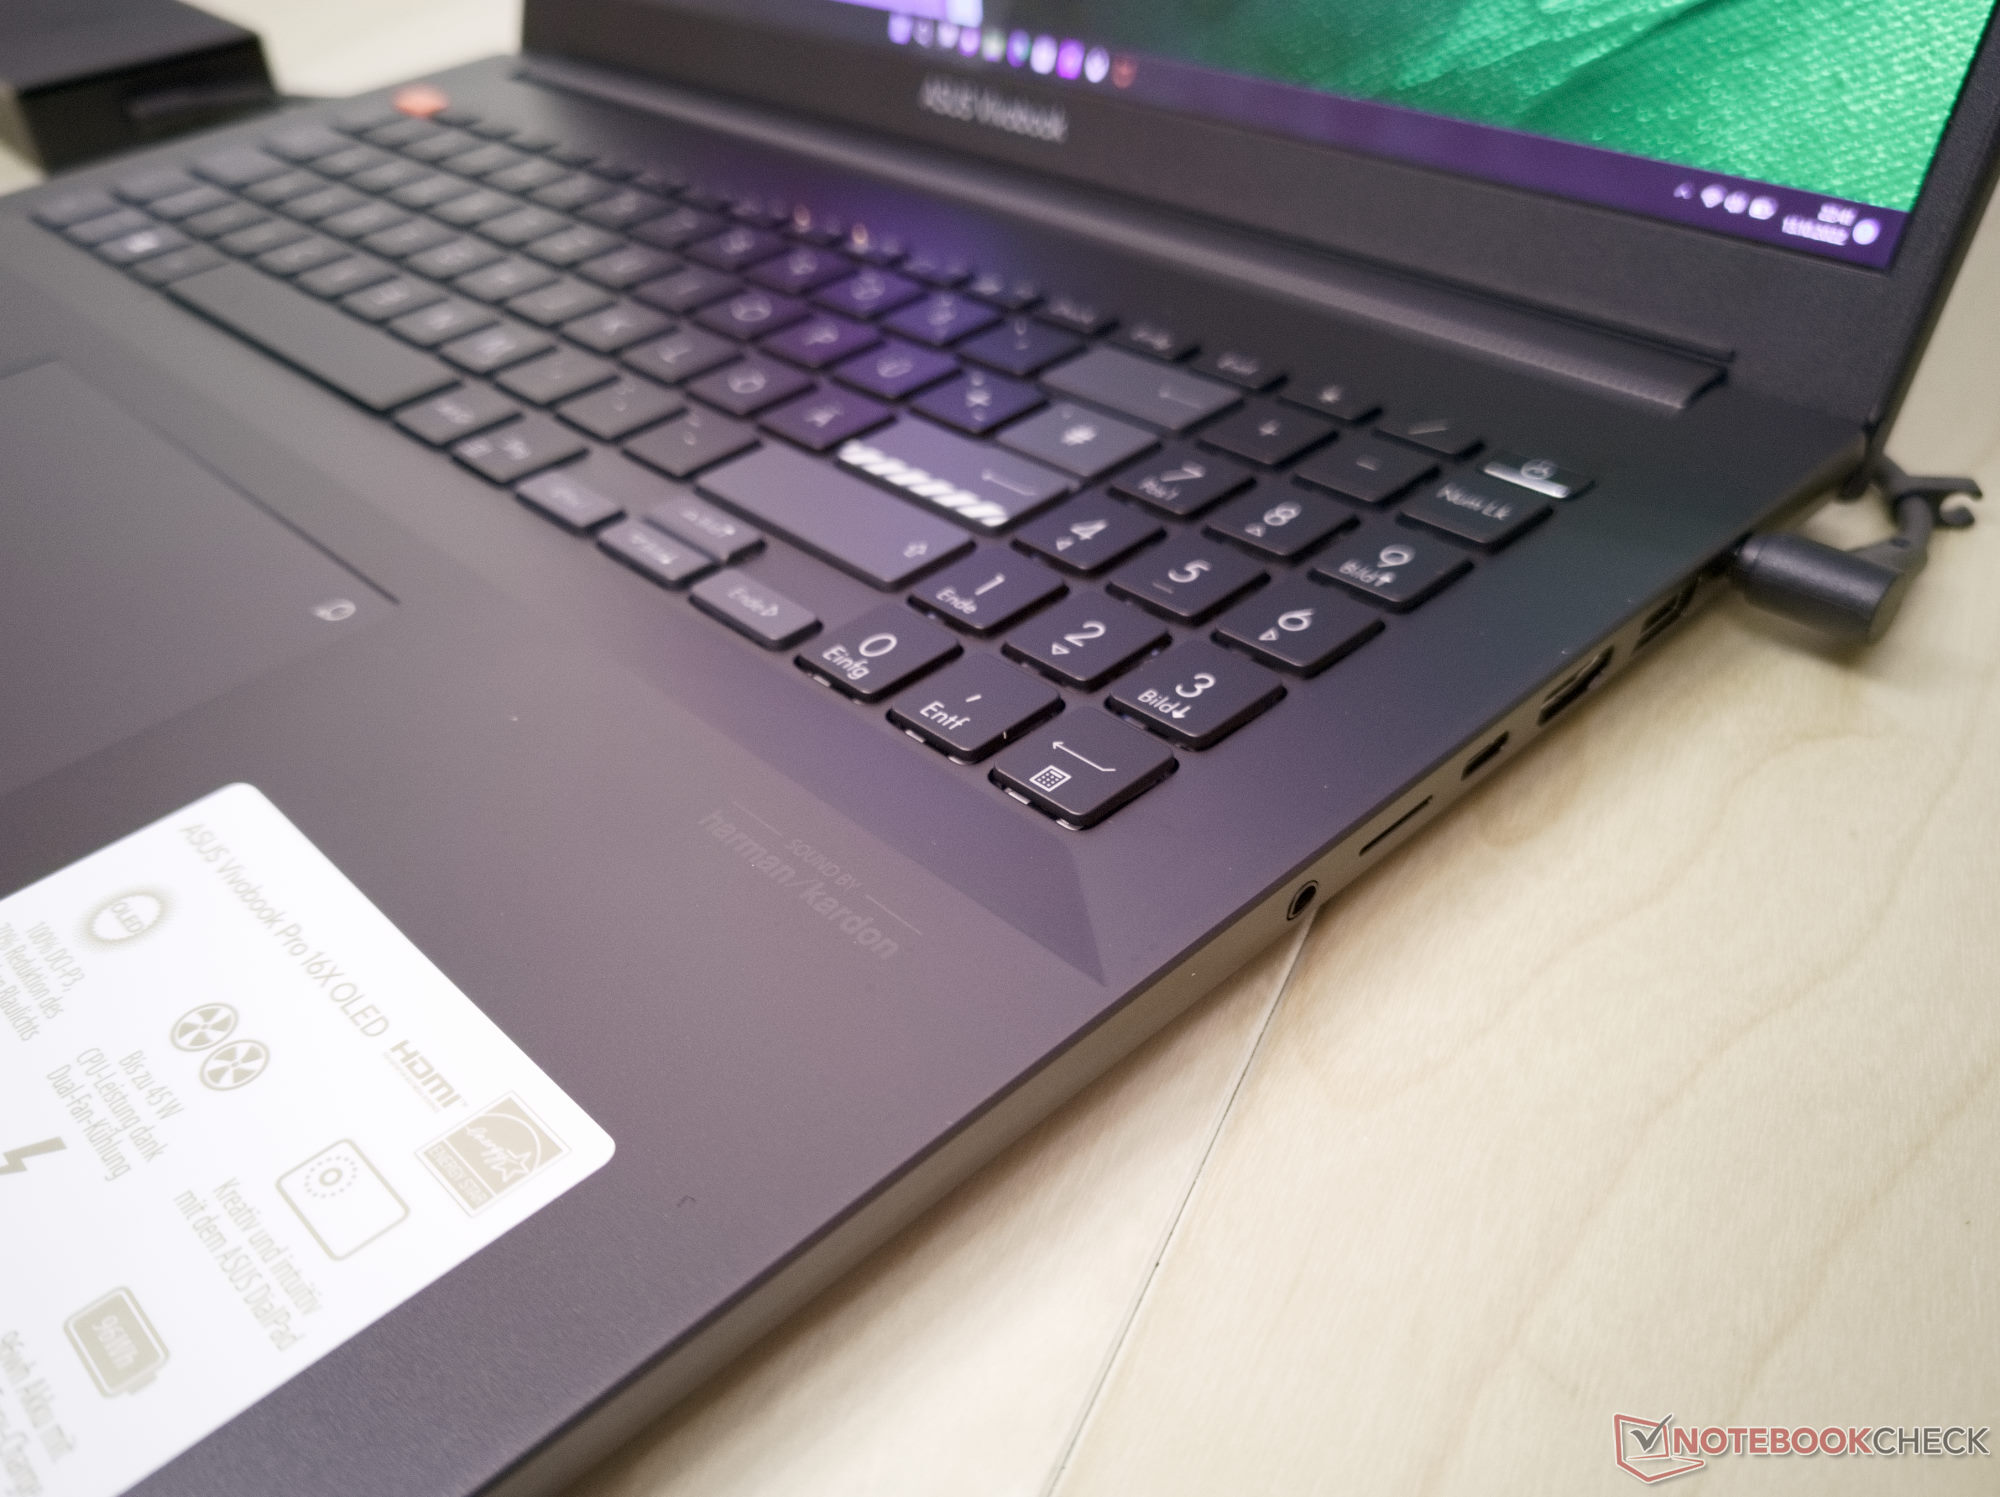
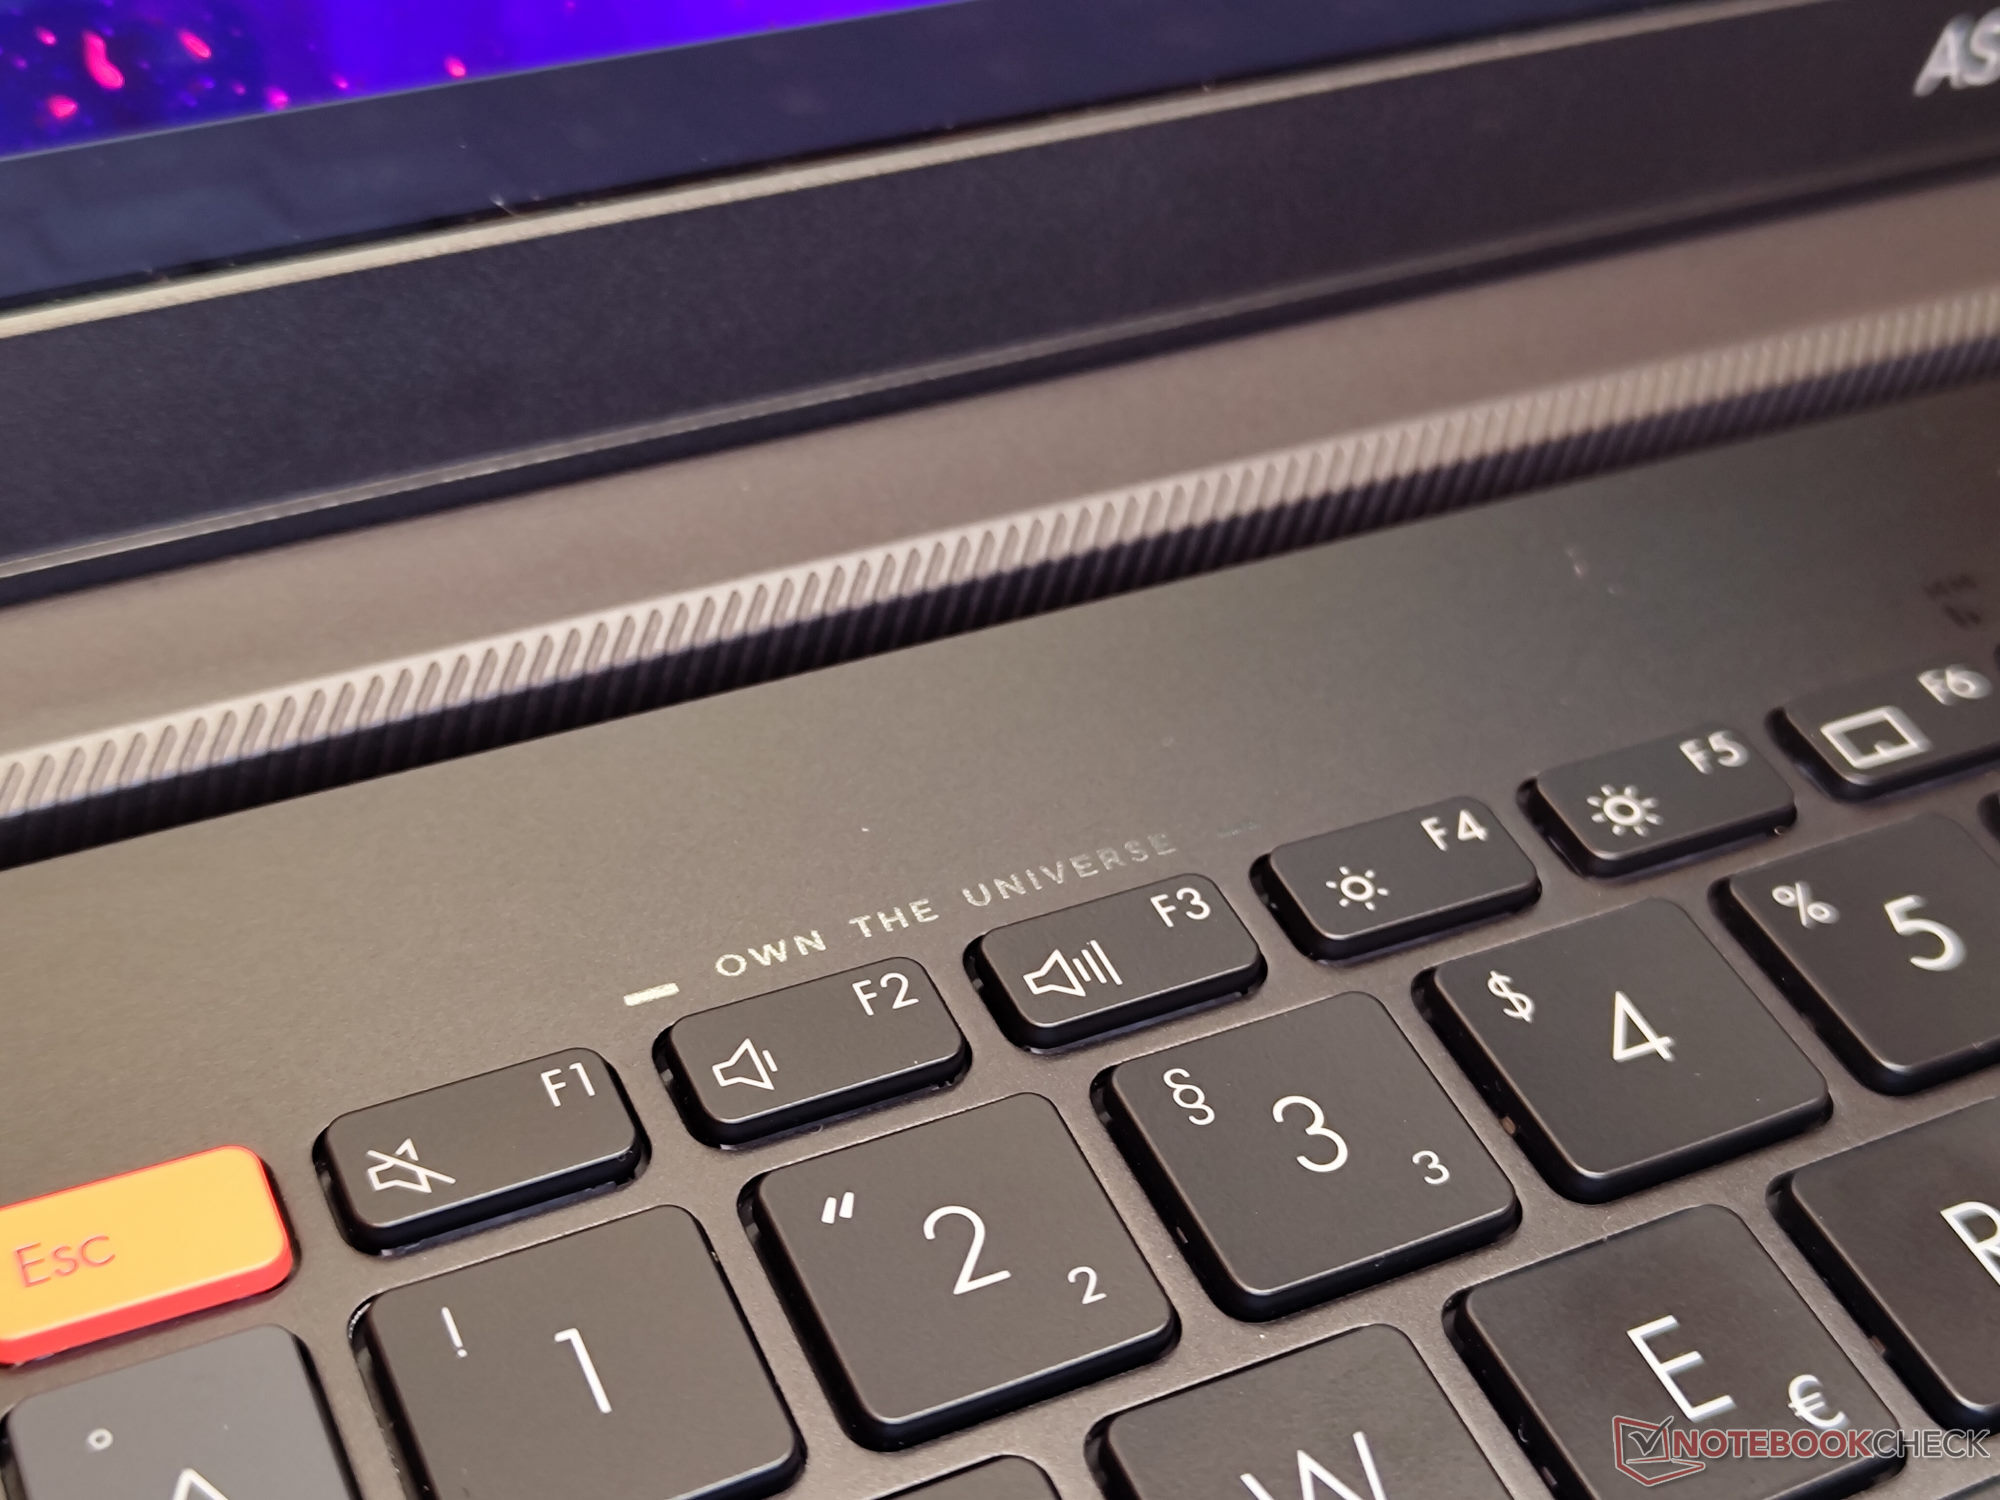
The keyboard of the Vivobook Pro 16X takes advantage of the available space on the 16-inch laptop and offers a numpad in addition to the normal-height keys. The most commonly accessed features can be accessed via the function keys. The 15-mm (~0.59 in) square buttons offer a comfortable travel of 1.6 mm (~0.06 in) and a good haptic feedback.
Touchpad
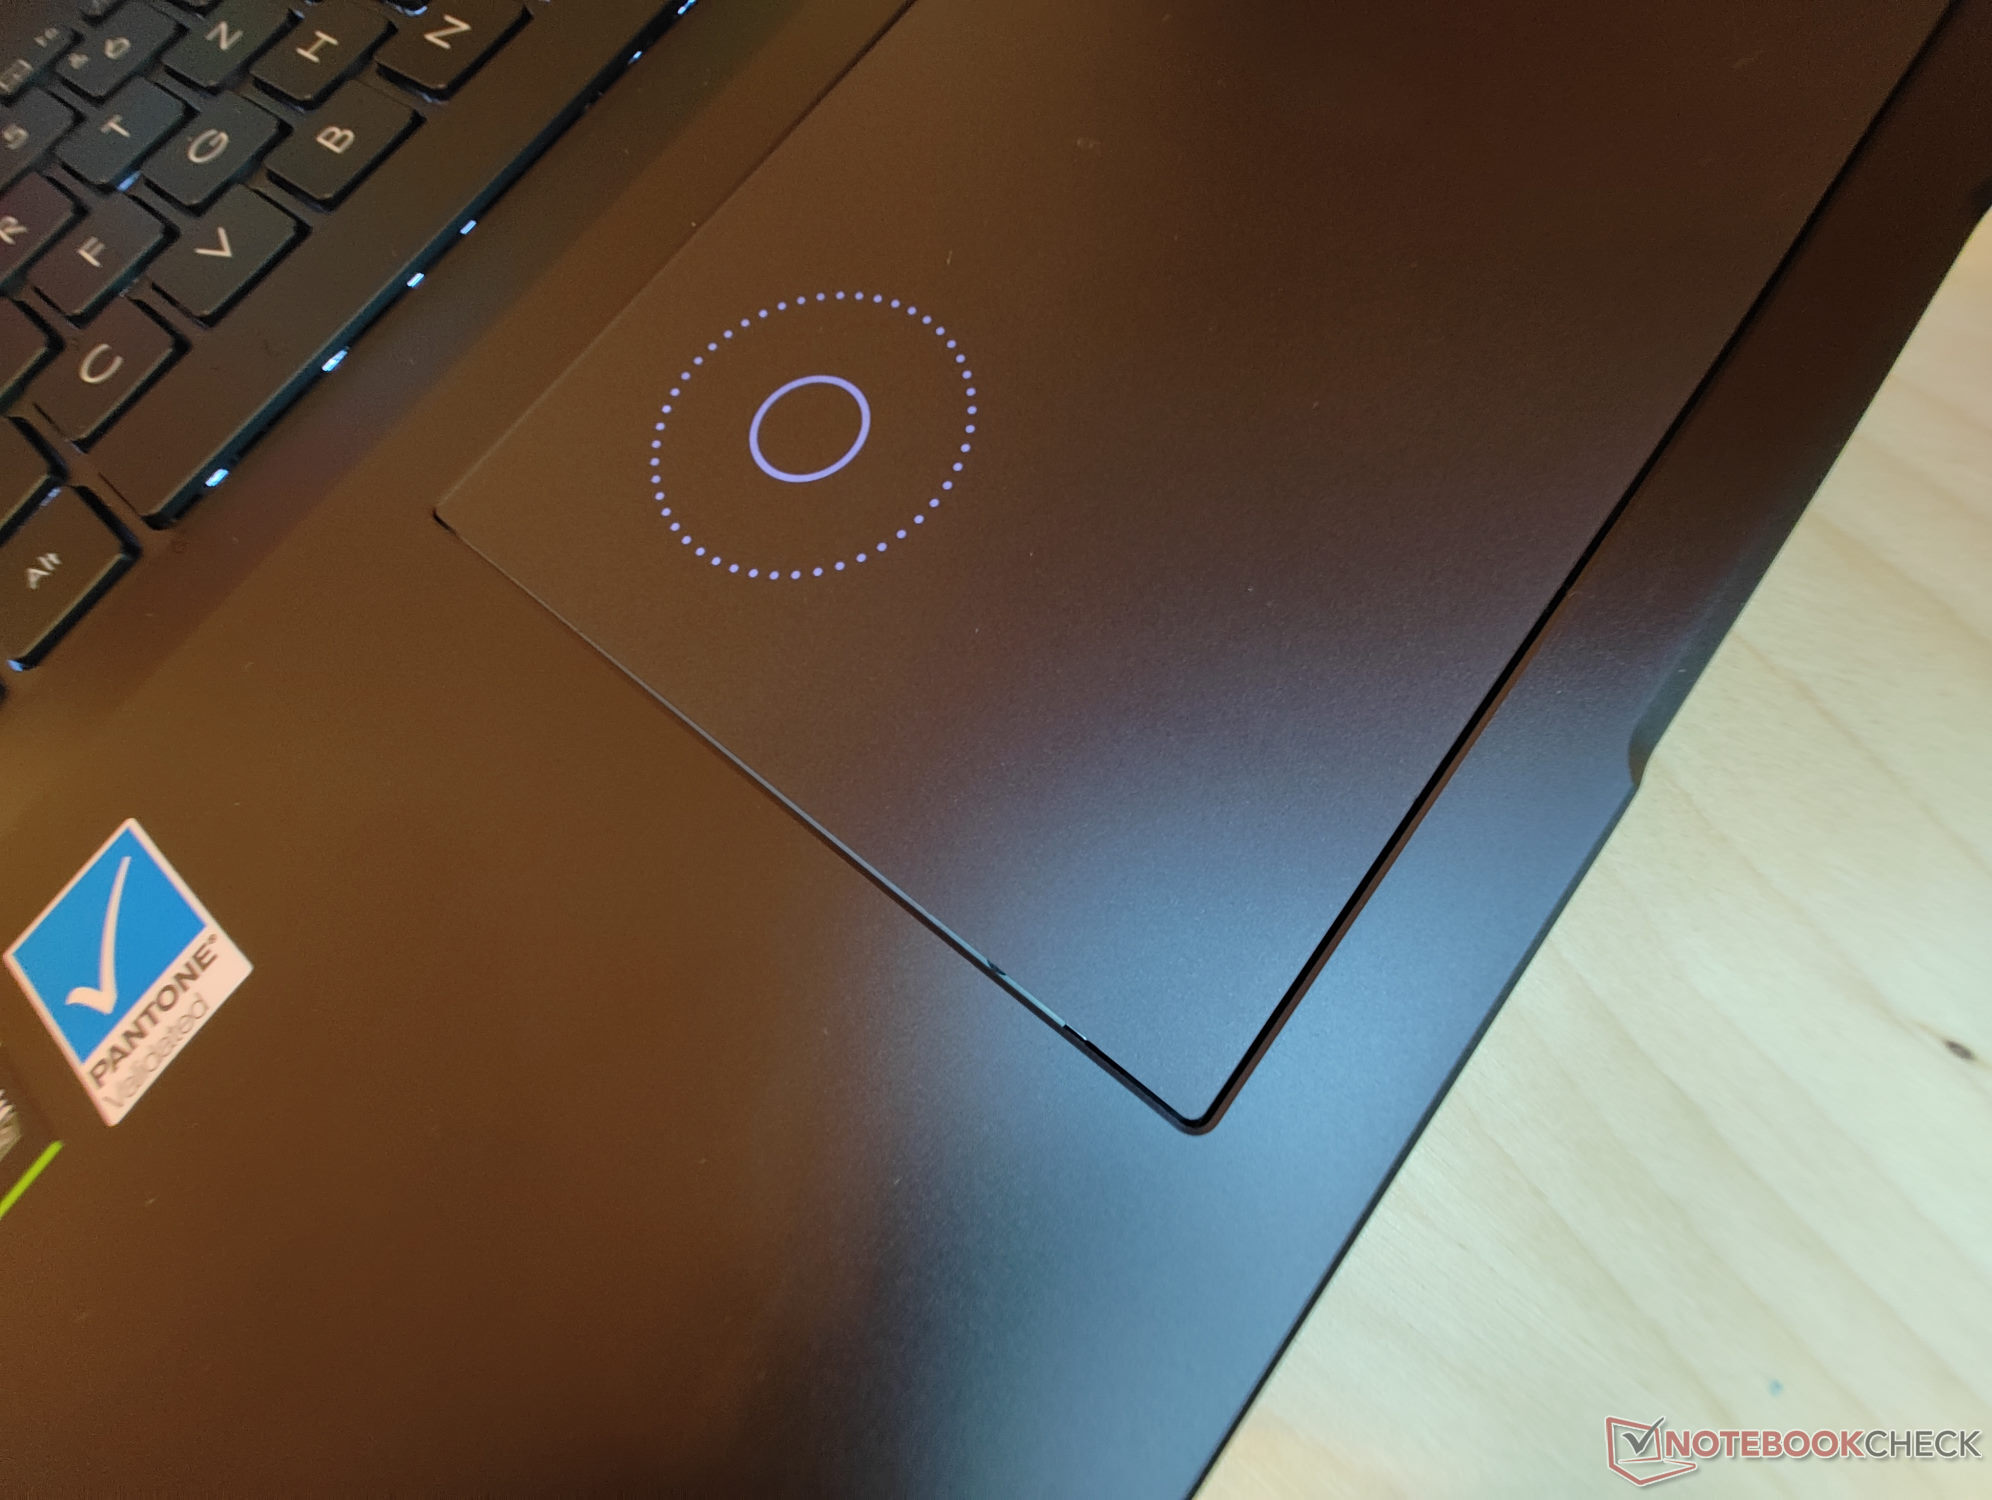
Like on certain other Asus models, the Vivobook Pro 16X also comes with Asus Dial integrated into the touchpad. The input surface allows users to change various settings after accessing the feature with a swipe down from the top right corner. Alternatively, the Microsoft Surface Dial functions are also available. The clickpad has a diagonal size of 15.5 cm (~6.10 in) and good gliding properties, while being very responsive.
Display - Windows PC with 16:10 OLED

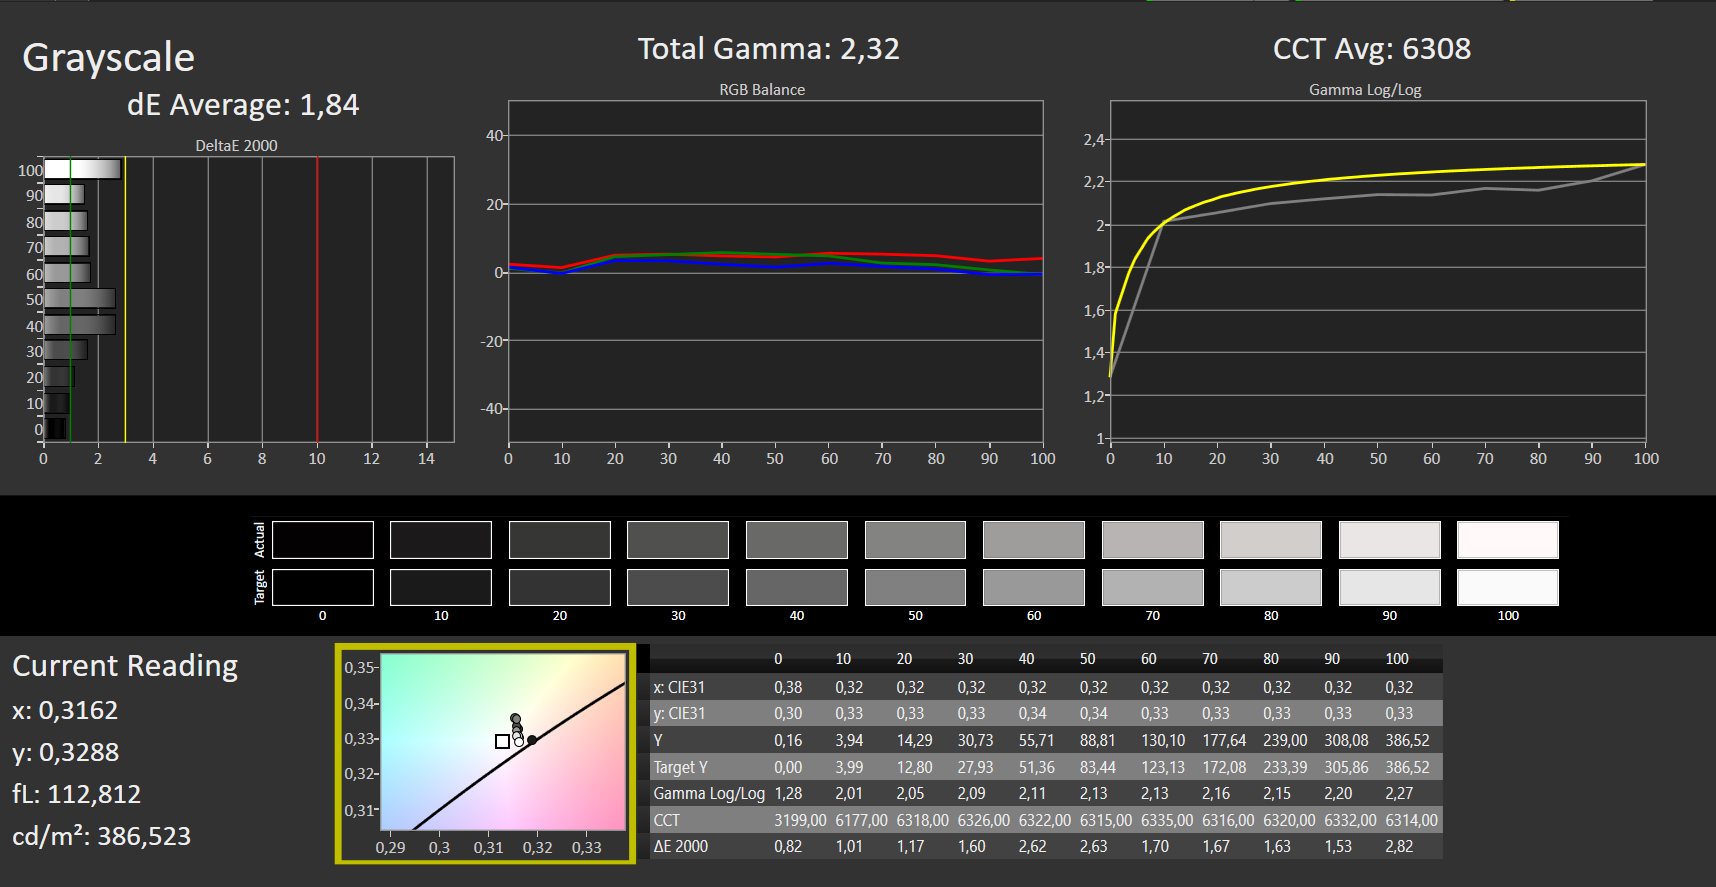
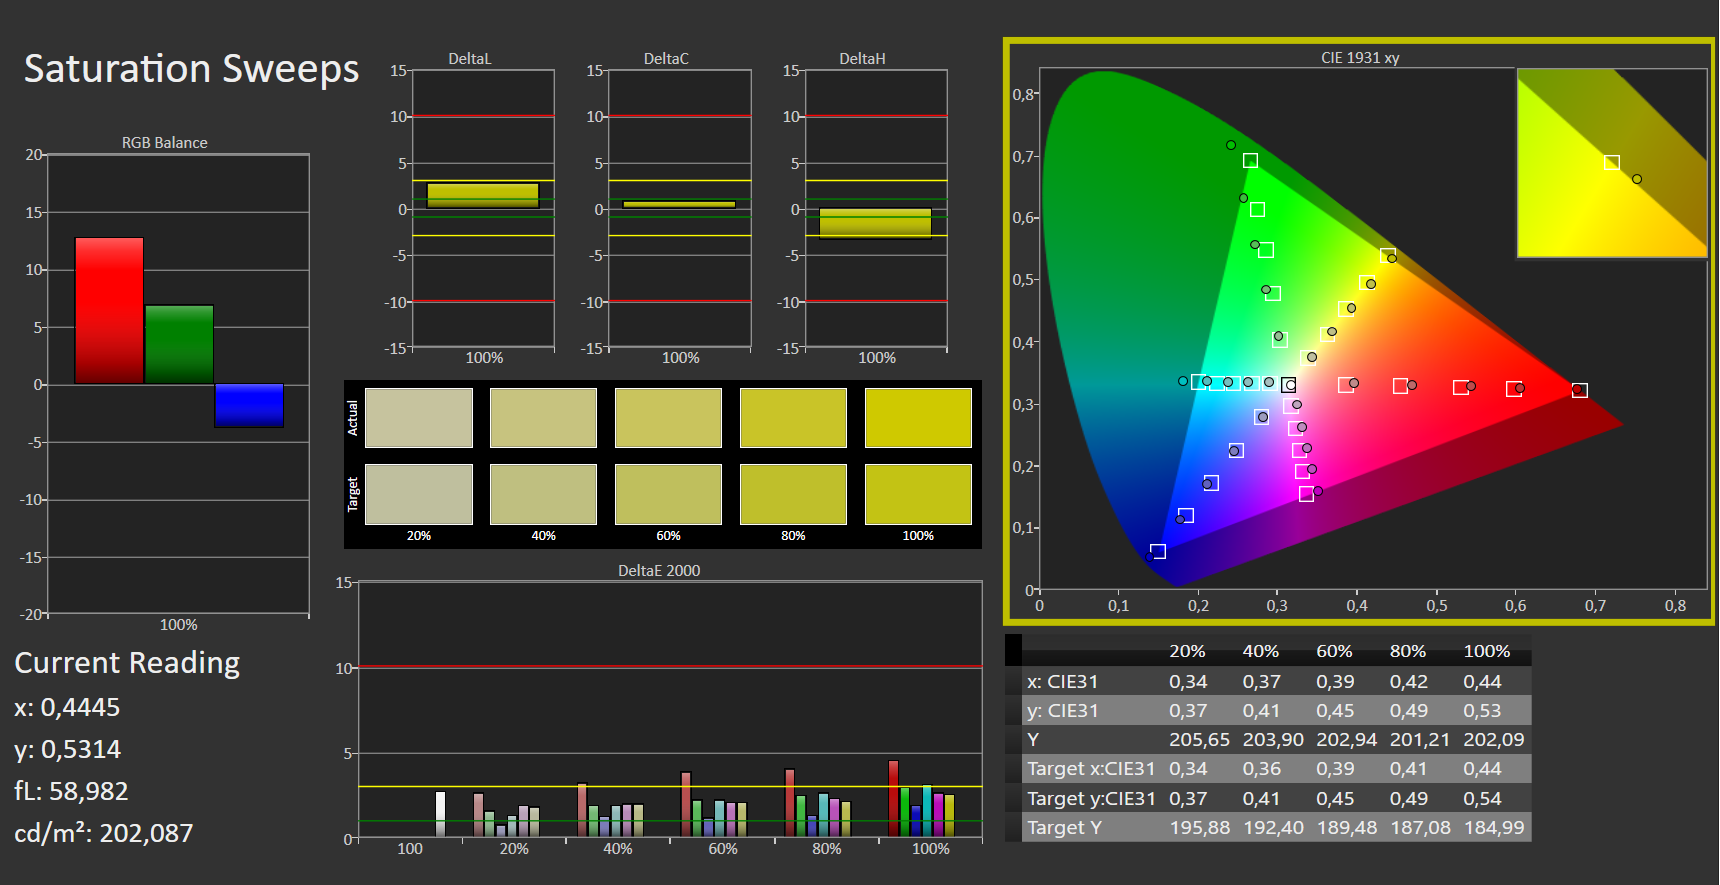
The great display of the Vivobook Pro 16X OLED is its best feature by far - this is both a good and a bad thing. The screen is Pantone validated for an excellent color space coverage with very low color deviations ex-factory. The 16:10 display offers natural colors, a high maximum brightness and a native resolution of 3840 x 2400 pixels. There are also drawbacks to the glossy OLED panel, however. Glare and reflections are commonplace under sunlight or suboptimal lighting conditions.
The illumination is very even, which is typical for OLED displays. The maximum deviation from the 390-nit average is only 7 nits. Due to the underlying technology, there is no screen bleeding. Similarly, the contrast ratio of 14185:1 is excellent.
| |||||||||||||||||||||||||
Brightness Distribution: 96 %
Center on Battery: 383 cd/m²
Contrast: 14185:1 (Black: 0.027 cd/m²)
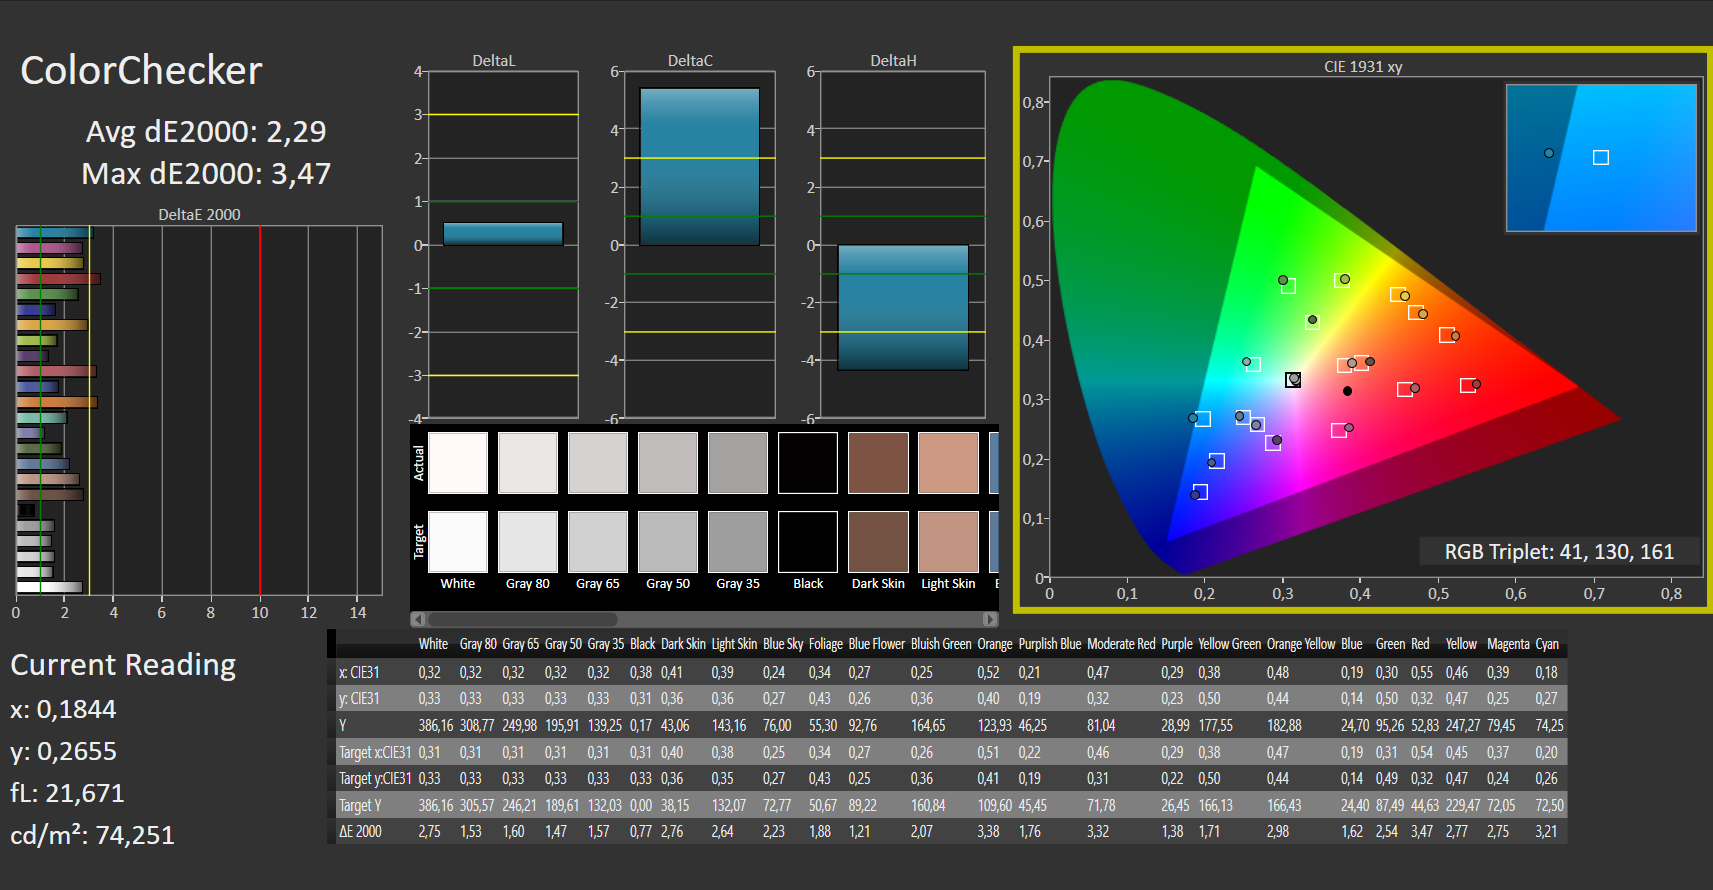
ΔE ColorChecker Calman: 2.29 | ∀{0.5-29.43 Ø4.72}
ΔE Greyscale Calman: 1.84 | ∀{0.09-98 Ø4.97}
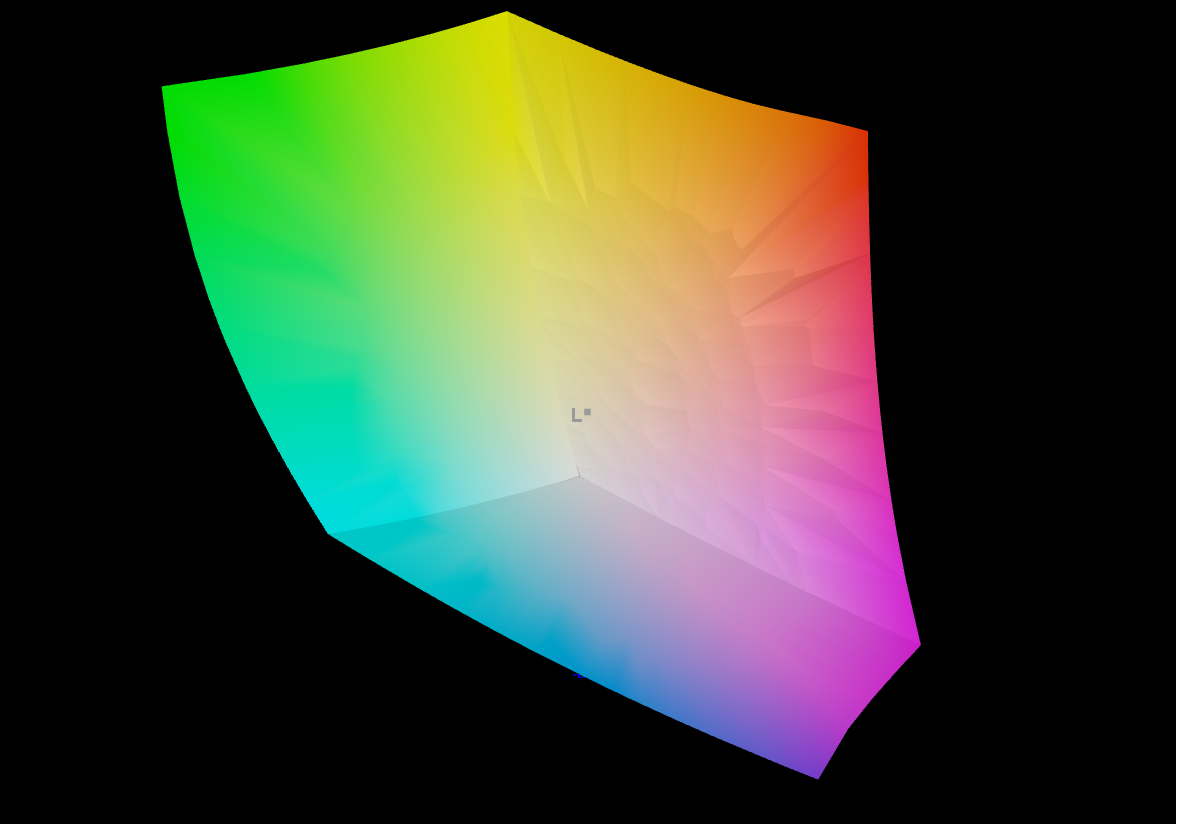
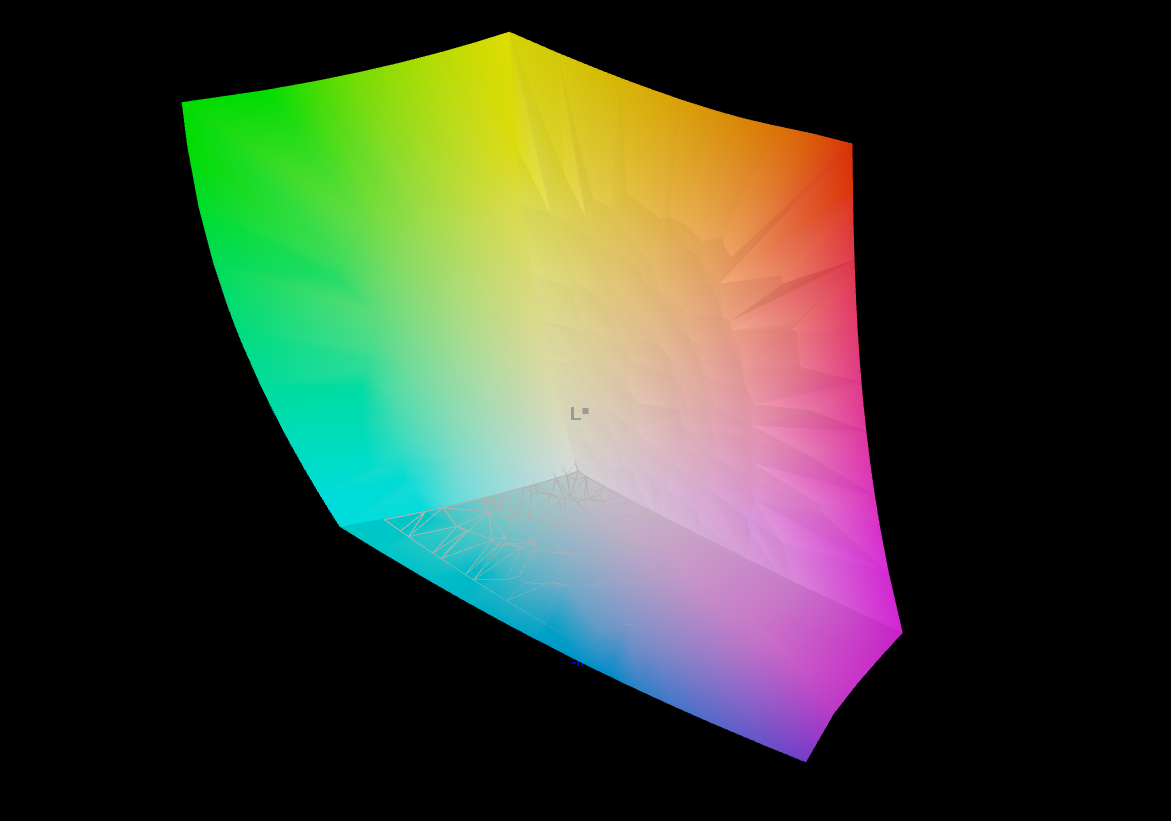
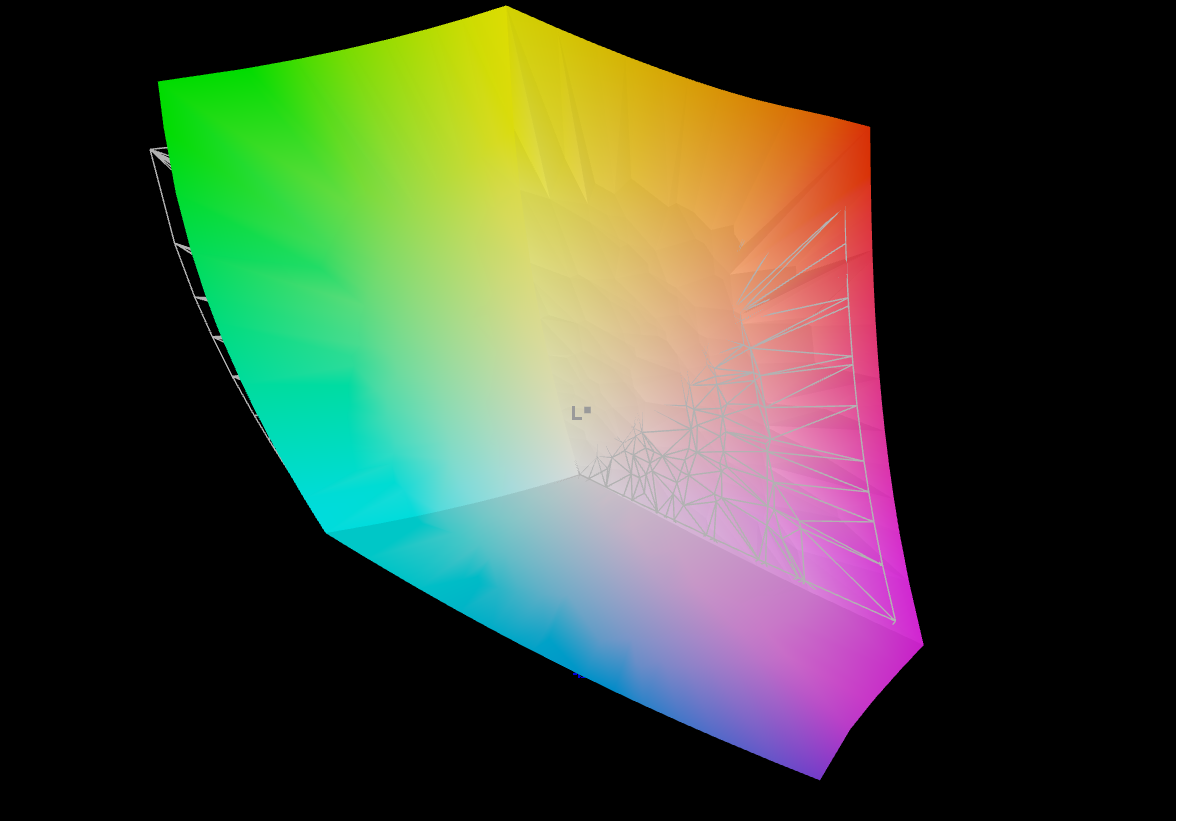
98.05% AdobeRGB 1998 (Argyll 3D)
100% sRGB (Argyll 3D)
99.9% Display P3 (Argyll 3D)
Gamma: 2.32
CCT: 6308 K
| Asus VivoBook Pro 16X OLED N7600PC-L2026X Samsung ATNA60YV02-0, OLED, 3840x2400, 16" | MSI Summit E16 Flip A12UDT-031 AU Optronics B16QAN02.N, IPS, 2560x1600, 16" | Microsoft Surface Laptop Studio i7 RTX 3050 Ti LQ144P1JX01, IPS, 2400x1600, 14.4" | Dell Inspiron 16 Plus 7610 AU Optronics B160QAN, IPS, 3072x1920, 16" | Lenovo ThinkPad X1 Extreme G4-20Y5CTO1WW (3050 Ti) LP160UQ1-SPB1, IPS LED, 3840x2400, 16" | Schenker XMG Focus 15 LG Philips LP156WFG-SPB5, IPS, 1920x1080, 15.6" | |
|---|---|---|---|---|---|---|
| Display | -4% | -13% | -17% | -6% | -24% | |
| Display P3 Coverage (%) | 99.9 | 98.9 -1% | 80.6 -19% | 74.1 -26% | 84.3 -16% | 64.6 -35% |
| sRGB Coverage (%) | 100 | 100 0% | 99.9 0% | 99.4 -1% | 98.3 -2% | 95.3 -5% |
| AdobeRGB 1998 Coverage (%) | 98.05 | 86.5 -12% | 78.5 -20% | 75.8 -23% | 97.8 0% | 66.5 -32% |
| Response Times | -775% | -3420% | -3280% | -3950% | -1020% | |
| Response Time Grey 50% / Grey 80% * (ms) | 1 | 13 ? -1200% | 58.4 ? -5740% | 49.2 ? -4820% | 60 ? -5900% | 18 ? -1700% |
| Response Time Black / White * (ms) | 2 ? | 9 ? -350% | 24 ? -1100% | 36.8 ? -1740% | 42 ? -2000% | 8.8 ? -340% |
| PWM Frequency (Hz) | 247 ? | 5000 ? | ||||
| Screen | -161% | -118% | -114% | -208% | -196% | |
| Brightness middle (cd/m²) | 383 | 314 -18% | 497 30% | 296.8 -23% | 639 67% | 418 9% |
| Brightness (cd/m²) | 390 | 294 -25% | 491 26% | 292 -25% | 612 57% | 376 -4% |
| Brightness Distribution (%) | 96 | 89 -7% | 92 -4% | 87 -9% | 84 -12% | 83 -14% |
| Black Level * (cd/m²) | 0.027 | 0.28 -937% | 0.29 -974% | 0.21 -678% | 0.47 -1641% | 0.41 -1419% |
| Contrast (:1) | 14185 | 1121 -92% | 1714 -88% | 1413 -90% | 1360 -90% | 1020 -93% |
| Colorchecker dE 2000 * | 2.29 | 3.08 -34% | 1.2 48% | 2.56 -12% | 2.2 4% | 1.67 27% |
| Colorchecker dE 2000 max. * | 3.47 | 5.49 -58% | 2.8 19% | 4.76 -37% | 5.3 -53% | 3.88 -12% |
| Greyscale dE 2000 * | 1.84 | 3.99 -117% | 1.9 -3% | 2.6 -41% | 1.7 8% | 2.9 -58% |
| Gamma | 2.32 95% | 2.3 96% | 2.14 103% | 2.07 106% | 2.31 95% | 2.26 97% |
| CCT | 6308 103% | 6219 105% | 6821 95% | 6628 98% | 6390 102% | 6209 105% |
| Colorchecker dE 2000 calibrated * | 0.88 | 0.8 | 1.86 | 1.4 | 0.98 | |
| Total Average (Program / Settings) | -313% /
-219% | -1184% /
-602% | -1137% /
-579% | -1388% /
-737% | -413% /
-283% |
* ... smaller is better
A display's Pantone validation does not necessarily translate into a wide color space coverage or extremely accurate colors in all cases. The Pantone color system was introduced to make colors for products and prints more comparable and predictable. Although the color system, which encompasses 1867 individual colors for prints and many more specific colors for products, is fairly extensive, it does not necessarily fully cover large color spaces such as DisplayP3. As a result, a monitor that only covers the smaller sRGB color space may still fulfill the requirements for the Pantone matching system. Furthermore, the color deviations outside the Pantone system may be larger.
In summary, it is still worth it to determine which color spaces a screen is able to display and which use cases it is suitable for, even in the case of a Pantone validated display. The requirements for video editing can be vastly different from those of graphic design for print media.
The OLED panel of the Asus Vivobook covers almost 100 percent of the three relevant color space. Thanks to the good AdobeRGB and DisplayP3 coverage, the display is well suited to photography and video editing, respectively.
The Pantone validated display of the Asus Vivobook has a very low color deviation ex-factory. In our test with the CalMAN ColorChecker software, the maximum color deviations only slightly exceed the target deltaE value of 3. With an average deltaE of 2.29, the screen comfortably falls into the ideal range.
Display Response Times
| ↔ Response Time Black to White | ||
|---|---|---|
| 2 ms ... rise ↗ and fall ↘ combined | ↗ 1 ms rise |  |
| ↘ 1 ms fall | ||
| The screen shows very fast response rates in our tests and should be very well suited for fast-paced gaming. In comparison, all tested devices range from 0.1 (minimum) to 240 (maximum) ms. » 11 % of all devices are better. This means that the measured response time is better than the average of all tested devices (19.8 ms). | ||
| ↔ Response Time 50% Grey to 80% Grey | ||
| 1 ms ... rise ↗ and fall ↘ combined | ↗ 0 ms rise |  |
| ↘ 0 ms fall | ||
| The screen shows very fast response rates in our tests and should be very well suited for fast-paced gaming. In comparison, all tested devices range from 0.165 (minimum) to 636 (maximum) ms. » 4 % of all devices are better. This means that the measured response time is better than the average of all tested devices (31 ms). | ||
Screen Flickering / PWM (Pulse-Width Modulation)
| Screen flickering / PWM detected | 247 Hz | ≤ 50 % brightness setting |  |
The display backlight flickers at 247 Hz (worst case, e.g., utilizing PWM) Flickering detected at a brightness setting of 50 % and below. There should be no flickering or PWM above this brightness setting. The frequency of 247 Hz is relatively low, so sensitive users will likely notice flickering and experience eyestrain at the stated brightness setting and below. In comparison: 52 % of all tested devices do not use PWM to dim the display. If PWM was detected, an average of 7750 (minimum: 5 - maximum: 343500) Hz was measured. | |||
As per usual, the OLED display's flickering varies depending on the brightness setting as well as the displayed images. In the case of the Vivobook Pro 16X, we only detect flickering at brightness levels of 50 percent and lower. As expected, the display does not simultaneously dim in its entirety and instead only lowers the brightness in certain rows. This reduces eyestrain on the OLED display when compared to an LCD display with the same flickering frequency.


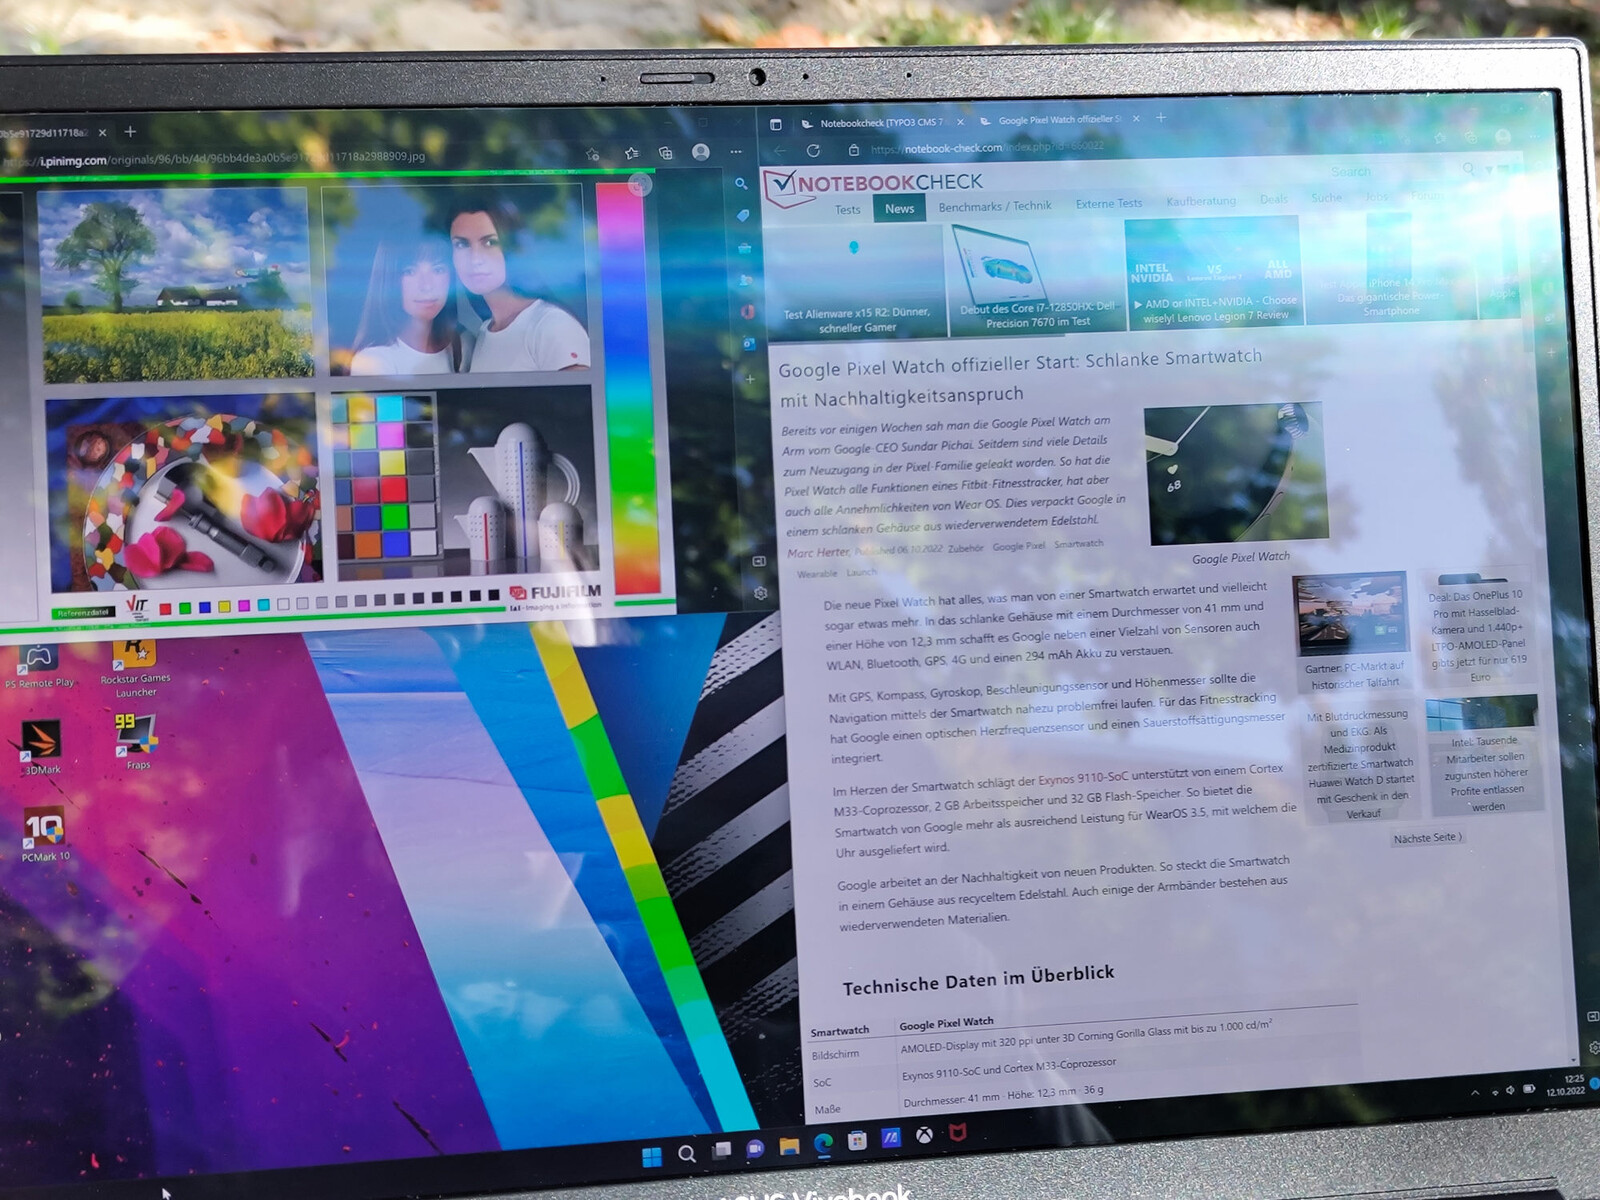
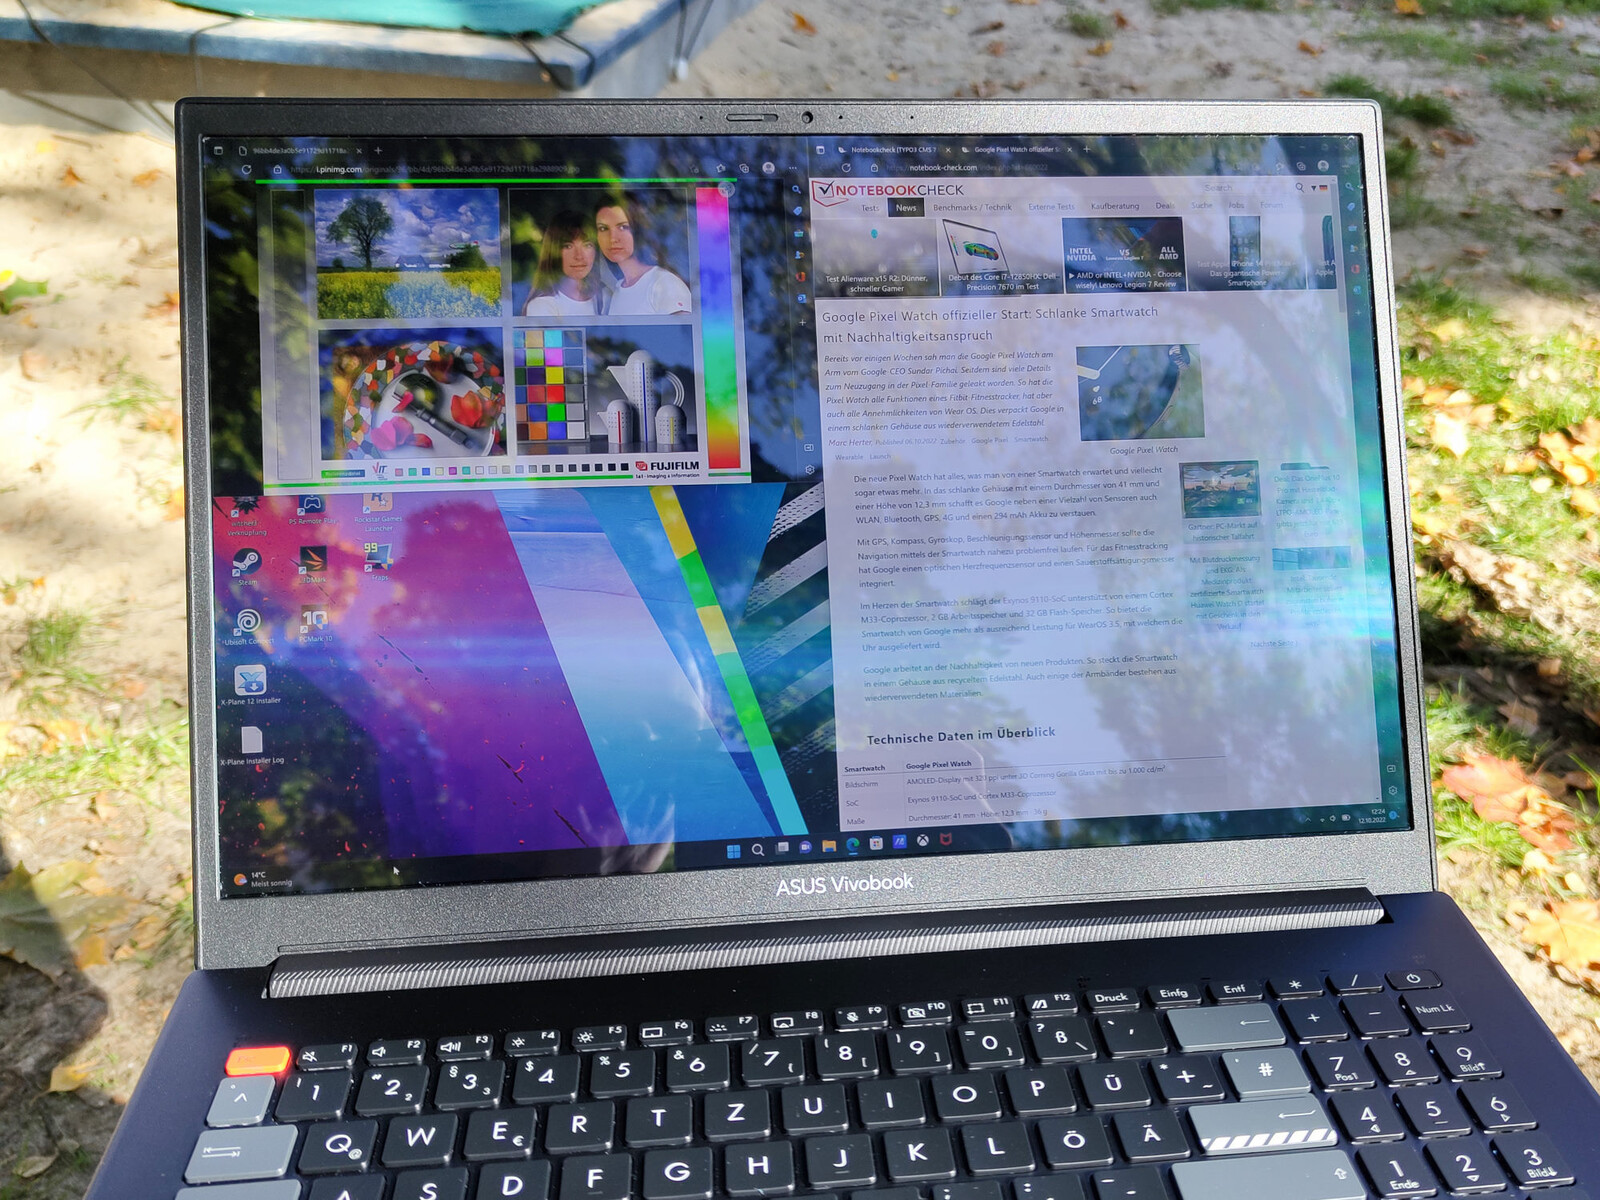
Despite its high maximum brightness, the glossy OLED display is not well suited to outdoor use. Glare an reflections degrade the perceived image quality particularly when the sun is shining. At particularly unfavorable angles under the sun or other bright light sources, the OLED display shows the characteristic, green refraction patters.

The 16-inch display shows no weaknesses in our viewing angle analysis. Even from extrem angles, the perceived brightness and color accuracy of the display is excellent.

Performance - Joy and Grief with the Nvidia Studio Drivers
There are various configurations of the Asus Vivobook Pro 16X OLED available. Aside form Intel 11th and 12th gen processors, the manufacturer also offers AMD-Ryzen-5000 and AMD-Ryzen-6000 series CPUs. The dGPU options range from the Nvidia GeForce RTX 3050 up to the 3070 Ti GPU.
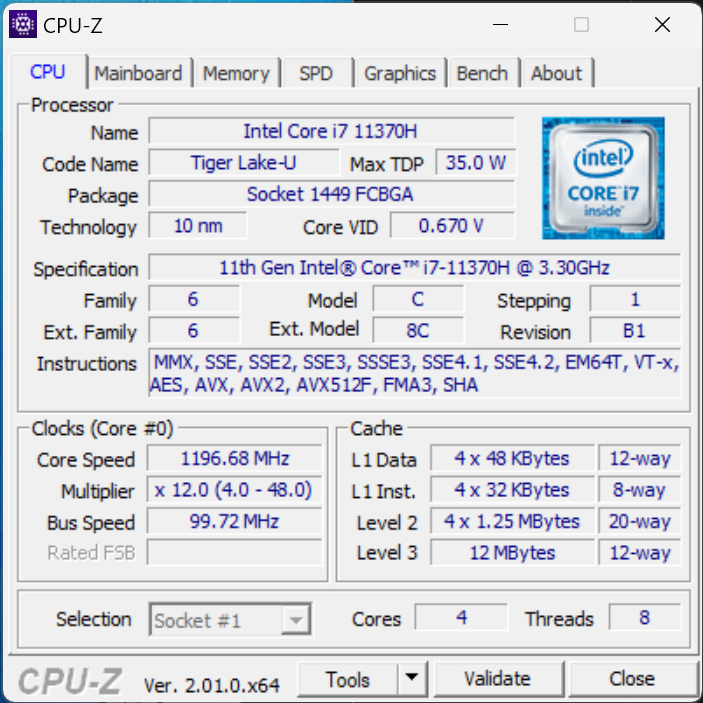
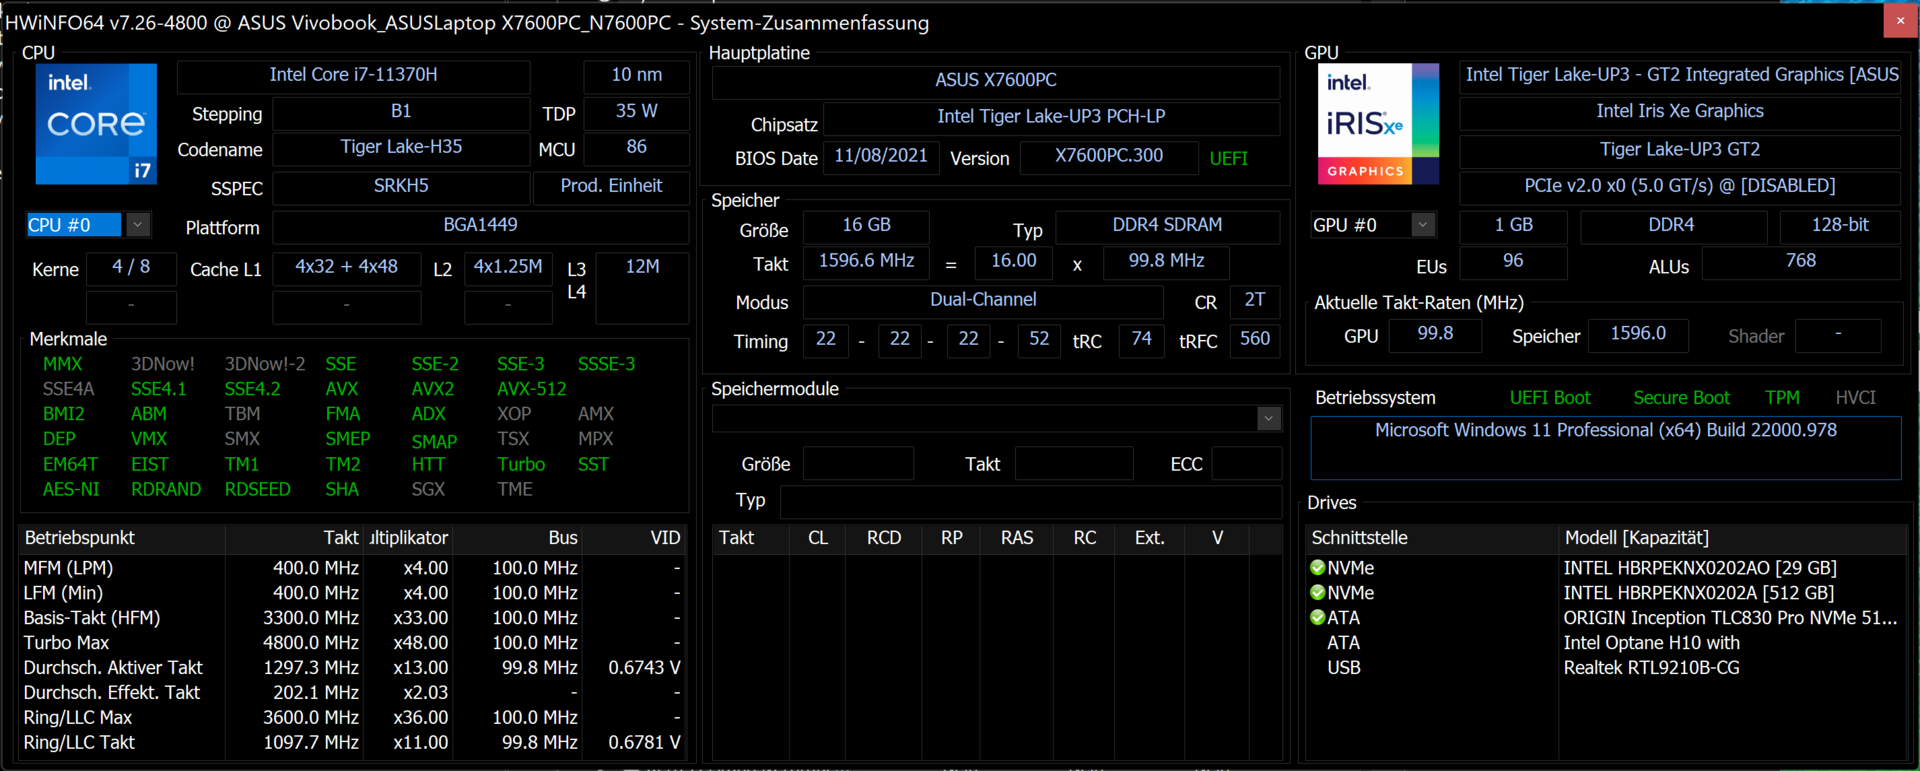
Our configuration relies on an Intel Core i7 11370H CPU, a GeForce RTX 3050 GPU, and 16 GB of RAM.
Testing Conditions
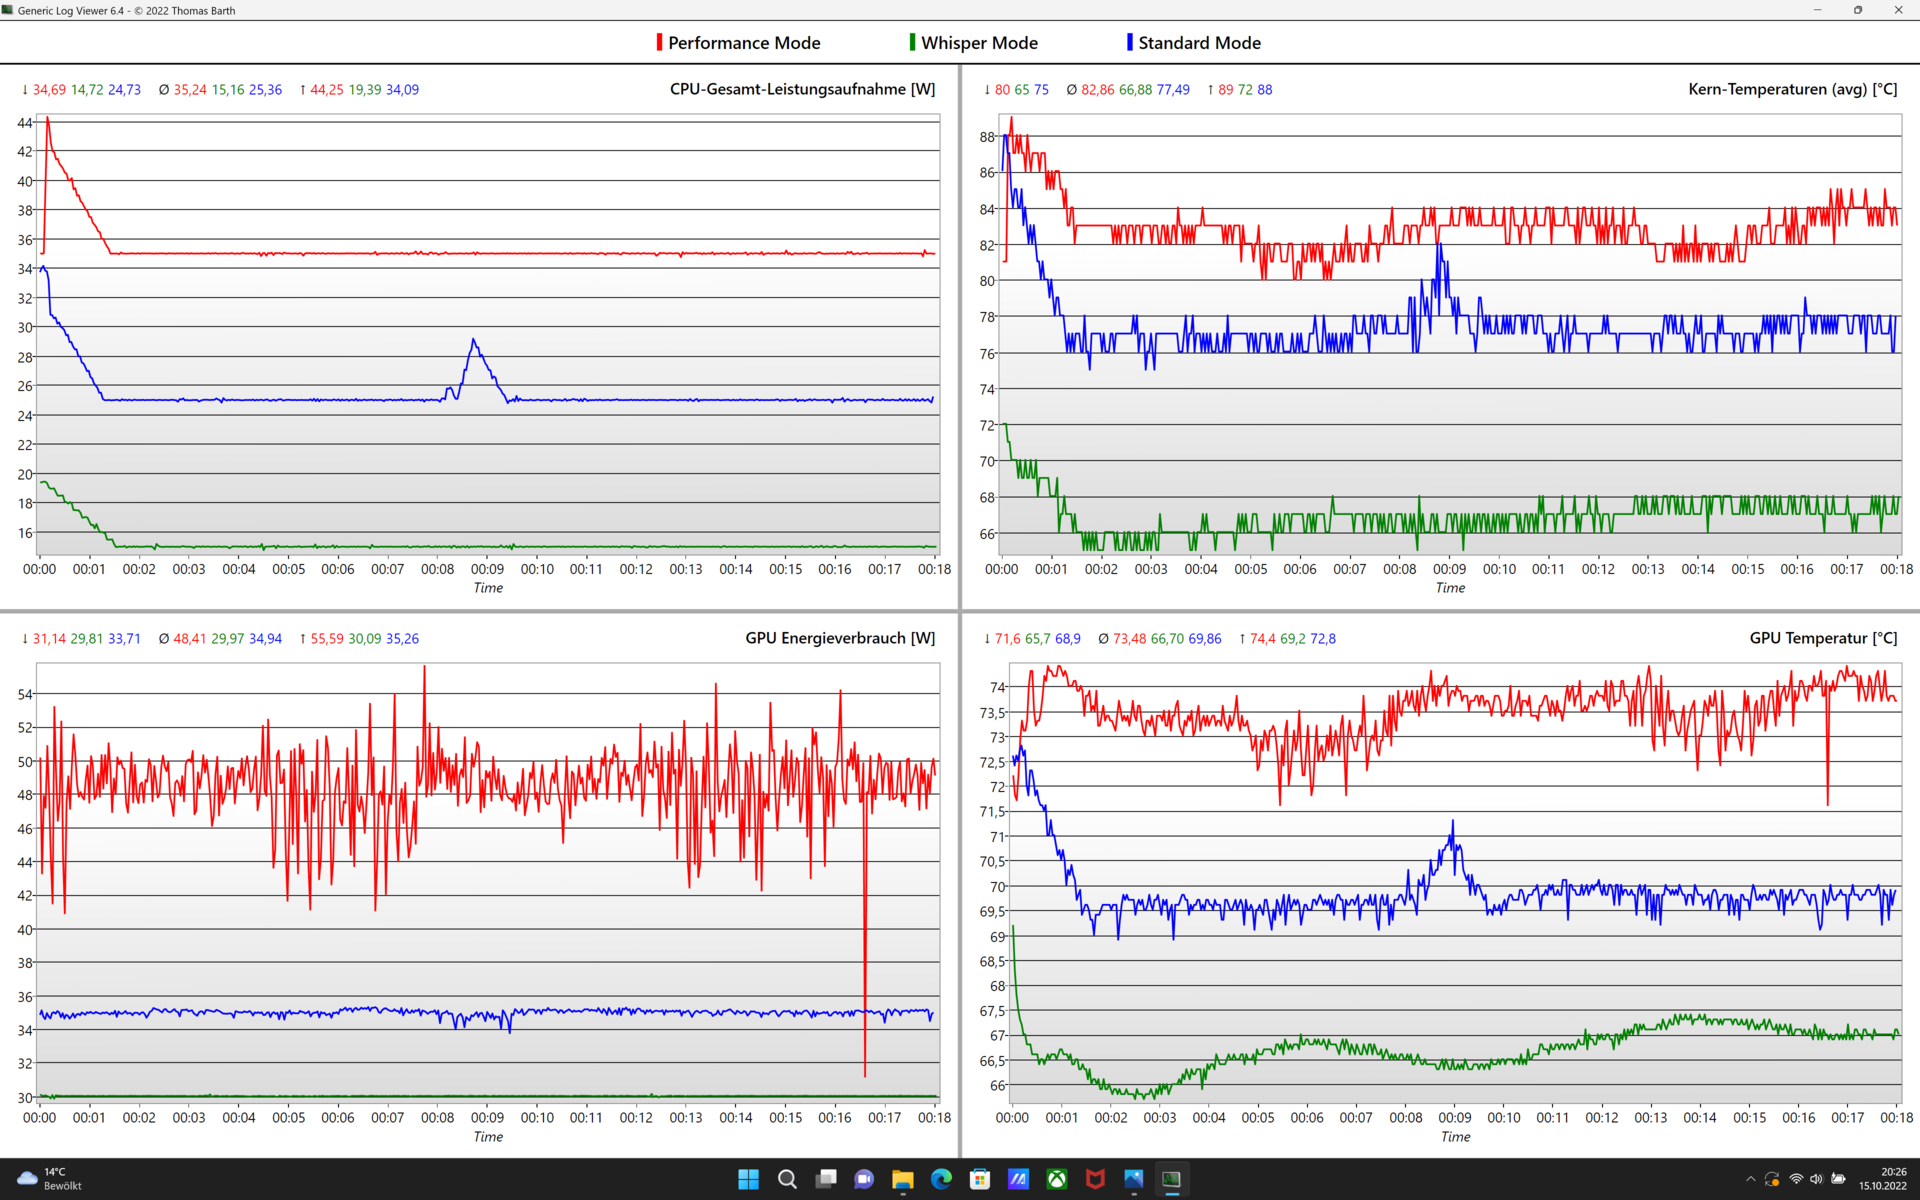
When it comes to the power settings of the laptop, Asus uses values that exceed Intel's recommended TDP in some cases. According to our logs, the Intel Core i7 11370H sustains a power draw of up to 45 W for short periods. However, the energy consumption of the CPU can drop down to 25 W, depending on the fan setting. The dedicated Nvidia GeForce RTX 3050 GPU inside the Vivobook is limited to 50 watts. The model appears to be the smaller Max-Q variant of the graphics card. In order to draw the full 50 watts, the graphics card has to make use of the power budget it shares with the processor. The combined consumption must not exceed 85 watts in performance mode. Meanwhile, the default and whisper modes allow for a combined consumption of just 60 and 45 watts, respectively.
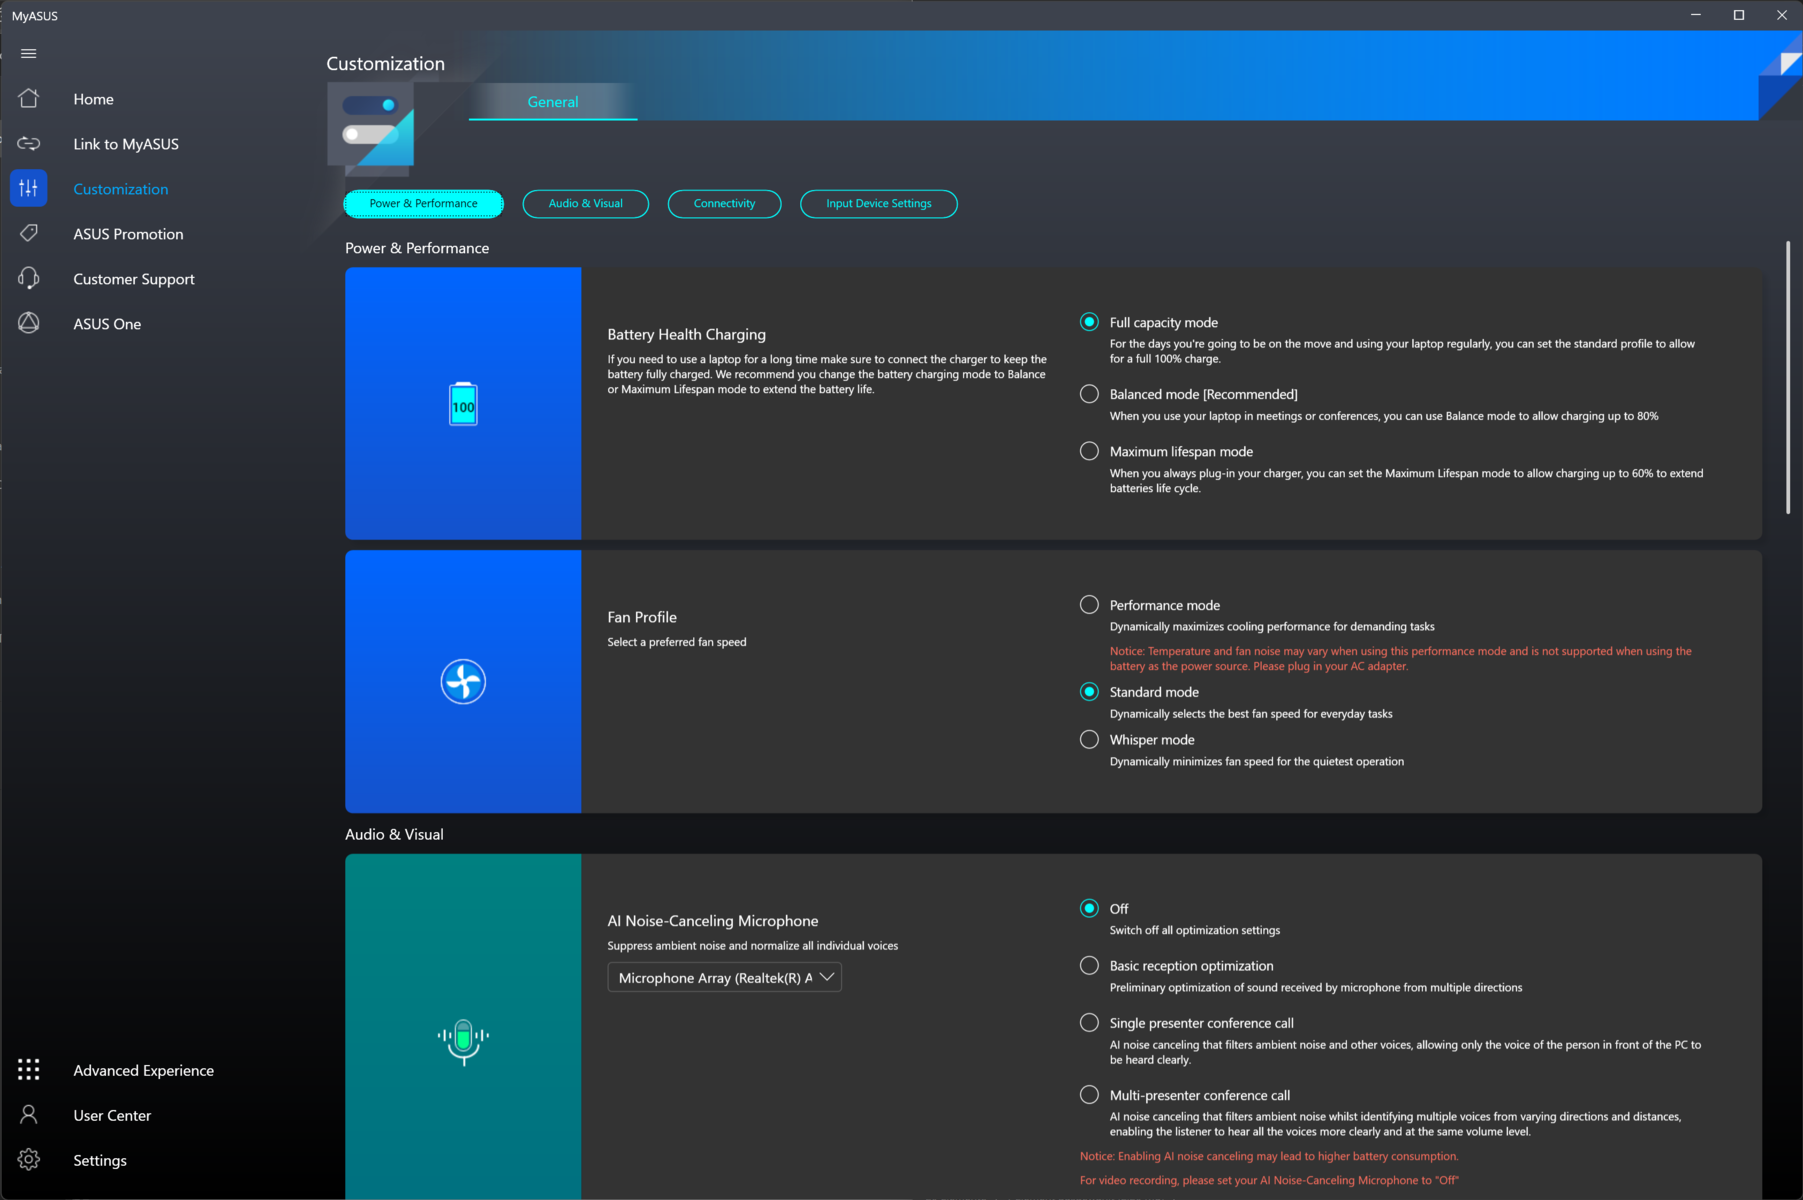
We selected Asus' performance mode before performing the following benchmarks. In order to determine the battery life, we chose the energy saver mode. For our noise testing, we used all three fan modes.
Processor
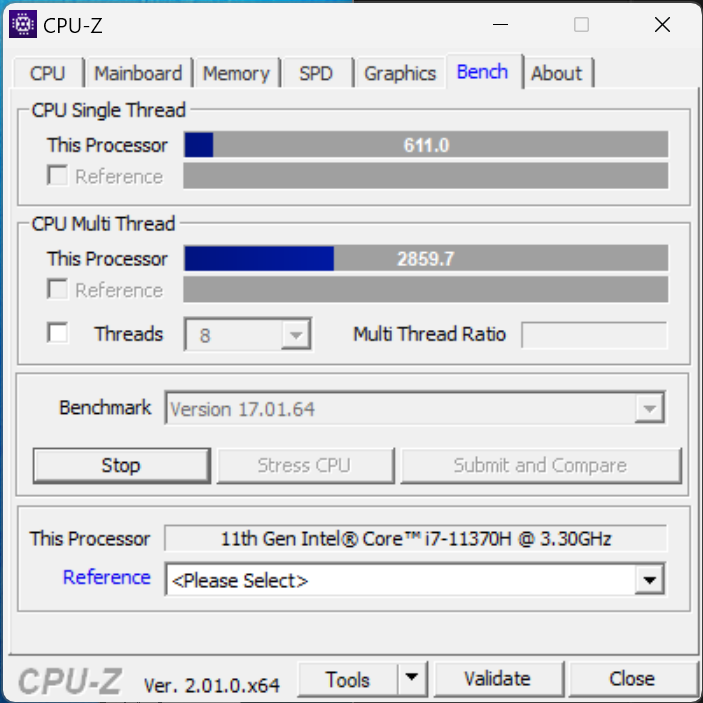
Our test device uses an Intel Core i7-11370H CPU. This processor is designed for slim, yet powerful laptops and the TDP can be configured relatively freely. With 35 watts, Asus even exceeds Intel's maximum recommended value. However, this value is only reached when only the CPU is stressed and even then limited to just a few minutes. 55 watts of boost performance means the Intel SoC has a lot of headroom. That being said, the Asus Vivobook Pro is more of a sprinter than a marathon runner. The high performance level, which the laptop is able to reach with the 11370H, quickly drops after a short time. The i7 from the 11th generation also cannot compete with the much more powerful Intel 12th gen processors.
Since normal use most frequently requires shorts bursts of performance, the Vivobook is pleasantly responsive during day-to-day use. By contrast, the multimedia laptop falls behind in the benchmarks with prolonged stress.
Cinebench R15 Multi Loop
Cinebench R23: Multi Core | Single Core
Cinebench R20: CPU (Multi Core) | CPU (Single Core)
Cinebench R15: CPU Multi 64Bit | CPU Single 64Bit
Blender: v2.79 BMW27 CPU
7-Zip 18.03: 7z b 4 | 7z b 4 -mmt1
Geekbench 5.5: Multi-Core | Single-Core
HWBOT x265 Benchmark v2.2: 4k Preset
LibreOffice : 20 Documents To PDF
R Benchmark 2.5: Overall mean
| CPU Performance rating | |
| Average of class Multimedia | |
| MSI Summit E16 Flip A12UDT-031 | |
| Lenovo ThinkPad X1 Extreme G4-20Y5CTO1WW (3050 Ti) | |
| Schenker XMG Focus 15 | |
| Dell Inspiron 16 Plus 7610 -2! | |
| Microsoft Surface Laptop Studio i7 RTX 3050 Ti | |
| Average Intel Core i7-11370H | |
| Xiaomi Mi NoteBook Pro | |
| Asus VivoBook Pro 16X OLED N7600PC-L2026X | |
| Cinebench R23 / Multi Core | |
| Average of class Multimedia (4861 - 33362, n=78, last 2 years) | |
| MSI Summit E16 Flip A12UDT-031 | |
| Lenovo ThinkPad X1 Extreme G4-20Y5CTO1WW (3050 Ti) | |
| Schenker XMG Focus 15 | |
| Dell Inspiron 16 Plus 7610 | |
| Microsoft Surface Laptop Studio i7 RTX 3050 Ti | |
| Average Intel Core i7-11370H (3696 - 6646, n=12) | |
| Xiaomi Mi NoteBook Pro | |
| Asus VivoBook Pro 16X OLED N7600PC-L2026X | |
| Cinebench R23 / Single Core | |
| Average of class Multimedia (1128 - 2459, n=70, last 2 years) | |
| MSI Summit E16 Flip A12UDT-031 | |
| Asus VivoBook Pro 16X OLED N7600PC-L2026X | |
| Lenovo ThinkPad X1 Extreme G4-20Y5CTO1WW (3050 Ti) | |
| Dell Inspiron 16 Plus 7610 | |
| Microsoft Surface Laptop Studio i7 RTX 3050 Ti | |
| Xiaomi Mi NoteBook Pro | |
| Average Intel Core i7-11370H (1081 - 1556, n=11) | |
| Schenker XMG Focus 15 | |
| Cinebench R20 / CPU (Multi Core) | |
| Average of class Multimedia (1887 - 12912, n=61, last 2 years) | |
| MSI Summit E16 Flip A12UDT-031 | |
| Lenovo ThinkPad X1 Extreme G4-20Y5CTO1WW (3050 Ti) | |
| Schenker XMG Focus 15 | |
| Dell Inspiron 16 Plus 7610 | |
| Microsoft Surface Laptop Studio i7 RTX 3050 Ti | |
| Average Intel Core i7-11370H (1438 - 2578, n=11) | |
| Xiaomi Mi NoteBook Pro | |
| Asus VivoBook Pro 16X OLED N7600PC-L2026X | |
| Cinebench R20 / CPU (Single Core) | |
| Average of class Multimedia (425 - 853, n=61, last 2 years) | |
| MSI Summit E16 Flip A12UDT-031 | |
| Asus VivoBook Pro 16X OLED N7600PC-L2026X | |
| Lenovo ThinkPad X1 Extreme G4-20Y5CTO1WW (3050 Ti) | |
| Dell Inspiron 16 Plus 7610 | |
| Microsoft Surface Laptop Studio i7 RTX 3050 Ti | |
| Average Intel Core i7-11370H (475 - 601, n=11) | |
| Xiaomi Mi NoteBook Pro | |
| Schenker XMG Focus 15 | |
| Cinebench R15 / CPU Multi 64Bit | |
| Average of class Multimedia (856 - 5224, n=65, last 2 years) | |
| MSI Summit E16 Flip A12UDT-031 | |
| Lenovo ThinkPad X1 Extreme G4-20Y5CTO1WW (3050 Ti) | |
| Schenker XMG Focus 15 | |
| Dell Inspiron 16 Plus 7610 | |
| Asus VivoBook Pro 16X OLED N7600PC-L2026X | |
| Microsoft Surface Laptop Studio i7 RTX 3050 Ti | |
| Average Intel Core i7-11370H (606 - 1086, n=17) | |
| Xiaomi Mi NoteBook Pro | |
| Cinebench R15 / CPU Single 64Bit | |
| Average of class Multimedia (184.8 - 326, n=63, last 2 years) | |
| MSI Summit E16 Flip A12UDT-031 | |
| Lenovo ThinkPad X1 Extreme G4-20Y5CTO1WW (3050 Ti) | |
| Dell Inspiron 16 Plus 7610 | |
| Asus VivoBook Pro 16X OLED N7600PC-L2026X | |
| Asus VivoBook Pro 16X OLED N7600PC-L2026X | |
| Microsoft Surface Laptop Studio i7 RTX 3050 Ti | |
| Xiaomi Mi NoteBook Pro | |
| Average Intel Core i7-11370H (162.9 - 233, n=15) | |
| Schenker XMG Focus 15 | |
| Blender / v2.79 BMW27 CPU | |
| Xiaomi Mi NoteBook Pro | |
| Average Intel Core i7-11370H (432 - 762, n=11) | |
| Microsoft Surface Laptop Studio i7 RTX 3050 Ti | |
| Asus VivoBook Pro 16X OLED N7600PC-L2026X | |
| MSI Summit E16 Flip A12UDT-031 | |
| Schenker XMG Focus 15 | |
| Dell Inspiron 16 Plus 7610 | |
| Lenovo ThinkPad X1 Extreme G4-20Y5CTO1WW (3050 Ti) | |
| Average of class Multimedia (100 - 557, n=62, last 2 years) | |
| 7-Zip 18.03 / 7z b 4 | |
| Average of class Multimedia (26062 - 130368, n=59, last 2 years) | |
| Lenovo ThinkPad X1 Extreme G4-20Y5CTO1WW (3050 Ti) | |
| Schenker XMG Focus 15 | |
| Dell Inspiron 16 Plus 7610 | |
| MSI Summit E16 Flip A12UDT-031 | |
| Asus VivoBook Pro 16X OLED N7600PC-L2026X | |
| Microsoft Surface Laptop Studio i7 RTX 3050 Ti | |
| Average Intel Core i7-11370H (18961 - 28520, n=11) | |
| Xiaomi Mi NoteBook Pro | |
| 7-Zip 18.03 / 7z b 4 -mmt1 | |
| Average of class Multimedia (3666 - 7545, n=60, last 2 years) | |
| Lenovo ThinkPad X1 Extreme G4-20Y5CTO1WW (3050 Ti) | |
| Dell Inspiron 16 Plus 7610 | |
| Asus VivoBook Pro 16X OLED N7600PC-L2026X | |
| Xiaomi Mi NoteBook Pro | |
| Average Intel Core i7-11370H (5074 - 5550, n=11) | |
| MSI Summit E16 Flip A12UDT-031 | |
| Schenker XMG Focus 15 | |
| Microsoft Surface Laptop Studio i7 RTX 3050 Ti | |
| Geekbench 5.5 / Multi-Core | |
| Average of class Multimedia (4652 - 20422, n=60, last 2 years) | |
| MSI Summit E16 Flip A12UDT-031 | |
| Schenker XMG Focus 15 | |
| Lenovo ThinkPad X1 Extreme G4-20Y5CTO1WW (3050 Ti) | |
| Microsoft Surface Laptop Studio i7 RTX 3050 Ti | |
| Average Intel Core i7-11370H (3828 - 6115, n=10) | |
| Xiaomi Mi NoteBook Pro | |
| Asus VivoBook Pro 16X OLED N7600PC-L2026X | |
| Geekbench 5.5 / Single-Core | |
| Average of class Multimedia (805 - 2974, n=60, last 2 years) | |
| MSI Summit E16 Flip A12UDT-031 | |
| Lenovo ThinkPad X1 Extreme G4-20Y5CTO1WW (3050 Ti) | |
| Xiaomi Mi NoteBook Pro | |
| Microsoft Surface Laptop Studio i7 RTX 3050 Ti | |
| Average Intel Core i7-11370H (1376 - 1607, n=10) | |
| Asus VivoBook Pro 16X OLED N7600PC-L2026X | |
| Schenker XMG Focus 15 | |
| HWBOT x265 Benchmark v2.2 / 4k Preset | |
| Average of class Multimedia (5.26 - 36.1, n=60, last 2 years) | |
| Schenker XMG Focus 15 | |
| Lenovo ThinkPad X1 Extreme G4-20Y5CTO1WW (3050 Ti) | |
| Dell Inspiron 16 Plus 7610 | |
| MSI Summit E16 Flip A12UDT-031 | |
| Microsoft Surface Laptop Studio i7 RTX 3050 Ti | |
| Average Intel Core i7-11370H (4.98 - 8.82, n=11) | |
| Xiaomi Mi NoteBook Pro | |
| Asus VivoBook Pro 16X OLED N7600PC-L2026X | |
| LibreOffice / 20 Documents To PDF | |
| Microsoft Surface Laptop Studio i7 RTX 3050 Ti | |
| Asus VivoBook Pro 16X OLED N7600PC-L2026X | |
| MSI Summit E16 Flip A12UDT-031 | |
| Average of class Multimedia (23.9 - 146.7, n=61, last 2 years) | |
| Schenker XMG Focus 15 | |
| Dell Inspiron 16 Plus 7610 | |
| Average Intel Core i7-11370H (23.6 - 56.5, n=11) | |
| Xiaomi Mi NoteBook Pro | |
| Lenovo ThinkPad X1 Extreme G4-20Y5CTO1WW (3050 Ti) | |
| R Benchmark 2.5 / Overall mean | |
| Schenker XMG Focus 15 | |
| Microsoft Surface Laptop Studio i7 RTX 3050 Ti | |
| Xiaomi Mi NoteBook Pro | |
| Average Intel Core i7-11370H (0.544 - 0.596, n=11) | |
| Dell Inspiron 16 Plus 7610 | |
| Asus VivoBook Pro 16X OLED N7600PC-L2026X | |
| Lenovo ThinkPad X1 Extreme G4-20Y5CTO1WW (3050 Ti) | |
| MSI Summit E16 Flip A12UDT-031 | |
| Average of class Multimedia (0.3604 - 0.947, n=60, last 2 years) | |
* ... smaller is better
AIDA64: FP32 Ray-Trace | FPU Julia | CPU SHA3 | CPU Queen | FPU SinJulia | FPU Mandel | CPU AES | CPU ZLib | FP64 Ray-Trace | CPU PhotoWorxx
| Performance rating | |
| Average of class Multimedia | |
| Lenovo ThinkPad X1 Extreme G4-20Y5CTO1WW (3050 Ti) | |
| MSI Summit E16 Flip A12UDT-031 | |
| Average Intel Core i7-11370H | |
| Microsoft Surface Laptop Studio i7 RTX 3050 Ti | |
| Xiaomi Mi NoteBook Pro | |
| Asus VivoBook Pro 16X OLED N7600PC-L2026X | |
| AIDA64 / FP32 Ray-Trace | |
| Average of class Multimedia (2214 - 50388, n=57, last 2 years) | |
| Lenovo ThinkPad X1 Extreme G4-20Y5CTO1WW (3050 Ti) | |
| MSI Summit E16 Flip A12UDT-031 | |
| Microsoft Surface Laptop Studio i7 RTX 3050 Ti | |
| Average Intel Core i7-11370H (5204 - 8413, n=10) | |
| Xiaomi Mi NoteBook Pro | |
| Asus VivoBook Pro 16X OLED N7600PC-L2026X | |
| AIDA64 / FPU Julia | |
| Average of class Multimedia (12867 - 201874, n=58, last 2 years) | |
| MSI Summit E16 Flip A12UDT-031 | |
| Lenovo ThinkPad X1 Extreme G4-20Y5CTO1WW (3050 Ti) | |
| Microsoft Surface Laptop Studio i7 RTX 3050 Ti | |
| Average Intel Core i7-11370H (23958 - 34020, n=10) | |
| Xiaomi Mi NoteBook Pro | |
| Asus VivoBook Pro 16X OLED N7600PC-L2026X | |
| AIDA64 / CPU SHA3 | |
| Lenovo ThinkPad X1 Extreme G4-20Y5CTO1WW (3050 Ti) | |
| Average of class Multimedia (626 - 8623, n=58, last 2 years) | |
| MSI Summit E16 Flip A12UDT-031 | |
| Average Intel Core i7-11370H (1656 - 2297, n=10) | |
| Microsoft Surface Laptop Studio i7 RTX 3050 Ti | |
| Xiaomi Mi NoteBook Pro | |
| Asus VivoBook Pro 16X OLED N7600PC-L2026X | |
| AIDA64 / CPU Queen | |
| MSI Summit E16 Flip A12UDT-031 | |
| Lenovo ThinkPad X1 Extreme G4-20Y5CTO1WW (3050 Ti) | |
| Average of class Multimedia (13483 - 181505, n=45, last 2 years) | |
| Xiaomi Mi NoteBook Pro | |
| Average Intel Core i7-11370H (42086 - 52930, n=10) | |
| Microsoft Surface Laptop Studio i7 RTX 3050 Ti | |
| Asus VivoBook Pro 16X OLED N7600PC-L2026X | |
| AIDA64 / FPU SinJulia | |
| Lenovo ThinkPad X1 Extreme G4-20Y5CTO1WW (3050 Ti) | |
| Average of class Multimedia (886 - 28794, n=58, last 2 years) | |
| MSI Summit E16 Flip A12UDT-031 | |
| Xiaomi Mi NoteBook Pro | |
| Average Intel Core i7-11370H (3755 - 5027, n=10) | |
| Microsoft Surface Laptop Studio i7 RTX 3050 Ti | |
| Asus VivoBook Pro 16X OLED N7600PC-L2026X | |
| AIDA64 / FPU Mandel | |
| Average of class Multimedia (6395 - 105740, n=57, last 2 years) | |
| Lenovo ThinkPad X1 Extreme G4-20Y5CTO1WW (3050 Ti) | |
| MSI Summit E16 Flip A12UDT-031 | |
| Average Intel Core i7-11370H (14433 - 20417, n=10) | |
| Microsoft Surface Laptop Studio i7 RTX 3050 Ti | |
| Xiaomi Mi NoteBook Pro | |
| Asus VivoBook Pro 16X OLED N7600PC-L2026X | |
| AIDA64 / CPU AES | |
| Lenovo ThinkPad X1 Extreme G4-20Y5CTO1WW (3050 Ti) | |
| Xiaomi Mi NoteBook Pro | |
| Average Intel Core i7-11370H (44267 - 76866, n=10) | |
| Average of class Multimedia (8171 - 126790, n=58, last 2 years) | |
| MSI Summit E16 Flip A12UDT-031 | |
| Asus VivoBook Pro 16X OLED N7600PC-L2026X | |
| Microsoft Surface Laptop Studio i7 RTX 3050 Ti | |
| AIDA64 / CPU ZLib | |
| Average of class Multimedia (143.8 - 2022, n=58, last 2 years) | |
| MSI Summit E16 Flip A12UDT-031 | |
| Lenovo ThinkPad X1 Extreme G4-20Y5CTO1WW (3050 Ti) | |
| Xiaomi Mi NoteBook Pro | |
| Average Intel Core i7-11370H (289 - 422, n=10) | |
| Microsoft Surface Laptop Studio i7 RTX 3050 Ti | |
| Asus VivoBook Pro 16X OLED N7600PC-L2026X | |
| AIDA64 / FP64 Ray-Trace | |
| Average of class Multimedia (1014 - 26875, n=58, last 2 years) | |
| Lenovo ThinkPad X1 Extreme G4-20Y5CTO1WW (3050 Ti) | |
| MSI Summit E16 Flip A12UDT-031 | |
| Average Intel Core i7-11370H (2756 - 4551, n=10) | |
| Microsoft Surface Laptop Studio i7 RTX 3050 Ti | |
| Xiaomi Mi NoteBook Pro | |
| Asus VivoBook Pro 16X OLED N7600PC-L2026X | |
| AIDA64 / CPU PhotoWorxx | |
| Average of class Multimedia (8187 - 88154, n=58, last 2 years) | |
| MSI Summit E16 Flip A12UDT-031 | |
| Microsoft Surface Laptop Studio i7 RTX 3050 Ti | |
| Average Intel Core i7-11370H (15892 - 40069, n=10) | |
| Xiaomi Mi NoteBook Pro | |
| Asus VivoBook Pro 16X OLED N7600PC-L2026X | |
| Lenovo ThinkPad X1 Extreme G4-20Y5CTO1WW (3050 Ti) | |
System Performance
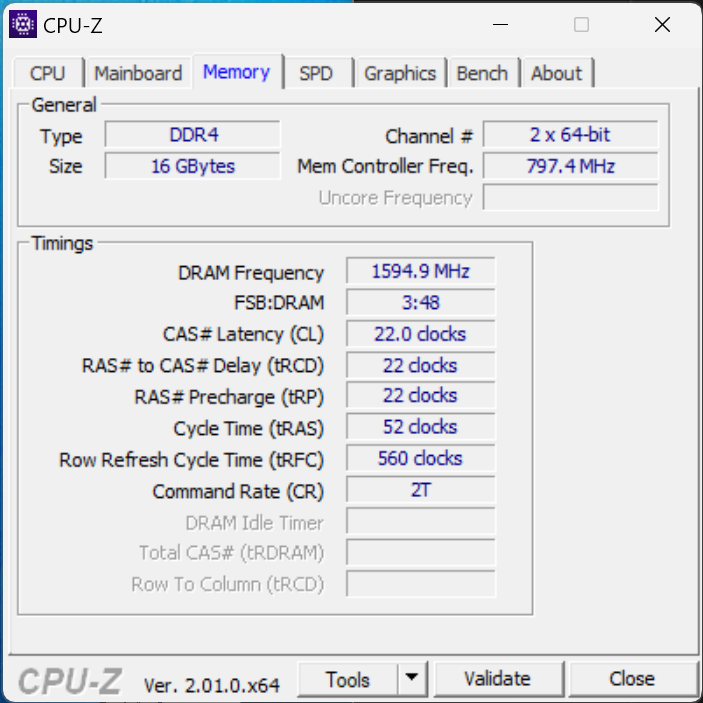
In our system performance, benchmarks, the Vivobook Pro 16X OLED achieves great results overall. The multimedia system places far above the average. At the same time, however, the Vivobook cannot quite match the other devices in our comparison. The laptop suffers from a reduced performance in PCMark 10 and CrossMark due to two issues. One of them is the performance profile setting that quickly limits the performance potential of both CPU and GPU after a short time and the second issue is the fairly slow speed of the laptop's RAM. As a result the AIDA memory test scores are relatively low and the latencies high.
Regardless, the Vivobook Pro is very responsive during daily use and able manage occasional demanding tasks without any issues. Most benchmarks stress a laptop significantly harder than a normal workflow.
CrossMark: Overall | Productivity | Creativity | Responsiveness
| PCMark 10 / Score | |
| Average of class Multimedia (4325 - 10386, n=56, last 2 years) | |
| Lenovo ThinkPad X1 Extreme G4-20Y5CTO1WW (3050 Ti) | |
| Schenker XMG Focus 15 | |
| Dell Inspiron 16 Plus 7610 | |
| MSI Summit E16 Flip A12UDT-031 | |
| Schenker Vision 14 | |
| Asus VivoBook Pro 16X OLED N7600PC-L2026X | |
| Average Intel Core i7-11370H, NVIDIA GeForce RTX 3050 4GB Laptop GPU (n=1) | |
| Microsoft Surface Laptop Studio i7 RTX 3050 Ti | |
| Lenovo IdeaPad Slim 7i Pro 14IHU5 | |
| Xiaomi Mi NoteBook Pro | |
| PCMark 10 / Essentials | |
| Lenovo ThinkPad X1 Extreme G4-20Y5CTO1WW (3050 Ti) | |
| Average of class Multimedia (8025 - 11664, n=55, last 2 years) | |
| Lenovo IdeaPad Slim 7i Pro 14IHU5 | |
| Schenker XMG Focus 15 | |
| Xiaomi Mi NoteBook Pro | |
| Dell Inspiron 16 Plus 7610 | |
| MSI Summit E16 Flip A12UDT-031 | |
| Schenker Vision 14 | |
| Asus VivoBook Pro 16X OLED N7600PC-L2026X | |
| Average Intel Core i7-11370H, NVIDIA GeForce RTX 3050 4GB Laptop GPU (n=1) | |
| Microsoft Surface Laptop Studio i7 RTX 3050 Ti | |
| PCMark 10 / Productivity | |
| Average of class Multimedia (7323 - 18233, n=55, last 2 years) | |
| Schenker Vision 14 | |
| Schenker XMG Focus 15 | |
| Asus VivoBook Pro 16X OLED N7600PC-L2026X | |
| Average Intel Core i7-11370H, NVIDIA GeForce RTX 3050 4GB Laptop GPU (n=1) | |
| Lenovo ThinkPad X1 Extreme G4-20Y5CTO1WW (3050 Ti) | |
| Dell Inspiron 16 Plus 7610 | |
| Microsoft Surface Laptop Studio i7 RTX 3050 Ti | |
| MSI Summit E16 Flip A12UDT-031 | |
| Xiaomi Mi NoteBook Pro | |
| Lenovo IdeaPad Slim 7i Pro 14IHU5 | |
| PCMark 10 / Digital Content Creation | |
| Average of class Multimedia (3651 - 16240, n=55, last 2 years) | |
| Schenker XMG Focus 15 | |
| Lenovo ThinkPad X1 Extreme G4-20Y5CTO1WW (3050 Ti) | |
| Dell Inspiron 16 Plus 7610 | |
| MSI Summit E16 Flip A12UDT-031 | |
| Schenker Vision 14 | |
| Asus VivoBook Pro 16X OLED N7600PC-L2026X | |
| Average Intel Core i7-11370H, NVIDIA GeForce RTX 3050 4GB Laptop GPU (n=1) | |
| Microsoft Surface Laptop Studio i7 RTX 3050 Ti | |
| Lenovo IdeaPad Slim 7i Pro 14IHU5 | |
| Xiaomi Mi NoteBook Pro | |
| CrossMark / Overall | |
| Average of class Multimedia (866 - 2728, n=64, last 2 years) | |
| MSI Summit E16 Flip A12UDT-031 | |
| Schenker Vision 14 | |
| Microsoft Surface Laptop Studio i7 RTX 3050 Ti | |
| Xiaomi Mi NoteBook Pro | |
| Asus VivoBook Pro 16X OLED N7600PC-L2026X | |
| Average Intel Core i7-11370H, NVIDIA GeForce RTX 3050 4GB Laptop GPU (n=1) | |
| CrossMark / Productivity | |
| Average of class Multimedia (931 - 2489, n=64, last 2 years) | |
| MSI Summit E16 Flip A12UDT-031 | |
| Schenker Vision 14 | |
| Xiaomi Mi NoteBook Pro | |
| Microsoft Surface Laptop Studio i7 RTX 3050 Ti | |
| Asus VivoBook Pro 16X OLED N7600PC-L2026X | |
| Average Intel Core i7-11370H, NVIDIA GeForce RTX 3050 4GB Laptop GPU (n=1) | |
| CrossMark / Creativity | |
| Average of class Multimedia (907 - 3465, n=64, last 2 years) | |
| MSI Summit E16 Flip A12UDT-031 | |
| Microsoft Surface Laptop Studio i7 RTX 3050 Ti | |
| Schenker Vision 14 | |
| Xiaomi Mi NoteBook Pro | |
| Asus VivoBook Pro 16X OLED N7600PC-L2026X | |
| Average Intel Core i7-11370H, NVIDIA GeForce RTX 3050 4GB Laptop GPU (n=1) | |
| CrossMark / Responsiveness | |
| MSI Summit E16 Flip A12UDT-031 | |
| Average of class Multimedia (605 - 2024, n=64, last 2 years) | |
| Schenker Vision 14 | |
| Xiaomi Mi NoteBook Pro | |
| Microsoft Surface Laptop Studio i7 RTX 3050 Ti | |
| Asus VivoBook Pro 16X OLED N7600PC-L2026X | |
| Average Intel Core i7-11370H, NVIDIA GeForce RTX 3050 4GB Laptop GPU (n=1) | |
| PCMark 10 Score | 5619 points | |
Help | ||
| AIDA64 / Memory Copy | |
| Average of class Multimedia (11299 - 132135, n=58, last 2 years) | |
| MSI Summit E16 Flip A12UDT-031 | |
| Microsoft Surface Laptop Studio i7 RTX 3050 Ti | |
| Average Intel Core i7-11370H (32035 - 64524, n=10) | |
| Lenovo ThinkPad X1 Extreme G4-20Y5CTO1WW (3050 Ti) | |
| Xiaomi Mi NoteBook Pro | |
| Asus VivoBook Pro 16X OLED N7600PC-L2026X | |
| AIDA64 / Memory Read | |
| Average of class Multimedia (11624 - 174586, n=58, last 2 years) | |
| MSI Summit E16 Flip A12UDT-031 | |
| Microsoft Surface Laptop Studio i7 RTX 3050 Ti | |
| Average Intel Core i7-11370H (37216 - 62417, n=10) | |
| Lenovo ThinkPad X1 Extreme G4-20Y5CTO1WW (3050 Ti) | |
| Xiaomi Mi NoteBook Pro | |
| Asus VivoBook Pro 16X OLED N7600PC-L2026X | |
| AIDA64 / Memory Write | |
| Average of class Multimedia (11755 - 134998, n=58, last 2 years) | |
| Microsoft Surface Laptop Studio i7 RTX 3050 Ti | |
| MSI Summit E16 Flip A12UDT-031 | |
| Average Intel Core i7-11370H (36920 - 65610, n=10) | |
| Lenovo ThinkPad X1 Extreme G4-20Y5CTO1WW (3050 Ti) | |
| Asus VivoBook Pro 16X OLED N7600PC-L2026X | |
| Xiaomi Mi NoteBook Pro | |
| AIDA64 / Memory Latency | |
| MSI Summit E16 Flip A12UDT-031 | |
| Average of class Multimedia (7 - 535, n=57, last 2 years) | |
| Microsoft Surface Laptop Studio i7 RTX 3050 Ti | |
| Asus VivoBook Pro 16X OLED N7600PC-L2026X | |
| Average Intel Core i7-11370H (73.4 - 103, n=10) | |
| Lenovo ThinkPad X1 Extreme G4-20Y5CTO1WW (3050 Ti) | |
| Xiaomi Mi NoteBook Pro | |
| Dell Inspiron 16 Plus 7610 | |
* ... smaller is better
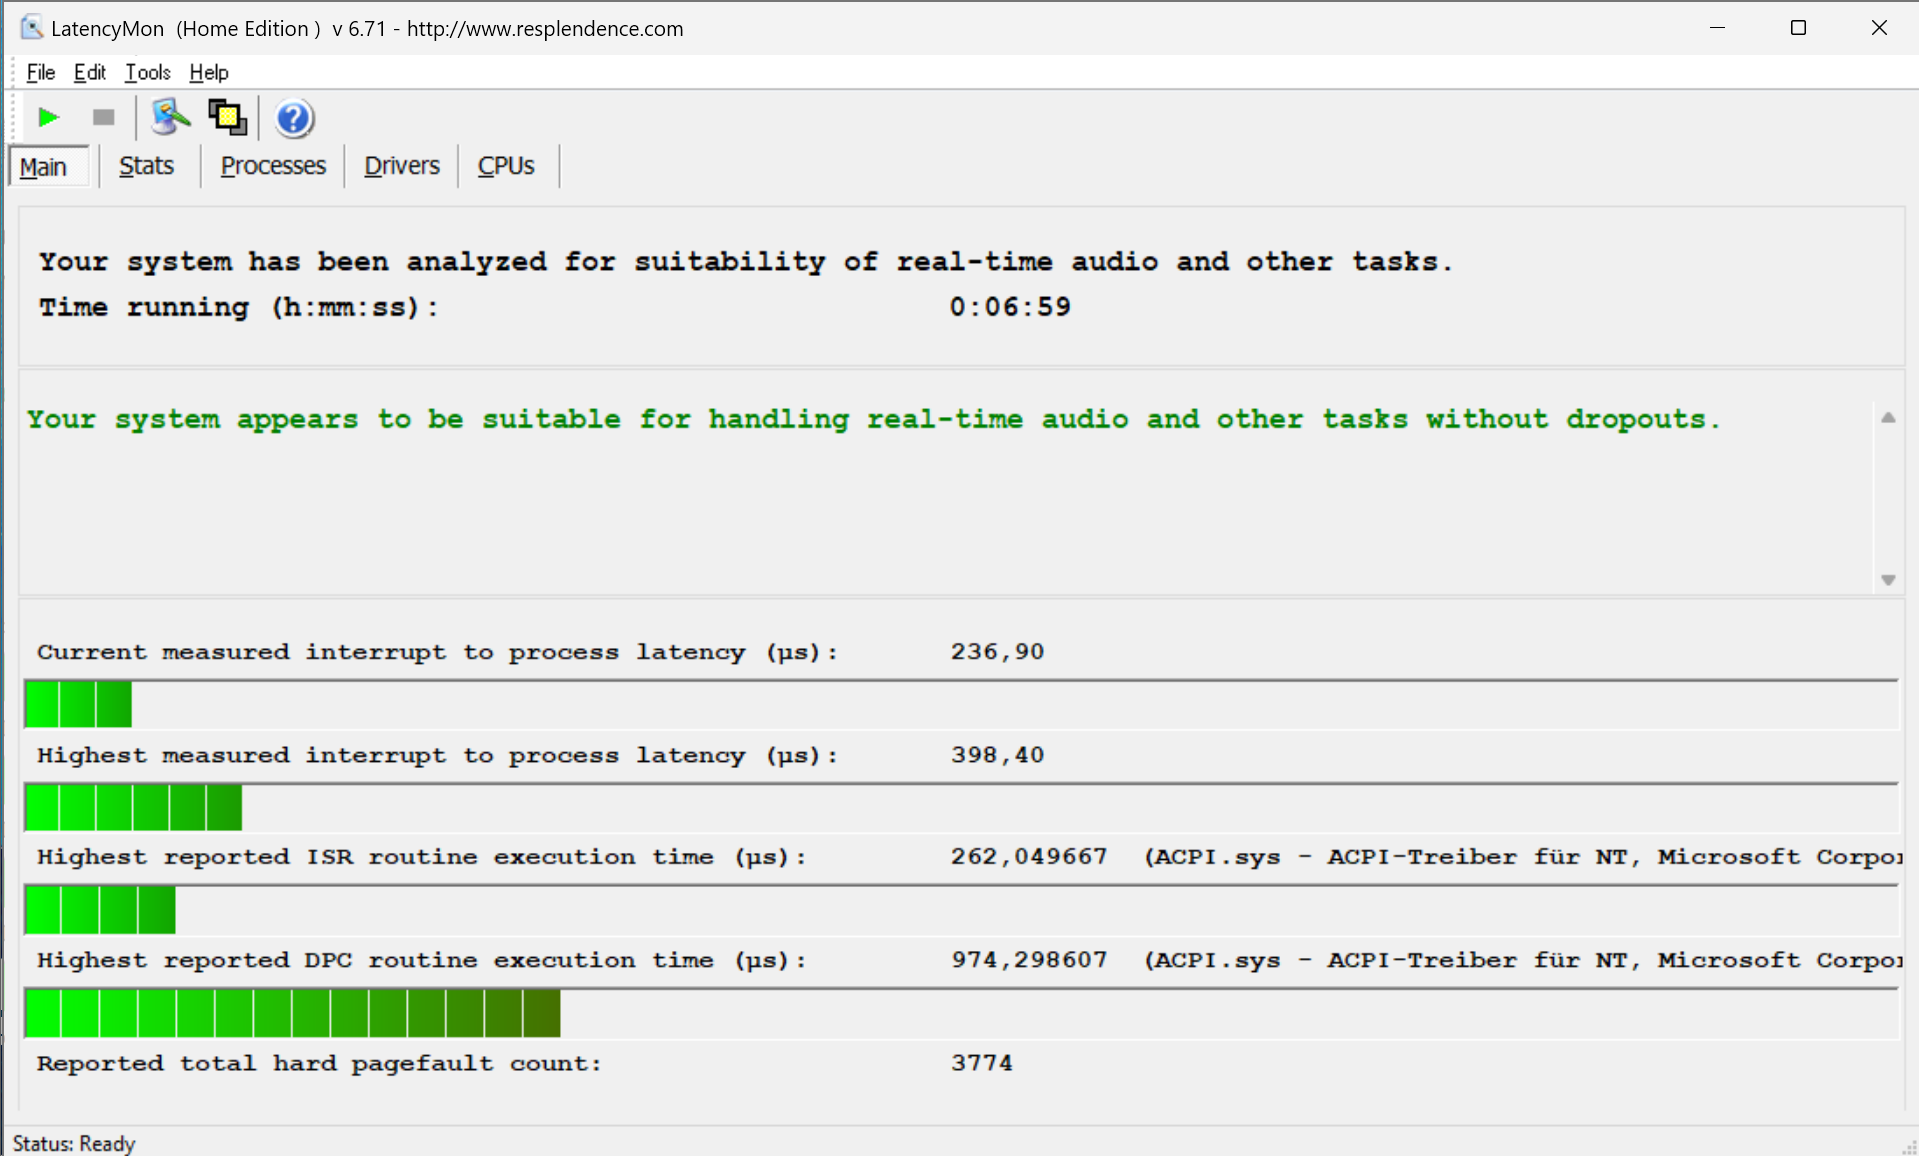
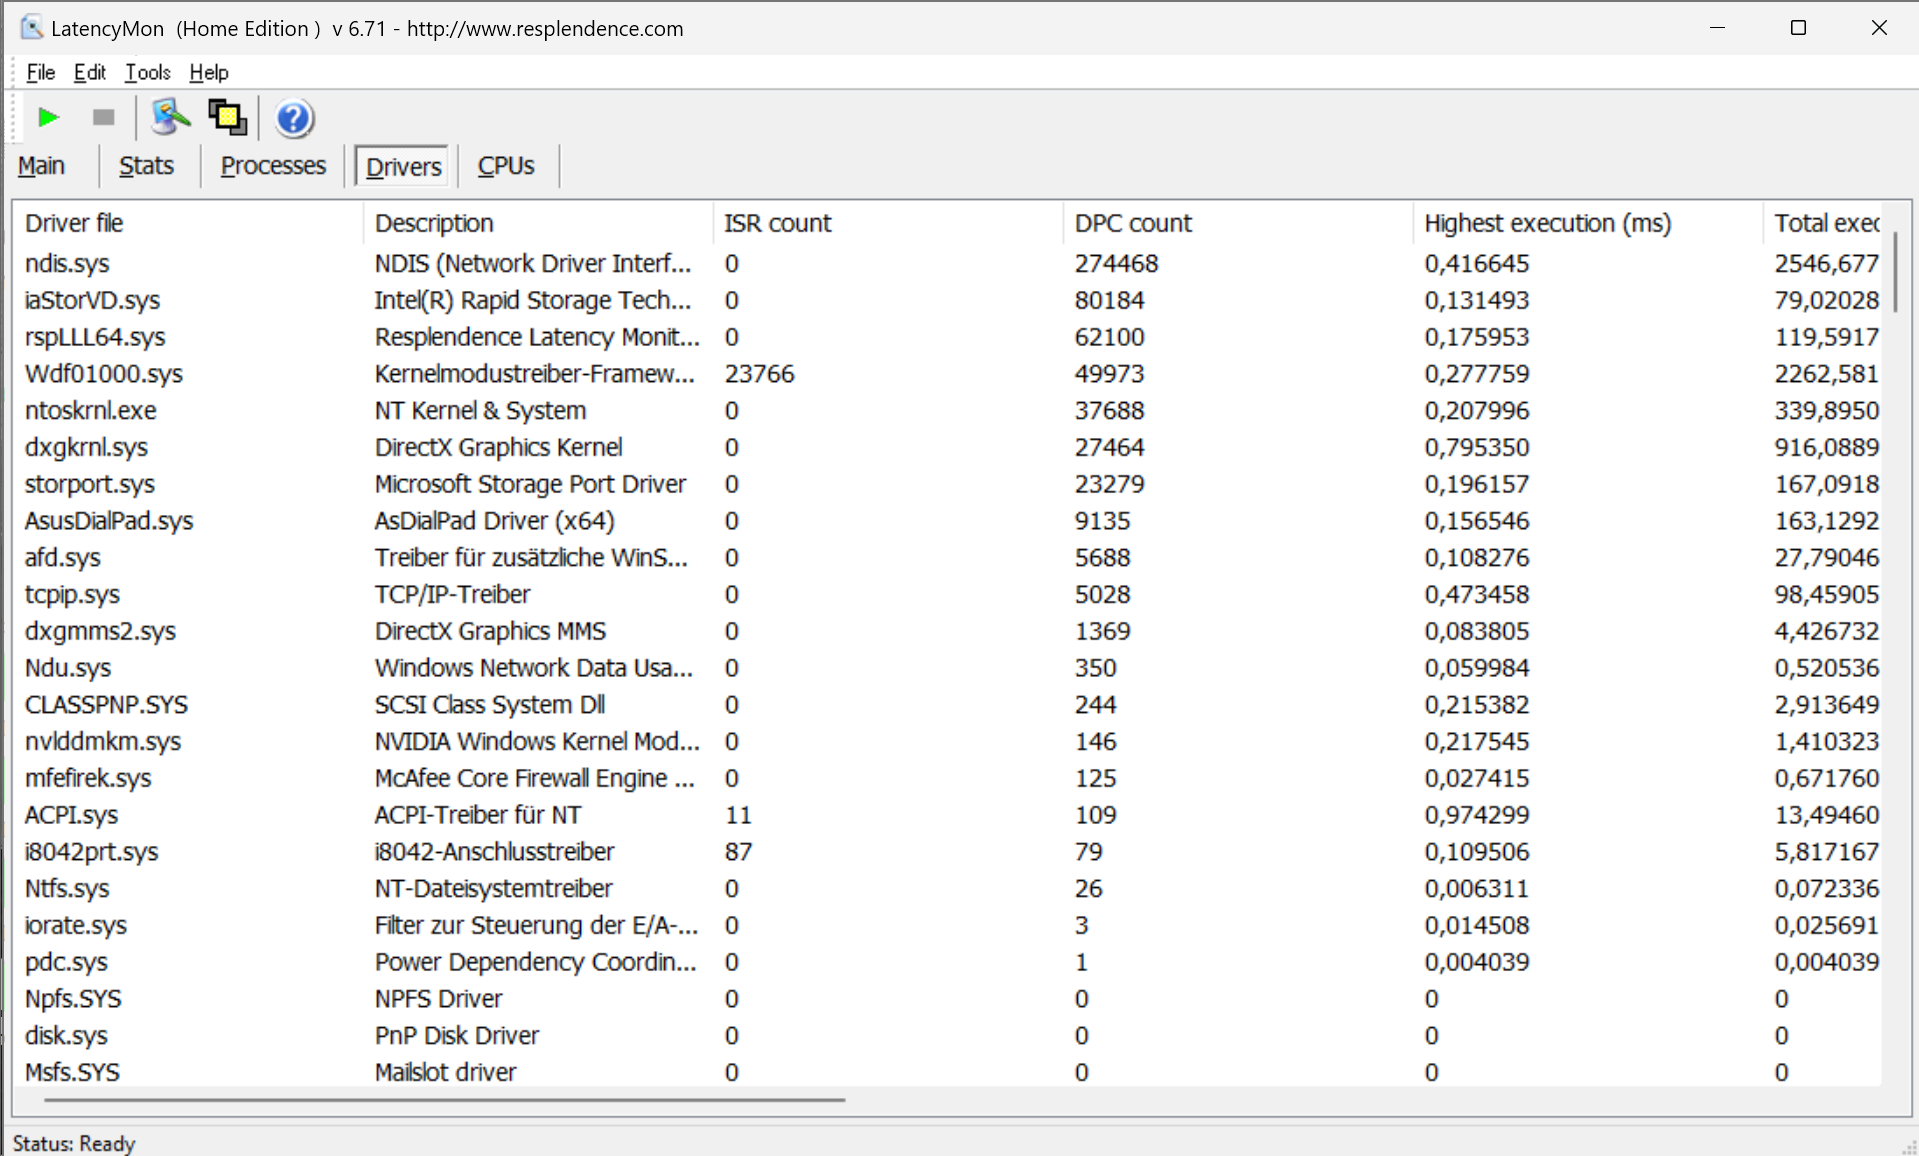
DPC Latency
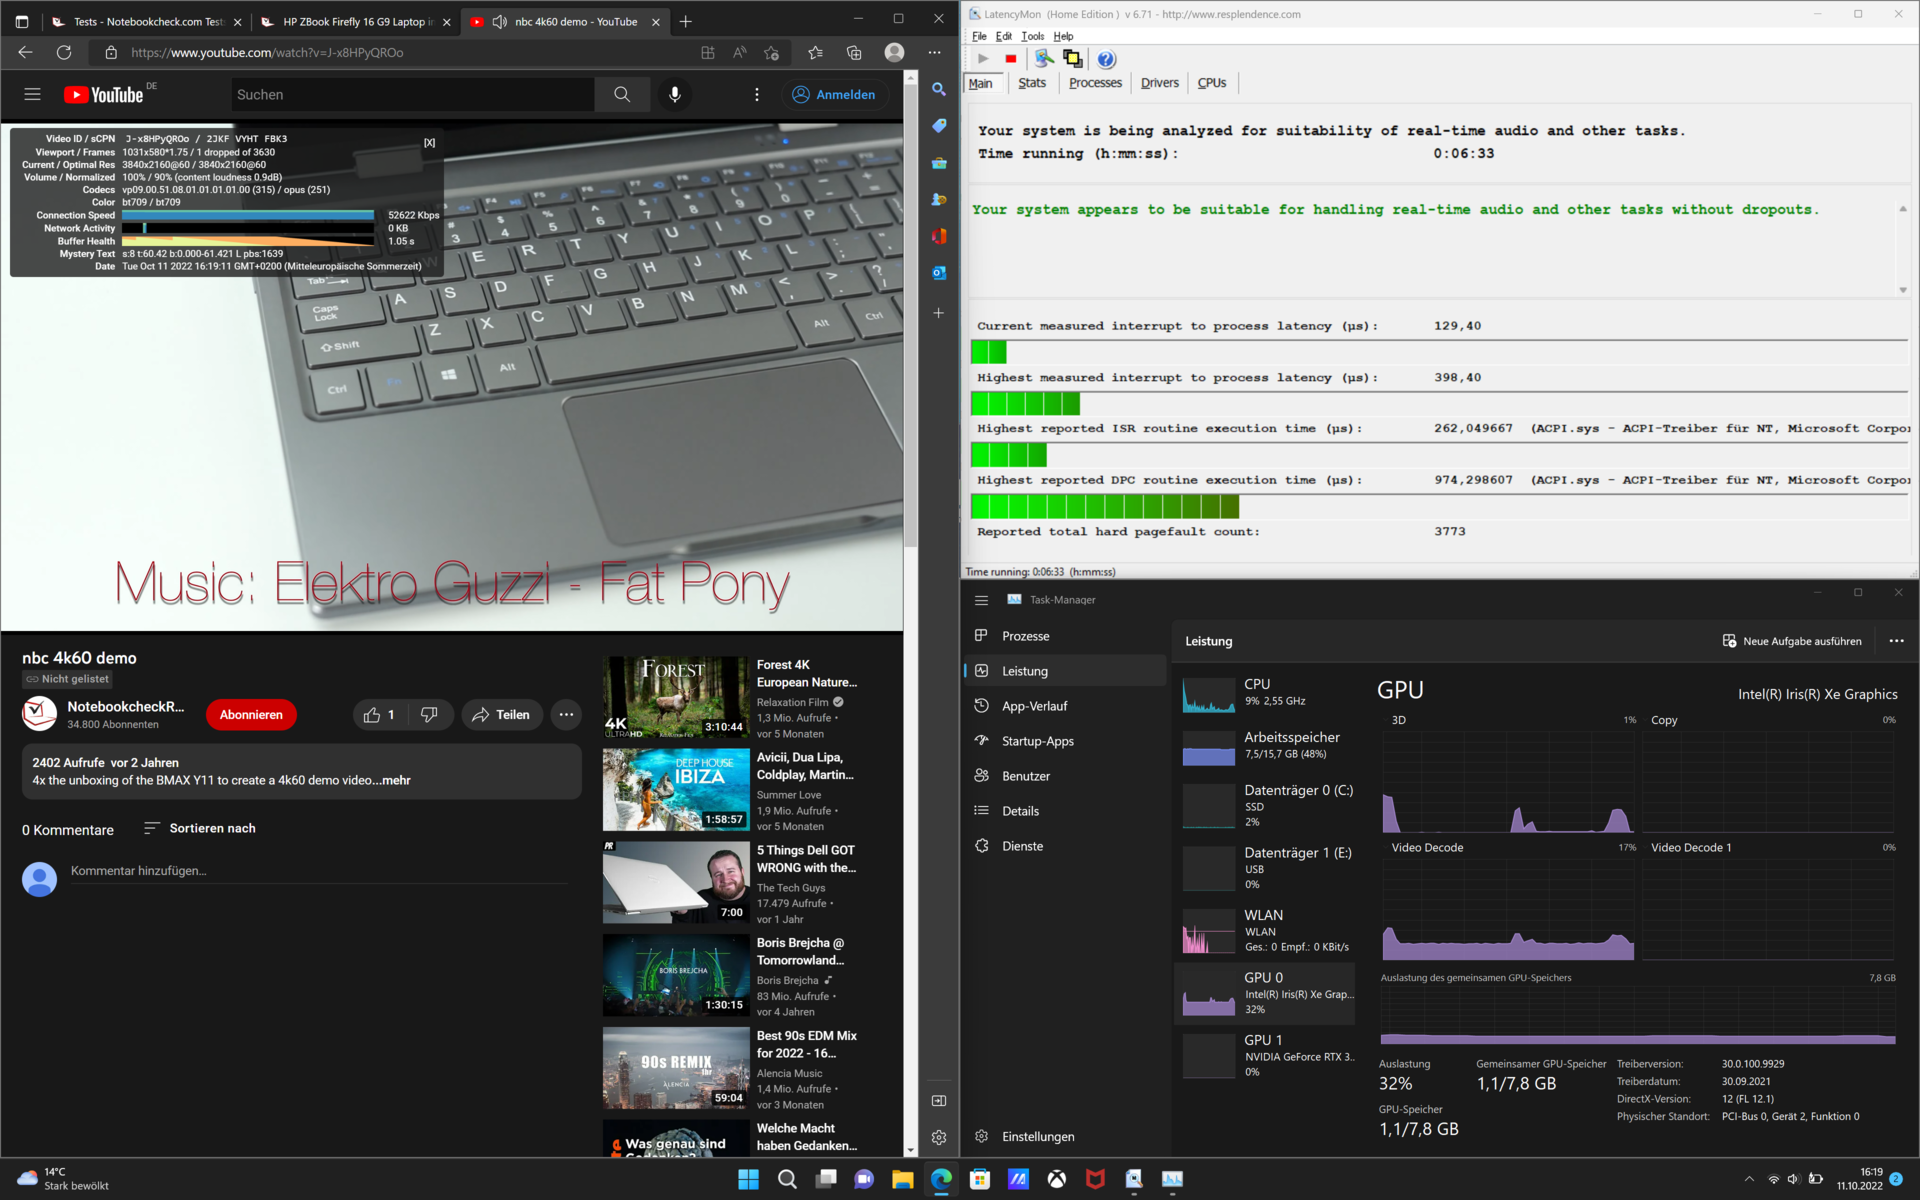
Before performing our benchmarks, we updated the device with all the available drivers and the latest Windows updates. On the Vivobook Pro 16X, this results in very low DPC latencies. We recorded one dropped frame during video playback of a 4K YouTube video with 60 Hz. With the current software and hardware configuration, the laptop runs very well.
| DPC Latencies / LatencyMon - interrupt to process latency (max), Web, Youtube, Prime95 | |
| Dell Inspiron 16 Plus 7610 | |
| Lenovo ThinkPad X1 Extreme G4-20Y5CTO1WW (3050 Ti) | |
| MSI Summit E16 Flip A12UDT-031 | |
| Microsoft Surface Laptop Studio i7 RTX 3050 Ti | |
| Schenker XMG Focus 15 | |
| Asus VivoBook Pro 16X OLED N7600PC-L2026X | |
* ... smaller is better
Storage Solution
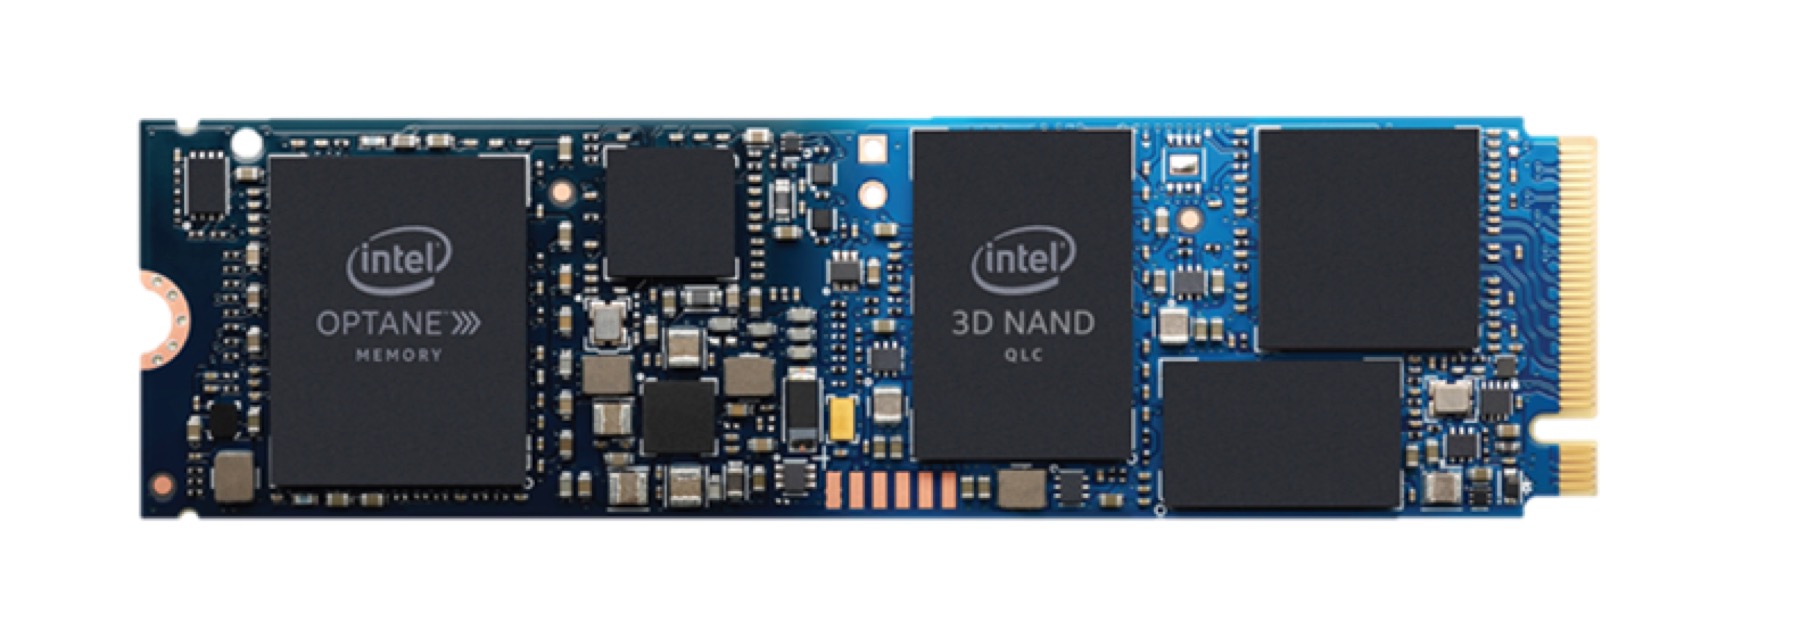
Intel's Optane Memory H10 NVMe SSD is an interesting concept. There are two different memory types and controllers on the PCB. Near the interface side, there is a 512-GB Intel QLC 3D NAND memory module with an appropriate controller. In the back of the M.2-2280 memory, there is a 32-GB Intel Optane memory module. Despite this, it is no longer one of the fastest drive options. In our SSD and HDD table, the Intel module now one of the lowest places. It should be noted that the Intel Optane technology drive was first introduced in 2019, making it three years old at the time of writing. The NVMe SSD with integrated, low-latency Optane cache is only connected via PCIe3.0x4, instead of the now common PCIe 4.0.
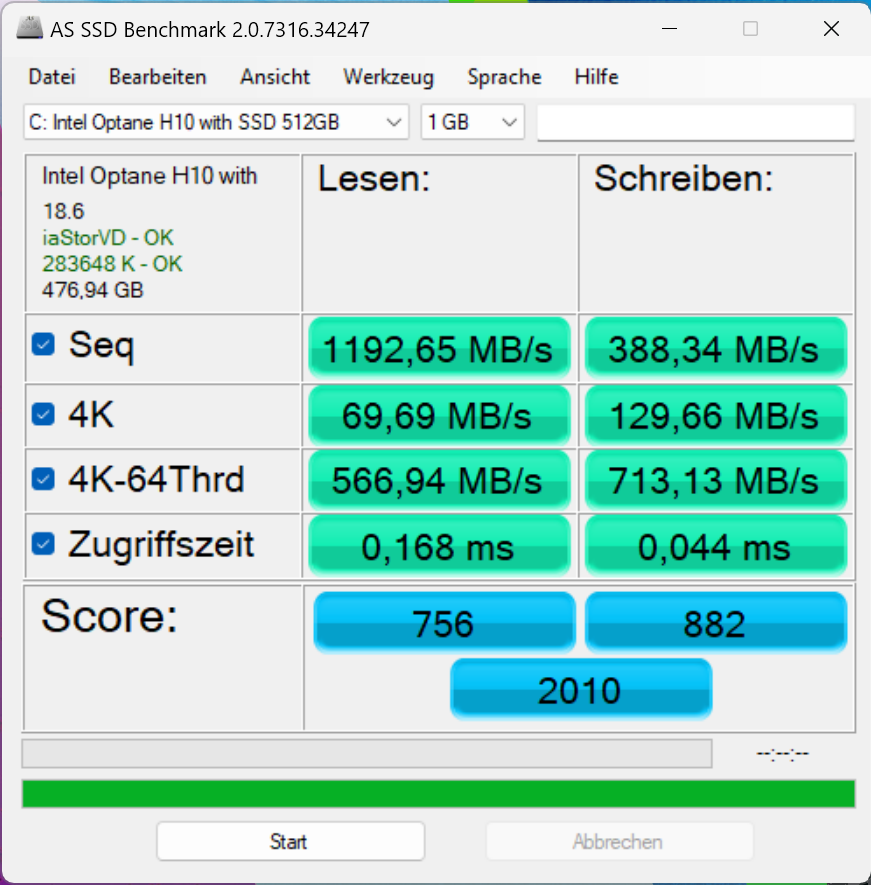
Our DiskSpd read loop quickly shows the internal layout of the SSD. As soon as the memory controller registers frequent access on a certain file, it is transferred to the Optane memory and accessed from there. This results in a signficant performance boost.

* ... smaller is better
Disk Throttling: DiskSpd Read Loop, Queue Depth 8
GPU Performance
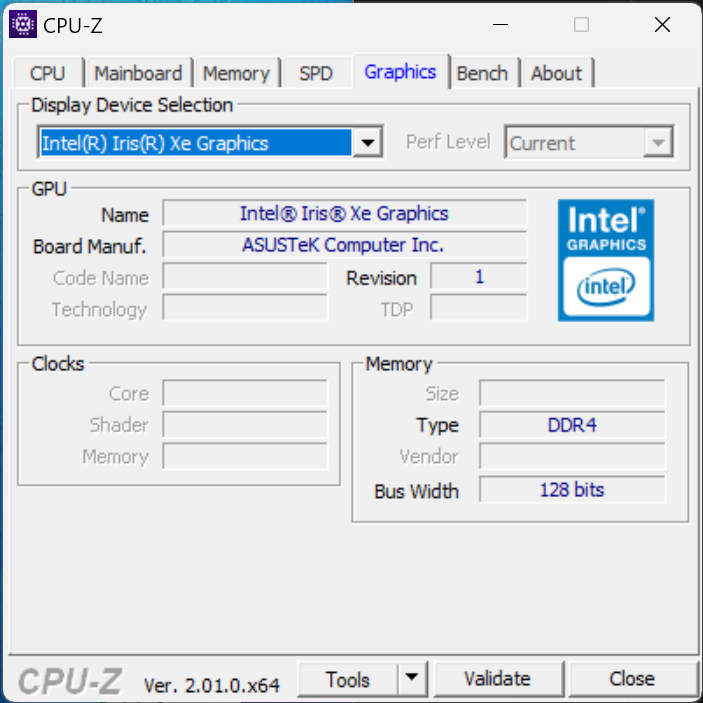
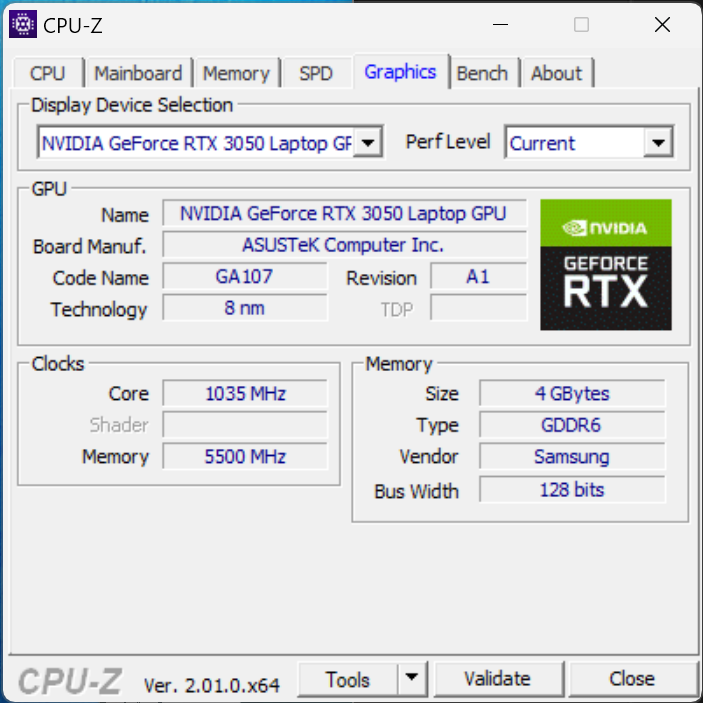
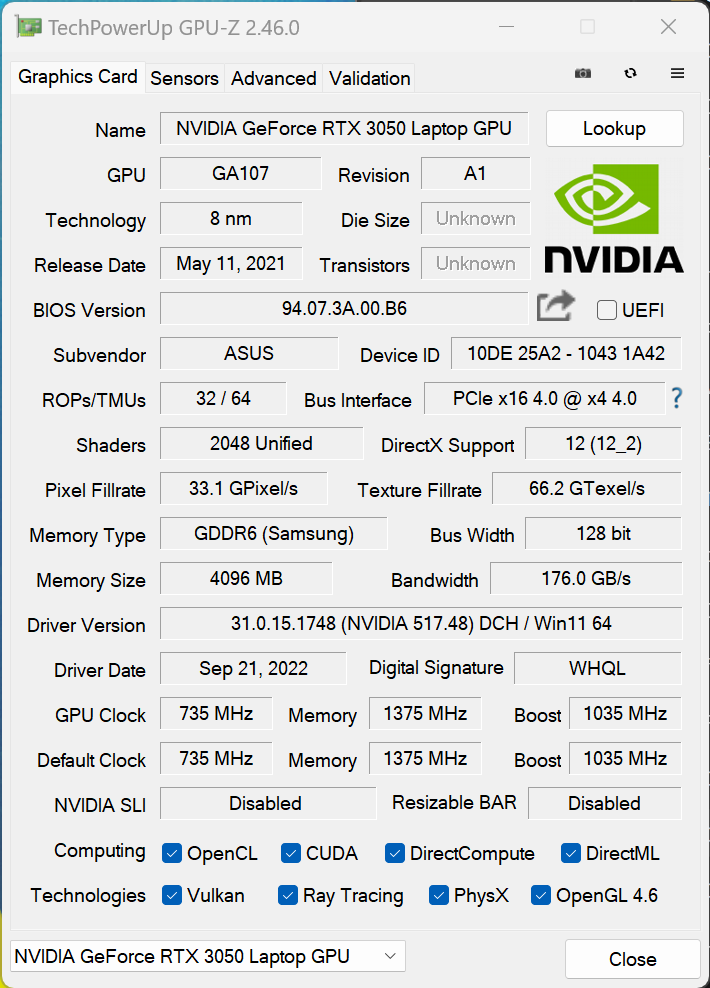
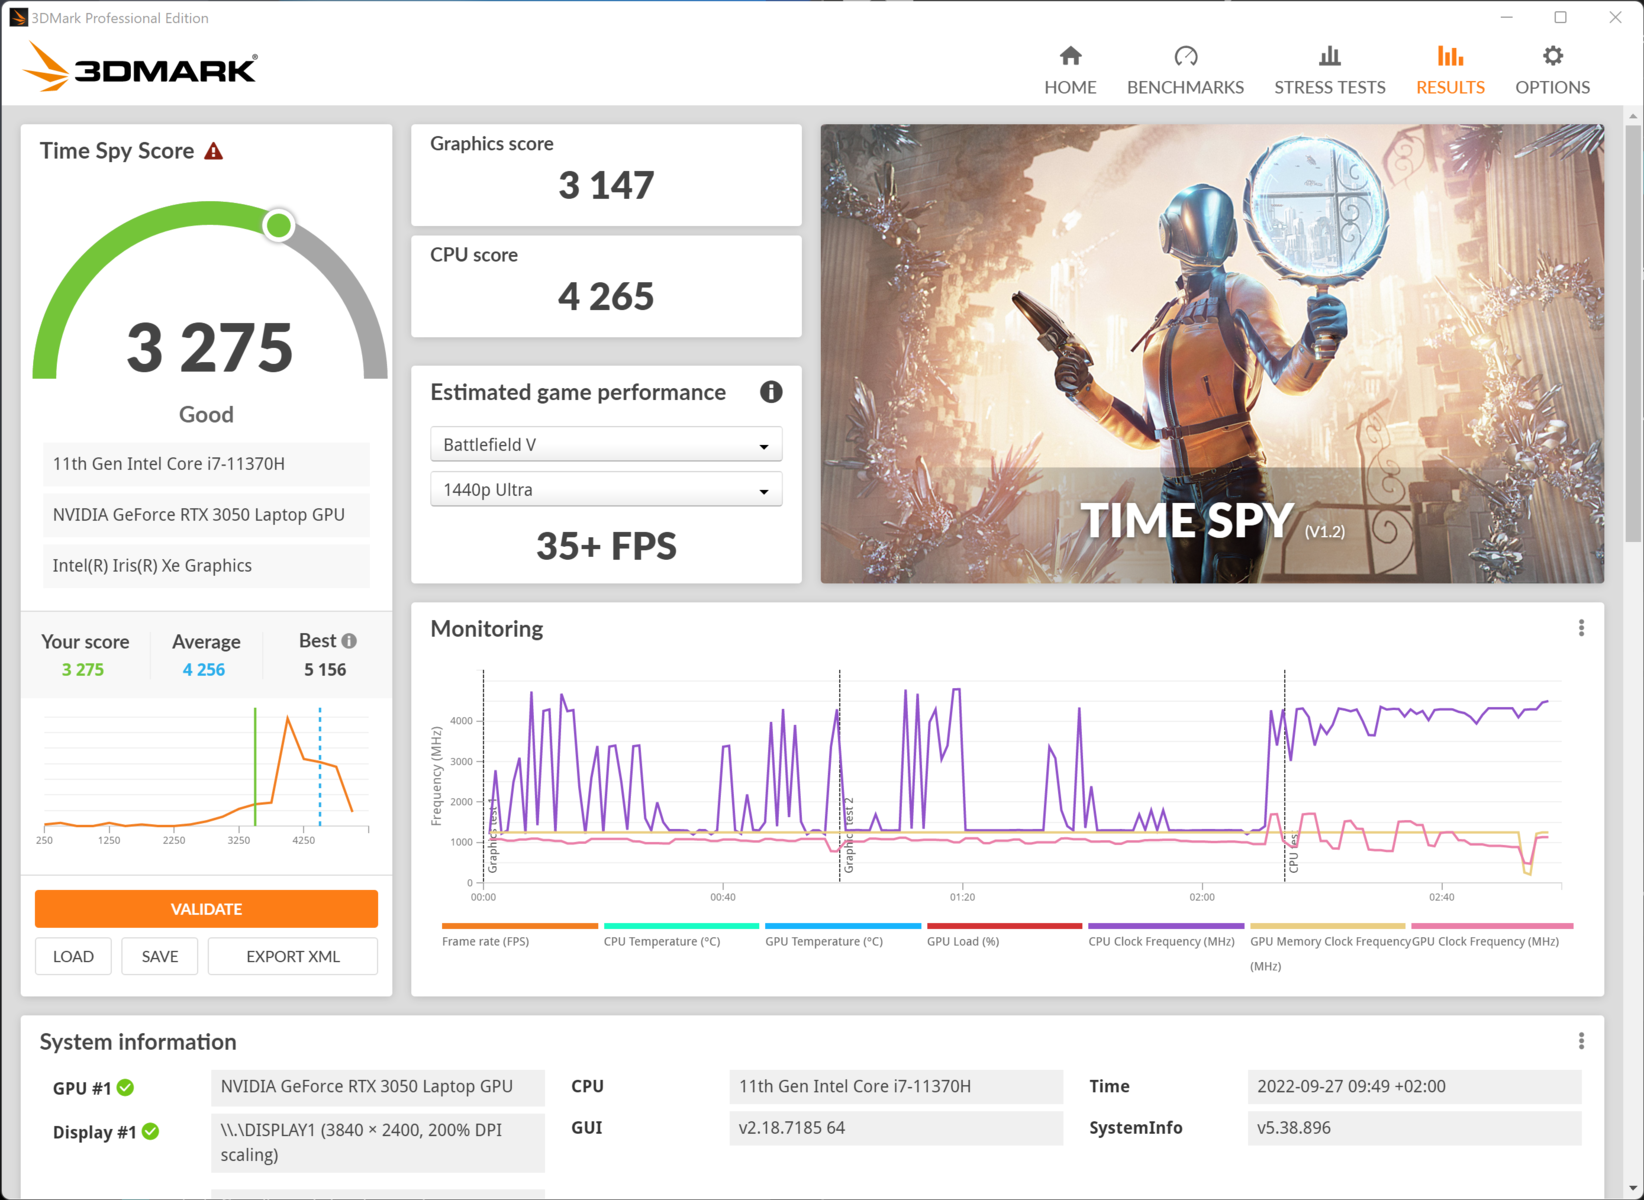
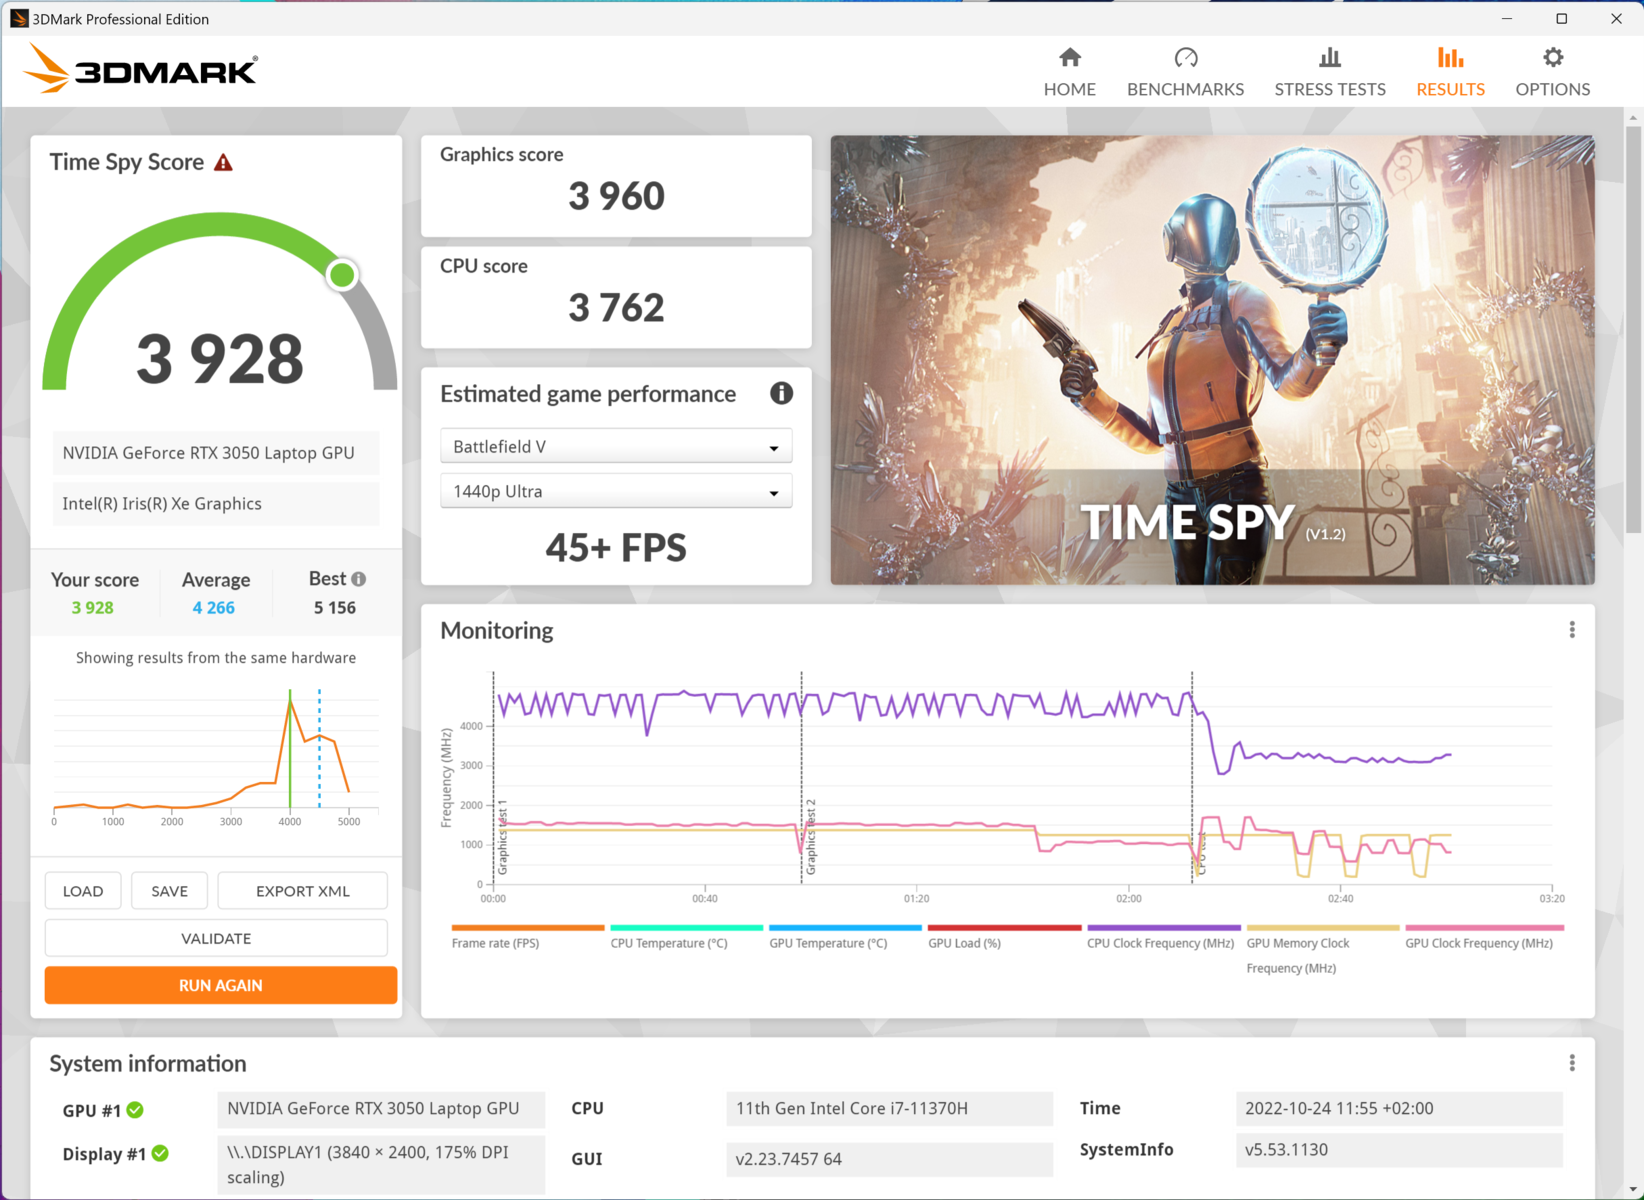
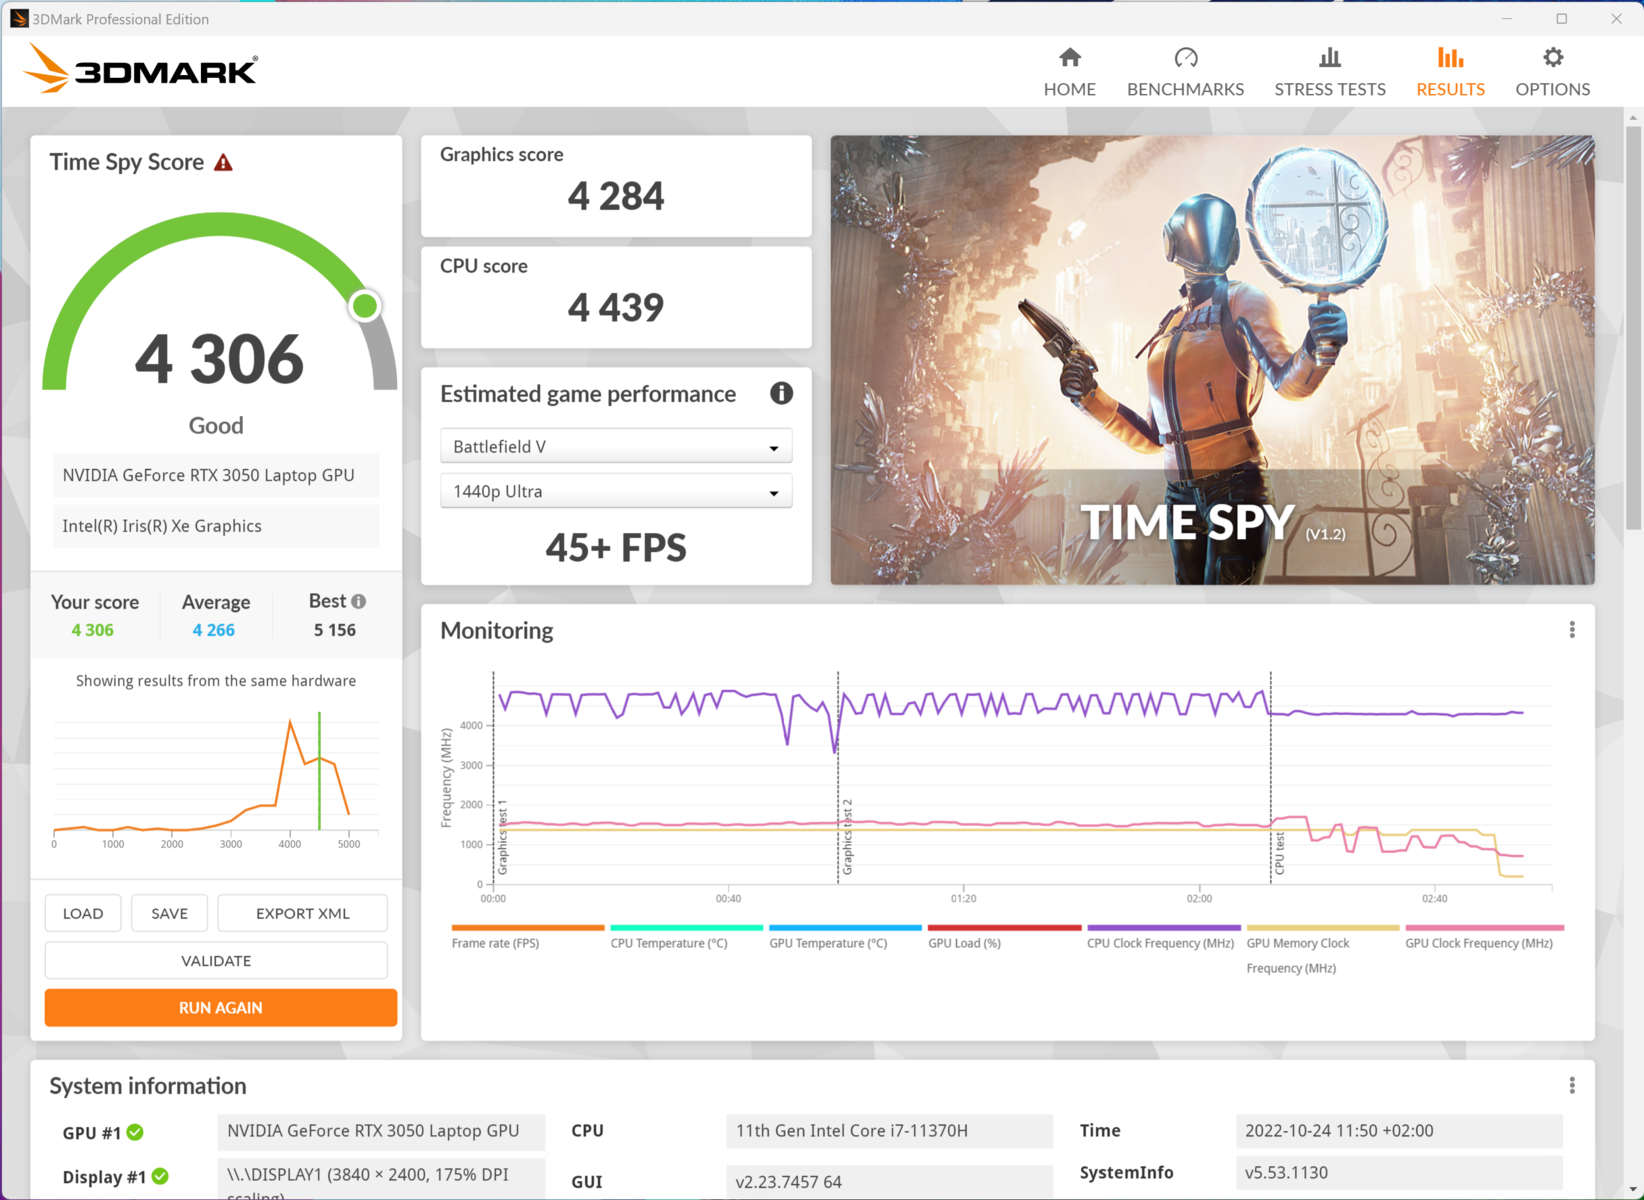
The Vivobook uses both the iGPU of the Intel Core i7 and the Nvidia GeForce RTX 3050. During undemanding workloads, the iGPU is active. Meanwhile, the GeForce dGPU is responsible for more demanding tasks. In our testing, we recorded a peak consumption of 50 watts from the GPU. Although the performance is good, it should be noted that this is the weakest option from Nvidia's RTX 3000 series. As our Blender test shows, the GPU is able to quickly render scenes. By contrast, it falls short of our expectations in the 3DMark benchmarks. This may be caused by the installed Nvidia Studio driver. It is less optimized for gaming performance. In exchange, many professional applications such as Blender, Autodesk Maya, and Adobe Illustrator receive a performance boost. An official overview of the programs, which are supported by the Nvidia Studio drivers, is available on the manufacturer's website.
The performance in battery mode is limited. Here, the TGP drops to around 25 watts. This roughly cuts the graphics performance in half. However, the 3DMark benchmark results are surprisingly not as severely affected as expected.
| 3DMark 11 Performance | 13624 points | |
| 3DMark Ice Storm Standard Score | 34267 points | |
| 3DMark Cloud Gate Standard Score | 20526 points | |
| 3DMark Fire Strike Score | 9732 points | |
| 3DMark Time Spy Score | 4310 points | |
Help | ||
* ... smaller is better
Gaming Performance
The performance is sufficient for more than 60 FPS at Full HD in almost all the games we tested. Far Cry 5 is one exception. The game shows an error indicating that the Nvidia Studio drivers are not supported. F1 2022 shows a similar error message.
The performance reserves of the 3050 are barely sufficient for the high native resolution of the 4K OLED display. Although the frame rates can still be acceptable in certain cases, our overview "Computer Games on Laptop Graphics Cards" shows that the RTX 3050 tends to fall below 30 FPS at 4K.
While the Vivobook achieves average results overall compared to other devices in our comparison, the multimedia laptop manages to outperform some alternatives with the nominally faster 3050 Ti.
| low | med. | high | ultra | QHD | 4K | |
|---|---|---|---|---|---|---|
| GTA V (2015) | 146.6 | 100.4 | 54.9 | |||
| The Witcher 3 (2015) | 193.3 | 117.8 | 61.3 | 47 | ||
| Dota 2 Reborn (2015) | 120.7 | 111.4 | 103.7 | 100.3 | 62.4 | |
| Final Fantasy XV Benchmark (2018) | 62 | 64.8 | 44.4 | 30.2 | ||
| X-Plane 11.11 (2018) | 95.3 | 78.4 | 66.9 | 41.4 | ||
| Far Cry 5 (2018) | 37 | 36 | 35 | 47 | ||
| Strange Brigade (2018) | 244 | 112.5 | 92.4 | 78.9 | ||
| F1 22 (2022) | 112.7 | 104.3 | 75 | 21.8 |
Emissions - The Laptop Can Be Silent
Noise Emissions
Although not quite silent, the Vivobook remains fairly quiet under most loads. During normal use, the laptop does not exceed 40 dB(A). The noise level increases to up to 62.9 dB(A) only when playing games or performing other compute-intensive tasks. The fans can be distracting in these scenarios, particularly since the noise is relatively high pitched. In whisper mode, the fans remain very quiet or idle.
Regardless of the fan mode, the fan control attempts to keep the fan speeds low for as long as possible. While this is advantageous for the noise levels of the Vivobook Pro, it is detrimental to the performance under load.
Noise level
| Idle |
| 30 / 30 / 30 dB(A) |
| Load |
| 57.6 / 62.9 dB(A) |
 | ||
30 dB silent 40 dB(A) audible 50 dB(A) loud |
||
min: | ||
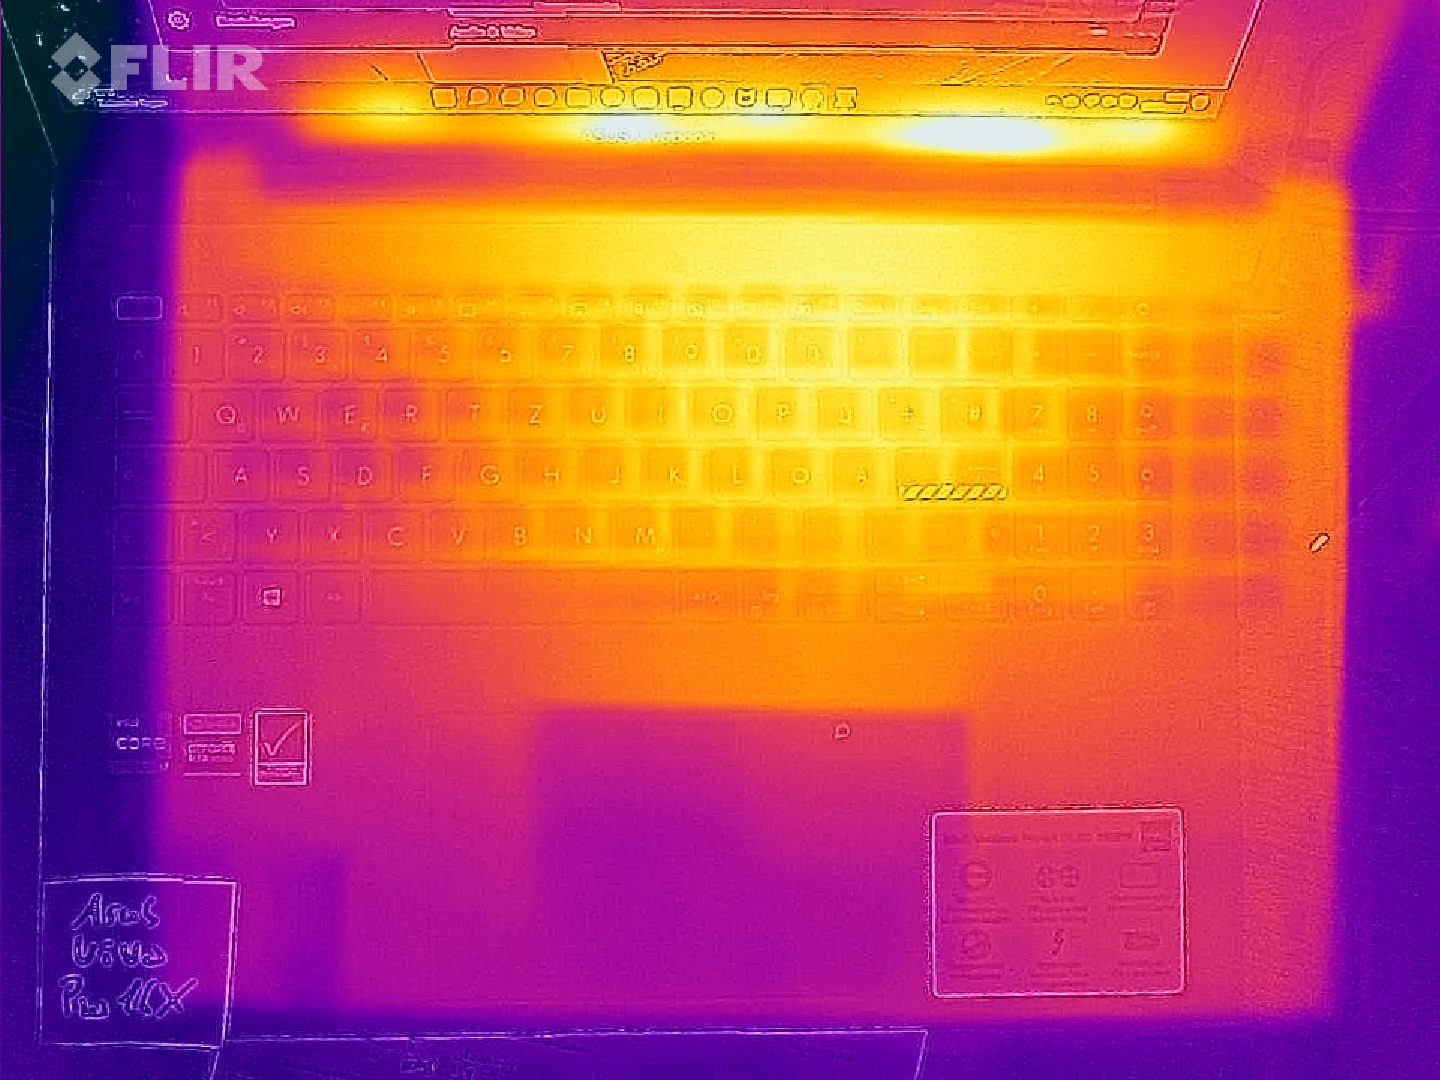
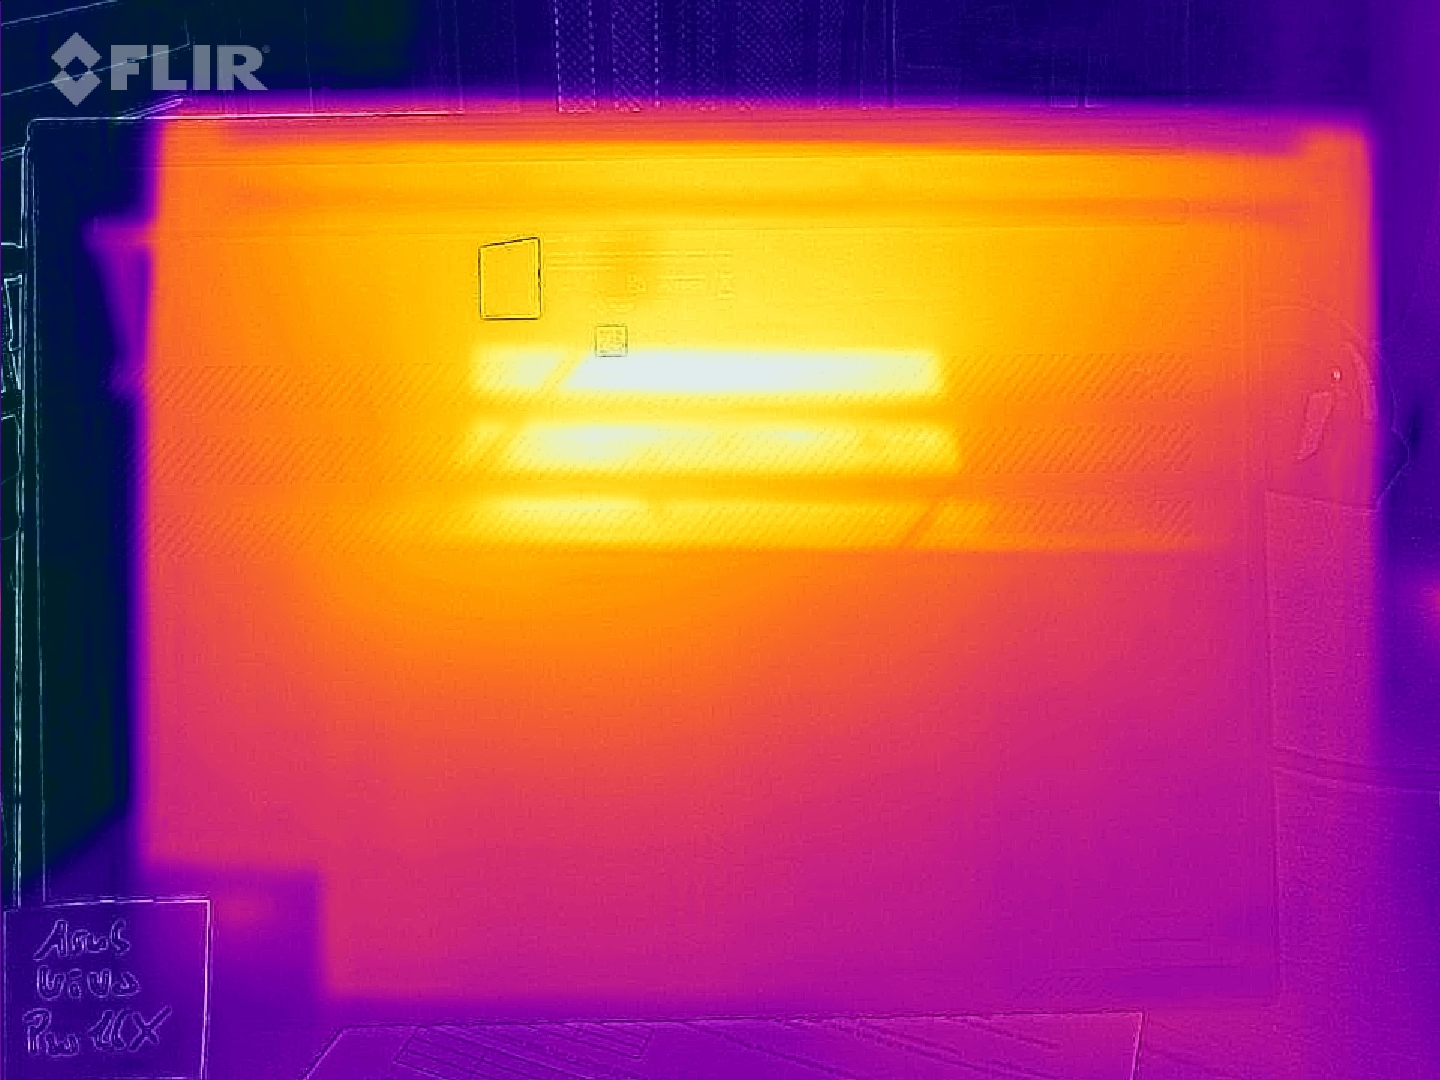
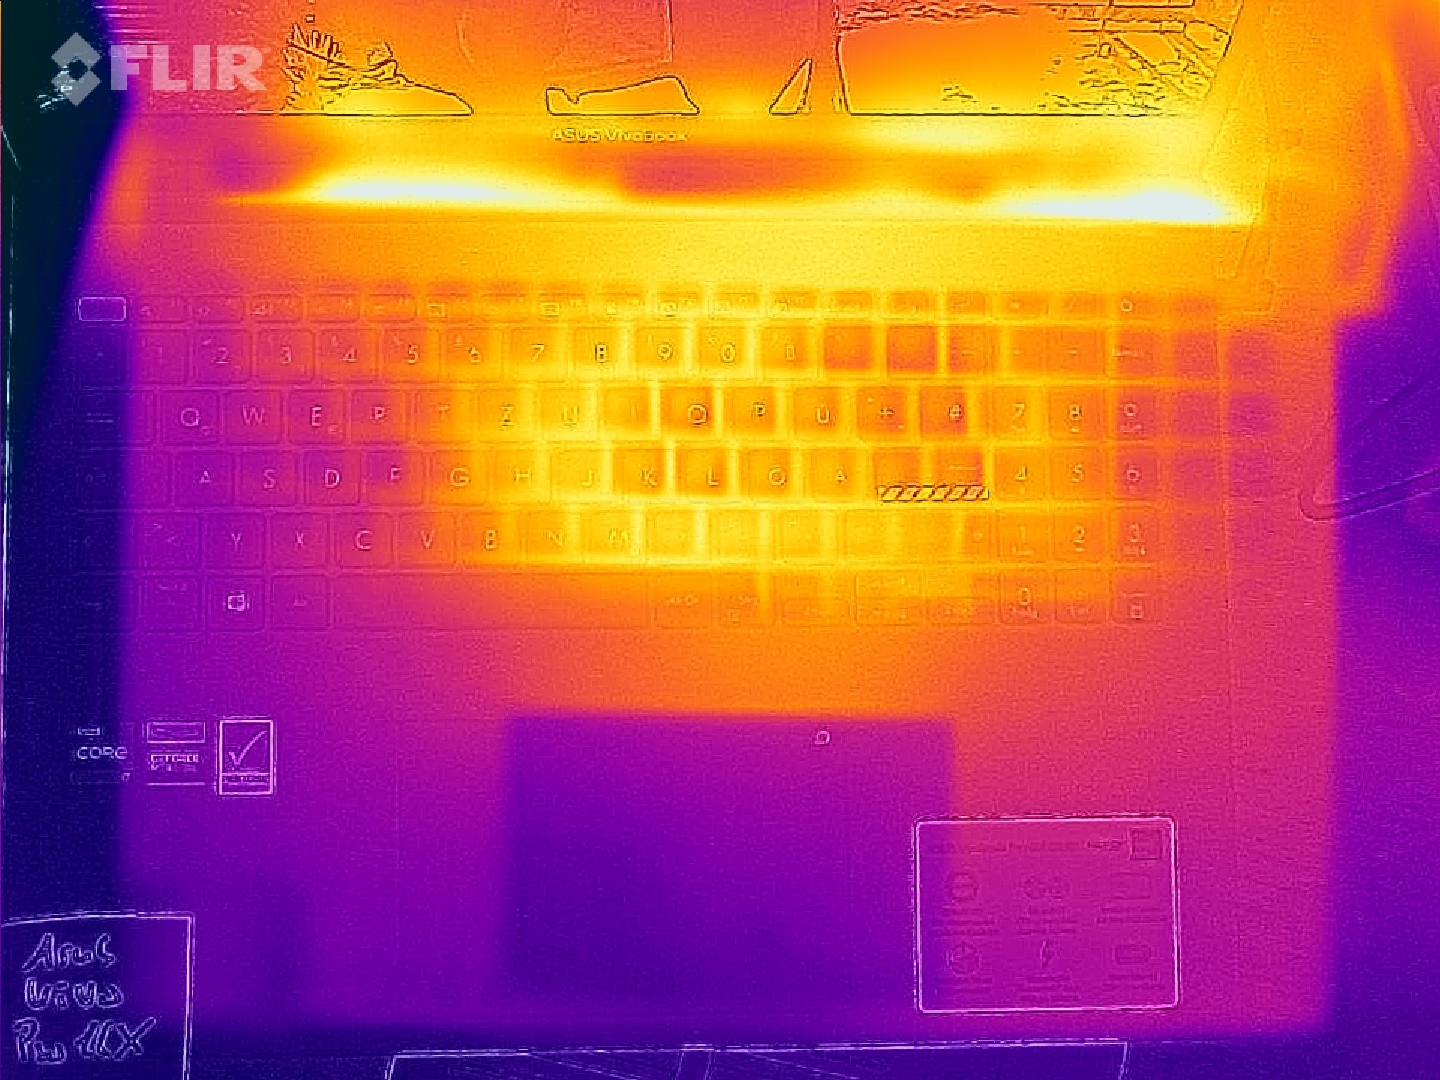
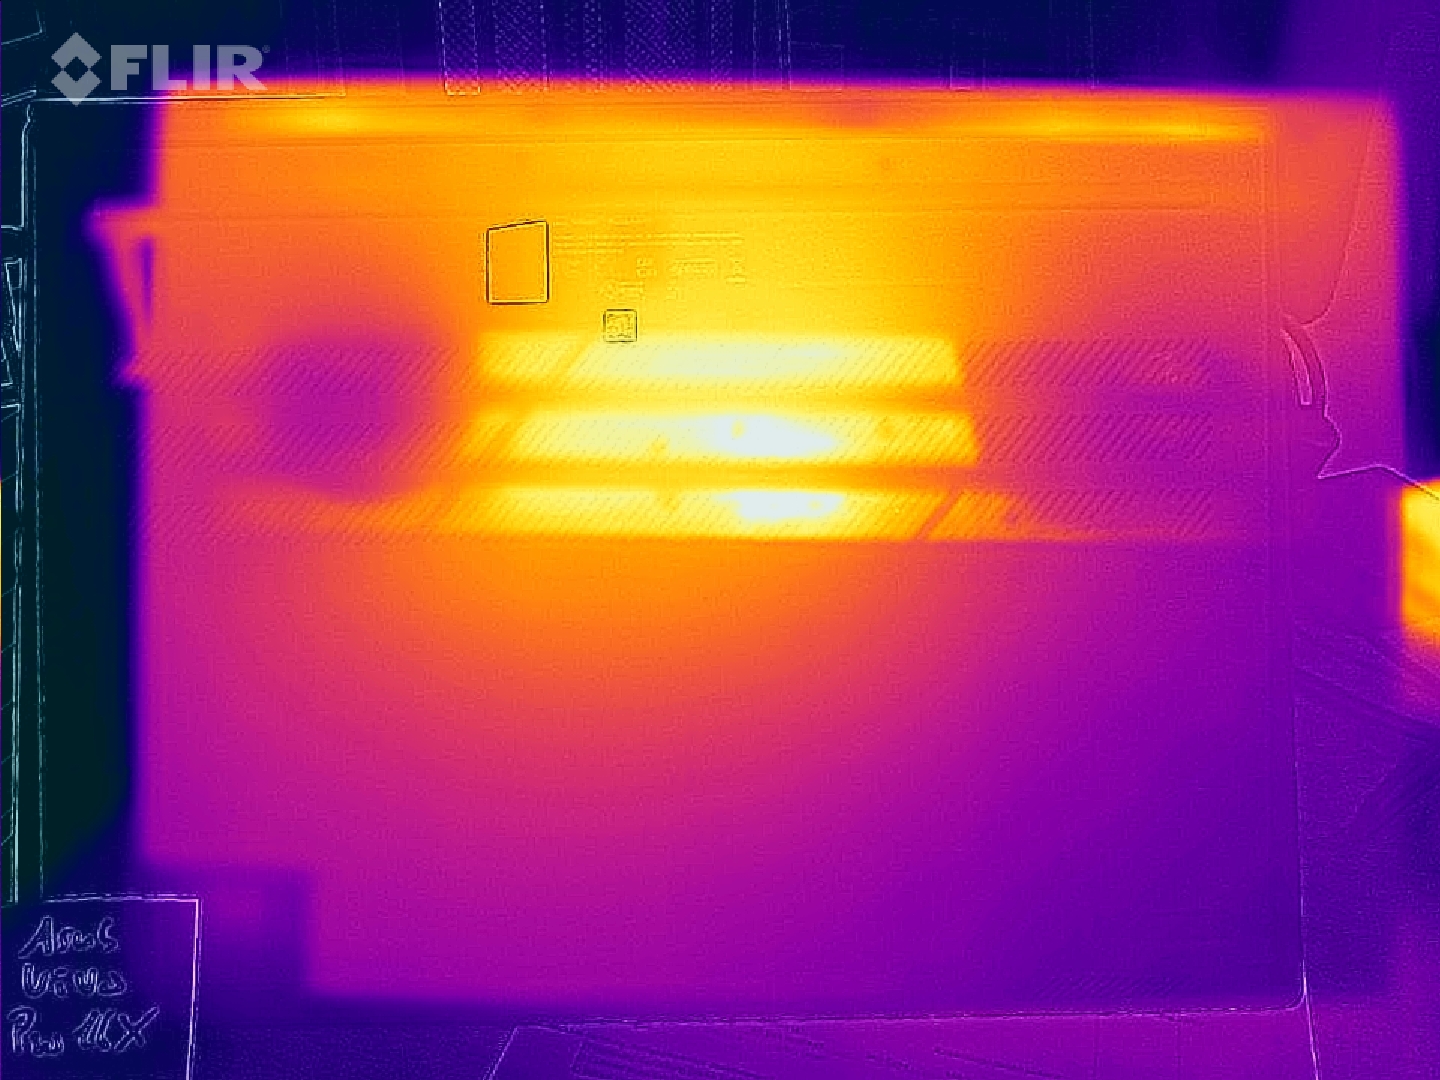
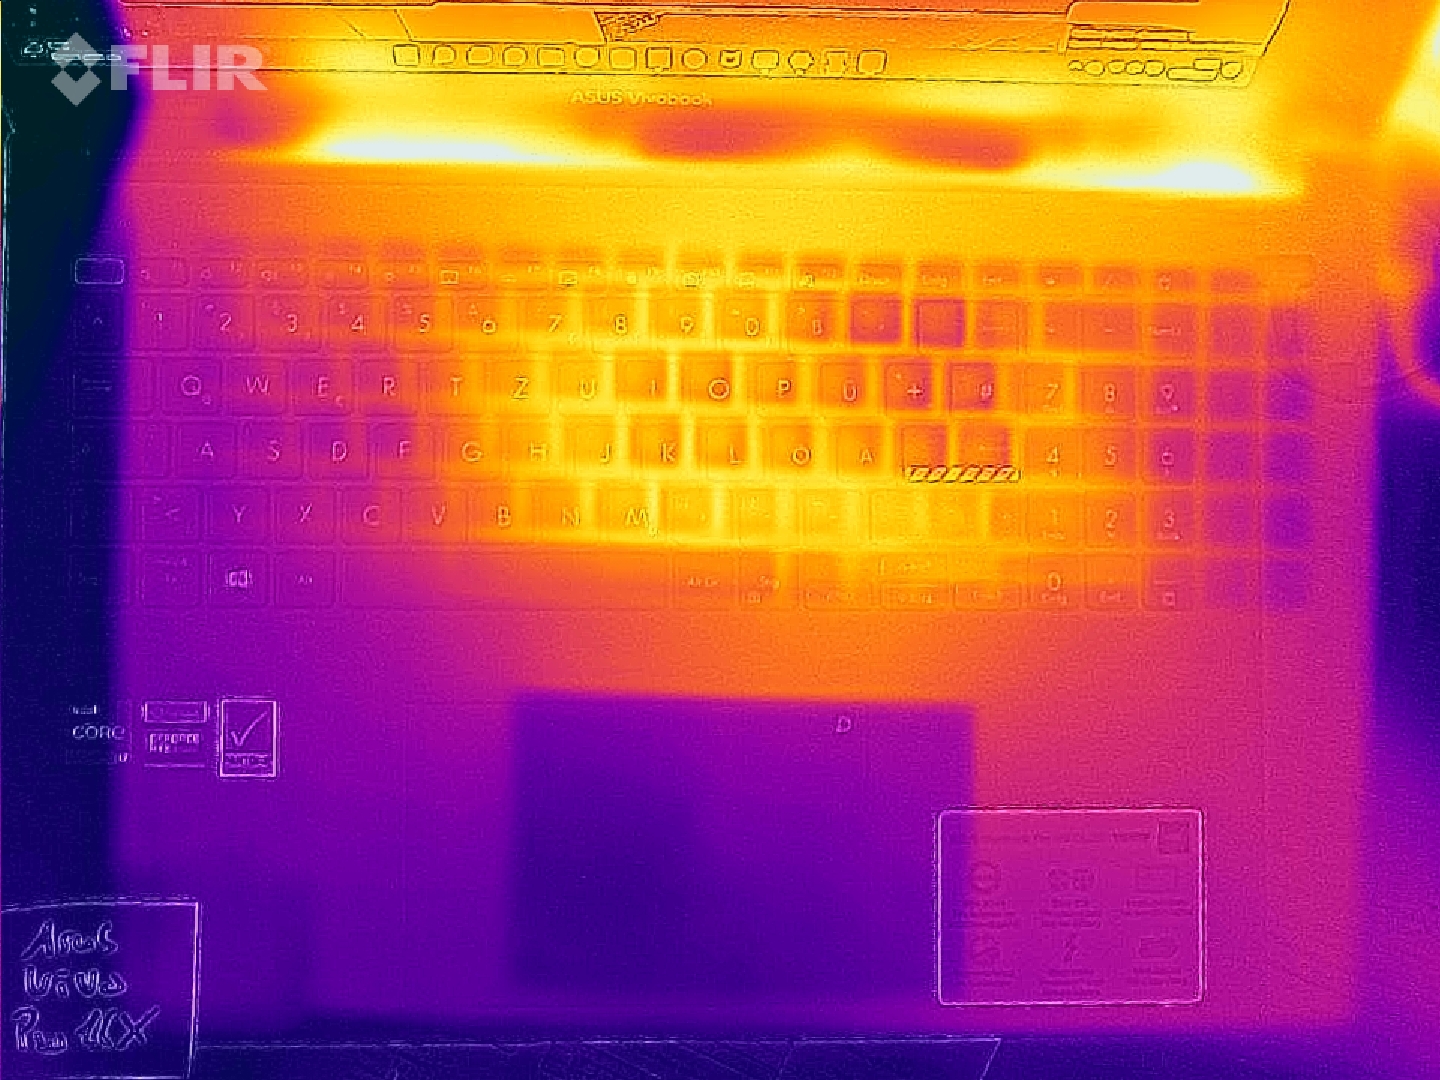
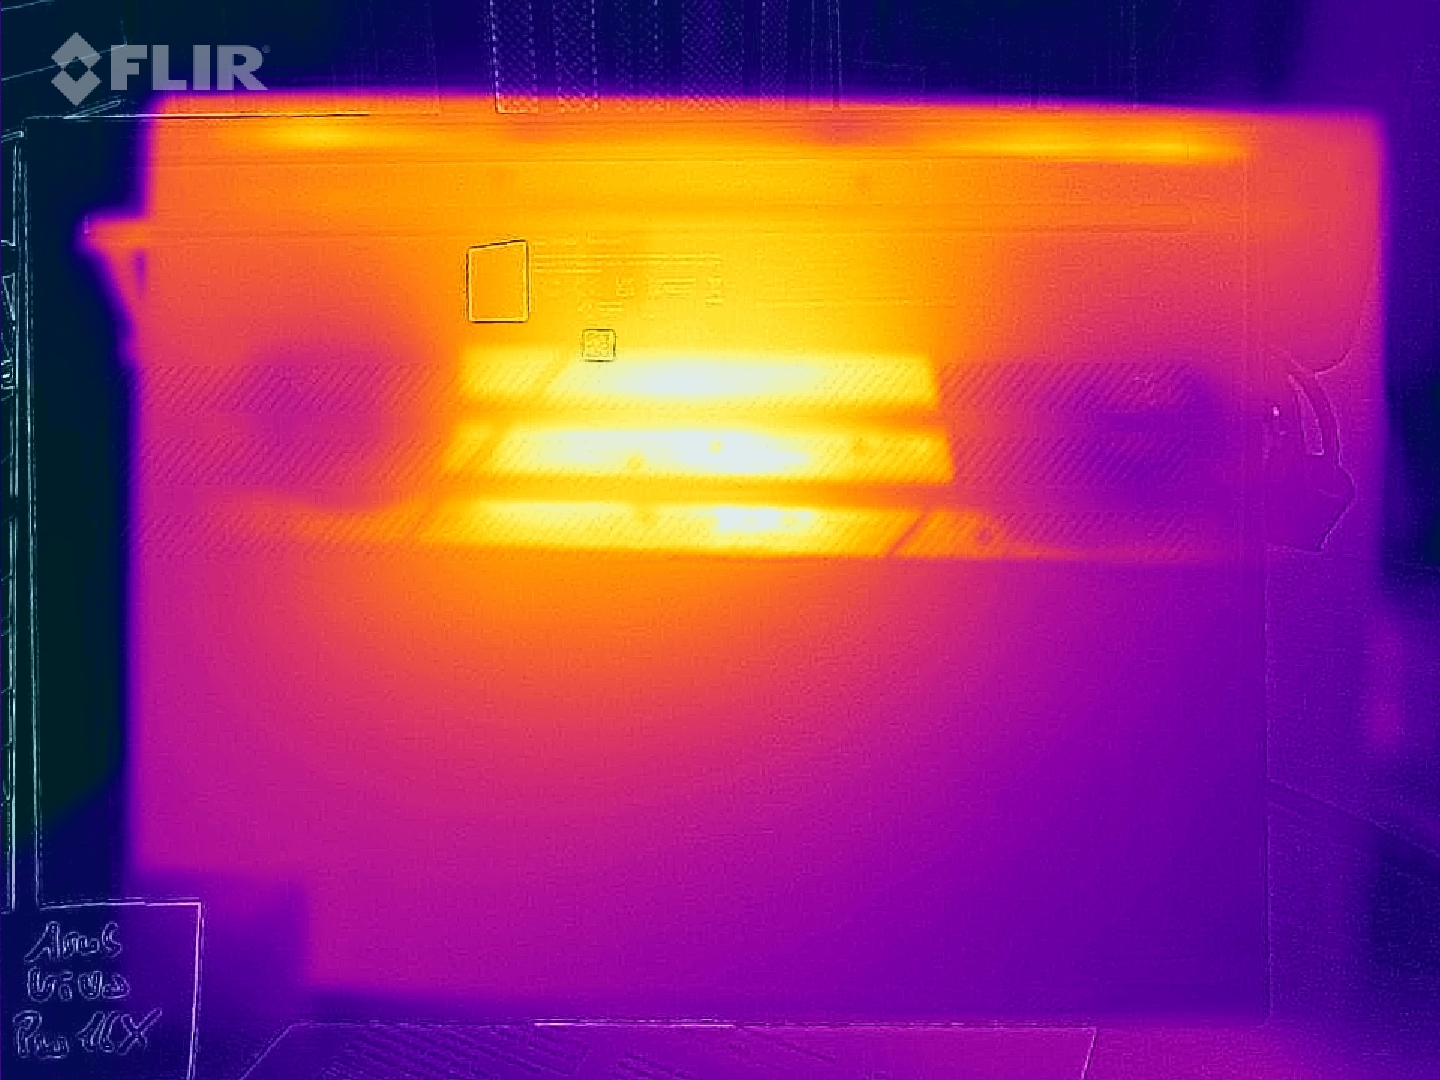
Temperatures
The surface temperatures of the Vivobook remain at reasonable levels overall, although we did record palm rest temperatures of more than 30 °C (86 °F) under load at a moderate room temperature. When stressed, hot spots on the bottom can become uncomfortably warm. 50 °C (122 °F) on the bottom is too high to be comfortable during use on your lap for extended periods. Fortunately, the hot spot area in the center of the laptop is fairly small. Thus, the Vivobook Pro can still be positioned in a way where this is not an issue.
| Asus VivoBook Pro 16X OLED N7600PC-L2026X GeForce RTX 3050 4GB Laptop GPU, i7-11370H, Intel Optane Memory H10 with Solid State Storage 32GB + 512GB HBRPEKNX0202A(L/H) | MSI Summit E16 Flip A12UDT-031 GeForce RTX 3050 Ti Laptop GPU, i7-1280P, Samsung PM9A1 MZVL22T0HBLB | Microsoft Surface Laptop Studio i7 RTX 3050 Ti GeForce RTX 3050 Ti Laptop GPU, i7-11370H, SK Hynix PC711 1TB HFS001TDE9X084N | Dell Inspiron 16 Plus 7610 GeForce RTX 3050 4GB Laptop GPU, i7-11800H, Kingston OM3PDP3512B | Lenovo ThinkPad X1 Extreme G4-20Y5CTO1WW (3050 Ti) GeForce RTX 3050 Ti Laptop GPU, i7-11800H, Samsung PM9A1 MZVL21T0HCLR | Schenker XMG Focus 15 GeForce RTX 3050 Ti Laptop GPU, i7-11800H, Samsung SSD 970 EVO Plus 1TB | |
|---|---|---|---|---|---|---|
| Noise | 13% | 21% | 16% | 19% | -2% | |
| off / environment * (dB) | 25.15 | 25 1% | 24.7 2% | 24.4 3% | 23.52 6% | 24 5% |
| Idle Minimum * (dB) | 30 | 25 17% | 24.7 18% | 24.4 19% | 23.52 22% | 25 17% |
| Idle Average * (dB) | 30 | 25 17% | 24.7 18% | 24.4 19% | 23.52 22% | 30 -0% |
| Idle Maximum * (dB) | 30 | 28.9 4% | 24.7 18% | 24.4 19% | 23.52 22% | 43 -43% |
| Load Average * (dB) | 57.6 | 49.3 14% | 33.2 42% | 48.3 16% | 42.9 26% | 56 3% |
| Load Maximum * (dB) | 62.9 | 48.2 23% | 46.7 26% | 48.9 22% | 52.45 17% | 58 8% |
| Witcher 3 ultra * (dB) | 44.5 | 48.9 | 52.5 | 56 |
* ... smaller is better
(±) The maximum temperature on the upper side is 40.6 °C / 105 F, compared to the average of 36.8 °C / 98 F, ranging from 21 to 71 °C for the class Multimedia.
(-) The bottom heats up to a maximum of 53 °C / 127 F, compared to the average of 39.1 °C / 102 F
(+) In idle usage, the average temperature for the upper side is 26.3 °C / 79 F, compared to the device average of 31.3 °C / 88 F.
(±) Playing The Witcher 3, the average temperature for the upper side is 33.7 °C / 93 F, compared to the device average of 31.3 °C / 88 F.
(+) The palmrests and touchpad are cooler than skin temperature with a maximum of 30.6 °C / 87.1 F and are therefore cool to the touch.
(±) The average temperature of the palmrest area of similar devices was 28.7 °C / 83.7 F (-1.9 °C / -3.4 F).
| Asus VivoBook Pro 16X OLED N7600PC-L2026X Intel Core i7-11370H, NVIDIA GeForce RTX 3050 4GB Laptop GPU | MSI Summit E16 Flip A12UDT-031 Intel Core i7-1280P, NVIDIA GeForce RTX 3050 Ti Laptop GPU | Microsoft Surface Laptop Studio i7 RTX 3050 Ti Intel Core i7-11370H, NVIDIA GeForce RTX 3050 Ti Laptop GPU | Dell Inspiron 16 Plus 7610 Intel Core i7-11800H, NVIDIA GeForce RTX 3050 4GB Laptop GPU | Lenovo ThinkPad X1 Extreme G4-20Y5CTO1WW (3050 Ti) Intel Core i7-11800H, NVIDIA GeForce RTX 3050 Ti Laptop GPU | Schenker XMG Focus 15 Intel Core i7-11800H, NVIDIA GeForce RTX 3050 Ti Laptop GPU | Xiaomi Mi NoteBook Pro Intel Core i7-11370H, Intel Iris Xe Graphics G7 96EUs | |
|---|---|---|---|---|---|---|---|
| Heat | -6% | 15% | -14% | -5% | -17% | -7% | |
| Maximum Upper Side * (°C) | 40.6 | 49.2 -21% | 42.3 -4% | 46.4 -14% | 49 -21% | 43 -6% | 48 -18% |
| Maximum Bottom * (°C) | 53 | 50.2 5% | 38.2 28% | 54.8 -3% | 44.4 16% | 46 13% | 45.8 14% |
| Idle Upper Side * (°C) | 29 | 29.4 -1% | 23.4 19% | 31.4 -8% | 32.1 -11% | 39 -34% | 32.2 -11% |
| Idle Bottom * (°C) | 28.3 | 30 -6% | 23.5 17% | 36.6 -29% | 29.8 -5% | 40 -41% | 32.2 -14% |
* ... smaller is better
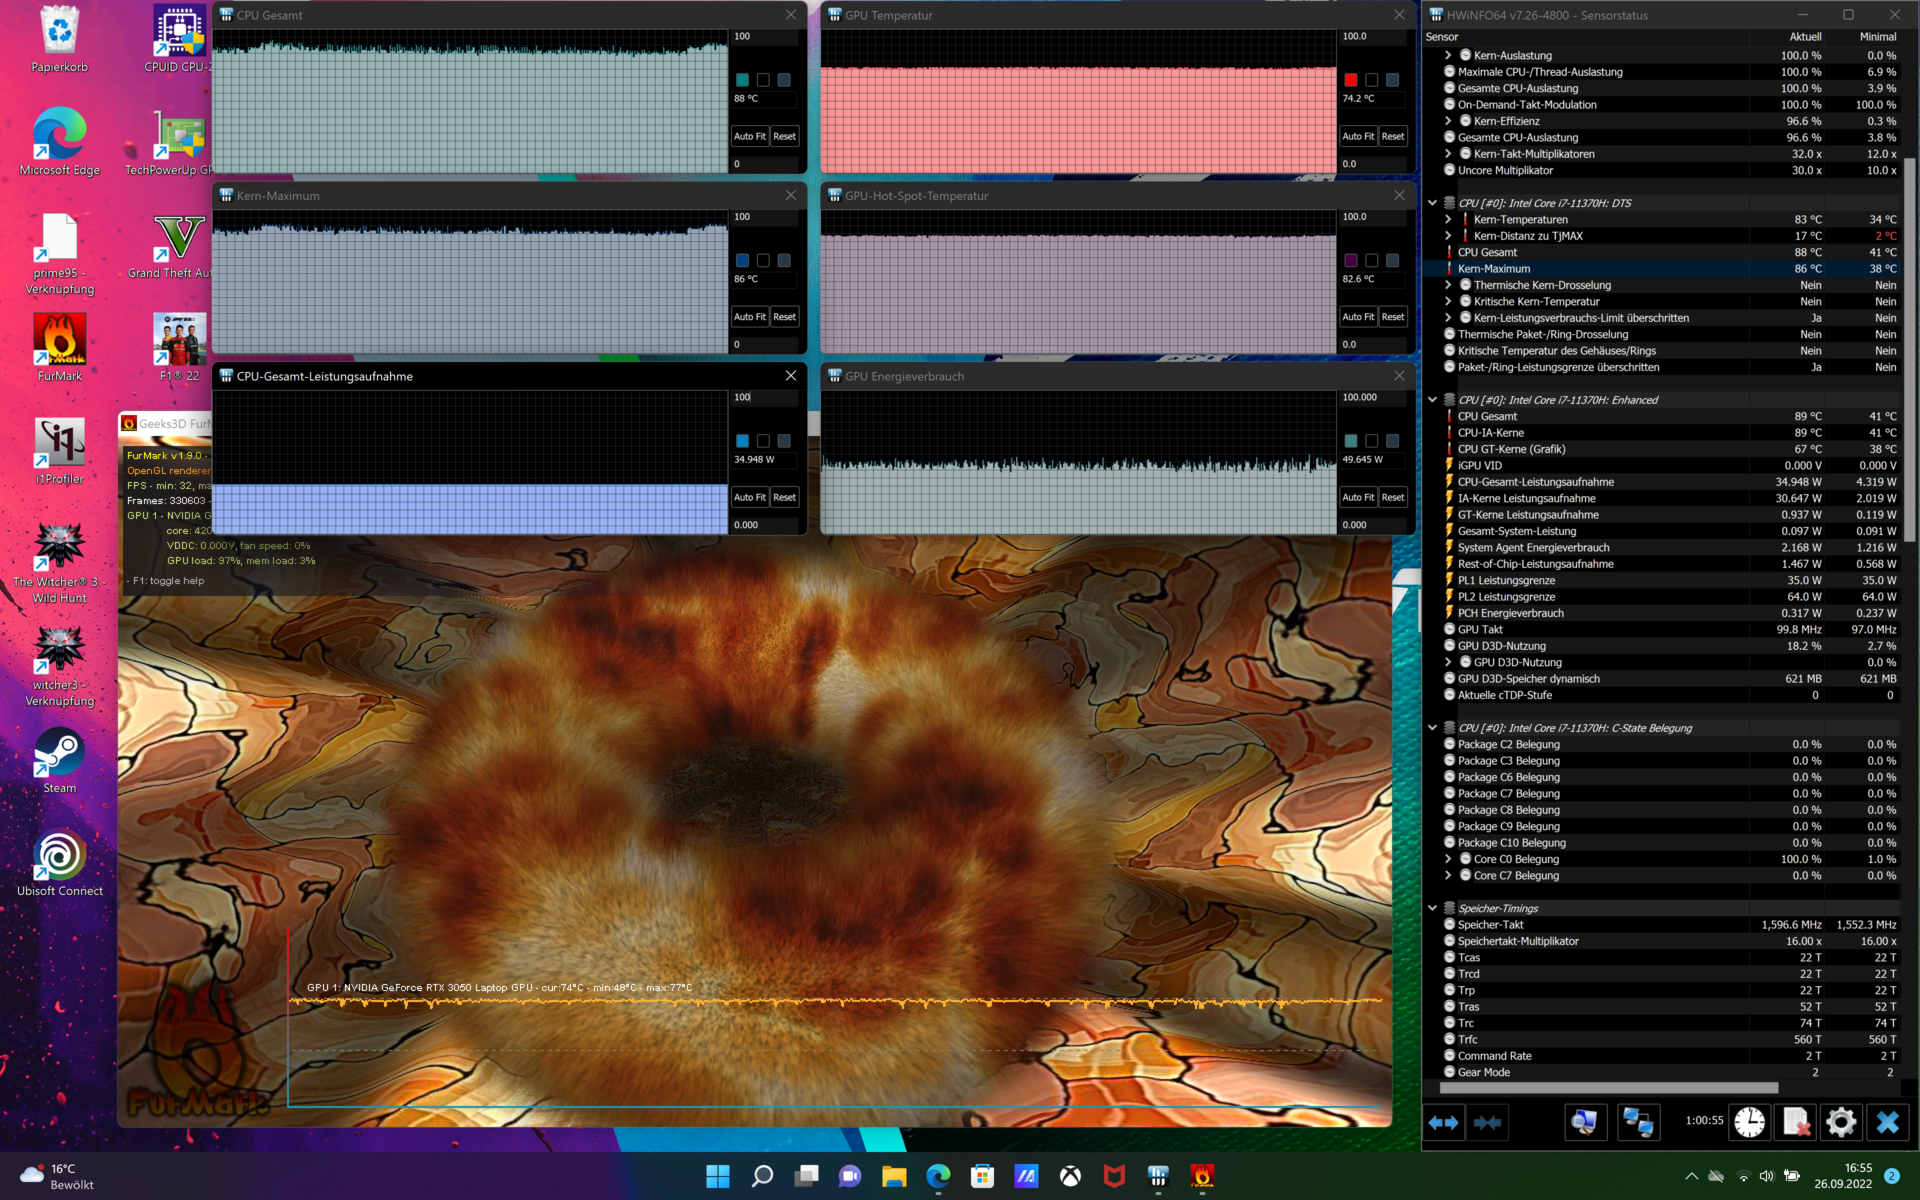
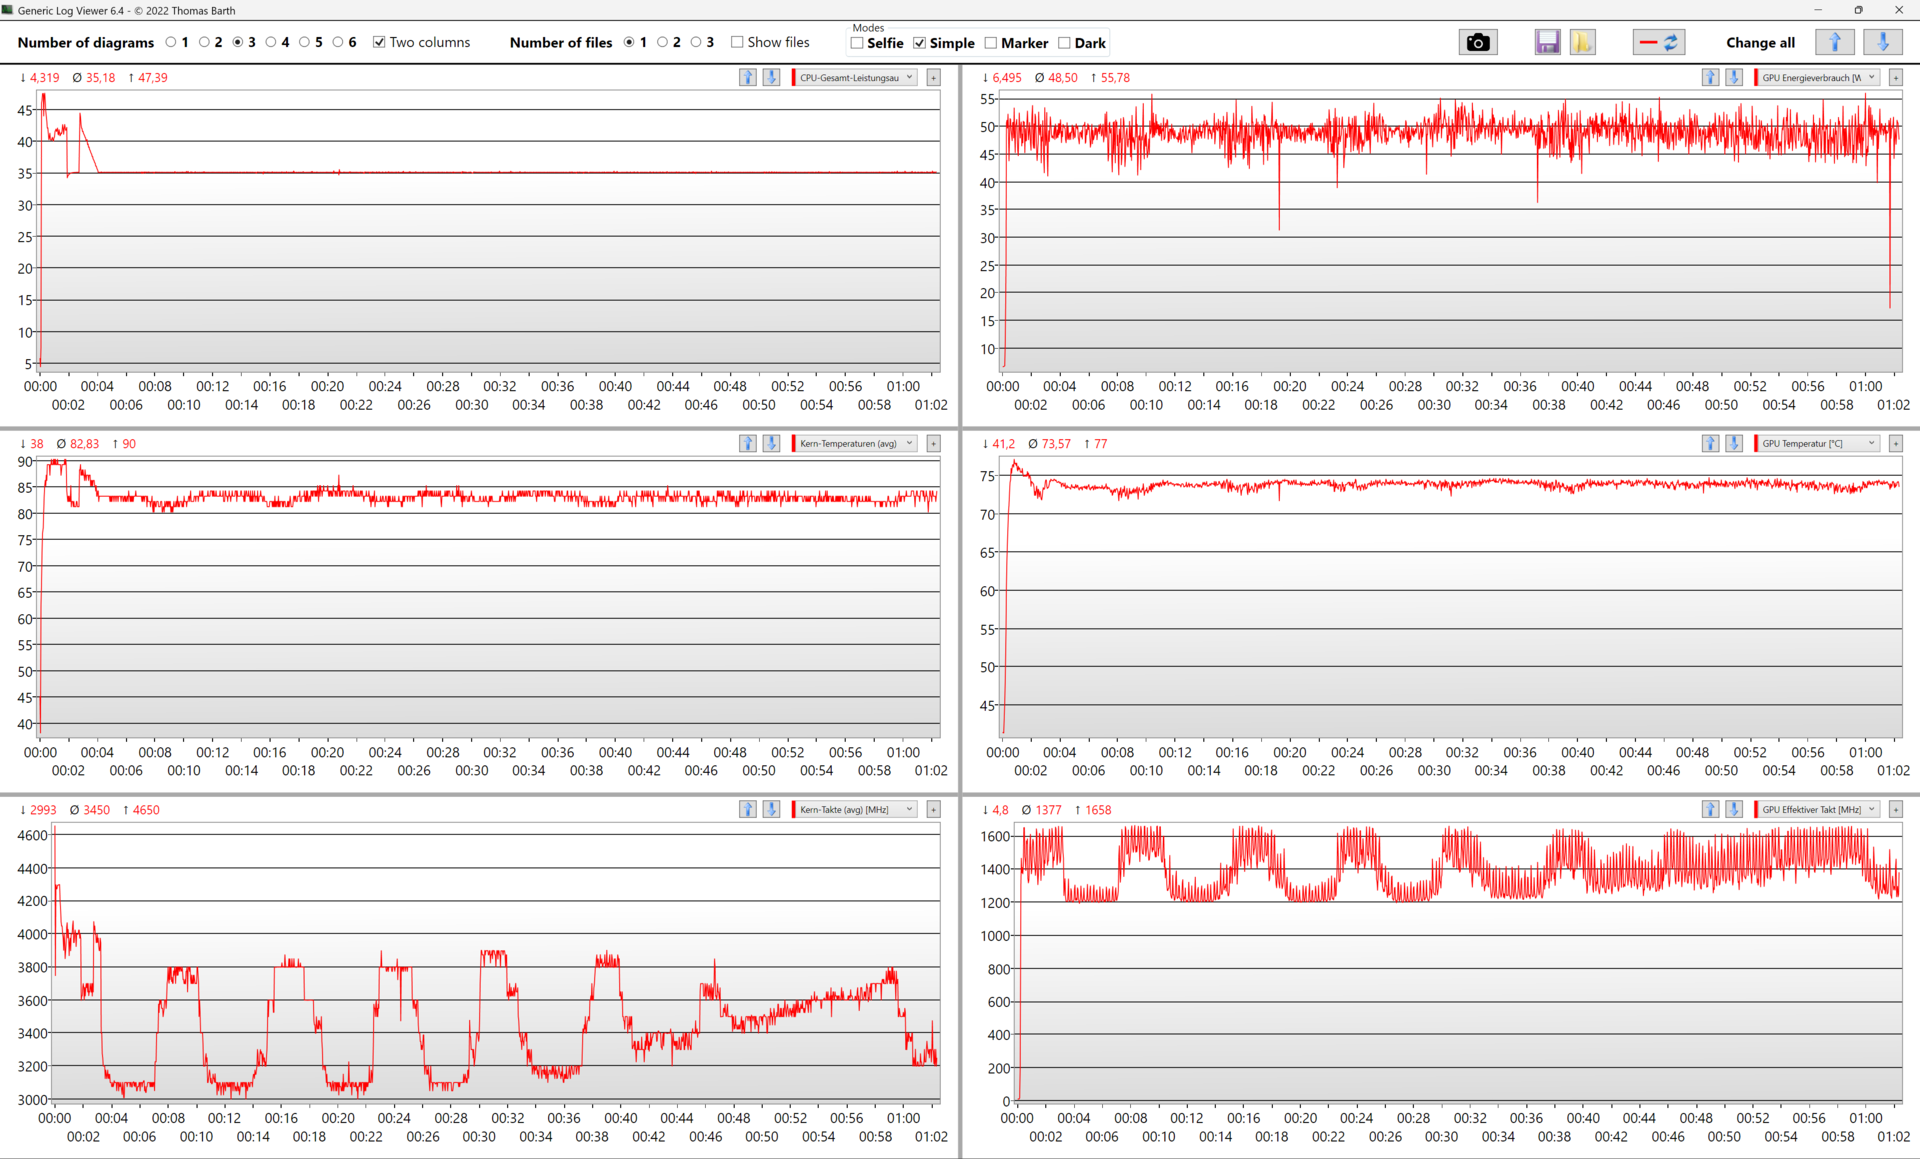
Stress Test
The performance of the Vivobook Pro 16X massively drops during the first two minutes. Subsequently, the laptop's performance remains consistent. This could also be regarded as a particularly long boost window. The processor begins the stress test with an impressive 46 watts and then slowly drops to 35 watts. This matches the theoretical maximum PL1 for the Intel Core i7-11370H. The temperatures remain non-critical even under continuous stress. None of the sensors reports above 90 °C (194 °F). As a result, the surface temperatures remain comfortable for the most part as well.
Speakers
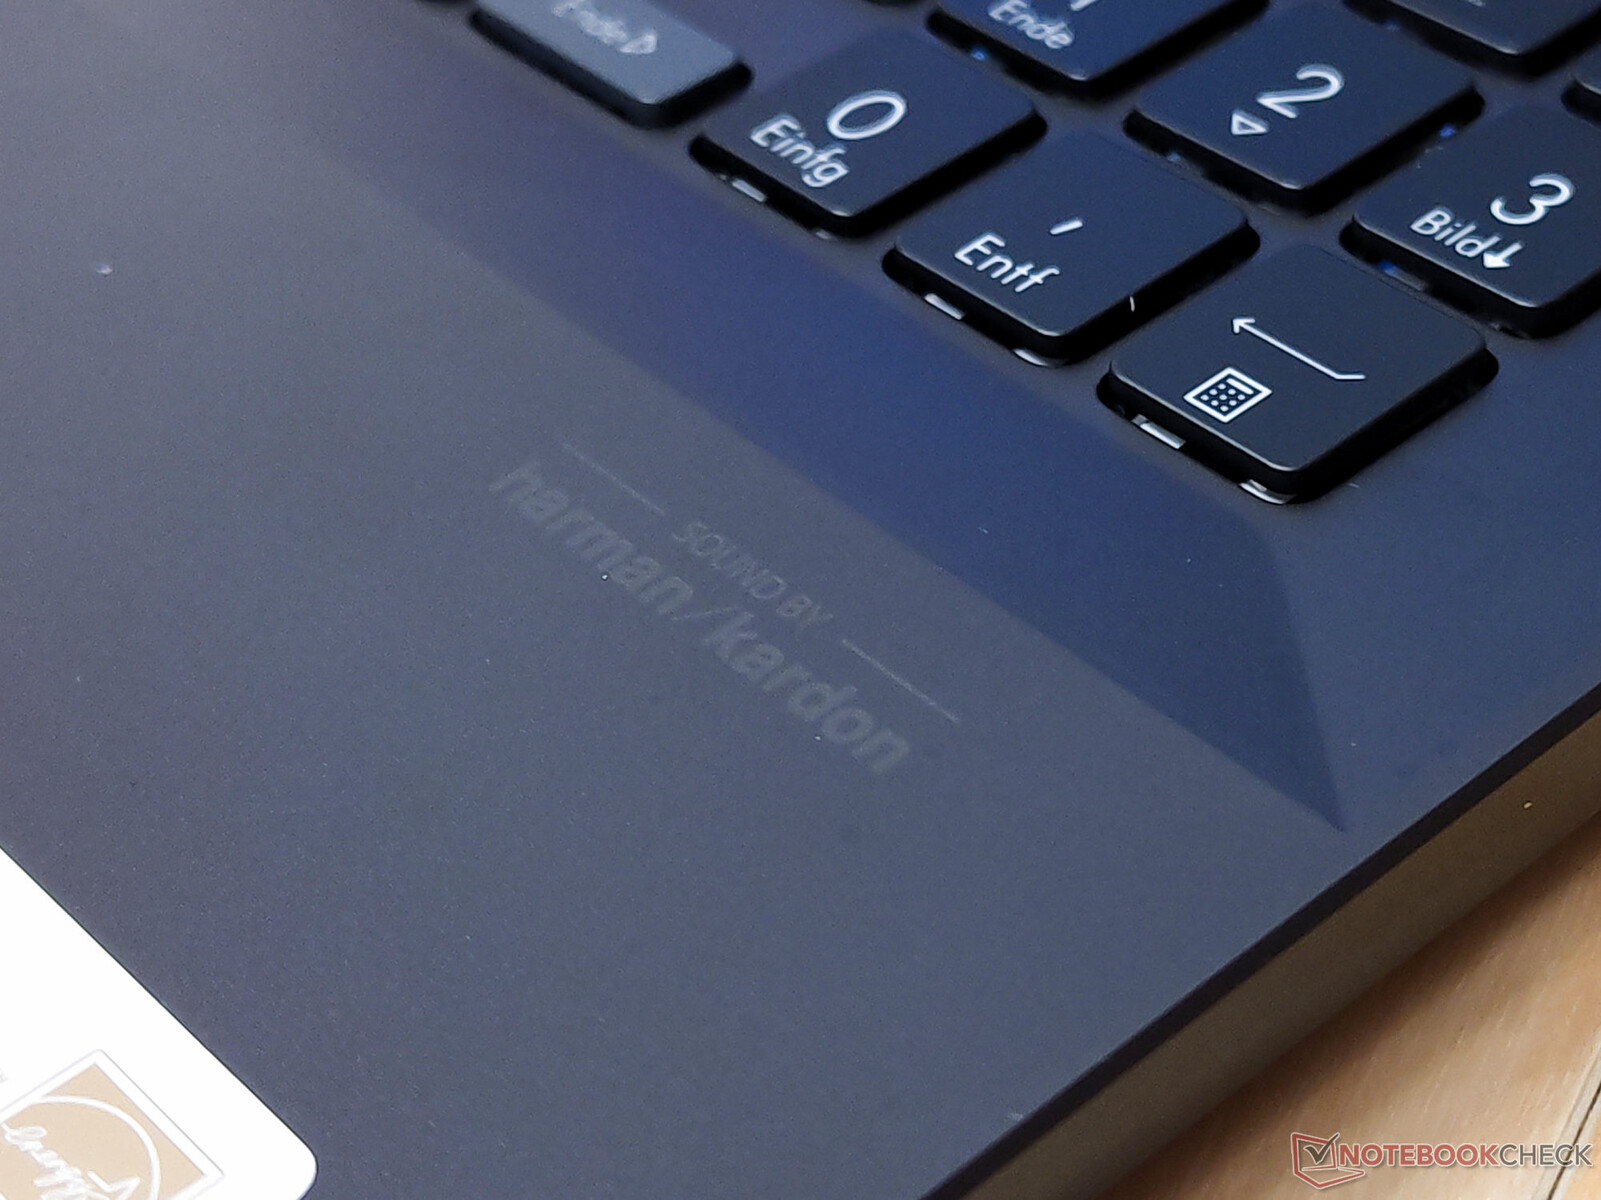
The Vivobook struggles to produce linear sound. Despite the "Sound by Harman/Kardon" logo, the audio experience is relatively poor. The small speakers lack bass. The significant overmodulation of higher frequencies is a much more major issue. They are often too loud even at lower volume levels. In this regard, there is room for improvement.
Asus VivoBook Pro 16X OLED N7600PC-L2026X audio analysis
(+) | speakers can play relatively loud (89 dB)
Bass 100 - 315 Hz
(-) | nearly no bass - on average 19.4% lower than median
(±) | linearity of bass is average (7.8% delta to prev. frequency)
Mids 400 - 2000 Hz
(+) | balanced mids - only 1.3% away from median
(+) | mids are linear (2.7% delta to prev. frequency)
Highs 2 - 16 kHz
(±) | higher highs - on average 7.7% higher than median
(+) | highs are linear (6.8% delta to prev. frequency)
Overall 100 - 16.000 Hz
(±) | linearity of overall sound is average (16% difference to median)
Compared to same class
» 40% of all tested devices in this class were better, 6% similar, 54% worse
» The best had a delta of 5%, average was 17%, worst was 45%
Compared to all devices tested
» 25% of all tested devices were better, 5% similar, 70% worse
» The best had a delta of 4%, average was 23%, worst was 134%
MSI Summit E16 Flip A12UDT-031 audio analysis
(±) | speaker loudness is average but good (79.8 dB)
Bass 100 - 315 Hz
(-) | nearly no bass - on average 23.6% lower than median
(-) | bass is not linear (15.1% delta to prev. frequency)
Mids 400 - 2000 Hz
(±) | higher mids - on average 5.6% higher than median
(±) | linearity of mids is average (7.4% delta to prev. frequency)
Highs 2 - 16 kHz
(±) | higher highs - on average 5.6% higher than median
(+) | highs are linear (4.5% delta to prev. frequency)
Overall 100 - 16.000 Hz
(±) | linearity of overall sound is average (22.6% difference to median)
Compared to same class
» 68% of all tested devices in this class were better, 5% similar, 27% worse
» The best had a delta of 6%, average was 20%, worst was 57%
Compared to all devices tested
» 67% of all tested devices were better, 6% similar, 28% worse
» The best had a delta of 4%, average was 23%, worst was 134%
Schenker XMG Focus 15 audio analysis
(±) | speaker loudness is average but good (78 dB)
Bass 100 - 315 Hz
(-) | nearly no bass - on average 25.5% lower than median
(±) | linearity of bass is average (8.4% delta to prev. frequency)
Mids 400 - 2000 Hz
(+) | balanced mids - only 4.9% away from median
(+) | mids are linear (5.6% delta to prev. frequency)
Highs 2 - 16 kHz
(+) | balanced highs - only 1.7% away from median
(+) | highs are linear (4.1% delta to prev. frequency)
Overall 100 - 16.000 Hz
(±) | linearity of overall sound is average (20% difference to median)
Compared to same class
» 70% of all tested devices in this class were better, 7% similar, 23% worse
» The best had a delta of 6%, average was 18%, worst was 132%
Compared to all devices tested
» 51% of all tested devices were better, 8% similar, 41% worse
» The best had a delta of 4%, average was 23%, worst was 134%
Energy Management - No Record Runtimes Despite 96-Wh Battery
Energy Consumption
The Vivobook Pro 16X OLED shows reasonable consumption values in our testing. Of course, the powerful hardware requires slightly more power when performing demanding tasks. While idling, the energy consumption of the Asus laptop is slightly increased by a few watts compared to other devices in our comparison. However, we often found that laptops with OLED displays were at a slight disadvantage in this aspect compared to LCD models.
| Off / Standby | |
| Idle | |
| Load |
|
Key:
min: | |
| Asus VivoBook Pro 16X OLED N7600PC-L2026X i7-11370H, GeForce RTX 3050 4GB Laptop GPU, Intel Optane Memory H10 with Solid State Storage 32GB + 512GB HBRPEKNX0202A(L/H), OLED, 3840x2400, 16" | MSI Summit E16 Flip A12UDT-031 i7-1280P, GeForce RTX 3050 Ti Laptop GPU, Samsung PM9A1 MZVL22T0HBLB, IPS, 2560x1600, 16" | Microsoft Surface Laptop Studio i7 RTX 3050 Ti i7-11370H, GeForce RTX 3050 Ti Laptop GPU, SK Hynix PC711 1TB HFS001TDE9X084N, IPS, 2400x1600, 14.4" | Dell Inspiron 16 Plus 7610 i7-11800H, GeForce RTX 3050 4GB Laptop GPU, Kingston OM3PDP3512B, IPS, 3072x1920, 16" | Lenovo ThinkPad X1 Extreme G4-20Y5CTO1WW (3050 Ti) i7-11800H, GeForce RTX 3050 Ti Laptop GPU, Samsung PM9A1 MZVL21T0HCLR, IPS LED, 3840x2400, 16" | Schenker XMG Focus 15 i7-11800H, GeForce RTX 3050 Ti Laptop GPU, Samsung SSD 970 EVO Plus 1TB, IPS, 1920x1080, 15.6" | Average NVIDIA GeForce RTX 3050 4GB Laptop GPU | Average of class Multimedia | |
|---|---|---|---|---|---|---|---|---|
| Power Consumption | -12% | 30% | -12% | -47% | -89% | -2% | 13% | |
| Idle Minimum * (Watt) | 8.9 | 9.8 -10% | 2.6 71% | 7.7 13% | 10.3 -16% | 23 -158% | 7.17 ? 19% | 5.67 ? 36% |
| Idle Average * (Watt) | 10.2 | 15.3 -50% | 7.1 30% | 10.7 -5% | 22.06 -116% | 25 -145% | 10.4 ? -2% | 10.1 ? 1% |
| Idle Maximum * (Watt) | 12 | 16.3 -36% | 7.9 34% | 16.8 -40% | 23 -92% | 29 -142% | 14.8 ? -23% | 12.3 ? -3% |
| Load Average * (Watt) | 94 | 87 7% | 76.8 18% | 100.39 -7% | 102.57 -9% | 106 -13% | 89.7 ? 5% | 65.6 ? 30% |
| Witcher 3 ultra * (Watt) | 93.1 | 86.1 8% | 83 11% | 108 -16% | 106 -14% | 128 -37% | ||
| Load Maximum * (Watt) | 112 | 100 11% | 97.3 13% | 129 -15% | 147.8 -32% | 156 -39% | 124.8 ? -11% | 113.2 ? -1% |
* ... smaller is better
Consumption Witcher 3 / Stress Test
Consumption external Monitor
Battery Life
Due to the high battery capacity of 96 Wh, one may expect long battery life. The capacity almost reaches the legal limit for a laptop. However, the high-resolution, 16-inch OLED display is clearly generous with its use of the battery's resources. At maximum brightness, our Asus test device lasts for only around 6:30 hours in our real-world Wi-Fi test. Reducing the brightness to 150 nits already results in 2 hours more runtime. One popular energy saving method for OLED displays is forcing the use of a dark mode whenever possible. Every bright area on the display consumes power. Since many large white areas are often displayed during our web-browsing test, it is particularly unforgiving for OLED displays.
| Asus VivoBook Pro 16X OLED N7600PC-L2026X i7-11370H, GeForce RTX 3050 4GB Laptop GPU, 96 Wh | MSI Summit E16 Flip A12UDT-031 i7-1280P, GeForce RTX 3050 Ti Laptop GPU, 82 Wh | Microsoft Surface Laptop Studio i7 RTX 3050 Ti i7-11370H, GeForce RTX 3050 Ti Laptop GPU, 58 Wh | Dell Inspiron 16 Plus 7610 i7-11800H, GeForce RTX 3050 4GB Laptop GPU, 86 Wh | Lenovo ThinkPad X1 Extreme G4-20Y5CTO1WW (3050 Ti) i7-11800H, GeForce RTX 3050 Ti Laptop GPU, 90 Wh | Schenker XMG Focus 15 i7-11800H, GeForce RTX 3050 Ti Laptop GPU, 49 Wh | Average of class Multimedia | |
|---|---|---|---|---|---|---|---|
| Battery runtime | -18% | -34% | 44% | -38% | -53% | 44% | |
| Reader / Idle (h) | 11.1 | 20.5 85% | 6.5 -41% | 25.2 ? 127% | |||
| WiFi v1.3 (h) | 8.7 | 7.1 -18% | 8 -8% | 9.9 14% | 6.6 -24% | 3.9 -55% | 12.1 ? 39% |
| Load (h) | 2.5 | 1 -60% | 3.3 32% | 1.2 -52% | 0.9 -64% | 1.654 ? -34% | |
| H.264 (h) | 12.3 | 6.7 | 16.3 ? |
Pros
Cons
Verdict - Average Performance, Outstanding Display
The screen of the Asus Vivobook Pro 16X OLED is arguably its best feature. The OLED panel shines with natural colors and very fast response times. Its drawbacks are almost entirely limited to outdoor use. The features of the laptop are mostly match our expectations for an upper-midrange multimedia laptop. That being said, the somewhat sluggish Optane storage and the lower version number on the USB ports to the left are somewhat disappointing. USB 2.0 is outdated by today's standards.
The aluminum chassis is subtle, but visually appealing. The weave coating is surprisingly resistant to grease, pleasant to the touch, and always an interesting sight to behold. Unfortunately, Asus dropped the ball when it comes to the build quality. The overall impression suffers from uneven clearances in multiple areas.
The fantastic OLED display of the Asus Vivobook Pro 16X is the center of attention. However, the laptop also offers a medium-to-high performance level and an overall decent case. The package is rounded off by interesting features such as Asus Dial.
In terms of the price, around 1600 USD places the Vivobook in the upper midrange. Relative to other devices in this category, the features, build quality, and design are adequate. Meanwhile, the Dell Inspiron 16 Plus 7610 is significantly cheaper. The latter offers similar features, a good IPS display and can be purchased for just above 1000 USD from various retailers. That being said, other configurations of the Asus Vivobook 16X are also available for significantly less, depending on the model. The Schenker XMG Focus 15 offers around the same level of performance, combined with a slightly inferior display. With Intel's 12th gen processors, both the MSI Summit E16 Flip and the latest Microsoft Surface Laptop offer considerably faster performance, albeit at a premium of around 1000 USD.
Price and Availability
A similar configuration of the Asus Vivobook is available from Amazon.com for around 1500 USD. On Newegg, the same configuration, but with 16 GB instead of 32 GB of RAM is currently on sale for 999 USD (regular price 1399 USD).
Asus VivoBook Pro 16X OLED N7600PC-L2026X
- 11/07/2022 v7 (old)
Marc Herter
Price comparison

