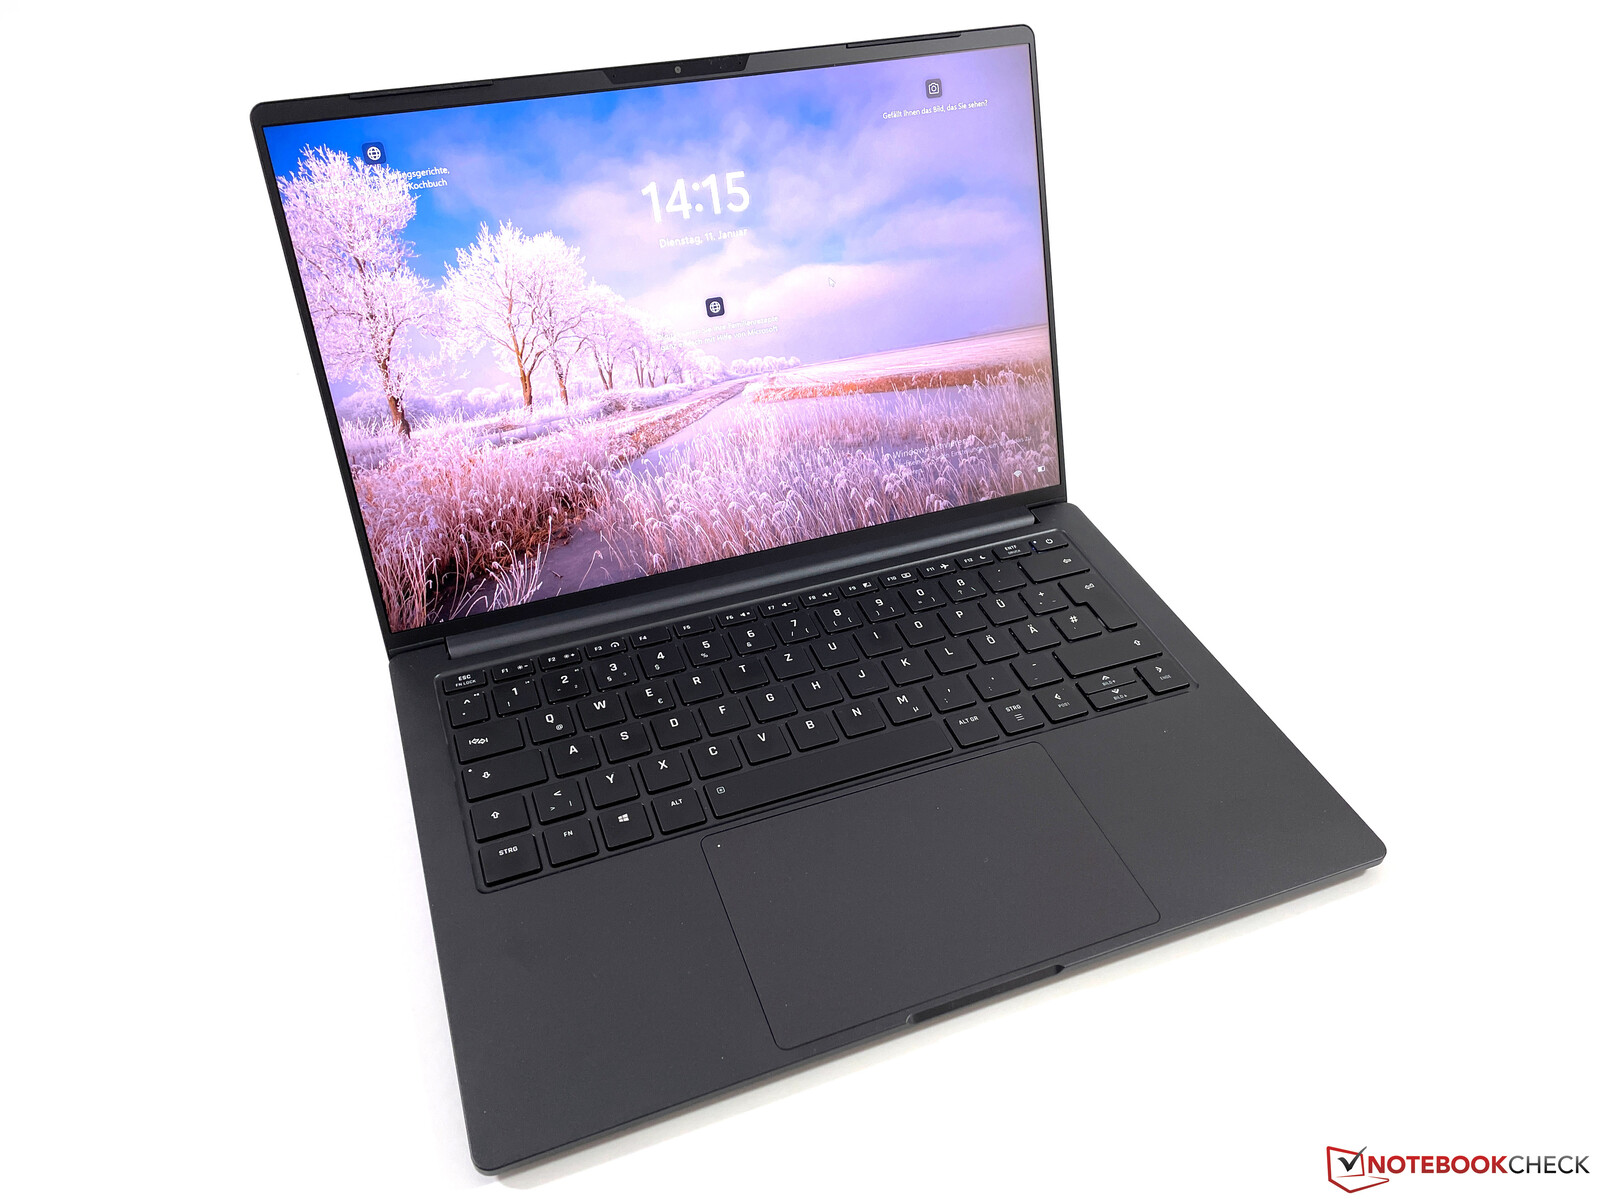
Schenker Vision 14 laptop in review: Now also available with the GeForce RTX 3050 Ti

We reviewed the Schenker Vision 14 with a 15 W Intel Tiger Lake processor about half a year ago. This lightweight device was compelling in many areas and also received a very good rating of 89% overall. It was already apparent in this model (which is still available) that Schenker had been preparing this case for a stronger cooling system with an additional fan as well as a dedicated graphics card. Now, we have this new version of the Vision 14 in review.
In terms of price, the Vision 14 starts at 1,249 Euros (~$1,402) with the H35 processor and iGPU (Core i5-11300H), which is 250 Euros (~$281) more expensive than the Vision 14 that comes with the normal Core i5 processor (15 W) but is only offered with the Full HD panel. The high-resolution 3K panel (2880x1800 pixels) with 90 Hz is only available for the H35 model and is also built in by default here. Our test configuration is well-equipped with a Core i7-11370H, a GeForce RTX 3050 Ti, 32 GB of RAM, and a 1 TB PCIe 4.0 SSD, and this reflects in the price which is a bit over 2,050 Euros (~$2,301).
In the 14-inch ultrabook segment, we now see a few models sporting Tiger Lake H35 CPUs (35 W) but lacking a dedicated GPU. The few exceptions present are significantly heavier models, so the Vision 14 doesn't really have any direct competition in this configuration. Users who prefer the Linux operating system should take a look at the identically built InfinityBook Pro 14 (with the Core i7-11370H and a 3K display, which starts at 1,449 Euros (~$1,627)).
Possible contenders in comparison
Rating | Date | Model | Weight | Height | Size | Resolution | Price |
|---|---|---|---|---|---|---|---|
| 87.7 % v7 (old) | 01 / 2022 | Schenker Vision 14 i7-11370H, GeForce RTX 3050 Ti Laptop GPU | 1.1 kg | 15.6 mm | 14.00" | 2880x1800 | |
| 86.9 % v7 (old) | 10 / 2021 | Lenovo IdeaPad Slim 7i Pro 14IHU5 i7-11370H, Iris Xe G7 96EUs | 1.4 kg | 16.9 mm | 14.00" | 2880x1800 | |
| 88.6 % v7 (old) | 10 / 2021 | Huawei MateBook 14s i7 i7-11370H, Iris Xe G7 96EUs | 1.4 kg | 16.7 mm | 14.20" | 2520x1680 | |
| 85.5 % v7 (old) | 10 / 2020 | Razer Blade Stealth i7-1165G7 GTX 1650 Ti Max-Q i7-1165G7, GeForce GTX 1650 Ti Max-Q | 1.4 kg | 15.3 mm | 13.30" | 1920x1080 | |
| 82.3 % v7 (old) | 07 / 2021 | MSI Summit E14 A11SCS i7-1185G7, GeForce GTX 1650 Ti Max-Q | 1.3 kg | 16 mm | 14.00" | 3840x2160 | |
| 89.1 % v7 (old) | 06 / 2021 | Schenker Vision 14 i7-1165G7, Iris Xe G7 96EUs | 1 kg | 15.6 mm | 14.00" | 2880x1800 |
Case, connectivity, and input devices
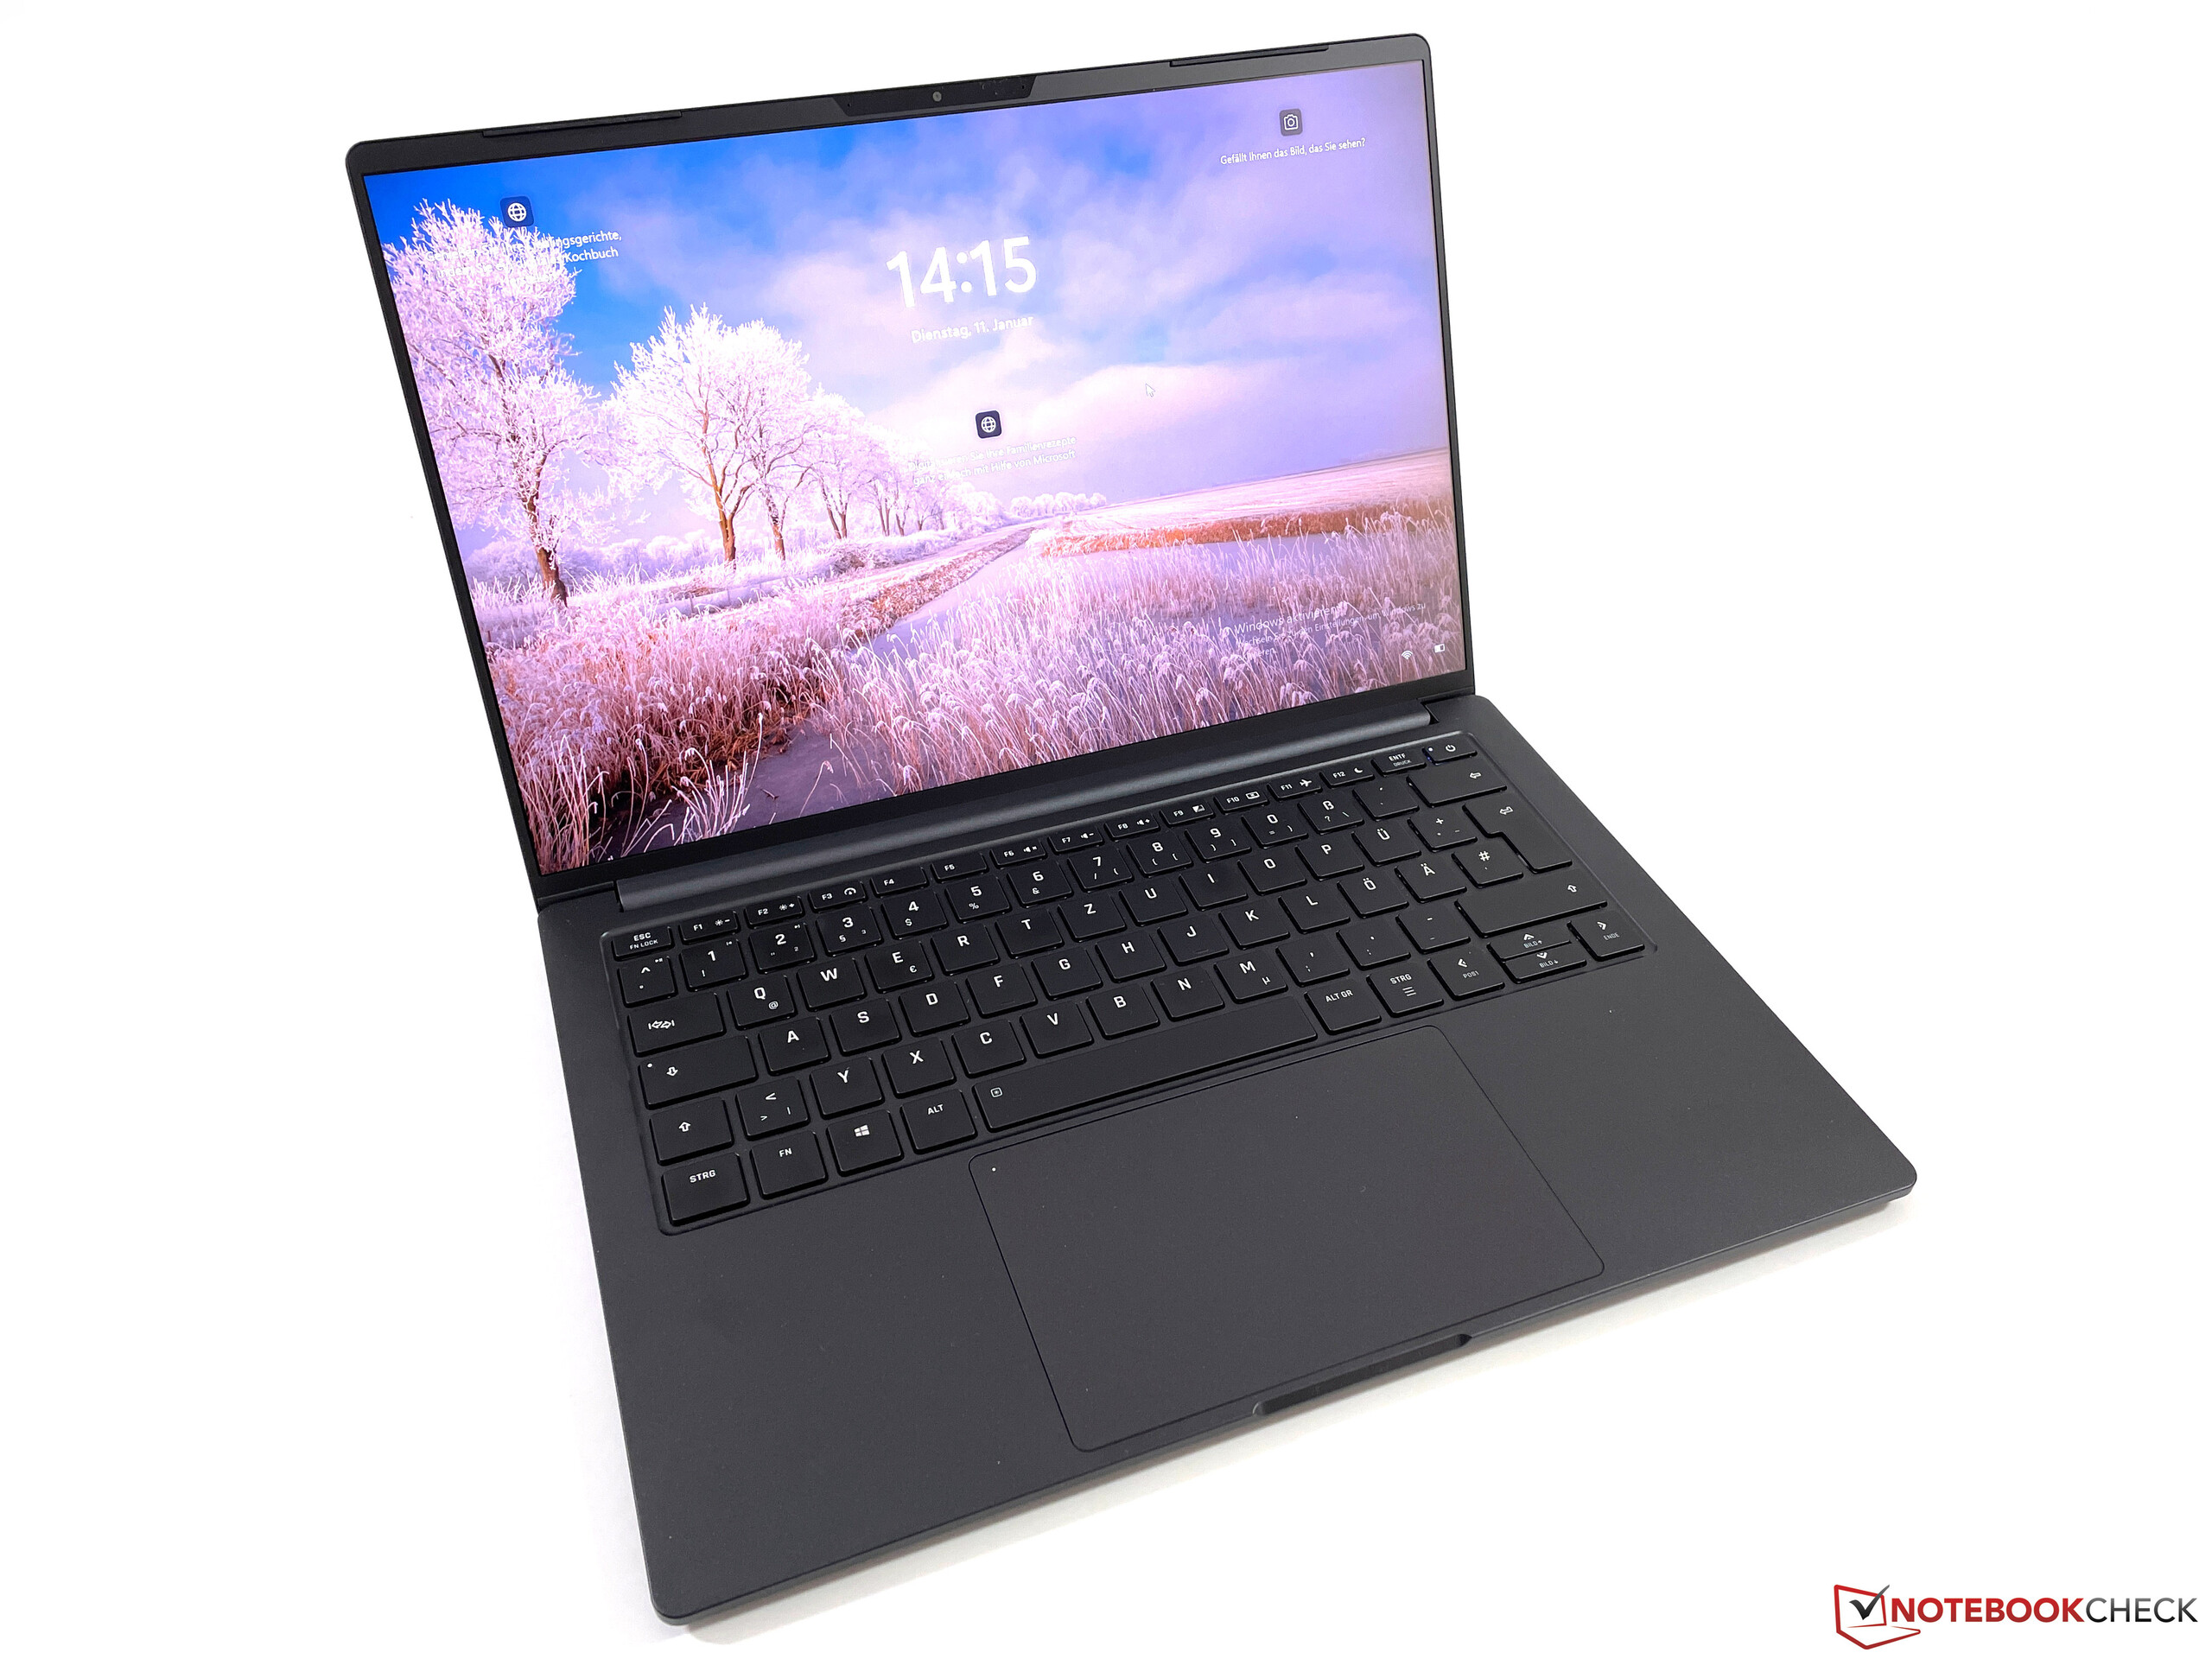
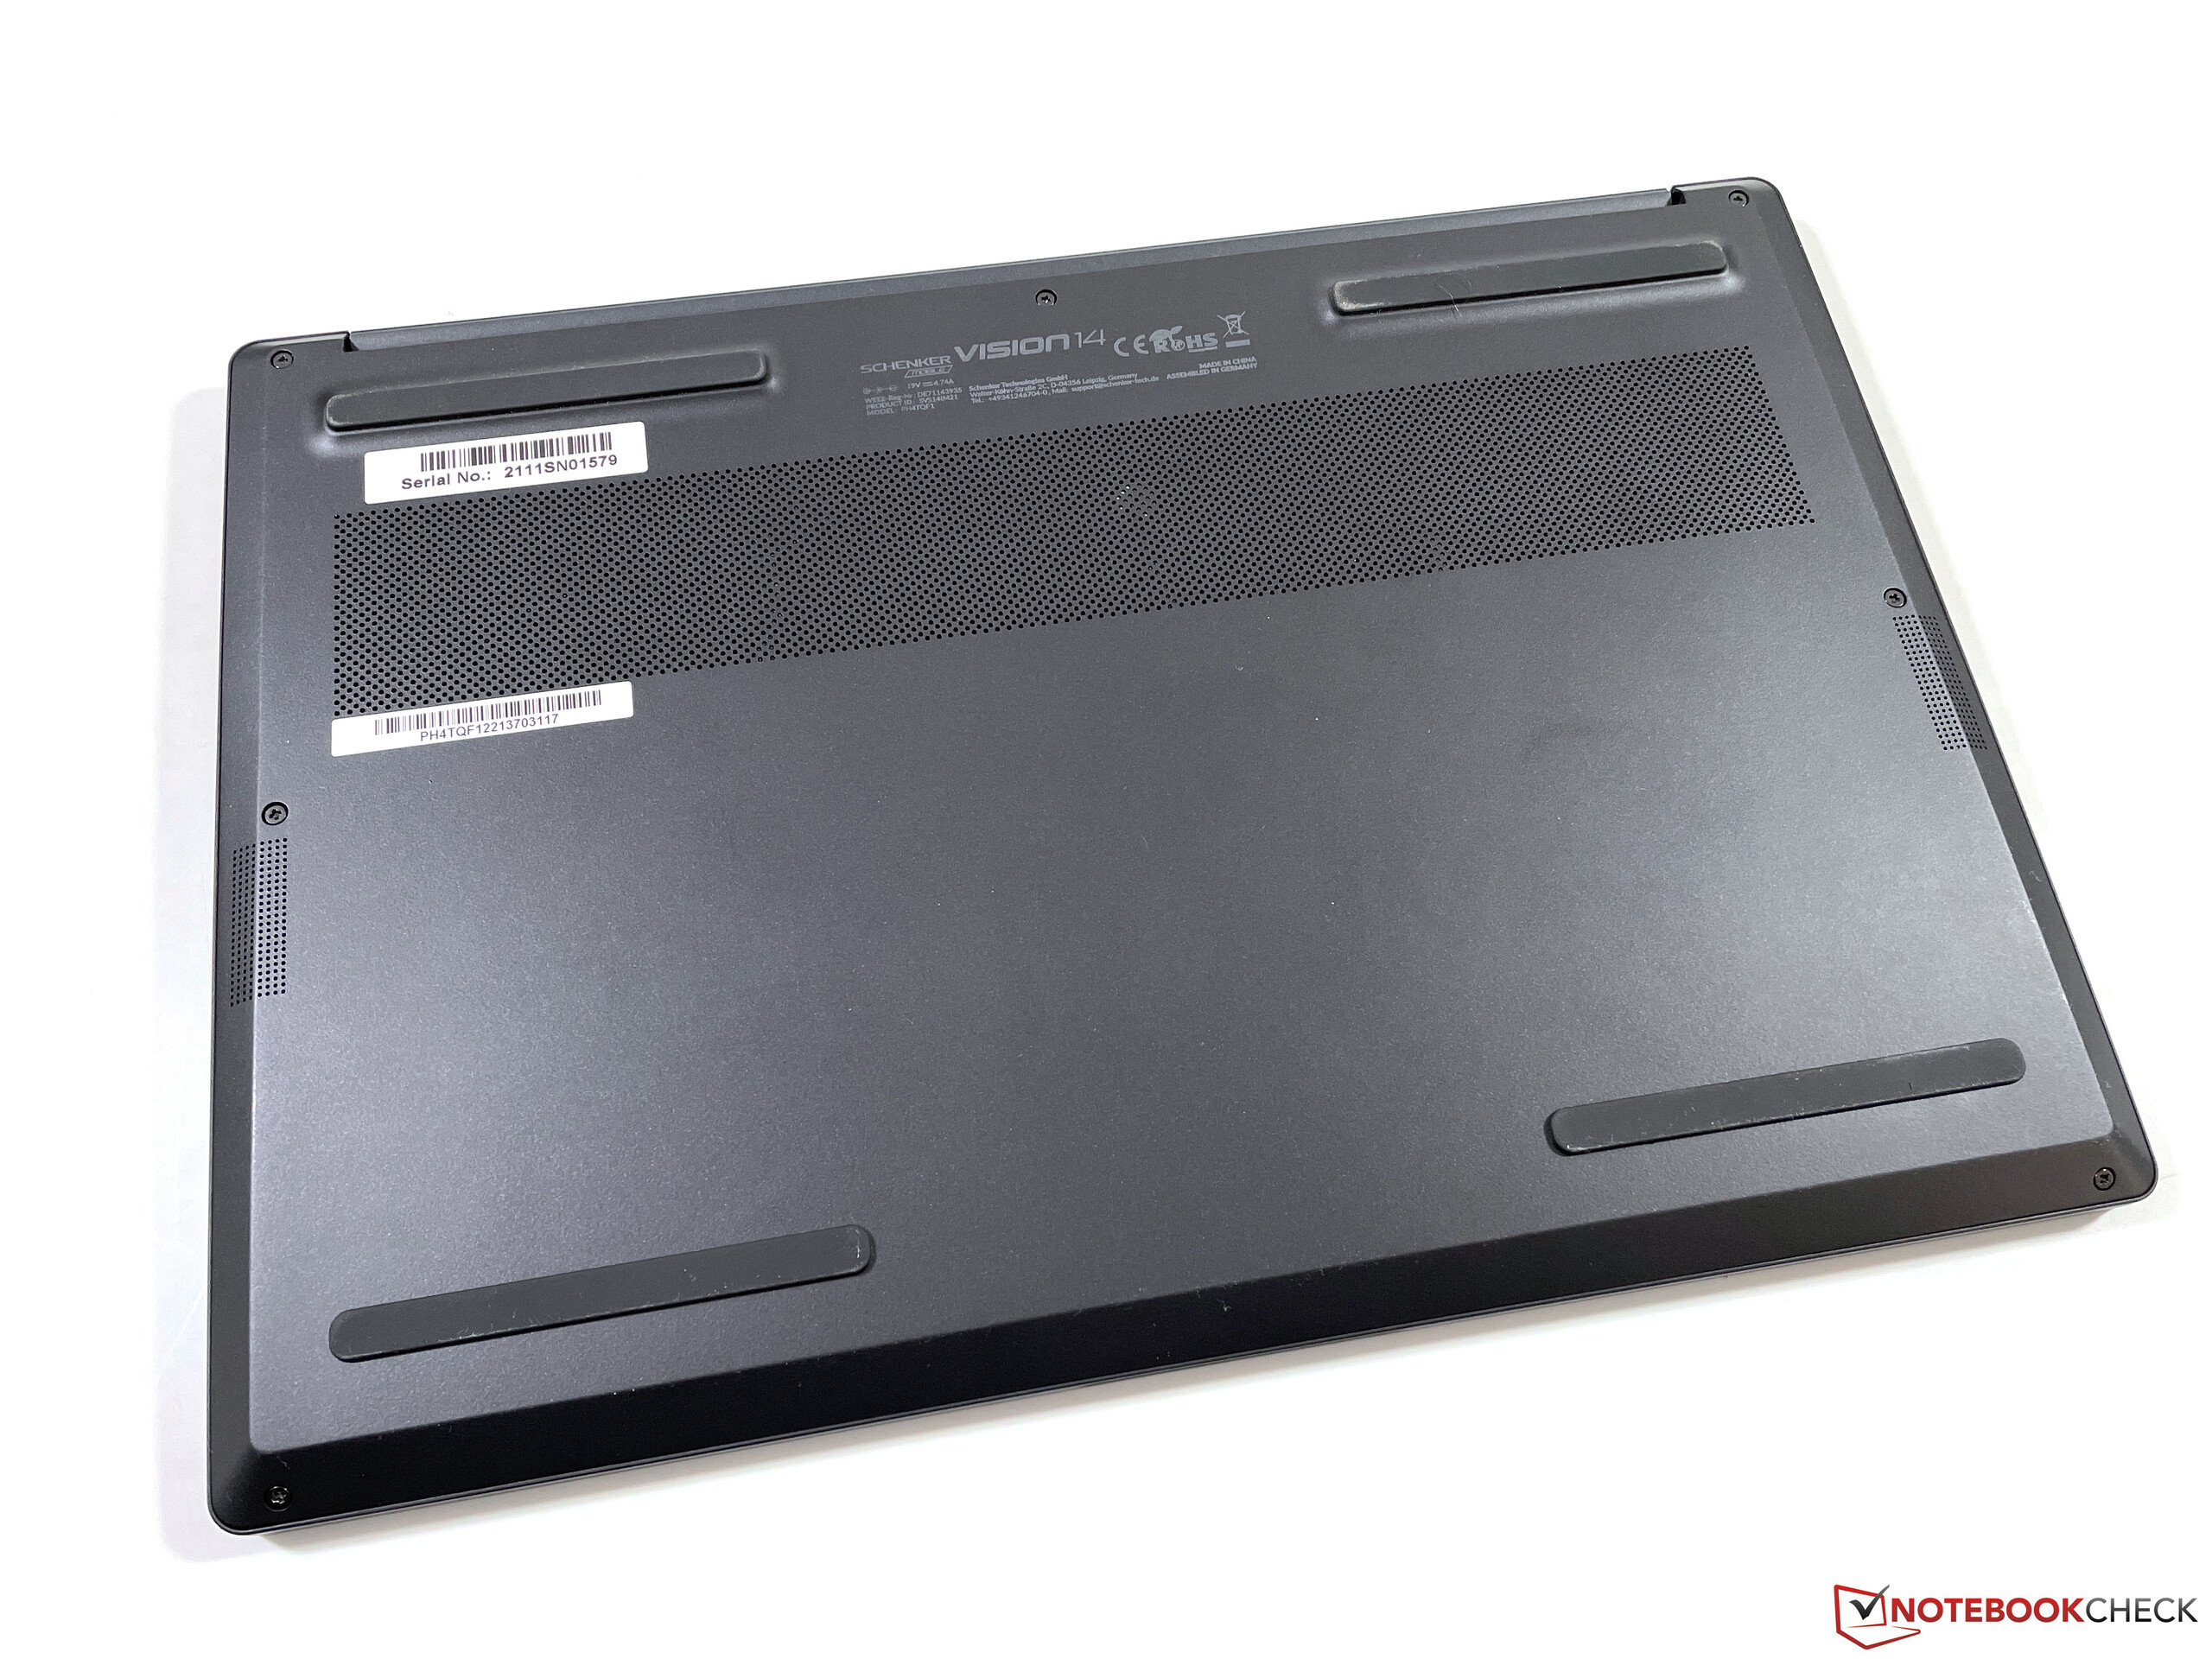
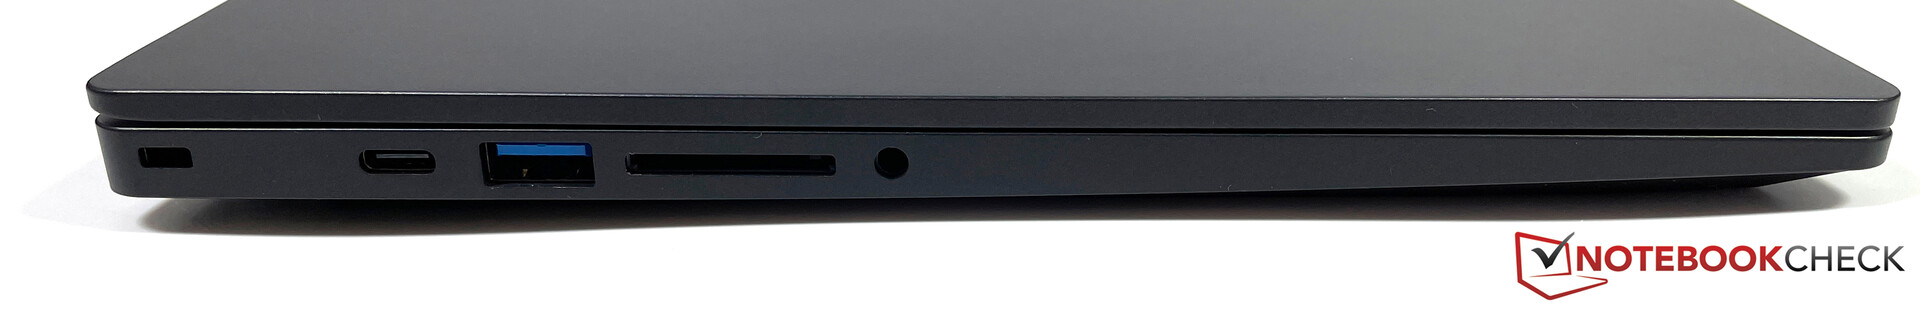
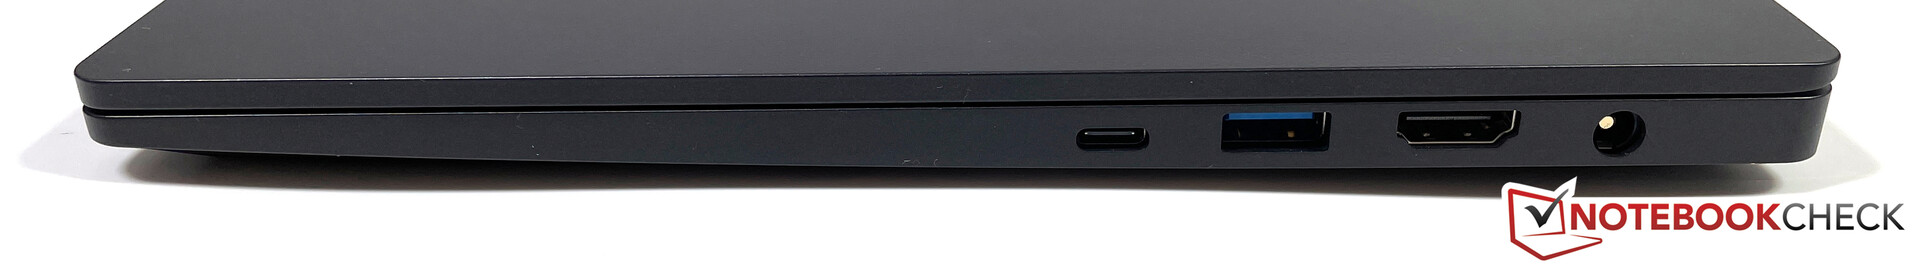
In principle, the black magnesium case is identical to the first model of the Vision 14 that we reviewed. For more information on the case quality, the connectivity, and the input devices, please refer to our detailed June 2021 review. The additional dedicated graphics card and the second fan increase the laptop's weight by 99 grams to 1.127 kg, which still makes the Vision 14 quite light.
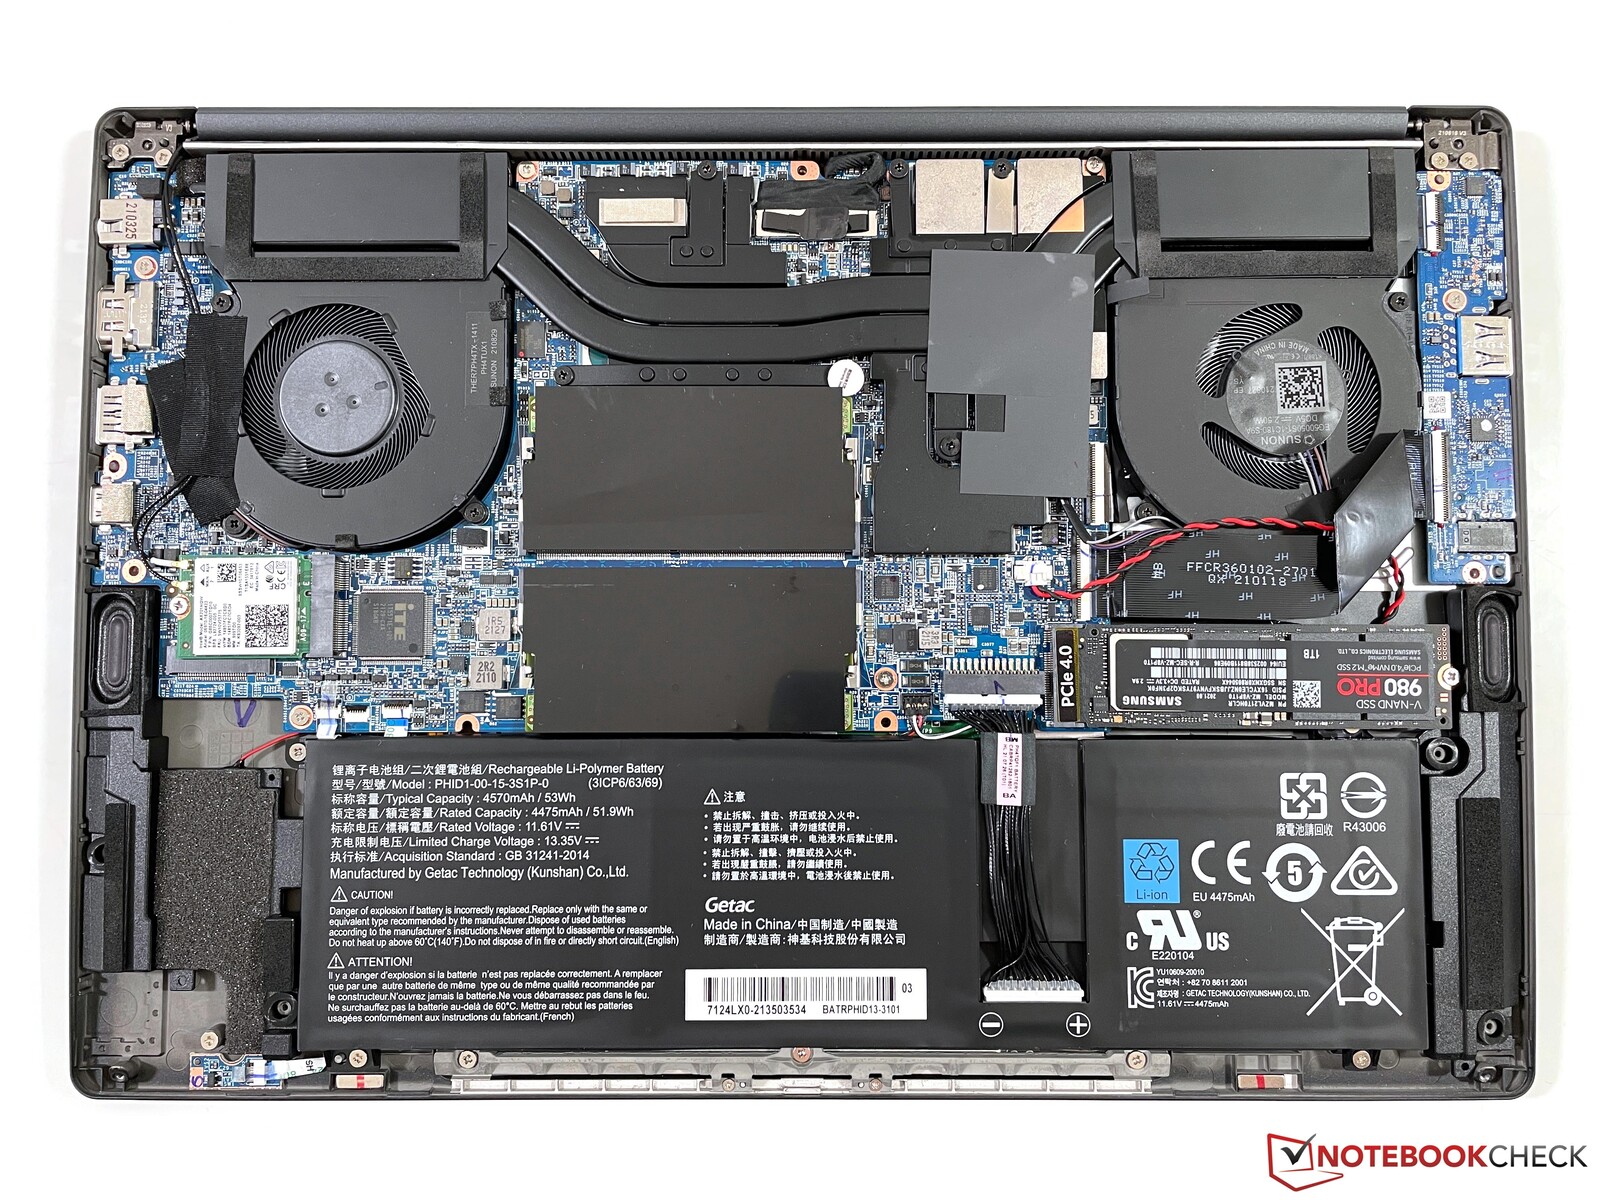
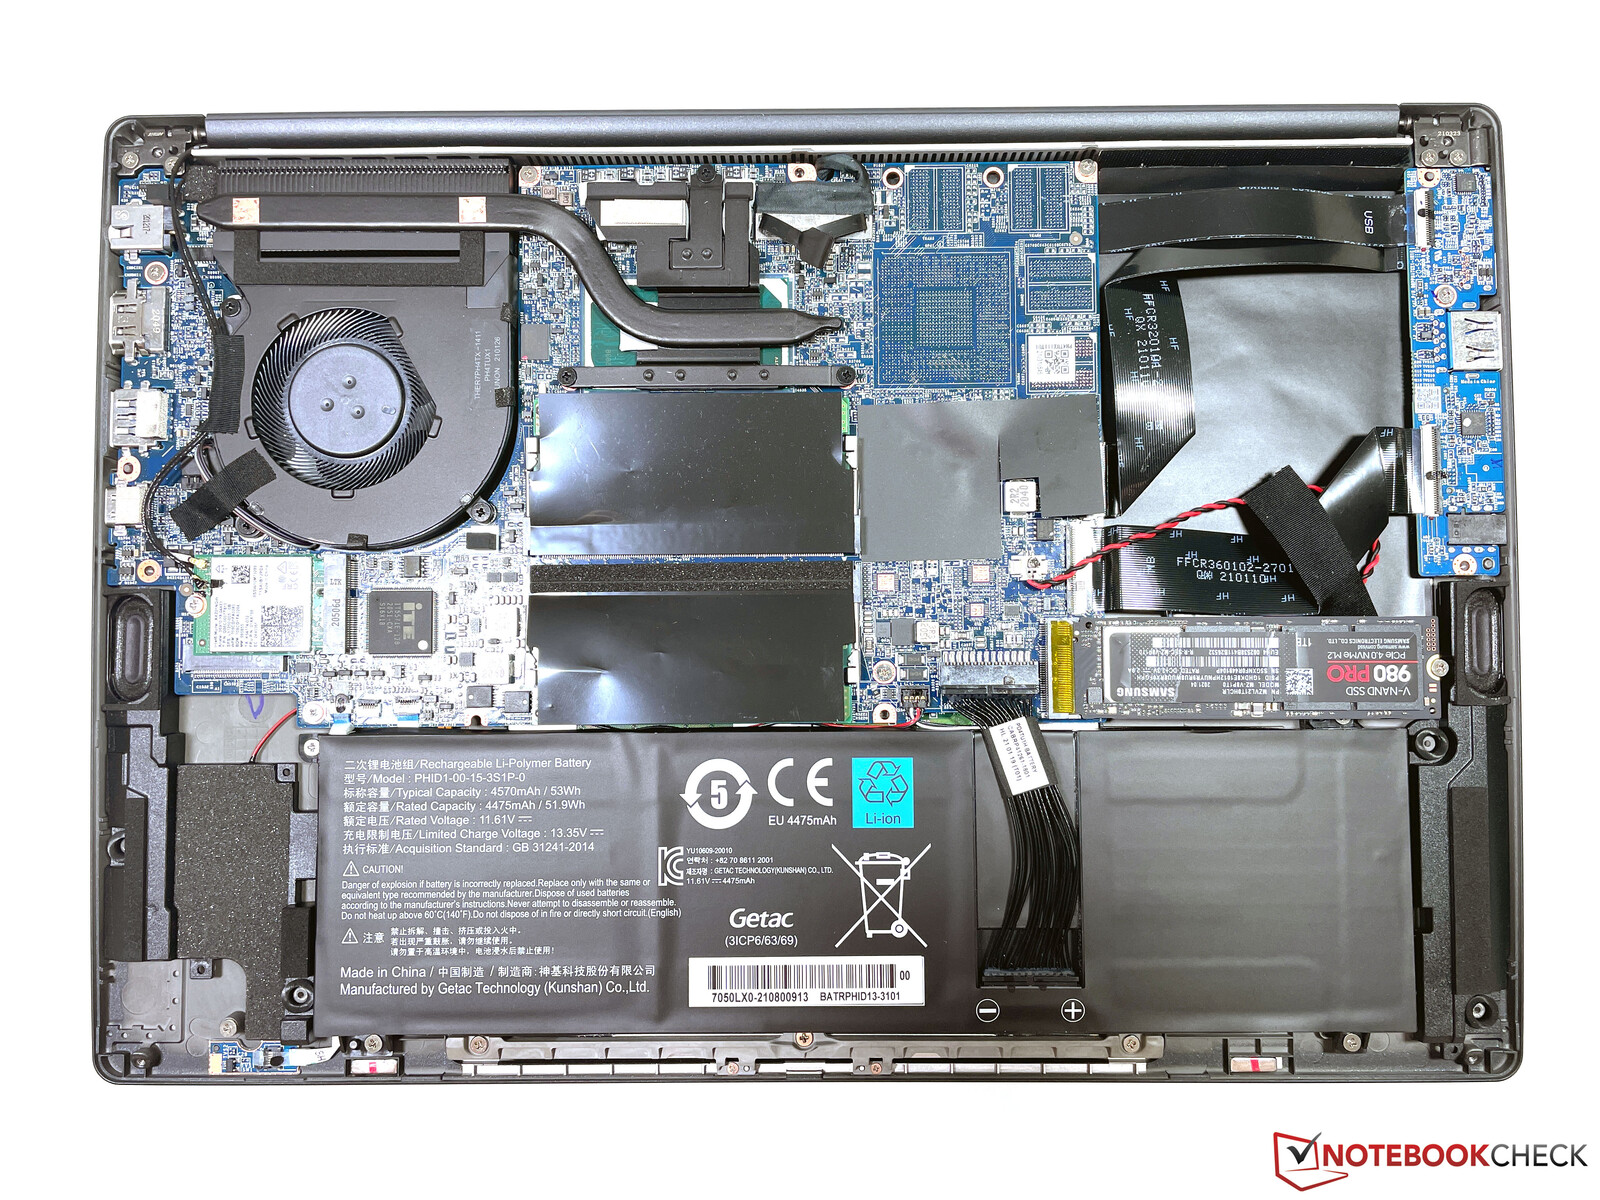
After opening the case, you can see the improved cooling with the second fan as well as the additional heat pipe. The welcome maintenance and upgrade options that include two SODIMM slots (max. 64 GB RAM) and two full-fledged M.2 2280 slots (1x PCIe 4.0 and 1x PCIe 3.0 x2) as well as the replaceable WLAN module are still present in the H35 model of the Vision 14.
| SD Card Reader | |
| average JPG Copy Test (av. of 3 runs) | |
| MSI Summit E14 A11SCS (AV Pro V60) | |
| Schenker Vision 14 (AV PRO V60) | |
| Schenker Vision 14 (Angelbird AV Pro V60) | |
| Average of class Subnotebook (23.7 - 188, n=9, last 2 years) | |
| maximum AS SSD Seq Read Test (1GB) | |
| MSI Summit E14 A11SCS (AV Pro V60) | |
| Average of class Subnotebook (24.9 - 195, n=8, last 2 years) | |
| Schenker Vision 14 (AV PRO V60) | |
| Schenker Vision 14 (Angelbird AV Pro V60) | |


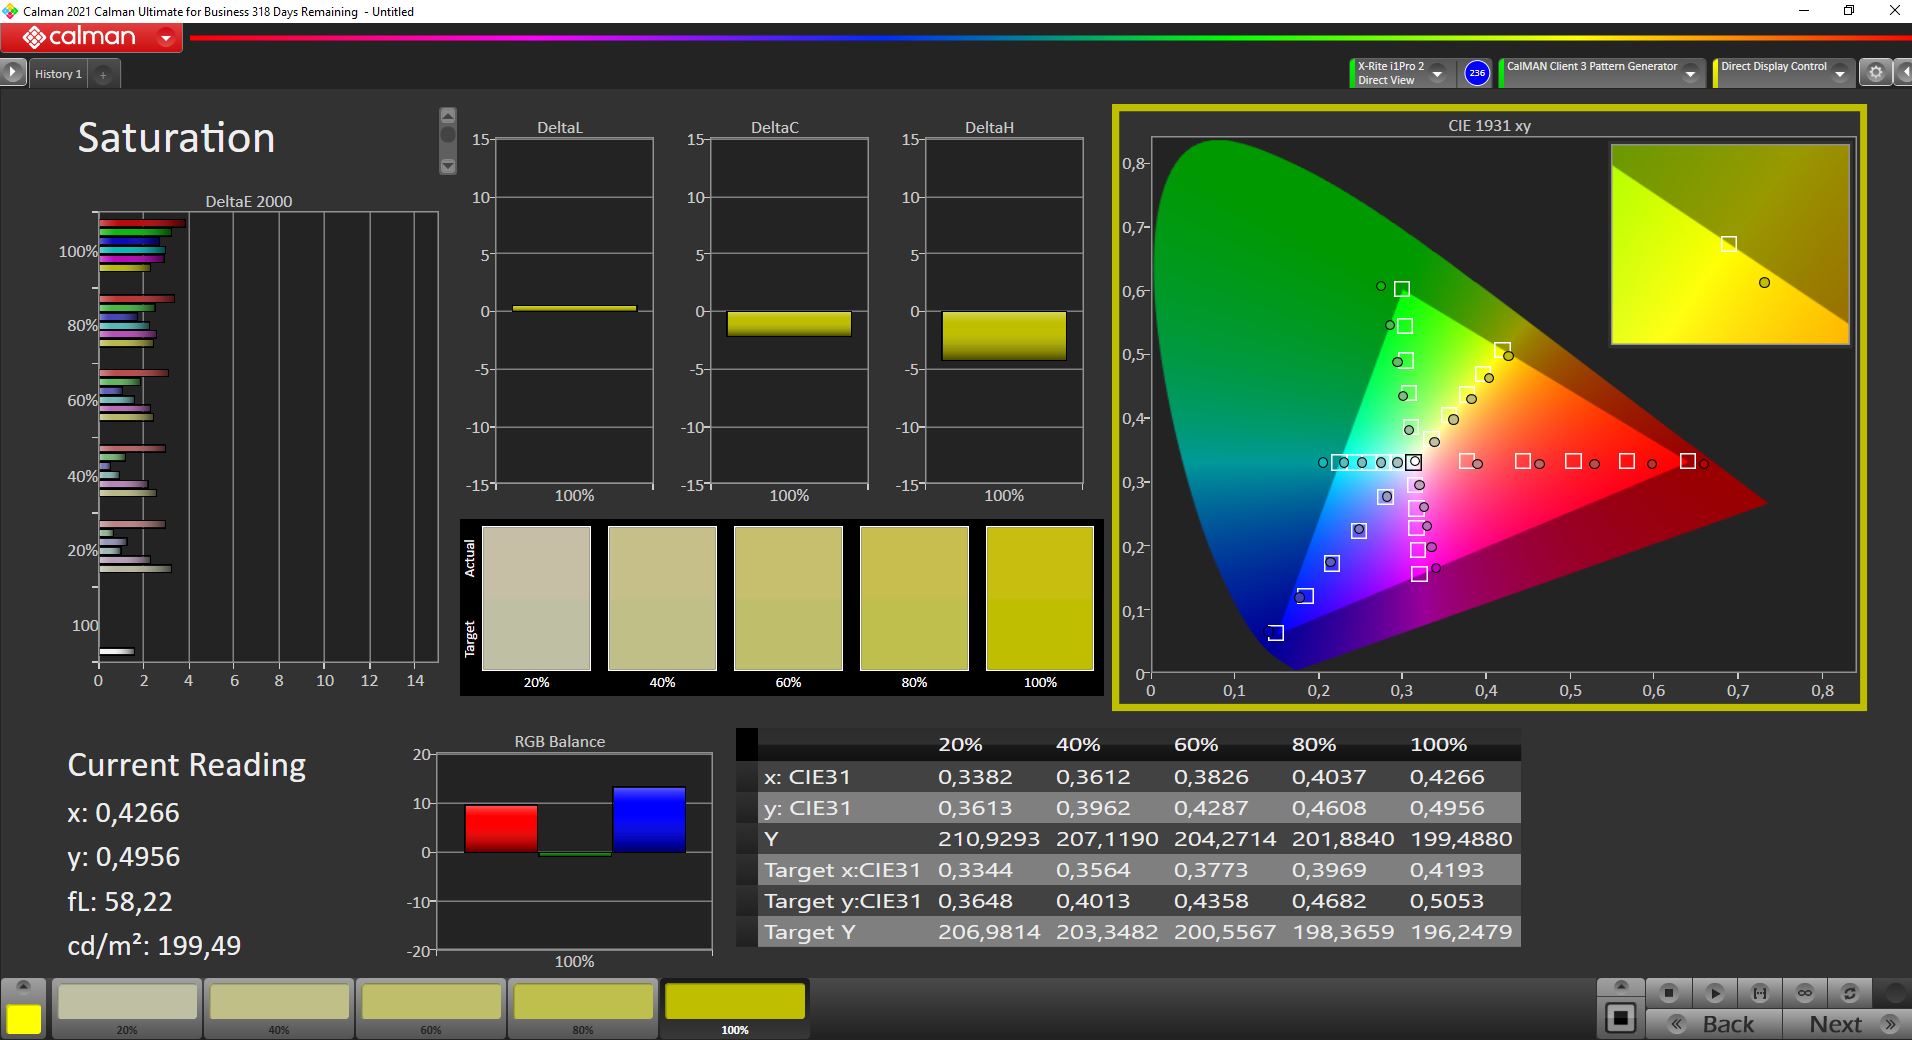
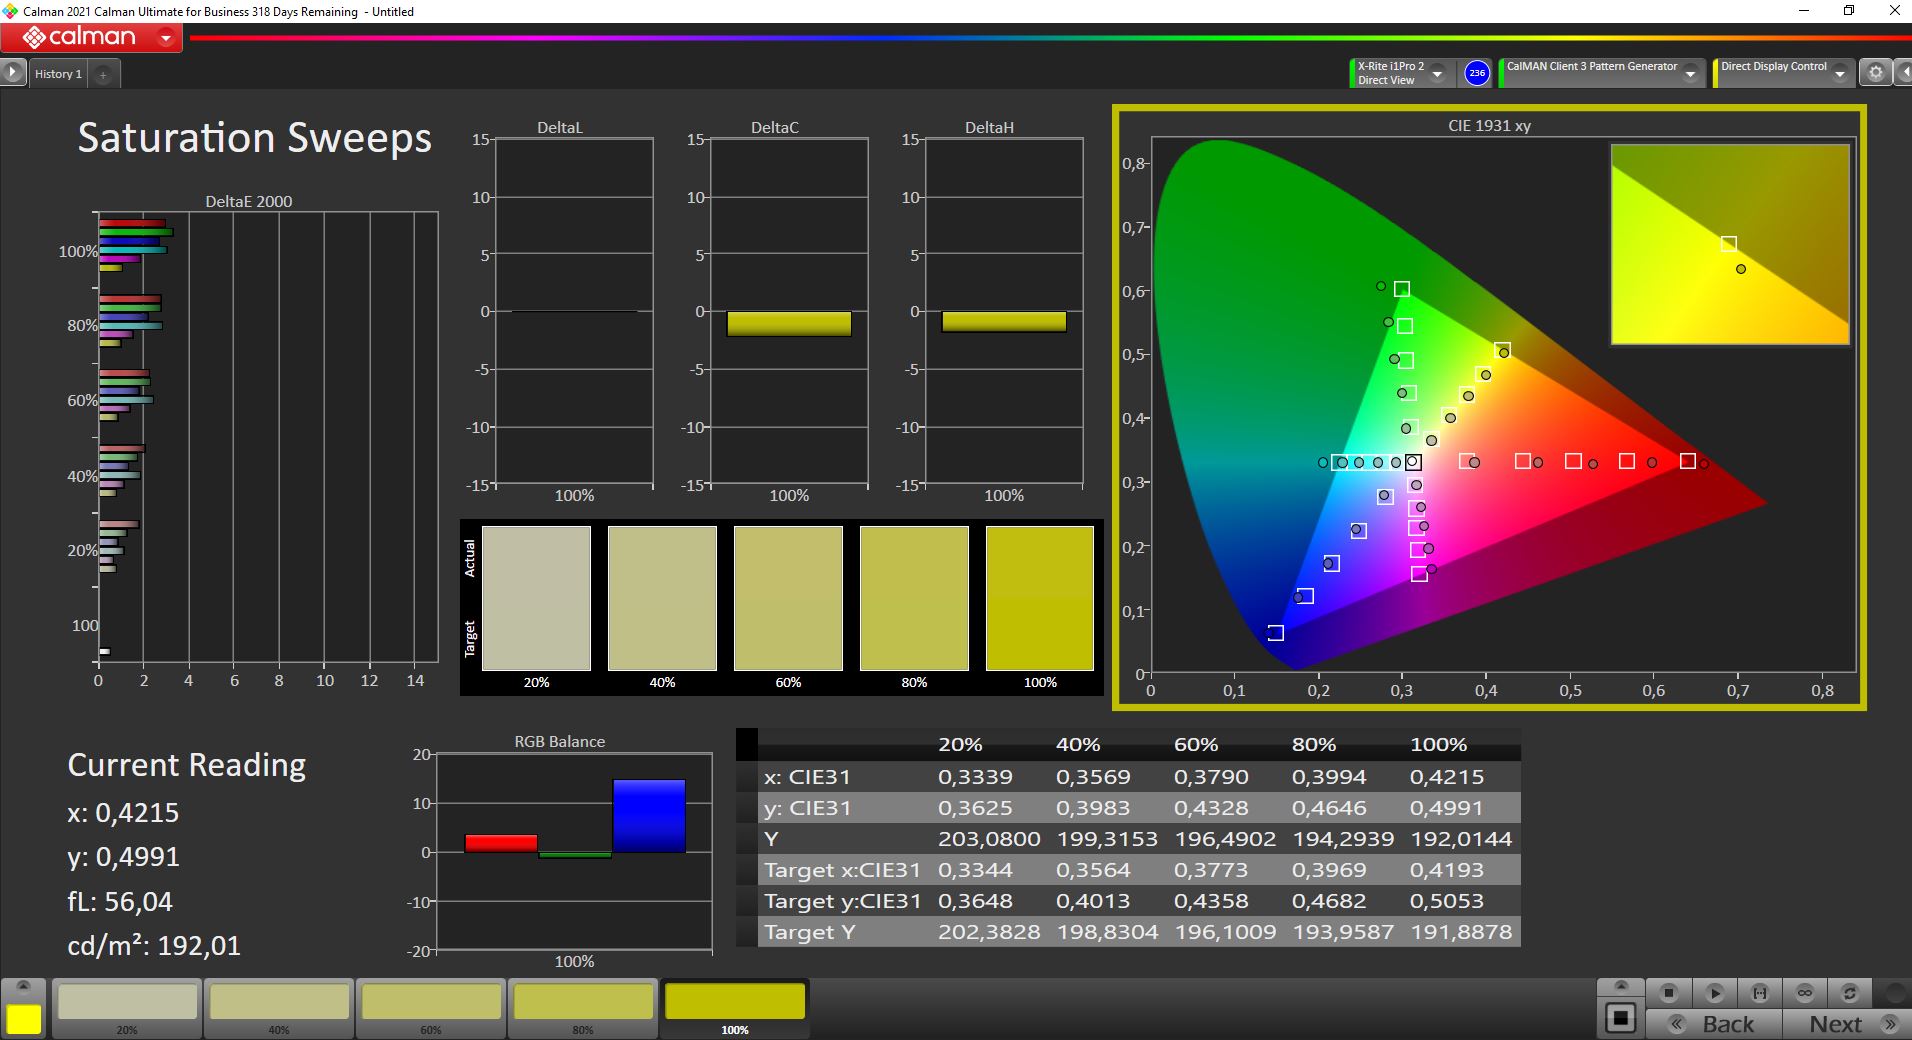
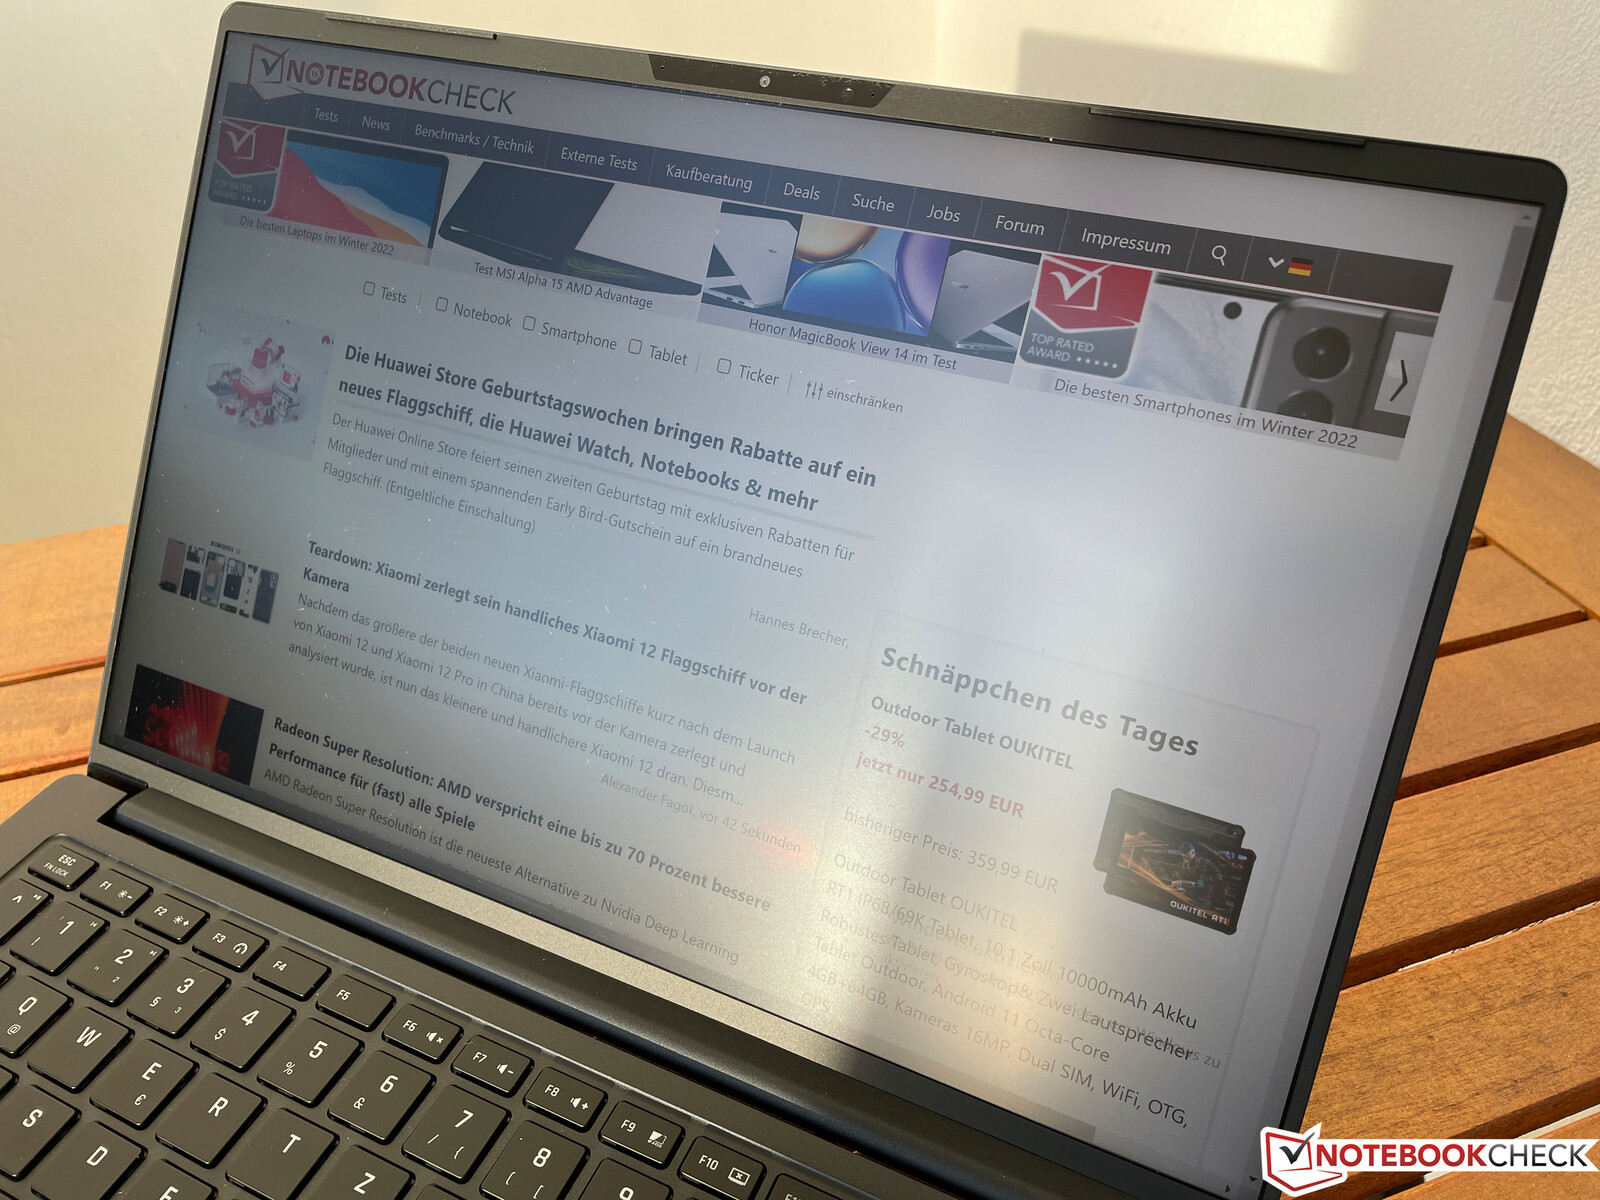
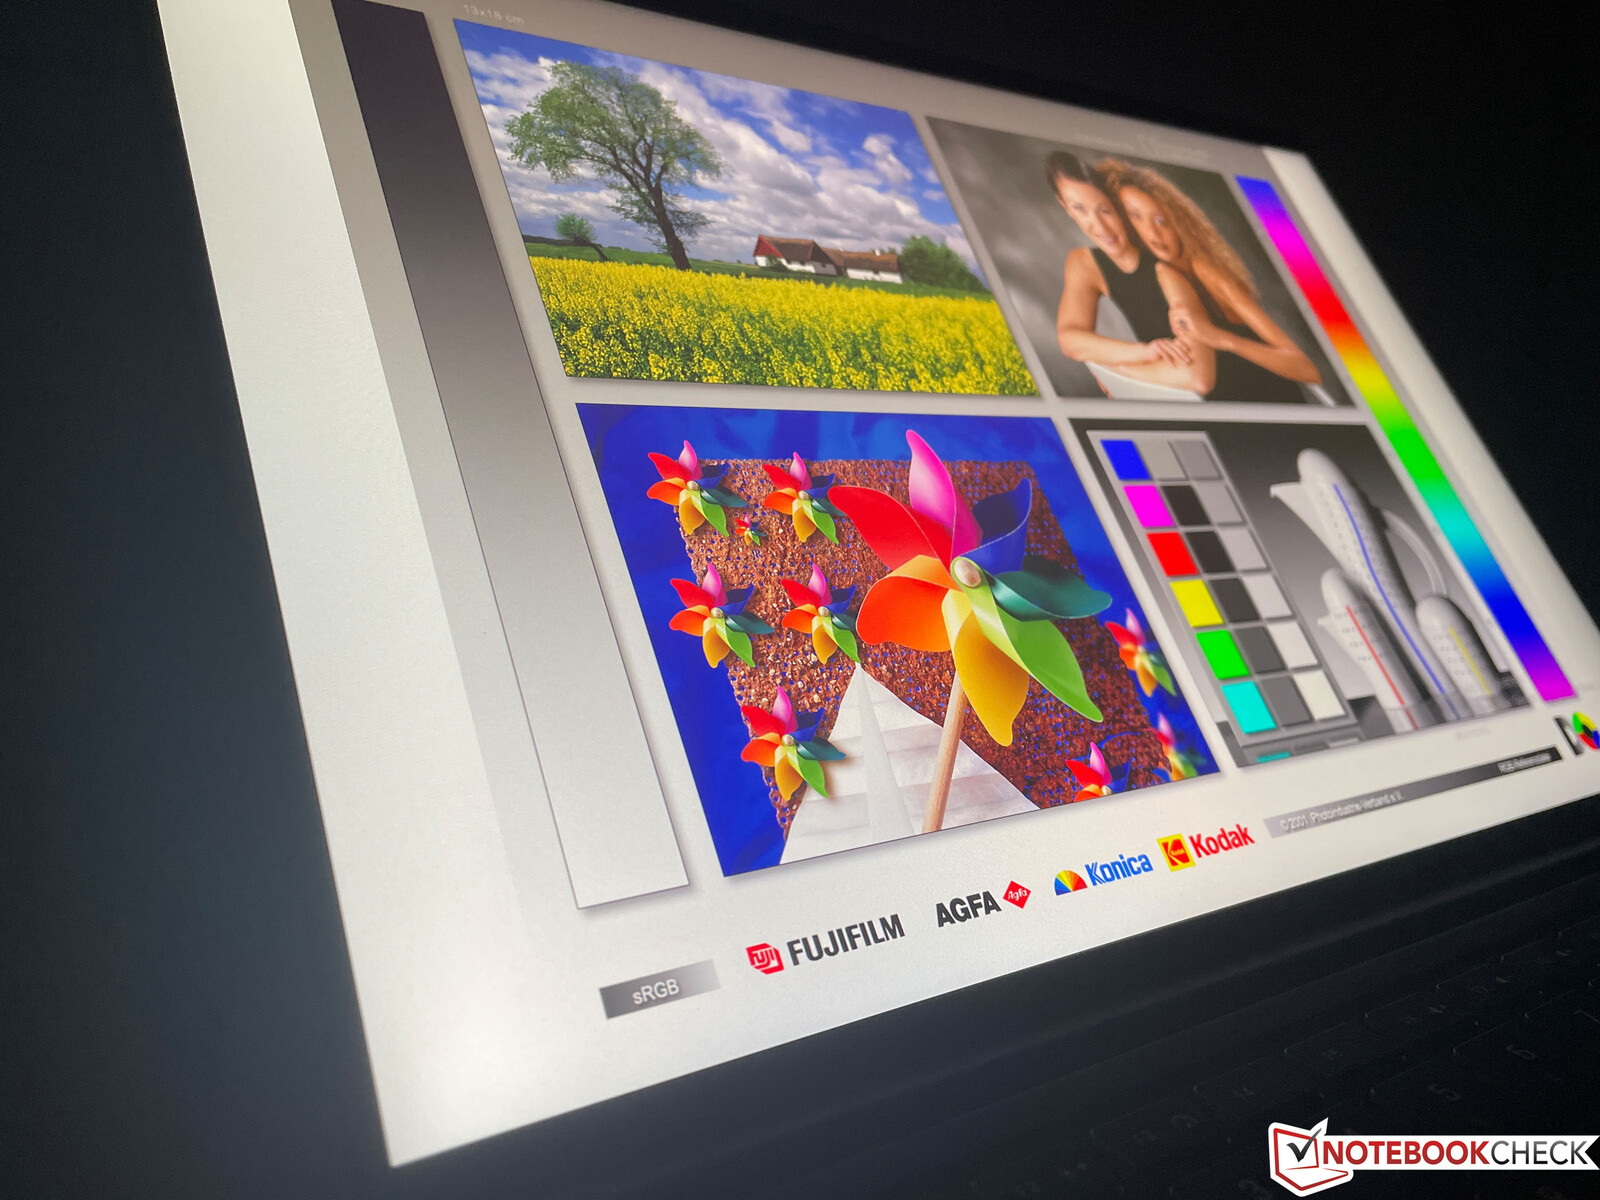
Display - Vision 14 H35 with matte 3K IPS panel

The Vision 14 H35 is exclusively available with a high-resolution 3K panel (2880x1800 pixels) with an aspect ratio of 16:10. The subjective impression of quality of the matte IPS panel is very good, the colors are vivid, content is sharp, and bright surfaces don't look grainy either. Due to the higher refresh rate of 90 Hz, motions look pleasantly smooth as well. There are no problems with slow response times or PWM flickering.
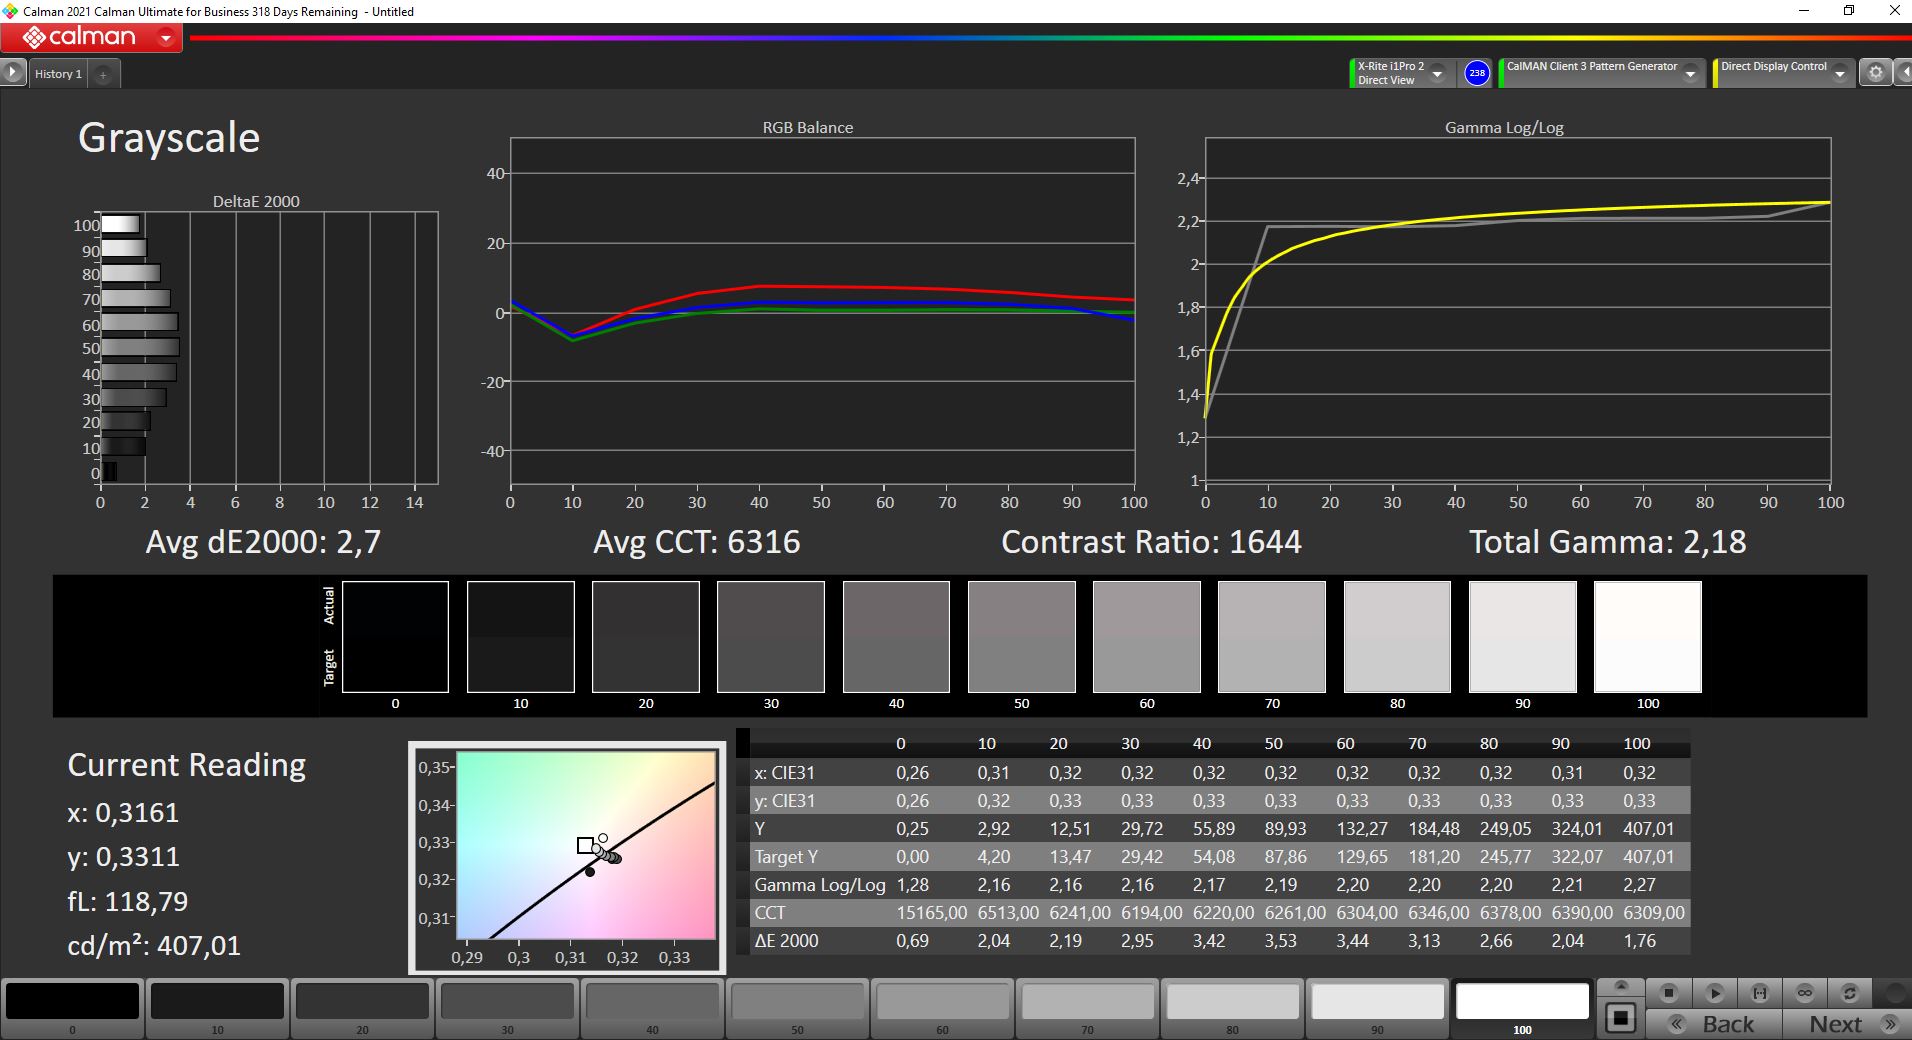
The panel is identical to the one found in the previously reviewed Vision 14 model, and even our measurements are only marginally different though still within normal levels of variation. Brightness is slightly higher with an average of 407 cd/m², and the black level is also a bit better. However, this difference isn't visible to the naked eye.
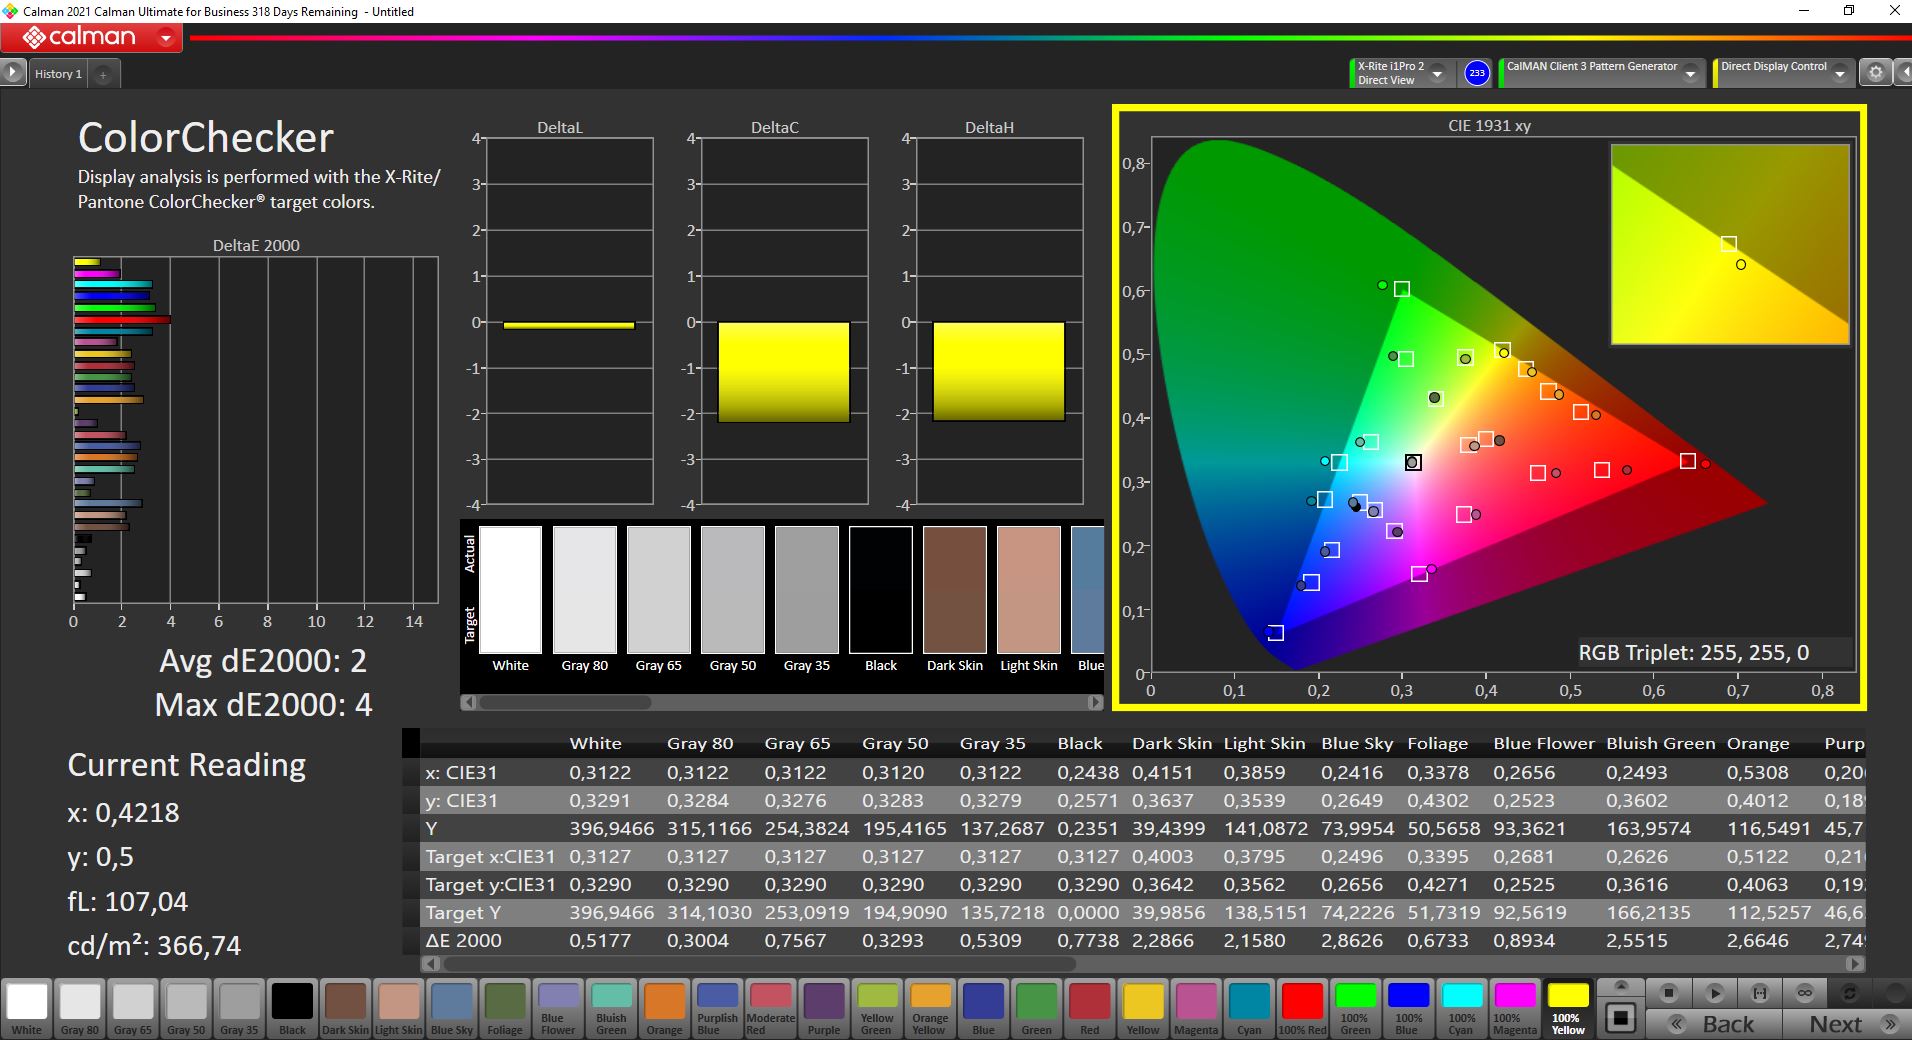
Color reproduction is already decent out of the box, but we are still able to improve color deviations with our own calibration (the profile is available to download for free in the box on the right). Together with the almost full sRGB coverage, this panel is also suitable for editing pictures/videos.
| |||||||||||||||||||||||||
Brightness Distribution: 94 %
Center on Battery: 411 cd/m²
Contrast: 1628:1 (Black: 0.25 cd/m²)
ΔE ColorChecker Calman: 2.6 | ∀{0.5-29.43 Ø4.72}
calibrated: 2
ΔE Greyscale Calman: 2.7 | ∀{0.09-98 Ø4.97}
75.7% AdobeRGB 1998 (Argyll 3D)
97.6% sRGB (Argyll 3D)
74.3% Display P3 (Argyll 3D)
Gamma: 2.18
CCT: 6316 K
| Schenker Vision 14 MNE007ZA1, IPS, 2880x1800, 14" | Lenovo IdeaPad Slim 7i Pro 14IHU5 LEN140WQ+, IPS, 2880x1800, 14" | Huawei MateBook 14s i7 CSOTT3 U17B MNE208ZA1-3, LTPS, 2520x1680, 14.2" | Razer Blade Stealth i7-1165G7 GTX 1650 Ti Max-Q Sharp LQ133M1JW46, IPS, 1920x1080, 13.3" | MSI Summit E14 A11SCS AU Optronics AUO123B, IPS, 3840x2160, 14" | Schenker Vision 14 CSOT T3_MNE007ZA1_1, IPS, 2880x1800, 14" | |
|---|---|---|---|---|---|---|
| Display | 2% | -5% | -7% | 17% | 1% | |
| Display P3 Coverage (%) | 74.3 | 76.9 3% | 67.8 -9% | 66 -11% | 87.5 18% | 75.4 1% |
| sRGB Coverage (%) | 97.6 | 99.8 2% | 98.3 1% | 97.4 0% | 100 2% | 99 1% |
| AdobeRGB 1998 Coverage (%) | 75.7 | 76.7 1% | 70.1 -7% | 67.1 -11% | 99.4 31% | 76.4 1% |
| Response Times | -6% | -5% | -74% | -48% | 4% | |
| Response Time Grey 50% / Grey 80% * (ms) | 40.4 ? | 36.4 ? 10% | 37.6 ? 7% | 57.6 ? -43% | 52 ? -29% | 32.8 ? 19% |
| Response Time Black / White * (ms) | 18.4 ? | 22.4 ? -22% | 21.6 ? -17% | 37.6 ? -104% | 30.8 ? -67% | 20.4 ? -11% |
| PWM Frequency (Hz) | 27780 ? | |||||
| Screen | -6% | 13% | -5% | -37% | -8% | |
| Brightness middle (cd/m²) | 407 | 410 1% | 419 3% | 356.8 -12% | 593.3 46% | 390 -4% |
| Brightness (cd/m²) | 407 | 395 -3% | 407 0% | 336 -17% | 571 40% | 387 -5% |
| Brightness Distribution (%) | 94 | 91 -3% | 93 -1% | 88 -6% | 87 -7% | 94 0% |
| Black Level * (cd/m²) | 0.25 | 0.29 -16% | 0.23 8% | 0.34 -36% | 0.53 -112% | 0.29 -16% |
| Contrast (:1) | 1628 | 1414 -13% | 1822 12% | 1049 -36% | 1119 -31% | 1345 -17% |
| Colorchecker dE 2000 * | 2.6 | 3.24 -25% | 1.9 27% | 1.63 37% | 4.42 -70% | 2.8 -8% |
| Colorchecker dE 2000 max. * | 4.4 | 5.26 -20% | 3.6 18% | 5.03 -14% | 7.16 -63% | 4.4 -0% |
| Colorchecker dE 2000 calibrated * | 2 | 0.41 79% | 0.9 55% | 1.08 46% | 4.3 -115% | 1.8 10% |
| Greyscale dE 2000 * | 2.7 | 4.2 -56% | 2.9 -7% | 3 -11% | 3.2 -19% | 3.5 -30% |
| Gamma | 2.18 101% | 2.18 101% | 2.14 103% | 2.23 99% | 2.04 108% | 2.24 98% |
| CCT | 6316 103% | 6012 108% | 6733 97% | 6434 101% | 6737 96% | 6174 105% |
| Color Space (Percent of AdobeRGB 1998) (%) | 62 | 76.4 | ||||
| Color Space (Percent of sRGB) (%) | 97.6 | 99 | ||||
| Total Average (Program / Settings) | -3% /
-4% | 1% /
6% | -29% /
-16% | -23% /
-27% | -1% /
-4% |
* ... smaller is better


Display Response Times
| ↔ Response Time Black to White | ||
|---|---|---|
| 18.4 ms ... rise ↗ and fall ↘ combined | ↗ 6 ms rise | 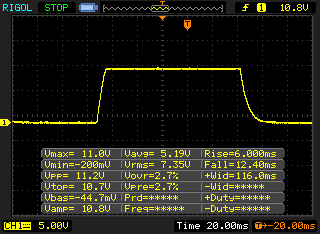 |
| ↘ 12.4 ms fall | ||
| The screen shows good response rates in our tests, but may be too slow for competitive gamers. In comparison, all tested devices range from 0.1 (minimum) to 240 (maximum) ms. » 41 % of all devices are better. This means that the measured response time is similar to the average of all tested devices (19.8 ms). | ||
| ↔ Response Time 50% Grey to 80% Grey | ||
| 40.4 ms ... rise ↗ and fall ↘ combined | ↗ 18.8 ms rise | 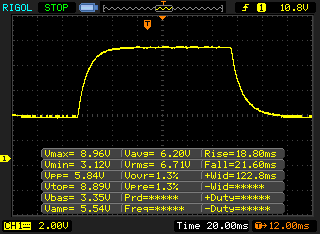 |
| ↘ 21.6 ms fall | ||
| The screen shows slow response rates in our tests and will be unsatisfactory for gamers. In comparison, all tested devices range from 0.165 (minimum) to 636 (maximum) ms. » 64 % of all devices are better. This means that the measured response time is worse than the average of all tested devices (31 ms). | ||
Screen Flickering / PWM (Pulse-Width Modulation)
| Screen flickering / PWM not detected |  | ||
In comparison: 52 % of all tested devices do not use PWM to dim the display. If PWM was detected, an average of 7763 (minimum: 5 - maximum: 343500) Hz was measured. | |||
Performance - Core i7-11370H and RTX 3050 Ti
Intel's Tiger Lake H35 CPUs are essentially regular Tiger Lake mobile processors with four cores (eight threads), but they just consume more power. However, we often see in our reviews that even the regular U-series CPUs (e.g., the Core i7-1165G7) run at more than 40 W at times during short load peaks. Compared to Intel's 45 W processors, which provide more CPU cores, the H35 CPUs use faster Iris Xe graphics adapters.
Therefore, most laptops use the H35 CPUs without a dedicated GPU, so that you also get some benefit from the faster iGPU. Combining these CPUs with a dedicated graphics card, on the other hand, actually doesn't make much sense because you sacrifice CPU performance in comparison to the 45 W CPUs and also cannot take full advantage of the fast Iris Xe GPU.
That being said, it would be unfair to blame Schenker itself since they depend on the available chips from Intel (AMD CPUs are not available due to supply bottlenecks). Sharing the same chipset as the Tiger Lake-U chips makes it comparatively easier to produce H35 chips. The Vision 14 is also available without the additional GeForce GPU, so this processor does make sense in that case. However, in our opinion, the same performance could have been achieved with a conventional Core i7-1165G7 or a Core i7-1185G7, if the latter had also been equipped with the liquid metal thermal compound and stronger cooling.
Test conditions
As was the case with the first review sample of the Vision 14, two basic profiles (Quiet and Performance) are once again available in the preinstalled Control Center along with three sub-profiles each, which we have listed in the table below:
| Profile | CPU load | GPU load | Combined CPU+GPU load |
|---|---|---|---|
| Quiet 20 dB | 10 W | 25 W | CPU: 10 W GPU: 25 W |
| Quiet 30 dB | 13 W | 32 W | CPU: 13 W GPU: 25 W |
| Quiet 40 dB | 15 W | 35 W | CPU: 15 W GPU: 35 W |
| Performance Balanced | 46 -> 20 W | 50 W | CPU: 20 W GPU: 40 W |
| Performance Enthusiast | 46 -> 40 W | 50 W | CPU: 35 -> 25 W GPU: 35 W |
| Performance Overboost | 46 -> 40 W | 50 W | CPU: 35 -> 30 W GPU: 35 W |
We used the Performance Balanced profile in our previous review of the Vision 14, but the additional graphics card has caused the default settings to shift slightly. Using Performance Balanced, the CPU power is now limited to only 20 W after a few seconds (even when the GeForce GPU is not running), which even makes the CPU performance drop clearly below the level of the Core i7-1165G7 in the Vision 14 (about 12% lower in Cinebench R15 Multi under constant load).
Therefore, we used the Performance Enthusiast profile by default for our benchmarks and measurements, which offers a better balance of CPU and GPU performance. However, we'll also take a look at the effects of the other profiles in individual categories.
Processor
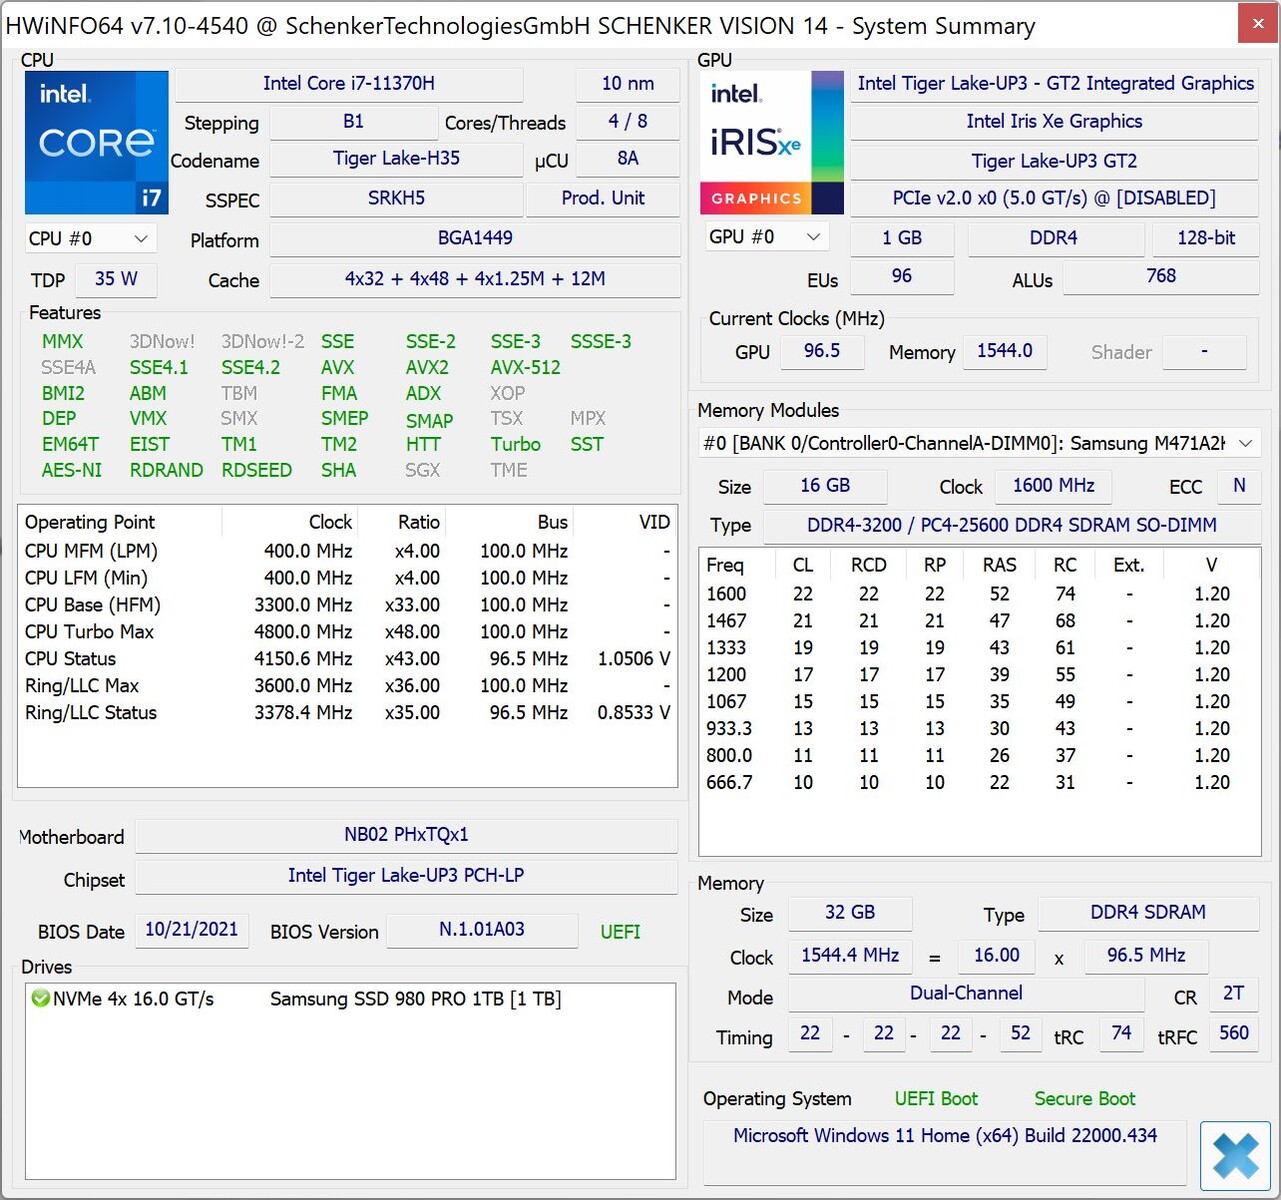
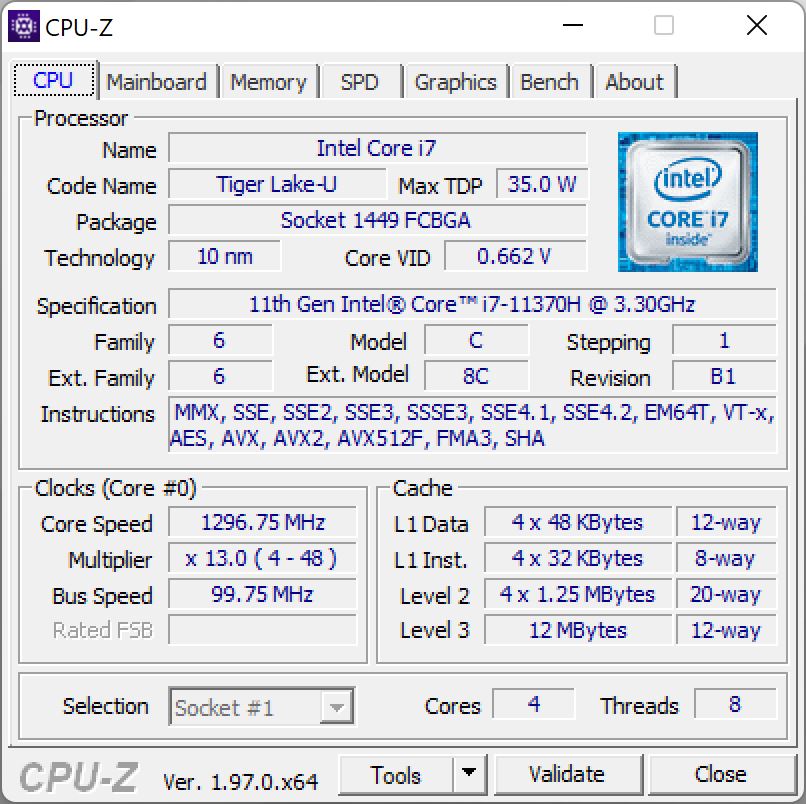
The Intel Core i7-11370H is based on the Tiger Lake generation and offers four cores (eight threads) that reach clock speeds of up to 4.8 GHz or 4.3 GHz when all four cores are active. Initially, the processor operates with up to 46 W in the multi-core benchmarks and then settles at 40 W.
These results are good in principle, but the CPU performance is unnecessarily slowed down by the low number of cores. In the end, the Vision 14 H35 isn't that far ahead of the Vision 14 with the Core i7-1165G7. Even the Schenker Vision 15, where the Core i7-1165G7 operates with comparable power limits (50/40 W), is only marginally slower. Nevertheless, Intel's quad-core CPU doesn't stand a chance against a modern AMD processor like the Ryzen 7 5800U in the ThinkBook 13s (which is run at considerably lower power limits here). In combination with the dedicated GeForce GPU, a throttled processor with six or eight cores (45 W class, e.g., the Core i5-11400H or Core i7-11800H) would have made more sense.
Performance is limited to 25 W on battery power, which results in a performance reduction of around 15% in the Multi test. Further benchmarks for the Core i7-11370H can be found in our CPU Benchmarks article.
Cinebench R15 Multi endurance test
Cinebench R23: Multi Core | Single Core
Cinebench R20: CPU (Multi Core) | CPU (Single Core)
Cinebench R15: CPU Multi 64Bit | CPU Single 64Bit
Blender: v2.79 BMW27 CPU
7-Zip 18.03: 7z b 4 | 7z b 4 -mmt1
Geekbench 5.5: Multi-Core | Single-Core
HWBOT x265 Benchmark v2.2: 4k Preset
LibreOffice : 20 Documents To PDF
R Benchmark 2.5: Overall mean
| CPU Performance rating | |
| Average of class Subnotebook | |
| Lenovo ThinkBook 13s G3 20YA0005GE | |
| Huawei MateBook 14s i7 | |
| Schenker Vision 14 | |
| Lenovo IdeaPad Slim 7i Pro 14IHU5 -2! | |
| Schenker Vision 14 | |
| Average Intel Core i7-11370H | |
| Razer Blade Stealth i7-1165G7 GTX 1650 Ti Max-Q -2! | |
| MSI Summit E14 A11SCS -2! | |
| Cinebench R23 / Multi Core | |
| Average of class Subnotebook (1555 - 21812, n=59, last 2 years) | |
| Lenovo ThinkBook 13s G3 20YA0005GE | |
| Lenovo IdeaPad Slim 7i Pro 14IHU5 | |
| Huawei MateBook 14s i7 | |
| Schenker Vision 14 | |
| Schenker Vision 14 | |
| MSI Summit E14 A11SCS | |
| Average Intel Core i7-11370H (3696 - 6646, n=12) | |
| Cinebench R23 / Single Core | |
| Average of class Subnotebook (358 - 2213, n=60, last 2 years) | |
| Lenovo IdeaPad Slim 7i Pro 14IHU5 | |
| Huawei MateBook 14s i7 | |
| Schenker Vision 14 | |
| MSI Summit E14 A11SCS | |
| Average Intel Core i7-11370H (1081 - 1556, n=11) | |
| Schenker Vision 14 | |
| Lenovo ThinkBook 13s G3 20YA0005GE | |
| Cinebench R20 / CPU (Multi Core) | |
| Average of class Subnotebook (579 - 8541, n=56, last 2 years) | |
| Lenovo ThinkBook 13s G3 20YA0005GE | |
| Huawei MateBook 14s i7 | |
| Lenovo IdeaPad Slim 7i Pro 14IHU5 | |
| Schenker Vision 14 | |
| MSI Summit E14 A11SCS | |
| Schenker Vision 14 | |
| Average Intel Core i7-11370H (1438 - 2578, n=11) | |
| Razer Blade Stealth i7-1165G7 GTX 1650 Ti Max-Q | |
| Cinebench R20 / CPU (Single Core) | |
| Average of class Subnotebook (128 - 832, n=56, last 2 years) | |
| Schenker Vision 14 | |
| Lenovo IdeaPad Slim 7i Pro 14IHU5 | |
| Huawei MateBook 14s i7 | |
| MSI Summit E14 A11SCS | |
| Schenker Vision 14 | |
| Razer Blade Stealth i7-1165G7 GTX 1650 Ti Max-Q | |
| Average Intel Core i7-11370H (475 - 601, n=11) | |
| Lenovo ThinkBook 13s G3 20YA0005GE | |
| Cinebench R15 / CPU Multi 64Bit | |
| Average of class Subnotebook (327 - 3345, n=56, last 2 years) | |
| Lenovo ThinkBook 13s G3 20YA0005GE | |
| Lenovo ThinkBook 13s G3 20YA0005GE | |
| Schenker Vision 14 | |
| Schenker Vision 14 | |
| Huawei MateBook 14s i7 | |
| Lenovo IdeaPad Slim 7i Pro 14IHU5 | |
| Average Intel Core i7-11370H (606 - 1086, n=17) | |
| Schenker Vision 14 | |
| MSI Summit E14 A11SCS | |
| Razer Blade Stealth i7-1165G7 GTX 1650 Ti Max-Q | |
| Cinebench R15 / CPU Single 64Bit | |
| Average of class Subnotebook (72.4 - 322, n=56, last 2 years) | |
| Huawei MateBook 14s i7 | |
| Schenker Vision 14 | |
| Lenovo IdeaPad Slim 7i Pro 14IHU5 | |
| Lenovo ThinkBook 13s G3 20YA0005GE | |
| Schenker Vision 14 | |
| MSI Summit E14 A11SCS | |
| Average Intel Core i7-11370H (162.9 - 233, n=15) | |
| Razer Blade Stealth i7-1165G7 GTX 1650 Ti Max-Q | |
| Blender / v2.79 BMW27 CPU | |
| Razer Blade Stealth i7-1165G7 GTX 1650 Ti Max-Q | |
| Average Intel Core i7-11370H (432 - 762, n=11) | |
| Schenker Vision 14 | |
| MSI Summit E14 A11SCS | |
| Huawei MateBook 14s i7 | |
| Lenovo IdeaPad Slim 7i Pro 14IHU5 | |
| Schenker Vision 14 | |
| Lenovo ThinkBook 13s G3 20YA0005GE | |
| Average of class Subnotebook (159 - 2271, n=57, last 2 years) | |
| 7-Zip 18.03 / 7z b 4 | |
| Average of class Subnotebook (11668 - 77867, n=56, last 2 years) | |
| Lenovo ThinkBook 13s G3 20YA0005GE | |
| Huawei MateBook 14s i7 | |
| Schenker Vision 14 | |
| Schenker Vision 14 | |
| Average Intel Core i7-11370H (18961 - 28520, n=11) | |
| MSI Summit E14 A11SCS | |
| Lenovo IdeaPad Slim 7i Pro 14IHU5 | |
| Razer Blade Stealth i7-1165G7 GTX 1650 Ti Max-Q | |
| 7-Zip 18.03 / 7z b 4 -mmt1 | |
| Schenker Vision 14 | |
| Average of class Subnotebook (2643 - 6699, n=58, last 2 years) | |
| Schenker Vision 14 | |
| Huawei MateBook 14s i7 | |
| Lenovo IdeaPad Slim 7i Pro 14IHU5 | |
| Average Intel Core i7-11370H (5074 - 5550, n=11) | |
| Lenovo ThinkBook 13s G3 20YA0005GE | |
| Razer Blade Stealth i7-1165G7 GTX 1650 Ti Max-Q | |
| MSI Summit E14 A11SCS | |
| Geekbench 5.5 / Multi-Core | |
| Average of class Subnotebook (2557 - 17218, n=47, last 2 years) | |
| Lenovo ThinkBook 13s G3 20YA0005GE | |
| Huawei MateBook 14s i7 | |
| Schenker Vision 14 | |
| Razer Blade Stealth i7-1165G7 GTX 1650 Ti Max-Q | |
| Schenker Vision 14 | |
| Average Intel Core i7-11370H (3828 - 6115, n=10) | |
| Geekbench 5.5 / Single-Core | |
| Average of class Subnotebook (726 - 2224, n=47, last 2 years) | |
| Schenker Vision 14 | |
| Huawei MateBook 14s i7 | |
| Schenker Vision 14 | |
| Razer Blade Stealth i7-1165G7 GTX 1650 Ti Max-Q | |
| Average Intel Core i7-11370H (1376 - 1607, n=10) | |
| Lenovo ThinkBook 13s G3 20YA0005GE | |
| HWBOT x265 Benchmark v2.2 / 4k Preset | |
| Average of class Subnotebook (0.97 - 25.1, n=56, last 2 years) | |
| Lenovo ThinkBook 13s G3 20YA0005GE | |
| Schenker Vision 14 | |
| Lenovo IdeaPad Slim 7i Pro 14IHU5 | |
| Huawei MateBook 14s i7 | |
| Schenker Vision 14 | |
| Average Intel Core i7-11370H (4.98 - 8.82, n=11) | |
| Razer Blade Stealth i7-1165G7 GTX 1650 Ti Max-Q | |
| MSI Summit E14 A11SCS | |
| LibreOffice / 20 Documents To PDF | |
| MSI Summit E14 A11SCS | |
| Average of class Subnotebook (39.9 - 220, n=55, last 2 years) | |
| Lenovo ThinkBook 13s G3 20YA0005GE | |
| Razer Blade Stealth i7-1165G7 GTX 1650 Ti Max-Q | |
| Schenker Vision 14 | |
| Lenovo IdeaPad Slim 7i Pro 14IHU5 | |
| Average Intel Core i7-11370H (23.6 - 56.5, n=11) | |
| Schenker Vision 14 | |
| Huawei MateBook 14s i7 | |
| R Benchmark 2.5 / Overall mean | |
| MSI Summit E14 A11SCS | |
| Schenker Vision 14 | |
| Razer Blade Stealth i7-1165G7 GTX 1650 Ti Max-Q | |
| Average Intel Core i7-11370H (0.544 - 0.596, n=11) | |
| Lenovo IdeaPad Slim 7i Pro 14IHU5 | |
| Huawei MateBook 14s i7 | |
| Lenovo ThinkBook 13s G3 20YA0005GE | |
| Schenker Vision 14 | |
| Average of class Subnotebook (0.4024 - 1.456, n=57, last 2 years) | |
* ... smaller is better
AIDA64: FP32 Ray-Trace | FPU Julia | CPU SHA3 | CPU Queen | FPU SinJulia | FPU Mandel | CPU AES | CPU ZLib | FP64 Ray-Trace | CPU PhotoWorxx
| Performance rating | |
| Lenovo ThinkBook 13s G3 20YA0005GE | |
| Average of class Subnotebook | |
| Lenovo IdeaPad Slim 7i Pro 14IHU5 | |
| Huawei MateBook 14s i7 | |
| Schenker Vision 14 | |
| Schenker Vision 14 | |
| Average Intel Core i7-11370H | |
| MSI Summit E14 A11SCS | |
| AIDA64 / FP32 Ray-Trace | |
| Average of class Subnotebook (1135 - 32888, n=57, last 2 years) | |
| Lenovo ThinkBook 13s G3 20YA0005GE | |
| Schenker Vision 14 | |
| Lenovo IdeaPad Slim 7i Pro 14IHU5 | |
| Huawei MateBook 14s i7 | |
| Schenker Vision 14 | |
| Average Intel Core i7-11370H (5204 - 8413, n=10) | |
| MSI Summit E14 A11SCS | |
| AIDA64 / FPU Julia | |
| Lenovo ThinkBook 13s G3 20YA0005GE | |
| Average of class Subnotebook (5218 - 123315, n=57, last 2 years) | |
| Schenker Vision 14 | |
| Lenovo IdeaPad Slim 7i Pro 14IHU5 | |
| Huawei MateBook 14s i7 | |
| Schenker Vision 14 | |
| Average Intel Core i7-11370H (23958 - 34020, n=10) | |
| MSI Summit E14 A11SCS | |
| AIDA64 / CPU SHA3 | |
| Average of class Subnotebook (444 - 5287, n=57, last 2 years) | |
| Lenovo ThinkBook 13s G3 20YA0005GE | |
| Lenovo IdeaPad Slim 7i Pro 14IHU5 | |
| Schenker Vision 14 | |
| Huawei MateBook 14s i7 | |
| Schenker Vision 14 | |
| Average Intel Core i7-11370H (1656 - 2297, n=10) | |
| MSI Summit E14 A11SCS | |
| AIDA64 / CPU Queen | |
| Lenovo ThinkBook 13s G3 20YA0005GE | |
| Average of class Subnotebook (10579 - 95002, n=49, last 2 years) | |
| Huawei MateBook 14s i7 | |
| Lenovo IdeaPad Slim 7i Pro 14IHU5 | |
| Schenker Vision 14 | |
| Average Intel Core i7-11370H (42086 - 52930, n=10) | |
| Schenker Vision 14 | |
| MSI Summit E14 A11SCS | |
| AIDA64 / FPU SinJulia | |
| Lenovo ThinkBook 13s G3 20YA0005GE | |
| Average of class Subnotebook (744 - 18418, n=57, last 2 years) | |
| Huawei MateBook 14s i7 | |
| Schenker Vision 14 | |
| Lenovo IdeaPad Slim 7i Pro 14IHU5 | |
| Schenker Vision 14 | |
| Average Intel Core i7-11370H (3755 - 5027, n=10) | |
| MSI Summit E14 A11SCS | |
| AIDA64 / FPU Mandel | |
| Lenovo ThinkBook 13s G3 20YA0005GE | |
| Average of class Subnotebook (3341 - 65433, n=57, last 2 years) | |
| Schenker Vision 14 | |
| Lenovo IdeaPad Slim 7i Pro 14IHU5 | |
| Huawei MateBook 14s i7 | |
| Schenker Vision 14 | |
| MSI Summit E14 A11SCS | |
| Average Intel Core i7-11370H (14433 - 20417, n=10) | |
| AIDA64 / CPU AES | |
| Lenovo ThinkBook 13s G3 20YA0005GE | |
| Lenovo IdeaPad Slim 7i Pro 14IHU5 | |
| Huawei MateBook 14s i7 | |
| Schenker Vision 14 | |
| Schenker Vision 14 | |
| Average Intel Core i7-11370H (44267 - 76866, n=10) | |
| Average of class Subnotebook (638 - 96917, n=57, last 2 years) | |
| MSI Summit E14 A11SCS | |
| AIDA64 / CPU ZLib | |
| Average of class Subnotebook (164.9 - 1379, n=57, last 2 years) | |
| Lenovo ThinkBook 13s G3 20YA0005GE | |
| Schenker Vision 14 | |
| Lenovo IdeaPad Slim 7i Pro 14IHU5 | |
| Huawei MateBook 14s i7 | |
| Schenker Vision 14 | |
| Average Intel Core i7-11370H (289 - 422, n=10) | |
| MSI Summit E14 A11SCS | |
| AIDA64 / FP64 Ray-Trace | |
| Average of class Subnotebook (610 - 17495, n=57, last 2 years) | |
| Lenovo ThinkBook 13s G3 20YA0005GE | |
| Schenker Vision 14 | |
| Lenovo IdeaPad Slim 7i Pro 14IHU5 | |
| Huawei MateBook 14s i7 | |
| Schenker Vision 14 | |
| Average Intel Core i7-11370H (2756 - 4551, n=10) | |
| MSI Summit E14 A11SCS | |
| AIDA64 / CPU PhotoWorxx | |
| Average of class Subnotebook (6569 - 85600, n=57, last 2 years) | |
| MSI Summit E14 A11SCS | |
| Lenovo IdeaPad Slim 7i Pro 14IHU5 | |
| Huawei MateBook 14s i7 | |
| Schenker Vision 14 | |
| Average Intel Core i7-11370H (15892 - 40069, n=10) | |
| Schenker Vision 14 | |
| Lenovo ThinkBook 13s G3 20YA0005GE | |
System performance
The Vision 14 makes a very good general performance impression. There are practically no waiting times in practice, and all tasks are carried out without any delays. Our review sample can also place itself at the top of the comparison charts in the synthetic PCMark 10 test.
CrossMark: Overall | Productivity | Creativity | Responsiveness
| PCMark 10 / Score | |
| Average of class Subnotebook (4920 - 9939, n=44, last 2 years) | |
| Schenker Vision 14 | |
| Average Intel Core i7-11370H, NVIDIA GeForce RTX 3050 Ti Laptop GPU (5538 - 5838, n=2) | |
| Razer Blade Stealth i7-1165G7 GTX 1650 Ti Max-Q | |
| Huawei MateBook 14s i7 | |
| Lenovo IdeaPad Slim 7i Pro 14IHU5 | |
| MSI Summit E14 A11SCS | |
| Schenker Vision 14 | |
| PCMark 10 / Essentials | |
| Huawei MateBook 14s i7 | |
| Average of class Subnotebook (8552 - 11646, n=44, last 2 years) | |
| Schenker Vision 14 | |
| Lenovo IdeaPad Slim 7i Pro 14IHU5 | |
| Schenker Vision 14 | |
| Razer Blade Stealth i7-1165G7 GTX 1650 Ti Max-Q | |
| MSI Summit E14 A11SCS | |
| Average Intel Core i7-11370H, NVIDIA GeForce RTX 3050 Ti Laptop GPU (8715 - 9234, n=2) | |
| PCMark 10 / Productivity | |
| Average of class Subnotebook (5435 - 16606, n=44, last 2 years) | |
| Schenker Vision 14 | |
| Razer Blade Stealth i7-1165G7 GTX 1650 Ti Max-Q | |
| Average Intel Core i7-11370H, NVIDIA GeForce RTX 3050 Ti Laptop GPU (8342 - 8806, n=2) | |
| MSI Summit E14 A11SCS | |
| Huawei MateBook 14s i7 | |
| Lenovo IdeaPad Slim 7i Pro 14IHU5 | |
| Schenker Vision 14 | |
| PCMark 10 / Digital Content Creation | |
| Average of class Subnotebook (5722 - 13779, n=44, last 2 years) | |
| Schenker Vision 14 | |
| Average Intel Core i7-11370H, NVIDIA GeForce RTX 3050 Ti Laptop GPU (6343 - 6641, n=2) | |
| Lenovo IdeaPad Slim 7i Pro 14IHU5 | |
| Razer Blade Stealth i7-1165G7 GTX 1650 Ti Max-Q | |
| Huawei MateBook 14s i7 | |
| MSI Summit E14 A11SCS | |
| Schenker Vision 14 | |
| CrossMark / Overall | |
| Average of class Subnotebook (365 - 2356, n=59, last 2 years) | |
| Schenker Vision 14 | |
| Average Intel Core i7-11370H, NVIDIA GeForce RTX 3050 Ti Laptop GPU (1407 - 1502, n=2) | |
| CrossMark / Productivity | |
| Average of class Subnotebook (364 - 2277, n=59, last 2 years) | |
| Schenker Vision 14 | |
| Average Intel Core i7-11370H, NVIDIA GeForce RTX 3050 Ti Laptop GPU (1417 - 1555, n=2) | |
| CrossMark / Creativity | |
| Average of class Subnotebook (372 - 2743, n=59, last 2 years) | |
| Average Intel Core i7-11370H, NVIDIA GeForce RTX 3050 Ti Laptop GPU (1452 - 1472, n=2) | |
| Schenker Vision 14 | |
| CrossMark / Responsiveness | |
| Schenker Vision 14 | |
| Average Intel Core i7-11370H, NVIDIA GeForce RTX 3050 Ti Laptop GPU (1202 - 1501, n=2) | |
| Average of class Subnotebook (312 - 1854, n=59, last 2 years) | |
| PCMark 10 Score | 5838 points | |
Help | ||
| AIDA64 / Memory Copy | |
| Average of class Subnotebook (14554 - 131023, n=57, last 2 years) | |
| Lenovo IdeaPad Slim 7i Pro 14IHU5 | |
| MSI Summit E14 A11SCS | |
| Huawei MateBook 14s i7 | |
| Average Intel Core i7-11370H (32035 - 64524, n=10) | |
| Schenker Vision 14 | |
| Schenker Vision 14 | |
| AIDA64 / Memory Read | |
| Average of class Subnotebook (15948 - 127174, n=57, last 2 years) | |
| Lenovo IdeaPad Slim 7i Pro 14IHU5 | |
| MSI Summit E14 A11SCS | |
| Huawei MateBook 14s i7 | |
| Schenker Vision 14 | |
| Average Intel Core i7-11370H (37216 - 62417, n=10) | |
| Schenker Vision 14 | |
| AIDA64 / Memory Write | |
| Average of class Subnotebook (15709 - 135141, n=57, last 2 years) | |
| Lenovo IdeaPad Slim 7i Pro 14IHU5 | |
| MSI Summit E14 A11SCS | |
| Huawei MateBook 14s i7 | |
| Average Intel Core i7-11370H (36920 - 65610, n=10) | |
| Schenker Vision 14 | |
| Schenker Vision 14 | |
| AIDA64 / Memory Latency | |
| Average of class Subnotebook (6.1 - 159.9, n=55, last 2 years) | |
| MSI Summit E14 A11SCS | |
| Huawei MateBook 14s i7 | |
| Average Intel Core i7-11370H (73.4 - 103, n=10) | |
| Lenovo IdeaPad Slim 7i Pro 14IHU5 | |
| Schenker Vision 14 | |
| Schenker Vision 14 | |
* ... smaller is better
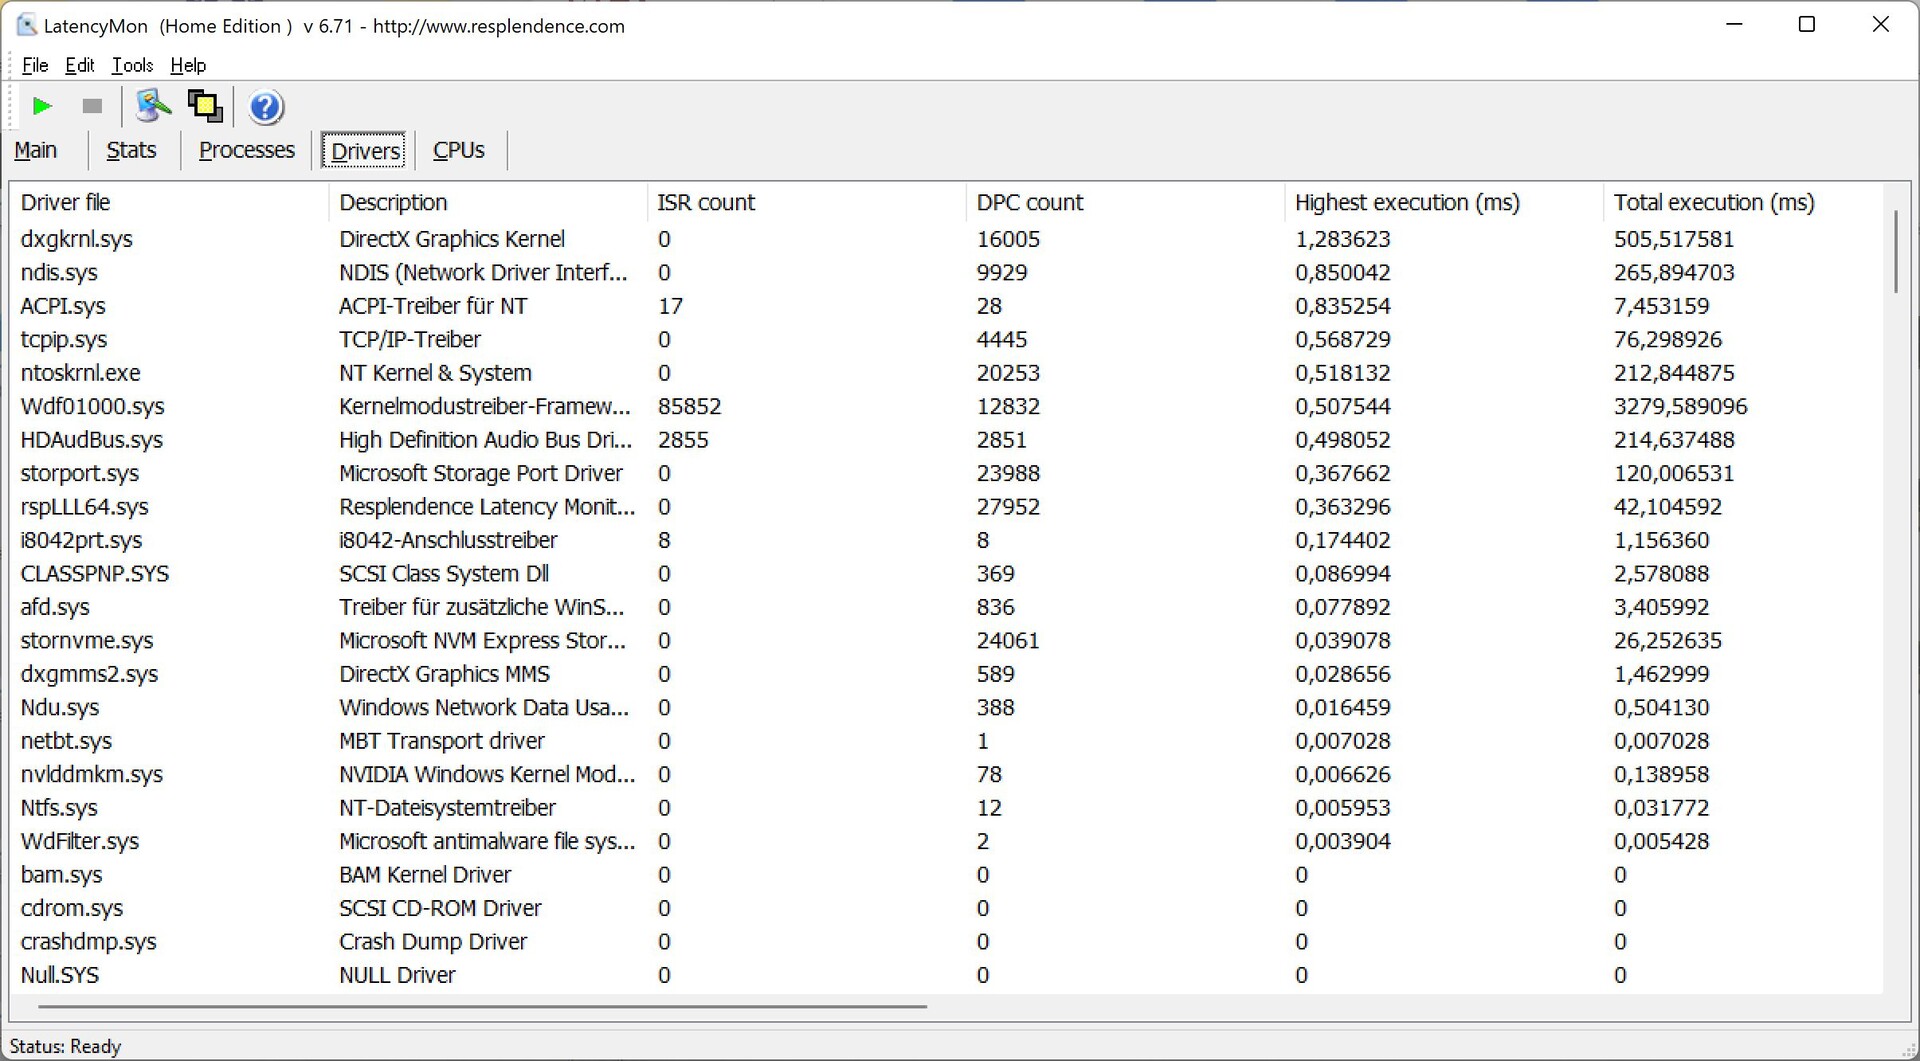
DPC latencies
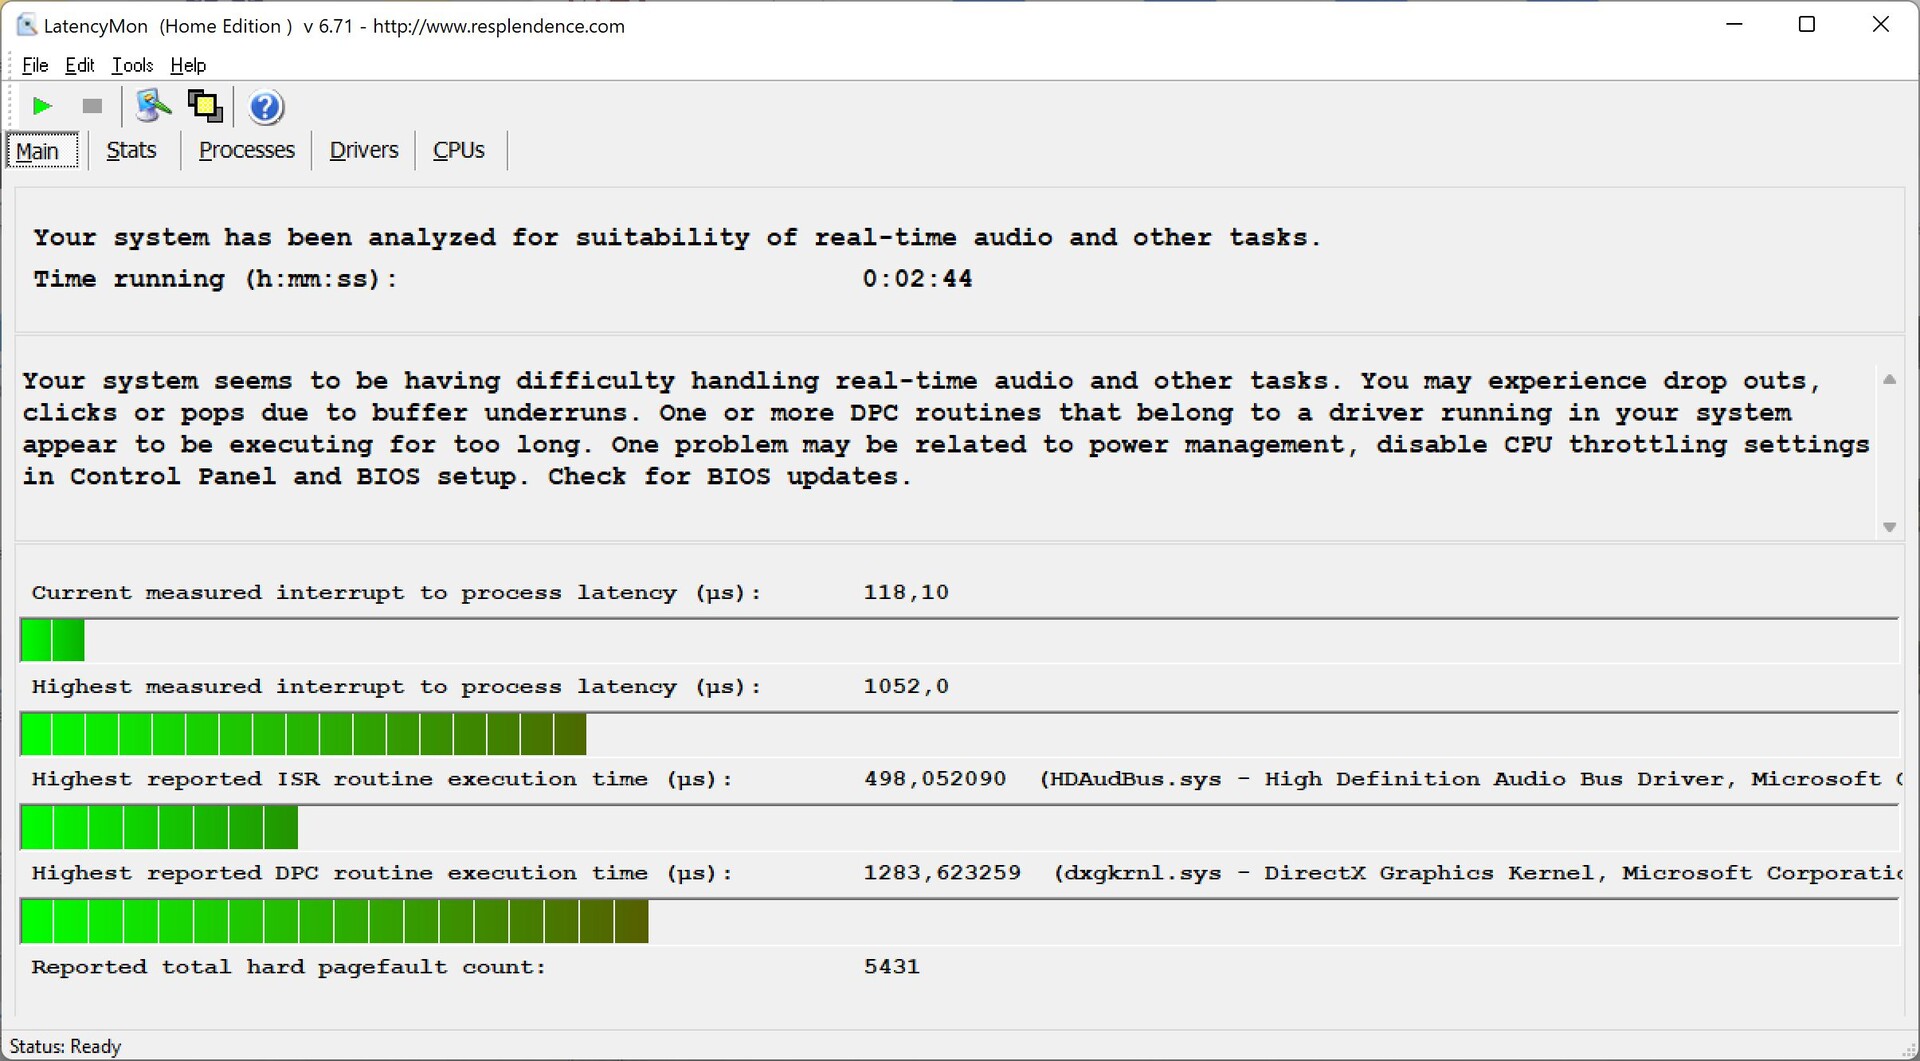
In our standardized latency test, the Vision 14 shows slightly elevated latencies with the current BIOS, which makes it suboptimal for real-time audio applications. However, there were no dropped frames when playing a 4K YouTube video.
| DPC Latencies / LatencyMon - interrupt to process latency (max), Web, Youtube, Prime95 | |
| Razer Blade Stealth i7-1165G7 GTX 1650 Ti Max-Q | |
| Schenker Vision 14 | |
| MSI Summit E14 A11SCS | |
| Lenovo IdeaPad Slim 7i Pro 14IHU5 | |
| Schenker Vision 14 | |
| Huawei MateBook 14s i7 | |
* ... smaller is better
Storage
The Vision 14 offers two M.2 2280 SSD slots (1x PCIe 4.0, 1x PCIe 3.0 x2). By default, a Samsung 970 Evo with a storage capacity of 250 GB is installed, but there are numerous options to choose from in the configurator. For example, a Samsung 980 Pro with a storage capacity of 1 TB (865 GB free after the first start-up) is included in our review device for an additional charge of 157 Euros (~$175).
The 980 Pro can take advantage of the fast PCIe 4.0 interface, and it achieves very good transfer rates. The second slot is limited in terms of speed (PCIe 3.0 x2, ~1,750 MB/s max), but it's still very useful when it comes to easily expanding the storage capacity if needed.
Further SSD benchmarks are available here.

* ... smaller is better
Continuous load read: DiskSpd Read Loop, Queue Depth 8
Graphics card
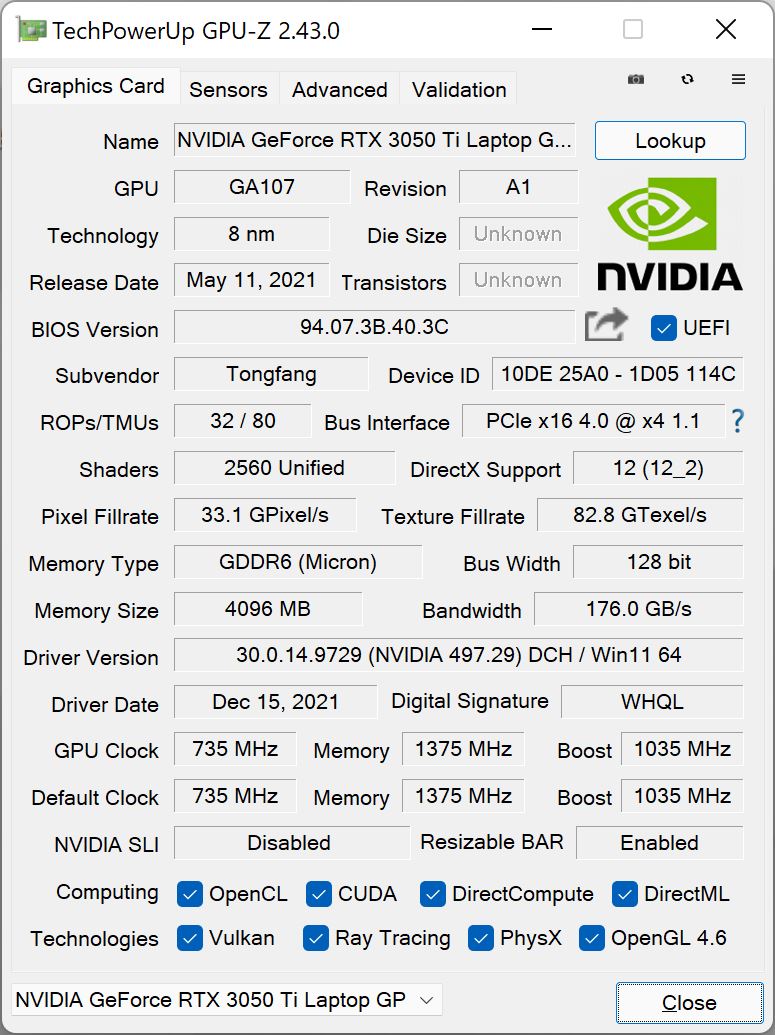
Besides the integrated Iris Xe Graphics G7 (96 EUs), our review sample is equipped with the dedicated GeForce RTX 3050 Ti. This is the 50 W version, where the base value is 35 W, and another 15 W of Dynamic Boost is supplied by the processor (this is also clearly evident in the performance profiles). So basically, this is a slow version of the RTX 3050 Ti (TGP range between 35 and 80 W). The maximum clock rate of the RTX 3050 Ti was 1,402 MHz in our benchmarks, but it usually settles at ~1,200 MHz.
Consequently, the performance in the benchmarks remains about 15% behind the average rates that we have in our database for the RTX 3050 Ti. Compared to the iGPU version of the Vision 14, the advantage is obviously clearly noticeable especially while playing games. In addition, performance remains stable even during extended sessions with the demanding Time Spy stress test being easily completed with 98.2%.
However, gaming isn't possible on battery power, as the GPU's power consumption is massively limited to just 12.5 W, making The Witcher 3 unplayable, for example (5 FPS vs. 41 FPS when plugged in @Ultra settings).
You can find further GPU benchmarks here.
| 3DMark 11 Performance | 15201 points | |
| 3DMark Cloud Gate Standard Score | 22441 points | |
| 3DMark Fire Strike Score | 9856 points | |
| 3DMark Time Spy Score | 4842 points | |
Help | ||
The Witcher 3 FPS diagram
| low | med. | high | ultra | QHD | |
|---|---|---|---|---|---|
| GTA V (2015) | 163 | 154 | 104 | 52.2 | 35.7 |
| The Witcher 3 (2015) | 205 | 112 | 73 | 41.4 | |
| Dota 2 Reborn (2015) | 148 | 132 | 117 | 113 | |
| Final Fantasy XV Benchmark (2018) | 110 | 58.3 | 40.8 | 29 | |
| X-Plane 11.11 (2018) | 98.3 | 88.3 | 75.7 | ||
| Far Cry 5 (2018) | 110 | 71 | 64 | 59 | 40 |
| Strange Brigade (2018) | 232 | 110 | 89.4 | 76.7 | 57.2 |
| F1 2021 (2021) | 207 | 125 | 97.1 | 46.8 | 30.9 |
Emissions - Vision 14 with loud fans
Noise emissions
In principle, the Vision 14 H35 is a comparatively loud subnotebook, but you can at least ensure that the fans remain off during low load using the various performance profiles. However, users who want to unleash the device's full performance, for example when gaming, will have to deal with around 45 dB(A). The noise levels were even close to 50 dB(A) in the stress test.
The fans aren't of a very high frequency, but you can naturally hear the noise. This is why we recommend headphones when gaming. We couldn't detect any other electronic noises, such as coil whine, either.
| Profile | Fan noise running The Witcher 3 Ultra | Fan noise during the stress test |
|---|---|---|
| Quiet 20 dB | 33.9 dB(A) | 33.1 dB(A) |
| Quiet 30 dB | 40.9 dB(A) | 33.1 dB(A) |
| Quiet 40 dB | 40.9 dB(A) | 40.3 dB(A) |
| Performance Balanced | 44.6 dB(A) | 46.6 dB(A) |
| Performance Enthusiast | 44.6 dB(A) | 49.5 dB(A) |
| Performance Overboost | 46.6 dB(A) | 51.9 dB(A) |
Noise level
| Idle |
| 24.3 / 24.3 / 25.9 dB(A) |
| Load |
| 43.3 / 49.5 dB(A) |
 | ||
30 dB silent 40 dB(A) audible 50 dB(A) loud |
||
min: | ||
| Schenker Vision 14 GeForce RTX 3050 Ti Laptop GPU, i7-11370H, Samsung SSD 980 Pro 1TB MZ-V8P1T0BW | Lenovo IdeaPad Slim 7i Pro 14IHU5 Iris Xe G7 96EUs, i7-11370H, WDC PC SN730 SDBPNTY-1T00 | Huawei MateBook 14s i7 Iris Xe G7 96EUs, i7-11370H, Toshiba XG6 KXG60ZNV512G | Razer Blade Stealth i7-1165G7 GTX 1650 Ti Max-Q GeForce GTX 1650 Ti Max-Q, i7-1165G7, Samsung SSD PM981a MZVLB512HBJQ | MSI Summit E14 A11SCS GeForce GTX 1650 Ti Max-Q, i7-1185G7, Phison 1TB SM2801T24GKBB4S-E162 | Schenker Vision 14 Iris Xe G7 96EUs, i7-1165G7, Samsung SSD 980 Pro 1TB MZ-V8P1T0BW | |
|---|---|---|---|---|---|---|
| Noise | 9% | 7% | -1% | -2% | 3% | |
| off / environment * (dB) | 24.3 | 24.6 -1% | 24.3 -0% | 25.3 -4% | 23.9 2% | 25 -3% |
| Idle Minimum * (dB) | 24.3 | 24.7 -2% | 24.3 -0% | 25.3 -4% | 24.2 -0% | 25 -3% |
| Idle Average * (dB) | 24.3 | 24.7 -2% | 24.3 -0% | 25.3 -4% | 24.2 -0% | 25 -3% |
| Idle Maximum * (dB) | 25.9 | 24.7 5% | 28.4 -10% | 27 -4% | 24.2 7% | 26.9 -4% |
| Load Average * (dB) | 43.3 | 30.8 29% | 31.7 27% | 47.9 -11% | 50.2 -16% | 38.6 11% |
| Witcher 3 ultra * (dB) | 44.6 | 33 26% | 31.7 29% | 38.4 14% | 47 -5% | 41.2 8% |
| Load Maximum * (dB) | 49.5 | 46.4 6% | 46.8 5% | 45.9 7% | 51.7 -4% | 41.2 17% |
* ... smaller is better
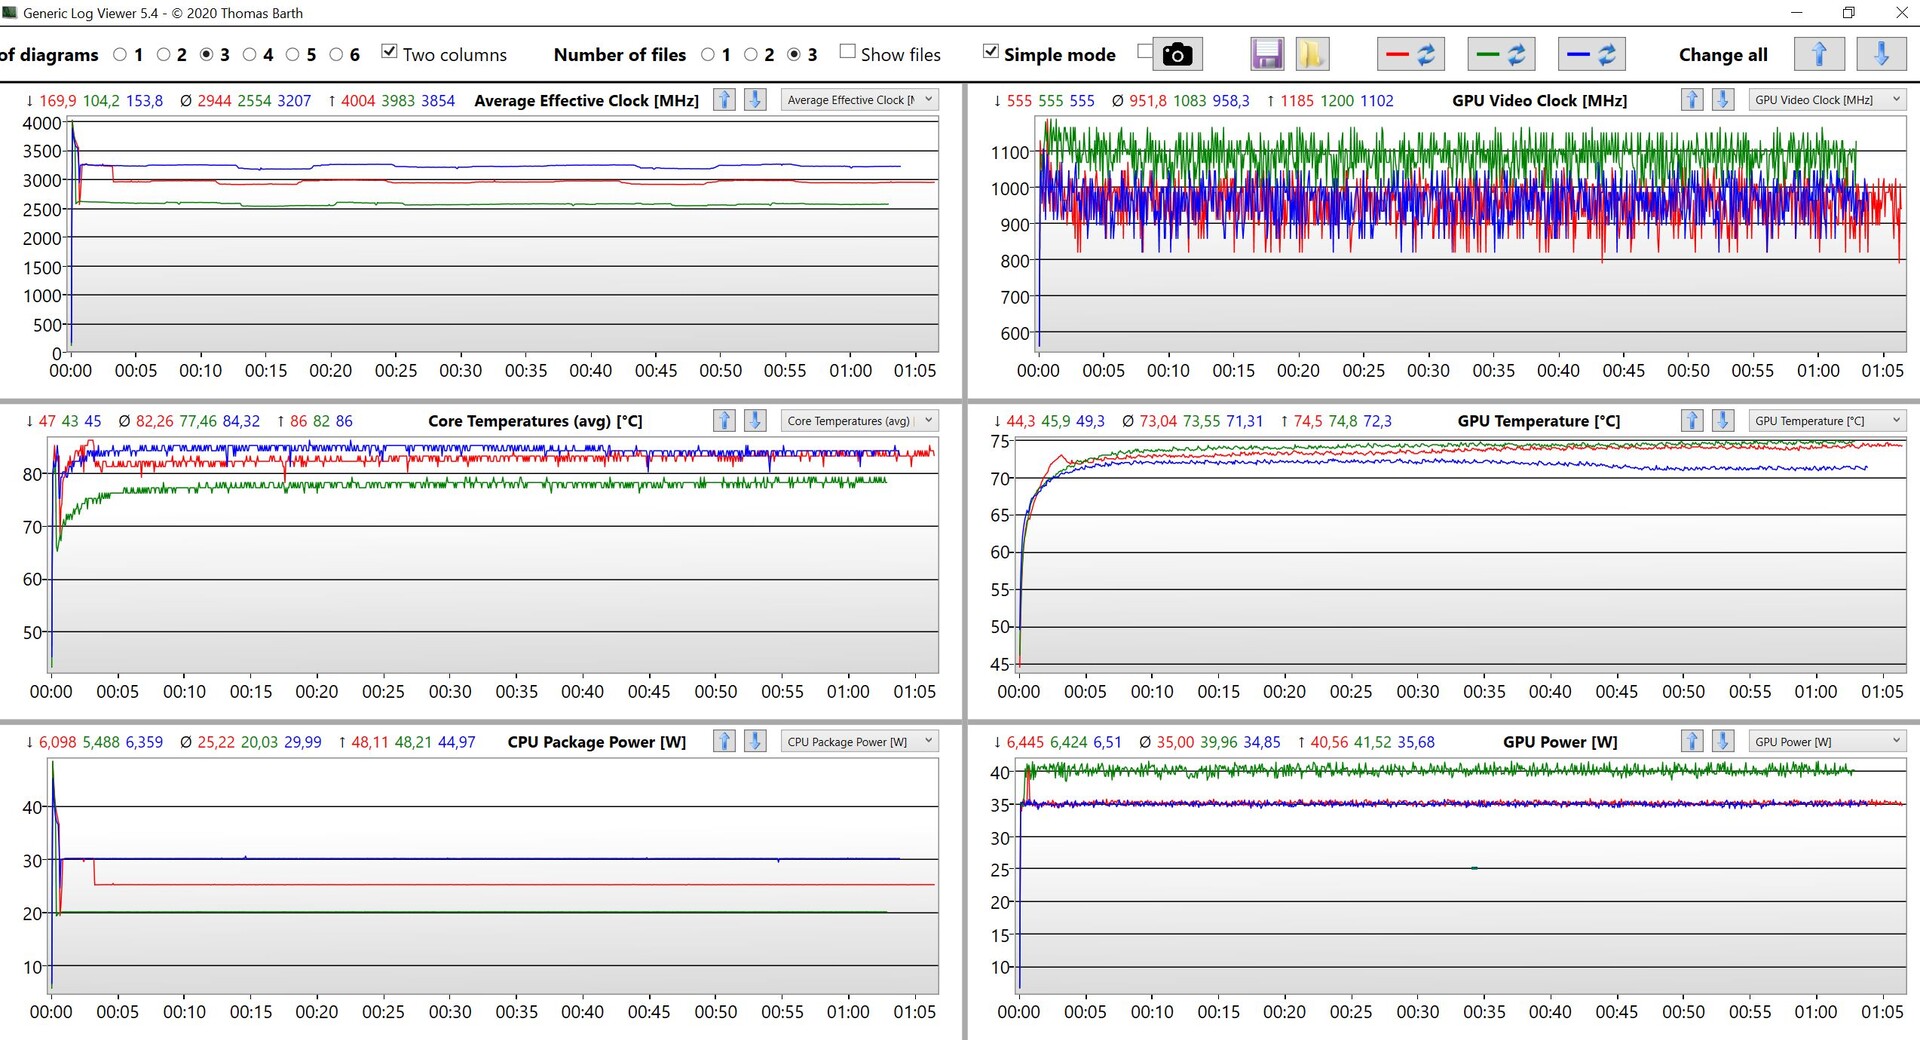
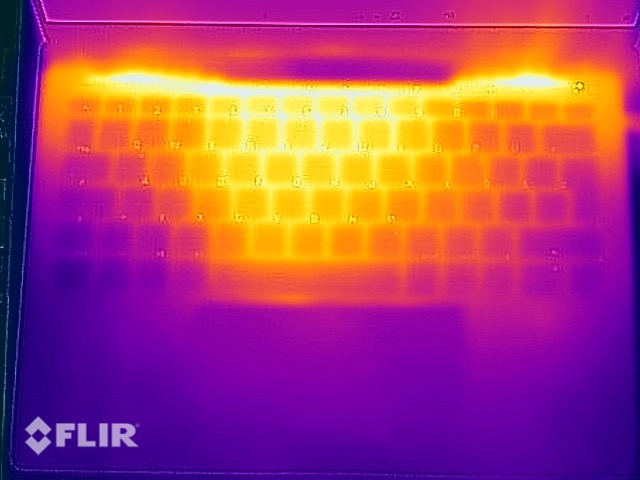
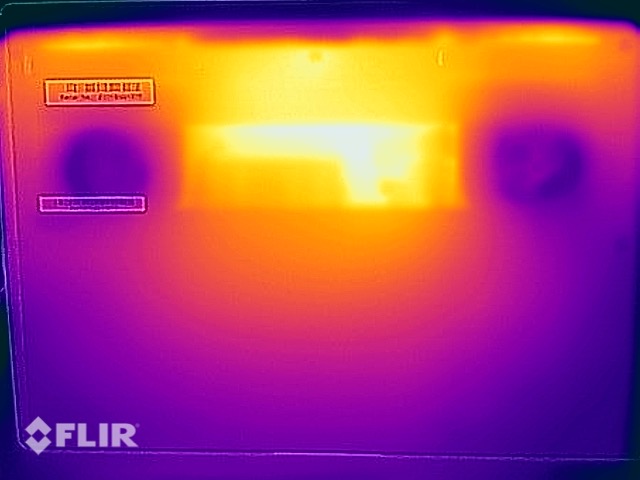
Temperature
The combination of the very thin and light case and the powerful components leads to high surface temperatures. You can already feel a slight temperature increase under low load, but it should be clearly stated that there are no restrictions in everyday use.
However, you shouldn't place the device on your lap when gaming or running demanding applications, because we could measure temperatures above 50 °C (~122 °F) on the bottom. The top also heats up considerably under load. Temperatures remain roughly comparable in the other performance modes, as the fan behavior changes here as well.
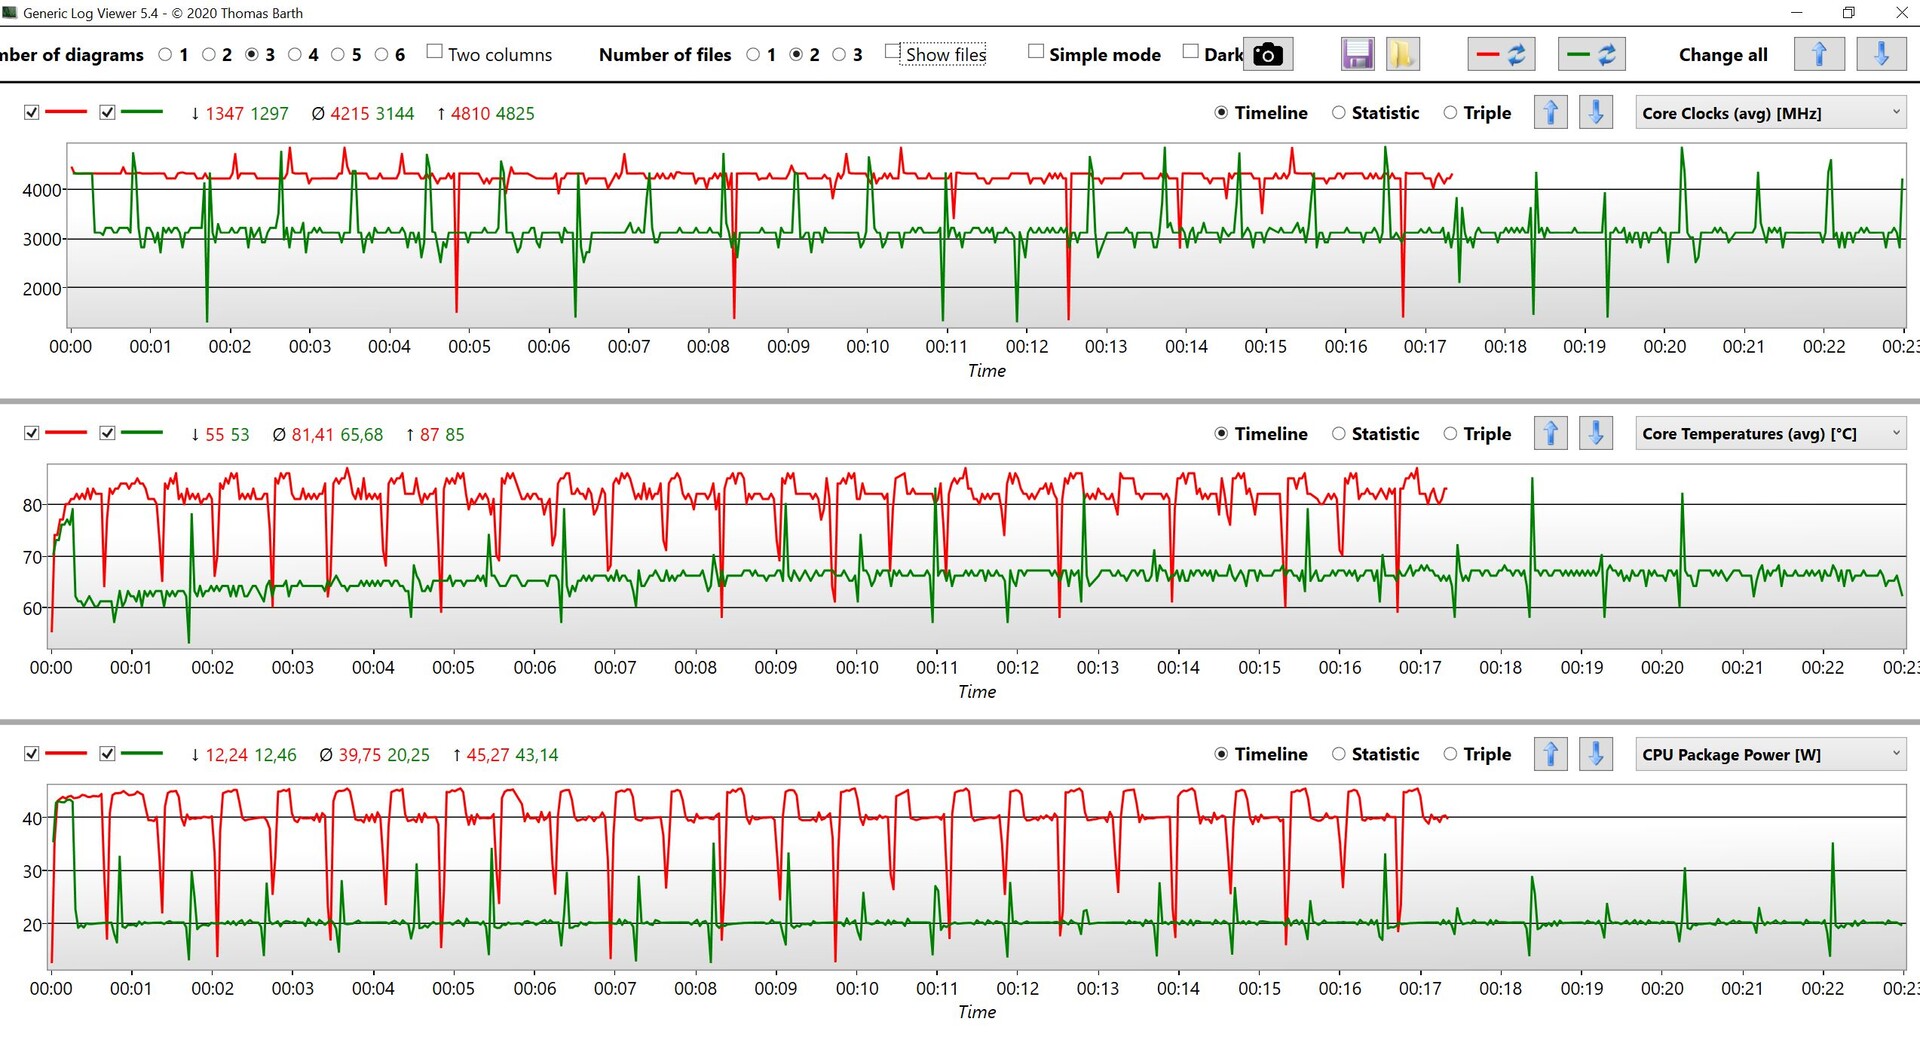
We performed the stress test using the three performance profiles, and the results are clearly visible in the screenshot below. After the values have leveled off after a few minutes, they remain completely stable.
(-) The maximum temperature on the upper side is 49.7 °C / 121 F, compared to the average of 35.9 °C / 97 F, ranging from 21.4 to 59 °C for the class Subnotebook.
(-) The bottom heats up to a maximum of 56 °C / 133 F, compared to the average of 39.2 °C / 103 F
(+) In idle usage, the average temperature for the upper side is 26.3 °C / 79 F, compared to the device average of 30.8 °C / 87 F.
(-) Playing The Witcher 3, the average temperature for the upper side is 38.7 °C / 102 F, compared to the device average of 30.8 °C / 87 F.
(+) The palmrests and touchpad are cooler than skin temperature with a maximum of 29.1 °C / 84.4 F and are therefore cool to the touch.
(±) The average temperature of the palmrest area of similar devices was 28.2 °C / 82.8 F (-0.9 °C / -1.6 F).
| Schenker Vision 14 Intel Core i7-11370H, NVIDIA GeForce RTX 3050 Ti Laptop GPU | Lenovo IdeaPad Slim 7i Pro 14IHU5 Intel Core i7-11370H, Intel Iris Xe Graphics G7 96EUs | Huawei MateBook 14s i7 Intel Core i7-11370H, Intel Iris Xe Graphics G7 96EUs | Razer Blade Stealth i7-1165G7 GTX 1650 Ti Max-Q Intel Core i7-1165G7, NVIDIA GeForce GTX 1650 Ti Max-Q | MSI Summit E14 A11SCS Intel Core i7-1185G7, NVIDIA GeForce GTX 1650 Ti Max-Q | Schenker Vision 14 Intel Core i7-1165G7, Intel Iris Xe Graphics G7 96EUs | |
|---|---|---|---|---|---|---|
| Heat | 19% | 15% | -1% | -9% | -1% | |
| Maximum Upper Side * (°C) | 49.7 | 39.4 21% | 41.1 17% | 44 11% | 49.4 1% | 46.2 7% |
| Maximum Bottom * (°C) | 56 | 51.4 8% | 45.4 19% | 47.4 15% | 60.6 -8% | 52.2 7% |
| Idle Upper Side * (°C) | 28.8 | 21.6 25% | 25.3 12% | 32.2 -12% | 30.6 -6% | 30.6 -6% |
| Idle Bottom * (°C) | 30.6 | 24.6 20% | 26.5 13% | 36 -18% | 37.4 -22% | 33.6 -10% |
* ... smaller is better
Speakers
Schenker Vision 14 audio analysis
(±) | speaker loudness is average but good (75.2 dB)
Bass 100 - 315 Hz
(-) | nearly no bass - on average 21.7% lower than median
(±) | linearity of bass is average (11% delta to prev. frequency)
Mids 400 - 2000 Hz
(+) | balanced mids - only 3.7% away from median
(+) | mids are linear (4.2% delta to prev. frequency)
Highs 2 - 16 kHz
(+) | balanced highs - only 3.2% away from median
(±) | linearity of highs is average (7.4% delta to prev. frequency)
Overall 100 - 16.000 Hz
(±) | linearity of overall sound is average (19.6% difference to median)
Compared to same class
» 61% of all tested devices in this class were better, 6% similar, 32% worse
» The best had a delta of 5%, average was 18%, worst was 53%
Compared to all devices tested
» 49% of all tested devices were better, 7% similar, 44% worse
» The best had a delta of 4%, average was 23%, worst was 134%
Huawei MateBook 14s i7 audio analysis
(+) | speakers can play relatively loud (84.1 dB)
Bass 100 - 315 Hz
(±) | reduced bass - on average 7.7% lower than median
(±) | linearity of bass is average (7.5% delta to prev. frequency)
Mids 400 - 2000 Hz
(+) | balanced mids - only 4.2% away from median
(+) | mids are linear (5.2% delta to prev. frequency)
Highs 2 - 16 kHz
(+) | balanced highs - only 2% away from median
(+) | highs are linear (4.1% delta to prev. frequency)
Overall 100 - 16.000 Hz
(+) | overall sound is linear (9.5% difference to median)
Compared to same class
» 5% of all tested devices in this class were better, 2% similar, 93% worse
» The best had a delta of 5%, average was 18%, worst was 53%
Compared to all devices tested
» 4% of all tested devices were better, 1% similar, 95% worse
» The best had a delta of 4%, average was 23%, worst was 134%
Energy management - The 3K panel consumes a lot of battery life
Energy consumption
Power consumption is slightly higher under low load than it was with the first Vision 14 review unit. Although the display has a slightly higher maximum brightness, we presume that Windows 11 is responsible for the higher consumption. Just like with the first Vision 14, the high-resolution panel requires a lot of power.
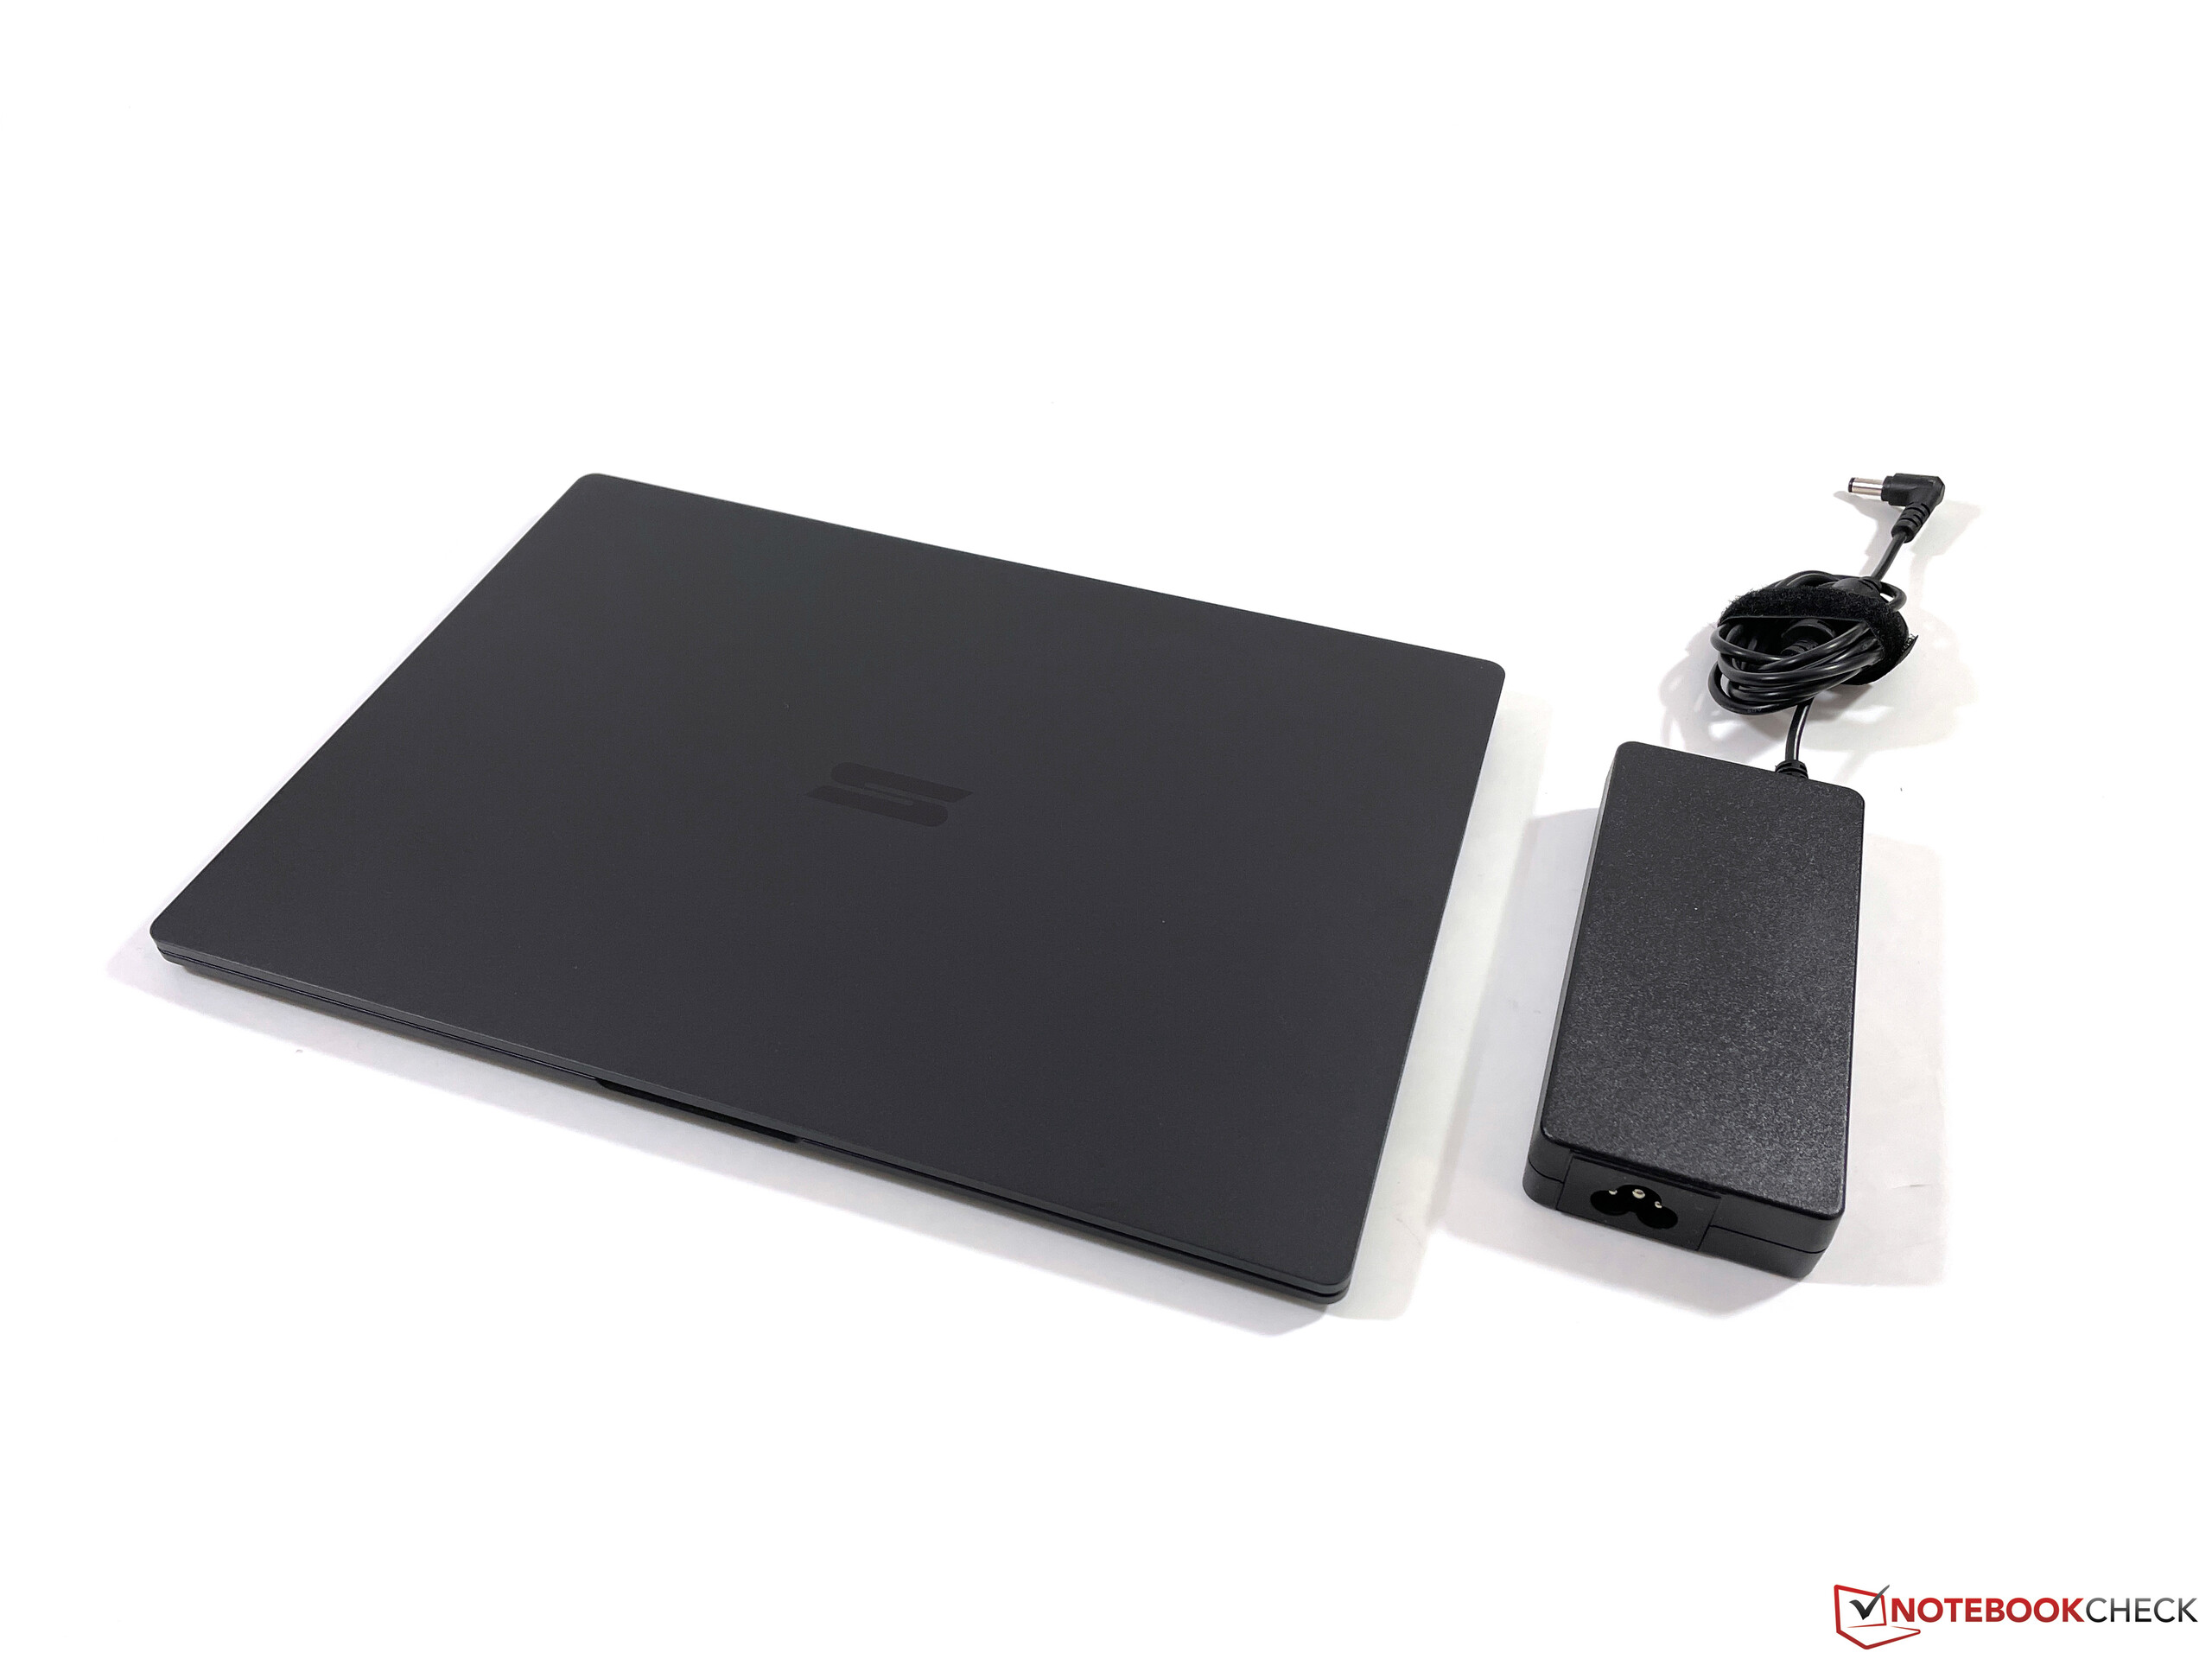
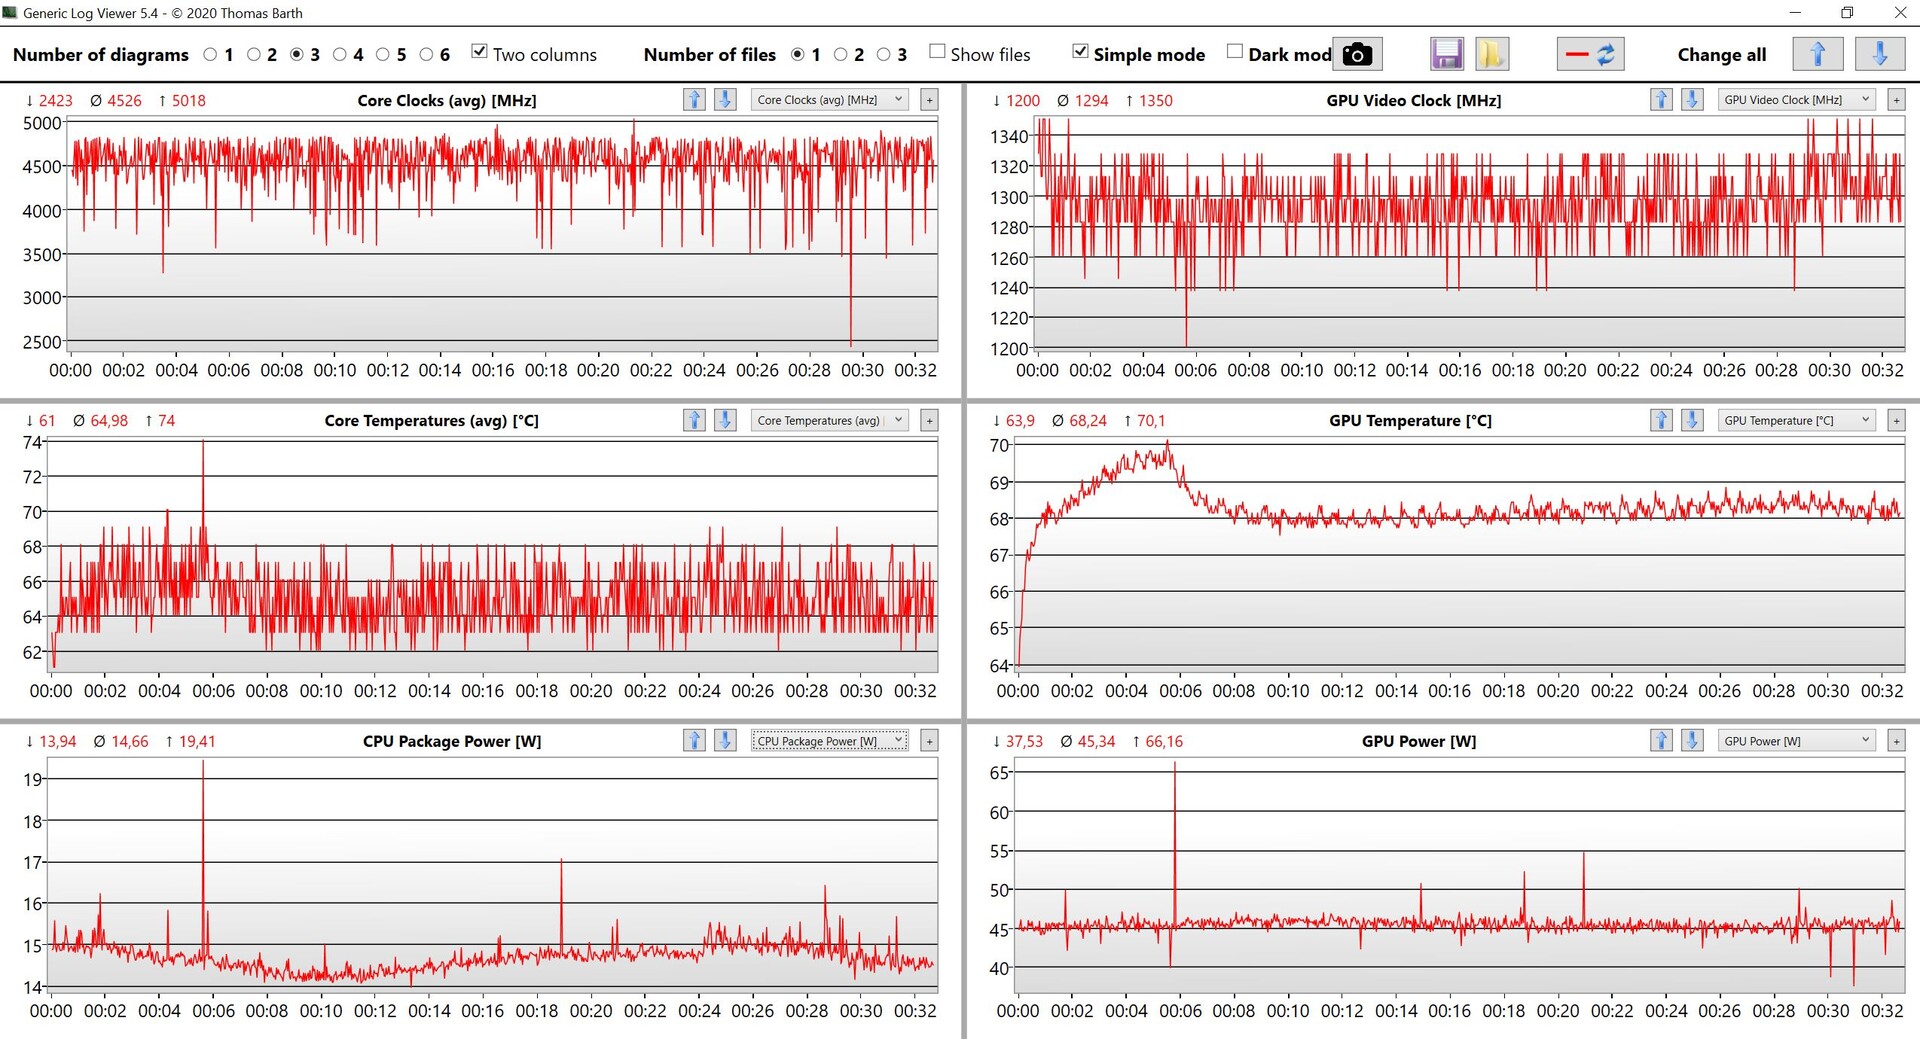
Naturally, consumption is much higher under load due to the dedicated graphics card. We even register 110 W at the beginning of the stress test. Only after four minutes does the consumption stabilize at 90 W, which is the nominal capacity of the power adapter. Therefore, a stronger power adapter would definitely still provide some headroom.
As with the previous review unit, we noticed the high standby consumption once again here. Schenker should work on this further, because you currently have to be prepared for a noticeable battery loss during extended standby times (e.g., overnight).
| Off / Standby | |
| Idle | |
| Load |
|
Key:
min: | |
| Schenker Vision 14 i7-11370H, GeForce RTX 3050 Ti Laptop GPU, Samsung SSD 980 Pro 1TB MZ-V8P1T0BW, IPS, 2880x1800, 14" | Lenovo IdeaPad Slim 7i Pro 14IHU5 i7-11370H, Iris Xe G7 96EUs, WDC PC SN730 SDBPNTY-1T00, IPS, 2880x1800, 14" | Huawei MateBook 14s i7 i7-11370H, Iris Xe G7 96EUs, Toshiba XG6 KXG60ZNV512G, LTPS, 2520x1680, 14.2" | Razer Blade Stealth i7-1165G7 GTX 1650 Ti Max-Q i7-1165G7, GeForce GTX 1650 Ti Max-Q, Samsung SSD PM981a MZVLB512HBJQ, IPS, 1920x1080, 13.3" | MSI Summit E14 A11SCS i7-1185G7, GeForce GTX 1650 Ti Max-Q, Phison 1TB SM2801T24GKBB4S-E162, IPS, 3840x2160, 14" | Schenker Vision 14 i7-1165G7, Iris Xe G7 96EUs, Samsung SSD 980 Pro 1TB MZ-V8P1T0BW, IPS, 2880x1800, 14" | Average NVIDIA GeForce RTX 3050 Ti Laptop GPU | Average of class Subnotebook | |
|---|---|---|---|---|---|---|---|---|
| Power Consumption | 40% | 37% | 22% | -17% | 17% | -13% | 47% | |
| Idle Minimum * (Watt) | 6.7 | 4.8 28% | 4.4 34% | 4 40% | 9.9 -48% | 9.8 -46% | 8.2 ? -22% | 3.78 ? 44% |
| Idle Average * (Watt) | 12.6 | 7.9 37% | 8.7 31% | 6.3 50% | 17.4 -38% | 12.5 1% | 12.6 ? -0% | 6.57 ? 48% |
| Idle Maximum * (Watt) | 15.4 | 8.6 44% | 9.6 38% | 14.5 6% | 22.5 -46% | 13.7 11% | 17.2 ? -12% | 7.94 ? 48% |
| Load Average * (Watt) | 85.7 | 46.5 46% | 46 46% | 79.2 8% | 85.6 -0% | 39.3 54% | 92 ? -7% | 41.9 ? 51% |
| Witcher 3 ultra * (Watt) | 83 | 43 48% | 42.2 49% | 68.2 18% | 70.9 15% | 44.8 46% | ||
| Load Maximum * (Watt) | 110.9 | 67.4 39% | 87.6 21% | 99.4 10% | 91.1 18% | 72.8 34% | 139.1 ? -25% | 64.4 ? 42% |
* ... smaller is better
Energy consumption during The Witcher 3 / stress test
Energy consumption with an external monitor
Battery life
The 53 Wh battery capacity has remained unchanged. Combined with the slightly higher consumption, the runtimes are a bit shorter than those of the first review sample of the Vision 14.
In the Wi-Fi test with a brightness of 150 cd/m² (corresponds to 35% of the maximum brightness in our test device), the device lasts just 5:30 hours, and this even drops to 4:30 hours at maximum brightness. The video runtime (150 cd/m²), on the other hand, remains the same (just under 7 hours).
The processor's higher short-term power consumption makes itself noticed here, and Windows 11 could also have an impact here. As a result, the Vision 14 H35 only occupies one of the lower places compared to its rivals. Only the MSI Summit E14 shuts down a bit sooner.
A full charge takes a bit less than 2 hours when the device is turned on, and 50% of the capacity is available again after only 28 minutes.
| Schenker Vision 14 i7-11370H, GeForce RTX 3050 Ti Laptop GPU, 53 Wh | Lenovo IdeaPad Slim 7i Pro 14IHU5 i7-11370H, Iris Xe G7 96EUs, 61 Wh | Huawei MateBook 14s i7 i7-11370H, Iris Xe G7 96EUs, 60 Wh | Razer Blade Stealth i7-1165G7 GTX 1650 Ti Max-Q i7-1165G7, GeForce GTX 1650 Ti Max-Q, 53.1 Wh | MSI Summit E14 A11SCS i7-1185G7, GeForce GTX 1650 Ti Max-Q, 52 Wh | Schenker Vision 14 i7-1165G7, Iris Xe G7 96EUs, 53 Wh | Average of class Subnotebook | |
|---|---|---|---|---|---|---|---|
| Battery runtime | 20% | 57% | 64% | -24% | 5% | 107% | |
| H.264 (h) | 6.8 | 11.6 71% | 6.7 -1% | 15.4 ? 126% | |||
| WiFi v1.3 (h) | 5.5 | 8.4 53% | 10.3 87% | 9 64% | 4.5 -18% | 6.1 11% | 14 ? 155% |
| Load (h) | 1.4 | 1.2 -14% | 1.6 14% | 1 -29% | 1.969 ? 41% | ||
| Reader / Idle (h) | 14.8 | 20.6 | 6.6 | 28.6 ? |
Pros
Cons
Verdict - The Vision 14 wastes potential
The new version of the Vision 14 provides the compact ultrabook with a decent performance boost thanks to the dedicated GeForce RTX 3050 Ti. Nevertheless, the device remains extremely light at under 1.2 kg and is, therefore, practically unrivaled. The competitors with dedicated GPUs weigh noticeably more, and all other models in this weight class only come with integrated GPUs.
At the same time, the processor has also been upgraded. Instead of a Tiger Lake-U chip, a slightly faster Tiger Lake-H35 processor is installed, and it also benefits from the stronger cooling. However, since this is basically a normal quad-core CPU, the performance increase provided by the processor remains low. The advantage of the fast iGPU, which isn't available with the H45 chips, simply doesn't play a role in models equipped with the GeForce GPU.
In our opinion, the ideal combination for the RTX 3050 Ti would have been a U processor from AMD, but these aren't found in the Vision 14 due to their limited availability. Also, a "slow" H45 processor from Intel with six or eight cores that would only require 40 W to run then, would have certainly been a better alternative (although a different chipset and its respective higher development costs would have been necessary in that case).
Thanks to the RTX 3050 Ti, the Vision 14's graphics performance is noticeably improved, but the Intel H35 processor can't really do a convincing job. Furthermore, the lightweight ultrabook struggles with short battery runtimes of around 5-6 hours in Wi-Fi mode in practice.
However, the performance development itself is fine although you have to deal with loud fans under high load. In the end, all the heat inside the compact case has to be dissipated somehow. The two other negative points are once again the wobbling lid and the short battery life. You're simply paying the price for the high image quality of the 3K display (90 Hz) without the use of PWM. Additionally, the GPU performance is massively throttled on battery power, and gaming is almost impossible when the device isn't plugged in.
Users looking for the lightest possible laptop with a fast GPU will currently only find a few alternatives like the Razer Blade Stealth 13 or the MSI Summit E14. On the other hand, those who don't intend to game and are satisfied with the iGPU's performance should take a look at the Huawei MateBook 14s or the Lenovo IdeaPad Slim i7 Pro. Of course, the Vision 14 H35 is also available without the RTX 3050 Ti, and there's also the "normal" Vision 14 with the Tiger Lake U processor and a Full HD panel (with longer battery life).
Price and availability
If you're within the EU, you're in luck because you can purchase the Vision 14 directly from the manufacturer's online store with prices starting at 1,249 Euros (~$1,392). Our test configuration with the Core i7, the RTX 3050 Ti, 32 GB of RAM, and a 1 TB PCIe 4.0 SSD costs a bit over 2,000 Euros (~$2,228), and the current delivery time is around two to three weeks.
Schenker Vision 14
- 01/24/2022 v7 (old)
Andreas Osthoff
Price comparison

