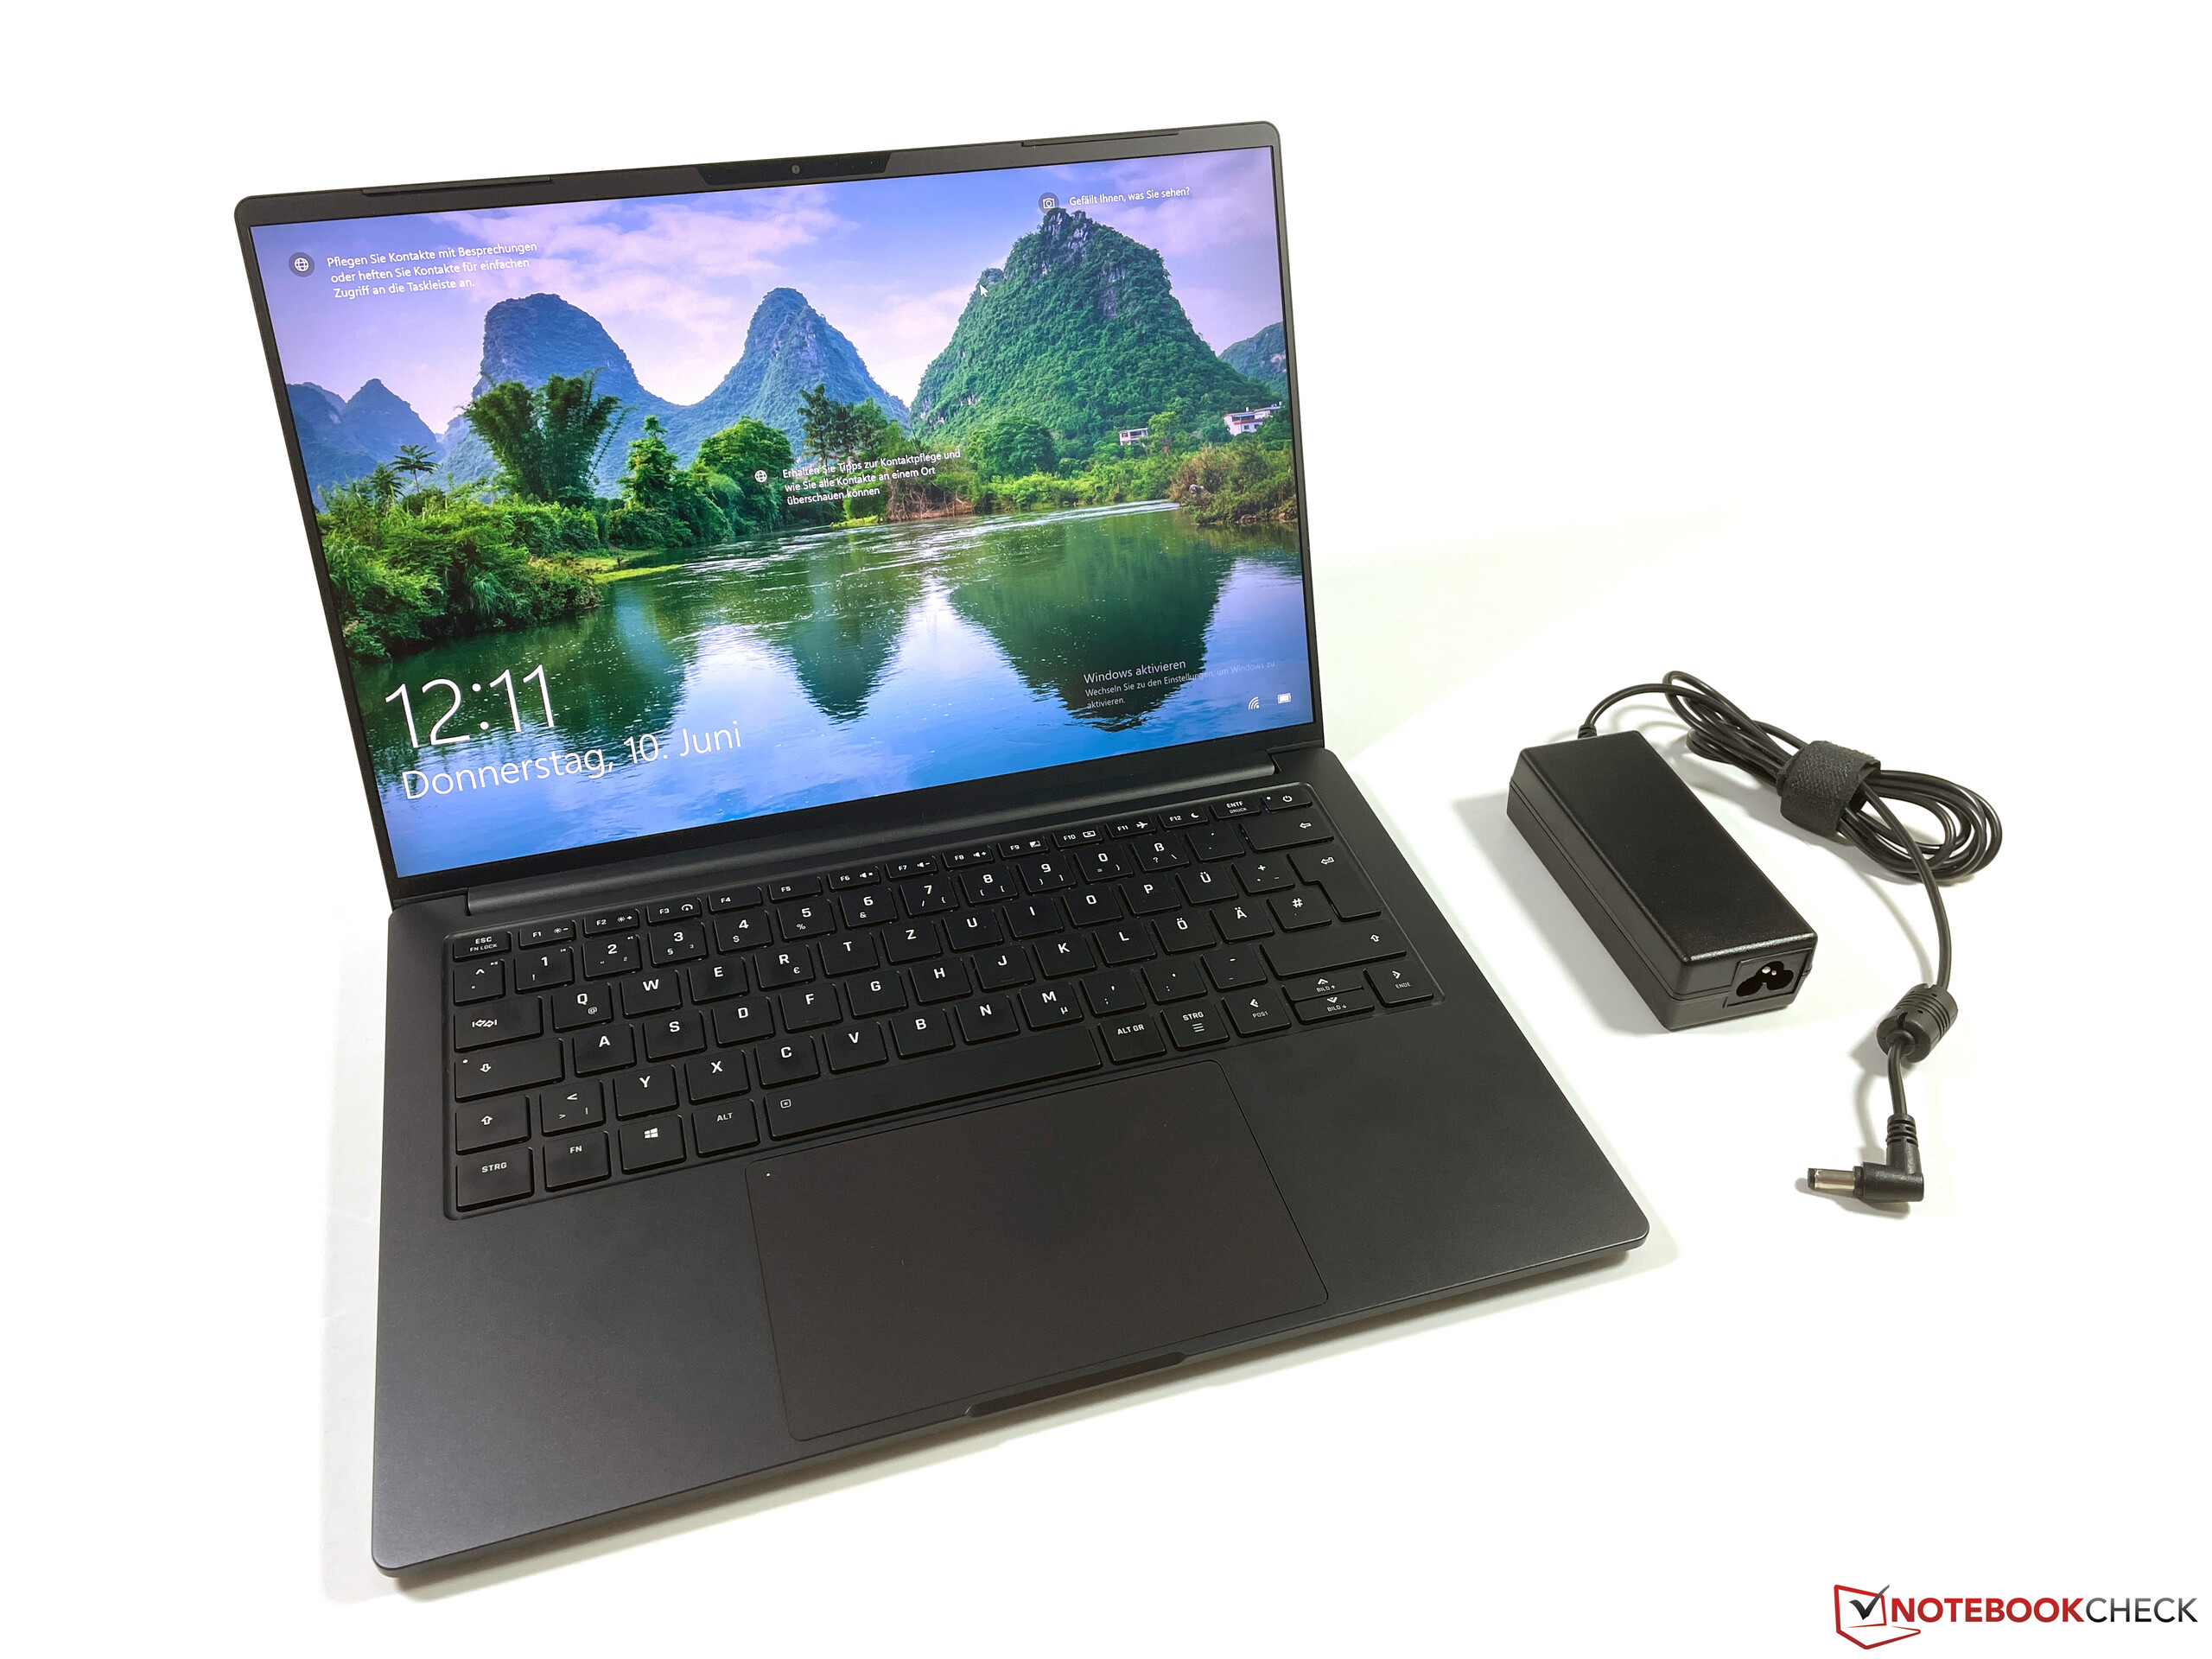
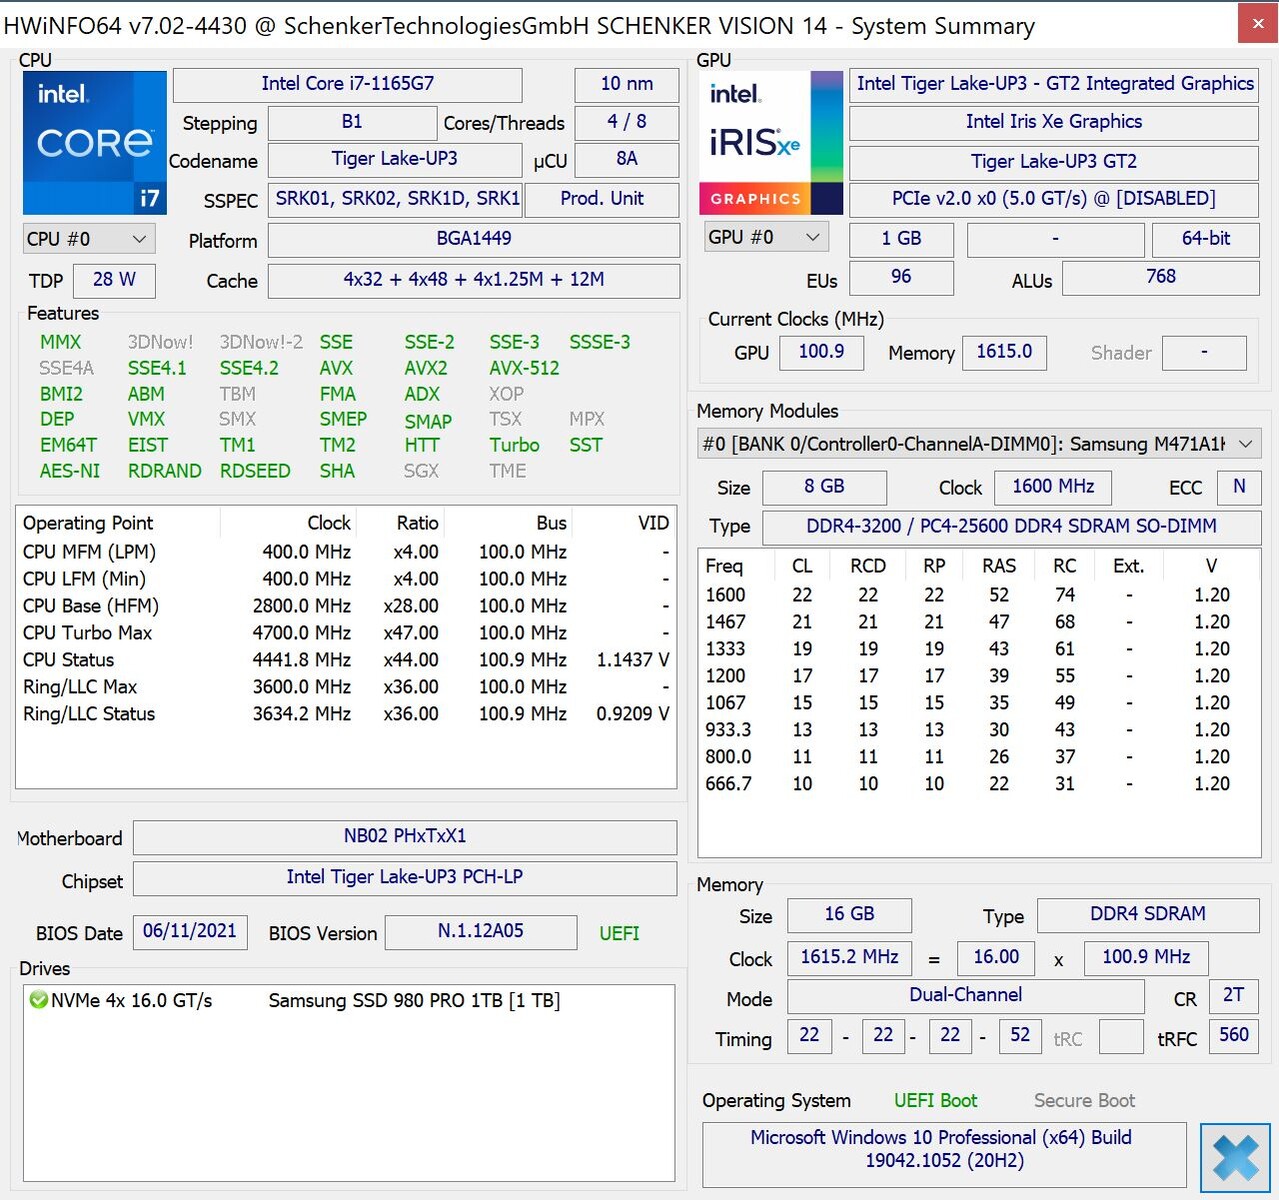
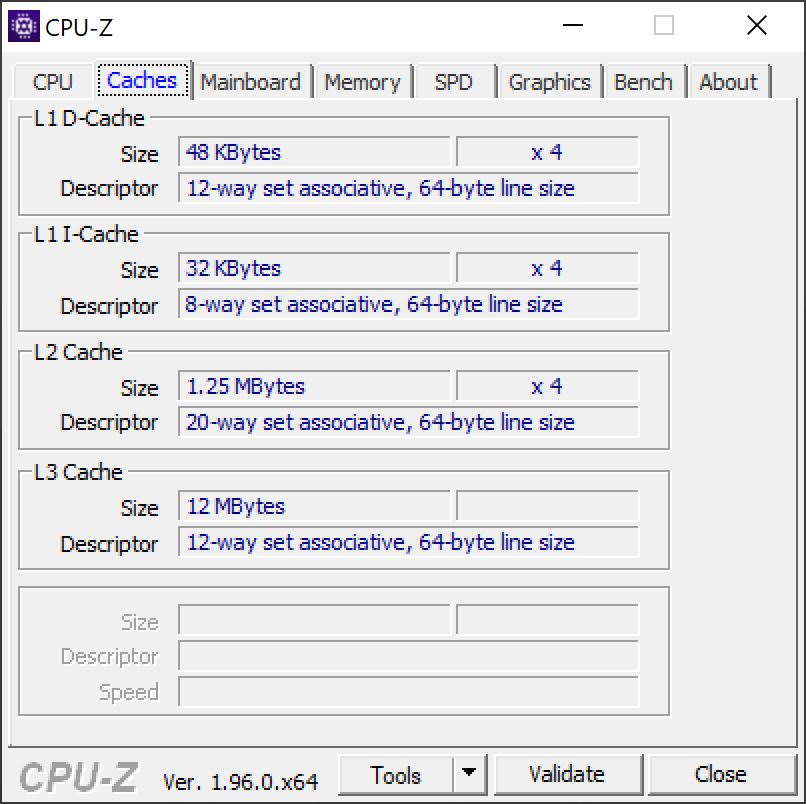
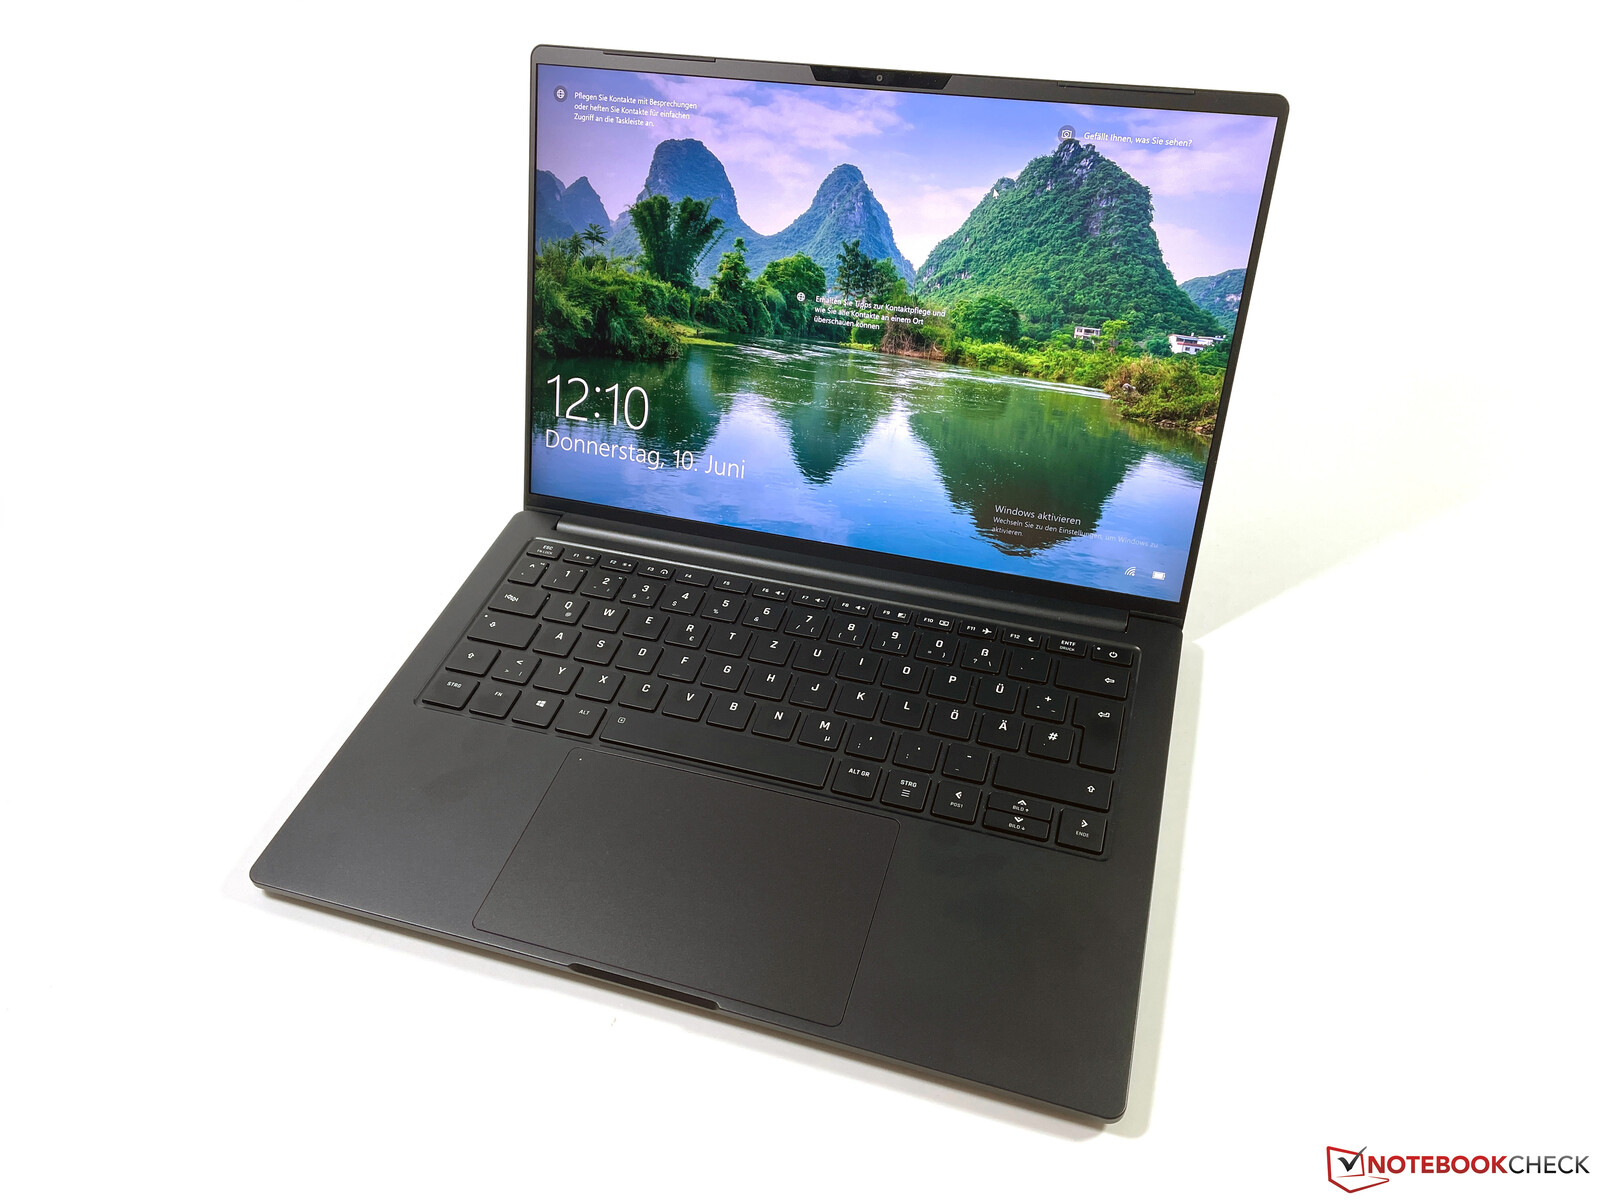
Schenker Vision 14 Laptop Review - Perfect Ultrabook with 1 kg and 16:10 display?
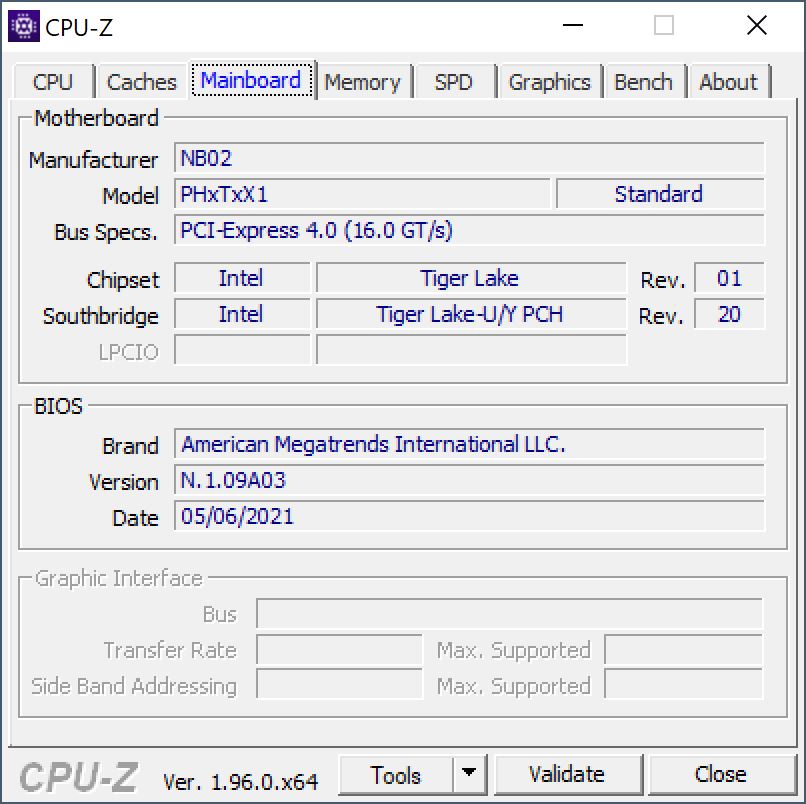
Modern Ultrabooks are getting thinner, but in return manufacturers often reduce the number of ports and they usually use soldered memory. The Vision 14 from Schenker follows another philosophy, because the 1 kg magnesium chassis offers plenty of ports including a full-size card reader, two DDR4-RAM slots, and two M.2 slots for SSDs. You can choose between two matte 16:10 aspect ratio screens; a 1080p model and a high-resolution 3K screen with 2880 x 1800 pixels and 90 Hz. Contrary to the Vision 15, which was a cooperation with Intel, the Vision 14 is developed by Schenker.
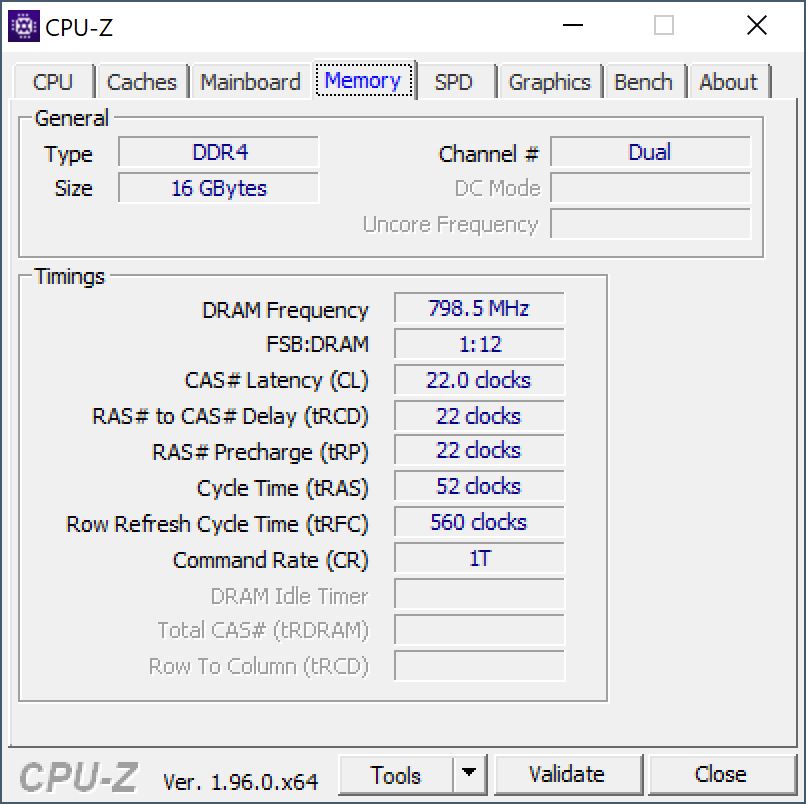
The entry-level model of the Vision is 1099 Euros; our review unit with the Tiger Lake i7 CPU, 16 GB RAM, the 3K display and the fast Samsung PCIe 4.0 SSD retails for around 1650 Euros. If you prefer Linux instead of Windows, you should take a look at the similarly constructed Infinity Book Pro 14 from Tuxedo, which starts at 1199 Euros.
Possible Competitors
Rating | Date | Model | Weight | Height | Size | Resolution | Price |
|---|---|---|---|---|---|---|---|
| 89.1 % v7 (old) | 06 / 2021 | Schenker Vision 14 i7-1165G7, Iris Xe G7 96EUs | 1 kg | 15.6 mm | 14.00" | 2880x1800 | |
| 88.3 % v7 (old) | 05 / 2021 | LG Gram 14Z90P-G.AA79G i7-1165G7, Iris Xe G7 96EUs | 967 g | 16.8 mm | 14.00" | 1920x1200 | |
| 87.1 % v7 (old) | 03 / 2021 | Asus ExpertBook B9 B9400CE-KC0166R i7-1165G7, Iris Xe G7 96EUs | 995 g | 14.9 mm | 14.00" | 1920x1080 | |
| 87.6 % v7 (old) | 03 / 2021 | Lenovo Yoga Slim 7i Carbon 13 ITL i7-1165G7, Iris Xe G7 96EUs | 975 g | 15 mm | 13.30" | 2560x1600 | |
| 87.8 % v7 (old) | 03 / 2021 | Huawei MateBook X Pro 2021 i7-1165G7, Iris Xe G7 96EUs | 1.3 kg | 14.6 mm | 13.90" | 3000x2000 |
Case & Connectivity
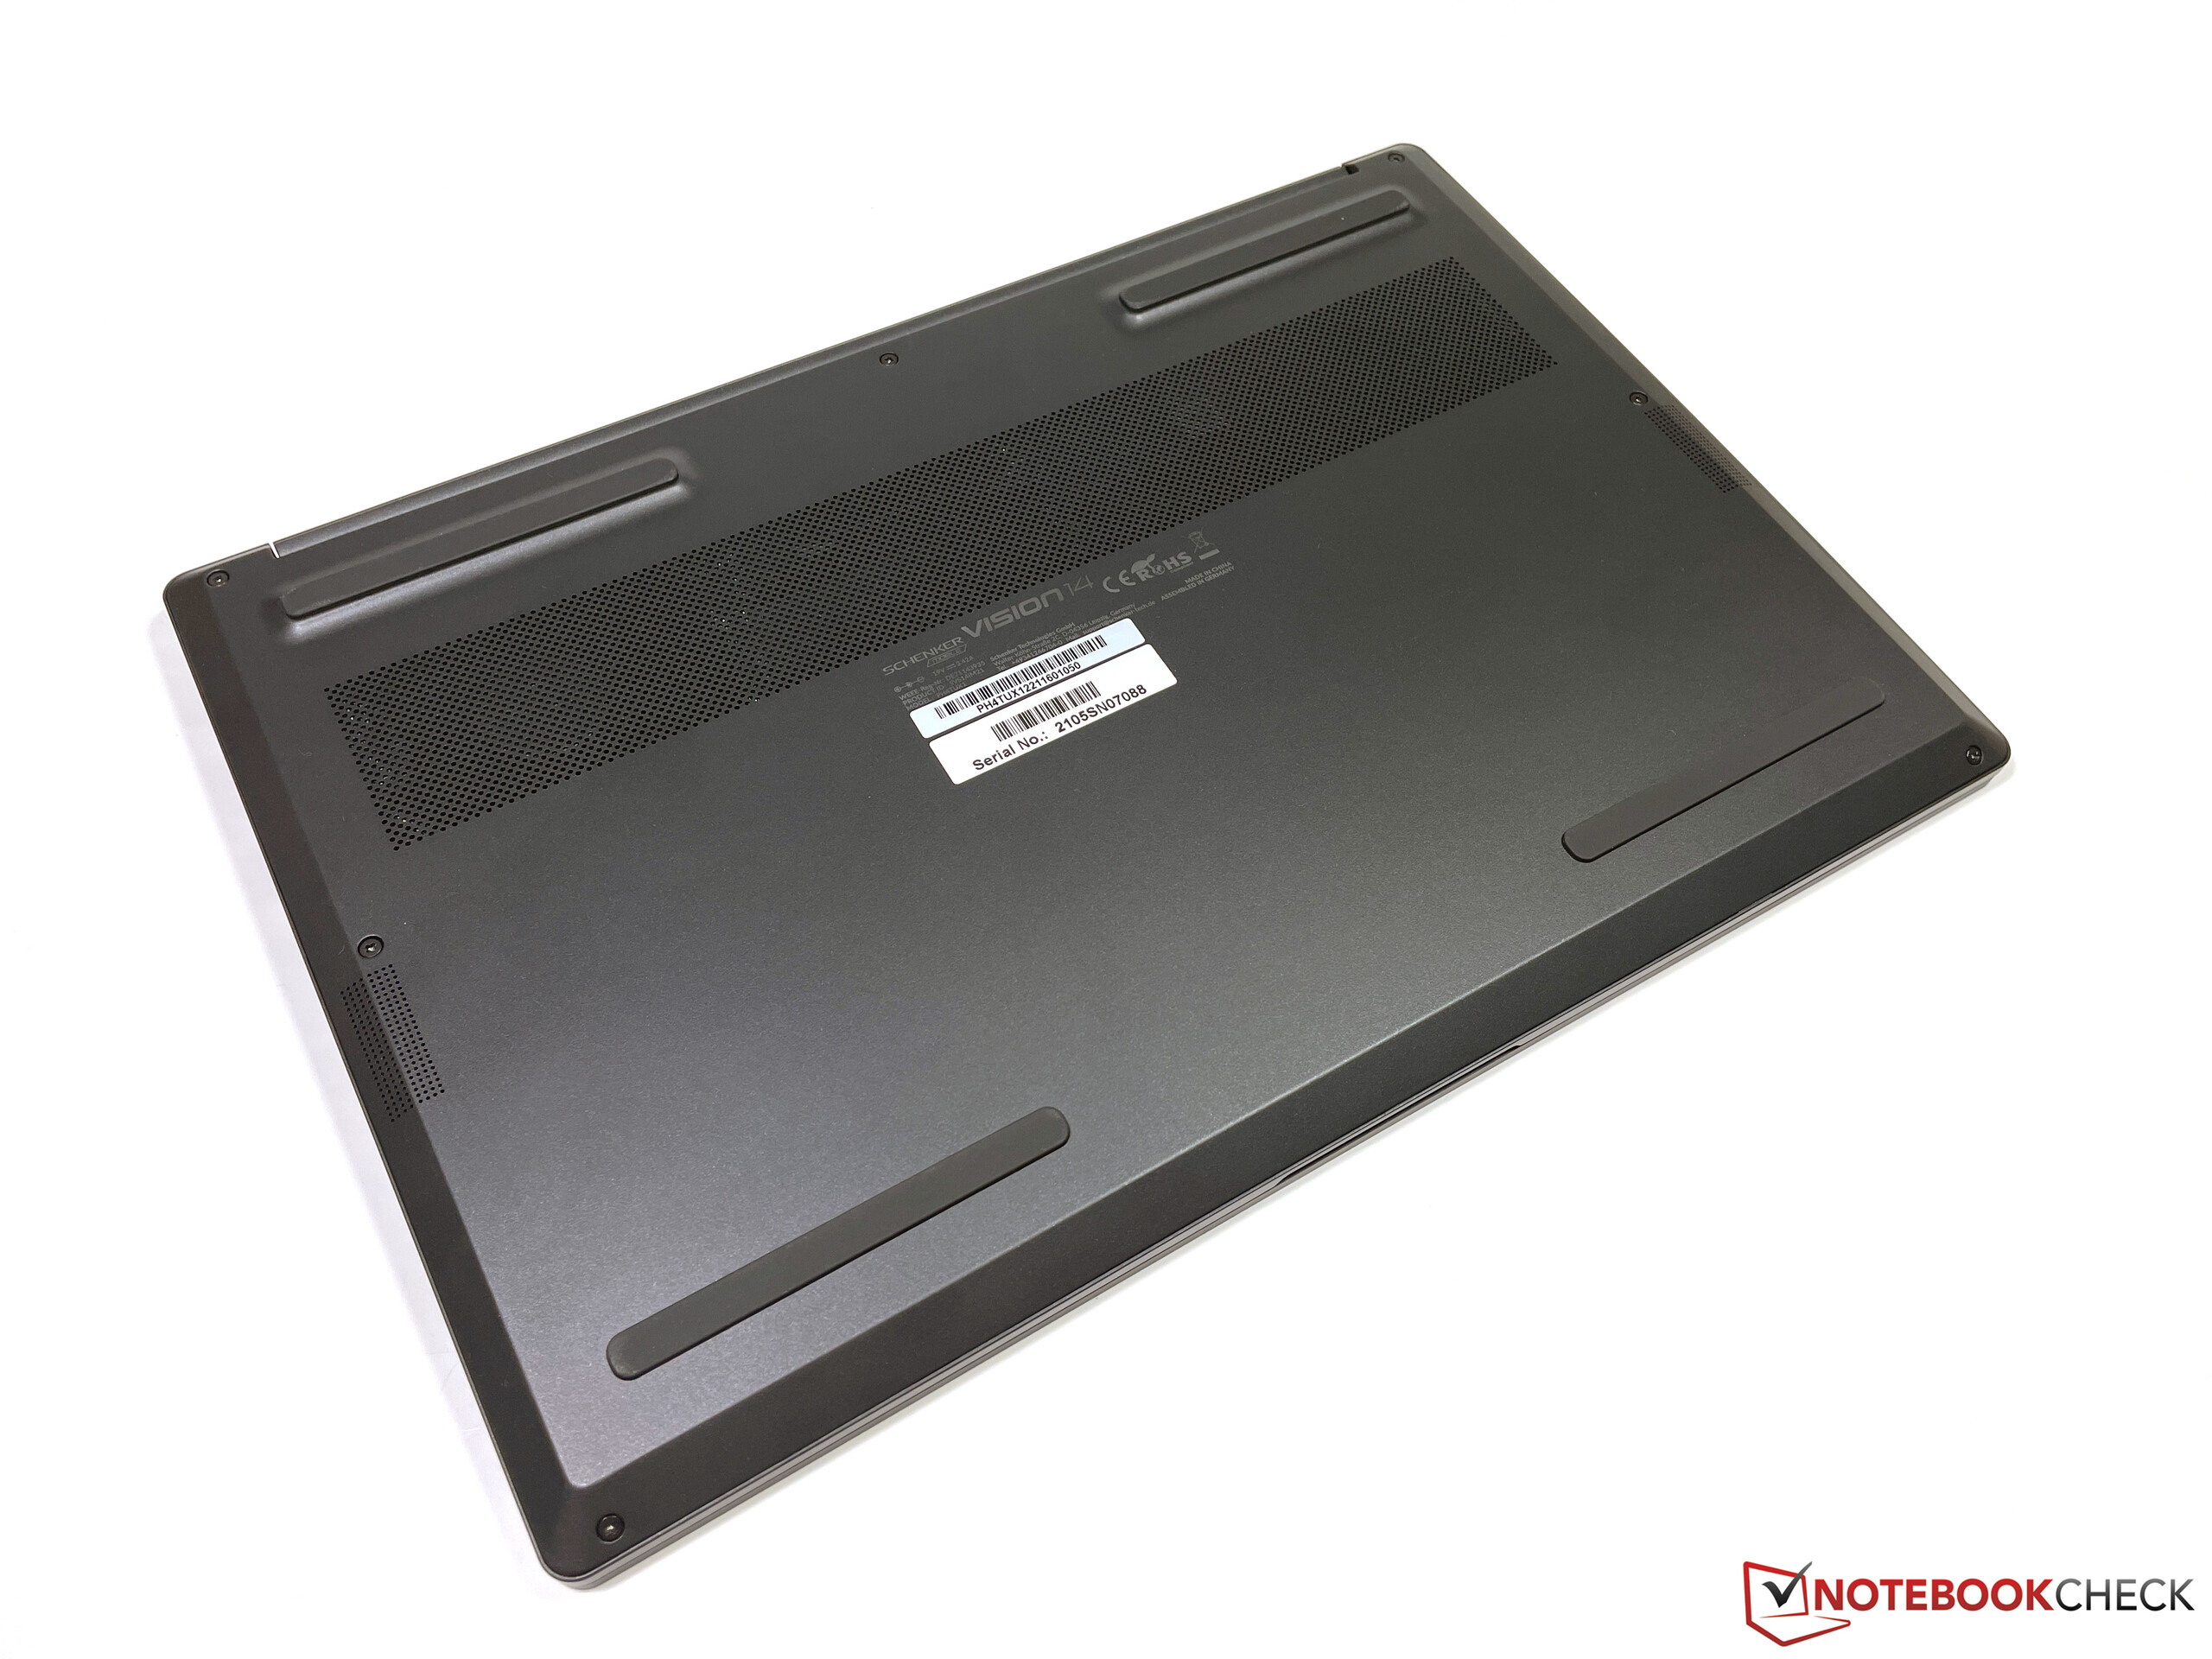
The whole chassis of the Vision 14 is made of a magnesium alloy, only the bezels are made of plastic. The whole laptop only weighs little more than 1 kg, but the stability of the base unit in particular is still very good and even the central keyboard area can hardly be dent. The thin lid is obviously a bit more flexible, but we cannot provoke picture distortions. The only weakness is the display hinge. You can open the lid with one hand (up to 160 degrees), but it wobbles quite a bit and we would have preferred firmer hinges. The surfaces are slightly roughened and are nice to touch, and fingerprints can easily be removed with a cloth.
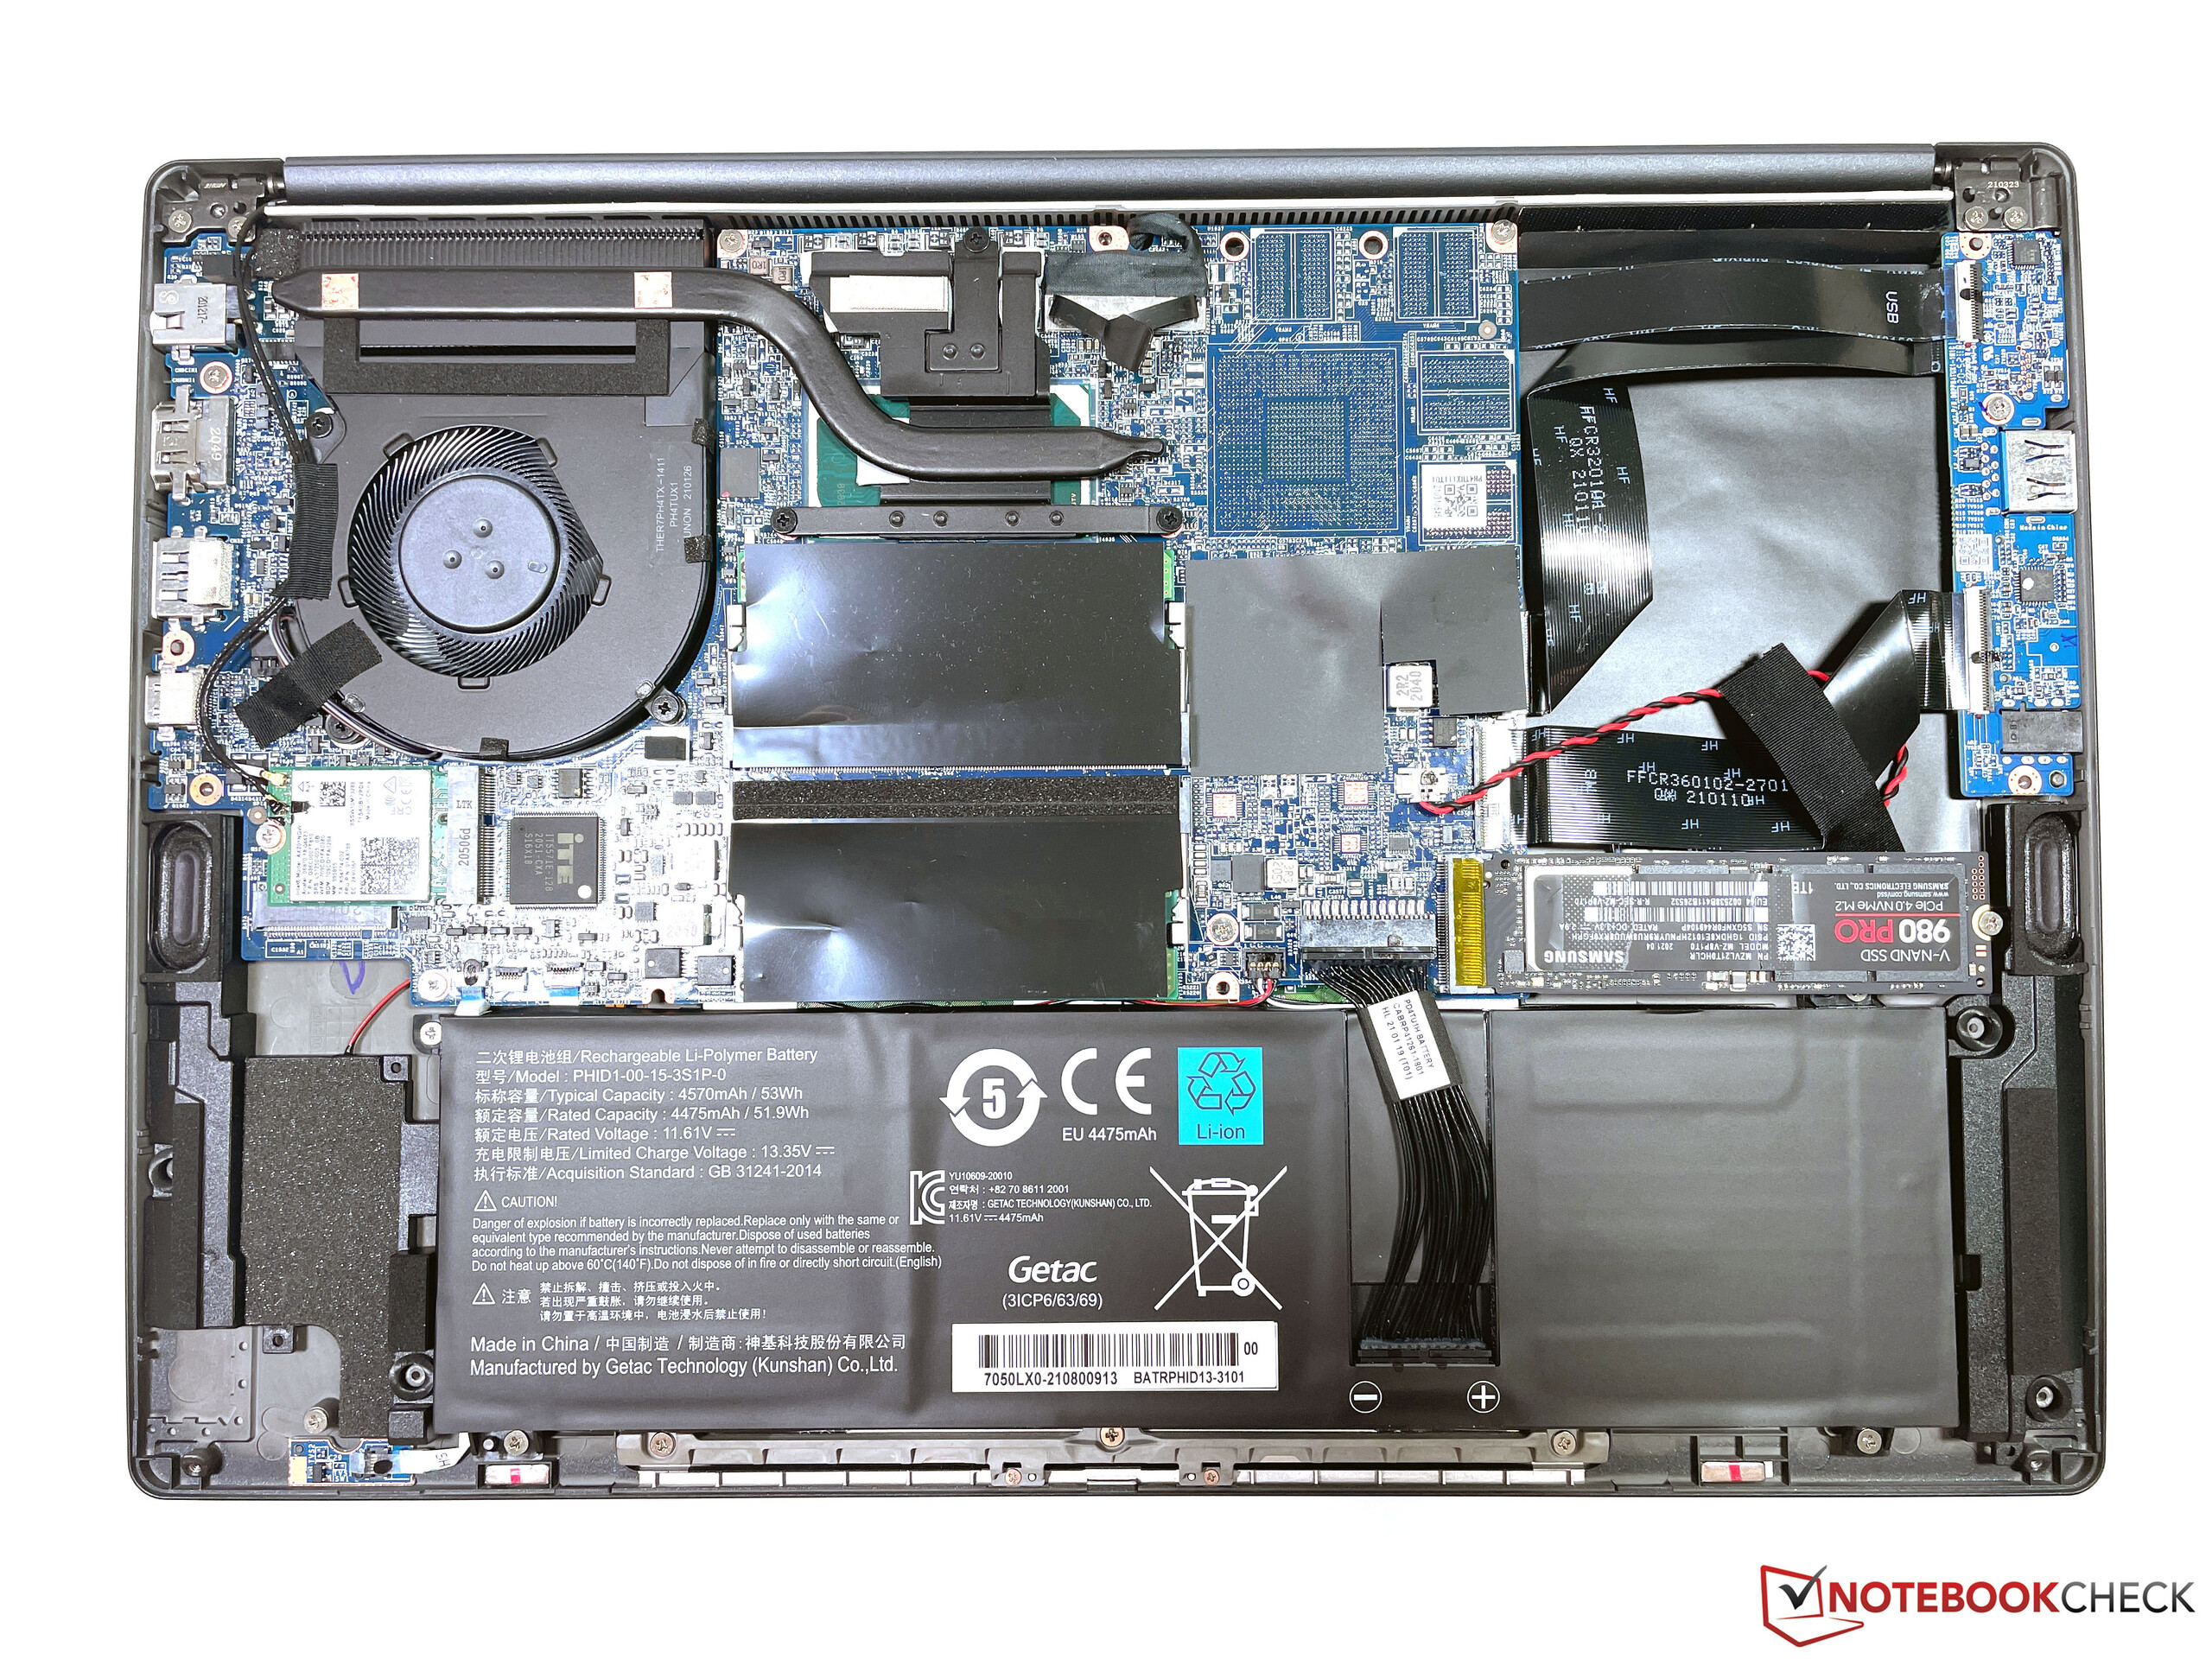
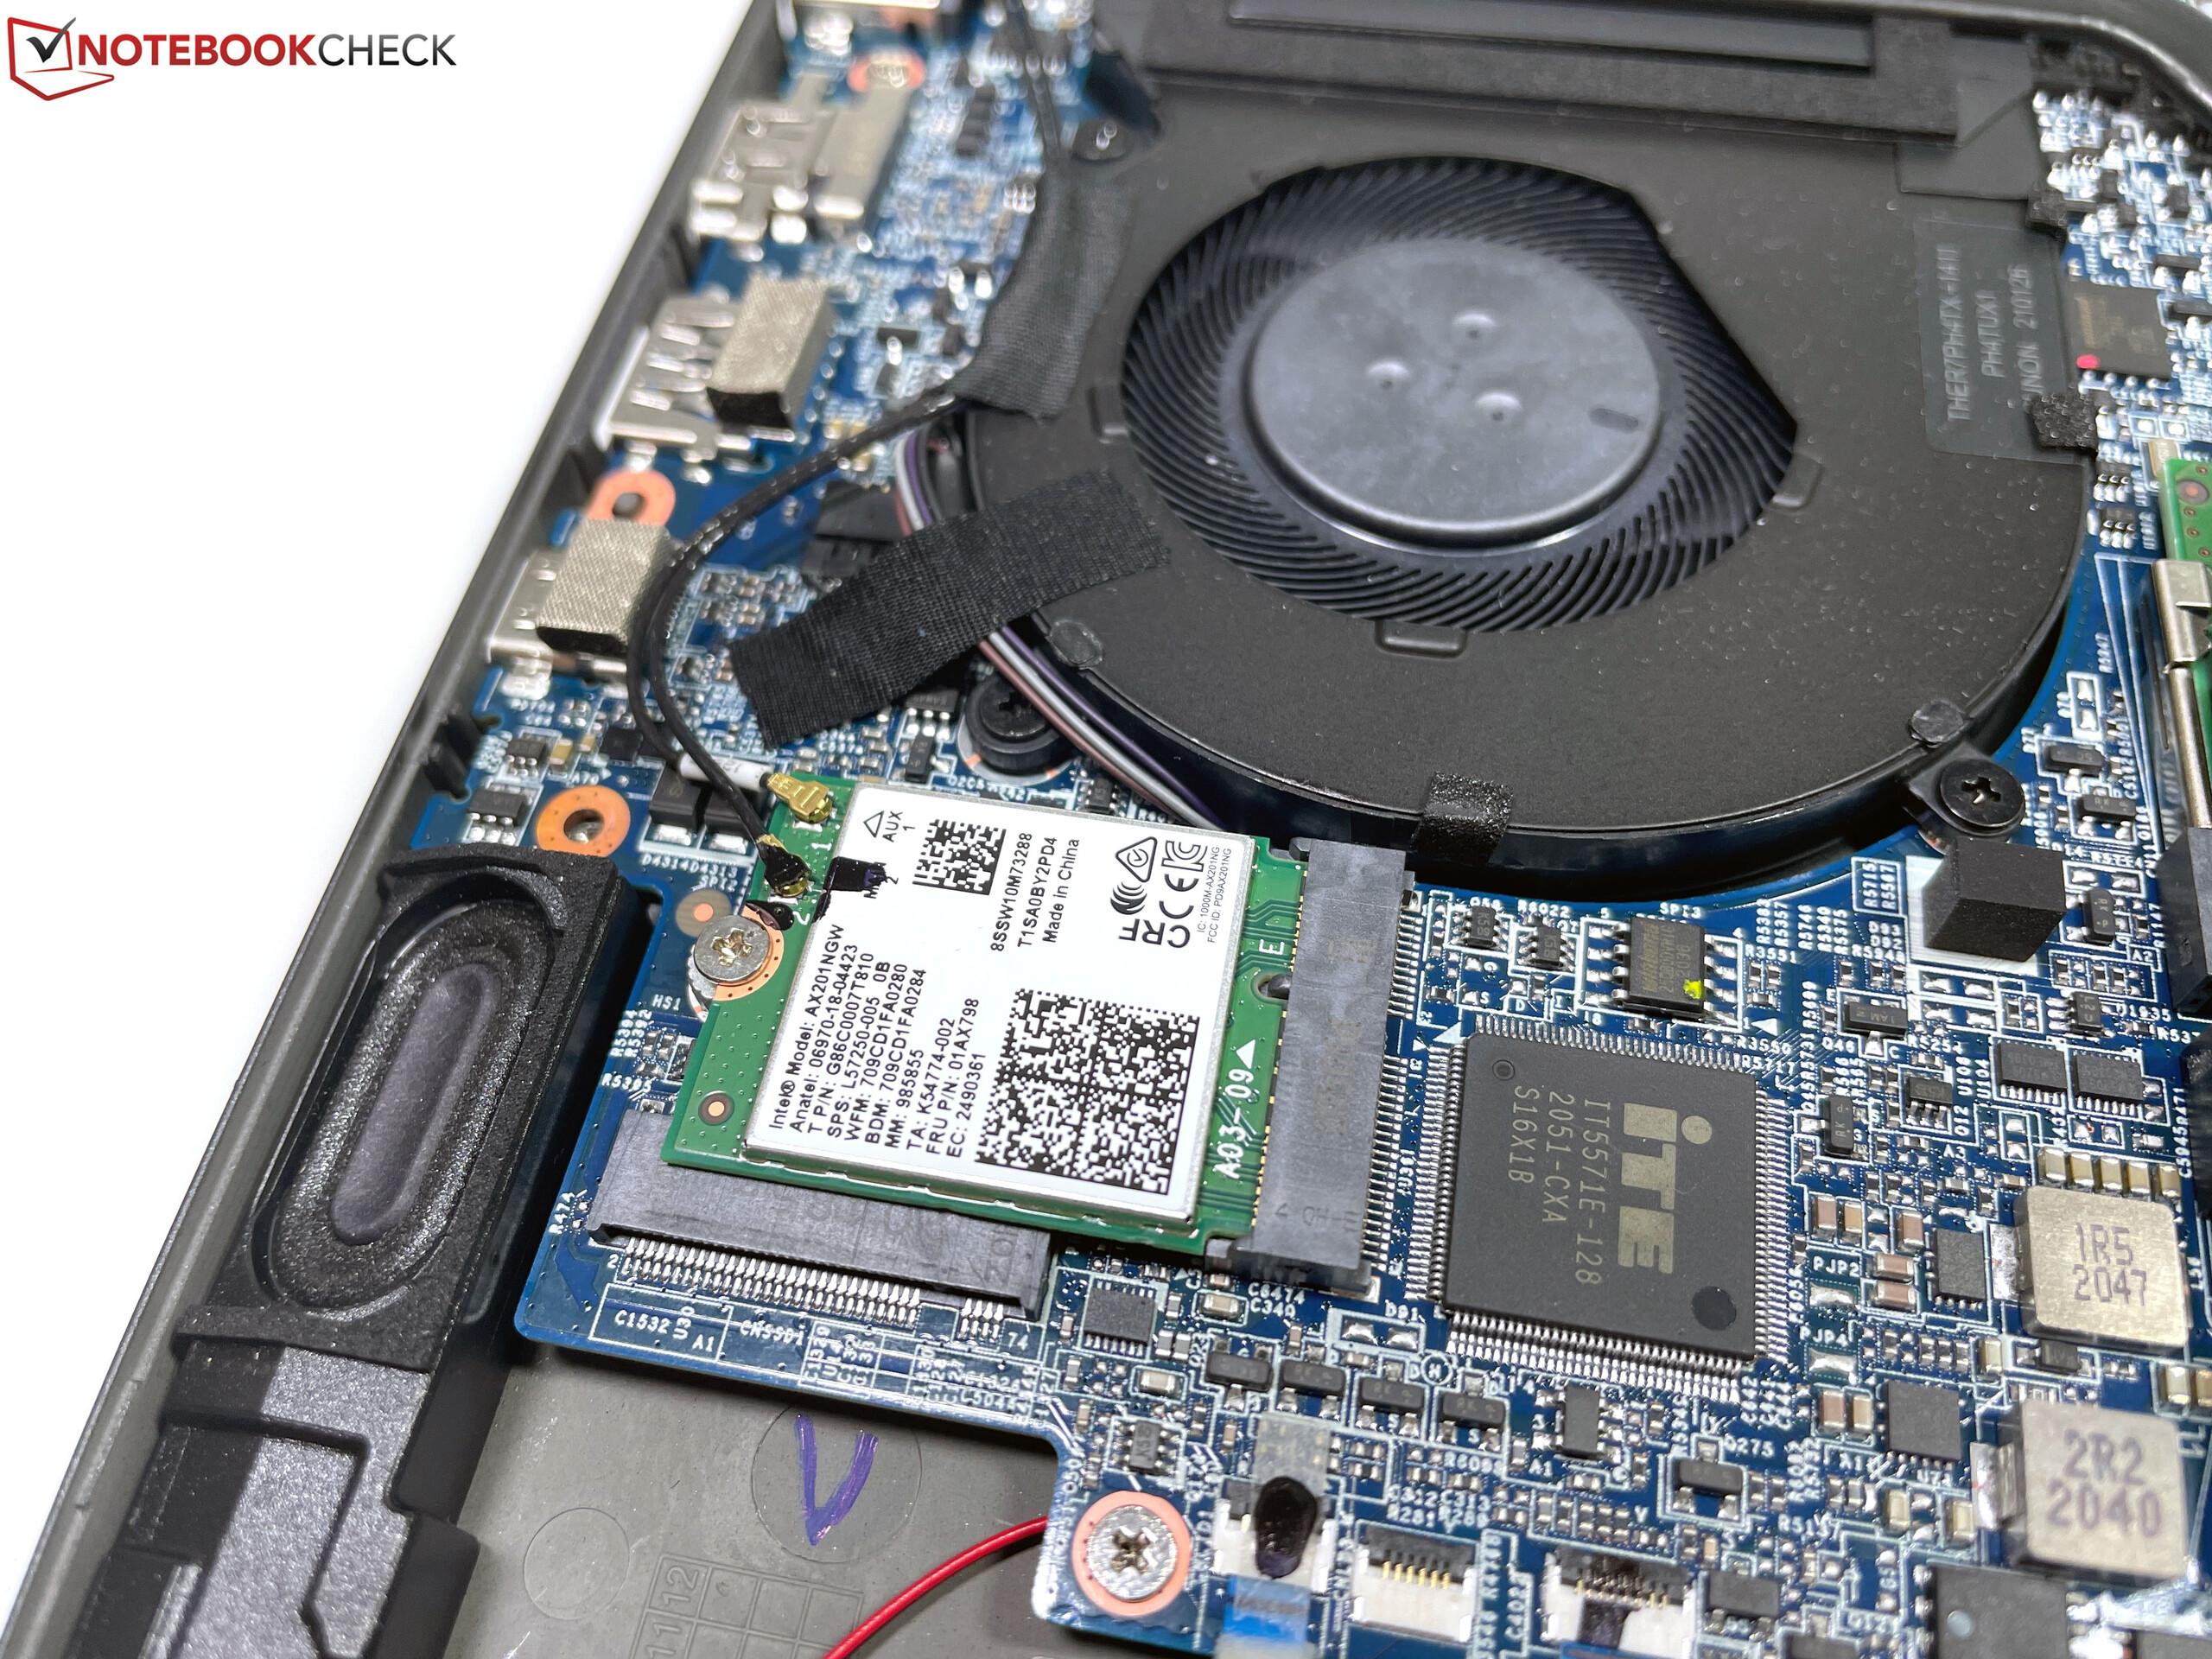
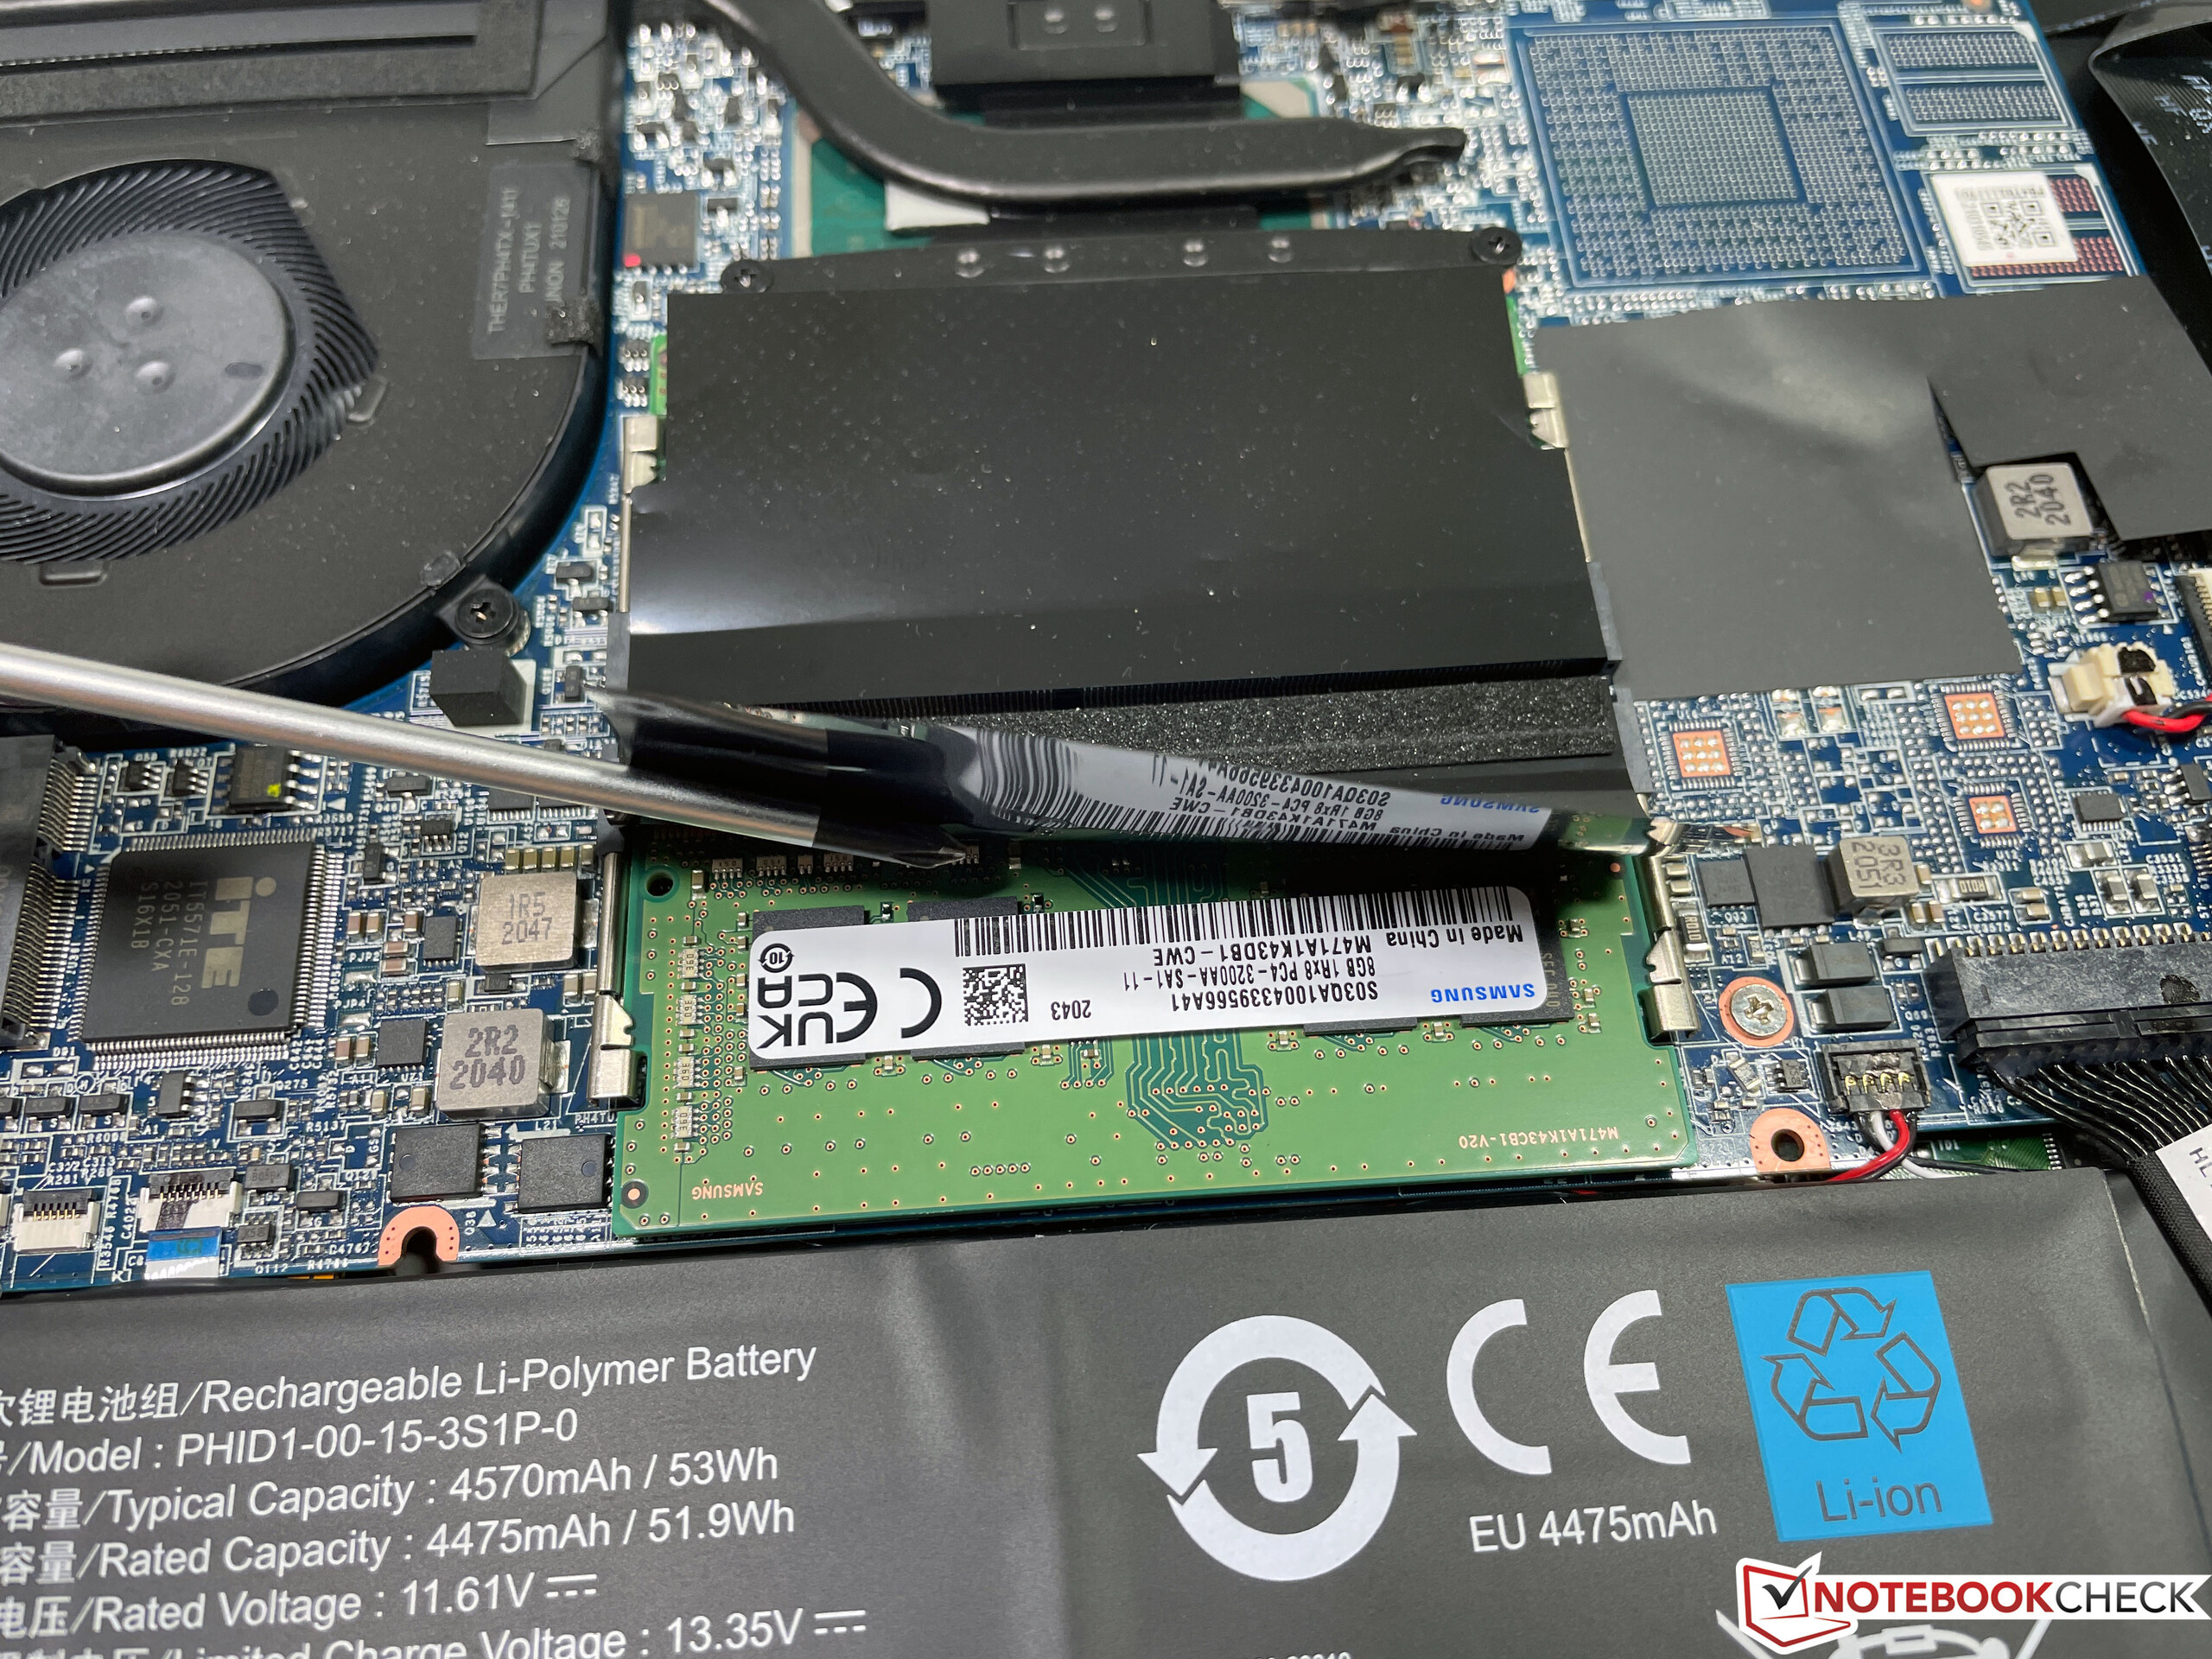
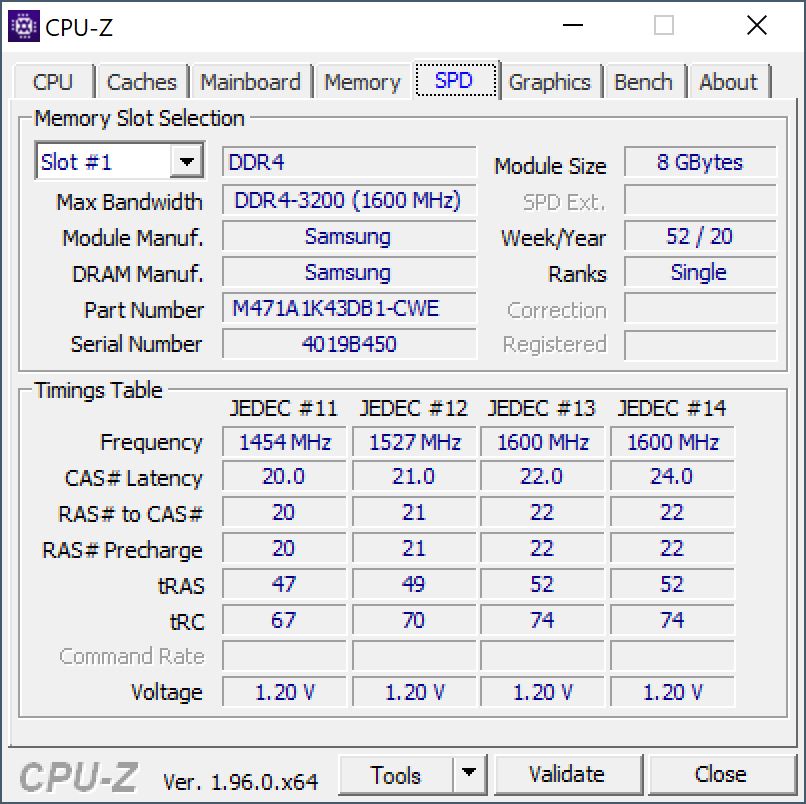
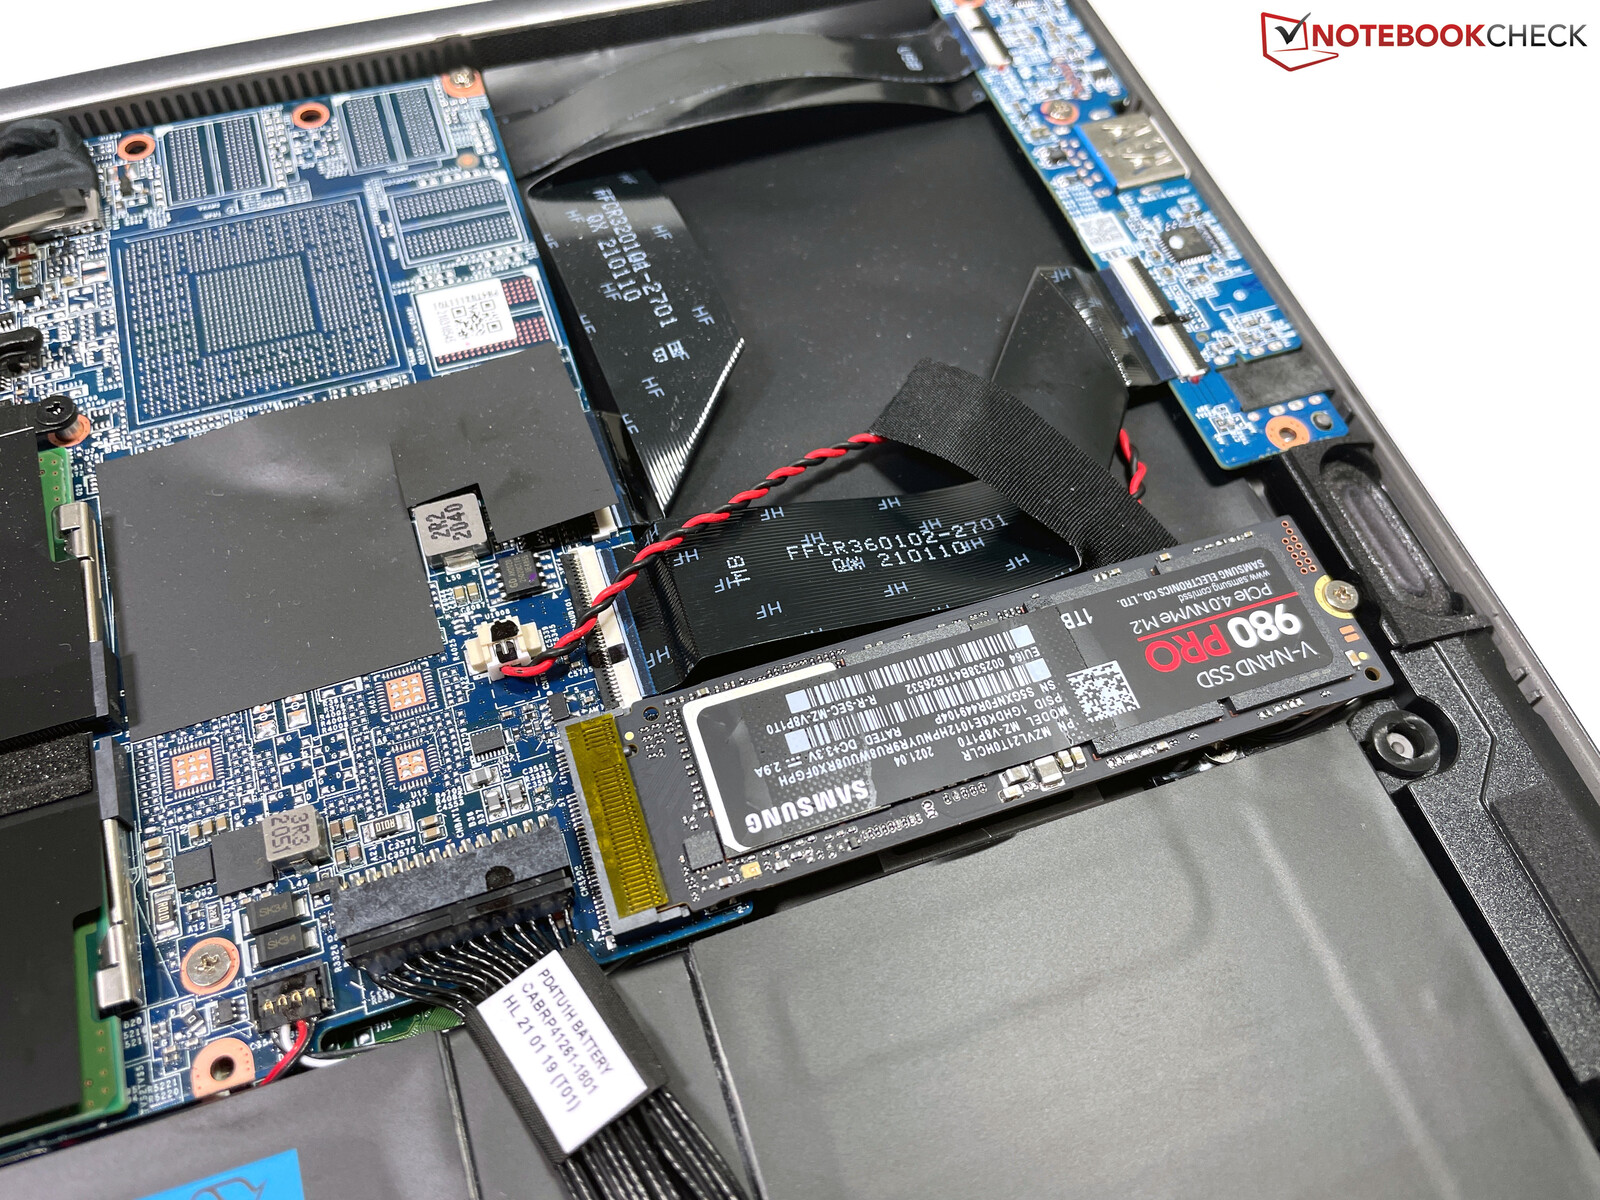
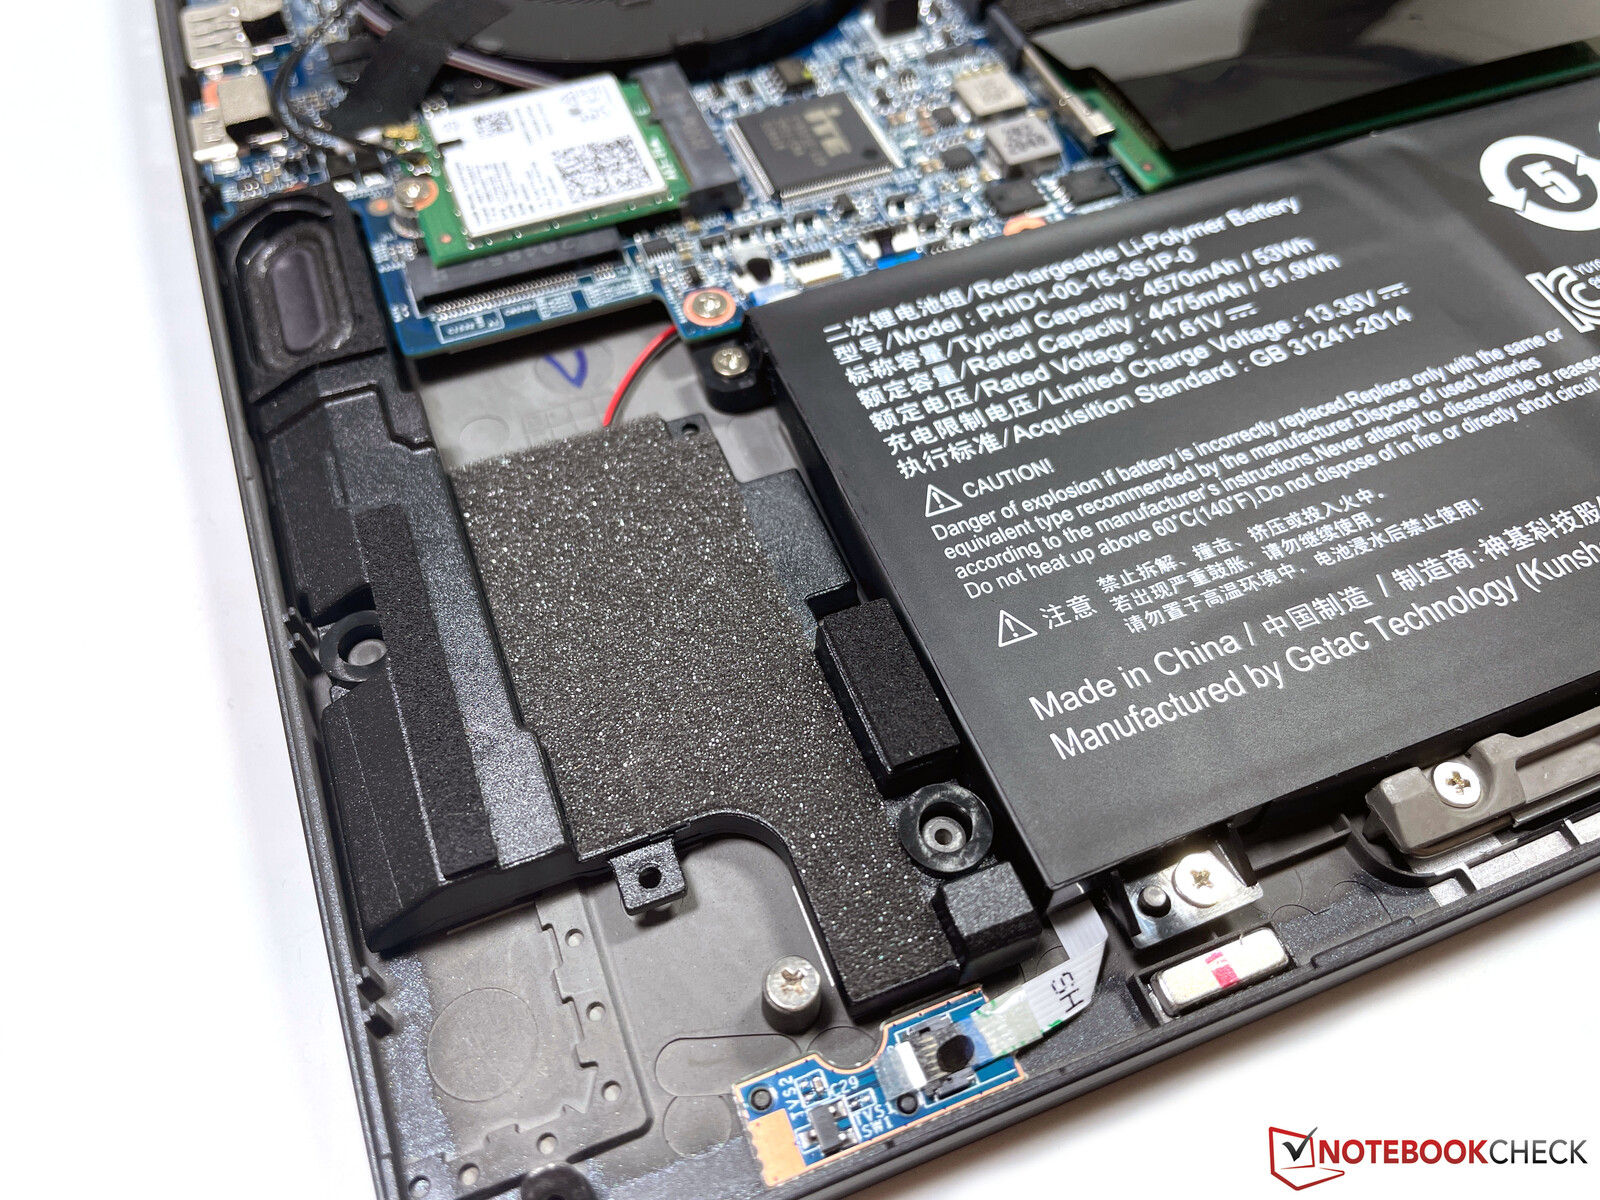
The bottom panel is only secured by a couple of Philips screws and can easily be removed. In addition to the battery, the fan, and the M.2-SSDs, you can also access the Wi-Fi module as well as the two RAM slots. Most slim devices usually use soldered RAM and Wi-Fi modules by now, but it is no problem to expand the memory on this laptop.
Ports
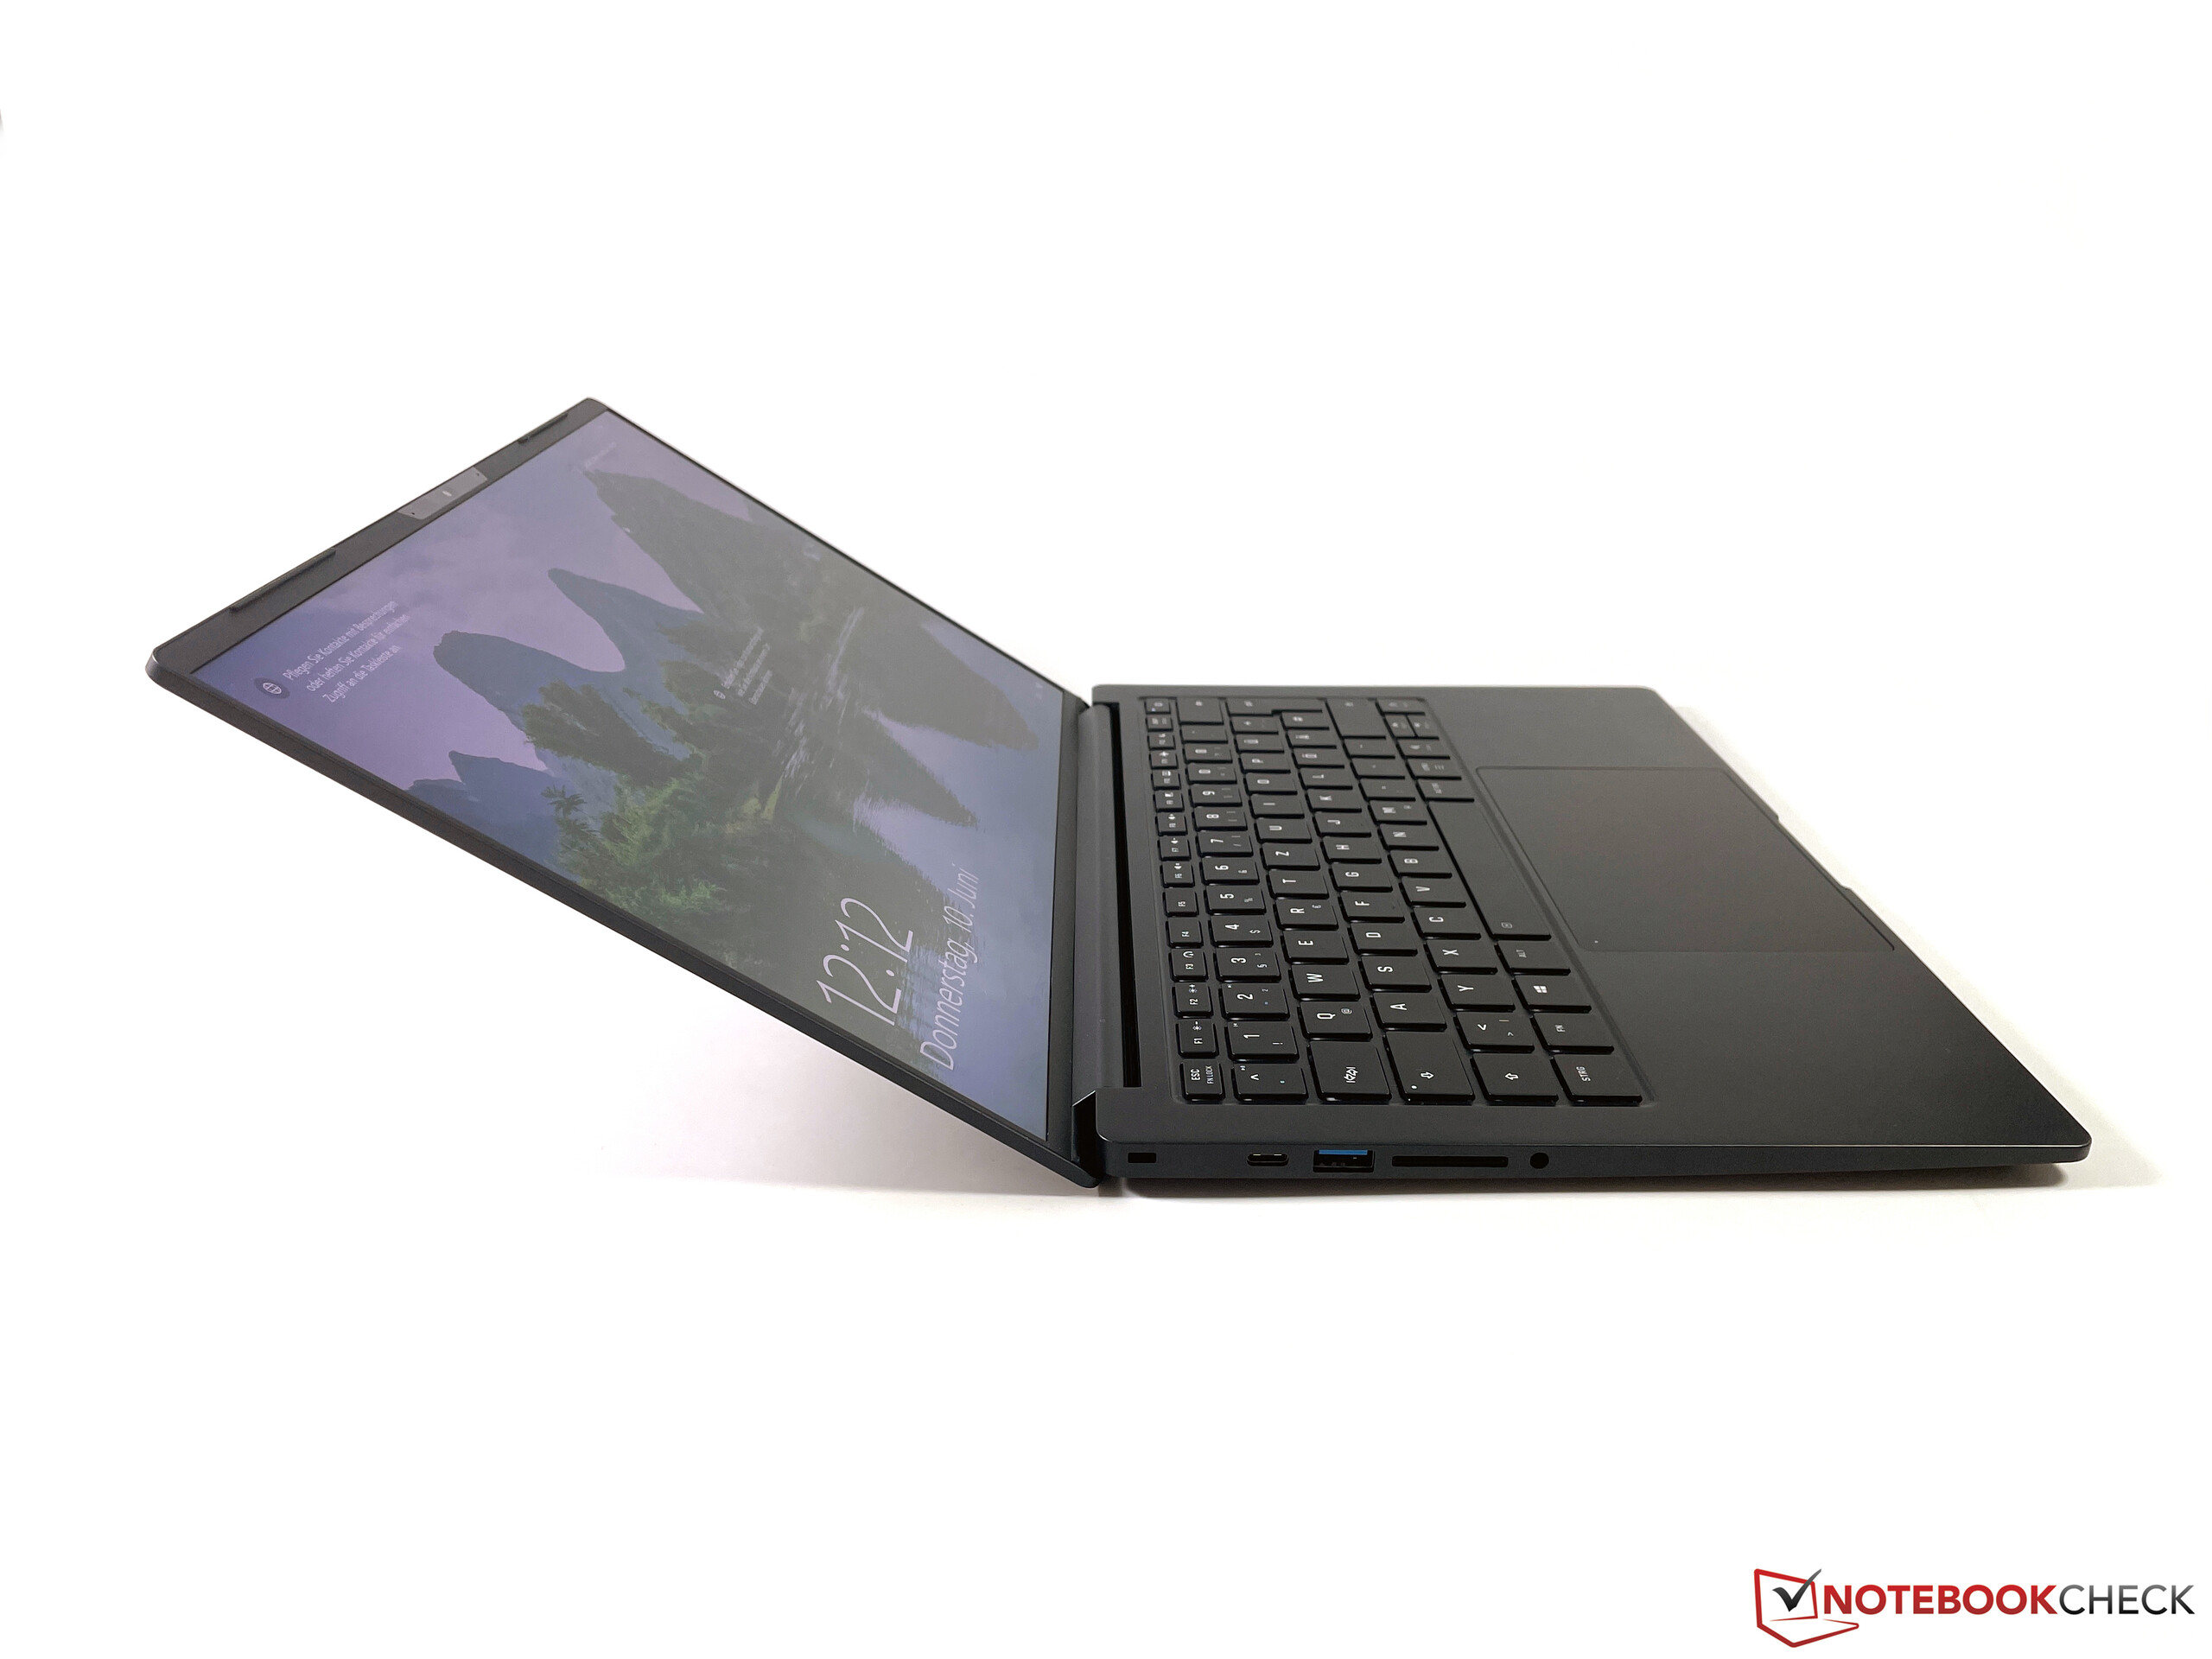
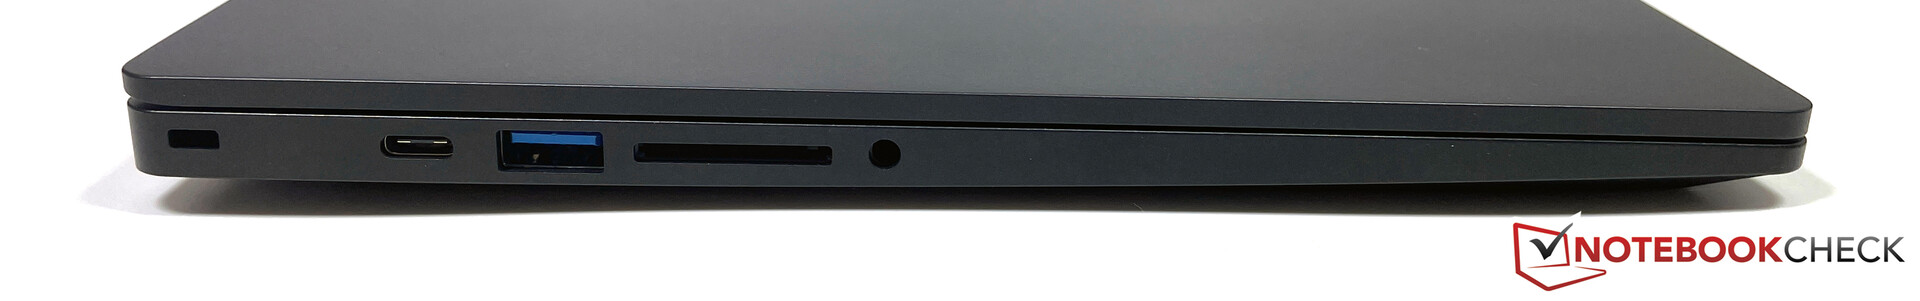
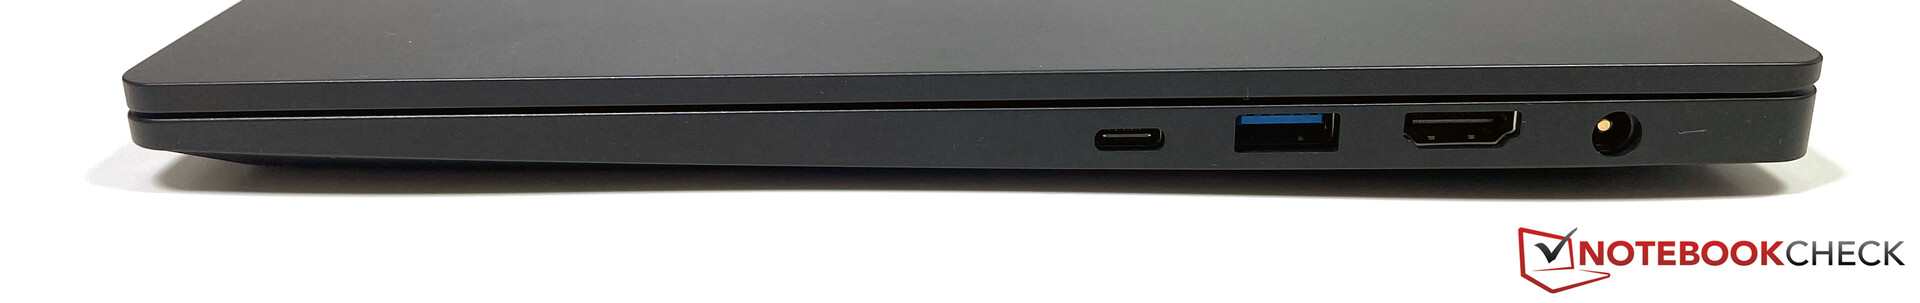
The Vision 14 offers USB-A and USB-C connectivity on both sides including Thunderbolt 4 on the right side. The laptop has a regular power connector, so previous power adapters are compatible, but charging via USB-C (on both sides) is also possible. Finally, you get an HDMI output as well as a full-size card reader, which manages good transfer rates of around 80 MB/s in combination with our reference card (AV PRO V60).
| SD Card Reader | |
| average JPG Copy Test (av. of 3 runs) | |
| Schenker Vision 14 (AV PRO V60) | |
| LG Gram 14Z90P-G.AA79G (Toshiba Exceria Pro M501 microSDXC 64GB) | |
| Average of class Subnotebook (23.7 - 188, n=9, last 2 years) | |
| maximum AS SSD Seq Read Test (1GB) | |
| Average of class Subnotebook (24.9 - 195, n=8, last 2 years) | |
| LG Gram 14Z90P-G.AA79G (Toshiba Exceria Pro M501 microSDXC 64GB) | |
| Schenker Vision 14 (AV PRO V60) | |


Input Devices
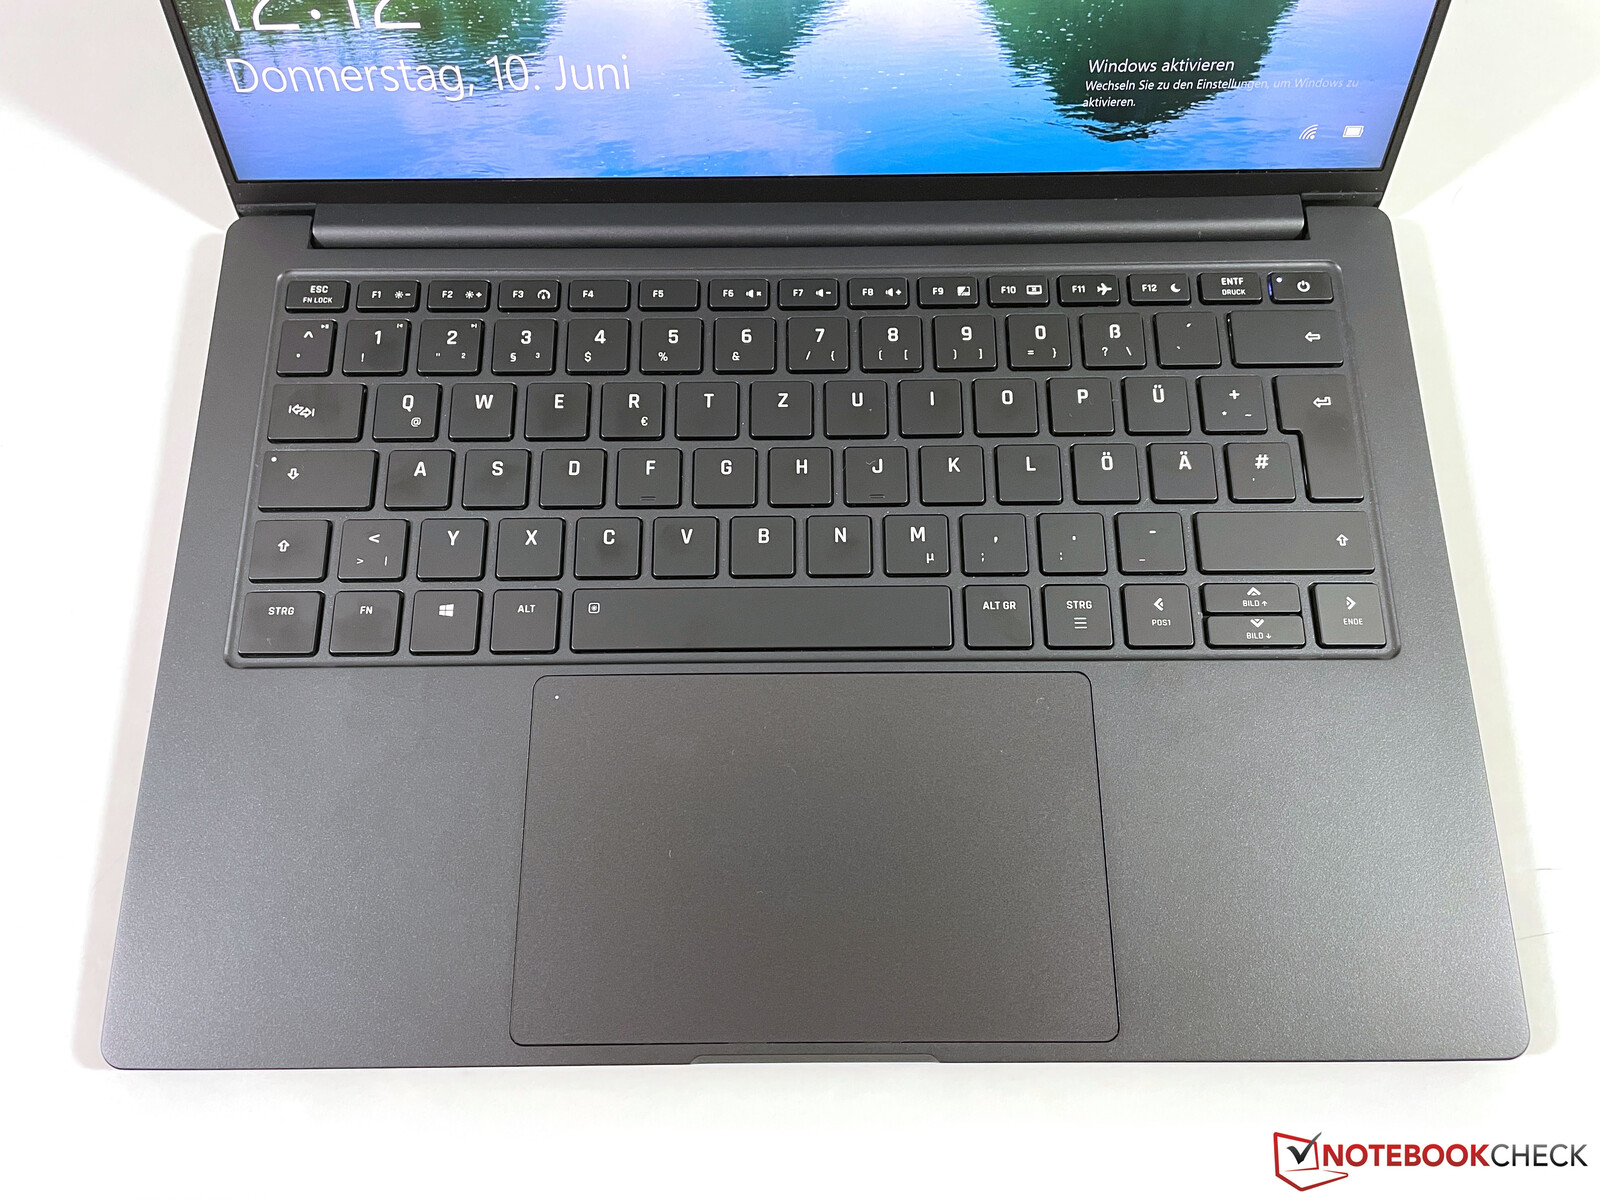
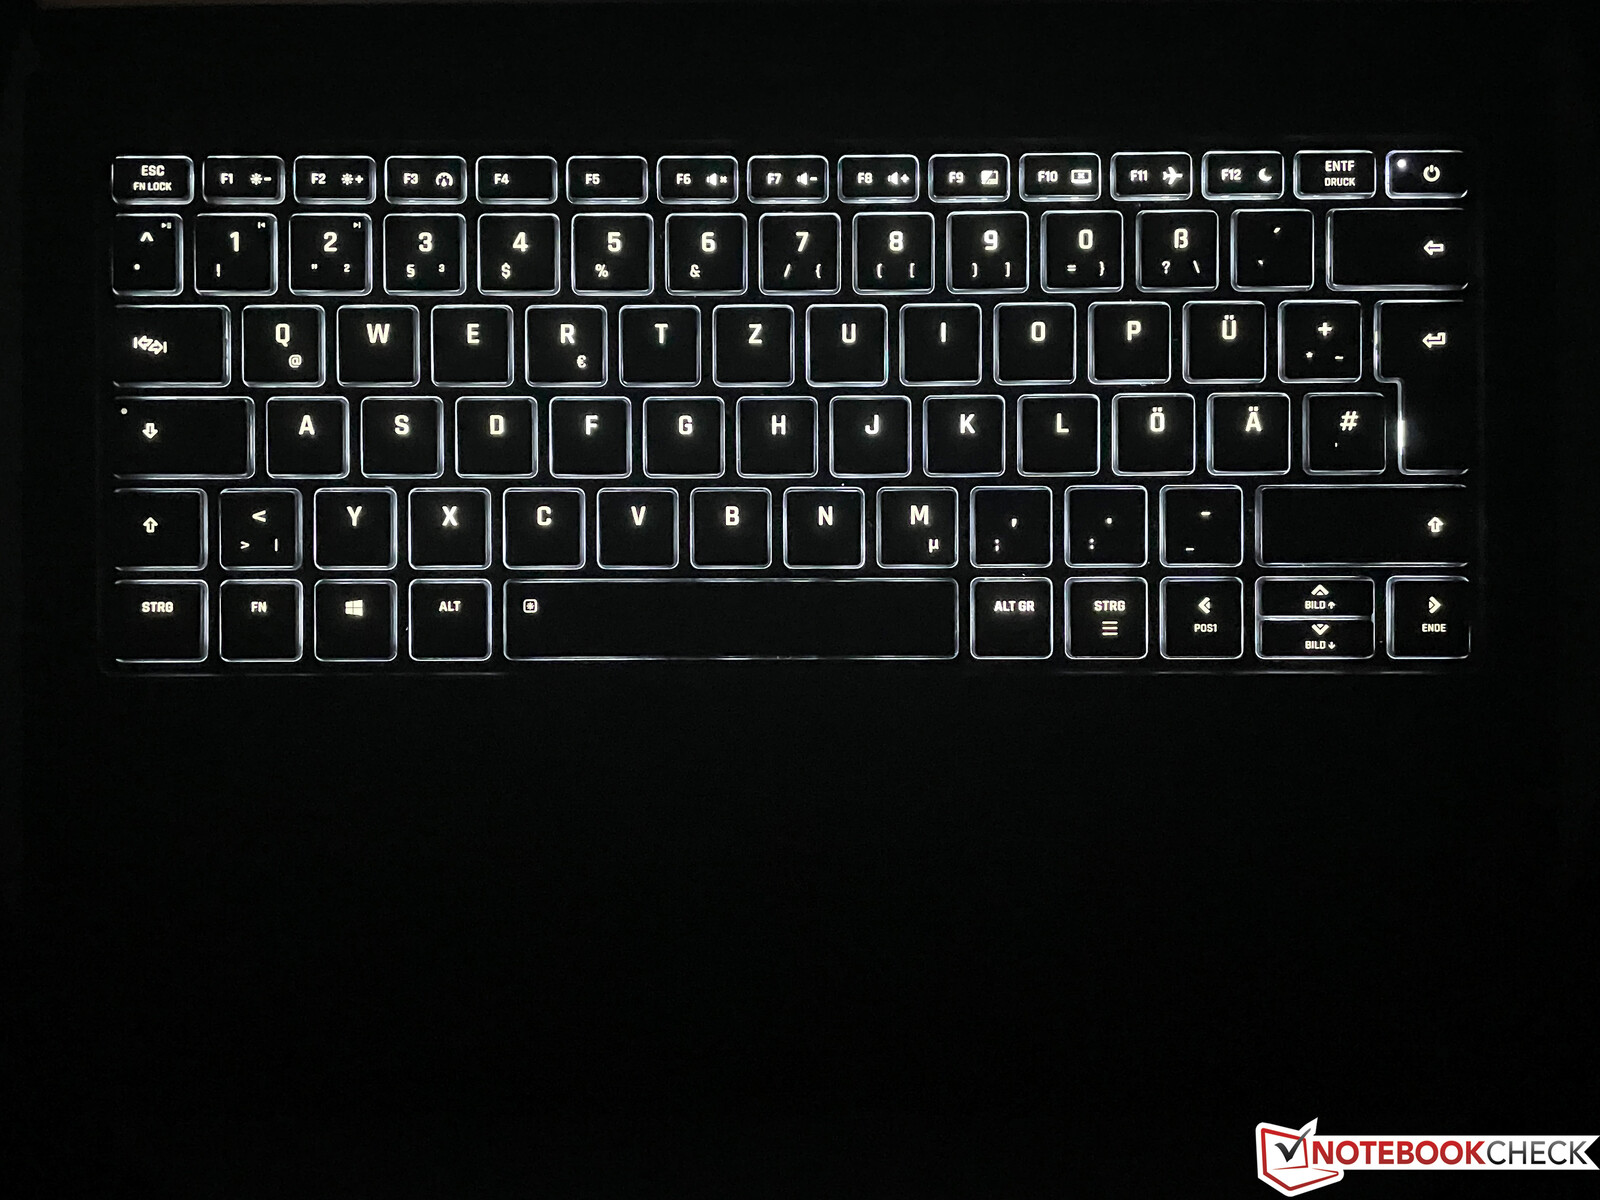
Typing on the white backlit keyboard is very comfortable and quiet. The keys offer precise feedback, only the power button, which is integrated in the upper right corner, may take some time getting used to. Schenker implements a large clickpad (13 x 8 cm) that supports Microsoft’s Precision standard and the glass surface provides excellent gliding capabilities. Cursor movements are very reliable and gestures also work well thanks to the large surface area. However, the integrated clickpad buttons create a loud noise, which sounds a bit cheap.
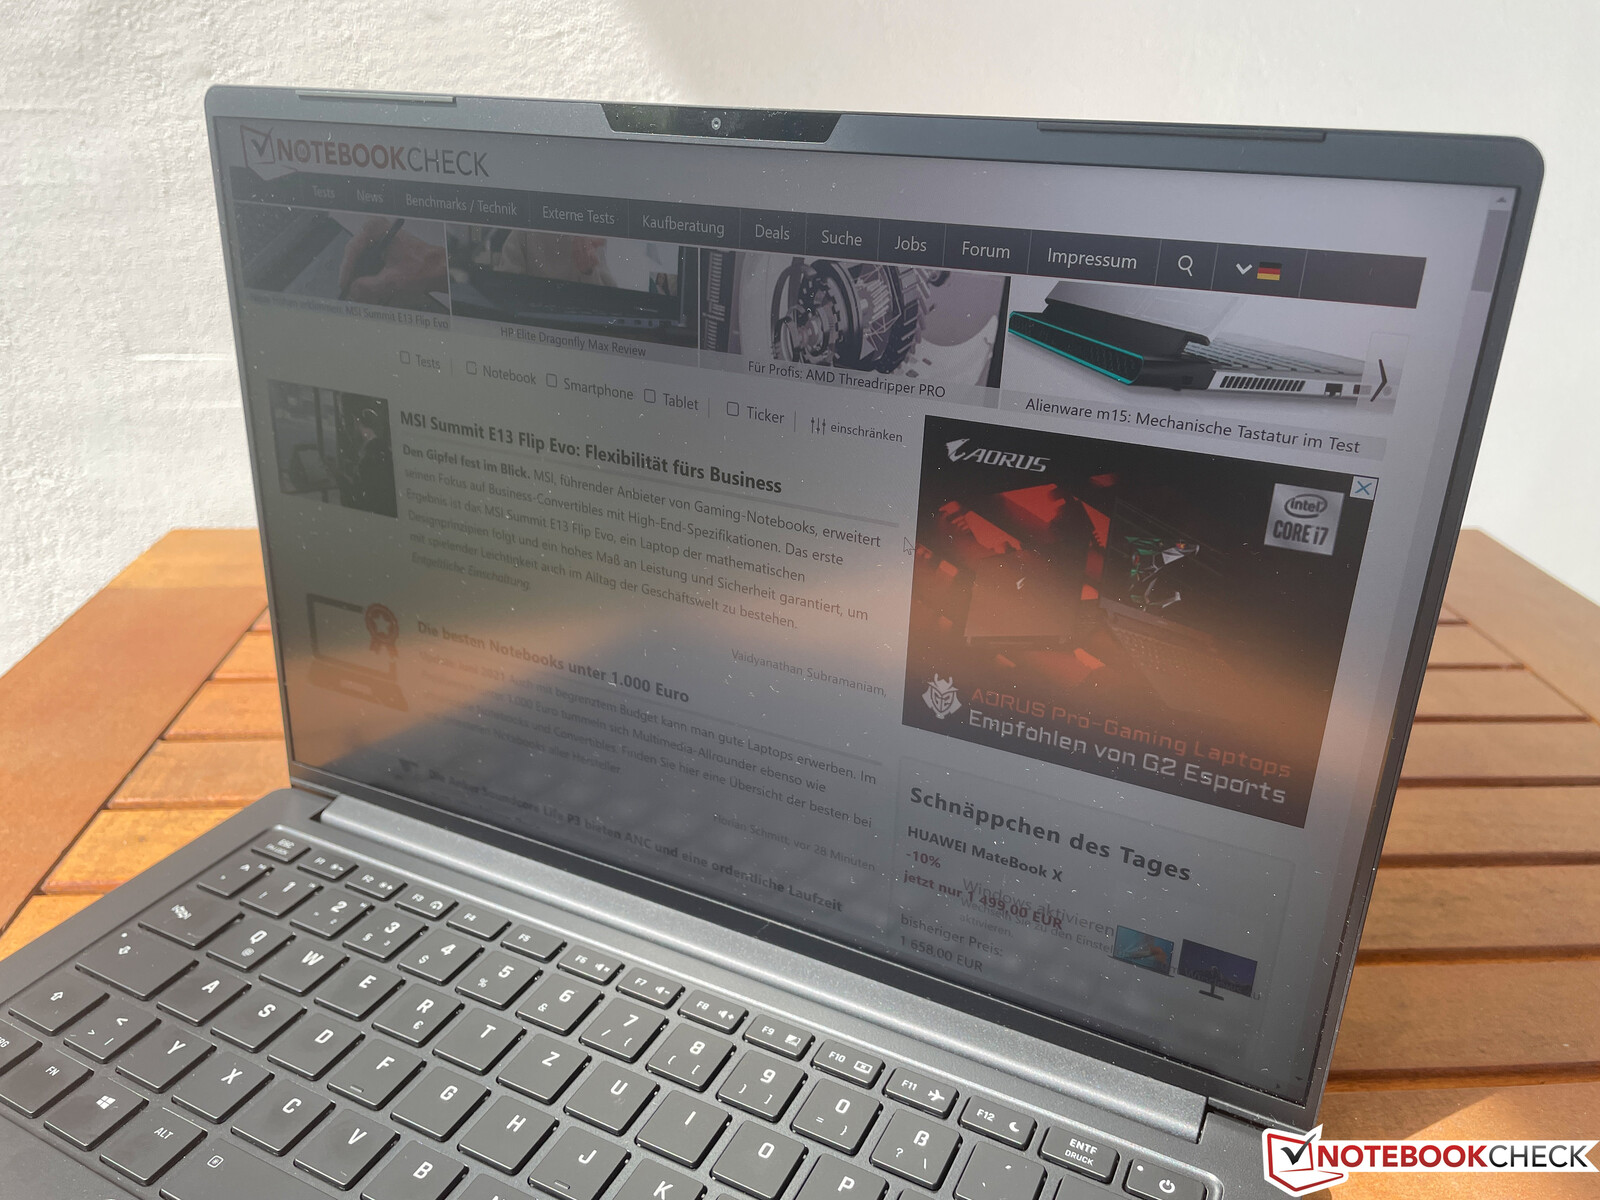
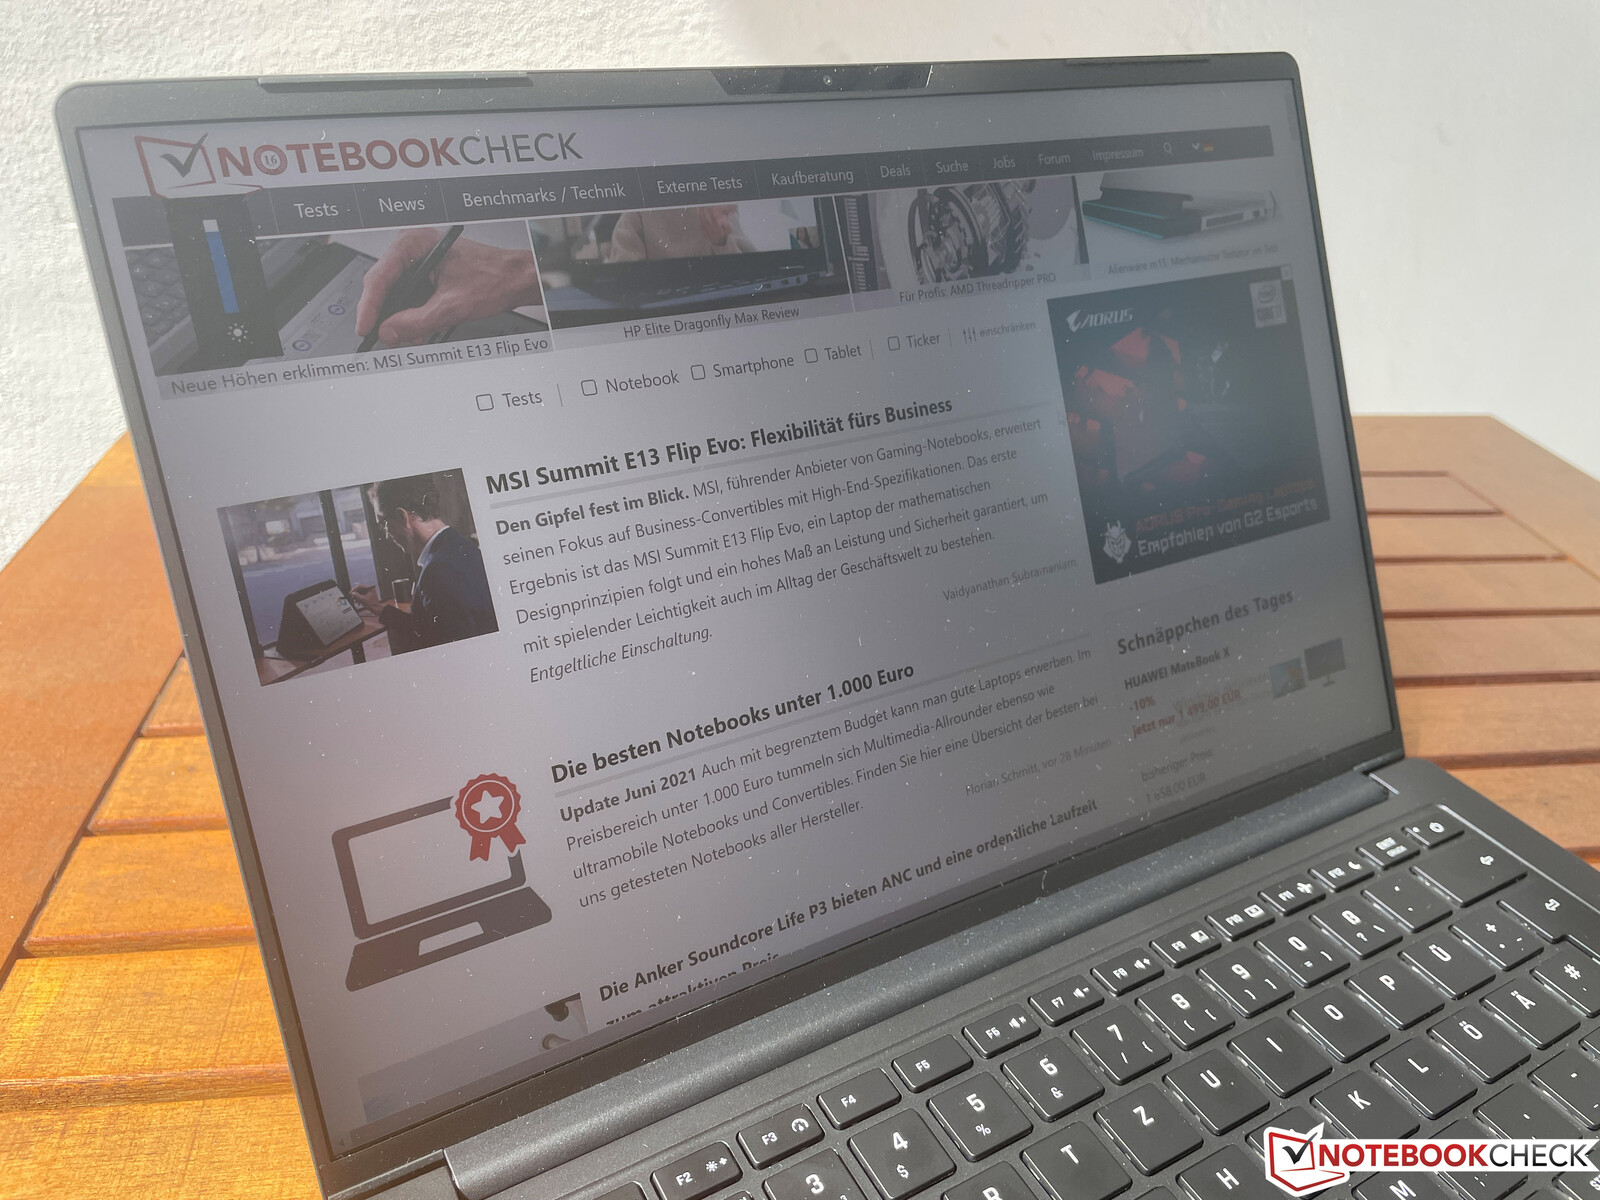
Display - Vision 14 wit 3K, 16:10 and 90 Hz
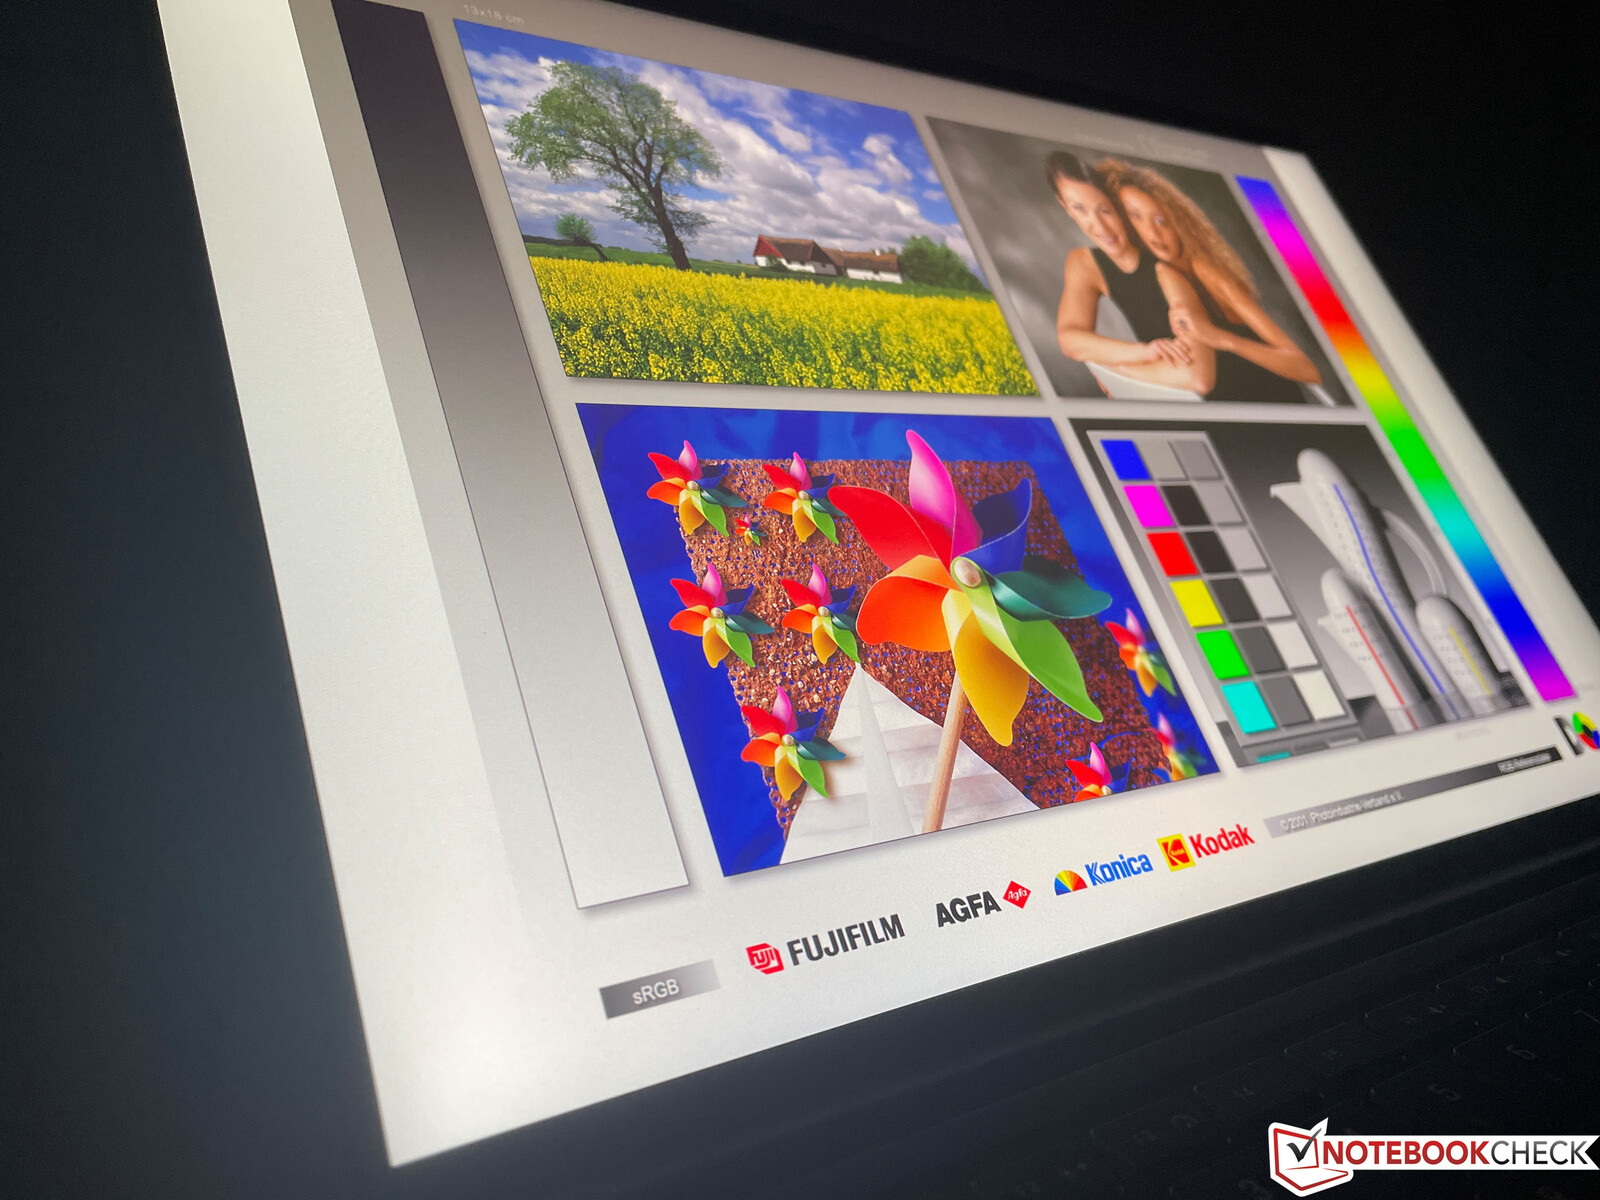
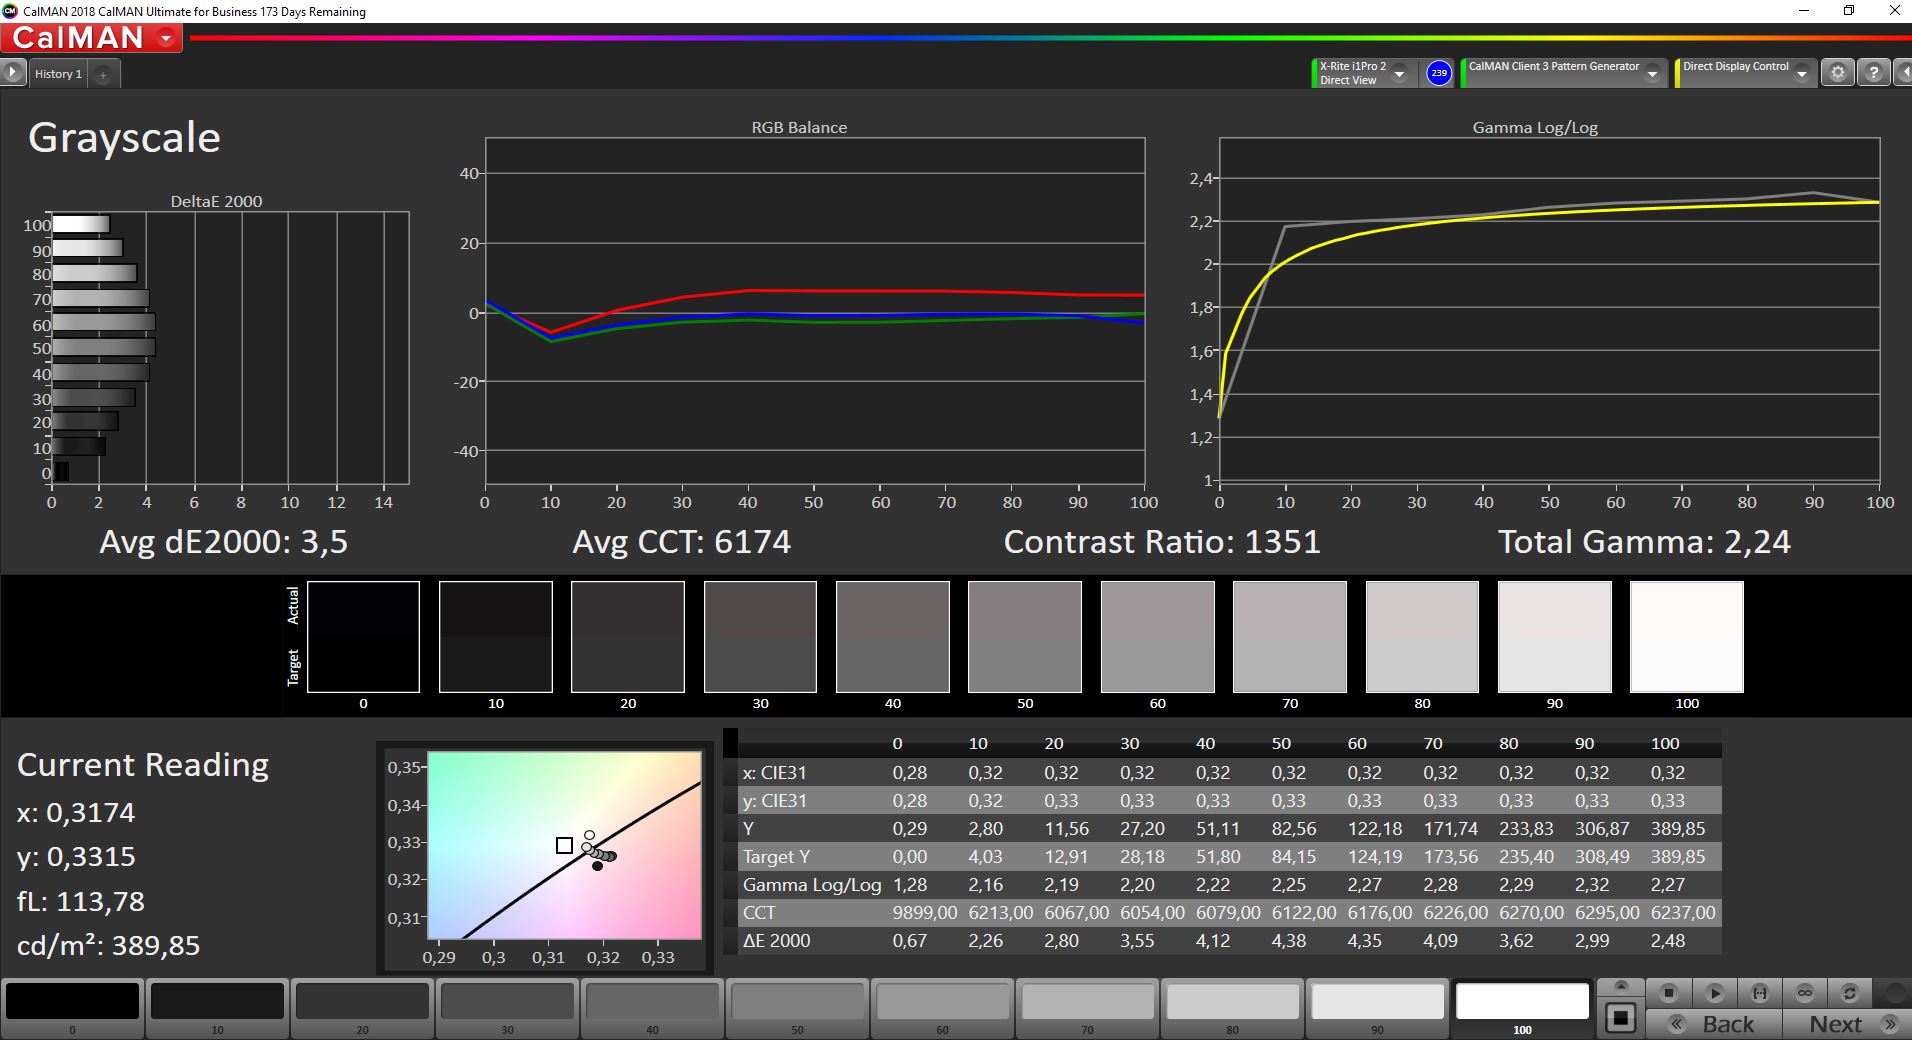
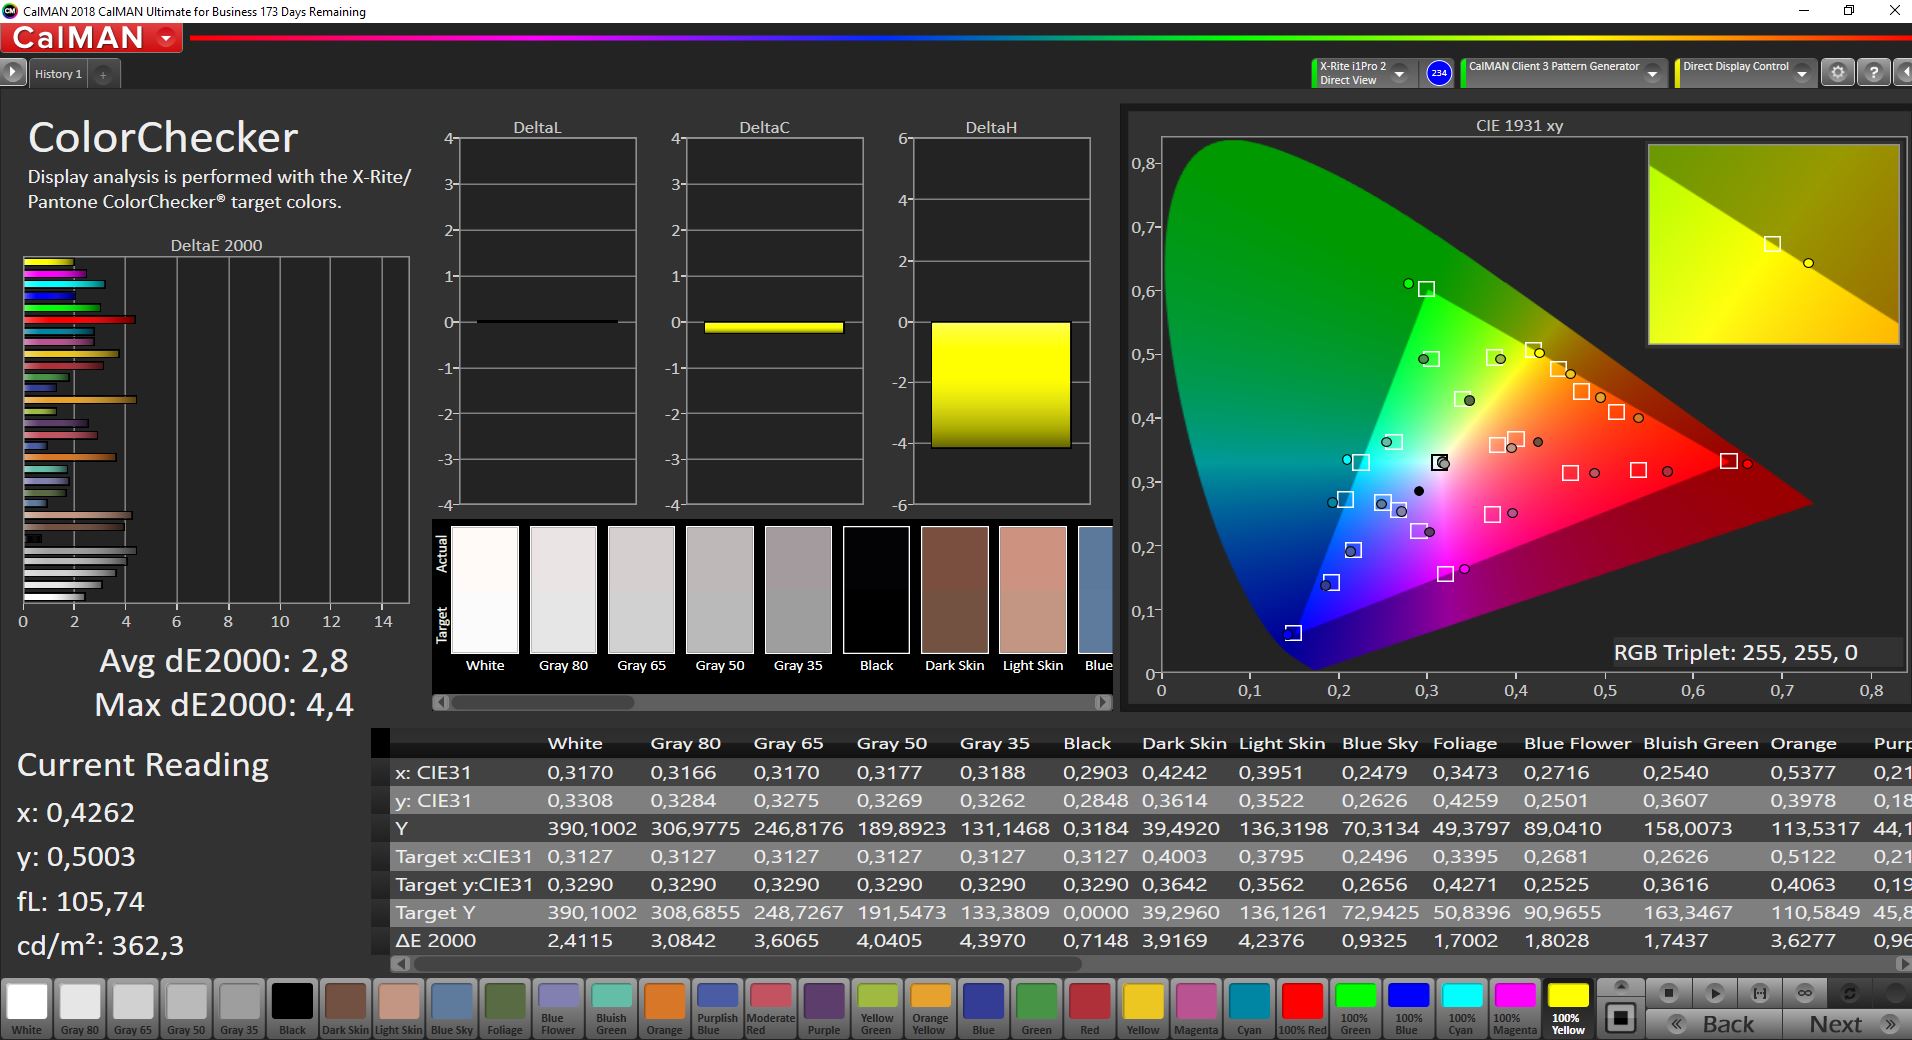
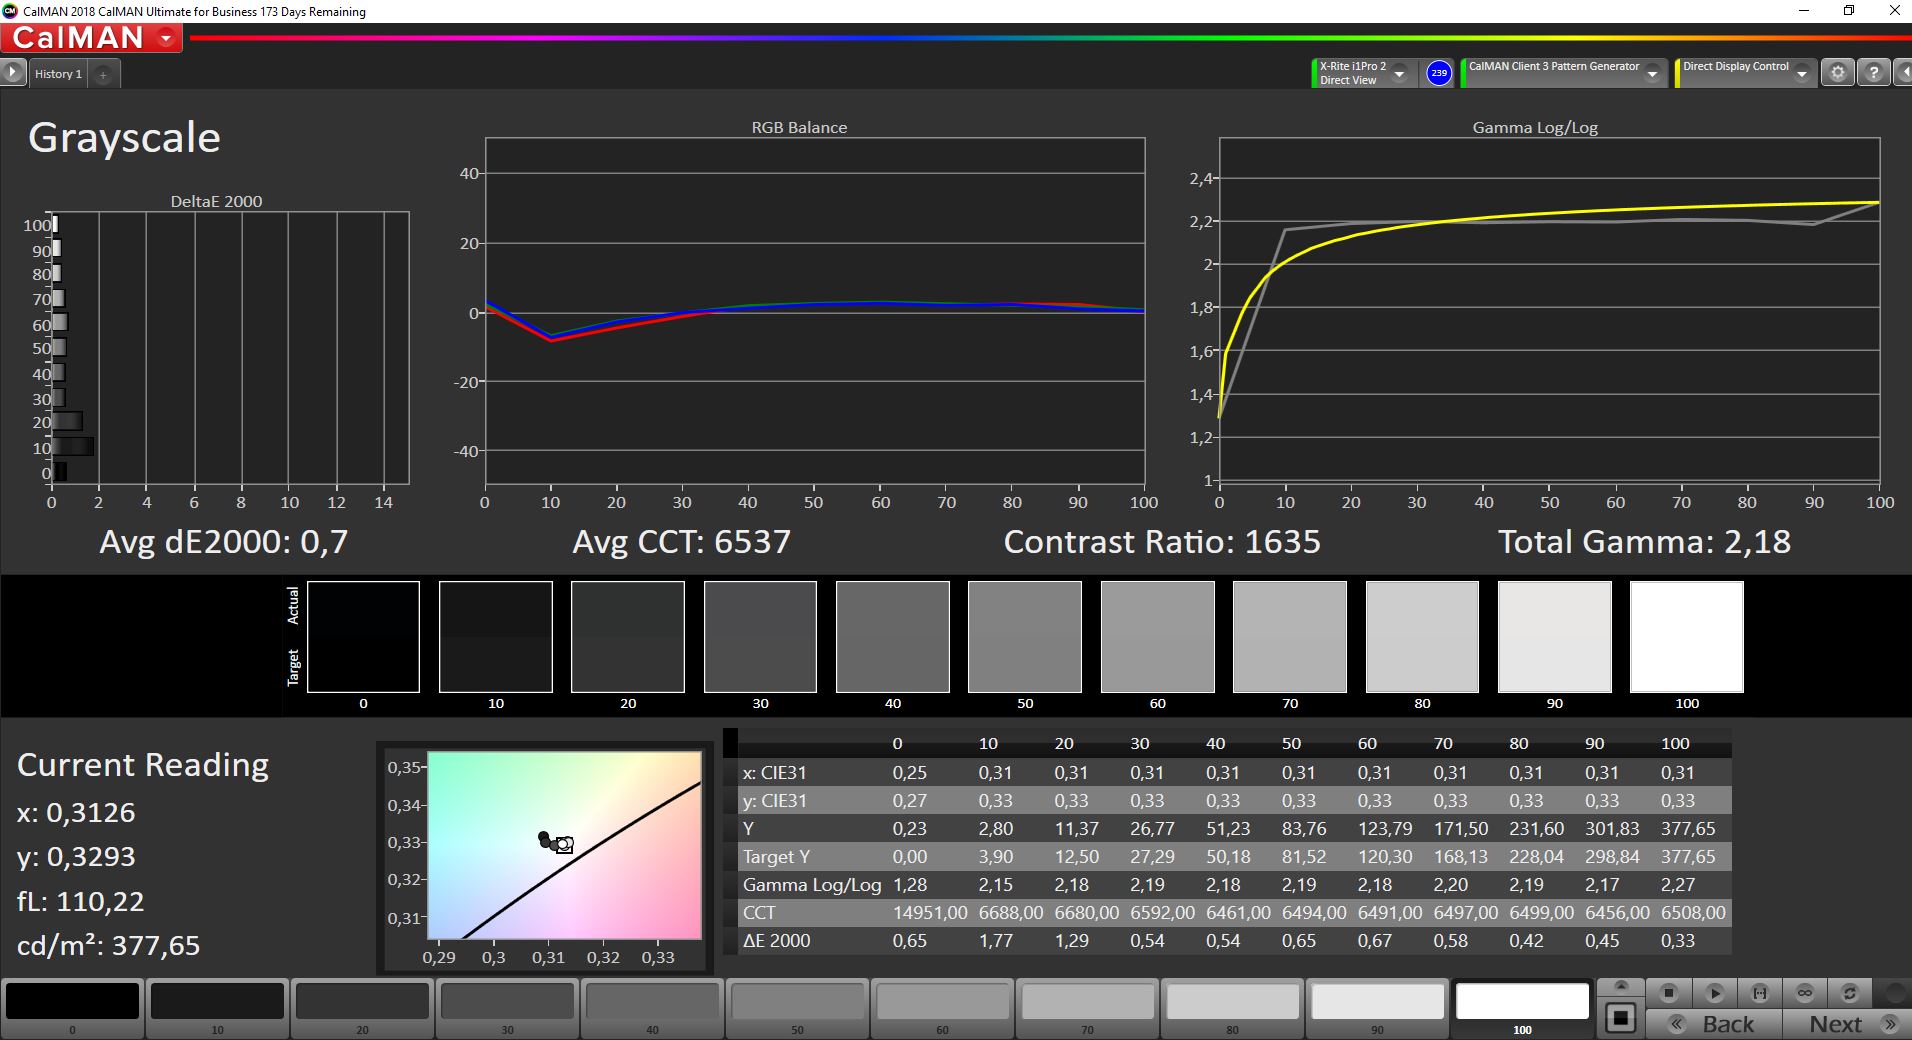
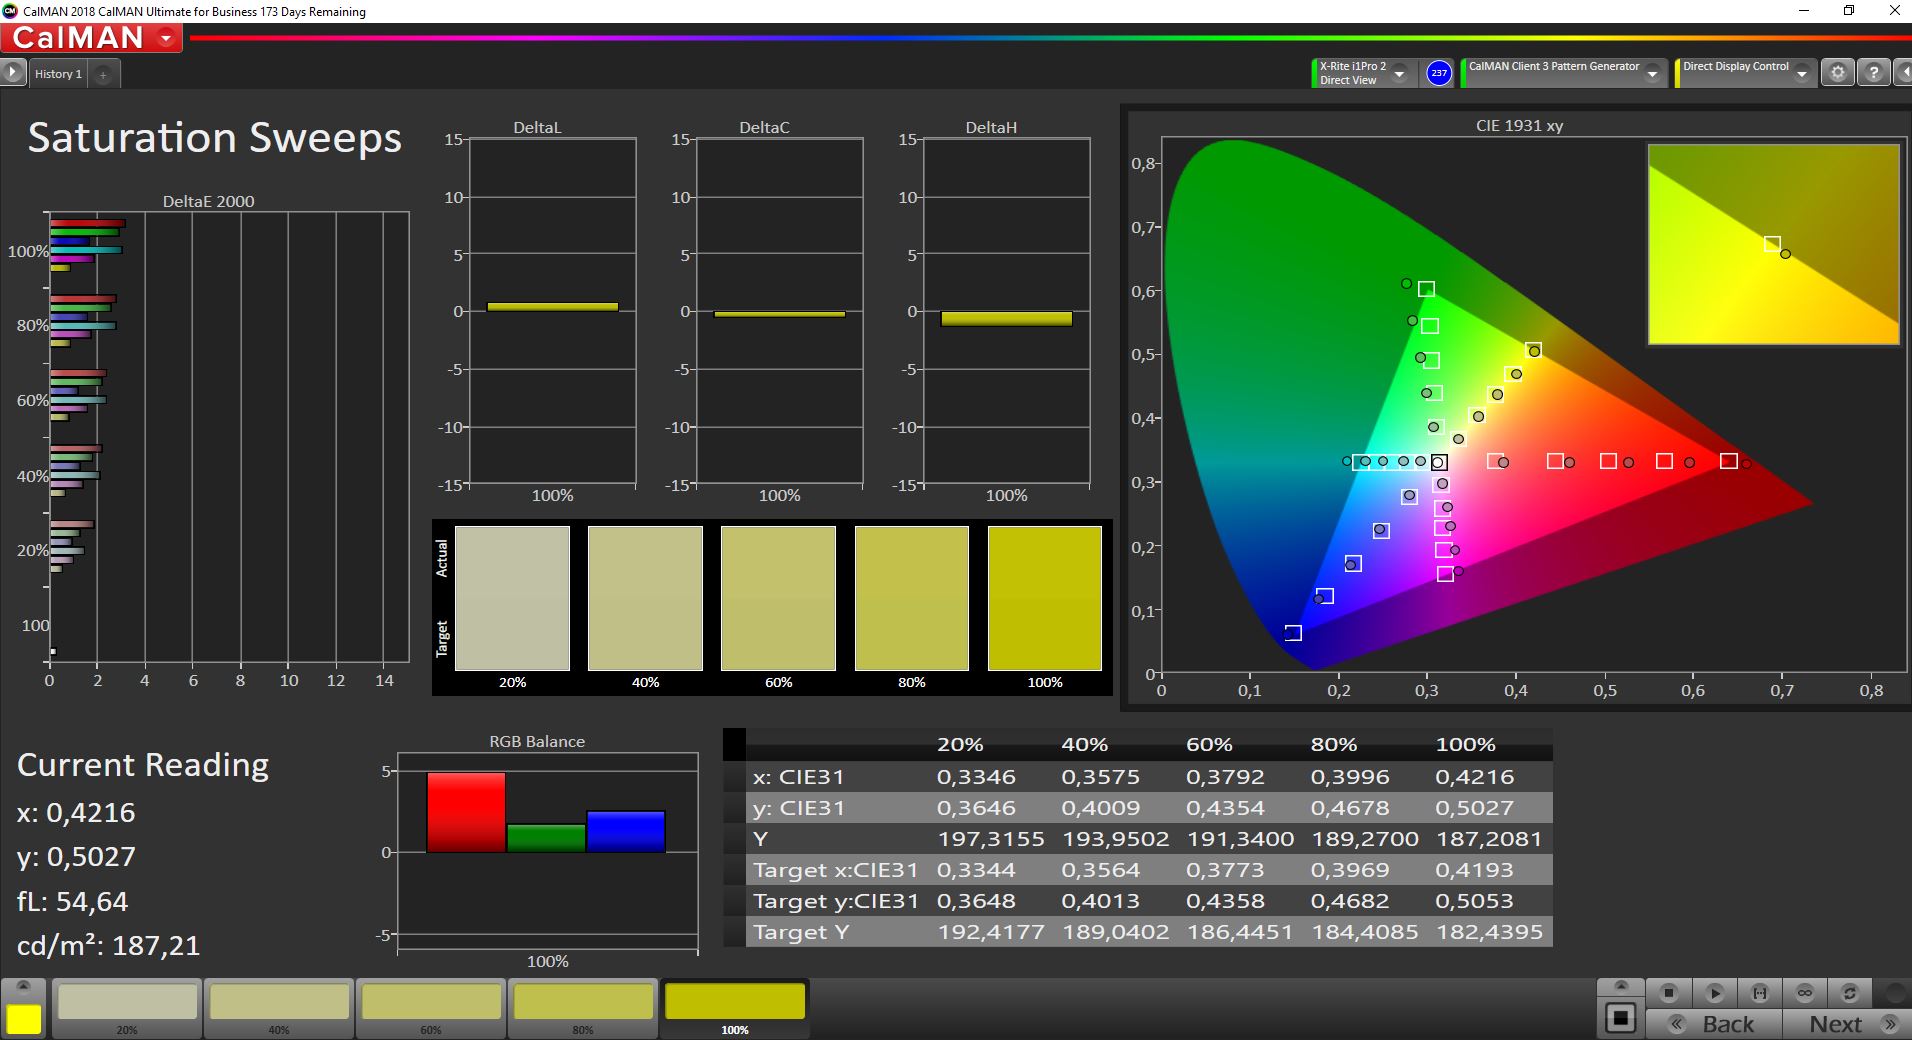
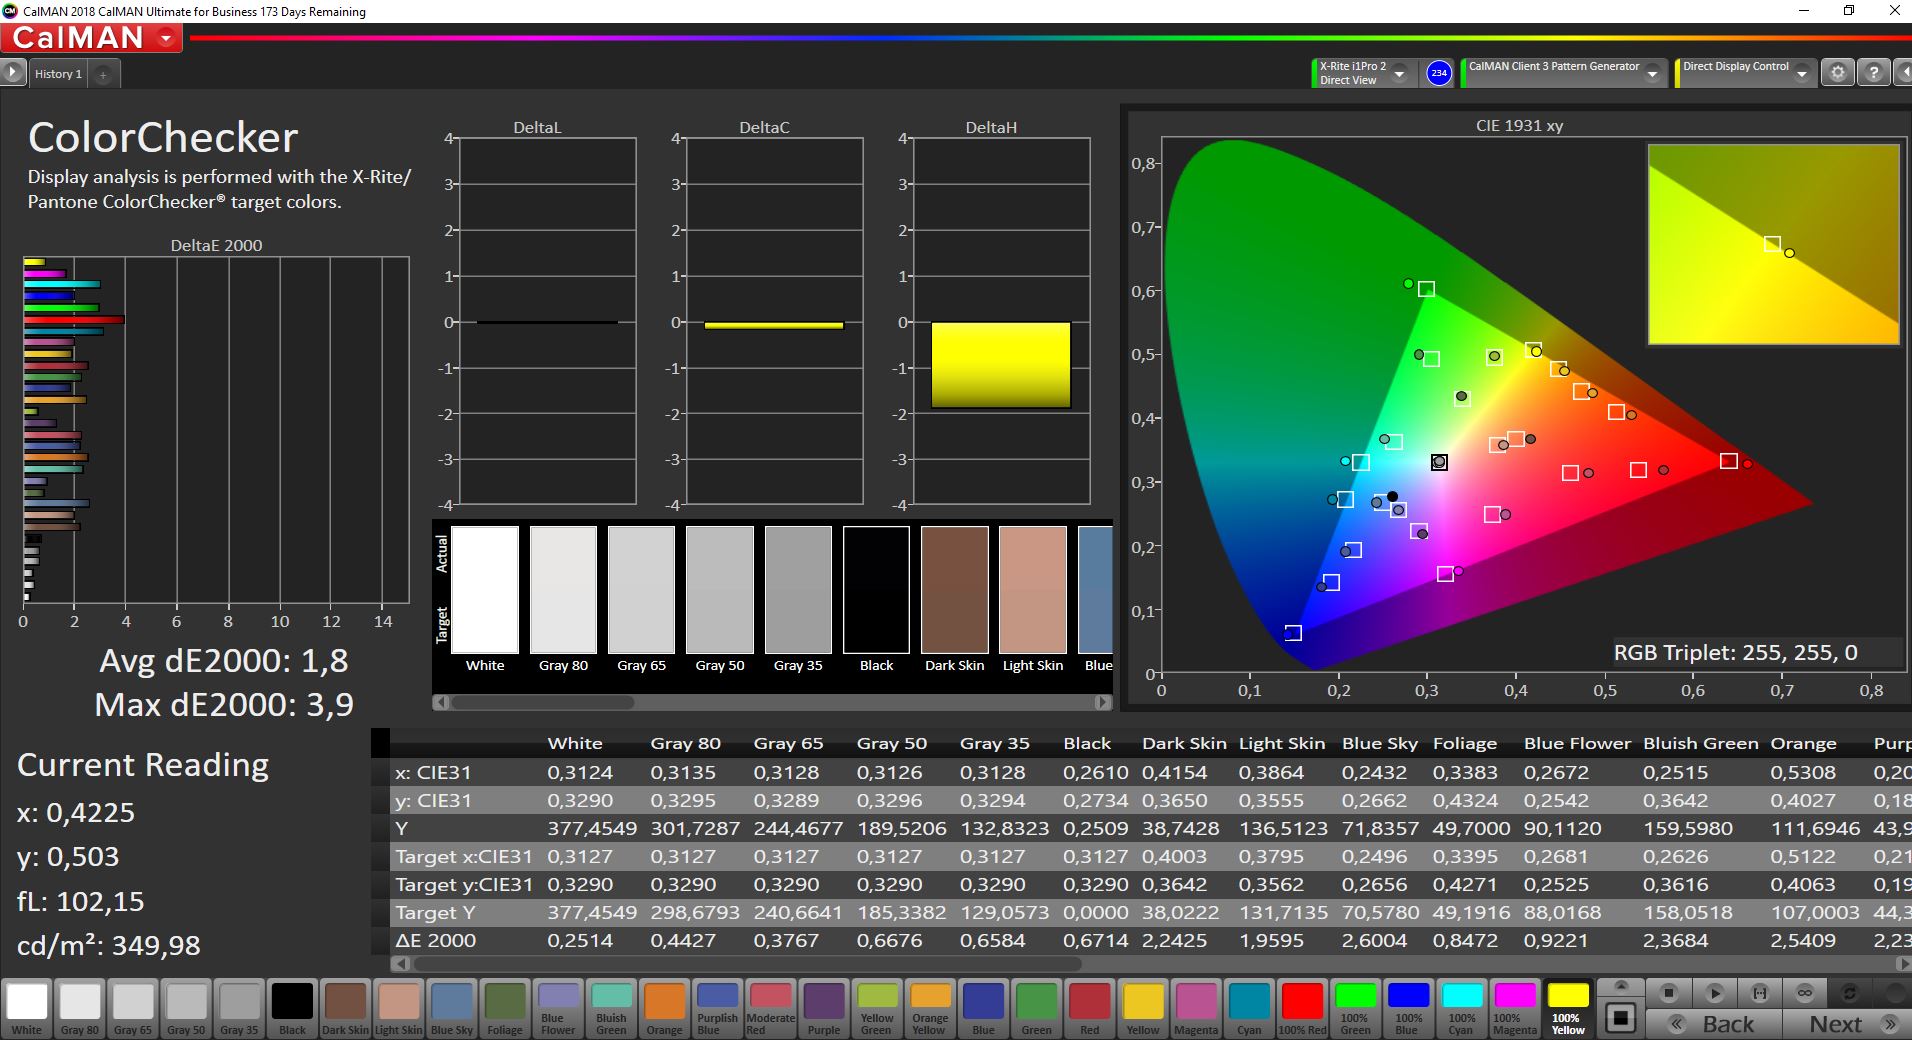
Schenker advertises the default 1080p screen with 330 cd/m² and 95% sRGB gamut, but our test unit is equipped with the optional 3K panel (2880 x 1800 pixels) and a refresh rate of 90 Hz. We determine an average brightness of 387 cd/m² with a good contrast ratio of more than 1300:1. Matte surfaces are not too grainy, despite the matte surface, and the overall subjective picture impression is excellent.
Contrary to many other modern laptops with slim bezels, the Vision 14 does not suffer from slow response times and we cannot detect PWM flickering, either. There is only minor backlight bleeding at the lower edge, but you will not notice it in practice.
| |||||||||||||||||||||||||
Brightness Distribution: 94 %
Center on Battery: 387 cd/m²
Contrast: 1345:1 (Black: 0.29 cd/m²)
ΔE ColorChecker Calman: 2.8 | ∀{0.5-29.43 Ø4.73}
calibrated: 1.8
ΔE Greyscale Calman: 3.5 | ∀{0.09-98 Ø4.97}
99% sRGB (Argyll 1.6.3 3D)
76.4% AdobeRGB 1998 (Argyll 1.6.3 3D)
76.4% AdobeRGB 1998 (Argyll 3D)
99% sRGB (Argyll 3D)
75.4% Display P3 (Argyll 3D)
Gamma: 2.24
CCT: 6174 K
| Schenker Vision 14 CSOT T3_MNE007ZA1_1, IPS, 2880x1800, 14" | LG Gram 14Z90P-G.AA79G LG Display LP140WU1-SPA1, IPS, 1920x1200, 14" | Asus ExpertBook B9 B9400CE-KC0166R B140HAN06.B, IPS, 1920x1080, 14" | Lenovo Yoga Slim 7i Carbon 13 ITL N133GCA-GQ1, a-SI IPS LED, 2560x1600, 13.3" | Huawei MateBook X Pro 2021 TIANMA XM, IPS, 3000x2000, 13.9" | |
|---|---|---|---|---|---|
| Display | 14% | -5% | -10% | -11% | |
| Display P3 Coverage (%) | 75.4 | 97.6 29% | 69.8 -7% | 65.1 -14% | 64.9 -14% |
| sRGB Coverage (%) | 99 | 99.9 1% | 98.8 0% | 97.1 -2% | 94.4 -5% |
| AdobeRGB 1998 Coverage (%) | 76.4 | 85.3 12% | 71.3 -7% | 66.6 -13% | 66.3 -13% |
| Response Times | -25% | -64% | -10% | -22% | |
| Response Time Grey 50% / Grey 80% * (ms) | 32.8 ? | 45 ? -37% | 60 ? -83% | 38.4 ? -17% | 37.6 ? -15% |
| Response Time Black / White * (ms) | 20.4 ? | 23 ? -13% | 29.6 ? -45% | 20.8 ? -2% | 26.4 ? -29% |
| PWM Frequency (Hz) | |||||
| Screen | -13% | 11% | 5% | 16% | |
| Brightness middle (cd/m²) | 390 | 352 -10% | 437 12% | 325 -17% | 502 29% |
| Brightness (cd/m²) | 387 | 332 -14% | 421 9% | 297 -23% | 474 22% |
| Brightness Distribution (%) | 94 | 91 -3% | 87 -7% | 83 -12% | 89 -5% |
| Black Level * (cd/m²) | 0.29 | 0.22 24% | 0.29 -0% | 0.26 10% | 0.33 -14% |
| Contrast (:1) | 1345 | 1600 19% | 1507 12% | 1250 -7% | 1521 13% |
| Colorchecker dE 2000 * | 2.8 | 2.89 -3% | 1.8 36% | 2.2 21% | 1.35 52% |
| Colorchecker dE 2000 max. * | 4.4 | 4.66 -6% | 3.5 20% | 3.5 20% | 3.67 17% |
| Colorchecker dE 2000 calibrated * | 1.8 | 2.7 -50% | 1.4 22% | 0.6 67% | 1.2 33% |
| Greyscale dE 2000 * | 3.5 | 6.9 -97% | 2.3 34% | 2.8 20% | 1.7 51% |
| Gamma | 2.24 98% | 2.34 94% | 2.18 101% | 2.05 107% | 2.24 98% |
| CCT | 6174 105% | 7904 82% | 6782 96% | 6452 101% | 6440 101% |
| Color Space (Percent of AdobeRGB 1998) (%) | 76.4 | 76 -1% | 65.4 -14% | 61.3 -20% | 61.1 -20% |
| Color Space (Percent of sRGB) (%) | 99 | 100 1% | 98.7 0% | 97 -2% | 94.3 -5% |
| Total Average (Program / Settings) | -8% /
-9% | -19% /
-1% | -5% /
1% | -6% /
6% |
* ... smaller is better
Display Response Times
| ↔ Response Time Black to White | ||
|---|---|---|
| 20.4 ms ... rise ↗ and fall ↘ combined | ↗ 10 ms rise | 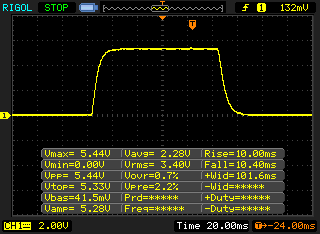 |
| ↘ 10.4 ms fall | ||
| The screen shows good response rates in our tests, but may be too slow for competitive gamers. In comparison, all tested devices range from 0.1 (minimum) to 240 (maximum) ms. » 46 % of all devices are better. This means that the measured response time is similar to the average of all tested devices (19.9 ms). | ||
| ↔ Response Time 50% Grey to 80% Grey | ||
| 32.8 ms ... rise ↗ and fall ↘ combined | ↗ 15.6 ms rise | 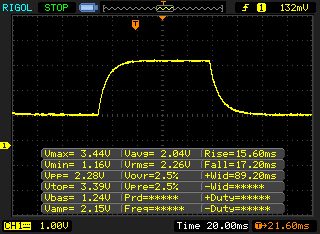 |
| ↘ 17.2 ms fall | ||
| The screen shows slow response rates in our tests and will be unsatisfactory for gamers. In comparison, all tested devices range from 0.165 (minimum) to 636 (maximum) ms. » 44 % of all devices are better. This means that the measured response time is similar to the average of all tested devices (31.1 ms). | ||
Screen Flickering / PWM (Pulse-Width Modulation)
| Screen flickering / PWM not detected | 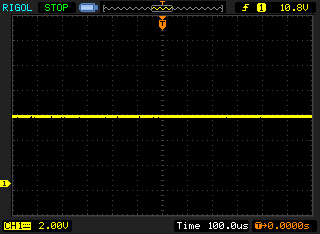 | ||
In comparison: 52 % of all tested devices do not use PWM to dim the display. If PWM was detected, an average of 7798 (minimum: 5 - maximum: 343500) Hz was measured. | |||
Schenker offers a pre-calibrated color profile you can download in the Control Center, but the picture quality was actually worse on our unit (darker, slight red hue) and the default profile result in better values. You will have to calibrate the panel (or use our profile, which is linked above) to get the best performance. Thanks to the full sRGB coverage, you can also edit pictures and videos.
You obviously benefit from the matte surface outdoors and as long as you avoid direct sunlight, you can even use it comfortable in bright environments.

Performance - Tiger Lake and PCIe 4.0
The Vision 14 is currently equipped with Tiger Lake U processors and iGPUs, but there are plans for Tiger Lake Refresh CPUs and the GeForce RTX 3050 (Ti). You can already see the designated position on the mainboard (then with a second fan). AMD processor are not offered due to supply problems.
Schenker offers two different performance profiles in the Control Center (Quiet & Performance), which can also be toggled via button. Every profile has three sub profiles, but they can only be accessed via the Control Center (default Quiet 20 dB & Performance Balanced). The default performance (balanced) profile, which we also used for our measurements and benchmarks, is a good compromise. The following table shows the different profiles including the TDP limits.
| Profile | CPU PL1 | CPU PL2 |
|---|---|---|
| Quiet 20 dB | 17 Watts | 35 Watts |
| Quiet 30 dB | 17 Watts | 35 Watts |
| Quiet 40 dB | 17 Watts | 35 Watts |
| Performance Balanced | 30 Watts | 60 Watts |
| Performance Enthusiast | 35 Watts | 60 Watts |
| Performance Overboost | 38 Watts | 60 Watts |
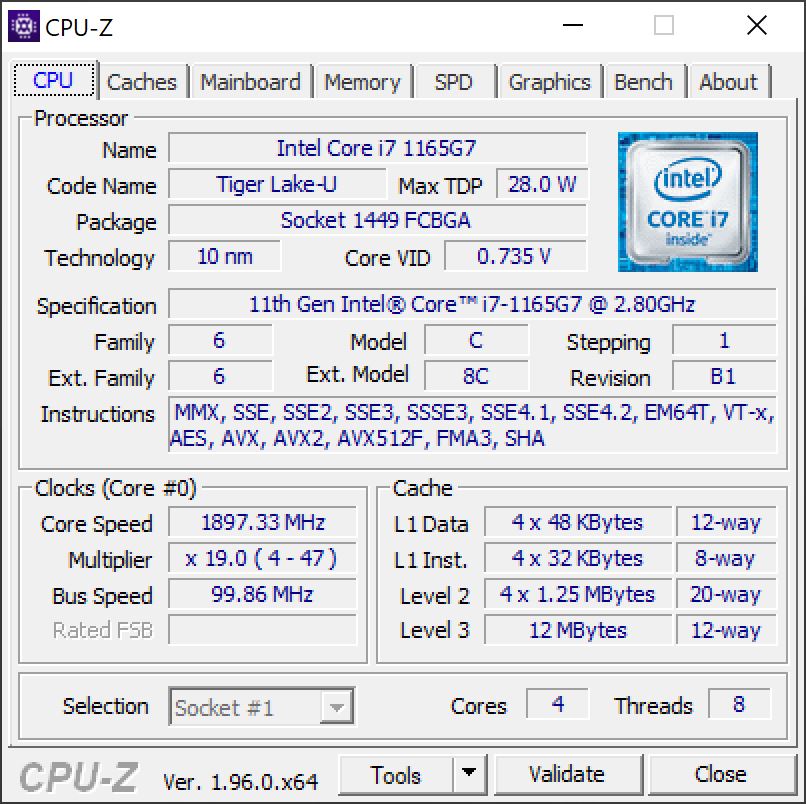
Processor - Core i7-1165G7
The performance of the Core i7-1165G7 (4 cores, up to 4.7 GHz) is very good, because the power limit of 30W can be maintained. The Vision 14 is also faster than the comparison devices, which are equipped with the i7-1165G7 as well. The advantage of the Intel processor is the high single-core performance, which is important in everyday scenarios, but modern AMD CPUs offer much more multi-core performance.
The performance of the processor is not reduced on battery power.
Cinebench R20: CPU (Single Core) | CPU (Multi Core)
Cinebench R15: CPU Single 64Bit | CPU Multi 64Bit
Blender: v2.79 BMW27 CPU
7-Zip 18.03: 7z b 4 -mmt1 | 7z b 4
Geekbench 5.5: Single-Core | Multi-Core
HWBOT x265 Benchmark v2.2: 4k Preset
LibreOffice : 20 Documents To PDF
R Benchmark 2.5: Overall mean
| Cinebench R23 / Single Core | |
| Average of class Subnotebook (358 - 2213, n=63, last 2 years) | |
| Schenker Vision 14 | |
| Average Intel Core i7-1165G7 (1110 - 1539, n=59) | |
| Asus ExpertBook B9 B9400CE-KC0166R | |
| Lenovo Yoga Slim 7i Carbon 13 ITL | |
| Huawei MateBook X Pro 2021 | |
| LG Gram 14Z90P-G.AA79G | |
| Cinebench R23 / Multi Core | |
| Average of class Subnotebook (1555 - 21812, n=62, last 2 years) | |
| Schenker Vision 14 | |
| Average Intel Core i7-1165G7 (2525 - 6862, n=64) | |
| Asus ExpertBook B9 B9400CE-KC0166R | |
| LG Gram 14Z90P-G.AA79G | |
| Huawei MateBook X Pro 2021 | |
| Lenovo Yoga Slim 7i Carbon 13 ITL | |
| Cinebench R20 / CPU (Single Core) | |
| Average of class Subnotebook (128 - 832, n=59, last 2 years) | |
| Schenker Vision 14 | |
| Asus ExpertBook B9 B9400CE-KC0166R | |
| Lenovo Yoga Slim 7i Carbon 13 ITL | |
| Average Intel Core i7-1165G7 (442 - 589, n=81) | |
| Huawei MateBook X Pro 2021 | |
| LG Gram 14Z90P-G.AA79G | |
| Cinebench R20 / CPU (Multi Core) | |
| Average of class Subnotebook (579 - 8541, n=59, last 2 years) | |
| Schenker Vision 14 | |
| Asus ExpertBook B9 B9400CE-KC0166R | |
| Average Intel Core i7-1165G7 (1060 - 2657, n=81) | |
| Lenovo Yoga Slim 7i Carbon 13 ITL | |
| LG Gram 14Z90P-G.AA79G | |
| Huawei MateBook X Pro 2021 | |
| Cinebench R15 / CPU Single 64Bit | |
| Average of class Subnotebook (72.4 - 322, n=59, last 2 years) | |
| Schenker Vision 14 | |
| Lenovo Yoga Slim 7i Carbon 13 ITL | |
| Asus ExpertBook B9 B9400CE-KC0166R | |
| Average Intel Core i7-1165G7 (115 - 230, n=78) | |
| Huawei MateBook X Pro 2021 | |
| LG Gram 14Z90P-G.AA79G | |
| Cinebench R15 / CPU Multi 64Bit | |
| Average of class Subnotebook (327 - 3345, n=59, last 2 years) | |
| Schenker Vision 14 | |
| Asus ExpertBook B9 B9400CE-KC0166R | |
| Average Intel Core i7-1165G7 (553 - 1027, n=86) | |
| Lenovo Yoga Slim 7i Carbon 13 ITL | |
| LG Gram 14Z90P-G.AA79G | |
| Huawei MateBook X Pro 2021 | |
| Blender / v2.79 BMW27 CPU | |
| Huawei MateBook X Pro 2021 | |
| Lenovo Yoga Slim 7i Carbon 13 ITL | |
| LG Gram 14Z90P-G.AA79G | |
| Average Intel Core i7-1165G7 (468 - 1138, n=80) | |
| Asus ExpertBook B9 B9400CE-KC0166R | |
| Schenker Vision 14 | |
| Average of class Subnotebook (159 - 2271, n=60, last 2 years) | |
| 7-Zip 18.03 / 7z b 4 -mmt1 | |
| Average of class Subnotebook (2643 - 6699, n=61, last 2 years) | |
| Schenker Vision 14 | |
| Lenovo Yoga Slim 7i Carbon 13 ITL | |
| Asus ExpertBook B9 B9400CE-KC0166R | |
| Average Intel Core i7-1165G7 (4478 - 5507, n=80) | |
| Huawei MateBook X Pro 2021 | |
| LG Gram 14Z90P-G.AA79G | |
| 7-Zip 18.03 / 7z b 4 | |
| Average of class Subnotebook (11668 - 77867, n=59, last 2 years) | |
| Schenker Vision 14 | |
| Asus ExpertBook B9 B9400CE-KC0166R | |
| Average Intel Core i7-1165G7 (15347 - 27405, n=80) | |
| LG Gram 14Z90P-G.AA79G | |
| Huawei MateBook X Pro 2021 | |
| Lenovo Yoga Slim 7i Carbon 13 ITL | |
| Geekbench 5.5 / Single-Core | |
| Average of class Subnotebook (726 - 2224, n=50, last 2 years) | |
| Schenker Vision 14 | |
| Lenovo Yoga Slim 7i Carbon 13 ITL | |
| Average Intel Core i7-1165G7 (1302 - 1595, n=77) | |
| LG Gram 14Z90P-G.AA79G | |
| Huawei MateBook X Pro 2021 | |
| Asus ExpertBook B9 B9400CE-KC0166R | |
| Geekbench 5.5 / Multi-Core | |
| Average of class Subnotebook (2557 - 17218, n=50, last 2 years) | |
| Lenovo Yoga Slim 7i Carbon 13 ITL | |
| Schenker Vision 14 | |
| Huawei MateBook X Pro 2021 | |
| Average Intel Core i7-1165G7 (3078 - 5926, n=77) | |
| Asus ExpertBook B9 B9400CE-KC0166R | |
| LG Gram 14Z90P-G.AA79G | |
| HWBOT x265 Benchmark v2.2 / 4k Preset | |
| Average of class Subnotebook (0.97 - 25.1, n=59, last 2 years) | |
| Schenker Vision 14 | |
| Asus ExpertBook B9 B9400CE-KC0166R | |
| Average Intel Core i7-1165G7 (1.39 - 8.47, n=80) | |
| LG Gram 14Z90P-G.AA79G | |
| Lenovo Yoga Slim 7i Carbon 13 ITL | |
| Huawei MateBook X Pro 2021 | |
| LibreOffice / 20 Documents To PDF | |
| Average of class Subnotebook (39.9 - 220, n=58, last 2 years) | |
| Lenovo Yoga Slim 7i Carbon 13 ITL | |
| Asus ExpertBook B9 B9400CE-KC0166R | |
| Average Intel Core i7-1165G7 (21.5 - 88.1, n=78) | |
| Schenker Vision 14 | |
| LG Gram 14Z90P-G.AA79G | |
| Huawei MateBook X Pro 2021 | |
| R Benchmark 2.5 / Overall mean | |
| LG Gram 14Z90P-G.AA79G | |
| Huawei MateBook X Pro 2021 | |
| Average Intel Core i7-1165G7 (0.552 - 1.002, n=80) | |
| Asus ExpertBook B9 B9400CE-KC0166R | |
| Lenovo Yoga Slim 7i Carbon 13 ITL | |
| Schenker Vision 14 | |
| Average of class Subnotebook (0.4024 - 1.456, n=60, last 2 years) | |
* ... smaller is better
System Performance
The Vision 14 also manages excellent results in the synthetic PCMark benchmarks and is at the top of the comparison group in most test. Our subjective impression confirms this; the laptop is always responsive and inputs are executed very quickly, which can be expected from a modern laptop.
| PCMark 10 Score | 5104 points | |
Help | ||
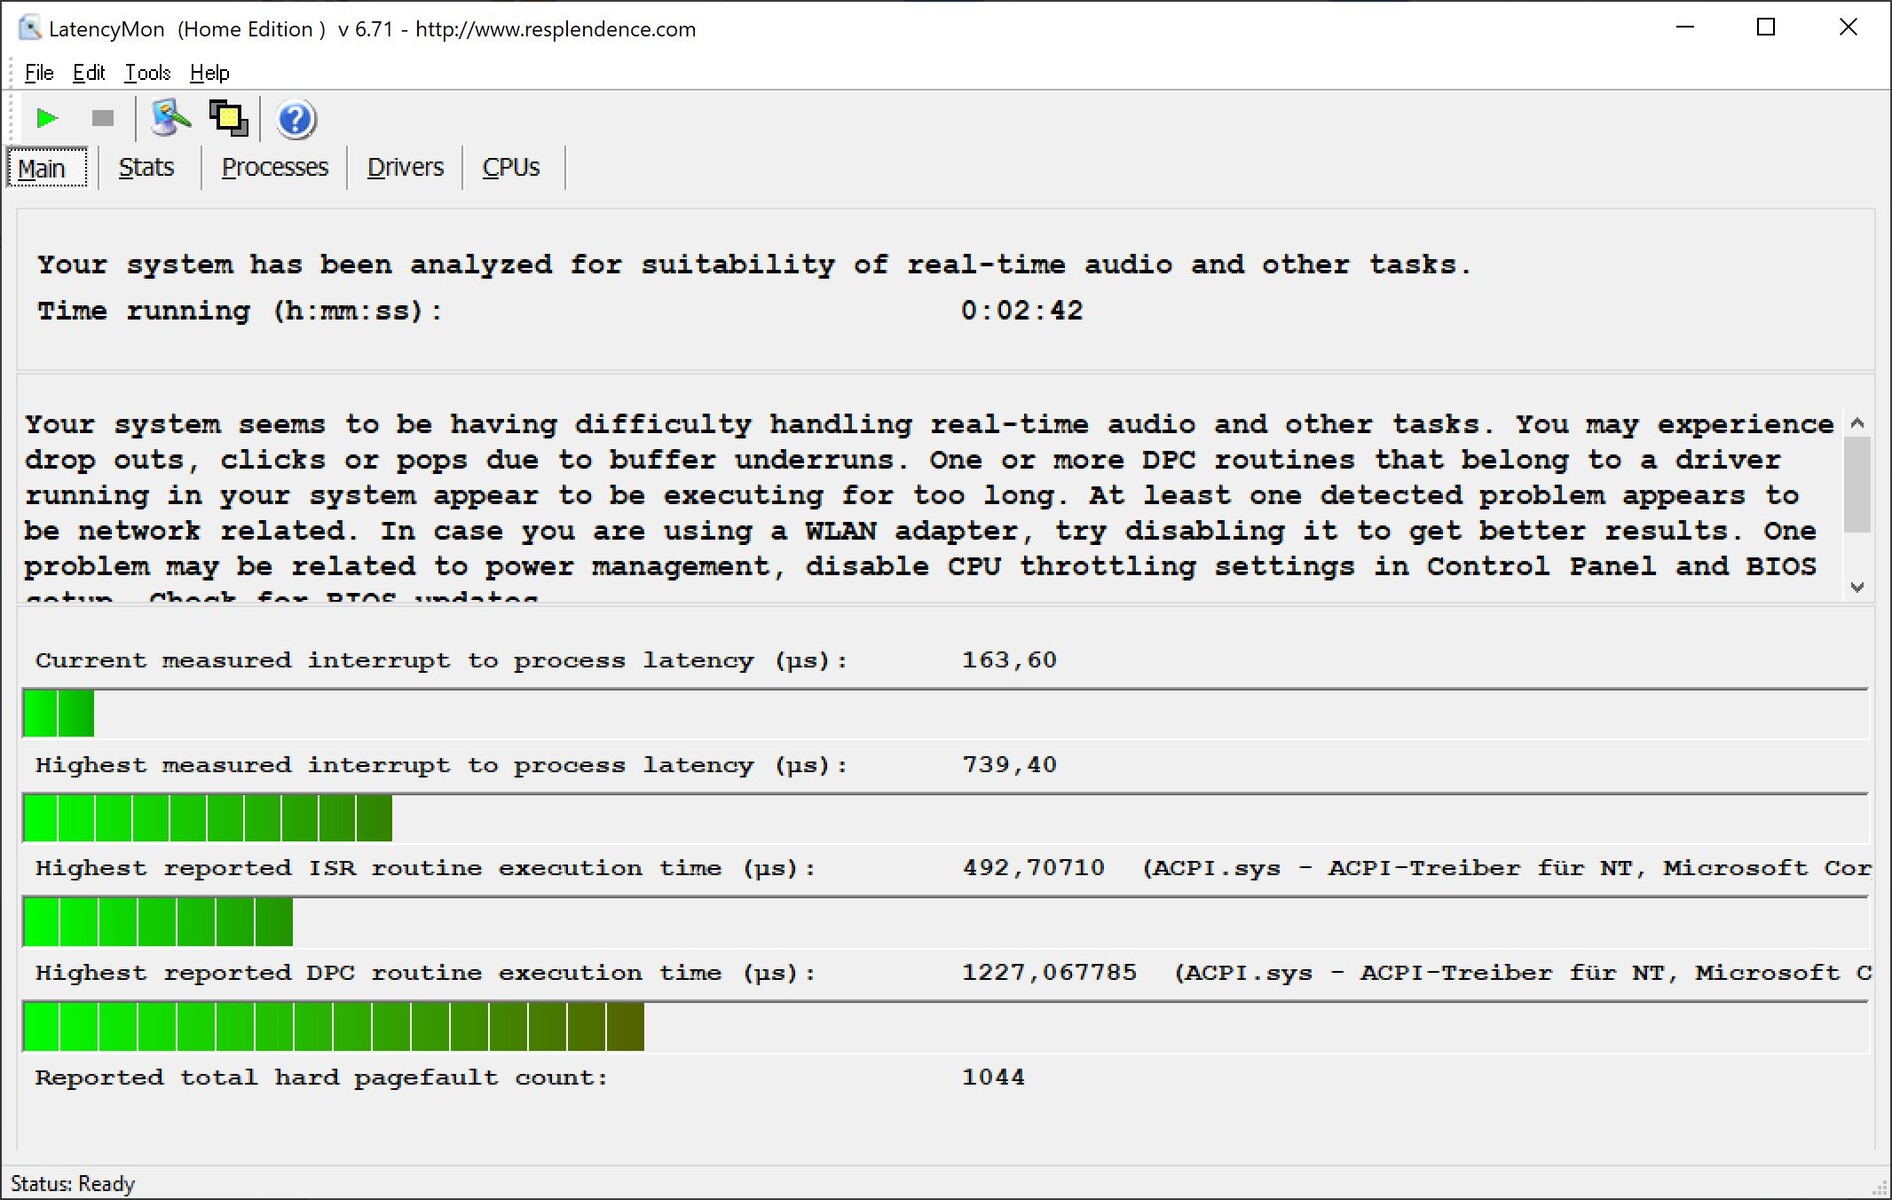
DPC Latency
| DPC Latencies / LatencyMon - interrupt to process latency (max), Web, Youtube, Prime95 | |
| Huawei MateBook X Pro 2021 | |
| LG Gram 14Z90P-G.AA79G | |
| Lenovo Yoga Slim 7i Carbon 13 ITL | |
| Schenker Vision 14 | |
| Asus ExpertBook B9 B9400CE-KC0166R | |
* ... smaller is better
Massenspeicher - Vision 14 mit PCIe 4.0
You get two M.2-2280 slots. One of them supports the fast PCIe-4.0-x4 interface and the second one PCIe-3.0-x2. The second slot is therefore primarily suited for additional storage, because you cannot use the full performance of fast PCIe-3.0 drives (up to ~1750 MB/s).
Our test unit is equipped with a fast Samsung SSD 980 Pro, which is attached via PCIe 4.0 and it manages very high transfer rates. More SSD benchmarks are available in our tech section.
| Schenker Vision 14 Samsung SSD 980 Pro 1TB MZ-V8P1T0BW | LG Gram 14Z90P-G.AA79G SK Hynix PC601 1TB HFS001TD9TNG | Asus ExpertBook B9 B9400CE-KC0166R Samsung PM981a MZVLB1T0HBLR | Lenovo Yoga Slim 7i Carbon 13 ITL Samsung SSD PM981a MZVLB512HBJQ | Huawei MateBook X Pro 2021 Samsung PM981a MZVLB1T0HBLR | Average Samsung SSD 980 Pro 1TB MZ-V8P1T0BW | Average of class Subnotebook | |
|---|---|---|---|---|---|---|---|
| CrystalDiskMark 5.2 / 6 | -33% | -43% | -45% | -32% | -2% | -27% | |
| Write 4K (MB/s) | 240 | 198.9 -17% | 153.5 -36% | 139.5 -42% | 197.5 -18% | 220 ? -8% | 153.3 ? -36% |
| Read 4K (MB/s) | 90.9 | 55.9 -39% | 47.69 -48% | 36.38 -60% | 52.9 -42% | 85.1 ? -6% | 64 ? -30% |
| Write Seq (MB/s) | 4236 | 2441 -42% | 2037 -52% | 1977 -53% | 2174 -49% | 3911 ? -8% | 2860 ? -32% |
| Read Seq (MB/s) | 4101 | 1939 -53% | 2208 -46% | 2207 -46% | 2156 -47% | 3999 ? -2% | 3311 ? -19% |
| Write 4K Q32T1 (MB/s) | 662 | 631 -5% | 516 -22% | 510 -23% | 632 -5% | 551 ? -17% | 429 ? -35% |
| Read 4K Q32T1 (MB/s) | 720 | 704 -2% | 366.8 -49% | 387.8 -46% | 694 -4% | 977 ? 36% | 493 ? -32% |
| Write Seq Q32T1 (MB/s) | 5222 | 2566 -51% | 3021 -42% | 2986 -43% | 3017 -42% | 4932 ? -6% | 4606 ? -12% |
| Read Seq Q32T1 (MB/s) | 7102 | 3451 -51% | 3532 -50% | 3540 -50% | 3561 -50% | 6842 ? -4% | 5795 ? -18% |
| AS SSD | -35% | -37% | -45% | -44% | -16% | -45% | |
| Seq Read (MB/s) | 4899 | 2975 -39% | 2784 -43% | 2861 -42% | 2794 -43% | 4838 ? -1% | 4466 ? -9% |
| Seq Write (MB/s) | 3952 | 1261 -68% | 1362 -66% | 1321 -67% | 2385 -40% | 3490 ? -12% | 2929 ? -26% |
| 4K Read (MB/s) | 83.8 | 49.97 -40% | 52.5 -37% | 52.5 -37% | 60.7 -28% | 72 ? -14% | 59.2 ? -29% |
| 4K Write (MB/s) | 205 | 168.4 -18% | 202.3 -1% | 196.7 -4% | 180.8 -12% | 188.8 ? -8% | 169.4 ? -17% |
| 4K-64 Read (MB/s) | 2938 | 1539 -48% | 1136 -61% | 1153 -61% | 1768 -40% | 2234 ? -24% | 844 ? -71% |
| 4K-64 Write (MB/s) | 2077 | 1517 -27% | 1642 -21% | 1807 -13% | 1800 -13% | 2622 ? 26% | 1697 ? -18% |
| Access Time Read * (ms) | 0.025 | 0.036 -44% | 0.038 -52% | 0.064 -156% | 0.037 -48% | 0.04075 ? -63% | 0.06516 ? -161% |
| Access Time Write * (ms) | 0.02 | 0.026 -30% | 0.017 15% | 0.018 10% | 0.073 -265% | 0.03363 ? -68% | 0.05493 ? -175% |
| Score Read (Points) | 3512 | 1886 -46% | 1467 -58% | 1491 -58% | 2108 -40% | 2811 ? -20% | 1348 ? -62% |
| Score Write (Points) | 2677 | 1811 -32% | 1980 -26% | 2136 -20% | 2219 -17% | 3159 ? 18% | 2159 ? -19% |
| Score Total (Points) | 7939 | 4579 -42% | 4135 -48% | 4322 -46% | 5392 -32% | 7334 ? -8% | 4135 ? -48% |
| Copy ISO MB/s (MB/s) | 2100 | 1510 -28% | 1737 -17% | 2065 -2% | 2688 ? 28% | 2574 ? 23% | |
| Copy Program MB/s (MB/s) | 994 | 950 -4% | 479.1 -52% | 734 -26% | 568 ? -43% | 827 ? -17% | |
| Copy Game MB/s (MB/s) | 1859 | 1470 -21% | 935 -50% | 1629 -12% | 1346 ? -28% | 1744 ? -6% | |
| Total Average (Program / Settings) | -34% /
-34% | -40% /
-39% | -45% /
-45% | -38% /
-40% | -9% /
-11% | -36% /
-39% |
* ... smaller is better

Disk Throttling: DiskSpd Read Loop, Queue Depth 8
GPU Performance
All the graphics calculations are handled by the integrated Iris Xe Graphics G7 with 96 shader units. The iGPU benefits from the dual-channel memory configuration, but some models with faster LPDDR4x memory are a little bit faster. The iGPU is a very good solution for many everyday scenarios including high-resolution video playback. If you get the Vision 14 with the Core i5, you will also get the Xe Graphics G7 with 80 shader units, which is about 15-20% slower.
The graphics performance is not reduced on battery power.
| 3DMark 11 Performance | 6965 points | |
| 3DMark Cloud Gate Standard Score | 17983 points | |
| 3DMark Fire Strike Score | 4365 points | |
| 3DMark Time Spy Score | 1613 points | |
Help | ||
Gaming Performance
Modern iGPUs are much faster compared to a couple of years ago, and you can play some games. However, it is obviously not a gaming laptop, so you are usually limited to low or medium settings for smooth gameplay in many titles. The gaming performance is stable in longer sessions. More gaming benchmarks are available here.
| low | med. | high | ultra | QHD | |
|---|---|---|---|---|---|
| GTA V (2015) | 103 | 86.3 | 20.6 | 9.02 | |
| The Witcher 3 (2015) | 90 | 56 | 28.6 | 12.6 | |
| Dota 2 Reborn (2015) | 84.2 | 74.8 | 48.9 | 46.5 | |
| Final Fantasy XV Benchmark (2018) | 40.8 | 21.4 | 15.5 | 11.2 | |
| X-Plane 11.11 (2018) | 46.1 | 37.9 | 38.7 | ||
| Strange Brigade (2018) | 83.5 | 34.9 | 28.4 | 22.9 | |
| F1 2020 (2020) | 82.8 | 43.2 | 33.4 | 21.6 |
Emissions & Energy
System Noise
The Vision 14 uses a single fan. We recommend the “Quiet” mode when you do not need the maximum performance, which can be easily toggled via F3 key. The fan is then often completely deactivated and you can enjoy a very quiet device. The fan will react much more quickly to load changes in the performance modes. We can measure a maximum fan noise of around 41 dB(A) when you play games or stress the system, which is definitely audible. The frequency is not annoying though. We do not recommend the other two performance modes, where the fan will get much louder. We did not experience any electronic noises. The following table shows the maximum fan noise in the different performance settings.
| Profile | Fan noise stress test |
|---|---|
| Quiet 20 dB | 29 dB(A) |
| Quiet 30 dB | 41.2 dB(A) |
| Quiet 40 dB | 46.7 dB(A) |
| Performance Balanced | 41.2 dB(A) |
| Performance Enthusiast | 46.7 dB(A) |
| Performance Overboost | 49.1 dB(A) |
Noise level
| Idle |
| 25 / 25 / 26.9 dB(A) |
| Load |
| 38.6 / 41.2 dB(A) |
 | ||
30 dB silent 40 dB(A) audible 50 dB(A) loud |
||
min: | ||
| Schenker Vision 14 Iris Xe G7 96EUs, i7-1165G7, Samsung SSD 980 Pro 1TB MZ-V8P1T0BW | LG Gram 14Z90P-G.AA79G Iris Xe G7 96EUs, i7-1165G7, SK Hynix PC601 1TB HFS001TD9TNG | Asus ExpertBook B9 B9400CE-KC0166R Iris Xe G7 96EUs, i7-1165G7, Samsung PM981a MZVLB1T0HBLR | Lenovo Yoga Slim 7i Carbon 13 ITL Iris Xe G7 96EUs, i7-1165G7, Samsung SSD PM981a MZVLB512HBJQ | Huawei MateBook X Pro 2021 Iris Xe G7 96EUs, i7-1165G7, Samsung PM981a MZVLB1T0HBLR | |
|---|---|---|---|---|---|
| Noise | 6% | -4% | -5% | 8% | |
| off / environment * (dB) | 25 | 26 -4% | 24 4% | 28.7 -15% | 25.4 -2% |
| Idle Minimum * (dB) | 25 | 26 -4% | 24 4% | 28.7 -15% | 25.6 -2% |
| Idle Average * (dB) | 25 | 26 -4% | 24 4% | 28.7 -15% | 25.6 -2% |
| Idle Maximum * (dB) | 26.9 | 26 3% | 24 11% | 30.6 -14% | 25.6 5% |
| Load Average * (dB) | 38.6 | 30.5 21% | 47.5 -23% | 37.3 3% | 28.7 26% |
| Witcher 3 ultra * (dB) | 41.2 | 47.5 -15% | 37.3 9% | 32 22% | |
| Load Maximum * (dB) | 41.2 | 30.5 26% | 47.5 -15% | 37.3 9% | 38.2 7% |
* ... smaller is better
Temperature
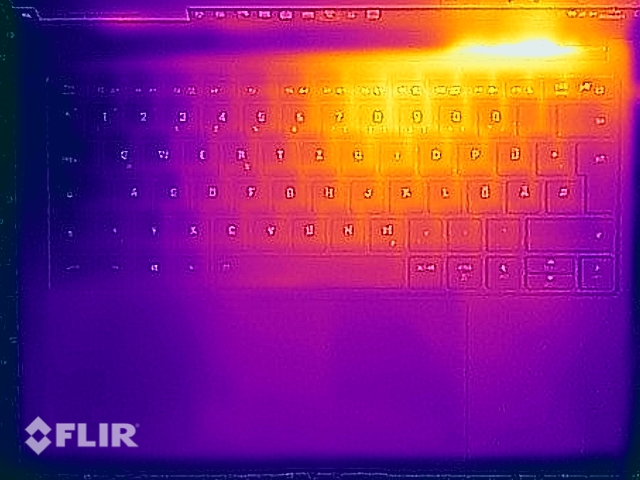
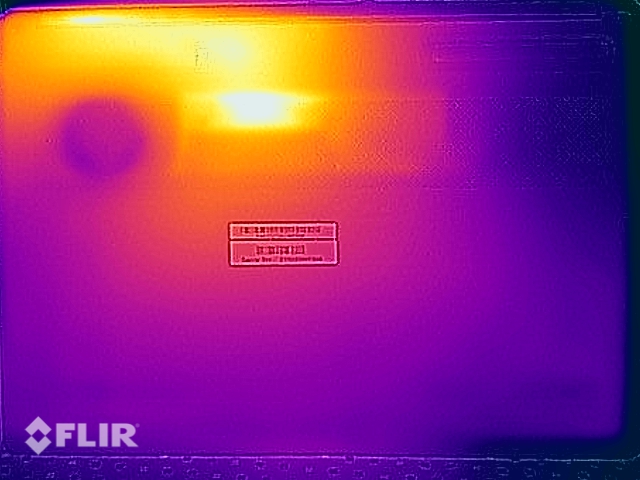
The temperature development is limited to the area around the processor and the fan exhaust. We can measure up to 46 °C at the top and even up to 52°C at the bottom. However, the hotspot is in the center of the chassis, so you can still use it on your lap. The laptop can maintain the power limit of 30W during the stress test and we have recorded the CPU data in the diagram below.
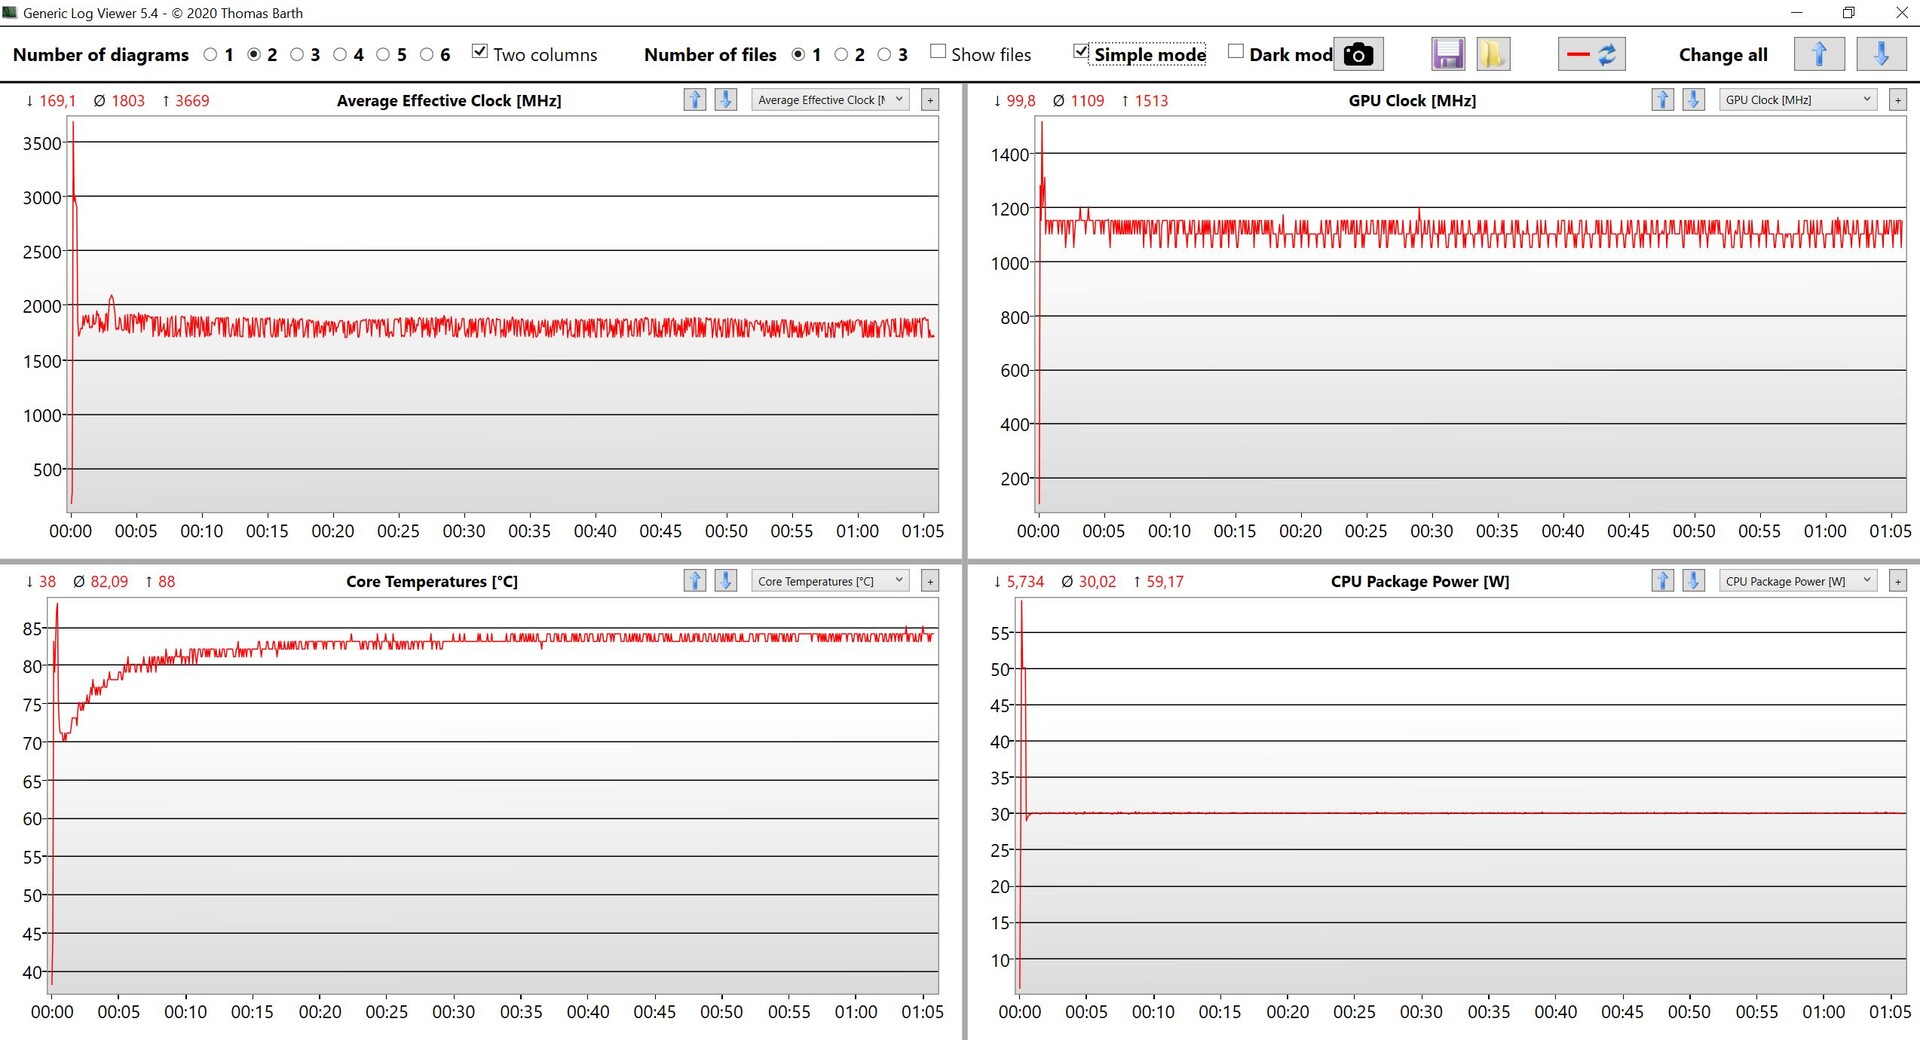
(-) The maximum temperature on the upper side is 46.2 °C / 115 F, compared to the average of 35.9 °C / 97 F, ranging from 21.4 to 59 °C for the class Subnotebook.
(-) The bottom heats up to a maximum of 52.2 °C / 126 F, compared to the average of 39.2 °C / 103 F
(+) In idle usage, the average temperature for the upper side is 27.6 °C / 82 F, compared to the device average of 30.8 °C / 87 F.
(±) Playing The Witcher 3, the average temperature for the upper side is 32.1 °C / 90 F, compared to the device average of 30.8 °C / 87 F.
(+) The palmrests and touchpad are cooler than skin temperature with a maximum of 26.9 °C / 80.4 F and are therefore cool to the touch.
(±) The average temperature of the palmrest area of similar devices was 28.2 °C / 82.8 F (+1.3 °C / 2.4 F).
Speakers
The two stereo speakers are decent, but the competition usually offers better solutions. Sounds distort at high volumes and the maximum volume is not great. The preloaded THX software offers different profiles and they really make a difference. The speakers are well suited for common videos or conferences, but you should use headphones or external speakers for better sound quality.
Schenker Vision 14 audio analysis
(±) | speaker loudness is average but good (75.2 dB)
Bass 100 - 315 Hz
(-) | nearly no bass - on average 21.7% lower than median
(±) | linearity of bass is average (11% delta to prev. frequency)
Mids 400 - 2000 Hz
(+) | balanced mids - only 3.7% away from median
(+) | mids are linear (4.2% delta to prev. frequency)
Highs 2 - 16 kHz
(+) | balanced highs - only 3.2% away from median
(±) | linearity of highs is average (7.4% delta to prev. frequency)
Overall 100 - 16.000 Hz
(±) | linearity of overall sound is average (19.6% difference to median)
Compared to same class
» 61% of all tested devices in this class were better, 6% similar, 32% worse
» The best had a delta of 5%, average was 18%, worst was 53%
Compared to all devices tested
» 49% of all tested devices were better, 7% similar, 44% worse
» The best had a delta of 4%, average was 24%, worst was 134%
Apple MacBook 12 (Early 2016) 1.1 GHz audio analysis
(+) | speakers can play relatively loud (83.6 dB)
Bass 100 - 315 Hz
(±) | reduced bass - on average 11.3% lower than median
(±) | linearity of bass is average (14.2% delta to prev. frequency)
Mids 400 - 2000 Hz
(+) | balanced mids - only 2.4% away from median
(+) | mids are linear (5.5% delta to prev. frequency)
Highs 2 - 16 kHz
(+) | balanced highs - only 2% away from median
(+) | highs are linear (4.5% delta to prev. frequency)
Overall 100 - 16.000 Hz
(+) | overall sound is linear (10.2% difference to median)
Compared to same class
» 7% of all tested devices in this class were better, 2% similar, 91% worse
» The best had a delta of 5%, average was 18%, worst was 53%
Compared to all devices tested
» 5% of all tested devices were better, 1% similar, 94% worse
» The best had a delta of 4%, average was 24%, worst was 134%
LG Gram 14Z90P-G.AA79G audio analysis
(±) | speaker loudness is average but good (76.8 dB)
Bass 100 - 315 Hz
(-) | nearly no bass - on average 18.4% lower than median
(±) | linearity of bass is average (12.3% delta to prev. frequency)
Mids 400 - 2000 Hz
(+) | balanced mids - only 2.3% away from median
(+) | mids are linear (4.7% delta to prev. frequency)
Highs 2 - 16 kHz
(±) | higher highs - on average 5.1% higher than median
(+) | highs are linear (6.1% delta to prev. frequency)
Overall 100 - 16.000 Hz
(±) | linearity of overall sound is average (15.4% difference to median)
Compared to same class
» 35% of all tested devices in this class were better, 6% similar, 60% worse
» The best had a delta of 5%, average was 18%, worst was 53%
Compared to all devices tested
» 22% of all tested devices were better, 4% similar, 73% worse
» The best had a delta of 4%, average was 24%, worst was 134%
Power Consumption
The 3K display consumes a lot of power. We measure almost 10W while idling at the minimum brightness. For comparison: Many competitors are more efficient even at the maximum brightness. Up to 14W at the full brightness is a lot for a modern Ultrabook. We can see 73W during the stress test for a couple of seconds, but it quickly settles at 54W. The 65W power adapter is therefore just sufficient.
| Off / Standby | |
| Idle | |
| Load |
|
Key:
min: | |
Battery Runtime
Due to the additional M.2 slot, there is only room for a 53Wh battery. We just talked about the high consumption of the optional 3K panel, and our Wi-Fi test only runs for 5-6 hours (depending on the brightness). This will be sufficient for many users, but the rivals manage longer runtimes and you should probably get the default FHD screen if you often work on the go. We would have liked to see an option for a larger battery in favor of the second M.2 slot.
Pros
Cons
Verdict - Vision 14 is a great Ultrabook with a very good screen
The Vision 14 is a refreshing concept. Instead of reducing all the features, Schenker offers a light and thin magnesium chassis with replaceable memory and numerous ports. The quality impression of the notebook is very good, only the hinge could be firmer for our taste.
The optional 3K screen offers excellent picture quality without PWM flickering. You can also edit pictures/videos after a calibration, but the panel requires a lot of power. The battery runtime is mediocre and the rivals last longer. We would have liked to see the option for a larger battery in favor of the second M.2 slot, at least in combination with the 3K panel.
The Schenker Vision 14 shows that a light and thin Ultrabook does not have to waive modular components and plenty of ports. The excellent 3K screen consumes a lot of power, which obviously affects the battery runtime.
The second M.2 slot as well as the replaceable memory are appreciated and pretty much unique among modern devices. All in all, you get a very good laptop with useful features and an excellent screen. The question is whether you can live with the battery runtime, otherwise you either have to get the default FHD screen or a rival with a high-resolution panel (like the Yoga Slim 7i Carbon).
Price and Availability
The Schenker Vision 14 can be configured at bestware.com starting at 1099 Euros; our test configuration retails for around 1650 Euros.
Schenker Vision 14
- 06/16/2021 v7 (old)
Andreas Osthoff
Price comparison
