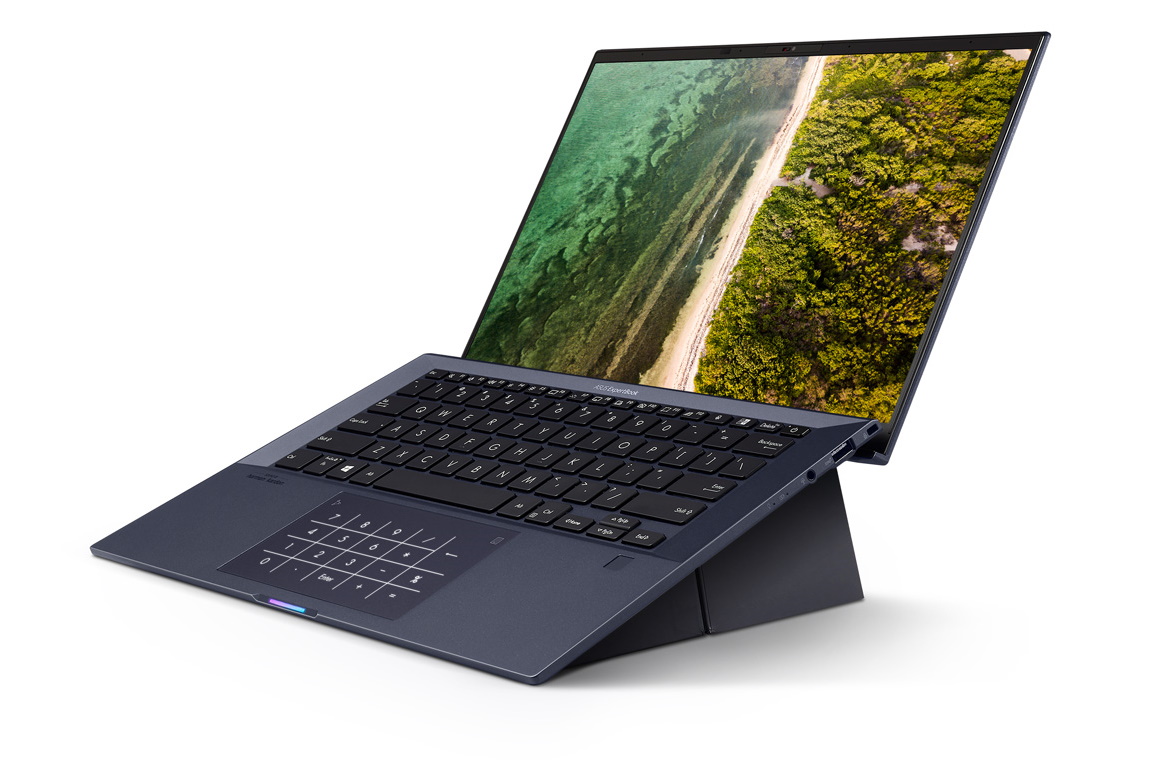
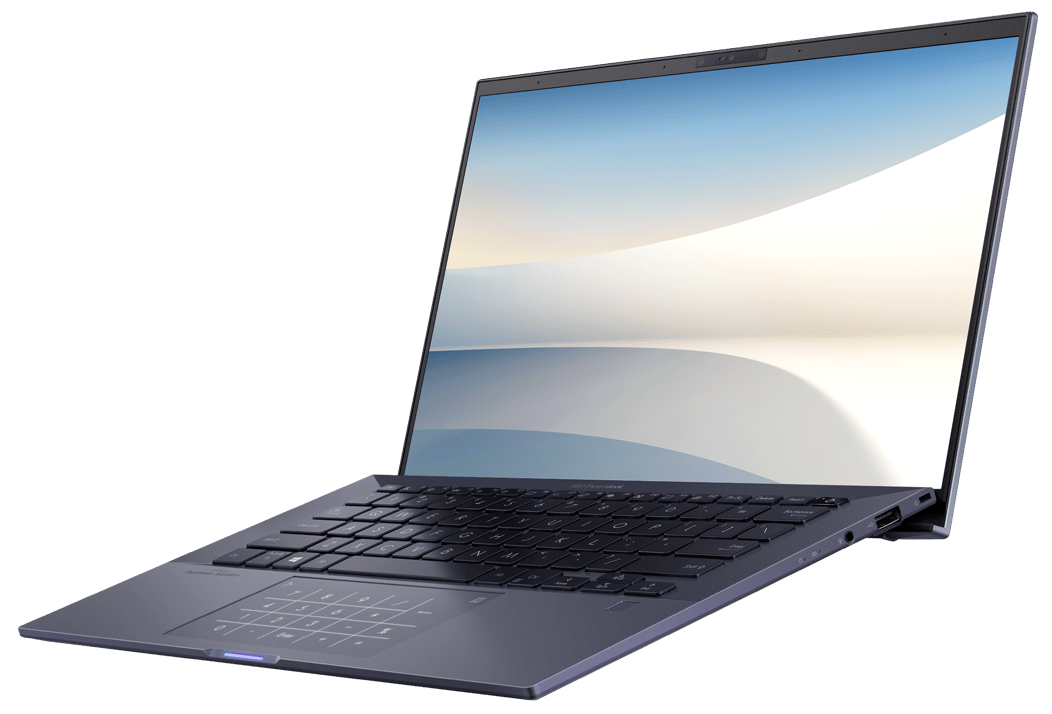
Asus ExpertBook B9 Laptop Review: Tiger Lake offers a decent boost in performance for the ultra-mobile flyweight
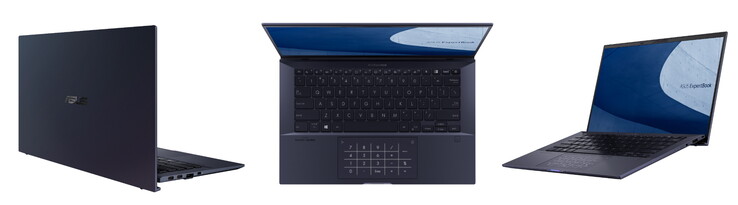
In our May 2020 review, the 1-kilogram (2.2-lb) ExpertBook proved to be a very long-lasting and light notebook. It is also quite robust because it has a military certification. This year, Asus released an updated version, which is based on Intel’s Tiger Lake platform (Gen 11).
Since there are no visual changes we forewent including the information about the housing, connectivity, speakers and input devices in this review. Readers can find all relevant information in our original review of the Asus ExpertBook.
Likely Competitors
Rating | Date | Model | Weight | Height | Size | Resolution | Price |
|---|---|---|---|---|---|---|---|
| 87.1 % v7 (old) | 03 / 2021 | Asus ExpertBook B9 B9400CE-KC0166R i7-1165G7, Iris Xe G7 96EUs | 995 g | 14.9 mm | 14.00" | 1920x1080 | |
| 86.5 % v7 (old) | 05 / 2020 | Asus ExpertBook B9450FA, i7-10510U i7-10510U, UHD Graphics 620 | 995 g | 14.9 mm | 14.00" | 1920x1080 | |
| 85.3 % v7 (old) | 05 / 2020 | LG Gram 14Z90N i7-1065G7, Iris Plus Graphics G7 (Ice Lake 64 EU) | 994 g | 18 mm | 14.00" | 1920x1080 | |
| 89.8 % v7 (old) | 02 / 2021 | Lenovo ThinkPad X1 Nano-20UN002UGE i7-1160G7, Iris Xe G7 96EUs | 946 g | 16 mm | 13.00" | 2160x1350 | |
| 85 % v7 (old) | 06 / 2020 | Acer Swift 3 SF314-42-R27B R3 4300U, Vega 5 | 1.2 kg | 16.55 mm | 14.00" | 1920x1080 |
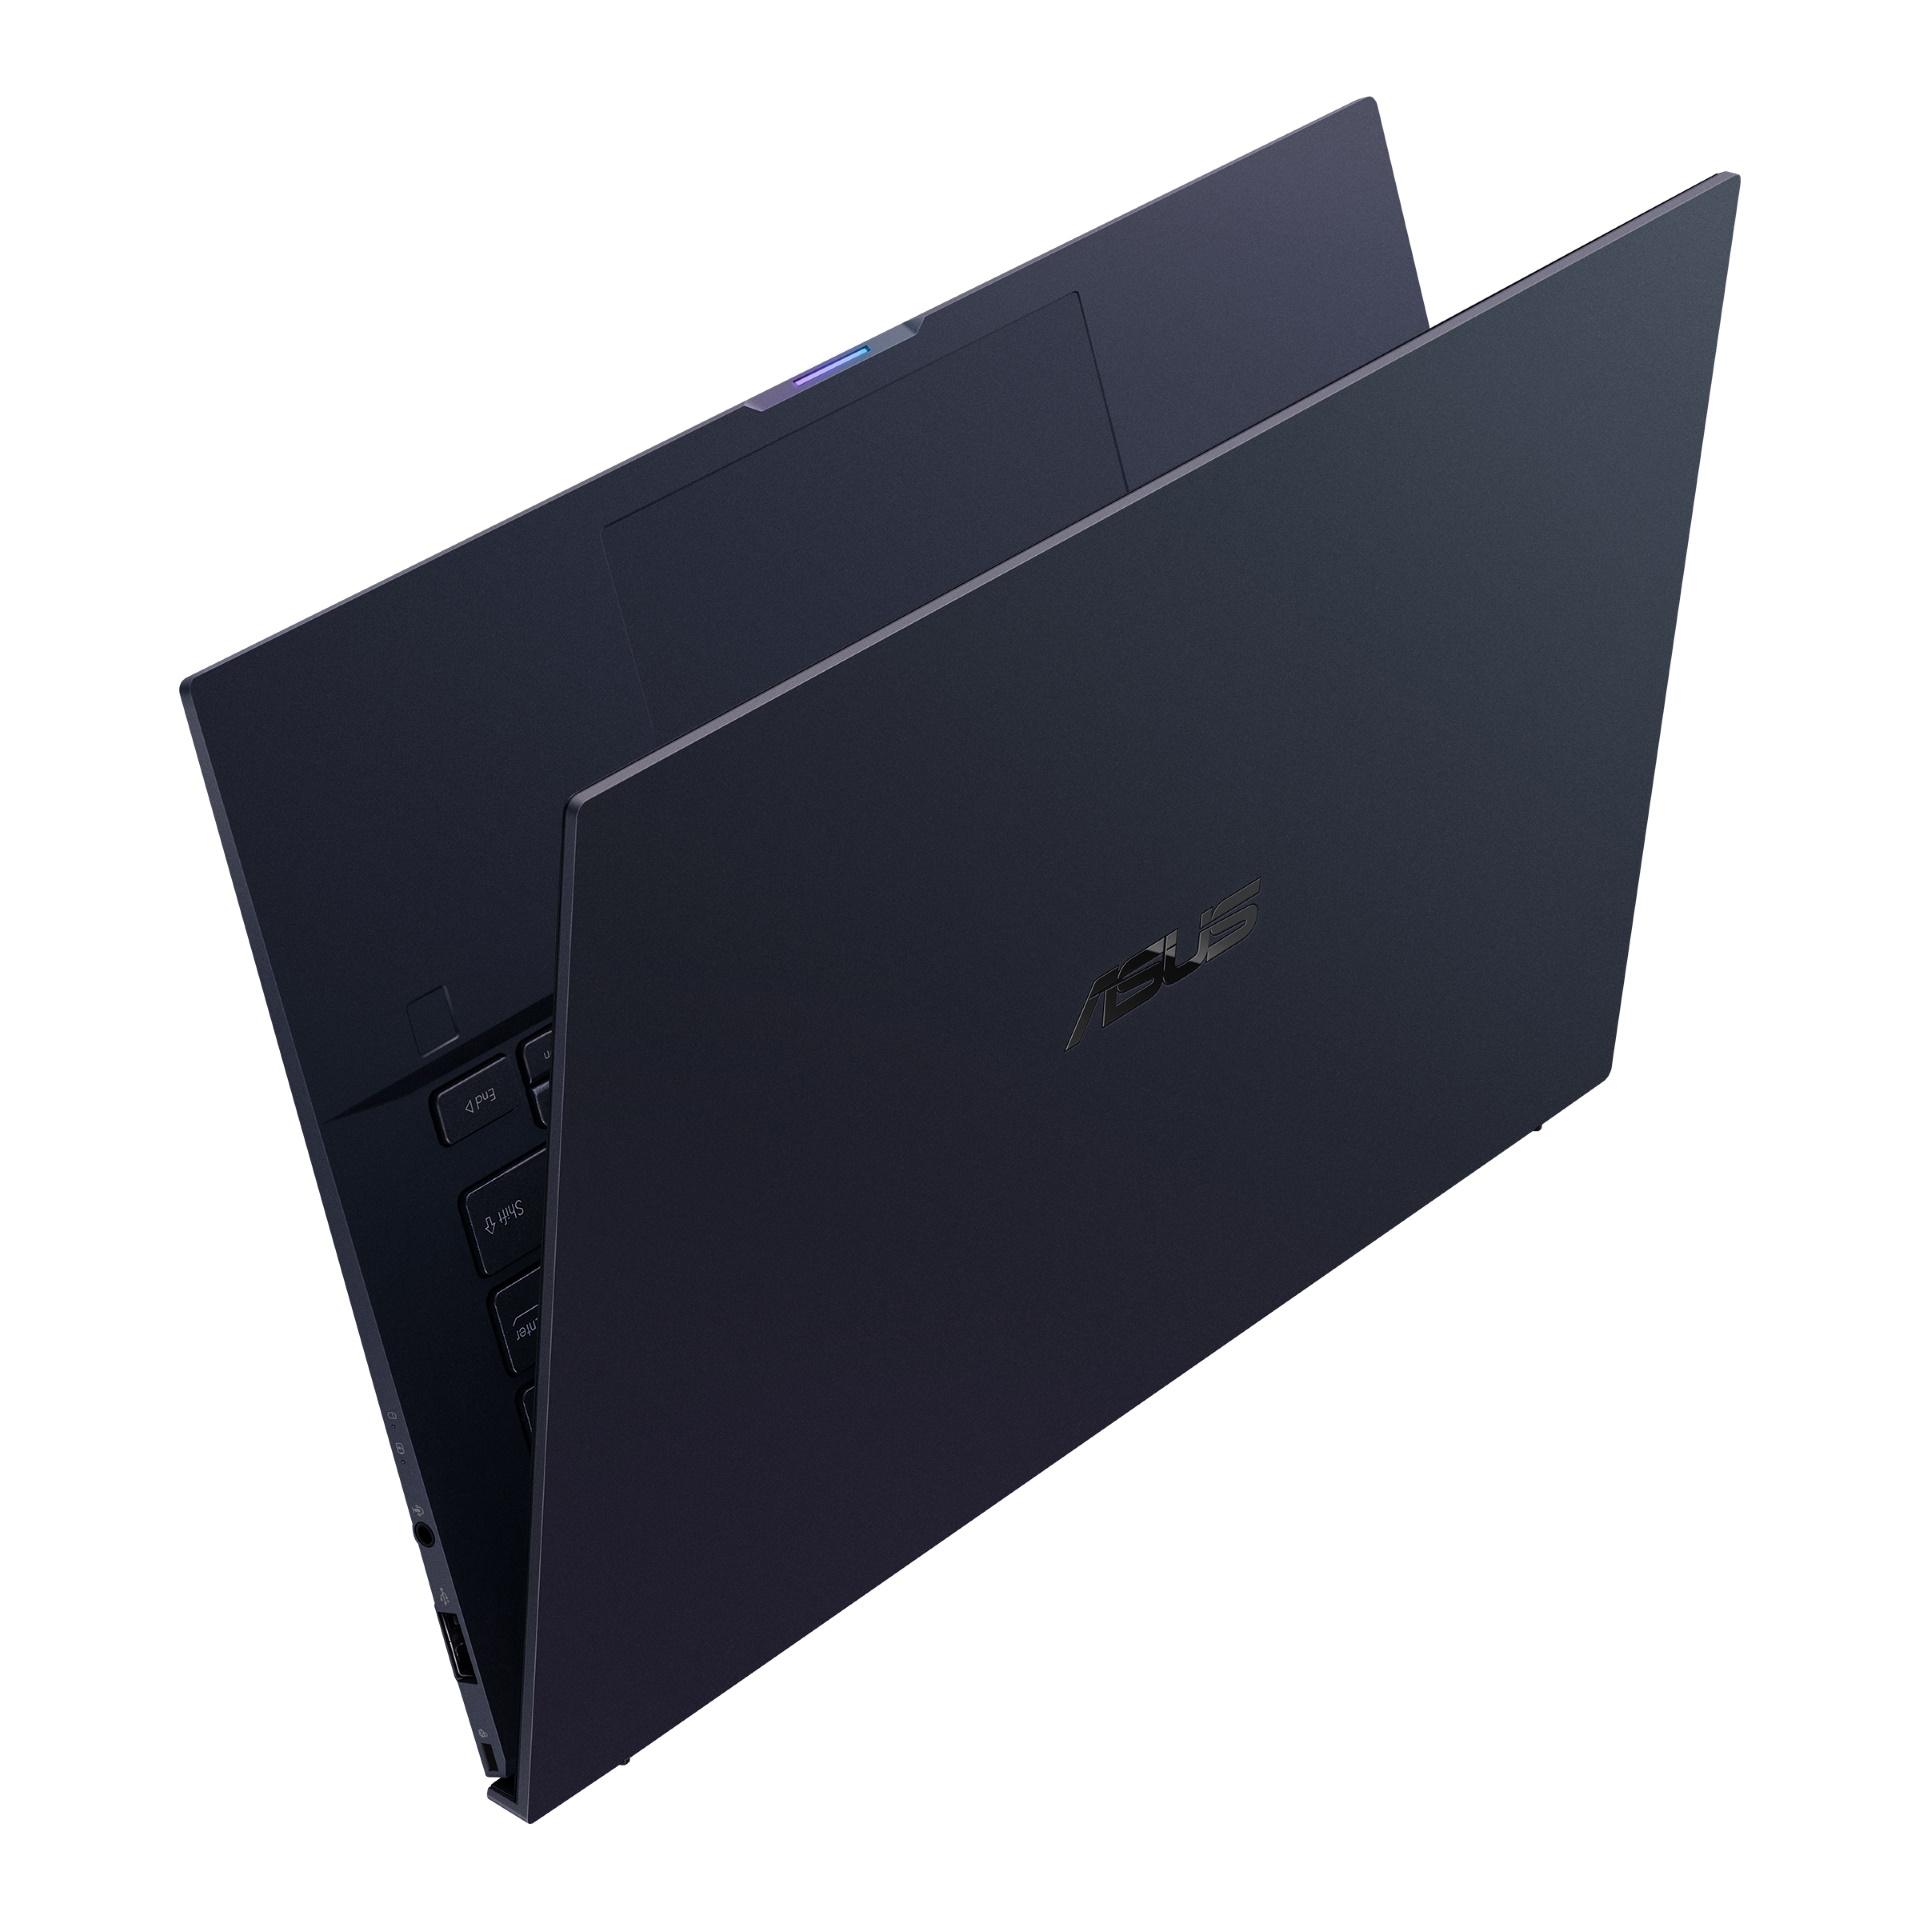
Case - No changes, still feather-light

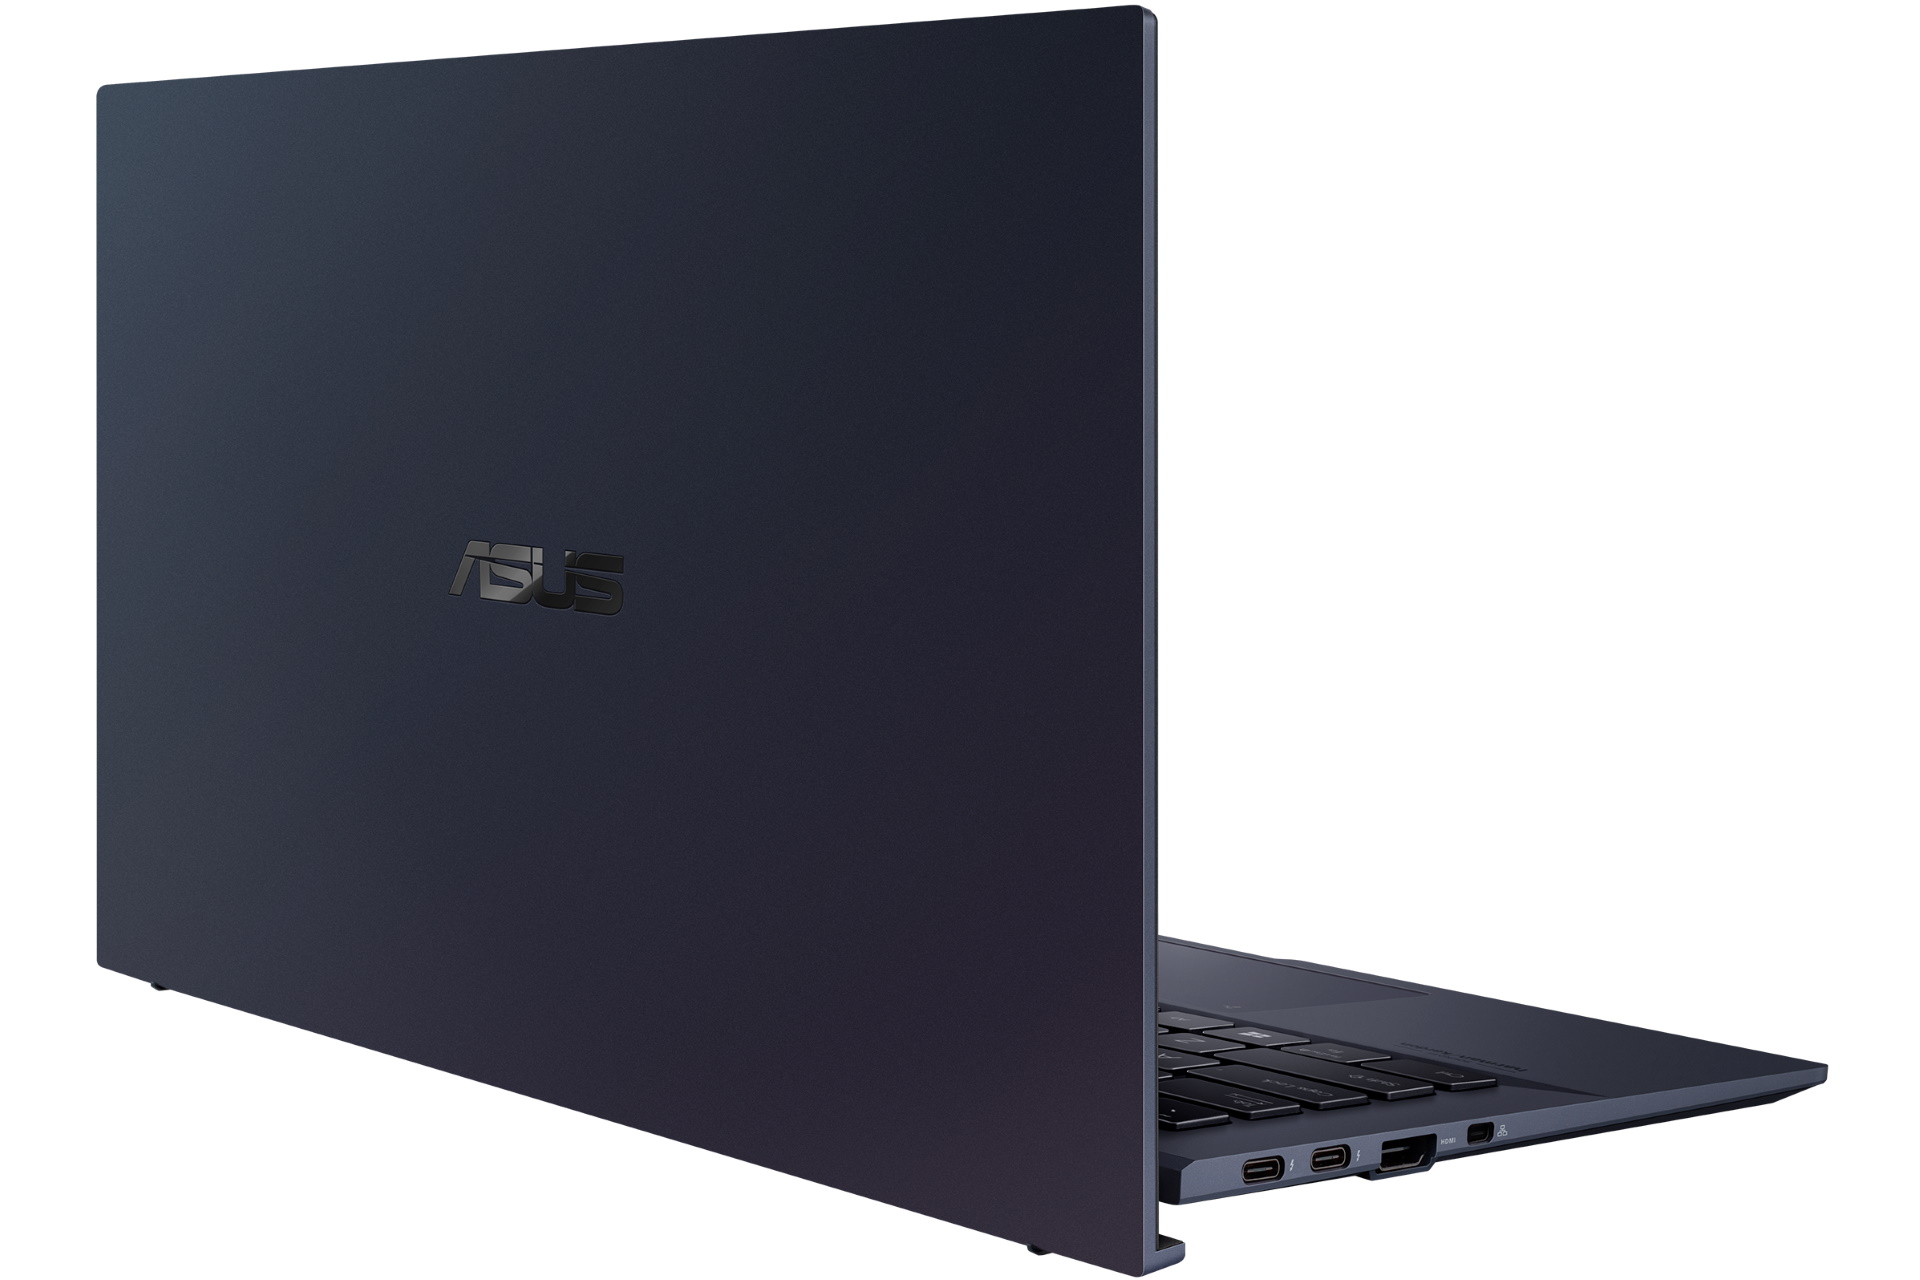
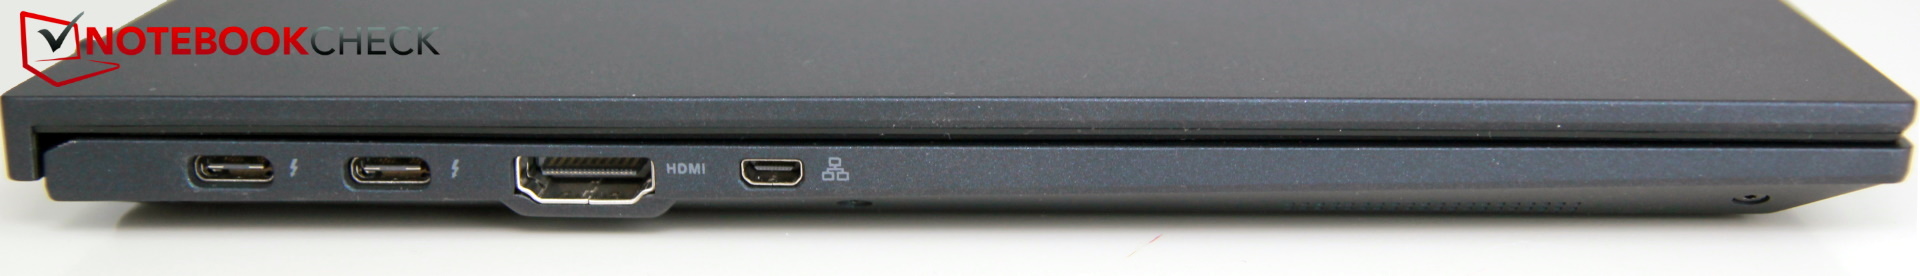
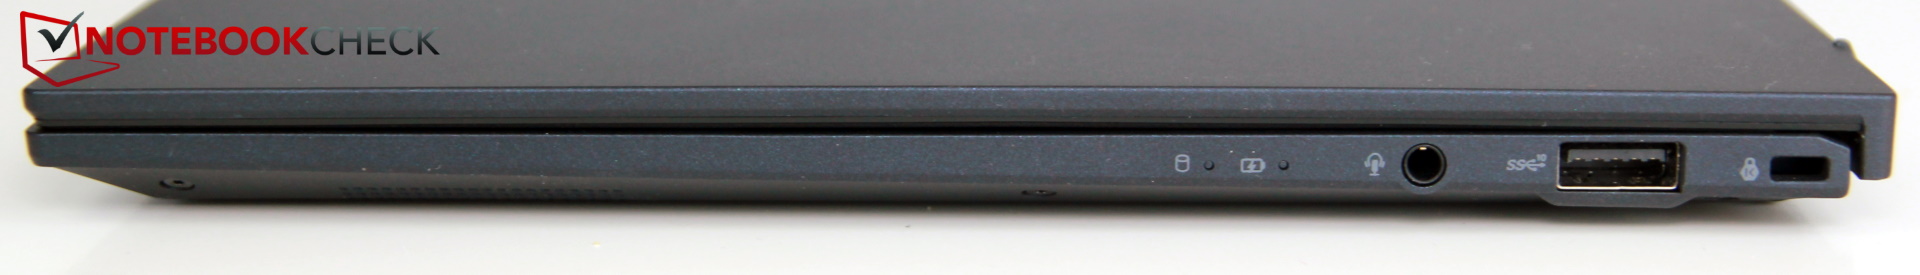
Connectivity - Now with Thunderbolt 4
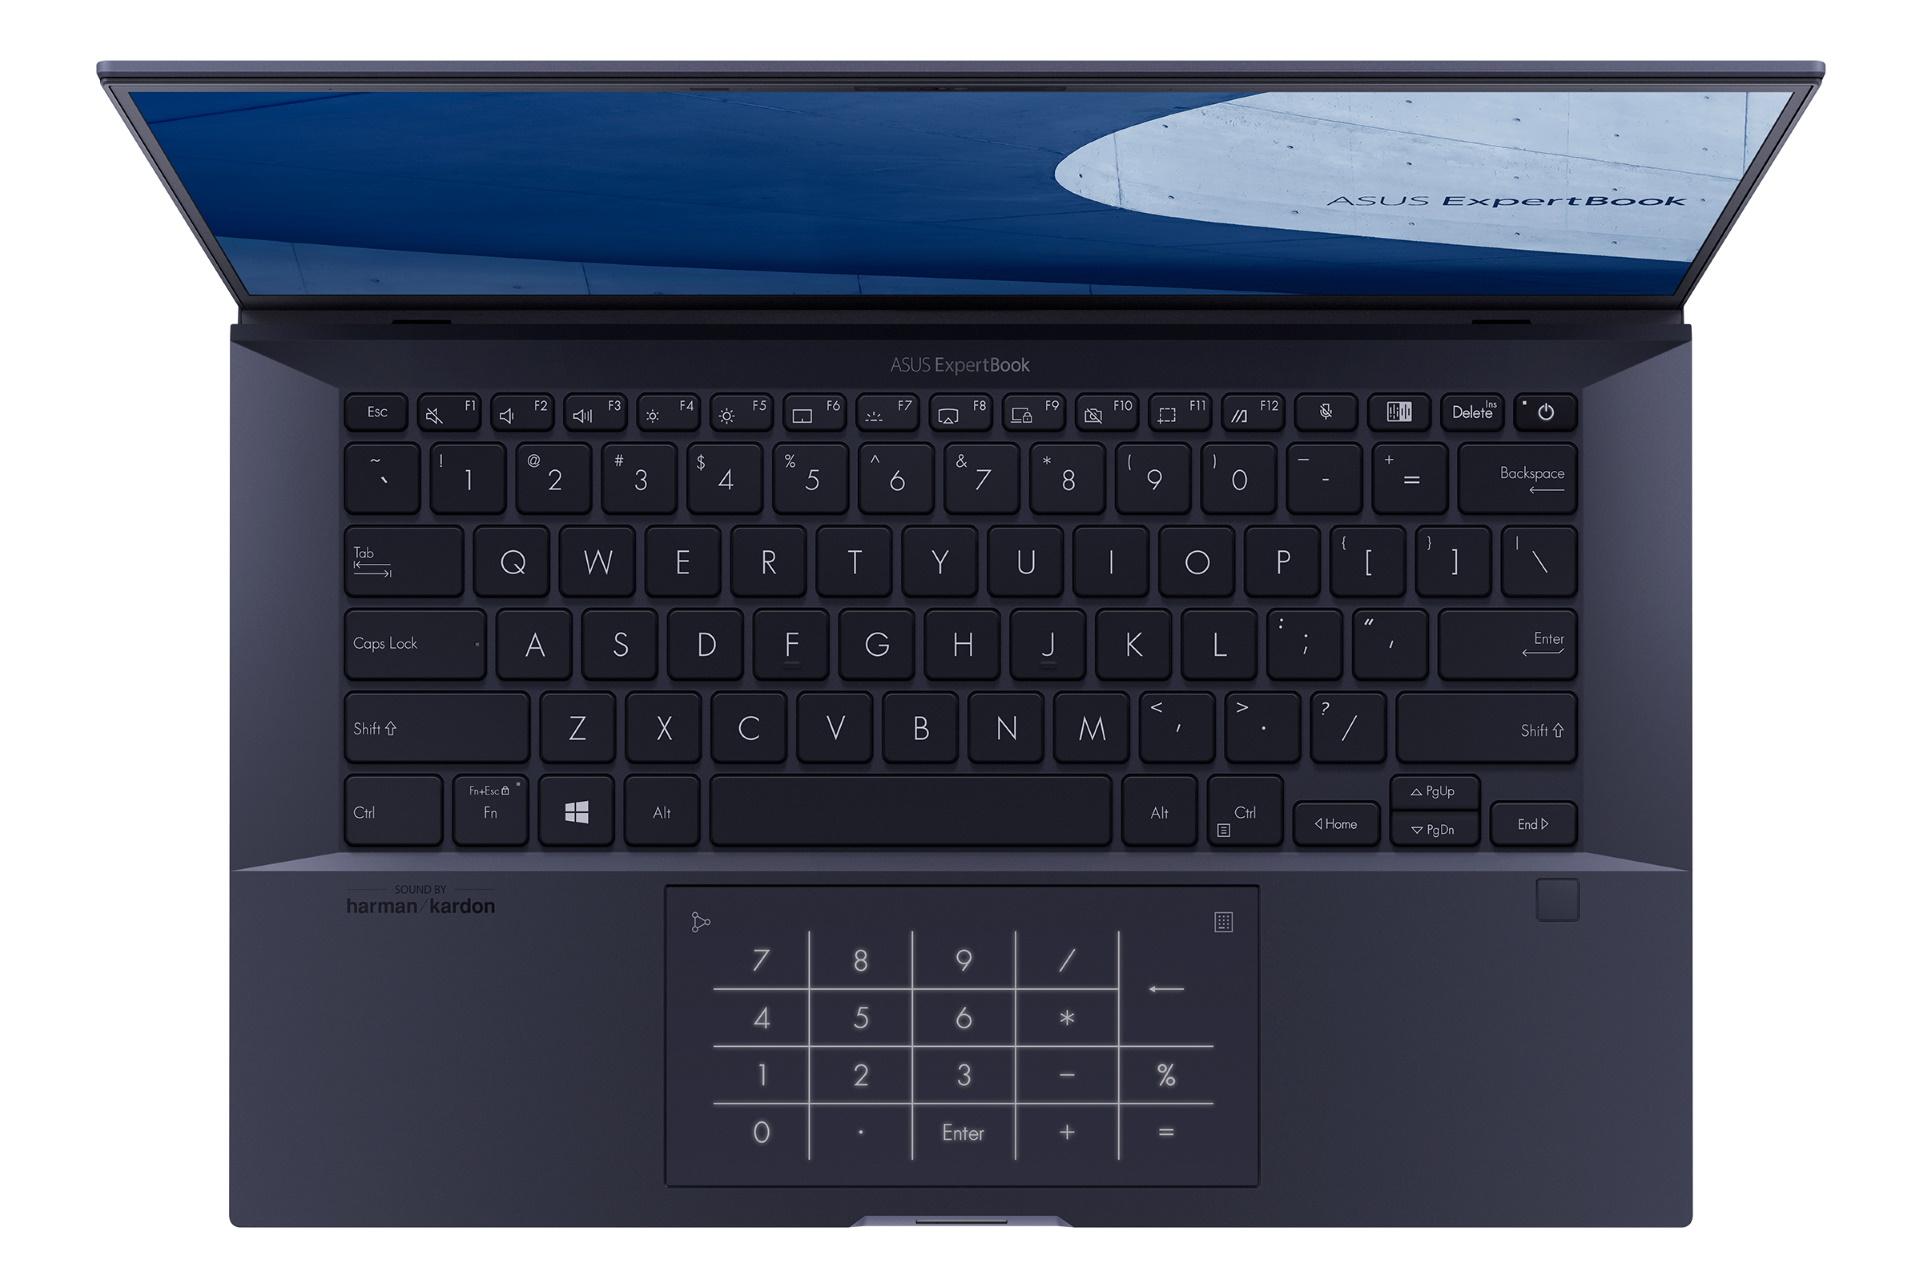
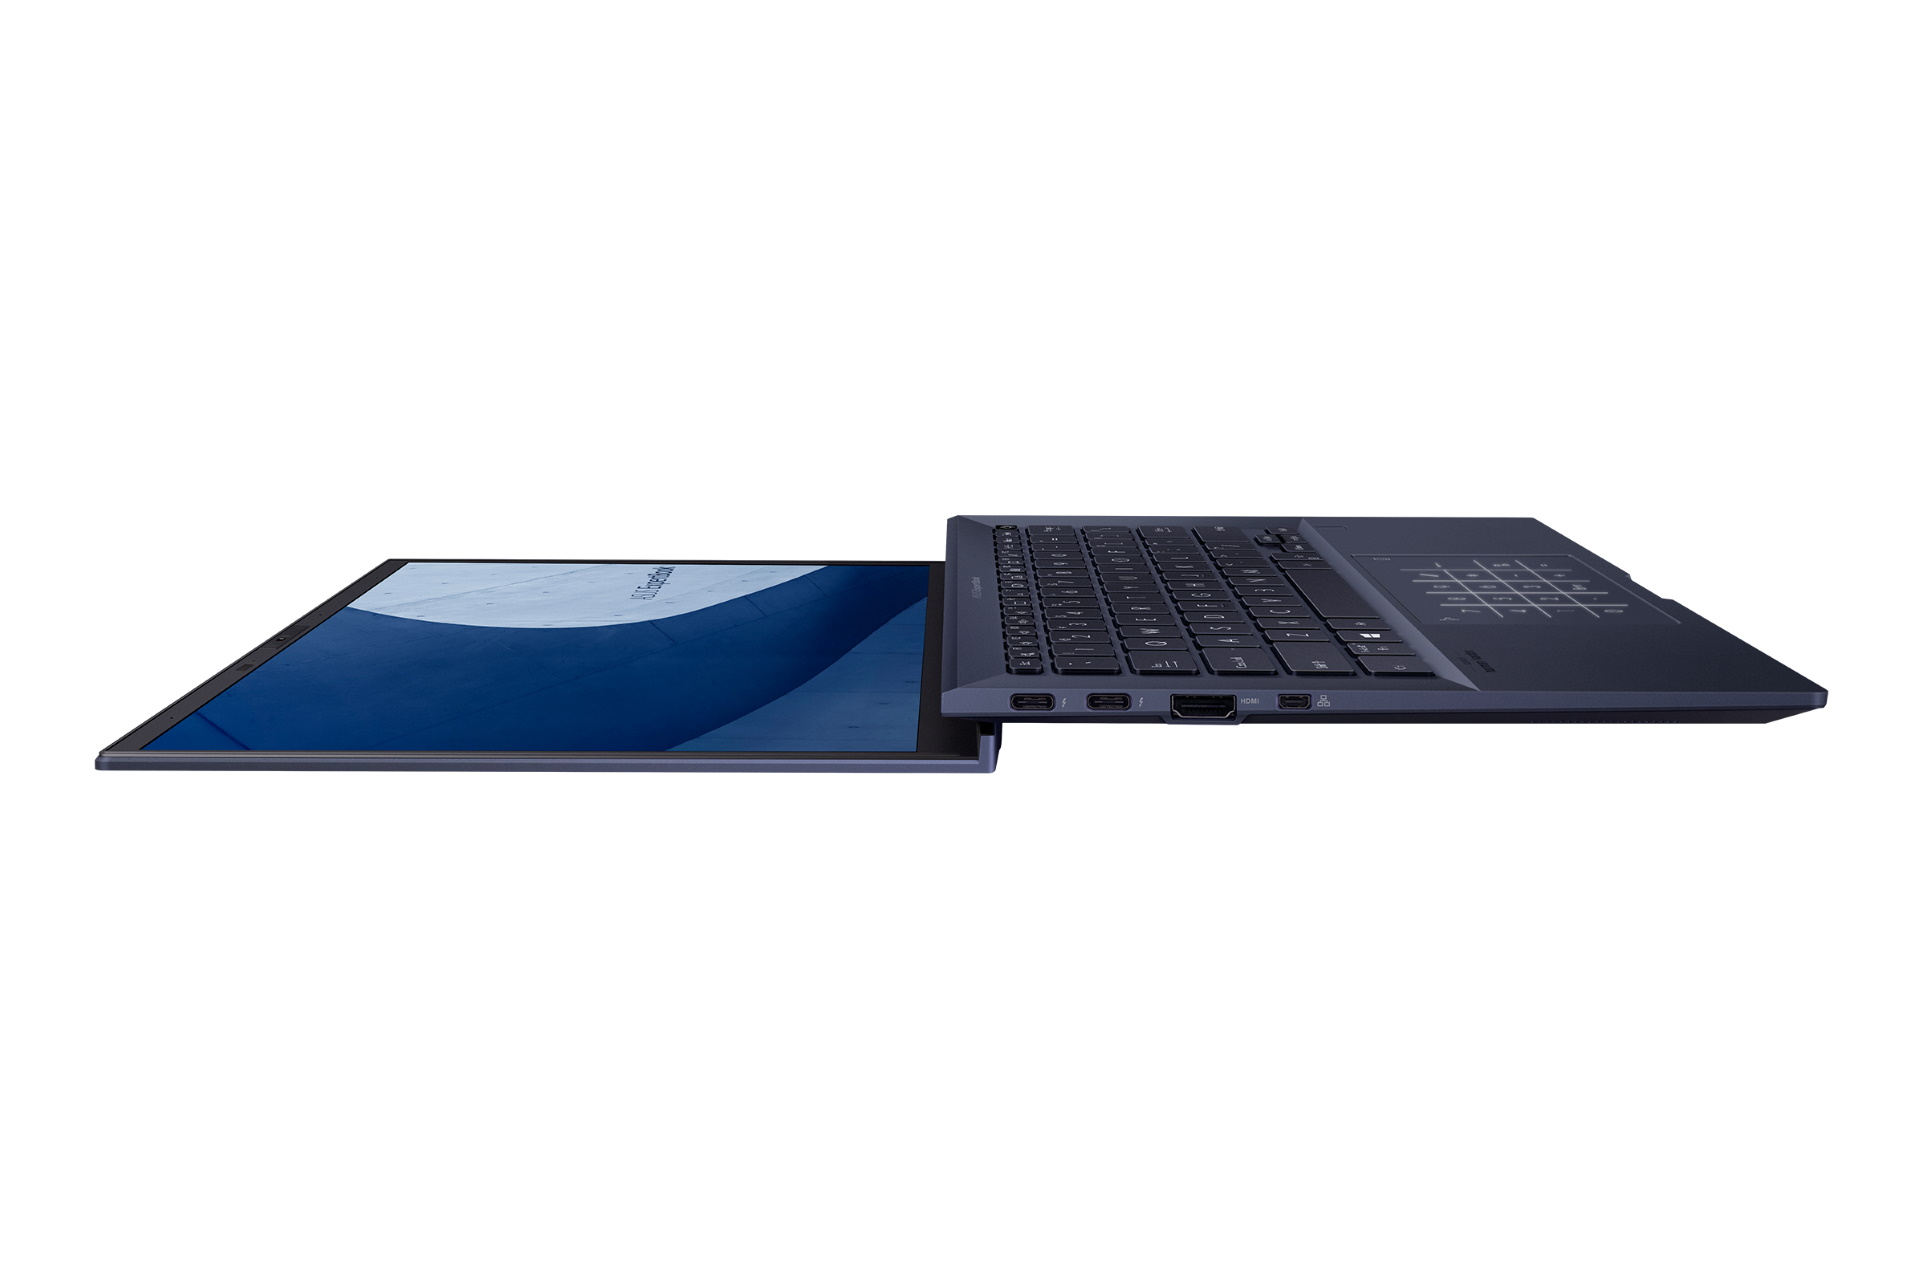
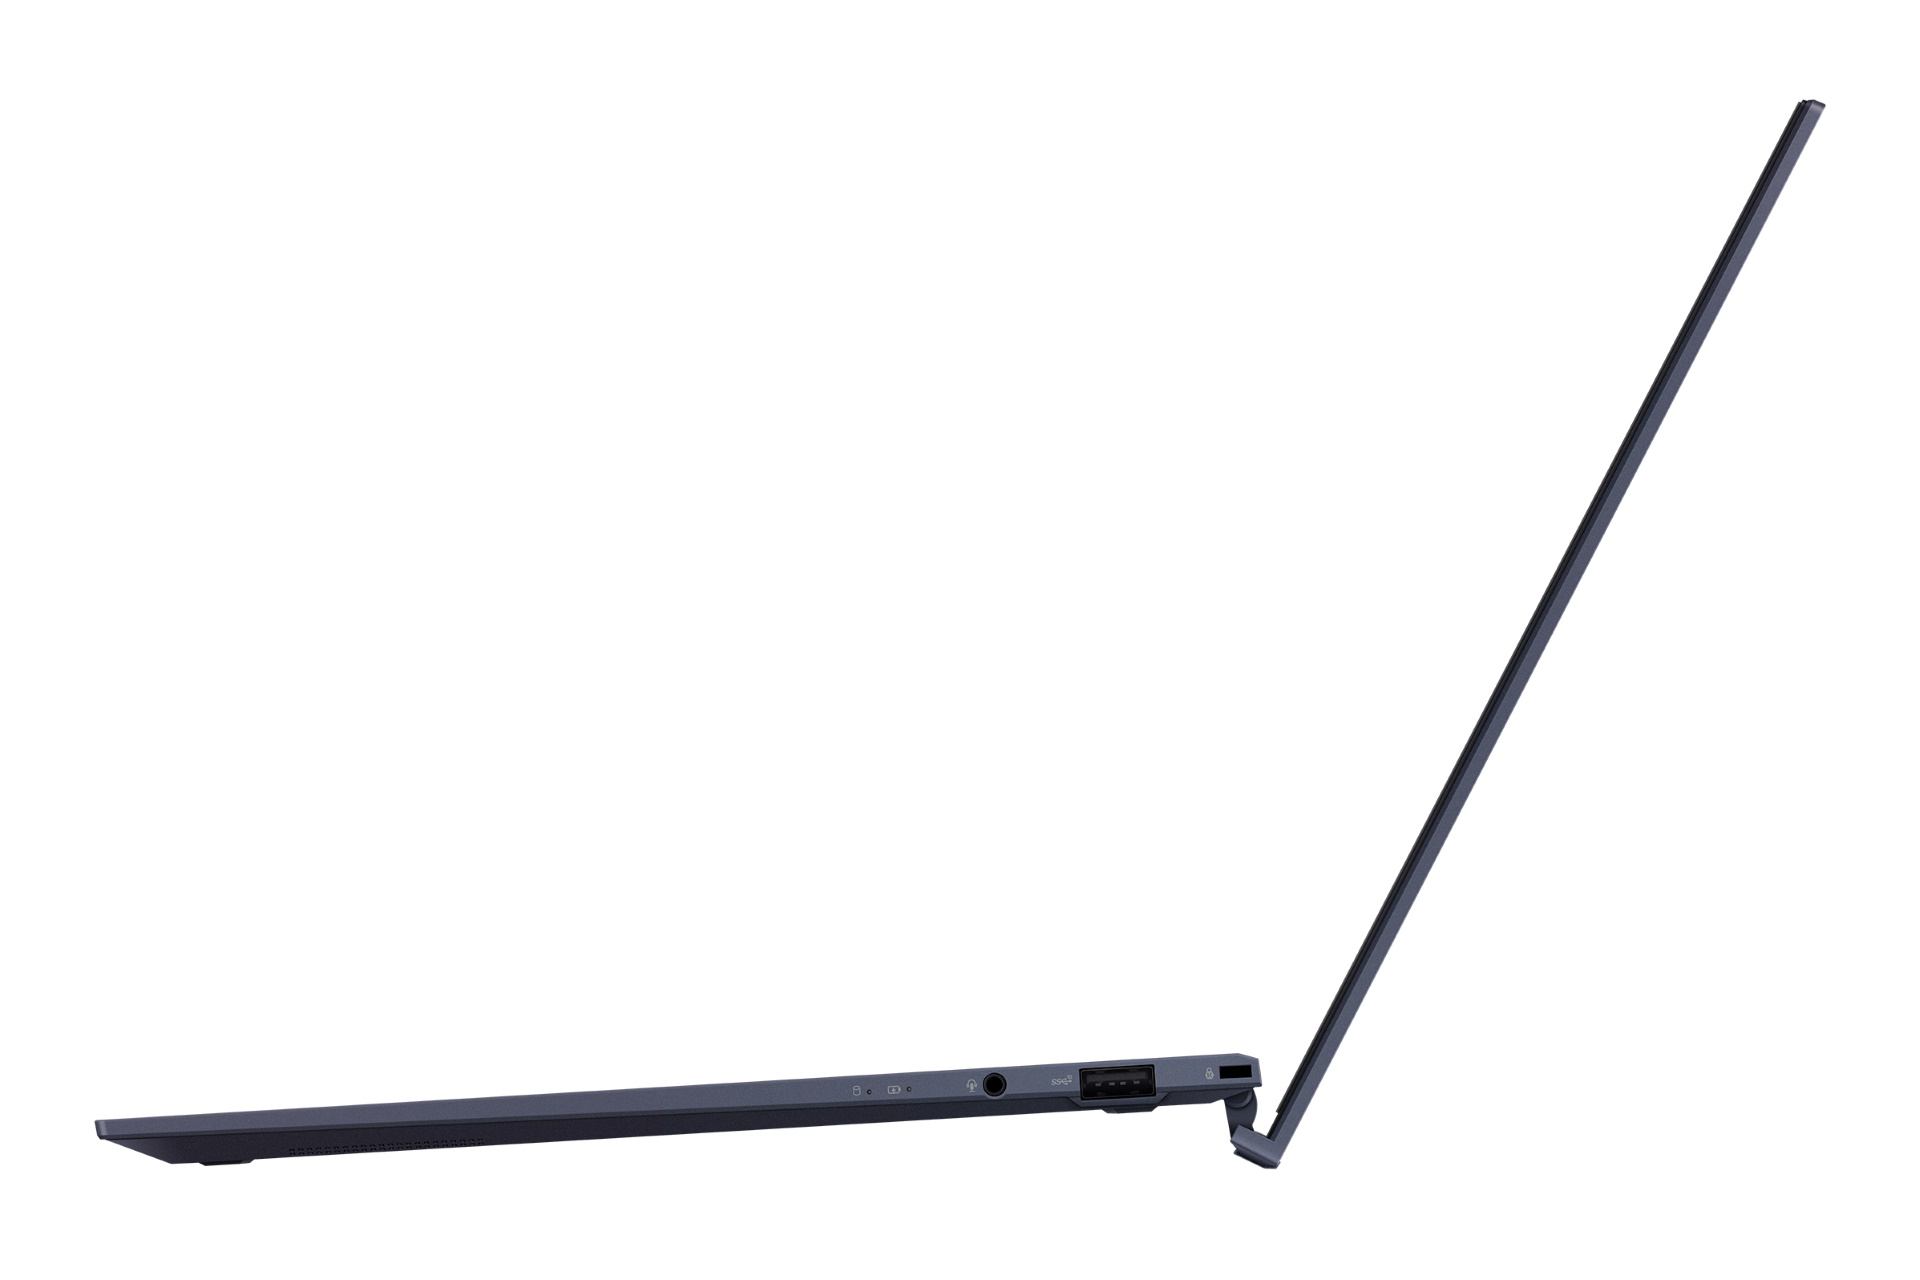
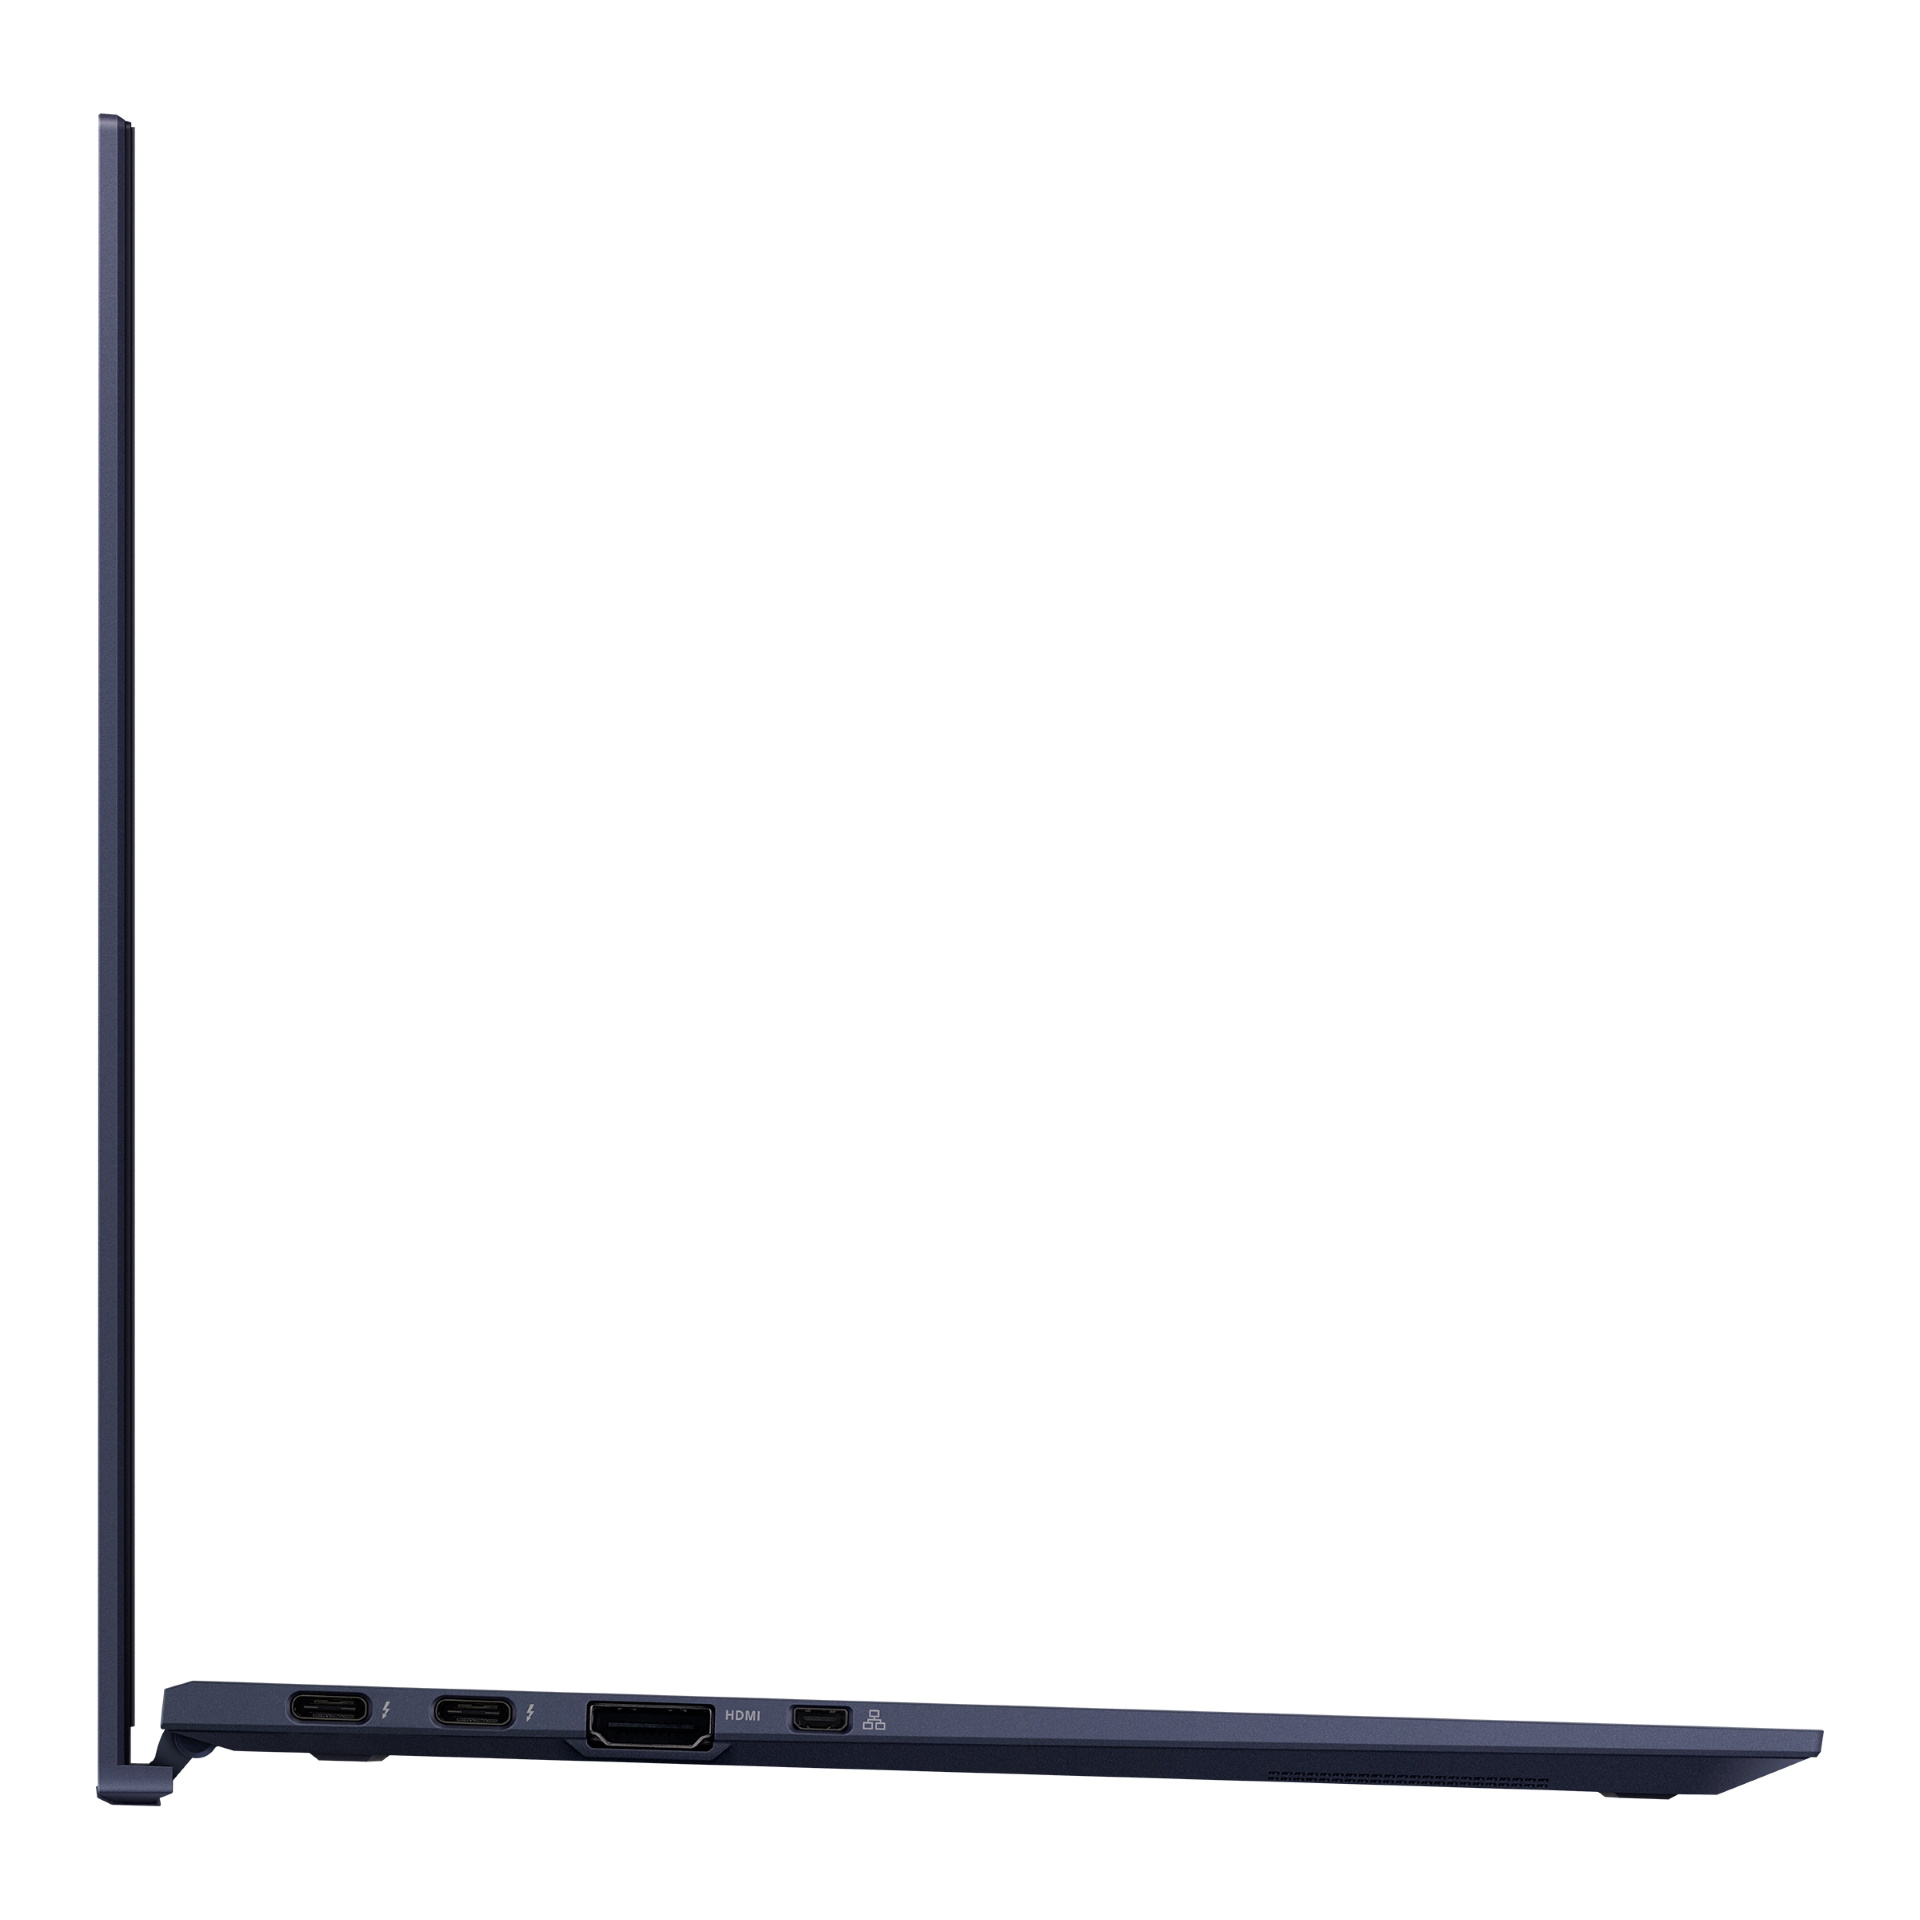
The type and number of ports have not changed, but the speed has. The two USB-C ports now support Thunderbolt 4 instead of Thunderbolt 3, and the upcoming USB4 standard is also supported. Moreover, the touchpad still turns into a numeric pad with the press of a button.
Communication
Web Camera
The ExpertBook comes with a quad-array microphone, which uses AI-based noise suppression to improve the video-conferencing experience.
It is not entirely clear to us why the Asus laptop, which costs more than 2000 Euros (~$2400), comes with a standard 720p web camera in the times of COVID-19. Anyone, who has to work or study at home, will find the otherwise high-end ExpertBook less valuable because of this webcam. However, the web camera shutter is still present.


")
")


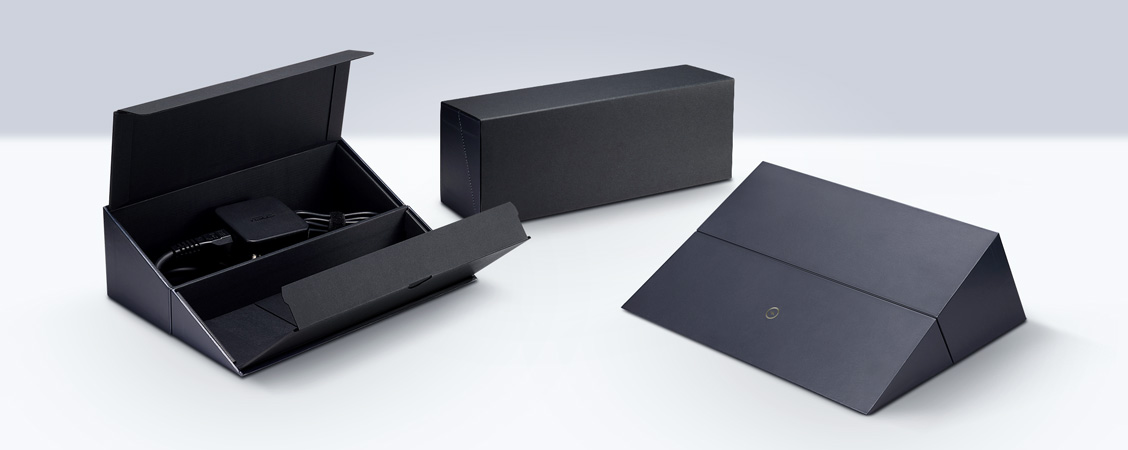
Accessories
Because the ExpertBook lacks an Ethernet port, the manufacturer has decided to put a microHDMI-to-RJ45 adapter in the box. In our opinion, this is a praiseworthy act. In addition, the Asus notebook also comes with a slightly padded carrying bag. The box for the power adapter is surprisingly inventive. It can double as a laptop stand, which is rather wonderful.
Maintenance
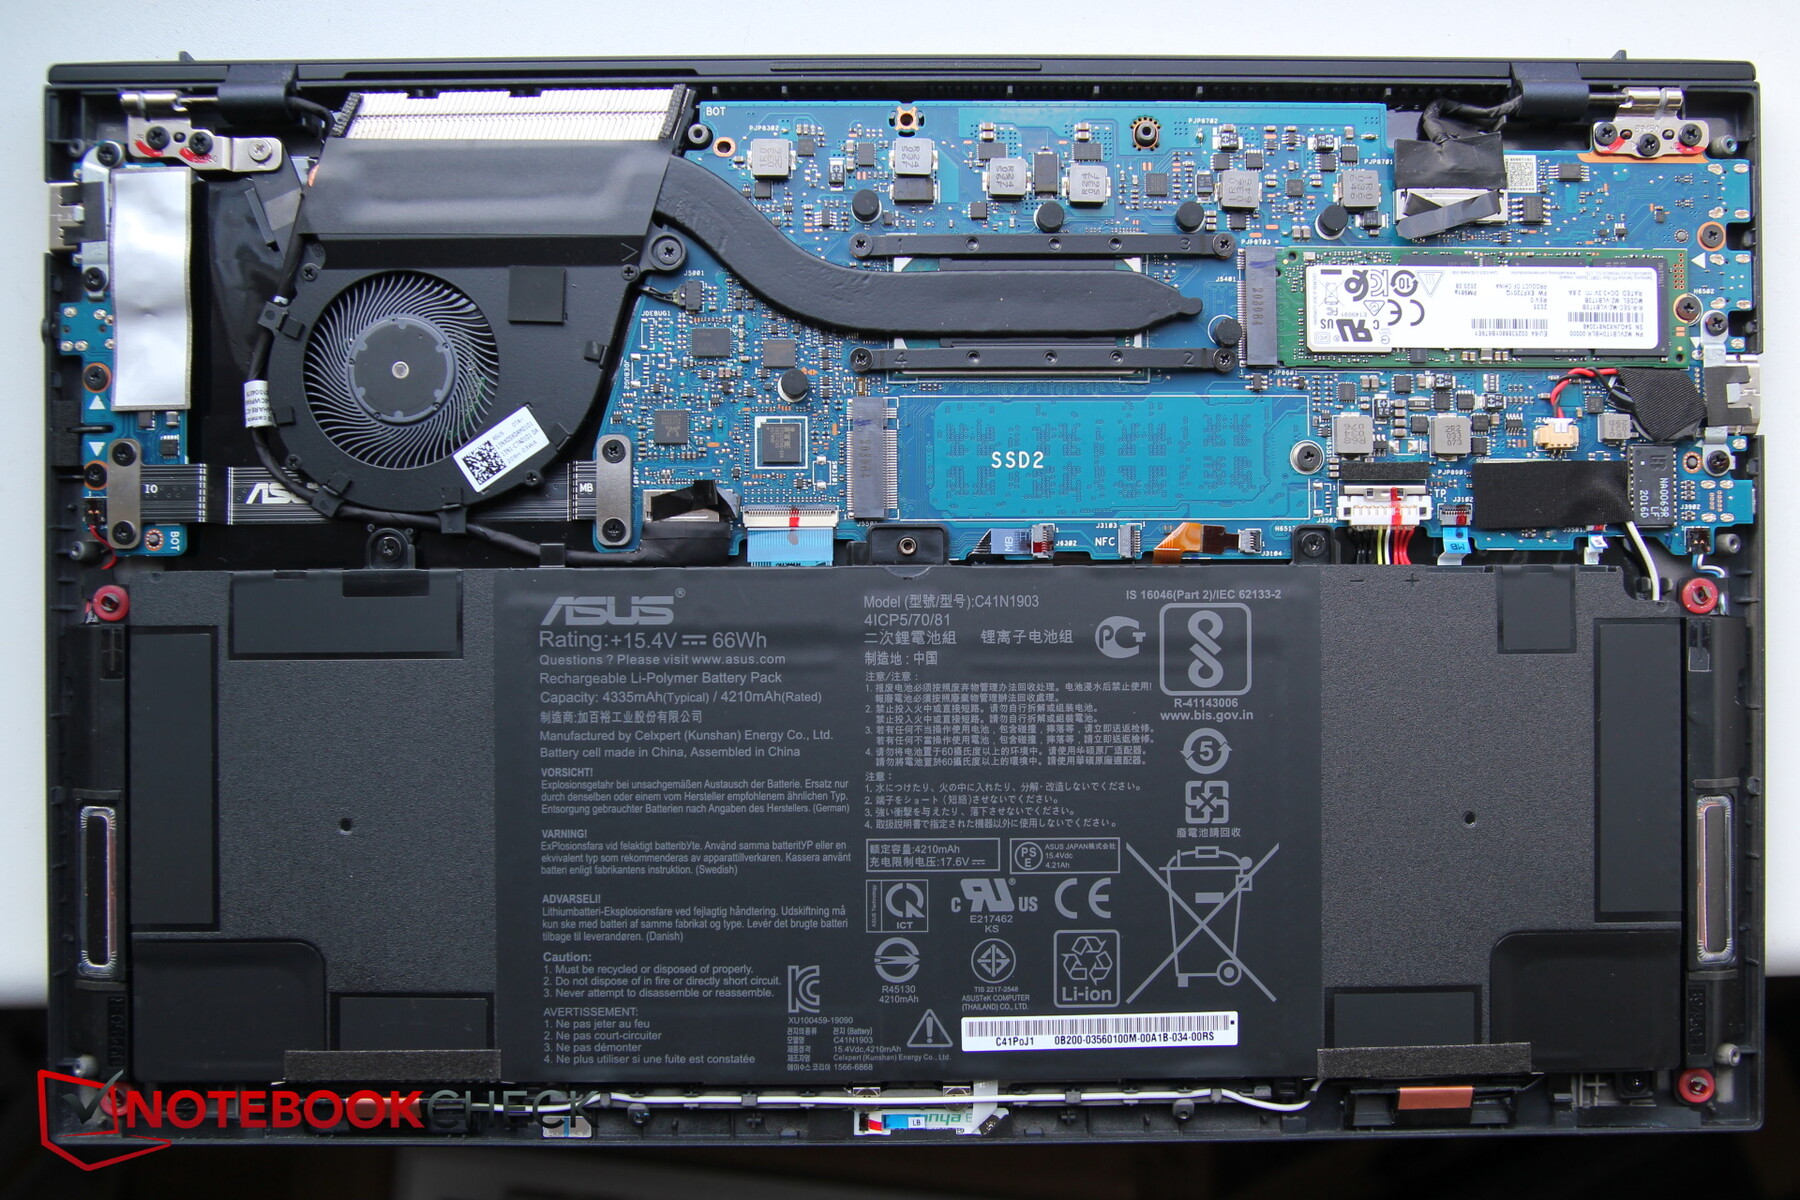
The back plate is secured with the help of 11 small Torx T5 screws. It is best to start prying it away at the front edges. This can be done without using an additional tool.
Inside the device, users will have access to the single fan, the battery and the two SSD slots.
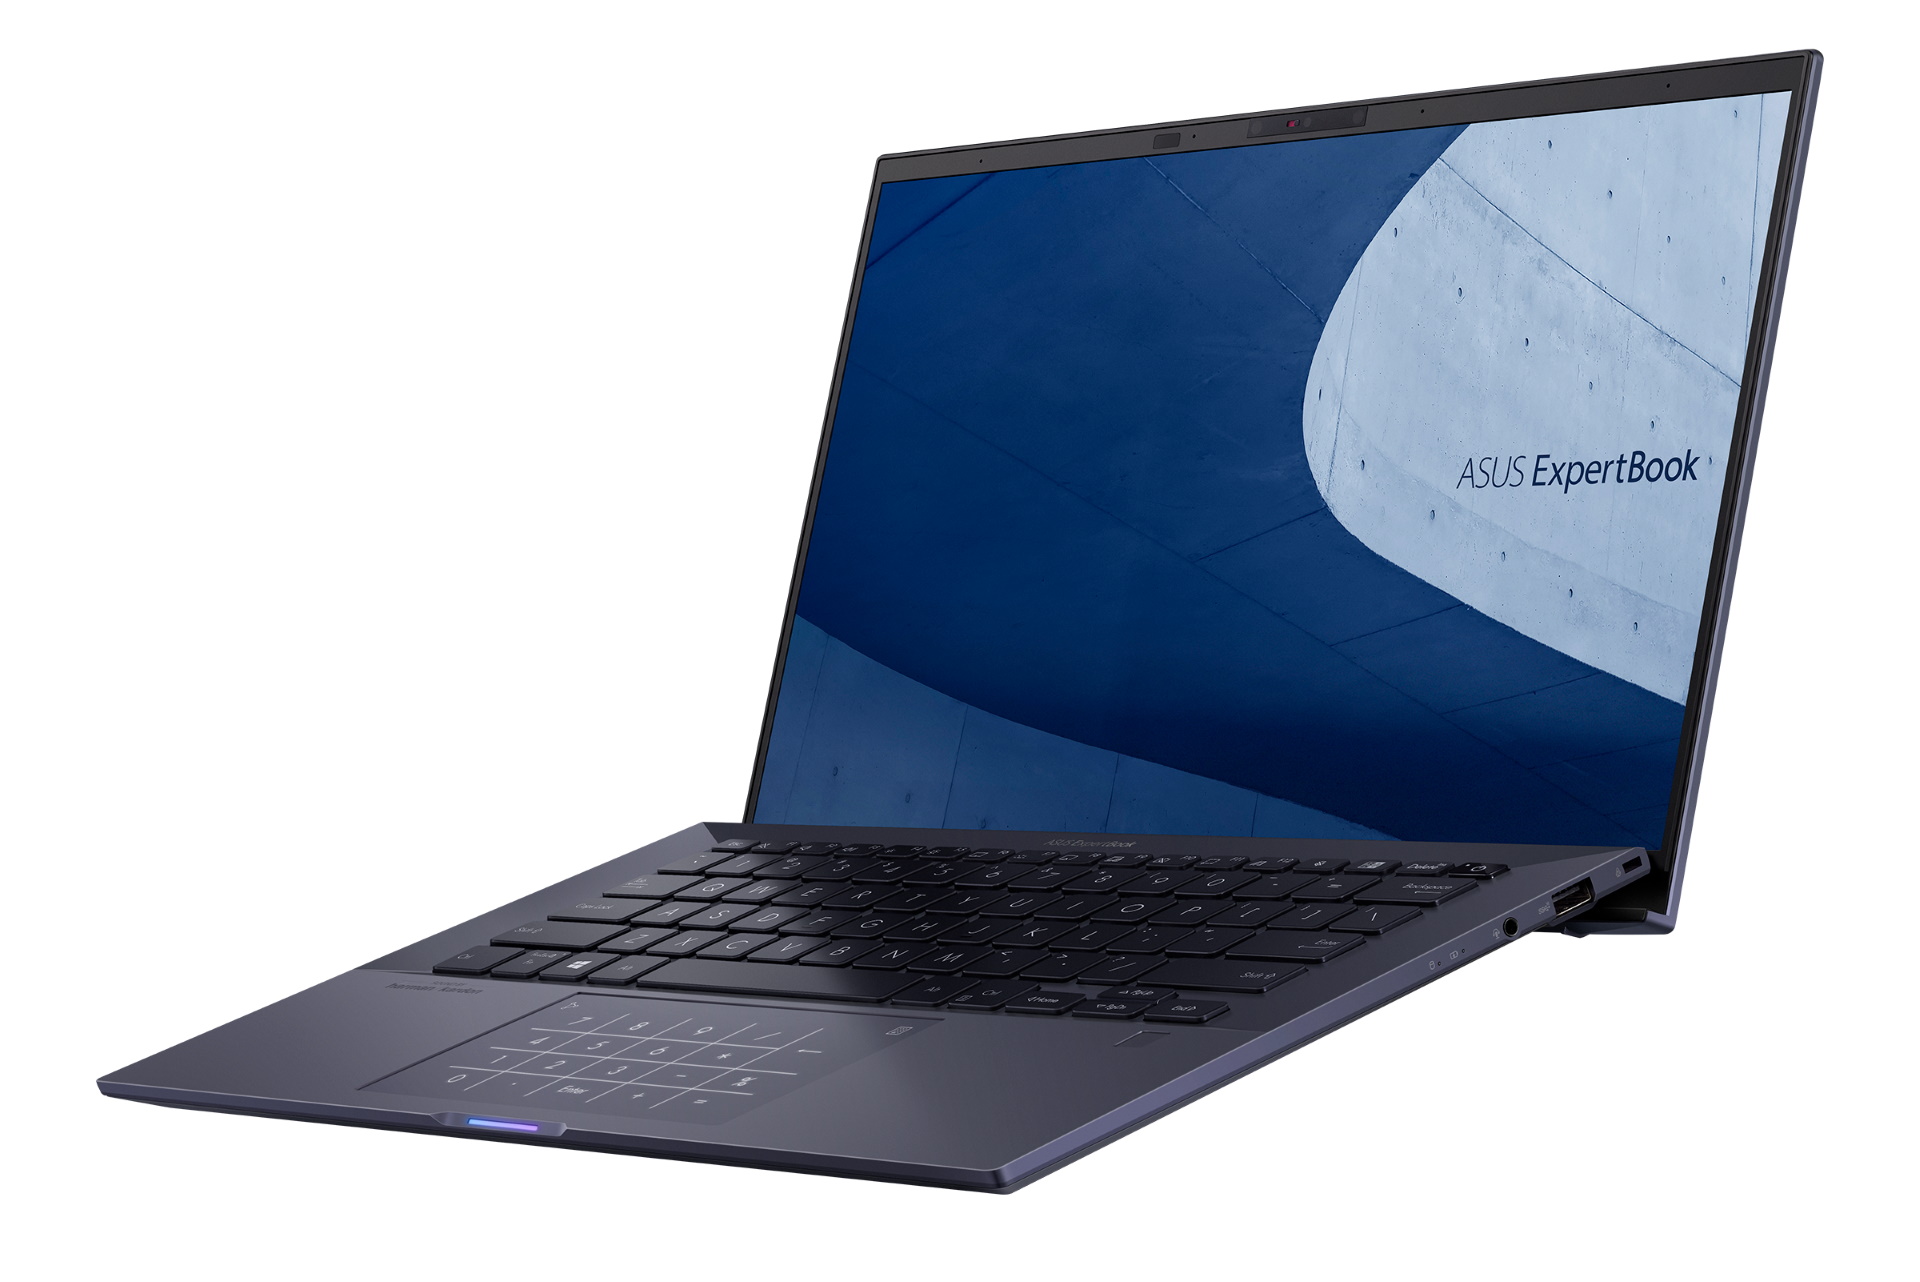
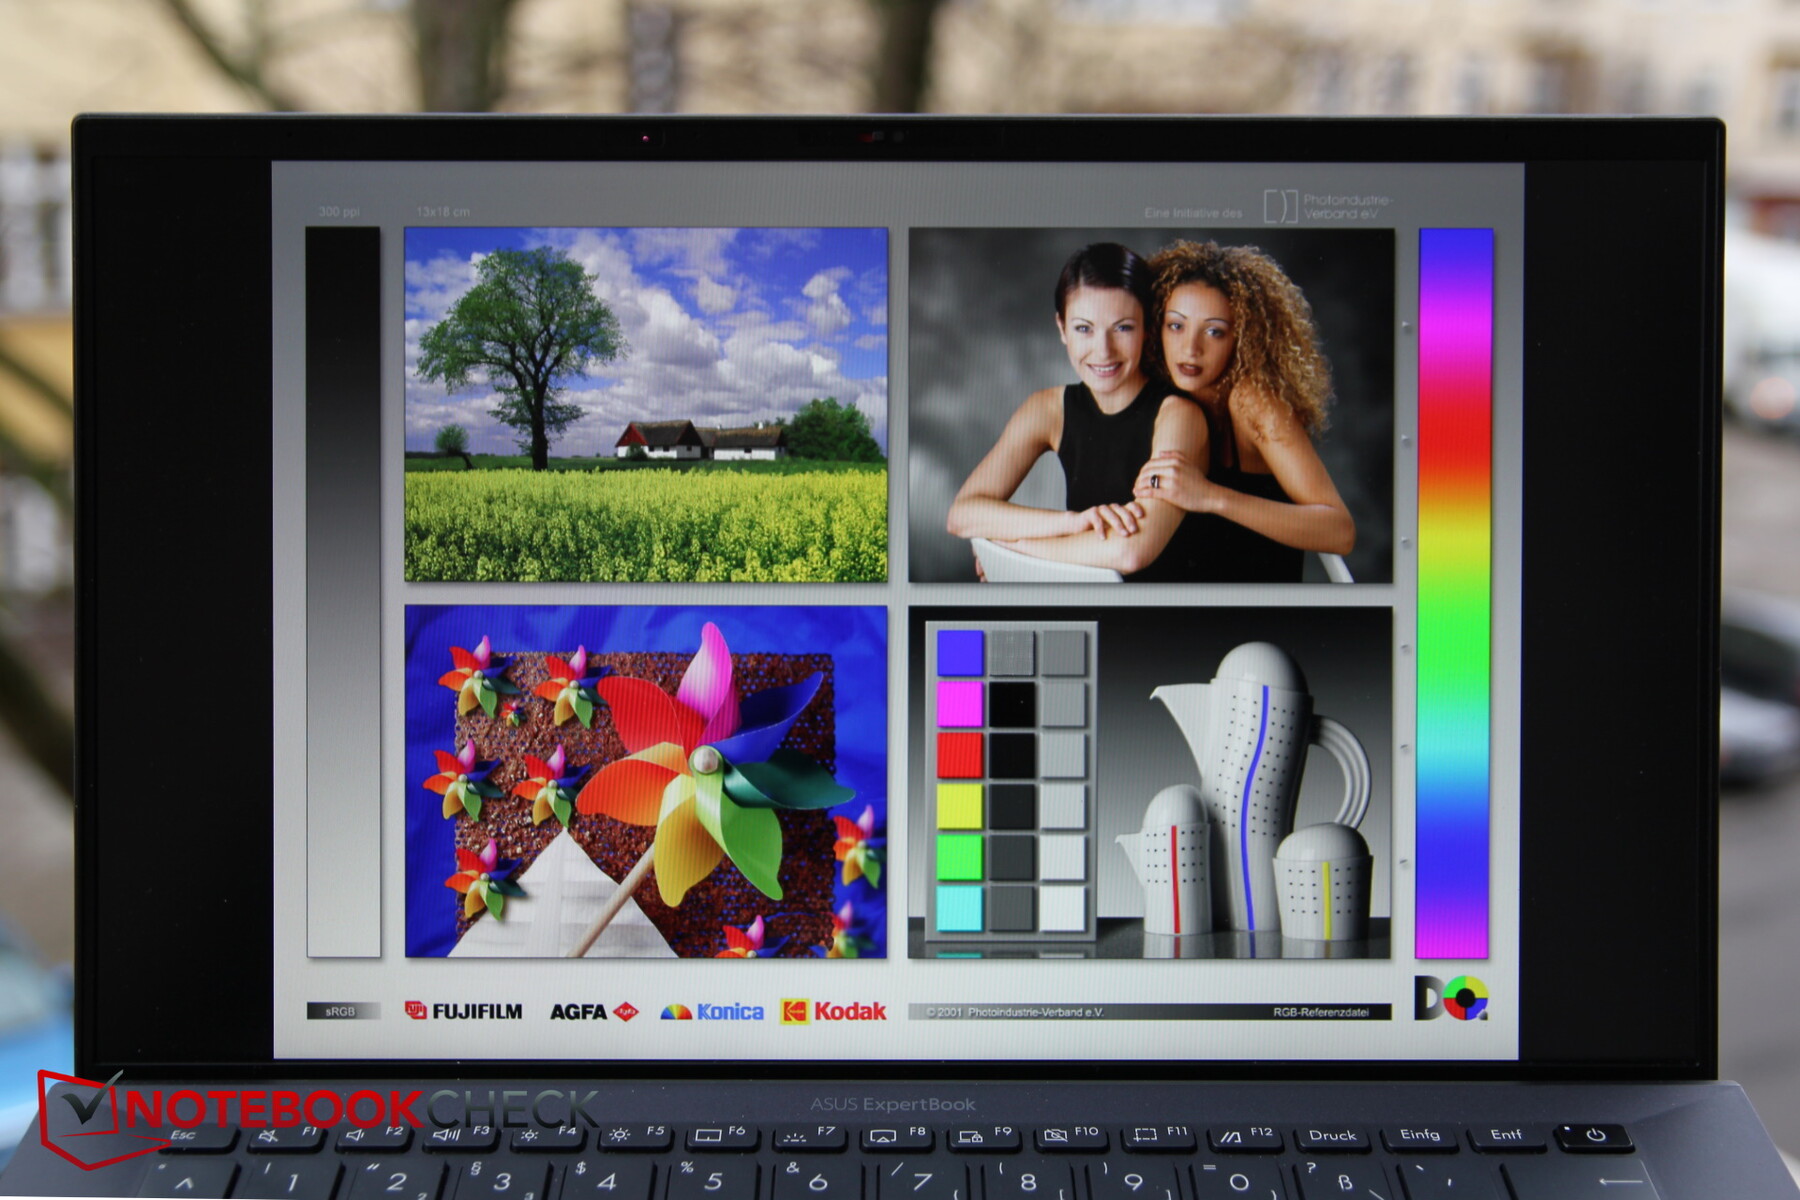
Display - Bright and contrast-rich
At the moment, it is not entirely clear from Asus’ website how many screen options there are. It appears as though Asus offers two different Full HD panels.
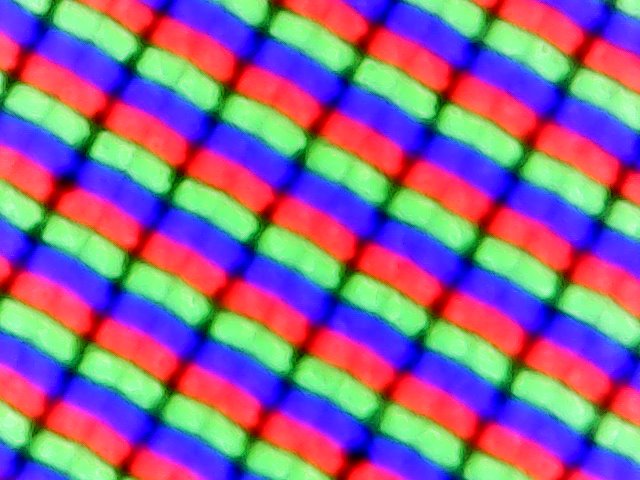
Just like the predecessor, our current review device features a matte Full HD IPS panel from AU Optronics. However, it looks as though it is an entirely different panel, because it is much brighter (421 cd/m² as opposed to 286 cd/m²). The brightness distribution of 87% is quite satisfactory.
There are no issues related to screen bleeding. The panel does not utilise PWM for brightness control.

| |||||||||||||||||||||||||
Brightness Distribution: 87 %
Center on Battery: 445 cd/m²
Contrast: 1507:1 (Black: 0.29 cd/m²)
ΔE ColorChecker Calman: 1.8 | ∀{0.5-29.43 Ø4.73}
calibrated: 1.4
ΔE Greyscale Calman: 2.3 | ∀{0.09-98 Ø4.97}
98.7% sRGB (Argyll 1.6.3 3D)
65.4% AdobeRGB 1998 (Argyll 1.6.3 3D)
71.3% AdobeRGB 1998 (Argyll 3D)
98.8% sRGB (Argyll 3D)
69.8% Display P3 (Argyll 3D)
Gamma: 2.18
CCT: 6782 K
| Asus ExpertBook B9 B9400CE-KC0166R B140HAN06.B, IPS, 1920x1080, 14" | Asus ExpertBook B9450FA, i7-10510U AU Optronics AUO623D, IPS, 1920x1080, 14" | Acer Swift 5 SF514-55T-58DN AU Optronics AUO7490, IPS, 1920x1080, 14" | LG Gram 14Z90N LG Philips LP140WF7-SPG1, IPS, 1920x1080, 14" | Lenovo ThinkPad X1 Nano-20UN002UGE MND007ZA1-2, IPS, 2160x1350, 13" | Acer Swift 3 SF314-42-R27B AU Optronics B140HAN04.0, IPS, 1920x1080, 14" | |
|---|---|---|---|---|---|---|
| Display | -2% | -3% | -6% | 1% | -45% | |
| Display P3 Coverage (%) | 69.8 | 68.3 -2% | 67 -4% | 65 -7% | 70.4 1% | 37.78 -46% |
| sRGB Coverage (%) | 98.8 | 98.9 0% | 98.3 -1% | 95.5 -3% | 99.9 1% | 56.8 -43% |
| AdobeRGB 1998 Coverage (%) | 71.3 | 69.3 -3% | 68.3 -4% | 66.1 -7% | 72 1% | 39.03 -45% |
| Response Times | 7% | 52% | 18% | 14% | 18% | |
| Response Time Grey 50% / Grey 80% * (ms) | 60 ? | 55 ? 8% | 30 ? 50% | 40.4 ? 33% | 46.8 ? 22% | 42 ? 30% |
| Response Time Black / White * (ms) | 29.6 ? | 28 ? 5% | 14 ? 53% | 28.8 ? 3% | 28 ? 5% | 28 ? 5% |
| PWM Frequency (Hz) | ||||||
| Screen | 13% | 9% | -16% | 9% | -99% | |
| Brightness middle (cd/m²) | 437 | 294 -33% | 404 -8% | 316.8 -28% | 460 5% | 256 -41% |
| Brightness (cd/m²) | 421 | 286 -32% | 377 -10% | 298 -29% | 434 3% | 237 -44% |
| Brightness Distribution (%) | 87 | 86 -1% | 79 -9% | 89 2% | 92 6% | 81 -7% |
| Black Level * (cd/m²) | 0.29 | 0.12 59% | 0.25 14% | 0.33 -14% | 0.27 7% | 0.17 41% |
| Contrast (:1) | 1507 | 2450 63% | 1616 7% | 960 -36% | 1704 13% | 1506 0% |
| Colorchecker dE 2000 * | 1.8 | 1.45 19% | 1.47 18% | 1.74 3% | 1.1 39% | 5.43 -202% |
| Colorchecker dE 2000 max. * | 3.5 | 2.74 22% | 2.6 26% | 5.41 -55% | 4.5 -29% | 19.73 -464% |
| Colorchecker dE 2000 calibrated * | 1.4 | 1.05 25% | 0.84 40% | 1.37 2% | 1 29% | 4.8 -243% |
| Greyscale dE 2000 * | 2.3 | 1.65 28% | 1.7 26% | 2.7 -17% | 1.6 30% | 3.29 -43% |
| Gamma | 2.18 101% | 2.47 89% | 2.35 94% | 2.23 99% | 2.2 100% | 2.52 87% |
| CCT | 6782 96% | 6685 97% | 6662 98% | 6655 98% | 6475 100% | 6840 95% |
| Color Space (Percent of AdobeRGB 1998) (%) | 65.4 | 64 -2% | 63 -4% | 61.3 -6% | 65.7 0% | 36 -45% |
| Color Space (Percent of sRGB) (%) | 98.7 | 99 0% | 98 -1% | 95.4 -3% | 99.9 1% | 57 -42% |
| Total Average (Program / Settings) | 6% /
10% | 19% /
12% | -1% /
-10% | 8% /
8% | -42% /
-74% |
* ... smaller is better
Both the black value (0.29 cd/m² to 0.12 cd/m²) and the contrast ratio (1507:1 to 2450:1) have gotten worse. However, these are still good results.
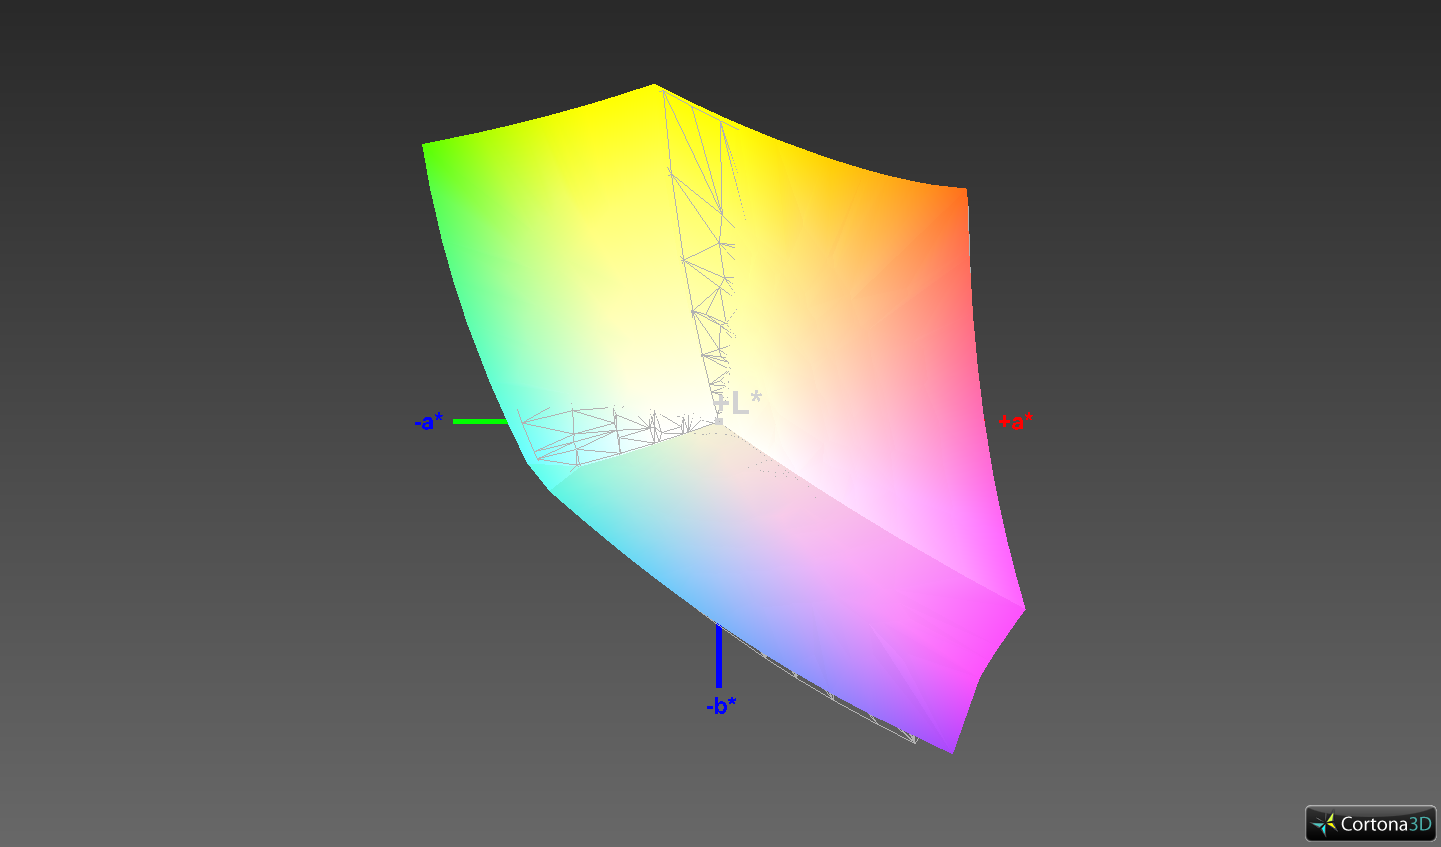
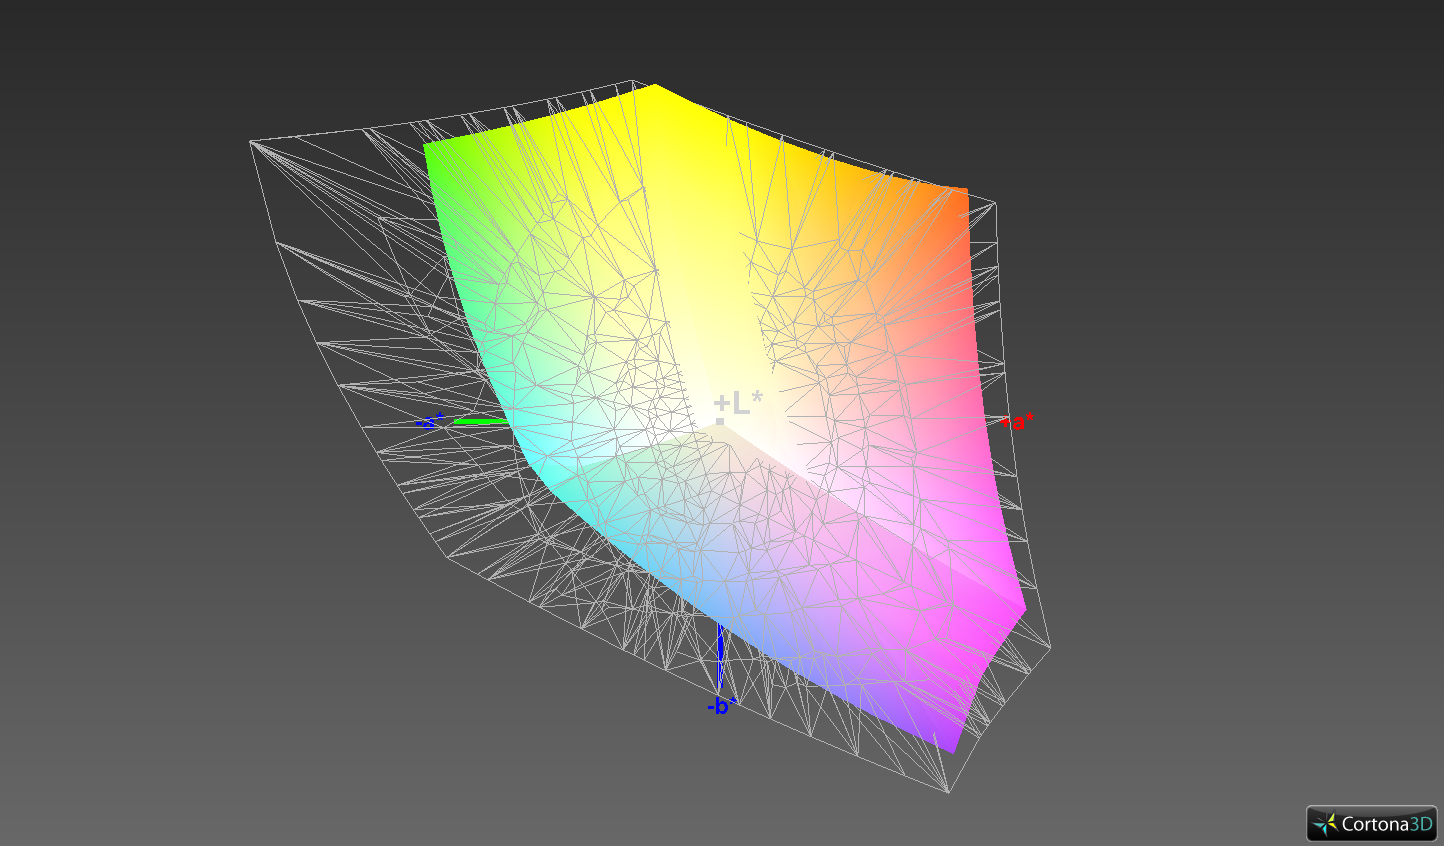
There are no changes in terms of colour space coverage. The panel still covers almost all of the sRGB colour space and up to 65% of the AdobeRGB colour space. Most other competing devices in this price range offer similar results.
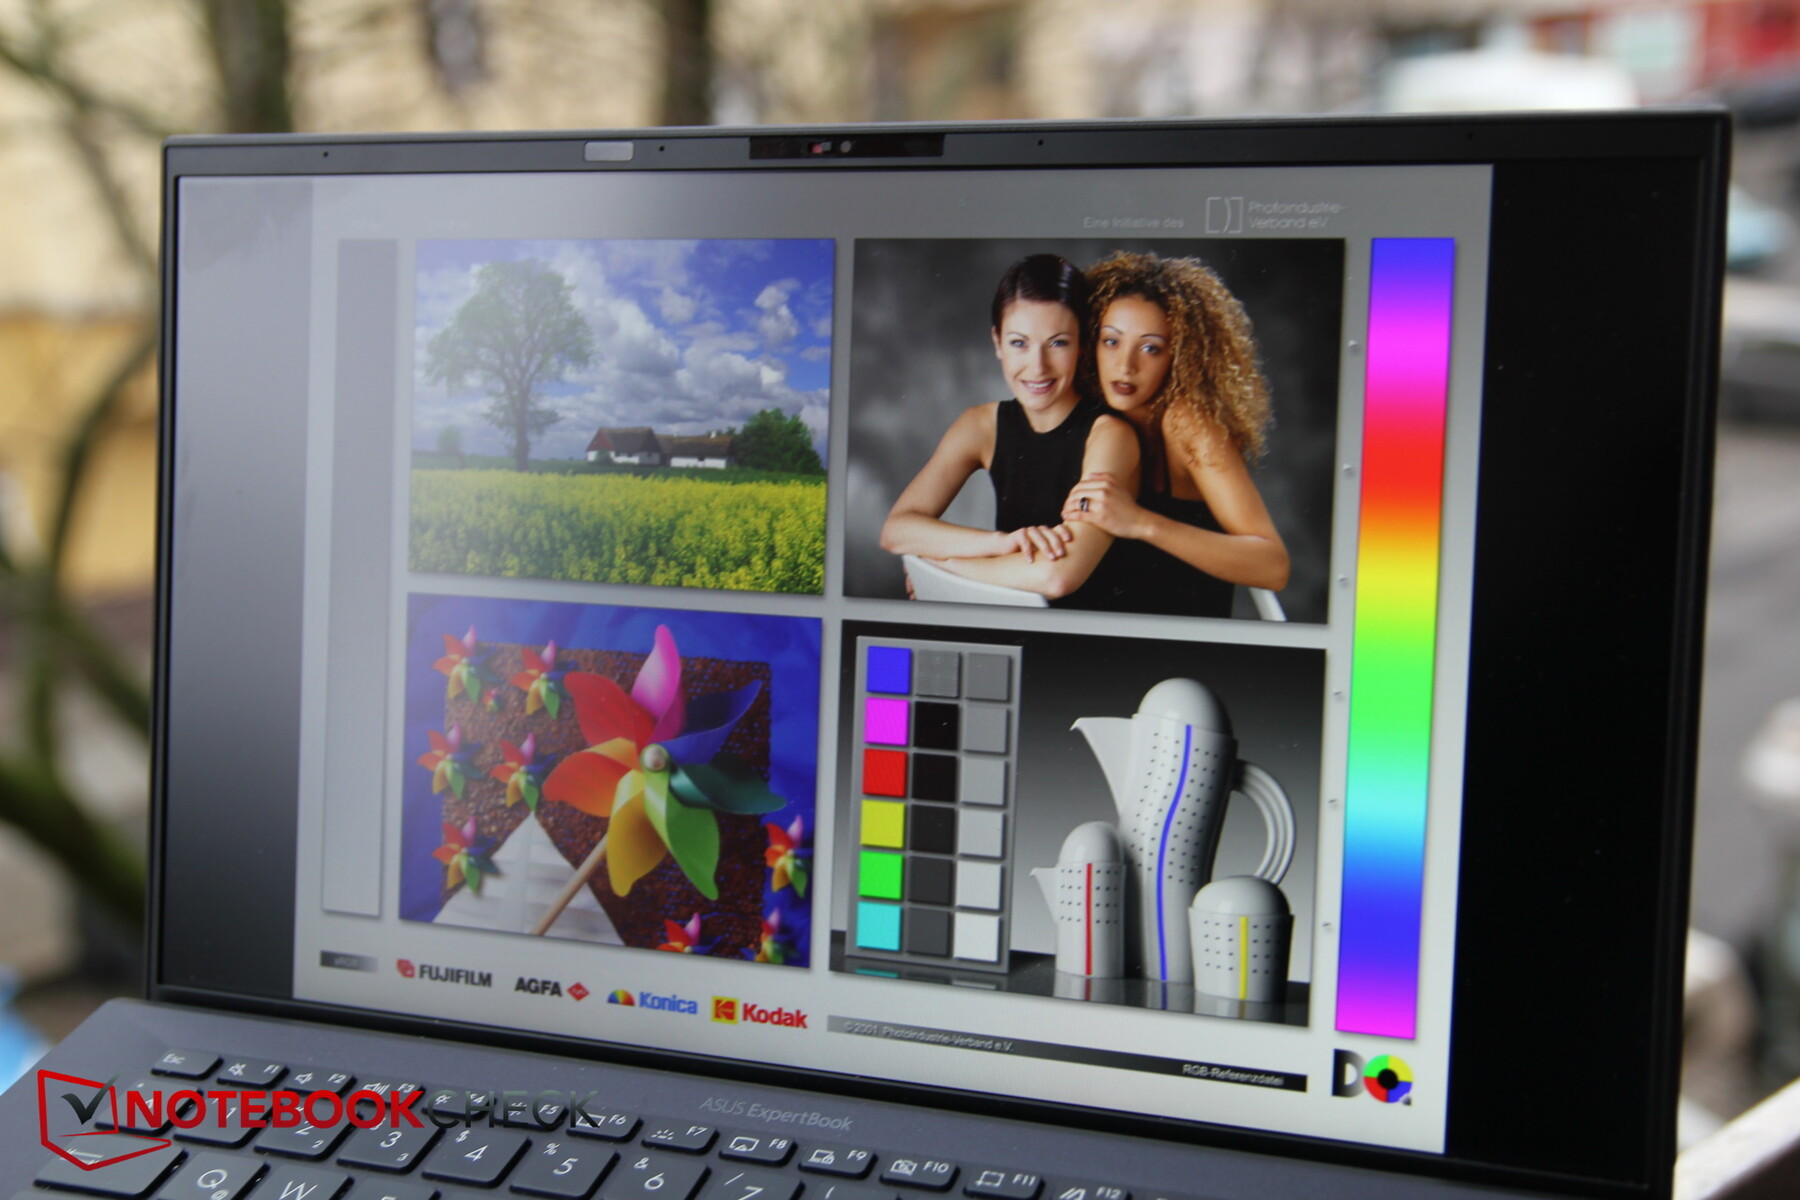
Thanks to a higher brightness and the matte screen surface, the light ExpertBook is more usable outdoors than its predecessor. However, we would not recommend using the Asus laptop in direct sunlight.
Display Response Times
| ↔ Response Time Black to White | ||
|---|---|---|
| 29.6 ms ... rise ↗ and fall ↘ combined | ↗ 14 ms rise | 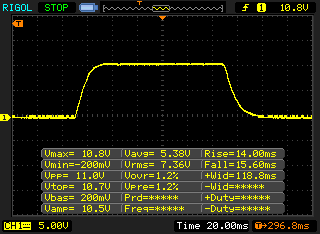 |
| ↘ 15.6 ms fall | ||
| The screen shows relatively slow response rates in our tests and may be too slow for gamers. In comparison, all tested devices range from 0.1 (minimum) to 240 (maximum) ms. » 79 % of all devices are better. This means that the measured response time is worse than the average of all tested devices (19.9 ms). | ||
| ↔ Response Time 50% Grey to 80% Grey | ||
| 60 ms ... rise ↗ and fall ↘ combined | ↗ 28.8 ms rise | 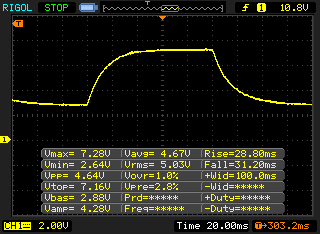 |
| ↘ 31.2 ms fall | ||
| The screen shows slow response rates in our tests and will be unsatisfactory for gamers. In comparison, all tested devices range from 0.165 (minimum) to 636 (maximum) ms. » 96 % of all devices are better. This means that the measured response time is worse than the average of all tested devices (31.1 ms). | ||
Screen Flickering / PWM (Pulse-Width Modulation)
| Screen flickering / PWM not detected |  | ||
In comparison: 52 % of all tested devices do not use PWM to dim the display. If PWM was detected, an average of 7798 (minimum: 5 - maximum: 343500) Hz was measured. | |||
As per usual, the IPS panel offers very wide viewing angles. Howbeit, the brightness drops slightly at acute angles.

Performance - Beats the predecessor by a large margin
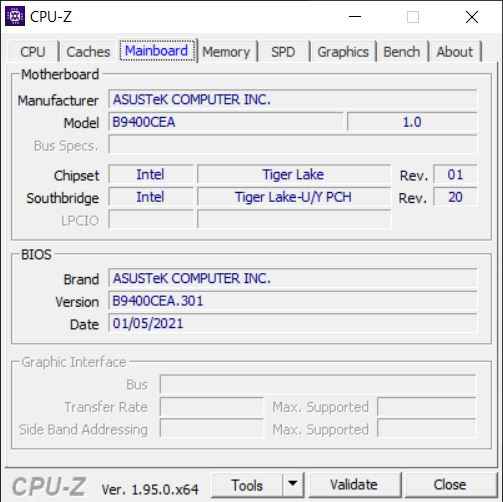
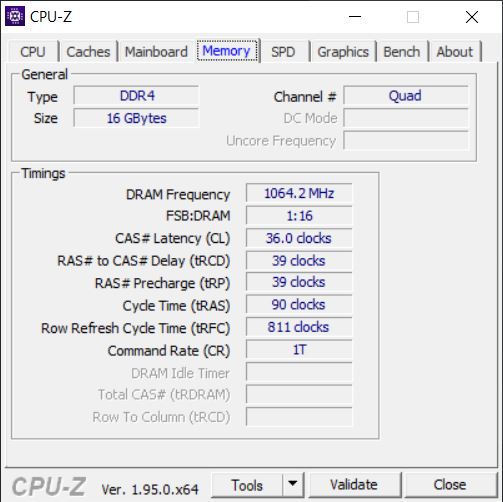
The ExpertBook is a feather-light business companion. Thanks to its Tiger Lake CPU, Iris Xe Graphics and 16 GB of RAM, it can handle most somewhat demanding tasks without breaking a sweat. The entire package offers a very good level of performance while weighing less than a carton of milk. However, the RAM is soldered onto the motherboard, which is why it cannot be replaced or upgraded.
We conducted all of our benchmarks in performance mode to get the best results. The performance mode can be enabled through the MyAsus
utility.

Processor
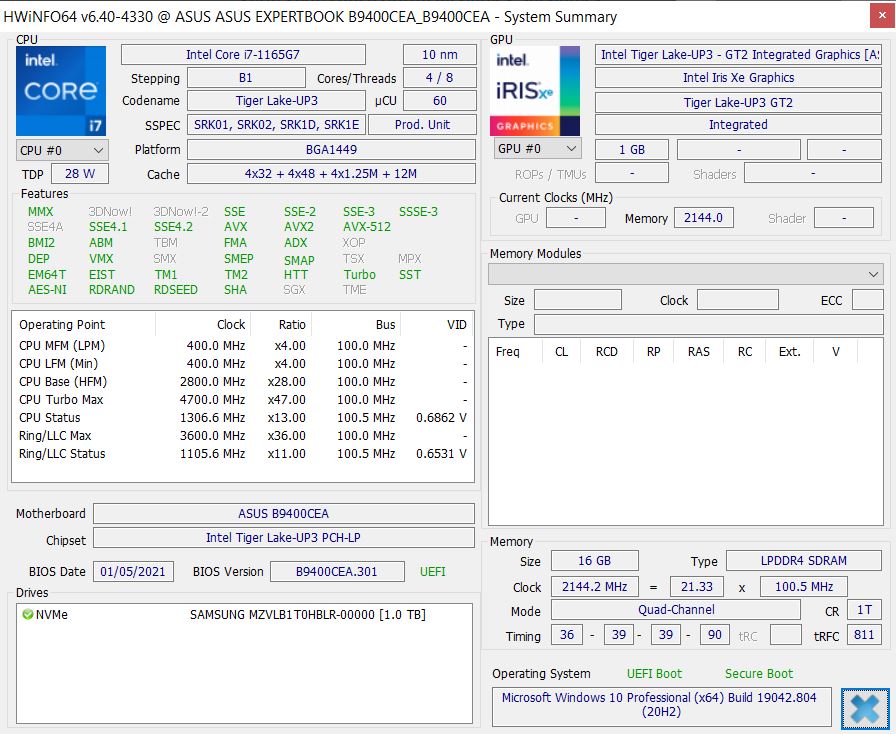
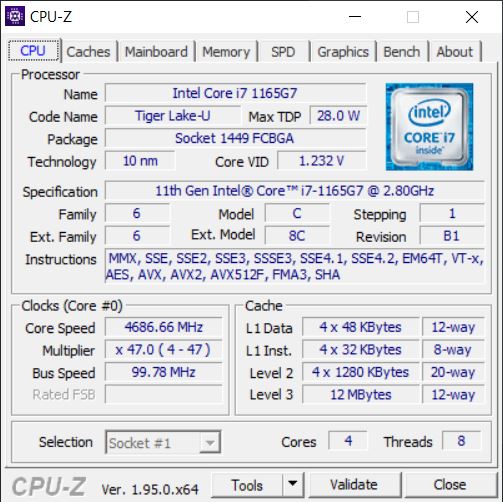
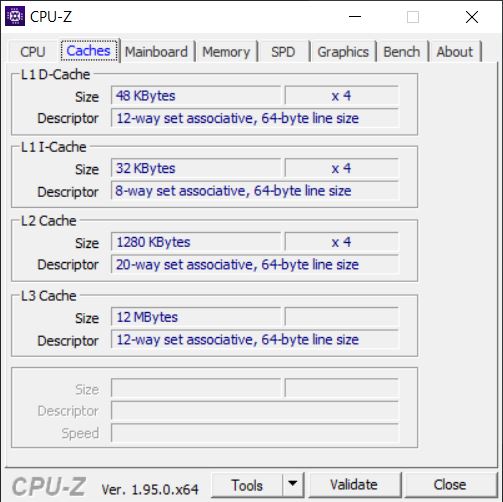
The Intel Core i7-1165G7 is one of the fastest Tiger Lake chips. The quad-core SoC can boost its frequency up to 4.7 GHz. When idle, the chip can downclock itself to 1.2 GHz to save energy. The Intel Iris Xe Graphics G7 (96 EUs) features 96 execution units with a clock rate in the range of 400 to 1300 MHz.
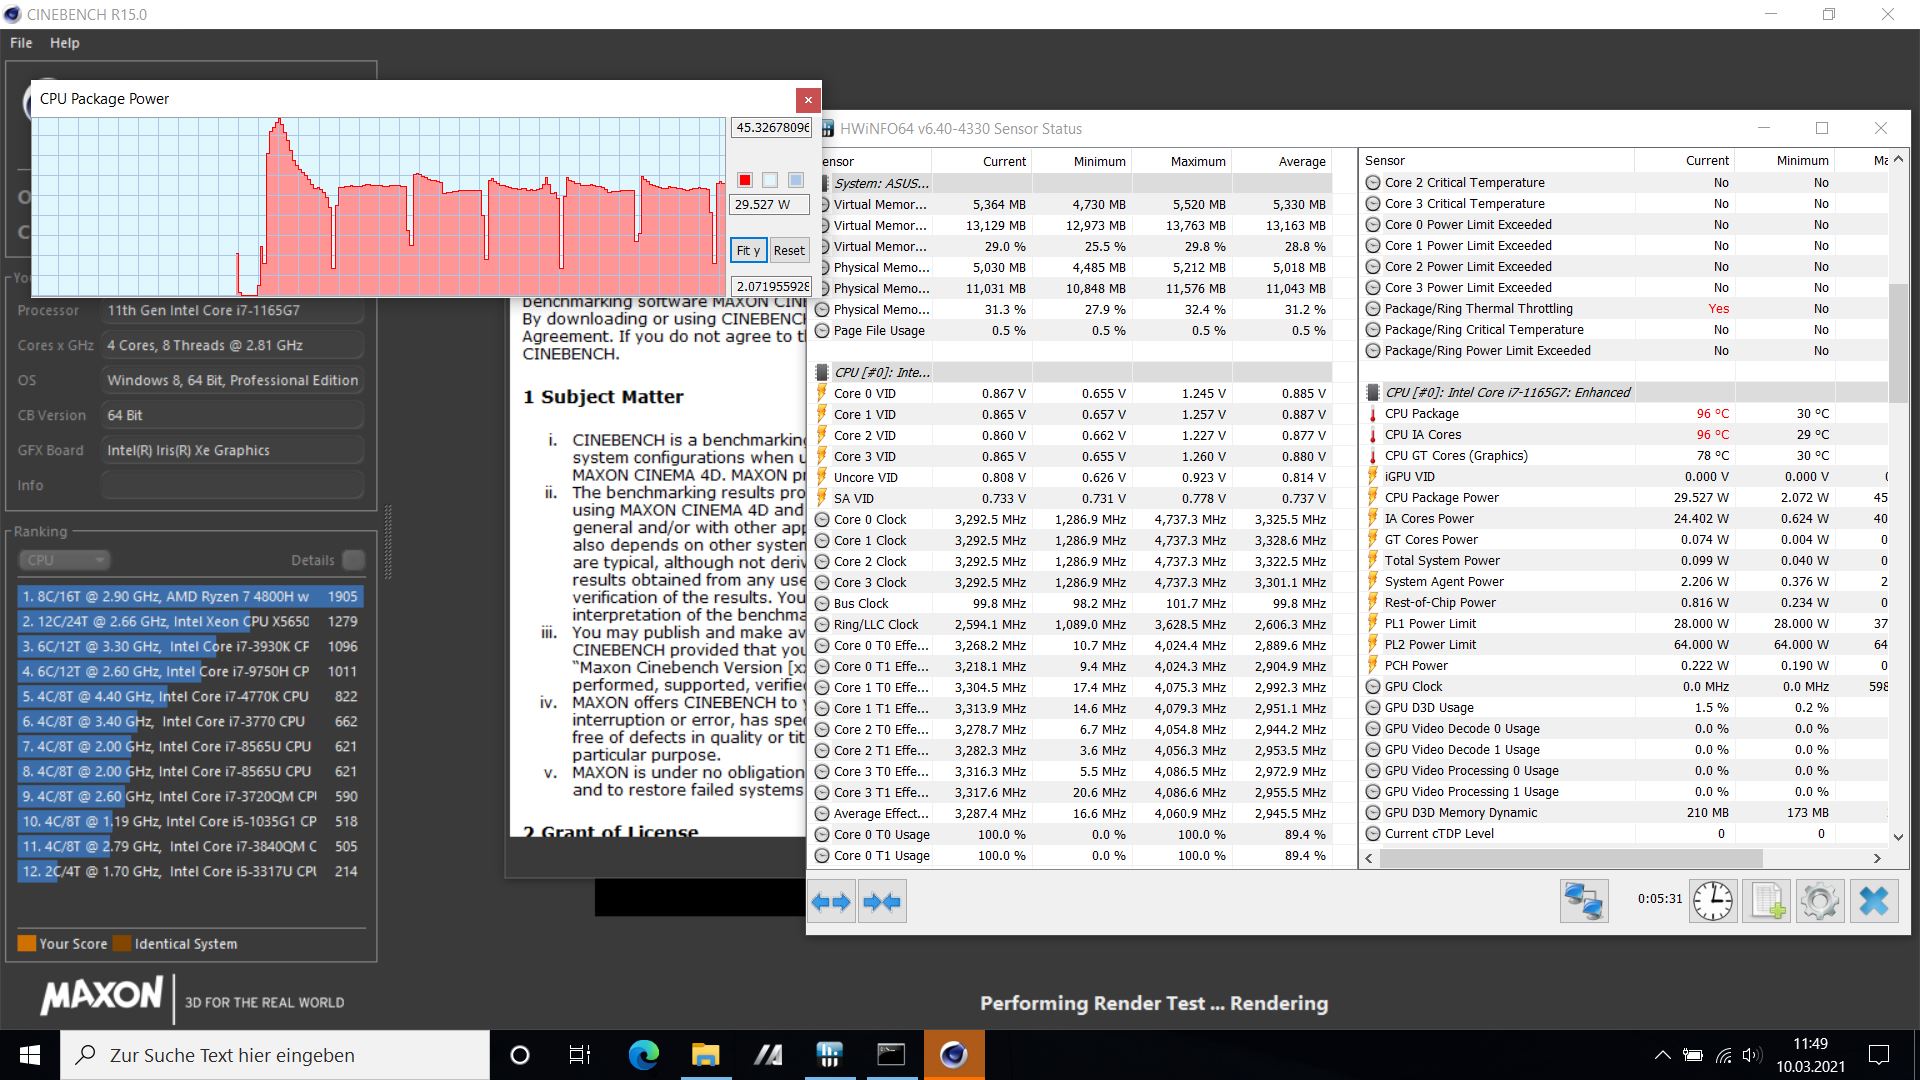
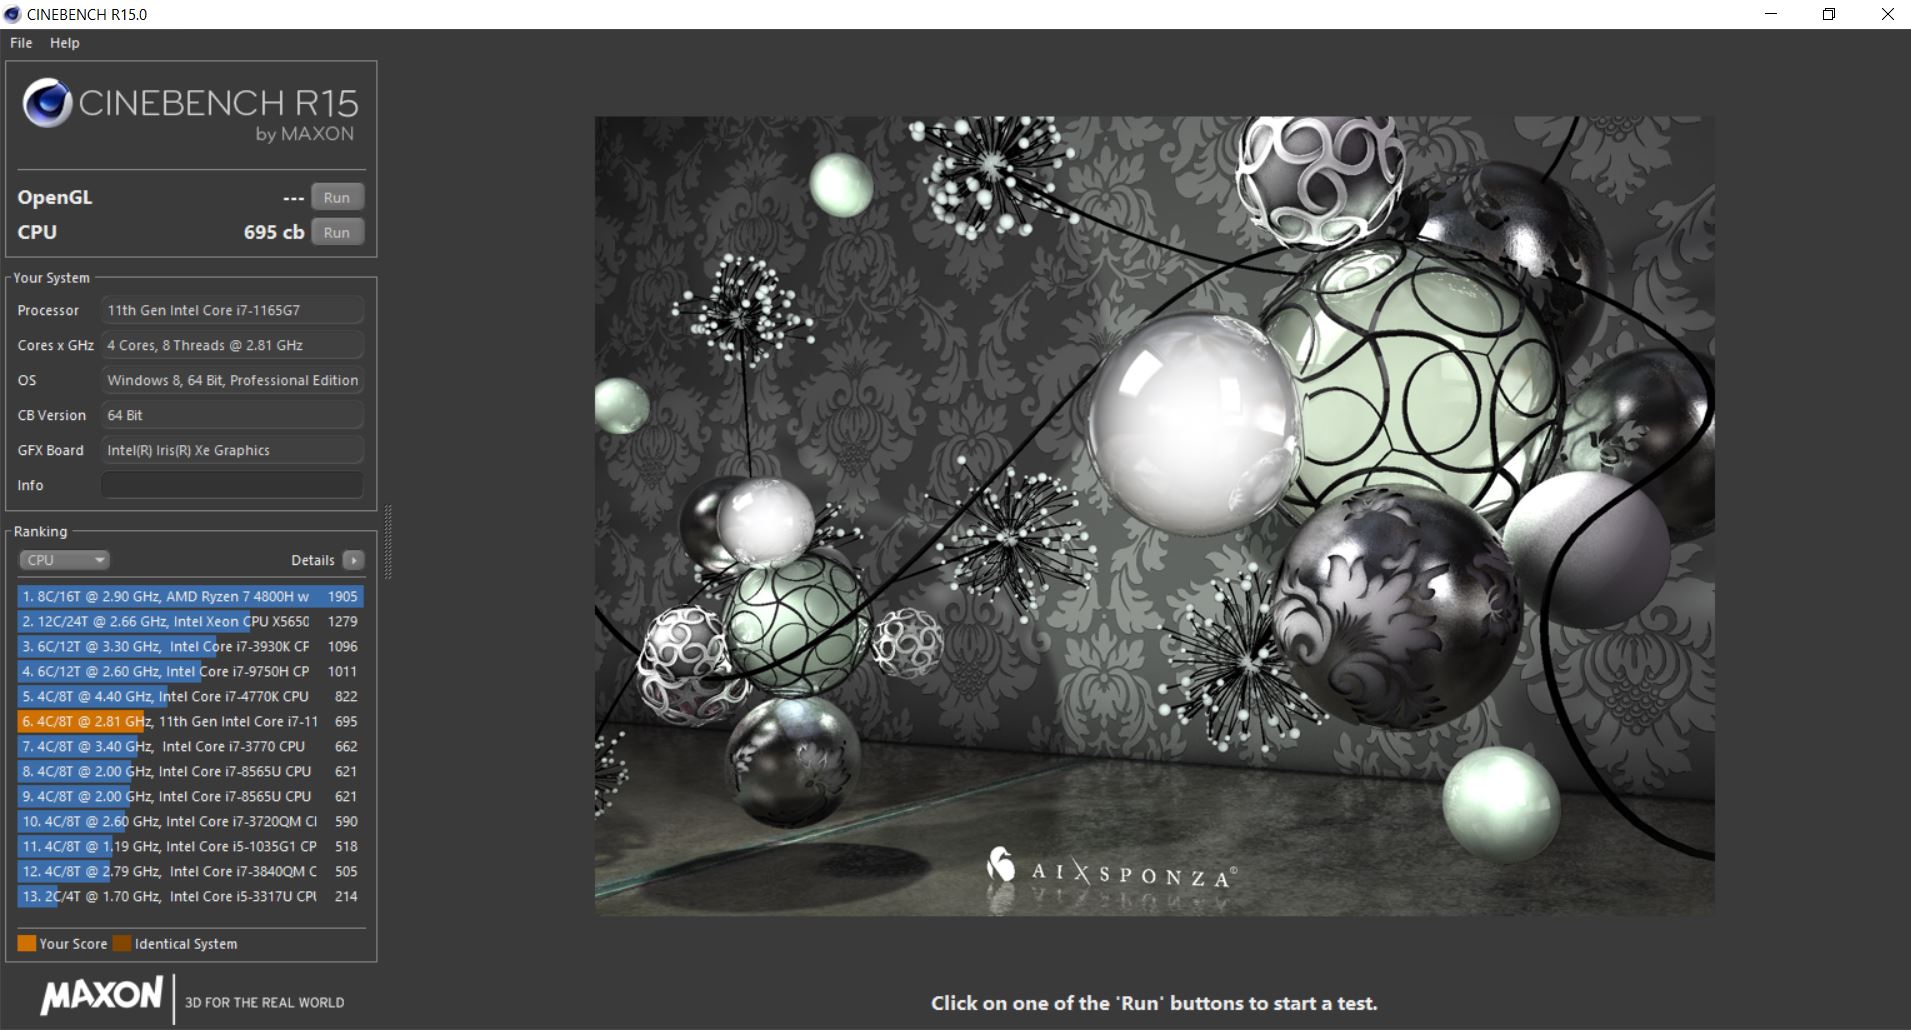
In the Cinebench loop, the CPU is able to maintain a very decent level of performance. The chip in the ExpertBook actually performs better than an average i7-1165G7. After the first benchmark run, the clock rates fall by about 8%. The Comet Lake CPU in the predecessor model is beaten by 60%, and the small
Ryzen 3 4300U in the Acer Swift 3 is beaten by 57%. It is commendable that our current review device is able to maintain a stable level of performance, unlike the Thinkpad X1 Nano with the same chip.
The TDP hit 45 W only in the first benchmark run. In the subsequent benchmark runs, the TDP fluctuated between 27 and 31 W, amounting to about 29 W on average.
When running on battery power, the performance fell by 17 to 24%, at least in the multi-core Cinebench R15 benchmarks.
Cinebench R15: CPU Single 64Bit | CPU Multi 64Bit
Blender: v2.79 BMW27 CPU
7-Zip 18.03: 7z b 4 -mmt1 | 7z b 4
Geekbench 5.5: Single-Core | Multi-Core
HWBOT x265 Benchmark v2.2: 4k Preset
LibreOffice : 20 Documents To PDF
R Benchmark 2.5: Overall mean
| Cinebench R20 / CPU (Single Core) | |
| Average of class Subnotebook (128 - 832, n=57, last 2 years) | |
| Asus ExpertBook B9 B9400CE-KC0166R | |
| Average Intel Core i7-1165G7 (442 - 589, n=81) | |
| Lenovo ThinkPad X1 Nano-20UN002UGE | |
| Acer Swift 5 SF514-55T-58DN | |
| Acer Swift 3 SF314-42-R27B | |
| LG Gram 14Z90N | |
| Cinebench R20 / CPU (Multi Core) | |
| Average of class Subnotebook (579 - 8541, n=57, last 2 years) | |
| Acer Swift 5 SF514-55T-58DN | |
| Asus ExpertBook B9 B9400CE-KC0166R | |
| Average Intel Core i7-1165G7 (1060 - 2657, n=81) | |
| Lenovo ThinkPad X1 Nano-20UN002UGE | |
| Acer Swift 3 SF314-42-R27B | |
| LG Gram 14Z90N | |
| Cinebench R15 / CPU Single 64Bit | |
| Average of class Subnotebook (72.4 - 322, n=57, last 2 years) | |
| Asus ExpertBook B9 B9400CE-KC0166R | |
| Average Intel Core i7-1165G7 (115 - 230, n=78) | |
| Lenovo ThinkPad X1 Nano-20UN002UGE | |
| Acer Swift 5 SF514-55T-58DN | |
| LG Gram 14Z90N | |
| Acer Swift 3 SF314-42-R27B | |
| Asus ExpertBook B9450FA, i7-10510U | |
| Cinebench R15 / CPU Multi 64Bit | |
| Average of class Subnotebook (327 - 3345, n=57, last 2 years) | |
| Acer Swift 5 SF514-55T-58DN | |
| Asus ExpertBook B9 B9400CE-KC0166R | |
| Lenovo ThinkPad X1 Nano-20UN002UGE | |
| Average Intel Core i7-1165G7 (553 - 1027, n=86) | |
| Acer Swift 3 SF314-42-R27B | |
| Asus ExpertBook B9450FA, i7-10510U | |
| LG Gram 14Z90N | |
| Blender / v2.79 BMW27 CPU | |
| LG Gram 14Z90N | |
| Acer Swift 3 SF314-42-R27B | |
| Lenovo ThinkPad X1 Nano-20UN002UGE | |
| Average Intel Core i7-1165G7 (468 - 1138, n=80) | |
| Acer Swift 5 SF514-55T-58DN | |
| Asus ExpertBook B9 B9400CE-KC0166R | |
| Average of class Subnotebook (159 - 2271, n=58, last 2 years) | |
| 7-Zip 18.03 / 7z b 4 -mmt1 | |
| Average of class Subnotebook (2643 - 6699, n=59, last 2 years) | |
| Asus ExpertBook B9 B9400CE-KC0166R | |
| Average Intel Core i7-1165G7 (4478 - 5507, n=80) | |
| Acer Swift 5 SF514-55T-58DN | |
| Lenovo ThinkPad X1 Nano-20UN002UGE | |
| LG Gram 14Z90N | |
| Acer Swift 3 SF314-42-R27B | |
| 7-Zip 18.03 / 7z b 4 | |
| Average of class Subnotebook (11668 - 77867, n=57, last 2 years) | |
| Acer Swift 5 SF514-55T-58DN | |
| Asus ExpertBook B9 B9400CE-KC0166R | |
| Average Intel Core i7-1165G7 (15347 - 27405, n=80) | |
| Lenovo ThinkPad X1 Nano-20UN002UGE | |
| Acer Swift 3 SF314-42-R27B | |
| LG Gram 14Z90N | |
| Geekbench 5.5 / Single-Core | |
| Average of class Subnotebook (726 - 2224, n=48, last 2 years) | |
| Average Intel Core i7-1165G7 (1302 - 1595, n=77) | |
| Asus ExpertBook B9 B9400CE-KC0166R | |
| Lenovo ThinkPad X1 Nano-20UN002UGE | |
| Acer Swift 5 SF514-55T-58DN | |
| Acer Swift 3 SF314-42-R27B | |
| LG Gram 14Z90N | |
| Geekbench 5.5 / Multi-Core | |
| Average of class Subnotebook (2557 - 17218, n=48, last 2 years) | |
| Acer Swift 5 SF514-55T-58DN | |
| Average Intel Core i7-1165G7 (3078 - 5926, n=77) | |
| Asus ExpertBook B9 B9400CE-KC0166R | |
| Lenovo ThinkPad X1 Nano-20UN002UGE | |
| Acer Swift 3 SF314-42-R27B | |
| LG Gram 14Z90N | |
| HWBOT x265 Benchmark v2.2 / 4k Preset | |
| Average of class Subnotebook (0.97 - 25.1, n=57, last 2 years) | |
| Asus ExpertBook B9 B9400CE-KC0166R | |
| Acer Swift 5 SF514-55T-58DN | |
| Average Intel Core i7-1165G7 (1.39 - 8.47, n=80) | |
| Lenovo ThinkPad X1 Nano-20UN002UGE | |
| Acer Swift 3 SF314-42-R27B | |
| LG Gram 14Z90N | |
| LibreOffice / 20 Documents To PDF | |
| Acer Swift 3 SF314-42-R27B | |
| LG Gram 14Z90N | |
| Average of class Subnotebook (39.9 - 220, n=56, last 2 years) | |
| Lenovo ThinkPad X1 Nano-20UN002UGE | |
| Acer Swift 5 SF514-55T-58DN | |
| Asus ExpertBook B9 B9400CE-KC0166R | |
| Average Intel Core i7-1165G7 (21.5 - 88.1, n=78) | |
| R Benchmark 2.5 / Overall mean | |
| LG Gram 14Z90N | |
| Acer Swift 3 SF314-42-R27B | |
| Lenovo ThinkPad X1 Nano-20UN002UGE | |
| Acer Swift 5 SF514-55T-58DN | |
| Average Intel Core i7-1165G7 (0.552 - 1.002, n=80) | |
| Asus ExpertBook B9 B9400CE-KC0166R | |
| Average of class Subnotebook (0.4024 - 1.456, n=58, last 2 years) | |
* ... smaller is better
System Performance
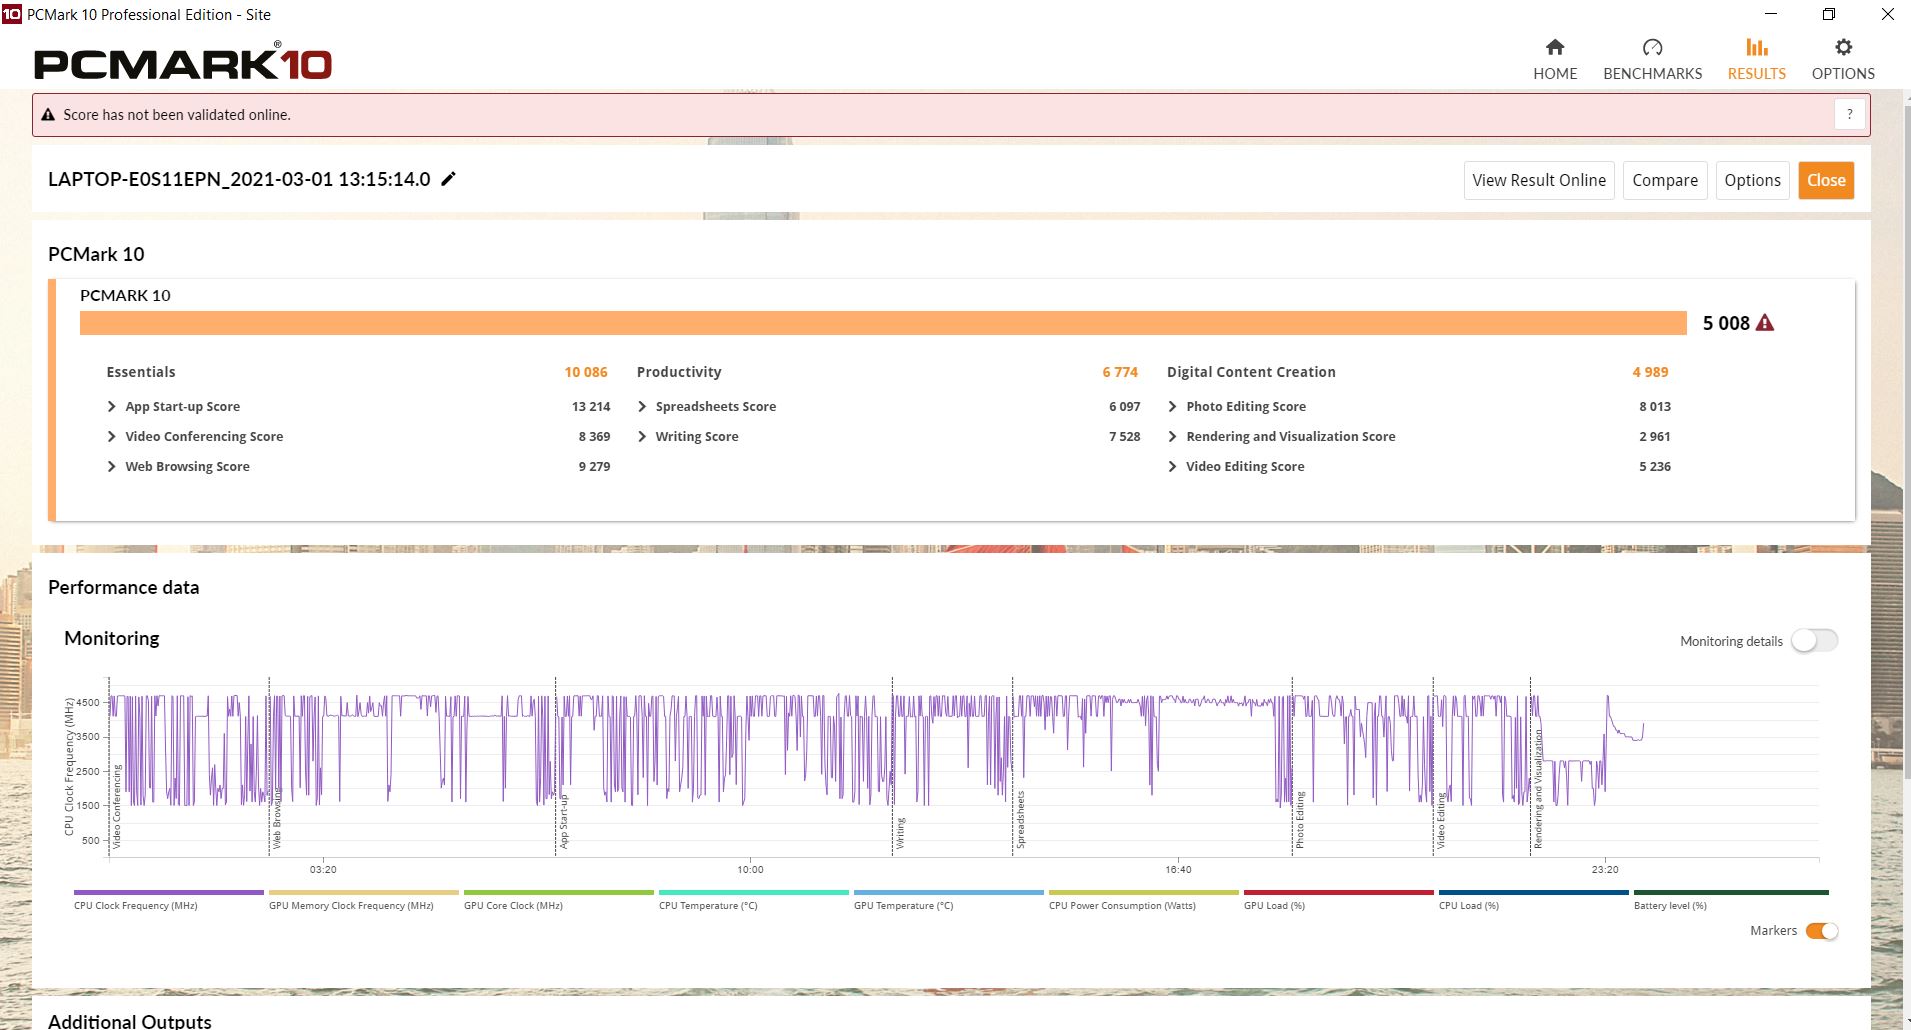
In PCMark 10, the CPU performs exactly as expected and beats the Comet Lake predecessor by 3% in the Productivity section and by up to 97% in the Digital Content Creation section.
The laptop feels very responsive in day-to-day use. There are no freezes or hitches to report.
| PCMark 10 Score | 5008 points | |
Help | ||
DPC Latencies
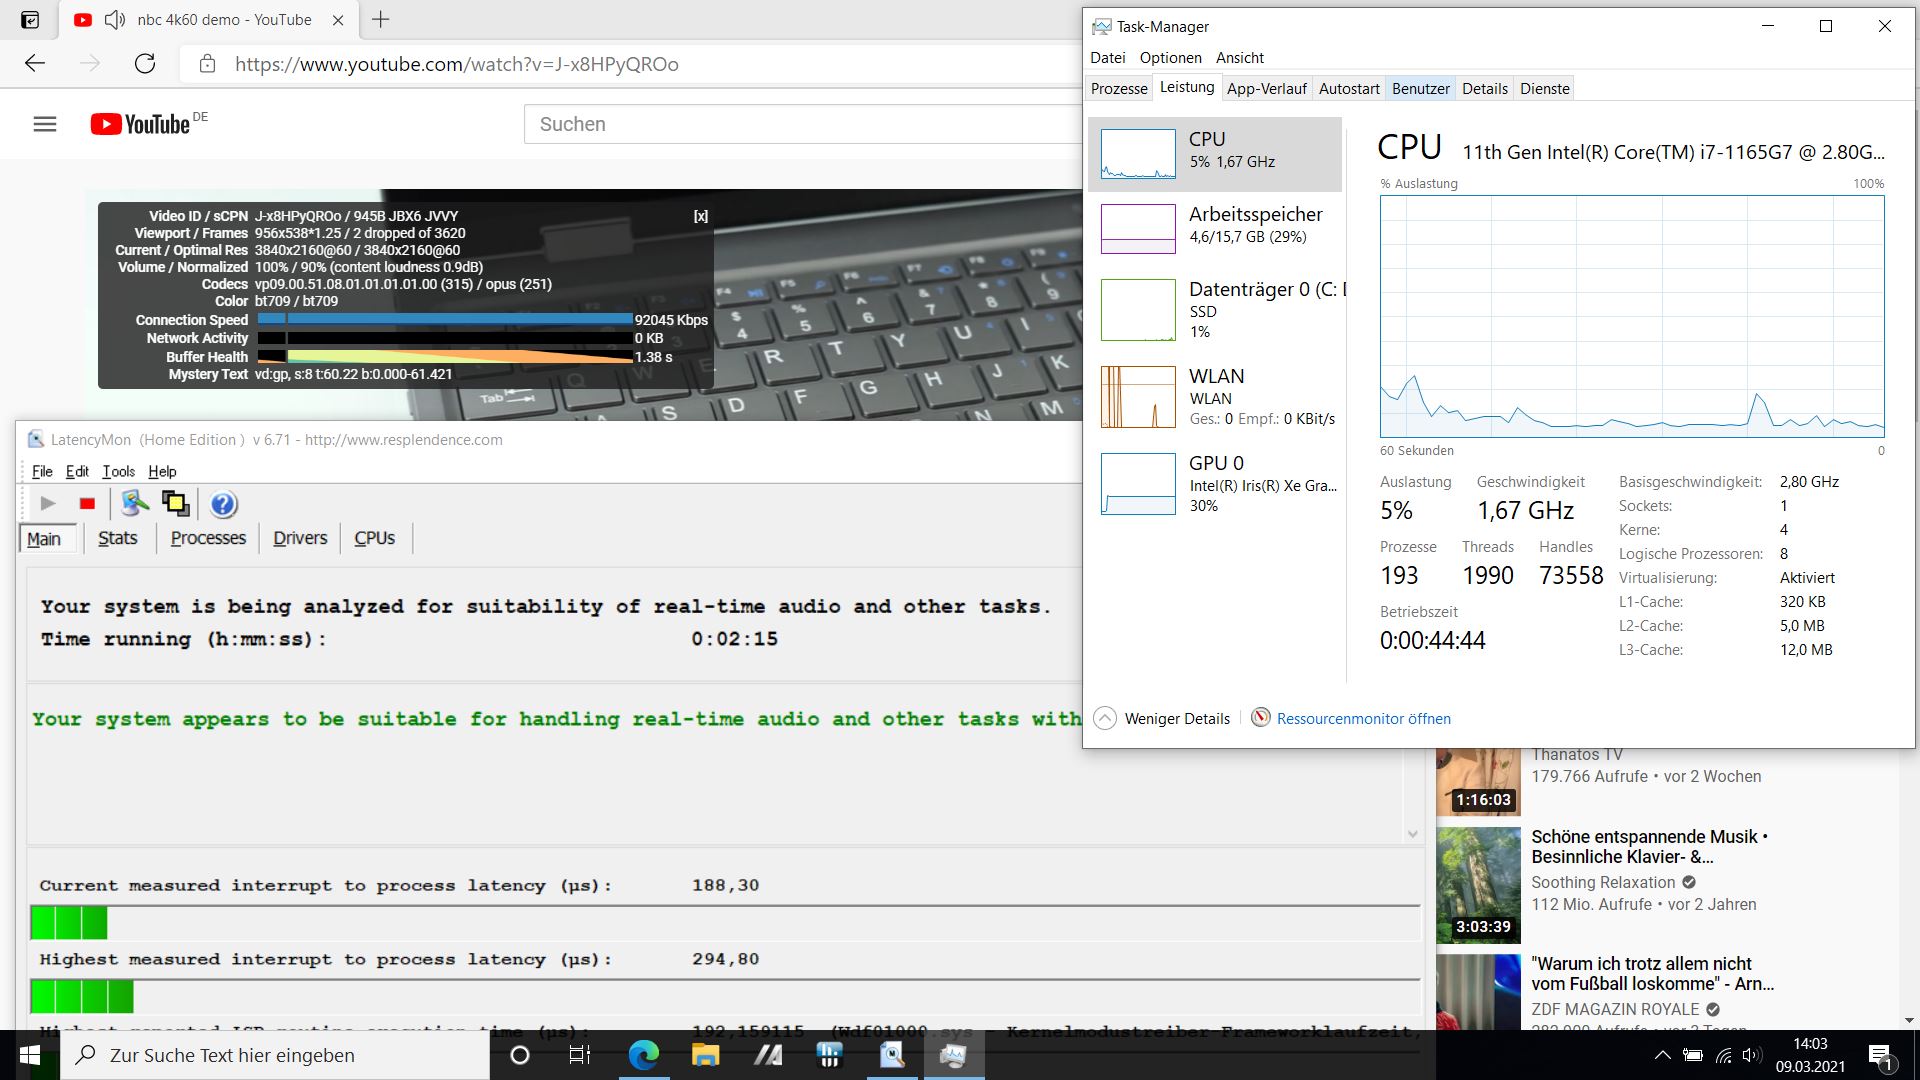
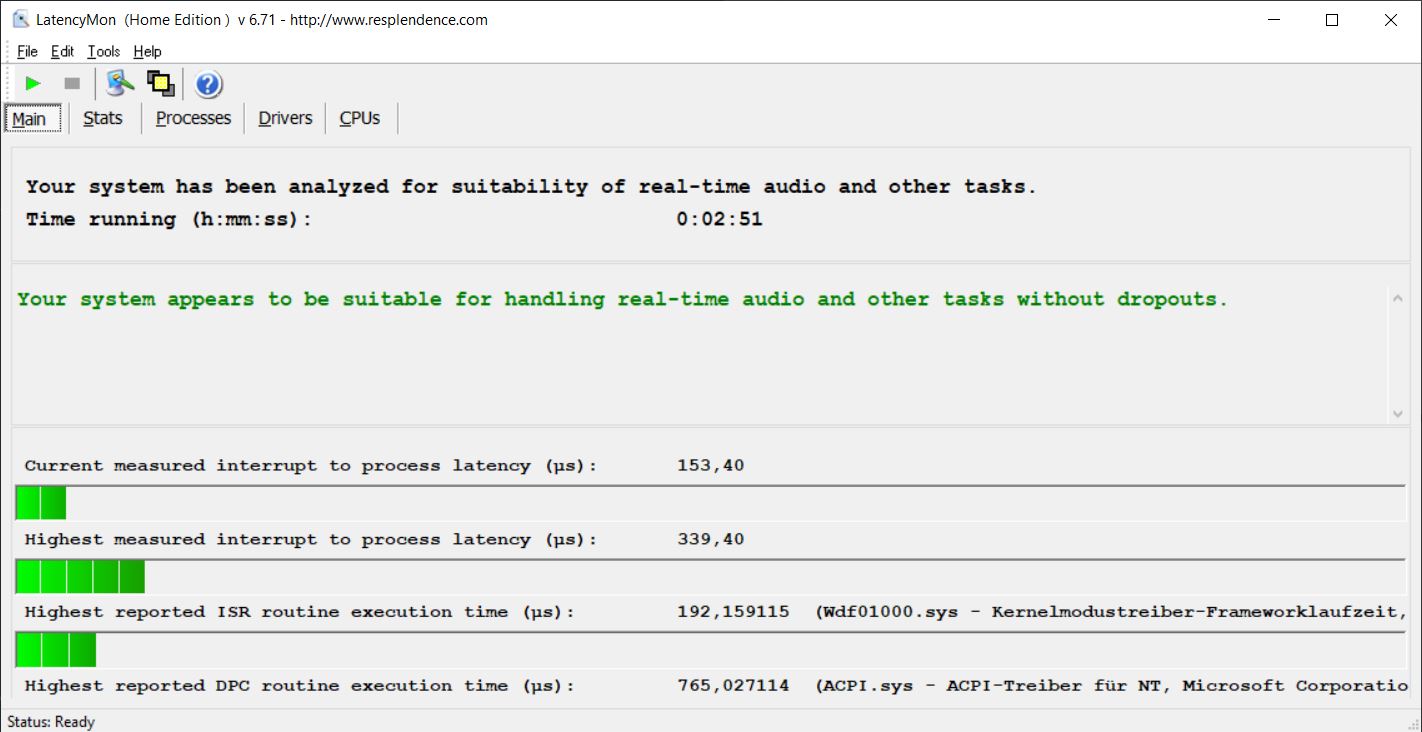
When opening several browser tabs or playing back our 4K60 YouTube video, the ExpertBook did not run into any difficulties. However, there were 2 dropped frames in our 4K60 test. All in all, the Asus laptop is suited for work with realtime audio and video.

| DPC Latencies / LatencyMon - interrupt to process latency (max), Web, Youtube, Prime95 | |
| LG Gram 14Z90N | |
| Asus ExpertBook B9450FA, i7-10510U | |
| Lenovo ThinkPad X1 Nano-20UN002UGE | |
| Acer Swift 3 SF314-42-R27B | |
| Acer Swift 5 SF514-55T-58DN | |
| Asus ExpertBook B9 B9400CE-KC0166R | |
* ... smaller is better
Storage Devices
The PM981a from Samsung has a storage capacity of 1 TB and is one of the fastest storage devices in our SSD data base, where it takes 14th place. The Samsung SSD in the ExpertBook performs exactly how it should and is able to beat most other storage devices.
| Asus ExpertBook B9 B9400CE-KC0166R Samsung PM981a MZVLB1T0HBLR | Asus ExpertBook B9450FA, i7-10510U 2x Samsung SSD PM981 MZVLB1T0HALR (RAID 0) | LG Gram 14Z90N Samsung SSD PM981 MZVLB256HAHQ | Lenovo ThinkPad X1 Nano-20UN002UGE WDC PC SN530 SDBPNPZ-512G | Acer Swift 3 SF314-42-R27B SK hynix BC511 HFM256GDJTNI-82A0 | Average Samsung PM981a MZVLB1T0HBLR | |
|---|---|---|---|---|---|---|
| CrystalDiskMark 5.2 / 6 | -8% | -2% | 11% | -33% | 1% | |
| Write 4K (MB/s) | 153.5 | 115.6 -25% | 183.6 20% | 269.4 76% | 96.3 -37% | 139.7 ? -9% |
| Read 4K (MB/s) | 47.69 | 45.68 -4% | 48.51 2% | 54.1 13% | 35.06 -26% | 49.9 ? 5% |
| Write Seq (MB/s) | 2037 | 2091 3% | 1520 -25% | 1739 -15% | 1001 -51% | 2036 ? 0% |
| Read Seq (MB/s) | 2208 | 2152 -3% | 1914 -13% | 1671 -24% | 1072 -51% | 2014 ? -9% |
| Write 4K Q32T1 (MB/s) | 516 | 422.2 -18% | 529 3% | 580 12% | 423.9 -18% | 461 ? -11% |
| Read 4K Q32T1 (MB/s) | 366.8 | 391.3 7% | 560 53% | 708 93% | 464.7 27% | 499 ? 36% |
| Write Seq Q32T1 (MB/s) | 3021 | 2403 -20% | 1540 -49% | 1812 -40% | 967 -68% | 2903 ? -4% |
| Read Seq Q32T1 (MB/s) | 3532 | 3414 -3% | 3408 -4% | 2485 -30% | 2179 -38% | 3479 ? -2% |
| AS SSD | -16% | -40% | -29% | -51% | -3% | |
| Seq Read (MB/s) | 2784 | 2602 -7% | 1744 -37% | 2228 -20% | 1682 -40% | 2553 ? -8% |
| Seq Write (MB/s) | 1362 | 1399 3% | 1450 6% | 1707 25% | 931 -32% | 2084 ? 53% |
| 4K Read (MB/s) | 52.5 | 46.9 -11% | 57.4 9% | 47.12 -10% | 41.53 -21% | 53.1 ? 1% |
| 4K Write (MB/s) | 202.3 | 132.9 -34% | 140.9 -30% | 237.4 17% | 109.1 -46% | 131.2 ? -35% |
| 4K-64 Read (MB/s) | 1136 | 1021 -10% | 907 -20% | 916 -19% | 603 -47% | 1477 ? 30% |
| 4K-64 Write (MB/s) | 1642 | 1302 -21% | 1372 -16% | 1245 -24% | 713 -57% | 1805 ? 10% |
| Access Time Read * (ms) | 0.038 | 0.032 16% | 0.059 -55% | 0.053 -39% | 0.04983 ? -31% | |
| Access Time Write * (ms) | 0.017 | 0.028 -65% | 0.081 -376% | 0.069 -306% | 0.035 -106% | 0.04222 ? -148% |
| Score Read (Points) | 1467 | 1328 -9% | 1138 -22% | 1186 -19% | 813 -45% | 1786 ? 22% |
| Score Write (Points) | 1980 | 1575 -20% | 1658 -16% | 1654 -16% | 915 -54% | 2144 ? 8% |
| Score Total (Points) | 4135 | 3530 -15% | 3380 -18% | 3431 -17% | 2118 -49% | 4826 ? 17% |
| Copy ISO MB/s (MB/s) | 1737 | 1520 -12% | 1520 -12% | 692 -60% | 2098 ? 21% | |
| Copy Program MB/s (MB/s) | 479.1 | 539 13% | 546 14% | 226.5 -53% | 500 ? 4% | |
| Copy Game MB/s (MB/s) | 935 | 1070 14% | 1080 16% | 391.5 -58% | 1132 ? 21% | |
| Total Average (Program / Settings) | -12% /
-12% | -21% /
-26% | -9% /
-15% | -42% /
-44% | -1% /
-1% |
* ... smaller is better

Continuous read speed: DiskSpd Read Loop, Queue Depth 8
Graphics Card
The Intel Iris Xe Graphics G7, which is integrated in the Core i7-1165G7, is one of the fastest iGPU on the market. It can, in the best case, rival the performance of a dedicated GeForce MX350. However, the level of performance depends strongly on the cooling solution and the configured TGP.
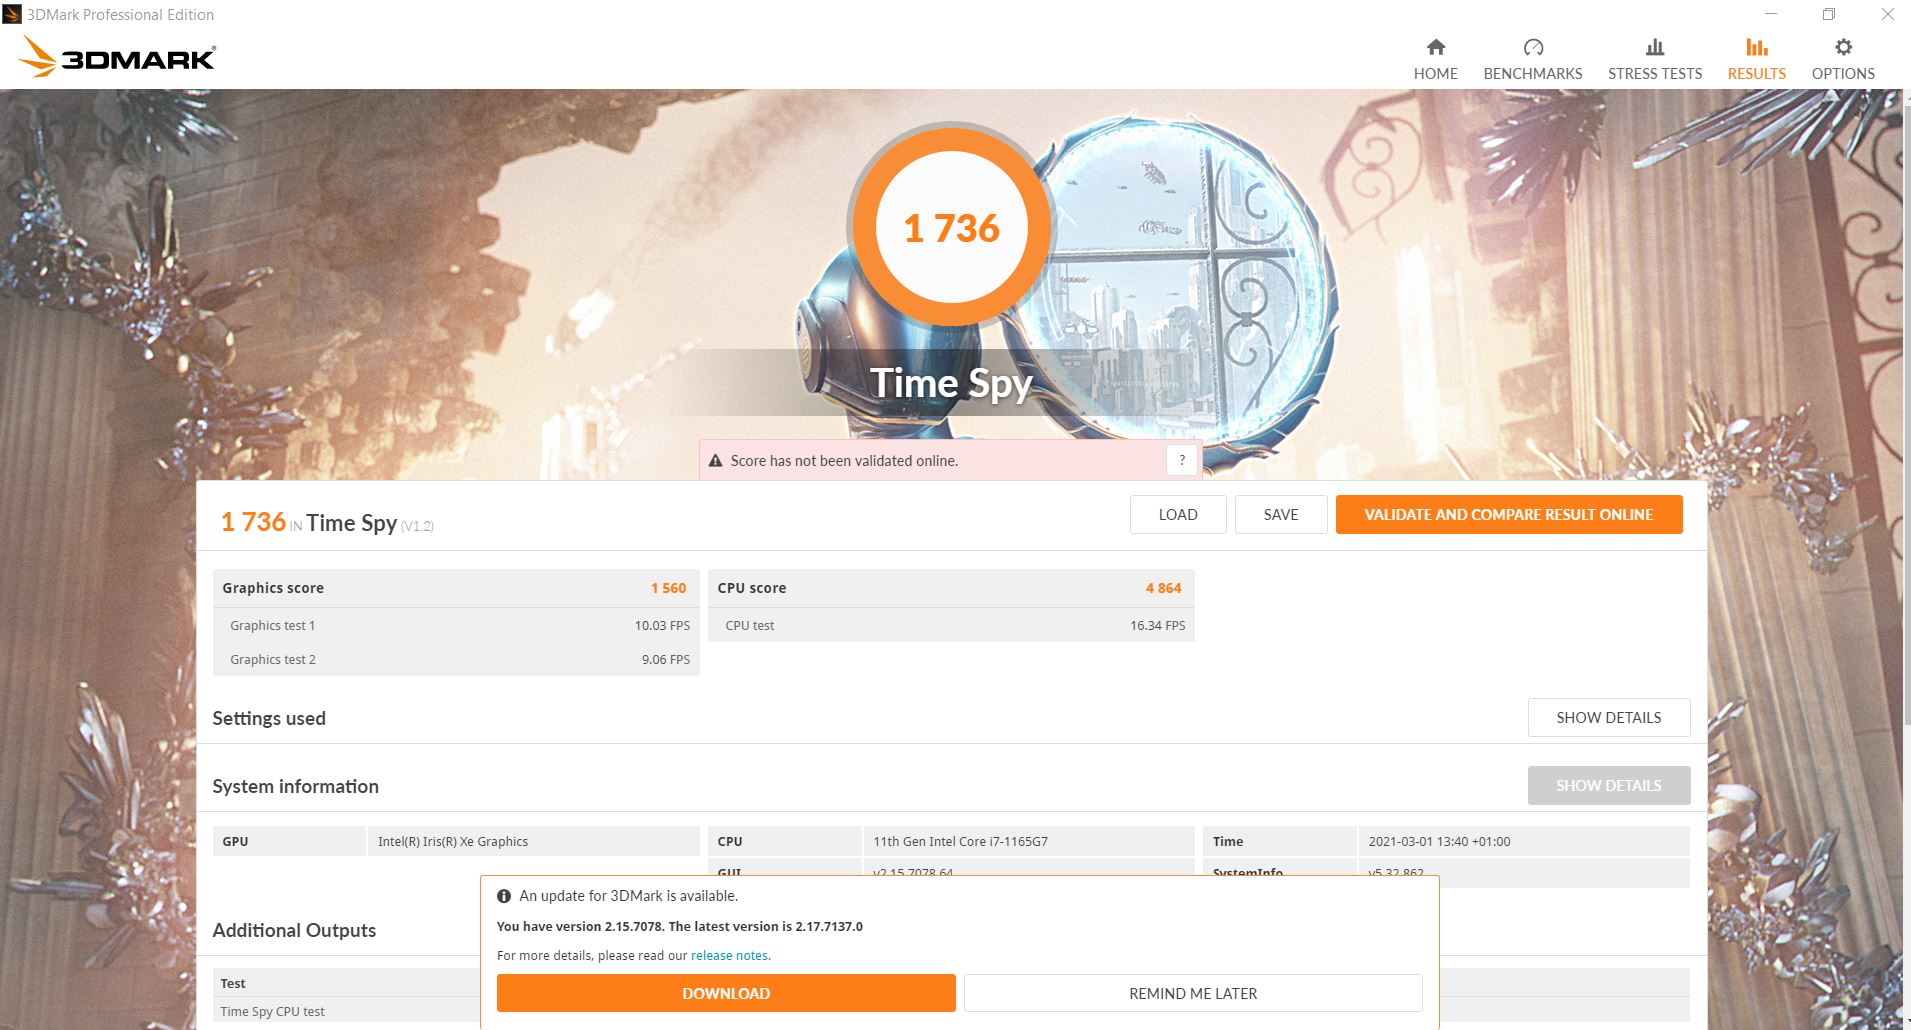
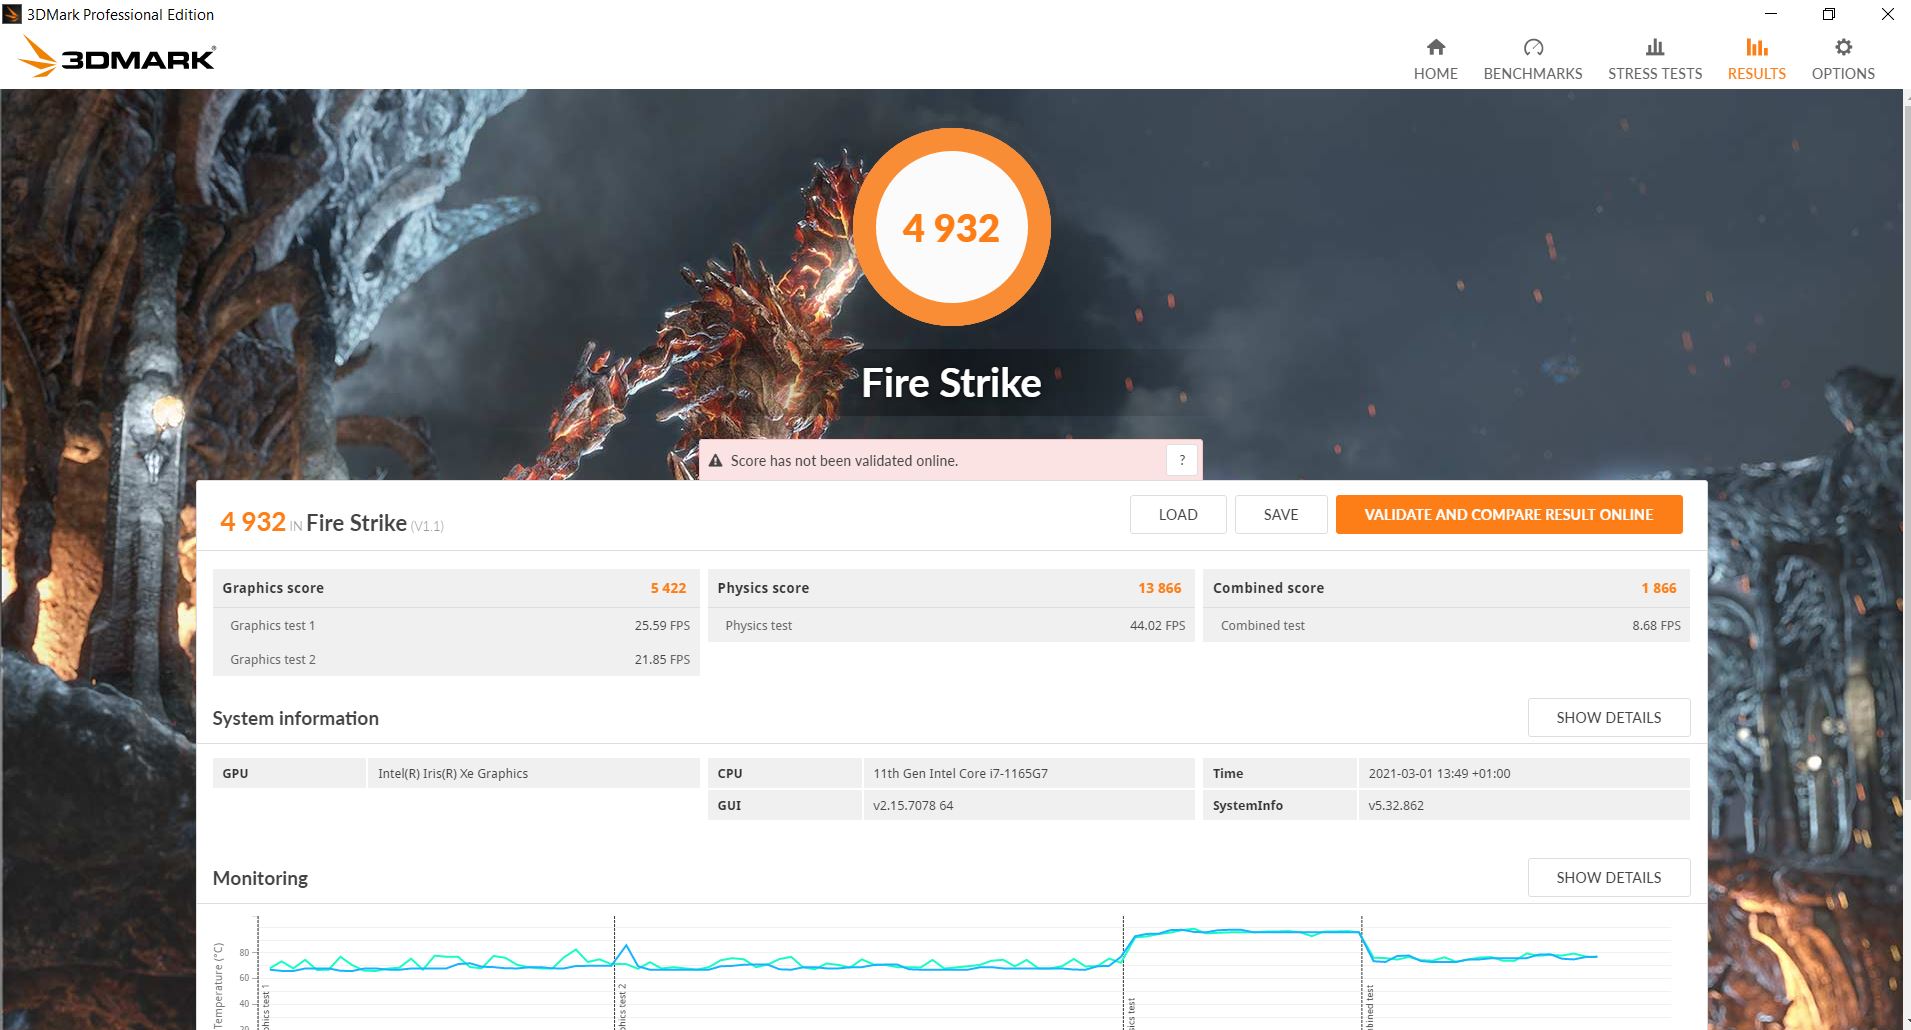
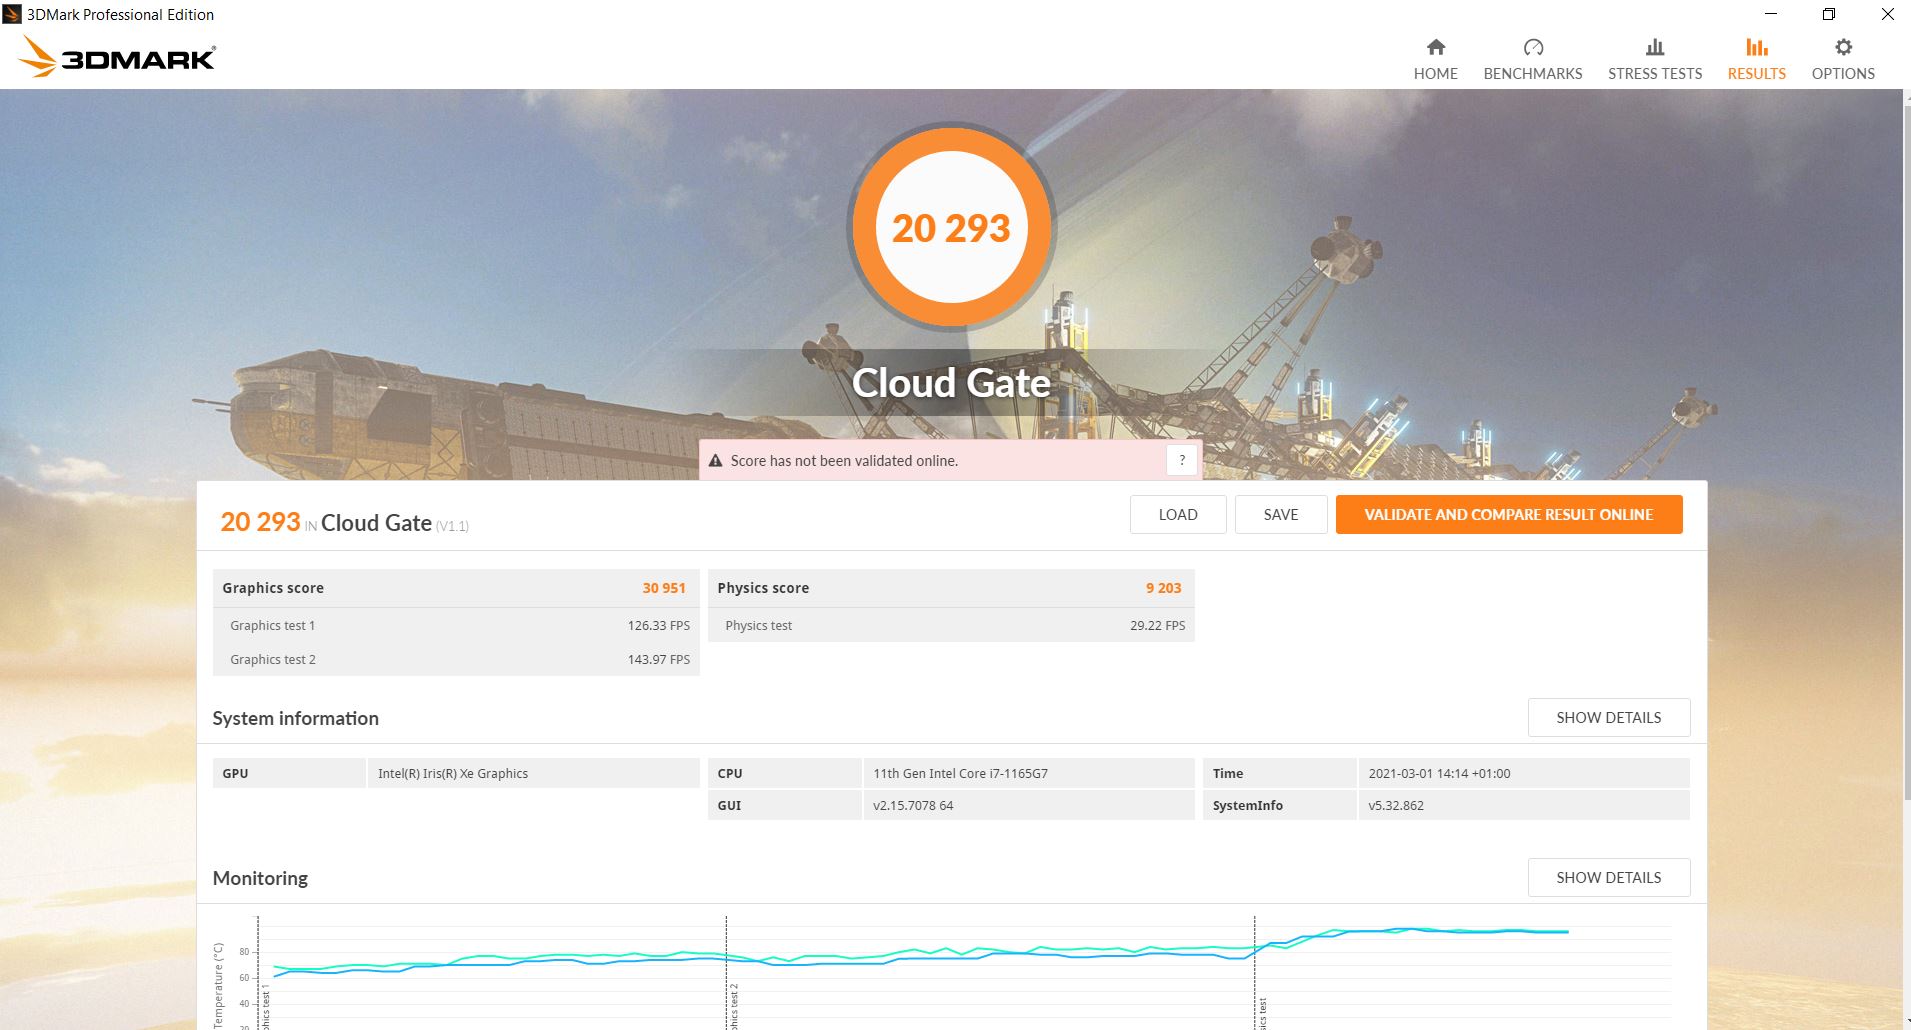
In the synthetic 3DMark benchmarks, the ExpertBook performs about 8% better than the average laptop with the same iGPU. This is a very good result. The predecessor with the UHD Graphics 620 is beaten by more than 70%.
The ExpertBook gets through the Fire Strike stress test. On battery power, the GPU performance falls by 27% as our 3DMark 11 benchmark run shows.
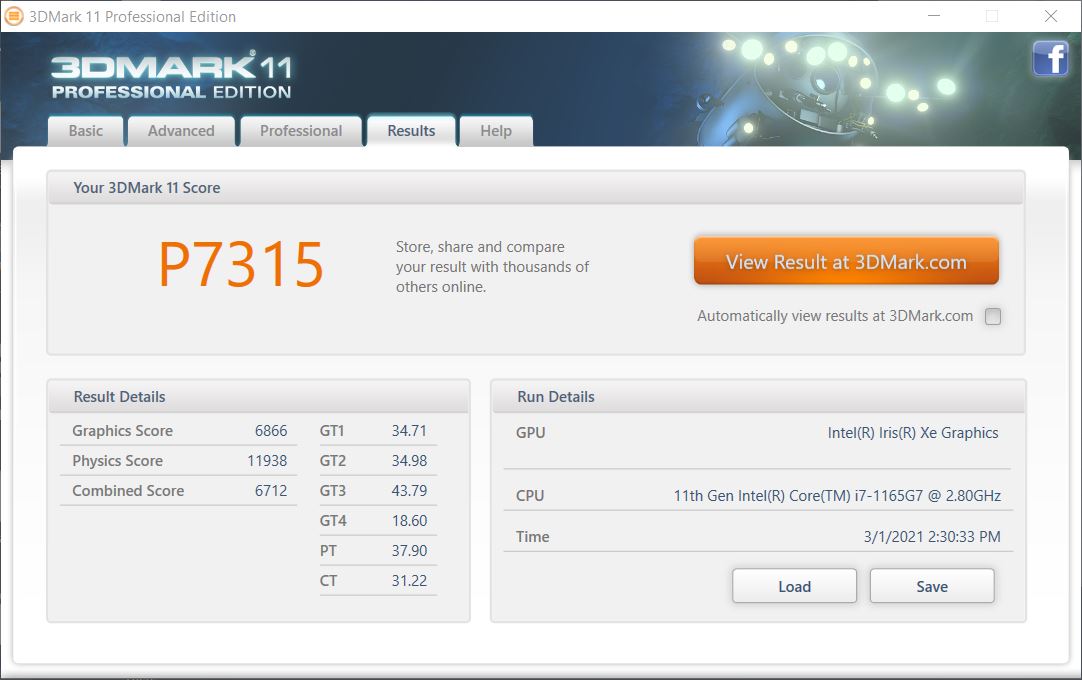
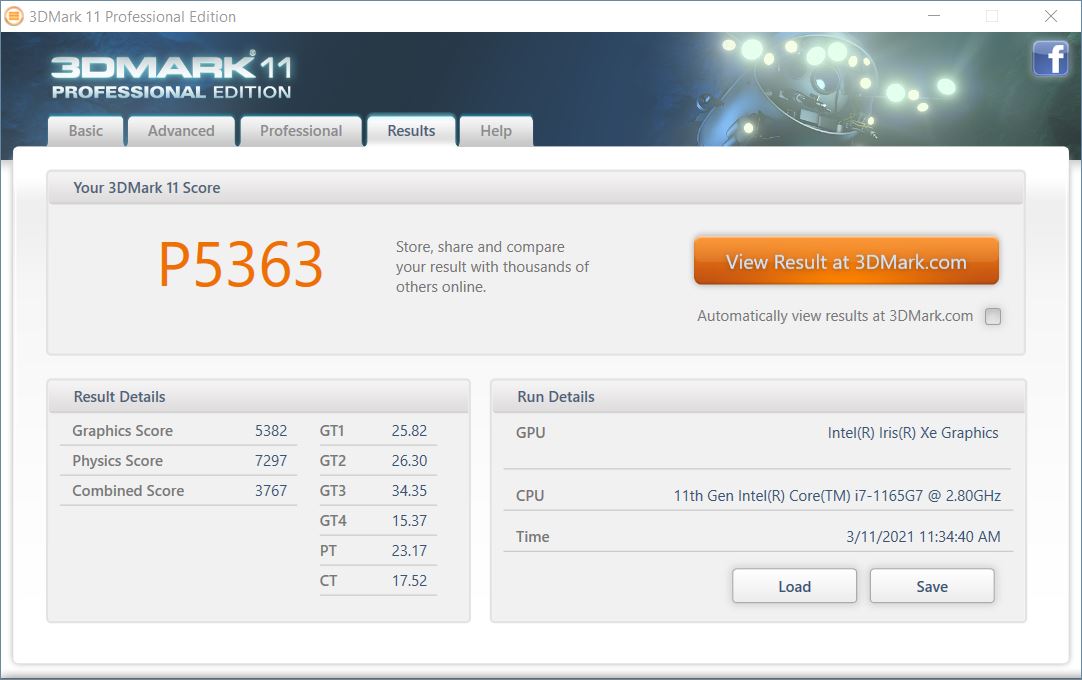
| 3DMark 11 Performance | 7315 points | |
| 3DMark Cloud Gate Standard Score | 20293 points | |
| 3DMark Fire Strike Score | 4932 points | |
| 3DMark Time Spy Score | 1736 points | |
Help | ||
Gaming Performance
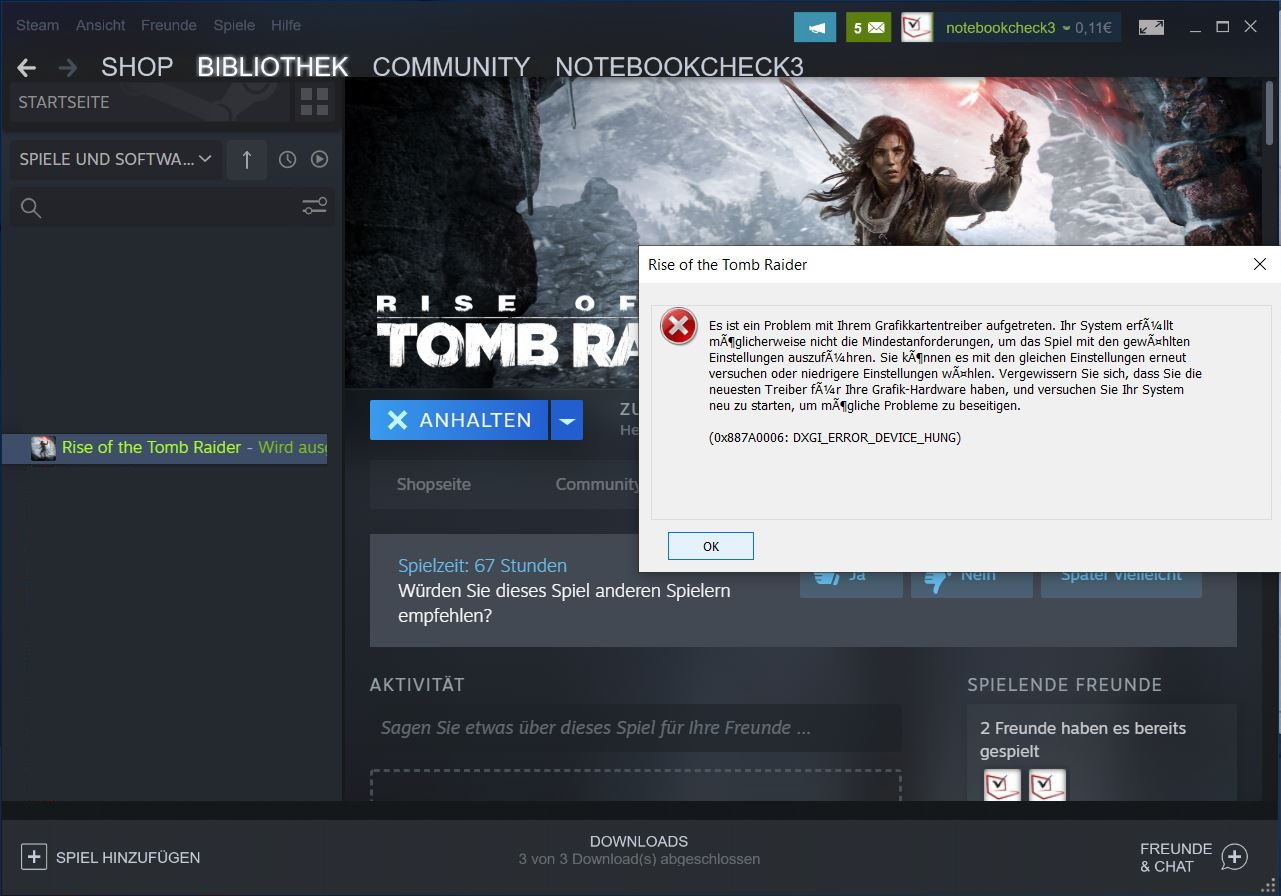
The Xe Graphics G7 cannot always achieve playable frame rates at 1080p and high settings. However, most titles run smoothly at lower resolutions and lower visual settings. Rise of the Tomb Raider
crashed constantly when using DirectX 11. However, it ran without any issues with DirectX 12.
The ExpertBook offers 15 to 37% more performance than the ThinkPad X1 Nano with the lower-clocked iGPU. The integrated GPU of the current ExpertBook is almost twice as fast as that of the predecessor.
| low | med. | high | ultra | |
|---|---|---|---|---|
| The Witcher 3 (2015) | 90.4 | 59.1 | 30.5 | 15.1 |
| Dota 2 Reborn (2015) | 83.1 | 67.5 | 49.1 | 46.4 |
| Rise of the Tomb Raider (2016) | 76.8 | 47.3 | 24 | 16.4 |
| X-Plane 11.11 (2018) | 58.1 | 43.6 | 38.3 | |
| Shadow of the Tomb Raider (2018) | 60 | 23 |
Emissions - Noise and temperature not entirely optimal
System Noise
In idle operation, the fans stand still, which is why the system is absolutely silent when typing or browsing the web. However, under load the fans get quite loud, which is why the ExpertBook produces more fan noise than the competition. All in all, this is not surprising, given the fact that it is quite powerful and thin. Under load, it is 25% louder than the ThinkPad X1 Nano which offers 20% less performance in 3D applications.
In the MyAsus
utility, users can select different fan modes. Hitherto we were talking about the amount of fan noise that the ExpertBook produces in performance mode. However, there are also two other modes: standard and quiet. In these modes, the laptop produces less noise but does not offer as much performance. The chart below shows how loud the ExpertBook gets in each mode.
| Usage scenario | Quiet mode | Standard mode | Performance mode |
|---|---|---|---|
| Load avg | 30.8 dB(A) | 37 dB(A) | 41,2 - 47.5 dB(A) |
| Witcher 3 | 32.2 dB(A) | 37 dB(A) | 41.2 - 47.5 dB(A) |
| Stress test | 32.2 dB(A) | 34.2 - 37 dB(A) | 41.2 - 47.5 dB(A) |
Noise level
| Idle |
| 24 / 24 / 24 dB(A) |
| Load |
| 47.5 / 47.5 dB(A) |
 | ||
30 dB silent 40 dB(A) audible 50 dB(A) loud |
||
min: | ||
| Asus ExpertBook B9 B9400CE-KC0166R Iris Xe G7 96EUs, i7-1165G7, Samsung PM981a MZVLB1T0HBLR | Asus ExpertBook B9450FA, i7-10510U UHD Graphics 620, i7-10510U, 2x Samsung SSD PM981 MZVLB1T0HALR (RAID 0) | Acer Swift 5 SF514-55T-58DN Iris Xe G7 80EUs, i5-1135G7, SK Hynix BC511 HFM512GDJTNI | LG Gram 14Z90N Iris Plus Graphics G7 (Ice Lake 64 EU), i7-1065G7, Samsung SSD PM981 MZVLB256HAHQ | Lenovo ThinkPad X1 Nano-20UN002UGE Iris Xe G7 96EUs, i7-1160G7, WDC PC SN530 SDBPNPZ-512G | Acer Swift 3 SF314-42-R27B Vega 5, R3 4300U, SK hynix BC511 HFM256GDJTNI-82A0 | |
|---|---|---|---|---|---|---|
| Noise | -7% | 7% | -1% | 4% | -8% | |
| off / environment * (dB) | 24 | 30.1 -25% | 25 -4% | 28.6 -19% | 24.9 -4% | 30.3 -26% |
| Idle Minimum * (dB) | 24 | 30.1 -25% | 25 -4% | 28.6 -19% | 24.9 -4% | 30.3 -26% |
| Idle Average * (dB) | 24 | 30.1 -25% | 25 -4% | 29.2 -22% | 26.3 -10% | 30.3 -26% |
| Idle Maximum * (dB) | 24 | 30.1 -25% | 25 -4% | 29.2 -22% | 31.8 -33% | 30.3 -26% |
| Load Average * (dB) | 47.5 | 30.1 37% | 34.7 27% | 29.2 39% | 34.3 28% | 32.6 31% |
| Witcher 3 ultra * (dB) | 47.5 | 34.3 28% | ||||
| Load Maximum * (dB) | 47.5 | 38.6 19% | 34 28% | 29.5 38% | 37.5 21% | 35.6 25% |
* ... smaller is better
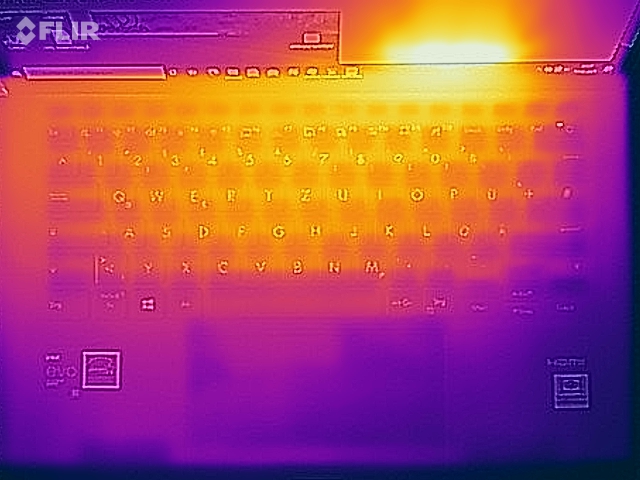
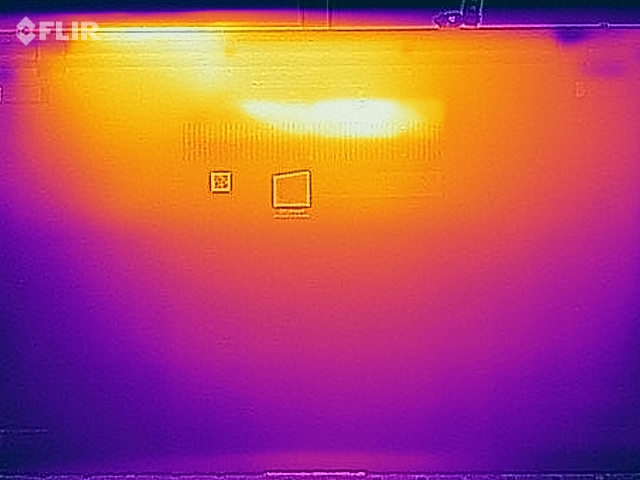
Temperature
Positive: The wrist rest area never gets hot. What is not positive is that the surface temperatures reach up to 57 °C (134.6 °F) on the underside (right in the centre). The ThinkPad X1 Nano is less powerful, but it is 10 °C (18 °F) cooler despite its smaller 13-inch form-factor! Nevertheless, these temperatures are not extreme.
(-) The maximum temperature on the upper side is 45.9 °C / 115 F, compared to the average of 35.9 °C / 97 F, ranging from 21.4 to 59 °C for the class Subnotebook.
(-) The bottom heats up to a maximum of 57 °C / 135 F, compared to the average of 39.2 °C / 103 F
(+) In idle usage, the average temperature for the upper side is 23.8 °C / 75 F, compared to the device average of 30.8 °C / 87 F.
(+) The palmrests and touchpad are cooler than skin temperature with a maximum of 28.3 °C / 82.9 F and are therefore cool to the touch.
(±) The average temperature of the palmrest area of similar devices was 28.2 °C / 82.8 F (-0.1 °C / -0.1 F).
| Asus ExpertBook B9 B9400CE-KC0166R Iris Xe G7 96EUs, i7-1165G7, Samsung PM981a MZVLB1T0HBLR | Asus ExpertBook B9450FA, i7-10510U UHD Graphics 620, i7-10510U, 2x Samsung SSD PM981 MZVLB1T0HALR (RAID 0) | Acer Swift 5 SF514-55T-58DN Iris Xe G7 80EUs, i5-1135G7, SK Hynix BC511 HFM512GDJTNI | LG Gram 14Z90N Iris Plus Graphics G7 (Ice Lake 64 EU), i7-1065G7, Samsung SSD PM981 MZVLB256HAHQ | Lenovo ThinkPad X1 Nano-20UN002UGE Iris Xe G7 96EUs, i7-1160G7, WDC PC SN530 SDBPNPZ-512G | Acer Swift 3 SF314-42-R27B Vega 5, R3 4300U, SK hynix BC511 HFM256GDJTNI-82A0 | |
|---|---|---|---|---|---|---|
| Heat | 5% | 18% | 4% | 7% | 8% | |
| Maximum Upper Side * (°C) | 45.9 | 42 8% | 34.5 25% | 41 11% | 42.2 8% | 36.2 21% |
| Maximum Bottom * (°C) | 57 | 43.1 24% | 35.4 38% | 40.2 29% | 47.5 17% | 39.7 30% |
| Idle Upper Side * (°C) | 24.5 | 26.4 -8% | 23.8 3% | 27.8 -13% | 24.3 1% | 26.8 -9% |
| Idle Bottom * (°C) | 25.9 | 26.8 -3% | 24 7% | 29 -12% | 25.3 2% | 28.2 -9% |
* ... smaller is better
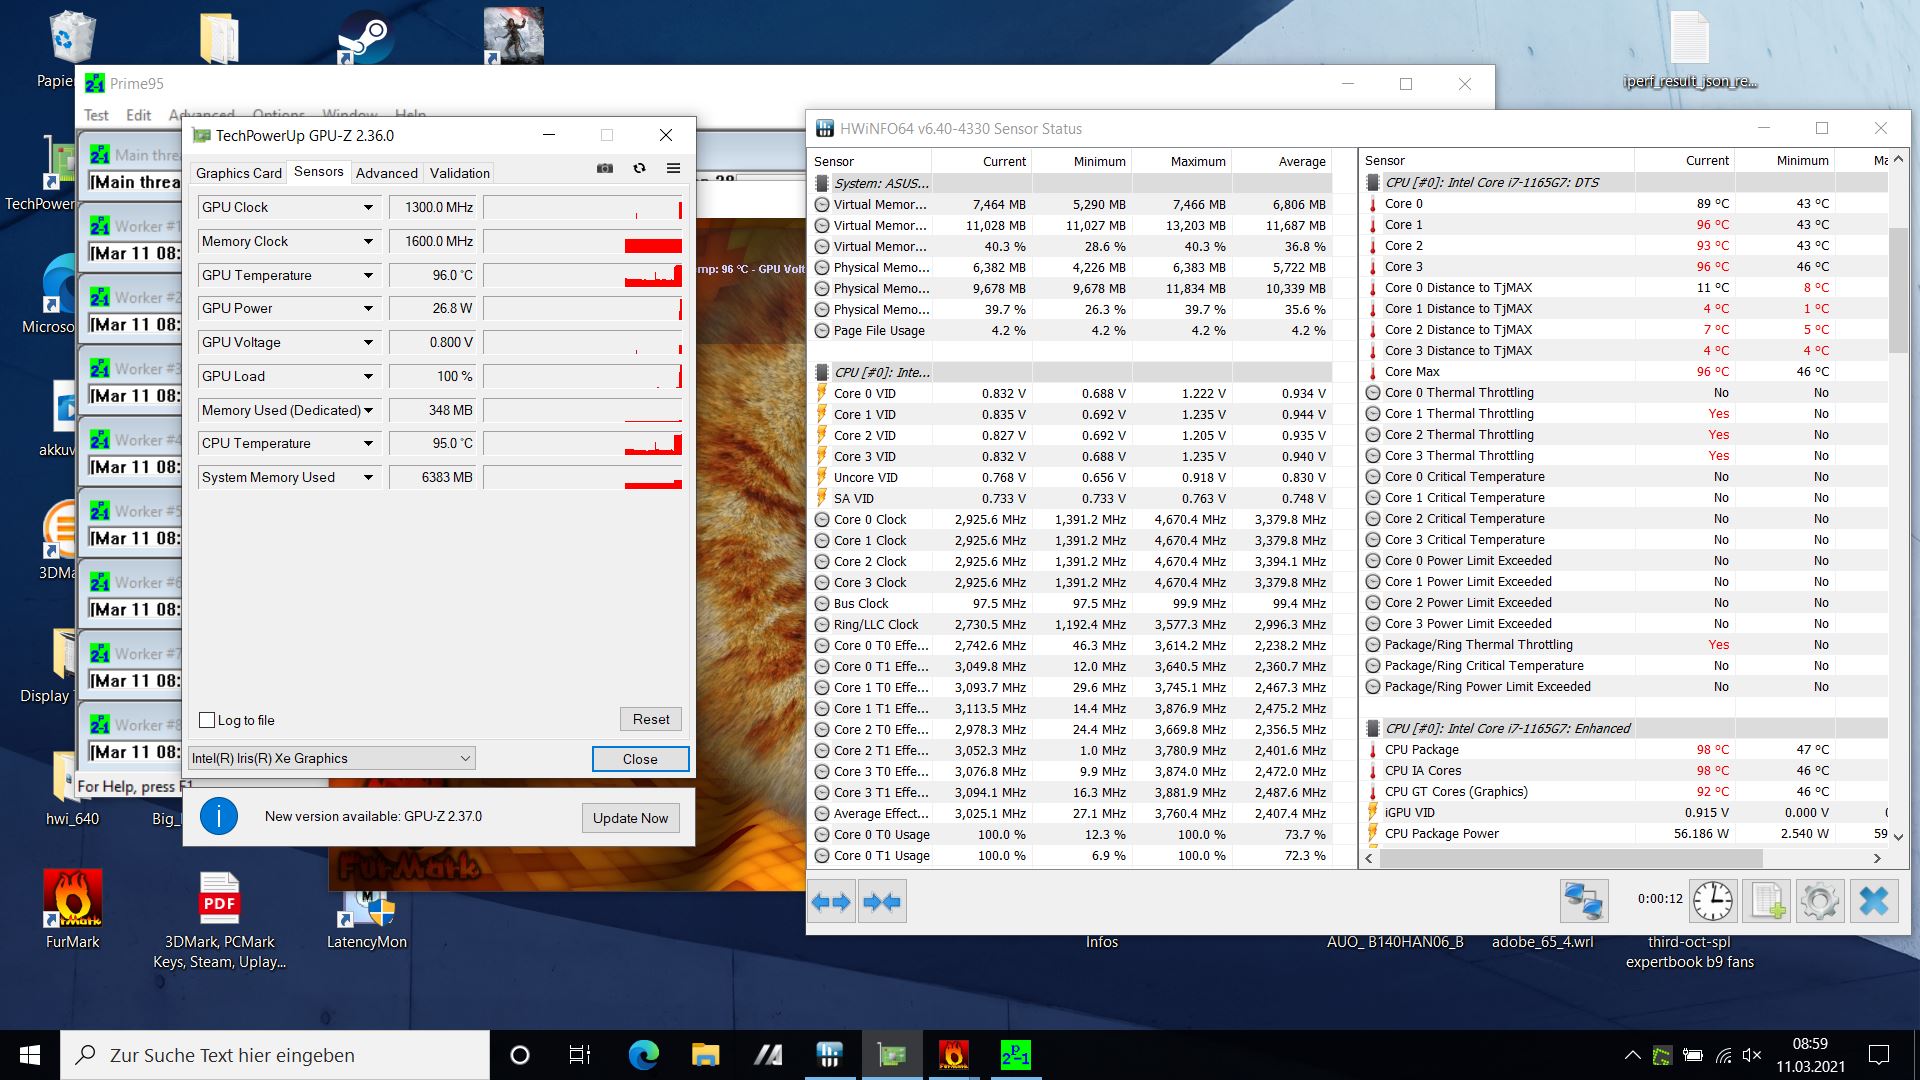
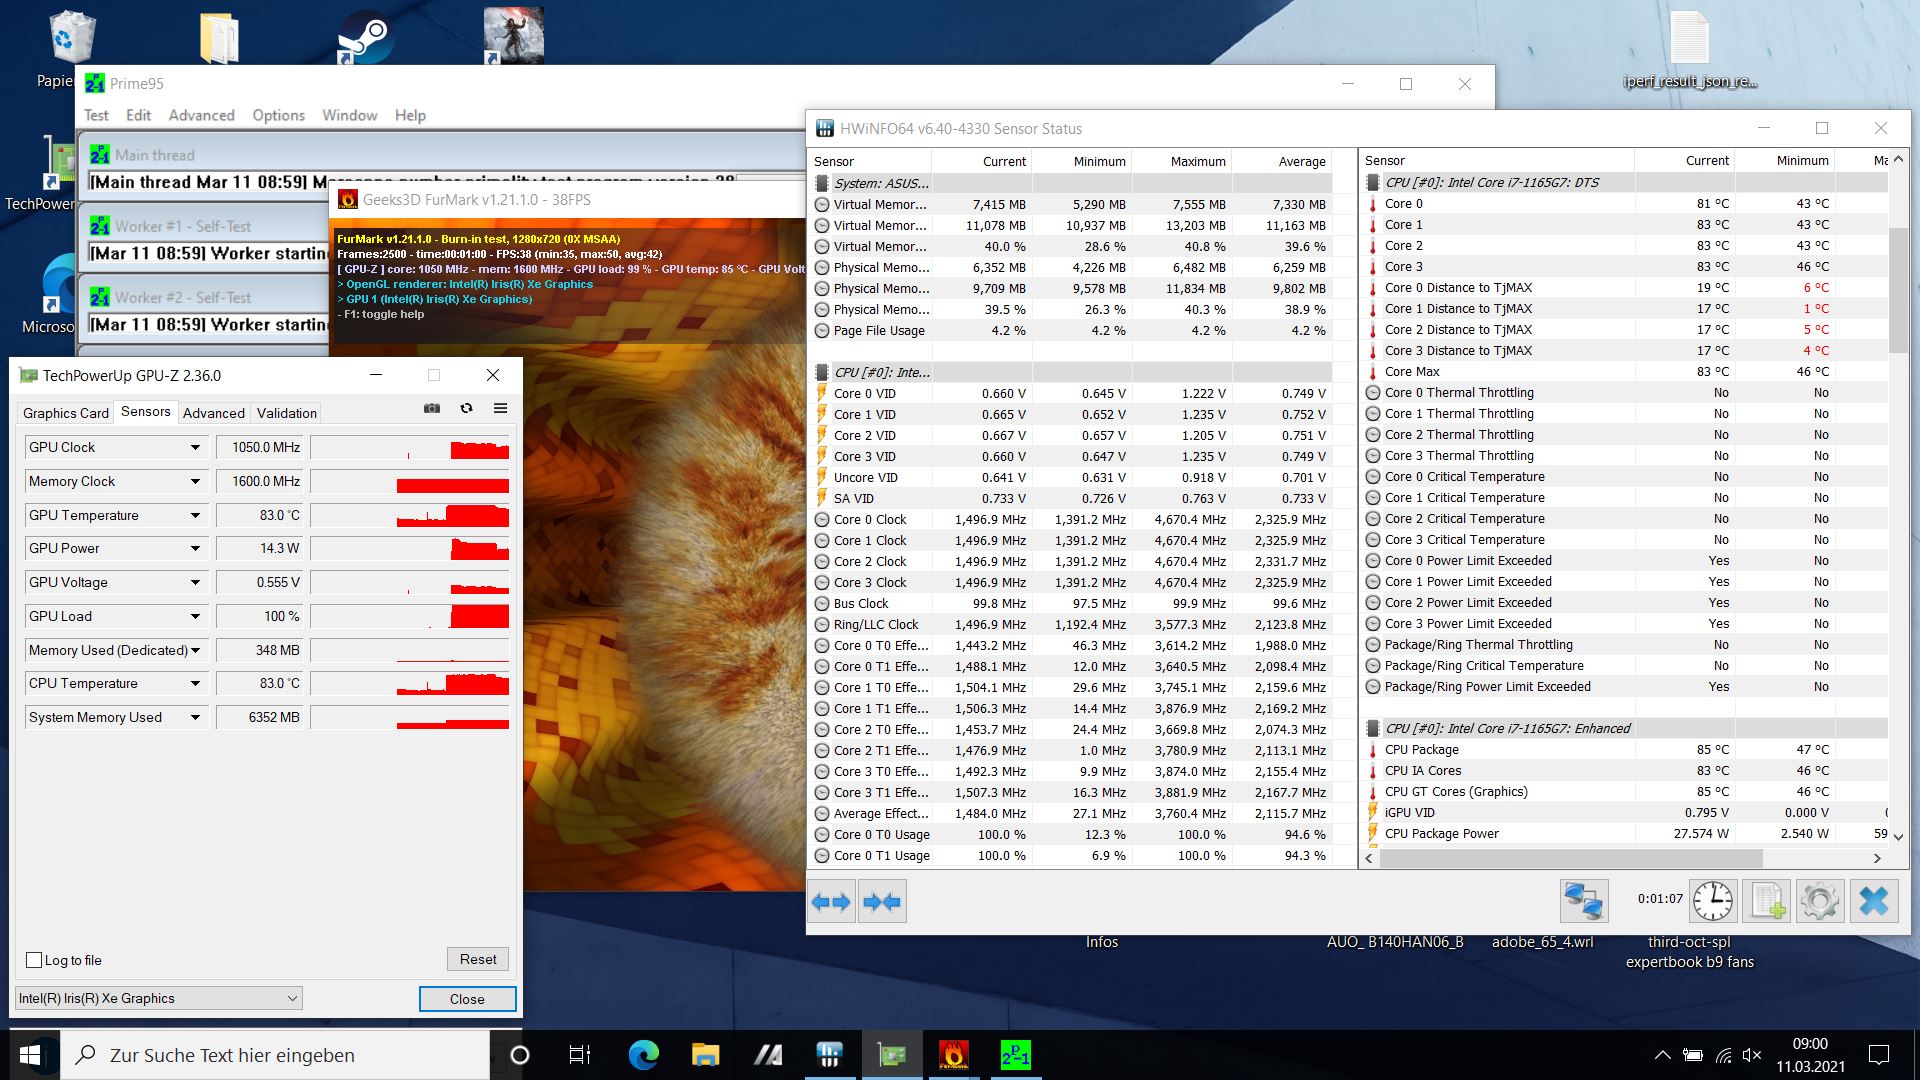
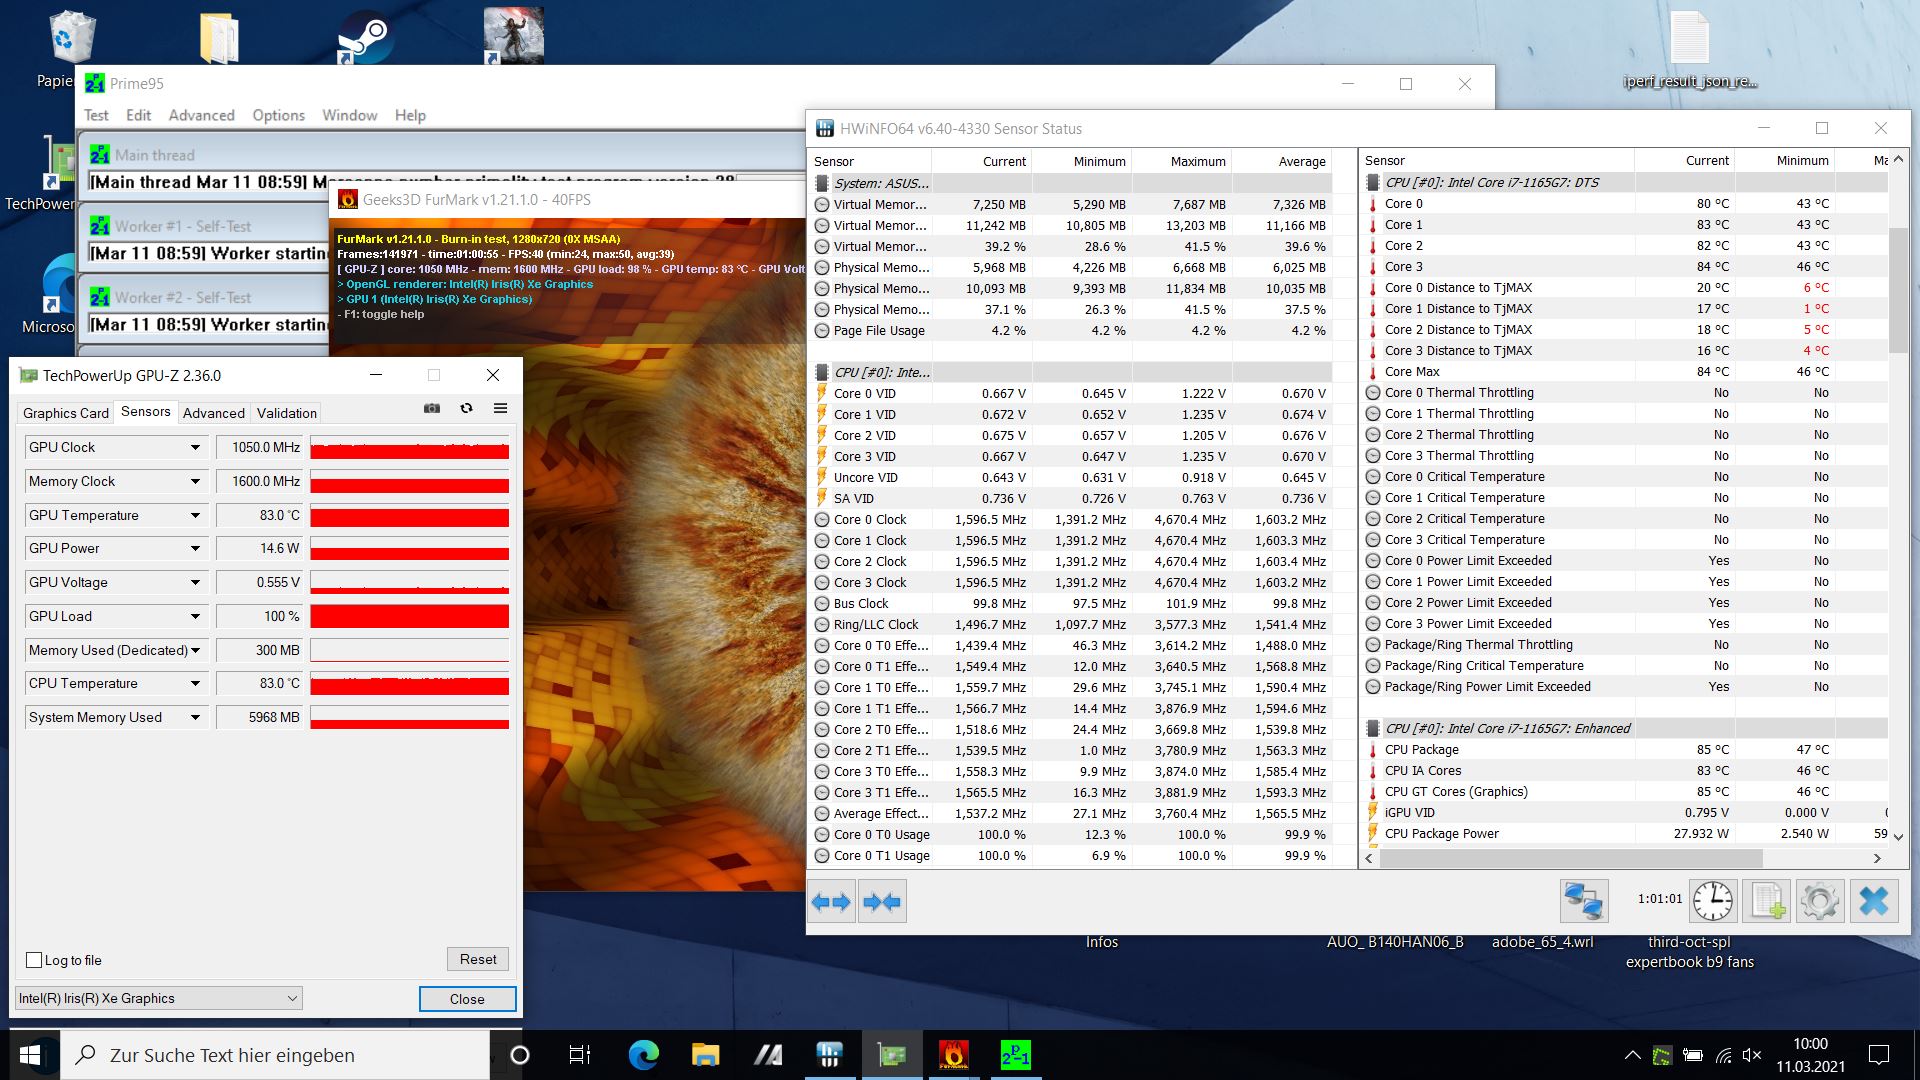
In our stress test (FurMark and Prime95 running for an hour), the CPU initially runs at 2.9 GHz, which is far from the theoretically possible 4.1 GHz all-core frequency. Moreover, the processor starts to throttle down quite hard after the CPU temperatures exceed 90 °C (194 °F). The clock rates eventually stabilise at about 1.5 GHz and the CPU temperatures at 81 °C (177.8 °F).
The GPU runs at 1.3 GHz at the beginning of the stress test. By the end of the test, the core clock fluctuates between 1000 and 1100 MHz.
The post-stress test 3DMark 11 benchmark run shows that the system recovers very quickly, because the score is not affected.
Speakers
Asus ExpertBook B9 B9400CE-KC0166R audio analysis
(±) | speaker loudness is average but good (77.7 dB)
Bass 100 - 315 Hz
(±) | reduced bass - on average 14.2% lower than median
(±) | linearity of bass is average (11.1% delta to prev. frequency)
Mids 400 - 2000 Hz
(+) | balanced mids - only 3.4% away from median
(+) | mids are linear (3.4% delta to prev. frequency)
Highs 2 - 16 kHz
(+) | balanced highs - only 2.6% away from median
(+) | highs are linear (3.6% delta to prev. frequency)
Overall 100 - 16.000 Hz
(+) | overall sound is linear (14.2% difference to median)
Compared to same class
» 27% of all tested devices in this class were better, 6% similar, 67% worse
» The best had a delta of 5%, average was 18%, worst was 53%
Compared to all devices tested
» 17% of all tested devices were better, 4% similar, 79% worse
» The best had a delta of 4%, average was 24%, worst was 134%
Asus ExpertBook B9450FA, i7-10510U audio analysis
(-) | not very loud speakers (62.5 dB)
Bass 100 - 315 Hz
(-) | nearly no bass - on average 17.2% lower than median
(±) | linearity of bass is average (13.3% delta to prev. frequency)
Mids 400 - 2000 Hz
(+) | balanced mids - only 2.5% away from median
(+) | mids are linear (4.5% delta to prev. frequency)
Highs 2 - 16 kHz
(+) | balanced highs - only 2.3% away from median
(+) | highs are linear (4.5% delta to prev. frequency)
Overall 100 - 16.000 Hz
(±) | linearity of overall sound is average (19.9% difference to median)
Compared to same class
» 63% of all tested devices in this class were better, 8% similar, 29% worse
» The best had a delta of 5%, average was 18%, worst was 53%
Compared to all devices tested
» 51% of all tested devices were better, 7% similar, 42% worse
» The best had a delta of 4%, average was 24%, worst was 134%
Energy Management - Predecessor lasted a little longer
Energy Consumption
The ExpertBook draws more power than the predecessor, but offers 60 to 100% more performance. The power draw peaks at 66.6 W. However, under high load, the power consumption amounted to about 39 W in performance mode and to 29 W in standard mode.
When idle, the energy consumption amounts to 5.7 W without the backlight. With it enabled, the power draw increases slightly to 5.9 W.
The small 65-W power adapter provides enough energy to charge the device.
| Off / Standby | |
| Idle | |
| Load |
|
Key:
min: | |
| Asus ExpertBook B9 B9400CE-KC0166R i7-1165G7, Iris Xe G7 96EUs, Samsung PM981a MZVLB1T0HBLR, IPS, 1920x1080, 14" | Asus ExpertBook B9450FA, i7-10510U i7-10510U, UHD Graphics 620, 2x Samsung SSD PM981 MZVLB1T0HALR (RAID 0), IPS, 1920x1080, 14" | Acer Swift 5 SF514-55T-58DN i5-1135G7, Iris Xe G7 80EUs, SK Hynix BC511 HFM512GDJTNI, IPS, 1920x1080, 14" | LG Gram 14Z90N i7-1065G7, Iris Plus Graphics G7 (Ice Lake 64 EU), Samsung SSD PM981 MZVLB256HAHQ, IPS, 1920x1080, 14" | Lenovo ThinkPad X1 Nano-20UN002UGE i7-1160G7, Iris Xe G7 96EUs, WDC PC SN530 SDBPNPZ-512G, IPS, 2160x1350, 13" | Acer Swift 3 SF314-42-R27B R3 4300U, Vega 5, SK hynix BC511 HFM256GDJTNI-82A0, IPS, 1920x1080, 14" | Average Intel Iris Xe Graphics G7 96EUs | Average of class Subnotebook | |
|---|---|---|---|---|---|---|---|---|
| Power Consumption | 35% | 5% | 9% | 0% | 6% | -49% | -17% | |
| Idle Minimum * (Watt) | 3.4 | 1.5 56% | 2.4 29% | 2.6 24% | 3.3 3% | 3.7 -9% | 5.51 ? -62% | 3.82 ? -12% |
| Idle Average * (Watt) | 4.9 | 2.8 43% | 3.5 29% | 5.9 -20% | 5.7 -16% | 5.6 -14% | 8.66 ? -77% | 6.61 ? -35% |
| Idle Maximum * (Watt) | 5.9 | 6.5 -10% | 6.6 -12% | 8 -36% | 9.1 -54% | 7.8 -32% | 10.9 ? -85% | 7.99 ? -35% |
| Load Average * (Watt) | 38.8 | 27 30% | 47 -21% | 29.8 23% | 29.6 24% | 26.4 32% | 45.6 ? -18% | 41.9 ? -8% |
| Witcher 3 ultra * (Watt) | 38.7 | 30.9 20% | 27.7 28% | |||||
| Load Maximum * (Watt) | 66.6 | 29 56% | 67.2 -1% | 39.5 41% | 55.1 17% | 31.4 53% | 67.8 ? -2% | 64.1 ? 4% |
* ... smaller is better
Battery Life
In our Wi-Fi test, the 66-Wh battery lasted 10 hours with the brightness maxed out and 12.5 hours with the brightness set to 150 cd/m². In our video test, the ExpertBook lasted for 13 hours. The battery runtimes depend on the energy profile used. All of our battery tests were conducted using the standard power mode.
The predecessor lasted longer than the current ExpertBook in every equivalent mode. However, the Asus laptop still offers decent battery runtimes when compared to the rest of the competition. For instance, the LG Gram, which has a 72-Wh battery, lasts only 12% longer.
| Asus ExpertBook B9 B9400CE-KC0166R i7-1165G7, Iris Xe G7 96EUs, 66 Wh | Asus ExpertBook B9450FA, i7-10510U i7-10510U, UHD Graphics 620, 66 Wh | LG Gram 14Z90N i7-1065G7, Iris Plus Graphics G7 (Ice Lake 64 EU), 72 Wh | Lenovo ThinkPad X1 Nano-20UN002UGE i7-1160G7, Iris Xe G7 96EUs, 48.2 Wh | Acer Swift 3 SF314-42-R27B R3 4300U, Vega 5, 48.85 Wh | Average of class Subnotebook | |
|---|---|---|---|---|---|---|
| Battery runtime | 33% | 13% | -17% | -2% | -2% | |
| H.264 (h) | 13.2 | 15.4 17% | 15.6 ? 18% | |||
| WiFi v1.3 (h) | 12.4 | 16.5 33% | 14 13% | 9.9 -20% | 12.1 -2% | 14 ? 13% |
| Load (h) | 3.1 | 3.5 13% | 1.6 -48% | 1.946 ? -37% | ||
| Reader / Idle (h) | 45.6 | 28.6 ? |
Pros
Cons
Verdict - Good performance update
The ultra-light and ultra-thin ExpertBook from Asus gets a very decent performance boost thanks to a Tiger Lake CPU. This year’s ExpertBook achieves a much higher level of CPU and GPU performance, has two Thunderbolt 4 ports (last year’s model had two Thunderbolt 3 ports) and features a brighter screen with a lower contrast ratio.
The ExpertBook has its strengths and weaknesses: It is super-mobile thanks to its light weight and good battery runtimes, but Asus also decided not to include an SD card reader and WWAN functionality. The increase in performance has led to higher temperatures, louder fan noise and shorter battery life.
The Asus ExpertBook is feather-light, slim and portable. The brighter display improves outdoor usability. This year’s model is also much faster thanks to a Tiger Lake chip. However, it is hotter and louder.
Price and Availability
The Asus ExpertBook B9 is available on bestbuy.com for $1699.99.
Asus ExpertBook B9 B9400CE-KC0166R
- 03/11/2021 v7 (old)
Christian Hintze
Price comparison

