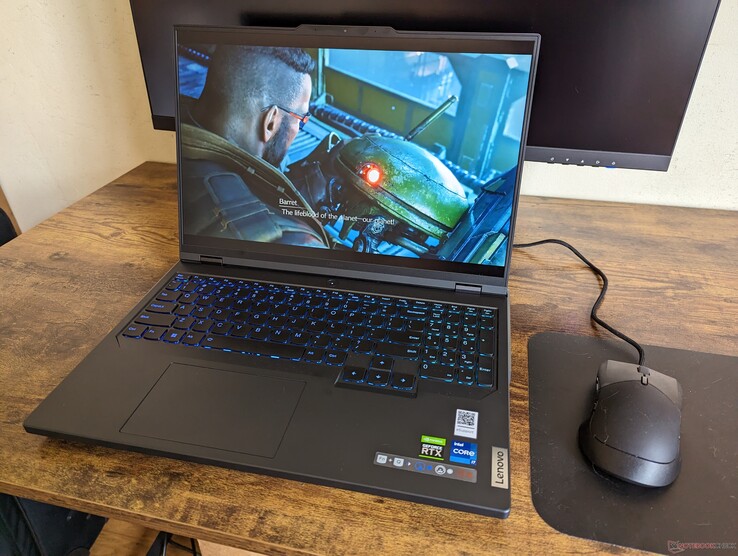
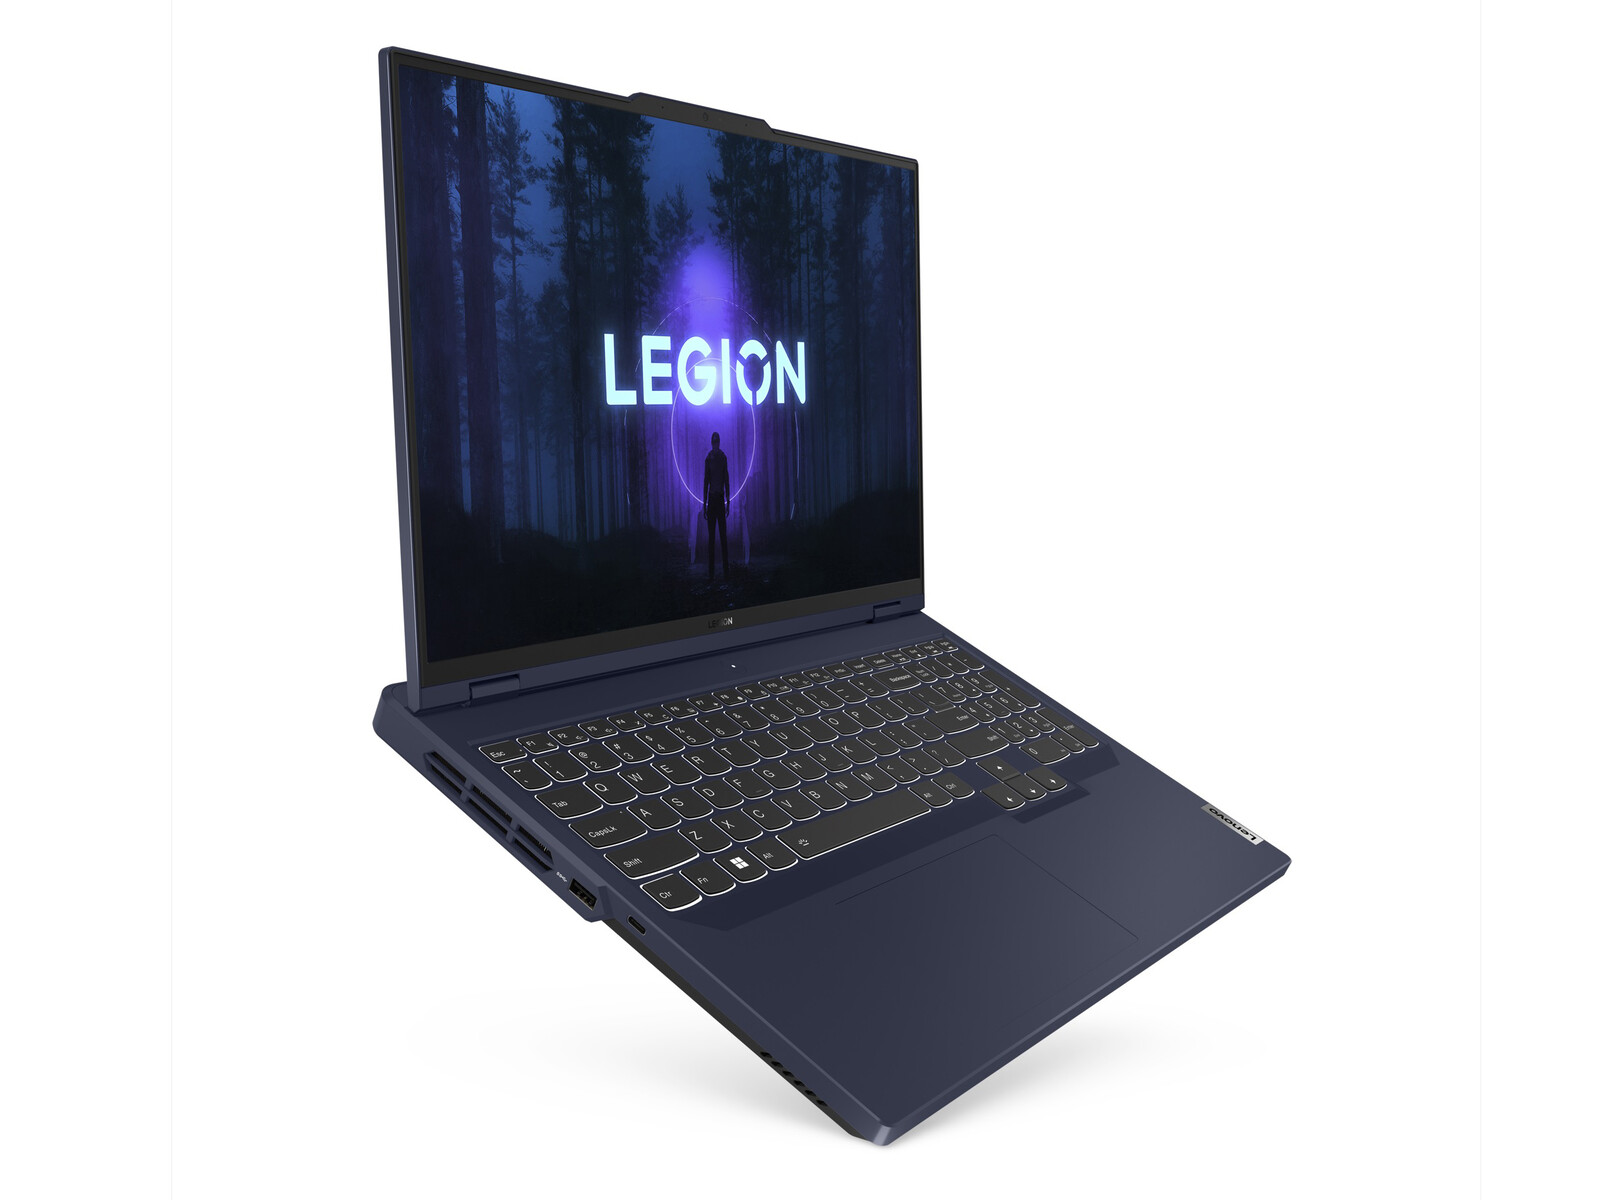
Lenovo Legion Pro 5 16IRX8 laptop review: A hefty US$1600 for the GeForce RTX 4060
The Legion Pro 5 16 IRX8 (or Legion Pro 5i 16 Gen 8) is the successor to the 2022 Legion Pro 5i 16 Gen 7. It introduces several changes including a chassis overhaul with 13th gen Intel Raptor Lake-H CPU and Nvidia Ada Lovelace GPU options to replace the older 12th gen Alder Lake-H and Ampere options, respectively. It's an upper midrange gaming model sitting in between the entry-level IdeaPad gaming series and the flagship Legion Pro 7 series.
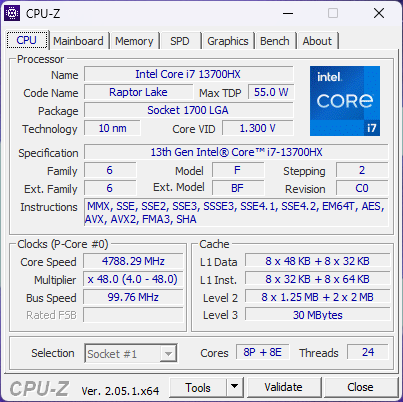
Our specific test unit is a middle configuration with the Core i7-13700HX, GeForce RTX 4060, and 165 Hz IPS display for approximately $1400 to $1700 USD. Lower-end and higher-end SKUs are available with the Core i5-12500H, RTX 4050, RTX 4070, or 240 Hz IPS display instead, but all display options at the moment have G-Sync and a native resolution of 2560 x 1600.
Competitors to the Legion Pro 5 16 include other 16-inch gaming laptops like the Razer Blade 16, Asus ROG Zephyrus M16, Dell G16 7620, or Gigabyte Aero 16.
More Lenovo reviews:
Potential Competitors in Comparison
Rating | Date | Model | Weight | Height | Size | Resolution | Price |
|---|---|---|---|---|---|---|---|
| 87.9 % v7 (old) | 05 / 2023 | Lenovo Legion Pro 5 16IRX8 i7-13700HX, GeForce RTX 4060 Laptop GPU | 2.5 kg | 26.8 mm | 16.00" | 2560x1600 | |
| 87.8 % v7 (old) | 02 / 2023 | Asus ROG Zephyrus M16 GU603Z i9-12900H, GeForce RTX 3070 Ti Laptop GPU | 2.1 kg | 19.9 mm | 16.00" | 2560x1600 | |
| 91.2 % v7 (old) | 02 / 2023 | Razer Blade 16 Early 2023 i9-13950HX, GeForce RTX 4080 Laptop GPU | 2.4 kg | 21.99 mm | 16.00" | 2560x1600 | |
| 89.4 % v7 (old) | 02 / 2023 | Lenovo Legion Pro 7 16IRX8H i9-13900HX, GeForce RTX 4080 Laptop GPU | 2.7 kg | 26 mm | 16.00" | 2560x1600 | |
| 87.7 % v7 (old) | 10 / 2022 | Lenovo Legion 5 Pro 16ARH7H RTX 3070 Ti R7 6800H, GeForce RTX 3070 Ti Laptop GPU | 2.6 kg | 26.6 mm | 16.00" | 2560x1600 | |
| 89.3 % v7 (old) | 11 / 2022 | Lenovo Legion S7 16ARHA7 R9 6900HX, Radeon RX 6800S | 2.2 kg | 16.9 mm | 16.00" | 2560x1600 |
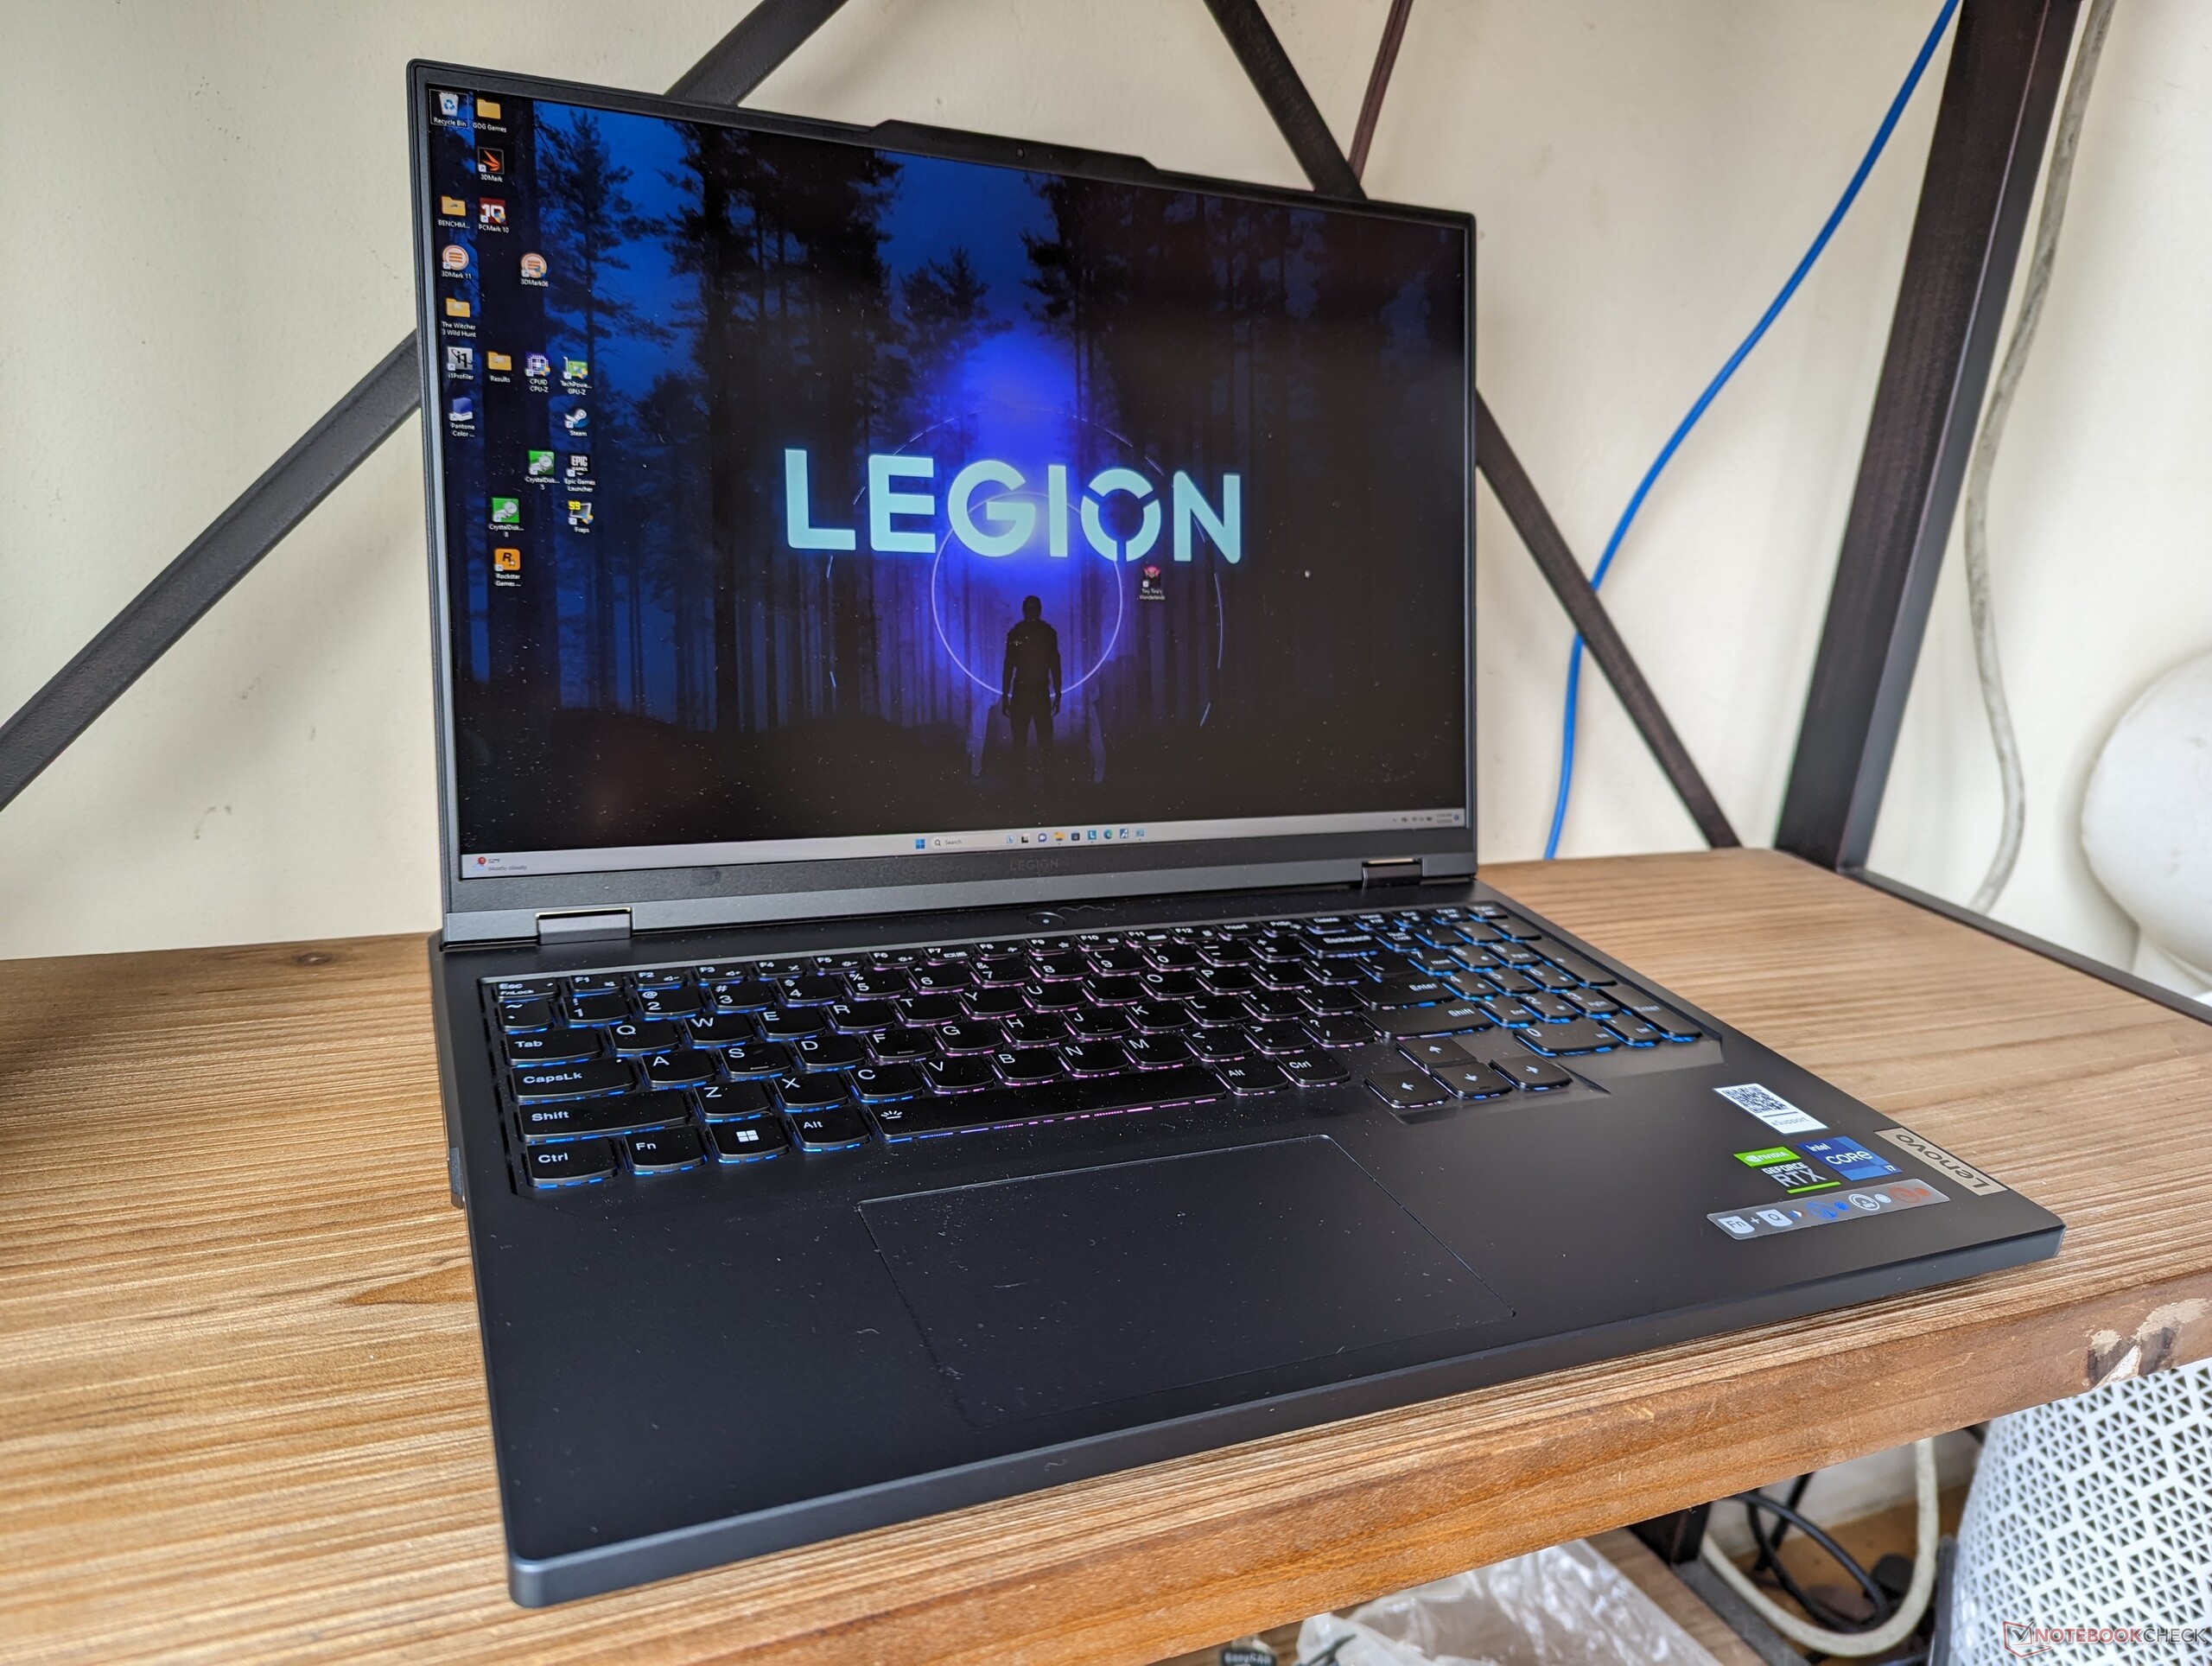
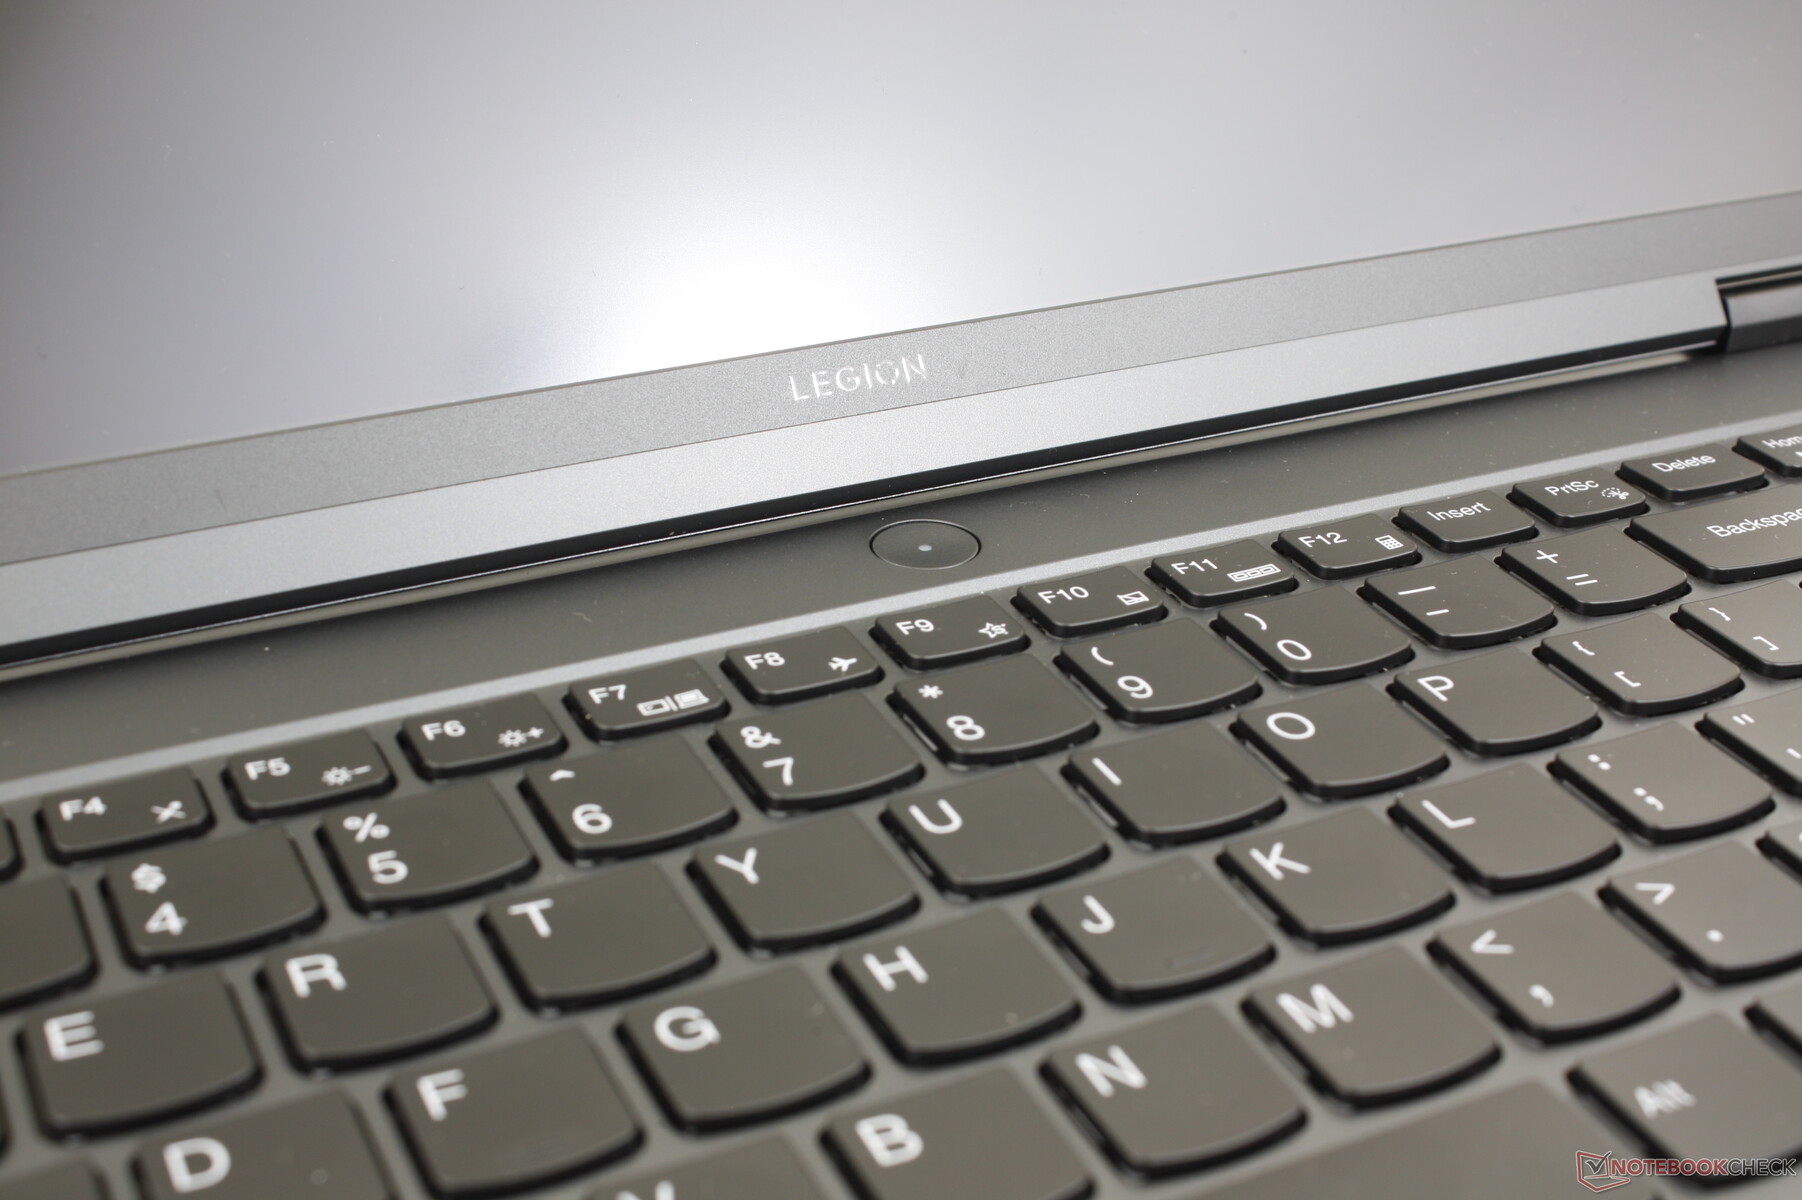
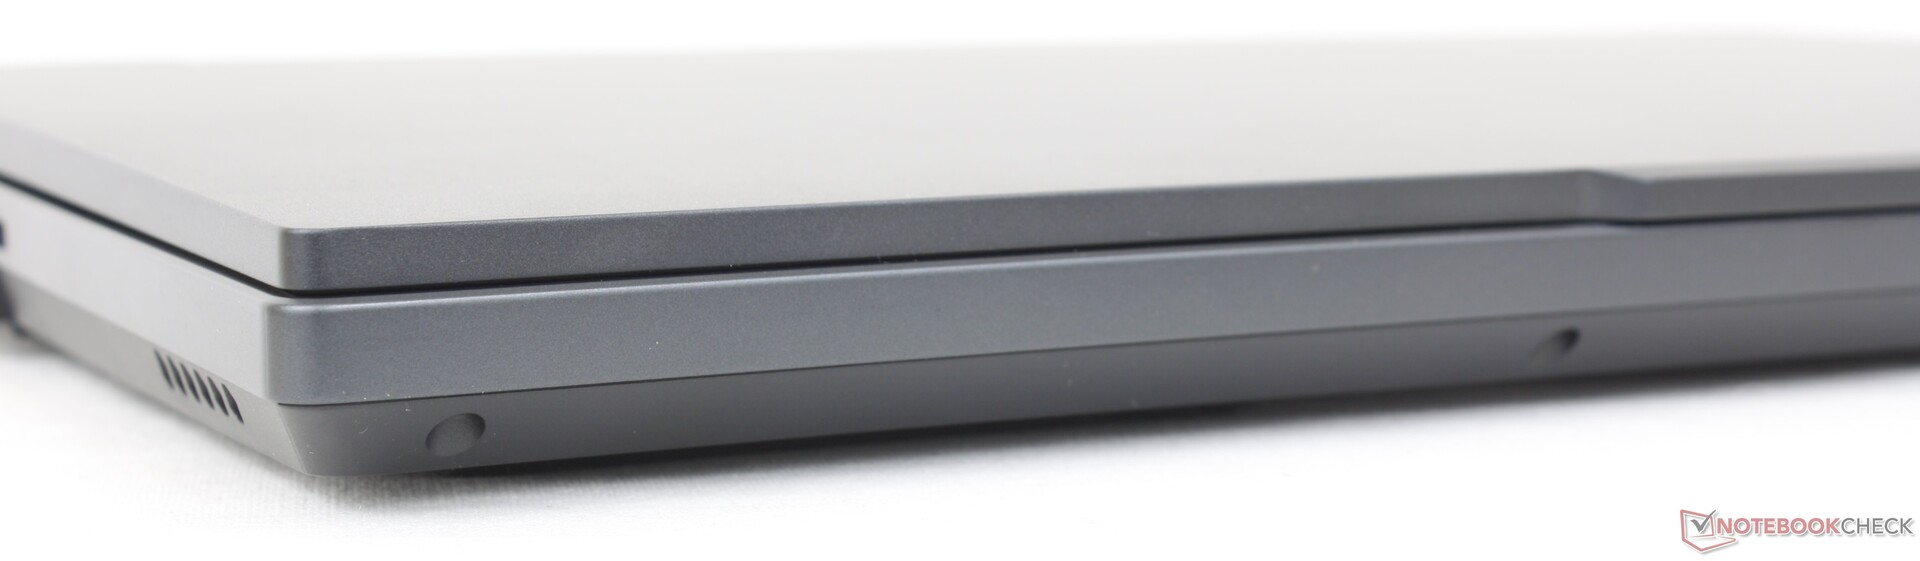
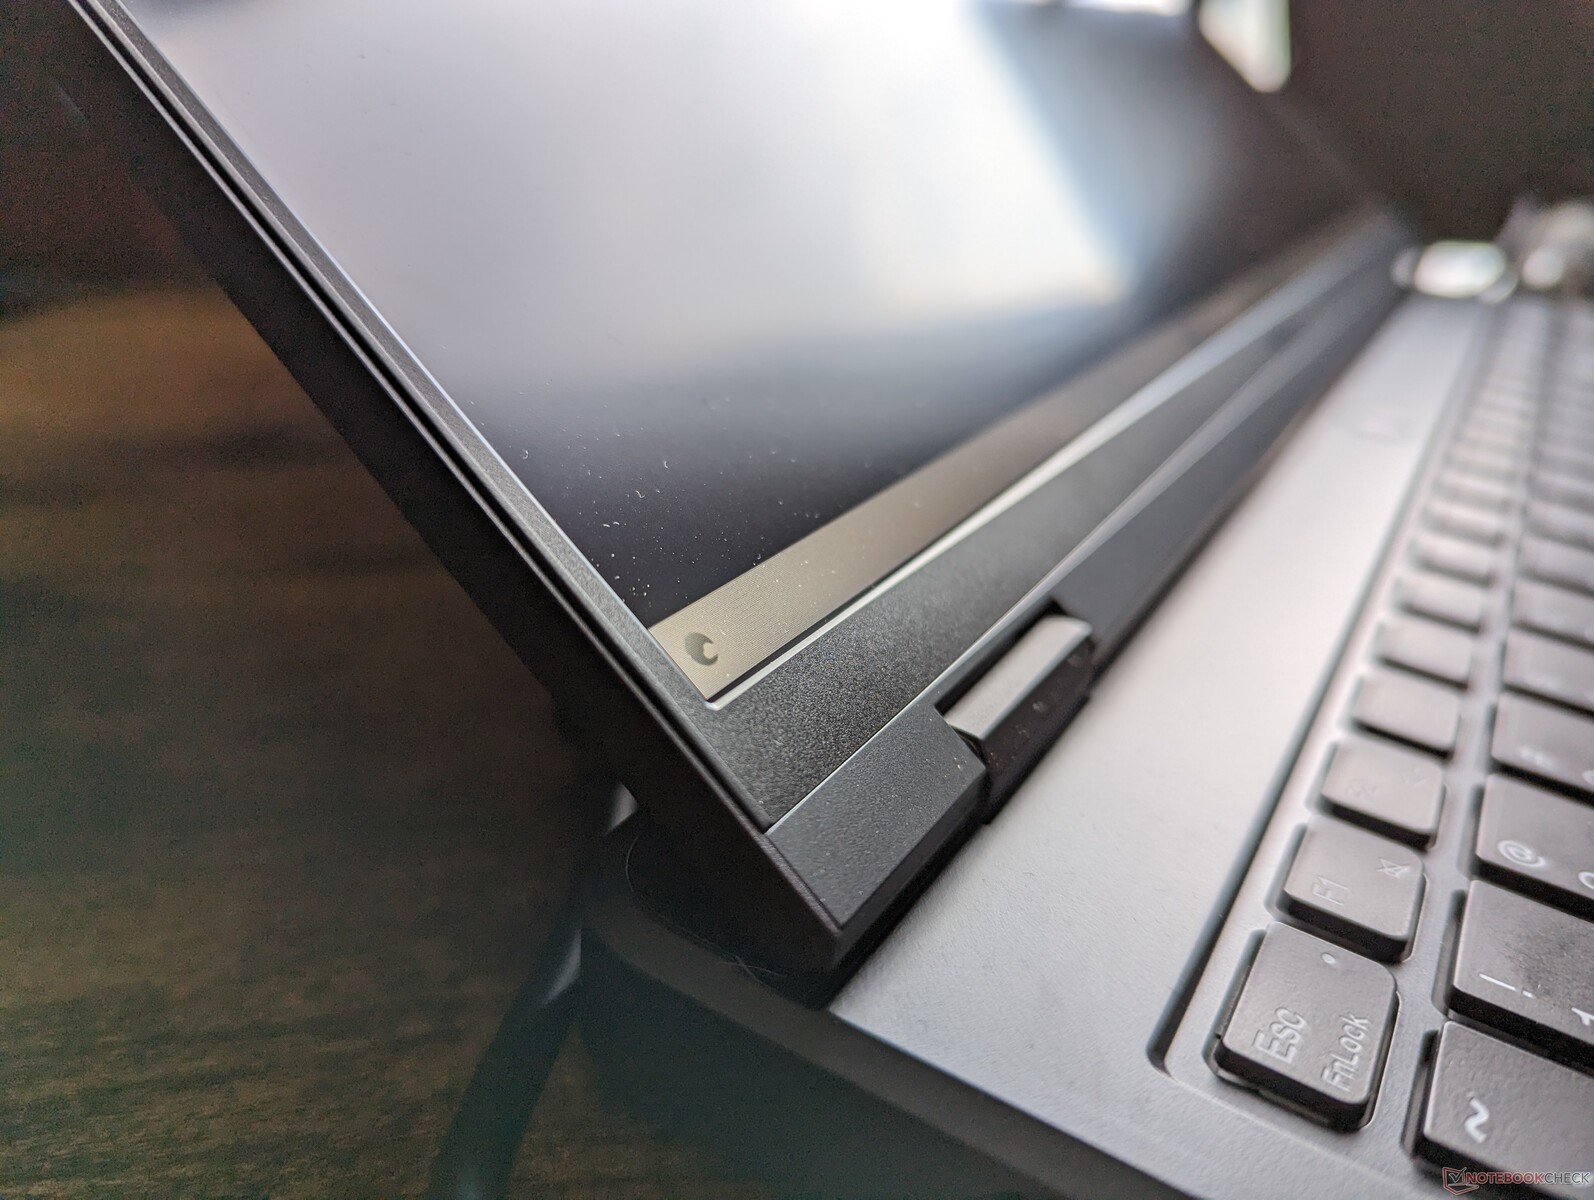
Case — A Leaner Legion
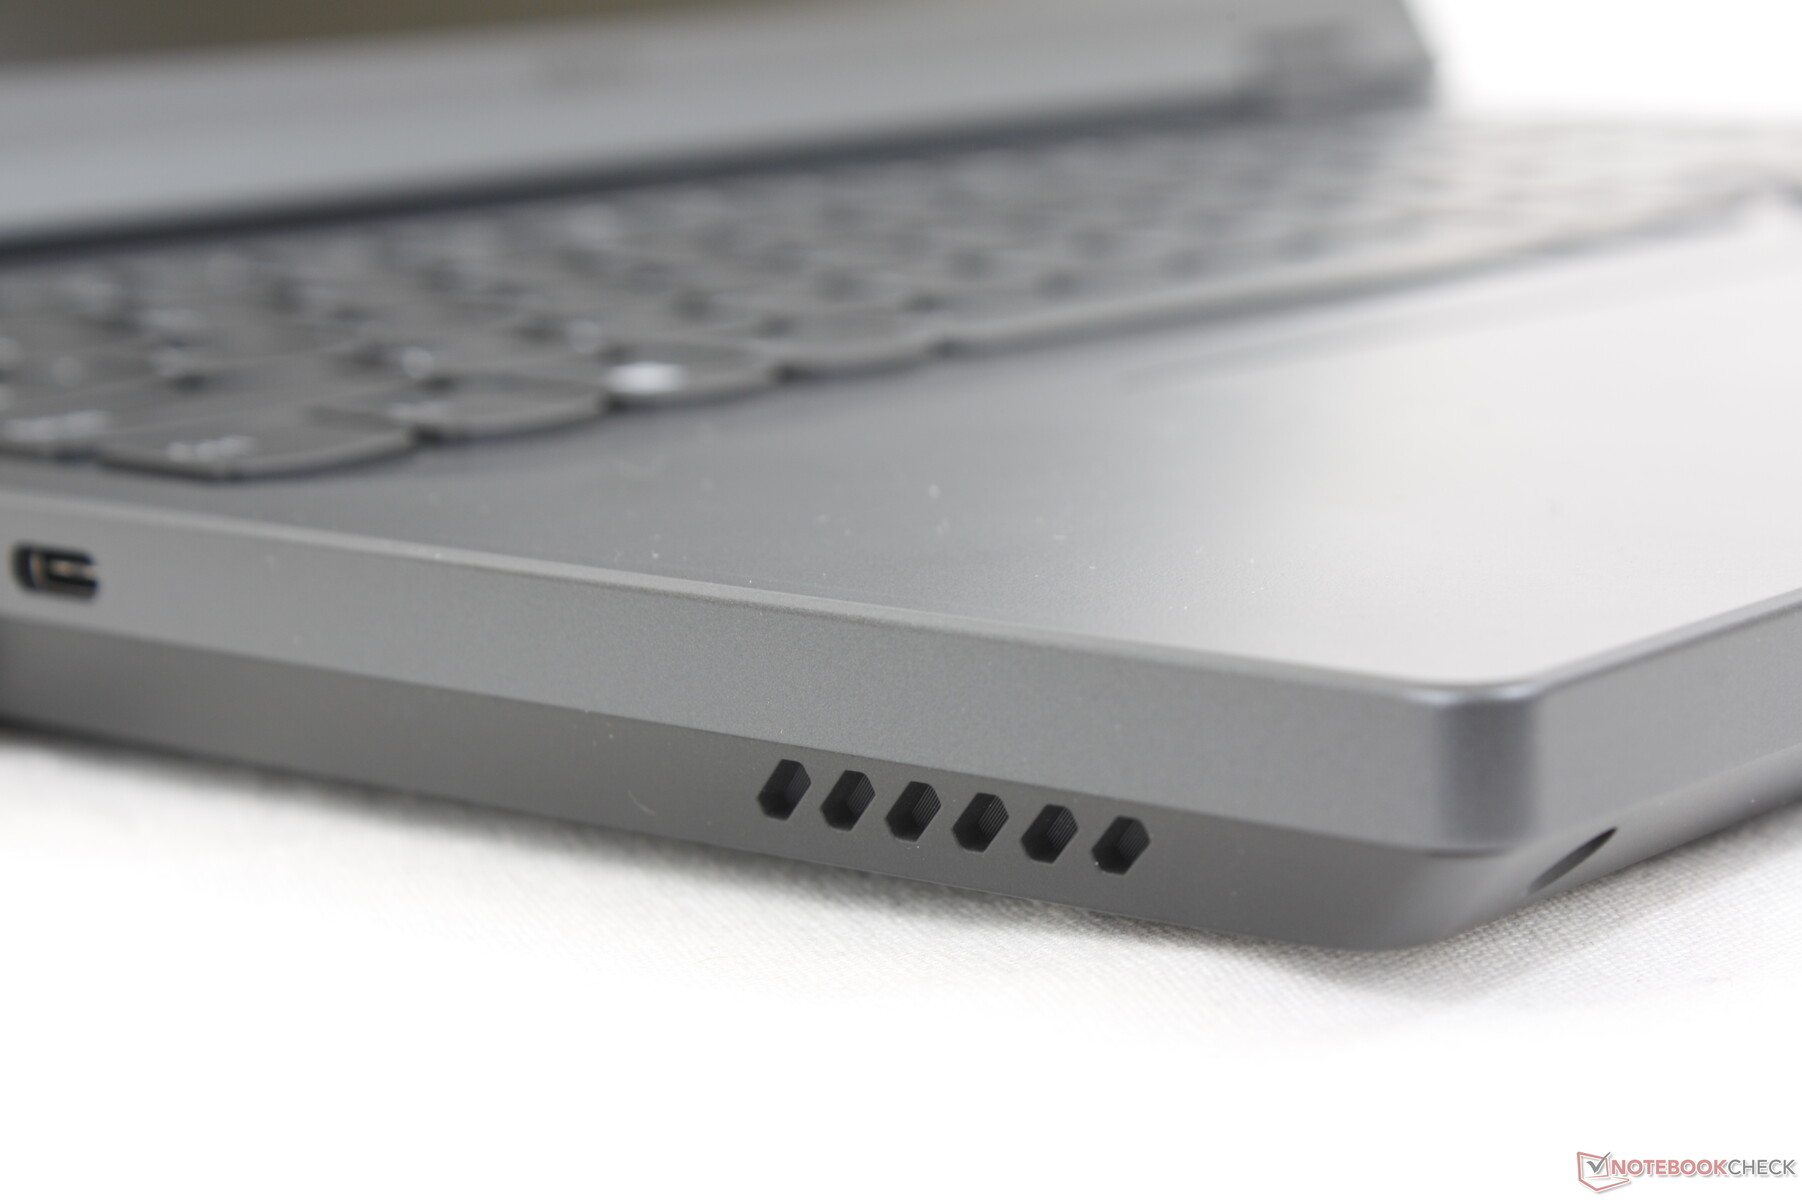
Visually, the revised chassis has fewer accents and angles for a flatter and more professional look than last year's model especially along the rear. The two-tone gray and silver color scheme is gone in favor of a more uniform appearance. We prefer the new design as it leans towards minimalism while maintaining many of the distinctive Legion features.
Chassis rigidity is excellent on our unit with no audible creaking or terribly weak points. The base and lid exhibit more twisting than the stiffer Blade 16, but not enough to be of any huge concern.
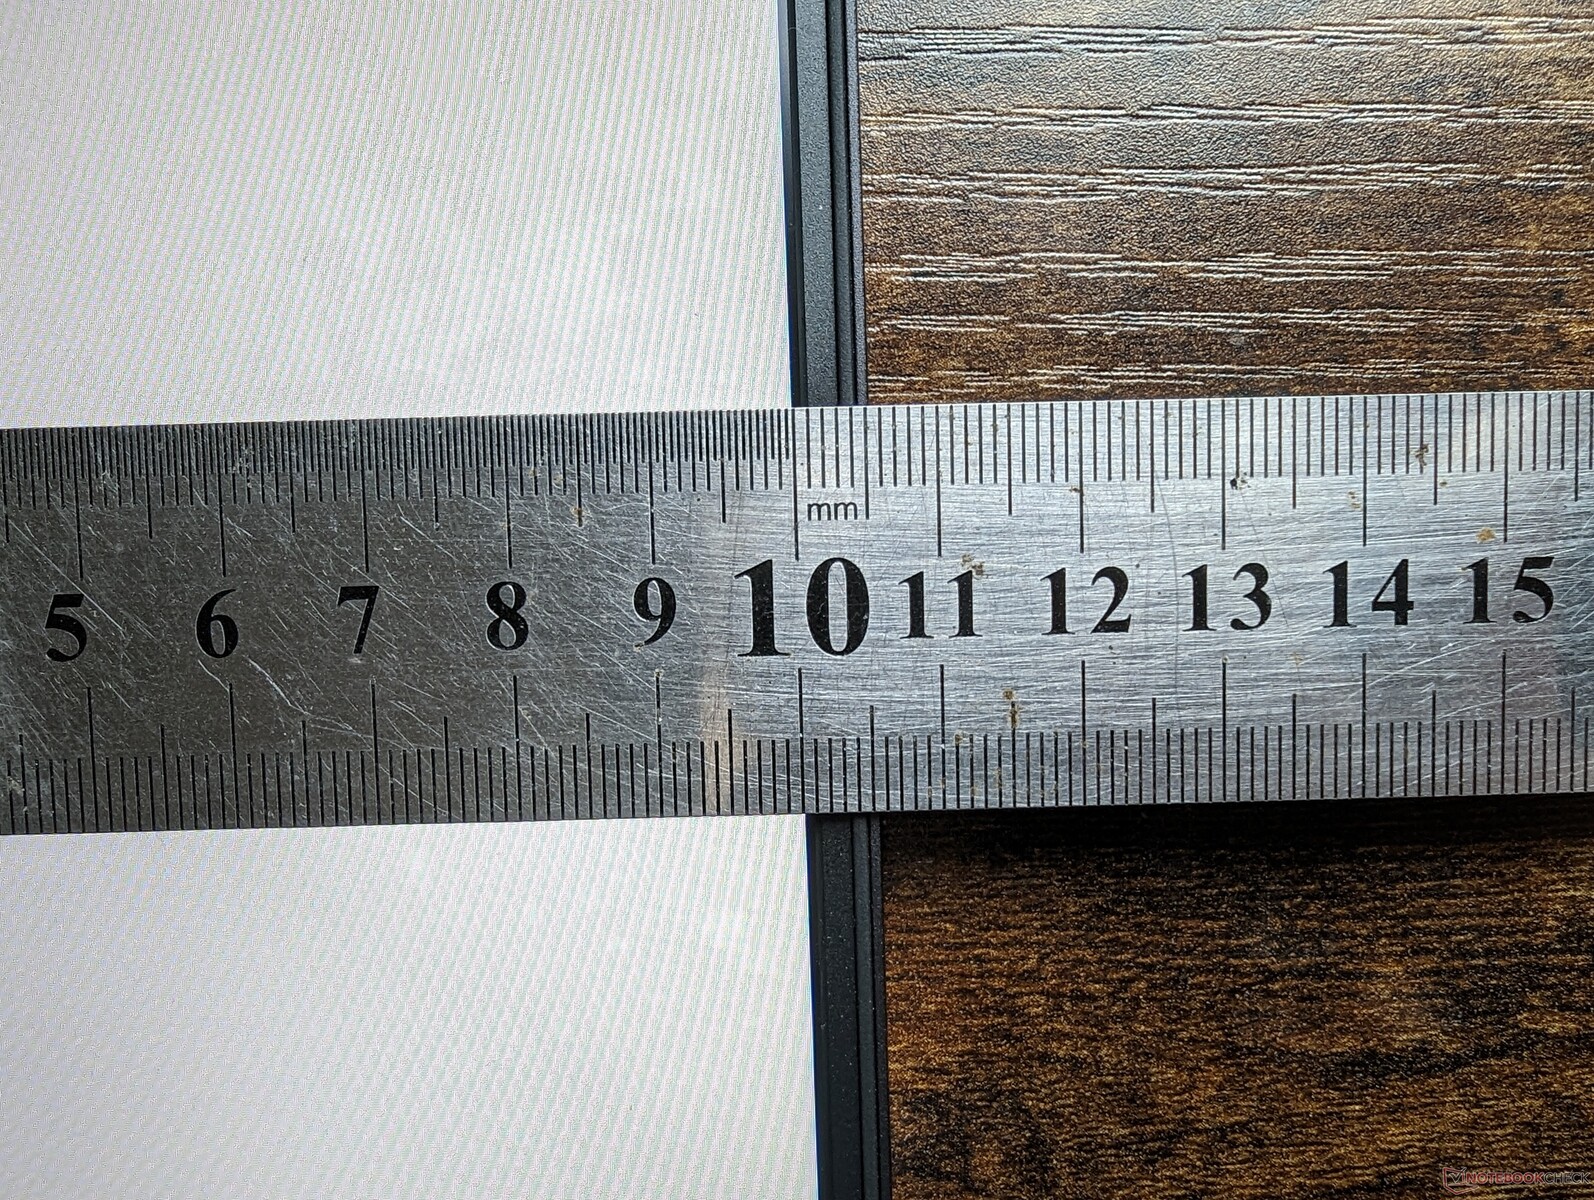
The Legion Pro 5 16 is noticeably larger and heavier than many of its peers. The Aero 16, Blade 16, and Zephyrus M16 are all thinner and lighter than the Lenovo by up to 8 mm or 400 grams which is not insignificant. Though it's certainly nowhere near as bulky as many 17.3-inch gaming laptops, the Legion Pro 5 16 isn't exactly the most travel-friendly option in its 16-inch size class, either.
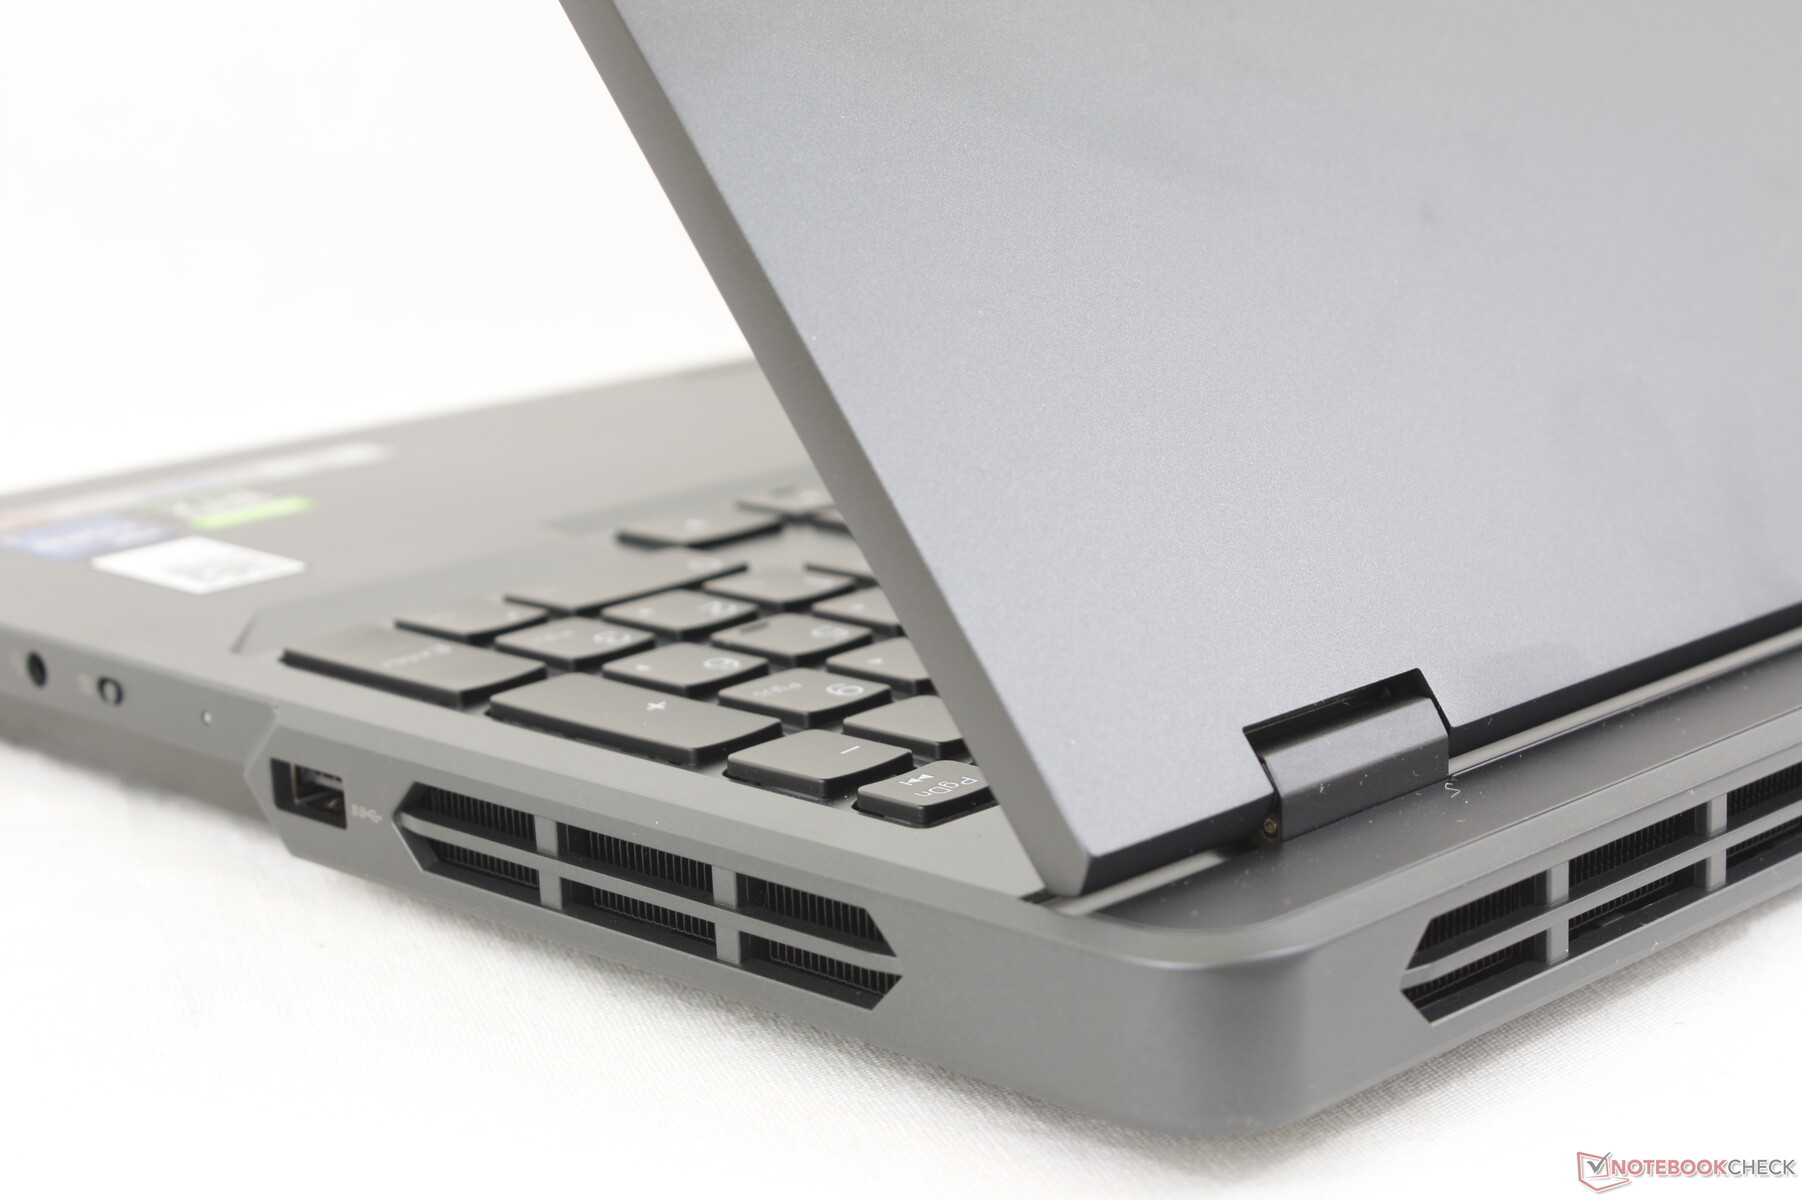
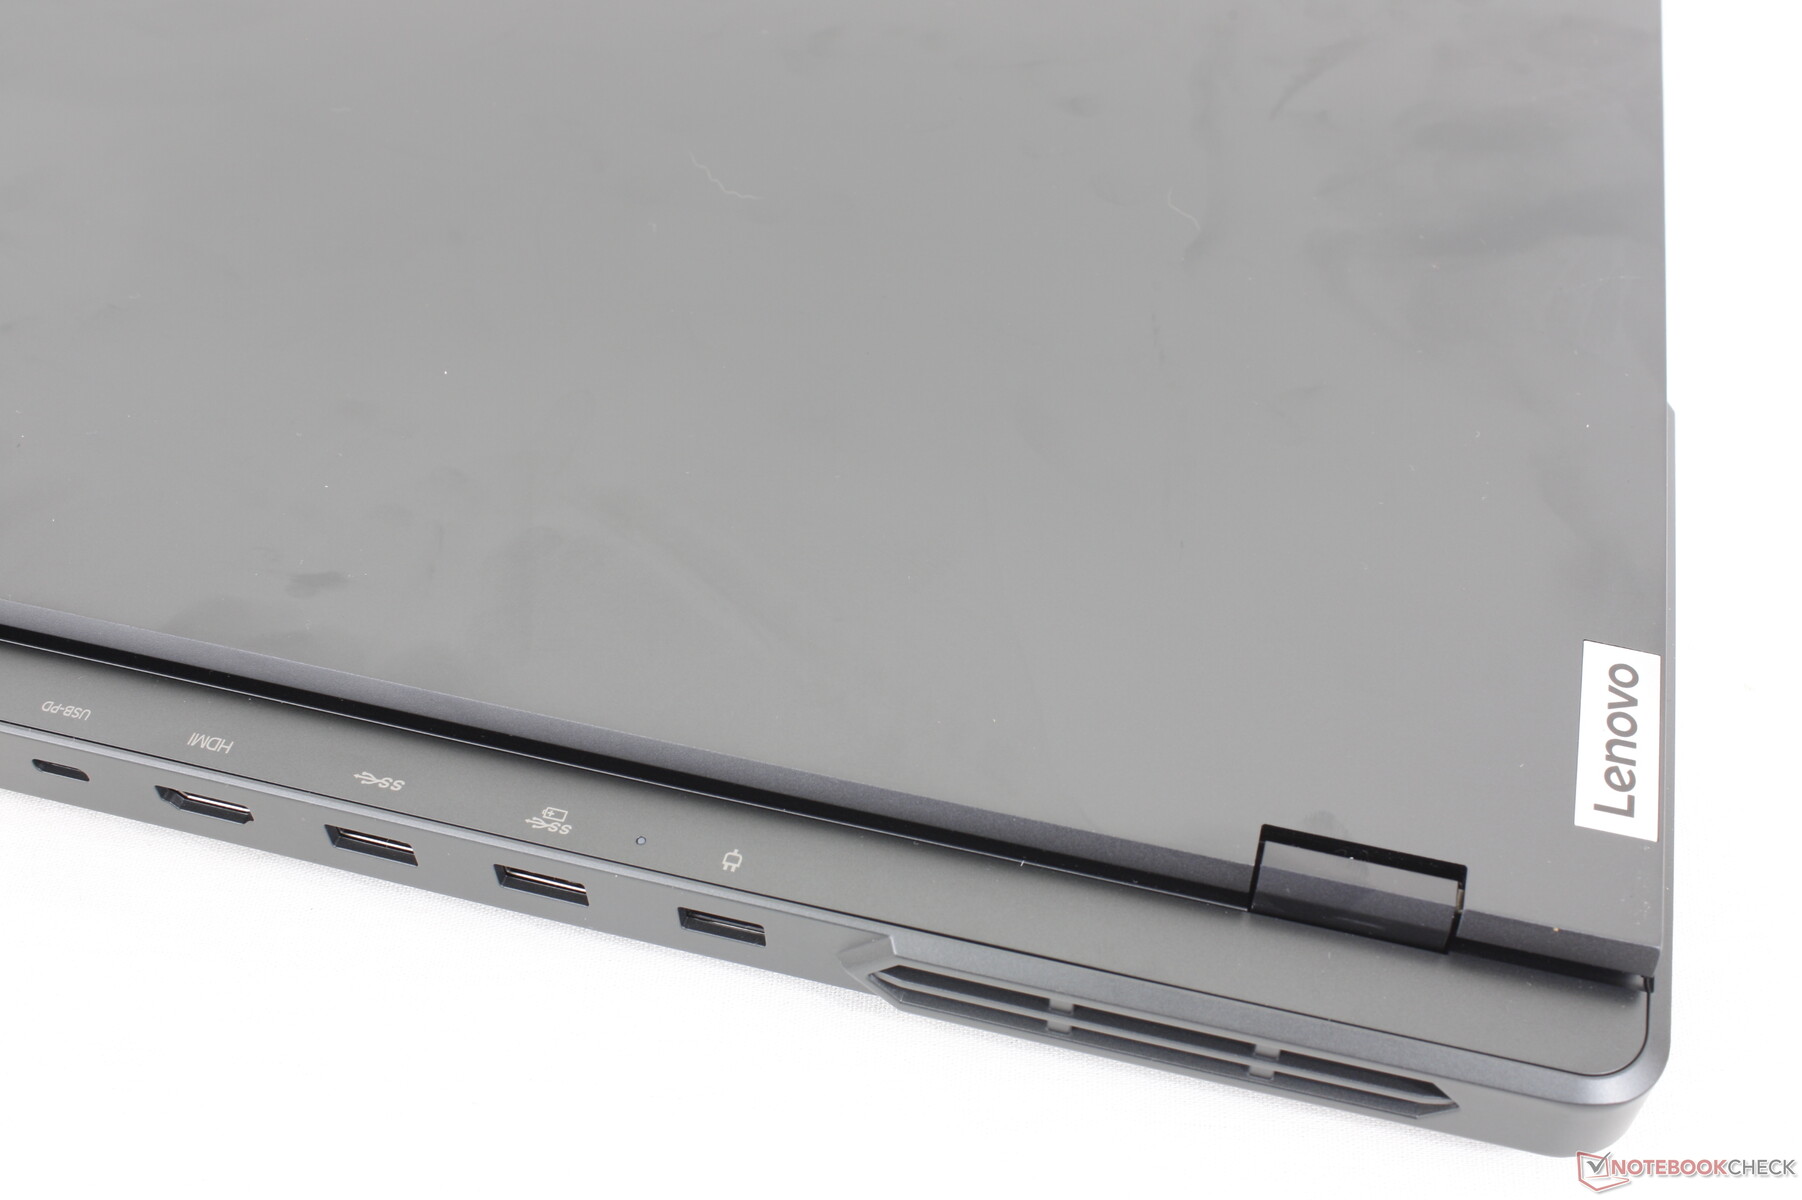
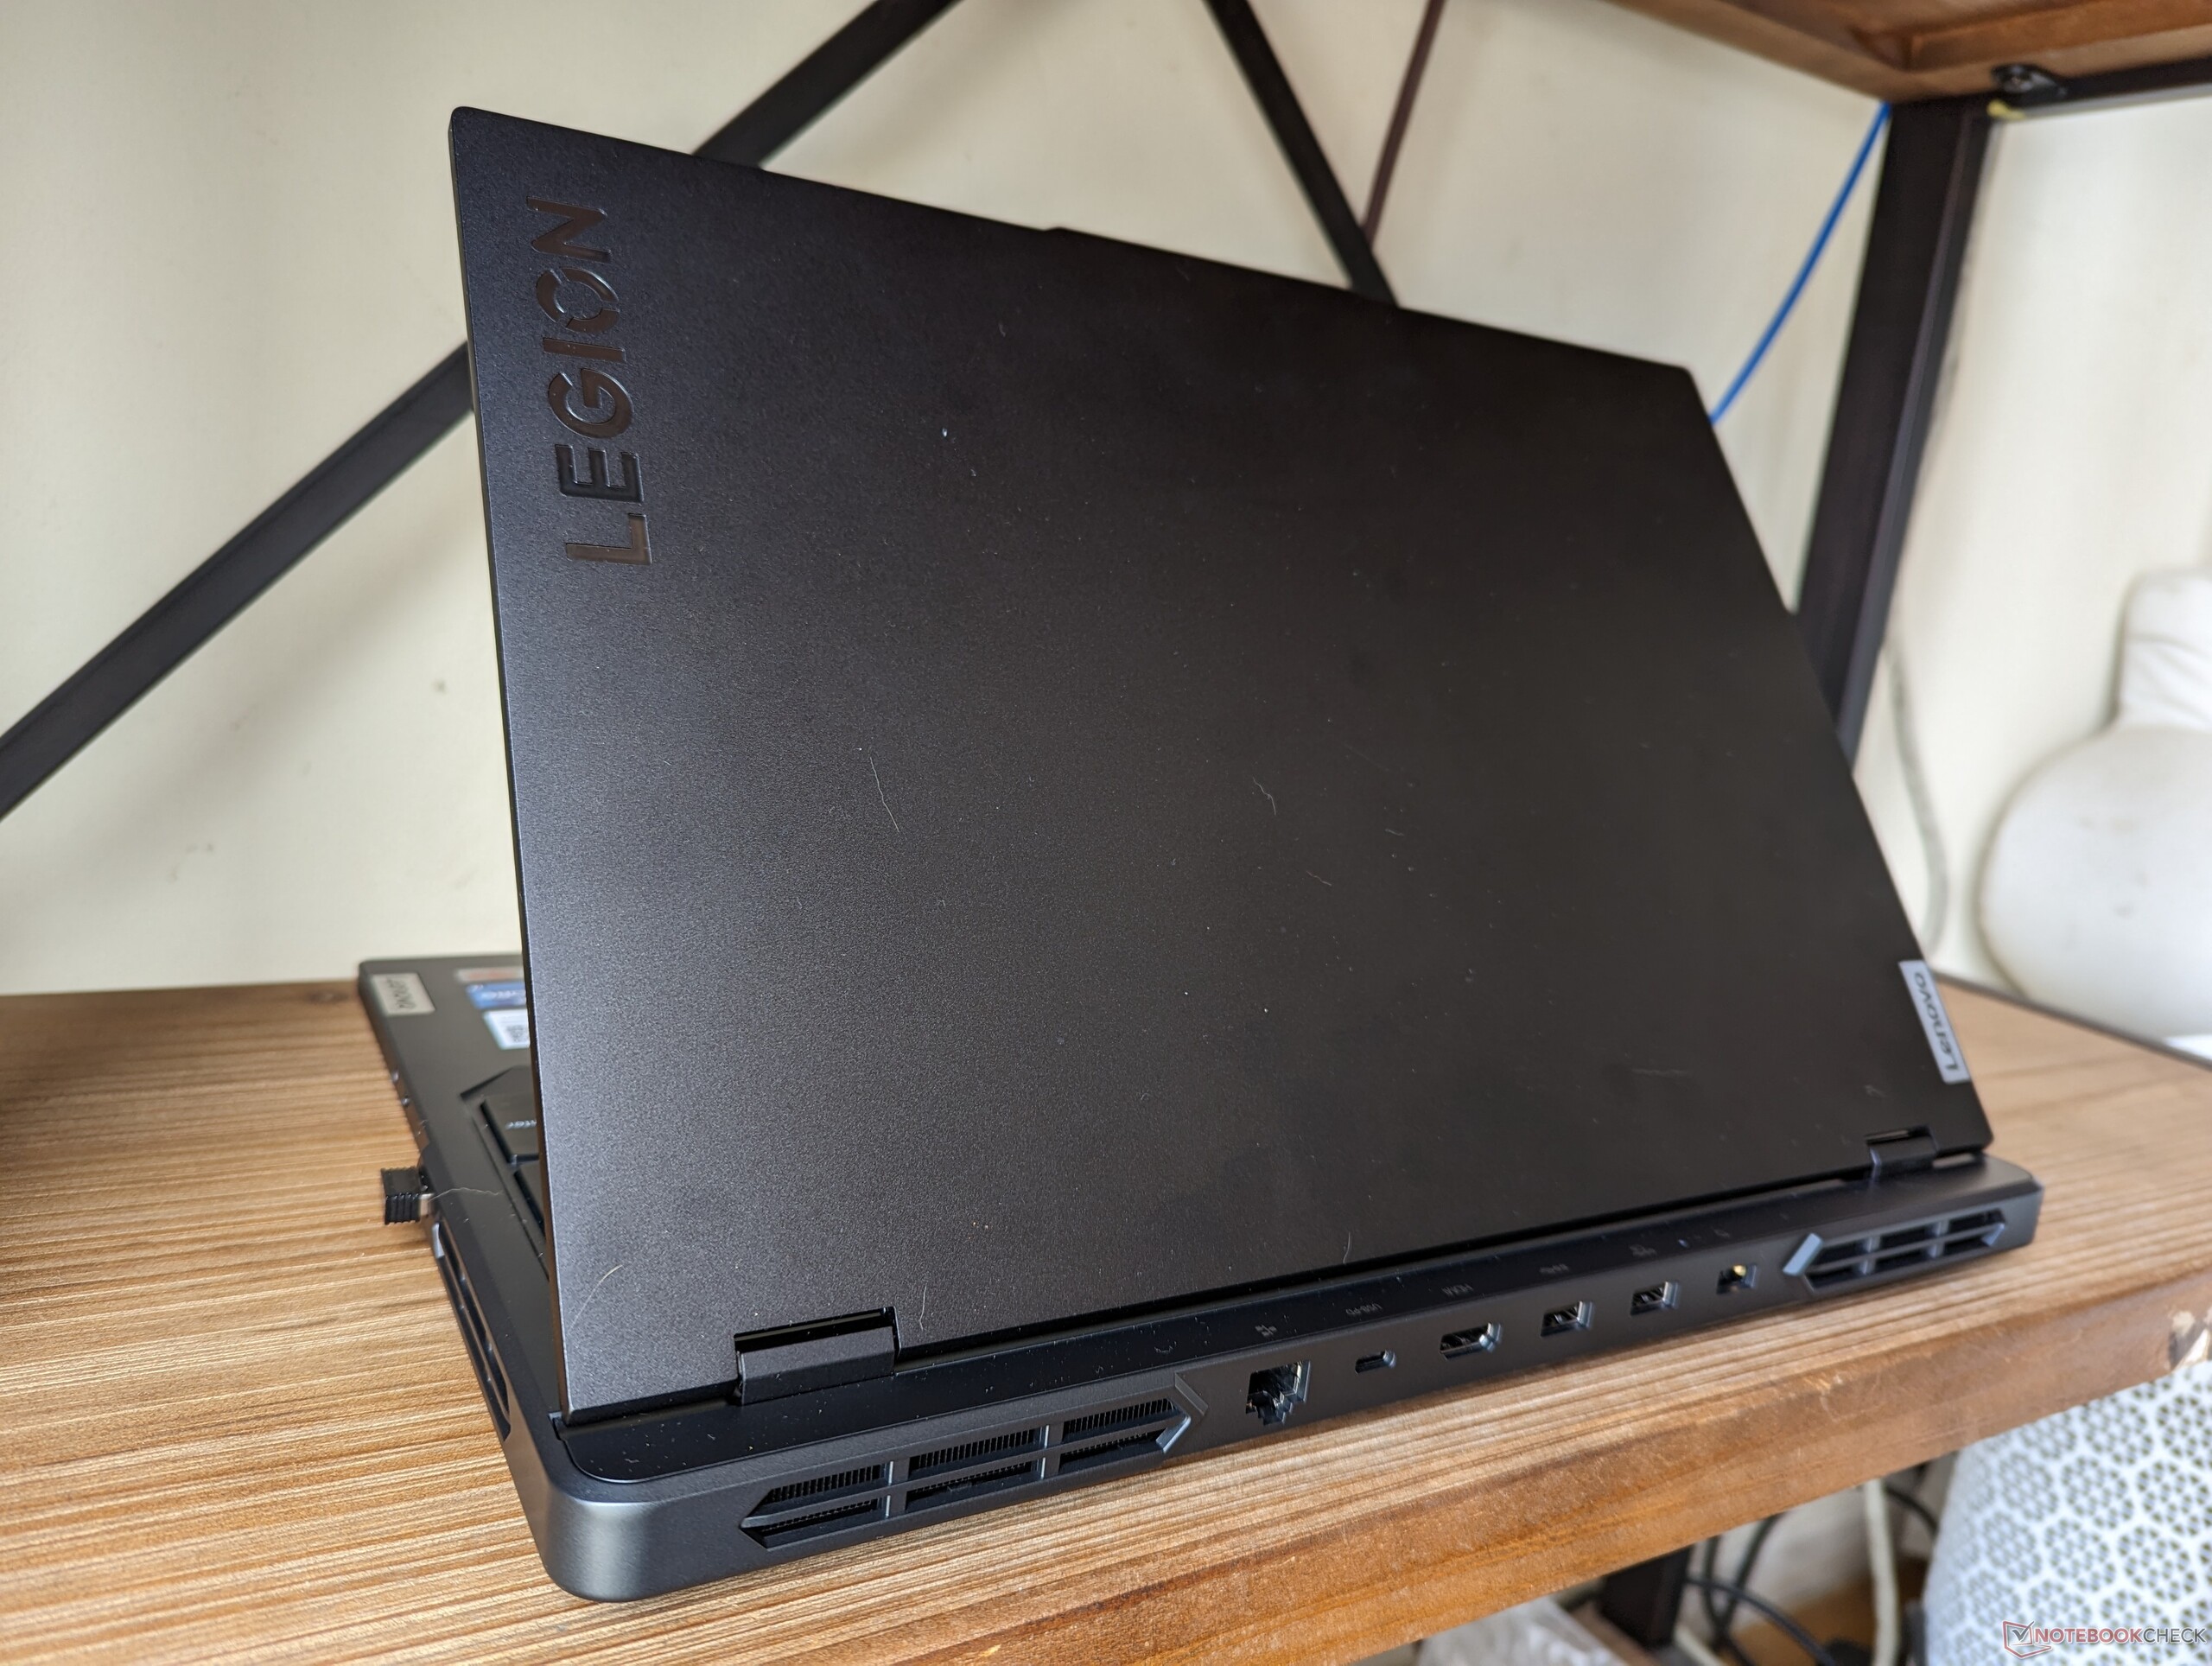
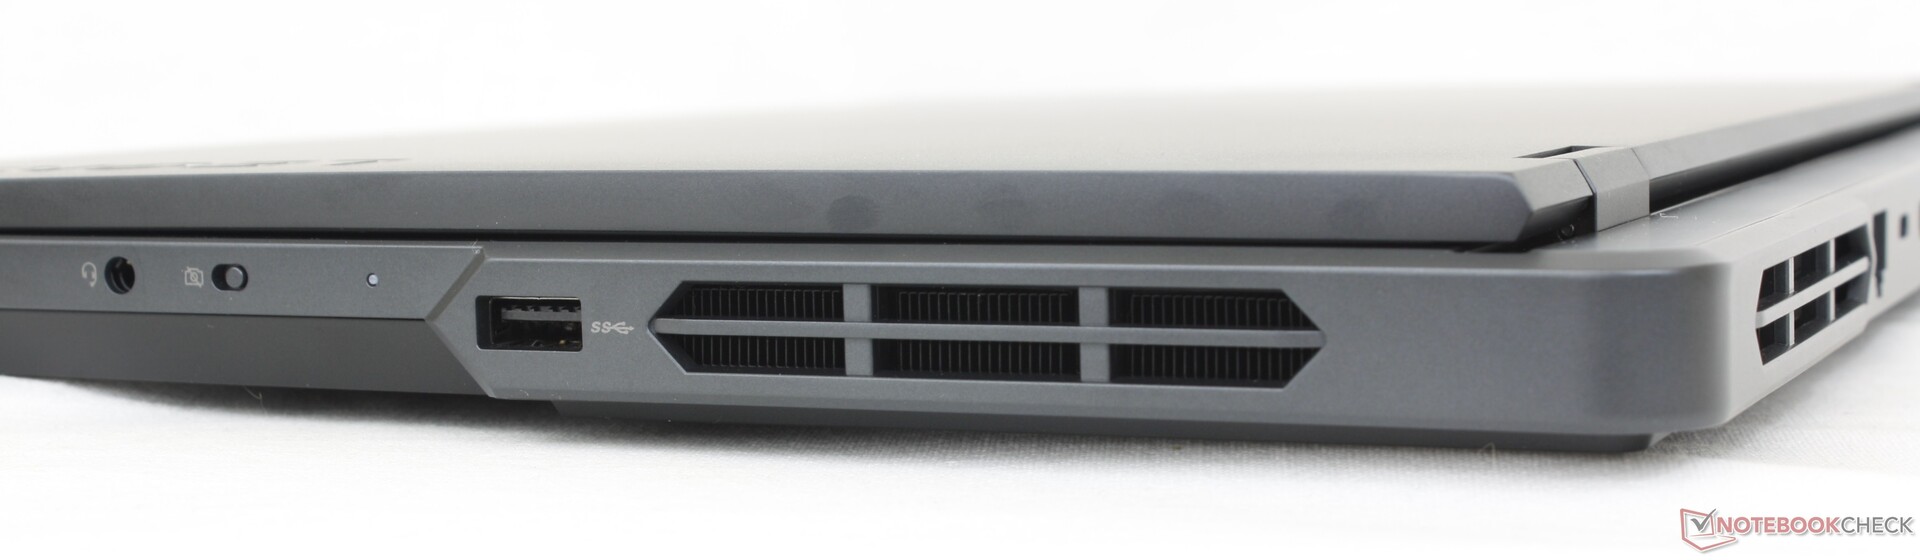
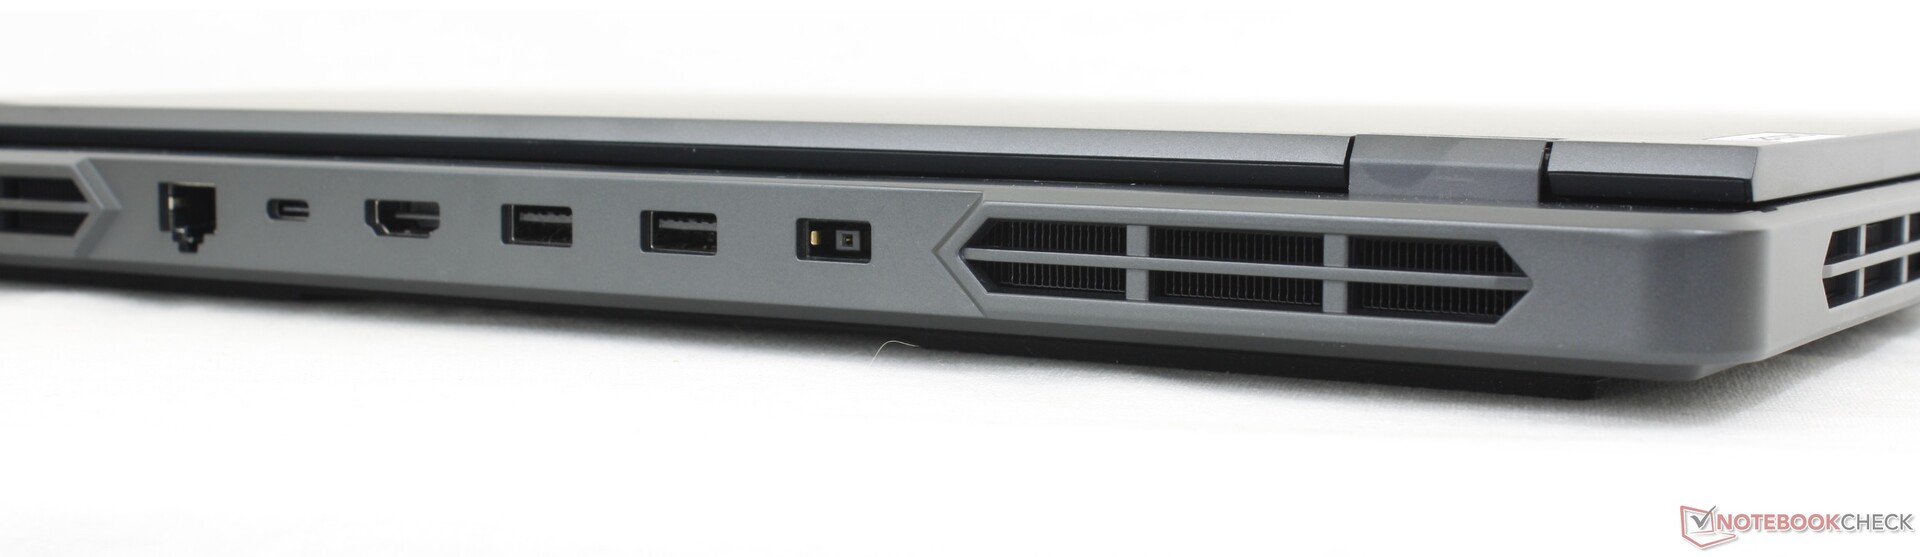
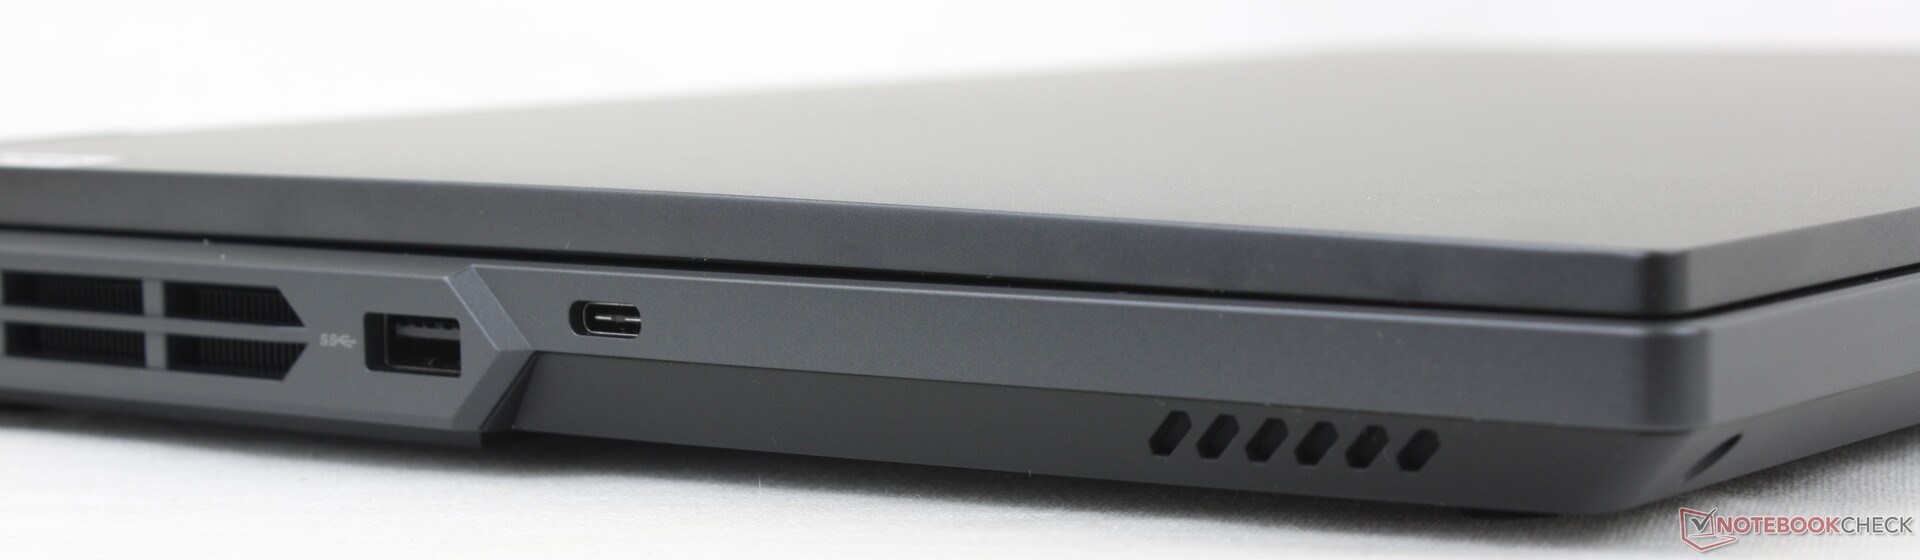
Connectivity — Lots Of Ports But No Thunderbolt
There is a healthy selection of ports with most of them positioned along the rear. In fact, the model shares the exact same ports and positioning as on the higher-end Legion Pro 7 16IRX8H even though both models are visually dissimilar.
Note that the model does not support Thunderbolt. It at least comes with an RJ-45 port unlike on the Blade 16.
The rear ports are labeled with icons visible from the top of the chassis as shown by the picture above. The icons make it easier to connect cables unlike on the rear ports of the Alienware m18, but they unfortunately do not light up.
Communication
An Intel AX211 comes standard for Wi-Fi 6E and Bluetooth 5.2 connectivity. We experienced stable transfer rates and no issues when paired to our 6 GHz Asus AXE11000 network.
Webcam
The 1080p or 2 MP webcam has become standard on gaming laptops. On our Lenovo, however, automatic brightness adjustments would occur slower than usual resulting in a darker picture.
There is an electronic webcam shutter for privacy control but no IR sensor.


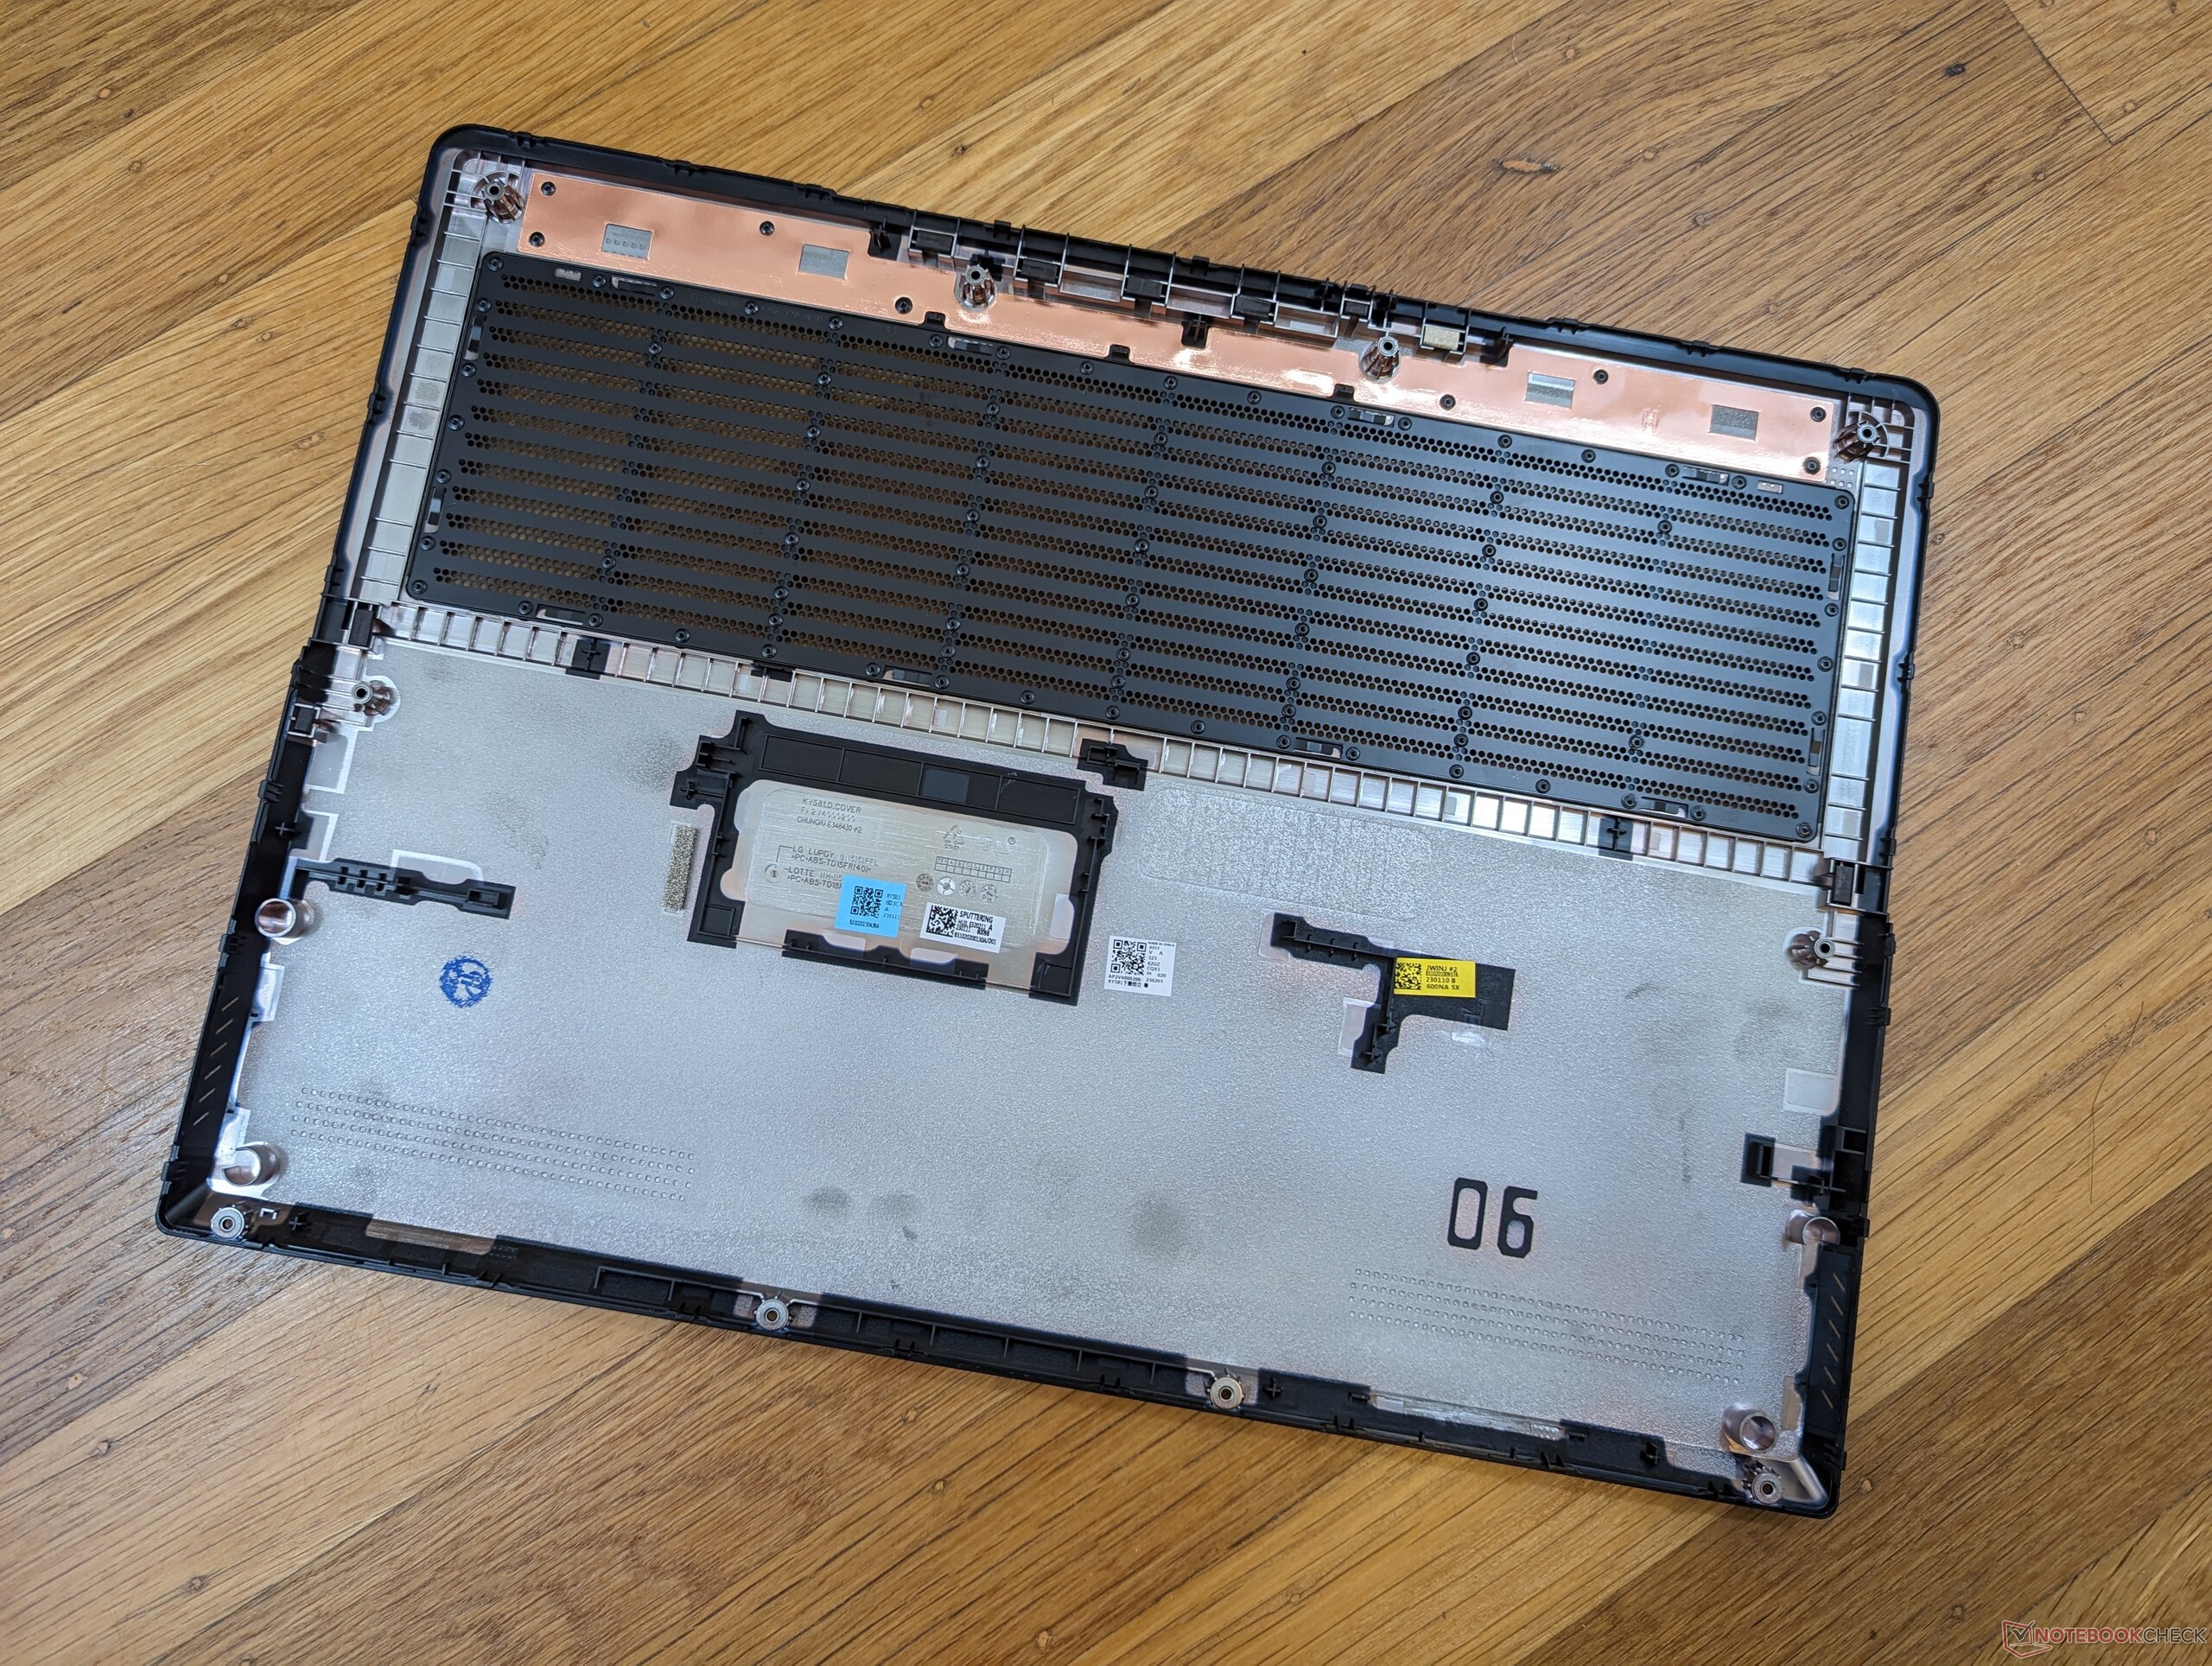
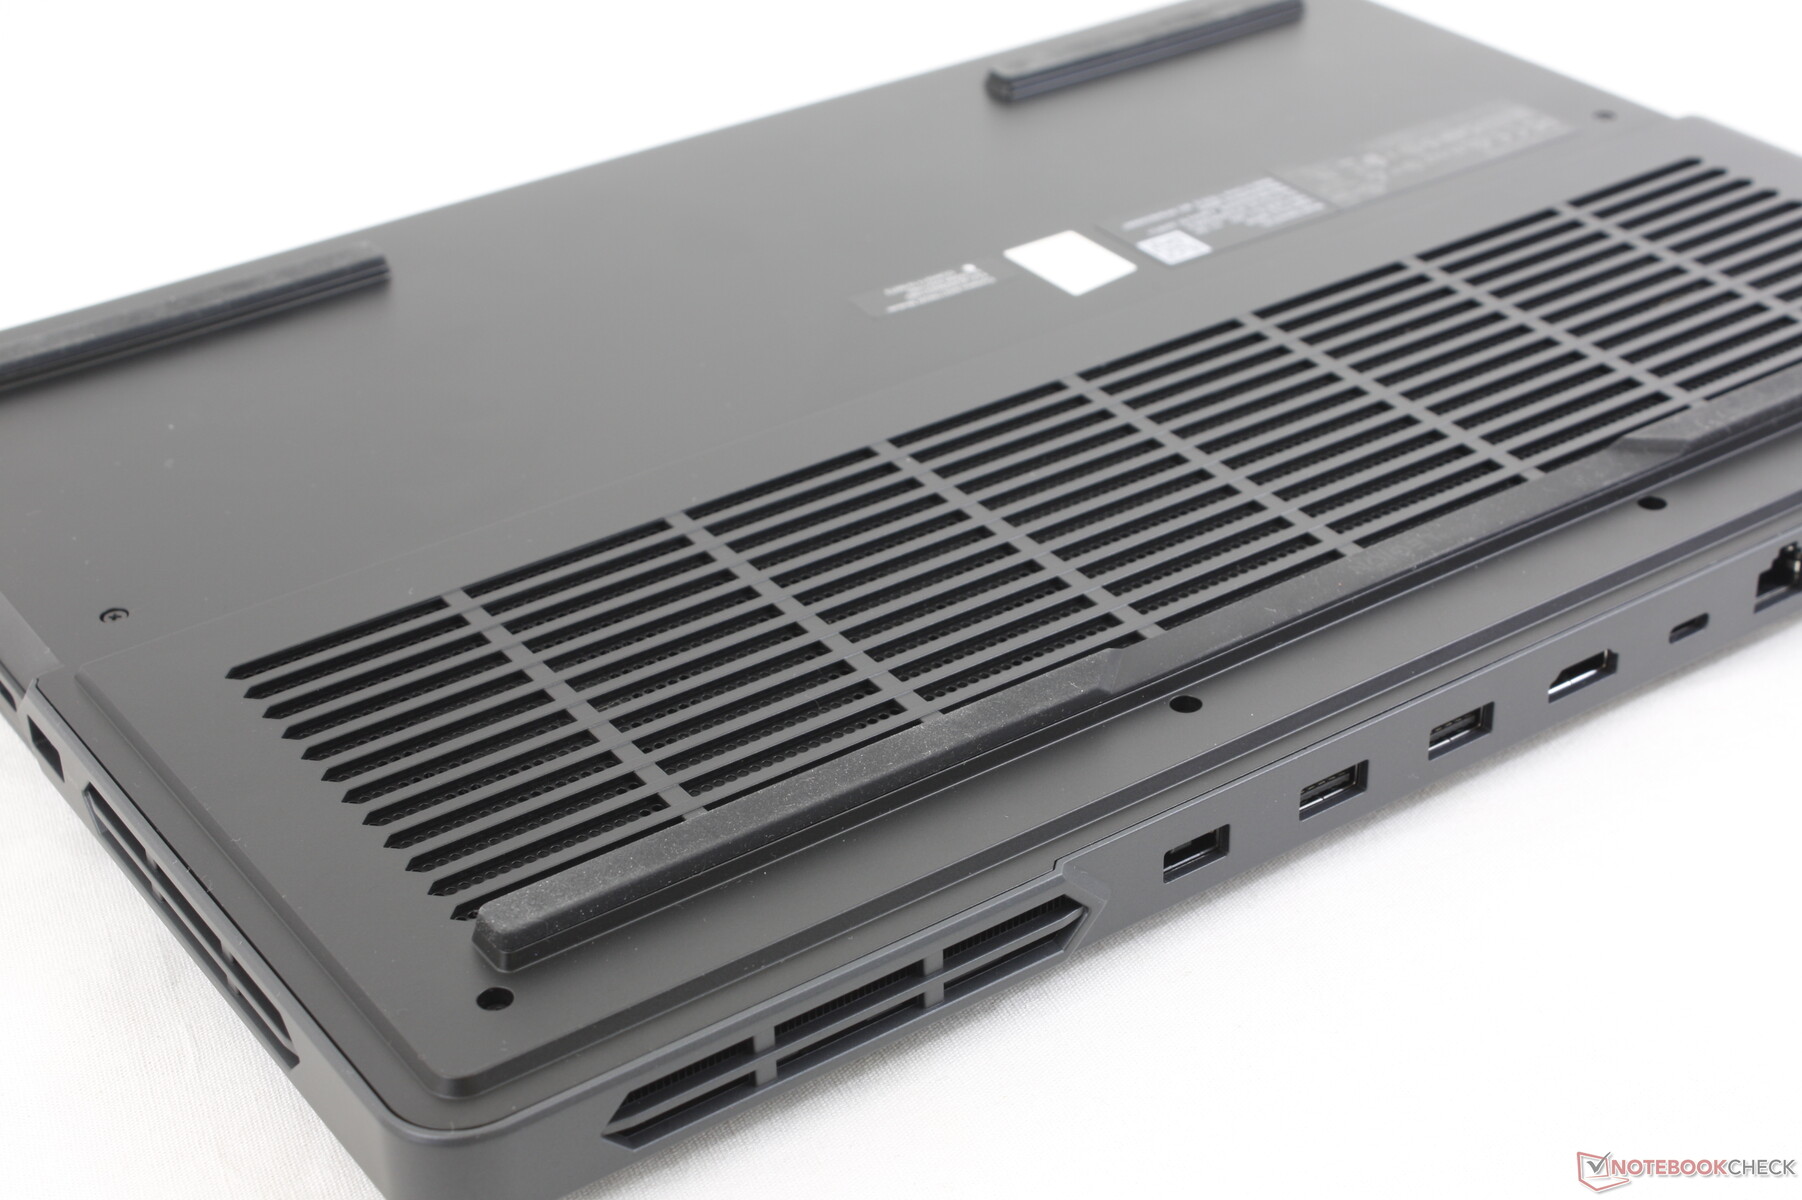
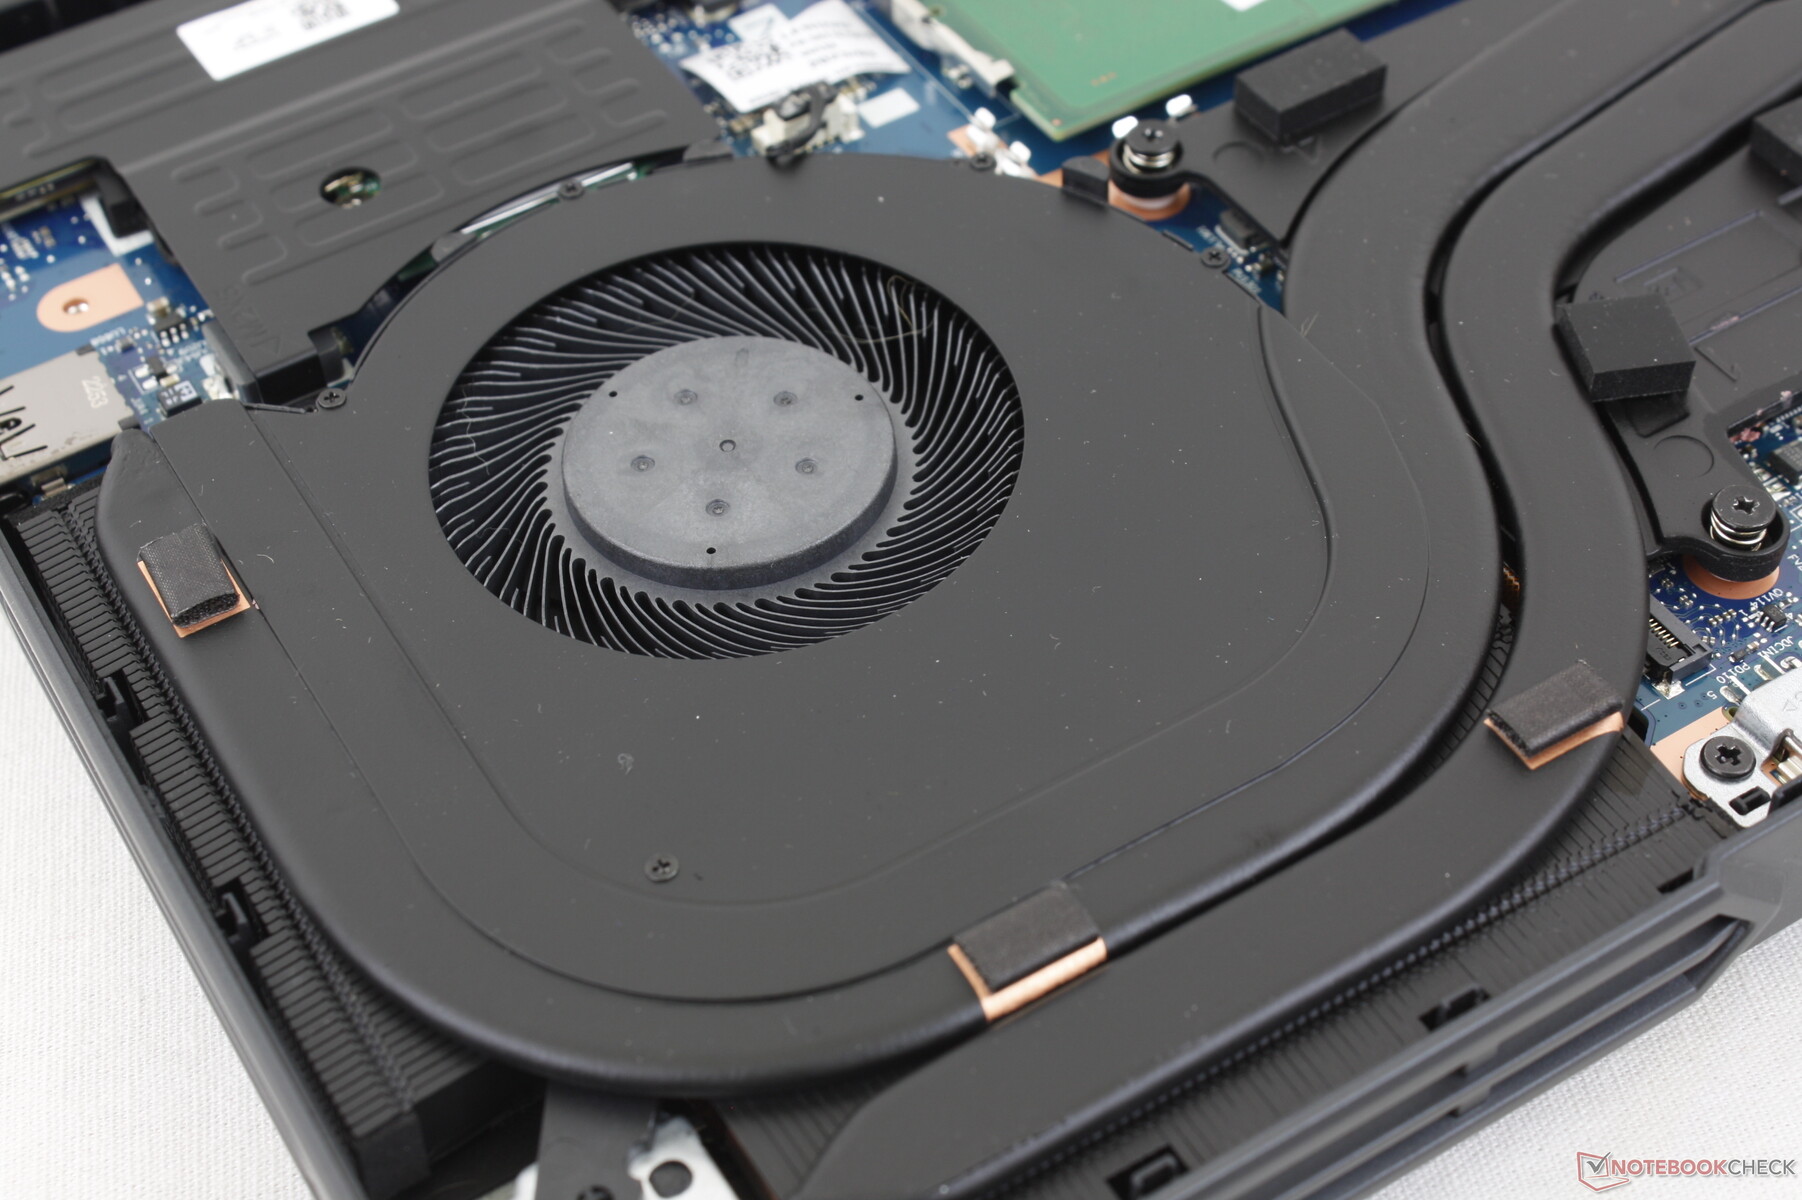
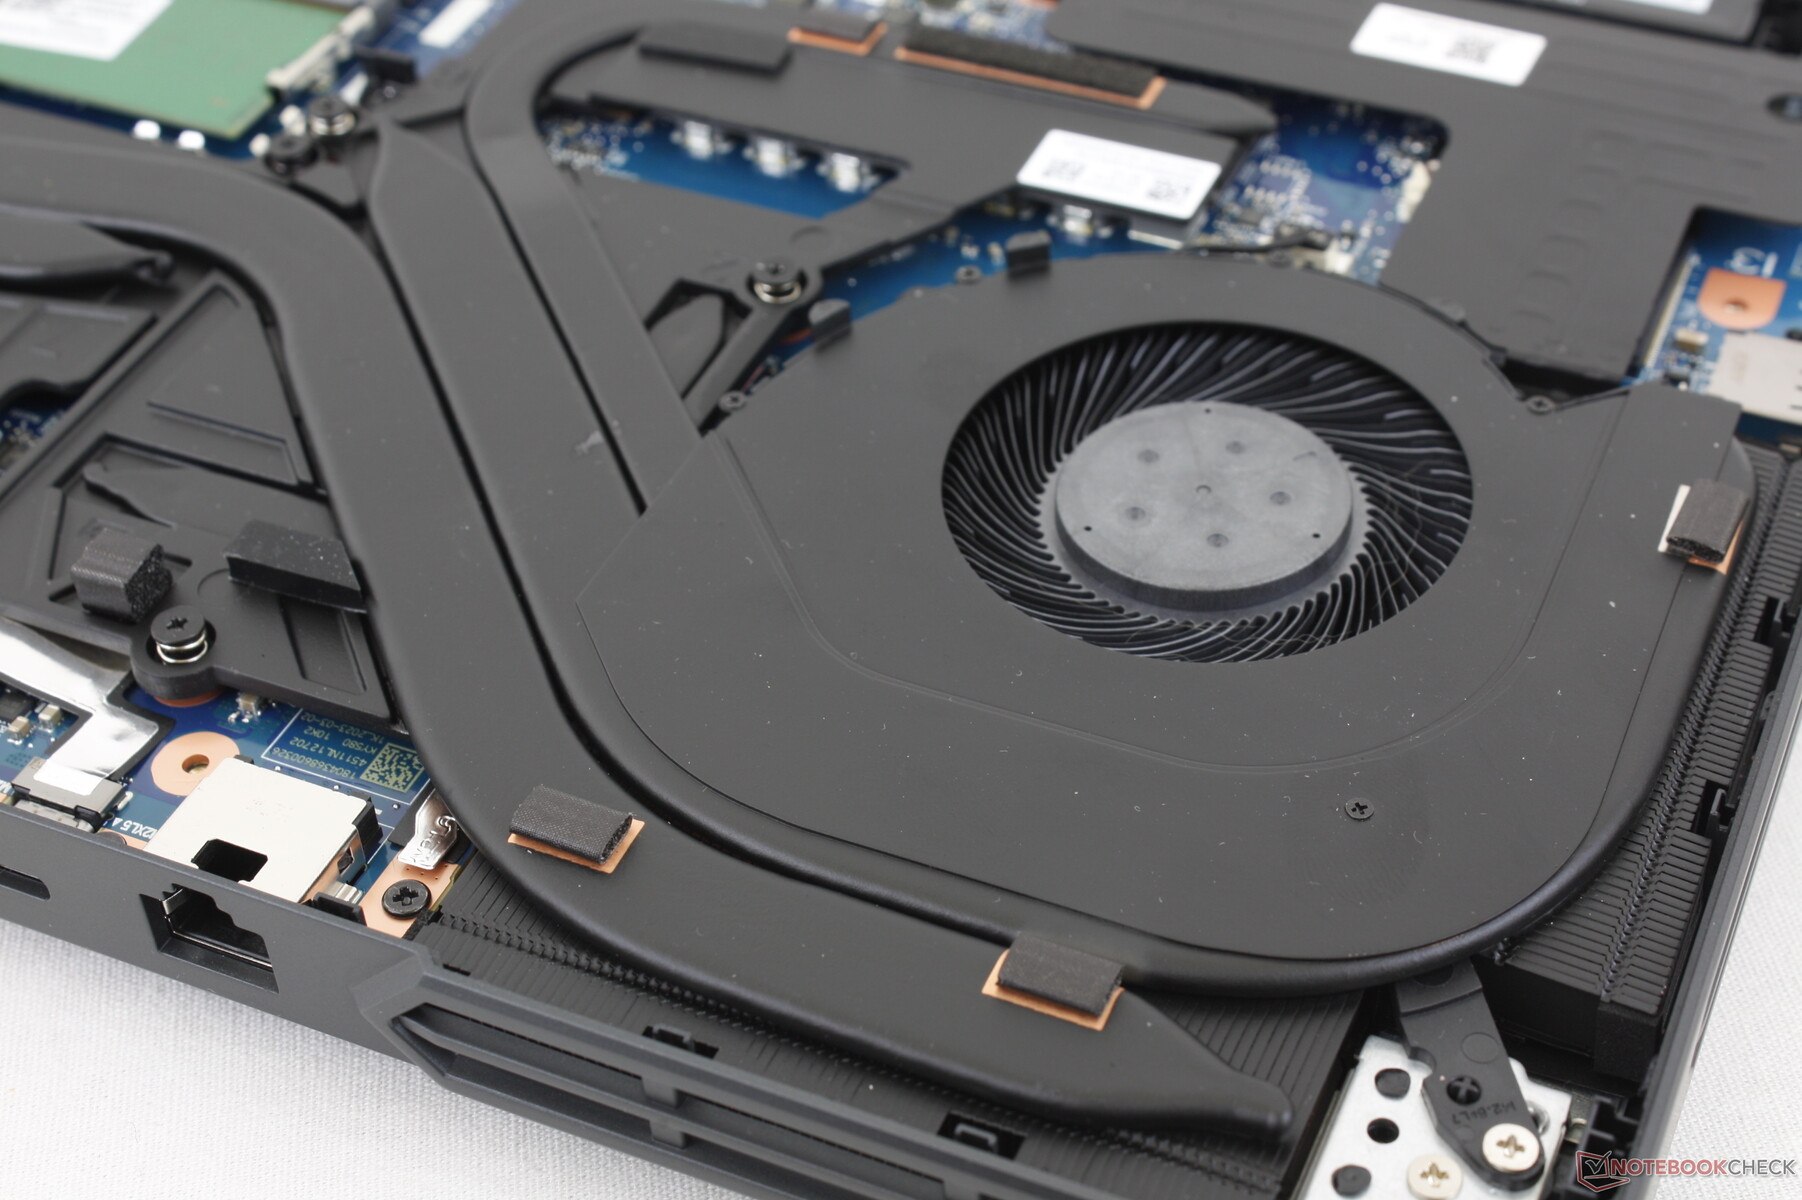
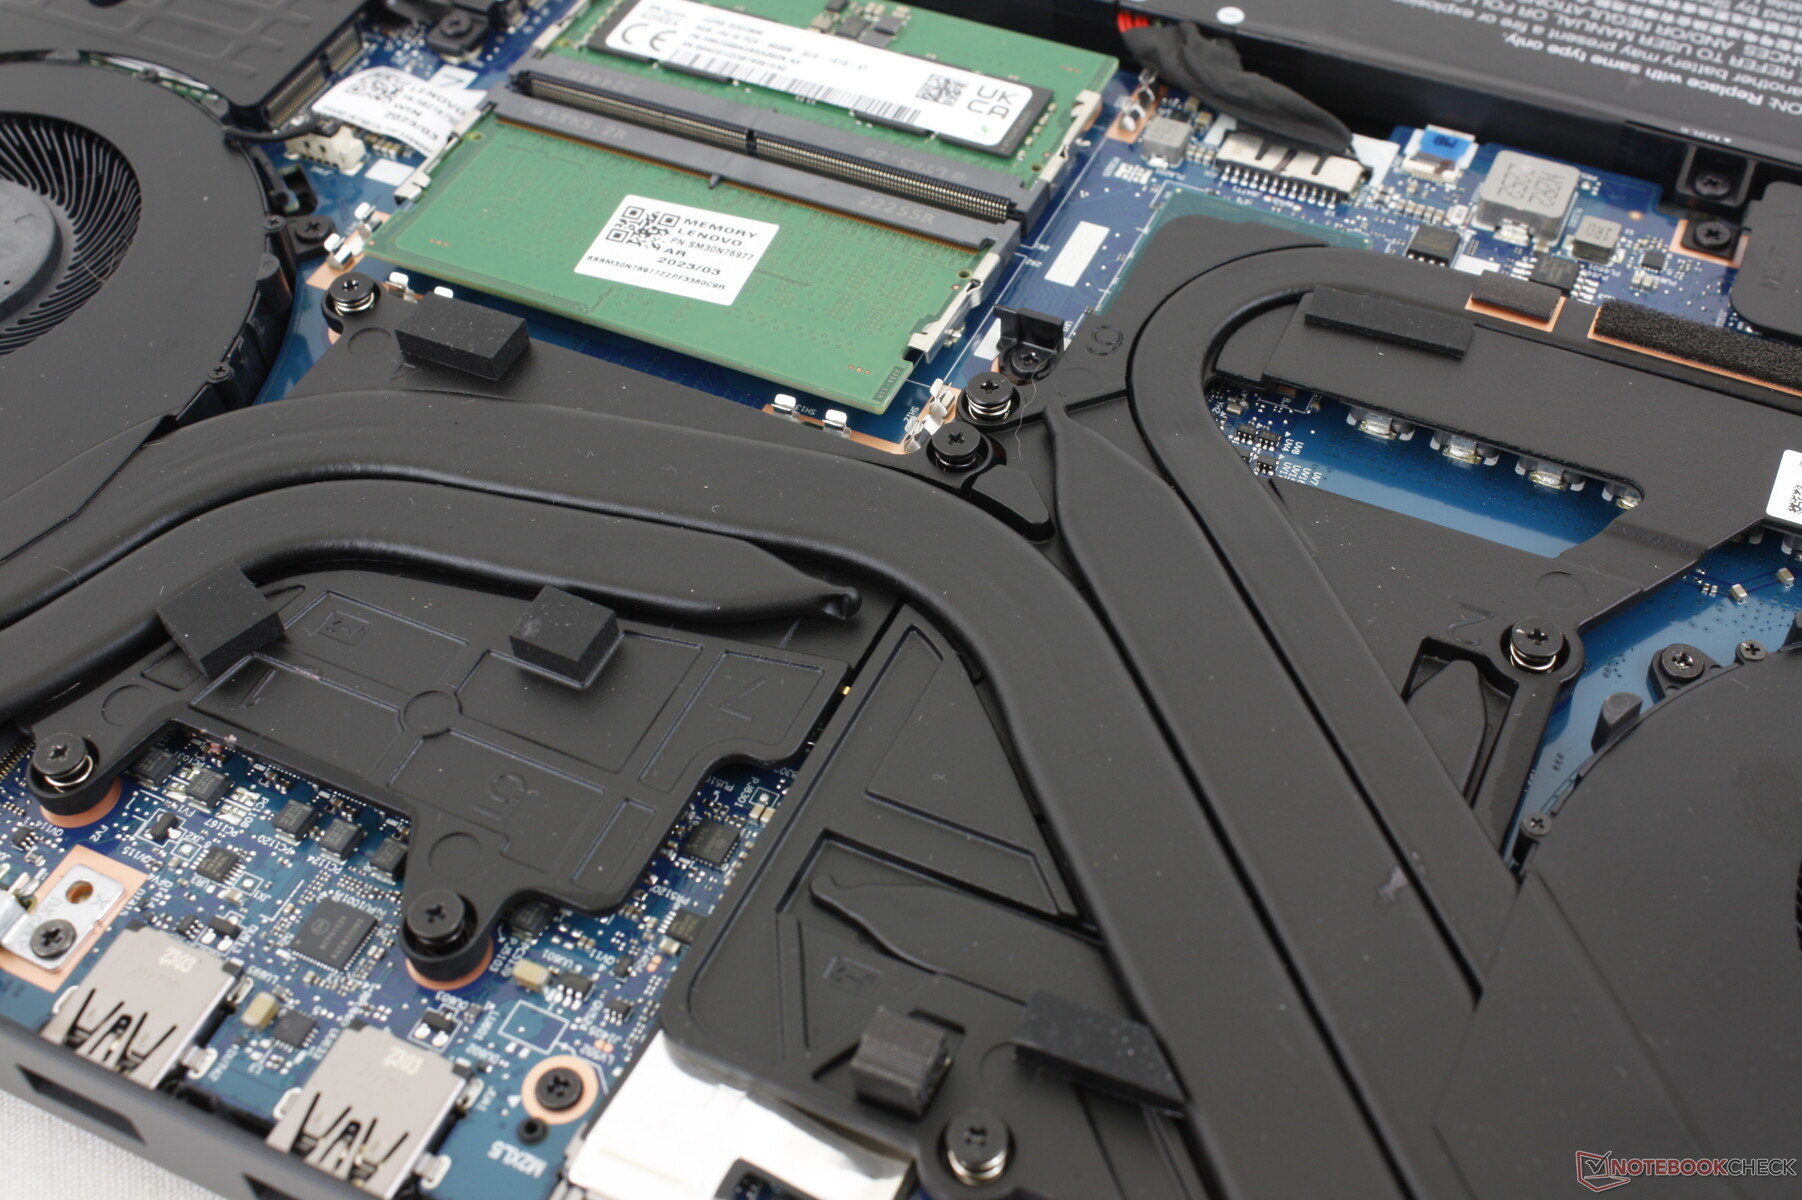
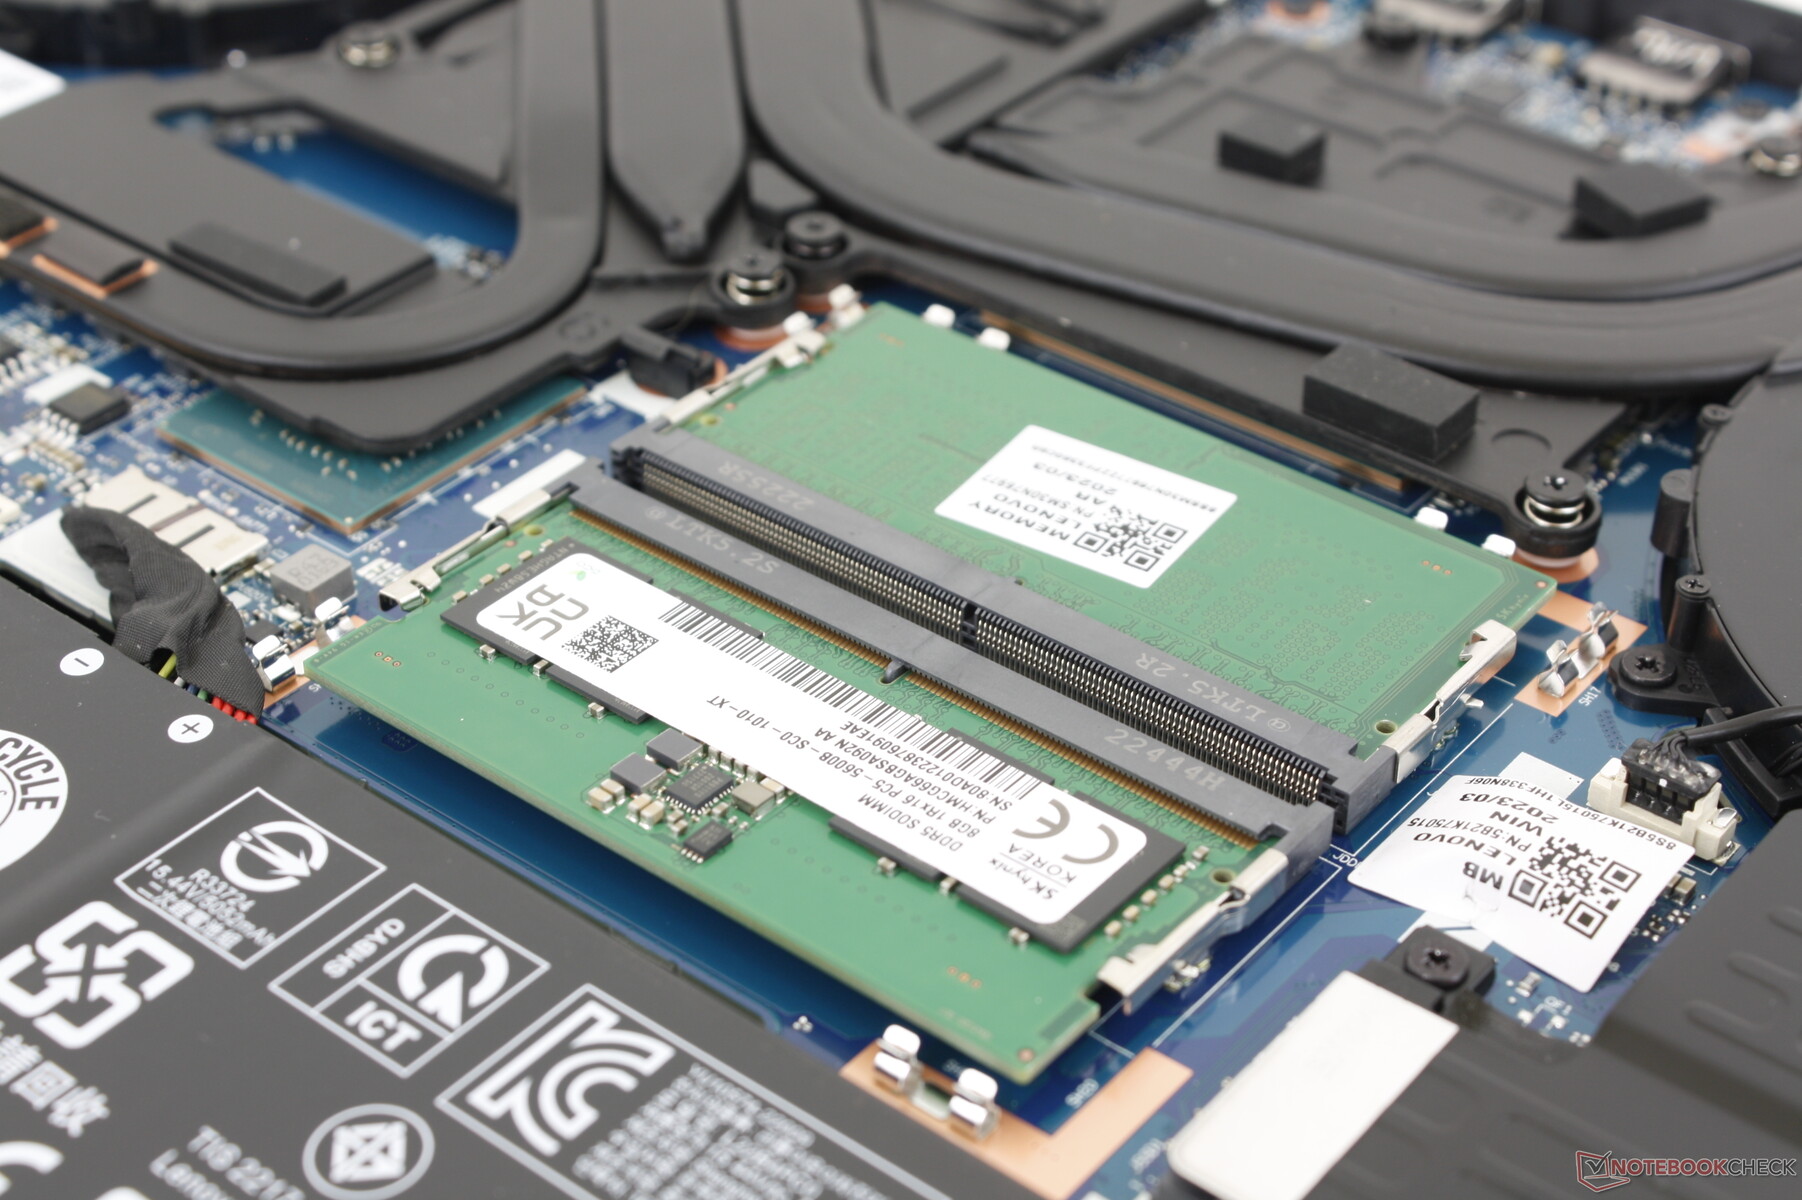
Maintenance
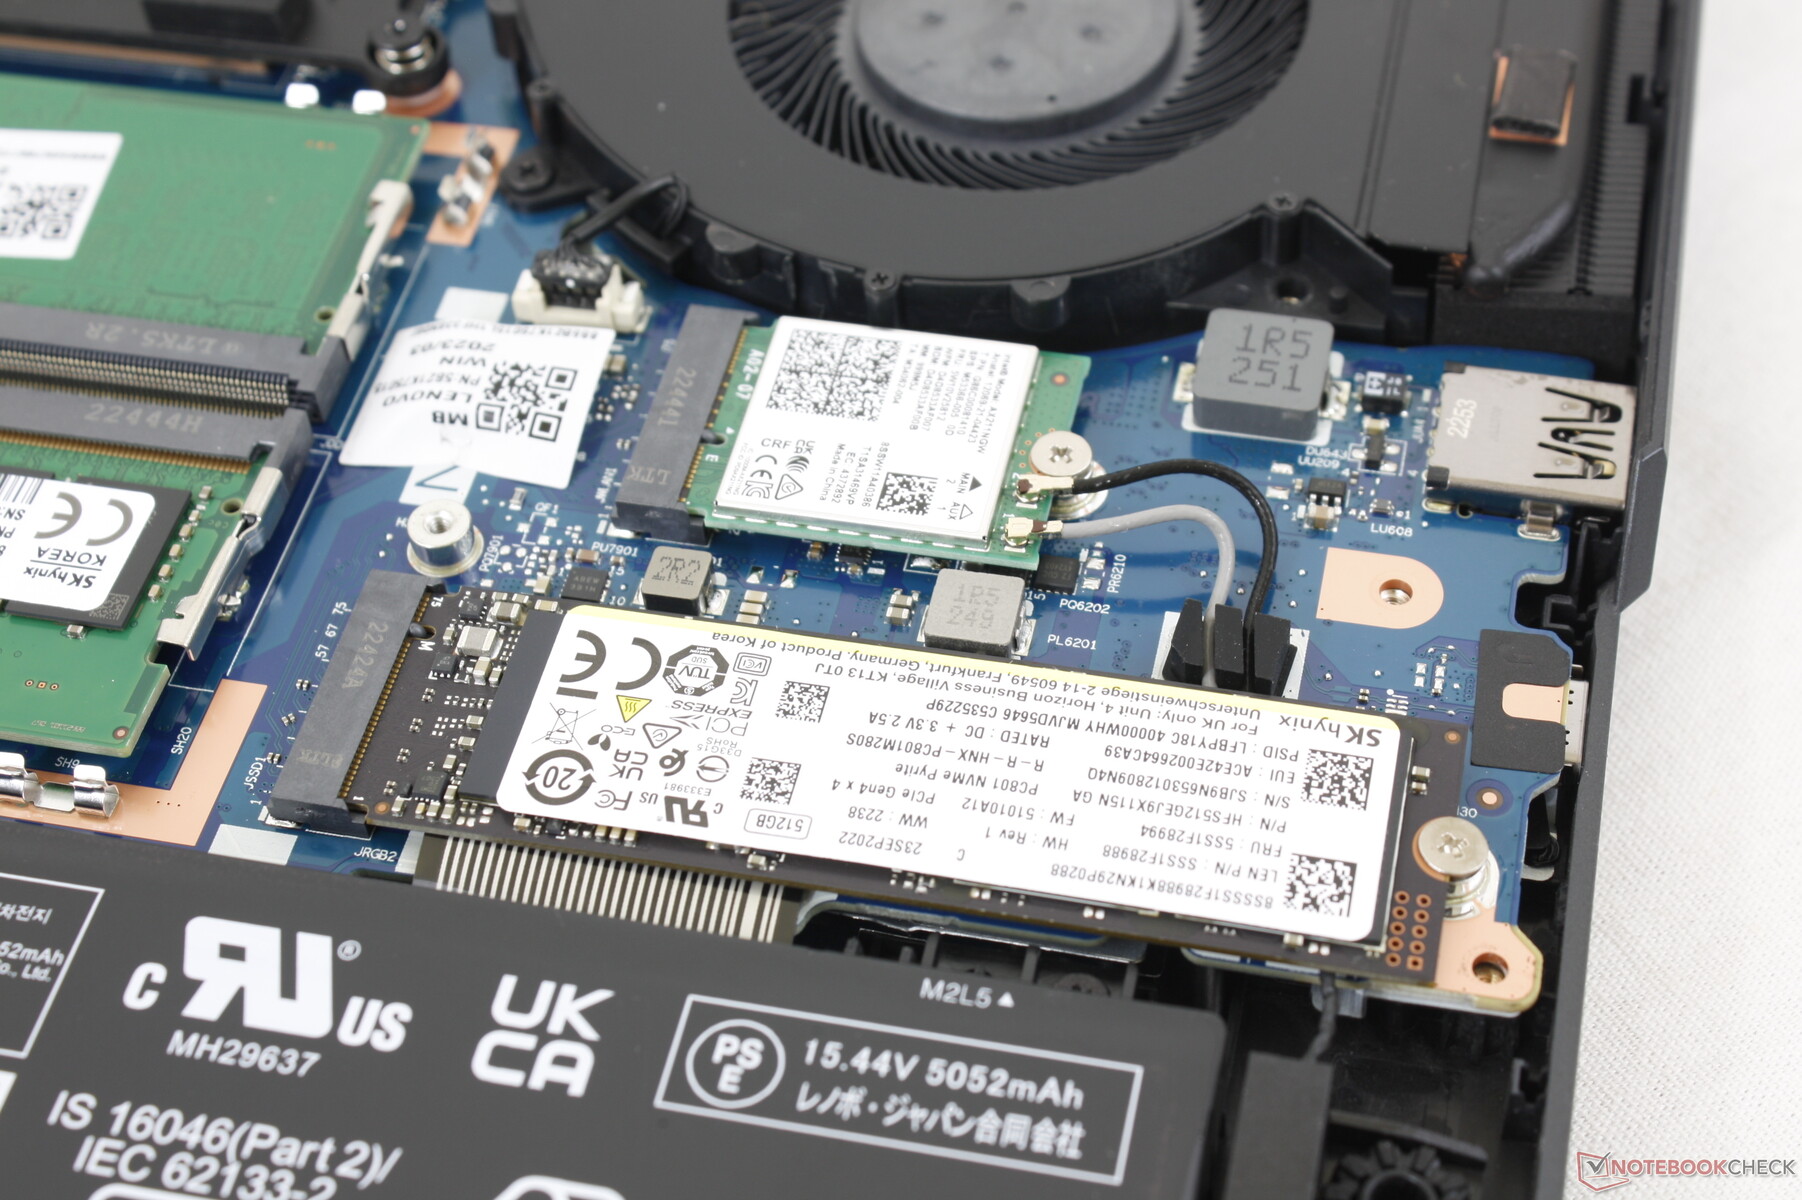
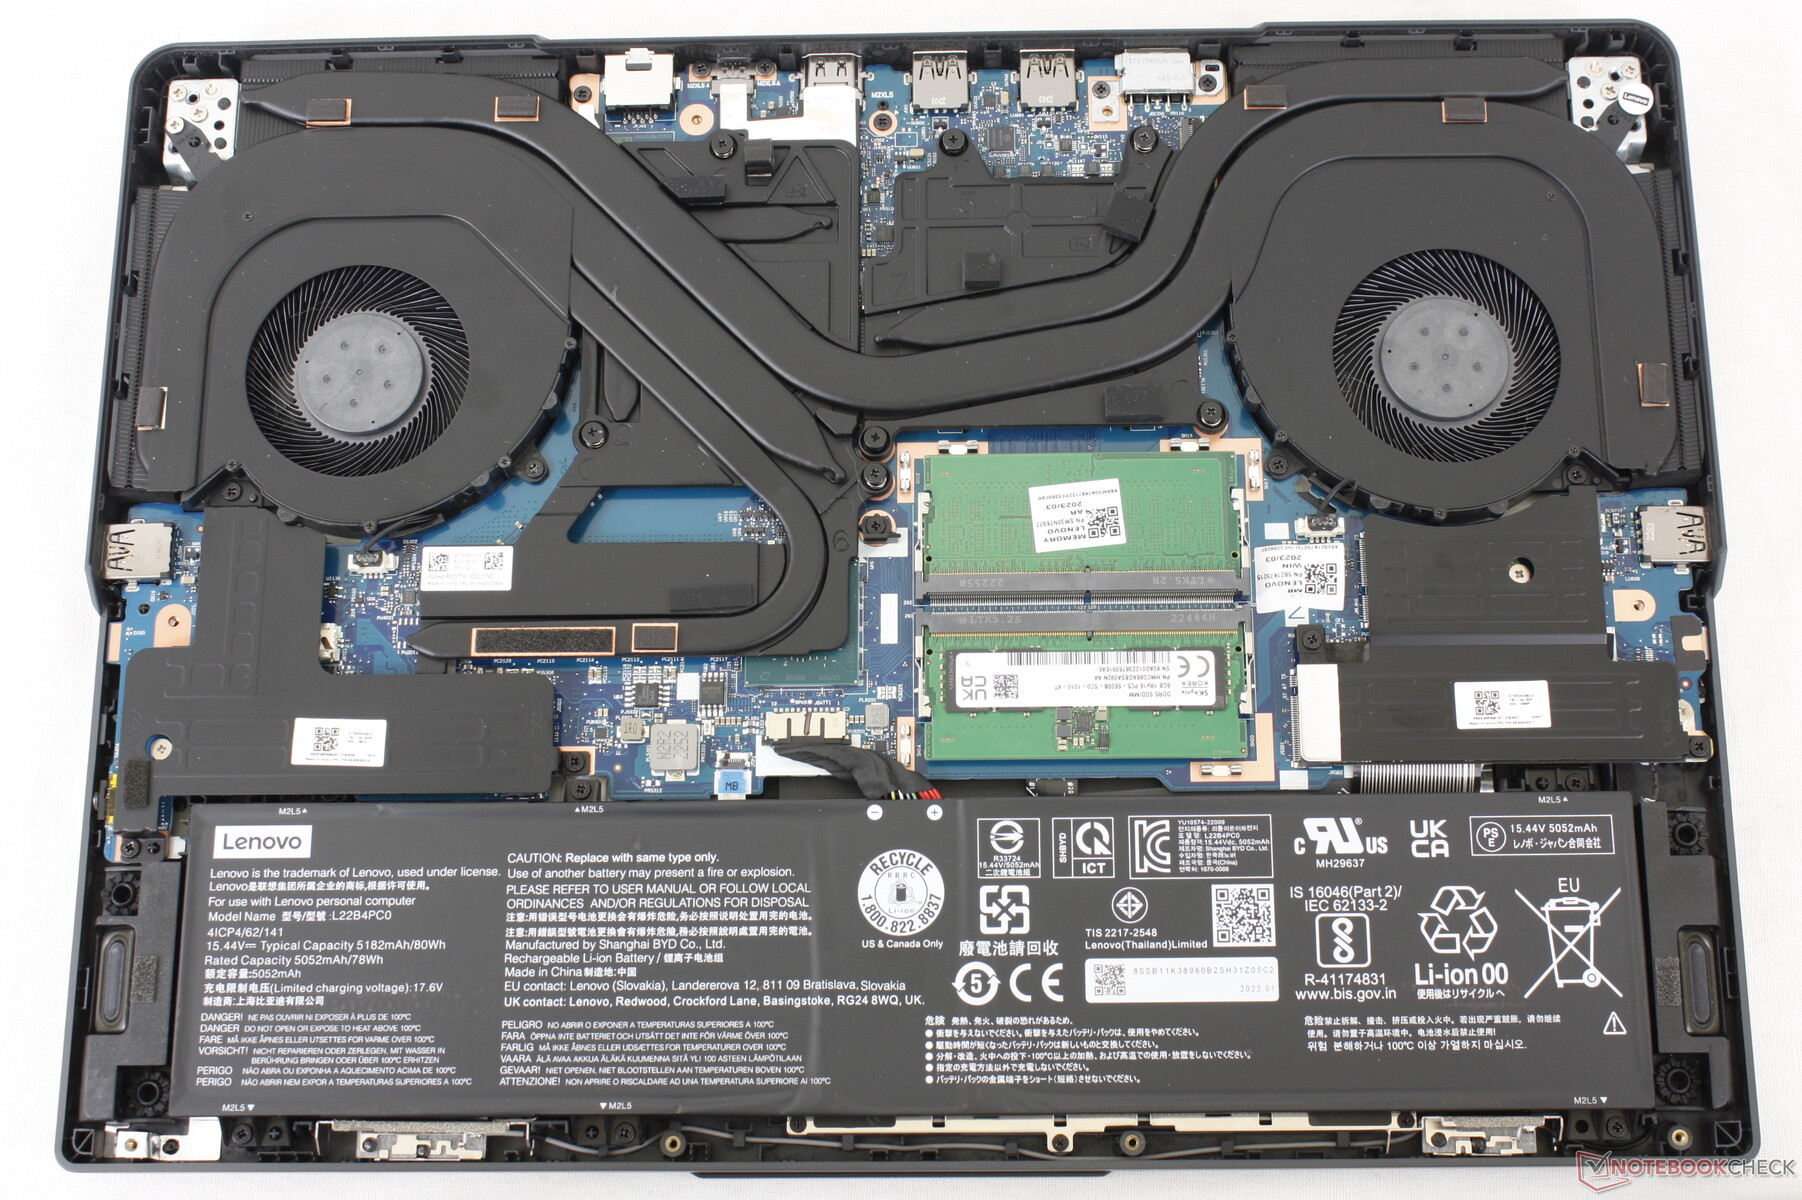
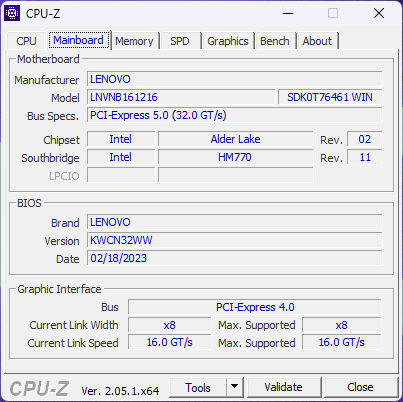
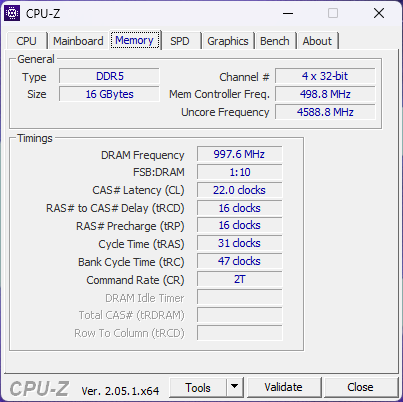
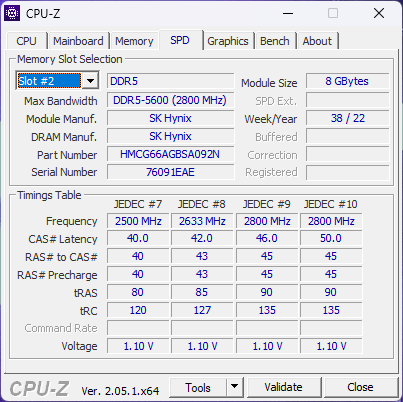
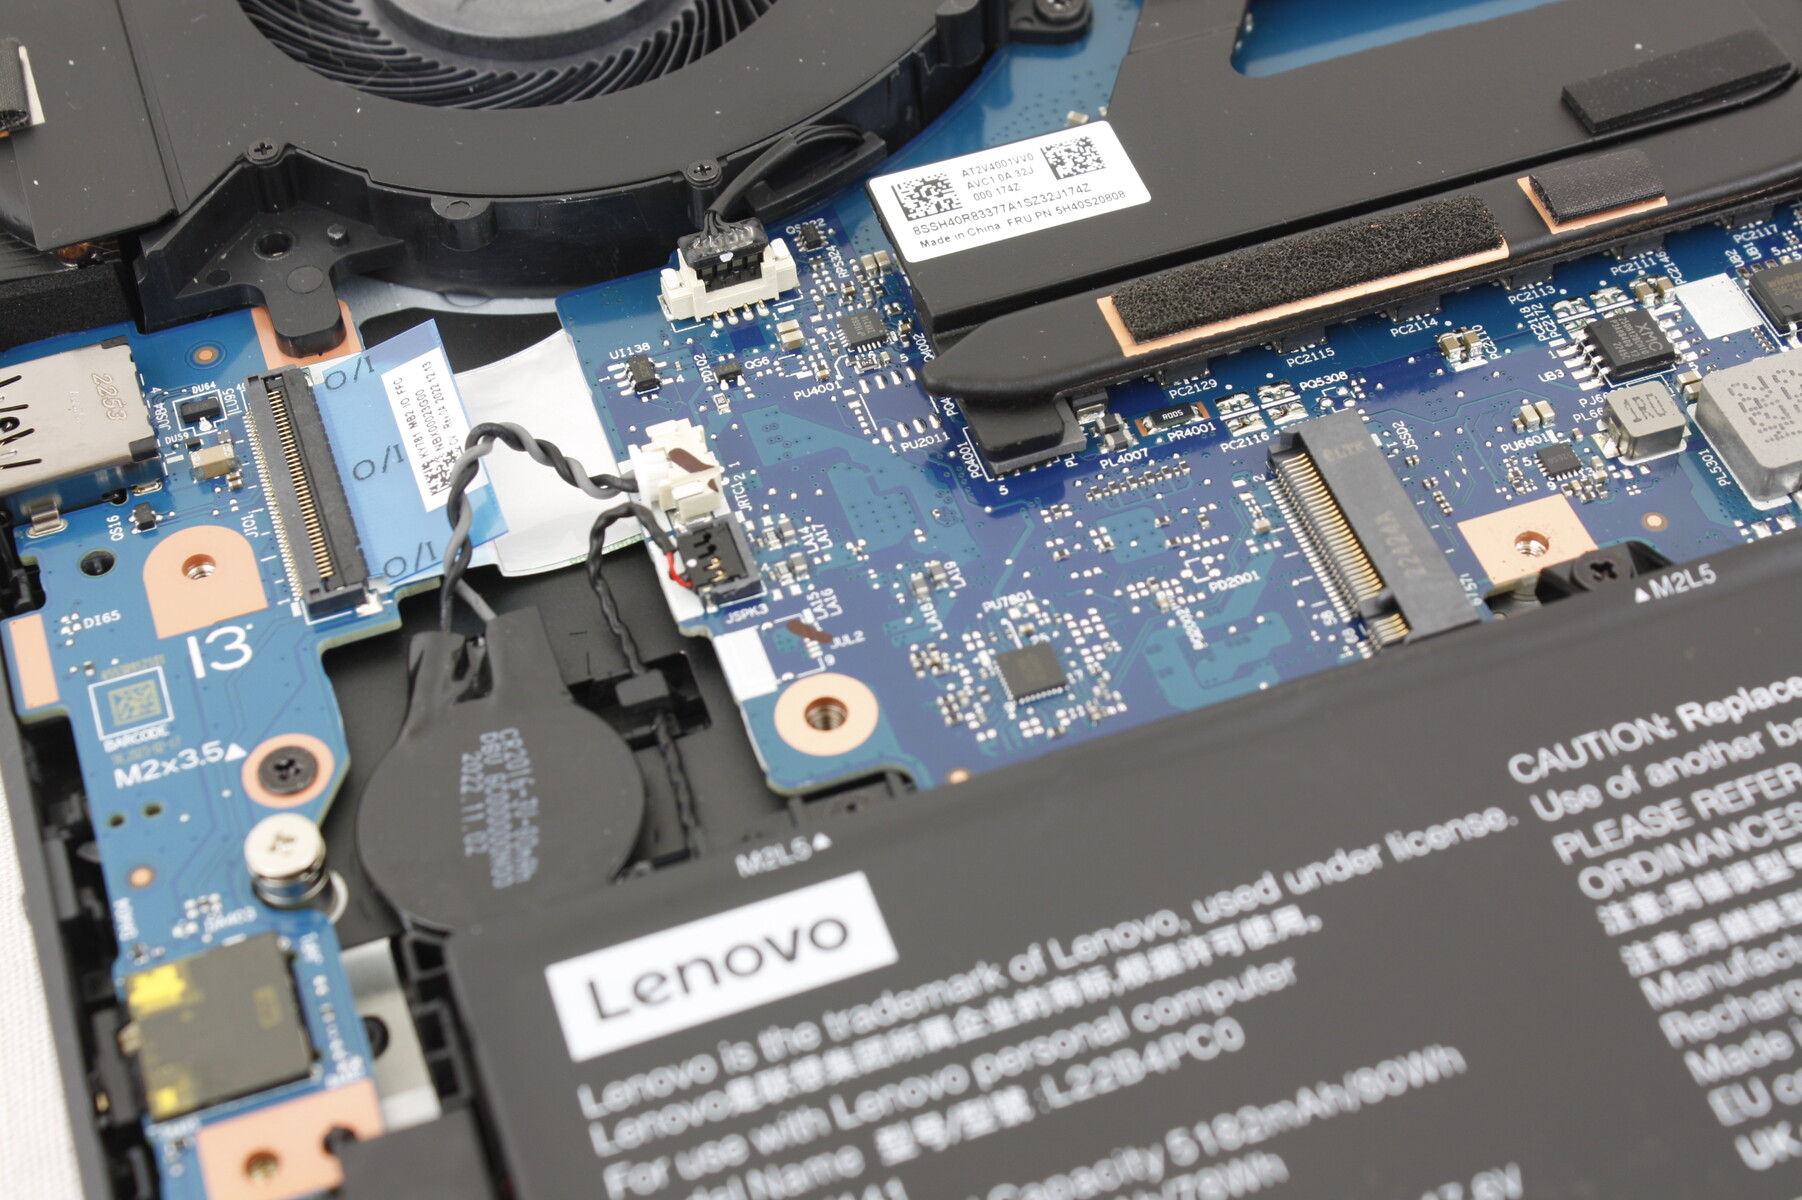
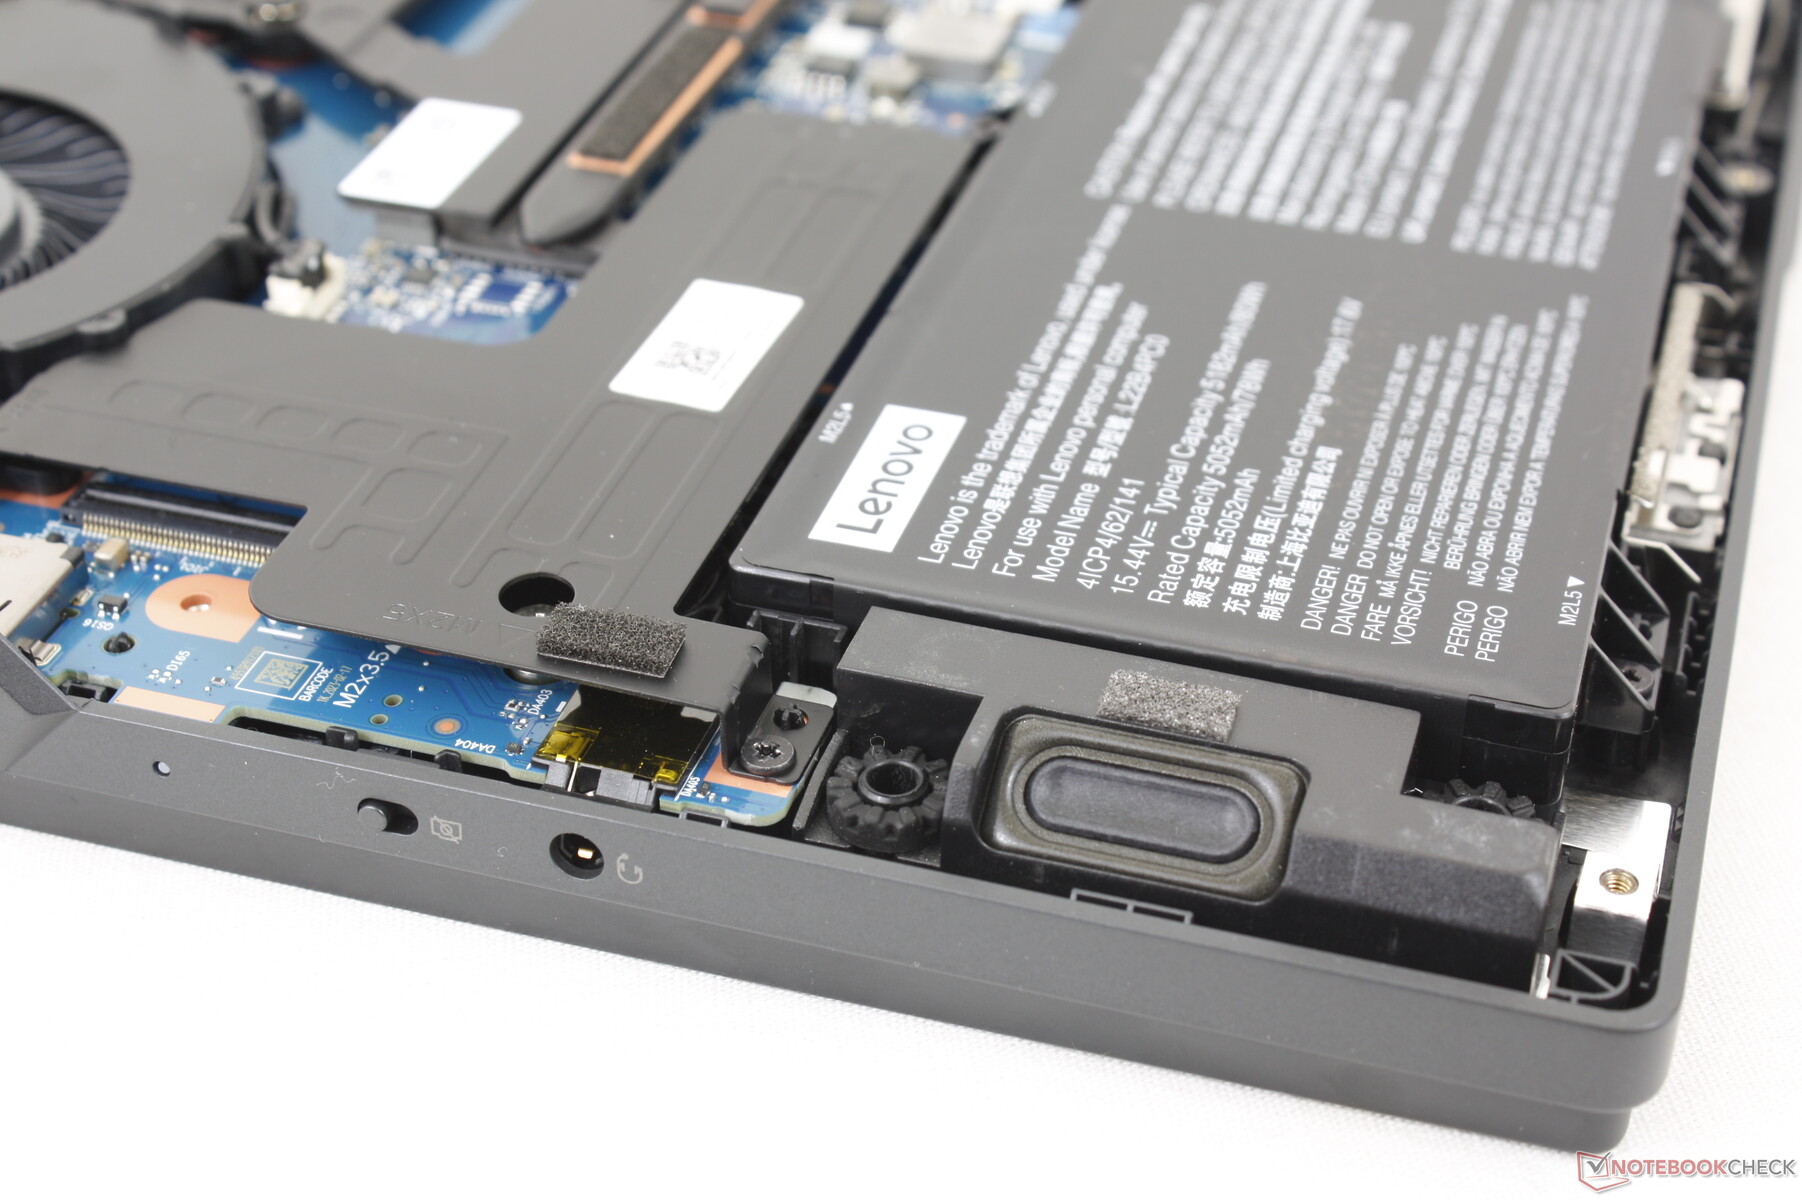
The bottom panel comes off easily with just a Philips screwdriver to reveal 2x M.2 2280 PCIe4 x4 bays, 2x SODIMM slots, and the removable WLAN module. Note that the bays and WLAN slot are covered by aluminum heat spreaders.
Accessories and Warranty
There are no extras in the box other than the AC adapter and paperwork. The usual one-year limited manufacturer applies if purchased in the US.
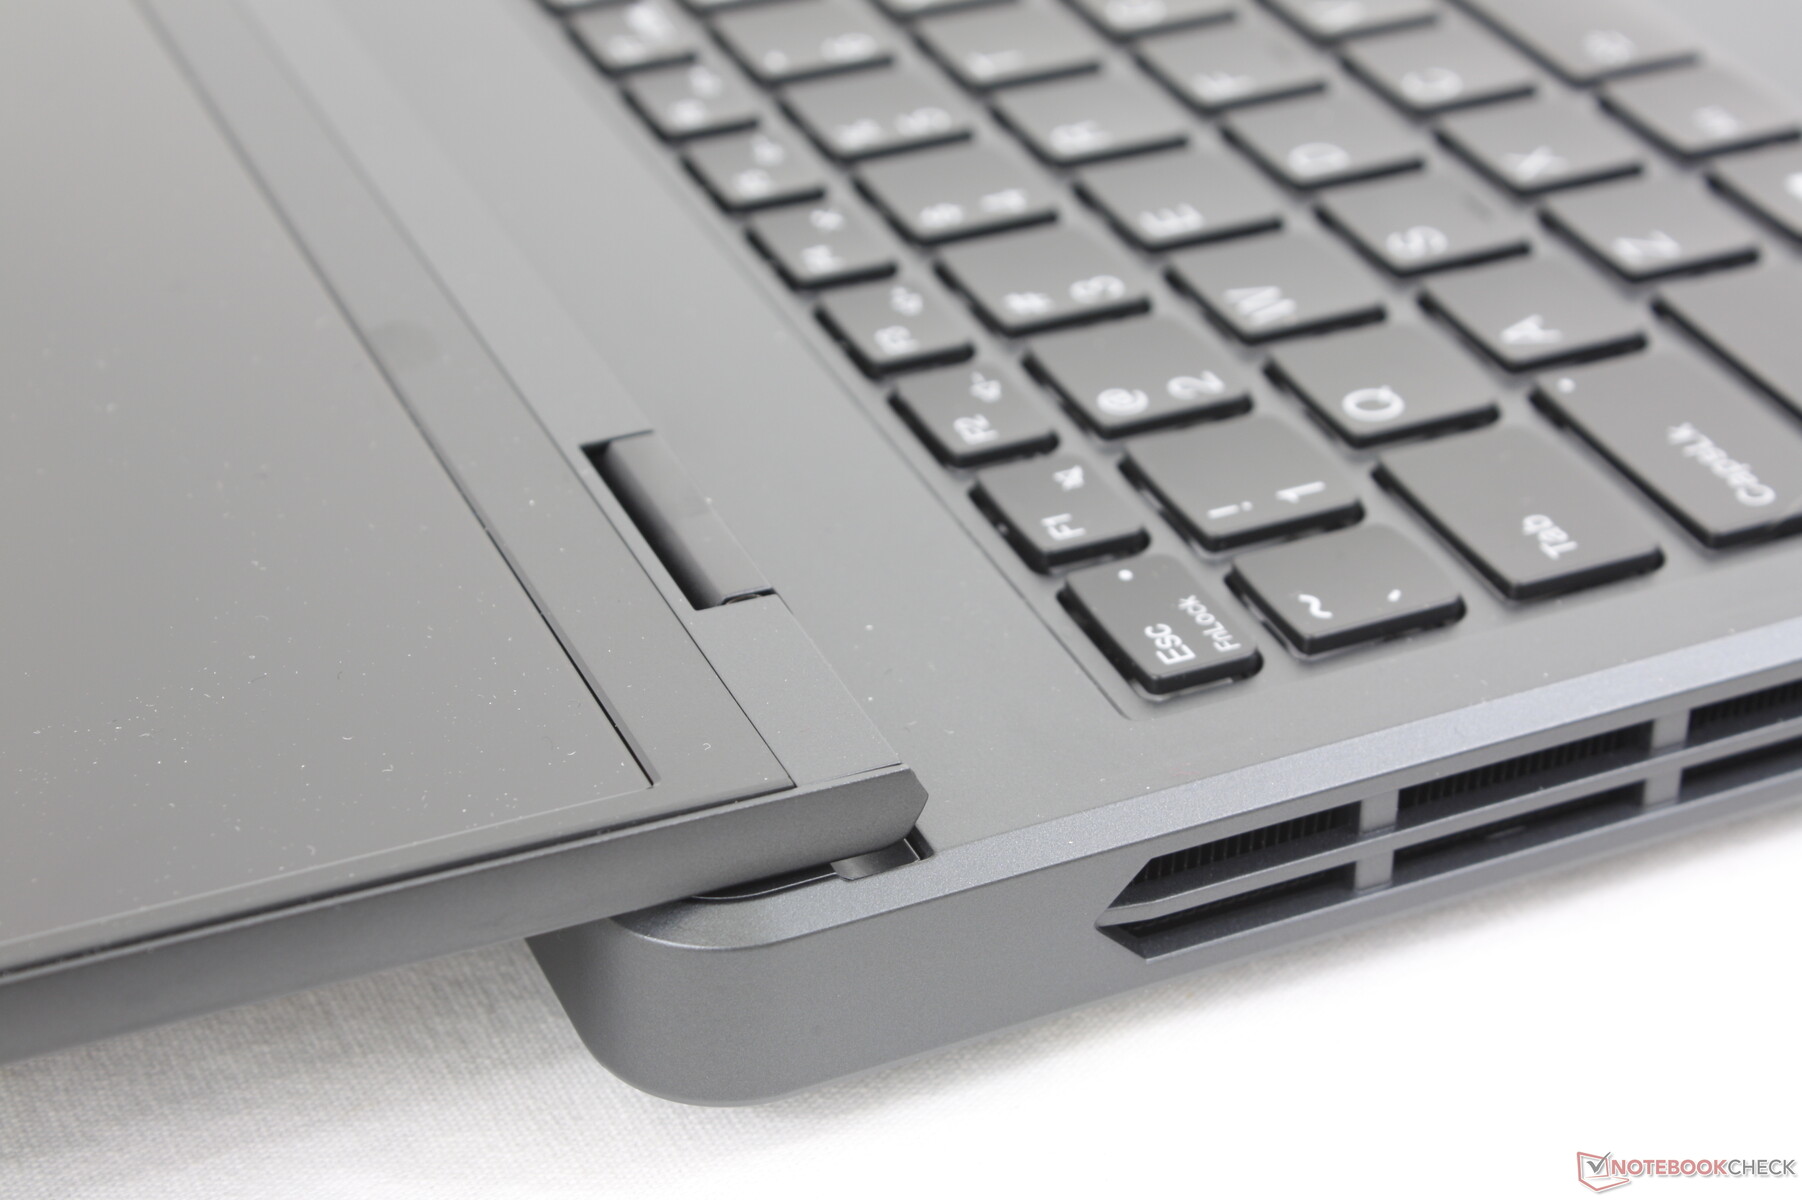
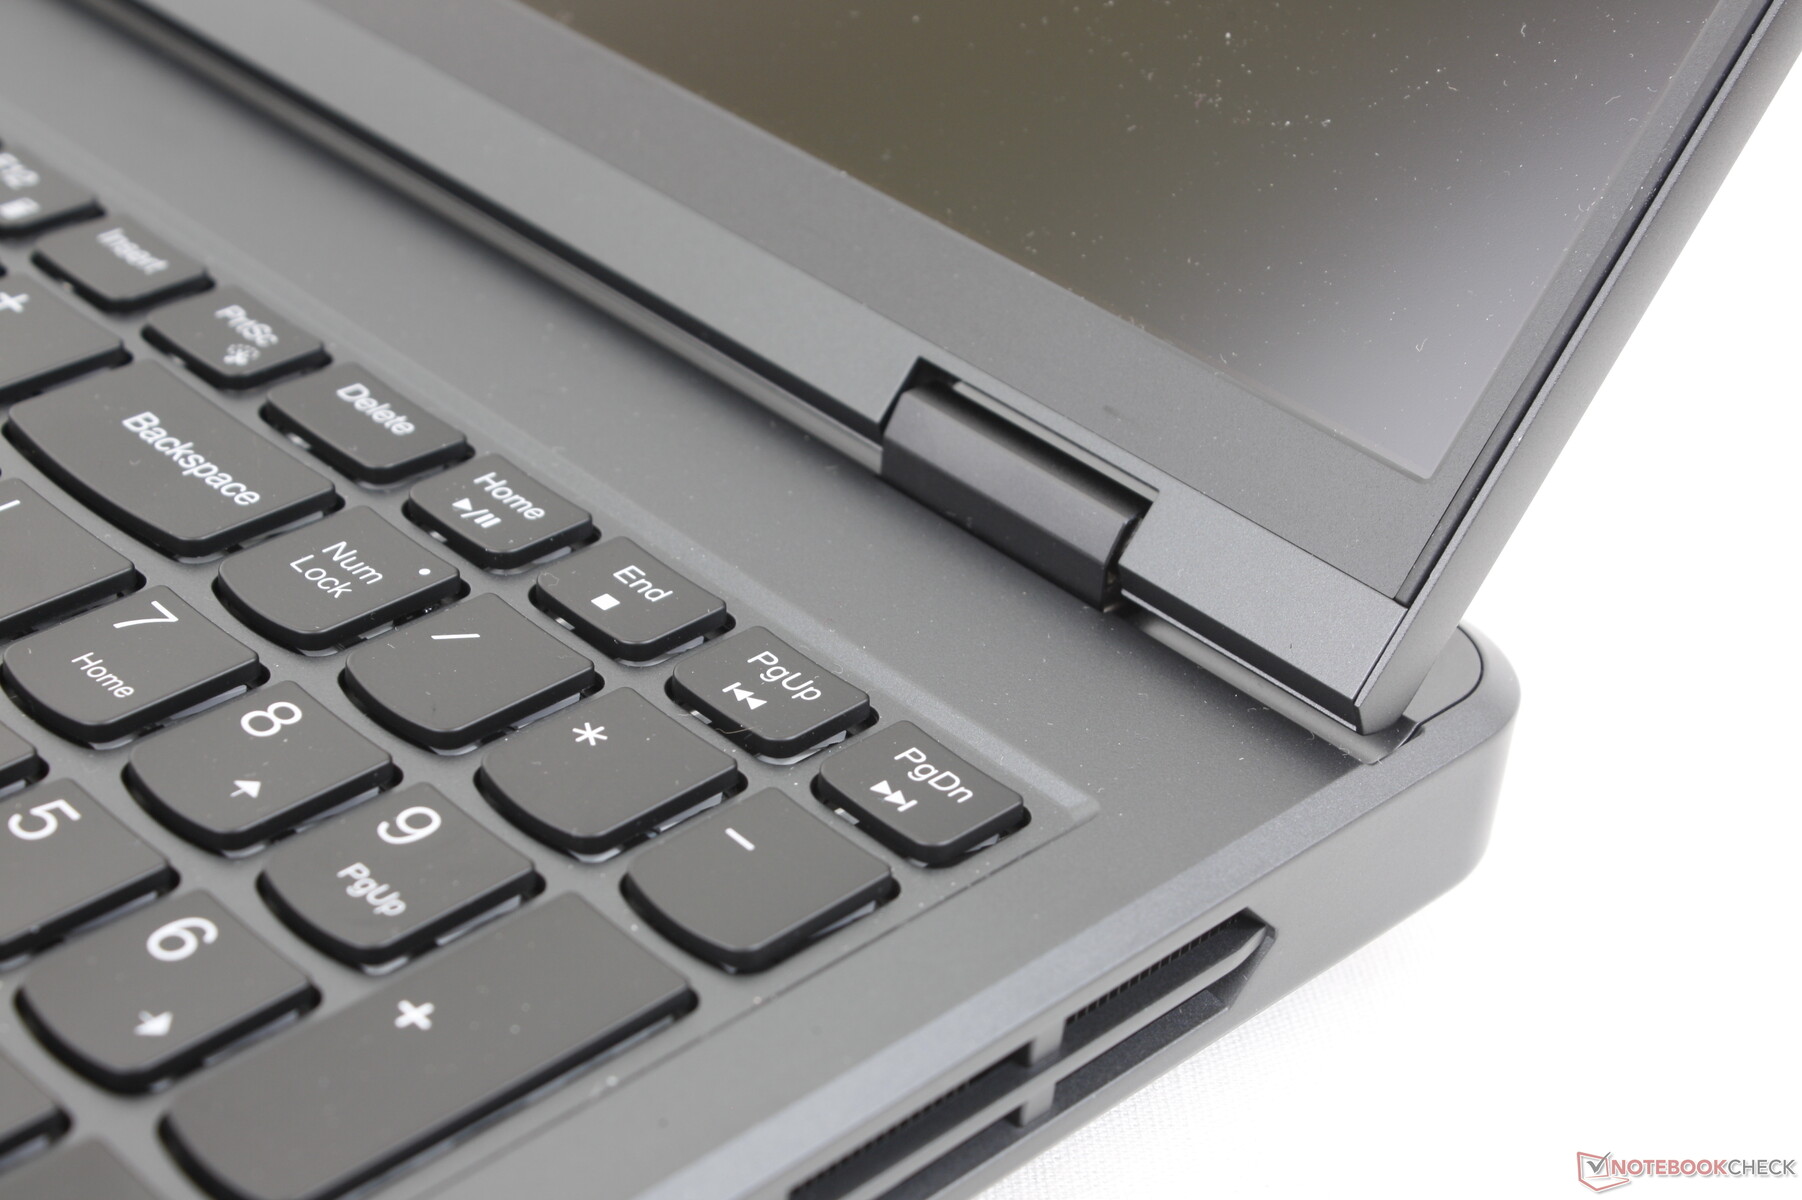
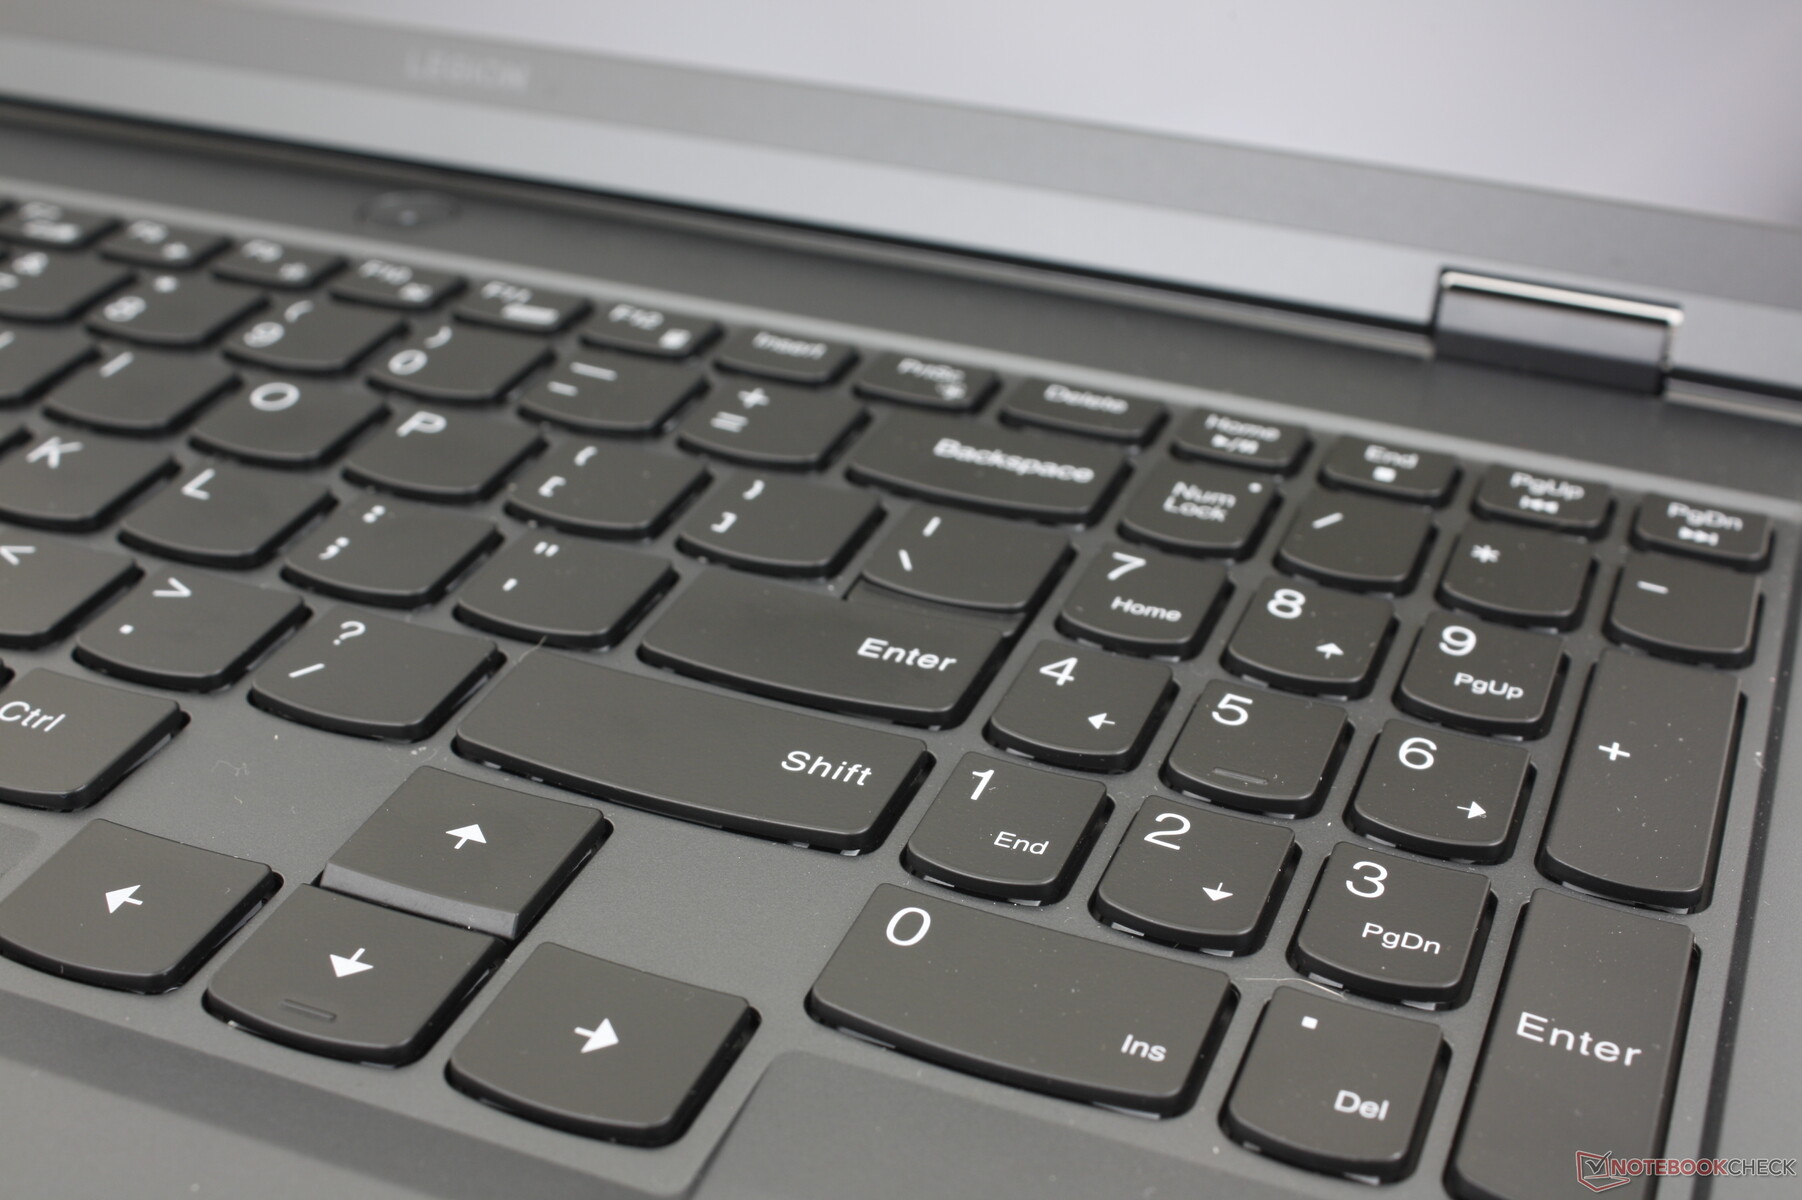
Input Devices — Comfortable And Spacious Keyboard
Keyboard
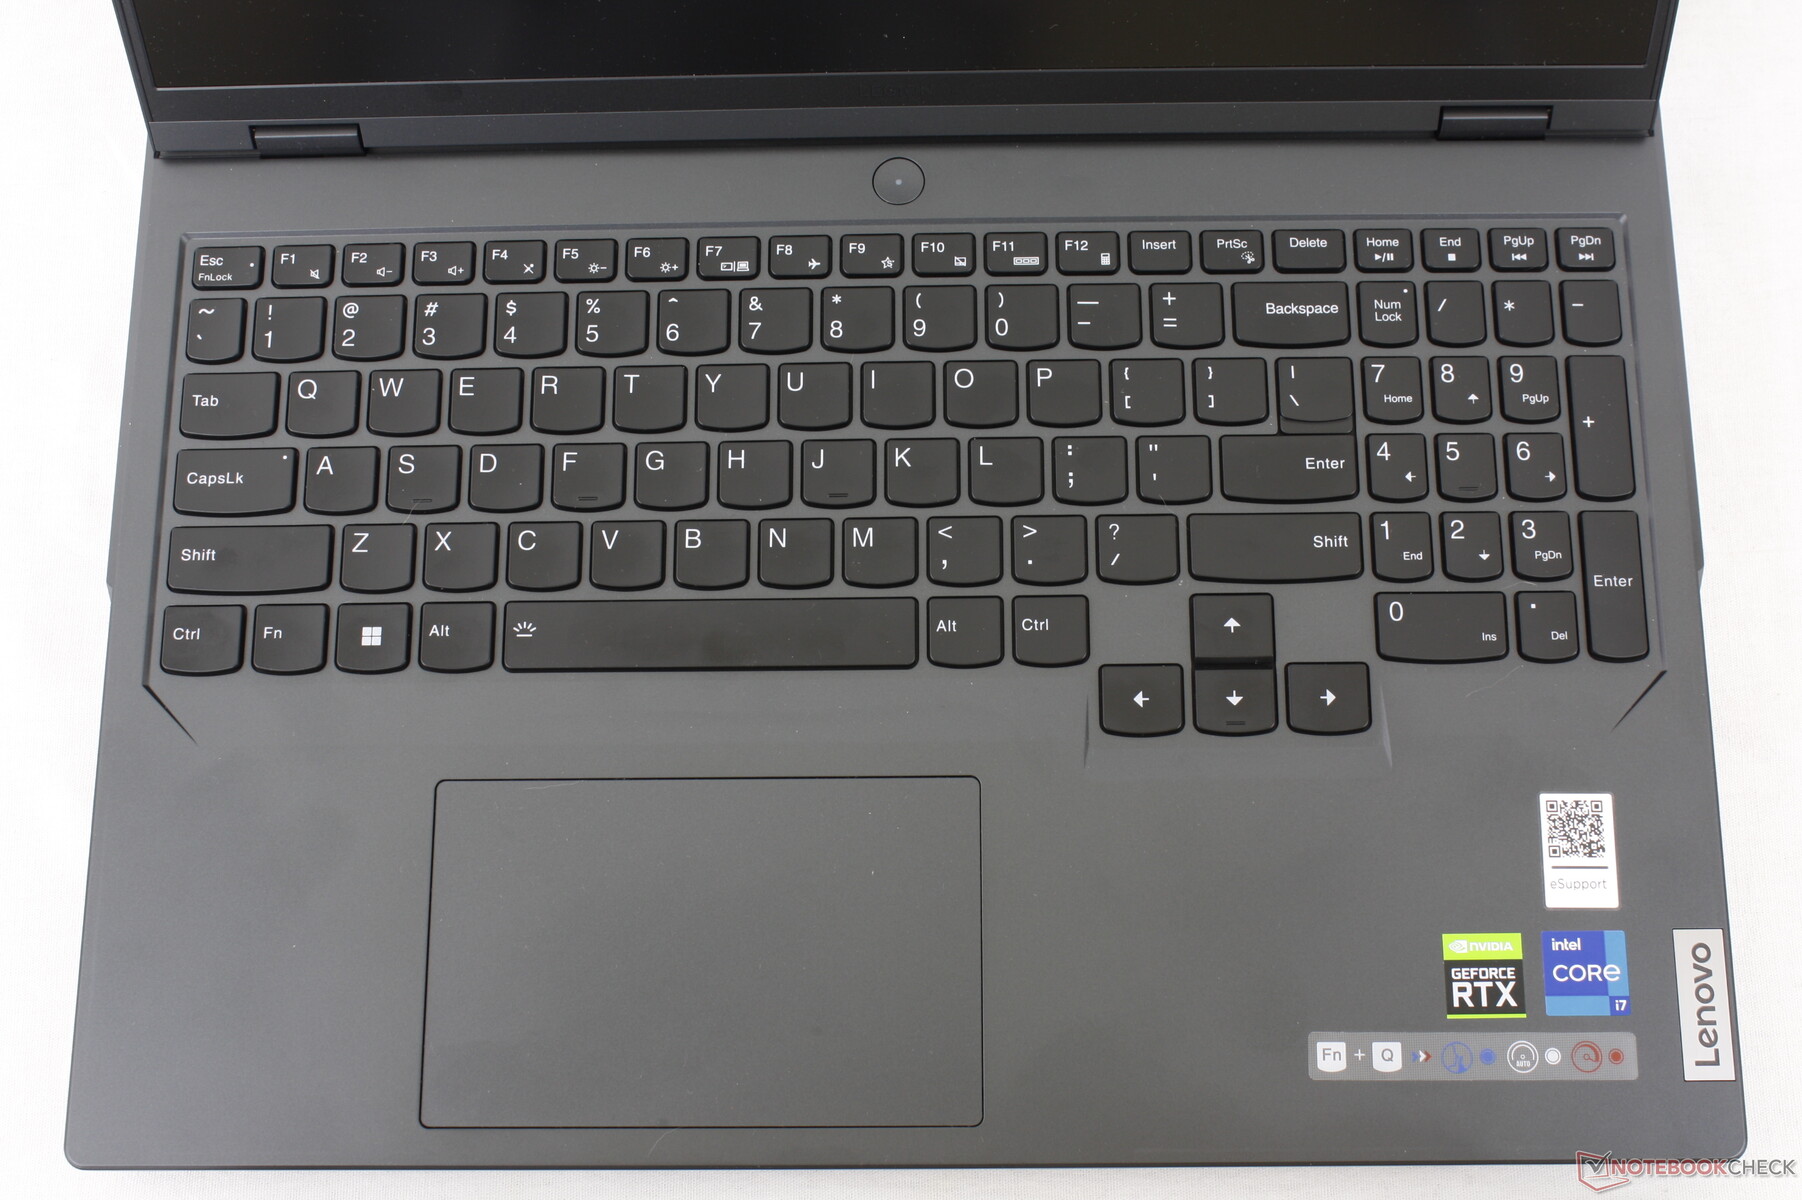
The keyboard offers 1.5 mm travel, 0.2 mm pitch, and 100 percent anti-ghosting for gaming purposes. The travel and feedback alone are already deeper and stronger, respectively, than the keyboards on the Razer Blade 16 or Asus Zephyrus M16 for a more satisfying typing experience than either competitor.
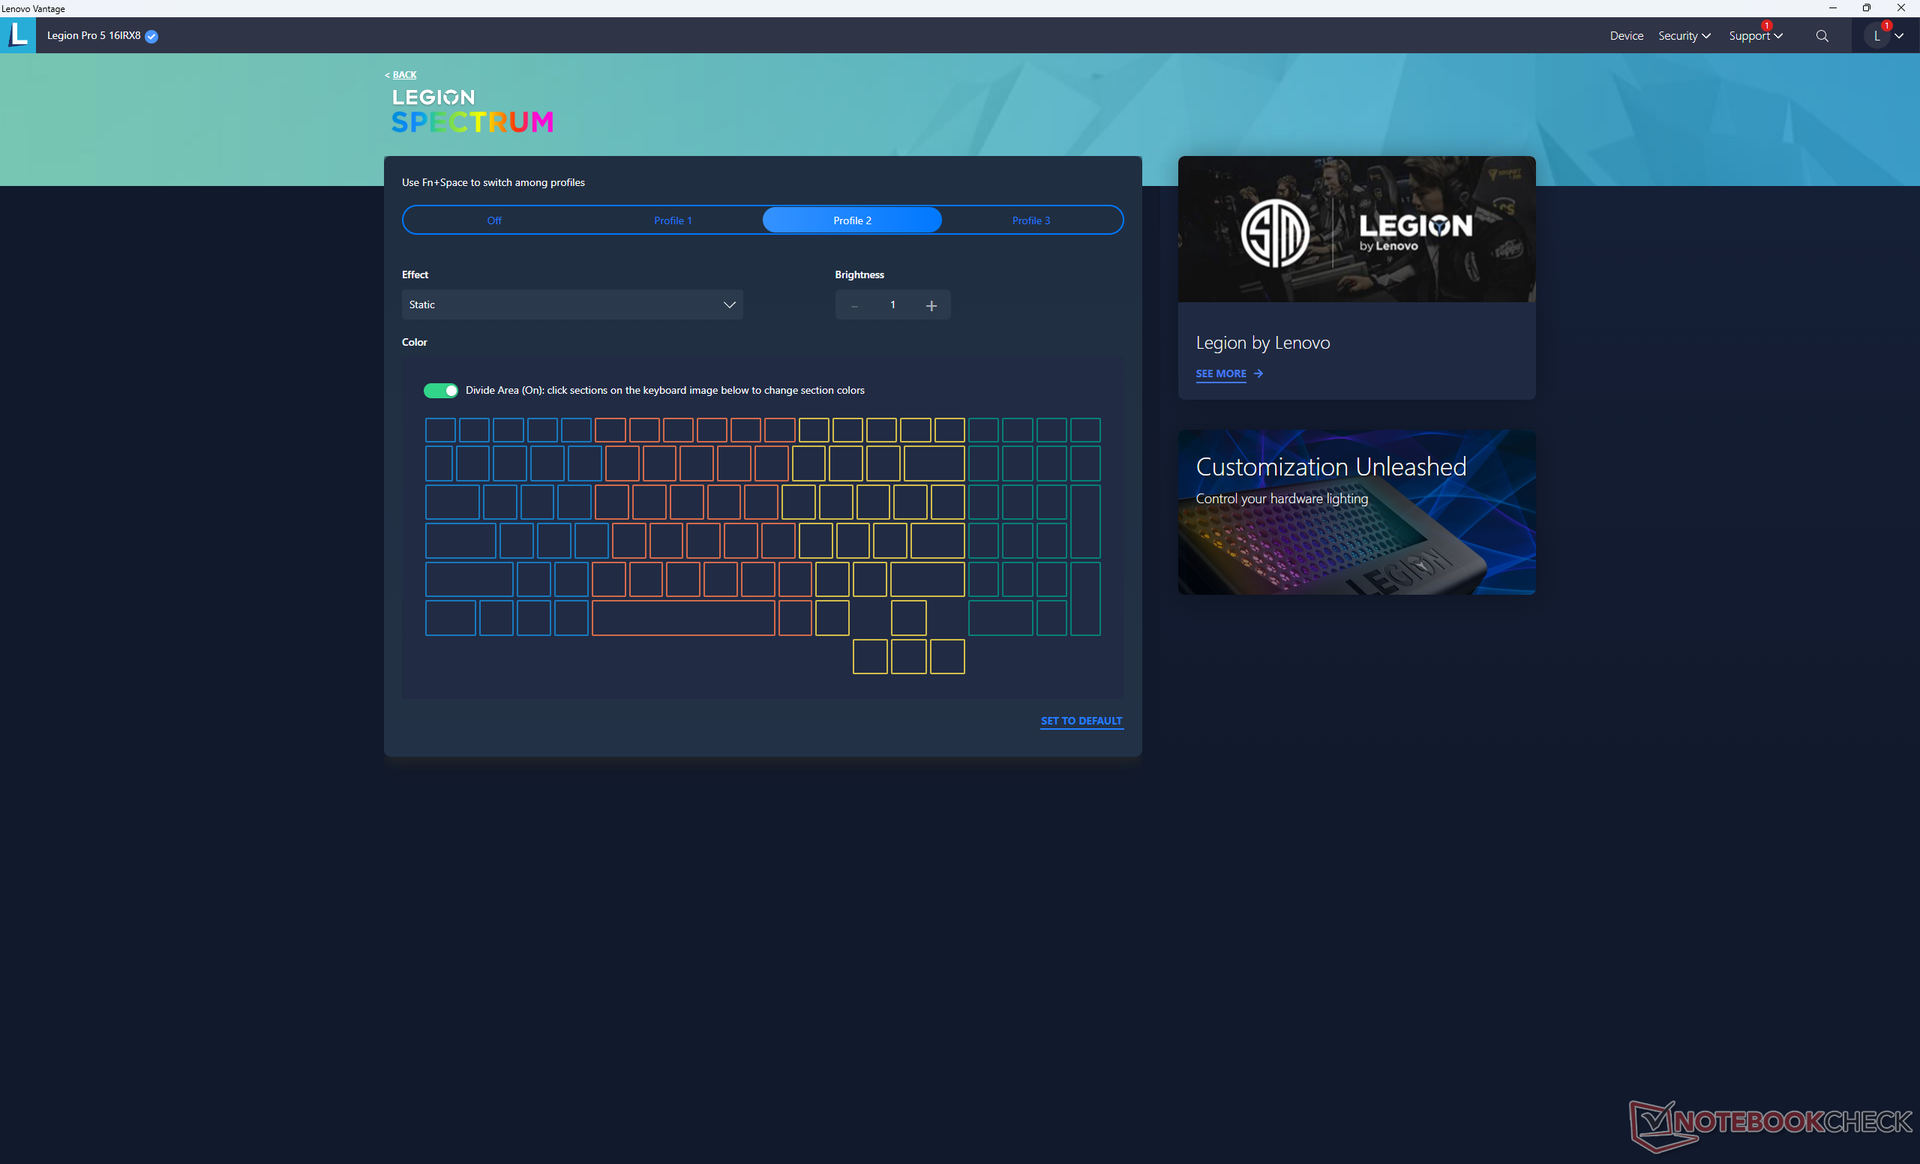
Certain features remain exclusive to the higher-end Legion 7 Pro series such the mechanical keyboard and per-key RGB lighting. The former is understandable, but we find it ridiculous that Lenovo doesn't offer the latter for our $1500+ configuration. Owners have to settle for quad-zone RGB lighting instead.
Touchpad
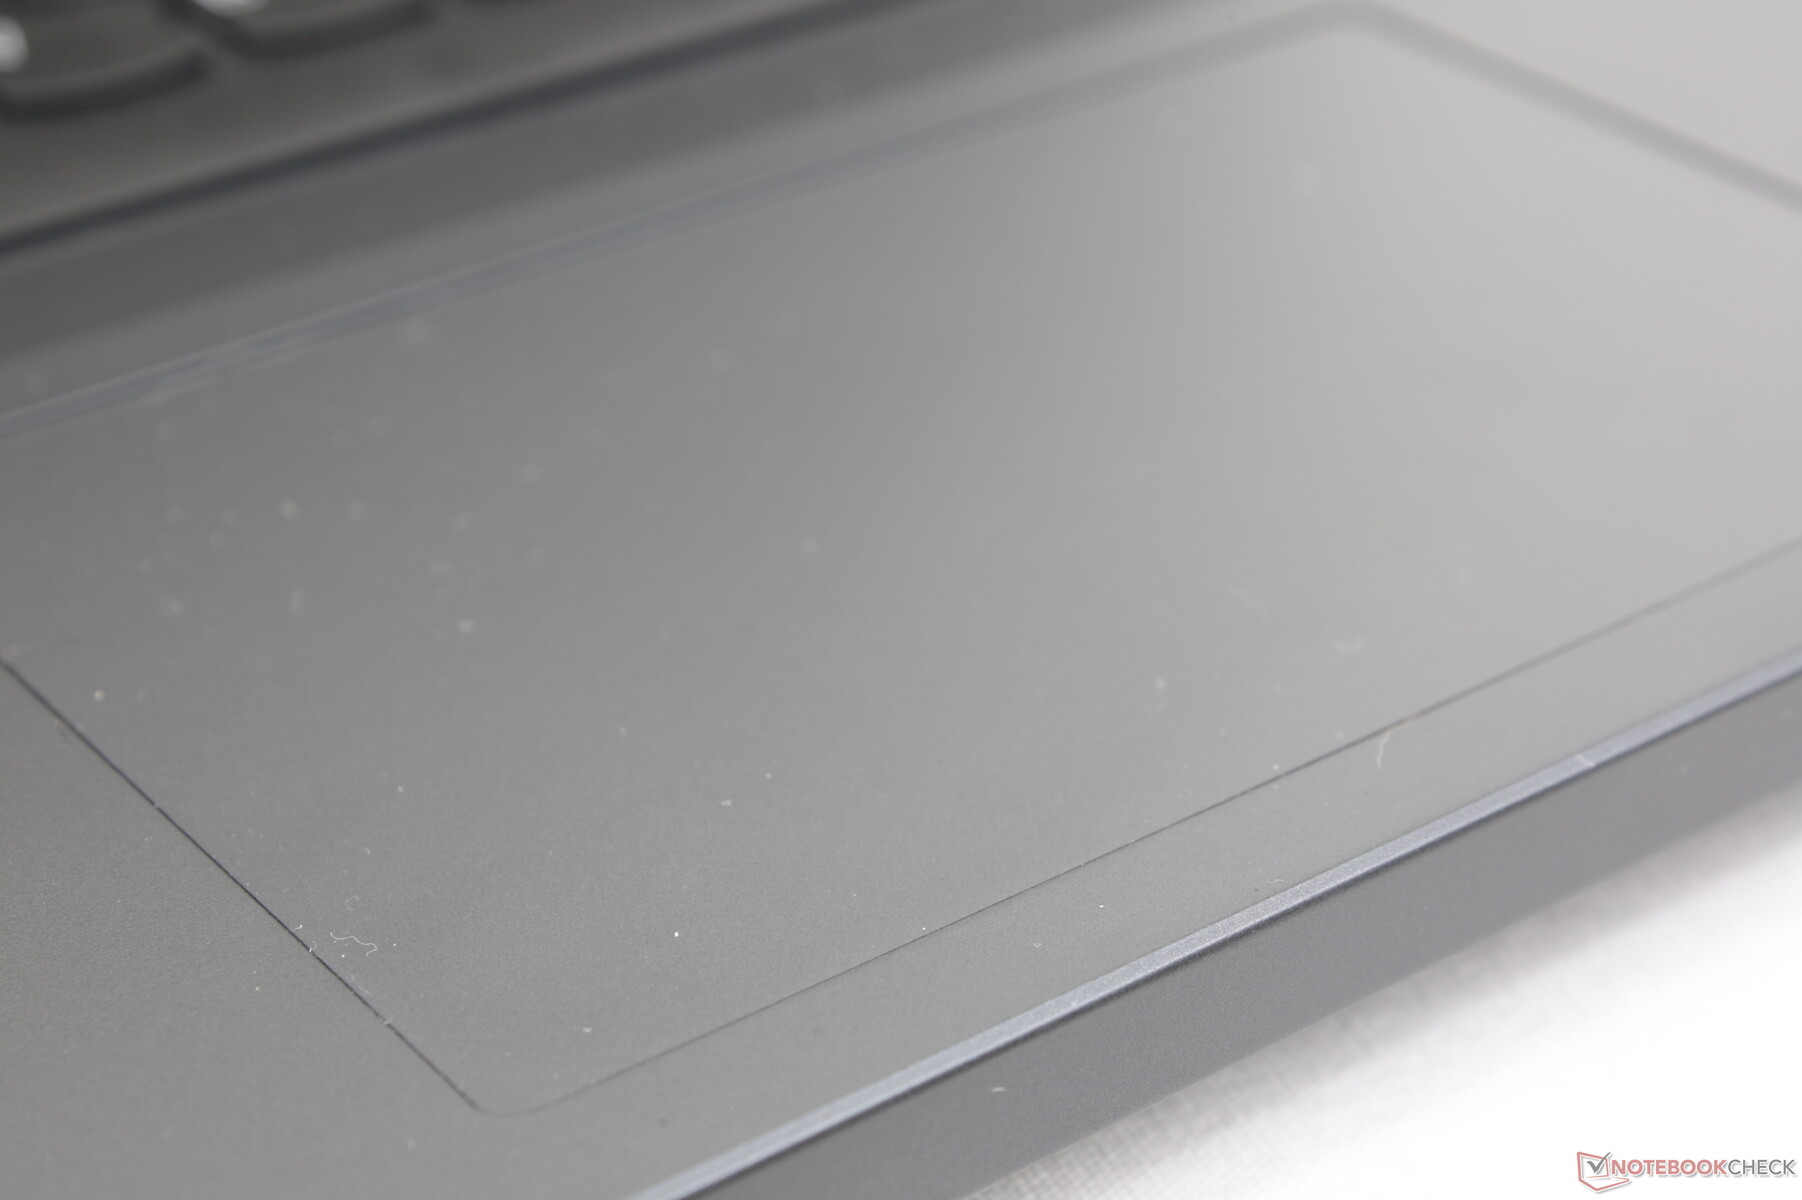
The clickpad (12 x 7.5 cm) is about the same size as the one on the Inspiron 16 Plus 7620 (11.5 x 8 cm). Gliding is smooth and responsive with just a bit of sticking at slower speeds for more accurate clicks. However, travel is very shallow when clicking and feedback isn't very strong. Nonetheless, the clickpad works reliably enough for simple tasks when a mouse isn't available.

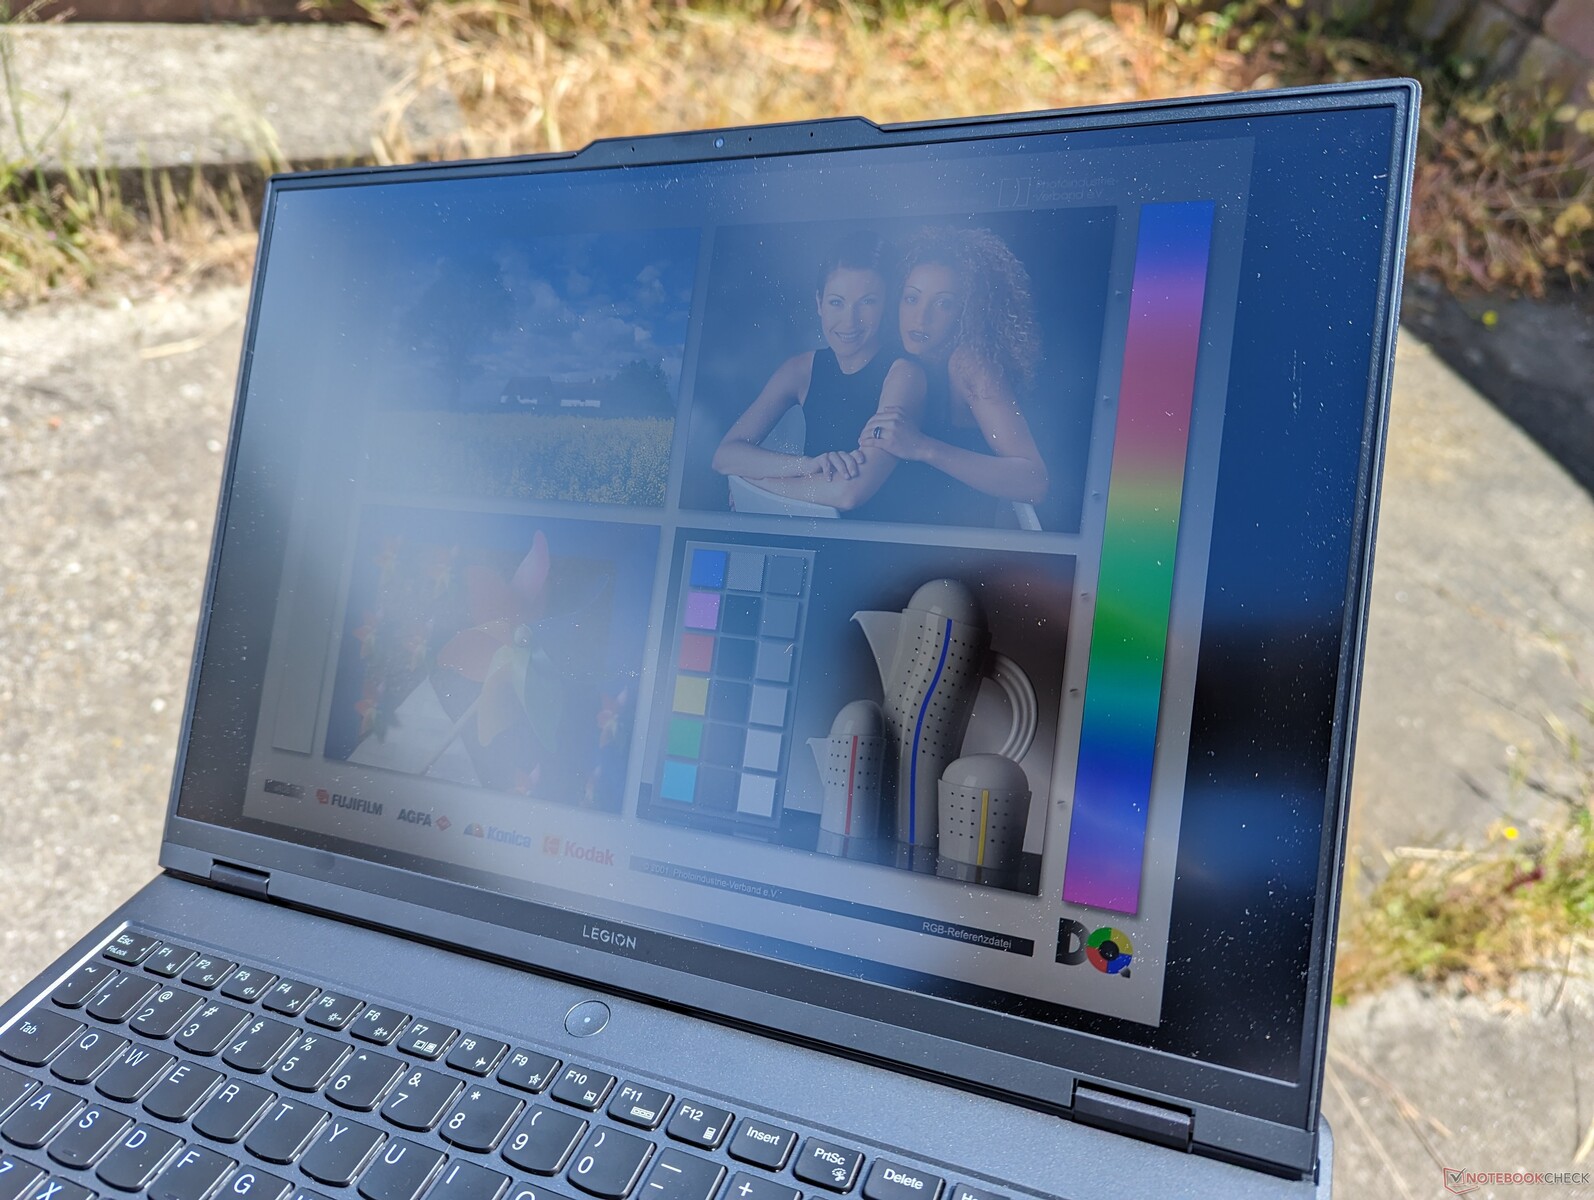
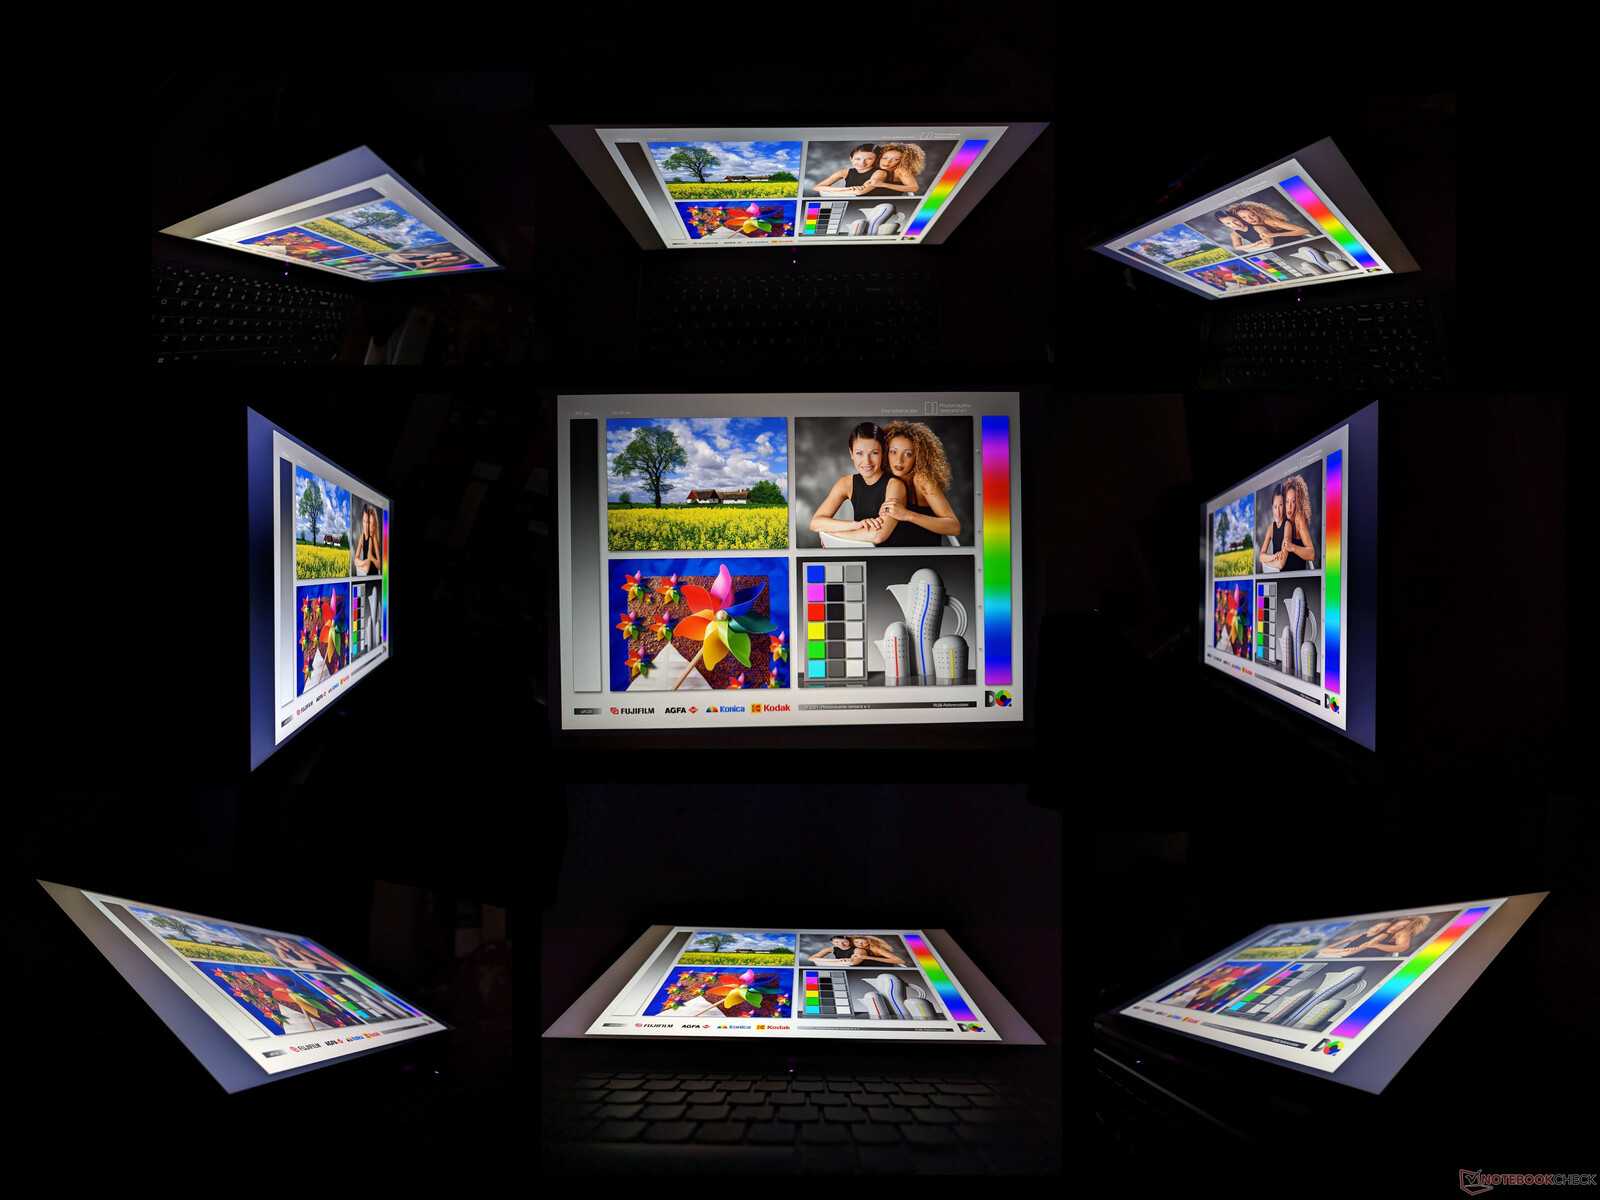
Display — 165 Hz Minimum
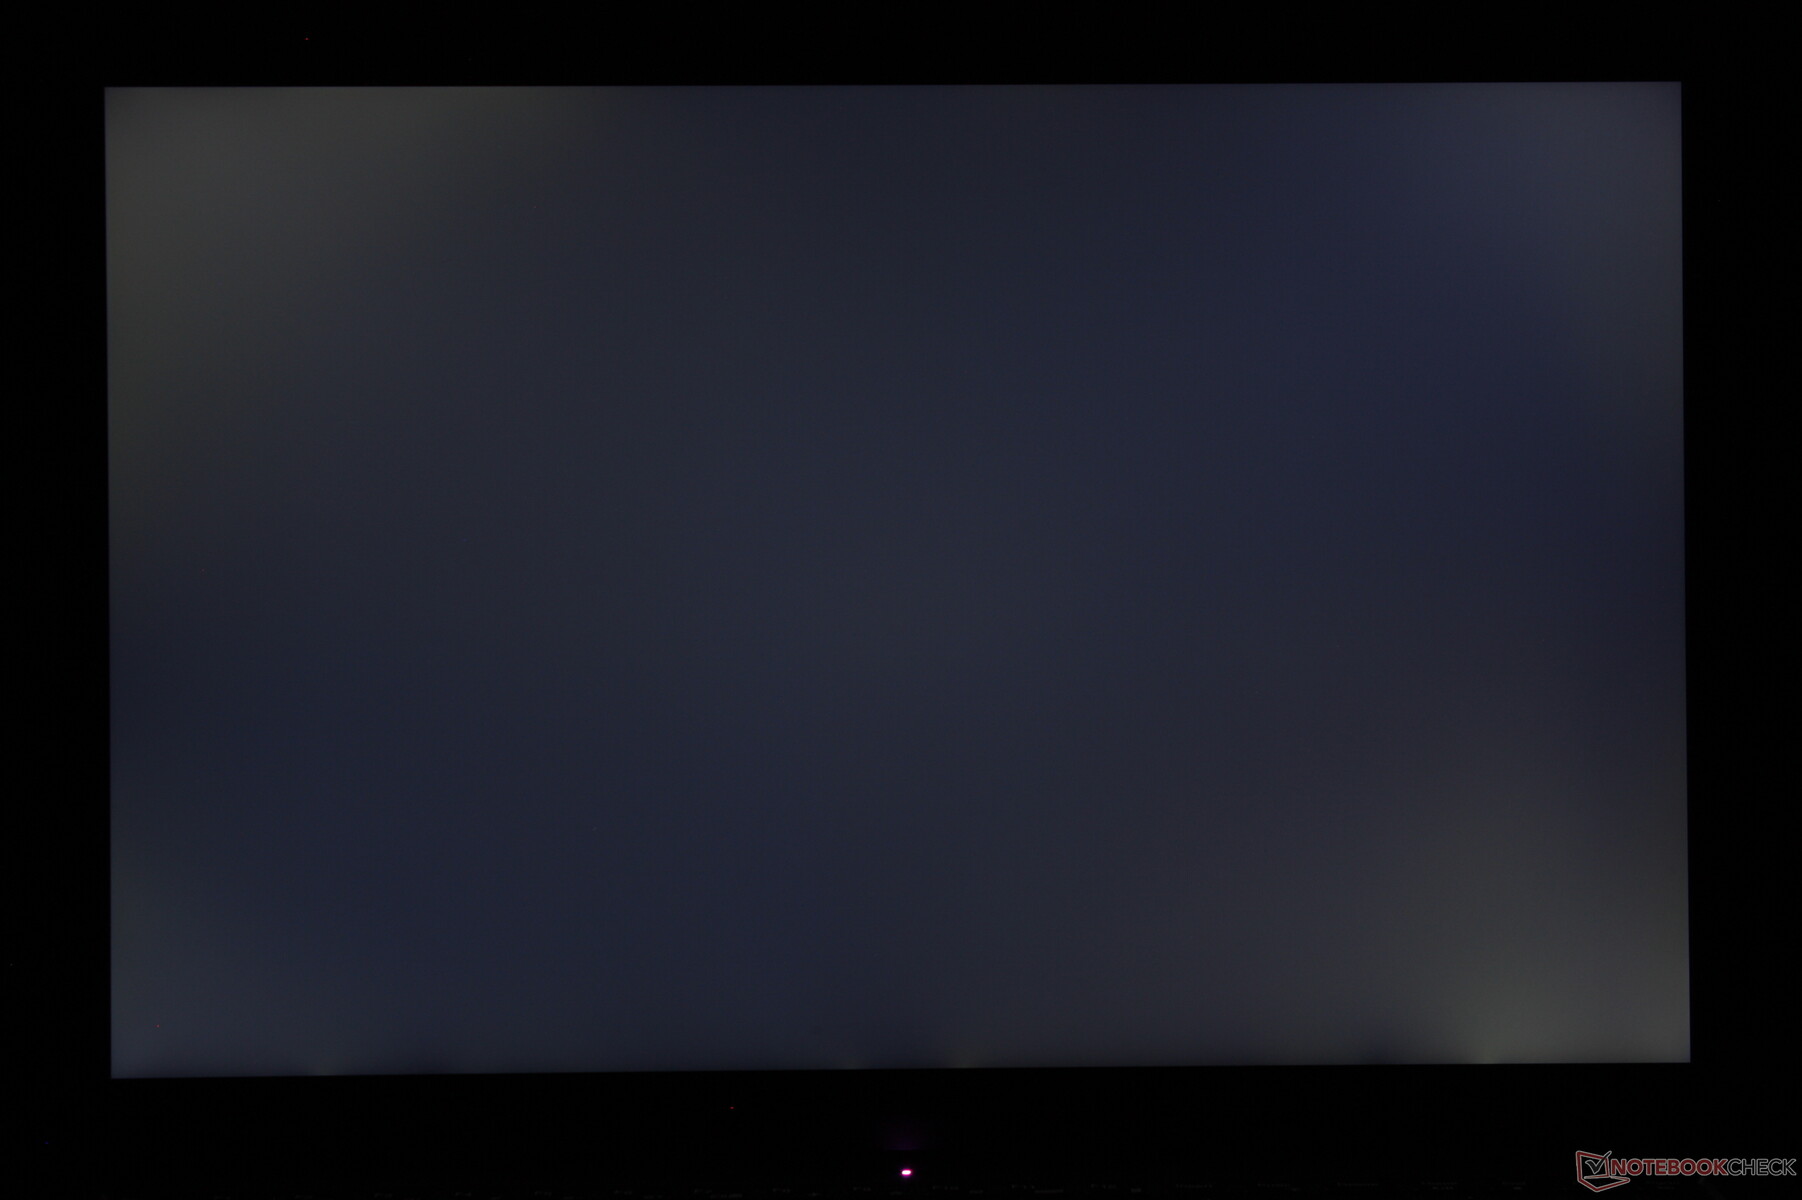
There are two display options for the 2023 Legion Pro 5 16: 165 Hz and 240 Hz. Both support G-Sync, 2560 x 1600 native resolution, and full sRGB coverage while only the 240 Hz panel supports HDR400. The base 165 Hz option should be more than sufficient for the target midrange gamer. Image quality is excellent with surprisingly minimal graininess for a matte panel.
Backlight bleeding could certainly be improved upon. Our unit would exhibit a fair amount of light bleeding which we find to be borderline unacceptable on a gaming laptop of this price range.
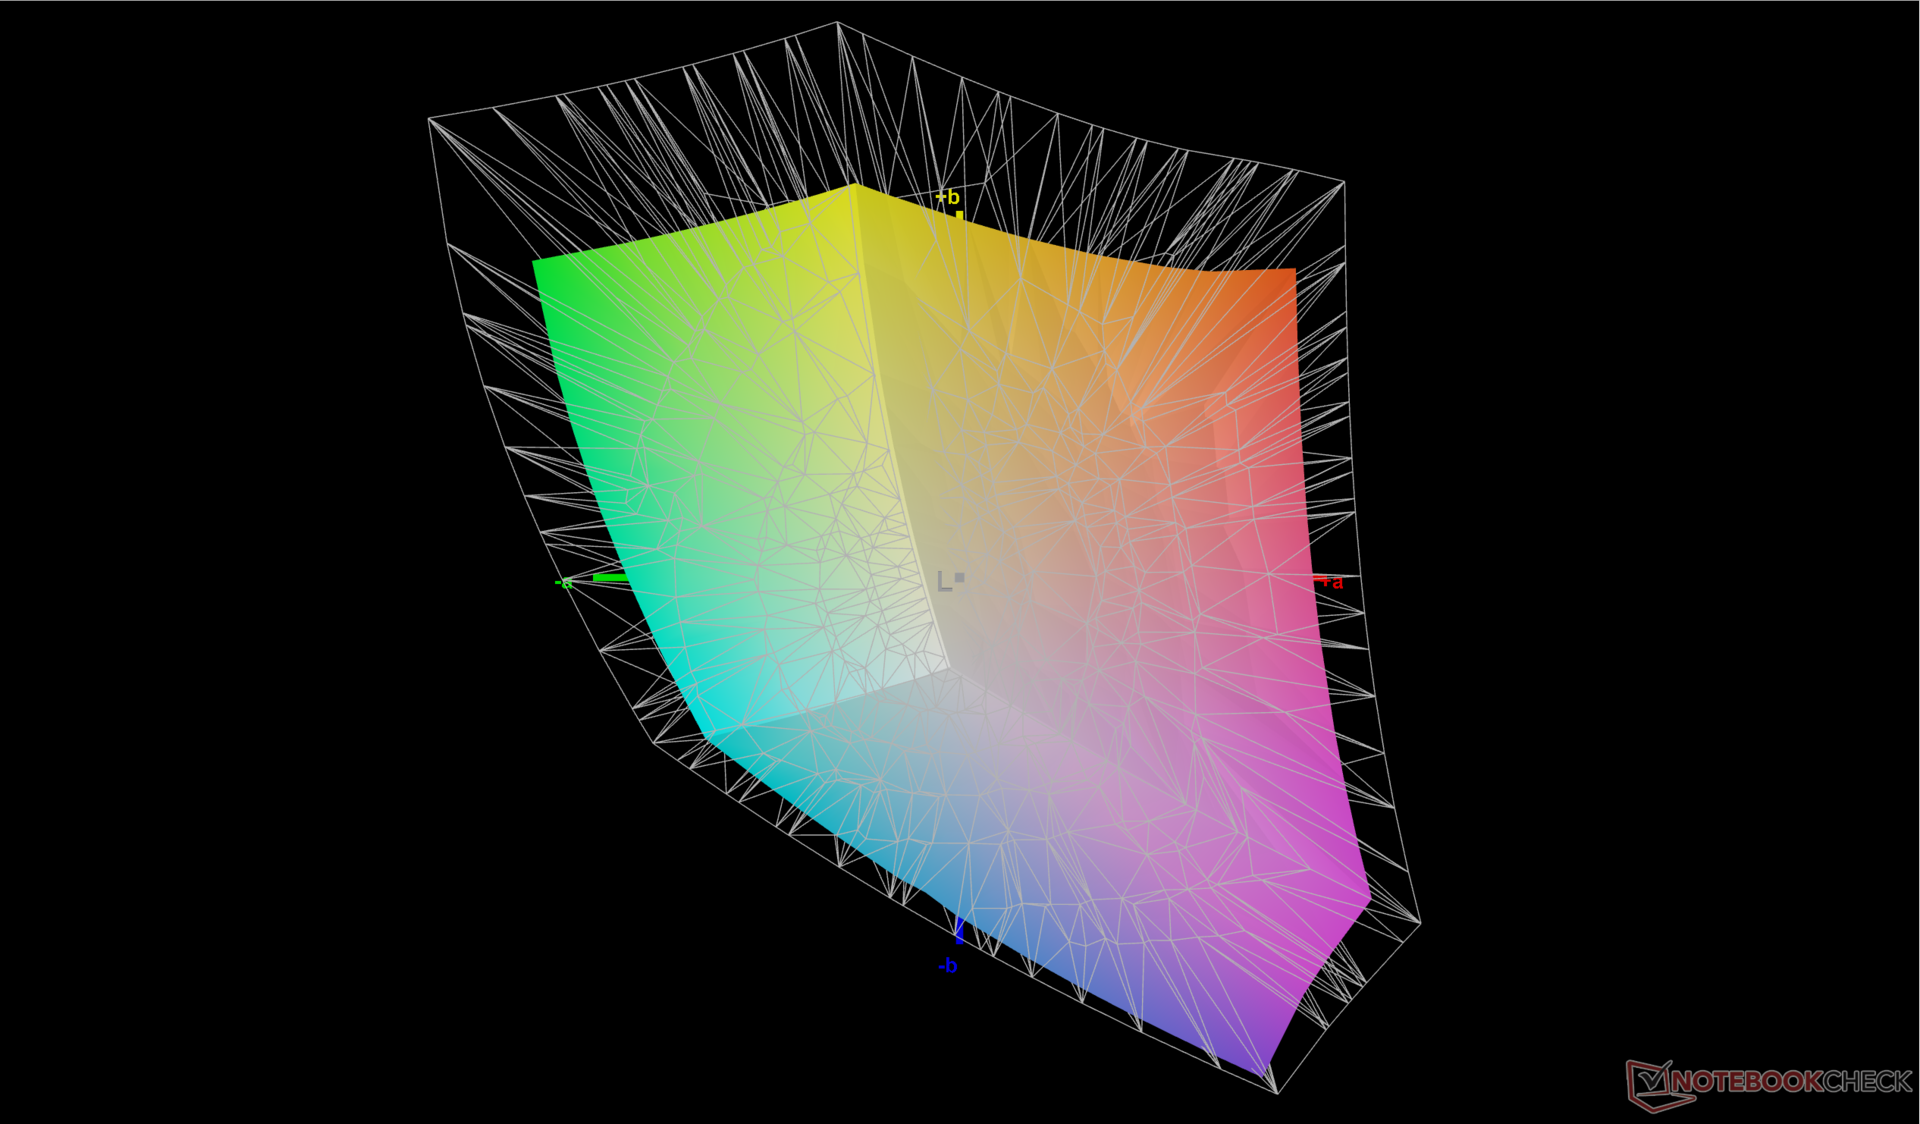
Users interested in OLED or wider AdobeRGB colors will have to look beyond the midrange Legion Pro 5 series.

| |||||||||||||||||||||||||
Brightness Distribution: 87 %
Center on Battery: 405.7 cd/m²
Contrast: 1068:1 (Black: 0.38 cd/m²)
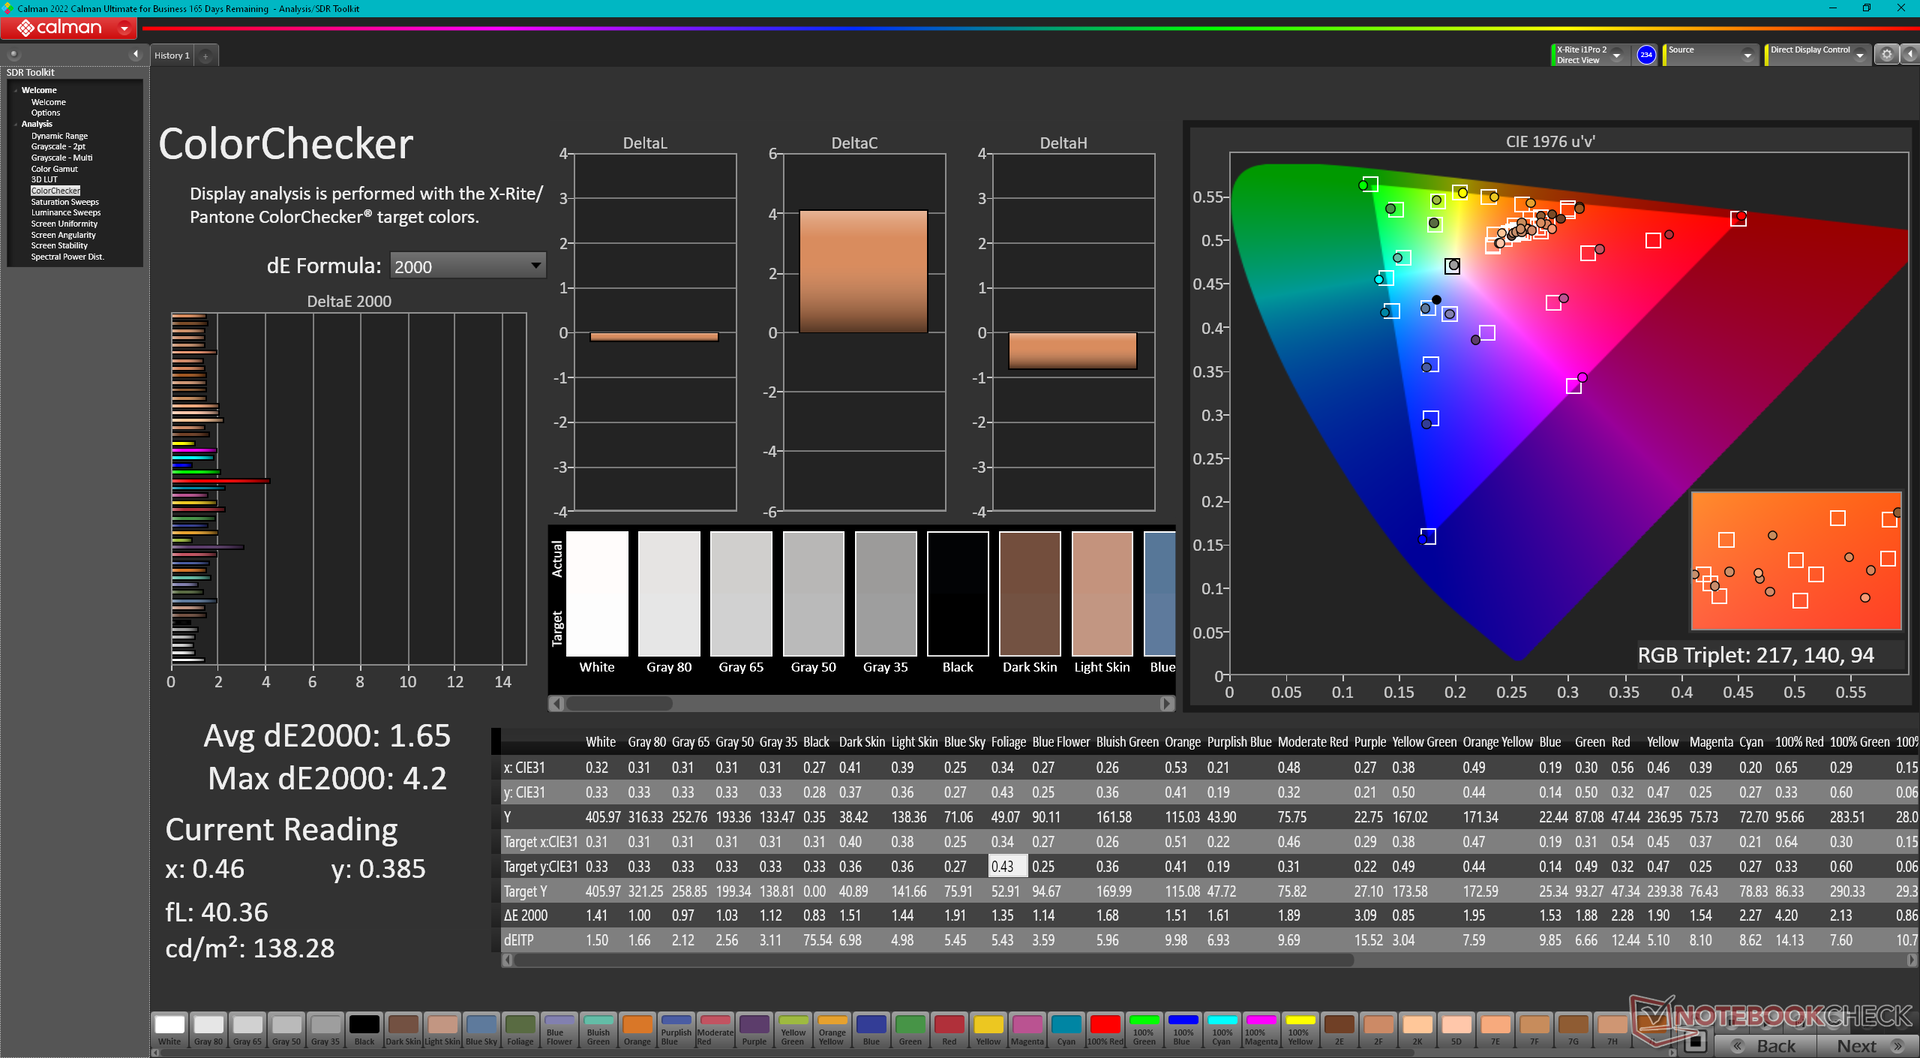
ΔE ColorChecker Calman: 1.65 | ∀{0.5-29.43 Ø4.71}
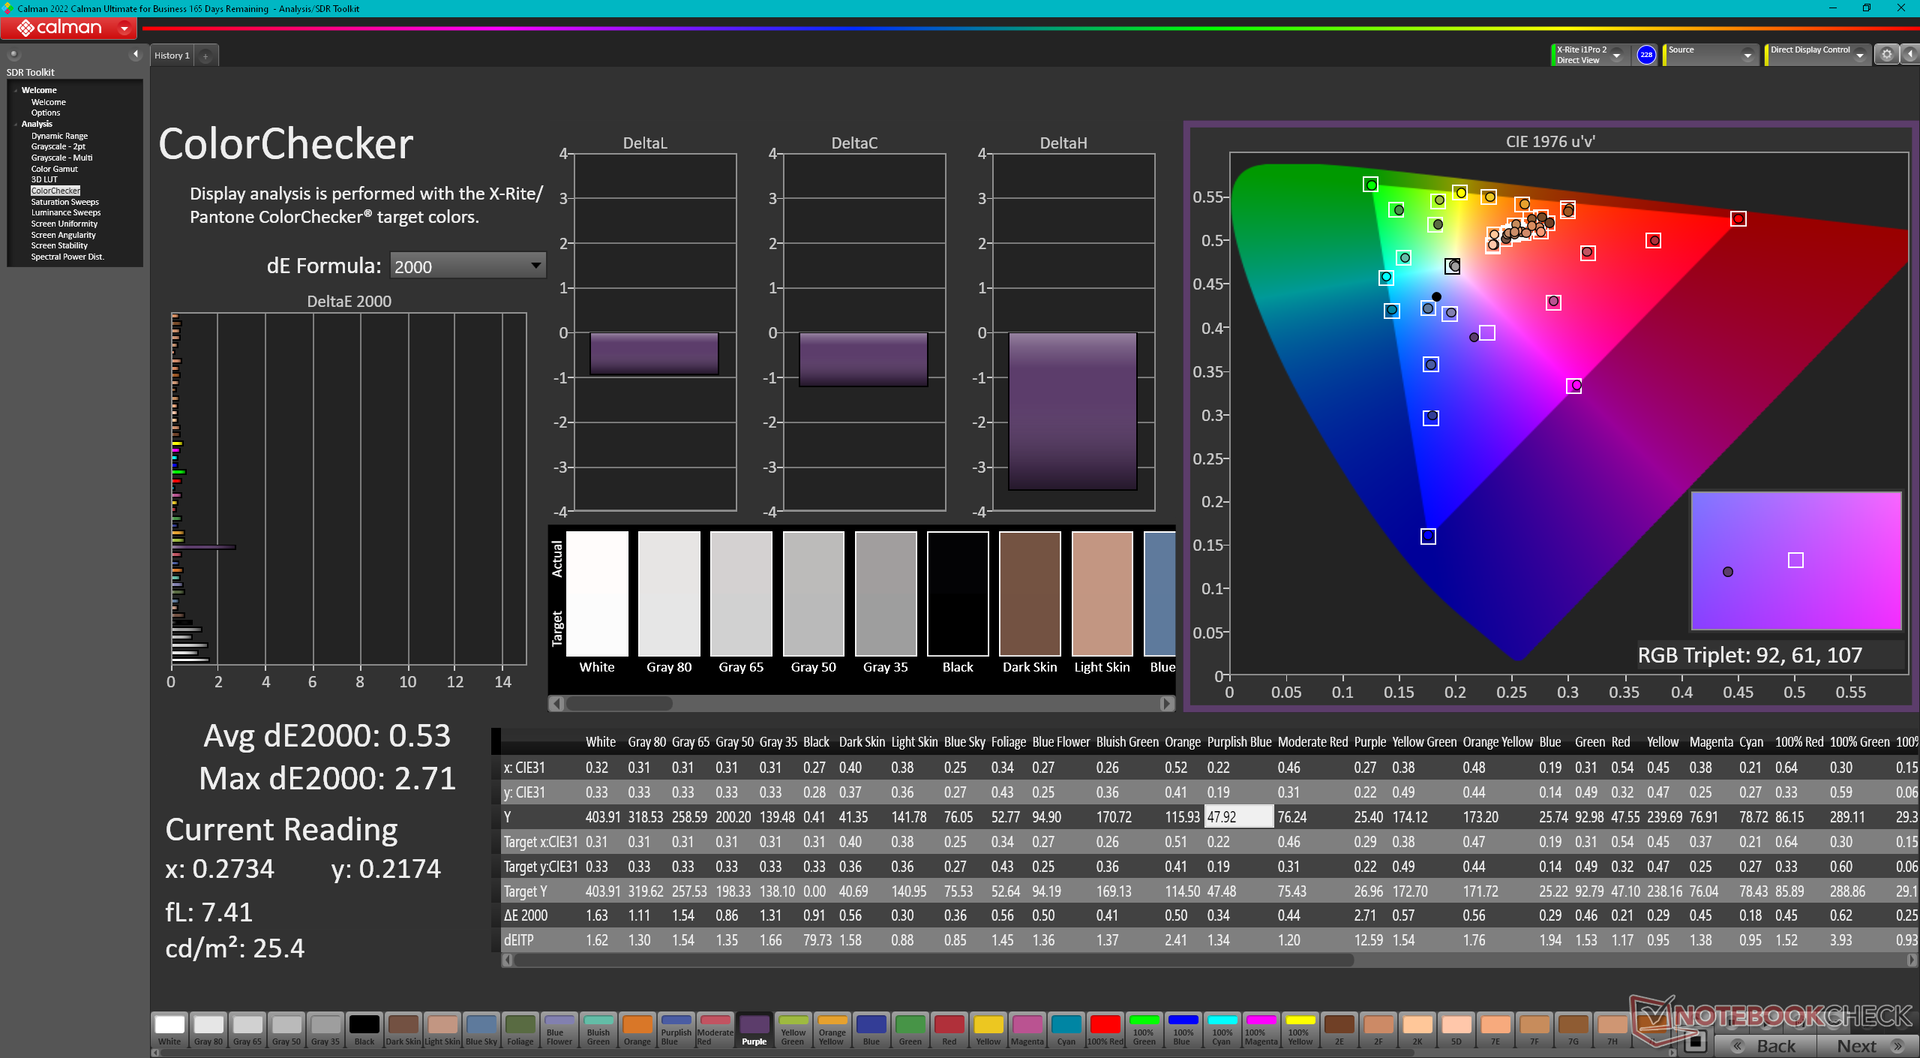
calibrated: 0.53
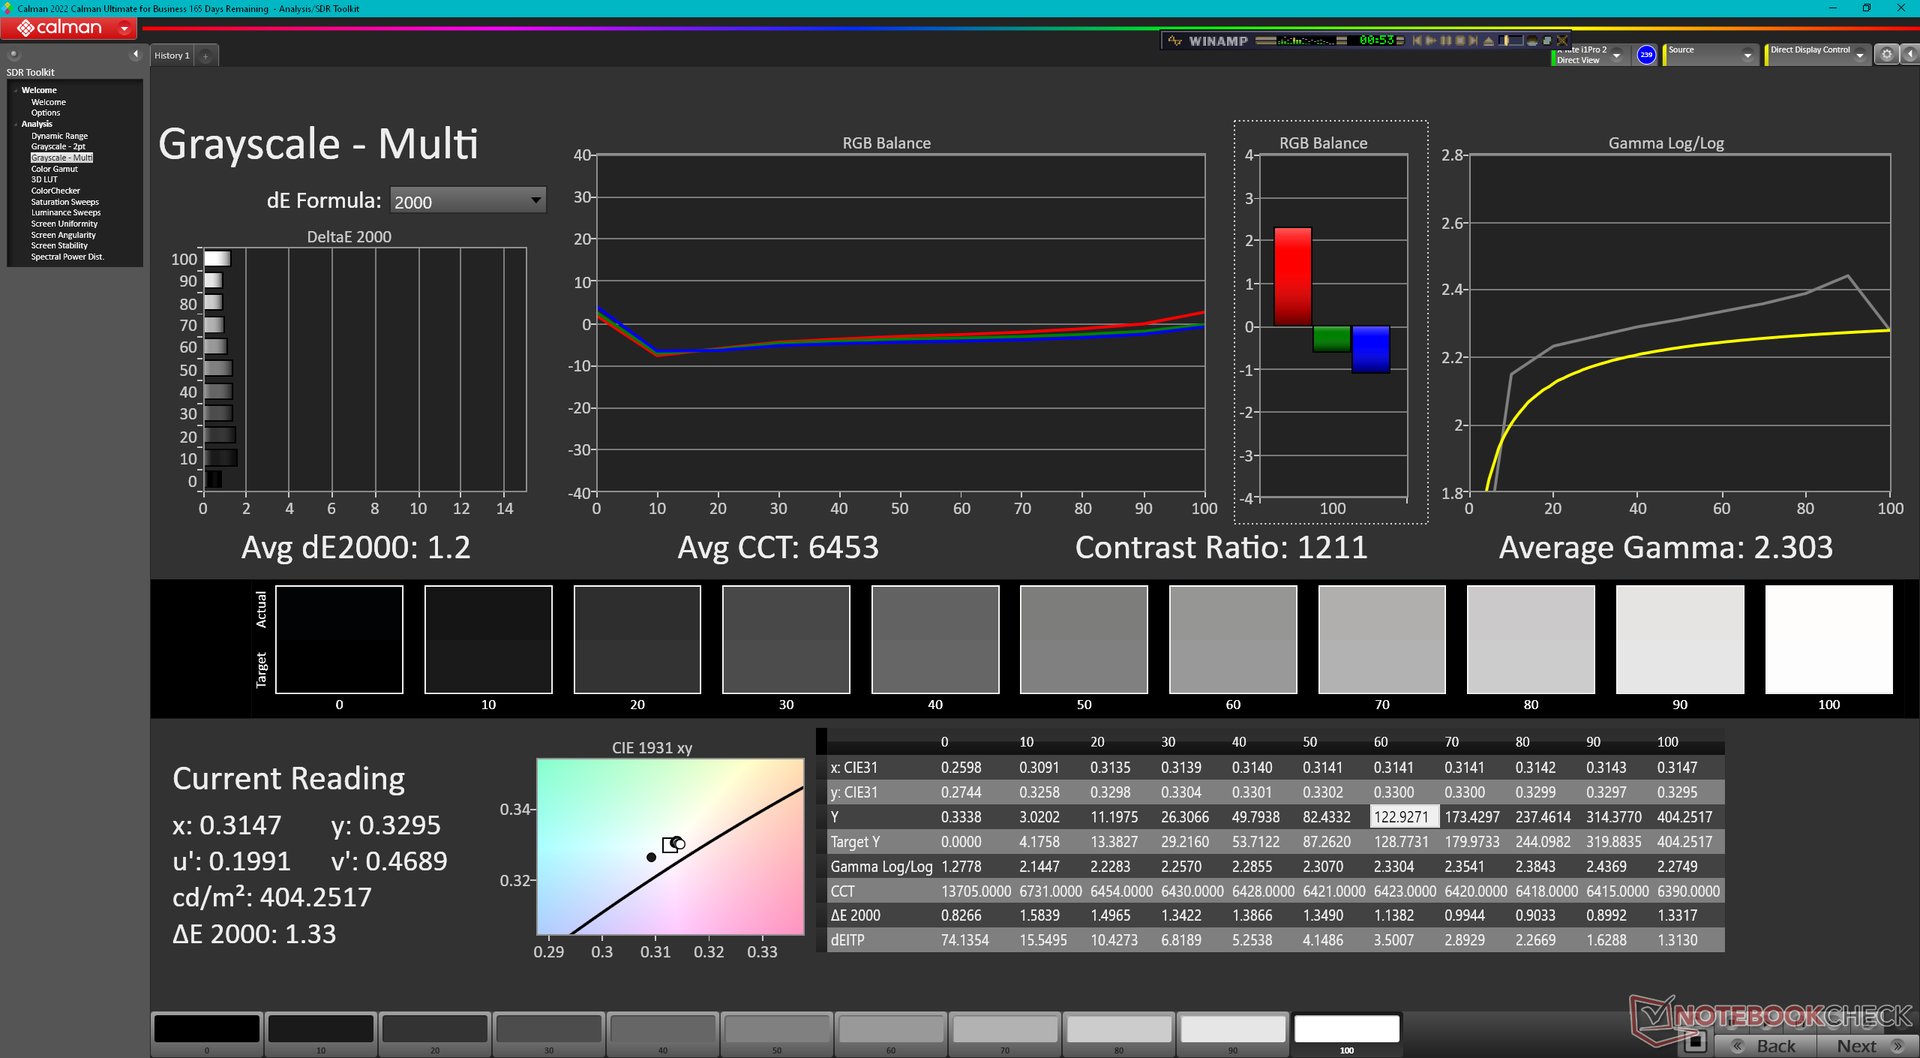
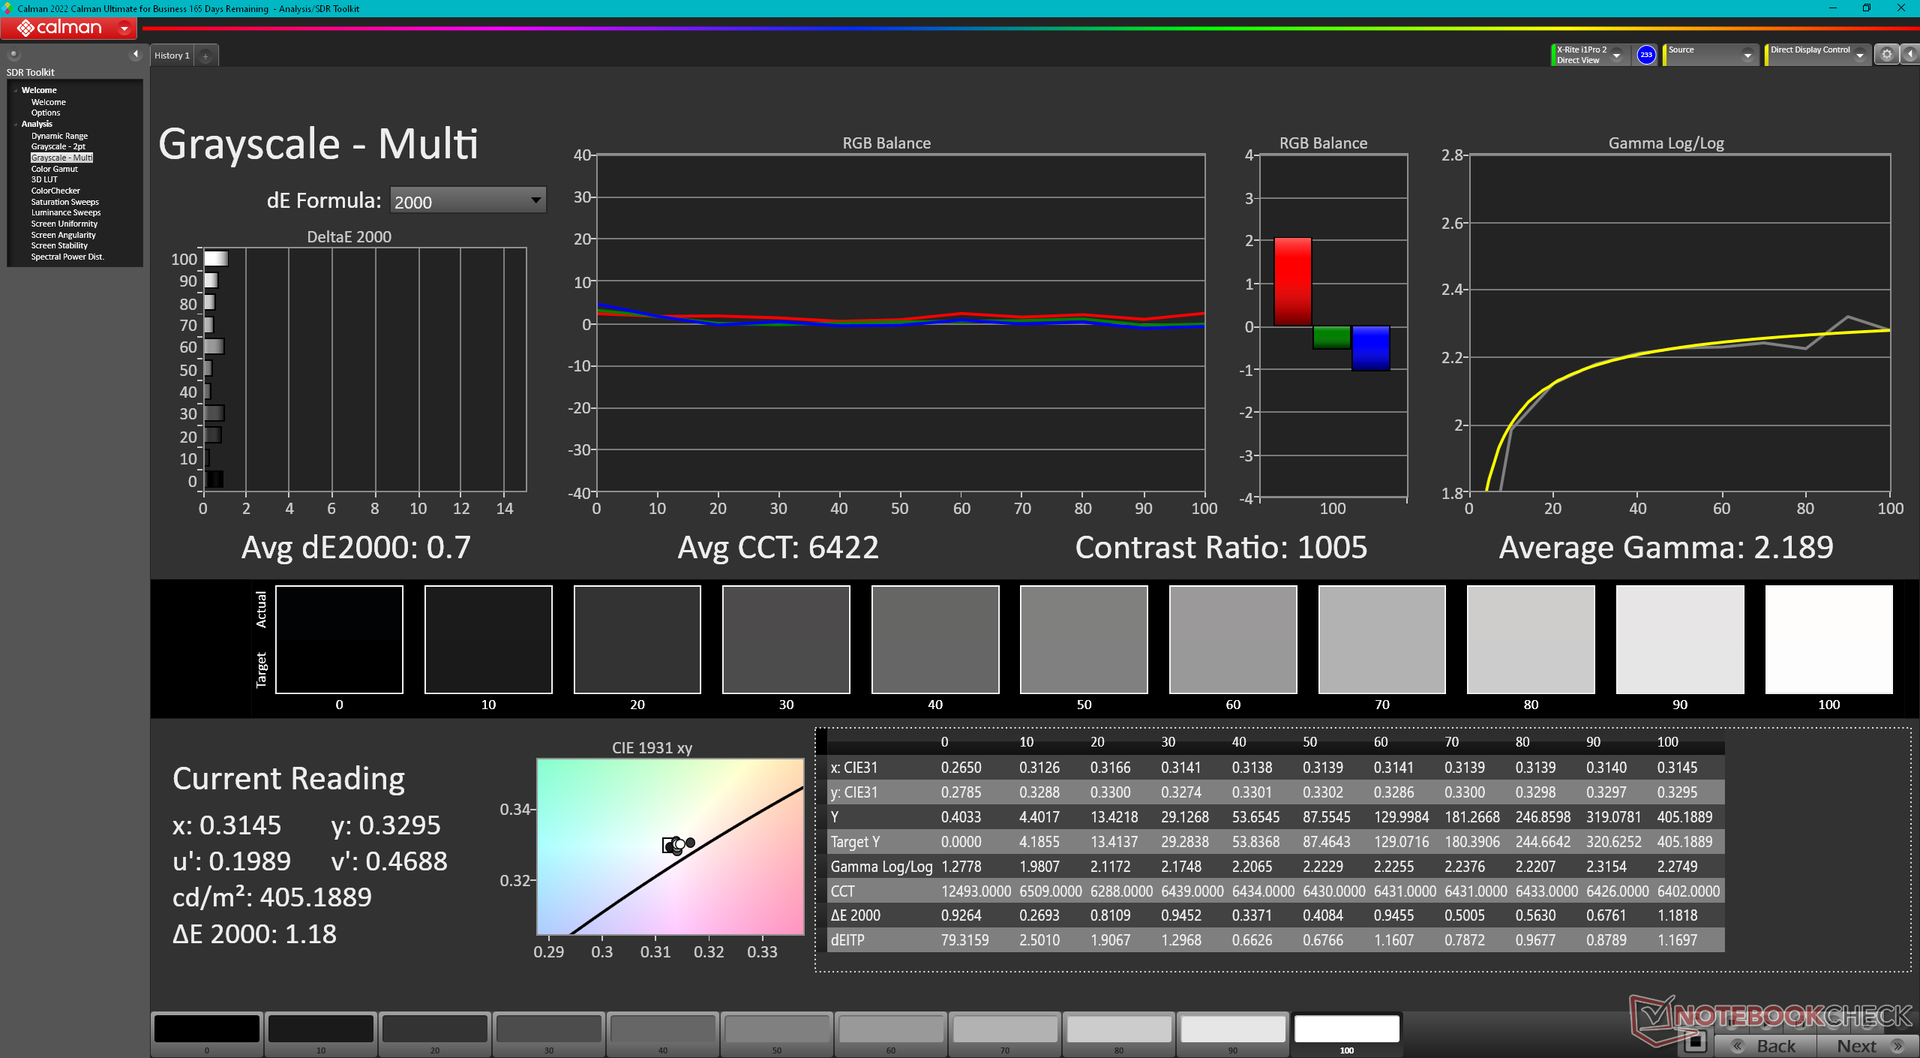
ΔE Greyscale Calman: 1.2 | ∀{0.09-98 Ø4.96}
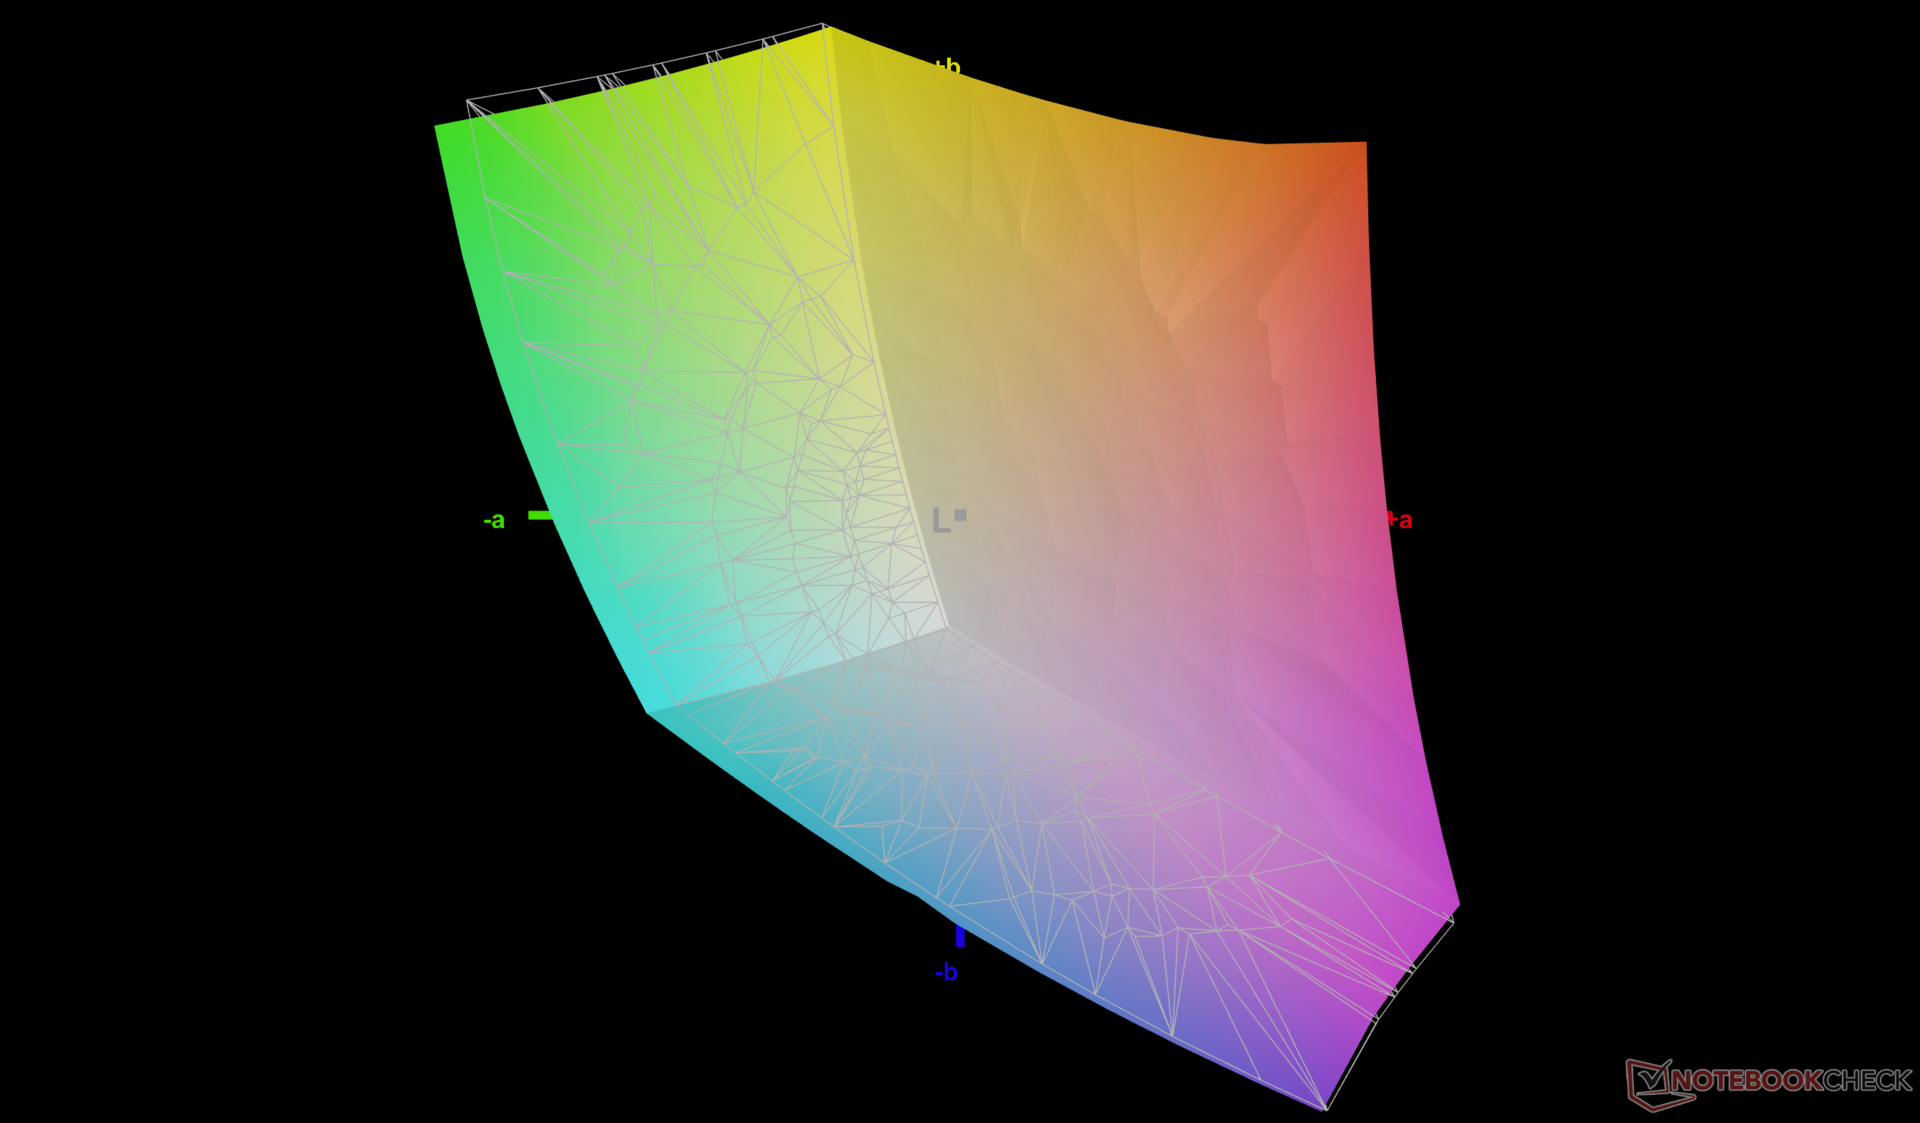
73.3% AdobeRGB 1998 (Argyll 3D)
98.8% sRGB (Argyll 3D)
71.2% Display P3 (Argyll 3D)
Gamma: 2.3
CCT: 6453 K
| Lenovo Legion Pro 5 16IRX8 AU Optronics B160QAN03.1, IPS, 2560x1600, 16" | Asus ROG Zephyrus M16 GU603Z BOE0A0B (BOE CQ NE160QDM-NY3), IPS, 2560x1600, 16" | Razer Blade 16 Early 2023 CSOT T3 MNG007DA4-1, IPS, 2560x1600, 16" | Lenovo Legion Pro 7 16IRX8H MNG007DA2-3 (CSO1628), IPS, 2560x1600, 16" | Lenovo Legion 5 Pro 16ARH7H RTX 3070 Ti BOE CQ NE160QDM-NY1, IPS, 2560x1600, 16" | Lenovo Legion S7 16ARHA7 BOE CQ NE160QDM-NY1, IPS, 2560x1600, 16" | |
|---|---|---|---|---|---|---|
| Display | 14% | 20% | -2% | -4% | -2% | |
| Display P3 Coverage (%) | 71.2 | 92.8 30% | 98.5 38% | 69.1 -3% | 67.3 -5% | 69.8 -2% |
| sRGB Coverage (%) | 98.8 | 98.5 0% | 100 1% | 99.7 1% | 96.1 -3% | 98.1 -1% |
| AdobeRGB 1998 Coverage (%) | 73.3 | 83.1 13% | 89.7 22% | 71.2 -3% | 69.5 -5% | 71.9 -2% |
| Response Times | 26% | 20% | 29% | -4% | 4% | |
| Response Time Grey 50% / Grey 80% * (ms) | 14.5 ? | 7.6 ? 48% | 6.6 ? 54% | 12.3 ? 15% | 14.4 ? 1% | 10 ? 31% |
| Response Time Black / White * (ms) | 10.4 ? | 10 ? 4% | 12 ? -15% | 5.9 ? 43% | 11.2 ? -8% | 12.8 ? -23% |
| PWM Frequency (Hz) | ||||||
| Screen | -62% | -29% | 15% | -22% | -8% | |
| Brightness middle (cd/m²) | 405.7 | 497 23% | 456.8 13% | 511 26% | 522.8 29% | 492.4 21% |
| Brightness (cd/m²) | 368 | 481 31% | 437 19% | 469 27% | 503 37% | 471 28% |
| Brightness Distribution (%) | 87 | 82 -6% | 83 -5% | 86 -1% | 84 -3% | 90 3% |
| Black Level * (cd/m²) | 0.38 | 0.21 45% | 0.35 8% | 0.4 -5% | 0.41 -8% | 0.4 -5% |
| Contrast (:1) | 1068 | 2367 122% | 1305 22% | 1278 20% | 1275 19% | 1231 15% |
| Colorchecker dE 2000 * | 1.65 | 3.53 -114% | 3.7 -124% | 0.95 42% | 2.47 -50% | 1.9 -15% |
| Colorchecker dE 2000 max. * | 4.2 | 6.15 -46% | 6.42 -53% | 2.07 51% | 6.56 -56% | 3.81 9% |
| Colorchecker dE 2000 calibrated * | 0.53 | 3.53 -566% | 0.66 -25% | 0.91 -72% | 0.61 -15% | 0.99 -87% |
| Greyscale dE 2000 * | 1.2 | 1.74 -45% | 2.6 -117% | 0.6 50% | 3 -150% | 1.7 -42% |
| Gamma | 2.3 96% | 2.2 100% | 2.3 96% | 2.176 101% | 2.27 97% | 2.36 93% |
| CCT | 6453 101% | 6418 101% | 6108 106% | 6545 99% | 6719 97% | 6497 100% |
| Total Average (Program / Settings) | -7% /
-33% | 4% /
-12% | 14% /
14% | -10% /
-16% | -2% /
-5% |
* ... smaller is better
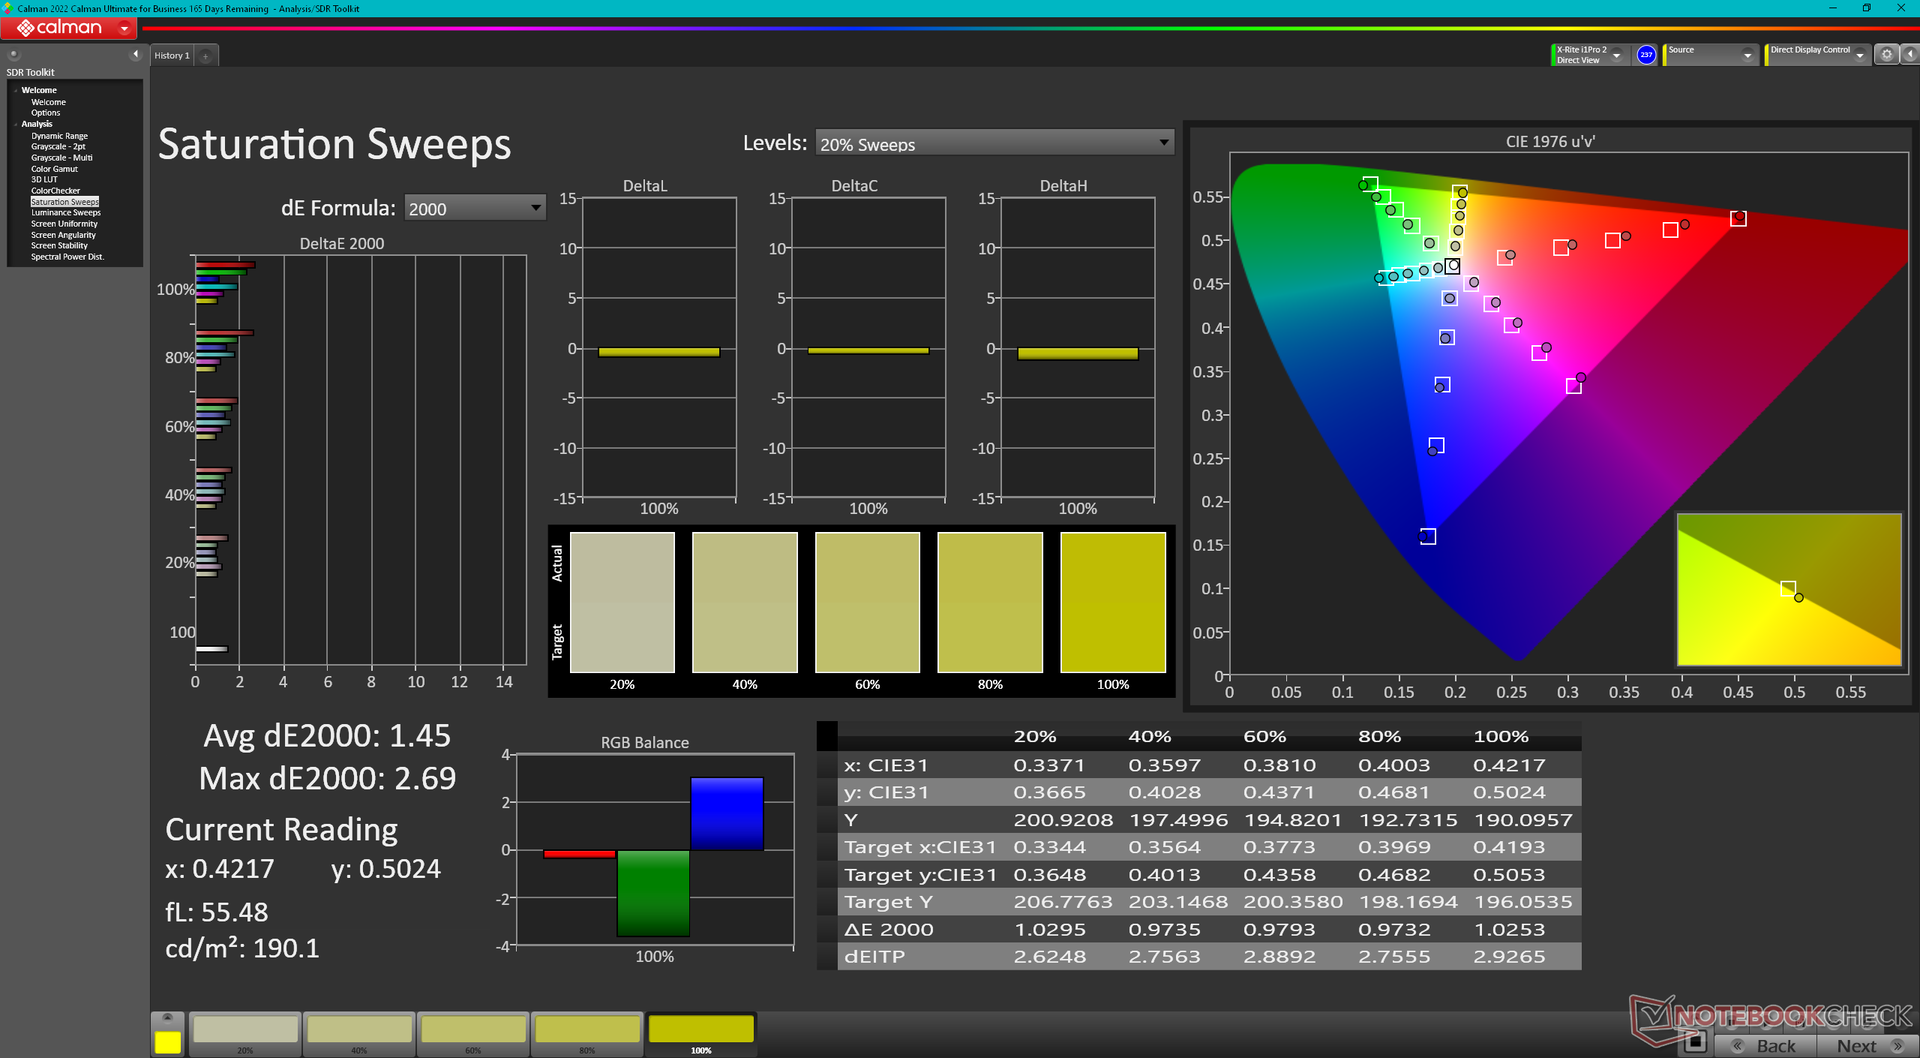
The display comes well-calibrated out of the box with average grayscale and color deltaE values of just 1.2 and 1.65, respectively. Such values are low enough where an end-user calibration is not needed. Calibrating the panel anyway would improve color accuracy even further to <1 as shown by the screenshots below. If we are to nitpick, purple appears to be the represented the least accurately out of all the tested colors with its deltaE of 2.71.

Display Response Times
| ↔ Response Time Black to White | ||
|---|---|---|
| 10.4 ms ... rise ↗ and fall ↘ combined | ↗ 5.7 ms rise | 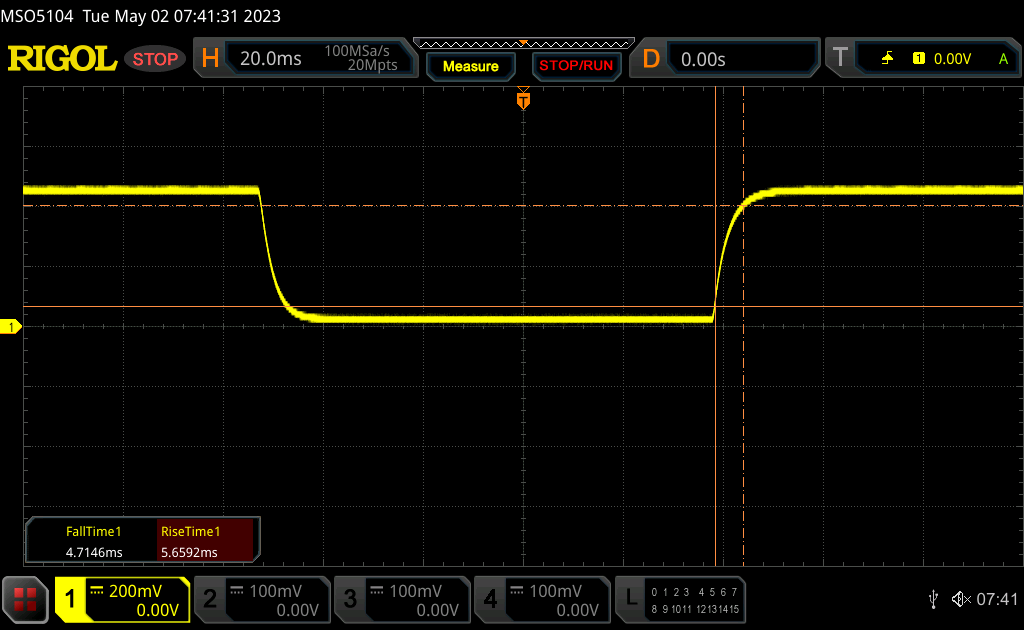 |
| ↘ 4.7 ms fall | ||
| The screen shows good response rates in our tests, but may be too slow for competitive gamers. In comparison, all tested devices range from 0.1 (minimum) to 240 (maximum) ms. » 28 % of all devices are better. This means that the measured response time is better than the average of all tested devices (19.8 ms). | ||
| ↔ Response Time 50% Grey to 80% Grey | ||
| 14.5 ms ... rise ↗ and fall ↘ combined | ↗ 7 ms rise | 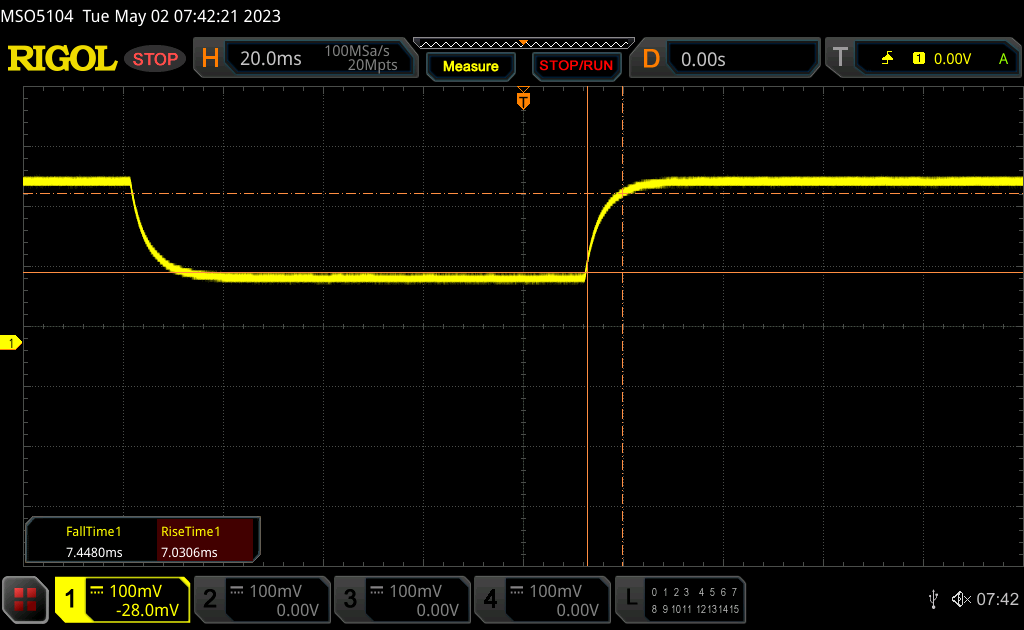 |
| ↘ 7.5 ms fall | ||
| The screen shows good response rates in our tests, but may be too slow for competitive gamers. In comparison, all tested devices range from 0.165 (minimum) to 636 (maximum) ms. » 29 % of all devices are better. This means that the measured response time is better than the average of all tested devices (31 ms). | ||
Screen Flickering / PWM (Pulse-Width Modulation)
| Screen flickering / PWM not detected | 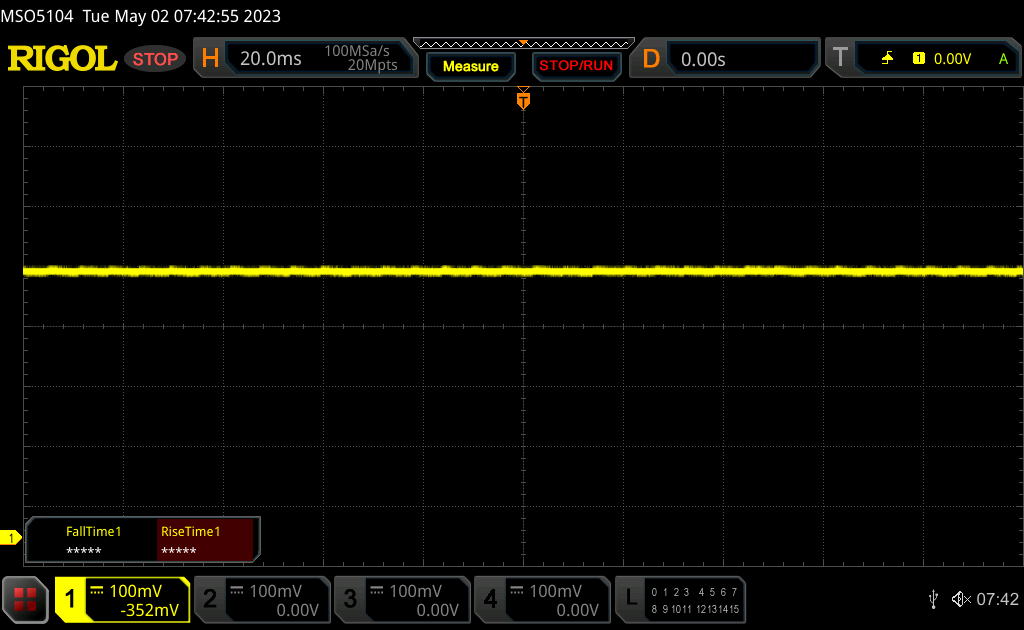 | ||
In comparison: 52 % of all tested devices do not use PWM to dim the display. If PWM was detected, an average of 7754 (minimum: 5 - maximum: 343500) Hz was measured. | |||
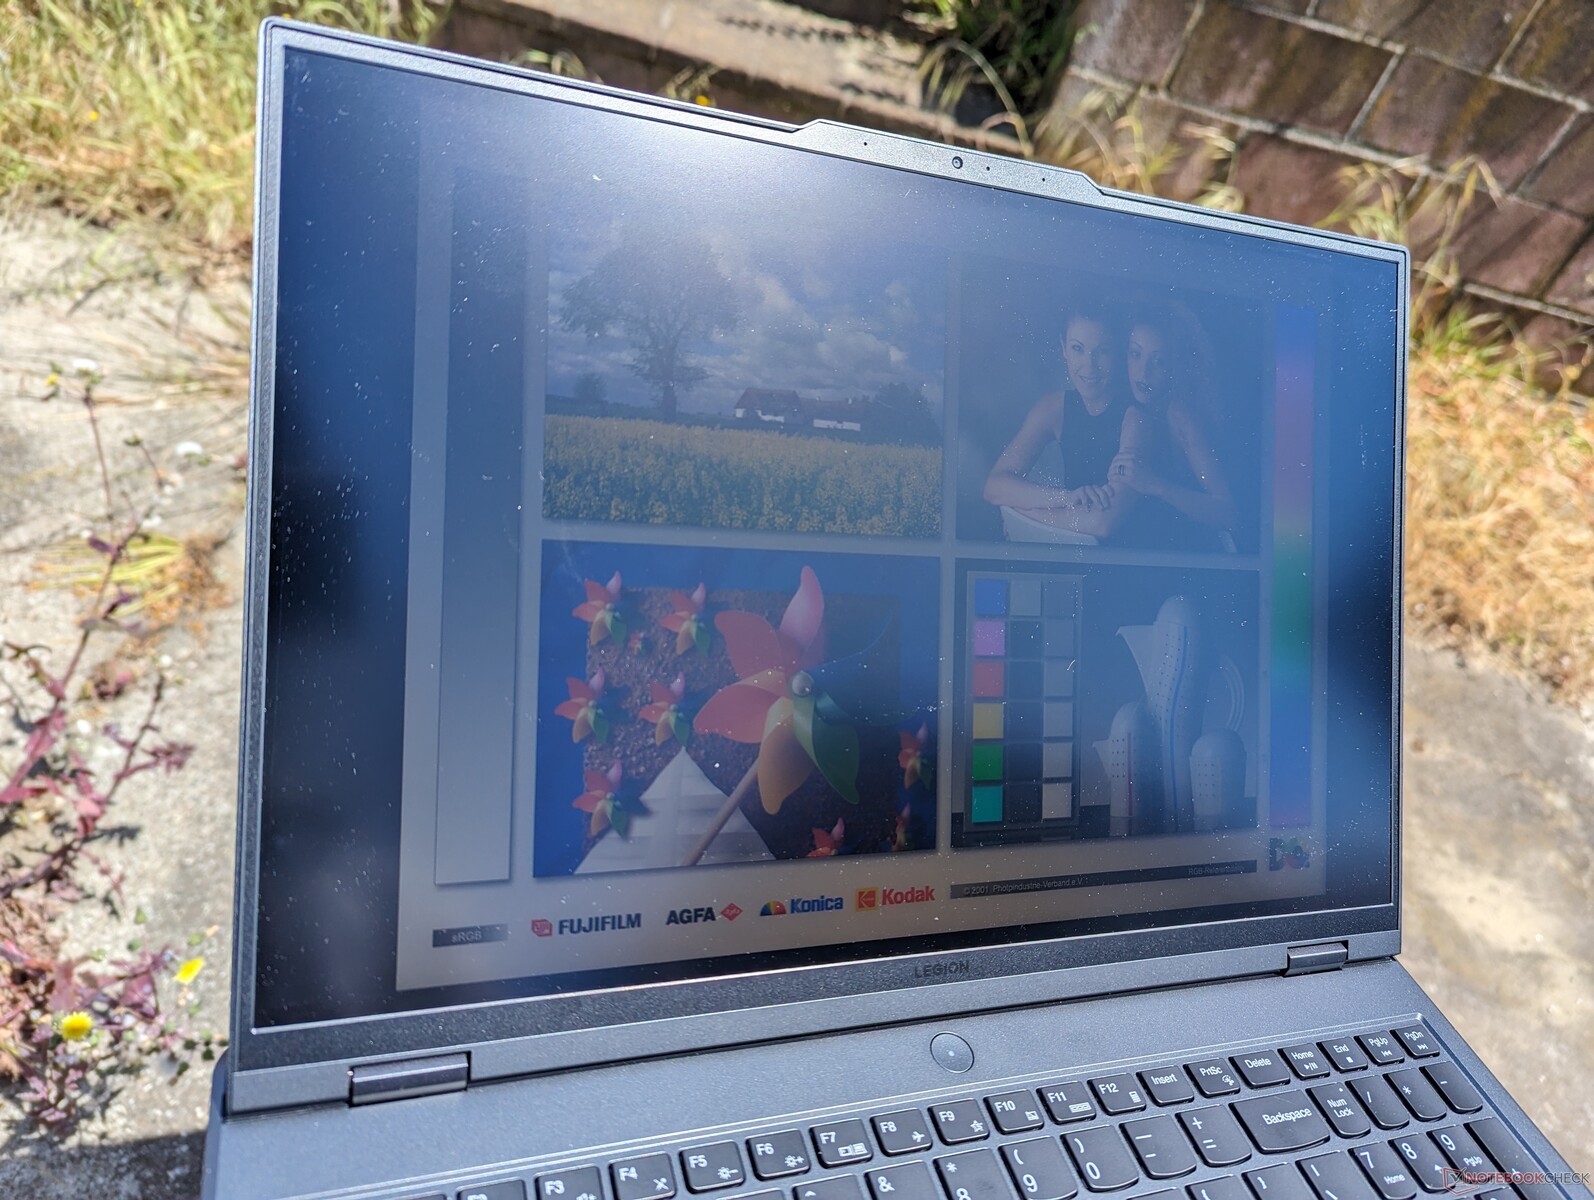
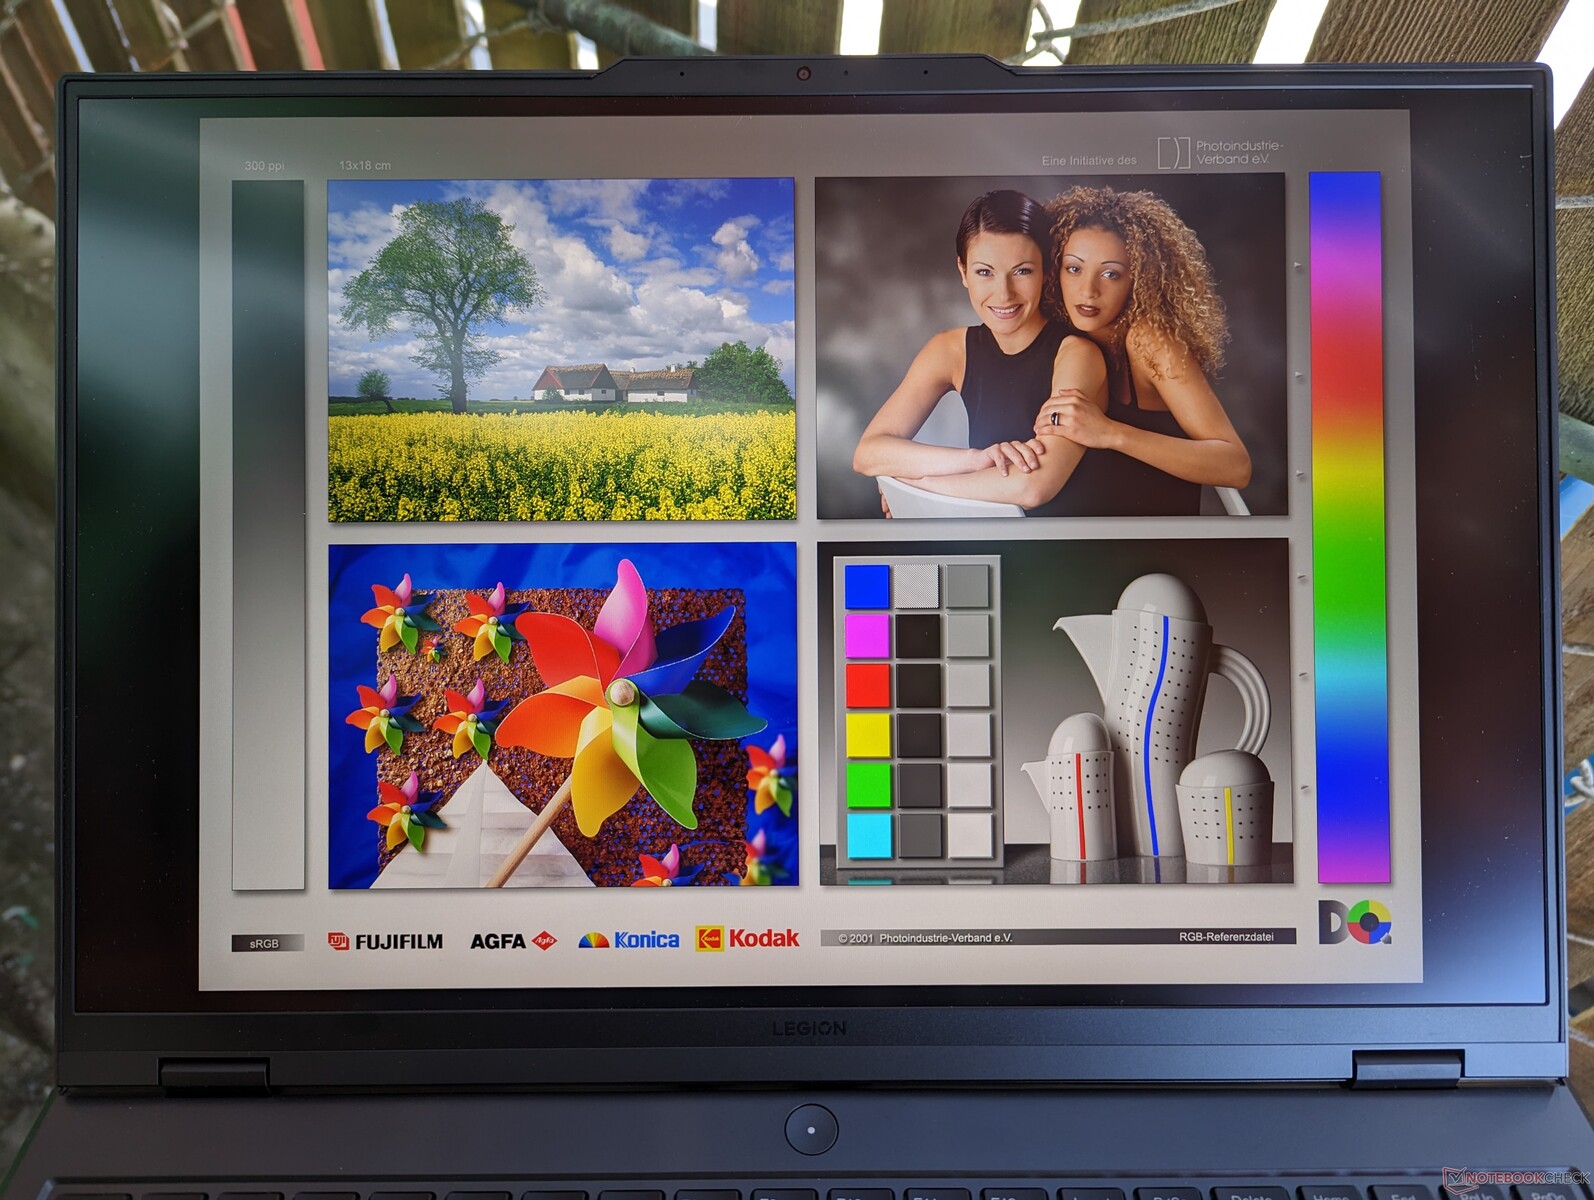
At 400 nits, the display is generally usable under shade. The 240 Hz panel option is slightly brighter if outdoor visibility is a concern. The displays on most 16-inch gaming machines are already brighter than on many midrange Ultrabooks where 300 nits is common.
Performance — 13th Gen Raptor Lake
Testing Conditions
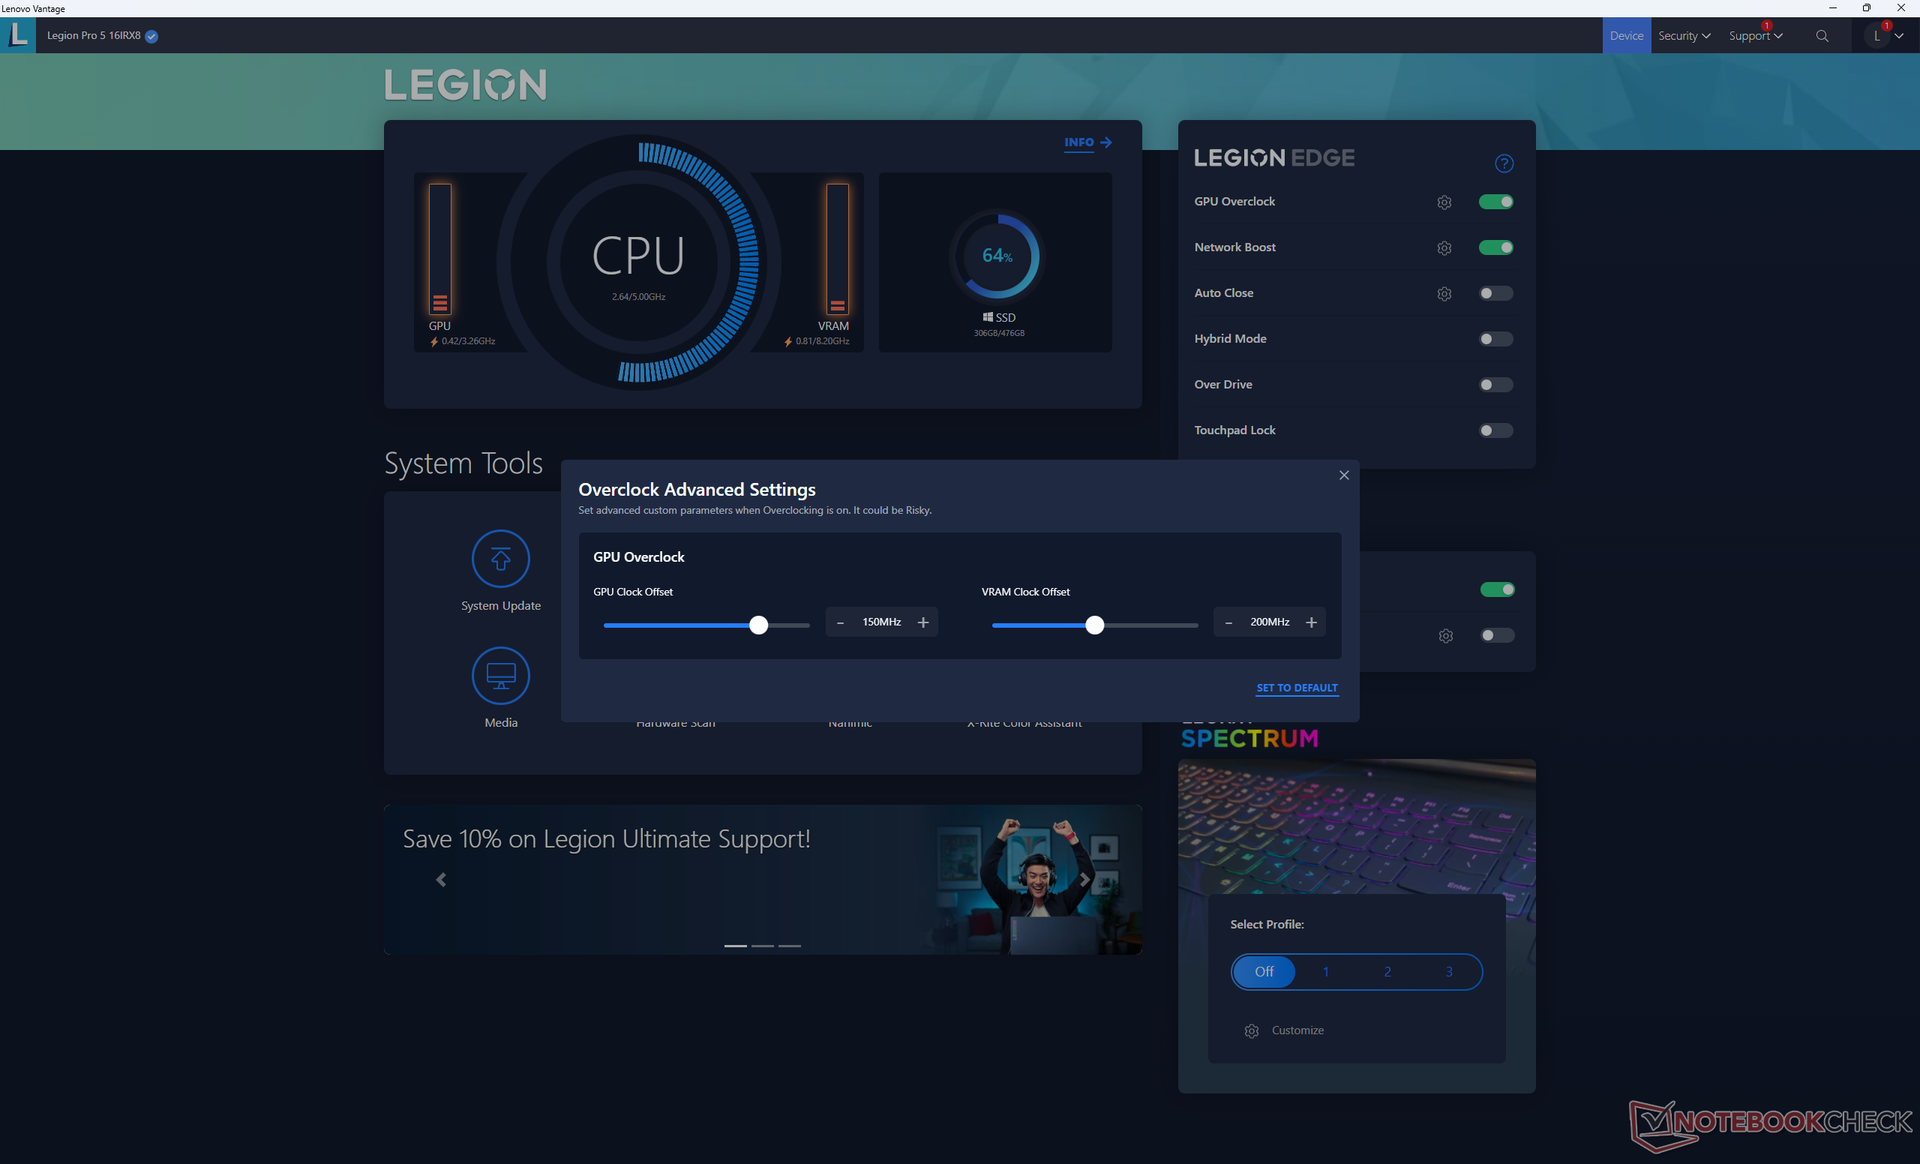
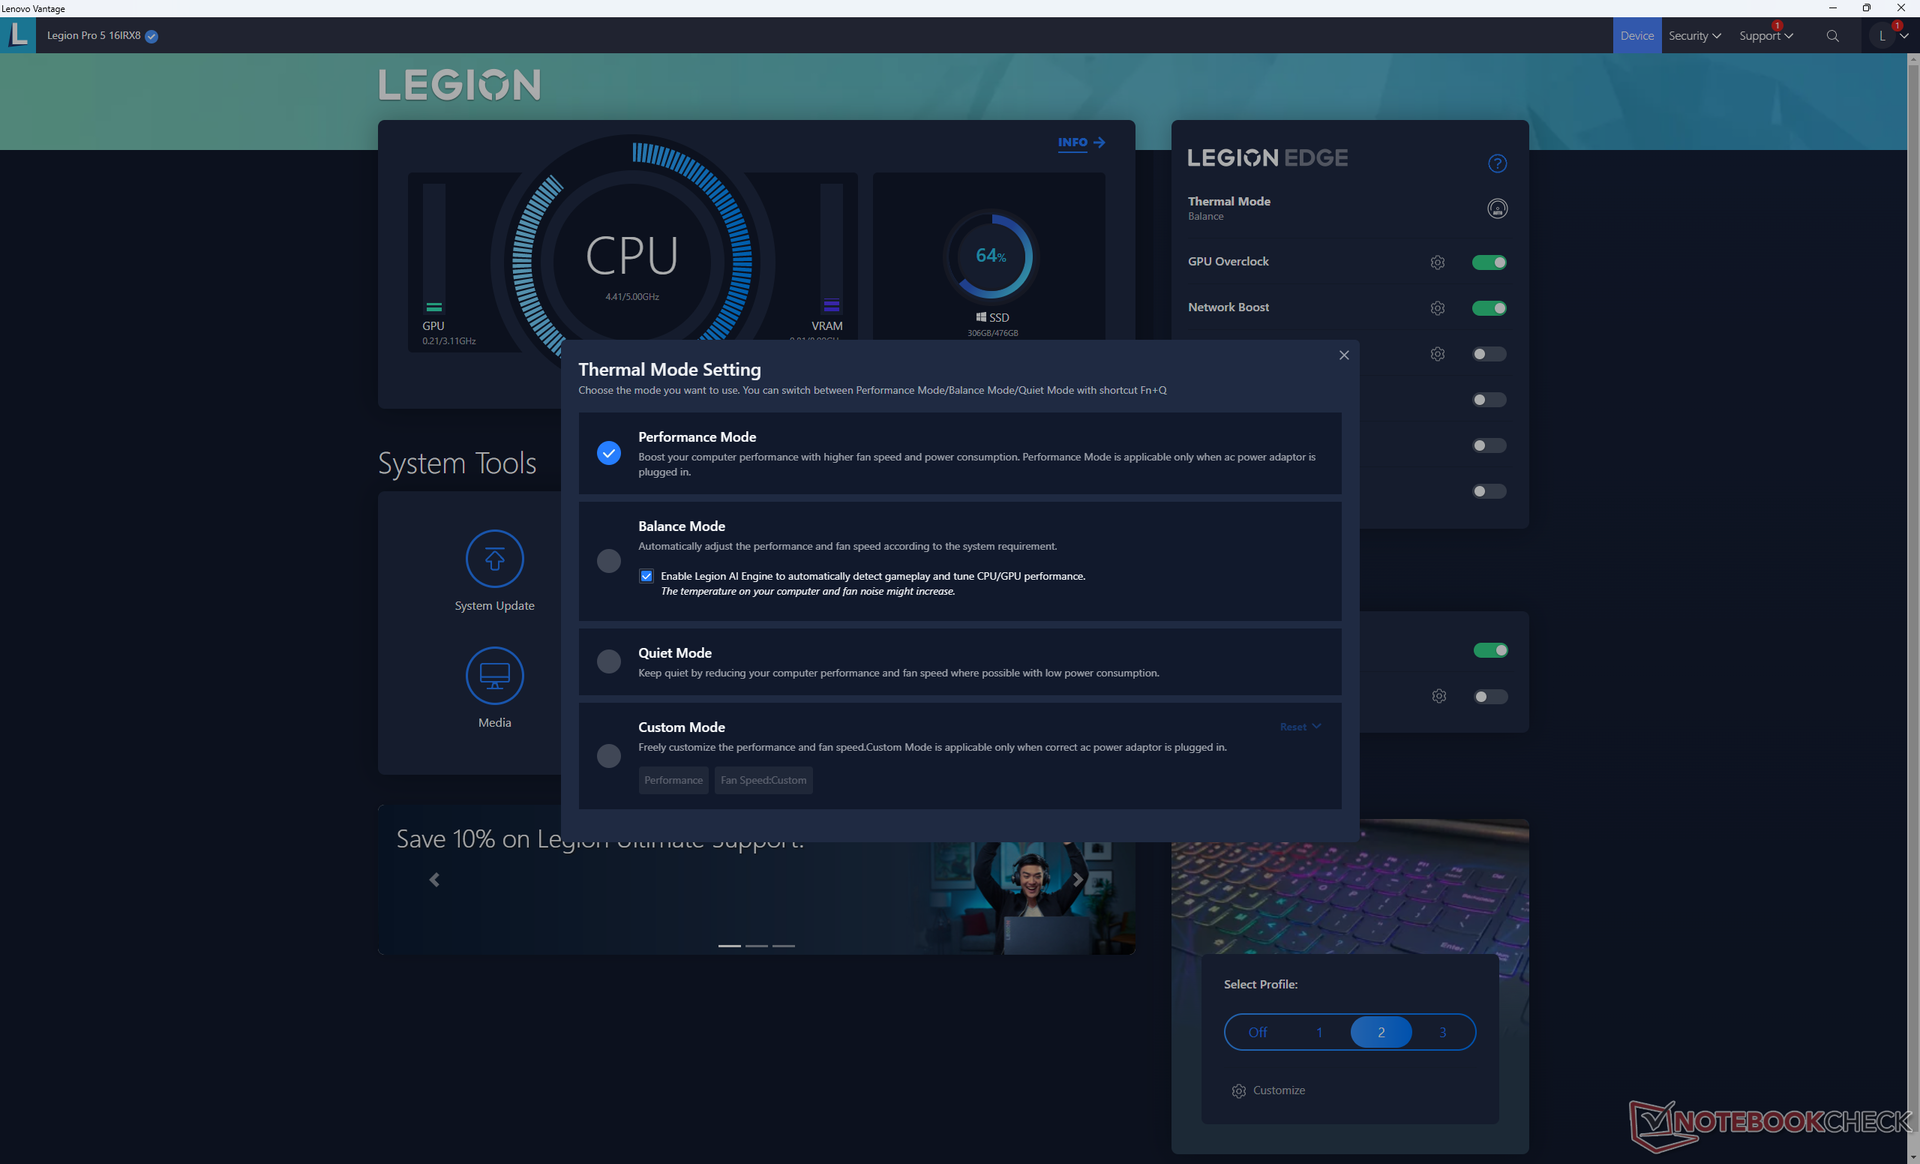
We set our test unit to Performance mode with GPU Overclock active and Hybrid mode off prior to running the benchmarks below. All of these settings are thankfully easily accessible via the Lenovo Vantage home screen.
Note that while MUX is supported for switching between Optimus and discrete GPU mode only, a system reboot would always be required. Advanced Optimus is therefore not supported. G-Sync for the internal display only works when on dGPU mode.
Processor
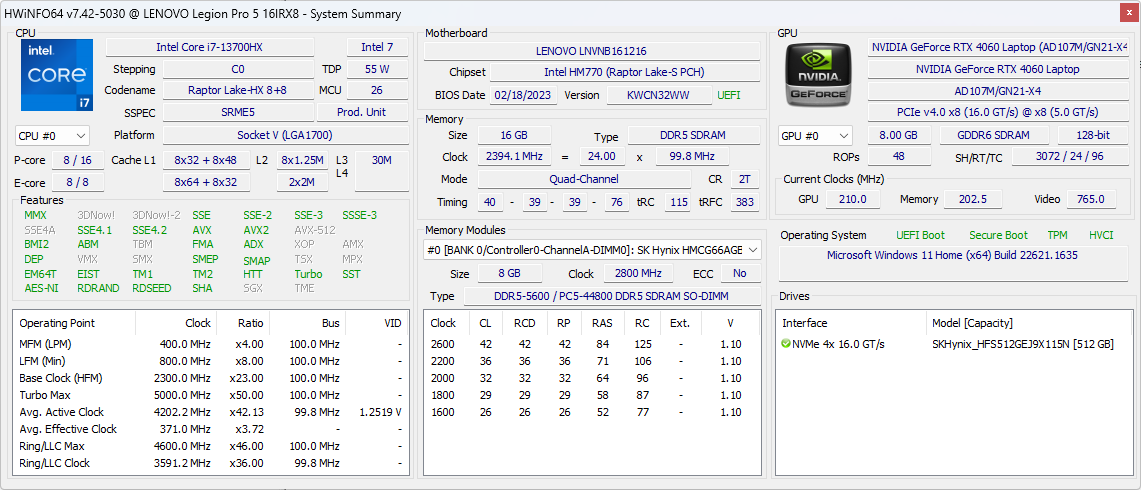
Our Core i7-13700HX is only about 5 to 15 percent faster in multi-threaded loads than the older Core i7-12700H that it replaces. The advantages are measurable albeit relatively minor. Overall performance is comparable to last year's Core i9-12900H.
Performance sustainability is excellent with no notable dips over time when running CineBench R15 xT in a loop.
Upgrading to the Core i9-13900HX SKU is expected to increase multi-thread performance significantly by 50 to 70 percent over the Core i7-13700HX. If you value processor performance, then it may be worth skipping the Core i5-13500H and Core i7-13700HX options for the Core i9.
Cinebench R15 Multi Loop
Cinebench R23: Multi Core | Single Core
Cinebench R20: CPU (Multi Core) | CPU (Single Core)
Cinebench R15: CPU Multi 64Bit | CPU Single 64Bit
Blender: v2.79 BMW27 CPU
7-Zip 18.03: 7z b 4 | 7z b 4 -mmt1
Geekbench 5.5: Multi-Core | Single-Core
HWBOT x265 Benchmark v2.2: 4k Preset
LibreOffice : 20 Documents To PDF
R Benchmark 2.5: Overall mean
* ... smaller is better
AIDA64: FP32 Ray-Trace | FPU Julia | CPU SHA3 | CPU Queen | FPU SinJulia | FPU Mandel | CPU AES | CPU ZLib | FP64 Ray-Trace | CPU PhotoWorxx
| Performance rating | |
| Lenovo Legion Pro 7 16IRX8H | |
| Razer Blade 16 Early 2023 | |
| Lenovo Legion Pro 5 16IRX8 | |
| Average Intel Core i7-13700HX | |
| Lenovo Legion 5 Pro 16ARH7H RTX 3070 Ti | |
| Lenovo Legion S7 16ARHA7 | |
| Asus ROG Zephyrus M16 GU603Z | |
System Performance
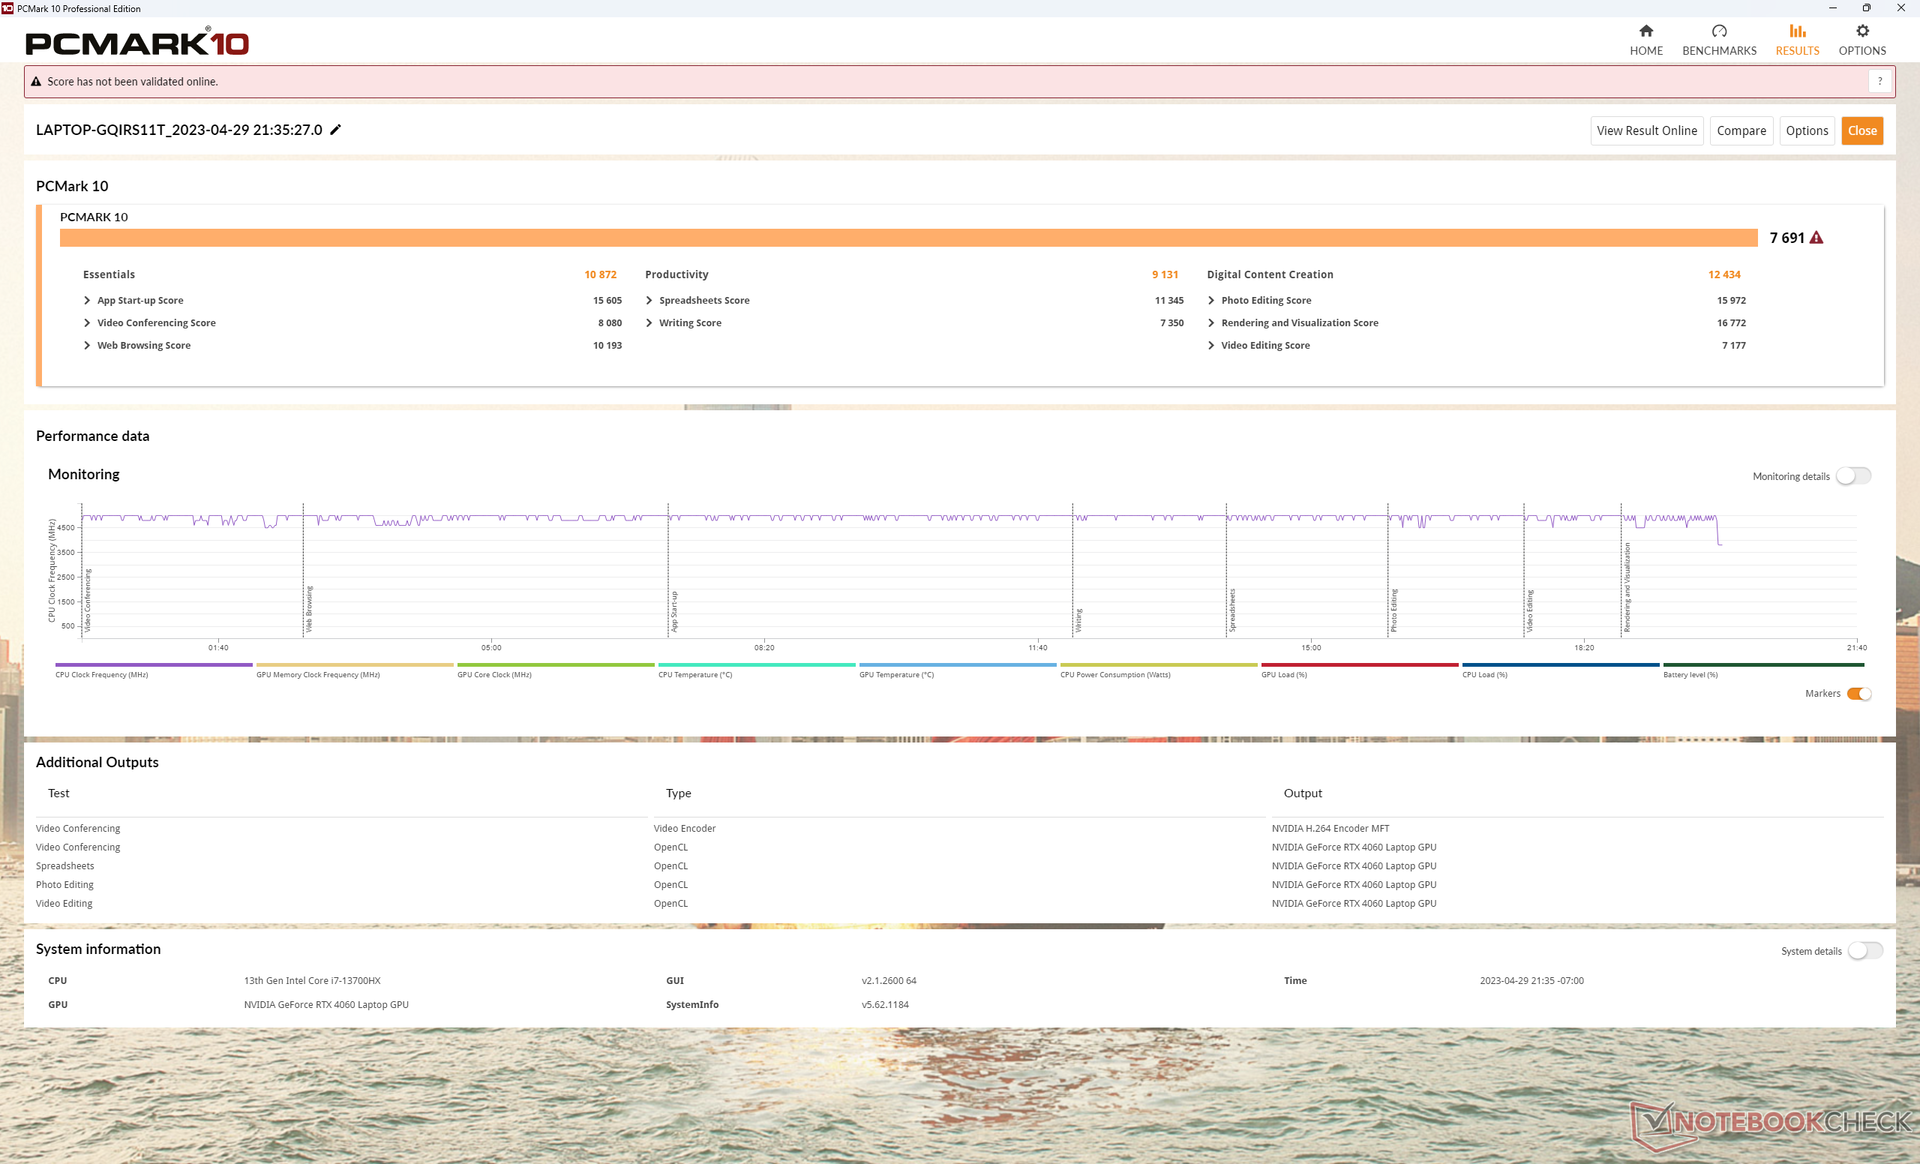
PCMark results are comparable to other Legion models like the 2022 Legion 5 Pro 16 despite the newer generational processors in our 2023 unit. This suggests that while the CPU and GPU may be faster this time around, they won't necessarily run day-to-day applications like office work or browsers noticeably faster than a gaming laptop from yesteryear.
CrossMark: Overall | Productivity | Creativity | Responsiveness
| PCMark 10 / Score | |
| Razer Blade 16 Early 2023 | |
| Asus ROG Zephyrus M16 GU603Z | |
| Lenovo Legion Pro 7 16IRX8H | |
| Lenovo Legion Pro 5 16IRX8 | |
| Lenovo Legion S7 16ARHA7 | |
| Lenovo Legion 5 Pro 16ARH7H RTX 3070 Ti | |
| Average Intel Core i7-13700HX, NVIDIA GeForce RTX 4060 Laptop GPU (6909 - 7743, n=5) | |
| PCMark 10 / Essentials | |
| Lenovo Legion Pro 7 16IRX8H | |
| Razer Blade 16 Early 2023 | |
| Asus ROG Zephyrus M16 GU603Z | |
| Lenovo Legion Pro 5 16IRX8 | |
| Lenovo Legion S7 16ARHA7 | |
| Average Intel Core i7-13700HX, NVIDIA GeForce RTX 4060 Laptop GPU (9760 - 11313, n=5) | |
| Lenovo Legion 5 Pro 16ARH7H RTX 3070 Ti | |
| PCMark 10 / Productivity | |
| Lenovo Legion Pro 7 16IRX8H | |
| Asus ROG Zephyrus M16 GU603Z | |
| Lenovo Legion S7 16ARHA7 | |
| Average Intel Core i7-13700HX, NVIDIA GeForce RTX 4060 Laptop GPU (9131 - 11018, n=5) | |
| Lenovo Legion 5 Pro 16ARH7H RTX 3070 Ti | |
| Lenovo Legion Pro 5 16IRX8 | |
| Razer Blade 16 Early 2023 | |
| PCMark 10 / Digital Content Creation | |
| Razer Blade 16 Early 2023 | |
| Lenovo Legion Pro 5 16IRX8 | |
| Asus ROG Zephyrus M16 GU603Z | |
| Lenovo Legion 5 Pro 16ARH7H RTX 3070 Ti | |
| Lenovo Legion S7 16ARHA7 | |
| Average Intel Core i7-13700HX, NVIDIA GeForce RTX 4060 Laptop GPU (9393 - 12434, n=5) | |
| Lenovo Legion Pro 7 16IRX8H | |
| CrossMark / Overall | |
| Asus ROG Zephyrus M16 GU603Z | |
| Average Intel Core i7-13700HX, NVIDIA GeForce RTX 4060 Laptop GPU (1663 - 2105, n=5) | |
| Lenovo Legion S7 16ARHA7 | |
| Lenovo Legion Pro 5 16IRX8 | |
| Lenovo Legion 5 Pro 16ARH7H RTX 3070 Ti | |
| Razer Blade 16 Early 2023 | |
| CrossMark / Productivity | |
| Asus ROG Zephyrus M16 GU603Z | |
| Average Intel Core i7-13700HX, NVIDIA GeForce RTX 4060 Laptop GPU (1618 - 1989, n=5) | |
| Lenovo Legion S7 16ARHA7 | |
| Lenovo Legion Pro 5 16IRX8 | |
| Lenovo Legion 5 Pro 16ARH7H RTX 3070 Ti | |
| Razer Blade 16 Early 2023 | |
| CrossMark / Creativity | |
| Average Intel Core i7-13700HX, NVIDIA GeForce RTX 4060 Laptop GPU (1710 - 2274, n=5) | |
| Asus ROG Zephyrus M16 GU603Z | |
| Lenovo Legion S7 16ARHA7 | |
| Razer Blade 16 Early 2023 | |
| Lenovo Legion 5 Pro 16ARH7H RTX 3070 Ti | |
| Lenovo Legion Pro 5 16IRX8 | |
| CrossMark / Responsiveness | |
| Asus ROG Zephyrus M16 GU603Z | |
| Average Intel Core i7-13700HX, NVIDIA GeForce RTX 4060 Laptop GPU (1269 - 1983, n=5) | |
| Lenovo Legion Pro 5 16IRX8 | |
| Lenovo Legion S7 16ARHA7 | |
| Lenovo Legion 5 Pro 16ARH7H RTX 3070 Ti | |
| Razer Blade 16 Early 2023 | |
| PCMark 10 Score | 7691 points | |
Help | ||
* ... smaller is better
DPC Latency
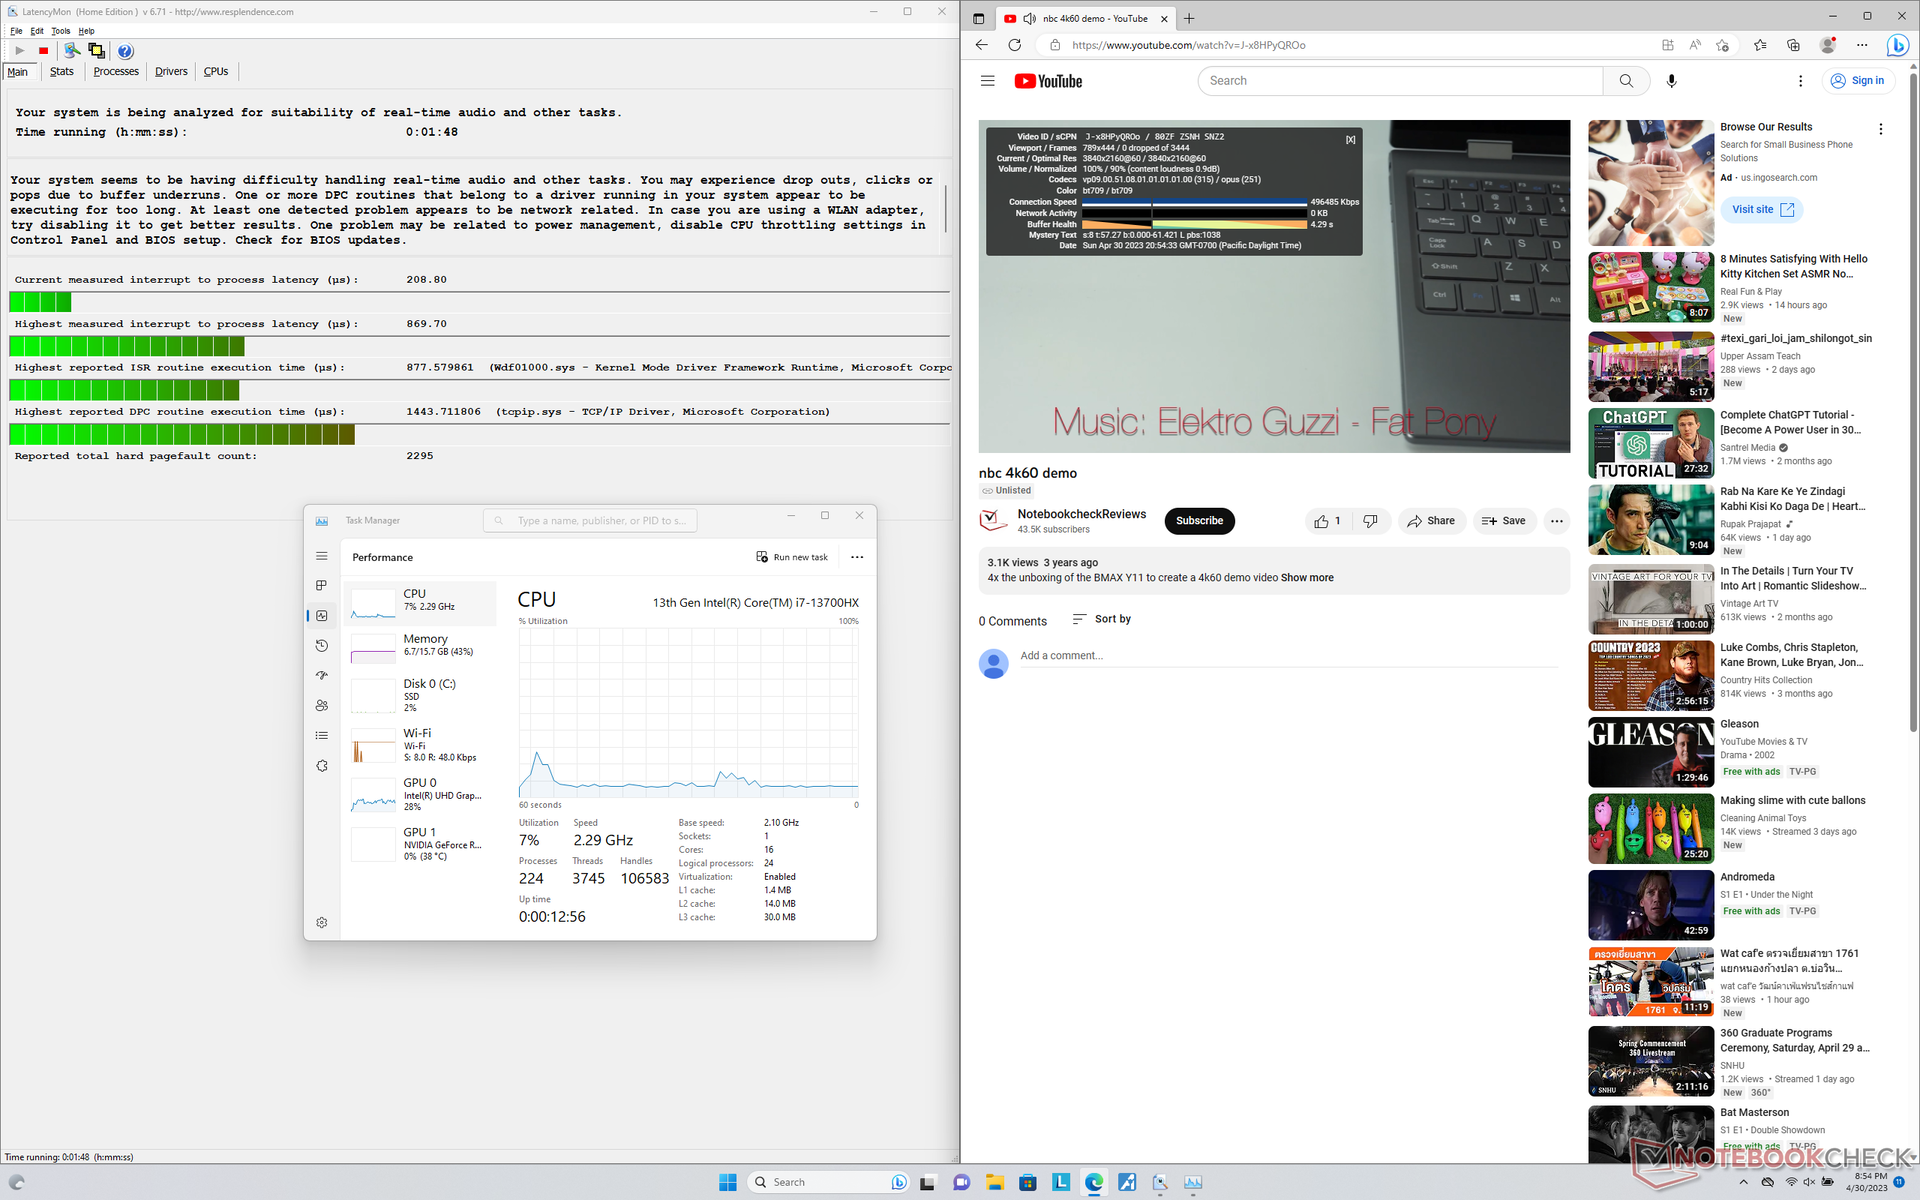
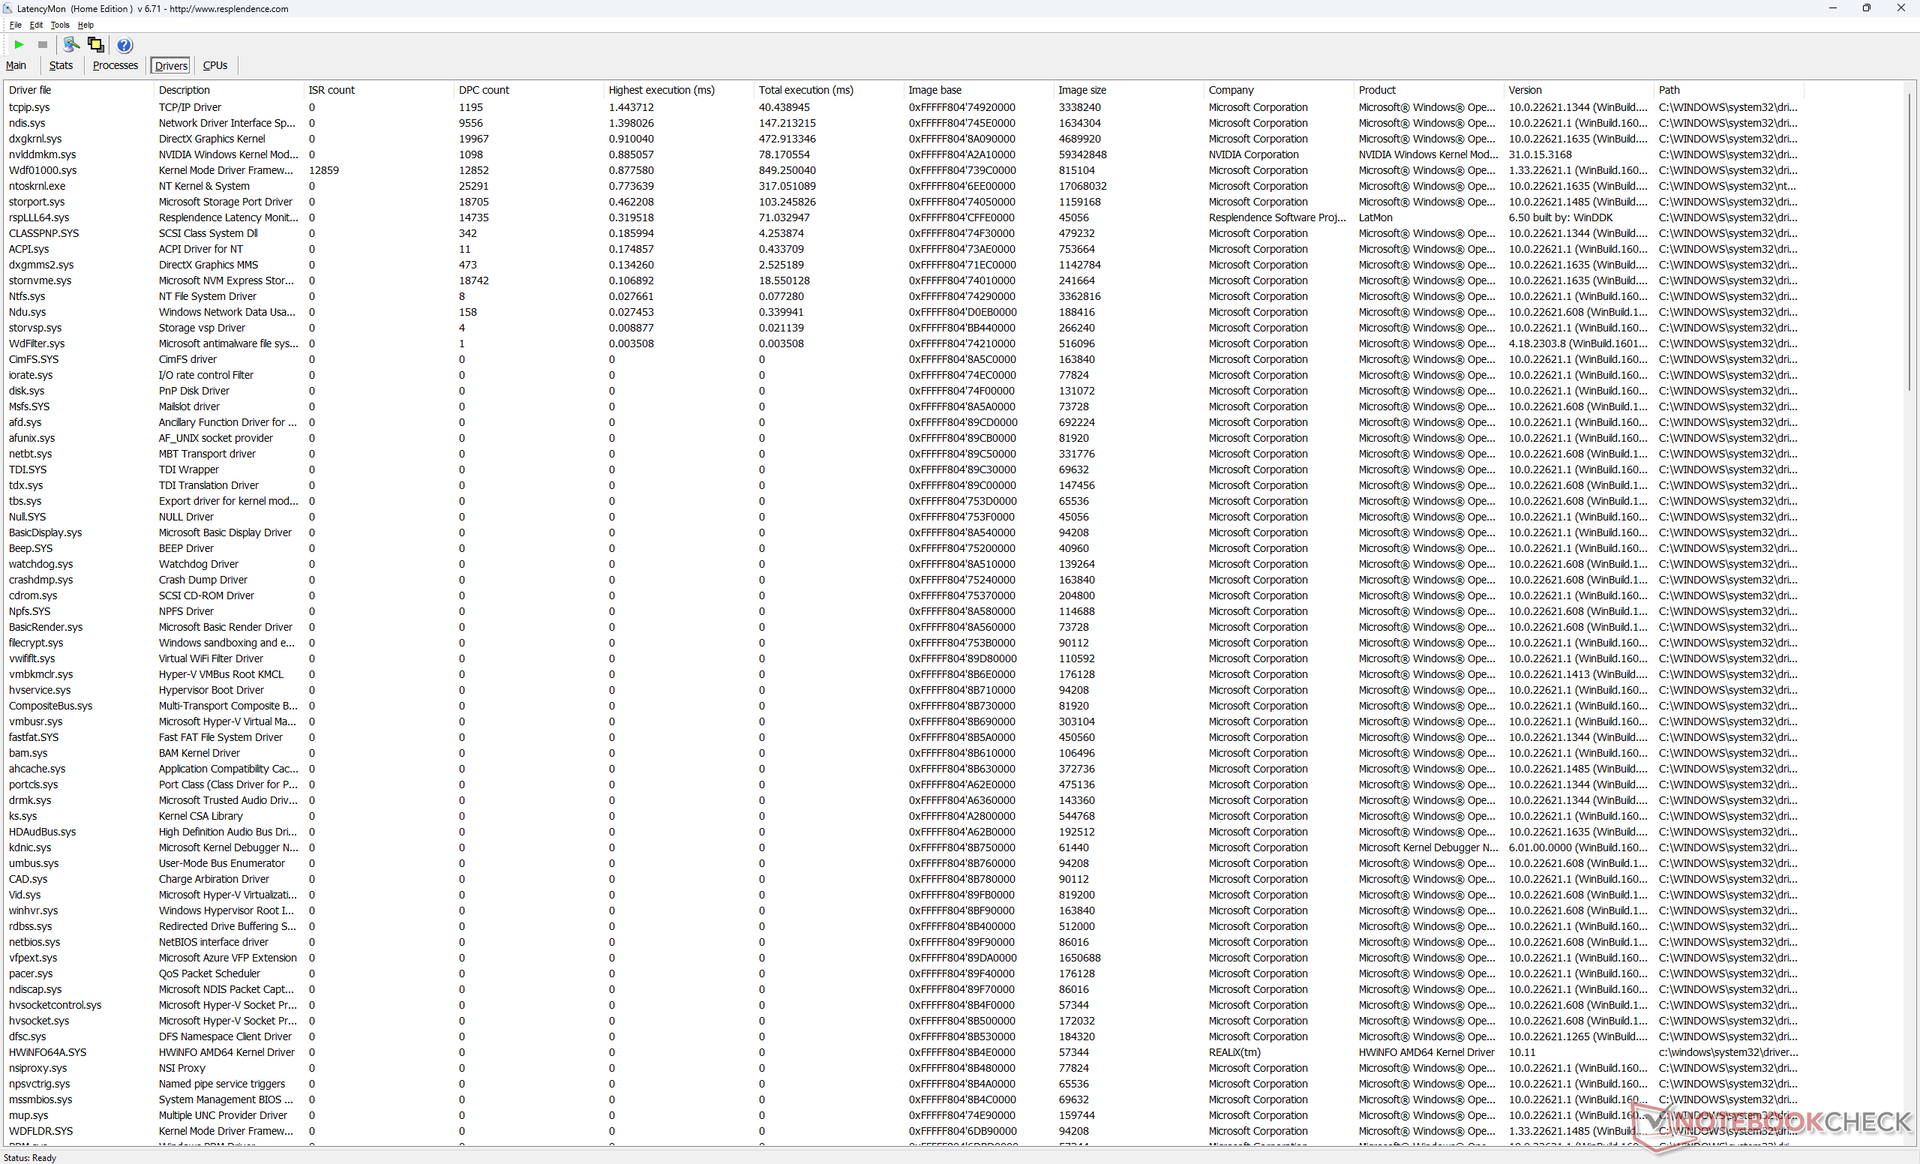
LatencyMon reveals minor DPC issues when opening multiple browser tabs of our homepage even when on iGPU mode. 4K video playback at 60 FPS is otherwise perfect with no dropped frames recorded.
| DPC Latencies / LatencyMon - interrupt to process latency (max), Web, Youtube, Prime95 | |
| Razer Blade 16 Early 2023 | |
| Asus ROG Zephyrus M16 GU603Z | |
| Lenovo Legion S7 16ARHA7 | |
| Lenovo Legion Pro 5 16IRX8 | |
| Lenovo Legion 5 Pro 16ARH7H RTX 3070 Ti | |
| Lenovo Legion Pro 7 16IRX8H | |
* ... smaller is better
Storage Devices — Up To Two PCIe4 x4 Drives
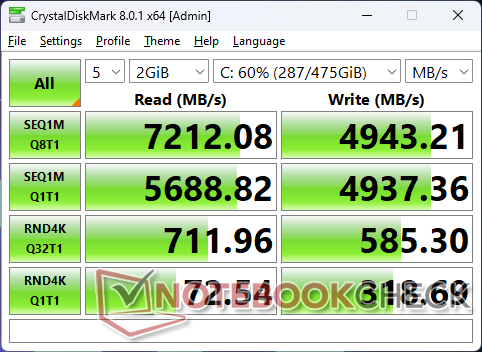
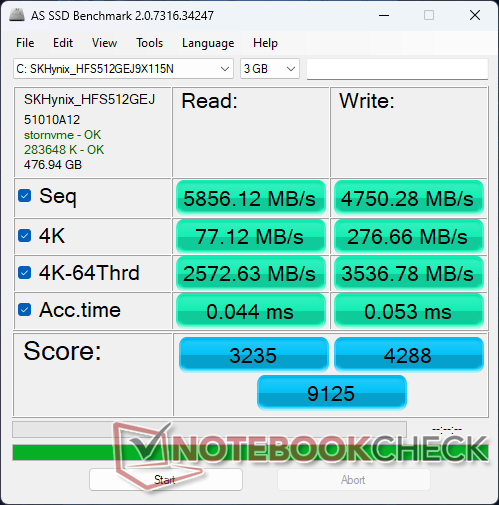
Our unit utilizes the same PCIe4 x4 512 GB SK Hynix drive as found on the Lenovo Legion S7 16. Performance is excellent with sequential read and write rates approaching 7200 MB/s and 5000 MB/s, respectively, rivaling the popular Samsung PM9A1. Even so, there's still room for improvement as transfer rates may periodically throttle to 6300 MB/s instead of maintaining a flat maximum of 7200 MB/s.

* ... smaller is better
Disk Throttling: DiskSpd Read Loop, Queue Depth 8
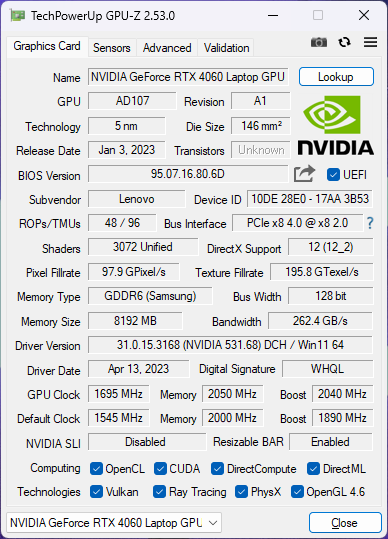
GPU Performance — GeForce RTX 4060
Graphics performance is 10 to 15 percent faster than the average laptop in our database with the same mobile GeForce RTX 4060 GPU. Thus, the Legion Pro 5 16 can be a good option for those who want to maximize graphics performance. The MSI Cyborg 15, for example, comes with the same GPU but it targets a much lower 45 W TGP for slower performance overall.
Last year's mobile RTX 3070 Ti is slightly faster than our mobile RTX 4060 by about 15 percent. Upgrading from an RTX 3060 laptop to our RTX 4060 will improve performance by about 20 to 25 percent which isn't bad for a midrange card. You'd have to play titles that support DLSS3 to better exploit the RTX 4060 as the feature is not available on GeForce 30 GPUs.
Upgrading to the RTX 4070 SKU will improve graphics performance by 15 to 20 percent over our RTX 4060. For RTX 4080 or RTX 4090 options, however, you'll have to consider the higher-end Legion 7 Pro series instead.
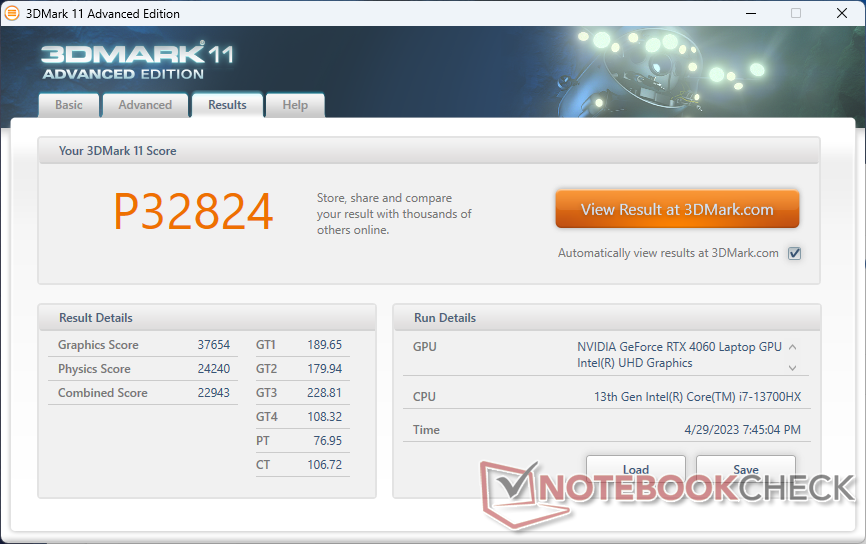
| 3DMark 11 Performance | 32824 points | |
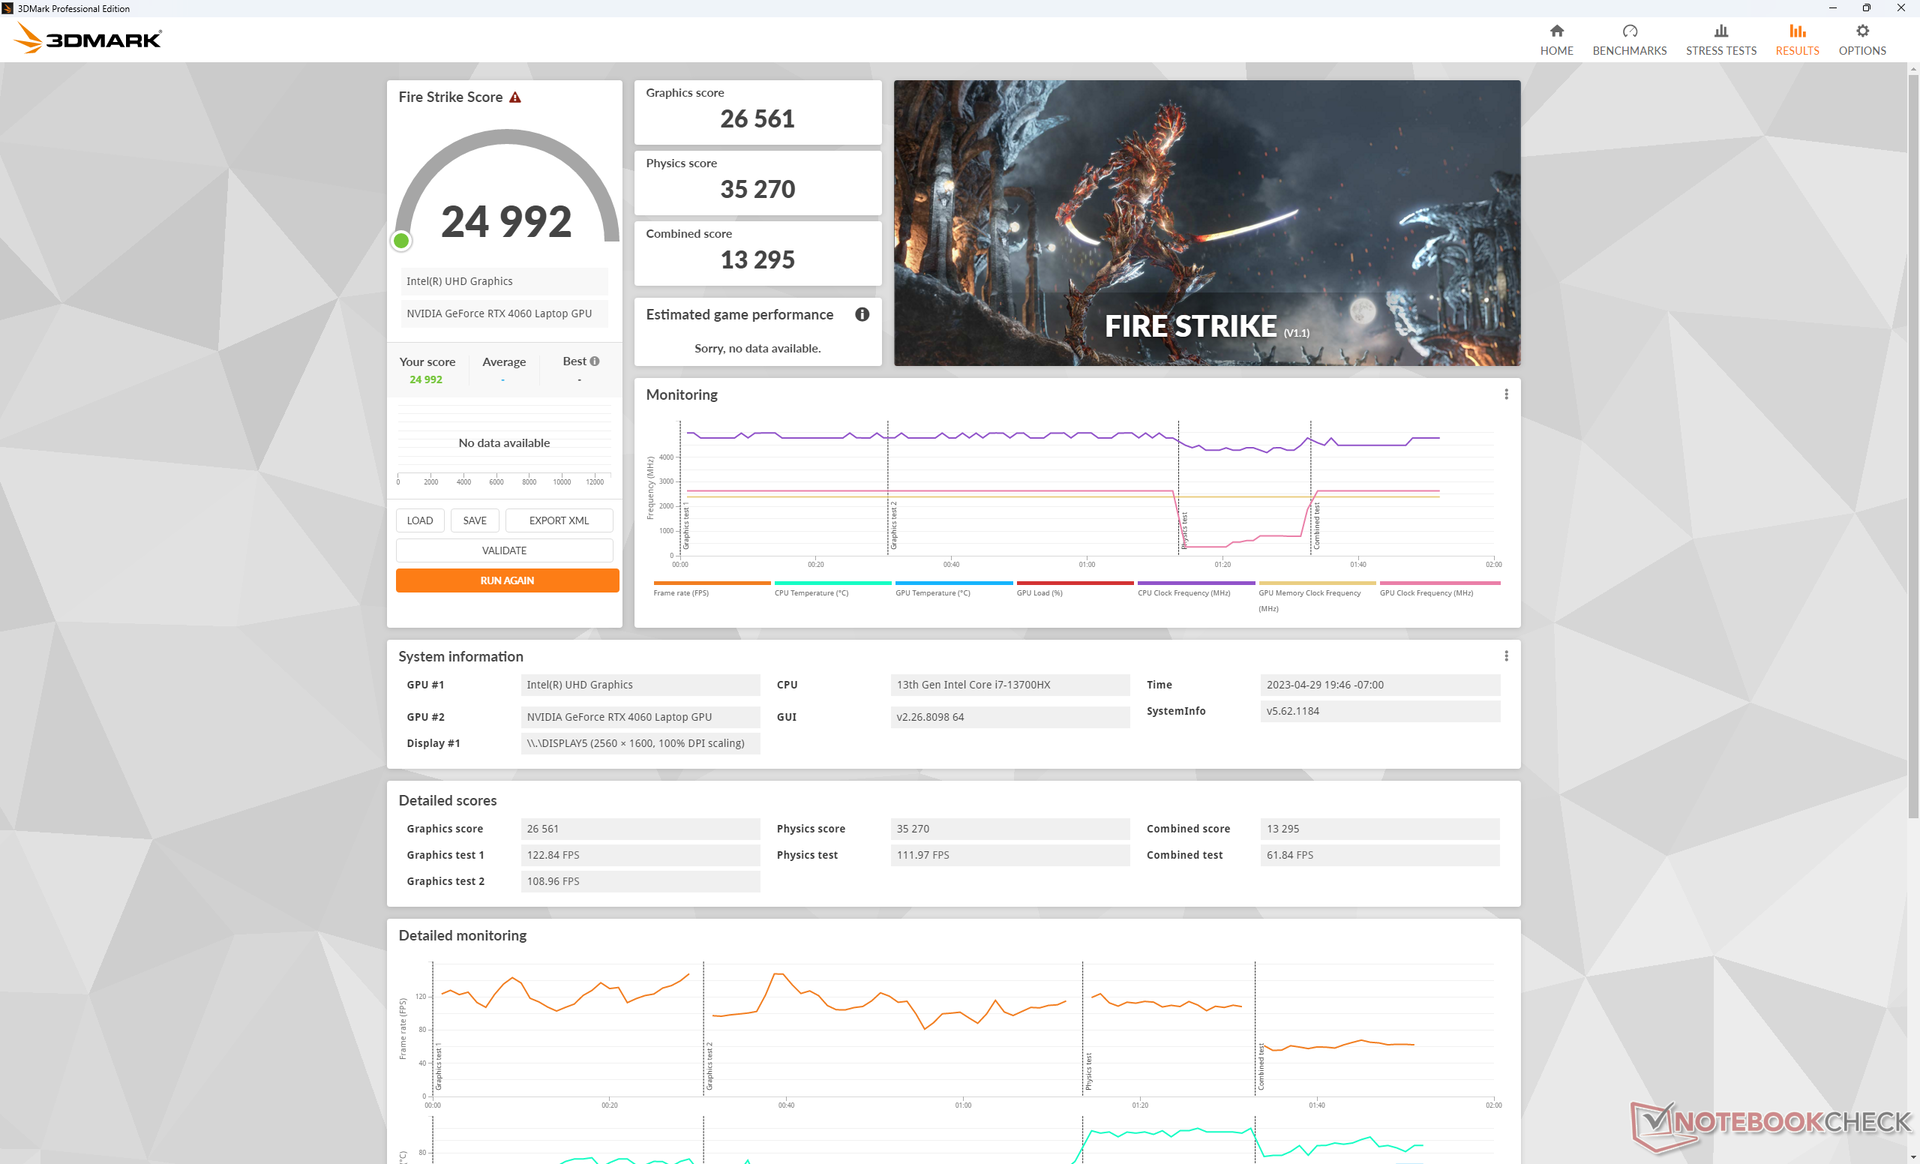
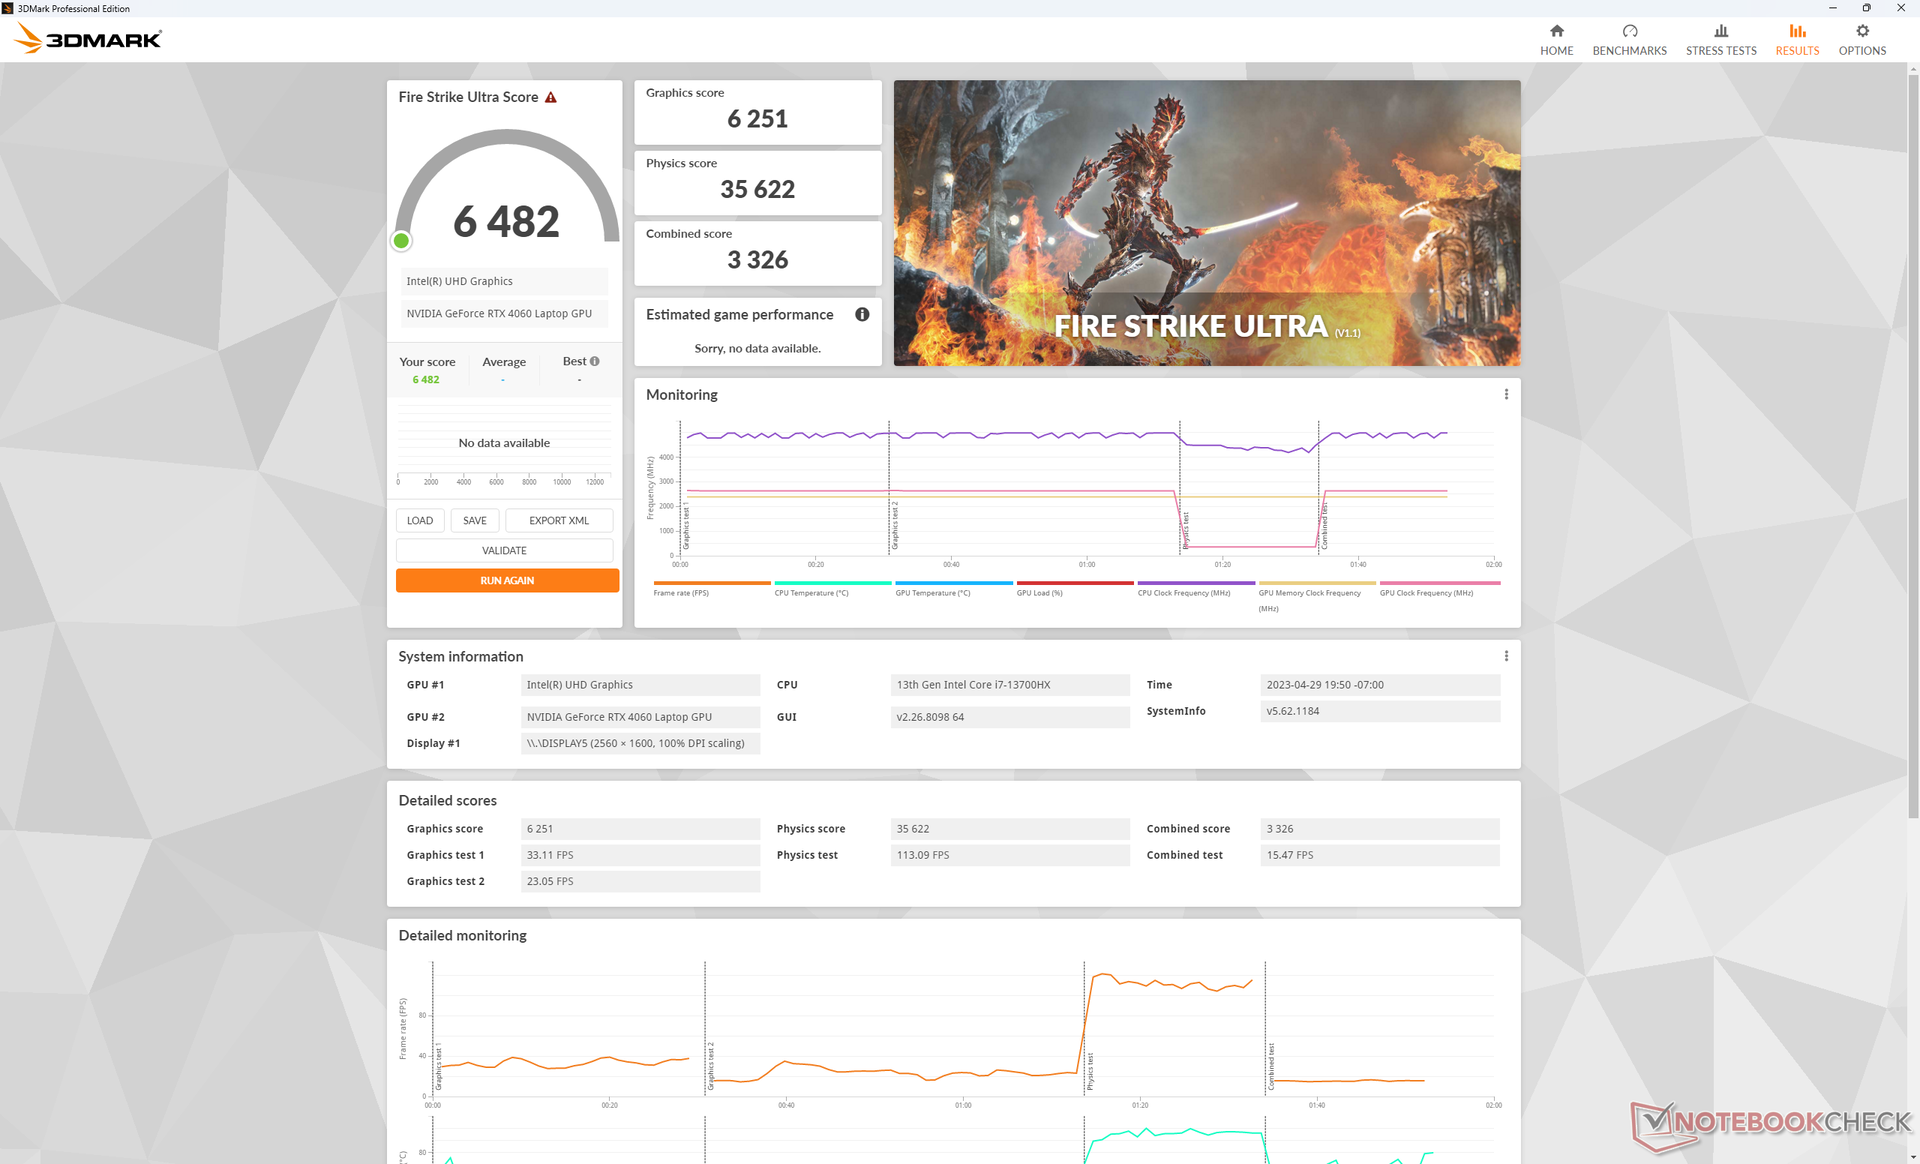
| 3DMark Fire Strike Score | 24992 points | |
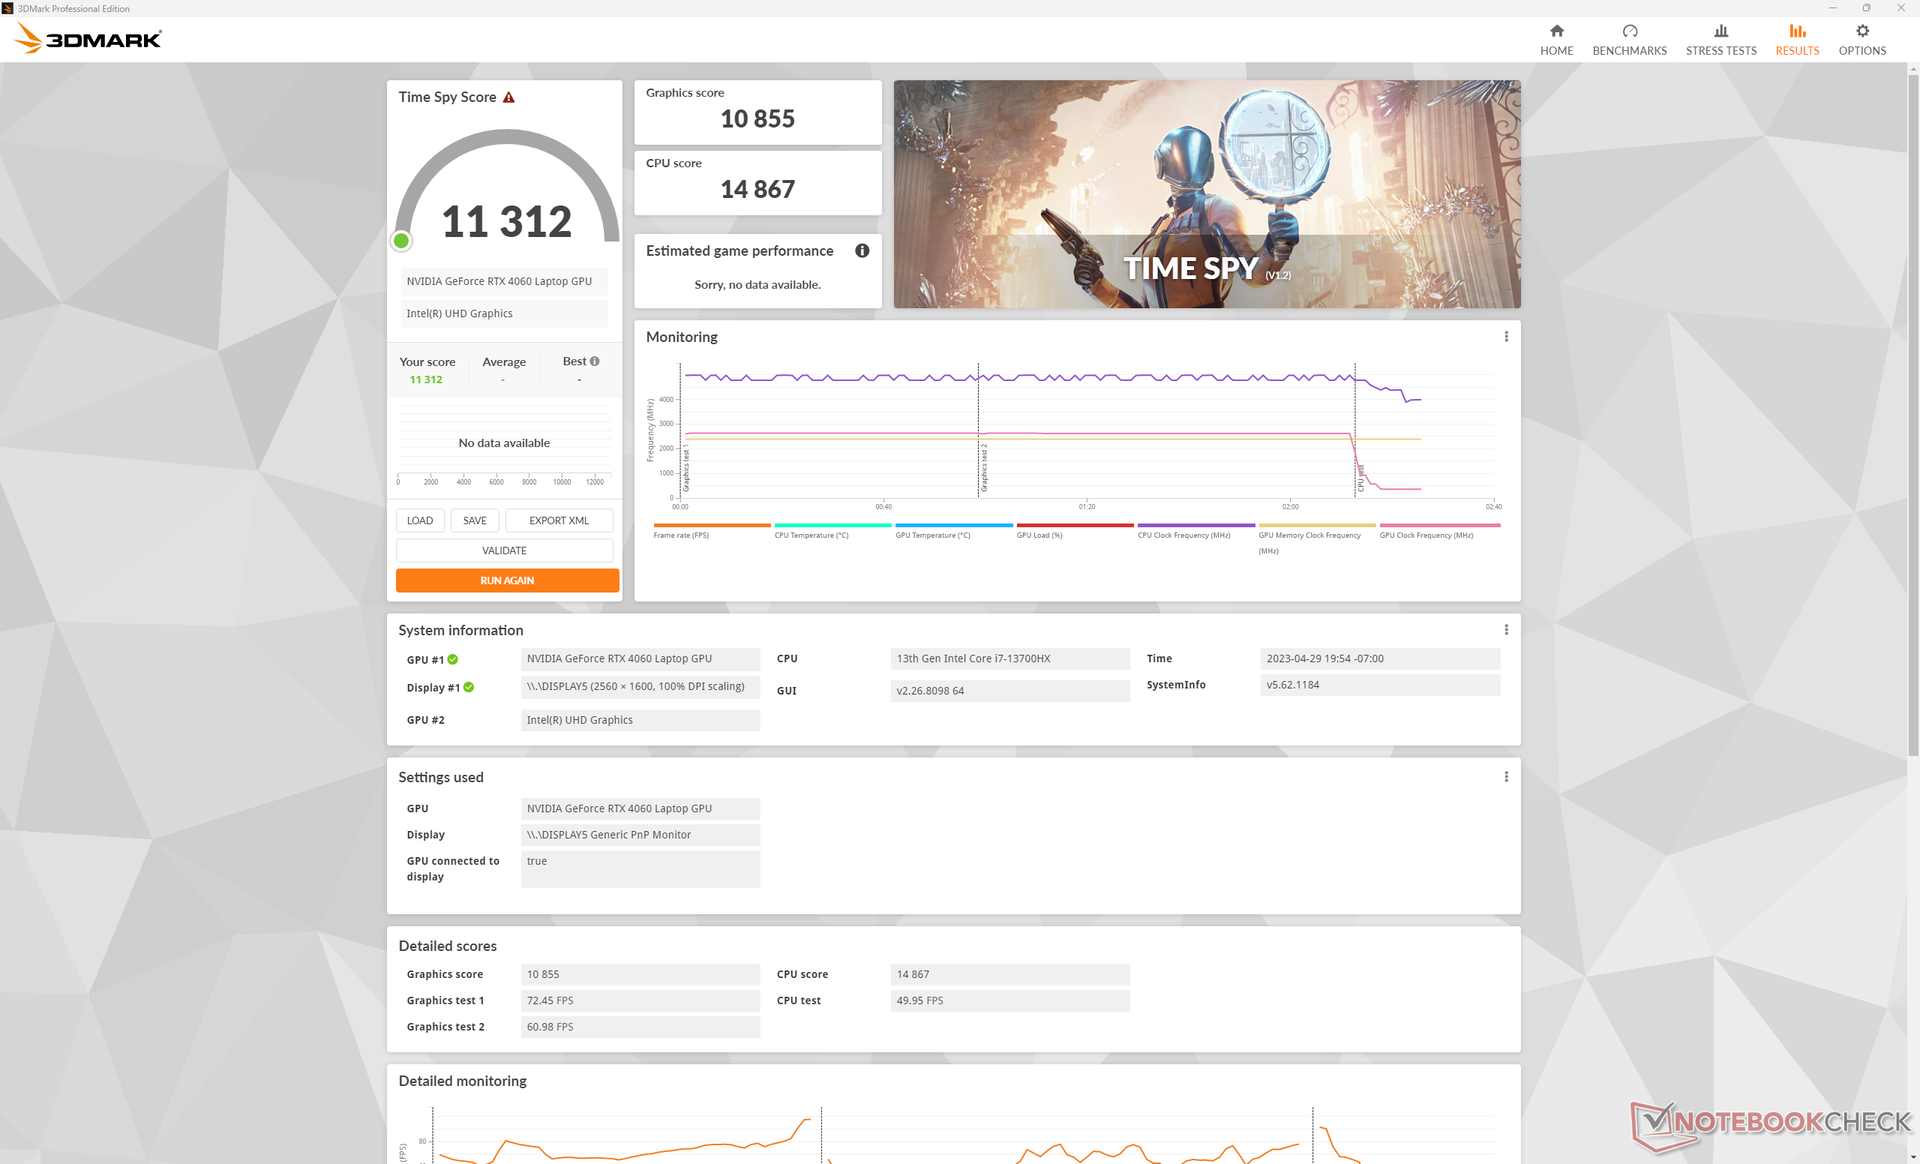
| 3DMark Time Spy Score | 11312 points | |
Help | ||
* ... smaller is better
Gaming Performance
Any current title can run well over 60 FPS at 1080p ultra settings. Running at the native QHD+ resolution, however, requires tuning down some settings especially for demanding titles like Returnal or F1 2022. Reaching a stable 165 FPS to match the 165 Hz refresh rate is difficult on most titles with the midrange RTX 3060. Instead, we recommend aiming for 50 to 100 FPS with G-Sync enabled to reduce screen tearing.
| Returnal | |
| 1920x1080 Low Preset | |
| Average NVIDIA GeForce RTX 4060 Laptop GPU (71 - 99, n=5) | |
| Lenovo Legion Pro 5 16IRX8 | |
| 1920x1080 Medium Preset | |
| Average NVIDIA GeForce RTX 4060 Laptop GPU (68 - 93, n=5) | |
| Lenovo Legion Pro 5 16IRX8 | |
| 1920x1080 High Preset | |
| Lenovo Legion Pro 5 16IRX8 | |
| Average NVIDIA GeForce RTX 4060 Laptop GPU (63 - 87, n=6) | |
| 1920x1080 Epic Preset | |
| Lenovo Legion Pro 5 16IRX8 | |
| Average NVIDIA GeForce RTX 4060 Laptop GPU (57 - 75, n=6) | |
| 2560x1440 Epic Preset | |
| Average NVIDIA GeForce RTX 4060 Laptop GPU (39 - 59.4, n=5) | |
| Lenovo Legion Pro 5 16IRX8 | |
| 3840x2160 Epic Preset | |
| Average NVIDIA GeForce RTX 4060 Laptop GPU (25 - 29, n=2) | |
| Lenovo Legion Pro 5 16IRX8 | |
Witcher 3 FPS Chart
| low | med. | high | ultra | QHD | 4K | |
|---|---|---|---|---|---|---|
| GTA V (2015) | 186.7 | 184 | 178.9 | 119.6 | 88.9 | 85.5 |
| The Witcher 3 (2015) | 521.8 | 369.3 | 215.8 | 107.6 | 67.2 | |
| Dota 2 Reborn (2015) | 196.6 | 176.5 | 170.3 | 161.8 | 142.9 | |
| Final Fantasy XV Benchmark (2018) | 222 | 161.2 | 109.8 | 79.4 | 45.4 | |
| X-Plane 11.11 (2018) | 177.4 | 156.3 | 121.9 | 104.4 | ||
| Cyberpunk 2077 1.6 (2022) | 150.7 | 136.6 | 106 | 87.4 | 51.7 | 22.9 |
| Tiny Tina's Wonderlands (2022) | 234.6 | 192.3 | 121.2 | 92.7 | 64.2 | 33.6 |
| F1 22 (2022) | 276 | 274 | 208 | 70.1 | 44.8 | 21.5 |
| Returnal (2023) | 81 | 79 | 75 | 70 | 48 | 25 |
Emissions
System Noise — Steady Fan RPM Behavior
Fan noise during low loads like browsing or video streaming tends to stabilize at 26.6 dB(A) against a silent background of 23 dB(A). It's loud enough to be audible, but not distractingly so. The fans are thankfully stable in RPM and do not pulse frequently in this state even when on Performance mode.
Fan noise when running Witcher 3 on Performance would stabilize at 47.6 dB(A) compared to 55 dB(A) each on last year's Legion Pro 5 16 with RTX 3070 Ti graphics and this year's Legion Pro 7. If the CPU and GPU are stressed significantly more such as with benchmarks or with very demanding games, however, our Legion Pro 5 16 can reach the same 55 dB(A) maximum.
Gaming on Balanced mode is slightly quieter at 46 dB(A) versus the 47.6 dB(A) noted above. The difference is so minor that there's little reason to be on Balanced mode in most gaming scenarios..
Noise level
| Idle |
| 23.1 / 23.1 / 26.6 dB(A) |
| Load |
| 34.7 / 54.8 dB(A) |
 | ||
30 dB silent 40 dB(A) audible 50 dB(A) loud |
||
min: | ||
| Lenovo Legion Pro 5 16IRX8 GeForce RTX 4060 Laptop GPU, i7-13700HX, SK hynix PC801 HFS512GEJ9X115N | Asus ROG Zephyrus M16 GU603Z GeForce RTX 3070 Ti Laptop GPU, i9-12900H, Micron 3400 1TB MTFDKBA1T0TFH | Razer Blade 16 Early 2023 GeForce RTX 4080 Laptop GPU, i9-13950HX, SSSTC CA6-8D1024 | Lenovo Legion Pro 7 16IRX8H GeForce RTX 4080 Laptop GPU, i9-13900HX, Samsung PM9A1 MZVL21T0HCLR | Lenovo Legion 5 Pro 16ARH7H RTX 3070 Ti GeForce RTX 3070 Ti Laptop GPU, R7 6800H, Samsung PM9A1 MZVL21T0HCLR | Lenovo Legion S7 16ARHA7 Radeon RX 6800S, R9 6900HX, SK Hynix HFS001TEJ9X115N | |
|---|---|---|---|---|---|---|
| Noise | -16% | -0% | -17% | -12% | 3% | |
| off / environment * (dB) | 23 | 23 -0% | 23 -0% | 24 -4% | 23.5 -2% | 23.1 -0% |
| Idle Minimum * (dB) | 23.1 | 23 -0% | 23 -0% | 26 -13% | 23.7 -3% | 23.1 -0% |
| Idle Average * (dB) | 23.1 | 24 -4% | 23 -0% | 28 -21% | 31.1 -35% | 23.1 -0% |
| Idle Maximum * (dB) | 26.6 | 47 -77% | 23.6 11% | 34 -28% | 32.2 -21% | 23.1 13% |
| Load Average * (dB) | 34.7 | 47.91 -38% | 39 -12% | 47 -35% | 38.4 -11% | 31.4 10% |
| Witcher 3 ultra * (dB) | 47.6 | 48.91 -3% | 51.6 -8% | 55 -16% | 54.8 -15% | 51.4 -8% |
| Load Maximum * (dB) | 54.8 | 50.25 8% | 51.3 6% | 56 -2% | 54.8 -0% | 51.2 7% |
* ... smaller is better
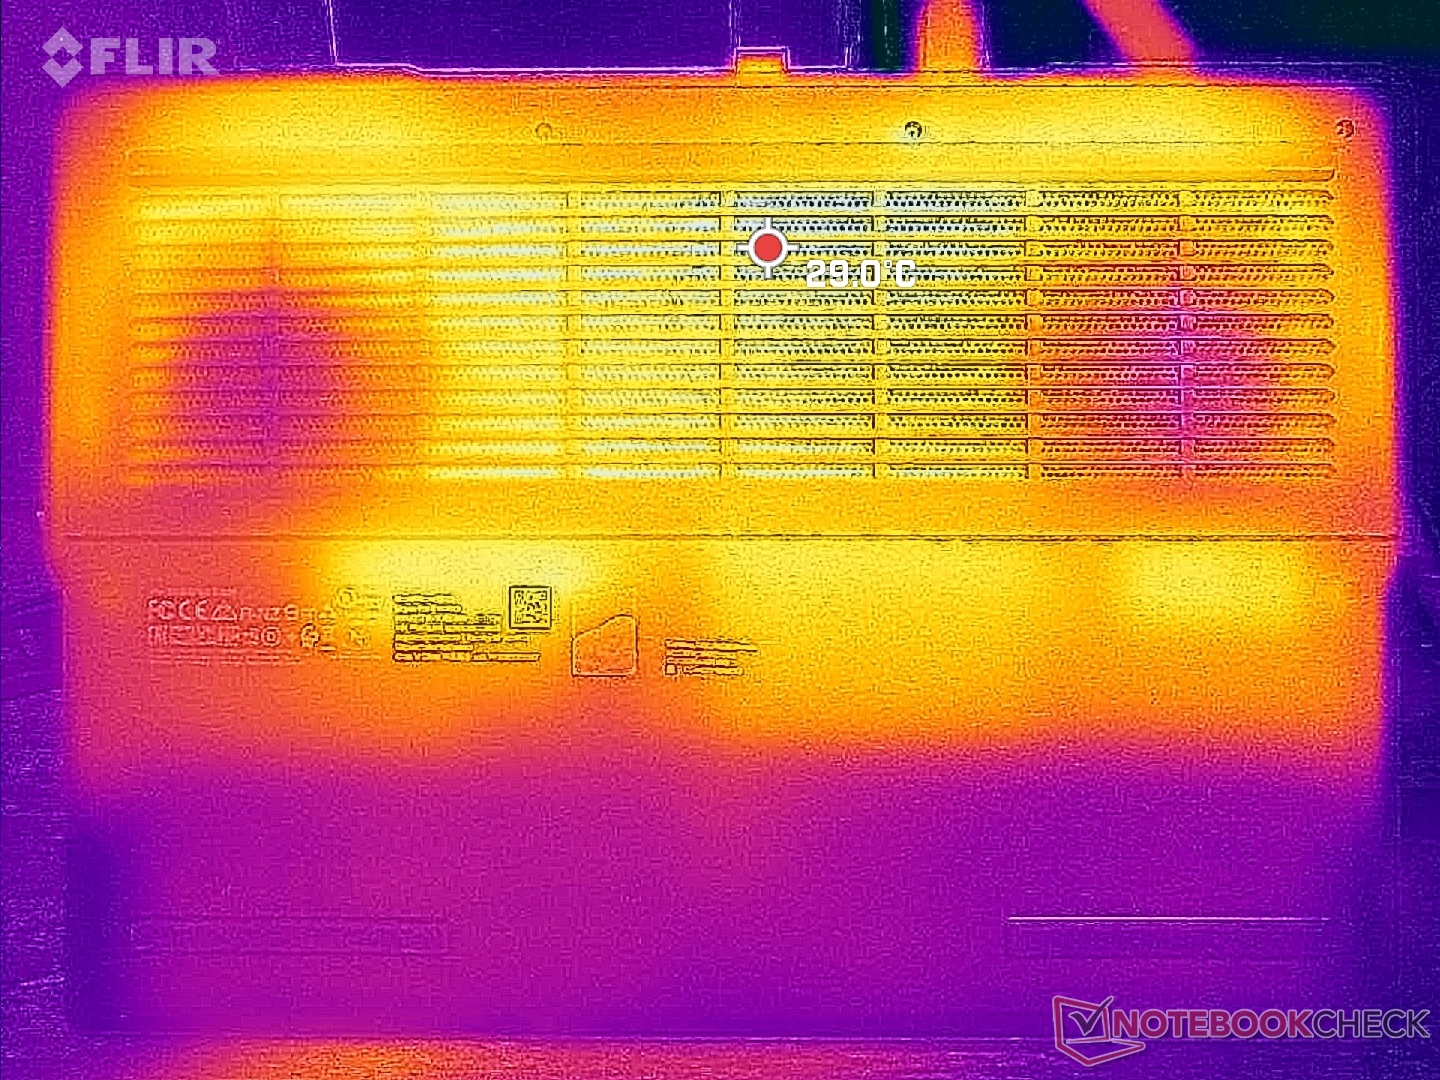
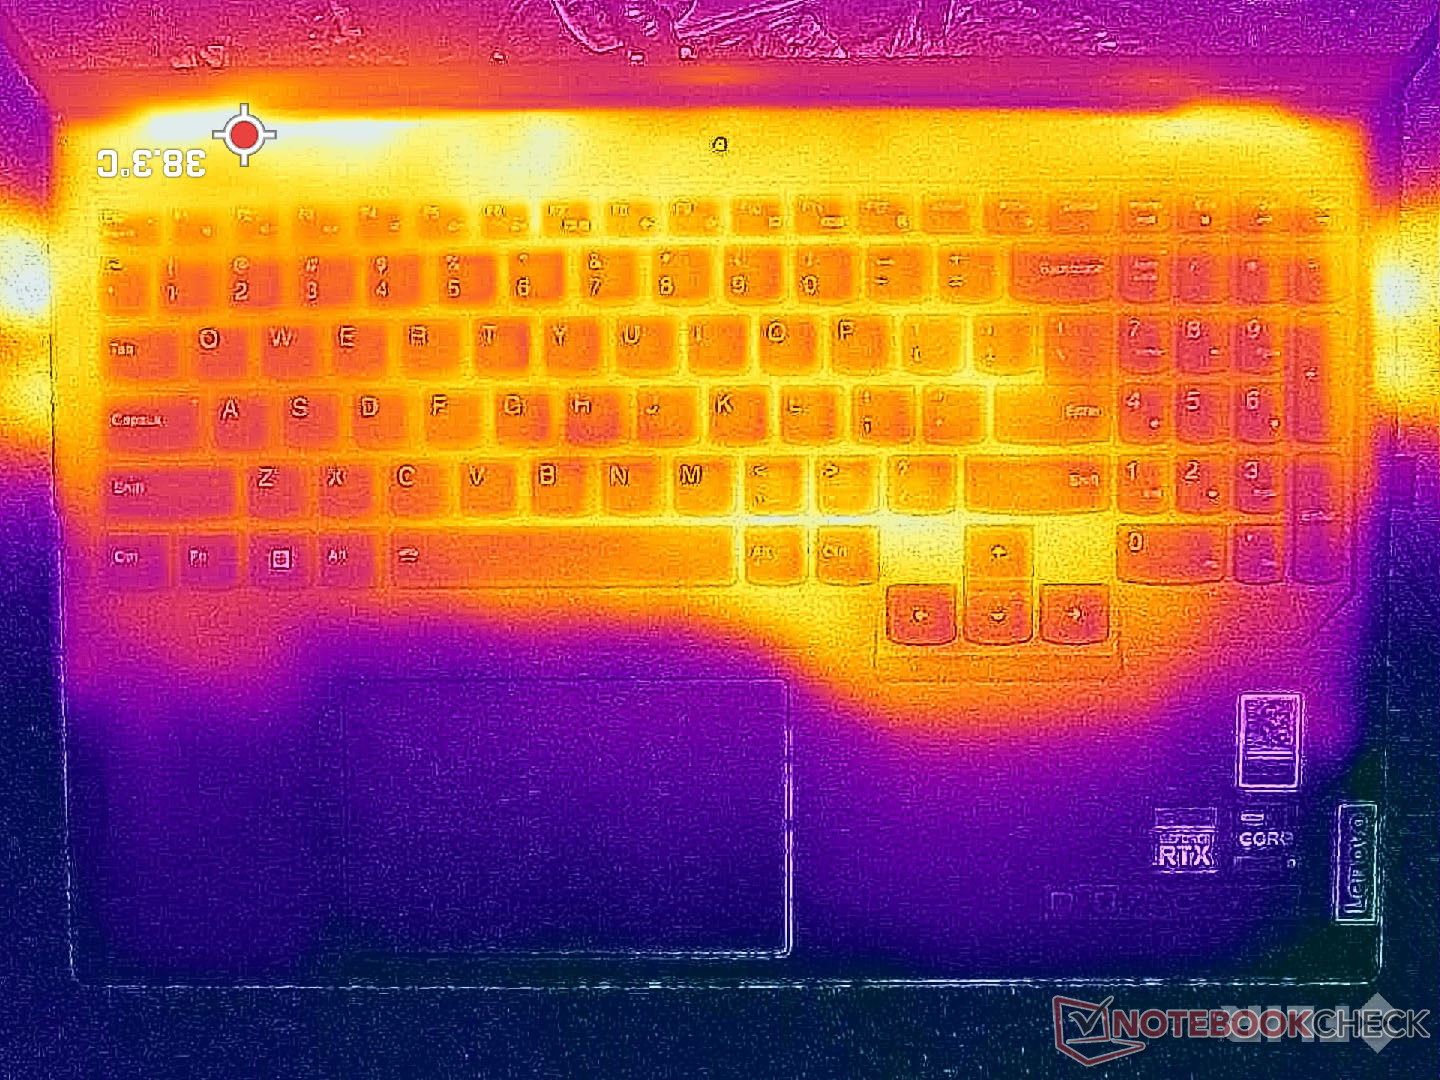
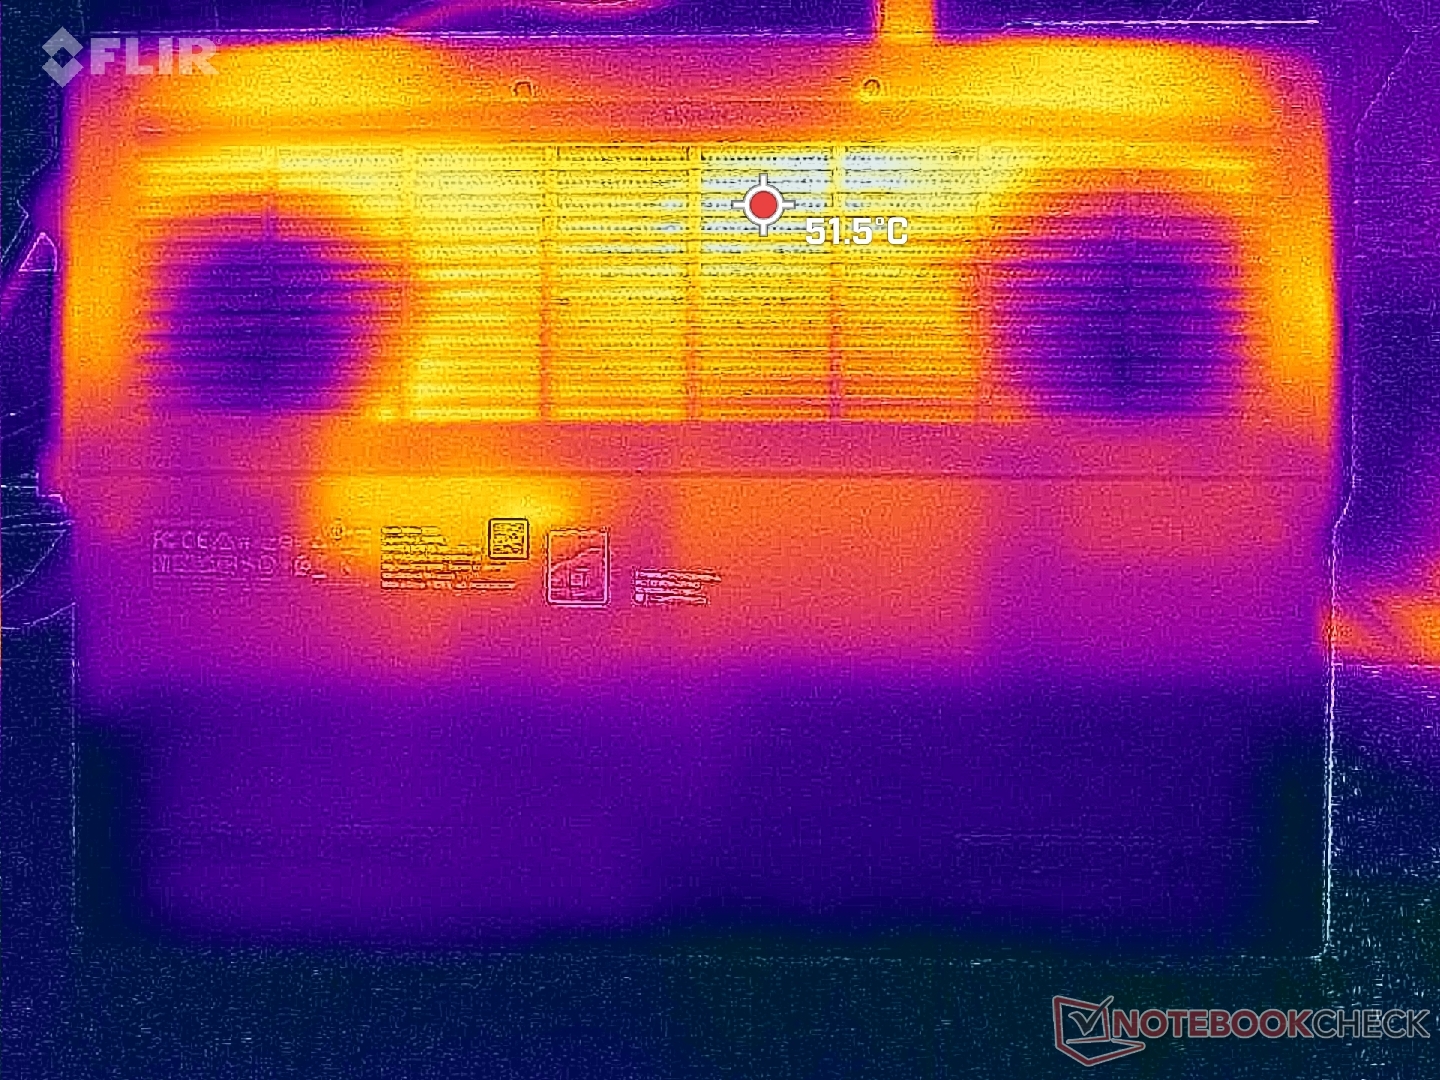
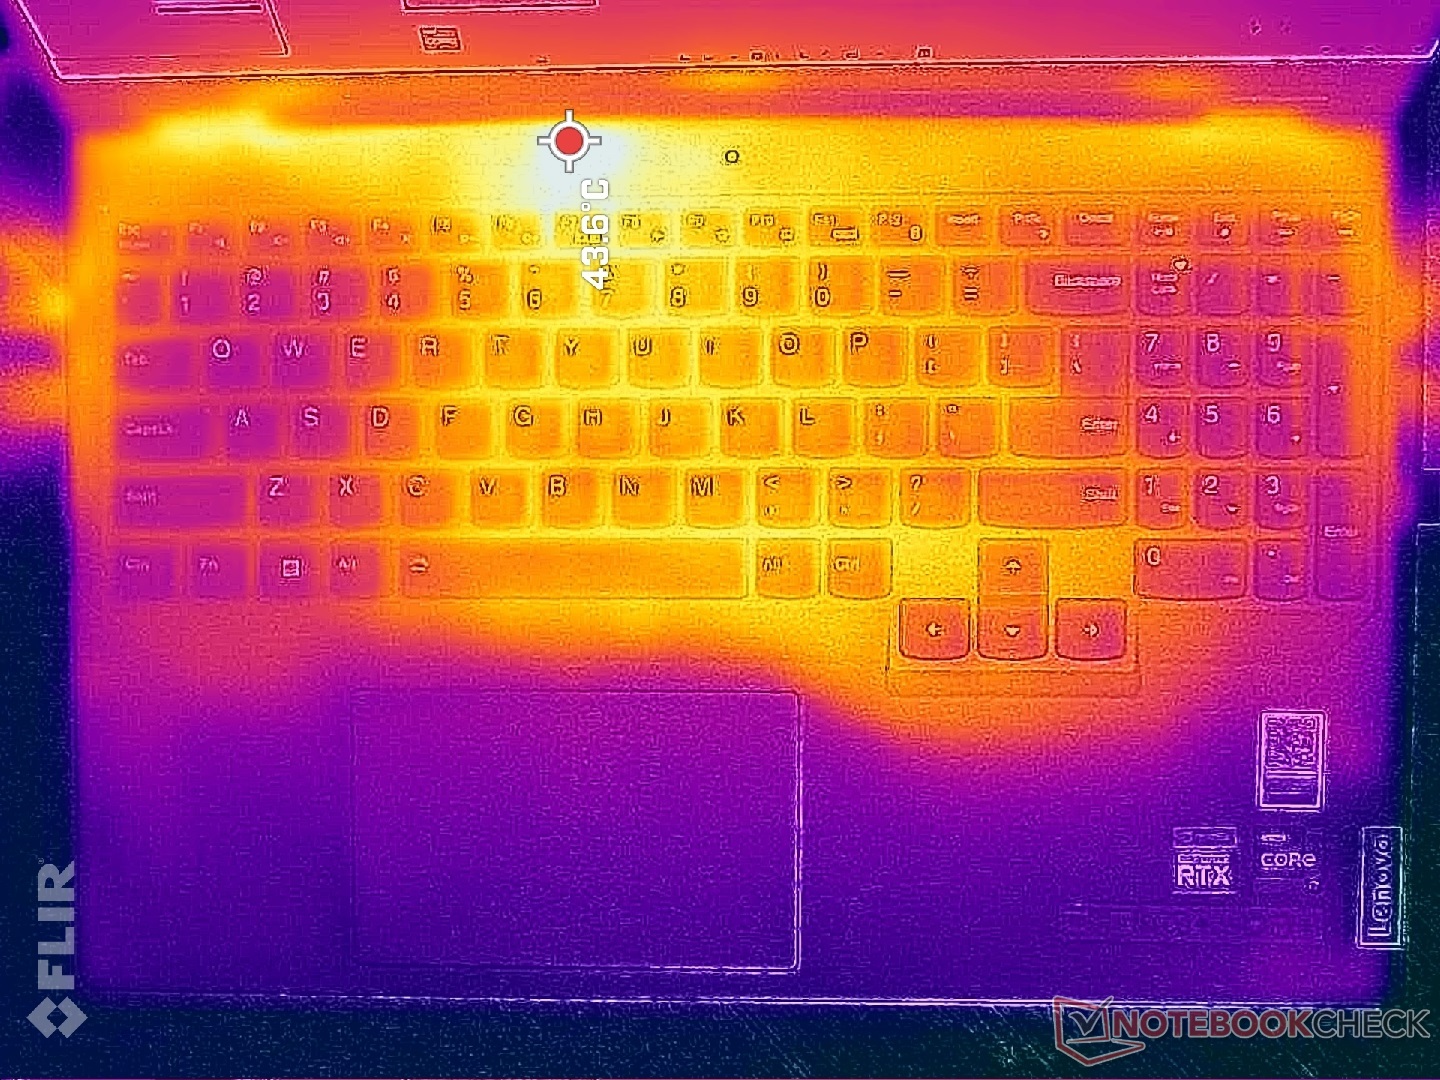
Temperature — Cool Palm Rests
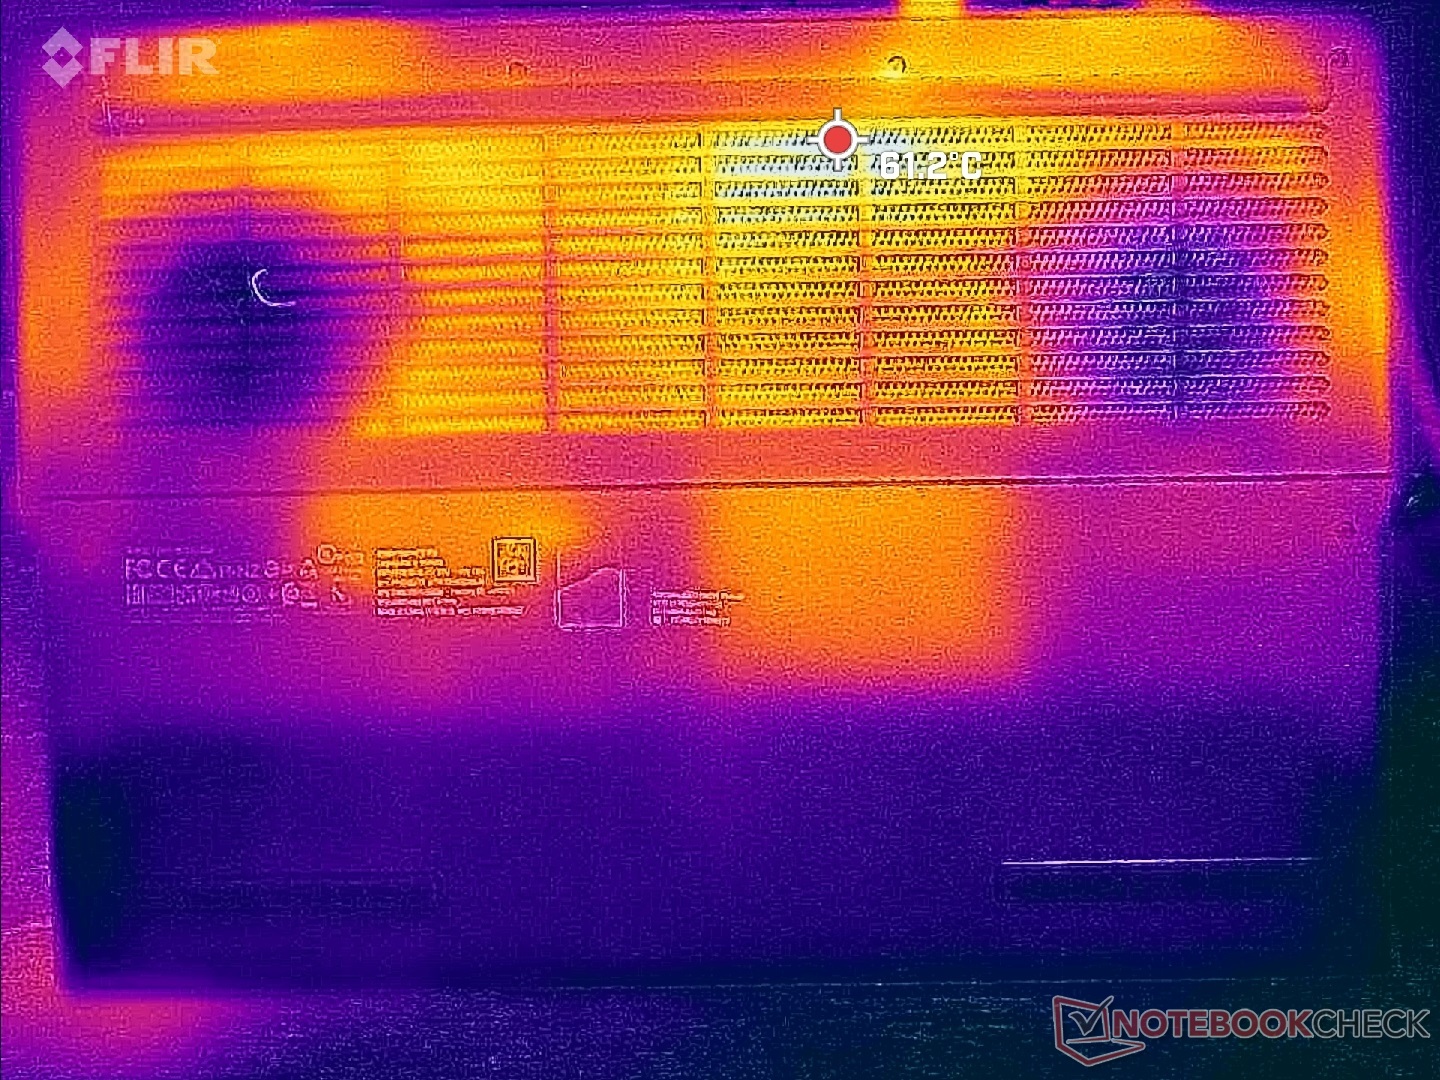
Surface temperatures when running games can be as warm as 43 C to 50 C on the top and bottom, respectively. These hot spots are thankfully concentrated toward the rear where skin is unlikely to touch. The thinner ROG Zephyrus M16 can be even warmer on average and with larger hot spots.
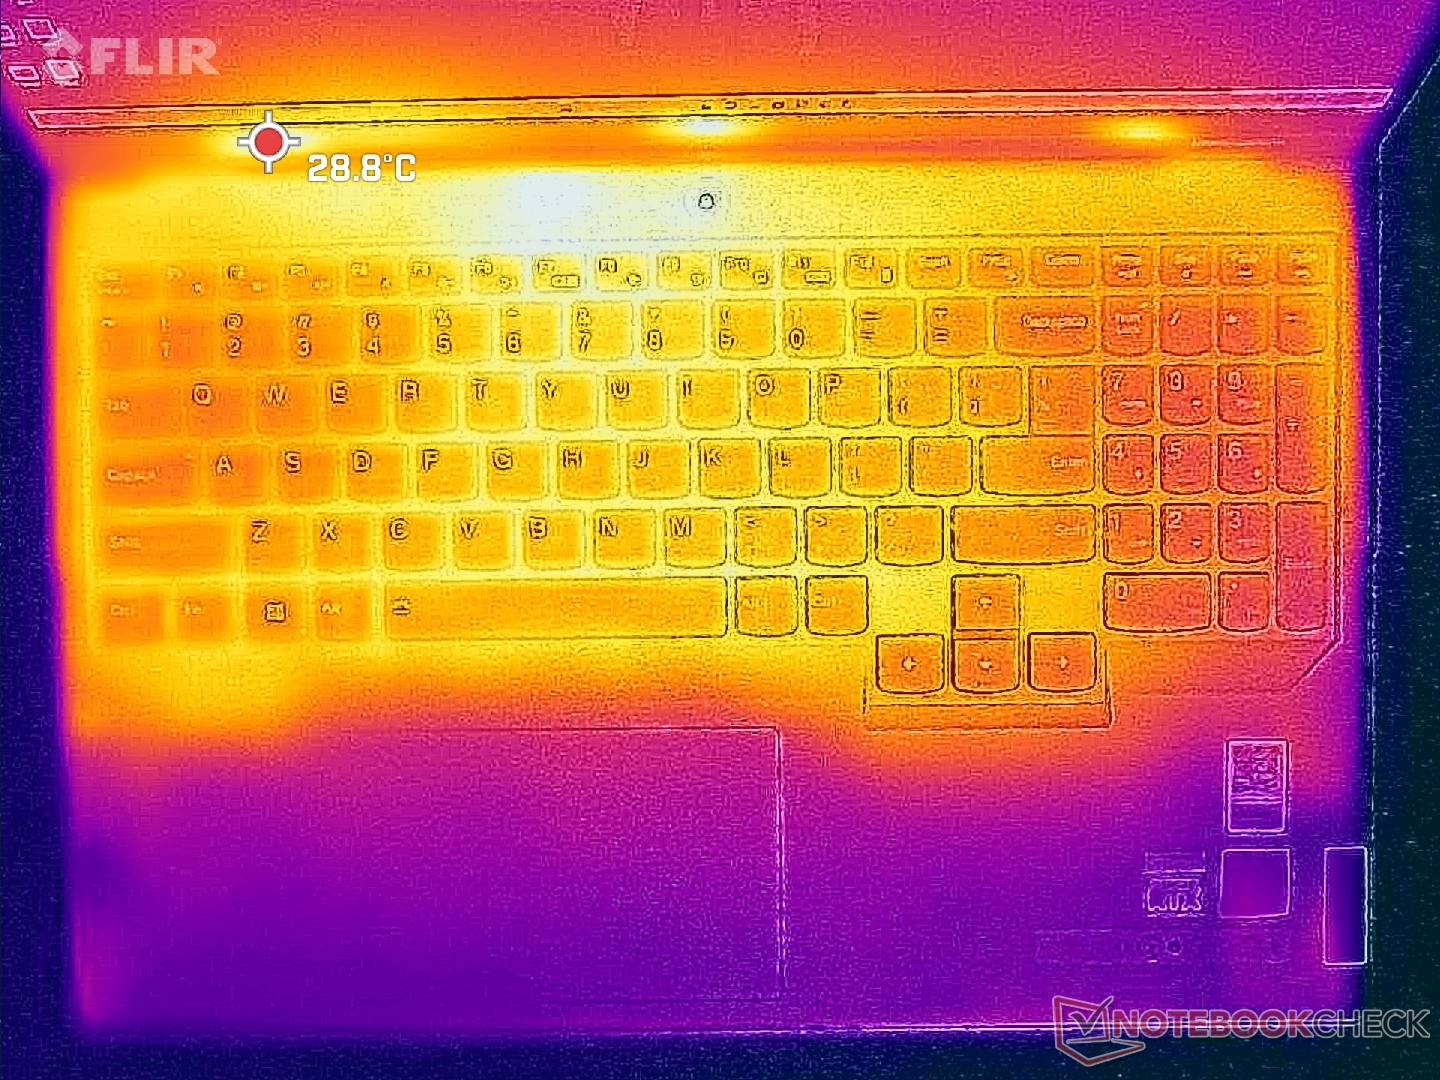
The sides of the keyboard are generally cooler than the center by a few degrees C since the fans are positioned directly underneath as shown by the temperature maps below. Palms and fingers are therefore less likely to be uncomfortable when gaming.
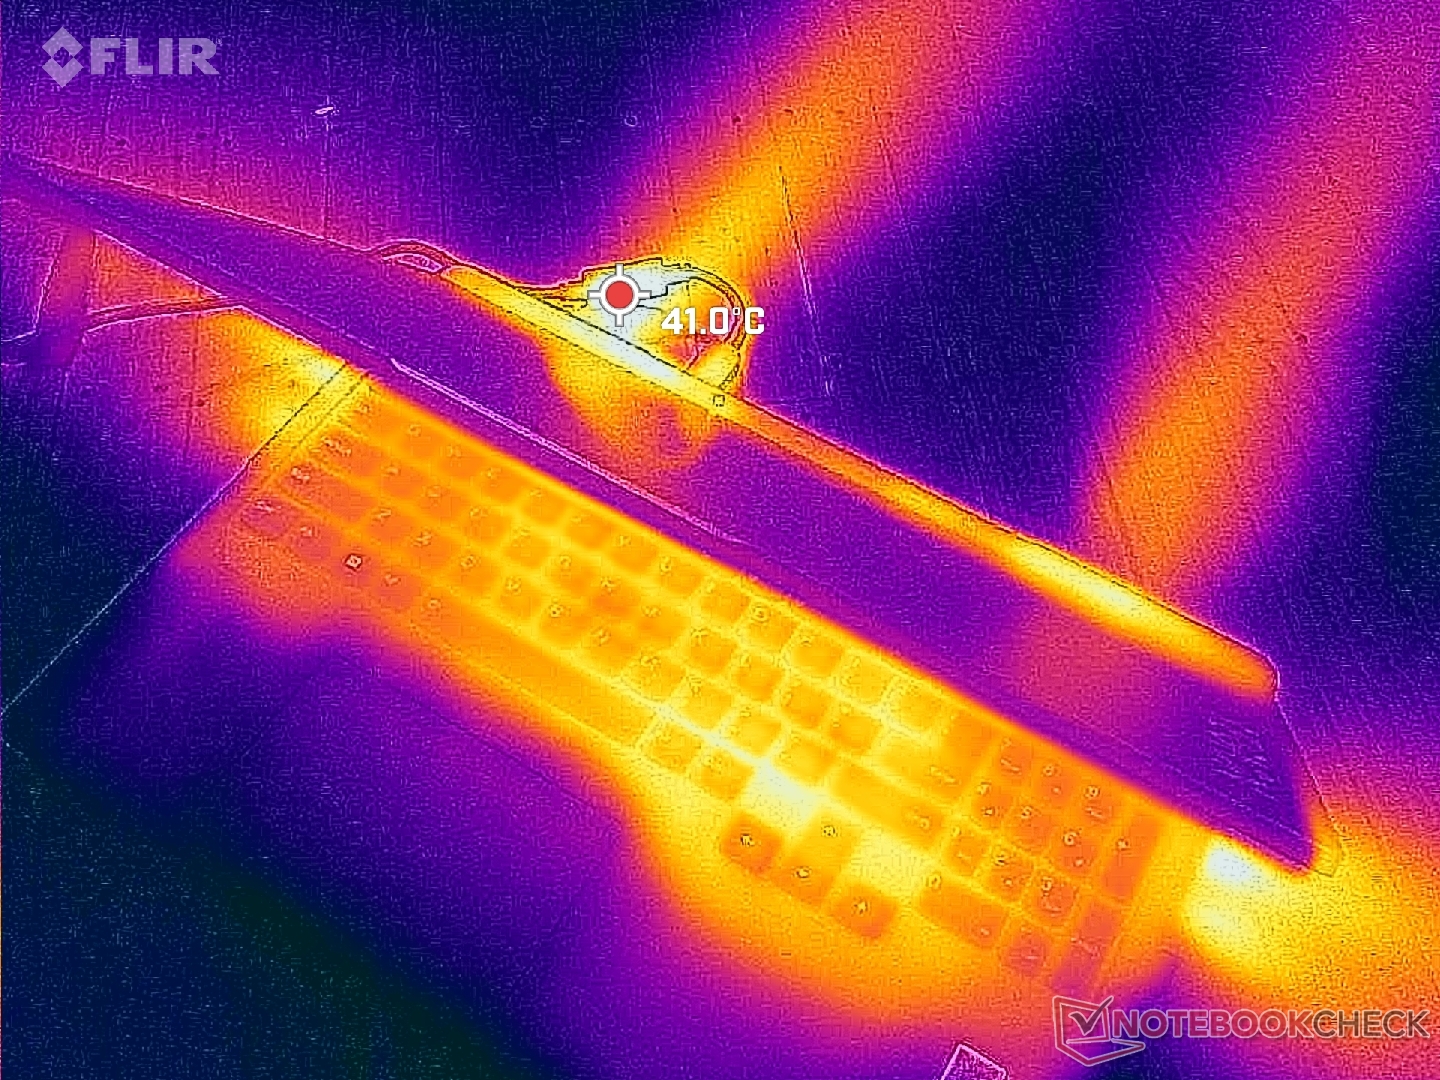
(±) The maximum temperature on the upper side is 42.8 °C / 109 F, compared to the average of 40.4 °C / 105 F, ranging from 21.2 to 68.8 °C for the class Gaming.
(-) The bottom heats up to a maximum of 50 °C / 122 F, compared to the average of 43.2 °C / 110 F
(+) In idle usage, the average temperature for the upper side is 27.2 °C / 81 F, compared to the device average of 33.9 °C / 93 F.
(±) Playing The Witcher 3, the average temperature for the upper side is 32.4 °C / 90 F, compared to the device average of 33.9 °C / 93 F.
(+) The palmrests and touchpad are cooler than skin temperature with a maximum of 26.2 °C / 79.2 F and are therefore cool to the touch.
(+) The average temperature of the palmrest area of similar devices was 28.8 °C / 83.8 F (+2.6 °C / 4.6 F).
| Lenovo Legion Pro 5 16IRX8 Intel Core i7-13700HX, NVIDIA GeForce RTX 4060 Laptop GPU | Asus ROG Zephyrus M16 GU603Z Intel Core i9-12900H, NVIDIA GeForce RTX 3070 Ti Laptop GPU | Razer Blade 16 Early 2023 Intel Core i9-13950HX, NVIDIA GeForce RTX 4080 Laptop GPU | Lenovo Legion Pro 7 16IRX8H Intel Core i9-13900HX, NVIDIA GeForce RTX 4080 Laptop GPU | Lenovo Legion 5 Pro 16ARH7H RTX 3070 Ti AMD Ryzen 7 6800H, NVIDIA GeForce RTX 3070 Ti Laptop GPU | Lenovo Legion S7 16ARHA7 AMD Ryzen 9 6900HX, AMD Radeon RX 6800S | |
|---|---|---|---|---|---|---|
| Heat | -5% | 8% | -11% | -1% | 5% | |
| Maximum Upper Side * (°C) | 42.8 | 52 -21% | 40 7% | 48 -12% | 43.8 -2% | 46.6 -9% |
| Maximum Bottom * (°C) | 50 | 51 -2% | 37.6 25% | 49 2% | 53 -6% | 50.8 -2% |
| Idle Upper Side * (°C) | 29.6 | 29 2% | 32.4 -9% | 40 -35% | 30 -1% | 26.4 11% |
| Idle Bottom * (°C) | 34 | 33 3% | 31.4 8% | 33 3% | 31.8 6% | 27.2 20% |
* ... smaller is better
Stress Test
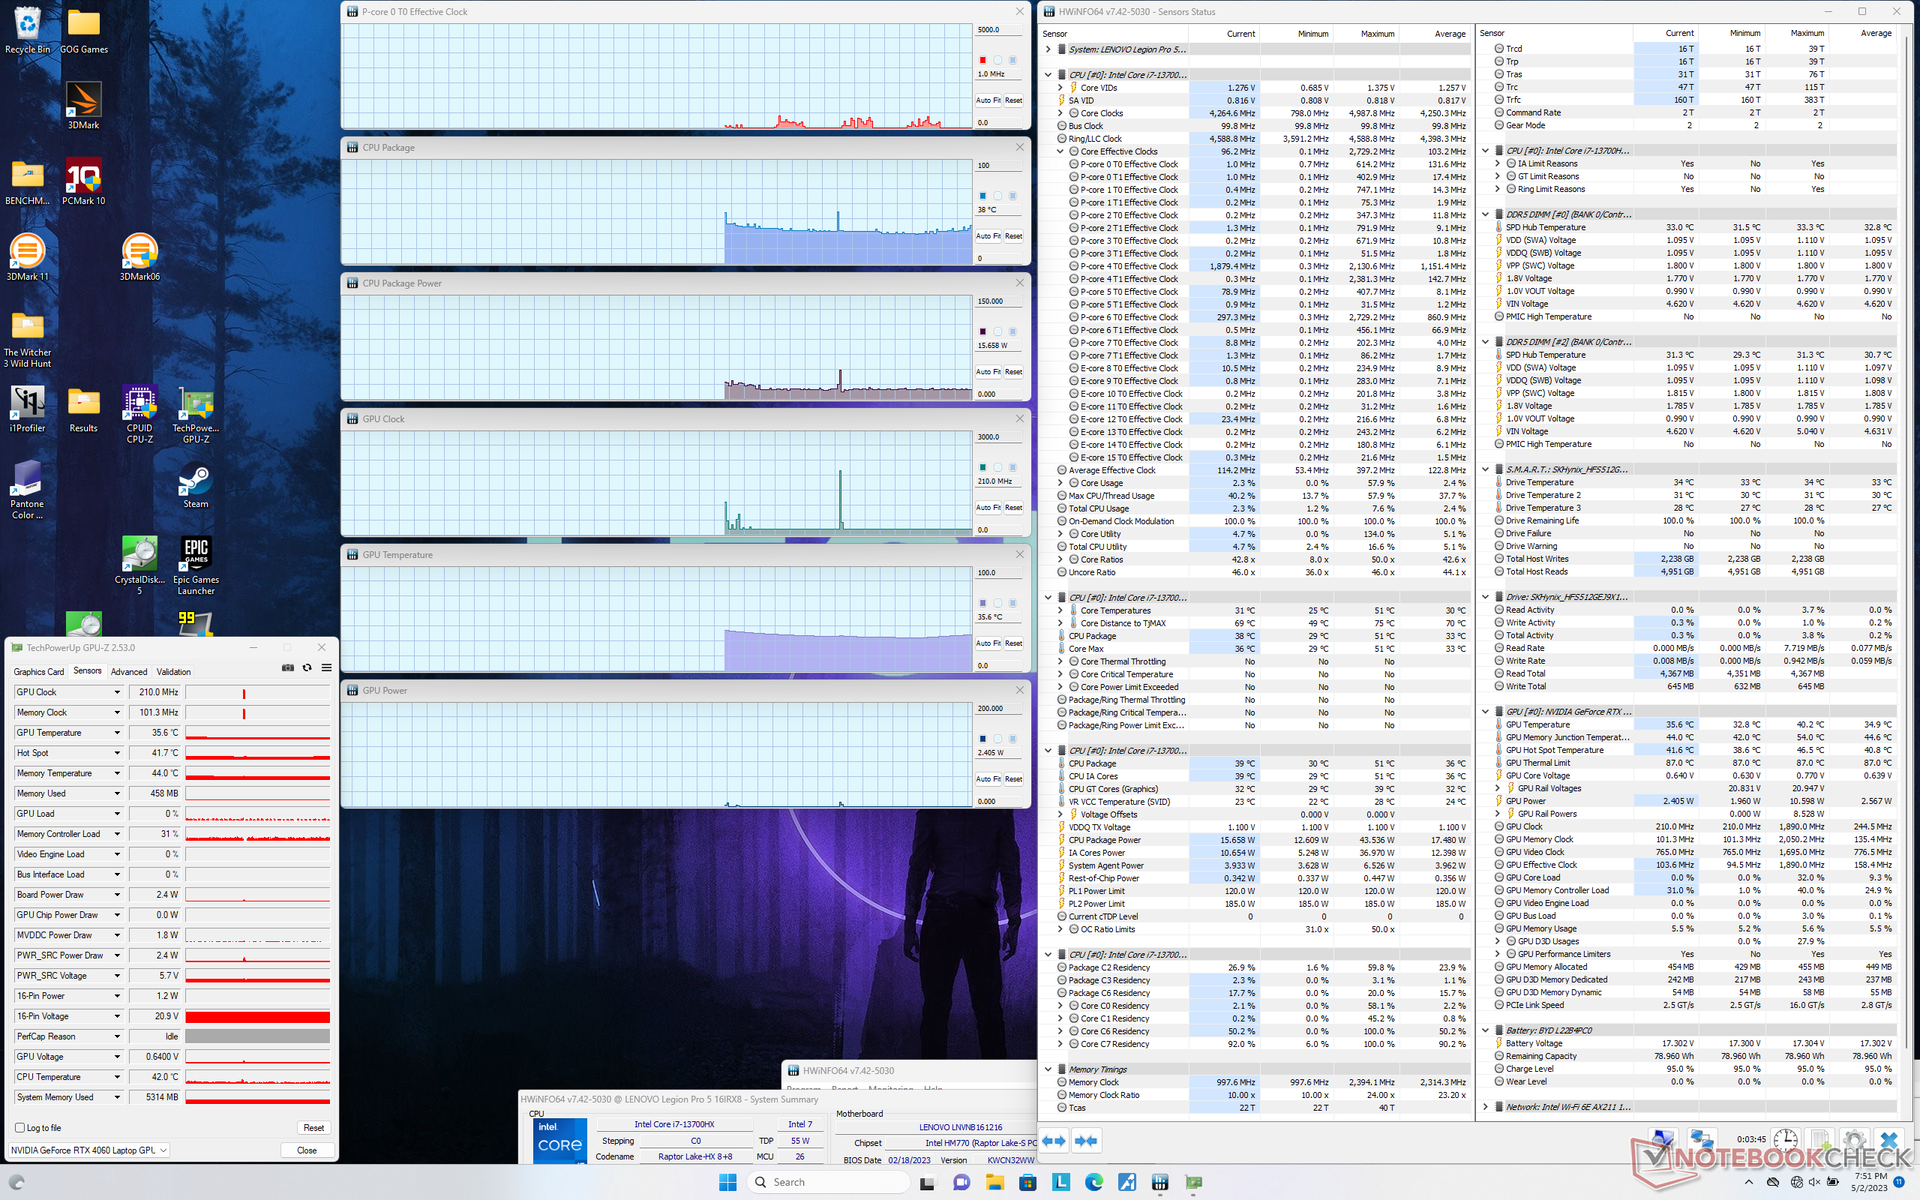
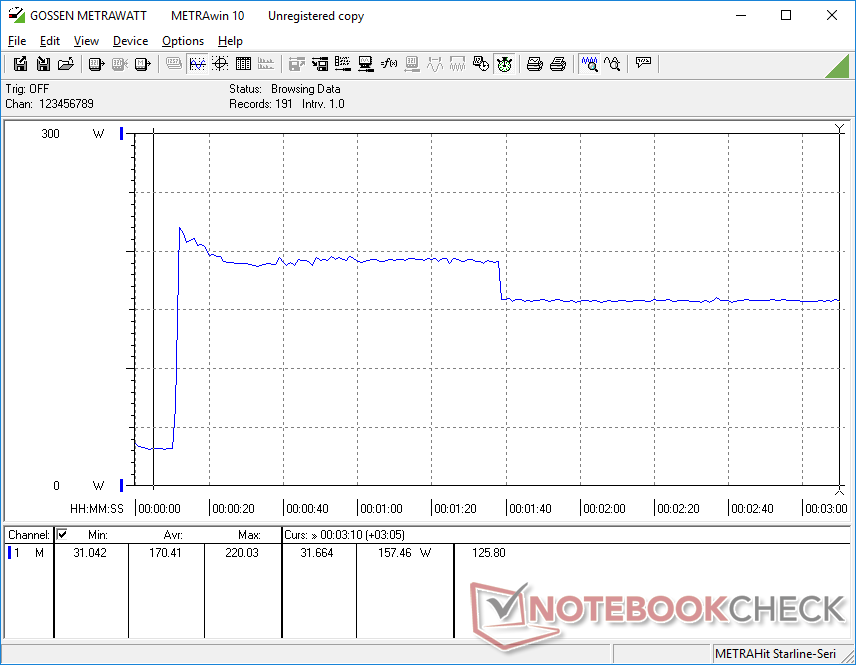
When stressed under Prime95, the CPU would boost to 4.3 GHz, 157 W, and 97 C lasting for about one minute. Thereafter, clock rates and board power draw would drop to the 3.3 to 3.6 GHz range and 117 W, respectively, in order to maintain a cooler core temperature of 81 C. Maximum Turbo Boost is therefore not sustainable for extended periods. Repeating this same test on last year's slower AMD-powered Legion Pro 5 16 would result in a warmer CPU temperature of 93 C.
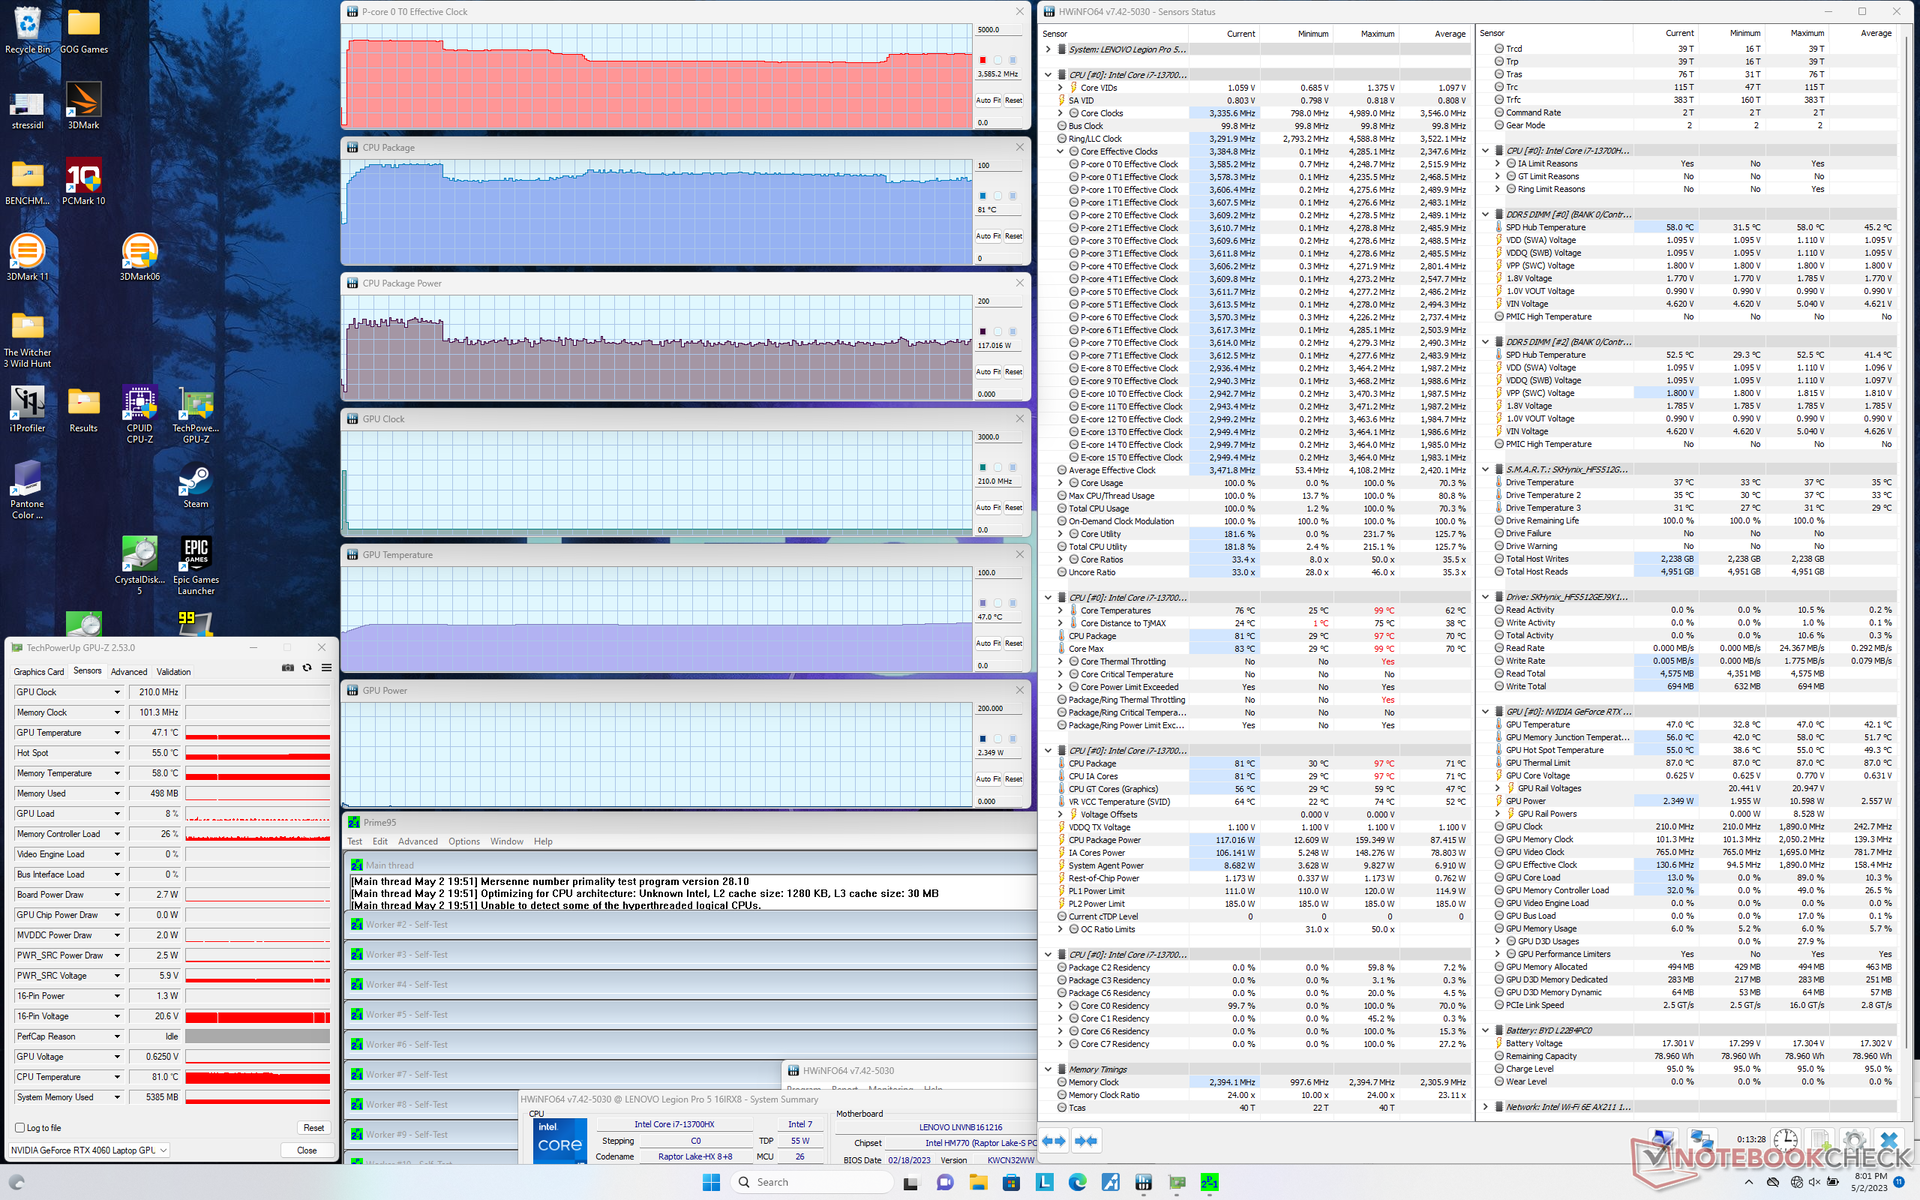
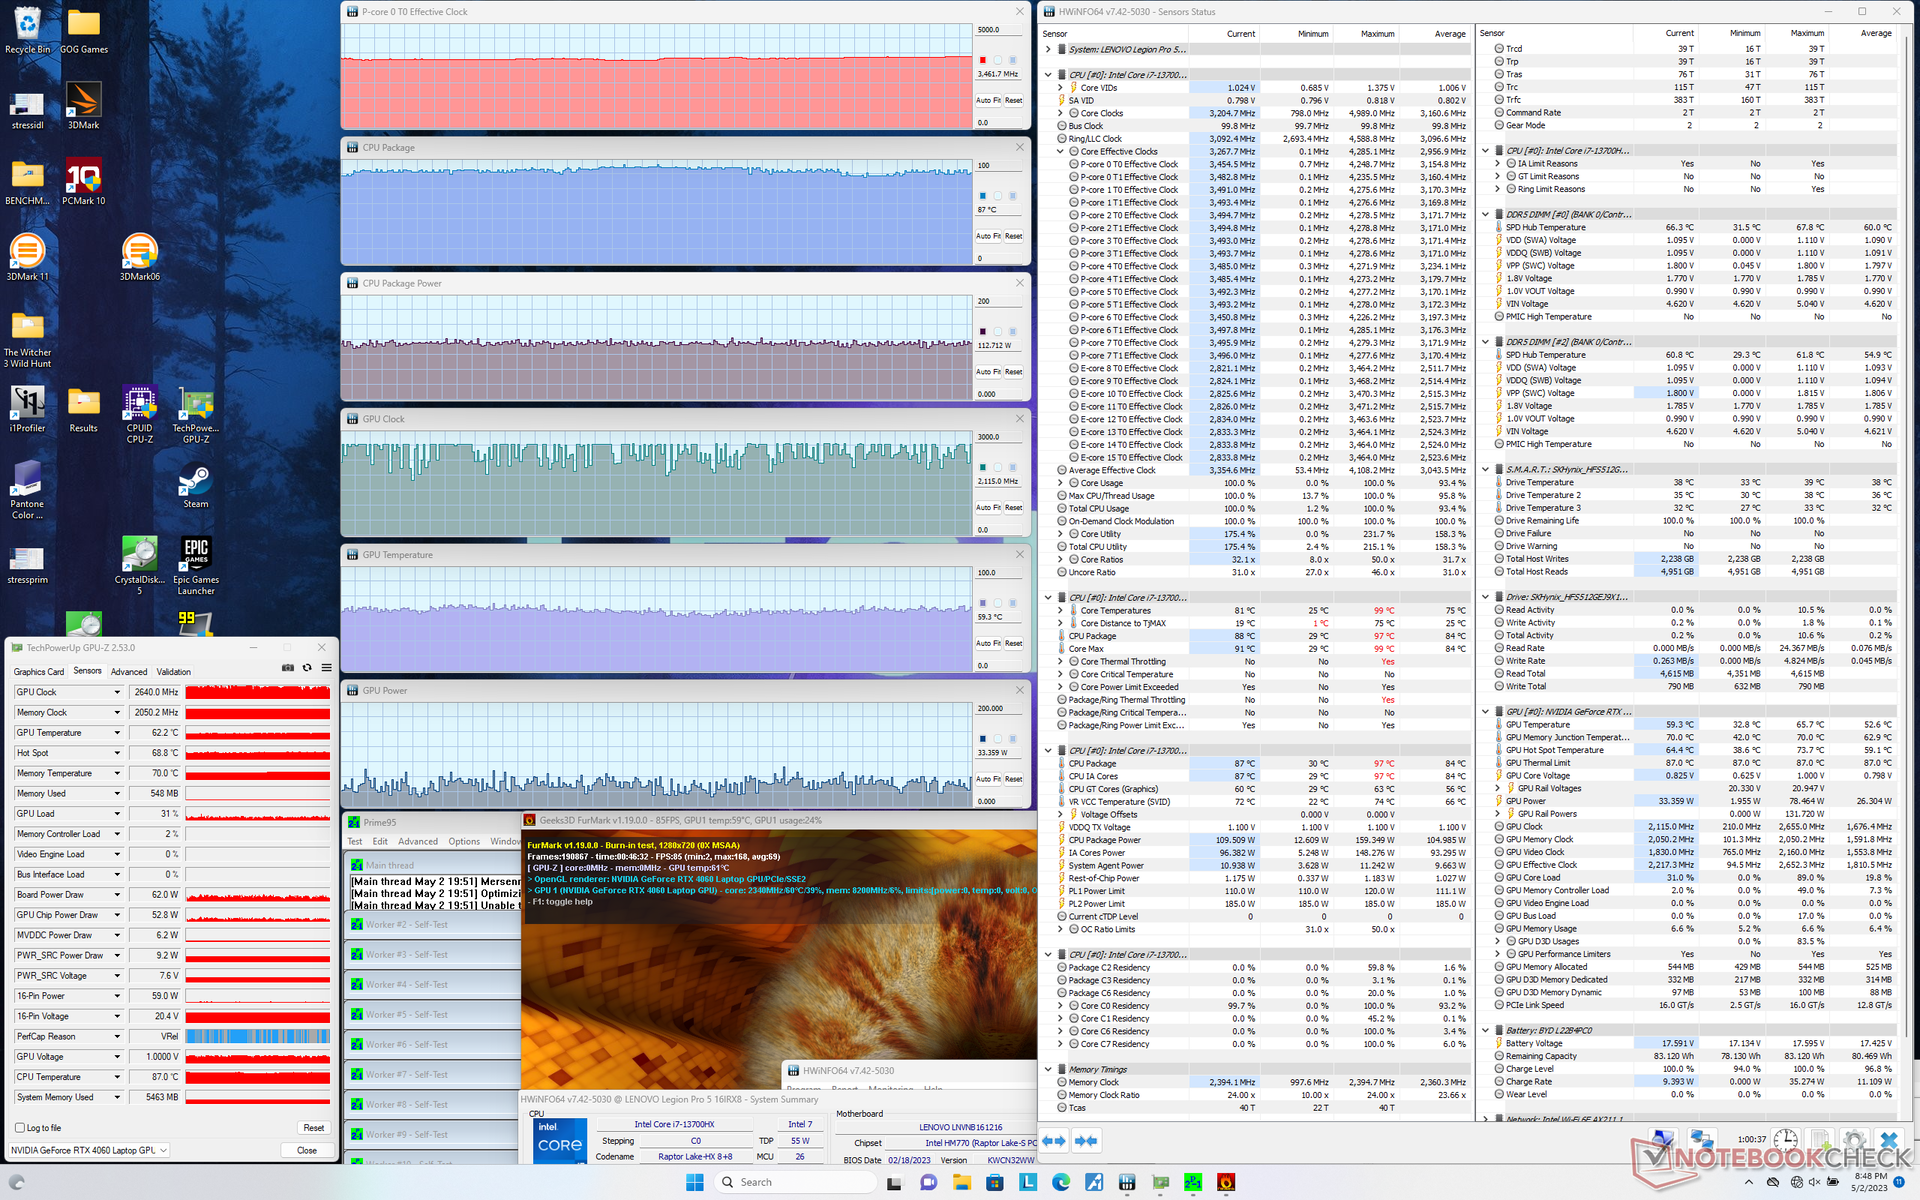
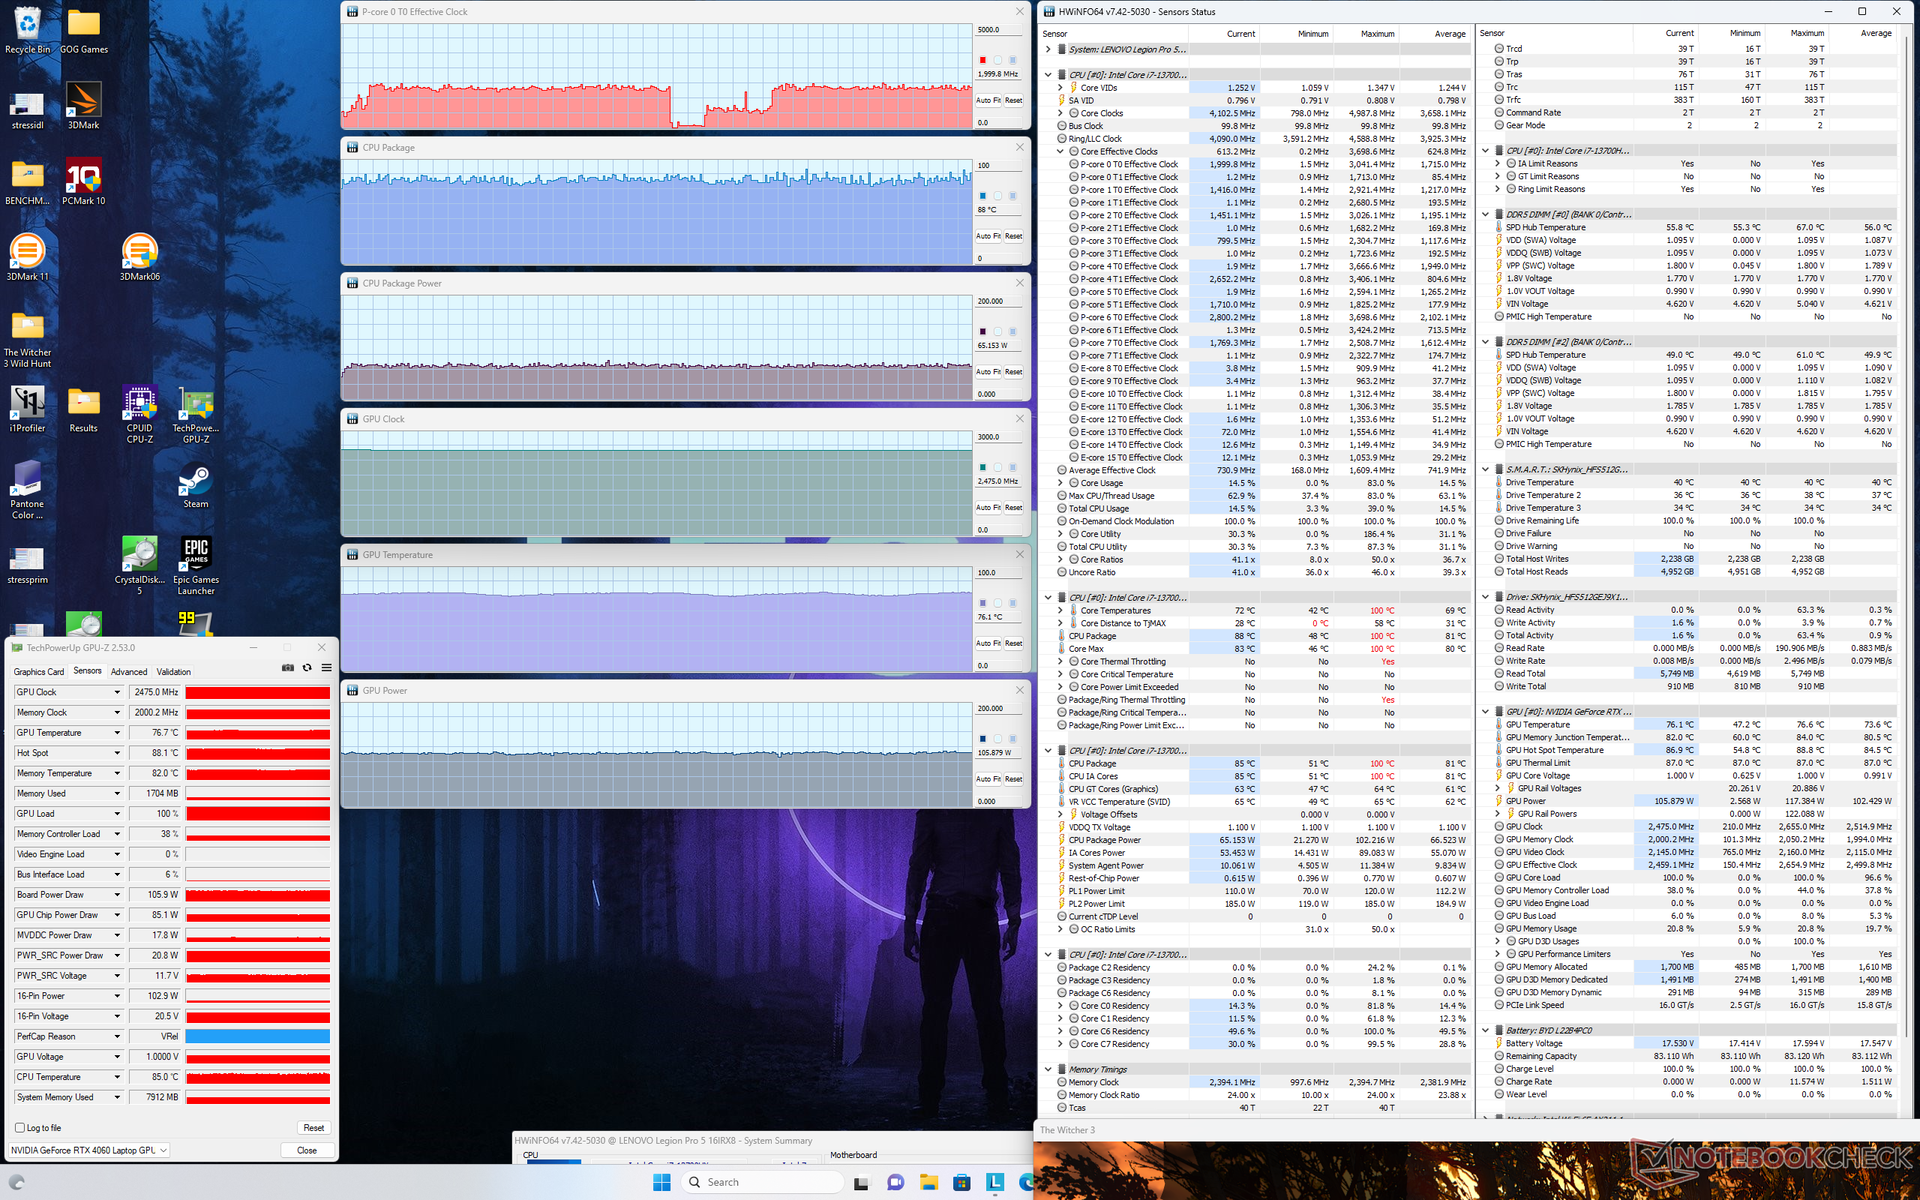
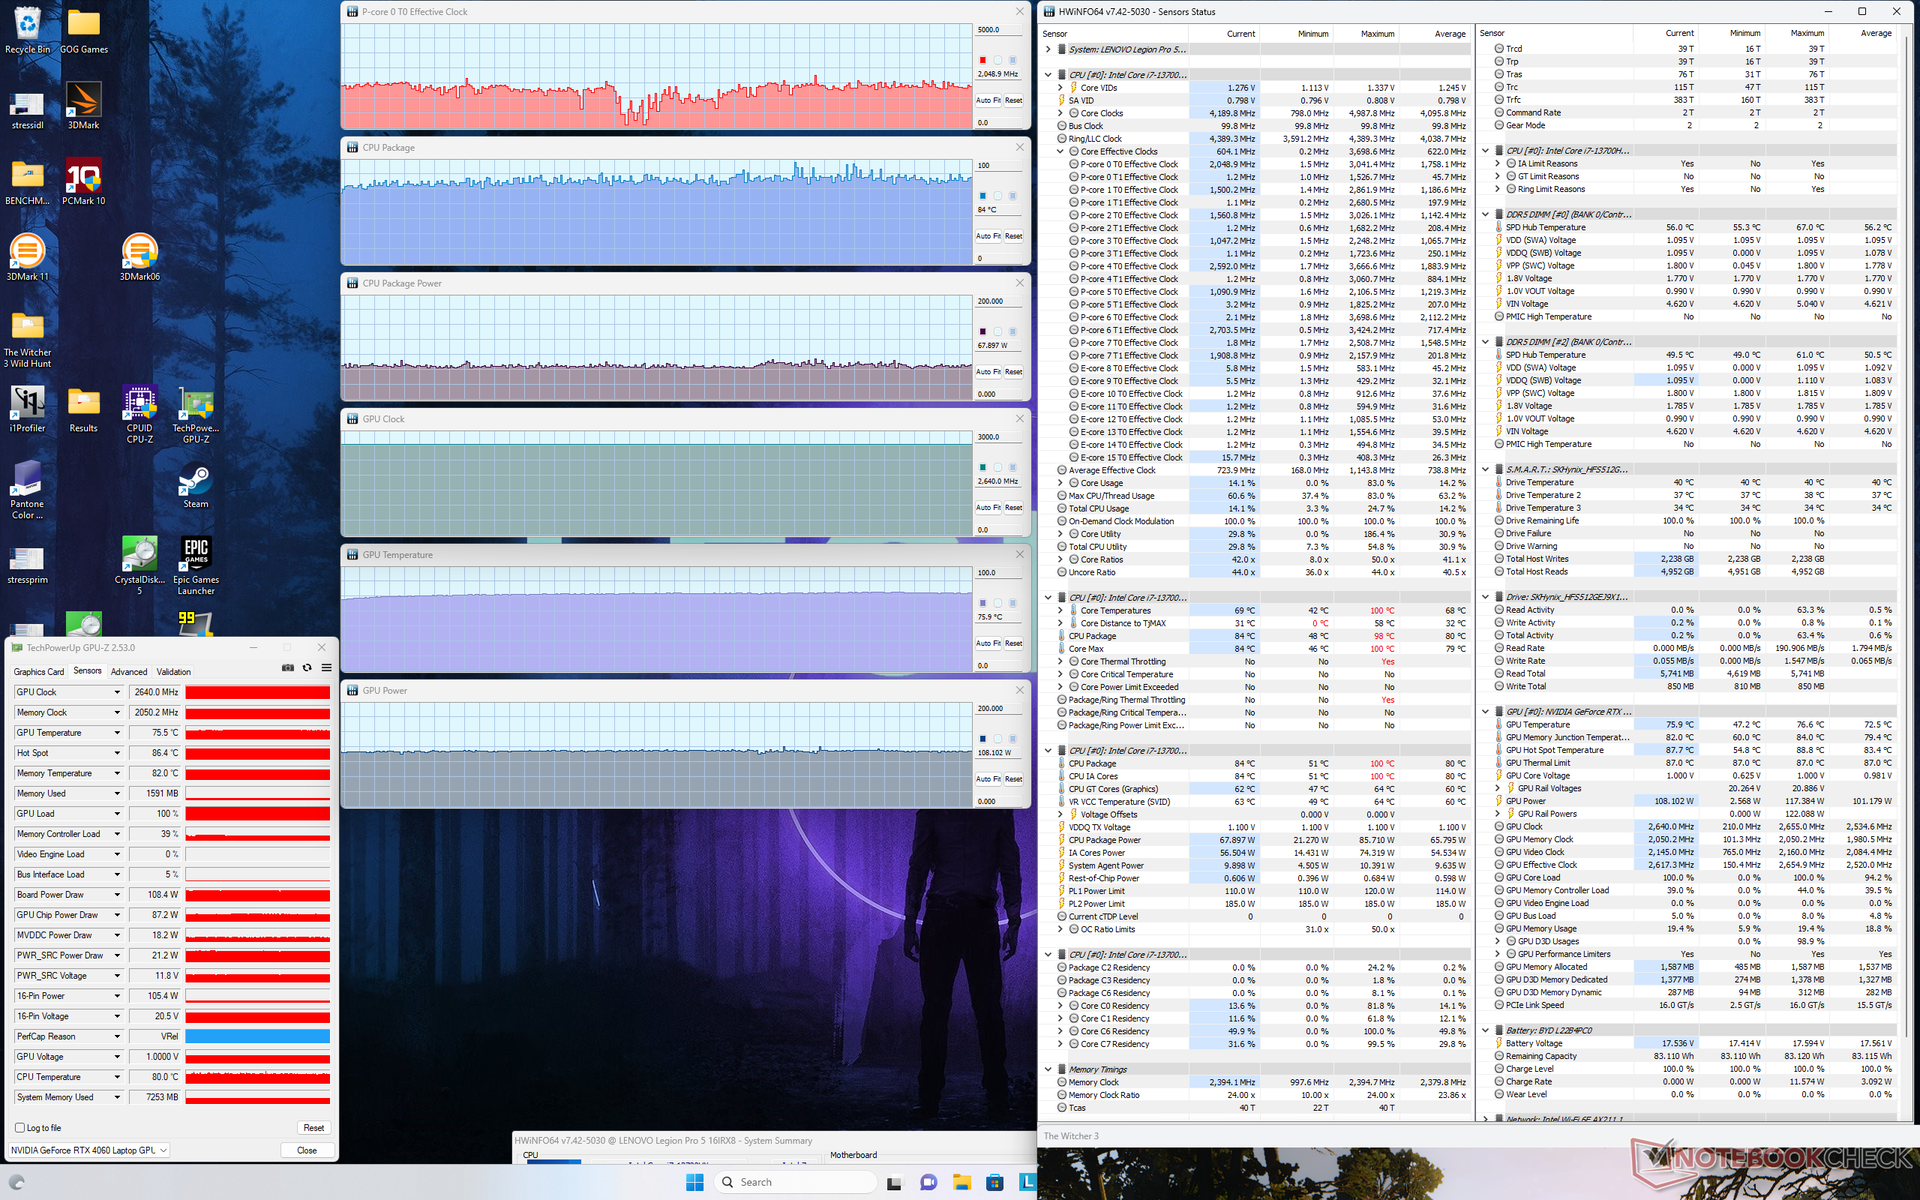
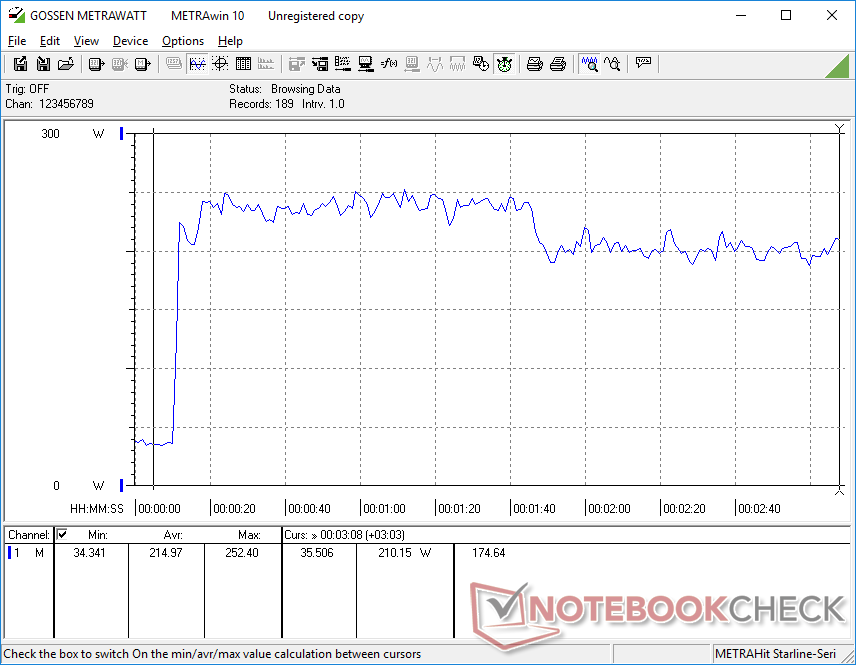
When running Witcher 3 on Performance mode to represent typical gaming loads, our RTX 4060 GPU would stabilize at 2640 MHz clock, 2050 MHz RAM, 76 C, and 109 W which is distinctly lower than the stated 140 W on Nvidia Control Panel. If on Balanced mode, the GPU would drop slightly to 2475 MHz clock, 2000 MHz RAM, and 105 W board power draw while core temperature would remain the same. Thus, you'll want to set the system to Performance mode in order to fully exploit the GPU. Core temperature is about 10 C cooler than on last year's model with the RTX 3070 Ti since the latter would reach a higher 149 W board power draw.
Running on battery power limits performance as to be expected. A Fire Strike test on batteries would return Physics and Graphics scores of 21363 and 12851 points, respectively, compared to 35270 and 26561 points when on mains.
| CPU Clock (GHz) | GPU Clock (MHz) | Average CPU Temperature (°C) | Average GPU Temperature (°C) | |
| System Idle | -- | -- | 37 | 36 |
| Prime95 Stress | 3.3 - 3.6 | -- | 81 - 86 | 47 |
| Prime95 + FurMark Stress | 3.5 | 1714 - 2640 | 87 | 59 |
| Witcher 3 Stress (Balanced mode) | ~2.0 | 2475 | 88 | 76 |
| Witcher 3 Stress (Performance mode) | ~2.0 | 2640 | 84 | 76 |
Speakers
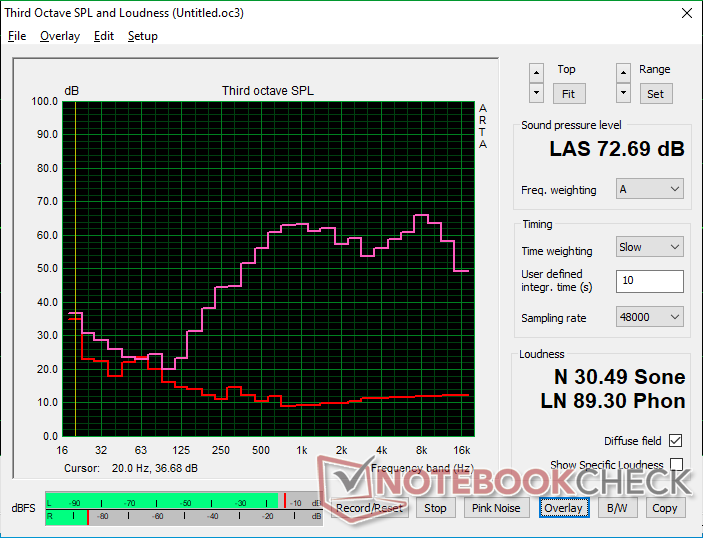
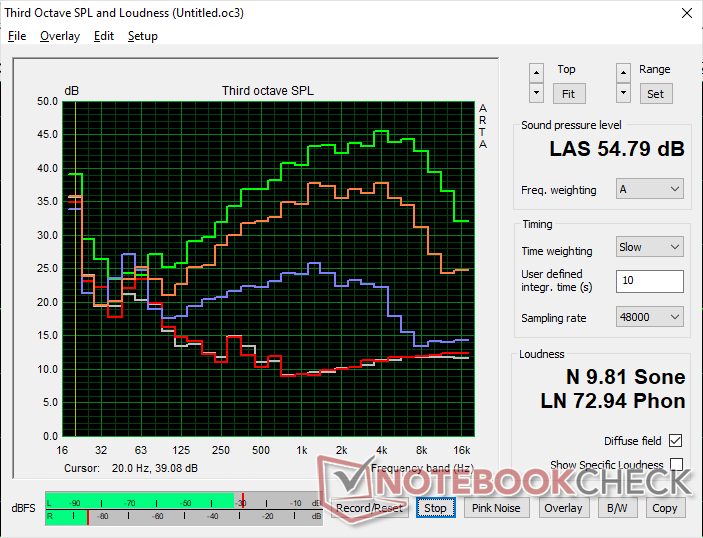
Lenovo Legion Pro 5 16IRX8 audio analysis
(±) | speaker loudness is average but good (72.7 dB)
Bass 100 - 315 Hz
(-) | nearly no bass - on average 23.7% lower than median
(±) | linearity of bass is average (10.7% delta to prev. frequency)
Mids 400 - 2000 Hz
(+) | balanced mids - only 3.8% away from median
(±) | linearity of mids is average (7.1% delta to prev. frequency)
Highs 2 - 16 kHz
(+) | balanced highs - only 3.7% away from median
(+) | highs are linear (6.7% delta to prev. frequency)
Overall 100 - 16.000 Hz
(±) | linearity of overall sound is average (21.9% difference to median)
Compared to same class
» 79% of all tested devices in this class were better, 6% similar, 16% worse
» The best had a delta of 6%, average was 18%, worst was 132%
Compared to all devices tested
» 63% of all tested devices were better, 7% similar, 30% worse
» The best had a delta of 4%, average was 23%, worst was 134%
Apple MacBook Pro 16 2021 M1 Pro audio analysis
(+) | speakers can play relatively loud (84.7 dB)
Bass 100 - 315 Hz
(+) | good bass - only 3.8% away from median
(+) | bass is linear (5.2% delta to prev. frequency)
Mids 400 - 2000 Hz
(+) | balanced mids - only 1.3% away from median
(+) | mids are linear (2.1% delta to prev. frequency)
Highs 2 - 16 kHz
(+) | balanced highs - only 1.9% away from median
(+) | highs are linear (2.7% delta to prev. frequency)
Overall 100 - 16.000 Hz
(+) | overall sound is linear (4.6% difference to median)
Compared to same class
» 0% of all tested devices in this class were better, 0% similar, 100% worse
» The best had a delta of 5%, average was 17%, worst was 45%
Compared to all devices tested
» 0% of all tested devices were better, 0% similar, 100% worse
» The best had a delta of 4%, average was 23%, worst was 134%
Energy Management
Power Consumption — Just As Demanding As Before
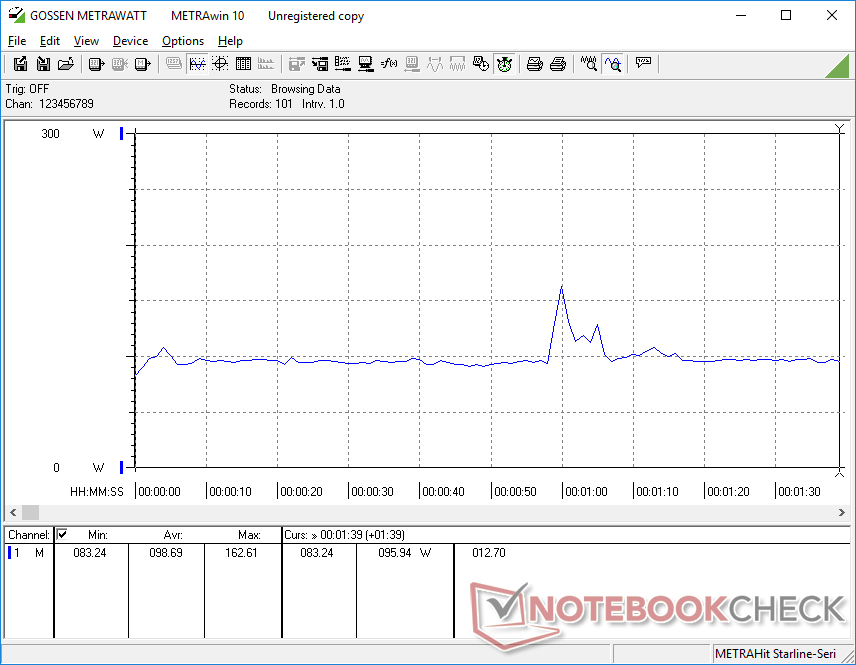
The system is unusually demanding when idling on desktop where we're able to measure a minimum of 24 W compared to just 10 W to 15 W on alternatives like the ROG Zephyrus M16 or Blade 16. We even made sure to set the system to Power Saver mode with the iGPU active and on the minimum brightness setting, but results would not improve. The relatively high consumption may be partly responsible for the shorter-than-expected battery life as noted in the next section.
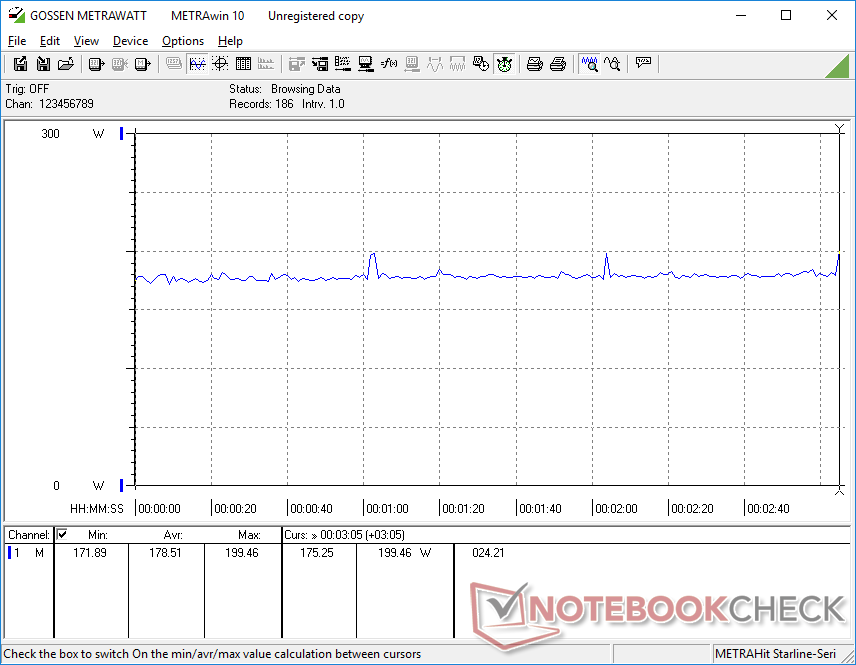
Running Witcher 3 would draw 179 W compared to 209 W on last year's Legion 5 Pro 16 with the RTX 3070 Ti. That particular GPU is about 15 to 20 percent faster than our RTX 4060 and with a higher TGP target as stated earlier which correlates with its 15 percent higher power consumption. Performance-per-watt remains relatively linear year-to-year as a result.
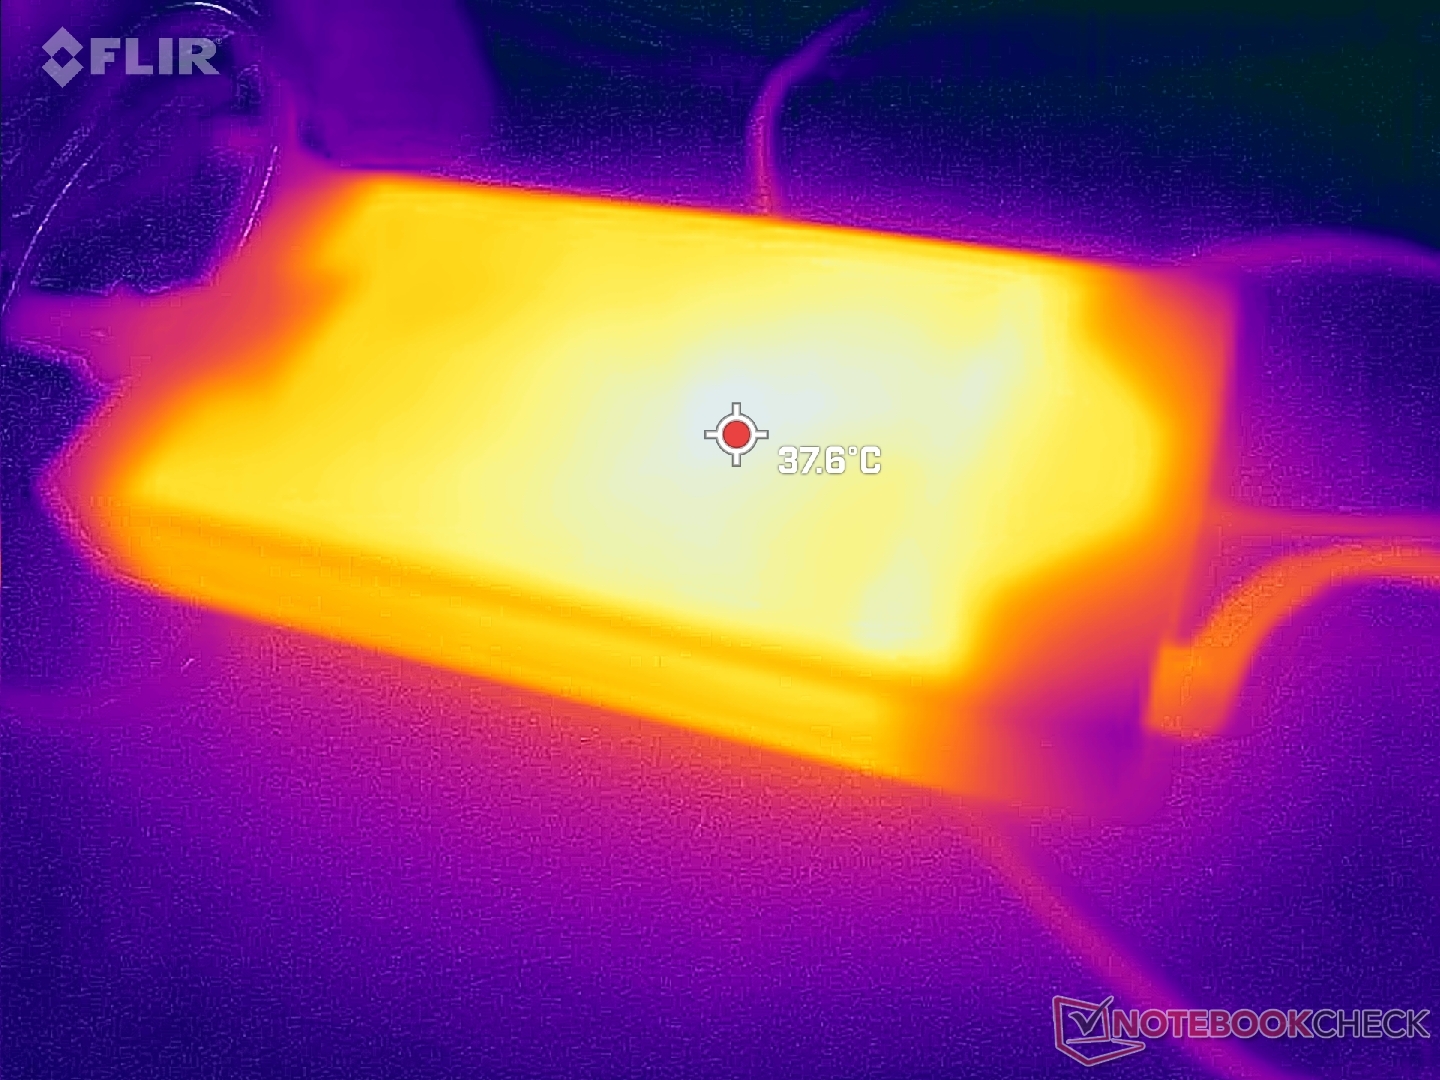
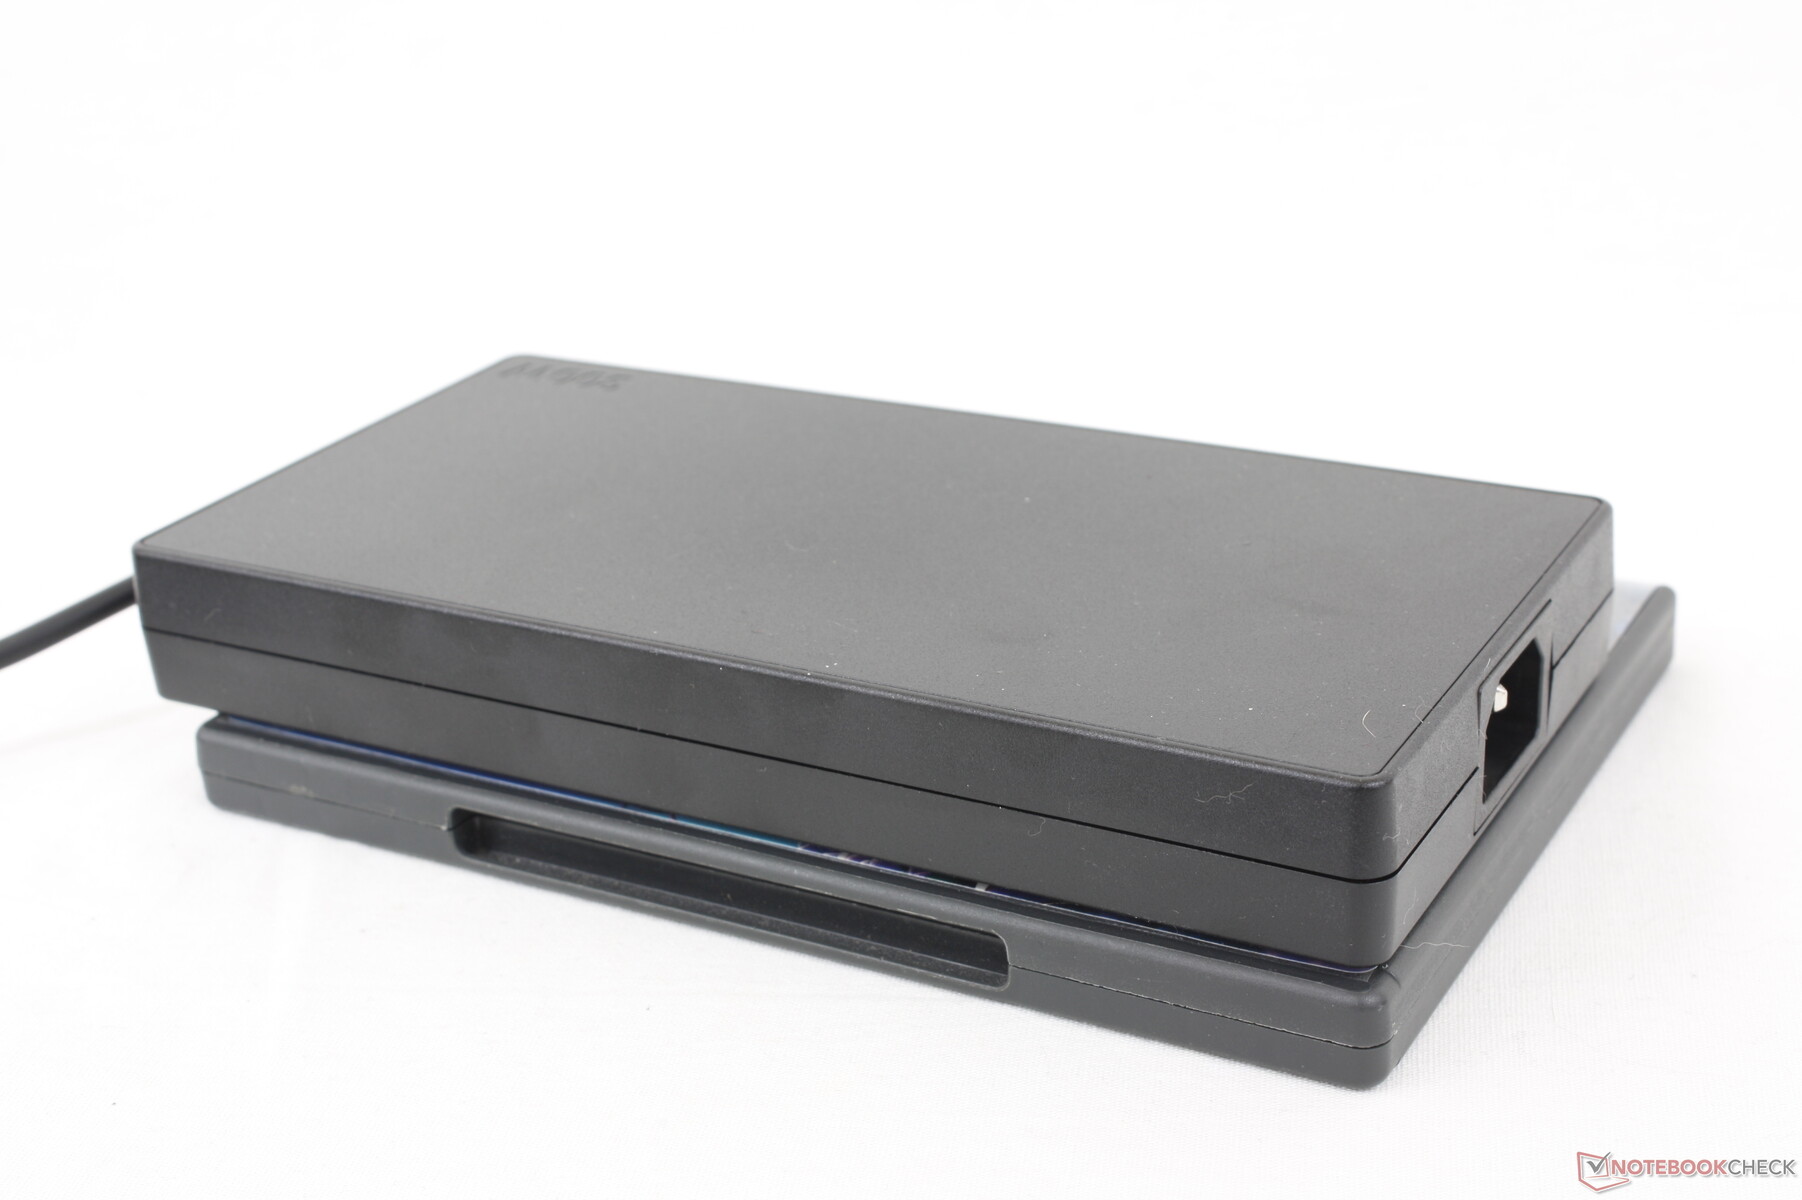
We're able to measure a maximum draw of 250 W from the large (~19.9 x 9.9 x 2.6 cm) 300 W AC adapter when both the CPU and GPU are at 100 percent utilization. Lenovo utilizes this same 300 W adapter for many of its other Legion models as well.
| Off / Standby | |
| Idle | |
| Load |
|
Key:
min: | |
| Lenovo Legion Pro 5 16IRX8 i7-13700HX, GeForce RTX 4060 Laptop GPU, SK hynix PC801 HFS512GEJ9X115N, IPS, 2560x1600, 16" | Asus ROG Zephyrus M16 GU603Z i9-12900H, GeForce RTX 3070 Ti Laptop GPU, Micron 3400 1TB MTFDKBA1T0TFH, IPS, 2560x1600, 16" | Razer Blade 16 Early 2023 i9-13950HX, GeForce RTX 4080 Laptop GPU, SSSTC CA6-8D1024, IPS, 2560x1600, 16" | Lenovo Legion Pro 7 16IRX8H i9-13900HX, GeForce RTX 4080 Laptop GPU, Samsung PM9A1 MZVL21T0HCLR, IPS, 2560x1600, 16" | Lenovo Legion 5 Pro 16ARH7H RTX 3070 Ti R7 6800H, GeForce RTX 3070 Ti Laptop GPU, Samsung PM9A1 MZVL21T0HCLR, IPS, 2560x1600, 16" | Lenovo Legion S7 16ARHA7 R9 6900HX, Radeon RX 6800S, SK Hynix HFS001TEJ9X115N, IPS, 2560x1600, 16" | |
|---|---|---|---|---|---|---|
| Power Consumption | 27% | -9% | -9% | 10% | 31% | |
| Idle Minimum * (Watt) | 24.5 | 10.8 56% | 15.2 38% | 18 27% | 9.7 60% | 8.8 64% |
| Idle Average * (Watt) | 29.2 | 17 42% | 22.8 22% | 24 18% | 14.8 49% | 14.7 50% |
| Idle Maximum * (Watt) | 34.3 | 17.8 48% | 49.8 -45% | 32 7% | 45.8 -34% | 19.8 42% |
| Load Average * (Watt) | 98.7 | 116 -18% | 121.2 -23% | 130 -32% | 87.2 12% | 85.3 14% |
| Witcher 3 ultra * (Watt) | 178.6 | 144 19% | 242 -35% | 260 -46% | 209 -17% | 167.5 6% |
| Load Maximum * (Watt) | 249.6 | 220 12% | 273.7 -10% | 320 -28% | 275.3 -10% | 230.7 8% |
* ... smaller is better
Power Consumption Witcher 3 / Stresstest
Power Consumption external Monitor
Battery Life — Shorter Than Other Gaming Laptops
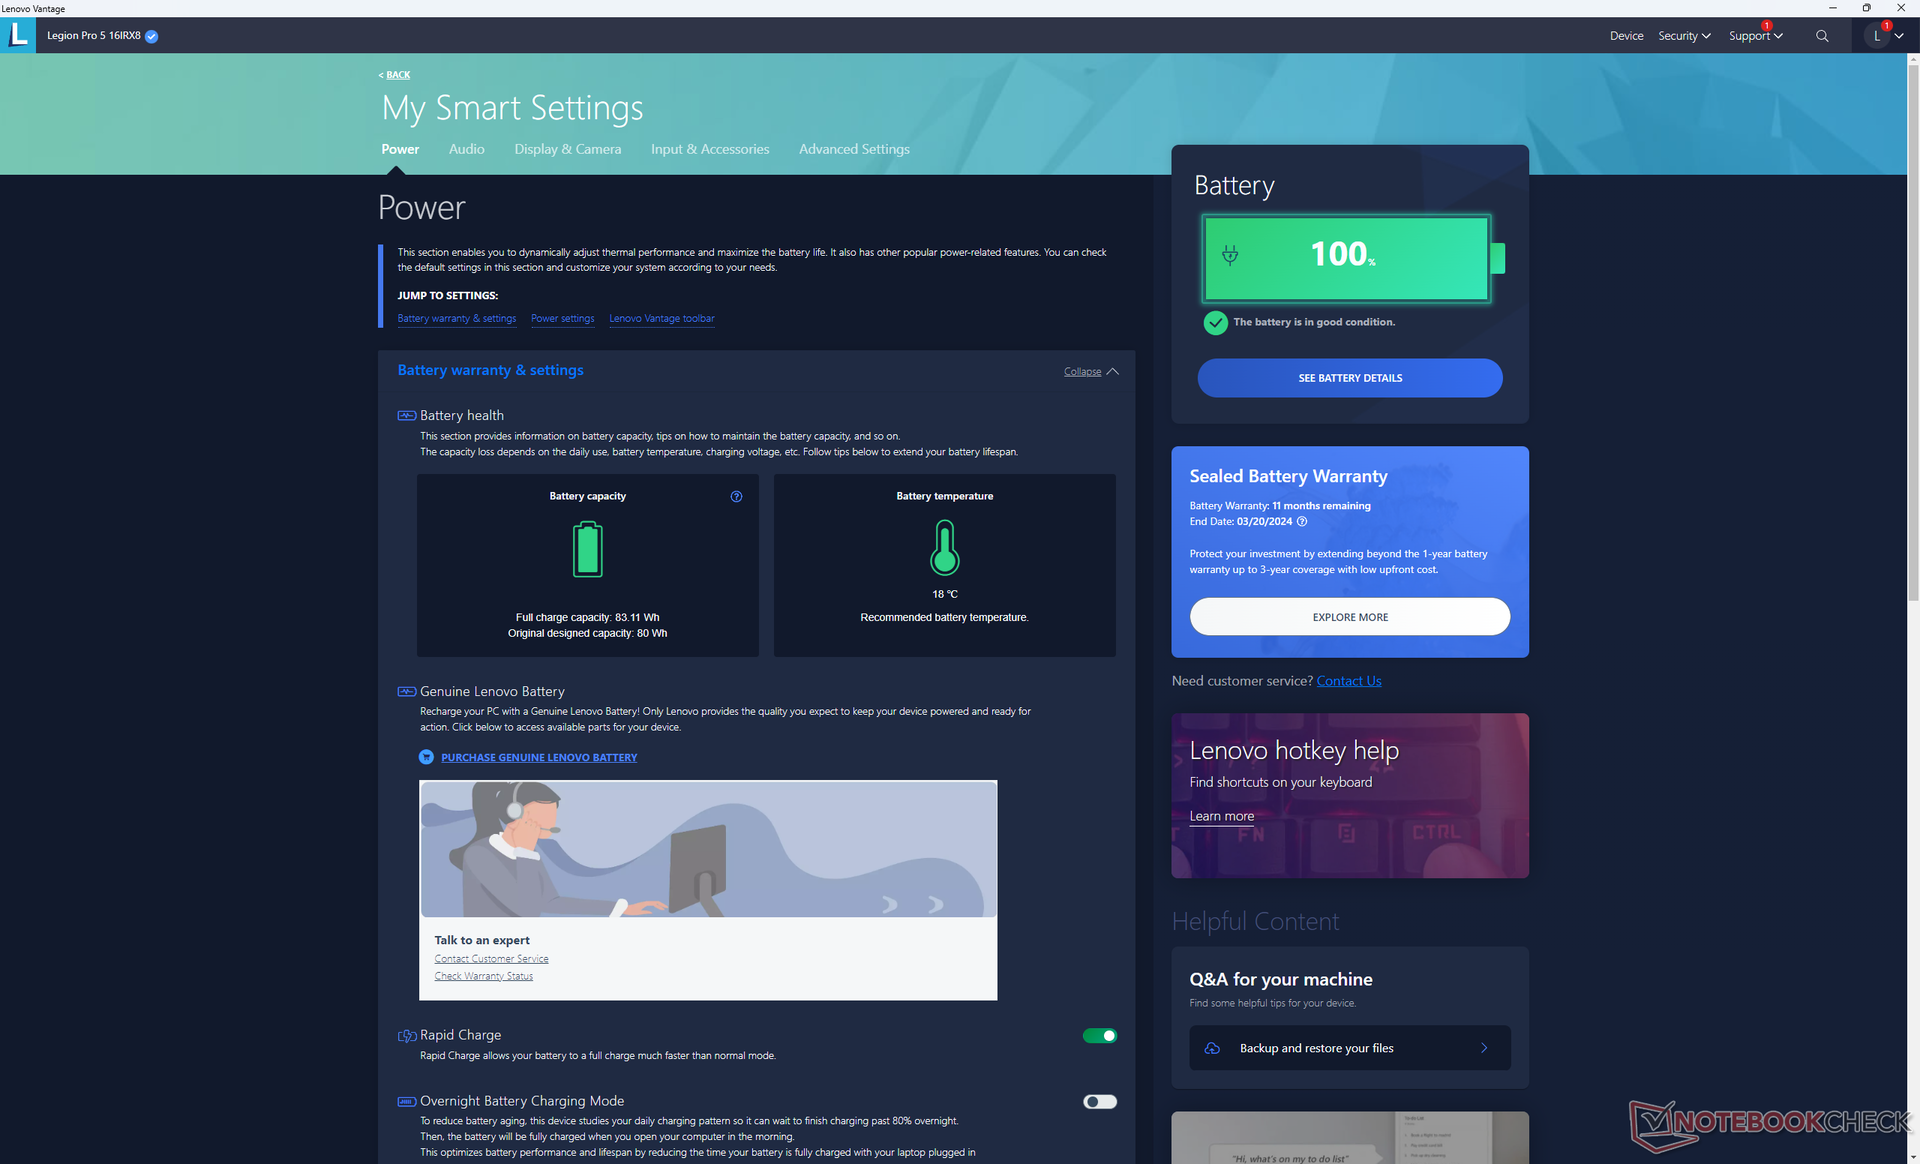
Battery capacity remains at 80 Wh compared to 99 Wh on the pricier Legion 7 Pro series. Runtimes are short which appears to be a trend amongst Legion models; we're only able to record a WLAN runtime of under 3.5 hours even when set to iGPU and Balanced profile modes. The Razer Blade 16 and Asus ROG Zephyrus M16 can each last for several hours longer in comparison.
Charging from empty to full is relatively fast at under 90 minutes with the included AC adapter. The system can also be recharged via smaller USB-C adapters albeit at a slower rate and with limited performance.
| Lenovo Legion Pro 5 16IRX8 i7-13700HX, GeForce RTX 4060 Laptop GPU, 80 Wh | Asus ROG Zephyrus M16 GU603Z i9-12900H, GeForce RTX 3070 Ti Laptop GPU, 90 Wh | Razer Blade 16 Early 2023 i9-13950HX, GeForce RTX 4080 Laptop GPU, 95.2 Wh | Lenovo Legion Pro 7 16IRX8H i9-13900HX, GeForce RTX 4080 Laptop GPU, 99.9 Wh | Lenovo Legion 5 Pro 16ARH7H RTX 3070 Ti R7 6800H, GeForce RTX 3070 Ti Laptop GPU, 80 Wh | Lenovo Legion S7 16ARHA7 R9 6900HX, Radeon RX 6800S, 71 Wh | |
|---|---|---|---|---|---|---|
| Battery runtime | 109% | 71% | 82% | 29% | 82% | |
| Reader / Idle (h) | 6.7 | 8.9 33% | 6.4 -4% | |||
| WiFi v1.3 (h) | 3.4 | 7.4 118% | 6.1 79% | 5.1 50% | 4.4 29% | 6.2 82% |
| Load (h) | 0.7 | 1.4 100% | 1.4 100% | 2.1 200% | ||
| H.264 (h) | 7.3 |
Pros
Cons
Verdict — Missing Some Features For The Price
The 2023 Legion Pro 5 16 configured with GeForce RTX 4060 graphics isn't a cheap gaming laptop at $1600 USD. That's not a problem, of course, so long as it comes packed with features that gamers actually want. G-Sync, QHD+ 165 Hz, full sRGB colors, easy serviceability, and large arrow keys all come standard to make the model a well-rounded gaming laptop.
We can notice some cut corners nonetheless even at this price range. The model omits a few key features like per-key RGB lighting, Thunderbolt support, Advanced Optimus, and AdobeRGB panel options. The latter in particular means that the Legion Pro 5 16 may not be the best solution for users who are both content creators or digital artists and gamers. Competing models like the Razer Blade 16, Aero 16, or Asus ROG Zephyrus M16 are not only lighter and thinner, but they offer wider display options alongside some of the aforementioned missing features.
The refreshed Legion Pro 5 16 covers almost everything you'd want from a midrange gaming laptop. However, some desirable features like AdobeRGB, Thunderbolt, and Advanced Optimus are unfortunately omitted.
On the performance side, users who may be rocking systems with 12th gen Intel CPUs and GeForce RTX 3070 or higher GPUs won't see too much of a benefit when upgrading to 13th gen Intel with GeForce RTX 4060 or 4070 graphics. Older machines running on GeForce RTX 20 GPUs with 11th gen Intel or AMD Zen 3 CPUs may want to consider making the jump.
Price and Availability
Lenovo is now shipping the Legion Pro 5 16IRX8 in our review configuration for $1600 USD.
Lenovo Legion Pro 5 16IRX8
- 05/05/2023 v7 (old)
Allen Ngo
Transparency
The selection of devices to be reviewed is made by our editorial team. The test sample was provided to the author as a loan by the manufacturer or retailer for the purpose of this review. The lender had no influence on this review, nor did the manufacturer receive a copy of this review before publication. There was no obligation to publish this review. As an independent media company, Notebookcheck is not subjected to the authority of manufacturers, retailers or publishers.
This is how Notebookcheck is testing
Every year, Notebookcheck independently reviews hundreds of laptops and smartphones using standardized procedures to ensure that all results are comparable. We have continuously developed our test methods for around 20 years and set industry standards in the process. In our test labs, high-quality measuring equipment is utilized by experienced technicians and editors. These tests involve a multi-stage validation process. Our complex rating system is based on hundreds of well-founded measurements and benchmarks, which maintains objectivity. Further information on our test methods can be found here.
Price comparison
