Lenovo Legion Pro 5i laptop review: Super powerful i7-14700HX and RTX 4060 performance
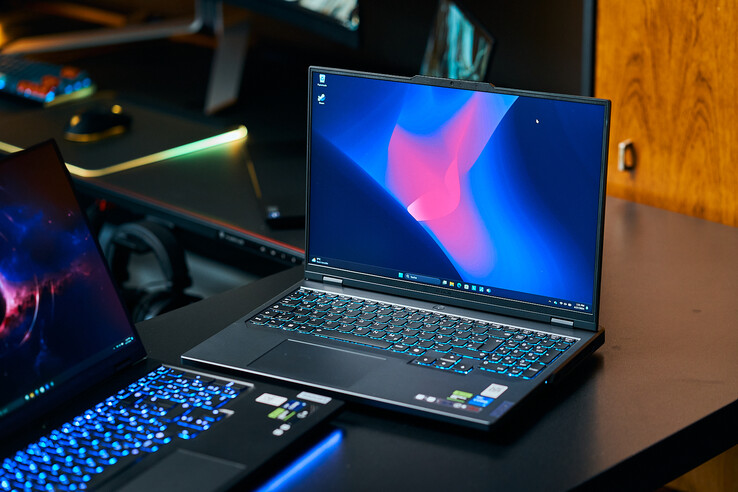
We have already tested one of the better configurations featuring a Core i9 14900HX CPU and a 140-watt GeForce RTX 4070. However, lots of gamers will likely go for the more affordable configuration with an i7 14700HX and an RTX 4060 which we are taking a look at today. This model may also put some of the "big" model's weak points into perspective, such as its high surface temperatures and noisy cooling system.
Aside from its big brother and the non-pro Legion 5, we will be comparing the Legion Pro 5 with other RTX 4060 gamers like the Dell G16, HP Victus 16 and the XMG Core 15.
Possible competitors compared
Version | Rating | Date | Model | Weight | Height | Size | Resolution | Price |
|---|---|---|---|---|---|---|---|---|
| v8 | 82.3 % | 07 / 2024 | Lenovo Legion Pro 5 16IRX9 G9 i7-14700HX, GeForce RTX 4060 Laptop GPU | 2.5 kg | 26.55 mm | 16.00" | 2560x1600 | |
| v7 (old) | 84.3 % v7 (old) | 05 / 2024 | HP Victus 16 (2024) i7-14700HX, GeForce RTX 4060 Laptop GPU | 2.4 kg | 23.9 mm | 16.10" | 1920x1080 | |
| v7 (old) | 85.5 % v7 (old) | 02 / 2024 | Dell G16, i7-13650HX, RTX 4060 i7-13650HX, GeForce RTX 4060 Laptop GPU | 2.8 kg | 25.65 mm | 16.00" | 2560x1600 | |
| v8 | 83.7 % | 06 / 2024 | Schenker XMG Core 15 (M24) R7 8845HS, GeForce RTX 4060 Laptop GPU | 2.1 kg | 21.9 mm | 15.30" | 2560x1600 | |
| v7 (old) | 89.3 % v7 (old) | 03 / 2024 | Lenovo Legion Pro 5 16IRX9 i9-14900HX, GeForce RTX 4070 Laptop GPU | 2.5 kg | 26.95 mm | 16.00" | 2560x1600 | |
| v7 (old) | 89.1 % v7 (old) | 01 / 2024 | Lenovo Legion 5 16IRX G9 i7-14650HX, GeForce RTX 4060 Laptop GPU | 2.4 kg | 25.2 mm | 16.00" | 2560x1600 |
Please note: We have updated our rating system and the results of version 8 are not comparable with the results of version 7. More information is available here.
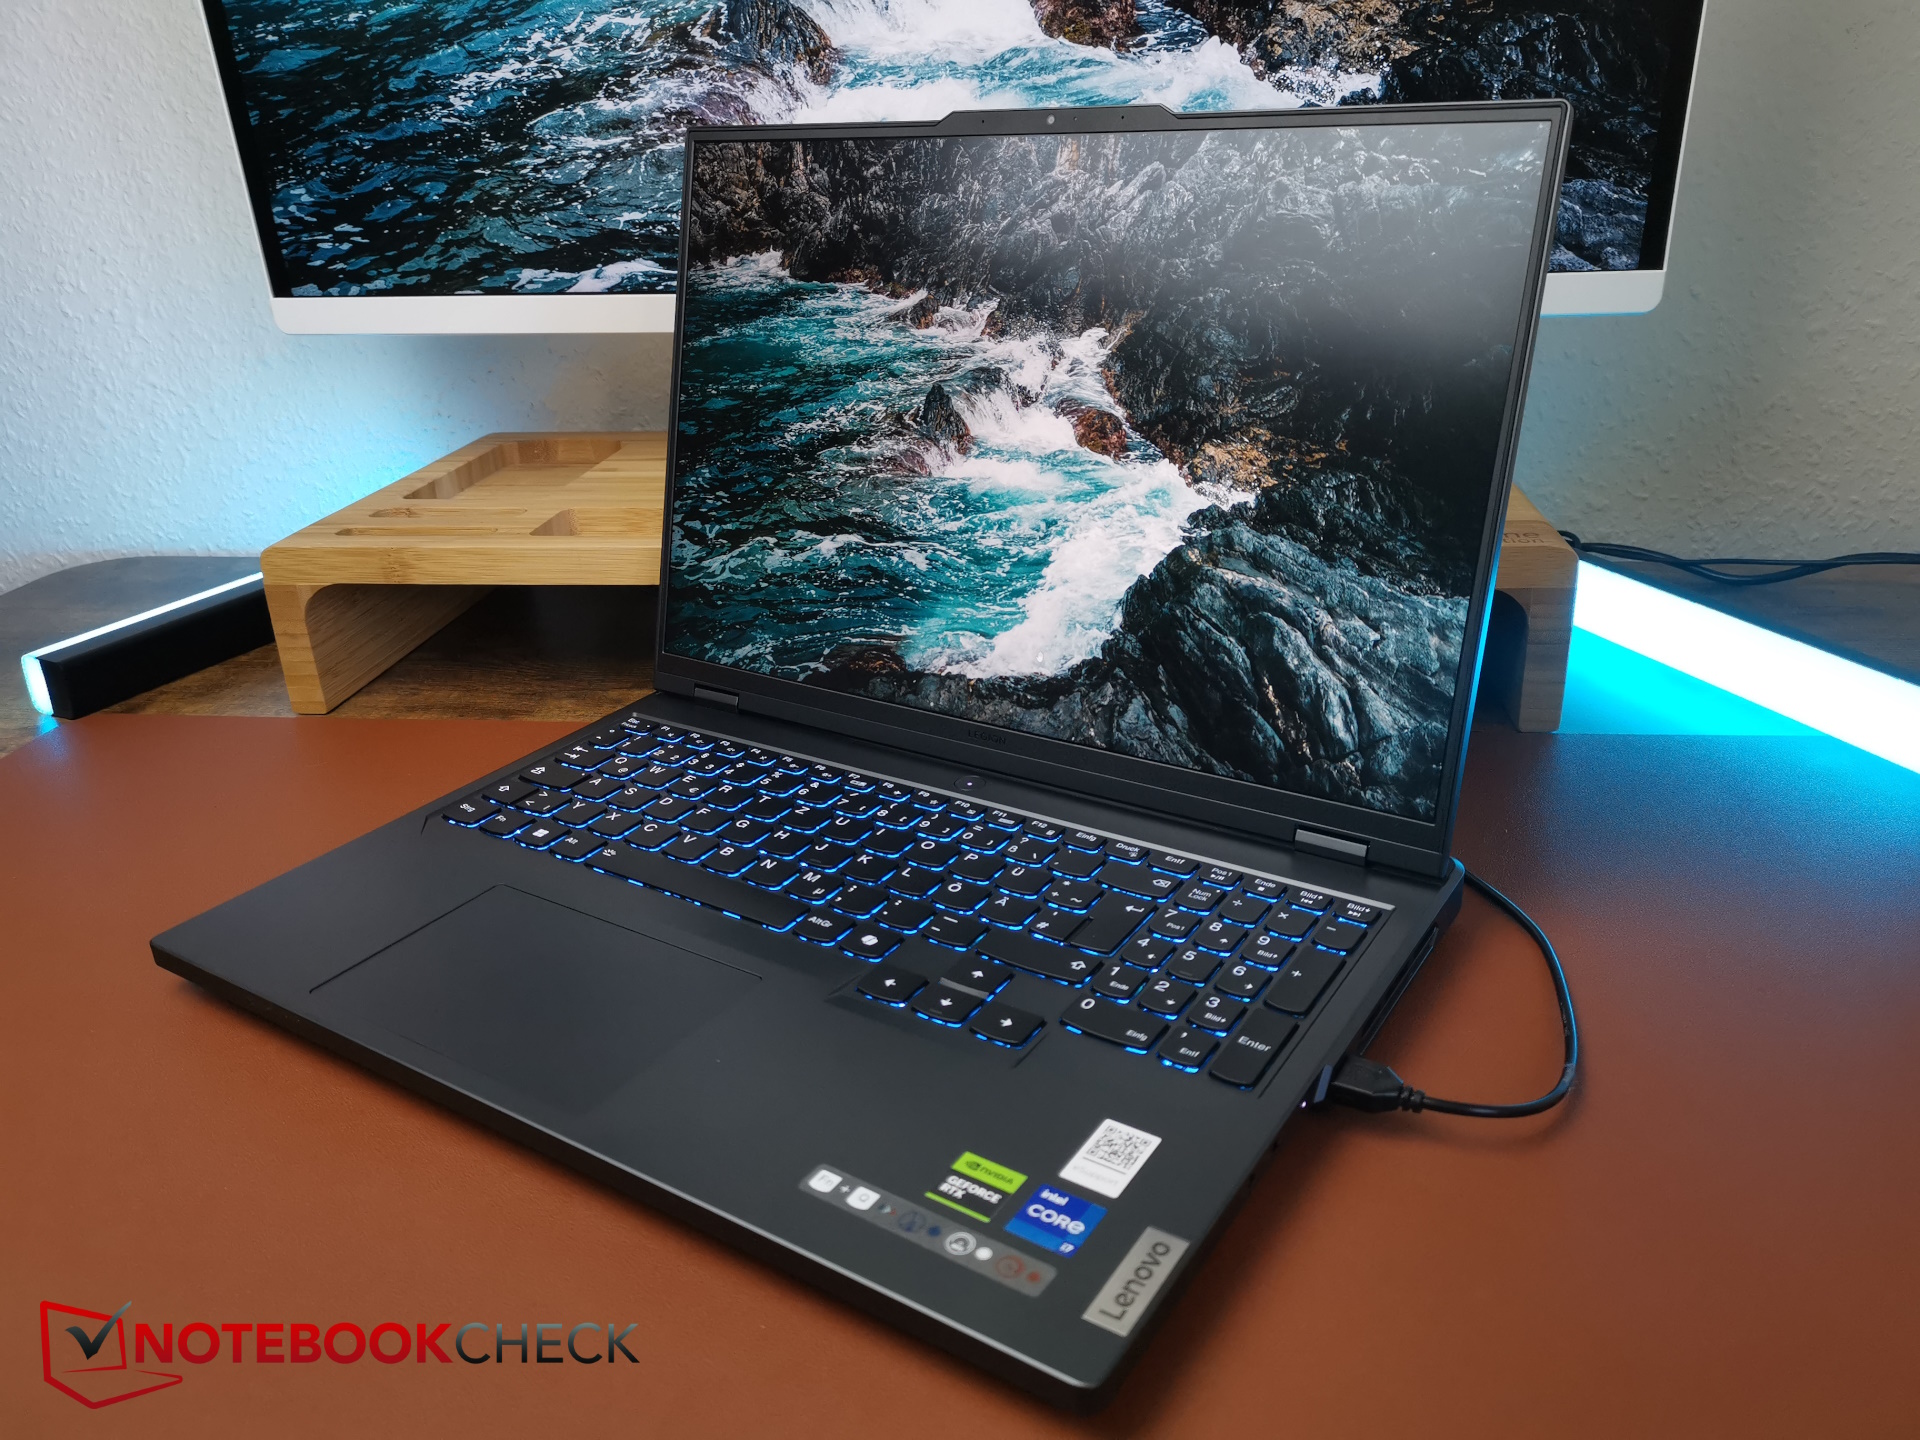
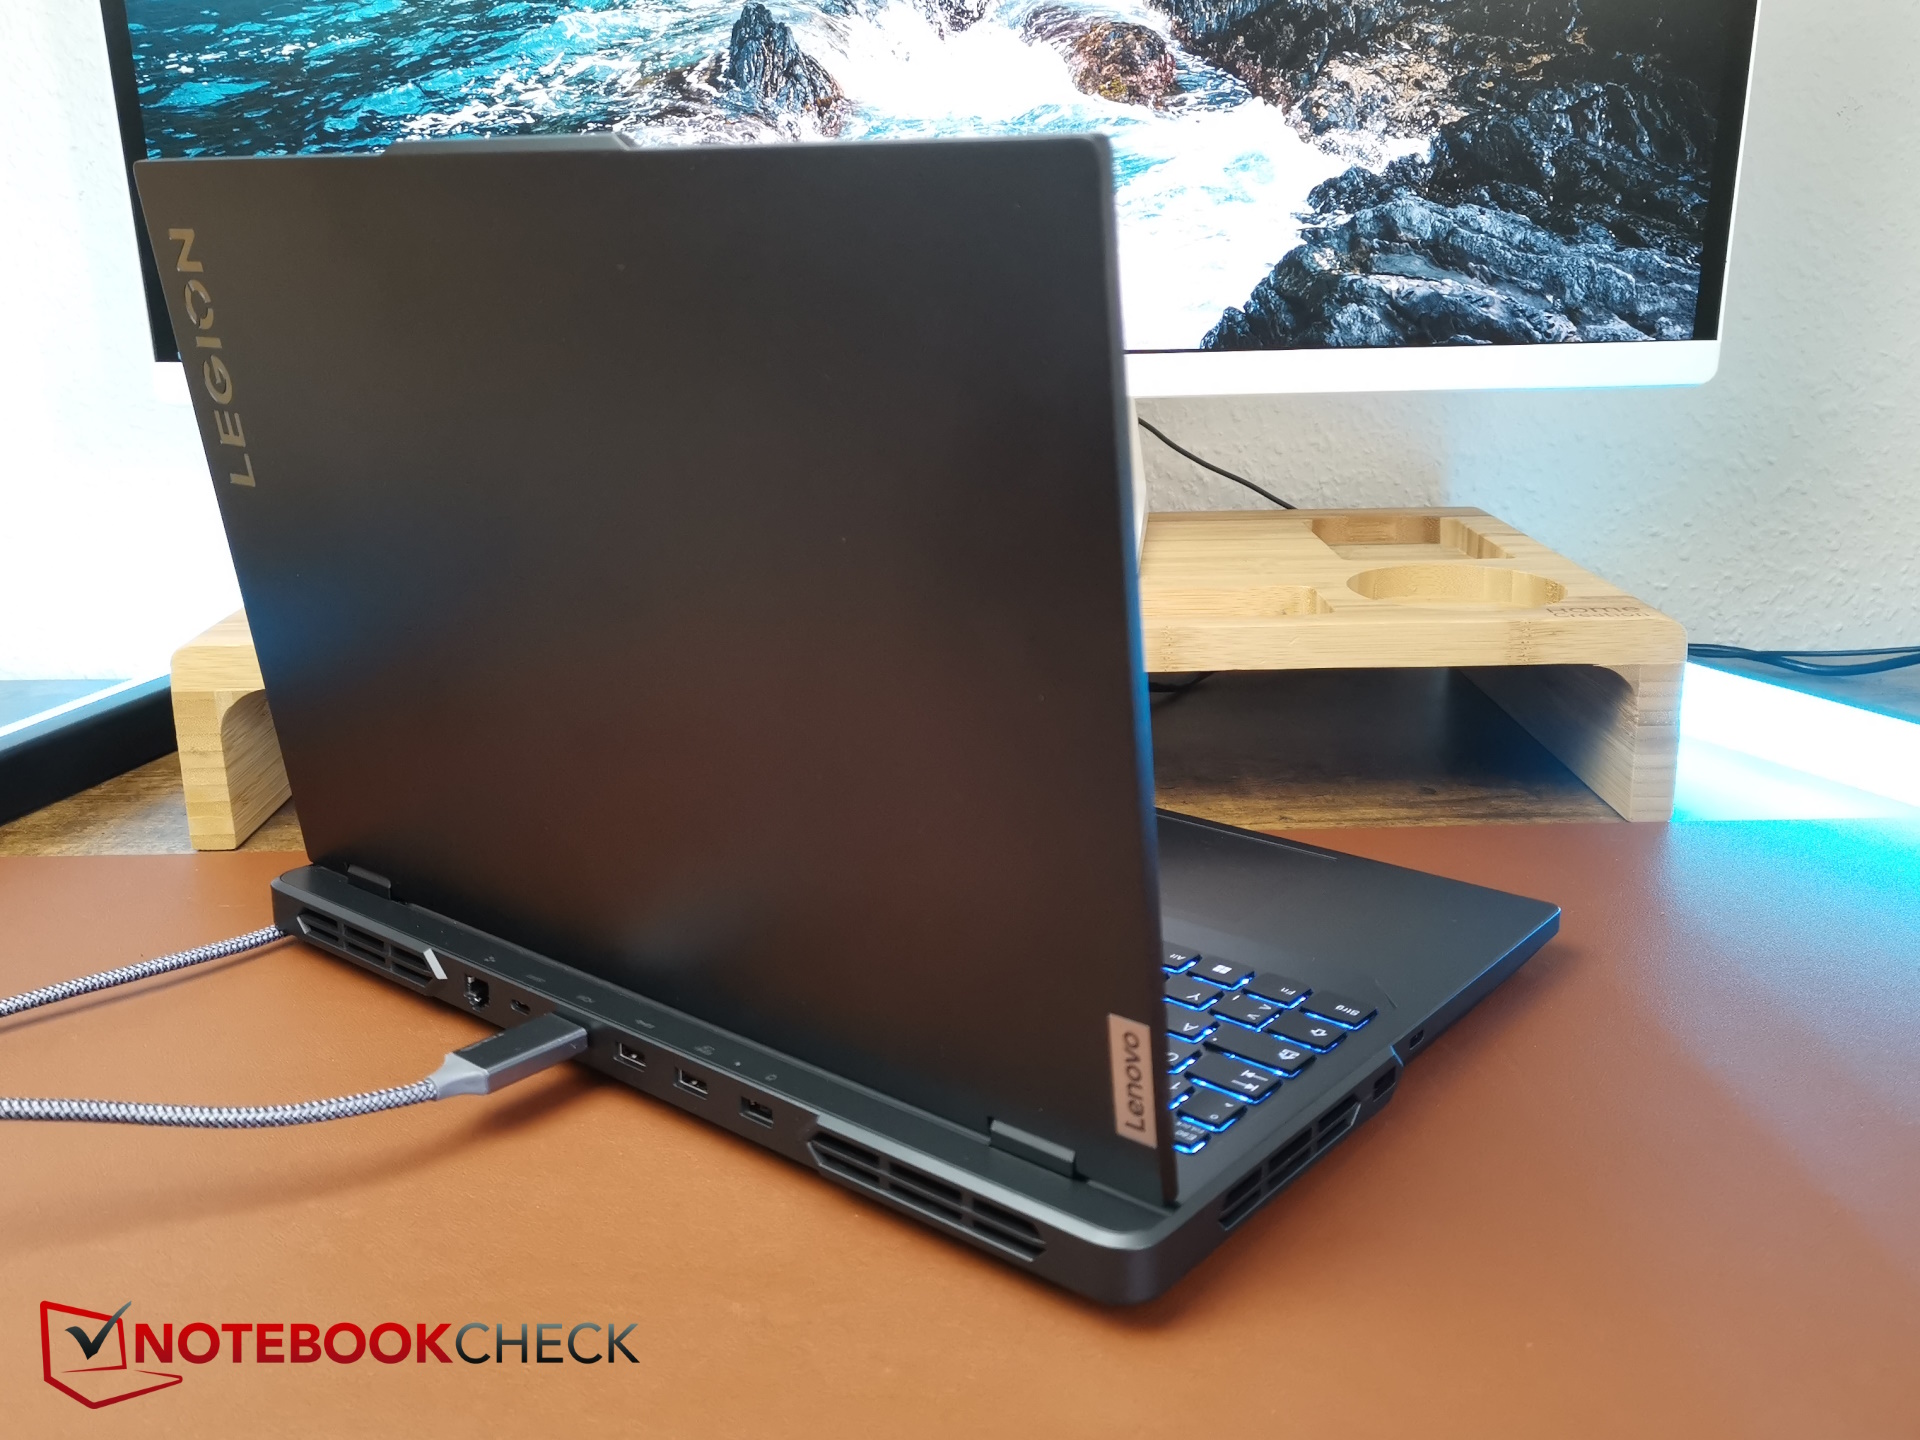
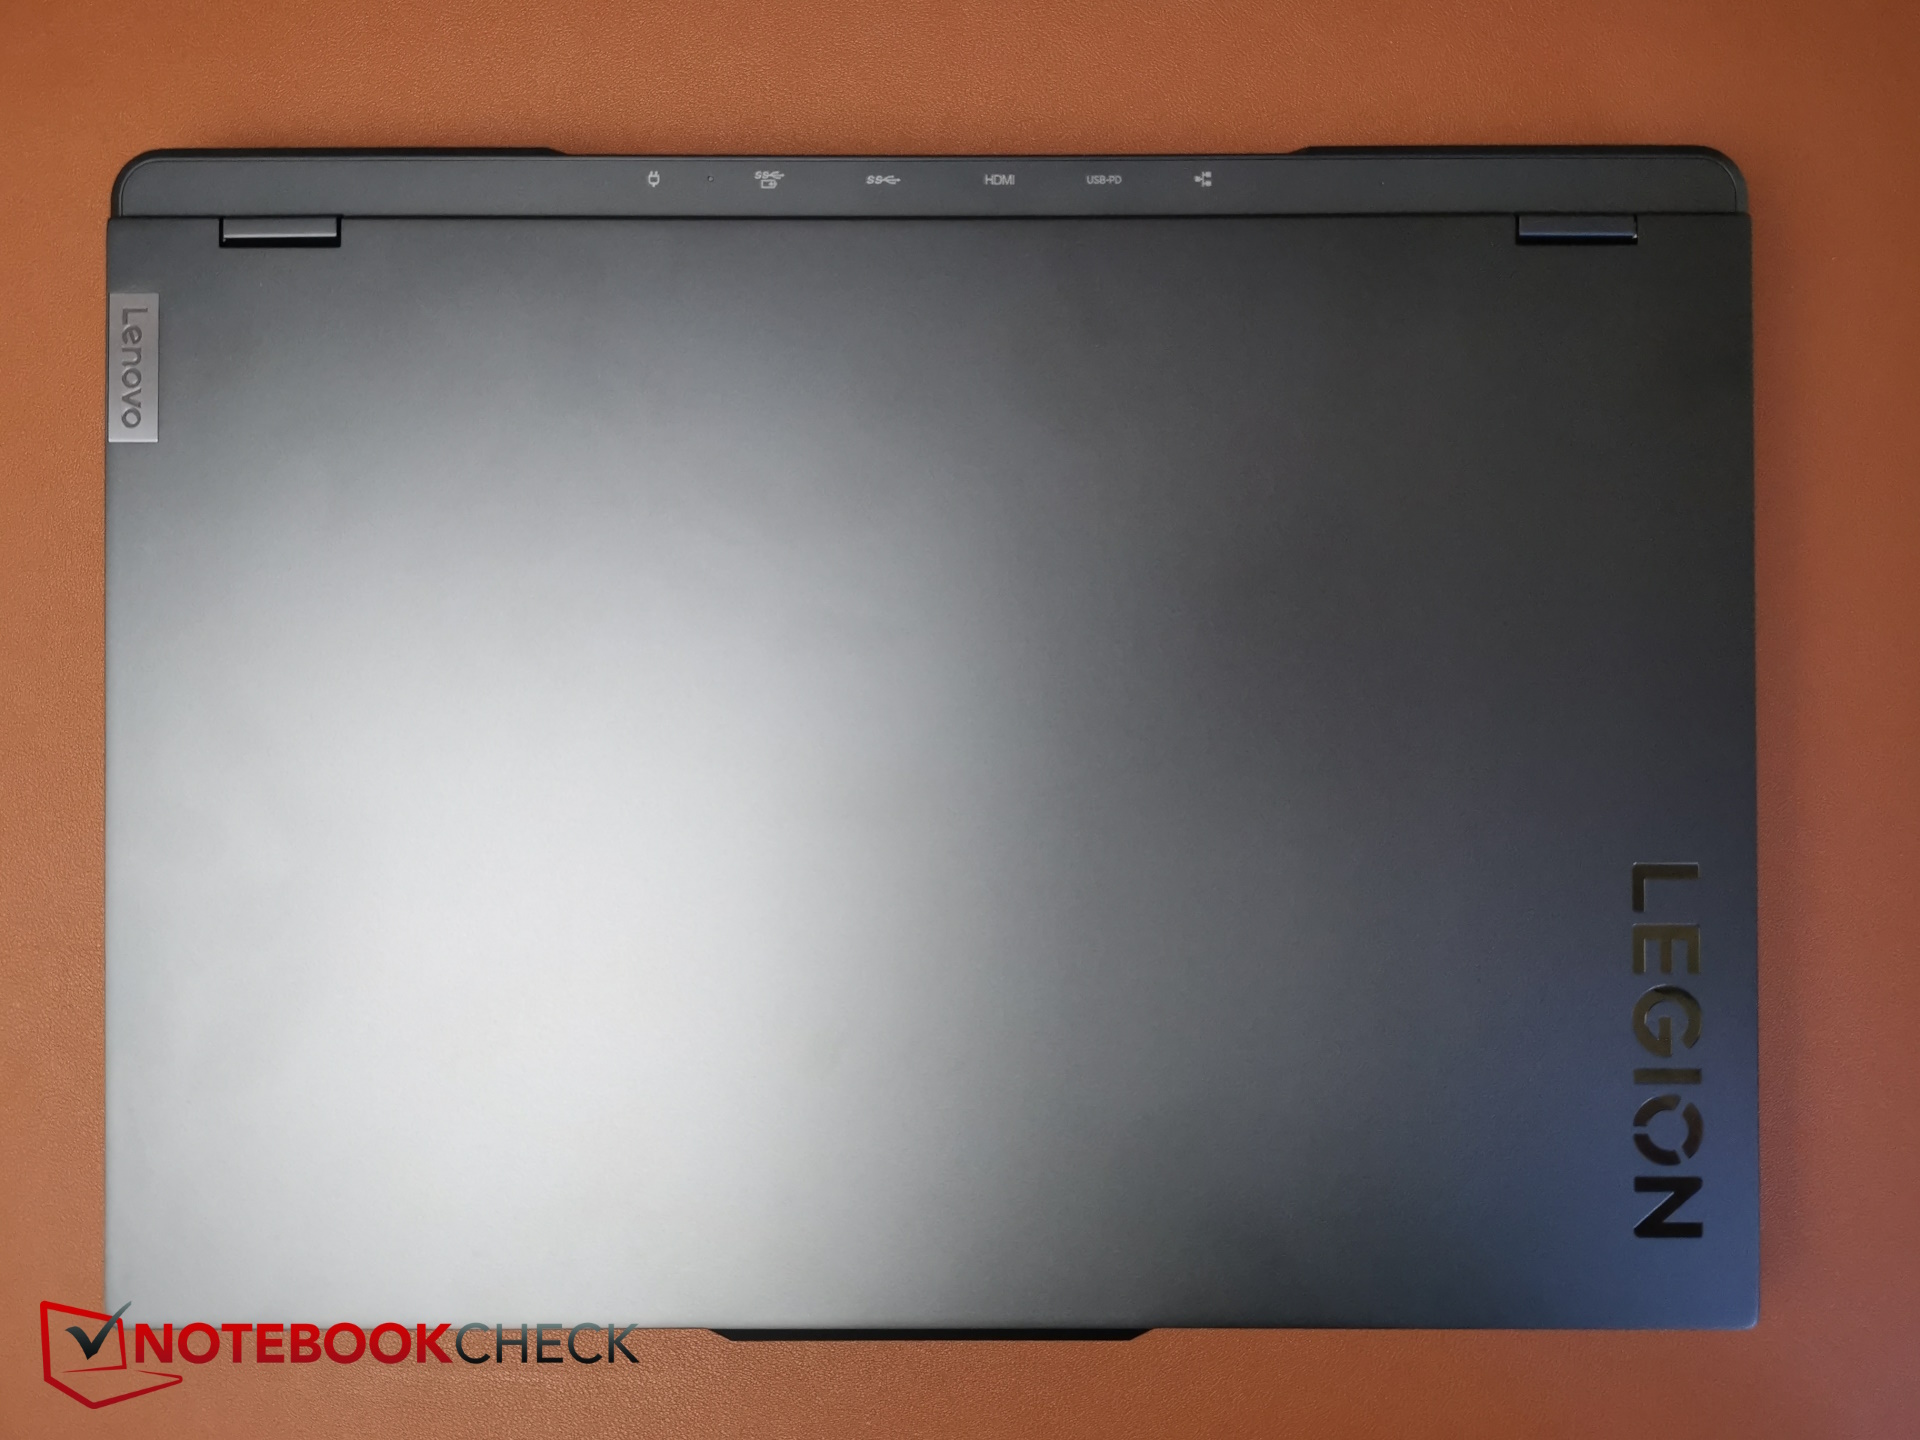
Case & connectivity: The Legion Pro without an SD card reader
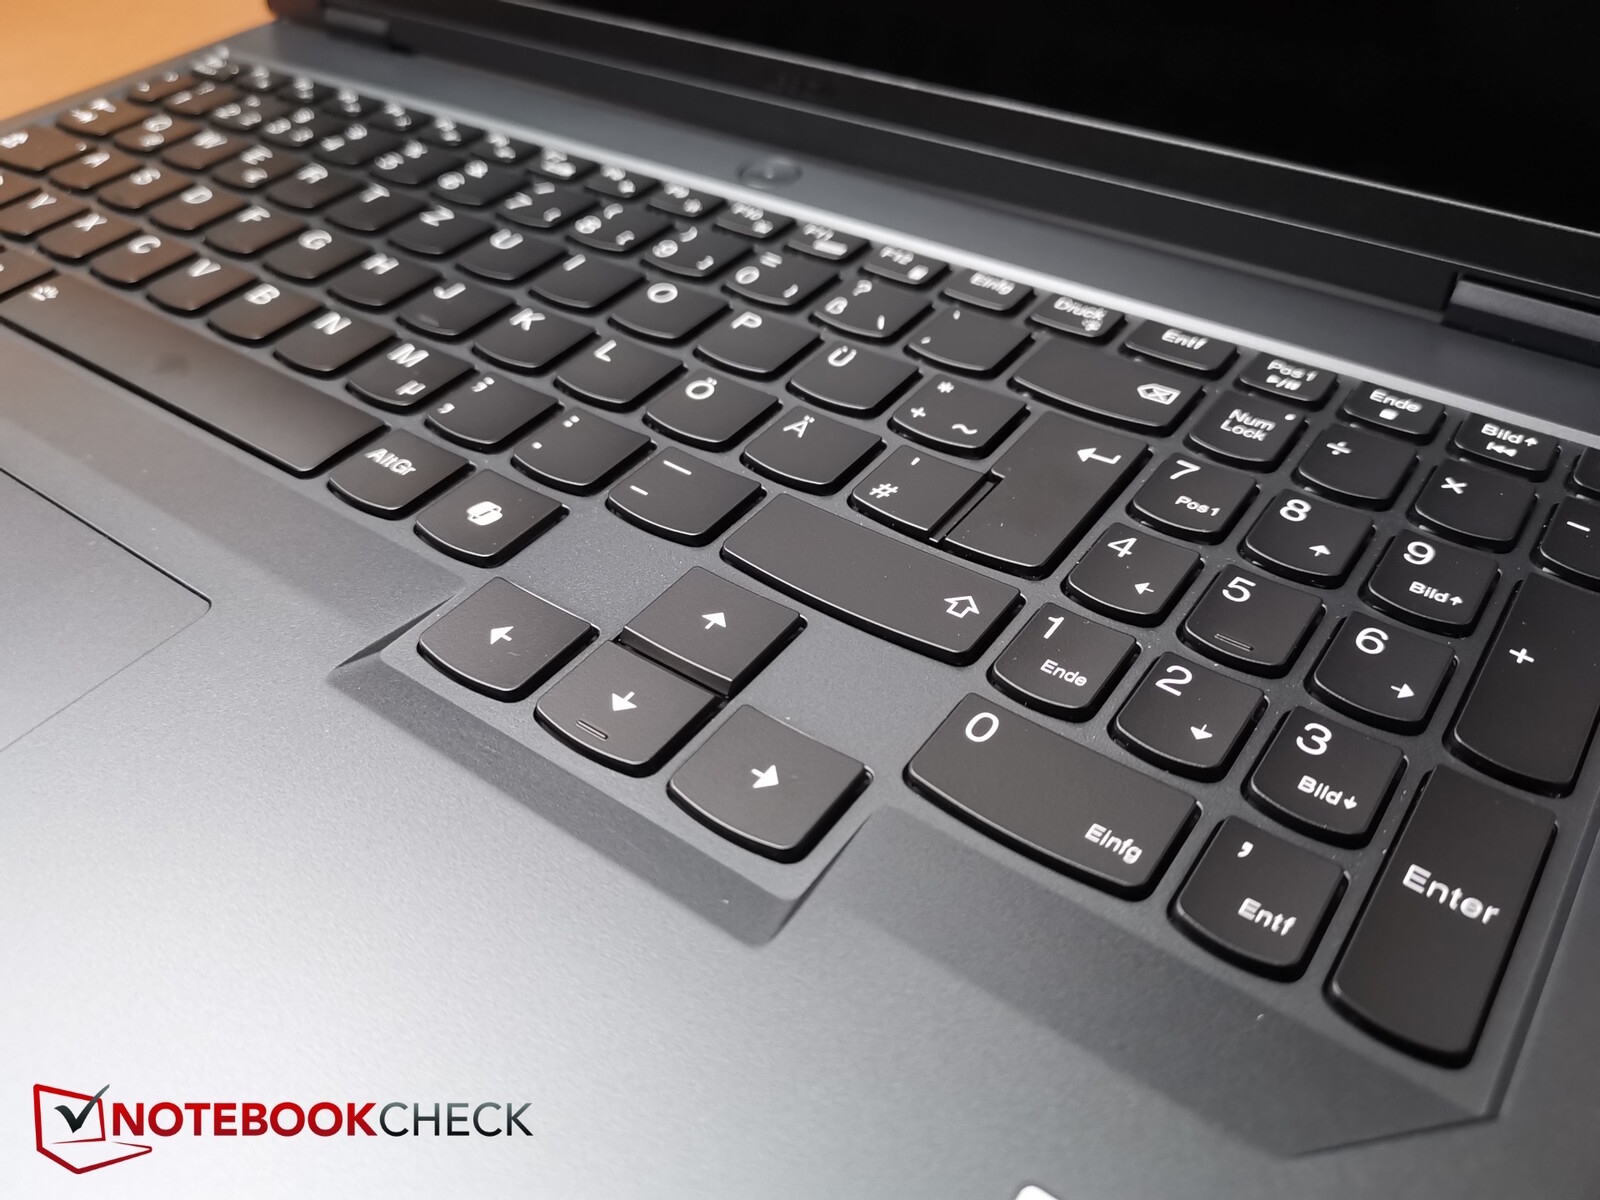
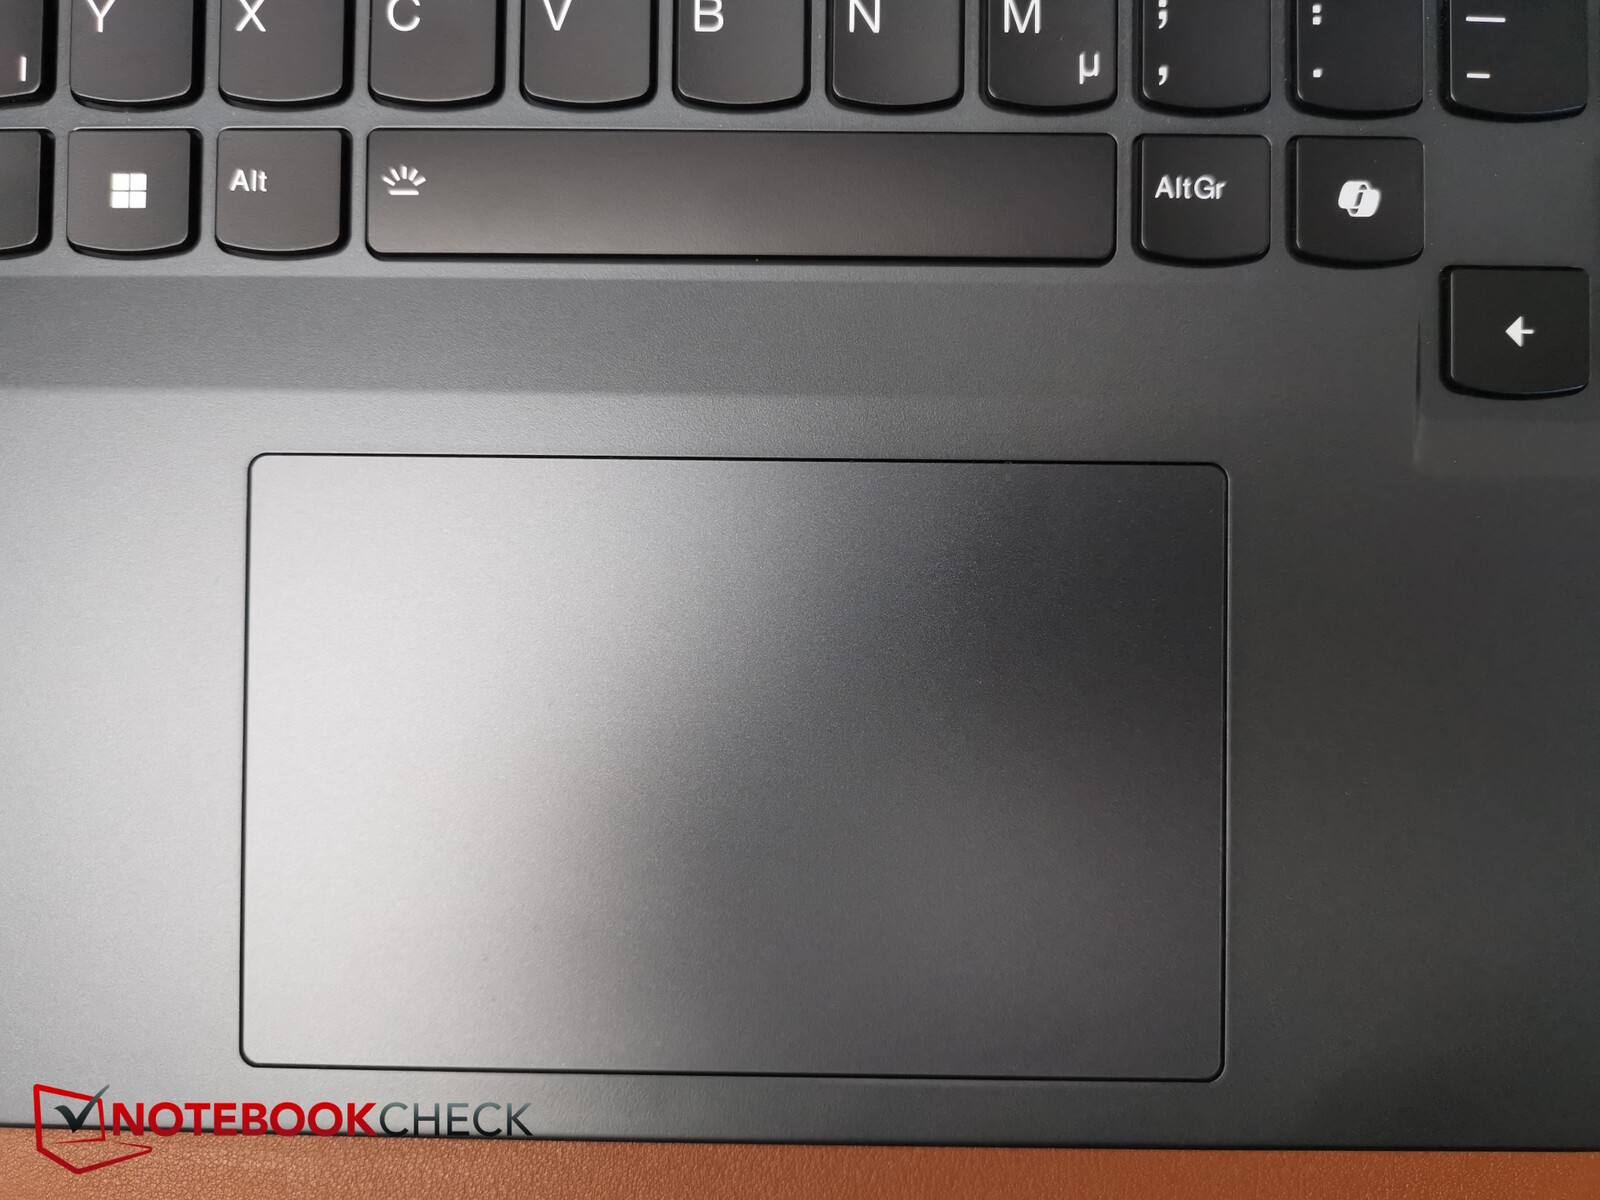
Since its physical features have otherwise remained unchanged, we recommend reading our original review of the Lenovo Legion Pro 5 16IRX9 for information on its case, maintenance options and input devices.
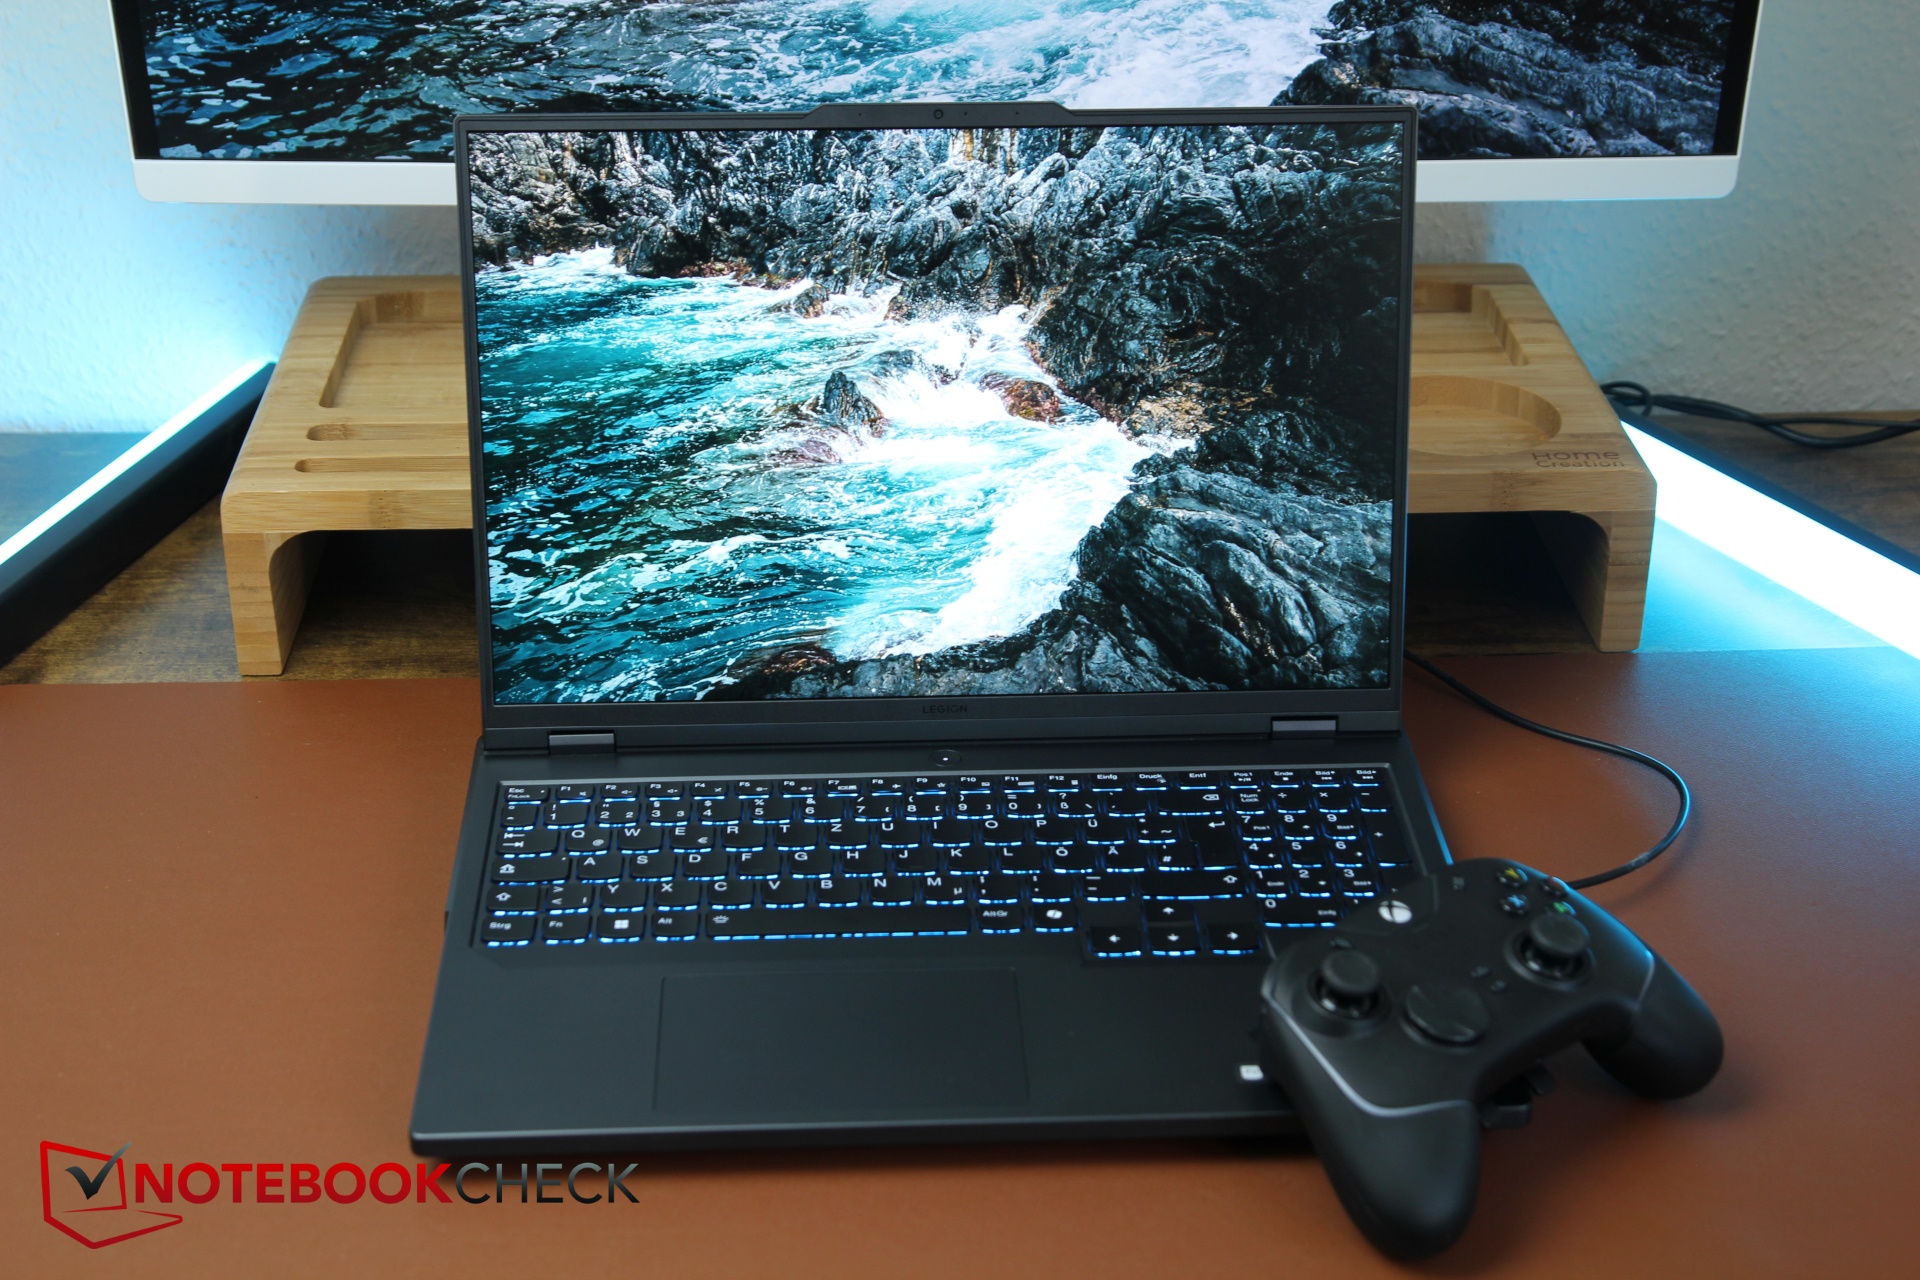


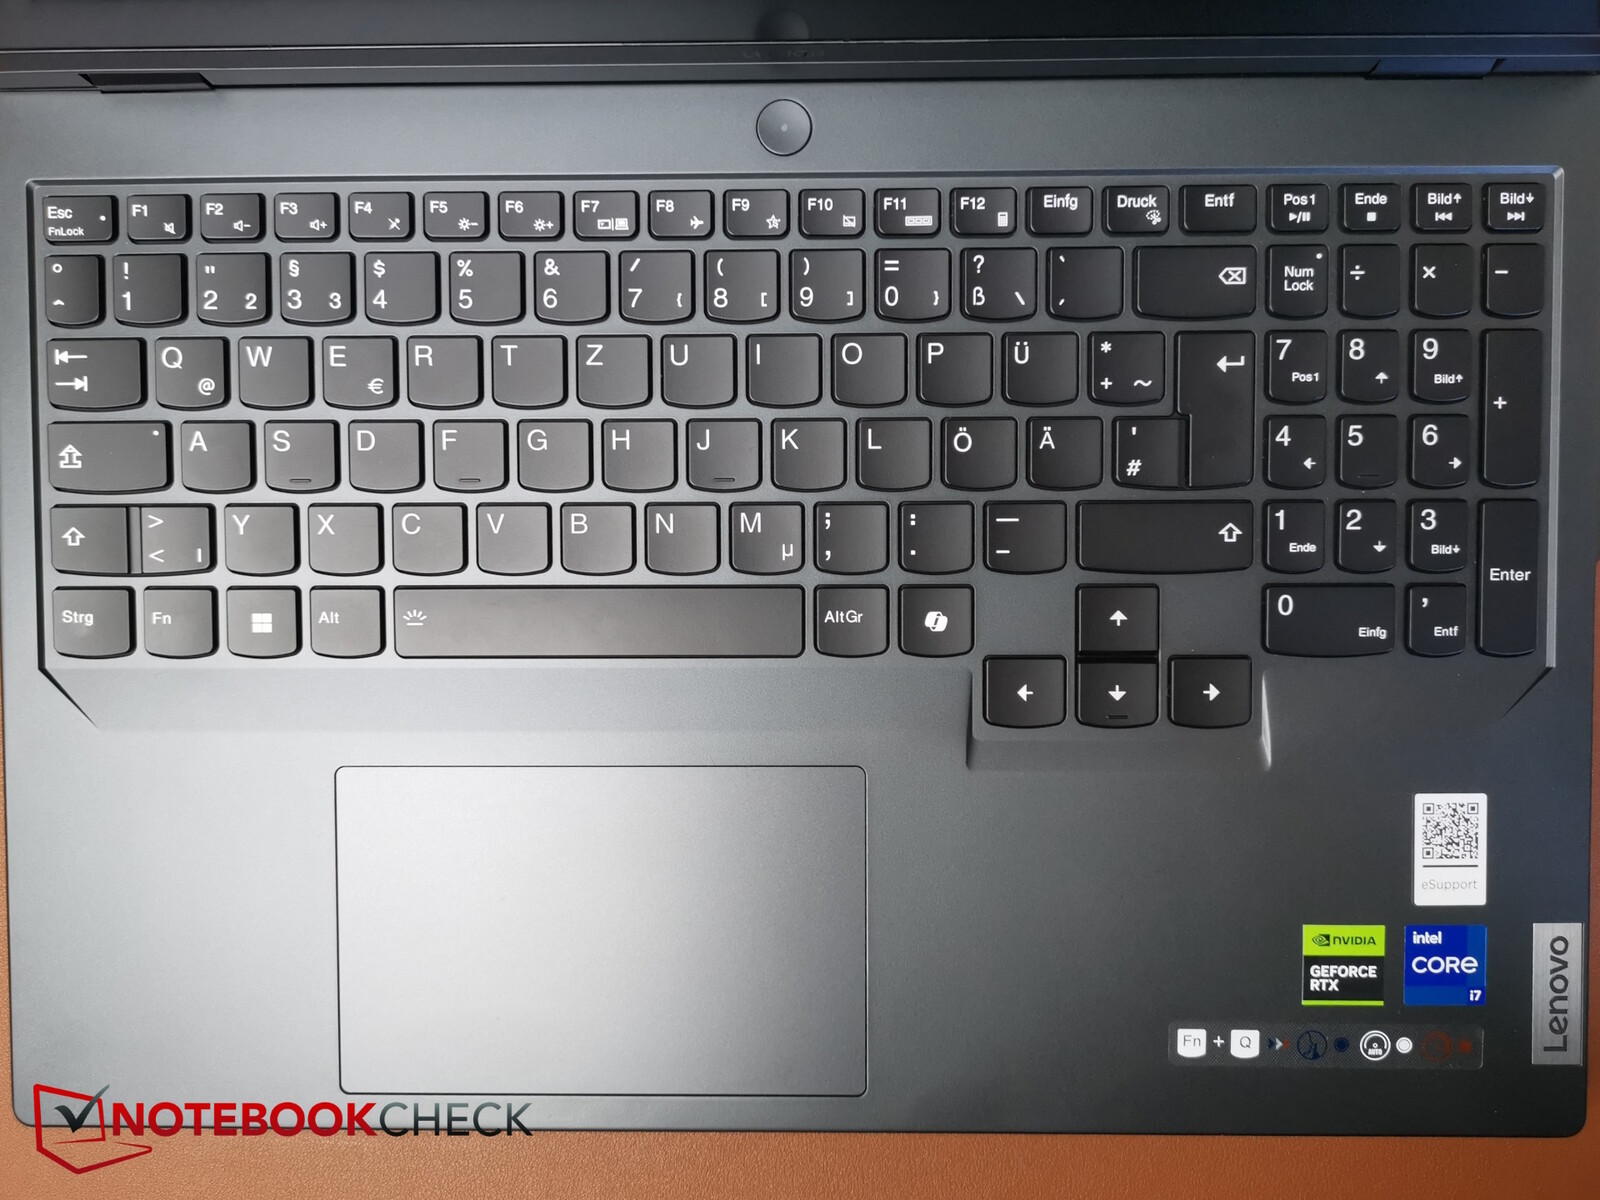
Input devices - Renowned Legion quality
Not mentioned in our first test of the Legion Pro 5i: Its refresh rate can be changed between three steps (240, 165 and 60 Hz) using the Fn + R key combination.

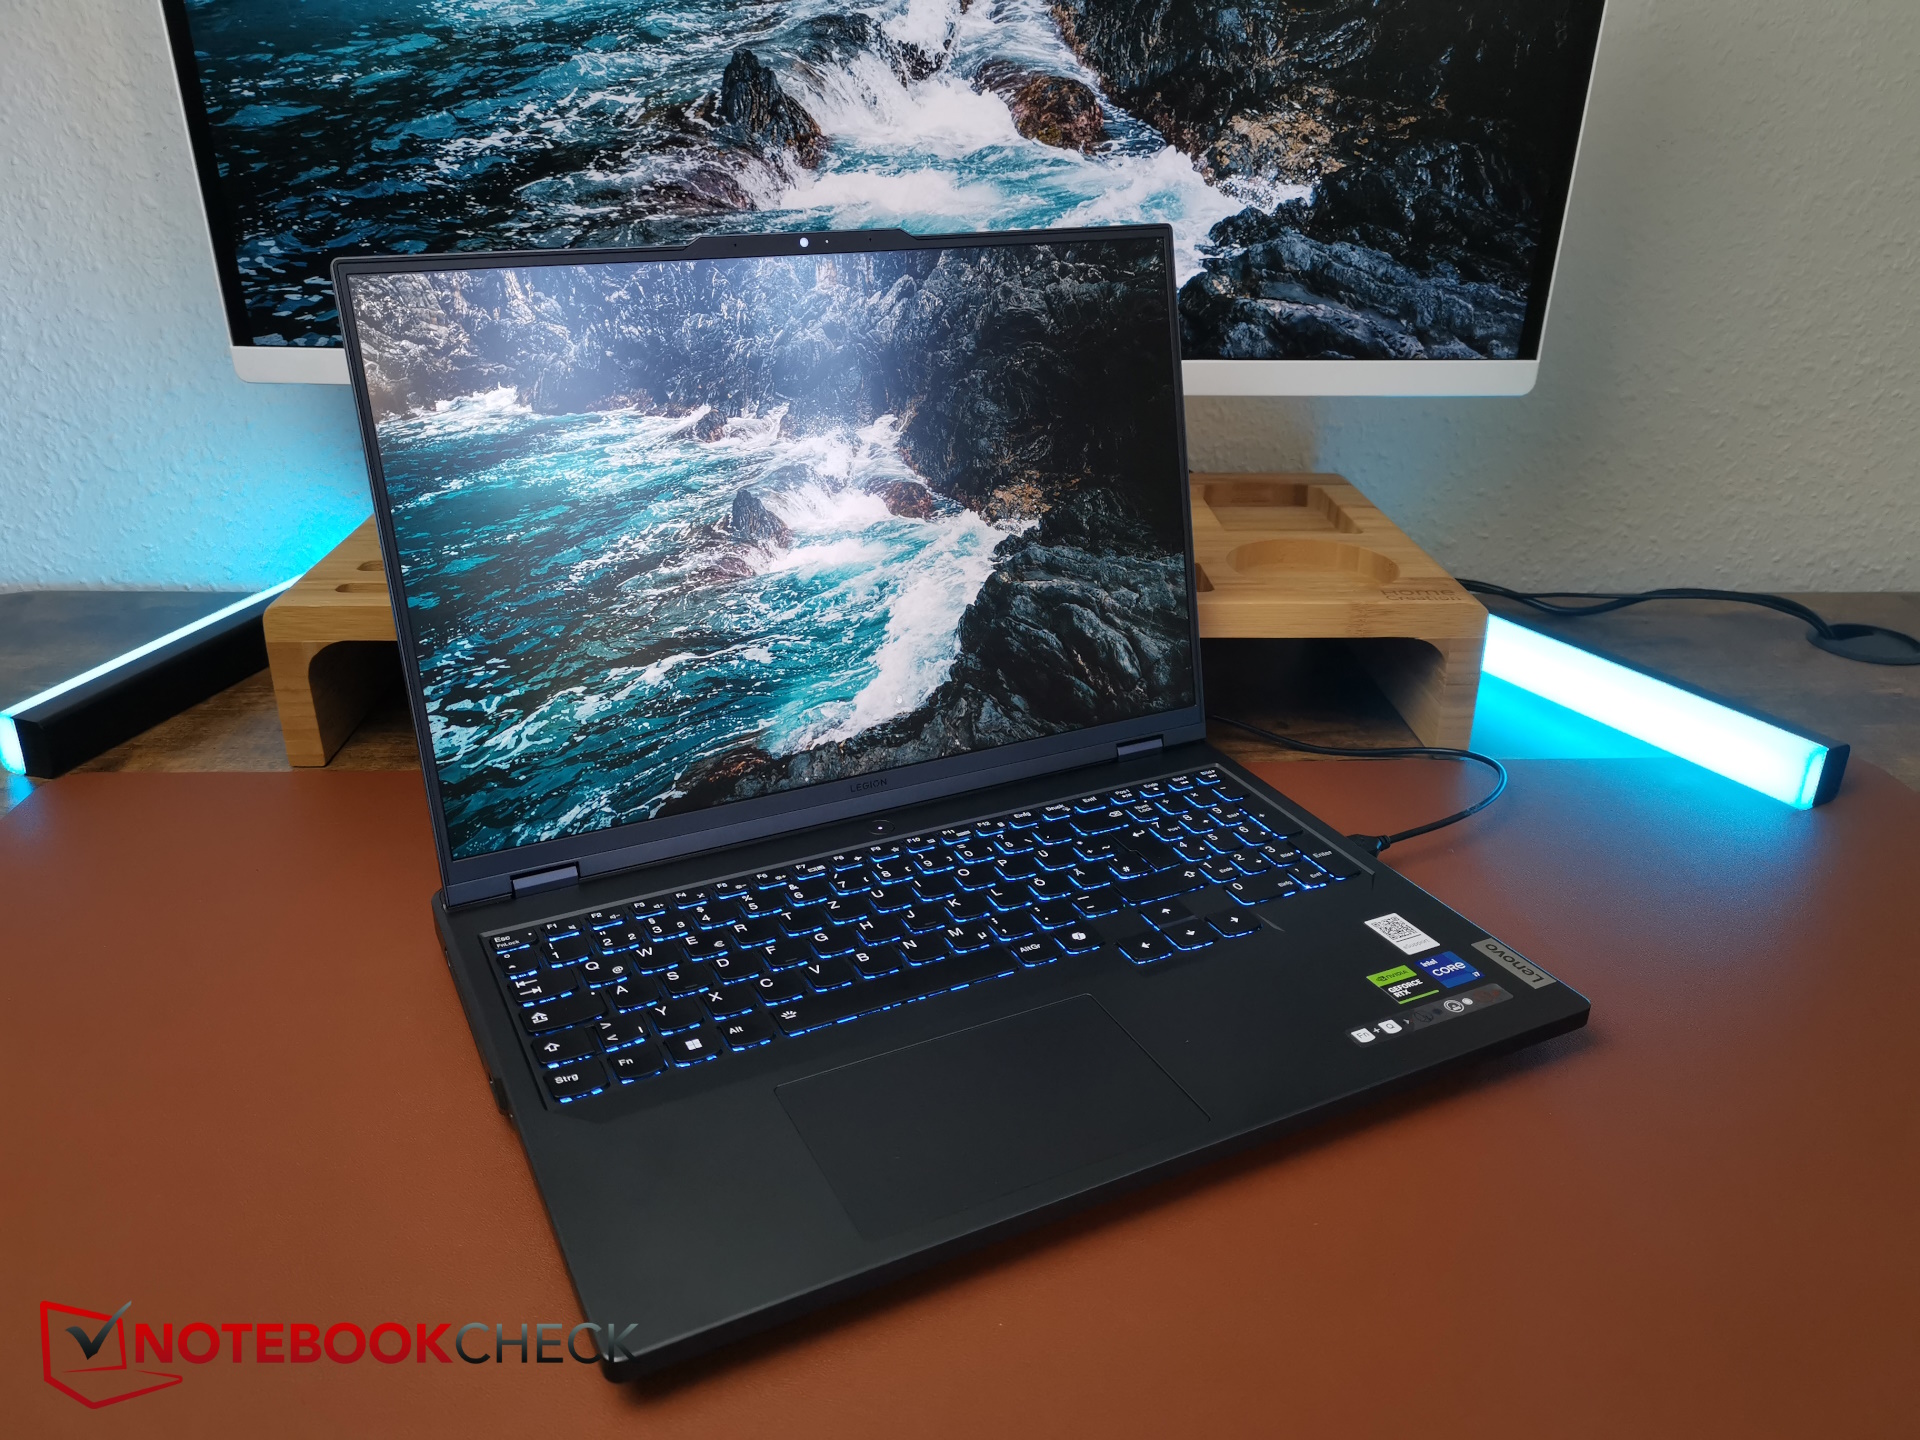
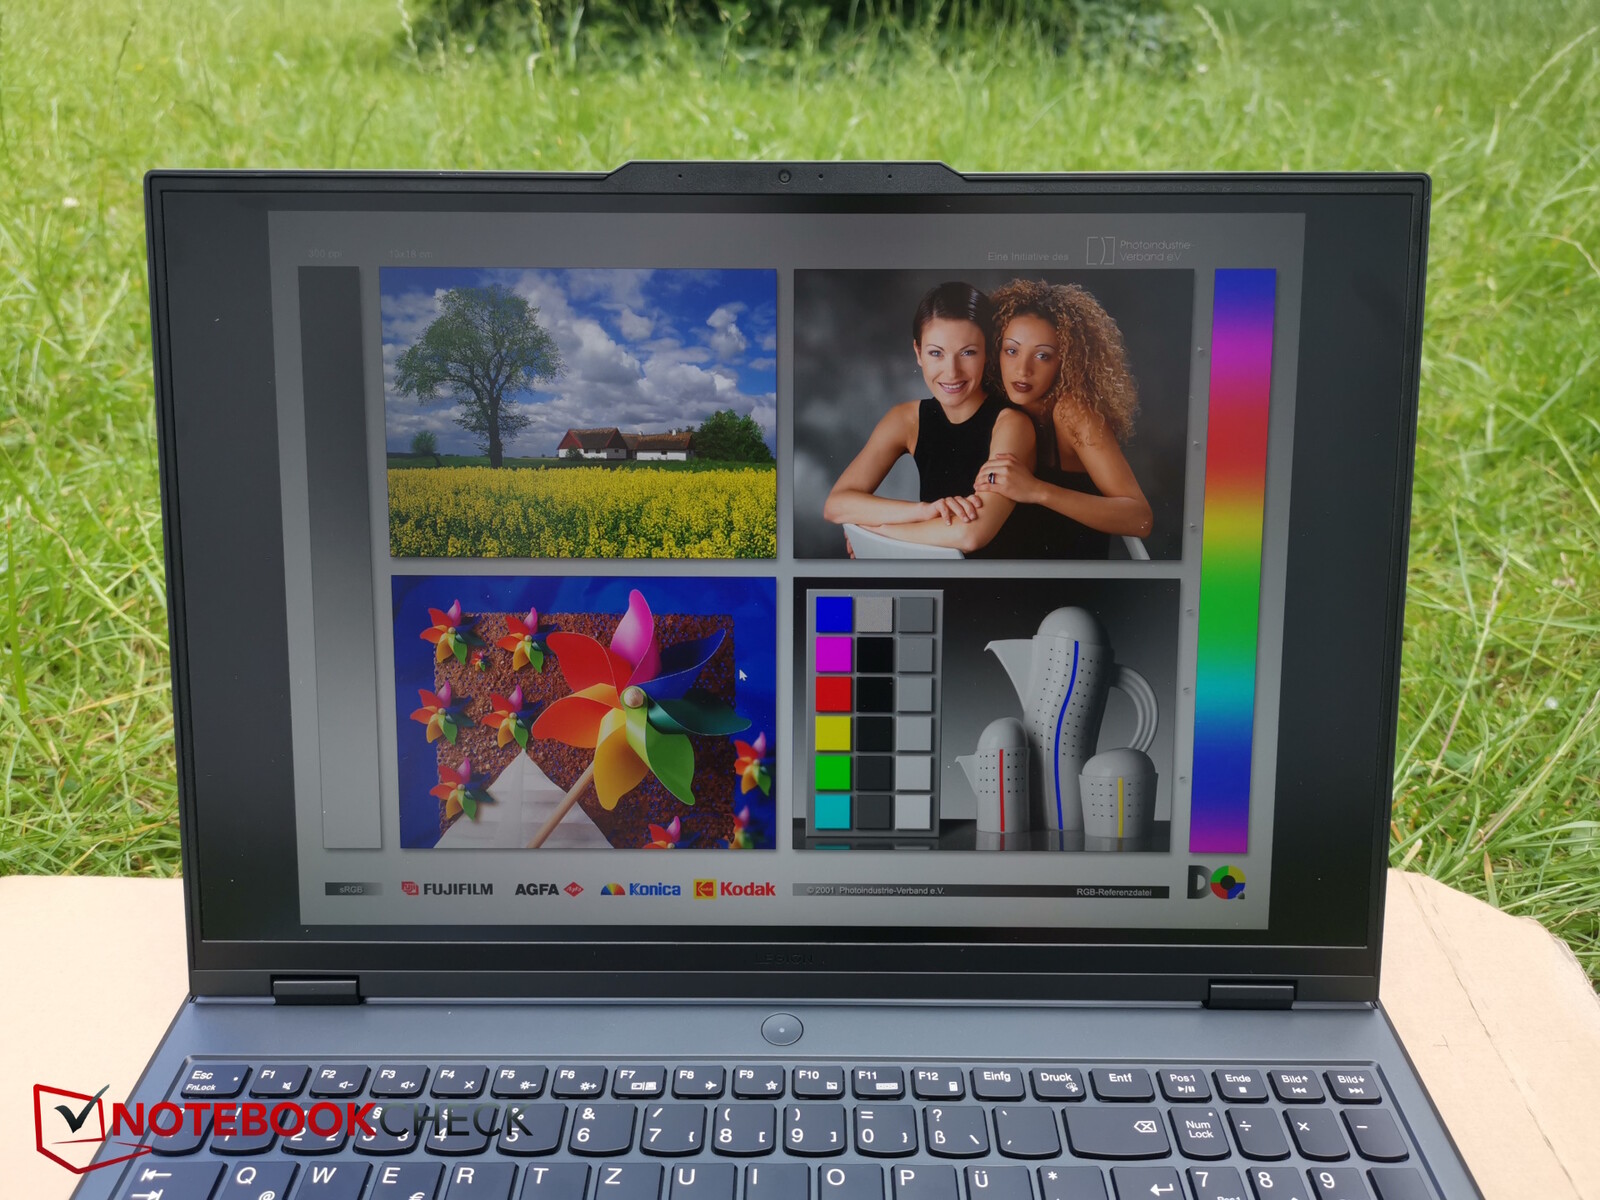
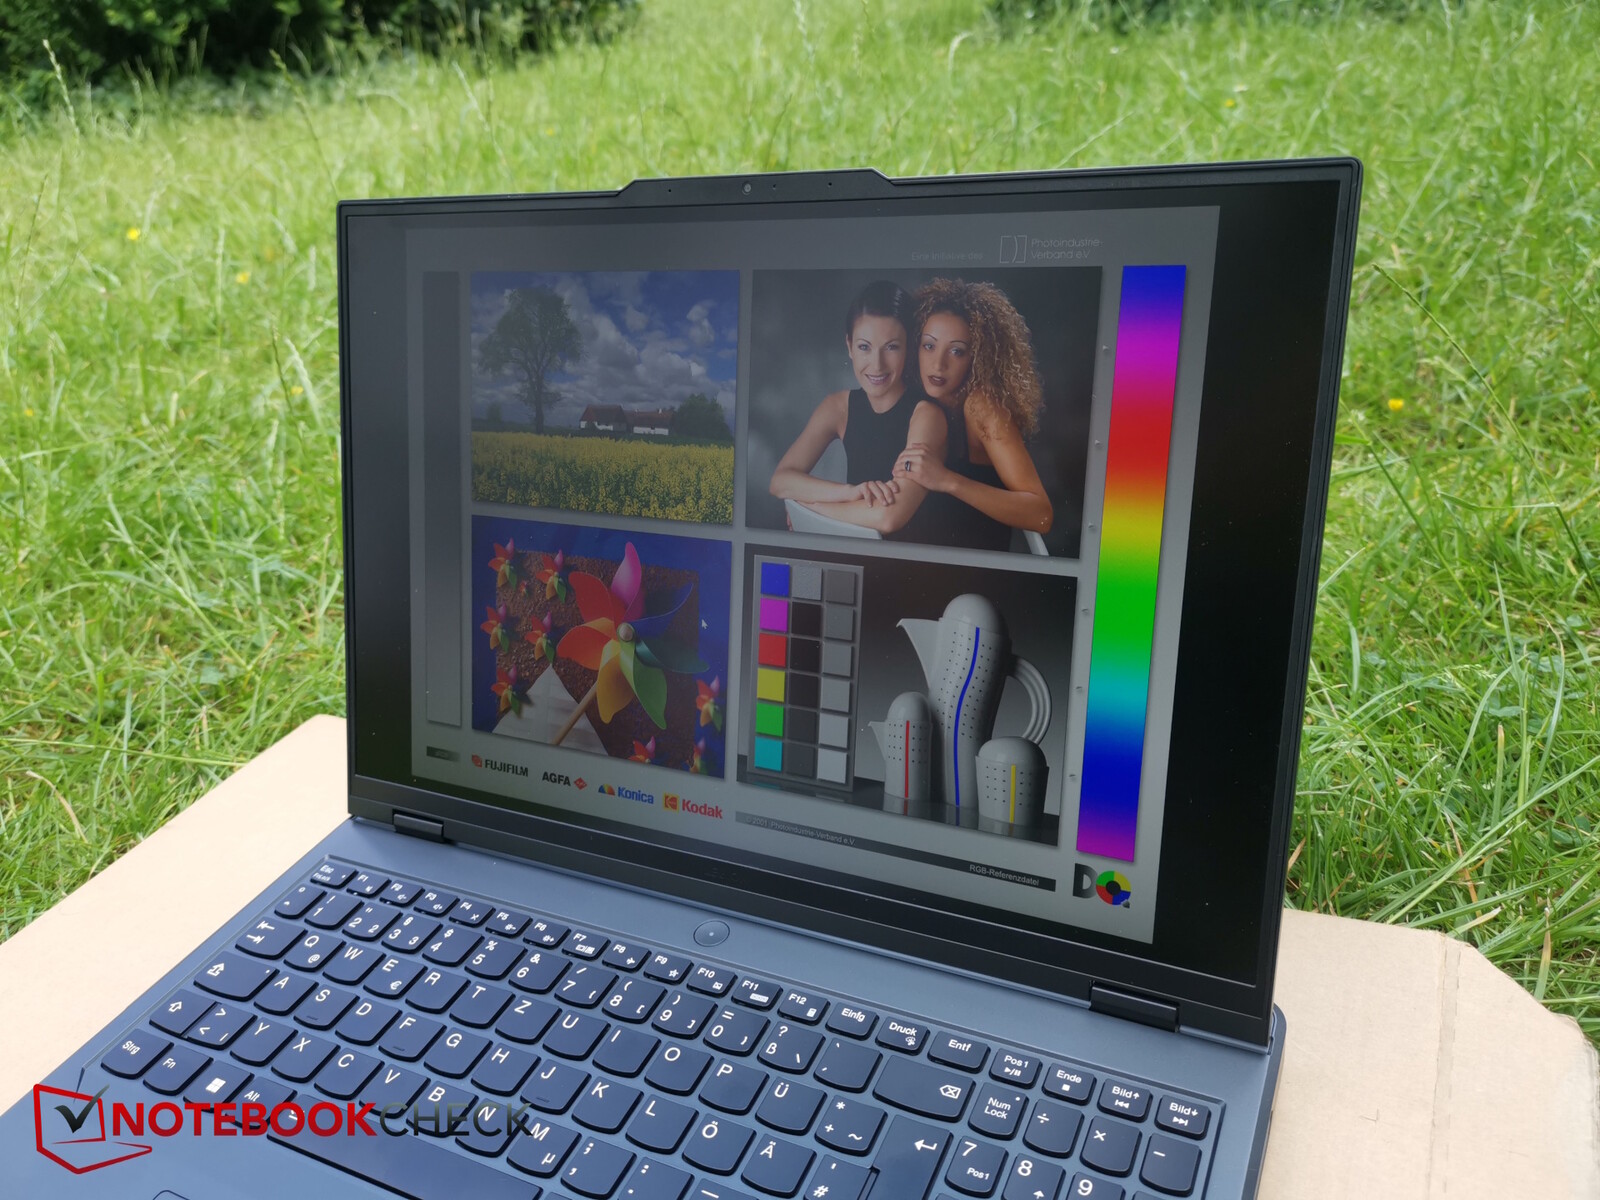
Display - A Legion Pro for content creators too


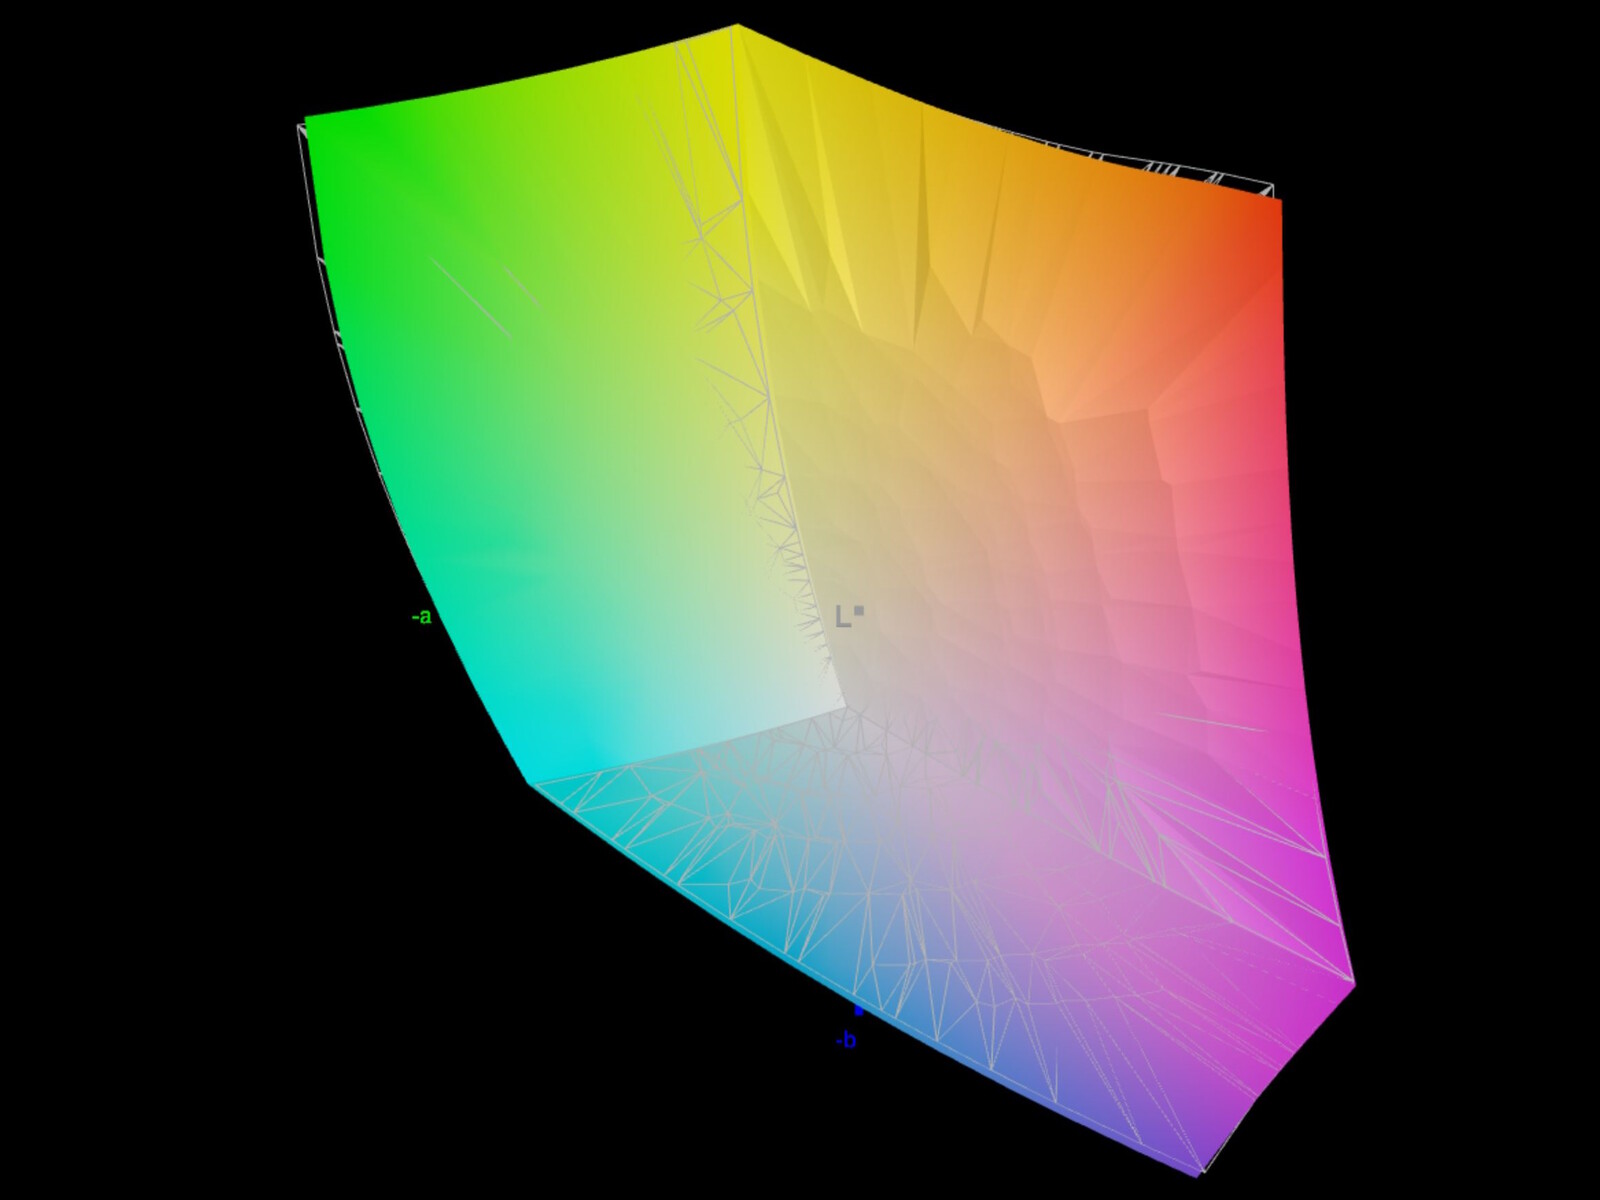
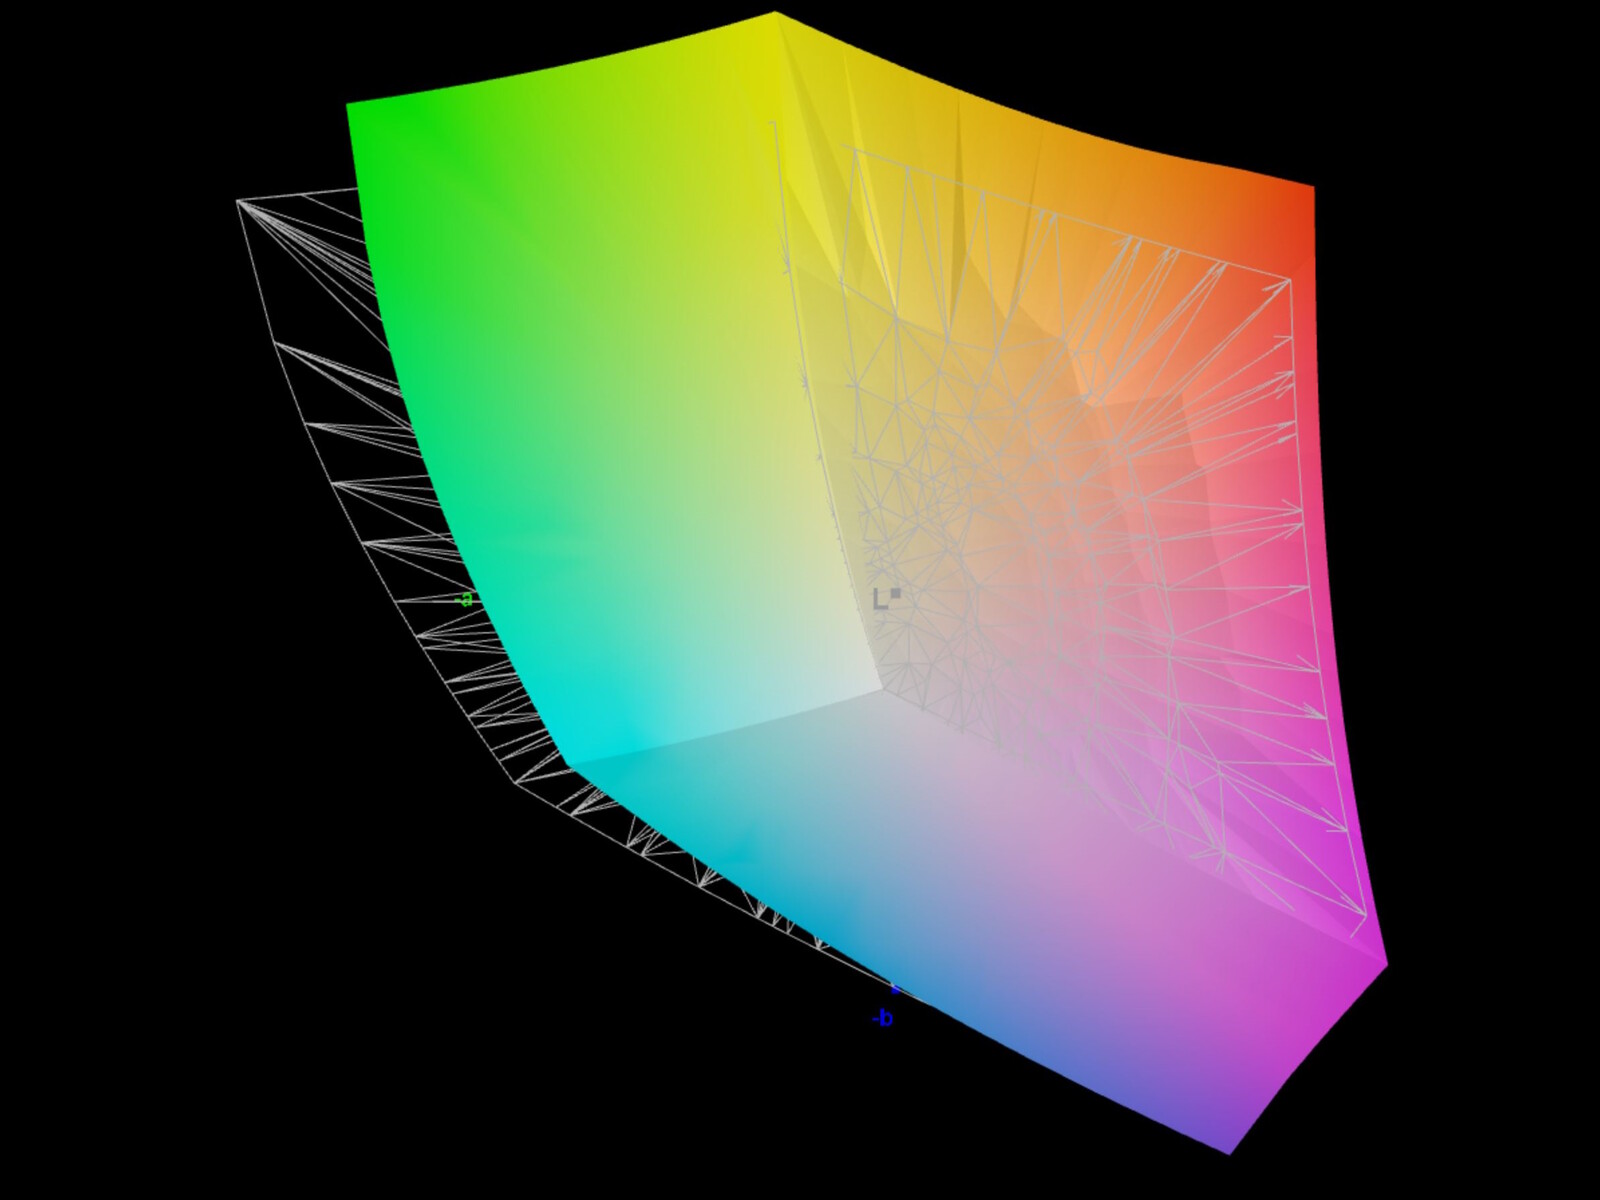
Lenovo has installed a matte IPS display with 2,560 x 1,600 pixels into this laptop. However, there are three display variants on offer, all with the same resolution. The entry-level model is supposed to cover sRGB, has a refresh rate of 165 Hz and a brightness of 300 nits. The other two models have a brightness of 500 nits and a refresh rate of 240 Hz, one of which also supports DCI-P3. Our test model has one of the 500 nits displays with a 240 Hz refresh rate.
We measured an average brightness of 491 nits and its illumination of 90 per cent is good. However, its black level could be a little better, but its contrast is fine.
We noted 150 nits at a brightness of around 58 per cent. It doesn't use PWM, so screen bleeding is not a problem and its response times are quite fast for an IPS panel.
| |||||||||||||||||||||||||
Brightness Distribution: 90 %
Center on Battery: 518 cd/m²
Contrast: 1439:1 (Black: 0.36 cd/m²)
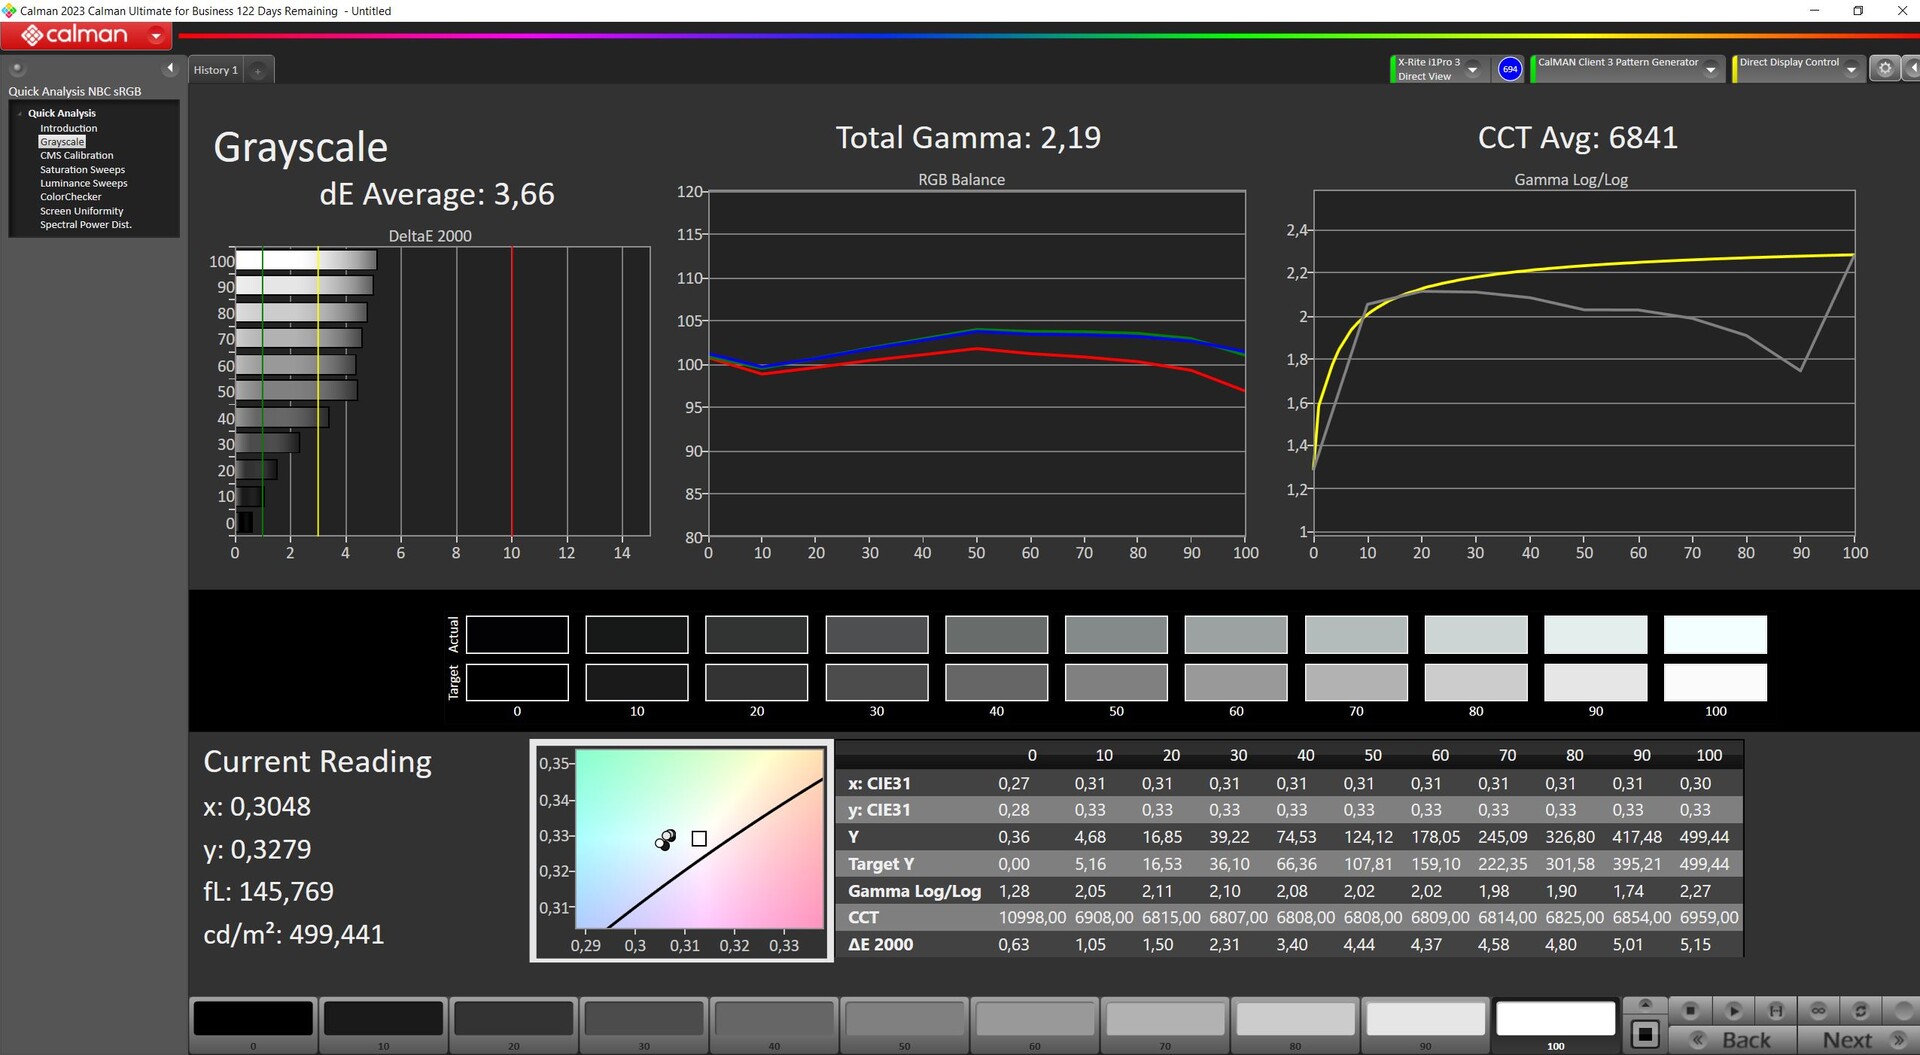
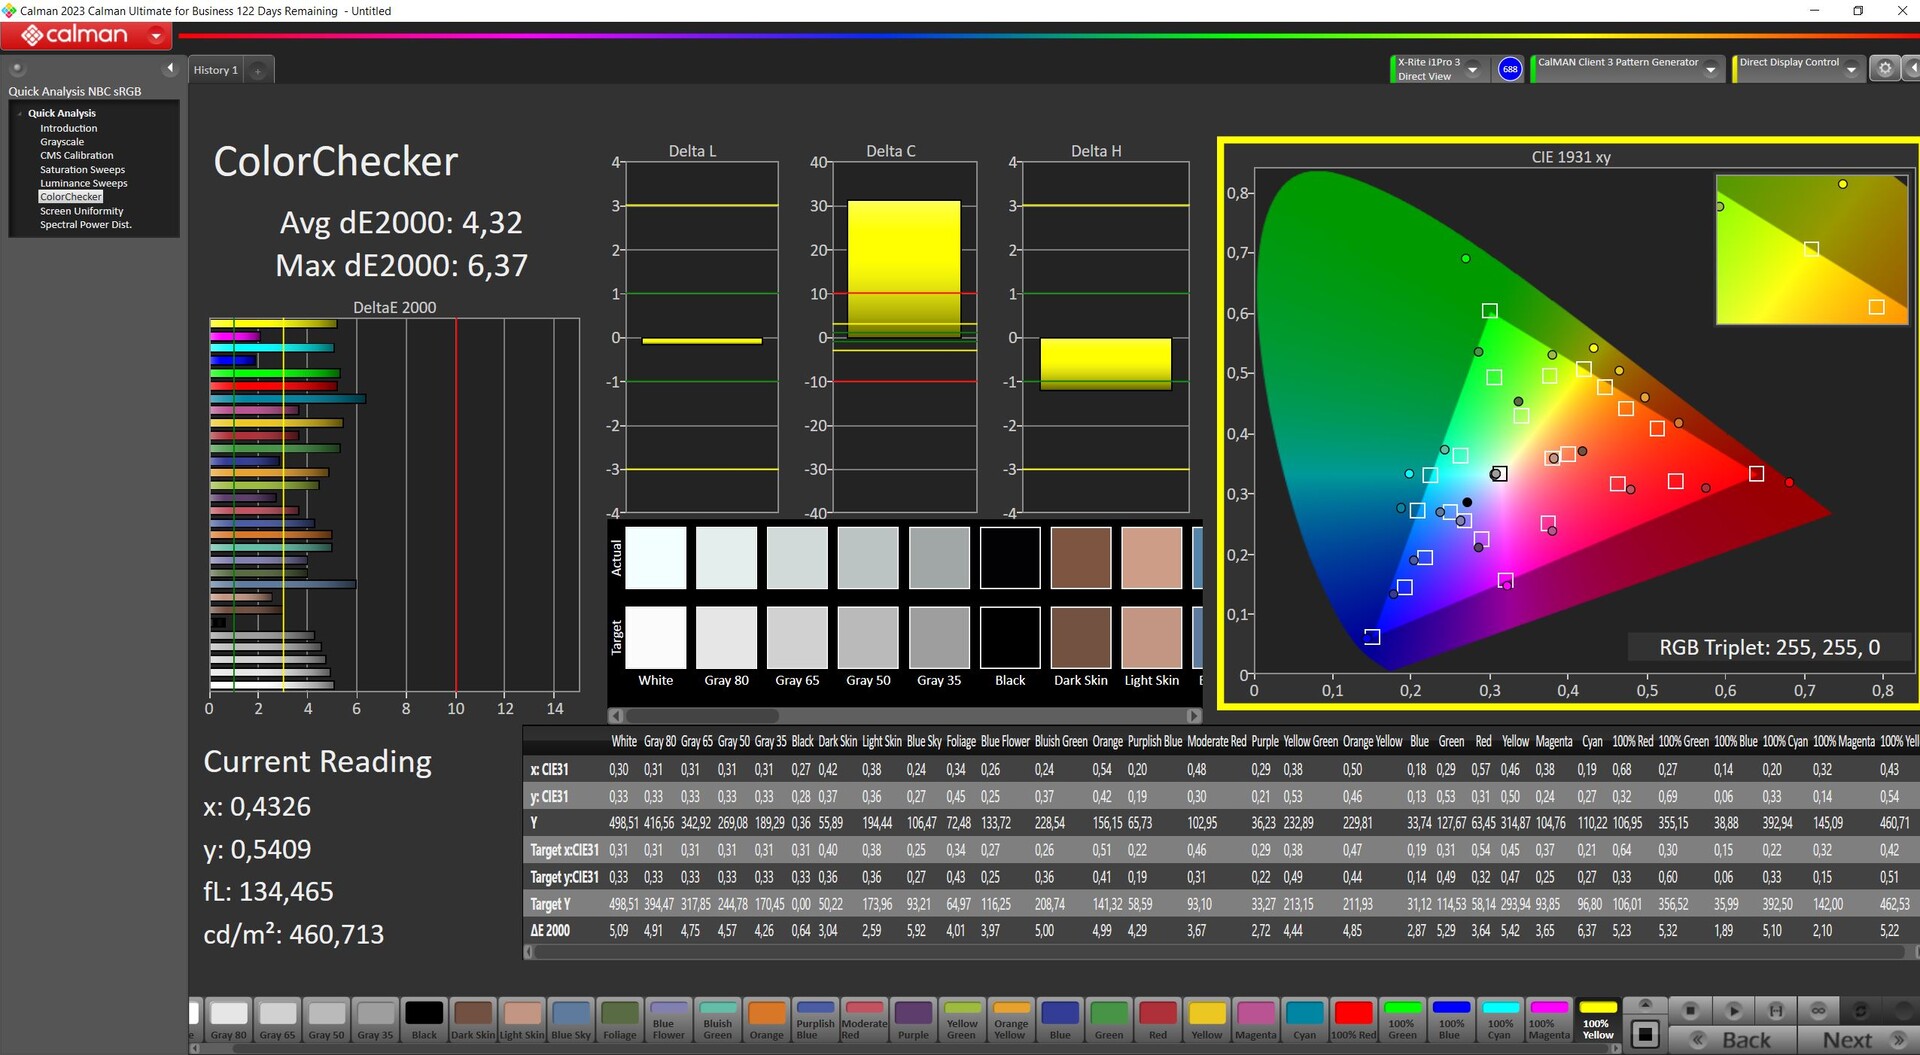
ΔE ColorChecker Calman: 4.32 | ∀{0.5-29.43 Ø4.71}
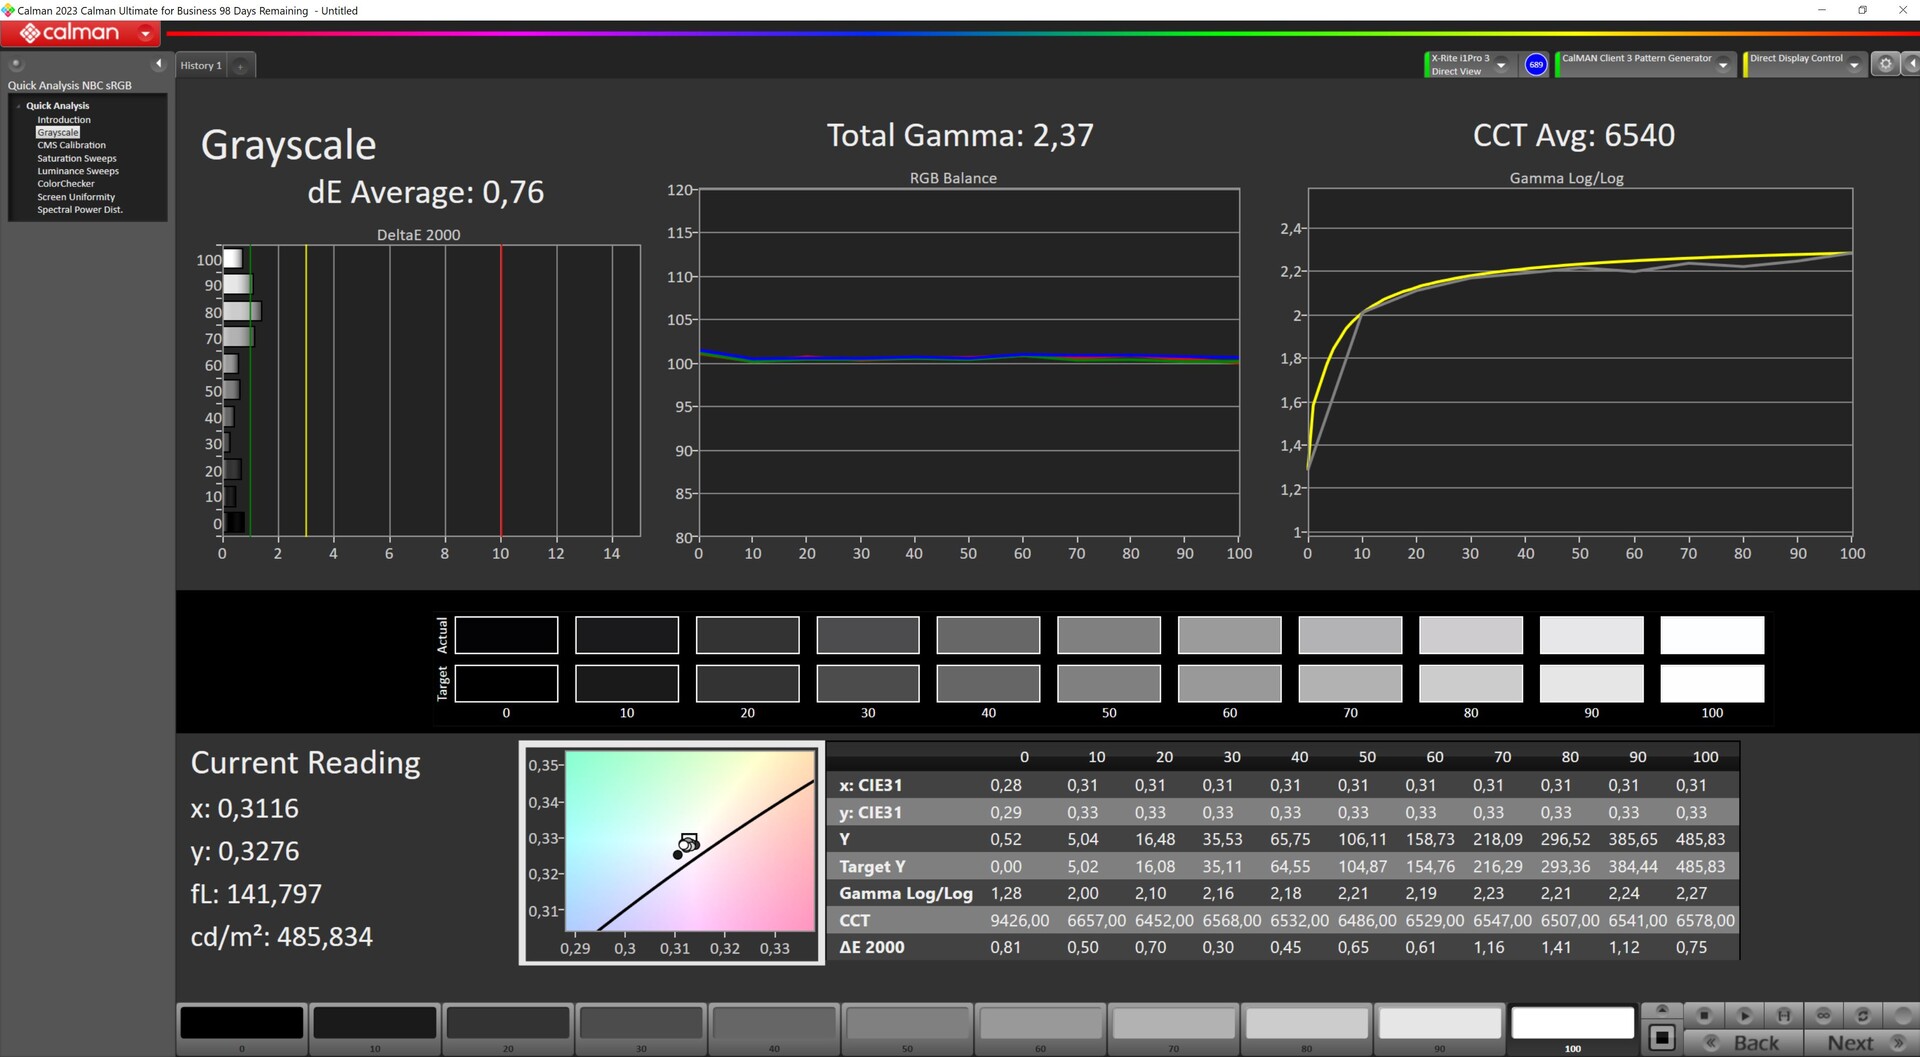
calibrated: 0.75
ΔE Greyscale Calman: 3.66 | ∀{0.09-98 Ø4.96}
87.81% AdobeRGB 1998 (Argyll 3D)
99.93% sRGB (Argyll 3D)
99.22% Display P3 (Argyll 3D)
Gamma: 2.19
CCT: 6841 K
| Lenovo Legion Pro 5 16IRX9 G9 BOE NE160QDM-NZB, IPS, 2560x1600, 16" | HP Victus 16 (2024) Chi Mei CMN163E, IPS, 1920x1080, 16.1" | Dell G16, i7-13650HX, RTX 4060 Chi Mei CMN161D (160GME), IPS, 2560x1600, 16" | Schenker XMG Core 15 (M24) BOE NJ NE153QDM-NZ1 (BOE0C8E), IPS, 2560x1600, 15.3" | Lenovo Legion Pro 5 16IRX9 BOE NE160QDM-NYC, IPS, 2560x1600, 16" | Lenovo Legion 5 16IRX G9 NE160QDM-NZ3, IPS, 2560x1600, 16" | |
|---|---|---|---|---|---|---|
| Display | -49% | -18% | -14% | -17% | -14% | |
| Display P3 Coverage (%) | 99.22 | 41.3 -58% | 67.5 -32% | 73.2 -26% | 69.3 -30% | 72.4 -27% |
| sRGB Coverage (%) | 99.93 | 61.7 -38% | 98.5 -1% | 100 0% | 99.4 -1% | 100 0% |
| AdobeRGB 1998 Coverage (%) | 87.81 | 42.7 -51% | 69.3 -21% | 74.6 -15% | 70.1 -20% | 74.1 -16% |
| Response Times | -300% | -36% | -50% | -73% | -78% | |
| Response Time Grey 50% / Grey 80% * (ms) | 4.8 ? | 28.6 ? -496% | 7.6 ? -58% | 9.6 ? -100% | 11.9 ? -148% | 12.5 ? -160% |
| Response Time Black / White * (ms) | 9.2 ? | 18.7 ? -103% | 10.4 ? -13% | 9.2 ? -0% | 8.9 ? 3% | 8.7 ? 5% |
| PWM Frequency (Hz) | ||||||
| Screen | -76% | -22% | 3% | 12% | 21% | |
| Brightness middle (cd/m²) | 518 | 287 -45% | 369 -29% | 635 23% | 384 -26% | 526 2% |
| Brightness (cd/m²) | 491 | 288 -41% | 344 -30% | 604 23% | 366 -25% | 500 2% |
| Brightness Distribution (%) | 90 | 86 -4% | 89 -1% | 91 1% | 91 1% | 87 -3% |
| Black Level * (cd/m²) | 0.36 | 0.19 47% | 0.26 28% | 0.64 -78% | 0.35 3% | 0.33 8% |
| Contrast (:1) | 1439 | 1511 5% | 1419 -1% | 992 -31% | 1097 -24% | 1594 11% |
| Colorchecker dE 2000 * | 4.32 | 5.46 -26% | 3.04 30% | 1.89 56% | 0.97 78% | 1.2 72% |
| Colorchecker dE 2000 max. * | 6.37 | 20.36 -220% | 5.56 13% | 3.14 51% | 3.57 44% | 2.1 67% |
| Colorchecker dE 2000 calibrated * | 0.75 | 3.52 -369% | 2.35 -213% | 1.14 -52% | 0.77 -3% | 1 -33% |
| Greyscale dE 2000 * | 3.66 | 4.8 -31% | 3.38 8% | 2.53 31% | 1.5 59% | 1.3 64% |
| Gamma | 2.19 100% | 2.108 104% | 2.47 89% | 2.36 93% | 2.24 98% | 2.23 99% |
| CCT | 6841 95% | 6442 101% | 6040 108% | 6434 101% | 6709 97% | 6391 102% |
| Total Average (Program / Settings) | -142% /
-102% | -25% /
-23% | -20% /
-8% | -26% /
-6% | -24% /
-1% |
* ... smaller is better
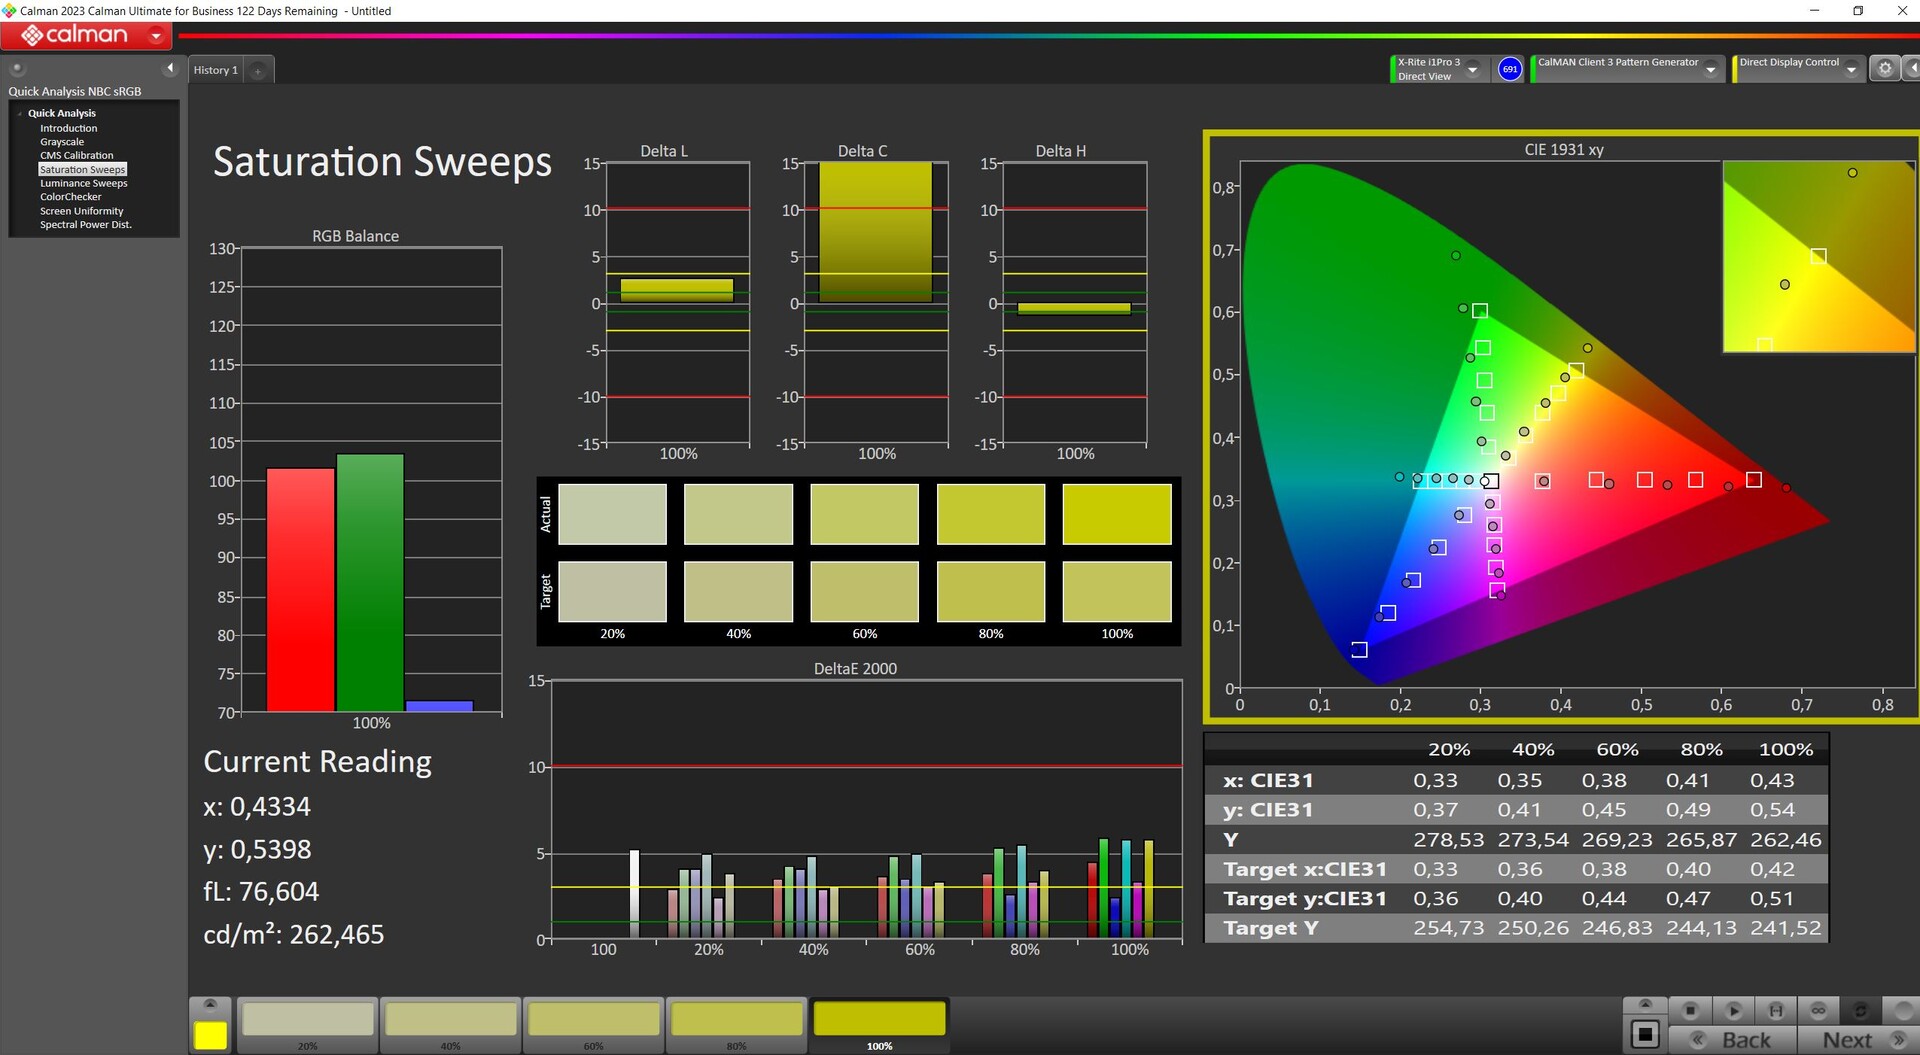
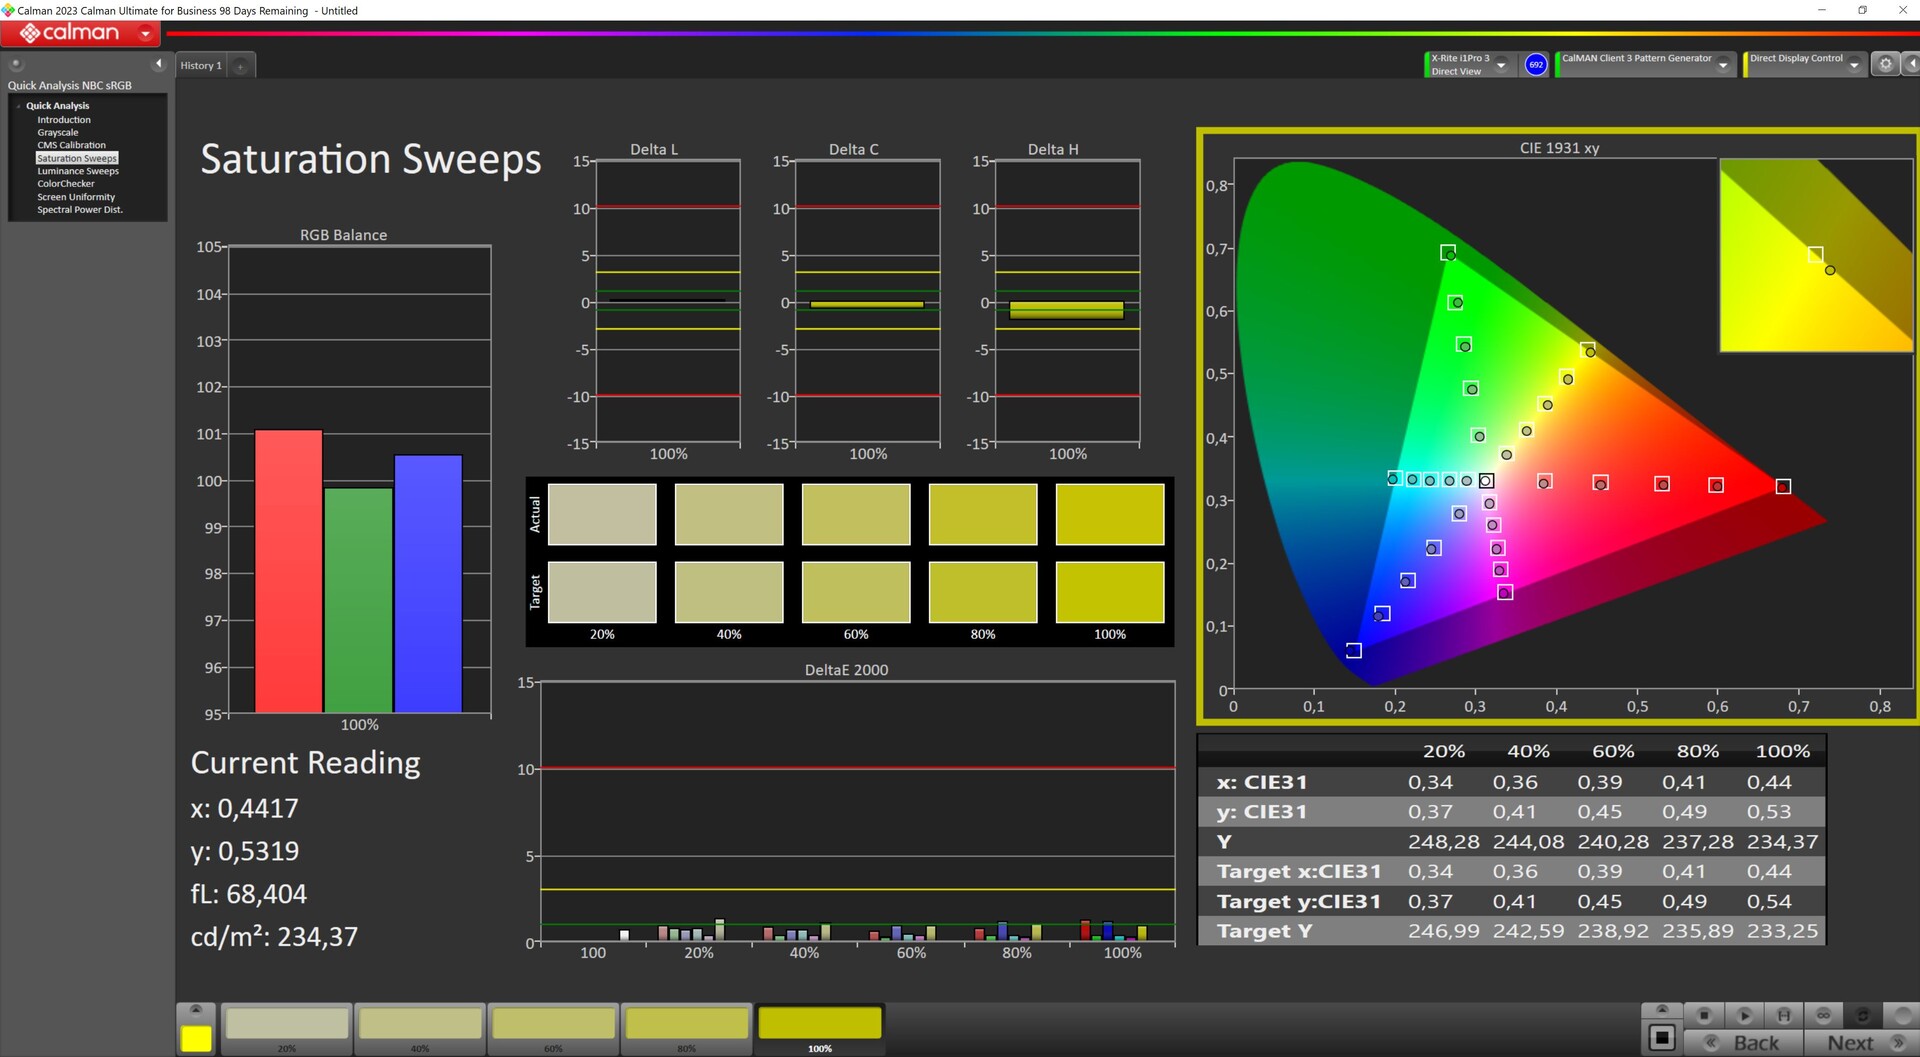
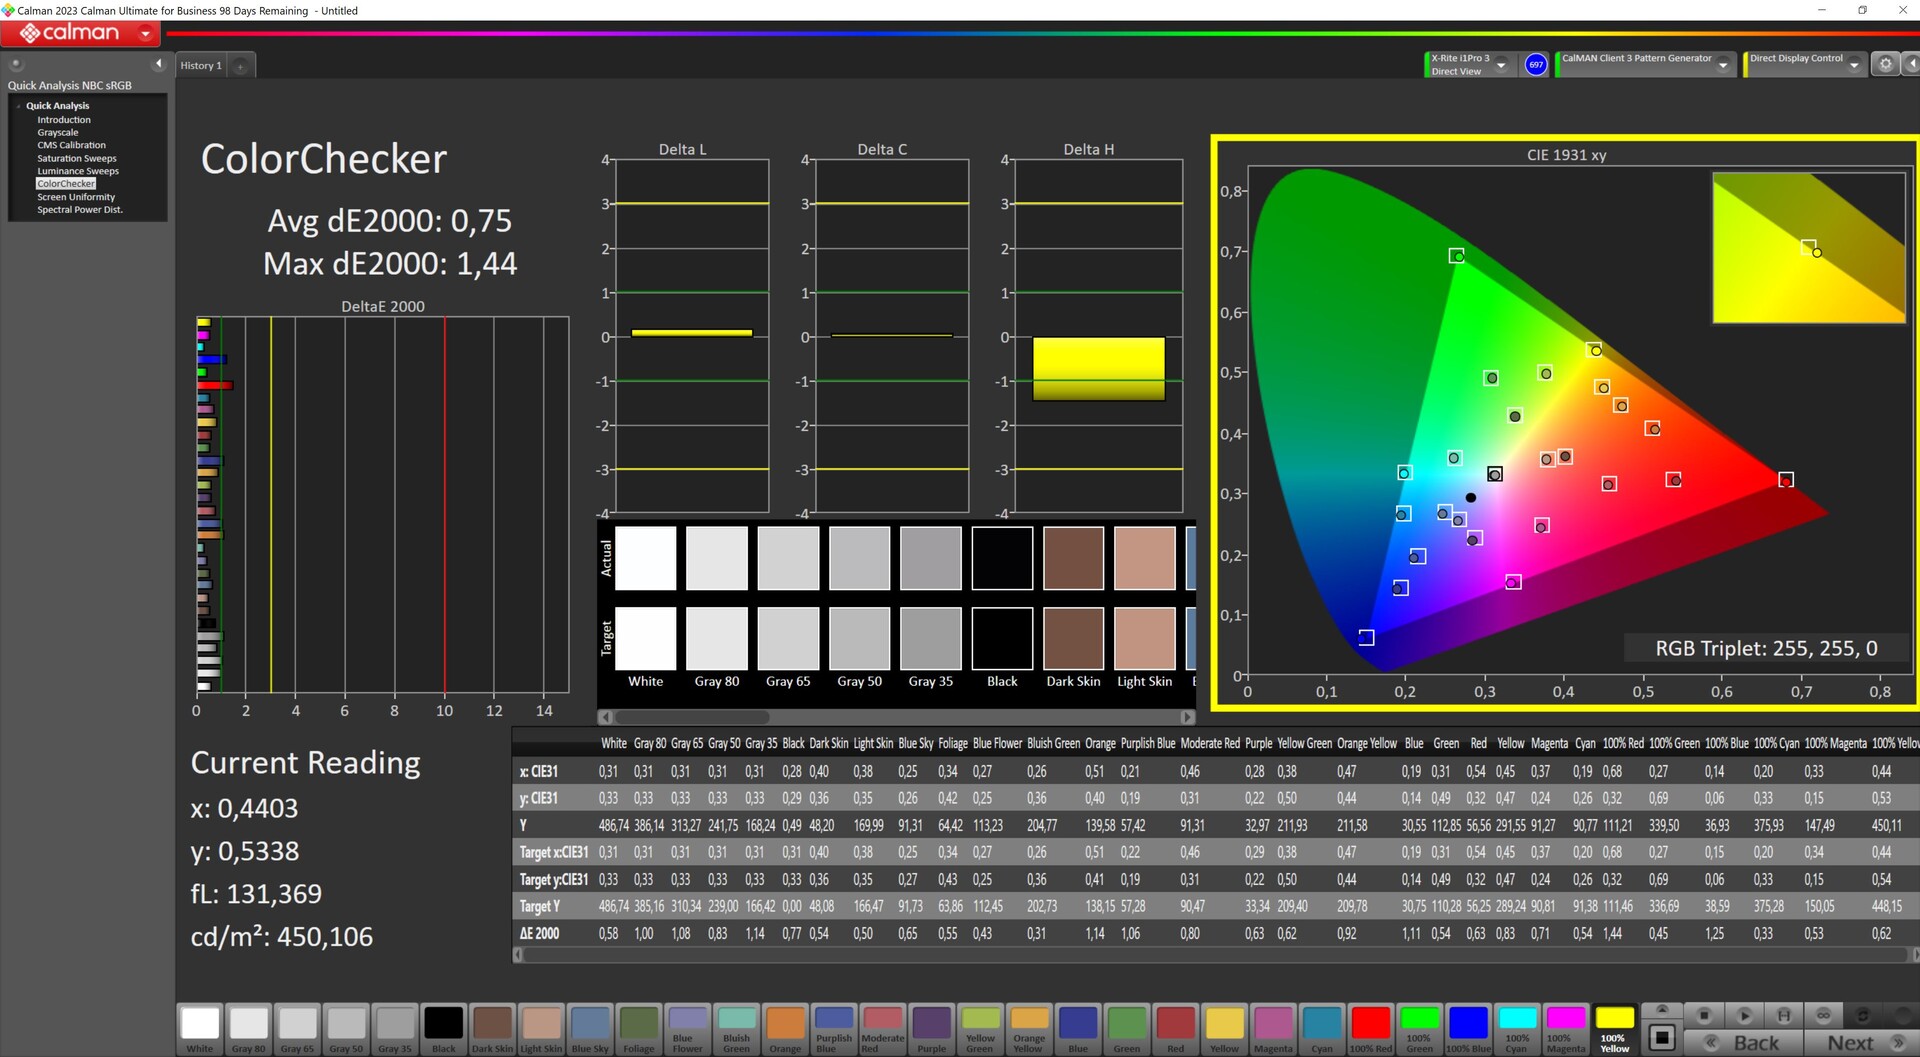
Both sRGB and Display P3 are nearly completely covered, and AdobeRGB is covered by almost 88 per cent.

Straight out of the box, the screen isn't calibrated totally optimally. Our own calibration using the X-Rite i1Pro color measurement device and the Calman software pushed its grayscale and color DeltaE values to below 1.
Display Response Times
| ↔ Response Time Black to White | ||
|---|---|---|
| 9.2 ms ... rise ↗ and fall ↘ combined | ↗ 4.6 ms rise | 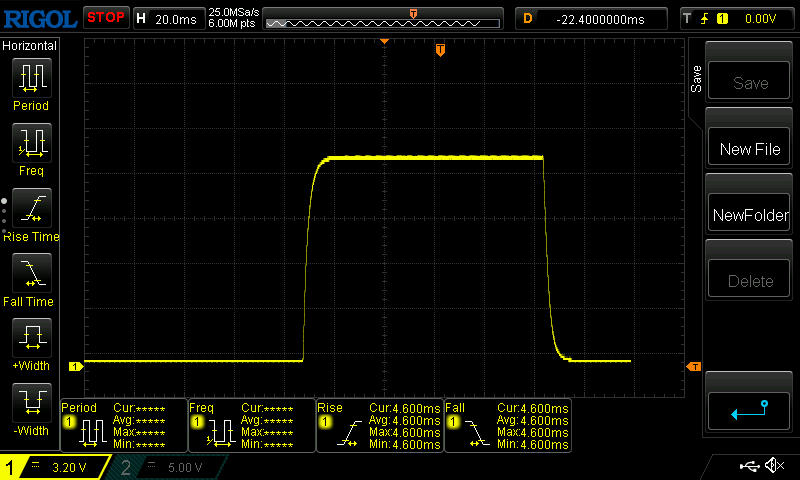 |
| ↘ 4.6 ms fall | ||
| The screen shows fast response rates in our tests and should be suited for gaming. In comparison, all tested devices range from 0.1 (minimum) to 240 (maximum) ms. » 26 % of all devices are better. This means that the measured response time is better than the average of all tested devices (19.8 ms). | ||
| ↔ Response Time 50% Grey to 80% Grey | ||
| 4.8 ms ... rise ↗ and fall ↘ combined | ↗ 2.2 ms rise | 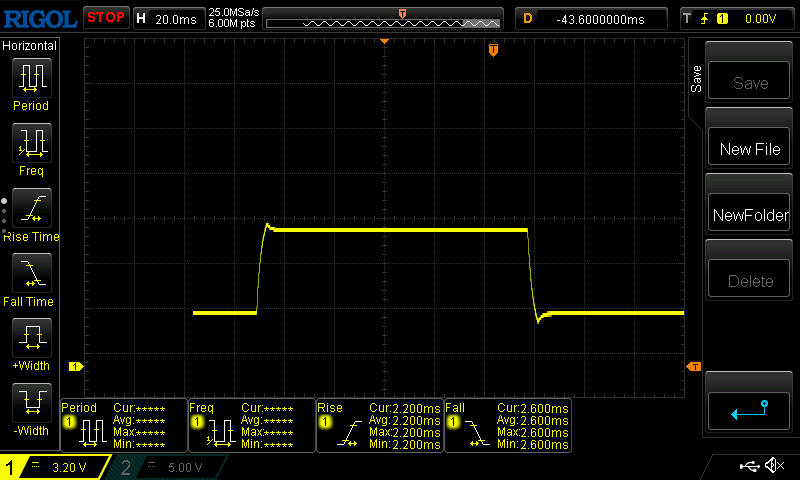 |
| ↘ 2.6 ms fall | ||
| The screen shows very fast response rates in our tests and should be very well suited for fast-paced gaming. In comparison, all tested devices range from 0.165 (minimum) to 636 (maximum) ms. » 17 % of all devices are better. This means that the measured response time is better than the average of all tested devices (30.9 ms). | ||
Screen Flickering / PWM (Pulse-Width Modulation)
| Screen flickering / PWM not detected |  | ||
In comparison: 52 % of all tested devices do not use PWM to dim the display. If PWM was detected, an average of 7748 (minimum: 5 - maximum: 343500) Hz was measured. | |||

As the screen is quite bright at almost 500 nits and also features a matte surface, most reflections are mitigated and you can use the laptop well outside, as long as you look directly at it and avoid direct sunlight.
Performance - The Pro 5i's great CPU and gaming performance
In contrast to the Legion Pro 5i with the high-end components i9 14900HX and RTX 4070 which we already tested, the current test device is fitted with an i7 14700HX and an RTX 4060. This means the laptop is classed as a mid-range gamer.
Thanks to its relatively color-accurate, bright display, the Legion will likely also be of interest to quite a few creators—although its design could just do with being a little more subtle.
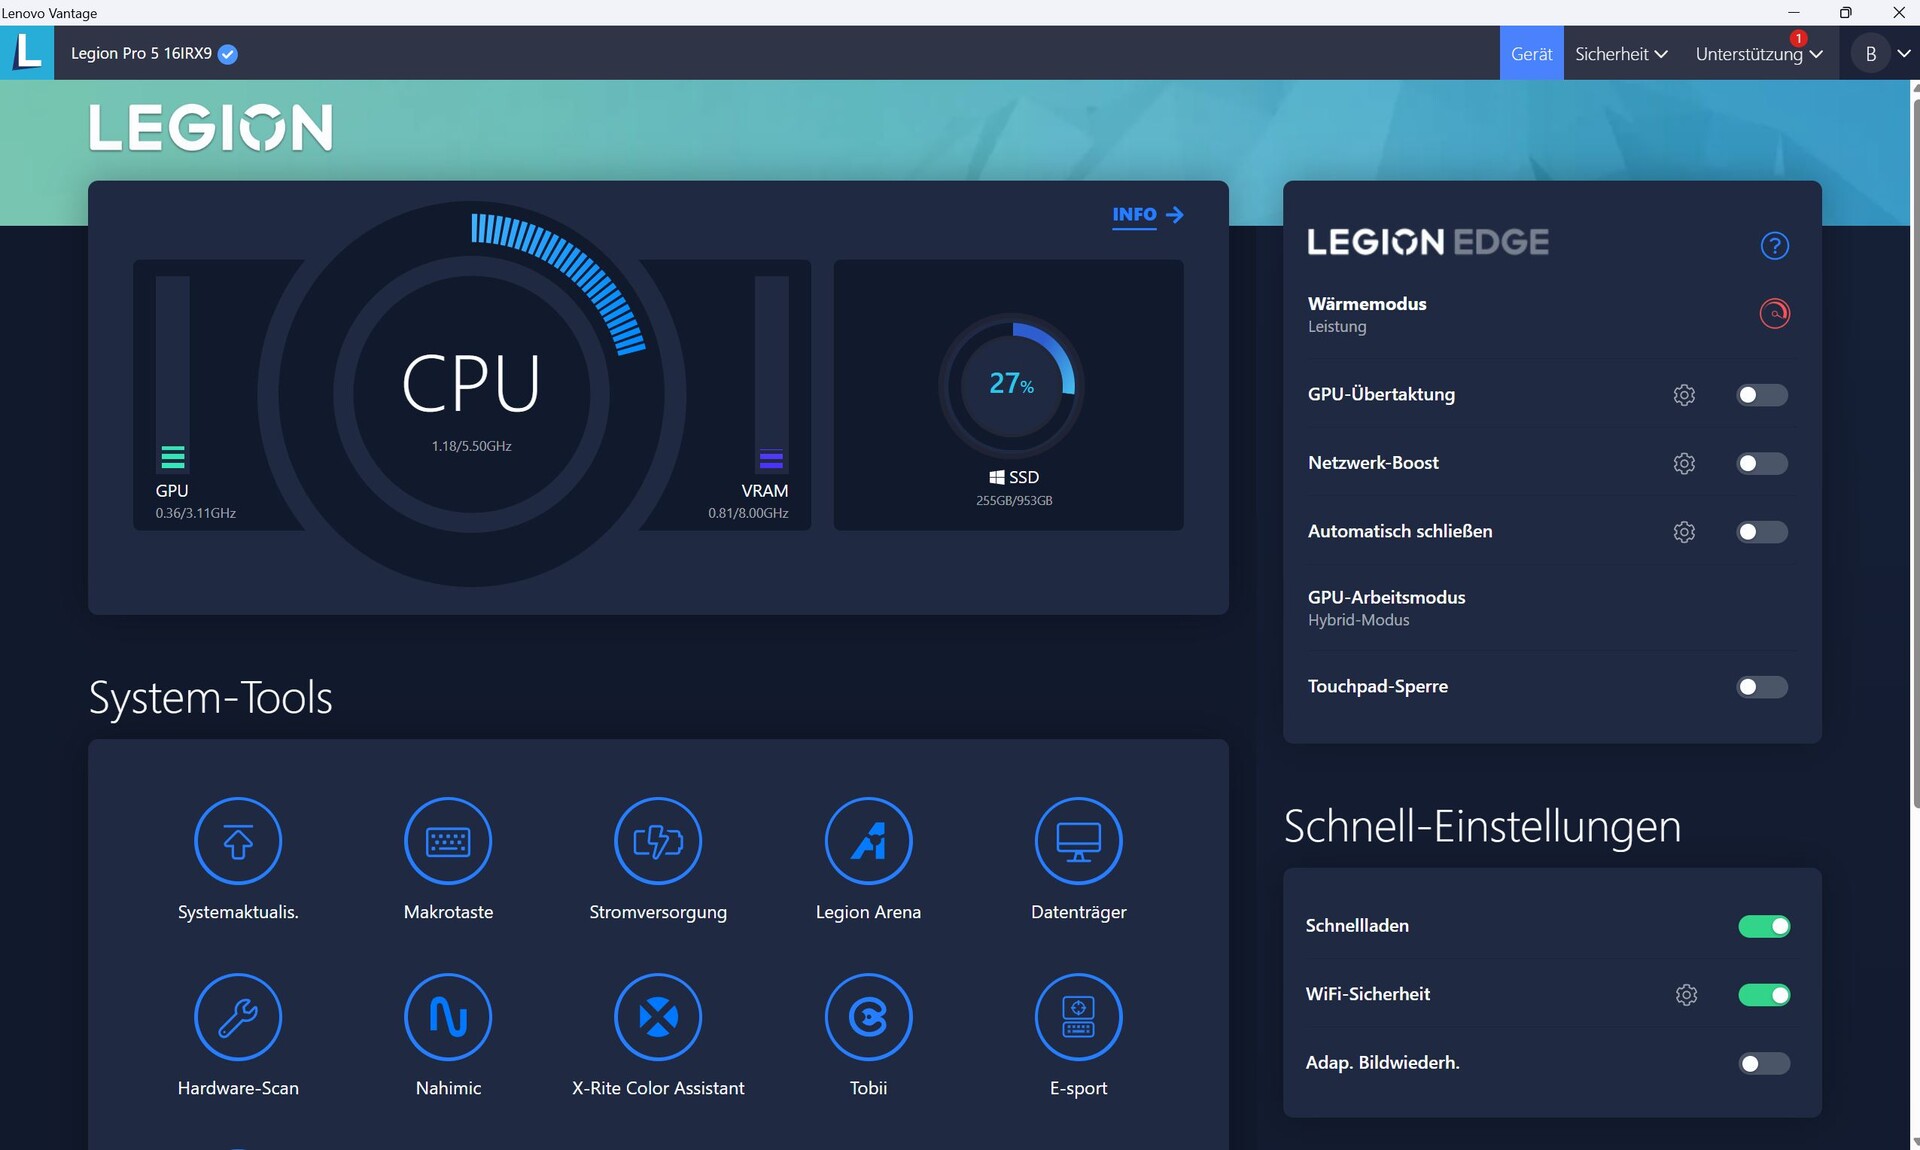
Testing conditions
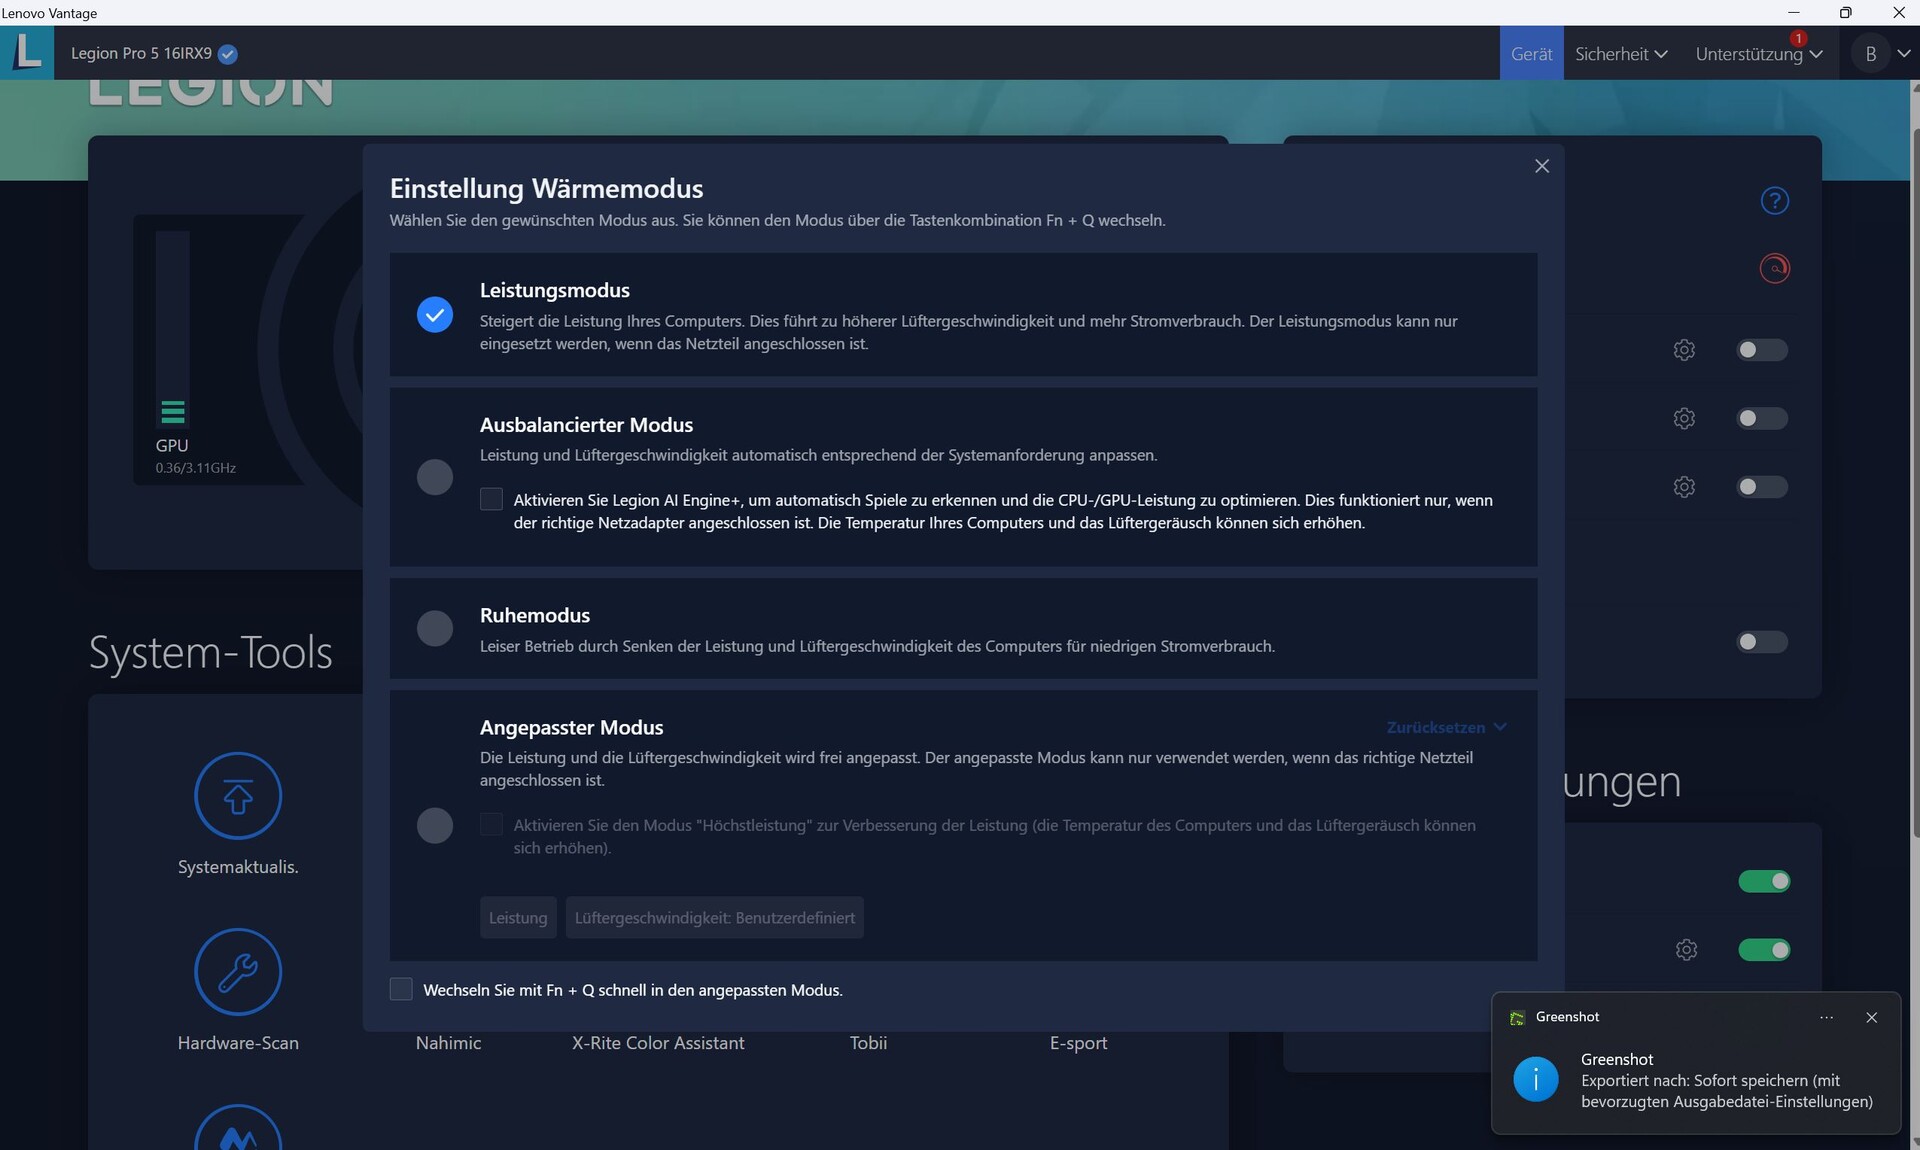
The Lenovo Vantage software acts as a control center inside the Legion Pro 5i. In addition to the performance profiles, various other settings can be found here—from keyboard lighting and power supply to the MUX switch and system updates.
There are three preset performance profiles to choose from (performance, balanced, quiet)—an AI engine can also be added in balanced mode and there is another customized mode in which various parameters can be set manually.
We used the performance mode without GPU overclocking for our benchmarks. Quiet mode was used for our battery tests. Occasionally, we have additionally provided measured values for the other performance modes.


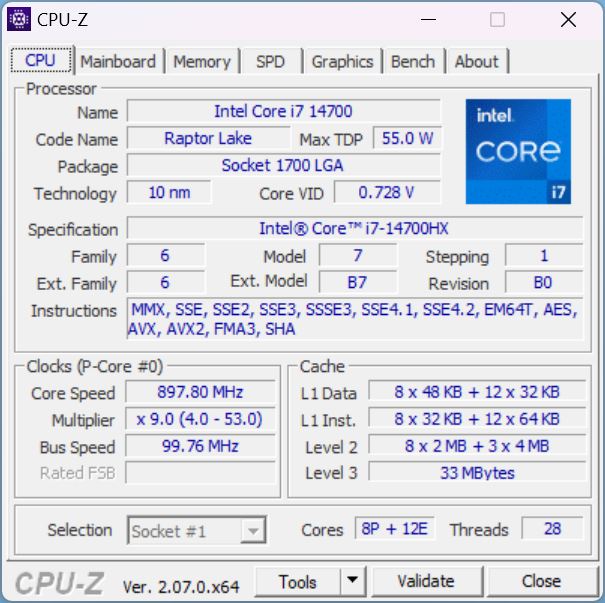
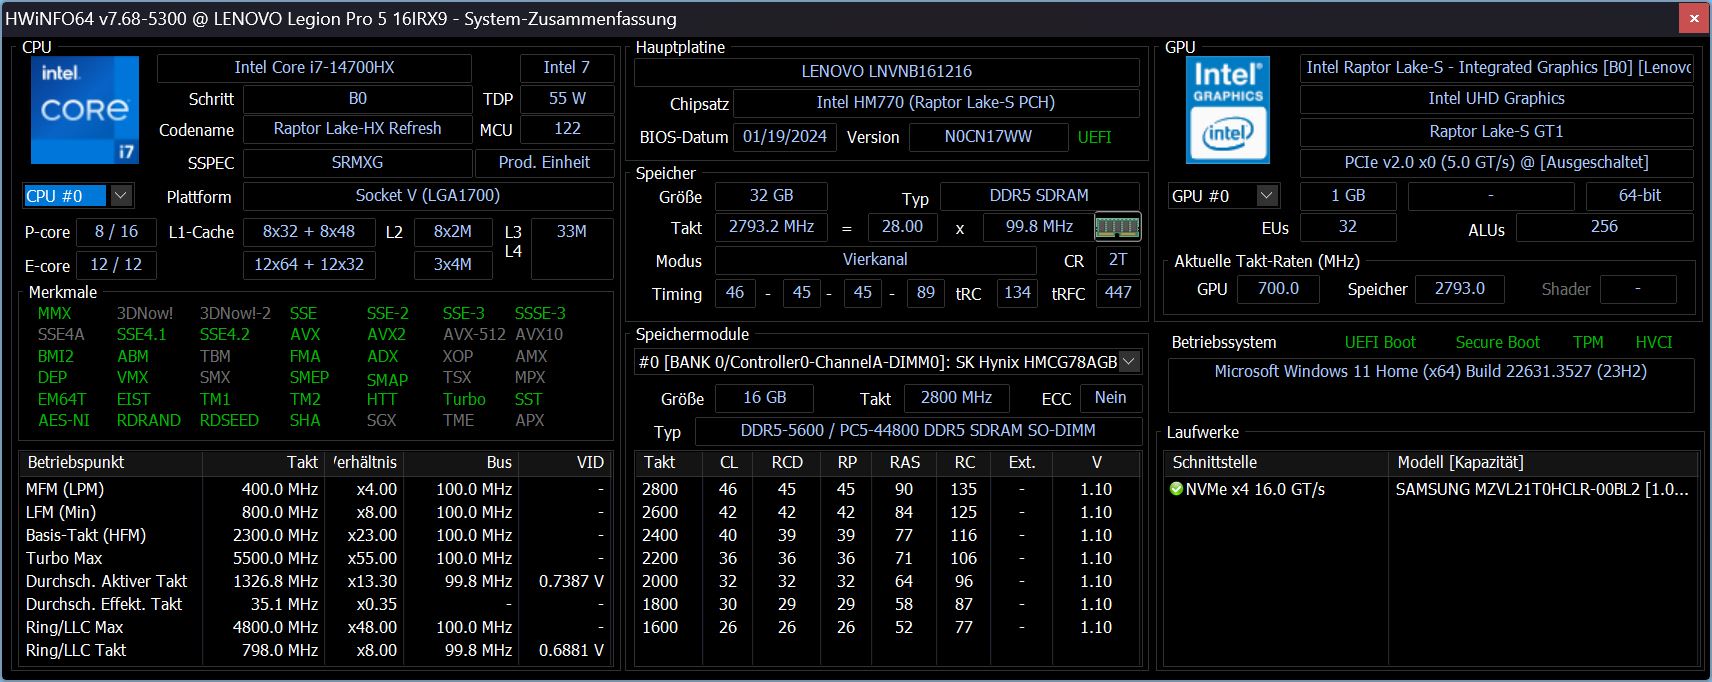
Processor
The Intel Core i7-14700HX is a high-end CPU based on the new Raptor Lake HX Refresh series. The CPU contains 8 P and 12 E cores and can process a total of 28 threads at once thanks to hyperthreading.
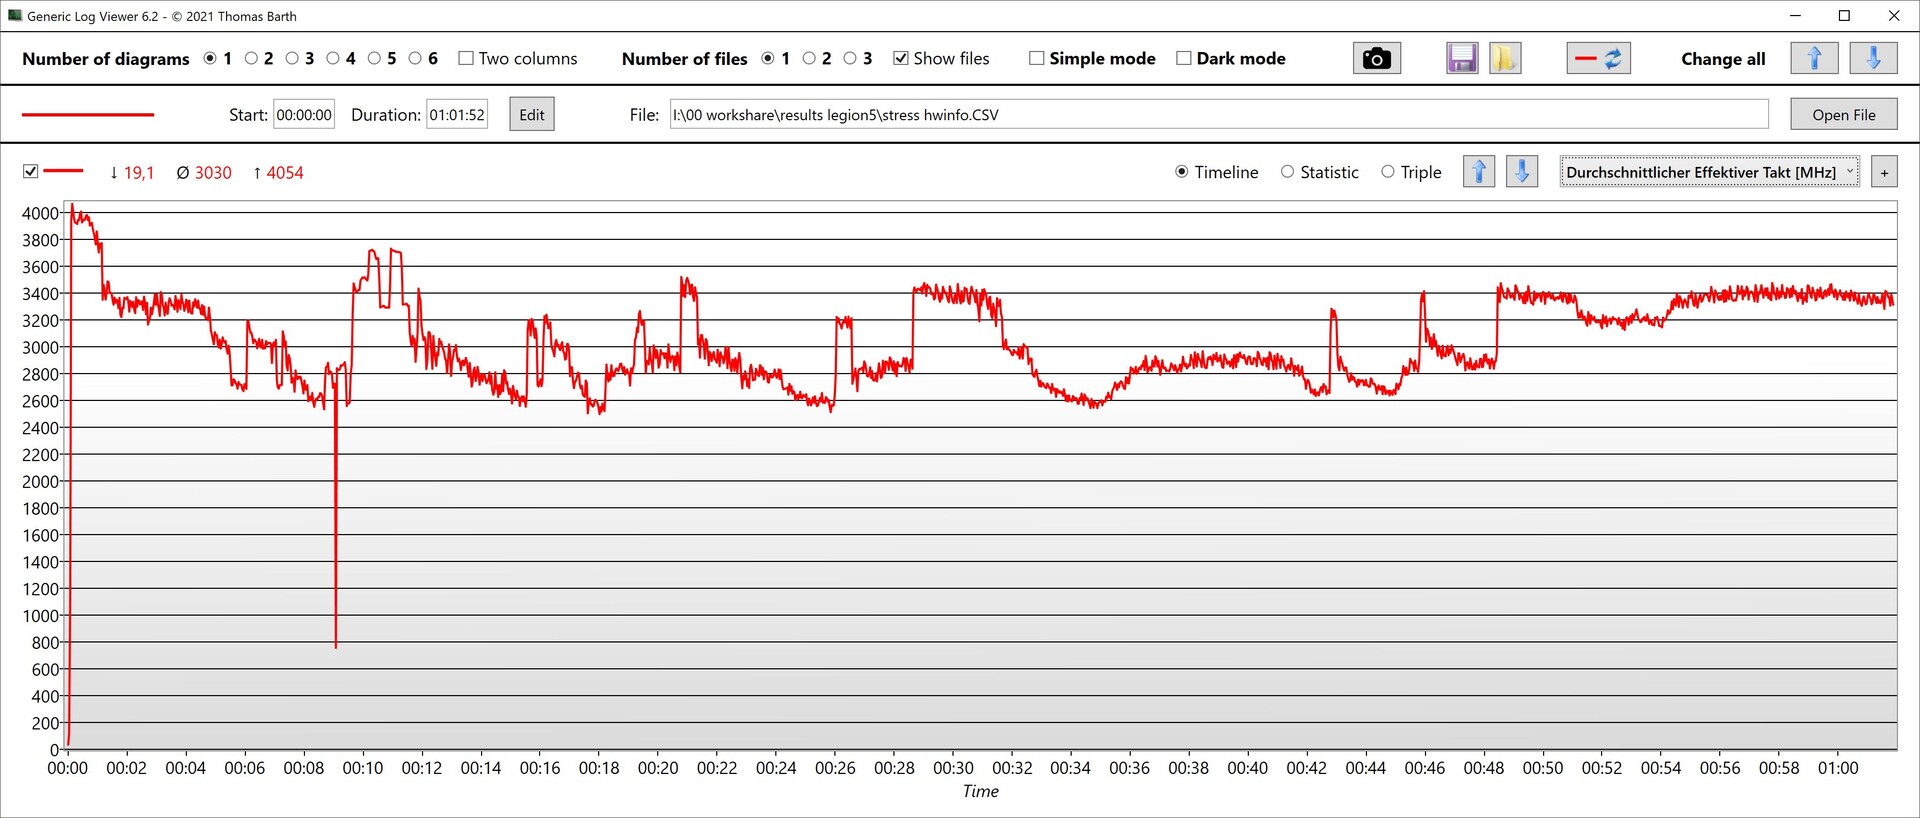
In our loop test, the CPU performed very consistently and with only minimal performance loss over the 30 minutes. It outperformed most of the competitors—only the Legion Pro 5i with the i9-14900HX did slightly better.
Across all benchmarks, however, it became clear that our Legion Pro 5i's processor performs impressively well. It came in 9 per cent above the average i7-14700HX from our database and only 5 per cent behind the i9-14900HX.
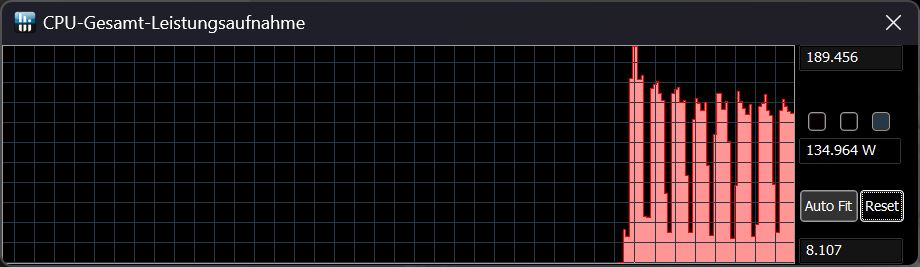
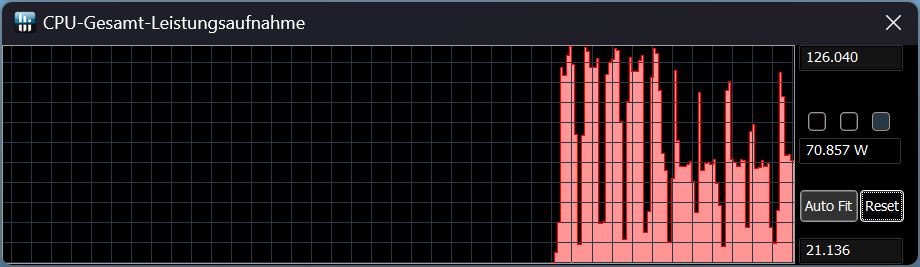
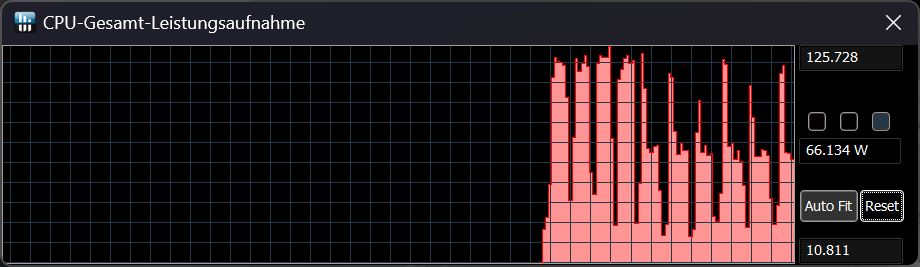
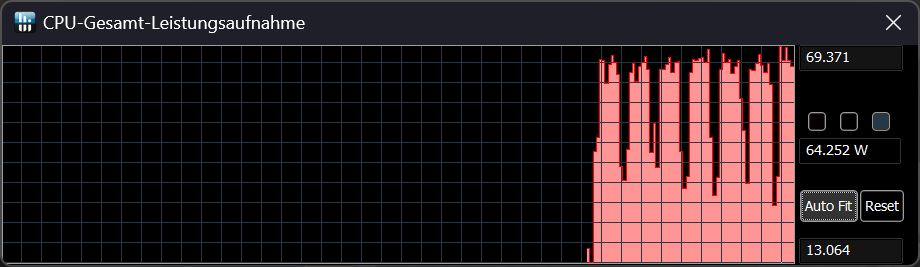
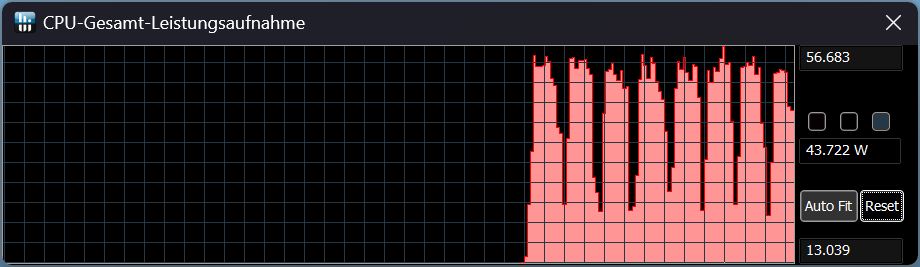
Disconnected from the mains, around 44 per cent of the CPU's performance was lost when running Cinebench R15 Multi. The table below shows its Cinebench R15 Multi scores and TDPs depending on the performance profile, with the corresponding TDP curves in the respective mode on the right.
| Performance mode/measurement value | Cinebench R 15 Multi score | TDP |
|---|---|---|
| Performance | 4137 | 190 - 130 |
| Balanced with AI | 3650 | 125 - 70 |
| Balanced without AI | 3367 | 125 - 65 |
| Quiet | 2640 | 70 - 65 |
| Battery | 2302 | 56 - 45 |
Cinebench R15 Multi continuous test
Cinebench R23: Multi Core | Single Core
Cinebench R20: CPU (Multi Core) | CPU (Single Core)
Cinebench R15: CPU Multi 64Bit | CPU Single 64Bit
Blender: v2.79 BMW27 CPU
7-Zip 18.03: 7z b 4 | 7z b 4 -mmt1
Geekbench 6.7: Multi-Core | Single-Core
Geekbench 5.5: Multi-Core | Single-Core
HWBOT x265 Benchmark v2.2: 4k Preset
LibreOffice : 20 Documents To PDF
R Benchmark 2.5: Overall mean
| CPU Performance rating | |
| Lenovo Legion Pro 5 16IRX9 | |
| Lenovo Legion Pro 5 16IRX9 G9 | |
| Average of class Gaming | |
| Lenovo Legion 5 16IRX G9 | |
| Average Intel Core i7-14700HX | |
| HP Victus 16 (2024) | |
| Schenker XMG Core 15 (M24) | |
| Dell G16, i7-13650HX, RTX 4060 | |
| Cinebench R23 / Multi Core | |
| Lenovo Legion Pro 5 16IRX9 | |
| Lenovo Legion Pro 5 16IRX9 G9 | |
| Average of class Gaming (10488 - 42661, n=108, last 2 years) | |
| Lenovo Legion 5 16IRX G9 | |
| Average Intel Core i7-14700HX (19365 - 28122, n=9) | |
| HP Victus 16 (2024) | |
| Dell G16, i7-13650HX, RTX 4060 | |
| Schenker XMG Core 15 (M24) | |
| Cinebench R23 / Single Core | |
| Lenovo Legion Pro 5 16IRX9 G9 | |
| Lenovo Legion Pro 5 16IRX9 | |
| Average of class Gaming (1166 - 2415, n=108, last 2 years) | |
| Average Intel Core i7-14700HX (1702 - 2144, n=9) | |
| Lenovo Legion 5 16IRX G9 | |
| Dell G16, i7-13650HX, RTX 4060 | |
| Schenker XMG Core 15 (M24) | |
| HP Victus 16 (2024) | |
| Cinebench R20 / CPU (Multi Core) | |
| Lenovo Legion Pro 5 16IRX9 | |
| Lenovo Legion Pro 5 16IRX9 G9 | |
| Average of class Gaming (4029 - 16433, n=107, last 2 years) | |
| Lenovo Legion 5 16IRX G9 | |
| HP Victus 16 (2024) | |
| Average Intel Core i7-14700HX (7988 - 10540, n=9) | |
| Dell G16, i7-13650HX, RTX 4060 | |
| Schenker XMG Core 15 (M24) | |
| Cinebench R20 / CPU (Single Core) | |
| Lenovo Legion Pro 5 16IRX9 G9 | |
| Lenovo Legion Pro 5 16IRX9 | |
| Average of class Gaming (442 - 913, n=107, last 2 years) | |
| Average Intel Core i7-14700HX (651 - 821, n=9) | |
| Lenovo Legion 5 16IRX G9 | |
| Dell G16, i7-13650HX, RTX 4060 | |
| Schenker XMG Core 15 (M24) | |
| HP Victus 16 (2024) | |
| Cinebench R15 / CPU Multi 64Bit | |
| Lenovo Legion Pro 5 16IRX9 | |
| Lenovo Legion Pro 5 16IRX9 G9 | |
| Average of class Gaming (1578 - 6330, n=106, last 2 years) | |
| HP Victus 16 (2024) | |
| Average Intel Core i7-14700HX (3328 - 4248, n=9) | |
| Lenovo Legion 5 16IRX G9 | |
| Dell G16, i7-13650HX, RTX 4060 | |
| Schenker XMG Core 15 (M24) | |
| Cinebench R15 / CPU Single 64Bit | |
| Lenovo Legion Pro 5 16IRX9 G9 | |
| Lenovo Legion Pro 5 16IRX9 | |
| Average of class Gaming (188.8 - 350, n=107, last 2 years) | |
| Lenovo Legion 5 16IRX G9 | |
| Average Intel Core i7-14700HX (238 - 304, n=9) | |
| Schenker XMG Core 15 (M24) | |
| Dell G16, i7-13650HX, RTX 4060 | |
| HP Victus 16 (2024) | |
| Blender / v2.79 BMW27 CPU | |
| Schenker XMG Core 15 (M24) | |
| HP Victus 16 (2024) | |
| Dell G16, i7-13650HX, RTX 4060 | |
| Average Intel Core i7-14700HX (126 - 212, n=9) | |
| Average of class Gaming (79 - 330, n=105, last 2 years) | |
| Lenovo Legion 5 16IRX G9 | |
| Lenovo Legion Pro 5 16IRX9 G9 | |
| Lenovo Legion Pro 5 16IRX9 | |
| 7-Zip 18.03 / 7z b 4 | |
| Lenovo Legion Pro 5 16IRX9 | |
| Lenovo Legion Pro 5 16IRX9 G9 | |
| Lenovo Legion 5 16IRX G9 | |
| Average Intel Core i7-14700HX (68734 - 104730, n=9) | |
| Average of class Gaming (33491 - 148086, n=106, last 2 years) | |
| HP Victus 16 (2024) | |
| Dell G16, i7-13650HX, RTX 4060 | |
| Schenker XMG Core 15 (M24) | |
| 7-Zip 18.03 / 7z b 4 -mmt1 | |
| Lenovo Legion Pro 5 16IRX9 G9 | |
| Lenovo Legion Pro 5 16IRX9 | |
| Lenovo Legion 5 16IRX G9 | |
| Average Intel Core i7-14700HX (5641 - 7041, n=9) | |
| Schenker XMG Core 15 (M24) | |
| Average of class Gaming (4199 - 7436, n=106, last 2 years) | |
| Dell G16, i7-13650HX, RTX 4060 | |
| HP Victus 16 (2024) | |
| Geekbench 6.7 / Multi-Core | |
| Lenovo Legion Pro 5 16IRX9 | |
| Lenovo Legion Pro 5 16IRX9 G9 | |
| Average of class Gaming (6625 - 22850, n=107, last 2 years) | |
| Lenovo Legion 5 16IRX G9 | |
| Average Intel Core i7-14700HX (14163 - 17562, n=9) | |
| HP Victus 16 (2024) | |
| Schenker XMG Core 15 (M24) | |
| Dell G16, i7-13650HX, RTX 4060 | |
| Geekbench 6.7 / Single-Core | |
| Lenovo Legion Pro 5 16IRX9 | |
| Lenovo Legion Pro 5 16IRX9 G9 | |
| Average of class Gaming (1490 - 3259, n=107, last 2 years) | |
| Average Intel Core i7-14700HX (2378 - 2975, n=9) | |
| Lenovo Legion 5 16IRX G9 | |
| Schenker XMG Core 15 (M24) | |
| Dell G16, i7-13650HX, RTX 4060 | |
| HP Victus 16 (2024) | |
| Geekbench 5.5 / Multi-Core | |
| Lenovo Legion Pro 5 16IRX9 | |
| Lenovo Legion Pro 5 16IRX9 G9 | |
| Average Intel Core i7-14700HX (15705 - 19597, n=9) | |
| Average of class Gaming (6460 - 28263, n=106, last 2 years) | |
| Lenovo Legion 5 16IRX G9 | |
| HP Victus 16 (2024) | |
| Schenker XMG Core 15 (M24) | |
| Dell G16, i7-13650HX, RTX 4060 | |
| Geekbench 5.5 / Single-Core | |
| Lenovo Legion Pro 5 16IRX9 G9 | |
| Average of class Gaming (986 - 2474, n=106, last 2 years) | |
| Lenovo Legion Pro 5 16IRX9 | |
| Average Intel Core i7-14700HX (1700 - 2133, n=9) | |
| Schenker XMG Core 15 (M24) | |
| Lenovo Legion 5 16IRX G9 | |
| Dell G16, i7-13650HX, RTX 4060 | |
| HP Victus 16 (2024) | |
| HWBOT x265 Benchmark v2.2 / 4k Preset | |
| Lenovo Legion Pro 5 16IRX9 | |
| Average of class Gaming (11.5 - 44.4, n=106, last 2 years) | |
| Lenovo Legion Pro 5 16IRX9 G9 | |
| Lenovo Legion 5 16IRX G9 | |
| Average Intel Core i7-14700HX (19.5 - 27.4, n=9) | |
| Schenker XMG Core 15 (M24) | |
| HP Victus 16 (2024) | |
| Dell G16, i7-13650HX, RTX 4060 | |
| LibreOffice / 20 Documents To PDF | |
| HP Victus 16 (2024) | |
| Dell G16, i7-13650HX, RTX 4060 | |
| Lenovo Legion Pro 5 16IRX9 G9 | |
| Average of class Gaming (33.2 - 88.8, n=106, last 2 years) | |
| Schenker XMG Core 15 (M24) | |
| Average Intel Core i7-14700HX (41.9 - 55.3, n=9) | |
| Lenovo Legion 5 16IRX G9 | |
| Lenovo Legion Pro 5 16IRX9 | |
| R Benchmark 2.5 / Overall mean | |
| HP Victus 16 (2024) | |
| Schenker XMG Core 15 (M24) | |
| Average of class Gaming (0.3439 - 0.759, n=107, last 2 years) | |
| Dell G16, i7-13650HX, RTX 4060 | |
| Dell G16, i7-13650HX, RTX 4060 | |
| Lenovo Legion 5 16IRX G9 | |
| Average Intel Core i7-14700HX (0.3821 - 0.4896, n=9) | |
| Lenovo Legion Pro 5 16IRX9 G9 | |
| Lenovo Legion Pro 5 16IRX9 | |
* ... smaller is better
AIDA64: FP32 Ray-Trace | FPU Julia | CPU SHA3 | CPU Queen | FPU SinJulia | FPU Mandel | CPU AES | CPU ZLib | FP64 Ray-Trace | CPU PhotoWorxx
| Performance rating | |
| Average of class Gaming | |
| Lenovo Legion Pro 5 16IRX9 | |
| Lenovo Legion Pro 5 16IRX9 G9 | |
| Schenker XMG Core 15 (M24) | |
| Average Intel Core i7-14700HX | |
| Lenovo Legion 5 16IRX G9 | |
| Dell G16, i7-13650HX, RTX 4060 | |
| HP Victus 16 (2024) | |
| AIDA64 / FP32 Ray-Trace | |
| Average of class Gaming (10227 - 85542, n=106, last 2 years) | |
| Schenker XMG Core 15 (M24) | |
| Lenovo Legion Pro 5 16IRX9 | |
| Lenovo Legion Pro 5 16IRX9 G9 | |
| Average Intel Core i7-14700HX (14147 - 23676, n=9) | |
| Lenovo Legion 5 16IRX G9 | |
| Dell G16, i7-13650HX, RTX 4060 | |
| HP Victus 16 (2024) | |
| AIDA64 / FPU Julia | |
| Average of class Gaming (51376 - 372155, n=106, last 2 years) | |
| Lenovo Legion Pro 5 16IRX9 | |
| Schenker XMG Core 15 (M24) | |
| Lenovo Legion Pro 5 16IRX9 G9 | |
| Average Intel Core i7-14700HX (71875 - 116556, n=9) | |
| Lenovo Legion 5 16IRX G9 | |
| Dell G16, i7-13650HX, RTX 4060 | |
| HP Victus 16 (2024) | |
| AIDA64 / CPU SHA3 | |
| Average of class Gaming (2180 - 10115, n=106, last 2 years) | |
| Lenovo Legion Pro 5 16IRX9 | |
| Lenovo Legion Pro 5 16IRX9 G9 | |
| Schenker XMG Core 15 (M24) | |
| Average Intel Core i7-14700HX (3388 - 5567, n=9) | |
| Dell G16, i7-13650HX, RTX 4060 | |
| Lenovo Legion 5 16IRX G9 | |
| HP Victus 16 (2024) | |
| AIDA64 / CPU Queen | |
| Lenovo Legion Pro 5 16IRX9 G9 | |
| Lenovo Legion Pro 5 16IRX9 | |
| Average Intel Core i7-14700HX (129134 - 152200, n=9) | |
| HP Victus 16 (2024) | |
| Schenker XMG Core 15 (M24) | |
| Average of class Gaming (49785 - 173351, n=90, last 2 years) | |
| Dell G16, i7-13650HX, RTX 4060 | |
| Lenovo Legion 5 16IRX G9 | |
| AIDA64 / FPU SinJulia | |
| Schenker XMG Core 15 (M24) | |
| Lenovo Legion Pro 5 16IRX9 | |
| Average of class Gaming (4424 - 33636, n=106, last 2 years) | |
| Lenovo Legion Pro 5 16IRX9 G9 | |
| Average Intel Core i7-14700HX (10266 - 14434, n=9) | |
| Lenovo Legion 5 16IRX G9 | |
| HP Victus 16 (2024) | |
| Dell G16, i7-13650HX, RTX 4060 | |
| AIDA64 / FPU Mandel | |
| Average of class Gaming (25115 - 196829, n=106, last 2 years) | |
| Schenker XMG Core 15 (M24) | |
| Lenovo Legion Pro 5 16IRX9 | |
| Lenovo Legion Pro 5 16IRX9 G9 | |
| Average Intel Core i7-14700HX (35155 - 58380, n=9) | |
| Lenovo Legion 5 16IRX G9 | |
| Dell G16, i7-13650HX, RTX 4060 | |
| HP Victus 16 (2024) | |
| AIDA64 / CPU AES | |
| Lenovo Legion Pro 5 16IRX9 | |
| Lenovo Legion Pro 5 16IRX9 G9 | |
| Average of class Gaming (39258 - 247074, n=106, last 2 years) | |
| Average Intel Core i7-14700HX (68616 - 113157, n=9) | |
| Schenker XMG Core 15 (M24) | |
| Lenovo Legion 5 16IRX G9 | |
| Dell G16, i7-13650HX, RTX 4060 | |
| HP Victus 16 (2024) | |
| AIDA64 / CPU ZLib | |
| Lenovo Legion Pro 5 16IRX9 | |
| Lenovo Legion Pro 5 16IRX9 G9 | |
| Average of class Gaming (574 - 2531, n=106, last 2 years) | |
| Average Intel Core i7-14700HX (1003 - 1682, n=9) | |
| Lenovo Legion 5 16IRX G9 | |
| Dell G16, i7-13650HX, RTX 4060 | |
| HP Victus 16 (2024) | |
| Schenker XMG Core 15 (M24) | |
| AIDA64 / FP64 Ray-Trace | |
| Average of class Gaming (5509 - 45446, n=106, last 2 years) | |
| Schenker XMG Core 15 (M24) | |
| Lenovo Legion Pro 5 16IRX9 | |
| Lenovo Legion Pro 5 16IRX9 G9 | |
| Average Intel Core i7-14700HX (7585 - 12928, n=9) | |
| Dell G16, i7-13650HX, RTX 4060 | |
| Lenovo Legion 5 16IRX G9 | |
| HP Victus 16 (2024) | |
| AIDA64 / CPU PhotoWorxx | |
| Lenovo Legion Pro 5 16IRX9 | |
| Lenovo Legion Pro 5 16IRX9 G9 | |
| Average of class Gaming (12271 - 89891, n=106, last 2 years) | |
| Average Intel Core i7-14700HX (24276 - 49671, n=9) | |
| Schenker XMG Core 15 (M24) | |
| HP Victus 16 (2024) | |
| Dell G16, i7-13650HX, RTX 4060 | |
| Lenovo Legion 5 16IRX G9 | |
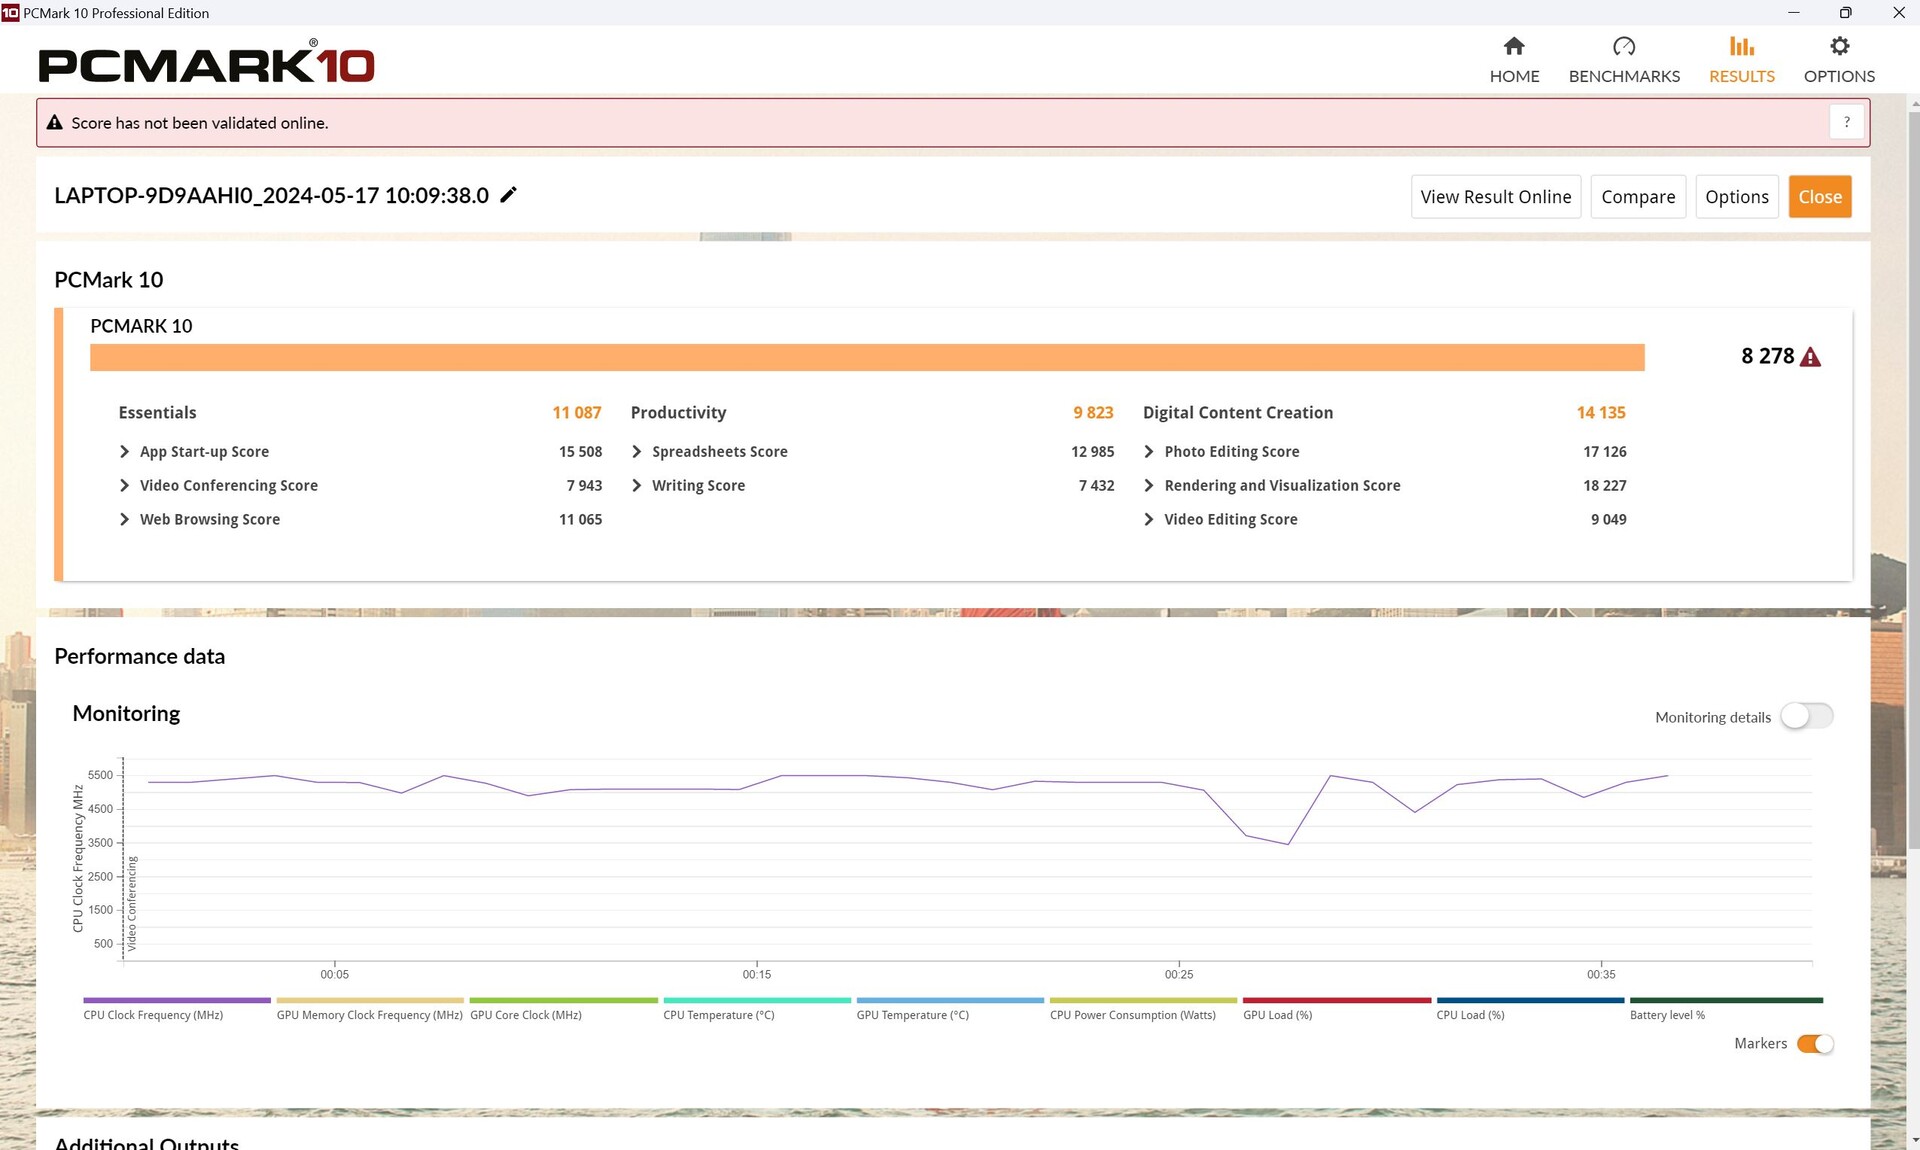
System performance
In PCMark 10, our Legion Pro was only slightly weaker when it came to productivity, but otherwise it always took second place directly behind the better-equipped Legion Pro.
In CrossMark, its results were again particularly good and our test model even managed to beat the "better" version of itself.
CrossMark: Overall | Productivity | Creativity | Responsiveness
WebXPRT 3: Overall
WebXPRT 4: Overall
Mozilla Kraken 1.1: Total
| PCMark 10 / Score | |
| Schenker XMG Core 15 (M24) | |
| Lenovo Legion Pro 5 16IRX9 | |
| Average of class Gaming (5828 - 12414, n=94, last 2 years) | |
| Lenovo Legion Pro 5 16IRX9 G9 | |
| Average Intel Core i7-14700HX, NVIDIA GeForce RTX 4060 Laptop GPU (7528 - 8278, n=2) | |
| Lenovo Legion 5 16IRX G9 | |
| HP Victus 16 (2024) | |
| Dell G16, i7-13650HX, RTX 4060 | |
| PCMark 10 / Essentials | |
| Lenovo Legion Pro 5 16IRX9 | |
| Lenovo Legion Pro 5 16IRX9 G9 | |
| Average Intel Core i7-14700HX, NVIDIA GeForce RTX 4060 Laptop GPU (10778 - 11087, n=2) | |
| Lenovo Legion 5 16IRX G9 | |
| HP Victus 16 (2024) | |
| Average of class Gaming (8810 - 11935, n=98, last 2 years) | |
| Schenker XMG Core 15 (M24) | |
| Dell G16, i7-13650HX, RTX 4060 | |
| PCMark 10 / Productivity | |
| Schenker XMG Core 15 (M24) | |
| Average of class Gaming (6845 - 25323, n=96, last 2 years) | |
| Lenovo Legion Pro 5 16IRX9 | |
| Dell G16, i7-13650HX, RTX 4060 | |
| HP Victus 16 (2024) | |
| Average Intel Core i7-14700HX, NVIDIA GeForce RTX 4060 Laptop GPU (9823 - 9910, n=2) | |
| Lenovo Legion Pro 5 16IRX9 G9 | |
| Lenovo Legion 5 16IRX G9 | |
| PCMark 10 / Digital Content Creation | |
| Lenovo Legion Pro 5 16IRX9 | |
| Lenovo Legion Pro 5 16IRX9 G9 | |
| Average of class Gaming (7602 - 19954, n=96, last 2 years) | |
| Schenker XMG Core 15 (M24) | |
| Average Intel Core i7-14700HX, NVIDIA GeForce RTX 4060 Laptop GPU (10841 - 14135, n=2) | |
| Lenovo Legion 5 16IRX G9 | |
| Dell G16, i7-13650HX, RTX 4060 | |
| HP Victus 16 (2024) | |
| CrossMark / Overall | |
| Lenovo Legion Pro 5 16IRX9 G9 | |
| Lenovo Legion 5 16IRX G9 | |
| Average Intel Core i7-14700HX, NVIDIA GeForce RTX 4060 Laptop GPU (1923 - 2132, n=2) | |
| Lenovo Legion Pro 5 16IRX9 | |
| Average of class Gaming (1366 - 2409, n=95, last 2 years) | |
| HP Victus 16 (2024) | |
| Schenker XMG Core 15 (M24) | |
| Dell G16, i7-13650HX, RTX 4060 | |
| CrossMark / Productivity | |
| Lenovo Legion Pro 5 16IRX9 G9 | |
| Lenovo Legion 5 16IRX G9 | |
| Average Intel Core i7-14700HX, NVIDIA GeForce RTX 4060 Laptop GPU (1782 - 1973, n=2) | |
| Average of class Gaming (1386 - 2254, n=95, last 2 years) | |
| Lenovo Legion Pro 5 16IRX9 | |
| Schenker XMG Core 15 (M24) | |
| HP Victus 16 (2024) | |
| Dell G16, i7-13650HX, RTX 4060 | |
| CrossMark / Creativity | |
| Lenovo Legion Pro 5 16IRX9 G9 | |
| Lenovo Legion 5 16IRX G9 | |
| Lenovo Legion Pro 5 16IRX9 | |
| Average Intel Core i7-14700HX, NVIDIA GeForce RTX 4060 Laptop GPU (2107 - 2399, n=2) | |
| Average of class Gaming (1343 - 2786, n=95, last 2 years) | |
| HP Victus 16 (2024) | |
| Schenker XMG Core 15 (M24) | |
| Dell G16, i7-13650HX, RTX 4060 | |
| CrossMark / Responsiveness | |
| Lenovo Legion 5 16IRX G9 | |
| Lenovo Legion Pro 5 16IRX9 G9 | |
| Average Intel Core i7-14700HX, NVIDIA GeForce RTX 4060 Laptop GPU (1835 - 1885, n=2) | |
| HP Victus 16 (2024) | |
| Lenovo Legion Pro 5 16IRX9 | |
| Average of class Gaming (1226 - 2334, n=95, last 2 years) | |
| Dell G16, i7-13650HX, RTX 4060 | |
| Schenker XMG Core 15 (M24) | |
| WebXPRT 3 / Overall | |
| Lenovo Legion Pro 5 16IRX9 | |
| Average of class Gaming (220 - 532, n=99, last 2 years) | |
| Lenovo Legion 5 16IRX G9 | |
| Schenker XMG Core 15 (M24) | |
| Lenovo Legion Pro 5 16IRX9 G9 | |
| Average Intel Core i7-14700HX, NVIDIA GeForce RTX 4060 Laptop GPU (276 - 301, n=2) | |
| HP Victus 16 (2024) | |
| Dell G16, i7-13650HX, RTX 4060 | |
| WebXPRT 4 / Overall | |
| Lenovo Legion Pro 5 16IRX9 | |
| Average of class Gaming (165 - 354, n=99, last 2 years) | |
| Lenovo Legion 5 16IRX G9 | |
| Lenovo Legion Pro 5 16IRX9 G9 | |
| Schenker XMG Core 15 (M24) | |
| Average Intel Core i7-14700HX, NVIDIA GeForce RTX 4060 Laptop GPU (251 - 273, n=2) | |
| HP Victus 16 (2024) | |
| Mozilla Kraken 1.1 / Total | |
| HP Victus 16 (2024) | |
| Dell G16, i7-13650HX, RTX 4060 | |
| Average Intel Core i7-14700HX, NVIDIA GeForce RTX 4060 Laptop GPU (467 - 542, n=2) | |
| Schenker XMG Core 15 (M24) | |
| Lenovo Legion 5 16IRX G9 | |
| Lenovo Legion Pro 5 16IRX9 G9 | |
| Average of class Gaming (391 - 590, n=101, last 2 years) | |
| Lenovo Legion Pro 5 16IRX9 | |
* ... smaller is better
| PCMark 10 Score | 8278 points | |
Help | ||
| AIDA64 / Memory Copy | |
| Lenovo Legion Pro 5 16IRX9 | |
| Lenovo Legion Pro 5 16IRX9 G9 | |
| Average of class Gaming (21750 - 129946, n=106, last 2 years) | |
| Schenker XMG Core 15 (M24) | |
| Average Intel Core i7-14700HX (41617 - 78742, n=9) | |
| HP Victus 16 (2024) | |
| Lenovo Legion 5 16IRX G9 | |
| Dell G16, i7-13650HX, RTX 4060 | |
| AIDA64 / Memory Read | |
| Lenovo Legion Pro 5 16IRX9 | |
| Lenovo Legion Pro 5 16IRX9 G9 | |
| HP Victus 16 (2024) | |
| Average Intel Core i7-14700HX (46627 - 86175, n=9) | |
| Average of class Gaming (22956 - 118858, n=106, last 2 years) | |
| Lenovo Legion 5 16IRX G9 | |
| Dell G16, i7-13650HX, RTX 4060 | |
| Schenker XMG Core 15 (M24) | |
| AIDA64 / Memory Write | |
| Schenker XMG Core 15 (M24) | |
| Lenovo Legion Pro 5 16IRX9 | |
| Lenovo Legion Pro 5 16IRX9 G9 | |
| Average of class Gaming (22297 - 135096, n=106, last 2 years) | |
| Average Intel Core i7-14700HX (39155 - 76976, n=9) | |
| HP Victus 16 (2024) | |
| Dell G16, i7-13650HX, RTX 4060 | |
| Lenovo Legion 5 16IRX G9 | |
| AIDA64 / Memory Latency | |
| Average of class Gaming (75.3 - 259, n=106, last 2 years) | |
| HP Victus 16 (2024) | |
| Dell G16, i7-13650HX, RTX 4060 | |
| Lenovo Legion 5 16IRX G9 | |
| Average Intel Core i7-14700HX (82.7 - 96.4, n=9) | |
| Schenker XMG Core 15 (M24) | |
| Lenovo Legion Pro 5 16IRX9 | |
| Lenovo Legion Pro 5 16IRX9 G9 | |
* ... smaller is better
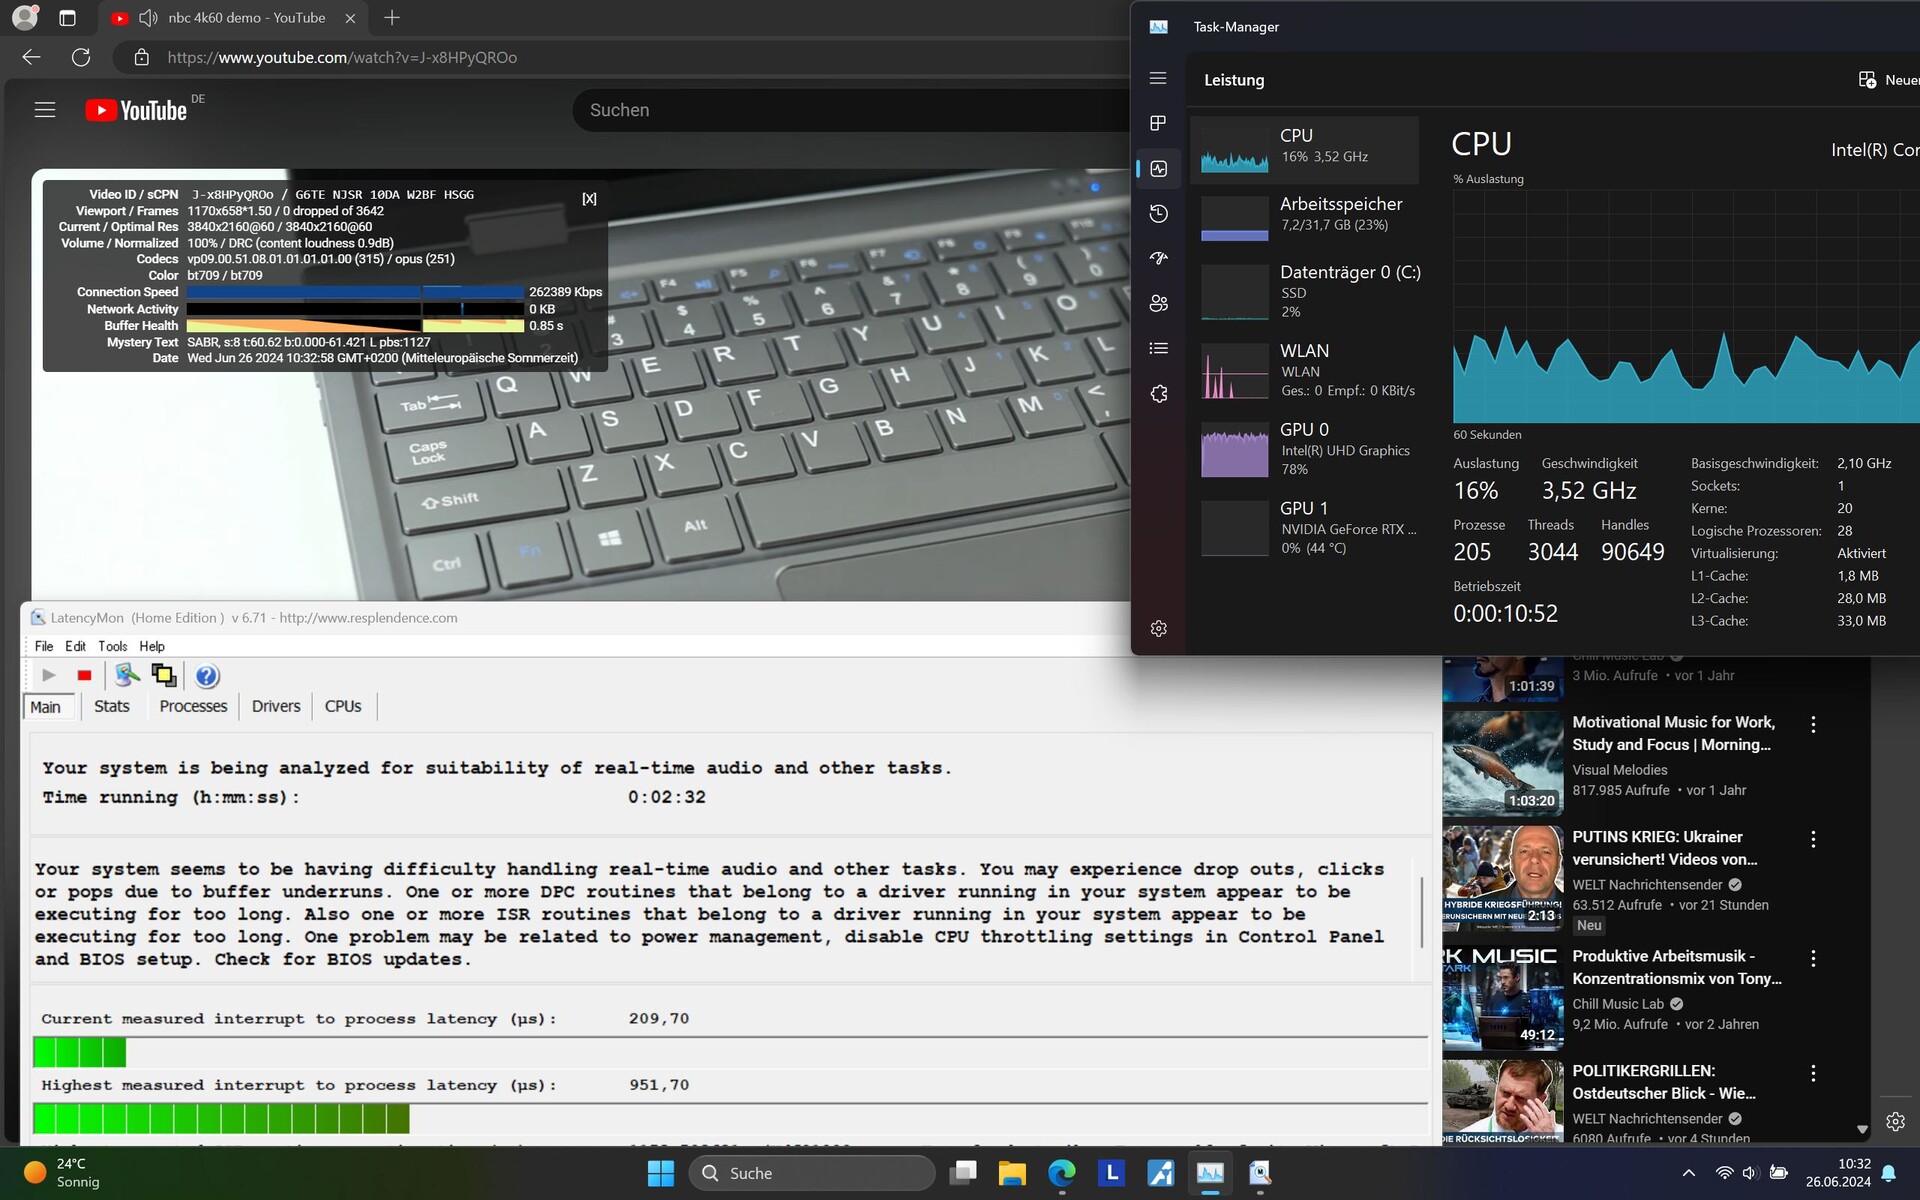
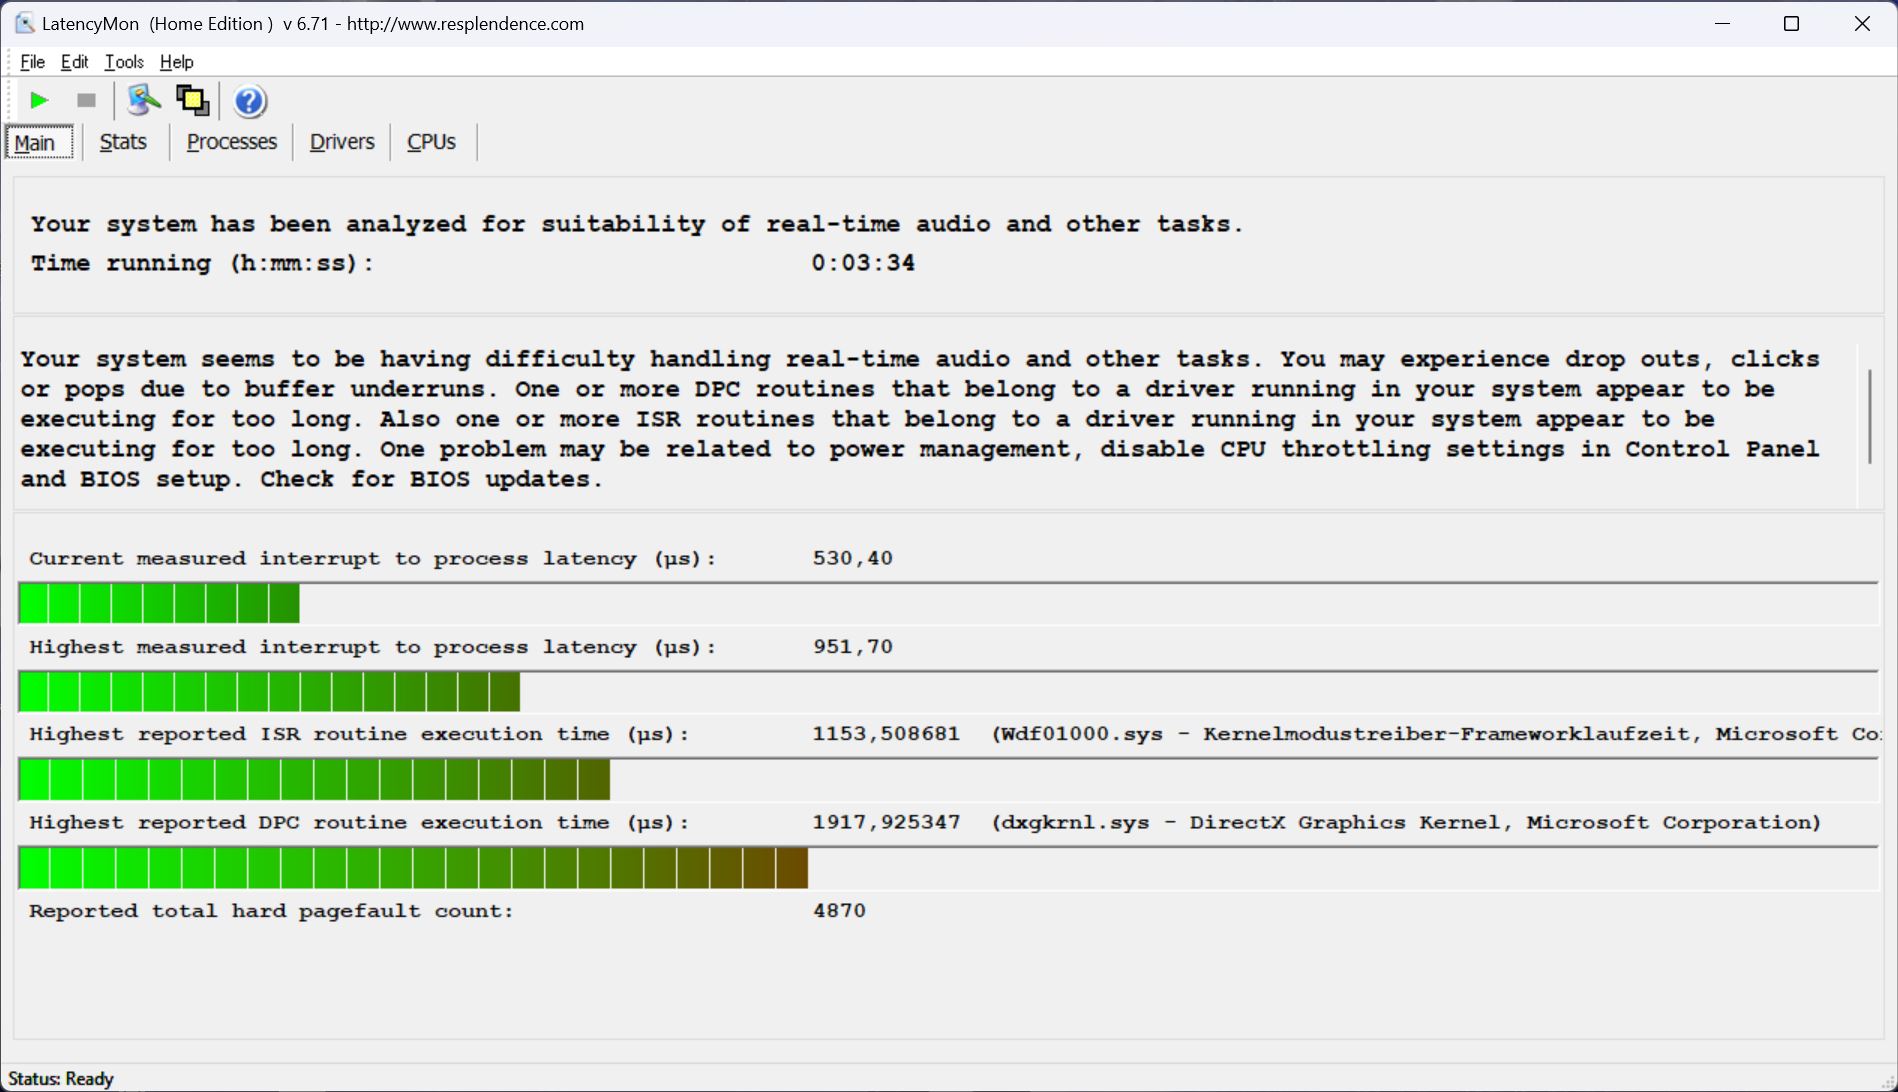
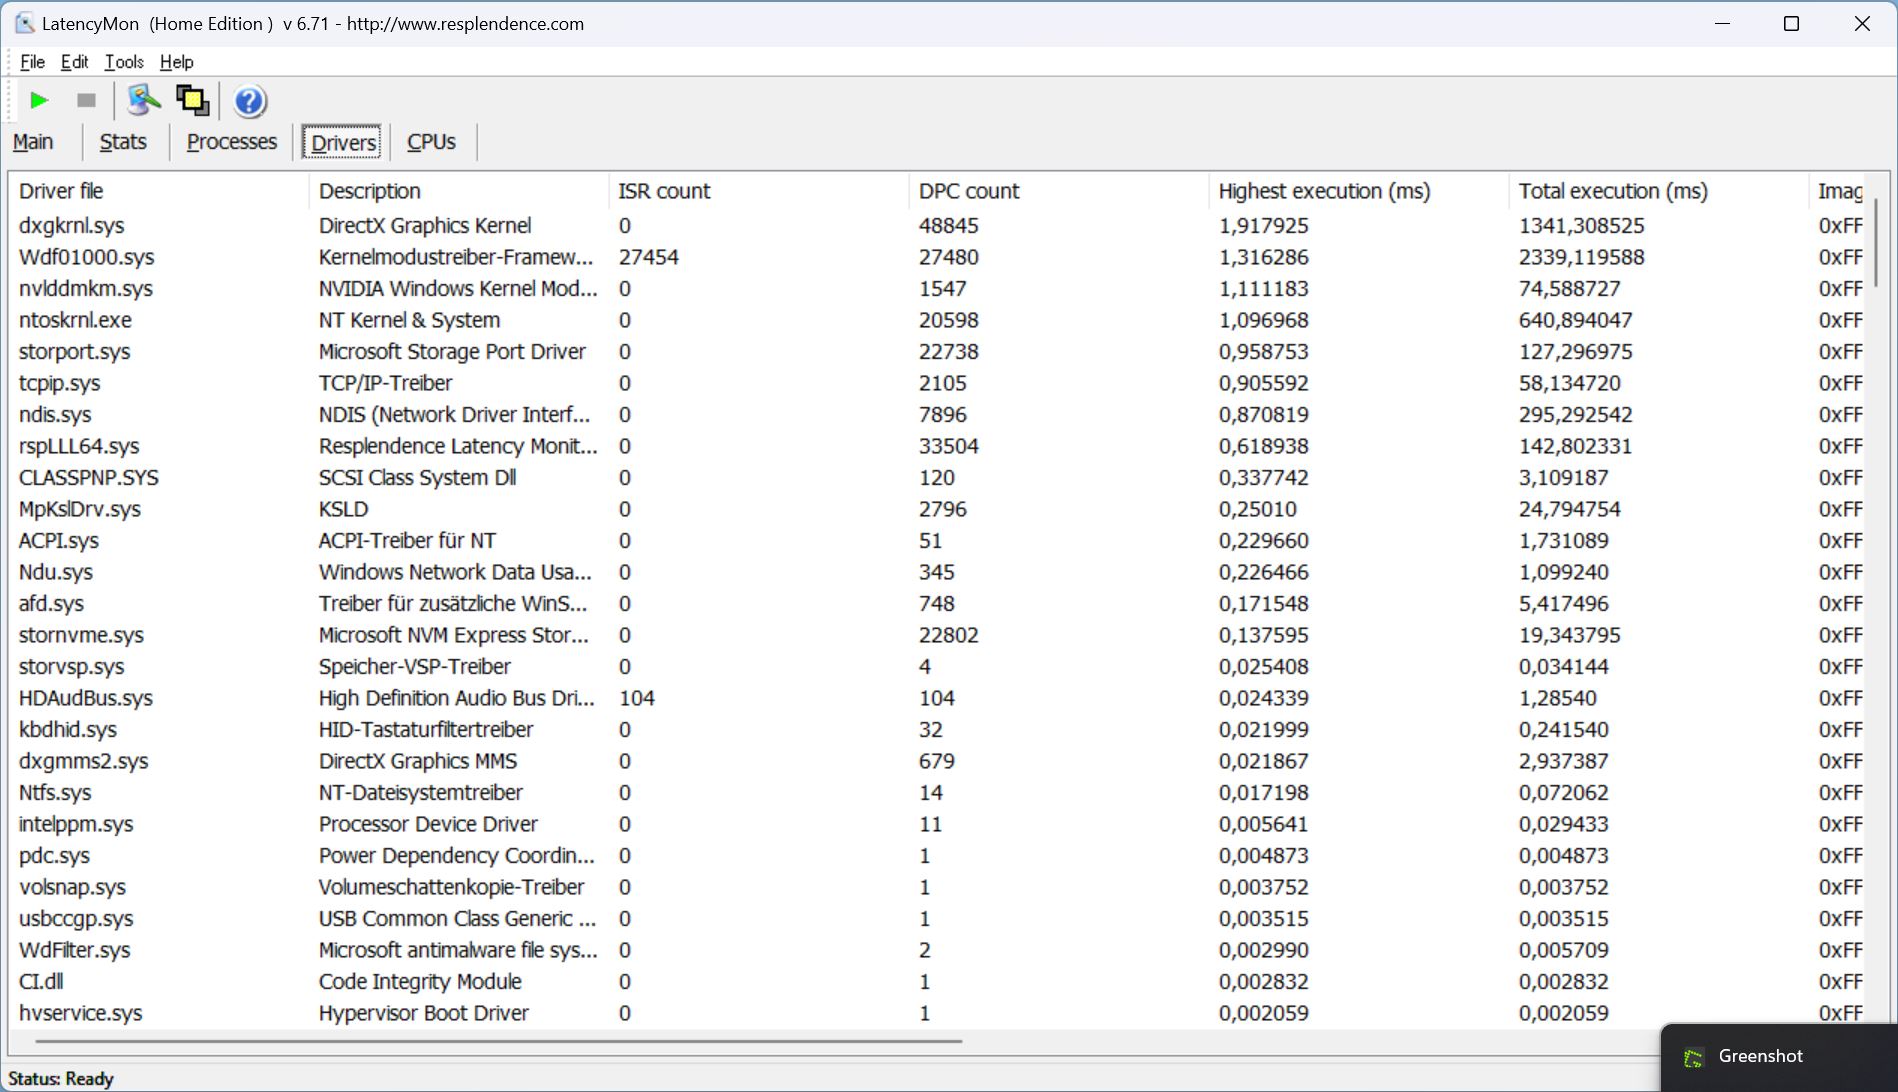
DPC latencies
The first, smaller latencies already occurred when opening the browser. The delay value increased again ever so slightly when opening several tabs on our website. However, our 4K/60fps YouTube video was played without any problems or any dropped frames. Its internal GPU load was very high at 78 per cent.
| DPC Latencies / LatencyMon - interrupt to process latency (max), Web, Youtube, Prime95 | |
| Lenovo Legion 5 16IRX G9 | |
| Schenker XMG Core 15 (M24) | |
| Dell G16, i7-13650HX, RTX 4060 | |
| Lenovo Legion Pro 5 16IRX9 | |
| Lenovo Legion Pro 5 16IRX9 G9 | |
| HP Victus 16 (2024) | |
* ... smaller is better
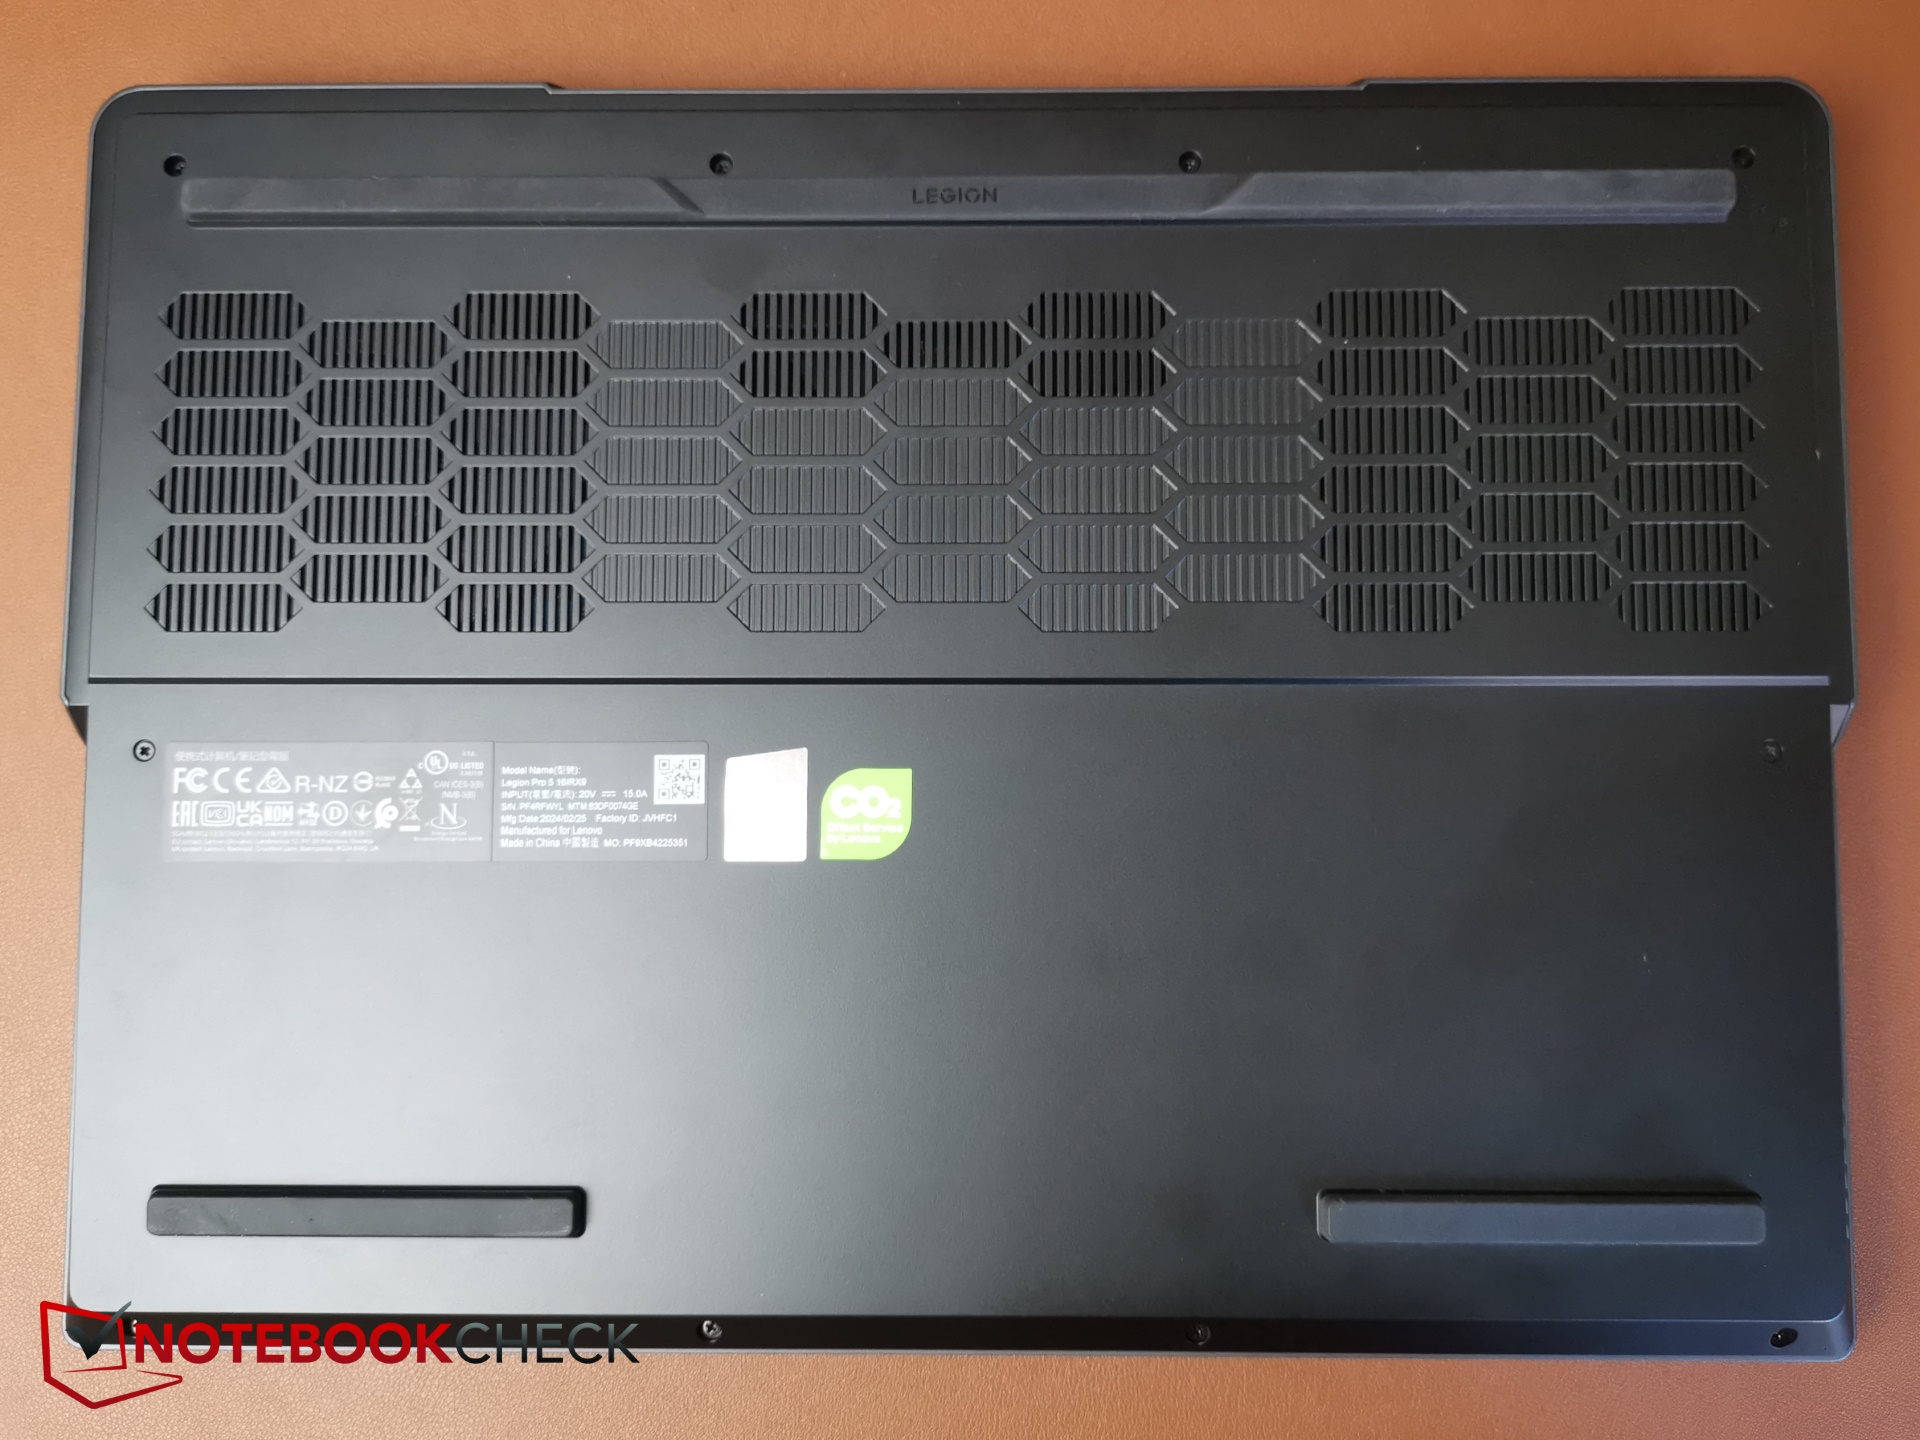
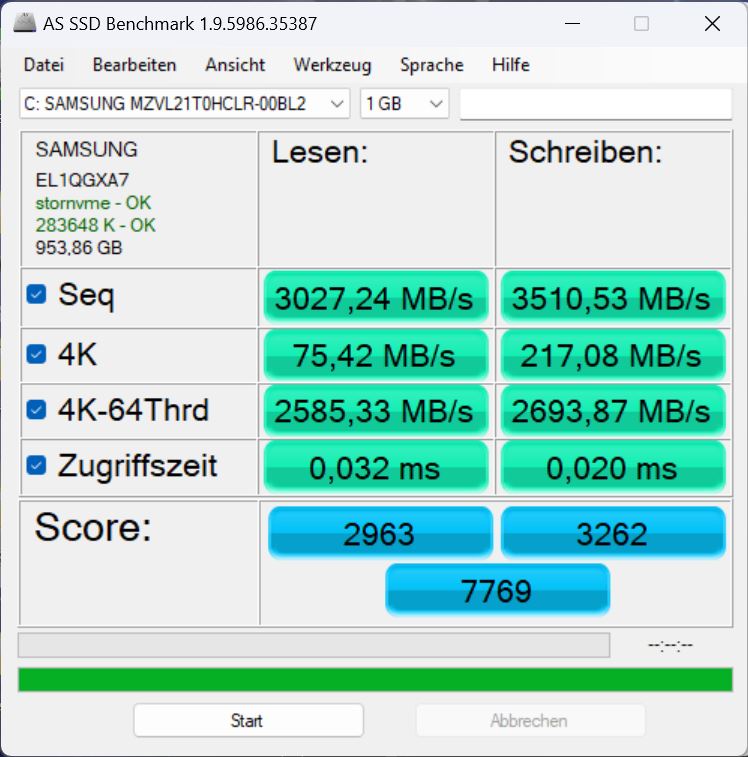
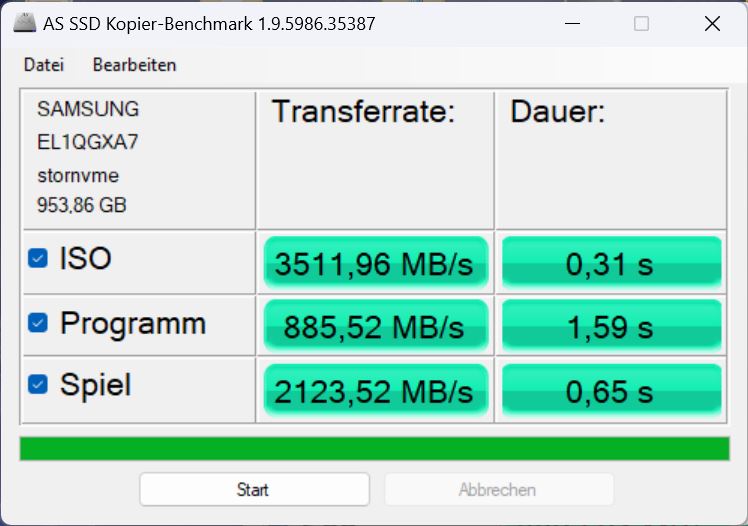
Storage device
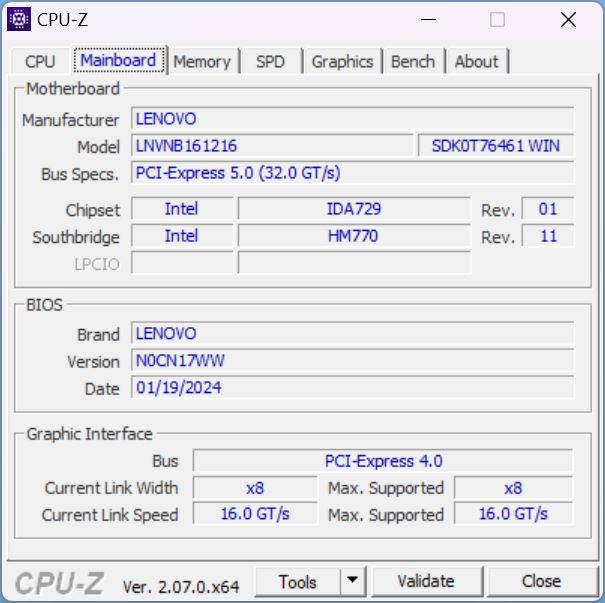
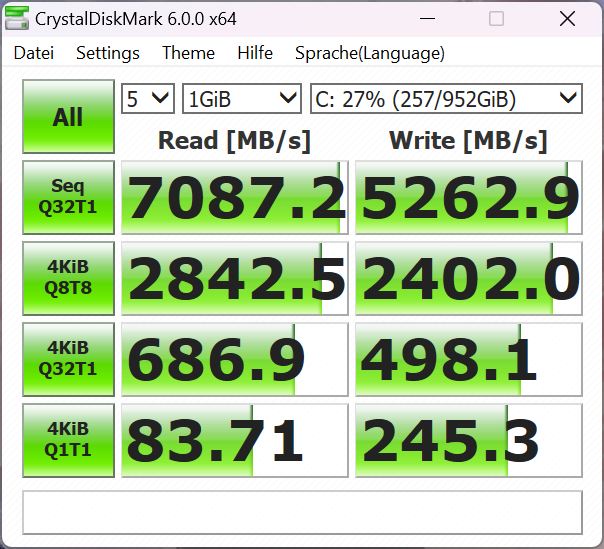
Lenovo has installed a fast PCIe 4 NVMe SSD from Samsung with 1 TB of storage into our model—more precisely an OEM version of the well-known 980 Pro. The model ranks 14th in our SSD best list and is therefore one of the fastest storage devices in the comparison field.
During our benchmarks, it achieved good values overall, but just like the SSDs in the other Legion (Pro) 5 models, it wasn't able to maintain its performance over a longer period of time and was thermally throttled. It's a shame that Lenovo hasn't equipped the laptop with a better cooling system and that the entire series seems to be affected by this issue.

* ... smaller is better
Reading continuous performance: DiskSpd Read Loop, Queue Depth 8
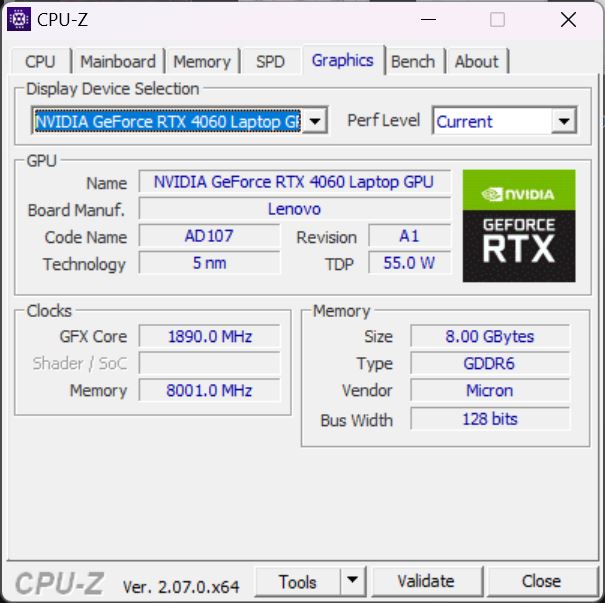
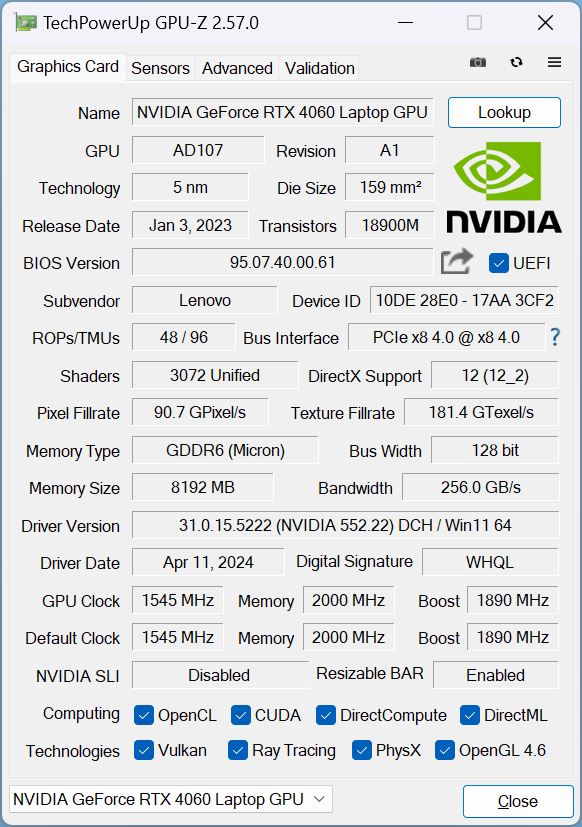
Graphics card
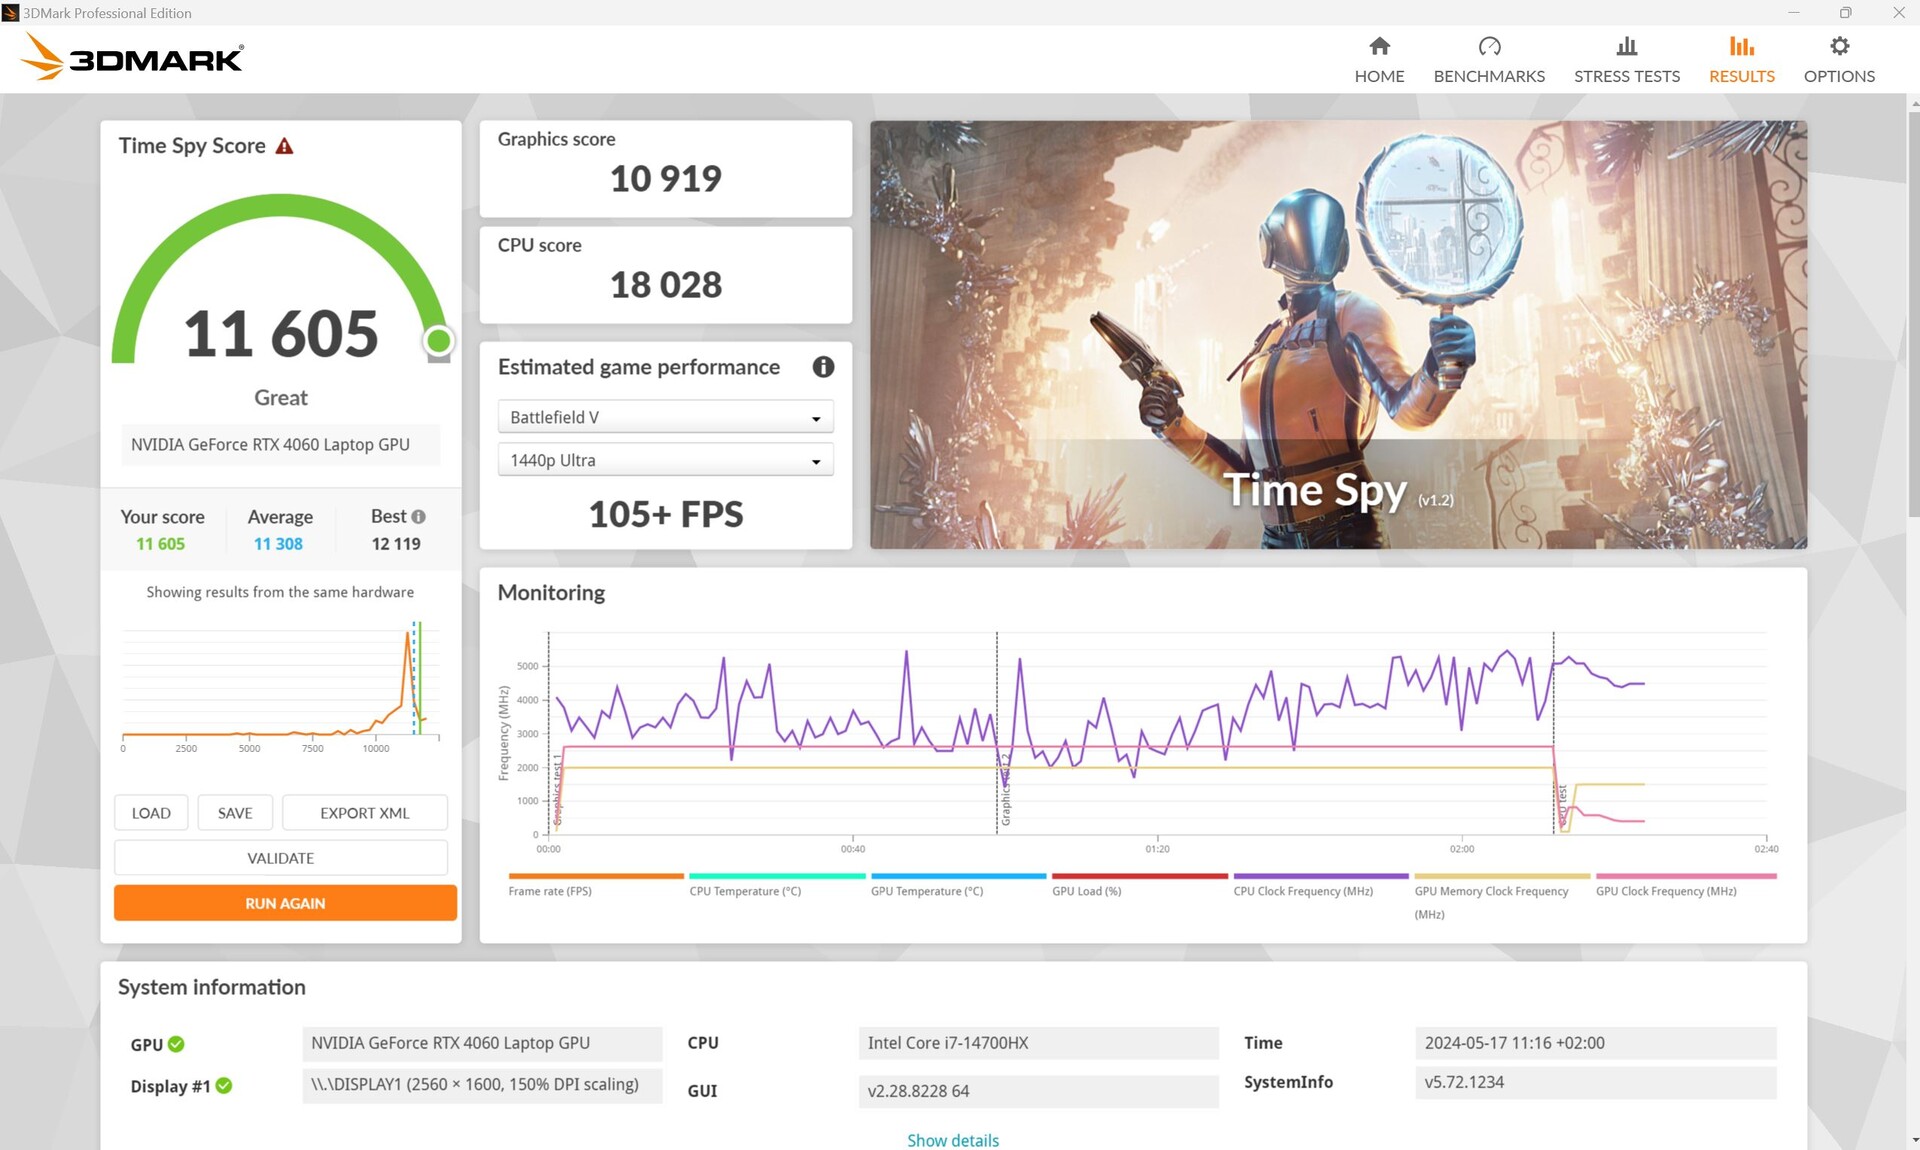
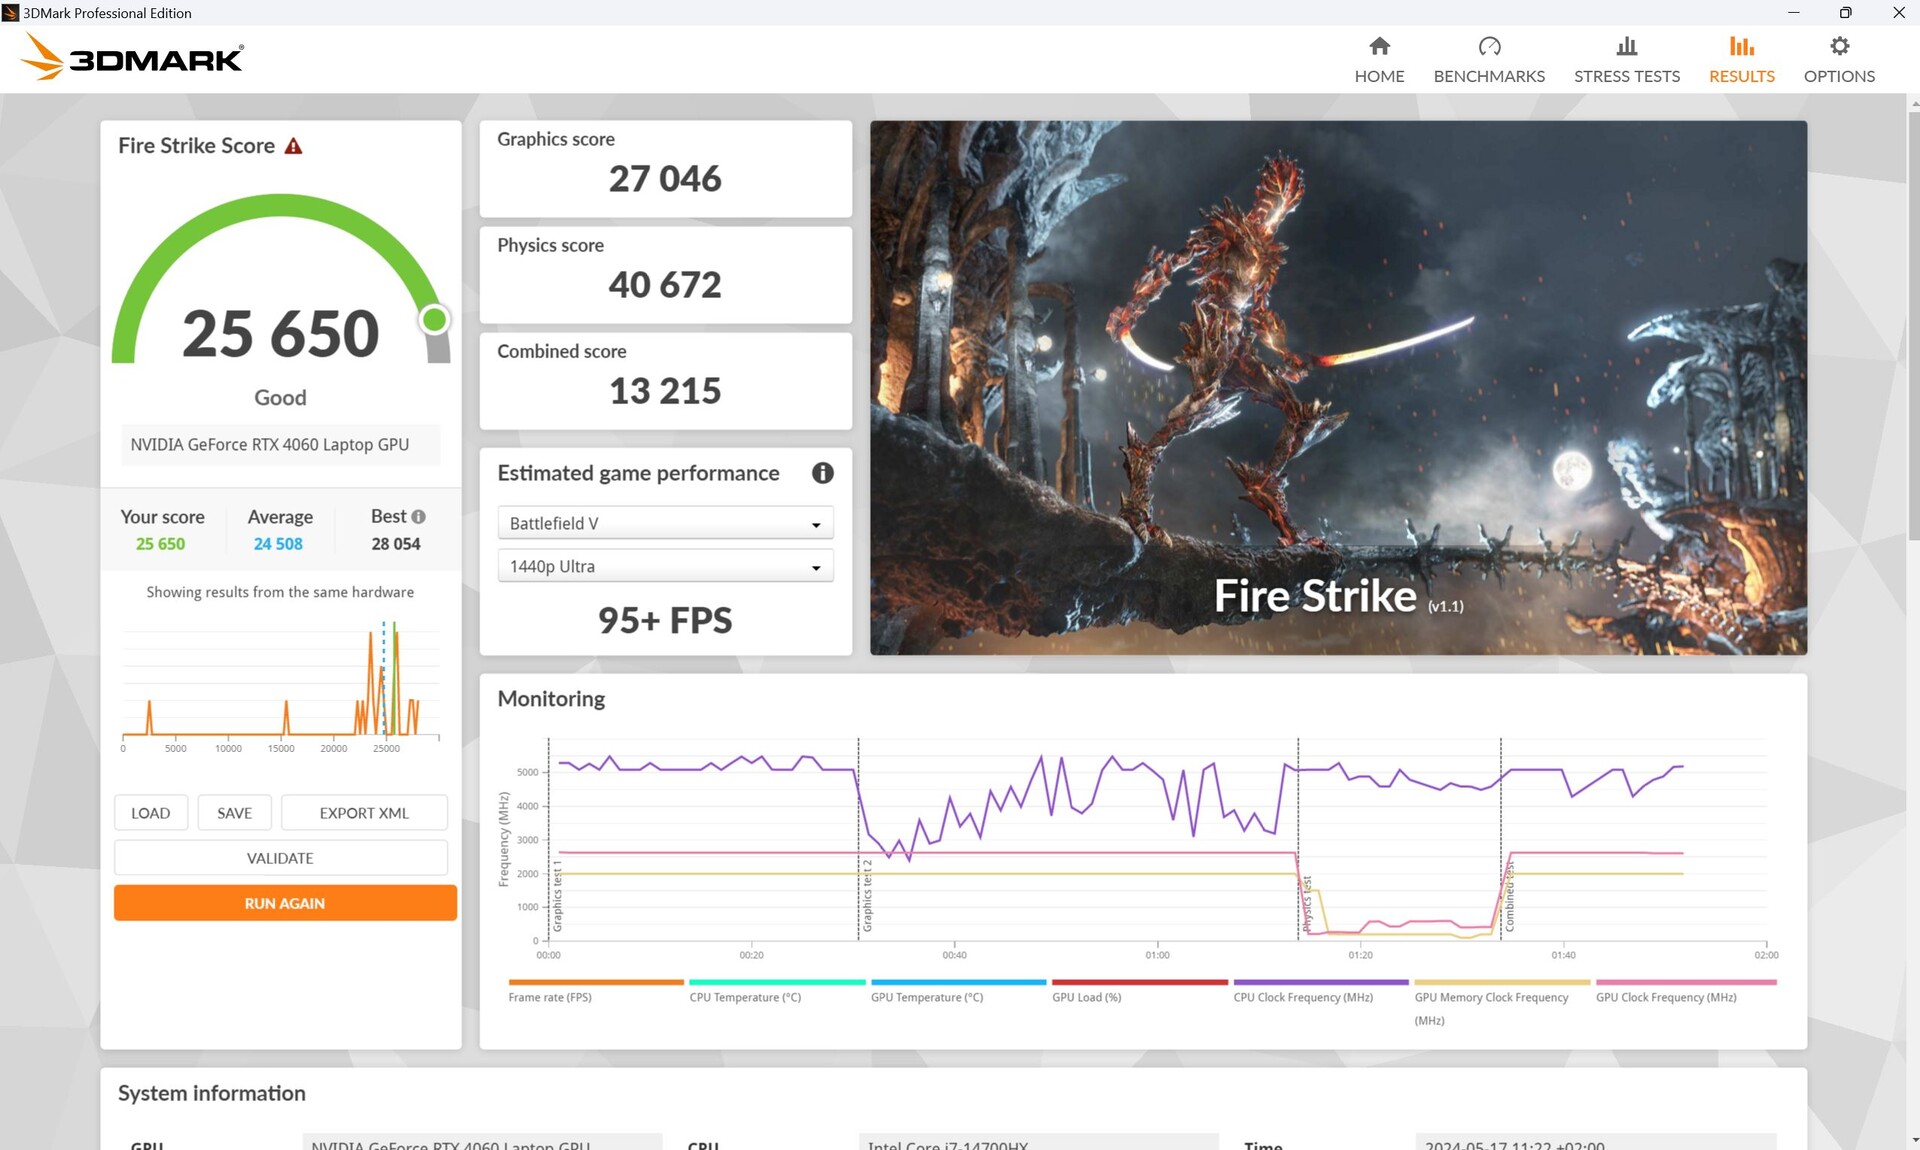
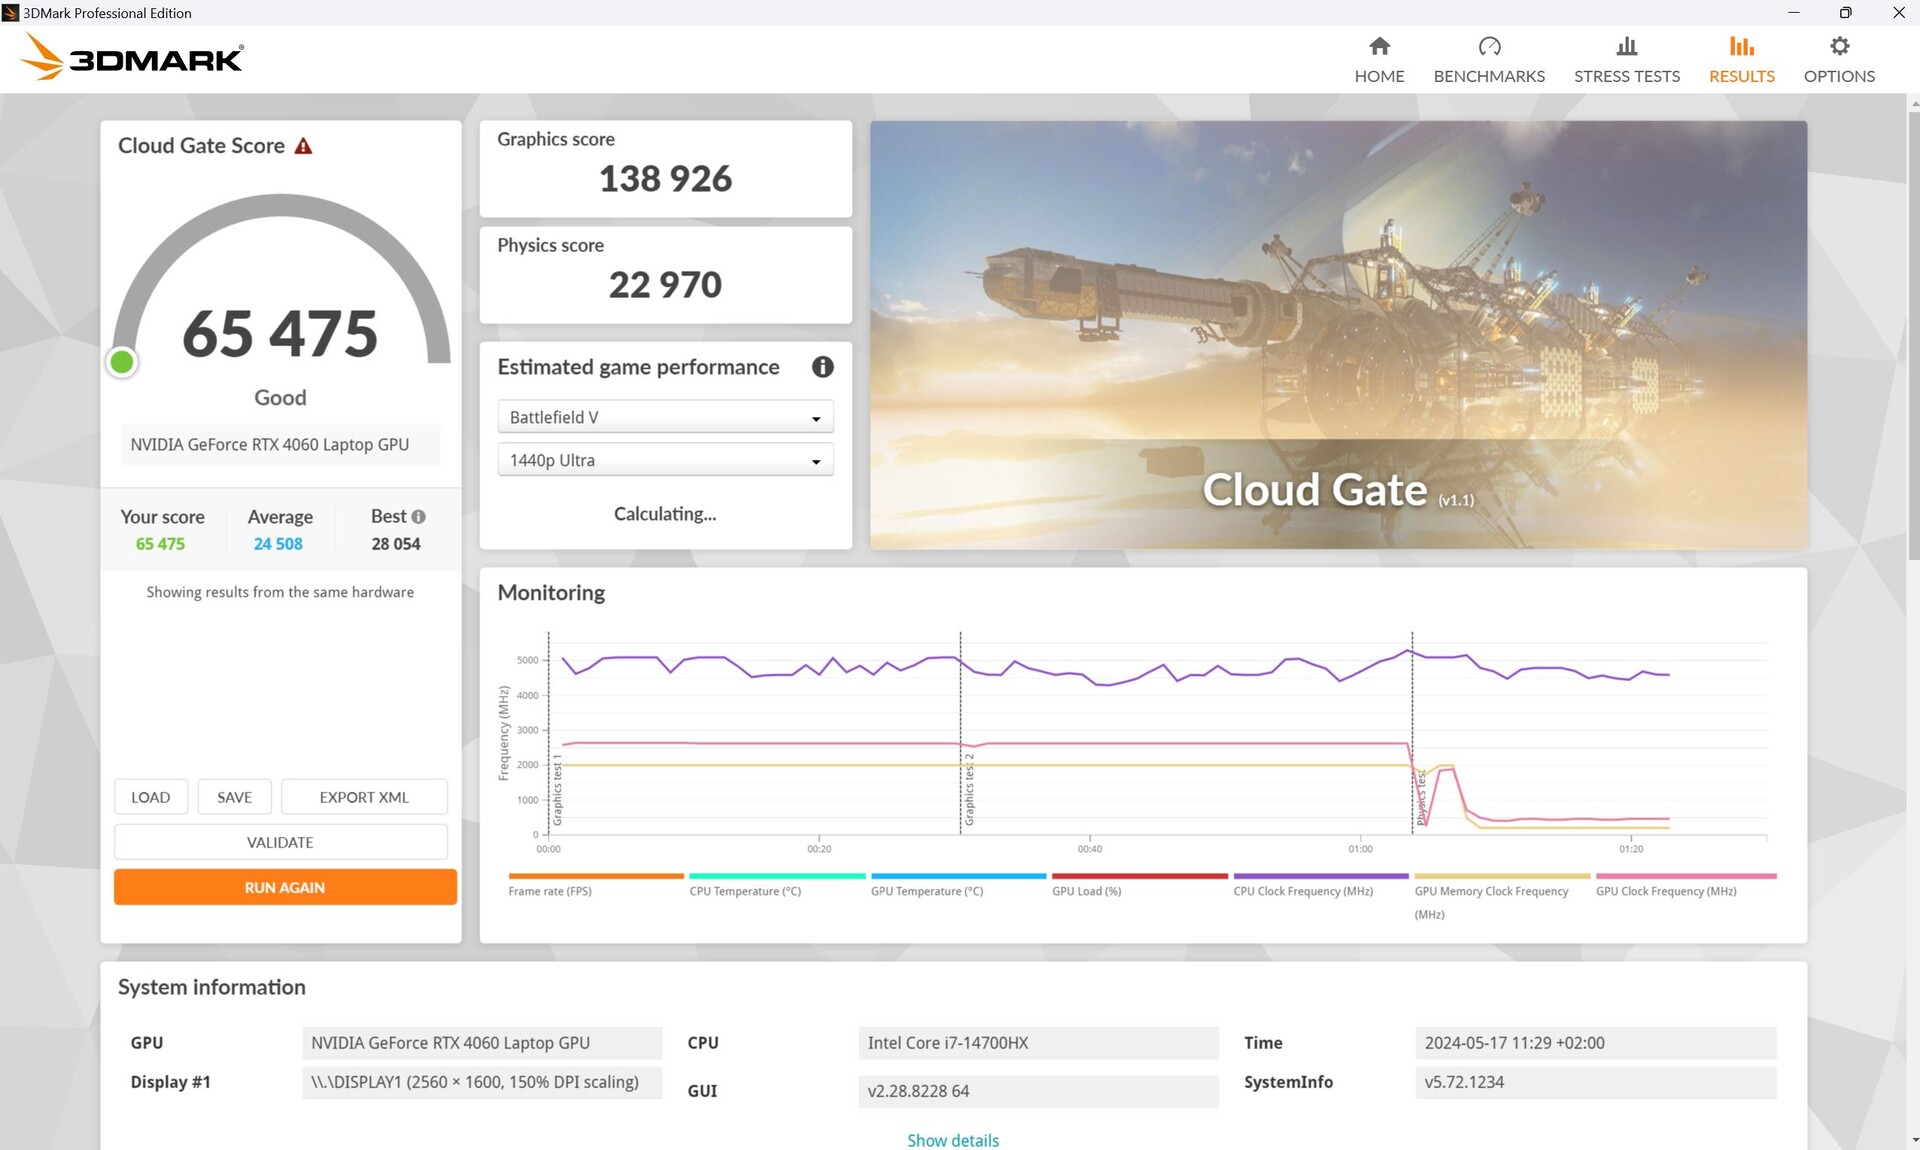
Our configuration is equipped with an Nvidia Geforce RTX 4060 at 140 watts.
During the synthetic 3DMark tests, the GPU performed slightly above average, but the same RTX 4060 was slightly faster in the Legion 5 without the Pro suffix. The Legion Pro 5 with the RTX 4070 and i9-14900HX was around 20 per cent faster in these tests.
In battery mode, its 3D performance decreased by 23 per cent when running Fire Strike once more.

| 3DMark 11 Performance | 33600 points | |
| 3DMark Cloud Gate Standard Score | 65475 points | |
| 3DMark Fire Strike Score | 25650 points | |
| 3DMark Time Spy Score | 11605 points | |
Help | ||
* ... smaller is better
When it comes to gaming, the Legion Pro 5 outperforms the entire competition featuring an RTX 4060—in particular the Victus with the same CPU and GPU which came in last place, scoring 15 points fewer. The RTX-4070 Legion Pro only came 10 points ahead.
Ultimately, all the games we tested can be played in Full HD with maximum details; in QHD, the frame rate may sometimes slip below 60 fps when running demanding games but even then, they still run smoothly.
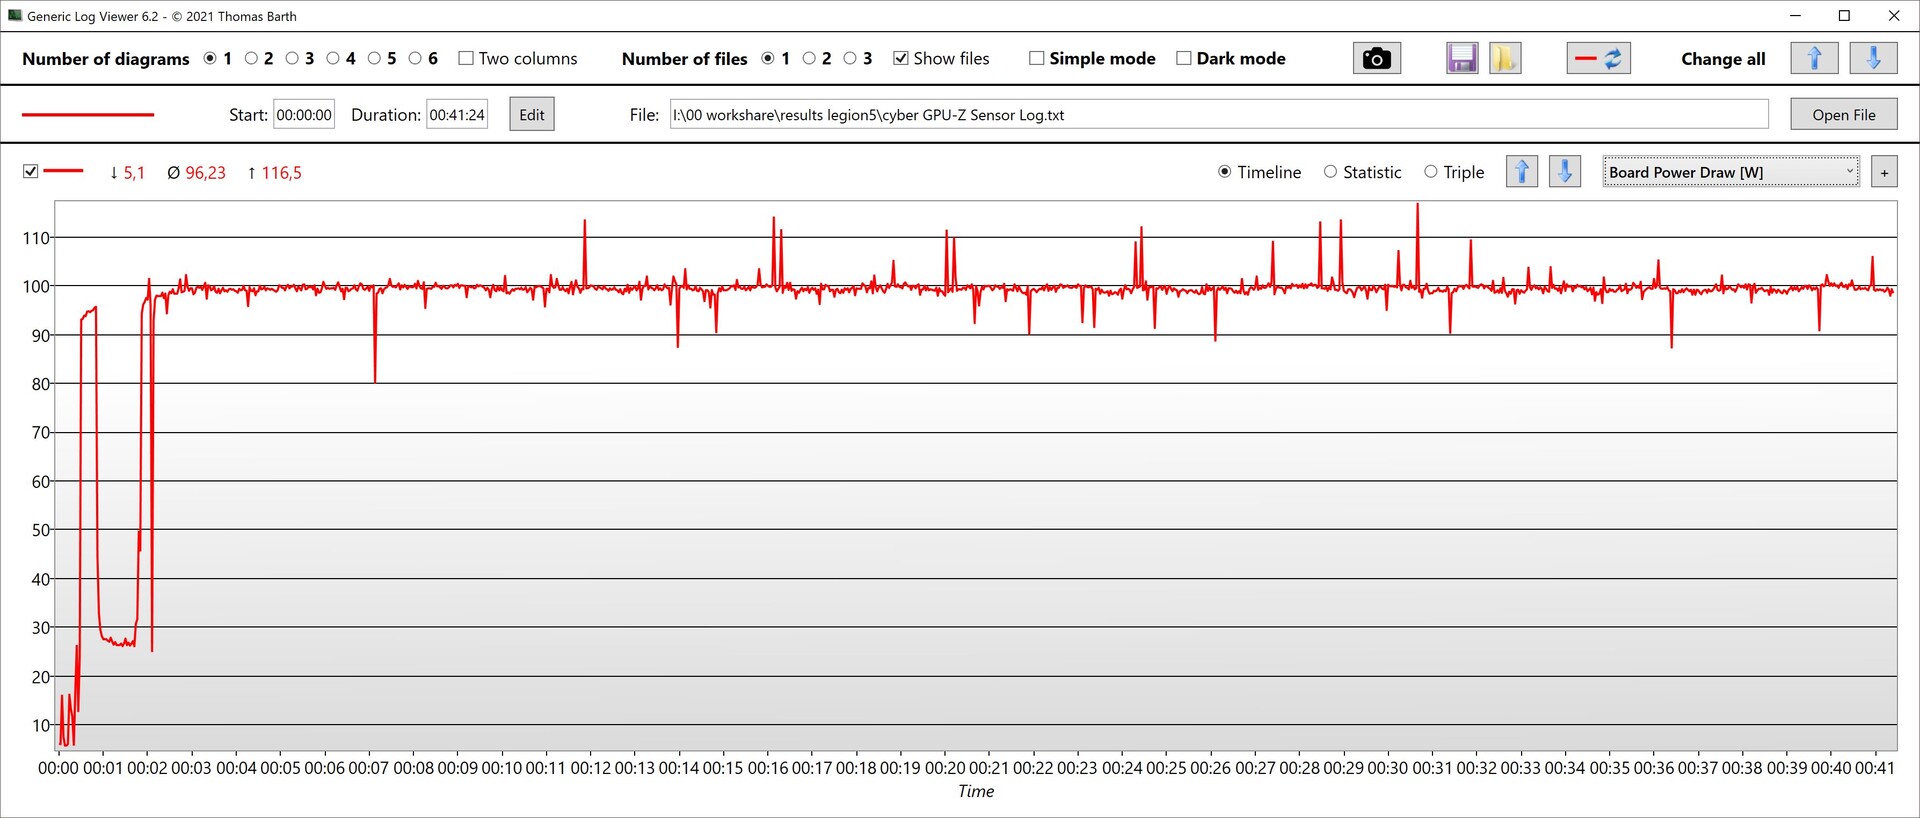
Our continuous test running Cyberpunk 2077 revealed a very constant frame rate without any major drops. The GPU clocked constantly at 2,610 MHz and heated up to 75 to 79 °C. Its power consumption was around 100 watts.


| The Witcher 3 - 1920x1080 Ultra Graphics & Postprocessing (HBAO+) | |
| Average of class Gaming (104.7 - 240, n=7, last 2 years) | |
| Lenovo Legion Pro 5 16IRX9 | |
| Lenovo Legion Pro 5 16IRX9 G9 | |
| Schenker XMG Core 15 (M24) | |
| Dell G16, i7-13650HX, RTX 4060 | |
| HP Victus 16 (2024) | |
| Lenovo Legion 5 16IRX G9 | |
| Final Fantasy XV Benchmark - 1920x1080 High Quality | |
| Average of class Gaming (41 - 215, n=95, last 2 years) | |
| Lenovo Legion Pro 5 16IRX9 | |
| Schenker XMG Core 15 (M24) | |
| Lenovo Legion 5 16IRX G9 | |
| Lenovo Legion Pro 5 16IRX9 G9 | |
| Dell G16, i7-13650HX, RTX 4060 | |
| HP Victus 16 (2024) | |
| Strange Brigade - 1920x1080 ultra AA:ultra AF:16 | |
| Average of class Gaming (76.3 - 458, n=87, last 2 years) | |
| Lenovo Legion Pro 5 16IRX9 | |
| Lenovo Legion 5 16IRX G9 | |
| Schenker XMG Core 15 (M24) | |
| Lenovo Legion Pro 5 16IRX9 G9 | |
| Dell G16, i7-13650HX, RTX 4060 | |
| HP Victus 16 (2024) | |
| Dota 2 Reborn - 1920x1080 ultra (3/3) best looking | |
| Lenovo Legion Pro 5 16IRX9 | |
| Lenovo Legion Pro 5 16IRX9 G9 | |
| Lenovo Legion 5 16IRX G9 | |
| Average of class Gaming (84.8 - 252, n=108, last 2 years) | |
| HP Victus 16 (2024) | |
| Dell G16, i7-13650HX, RTX 4060 | |
| Schenker XMG Core 15 (M24) | |
| The Witcher 3 | |
| 1920x1080 High Graphics & Postprocessing (Nvidia HairWorks Off) | |
| Average of class Gaming (341 - 404, n=2, last 2 years) | |
| Lenovo Legion Pro 5 16IRX9 | |
| Lenovo Legion 5 16IRX G9 | |
| Lenovo Legion Pro 5 16IRX9 G9 | |
| Schenker XMG Core 15 (M24) | |
| Average NVIDIA GeForce RTX 4060 Laptop GPU (110 - 229, n=36) | |
| HP Victus 16 (2024) | |
| Dell G16, i7-13650HX, RTX 4060 | |
| 1920x1080 Ultra Graphics & Postprocessing (HBAO+) | |
| Average of class Gaming (104.7 - 240, n=7, last 2 years) | |
| Lenovo Legion Pro 5 16IRX9 | |
| Lenovo Legion Pro 5 16IRX9 G9 | |
| Schenker XMG Core 15 (M24) | |
| Dell G16, i7-13650HX, RTX 4060 | |
| Average NVIDIA GeForce RTX 4060 Laptop GPU (77 - 159.7, n=42) | |
| HP Victus 16 (2024) | |
| Lenovo Legion 5 16IRX G9 | |
| Skull & Bones | |
| 1920x1080 Ultra High Preset AA:T | |
| Schenker XMG Core 15 (M24) | |
| Average NVIDIA GeForce RTX 4060 Laptop GPU (65 - 73, n=5) | |
| Lenovo Legion Pro 5 16IRX9 G9 | |
| 2560x1440 Ultra High Preset AA:T | |
| Schenker XMG Core 15 (M24) | |
| Average NVIDIA GeForce RTX 4060 Laptop GPU (51 - 57, n=3) | |
| Lenovo Legion Pro 5 16IRX9 G9 | |
| F1 24 - 1920x1080 Ultra High Preset AA:T AF:16x | |
| Average of class Gaming (58.8 - 163.6, n=58, last 2 years) | |
| Lenovo Legion Pro 5 16IRX9 G9 | |
| Average NVIDIA GeForce RTX 4060 Laptop GPU (47.5 - 61.6, n=10) | |
Cyberpunk 2077 FPS diagram
| low | med. | high | ultra | QHD | 4K | |
|---|---|---|---|---|---|---|
| GTA V (2015) | 187.2 | 185.9 | 185.2 | 124.9 | 87.3 | |
| The Witcher 3 (2015) | 531 | 364 | 217 | 112 | 83 | |
| Dota 2 Reborn (2015) | 228 | 203 | 191.7 | 183.8 | 129.4 | |
| Final Fantasy XV Benchmark (2018) | 226 | 155.5 | 106.1 | 78.1 | ||
| X-Plane 11.11 (2018) | 201 | 172.9 | 135.1 | 124.7 | ||
| Far Cry 5 (2018) | 192 | 165 | 158 | 148 | 106 | |
| Strange Brigade (2018) | 526 | 295 | 231 | 199.9 | ||
| Baldur's Gate 3 (2023) | 138.6 | 85.7 | 71.1 | 66.5 | 49.1 | |
| Cyberpunk 2077 (2023) | 135.3 | 100.8 | 88.7 | 79.5 | 47.5 | |
| Skull & Bones (2024) | 137 | 124 | 98 | 69 | 53 | |
| F1 24 (2024) | 286 | 247 | 185.3 | 60.6 |
Emissions & power: Left gaming side of the Lenovo gets hotter than the right
Noise emissions
In performance mode, the fans are mostly active and this is often also the case in idle mode—they then spin at a quiet 25 to 26 dB. In our medium load scenario via 3DMark06, they already reached up to 45 dB, but the competition is similarly loud.
Under higher loads, the fan's noise emissions fluctuate and don't remain constant. The data in the table shows its maximum values. For example, its emissions fluctuated between 47.5 dB and 52.69 dB when playing Cyberpunk.
Noise level
| Idle |
| 23 / 23 / 25 dB(A) |
| Load |
| 45.18 / 53.13 dB(A) |
 | ||
30 dB silent 40 dB(A) audible 50 dB(A) loud |
||
min: | ||
| Lenovo Legion Pro 5 16IRX9 G9 GeForce RTX 4060 Laptop GPU, i7-14700HX, Samsung PM9A1 MZVL21T0HCLR | HP Victus 16 (2024) GeForce RTX 4060 Laptop GPU, i7-14700HX, Kioxia XG8 KXG80ZNV512G | Dell G16, i7-13650HX, RTX 4060 GeForce RTX 4060 Laptop GPU, i7-13650HX, WD PC SN740 SDDPNQD-1T00 | Schenker XMG Core 15 (M24) GeForce RTX 4060 Laptop GPU, R7 8845HS, Samsung 990 Pro 1 TB | Lenovo Legion Pro 5 16IRX9 GeForce RTX 4070 Laptop GPU, i9-14900HX, Samsung PM9A1 MZVL21T0HCLR | Lenovo Legion 5 16IRX G9 GeForce RTX 4060 Laptop GPU, i7-14650HX, Samsung PM9A1 MZVL21T0HCLR | |
|---|---|---|---|---|---|---|
| Noise | -13% | 6% | 4% | -7% | -11% | |
| off / environment * (dB) | 23 | 25 -9% | 23 -0% | 23 -0% | 23.9 -4% | 24 -4% |
| Idle Minimum * (dB) | 23 | 28 -22% | 23 -0% | 23 -0% | 24.3 -6% | 24 -4% |
| Idle Average * (dB) | 23 | 29 -26% | 23 -0% | 23 -0% | 24.3 -6% | 28.8 -25% |
| Idle Maximum * (dB) | 25 | 33 -32% | 27.96 -12% | 23 8% | 28.9 -16% | 32 -28% |
| Load Average * (dB) | 45.18 | 45 -0% | 27.96 38% | 38.92 14% | 45.8 -1% | 45.5 -1% |
| Cyberpunk 2077 ultra * (dB) | 52.69 | 52.06 1% | ||||
| Load Maximum * (dB) | 53.13 | 48 10% | 47.89 10% | 52.09 2% | 56.6 -7% | 55.7 -5% |
| Witcher 3 ultra * (dB) | 43 | 47.89 | 50.96 | 51 | 53.1 |
* ... smaller is better
Temperature
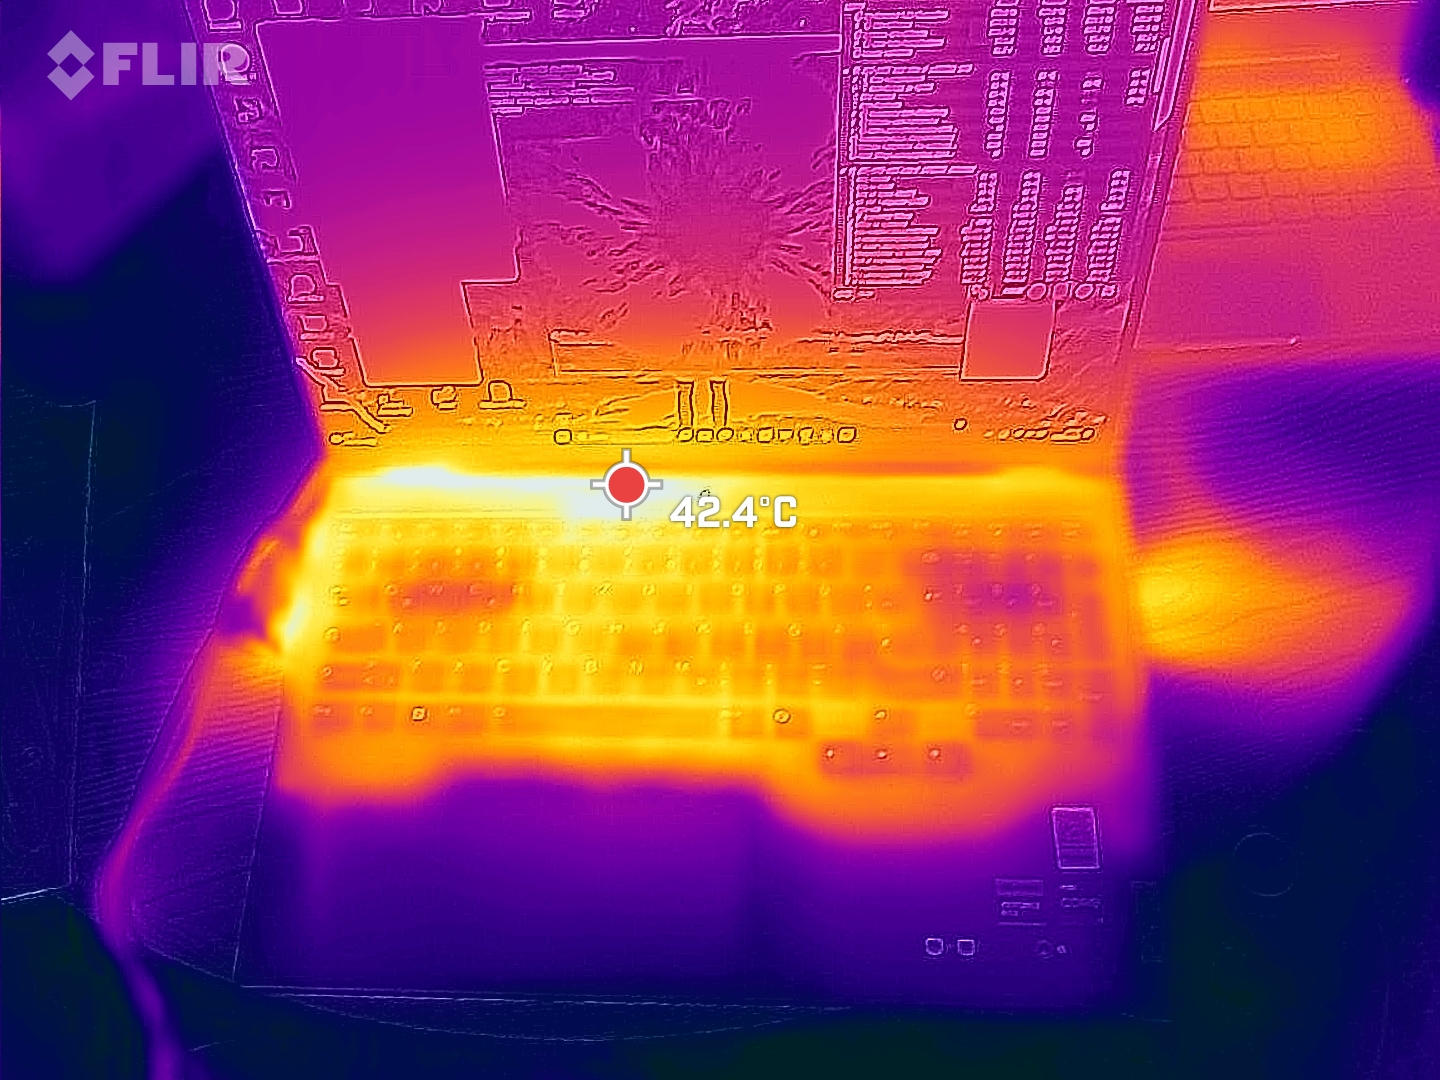
The Legion already gets quite warm when idling—we measured up to 39 °C on the bottom of the device. In general, the left side with the WASD keys (which are important for gamers) seems to heat up more than the right side.
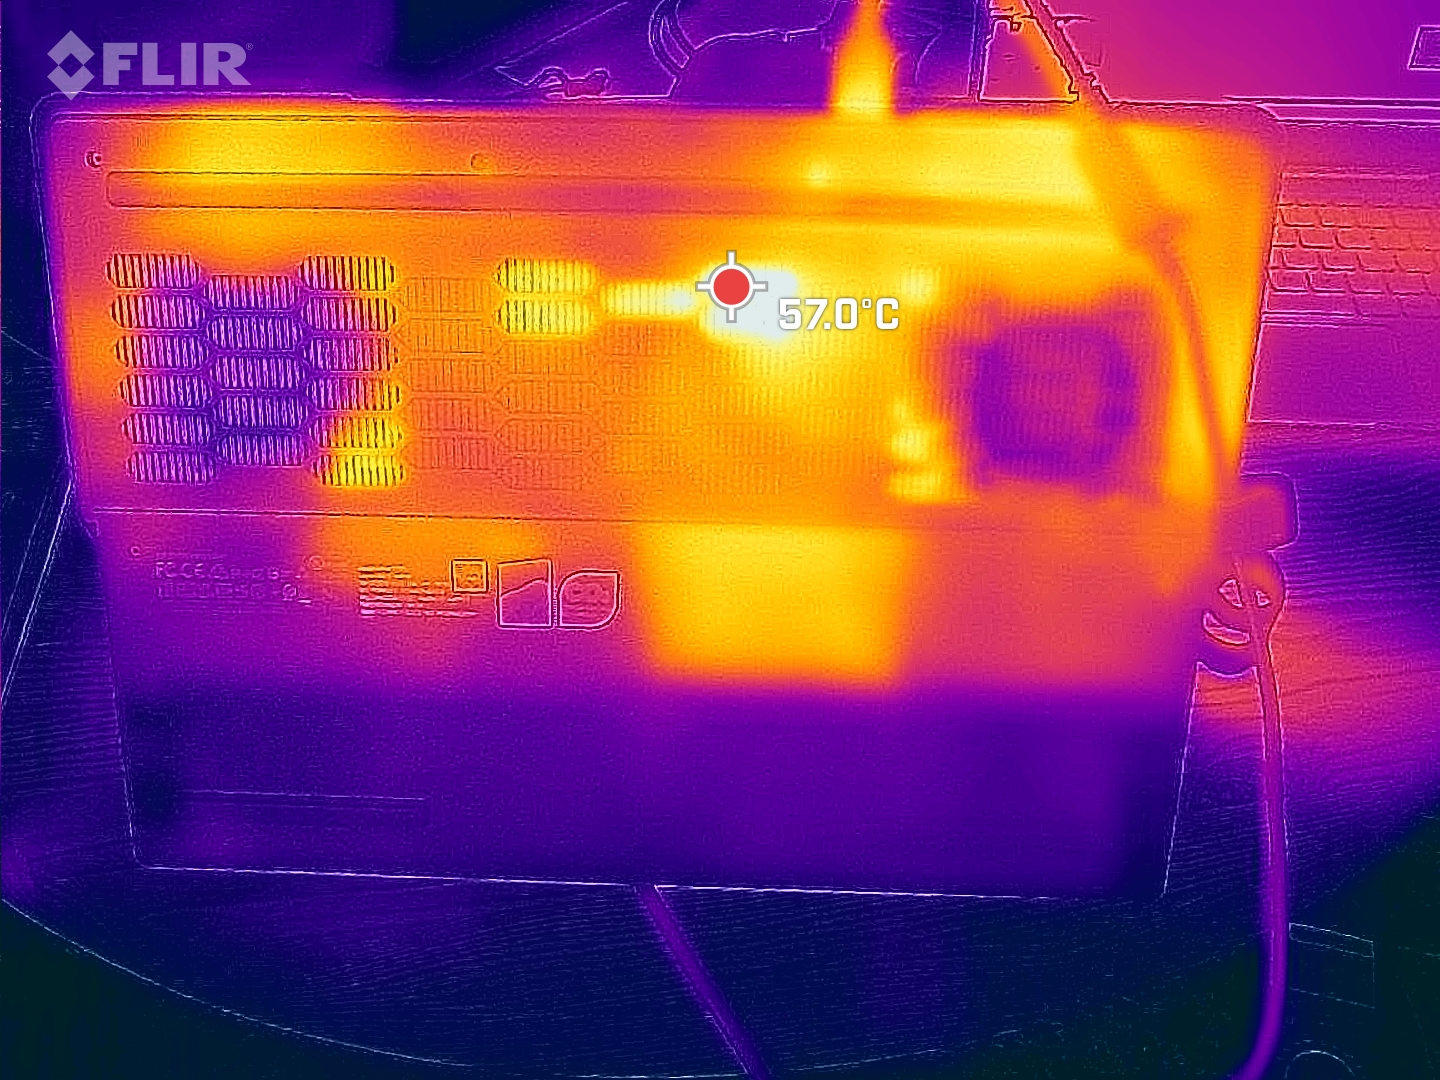
Under heavy load, we measured a hot spot of 57 °C on the bottom. The Dell G16 and the Core 15 got similarly hot, while the other competitors tended to stay cooler.
(-) The maximum temperature on the upper side is 50 °C / 122 F, compared to the average of 40.4 °C / 105 F, ranging from 21.2 to 68.8 °C for the class Gaming.
(-) The bottom heats up to a maximum of 57 °C / 135 F, compared to the average of 43.2 °C / 110 F
(±) In idle usage, the average temperature for the upper side is 32.9 °C / 91 F, compared to the device average of 33.9 °C / 93 F.
(-) 3: The average temperature for the upper side is 38.4 °C / 101 F, compared to the average of 33.9 °C / 93 F for the class Gaming.
(±) The palmrests and touchpad can get very hot to the touch with a maximum of 36 °C / 96.8 F.
(-) The average temperature of the palmrest area of similar devices was 28.8 °C / 83.8 F (-7.2 °C / -13 F).
| Lenovo Legion Pro 5 16IRX9 G9 Intel Core i7-14700HX, NVIDIA GeForce RTX 4060 Laptop GPU | HP Victus 16 (2024) Intel Core i7-14700HX, NVIDIA GeForce RTX 4060 Laptop GPU | Dell G16, i7-13650HX, RTX 4060 Intel Core i7-13650HX, NVIDIA GeForce RTX 4060 Laptop GPU | Schenker XMG Core 15 (M24) AMD Ryzen 7 8845HS, NVIDIA GeForce RTX 4060 Laptop GPU | Lenovo Legion Pro 5 16IRX9 Intel Core i9-14900HX, NVIDIA GeForce RTX 4070 Laptop GPU | Lenovo Legion 5 16IRX G9 Intel Core i7-14650HX, NVIDIA GeForce RTX 4060 Laptop GPU | |
|---|---|---|---|---|---|---|
| Heat | 19% | 3% | -2% | 8% | 17% | |
| Maximum Upper Side * (°C) | 50 | 50 -0% | 49 2% | 52 -4% | 43.8 12% | 40.4 19% |
| Maximum Bottom * (°C) | 57 | 50 12% | 58 -2% | 61 -7% | 55.4 3% | 43.8 23% |
| Idle Upper Side * (°C) | 36 | 25 31% | 35 3% | 35 3% | 32.8 9% | 30.3 16% |
| Idle Bottom * (°C) | 39 | 26 33% | 35 10% | 39 -0% | 36 8% | 35.3 9% |
* ... smaller is better
Speakers
The speakers don't stand out positively from the competition: they are only moderately loud and we noted hardly any bass at all. A standard headphone jack is available for connecting analogue devices.
Lenovo Legion Pro 5 16IRX9 G9 audio analysis
(±) | speaker loudness is average but good (77.13 dB)
Bass 100 - 315 Hz
(-) | nearly no bass - on average 18.3% lower than median
(±) | linearity of bass is average (12% delta to prev. frequency)
Mids 400 - 2000 Hz
(±) | higher mids - on average 6.9% higher than median
(+) | mids are linear (4.9% delta to prev. frequency)
Highs 2 - 16 kHz
(+) | balanced highs - only 4.5% away from median
(±) | linearity of highs is average (9.5% delta to prev. frequency)
Overall 100 - 16.000 Hz
(±) | linearity of overall sound is average (21.6% difference to median)
Compared to same class
» 77% of all tested devices in this class were better, 5% similar, 18% worse
» The best had a delta of 6%, average was 18%, worst was 132%
Compared to all devices tested
» 61% of all tested devices were better, 7% similar, 32% worse
» The best had a delta of 4%, average was 23%, worst was 134%
Dell G16, i7-13650HX, RTX 4060 audio analysis
(±) | speaker loudness is average but good (80.55 dB)
Bass 100 - 315 Hz
(-) | nearly no bass - on average 25.1% lower than median
(-) | bass is not linear (18.9% delta to prev. frequency)
Mids 400 - 2000 Hz
(±) | higher mids - on average 8% higher than median
(+) | mids are linear (5.9% delta to prev. frequency)
Highs 2 - 16 kHz
(+) | balanced highs - only 3.5% away from median
(±) | linearity of highs is average (8.6% delta to prev. frequency)
Overall 100 - 16.000 Hz
(±) | linearity of overall sound is average (23.4% difference to median)
Compared to same class
» 85% of all tested devices in this class were better, 5% similar, 11% worse
» The best had a delta of 6%, average was 18%, worst was 132%
Compared to all devices tested
» 70% of all tested devices were better, 6% similar, 24% worse
» The best had a delta of 4%, average was 23%, worst was 134%
Power consumption
It isn't the easiest to measure the Legion Pro 5's true idle consumption because the laptop draws around 50 watts from the socket almost continuously—even when idle! If you wait a very long time, its idle consumption finally levels out to comparatively normal values (15 to 20 watts), but as soon as you just change the laptop's brightness with the F key, its consumption goes back up to 50 watts and stays there for an unusually long time. The idle values given in the table are therefore rather optimistically low.
Under heavy load, its consumption and the GPU's performance fluctuate quite strongly, as you can see from our consumption graphs—especially when the CPU and GPU are equally stressed, like in our stress test.

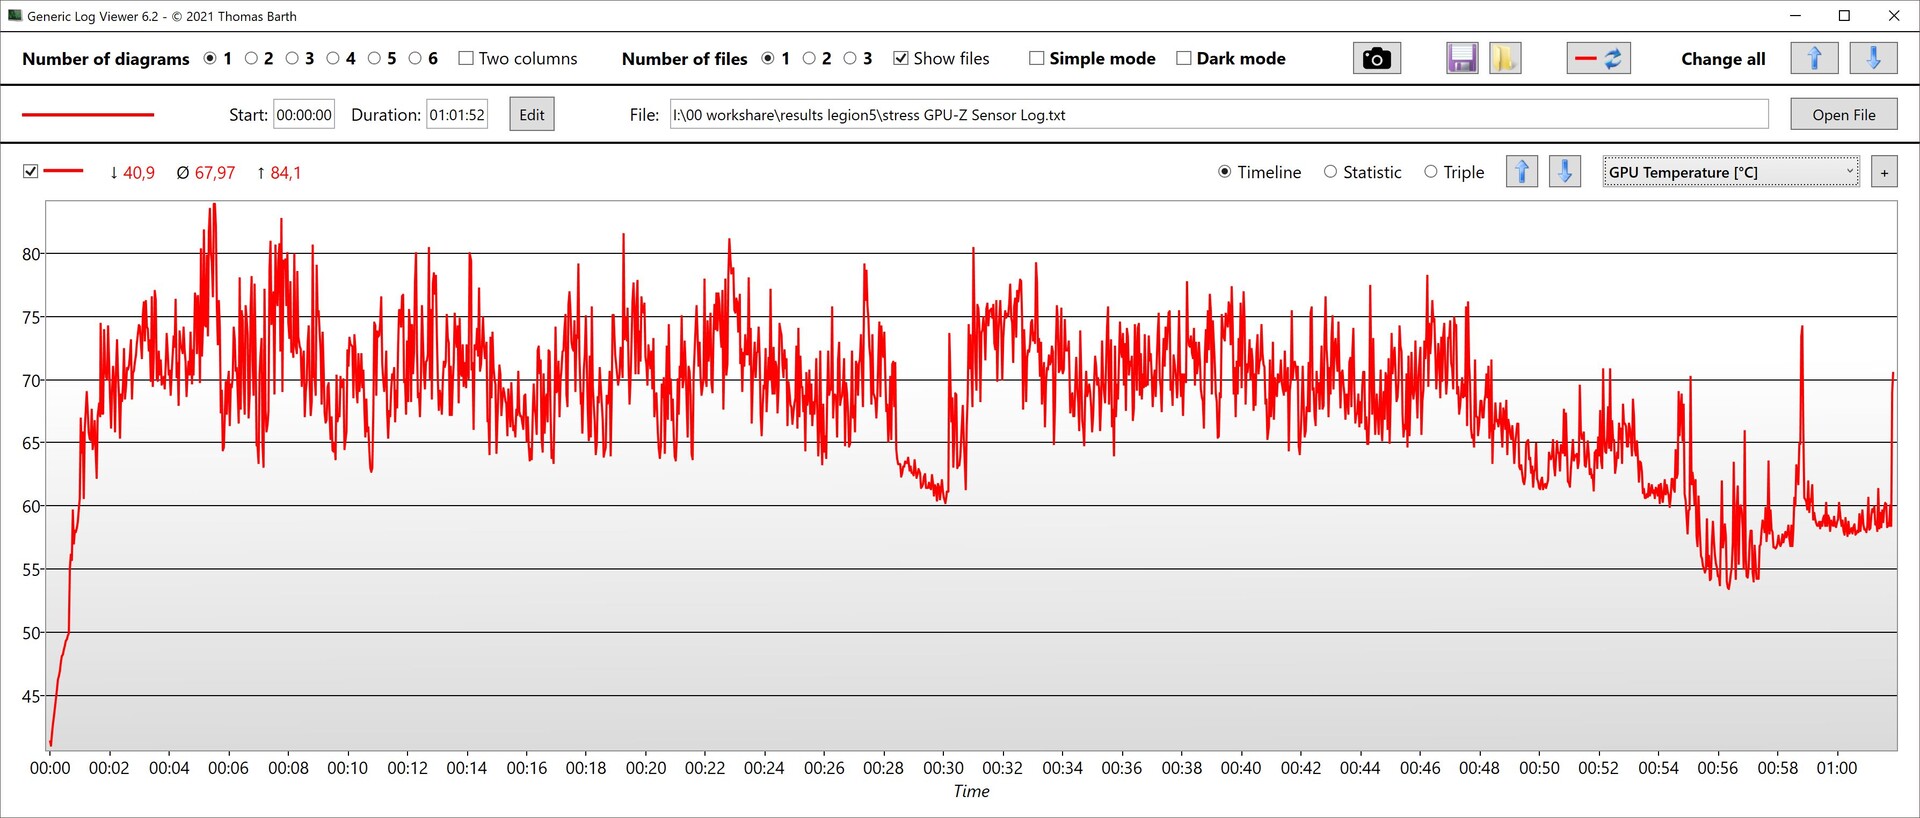
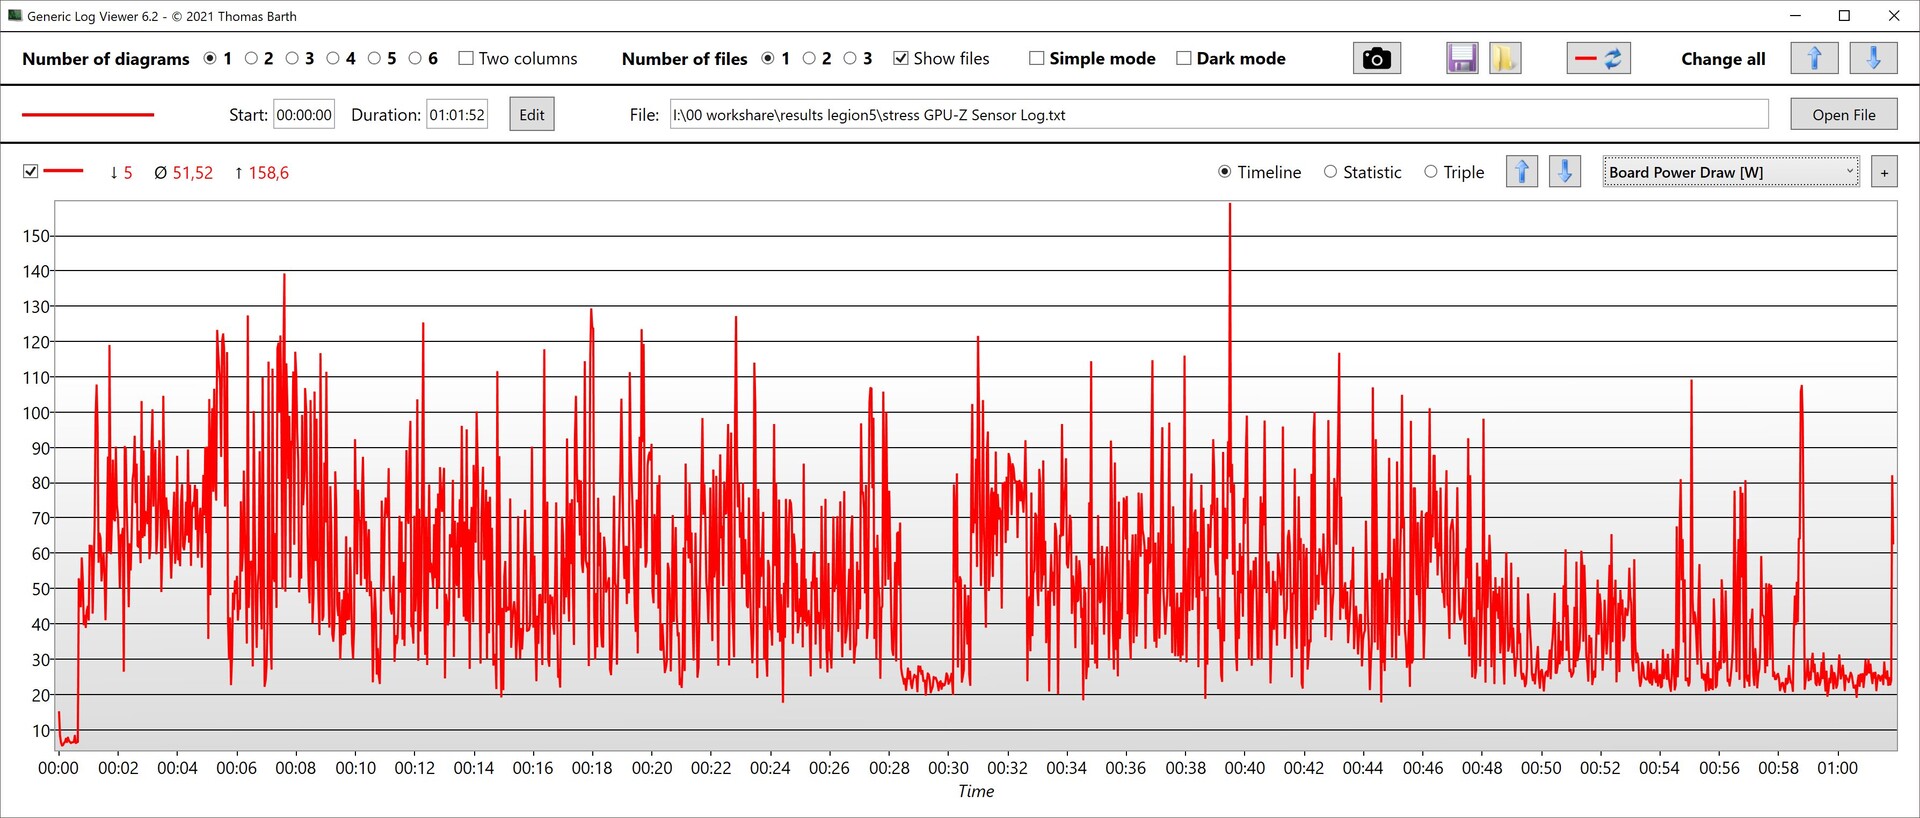
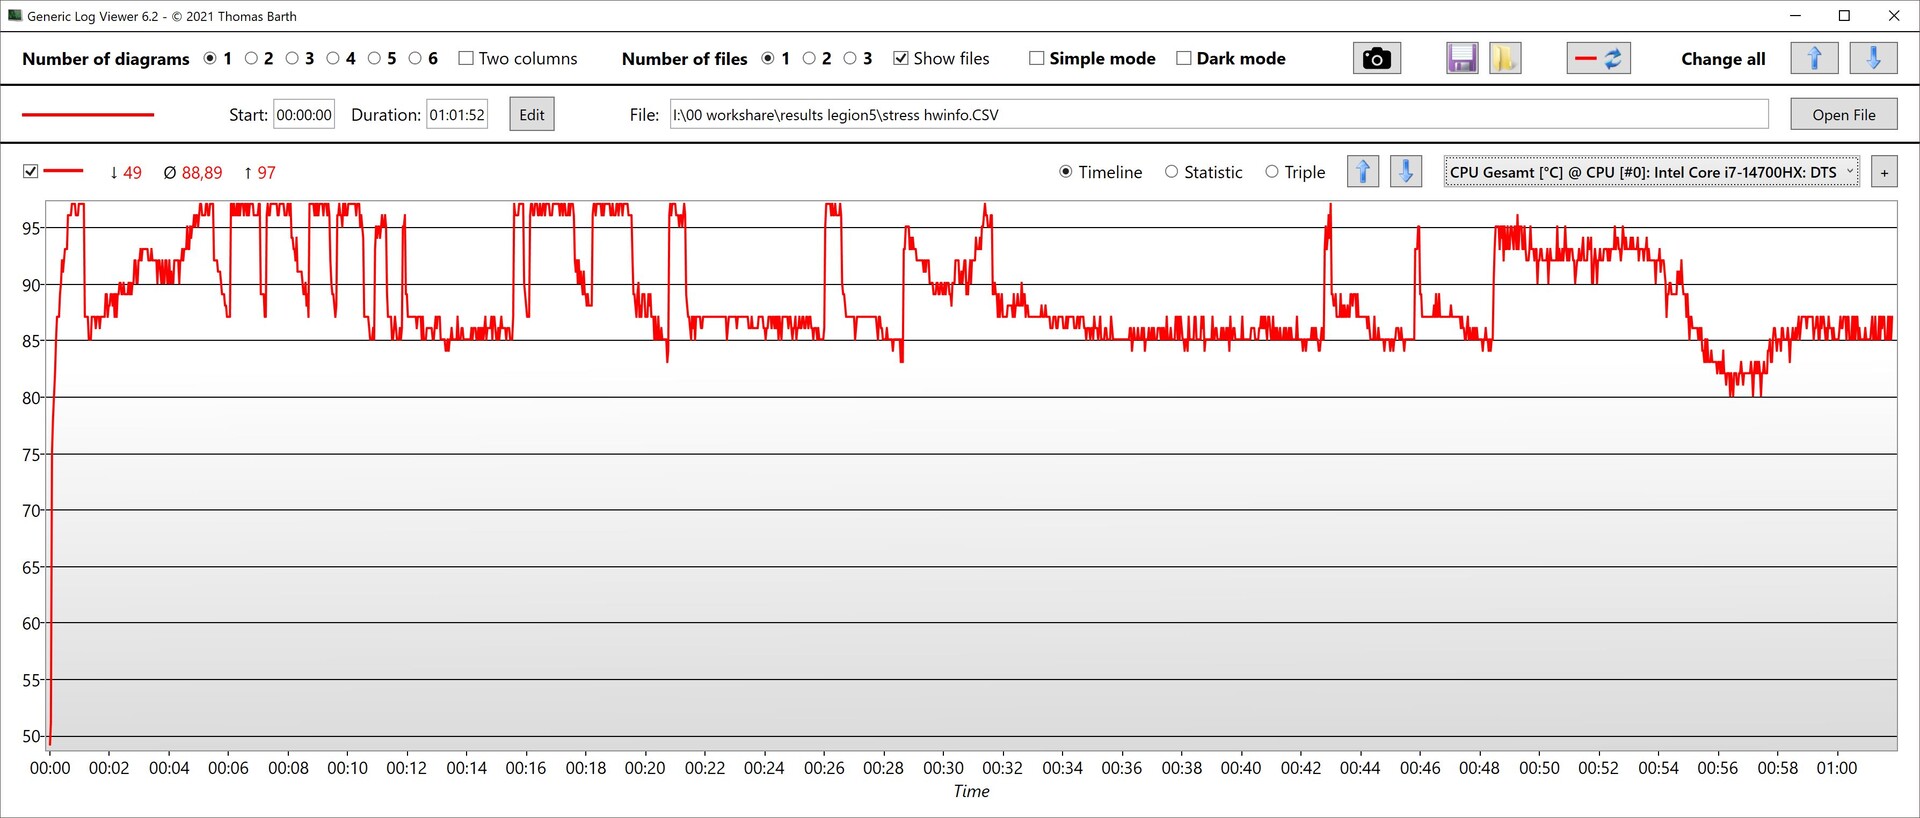
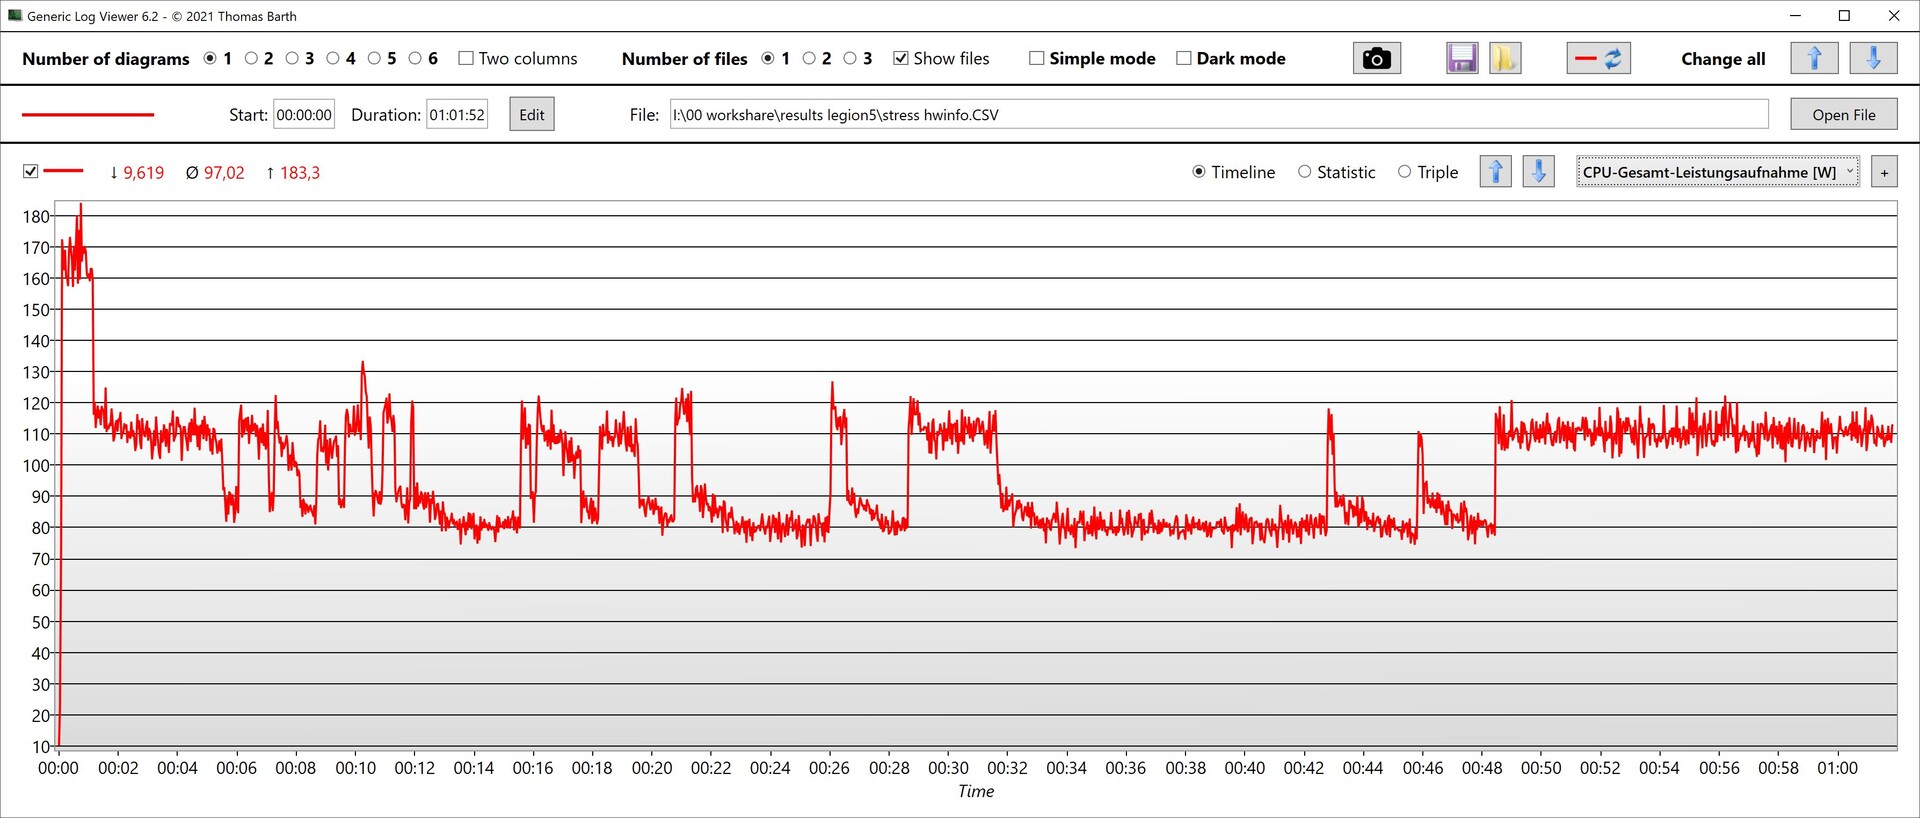
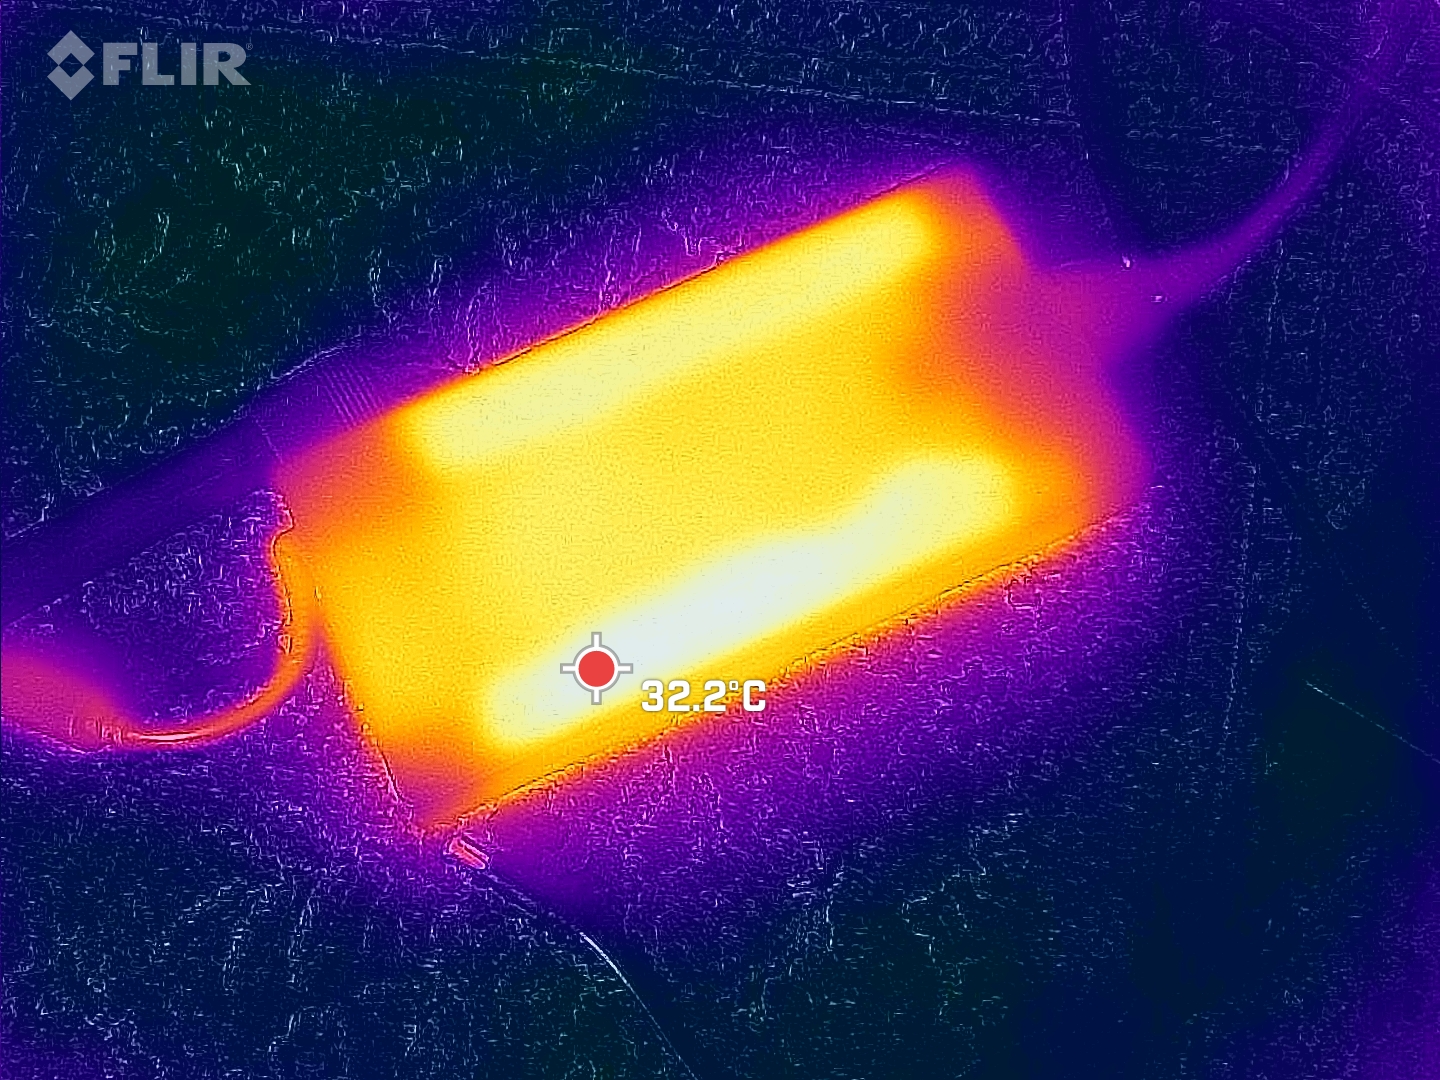
We measured an average consumption of 229 watts when running Cyberpunk 2077. In the stress test, our measuring device registered a maximum and only short-term consumption of up to 297 watts, which the flat but rather large 300-watt power supply should be able to cope with.
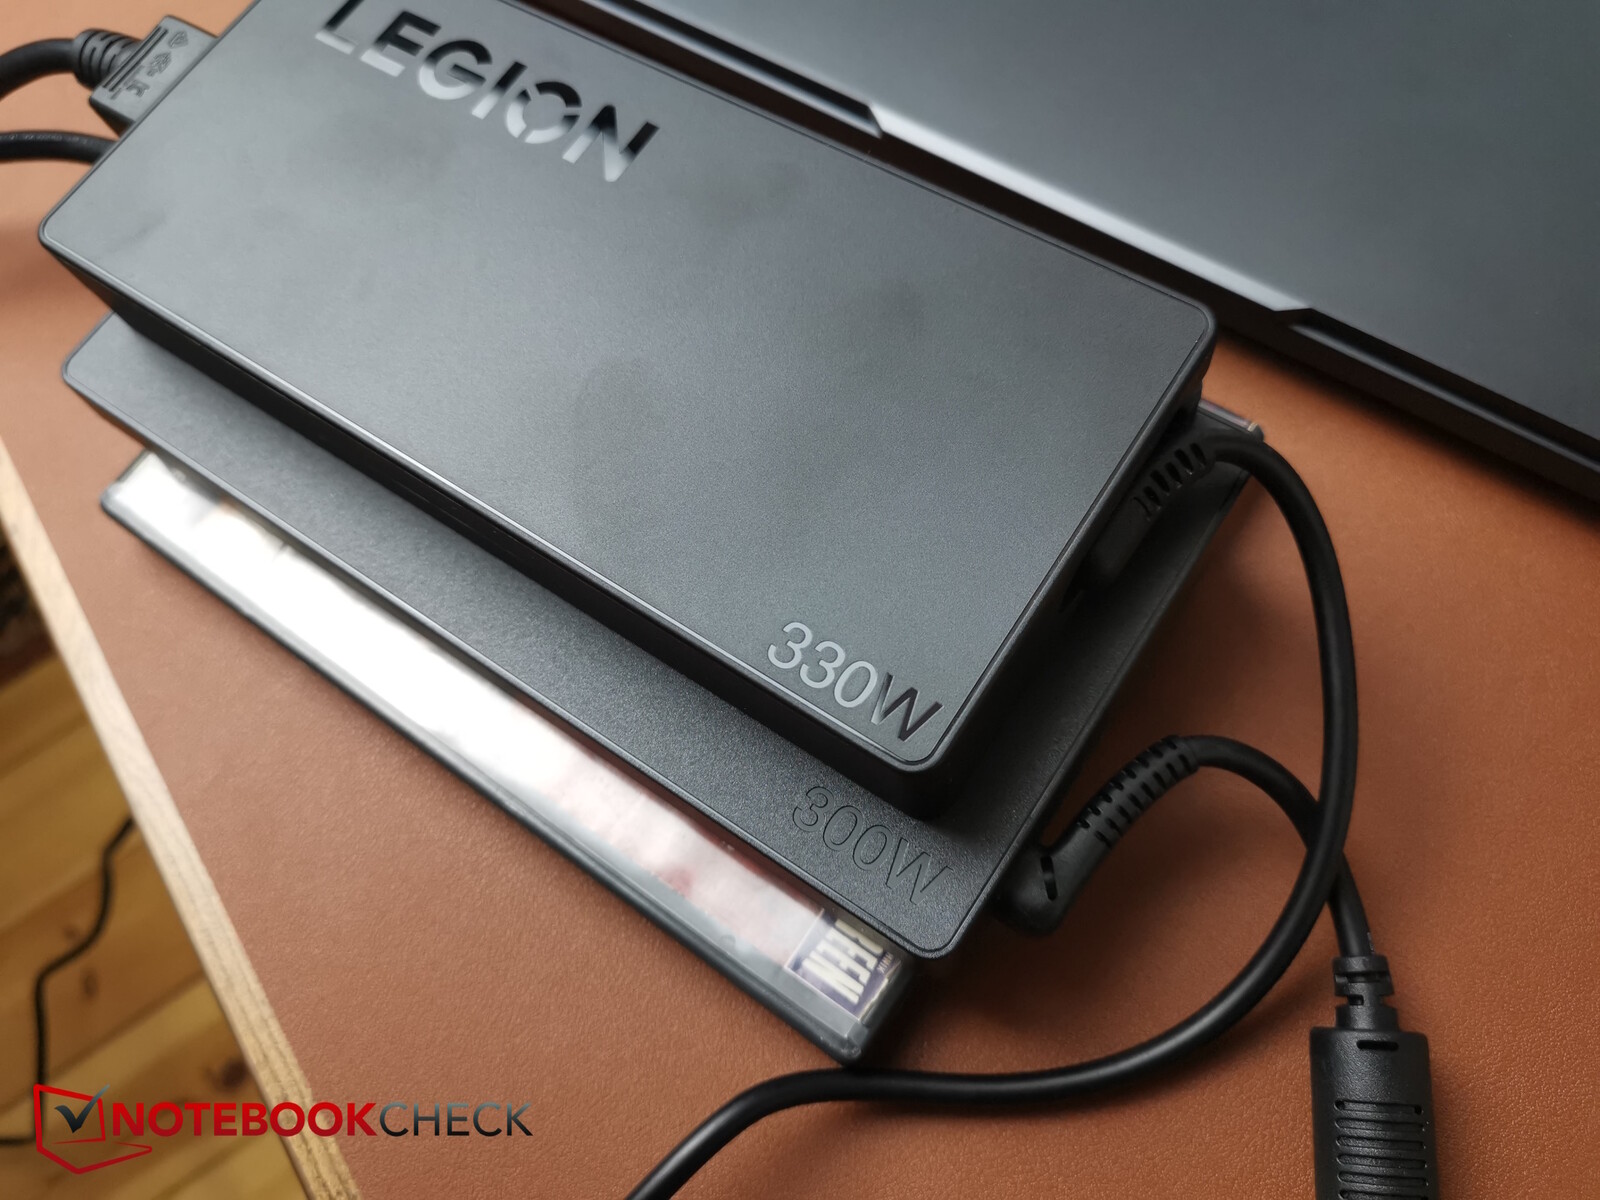
Speaking of power supply units: The 300-watt power supply delivered with our Legion Pro 5i is considerably larger than the 330-watt power supply unit of the more expensive Legion 9i.

| Off / Standby | |
| Idle | |
| Load |
|
Key:
min: | |
| Lenovo Legion Pro 5 16IRX9 G9 GeForce RTX 4060 Laptop GPU, i7-14700HX, Samsung PM9A1 MZVL21T0HCLR | HP Victus 16 (2024) GeForce RTX 4060 Laptop GPU, i7-14700HX, Kioxia XG8 KXG80ZNV512G | Dell G16, i7-13650HX, RTX 4060 GeForce RTX 4060 Laptop GPU, i7-13650HX, WD PC SN740 SDDPNQD-1T00 | Schenker XMG Core 15 (M24) GeForce RTX 4060 Laptop GPU, R7 8845HS, Samsung 990 Pro 1 TB | Lenovo Legion Pro 5 16IRX9 GeForce RTX 4070 Laptop GPU, i9-14900HX, Samsung PM9A1 MZVL21T0HCLR | Lenovo Legion 5 16IRX G9 GeForce RTX 4060 Laptop GPU, i7-14650HX, Samsung PM9A1 MZVL21T0HCLR | |
|---|---|---|---|---|---|---|
| Power Consumption | 11% | 14% | 23% | -22% | -8% | |
| Idle 150cd/m2 * (Watt) | 16.4 | 15.4 6% | 14 15% | 11.8 28% | 21 -28% | 17.6 -7% |
| 3DMark06 Return To Proxycon * (Watt) | 124 | 104 16% | 77.5 37% | |||
| Cyberpunk 2077 FHD ultra no FSR 150cd * (Watt) | 229 | |||||
| 1280x720 Prime95 28.10 and Furmark 1.25 * (Watt) | 211 | 176.9 16% | 190 10% | 200.6 5% | 245 -16% | 227 -8% |
* ... smaller is better
Power consumption Witcher 3 / stress test
Power consumption with external monitor
Runtimes
Lenovo has installed an 80-Wh battery into the laptop; apart from the Core 15 with a larger battery, the competition uses models with a similar capacity.
Our test device lasted just over 5 hours in the Wi-Fi and video tests with the brightness reduced to 150 nits—an average to slightly below-average value that was often surpassed by the competition.
| Lenovo Legion Pro 5 16IRX9 G9 i7-14700HX, GeForce RTX 4060 Laptop GPU, 80 Wh | HP Victus 16 (2024) i7-14700HX, GeForce RTX 4060 Laptop GPU, 83 Wh | Dell G16, i7-13650HX, RTX 4060 i7-13650HX, GeForce RTX 4060 Laptop GPU, 86 Wh | Schenker XMG Core 15 (M24) R7 8845HS, GeForce RTX 4060 Laptop GPU, 99.8 Wh | Lenovo Legion Pro 5 16IRX9 i9-14900HX, GeForce RTX 4070 Laptop GPU, 80 Wh | Lenovo Legion 5 16IRX G9 i7-14650HX, GeForce RTX 4060 Laptop GPU, 80 Wh | Average of class Gaming | |
|---|---|---|---|---|---|---|---|
| Battery runtime | 67% | 6% | 108% | -23% | 25% | 27% | |
| H.264 (h) | 5.2 | 6.4 23% | 10.1 94% | 9.6 85% | 8.32 ? 60% | ||
| WiFi v1.3 (h) | 5.1 | 8.5 67% | 6.3 24% | 14.8 190% | 4.8 -6% | 7.4 45% | 7.11 ? 39% |
| Load (h) | 1.8 | 1.3 -28% | 2.5 39% | 1.1 -39% | 0.8 -56% | 1.502 ? -17% | |
| Reader / Idle (h) | 6.7 | 8.27 ? |
Pros
Cons
Verdict - Full focus on performance


The Legion Pro 5 focuses solely on performance. Its already powerful i7-14700HX and its RTX 4060 work faster than average and purely in terms of performance, they even come close to the configuration with the i9-14900HX and the RTX 4070. Thanks to the laptop's potentially extremely colour-accurate display, the Legion Pro could also be interesting for content creators.
In turn, it's a shame that the screen isn't calibrated terribly accurately straight out of the box. Considering its focus on gaming performance, the manufacturer should have noticed that the cooling system works a little better on the right side than on the WASD side, which is important for gamers. Other negative points include the SSD's thermal throttling as well as the device's partial high idle performance that takes quite a while to calm down again. Still, the positives outweigh the negatives in total.
If you are on the hunt for a super powerful gaming laptop, then look no further than the Lenovo Legion Pro 5i. Content creators may also be happy, however, a few smaller details leave more room for potential optimisation.
Price and availability
You can order the Lenovo Legion Pro 5i directly from the manufacturer. The MRSP for our test device is US$1,395.
Please note: We have updated our rating system and the results of version 8 are not comparable with the results of version 7. More information is available here.
Lenovo Legion Pro 5 16IRX9 G9
- 07/03/2024 v8
Christian Hintze
 Total Sustainability Score:
 Transparency
The selection of devices to be reviewed is made by our editorial team. The test sample was provided to the author as a loan by the manufacturer or retailer for the purpose of this review. The lender had no influence on this review, nor did the manufacturer receive a copy of this review before publication. There was no obligation to publish this review. As an independent media company, Notebookcheck is not subjected to the authority of manufacturers, retailers or publishers.
This is how Notebookcheck is testing
Every year, Notebookcheck independently reviews hundreds of laptops and smartphones using standardized procedures to ensure that all results are comparable. We have continuously developed our test methods for around 20 years and set industry standards in the process. In our test labs, high-quality measuring equipment is utilized by experienced technicians and editors. These tests involve a multi-stage validation process. Our complex rating system is based on hundreds of well-founded measurements and benchmarks, which maintains objectivity. Further information on our test methods can be found here.
Price comparison

