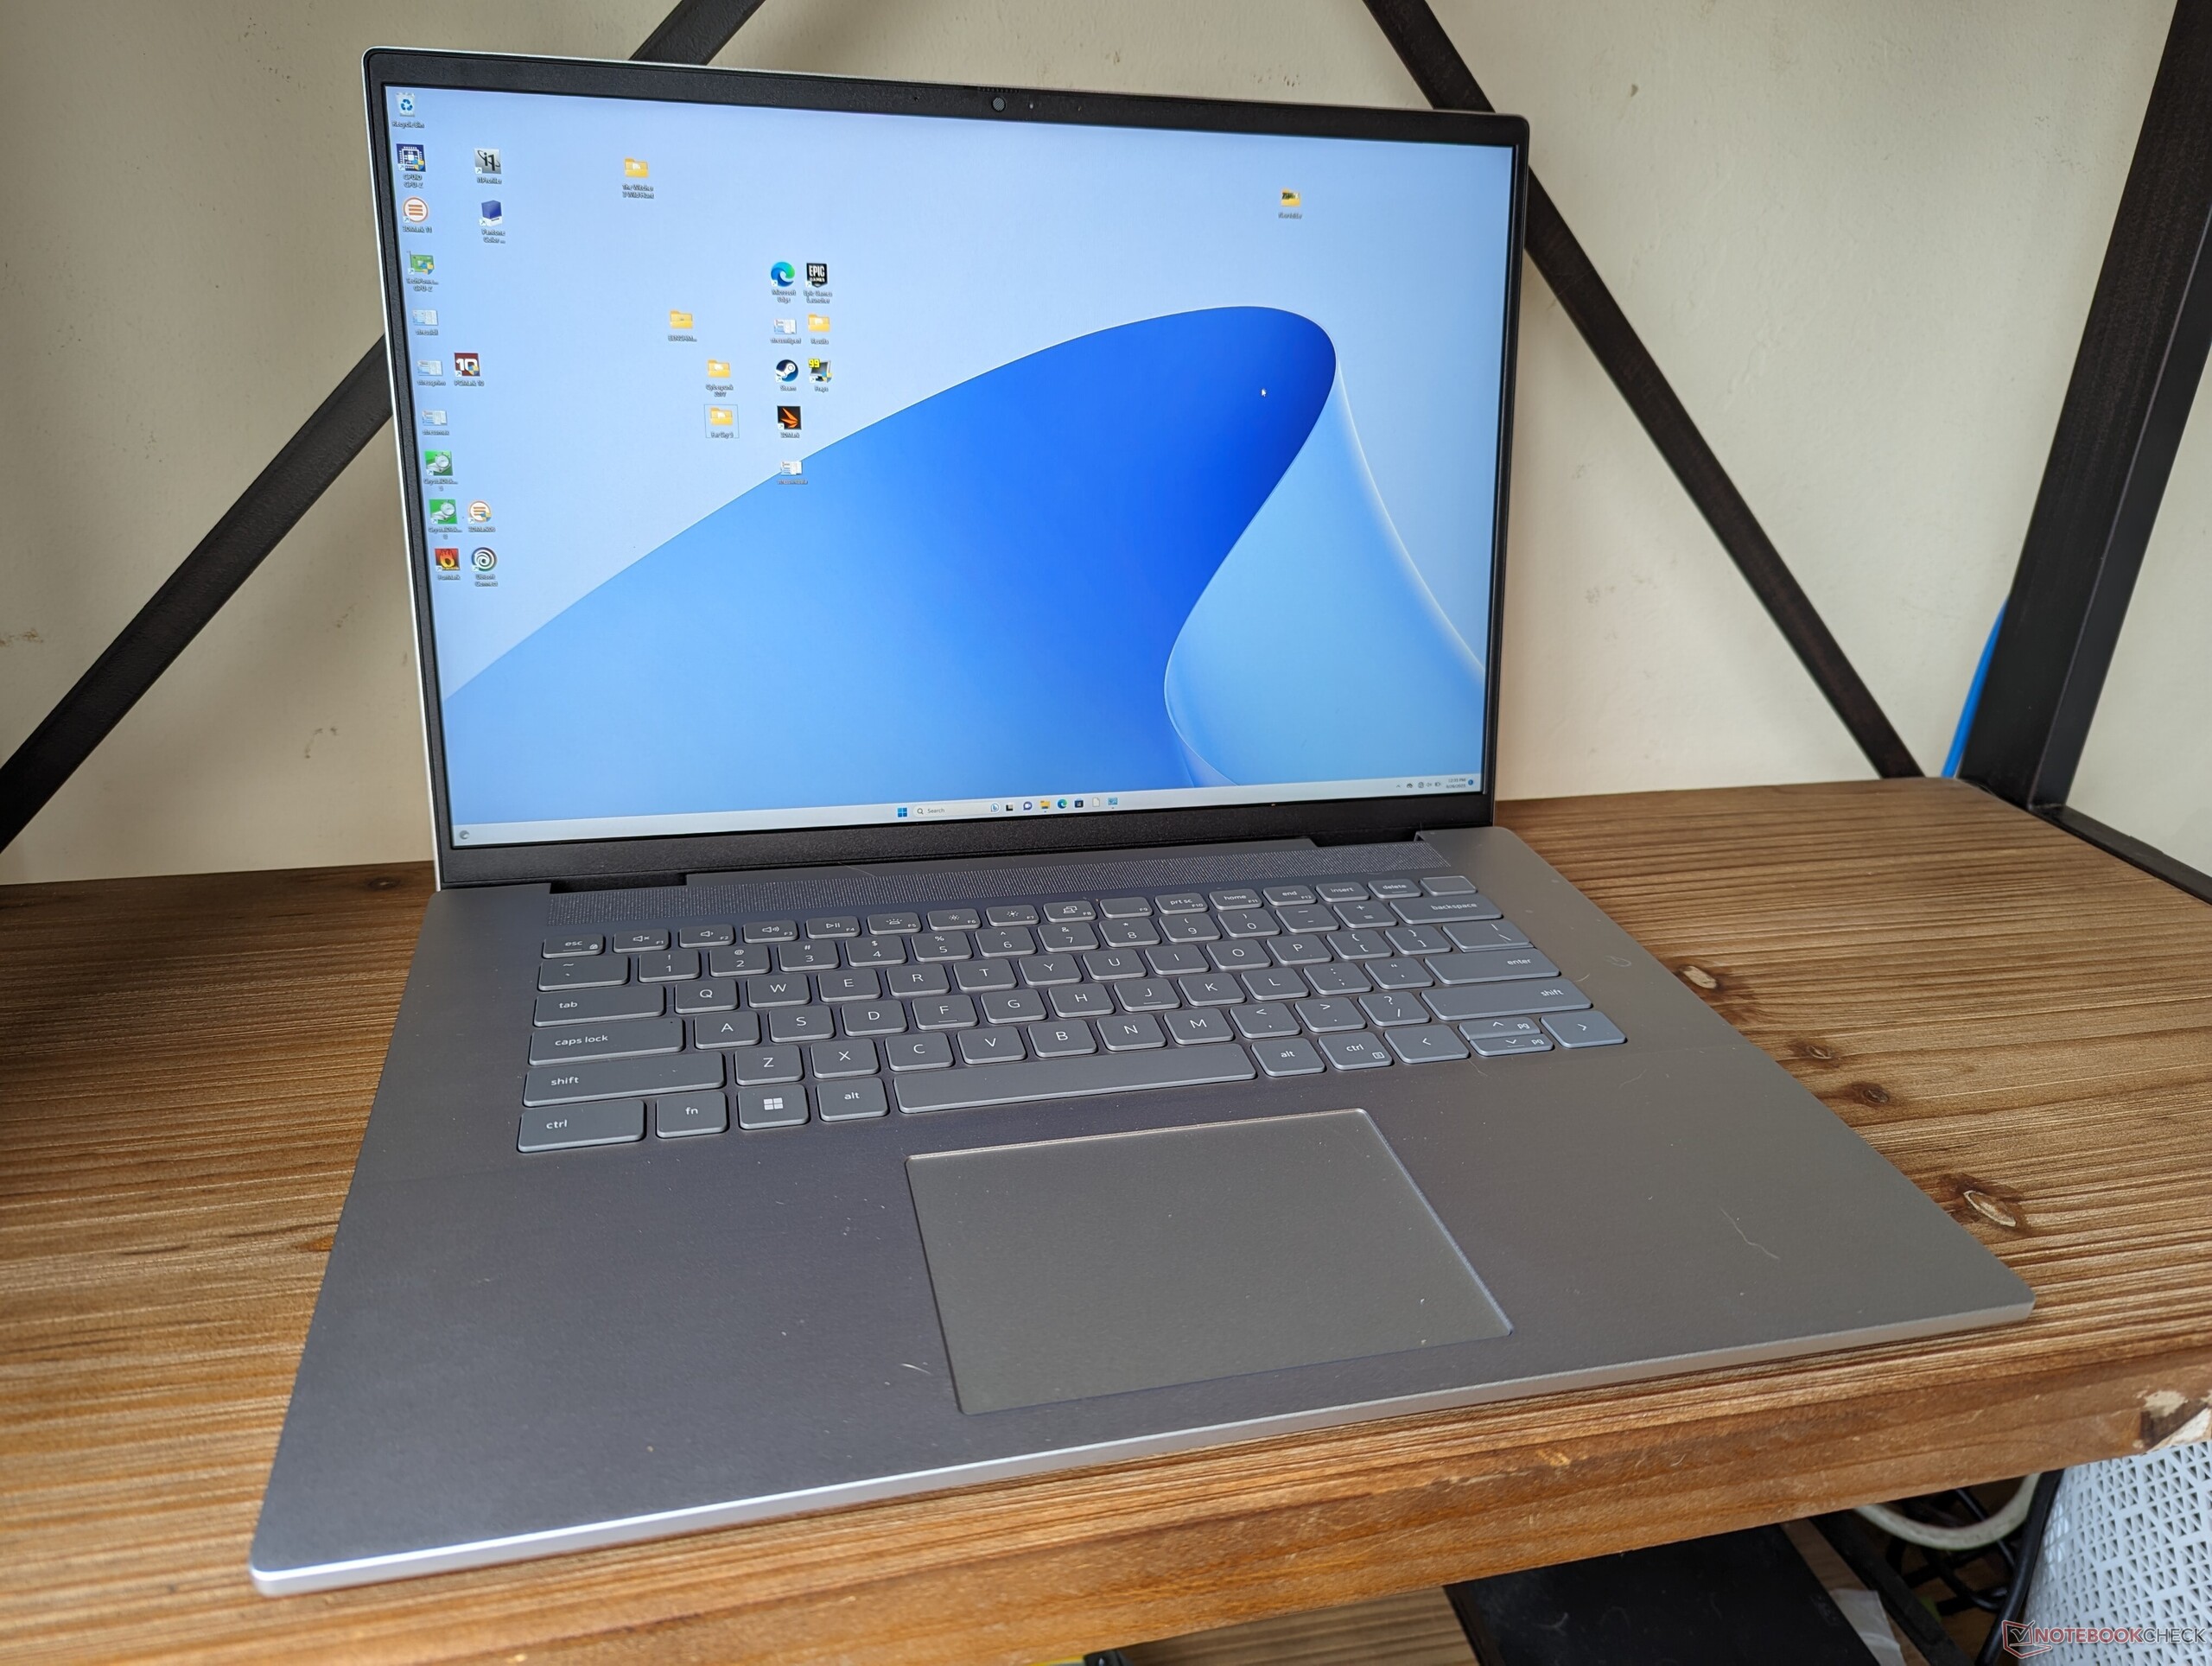
Dell Inspiron 16 Plus 7630 laptop review: 60 W GeForce RTX 4060 isn't so bad

The 2023 Dell Inspiron 16 Plus 7630 succeeds last year's 2022 Inspiron 16 Plus 7620 with updated internals and externals despite the fact that the 2022 model was already a full-on redesign of the 2021 Inspiron 16 Plus 7610. It's rare to see a series undergo three major redesigns three years in a row as manufacturers more commonly revise the exterior only once every few years. Like other multimedia laptops of 2023, the Inspiron 16 Plus 7630 incorporates Intel 13th gen Raptor Lake-H CPUs and Nvidia Ada Lovelace GPUs.
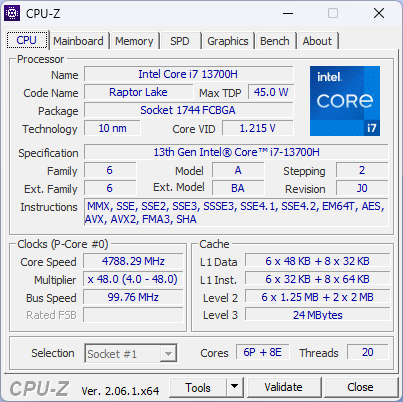
Our review unit is a high-end configuration with the Core i7-13700H CPU, GeForce RTX 4060 GPU, and 2560 x 1600 120 Hz IPS display for approximately $1250 USD or $400 off the original launch price at the time of writing. Lesser SKUs with the Core i5-13500H, integrated iris Xe, RTX 3050, RTX 4050, or 1200p 60 Hz display are in the works. AMD variants with the Ryzen 5 7640HS and Ryzen 7 7840HS are also planned under the model name Inspiron 16 Plus 7635.
Alternatives to the Inspiron 16 Plus 7630 include other 16-inch multimedia laptops like the Lenovo Slim Pro 9i 16, Asus VivoBook Pro 16X, HP Envy 16, or MSI Summit E16 Flip. The Inspiron 16 Plus 7630 should not be confused with the standard slower Inspiron 16 or the Inspiron 16 Plus 7630 2-in-1 which have very different specifications and features.
More Dell reviews:
Potential Competitors in Comparison
Rating | Date | Model | Weight | Height | Size | Resolution | Price |
|---|---|---|---|---|---|---|---|
| 87.1 % v7 (old) | 08 / 2023 | Dell Inspiron 16 Plus 7630 i7-13700H, GeForce RTX 4060 Laptop GPU | 2.2 kg | 19.95 mm | 16.00" | 2560x1600 | |
| 87.4 % v7 (old) | 08 / 2022 | Dell Inspiron 16 Plus 7620 i7-12700H, GeForce RTX 3050 Ti Laptop GPU | 2.1 kg | 18.99 mm | 16.00" | 3072x1920 | |
| 88 % v7 (old) | 08 / 2023 | Lenovo Slim Pro 9i 16IRP8 i9-13905H, GeForce RTX 4050 Laptop GPU | 2.2 kg | 18.2 mm | 16.00" | 3200x2000 | |
| 86.2 % v7 (old) | 07 / 2023 | Asus Vivobook Pro 16X K6604JV-MX016W i9-13980HX, GeForce RTX 4060 Laptop GPU | 2.1 kg | 22.8 mm | 16.00" | 3200x2000 | |
| 86.9 % v7 (old) | 09 / 2022 | HP Envy 16 h0112nr i7-12700H, GeForce RTX 3060 Laptop GPU | 2.3 kg | 19.8 mm | 16.00" | 3840x2400 | |
| 84.2 % v7 (old) | 10 / 2022 | MSI Summit E16 Flip A12UDT-031 i7-1280P, GeForce RTX 3050 Ti Laptop GPU | 1.9 kg | 16.85 mm | 16.00" | 2560x1600 |
Case — Keeping It Simple
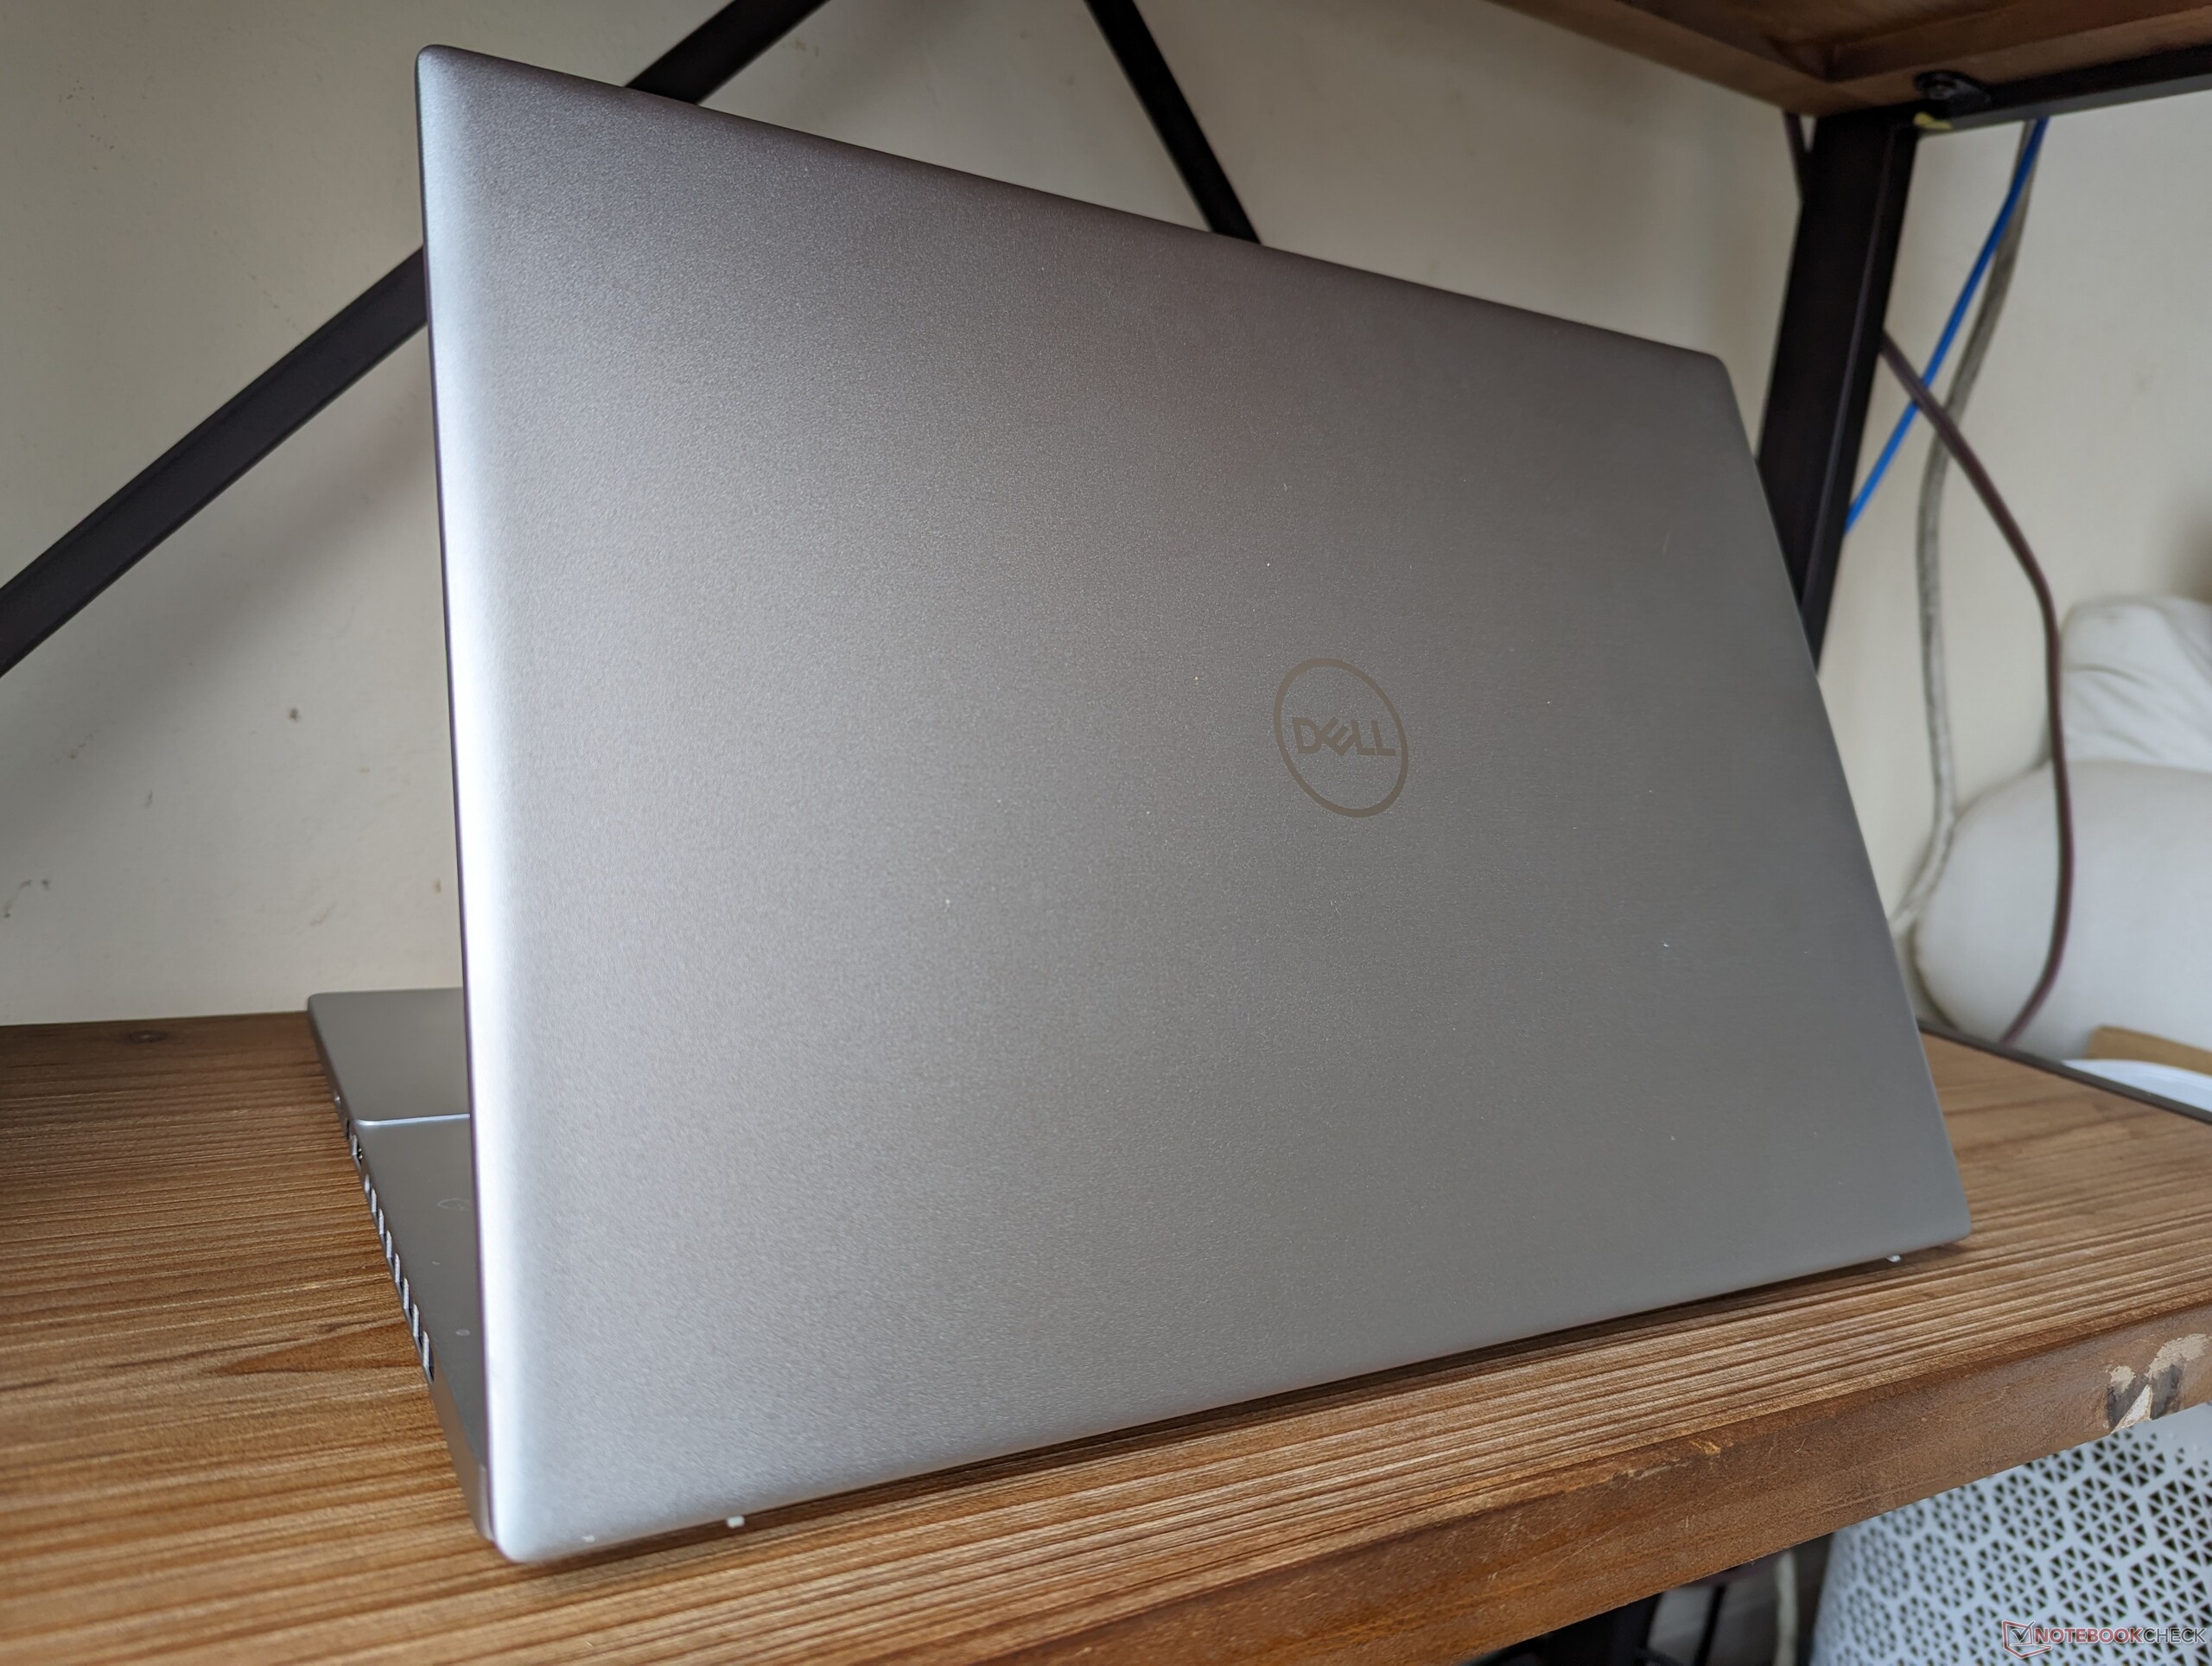
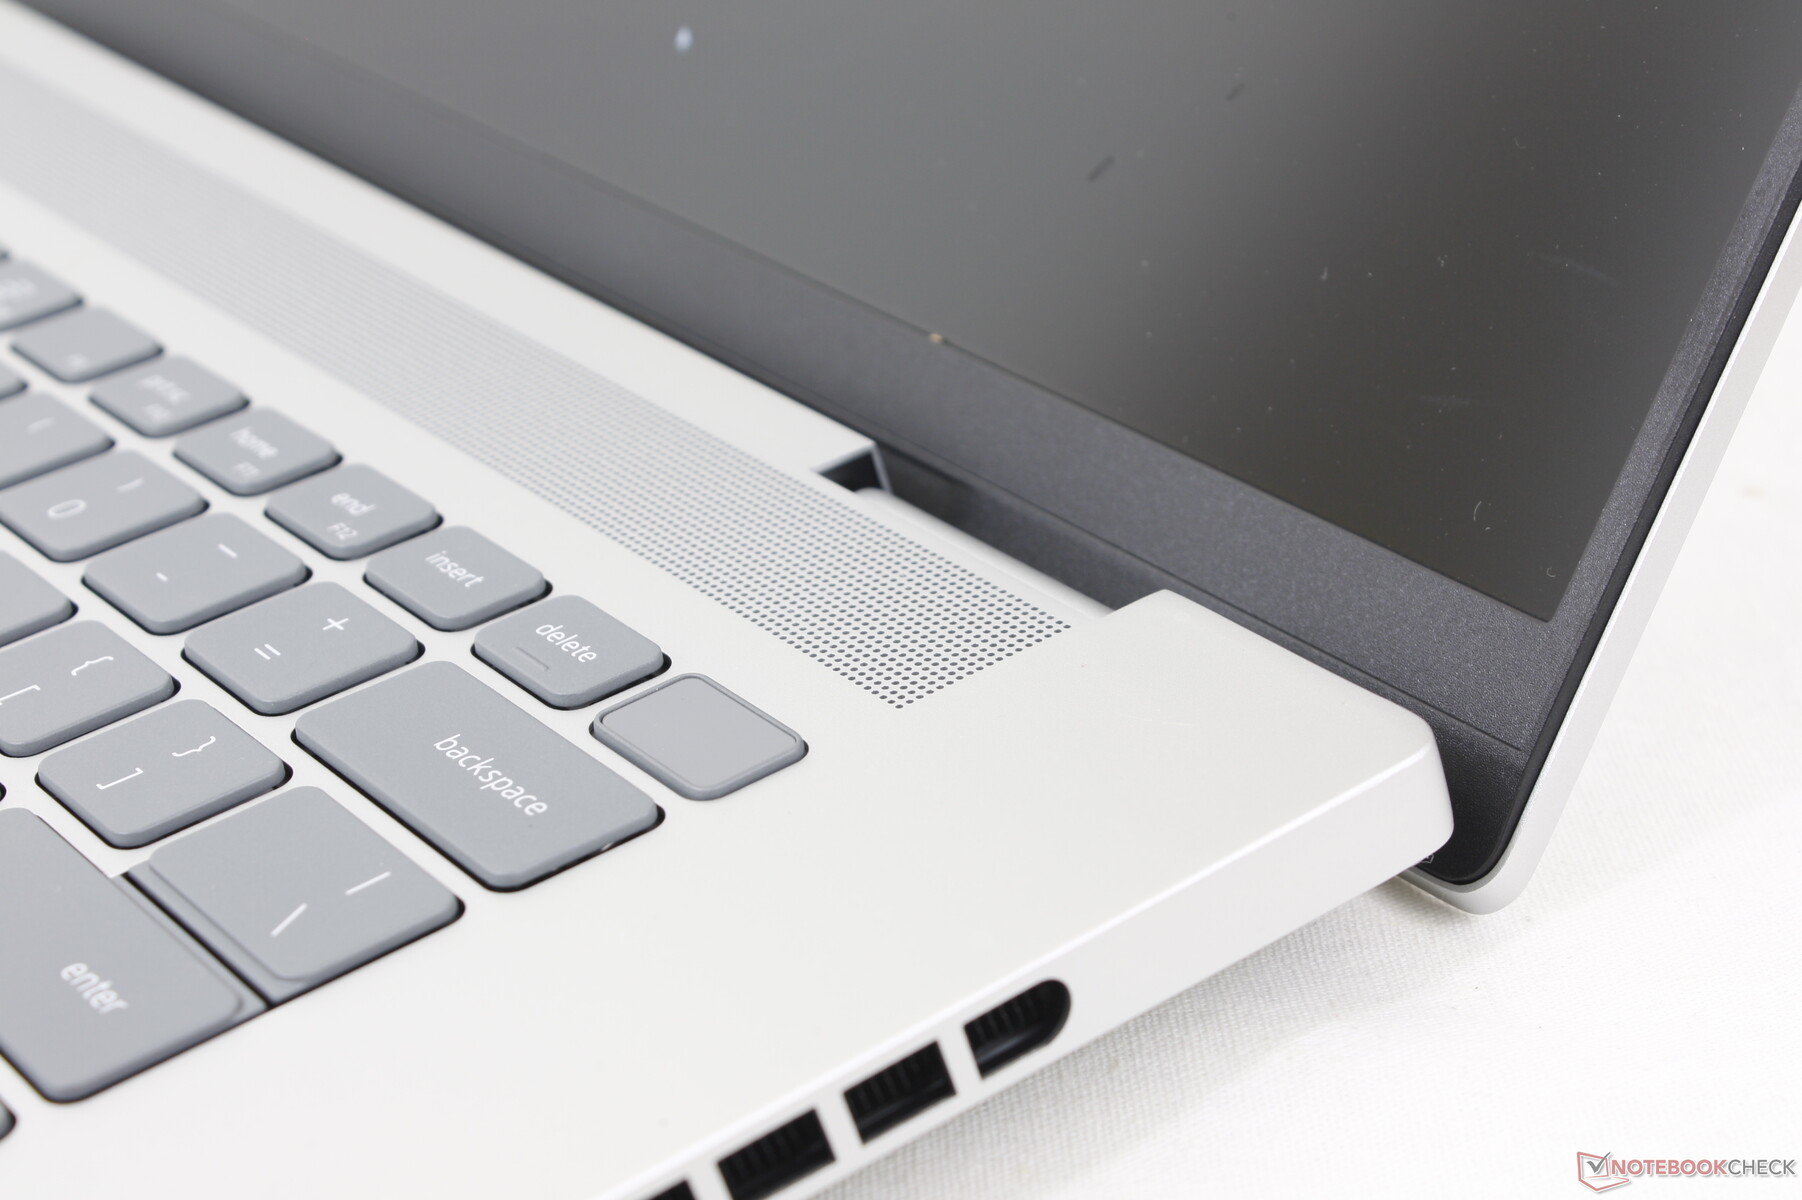
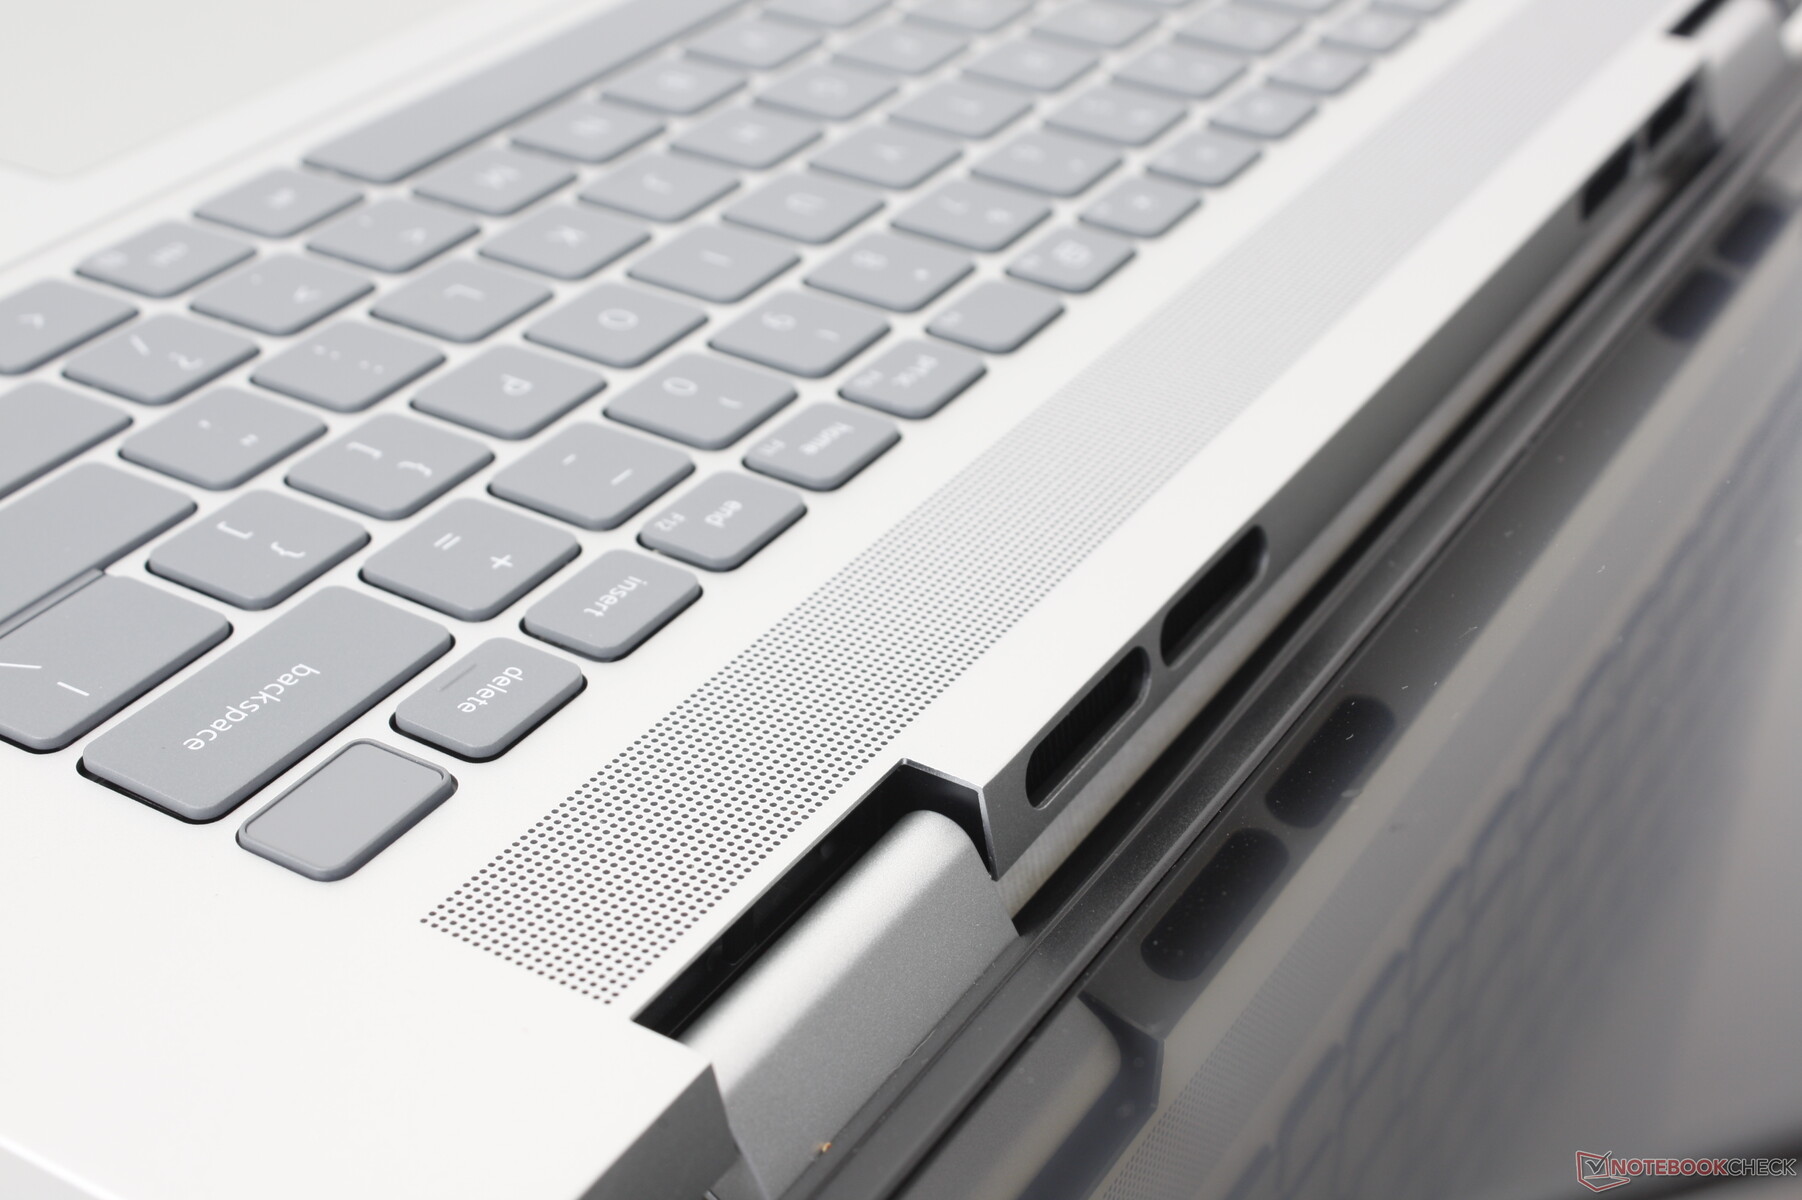
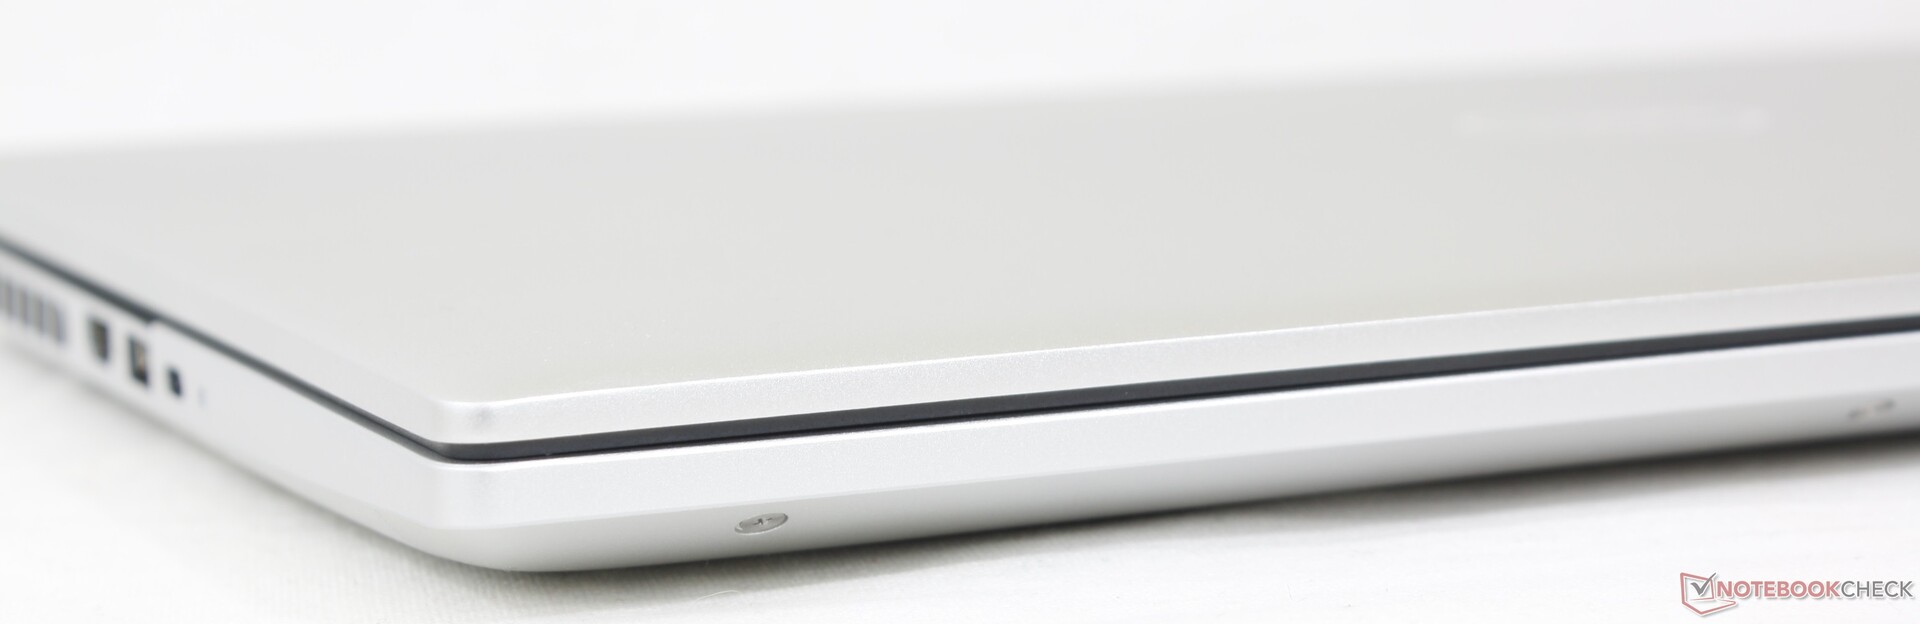
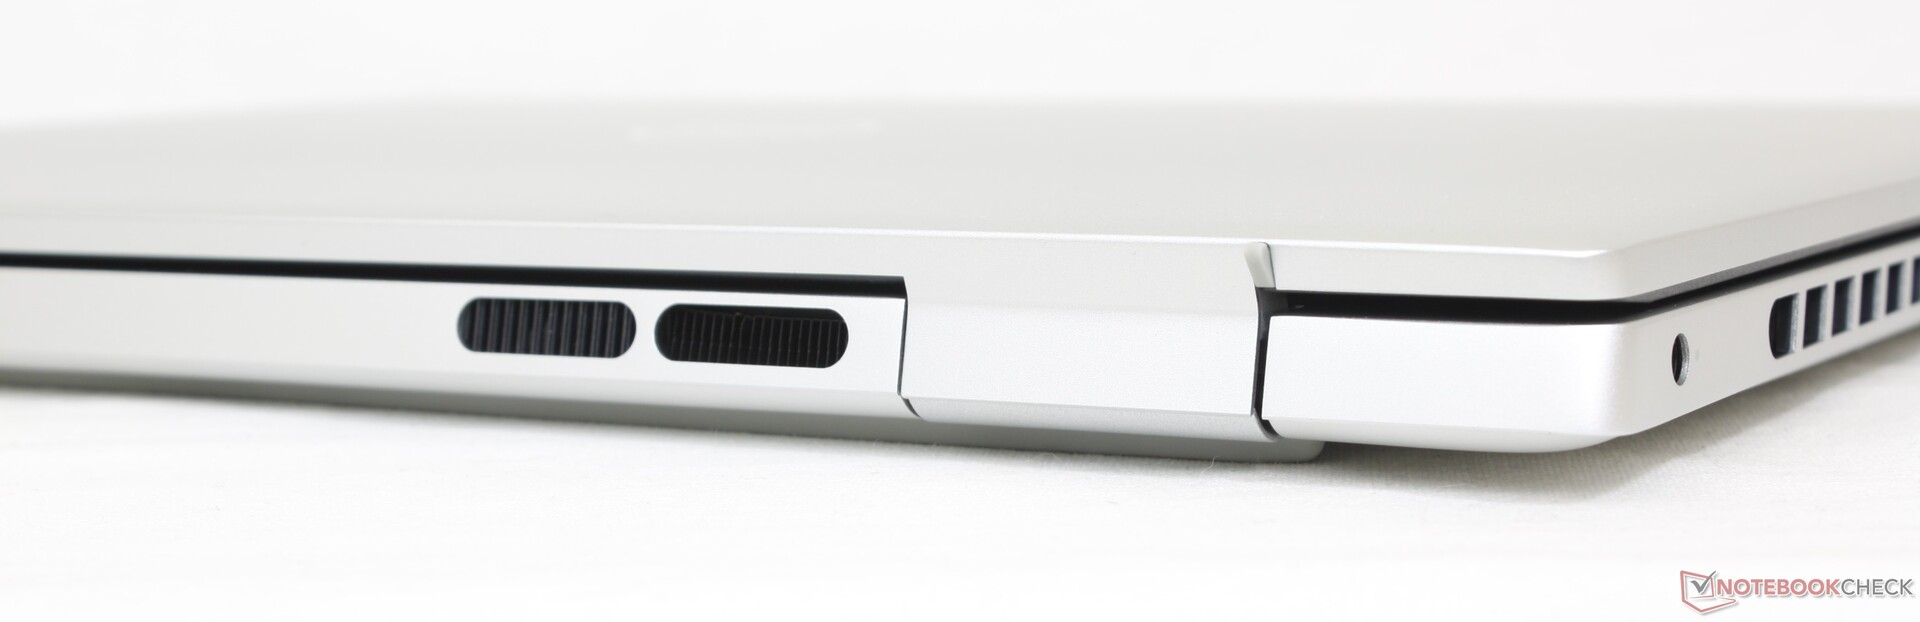
The Inspiron 16 Plus 7630 carries three notable exterior changes over last year's model. Firstly and perhaps most importantly, the hinges have been redesigned to be thicker and stronger than before. Secondly, there are now additional ventilation grilles along the edges to aid in cooling. And lastly, the Mylar palm rests and clickpad have been removed much like on the Inspiron 16 Plus 7635 2-in-1. The first two in particular should hopefully increase the lifespan of the system while the last is likely a cost-saving measure.
Overall chassis rigidity is otherwise about the same as the Inspiron 16 Plus 7620 since their skeletons are of the same materials. The unit feels strong in the hand similar to the Envy 16 but with a slightly weaker lid since the Dell lacks any Gorilla Glass reinforcement.
Dimensions and weight remain about the same as on last year's design if not slightly heavier by about 100 g. Though not exactly lightweight, the Dell is still comparable to alternatives like the Slim Pro 9i 16 or Envy 16 in this regard.
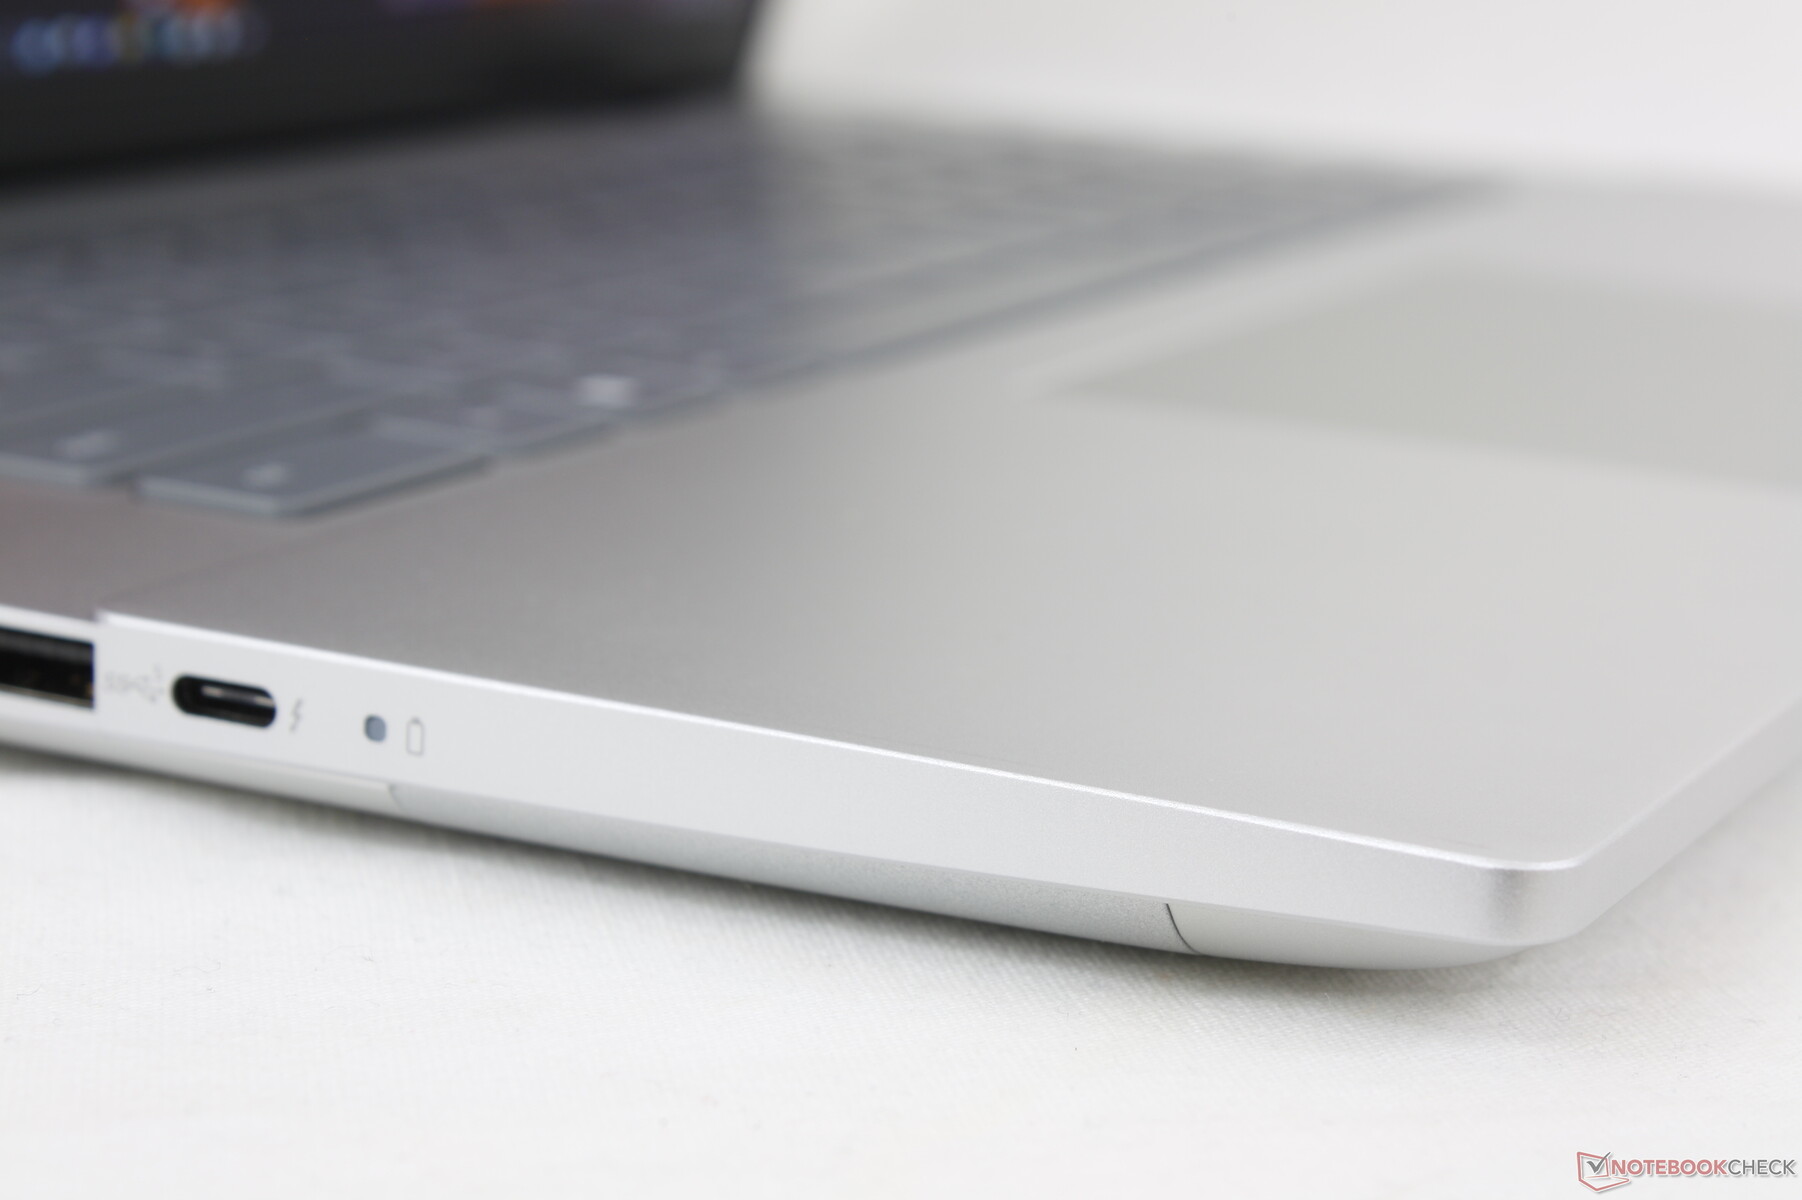
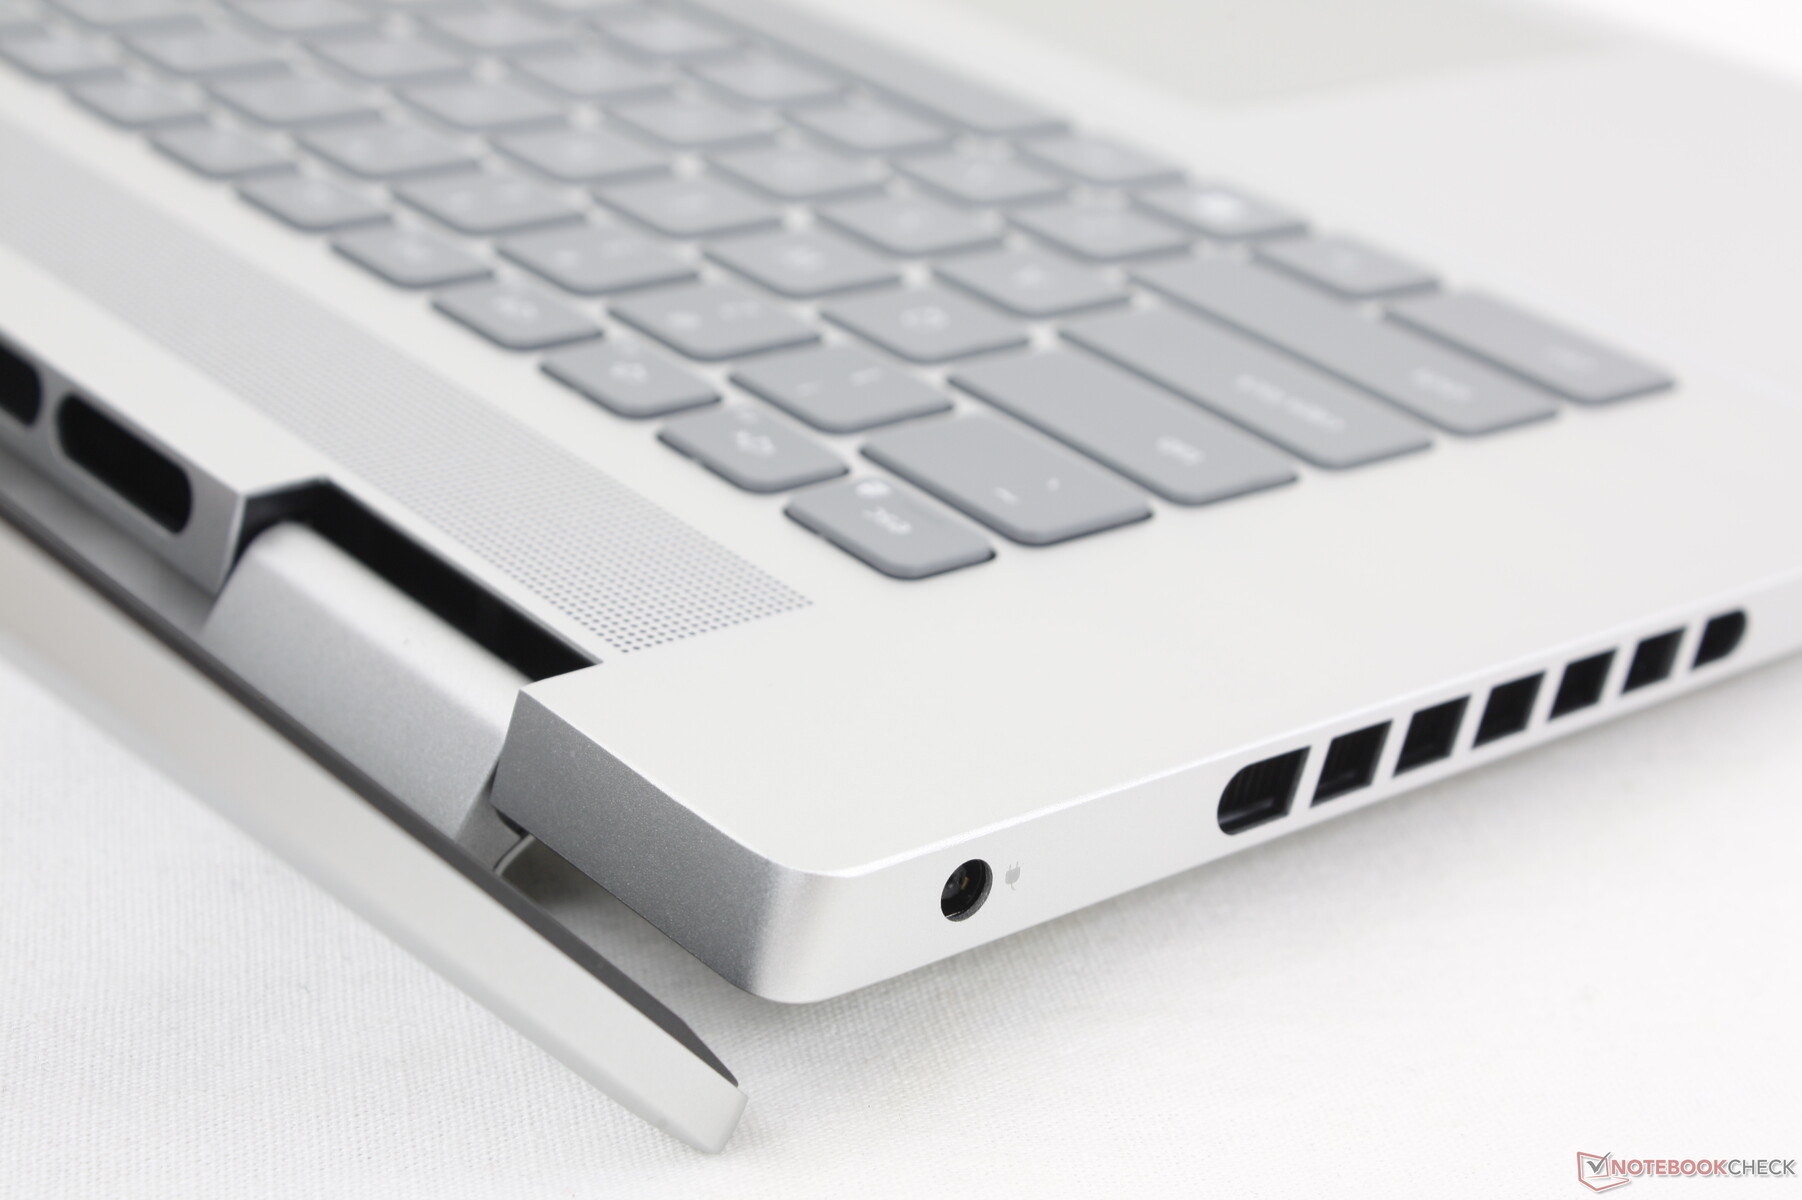
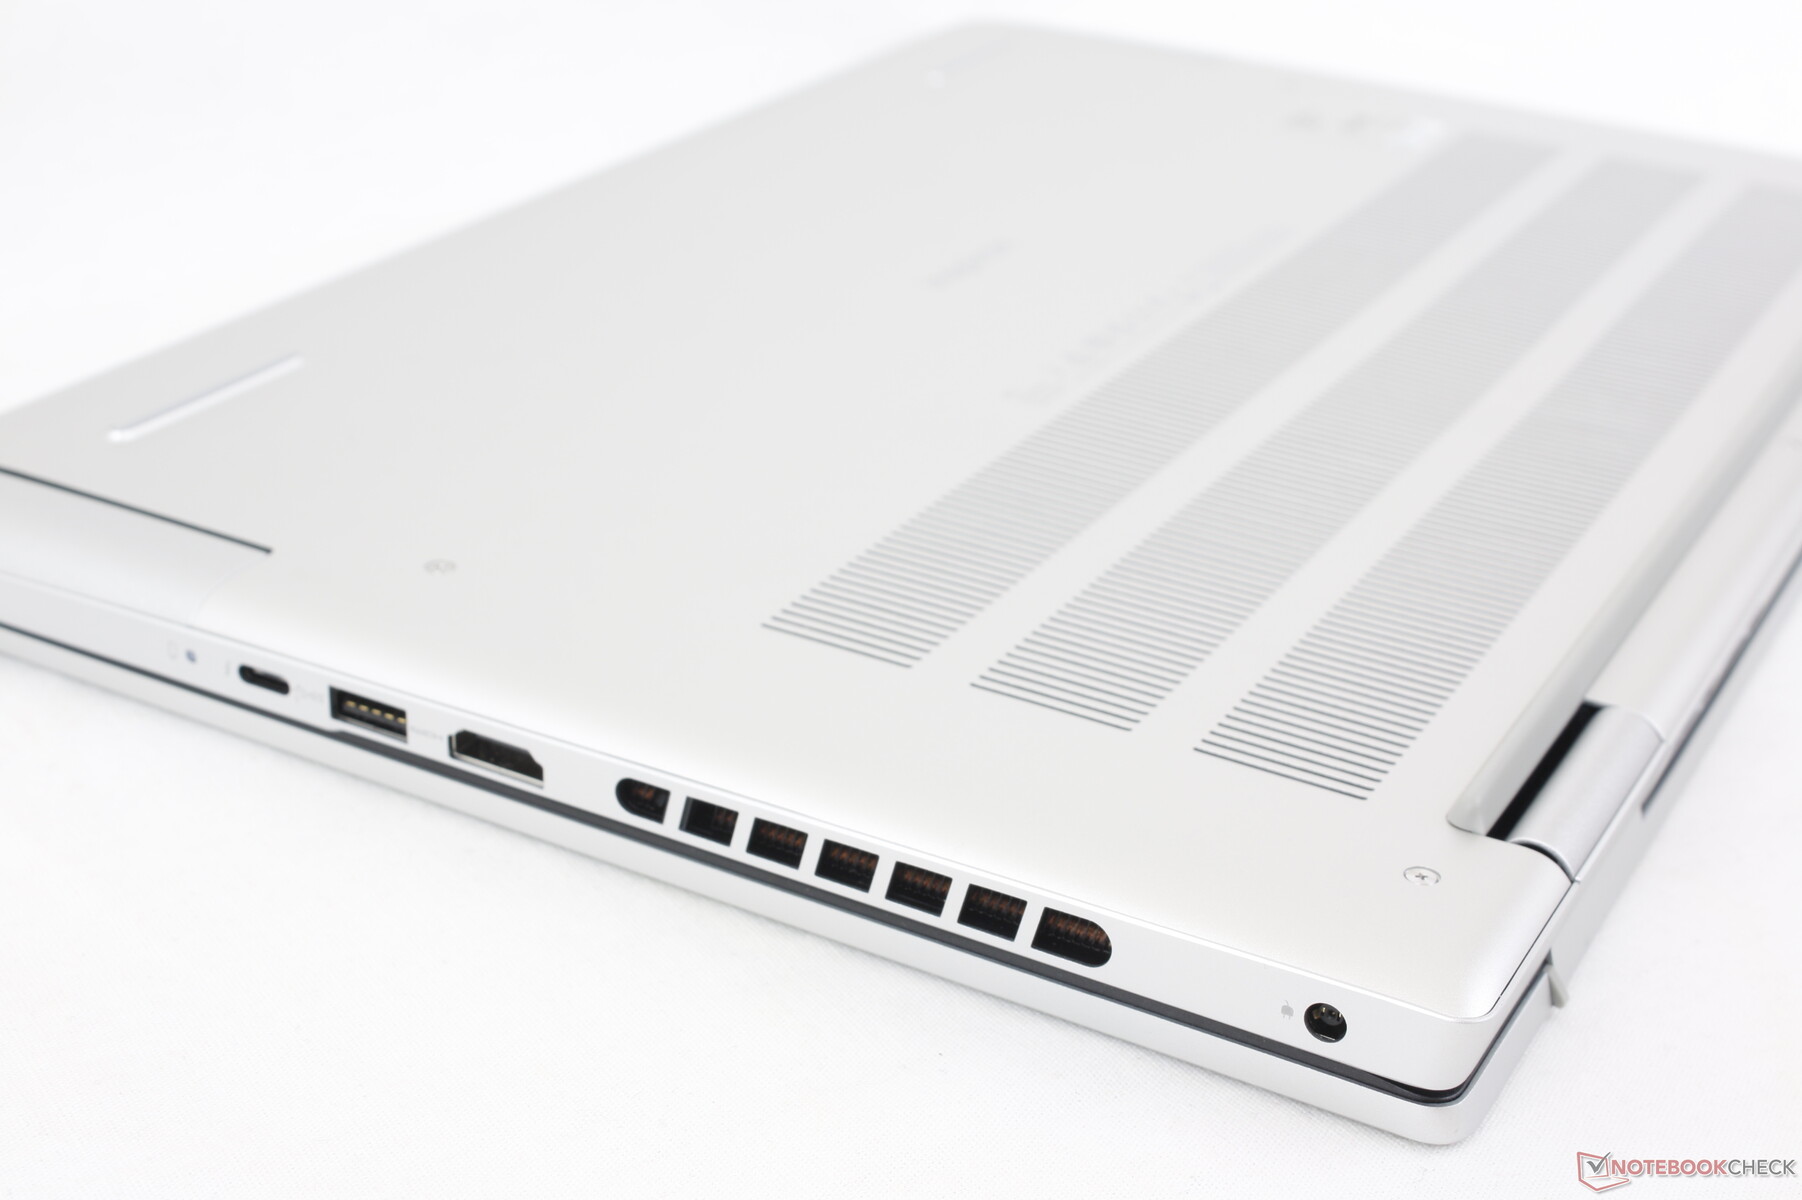
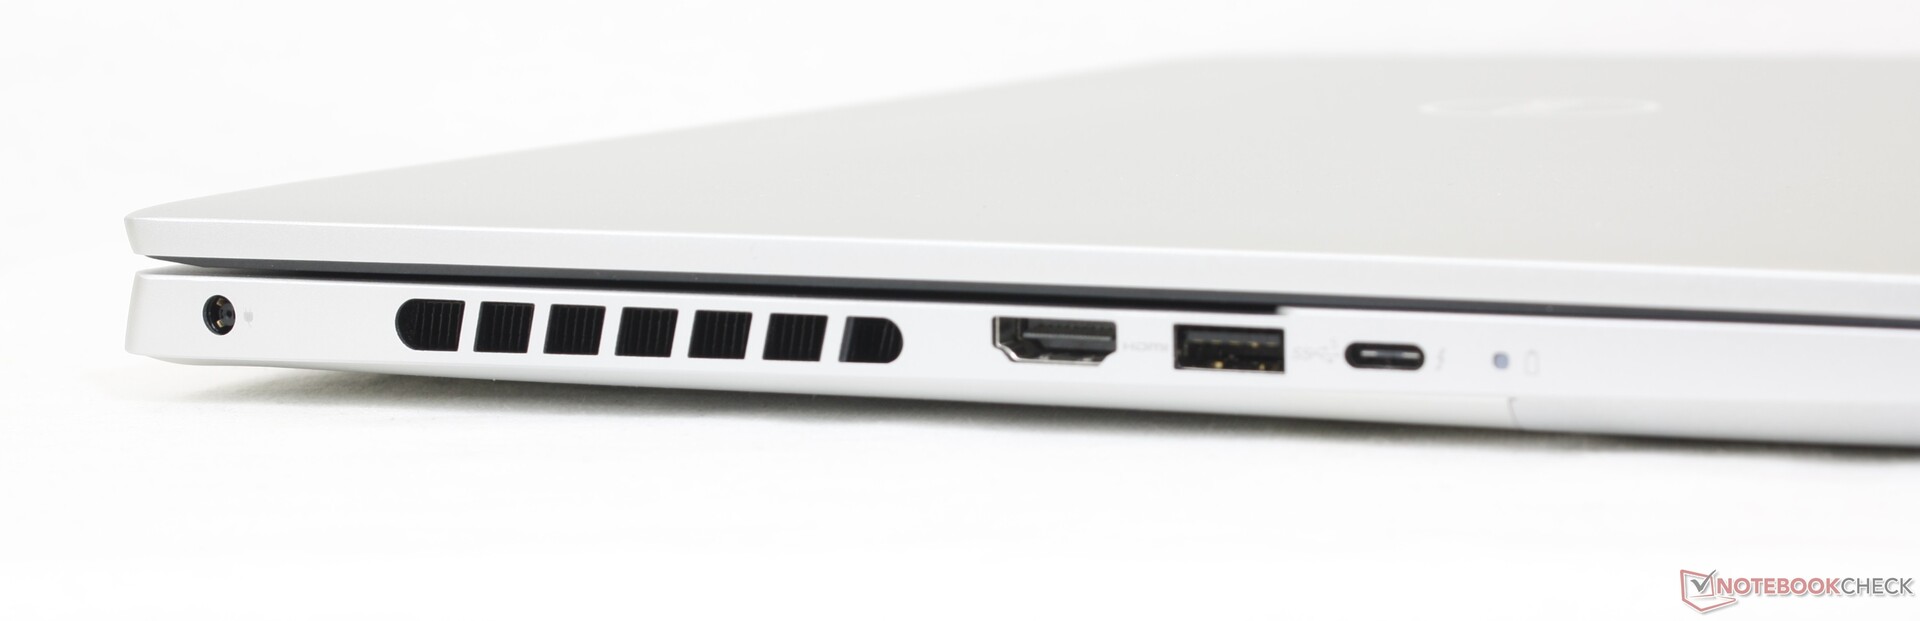
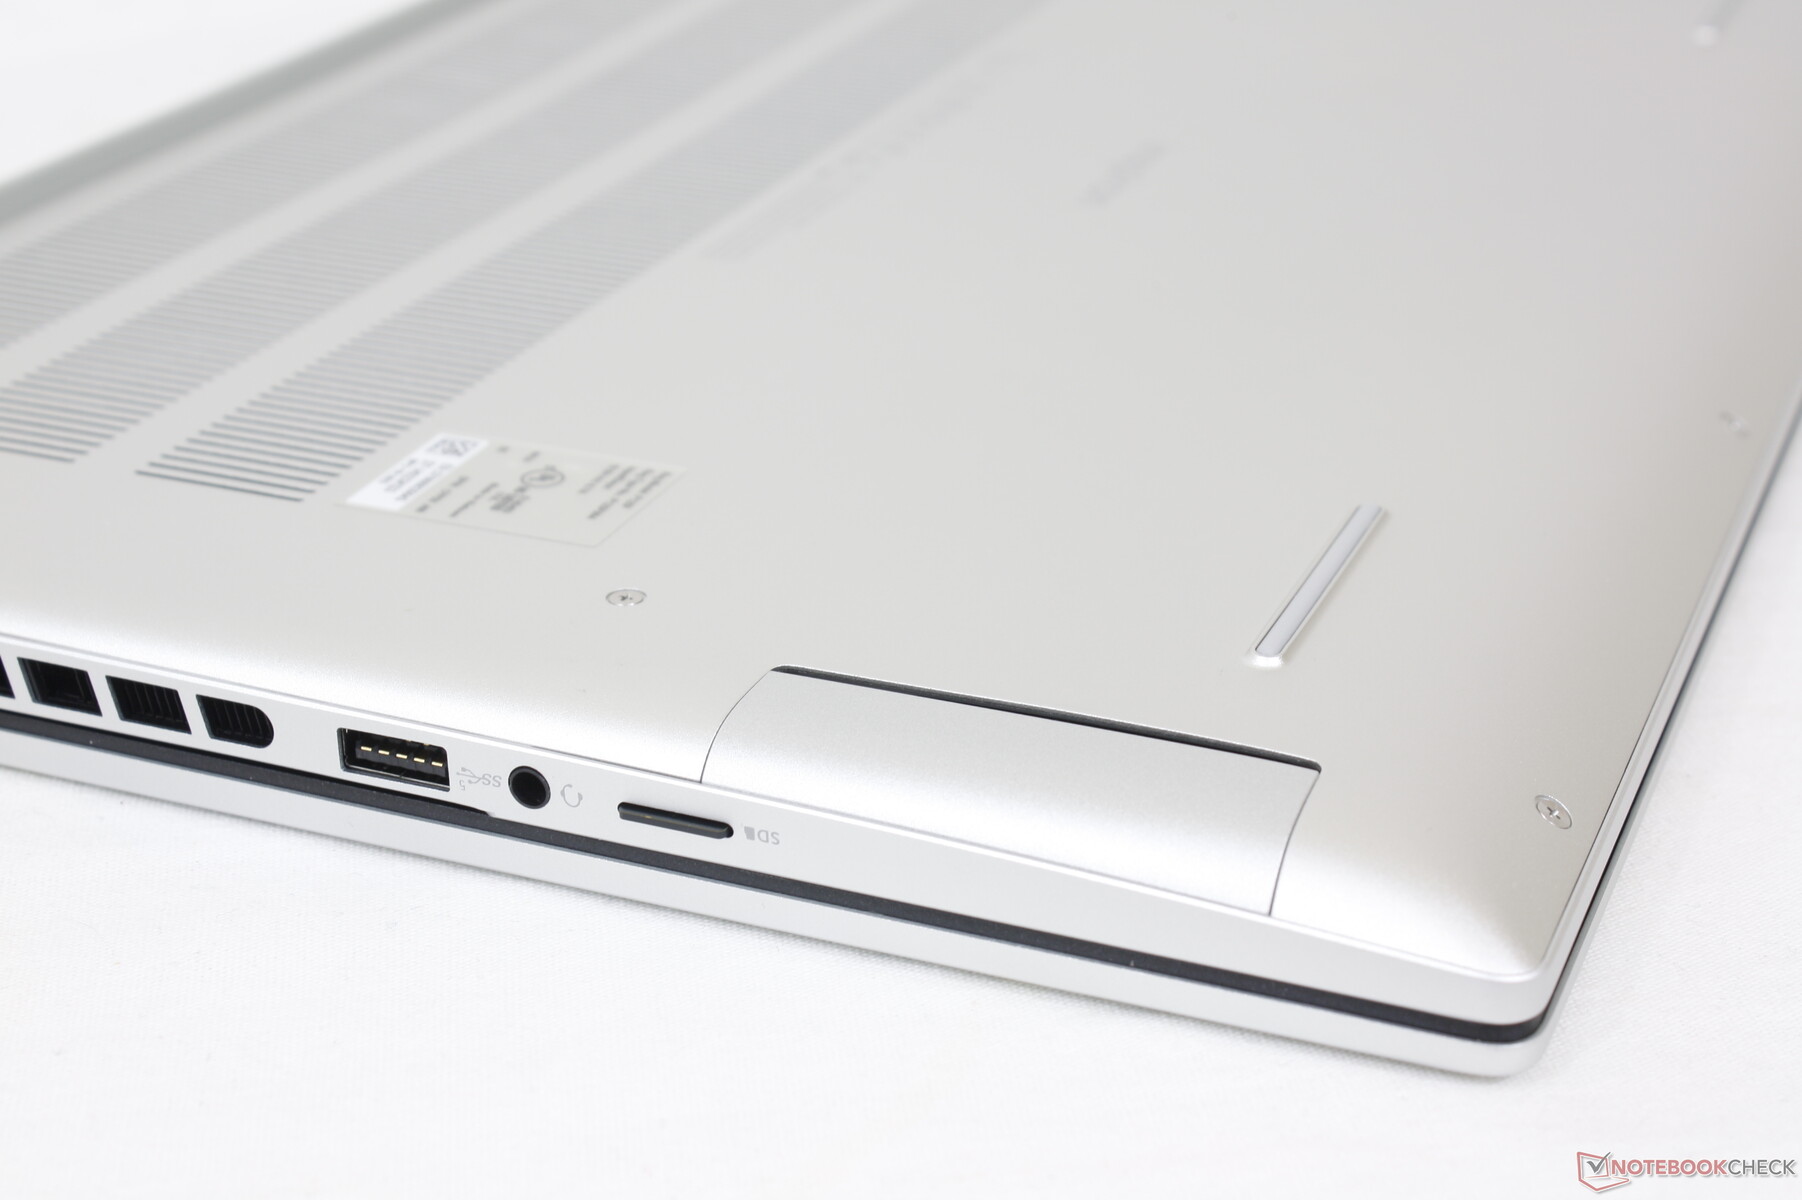
Connectivity — Could Use More USB-C
Port positioning and options include everything from last year's model but with one notable downgrade: the full-size SD card reader has been removed for a smaller microSD reader on all RTX 4060 configurations instead. Alternatives like the Envy 16 or VivoBook Pro 16X integrate more USB-C ports than our Dell or have full-size SD card readers.
We'd also love to see future Inspiron models drop the proprietary AC adapter barrel port in favor of USB-C charging much like on the XPS 15 and XPS 17 series.
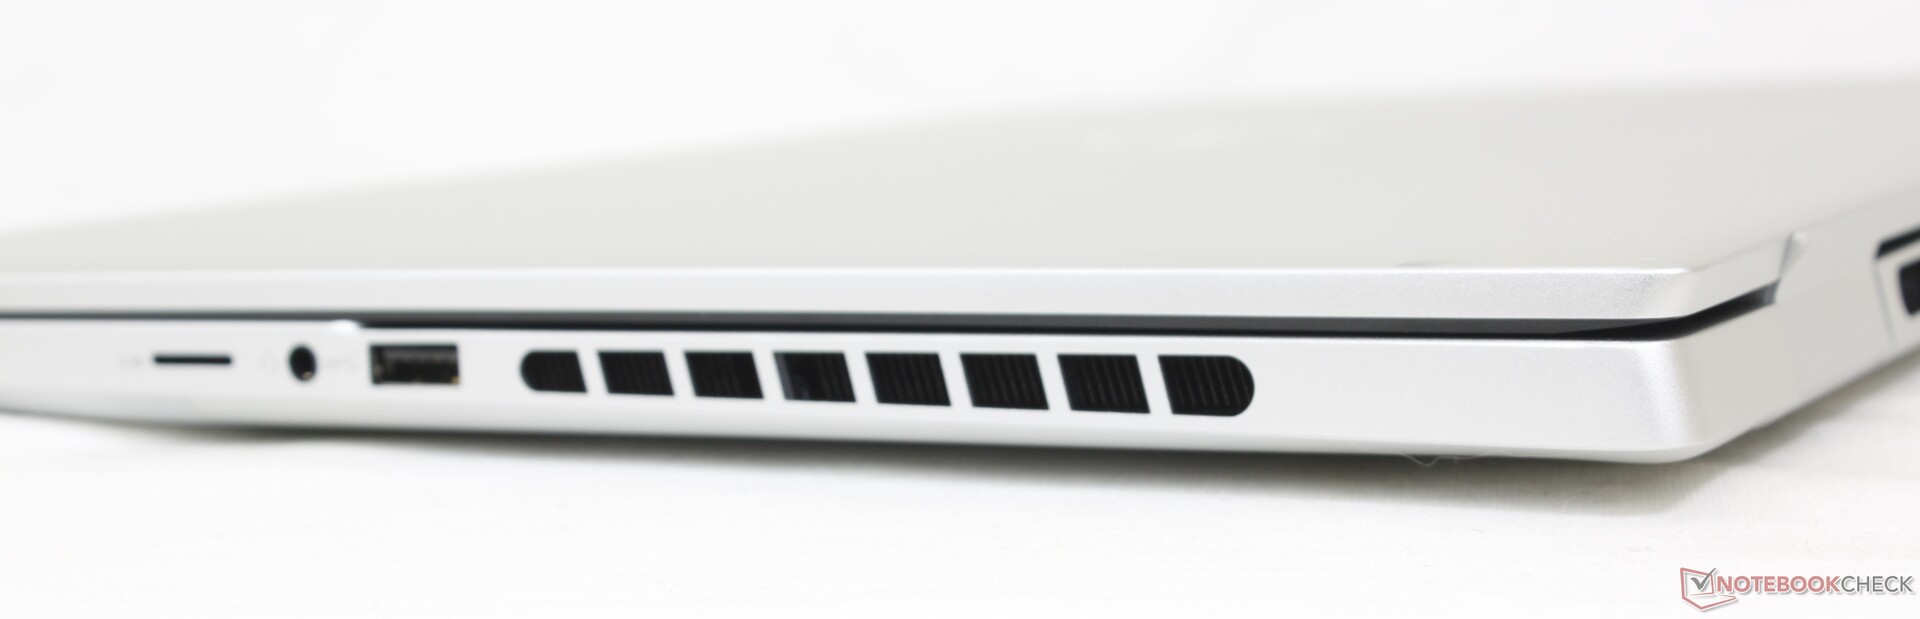
SD Card Reader
Whereas the XPS series is home to some of the fastest SD card readers on any laptop, the Inspiron series includes some of the slowest. Moving 1 GB of pictures from our UHS-II test card to desktop would take over 50 seconds compared to just 5 to 6 seconds on an XPS 15 or XPS 17.
| SD Card Reader | |
| average JPG Copy Test (av. of 3 runs) | |
| MSI Summit E16 Flip A12UDT-031 (AV Pro SD microSD 128 GB V60) | |
| Asus Vivobook Pro 16X K6604JV-MX016W | |
| Lenovo Slim Pro 9i 16IRP8 (PNY EliteX-Pro60 V60 256 GB) | |
| HP Envy 16 h0112nr (AV Pro SD microSD 128 GB V60) | |
| Dell Inspiron 16 Plus 7620 (Toshiba Exceria Pro SDXC 64 GB UHS-II) | |
| Dell Inspiron 16 Plus 7630 (AV Pro SD microSD 128 GB V60) | |
| maximum AS SSD Seq Read Test (1GB) | |
| MSI Summit E16 Flip A12UDT-031 (AV Pro SD microSD 128 GB V60) | |
| Asus Vivobook Pro 16X K6604JV-MX016W | |
| Lenovo Slim Pro 9i 16IRP8 (PNY EliteX-Pro60 V60 256 GB) | |
| HP Envy 16 h0112nr (AV Pro SD microSD 128 GB V60) | |
| Dell Inspiron 16 Plus 7620 (Toshiba Exceria Pro SDXC 64 GB UHS-II) | |
| Dell Inspiron 16 Plus 7630 (AV Pro SD microSD 128 GB V60) | |
Communication
An Intel AX211 comes standard for Wi-Fi 6E and Bluetooth 5.3 connectivity. We experienced steady and reliable performance when paired to our Asus AXE11000 6GHz test network.
A MediaTek module is included instead if configured with an AMD CPU.
Webcam
The 2 MP webcam has become standard on most multimedia laptops. More expensive models from HP include 5 MP or even 8 MP webcams if webcam quality is priority.
A physical slider is included for privacy, but IR is not supported.


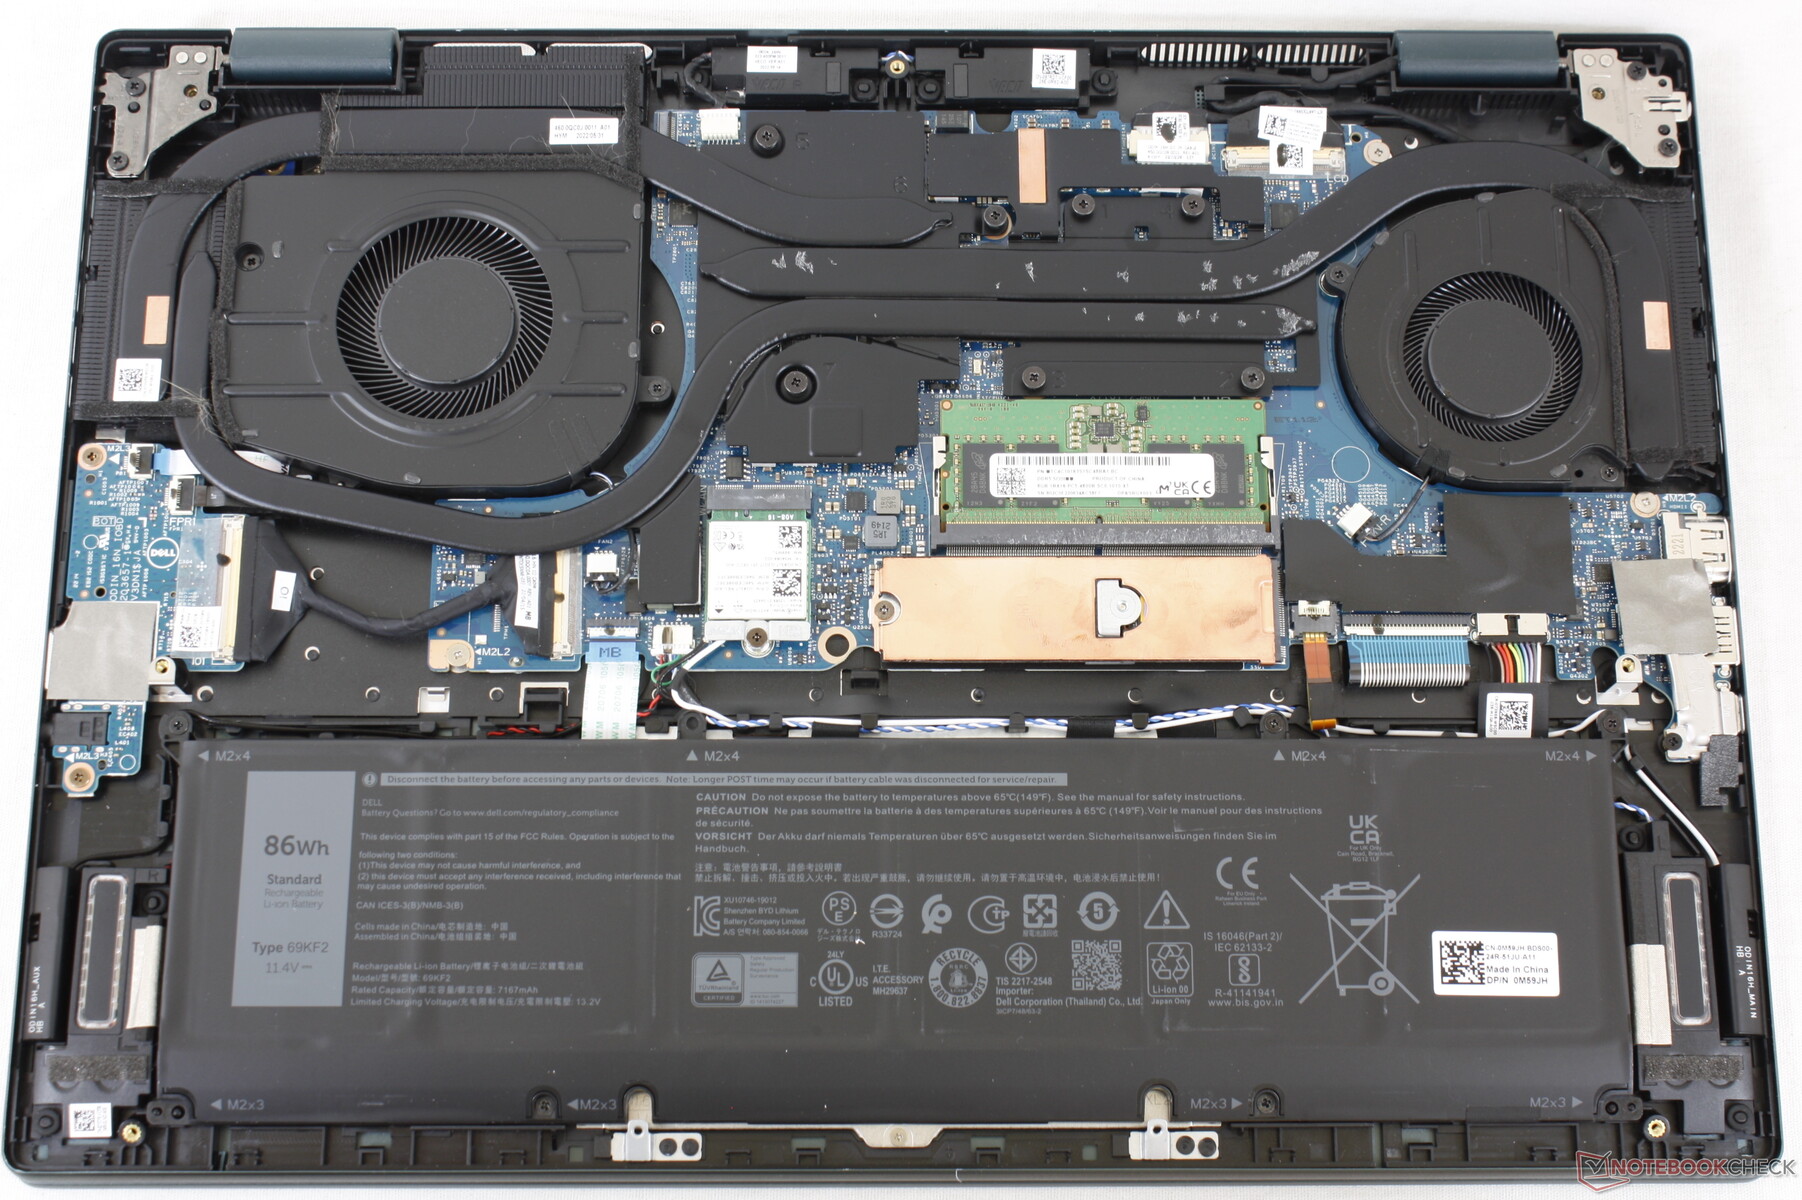
Maintenance
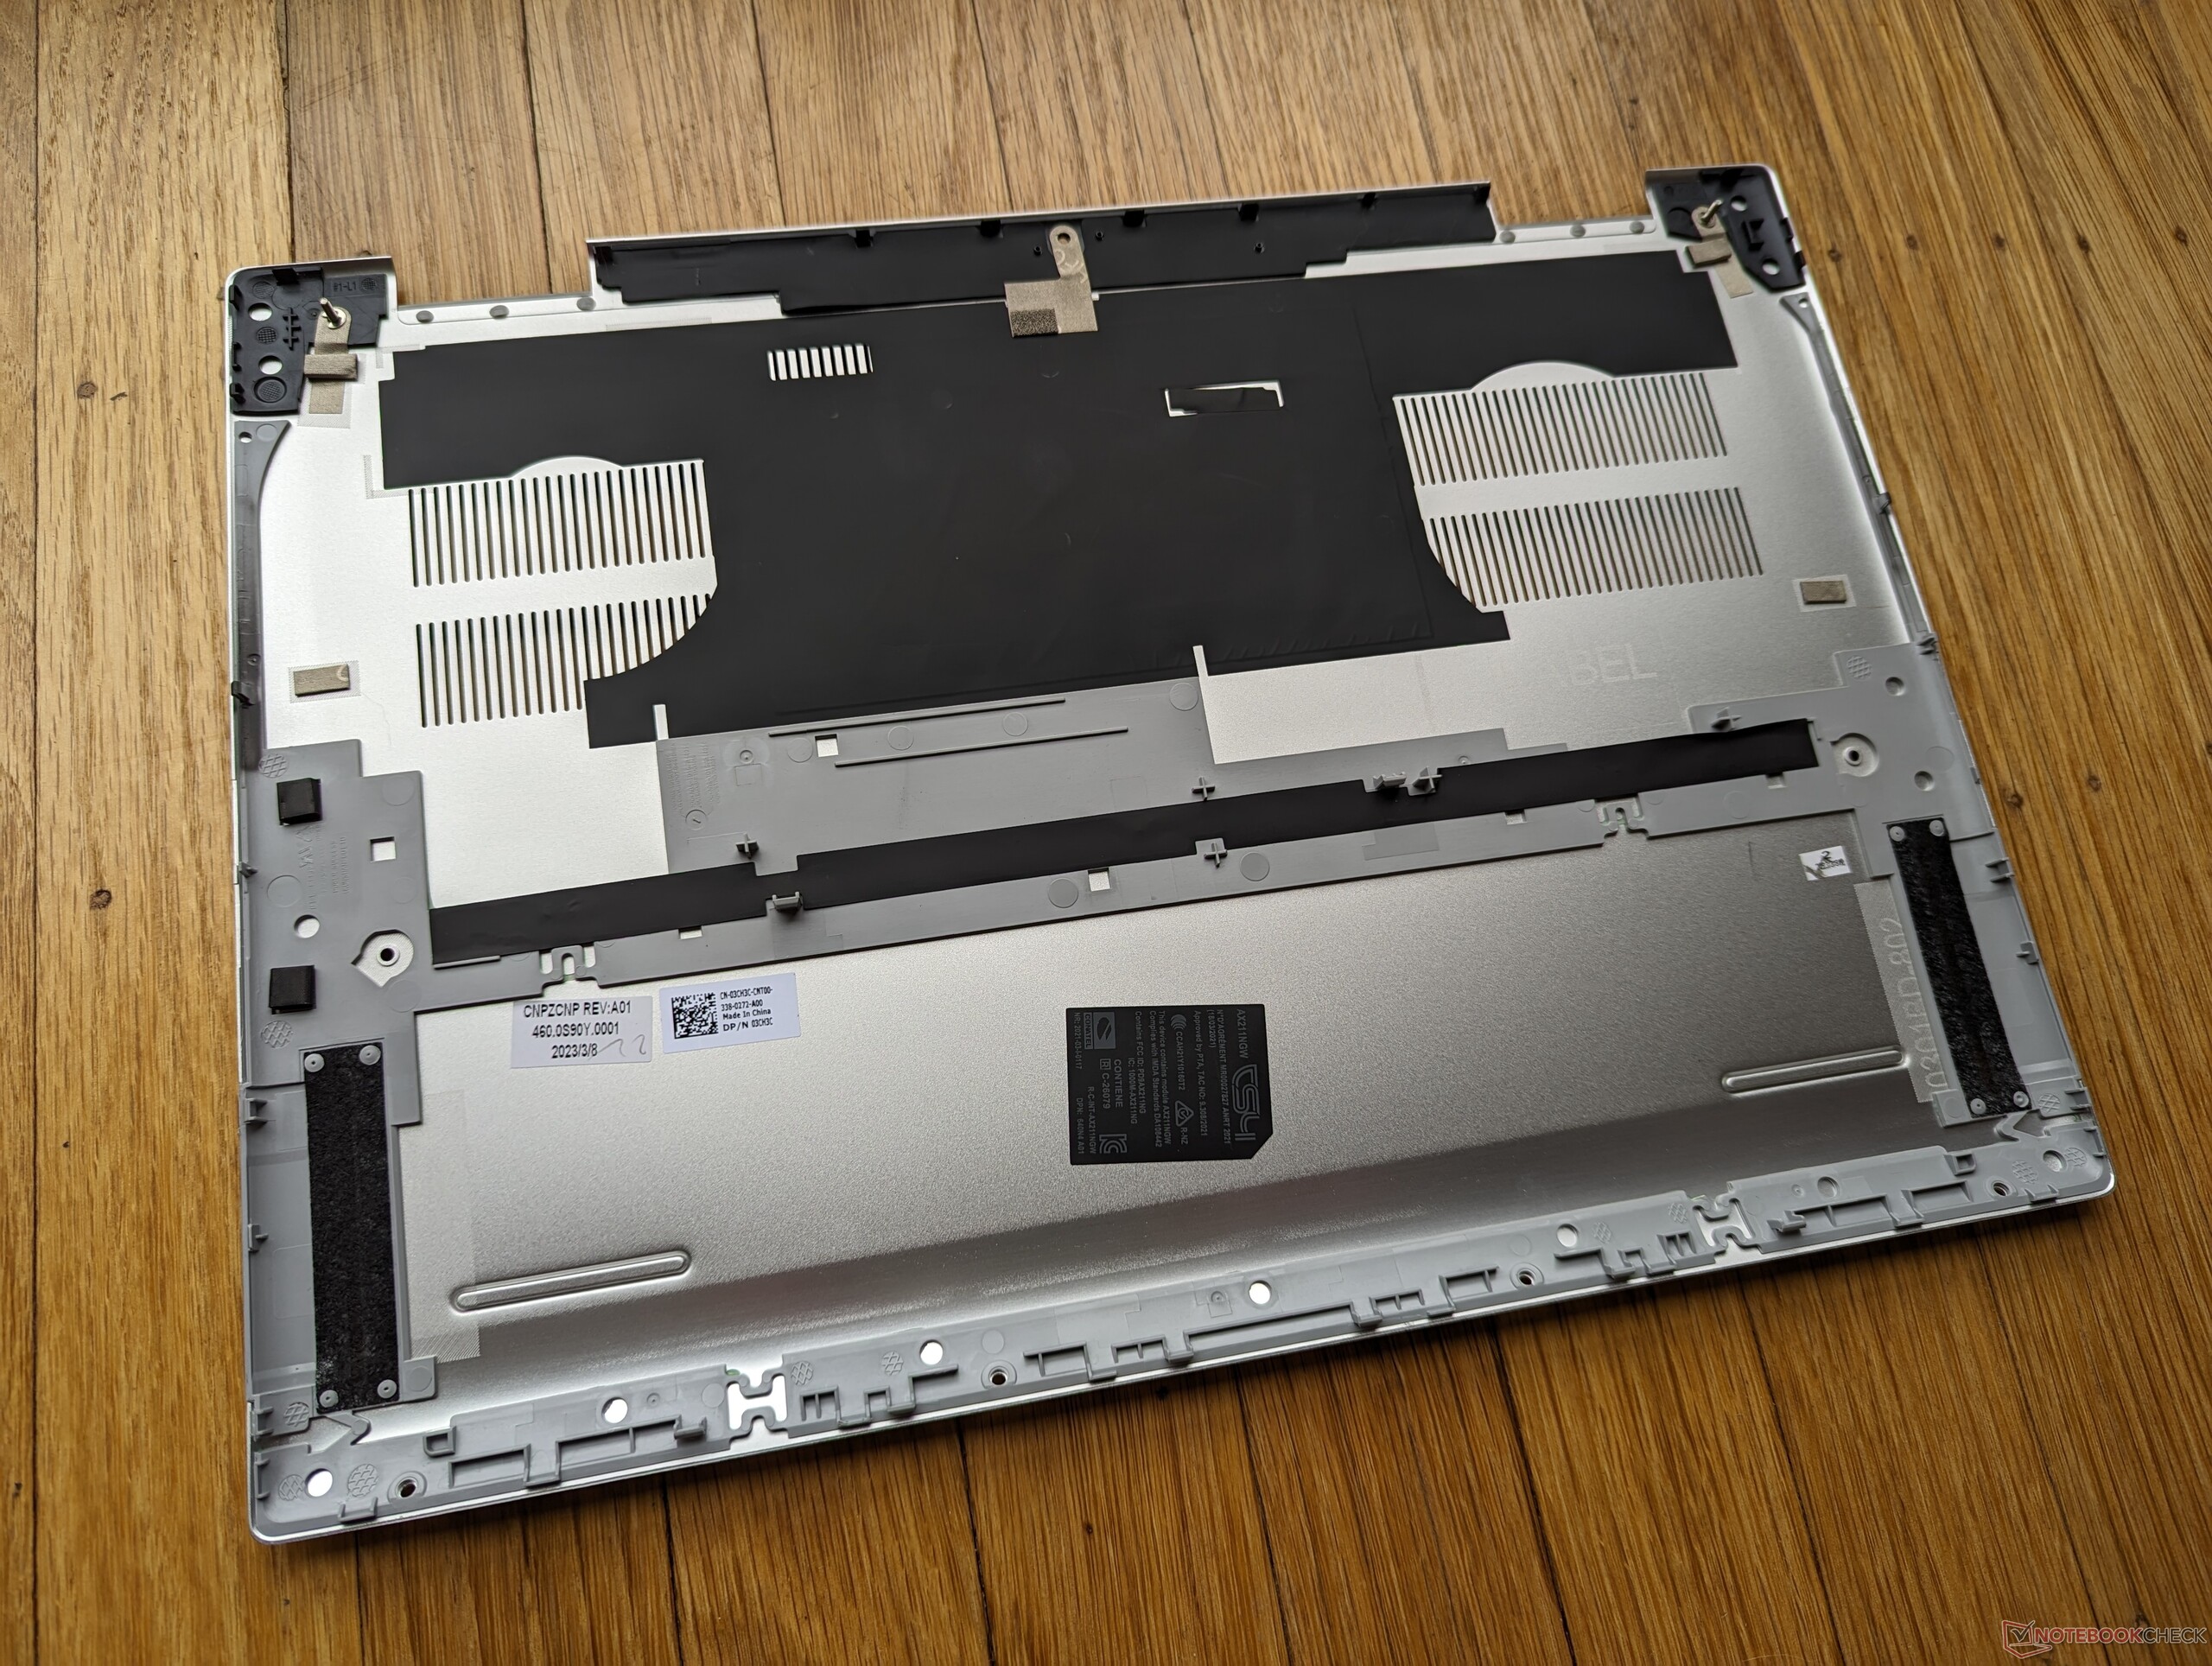
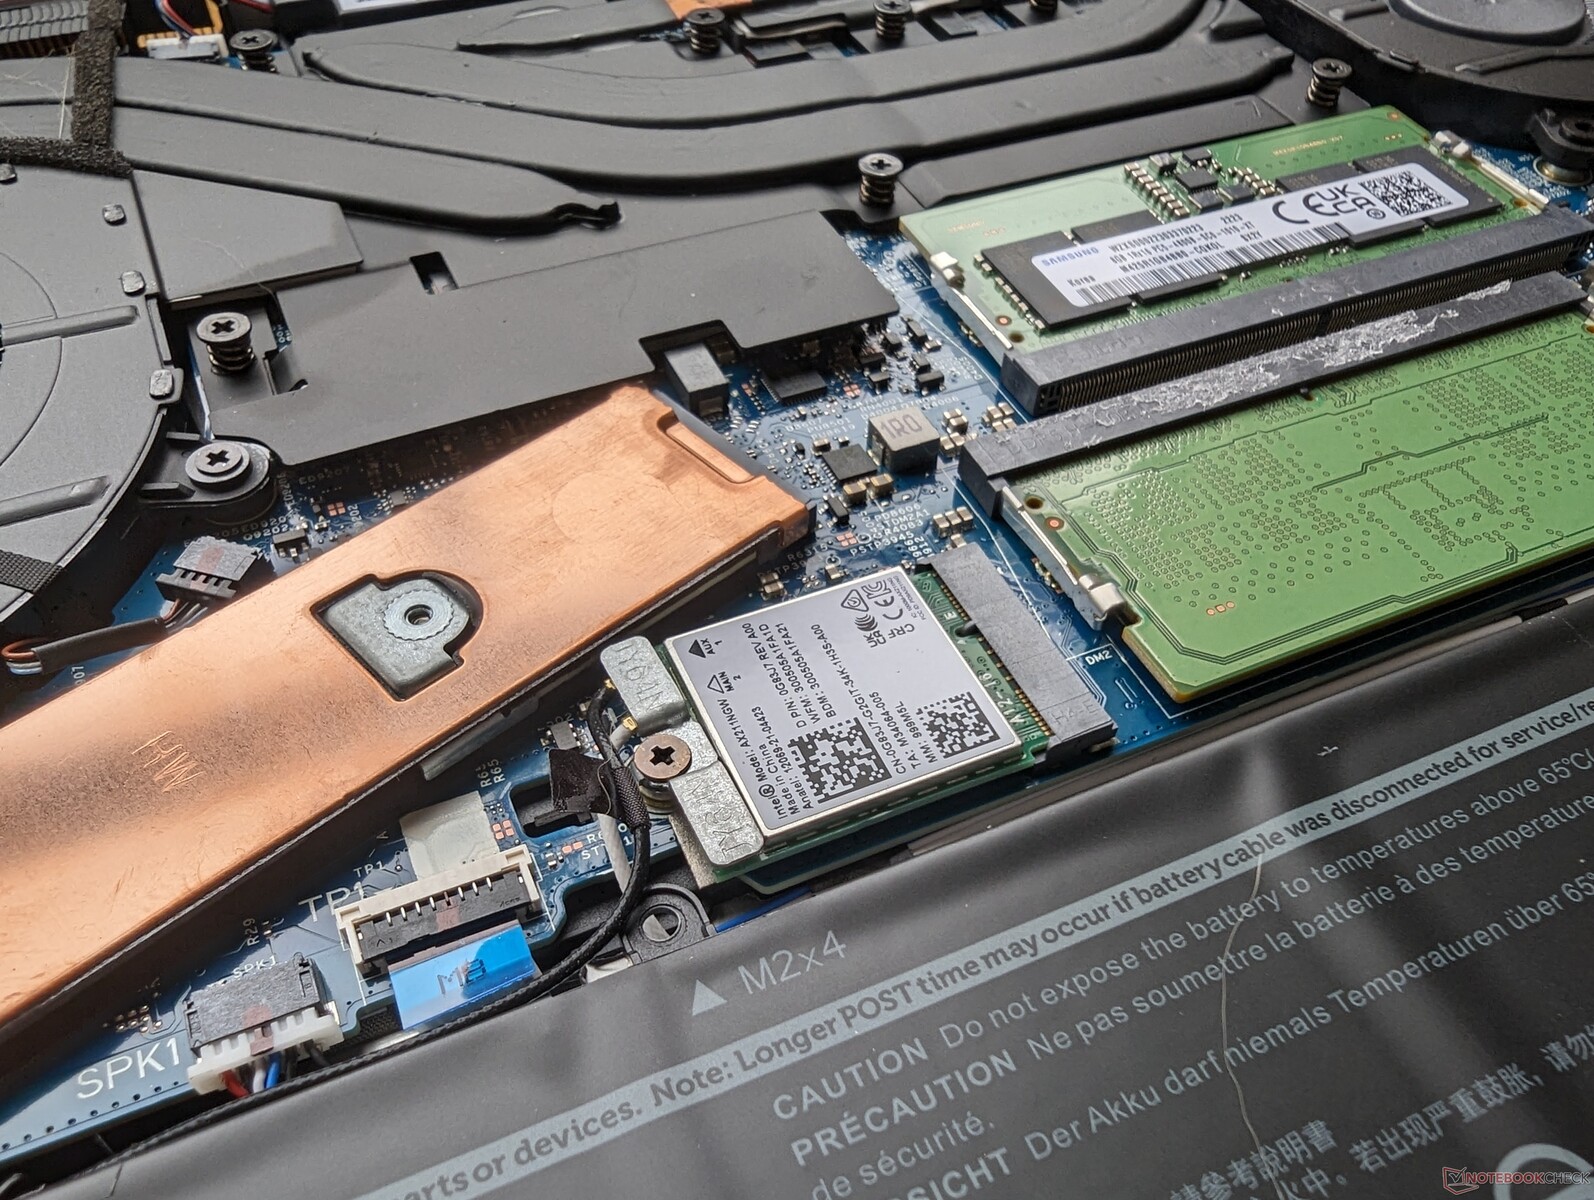
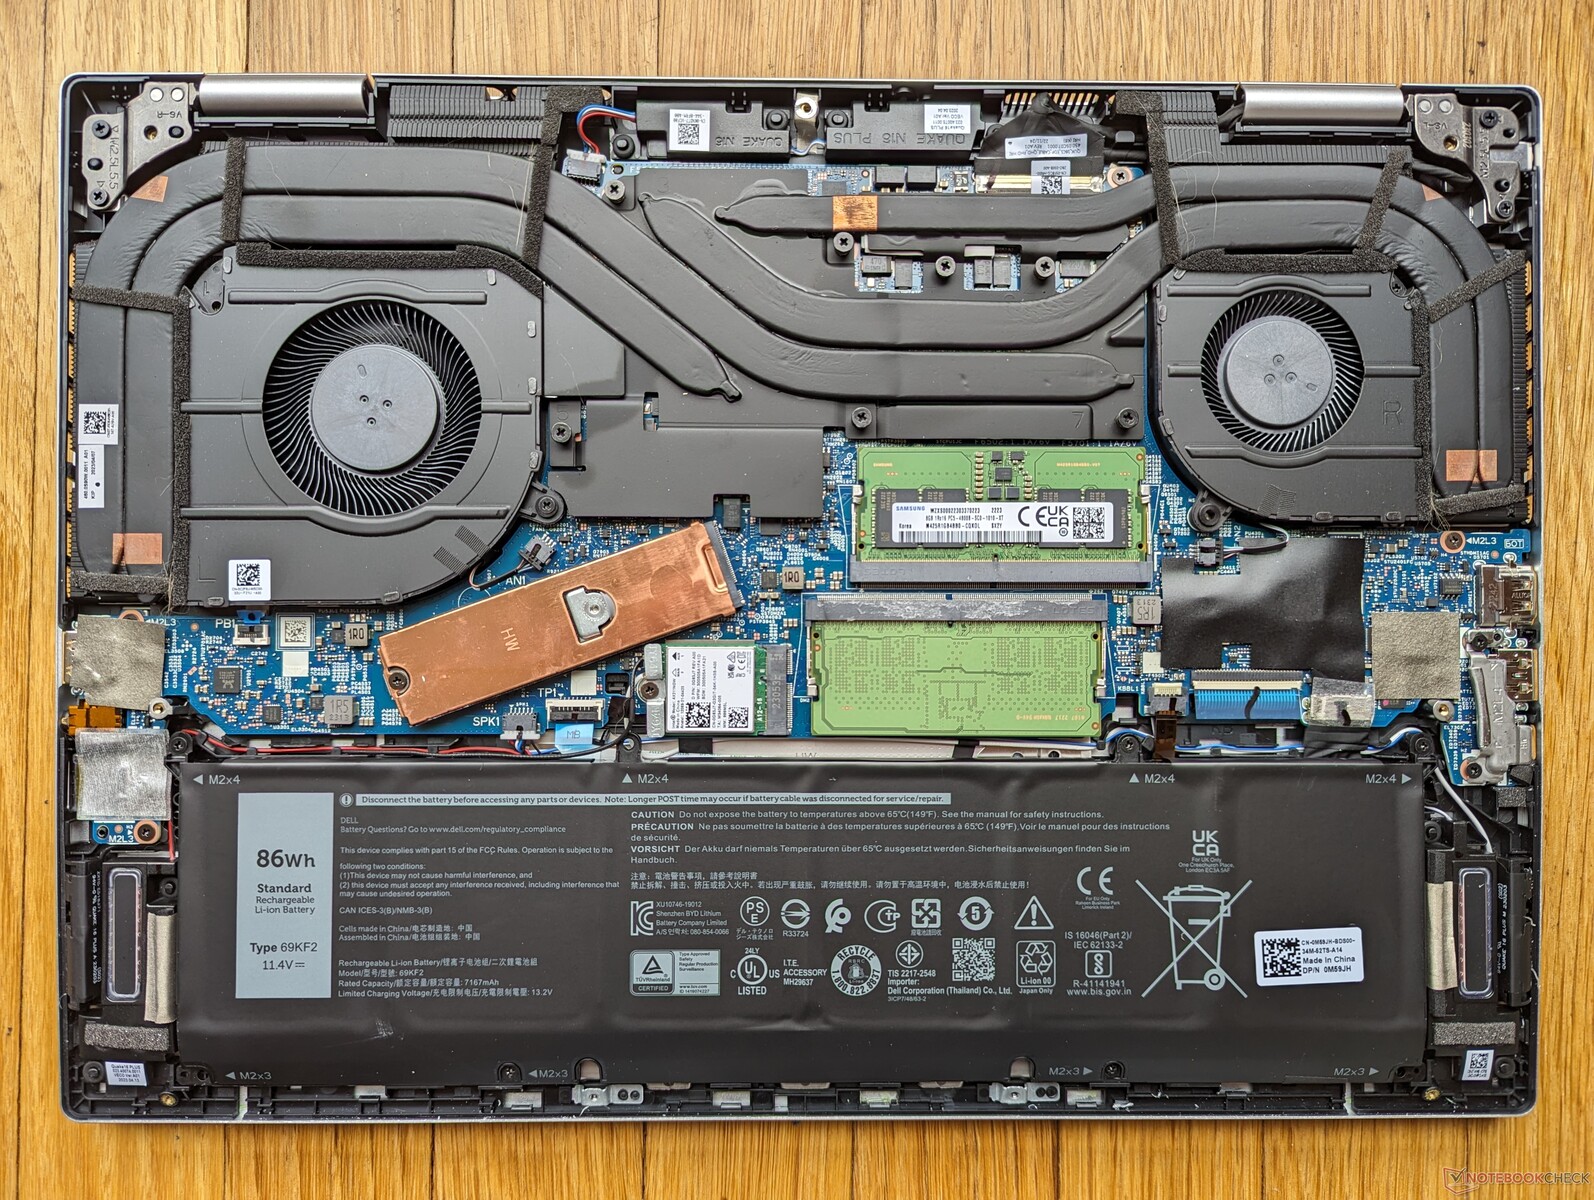
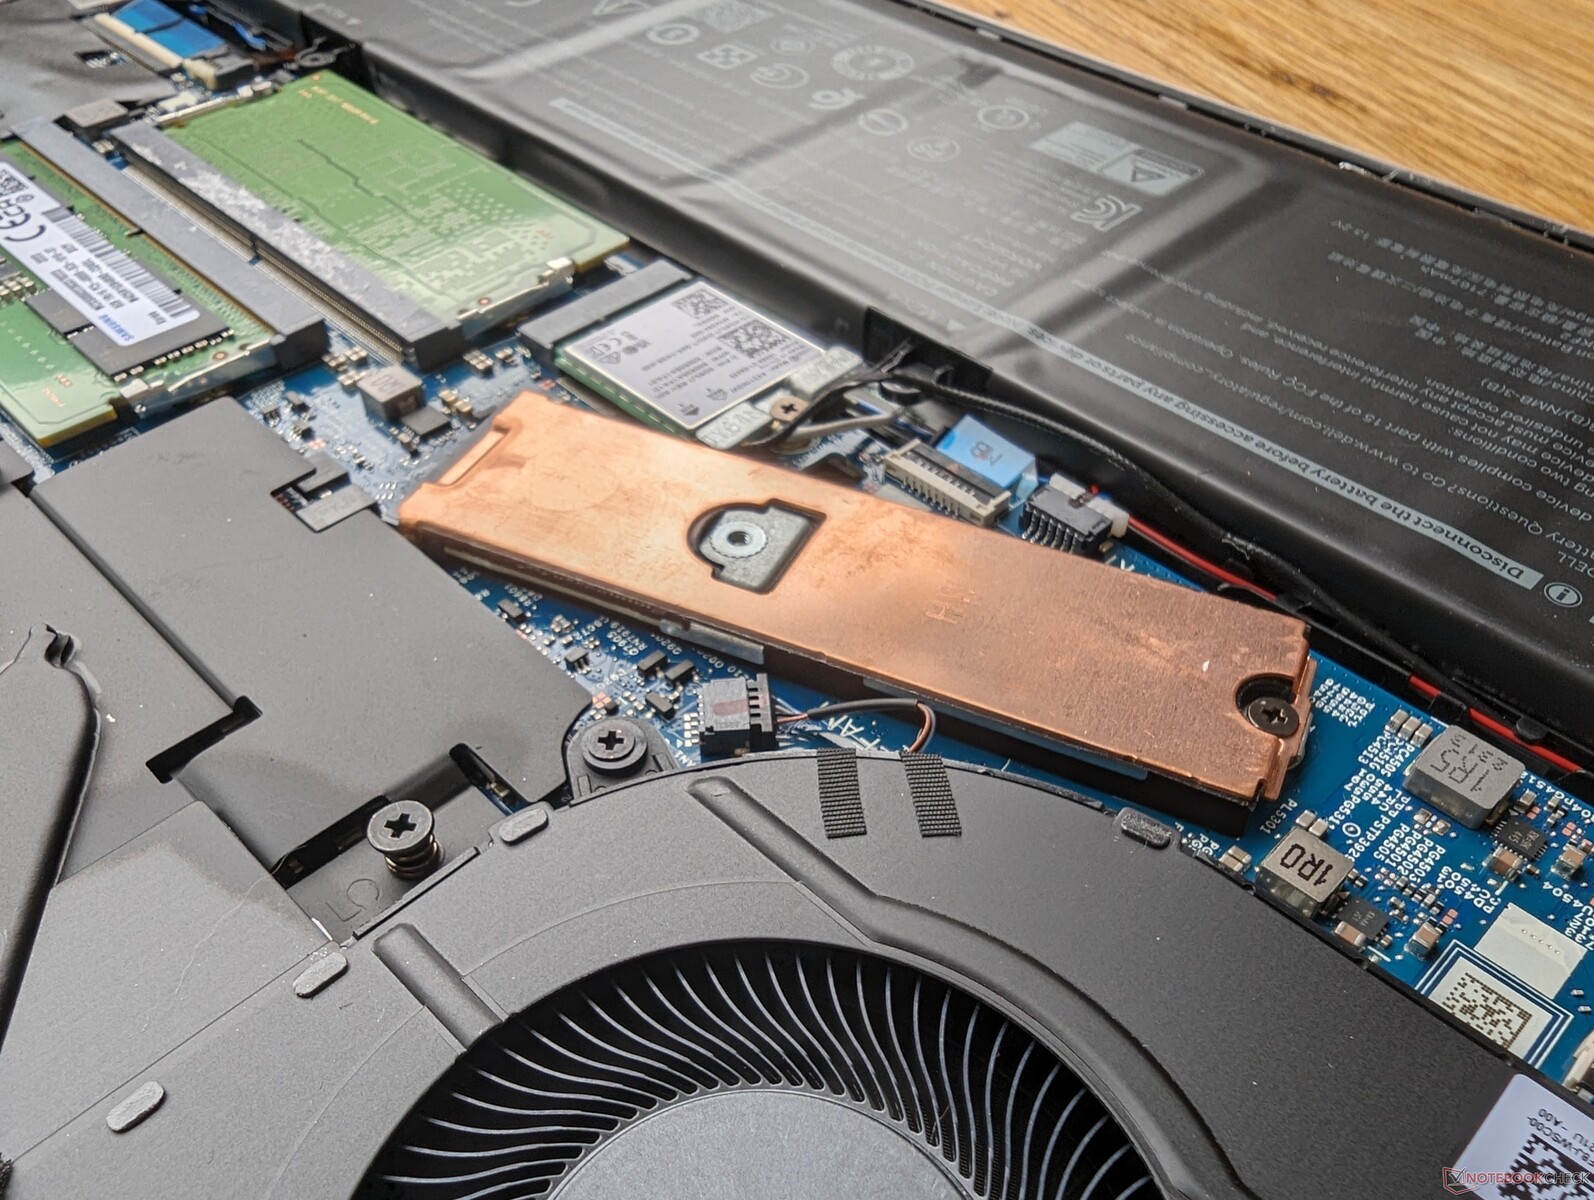
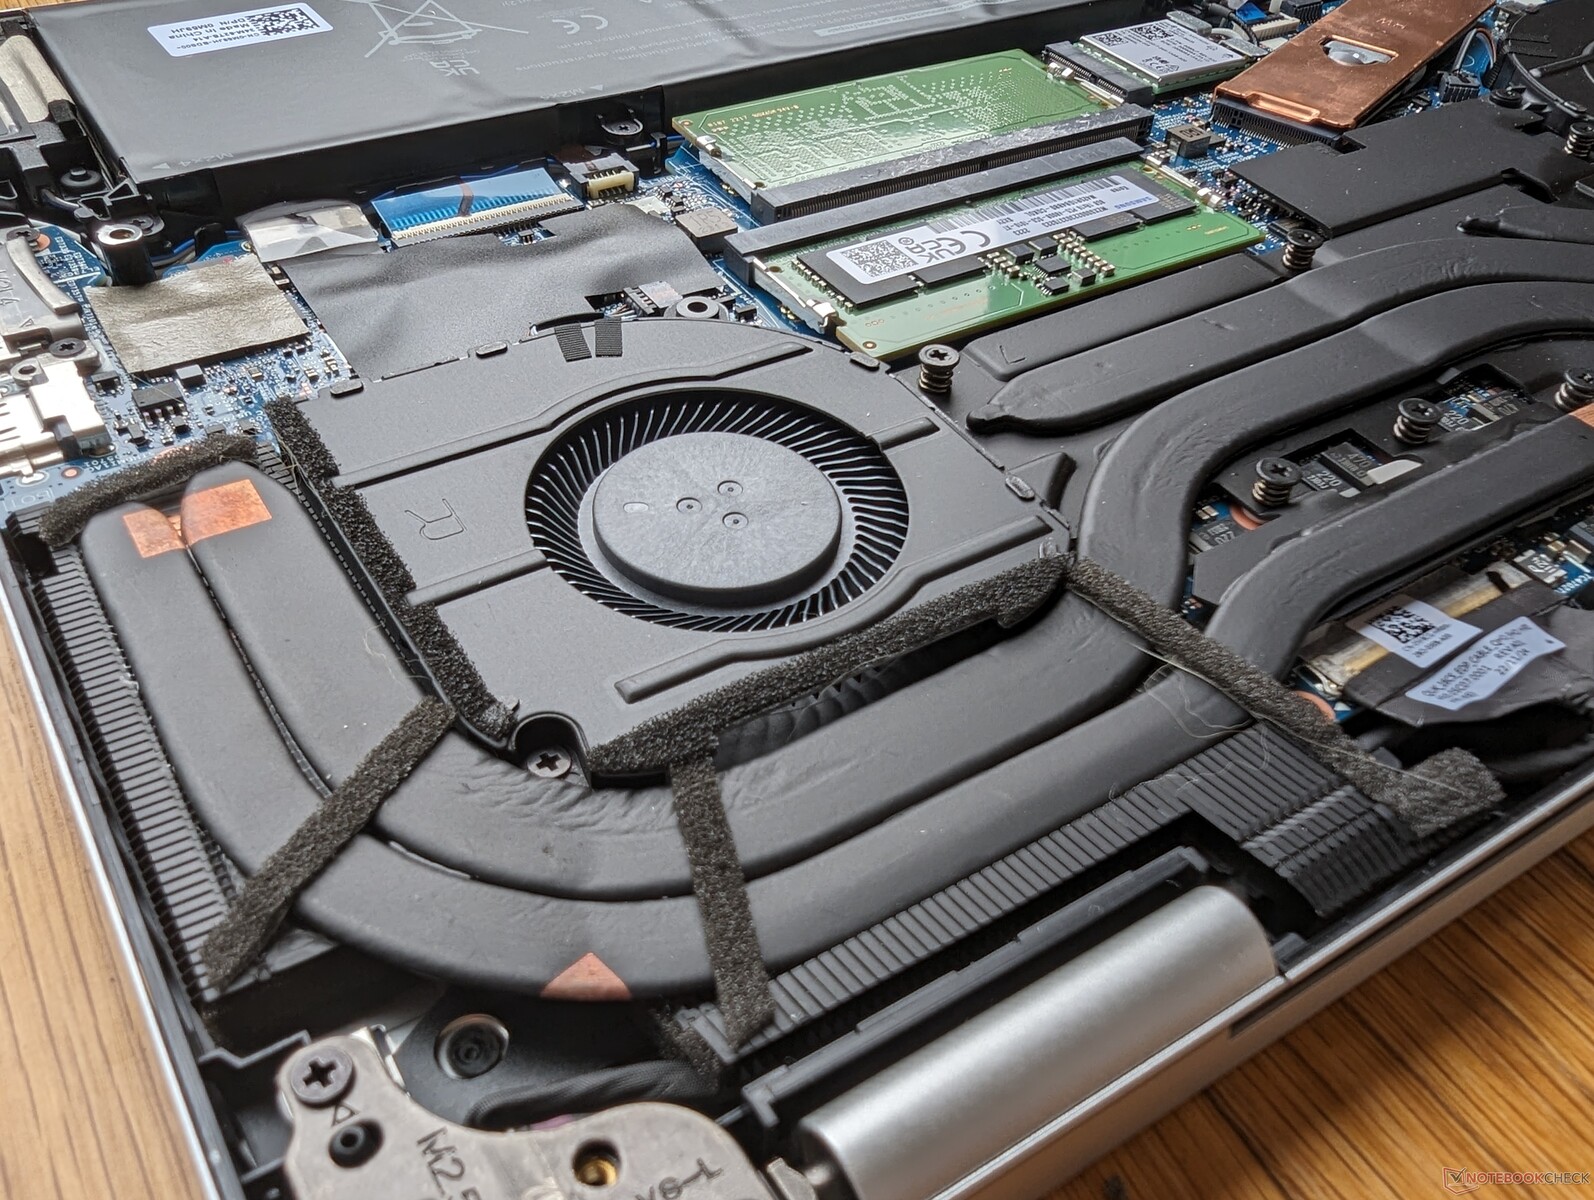
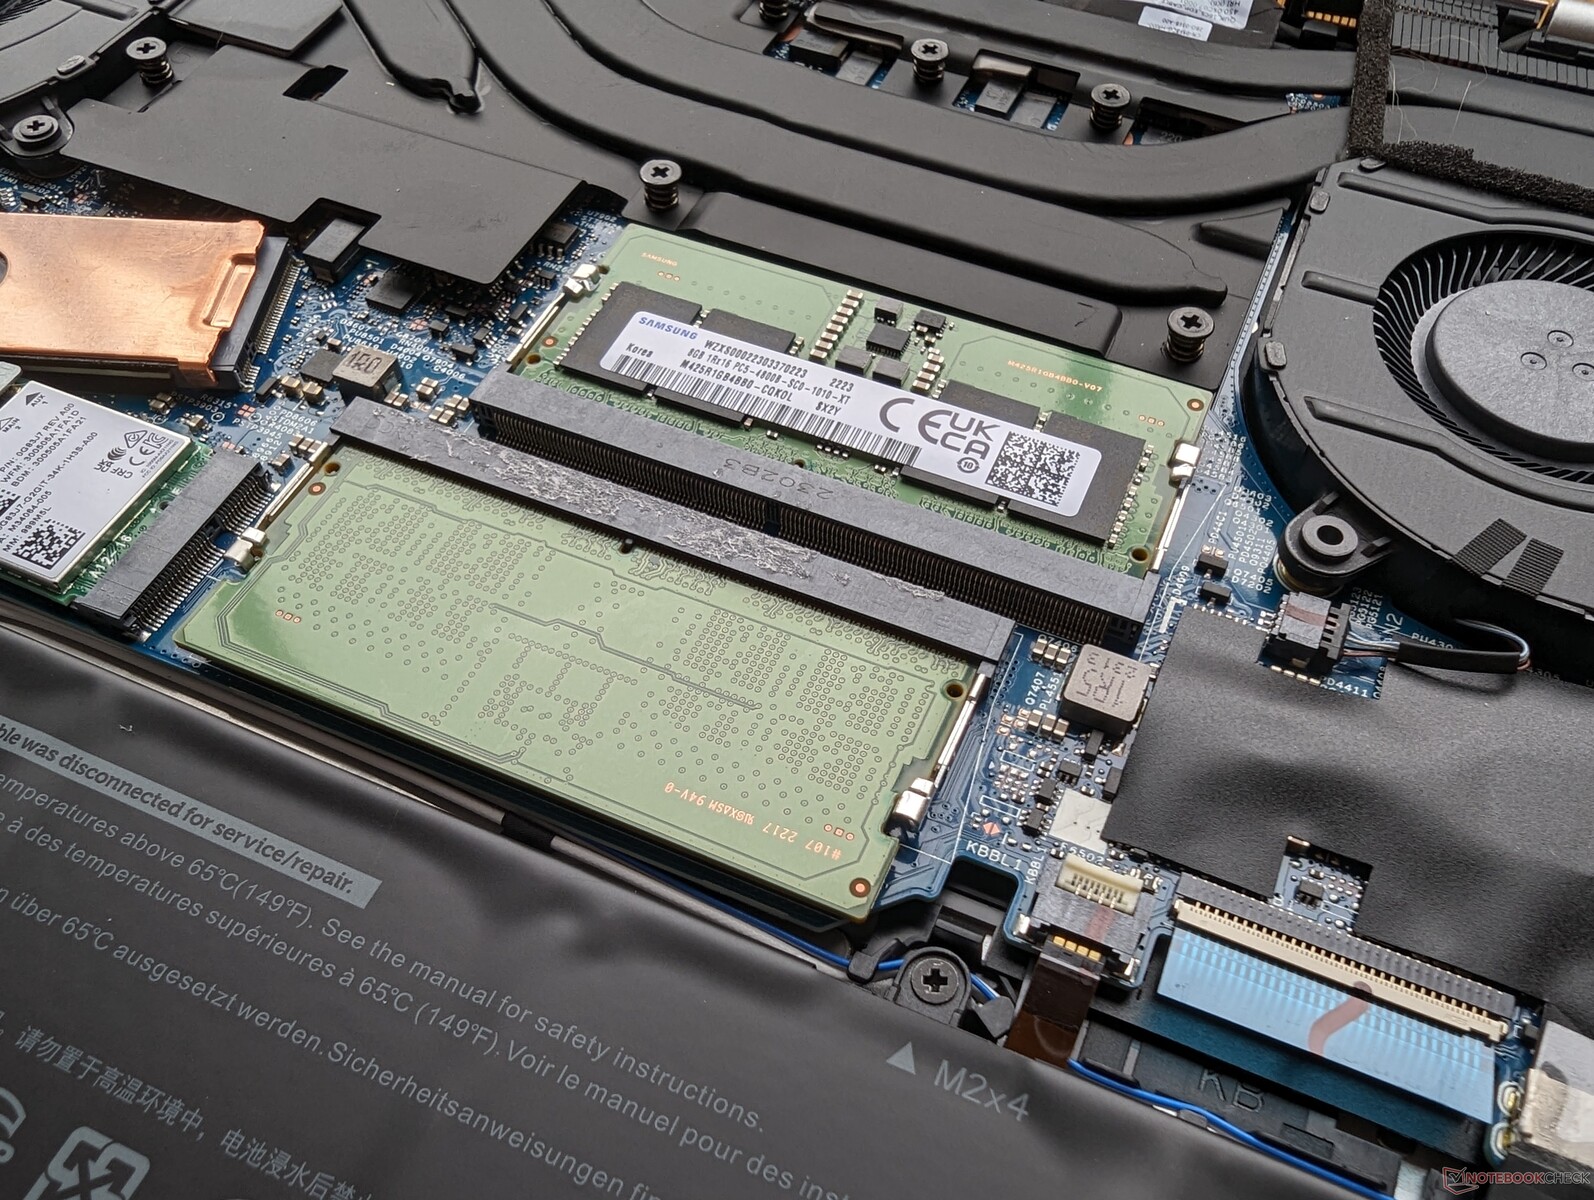
The bottom panel requires only a Phillips screwdriver and sharp edge for relatively easy servicing. Owners have direct access to the SSD, WLAN, and 2x SODIMM slots whereas last year's model was limited to just 1x SODIMM slot as shown by the comparison shots below. The fans are also larger this time around and with thicker copper heat pipes for improved cooling potential.
Note that the AMD version of this model utilizes soldered LPDDR5 RAM in contrast to the fully expandable 2x SODIMM approach of our Intel version.
Accessories And Warranty
There are no extras in the box other than the AC adapter and paperwork. The usual one-year limited manufacturer warranty applies if purchased in the US.
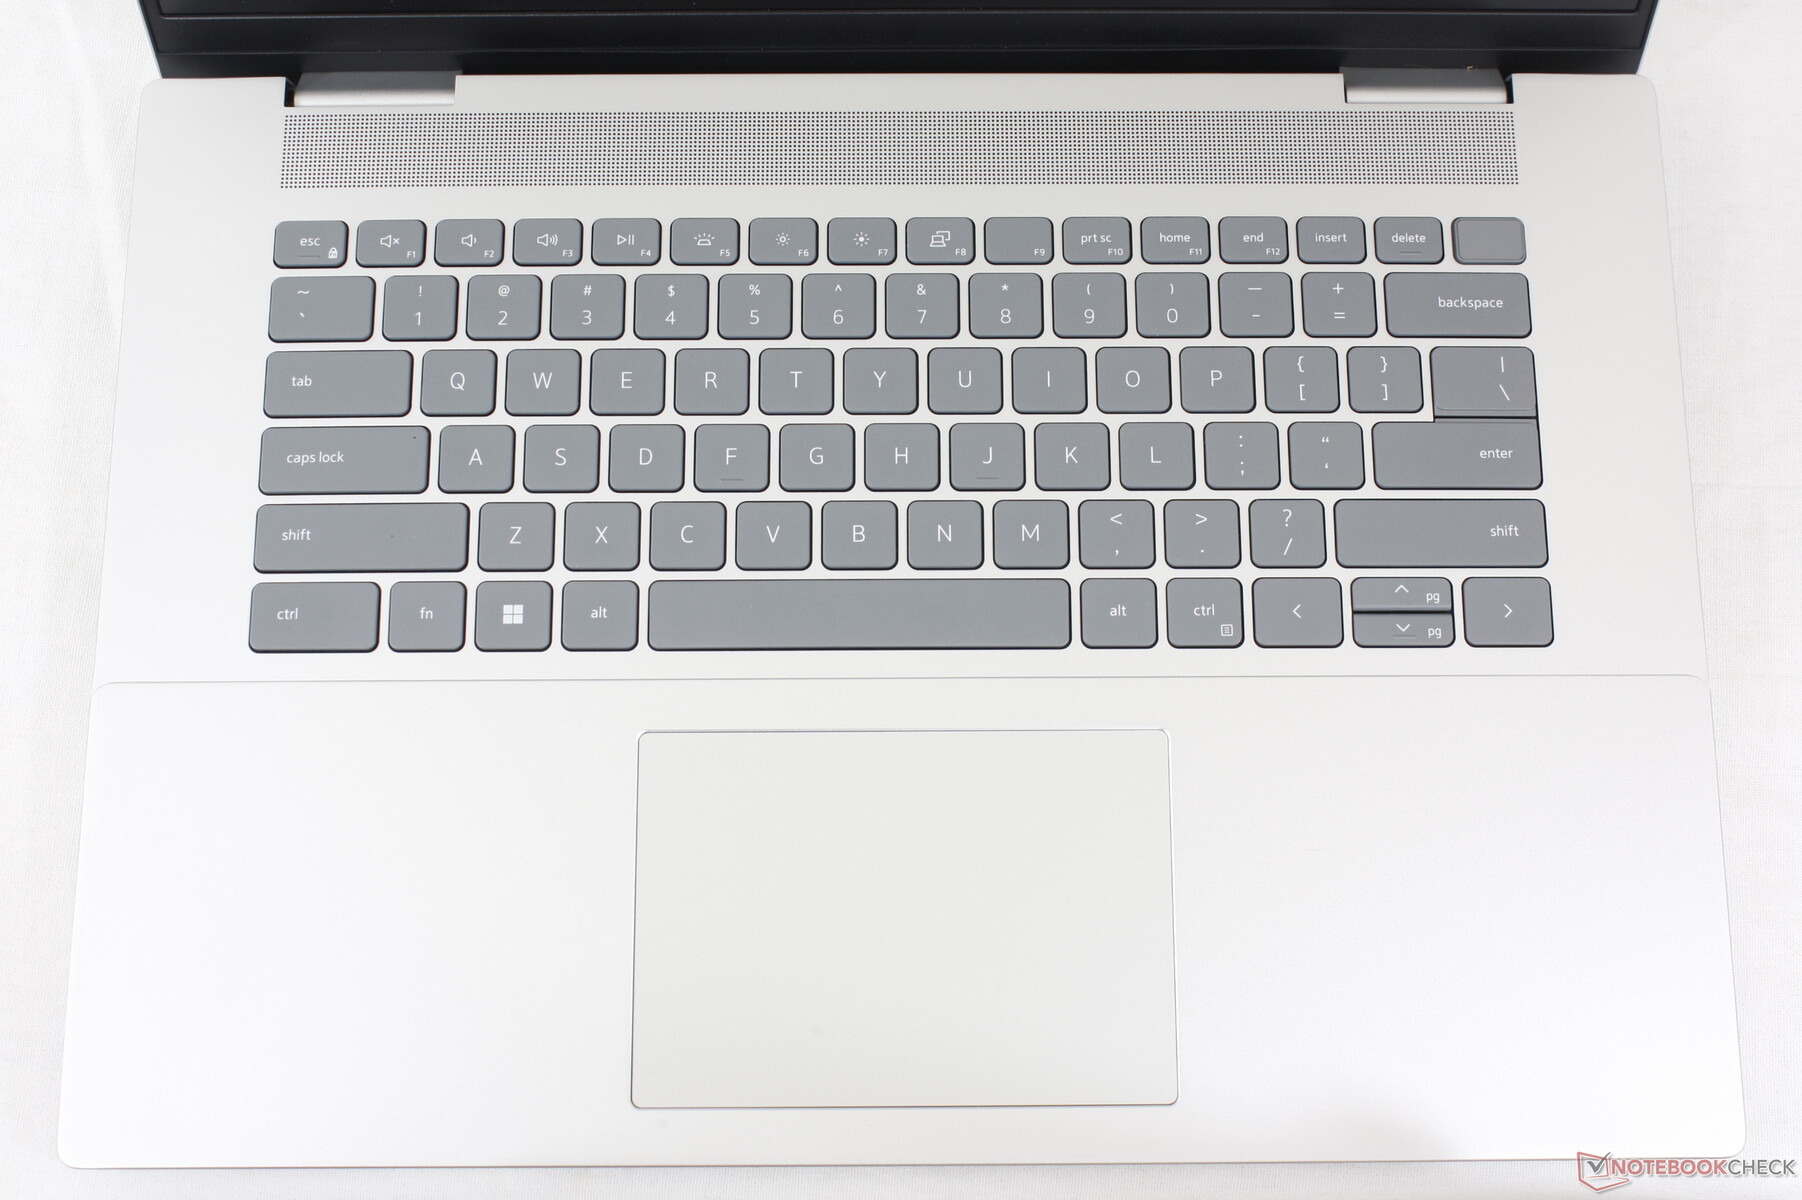
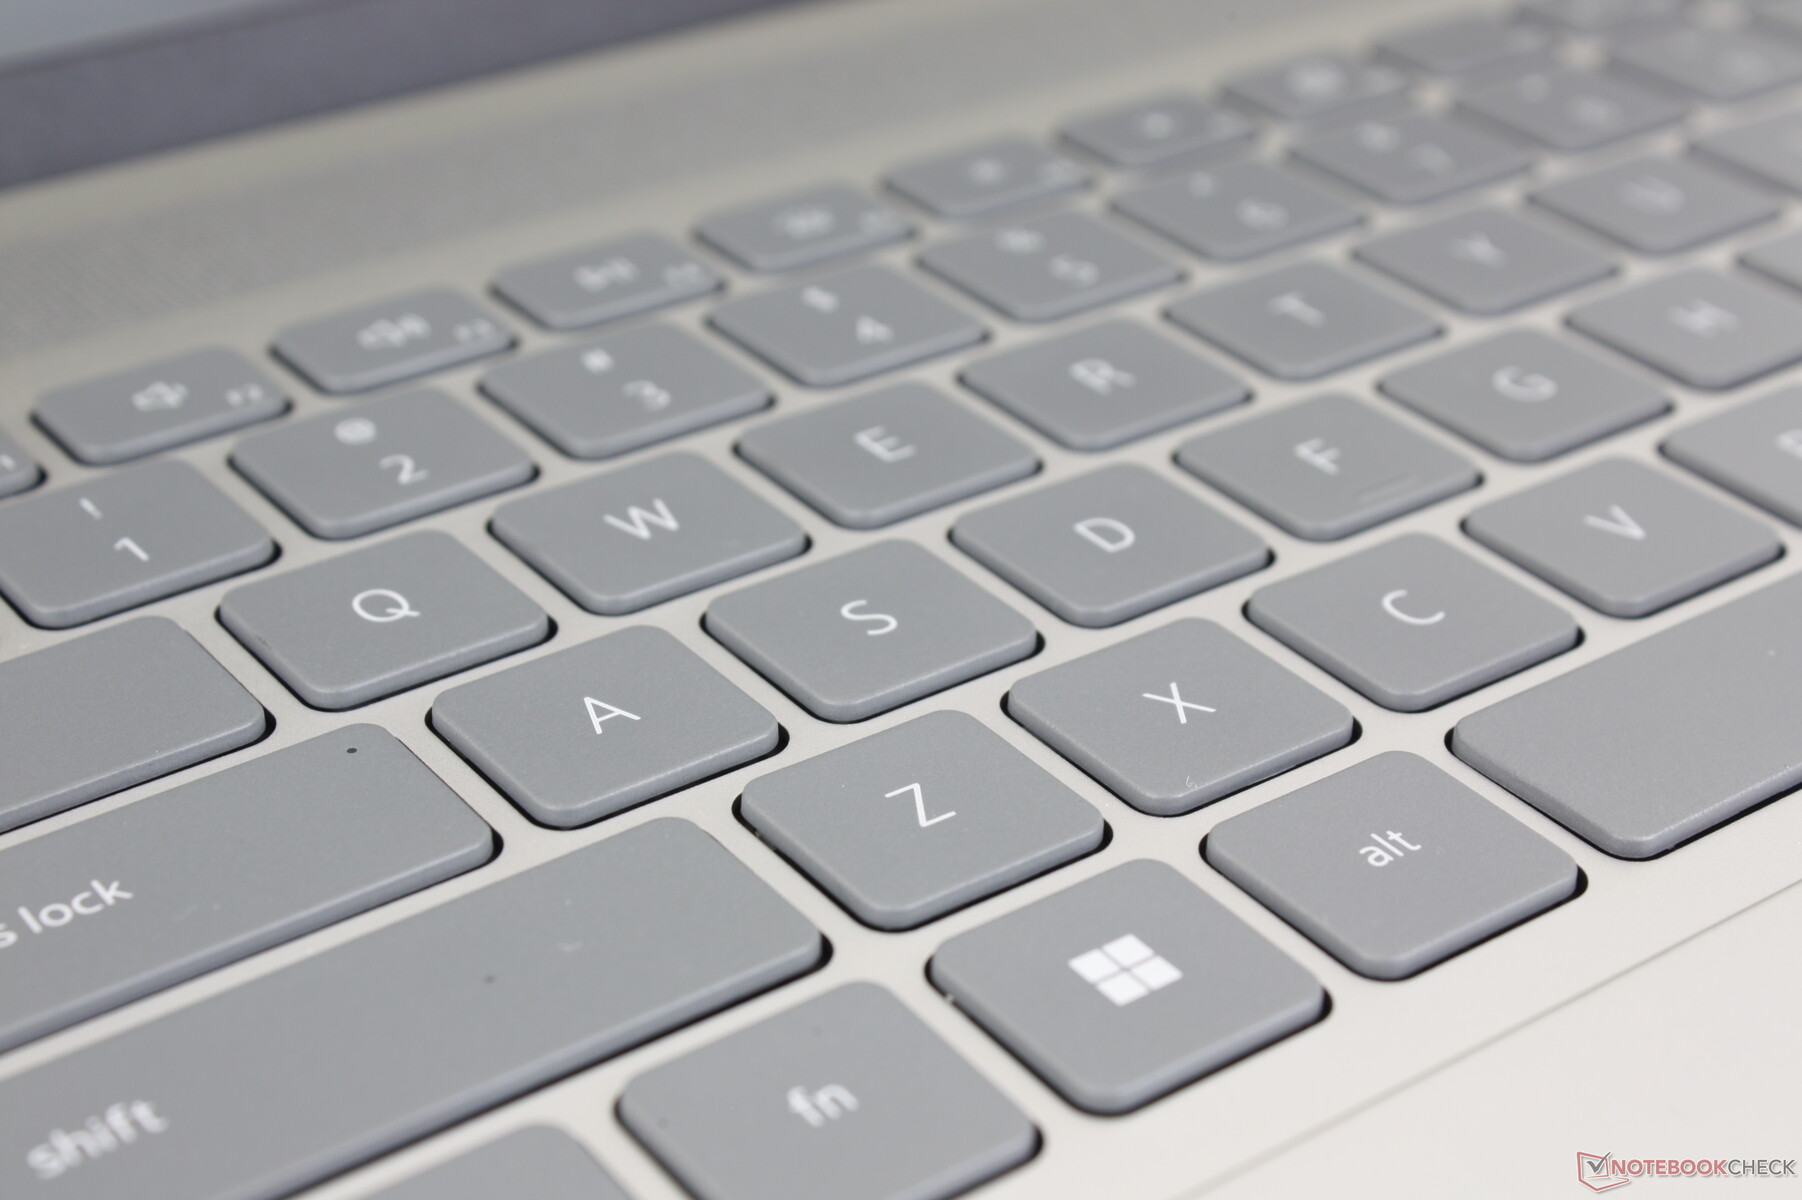
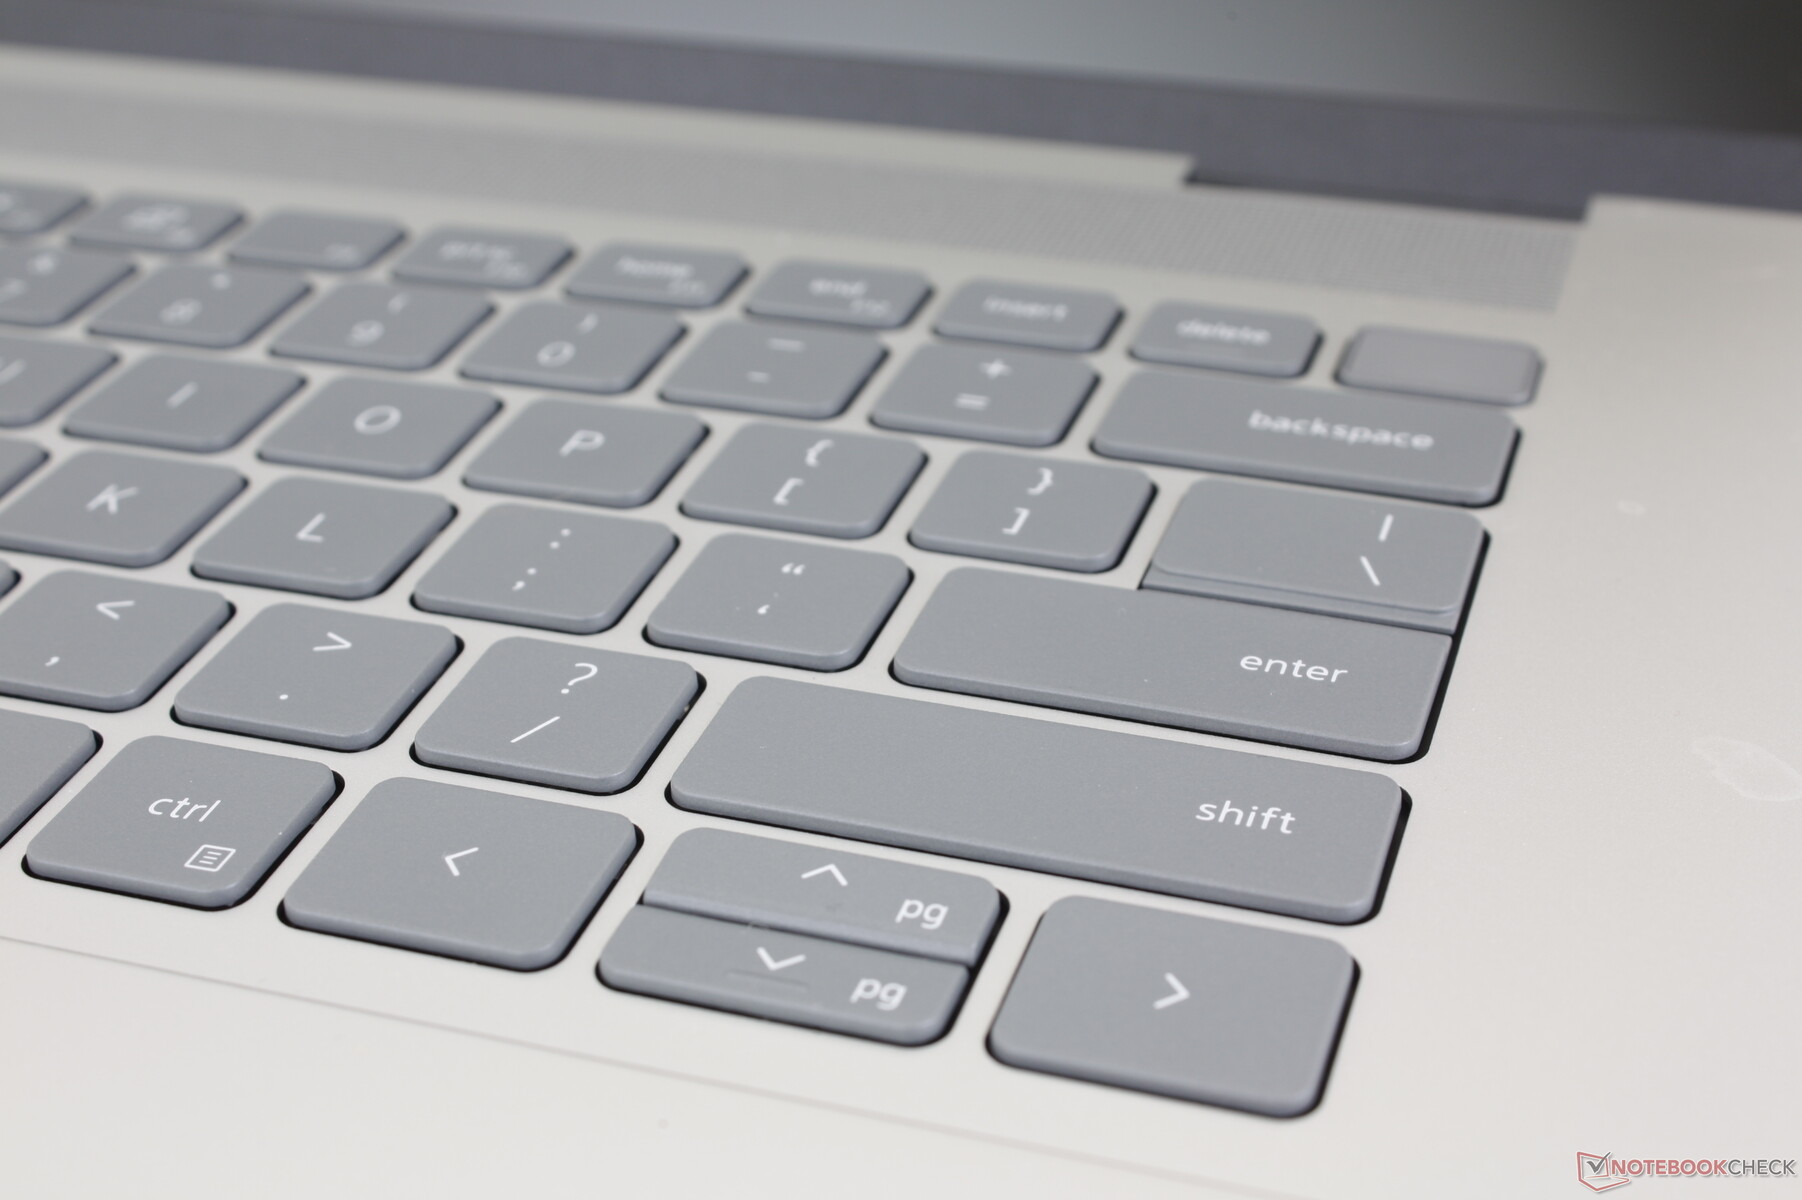
Input Devices — Familiar Inspiron Feel
Keyboard
The typing experience remains identical to the Inspiron 16 Plus 7620 down to each function key and secondary action. This isn't necessarily a bad thing as the consistency between different Inspiron models is appreciated. However, other multimedia laptops like the LG Gram 16 or HP Spectre x360 16 have noticeably firmer and more comfortable keys.
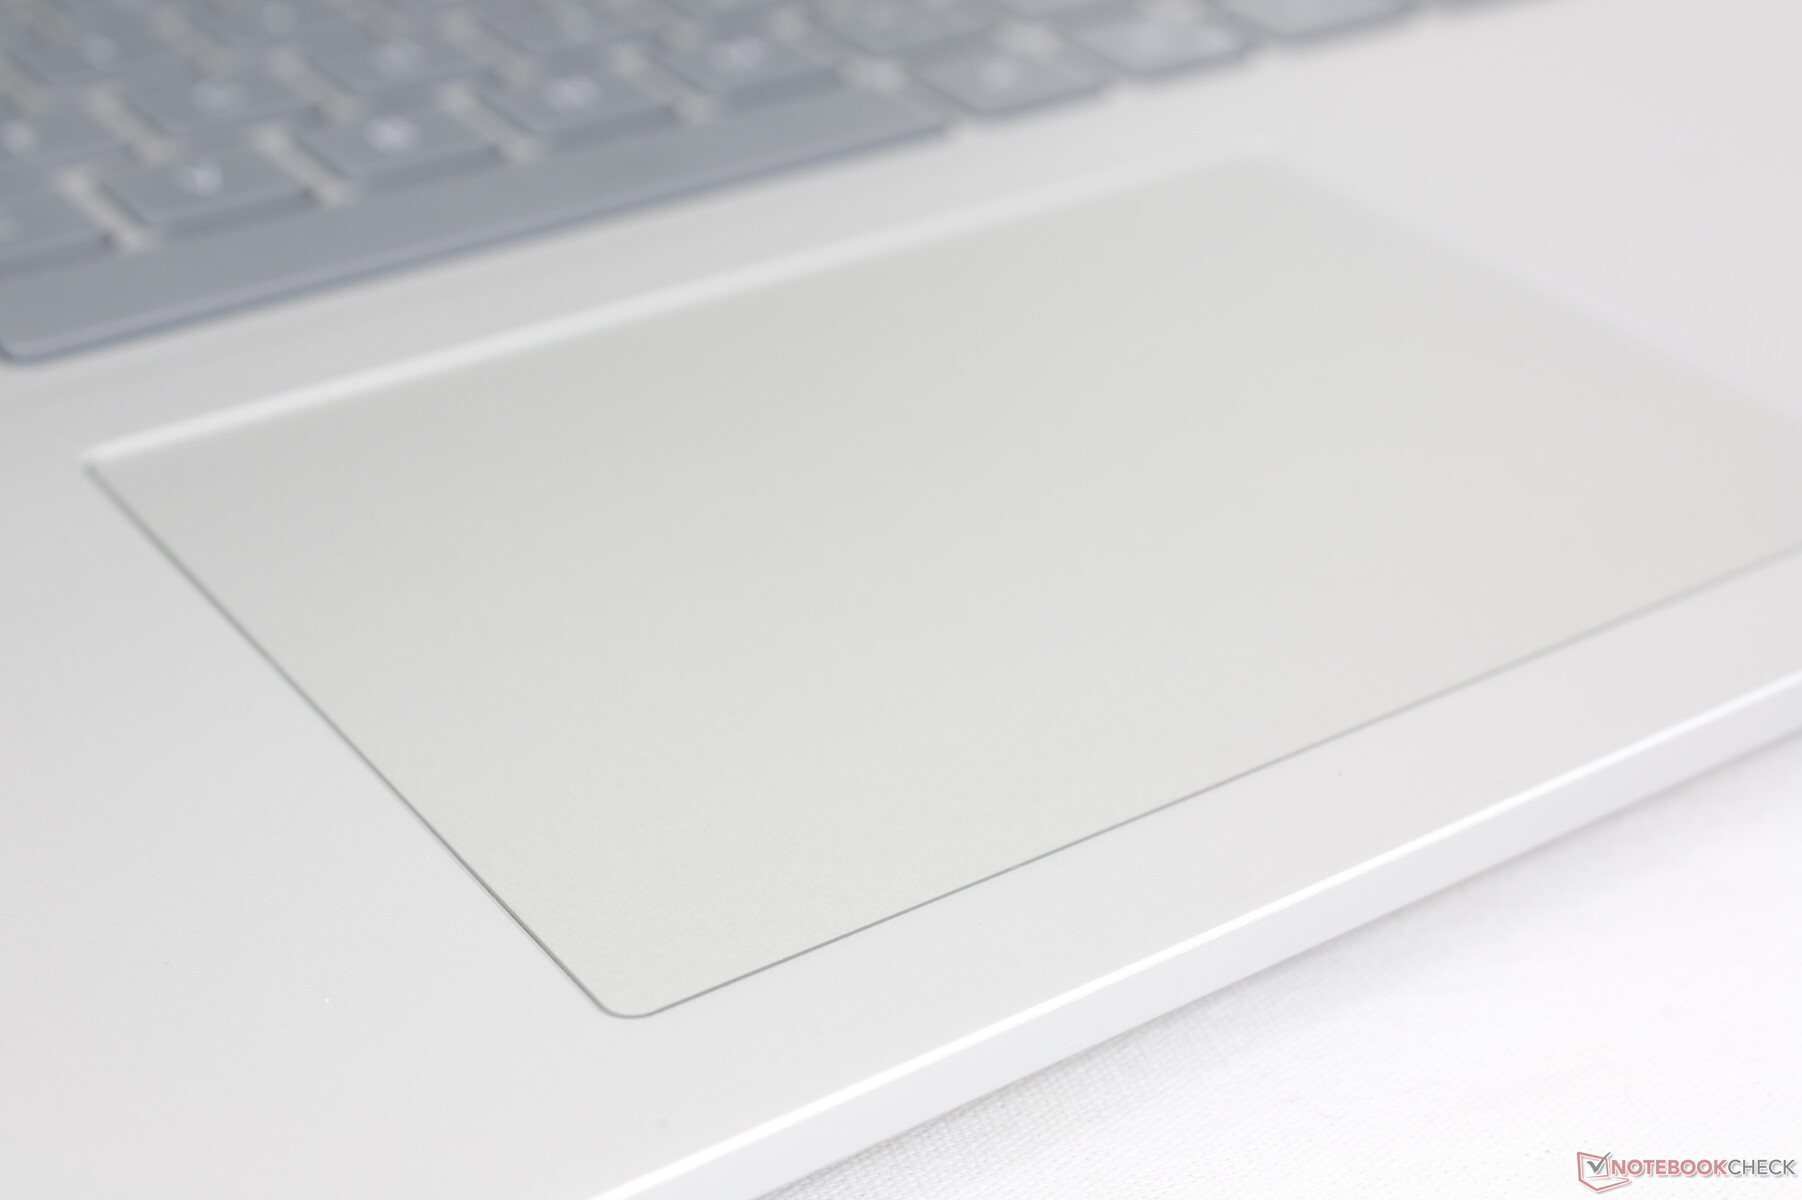
Touchpad
The clickpad is the same size as the one on last year's model (11.5 x 8 cm). Gliding is smooth with a bit of sticking at slower speeds for more accurate inputs. Feedback when pushing down on the clickpad is unfortunately on the squishy side despite the loud click.
Display — Decent But Limited Options
Display options have changed from the older Inspiron 16 Plus 7620. Gone is the 3K 3072 x 1920 panel in favor of these two new choices:
- 2560 x 1600 (2.5K), 120 Hz
- 1920 x 1200, 60 Hz
Both options are IPS and non-touch and neither support G-Sync. Our measurements below reflect only the bolded 1600p option.
When compared to last year's BOE 3K panel, the new LG Philips 2.5K panel has double the native refresh rate at the cost of a lower native resolution. The full sRGB coverage, 300-nit brightness, >1000:1 contrast ratio, and average response times are otherwise quite similar between them. Nonetheless, competing models like the Vivobook Pro 16X or Envy 16 each offer higher resolution options with even deeper colors that content creators might appreciate. Our LG Philips panel is more budget-conscious as a result.
| |||||||||||||||||||||||||
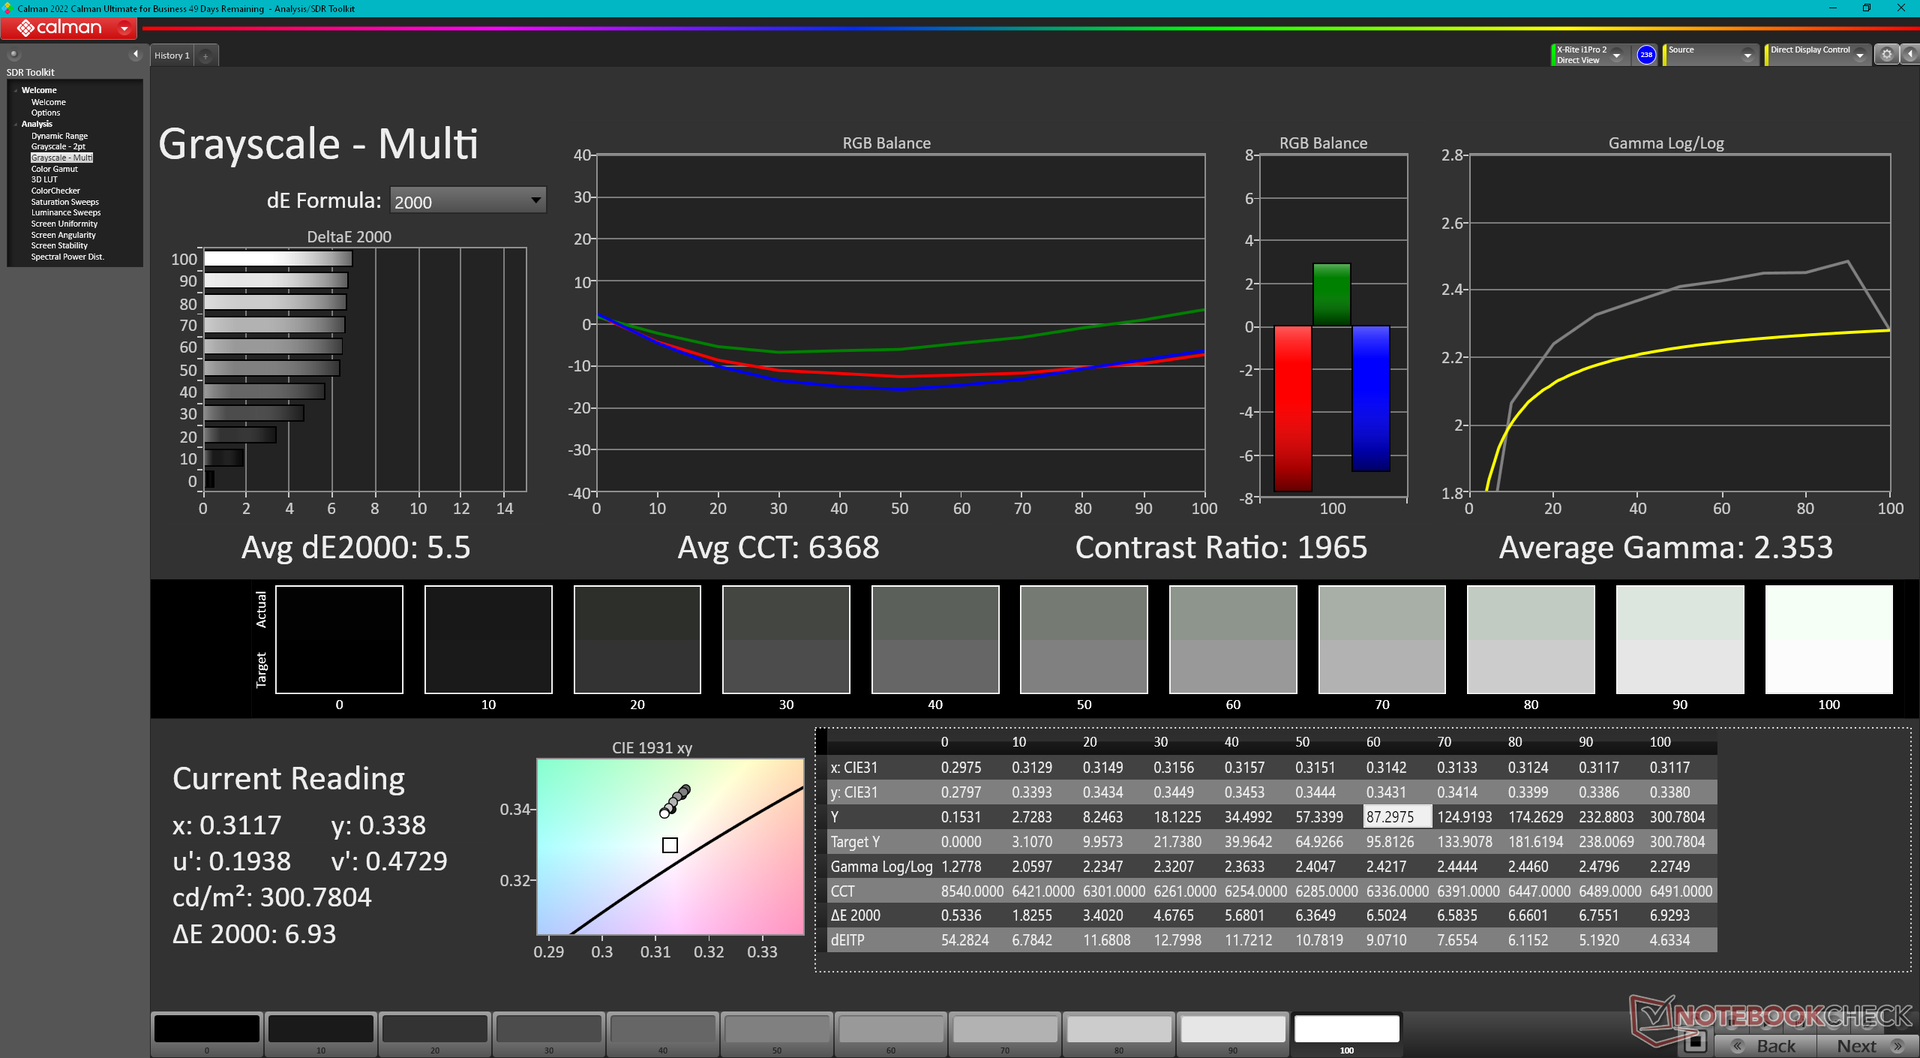
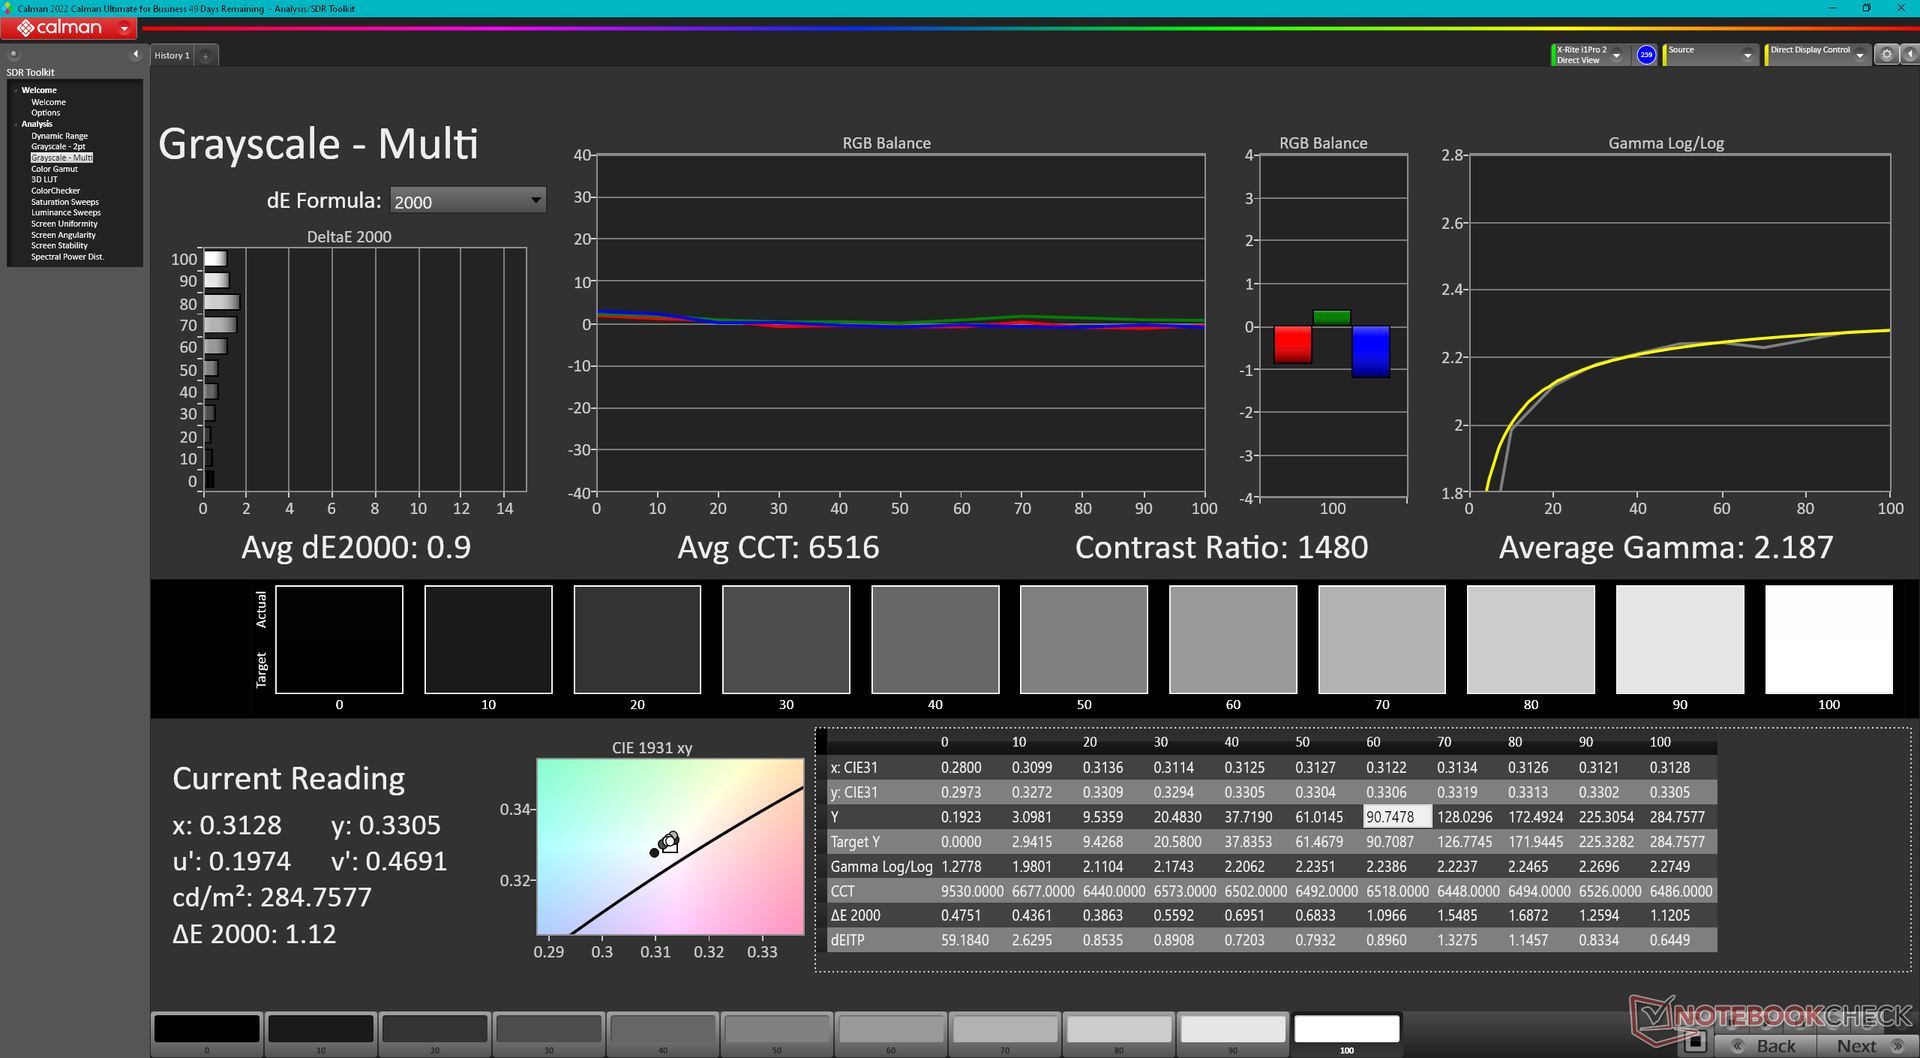
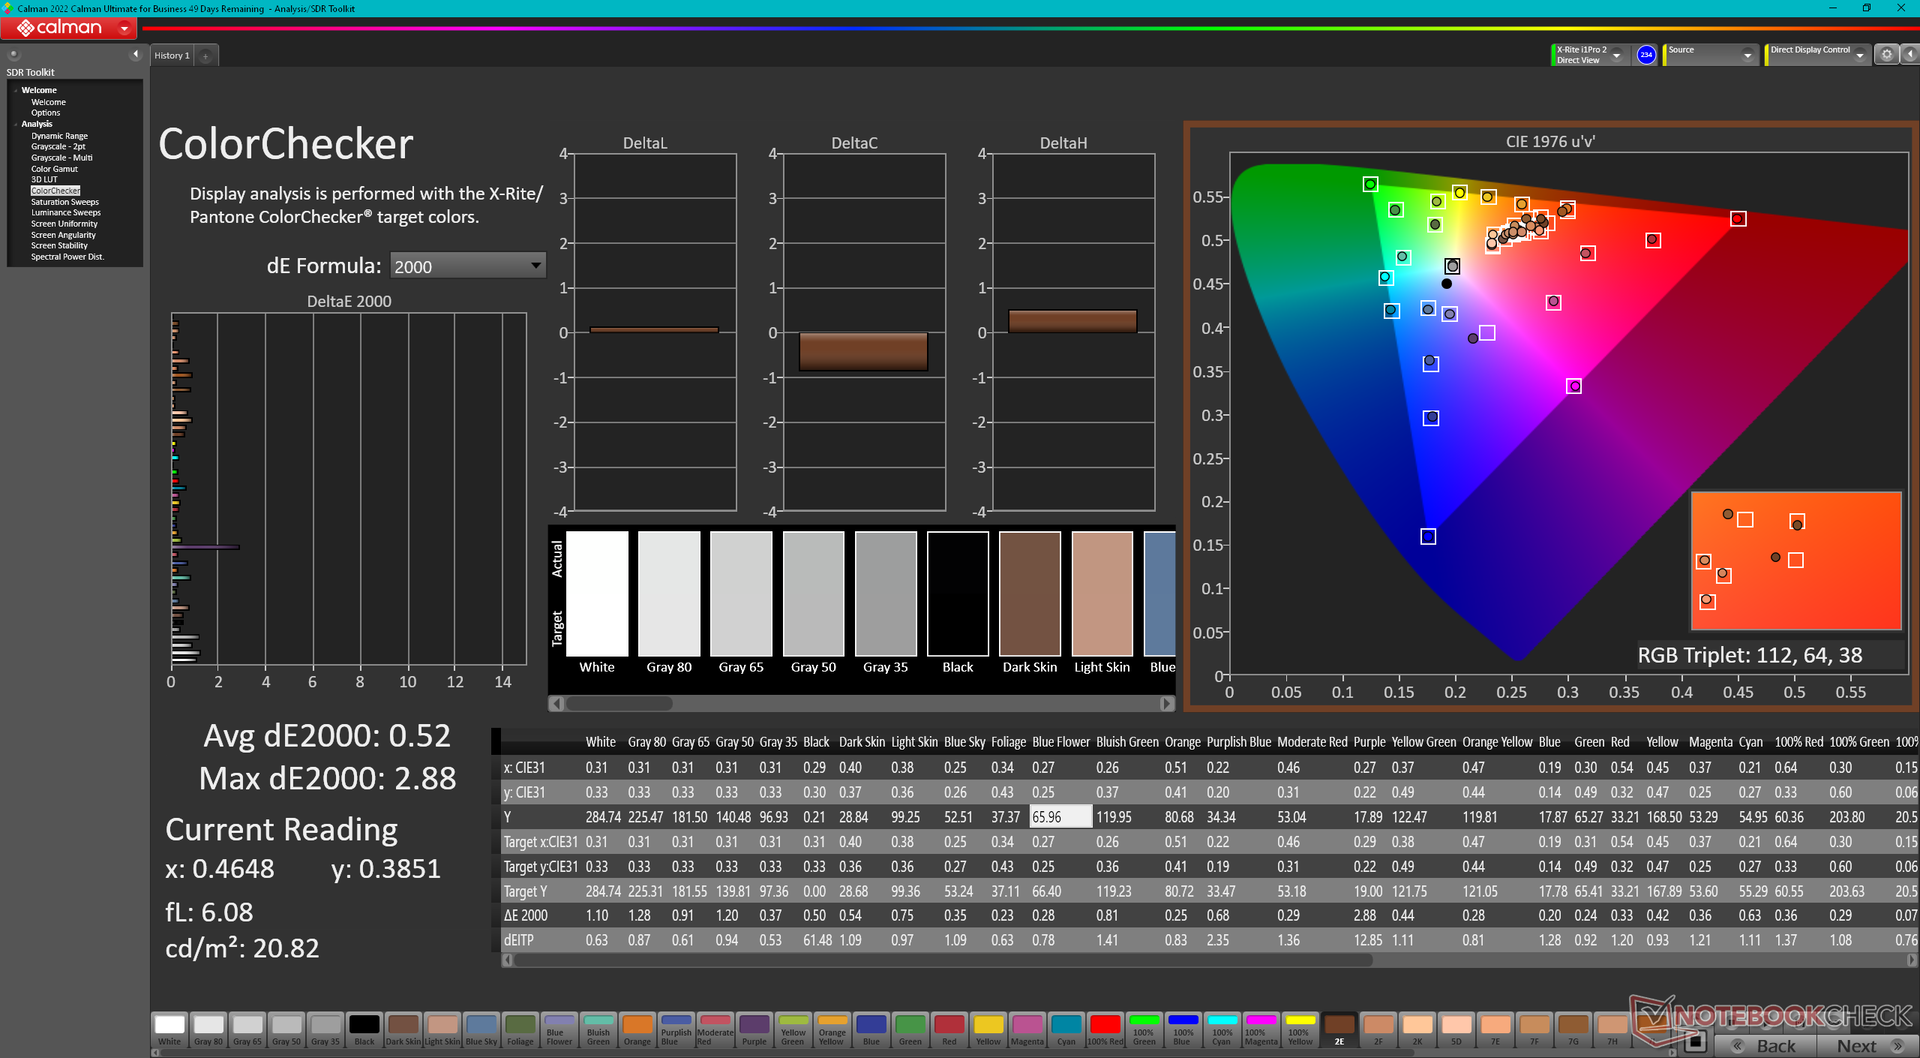
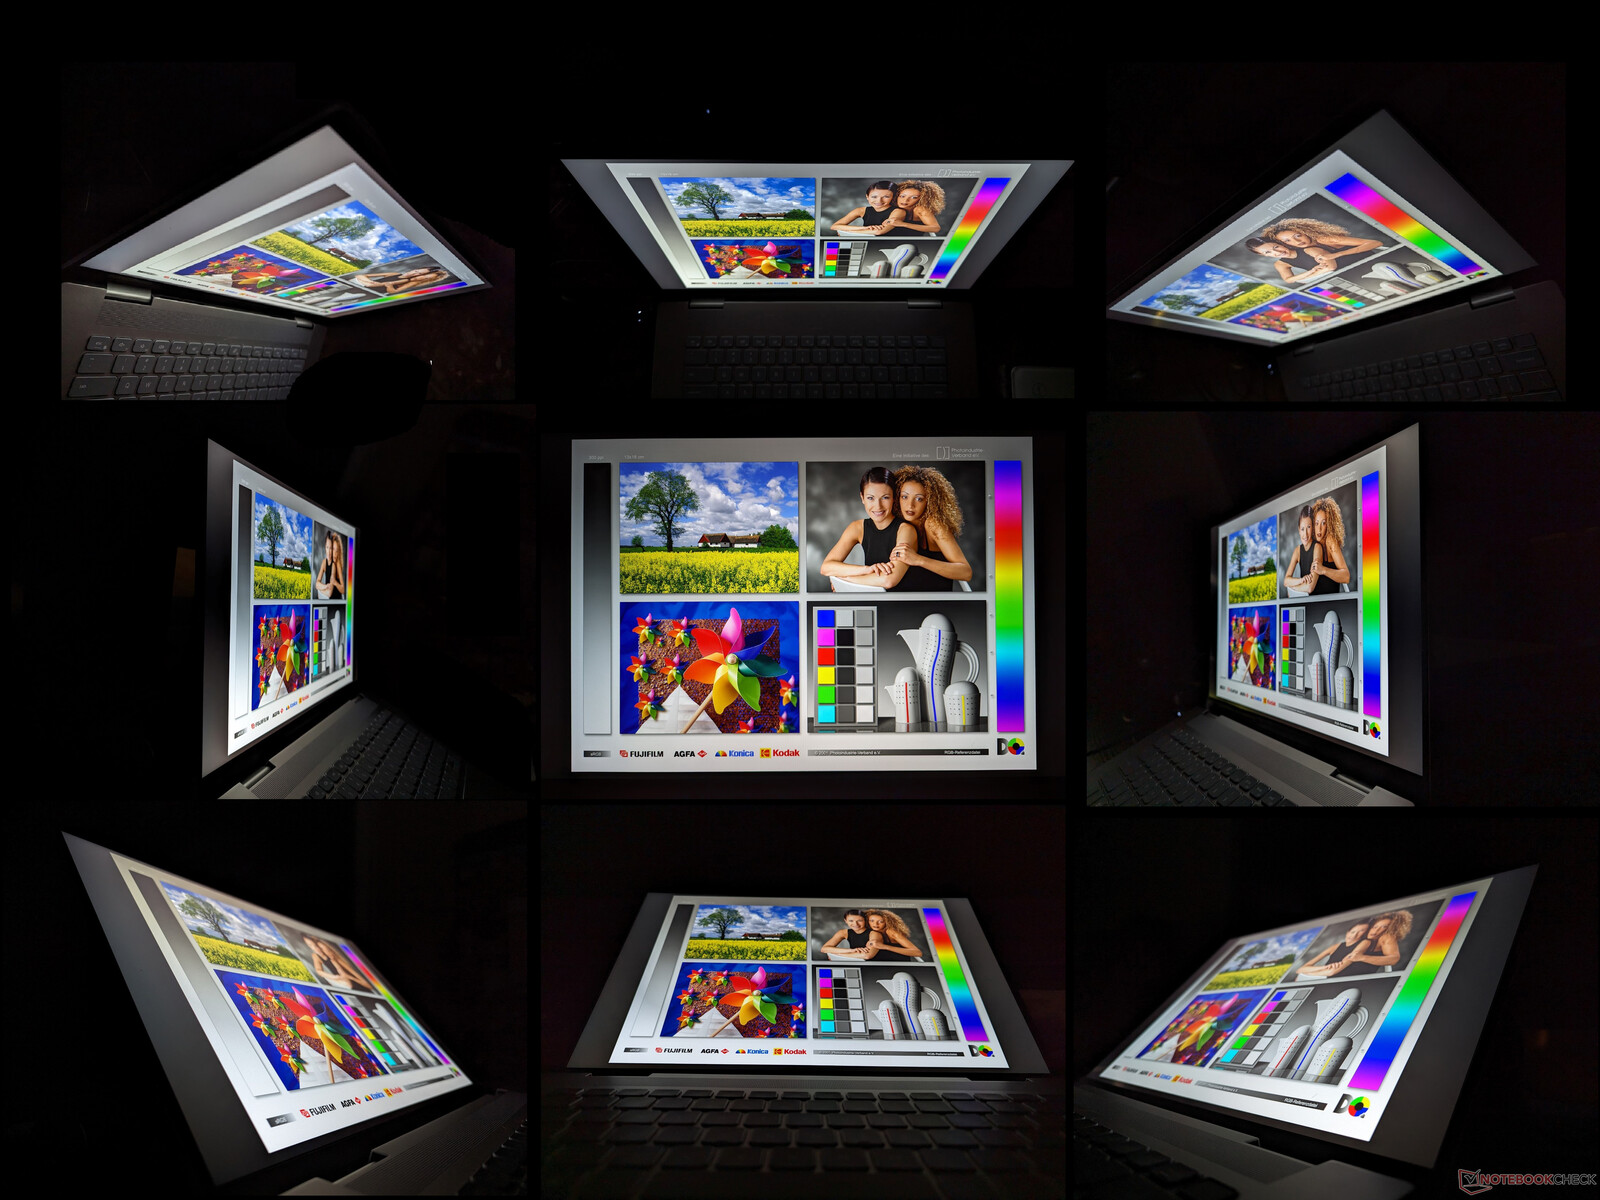
Brightness Distribution: 92 %
Center on Battery: 299.4 cd/m²
Contrast: 1426:1 (Black: 0.21 cd/m²)
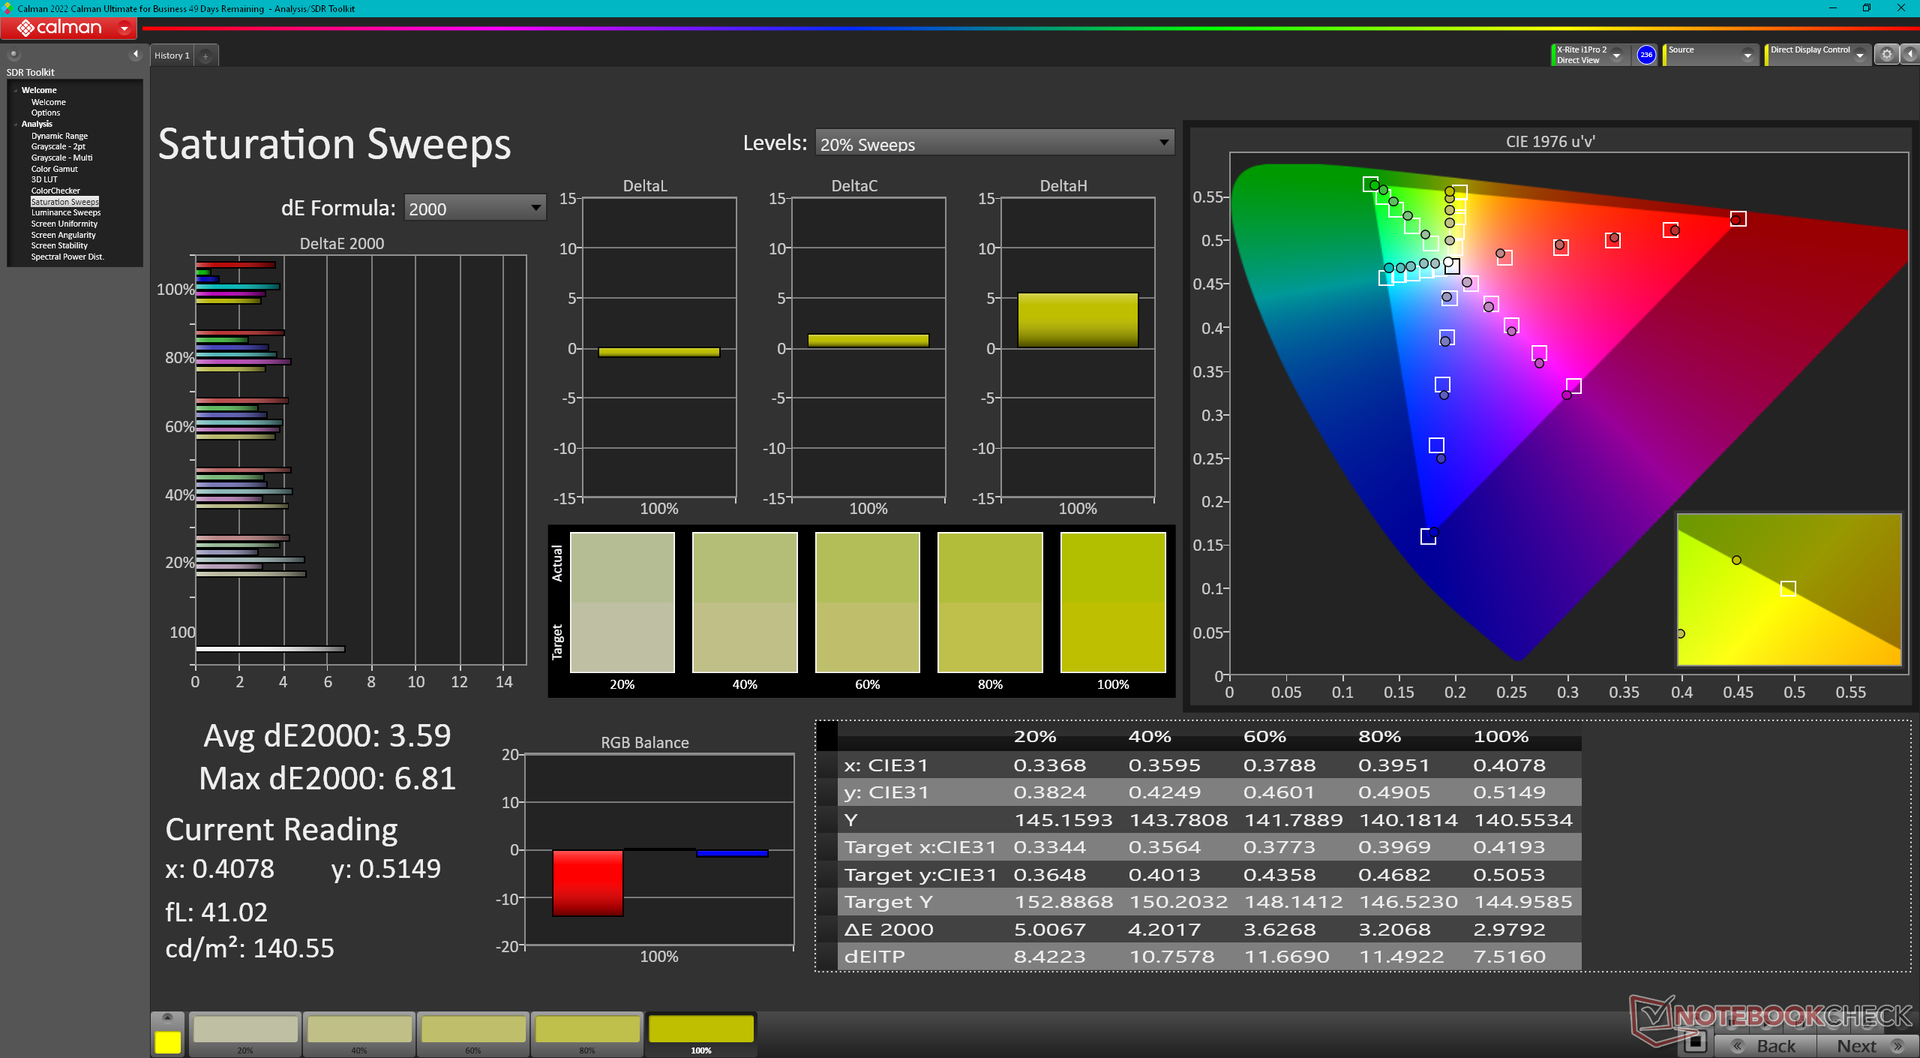
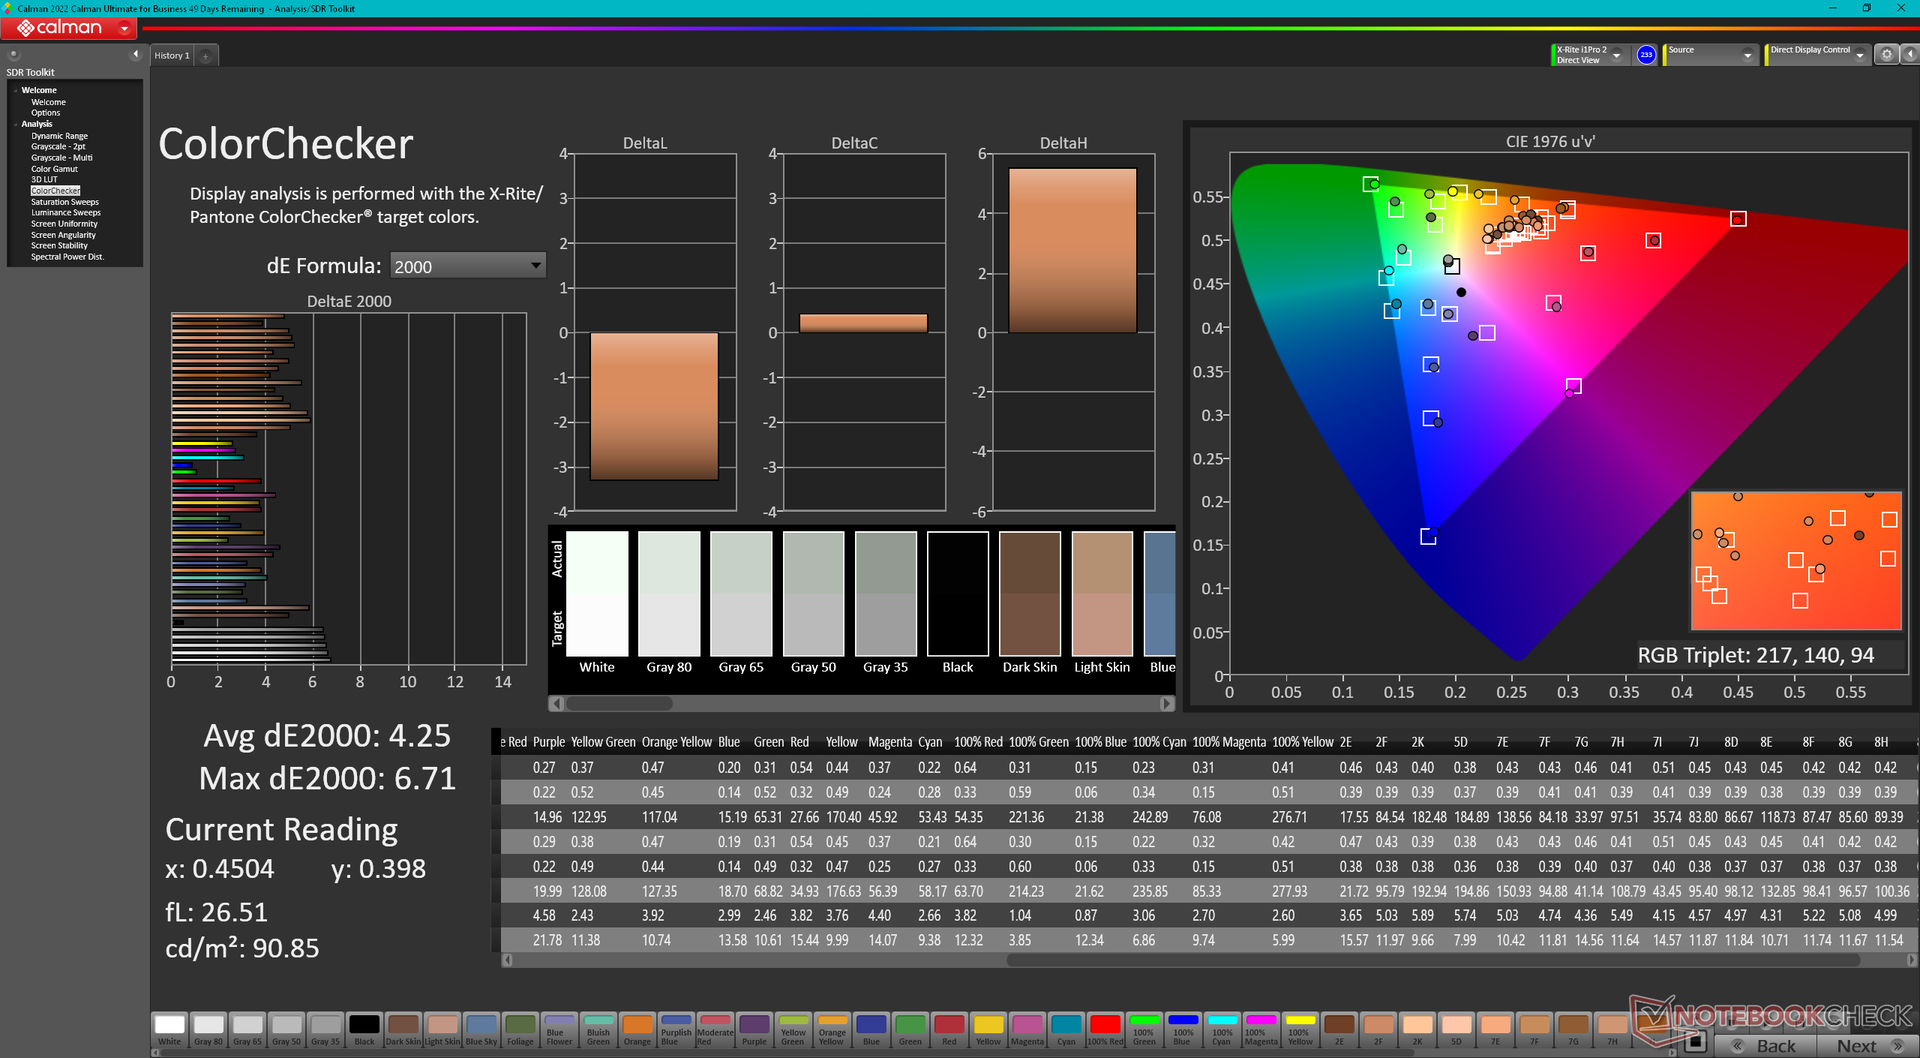
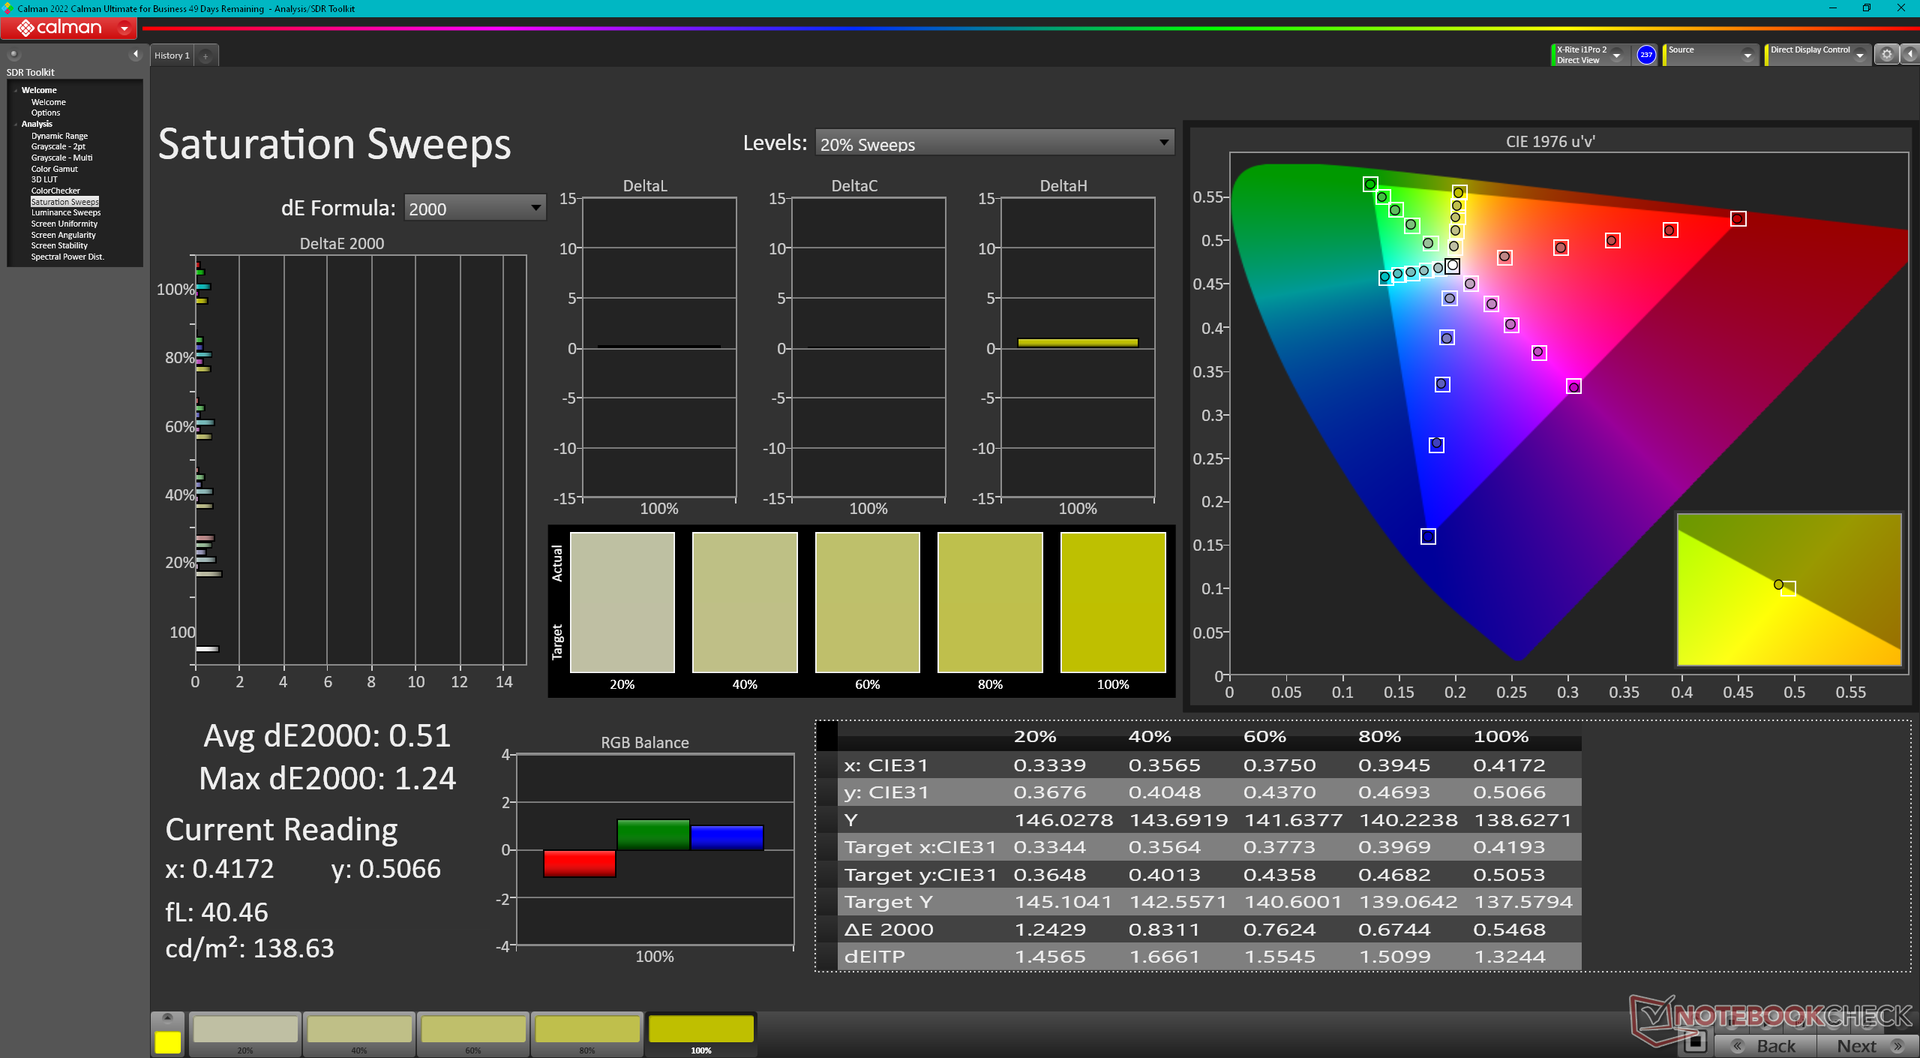
ΔE ColorChecker Calman: 4.25 | ∀{0.5-29.43 Ø4.71}
calibrated: 0.52
ΔE Greyscale Calman: 5.5 | ∀{0.09-98 Ø4.96}
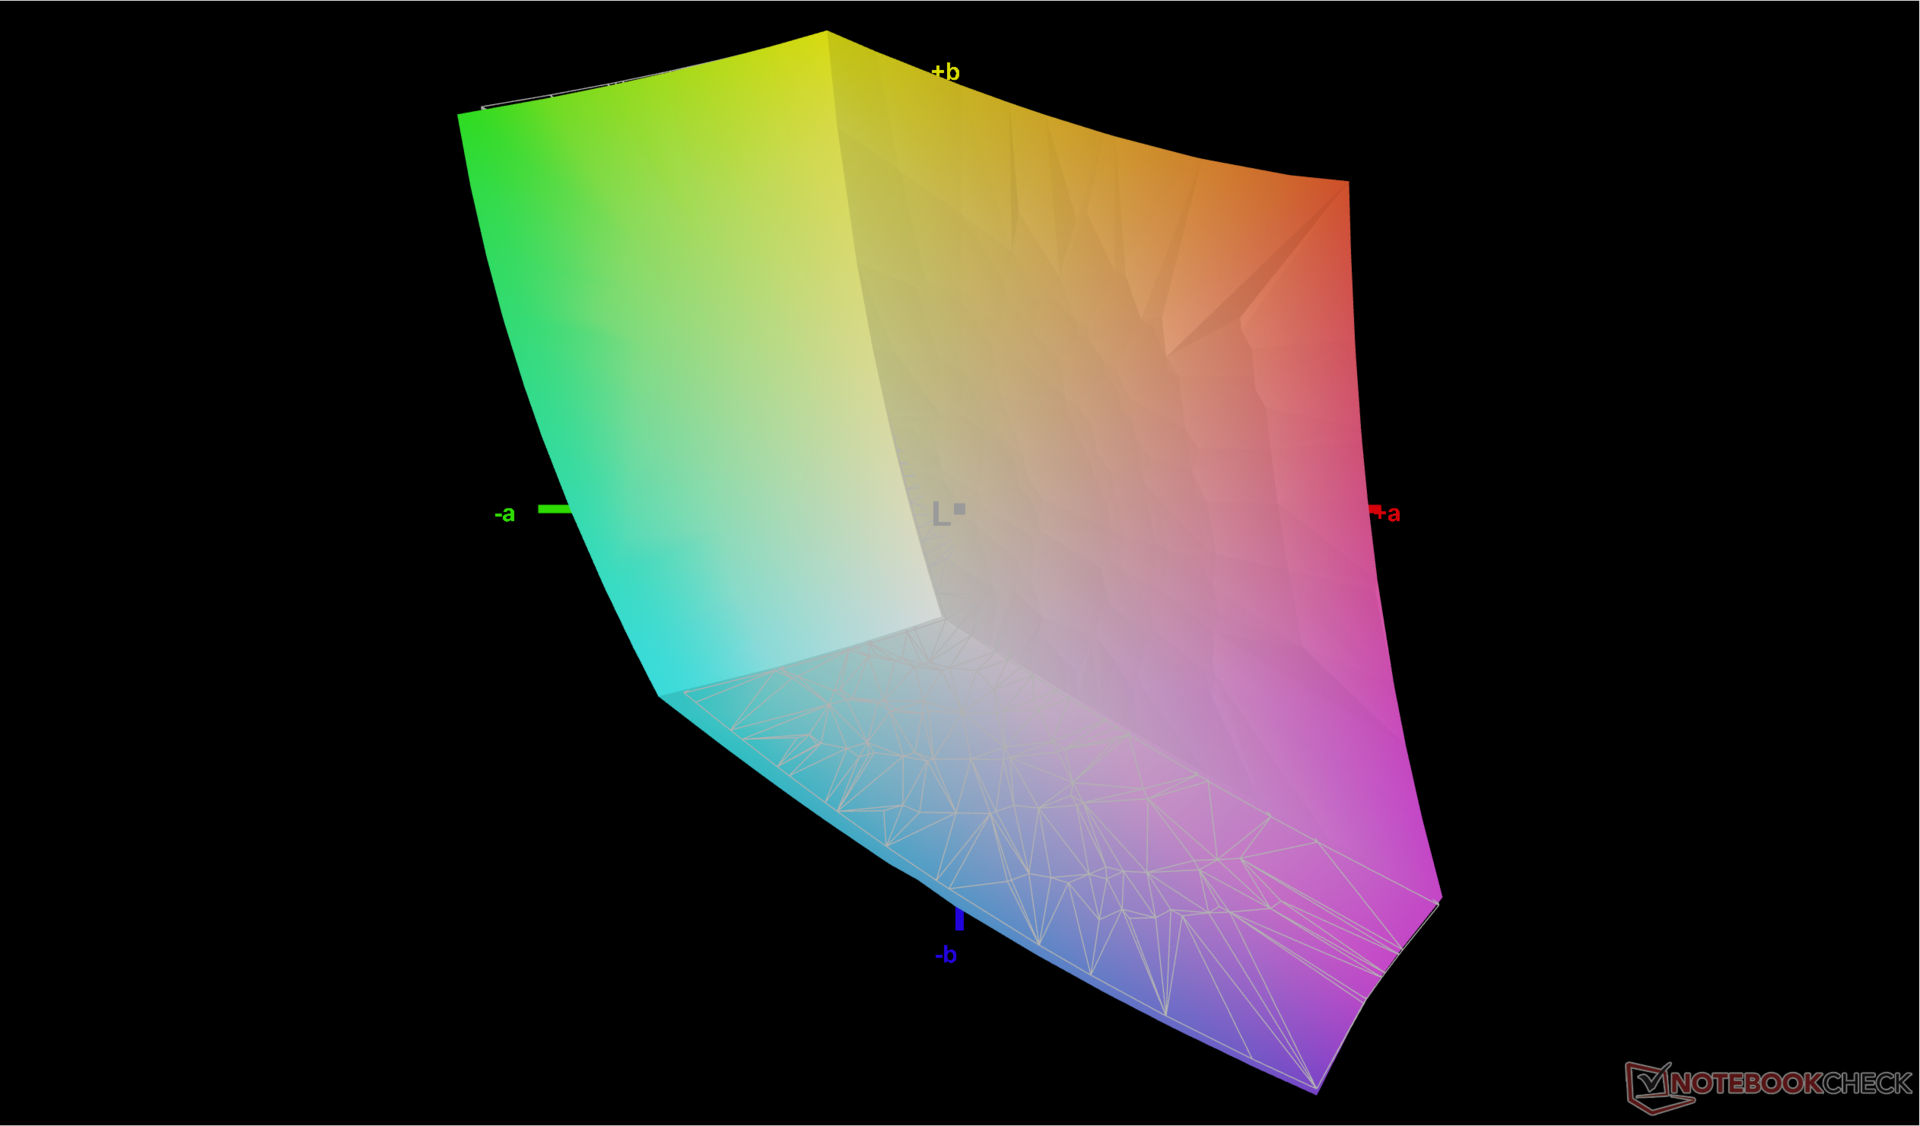
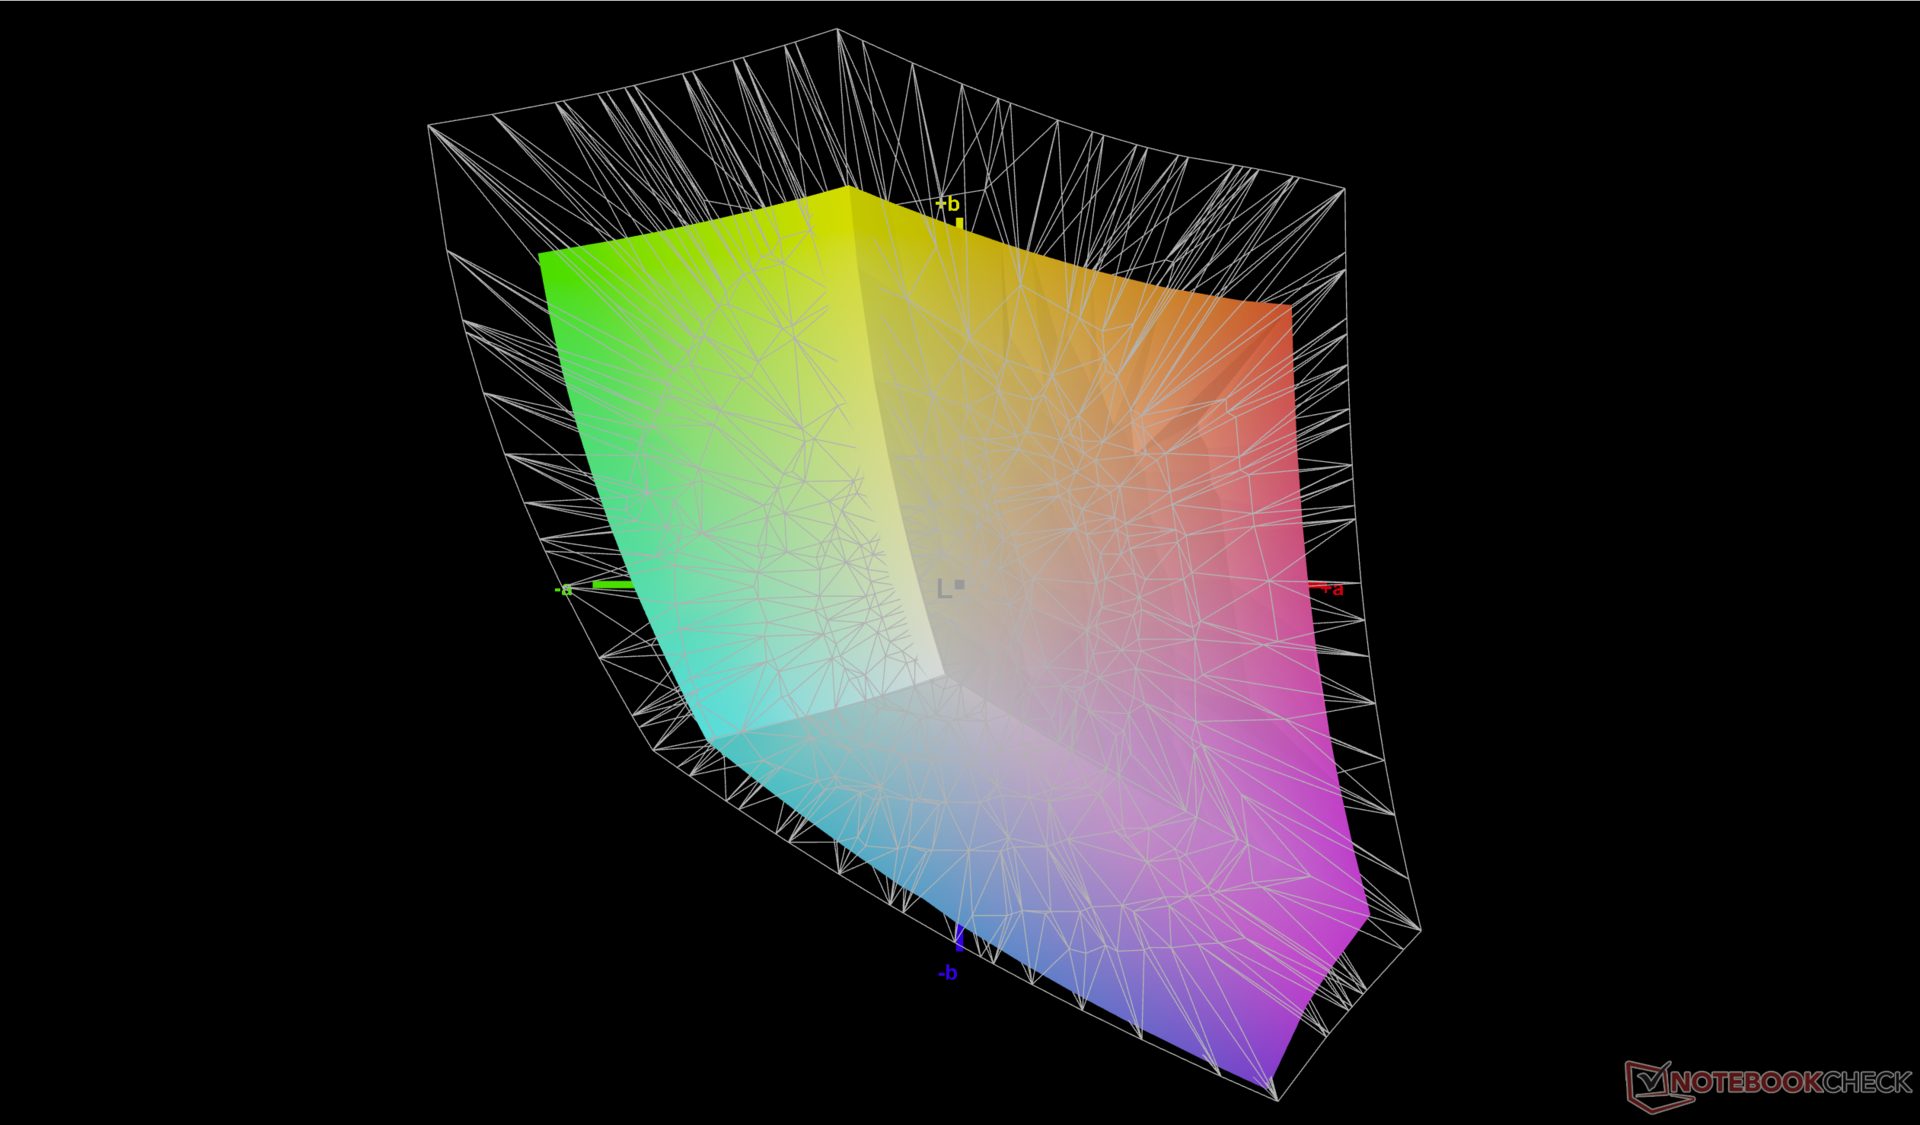
72.3% AdobeRGB 1998 (Argyll 3D)
99.6% sRGB (Argyll 3D)
70.1% Display P3 (Argyll 3D)
Gamma: 2.35
CCT: 6368 K
| Dell Inspiron 16 Plus 7630 LG Philips 160WQ2, IPS, 2560x1600, 16" | Dell Inspiron 16 Plus 7620 BOE NE16N41, IPS, 3072x1920, 16" | Lenovo Slim Pro 9i 16IRP8 LEN160-3.2K, Mini-LED, 3200x2000, 16" | Asus Vivobook Pro 16X K6604JV-MX016W Samsung SDC4178 ATNA60BX01-1, OLED, 3200x2000, 16" | HP Envy 16 h0112nr Samsung SDC4174, OLED, 3840x2400, 16" | MSI Summit E16 Flip A12UDT-031 AU Optronics B16QAN02.N, IPS, 2560x1600, 16" | |
|---|---|---|---|---|---|---|
| Display | 1% | 18% | 24% | 21% | 20% | |
| Display P3 Coverage (%) | 70.1 | 70.8 1% | 95.1 36% | 98.4 40% | 99.3 42% | 98.9 41% |
| sRGB Coverage (%) | 99.6 | 99.5 0% | 99.9 0% | 99.7 0% | 100 0% | 100 0% |
| AdobeRGB 1998 Coverage (%) | 72.3 | 73.2 1% | 84.6 17% | 95.8 33% | 88 22% | 86.5 20% |
| Response Times | -13% | 61% | 95% | 93% | 63% | |
| Response Time Grey 50% / Grey 80% * (ms) | 35 ? | 38 ? -9% | 14 ? 60% | 1.6 ? 95% | 2 ? 94% | 13 ? 63% |
| Response Time Black / White * (ms) | 24.2 ? | 28 ? -16% | 9.2 ? 62% | 1.4 ? 94% | 1.9 ? 92% | 9 ? 63% |
| PWM Frequency (Hz) | 5784 ? | 120 ? | 240.4 ? | |||
| Screen | 14% | -55% | 35% | 30% | -5% | |
| Brightness middle (cd/m²) | 299.4 | 288.9 -4% | 627.4 110% | 347 16% | 328.8 10% | 314 5% |
| Brightness (cd/m²) | 290 | 276 -5% | 618 113% | 346 19% | 332 14% | 294 1% |
| Brightness Distribution (%) | 92 | 92 0% | 95 3% | 97 5% | 97 5% | 89 -3% |
| Black Level * (cd/m²) | 0.21 | 0.26 -24% | 0.19 10% | 0.06 71% | 0.28 -33% | |
| Contrast (:1) | 1426 | 1111 -22% | 3302 132% | 5783 306% | 1121 -21% | |
| Colorchecker dE 2000 * | 4.25 | 1.88 56% | 5.84 -37% | 1.89 56% | 1.53 64% | 3.08 28% |
| Colorchecker dE 2000 max. * | 6.71 | 4.37 35% | 10.22 -52% | 3.26 51% | 6.04 10% | 5.49 18% |
| Colorchecker dE 2000 calibrated * | 0.52 | 0.42 19% | 4.45 -756% | 1.97 -279% | 0.88 -69% | |
| Greyscale dE 2000 * | 5.5 | 1.4 75% | 6.7 -22% | 1.55 72% | 1.3 76% | 3.99 27% |
| Gamma | 2.35 94% | 2.3 96% | 2.77 79% | 2.39 92% | 2.18 101% | 2.3 96% |
| CCT | 6368 102% | 6634 98% | 5795 112% | 6458 101% | 6362 102% | 6219 105% |
| Total Average (Program / Settings) | 1% /
8% | 8% /
-23% | 51% /
41% | 48% /
39% | 26% /
10% |
* ... smaller is better
The display does not come pre-calibrated with average grayscale and color deltaE values of 5.5 and 4.25, respectively. Color temperature is also warmer than usual at 6368. A proper calibration with our X-Rite colorimeter would address all these issues for a noticeably more accurate display as shown by our CalMAN results below. Our calibrated ICM profile is available to download for free if owners don't have their own calibration tools.
Display Response Times
| ↔ Response Time Black to White | ||
|---|---|---|
| 24.2 ms ... rise ↗ and fall ↘ combined | ↗ 10.8 ms rise | 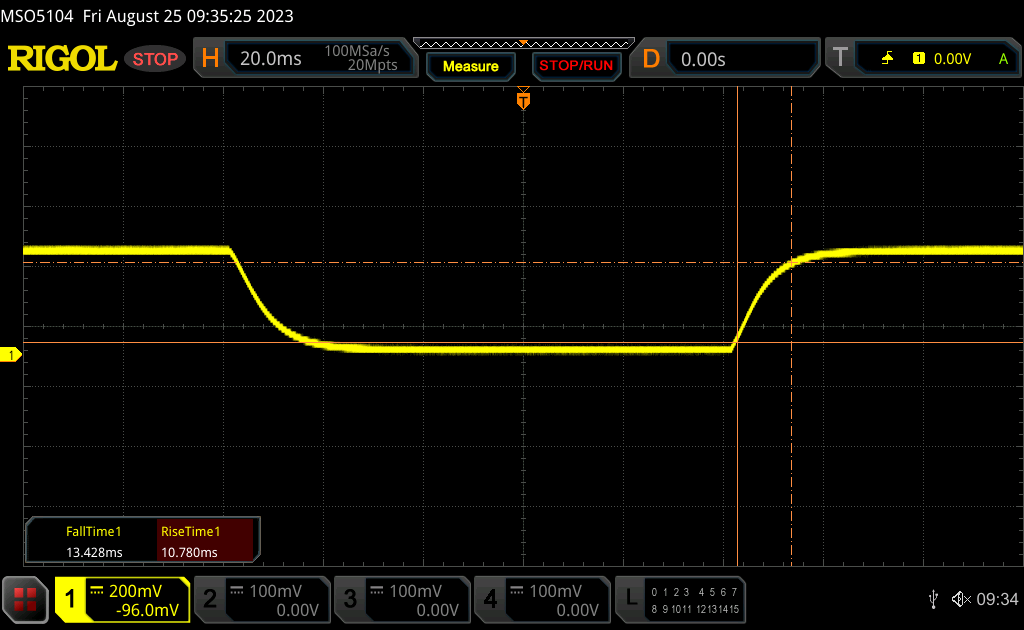 |
| ↘ 13.4 ms fall | ||
| The screen shows good response rates in our tests, but may be too slow for competitive gamers. In comparison, all tested devices range from 0.1 (minimum) to 240 (maximum) ms. » 57 % of all devices are better. This means that the measured response time is worse than the average of all tested devices (19.8 ms). | ||
| ↔ Response Time 50% Grey to 80% Grey | ||
| 35 ms ... rise ↗ and fall ↘ combined | ↗ 15.7 ms rise | 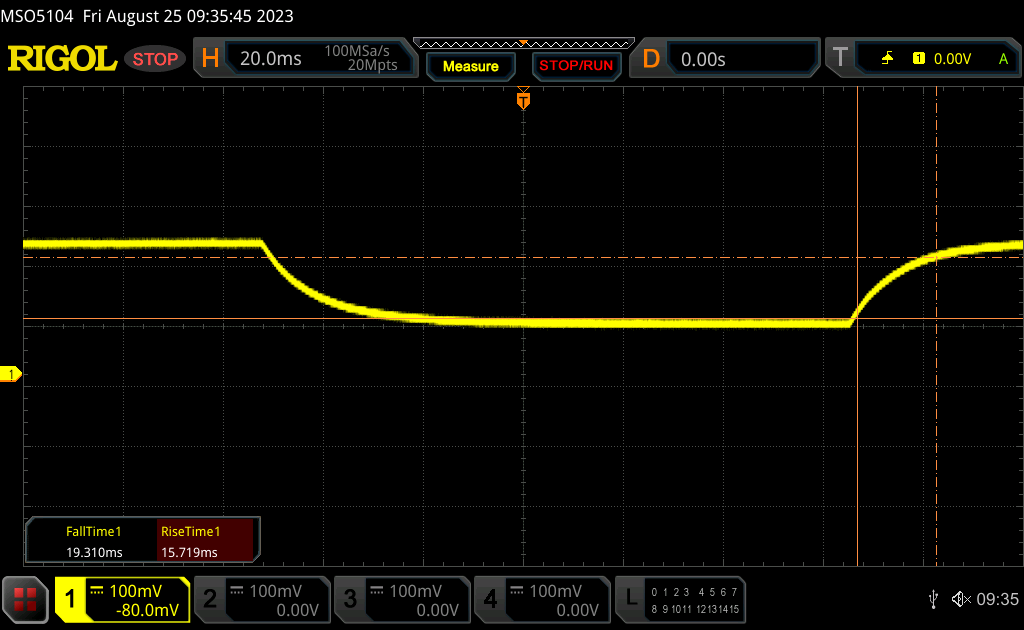 |
| ↘ 19.3 ms fall | ||
| The screen shows slow response rates in our tests and will be unsatisfactory for gamers. In comparison, all tested devices range from 0.165 (minimum) to 636 (maximum) ms. » 49 % of all devices are better. This means that the measured response time is worse than the average of all tested devices (31 ms). | ||
Screen Flickering / PWM (Pulse-Width Modulation)
| Screen flickering / PWM not detected | 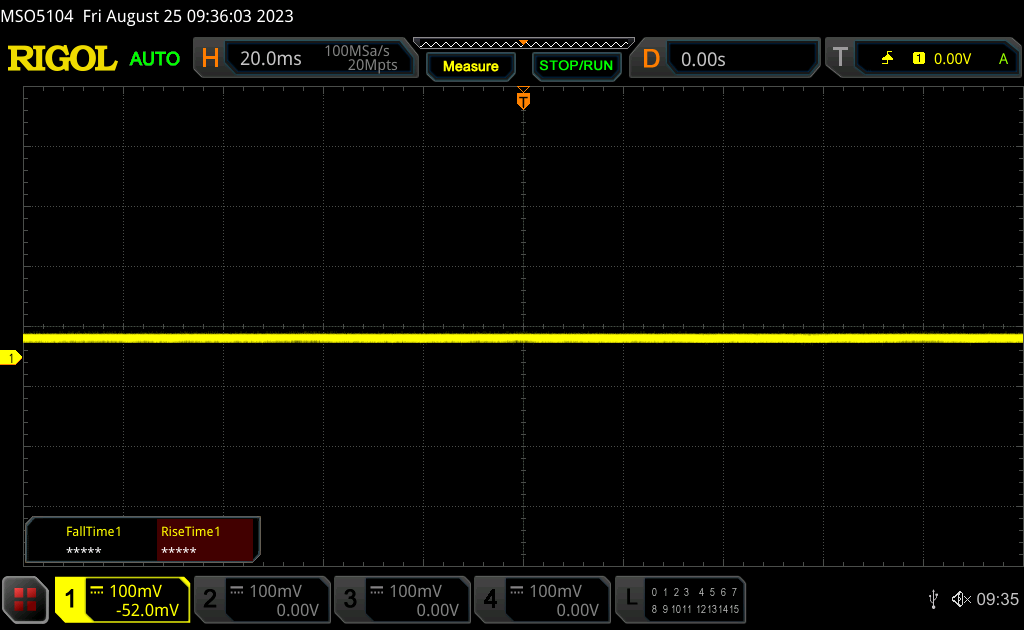 | ||
In comparison: 52 % of all tested devices do not use PWM to dim the display. If PWM was detected, an average of 7754 (minimum: 5 - maximum: 343500) Hz was measured. | |||
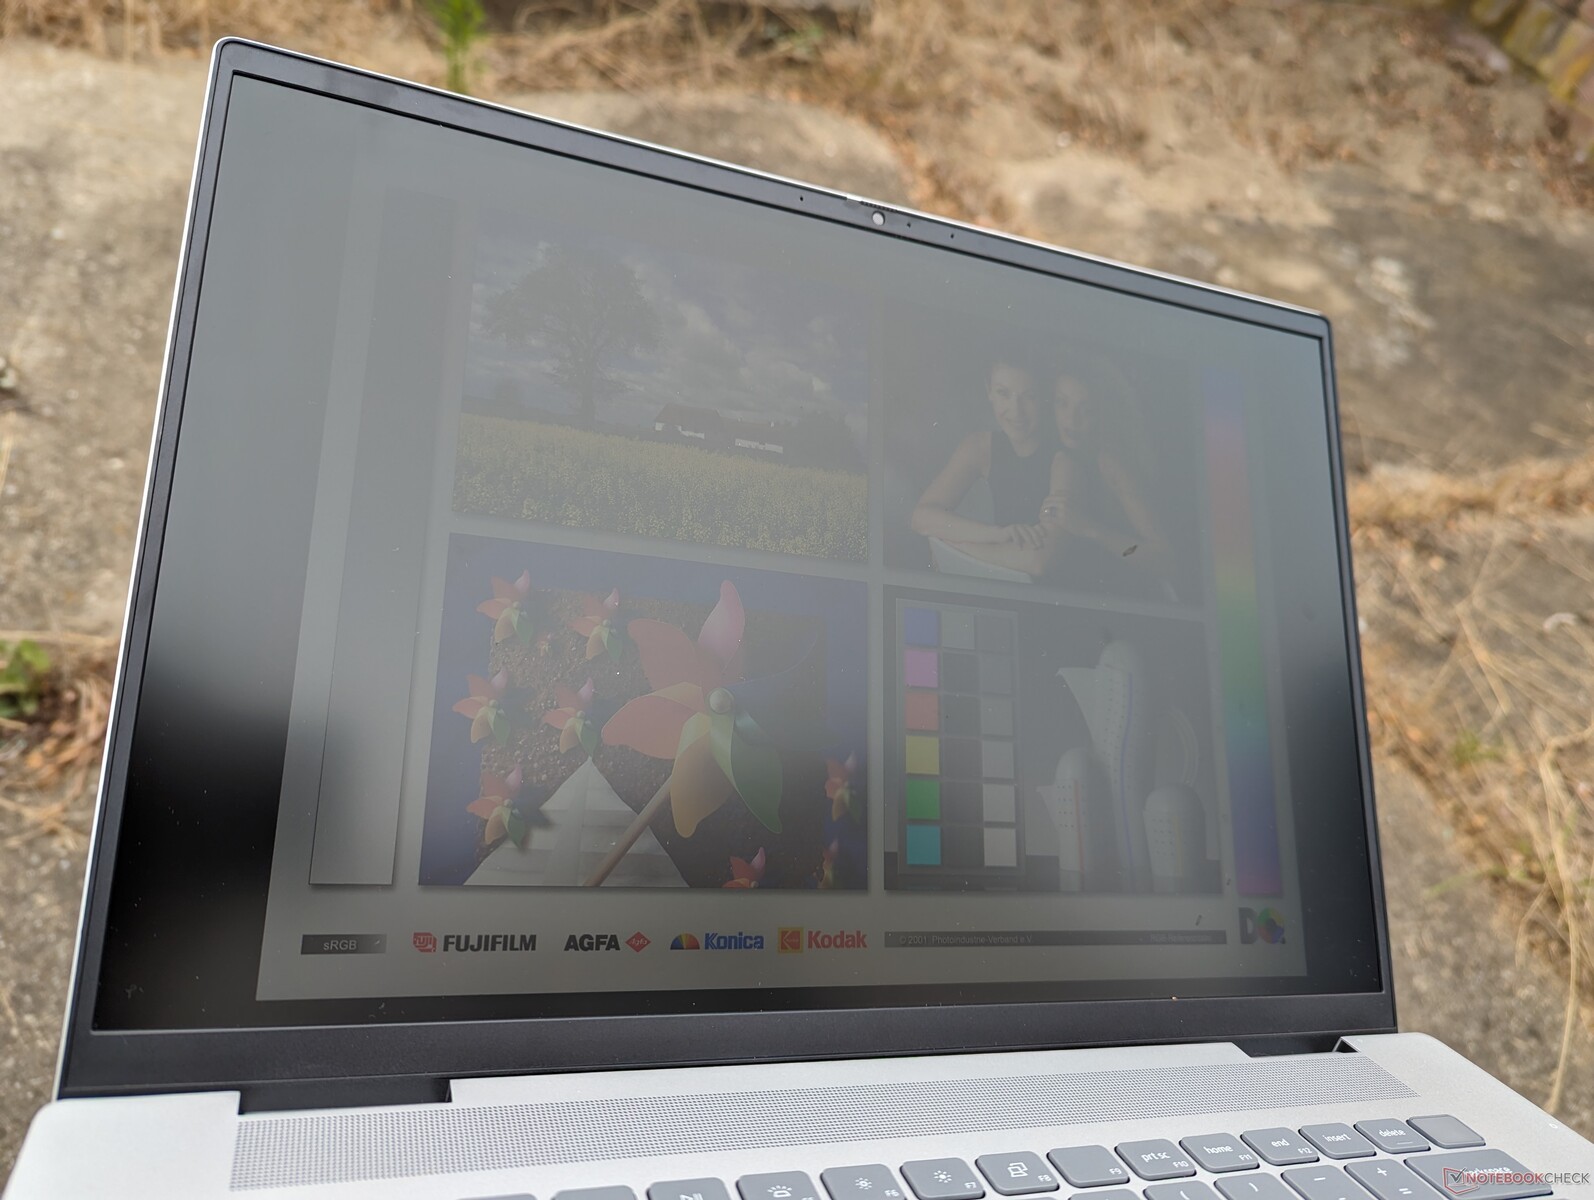
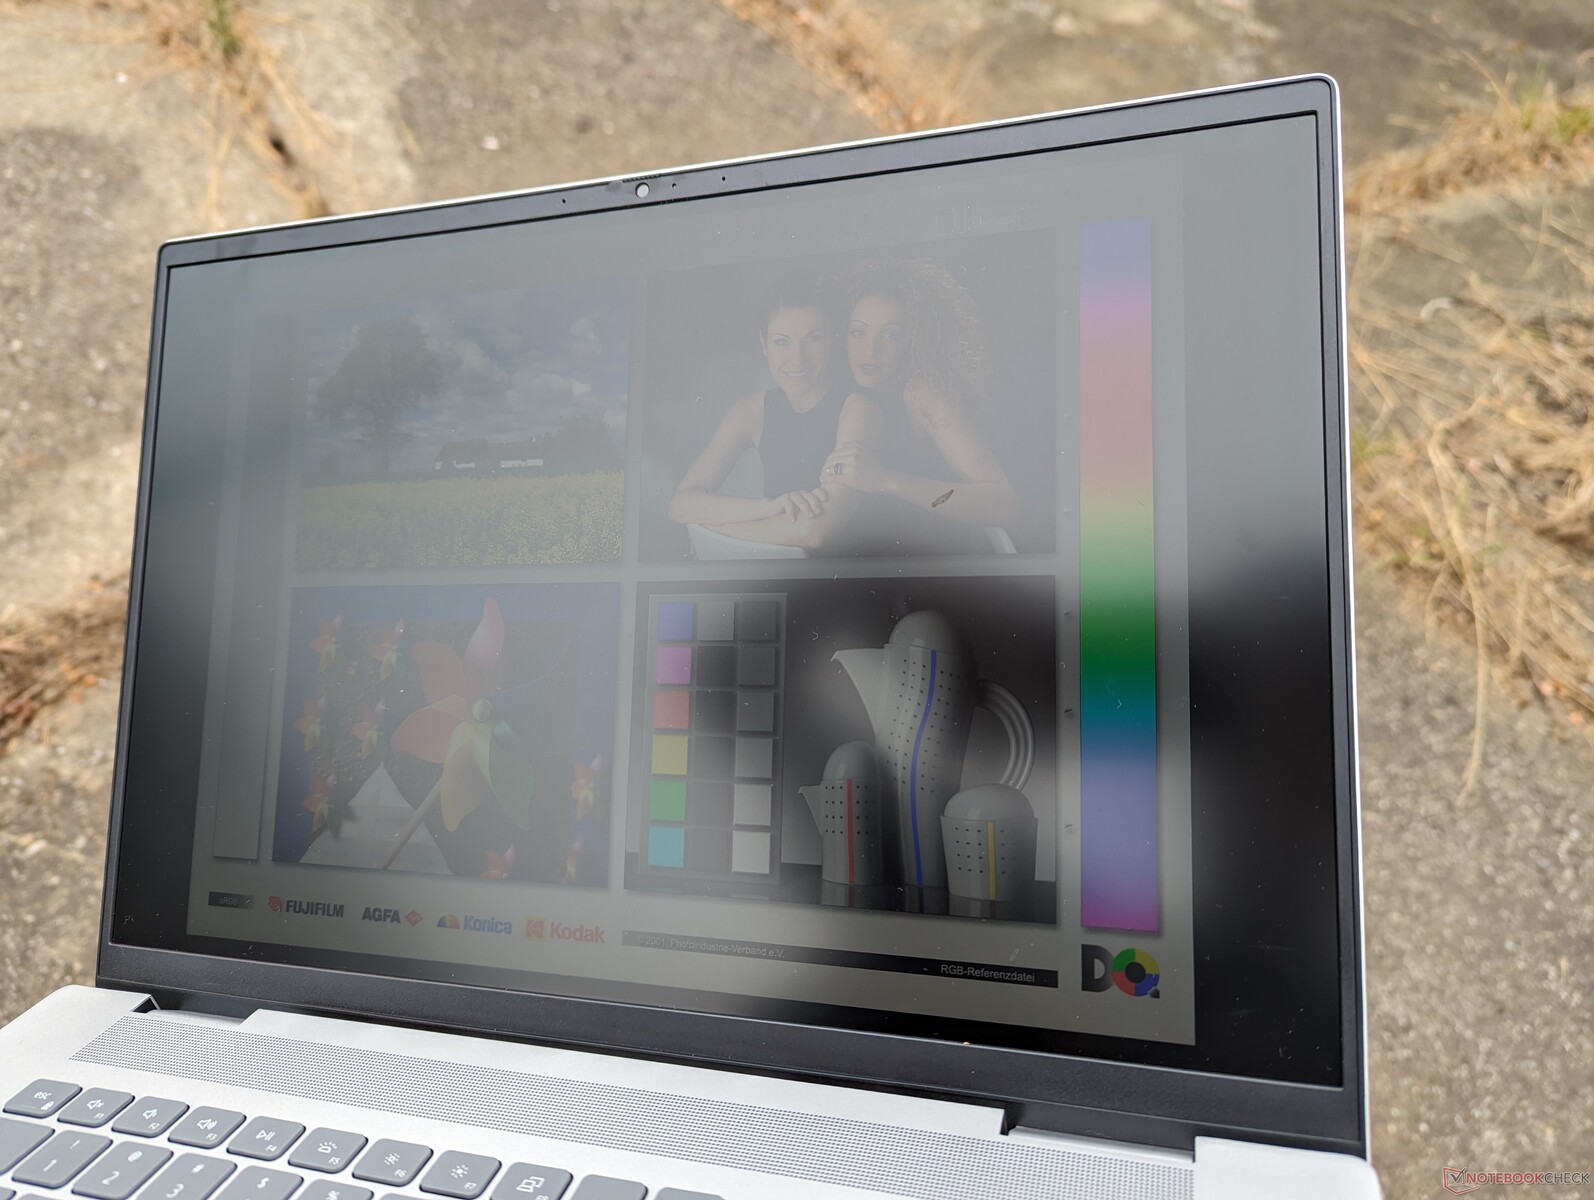
Outdoor visibility is comparable to last year's model and decent only when under shade to minimize glare. Other 16-inch laptops with mini-LED or OLED like the Yoga 9i 16 or Razer Blade 16 tend to be brighter for improved outdoor viewability, but they are also much more expensive than our Dell.
Performance — Intel 13th Gen Raptor Lake-H
Testing Conditions
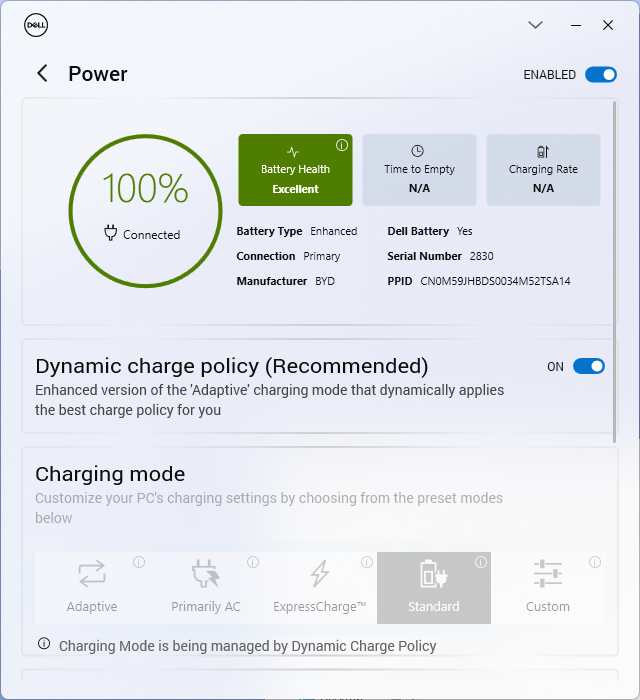
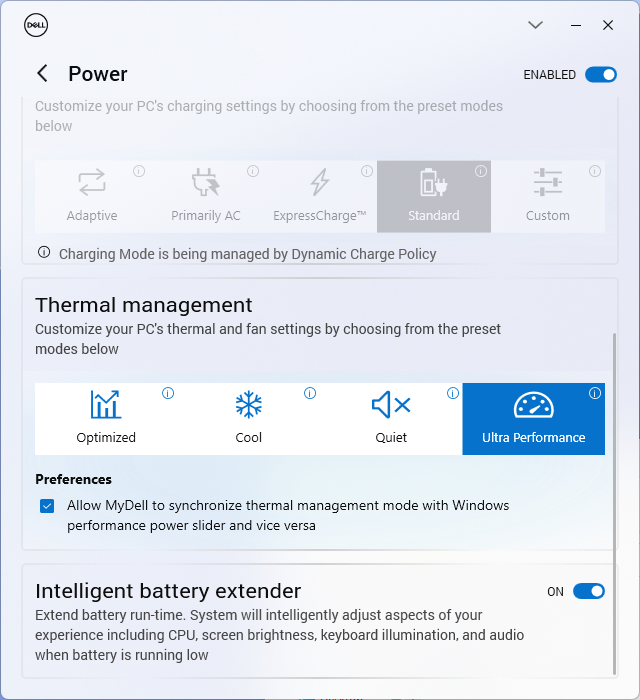
We set our unit to Performance mode via the pre-installed MyDell software prior to running the benchmarks below. The MyDell power profiles can sync with the Windows power profiles to reduce confusion and avoid conflicting settings.
The Inspiron does not support Advanced Optimus or MUX which are instead common features on dedicated gaming models from the Dell G series or Alienware series.
Processor
CPU performance from our 13th gen Core i7-13700H is only up to 10 percent faster than the 12th gen Core i7-12700H in last year's Inspiron 16 Plus 7620. Once their respective Turbo Boost benefits diminish, however, their performance differences become even narrower as shown by our CineBench R15 xT loop results below. In other words, the Inspiron 16 Plus 7630 is only marginally faster than last year's model at best when it comes to processor performance.
Downgrading to the Core i5-13500H configuration is expected to impact processor performance only by about 10 percent based on our experience with the Asus VivoBook 14X. Meanwhile, the AMD-based Ryzen 7 7840HS configuration is expected to perform neck-to-neck with our Core i7-13700H.
Cinebench R15 Multi Loop
Cinebench R23: Multi Core | Single Core
Cinebench R20: CPU (Multi Core) | CPU (Single Core)
Cinebench R15: CPU Multi 64Bit | CPU Single 64Bit
Blender: v2.79 BMW27 CPU
7-Zip 18.03: 7z b 4 | 7z b 4 -mmt1
Geekbench 5.5: Multi-Core | Single-Core
HWBOT x265 Benchmark v2.2: 4k Preset
LibreOffice : 20 Documents To PDF
R Benchmark 2.5: Overall mean
* ... smaller is better
AIDA64: FP32 Ray-Trace | FPU Julia | CPU SHA3 | CPU Queen | FPU SinJulia | FPU Mandel | CPU AES | CPU ZLib | FP64 Ray-Trace | CPU PhotoWorxx
| Performance rating | |
| Asus Vivobook Pro 16X K6604JV-MX016W | |
| Lenovo Slim Pro 9i 16IRP8 | |
| Average Intel Core i7-13700H | |
| Dell Inspiron 16 Plus 7630 | |
| MSI Summit E16 Flip A12UDT-031 | |
| HP Envy 16 h0112nr | |
| Dell Inspiron 16 Plus 7620 | |
| AIDA64 / FP32 Ray-Trace | |
| Asus Vivobook Pro 16X K6604JV-MX016W | |
| Lenovo Slim Pro 9i 16IRP8 | |
| Average Intel Core i7-13700H (4986 - 18908, n=29) | |
| Dell Inspiron 16 Plus 7630 | |
| MSI Summit E16 Flip A12UDT-031 | |
| Dell Inspiron 16 Plus 7620 | |
| HP Envy 16 h0112nr | |
| AIDA64 / FPU Julia | |
| Asus Vivobook Pro 16X K6604JV-MX016W | |
| Lenovo Slim Pro 9i 16IRP8 | |
| Average Intel Core i7-13700H (25360 - 92359, n=29) | |
| Dell Inspiron 16 Plus 7630 | |
| MSI Summit E16 Flip A12UDT-031 | |
| Dell Inspiron 16 Plus 7620 | |
| HP Envy 16 h0112nr | |
| AIDA64 / CPU SHA3 | |
| Asus Vivobook Pro 16X K6604JV-MX016W | |
| Lenovo Slim Pro 9i 16IRP8 | |
| Average Intel Core i7-13700H (1339 - 4224, n=29) | |
| Dell Inspiron 16 Plus 7630 | |
| MSI Summit E16 Flip A12UDT-031 | |
| Dell Inspiron 16 Plus 7620 | |
| HP Envy 16 h0112nr | |
| AIDA64 / CPU Queen | |
| Asus Vivobook Pro 16X K6604JV-MX016W | |
| Lenovo Slim Pro 9i 16IRP8 | |
| Dell Inspiron 16 Plus 7630 | |
| HP Envy 16 h0112nr | |
| MSI Summit E16 Flip A12UDT-031 | |
| Average Intel Core i7-13700H (59324 - 107159, n=29) | |
| Dell Inspiron 16 Plus 7620 | |
| AIDA64 / FPU SinJulia | |
| Asus Vivobook Pro 16X K6604JV-MX016W | |
| Lenovo Slim Pro 9i 16IRP8 | |
| Dell Inspiron 16 Plus 7630 | |
| Average Intel Core i7-13700H (4800 - 11050, n=29) | |
| MSI Summit E16 Flip A12UDT-031 | |
| Dell Inspiron 16 Plus 7620 | |
| HP Envy 16 h0112nr | |
| AIDA64 / FPU Mandel | |
| Asus Vivobook Pro 16X K6604JV-MX016W | |
| Lenovo Slim Pro 9i 16IRP8 | |
| Average Intel Core i7-13700H (12321 - 45118, n=29) | |
| Dell Inspiron 16 Plus 7630 | |
| MSI Summit E16 Flip A12UDT-031 | |
| Dell Inspiron 16 Plus 7620 | |
| HP Envy 16 h0112nr | |
| AIDA64 / CPU AES | |
| HP Envy 16 h0112nr | |
| Asus Vivobook Pro 16X K6604JV-MX016W | |
| Lenovo Slim Pro 9i 16IRP8 | |
| Average Intel Core i7-13700H (28769 - 151254, n=29) | |
| Dell Inspiron 16 Plus 7620 | |
| MSI Summit E16 Flip A12UDT-031 | |
| Dell Inspiron 16 Plus 7630 | |
| AIDA64 / CPU ZLib | |
| Asus Vivobook Pro 16X K6604JV-MX016W | |
| Lenovo Slim Pro 9i 16IRP8 | |
| Dell Inspiron 16 Plus 7620 | |
| Average Intel Core i7-13700H (389 - 1215, n=29) | |
| MSI Summit E16 Flip A12UDT-031 | |
| Dell Inspiron 16 Plus 7630 | |
| HP Envy 16 h0112nr | |
| AIDA64 / FP64 Ray-Trace | |
| Asus Vivobook Pro 16X K6604JV-MX016W | |
| Lenovo Slim Pro 9i 16IRP8 | |
| Average Intel Core i7-13700H (2540 - 10135, n=29) | |
| Dell Inspiron 16 Plus 7630 | |
| MSI Summit E16 Flip A12UDT-031 | |
| Dell Inspiron 16 Plus 7620 | |
| HP Envy 16 h0112nr | |
| AIDA64 / CPU PhotoWorxx | |
| Lenovo Slim Pro 9i 16IRP8 | |
| Asus Vivobook Pro 16X K6604JV-MX016W | |
| MSI Summit E16 Flip A12UDT-031 | |
| Average Intel Core i7-13700H (12872 - 52727, n=29) | |
| Dell Inspiron 16 Plus 7630 | |
| HP Envy 16 h0112nr | |
| Dell Inspiron 16 Plus 7620 | |
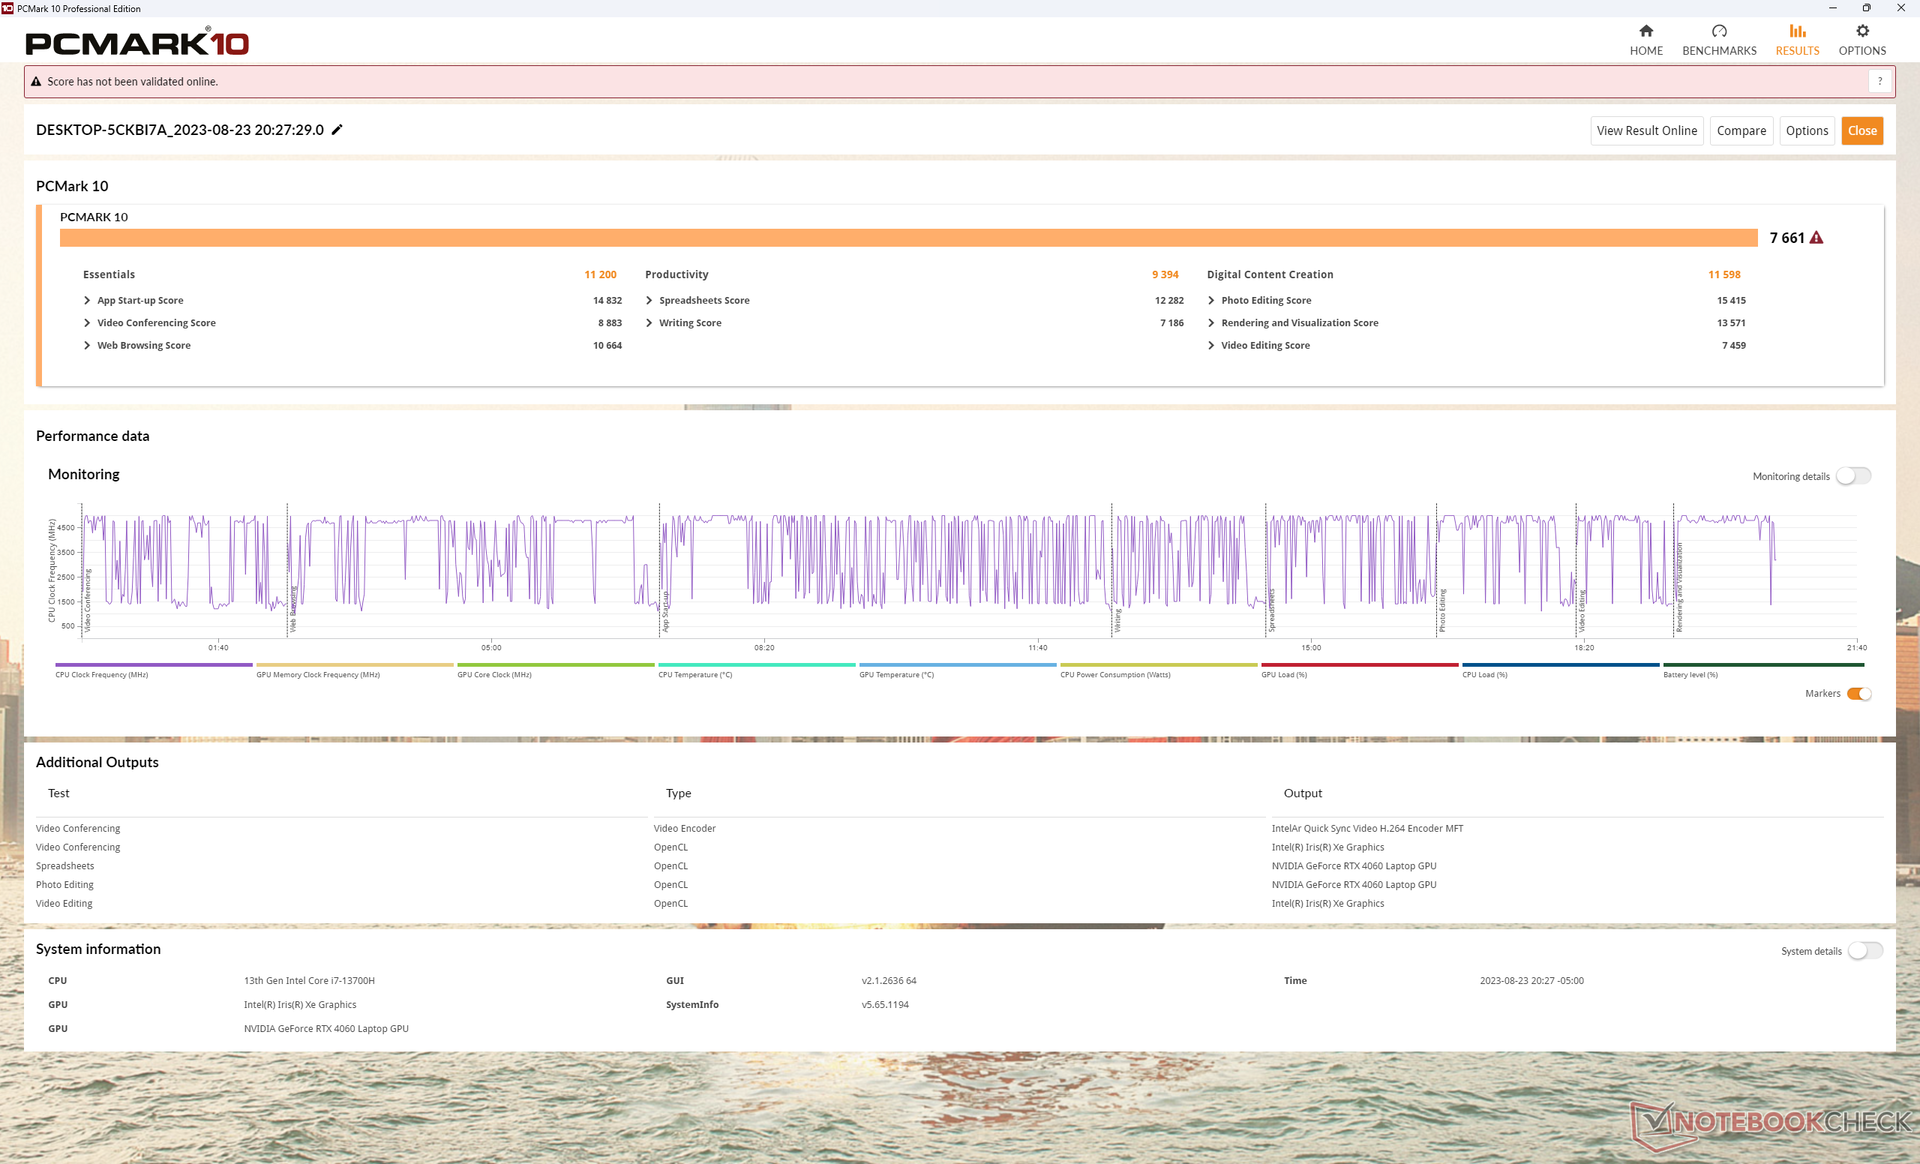
System Performance
PCMark scores are consistently higher than on last year's Inspiron 16 Plus 7620 particularly in the Digital Content Creation subtest where GPU performance matters most.
We experienced no wake-from-sleep issues or BSODs unlike on the recent Alienware m16 R1.
CrossMark: Overall | Productivity | Creativity | Responsiveness
| PCMark 10 / Score | |
| Lenovo Slim Pro 9i 16IRP8 | |
| Dell Inspiron 16 Plus 7630 | |
| HP Envy 16 h0112nr | |
| Average Intel Core i7-13700H, NVIDIA GeForce RTX 4060 Laptop GPU (7157 - 7661, n=5) | |
| Asus Vivobook Pro 16X K6604JV-MX016W | |
| Dell Inspiron 16 Plus 7620 | |
| MSI Summit E16 Flip A12UDT-031 | |
| PCMark 10 / Essentials | |
| HP Envy 16 h0112nr | |
| Lenovo Slim Pro 9i 16IRP8 | |
| Dell Inspiron 16 Plus 7630 | |
| Average Intel Core i7-13700H, NVIDIA GeForce RTX 4060 Laptop GPU (10179 - 11200, n=5) | |
| Asus Vivobook Pro 16X K6604JV-MX016W | |
| Dell Inspiron 16 Plus 7620 | |
| MSI Summit E16 Flip A12UDT-031 | |
| PCMark 10 / Productivity | |
| Lenovo Slim Pro 9i 16IRP8 | |
| Average Intel Core i7-13700H, NVIDIA GeForce RTX 4060 Laptop GPU (8238 - 10249, n=5) | |
| Dell Inspiron 16 Plus 7630 | |
| HP Envy 16 h0112nr | |
| Dell Inspiron 16 Plus 7620 | |
| Asus Vivobook Pro 16X K6604JV-MX016W | |
| MSI Summit E16 Flip A12UDT-031 | |
| PCMark 10 / Digital Content Creation | |
| Dell Inspiron 16 Plus 7630 | |
| Lenovo Slim Pro 9i 16IRP8 | |
| Average Intel Core i7-13700H, NVIDIA GeForce RTX 4060 Laptop GPU (10308 - 11862, n=5) | |
| HP Envy 16 h0112nr | |
| Dell Inspiron 16 Plus 7620 | |
| Asus Vivobook Pro 16X K6604JV-MX016W | |
| MSI Summit E16 Flip A12UDT-031 | |
| CrossMark / Overall | |
| Asus Vivobook Pro 16X K6604JV-MX016W | |
| Dell Inspiron 16 Plus 7630 | |
| HP Envy 16 h0112nr | |
| Lenovo Slim Pro 9i 16IRP8 | |
| Dell Inspiron 16 Plus 7620 | |
| Average Intel Core i7-13700H, NVIDIA GeForce RTX 4060 Laptop GPU (1629 - 1849, n=5) | |
| MSI Summit E16 Flip A12UDT-031 | |
| CrossMark / Productivity | |
| Asus Vivobook Pro 16X K6604JV-MX016W | |
| Dell Inspiron 16 Plus 7630 | |
| HP Envy 16 h0112nr | |
| Dell Inspiron 16 Plus 7620 | |
| Lenovo Slim Pro 9i 16IRP8 | |
| Average Intel Core i7-13700H, NVIDIA GeForce RTX 4060 Laptop GPU (1561 - 1743, n=5) | |
| MSI Summit E16 Flip A12UDT-031 | |
| CrossMark / Creativity | |
| Asus Vivobook Pro 16X K6604JV-MX016W | |
| Lenovo Slim Pro 9i 16IRP8 | |
| Dell Inspiron 16 Plus 7630 | |
| HP Envy 16 h0112nr | |
| Dell Inspiron 16 Plus 7620 | |
| Average Intel Core i7-13700H, NVIDIA GeForce RTX 4060 Laptop GPU (1691 - 2064, n=5) | |
| MSI Summit E16 Flip A12UDT-031 | |
| CrossMark / Responsiveness | |
| Asus Vivobook Pro 16X K6604JV-MX016W | |
| HP Envy 16 h0112nr | |
| Dell Inspiron 16 Plus 7630 | |
| MSI Summit E16 Flip A12UDT-031 | |
| Dell Inspiron 16 Plus 7620 | |
| Average Intel Core i7-13700H, NVIDIA GeForce RTX 4060 Laptop GPU (1381 - 1656, n=5) | |
| Lenovo Slim Pro 9i 16IRP8 | |
| PCMark 10 Score | 7661 points | |
Help | ||
| AIDA64 / Memory Copy | |
| Lenovo Slim Pro 9i 16IRP8 | |
| Asus Vivobook Pro 16X K6604JV-MX016W | |
| MSI Summit E16 Flip A12UDT-031 | |
| Average Intel Core i7-13700H (24334 - 78081, n=29) | |
| Dell Inspiron 16 Plus 7630 | |
| HP Envy 16 h0112nr | |
| Dell Inspiron 16 Plus 7620 | |
| AIDA64 / Memory Read | |
| Asus Vivobook Pro 16X K6604JV-MX016W | |
| Lenovo Slim Pro 9i 16IRP8 | |
| Dell Inspiron 16 Plus 7630 | |
| HP Envy 16 h0112nr | |
| MSI Summit E16 Flip A12UDT-031 | |
| Average Intel Core i7-13700H (23681 - 79656, n=29) | |
| Dell Inspiron 16 Plus 7620 | |
| AIDA64 / Memory Write | |
| Lenovo Slim Pro 9i 16IRP8 | |
| Asus Vivobook Pro 16X K6604JV-MX016W | |
| Average Intel Core i7-13700H (22986 - 99898, n=29) | |
| Dell Inspiron 16 Plus 7630 | |
| HP Envy 16 h0112nr | |
| MSI Summit E16 Flip A12UDT-031 | |
| Dell Inspiron 16 Plus 7620 | |
| AIDA64 / Memory Latency | |
| MSI Summit E16 Flip A12UDT-031 | |
| Lenovo Slim Pro 9i 16IRP8 | |
| Dell Inspiron 16 Plus 7620 | |
| Average Intel Core i7-13700H (82.4 - 136.8, n=29) | |
| Dell Inspiron 16 Plus 7630 | |
| HP Envy 16 h0112nr | |
| Asus Vivobook Pro 16X K6604JV-MX016W | |
* ... smaller is better
DPC Latency
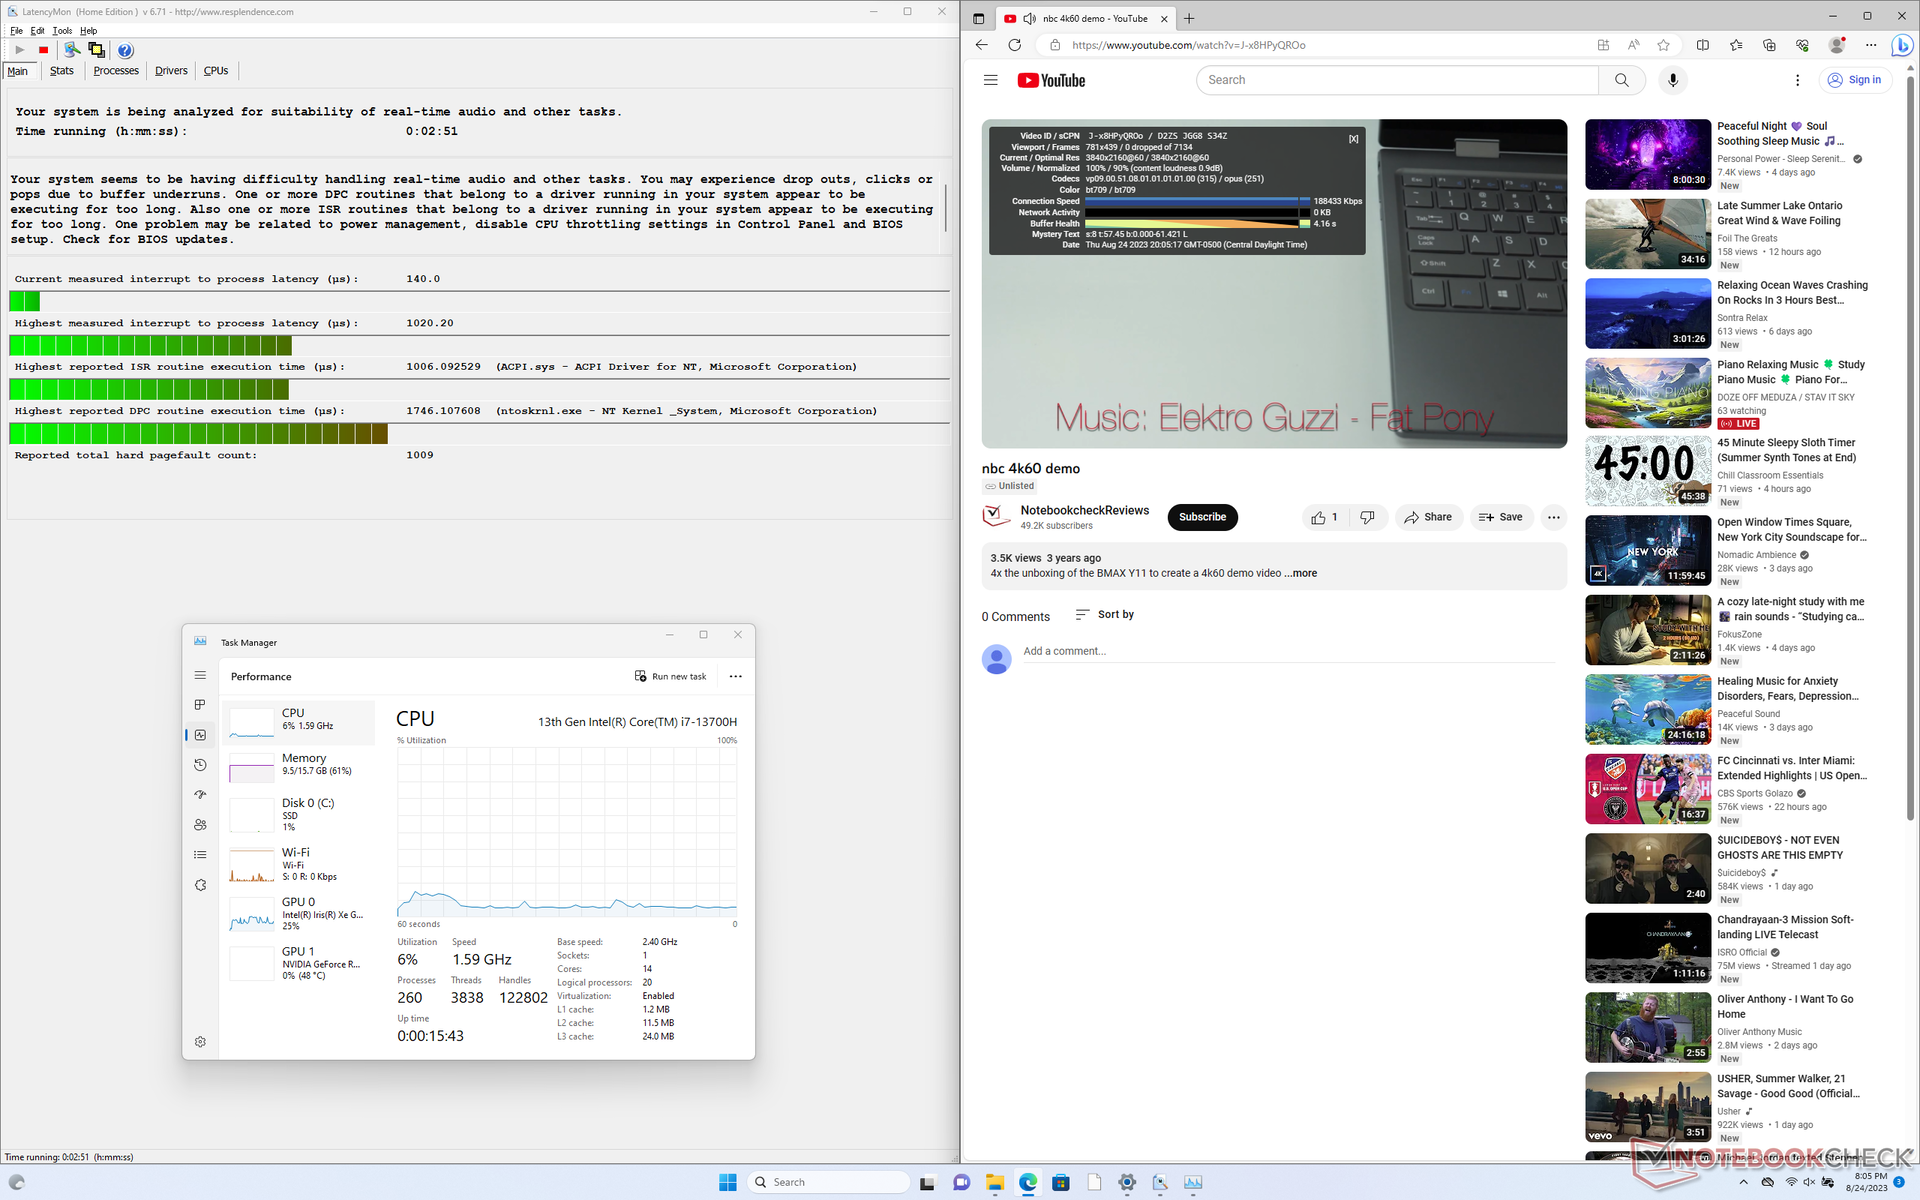
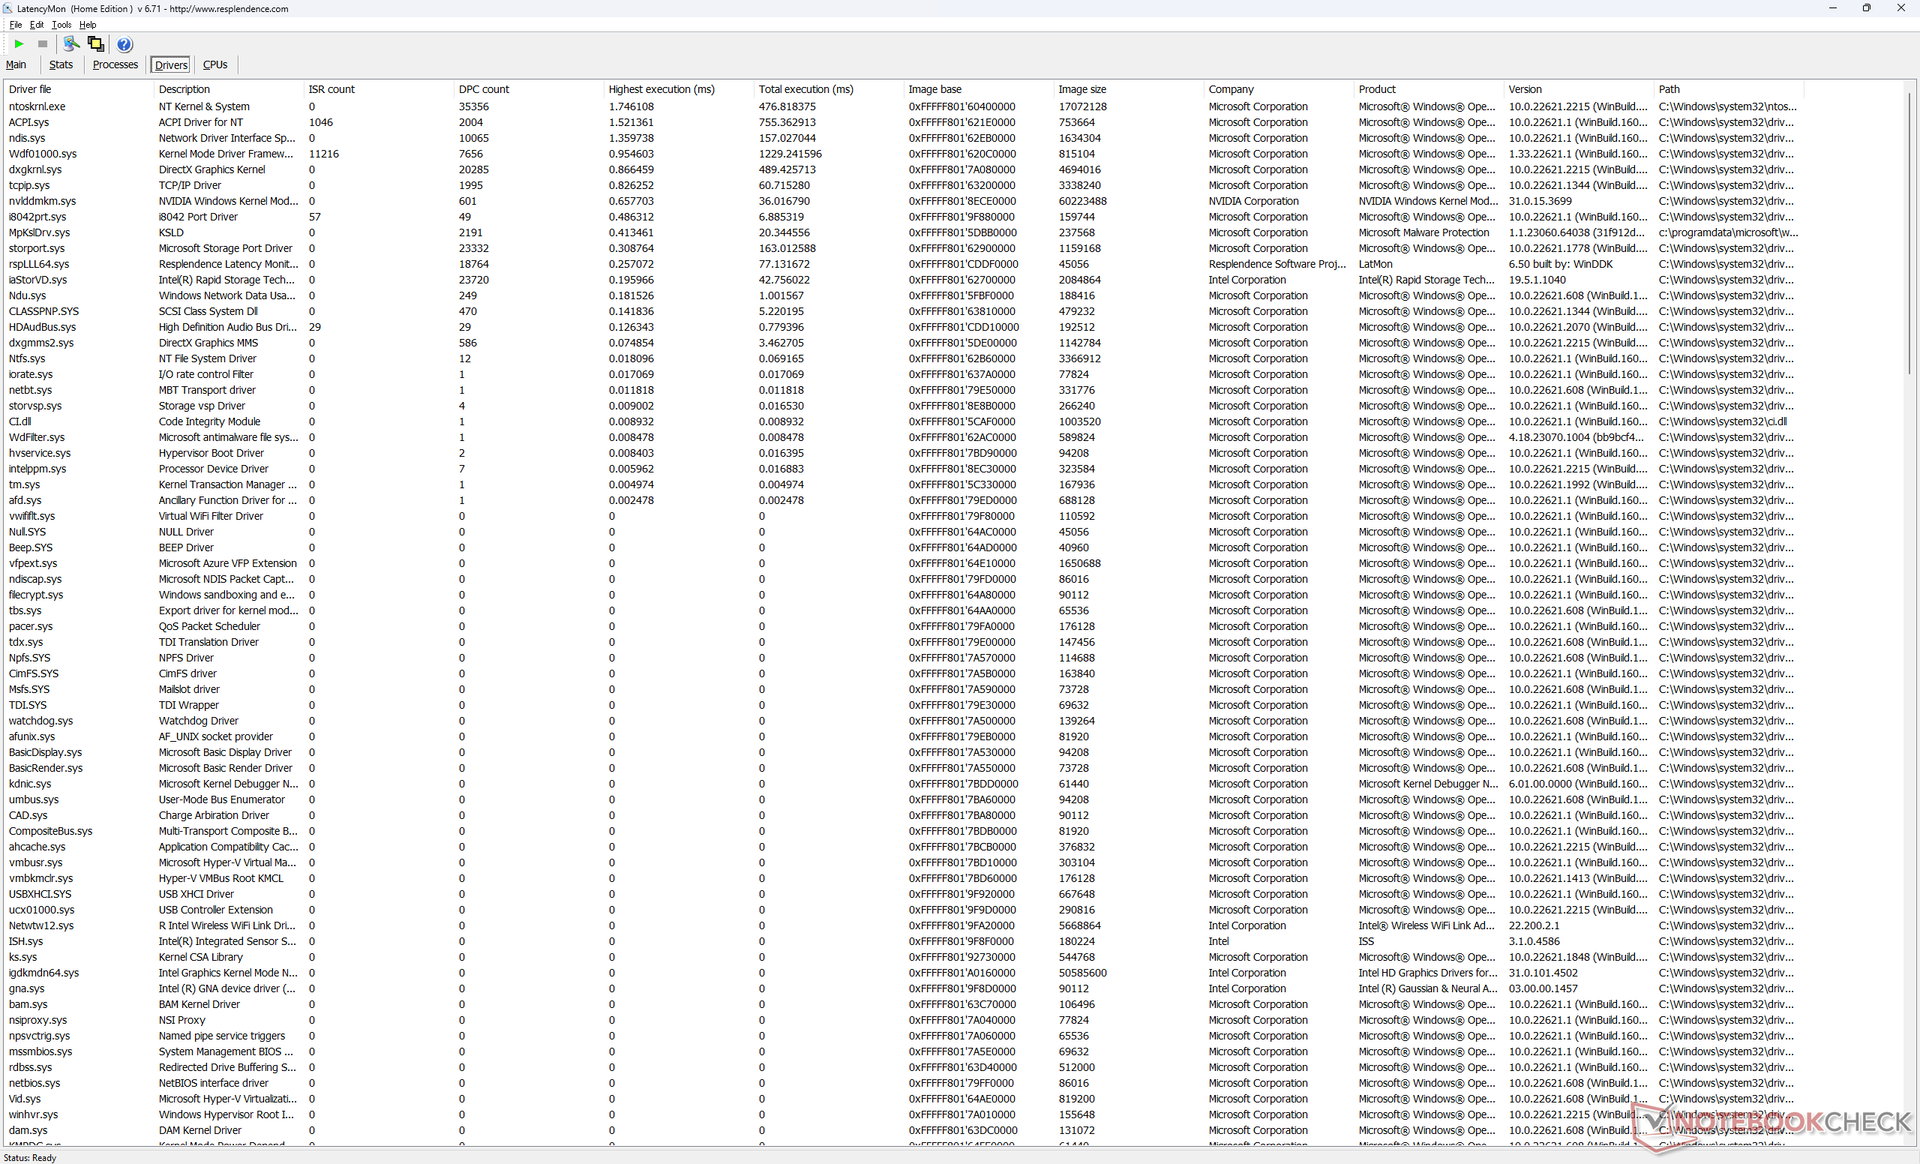
LatencyMon shows only minor DPC issues when opening multiple browser tabs of our homepage. 4K video playback at 60 FPS is otherwise perfect with no dropped frames recorded unlike on the recent Alienware m16 R1 where frame skips were persistent.
| DPC Latencies / LatencyMon - interrupt to process latency (max), Web, Youtube, Prime95 | |
| Asus Vivobook Pro 16X K6604JV-MX016W | |
| Lenovo Slim Pro 9i 16IRP8 | |
| Dell Inspiron 16 Plus 7630 | |
| Dell Inspiron 16 Plus 7620 | |
| MSI Summit E16 Flip A12UDT-031 | |
| HP Envy 16 h0112nr | |
* ... smaller is better
Storage Devices — Supports Just One SSD
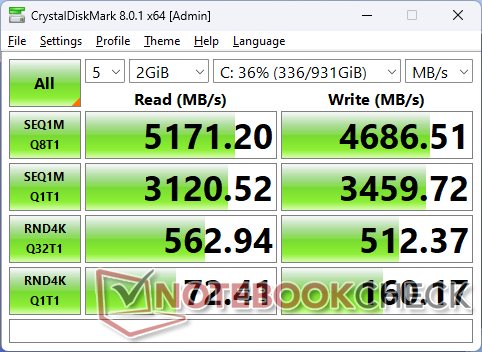
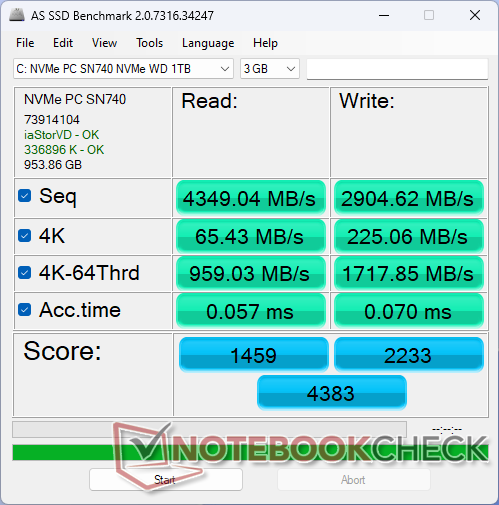
Our unit comes with a midrange Western Digital SN740 PCIe4 x4 NVMe SSD offering transfer rates of up to 5200 MB/s. This maximum is only sustainable for about a minute, however, before it eventually throttles to the low 2400 MB/s as shown by our DiskSpd loop test results below. This limitation is not an issue for gaming performance and the vast majority of usage scenarios.
The model only supports up to one internal SSD whereas a few other 16-inch laptops like the Envy 16 can support up to two drives.

| Drive Performance rating - Percent | |
| MSI Summit E16 Flip A12UDT-031 | |
| Lenovo Slim Pro 9i 16IRP8 | |
| HP Envy 16 h0112nr | |
| Dell Inspiron 16 Plus 7630 | |
| Asus Vivobook Pro 16X K6604JV-MX016W | |
| Dell Inspiron 16 Plus 7620 | |
* ... smaller is better
Disk Throttling: DiskSpd Read Loop, Queue Depth 8
GPU Performance
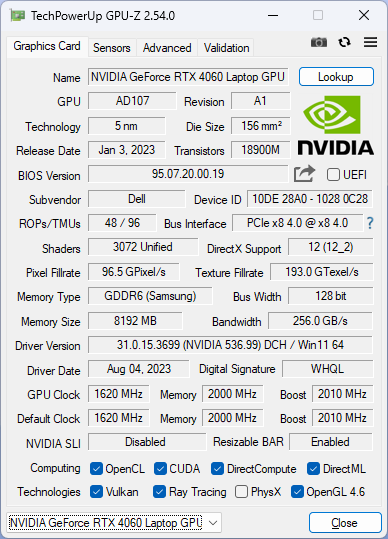
The GeForce RTX 4060 in our Dell is about 10 to 15 percent slower than the average laptop in our database equipped with the same GPU. The delta is likely due to the relatively low 60 W TGP target of the Inspiron 16 Plus 7630 since most laptops with the RTX 4060 tend to be dedicated gaming laptops optimized for higher GPU power ranges of 90 W or higher. Overall performance is therefore more comparable to the GeForce RTX 4050 in the Lenovo Slim Pro 9i 16 which is a bit disappointing to see. Nonetheless, the gen-to-gen performance upgrade over the RTX 3050 Ti in last year's Inspiron 16 Plus 7620 is still significant at 40 to 60 percent.
Users may want to consider configuring the Inspiron 16 Plus 7630 with the cheaper RTX 4050 instead since the RTX 4060 option is an underperformer. All GPU options target the same 60 W TGP.
Switching from Performance mode to Balanced mode impacts CPU performance quite heavily while GPU performance would remain almost the same as shown by our Fire Strike results below. Be sure to be on Performance mode if running CPU-intensive tasks.
| Power Profile | Graphics Score | Physics Score | Combined Score |
| Battery Power | 19574 (-9%) | 10010 (-61%) | 4793 (-46%) |
| Balanced Mode | 23511 (-2%) | 15963 (-41%) | 8110 (-21%) |
| Performance Mode | 24008 | 26852 | 10239 |

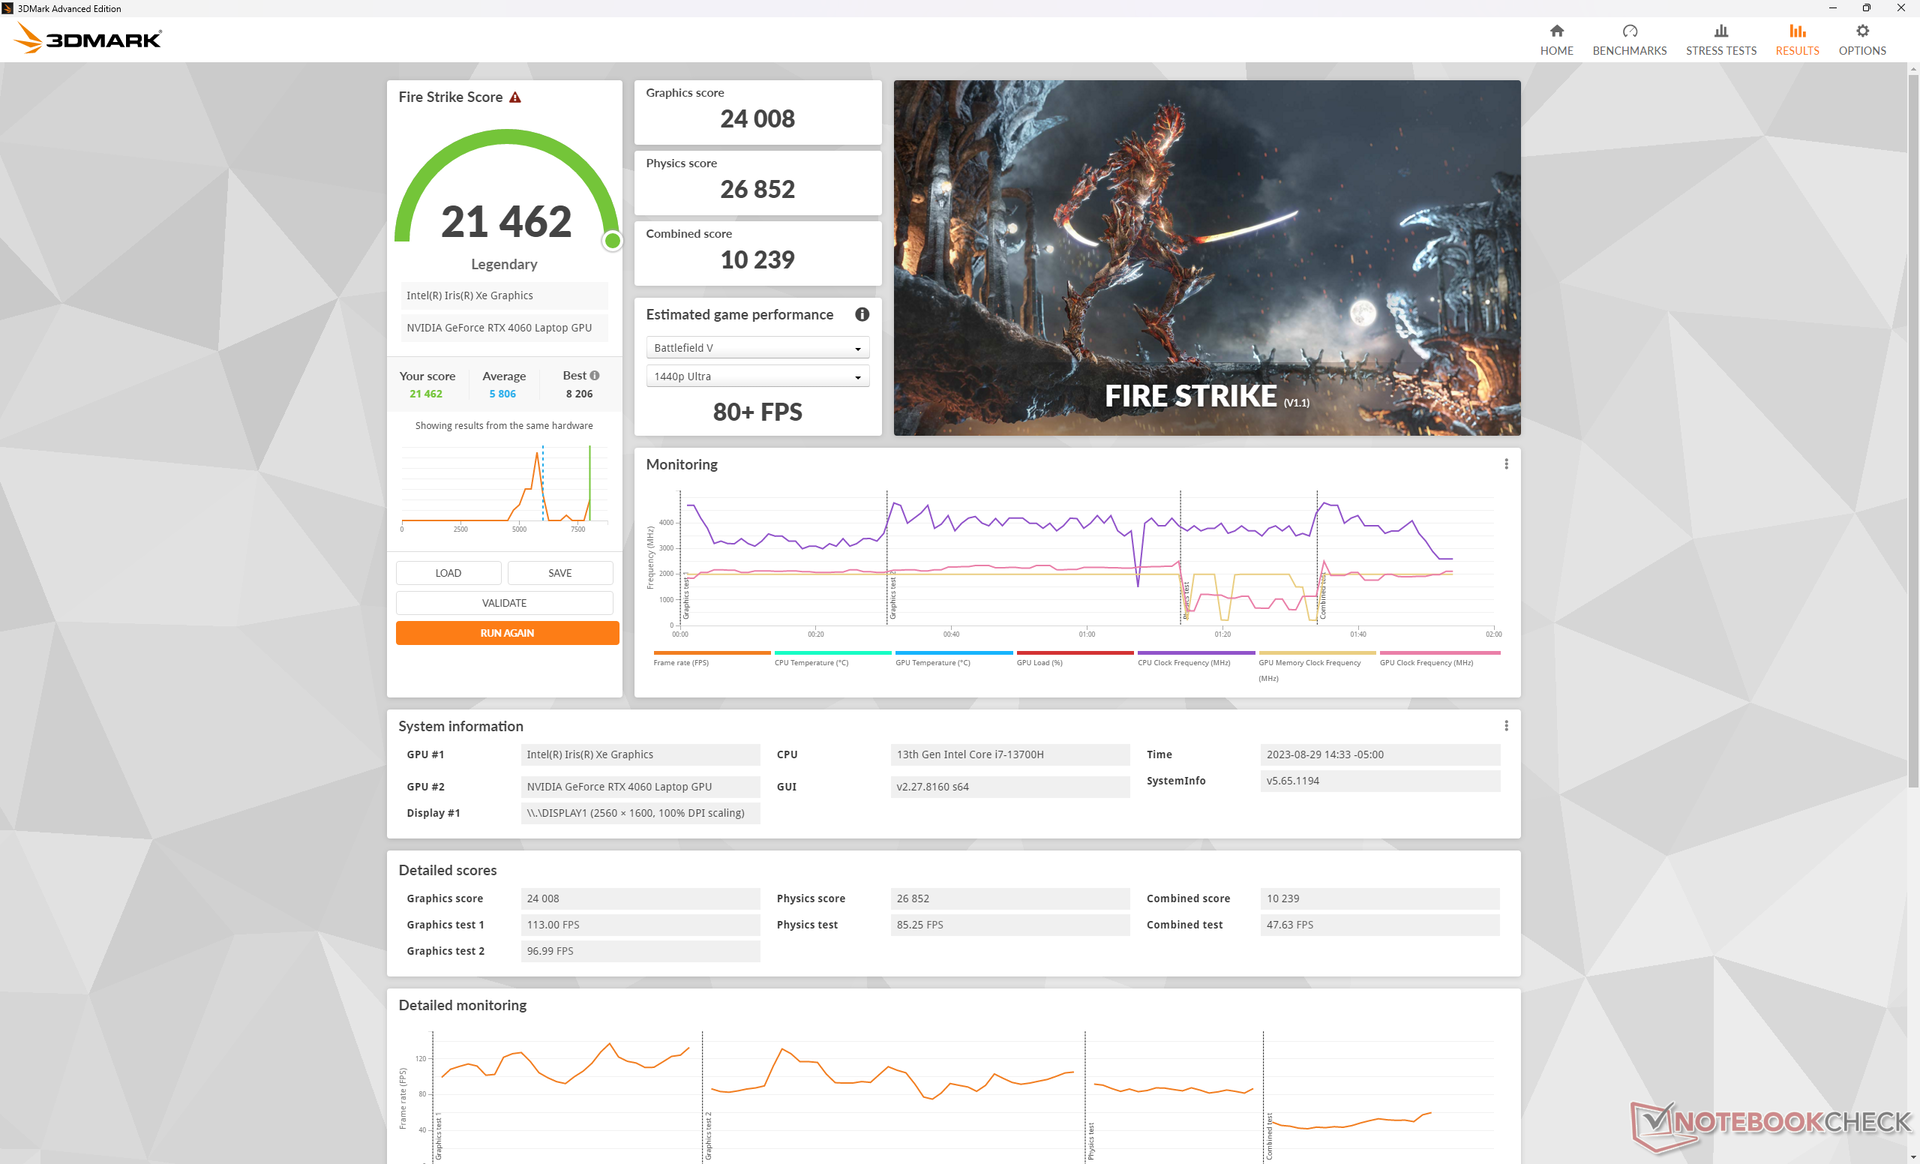


| 3DMark 11 Performance | 25824 points | |
| 3DMark Fire Strike Score | 19289 points | |
| 3DMark Time Spy Score | 8240 points | |
Help | ||
* ... smaller is better
Gaming Performance
As predicted by the 3DMark results above, overall gaming performance is slightly below average for a laptop with RTX 4060 graphics. Tiny Tina's Wonderlands, for example, runs at 48 FPS when on the maximum 1440p settings compared to 57 FPS on most other RTX 4060 laptops. G-Sync is unfortunately not supported on the Inspiron 7630 series which would have smoothed out the frame tearing.
Witcher 3 FPS Chart
| low | med. | high | ultra | QHD | |
|---|---|---|---|---|---|
| The Witcher 3 (2015) | 409.3 | 275.3 | 169.5 | 90.9 | 68 |
| Dota 2 Reborn (2015) | 184.7 | 166.6 | 157.9 | 146.1 | |
| Final Fantasy XV Benchmark (2018) | 172.2 | 122.2 | 88.9 | 64.4 | |
| X-Plane 11.11 (2018) | 153.5 | 135.7 | 109.7 | ||
| Far Cry 5 (2018) | 133 | 120 | 115 | 103 | 83 |
| Strange Brigade (2018) | 378 | 234 | 185.9 | 161 | 110.9 |
| Cyberpunk 2077 1.6 (2022) | 108.1 | 84.2 | 72.9 | 65.7 | 40.8 |
| Tiny Tina's Wonderlands (2022) | 169.5 | 141.5 | 92.1 | 71.4 | 48 |
| F1 22 (2022) | 205 | 201 | 148.4 | 53.8 | 34.1 |
| Returnal (2023) | 71 | 68 | 63 | 57 | 39 |
Emissions
System Noise — Quieter And Louder Than Before
The internal fans can be silent when idling on desktop, but they are more often than not hovering around 26 to 28 dB(A) when running common loads like web browsers or video streams. More impressively, they can remain relatively quiet for a good while even when higher loads are introduced whereas the fans in the Inspiron 16 Plus 7620 would pulse more quickly and readily. When running 3DMark 06, for example, fan noise would only ramp up to 35 dB(A) towards the end of the first 90-second benchmark scene.
Fan noise increases significantly when running games. While the Inspiron 16 Plus 7630 is generally quieter than last year's model when running undemanding loads, the opposite is true when gaming. Fan noise would top out at almost 53 dB(A) when running Witcher 3 compared to just over 49 dB(A) on the Inspiron 16 Plus 7620. Nonetheless, the low 50 dB(A) range is comparable to competitors like the Slim Pro 9i 16 or Envy 16.
Interestingly, changing the power profile between Balanced and Performance modes does not impact the fan noise ceiling when gaming as it still tops out at 52.5 dB(A) on either setting.


Noise level
| Idle |
| 23.2 / 23.2 / 23.2 dB(A) |
| Load |
| 35.1 / 52.5 dB(A) |
 | ||
30 dB silent 40 dB(A) audible 50 dB(A) loud |
||
min: | ||
| Dell Inspiron 16 Plus 7630 GeForce RTX 4060 Laptop GPU, i7-13700H, WD PC SN740 SDDPTQD-1T00 | Dell Inspiron 16 Plus 7620 GeForce RTX 3050 Ti Laptop GPU, i7-12700H, Kioxia BG5 KBG50ZNS512G | Lenovo Slim Pro 9i 16IRP8 GeForce RTX 4050 Laptop GPU, i9-13905H, Samsung PM9A1 MZVL21T0HCLR | Asus Vivobook Pro 16X K6604JV-MX016W GeForce RTX 4060 Laptop GPU, i9-13980HX, Solidigm P41 Plus SSDPFKNU010TZ | HP Envy 16 h0112nr GeForce RTX 3060 Laptop GPU, i7-12700H, Micron 3400 1TB MTFDKBA1T0TFH | MSI Summit E16 Flip A12UDT-031 GeForce RTX 3050 Ti Laptop GPU, i7-1280P, Samsung PM9A1 MZVL22T0HBLB | |
|---|---|---|---|---|---|---|
| Noise | -11% | 1% | -21% | -6% | -14% | |
| off / environment * (dB) | 23.2 | 23.3 -0% | 22.7 2% | 25.2 -9% | 22.8 2% | 25 -8% |
| Idle Minimum * (dB) | 23.2 | 25.7 -11% | 22.7 2% | 26.6 -15% | 22.9 1% | 25 -8% |
| Idle Average * (dB) | 23.2 | 26.1 -13% | 22.7 2% | 26.6 -15% | 22.9 1% | 25 -8% |
| Idle Maximum * (dB) | 23.2 | 30.6 -32% | 27.5 -19% | 29.2 -26% | 30.5 -31% | 28.9 -25% |
| Load Average * (dB) | 35.1 | 46.2 -32% | 28.9 18% | 53.4 -52% | 41.4 -18% | 49.3 -40% |
| Witcher 3 ultra * (dB) | 52.5 | 49.2 6% | 52.6 -0% | 51.1 3% | ||
| Load Maximum * (dB) | 52.5 | 49.4 6% | 52.5 -0% | 56.9 -8% | 51.4 2% | 48.2 8% |
* ... smaller is better
Temperature
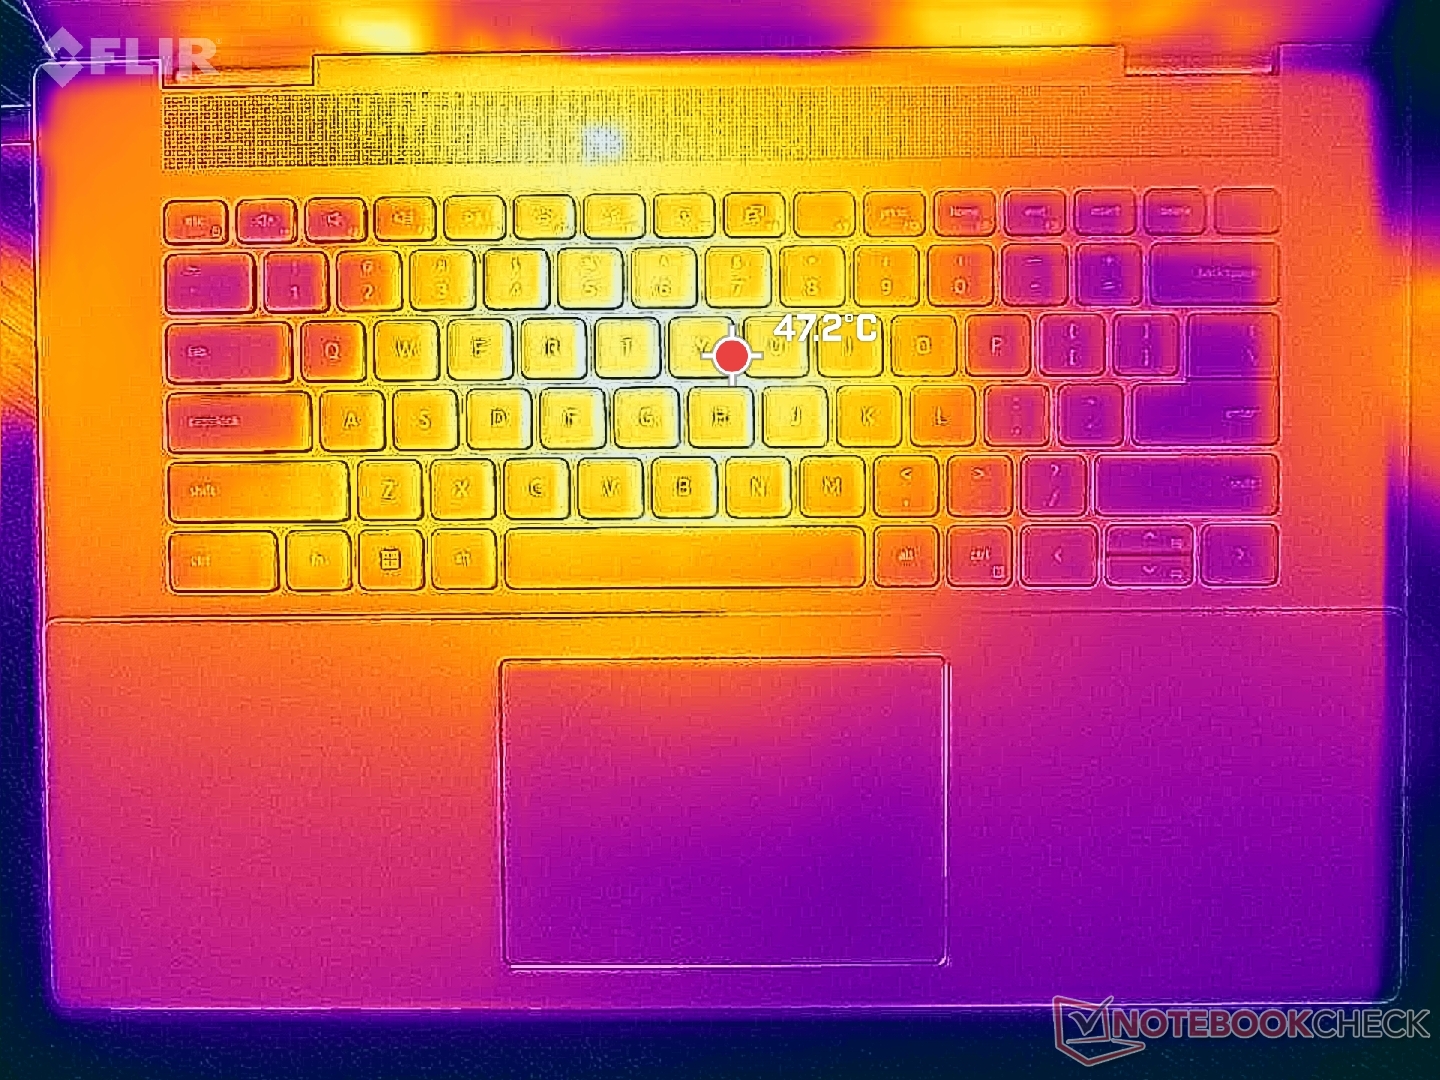
Surface temperatures when running demanding loads like games are warmer than expected. Hot spots on the top and bottom can be as warm as 48 C and 43 C, respectively, near the center of the keyboard. The palm rests can also be very warm at up to 37 C compared to just 31 C on the Asus Vivobook Pro 16X or HP Envy 16. This is certainly more of a handwarmer when compared to other laptops.
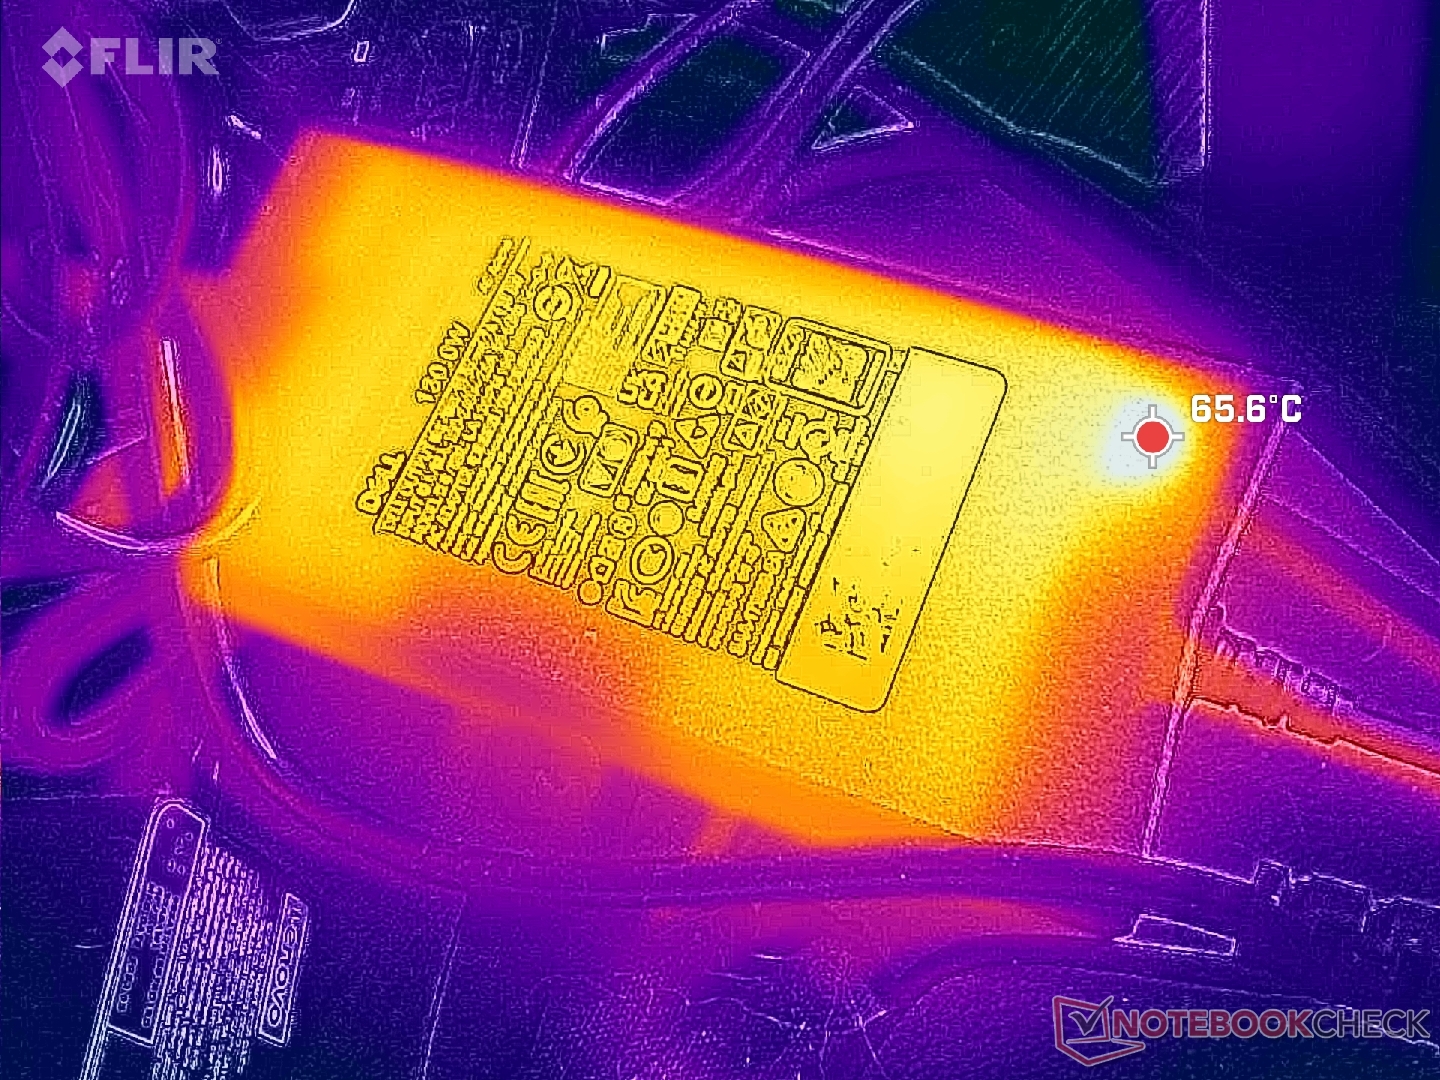
Additionally, the AC adapter is noticeably warmer than average at over 65 C. You'll want to give ample breathing space for the AC adapter just in case.

(-) The maximum temperature on the upper side is 47.8 °C / 118 F, compared to the average of 36.8 °C / 98 F, ranging from 21 to 71 °C for the class Multimedia.
(±) The bottom heats up to a maximum of 42.2 °C / 108 F, compared to the average of 39.1 °C / 102 F
(±) In idle usage, the average temperature for the upper side is 32 °C / 90 F, compared to the device average of 31.3 °C / 88 F.
(-) Playing The Witcher 3, the average temperature for the upper side is 40.6 °C / 105 F, compared to the device average of 31.3 °C / 88 F.
(±) The palmrests and touchpad can get very hot to the touch with a maximum of 36.6 °C / 97.9 F.
(-) The average temperature of the palmrest area of similar devices was 28.7 °C / 83.7 F (-7.9 °C / -14.2 F).


| Dell Inspiron 16 Plus 7630 Intel Core i7-13700H, NVIDIA GeForce RTX 4060 Laptop GPU | Dell Inspiron 16 Plus 7620 Intel Core i7-12700H, NVIDIA GeForce RTX 3050 Ti Laptop GPU | Lenovo Slim Pro 9i 16IRP8 Intel Core i9-13905H, NVIDIA GeForce RTX 4050 Laptop GPU | Asus Vivobook Pro 16X K6604JV-MX016W Intel Core i9-13980HX, NVIDIA GeForce RTX 4060 Laptop GPU | HP Envy 16 h0112nr Intel Core i7-12700H, NVIDIA GeForce RTX 3060 Laptop GPU | MSI Summit E16 Flip A12UDT-031 Intel Core i7-1280P, NVIDIA GeForce RTX 3050 Ti Laptop GPU | |
|---|---|---|---|---|---|---|
| Heat | 6% | 10% | -3% | 3% | 2% | |
| Maximum Upper Side * (°C) | 47.8 | 46 4% | 37.8 21% | 39.7 17% | 45.2 5% | 49.2 -3% |
| Maximum Bottom * (°C) | 42.2 | 45.8 -9% | 44.8 -6% | 60 -42% | 44 -4% | 50.2 -19% |
| Idle Upper Side * (°C) | 35.2 | 29.2 17% | 30.6 13% | 30.9 12% | 33.6 5% | 29.4 16% |
| Idle Bottom * (°C) | 35 | 31 11% | 31 11% | 34.7 1% | 32.6 7% | 30 14% |
* ... smaller is better
Stress Test

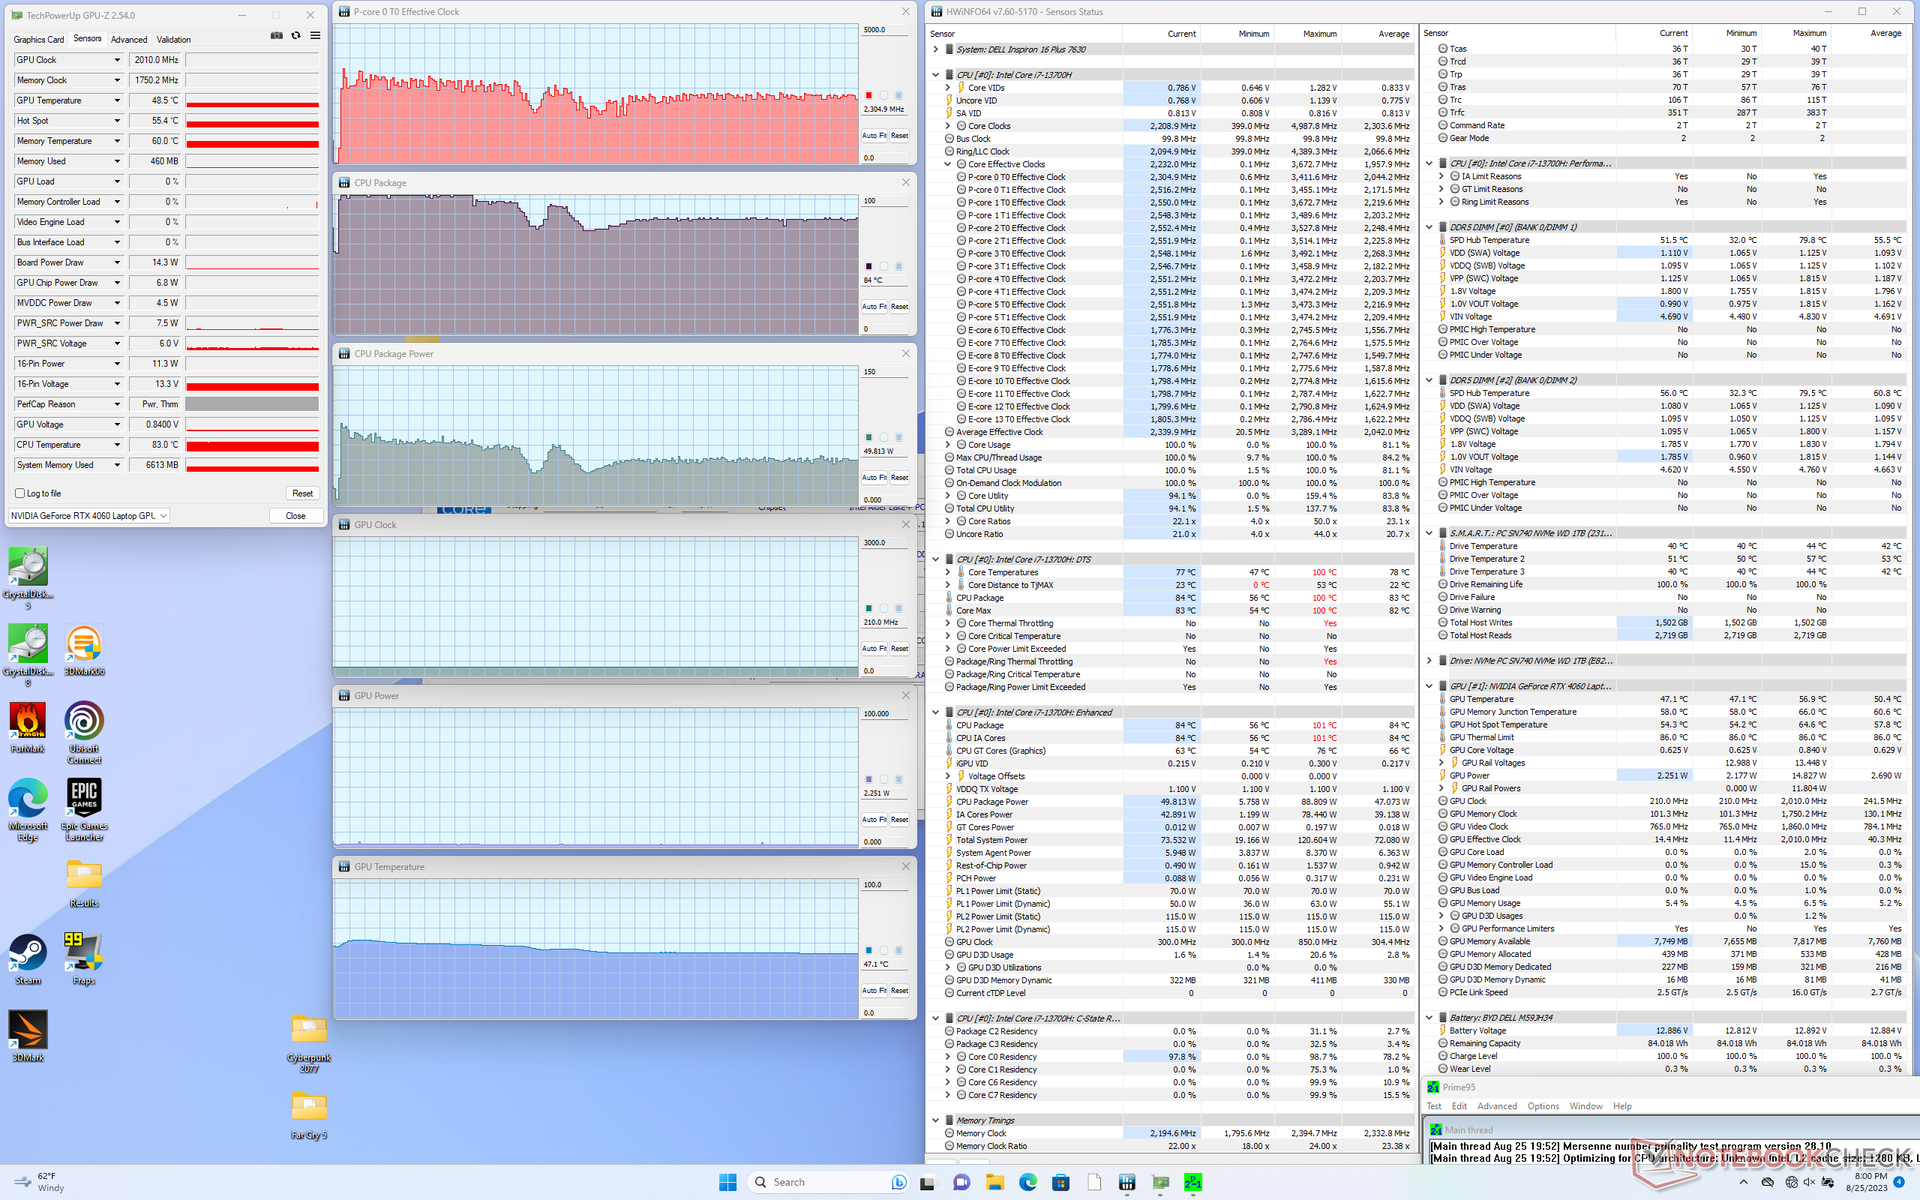
When running Prime95, the CPU would boost to 3.4 GHz, 89 W, and a toasty 100 C for only a few seconds before eventually stabilizing at around 2.3 GHz and 50 W in order to maintain a more reasonable core temperature of 84 C. Last year's model would stabilize at around the same values as well when running the same test.
When running Witcher 3 on Performance mode to represent typical gaming loads, the Nvidia GPU would stabilize at 2235 MHz, 71 C, and 69 W according to HWiNFO. Dropping to Balanced mode does not significantly impact these values which aligns with our Fire Strike observations above. Interestingly, core temperatures would be much cooler than what we recorded on the Inspiron 16 Plus 7620 when running the same game likely due to our louder fan noise and overall improvements to the cooling solution.
Note that while HWiNFO reports a GPU power draw of 69 W when gaming, Dell advertises a GPU power of only 60 W. Nvidia Control Panel reports a target GPU power of 70 W.


| CPU Clock (GHz) | GPU Clock (MHz) | Average CPU Temperature (°C) | Average GPU Temperature (°C) | |
| System Idle | -- | -- | 56 | 50 |
| Prime95 Stress | 2.3 - 2.4 | -- | 84 | 47 |
| Prime95 + FurMark Stress | ~1.8 | ~2445 | 85 | 65 |
| Witcher 3 Stress (Balanced mode) | ~1.1 | 2055 | 77 | 71 |
| Witcher 3 Stress (Performance mode) | ~1.1 | 2250 | 76 | 71 |
Speakers

Dell Inspiron 16 Plus 7630 audio analysis
(±) | speaker loudness is average but good (81.8 dB)
Bass 100 - 315 Hz
(-) | nearly no bass - on average 17% lower than median
(±) | linearity of bass is average (8.4% delta to prev. frequency)
Mids 400 - 2000 Hz
(±) | higher mids - on average 6.3% higher than median
(+) | mids are linear (6.2% delta to prev. frequency)
Highs 2 - 16 kHz
(+) | balanced highs - only 2.2% away from median
(+) | highs are linear (5.6% delta to prev. frequency)
Overall 100 - 16.000 Hz
(±) | linearity of overall sound is average (15.9% difference to median)
Compared to same class
» 40% of all tested devices in this class were better, 6% similar, 54% worse
» The best had a delta of 5%, average was 17%, worst was 45%
Compared to all devices tested
» 25% of all tested devices were better, 5% similar, 70% worse
» The best had a delta of 4%, average was 23%, worst was 134%
Apple MacBook Pro 16 2021 M1 Pro audio analysis
(+) | speakers can play relatively loud (84.7 dB)
Bass 100 - 315 Hz
(+) | good bass - only 3.8% away from median
(+) | bass is linear (5.2% delta to prev. frequency)
Mids 400 - 2000 Hz
(+) | balanced mids - only 1.3% away from median
(+) | mids are linear (2.1% delta to prev. frequency)
Highs 2 - 16 kHz
(+) | balanced highs - only 1.9% away from median
(+) | highs are linear (2.7% delta to prev. frequency)
Overall 100 - 16.000 Hz
(+) | overall sound is linear (4.6% difference to median)
Compared to same class
» 0% of all tested devices in this class were better, 0% similar, 100% worse
» The best had a delta of 5%, average was 17%, worst was 45%
Compared to all devices tested
» 0% of all tested devices were better, 0% similar, 100% worse
» The best had a delta of 4%, average was 23%, worst was 134%
Energy Management
Power Consumption — High GPU Performance-Per-Watt
Consumption is slightly higher than on last year's model when idling on desktop or when running games. The 8 percent increase when running games, however, pales in comparison to the 40 to 60 percent increase in graphics performance over the RTX 3050 Ti. Thus, performance-per-watt still favors our newer model even if power consumption can be a bit higher.
Gaming laptops with the same CPU and GPU as our Dell Inspiron, such as the Acer Nitro 17, tend to be more power-hungry since they target higher power levels to squeeze more performance from the processors. When gaming, for example, the Acer would demand about 30 W more.
We're able to measure a temporary maximum consumption of 138 W from the medium-sized (~15 x 7.4 x 2.5 cm) 130 W AC adapter when the CPU and GPU are at 100 percent utilization. Note that configurations with no discrete graphics ship with a smaller 90 W AC adapter instead.


| Off / Standby | |
| Idle | |
| Load |
|
Key:
min: | |
| Dell Inspiron 16 Plus 7630 i7-13700H, GeForce RTX 4060 Laptop GPU, WD PC SN740 SDDPTQD-1T00, IPS, 2560x1600, 16" | Dell Inspiron 16 Plus 7620 i7-12700H, GeForce RTX 3050 Ti Laptop GPU, Kioxia BG5 KBG50ZNS512G, IPS, 3072x1920, 16" | Lenovo Slim Pro 9i 16IRP8 i9-13905H, GeForce RTX 4050 Laptop GPU, Samsung PM9A1 MZVL21T0HCLR, Mini-LED, 3200x2000, 16" | Asus Vivobook Pro 16X K6604JV-MX016W i9-13980HX, GeForce RTX 4060 Laptop GPU, Solidigm P41 Plus SSDPFKNU010TZ, OLED, 3200x2000, 16" | HP Envy 16 h0112nr i7-12700H, GeForce RTX 3060 Laptop GPU, Micron 3400 1TB MTFDKBA1T0TFH, OLED, 3840x2400, 16" | MSI Summit E16 Flip A12UDT-031 i7-1280P, GeForce RTX 3050 Ti Laptop GPU, Samsung PM9A1 MZVL22T0HBLB, IPS, 2560x1600, 16" | |
|---|---|---|---|---|---|---|
| Power Consumption | 15% | -28% | -23% | -9% | 22% | |
| Idle Minimum * (Watt) | 15.6 | 6.8 56% | 16 -3% | 13.8 12% | 10 36% | 9.8 37% |
| Idle Average * (Watt) | 17.7 | 9.6 46% | 30 -69% | 16 10% | 10.9 38% | 15.3 14% |
| Idle Maximum * (Watt) | 20.6 | 17 17% | 30.4 -48% | 19 8% | 27.8 -35% | 16.3 21% |
| Load Average * (Watt) | 87.4 | 117.5 -34% | 78.9 10% | 147 -68% | 116.4 -33% | 87 -0% |
| Witcher 3 ultra * (Watt) | 121.7 | 113.1 7% | 155.3 -28% | 147.8 -21% | 133.7 -10% | 86.1 29% |
| Load Maximum * (Watt) | 138 | 137.4 -0% | 180.4 -31% | 244 -77% | 209.8 -52% | 100 28% |
* ... smaller is better
Power Consumption Witcher 3 / Stresstest
Power Consumption external Monitor
Battery Life

Both battery capacity and battery life remain the same as before. We're able to record 9.5 hours of real-world WLAN browsing when on Balanced mode which is longer than on competing models like the Lenovo Slim Pro 9i 16IRP8 or HP Envy 16 by at least a couple of hours each.
Charging from empty to full capacity takes about 90 minutes with the included AC adapter. The system can also be recharged with USB-C adapters such as the ones that ship with the XPS series.
| Dell Inspiron 16 Plus 7630 i7-13700H, GeForce RTX 4060 Laptop GPU, 86 Wh | Dell Inspiron 16 Plus 7620 i7-12700H, GeForce RTX 3050 Ti Laptop GPU, 86 Wh | Lenovo Slim Pro 9i 16IRP8 i9-13905H, GeForce RTX 4050 Laptop GPU, 75 Wh | Asus Vivobook Pro 16X K6604JV-MX016W i9-13980HX, GeForce RTX 4060 Laptop GPU, 90 Wh | HP Envy 16 h0112nr i7-12700H, GeForce RTX 3060 Laptop GPU, 83 Wh | MSI Summit E16 Flip A12UDT-031 i7-1280P, GeForce RTX 3050 Ti Laptop GPU, 82 Wh | |
|---|---|---|---|---|---|---|
| Battery runtime | -2% | -30% | -12% | -0% | -24% | |
| Reader / Idle (h) | 17.6 | 18.6 6% | 17.8 1% | |||
| WiFi v1.3 (h) | 9.4 | 9.6 2% | 6.6 -30% | 6.5 -31% | 7.9 -16% | 7.1 -24% |
| Load (h) | 1.4 | 1.2 -14% | 1.5 7% | 1.6 14% | ||
| H.264 (h) | 5.3 |
Pros
Cons
Verdict — Upgrade For the Faster GPU
The upgrades over last year's Inspiron 16 Plus 7620 are more significant than initially expected in many respects. Aside from the huge uptick in graphics performance when jumping from the RTX 3050 Ti to the RTX 4060, the quieter and louder fan noise between the two models are notable as well as the cooler core temperatures on the newer model. Display options are different as they now include an optional 120 Hz refresh rate while SODIMM upgrades now offer two slots instead of one. The stiffer hinges are also a welcomed change to reduce the chances of them breaking down too soon. The user experience has sufficiently improved even if CPU performance is stale and the keyboard remains the same as before.
The Inspiron 16 Plus 7630 is all about balance. Its features and performance are just enough to satisfy the majority of multimedia and gaming purposes without needing to spend an arm and a leg.
As a jack-of-all-trades multimedia and gaming laptop, however, the Inspiron 16 Plus 7630 lacks a few features that hardcore multimedia laptops and hardcore gaming laptops tend to carry. On the multimedia side, Inspiron 16 Plus 7630 owners will be missing out on fuller DCi-P3 colors, higher native resolutions, and a fast integrated SD card reader. On the gaming side, the system omits G-Sync and MUX and its RTX 4060 is generally slower than average. The Inspiron 16 Plus 7630 is great for content creation and gaming, but users who lean more towards content creation should consider an HP Envy 16 or Asus ZenBook Pro Duo while heavy gamers will want to look at dedicated gaming machines like a Dell G model or an Asus ROG.
Price and Availability
Dell is now shipping the Inspiron 16 Plus 7630 with the Core i7 and RTX 4060 for $1250 USD.
Dell Inspiron 16 Plus 7630
- 08/30/2023 v7 (old)
Allen Ngo
Transparency
The selection of devices to be reviewed is made by our editorial team. The test sample was provided to the author as a loan by the manufacturer or retailer for the purpose of this review. The lender had no influence on this review, nor did the manufacturer receive a copy of this review before publication. There was no obligation to publish this review. As an independent media company, Notebookcheck is not subjected to the authority of manufacturers, retailers or publishers.
This is how Notebookcheck is testing
Every year, Notebookcheck independently reviews hundreds of laptops and smartphones using standardized procedures to ensure that all results are comparable. We have continuously developed our test methods for around 20 years and set industry standards in the process. In our test labs, high-quality measuring equipment is utilized by experienced technicians and editors. These tests involve a multi-stage validation process. Our complex rating system is based on hundreds of well-founded measurements and benchmarks, which maintains objectivity. Further information on our test methods can be found here.
Price comparison
