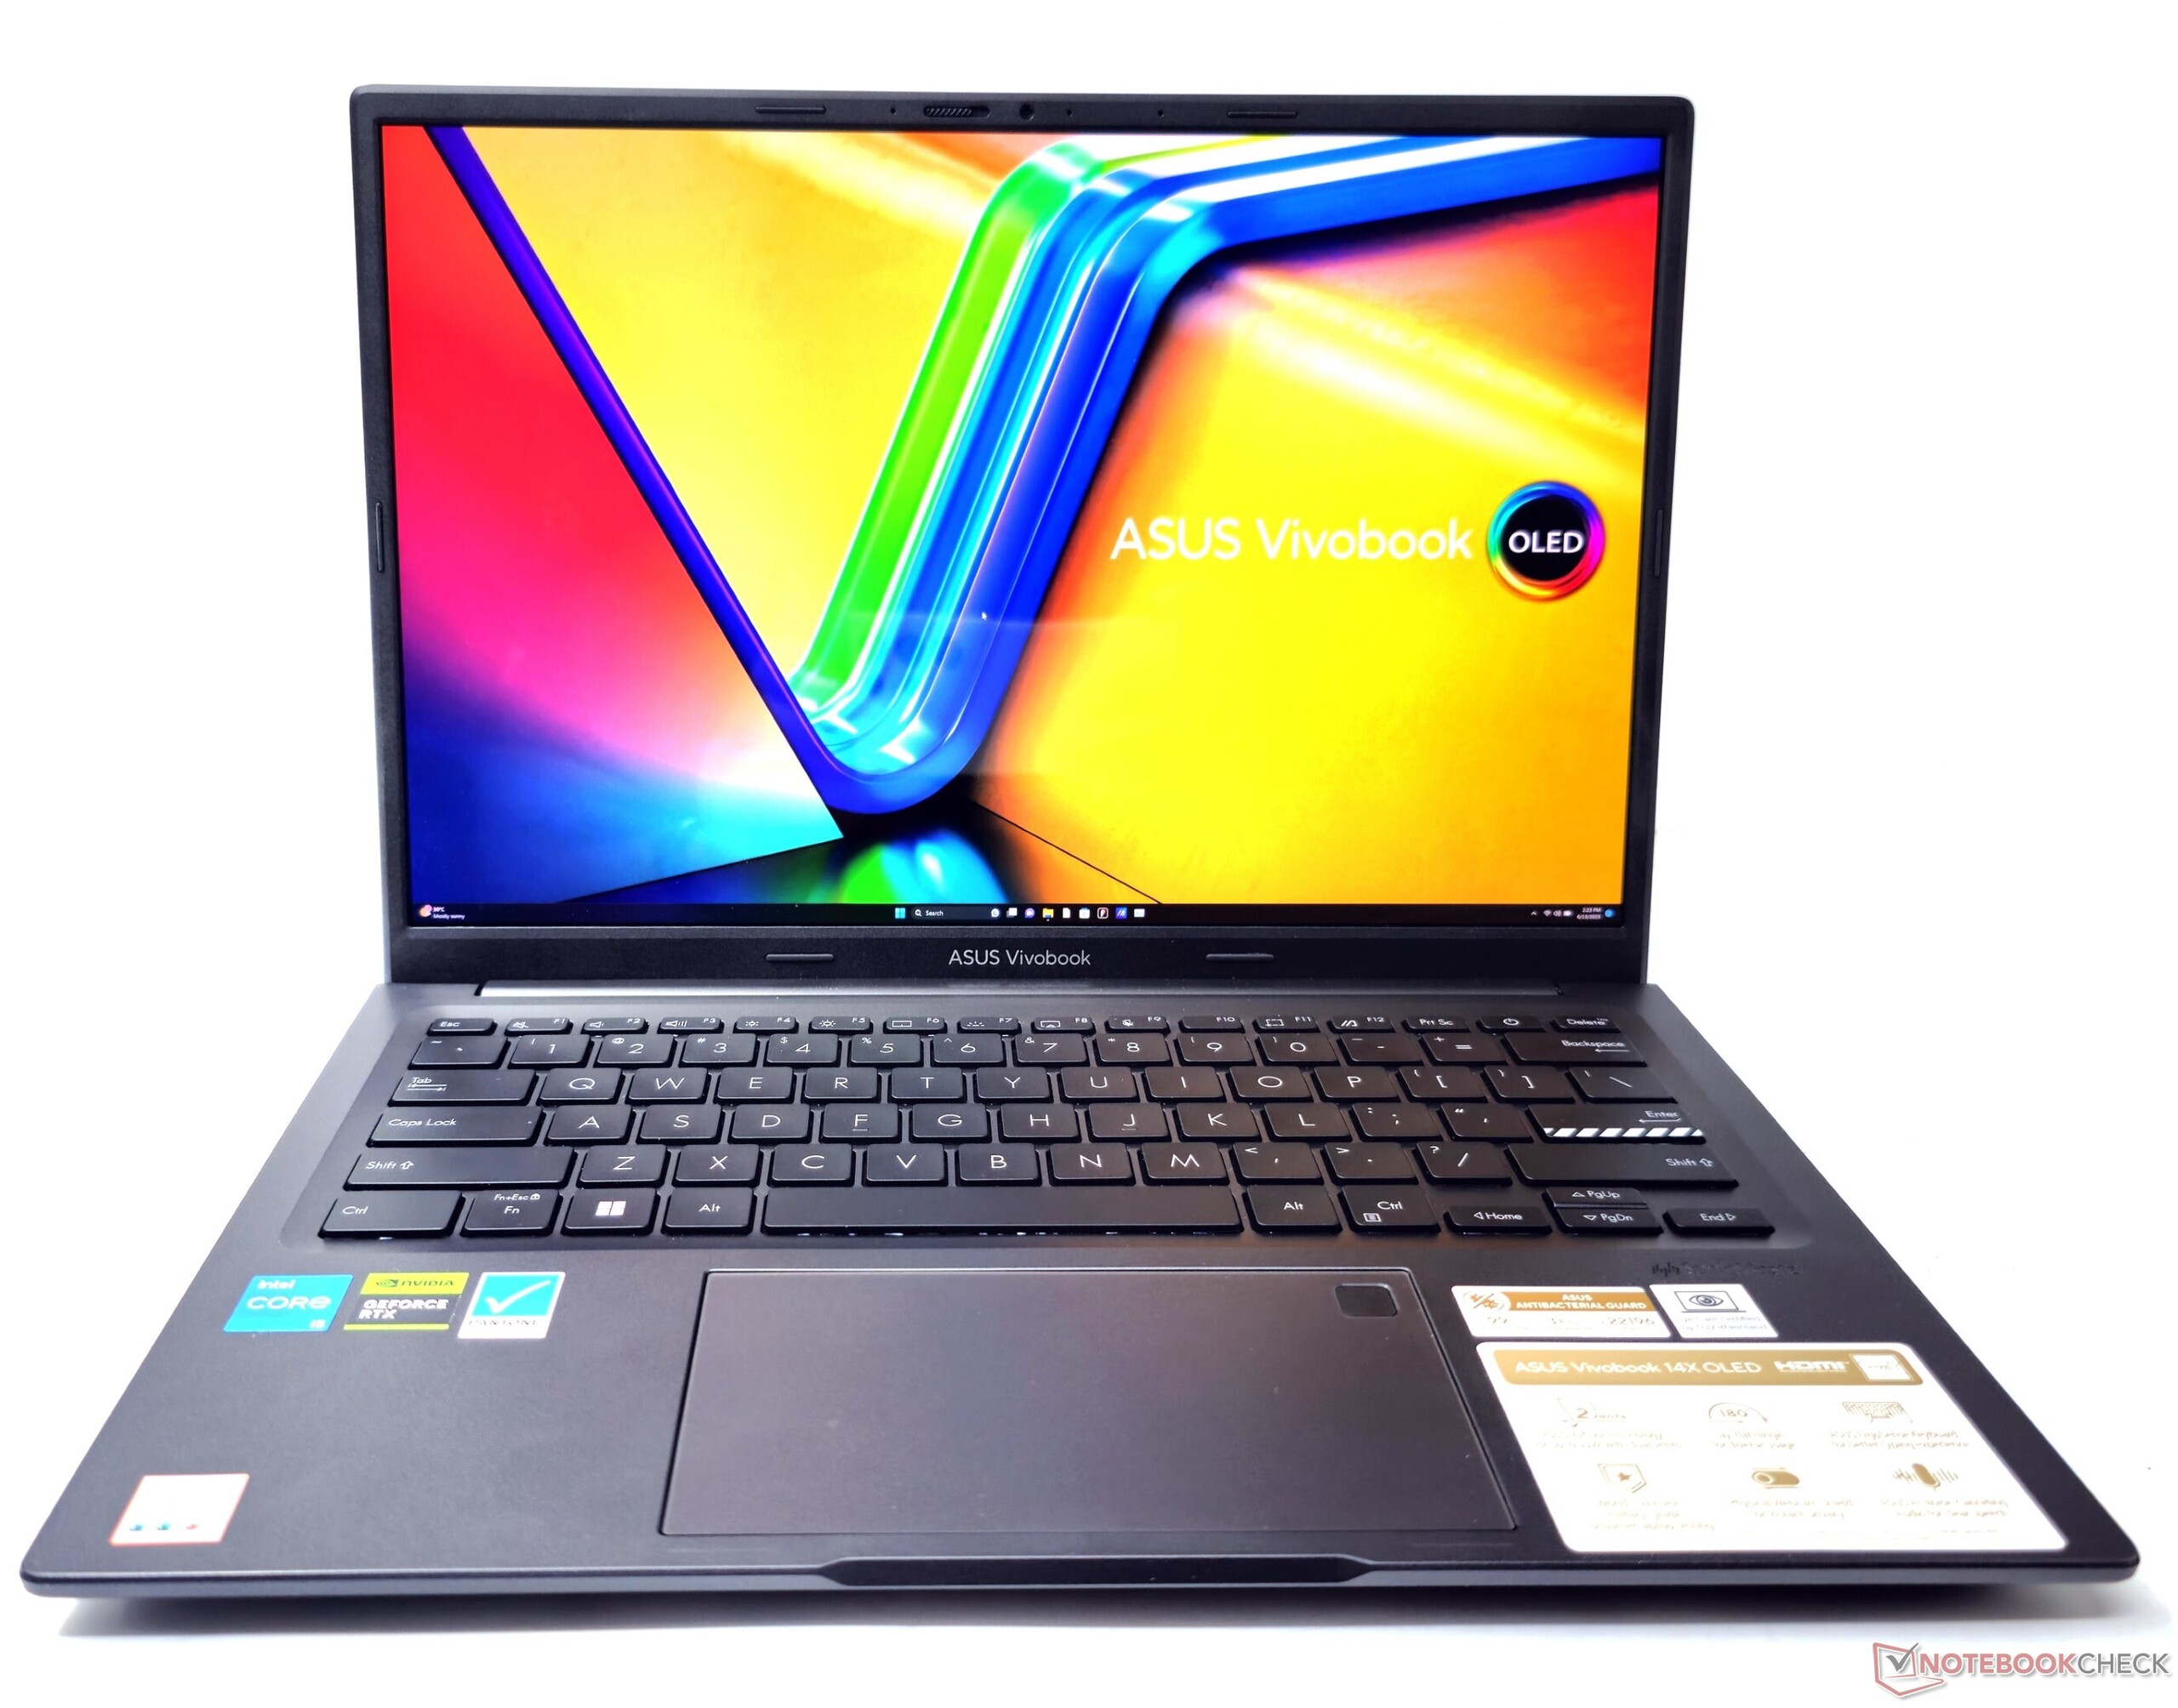
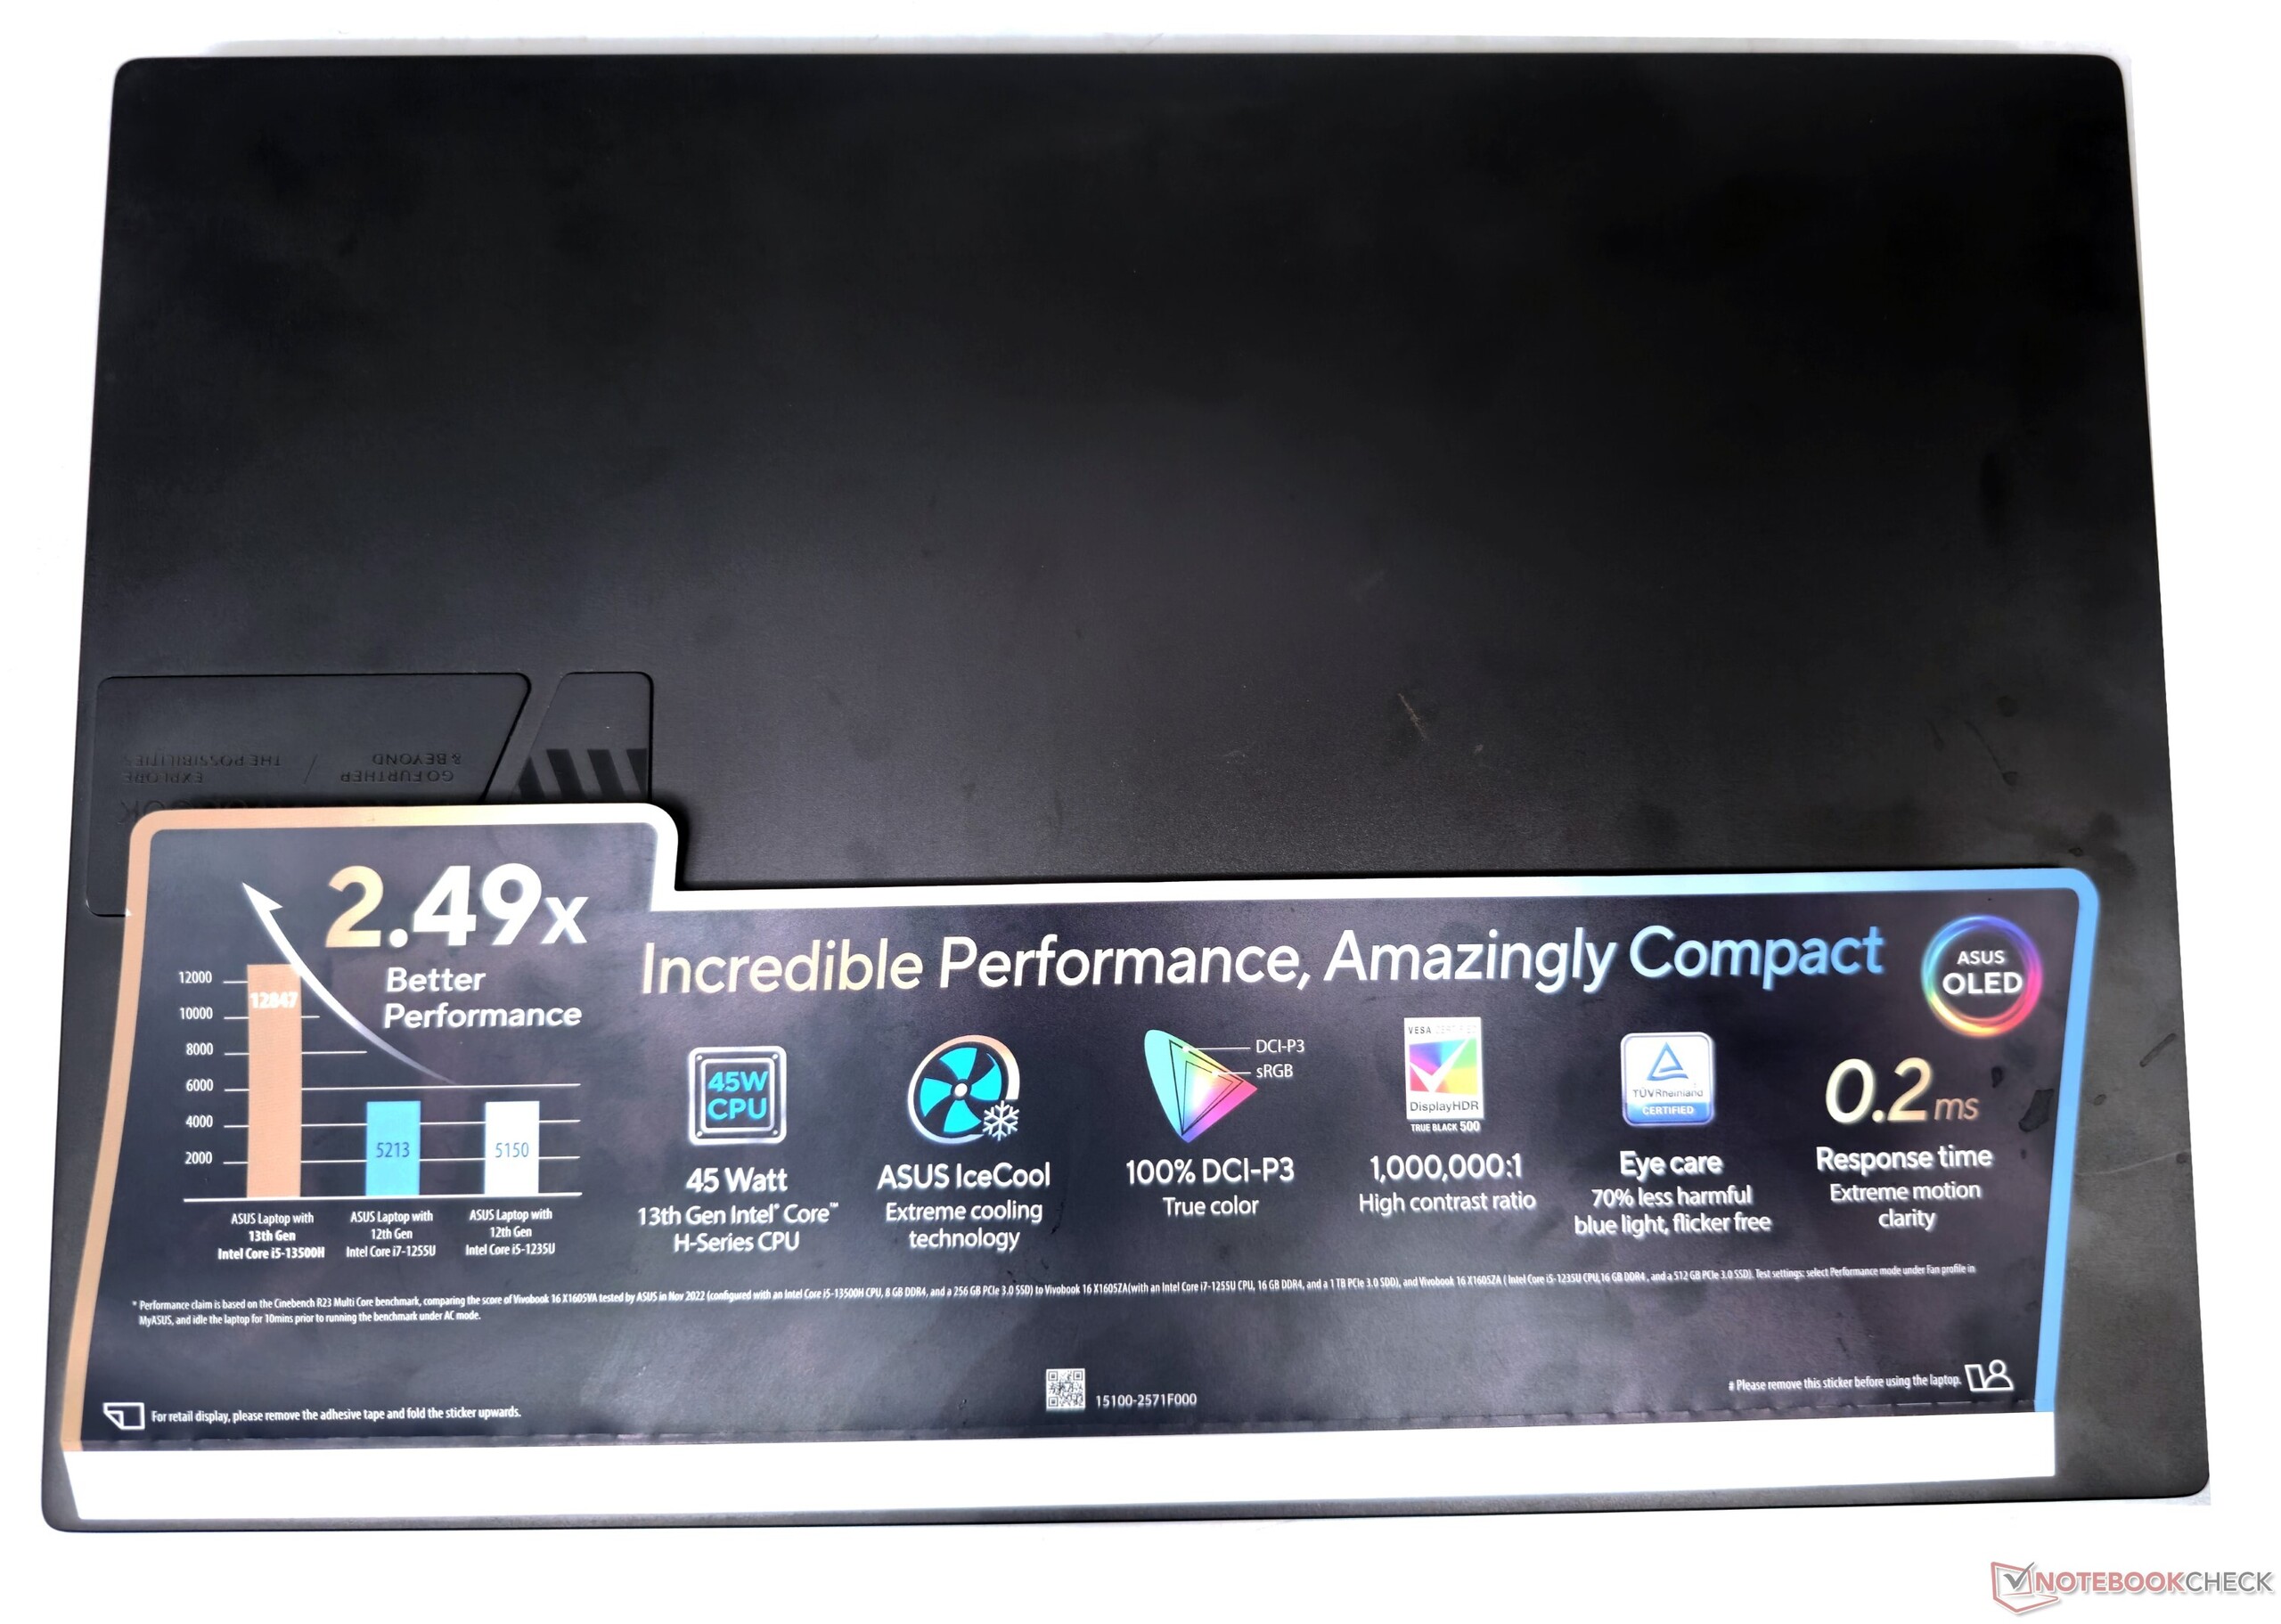
Asus VivoBook 14X OLED K3405 Laptop Review: No-frills multimedia laptop with Core i5-13500H and vibrant 2.8K OLED display

Asus has launched several upgraded VivoBooks this year. While the new VivoBook 15X offers Intel Raptor Lake-P and AMD Ryzen 7030U Barcelo-R options, the VivoBook Pro 16X turns up the notch all the way to the Core i9-13980HX. We now turn our focus towards the VivoBook 14X that comes with a Raptor Lake-H45 CPU.
The VivoBook 14X offers us the first glimpse of the Intel Core i5-13500H's performance together with an Nvidia GeForce RTX 3050 Laptop GPU. OLEDs have now become more or less the mainstay of VivoBooks, excluding a few low-end SKUs. In this case, the VivoBook 14X boasts a 14-inch 2.8K OLED display with a 90 Hz refresh rate.
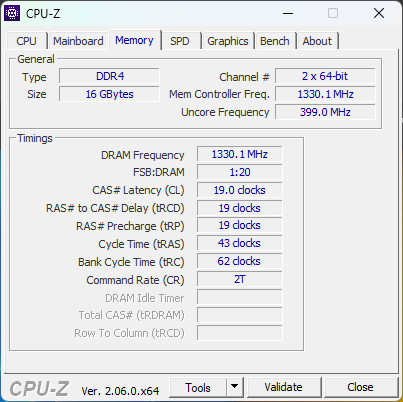
Asus also equips the laptop with 16 GB DDR4-3200 RAM, Wi-Fi 6E, and a 512 GB NVMe SSD. This configuration will set you back by ₹96,990 (US$1,172).
Potential competitors in comparison
Rating | Date | Model | Weight | Height | Size | Resolution | Price |
|---|---|---|---|---|---|---|---|
| 85.6 % v7 (old) | 08 / 2023 | Asus VivoBook 14X K3405 i5-13500H, GeForce RTX 3050 4GB Laptop GPU | 1.4 kg | 18.9 mm | 14.00" | 2880x1800 | |
| 86.3 % v7 (old) | 07 / 2023 | Acer Swift X SFX14-71G i7-13700H, GeForce RTX 4050 Laptop GPU | 1.5 kg | 17.9 mm | 14.50" | 2880x1800 | |
| 85.4 % v7 (old) | 07 / 2023 | MSI Stealth 14 Studio A13V i7-13700H, GeForce RTX 4050 Laptop GPU | 1.7 kg | 19 mm | 14.00" | 2560x1600 | |
| 89.4 % v7 (old) | 05 / 2023 | Gigabyte Aero 14 OLED BMF i7-13700H, GeForce RTX 4050 Laptop GPU | 1.4 kg | 17 mm | 14.00" | 2880x1800 | |
| 89.2 % v7 (old) | 04 / 2023 | Lenovo Slim Pro 7 14ARP8 R7 7735HS, GeForce RTX 3050 6GB Laptop GPU | 1.6 kg | 15.6 mm | 14.50" | 2560x1600 | |
| 88.8 % v7 (old) | 10 / 2022 | Schenker Vision 14 2022 RTX 3050 Ti i7-12700H, GeForce RTX 3050 Ti Laptop GPU | 1.3 kg | 16.6 mm | 14.00" | 2880x1800 |
Chassis: Lightweight yet utilitarian
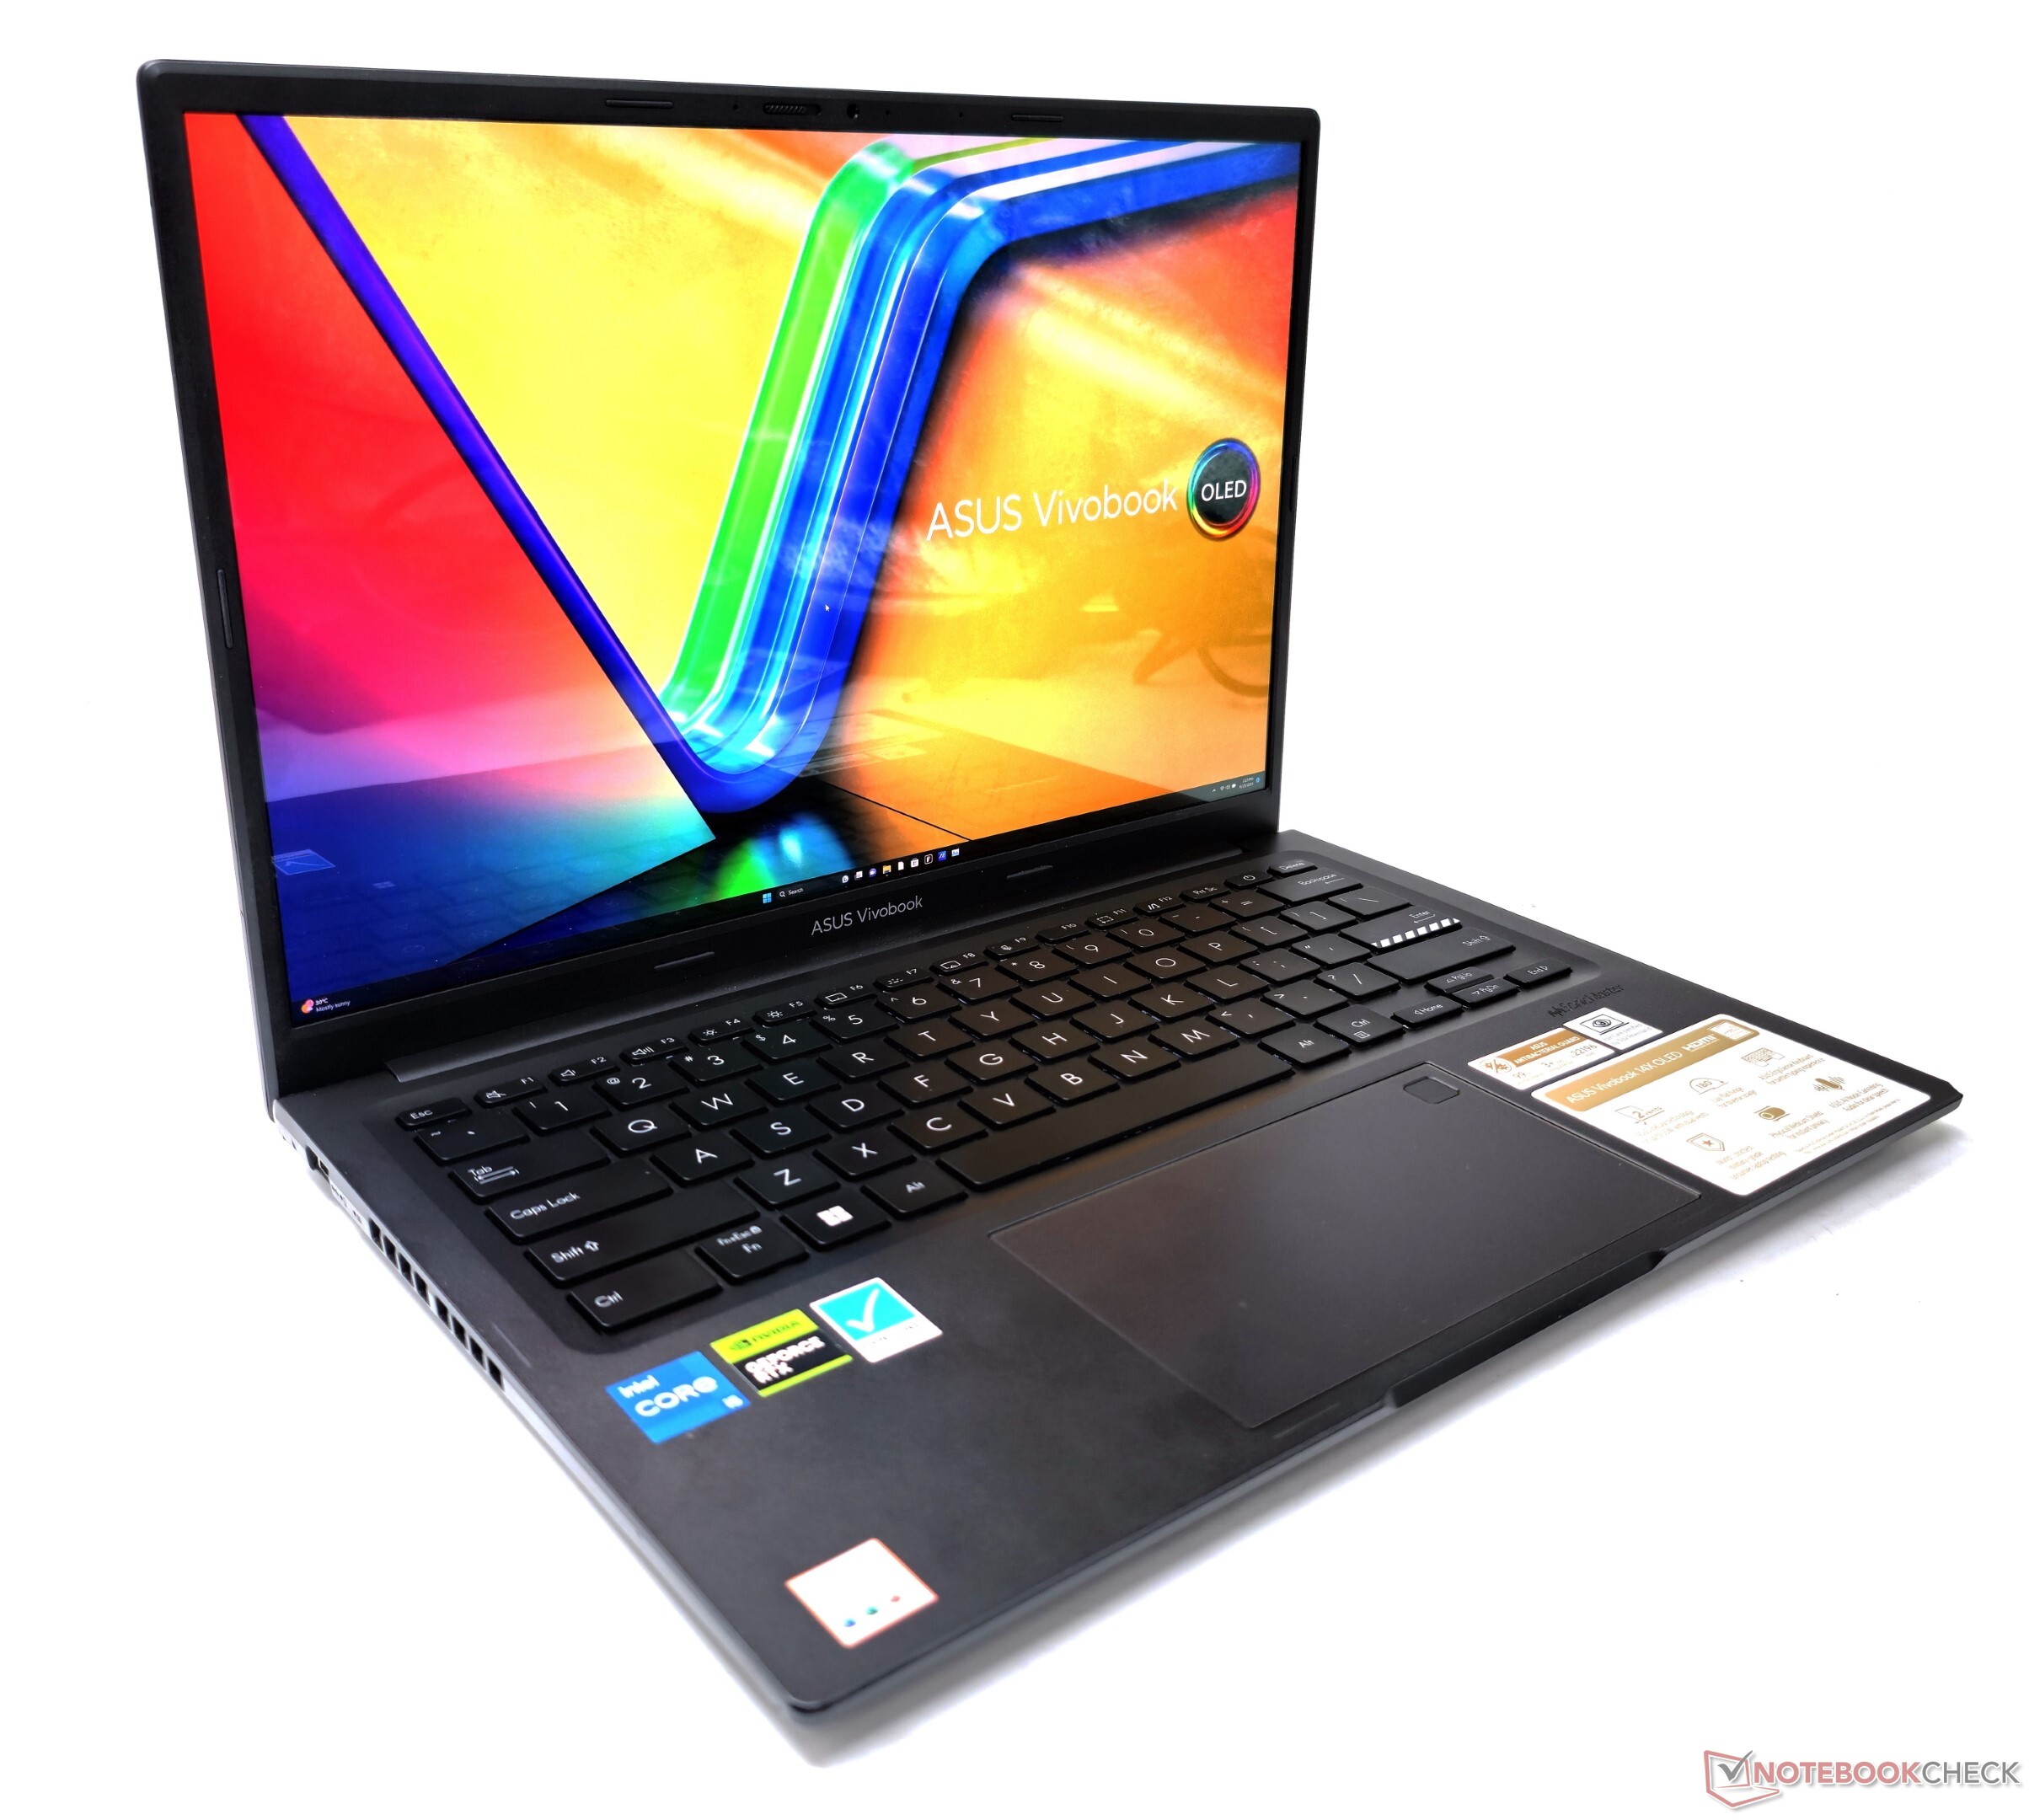
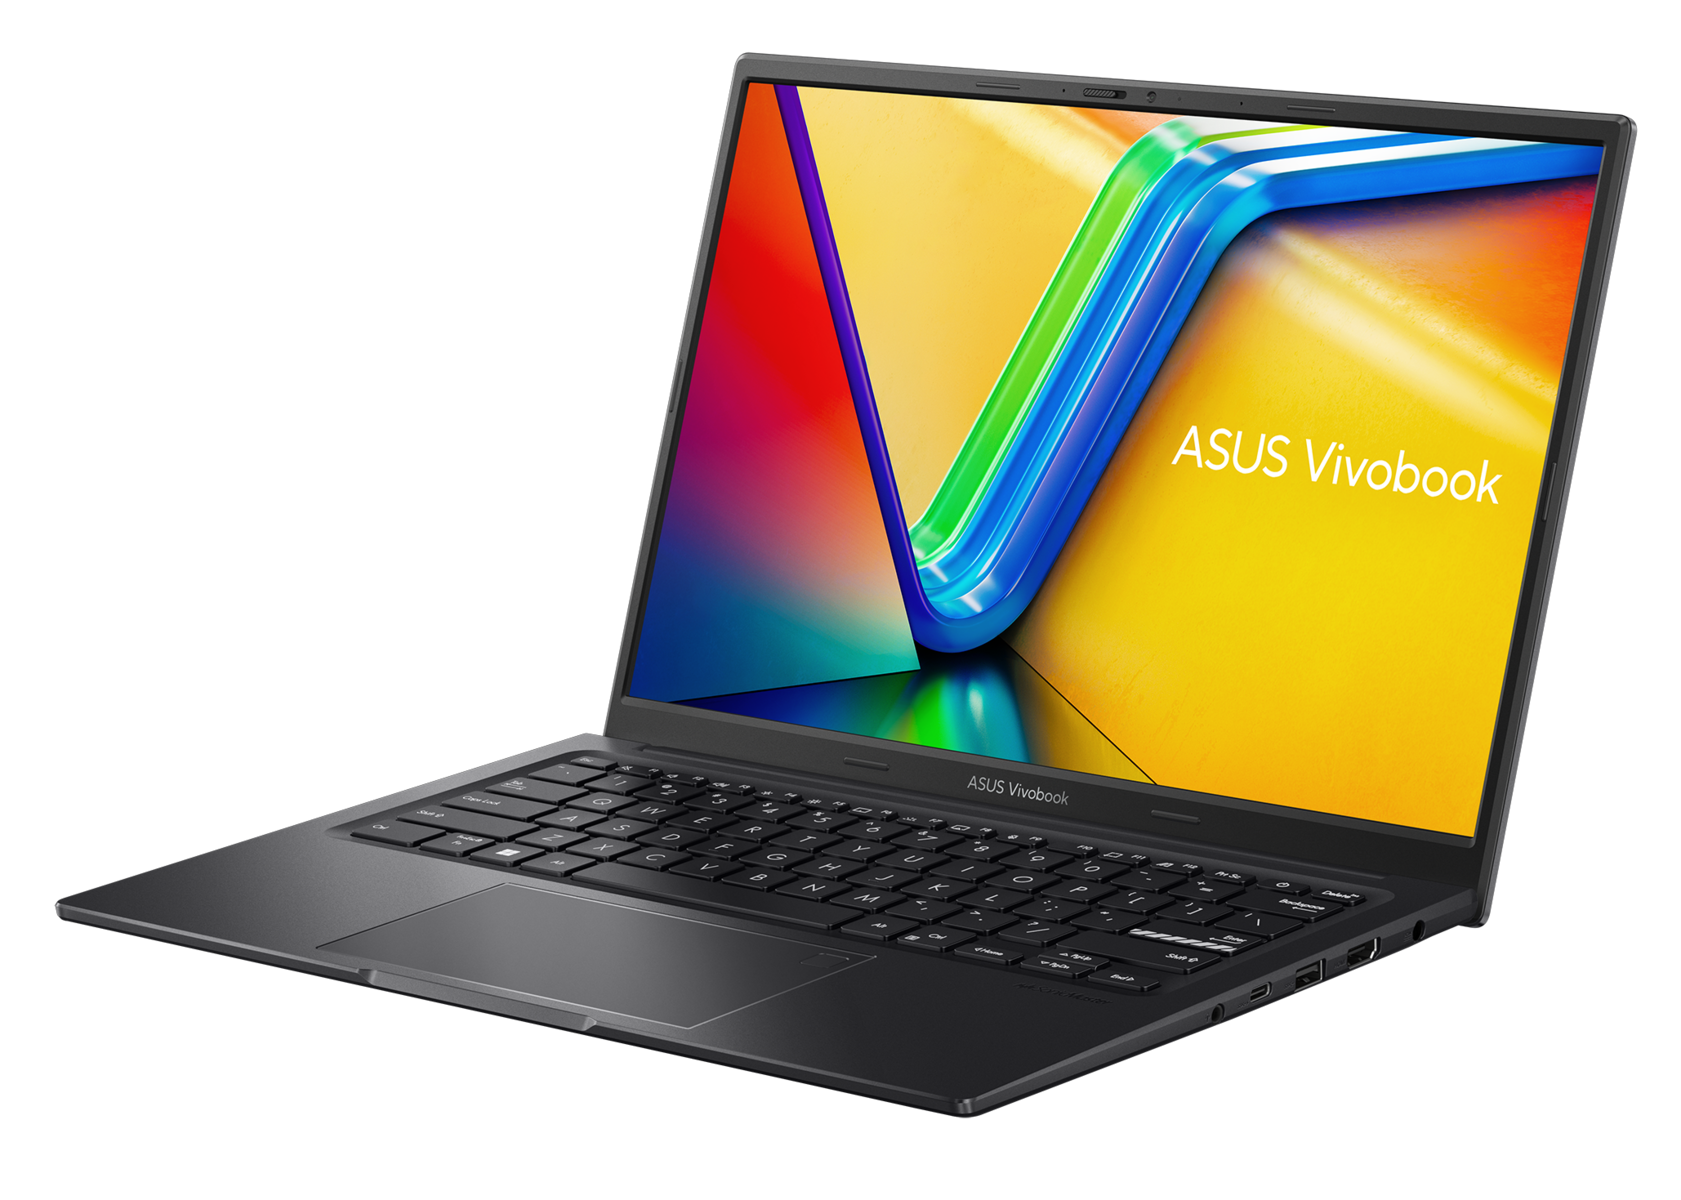
Similar to the VivoBook 15X, Asus offers the VivoBook 14X in two color options: Cool Silver and Indie Black (our variant). As is generally the norm with VivoBooks, the 1.4 kg chassis primarily sports a plastic construction while the metallic lid features the distinctive VivoBook logo.
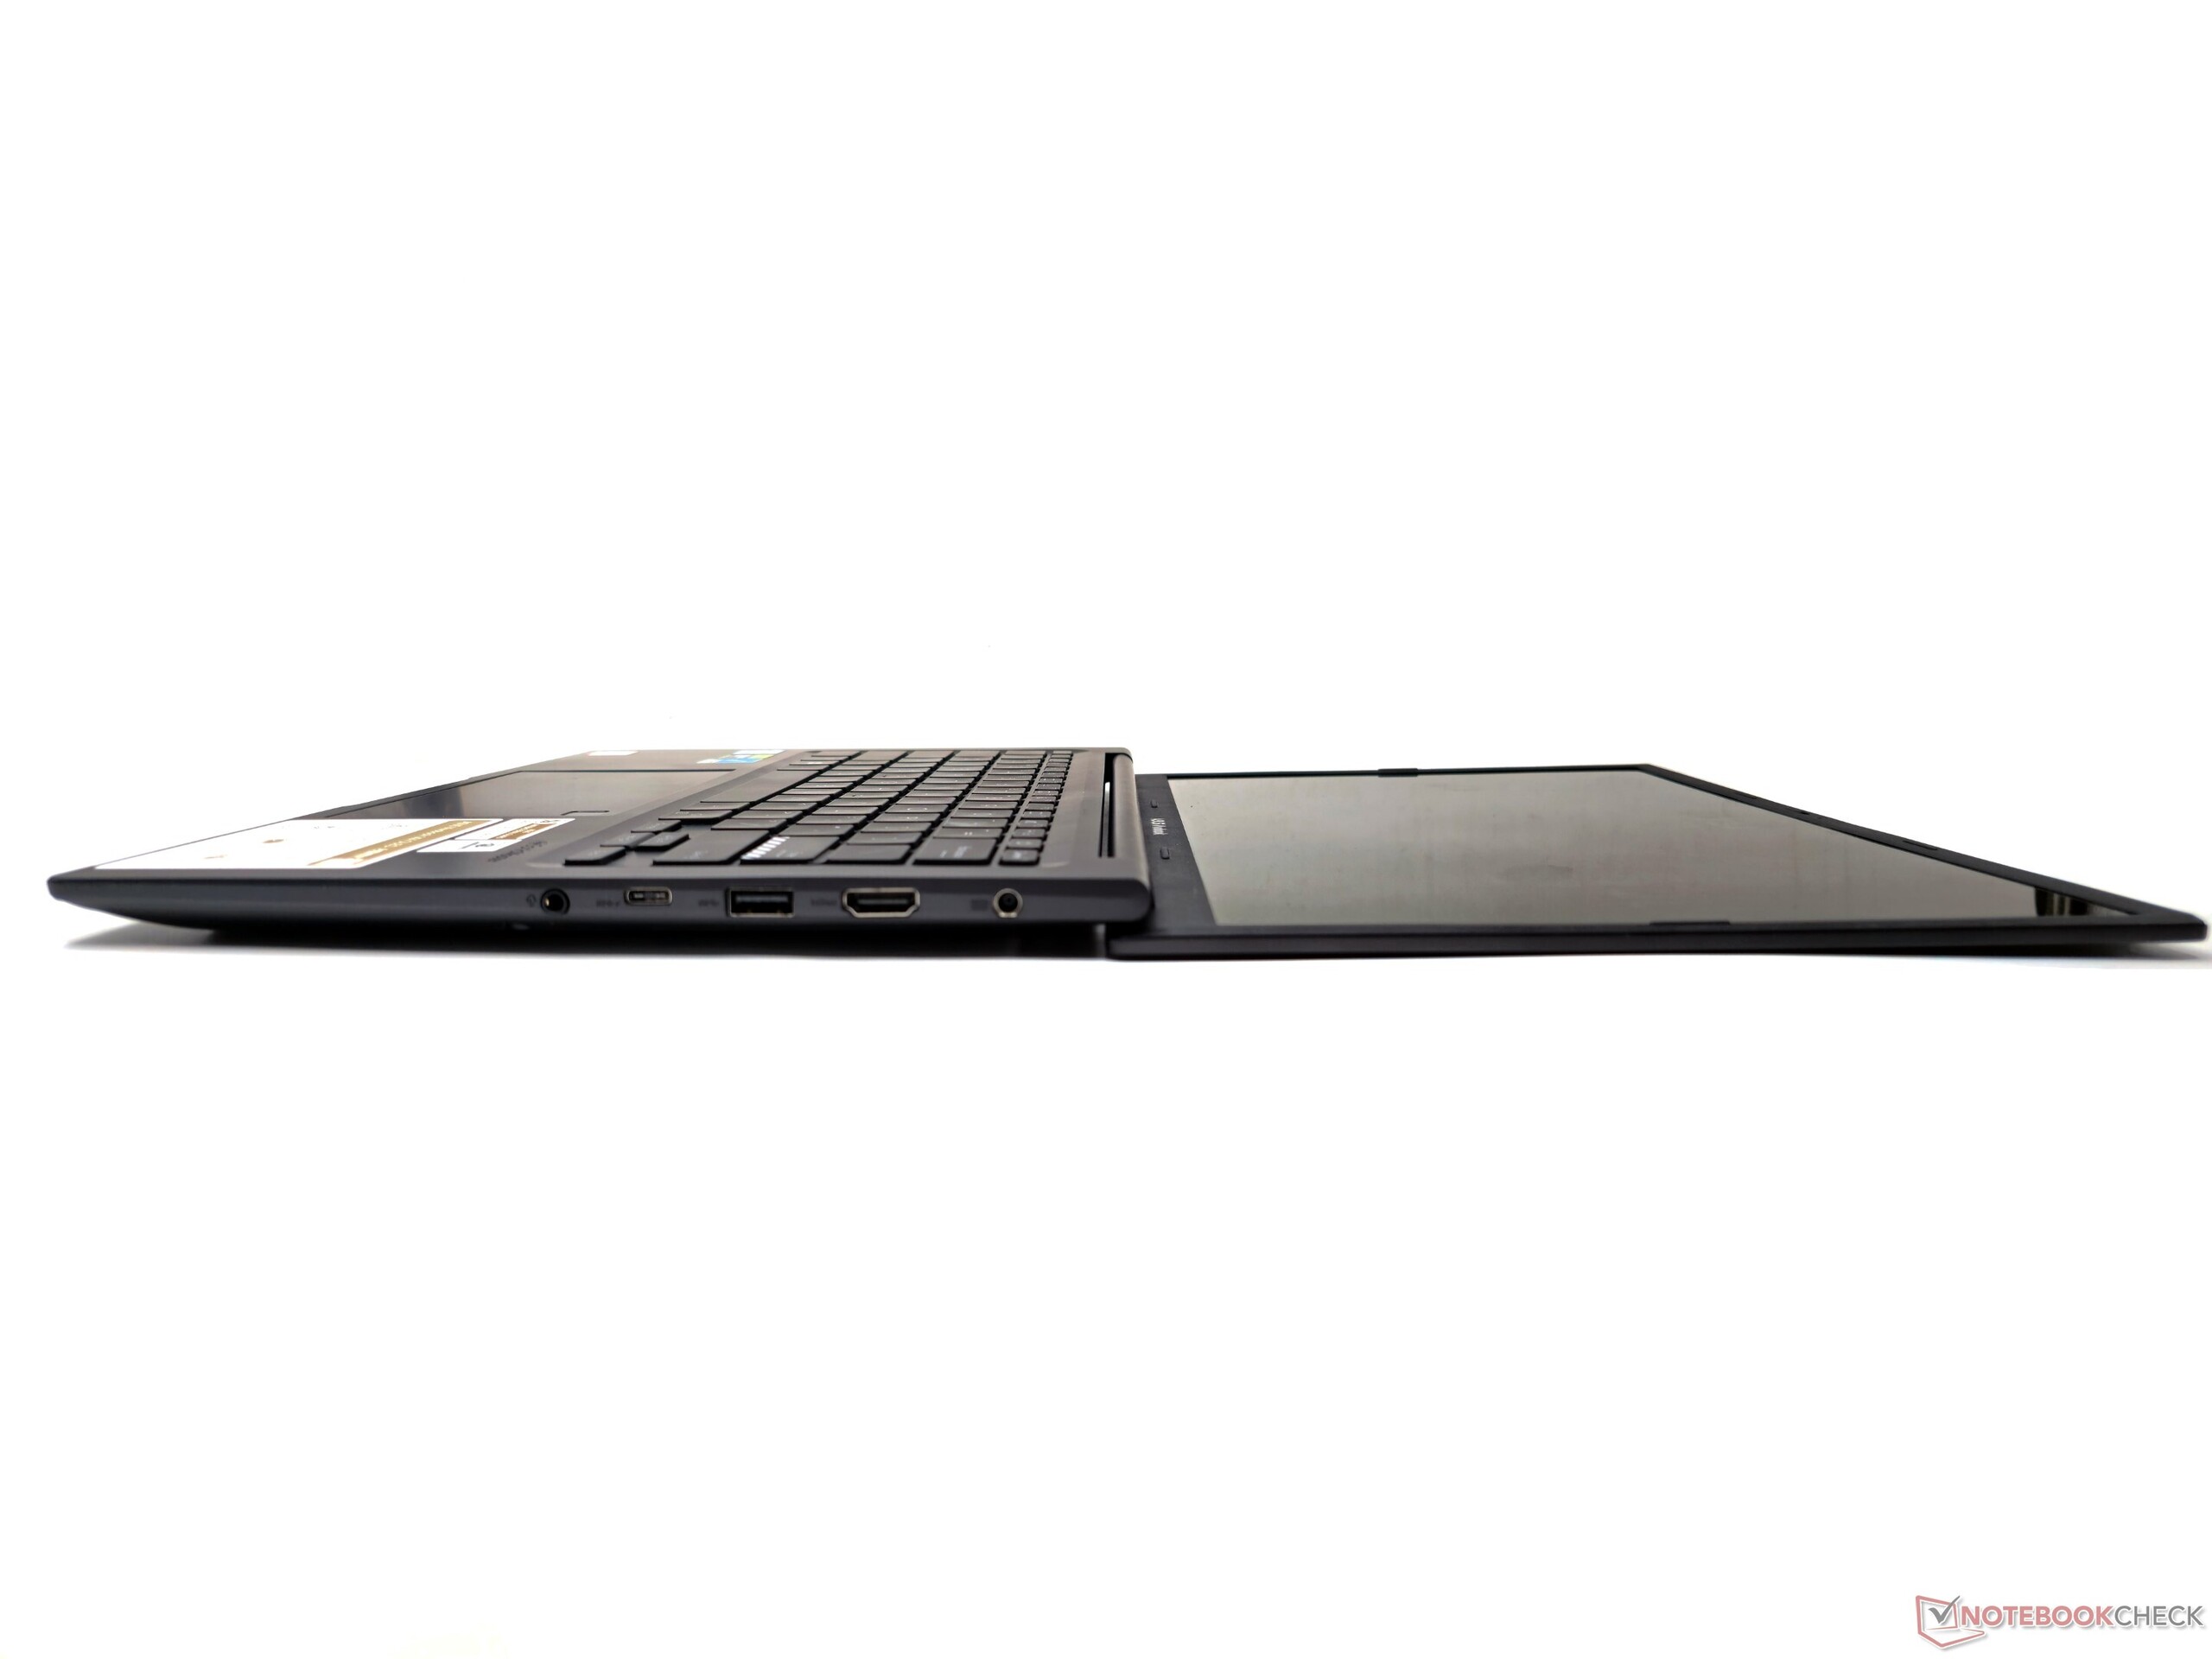
Opening the display lid is a breeze, requiring just one finger, and the laptop remains stable without sliding. The display can be laid flat at a 180° angle. There is some flex in the display and the keyboard deck, but this should not be a concern during normal use.
The hinges feel solid with no creaks or excessive resistance. There's also Asus's antimicrobial guard that is touted to inhibit bacterial growth for at least three years. Asus also claims that the laptop meets MIL-STD-810H durability standards.
Connectivity: Wi-Fi 6E performance not up to the mark
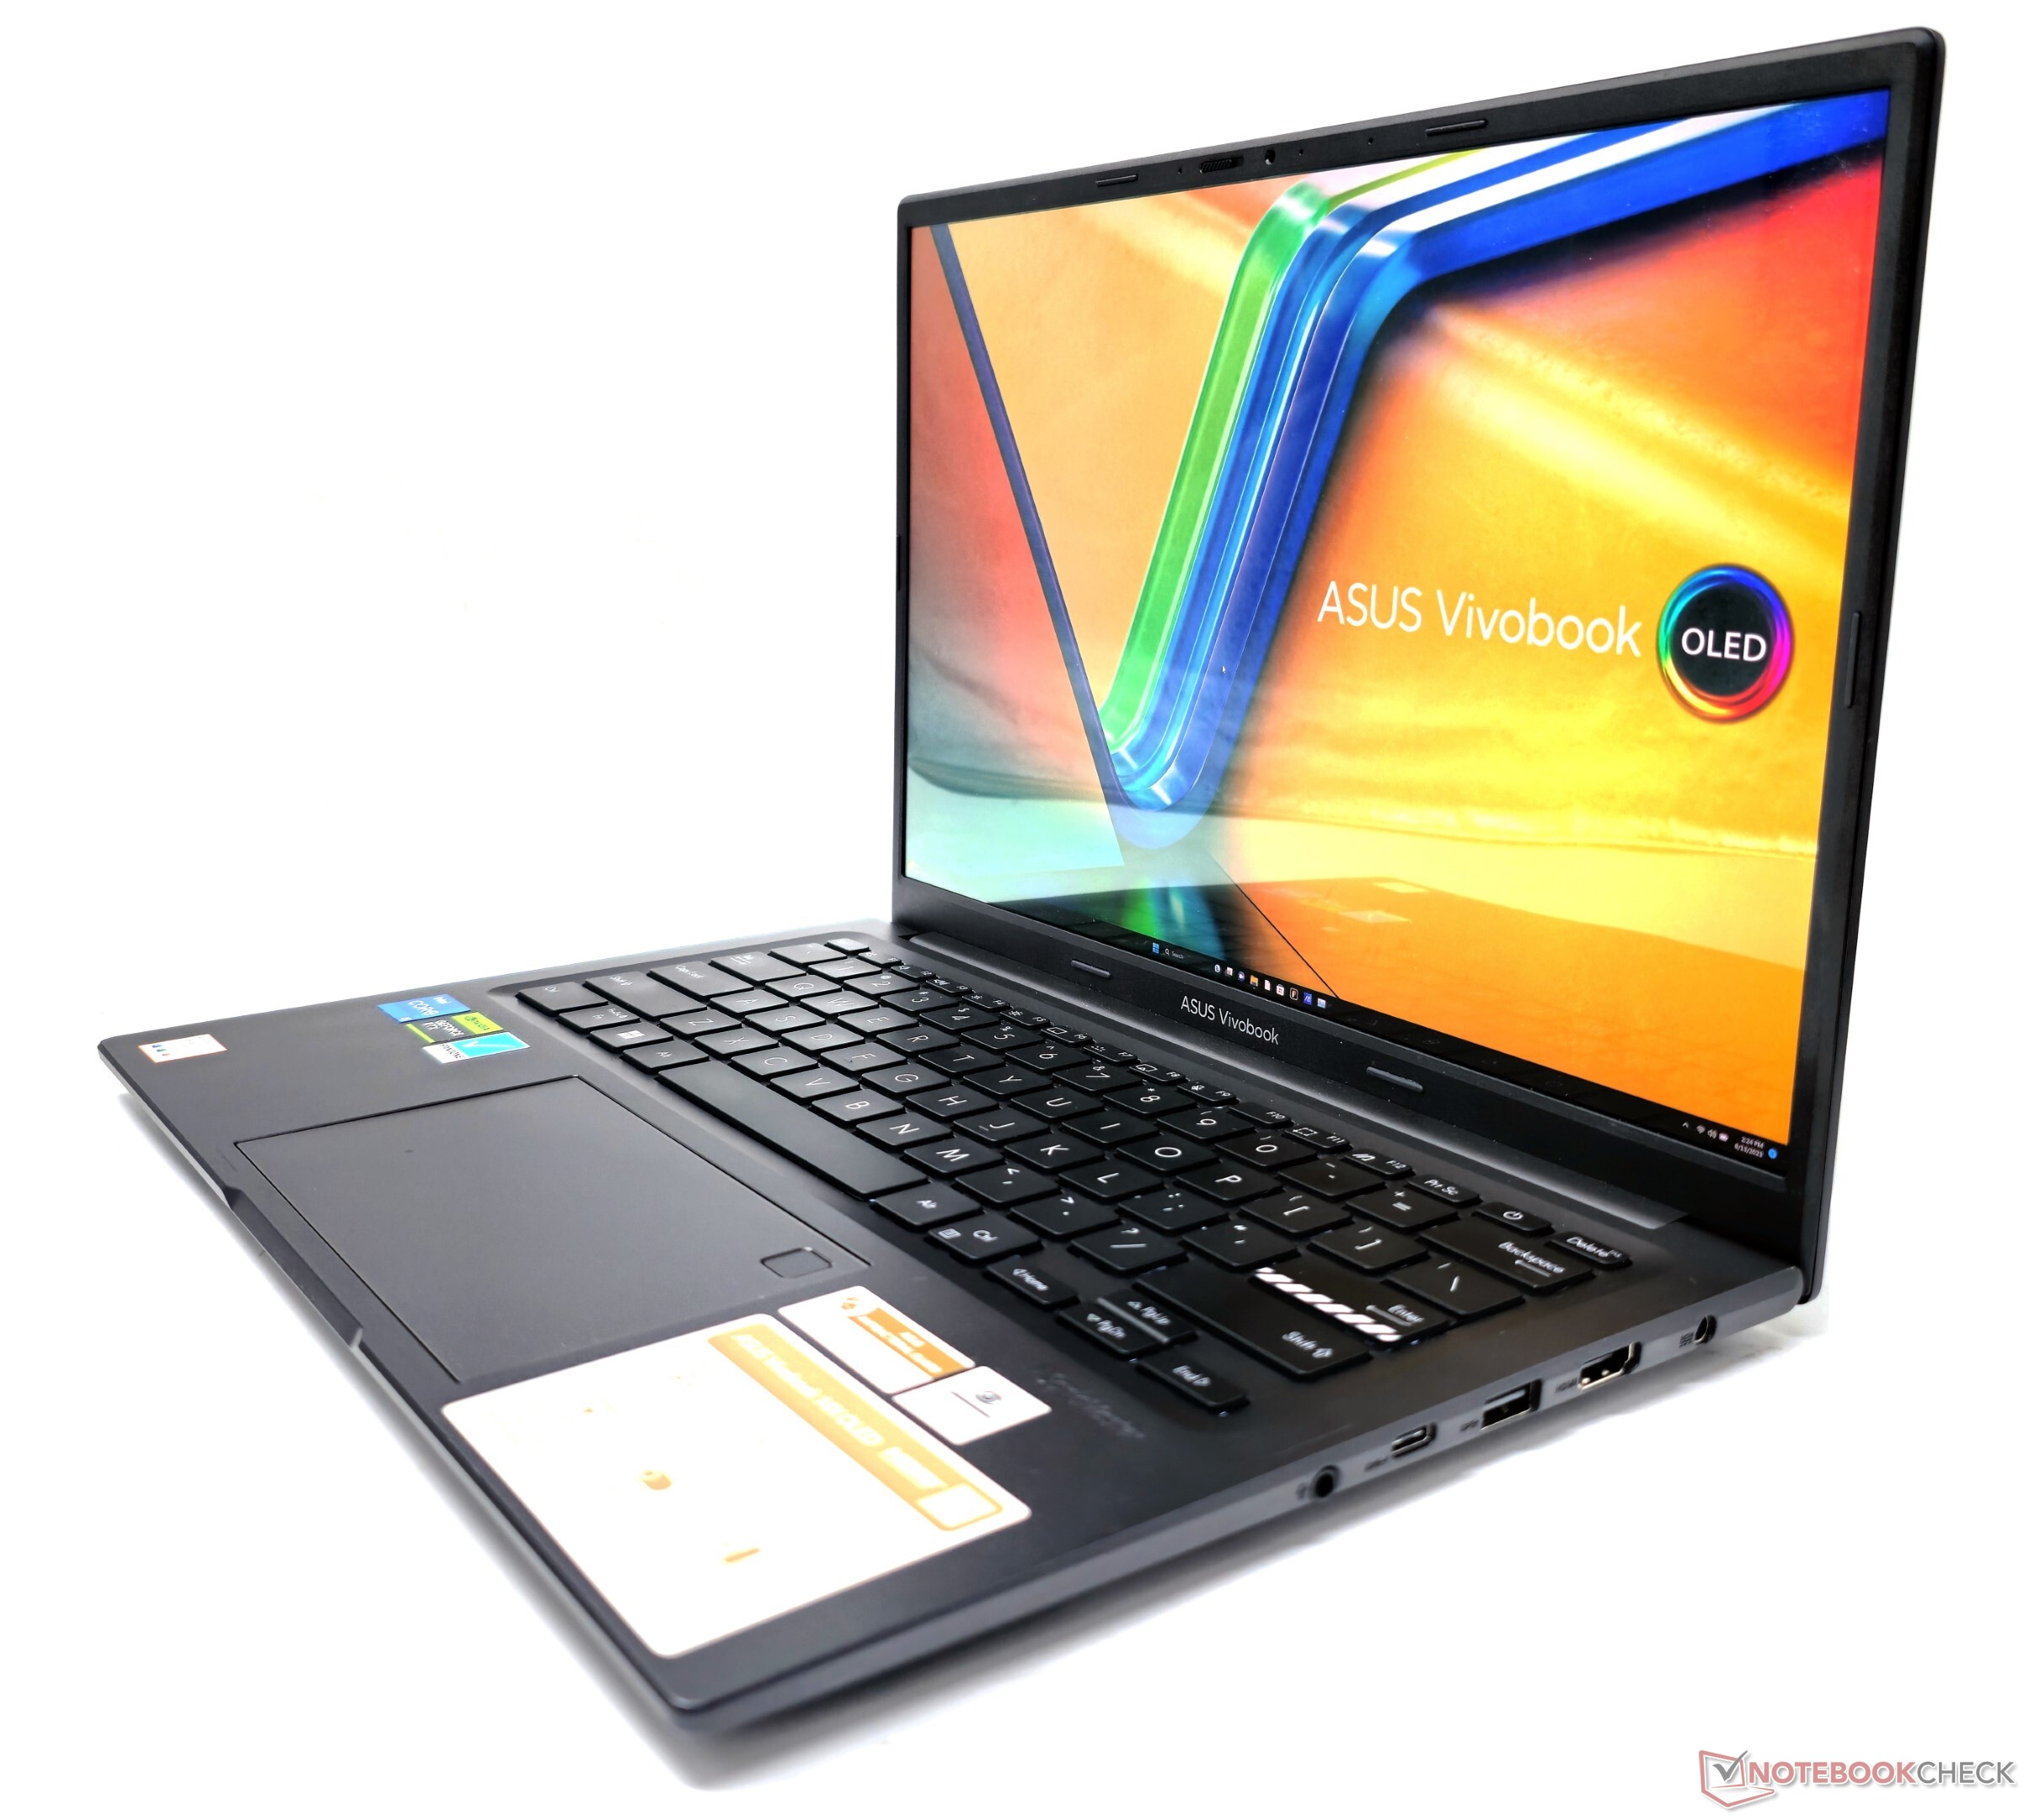
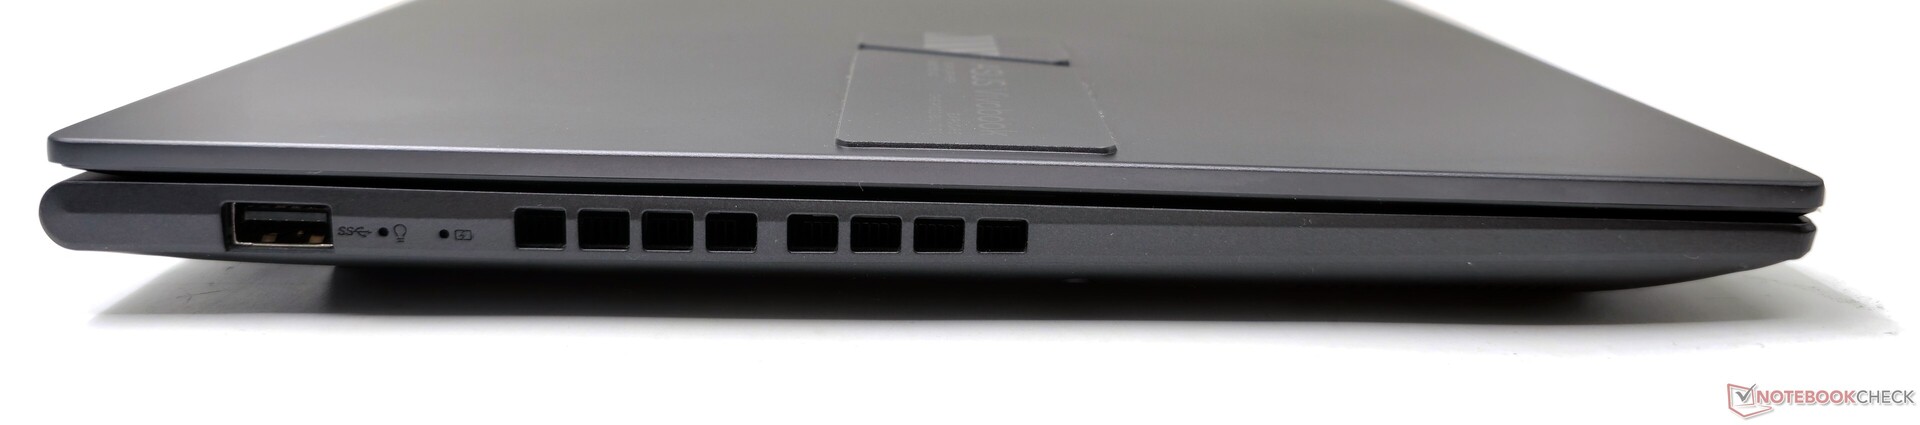
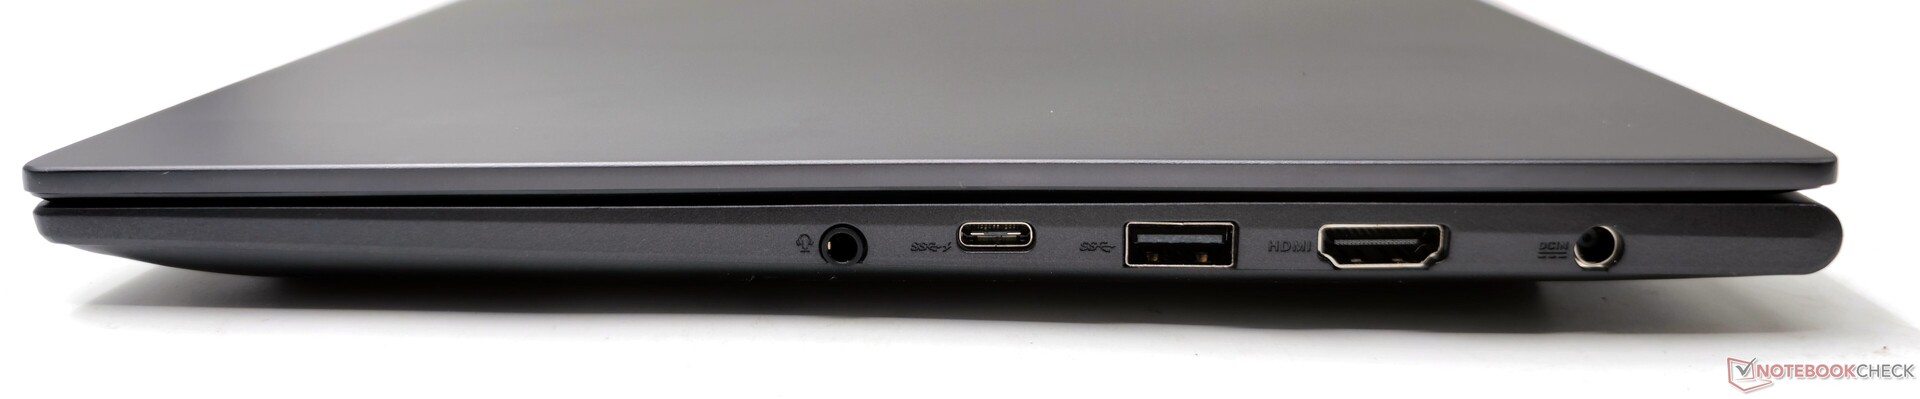
The port arrangement resembles what we've seen on the VivoBook 15X before. On the left side, there is a single USB 3.2 Gen1 Type-A port, while the rest are positioned on the right side.
This one-sided distribution of ports can be bothersome, especially when using an external mouse and if you intend to connect multiple peripherals. However, the spacing between the ports is sufficient and won't cause any issues with connectivity.
Communication
The Intel Wi-Fi 6E AX211 card shows excellent performance in the 5 GHz band with no perceivable drops when tested with our reference Asus ROG Rapture GT-AXE11000 router.
However, the same cannot be said for the 6 GHz band, which shows inconsistent performance with regular throughput drops during the test.
In comparison, the Gigabyte Aero 14 OLED with an Intel Wi-Fi 6E AX210 card performs well in both the bands.
| Networking / iperf3 transmit AXE11000 | |
| Asus VivoBook 14X K3405 (iperf 3.1.3) | |
| Acer Swift X SFX14-71G | |
| Gigabyte Aero 14 OLED BMF (iperf 3.1.3) | |
| MSI Stealth 14 Studio A13V | |
| Schenker Vision 14 2022 RTX 3050 Ti (iperf 3.1.3) | |
| Lenovo Slim Pro 7 14ARP8 (iperf 3.1.3) | |
| Average of class Multimedia (606 - 1978, n=53, last 2 years) | |
| Average Intel Wi-Fi 6E AX211 (64 - 1921, n=276) | |
| Networking / iperf3 receive AXE11000 | |
| Asus VivoBook 14X K3405 (iperf 3.1.3) | |
| Gigabyte Aero 14 OLED BMF (iperf 3.1.3) | |
| Schenker Vision 14 2022 RTX 3050 Ti (iperf 3.1.3) | |
| MSI Stealth 14 Studio A13V | |
| Acer Swift X SFX14-71G | |
| Lenovo Slim Pro 7 14ARP8 (iperf 3.1.3) | |
| Average Intel Wi-Fi 6E AX211 (582 - 1890, n=276) | |
| Average of class Multimedia (682 - 1818, n=53, last 2 years) | |
| Networking / iperf3 transmit AXE11000 6GHz | |
| Gigabyte Aero 14 OLED BMF (iperf 3.1.3) | |
| Average of class Multimedia (869 - 2373, n=23, last 2 years) | |
| Asus VivoBook 14X K3405 (iperf 3.1.3) | |
| Average Intel Wi-Fi 6E AX211 (385 - 1851, n=226) | |
| Networking / iperf3 receive AXE11000 6GHz | |
| Gigabyte Aero 14 OLED BMF (iperf 3.1.3) | |
| Average of class Multimedia (1212 - 2361, n=23, last 2 years) | |
| Asus VivoBook 14X K3405 (iperf 3.1.3) | |
| Average Intel Wi-Fi 6E AX211 (700 - 1857, n=226) | |
Webcam
The integrated 720p webcam on the VivoBook 14X exhibits poor sharpness and significant color deviations. The X-Rite ColorChecker Passport test reveals the highest Delta E of 22.45 with the Purplish Blue color.
While the webcam may suffice for occasional video calls, Asus should have ideally equipped the laptop with a 1080p module for improved quality.
A physical webcam shutter is provided for added privacy.


Security
Biometric logins are facilitated by a fingerprint scanner embedded in the touchpad. Additionally, a TPM 2.0 module is also present.
Accessories and Warranty
There are no additional accessories in the box apart from the 90 W power adapter and the usual paperwork.
In India, Asus offers the VivoBook 14X with a one-year standard warranty. Those who purchase the laptop before August 31, 2023 can also take advantage of Back to College benefits that include several warranty extension and local accidental damage protection options ranging from ₹99 to ₹2,999.
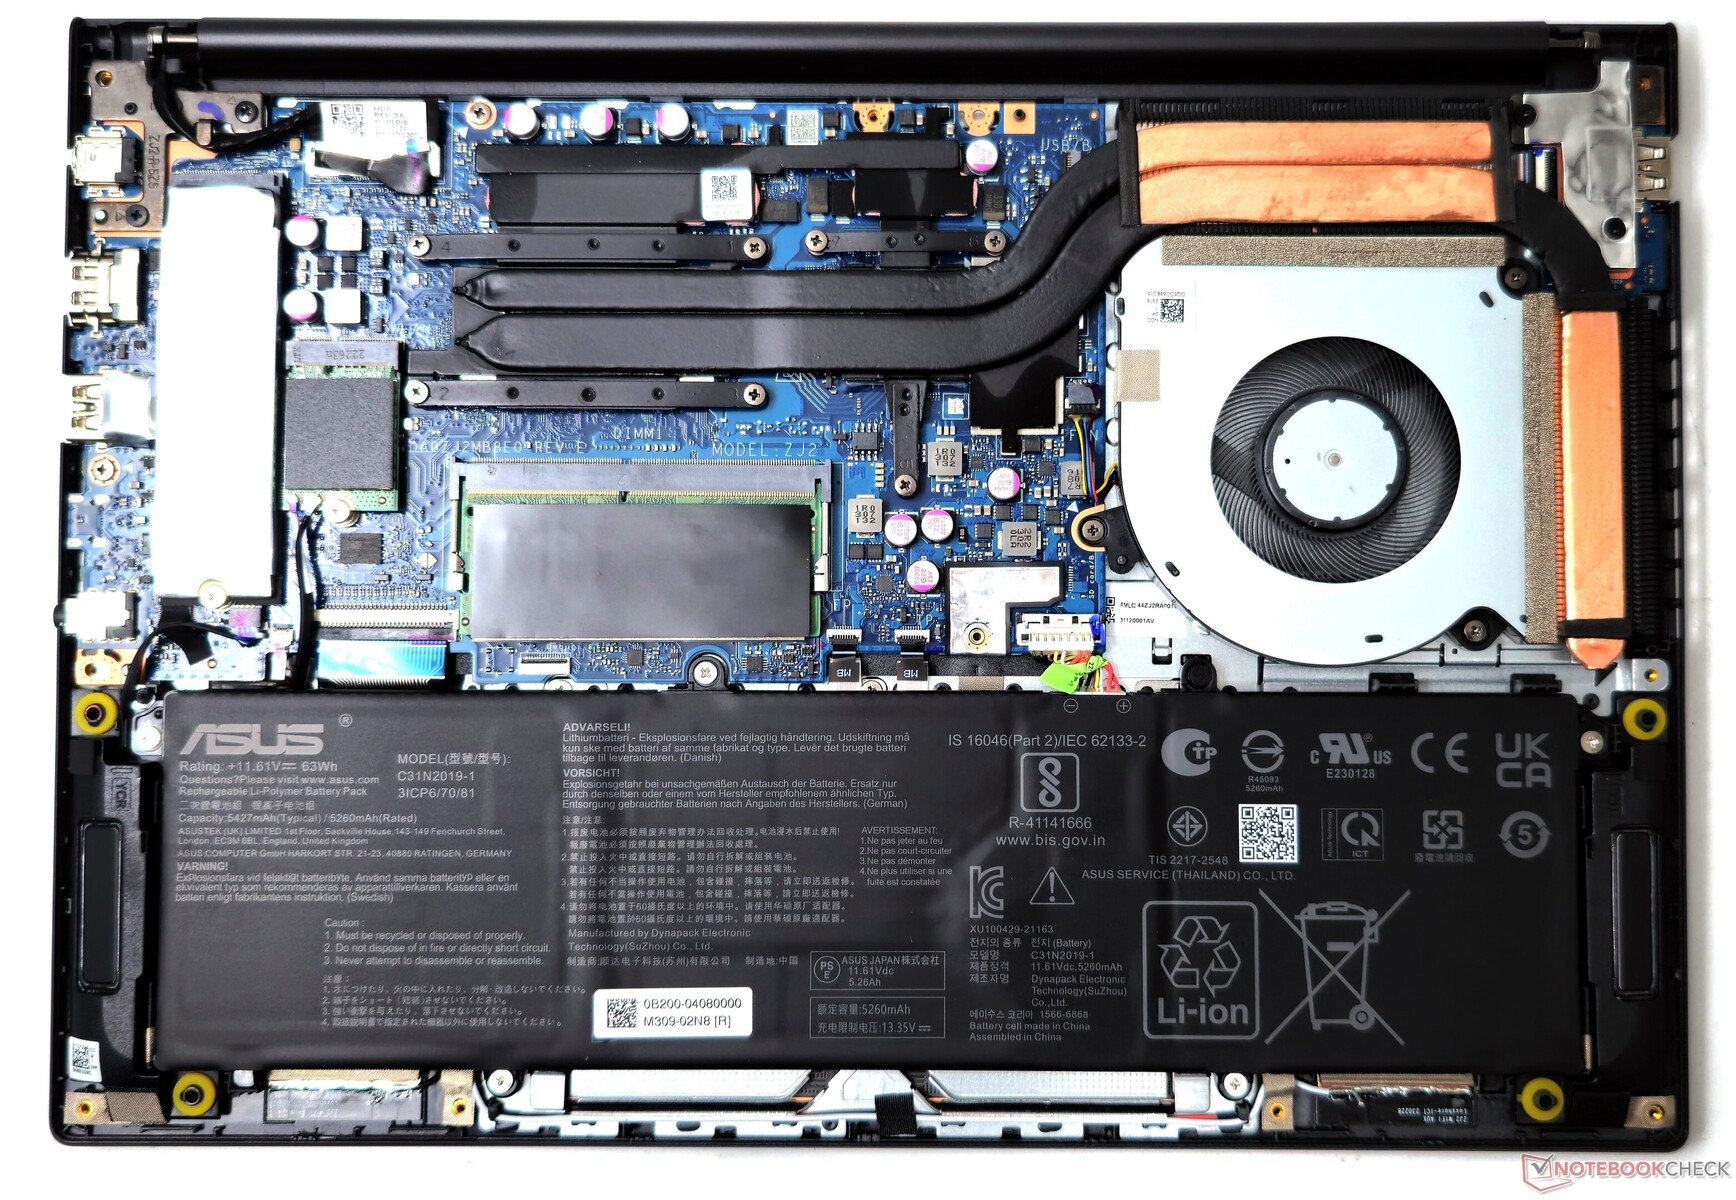
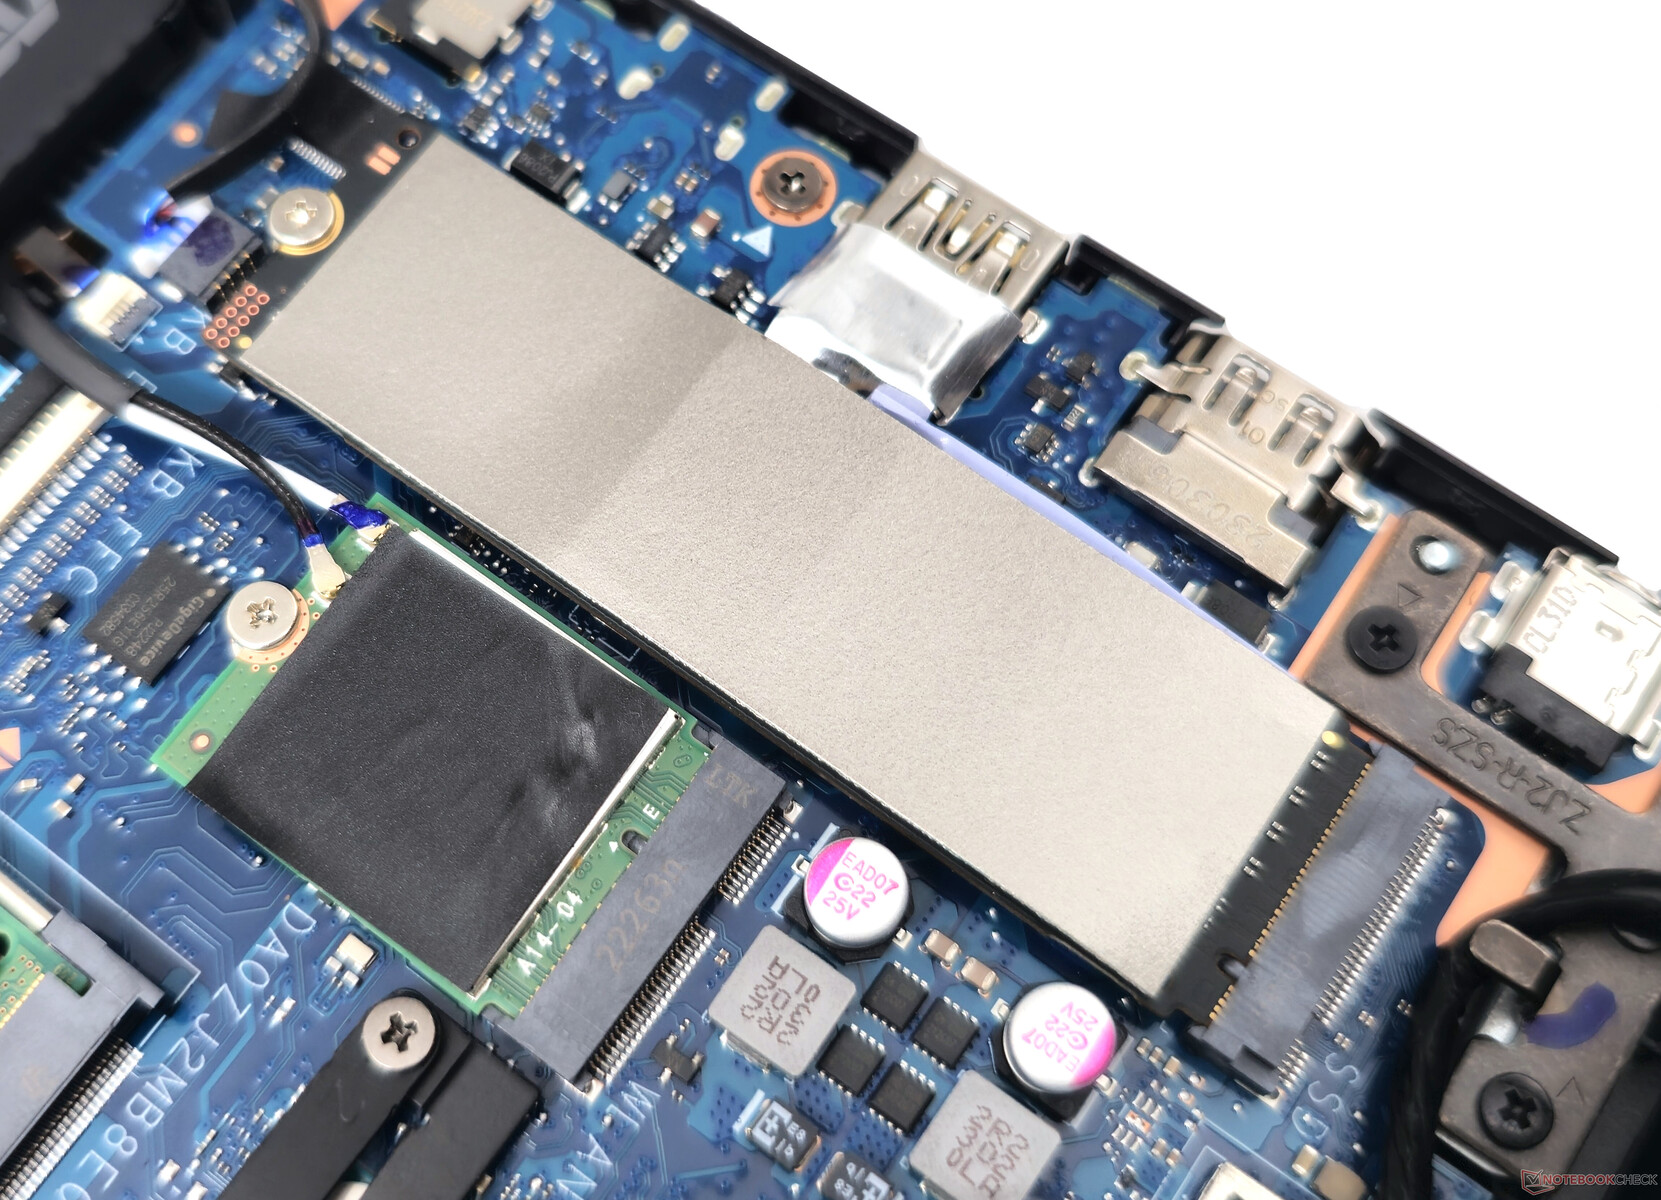
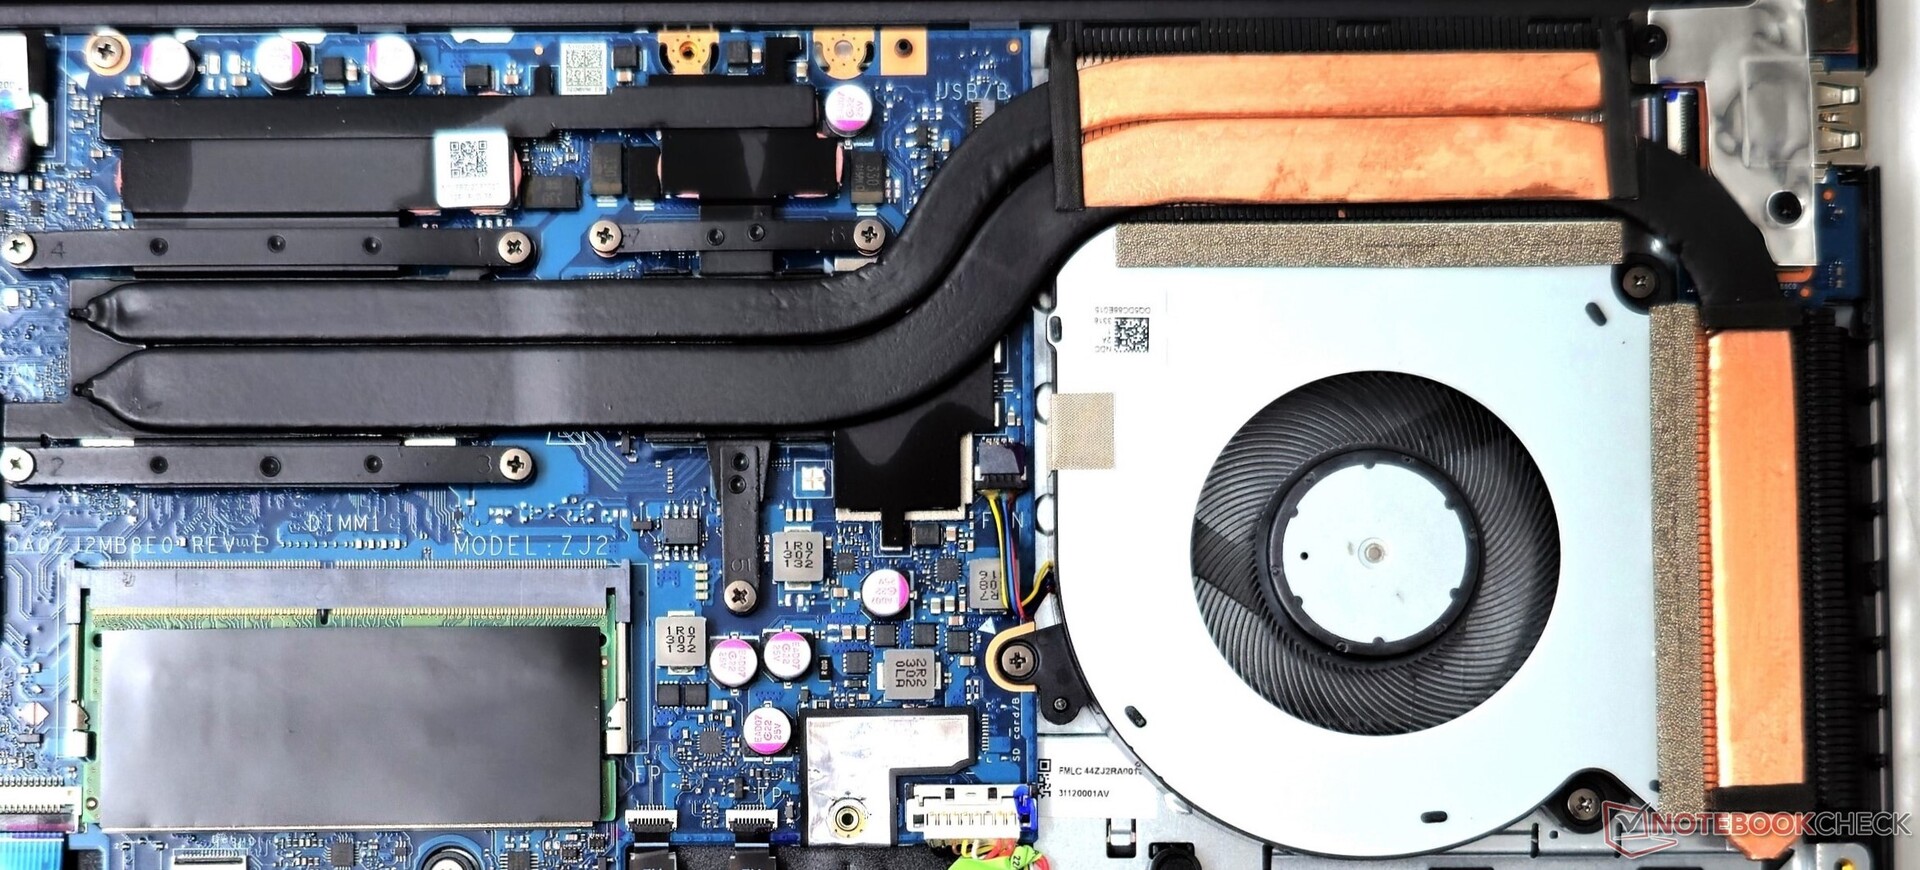
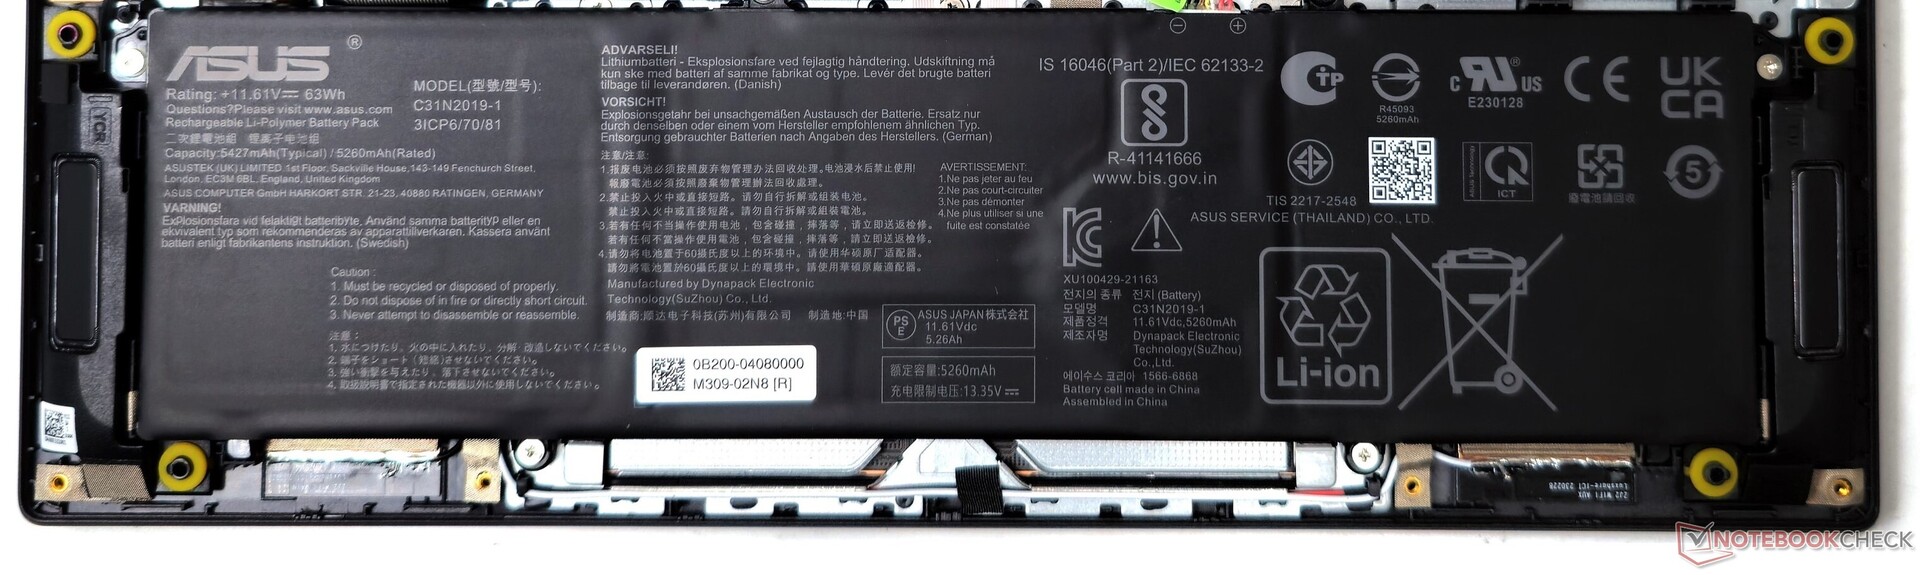
Maintenance
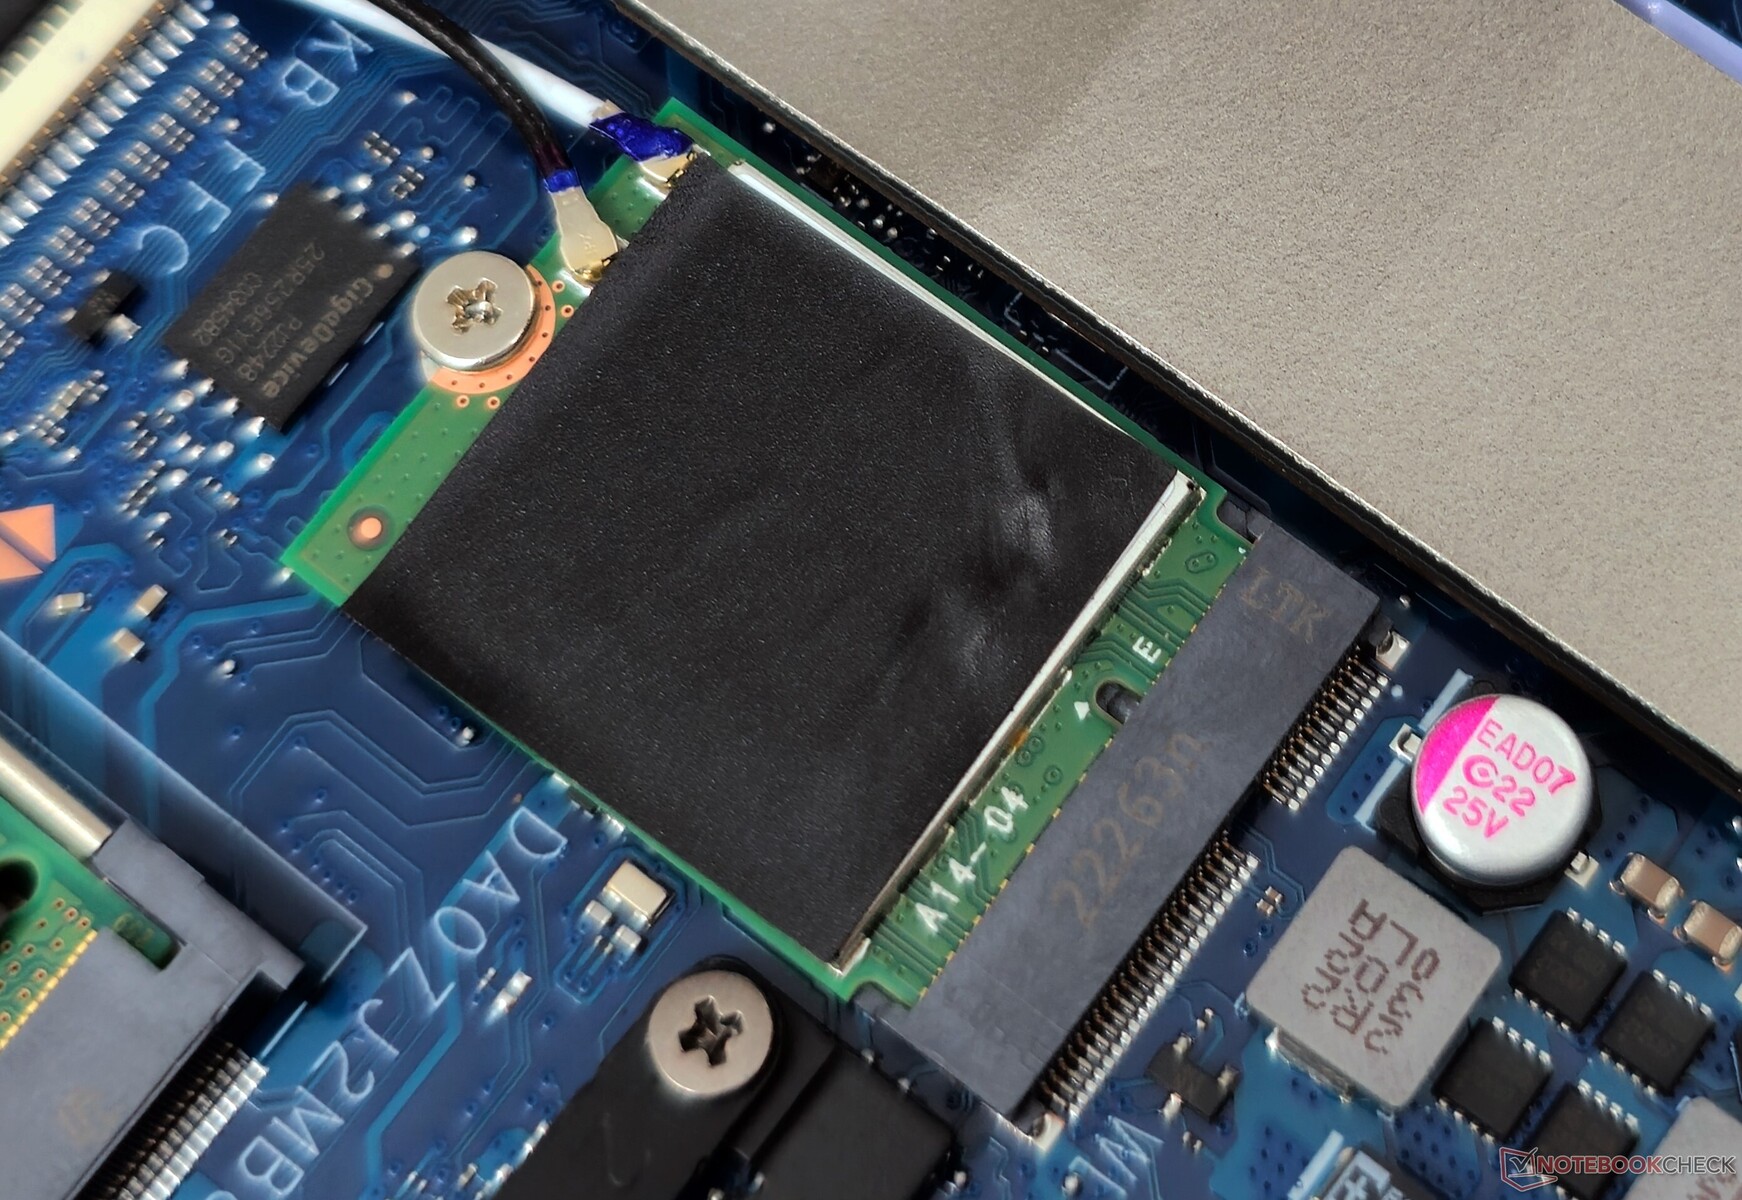
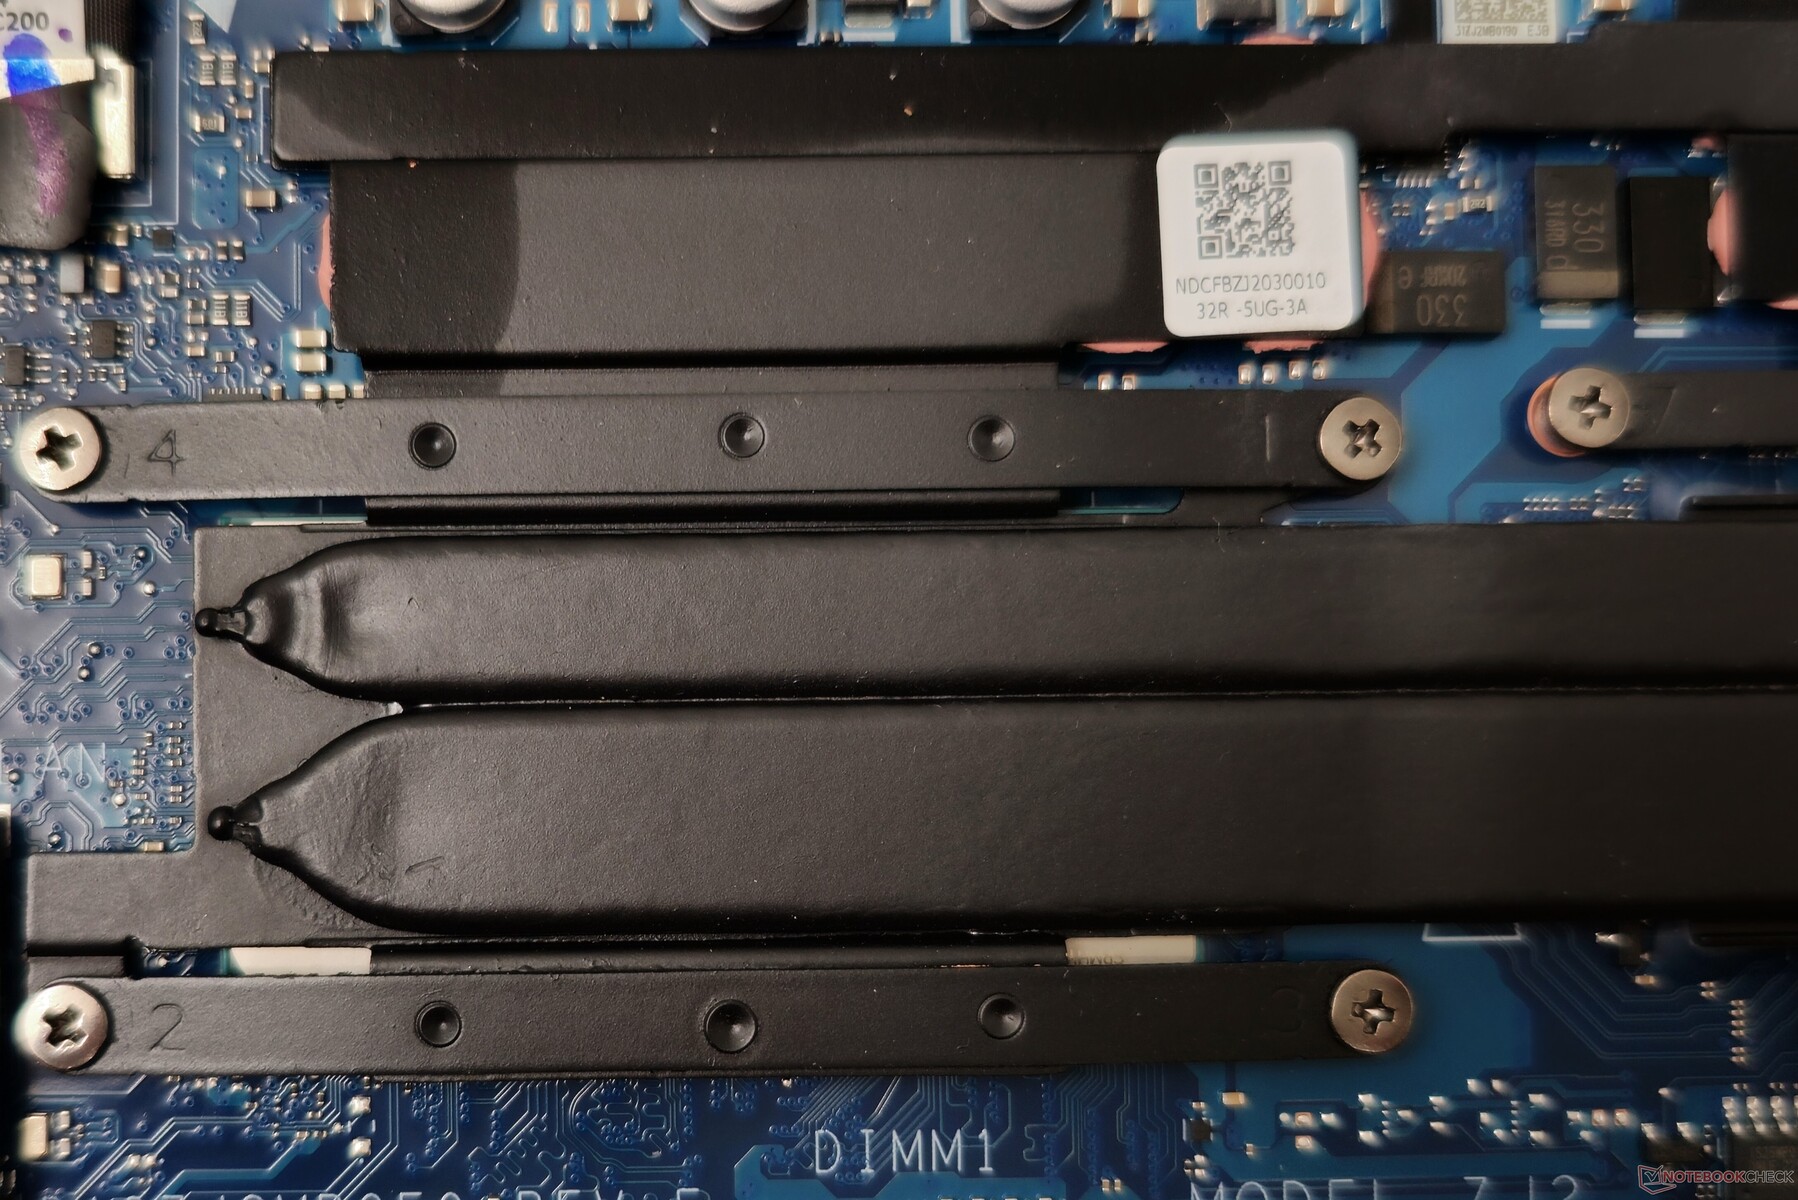
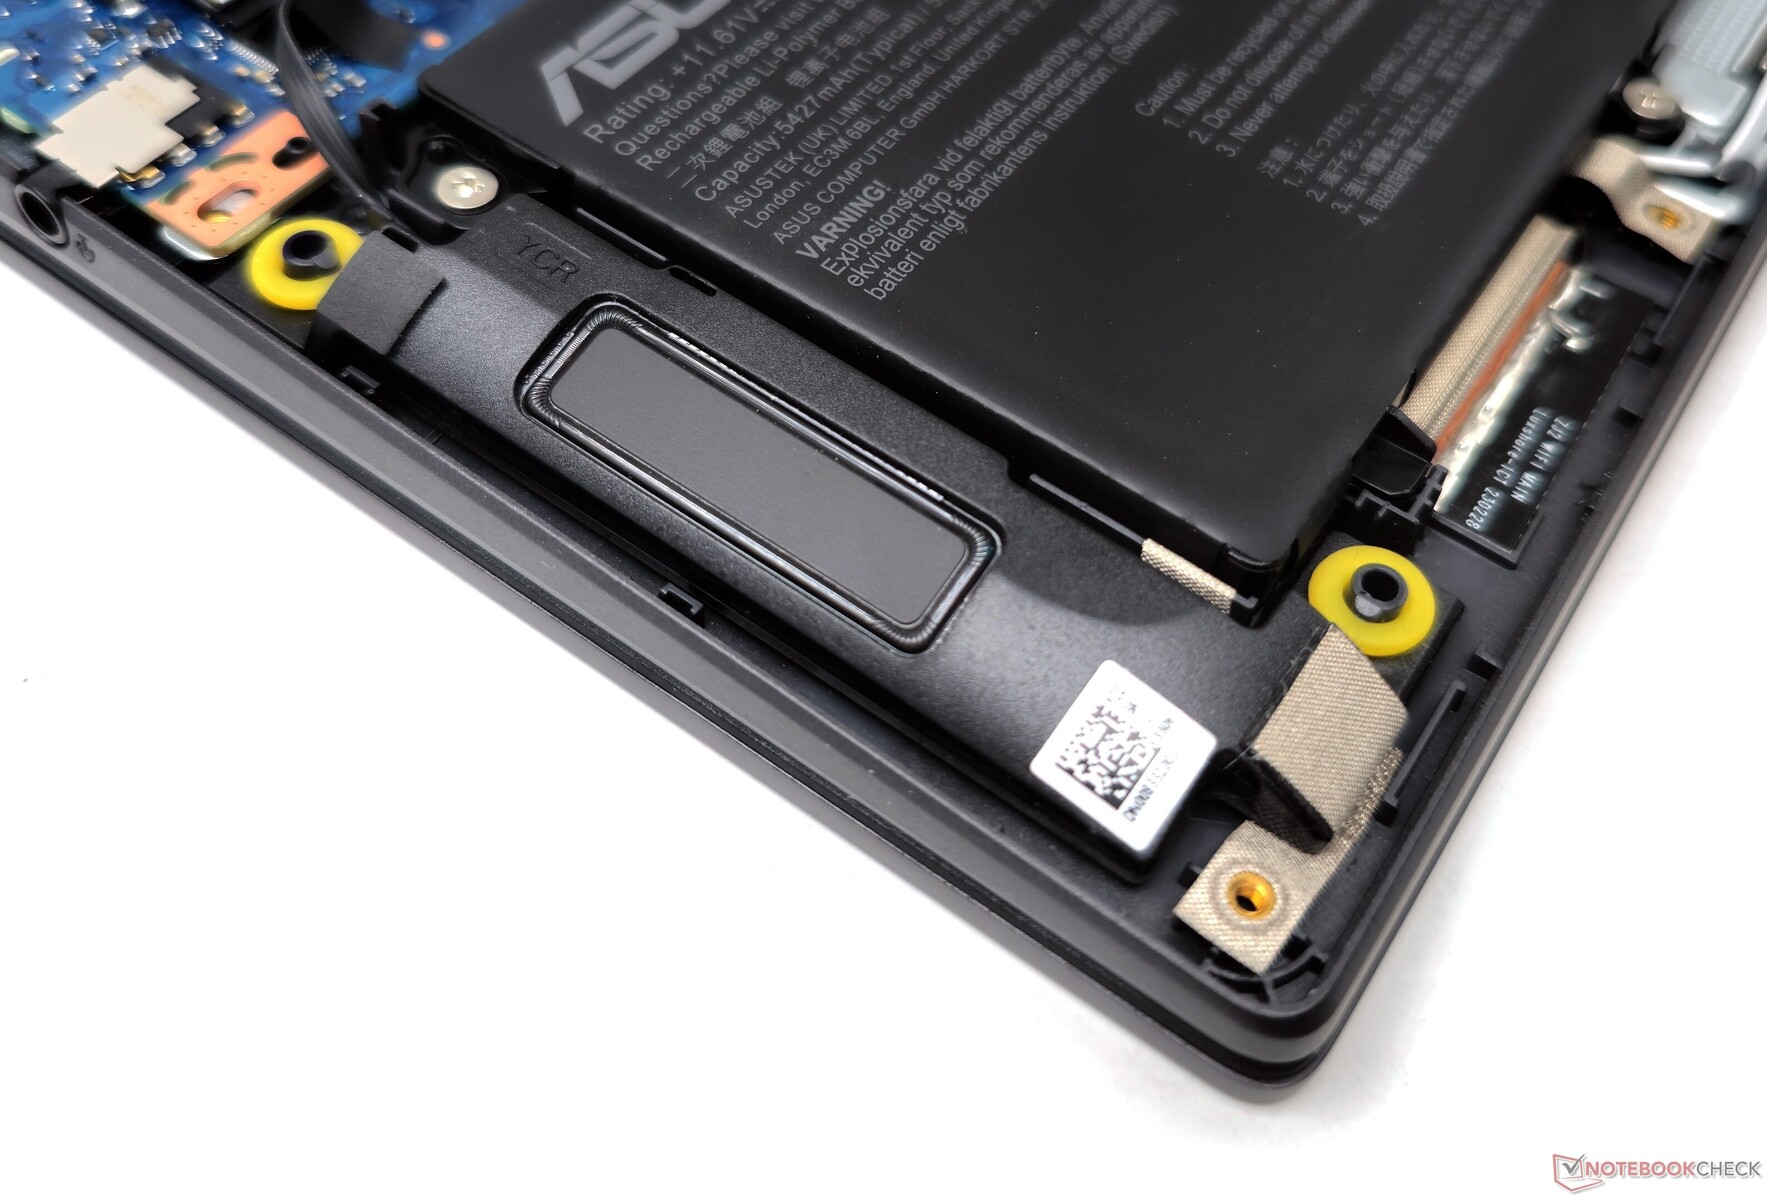
Accessing the internals requires removing seven PH0 screws from the back panel. Once inside, you can easily swap out the WLAN card and NVMe SSD.
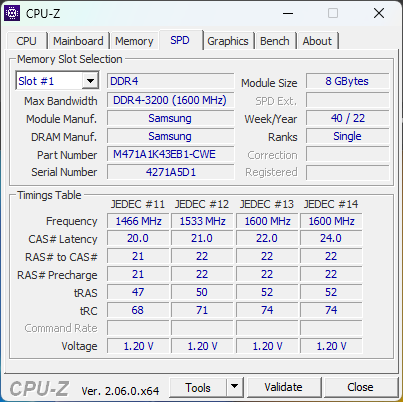
It is worth noting that 8 GB of RAM comes soldered onto the motherboard, which means you can only upgrade one SO-DIMM slot. The battery can be unscrewed and replaced if necessary.
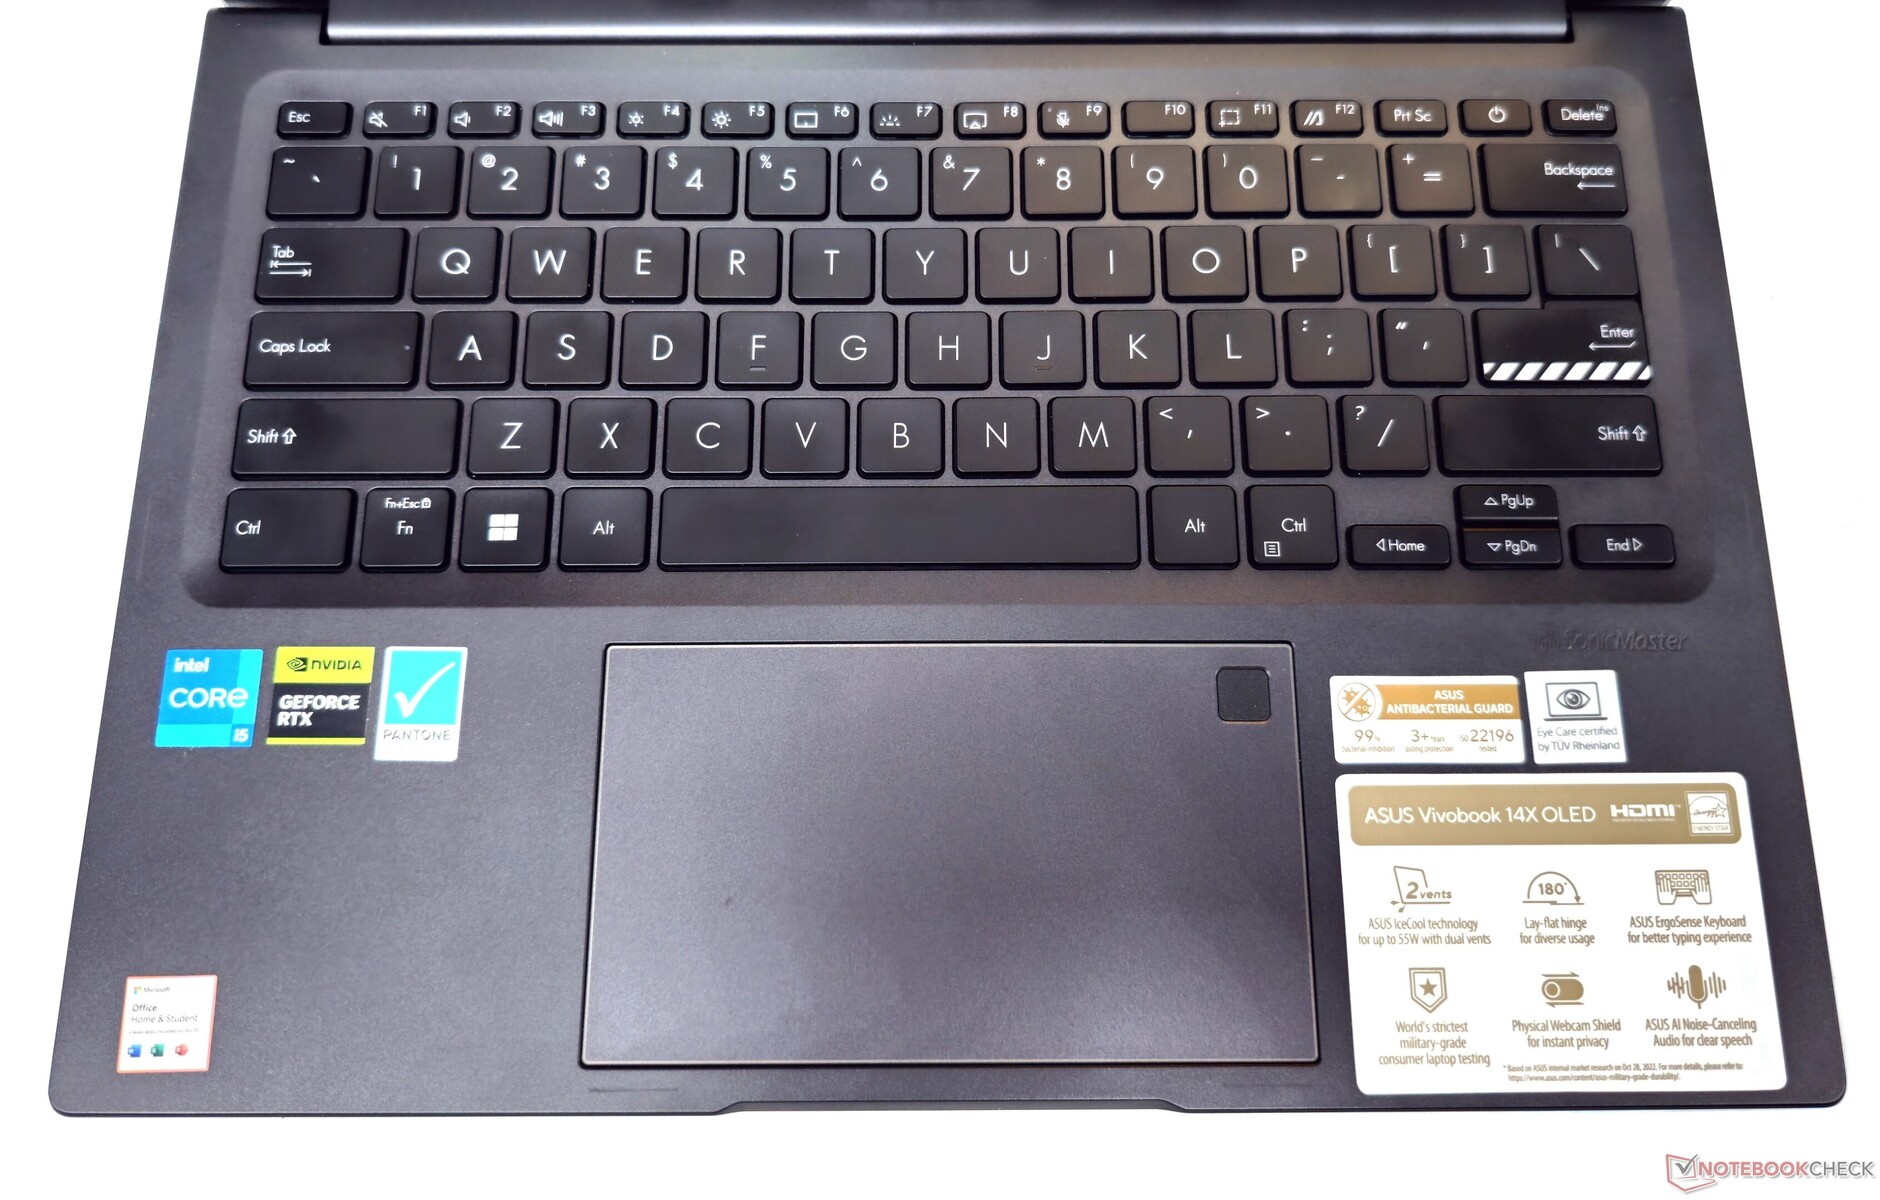
Input Devices: Decent keyboard and touchpad
Keyboard
The VivoBook 14X is equipped with what Asus calls an ErgoSense keyboard, offering a 1.4 mm key travel. Typing on this keyboard is a comfortable experience, thanks to the dished keycaps and well-spaced keys.
The top row contains both F1-F12 keys and special keys, whose primary functions can be configured using the MyAsus app. The arrow keys may feel slightly cramped, but this is typical for a laptop in this form factor. The three-stage backlighting offers decent legibility in dark environments.
Touchpad
The VivoBook 14X's touchpad measures 7.5 cm x 13 cm, providing ample space for navigation, and it offers a smooth gliding experience.
The entire surface serves as the left mouse button, and the clicks are responsive and relatively quiet.
Display: 2.8K OLED with HDR and 90 Hz PWM
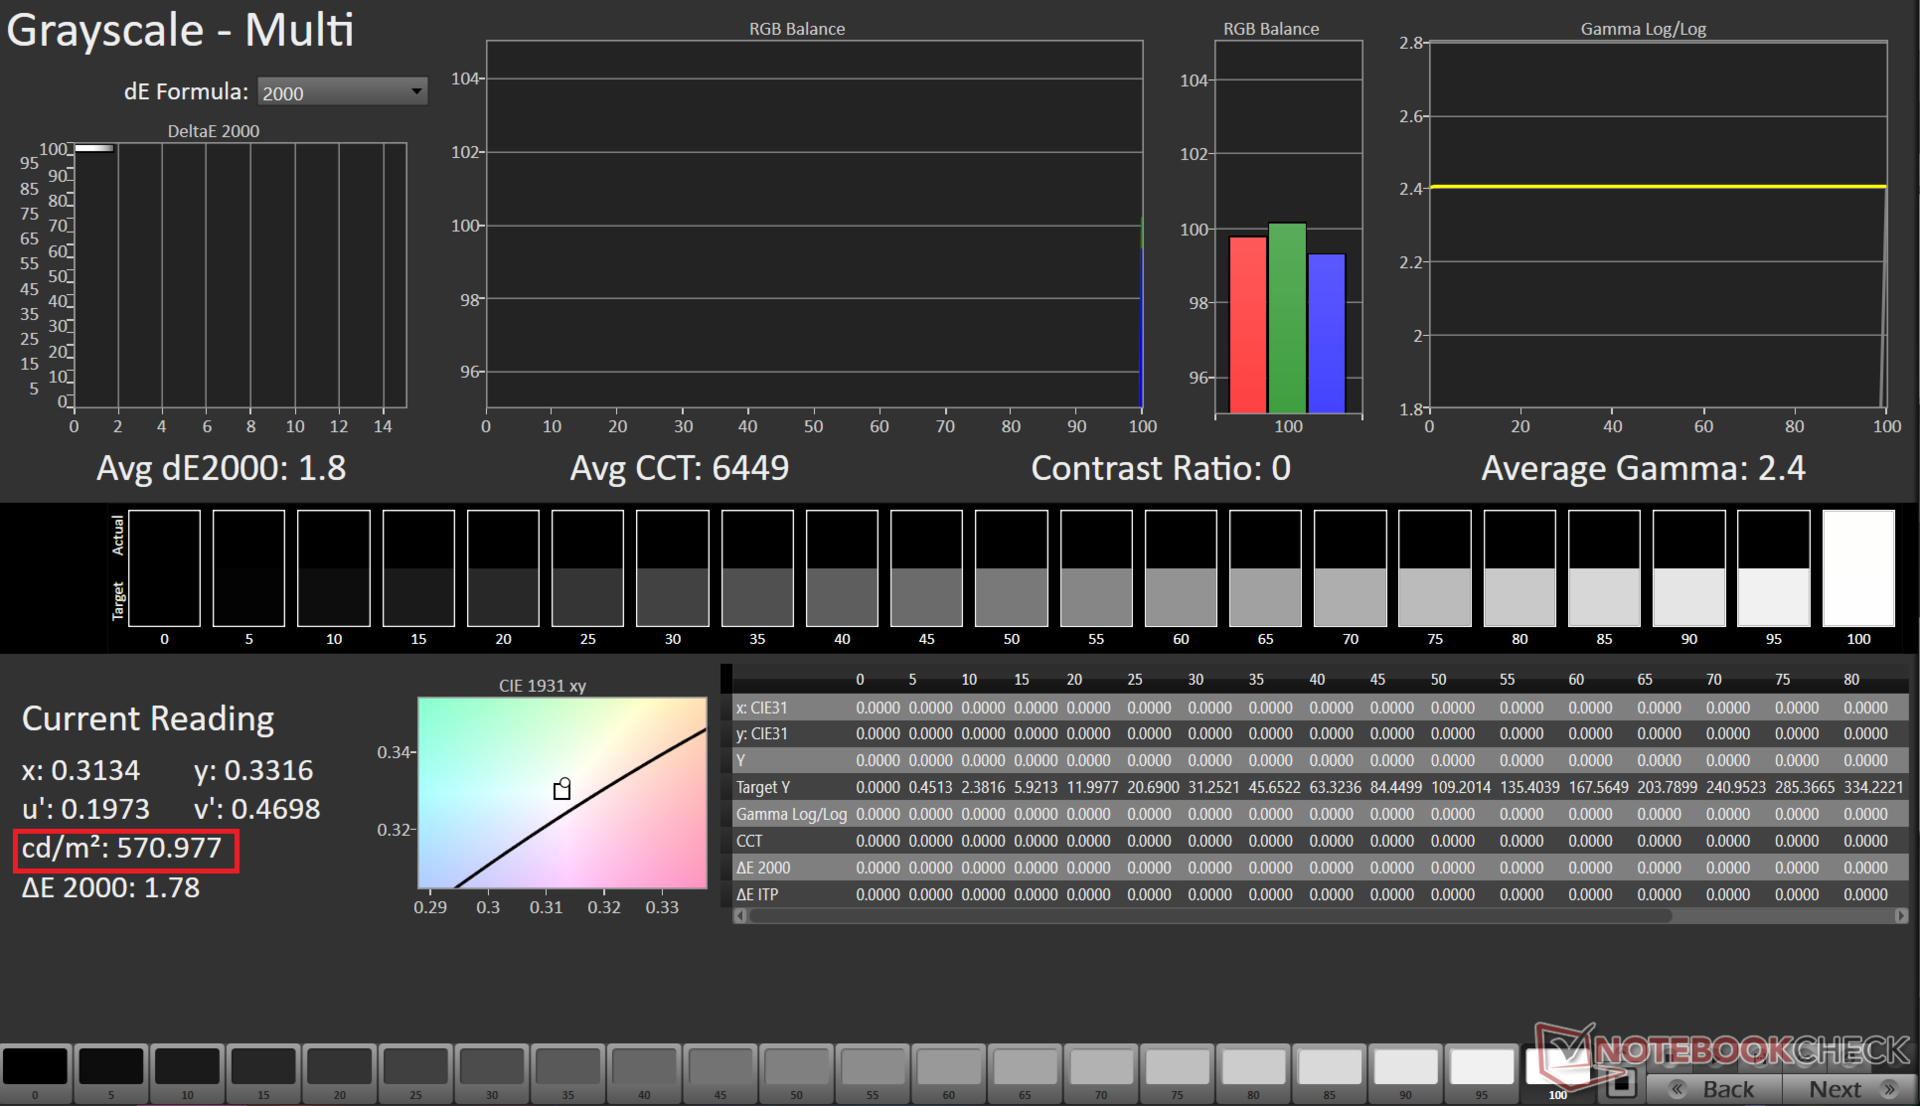
The 2880 x 1800 16:10 90 Hz Samsung OLED panel in the VivoBook 14X offers a good brightness distribution and an essentially infinite contrast ratio.
We measured a maximum brightness of 373 nits in SDR mode. The display is certified for VESA DisplayHDR True Black 600, and we could measure up to 571 nits while playing HDR content. There is no backlight bleeding given that this is an OLED display.
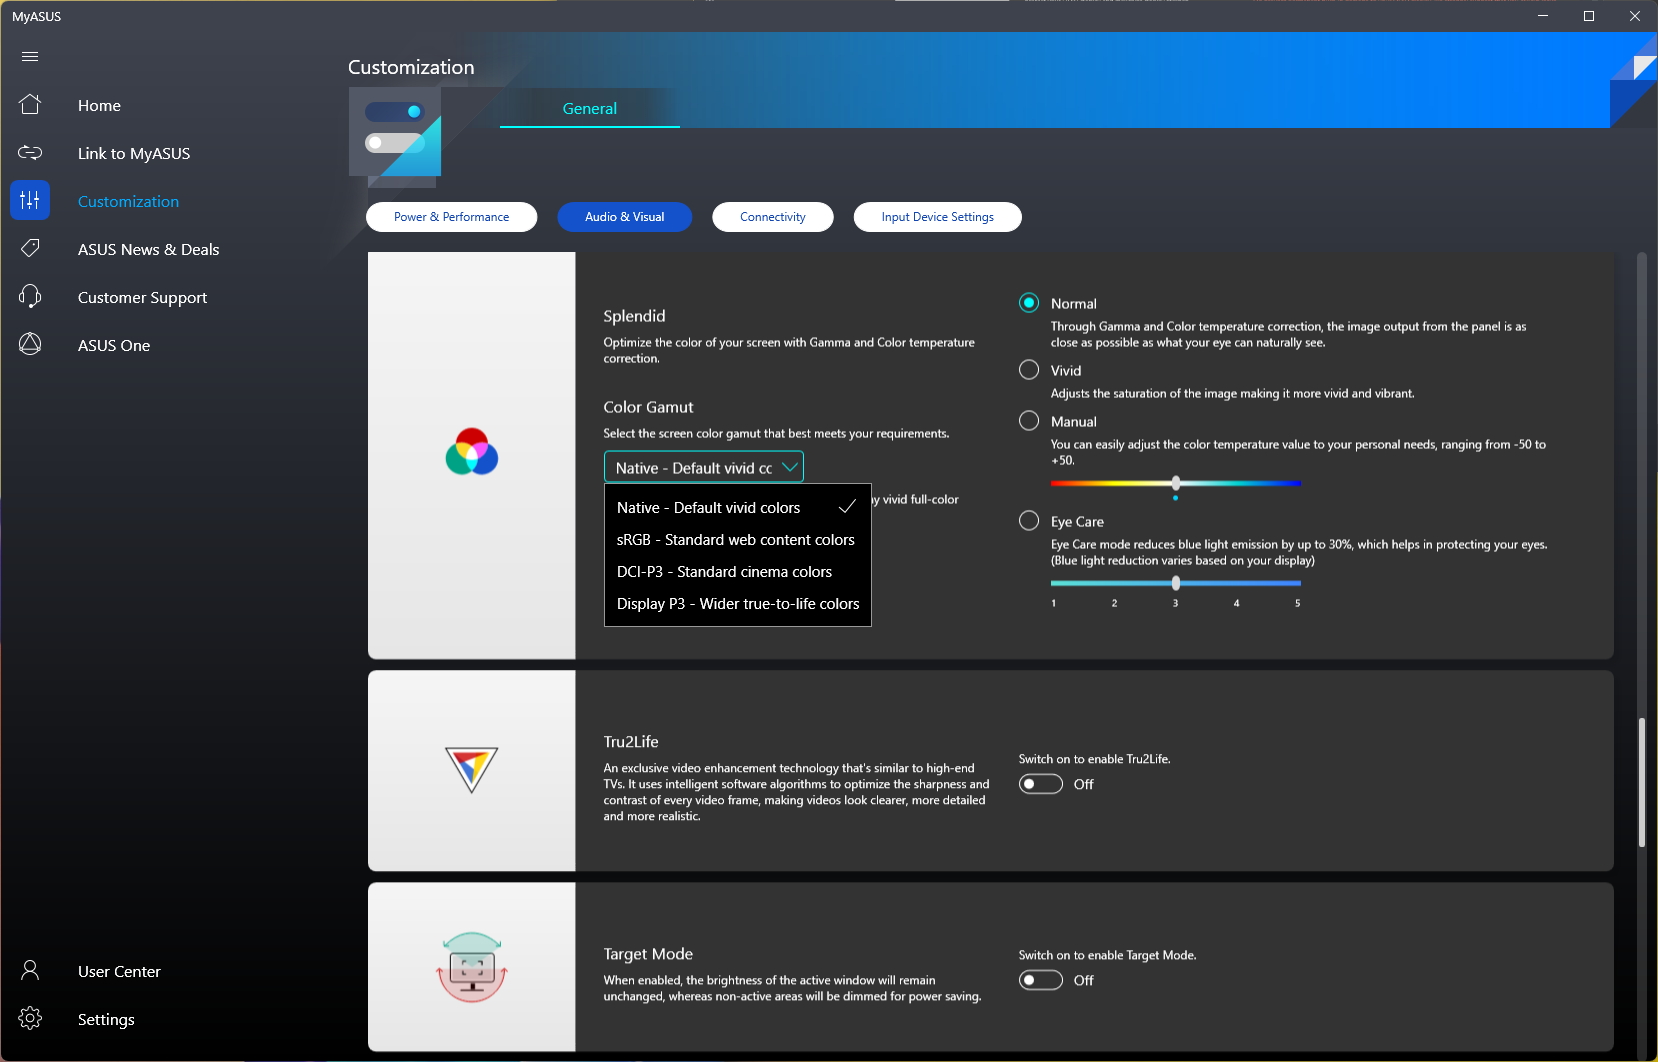
The MyAsus app offers several display options. We performed all testing using the factory-default Normal mode with a Native color gamut.

| |||||||||||||||||||||||||
Brightness Distribution: 85 %
Center on Battery: 367 cd/m²
Contrast: ∞:1 (Black: 0 cd/m²)
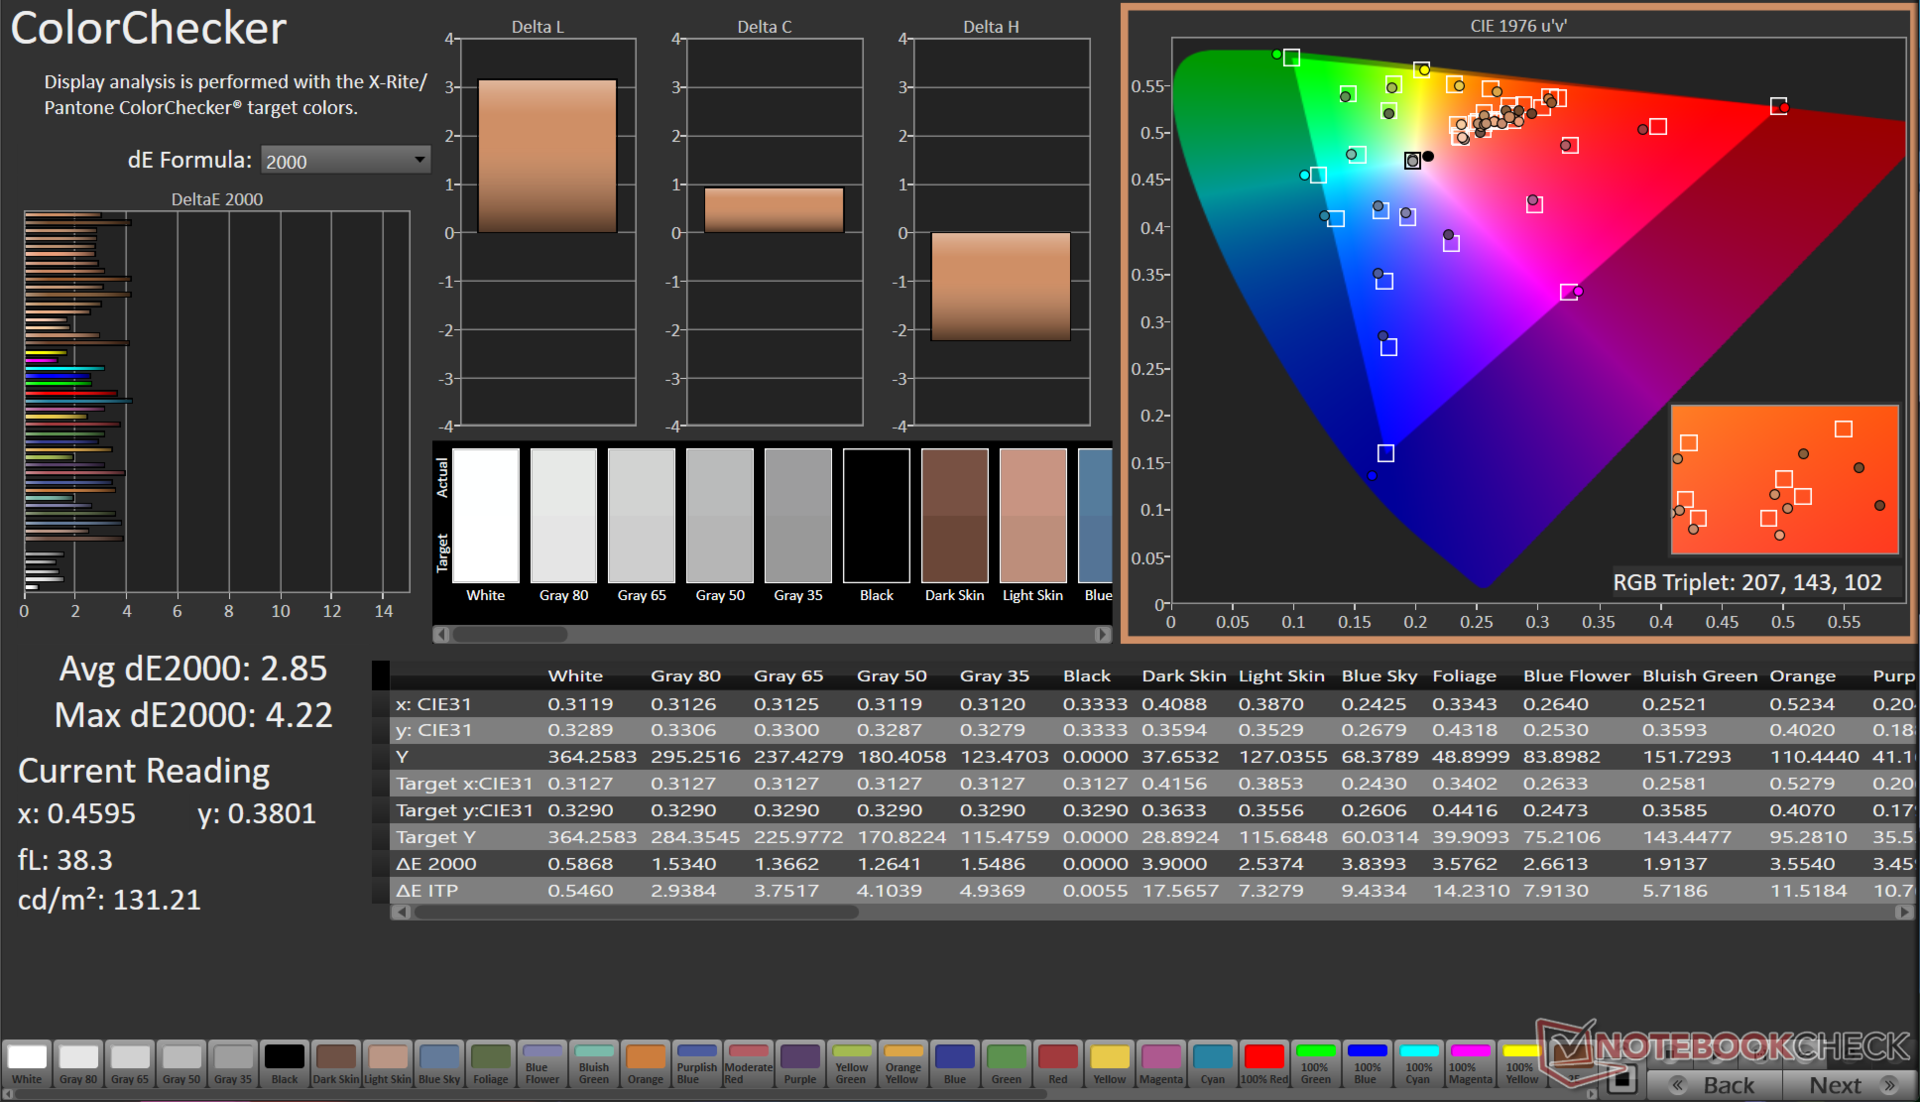
ΔE ColorChecker Calman: 2.85 | ∀{0.5-29.43 Ø4.71}
calibrated: 2.18
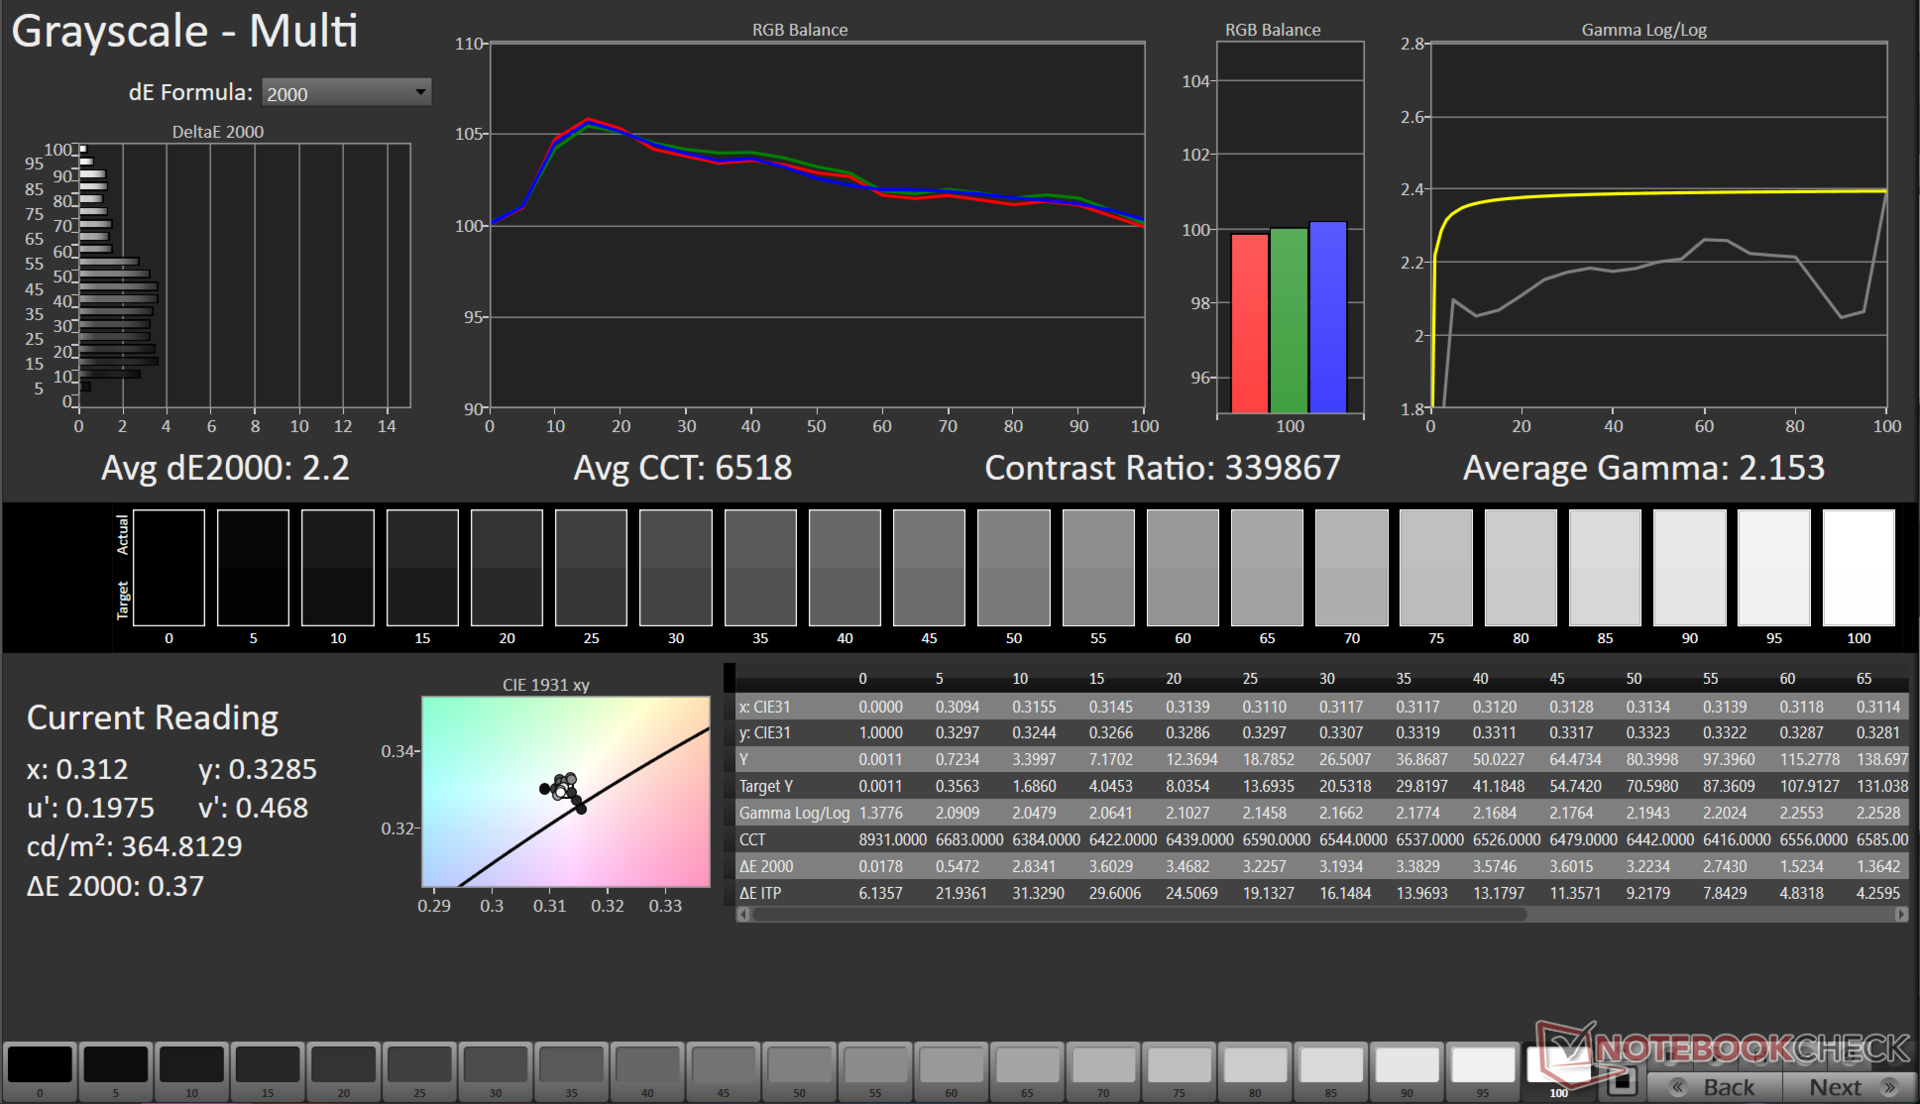
ΔE Greyscale Calman: 2.2 | ∀{0.09-98 Ø4.96}
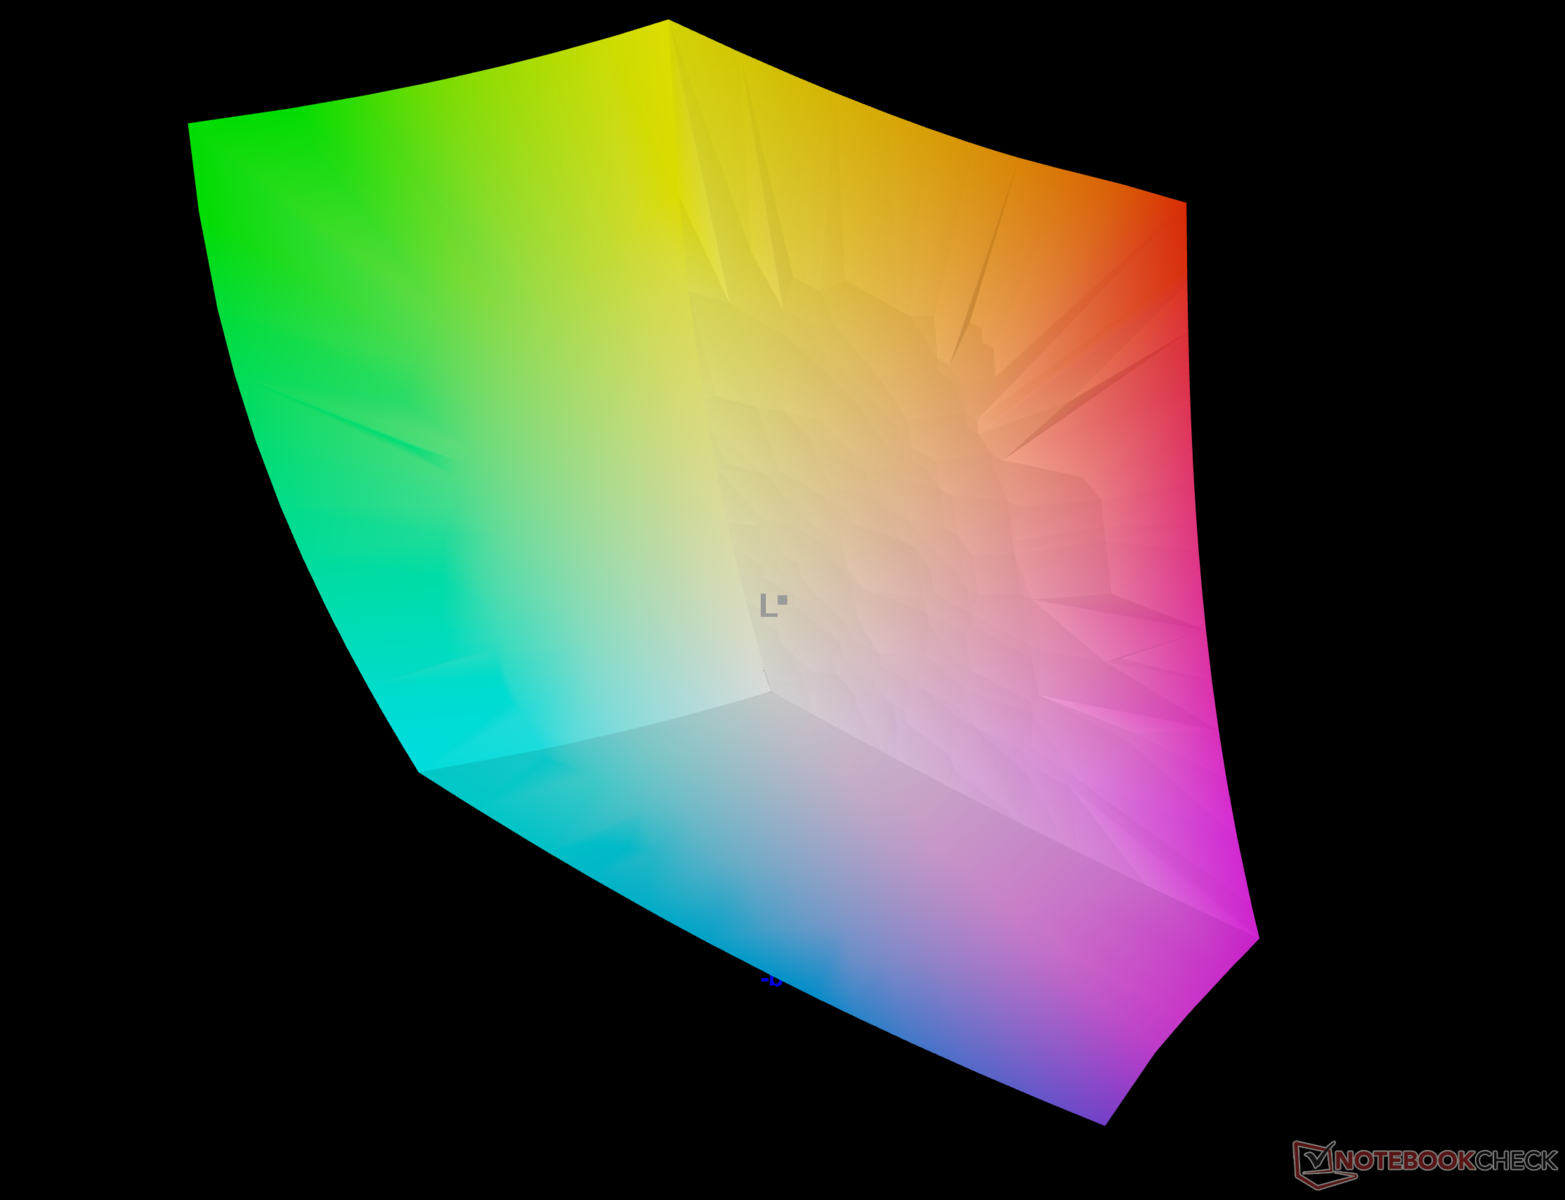
96.5% AdobeRGB 1998 (Argyll 3D)
100% sRGB (Argyll 3D)
99.9% Display P3 (Argyll 3D)
Gamma: 2.15
CCT: 6518 K
| Asus VivoBook 14X K3405 Samsung ATNA40YK07-1, , 2880x1800, 14" | Acer Swift X SFX14-71G ATNA45AF03-0, OLED, 2880x1800, 14.5" | MSI Stealth 14 Studio A13V B140QAN06.T, IPS, 2560x1600, 14" | Gigabyte Aero 14 OLED BMF Samsung SDC4192 (ATNA40YK14-0), OLED, 2880x1800, 14" | Lenovo Slim Pro 7 14ARP8 LEN89C1, IPS, 2560x1600, 14.5" | Schenker Vision 14 2022 RTX 3050 Ti MNE007ZA1-1, IPS, 2880x1800, 14" | |
|---|---|---|---|---|---|---|
| Display | 0% | -5% | -3% | -17% | -17% | |
| Display P3 Coverage (%) | 99.9 | 99.9 0% | 96.2 -4% | 99.8 0% | 72.9 -27% | 74.1 -26% |
| sRGB Coverage (%) | 100 | 99.9 0% | 99.6 0% | 100 0% | 98.2 -2% | 97.4 -3% |
| AdobeRGB 1998 Coverage (%) | 96.5 | 96.2 0% | 85.3 -12% | 88.7 -8% | 74.6 -23% | 75.3 -22% |
| Response Times | 81% | -159% | -13% | -1350% | -1320% | |
| Response Time Grey 50% / Grey 80% * (ms) | 1.15 ? | 0.4 ? 65% | 5.5 ? -378% | 2.4 ? -109% | 31.8 ? -2665% | 31.5 ? -2639% |
| Response Time Black / White * (ms) | 14.4 ? | 0.6 ? 96% | 5.8 ? 60% | 2.4 ? 83% | 19.3 ? -34% | 14.5 ? -1% |
| PWM Frequency (Hz) | 90.02 ? | 240 ? | 300 | |||
| Screen | 15% | 3% | 45% | -16% | -14% | |
| Brightness middle (cd/m²) | 369 | 388 5% | 419 14% | 423 15% | 344.7 -7% | 421 14% |
| Brightness (cd/m²) | 364 | 390 7% | 402 10% | 427 17% | 334 -8% | 416 14% |
| Brightness Distribution (%) | 85 | 98 15% | 89 5% | 98 15% | 92 8% | 89 5% |
| Black Level * (cd/m²) | 0.43 | 0.1 | 0.31 | 0.28 | ||
| Colorchecker dE 2000 * | 2.85 | 2.2 23% | 2.3 19% | 0.55 81% | 3.01 -6% | 3.2 -12% |
| Colorchecker dE 2000 max. * | 4.22 | 3.9 8% | 5.8 -37% | 1.15 73% | 6.3 -49% | 5.5 -30% |
| Colorchecker dE 2000 calibrated * | 2.18 | 1.9 13% | 0.9 59% | 1.15 47% | 0.83 62% | 2 8% |
| Greyscale dE 2000 * | 2.2 | 1.4 36% | 3.3 -50% | 0.69 69% | 4.6 -109% | 4.4 -100% |
| Gamma | 2.15 102% | 2.22 99% | 2.14 103% | 2.42 91% | 2.28 96% | 2.22 99% |
| CCT | 6518 100% | 6380 102% | 6550 99% | 6479 100% | 6420 101% | 6384 102% |
| Contrast (:1) | 974 | 4230 | 1112 | 1504 | ||
| Total Average (Program / Settings) | 32% /
22% | -54% /
-26% | 10% /
24% | -461% /
-238% | -450% /
-233% |
* ... smaller is better
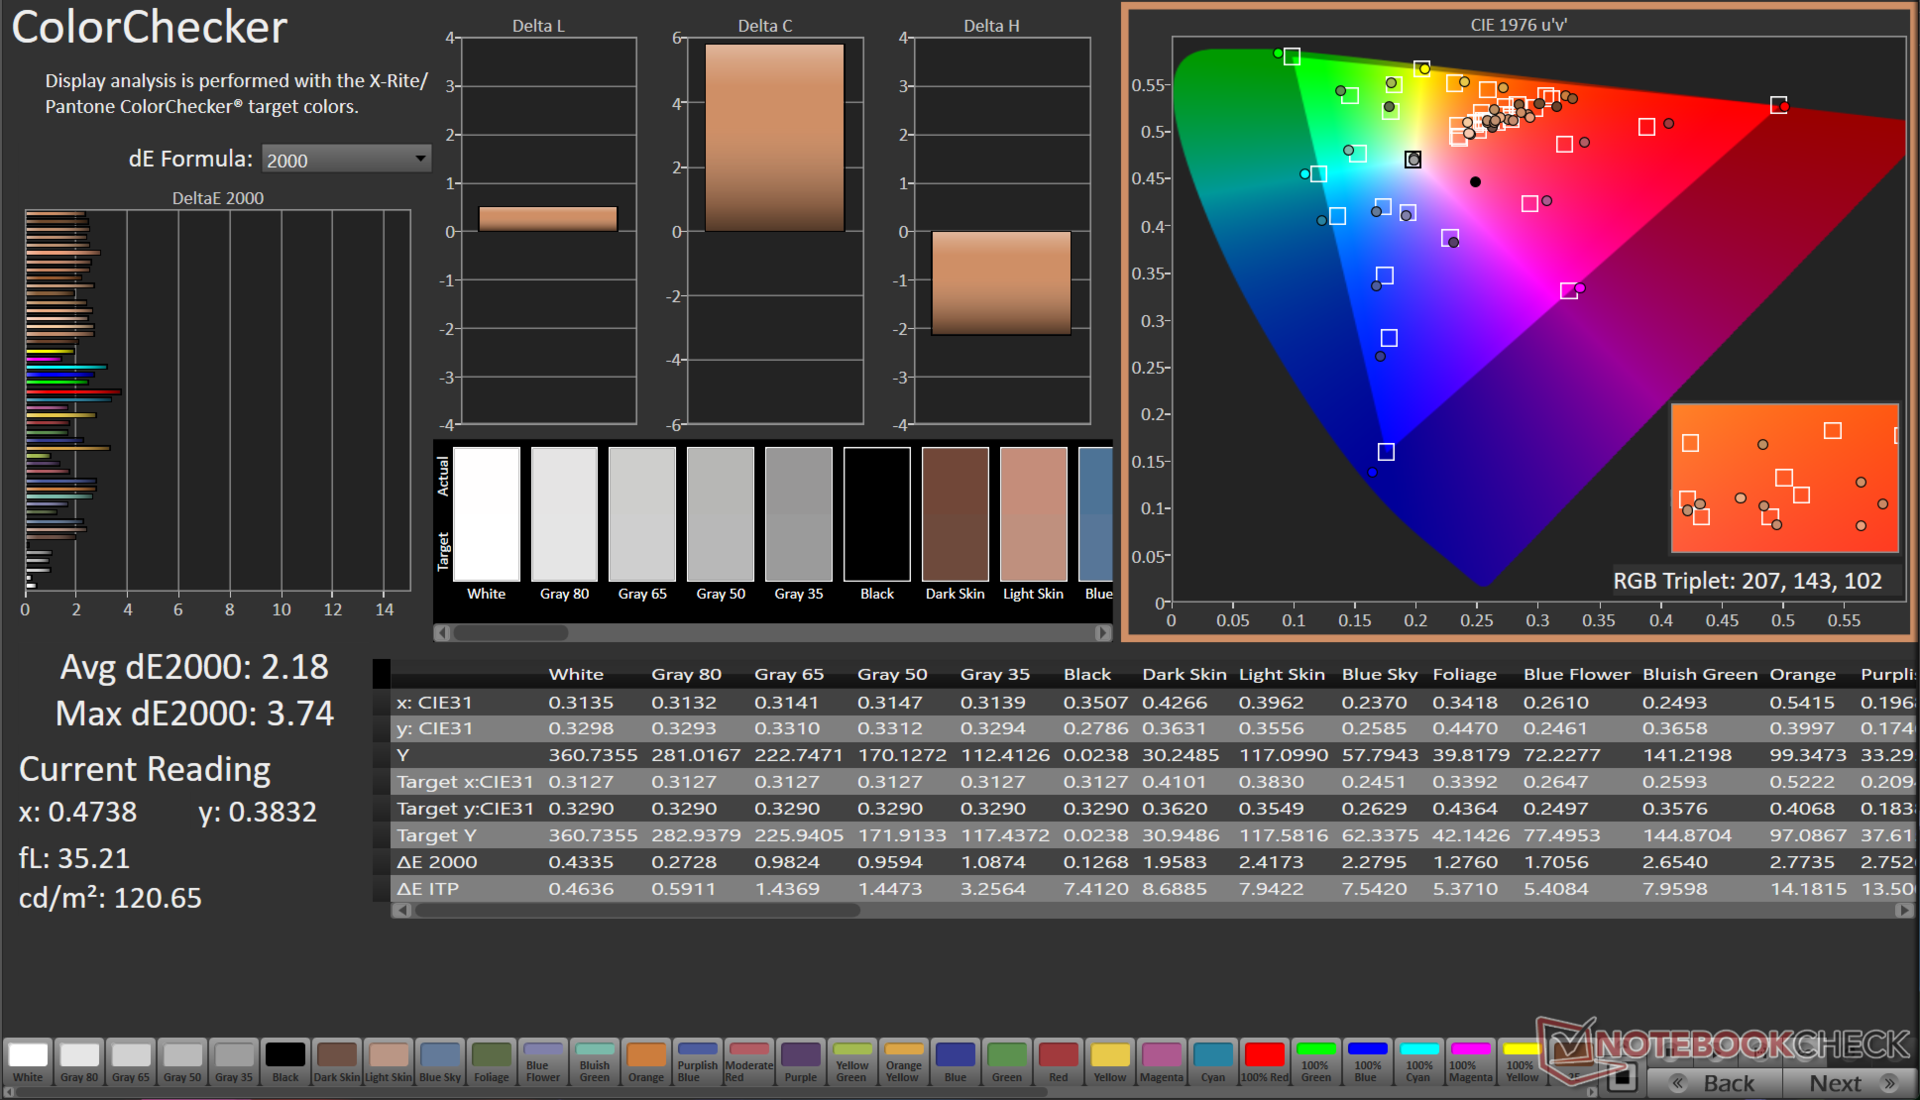
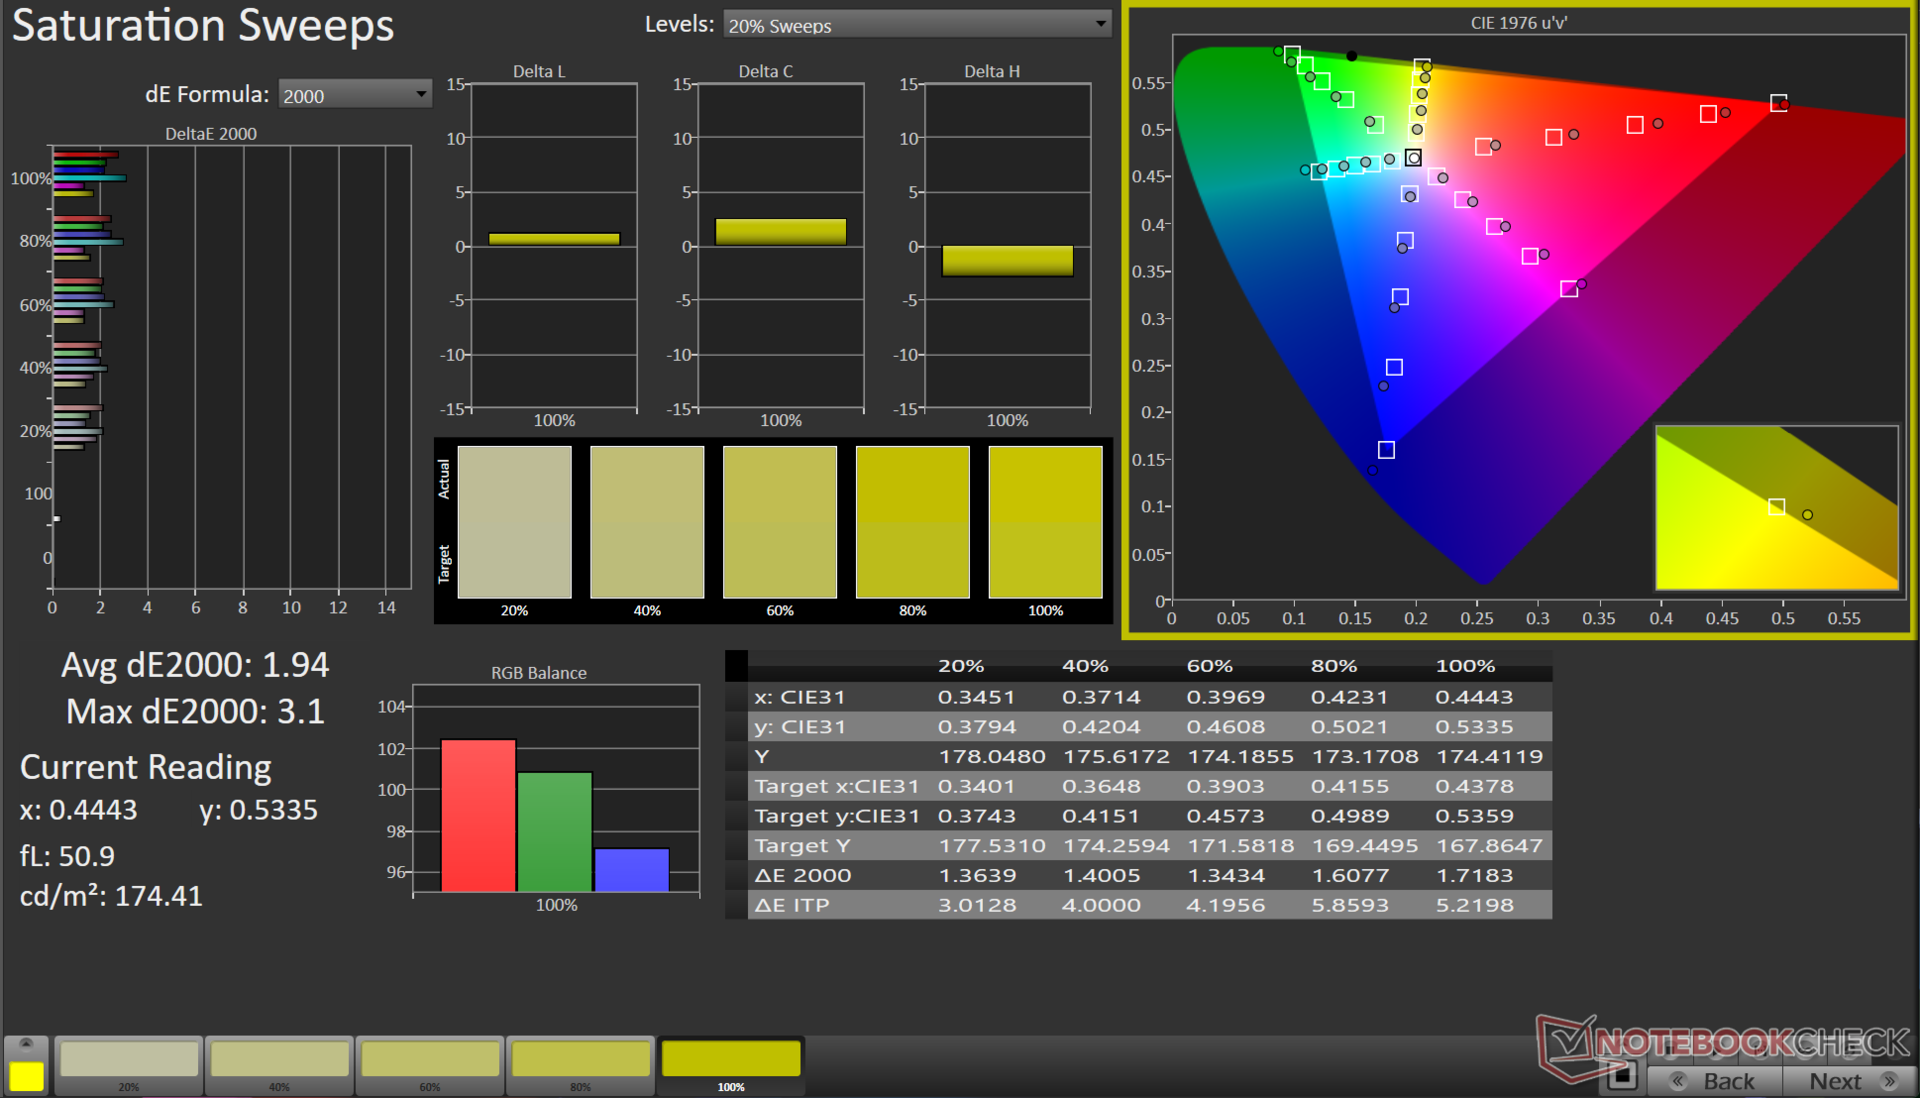
Content creators will be pleased with the VivoBook 14X's impressive coverage of the entire sRGB color space (100%), along with a near-complete coverage of Adobe RGB (96.5%) and Display P3 (99.9%) color gamuts.


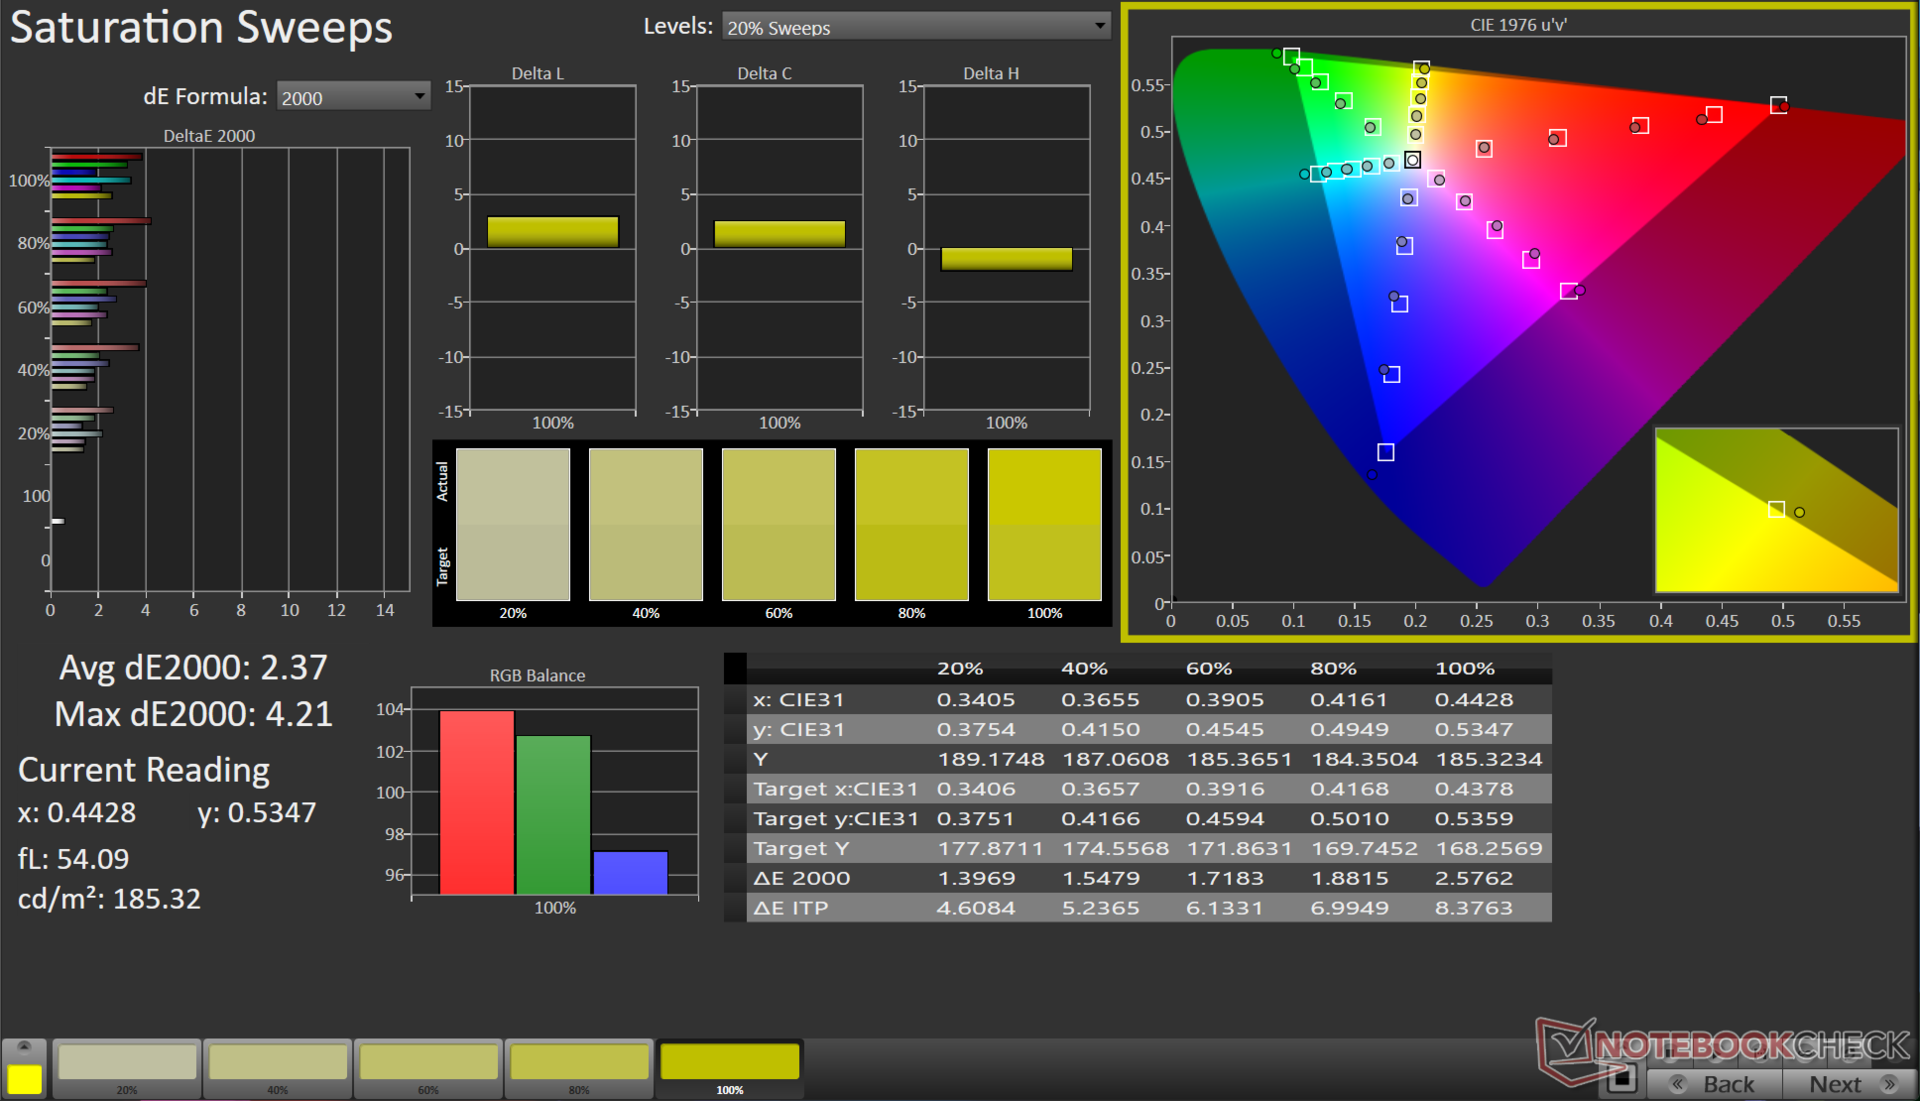
We performed color calibration in the Display P3 color space. The VivoBook 14X already shows low Delta E values in Grayscale and ColorChecker out-of-the-box. You can also use the ProArt Creator Hub and a compatible X-Rite i1Display calibrator to perform your own calibration.
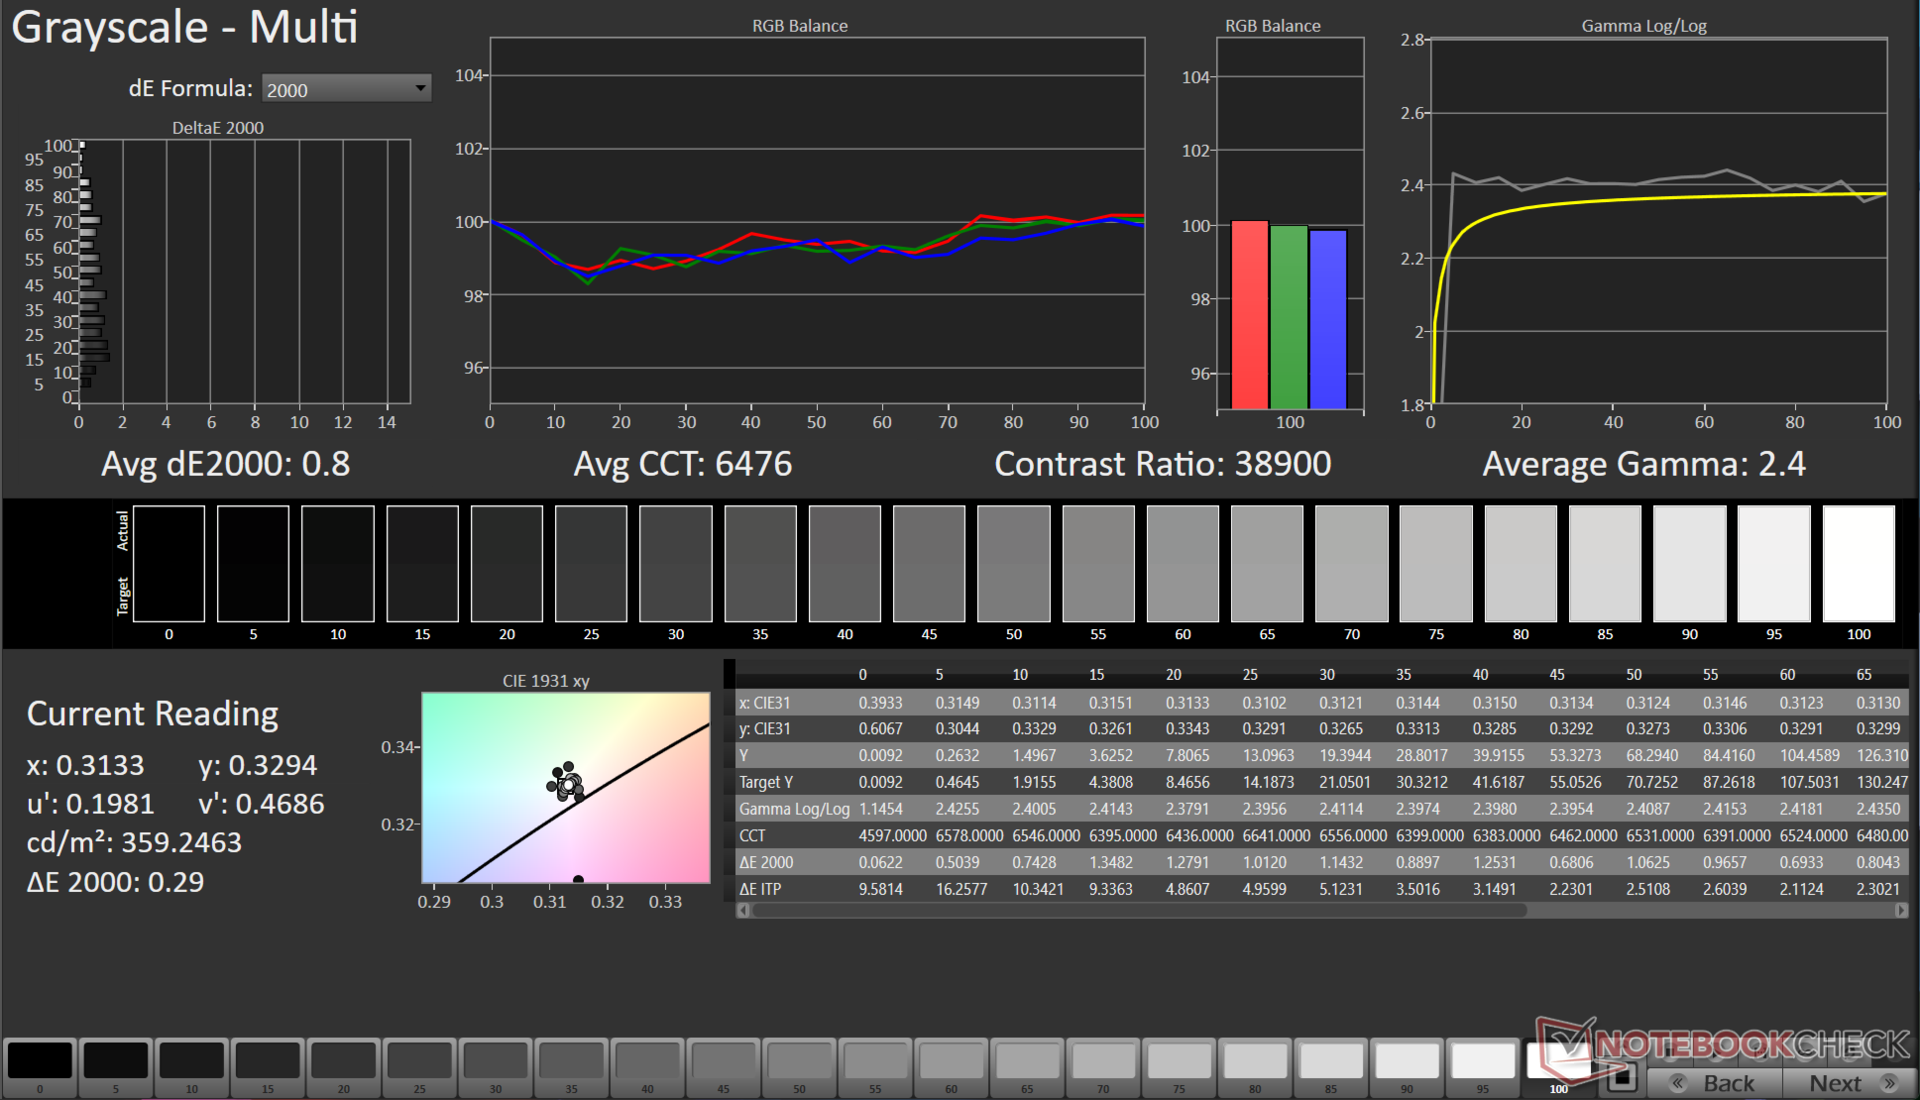
Using our X-Rite i1Basic Pro 3 spectrophotometer and Calman Ultimate software from Portrait Displays, we could achieve a significantly lower Delta E of 0.8 in Grayscale. However, only marginal improvements were seen in ColorChecker values.
The calibrated ICC file can be downloaded from the link above.
Display Response Times
| ↔ Response Time Black to White | ||
|---|---|---|
| 14.4 ms ... rise ↗ and fall ↘ combined | ↗ 12.8 ms rise | 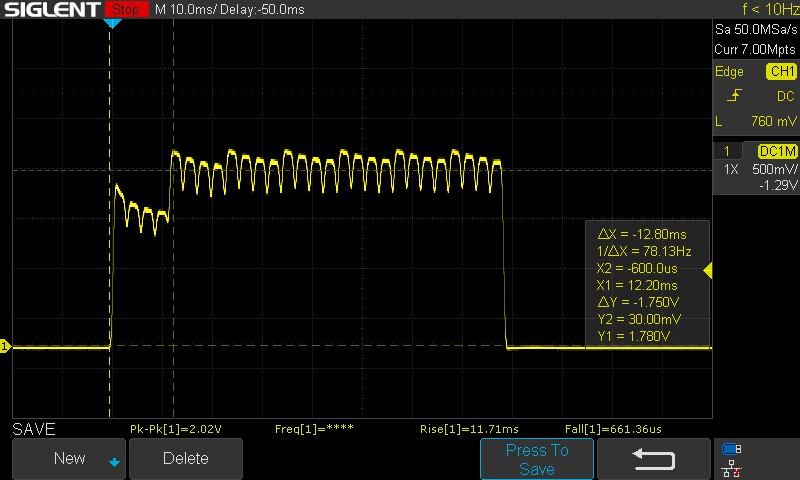 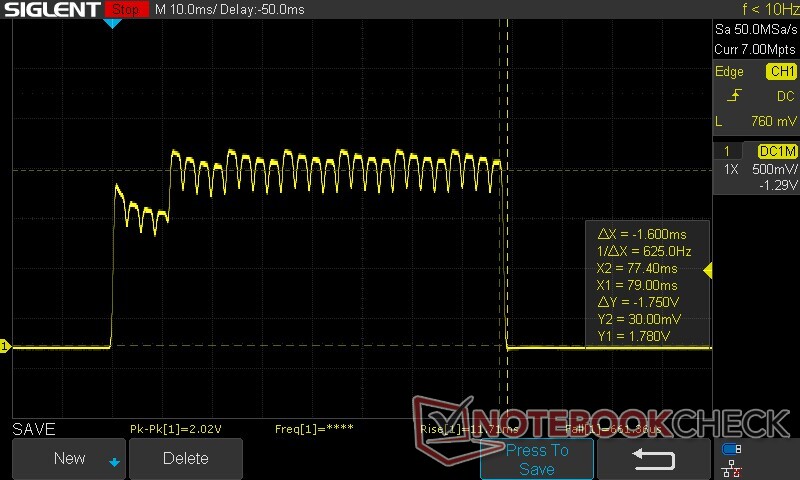 |
| ↘ 1.6 ms fall | ||
| The screen shows good response rates in our tests, but may be too slow for competitive gamers. In comparison, all tested devices range from 0.1 (minimum) to 240 (maximum) ms. » 36 % of all devices are better. This means that the measured response time is better than the average of all tested devices (19.8 ms). | ||
| ↔ Response Time 50% Grey to 80% Grey | ||
| 1.15 ms ... rise ↗ and fall ↘ combined | ↗ 0.57 ms rise | 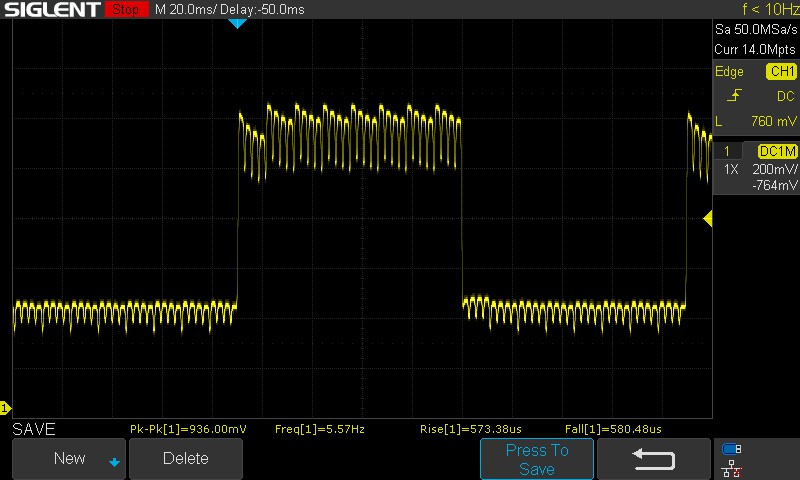 |
| ↘ 0.58 ms fall | ||
| The screen shows very fast response rates in our tests and should be very well suited for fast-paced gaming. In comparison, all tested devices range from 0.165 (minimum) to 636 (maximum) ms. » 5 % of all devices are better. This means that the measured response time is better than the average of all tested devices (30.9 ms). | ||
Manual measurement was necessary to estimate response times due to the background flicker. A 100% black to 100% white transition takes 14.4 ms, which is slightly on the higher side for an OLED panel. However, the 50% grey to 80% grey transitions are much quicker at 1.15 ms.
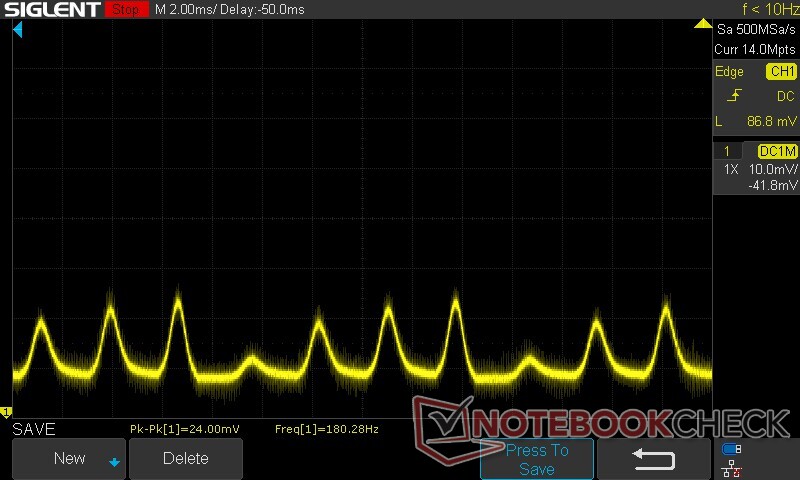
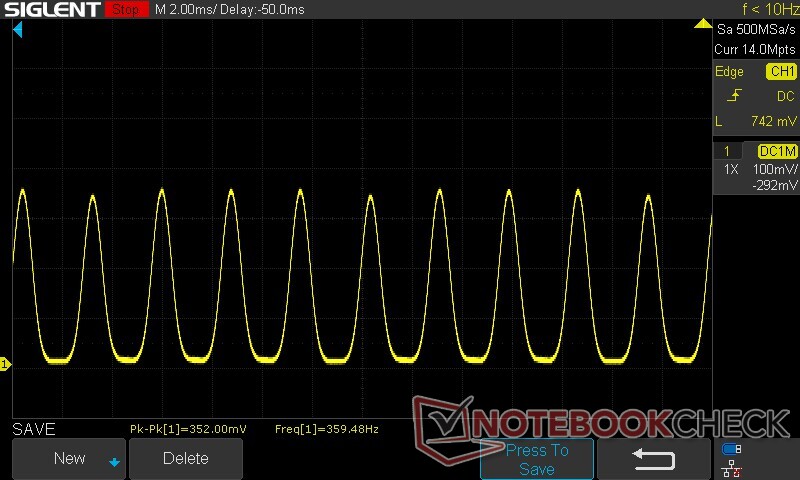
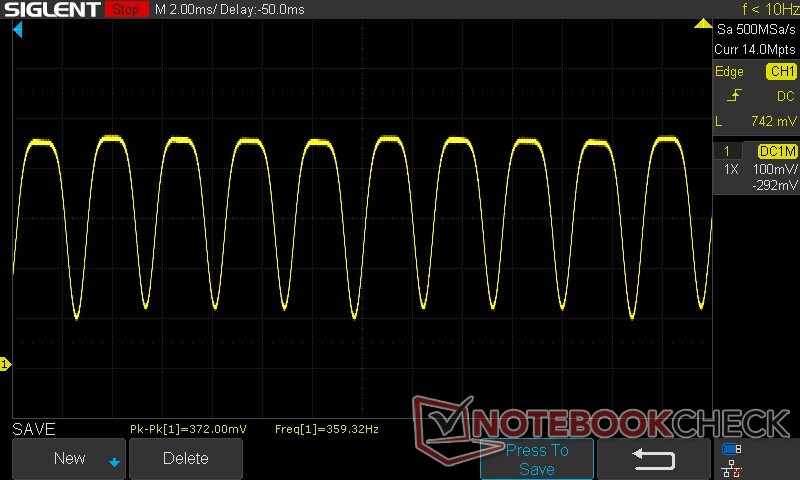
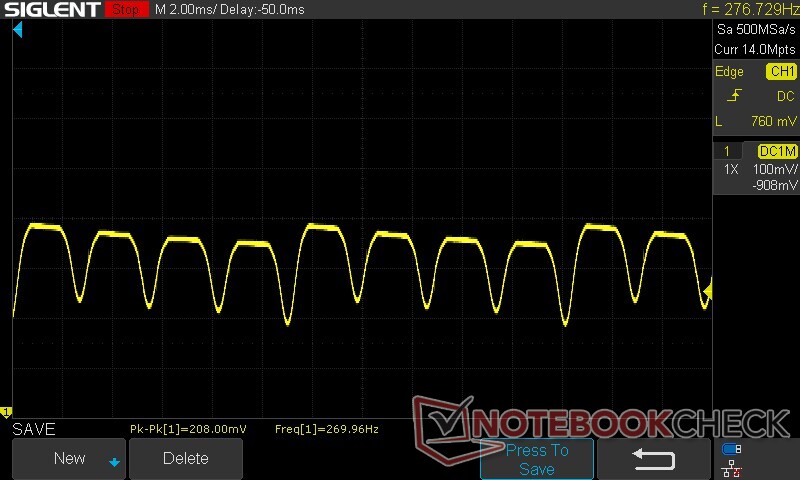
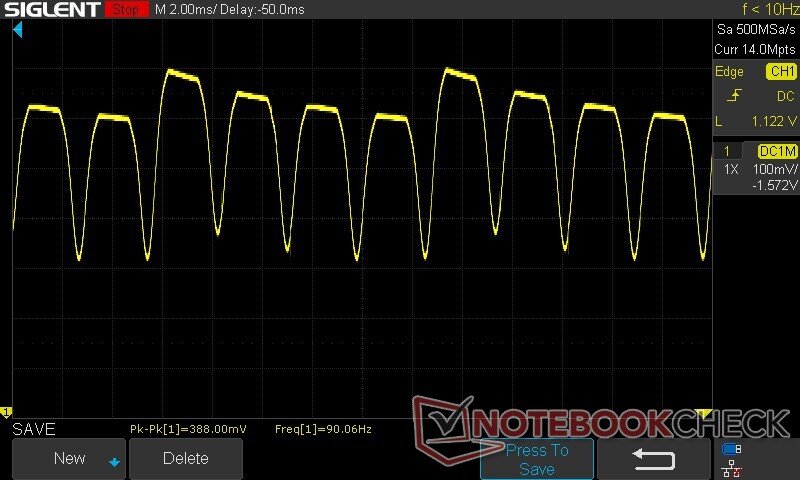
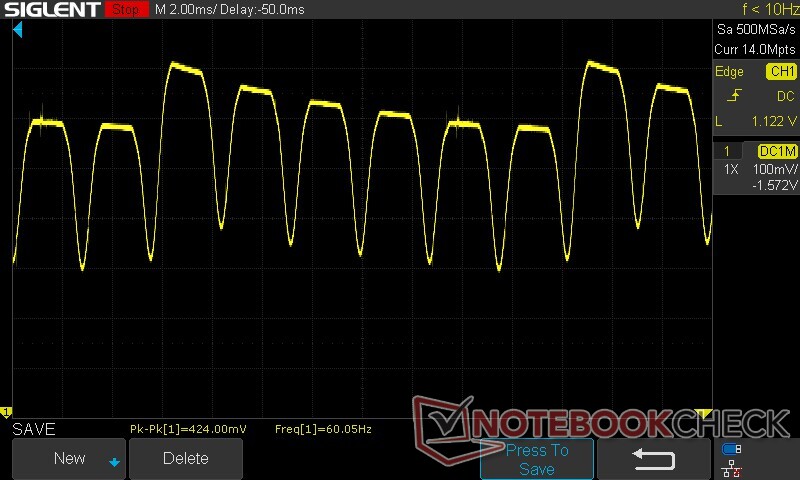
Screen Flickering / PWM (Pulse-Width Modulation)
| Screen flickering / PWM detected | 90.02 Hz | 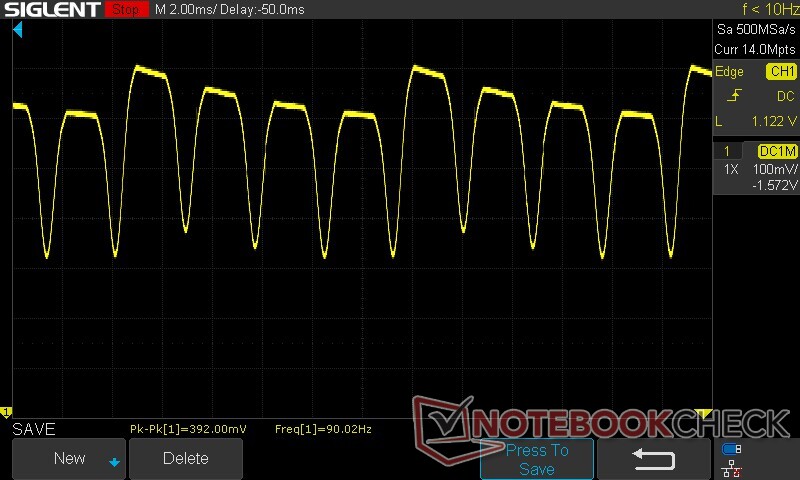 | |
| ≤ 100 cd/m² brightness | |||
The display backlight flickers at 90.02 Hz (worst case, e.g., utilizing PWM) Flickering detected at a brightness setting of 100 cd/m² and below. There should be no flickering or PWM above this brightness setting. The frequency of 90.02 Hz is very low, so the flickering may cause eyestrain and headaches after extended use. Flickering occurs at relatively low brightness settings, so extended use at this brightness setting or lower can cause eyestrain. In comparison: 52 % of all tested devices do not use PWM to dim the display. If PWM was detected, an average of 7741 (minimum: 5 - maximum: 343500) Hz was measured. | |||
The panel uses 90 Hz DC Dimming between 75% to 100% brightness. Below 75%, the panel switches to a PWM frequency of about 360 Hz.
The 90 Hz DC Dimming should be relatively less strenuous on the eyes compared to PWM flickering. This frequency goes down to 60 Hz at the corresponding refresh rate.
We recommend setting the brightness levels above 50% to minimize visual fatigue.
For more information, check out "Why PWM is such a headache" and "Analysis: DC Dimming vs PWM — Can you dim AMOLED displays without the flickering". An overview of measured PWM across all reviewed devices can be found in our PWM Ranking table.
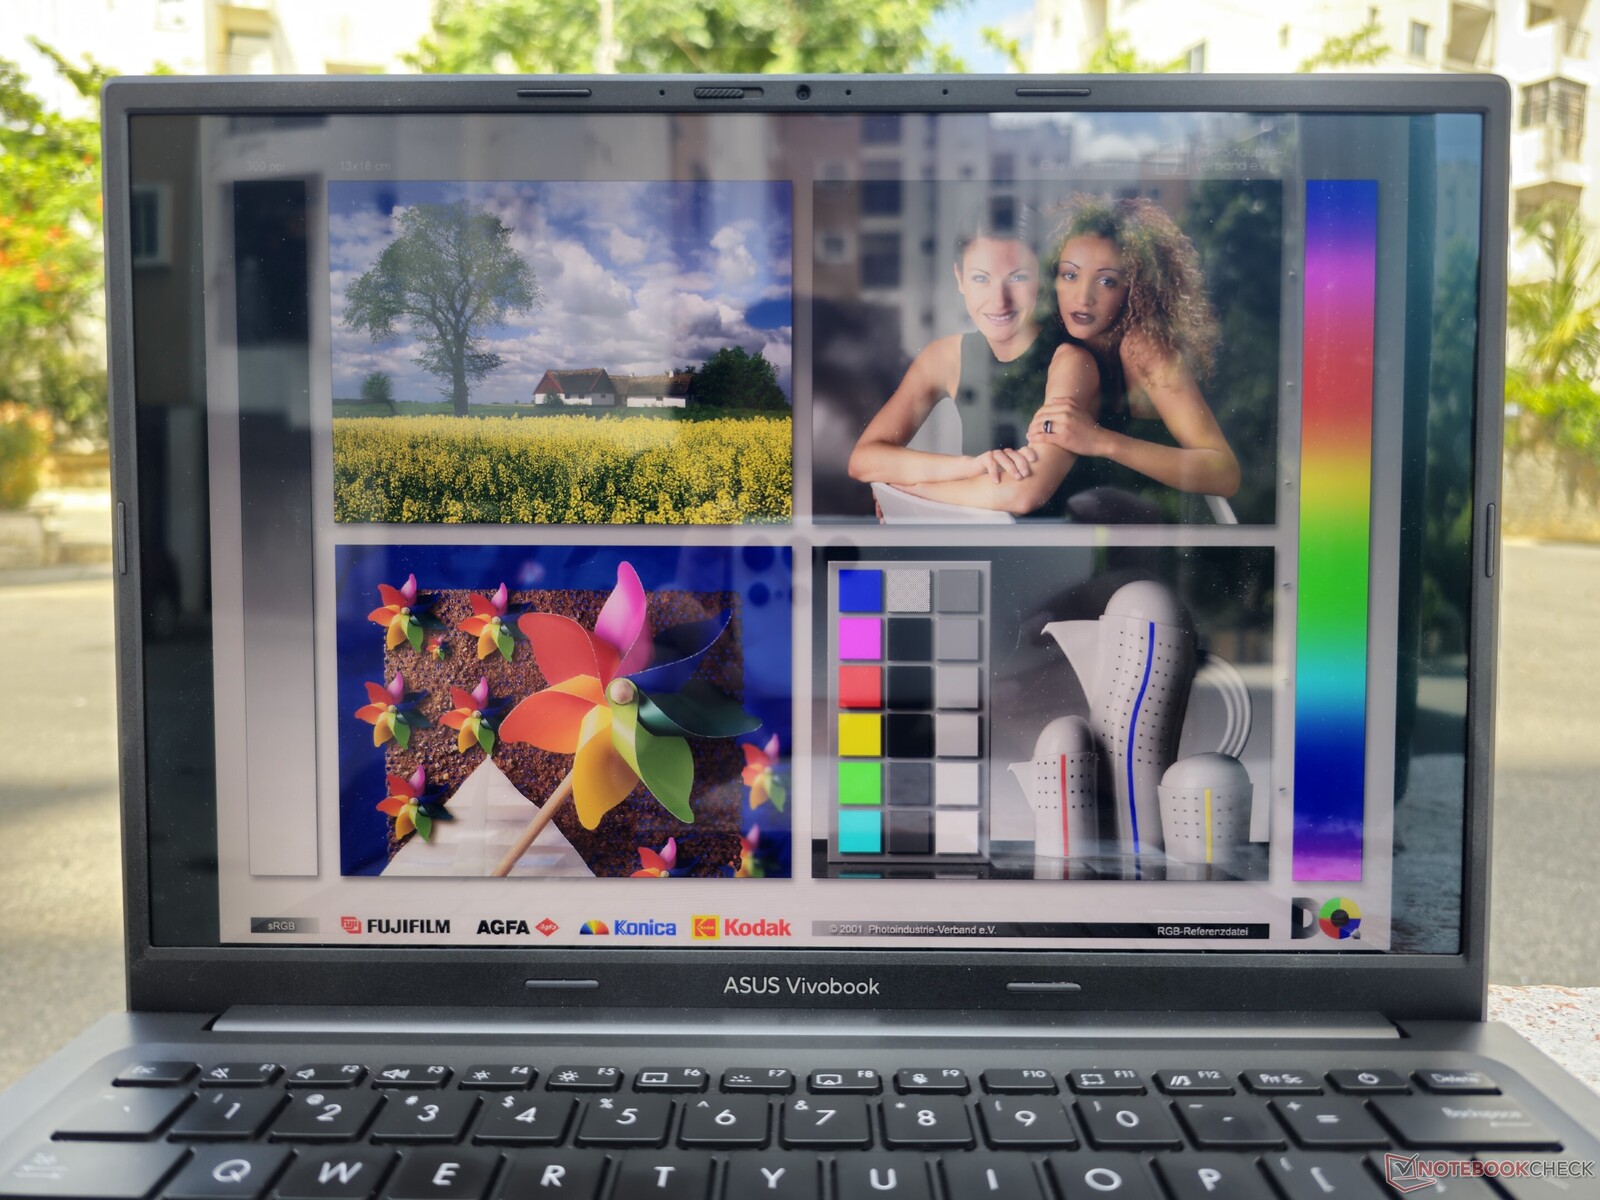
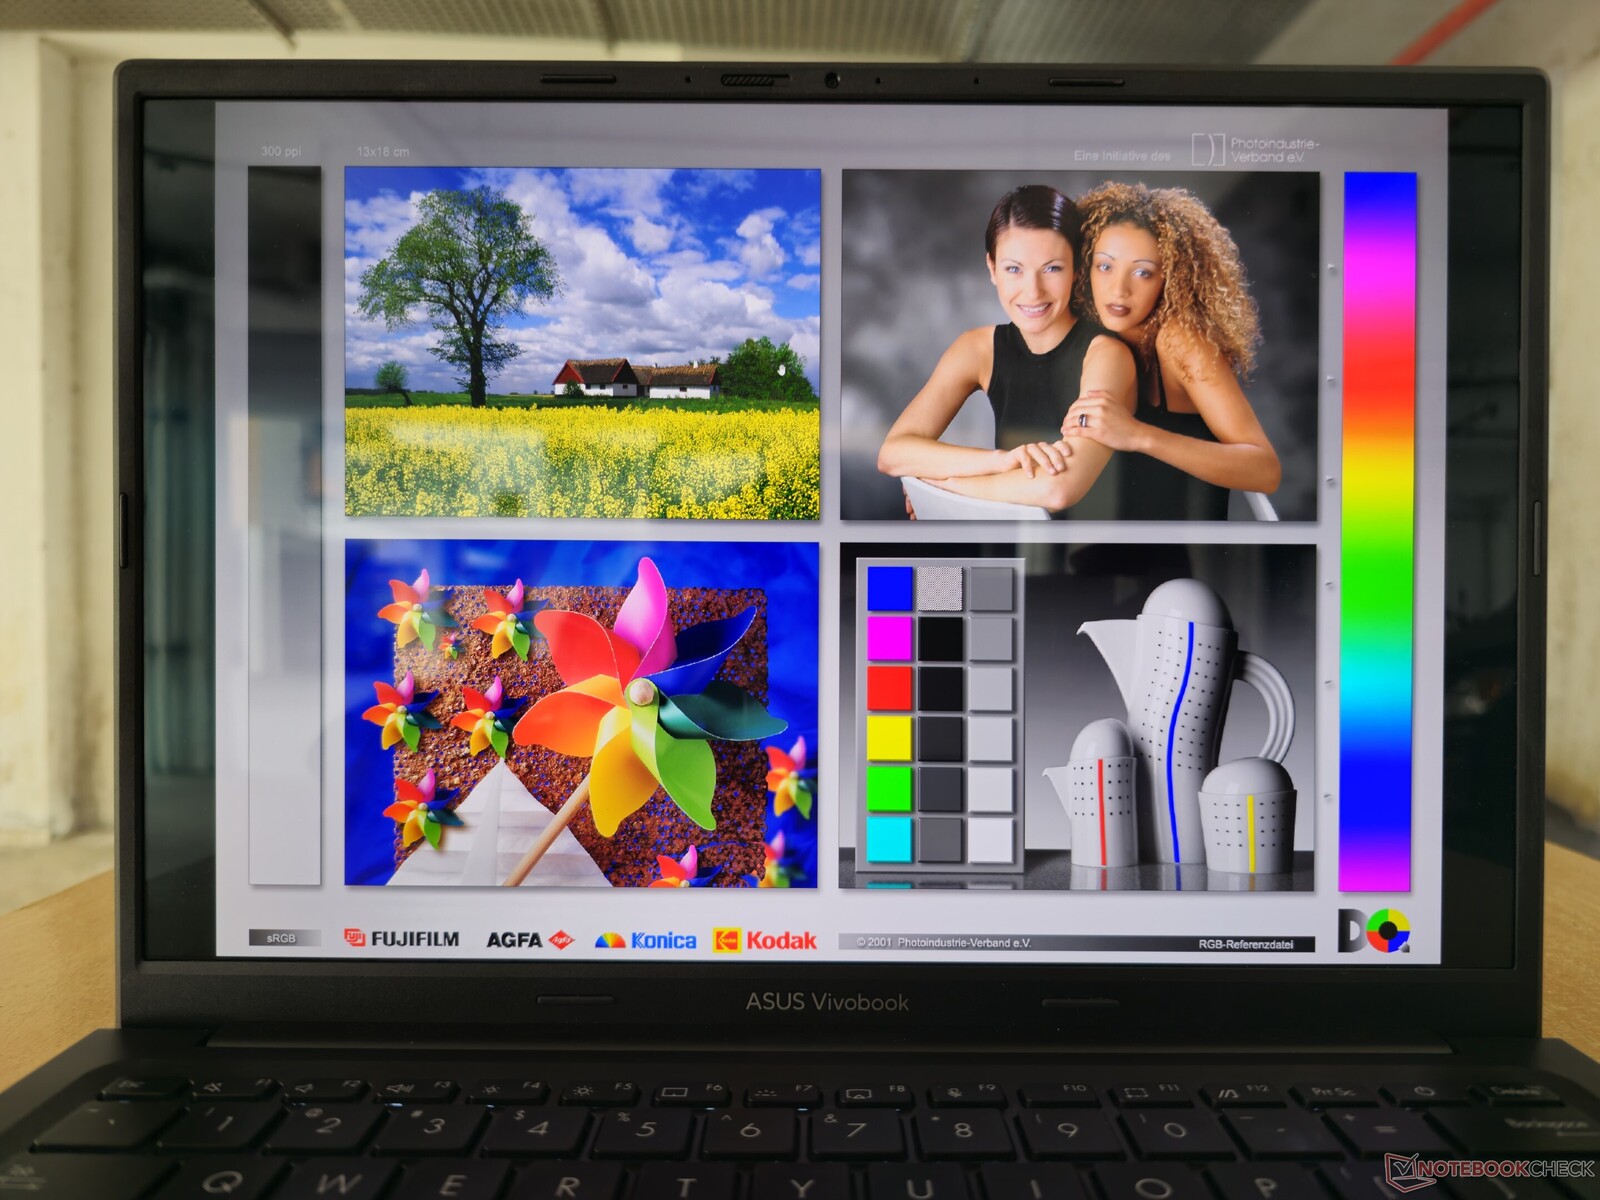
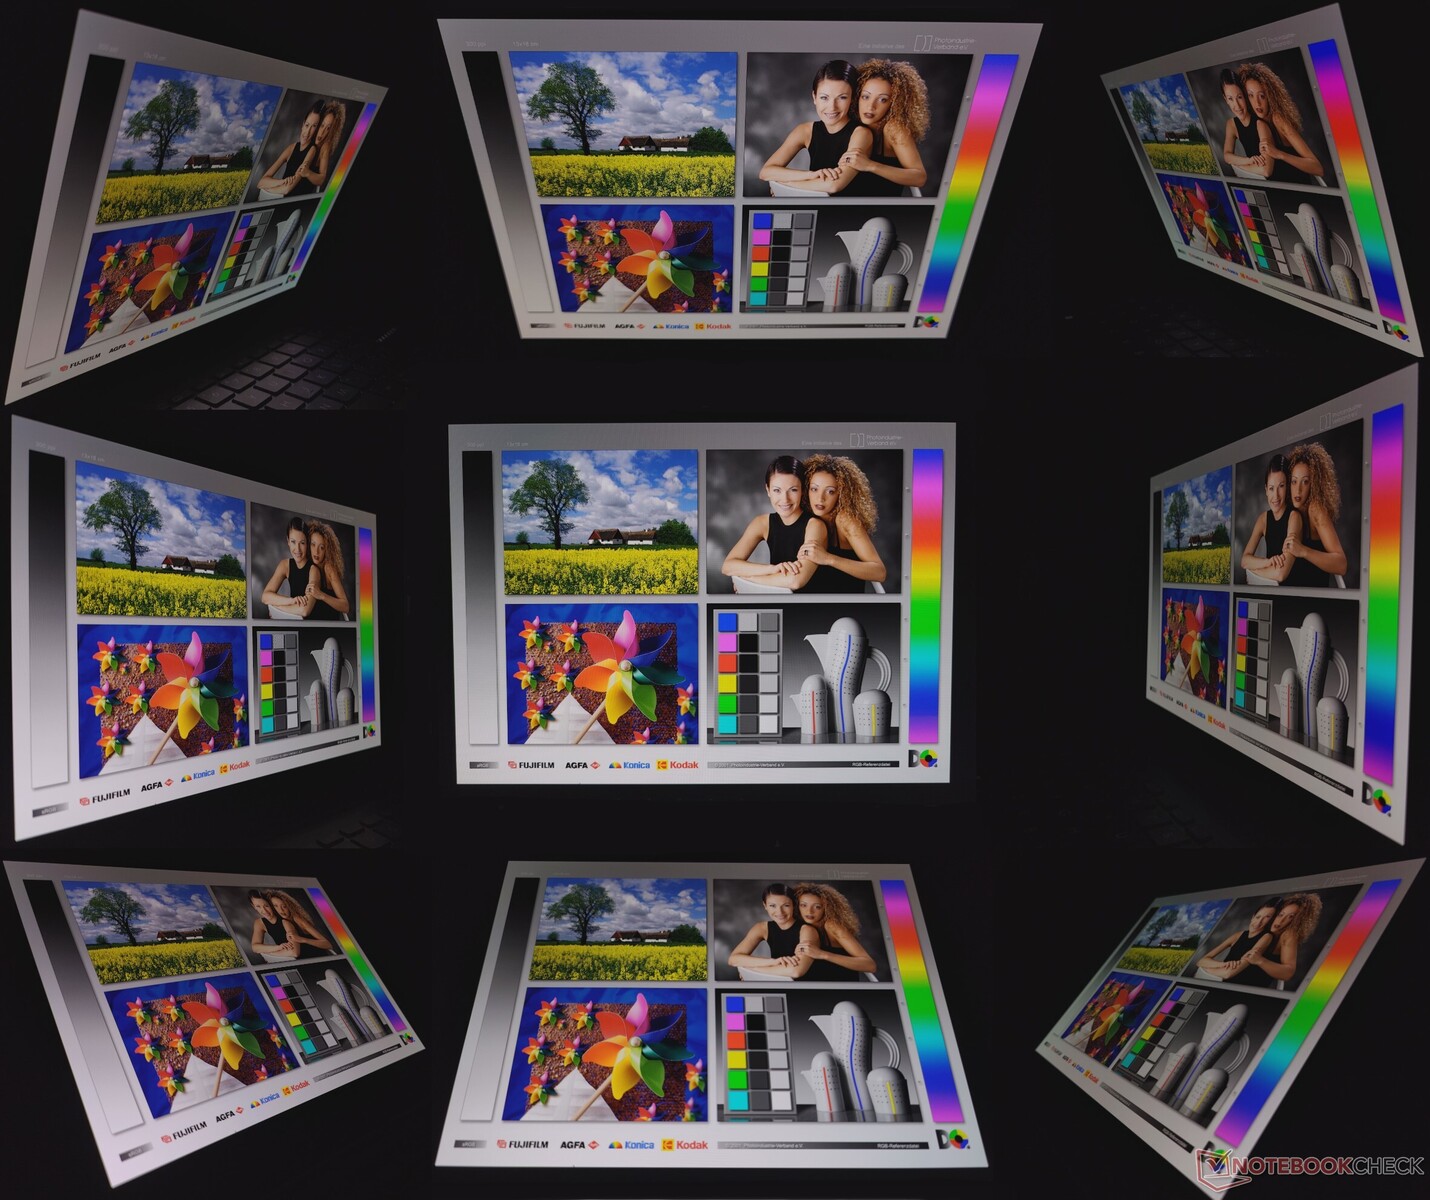
Outdoor viewing under sunlight can be irksome owing to the glossy screen. Viewing angles are good with minimal loss of brightness at extreme angles and no visible green tinting.
Performance: Hamstrung Core i5-13500H with a bit of throttling
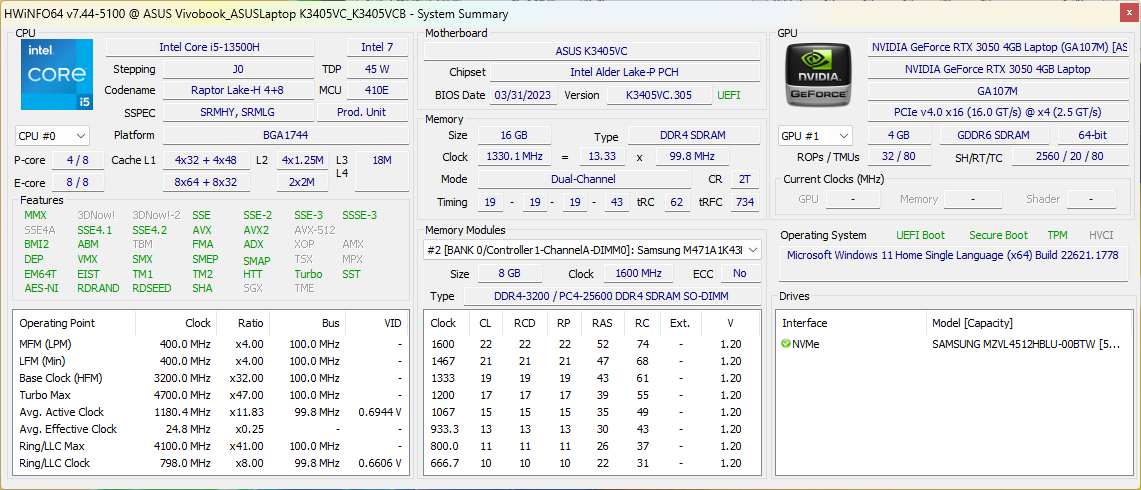
Our Asus VivoBook 14X OLED is powered by the Intel Core i5-13500H CPU and Nvidia GeForce RTX 3050 4 GB Laptop GPU. The RTX 3050 SKUs can be configured either with a Core i5-13500H or a Core i9-13900H.
An RTX 2050 Mobile option is also available but only with a Core i5-13500H.
Testing Conditions
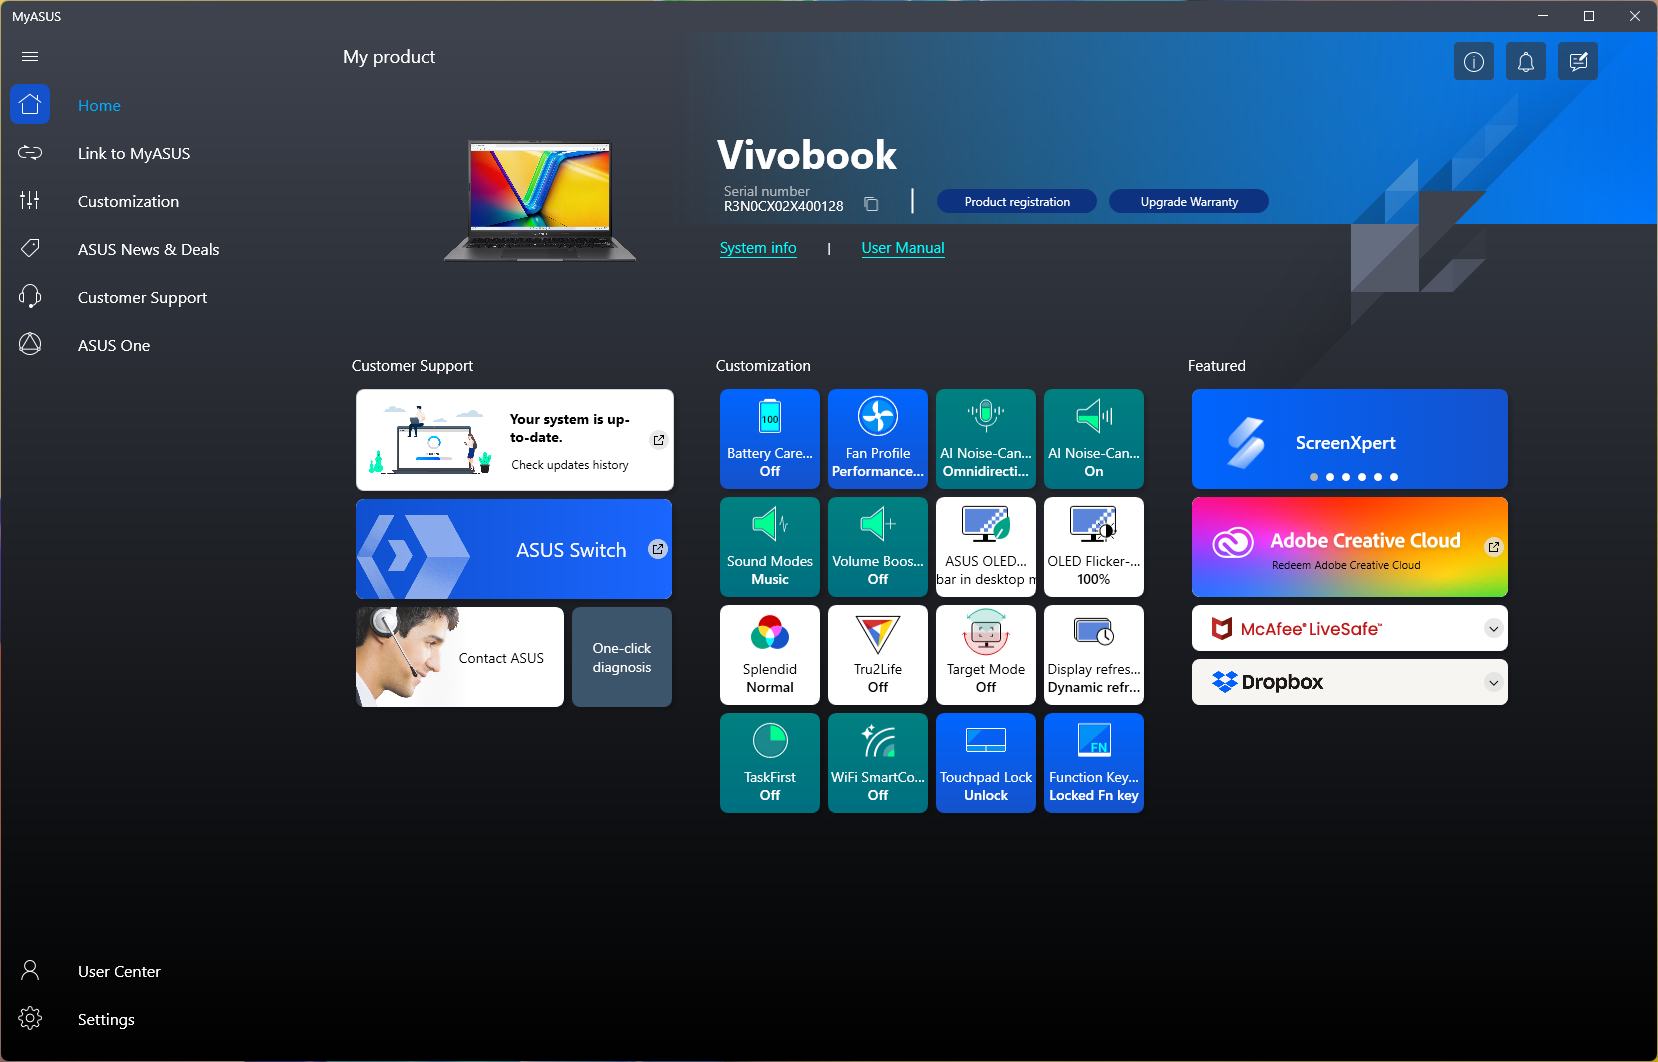
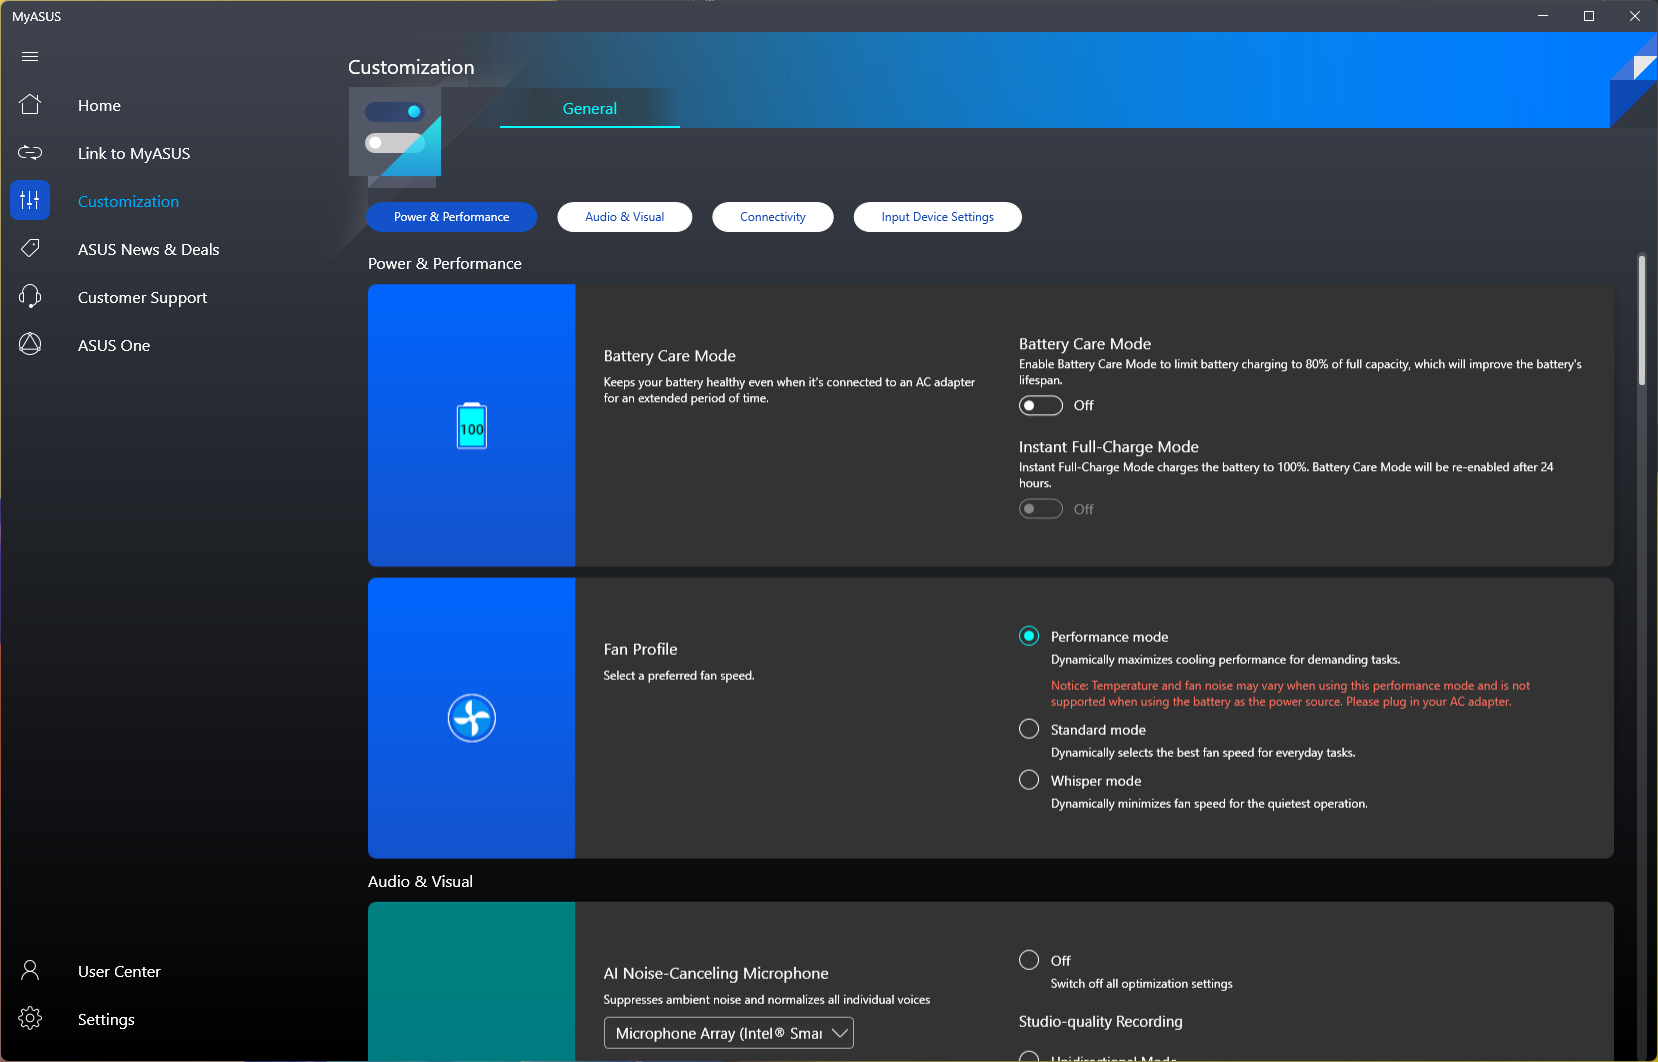
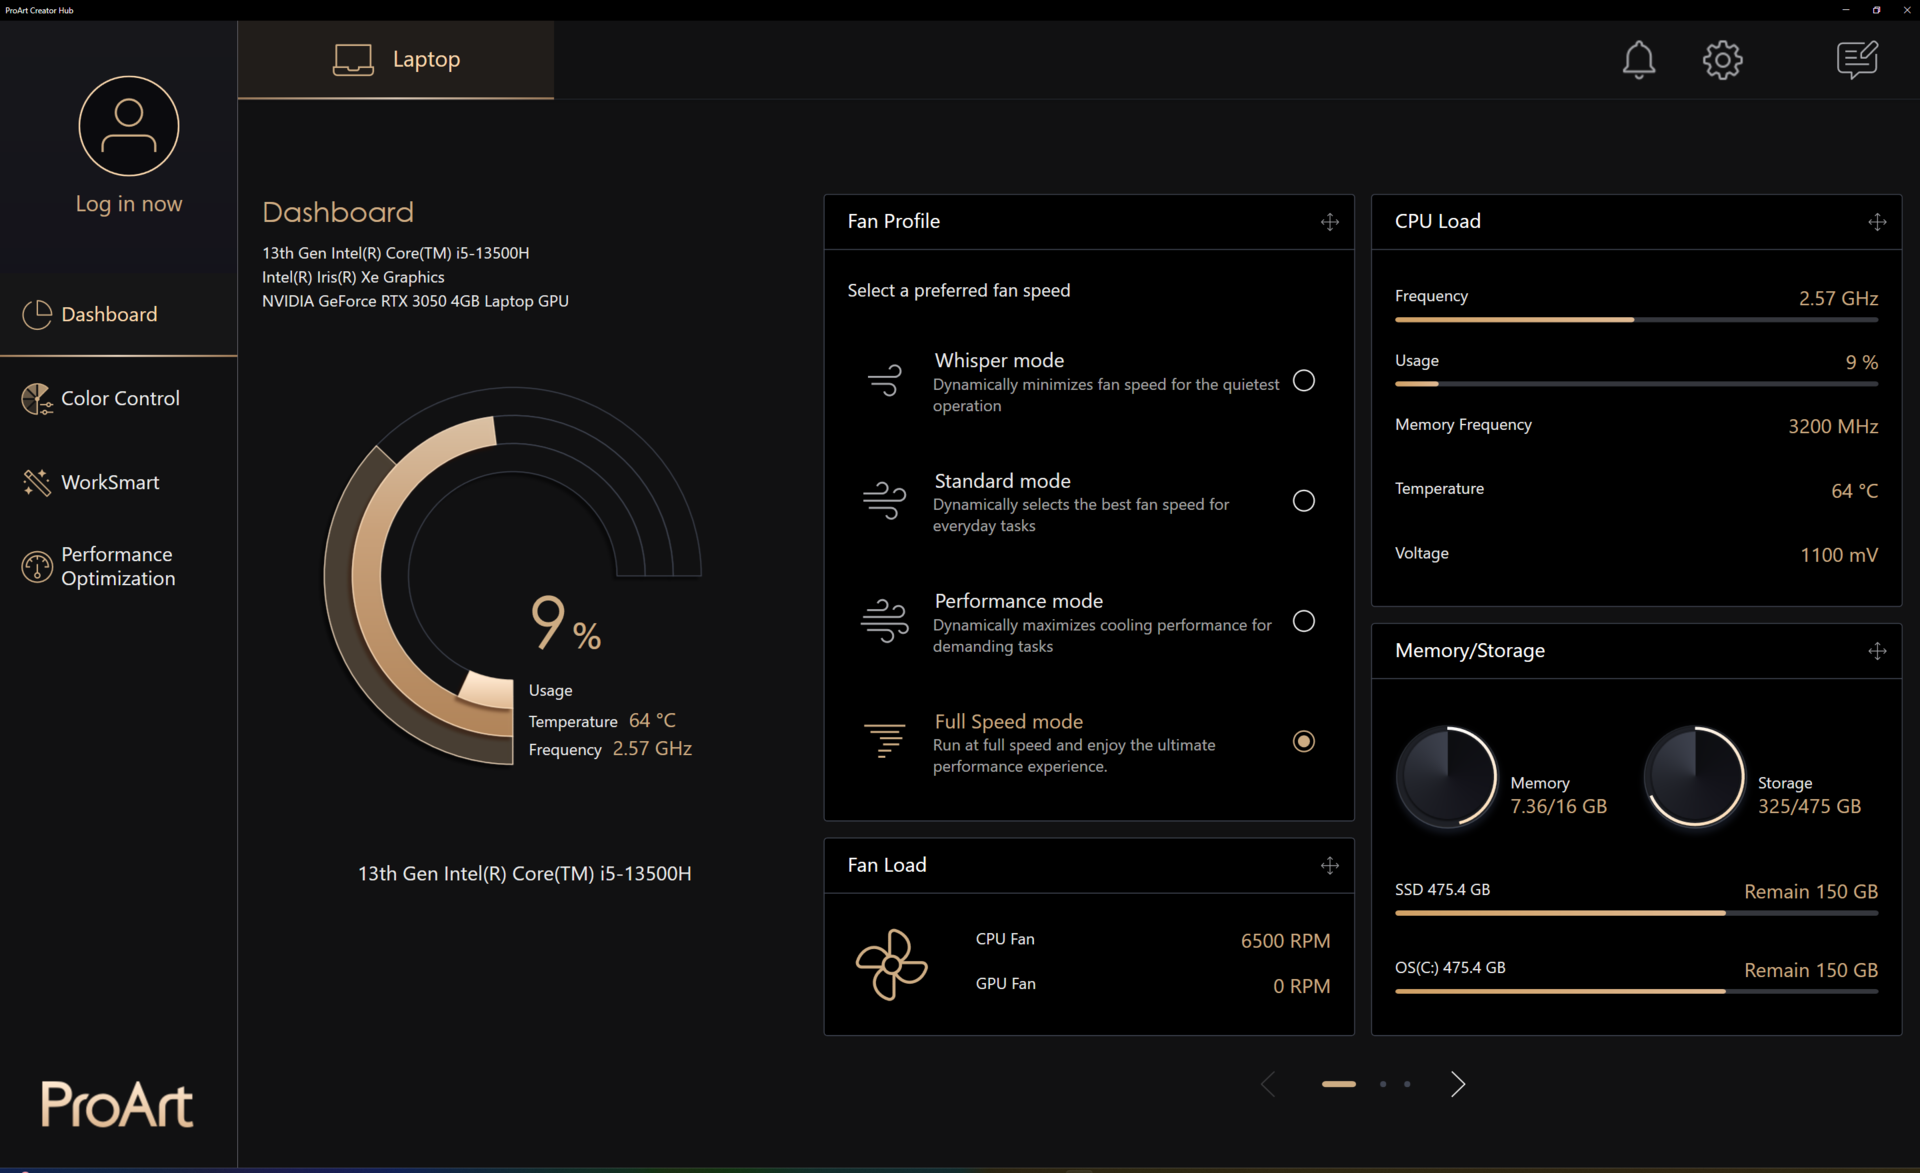
Asus redundantly splits performance settings between the MyAsus app and the ProArt Creator Hub, although the MyAsus app should be sufficient in most cases. However, you will need to use the ProArt Creator Hub to access the Full Speed mode.
We utilized the Full Speed mode for all performance benchmarks and the Standard mode for battery tests.
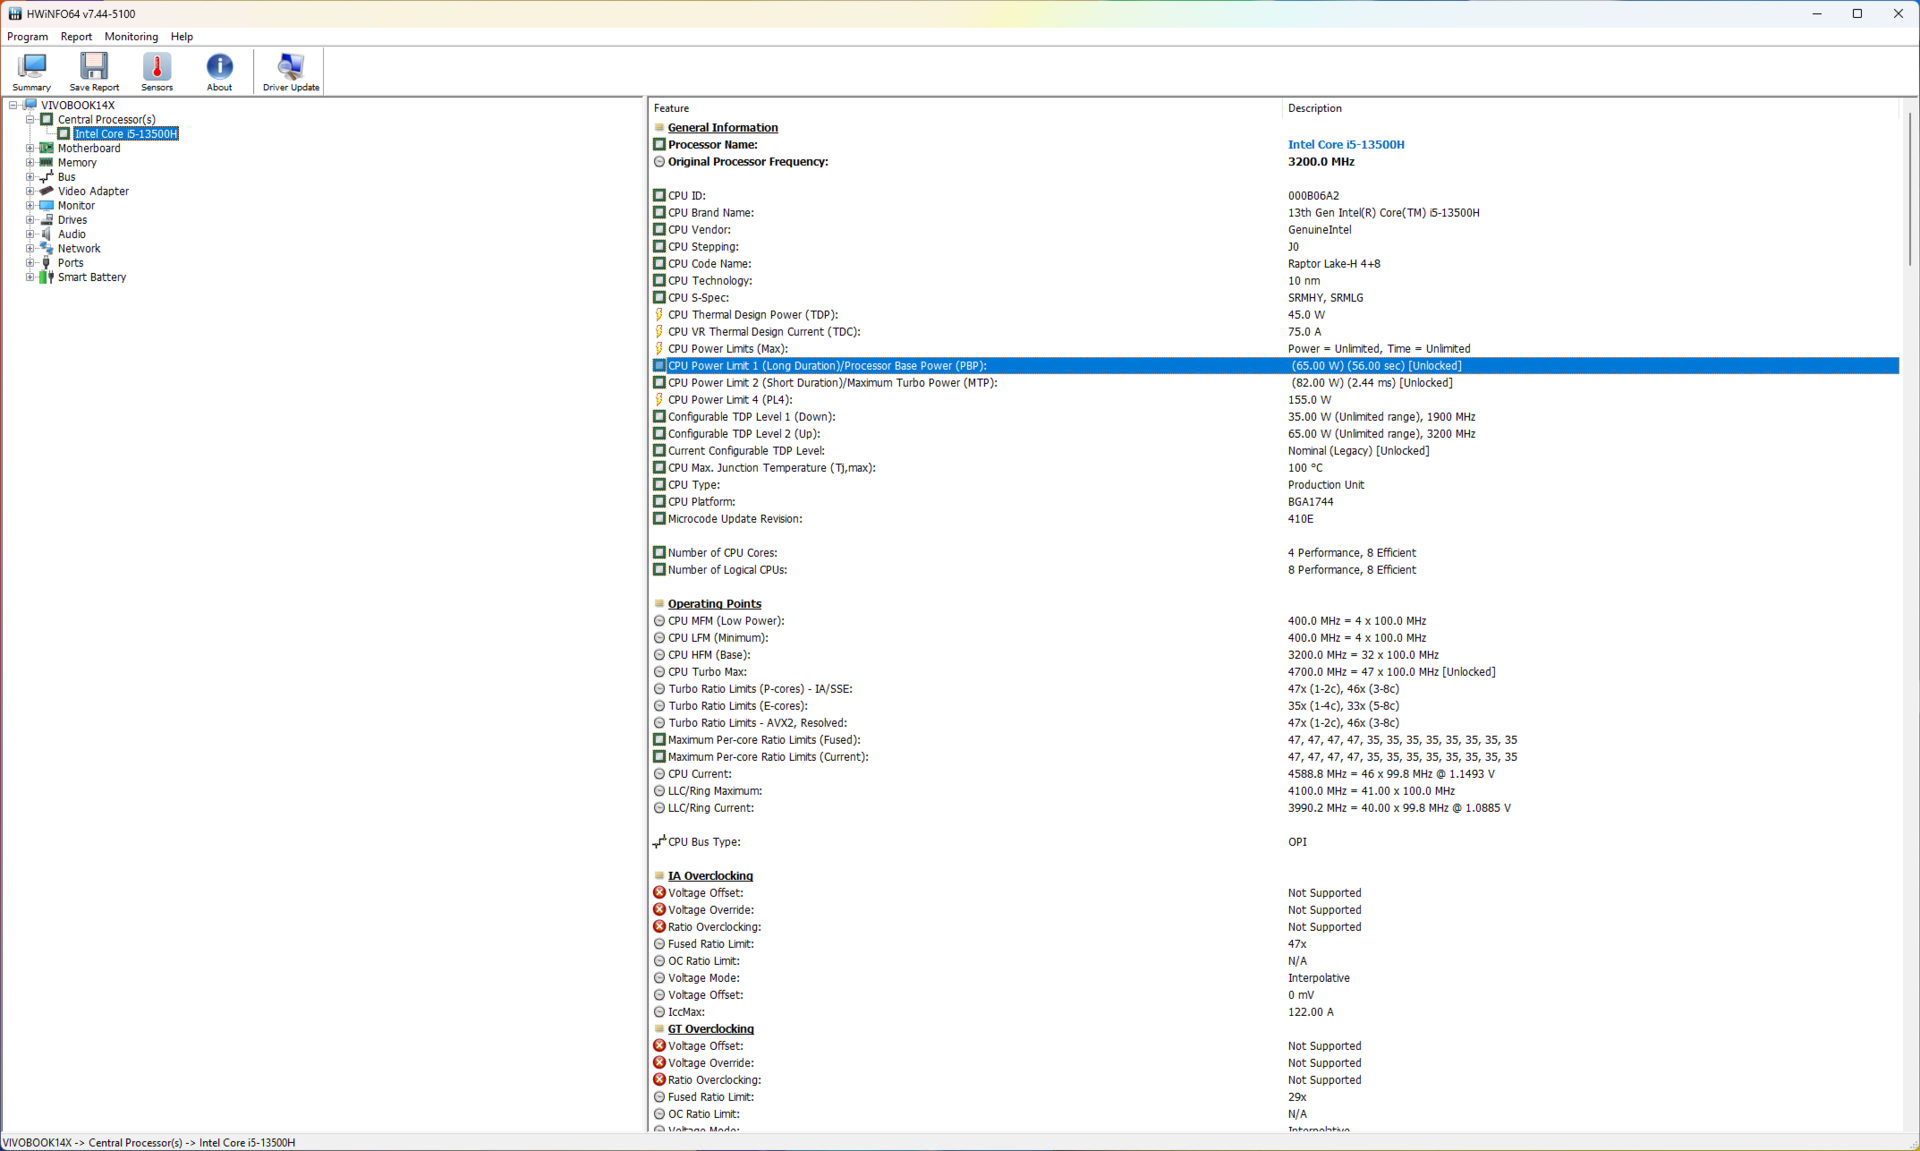
The table below illustrates how the Core i5-13500H's PL1 and PL2 values vary depending on the chosen performance setting.
| Performance mode | PL1 (PBP) / Tau | PL2 (MTP) / Tau |
|---|---|---|
| Whisper | 30 W / 56 s | 54 W / 2.44 ms |
| Standard | 50 W / 56 s | 82 W / 2.44 ms |
| Performance | 55 W / 56 s | 82 W / 2.44 ms |
| Full Speed | 65 W / 56 s | 82 W / 2.44 ms |
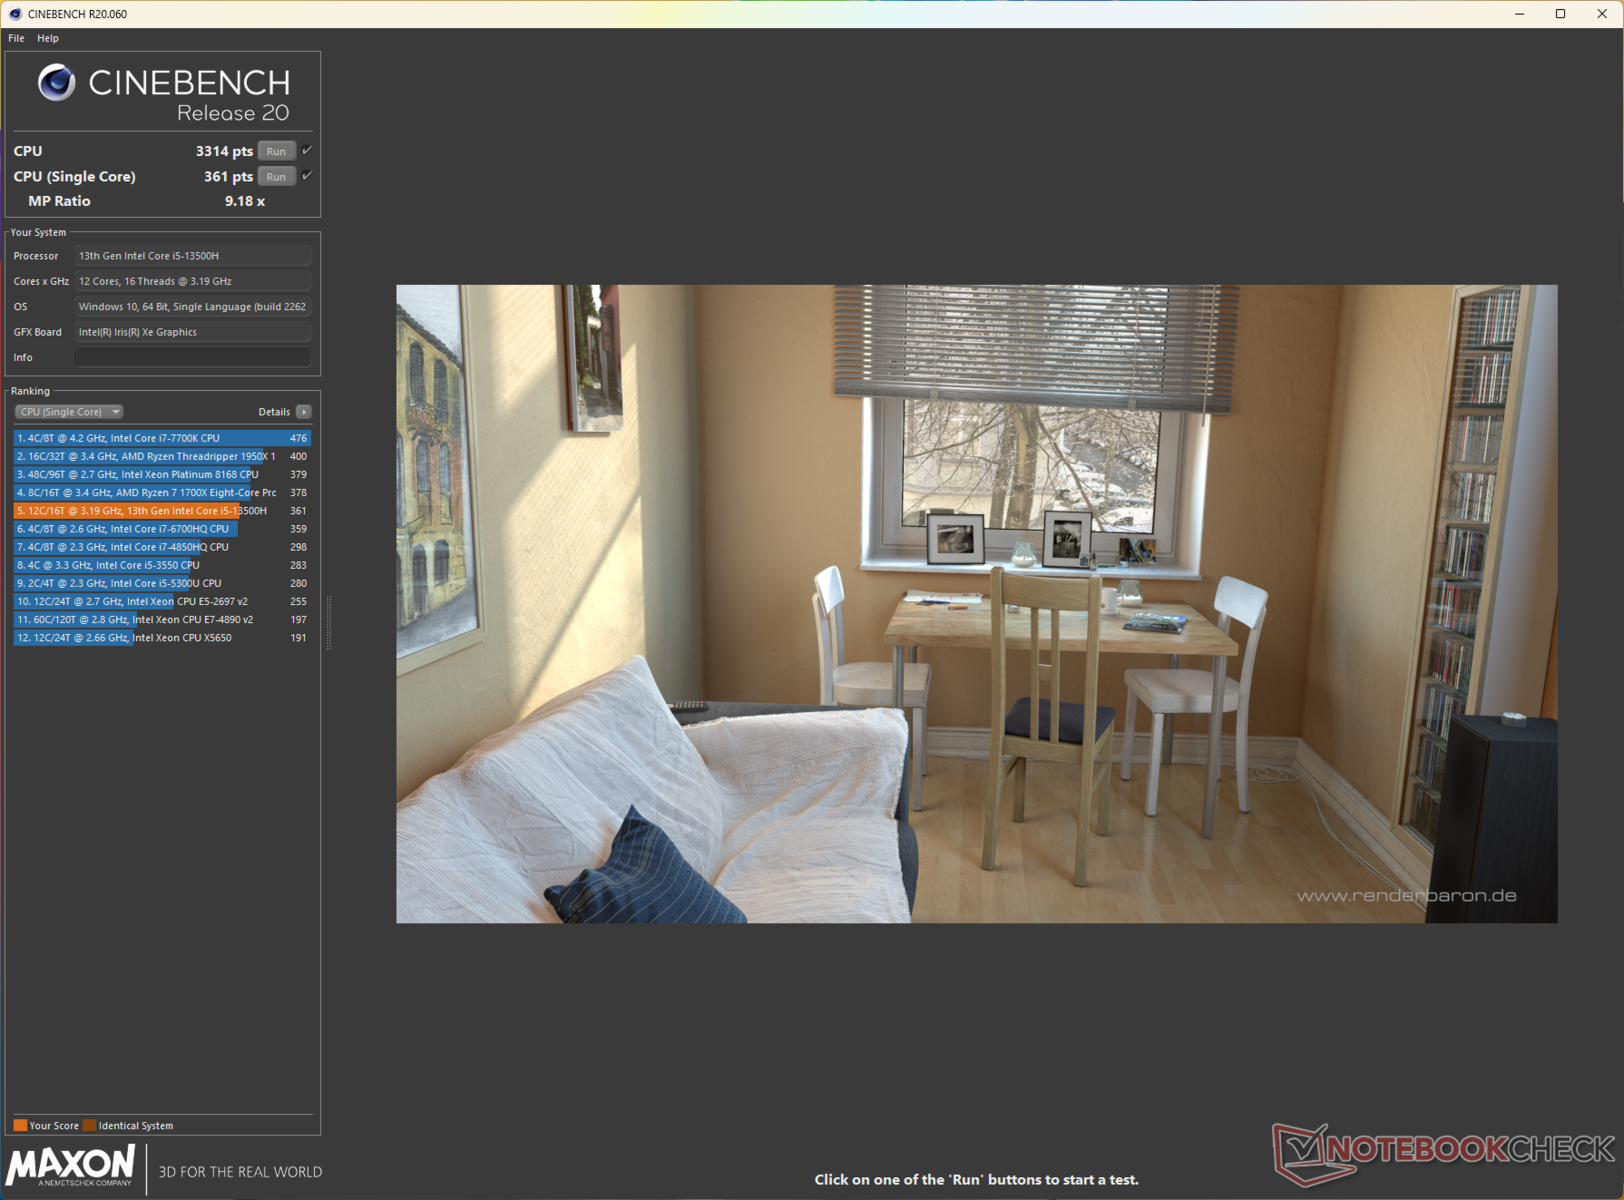
Processor
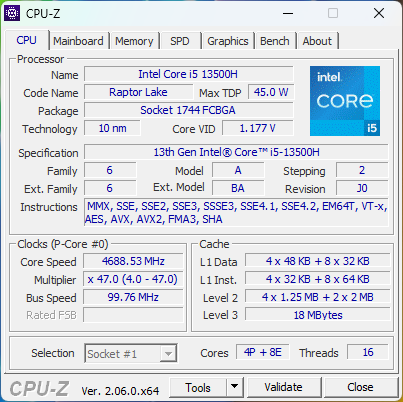
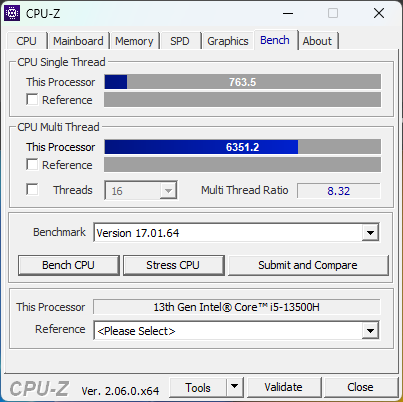
The Core i5-13500H offers 12 cores (4P + 8E) and 16 threads with single-core boosts up to 4.7 GHz and a TDP of 45 W. Overall CPU performance is largely in line with a Core i7-12700H, but it falls about 10% behind the Core i7-13700H in the MSI Stealth 14 Studio.
That being said, the CPU performance drops by about 18% by the end of the Cinebench R15 multi-core loop test. However, this throttling is not as drastic compared to what we observe with the Core i7-13700H in the Acer Swift X SFX14.
Cinebench R15 Multi Loop
Cinebench R23: Multi Core | Single Core
Cinebench R20: CPU (Multi Core) | CPU (Single Core)
Cinebench R15: CPU Multi 64Bit | CPU Single 64Bit
Blender: v2.79 BMW27 CPU
7-Zip 18.03: 7z b 4 | 7z b 4 -mmt1
Geekbench 5.5: Multi-Core | Single-Core
HWBOT x265 Benchmark v2.2: 4k Preset
LibreOffice : 20 Documents To PDF
R Benchmark 2.5: Overall mean
| CPU Performance rating | |
| Average of class Multimedia | |
| MSI Stealth 14 Studio A13V | |
| Gigabyte Aero 14 OLED BMF | |
| Acer Swift X SFX14-71G | |
| Schenker Vision 14 2022 RTX 3050 Ti | |
| Average Intel Core i5-13500H | |
| Asus VivoBook 14X K3405 | |
| Lenovo Slim Pro 7 14ARP8 | |
| Cinebench R23 / Multi Core | |
| MSI Stealth 14 Studio A13V | |
| Average of class Multimedia (4861 - 33362, n=65, last 2 years) | |
| Acer Swift X SFX14-71G | |
| Schenker Vision 14 2022 RTX 3050 Ti | |
| Average Intel Core i5-13500H (13542 - 16335, n=5) | |
| Asus VivoBook 14X K3405 | |
| Gigabyte Aero 14 OLED BMF | |
| Lenovo Slim Pro 7 14ARP8 | |
| Cinebench R23 / Single Core | |
| Average of class Multimedia (1128 - 2459, n=64, last 2 years) | |
| Acer Swift X SFX14-71G | |
| Gigabyte Aero 14 OLED BMF | |
| Average Intel Core i5-13500H (1704 - 1799, n=5) | |
| Asus VivoBook 14X K3405 | |
| Schenker Vision 14 2022 RTX 3050 Ti | |
| MSI Stealth 14 Studio A13V | |
| Lenovo Slim Pro 7 14ARP8 | |
| Cinebench R20 / CPU (Multi Core) | |
| MSI Stealth 14 Studio A13V | |
| Average of class Multimedia (1887 - 12912, n=56, last 2 years) | |
| Acer Swift X SFX14-71G | |
| Schenker Vision 14 2022 RTX 3050 Ti | |
| Asus VivoBook 14X K3405 | |
| Average Intel Core i5-13500H (5108 - 6212, n=5) | |
| Gigabyte Aero 14 OLED BMF | |
| Lenovo Slim Pro 7 14ARP8 | |
| Cinebench R20 / CPU (Single Core) | |
| Acer Swift X SFX14-71G | |
| Average of class Multimedia (425 - 853, n=56, last 2 years) | |
| Gigabyte Aero 14 OLED BMF | |
| Schenker Vision 14 2022 RTX 3050 Ti | |
| Average Intel Core i5-13500H (655 - 687, n=5) | |
| Asus VivoBook 14X K3405 | |
| MSI Stealth 14 Studio A13V | |
| Lenovo Slim Pro 7 14ARP8 | |
| Cinebench R15 / CPU Multi 64Bit | |
| MSI Stealth 14 Studio A13V | |
| Average of class Multimedia (856 - 5224, n=60, last 2 years) | |
| Gigabyte Aero 14 OLED BMF | |
| Acer Swift X SFX14-71G | |
| Average Intel Core i5-13500H (2234 - 2475, n=5) | |
| Asus VivoBook 14X K3405 | |
| Schenker Vision 14 2022 RTX 3050 Ti | |
| Lenovo Slim Pro 7 14ARP8 | |
| Cinebench R15 / CPU Single 64Bit | |
| Average of class Multimedia (184.8 - 326, n=58, last 2 years) | |
| Acer Swift X SFX14-71G | |
| Gigabyte Aero 14 OLED BMF | |
| Schenker Vision 14 2022 RTX 3050 Ti | |
| Average Intel Core i5-13500H (243 - 261, n=5) | |
| Asus VivoBook 14X K3405 | |
| MSI Stealth 14 Studio A13V | |
| Lenovo Slim Pro 7 14ARP8 | |
| Blender / v2.79 BMW27 CPU | |
| Acer Swift X SFX14-71G | |
| Schenker Vision 14 2022 RTX 3050 Ti | |
| Average of class Multimedia (100 - 557, n=57, last 2 years) | |
| Lenovo Slim Pro 7 14ARP8 | |
| Average Intel Core i5-13500H (205 - 263, n=6) | |
| Asus VivoBook 14X K3405 | |
| Gigabyte Aero 14 OLED BMF | |
| MSI Stealth 14 Studio A13V | |
| 7-Zip 18.03 / 7z b 4 | |
| MSI Stealth 14 Studio A13V | |
| Gigabyte Aero 14 OLED BMF | |
| Average of class Multimedia (26062 - 130368, n=54, last 2 years) | |
| Acer Swift X SFX14-71G | |
| Lenovo Slim Pro 7 14ARP8 | |
| Average Intel Core i5-13500H (50846 - 58567, n=6) | |
| Asus VivoBook 14X K3405 | |
| Schenker Vision 14 2022 RTX 3050 Ti | |
| 7-Zip 18.03 / 7z b 4 -mmt1 | |
| Acer Swift X SFX14-71G | |
| Gigabyte Aero 14 OLED BMF | |
| Average of class Multimedia (3666 - 7545, n=55, last 2 years) | |
| Schenker Vision 14 2022 RTX 3050 Ti | |
| Average Intel Core i5-13500H (5500 - 5885, n=6) | |
| Asus VivoBook 14X K3405 | |
| MSI Stealth 14 Studio A13V | |
| Lenovo Slim Pro 7 14ARP8 | |
| Geekbench 5.5 / Multi-Core | |
| Average of class Multimedia (4652 - 20422, n=55, last 2 years) | |
| MSI Stealth 14 Studio A13V | |
| Acer Swift X SFX14-71G | |
| Schenker Vision 14 2022 RTX 3050 Ti | |
| Gigabyte Aero 14 OLED BMF | |
| Average Intel Core i5-13500H (9312 - 11465, n=5) | |
| Asus VivoBook 14X K3405 | |
| Lenovo Slim Pro 7 14ARP8 | |
| Geekbench 5.5 / Single-Core | |
| Average of class Multimedia (805 - 2974, n=55, last 2 years) | |
| Gigabyte Aero 14 OLED BMF | |
| Acer Swift X SFX14-71G | |
| Schenker Vision 14 2022 RTX 3050 Ti | |
| Average Intel Core i5-13500H (1674 - 1762, n=5) | |
| MSI Stealth 14 Studio A13V | |
| Asus VivoBook 14X K3405 | |
| Lenovo Slim Pro 7 14ARP8 | |
| HWBOT x265 Benchmark v2.2 / 4k Preset | |
| Average of class Multimedia (5.26 - 36.1, n=55, last 2 years) | |
| MSI Stealth 14 Studio A13V | |
| Lenovo Slim Pro 7 14ARP8 | |
| Asus VivoBook 14X K3405 | |
| Average Intel Core i5-13500H (14.4 - 17.9, n=6) | |
| Gigabyte Aero 14 OLED BMF | |
| Schenker Vision 14 2022 RTX 3050 Ti | |
| Acer Swift X SFX14-71G | |
| LibreOffice / 20 Documents To PDF | |
| Lenovo Slim Pro 7 14ARP8 | |
| MSI Stealth 14 Studio A13V | |
| Average Intel Core i5-13500H (44 - 65.5, n=5) | |
| Average of class Multimedia (23.9 - 146.7, n=56, last 2 years) | |
| Asus VivoBook 14X K3405 | |
| Schenker Vision 14 2022 RTX 3050 Ti | |
| Gigabyte Aero 14 OLED BMF | |
| Acer Swift X SFX14-71G | |
| R Benchmark 2.5 / Overall mean | |
| Lenovo Slim Pro 7 14ARP8 | |
| MSI Stealth 14 Studio A13V | |
| Asus VivoBook 14X K3405 | |
| Average Intel Core i5-13500H (0.471 - 0.51, n=6) | |
| Average of class Multimedia (0.3604 - 0.947, n=55, last 2 years) | |
| Schenker Vision 14 2022 RTX 3050 Ti | |
| Gigabyte Aero 14 OLED BMF | |
| Acer Swift X SFX14-71G | |
* ... smaller is better
Running the Cinebench R15 multi-core loop in different performance modes reveals that the VivoBook 14X's Core i5-13500H implementation cannot fully utilize its allocated TDP budget. In the Standard and Full Speed profiles, the peak package power observed is only 70 W against the allowed 82 W.
Additionally, this power level is reached only during the initial loop, with the maximum clock around the 3.5 GHz mark. In the Whisper mode, the processor can utilize up to 54 W peak but averages at just about 16 W during the test.
Cinebench R20 takes a nosedive on battery mode with 45% and 41% drops single-core and multi-core performance, respectively.
AIDA64: FP32 Ray-Trace | FPU Julia | CPU SHA3 | CPU Queen | FPU SinJulia | FPU Mandel | CPU AES | CPU ZLib | FP64 Ray-Trace | CPU PhotoWorxx
| Performance rating | |
| MSI Stealth 14 Studio A13V | |
| Average of class Multimedia | |
| Lenovo Slim Pro 7 14ARP8 | |
| Gigabyte Aero 14 OLED BMF | |
| Asus VivoBook 14X K3405 | |
| Average Intel Core i5-13500H | |
| Schenker Vision 14 2022 RTX 3050 Ti | |
| Acer Swift X SFX14-71G | |
| AIDA64 / FP32 Ray-Trace | |
| Average of class Multimedia (2214 - 50388, n=53, last 2 years) | |
| MSI Stealth 14 Studio A13V | |
| Lenovo Slim Pro 7 14ARP8 | |
| Asus VivoBook 14X K3405 | |
| Average Intel Core i5-13500H (11081 - 15390, n=6) | |
| Gigabyte Aero 14 OLED BMF | |
| Schenker Vision 14 2022 RTX 3050 Ti | |
| Acer Swift X SFX14-71G | |
| AIDA64 / FPU Julia | |
| Lenovo Slim Pro 7 14ARP8 | |
| MSI Stealth 14 Studio A13V | |
| Average of class Multimedia (12867 - 201874, n=53, last 2 years) | |
| Asus VivoBook 14X K3405 | |
| Average Intel Core i5-13500H (56813 - 74251, n=6) | |
| Gigabyte Aero 14 OLED BMF | |
| Schenker Vision 14 2022 RTX 3050 Ti | |
| Acer Swift X SFX14-71G | |
| AIDA64 / CPU SHA3 | |
| Average of class Multimedia (626 - 8623, n=53, last 2 years) | |
| MSI Stealth 14 Studio A13V | |
| Asus VivoBook 14X K3405 | |
| Lenovo Slim Pro 7 14ARP8 | |
| Average Intel Core i5-13500H (2621 - 3623, n=6) | |
| Gigabyte Aero 14 OLED BMF | |
| Schenker Vision 14 2022 RTX 3050 Ti | |
| Acer Swift X SFX14-71G | |
| AIDA64 / CPU Queen | |
| Gigabyte Aero 14 OLED BMF | |
| MSI Stealth 14 Studio A13V | |
| Acer Swift X SFX14-71G | |
| Schenker Vision 14 2022 RTX 3050 Ti | |
| Lenovo Slim Pro 7 14ARP8 | |
| Average Intel Core i5-13500H (77835 - 85727, n=6) | |
| Asus VivoBook 14X K3405 | |
| Average of class Multimedia (13483 - 181505, n=40, last 2 years) | |
| AIDA64 / FPU SinJulia | |
| Lenovo Slim Pro 7 14ARP8 | |
| MSI Stealth 14 Studio A13V | |
| Gigabyte Aero 14 OLED BMF | |
| Average of class Multimedia (886 - 28794, n=53, last 2 years) | |
| Schenker Vision 14 2022 RTX 3050 Ti | |
| Average Intel Core i5-13500H (7249 - 8086, n=6) | |
| Asus VivoBook 14X K3405 | |
| Acer Swift X SFX14-71G | |
| AIDA64 / FPU Mandel | |
| Lenovo Slim Pro 7 14ARP8 | |
| Average of class Multimedia (6395 - 105740, n=53, last 2 years) | |
| MSI Stealth 14 Studio A13V | |
| Asus VivoBook 14X K3405 | |
| Average Intel Core i5-13500H (27820 - 38336, n=6) | |
| Gigabyte Aero 14 OLED BMF | |
| Schenker Vision 14 2022 RTX 3050 Ti | |
| Acer Swift X SFX14-71G | |
| AIDA64 / CPU AES | |
| Gigabyte Aero 14 OLED BMF | |
| Asus VivoBook 14X K3405 | |
| Average Intel Core i5-13500H (62657 - 120493, n=6) | |
| Acer Swift X SFX14-71G | |
| MSI Stealth 14 Studio A13V | |
| Schenker Vision 14 2022 RTX 3050 Ti | |
| Average of class Multimedia (8171 - 126790, n=53, last 2 years) | |
| Lenovo Slim Pro 7 14ARP8 | |
| AIDA64 / CPU ZLib | |
| MSI Stealth 14 Studio A13V | |
| Average of class Multimedia (143.8 - 2022, n=53, last 2 years) | |
| Schenker Vision 14 2022 RTX 3050 Ti | |
| Asus VivoBook 14X K3405 | |
| Average Intel Core i5-13500H (782 - 992, n=6) | |
| Gigabyte Aero 14 OLED BMF | |
| Lenovo Slim Pro 7 14ARP8 | |
| Acer Swift X SFX14-71G | |
| AIDA64 / FP64 Ray-Trace | |
| Average of class Multimedia (1014 - 26875, n=53, last 2 years) | |
| MSI Stealth 14 Studio A13V | |
| Lenovo Slim Pro 7 14ARP8 | |
| Asus VivoBook 14X K3405 | |
| Average Intel Core i5-13500H (5955 - 8495, n=6) | |
| Gigabyte Aero 14 OLED BMF | |
| Schenker Vision 14 2022 RTX 3050 Ti | |
| Acer Swift X SFX14-71G | |
| AIDA64 / CPU PhotoWorxx | |
| Gigabyte Aero 14 OLED BMF | |
| Average of class Multimedia (8187 - 88154, n=53, last 2 years) | |
| Acer Swift X SFX14-71G | |
| MSI Stealth 14 Studio A13V | |
| Average Intel Core i5-13500H (20212 - 37618, n=6) | |
| Schenker Vision 14 2022 RTX 3050 Ti | |
| Lenovo Slim Pro 7 14ARP8 | |
| Asus VivoBook 14X K3405 | |
System Performance
The VivoBook 14X trails behind the MSI Stealth 14 in PCMark 10 and CrossMark tests but not by much. Overall system performance in typical daily usage is smooth and responsive.
CrossMark: Overall | Productivity | Creativity | Responsiveness
AIDA64: Memory Copy | Memory Read | Memory Write | Memory Latency
| PCMark 10 / Score | |
| Average of class Multimedia (4325 - 10386, n=51, last 2 years) | |
| Gigabyte Aero 14 OLED BMF | |
| Acer Swift X SFX14-71G | |
| MSI Stealth 14 Studio A13V | |
| Asus VivoBook 14X K3405 | |
| Average Intel Core i5-13500H, NVIDIA GeForce RTX 3050 4GB Laptop GPU (n=1) | |
| Schenker Vision 14 2022 RTX 3050 Ti | |
| Lenovo Slim Pro 7 14ARP8 | |
| PCMark 10 / Essentials | |
| Gigabyte Aero 14 OLED BMF | |
| Acer Swift X SFX14-71G | |
| Average of class Multimedia (8025 - 11664, n=50, last 2 years) | |
| Schenker Vision 14 2022 RTX 3050 Ti | |
| MSI Stealth 14 Studio A13V | |
| Asus VivoBook 14X K3405 | |
| Average Intel Core i5-13500H, NVIDIA GeForce RTX 3050 4GB Laptop GPU (n=1) | |
| Lenovo Slim Pro 7 14ARP8 | |
| PCMark 10 / Productivity | |
| Average of class Multimedia (7323 - 18233, n=50, last 2 years) | |
| Acer Swift X SFX14-71G | |
| Gigabyte Aero 14 OLED BMF | |
| Asus VivoBook 14X K3405 | |
| Average Intel Core i5-13500H, NVIDIA GeForce RTX 3050 4GB Laptop GPU (n=1) | |
| Schenker Vision 14 2022 RTX 3050 Ti | |
| MSI Stealth 14 Studio A13V | |
| Lenovo Slim Pro 7 14ARP8 | |
| PCMark 10 / Digital Content Creation | |
| MSI Stealth 14 Studio A13V | |
| Average of class Multimedia (3651 - 16240, n=50, last 2 years) | |
| Acer Swift X SFX14-71G | |
| Gigabyte Aero 14 OLED BMF | |
| Lenovo Slim Pro 7 14ARP8 | |
| Schenker Vision 14 2022 RTX 3050 Ti | |
| Asus VivoBook 14X K3405 | |
| Average Intel Core i5-13500H, NVIDIA GeForce RTX 3050 4GB Laptop GPU (n=1) | |
| CrossMark / Overall | |
| Acer Swift X SFX14-71G | |
| Average of class Multimedia (866 - 2728, n=59, last 2 years) | |
| Gigabyte Aero 14 OLED BMF | |
| MSI Stealth 14 Studio A13V | |
| Schenker Vision 14 2022 RTX 3050 Ti | |
| Asus VivoBook 14X K3405 | |
| Average Intel Core i5-13500H, NVIDIA GeForce RTX 3050 4GB Laptop GPU (n=1) | |
| Lenovo Slim Pro 7 14ARP8 | |
| CrossMark / Productivity | |
| Acer Swift X SFX14-71G | |
| Gigabyte Aero 14 OLED BMF | |
| Average of class Multimedia (931 - 2489, n=59, last 2 years) | |
| MSI Stealth 14 Studio A13V | |
| Schenker Vision 14 2022 RTX 3050 Ti | |
| Asus VivoBook 14X K3405 | |
| Average Intel Core i5-13500H, NVIDIA GeForce RTX 3050 4GB Laptop GPU (n=1) | |
| Lenovo Slim Pro 7 14ARP8 | |
| CrossMark / Creativity | |
| Average of class Multimedia (907 - 3465, n=59, last 2 years) | |
| Acer Swift X SFX14-71G | |
| Gigabyte Aero 14 OLED BMF | |
| MSI Stealth 14 Studio A13V | |
| Schenker Vision 14 2022 RTX 3050 Ti | |
| Asus VivoBook 14X K3405 | |
| Average Intel Core i5-13500H, NVIDIA GeForce RTX 3050 4GB Laptop GPU (n=1) | |
| Lenovo Slim Pro 7 14ARP8 | |
| CrossMark / Responsiveness | |
| Acer Swift X SFX14-71G | |
| Gigabyte Aero 14 OLED BMF | |
| MSI Stealth 14 Studio A13V | |
| Schenker Vision 14 2022 RTX 3050 Ti | |
| Average of class Multimedia (605 - 2024, n=59, last 2 years) | |
| Asus VivoBook 14X K3405 | |
| Average Intel Core i5-13500H, NVIDIA GeForce RTX 3050 4GB Laptop GPU (n=1) | |
| Lenovo Slim Pro 7 14ARP8 | |
| AIDA64 / Memory Copy | |
| Average of class Multimedia (11299 - 132135, n=53, last 2 years) | |
| Gigabyte Aero 14 OLED BMF | |
| Acer Swift X SFX14-71G | |
| MSI Stealth 14 Studio A13V | |
| Lenovo Slim Pro 7 14ARP8 | |
| Schenker Vision 14 2022 RTX 3050 Ti | |
| Asus VivoBook 14X K3405 | |
| Average Intel Core i5-13500H, NVIDIA GeForce RTX 3050 4GB Laptop GPU (n=1) | |
| AIDA64 / Memory Read | |
| Average of class Multimedia (11624 - 174586, n=53, last 2 years) | |
| Gigabyte Aero 14 OLED BMF | |
| MSI Stealth 14 Studio A13V | |
| Acer Swift X SFX14-71G | |
| Lenovo Slim Pro 7 14ARP8 | |
| Asus VivoBook 14X K3405 | |
| Average Intel Core i5-13500H, NVIDIA GeForce RTX 3050 4GB Laptop GPU (n=1) | |
| Schenker Vision 14 2022 RTX 3050 Ti | |
| AIDA64 / Memory Write | |
| Gigabyte Aero 14 OLED BMF | |
| Average of class Multimedia (11755 - 134998, n=53, last 2 years) | |
| Acer Swift X SFX14-71G | |
| Lenovo Slim Pro 7 14ARP8 | |
| MSI Stealth 14 Studio A13V | |
| Schenker Vision 14 2022 RTX 3050 Ti | |
| Asus VivoBook 14X K3405 | |
| Average Intel Core i5-13500H, NVIDIA GeForce RTX 3050 4GB Laptop GPU (n=1) | |
| AIDA64 / Memory Latency | |
| Average of class Multimedia (7 - 535, n=52, last 2 years) | |
| Lenovo Slim Pro 7 14ARP8 | |
| Acer Swift X SFX14-71G | |
| Gigabyte Aero 14 OLED BMF | |
| Schenker Vision 14 2022 RTX 3050 Ti | |
| Asus VivoBook 14X K3405 | |
| Average Intel Core i5-13500H, NVIDIA GeForce RTX 3050 4GB Laptop GPU (n=1) | |
| MSI Stealth 14 Studio A13V | |
* ... smaller is better
| PCMark 8 Home Score Accelerated v2 | 5514 points | |
| PCMark 8 Work Score Accelerated v2 | 6078 points | |
| PCMark 10 Score | 6645 points | |
Help | ||
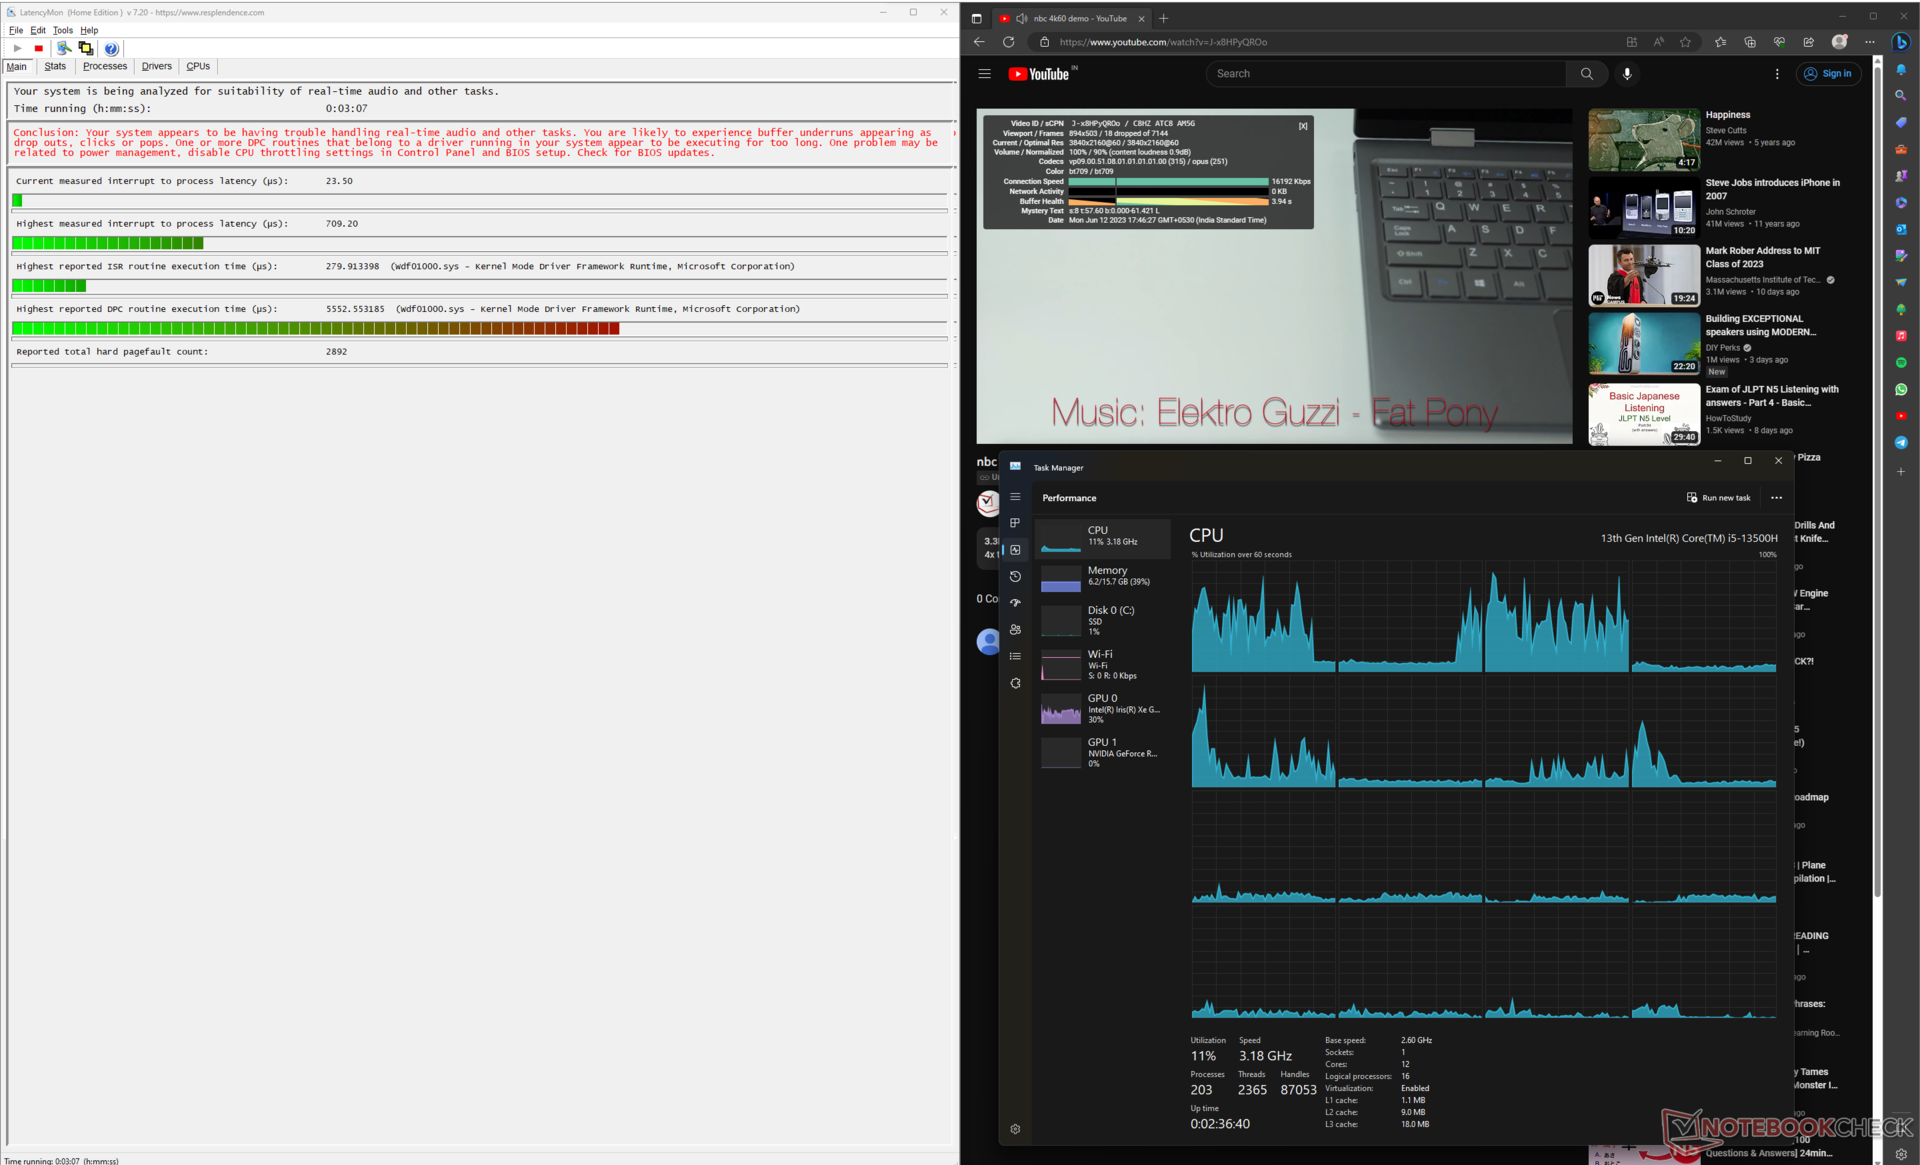
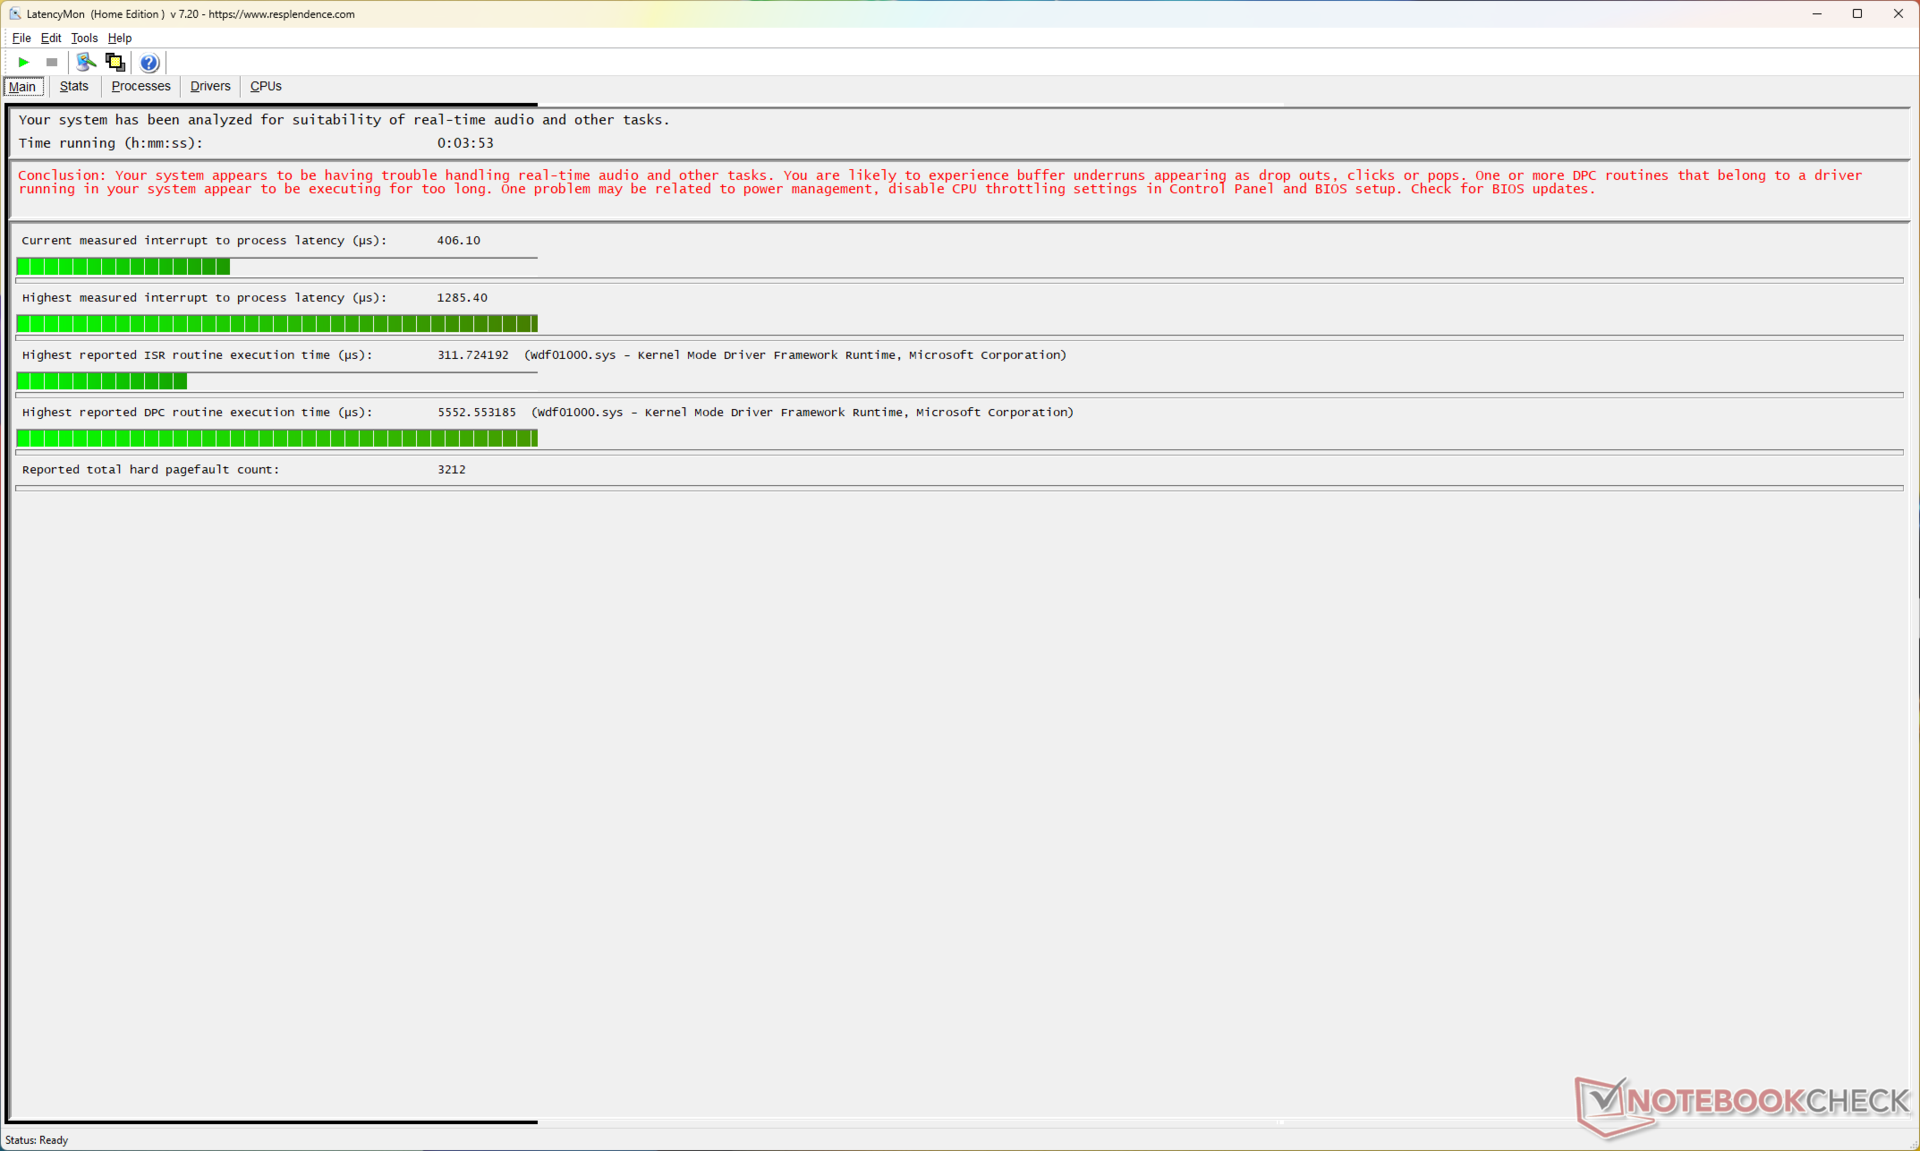
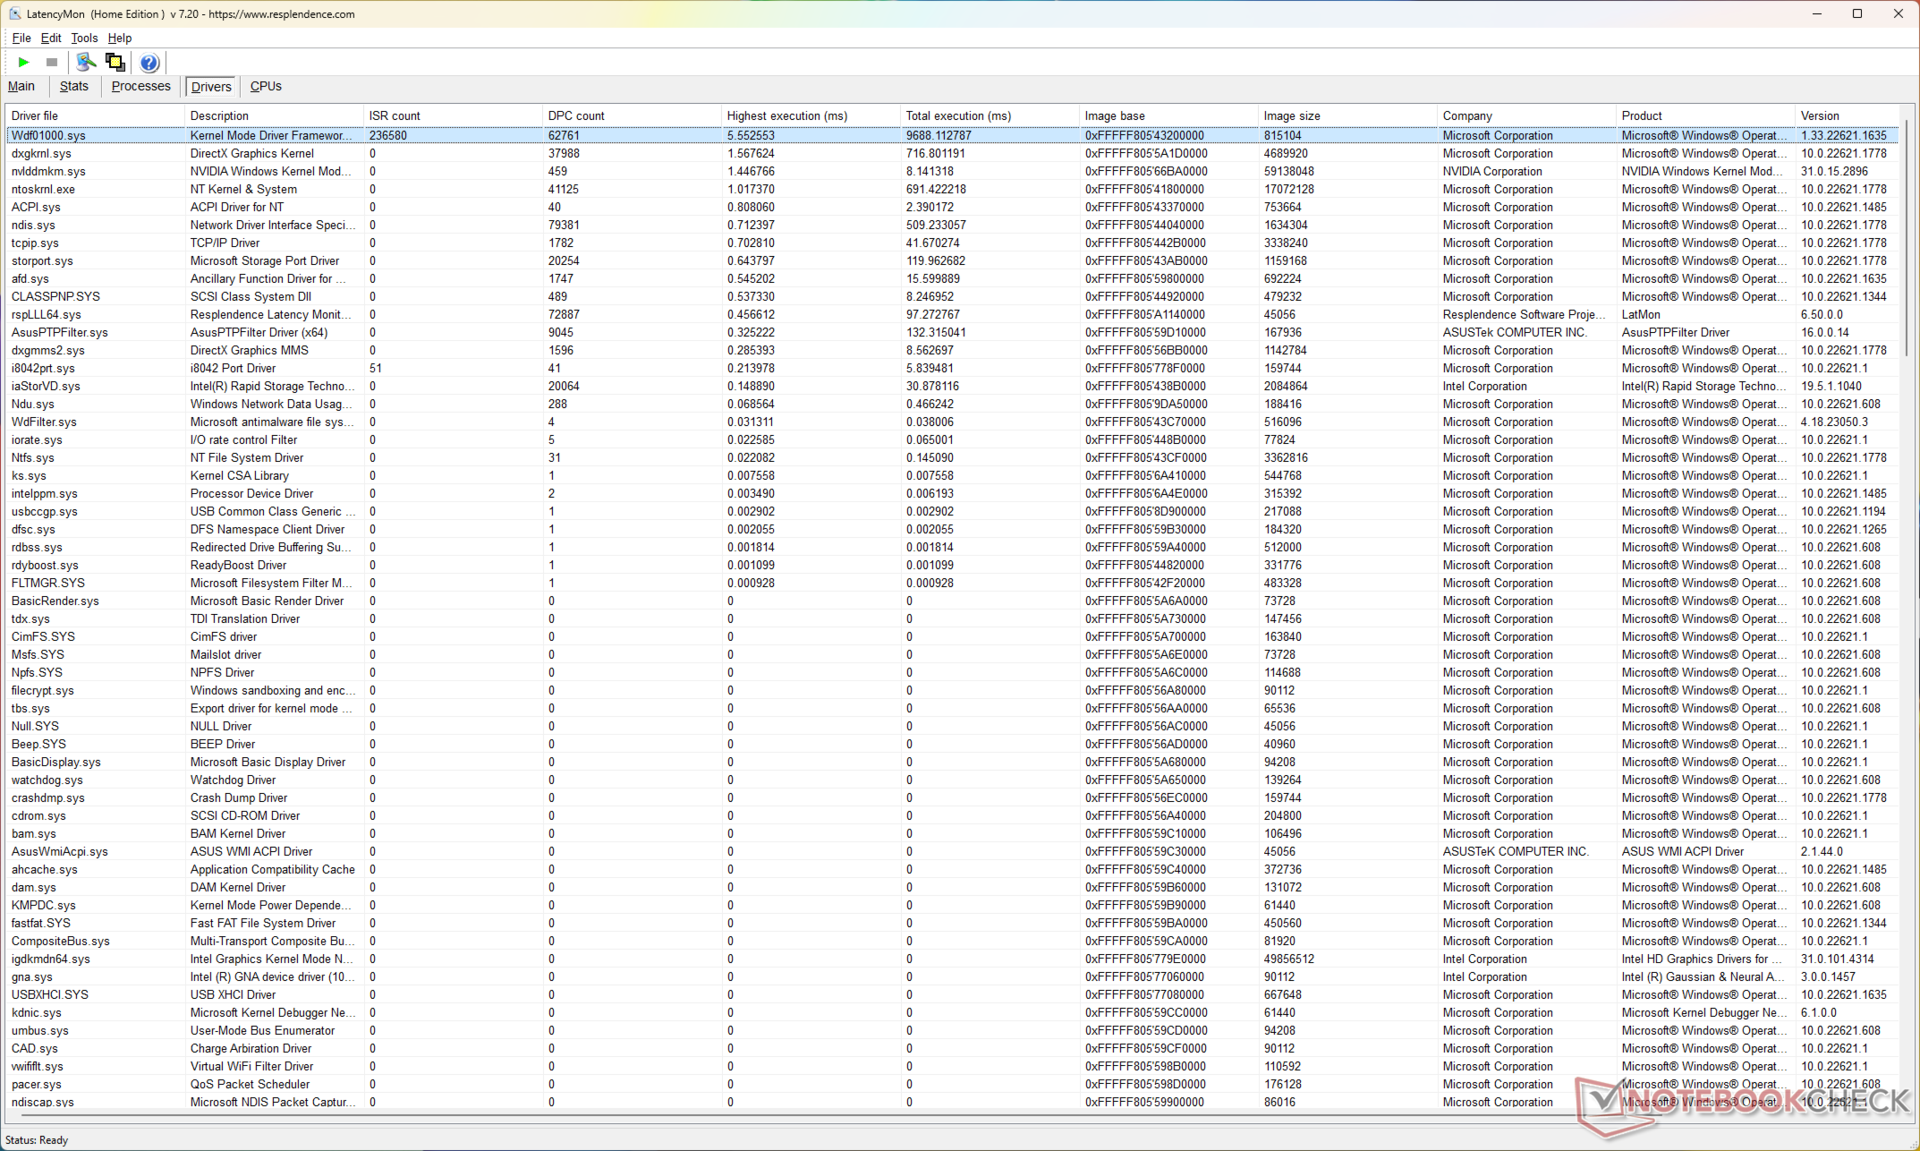
DPC Latency
DPC latency seems to be on the higher side. The measured interrupt-to-process latency was initially 709.20 µs during a 4K YouTube video playback.
This value increased to 1285.40 µs after a 10-second Prime95 stress, suggesting that real-time workflows can get impacted under heavy load.
| DPC Latencies / LatencyMon - interrupt to process latency (max), Web, Youtube, Prime95 | |
| Acer Swift X SFX14-71G | |
| Gigabyte Aero 14 OLED BMF | |
| MSI Stealth 14 Studio A13V | |
| Lenovo Slim Pro 7 14ARP8 | |
| Asus VivoBook 14X K3405 | |
| Schenker Vision 14 2022 RTX 3050 Ti | |
* ... smaller is better
Our DPC Latency Ranking page offers more latency comparisons across reviewed devices.
Storage Devices
The installed Samsung PM9B1 NVMe SSD is offers satisfactory performance for most applications. Asus has provided a thermal pad underneath the drive, which helps maintain relatively stable performance during the DiskSpd read loop test.
That being said, the PM9B1 SSD falls significantly behind the competition in nearly all aspects save for 4K writes. There is no scope for storage expansion.

* ... smaller is better
Disk Throttling: DiskSpd Read Loop, Queue Depth 8
More storage performance comparisons can be found in our HDD and SSD benchmarks page.
GPU Performance
Asus implements a 40 W Nvidia GeForce RTX 3050 4 GB Laptop GPU in the VivoBook 14X. The RTX 3050 4 GB is outdated for a 2023 device with a 13th gen Intel processor, and we see this reflect in synthetic and gaming benchmarks.
Cumulative 3DMark performance trails by 23% compared to the RTX 3050 Ti in the Schenker Vision 14 and by 26% compared to the RTX 3050 6 GB in the Lenovo Slim Pro 7.
The VivoBook 14X also falls behind by 38% against the newer 35 W RTX 4050 in the Gigabyte Aero 14 OLED.
| 3DMark 11 Performance | 13942 points | |
| 3DMark Ice Storm Standard Score | 70334 points | |
| 3DMark Cloud Gate Standard Score | 36793 points | |
| 3DMark Fire Strike Score | 8504 points | |
| 3DMark Fire Strike Extreme Score | 4371 points | |
| 3DMark Time Spy Score | 3832 points | |
Help | ||
| Blender / v3.3 Classroom OPTIX/RTX | |
| Asus VivoBook 14X K3405 | |
| Average NVIDIA GeForce RTX 3050 4GB Laptop GPU (53 - 99, n=12) | |
| Lenovo Slim Pro 7 14ARP8 | |
| Schenker Vision 14 2022 RTX 3050 Ti | |
| Average of class Multimedia (12 - 105, n=21, last 2 years) | |
| Gigabyte Aero 14 OLED BMF | |
| Acer Swift X SFX14-71G | |
| MSI Stealth 14 Studio A13V | |
| Blender / v3.3 Classroom CUDA | |
| Asus VivoBook 14X K3405 | |
| Asus VivoBook 14X K3405 | |
| Average NVIDIA GeForce RTX 3050 4GB Laptop GPU (97 - 152, n=13) | |
| Lenovo Slim Pro 7 14ARP8 | |
| Schenker Vision 14 2022 RTX 3050 Ti | |
| Average of class Multimedia (20 - 186, n=21, last 2 years) | |
| Gigabyte Aero 14 OLED BMF | |
| Acer Swift X SFX14-71G | |
| Blender / v3.3 Classroom CPU | |
| Average NVIDIA GeForce RTX 3050 4GB Laptop GPU (388 - 937, n=11) | |
| Acer Swift X SFX14-71G | |
| Schenker Vision 14 2022 RTX 3050 Ti | |
| Gigabyte Aero 14 OLED BMF | |
| Asus VivoBook 14X K3405 | |
| Average of class Multimedia (134.5 - 1042, n=61, last 2 years) | |
| Lenovo Slim Pro 7 14ARP8 | |
| MSI Stealth 14 Studio A13V | |
* ... smaller is better
Gaming Performance
The VivoBook 14X isn't targeted at a gaming audience but is still capable of decent 1080p Ultra gaming, particularly with less-demanding eSports titles.
Perceivable increases in frame rates may be afforded by leveraging upscaling algorithms in supported games.
| The Witcher 3 - 1920x1080 Ultra Graphics & Postprocessing (HBAO+) | |
| MSI Stealth 14 Studio A13V | |
| Gigabyte Aero 14 OLED BMF | |
| Gigabyte Aero 14 OLED BMF | |
| Acer Swift X SFX14-71G | |
| Lenovo Slim Pro 7 14ARP8 | |
| Average of class Multimedia (11 - 107, n=5, last 2 years) | |
| Schenker Vision 14 2022 RTX 3050 Ti | |
| Asus VivoBook 14X K3405 | |
| Final Fantasy XV Benchmark - 1920x1080 High Quality | |
| MSI Stealth 14 Studio A13V | |
| Acer Swift X SFX14-71G | |
| Gigabyte Aero 14 OLED BMF | |
| Average of class Multimedia (7.61 - 144.4, n=56, last 2 years) | |
| Lenovo Slim Pro 7 14ARP8 | |
| Schenker Vision 14 2022 RTX 3050 Ti | |
| Asus VivoBook 14X K3405 | |
| Strange Brigade - 1920x1080 ultra AA:ultra AF:16 | |
| MSI Stealth 14 Studio A13V | |
| Acer Swift X SFX14-71G | |
| Gigabyte Aero 14 OLED BMF | |
| Average of class Multimedia (13.3 - 303, n=55, last 2 years) | |
| Schenker Vision 14 2022 RTX 3050 Ti | |
| Asus VivoBook 14X K3405 | |
| Dota 2 Reborn - 1920x1080 ultra (3/3) best looking | |
| MSI Stealth 14 Studio A13V | |
| Gigabyte Aero 14 OLED BMF | |
| Acer Swift X SFX14-71G | |
| Asus VivoBook 14X K3405 | |
| Schenker Vision 14 2022 RTX 3050 Ti | |
| Lenovo Slim Pro 7 14ARP8 | |
| Average of class Multimedia (29 - 179.9, n=57, last 2 years) | |
The Witcher 3 FPS Chart
There are no major qualms with GPU cooling given that we observe relatively stable frame rates while running The Witcher 3 at 1080p Ultra.
Witcher 3 FPS Chart
| low | med. | high | ultra | QHD | 4K | |
|---|---|---|---|---|---|---|
| GTA V (2015) | 175 | 167.8 | 100.4 | 48.4 | 33.7 | 32 |
| The Witcher 3 (2015) | 150.4 | 68.8 | 70.6 | 40 | 24.4 | |
| Dota 2 Reborn (2015) | 163.4 | 141 | 135.3 | 115.3 | 57.1 | |
| Final Fantasy XV Benchmark (2018) | 99.4 | 52.5 | 37.7 | 27.3 | 15 | |
| X-Plane 11.11 (2018) | 111 | 95.2 | 78.9 | 66.1 | ||
| Far Cry 5 (2018) | 127 | 68 | 61 | 57 | 39 | 19 |
| Strange Brigade (2018) | 179.7 | 78.6 | 65.2 | 57.9 | 41.1 | 23.4 |
| F1 2021 (2021) | 232 | 123.6 | 96 | 44.1 | 32.1 | 12.7 |
| Cyberpunk 2077 1.6 (2022) | 51.7 | 38.2 | 28.4 | 25.3 | 15.6 | 5.57 |
| F1 22 (2022) | 119.4 | 108.5 | 75.2 | 21.3 | 13.2 | 5.9 |
Check out our dedicated Nvidia GeForce RTX 3050 Laptop GPU page for more information and performance comparisons.
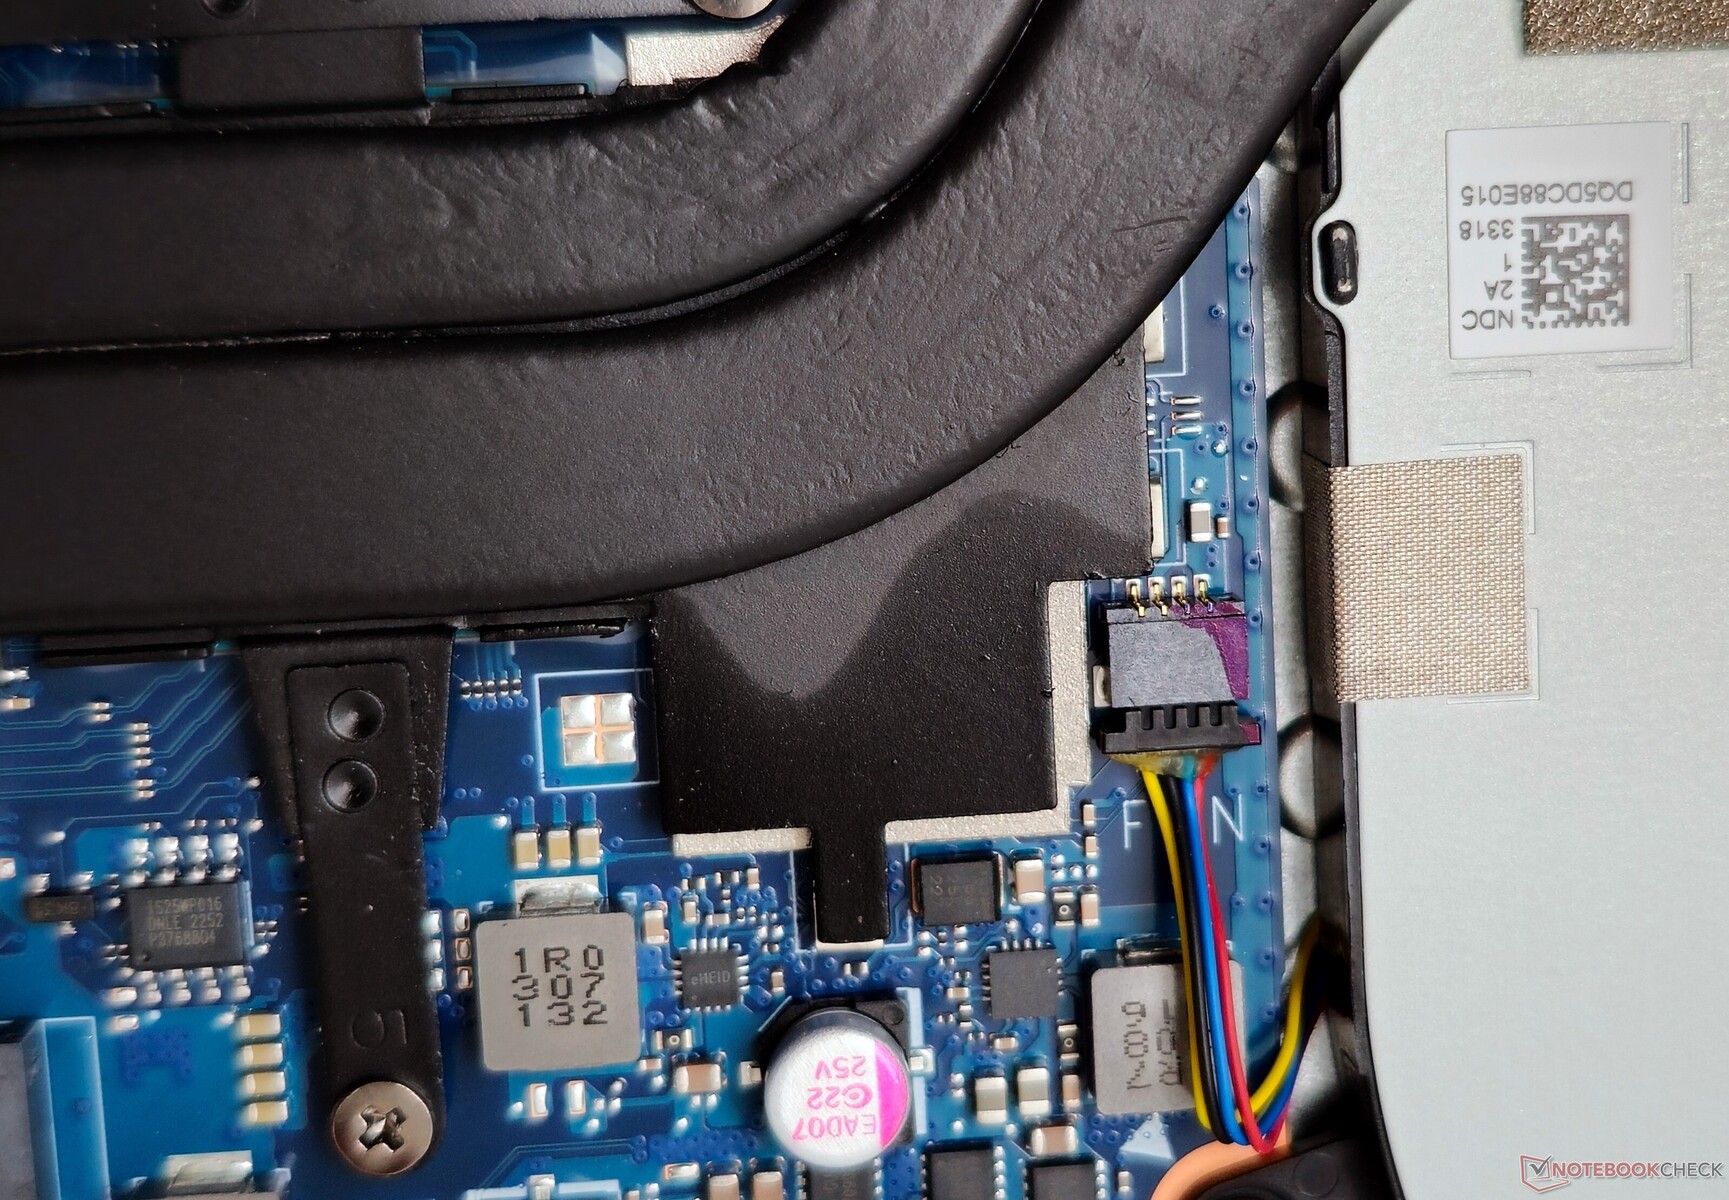
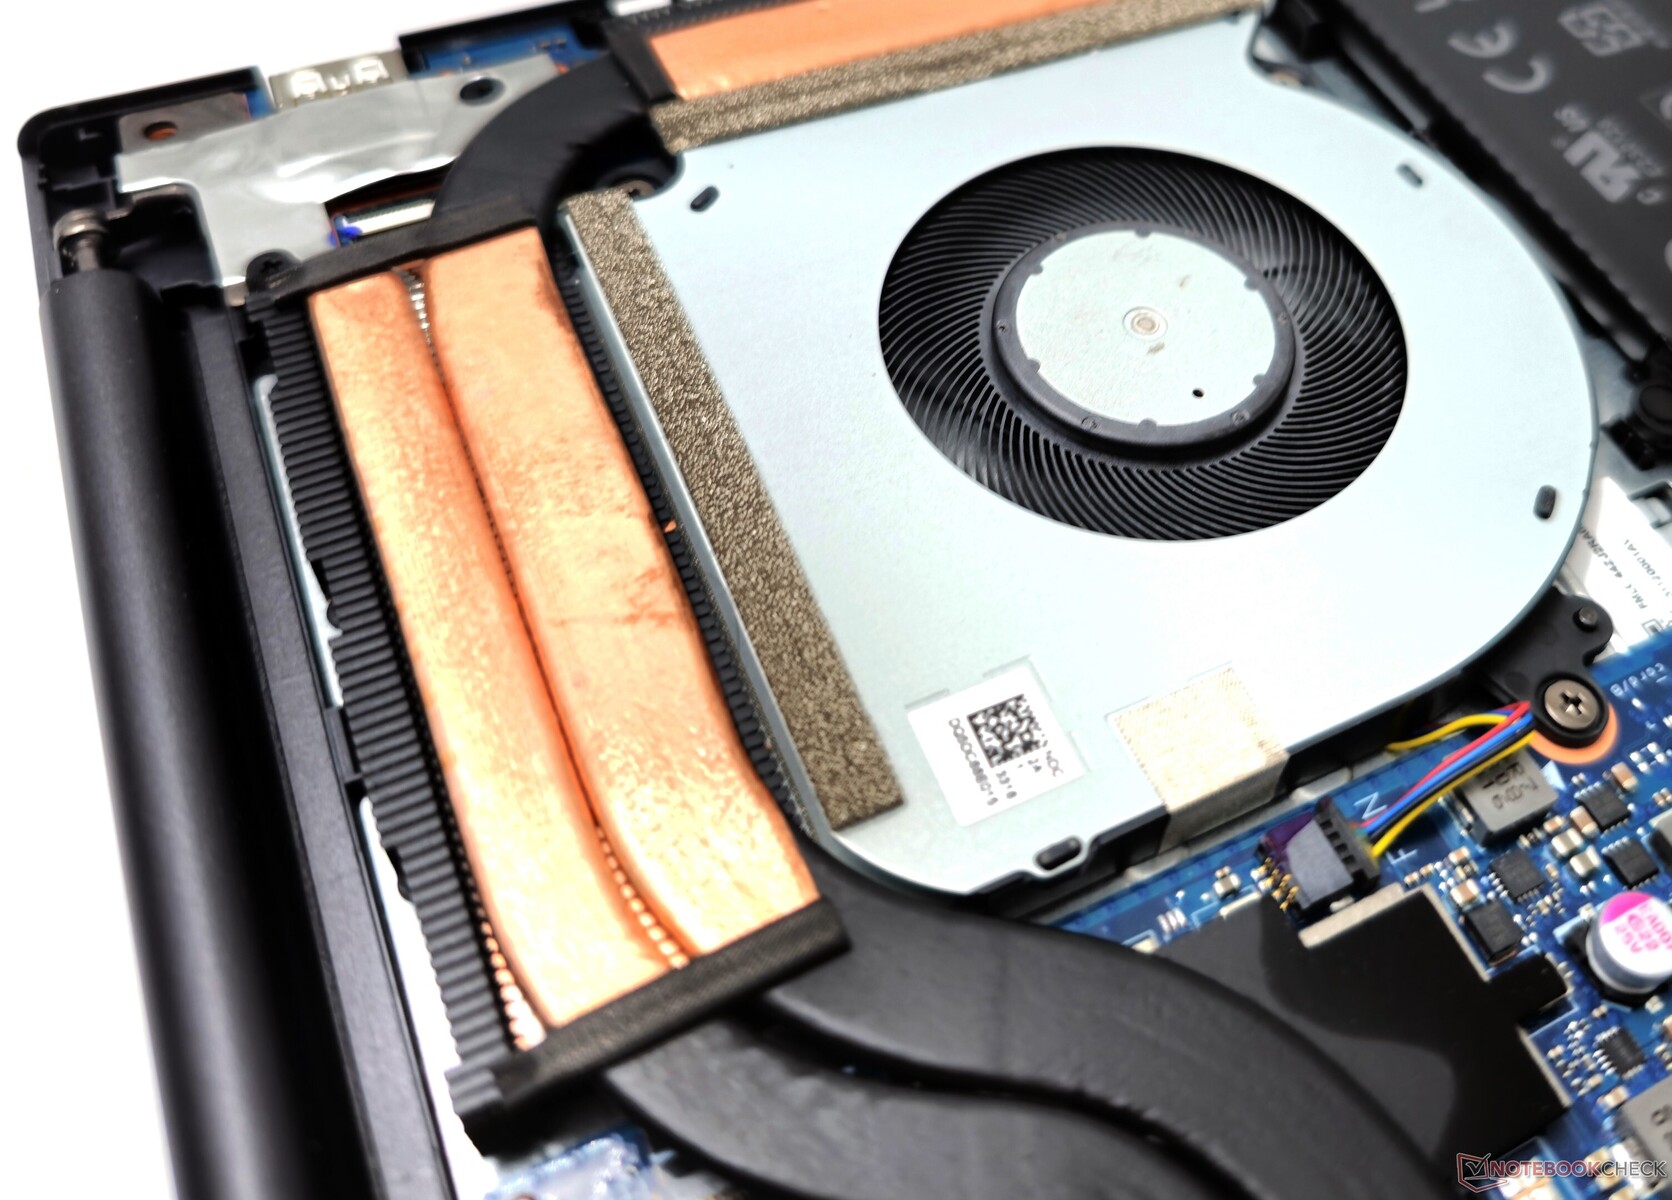
Emissions: Single fan dual-heatpipe combo pushed to the hilt
System Noise
Asus equips the VivoBook 14X with a single fan to cool both the CPU and the GPU. Similar to our findings with other VivoBook models, Asus appears to have set a limit on the maximum fan noise for each performance profile.
The company claims less than 40 dB(A) fan noise in the Standard profile. We recorded sound pressure levels of 31 dB(A) in the Whisper mode, 42 dB(A) in Standard, and nearly 53 dB(A) in the Performance mode.
The Full Speed mode profile maintains a consistent SPL of nearly 53 dB(A) regardless of load.
Noise level
| Idle |
| 22.08 / 22.08 / 22.08 dB(A) |
| Load |
| 52.98 / 52.67 dB(A) |
 | ||
30 dB silent 40 dB(A) audible 50 dB(A) loud |
||
min: | ||
| Performance mode | Idle dB(A) | Load average dB(A) | Load maximum dB(A) | The Witcher 3 1080p Ultra dB(A) |
|---|---|---|---|---|
| Whisper | 21.73 | 30.61 | 31.13 | 30.67 / 34 fps |
| Standard | 21.62 | 42.33 | 42.12 | 42.23 / 38 fps |
| Performance | 22.08 | 52.98 | 52.67 | 52.65 / 40 fps |
| Asus VivoBook 14X K3405 i5-13500H, GeForce RTX 3050 4GB Laptop GPU | Acer Swift X SFX14-71G i7-13700H, GeForce RTX 4050 Laptop GPU | MSI Stealth 14 Studio A13V i7-13700H, GeForce RTX 4050 Laptop GPU | Gigabyte Aero 14 OLED BMF i7-13700H, GeForce RTX 4050 Laptop GPU | Lenovo Slim Pro 7 14ARP8 R7 7735HS, GeForce RTX 3050 6GB Laptop GPU | Schenker Vision 14 2022 RTX 3050 Ti i7-12700H, GeForce RTX 3050 Ti Laptop GPU | |
|---|---|---|---|---|---|---|
| Noise | -14% | -10% | -11% | 4% | -4% | |
| off / environment * (dB) | 21.46 | 24.8 -16% | 25.3 -18% | 24 -12% | 22.7 -6% | 24.4 -14% |
| Idle Minimum * (dB) | 22.08 | 28.2 -28% | 25.3 -15% | 24 -9% | 22.8 -3% | 24.4 -11% |
| Idle Average * (dB) | 22.08 | 31.8 -44% | 25 -13% | 24 -9% | 22.8 -3% | 24.4 -11% |
| Idle Maximum * (dB) | 22.08 | 31.8 -44% | 33.7 -53% | 35.71 -62% | 22.8 -3% | 27.8 -26% |
| Load Average * (dB) | 52.98 | 38.2 28% | 42.2 20% | 43.8 17% | 43.3 18% | |
| Witcher 3 ultra * (dB) | 52.7 | 50 5% | 51 3% | 40.22 24% | 43.8 17% | 48.2 9% |
| Load Maximum * (dB) | 52.67 | 52.2 1% | 51 3% | 51.93 1% | 47.1 11% | 48.8 7% |
* ... smaller is better
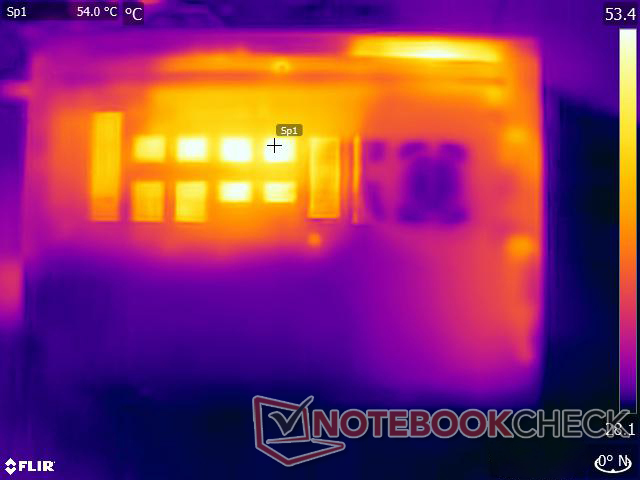
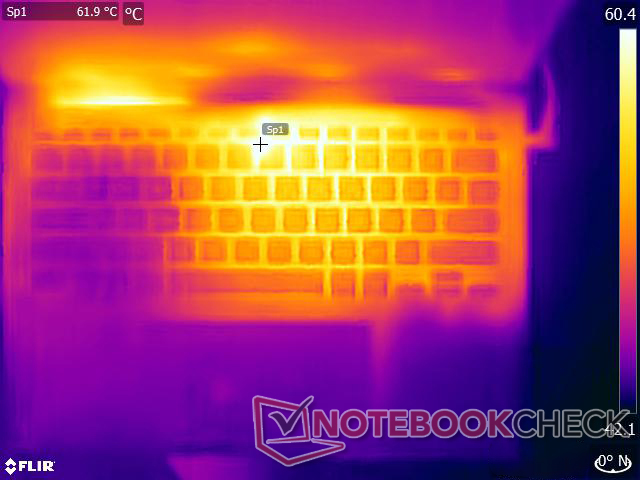
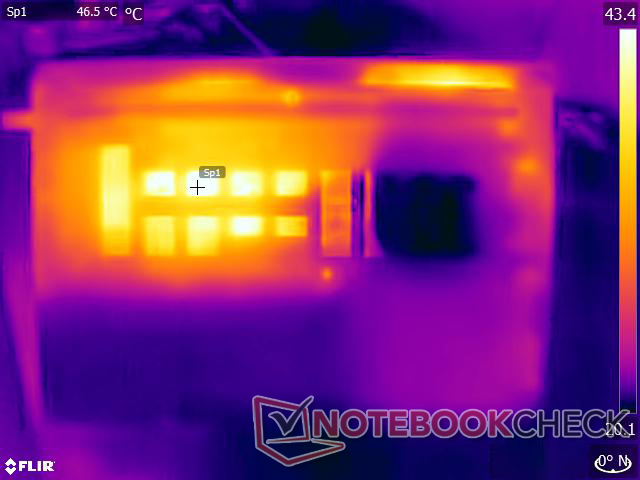
Temperature
Asus claims enhanced thermal performance with the new fan design, but the single-fan dual-heatpipe combination has its limits in keeping surface temperatures under control when stressed.
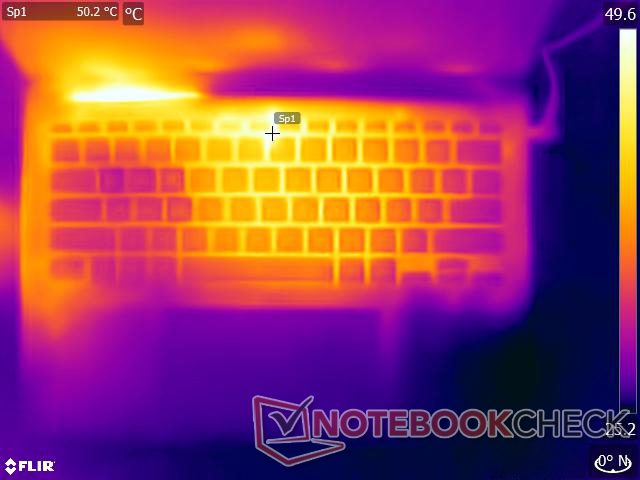
We recorded temperatures up to 49 °C on the top and up to 54 °C on the bottom under max load. The touchpad and right palm rest areas remain relatively cool, however.
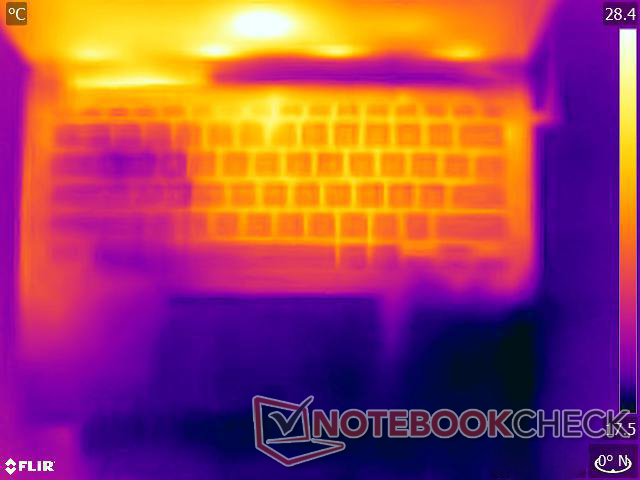
(-) The maximum temperature on the upper side is 49.2 °C / 121 F, compared to the average of 36.8 °C / 98 F, ranging from 21 to 71 °C for the class Multimedia.
(-) The bottom heats up to a maximum of 54 °C / 129 F, compared to the average of 39.1 °C / 102 F
(+) In idle usage, the average temperature for the upper side is 30.6 °C / 87 F, compared to the device average of 31.3 °C / 88 F.
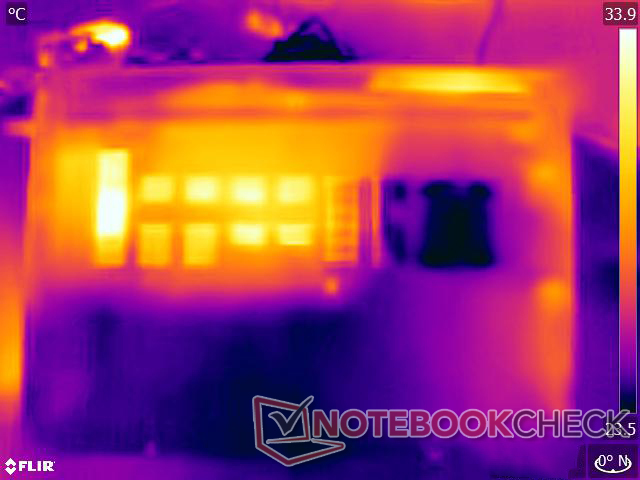
(±) Playing The Witcher 3, the average temperature for the upper side is 37.8 °C / 100 F, compared to the device average of 31.3 °C / 88 F.
(+) The palmrests and touchpad are reaching skin temperature as a maximum (35.4 °C / 95.7 F) and are therefore not hot.
(-) The average temperature of the palmrest area of similar devices was 28.7 °C / 83.7 F (-6.7 °C / -12 F).
| Asus VivoBook 14X K3405 Intel Core i5-13500H, NVIDIA GeForce RTX 3050 4GB Laptop GPU | Acer Swift X SFX14-71G Intel Core i7-13700H, NVIDIA GeForce RTX 4050 Laptop GPU | MSI Stealth 14 Studio A13V Intel Core i7-13700H, NVIDIA GeForce RTX 4050 Laptop GPU | Gigabyte Aero 14 OLED BMF Intel Core i7-13700H, NVIDIA GeForce RTX 4050 Laptop GPU | Lenovo Slim Pro 7 14ARP8 AMD Ryzen 7 7735HS, NVIDIA GeForce RTX 3050 6GB Laptop GPU | Schenker Vision 14 2022 RTX 3050 Ti Intel Core i7-12700H, NVIDIA GeForce RTX 3050 Ti Laptop GPU | |
|---|---|---|---|---|---|---|
| Heat | 16% | -0% | 18% | 21% | 9% | |
| Maximum Upper Side * (°C) | 49.2 | 46.4 6% | 46.9 5% | 42 15% | 42.2 14% | 48.4 2% |
| Maximum Bottom * (°C) | 54 | 49 9% | 56.1 -4% | 52 4% | 49 9% | 57.1 -6% |
| Idle Upper Side * (°C) | 33.6 | 26.5 21% | 33.8 -1% | 26 23% | 24.4 27% | 28.1 16% |
| Idle Bottom * (°C) | 37.6 | 26.6 29% | 37.9 -1% | 27 28% | 25.2 33% | 29 23% |
* ... smaller is better
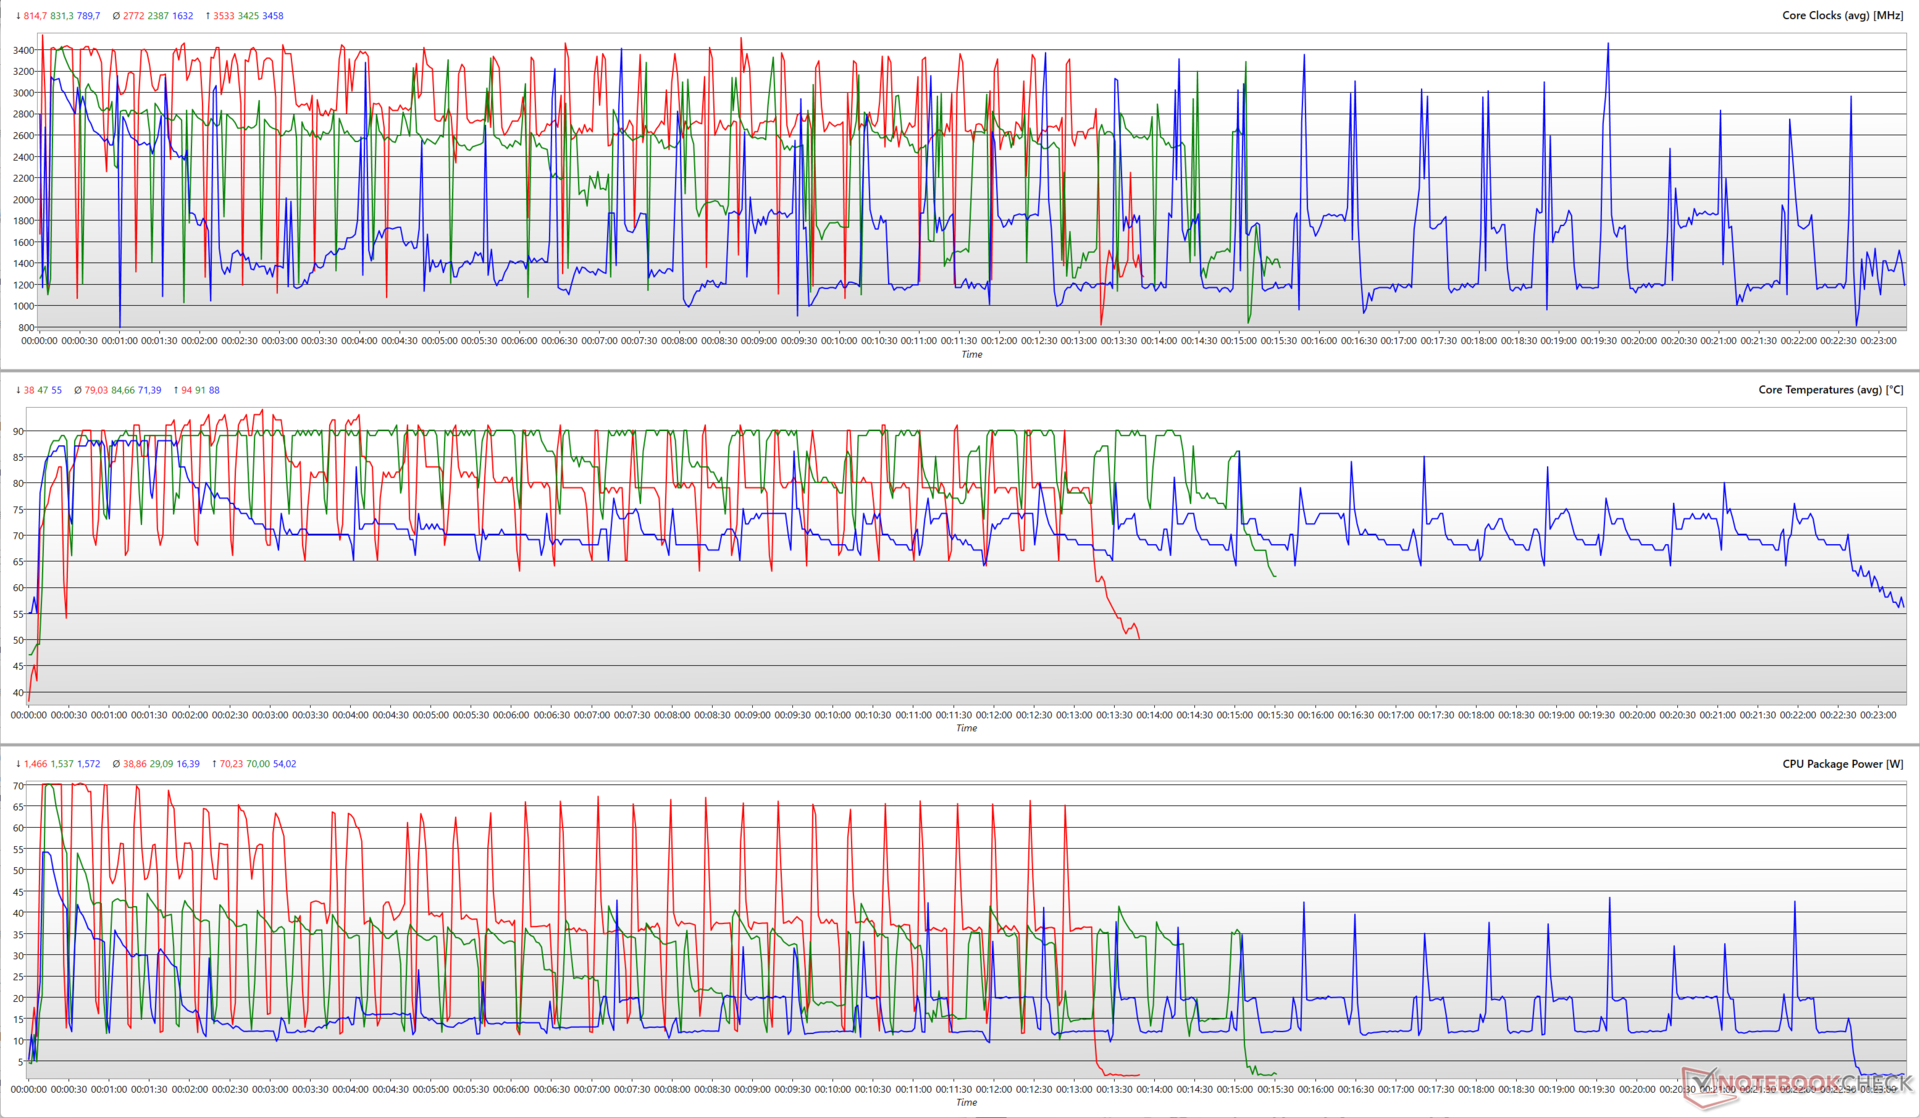
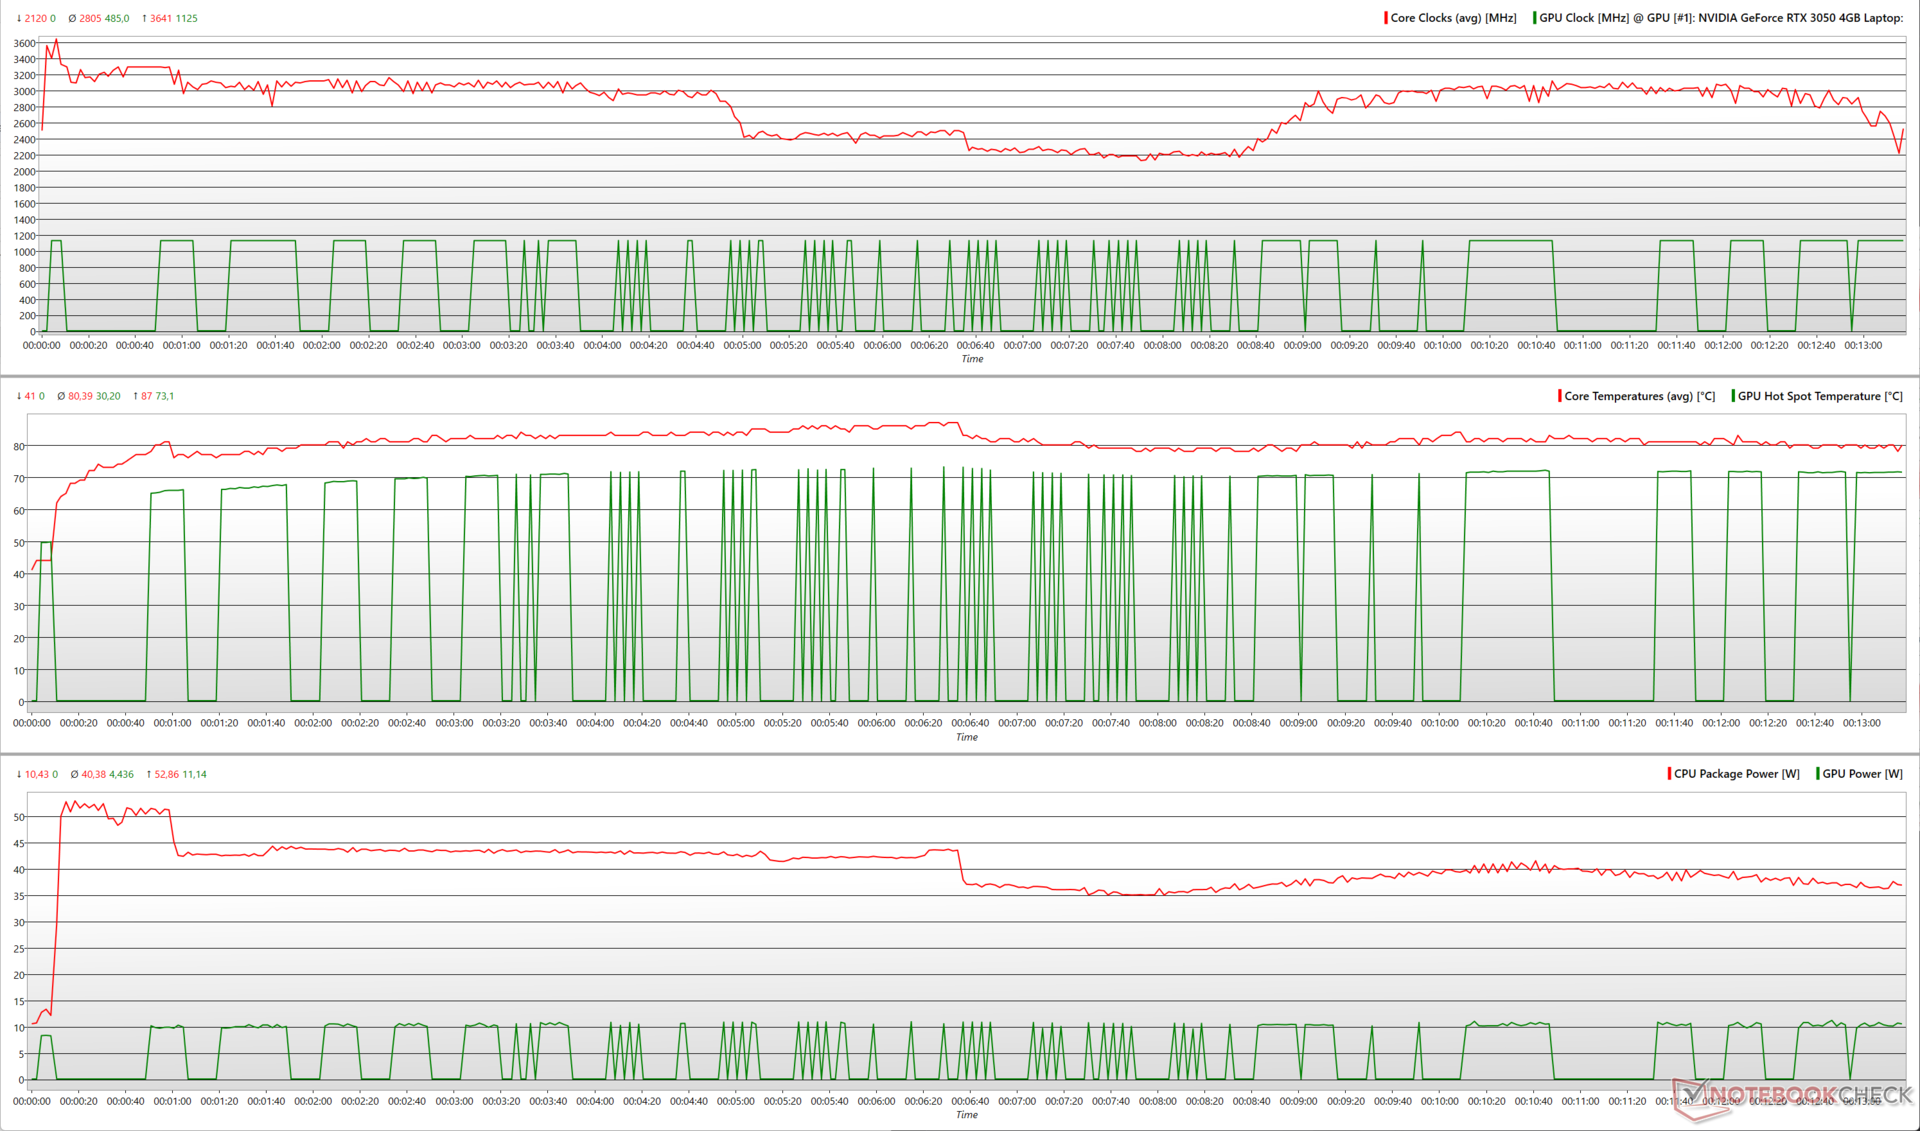
Stress Test
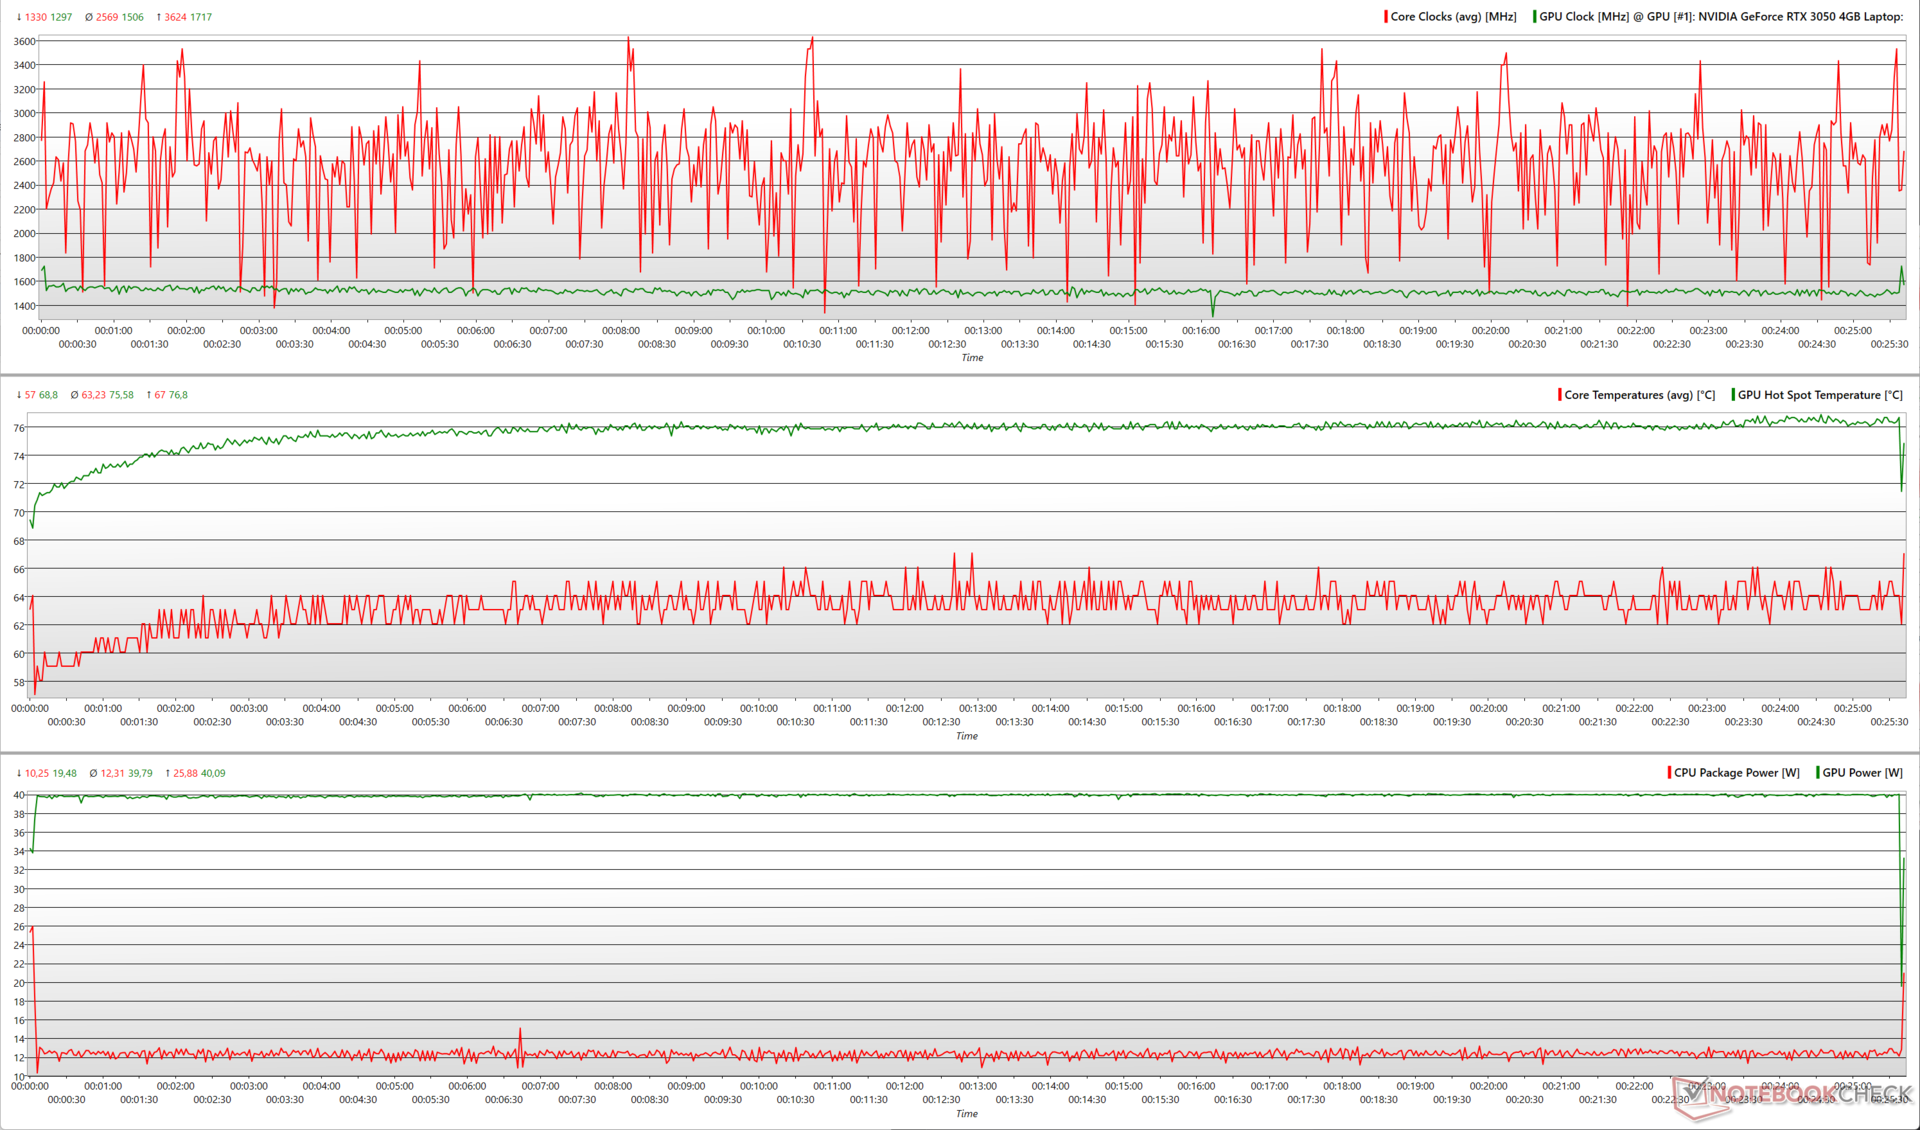
Stressing the VivoBook 14X with Prime95 in-place large FFTs sees the Core i5-13500H peaking at 3.6 GHz while consuming almost 53 W power.
Adding FurMark to the mix sees the CPU peak package power dropping to 48.6 W and sustaining at 22 W. The RTX 3050 shows average clocks of 1,192 MHz with the power consumption maintained at a consistent 34 W.
| Stress Test | CPU Clock (GHz) | GPU Clock (MHz) | Average CPU Temperature (°C) | Average GPU Temperature (°C) |
| System Idle | 3.8 | 0 | 40 | 25.1 |
| Prime95 | 2.95 | 0 | 80 | 25.3 |
| Prime95 + FurMark | 1.75 | 1,177 | 72 | 68.3 |
| The Witcher 3 1080p Ultra | 2.56 | 1,506 | 63.2 | 75.6 |
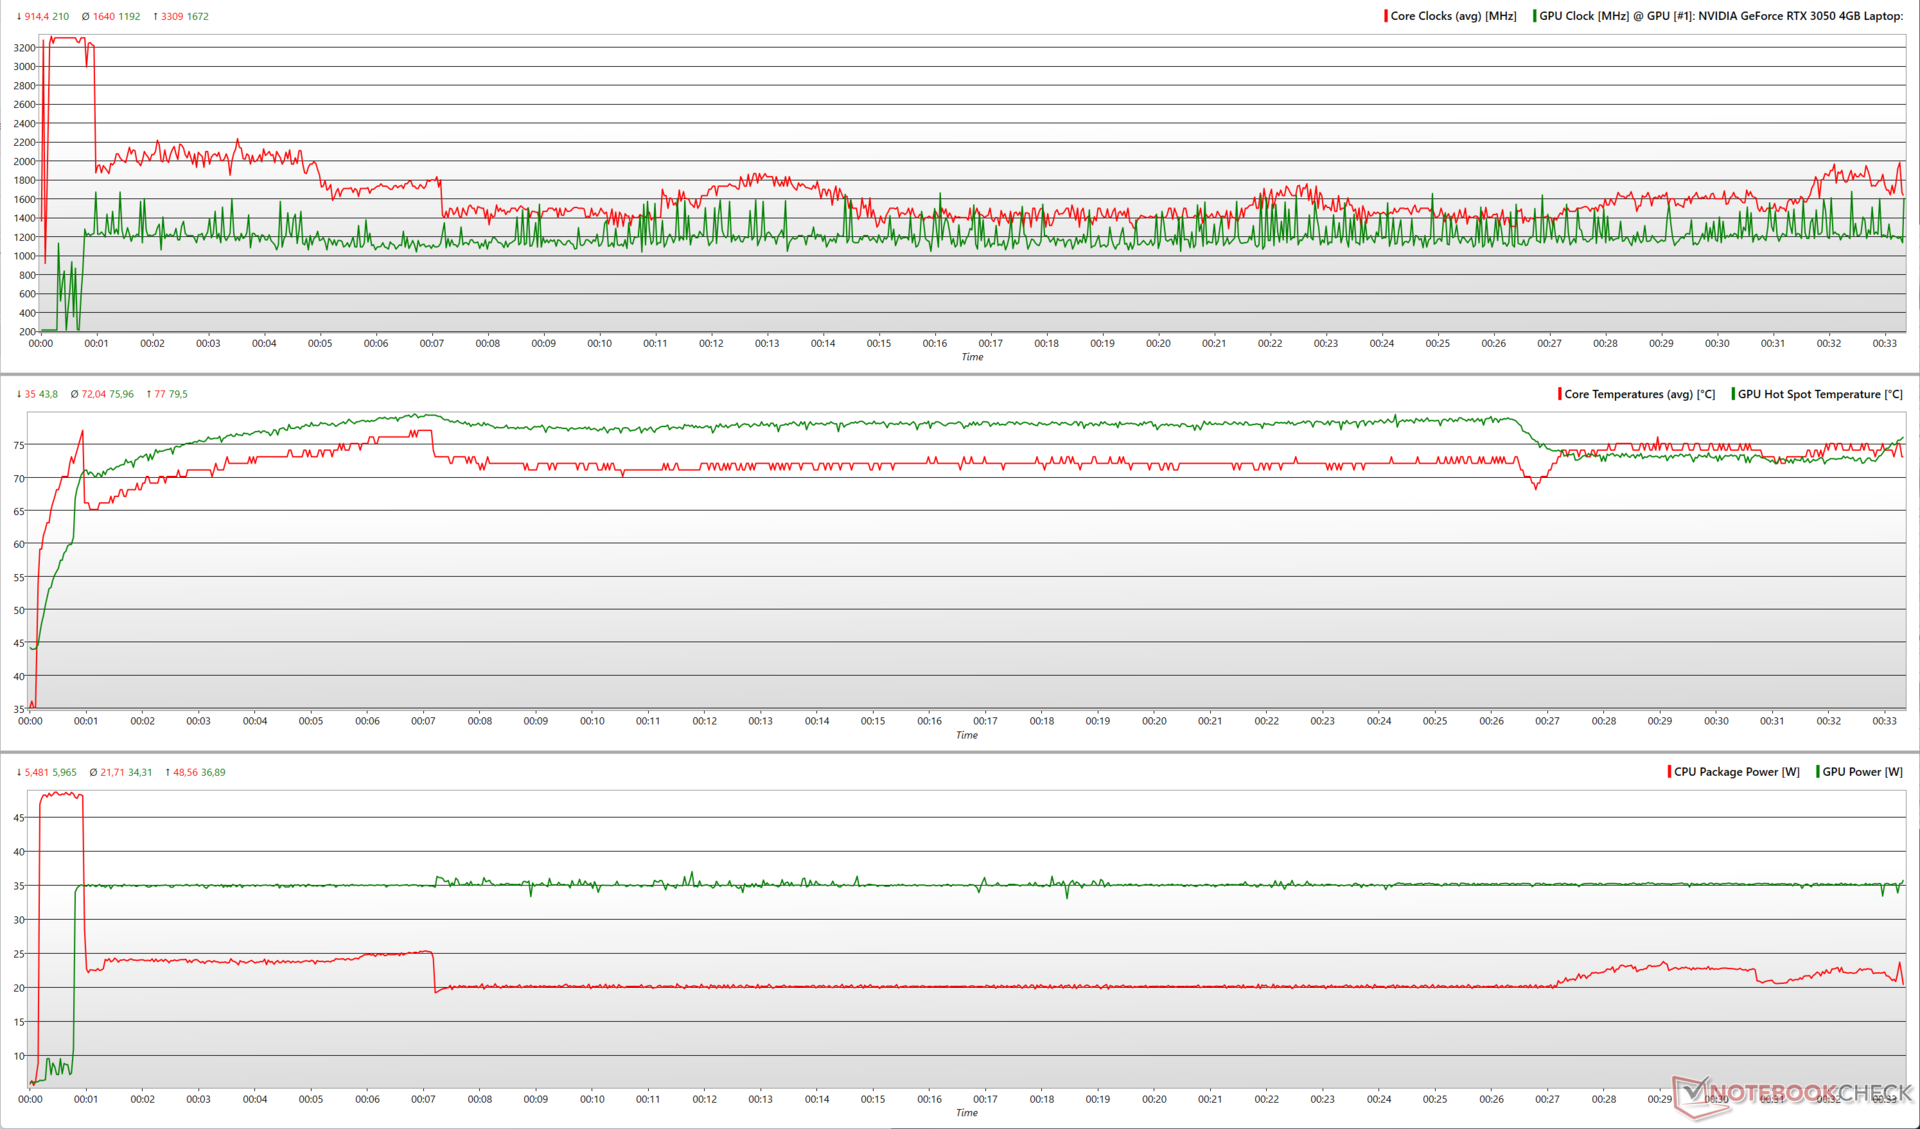
With The Witcher 3 at 1080p Ultra, the RTX 3050 can peak at 1,717 MHz while consuming 40 W. The Core i5-13500H averages out at 12 W while yielding average clocks of about 2.6 GHz.
According to Asus, the VivoBook 14X's cooling system can afford a combined 55 W TDP from the CPU and the GPU. Our stress testing confirms this claim, as we observe an average power consumption of 56 W while running Prime95 + FurMark and 52 W during The Witcher 3 stress test.
Speakers
At a peak loudness of 70.7 db(A), the VivoBook 14X's stereo speakers aren't adequately loud. That being said, the Dirac tuning can afford some amount of bass while maintaining balanced mids and highs.
Users can get a much better audio experience by connecting external audio devices using the 3.5 mm audio jack or via Bluetooth 5.3.
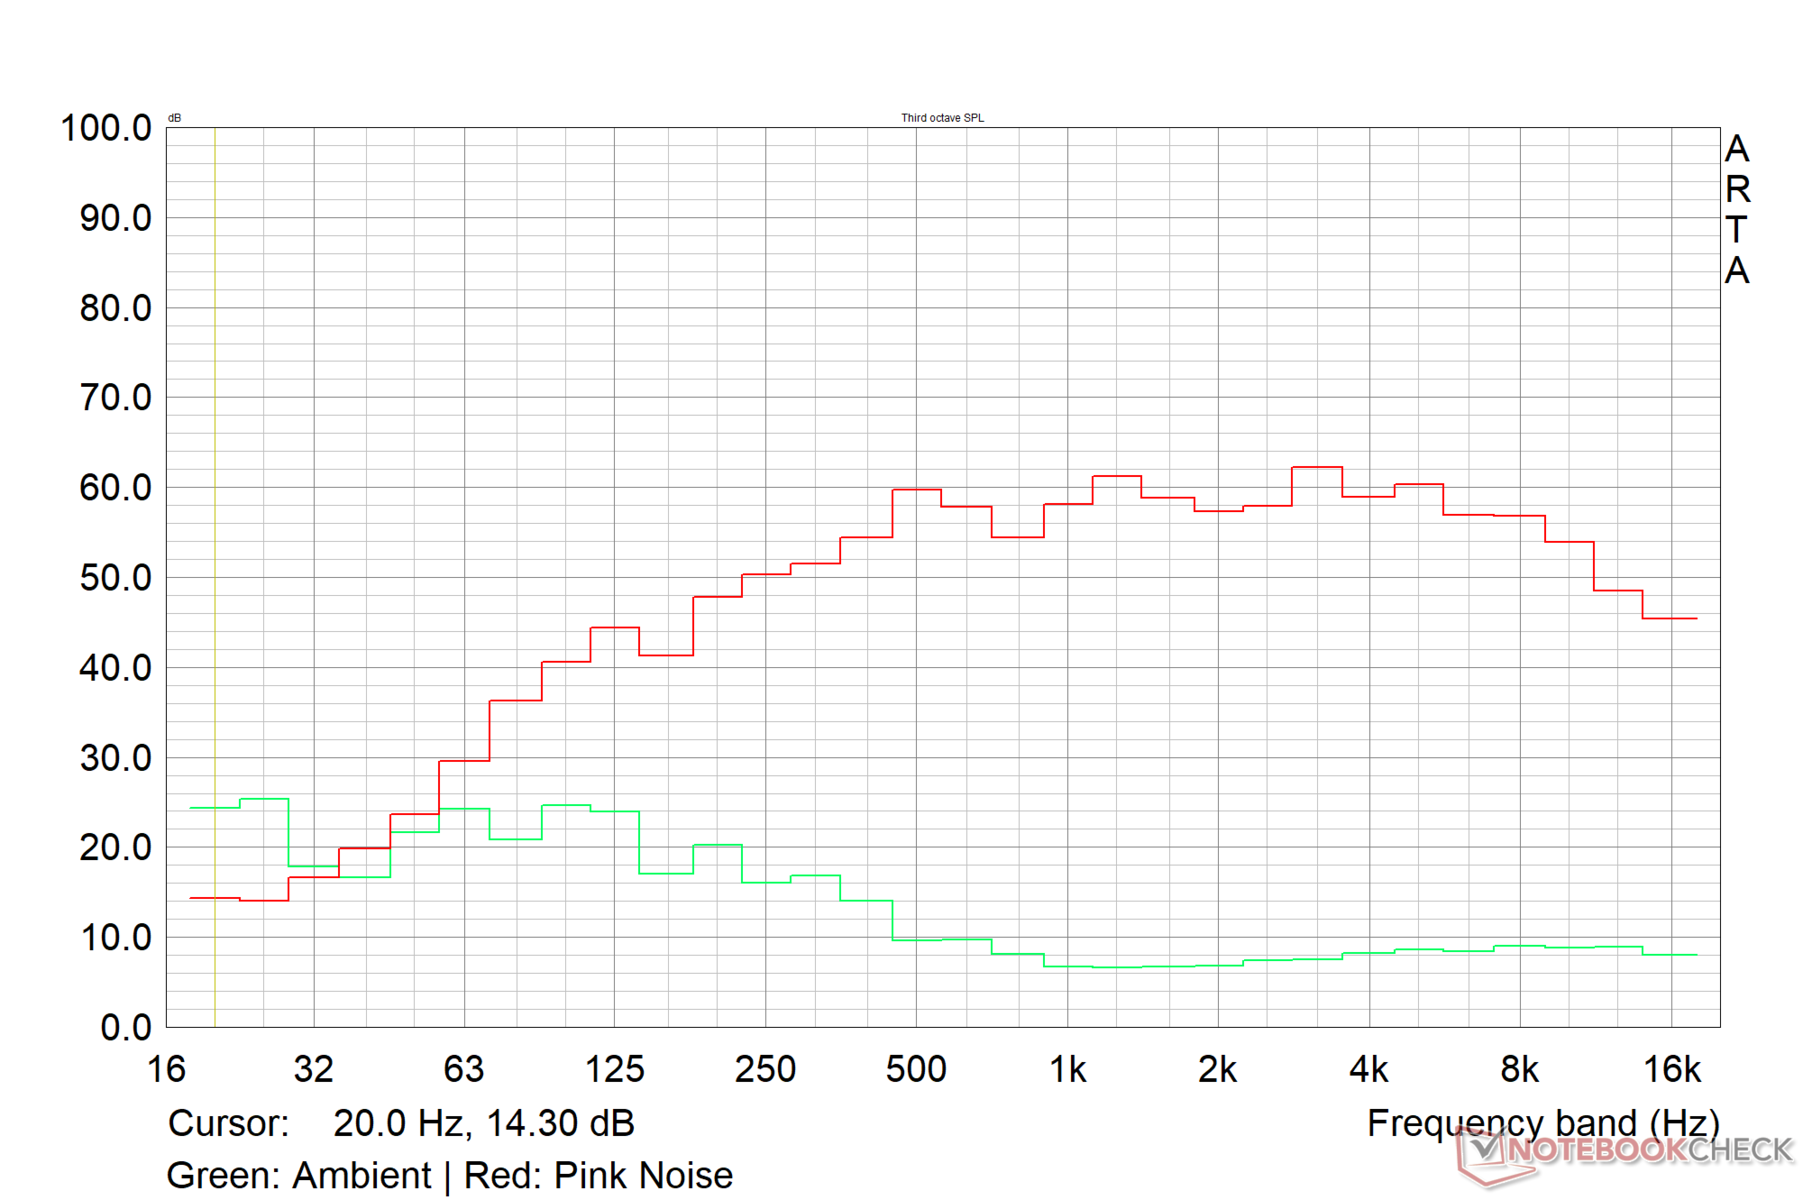
Asus VivoBook 14X K3405 audio analysis
(-) | not very loud speakers (70.7 dB)
Bass 100 - 315 Hz
(±) | reduced bass - on average 10.8% lower than median
(±) | linearity of bass is average (7.4% delta to prev. frequency)
Mids 400 - 2000 Hz
(+) | balanced mids - only 2.1% away from median
(+) | mids are linear (6.3% delta to prev. frequency)
Highs 2 - 16 kHz
(+) | balanced highs - only 2.2% away from median
(+) | highs are linear (4.8% delta to prev. frequency)
Overall 100 - 16.000 Hz
(+) | overall sound is linear (13.2% difference to median)
Compared to same class
» 27% of all tested devices in this class were better, 5% similar, 68% worse
» The best had a delta of 5%, average was 17%, worst was 45%
Compared to all devices tested
» 14% of all tested devices were better, 3% similar, 84% worse
» The best had a delta of 4%, average was 23%, worst was 134%
Apple MacBook Pro 16 2021 M1 Pro audio analysis
(+) | speakers can play relatively loud (84.7 dB)
Bass 100 - 315 Hz
(+) | good bass - only 3.8% away from median
(+) | bass is linear (5.2% delta to prev. frequency)
Mids 400 - 2000 Hz
(+) | balanced mids - only 1.3% away from median
(+) | mids are linear (2.1% delta to prev. frequency)
Highs 2 - 16 kHz
(+) | balanced highs - only 1.9% away from median
(+) | highs are linear (2.7% delta to prev. frequency)
Overall 100 - 16.000 Hz
(+) | overall sound is linear (4.6% difference to median)
Compared to same class
» 0% of all tested devices in this class were better, 0% similar, 100% worse
» The best had a delta of 5%, average was 17%, worst was 45%
Compared to all devices tested
» 0% of all tested devices were better, 0% similar, 100% worse
» The best had a delta of 4%, average was 23%, worst was 134%
Energy Management: Frugal sipper in idle and load
Power Consumption
The Core i5-13500H and RTX 3050 combination is quite economical in terms of power consumption compared to the competition. The VivoBook 14X OLED is able to fully utilize the supplied 90 W power adapter under maximum load.
While the Lenovo Slim Pro 7 with a Ryzen 7 7735HS and an RTX 3050 6 GB demonstrates an 8% lower power consumption in load average, it shows higher draws during idle, gaming, and max load.
| Off / Standby | |
| Idle | |
| Load |
|
Key:
min: | |
| Asus VivoBook 14X K3405 i5-13500H, GeForce RTX 3050 4GB Laptop GPU, , 2880x1800, 14" | Acer Swift X SFX14-71G i7-13700H, GeForce RTX 4050 Laptop GPU, OLED, 2880x1800, 14.5" | MSI Stealth 14 Studio A13V i7-13700H, GeForce RTX 4050 Laptop GPU, IPS, 2560x1600, 14" | Gigabyte Aero 14 OLED BMF i7-13700H, GeForce RTX 4050 Laptop GPU, OLED, 2880x1800, 14" | Lenovo Slim Pro 7 14ARP8 R7 7735HS, GeForce RTX 3050 6GB Laptop GPU, IPS, 2560x1600, 14.5" | Schenker Vision 14 2022 RTX 3050 Ti i7-12700H, GeForce RTX 3050 Ti Laptop GPU, IPS, 2880x1800, 14" | Average NVIDIA GeForce RTX 3050 4GB Laptop GPU | Average of class Multimedia | |
|---|---|---|---|---|---|---|---|---|
| Power Consumption | -30% | -100% | -14% | -36% | -26% | -37% | -16% | |
| Idle Minimum * (Watt) | 4.96 | 8.4 -69% | 10.4 -110% | 7.4 -49% | 7.6 -53% | 7.5 -51% | 7.17 ? -45% | 5.62 ? -13% |
| Idle Average * (Watt) | 7.54 | 11.5 -53% | 19.1 -153% | 8.3 -10% | 12.2 -62% | 10.4 -38% | 10.4 ? -38% | 10.2 ? -35% |
| Idle Maximum * (Watt) | 9.31 | 11.9 -28% | 19.4 -108% | 8.7 7% | 12.8 -37% | 11.4 -22% | 14.8 ? -59% | 12.5 ? -34% |
| Load Average * (Watt) | 83.4 | 84.9 -2% | 95.9 -15% | 76 9% | 76.5 8% | 83.3 -0% | 89.7 ? -8% | 65 ? 22% |
| Witcher 3 ultra * (Watt) | 73.3 | 83.6 -14% | 141.6 -93% | 70 5% | 89.5 -22% | 92.7 -26% | ||
| Load Maximum * (Watt) | 91.74 | 104.2 -14% | 203 -121% | 132 -44% | 135.7 -48% | 110.3 -20% | 124.8 ? -36% | 111.9 ? -22% |
* ... smaller is better
Power Consumption: The Witcher 3 / Stress test
Power Consumption: External monitor
Battery Life
The VivoBook 14X's 63 WHr battery doesn't offer extraordinary longevity, but it should manage to endure through most of a standard workday before necessitating a recharge.
The battery lasts for nearly 10.5 hours while looping a 1080p H.264 video at 150 nits brightness, which is impressive. However, the laptop's gaming endurance is considerably shorter, clocking in at slightly over an hour.
The bundled power adapter is capable of replenishing the laptop's battery from 0% to 60% in about 50 minutes.
| Asus VivoBook 14X K3405 i5-13500H, GeForce RTX 3050 4GB Laptop GPU, 63 Wh | Acer Swift X SFX14-71G i7-13700H, GeForce RTX 4050 Laptop GPU, 76 Wh | MSI Stealth 14 Studio A13V i7-13700H, GeForce RTX 4050 Laptop GPU, 72 Wh | Gigabyte Aero 14 OLED BMF i7-13700H, GeForce RTX 4050 Laptop GPU, 63 Wh | Lenovo Slim Pro 7 14ARP8 R7 7735HS, GeForce RTX 3050 6GB Laptop GPU, 73 Wh | Schenker Vision 14 2022 RTX 3050 Ti i7-12700H, GeForce RTX 3050 Ti Laptop GPU, 99.8 Wh | Average of class Multimedia | |
|---|---|---|---|---|---|---|---|
| Battery runtime | -17% | -17% | 15% | 30% | 41% | 55% | |
| H.264 (h) | 10.4 | 9.5 -9% | 6.6 -37% | 11.1 7% | 16.8 ? 62% | ||
| WiFi v1.3 (h) | 8.1 | 7.7 -5% | 6.3 -22% | 7.6 -6% | 10.5 30% | 10.1 25% | 12.3 ? 52% |
| Witcher 3 ultra (h) | 1.3 | ||||||
| Load (h) | 1.1 | 0.7 -36% | 1.2 9% | 1.5 36% | 2.1 91% | 1.645 ? 50% | |
| Reader / Idle (h) | 11.3 | 24.9 ? |
Pros
Cons
Verdict: Versatile multimedia laptop with lots of room for improvement
The Asus VivoBook 14X K3405 brings forth the performance and efficiency advantages of the Intel Core i5-13500H in a sleek and lightweight chassis.
The laptop offers decent connectivity, but Wi-Fi 6E performance needs further refinements. Thunderbolt 4 is missing as well.
Asus uses a 2.8K 90 Hz Samsung OLED panel in the VivoBook 14X that shows excellent color characteristics for budding editors. The panel suffers from PWM at lower brightness levels but uses DC Dimming to somewhat compensate for the flickering at higher illumination.
The Asus VivoBook 14X does not exactly scream power and can certainly benefit from GPU and cooling upgrades, but it is a well-endowed multimedia laptop that also allows for some light gaming on the side."
The Core i5-13500H does have some merits going for it in our testing, but the VivoBook 14X's chassis and cooling constraints do not allow the CPU to fully flex its muscles. A 35 W RTX 4050 would have been the icing on the cake, but it is likely that Asus opted for the ageing RTX 3050 to keep costs down.
We would also like to see Asus transition to a dual-fan cooling system in upcoming iterations as the single-fan solution in the VivoBook 14X can quickly hit its limits.
Despite these limitations, the Asus VivoBook 14X remains an attractive upper mid-range multimedia laptop near the €1,100 (under ₹1,00,000) mark. A viable alternative is the Lenovo Slim Pro 7 that offers a 2.5K IPS touchscreen and Ryzen 7 7735HS.
The Gigabyte Aero 14 OLED with a 35 W RTX 4050 and Core i7-13700H offers a more up-to-date configuration, provided you're willing to fork out the premium.
Price and Availability
The tested Core i5-13500 and RTX 3050 combination of the VivoBook 14X OLED retails for ₹96,990, and the only way to purchase this is via the Asus India online store.
Amazon India and Flipkart only stock the Core i5-13500H and RTX 2050 SKU that costs about ₹82,000. Amazon US and Best Buy US also seem to have only the RTX 2050 SKUs with FHD+ OLED panels for about US$850.
Asus VivoBook 14X K3405
- 08/07/2023 v7 (old)
Vaidyanathan Subramaniam
