Mini-LED on a 16-inch convertible: Dell Inspiron 16 7640 2-in-1 review

The 2024 Inspiron 16 7640 2-in-1 succeeds the 2023 Inspiron 16 7630 2-in-1 with updated Intel 14th gen internals and several external changes. Perhaps most notably, this year's model includes a 90 Hz 1600p mini-LED touchscreen which replaces the 2400p OLED touchscreen on the Inspiron 16 7630 2-in-1. Meanwhile, the 60 Hz 1200p IPS touchscreen from the Inspiron 16 7635 2-in-1 has returned on select lower-end SKUs.
Our test unit is a higher-end configuration with the Meteor Lake-H Core Ultra 7 155H CPU and integrated Arc 8 graphics for approximately $1000 USD. A lower-end option with the Core Ultra 5 125U is available with the older 60 Hz 1200p IPS panel for $200 less, but there are no discrete GPU options in either case. Interestingly, the Inspiron 16 7640 2-in-1 is one of the few convertibles with both Core-U and Core-H processor options as most offer only one but not the other.
There are no AMD Zen 4 SKUs available as of this writing. Should there be any in the future, these will likely be under the model name Inspiron 16 7645 2-in-1 which would succeed the AMD-based Inspiron 16 7635 2-in-1.
Competitors to the Inspiron 16 7640 2-in-1 include other midrange to upper midrange 16-inch convertibles like the HP Envy x360 2-in-1 16 or Lenovo Yoga 7 2-in-1 16. The Dell, however, is unique with its mini-LED option.
More Dell reviews:
Potential Competitors in Comparison
Rating | Version | Date | Model | Weight | Height | Size | Resolution | Price |
|---|---|---|---|---|---|---|---|---|
| 82.1 % | v8 | 07 / 2024 | Dell Inspiron 16 7640 2-in-1 Ultra 7 155H, Arc 8-Core | 2.1 kg | 18.99 mm | 16.00" | 2560x1600 | |
| 83.4 % | v8 | 06 / 2024 | Dell Inspiron 16 Plus 7640 Ultra 7 155H, GeForce RTX 4060 Laptop GPU | 2.2 kg | 19.9 mm | 16.00" | 2560x1600 | |
| 87.2 % v7 (old) | v7 (old) | 05 / 2024 | HP Envy x360 2-in-1 16-ad0097nr R7 8840HS, Radeon 780M | 1.8 kg | 18.3 mm | 16.00" | 2880x1800 | |
| 87.9 % v7 (old) | v7 (old) | 05 / 2024 | Lenovo IdeaPad Pro 5 16IMH G9 Ultra 7 155H, Arc 8-Core | 1.9 kg | 17.5 mm | 16.00" | 2560x1600 | |
| 88.7 % v7 (old) | v7 (old) | 02 / 2024 | HP Pavilion Plus 16-ab0456tx i7-13700H, GeForce RTX 3050 6GB Laptop GPU | 1.9 kg | 19.9 mm | 16.00" | 2560x1600 | |
| 87.6 % v7 (old) | v7 (old) | 11 / 2023 | Asus VivoBook Pro 16 K6602VU i9-13900H, GeForce RTX 4050 Laptop GPU | 1.9 kg | 19 mm | 16.00" | 3200x2000 |
Hinweis: Wir haben unser Rating-System kürzlich aktualisiert und die Ergebnisse von Version 8 sind nicht mit den Ergebnissen von Version 7 vergleichbar. Weitere Informationen dazu sind hier verfügbar.
Note: We have recently updated our rating system and the results of version 8 are not comparable with the results of version 7. More information is available here .
Case — Sturdy But Heavy
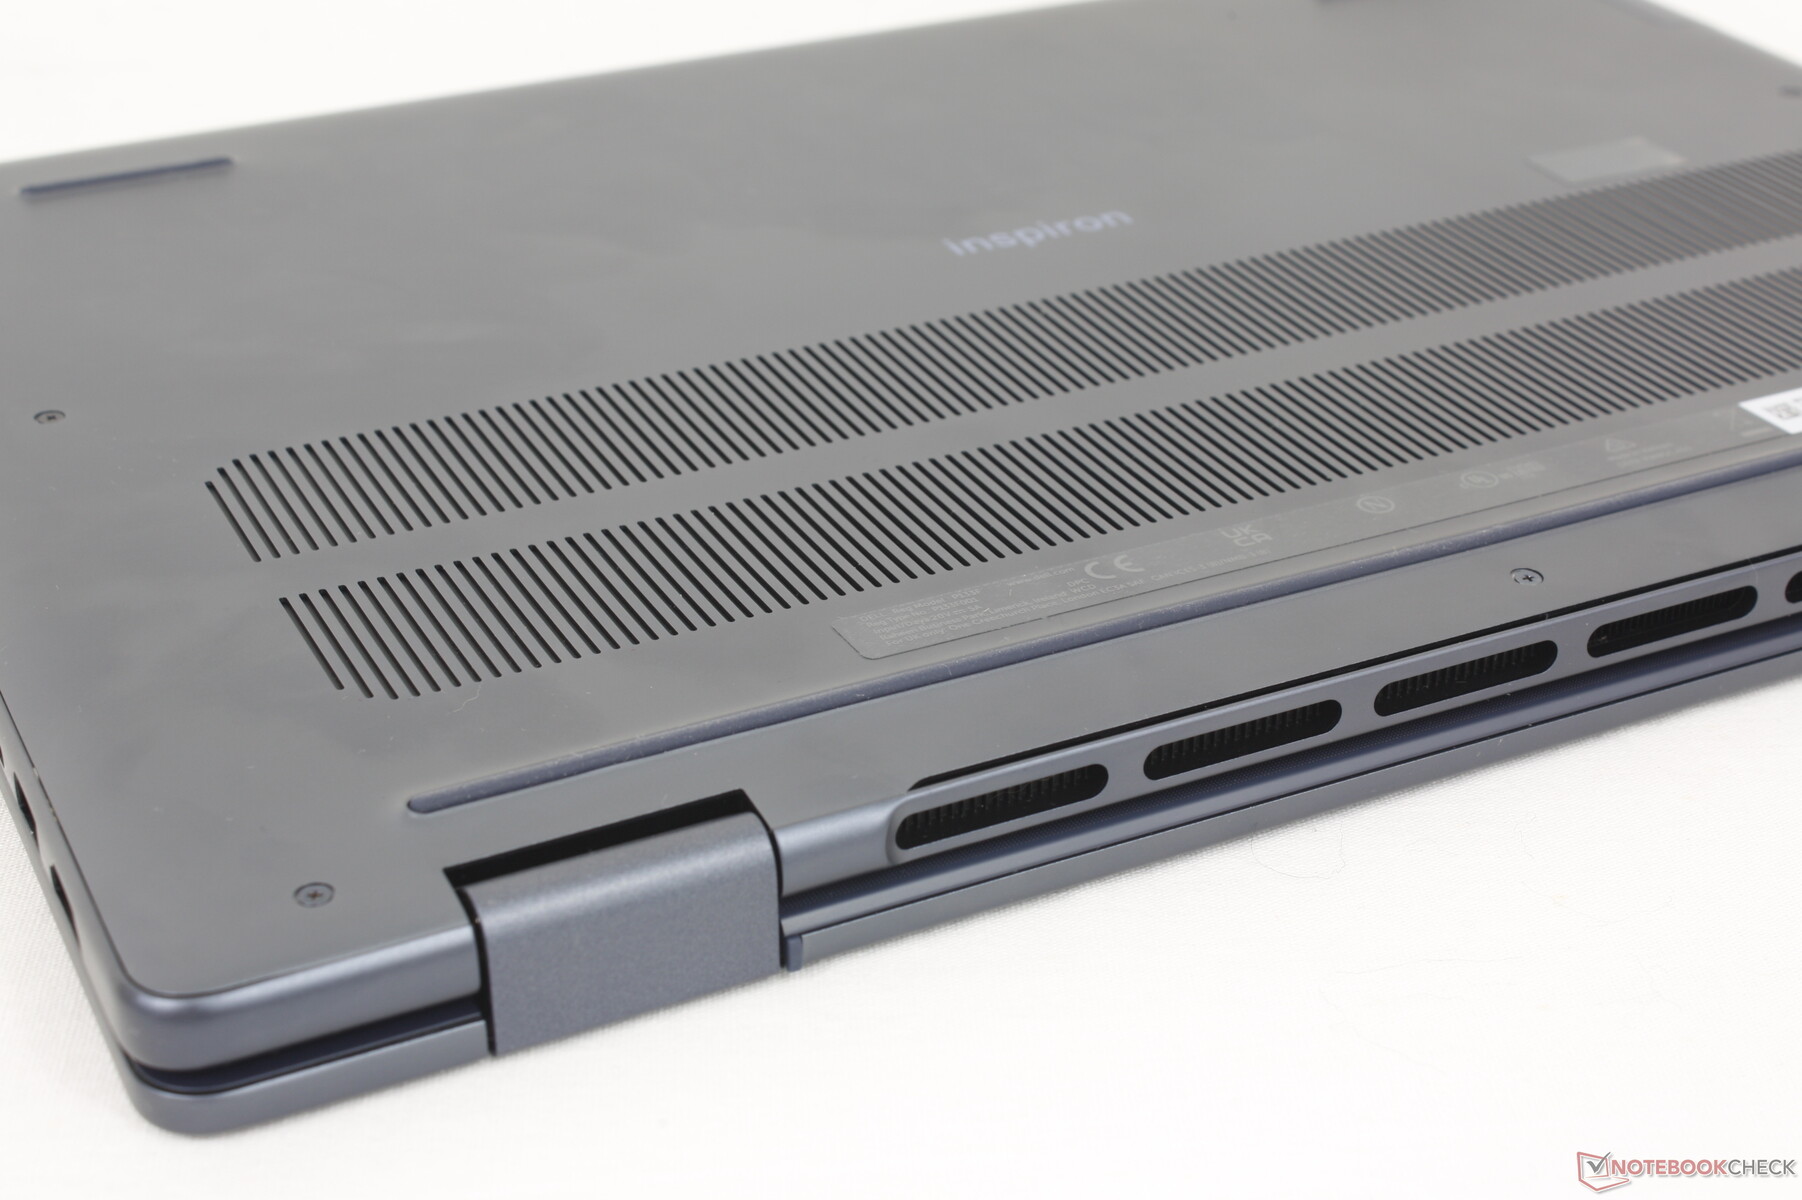
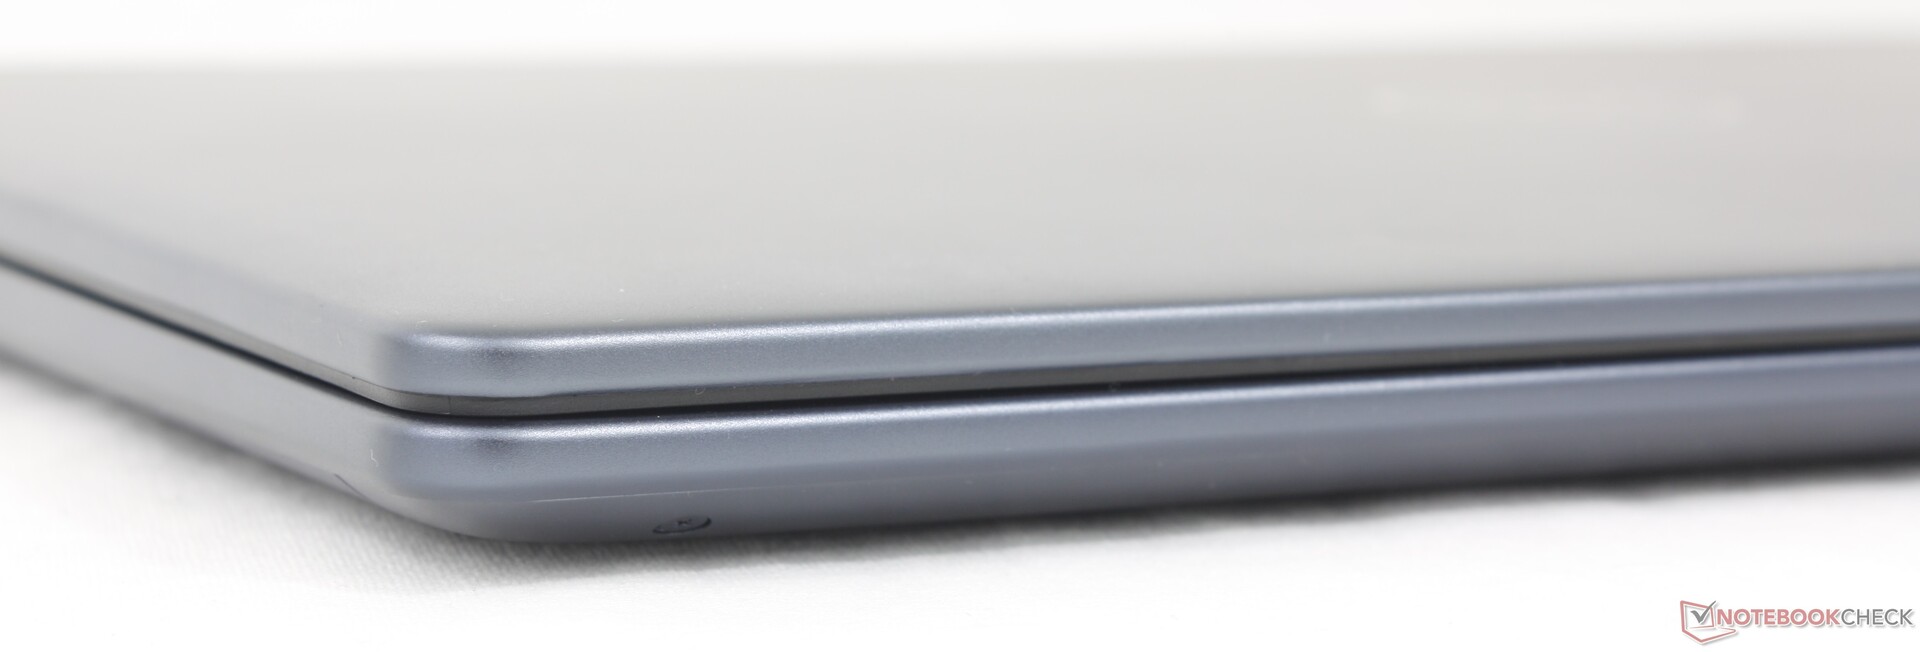
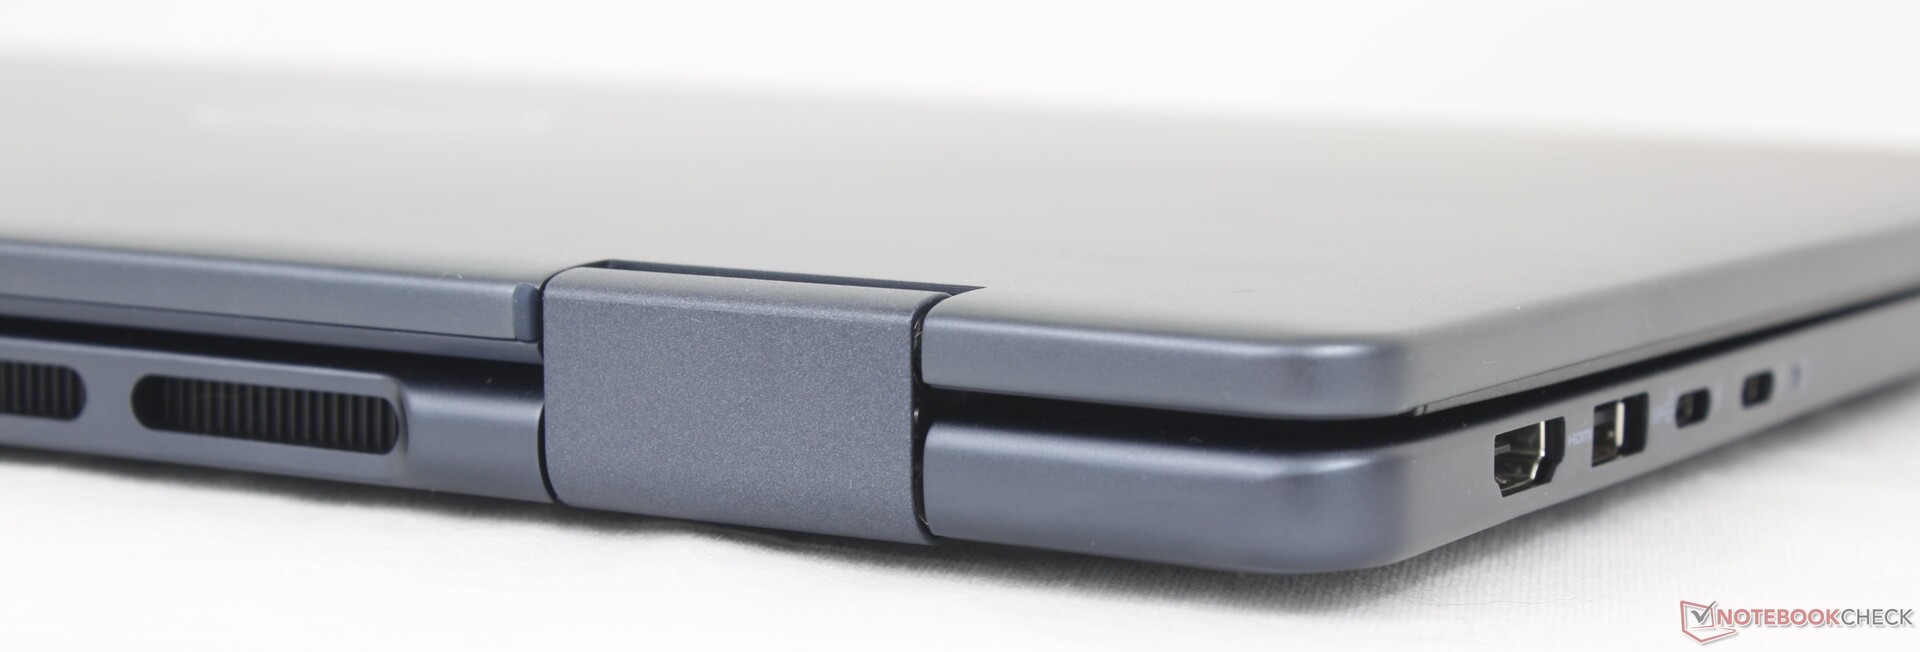
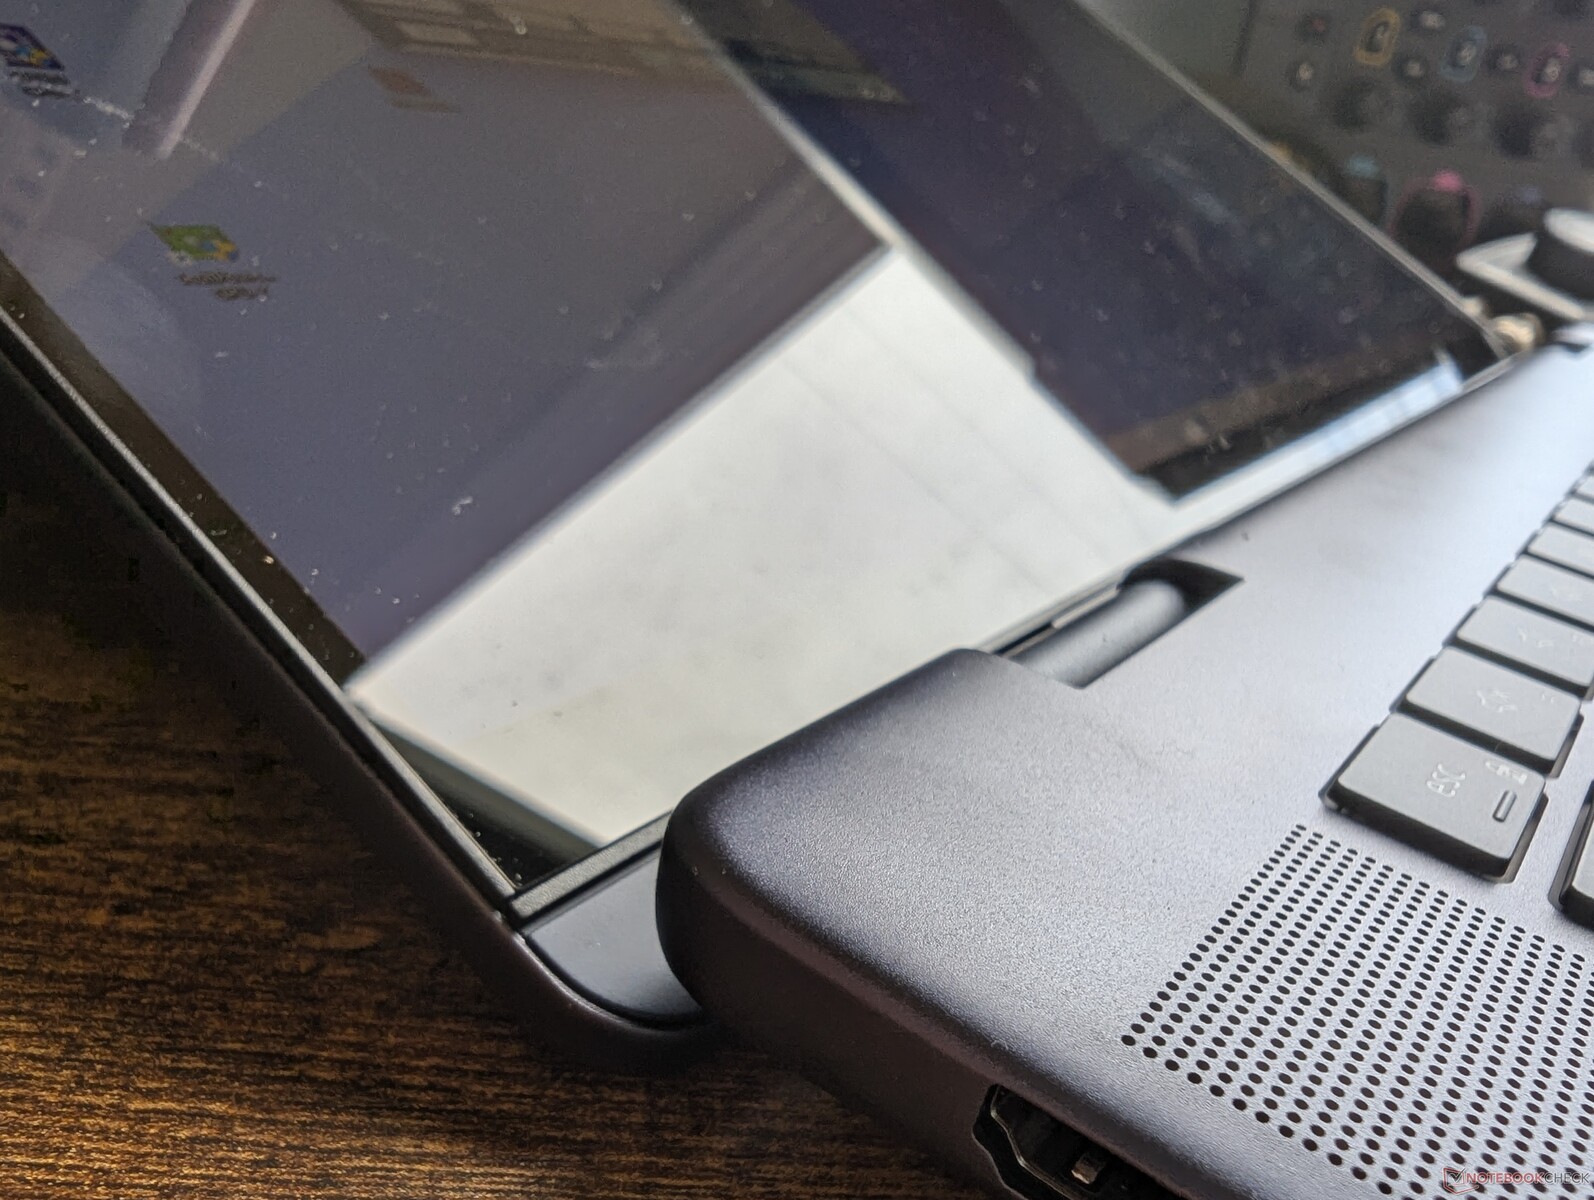
There are several exterior changes from the outgoing model. Firstly, the palm rest portion is no longer raised for a cleaner edge between it and the keyboard deck. Secondly, the ventilation grilles along the bottom and rear edge have been redesigned to be slightly larger. Thirdly, the rear edge itself is bolder for a boxier appearance.
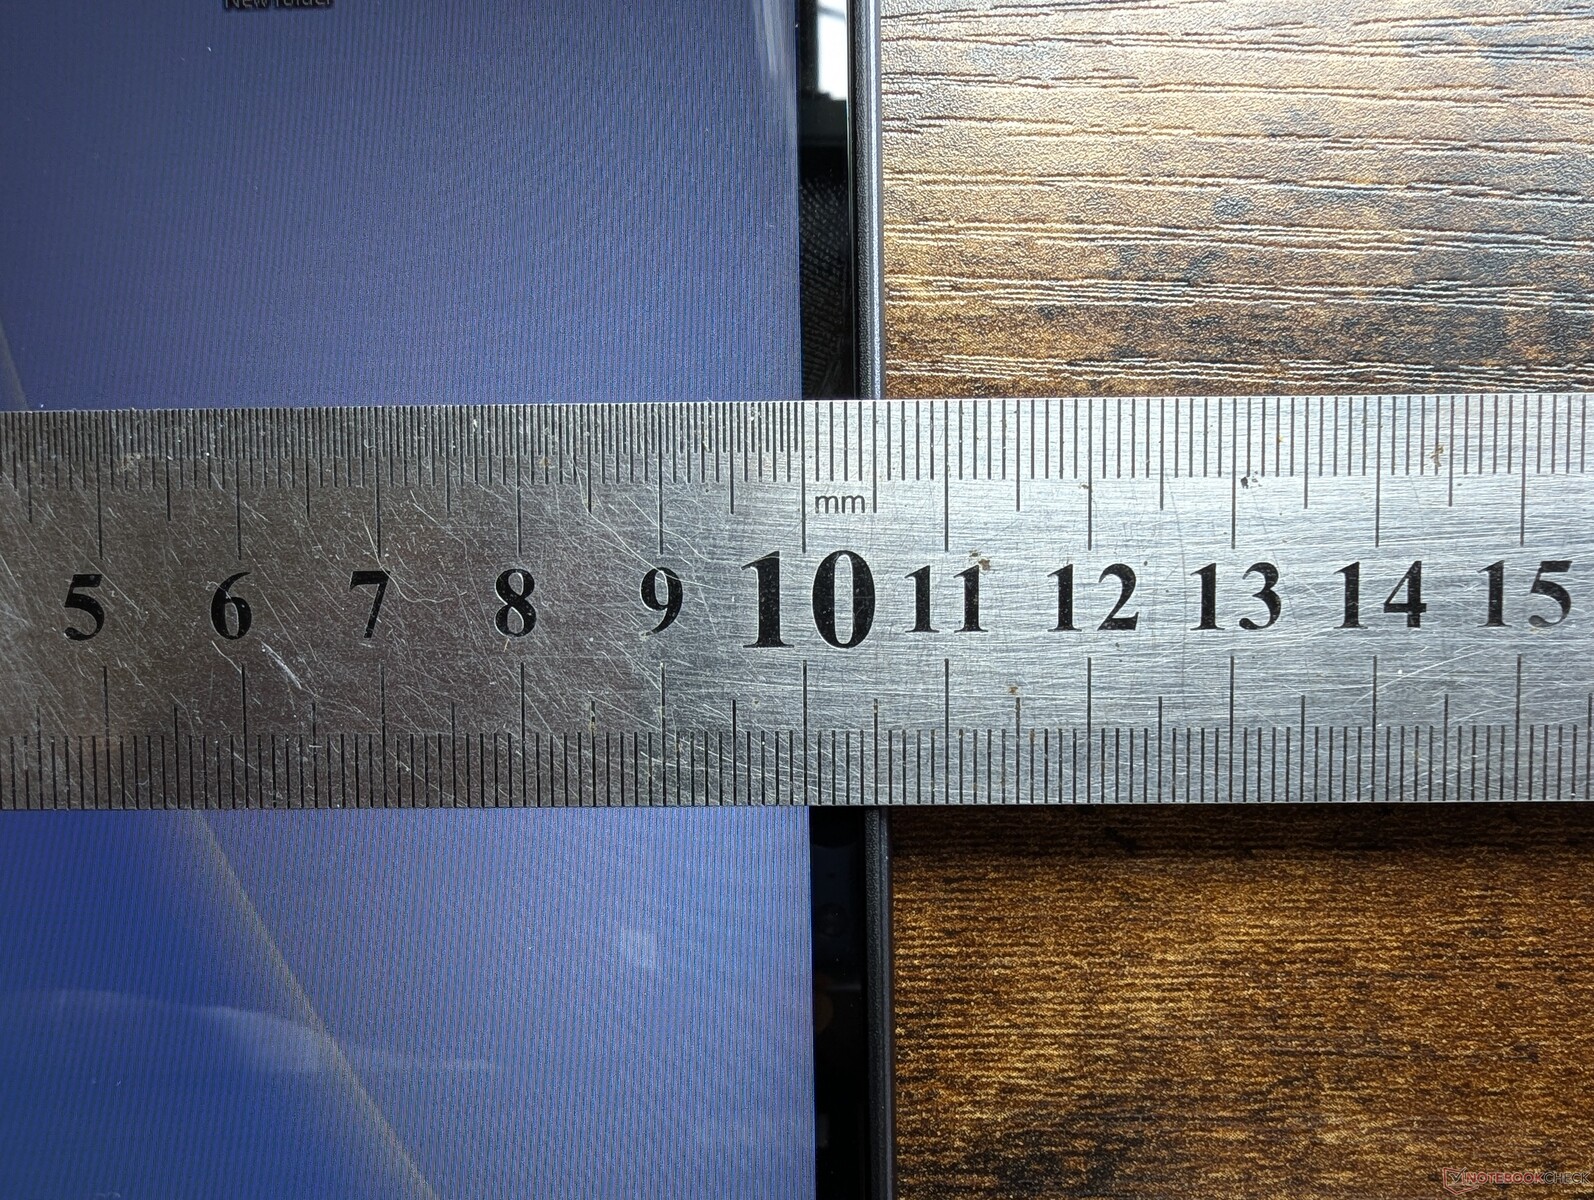
Other than the aesthetic changes above, chassis materials remain the same as before for no major improvements when it comes to rigidity or quality. The lid and base still consist of aluminum and plastics, respectively, with good resistance to twisting and depressions for solid first impressions especially for a midrange model. We're not so much concerned about the build quality of the model as we are about how heavy it is to use in tablet mode.
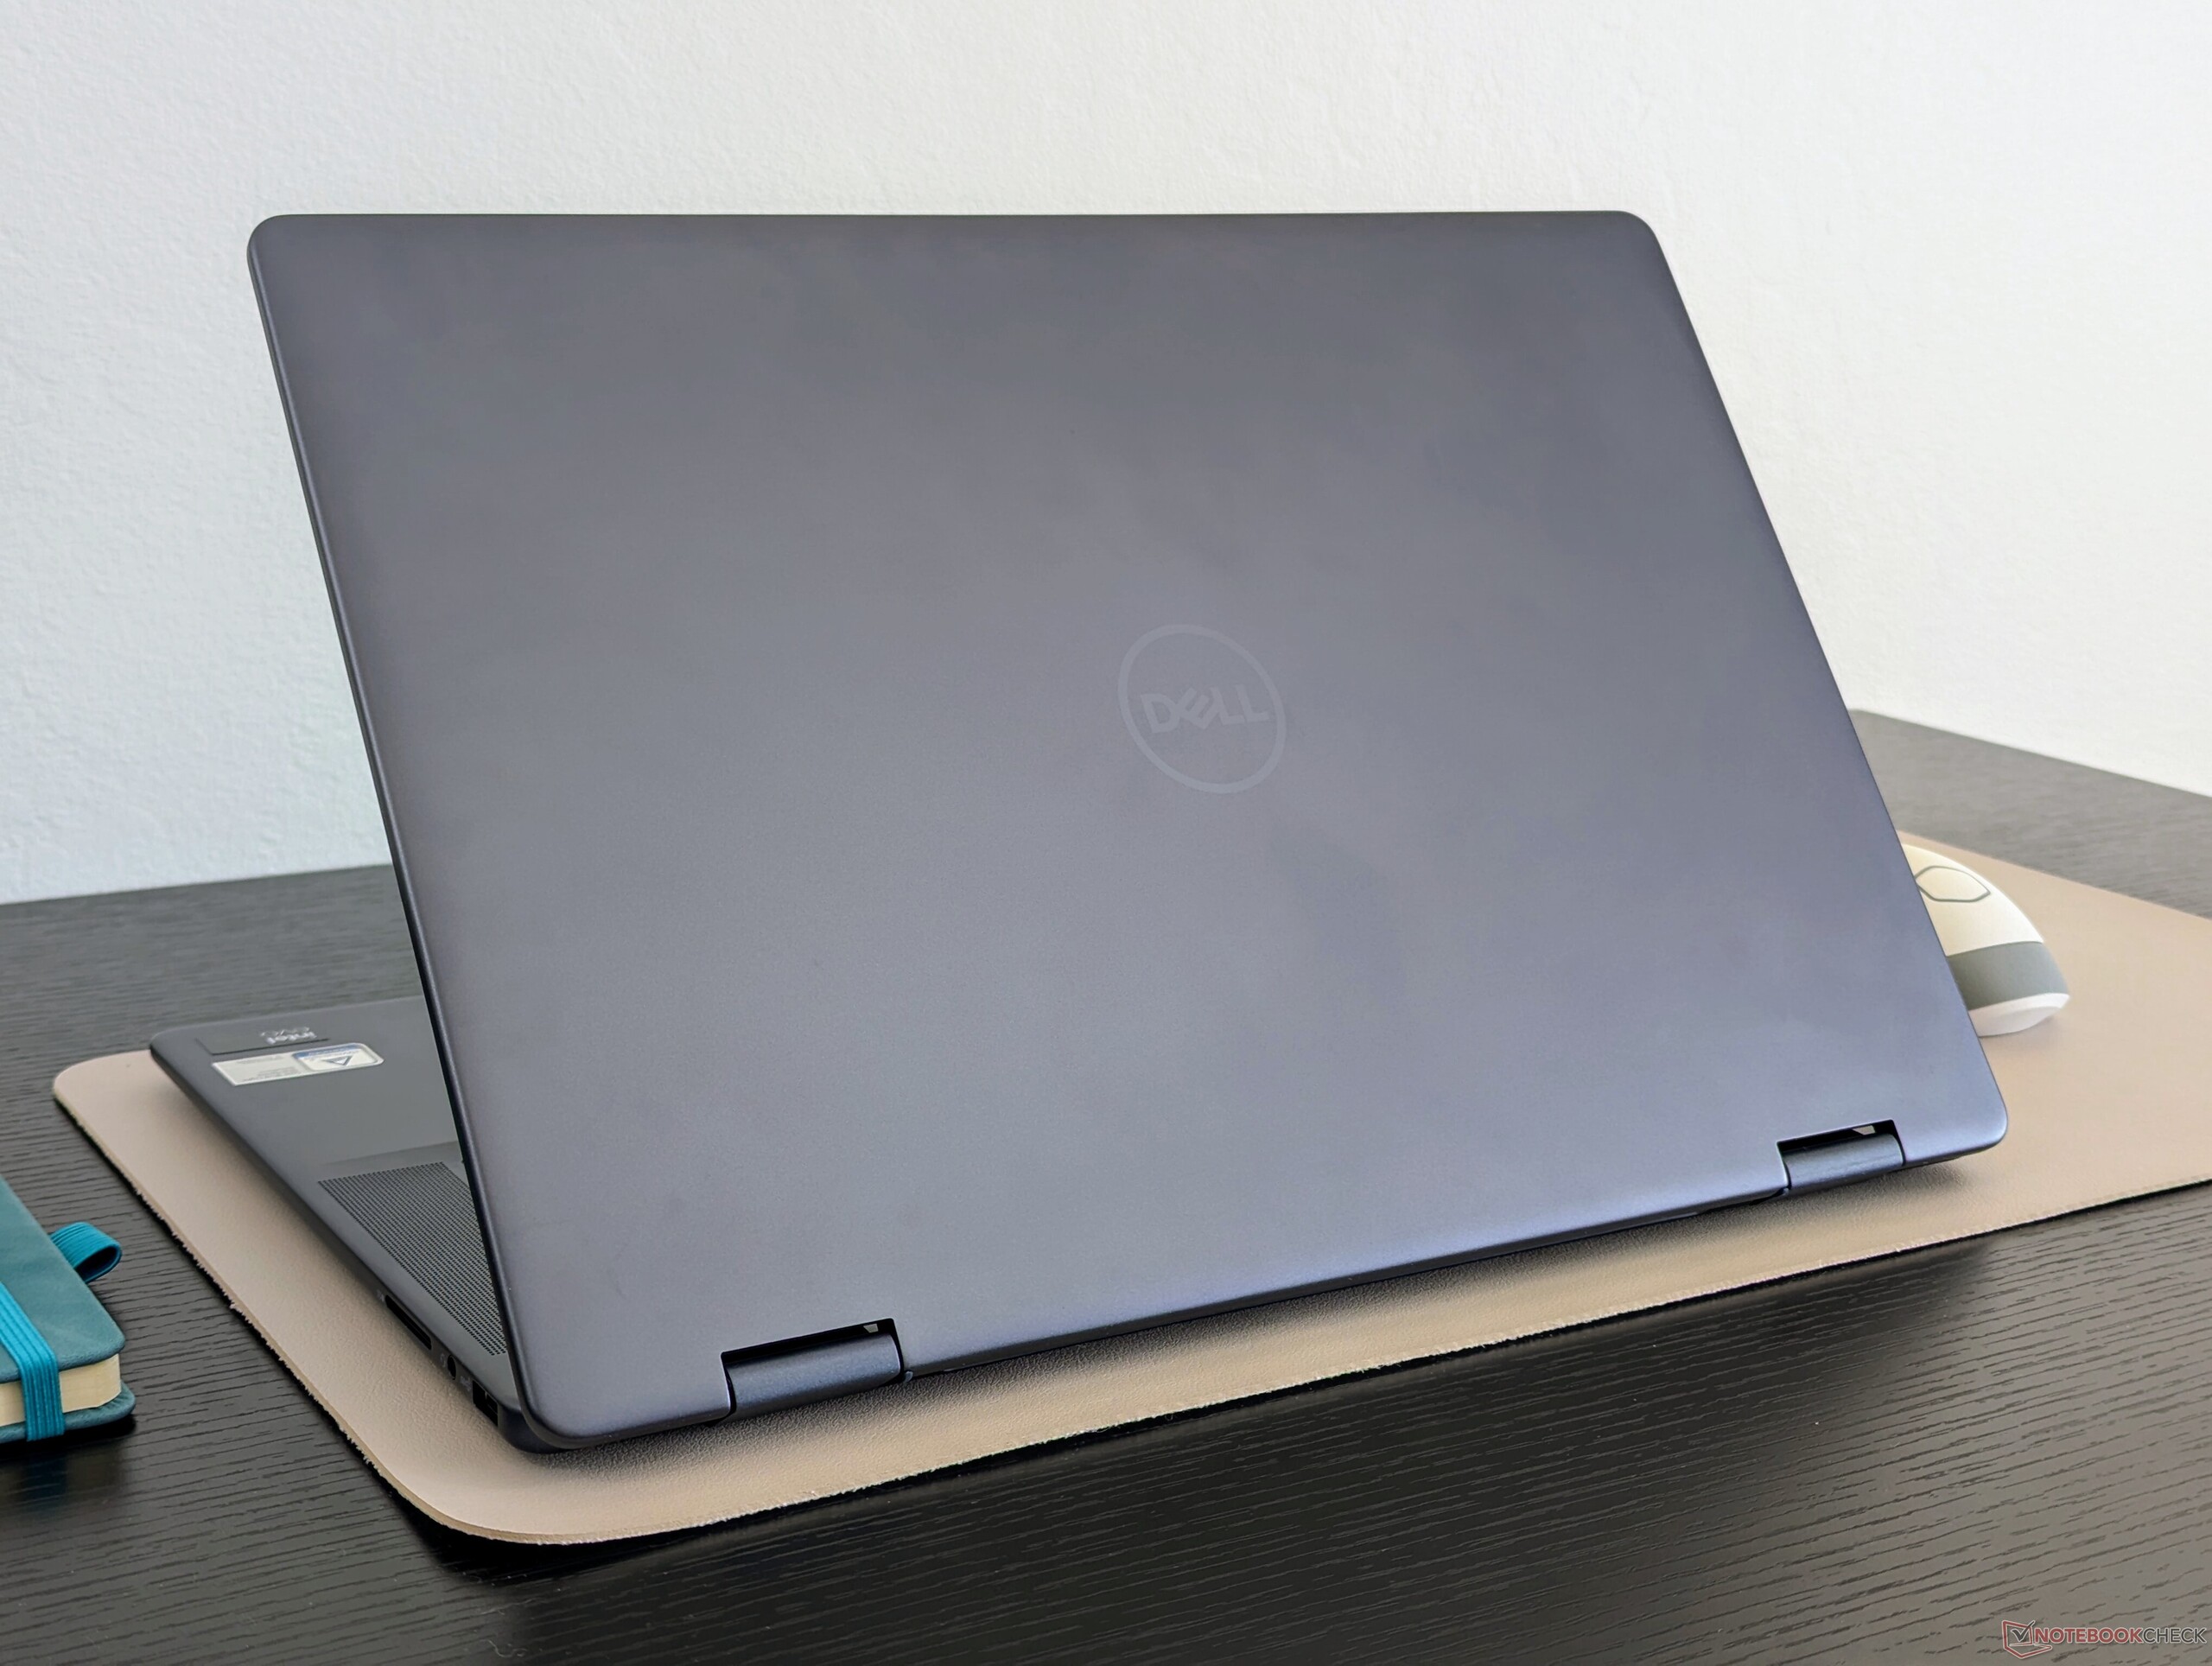
Both dimensions and weight are almost exactly the same as both the 2023 Inspiron 16 7630 2-in-1 and 2024 Inspiron 16 Plus 7640 clamshell even though the latter includes a discrete GPU option. We would have preferred a lighter design since the 16-inch HP Envy x360 16 and Samsung Galaxy Book4 Pro 360 are each noticeably lighter than our Dell. While a 16-inch convertible is going to be relatively heavy no matter what, the Inspiron 16 7640 2-in-1 is probably one of the worst of the bunch for traveling.

Connectivity
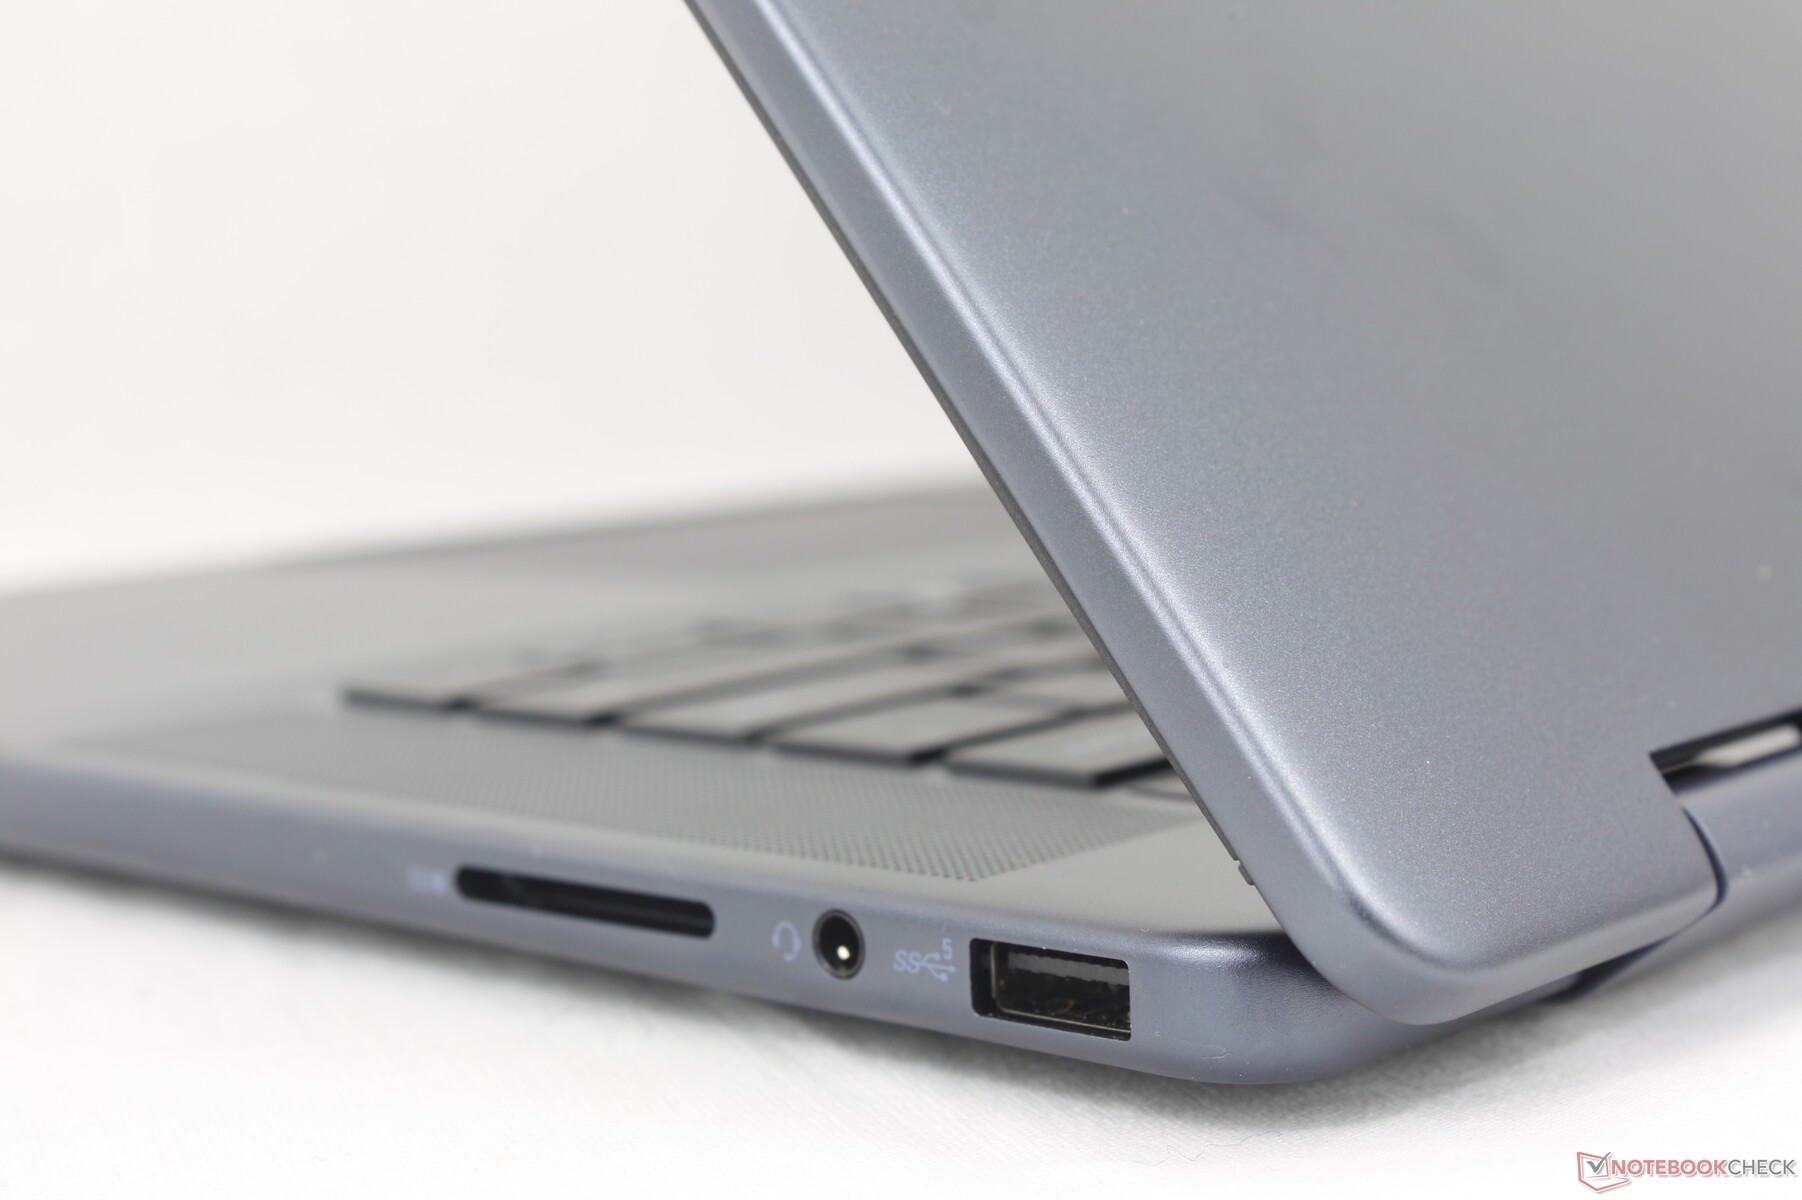
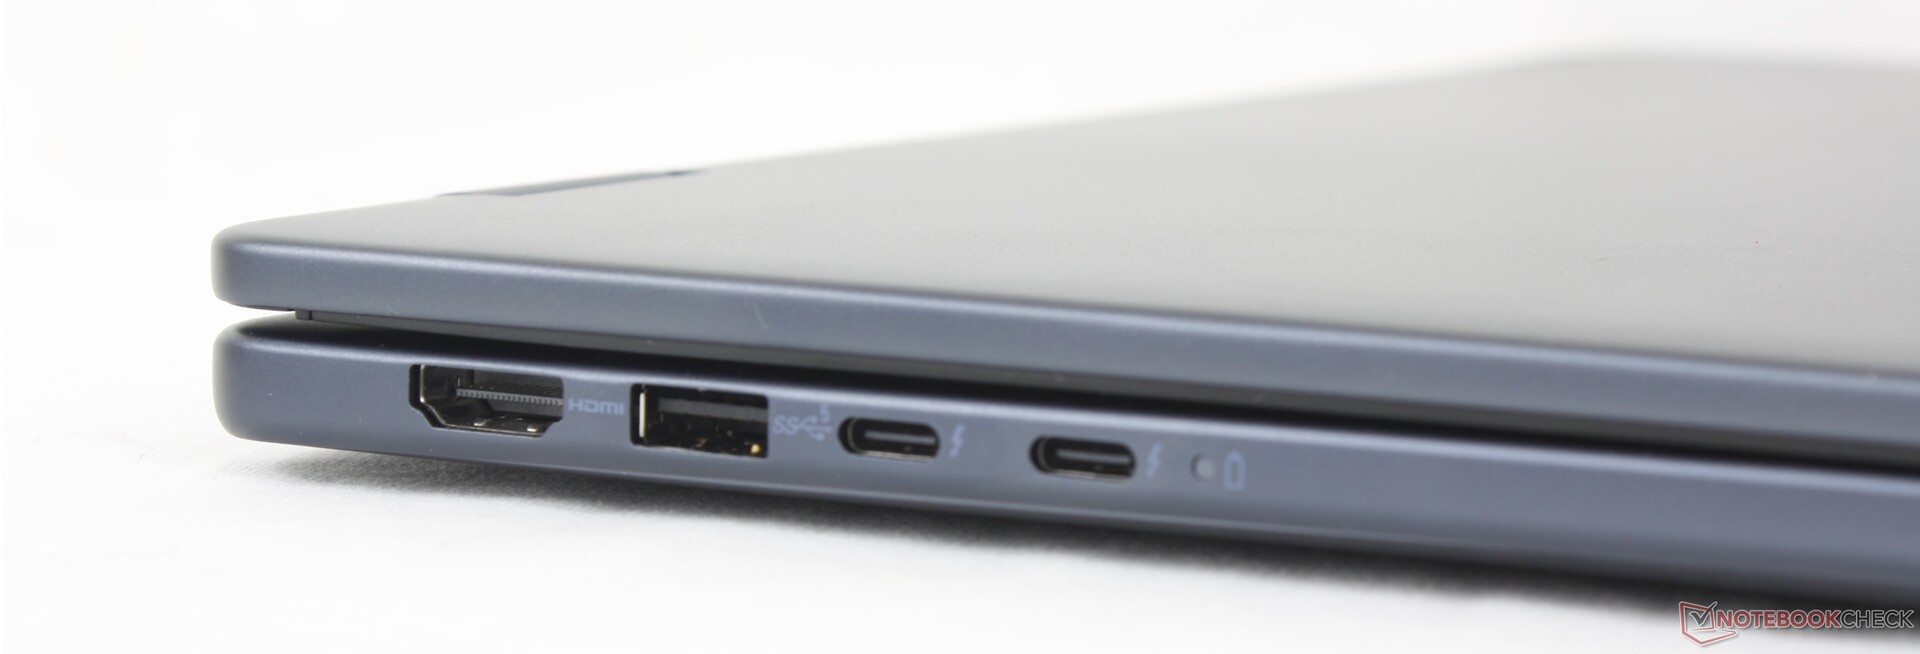
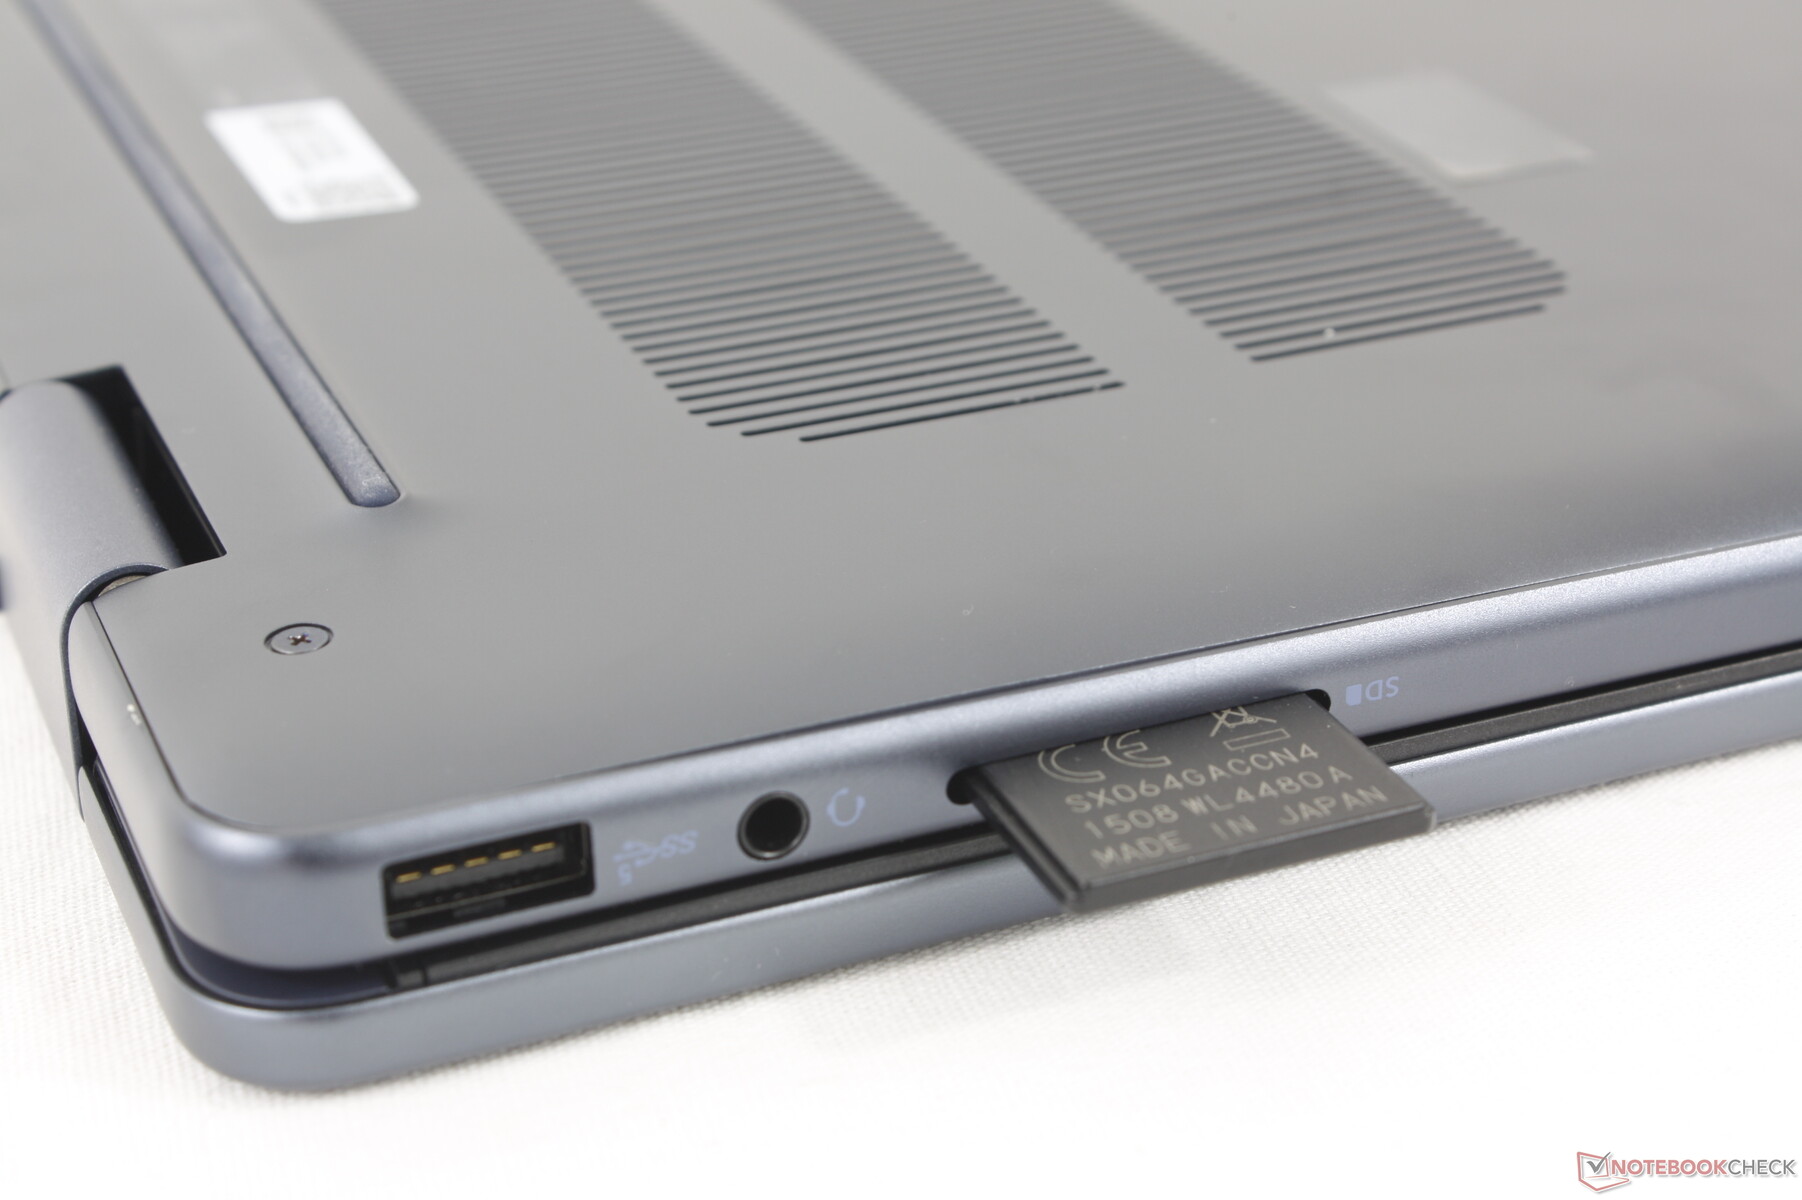
Port options and positioning remain identical to the Inspiron 16 7635 2-in-1 or 7630 2-in-1 despite the numerous exterior changes. Note that Thunderbolt 4 is again available only on the Intel SKUs and that the HDMI port continues to be version 1.4 only.
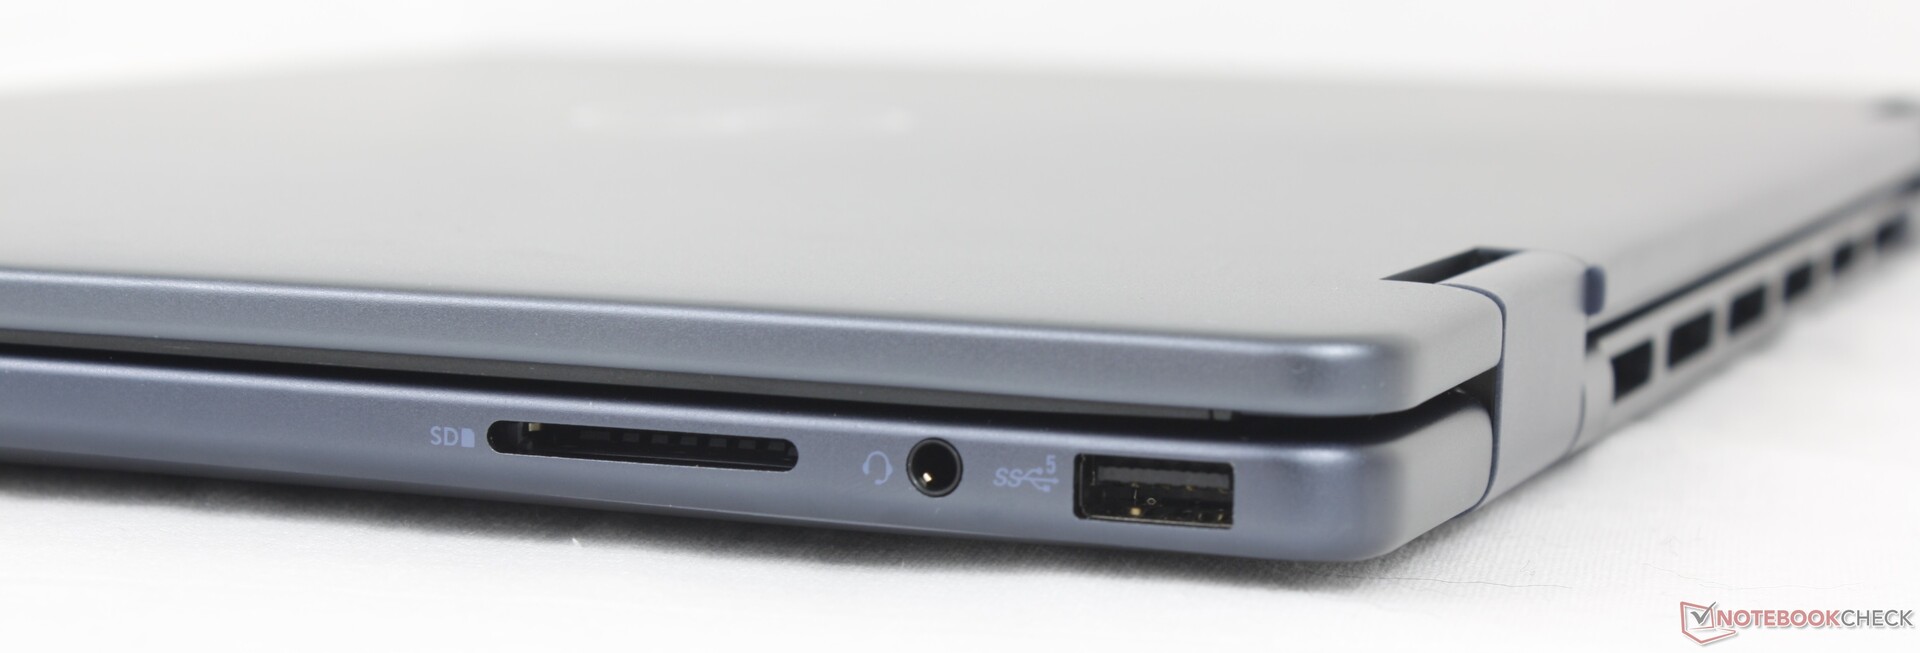
SD Card Reader
Transfer rates with the integrated SD card reader have not improved over last year's model at just under 30 MB/s. 16-inch clamshells like the Lenovo IdeaPad Pro 5 16 can be over 2x faster and the XPS 16 is even faster still. Users who rely on SD cards can appreciate the handy integrated card reader on the Inspiron, but they'll also likely be disappointed by the slow speeds.
| SD Card Reader | |
| average JPG Copy Test (av. of 3 runs) | |
| Samsung Galaxy Book4 Pro 360 (Angelbird AV Pro V60) | |
| Lenovo IdeaPad Pro 5 16IMH G9 (Angelbird AV Pro V60) | |
| Dell Inspiron 16 7635 2-in-1 (PNY EliteX-Pro60 V60 256 GB) | |
| Dell Inspiron 16 7640 2-in-1 (Toshiba Exceria Pro SDXC 64 GB UHS-II) | |
| Dell Inspiron 16 Plus 7640 (Angelbird AV Pro V60) | |
| maximum AS SSD Seq Read Test (1GB) | |
| Lenovo IdeaPad Pro 5 16IMH G9 (Angelbird AV Pro V60) | |
| Samsung Galaxy Book4 Pro 360 (Angelbird AV Pro V60) | |
| Dell Inspiron 16 7635 2-in-1 (PNY EliteX-Pro60 V60 256 GB) | |
| Dell Inspiron 16 7640 2-in-1 (Toshiba Exceria Pro SDXC 64 GB UHS-II) | |
| Dell Inspiron 16 Plus 7640 (Angelbird AV Pro V60) | |
Communication
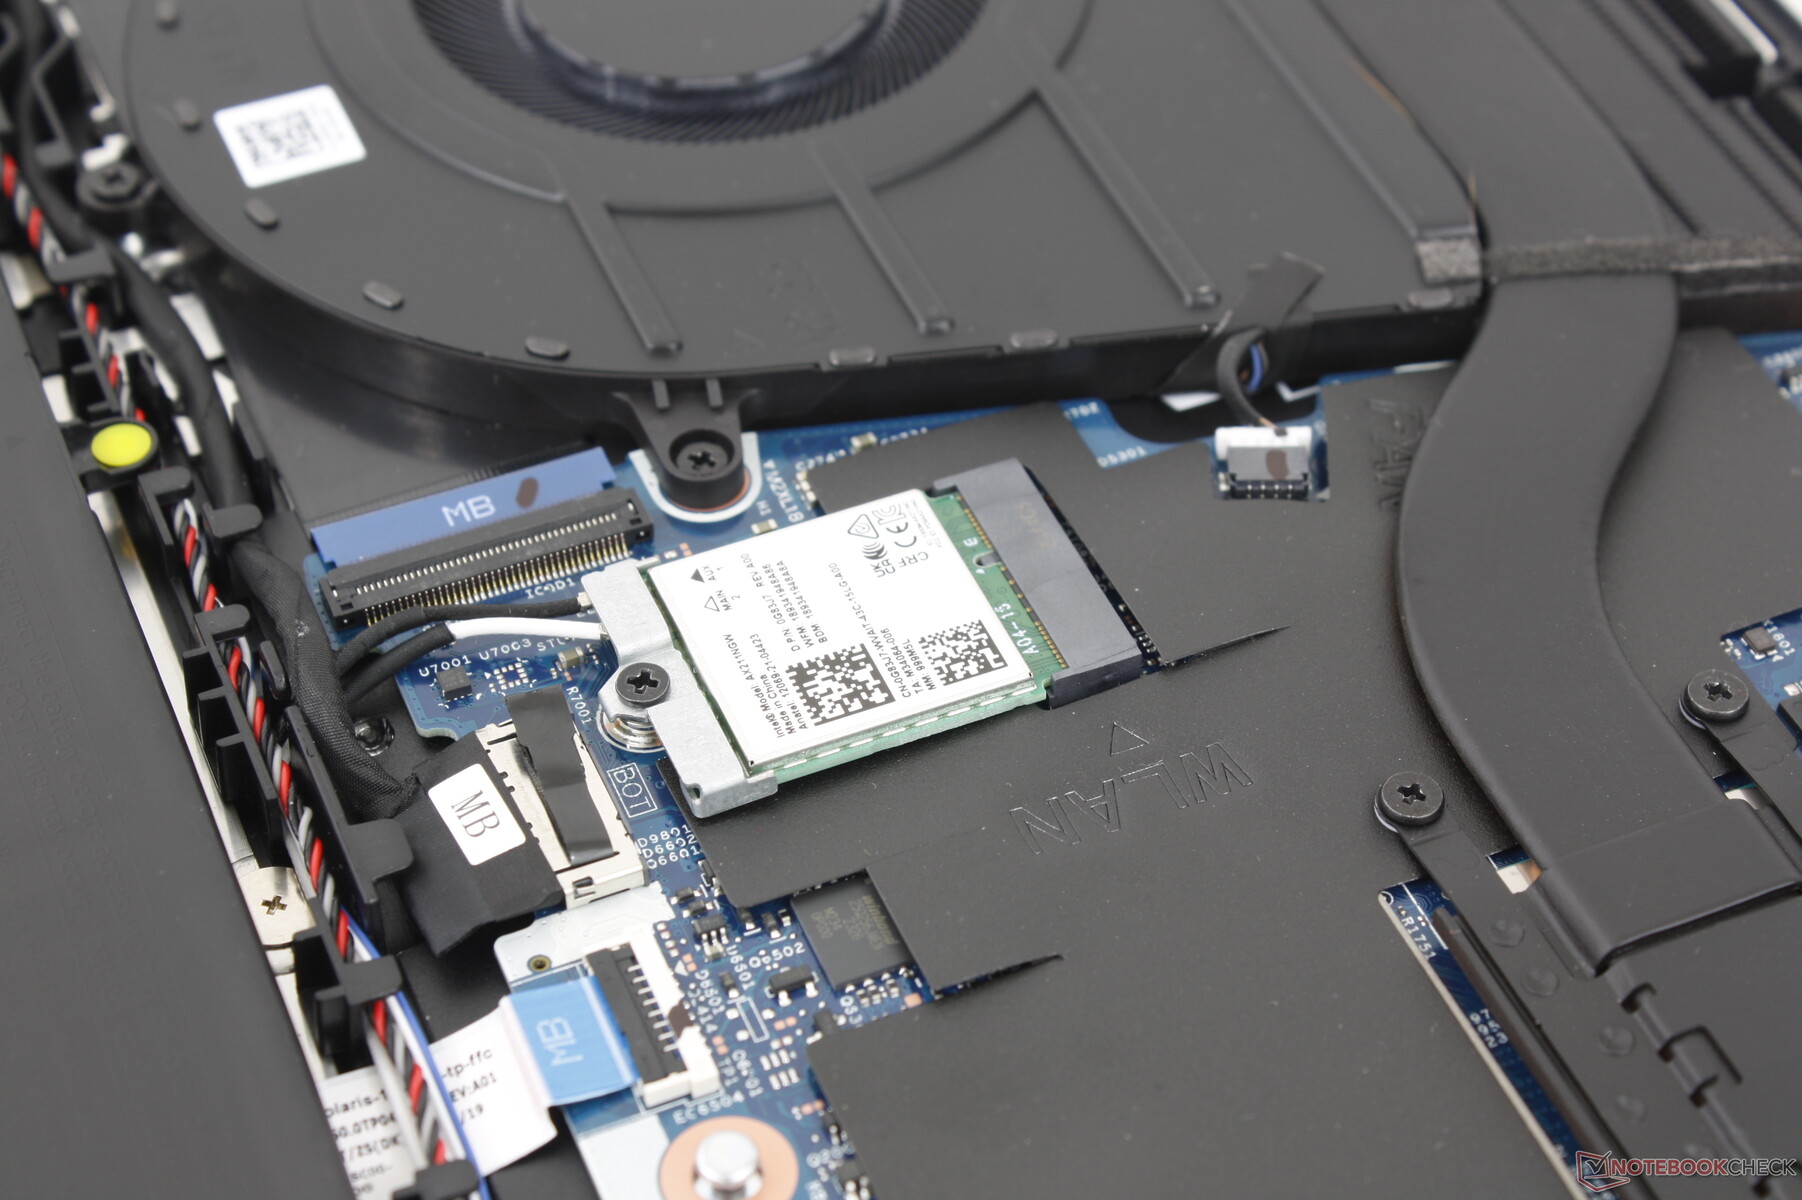
The model ships with the same Intel AX211 WLAN module as found on the Inspiron 16 7640 clamshell for Wi-Fi 6E and Bluetooth 5.3 connectivity. Performance is stead when paired to our Asus AXE11000 test router, but transfer rates on the 6 GHz network could have been faster.
Webcam
The 2 MP webcam comes standard once again with an IR sensor and physical shutter.


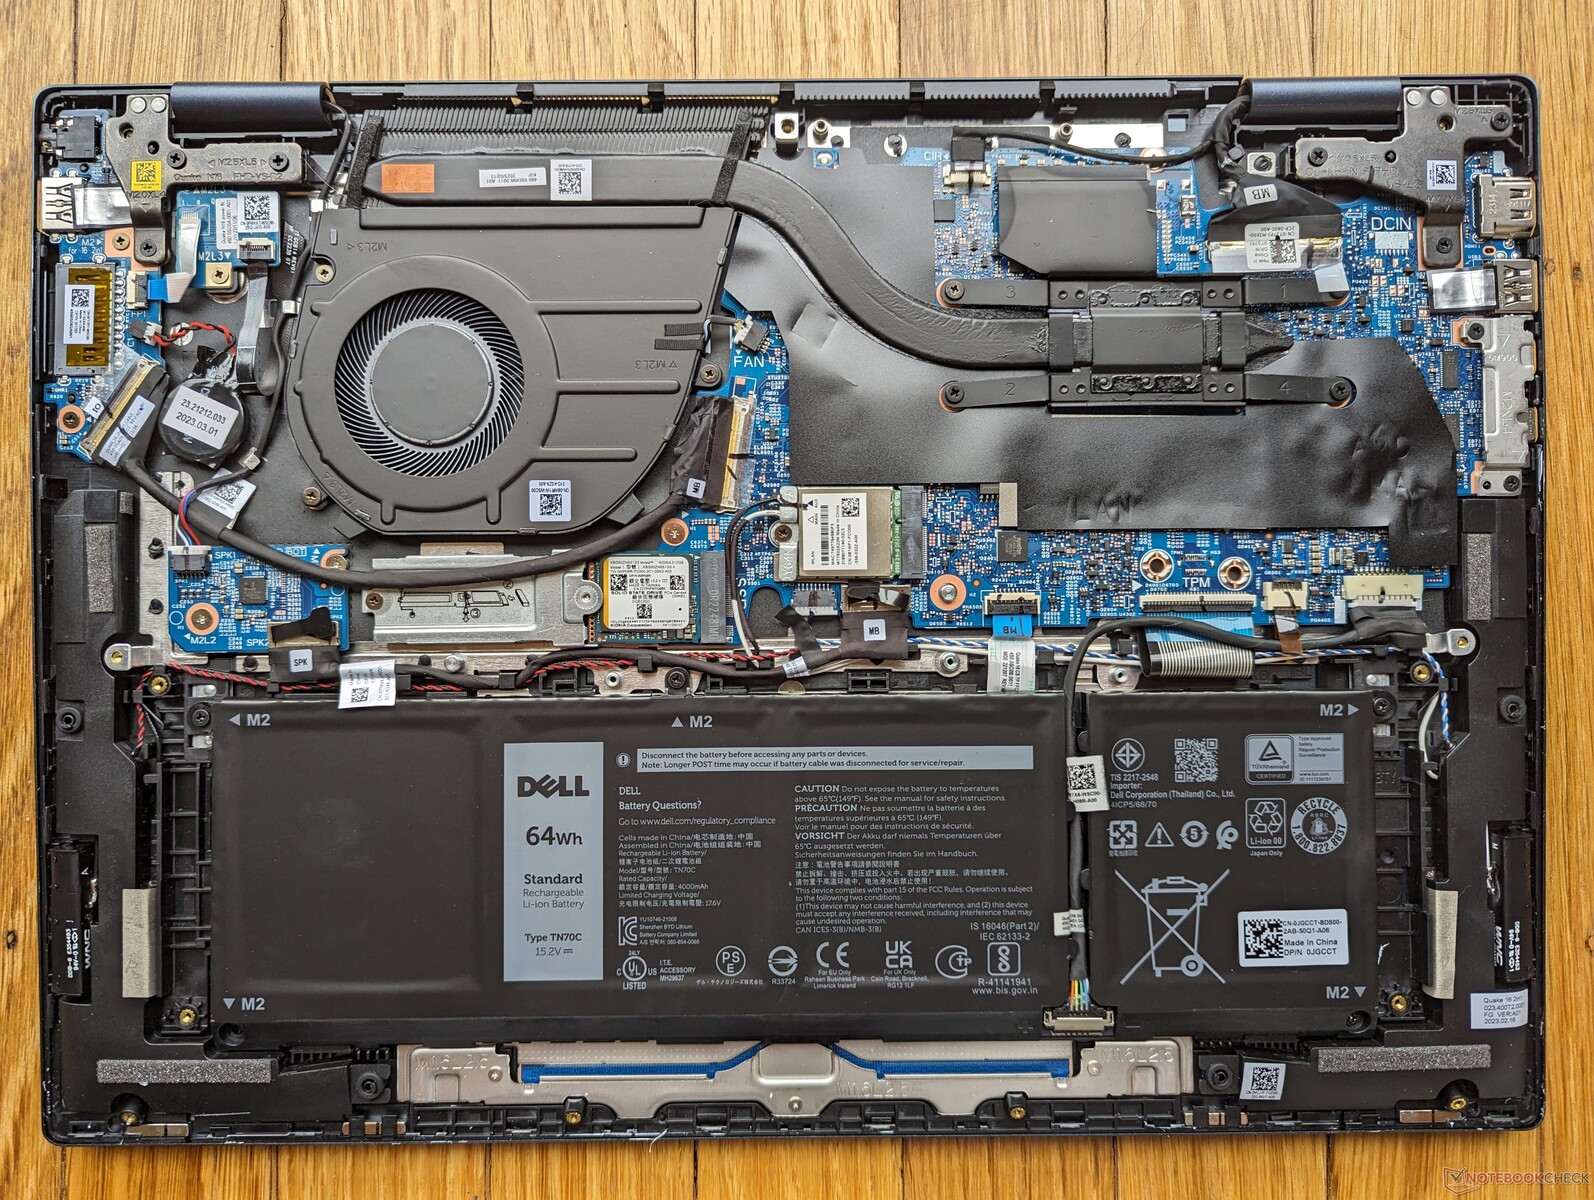
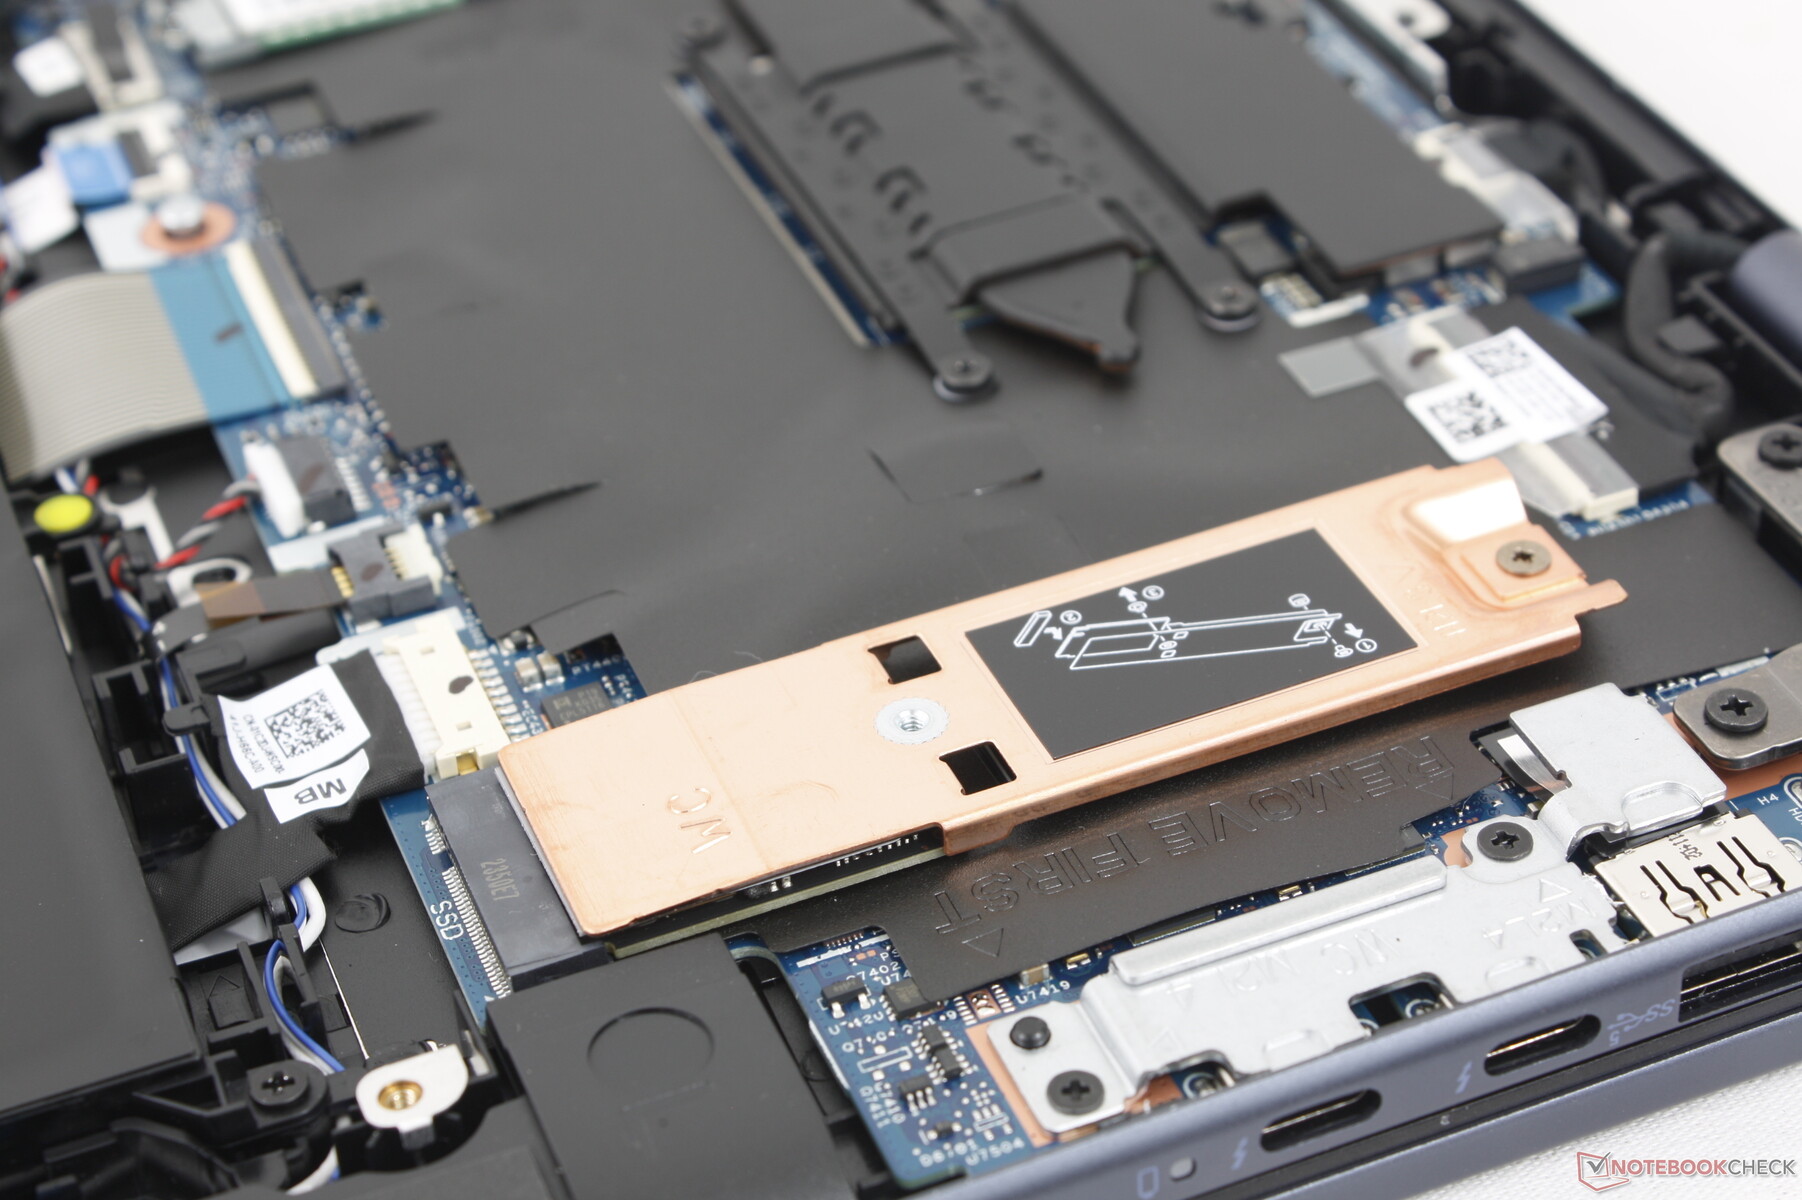
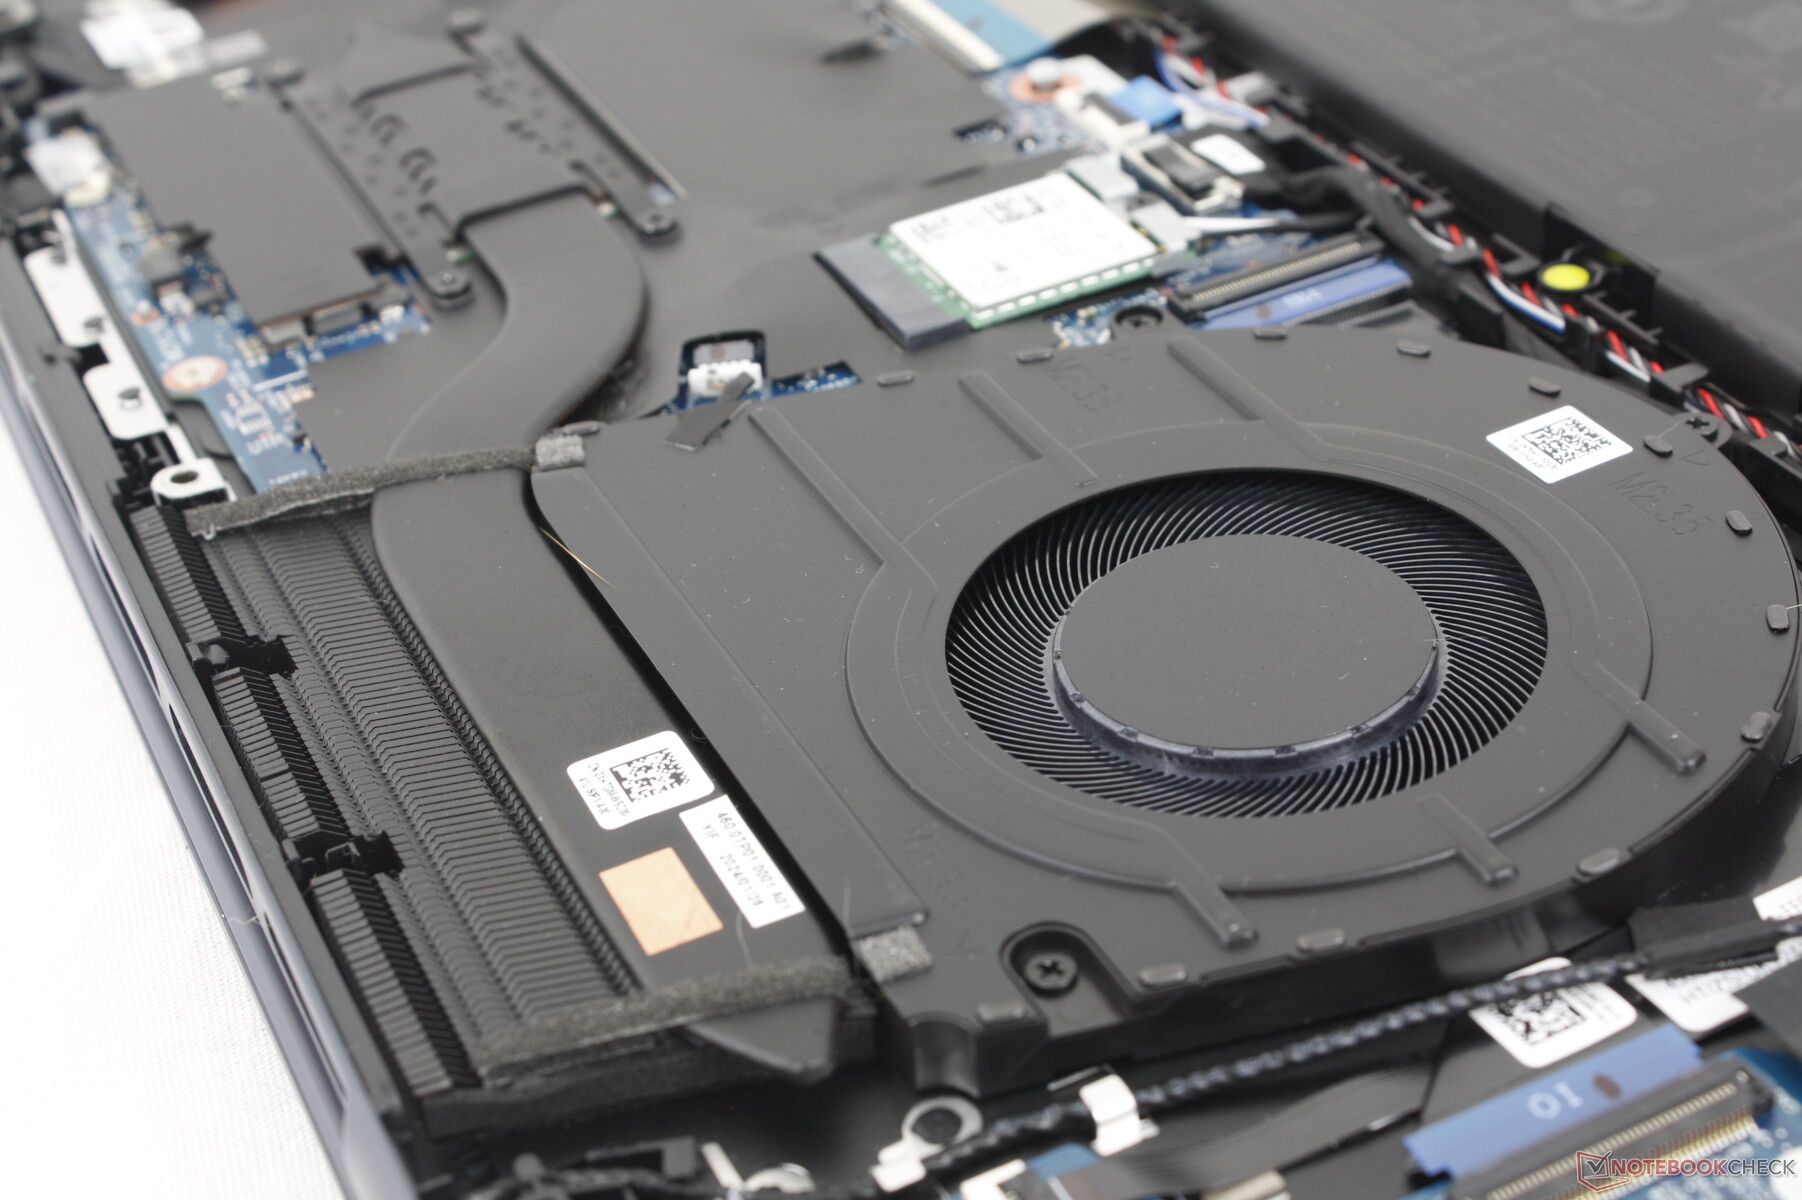
Maintenance
There are several internal differences between our model and last year's Inspiron 16 7635 2-in-1. The SSD in particular has been repositioned to make room for the larger fan and battery while the heat pipe is now slightly thicker to compensate for the shorter length. Secondary SSDs continue to be unsupported and RAM is not user upgradeable.

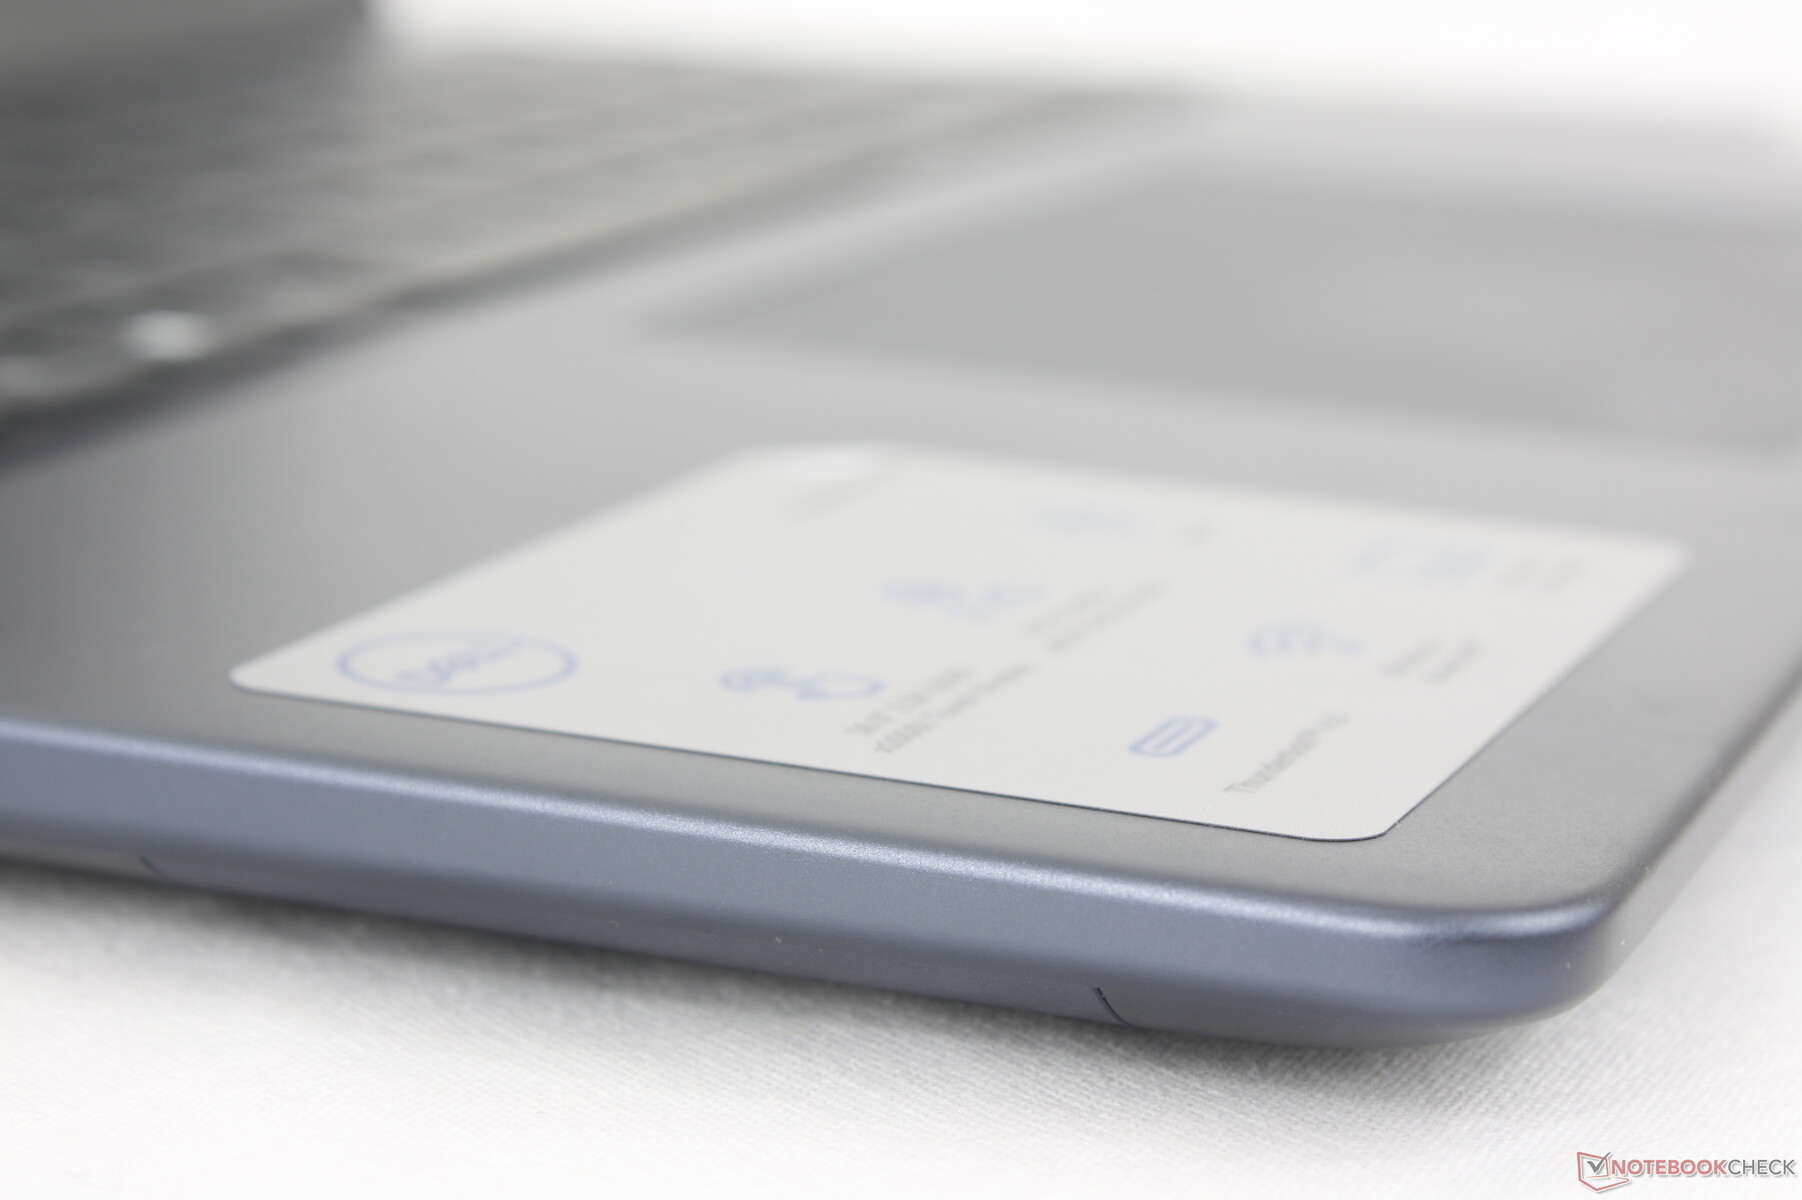
Accessories And Warranty
The retail box includes an active stylus pen (PN5122W) in addition to the paperwork and AC adapter. The standard one-year limited warranty applies if purchased in the US.
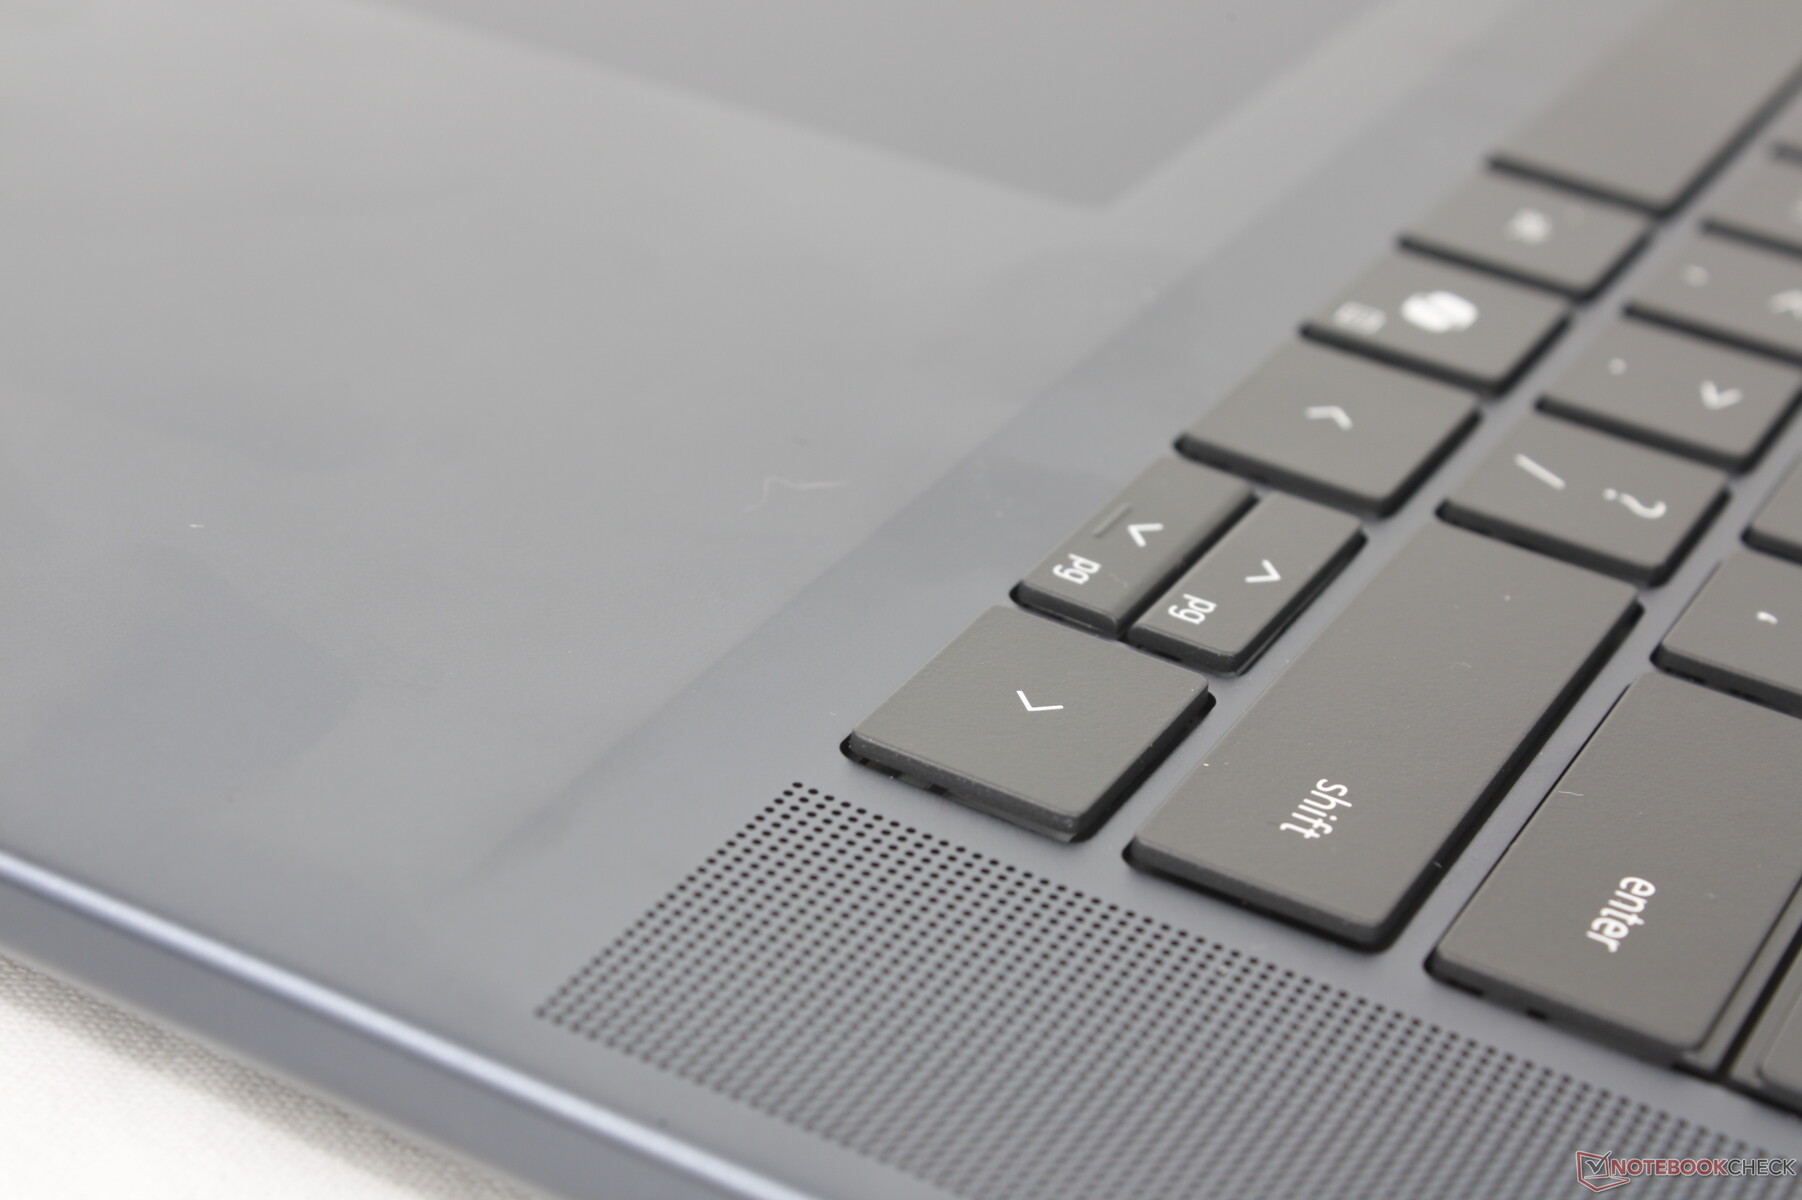
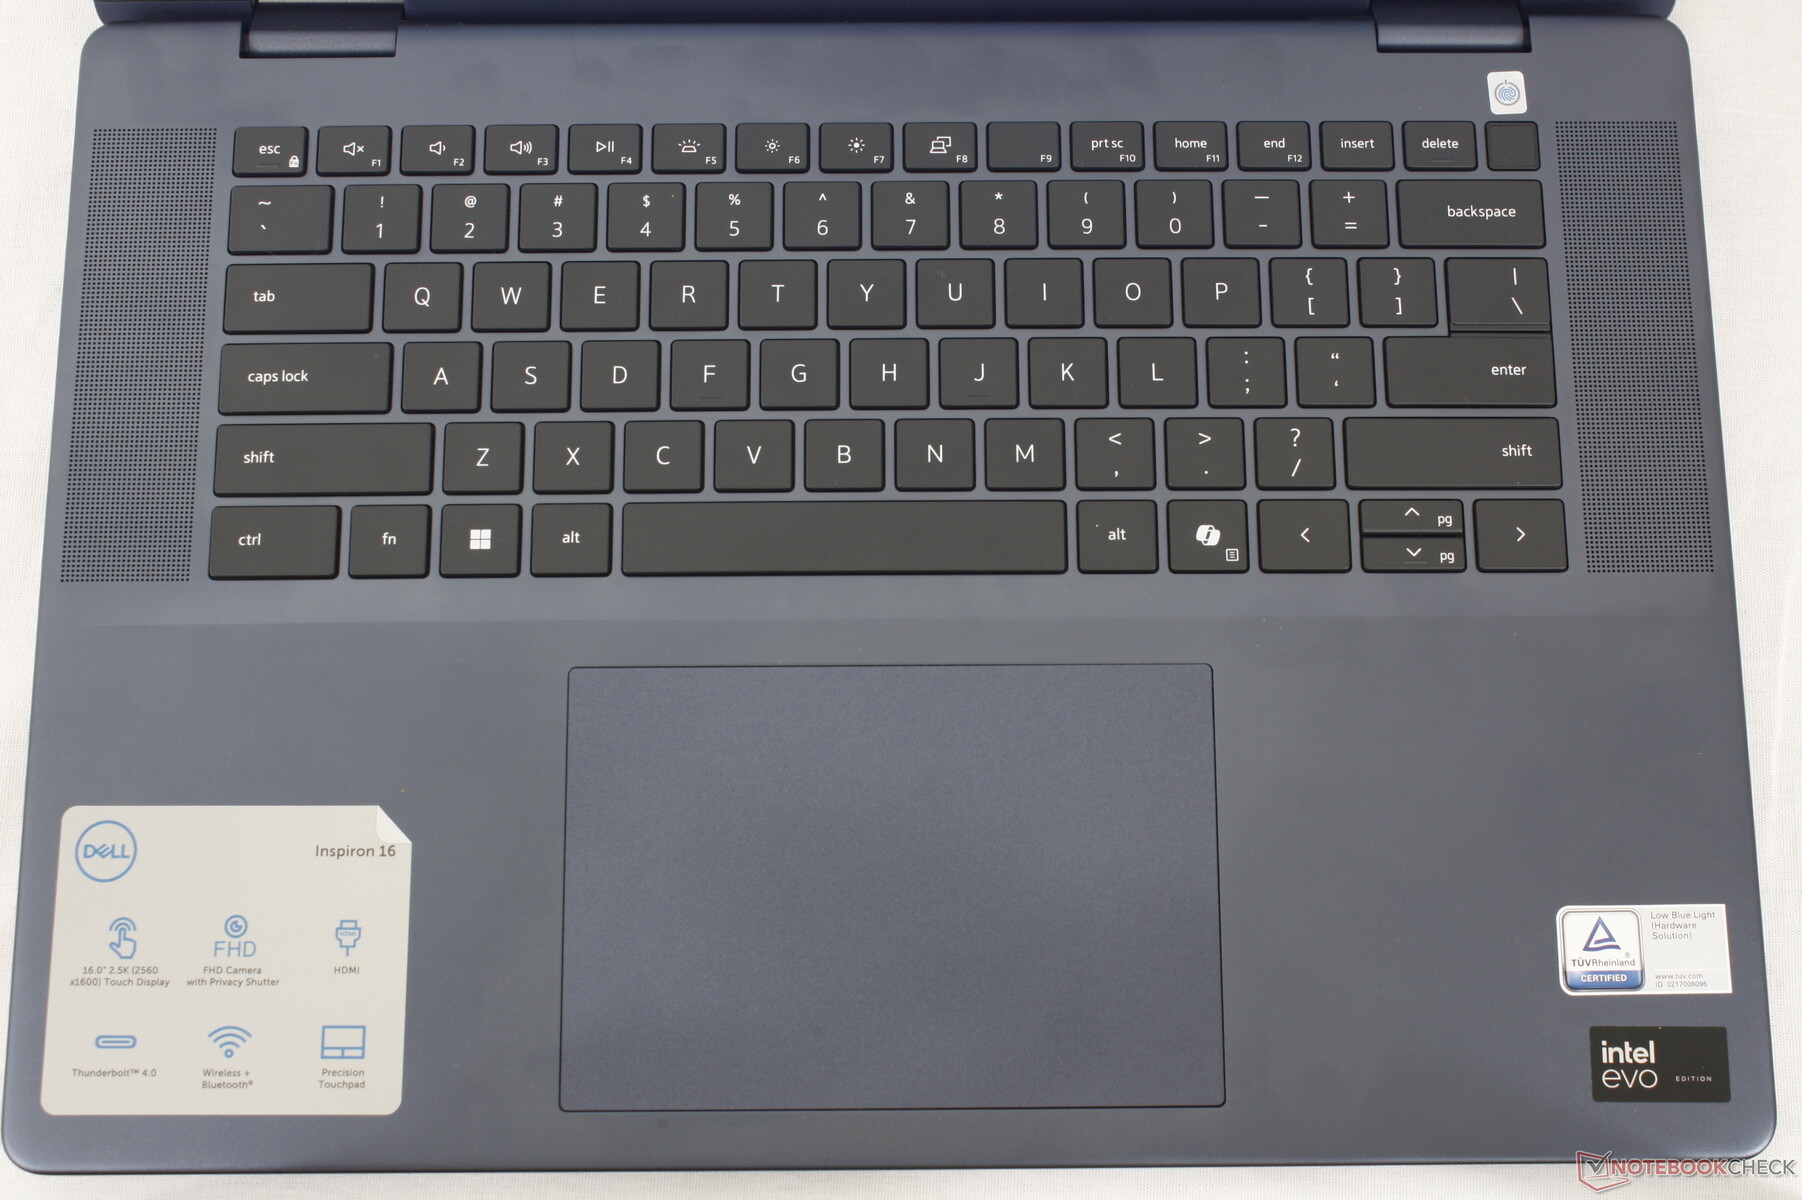
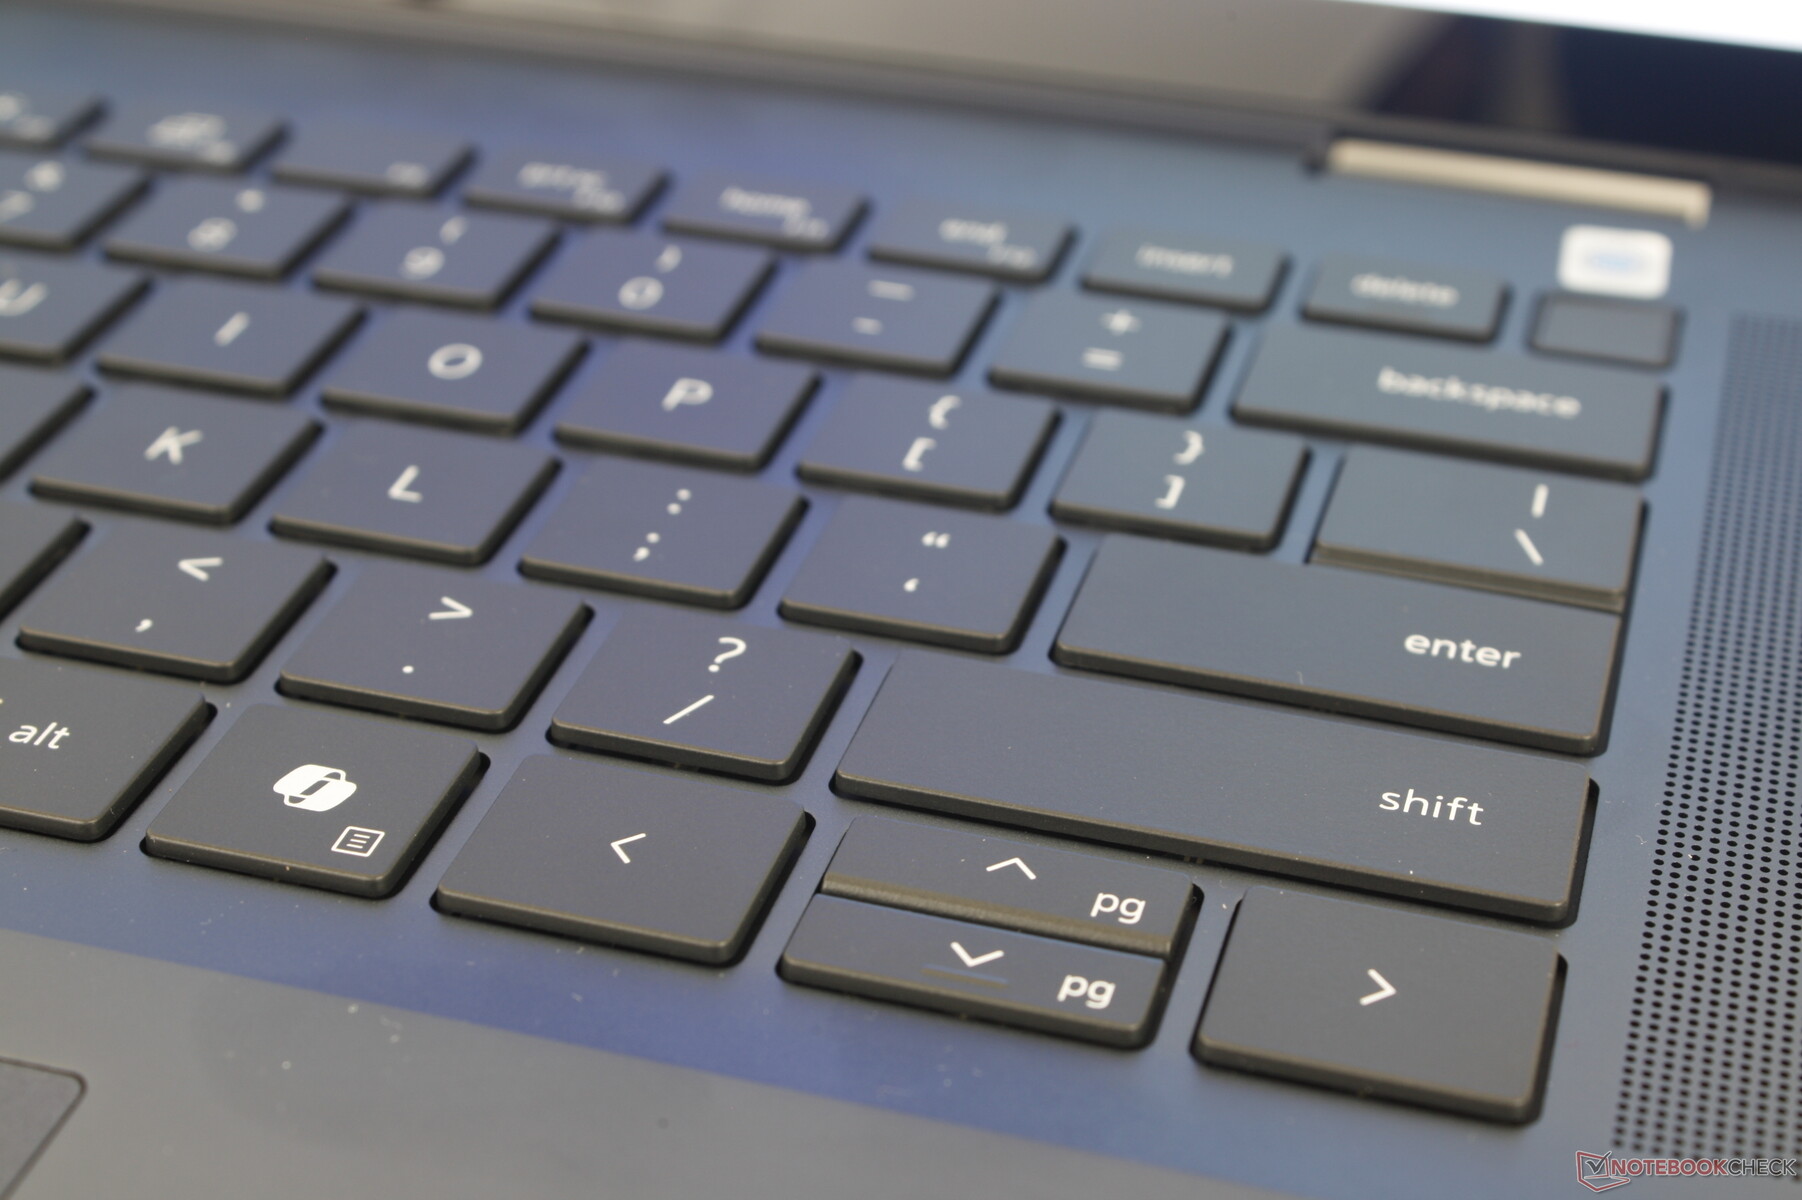
Input Devices — Good But Still A Bit Spongy
Keyboard And Touchpad
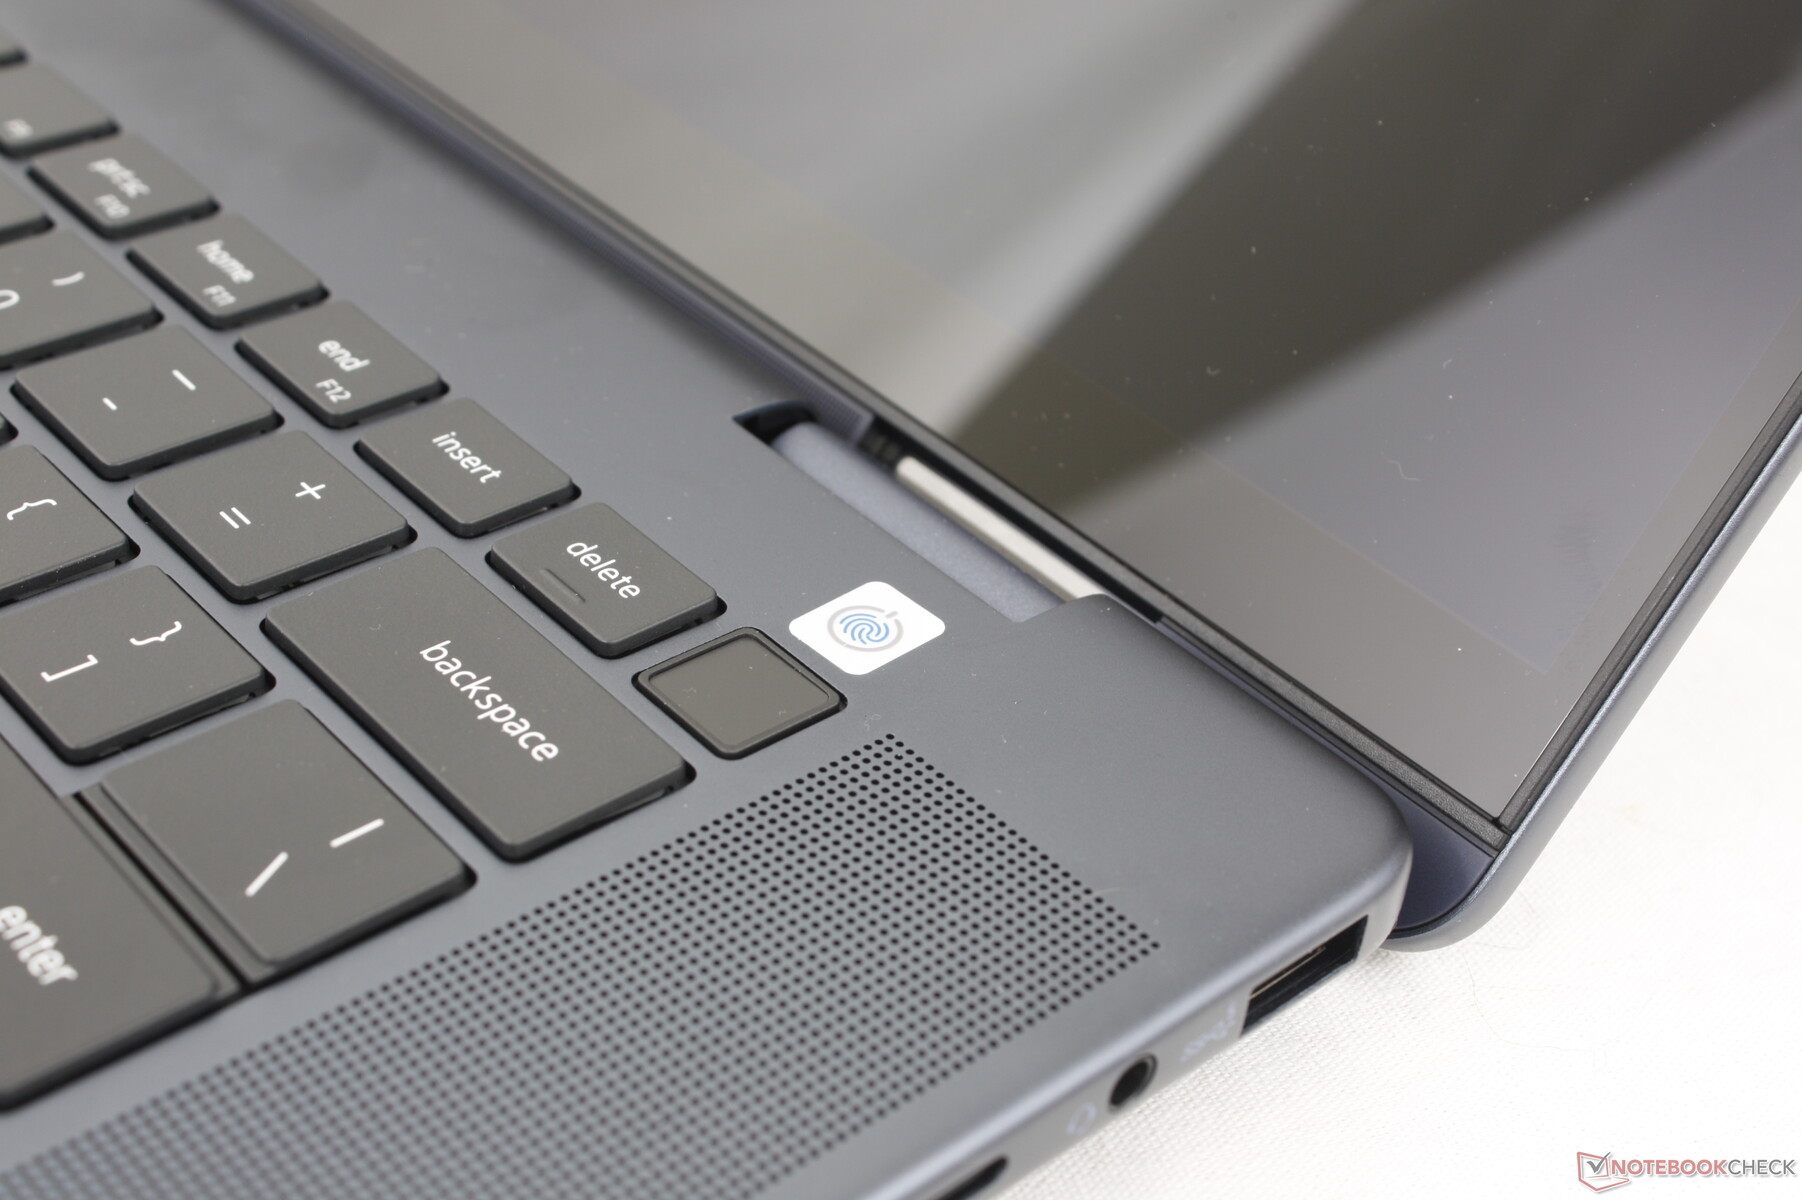
The keyboard and touchpad have not changed from the Inspiron 7630 2-in-1 series despite all the physical changes elsewhere on the chassis. There are a couple of minor differences such as the slightly smaller Power button on our newer model and the introduction of the dedicated Co-Pilot key, but everything from clickpad size (13.3 x 9 cm) and key feedback are identical to last year's model. It would've been nice to see improvements in this regard as we still find the keys and clickpad on the Inspiron to be spongier and with less satisfying feedback than the keys and clickpad on the HP Envy series.

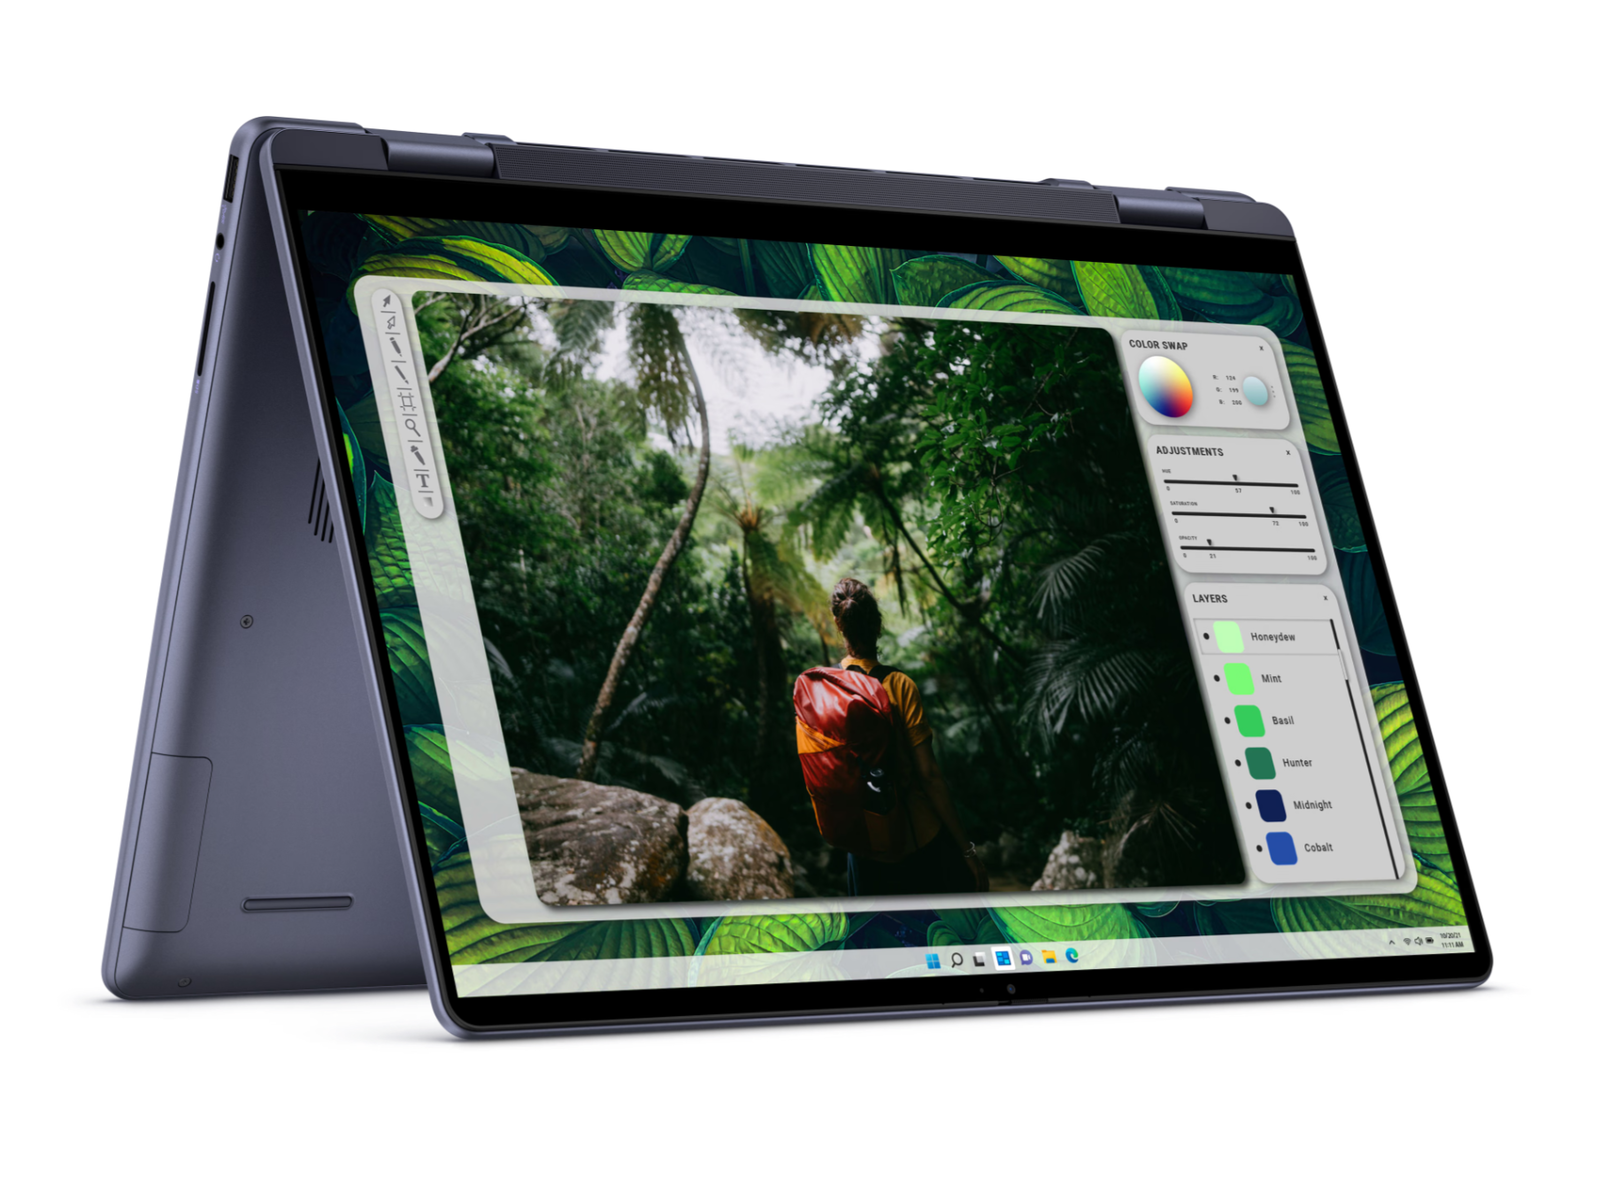
Display — 2.5K Mini-LED HDR600
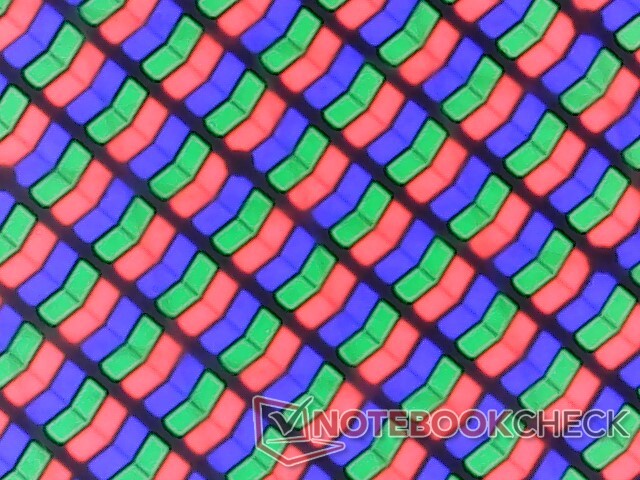
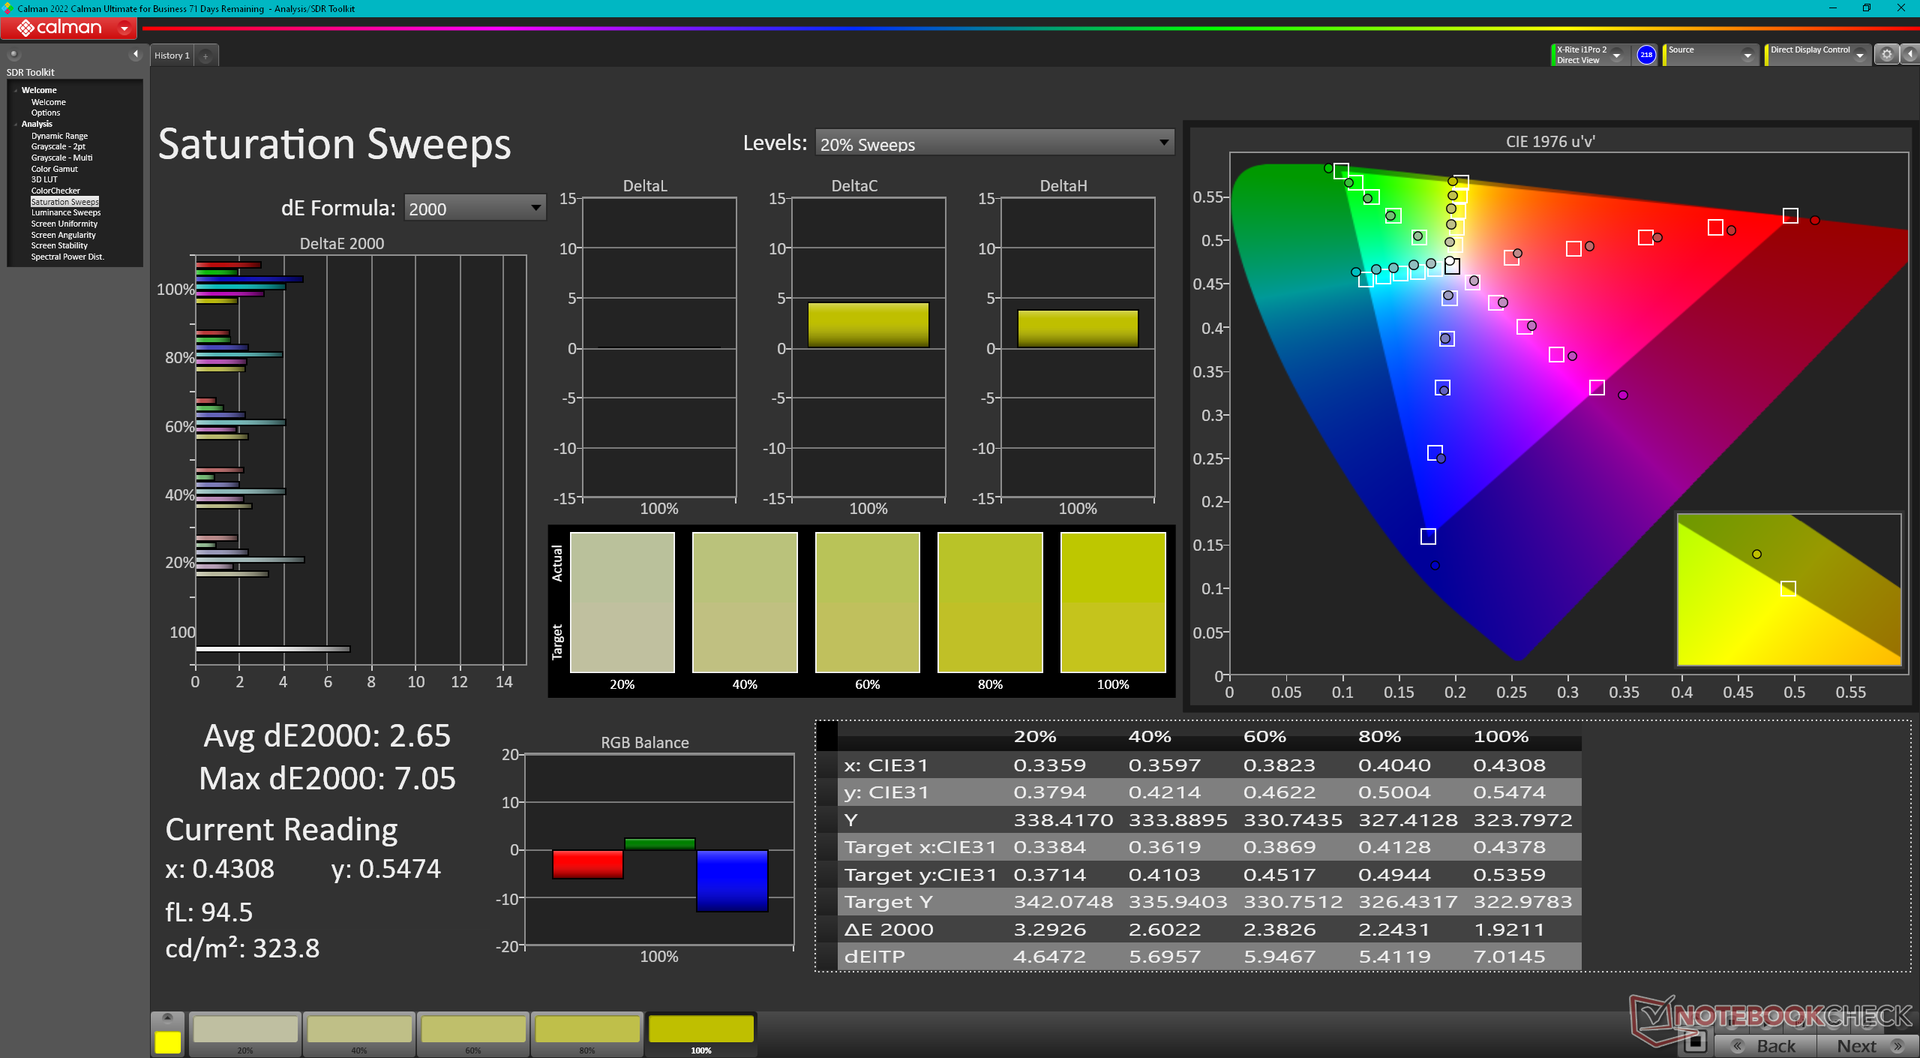
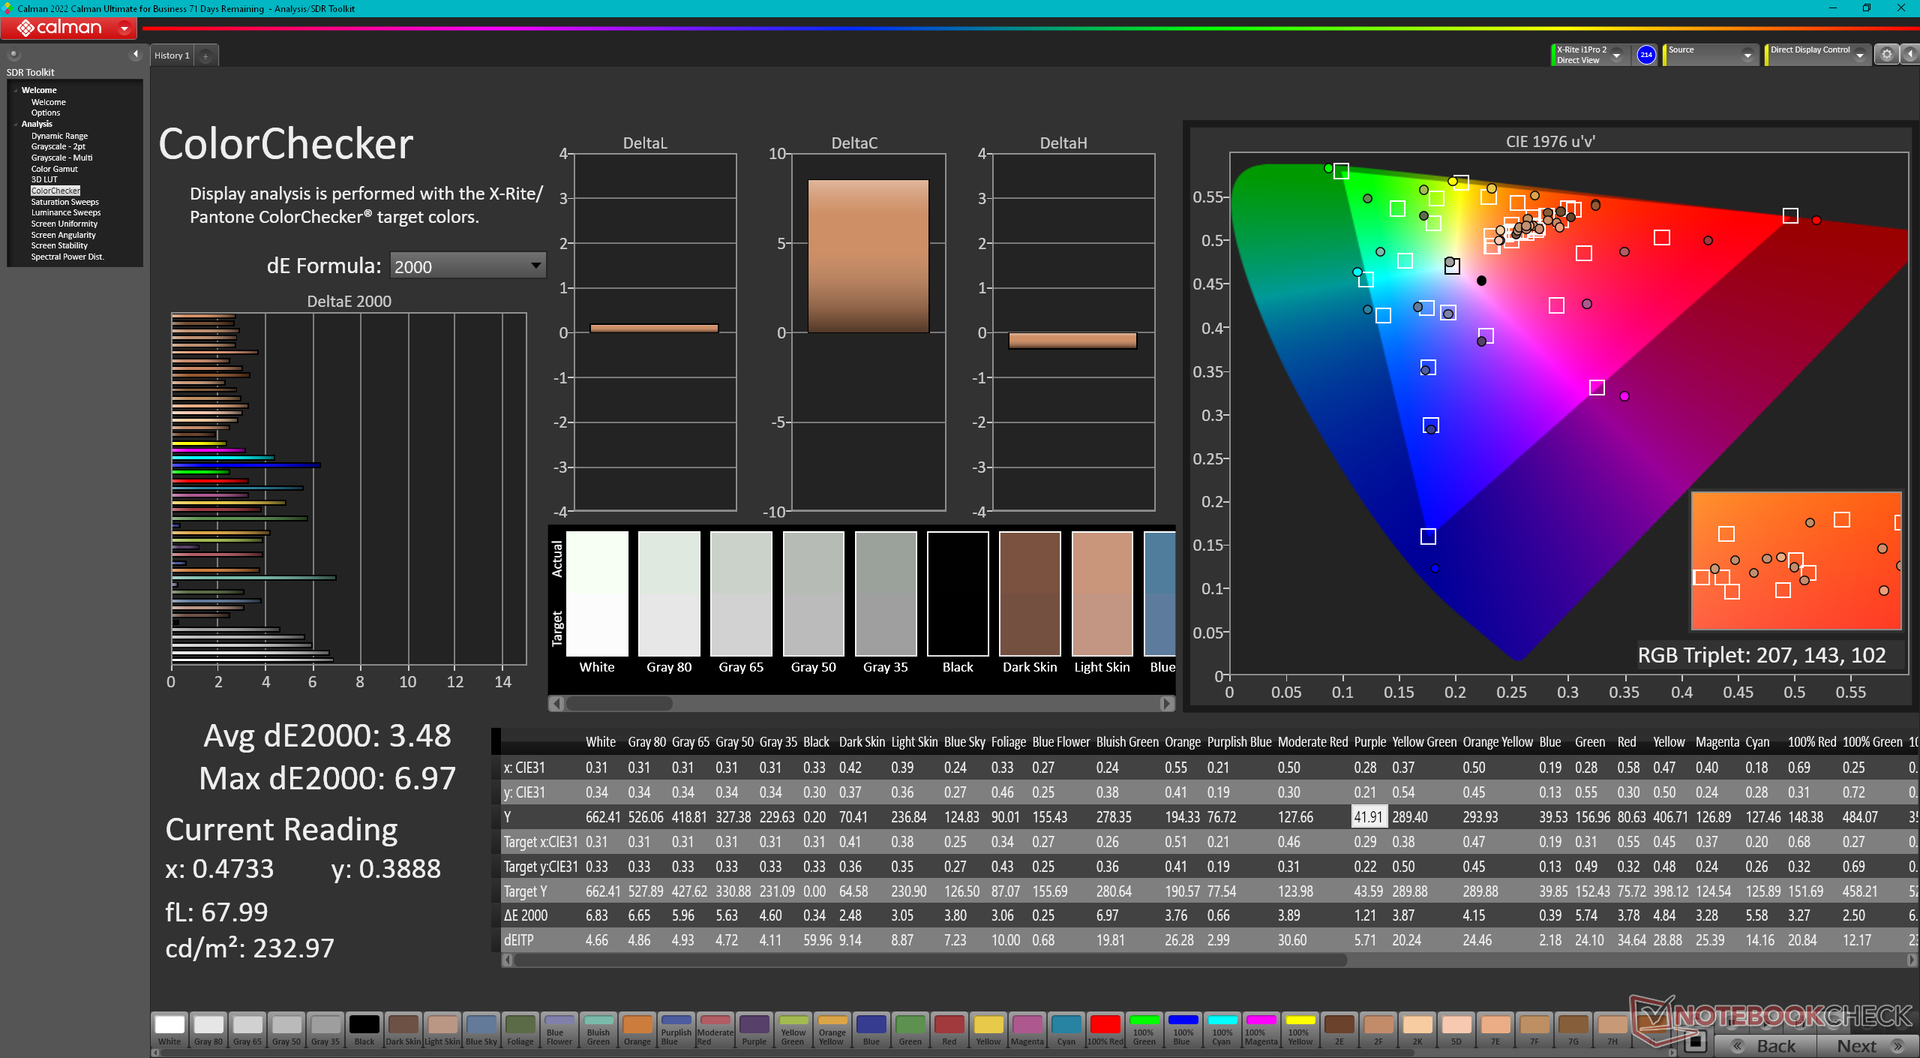
The optional Mini-LED panel is a key selling point for this year's Inspiron 16 2-in-1. While it may not offer 4K and HDR1000 like on some extreme gaming laptops, its 2.5K resolution and HDR600 support is still impressive for a 16-inch convertible retailing around $1000. Users are still getting the same excellent 3000:1 contrast ratio and full DCI-P3 colors as on most other mini-LED panels on pricier laptops.
Both colors and brightness are automatically set to sRGB and 400 nits maximum, respectively, when HDR is turned off. Enabling HDR changes the color profile to DCI-P3 while raising the maximum brightness to 663 nits when playing HDR content.
The native 90 Hz refresh rate is respectable, but the panel lacks support for adaptive sync and Windows variable refresh rate to save on energy.
| |||||||||||||||||||||||||
Brightness Distribution: 97 %
Center on Battery: 413 cd/m²
Contrast: 2950:1 (Black: 0.14 cd/m²)
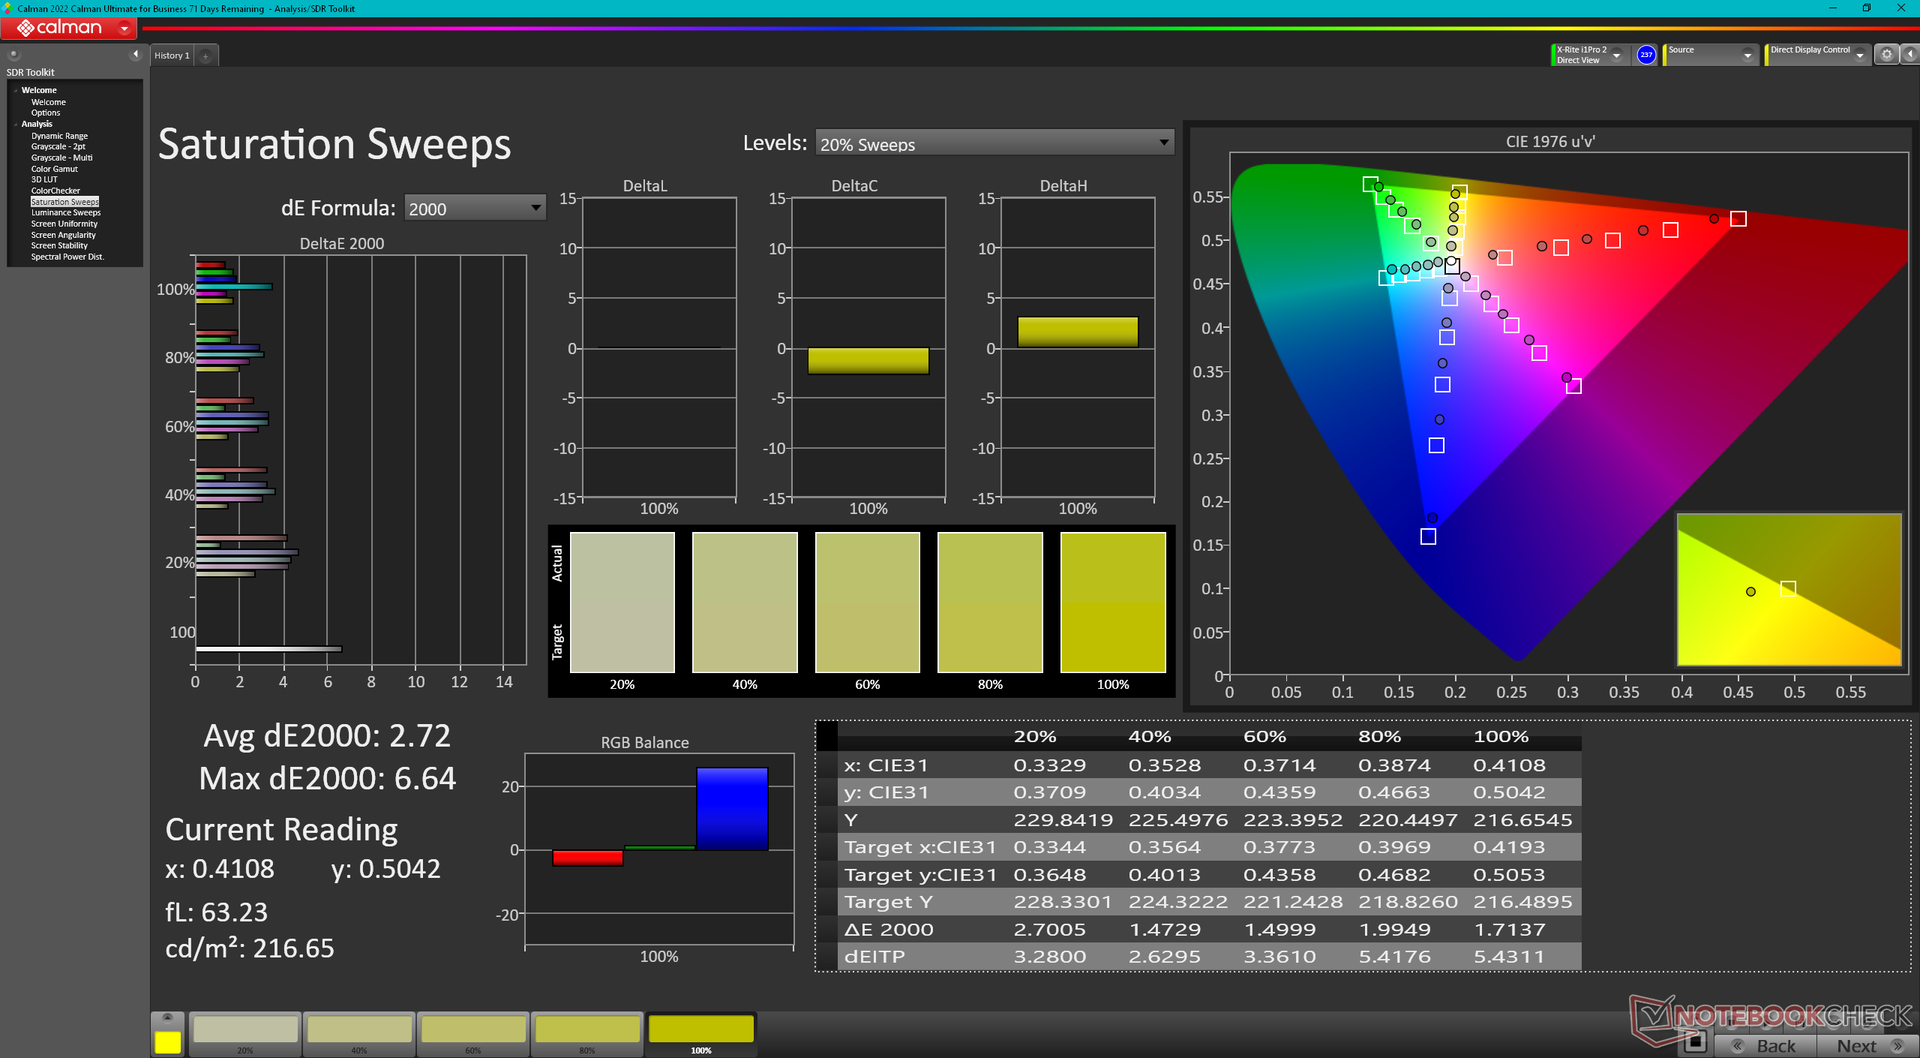
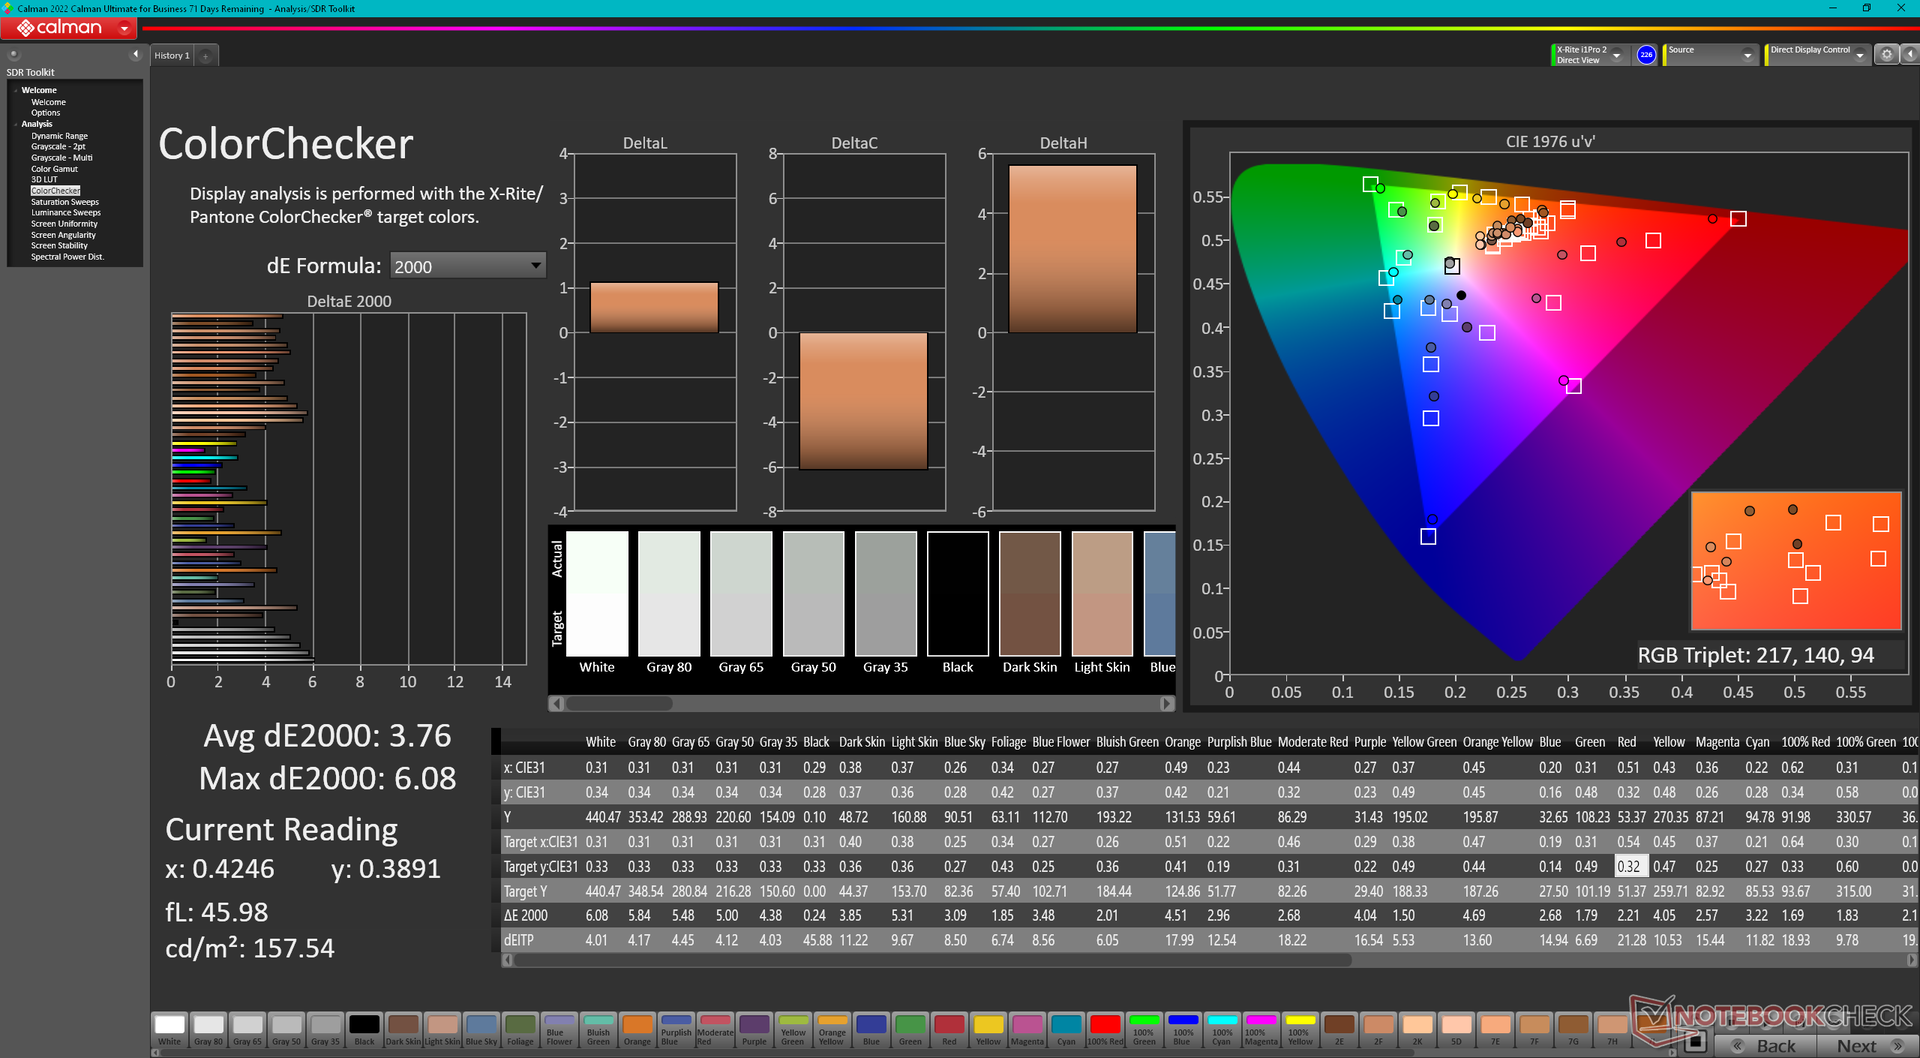
ΔE ColorChecker Calman: 3.48 | ∀{0.5-29.43 Ø4.71}
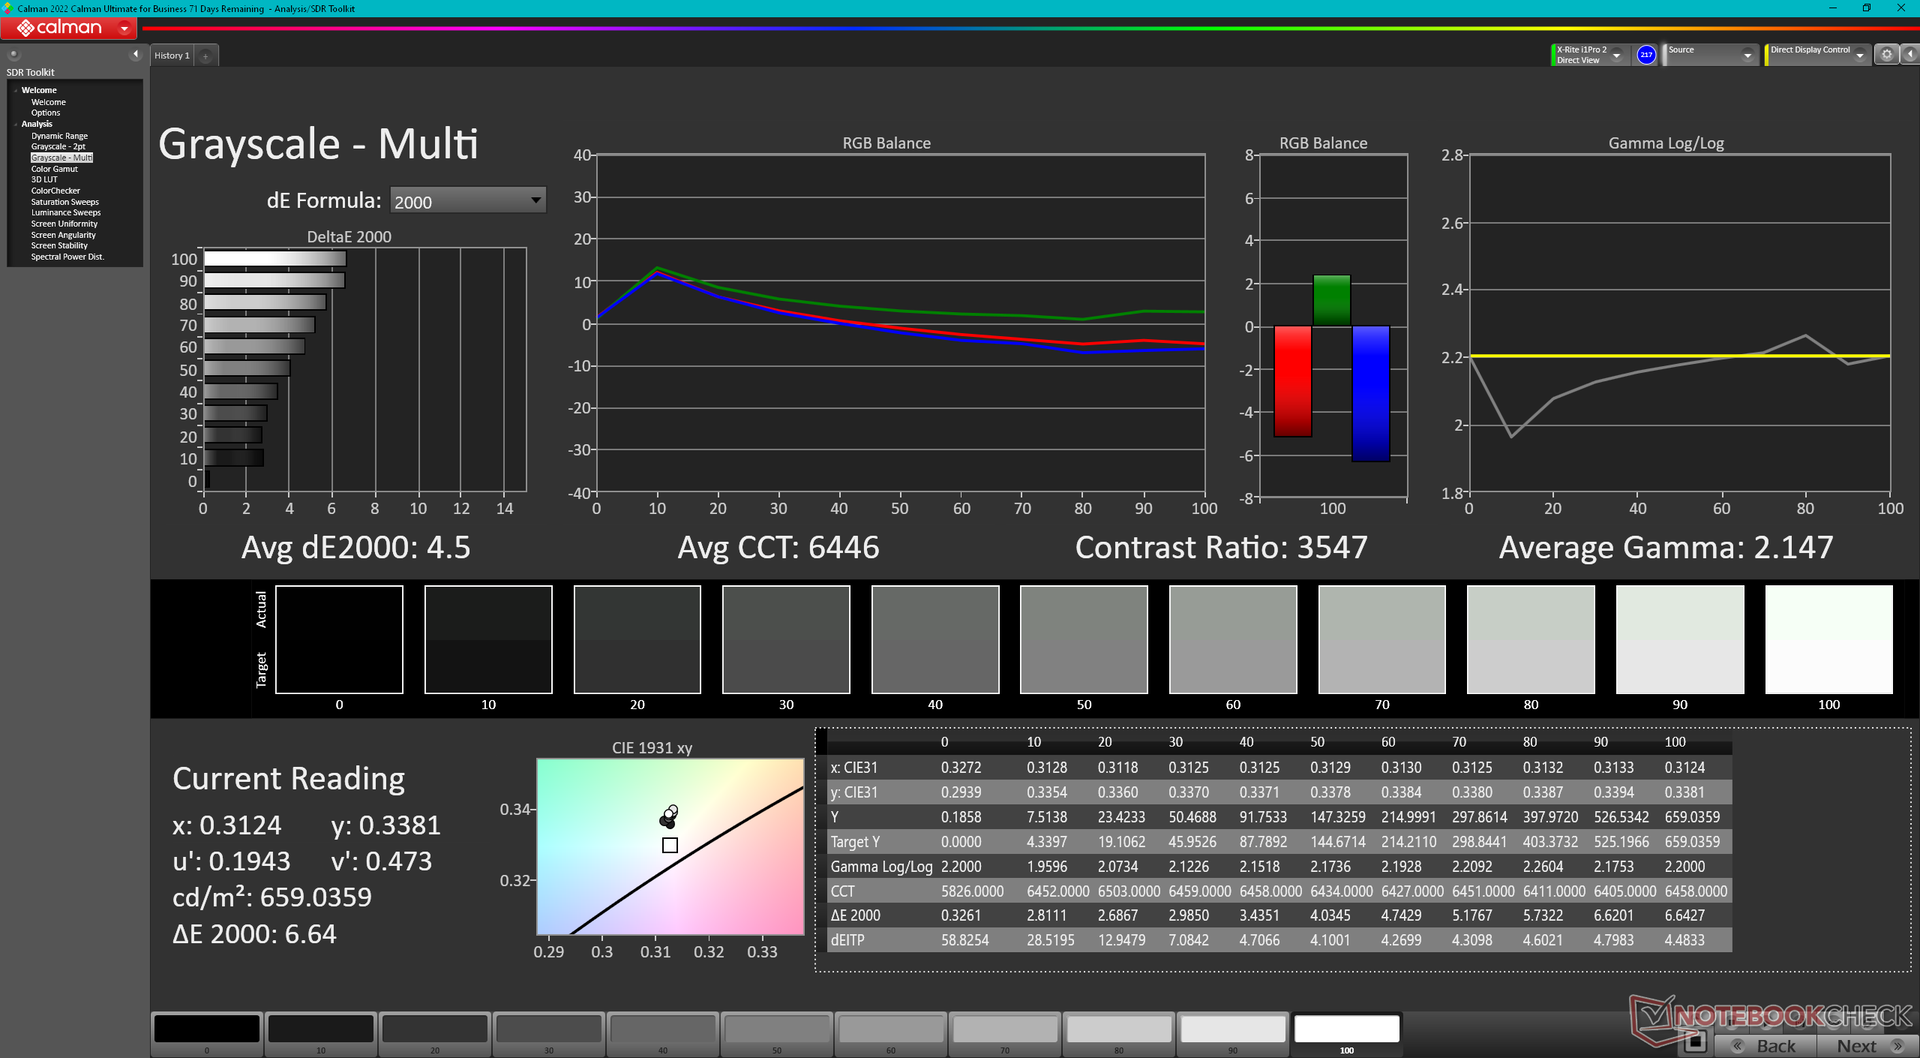
ΔE Greyscale Calman: 4.5 | ∀{0.09-98 Ø4.96}
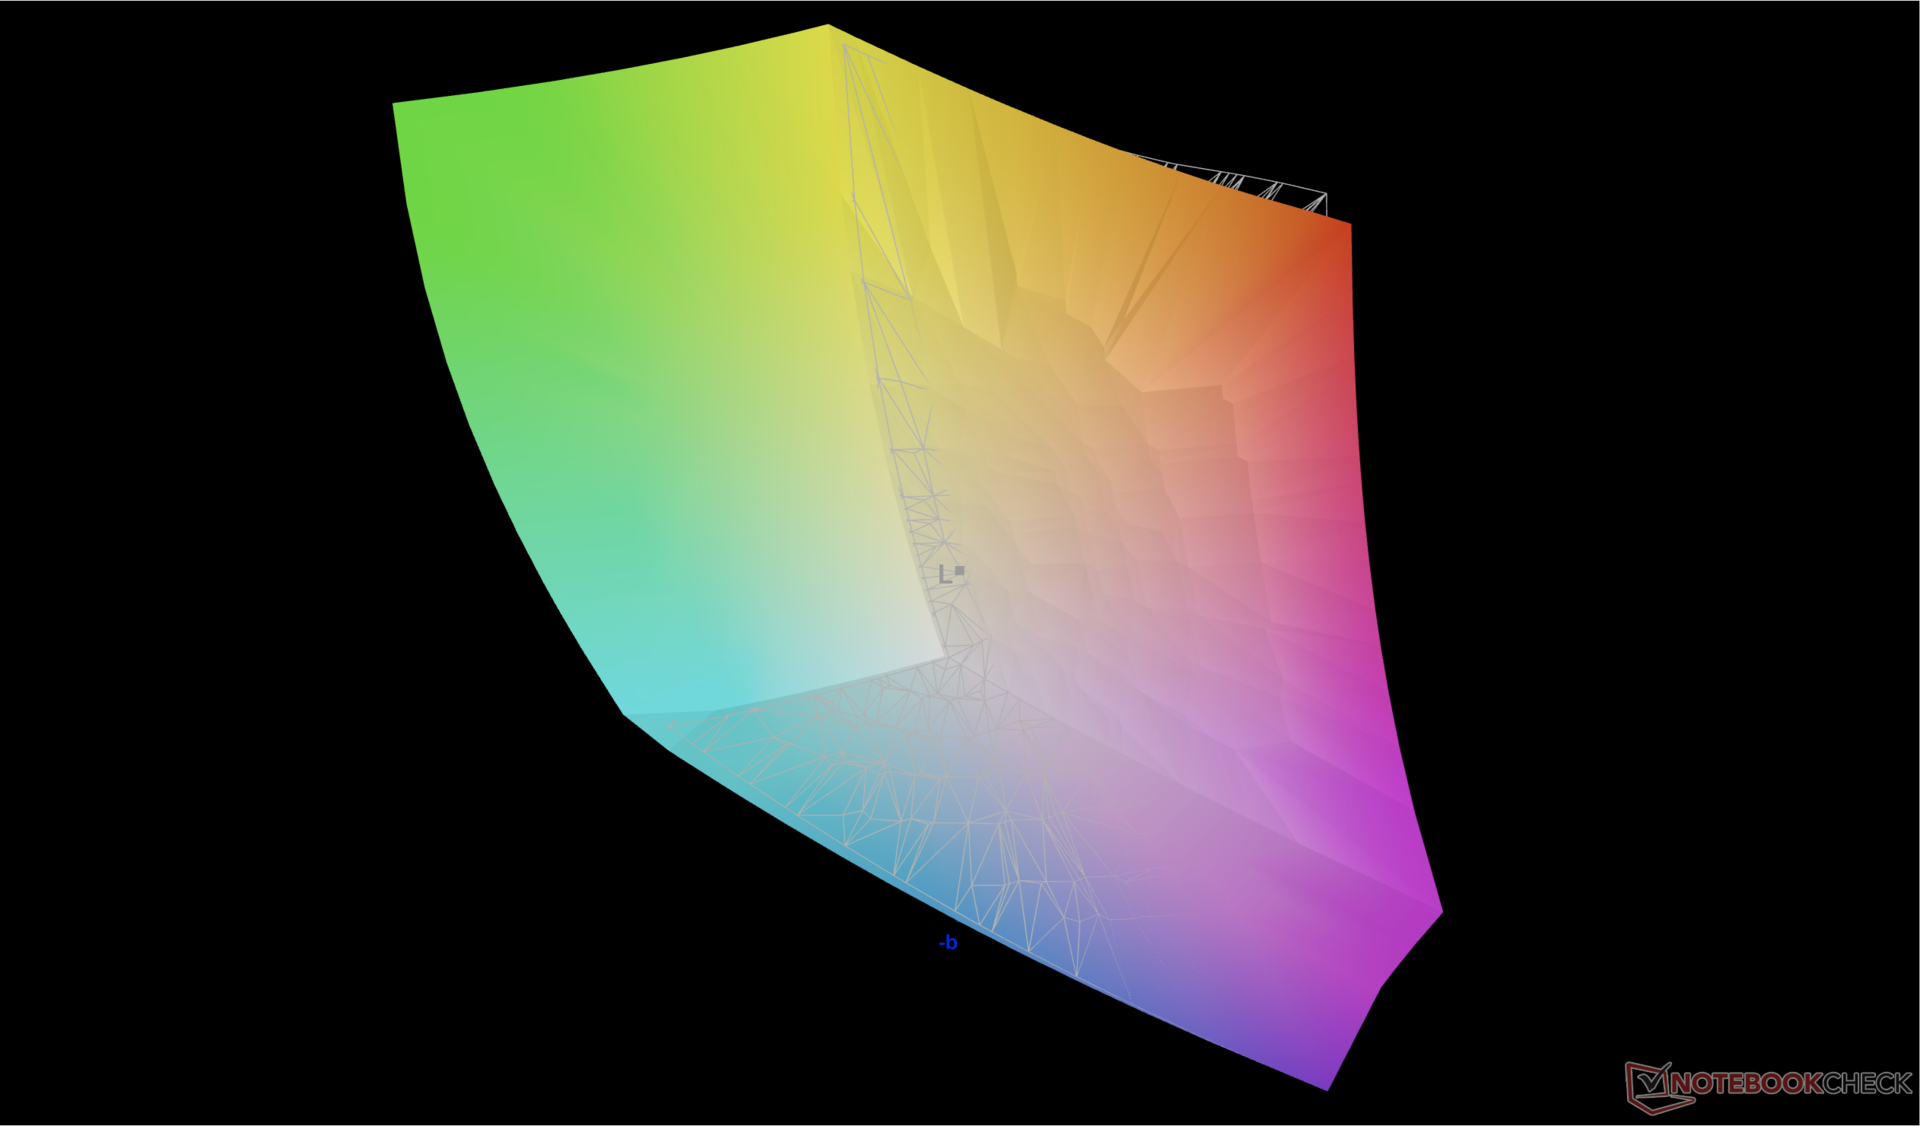
92.5% AdobeRGB 1998 (Argyll 3D)
100% sRGB (Argyll 3D)
99.4% Display P3 (Argyll 3D)
Gamma: 2.15
CCT: 6446 K
| Dell Inspiron 16 7640 2-in-1 AU Optronics B160QAT, Mini-LED, 2560x1600, 16", 90 Hz | Dell Inspiron 16 Plus 7640 AU Optronics B160QAN, IPS, 2560x1600, 16", 120 Hz | Dell Inspiron 16 7635 2-in-1 Chi Mei 160JCA, IPS, 1920x1200, 16", 60 Hz | HP Envy x360 2-in-1 16-ad0097nr Samsung SDC41A6, OLED, 2880x1800, 16", 120 Hz | Lenovo IdeaPad Pro 5 16IMH G9 NE160QDM-NY2, IPS, 2560x1600, 16", 120 Hz | Samsung Galaxy Book4 Pro 360 ATNA60CL09-0, OLED, 2880x1800, 16", 120 Hz | |
|---|---|---|---|---|---|---|
| Display | -14% | -20% | 1% | -23% | 2% | |
| Display P3 Coverage (%) | 99.4 | 76 -24% | 67.4 -32% | 99.6 0% | 63.3 -36% | 99.9 1% |
| sRGB Coverage (%) | 100 | 99.8 0% | 98.2 -2% | 100 0% | 95.2 -5% | 100 0% |
| AdobeRGB 1998 Coverage (%) | 92.5 | 76.7 -17% | 69.5 -25% | 96.5 4% | 65.3 -29% | 96.6 4% |
| Response Times | 3% | -5% | 97% | 43% | 98% | |
| Response Time Grey 50% / Grey 80% * (ms) | 15.4 ? | 25.6 ? -66% | 27.6 ? -79% | 0.8 ? 95% | 15 ? 3% | 0.49 ? 97% |
| Response Time Black / White * (ms) | 60.6 ? | 17.6 ? 71% | 18.2 ? 70% | 0.89 ? 99% | 10.3 ? 83% | 0.67 ? 99% |
| PWM Frequency (Hz) | 2753.7 ? | 491.8 ? | 240 ? | |||
| Screen | -5% | -25% | 10% | -21% | 33% | |
| Brightness middle (cd/m²) | 413 | 314.7 -24% | 301.3 -27% | 399.4 -3% | 368 -11% | 387 -6% |
| Brightness (cd/m²) | 409 | 291 -29% | 269 -34% | 405 -1% | 368 -10% | 392 -4% |
| Brightness Distribution (%) | 97 | 89 -8% | 79 -19% | 98 1% | 91 -6% | 98 1% |
| Black Level * (cd/m²) | 0.14 | 0.28 -100% | 0.28 -100% | 0.31 -121% | ||
| Contrast (:1) | 2950 | 1124 -62% | 1076 -64% | 1187 -60% | ||
| Colorchecker dE 2000 * | 3.48 | 1.62 53% | 3.1 11% | 4.05 -16% | 2.4 31% | 1 71% |
| Colorchecker dE 2000 max. * | 6.97 | 2.94 58% | 5.5 21% | 6.69 4% | 6.5 7% | 1.9 73% |
| Greyscale dE 2000 * | 4.5 | 1.3 71% | 3.9 13% | 1.1 76% | 4.5 -0% | 1.7 62% |
| Gamma | 2.15 102% | 2.26 97% | 2.19 100% | 2.27 97% | 2.21 100% | 2.25 98% |
| CCT | 6446 101% | 6385 102% | 6186 105% | 6419 101% | 6324 103% | 6325 103% |
| Colorchecker dE 2000 calibrated * | 1.08 | 0.49 | 1.02 | 0.8 | ||
| Total Average (Program / Settings) | -5% /
-6% | -17% /
-21% | 36% /
24% | -0% /
-12% | 44% /
36% |
* ... smaller is better
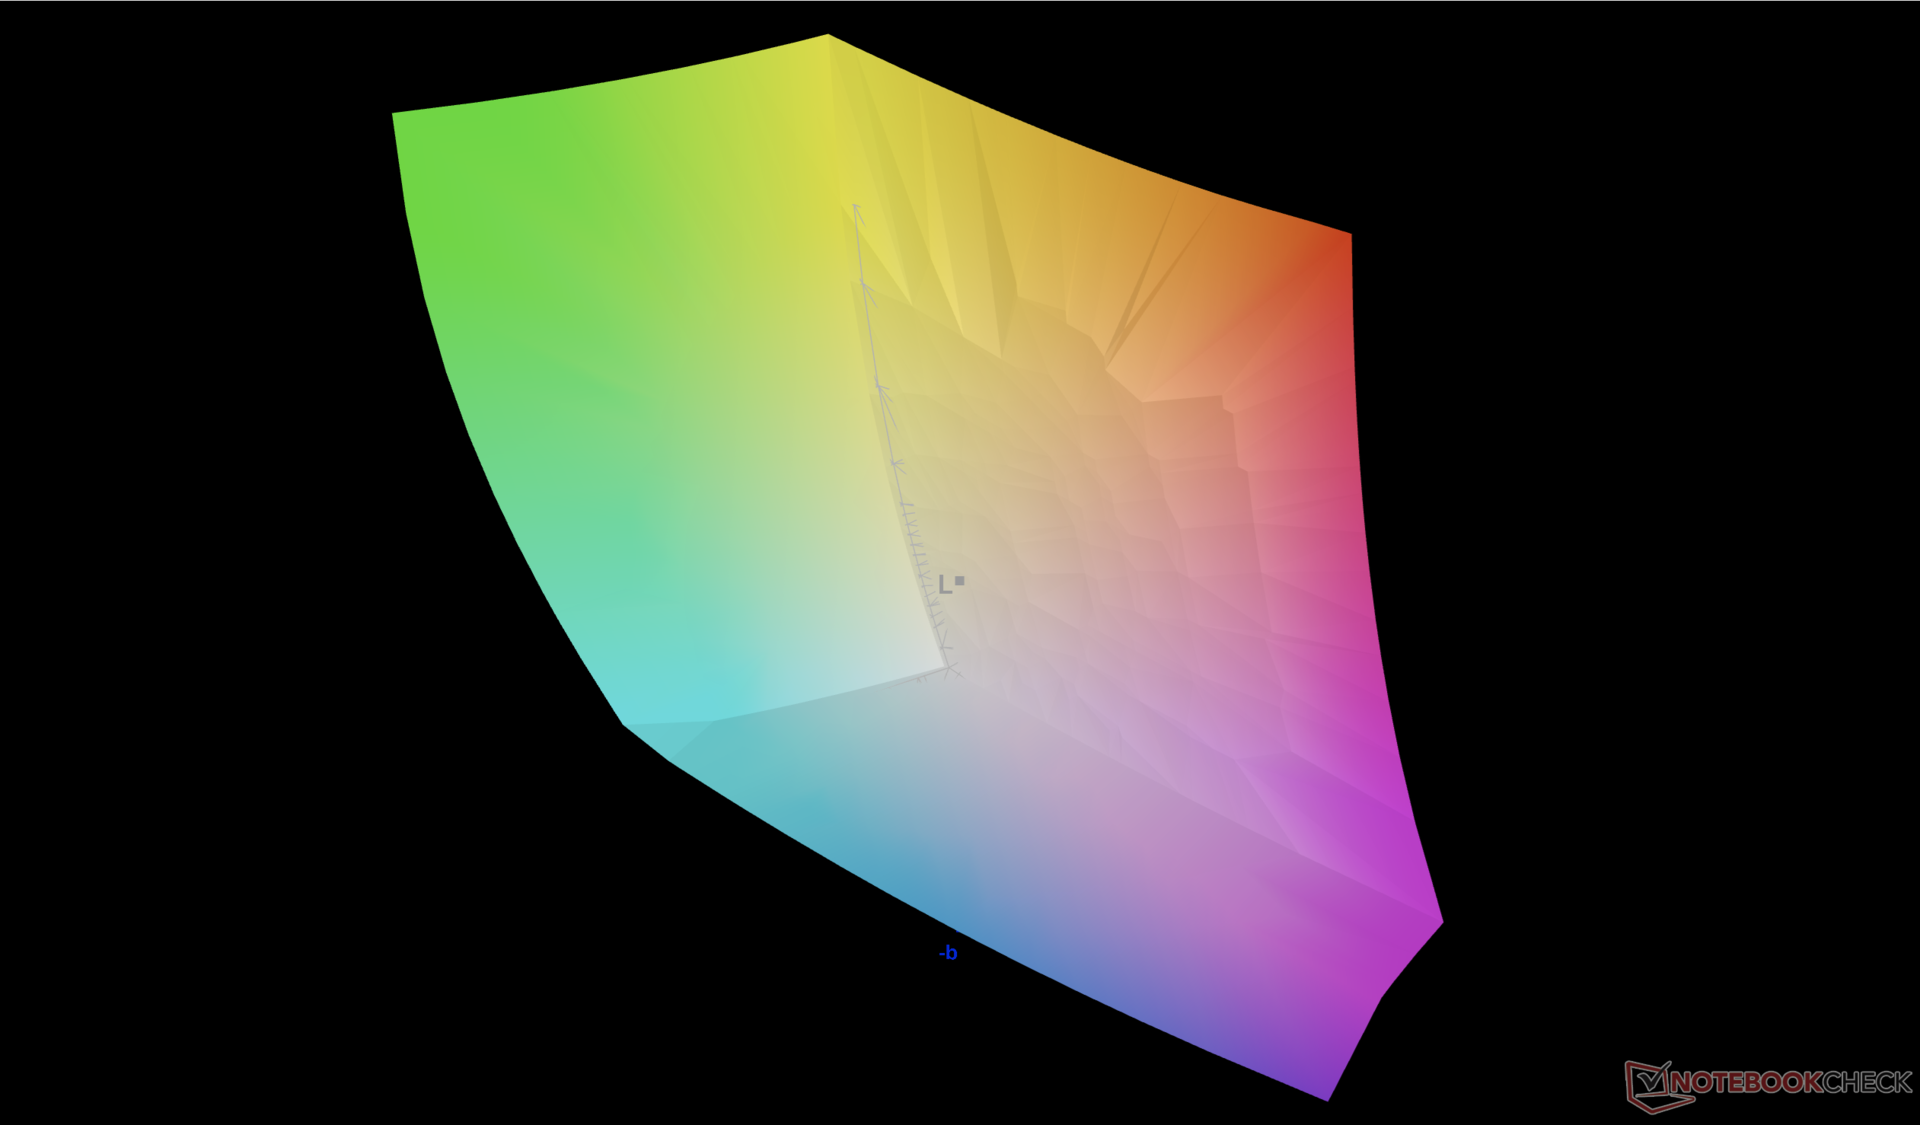
The display is reasonably accurate for a midrange PC with average grayscale and color DeltaE values of 4.2 and 3.76, respectively. These values would remain relatively steady when HDR is enabled as well wich automatically switches the system to DCI-P3 colors. In either case, color temperature is slightly too cool around 6500K.

Display Response Times
| ↔ Response Time Black to White | ||
|---|---|---|
| 60.6 ms ... rise ↗ and fall ↘ combined | ↗ 56.2 ms rise | 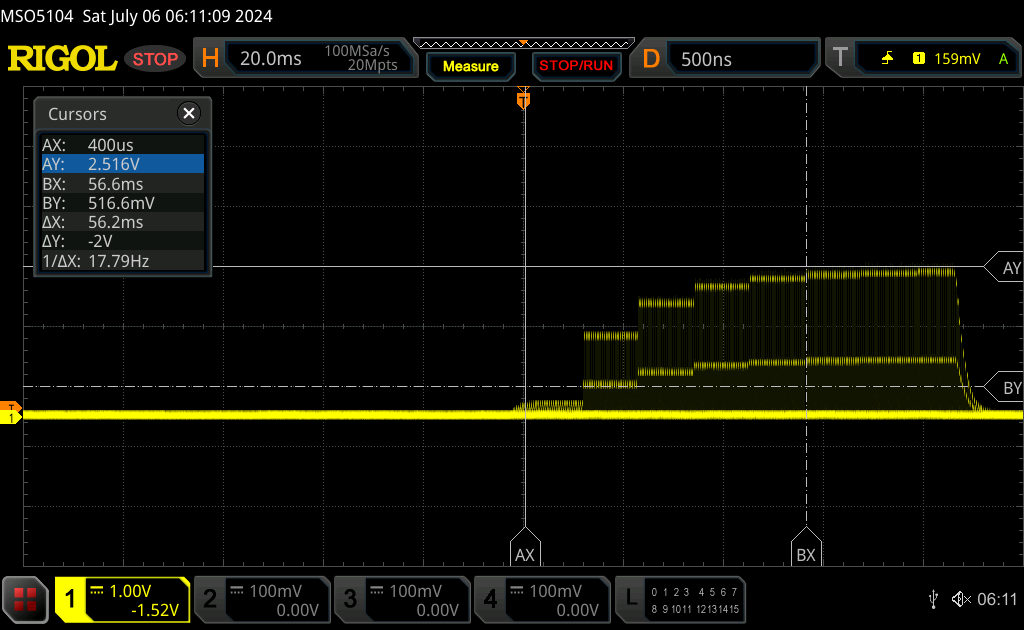 |
| ↘ 4.4 ms fall | ||
| The screen shows slow response rates in our tests and will be unsatisfactory for gamers. In comparison, all tested devices range from 0.1 (minimum) to 240 (maximum) ms. » 100 % of all devices are better. This means that the measured response time is worse than the average of all tested devices (19.8 ms). | ||
| ↔ Response Time 50% Grey to 80% Grey | ||
| 15.4 ms ... rise ↗ and fall ↘ combined | ↗ 8.6 ms rise | 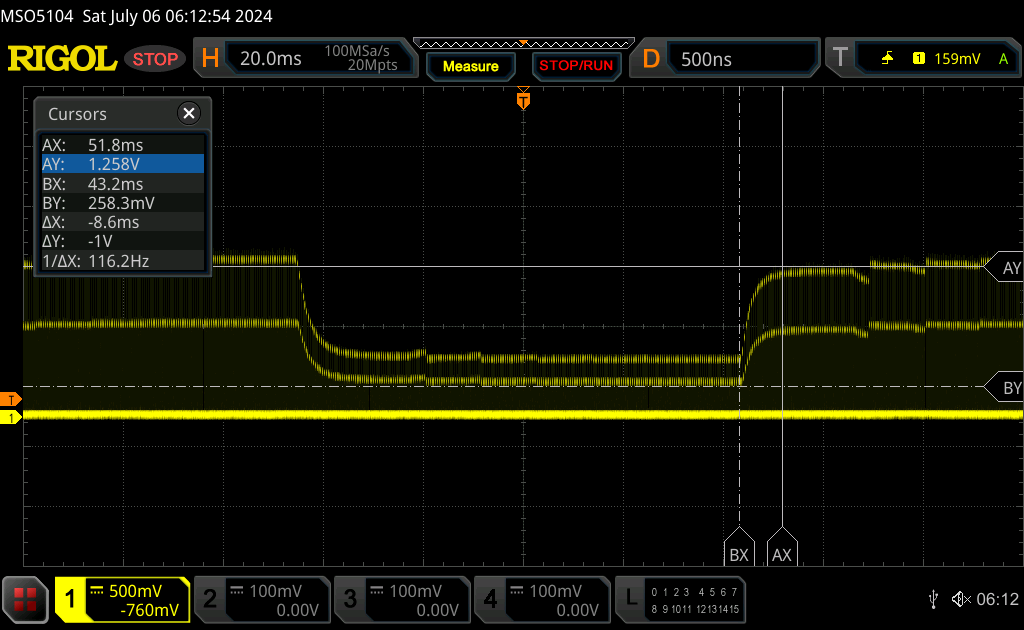 |
| ↘ 6.8 ms fall | ||
| The screen shows good response rates in our tests, but may be too slow for competitive gamers. In comparison, all tested devices range from 0.165 (minimum) to 636 (maximum) ms. » 30 % of all devices are better. This means that the measured response time is better than the average of all tested devices (31 ms). | ||
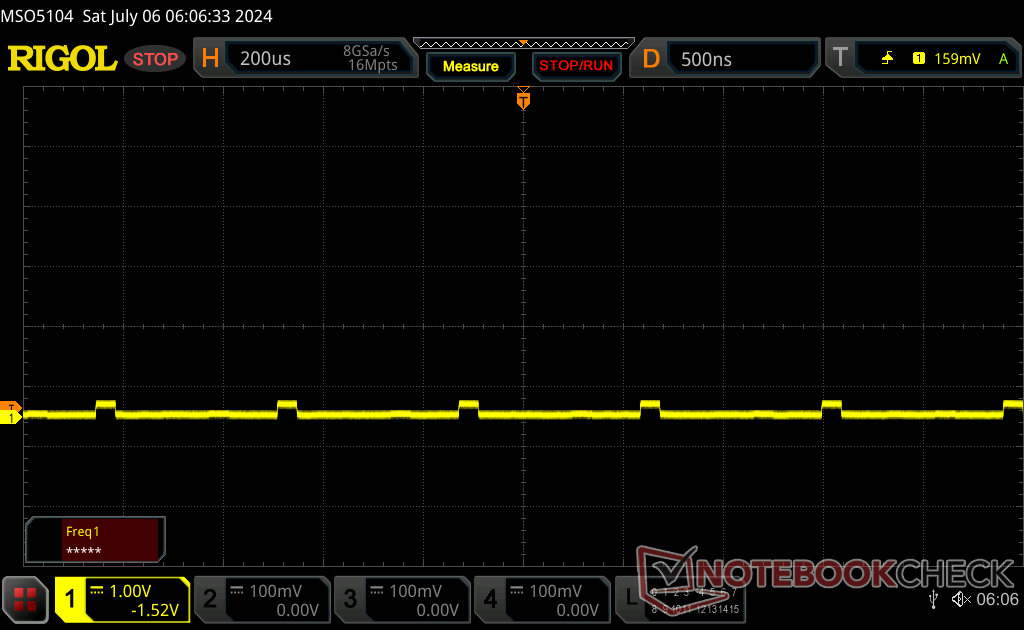
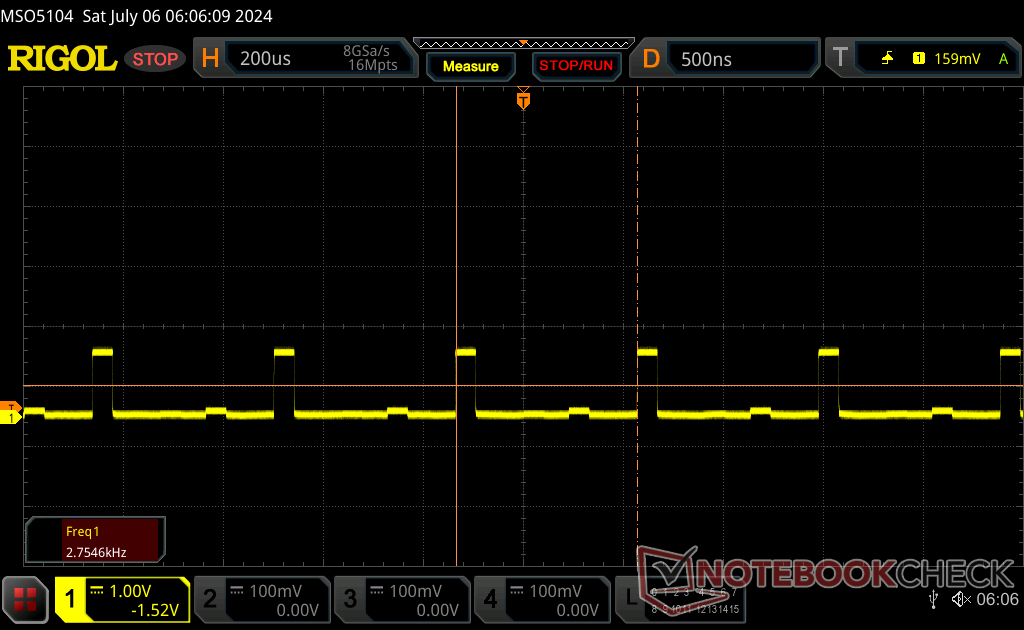
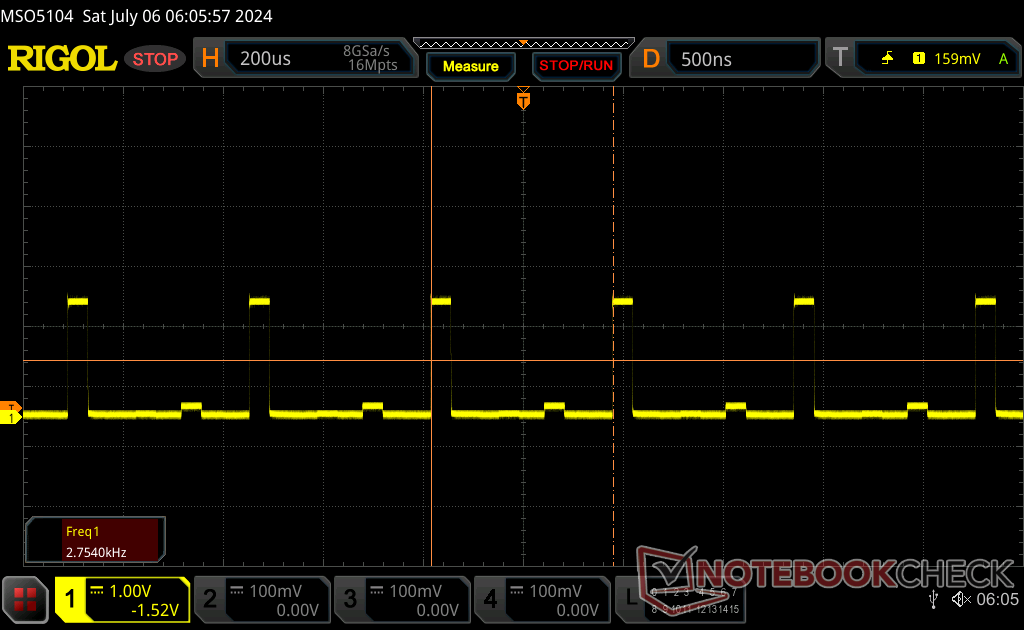
Screen Flickering / PWM (Pulse-Width Modulation)
| Screen flickering / PWM detected | 2753.7 Hz | ≤ 100 % brightness setting | 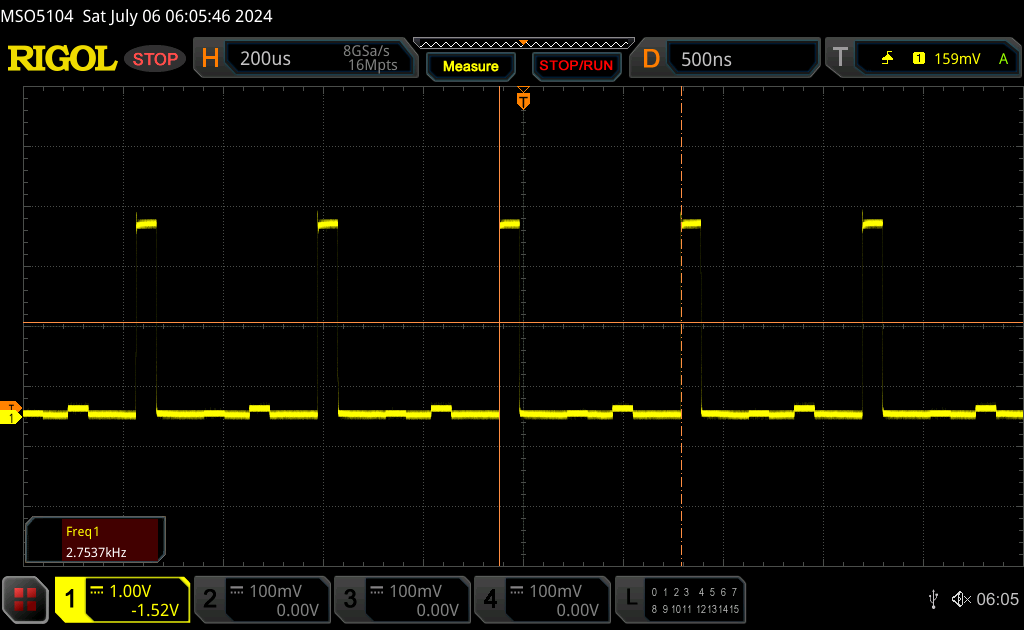 |
The display backlight flickers at 2753.7 Hz (worst case, e.g., utilizing PWM) Flickering detected at a brightness setting of 100 % and below. There should be no flickering or PWM above this brightness setting. The frequency of 2753.7 Hz is quite high, so most users sensitive to PWM should not notice any flickering. In comparison: 52 % of all tested devices do not use PWM to dim the display. If PWM was detected, an average of 7747 (minimum: 5 - maximum: 343500) Hz was measured. | |||
Pulse-width modulation or flickering is present on all brightness levels at a constant frequency of 2753 Hz. This behavior is to be expected from a mini-LED panel and the frequency is thankfully fast enough to be unnoticeable to most viewers.

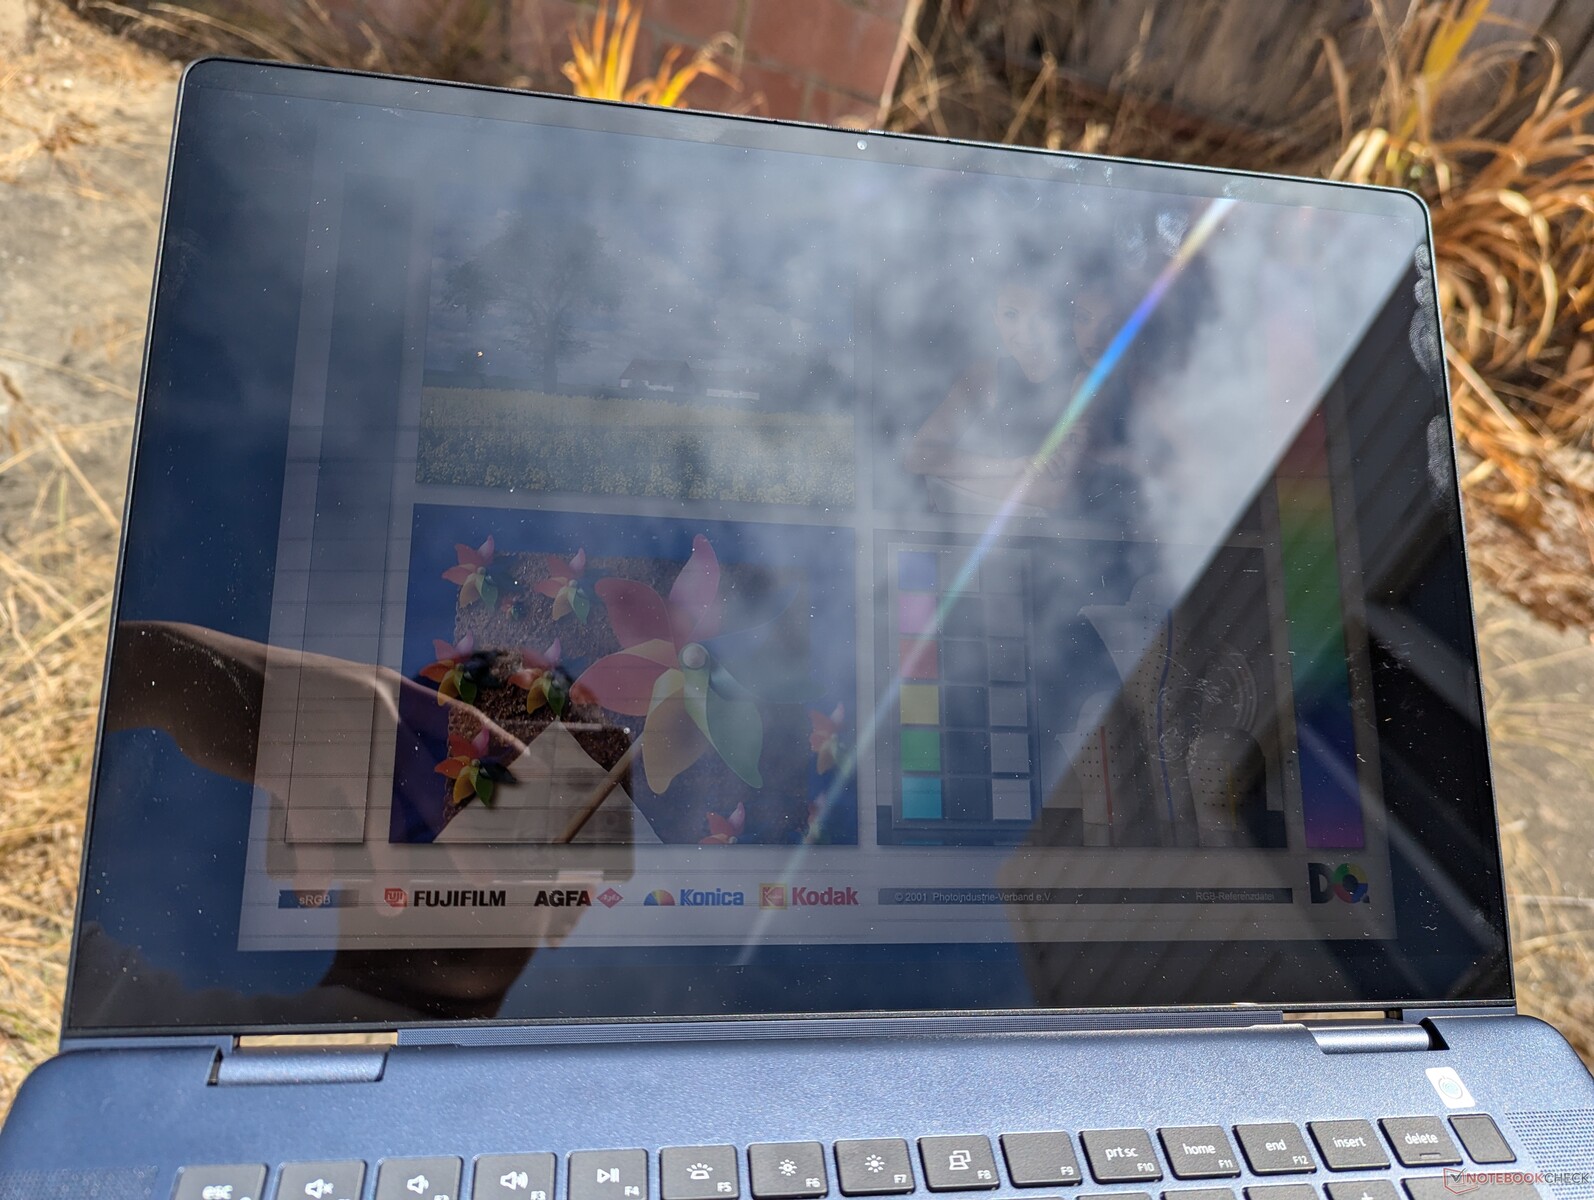
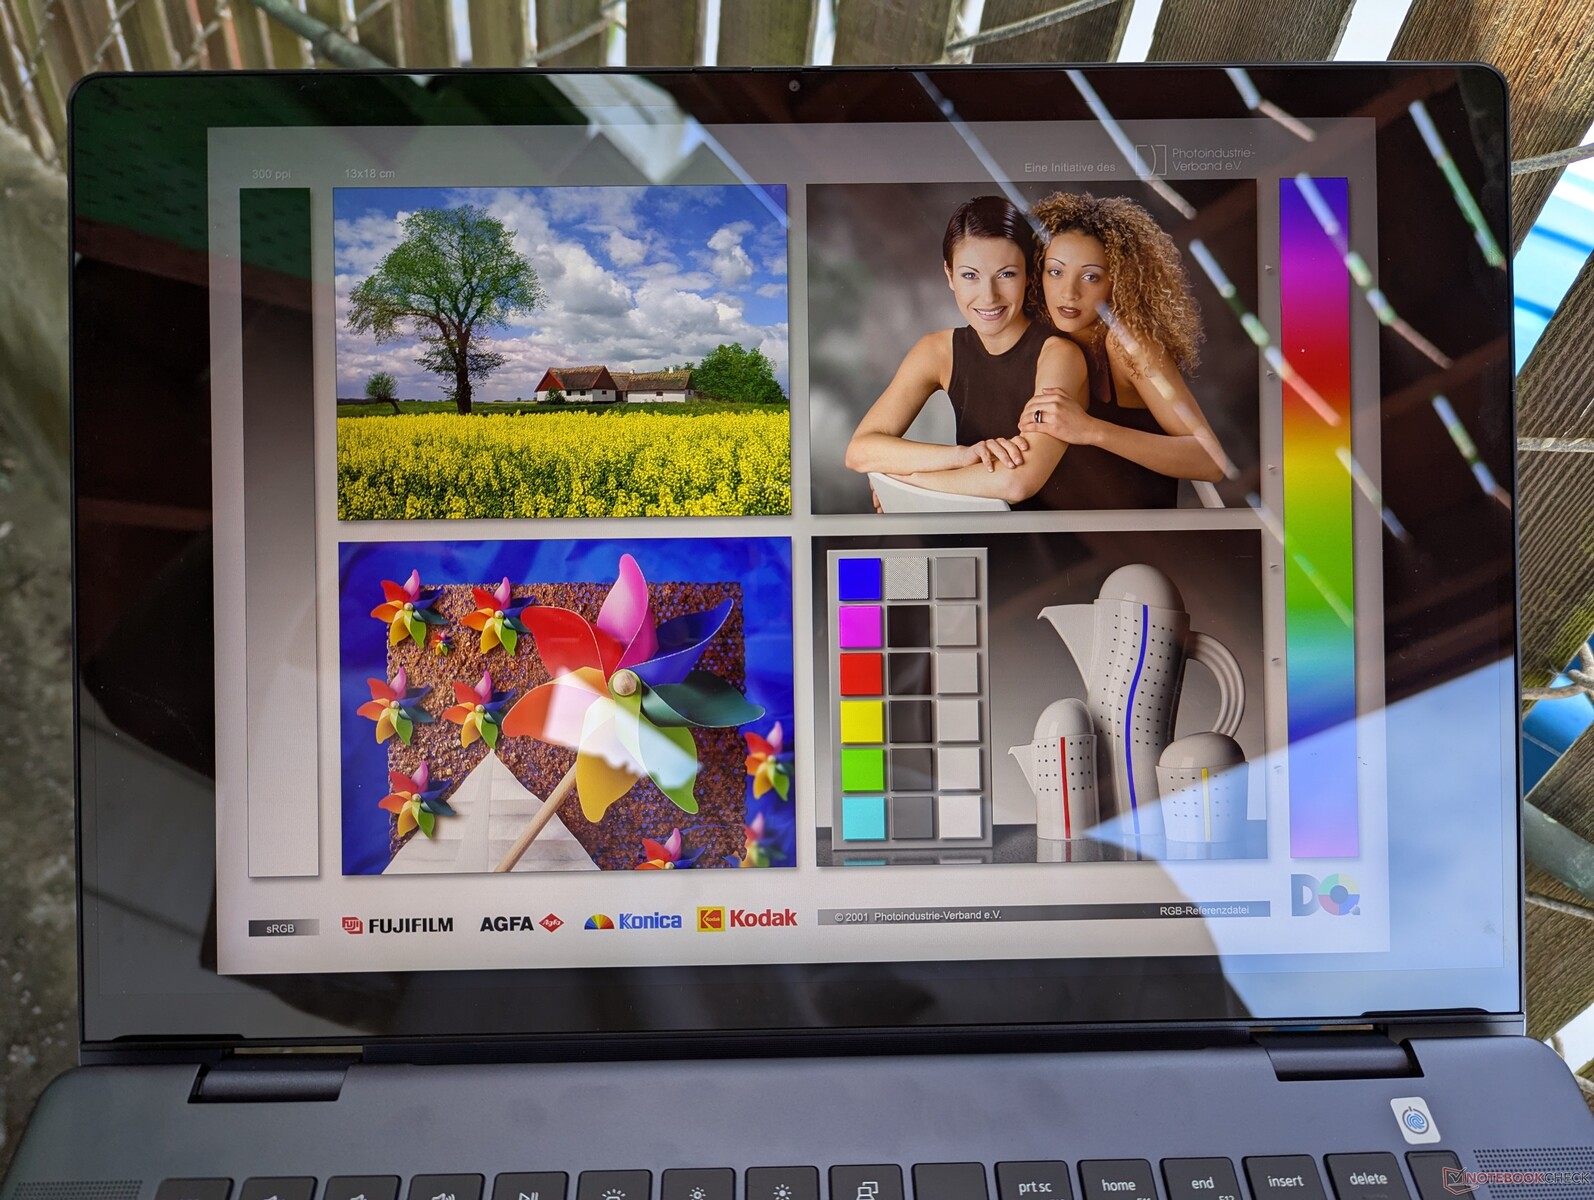
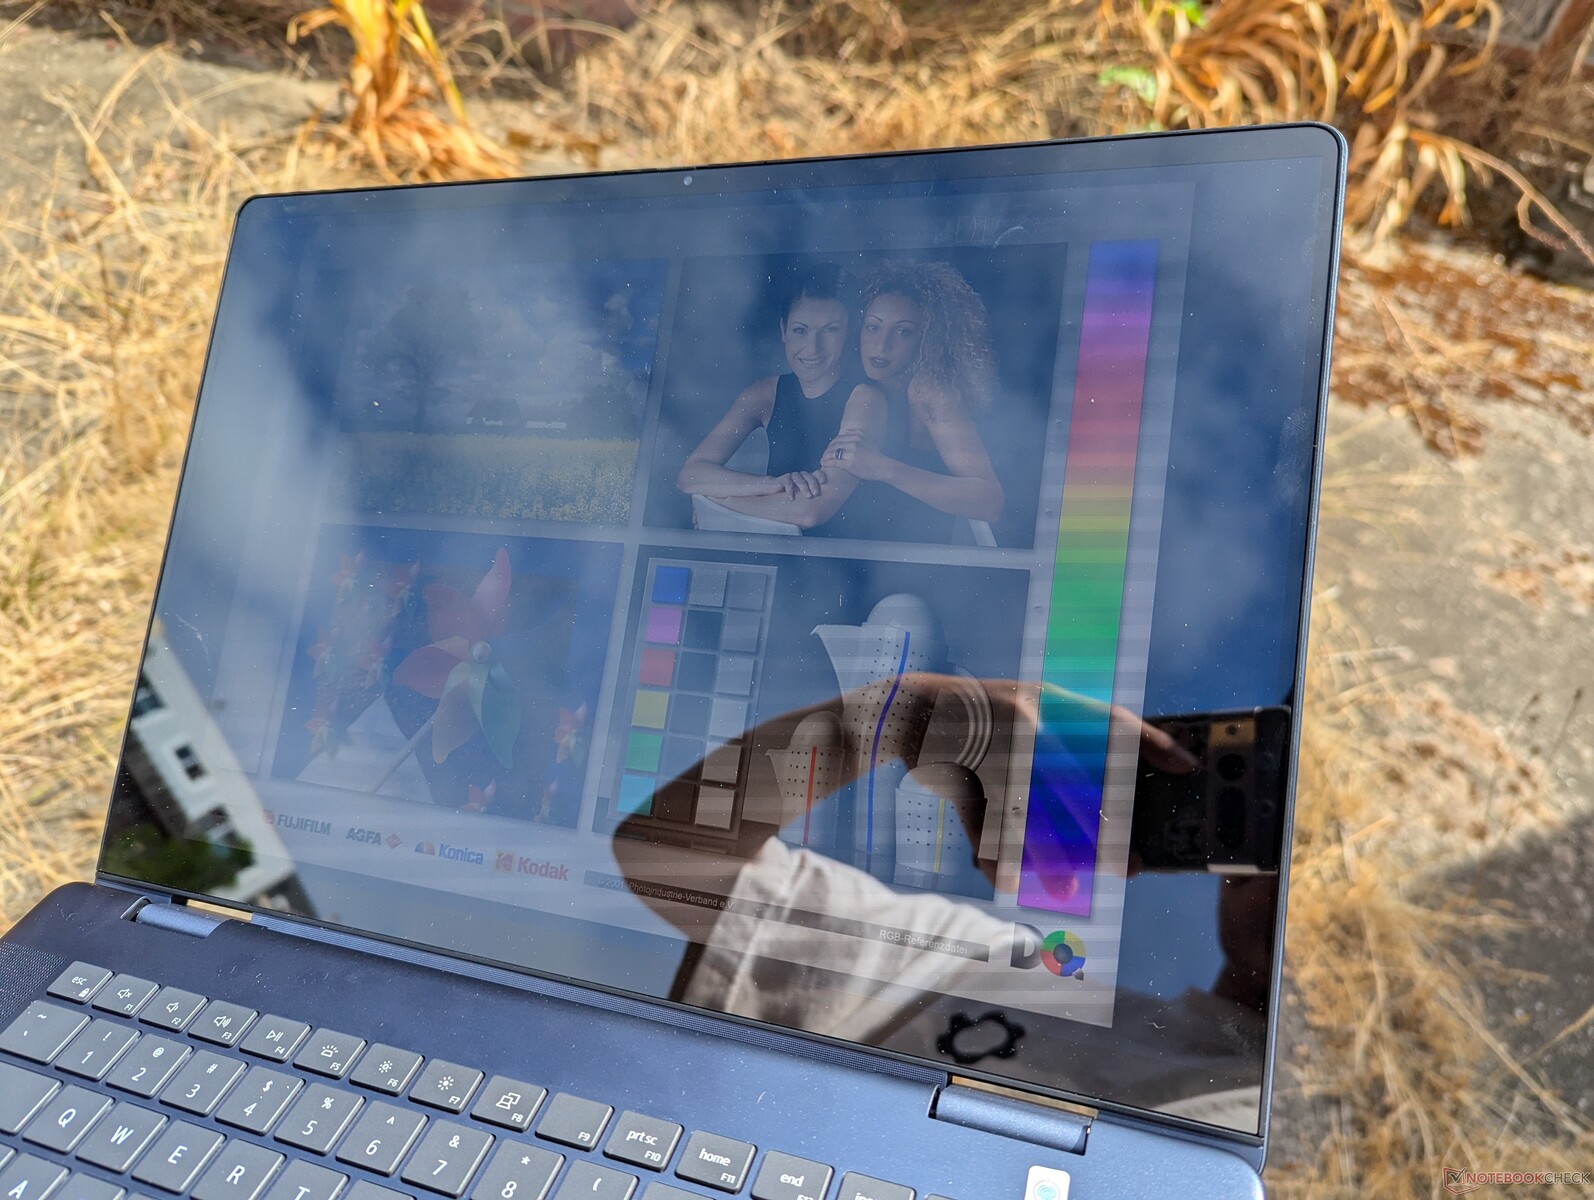
At 400 nits in SDR mode or 600 nits in HDR mode, the screen is brighter than both the base IPS option and OLED option on the outgoing model. The Inspiron 16 2-in-1 is nonetheless still not bright enough for outdoor conditions where glare quickly becomes a problem. You might think that enabling HDR can alleviate the issue as it raises the brightness ceiling, but keep in mind that Windows HDR mode is not available on battery power.
Performance — Fast For A Convertible
Testing Conditions
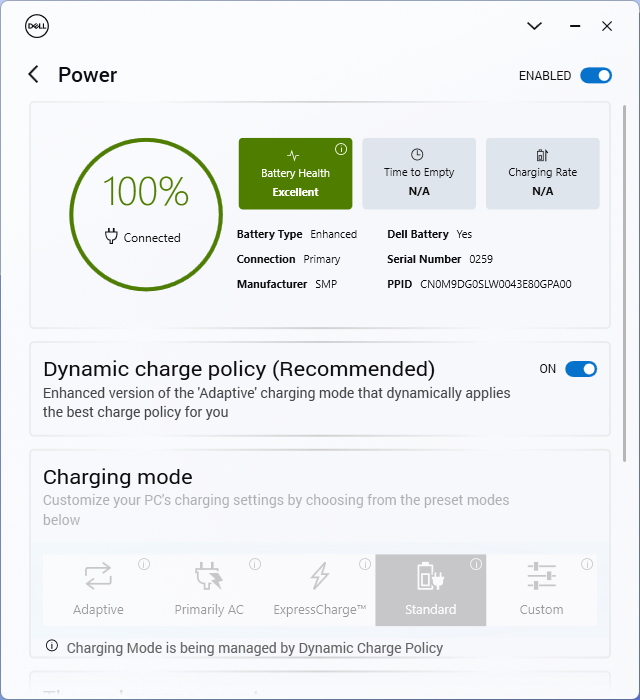
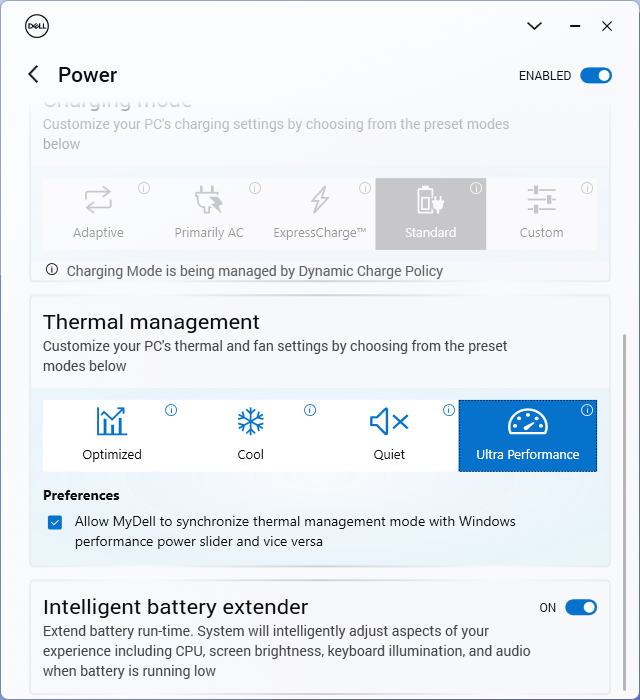
We set MyDell to Performance mode prior to running the benchmarks below. The software has a handy toggle to sync the Dell power profiles with the Windows power profiles to make switching between power settings a simpler process.
Processor
Having a Core H-series CPU in a convertible form factor can sometimes be concerning as the manufacturer may underclock its performance. Thankfully, this does not appear to be the case for the Inspiron 16 7640 2-in-1 as its Core Ultra 7 155H would perform within 5 percent of the average PC in our database equipped with the same processor. This makes the Dell model one of the fastest convertibles in the 16-inch size category beating out high-performance options like the Ryzen 7 8840HS in the HP Envy x360 16 2-in-1. It's also worth noting that this same CPU can also be found on many gaming laptops to show that this Dell convertible isn't fooling around when it comes to processor performance.
Turbo Boost sustainability is good but not perfect. When running CineBench R15 xT in a loop, our initial score of 2680 points would dip by roughly 15 percent after just three runs. 16-inch clamshells like the Lenovo IdeaPad Pro 5 16 or Inspiron 16 Plus 7640 with the same CPU are able to maintain higher Turbo Boost clock rates for longer as shown by the graph below.
Settling for the lower-end Core Ultra 5 125U configuration is expected to impact multi-thread performance significantly by 40 percent based on our time with the Lenovo Yoga 7 2-in-1 16. However, the Core U-series option might still be ideal for those who prefer battery life over raw performance.
Cinebench R15 Multi Loop
Cinebench R23: Multi Core | Single Core
Cinebench R20: CPU (Multi Core) | CPU (Single Core)
Cinebench R15: CPU Multi 64Bit | CPU Single 64Bit
Blender: v2.79 BMW27 CPU
7-Zip 18.03: 7z b 4 | 7z b 4 -mmt1
Geekbench 6.7: Multi-Core | Single-Core
Geekbench 5.5: Multi-Core | Single-Core
HWBOT x265 Benchmark v2.2: 4k Preset
LibreOffice : 20 Documents To PDF
R Benchmark 2.5: Overall mean
* ... smaller is better
AIDA64: FP32 Ray-Trace | FPU Julia | CPU SHA3 | CPU Queen | FPU SinJulia | FPU Mandel | CPU AES | CPU ZLib | FP64 Ray-Trace | CPU PhotoWorxx
| Performance rating | |
| Lenovo IdeaPad Pro 5 16IMH G9 | |
| HP Envy x360 2-in-1 16-ad0097nr | |
| Dell Inspiron 16 7640 2-in-1 | |
| Dell Inspiron 16 Plus 7640 | |
| Average Intel Core Ultra 7 155H | |
| Dell Inspiron 16 7635 2-in-1 | |
| Samsung Galaxy Book4 Pro 360 | |
| AIDA64 / FP32 Ray-Trace | |
| HP Envy x360 2-in-1 16-ad0097nr | |
| Lenovo IdeaPad Pro 5 16IMH G9 | |
| Dell Inspiron 16 7640 2-in-1 | |
| Dell Inspiron 16 Plus 7640 | |
| Average Intel Core Ultra 7 155H (6670 - 18470, n=50) | |
| Dell Inspiron 16 7635 2-in-1 | |
| Samsung Galaxy Book4 Pro 360 | |
| AIDA64 / FPU Julia | |
| Lenovo IdeaPad Pro 5 16IMH G9 | |
| HP Envy x360 2-in-1 16-ad0097nr | |
| Dell Inspiron 16 7640 2-in-1 | |
| Dell Inspiron 16 Plus 7640 | |
| Average Intel Core Ultra 7 155H (40905 - 93181, n=50) | |
| Dell Inspiron 16 7635 2-in-1 | |
| Samsung Galaxy Book4 Pro 360 | |
| AIDA64 / CPU SHA3 | |
| Lenovo IdeaPad Pro 5 16IMH G9 | |
| HP Envy x360 2-in-1 16-ad0097nr | |
| Dell Inspiron 16 7640 2-in-1 | |
| Dell Inspiron 16 Plus 7640 | |
| Average Intel Core Ultra 7 155H (1940 - 4436, n=50) | |
| Samsung Galaxy Book4 Pro 360 | |
| Dell Inspiron 16 7635 2-in-1 | |
| AIDA64 / CPU Queen | |
| HP Envy x360 2-in-1 16-ad0097nr | |
| Dell Inspiron 16 7640 2-in-1 | |
| Dell Inspiron 16 Plus 7640 | |
| Lenovo IdeaPad Pro 5 16IMH G9 | |
| Average Intel Core Ultra 7 155H (64698 - 94181, n=50) | |
| Samsung Galaxy Book4 Pro 360 | |
| Dell Inspiron 16 7635 2-in-1 | |
| AIDA64 / FPU SinJulia | |
| HP Envy x360 2-in-1 16-ad0097nr | |
| Lenovo IdeaPad Pro 5 16IMH G9 | |
| Dell Inspiron 16 7640 2-in-1 | |
| Dell Inspiron 16 Plus 7640 | |
| Average Intel Core Ultra 7 155H (5639 - 10647, n=50) | |
| Dell Inspiron 16 7635 2-in-1 | |
| Samsung Galaxy Book4 Pro 360 | |
| AIDA64 / FPU Mandel | |
| HP Envy x360 2-in-1 16-ad0097nr | |
| Lenovo IdeaPad Pro 5 16IMH G9 | |
| Dell Inspiron 16 7640 2-in-1 | |
| Dell Inspiron 16 Plus 7640 | |
| Dell Inspiron 16 7635 2-in-1 | |
| Average Intel Core Ultra 7 155H (18236 - 47685, n=50) | |
| Samsung Galaxy Book4 Pro 360 | |
| AIDA64 / CPU AES | |
| Lenovo IdeaPad Pro 5 16IMH G9 | |
| Average Intel Core Ultra 7 155H (45713 - 152179, n=50) | |
| Dell Inspiron 16 7640 2-in-1 | |
| HP Envy x360 2-in-1 16-ad0097nr | |
| Dell Inspiron 16 Plus 7640 | |
| Samsung Galaxy Book4 Pro 360 | |
| Dell Inspiron 16 7635 2-in-1 | |
| AIDA64 / CPU ZLib | |
| Lenovo IdeaPad Pro 5 16IMH G9 | |
| Dell Inspiron 16 Plus 7640 | |
| Dell Inspiron 16 7640 2-in-1 | |
| Average Intel Core Ultra 7 155H (557 - 1250, n=50) | |
| HP Envy x360 2-in-1 16-ad0097nr | |
| Samsung Galaxy Book4 Pro 360 | |
| Dell Inspiron 16 7635 2-in-1 | |
| AIDA64 / FP64 Ray-Trace | |
| HP Envy x360 2-in-1 16-ad0097nr | |
| Lenovo IdeaPad Pro 5 16IMH G9 | |
| Dell Inspiron 16 7640 2-in-1 | |
| Dell Inspiron 16 Plus 7640 | |
| Average Intel Core Ultra 7 155H (3569 - 9802, n=50) | |
| Dell Inspiron 16 7635 2-in-1 | |
| Samsung Galaxy Book4 Pro 360 | |
| AIDA64 / CPU PhotoWorxx | |
| Lenovo IdeaPad Pro 5 16IMH G9 | |
| Average Intel Core Ultra 7 155H (32719 - 54223, n=50) | |
| Samsung Galaxy Book4 Pro 360 | |
| Dell Inspiron 16 7640 2-in-1 | |
| Dell Inspiron 16 Plus 7640 | |
| HP Envy x360 2-in-1 16-ad0097nr | |
| Dell Inspiron 16 7635 2-in-1 | |
Stress Test
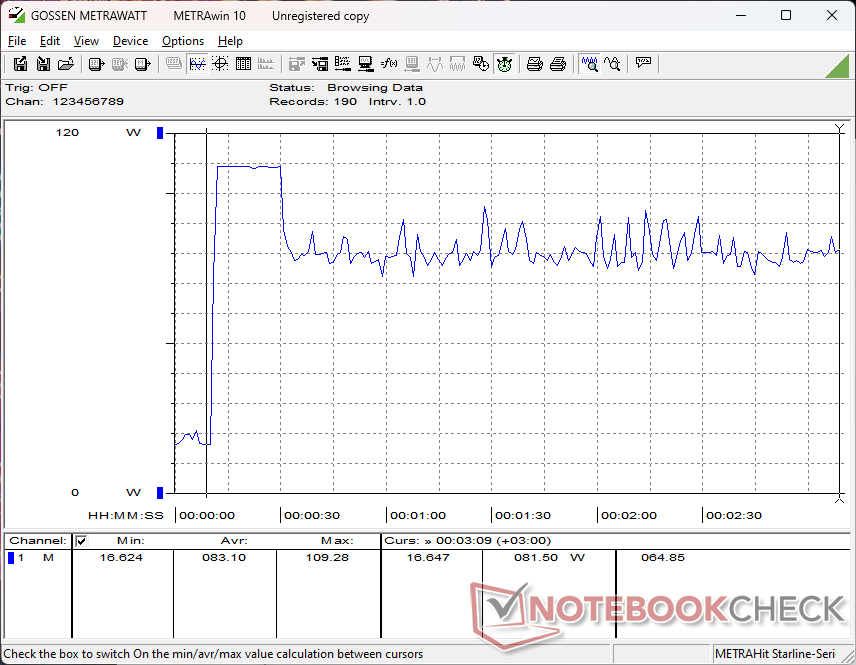
The CPU would boost to 3.2 GHz and 88 W lasting for only a few seconds before reaching a very high core package temperature of 109 C (!). It would then swiftly drop to just 2.3 GHz and 44 W in order to maintain a cooler core temperature of 86 C. The temperature ranges are nonetheless warmer than what we recorded on the Inspiron 16 7635 2-in-1 particularly when running games where our CPU would stabilize in the high 90 C range compared to the 70 C range on the older Inspiron 16 7635 2-in-1. This difference would also contribute to the overall warmer surface temperatures as shown in our Temperature section below.
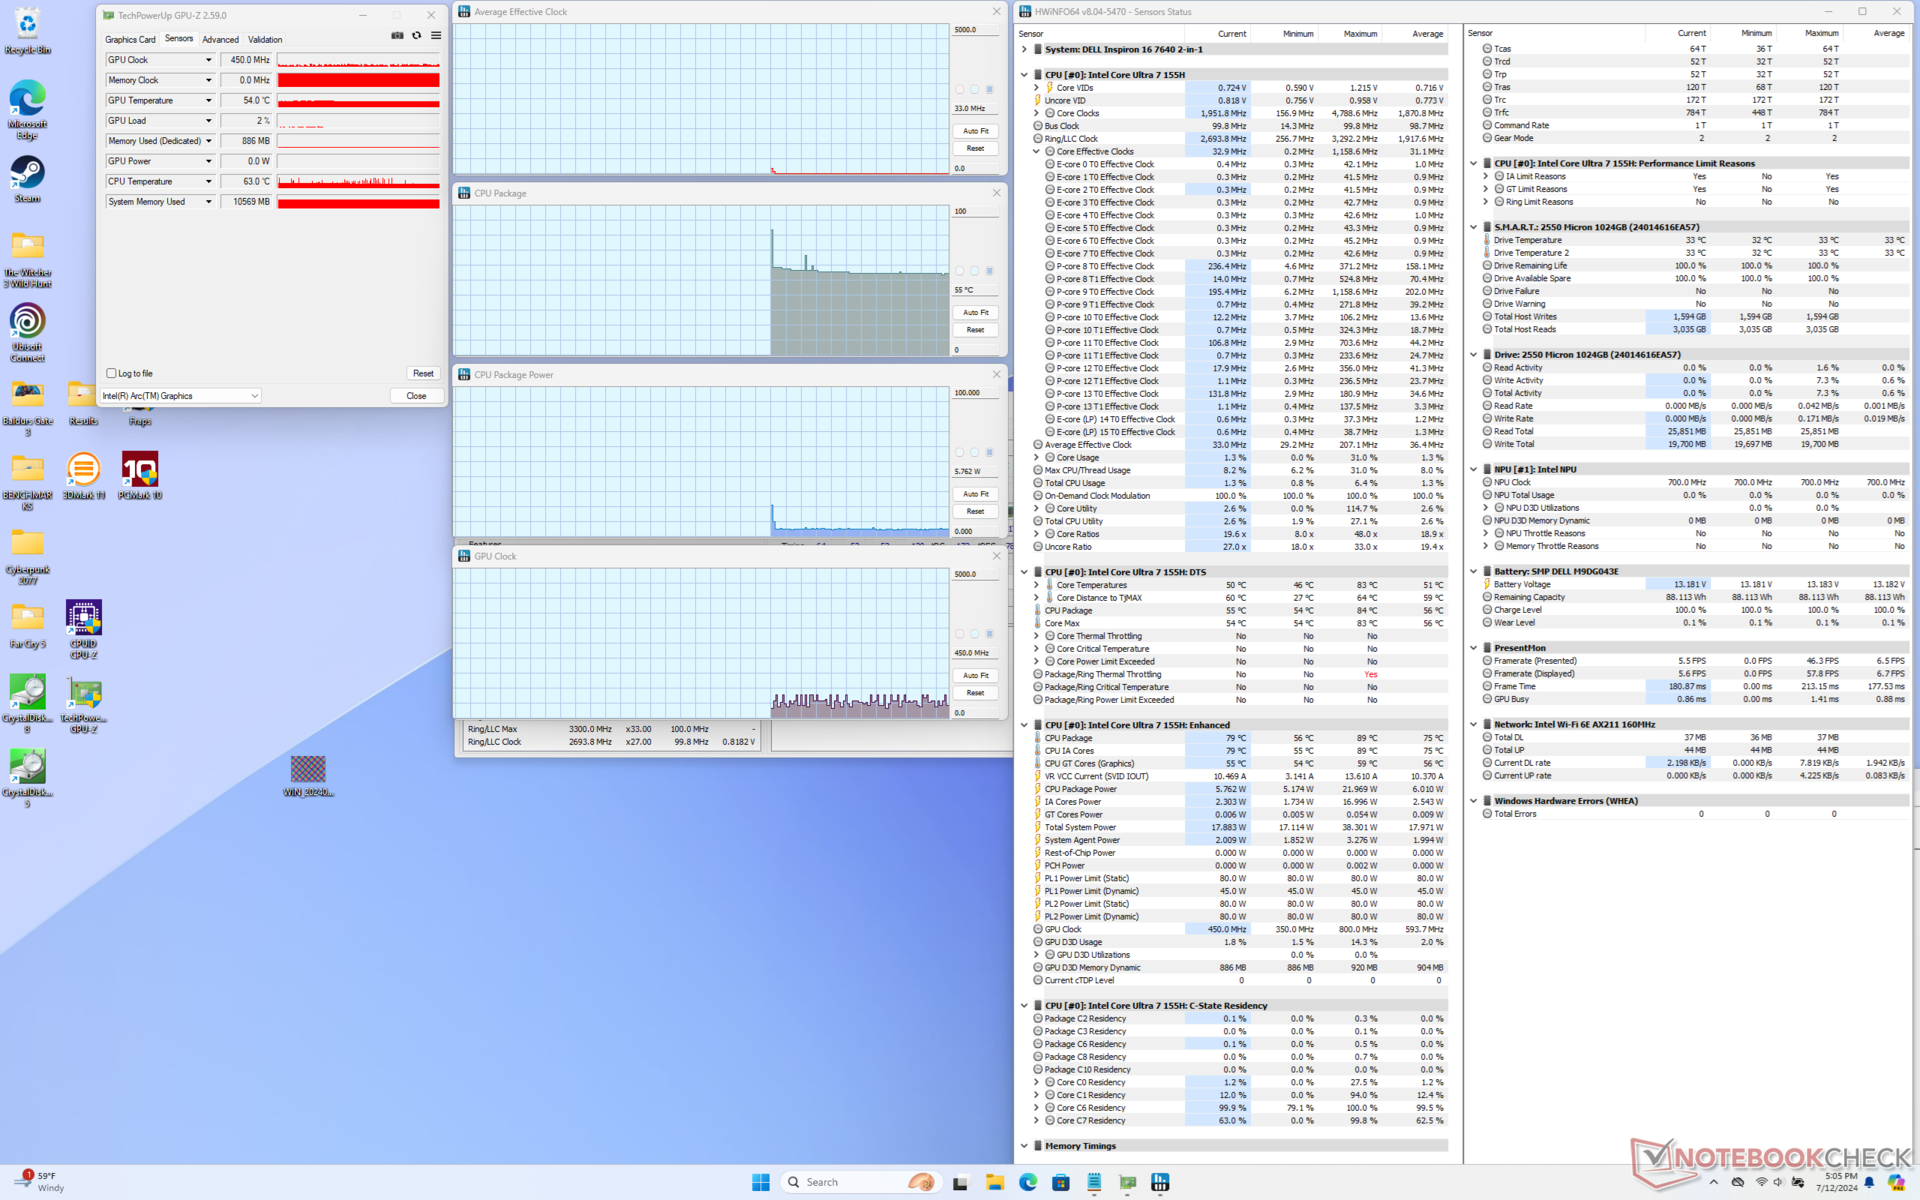
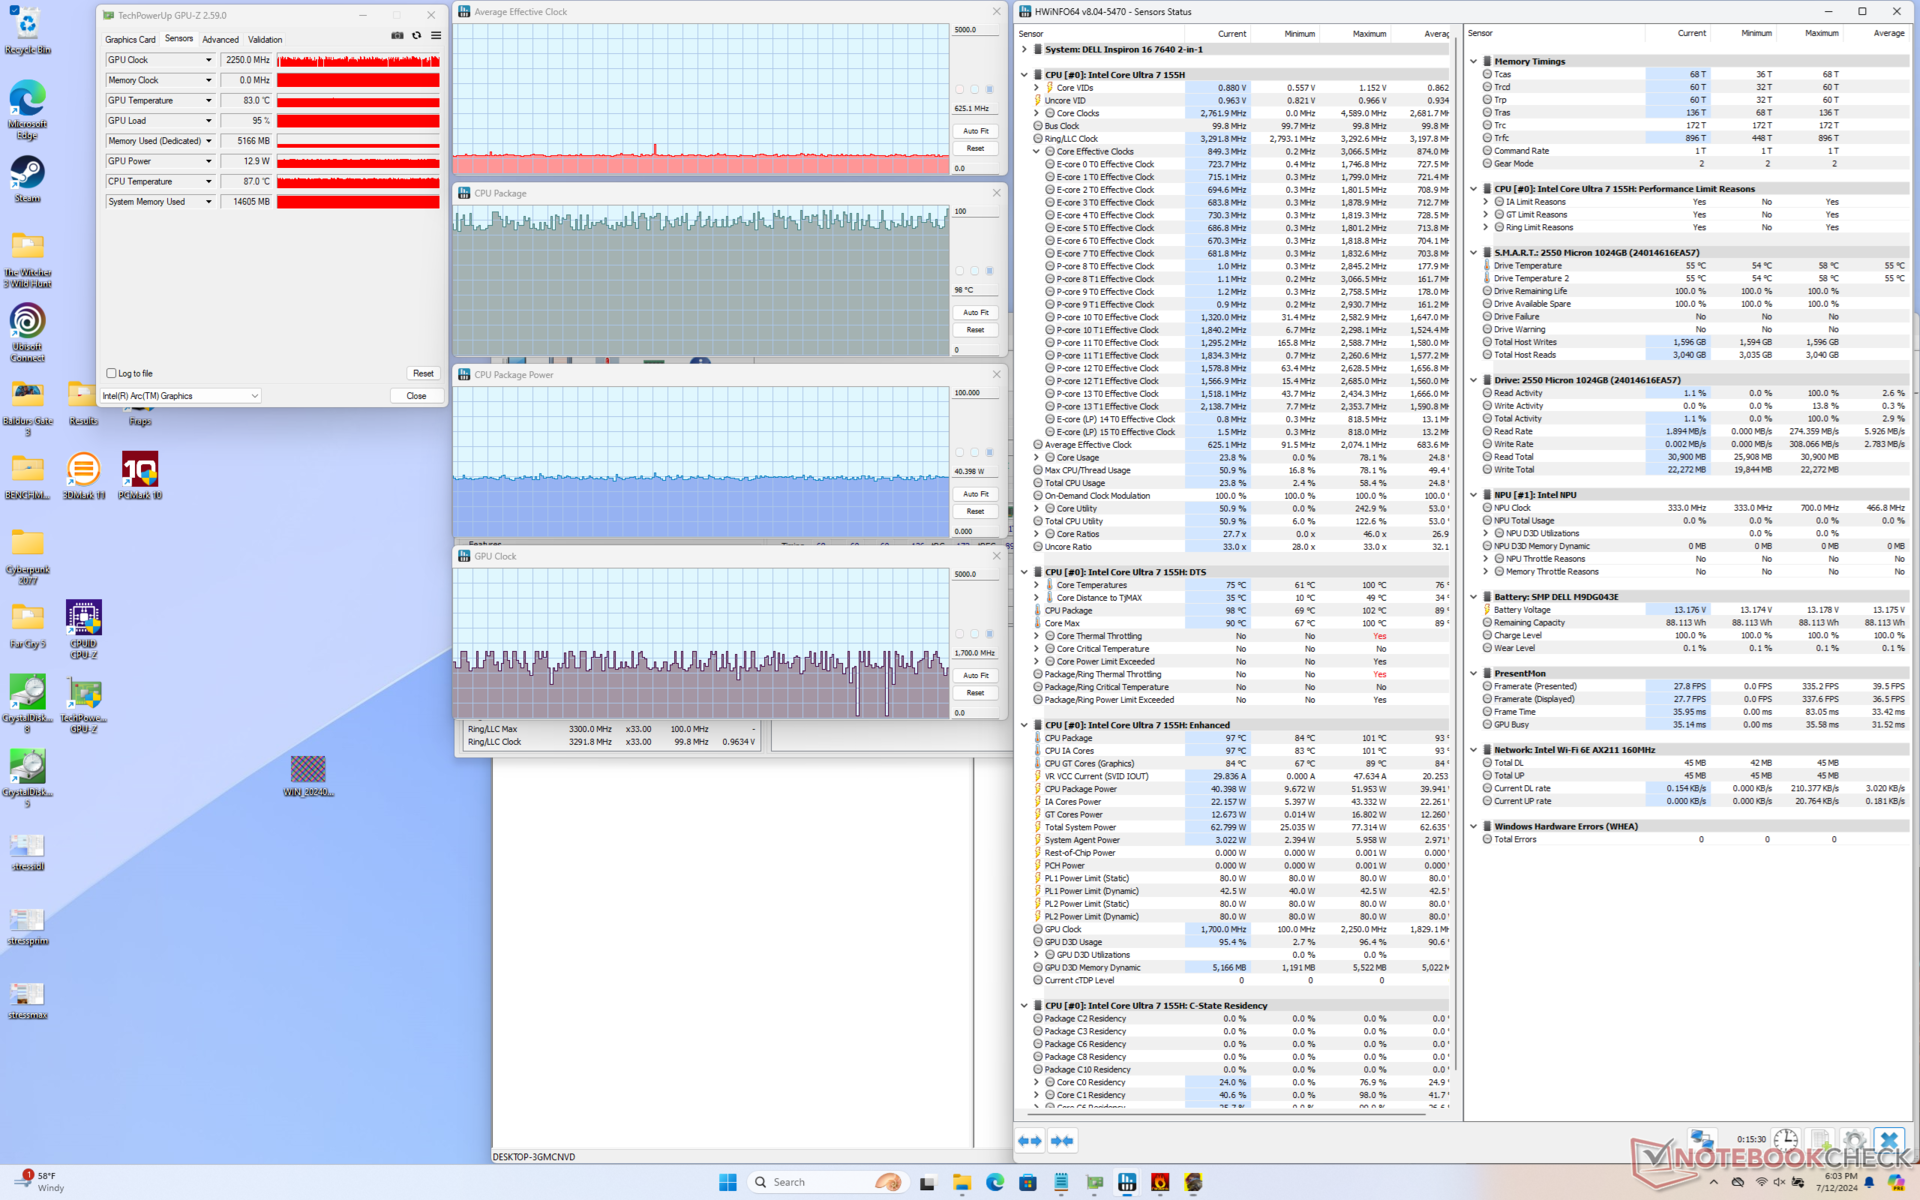
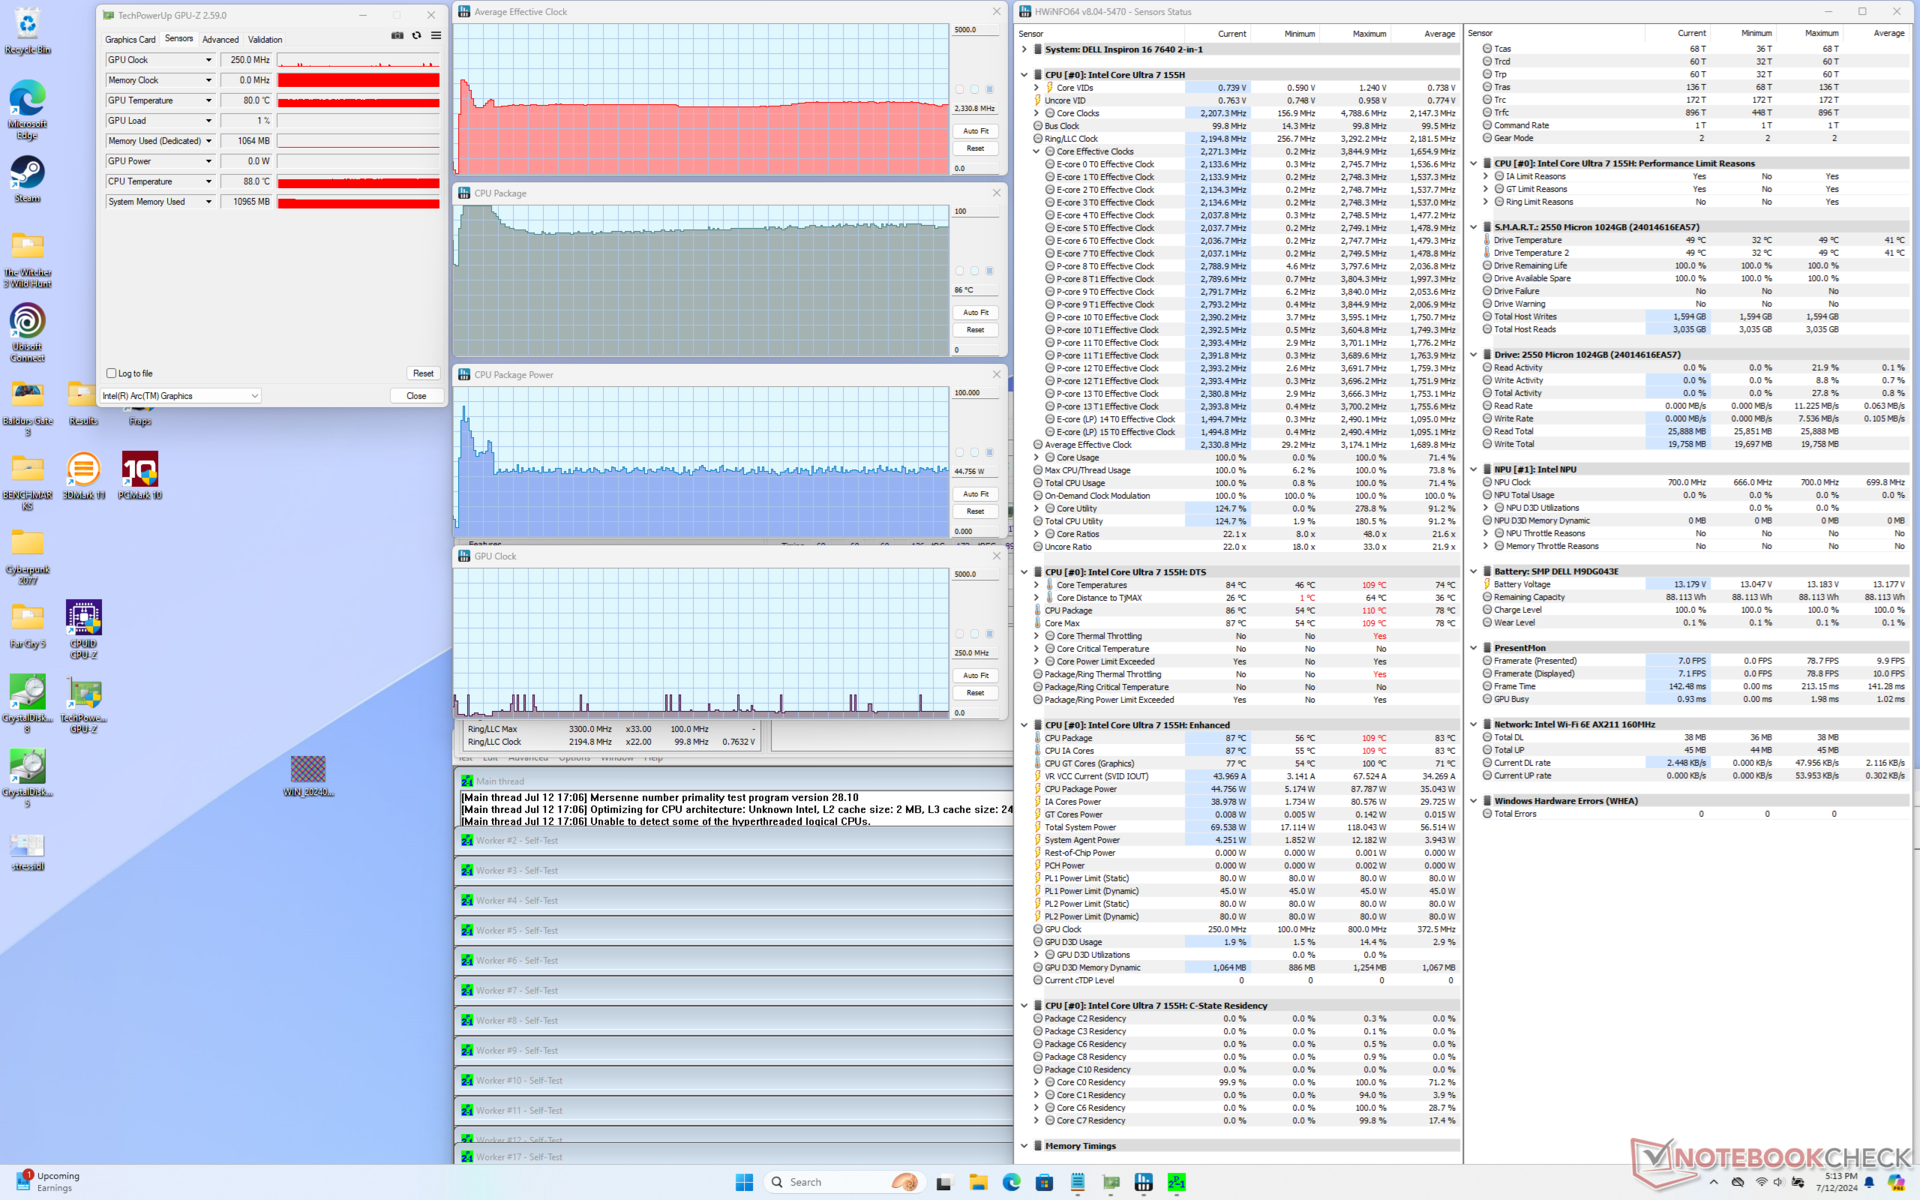
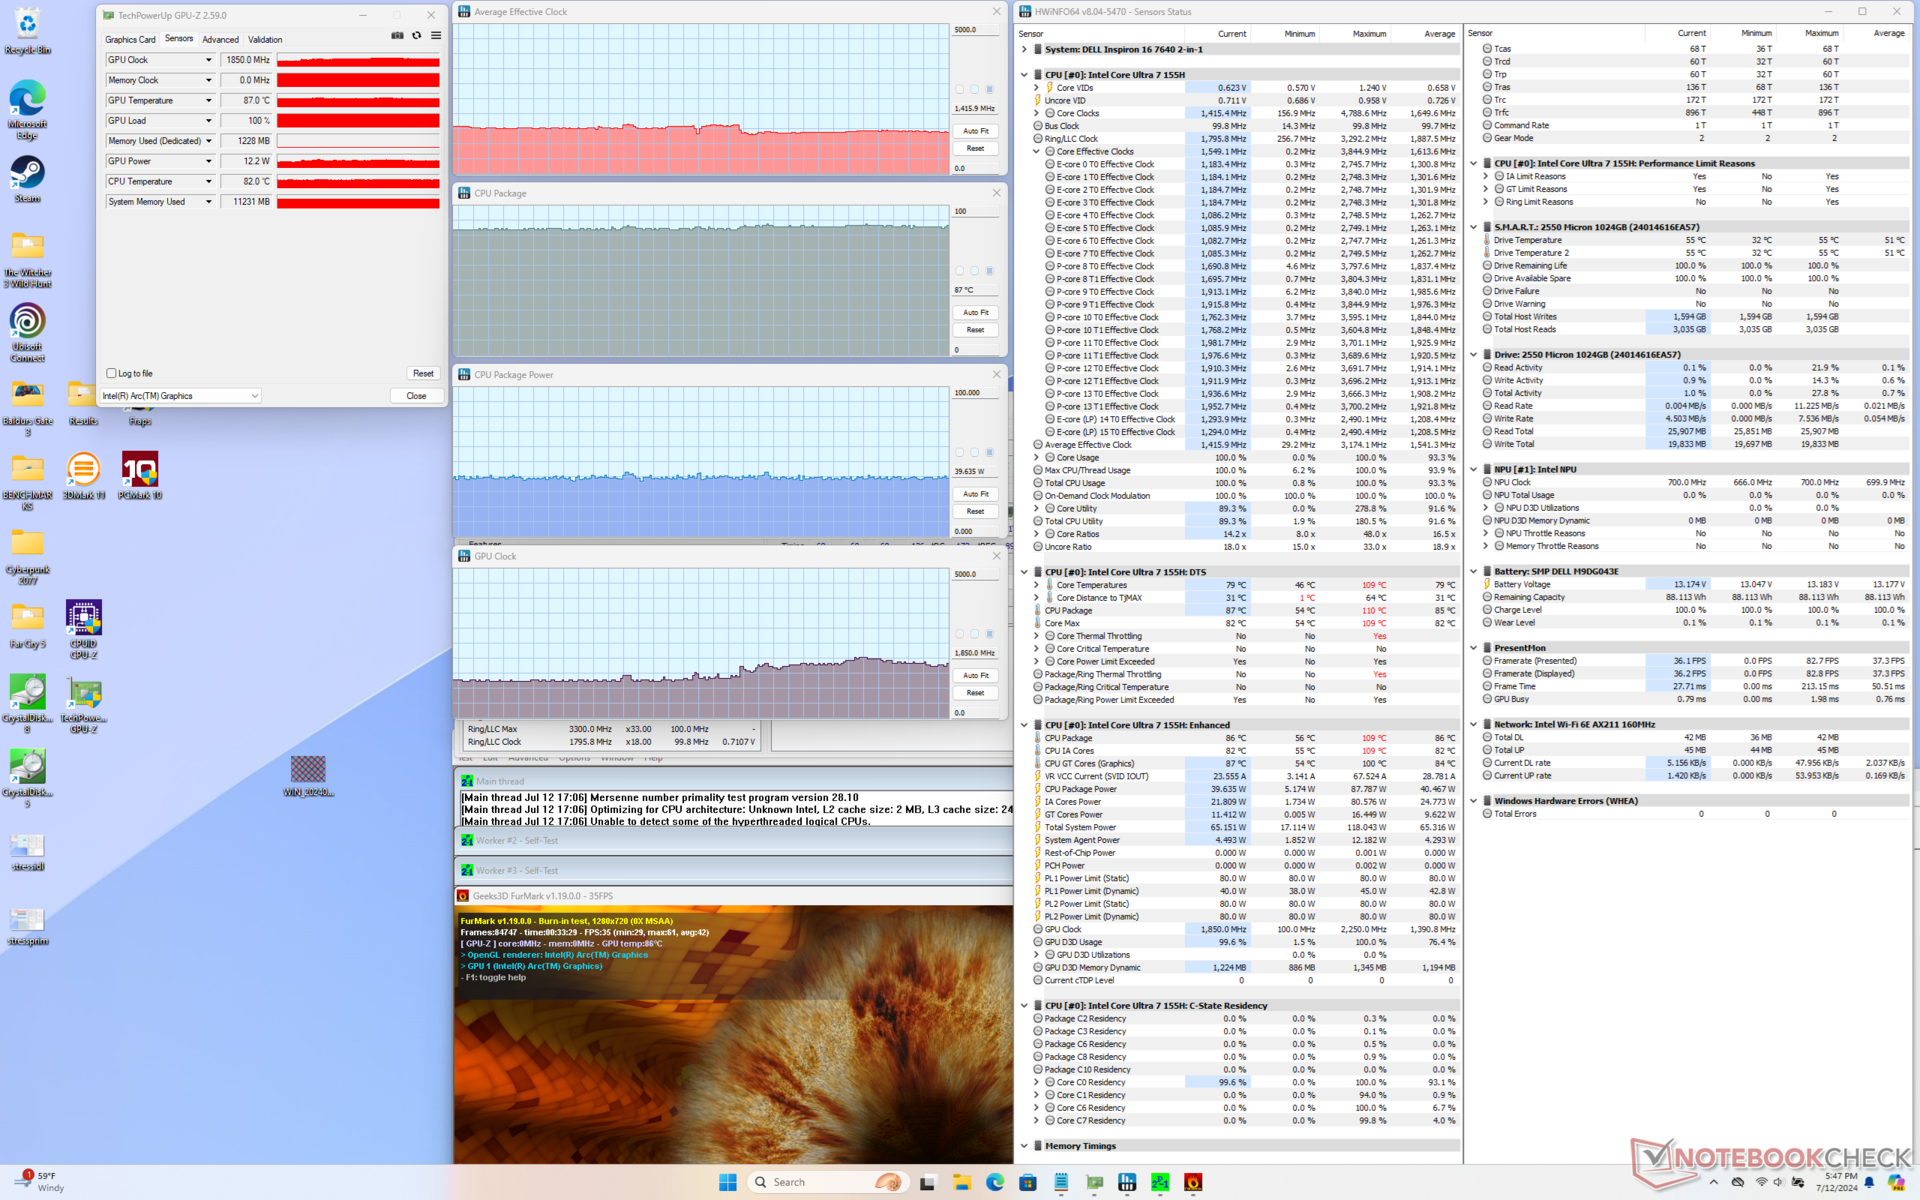
| Average CPU Clock (GHz) | GPU Clock (MHz) | Average CPU Temperature (°C) | |
| System Idle | -- | -- | 55 |
| Prime95 Stress | 2.3 | -- | 86 |
| Prime95 + FurMark Stress | 1.4 | 1250 - 1850 | 87 |
| Cyberpunk 2077 Stress | 0.6 | 1650 - 2250 | 90 - 98 |
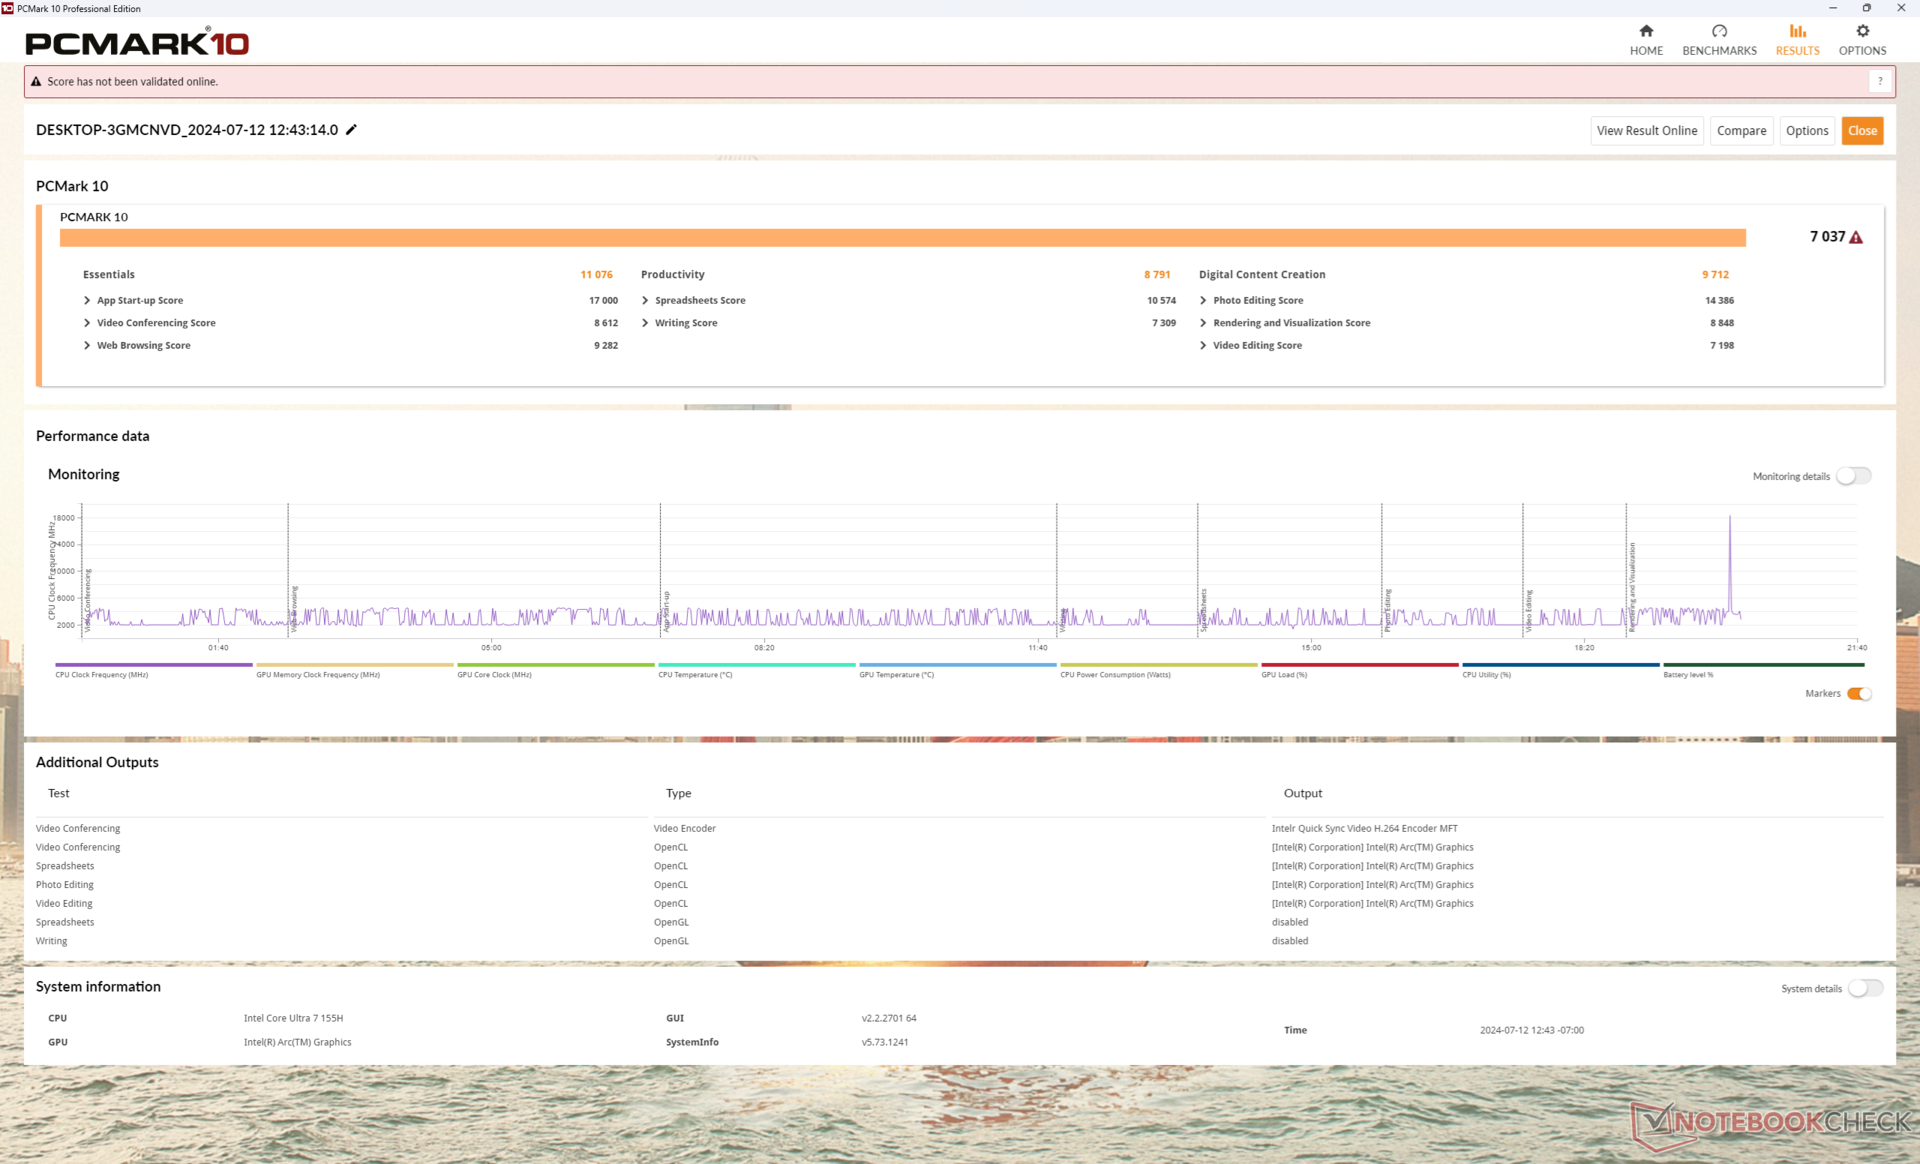
System Performance
PCMark results are excellent and comparable to other machines in our database sporting the same CPU and integrated GPU. Our average score for the Dell is one of the highest of any 16-inch convertible, but alternatives with discrete GPUs like the HP Spectre x360 16 are still going to offer faster graphics performance.
CrossMark: Overall | Productivity | Creativity | Responsiveness
WebXPRT 3: Overall
WebXPRT 4: Overall
Mozilla Kraken 1.1: Total
| PCMark 10 / Score | |
| Lenovo IdeaPad Pro 5 16IMH G9 | |
| Dell Inspiron 16 Plus 7640 | |
| Dell Inspiron 16 7640 2-in-1 | |
| HP Envy x360 2-in-1 16-ad0097nr | |
| Average Intel Core Ultra 7 155H, Intel Arc 8-Core iGPU (4809 - 7529, n=34) | |
| Samsung Galaxy Book4 Pro 360 | |
| Dell Inspiron 16 7635 2-in-1 | |
| PCMark 10 / Essentials | |
| Lenovo IdeaPad Pro 5 16IMH G9 | |
| Dell Inspiron 16 7640 2-in-1 | |
| Dell Inspiron 16 7635 2-in-1 | |
| Samsung Galaxy Book4 Pro 360 | |
| HP Envy x360 2-in-1 16-ad0097nr | |
| Average Intel Core Ultra 7 155H, Intel Arc 8-Core iGPU (7605 - 11289, n=34) | |
| Dell Inspiron 16 Plus 7640 | |
| PCMark 10 / Productivity | |
| HP Envy x360 2-in-1 16-ad0097nr | |
| Dell Inspiron 16 7635 2-in-1 | |
| Lenovo IdeaPad Pro 5 16IMH G9 | |
| Dell Inspiron 16 7640 2-in-1 | |
| Average Intel Core Ultra 7 155H, Intel Arc 8-Core iGPU (6042 - 10591, n=34) | |
| Dell Inspiron 16 Plus 7640 | |
| Samsung Galaxy Book4 Pro 360 | |
| PCMark 10 / Digital Content Creation | |
| Dell Inspiron 16 Plus 7640 | |
| Lenovo IdeaPad Pro 5 16IMH G9 | |
| Dell Inspiron 16 7640 2-in-1 | |
| Average Intel Core Ultra 7 155H, Intel Arc 8-Core iGPU (4985 - 10709, n=34) | |
| HP Envy x360 2-in-1 16-ad0097nr | |
| Samsung Galaxy Book4 Pro 360 | |
| Dell Inspiron 16 7635 2-in-1 | |
| CrossMark / Overall | |
| Dell Inspiron 16 7640 2-in-1 | |
| Dell Inspiron 16 Plus 7640 | |
| Average Intel Core Ultra 7 155H, Intel Arc 8-Core iGPU (1366 - 1903, n=34) | |
| HP Envy x360 2-in-1 16-ad0097nr | |
| Samsung Galaxy Book4 Pro 360 | |
| Lenovo IdeaPad Pro 5 16IMH G9 | |
| Dell Inspiron 16 7635 2-in-1 | |
| CrossMark / Productivity | |
| Dell Inspiron 16 7640 2-in-1 | |
| HP Envy x360 2-in-1 16-ad0097nr | |
| Dell Inspiron 16 Plus 7640 | |
| Average Intel Core Ultra 7 155H, Intel Arc 8-Core iGPU (1291 - 1798, n=33) | |
| Samsung Galaxy Book4 Pro 360 | |
| Lenovo IdeaPad Pro 5 16IMH G9 | |
| Dell Inspiron 16 7635 2-in-1 | |
| CrossMark / Creativity | |
| Dell Inspiron 16 Plus 7640 | |
| Dell Inspiron 16 7640 2-in-1 | |
| Lenovo IdeaPad Pro 5 16IMH G9 | |
| Average Intel Core Ultra 7 155H, Intel Arc 8-Core iGPU (1519 - 1929, n=33) | |
| HP Envy x360 2-in-1 16-ad0097nr | |
| Samsung Galaxy Book4 Pro 360 | |
| Dell Inspiron 16 7635 2-in-1 | |
| CrossMark / Responsiveness | |
| Samsung Galaxy Book4 Pro 360 | |
| Average Intel Core Ultra 7 155H, Intel Arc 8-Core iGPU (939 - 1802, n=33) | |
| Dell Inspiron 16 7640 2-in-1 | |
| HP Envy x360 2-in-1 16-ad0097nr | |
| Dell Inspiron 16 Plus 7640 | |
| Lenovo IdeaPad Pro 5 16IMH G9 | |
| Dell Inspiron 16 7635 2-in-1 | |
| WebXPRT 3 / Overall | |
| HP Envy x360 2-in-1 16-ad0097nr | |
| Dell Inspiron 16 Plus 7640 | |
| Lenovo IdeaPad Pro 5 16IMH G9 | |
| Dell Inspiron 16 7640 2-in-1 | |
| Average Intel Core Ultra 7 155H, Intel Arc 8-Core iGPU (252 - 299, n=34) | |
| Dell Inspiron 16 7635 2-in-1 | |
| Samsung Galaxy Book4 Pro 360 | |
| WebXPRT 4 / Overall | |
| Lenovo IdeaPad Pro 5 16IMH G9 | |
| Dell Inspiron 16 7640 2-in-1 | |
| Dell Inspiron 16 Plus 7640 | |
| Average Intel Core Ultra 7 155H, Intel Arc 8-Core iGPU (166.4 - 309, n=29) | |
| HP Envy x360 2-in-1 16-ad0097nr | |
| Samsung Galaxy Book4 Pro 360 | |
| Dell Inspiron 16 7635 2-in-1 | |
| Mozilla Kraken 1.1 / Total | |
| Dell Inspiron 16 7635 2-in-1 | |
| Samsung Galaxy Book4 Pro 360 | |
| Average Intel Core Ultra 7 155H, Intel Arc 8-Core iGPU (517 - 614, n=35) | |
| HP Envy x360 2-in-1 16-ad0097nr | |
| Dell Inspiron 16 7640 2-in-1 | |
| Dell Inspiron 16 Plus 7640 | |
| Lenovo IdeaPad Pro 5 16IMH G9 | |
* ... smaller is better
| PCMark 10 Score | 7037 points | |
Help | ||
| AIDA64 / Memory Copy | |
| Lenovo IdeaPad Pro 5 16IMH G9 | |
| Samsung Galaxy Book4 Pro 360 | |
| Average Intel Core Ultra 7 155H (62397 - 96791, n=50) | |
| Dell Inspiron 16 7640 2-in-1 | |
| HP Envy x360 2-in-1 16-ad0097nr | |
| Dell Inspiron 16 Plus 7640 | |
| Dell Inspiron 16 7635 2-in-1 | |
| AIDA64 / Memory Read | |
| Lenovo IdeaPad Pro 5 16IMH G9 | |
| Average Intel Core Ultra 7 155H (60544 - 90647, n=50) | |
| Dell Inspiron 16 Plus 7640 | |
| Samsung Galaxy Book4 Pro 360 | |
| Dell Inspiron 16 7640 2-in-1 | |
| HP Envy x360 2-in-1 16-ad0097nr | |
| Dell Inspiron 16 7635 2-in-1 | |
| AIDA64 / Memory Write | |
| HP Envy x360 2-in-1 16-ad0097nr | |
| Dell Inspiron 16 7640 2-in-1 | |
| Lenovo IdeaPad Pro 5 16IMH G9 | |
| Average Intel Core Ultra 7 155H (58692 - 93451, n=50) | |
| Samsung Galaxy Book4 Pro 360 | |
| Dell Inspiron 16 Plus 7640 | |
| Dell Inspiron 16 7635 2-in-1 | |
| AIDA64 / Memory Latency | |
| Dell Inspiron 16 7640 2-in-1 | |
| Average Intel Core Ultra 7 155H (116.2 - 233, n=50) | |
| Lenovo IdeaPad Pro 5 16IMH G9 | |
| Samsung Galaxy Book4 Pro 360 | |
| HP Envy x360 2-in-1 16-ad0097nr | |
| Dell Inspiron 16 Plus 7640 | |
| Dell Inspiron 16 7635 2-in-1 | |
* ... smaller is better
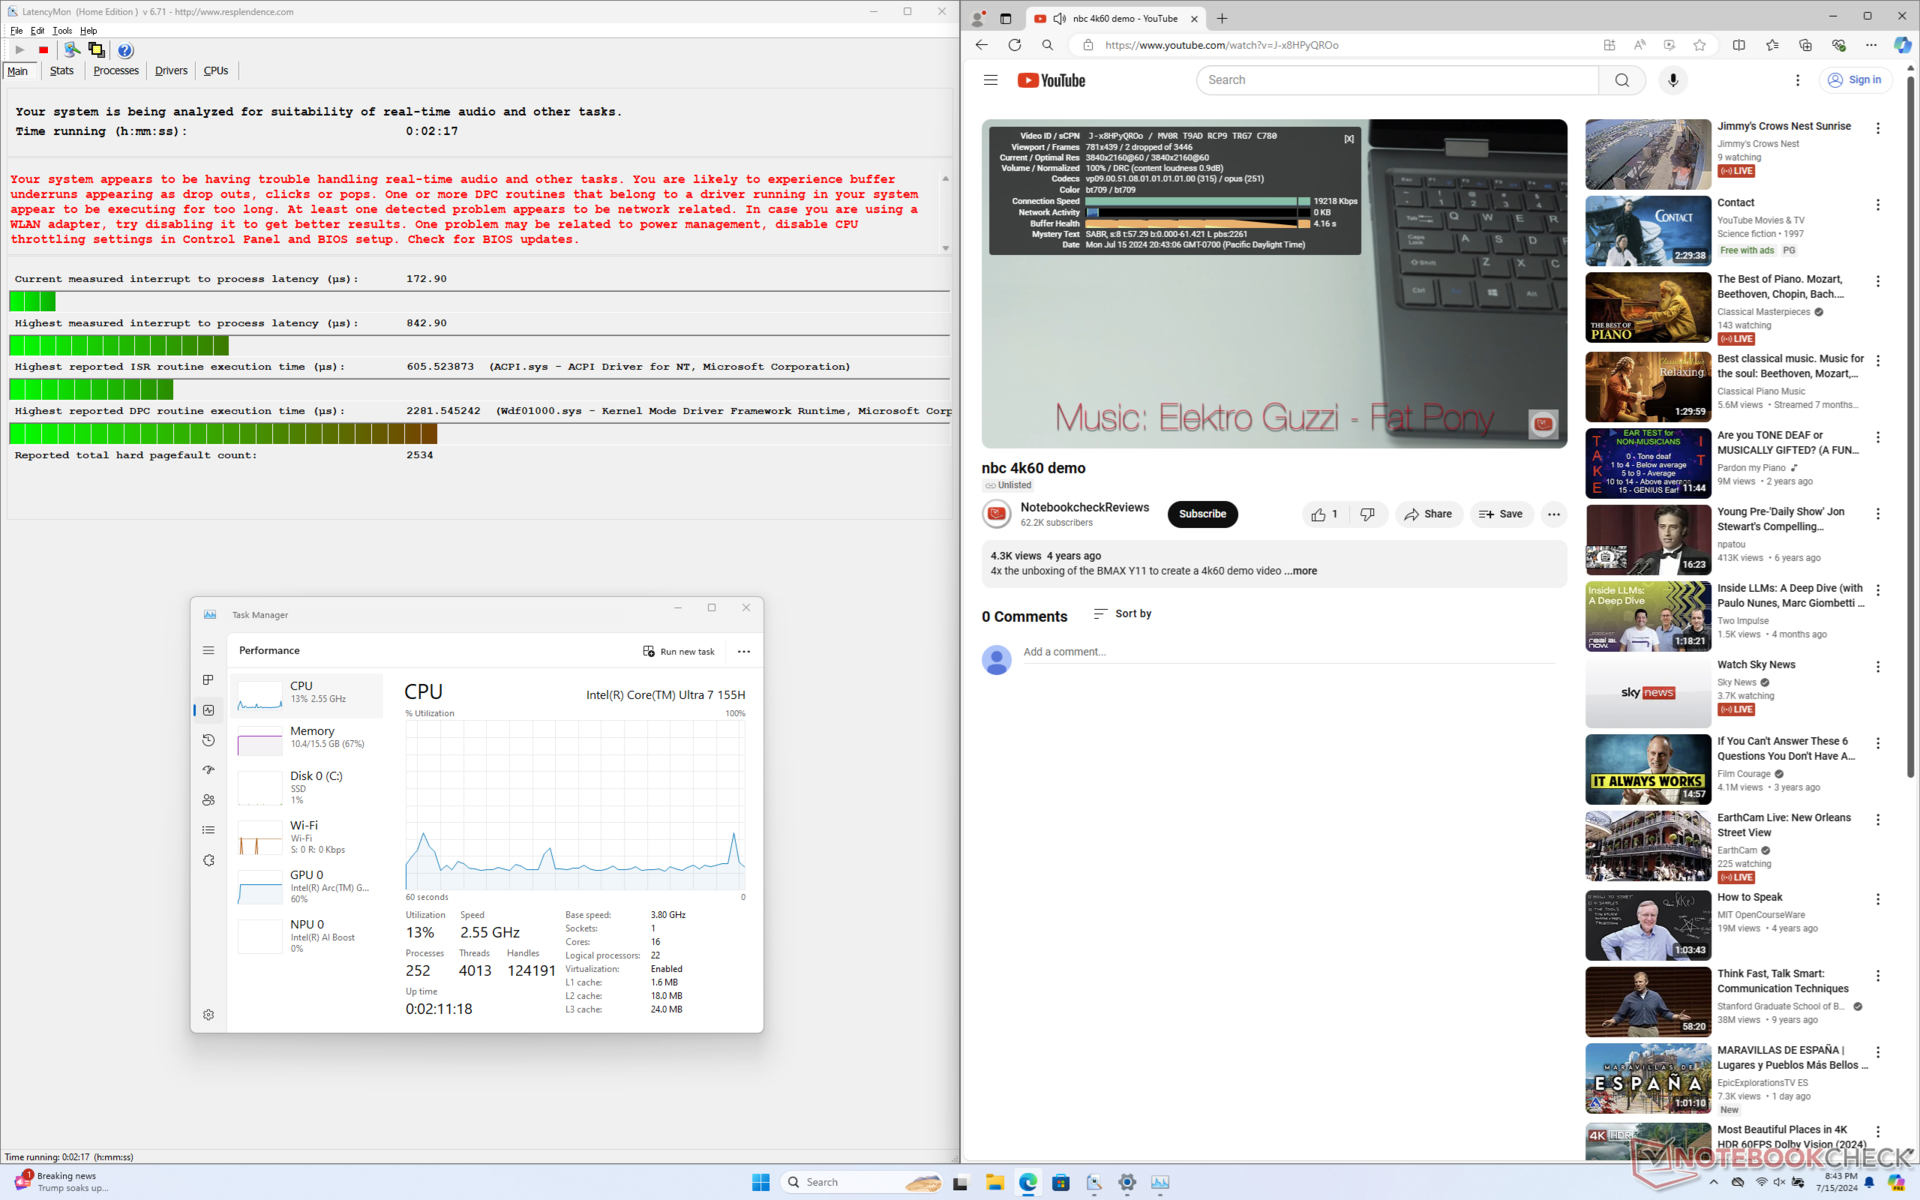
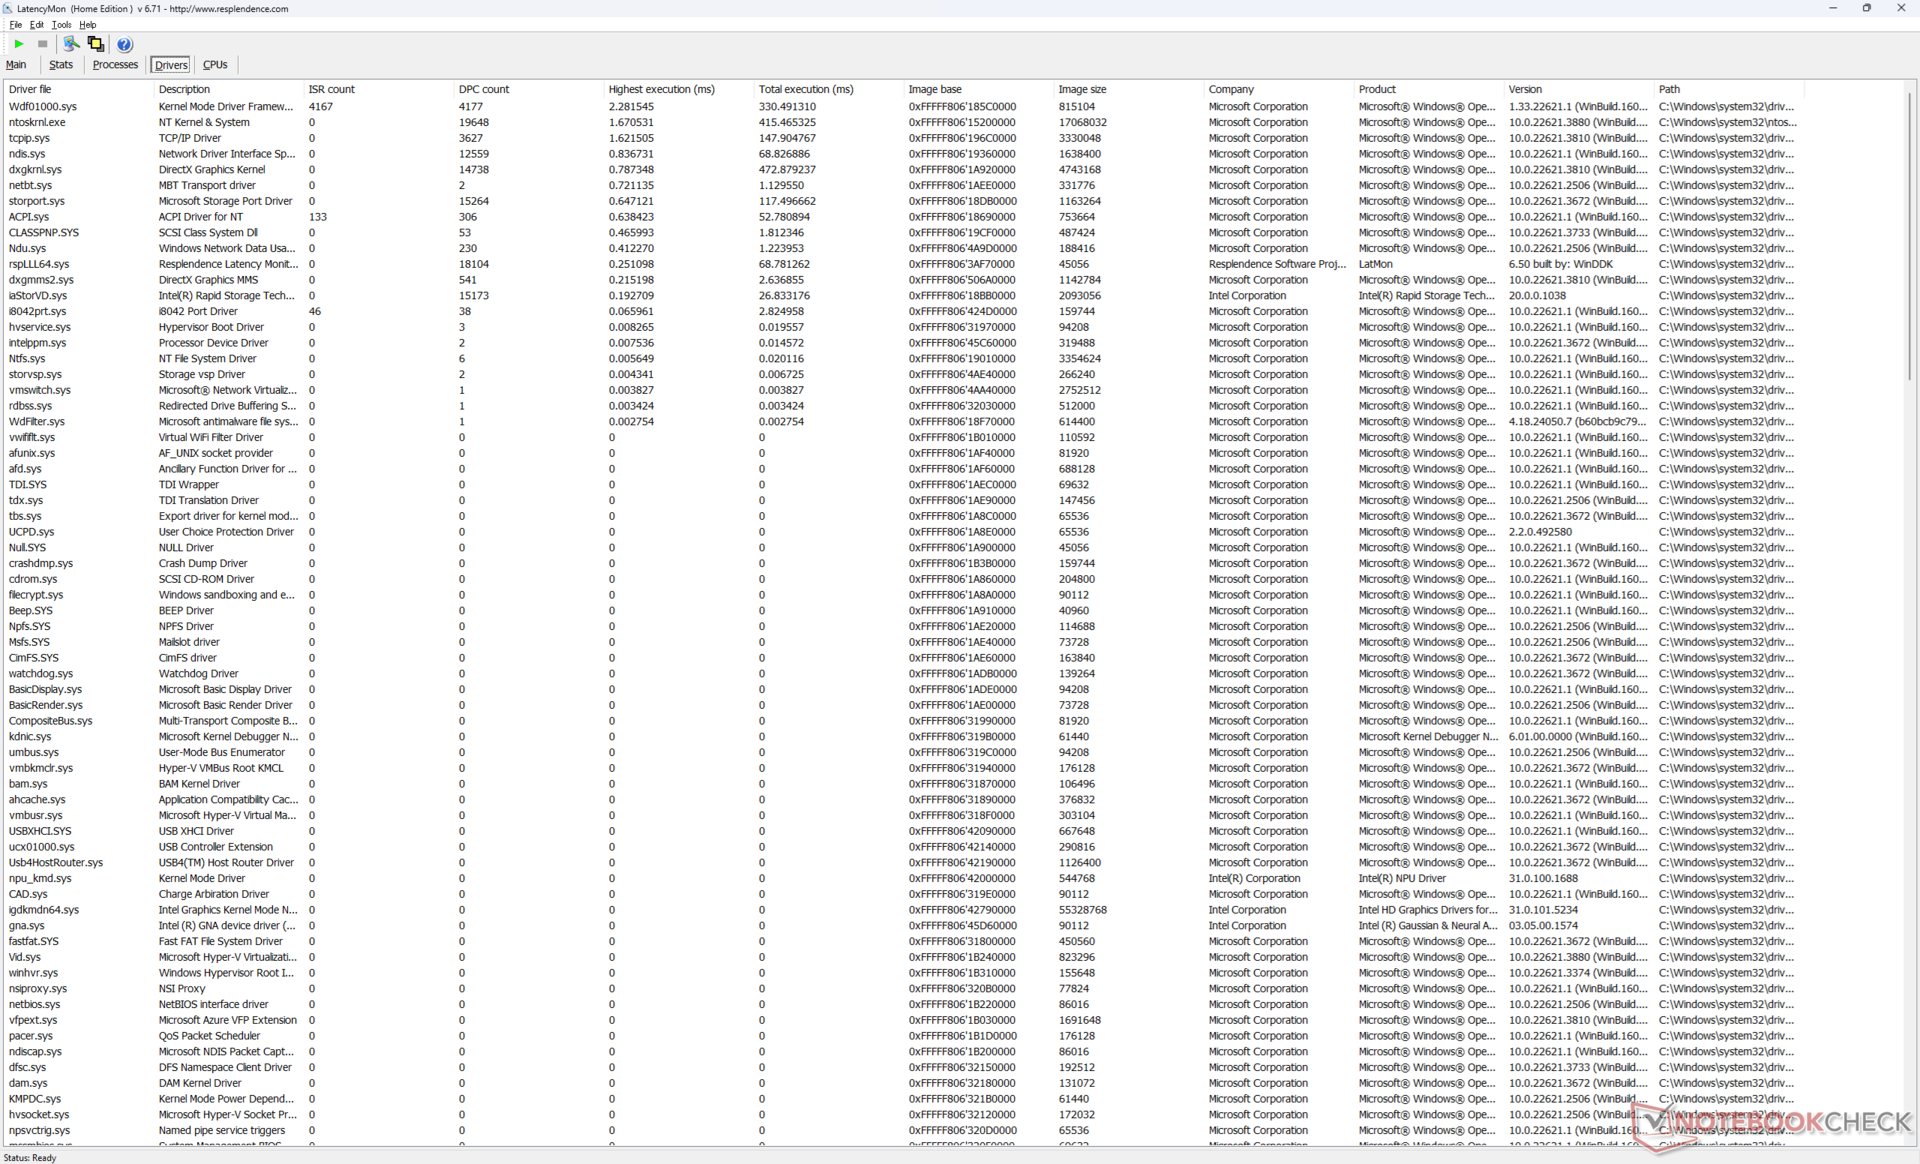
DPC Latency
LatencyMon reveals minor DPC issues when opening multiple browser tabs of our homepage. We're also able to record 2 dropped frames during a minute-long 4K60 video test when there should ideally be 0. The discrepancies are thankfully minor enough to be essentially unnoticeable during actual use.
| DPC Latencies / LatencyMon - interrupt to process latency (max), Web, Youtube, Prime95 | |
| Samsung Galaxy Book4 Pro 360 | |
| HP Envy x360 2-in-1 16-ad0097nr | |
| Dell Inspiron 16 7640 2-in-1 | |
| Lenovo IdeaPad Pro 5 16IMH G9 | |
| Dell Inspiron 16 Plus 7640 | |
| Dell Inspiron 16 7635 2-in-1 | |
* ... smaller is better
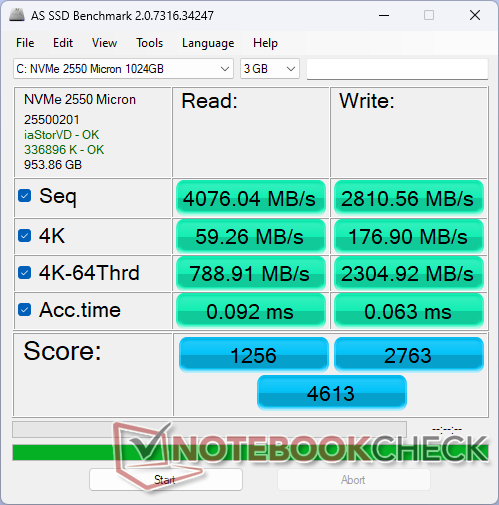
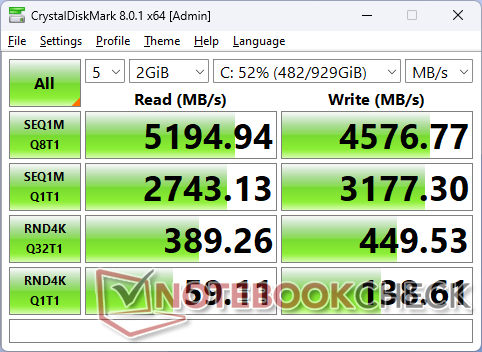
Storage Devices
Dell sources its SSDs from multiple vendors for its Inspiron series including Kioxia, SK Hynix, and Micron. Our specific test unit ships with the Micron 2550 which is a midrange PCIe4 NVMe SSD capable of read rates of up to 5200 MB/s. More expensive drives like the Samsung PM9A1 can reach over 7000 MB/s in comparison, but the Micron 2550 is sufficient and appropriate for a midrange model like our Inspiron 16 2-in-1.
Transfer rates are well ahead of the Kioxia BG5 in last year's Inspiron 16 7635 2-in-1 by wide margins even after accounting for any throttling when stressed.

* ... smaller is better
Disk Throttling: DiskSpd Read Loop, Queue Depth 8
GPU Performance
Graphics performance is quite good and one of the fastest for a convertible without resorting to discrete options. The Arc 8 GPU is comparable to the Radeon 780M and well ahead of the older Iris Xe 96 EUs or Radeon RX Vega solutions by over 2x in many cases. The Radeon RX Vega 7 in last year's Inspiron 16 7635 2-in-1, for example, is almost 60 percent behind.
Users who demand gaming-level performance and CUDA acceleration can consider the Spectre x360 16 with the GeForce RTX 4050 which is another 2x graphics increase over the Arc 8. Of course, the Spectre is also significantly more expensive than our Dell.
Keep in mind that the Arc 8 GPU is only available with the Core Ultra 7 155H configuration. Opting for the Core Ultra 5 125U instead will mean settling for the Arc 4 which entails a significant 40 to 45 percent decrease in graphics performance.
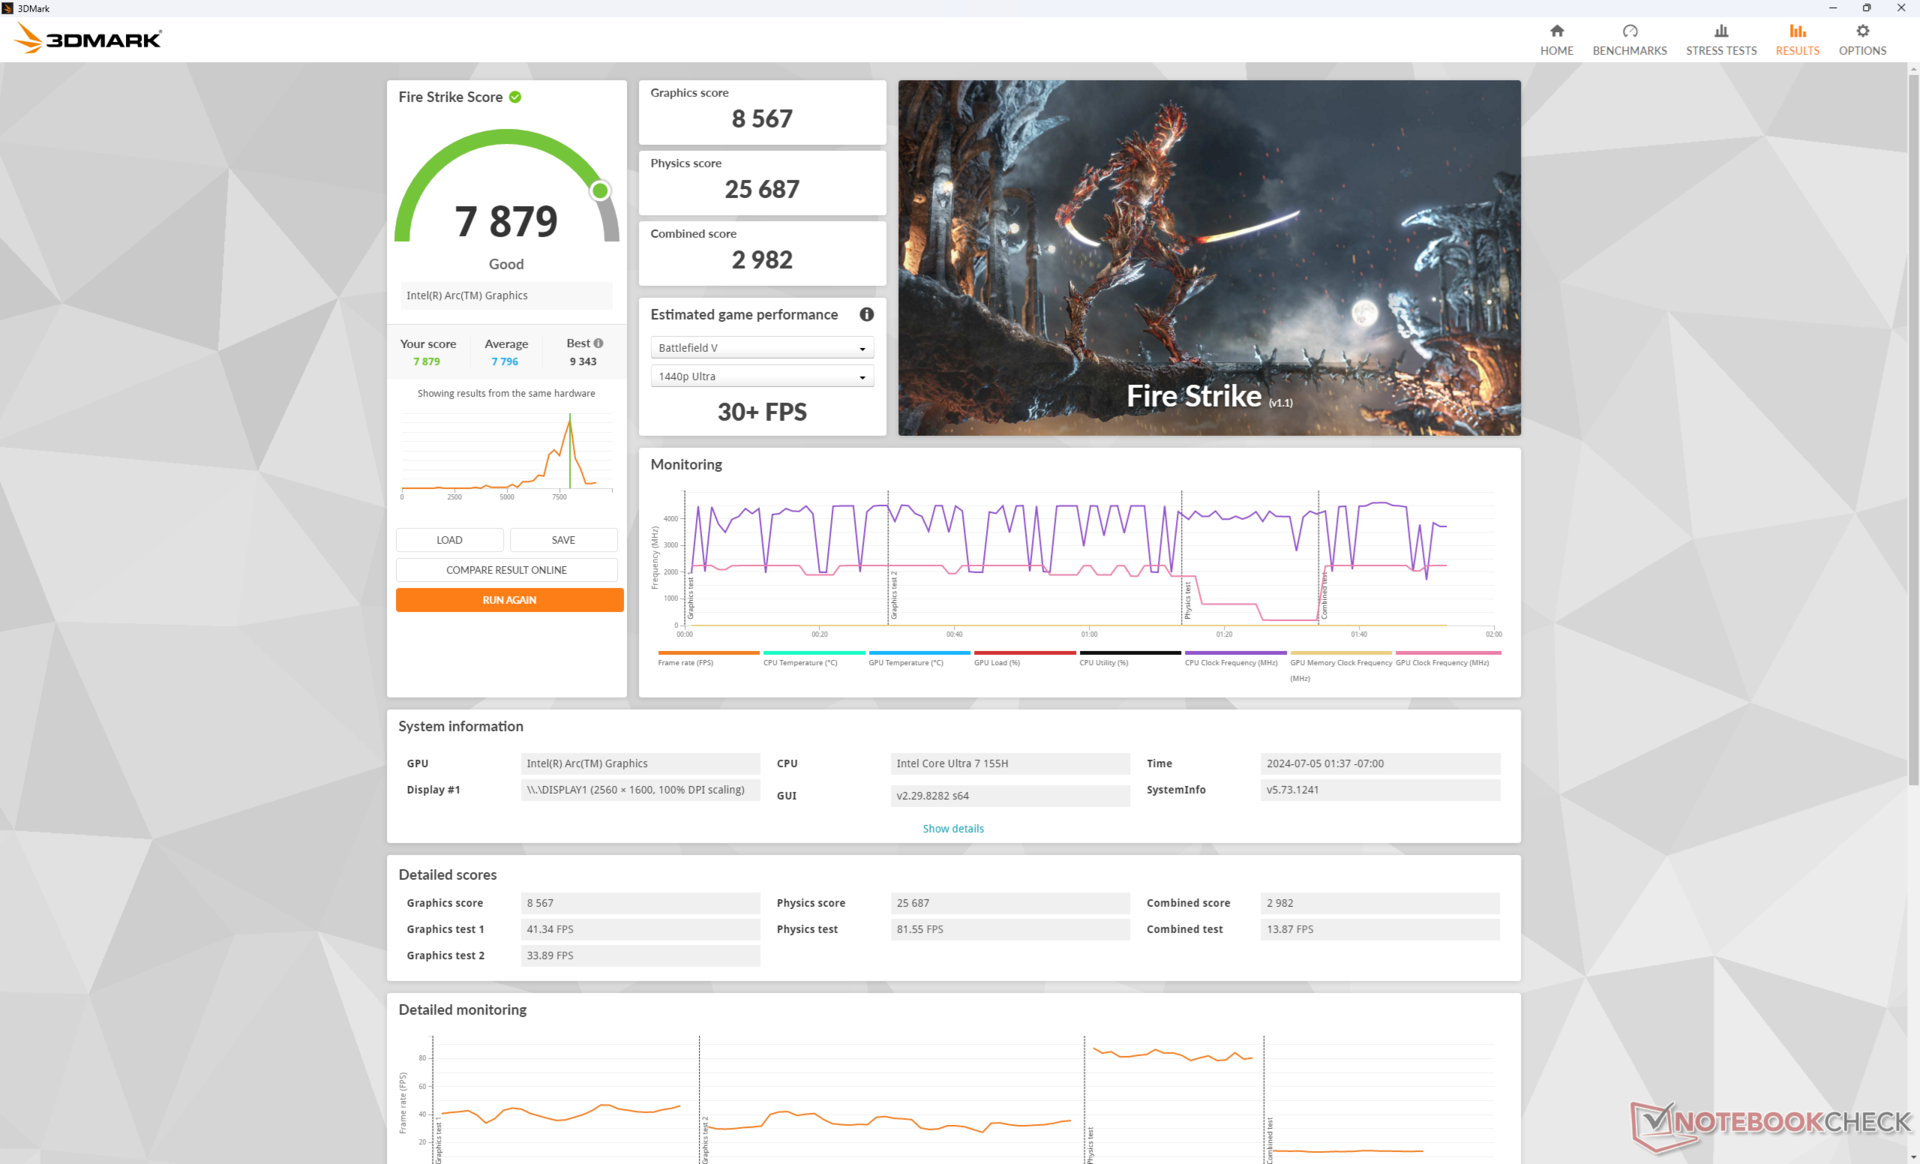
| Power Profile | Fire Strike Graphics Score | Fire Strike Physics Score | Combined Score |
| Performance Mode | 8567 | 25687 | 2982 |
| Balanced Mode | 8640 (-0%) | 26567 (-0%) | 2781 (-7%) |
| Battery Power | 7734 (-10%) | 25155 (-2%) | 2886 (-3%) |
Running on Balanced mode would impact performance only minimally at most based on our Fire Strike results in the table above. The performance deficit when running on battery power is lower than expected at just 10 percent for good consistency between the different power modes.
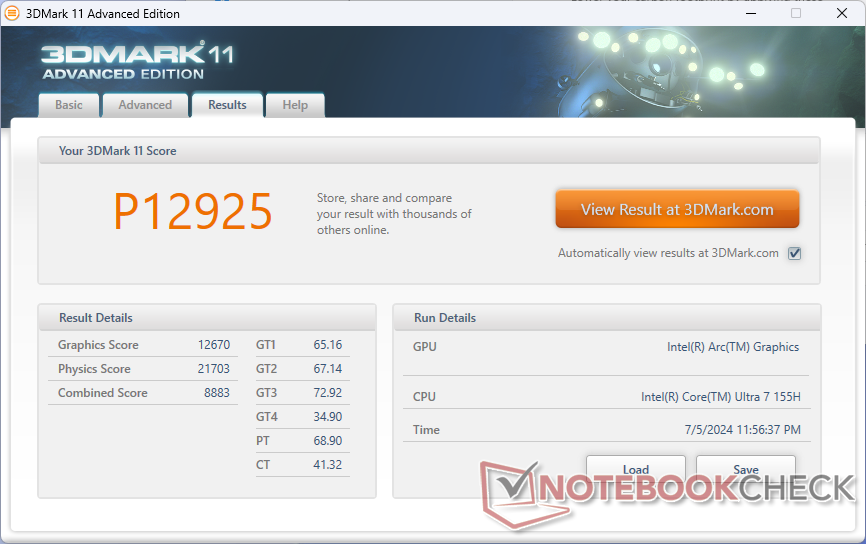
| 3DMark 11 Performance | 12925 points | |
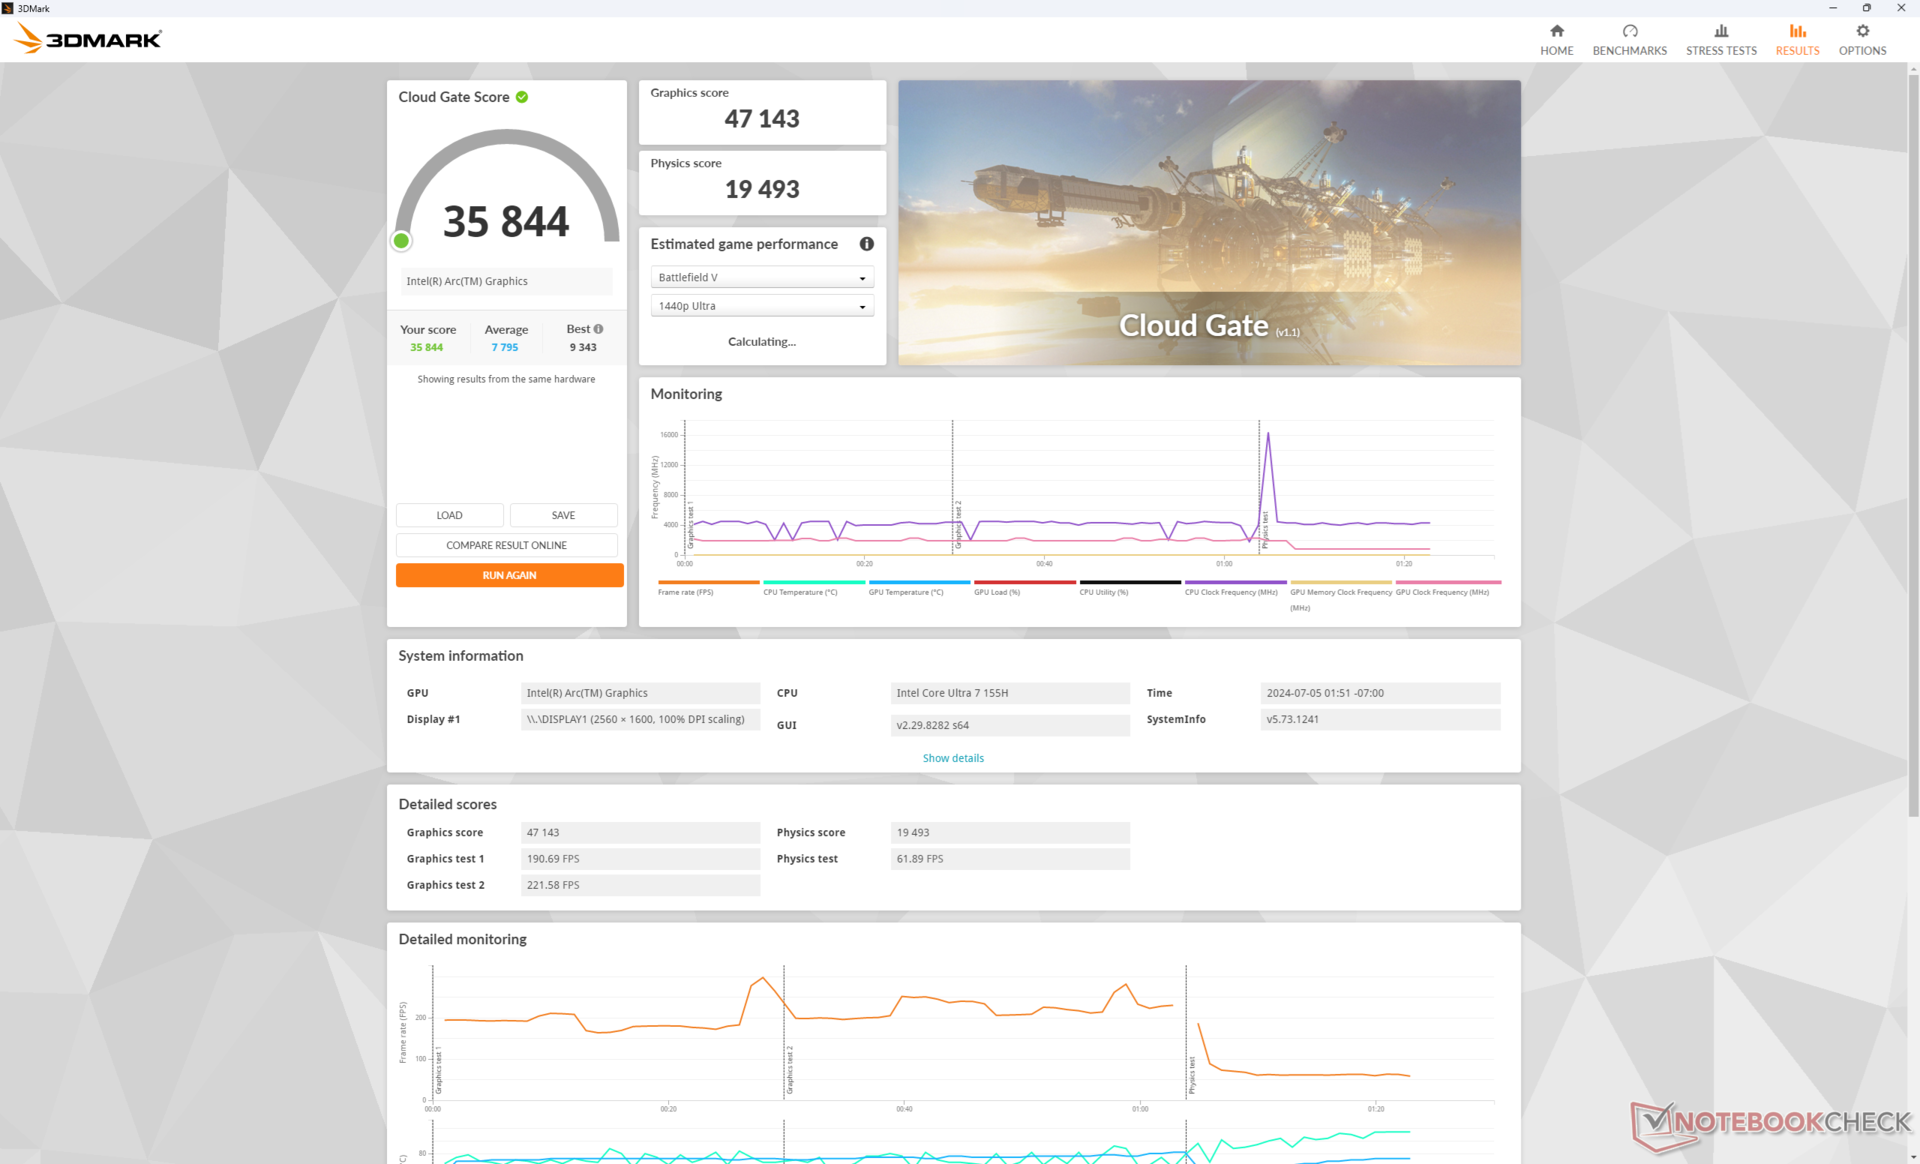
| 3DMark Cloud Gate Standard Score | 35844 points | |
| 3DMark Fire Strike Score | 7879 points | |
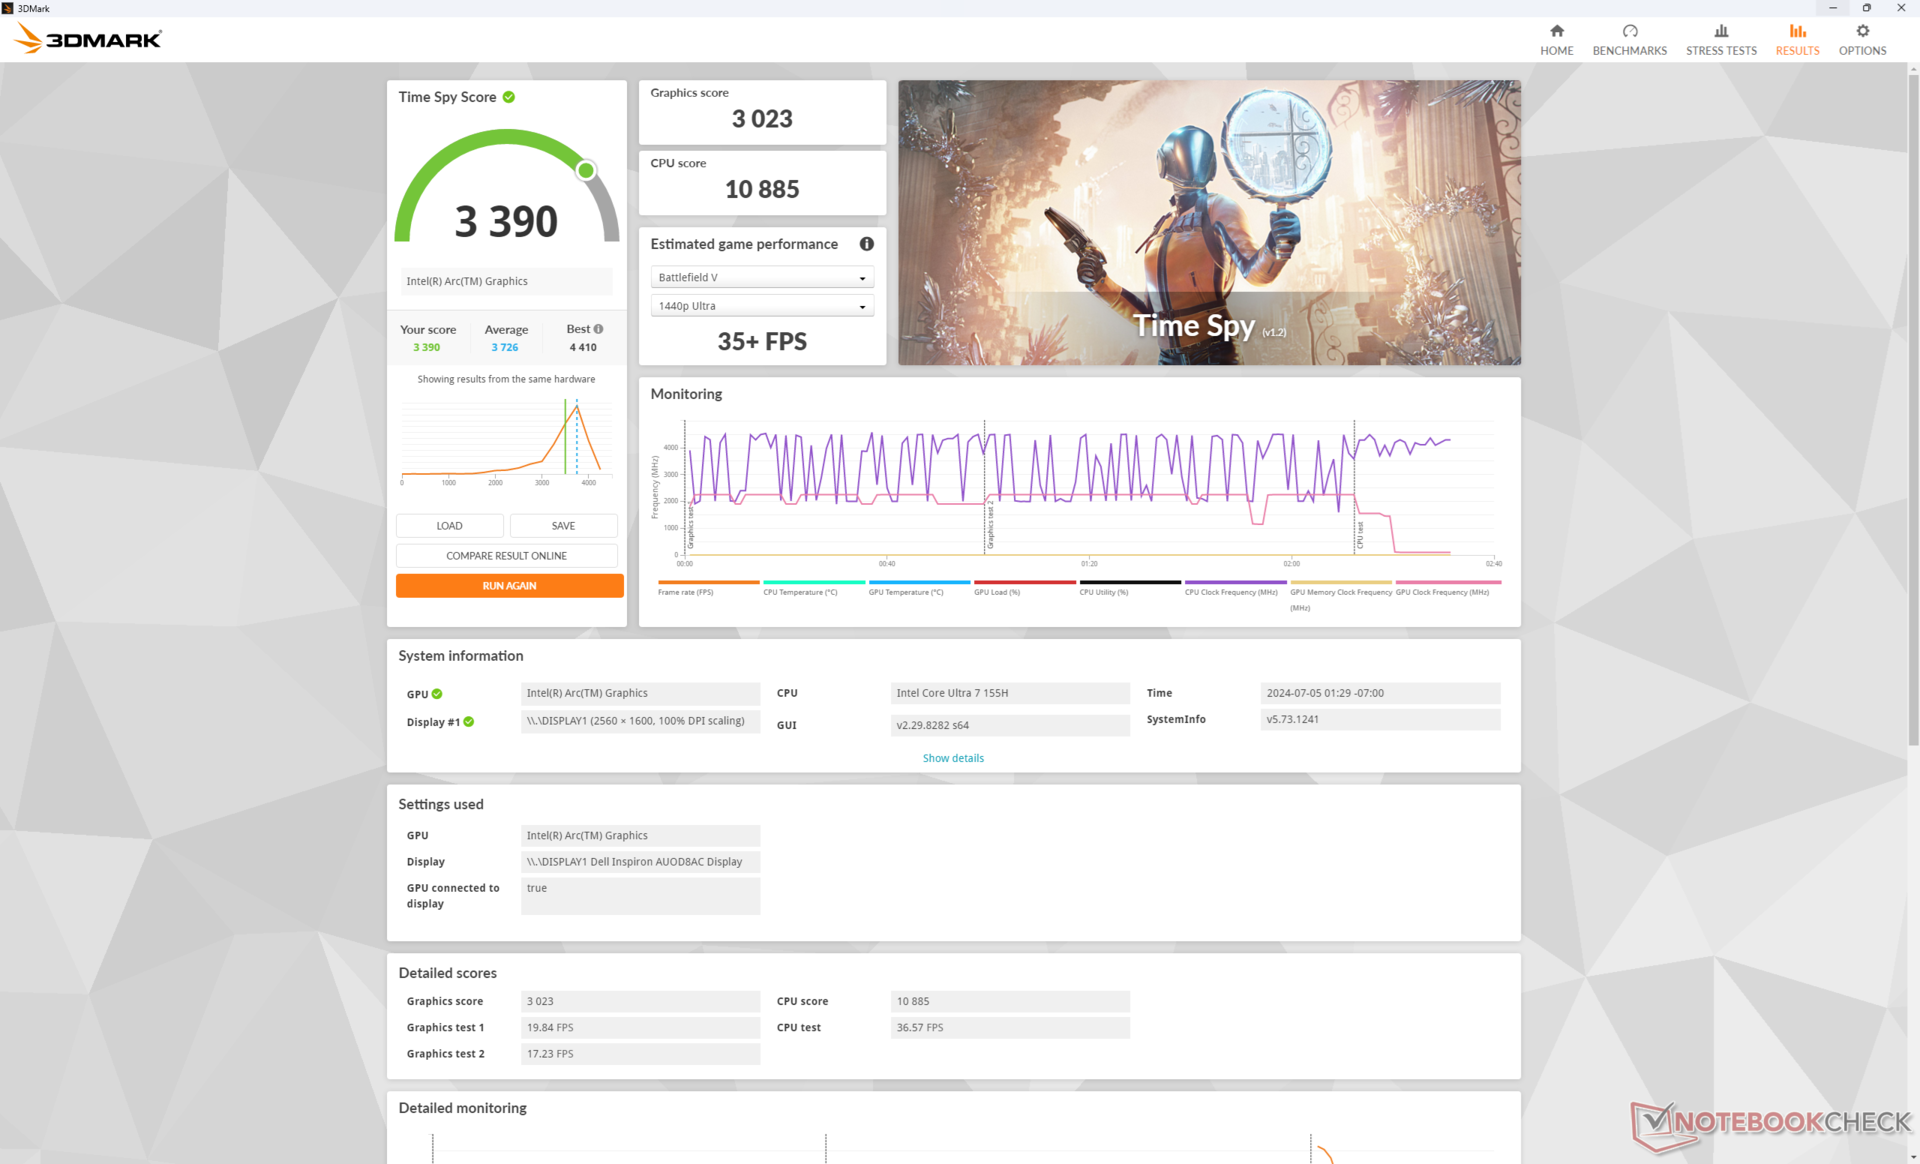
| 3DMark Time Spy Score | 3390 points | |
Help | ||
* ... smaller is better
| The Witcher 3 - 1920x1080 Ultra Graphics & Postprocessing (HBAO+) | |
| Dell Inspiron 16 Plus 7640 | |
| HP Envy x360 2-in-1 16-ad0097nr | |
| Lenovo IdeaPad Pro 5 16IMH G9 | |
| Dell Inspiron 16 7640 2-in-1 | |
| Samsung Galaxy Book4 Pro 360 | |
| Dell Inspiron 16 7635 2-in-1 | |
| Final Fantasy XV Benchmark - 1920x1080 High Quality | |
| Dell Inspiron 16 Plus 7640 | |
| Lenovo IdeaPad Pro 5 16IMH G9 | |
| Dell Inspiron 16 7640 2-in-1 | |
| HP Envy x360 2-in-1 16-ad0097nr | |
| Samsung Galaxy Book4 Pro 360 | |
| Dell Inspiron 16 7635 2-in-1 | |
| Strange Brigade - 1920x1080 ultra AA:ultra AF:16 | |
| Dell Inspiron 16 Plus 7640 | |
| Lenovo IdeaPad Pro 5 16IMH G9 | |
| Dell Inspiron 16 7640 2-in-1 | |
| HP Envy x360 2-in-1 16-ad0097nr | |
| Samsung Galaxy Book4 Pro 360 | |
| Dell Inspiron 16 7635 2-in-1 | |
| Dota 2 Reborn - 1920x1080 ultra (3/3) best looking | |
| Dell Inspiron 16 Plus 7640 | |
| Lenovo IdeaPad Pro 5 16IMH G9 | |
| Dell Inspiron 16 7640 2-in-1 | |
| HP Envy x360 2-in-1 16-ad0097nr | |
| Samsung Galaxy Book4 Pro 360 | |
| Dell Inspiron 16 7635 2-in-1 | |
| X-Plane 11.11 - 1920x1080 high (fps_test=3) | |
| Dell Inspiron 16 Plus 7640 | |
| Dell Inspiron 16 7640 2-in-1 | |
| Lenovo IdeaPad Pro 5 16IMH G9 | |
| Samsung Galaxy Book4 Pro 360 | |
| HP Envy x360 2-in-1 16-ad0097nr | |
| Dell Inspiron 16 7635 2-in-1 | |
| Far Cry 5 - 1920x1080 Ultra Preset AA:T | |
| Dell Inspiron 16 Plus 7640 | |
| Lenovo IdeaPad Pro 5 16IMH G9 | |
| Dell Inspiron 16 7640 2-in-1 | |
| HP Envy x360 2-in-1 16-ad0097nr | |
Cyberpunk 2077 ultra FPS Chart
| low | med. | high | ultra | |
|---|---|---|---|---|
| The Witcher 3 (2015) | 141.5 | 81.2 | 44.5 | 23.9 |
| Dota 2 Reborn (2015) | 101.5 | 93.3 | 77.8 | 78 |
| Final Fantasy XV Benchmark (2018) | 65 | 36.5 | 26.8 | |
| X-Plane 11.11 (2018) | 50.8 | 40.8 | 40.1 | |
| Far Cry 5 (2018) | 68 | 38 | 36 | 34 |
| Strange Brigade (2018) | 145.6 | 71.8 | 55.4 | 45.4 |
| Tiny Tina's Wonderlands (2022) | 49.2 | 37.3 | 26.4 | 21.2 |
| F1 22 (2022) | 68.8 | 65.6 | ||
| Baldur's Gate 3 (2023) | 30.8 | 27.4 | 23.7 | 22 |
| Cyberpunk 2077 (2023) | 31 | 26.3 | 21.9 |
Emissions
System Noise — Loud And Proud
With no major changes to the cooling solution over the 2023 model in spite our more demanding processor, the internal fan will have to run as loud or louder than before and that is exactly what we have recorded in our tests. The fan in the Inspiron 16 7640 2-in-1 speeds up more readily from silent to loud when heavier loads are introduced. For example, we're able to record a fan noise of 45 dB(A) less than halfway into the first benchmark scene of 3DMark 06 whereas the Inspiron 16 7635 2-in-1 would top out at 40 dB(A). Running games would also result in a fan noise of 45 dB(A) making our Dell one of the louder 16-inch convertibles in the market.

Noise level
| Idle |
| 22.9 / 22.9 / 25 dB(A) |
| Load |
| 45.1 / 44.9 dB(A) |
 | ||
30 dB silent 40 dB(A) audible 50 dB(A) loud |
||
min: | ||
| Dell Inspiron 16 7640 2-in-1 Arc 8-Core, Ultra 7 155H, Micron 2550 1TB | Dell Inspiron 16 Plus 7640 GeForce RTX 4060 Laptop GPU, Ultra 7 155H, SK hynix BC901 HFS001TEJ4X164N | Dell Inspiron 16 7635 2-in-1 Vega 7, R5 7530U, Kioxia BG5 KBG50ZNS512G | HP Envy x360 2-in-1 16-ad0097nr Radeon 780M, R7 8840HS, KIOXIA BG5 KBG50ZNV1T02 | Lenovo IdeaPad Pro 5 16IMH G9 Arc 8-Core, Ultra 7 155H, Samsung PM9C1a MZAL81T0HDLB | Samsung Galaxy Book4 Pro 360 Arc 7-Core, Ultra 5 125H, Samsung PM9B1 512GB MZVL4512HBLU | |
|---|---|---|---|---|---|---|
| Noise | 2% | 2% | 10% | -4% | 2% | |
| off / environment * (dB) | 22.9 | 23.8 -4% | 23.6 -3% | 22.9 -0% | 24.1 -5% | 24.1 -5% |
| Idle Minimum * (dB) | 22.9 | 24.2 -6% | 23.6 -3% | 23 -0% | 24.1 -5% | 24.1 -5% |
| Idle Average * (dB) | 22.9 | 24.2 -6% | 23.6 -3% | 23 -0% | 24.1 -5% | 24.1 -5% |
| Idle Maximum * (dB) | 25 | 24.2 3% | 23.6 6% | 23 8% | 28.2 -13% | 26.4 -6% |
| Load Average * (dB) | 45.1 | 28.9 36% | 40.3 11% | 23.8 47% | 44.4 2% | 35.2 22% |
| Cyberpunk 2077 ultra * (dB) | 44.9 | |||||
| Load Maximum * (dB) | 44.9 | 51 -14% | 44.2 2% | 43.8 2% | 44.4 1% | 39.2 13% |
| Witcher 3 ultra * (dB) | 51 | 44.2 | 43.8 | 36.5 | 38.5 |
* ... smaller is better
Temperature
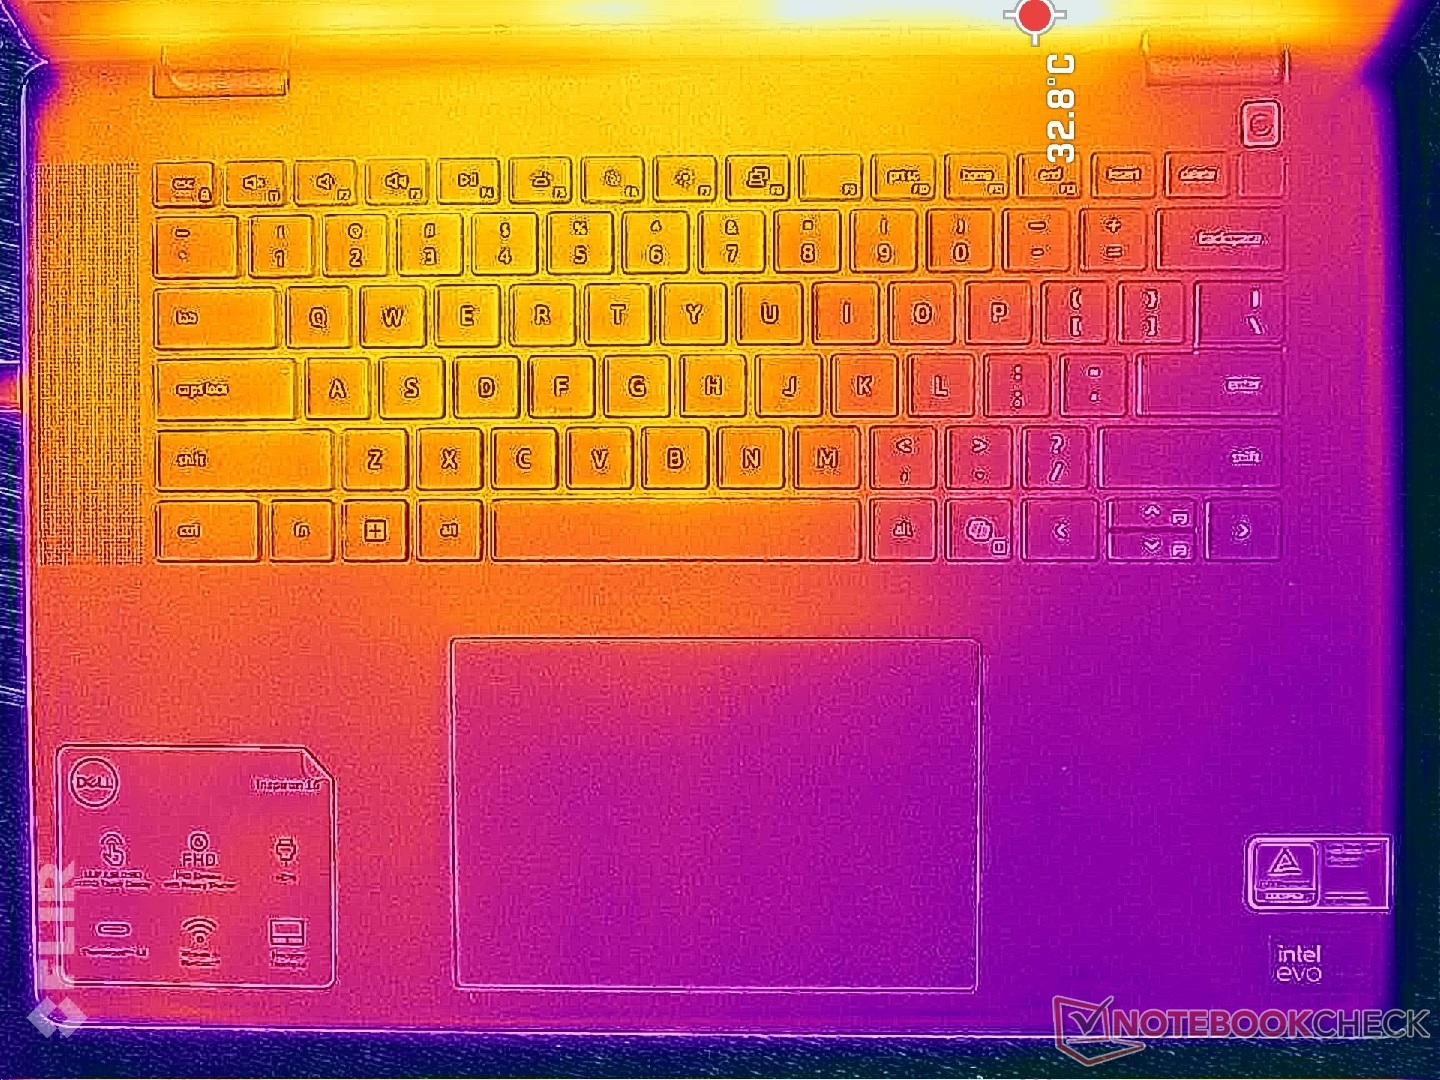
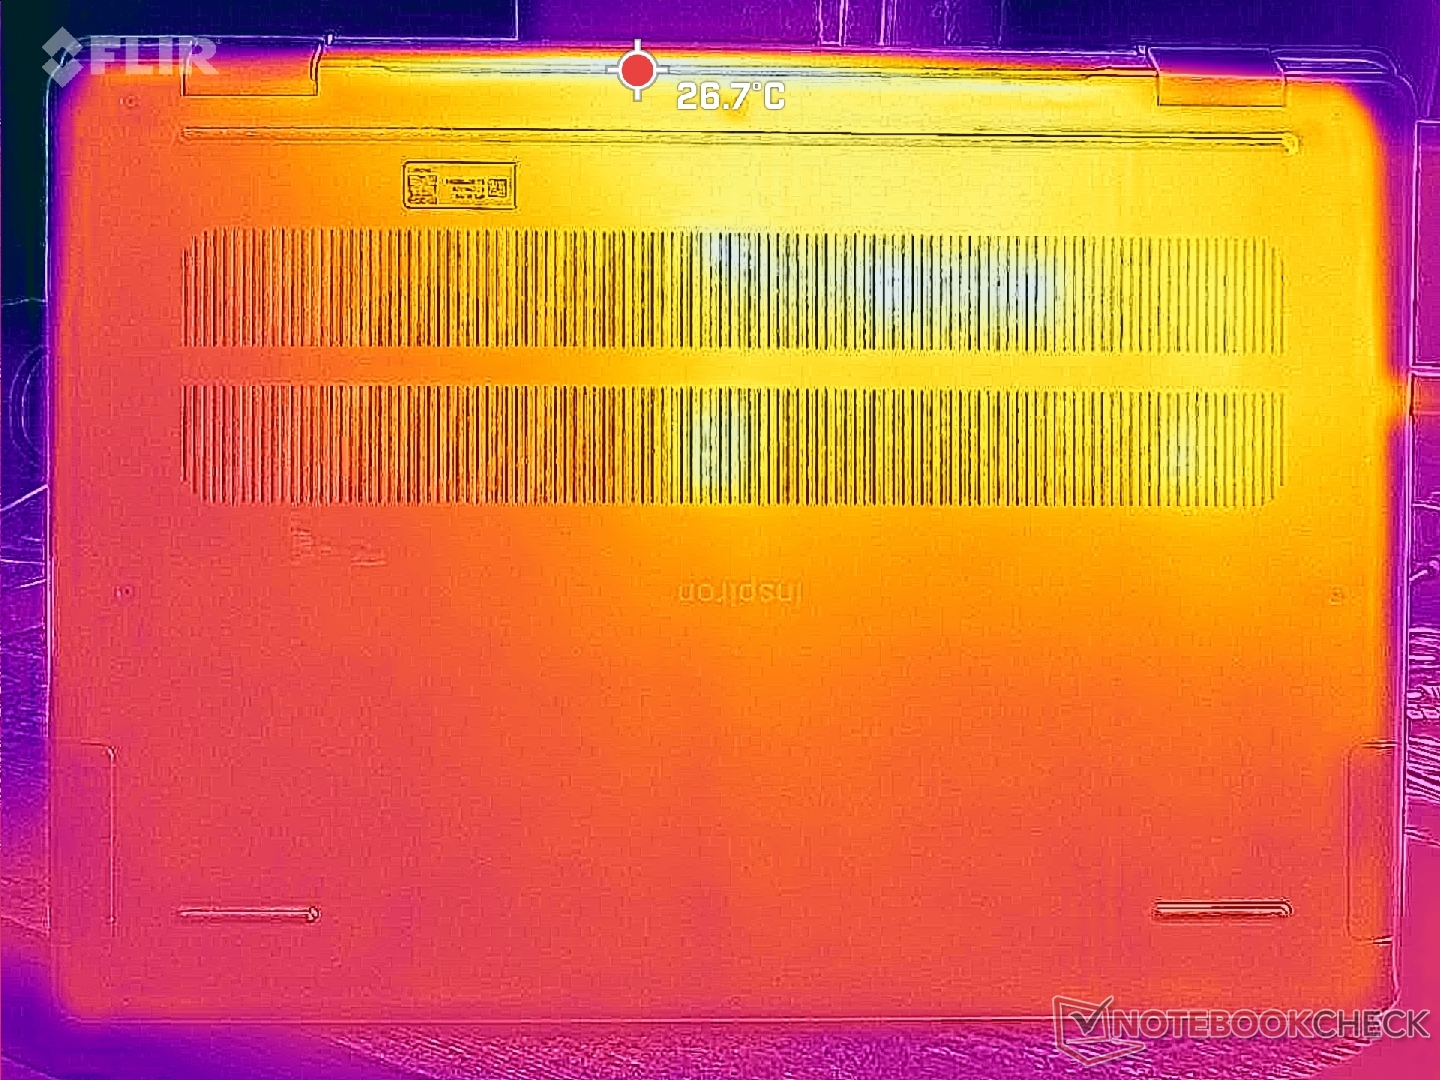
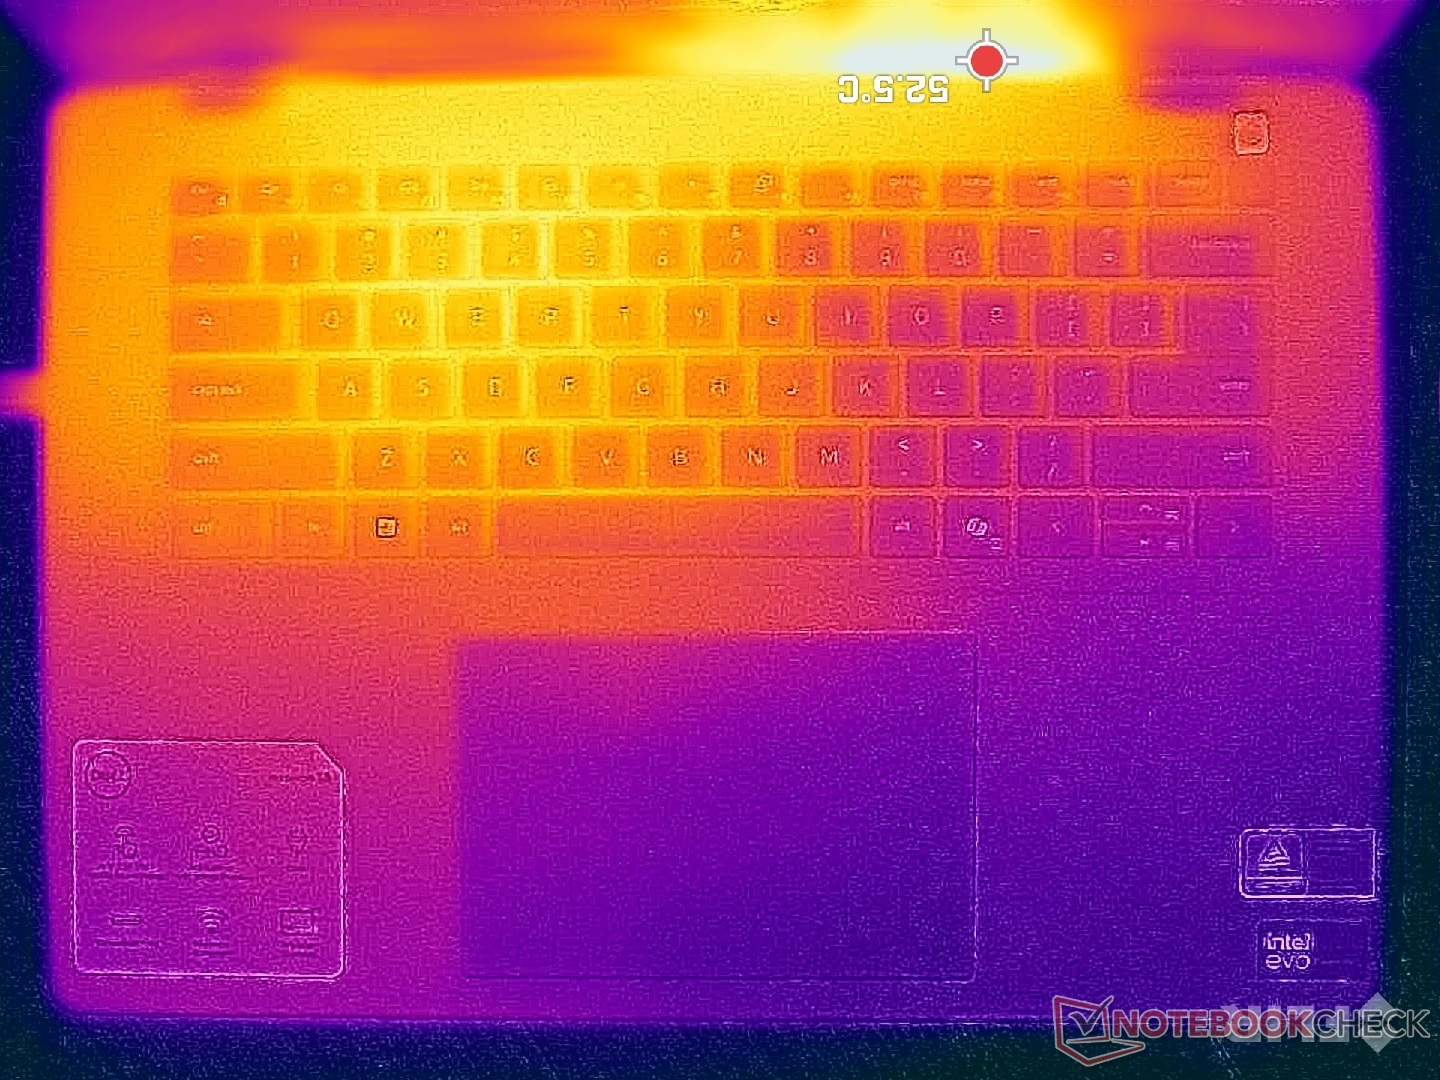
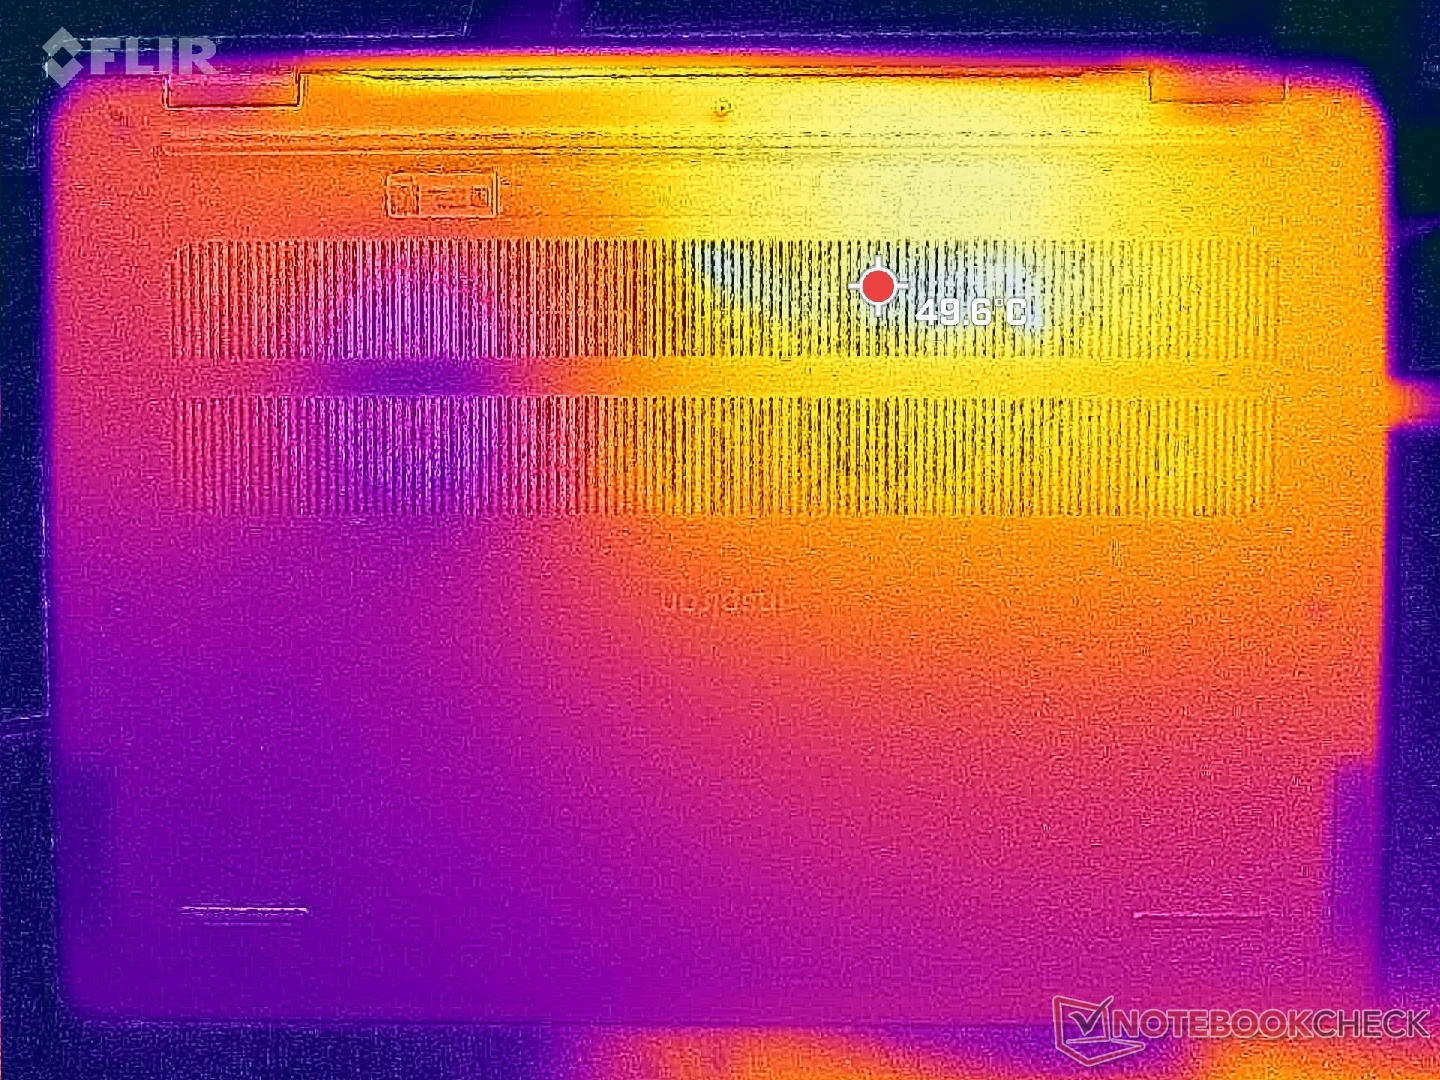
Surface temperatures are again warmer on the left half of the chassis than the right due to the asymmetric cooling solution. This time, however, average temperatures can be much warmer than before because of the more powerful Core H-series CPU. Hot spots on our unit, for example, can reach 47 C on both the C and D covers compared to just 39 C to 42 C on last year's model. These spots are thankfully toward the rear of the unit where fingers are less likely to touch.
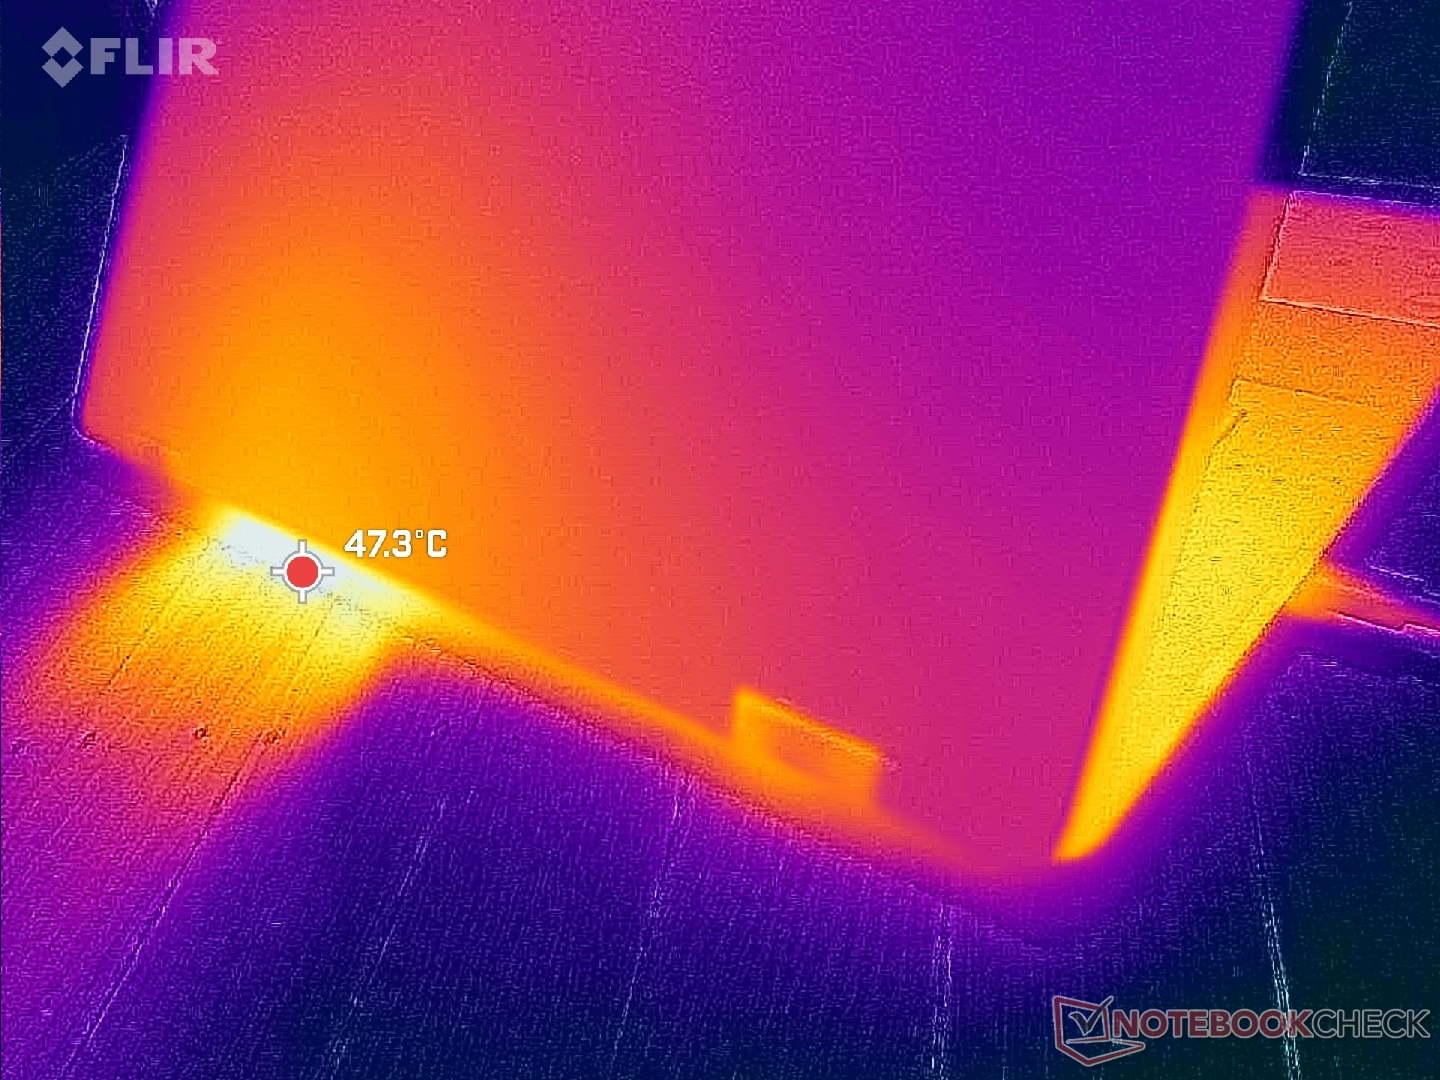
(-) The maximum temperature on the upper side is 46.8 °C / 116 F, compared to the average of 35.4 °C / 96 F, ranging from 19.6 to 60 °C for the class Convertible.
(-) The bottom heats up to a maximum of 45.6 °C / 114 F, compared to the average of 36.9 °C / 98 F
(+) In idle usage, the average temperature for the upper side is 29.9 °C / 86 F, compared to the device average of 30.3 °C / 87 F.
(+) The palmrests and touchpad are reaching skin temperature as a maximum (33.8 °C / 92.8 F) and are therefore not hot.
(-) The average temperature of the palmrest area of similar devices was 28 °C / 82.4 F (-5.8 °C / -10.4 F).
| Dell Inspiron 16 7640 2-in-1 Intel Core Ultra 7 155H, Intel Arc 8-Core iGPU | Dell Inspiron 16 Plus 7640 Intel Core Ultra 7 155H, NVIDIA GeForce RTX 4060 Laptop GPU | Dell Inspiron 16 7635 2-in-1 AMD Ryzen 5 7530U, AMD Radeon RX Vega 7 | HP Envy x360 2-in-1 16-ad0097nr AMD Ryzen 7 8840HS, AMD Radeon 780M | Lenovo IdeaPad Pro 5 16IMH G9 Intel Core Ultra 7 155H, Intel Arc 8-Core iGPU | Samsung Galaxy Book4 Pro 360 Intel Core Ultra 5 125H, Intel Arc 7-Core iGPU | |
|---|---|---|---|---|---|---|
| Heat | 3% | 11% | 8% | 19% | 18% | |
| Maximum Upper Side * (°C) | 46.8 | 43.4 7% | 41.6 11% | 42.6 9% | 36.3 22% | 38.6 18% |
| Maximum Bottom * (°C) | 45.6 | 41.6 9% | 39 14% | 47.8 -5% | 39.1 14% | 39.2 14% |
| Idle Upper Side * (°C) | 32.2 | 32.8 -2% | 29.4 9% | 27.4 15% | 24.9 23% | 25.2 22% |
| Idle Bottom * (°C) | 31.4 | 32.4 -3% | 28.6 9% | 27.8 11% | 26.1 17% | 25.7 18% |
* ... smaller is better
Speakers
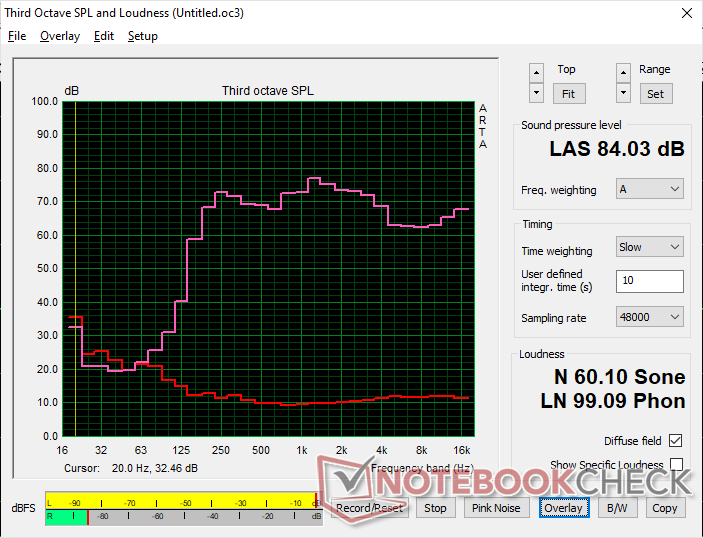

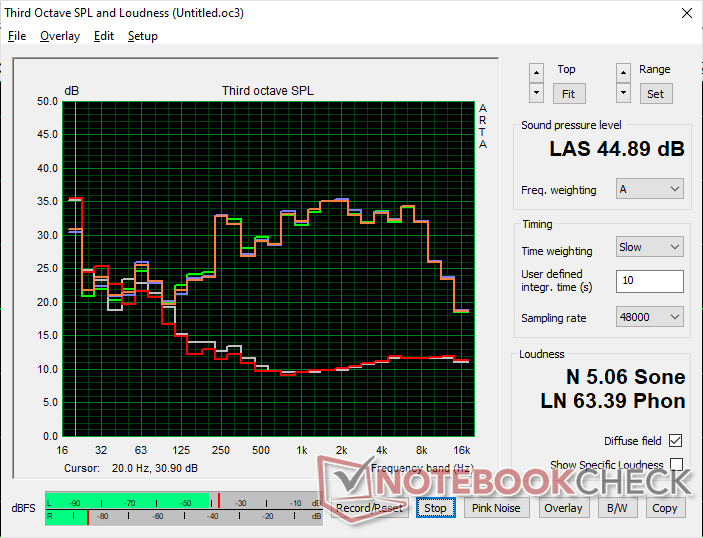
Dell Inspiron 16 7640 2-in-1 audio analysis
(+) | speakers can play relatively loud (84 dB)
Bass 100 - 315 Hz
(±) | reduced bass - on average 13.9% lower than median
(±) | linearity of bass is average (14% delta to prev. frequency)
Mids 400 - 2000 Hz
(+) | balanced mids - only 3.6% away from median
(+) | mids are linear (3.6% delta to prev. frequency)
Highs 2 - 16 kHz
(+) | balanced highs - only 4.5% away from median
(+) | highs are linear (2.8% delta to prev. frequency)
Overall 100 - 16.000 Hz
(+) | overall sound is linear (12% difference to median)
Compared to same class
» 12% of all tested devices in this class were better, 4% similar, 84% worse
» The best had a delta of 6%, average was 20%, worst was 57%
Compared to all devices tested
» 9% of all tested devices were better, 2% similar, 88% worse
» The best had a delta of 4%, average was 23%, worst was 134%
Apple MacBook Pro 16 2021 M1 Pro audio analysis
(+) | speakers can play relatively loud (84.7 dB)
Bass 100 - 315 Hz
(+) | good bass - only 3.8% away from median
(+) | bass is linear (5.2% delta to prev. frequency)
Mids 400 - 2000 Hz
(+) | balanced mids - only 1.3% away from median
(+) | mids are linear (2.1% delta to prev. frequency)
Highs 2 - 16 kHz
(+) | balanced highs - only 1.9% away from median
(+) | highs are linear (2.7% delta to prev. frequency)
Overall 100 - 16.000 Hz
(+) | overall sound is linear (4.6% difference to median)
Compared to same class
» 0% of all tested devices in this class were better, 0% similar, 100% worse
» The best had a delta of 5%, average was 17%, worst was 45%
Compared to all devices tested
» 0% of all tested devices were better, 0% similar, 100% worse
» The best had a delta of 4%, average was 23%, worst was 134%
Energy Management — Core-H And Mini-LED Can Be Demanding
Power Consumption
Idling on desktop demands between 6 W and 14 W depending on the brightness setting which is several watts higher than what we recorded on the Inspiron 16 7635 2-in-1. Of course, the more demanding H-series CPU and higher resolution mini-LED panel are both responsible for the generally higher consumption.
Consumption is again higher than the Inspiron 16 7635 2-in-1 by over 40 percent when running more demanding applications like games. With a GPU performance uptick of more than 2x over the RX Vega 7, however, the consumption increase should be well worth it for most users. A similar conclusion can be made for CPU-intensive tasks as well when running Prime95. If battery life is more desirable over performance, then opting for the cheaper and slower Core Ultra 5 125U configuration is expected to save a lot of power in this regard.
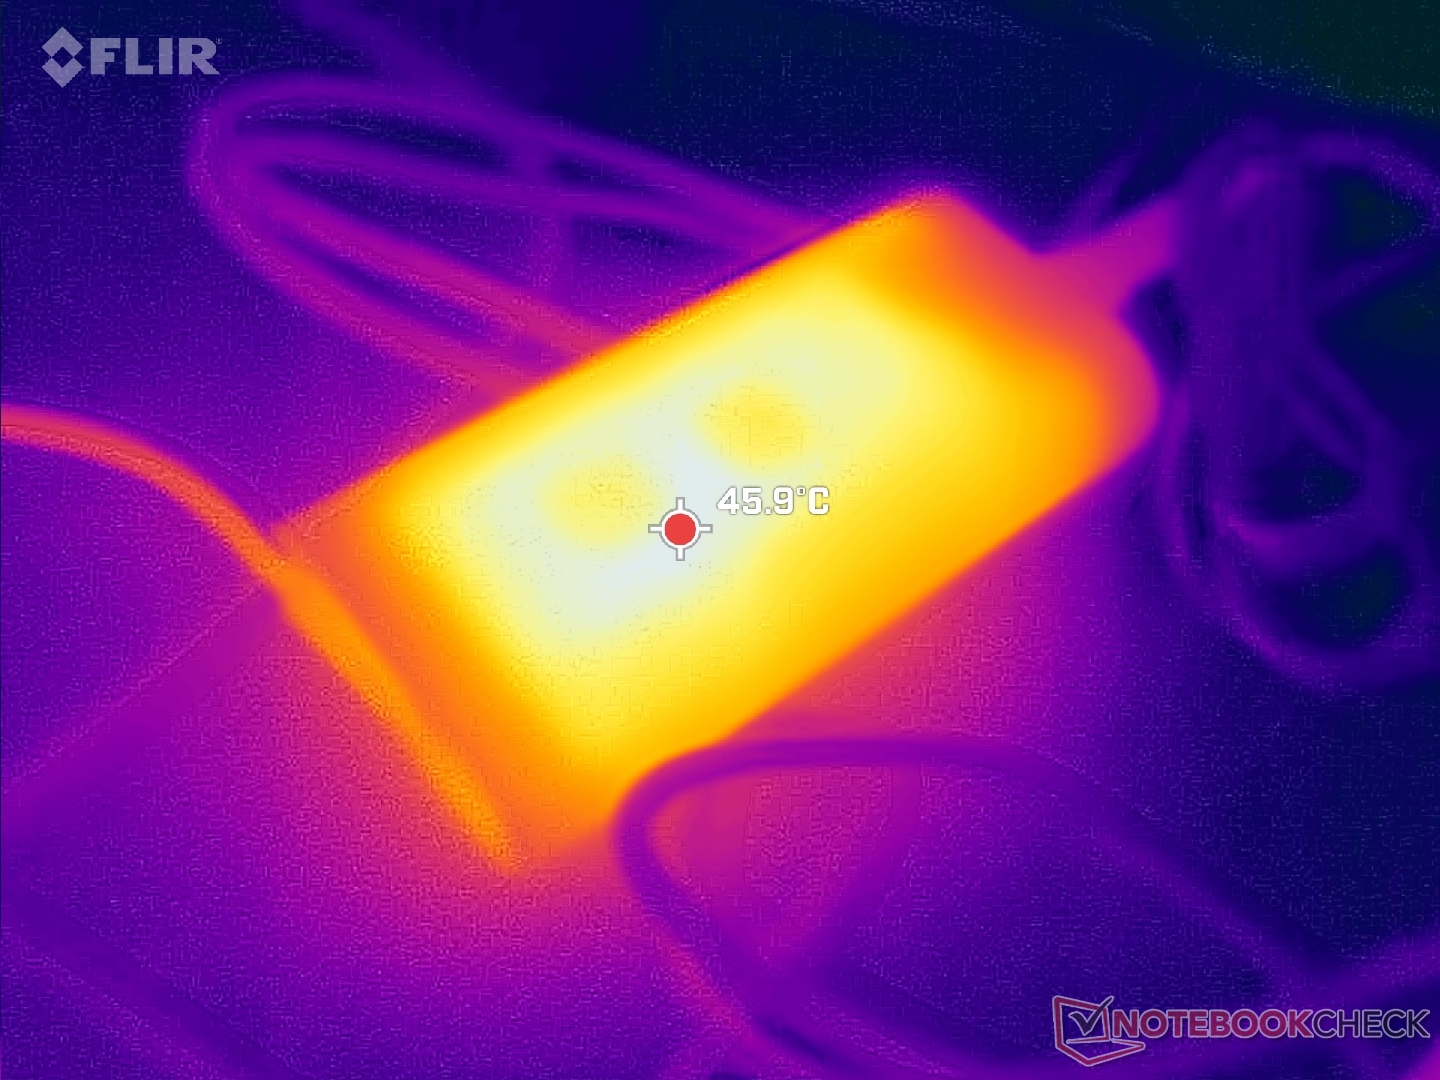
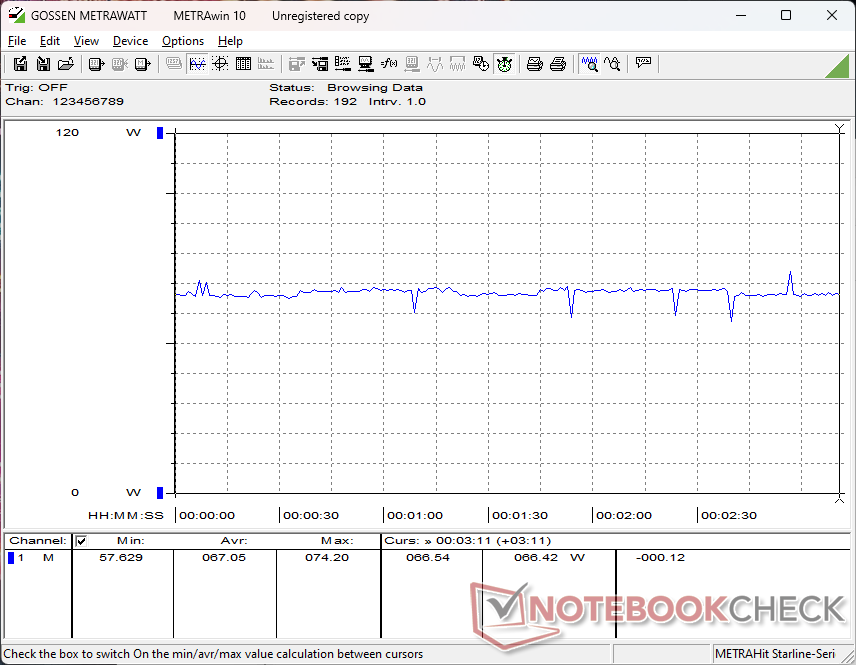
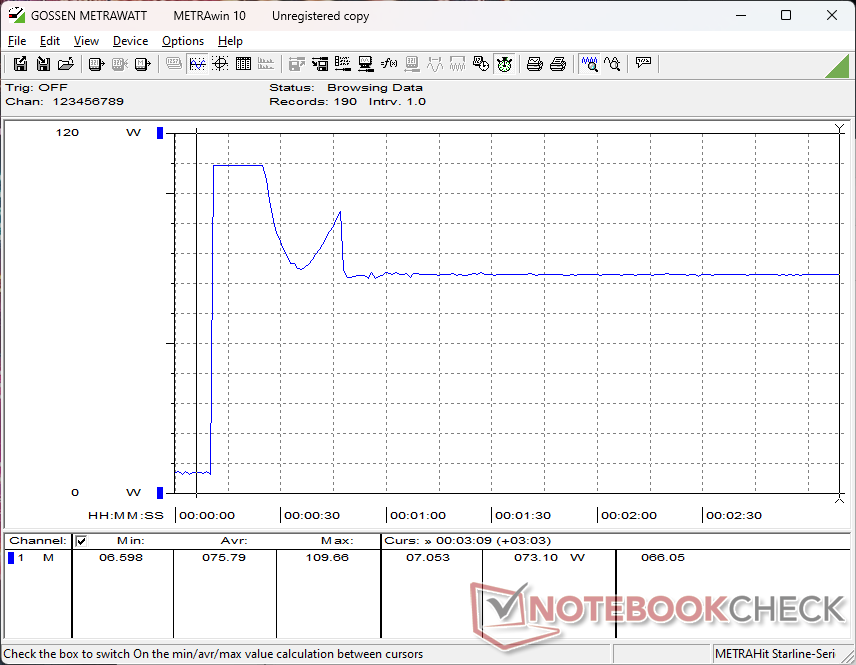
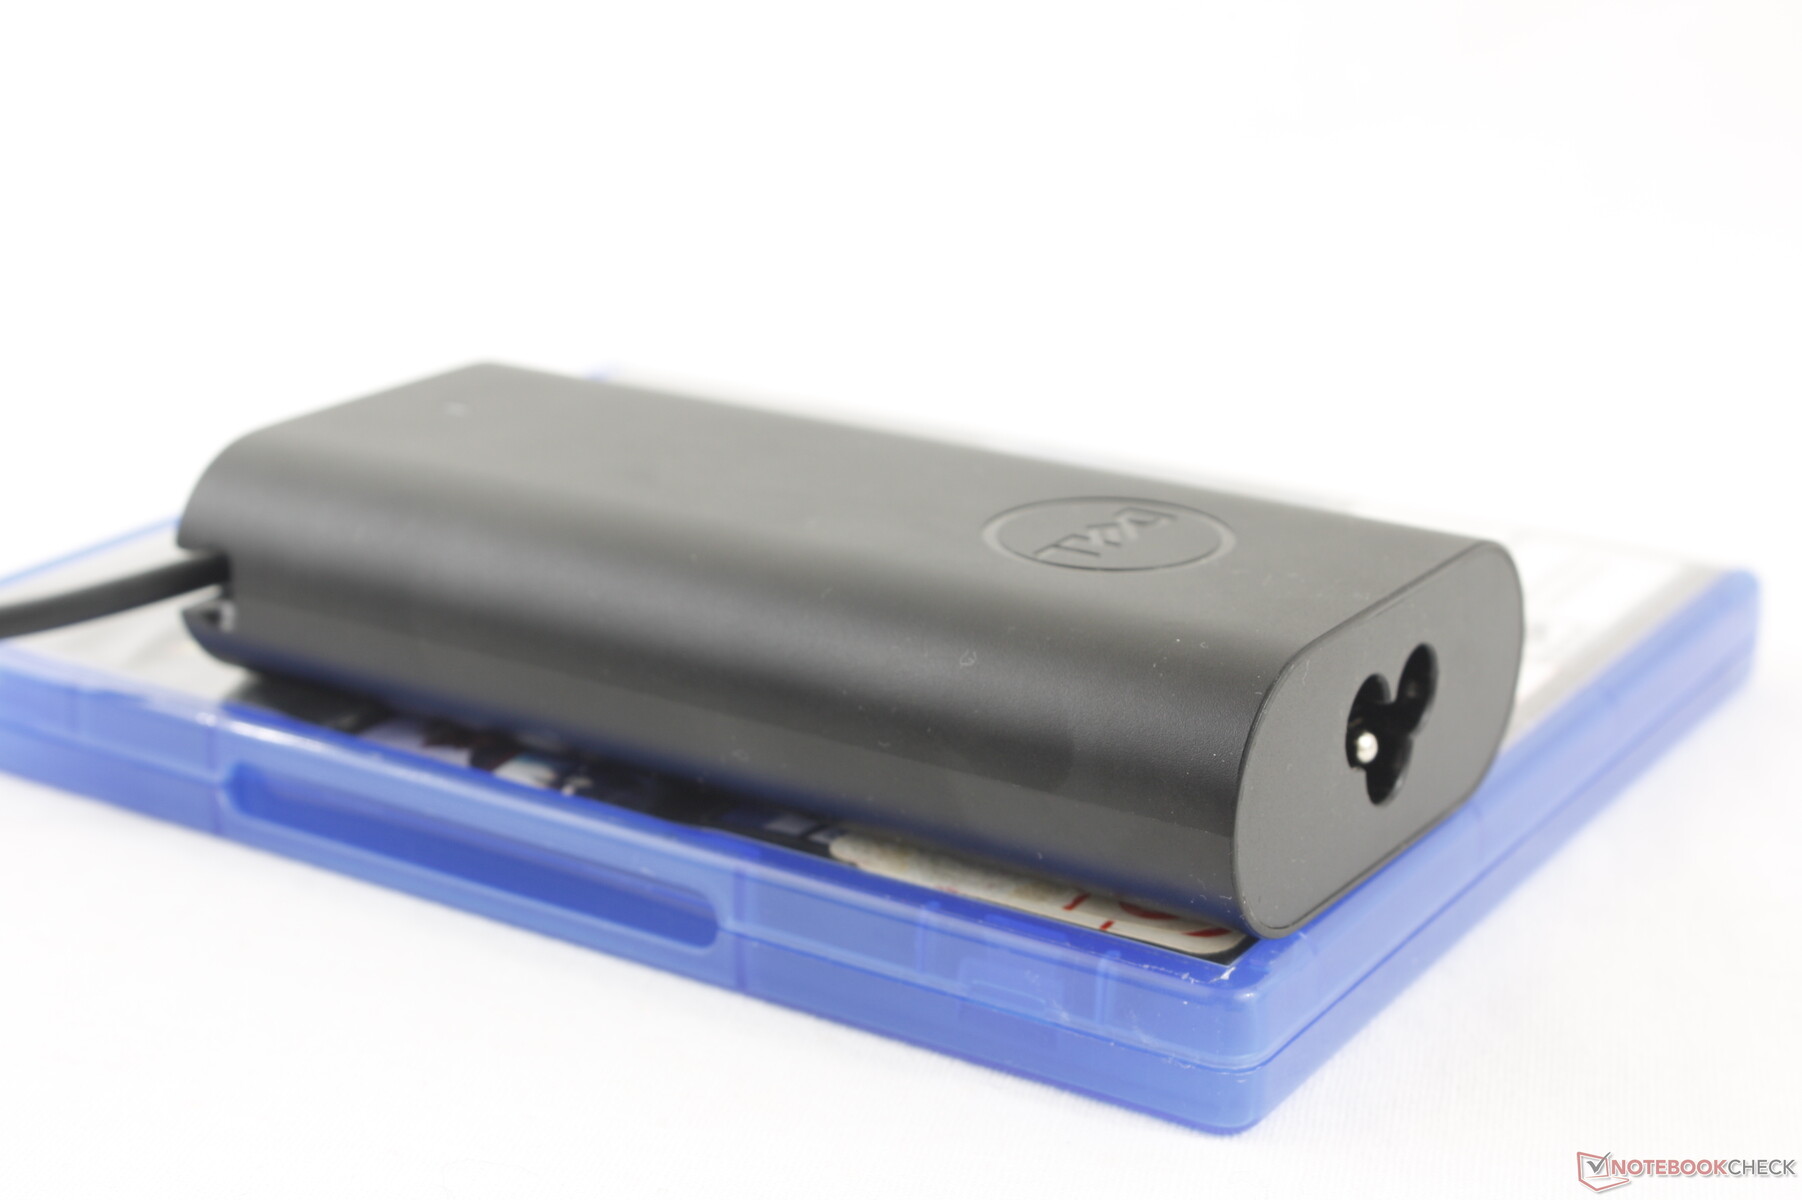
We're able to record a maximum consumption of 110 W even though the small-medium (~12.2 x 5.9 x 2.7 cm) USB-C AC adapter is only rated for 100 W. This maximum draw is only temporary as shown by our graph below due to thermal limitations. It's nonetheless much higher than what we recorded on the Inspiron 16 7635 2-in-1 due to the higher Turbo Boost potential of the Core H-series CPU.

| Off / Standby | |
| Idle | |
| Load |
|
Key:
min: | |
| Dell Inspiron 16 7640 2-in-1 Ultra 7 155H, Arc 8-Core, Micron 2550 1TB, Mini-LED, 2560x1600, 16" | Dell Inspiron 16 Plus 7640 Ultra 7 155H, GeForce RTX 4060 Laptop GPU, SK hynix BC901 HFS001TEJ4X164N, IPS, 2560x1600, 16" | Dell Inspiron 16 7635 2-in-1 R5 7530U, Vega 7, Kioxia BG5 KBG50ZNS512G, IPS, 1920x1200, 16" | HP Envy x360 2-in-1 16-ad0097nr R7 8840HS, Radeon 780M, KIOXIA BG5 KBG50ZNV1T02, OLED, 2880x1800, 16" | Lenovo IdeaPad Pro 5 16IMH G9 Ultra 7 155H, Arc 8-Core, Samsung PM9C1a MZAL81T0HDLB, IPS, 2560x1600, 16" | Samsung Galaxy Book4 Pro 360 Ultra 5 125H, Arc 7-Core, Samsung PM9B1 512GB MZVL4512HBLU, OLED, 2880x1800, 16" | |
|---|---|---|---|---|---|---|
| Power Consumption | 7% | 35% | 26% | 22% | 44% | |
| Idle Minimum * (Watt) | 6.1 | 4.2 31% | 4.8 21% | 5 18% | 3.5 43% | 3 51% |
| Idle Average * (Watt) | 13.5 | 6.9 49% | 7.6 44% | 6.2 54% | 9.6 29% | 6.3 53% |
| Idle Maximum * (Watt) | 13.8 | 15.2 -10% | 8.7 37% | 14.7 -7% | 9.9 28% | 6.5 53% |
| Load Average * (Watt) | 63.6 | 70.4 -11% | 47.1 26% | 49.9 22% | 62.7 1% | 49.3 22% |
| Cyberpunk 2077 ultra external monitor * (Watt) | 64.6 | |||||
| Cyberpunk 2077 ultra * (Watt) | 67 | |||||
| Load Maximum * (Watt) | 109.7 | 137.4 -25% | 56.4 49% | 65 41% | 101.2 8% | 65.5 40% |
| Witcher 3 ultra * (Watt) | 115.9 | 46.6 | 54.5 | 55.8 | 45.9 |
* ... smaller is better
Power Consumption Cyberpunk / Stress Test
Power Consumption external Monitor
Battery Life
The 90 Wh battery pack is larger than the 64 Wh pack in last year's Inspiron 16 7635 2-in-1. Even so, runtimes are shorter by almost three hours during our browsing test due to the more demanding display and CPU as mentioned above. The runtime differences hold true even when the screens are set to an identical brightness level of 150 nits.
Charging the large battery pack from empty to full capacity is relatively slow at around 2.5 hours compared to 1.5 hours on most other Ultrabooks.
| Dell Inspiron 16 7640 2-in-1 Ultra 7 155H, Arc 8-Core, 90 Wh | Dell Inspiron 16 Plus 7640 Ultra 7 155H, GeForce RTX 4060 Laptop GPU, 90 Wh | Dell Inspiron 16 7635 2-in-1 R5 7530U, Vega 7, 64 Wh | HP Envy x360 2-in-1 16-ad0097nr R7 8840HS, Radeon 780M, 68 Wh | Lenovo IdeaPad Pro 5 16IMH G9 Ultra 7 155H, Arc 8-Core, 84 Wh | Samsung Galaxy Book4 Pro 360 Ultra 5 125H, Arc 7-Core, 76 Wh | |
|---|---|---|---|---|---|---|
| Battery runtime | 17% | 22% | -14% | -10% | -2% | |
| Reader / Idle (h) | 21.8 | 26 19% | 15.6 -28% | |||
| WiFi v1.3 (h) | 11.4 | 13.3 17% | 14.5 27% | 7.7 -32% | 12.6 11% | 8.9 -22% |
| Load (h) | 1.6 | 1.9 19% | 1.9 19% | 1.1 -31% | 1.9 19% | |
| H.264 (h) | 16 | 14.7 |
Pros
Cons
Verdict — Big On Size And Performance
There are several strong points about the Inspiron 16 7640 2-in-1. Firstly, its performance with the Core Ultra 7 155H is top notch especially when compared to other 16-inch convertibles running on integrated graphics. This is a gaming-class CPU with no major throttling issues and it should blaze through any content or multi-tasking applications you can throw at the machine. Secondly, the mini-LED panel cements the model as a high-end multimedia player with a handy 2-in-1 form factor and active pen.
The Inspiron 16 7640 2-in-1 is large and in charge. While its performance and display are impressive for the price, users are paying for it with a bulky chassis and shorter battery life.
Higher performance and brighter displays come at the predictable cost of higher power consumption. The more demanding components lead to more generated heat resulting in louder fan noise and shorter runtimes than on last year's model. The differences aren't minor either as demonstrated by our tests and measurements above.
Additionally, the large size and heavy weight of the model can't be ignored. Lighter 16-inch convertibles are available including the LG Gram 16 2-in-1 or Samsung Galaxy Book4 Pro 360 for a more travel-friendly experience. The Dell is larger and heavier than even the HP Spectre x360 16 which notably offers discrete GeForce graphics.
The Inspiron 16 7640 2-in-1 is nonetheless still attractive despite its flaws because of its reasonable $1000 asking price. It excels when it comes to speed and image quality against other laptops in the same price range.
Price and Availability
The base configuration with the Core Ultra 5 125U and standard 1200p IPS touchscreen starts at $800 while the Core Ultra 7 155H and 2.5K mini-LED configuration as reviewed is currently shipping for $1000.
Hinweis: Wir haben unser Rating-System kürzlich aktualisiert und die Ergebnisse von Version 8 sind nicht mit den Ergebnissen von Version 7 vergleichbar. Weitere Informationen dazu sind hier verfügbar.
Note: We have recently updated our rating system and the results of version 8 are not comparable with the results of version 7. More information is available here .
Dell Inspiron 16 7640 2-in-1
- 07/19/2024 v8
Allen Ngo
 Total Sustainability Score:
 Transparency
The selection of devices to be reviewed is made by our editorial team. The test sample was provided to the author as a loan by the manufacturer or retailer for the purpose of this review. The lender had no influence on this review, nor did the manufacturer receive a copy of this review before publication. There was no obligation to publish this review. As an independent media company, Notebookcheck is not subjected to the authority of manufacturers, retailers or publishers.
This is how Notebookcheck is testing
Every year, Notebookcheck independently reviews hundreds of laptops and smartphones using standardized procedures to ensure that all results are comparable. We have continuously developed our test methods for around 20 years and set industry standards in the process. In our test labs, high-quality measuring equipment is utilized by experienced technicians and editors. These tests involve a multi-stage validation process. Our complex rating system is based on hundreds of well-founded measurements and benchmarks, which maintains objectivity. Further information on our test methods can be found here.
Price comparison
