Dell Inspiron 14 7445 2-in-1 convertible review: Transitioning from Ryzen-U to Ryzen-HS

The Inspiron 14 7445 2-in-1 is the successor to last year's Inspiron 14 7435 2-in-1. The new model is notable for its transition to not just AMD Zen 4, but to the Ryzen HS-series instead of ULV Ryzen-U as found on last year's model. This alone is expected to boost performance by much more than your typical yearly processor update.
Our review unit is the highest-end configuration with the Ryzen 7 8840HS for approximately $950 USD. Lesser SKUs are available with the Ryzen 5 8640HS instead, but all options utilize the same 1200p60 touchscreen. Intel Raptor Lake-U SKUs are also available under the model name Inspiron 14 7440 2-in-1.
Competitors to the Inspiron 14 7445 2-in-1 include other budget 14-inch convertibles like the Lenovo IdeaPad Flex 5 14, HP Pavilion x360 14, or Asus VivoBook Flip 14.
More Dell reviews:
Potential Competitors in Comparison
Rating | Version | Date | Model | Weight | Height | Size | Resolution | Price |
|---|---|---|---|---|---|---|---|---|
| 80.1 % | v8 | 06 / 2024 | Dell Inspiron 14 7445 2-in-1 R7 8840HS, Radeon 780M | 1.7 kg | 18.9 mm | 14.00" | 1920x1200 | |
| 84.5 % v7 (old) | v7 (old) | 08 / 2023 | Dell Inspiron 14 7435 2-in-1 R5 7530U, Vega 7 | 1.6 kg | 18.6 mm | 14.00" | 1920x1200 | |
| 86.7 % v7 (old) | v7 (old) | 10 / 2021 | Dell XPS 13 9310 2-in-1 i7-1165G7, Iris Xe G7 96EUs | 1.3 kg | 14.35 mm | 13.40" | 1920x1200 | |
| 81.9 % v7 (old) | v7 (old) | 08 / 2023 | Lenovo IdeaPad Flex 5 14IRU8 i5-1335U, Iris Xe G7 80EUs | 1.6 kg | 17.4 mm | 14.00" | 1920x1200 | |
| 81.8 % v7 (old) | v7 (old) | 07 / 2021 | HP Pavilion x360 14-dy0157ng i5-1135G7, Iris Xe G7 80EUs | 1.5 kg | 19.9 mm | 14.00" | 1920x1080 | |
| 79.1 % v7 (old) | v7 (old) | 06 / 2021 | Asus VivoBook Flip 14 TP470EZ i5-1135G7, Xe MAX | 1.5 kg | 18.7 mm | 14.00" | 1920x1080 |
Note: We have recently updated our rating system and the results of version 8 are not comparable with the results of version 7. More information is available here .
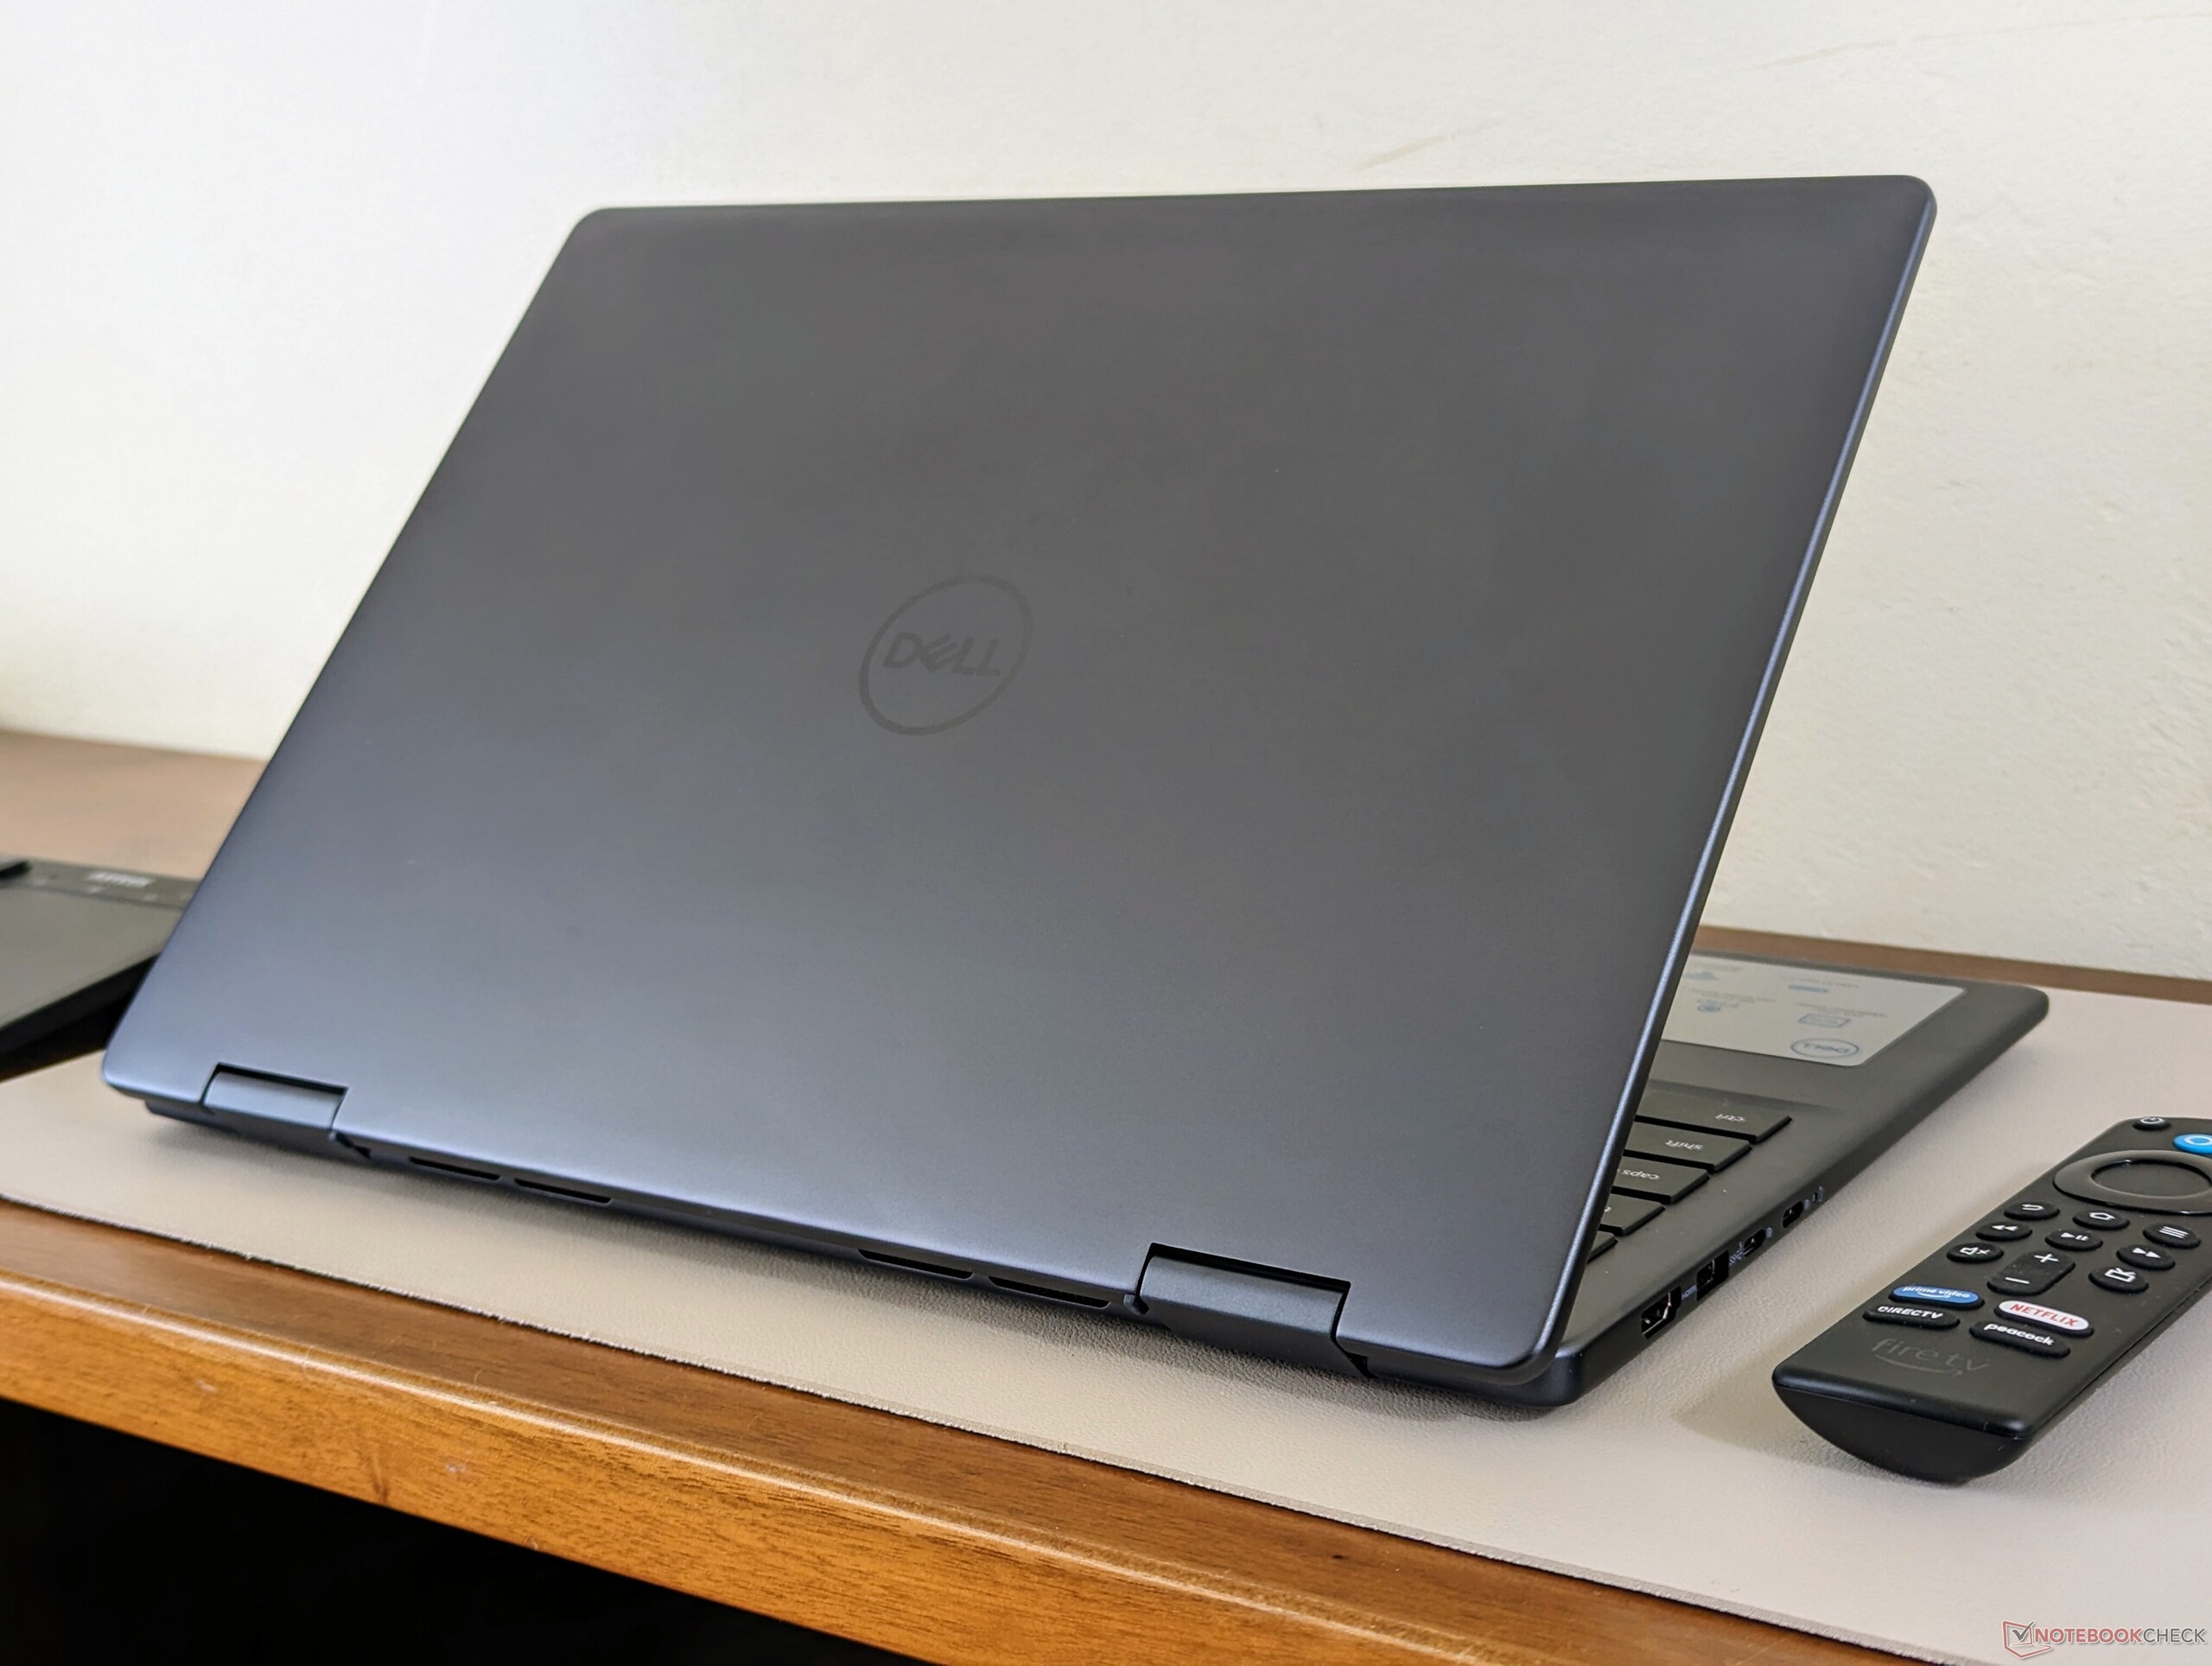
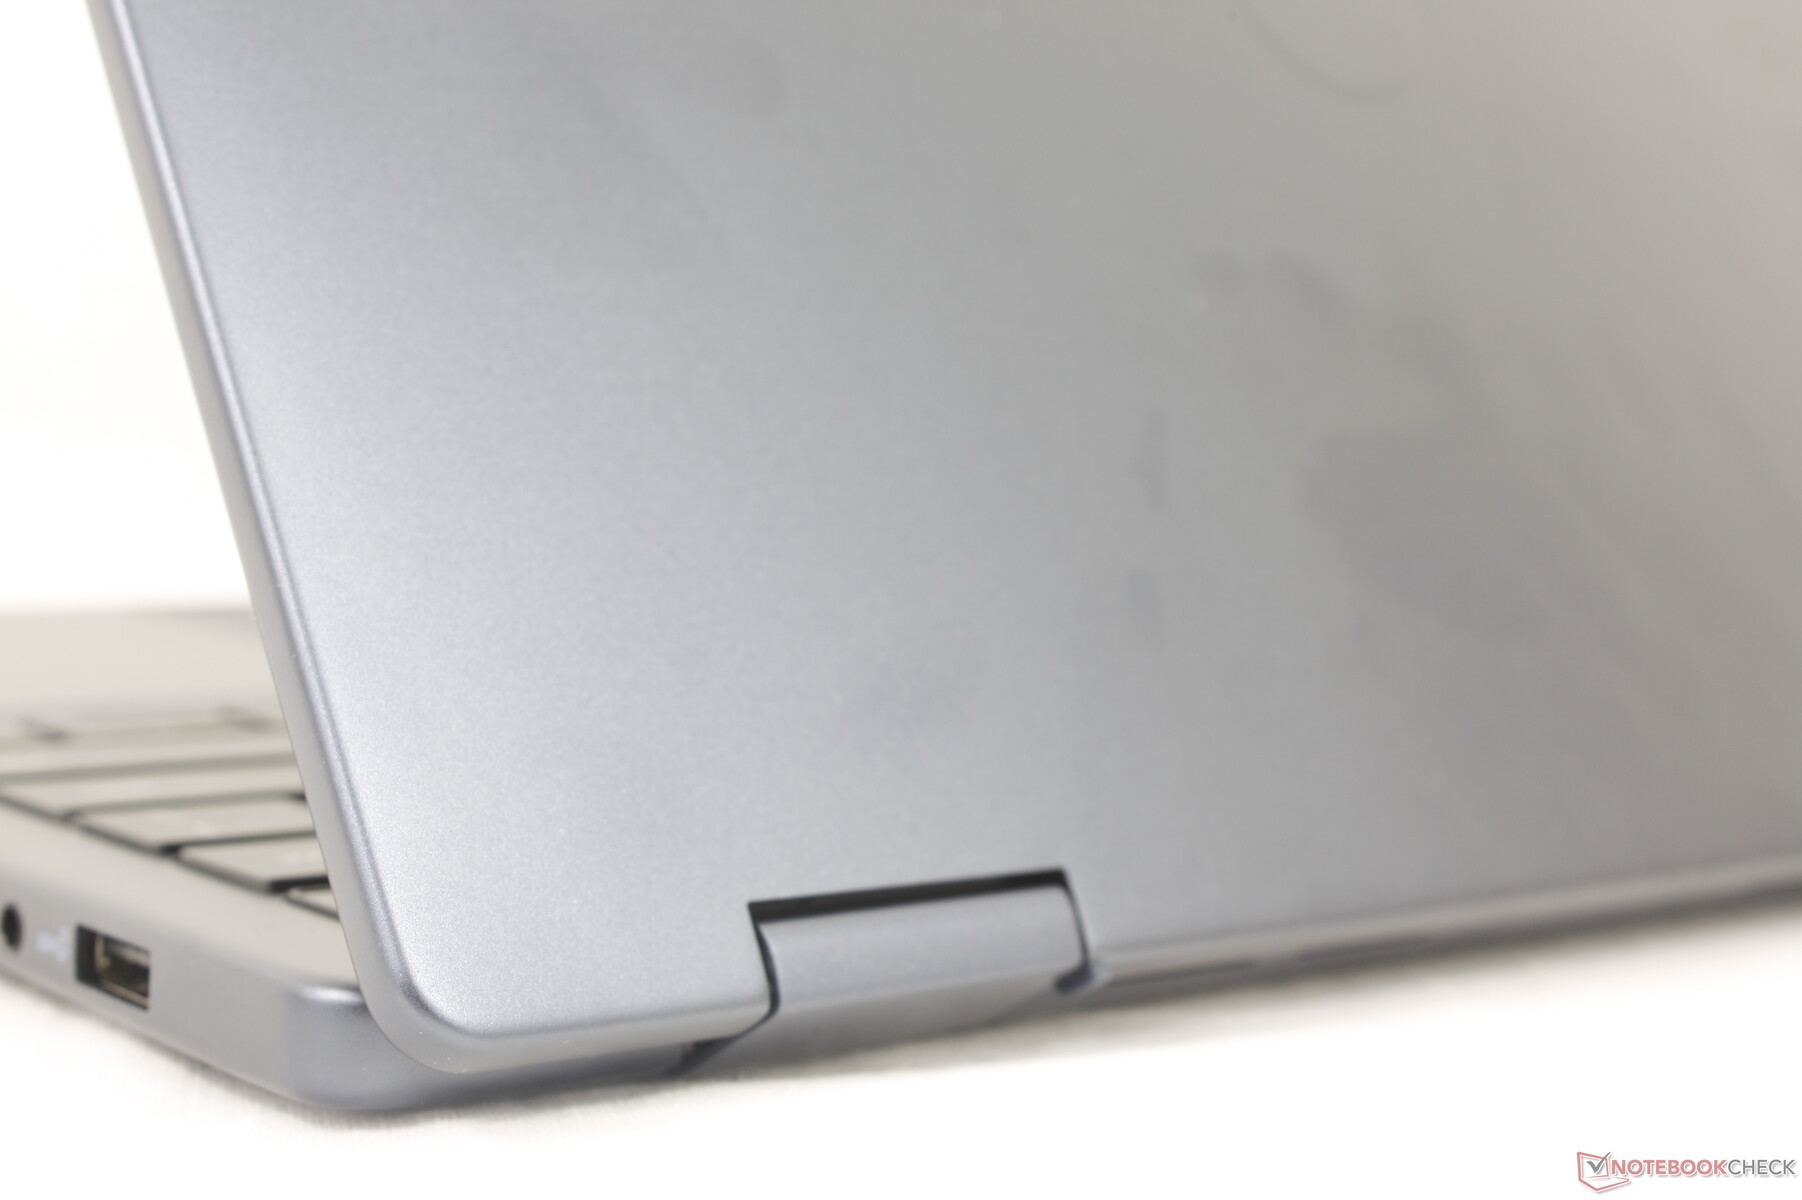
Case — Excellent For A Model Under $1000
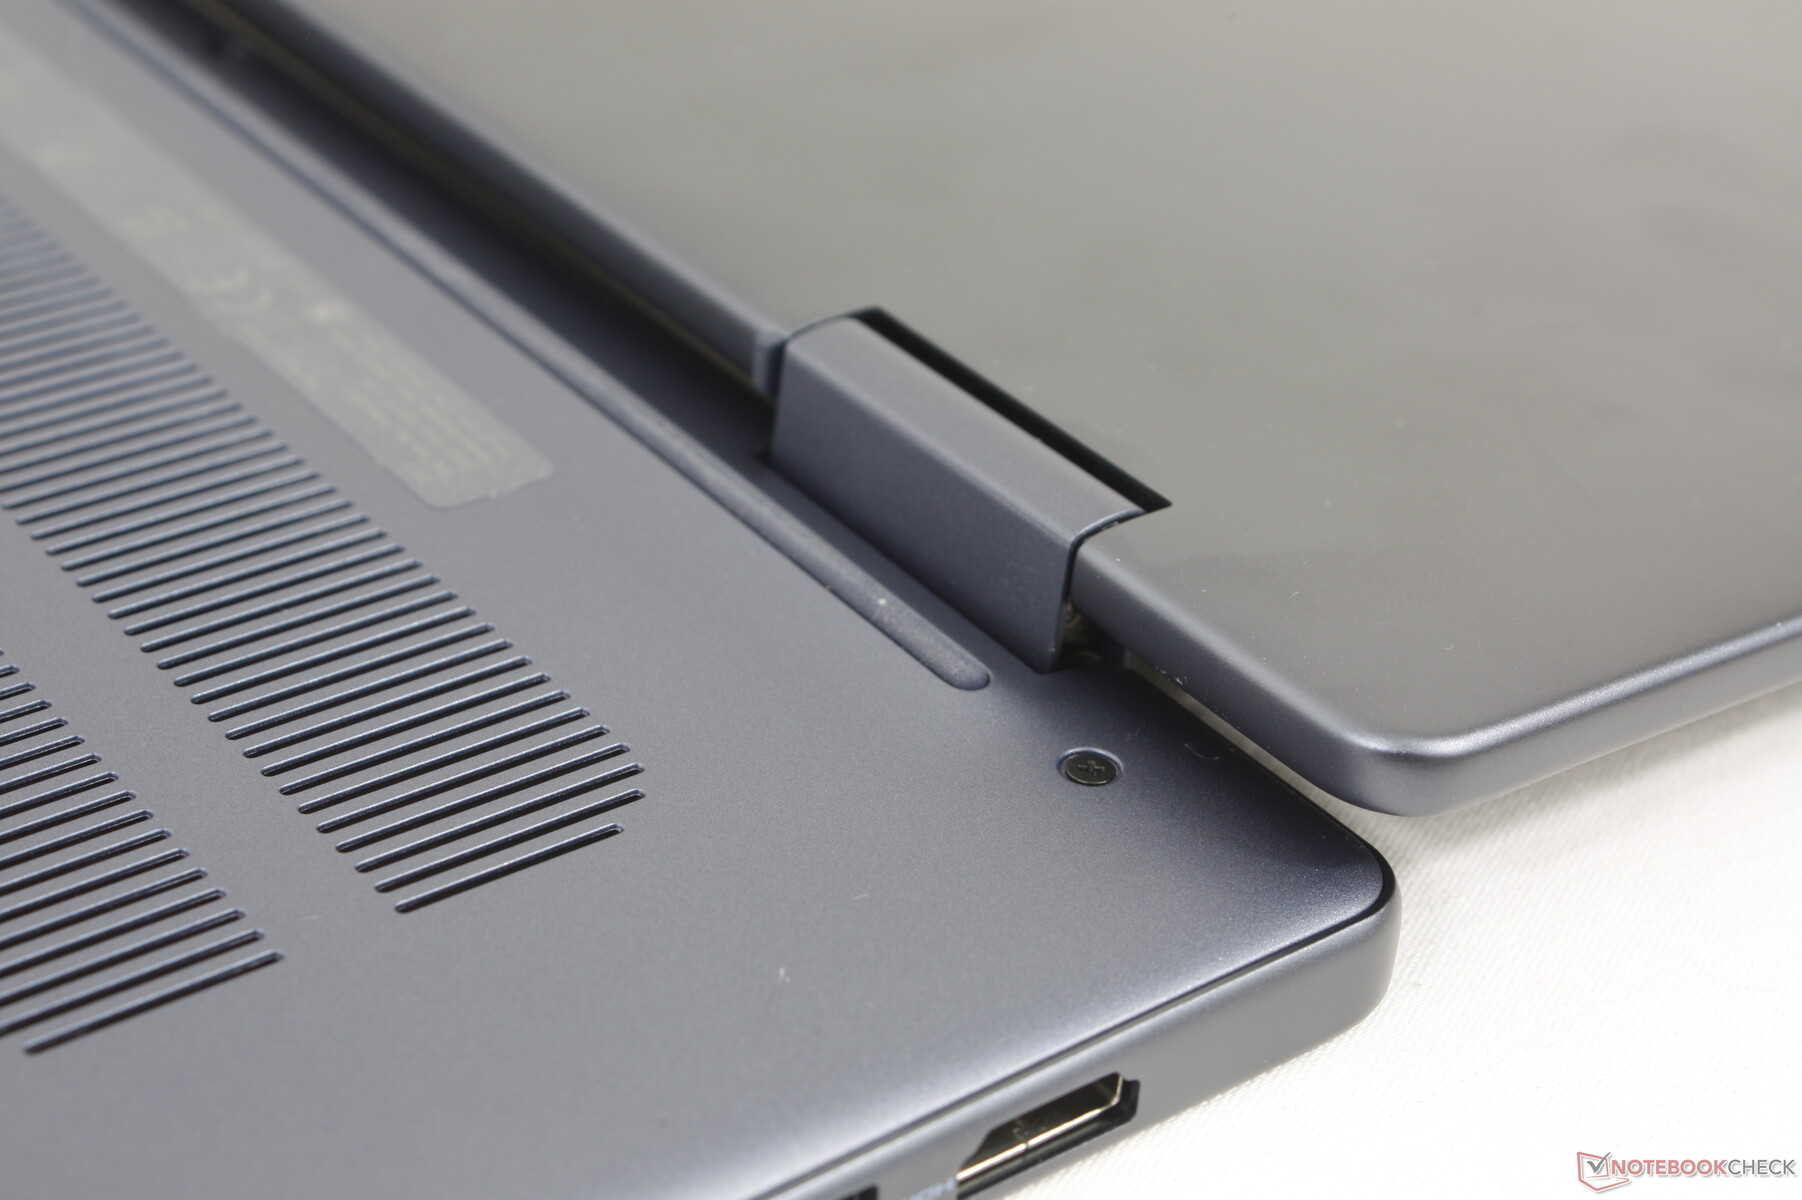
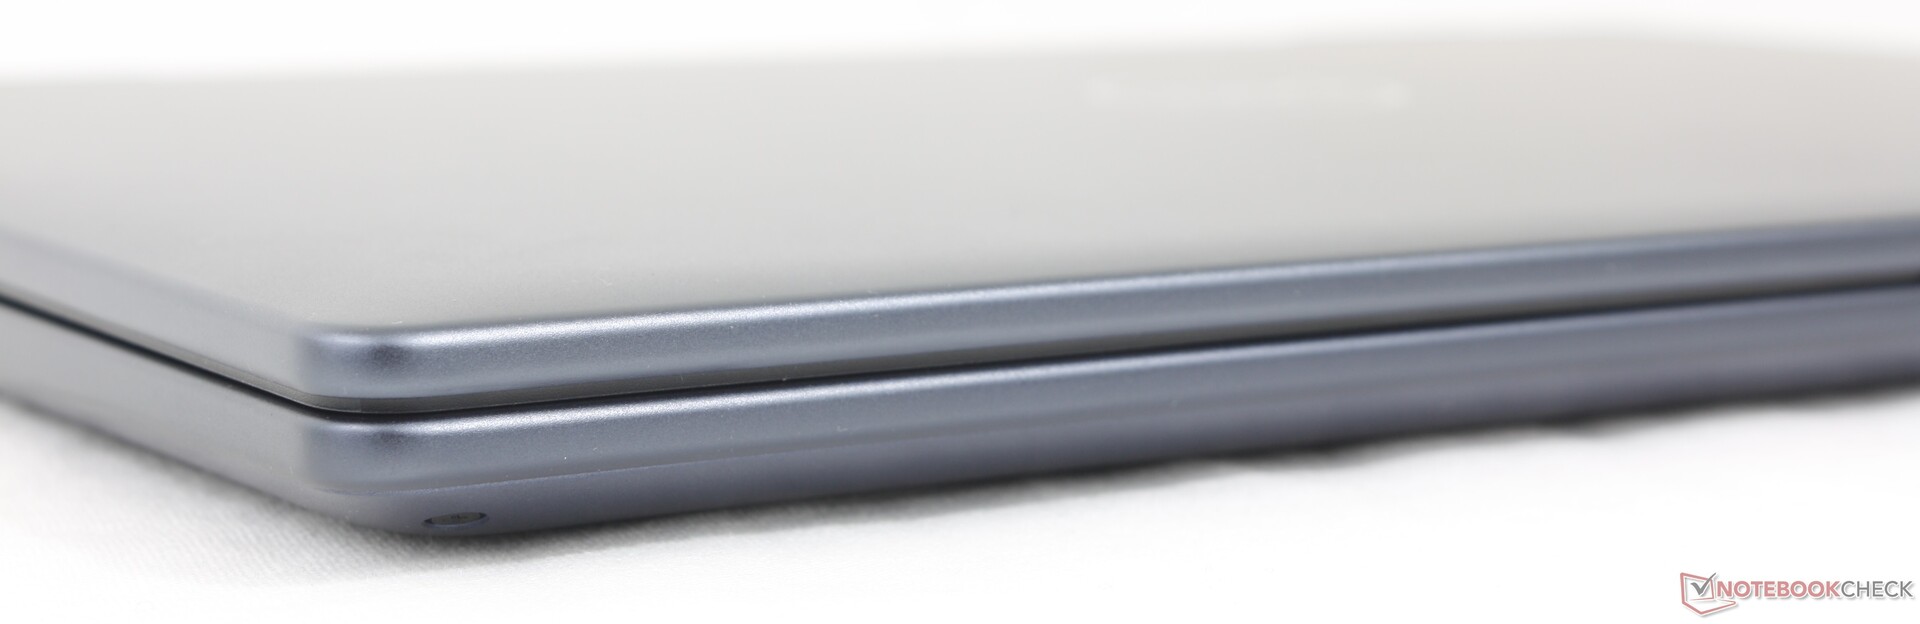
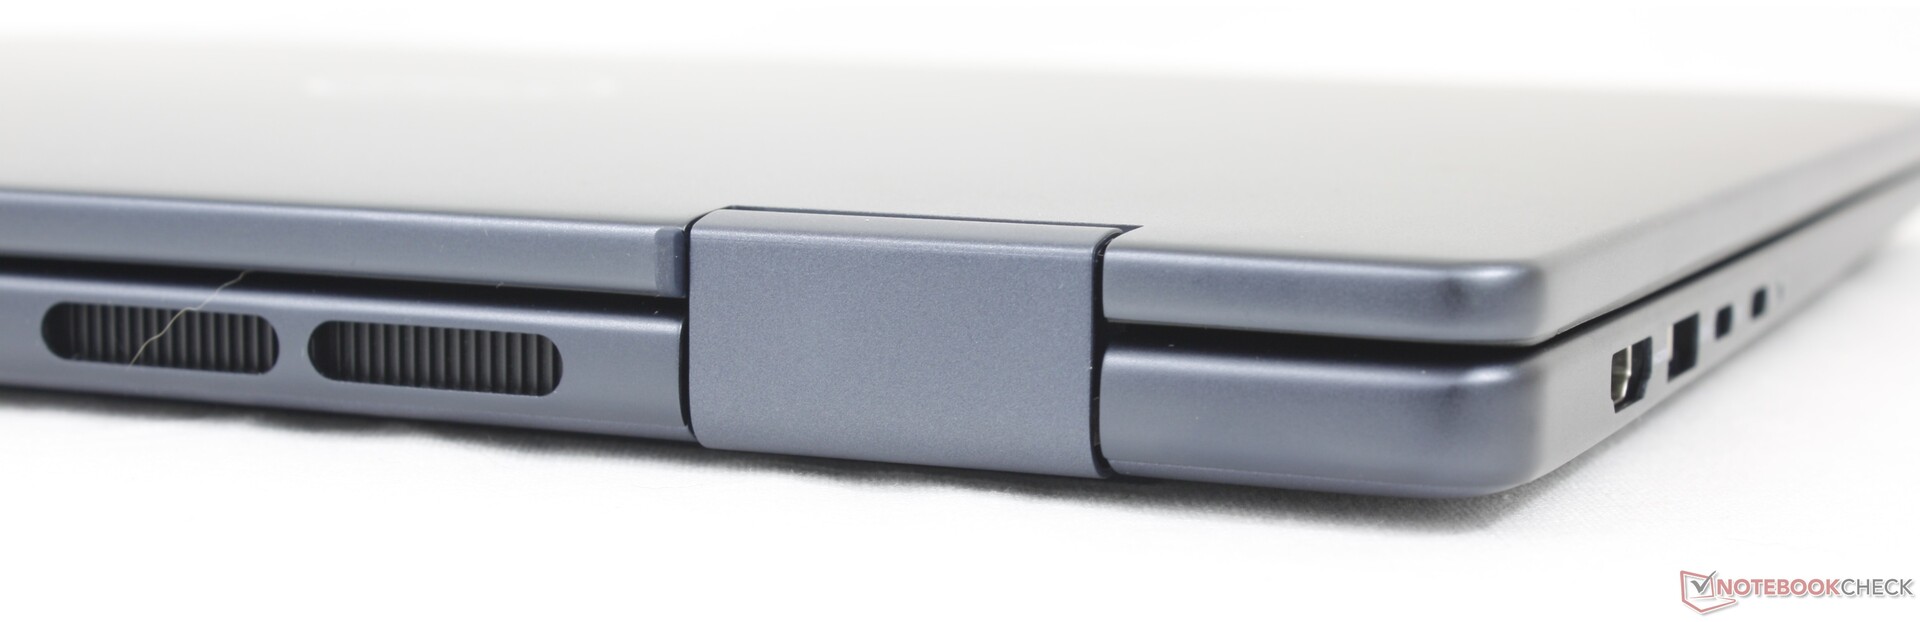
The chassis is again mostly aluminum but with several visual changes from the previous model. Most obvious are the relocated speaker grilles which are now underneath the laptop instead of along the sides of the keyboard. The rear edge is flatter, edges and corners are a bit rounder, and the bottom ventilation grilles have a slightly different design. Most of these changes appear to be only for aesthetic reasons as rigidity and texture are otherwise very similar to the Inspiron 14 7435 2-in-1.
The model is solidly built with almost no warping around the base. The outer lid, however, bends much more easily with applying pressure.
Dimensions and weight are ever-so-slightly bigger and heavier than before, but the differences are very marginal to be essentially unnoticeable. Nevertheless, our Dell is still one of the heavier budget 14-inch convertibles as alternatives like the Pavilion x360 14, VivoBook Flip 14, or IdeaPad Flex 5 14 are each at least 100 g lighter.
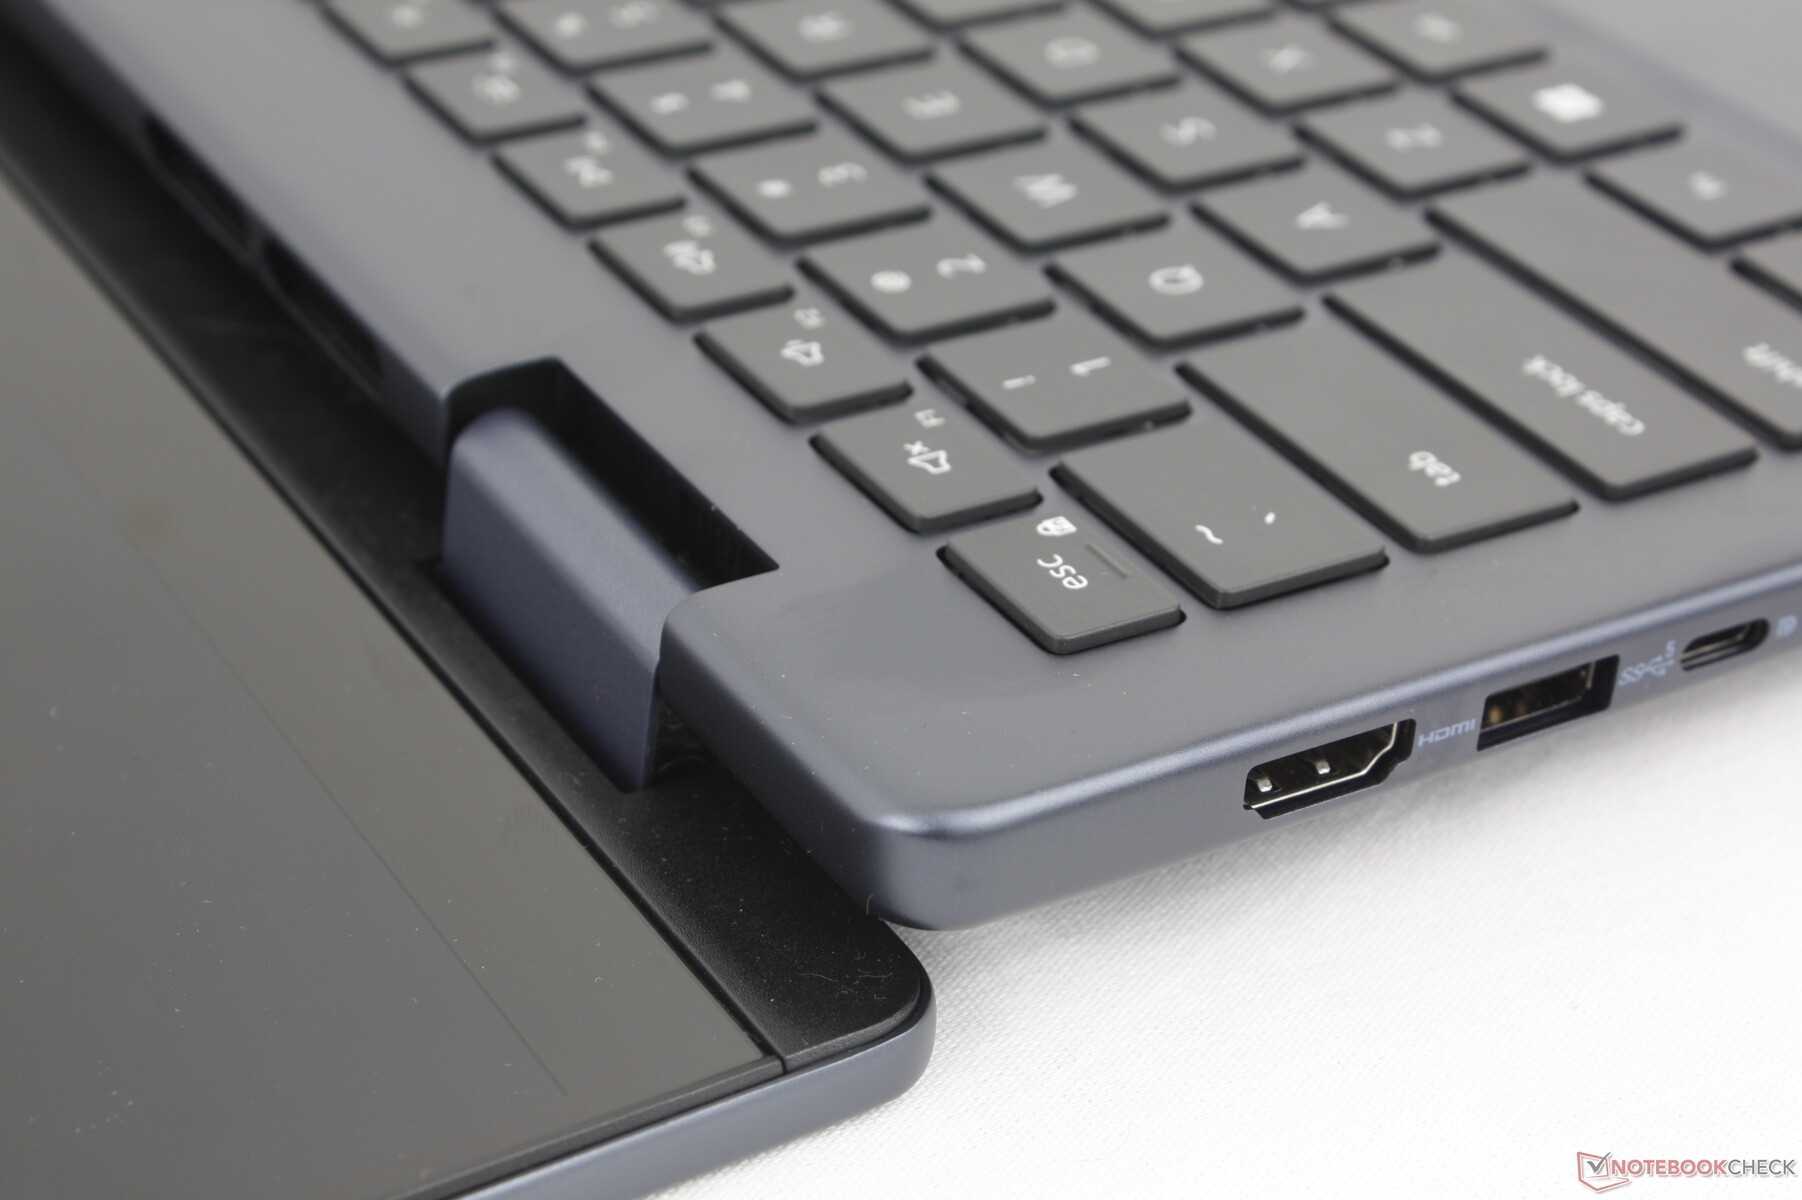
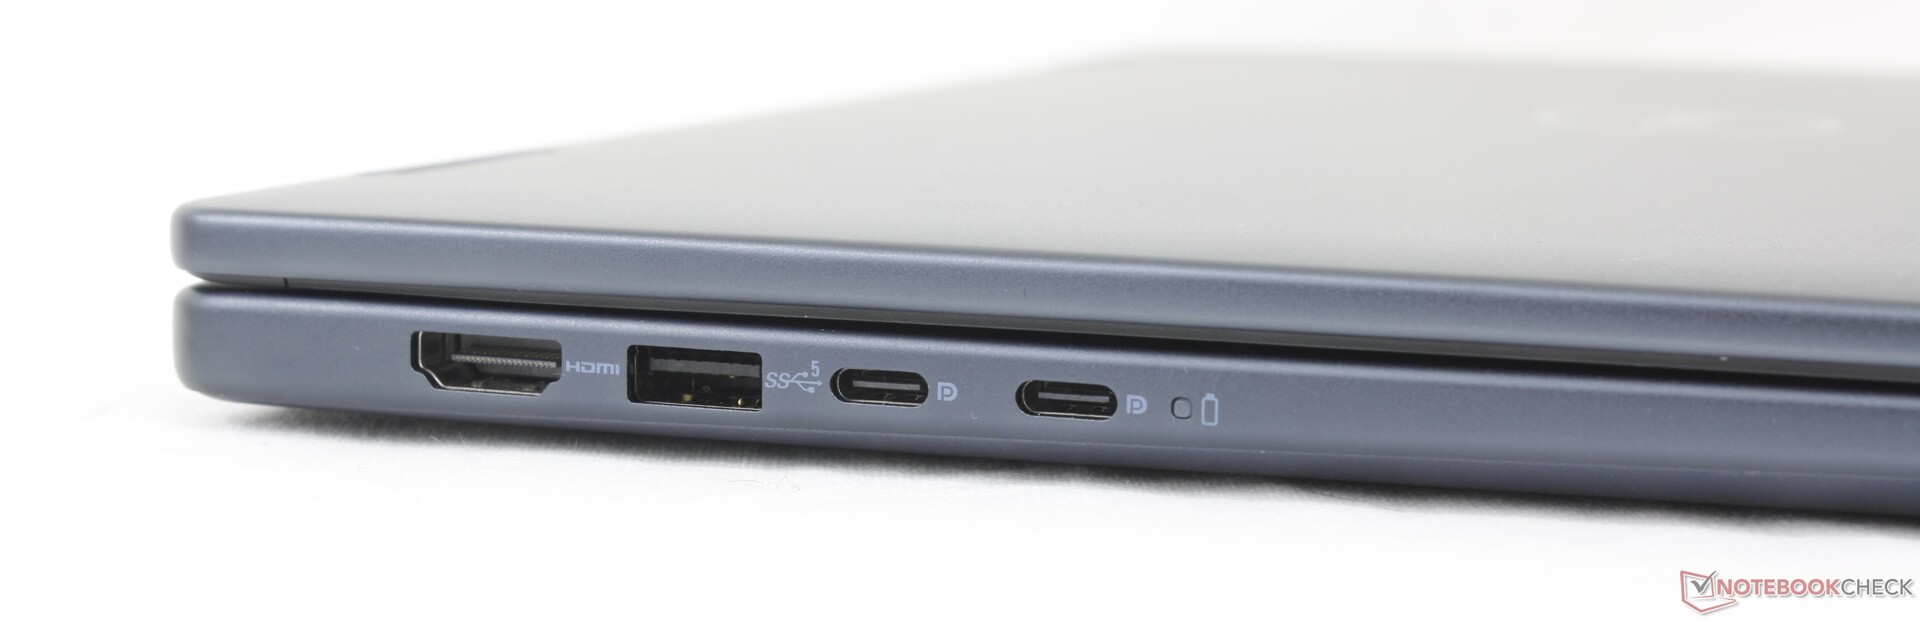
Connectivity
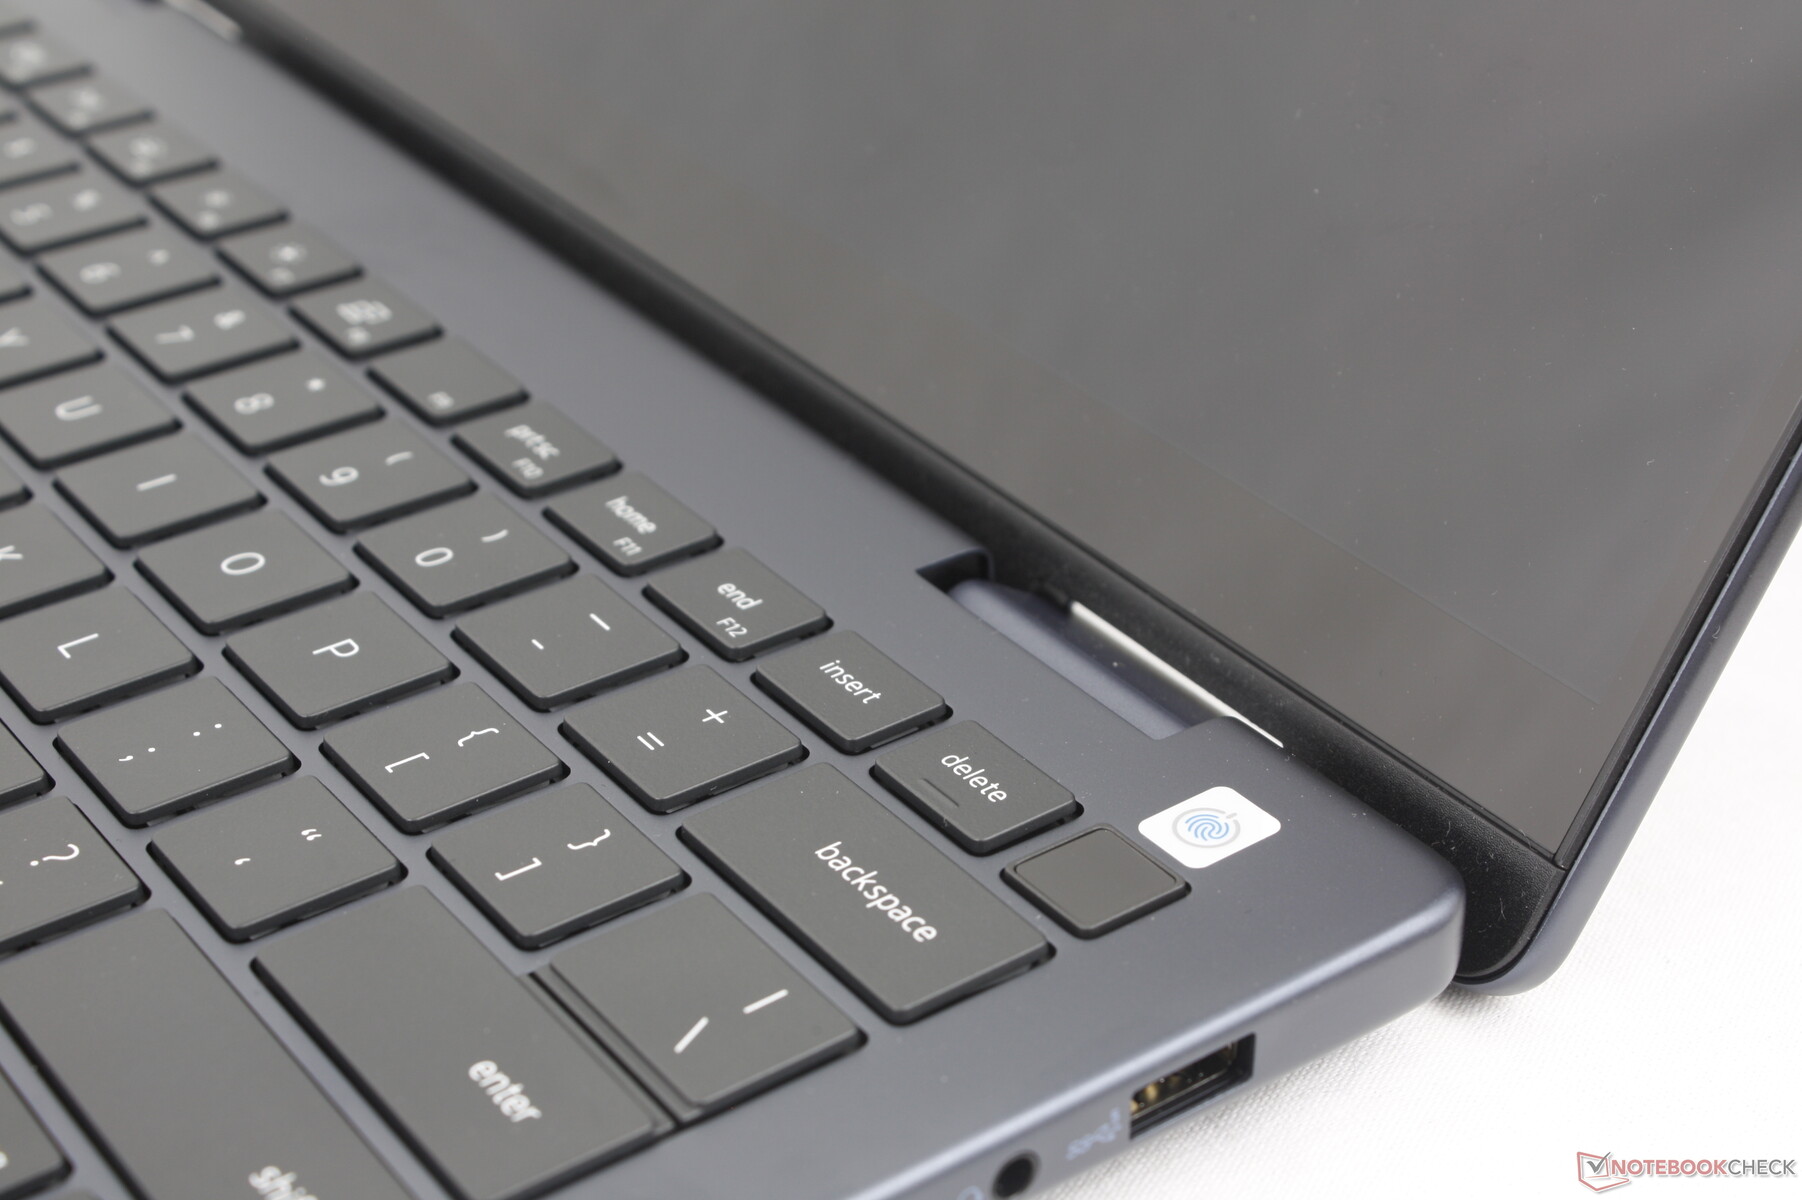
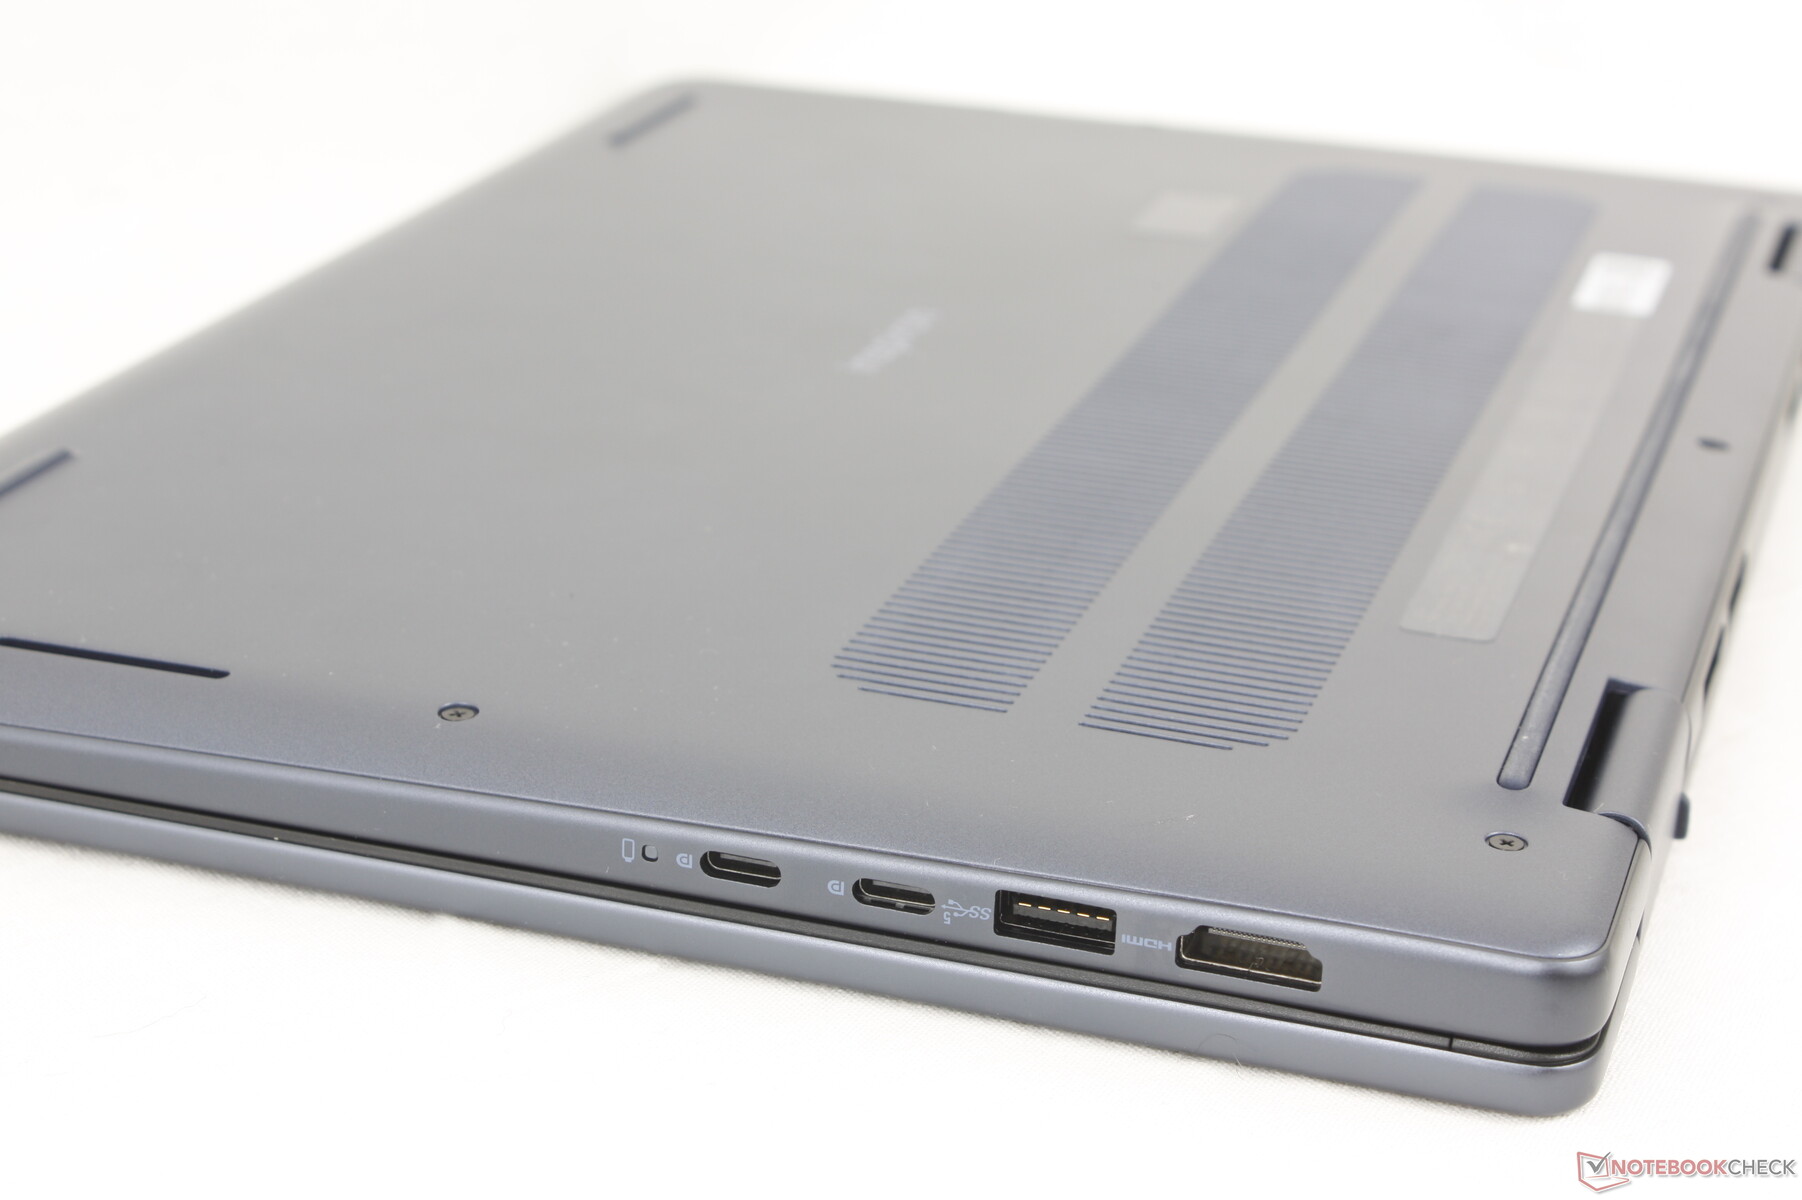
All ports from the Inspiron 14 7435 2-in-1 have returned alongside the addition of a new second USB-A port along the left edge. The two USB-C ports have unfortunately not been upgraded to USB4 and so they are still limited to Gen. 2 speeds. with no Thunderbolt support Similarly, the HDMI port is still limited to 1080p output meaning USB-C must be used for any external 2K or 4K monitors.
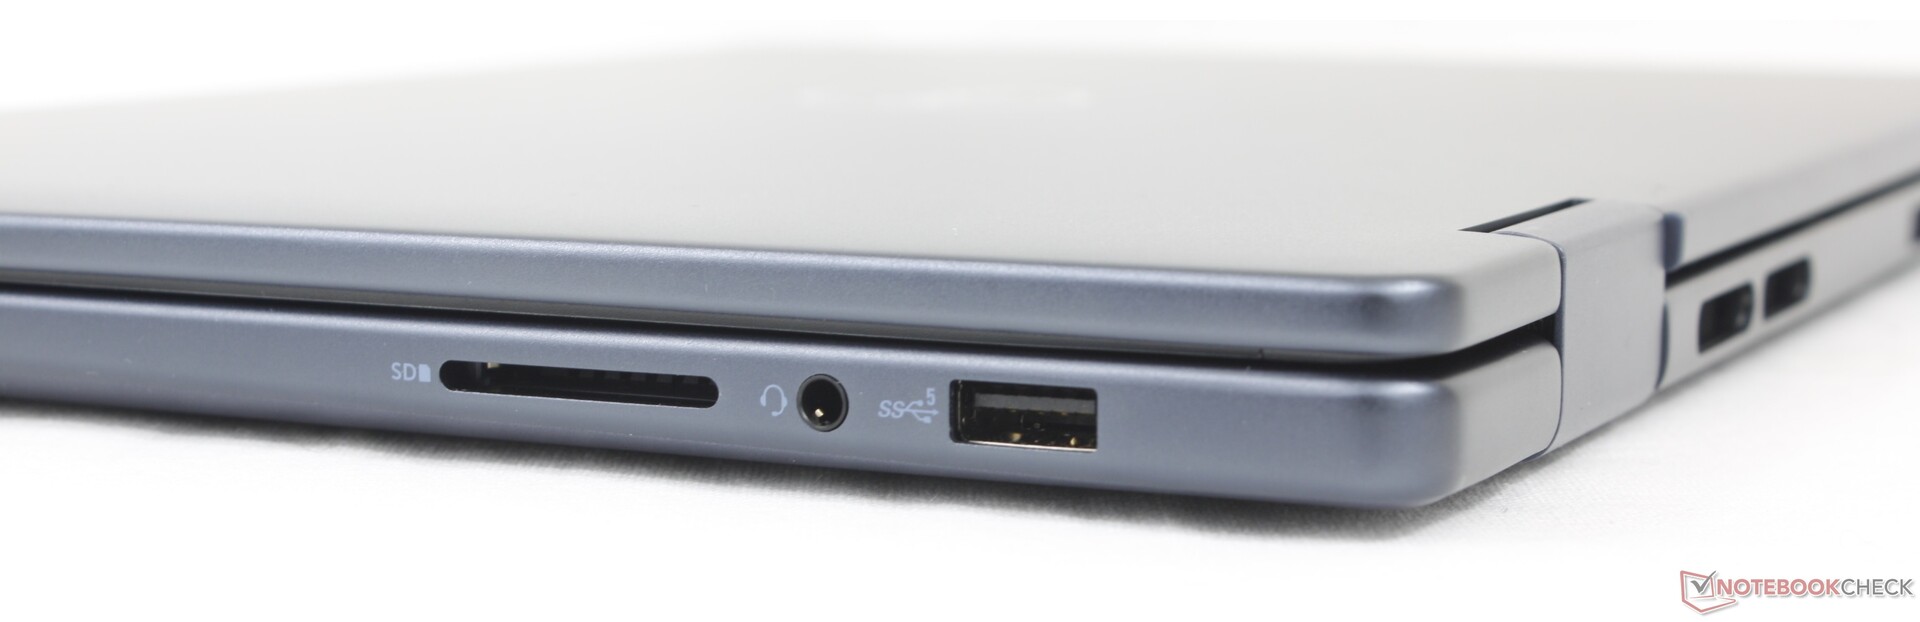
SD Card Reader
Transfer rates with the integrated SD reader have not improved from last year's model. In comparison, competing models like the HP Pavilion x360 14 or Lenovo IdeaPad Flex 5 14 each have SD readers with over 2x the transfer rates.
| SD Card Reader | |
| average JPG Copy Test (av. of 3 runs) | |
| Dell XPS 13 9310 2-in-1 (AV Pro V60) | |
| Lenovo IdeaPad Flex 5 14IRU8 (PNY EliteX-Pro60 V60 256 GB) | |
| HP Pavilion x360 14-dy0157ng (Toshiba Exceria Pro M501 microSDXC 64GB) | |
| Dell Inspiron 14 7445 2-in-1 (AV Pro V60) | |
| Dell Inspiron 14 7435 2-in-1 (PNY EliteX-Pro60 V60 256 GB) | |
| Asus VivoBook Flip 14 TP470EZ (AV PRO microSD 128 GB V60) | |
| maximum AS SSD Seq Read Test (1GB) | |
| Dell XPS 13 9310 2-in-1 (AV Pro V60) | |
| Lenovo IdeaPad Flex 5 14IRU8 (PNY EliteX-Pro60 V60 256 GB) | |
| HP Pavilion x360 14-dy0157ng (Toshiba Exceria Pro M501 microSDXC 64GB) | |
| Dell Inspiron 14 7445 2-in-1 (AV Pro V60) | |
| Dell Inspiron 14 7435 2-in-1 (PNY EliteX-Pro60 V60 256 GB) | |
| Asus VivoBook Flip 14 TP470EZ (AV PRO microSD 128 GB V60) | |
Communication
Wi-Fi 6 and 6E provided by a RealTek RTL8852CE instead of the usual Intel AX200 series to save on costs. Transfer rates are steady but nonetheless slower than what we recorded on the MediaTek MT7922 on last year's Inspiron model.
| Networking | |
| iperf3 transmit AX12 | |
| Dell XPS 13 9310 2-in-1 | |
| Asus VivoBook Flip 14 TP470EZ | |
| HP Pavilion x360 14-dy0157ng | |
| iperf3 receive AX12 | |
| Dell XPS 13 9310 2-in-1 | |
| Asus VivoBook Flip 14 TP470EZ | |
| HP Pavilion x360 14-dy0157ng | |
| iperf3 transmit AXE11000 | |
| Dell Inspiron 14 7435 2-in-1 | |
| Dell Inspiron 14 7445 2-in-1 | |
| Lenovo IdeaPad Flex 5 14IRU8 | |
| iperf3 receive AXE11000 | |
| Dell Inspiron 14 7435 2-in-1 | |
| Dell Inspiron 14 7445 2-in-1 | |
| Lenovo IdeaPad Flex 5 14IRU8 | |
| iperf3 transmit AXE11000 6GHz | |
| Dell Inspiron 14 7435 2-in-1 | |
| Dell Inspiron 14 7445 2-in-1 | |
| iperf3 receive AXE11000 6GHz | |
| Dell Inspiron 14 7435 2-in-1 | |
| Dell Inspiron 14 7445 2-in-1 | |
Webcam
A 2 MP webcam with physical shutter slider come standard. There is no integrated IR.


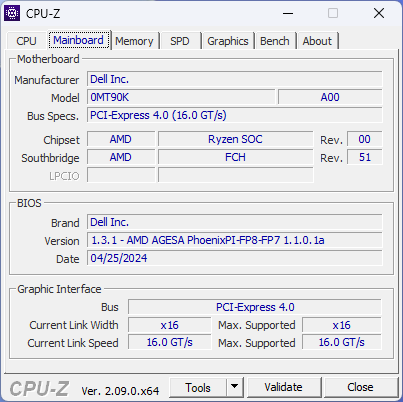
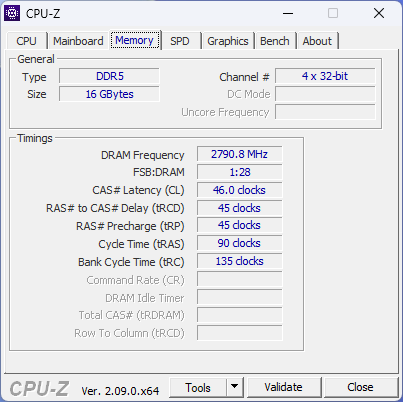
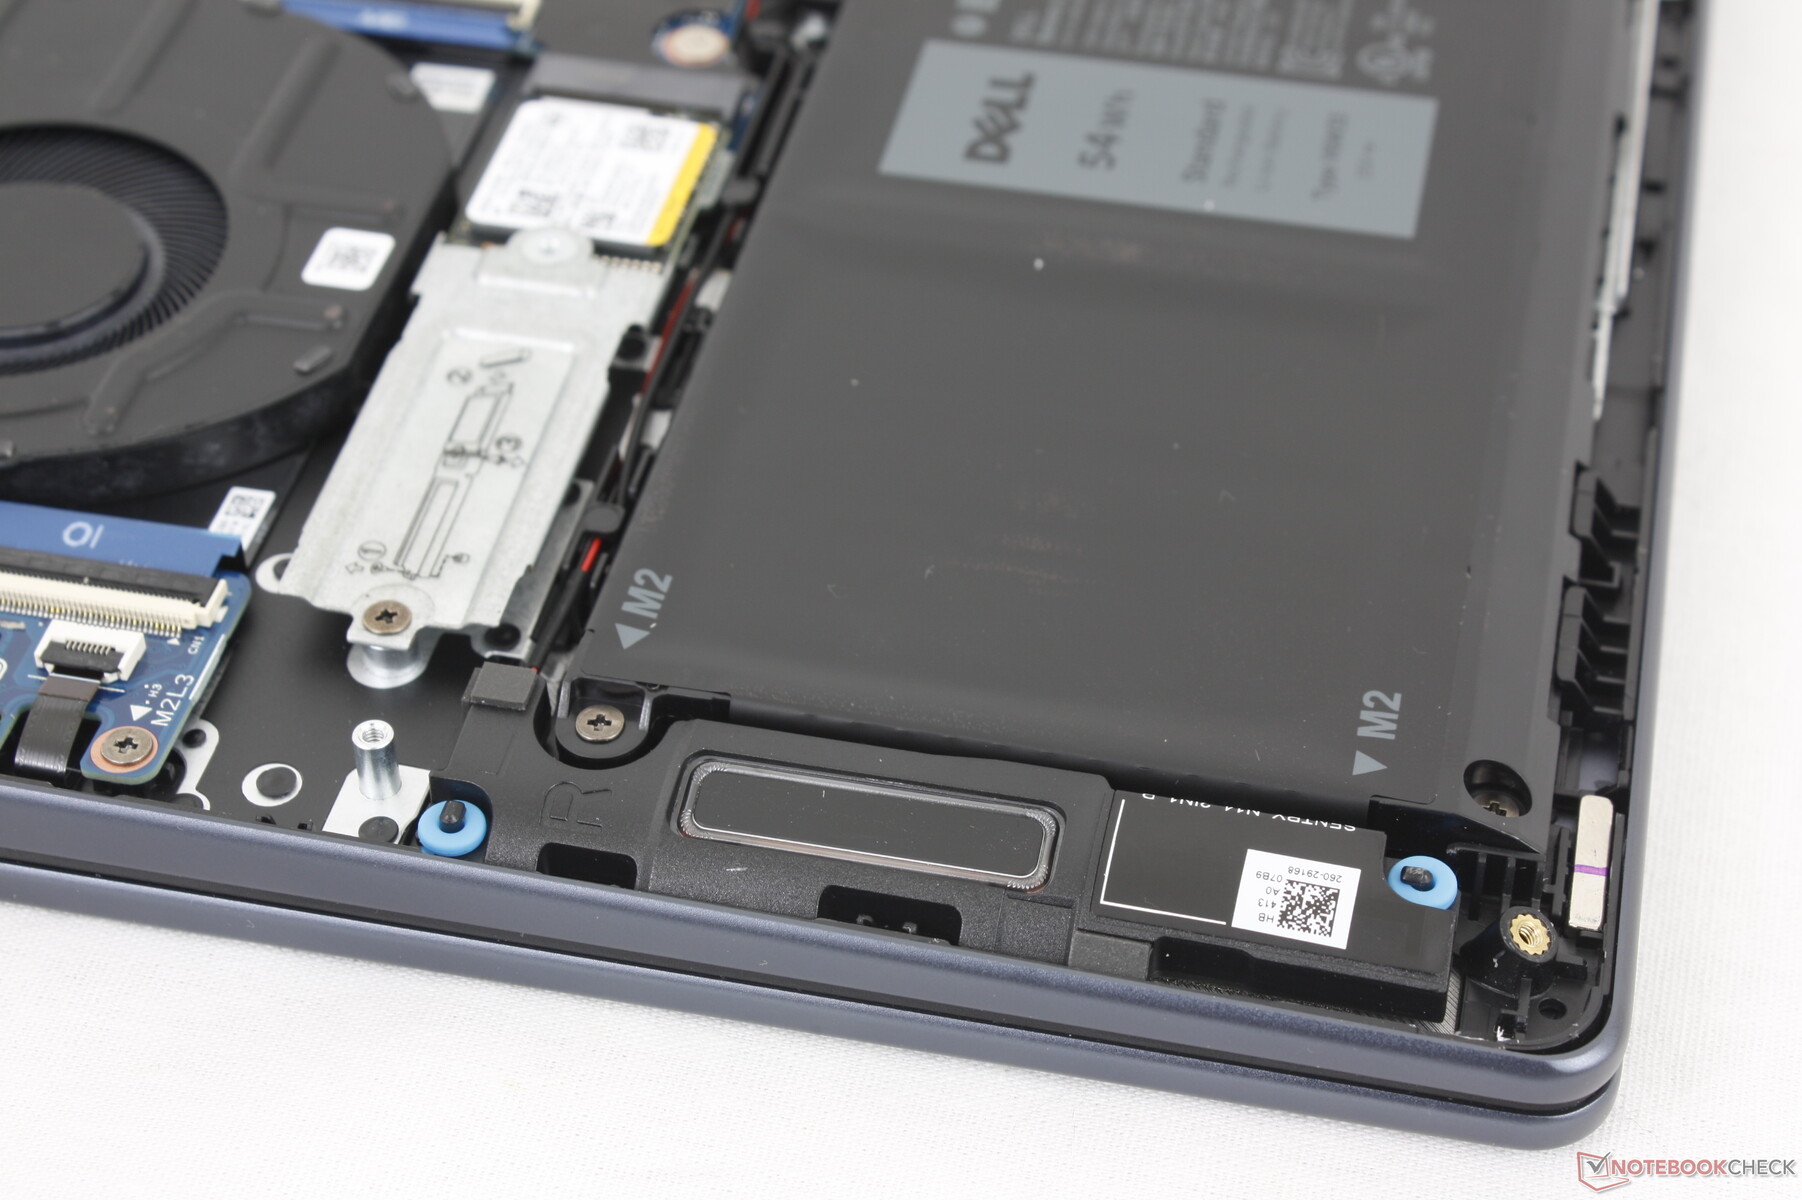
Maintenance
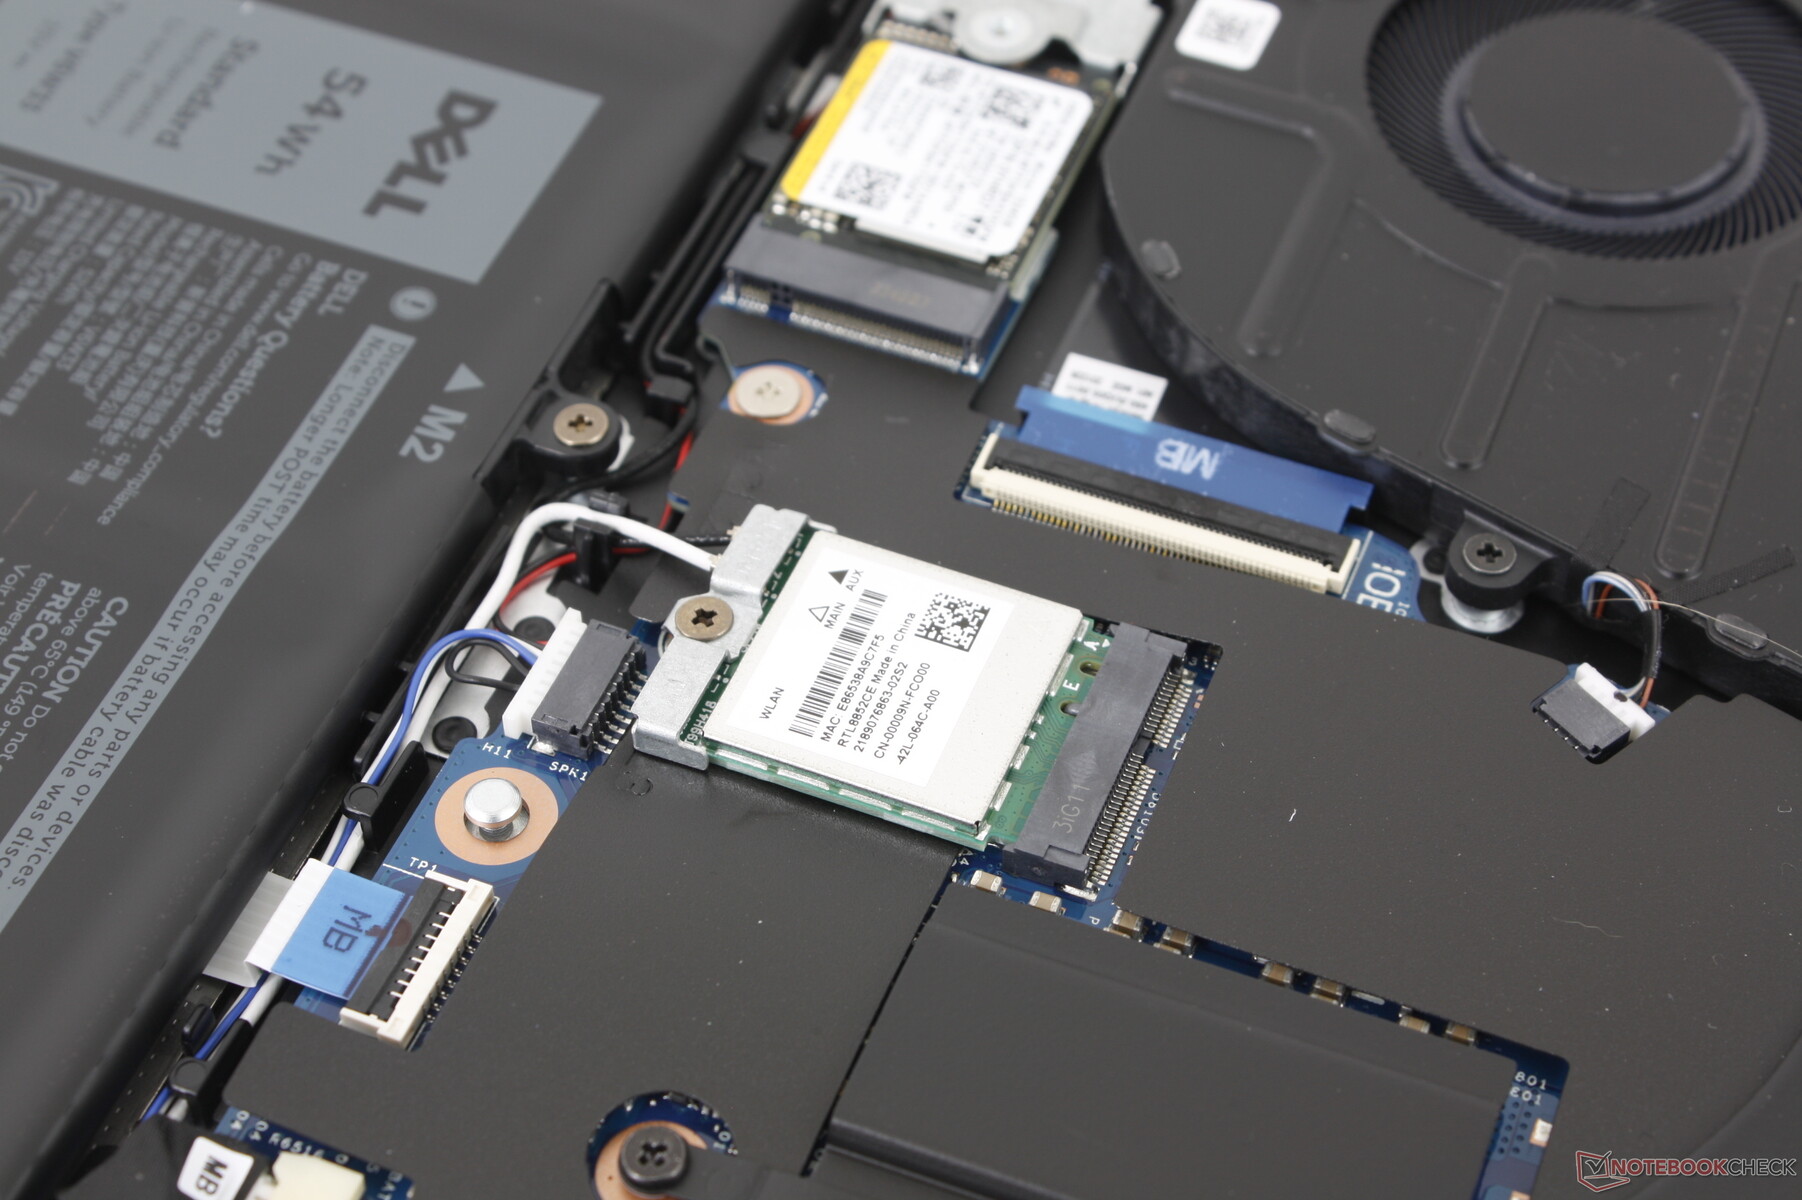
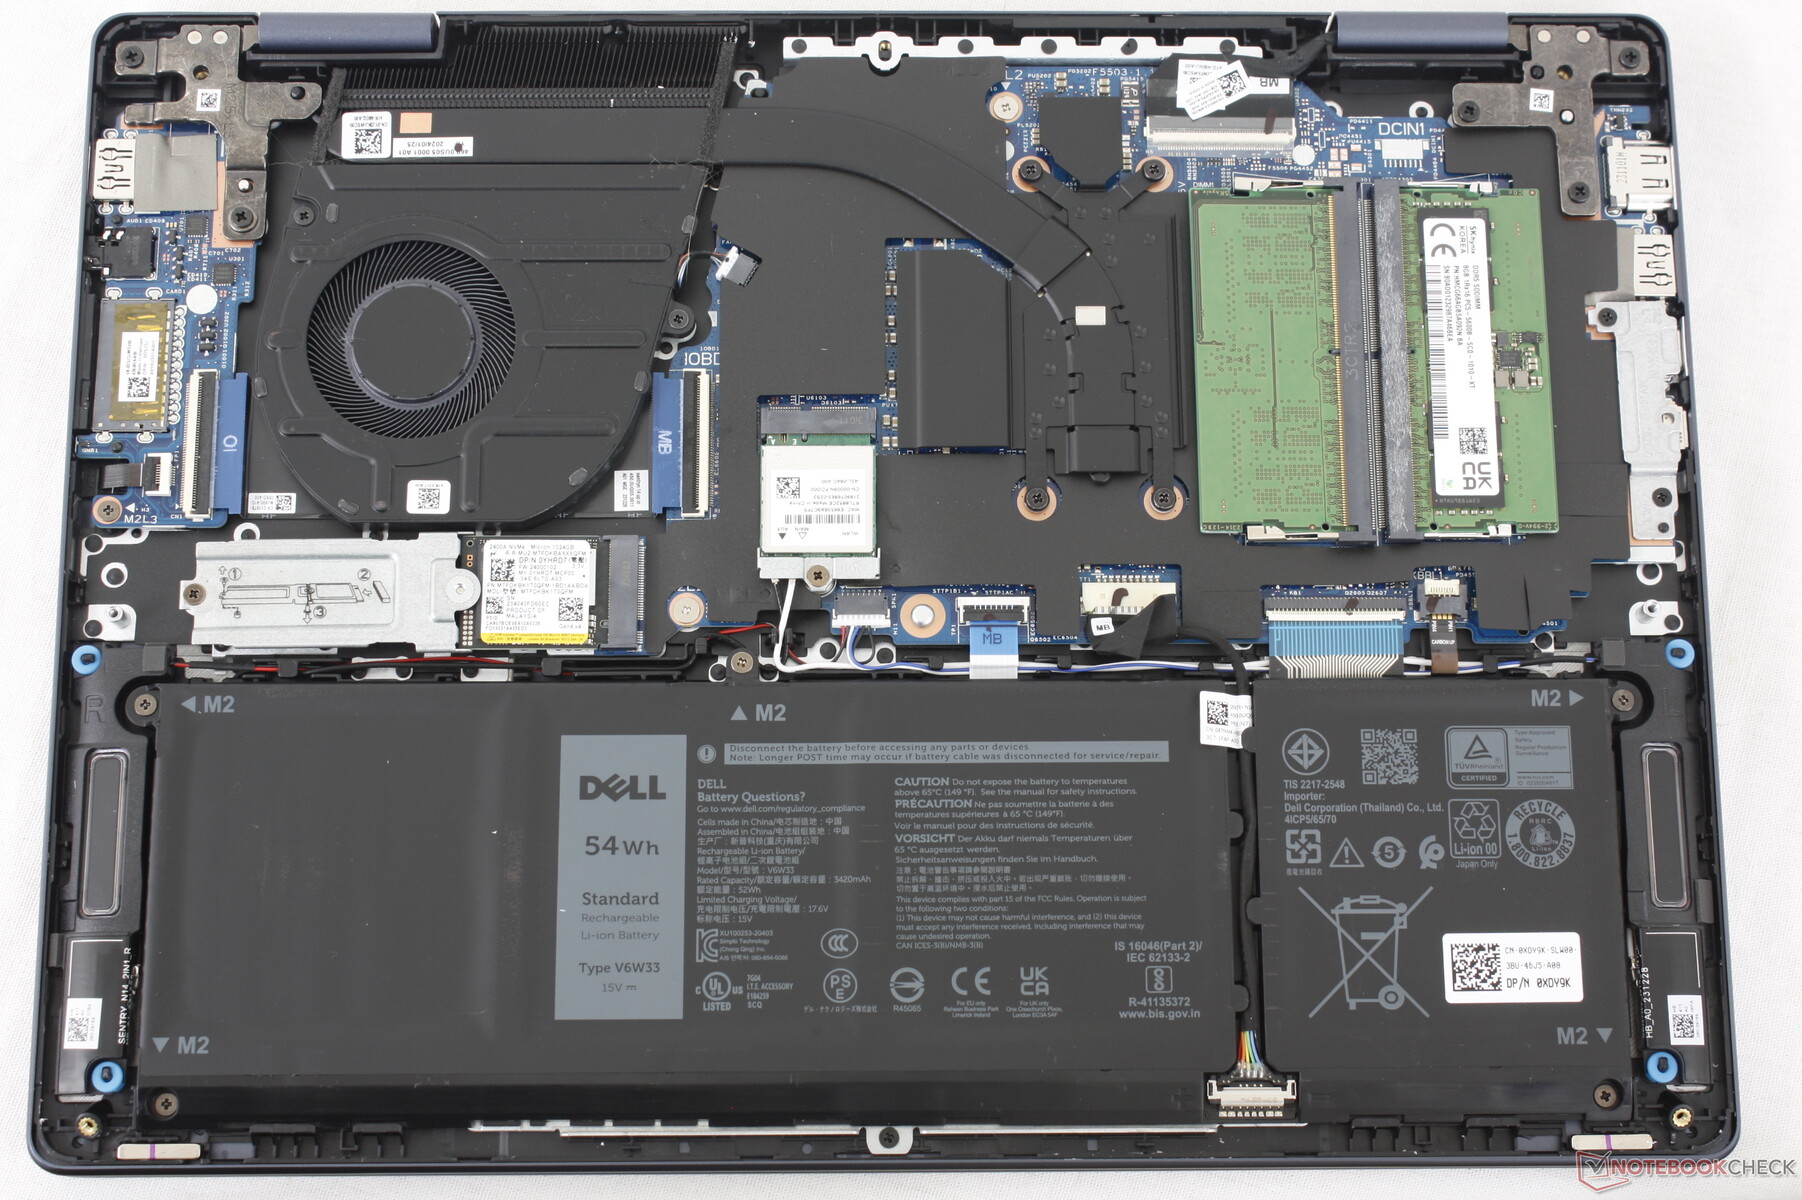
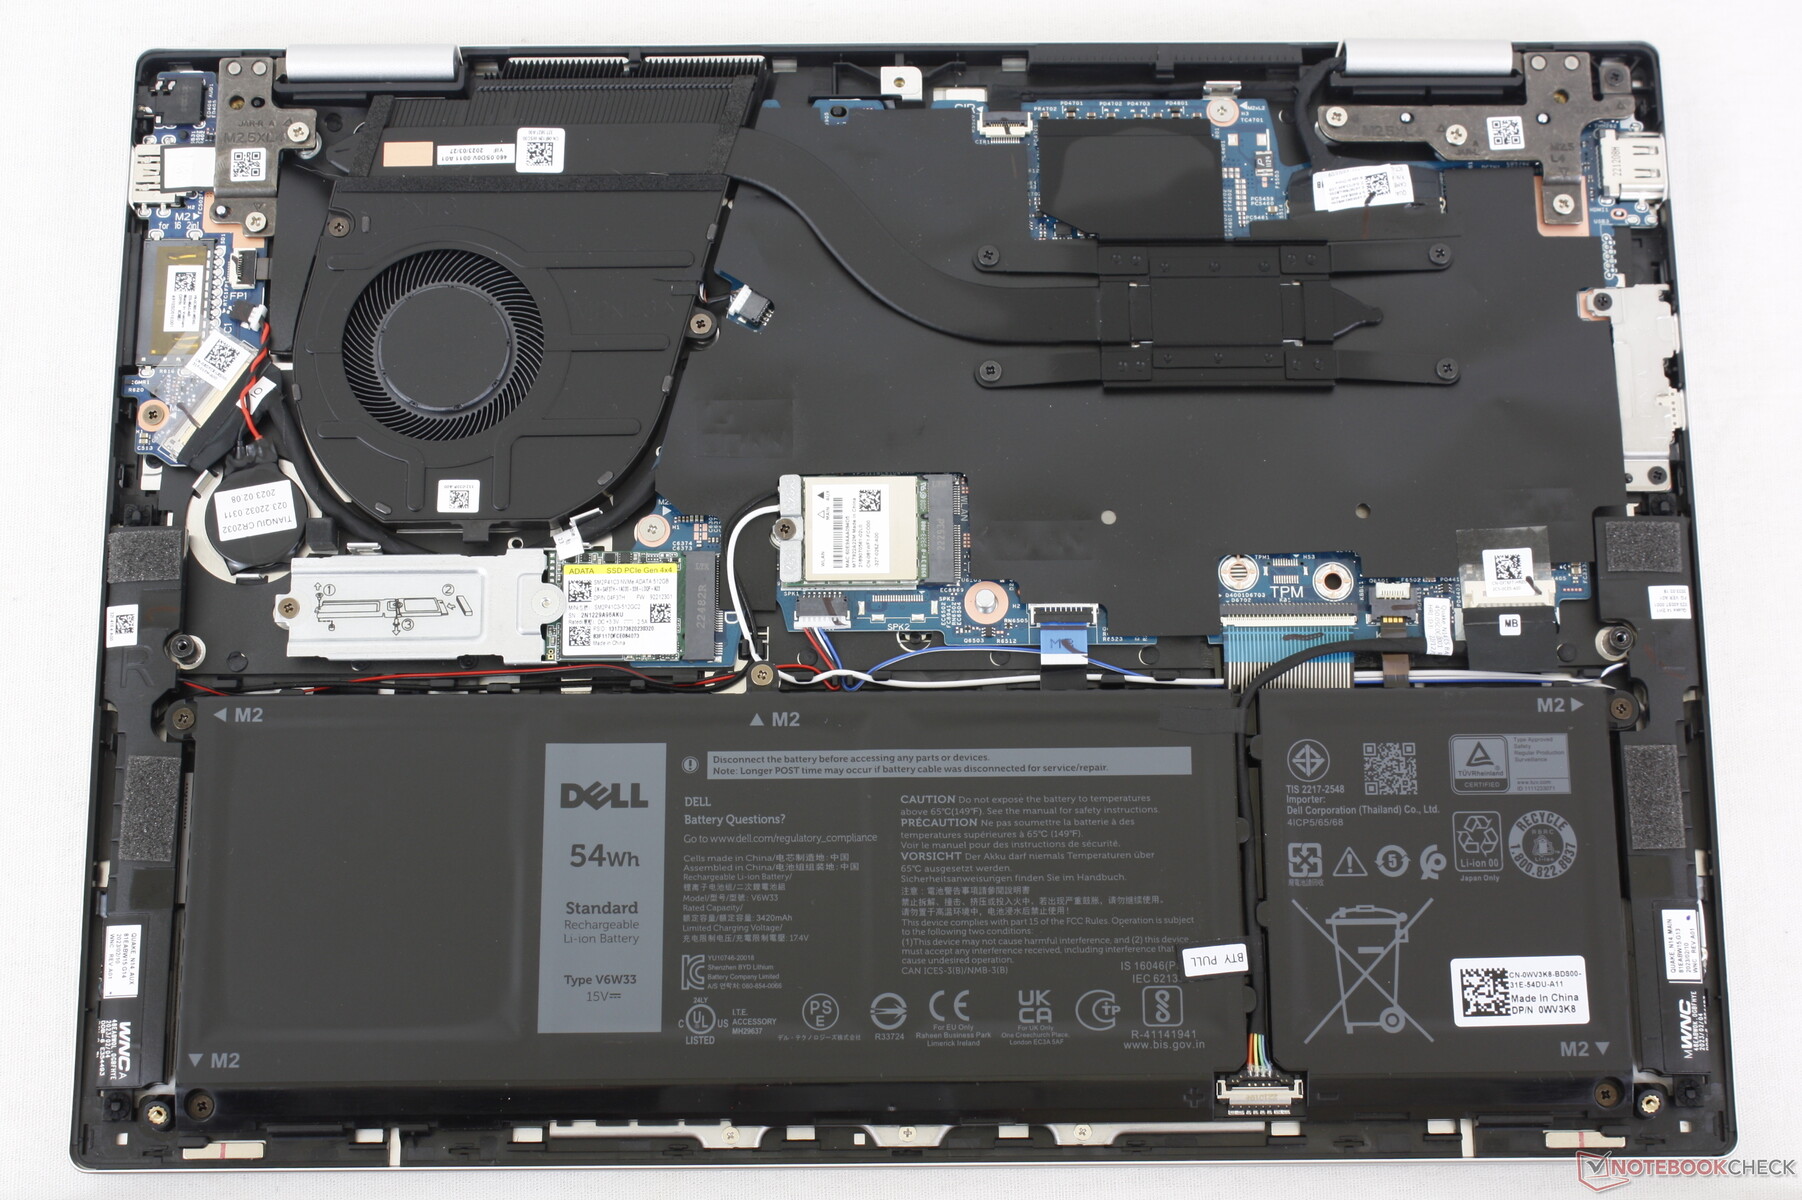
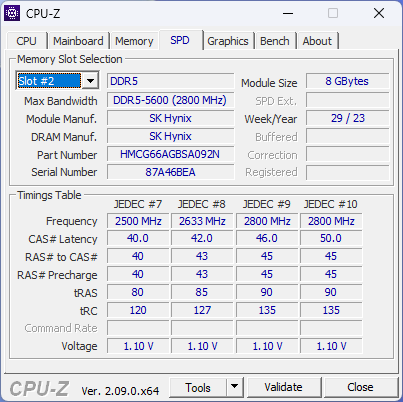
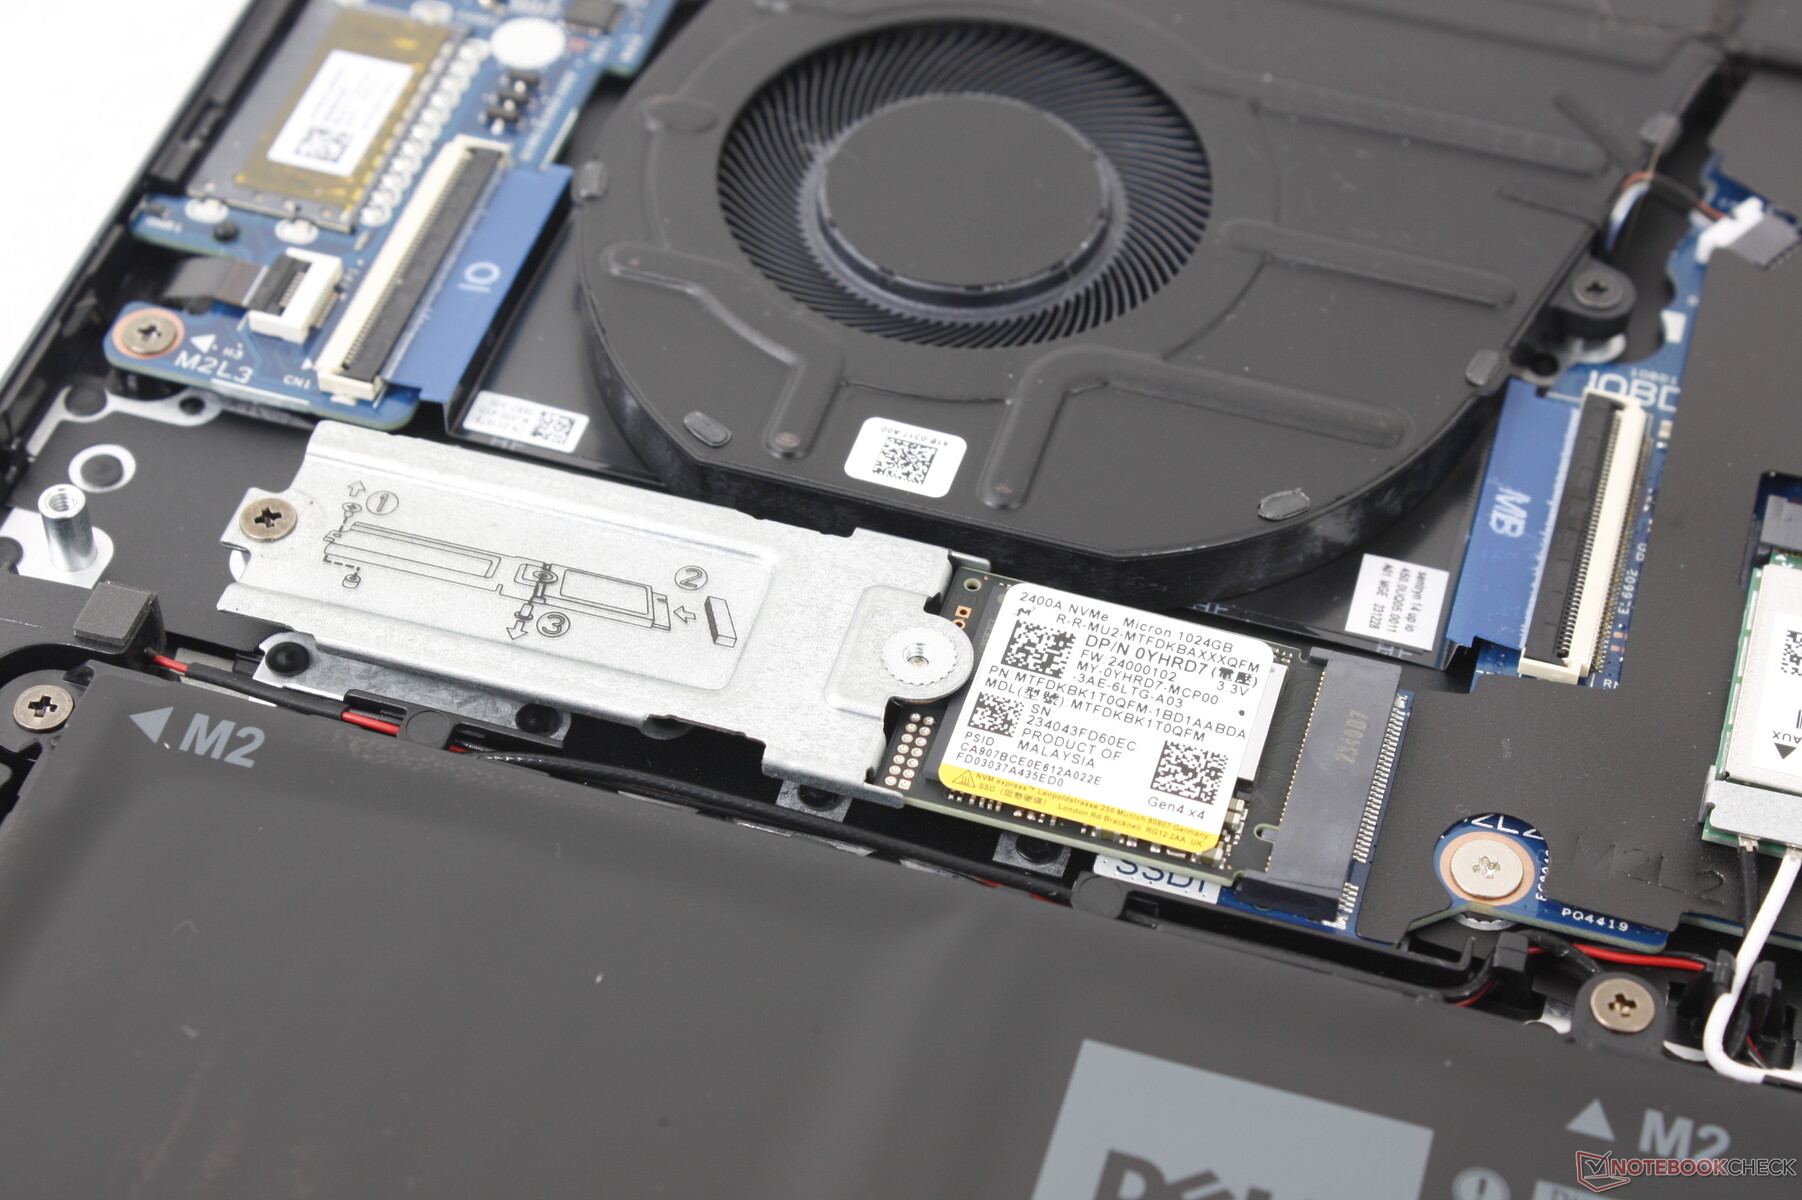
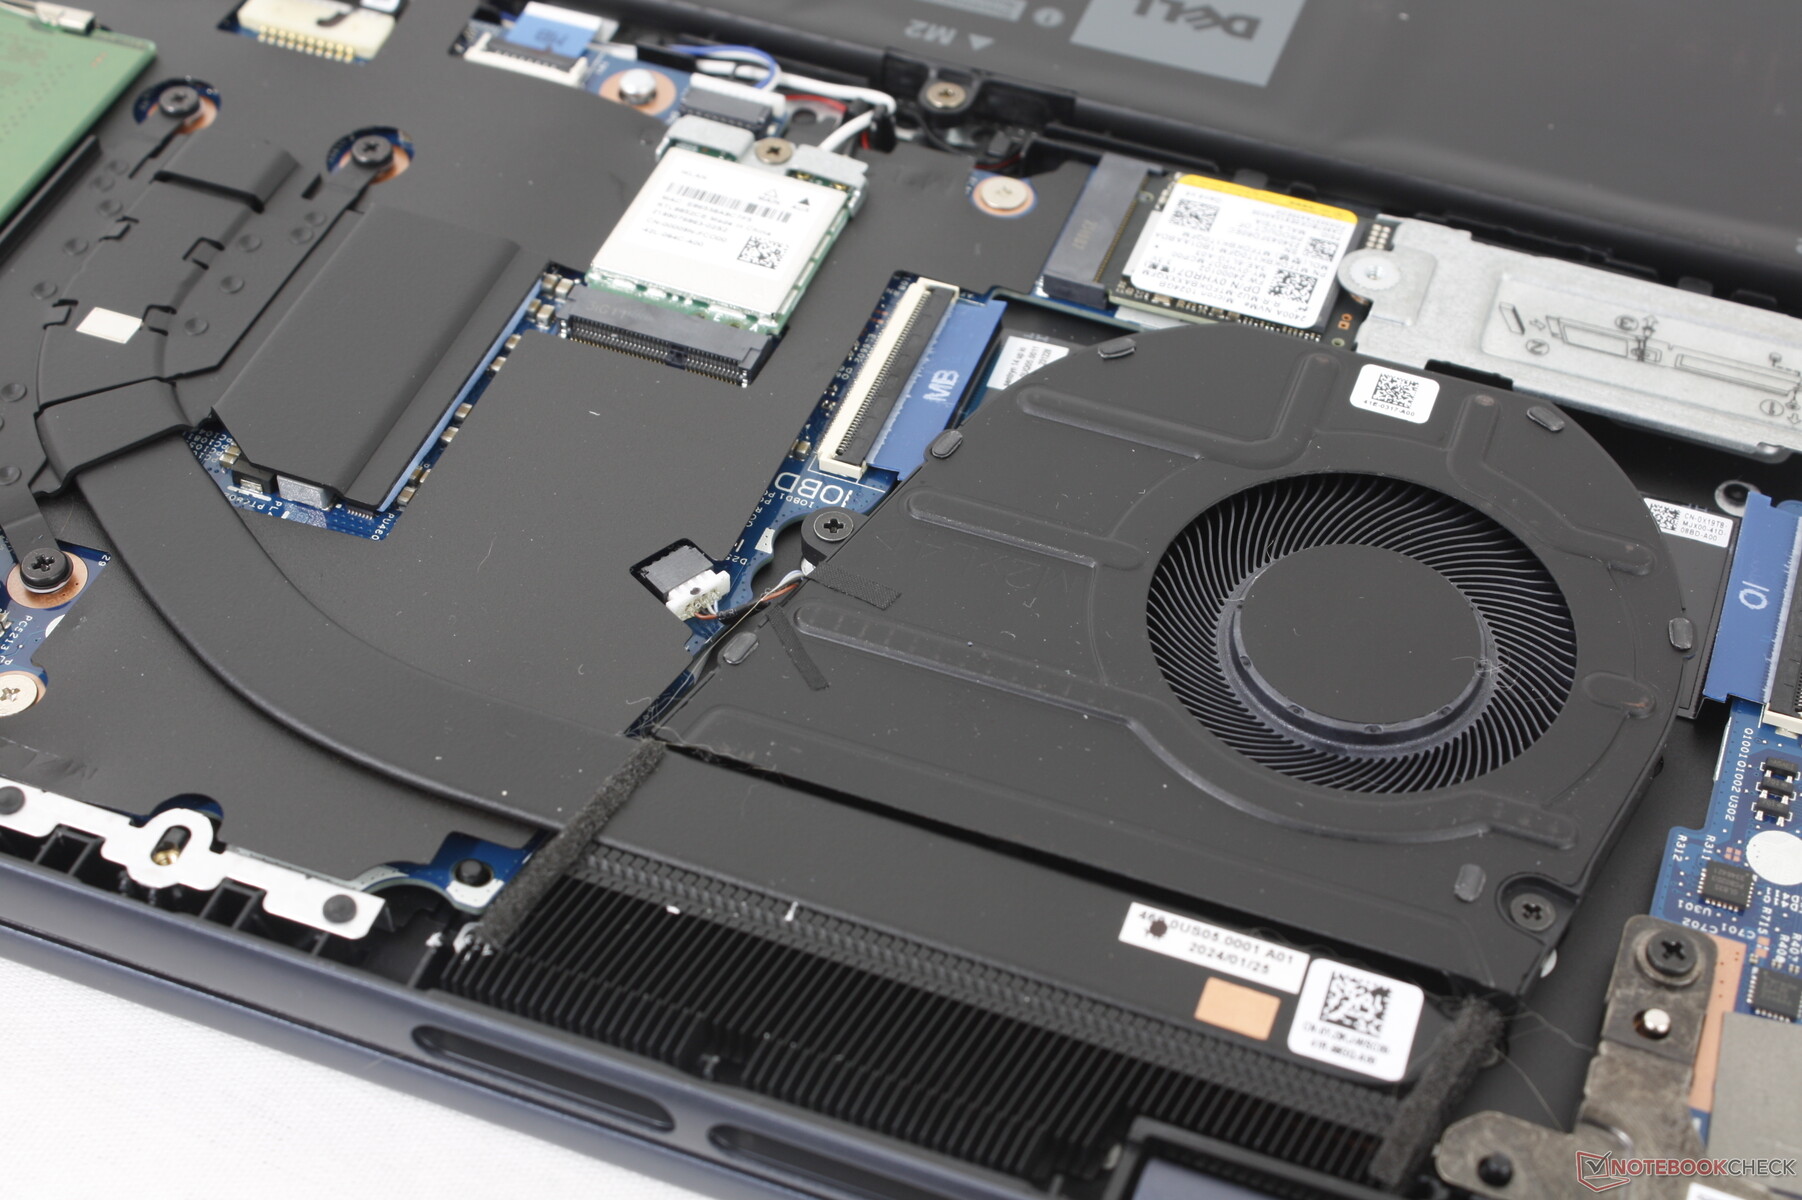
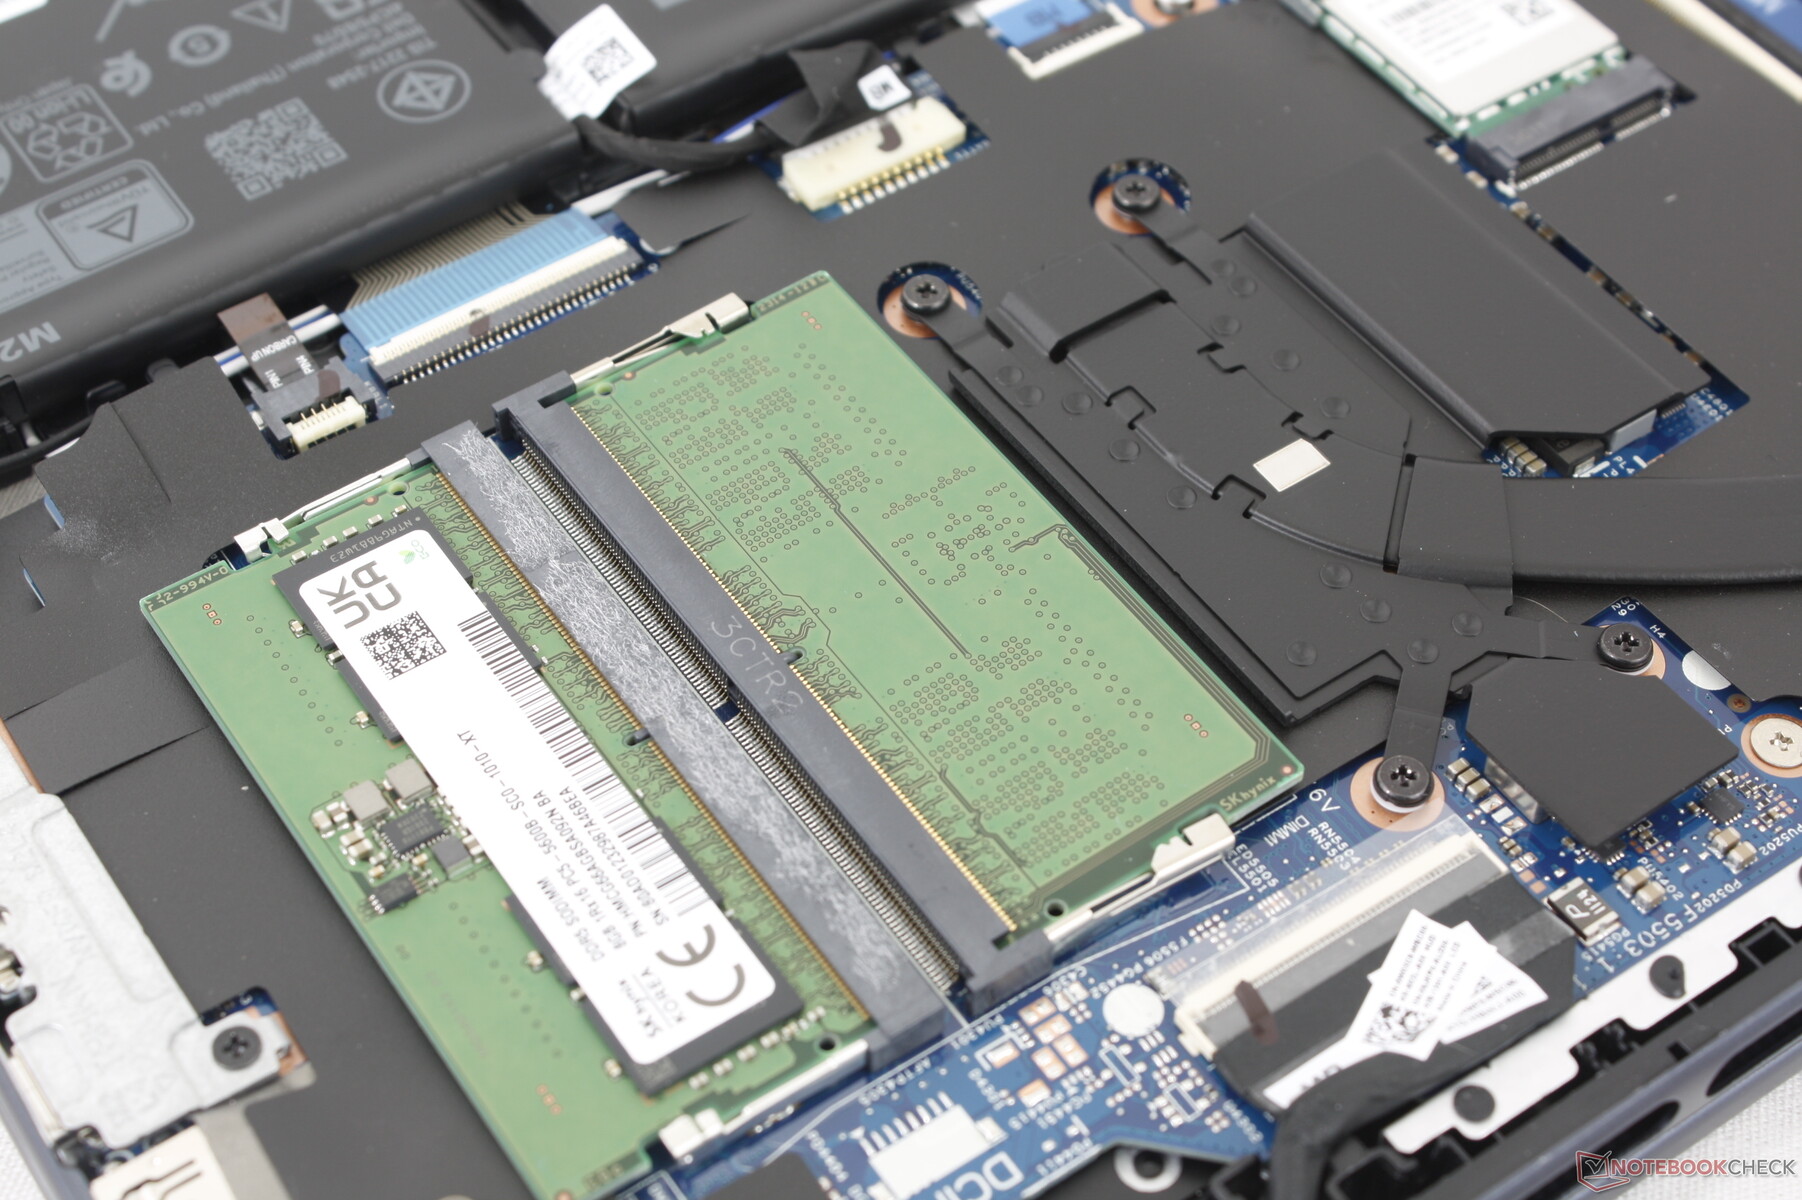
The bottom panel pops off without much effort after loosening its 7 Phillips screws. Once inside, several changes can be observed when compared to last year's design. Most notable is the move away from LPDDR5 in favor of user-upgradeable DDR5 modules.
Accessories And Warranty
There are no extras in the box other than the USB-C AC adapter and paperwork. The standard one-year limited manufacturer warranty applies if purchased in the US.
Input Devices — Improved Feedback With Firmer Keys
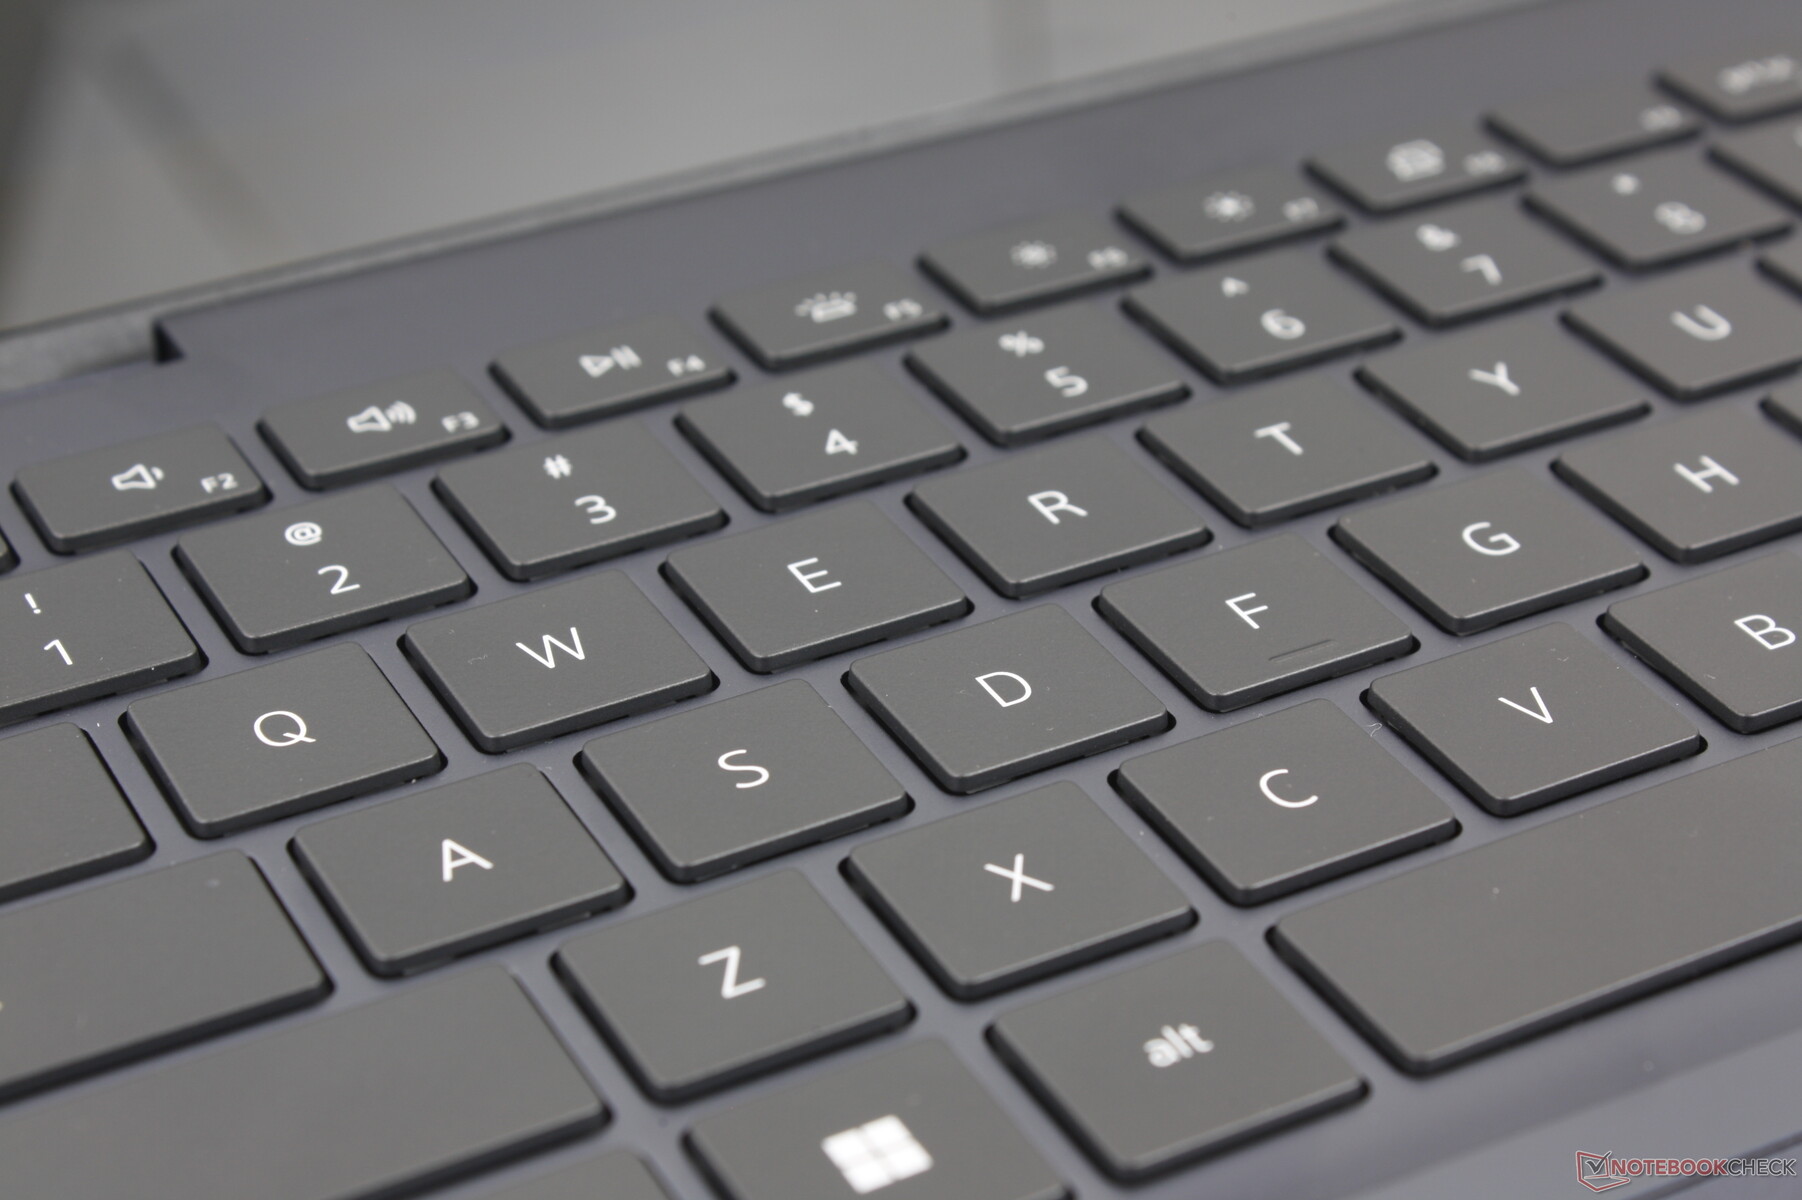
Keyboard
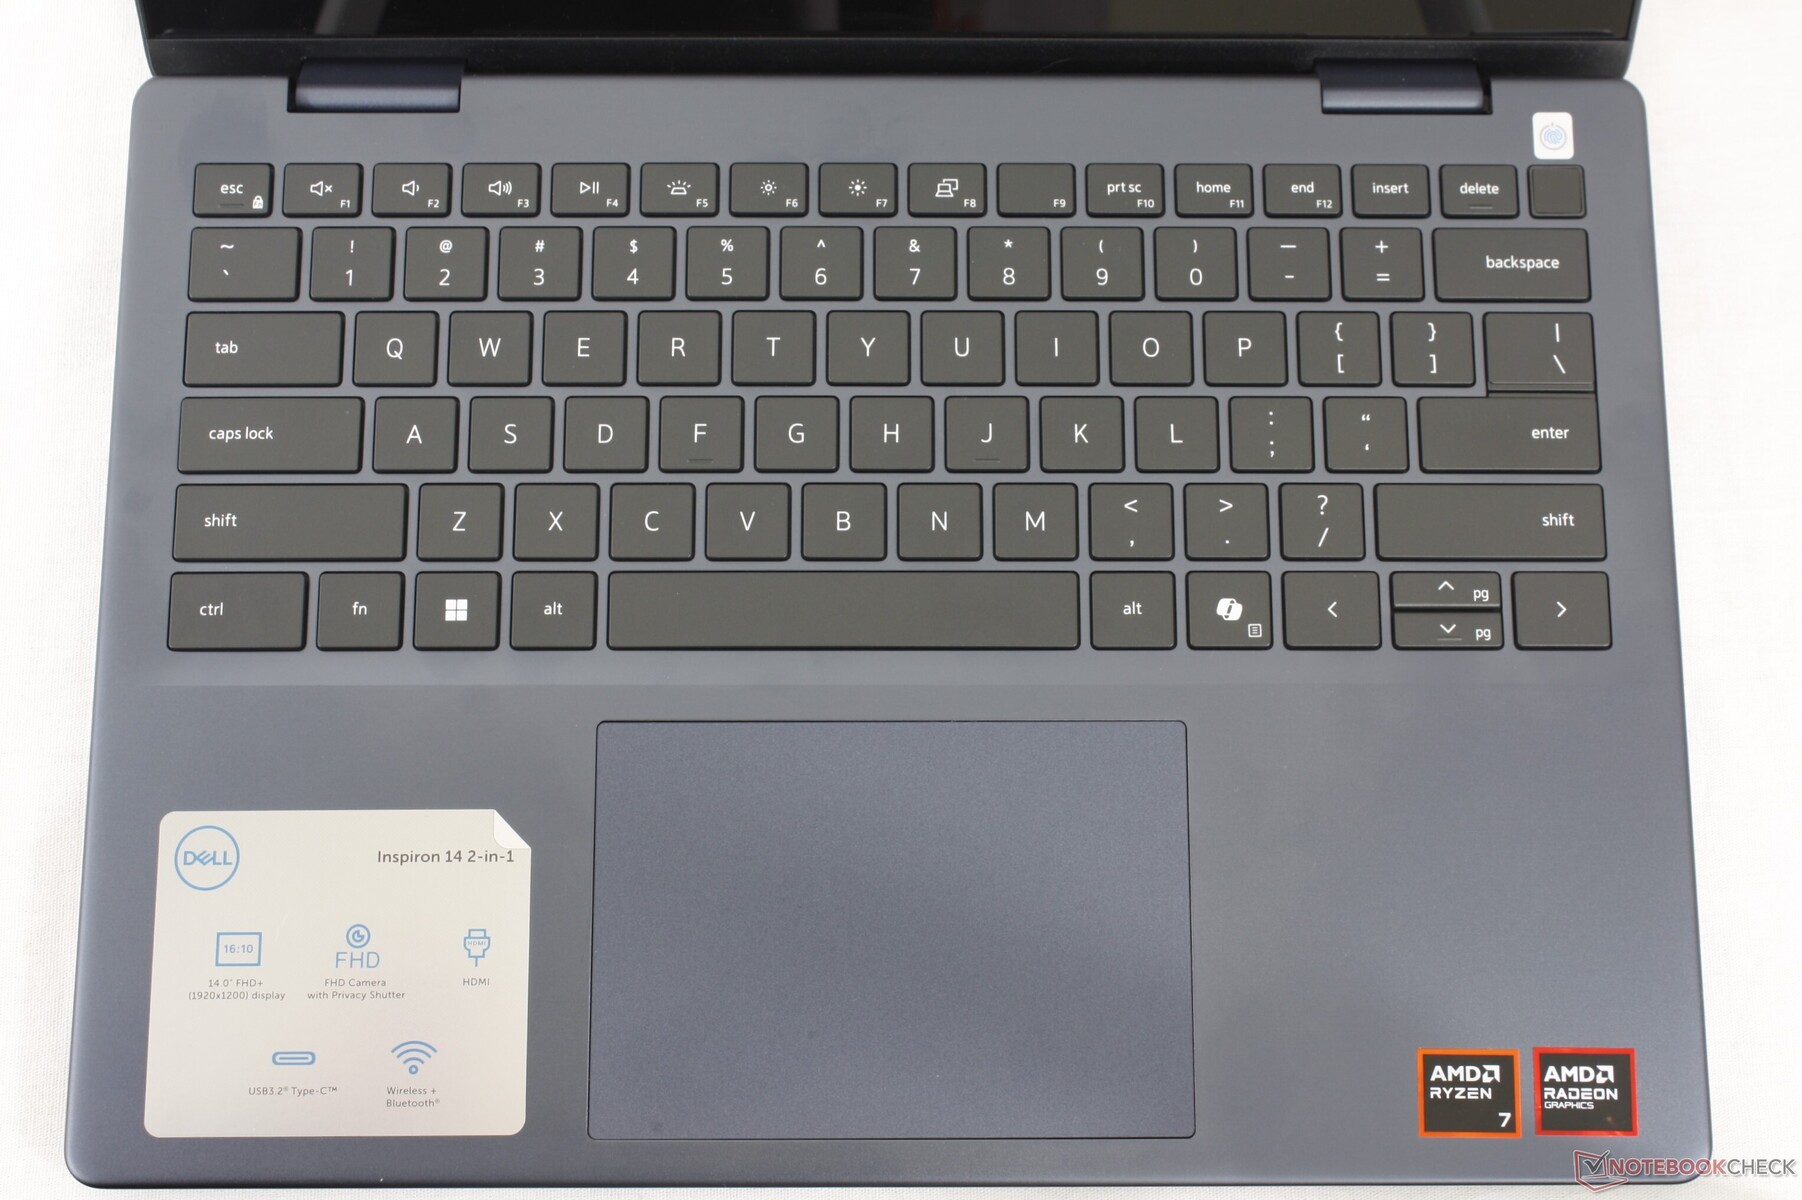
Keyboard layout remains largely the same except with a slightly smaller power button this time. On the other hand, overall key feedback feels firmer than before especially with regards to the Space key which was notably softer on the older Inspiron 14 7435 2-in-1 or Inspiron 14 7420. This specific key is now much louder than the rest of the keyboard when pressed for a more satisfying typing experience.
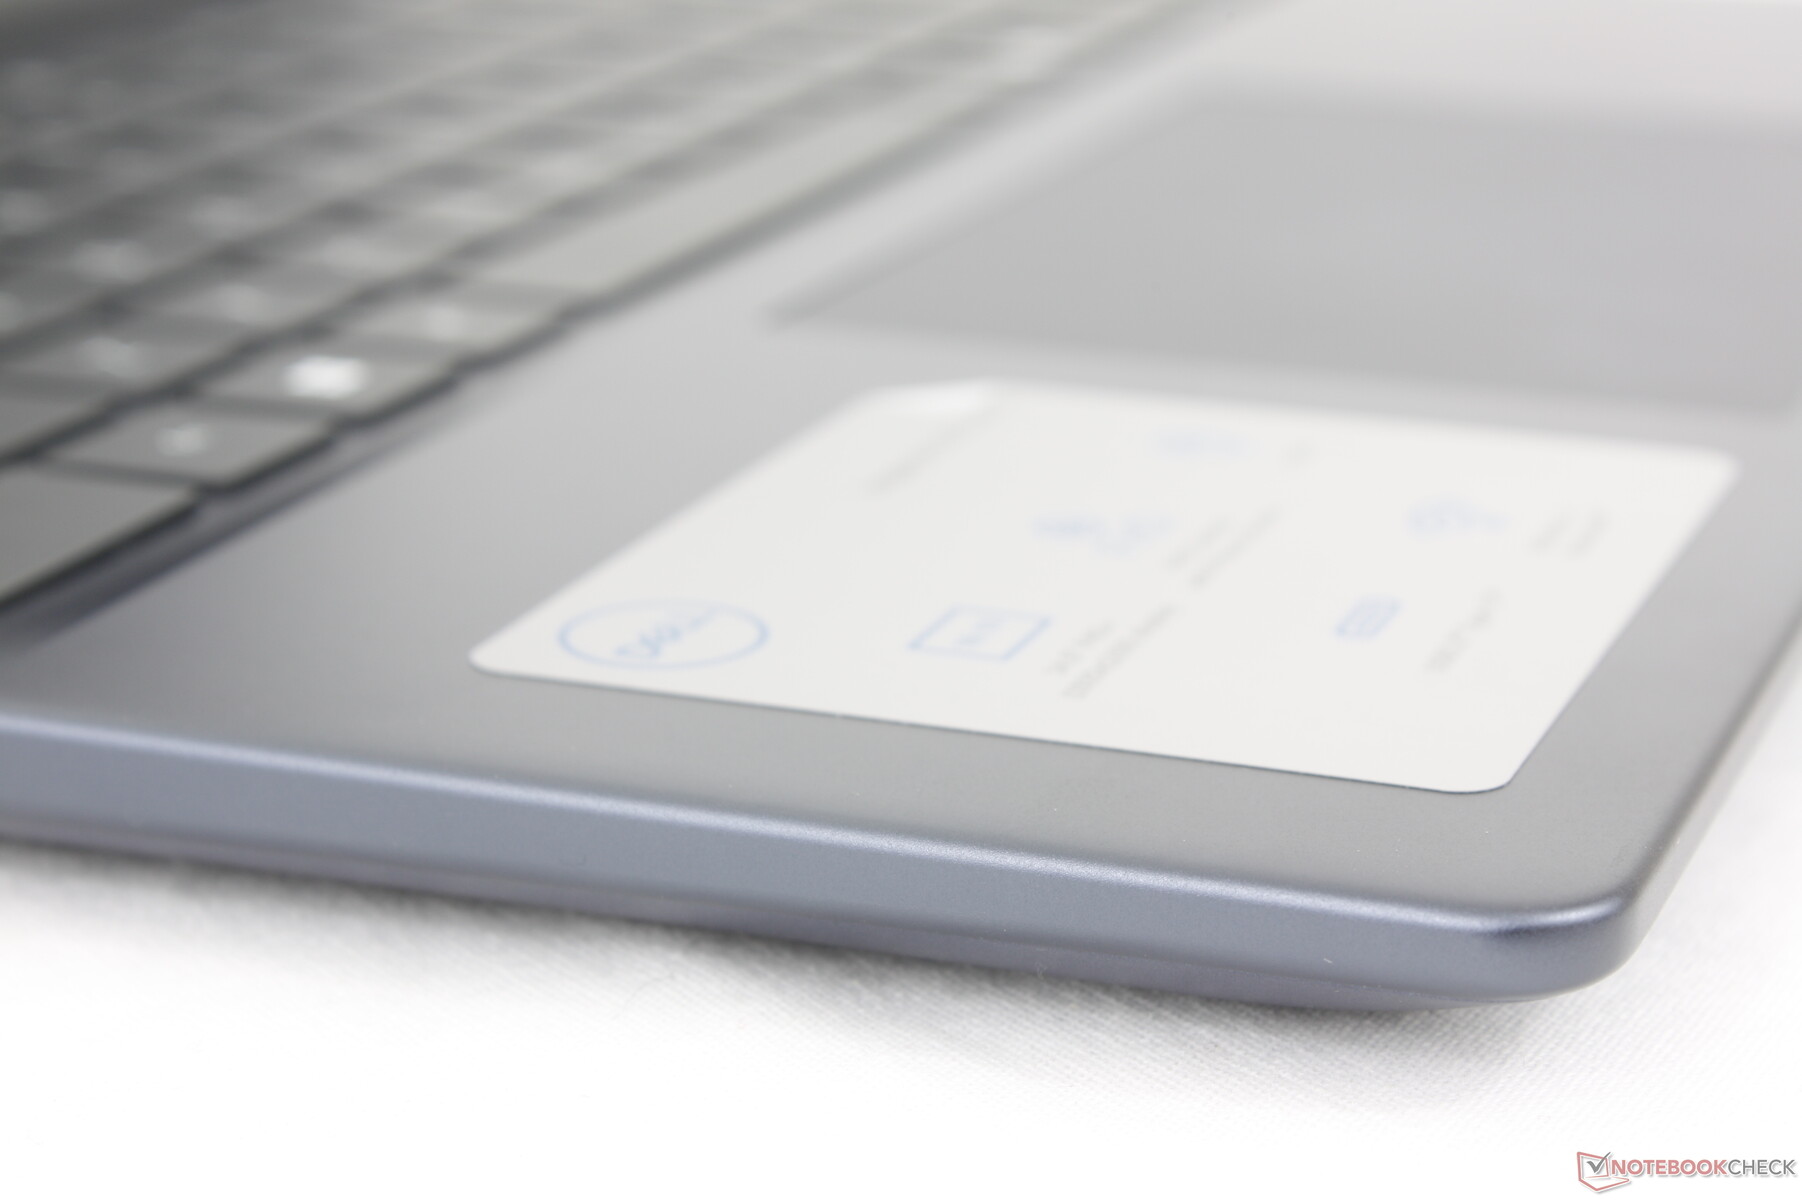
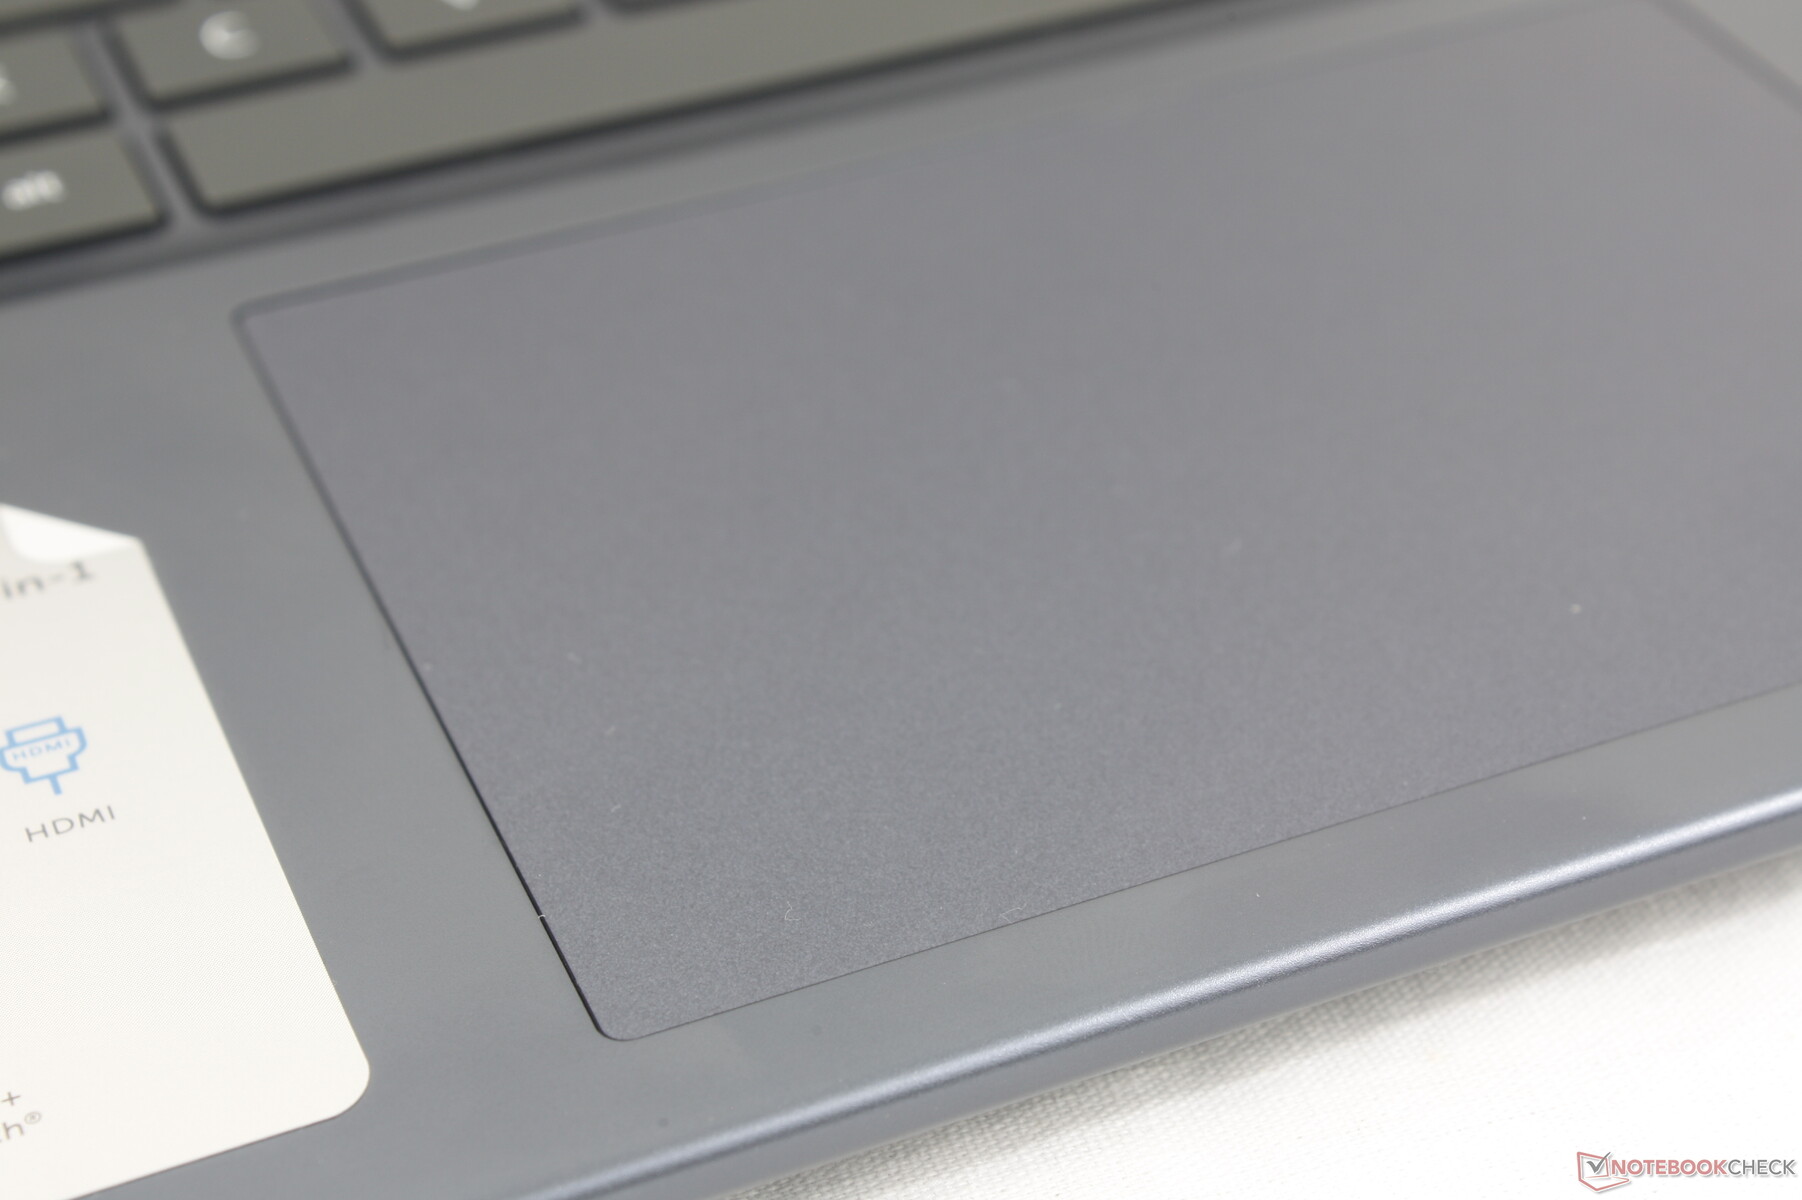
Touchpad
Clickpad size has not changed and so it remains 11.5 x 8 cm which is more than adequate for the 14-inch screen. This time, however, Dell has improved the feedback of the clickpad with a louder, sharper, and more satisfying click when pressed whereas feedback was too spongy on the Inspiron 14 7435 2-in-1. Travel is still a bit too shallow, but the improvements elsewhere alleviate the concern.

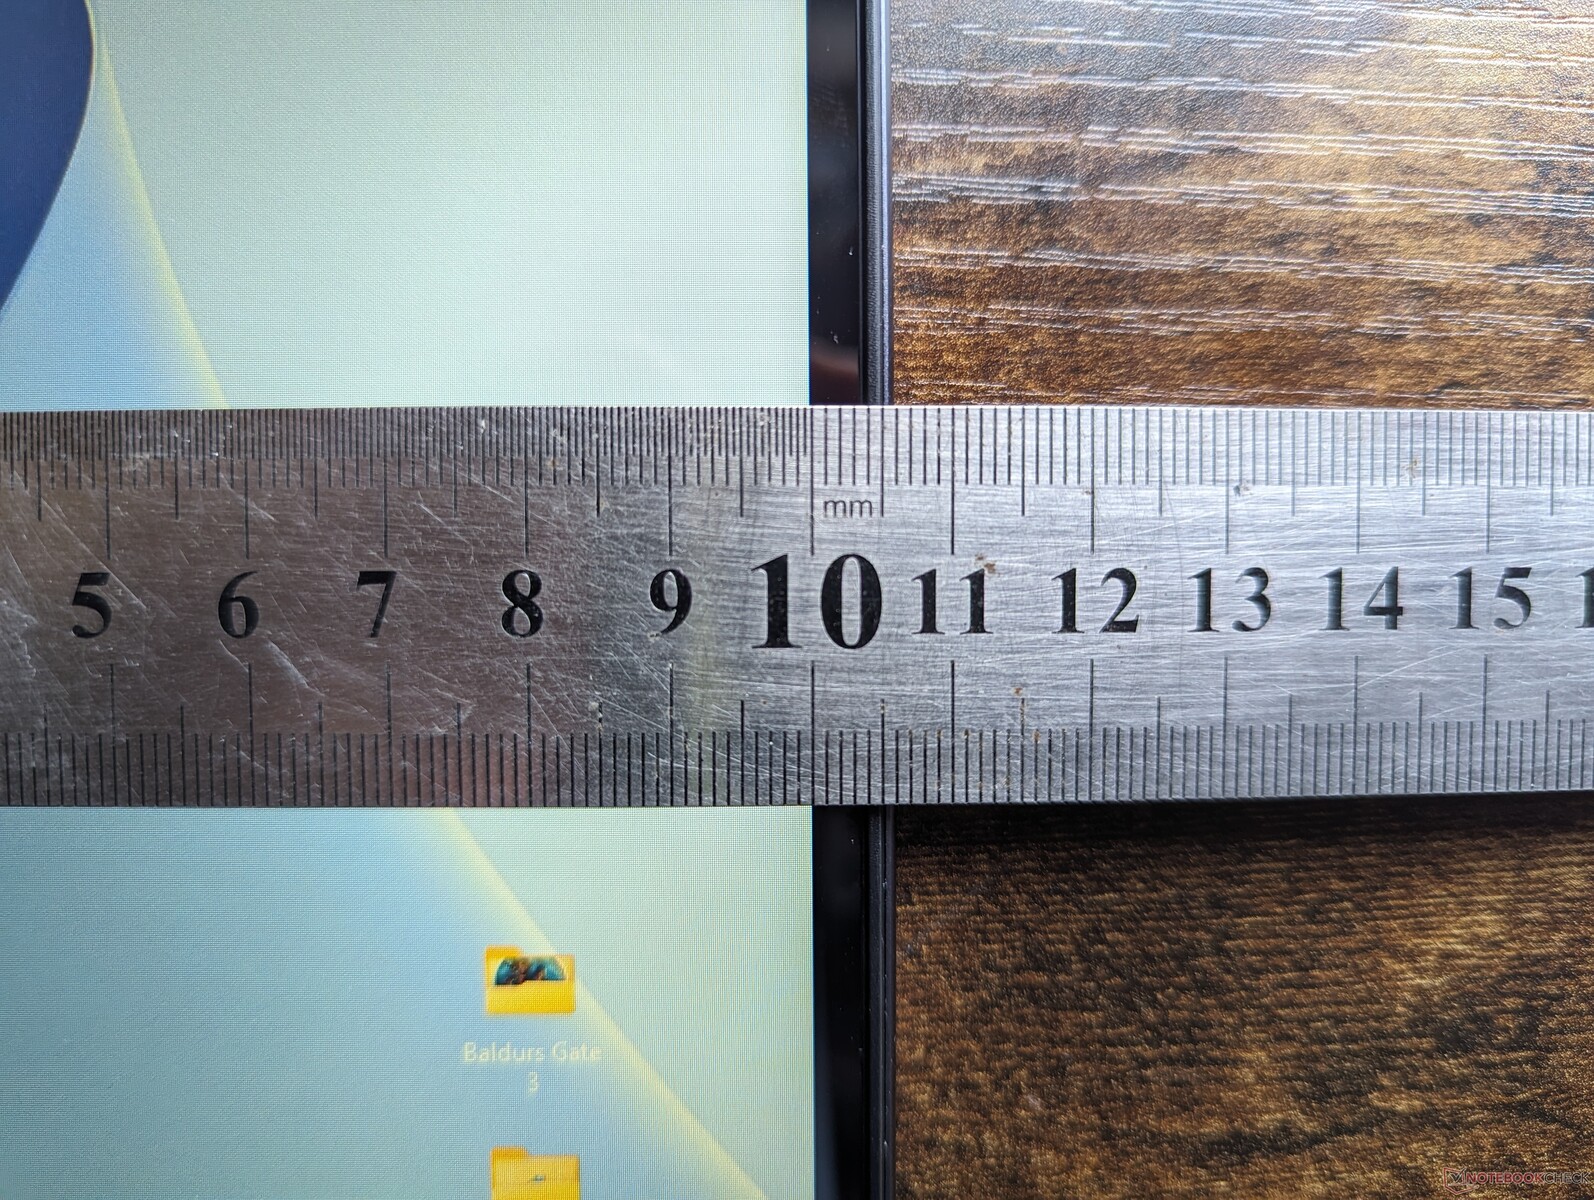
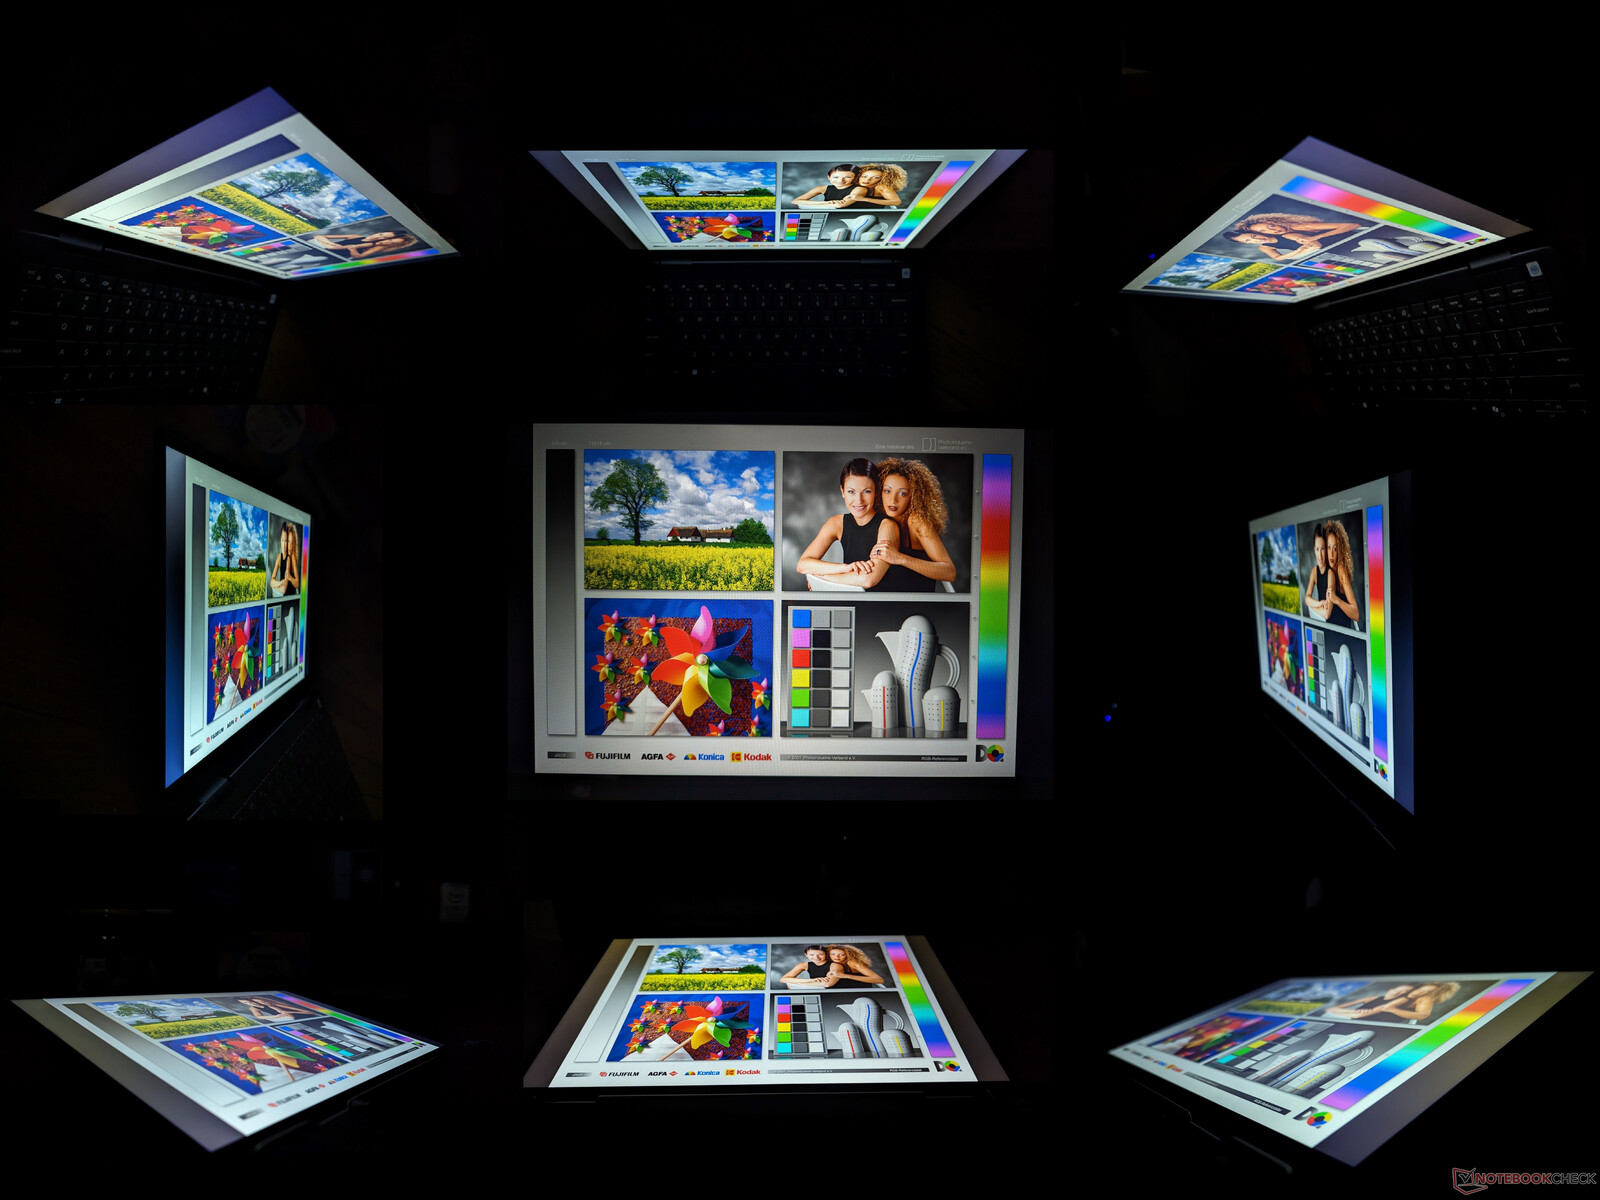
Display — Budget-Grade IPS
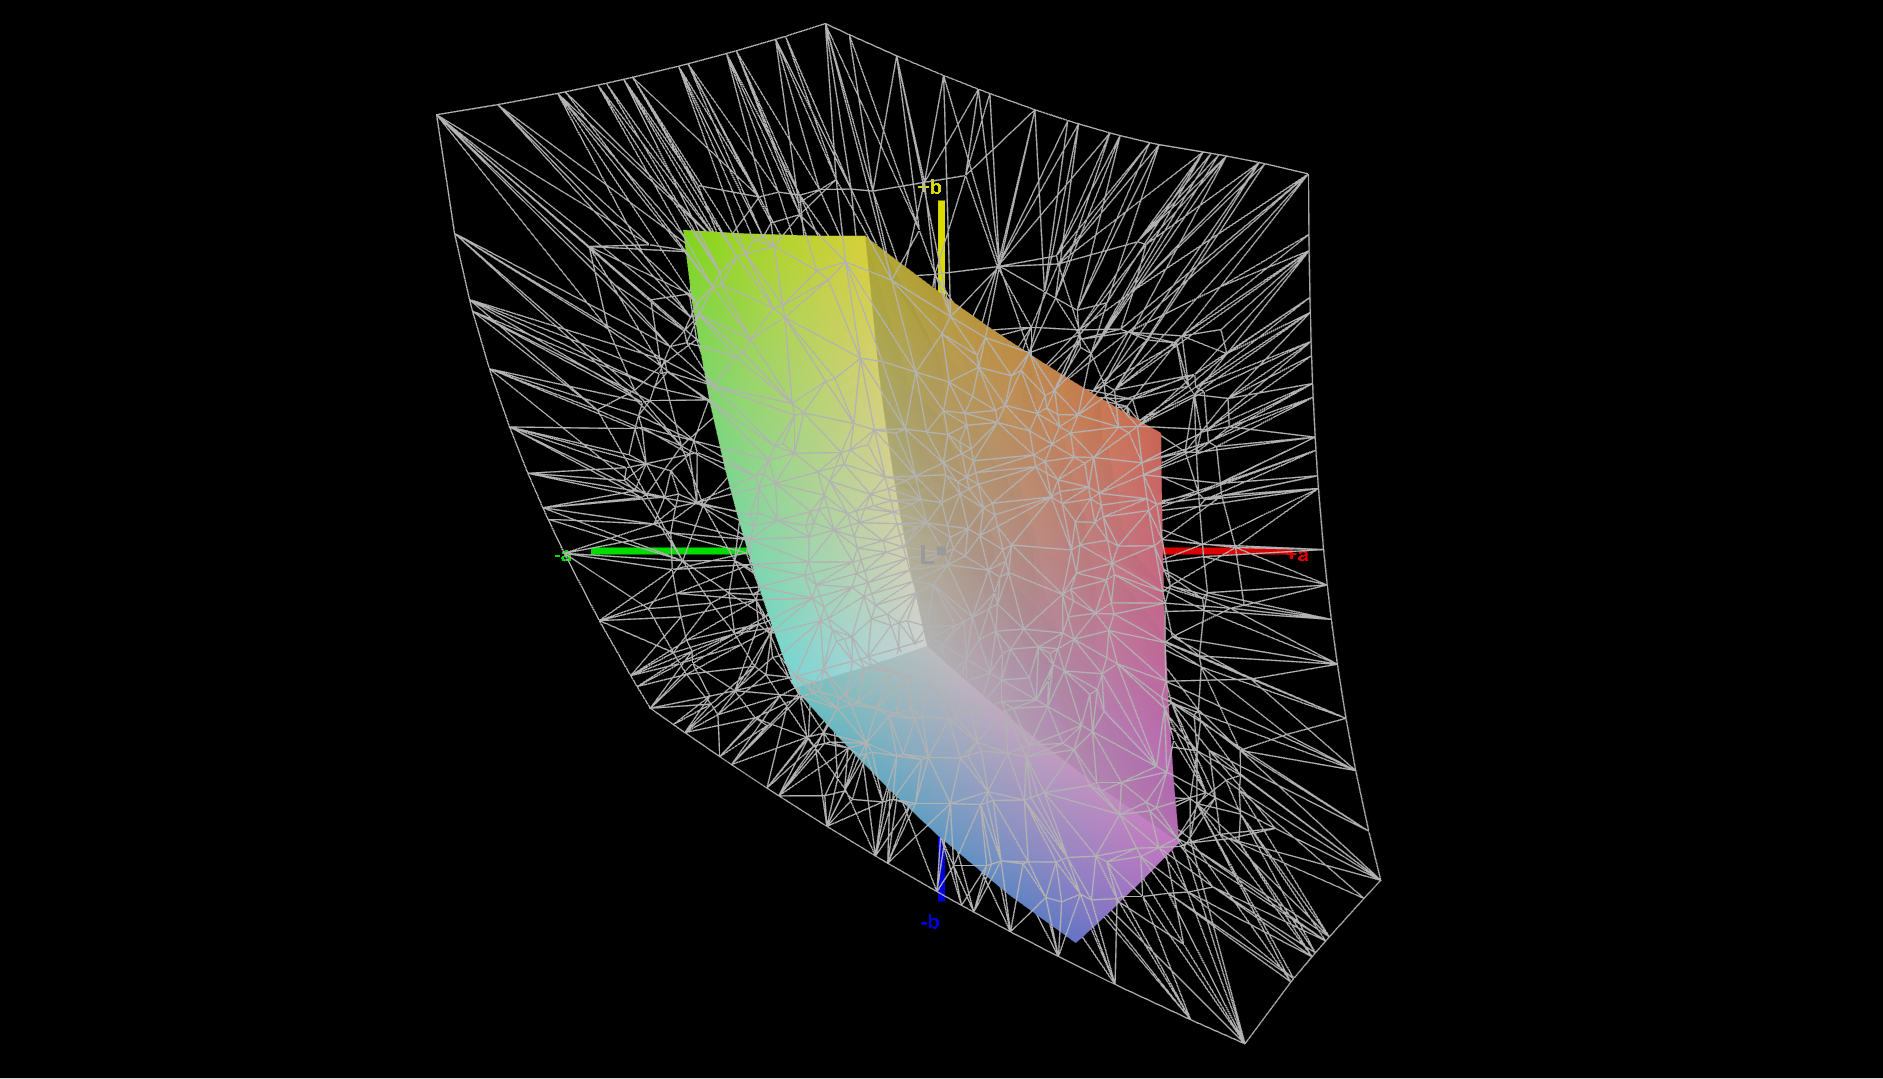
Whereas the Inspiron 14 7435 2-in-1 would ship with a panel from LG Philips, our Inspiron 14 7445 2-in-1 would come with a panel from AU Optronics instead. Unfortunately, the AUO panel doesn't offer anything better than the older LG one as they share similar color spaces, response times, brightness levels, and even contrast ratios for a similar viewing experience. As a budget convertible, however, these specifications are par for the course as shown by the comparison table below. Users who want to maximize display quality may want to consider the Asus VivoBook 14 OLED which retails for around the same price as our Dell.


| |||||||||||||||||||||||||
Brightness Distribution: 84 %
Center on Battery: 267.6 cd/m²
Contrast: 863:1 (Black: 0.31 cd/m²)
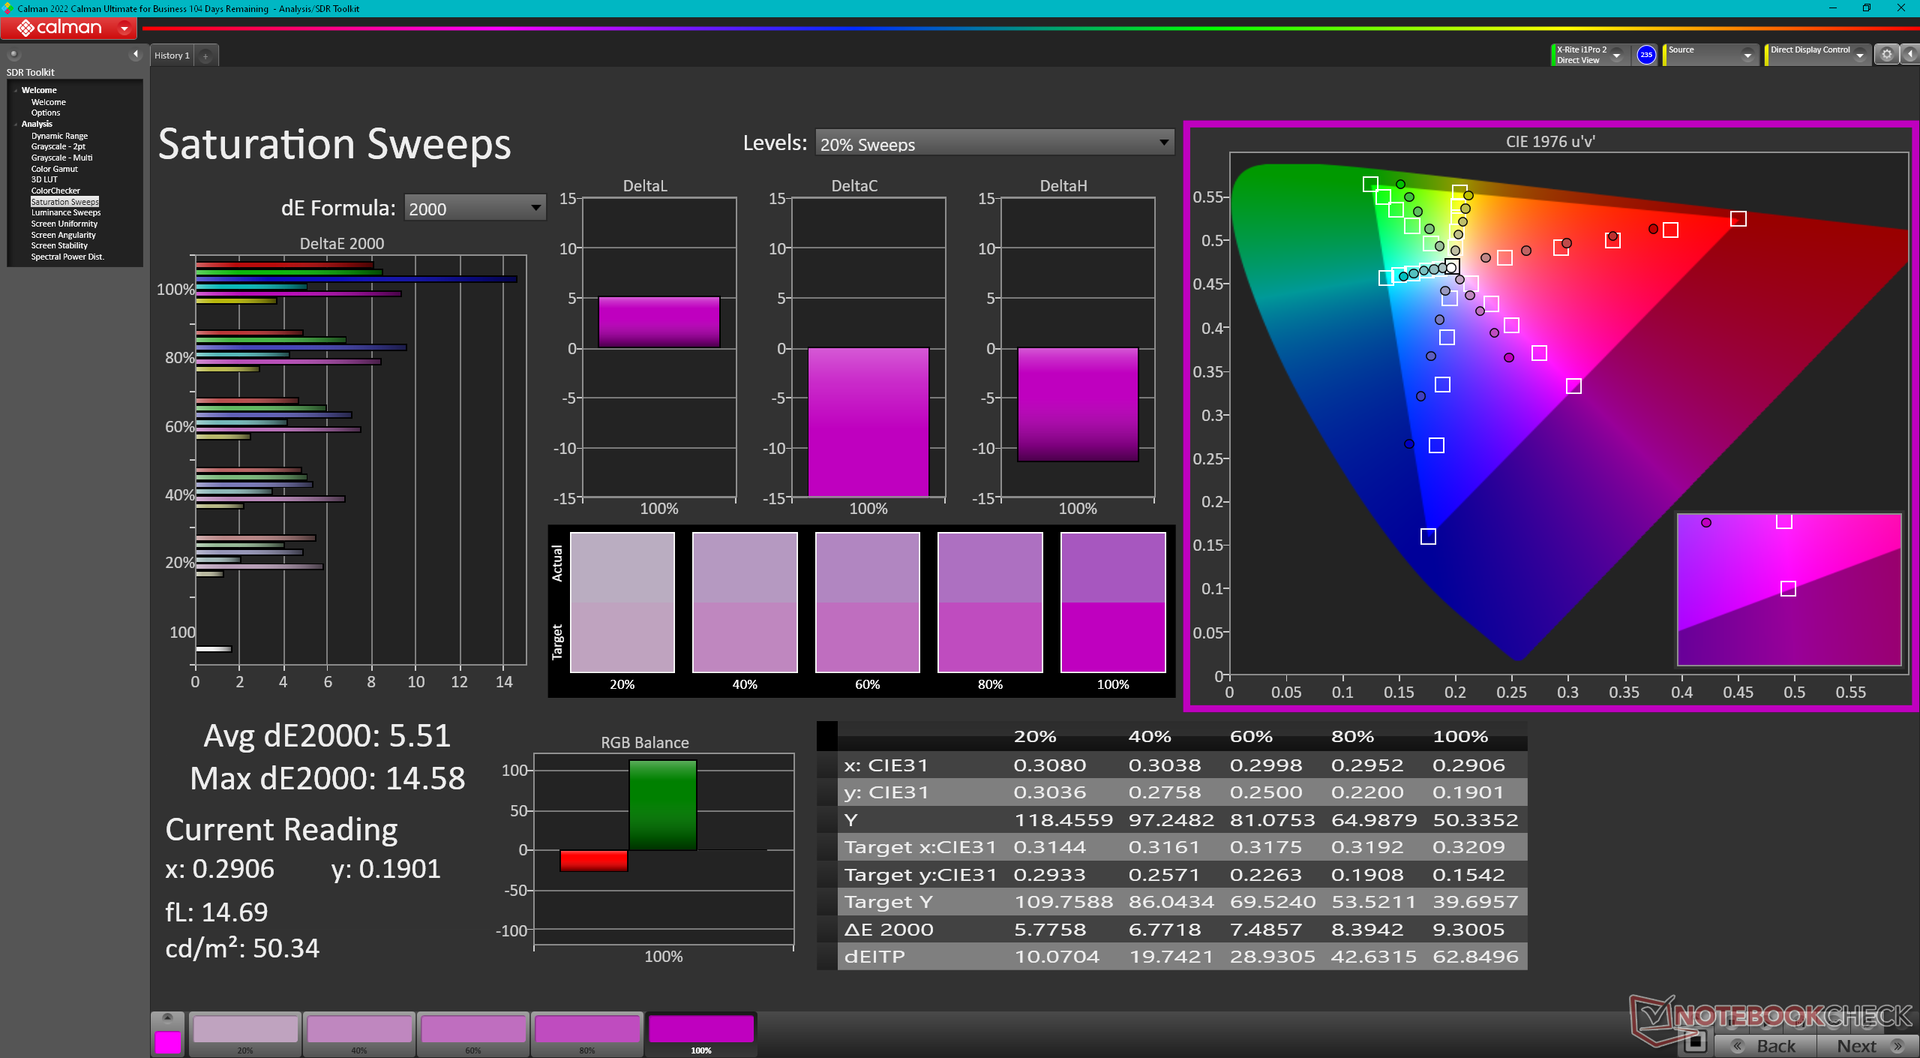
ΔE ColorChecker Calman: 4.67 | ∀{0.5-29.43 Ø4.71}
calibrated: 2.49
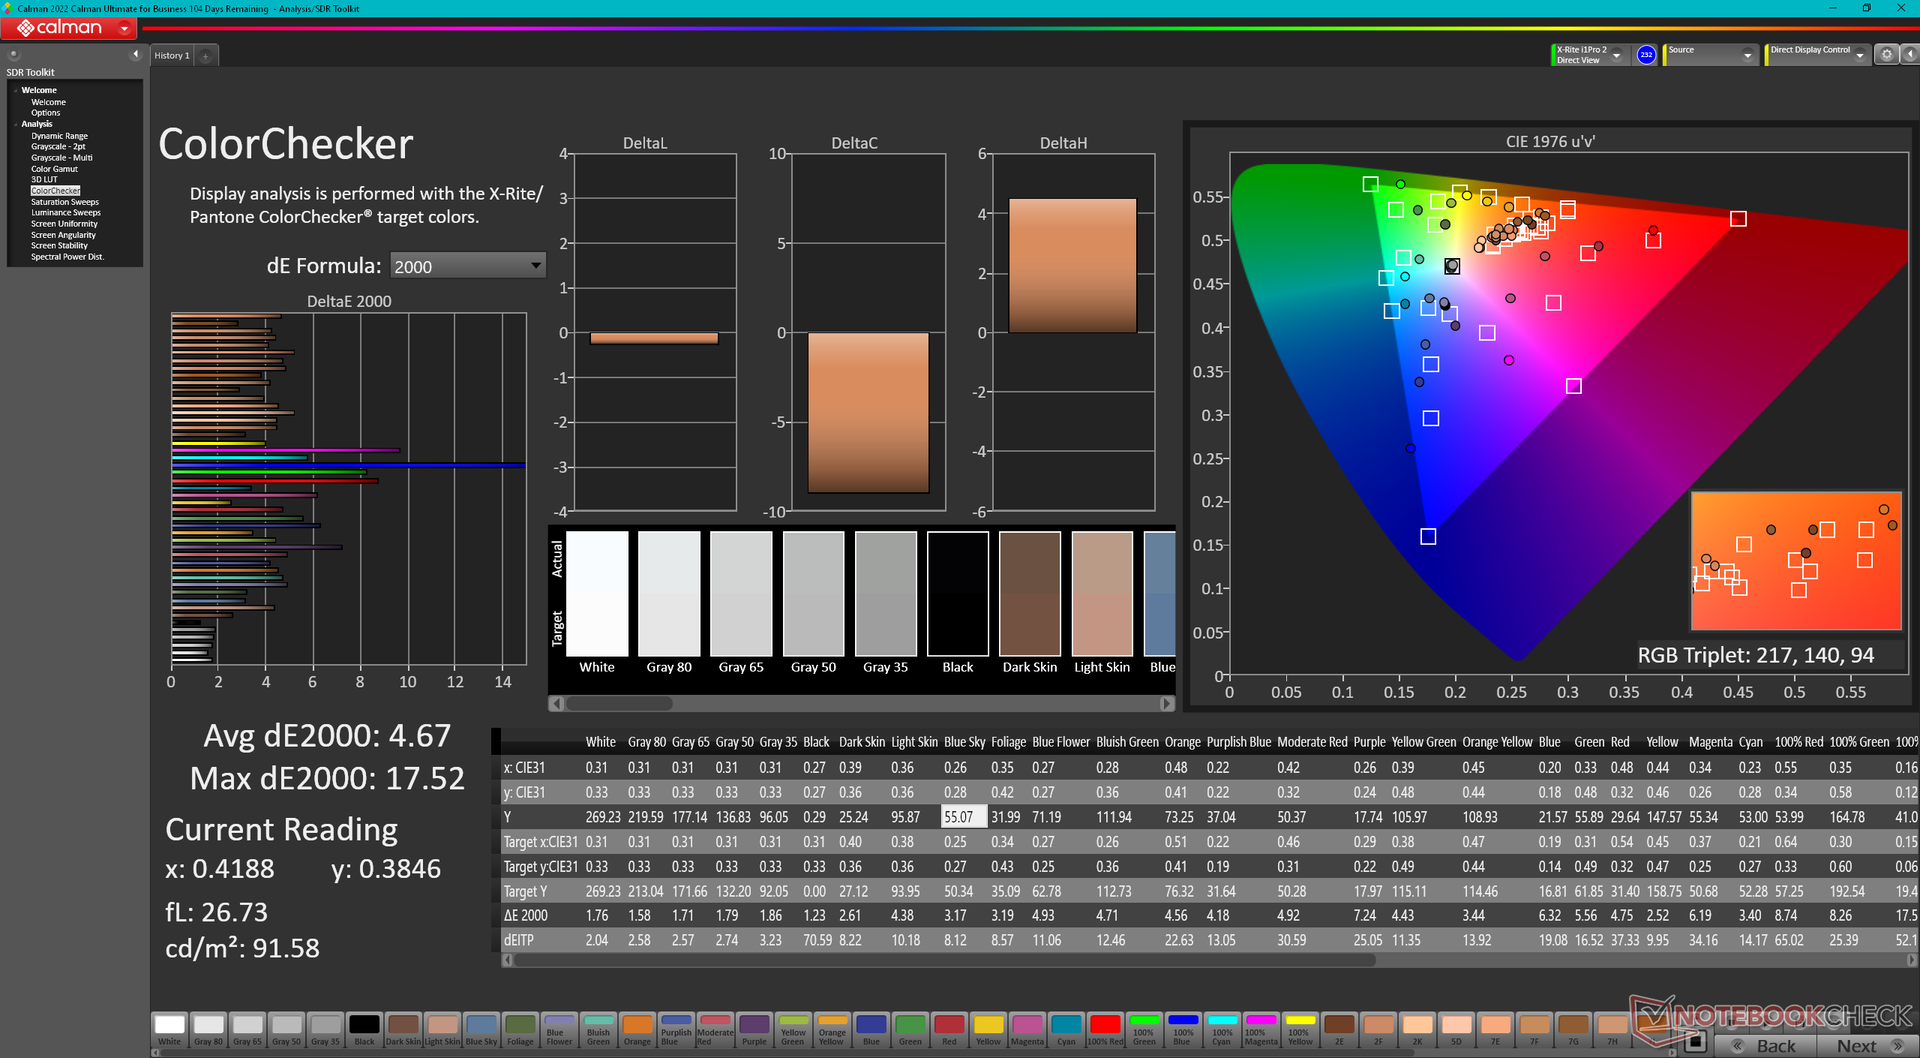
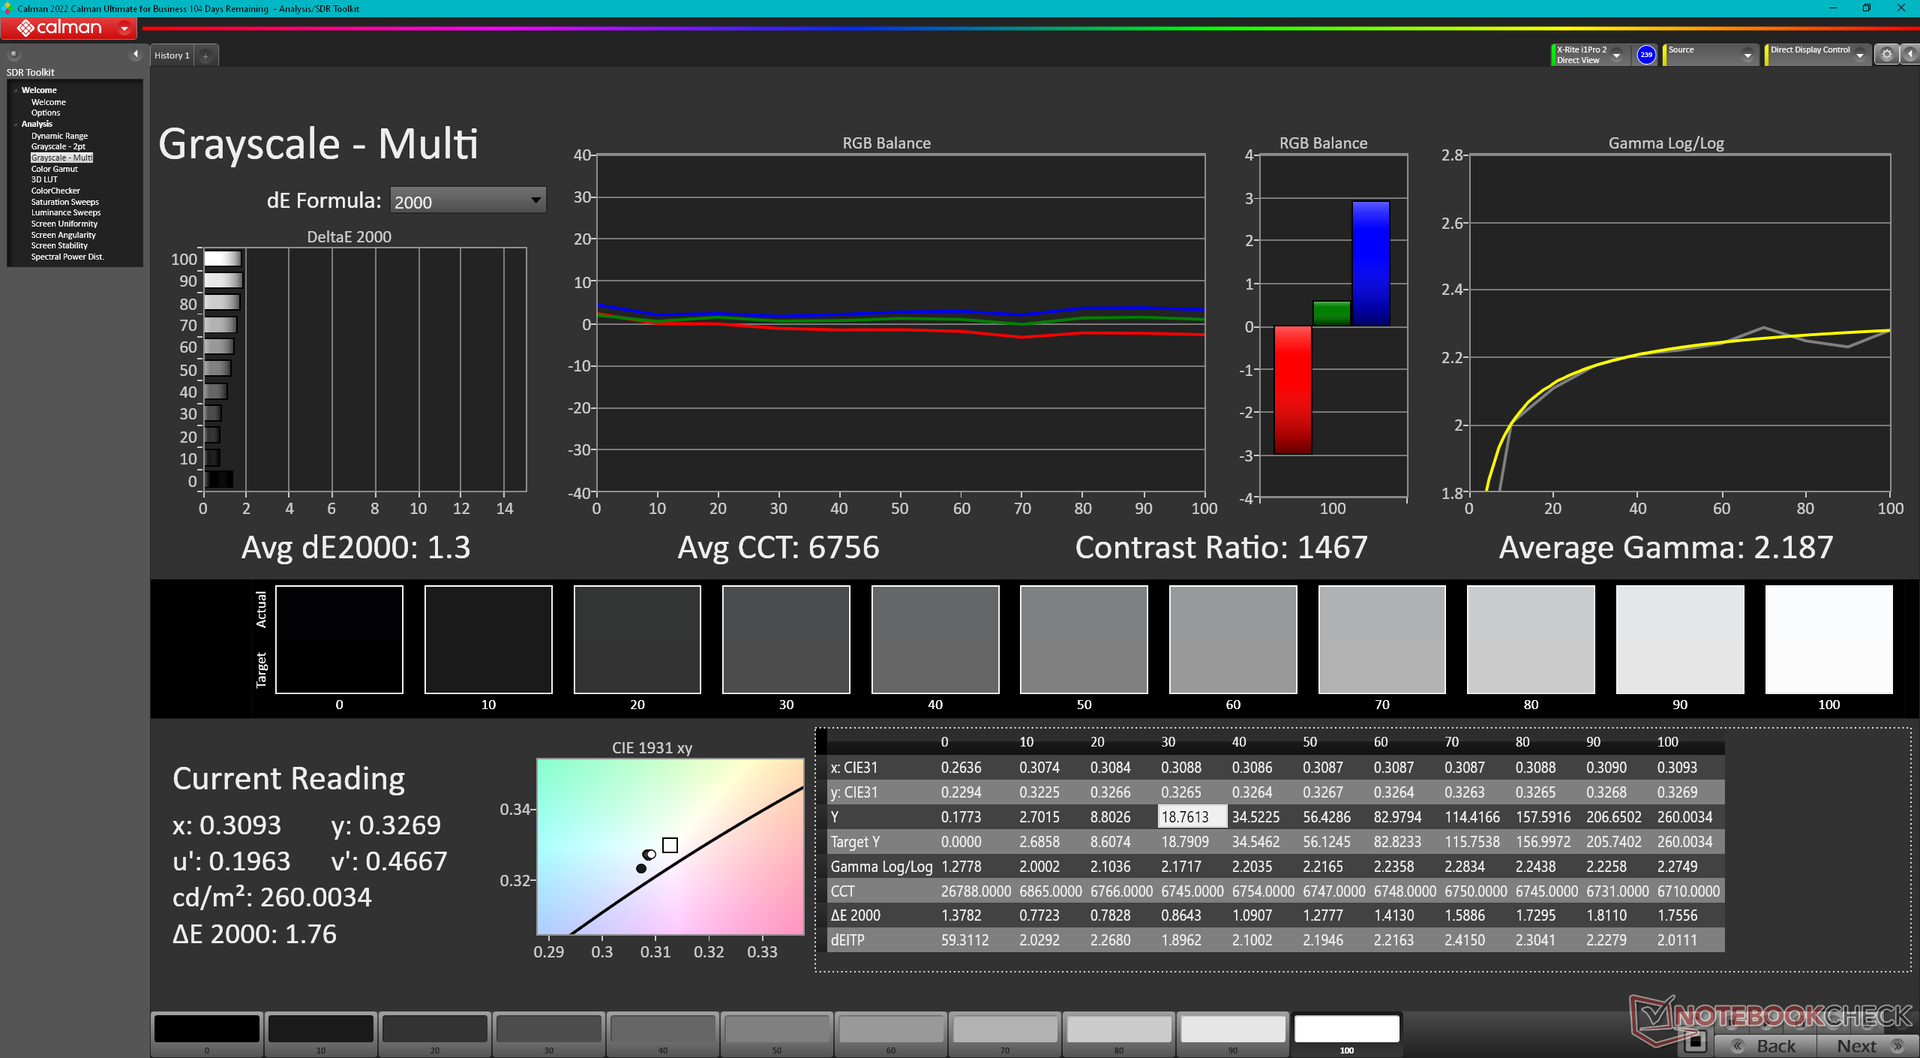
ΔE Greyscale Calman: 2 | ∀{0.09-98 Ø4.96}
36.9% AdobeRGB 1998 (Argyll 3D)
53.6% sRGB (Argyll 3D)
35.7% Display P3 (Argyll 3D)
Gamma: 2.15
CCT: 6585 K
| Dell Inspiron 14 7445 2-in-1 AU Optronics B14UAT, IPS, 1920x1200, 14" | Dell Inspiron 14 7435 2-in-1 LG Philips 140WU2, IPS, 1920x1200, 14" | Dell XPS 13 9310 2-in-1 Sharp LQ134N1, IPS, 1920x1200, 13.4" | Lenovo IdeaPad Flex 5 14IRU8 LEN140WUXGA, IPS, 1920x1200, 14" | HP Pavilion x360 14-dy0157ng Chi Mei N140HCA-E5B, IPS, 1920x1080, 14" | Asus VivoBook Flip 14 TP470EZ Chi Mei CMN N140HCA-EAC, IPS, 1920x1080, 14" | |
|---|---|---|---|---|---|---|
| Display | 23% | 91% | 10% | 20% | 17% | |
| Display P3 Coverage (%) | 35.7 | 44.4 24% | 69.7 95% | 39.8 11% | 42.7 20% | 41.6 17% |
| sRGB Coverage (%) | 53.6 | 64.4 20% | 99 85% | 58 8% | 63.7 19% | 62.1 16% |
| AdobeRGB 1998 Coverage (%) | 36.9 | 45.8 24% | 71.7 94% | 41.1 11% | 44.2 20% | 43 17% |
| Response Times | -4% | -149% | -27% | -39% | -74% | |
| Response Time Grey 50% / Grey 80% * (ms) | 23 ? | 19.6 ? 15% | 55.6 ? -142% | 30.2 ? -31% | 32 ? -39% | 39 ? -70% |
| Response Time Black / White * (ms) | 15.8 ? | 19.3 ? -22% | 40.4 ? -156% | 19.3 ? -22% | 22 ? -39% | 28 ? -77% |
| PWM Frequency (Hz) | 2500 ? | 25000 ? | ||||
| Screen | -25% | 24% | -24% | 15% | -19% | |
| Brightness middle (cd/m²) | 267.6 | 231.8 -13% | 555.7 108% | 335.2 25% | 269 1% | 205 -23% |
| Brightness (cd/m²) | 240 | 216 -10% | 528 120% | 316 32% | 241 0% | 186 -22% |
| Brightness Distribution (%) | 84 | 87 4% | 90 7% | 86 2% | 82 -2% | 78 -7% |
| Black Level * (cd/m²) | 0.31 | 0.27 13% | 0.35 -13% | 0.29 6% | 0.11 65% | 0.22 29% |
| Contrast (:1) | 863 | 859 0% | 1588 84% | 1156 34% | 2445 183% | 932 8% |
| Colorchecker dE 2000 * | 4.67 | 6.59 -41% | 4.83 -3% | 7.49 -60% | 5.68 -22% | 5.14 -10% |
| Colorchecker dE 2000 max. * | 17.52 | 16.83 4% | 8.46 52% | 22.25 -27% | 9.61 45% | 19.57 -12% |
| Colorchecker dE 2000 calibrated * | 2.49 | 3.94 -58% | 0.76 69% | 2.17 13% | 3.17 -27% | |
| Greyscale dE 2000 * | 2 | 4.5 -125% | 6.1 -205% | 6.9 -245% | 4.95 -148% | 4.1 -105% |
| Gamma | 2.15 102% | 2.17 101% | 1.98 111% | 2.17 101% | 2.17 101% | 2.2 100% |
| CCT | 6585 99% | 6110 106% | 6686 97% | 5988 109% | 6628 98% | 6807 95% |
| Color Space (Percent of AdobeRGB 1998) (%) | 44.2 | 43.04 | ||||
| Color Space (Percent of sRGB) (%) | 63.7 | 62.1 | ||||
| Total Average (Program / Settings) | -2% /
-12% | -11% /
14% | -14% /
-17% | -1% /
8% | -25% /
-19% |
* ... smaller is better
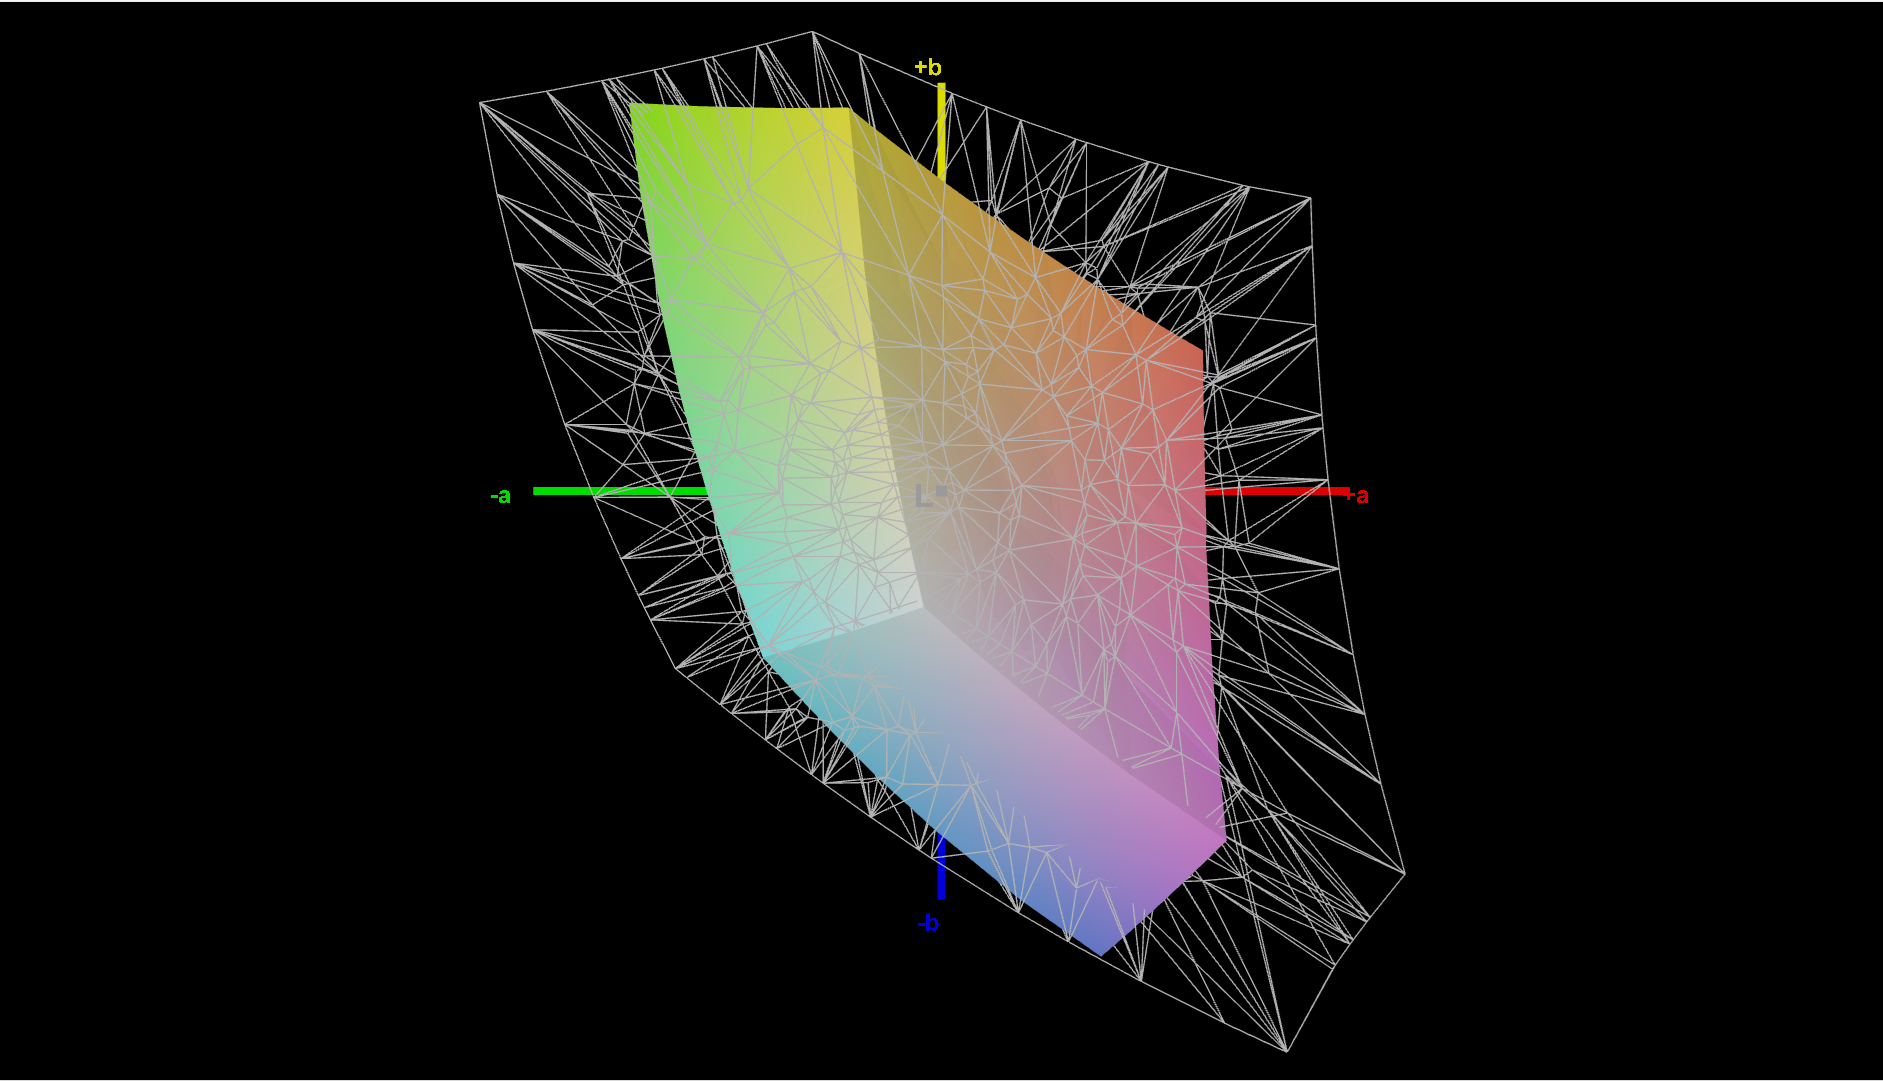
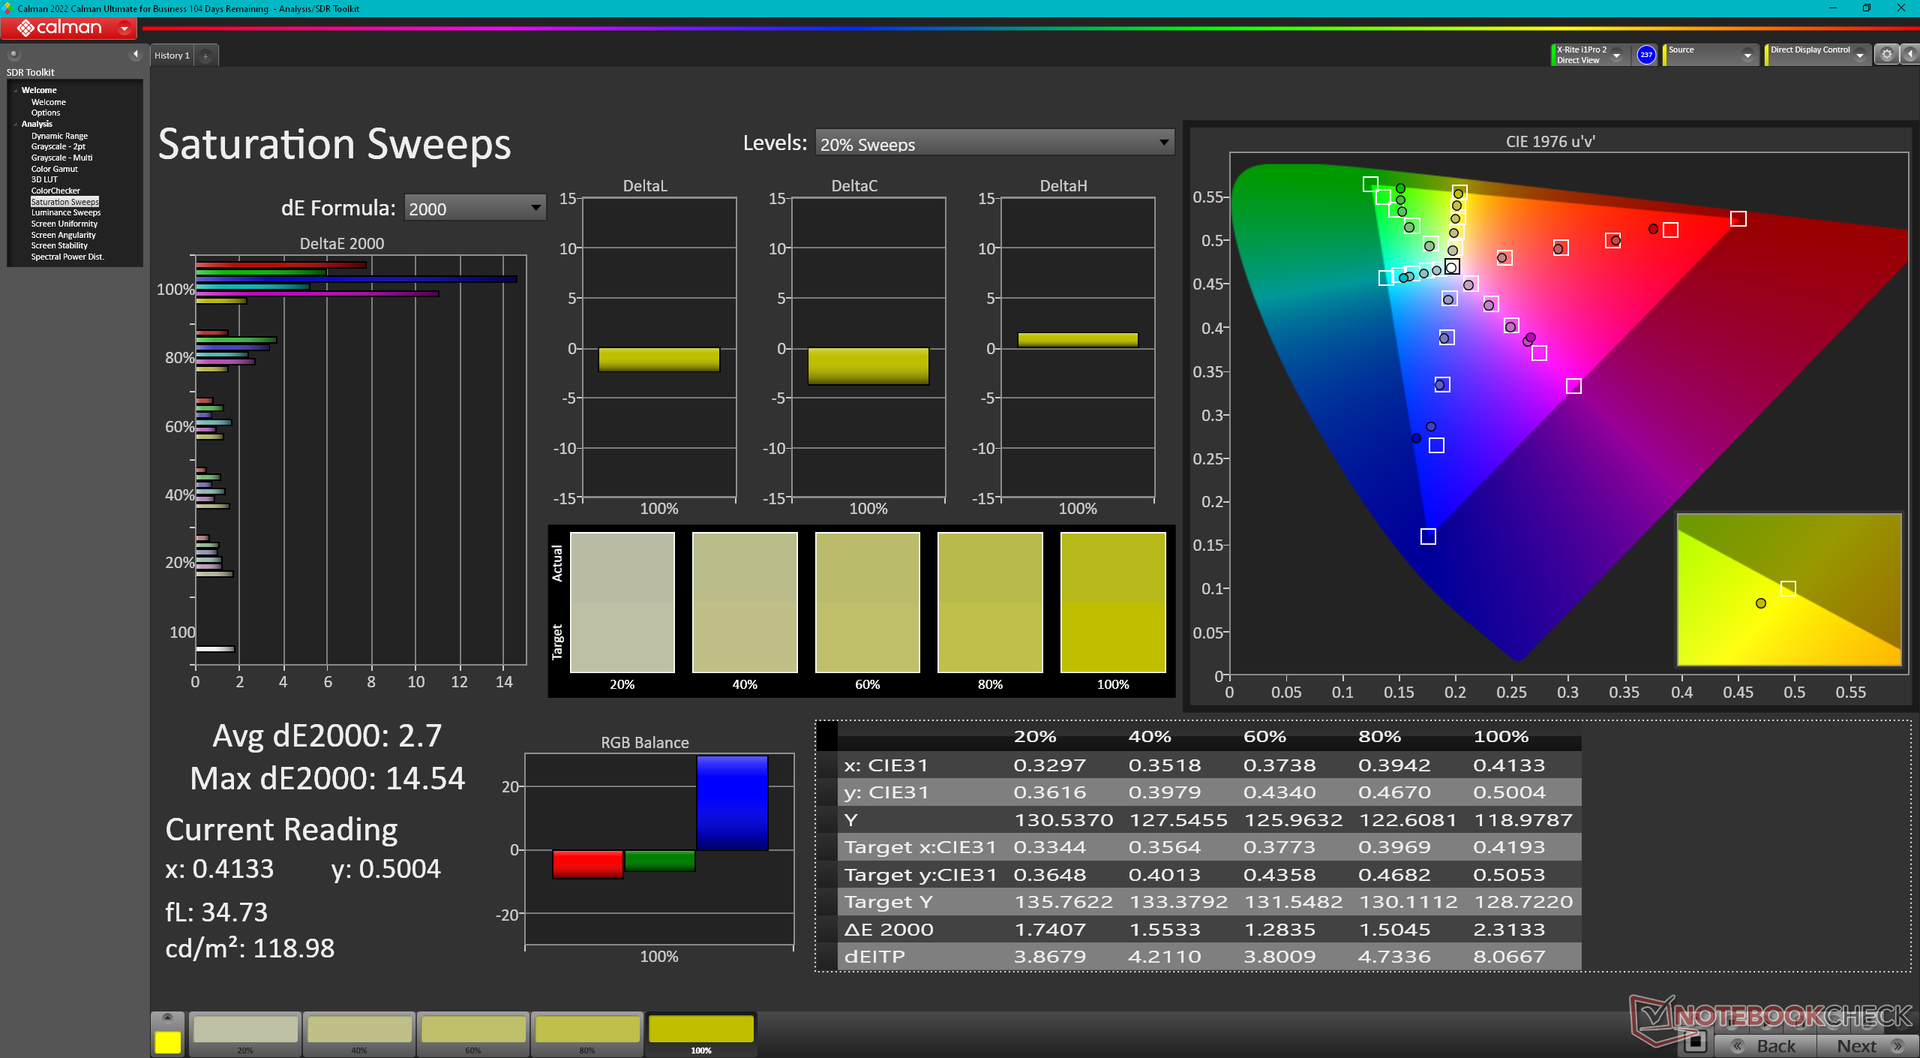
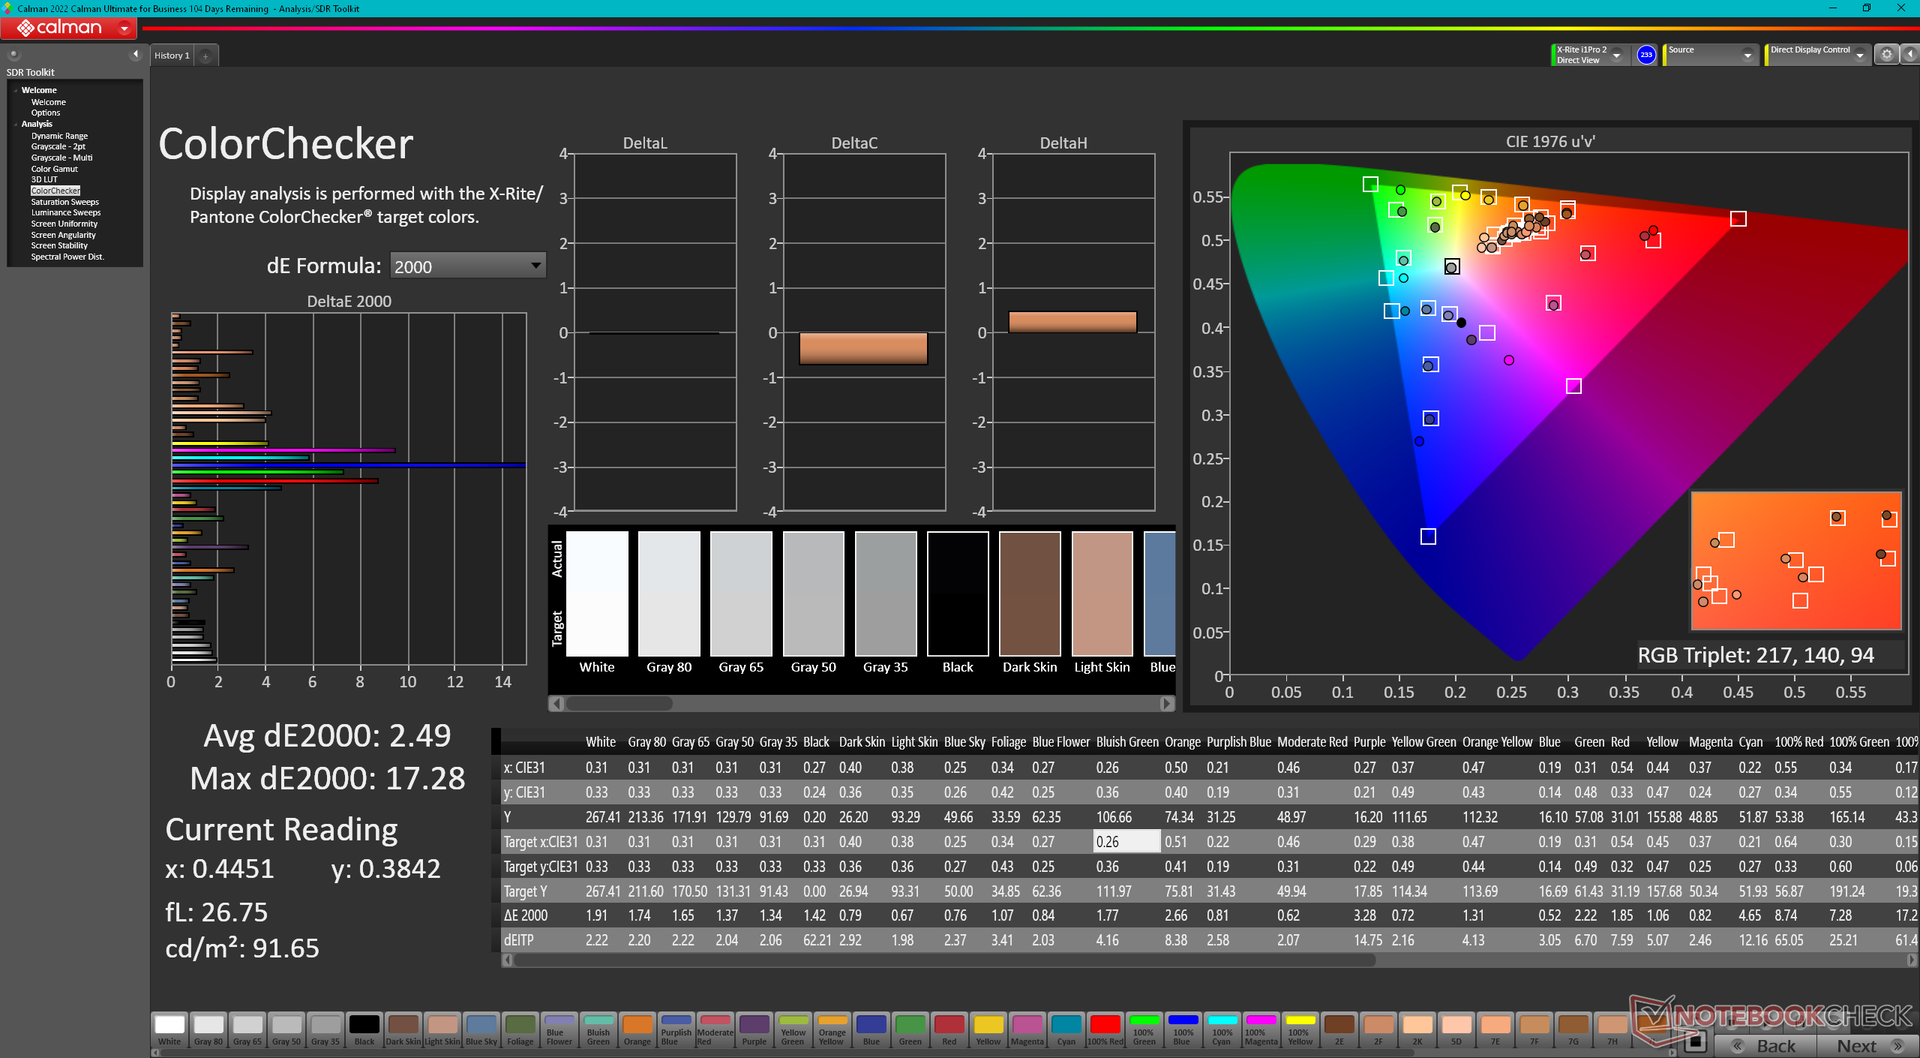
Although color temperature and grayscale are good out of the box, gamma correction is off leading to more inaccurate colors across the board. Calibrating with our X-Rite colorimeter addresses this issue for more accurate colors especially at lower saturation levels as shown by the CalMan screenshots below. Keep in mind that colors remain very inaccurate at higher saturation levels due to the limited sRGB coverage mentioned above.

Display Response Times
| ↔ Response Time Black to White | ||
|---|---|---|
| 15.8 ms ... rise ↗ and fall ↘ combined | ↗ 9.1 ms rise | 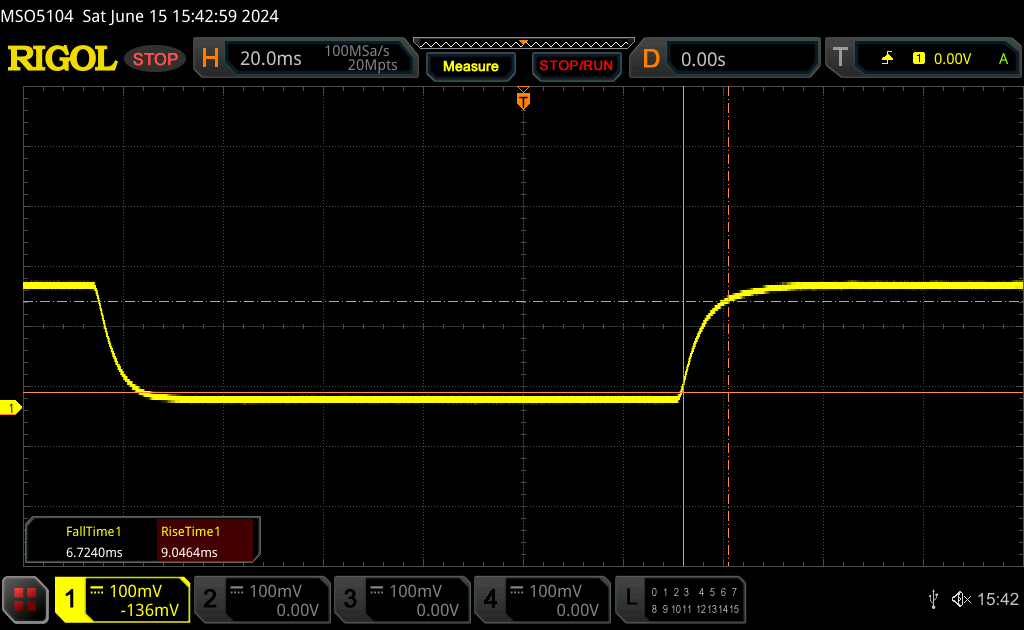 |
| ↘ 6.7 ms fall | ||
| The screen shows good response rates in our tests, but may be too slow for competitive gamers. In comparison, all tested devices range from 0.1 (minimum) to 240 (maximum) ms. » 37 % of all devices are better. This means that the measured response time is better than the average of all tested devices (19.8 ms). | ||
| ↔ Response Time 50% Grey to 80% Grey | ||
| 23 ms ... rise ↗ and fall ↘ combined | ↗ 10.7 ms rise | 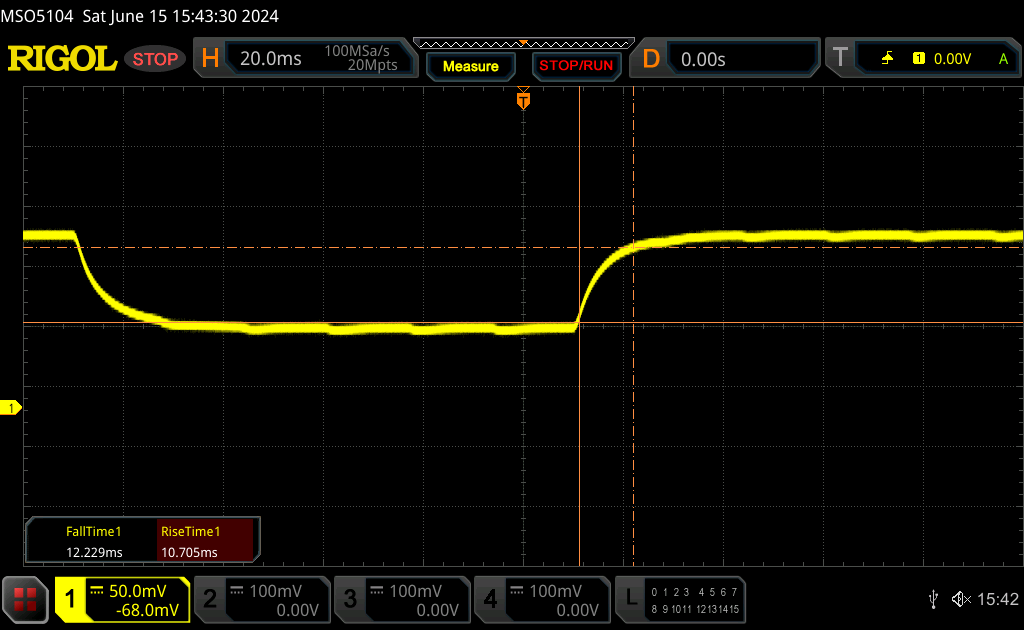 |
| ↘ 12.3 ms fall | ||
| The screen shows good response rates in our tests, but may be too slow for competitive gamers. In comparison, all tested devices range from 0.165 (minimum) to 636 (maximum) ms. » 34 % of all devices are better. This means that the measured response time is better than the average of all tested devices (31 ms). | ||
Screen Flickering / PWM (Pulse-Width Modulation)
| Screen flickering / PWM not detected |  | ||
In comparison: 52 % of all tested devices do not use PWM to dim the display. If PWM was detected, an average of 7747 (minimum: 5 - maximum: 343500) Hz was measured. | |||
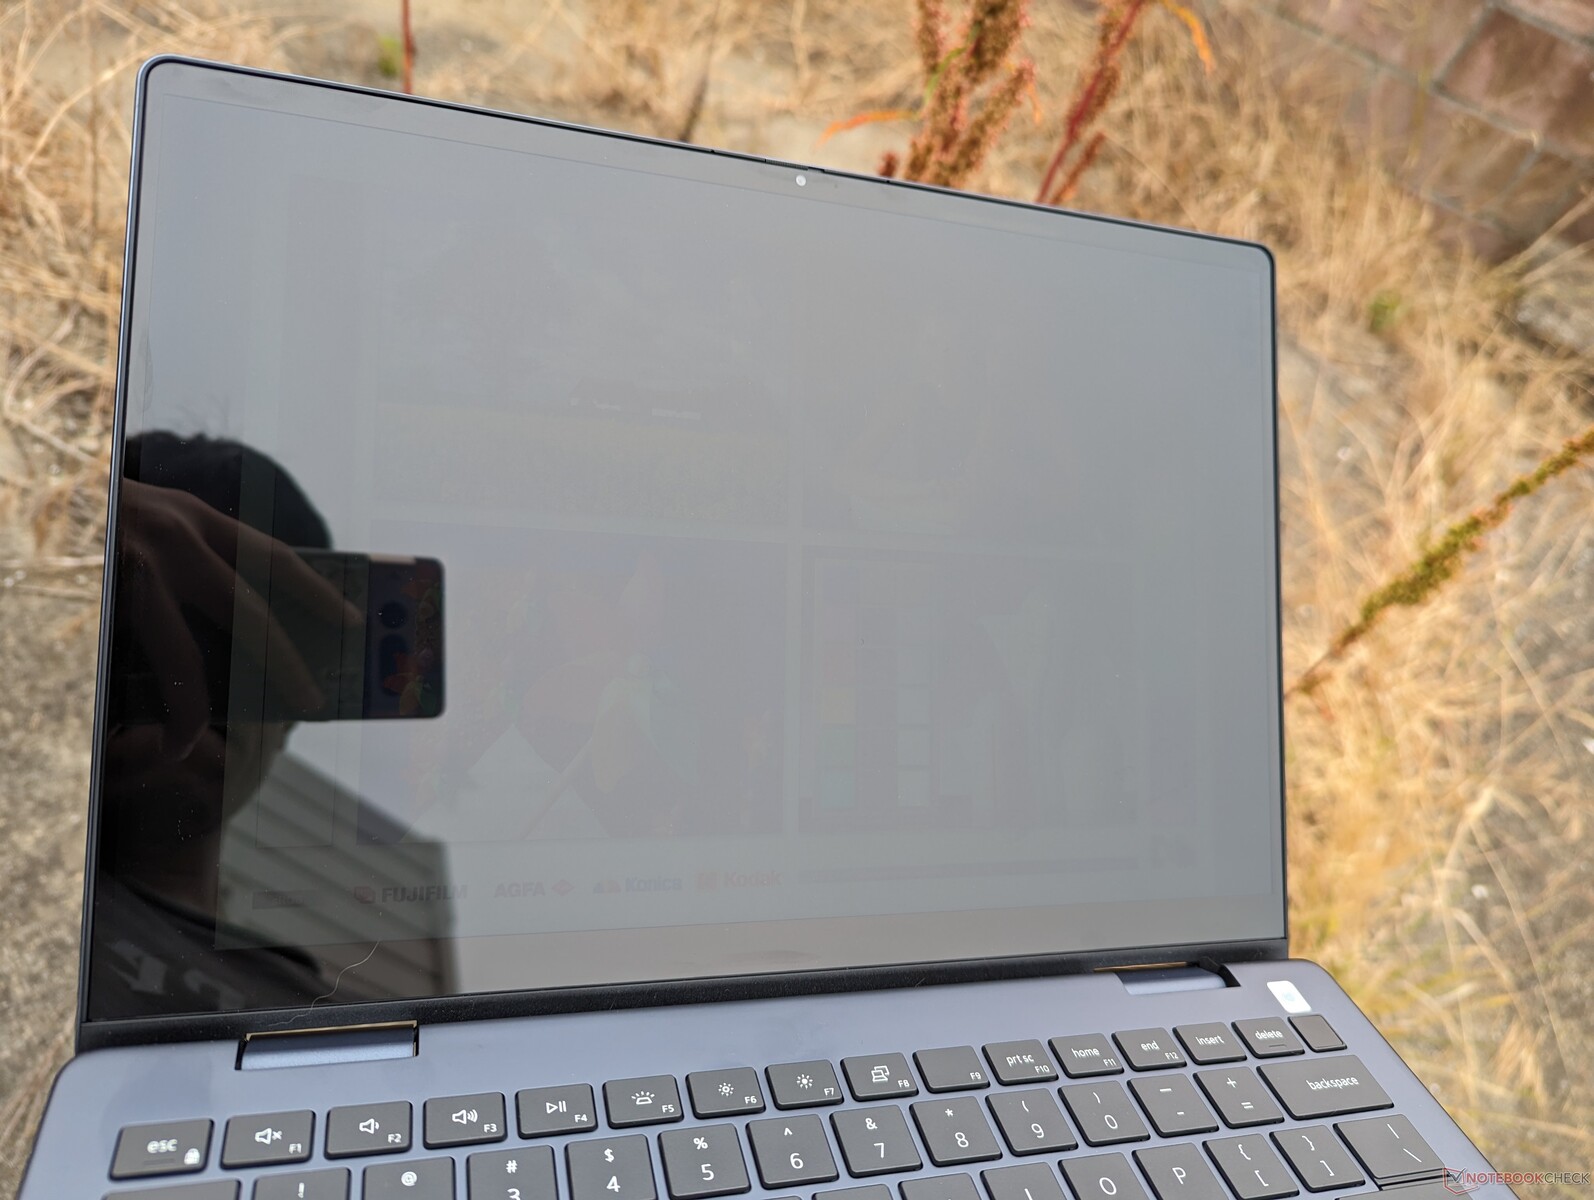
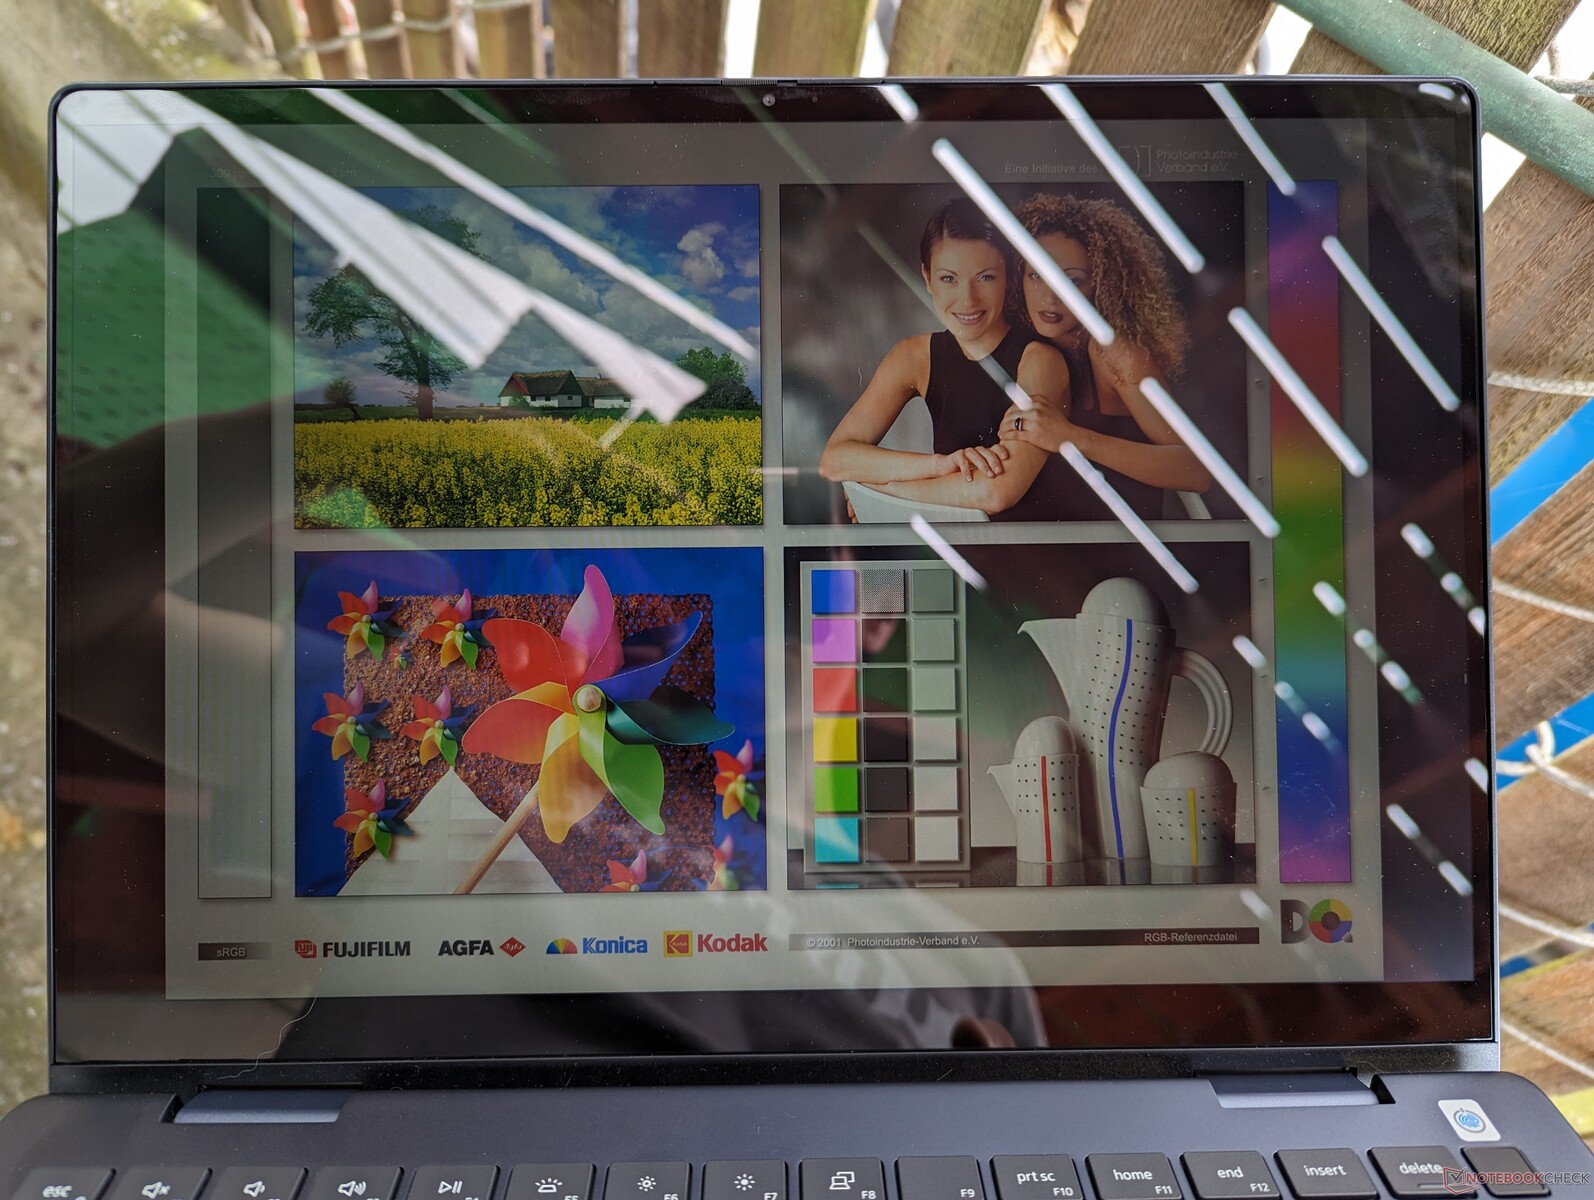
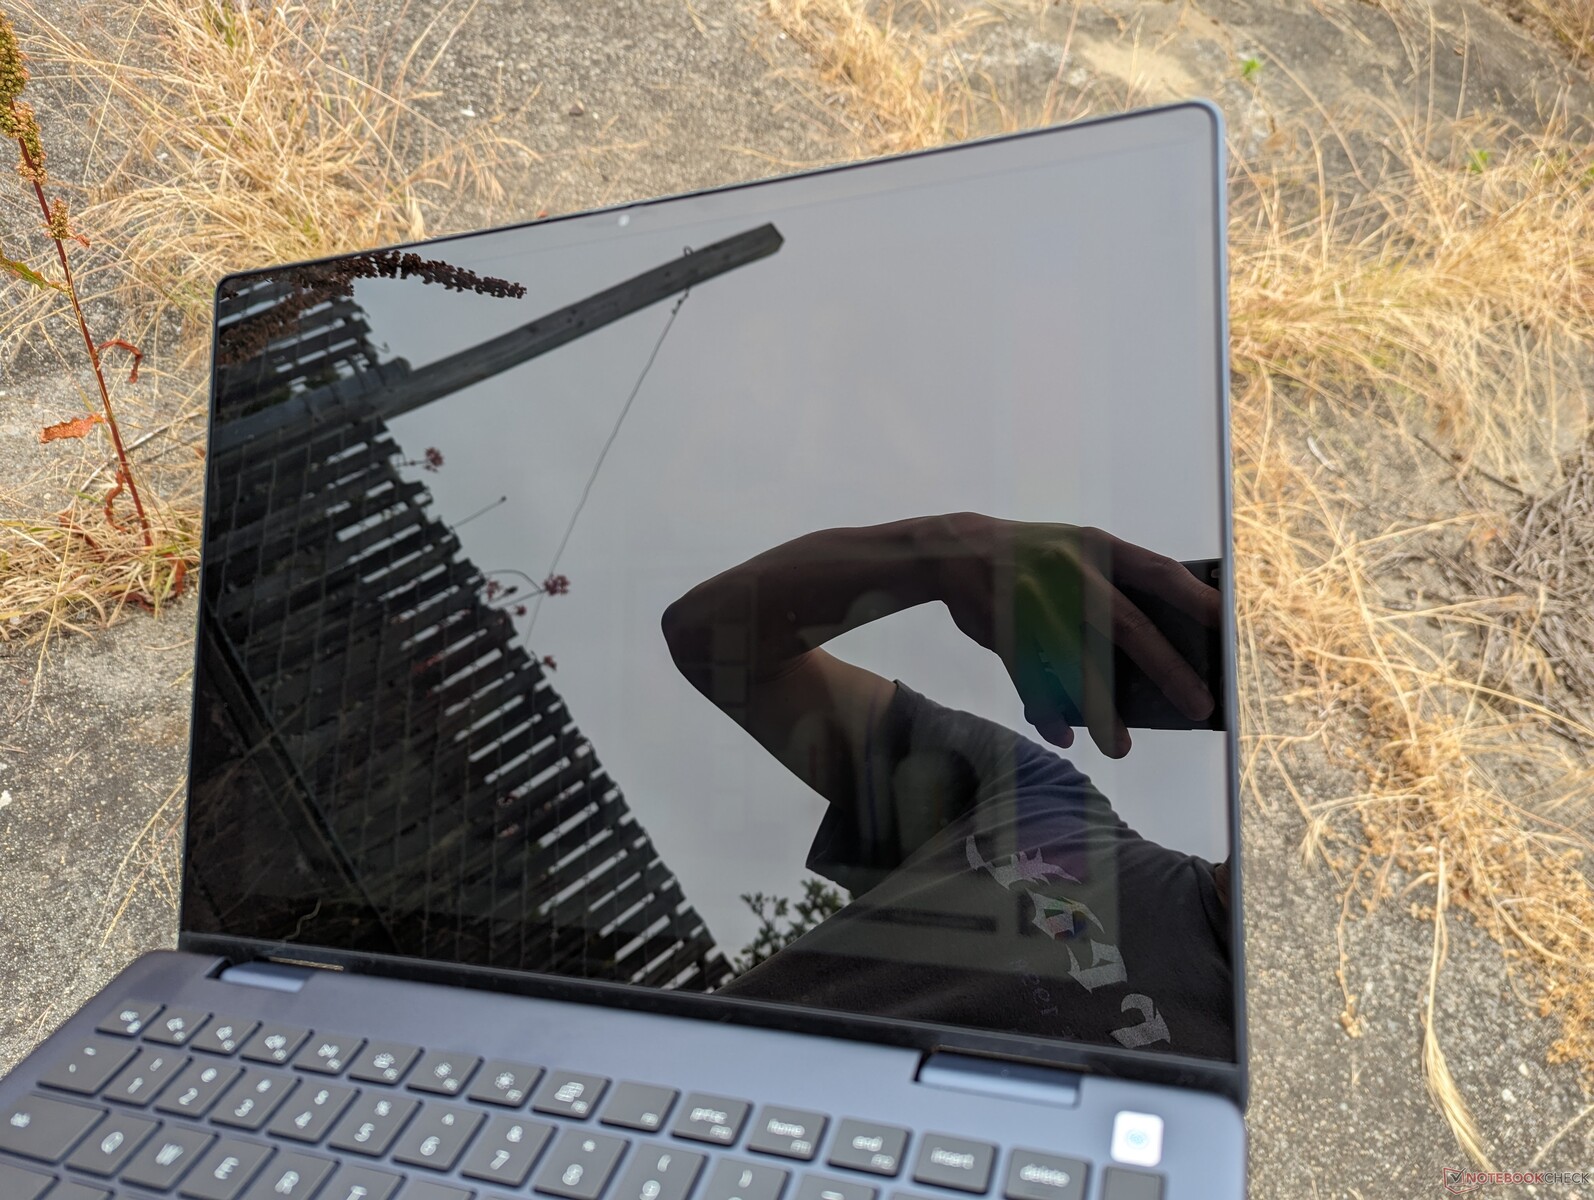
Dim displays abound on affordable convertible laptops and the Inspiron 14 7445 2-in-1 is no exception. The display here is not any brighter than on last year's model for the same viewing experience when outdoors. Ambient lighting quickly overwhelms the glossy screen resulting in glare and washed out colors. Users will have to upgrade to pricier models from the XPS, Yoga 9, Spectre, or EliteBook families for much better outdoor visibility.
Performance — Zen 4 Hawk Point For Relatively Cheap
Testing Conditions
We set Windows to Performance mode prior to running the benchmarks below. The system does not come with Dell Optimizer which is currently exclusive to higher-end models like the Dell XPS or Latitude.
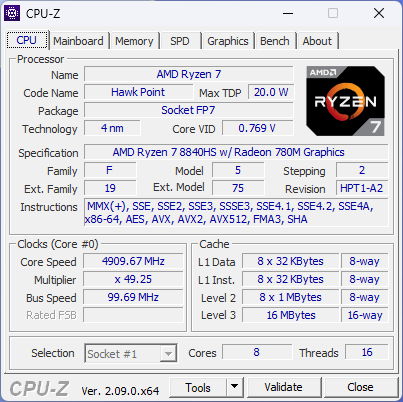
Processor
Processor performance with our Ryzen 7 8840HS is well ahead of the Ryzen 5 7530U in last year's Inspiron 14 7435 2-in-1 by up to 25 percent and 50 percent in single-thread and multi-thread operations, respectively. It's a pretty big performance jump over the course of a single year, but this can be largely attributed to the higher power envelope afforded by the HS-series CPU.
When looking at the bigger picture, however, the Zen 4 Ryzen 7 8840HS runs slower than the Zen 3+ Ryzen 7 7840HS by about 20 percent. This can be attributed to the lower power ceiling (28 W vs. 35 W) which also negatively impacts graphics performance as our GPU section will show.
Performance sustainability is not perfect, either. When running CineBench R15 xT in a loop, for example, the initial score of 1900 points would drop by about 11 percent over time. To Dell's credit, it takes several loops before the throttling kicks in and so at least the Turbo Core performance can last for several minutes.
The integrated NPU also deserves a mention as it helps to further distinguish the Ryzen 7 8840HS from Zen 3+ or earlier architectures. As of this writing, however, its applications are very limited until Windows can integrate more AI-enhanced features.
Cinebench R15 Multi Loop
Cinebench R23: Multi Core | Single Core
Cinebench R20: CPU (Multi Core) | CPU (Single Core)
Cinebench R15: CPU Multi 64Bit | CPU Single 64Bit
Blender: v2.79 BMW27 CPU
7-Zip 18.03: 7z b 4 | 7z b 4 -mmt1
Geekbench 6.7: Multi-Core | Single-Core
Geekbench 5.5: Multi-Core | Single-Core
HWBOT x265 Benchmark v2.2: 4k Preset
LibreOffice : 20 Documents To PDF
R Benchmark 2.5: Overall mean
| Geekbench 6.7 / Multi-Core | |
| Huawei MateBook X Pro 2024 | |
| Lenovo Yoga Pro 7 14APH G8 | |
| Lenovo IdeaPad Pro 5 14AHP9 | |
| Samsung Galaxy Book4 Pro 14 | |
| Dell Inspiron 14 7445 2-in-1 | |
| Average AMD Ryzen 7 8840HS (9922 - 11700, n=5) | |
| HP Pavilion Plus 14-ey0095cl | |
| Lenovo ThinkBook 14 2-in-1 G4 IML | |
| Geekbench 6.7 / Single-Core | |
| Lenovo Yoga Pro 7 14APH G8 | |
| Dell Inspiron 14 7445 2-in-1 | |
| Average AMD Ryzen 7 8840HS (2477 - 2602, n=5) | |
| HP Pavilion Plus 14-ey0095cl | |
| Lenovo IdeaPad Pro 5 14AHP9 | |
| Huawei MateBook X Pro 2024 | |
| Samsung Galaxy Book4 Pro 14 | |
| Lenovo ThinkBook 14 2-in-1 G4 IML | |
Cinebench R23: Multi Core | Single Core
Cinebench R20: CPU (Multi Core) | CPU (Single Core)
Cinebench R15: CPU Multi 64Bit | CPU Single 64Bit
Blender: v2.79 BMW27 CPU
7-Zip 18.03: 7z b 4 | 7z b 4 -mmt1
Geekbench 6.7: Multi-Core | Single-Core
Geekbench 5.5: Multi-Core | Single-Core
HWBOT x265 Benchmark v2.2: 4k Preset
LibreOffice : 20 Documents To PDF
R Benchmark 2.5: Overall mean
* ... smaller is better
AIDA64: FP32 Ray-Trace | FPU Julia | CPU SHA3 | CPU Queen | FPU SinJulia | FPU Mandel | CPU AES | CPU ZLib | FP64 Ray-Trace | CPU PhotoWorxx
| Performance rating | |
| Dell Inspiron 14 7445 2-in-1 | |
| Average AMD Ryzen 7 8840HS | |
| Dell Inspiron 14 7435 2-in-1 | |
| Lenovo IdeaPad Flex 5 14IRU8 | |
| Dell XPS 13 9310 2-in-1 | |
| HP Pavilion x360 14-dy0157ng | |
| AIDA64 / FP32 Ray-Trace | |
| Dell Inspiron 14 7445 2-in-1 | |
| Average AMD Ryzen 7 8840HS (17814 - 22477, n=5) | |
| Dell Inspiron 14 7435 2-in-1 | |
| Lenovo IdeaPad Flex 5 14IRU8 | |
| Dell XPS 13 9310 2-in-1 | |
| HP Pavilion x360 14-dy0157ng | |
| AIDA64 / FPU Julia | |
| Dell Inspiron 14 7445 2-in-1 | |
| Average AMD Ryzen 7 8840HS (71472 - 93550, n=5) | |
| Dell Inspiron 14 7435 2-in-1 | |
| Lenovo IdeaPad Flex 5 14IRU8 | |
| Dell XPS 13 9310 2-in-1 | |
| HP Pavilion x360 14-dy0157ng | |
| AIDA64 / CPU SHA3 | |
| Dell Inspiron 14 7445 2-in-1 | |
| Average AMD Ryzen 7 8840HS (3559 - 4132, n=5) | |
| Lenovo IdeaPad Flex 5 14IRU8 | |
| Dell Inspiron 14 7435 2-in-1 | |
| Dell XPS 13 9310 2-in-1 | |
| HP Pavilion x360 14-dy0157ng | |
| AIDA64 / CPU Queen | |
| Dell Inspiron 14 7445 2-in-1 | |
| Average AMD Ryzen 7 8840HS (90515 - 111581, n=5) | |
| Dell Inspiron 14 7435 2-in-1 | |
| Lenovo IdeaPad Flex 5 14IRU8 | |
| Dell XPS 13 9310 2-in-1 | |
| HP Pavilion x360 14-dy0157ng | |
| AIDA64 / FPU SinJulia | |
| Dell Inspiron 14 7445 2-in-1 | |
| Average AMD Ryzen 7 8840HS (12168 - 13731, n=5) | |
| Dell Inspiron 14 7435 2-in-1 | |
| Lenovo IdeaPad Flex 5 14IRU8 | |
| Dell XPS 13 9310 2-in-1 | |
| HP Pavilion x360 14-dy0157ng | |
| AIDA64 / FPU Mandel | |
| Dell Inspiron 14 7445 2-in-1 | |
| Average AMD Ryzen 7 8840HS (38404 - 49687, n=5) | |
| Dell Inspiron 14 7435 2-in-1 | |
| Lenovo IdeaPad Flex 5 14IRU8 | |
| Dell XPS 13 9310 2-in-1 | |
| HP Pavilion x360 14-dy0157ng | |
| AIDA64 / CPU AES | |
| Average AMD Ryzen 7 8840HS (60328 - 76247, n=5) | |
| Dell XPS 13 9310 2-in-1 | |
| Dell Inspiron 14 7445 2-in-1 | |
| HP Pavilion x360 14-dy0157ng | |
| Lenovo IdeaPad Flex 5 14IRU8 | |
| Dell Inspiron 14 7435 2-in-1 | |
| AIDA64 / CPU ZLib | |
| Dell Inspiron 14 7445 2-in-1 | |
| Average AMD Ryzen 7 8840HS (468 - 930, n=5) | |
| Lenovo IdeaPad Flex 5 14IRU8 | |
| Dell Inspiron 14 7435 2-in-1 | |
| Dell XPS 13 9310 2-in-1 | |
| HP Pavilion x360 14-dy0157ng | |
| AIDA64 / FP64 Ray-Trace | |
| Dell Inspiron 14 7445 2-in-1 | |
| Average AMD Ryzen 7 8840HS (9368 - 11880, n=5) | |
| Dell Inspiron 14 7435 2-in-1 | |
| Lenovo IdeaPad Flex 5 14IRU8 | |
| Dell XPS 13 9310 2-in-1 | |
| HP Pavilion x360 14-dy0157ng | |
| AIDA64 / CPU PhotoWorxx | |
| Lenovo IdeaPad Flex 5 14IRU8 | |
| Dell XPS 13 9310 2-in-1 | |
| Average AMD Ryzen 7 8840HS (31491 - 35861, n=5) | |
| Dell Inspiron 14 7445 2-in-1 | |
| HP Pavilion x360 14-dy0157ng | |
| Dell Inspiron 14 7435 2-in-1 | |
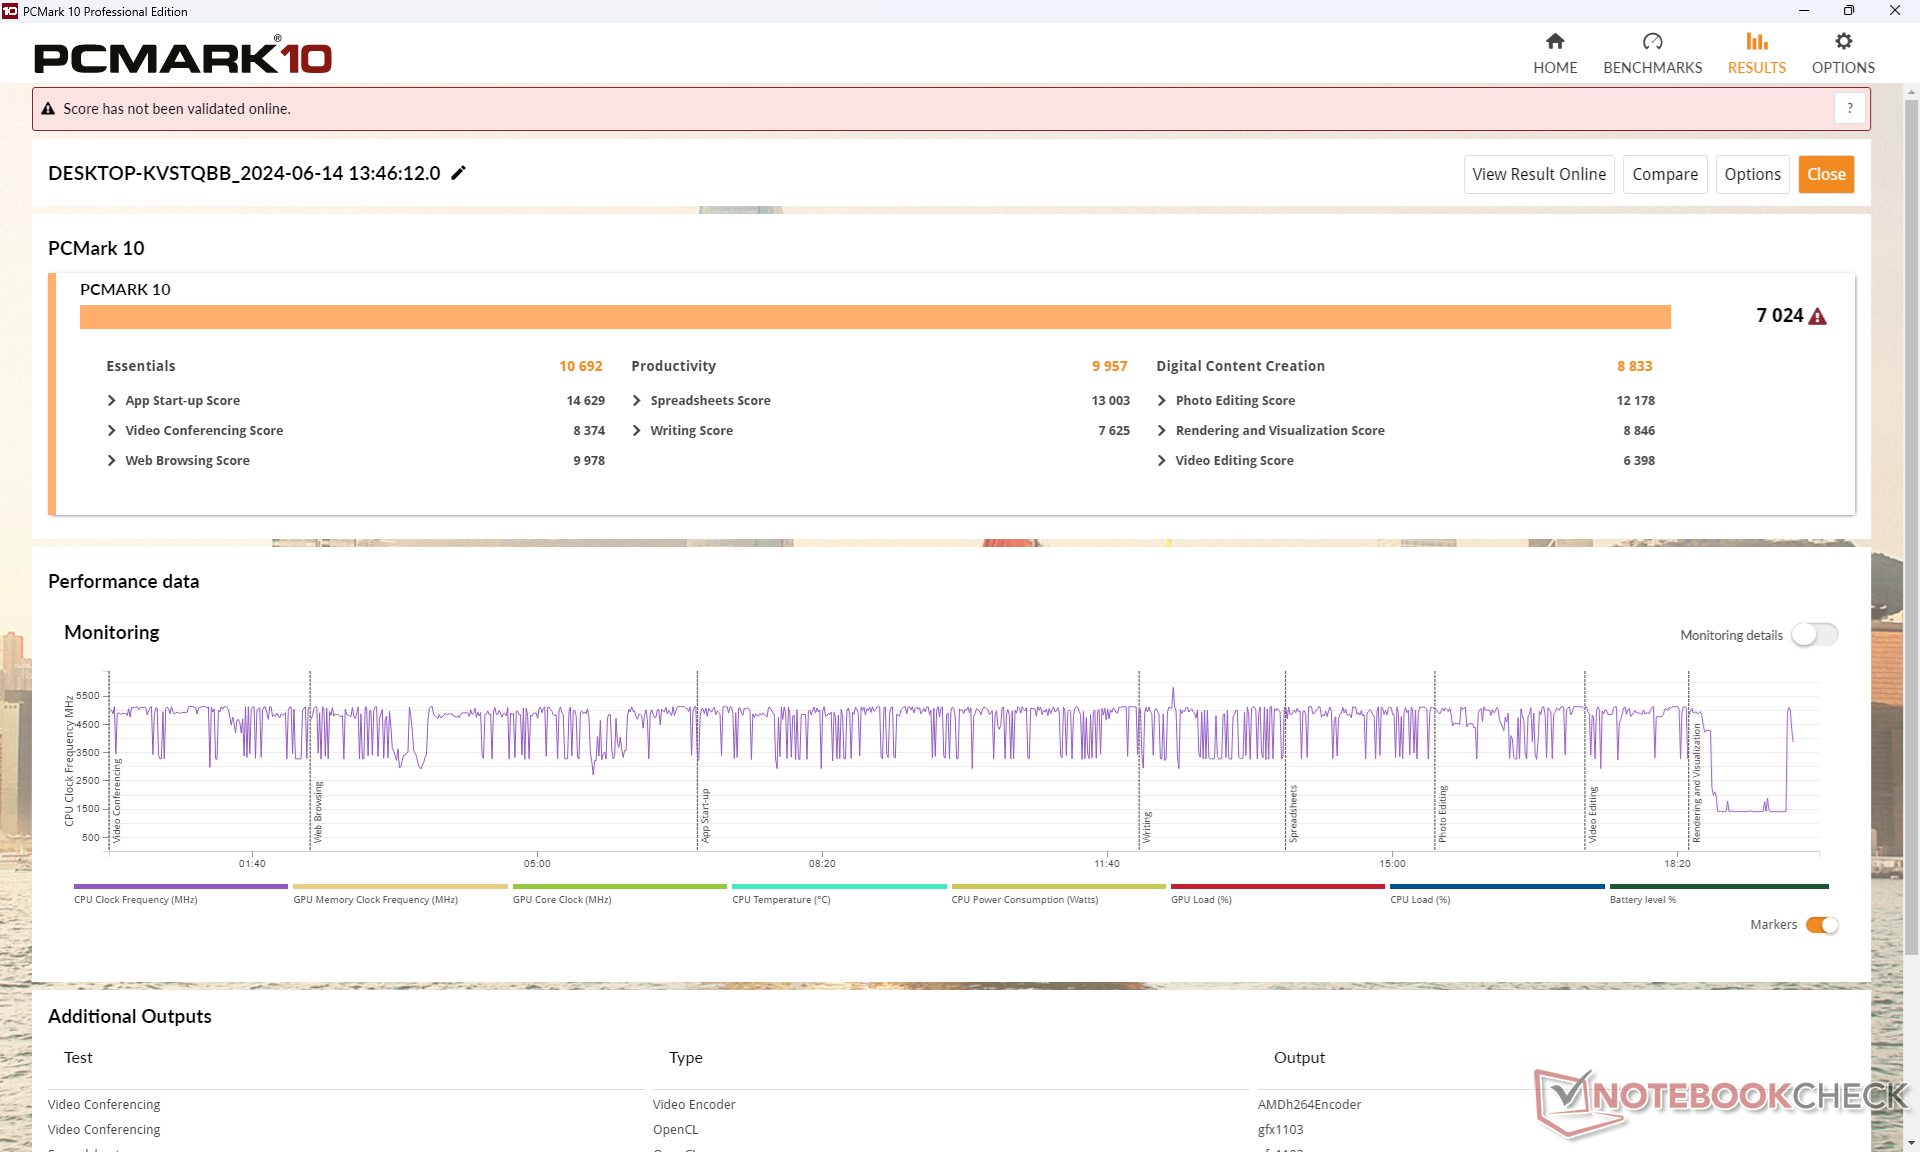
System Performance
PCMark results are well ahead of last year's model due to the new processor. The delta is especially wide in the Digital Content Creation subtest where the Radeon 780M trounces the older Radeon RX Vega 7. Amateur video and image editors can benefit from the faster iGPU performance in this regard.
CrossMark: Overall | Productivity | Creativity | Responsiveness
WebXPRT 3: Overall
WebXPRT 4: Overall
Mozilla Kraken 1.1: Total
| PCMark 10 / Score | |
| Average AMD Ryzen 7 8840HS, AMD Radeon 780M (6775 - 7213, n=5) | |
| Dell Inspiron 14 7445 2-in-1 | |
| Dell Inspiron 14 7435 2-in-1 | |
| Lenovo IdeaPad Flex 5 14IRU8 | |
| Dell XPS 13 9310 2-in-1 | |
| Asus VivoBook Flip 14 TP470EZ | |
| HP Pavilion x360 14-dy0157ng | |
| PCMark 10 / Essentials | |
| Lenovo IdeaPad Flex 5 14IRU8 | |
| Average AMD Ryzen 7 8840HS, AMD Radeon 780M (10178 - 11449, n=5) | |
| Dell Inspiron 14 7445 2-in-1 | |
| Dell XPS 13 9310 2-in-1 | |
| Dell Inspiron 14 7435 2-in-1 | |
| HP Pavilion x360 14-dy0157ng | |
| Asus VivoBook Flip 14 TP470EZ | |
| PCMark 10 / Productivity | |
| Dell Inspiron 14 7445 2-in-1 | |
| Average AMD Ryzen 7 8840HS, AMD Radeon 780M (9706 - 10449, n=5) | |
| Dell Inspiron 14 7435 2-in-1 | |
| Lenovo IdeaPad Flex 5 14IRU8 | |
| Dell XPS 13 9310 2-in-1 | |
| HP Pavilion x360 14-dy0157ng | |
| Asus VivoBook Flip 14 TP470EZ | |
| PCMark 10 / Digital Content Creation | |
| Dell Inspiron 14 7445 2-in-1 | |
| Average AMD Ryzen 7 8840HS, AMD Radeon 780M (8519 - 9163, n=5) | |
| Lenovo IdeaPad Flex 5 14IRU8 | |
| Dell Inspiron 14 7435 2-in-1 | |
| Asus VivoBook Flip 14 TP470EZ | |
| Dell XPS 13 9310 2-in-1 | |
| HP Pavilion x360 14-dy0157ng | |
| CrossMark / Overall | |
| Dell Inspiron 14 7445 2-in-1 | |
| Average AMD Ryzen 7 8840HS, AMD Radeon 780M (1643 - 1698, n=5) | |
| Lenovo IdeaPad Flex 5 14IRU8 | |
| Dell Inspiron 14 7435 2-in-1 | |
| CrossMark / Productivity | |
| Dell Inspiron 14 7445 2-in-1 | |
| Average AMD Ryzen 7 8840HS, AMD Radeon 780M (1605 - 1666, n=5) | |
| Lenovo IdeaPad Flex 5 14IRU8 | |
| Dell Inspiron 14 7435 2-in-1 | |
| CrossMark / Creativity | |
| Dell Inspiron 14 7445 2-in-1 | |
| Average AMD Ryzen 7 8840HS, AMD Radeon 780M (1739 - 1863, n=5) | |
| Lenovo IdeaPad Flex 5 14IRU8 | |
| Dell Inspiron 14 7435 2-in-1 | |
| CrossMark / Responsiveness | |
| Average AMD Ryzen 7 8840HS, AMD Radeon 780M (1334 - 1498, n=5) | |
| Dell Inspiron 14 7445 2-in-1 | |
| Lenovo IdeaPad Flex 5 14IRU8 | |
| Dell Inspiron 14 7435 2-in-1 | |
| WebXPRT 3 / Overall | |
| Average AMD Ryzen 7 8840HS, AMD Radeon 780M (297 - 440, n=5) | |
| Dell Inspiron 14 7445 2-in-1 | |
| Lenovo IdeaPad Flex 5 14IRU8 | |
| Dell Inspiron 14 7435 2-in-1 | |
| Dell XPS 13 9310 2-in-1 | |
| HP Pavilion x360 14-dy0157ng | |
| WebXPRT 4 / Overall | |
| Dell Inspiron 14 7445 2-in-1 | |
| Average AMD Ryzen 7 8840HS, AMD Radeon 780M (246 - 257, n=5) | |
| Lenovo IdeaPad Flex 5 14IRU8 | |
| Dell Inspiron 14 7435 2-in-1 | |
| Mozilla Kraken 1.1 / Total | |
| Asus VivoBook Flip 14 TP470EZ | |
| HP Pavilion x360 14-dy0157ng | |
| Dell XPS 13 9310 2-in-1 | |
| Dell Inspiron 14 7435 2-in-1 | |
| Lenovo IdeaPad Flex 5 14IRU8 | |
| Average AMD Ryzen 7 8840HS, AMD Radeon 780M (518 - 563, n=5) | |
| Dell Inspiron 14 7445 2-in-1 | |
* ... smaller is better
| PCMark 10 Score | 7024 points | |
Help | ||
| AIDA64 / Memory Copy | |
| Average AMD Ryzen 7 8840HS (62098 - 76766, n=5) | |
| Dell Inspiron 14 7445 2-in-1 | |
| Dell XPS 13 9310 2-in-1 | |
| Lenovo IdeaPad Flex 5 14IRU8 | |
| HP Pavilion x360 14-dy0157ng | |
| Dell Inspiron 14 7435 2-in-1 | |
| AIDA64 / Memory Read | |
| Dell Inspiron 14 7445 2-in-1 | |
| Dell XPS 13 9310 2-in-1 | |
| Average AMD Ryzen 7 8840HS (50273 - 61739, n=5) | |
| Lenovo IdeaPad Flex 5 14IRU8 | |
| HP Pavilion x360 14-dy0157ng | |
| Dell Inspiron 14 7435 2-in-1 | |
| AIDA64 / Memory Write | |
| Average AMD Ryzen 7 8840HS (78025 - 107658, n=5) | |
| Dell Inspiron 14 7445 2-in-1 | |
| Lenovo IdeaPad Flex 5 14IRU8 | |
| Dell XPS 13 9310 2-in-1 | |
| HP Pavilion x360 14-dy0157ng | |
| Dell Inspiron 14 7435 2-in-1 | |
| AIDA64 / Memory Latency | |
| Dell Inspiron 14 7435 2-in-1 | |
| Average AMD Ryzen 7 8840HS (91 - 122.4, n=5) | |
| Lenovo IdeaPad Flex 5 14IRU8 | |
| Dell XPS 13 9310 2-in-1 | |
| Dell Inspiron 14 7445 2-in-1 | |
| HP Pavilion x360 14-dy0157ng | |
* ... smaller is better
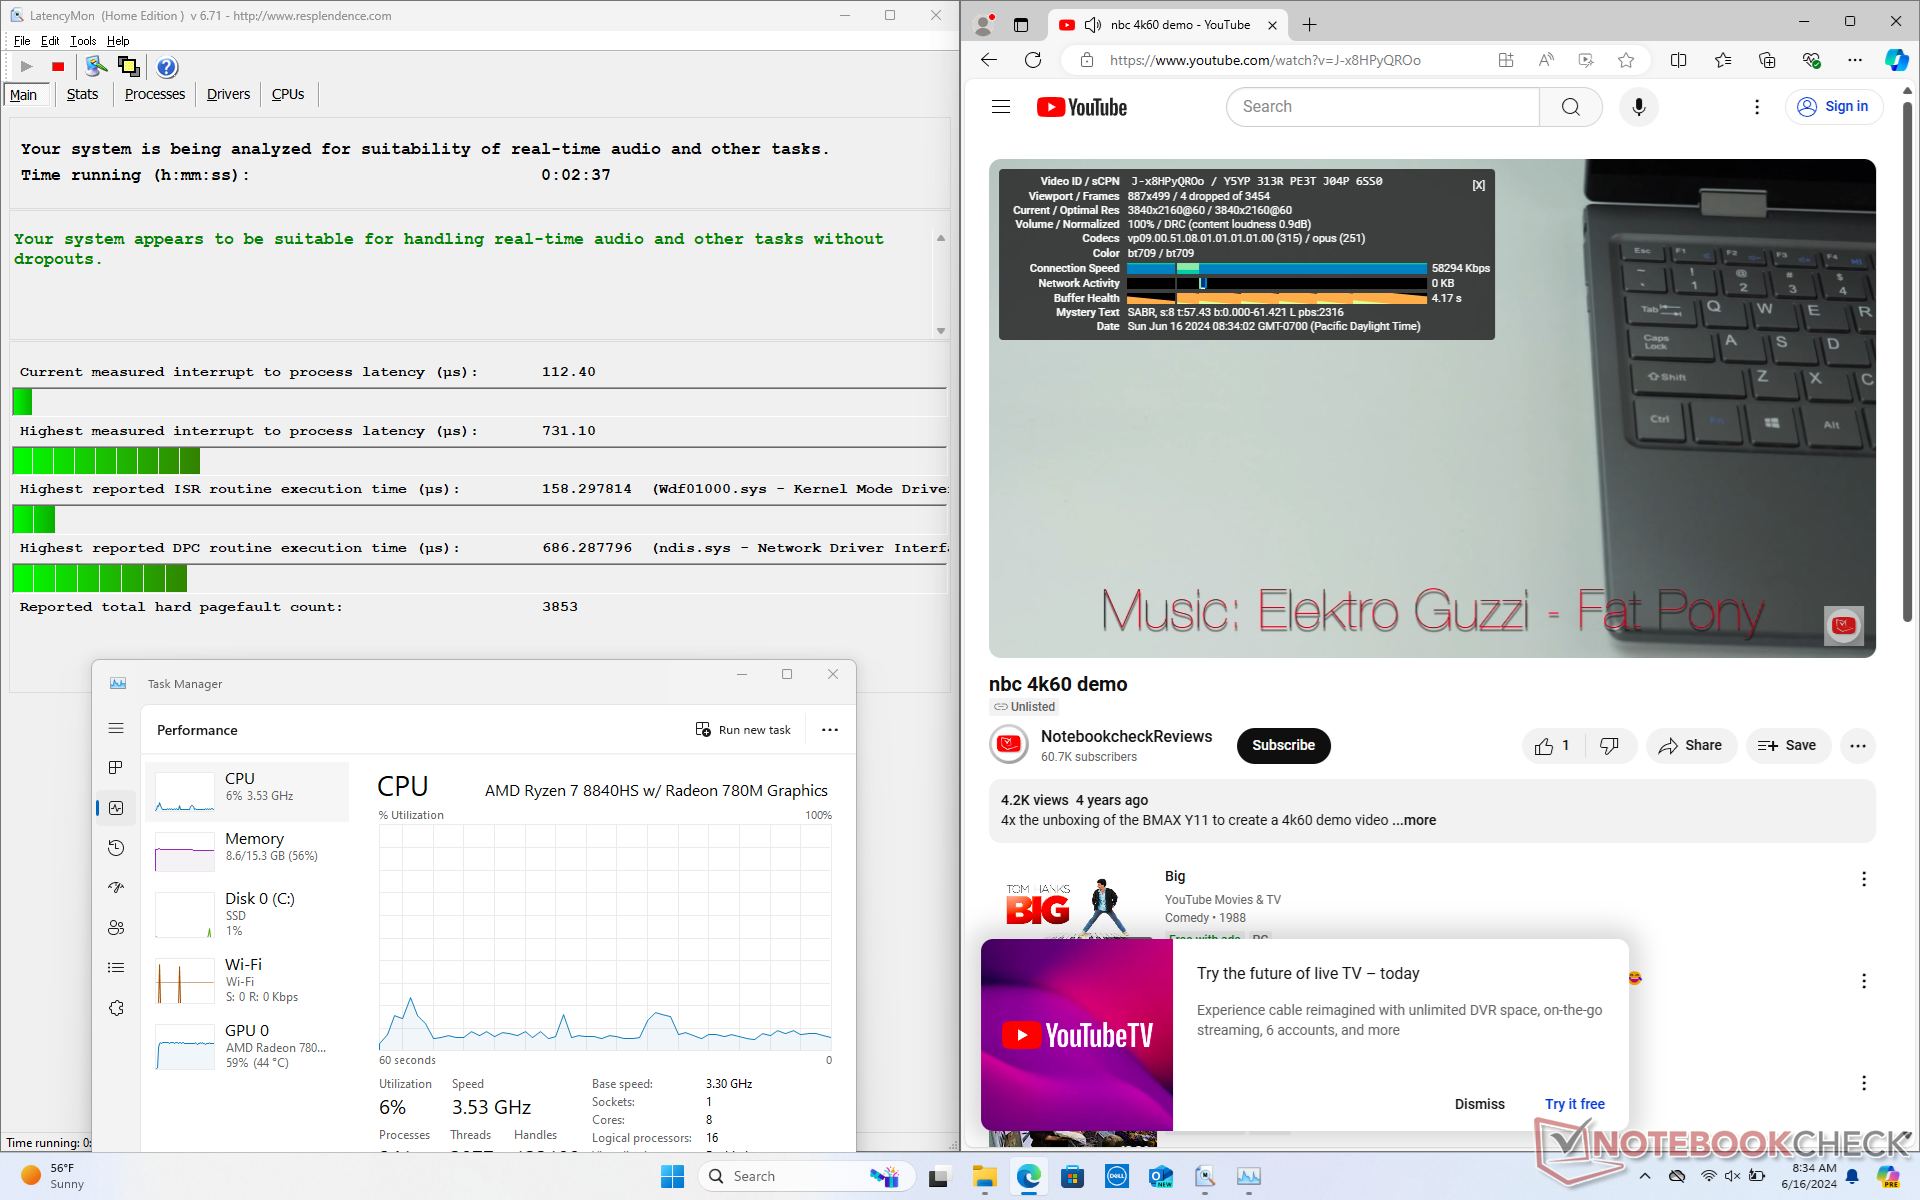
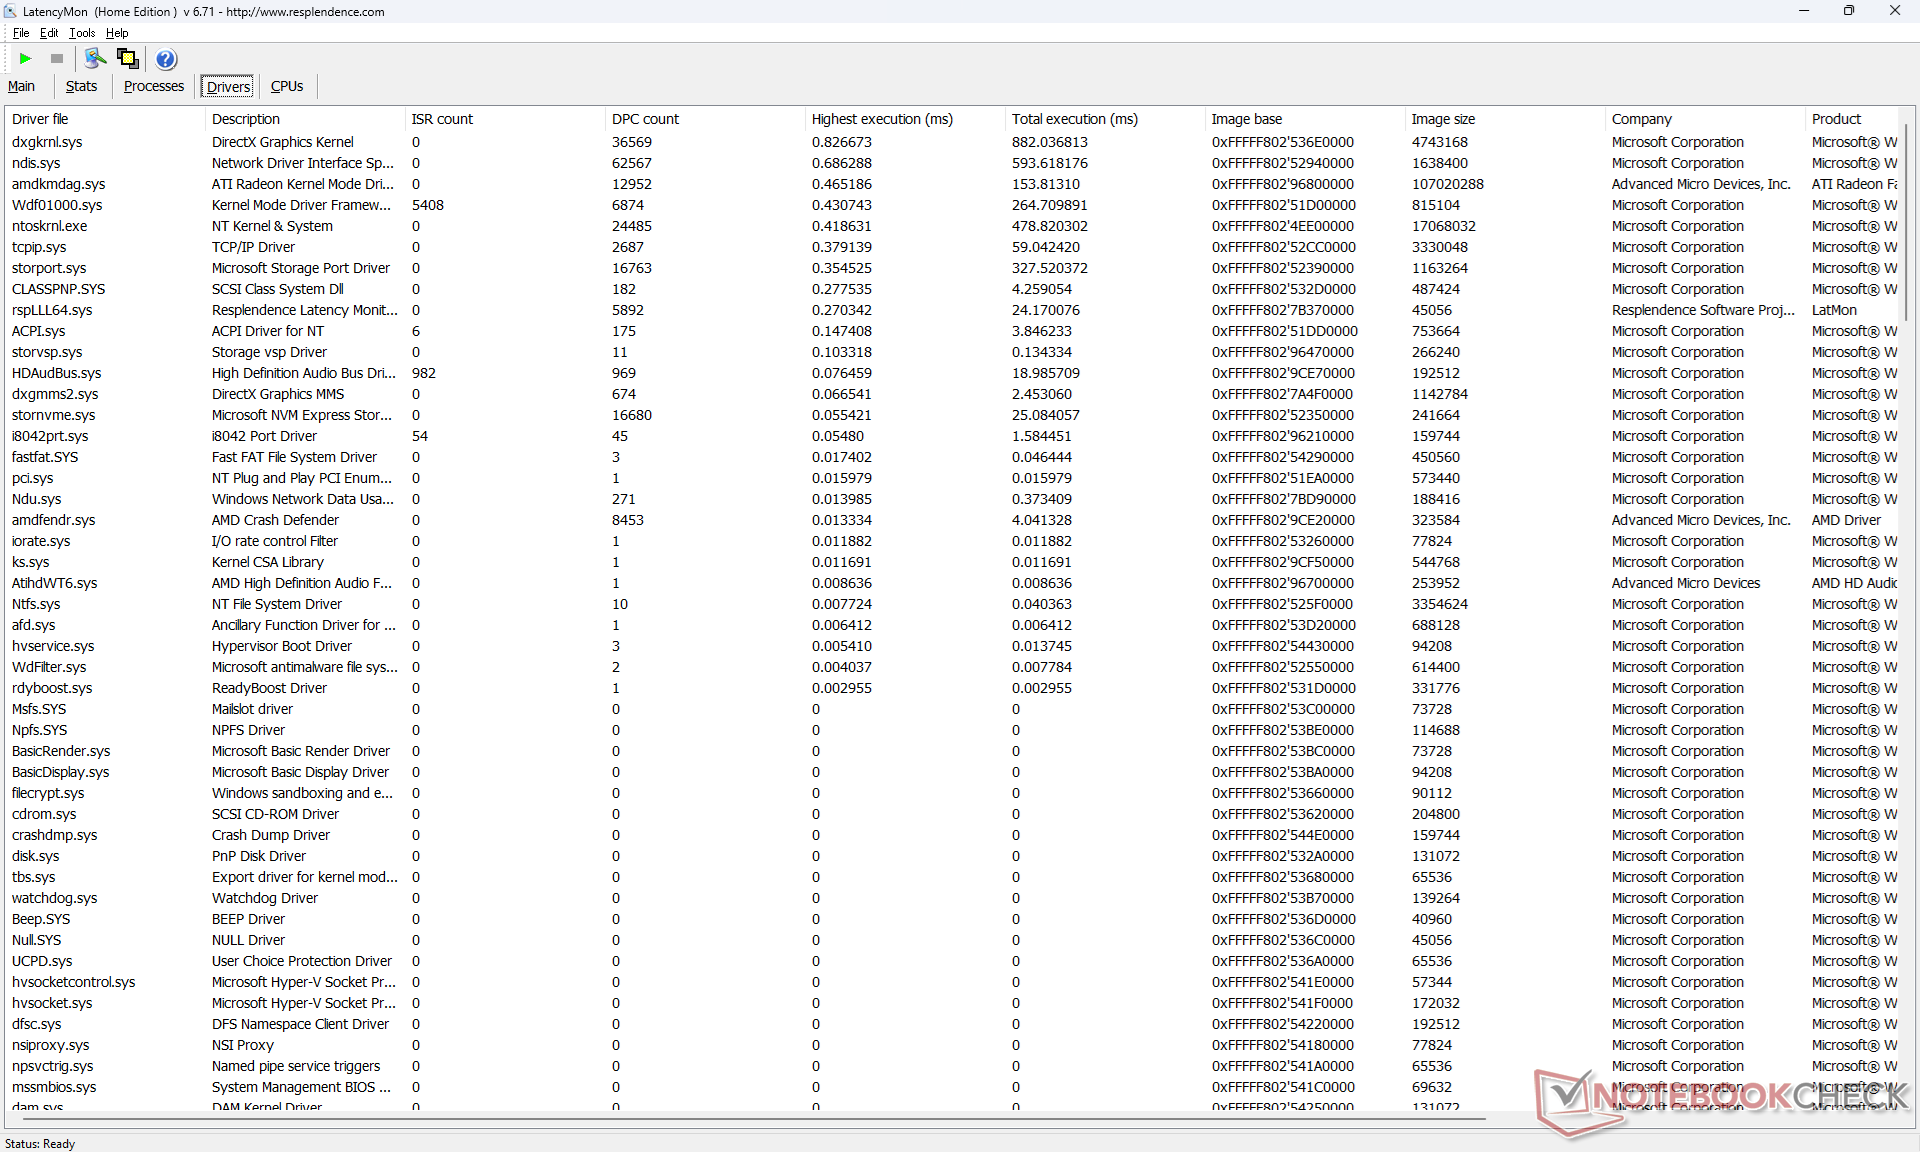
DPC Latency
LatencyMon reveals minor DPC issues when opening multiple browser tabs of our homepage. 4K video playback at 60 FPS is also imperfect with 4 dropped frames recorded during a one-minute timeframe. AMD-based laptops appear to suffer from more dropped frames on average than Intel ones.
| DPC Latencies / LatencyMon - interrupt to process latency (max), Web, Youtube, Prime95 | |
| Lenovo IdeaPad Flex 5 14IRU8 | |
| Dell Inspiron 14 7435 2-in-1 | |
| HP Pavilion x360 14-dy0157ng | |
| Dell Inspiron 14 7445 2-in-1 | |
| Dell XPS 13 9310 2-in-1 | |
| Asus VivoBook Flip 14 TP470EZ | |
* ... smaller is better
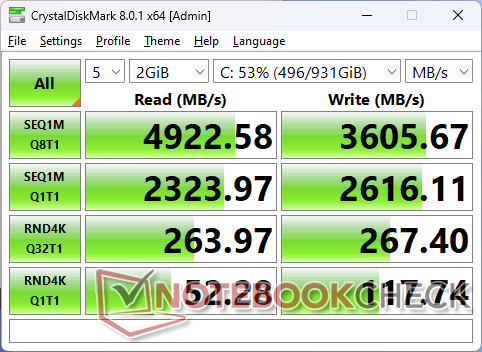
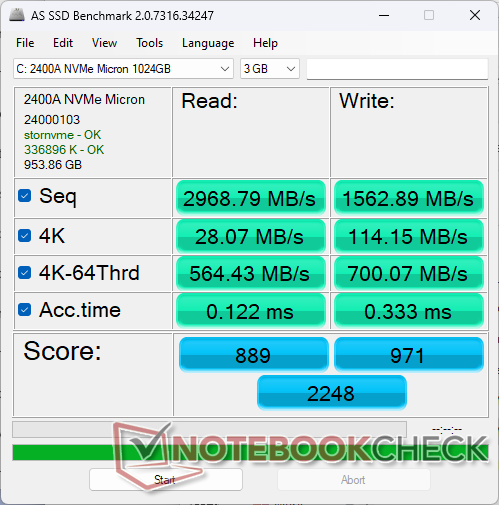
Storage Devices
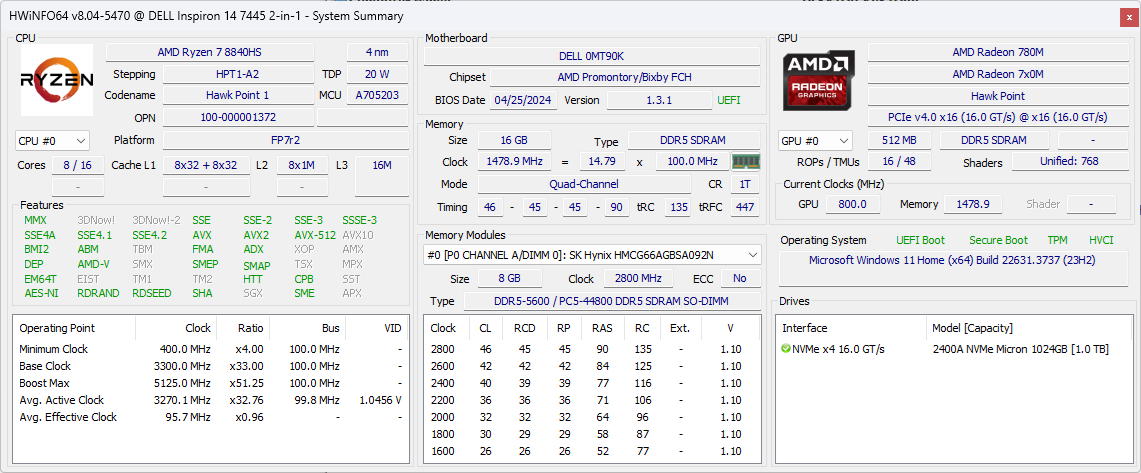
Our unit includes a Micron 2400 drive instead of an ADATA one as found on last year's model. The Micron drive can offer faster transfer rates of up to 5000 MB/s, but it would suffer from throttling after just a few minutes of stress as shown by our DiskSpd loop test results below.

| Drive Performance rating - Percent | |
| Lenovo IdeaPad Flex 5 14IRU8 | |
| HP Pavilion x360 14-dy0157ng | |
| Dell Inspiron 14 7445 2-in-1 | |
| Dell XPS 13 9310 2-in-1 | |
| Asus VivoBook Flip 14 TP470EZ | |
| Dell Inspiron 14 7435 2-in-1 | |
* ... smaller is better
Disk Throttling: DiskSpd Read Loop, Queue Depth 8
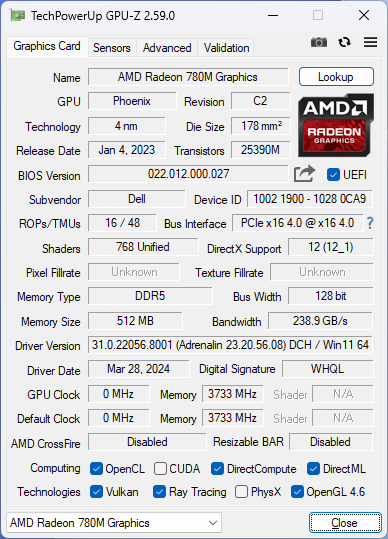
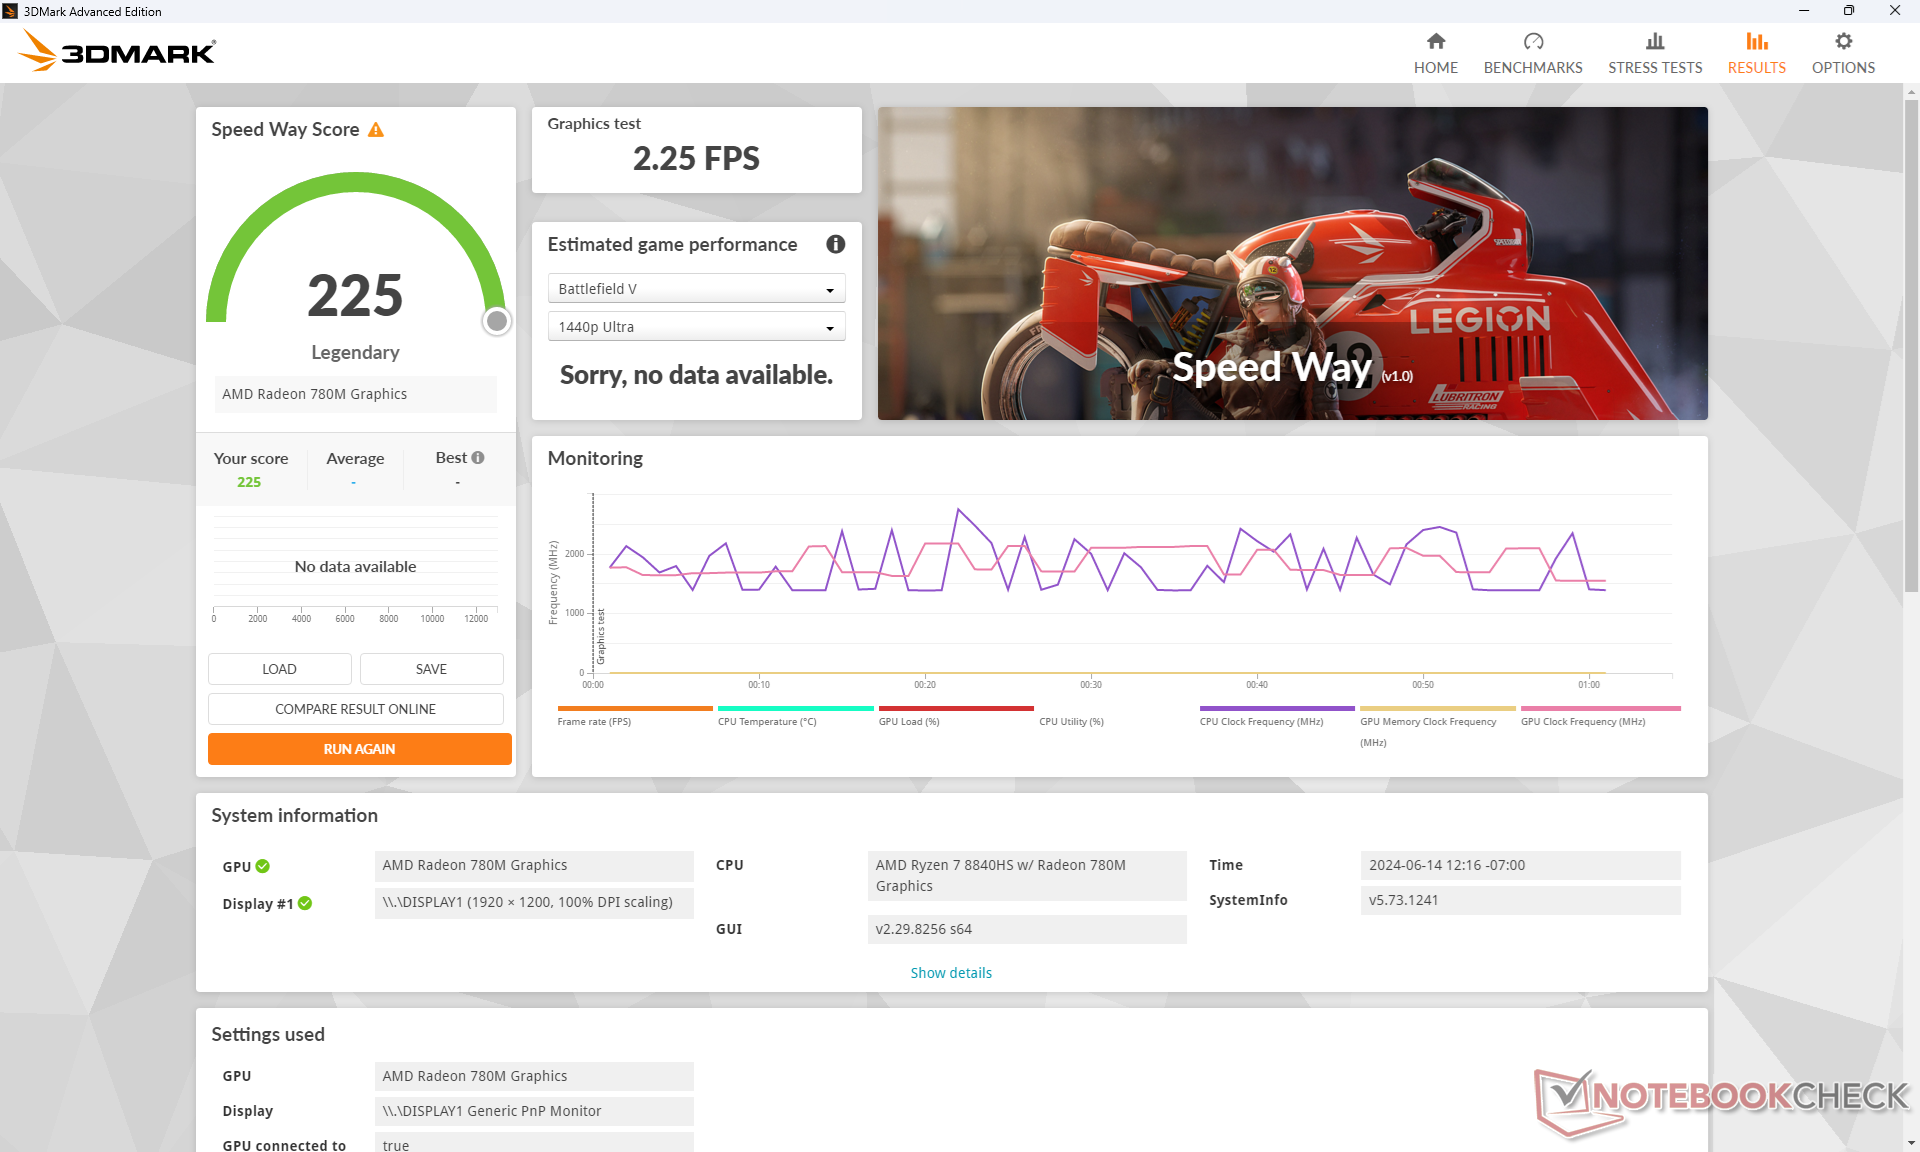
GPU Performance — Radeon 780M
Graphics performance is about 15 percent slower than the average laptop in our database equipped with the same integrated Radeon 780M GPU even though the majority of these laptops are shipping with older Zen 3+ CPUs. This deficit can be partly attributed to the new integrated NPU and generally slower core clock rates mentioned above which can all impact integrated graphics performance. The Radeon 780M in the Inspiron 14 7445 2-in-1 therefore performs closer to the older Radeon 680M.
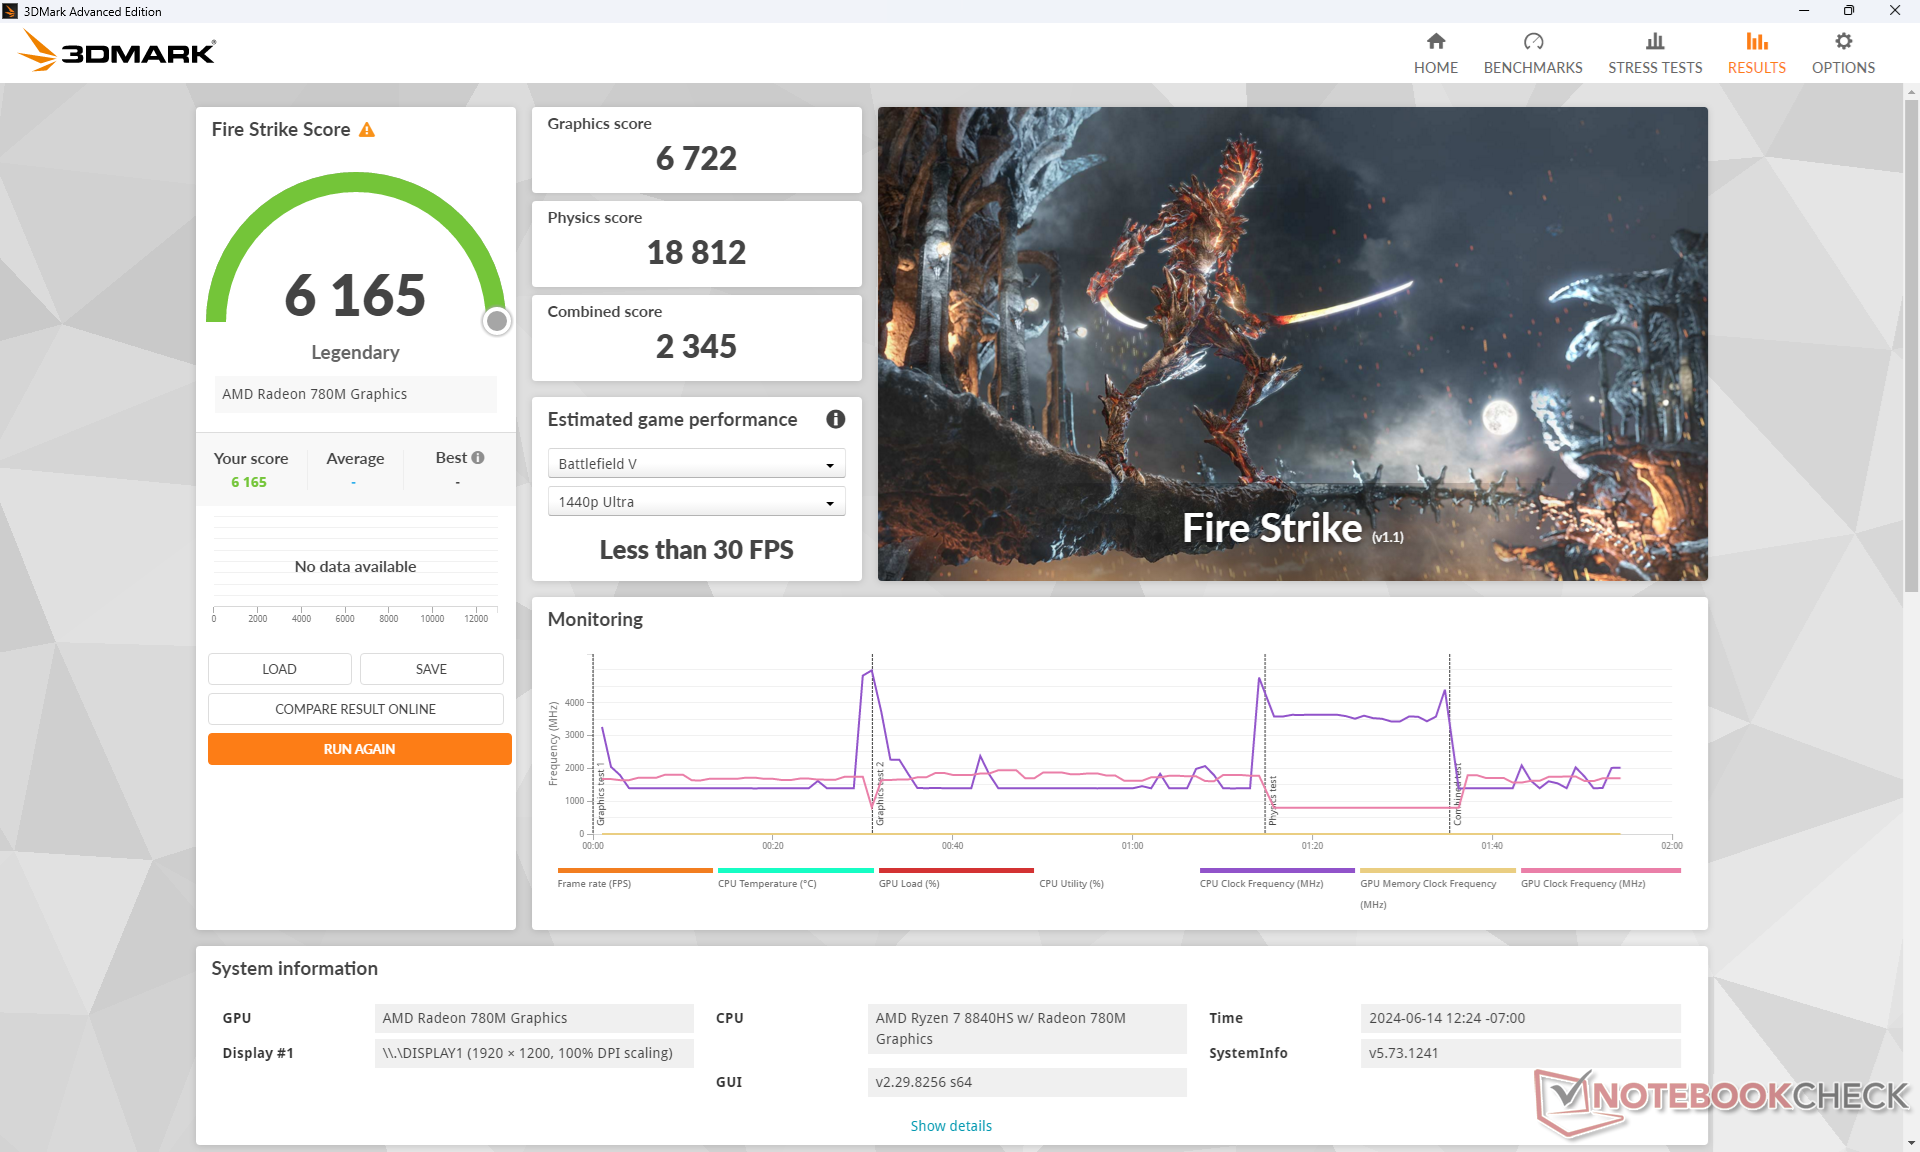
| Power Profile | Graphics Score | Physics Score | Combined Score |
| Performance Mode | 6722 | 18812 | 2345 |
| Balanced Mode | 6755 (-0%) | 18578 (-1%) | 2296 (-2%) |
| Battery Power | 5164 (-23%) | 15664 (-17%) | 1663 (-29%) |
Running on Balanced mode does not appear to impact performance as shown by our Fire Strike table above. However, running on battery power entails a steeper performance penalty of up to 25 percent.
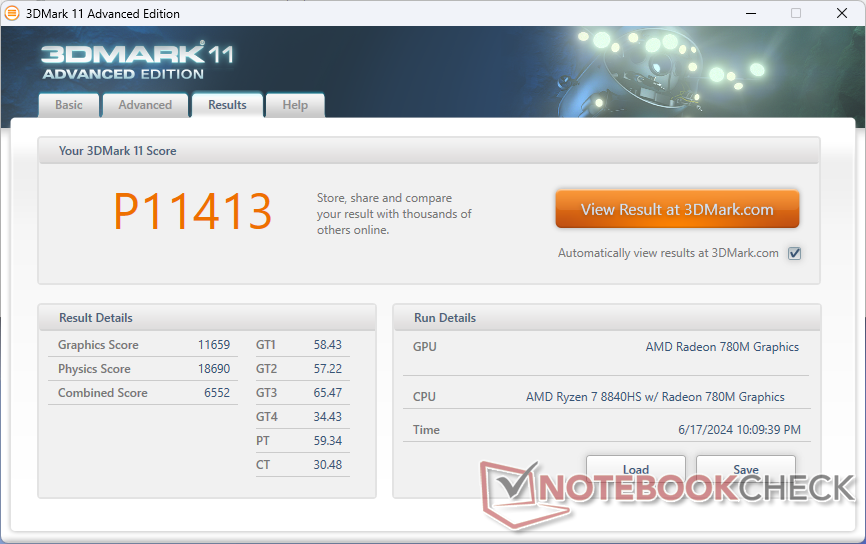

| 3DMark 11 Performance | 11413 points | |
| 3DMark Cloud Gate Standard Score | 32501 points | |
| 3DMark Fire Strike Score | 6165 points | |
| 3DMark Time Spy Score | 2514 points | |
Help | ||
* ... smaller is better
Gaming Performance
While slower than the average Radeon 780M, performance is still significantly ahead of the Iris Xe 96 EUs and especially the Radeon Vega RX 7 in last year's Inspiron model. Modern titles run decently well at 1080p and 30 FPS including Baldur's Gate 3.
| Performance rating - Percent | |
| Dell Inspiron 14 7445 2-in-1 | |
| Dell XPS 13 9310 2-in-1 | |
| Asus VivoBook Flip 14 TP470EZ -2! | |
| Dell Inspiron 14 7435 2-in-1 -1! | |
| Lenovo IdeaPad Flex 5 14IRU8 -1! | |
| HP Pavilion x360 14-dy0157ng | |
| The Witcher 3 - 1920x1080 Ultra Graphics & Postprocessing (HBAO+) | |
| Dell Inspiron 14 7445 2-in-1 | |
| Asus VivoBook Flip 14 TP470EZ | |
| Dell XPS 13 9310 2-in-1 | |
| Dell Inspiron 14 7435 2-in-1 | |
| HP Pavilion x360 14-dy0157ng | |
| Lenovo IdeaPad Flex 5 14IRU8 | |
| Final Fantasy XV Benchmark - 1920x1080 High Quality | |
| Dell Inspiron 14 7445 2-in-1 | |
| Dell XPS 13 9310 2-in-1 | |
| Lenovo IdeaPad Flex 5 14IRU8 | |
| Dell Inspiron 14 7435 2-in-1 | |
| HP Pavilion x360 14-dy0157ng | |
| Strange Brigade - 1920x1080 ultra AA:ultra AF:16 | |
| Dell Inspiron 14 7445 2-in-1 | |
| Asus VivoBook Flip 14 TP470EZ | |
| Dell XPS 13 9310 2-in-1 | |
| Dell Inspiron 14 7435 2-in-1 | |
| Lenovo IdeaPad Flex 5 14IRU8 | |
| HP Pavilion x360 14-dy0157ng | |
| Dota 2 Reborn - 1920x1080 ultra (3/3) best looking | |
| Dell Inspiron 14 7445 2-in-1 | |
| Lenovo IdeaPad Flex 5 14IRU8 | |
| Dell XPS 13 9310 2-in-1 | |
| Dell Inspiron 14 7435 2-in-1 | |
| Asus VivoBook Flip 14 TP470EZ | |
| HP Pavilion x360 14-dy0157ng | |
| X-Plane 11.11 - 1920x1080 high (fps_test=3) | |
| Dell Inspiron 14 7445 2-in-1 | |
| Dell XPS 13 9310 2-in-1 | |
| HP Pavilion x360 14-dy0157ng | |
| Dell Inspiron 14 7435 2-in-1 | |
| Lenovo IdeaPad Flex 5 14IRU8 | |
| Far Cry 5 - 1920x1080 High Preset AA:T | |
| Dell Inspiron 14 7445 2-in-1 | |
| Asus VivoBook Flip 14 TP470EZ | |
| Dell XPS 13 9310 2-in-1 | |
| HP Pavilion x360 14-dy0157ng | |
| Baldur's Gate 3 | |
| 1280x720 Low Preset AA:SM | |
| Average AMD Radeon 780M (30.7 - 67.6, n=34) | |
| Dell Inspiron 14 7445 2-in-1 | |
| Lenovo ThinkBook 14 2-in-1 G4 IML | |
| 1920x1080 Low Preset AA:SM | |
| Average AMD Radeon 780M (20.2 - 44.1, n=47) | |
| Dell Inspiron 14 7445 2-in-1 | |
| HP ZBook Firefly 14 G10 A | |
| Lenovo ThinkBook 14 2-in-1 G4 IML | |
| 1920x1080 Medium Preset AA:T | |
| Average AMD Radeon 780M (15.7 - 36.8, n=50) | |
| Dell Inspiron 14 7445 2-in-1 | |
| HP ZBook Firefly 14 G10 A | |
| Lenovo ThinkBook 14 2-in-1 G4 IML | |
| 1920x1080 High Preset AA:T | |
| Average AMD Radeon 780M (13.3 - 30.6, n=50) | |
| Dell Inspiron 14 7445 2-in-1 | |
| HP ZBook Firefly 14 G10 A | |
| 1920x1080 Ultra Preset AA:T | |
| Average AMD Radeon 780M (12.8 - 29.6, n=49) | |
| Dell Inspiron 14 7445 2-in-1 | |
Frame rates when idling on Witcher 3 appear to be higher at the mid 40 FPS range for the first couple of minutes before falling to the high 30 FPS and low 40 FPS range thereafter. This observation aligns with our power consumption data to suggest decreasing GPU clock rates after a few minutes of stress.
Witcher 3 FPS Chart
| low | med. | high | ultra | |
|---|---|---|---|---|
| The Witcher 3 (2015) | 119 | 39.1 | 24.1 | |
| Dota 2 Reborn (2015) | 146.3 | 111.9 | 74.5 | 66.7 |
| Final Fantasy XV Benchmark (2018) | 60.5 | 32.3 | 23.7 | |
| X-Plane 11.11 (2018) | 57.2 | 42.3 | 35.9 | |
| Far Cry 5 (2018) | 66 | 36 | 33 | 31 |
| Strange Brigade (2018) | 134.7 | 56.8 | 47 | 39.9 |
| Tiny Tina's Wonderlands (2022) | 48.2 | 37.1 | 26.3 | 19.8 |
| F1 22 (2022) | 68.2 | 58.4 | 43.7 | 11.6 |
| Baldur's Gate 3 (2023) | 31 | 26.3 | 22.2 | 21.2 |
| Cyberpunk 2077 (2023) | 34.3 | 26.5 | 21.5 | 19.1 |
Emissions
System Noise
Fan noise is very quiet when running undemanding loads like browsers or video streaming similar to what we experienced on the Inspiron 14 7435 2-in-1. Processing spikes like launching several applications in a row can cause fan noise to rise to 34 dB(A) temporarily before falling back down.
When running more demanding loads for extended periods like games, fan noise would max out at just under 44 dB(A) to be slightly louder than what we recorded on last year's model. In other words, the Inspiron 14 7445 2-in-1 is only louder than its predecessor when stressed as there is otherwise little no difference between them.
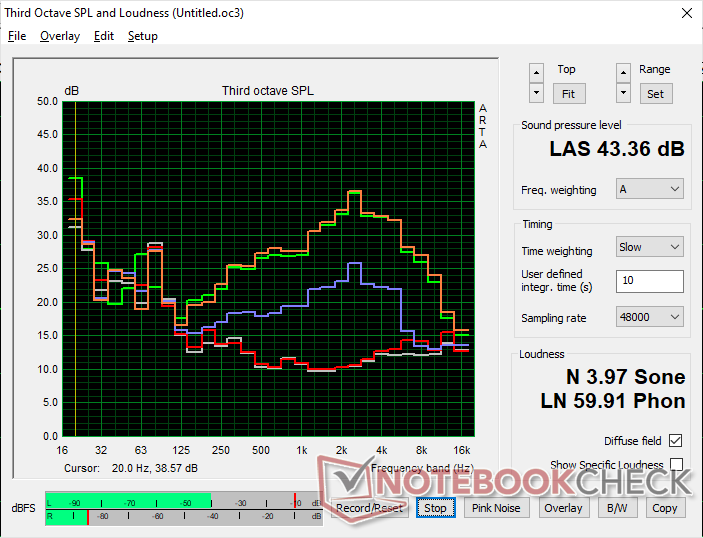
Noise level
| Idle |
| 24.3 / 24.3 / 24.8 dB(A) |
| Load |
| 33.5 / 43.8 dB(A) |
 | ||
30 dB silent 40 dB(A) audible 50 dB(A) loud |
||
min: | ||
| Dell Inspiron 14 7445 2-in-1 Radeon 780M, R7 8840HS, Micron 2400 MTFDKBK1T0QFM | Dell Inspiron 14 7435 2-in-1 Vega 7, R5 7530U | Dell XPS 13 9310 2-in-1 Iris Xe G7 96EUs, i7-1165G7, Toshiba BG4 KBG40ZPZ512G | Lenovo IdeaPad Flex 5 14IRU8 Iris Xe G7 80EUs, i5-1335U, Samsung PM9B1 512GB MZAL4512HBLU | HP Pavilion x360 14-dy0157ng Iris Xe G7 80EUs, i5-1135G7, Toshiba KBG40ZNV512G | Asus VivoBook Flip 14 TP470EZ Xe MAX, i5-1135G7, Intel SSD 660p SSDPEKNW512G8 | |
|---|---|---|---|---|---|---|
| Noise | 5% | -0% | 4% | -6% | -14% | |
| off / environment * (dB) | 23.6 | 22.8 3% | 24.3 -3% | 23.1 2% | 27 -14% | 29.95 -27% |
| Idle Minimum * (dB) | 24.3 | 23.2 5% | 24.8 -2% | 23.3 4% | 27 -11% | 29.95 -23% |
| Idle Average * (dB) | 24.3 | 23.2 5% | 24.8 -2% | 23.3 4% | 27 -11% | 29.95 -23% |
| Idle Maximum * (dB) | 24.8 | 23.2 6% | 24.8 -0% | 23.3 6% | 27 -9% | 29.95 -21% |
| Load Average * (dB) | 33.5 | 33 1% | 38 -13% | 37.3 -11% | 38.3 -14% | 39.84 -19% |
| Witcher 3 ultra * (dB) | 43.8 | 40.9 7% | 38 13% | 38.7 12% | 42.3 3% | |
| Load Maximum * (dB) | 43.8 | 41.3 6% | 41.5 5% | 38.6 12% | 33.2 24% | 39.84 9% |
* ... smaller is better
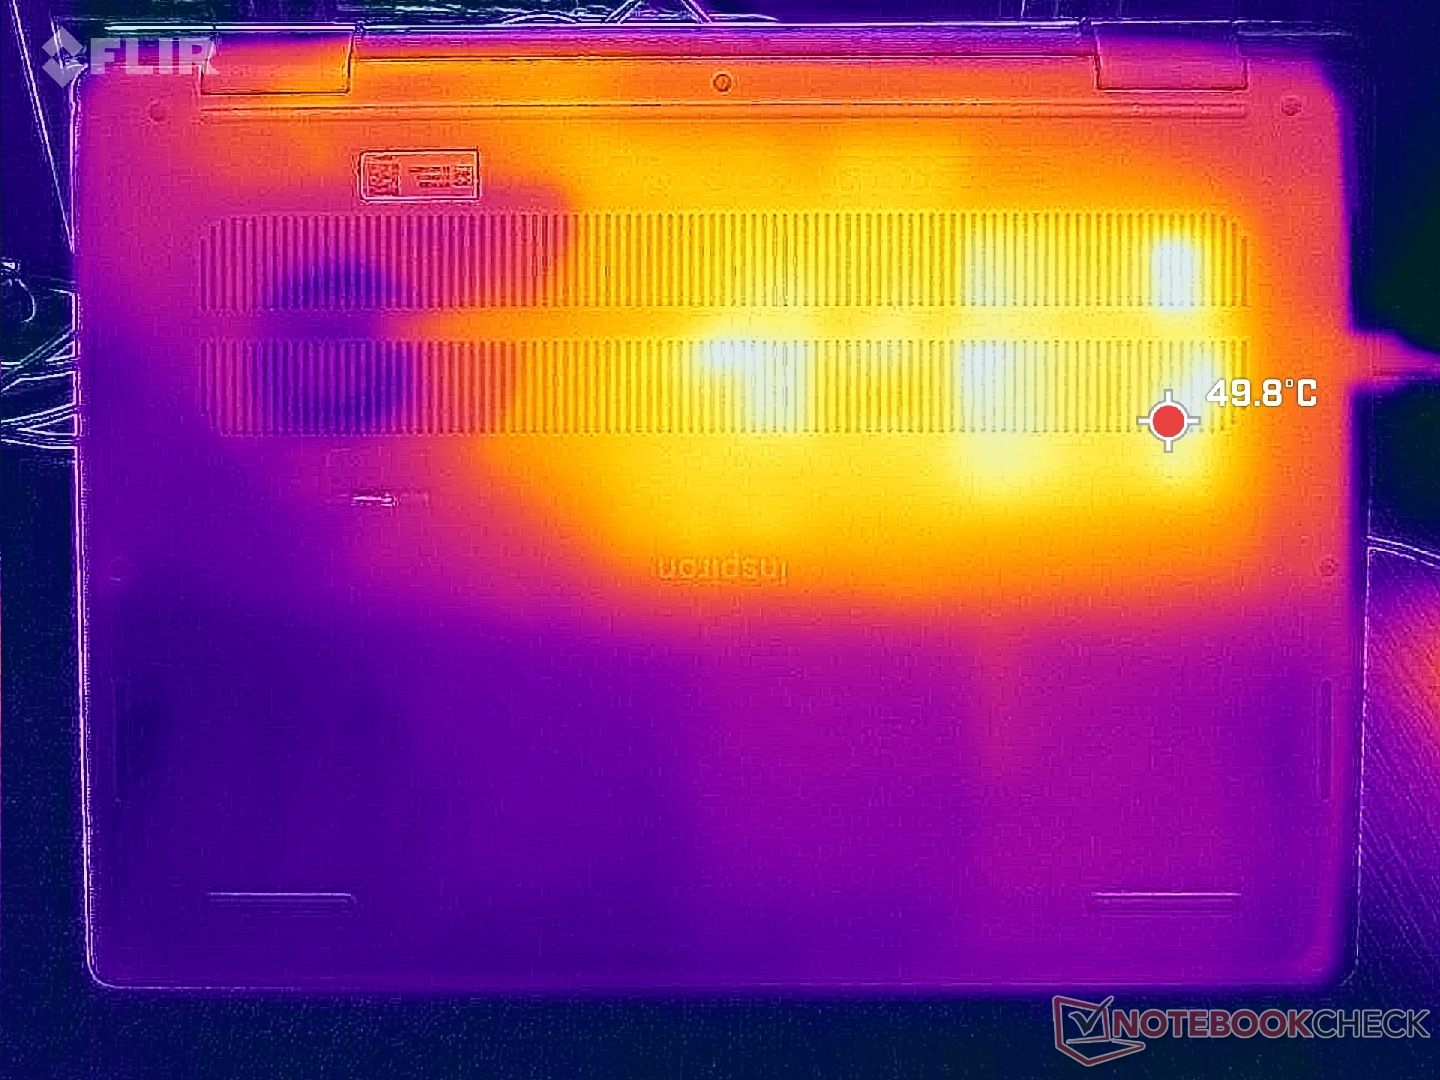
Temperature
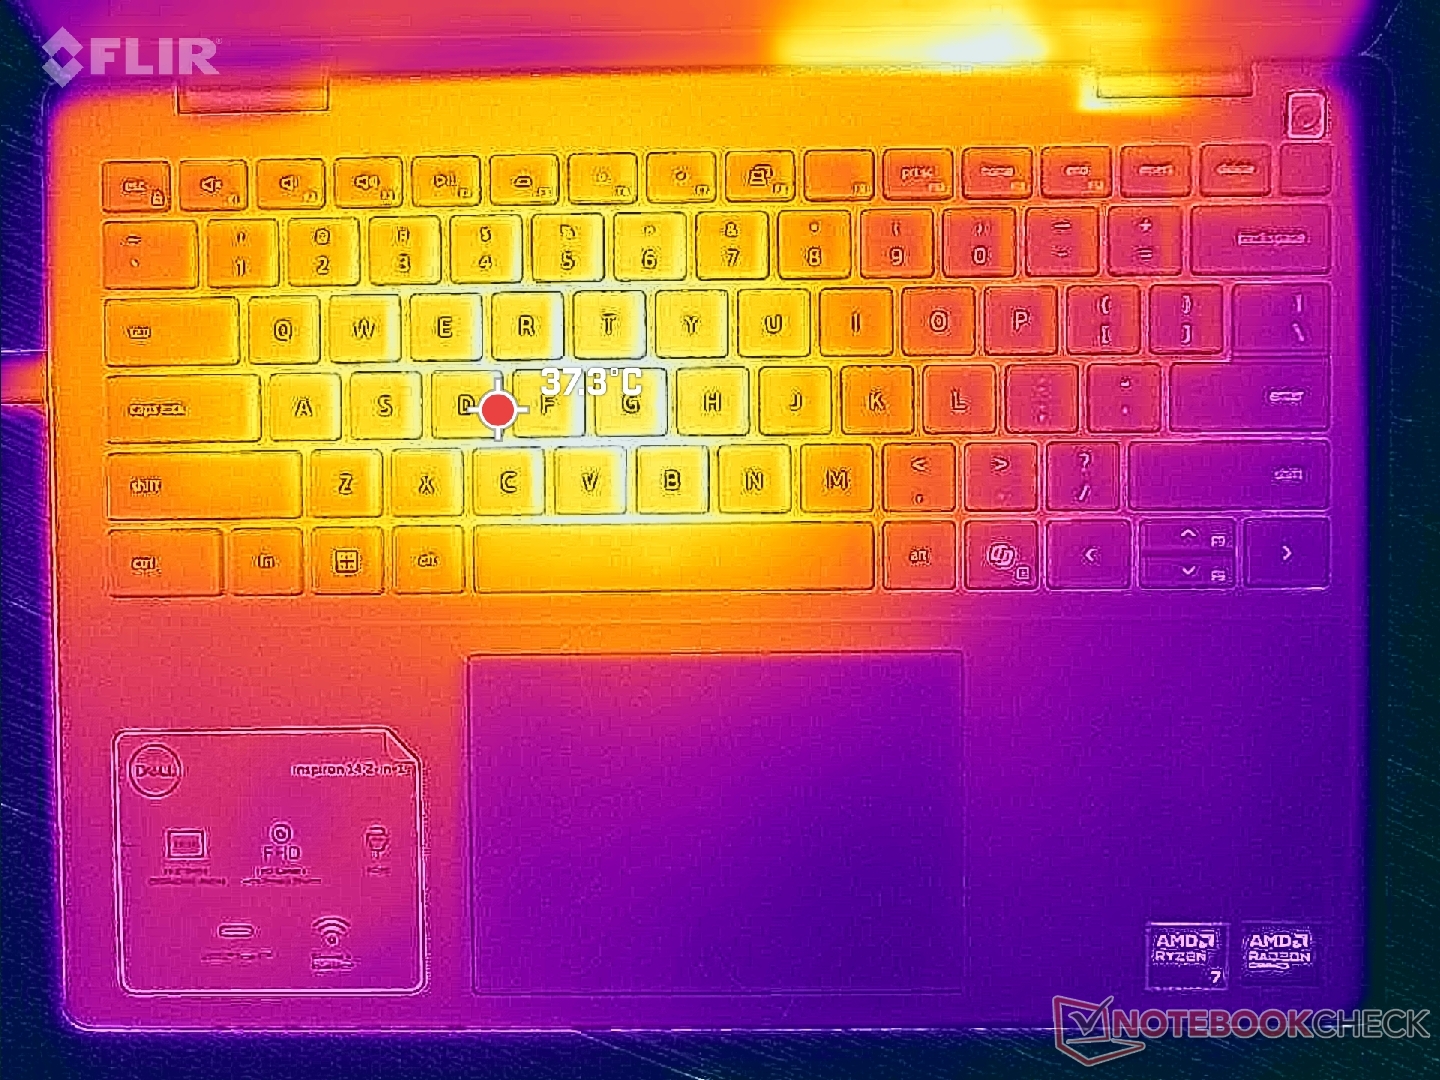
Hot spots are on the left side of the chassis where the C and D covers can reach up to 42 C and 50 C, respectively, when running demanding loads for long periods. The system runs noticeably warmer than its predecessor by over 10 C on average likely due in part to the transition to a more demanding HS-series processor. Most competitors run cooler than our Dell as well including the Lenovo IdeaPad Flex 5i 14. We recommend placing the system on a flat surface or desk if CPU utilization is high.
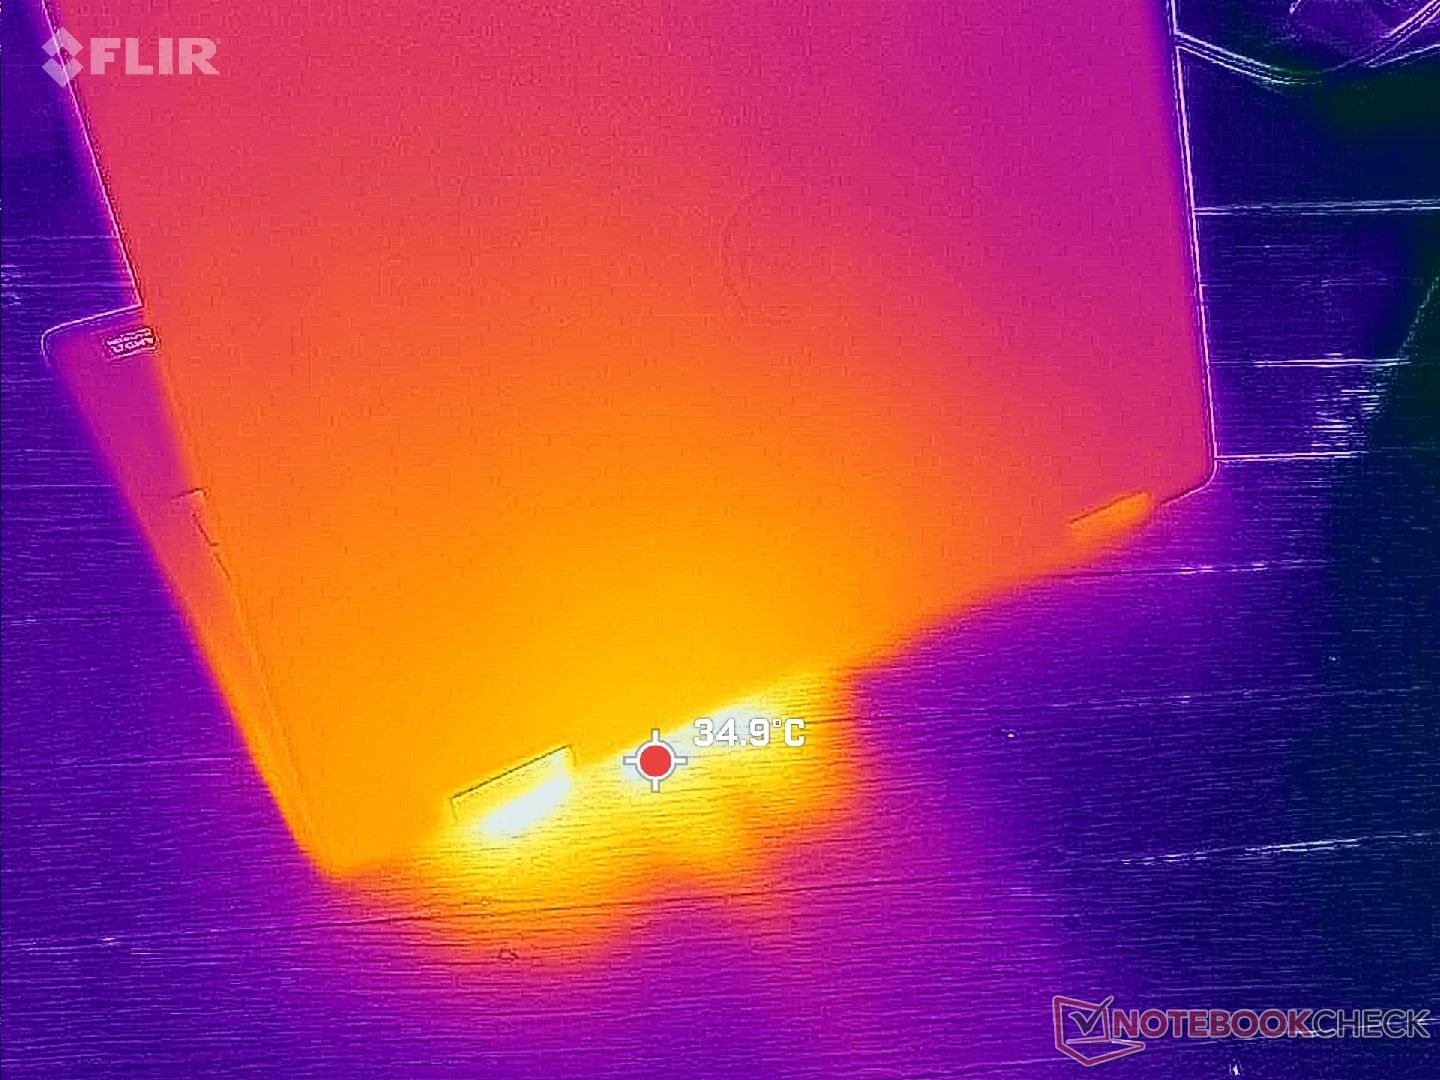
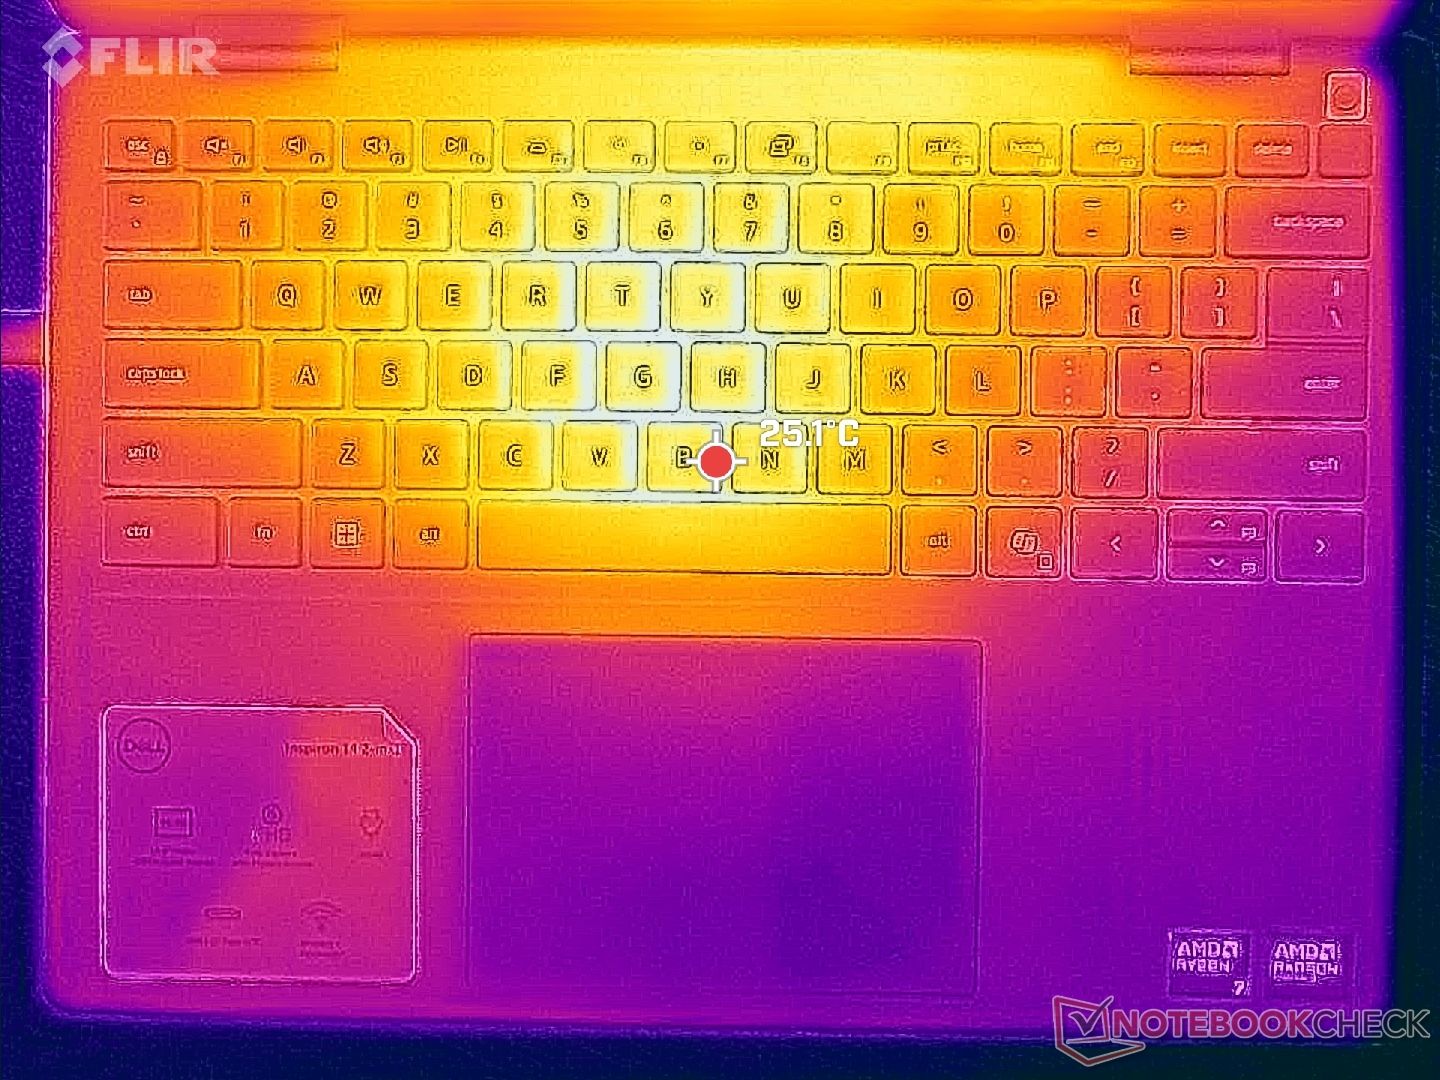
(±) The maximum temperature on the upper side is 41.2 °C / 106 F, compared to the average of 35.4 °C / 96 F, ranging from 19.6 to 60 °C for the class Convertible.
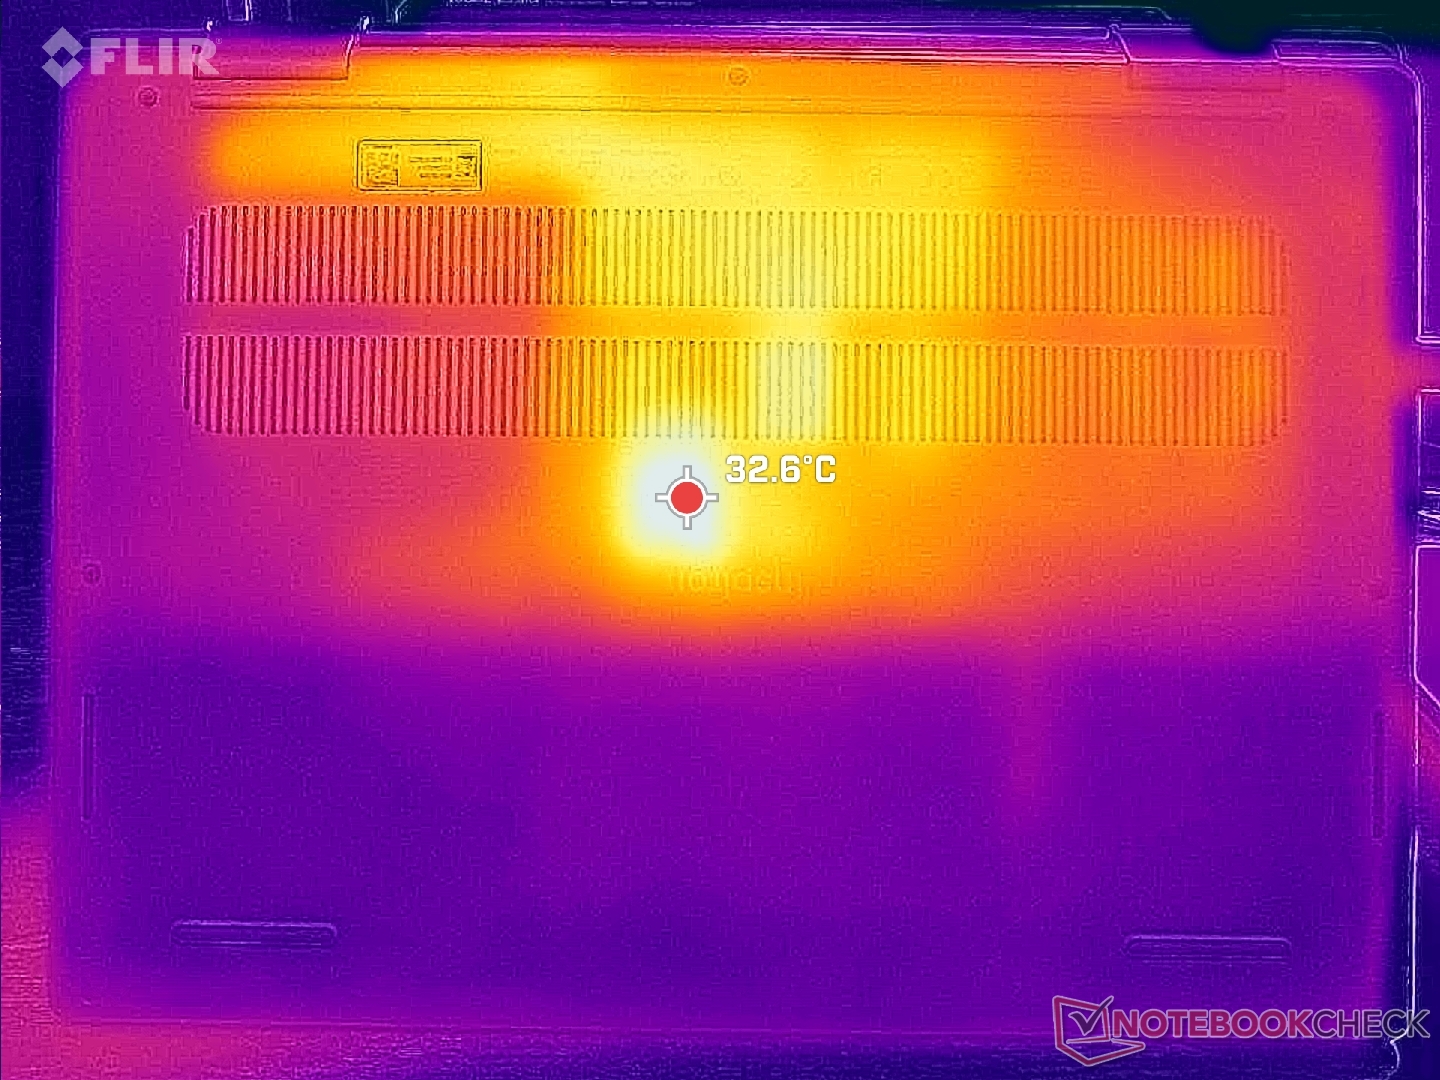
(-) The bottom heats up to a maximum of 48.4 °C / 119 F, compared to the average of 36.9 °C / 98 F
(+) In idle usage, the average temperature for the upper side is 26.3 °C / 79 F, compared to the device average of 30.3 °C / 87 F.
(+) The palmrests and touchpad are cooler than skin temperature with a maximum of 29.8 °C / 85.6 F and are therefore cool to the touch.
(±) The average temperature of the palmrest area of similar devices was 28 °C / 82.4 F (-1.8 °C / -3.2 F).
| Dell Inspiron 14 7445 2-in-1 AMD Ryzen 7 8840HS, AMD Radeon 780M | Dell Inspiron 14 7435 2-in-1 AMD Ryzen 5 7530U, AMD Radeon RX Vega 7 | Dell XPS 13 9310 2-in-1 Intel Core i7-1165G7, Intel Iris Xe Graphics G7 96EUs | Lenovo IdeaPad Flex 5 14IRU8 Intel Core i5-1335U, Intel Iris Xe Graphics G7 80EUs | HP Pavilion x360 14-dy0157ng Intel Core i5-1135G7, Intel Iris Xe Graphics G7 80EUs | Asus VivoBook Flip 14 TP470EZ Intel Core i5-1135G7, Intel Iris Xe MAX Graphics | |
|---|---|---|---|---|---|---|
| Heat | 11% | 5% | 6% | 9% | 7% | |
| Maximum Upper Side * (°C) | 41.2 | 35.2 15% | 51 -24% | 39.4 4% | 38.9 6% | 41 -0% |
| Maximum Bottom * (°C) | 48.4 | 38.2 21% | 45.4 6% | 38.8 20% | 40.3 17% | 41.2 15% |
| Idle Upper Side * (°C) | 29.4 | 31.2 -6% | 24.4 17% | 31.2 -6% | 31.8 -8% | 29.6 -1% |
| Idle Bottom * (°C) | 35.2 | 30.4 14% | 27.4 22% | 32.8 7% | 27.4 22% | 30 15% |
* ... smaller is better
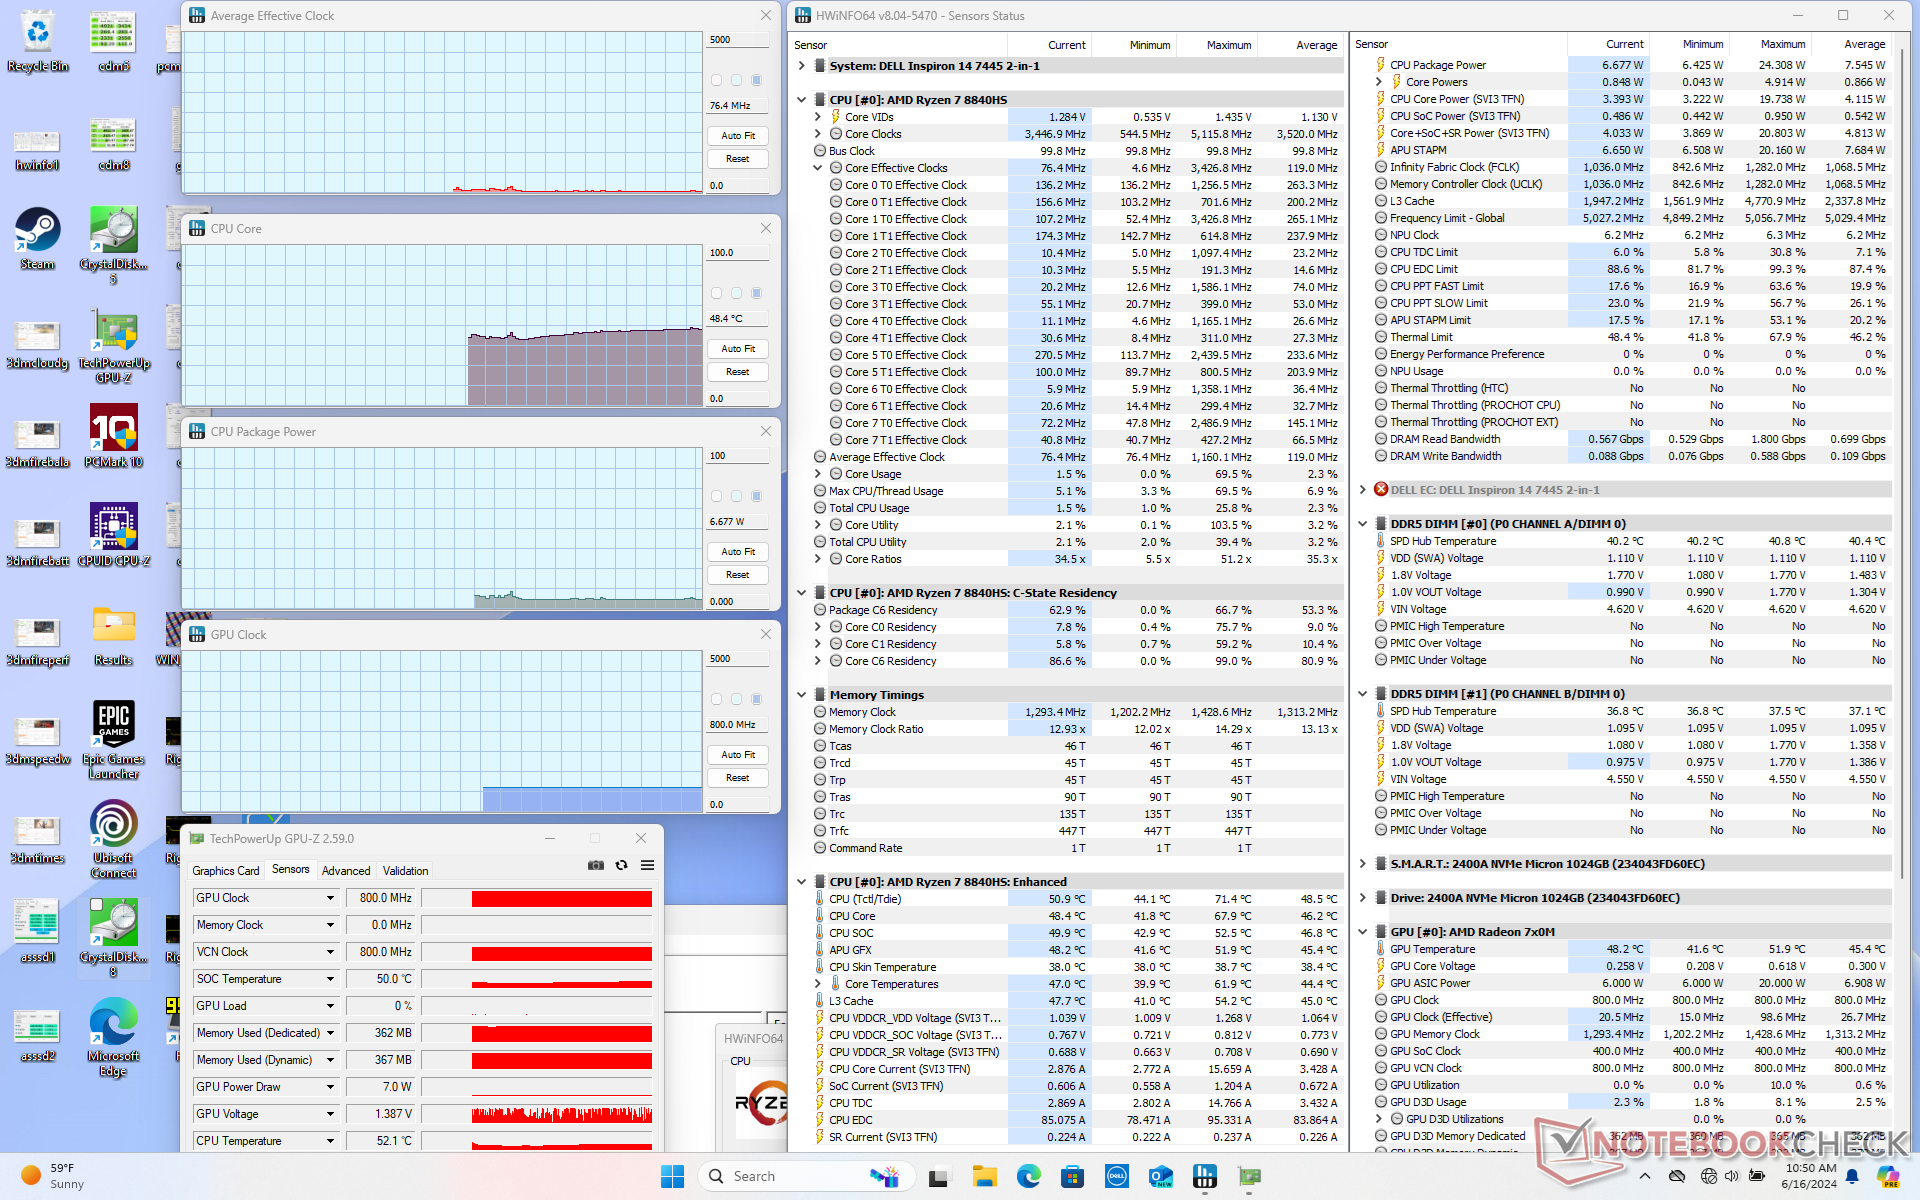
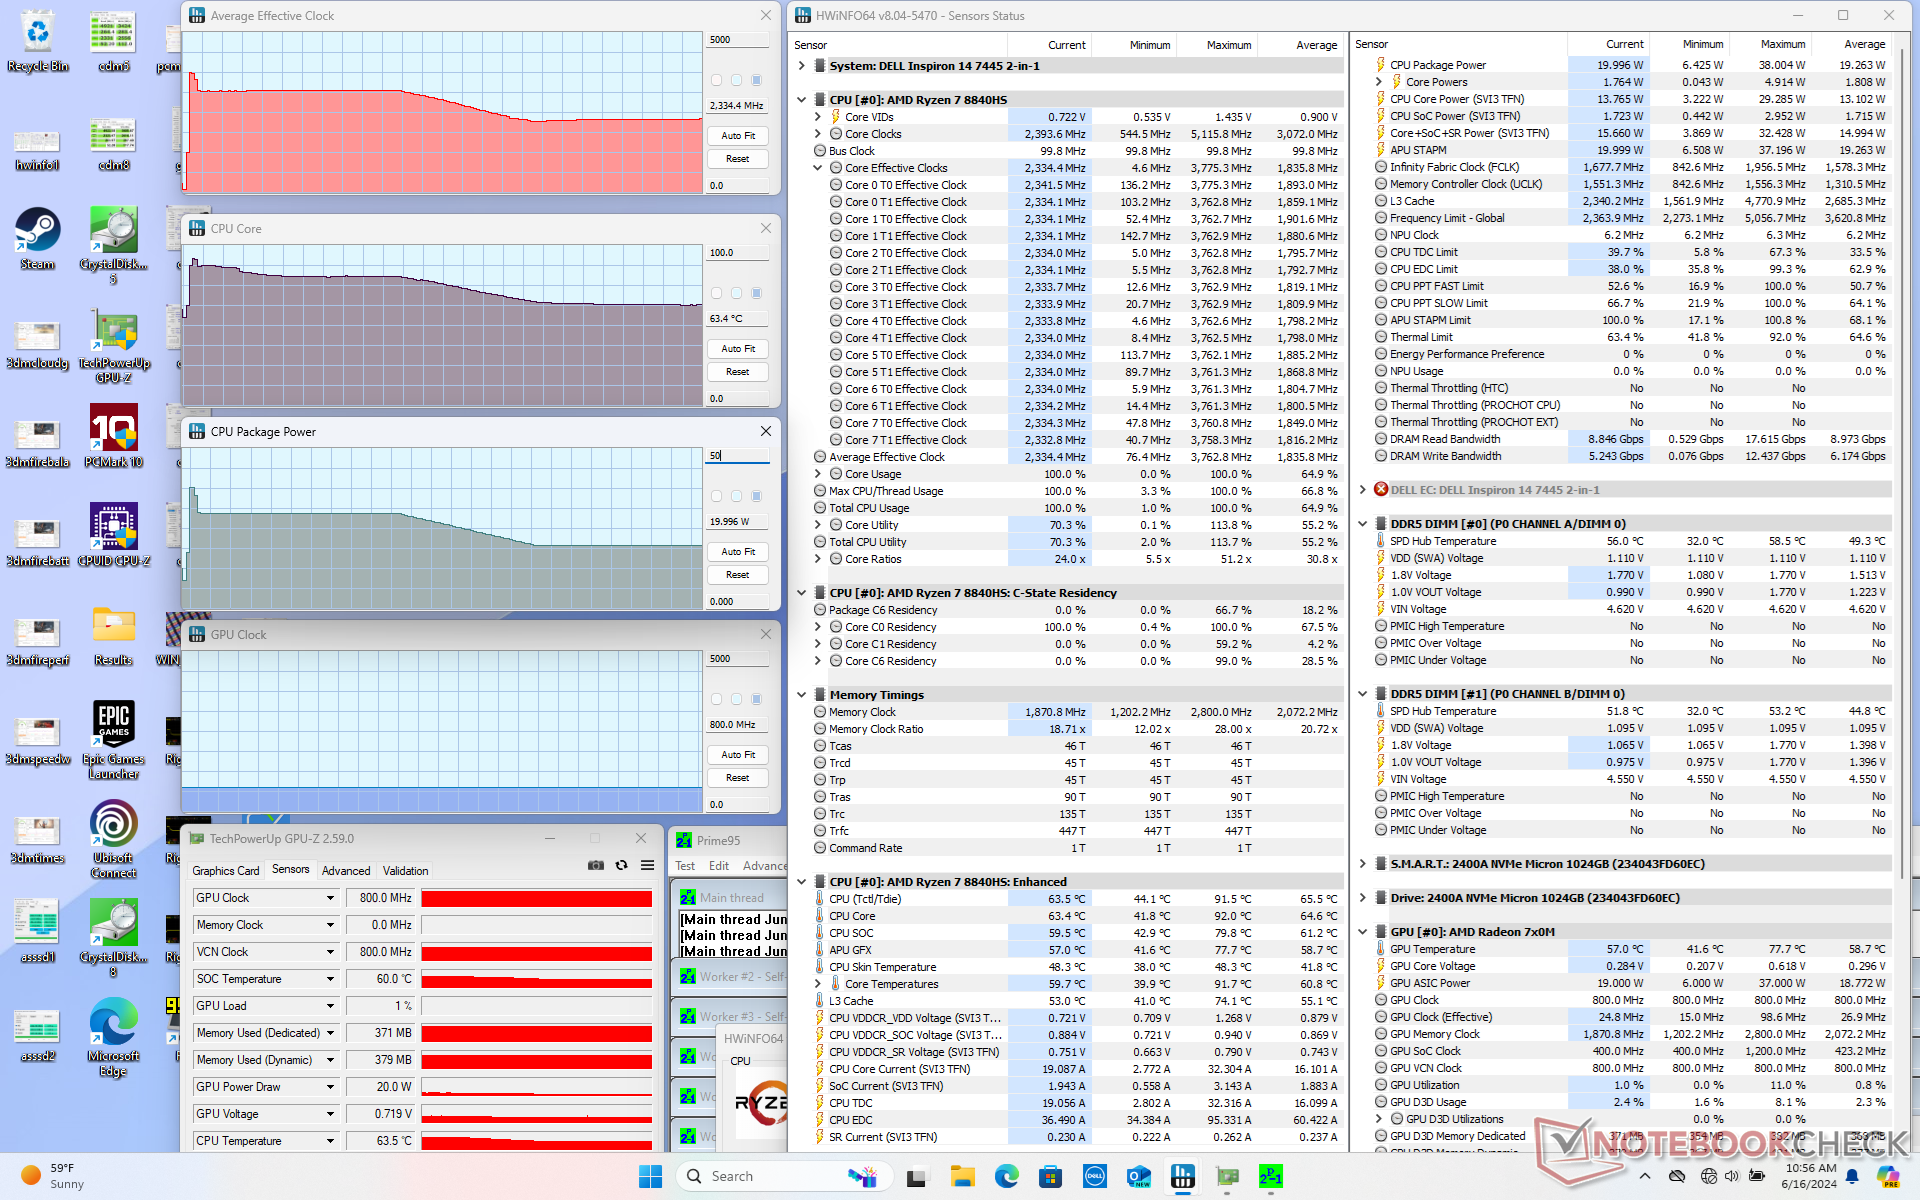
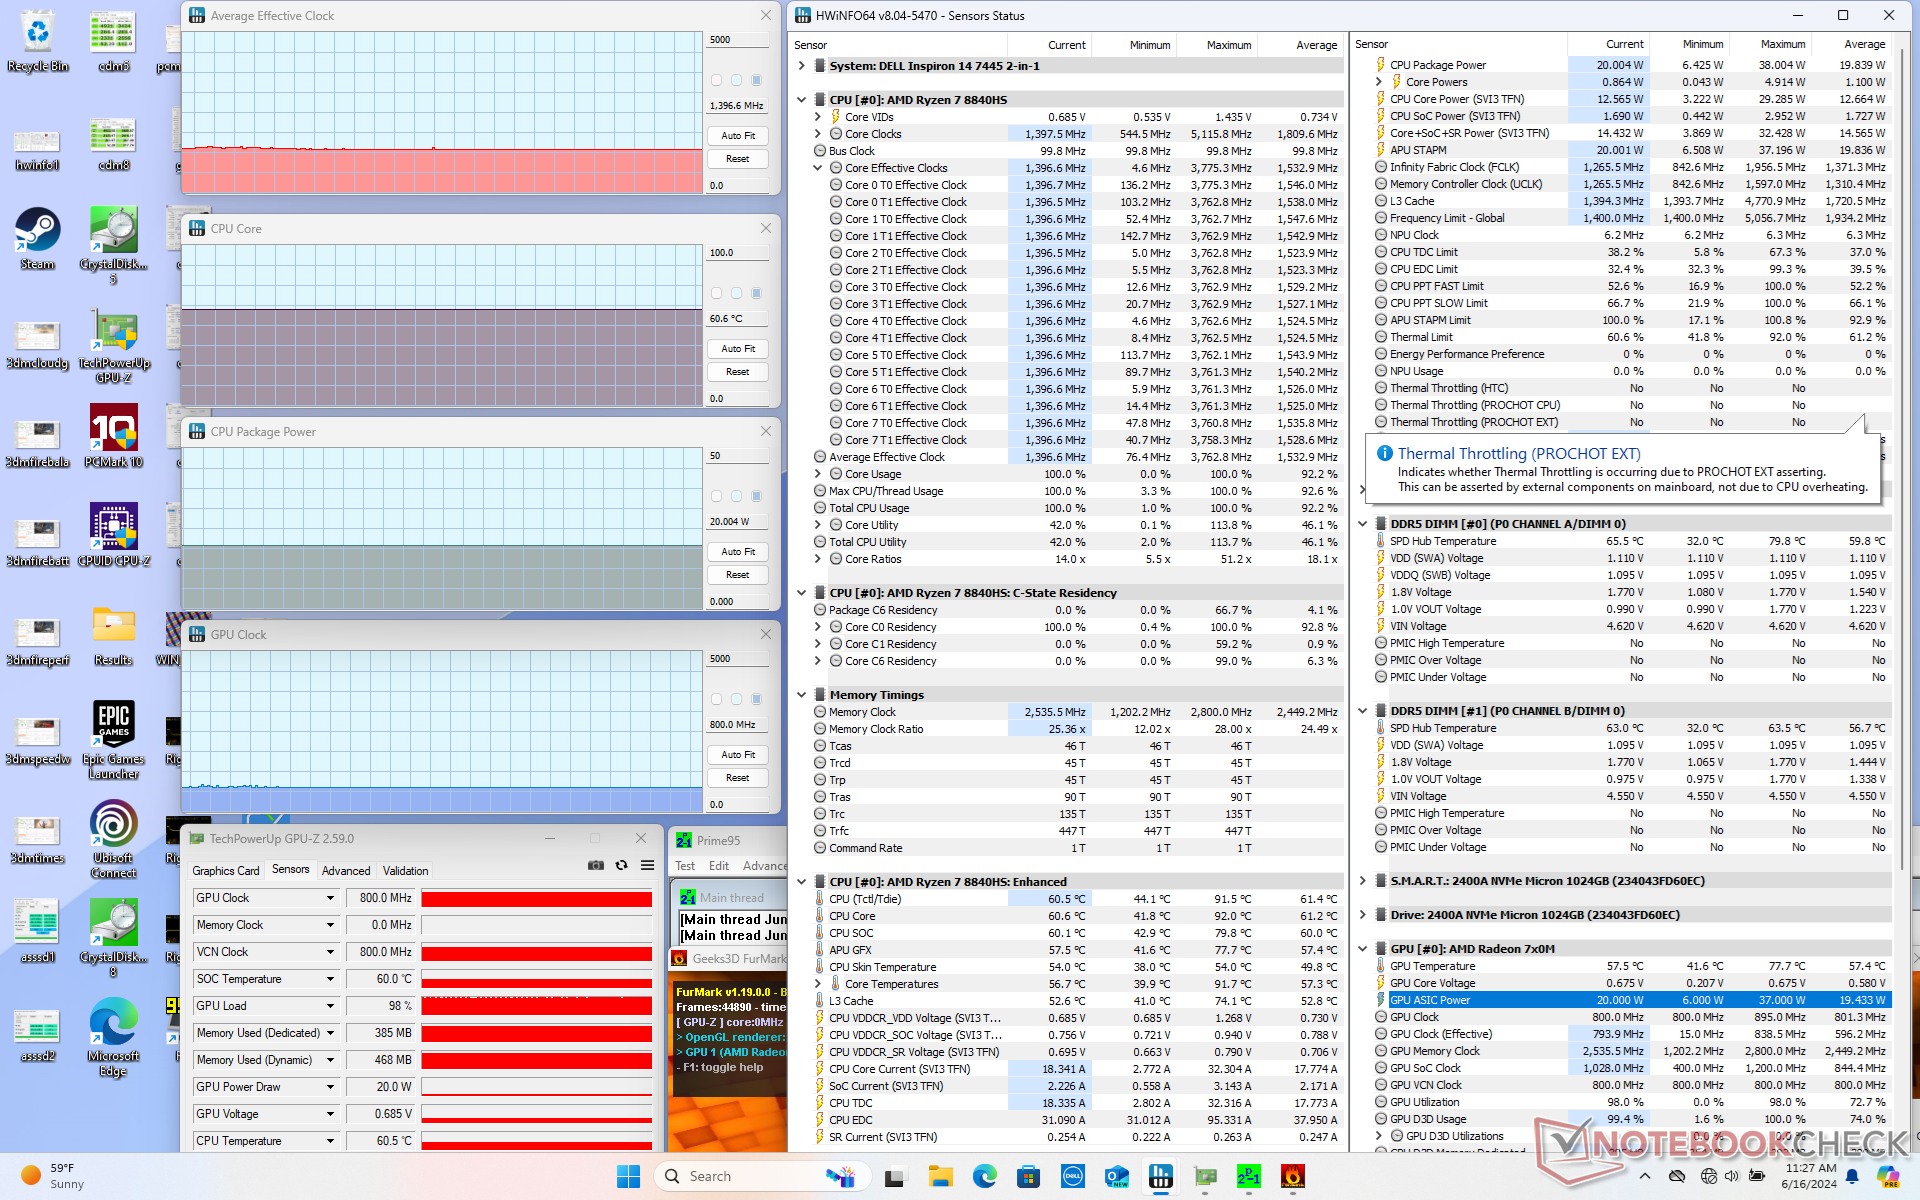
Stress Test
The CPU would boost to 3.8 GHz, 92 C, and 38 W when initiating Prime95 stress before quickly falling to 3.2 GHz, 83 C, and 30 W just a few seconds later. This would drop even further to 2.3 GHz, 63 C, and 20 W after several minutes as shown by the screenshot below. Dell is running the Ryzen 7 8840HS somewhat conservatively as the same CPU in the larger HP Envy x360 16 would stabilize at faster clock rates (3.1 GHz), warmer temperatures (77 C), and at higher power levels (25 W) when under similar testing conditions.
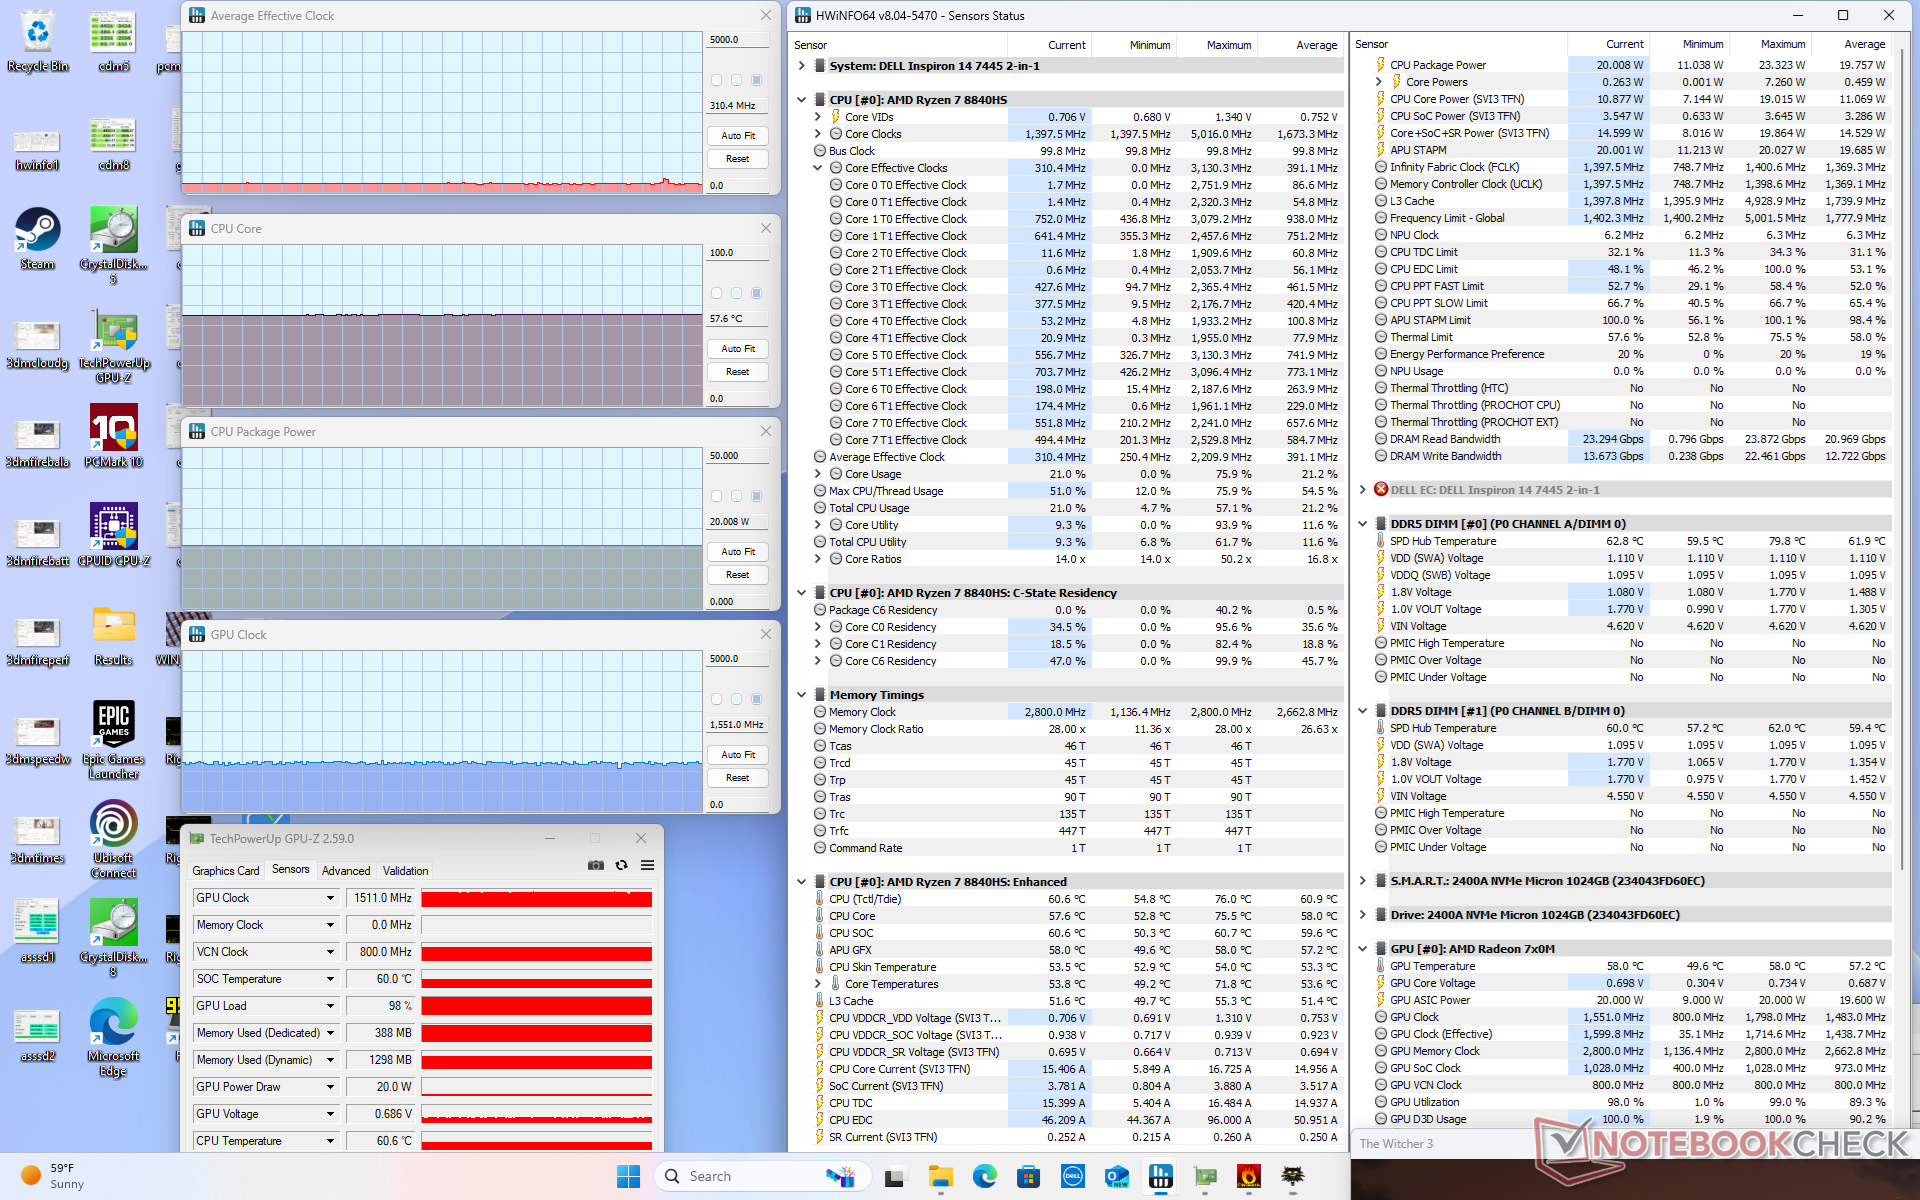
When running Witcher 3, GPU clock rates and temperature would stabilize at 1511 MHz and 58 C which are again very conservative targets. The aforementioned HP, for example, would stabilize at 2180 MHz and 68 C, respectively.
| CPU Clock (GHz) | GPU Clock (MHz) | Average CPU Temperature (°C) | |
| System Idle | -- | -- | 49 |
| Prime95 Stress | 2.3 | -- | 63 |
| Prime95 + FurMark Stress | 1.4 | 800 | 61 |
| Witcher 3 Stress | 0.3 | 1511 | 58 |
Speakers
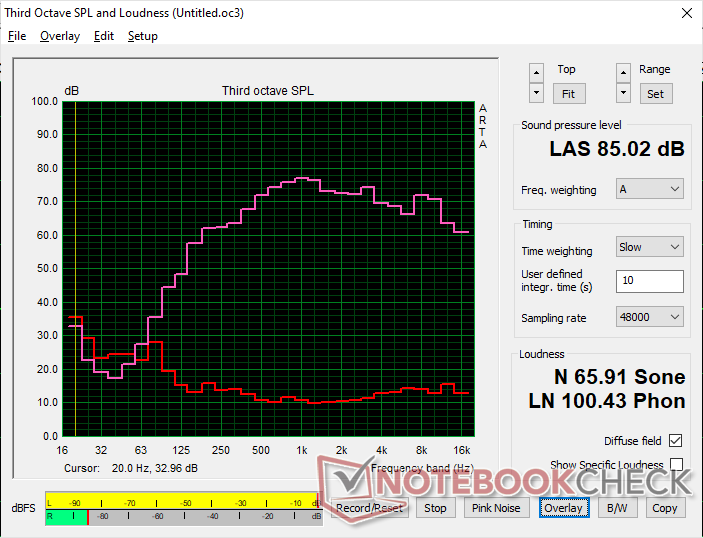
Dell Inspiron 14 7445 2-in-1 audio analysis
(+) | speakers can play relatively loud (85 dB)
Bass 100 - 315 Hz
(±) | reduced bass - on average 13.2% lower than median
(±) | linearity of bass is average (8.2% delta to prev. frequency)
Mids 400 - 2000 Hz
(+) | balanced mids - only 4.4% away from median
(+) | mids are linear (4% delta to prev. frequency)
Highs 2 - 16 kHz
(+) | balanced highs - only 2.2% away from median
(+) | highs are linear (4.2% delta to prev. frequency)
Overall 100 - 16.000 Hz
(+) | overall sound is linear (11.5% difference to median)
Compared to same class
» 9% of all tested devices in this class were better, 3% similar, 88% worse
» The best had a delta of 6%, average was 20%, worst was 57%
Compared to all devices tested
» 8% of all tested devices were better, 2% similar, 90% worse
» The best had a delta of 4%, average was 23%, worst was 134%
Apple MacBook Pro 16 2021 M1 Pro audio analysis
(+) | speakers can play relatively loud (84.7 dB)
Bass 100 - 315 Hz
(+) | good bass - only 3.8% away from median
(+) | bass is linear (5.2% delta to prev. frequency)
Mids 400 - 2000 Hz
(+) | balanced mids - only 1.3% away from median
(+) | mids are linear (2.1% delta to prev. frequency)
Highs 2 - 16 kHz
(+) | balanced highs - only 1.9% away from median
(+) | highs are linear (2.7% delta to prev. frequency)
Overall 100 - 16.000 Hz
(+) | overall sound is linear (4.6% difference to median)
Compared to same class
» 0% of all tested devices in this class were better, 0% similar, 100% worse
» The best had a delta of 5%, average was 17%, worst was 45%
Compared to all devices tested
» 0% of all tested devices were better, 0% similar, 100% worse
» The best had a delta of 4%, average was 23%, worst was 134%
Energy Management
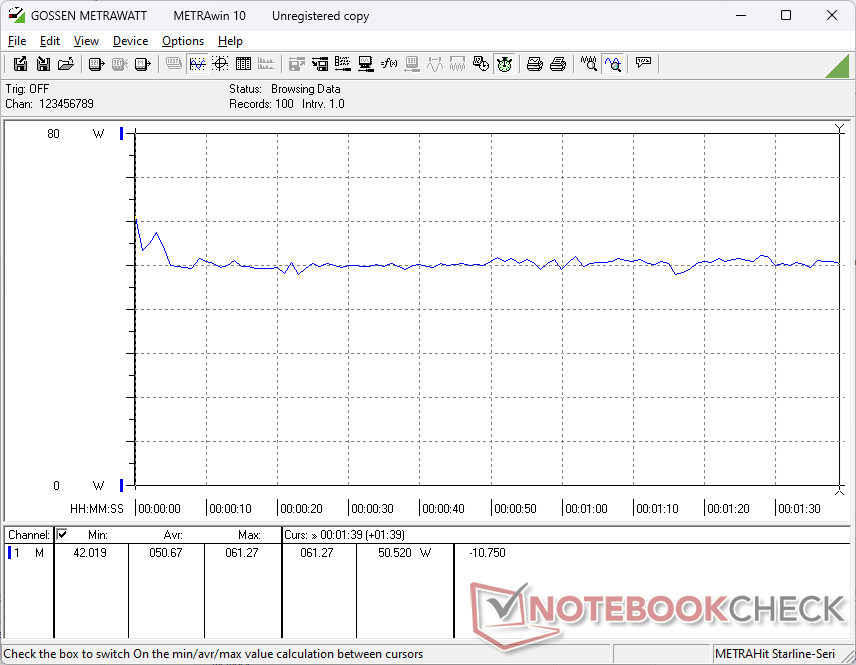
Power Consumption
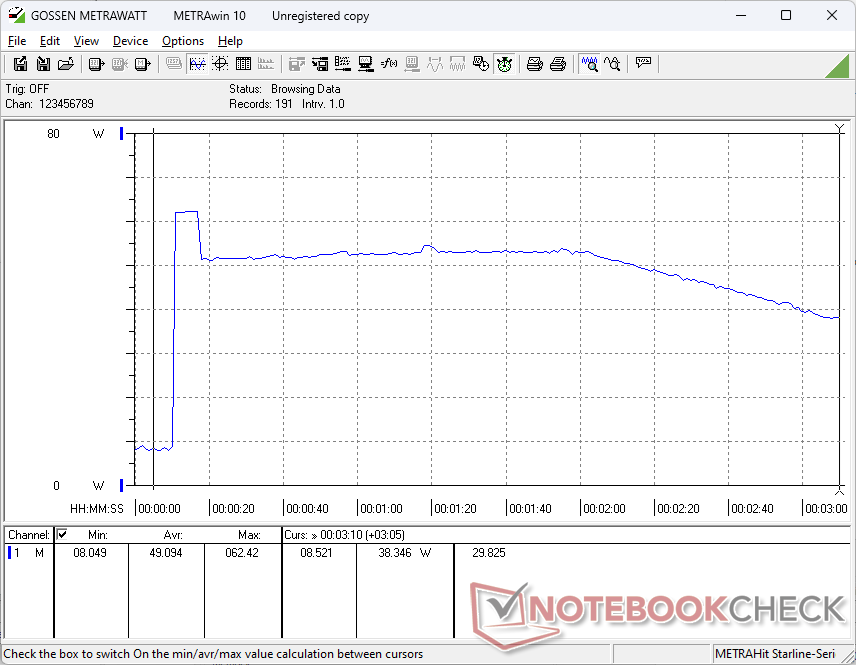
Power consumption is quite close to what we recorded on last year's Inspiron 14 7435 2-in-1 if not slightly lower at times. Exceptions are when running games or Prime95 where the the Ryzen 7 8840HS can offer faster initial Turbo Core performance before eventually throttling a few minutes later. During this time of high initial performance, the Inspiron 14 7445 2-in-1 can demand several more watts than its predecessor. Results are still very impressive from a performance-per-watt perspective.
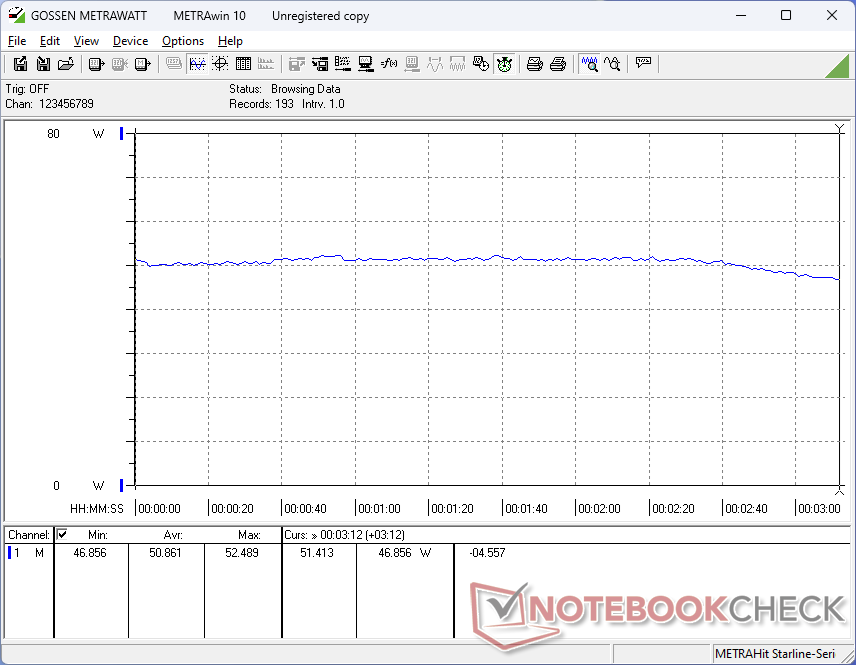
Consumption can fall by quite a bit after a few minutes of gaming. When running Witcher 3, for example, consumption would be as high as 50 W during the start of the test before falling to 35 W and more after just 6 minutes.
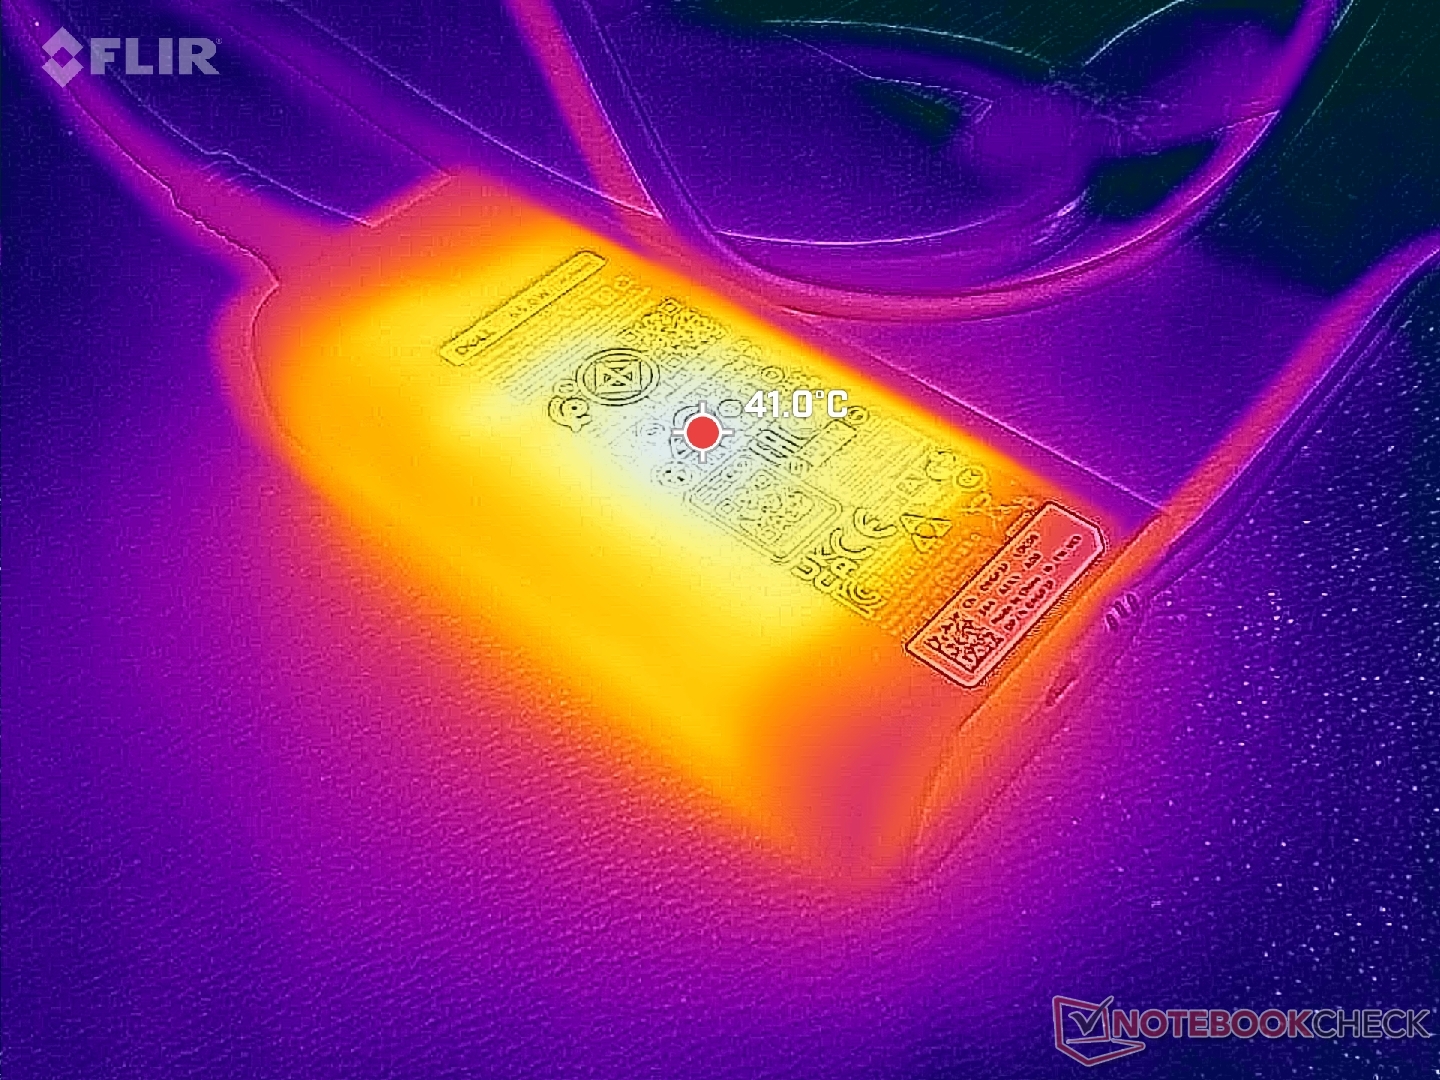
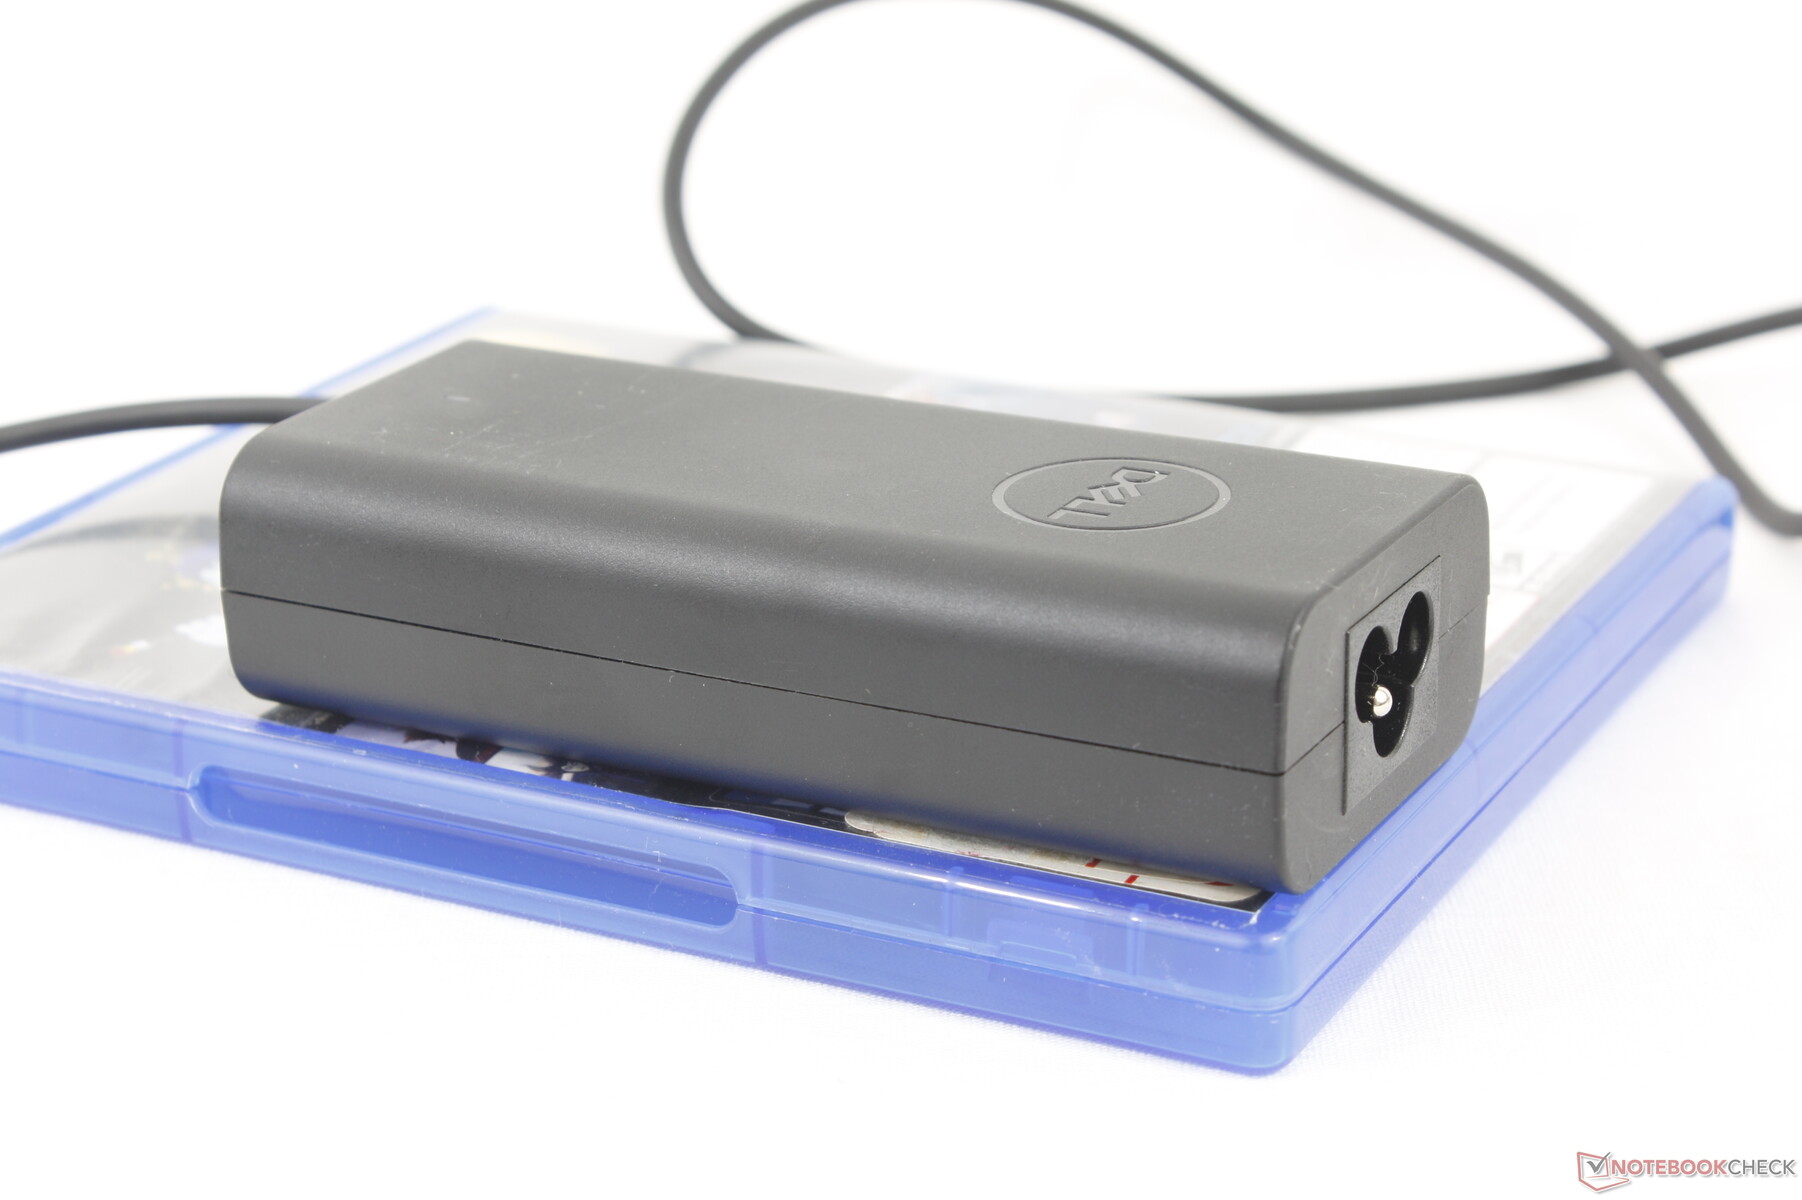
We're able to record a temporary maximum draw of 63 W from the small and universal (11.3 x 5 x 2.7 cm) 65 W USB-C AC adapter.

| Off / Standby | |
| Idle | |
| Load |
|
Key:
min: | |
| Dell Inspiron 14 7445 2-in-1 R7 8840HS, Radeon 780M, Micron 2400 MTFDKBK1T0QFM, IPS, 1920x1200, 14" | Dell Inspiron 14 7435 2-in-1 R5 7530U, Vega 7, , IPS, 1920x1200, 14" | Dell XPS 13 9310 2-in-1 i7-1165G7, Iris Xe G7 96EUs, Toshiba BG4 KBG40ZPZ512G, IPS, 1920x1200, 13.4" | Lenovo IdeaPad Flex 5 14IRU8 i5-1335U, Iris Xe G7 80EUs, Samsung PM9B1 512GB MZAL4512HBLU, IPS, 1920x1200, 14" | HP Pavilion x360 14-dy0157ng i5-1135G7, Iris Xe G7 80EUs, Toshiba KBG40ZNV512G, IPS, 1920x1080, 14" | Asus VivoBook Flip 14 TP470EZ i5-1135G7, Xe MAX, Intel SSD 660p SSDPEKNW512G8, IPS, 1920x1080, 14" | |
|---|---|---|---|---|---|---|
| Power Consumption | -3% | 30% | -13% | 30% | -48% | |
| Idle Minimum * (Watt) | 4.5 | 5.3 -18% | 2.6 42% | 8 -78% | 4 11% | 8.6 -91% |
| Idle Average * (Watt) | 8.4 | 9.1 -8% | 6.4 24% | 10.6 -26% | 6.7 20% | 9.56 -14% |
| Idle Maximum * (Watt) | 8.9 | 9.4 -6% | 7.7 13% | 10.7 -20% | 8.2 8% | 25.82 -190% |
| Load Average * (Watt) | 50.7 | 54.9 -8% | 29.9 41% | 46.8 8% | 29.6 42% | 47 7% |
| Witcher 3 ultra * (Watt) | 50.8 | 45 11% | 32.2 37% | 27.7 45% | 29.6 42% | 45.9 10% |
| Load Maximum * (Watt) | 62.4 | 55.8 11% | 47.5 24% | 68.3 -9% | 26.7 57% | 69.48 -11% |
* ... smaller is better
Power Consumption Witcher 3 / Stresstest
Power Consumption external Monitor
Battery Life
Runtimes are slightly longer than before despite having no upgrades to battery capacity. We're able to record just over 13 hours of real-world WLAN browsing compared to 11 hours on last year's model. This boost is enough to make the Inspiron 14 7445 2-in-1 one of the longer-lasting convertibles in its size category.
Charging from empty to full is relatively slow at 2 to 2.5 hours.
| Dell Inspiron 14 7445 2-in-1 R7 8840HS, Radeon 780M, 54 Wh | Dell Inspiron 14 7435 2-in-1 R5 7530U, Vega 7, 54 Wh | Dell XPS 13 9310 2-in-1 i7-1165G7, Iris Xe G7 96EUs, 51 Wh | Lenovo IdeaPad Flex 5 14IRU8 i5-1335U, Iris Xe G7 80EUs, 52.5 Wh | HP Pavilion x360 14-dy0157ng i5-1135G7, Iris Xe G7 80EUs, 43 Wh | Asus VivoBook Flip 14 TP470EZ i5-1135G7, Xe MAX, 42 Wh | |
|---|---|---|---|---|---|---|
| Battery runtime | -11% | 17% | -25% | -31% | -44% | |
| Reader / Idle (h) | 22.2 | 19.9 -10% | 25.4 14% | 17.7 -20% | ||
| WiFi v1.3 (h) | 13.1 | 11.1 -15% | 10.7 -18% | 9.8 -25% | 7.1 -46% | 7.3 -44% |
| Load (h) | 2.2 | 2 -9% | 3.4 55% | 1.6 -27% | ||
| H.264 (h) | 8.9 |
Pros
Cons
Verdict — Fast And Versatile For The Price
The Inspiron 14 7445 2-in-1 has a respectable list of features including its convertible form factor, latest generation Zen 4 Ryzen-HS CPU, and an AI-ready integrated NPU all for under $1000. The jump from Ryzen-U to Ryzen-HS is probably the most notable change especially for multi-taskers, casual gamers, or graphics editors who can all benefit from the much faster CPU. This also gives Dell a leg up against competitors as the HP Pavilion x360 14, Asus VivoBook Flip 14, and Lenovo IdeaPad Flex 5 14 are still running U-series CPUs.
As a budget-range convertible, however, cut corners are inevitable and there are certainly a few to be wary of. More specifically, display colors and brightness are limited which make the Inspiron 14 7445 2-in-1 poor for most graphics work and outdoor use, respectively, despite the relatively fast processor and small form factor. USB4 is also not supported meaning more limited docking capabilities. If such features are important to you, then you'll have to upgrade to the Dell Latitude series instead which can easily cost twice as much our Inspiron.
The Inspiron 14 7445 2-in-1 is fast with comfortable inputs and it's ready for the AI revolution all for an affordable price. Display quality, however, leaves a lot to be desired.
A strong alternative to the Inspiron 14 7445 2-in-1 is perhaps the Asus VivoBook 14X which offers OLED, discrete GeForce RTX graphics, and an even lighter weight while costing around the same. It may not have a convertible design, but its raw graphics performance and superior image quality may make up for the shortcoming.
Price and Availability
Dell is now shipping our configuration with the Ryzen 7 CPU, 16 GB of RAM, and 1 TB SSD for $950. The lower-end configuration with the Ryzen 5 and just half the RAM and storage comes out to $730.
Note: We have recently updated our rating system and the results of version 8 are not comparable with the results of version 7. More information is available here .
Dell Inspiron 14 7445 2-in-1
- 06/24/2024 v8
Allen Ngo
Transparency
The selection of devices to be reviewed is made by our editorial team. The test sample was provided to the author as a loan by the manufacturer or retailer for the purpose of this review. The lender had no influence on this review, nor did the manufacturer receive a copy of this review before publication. There was no obligation to publish this review. As an independent media company, Notebookcheck is not subjected to the authority of manufacturers, retailers or publishers.
This is how Notebookcheck is testing
Every year, Notebookcheck independently reviews hundreds of laptops and smartphones using standardized procedures to ensure that all results are comparable. We have continuously developed our test methods for around 20 years and set industry standards in the process. In our test labs, high-quality measuring equipment is utilized by experienced technicians and editors. These tests involve a multi-stage validation process. Our complex rating system is based on hundreds of well-founded measurements and benchmarks, which maintains objectivity. Further information on our test methods can be found here.
Price comparison
