Dell XPS 13 9340 laptop review - The compact subnotebook with long runtimes and quite a few flaws
After previously testing both the new 14-inch and 16-inch models of the latest XPS series, it is now time to take a look at the compact Dell XPS 13 9340. The old XPS 13 Plus, which inspired the new models' design, is no longer available. However, Dell offers a slimmed-down XPS 13 9315 with old Alder Lake processors as well as conventional input devices—apart from this, they have an identical case.
Our test device is fitted with the new Meteor Lake processor—the Core Ultra 7 155H—as well as 32 GB RAM, a 512-GB PCIe SSD and a Full HD panel. Dell's asking price for this configuration is US$1,599 (introductory price with the Core Ultra 5 and 16 GB RAM is US$1,149). You can raise this price to a maximum of US$2,659 (Core Ultra 7, 64 GB RAM, 2-TB SSD, QHD+).
Possible competitors compared
Rating | Date | Model | Weight | Height | Size | Resolution | Price |
|---|---|---|---|---|---|---|---|
| 86.5 % v7 (old) | 05 / 2024 | Dell XPS 13 9340 Core Ultra 7 Ultra 7 155H, Arc 8-Core | 1.2 kg | 15.3 mm | 13.40" | 1920x1200 | |
| 92.4 % v7 (old) | 03 / 2024 | Apple MacBook Air 13 M3 10C GPU M3, M3 10-Core GPU | 1.2 kg | 11.3 mm | 13.60" | 2560x1664 | |
| 85.4 % v7 (old) | 05 / 2023 | Asus ZenBook S13 OLED UX5304 i7-1355U, Iris Xe G7 96EUs | 1 kg | 11.8 mm | 13.30" | 2880x1800 | |
| 89.5 % v7 (old) | 01 / 2024 | Lenovo ThinkPad Z13 Gen 2 R7 PRO 7840U, Radeon 780M | 1.2 kg | 13.99 mm | 13.30" | 2880x1800 | |
| 91.9 % v7 (old) | 07 / 2023 | HP Dragonfly G4 i7-1365U, Iris Xe G7 96EUs | 1.1 kg | 16.3 mm | 13.50" | 1920x1280 |
Case - Stable aluminum
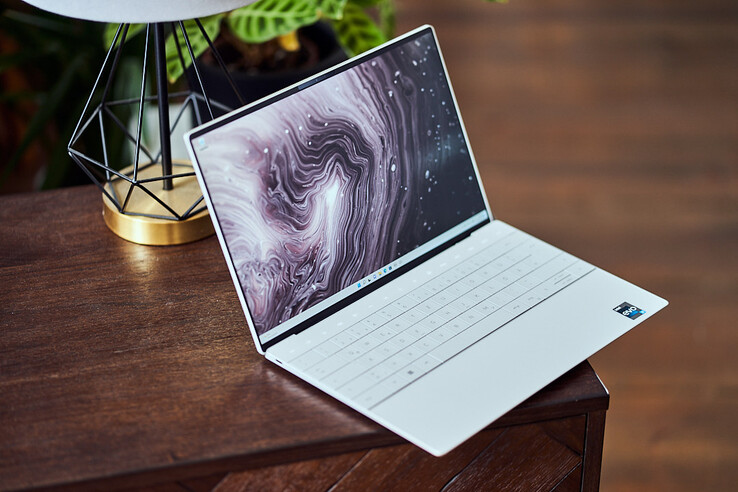
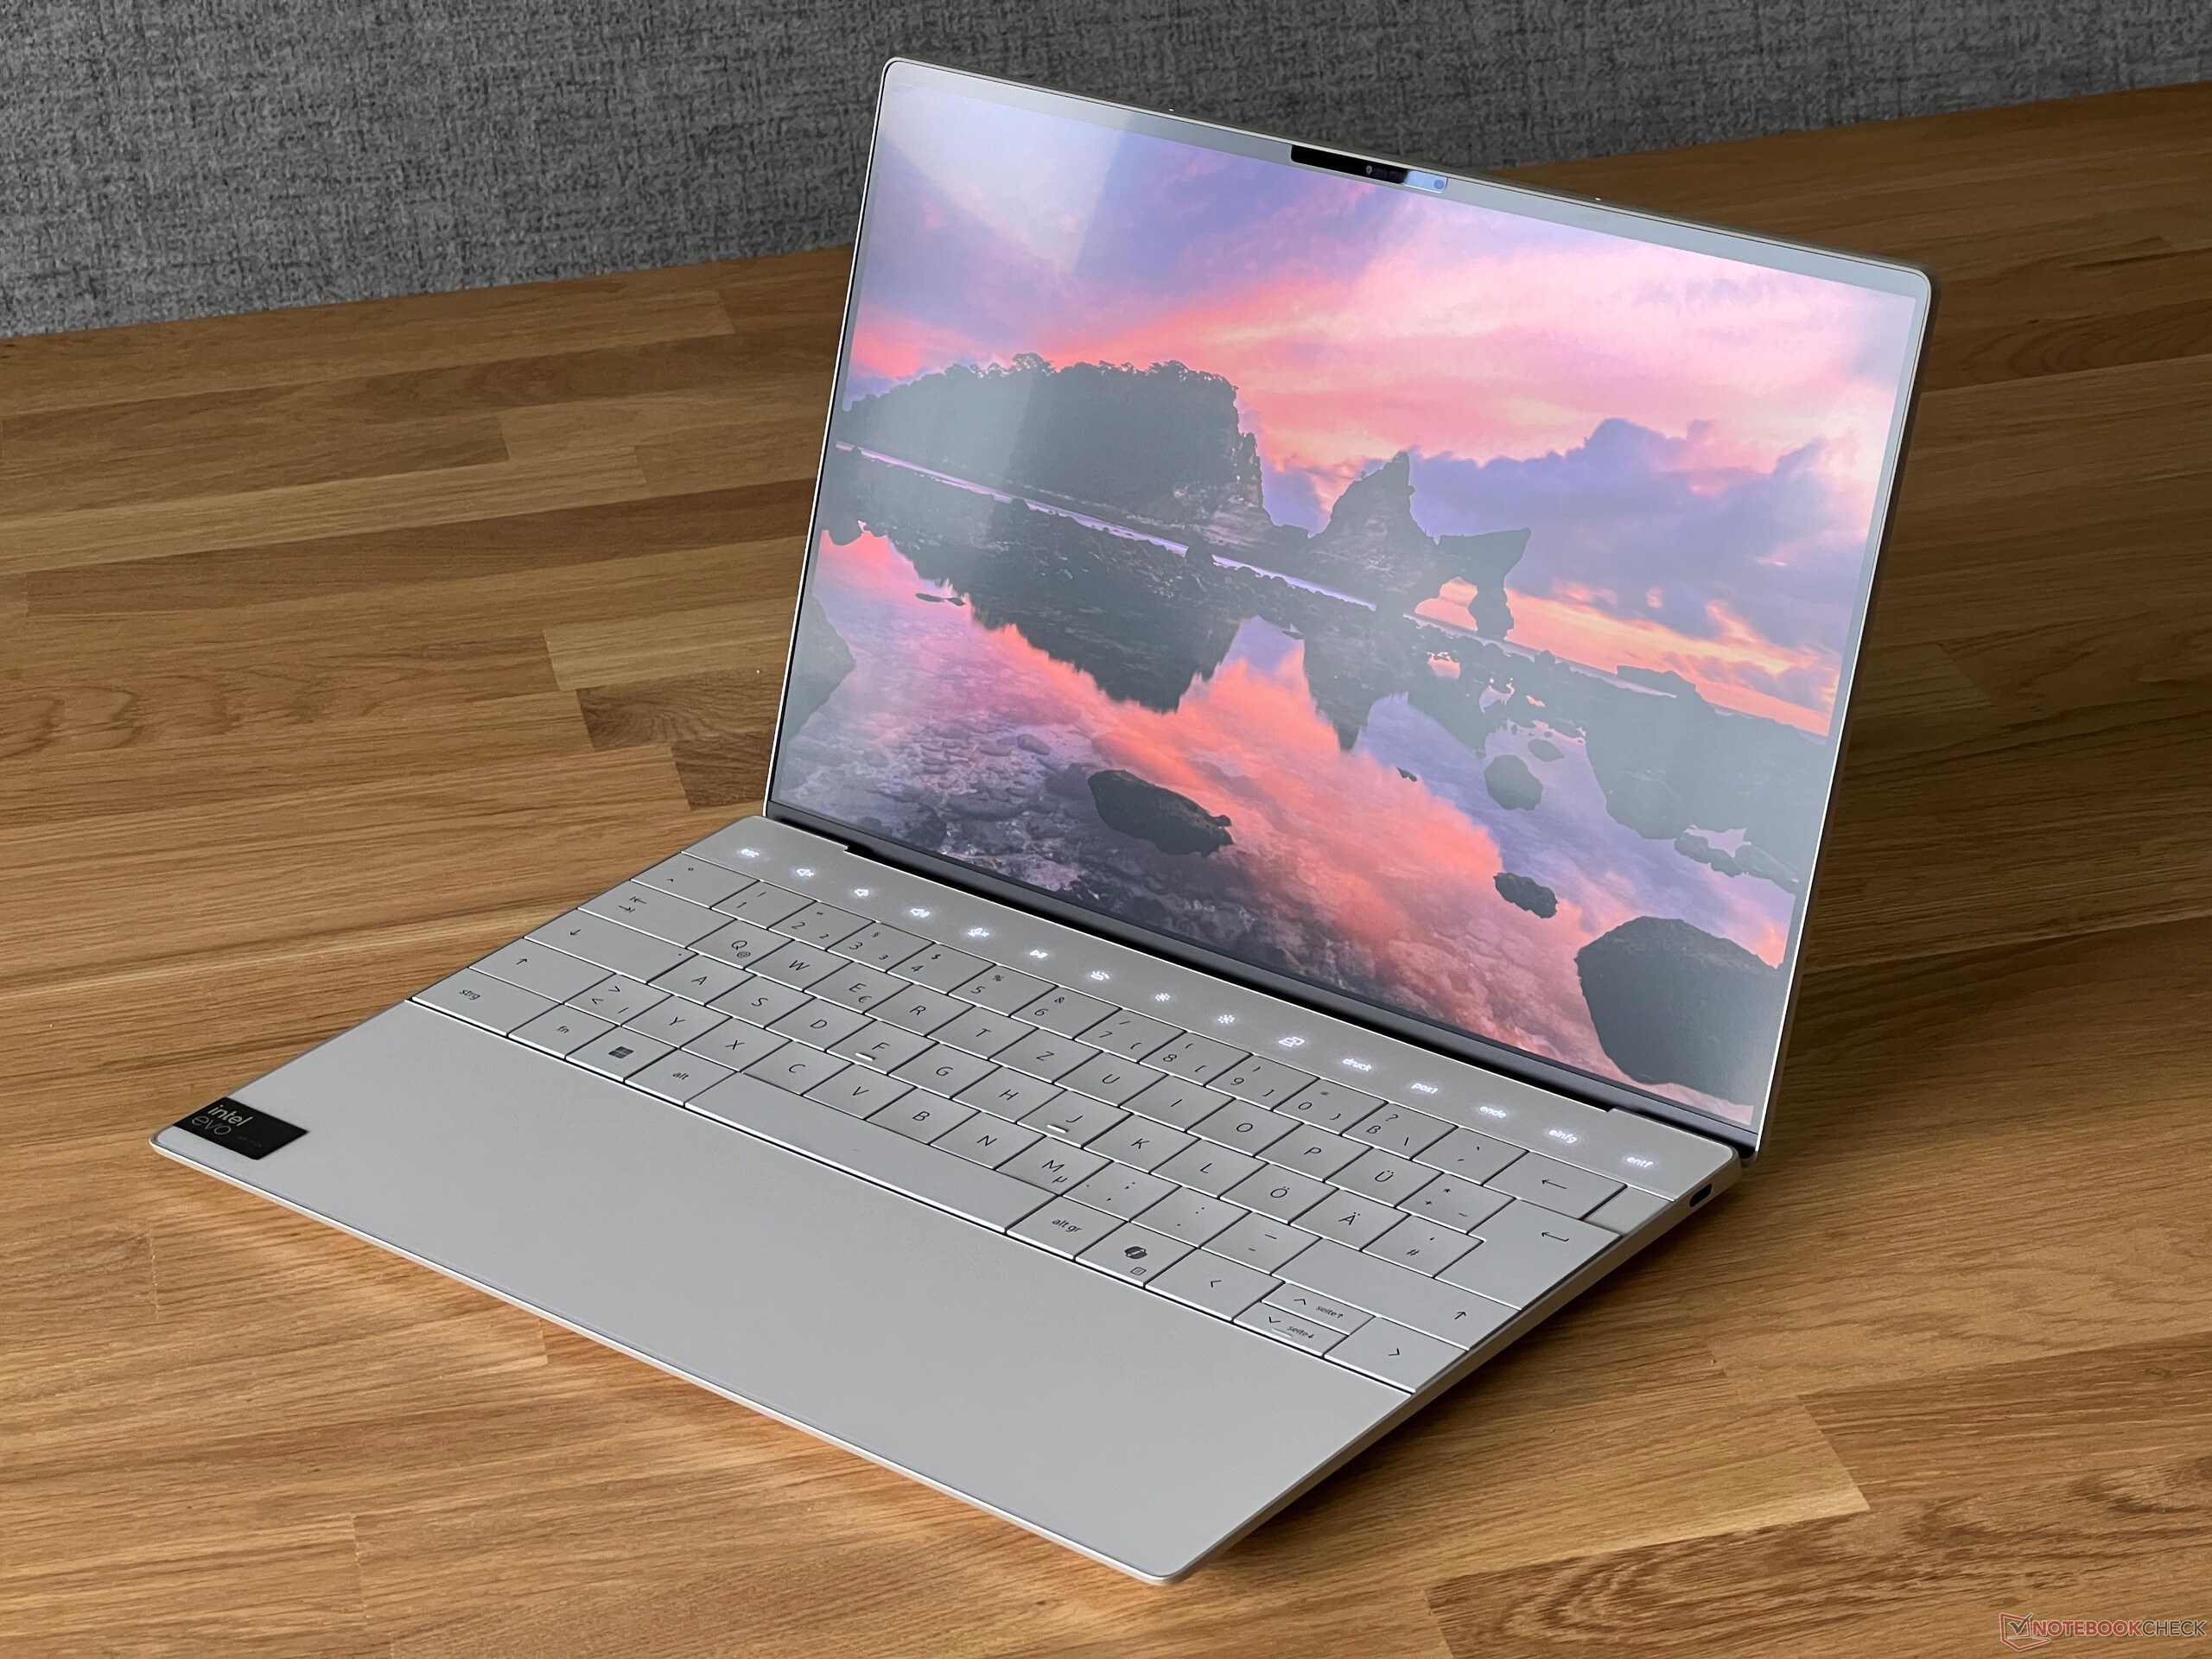
Dell introduced its current XPS design a while ago on the XPS 13 Plus, now using it for the entire series. We believe that the design works the best on the small XPS 13 9340, as the device feels extremely compact (especially in comparison to the bulky XPS 14). Aside from a silver variant, the manufacturer also offers a dark-gray model. The device looks high-quality and we noted no build issues. In addition, it doesn't appear to be much of a fingerprint magnet.
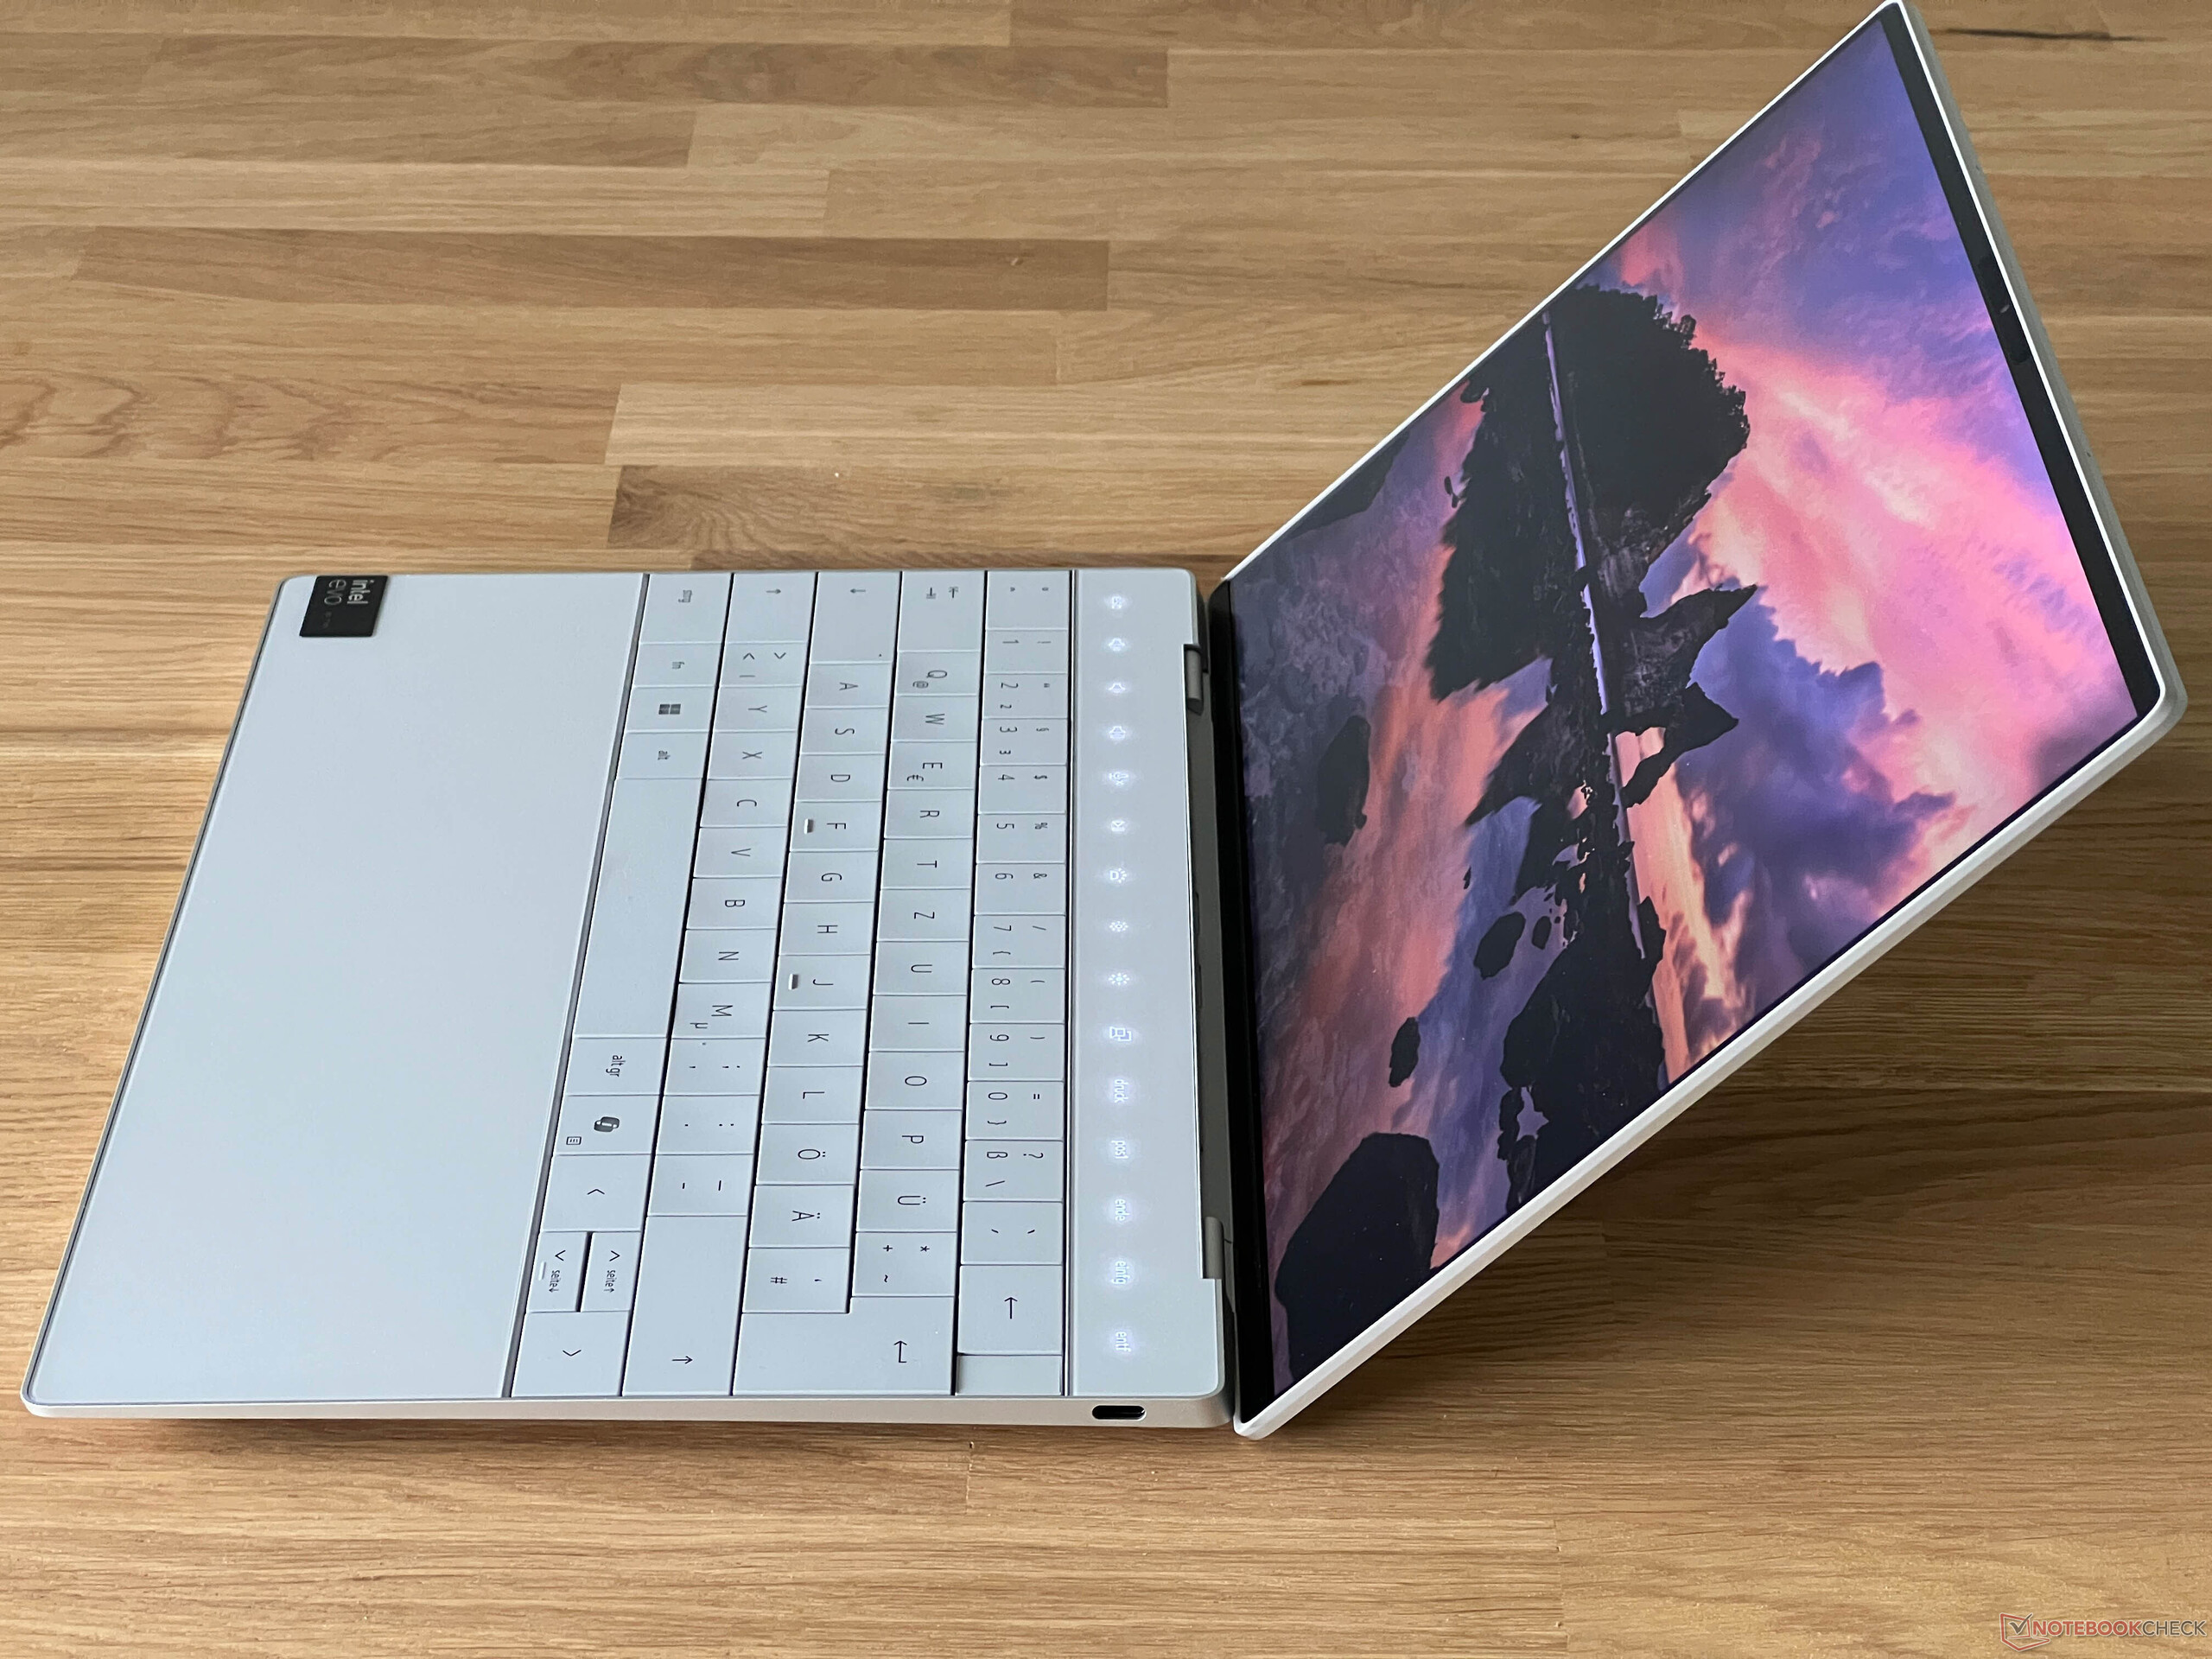
The display lid can be easily opened with one hand and aside from its unique input devices (more on that later), the laptop's slim bezels catch your eye immediately. The hinges are adjusted well, however, the screen's maximum opening angle is limited to ~135 degrees. The base unit's stability is great and even when using lots of pressure, we were only able to dent the keyboard slightly. The same can be said for the display lid from which we weren't able to elicit any image errors.

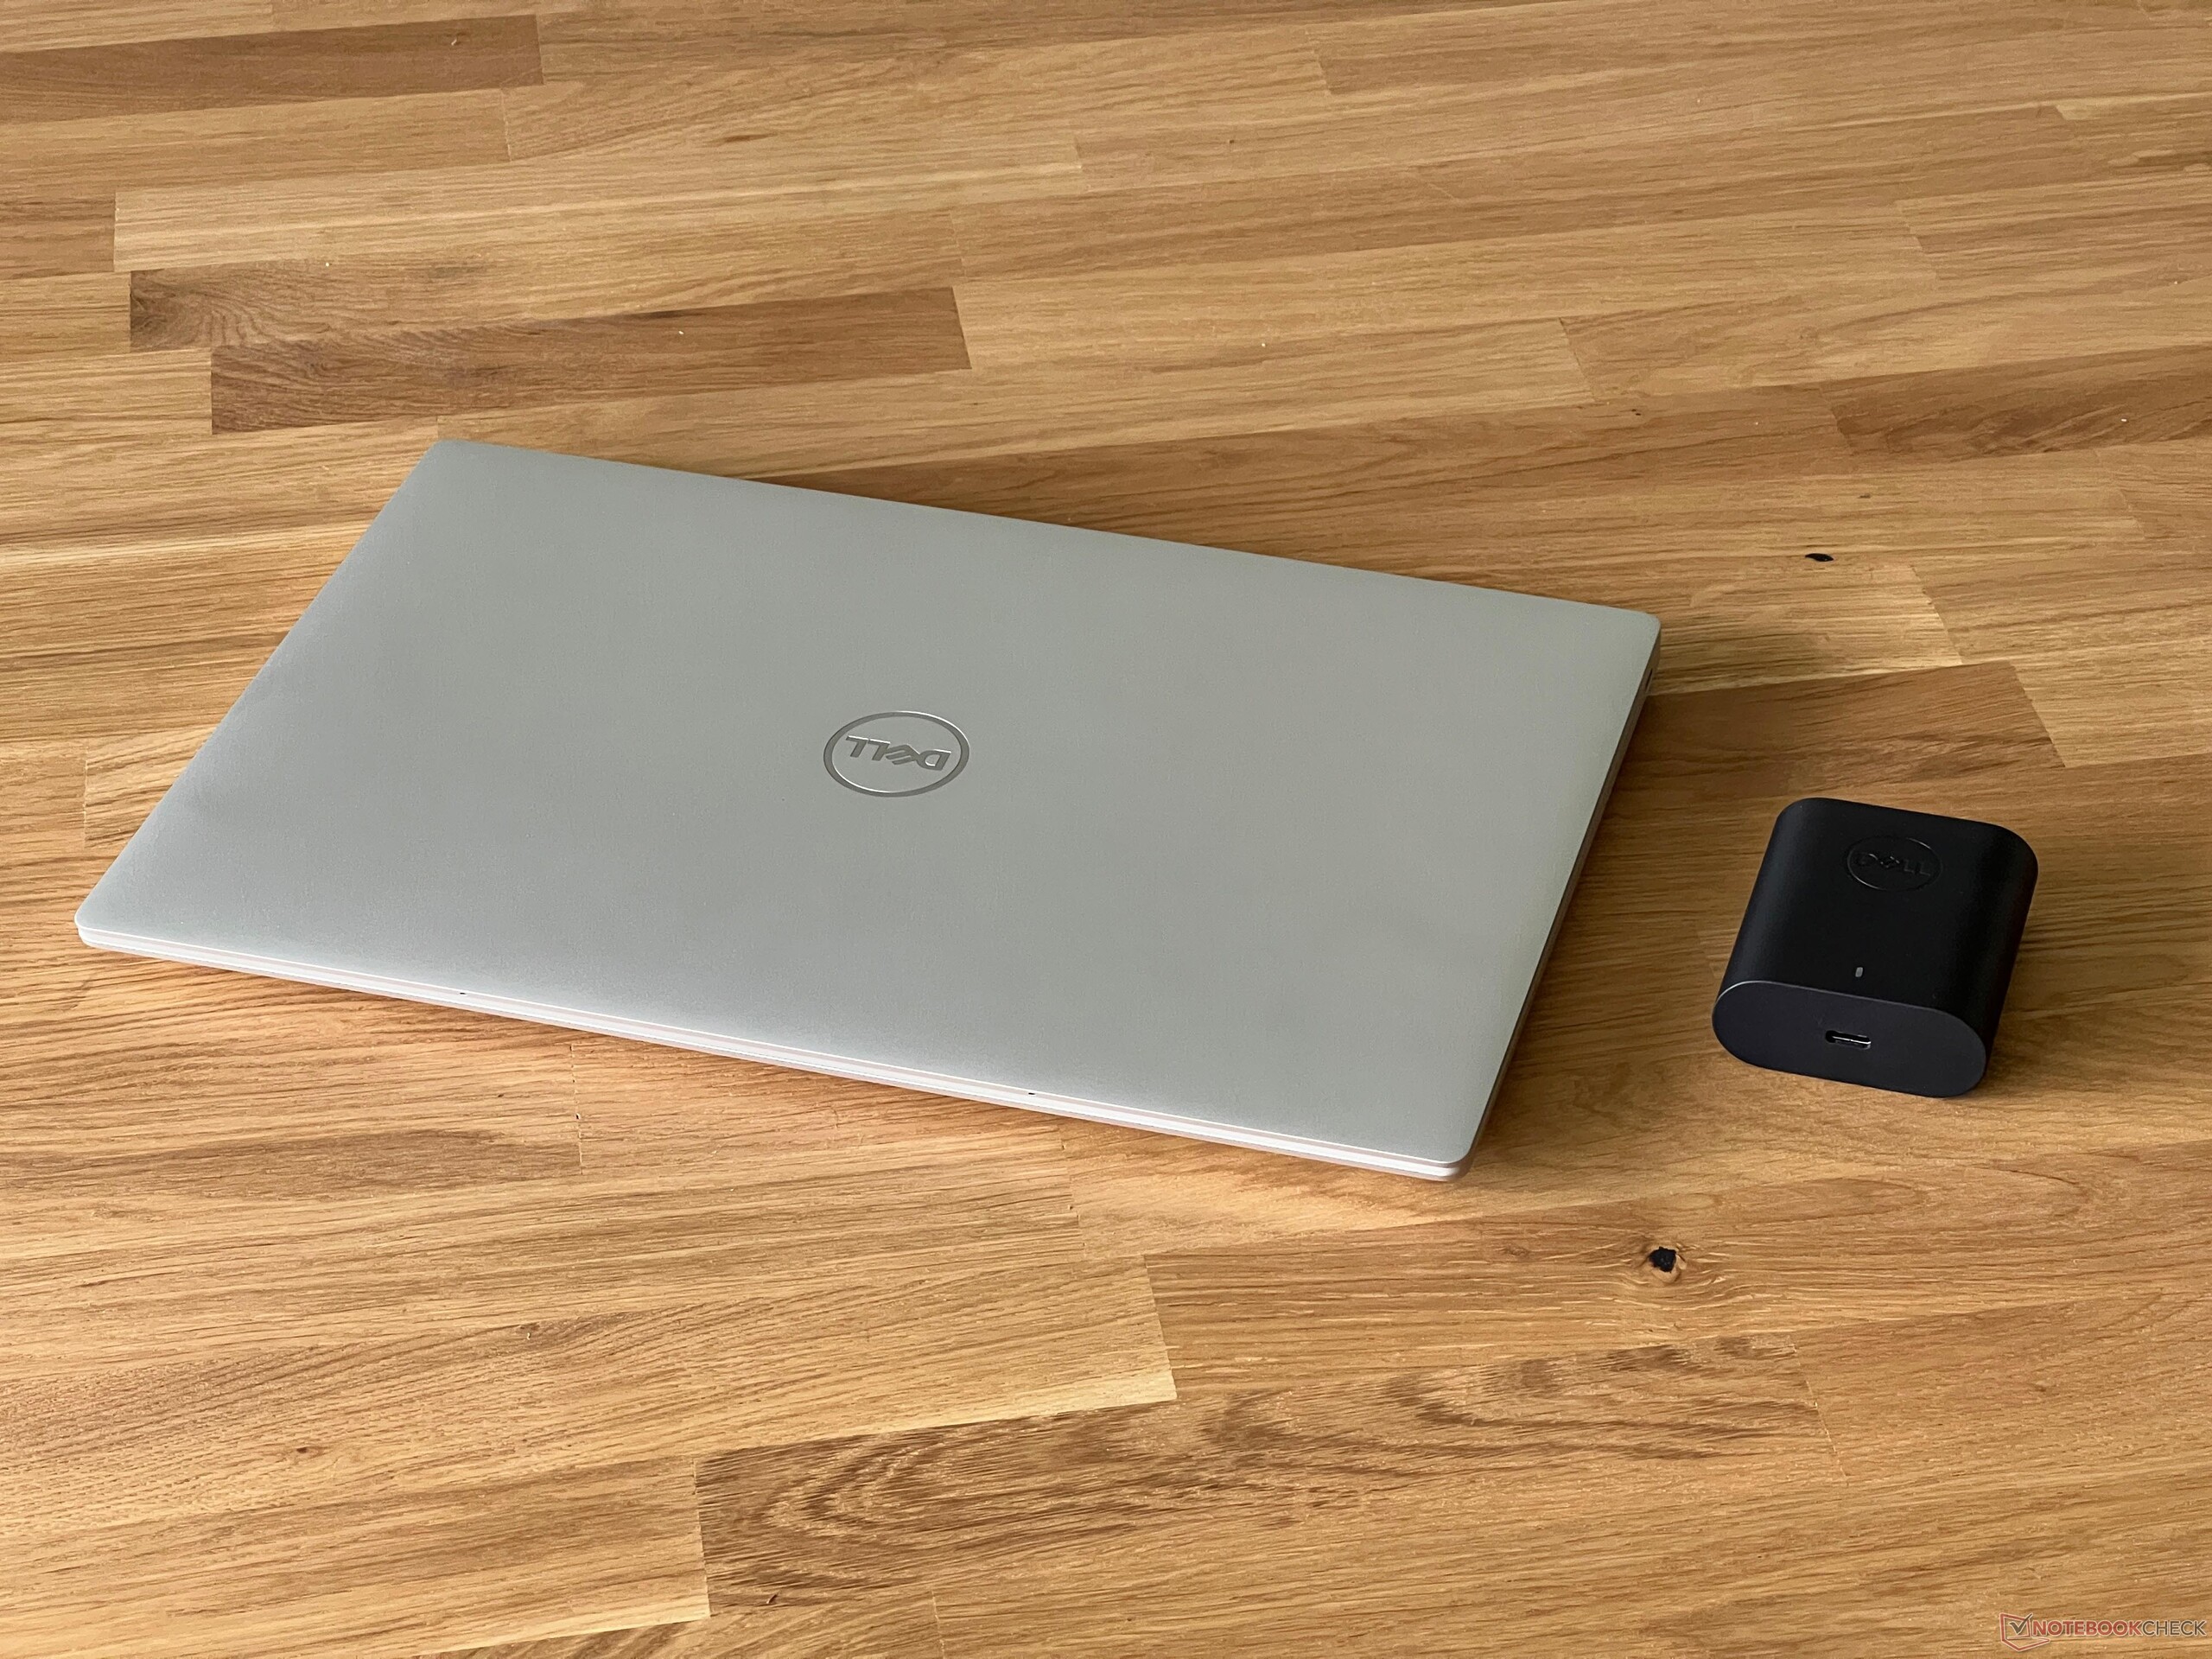
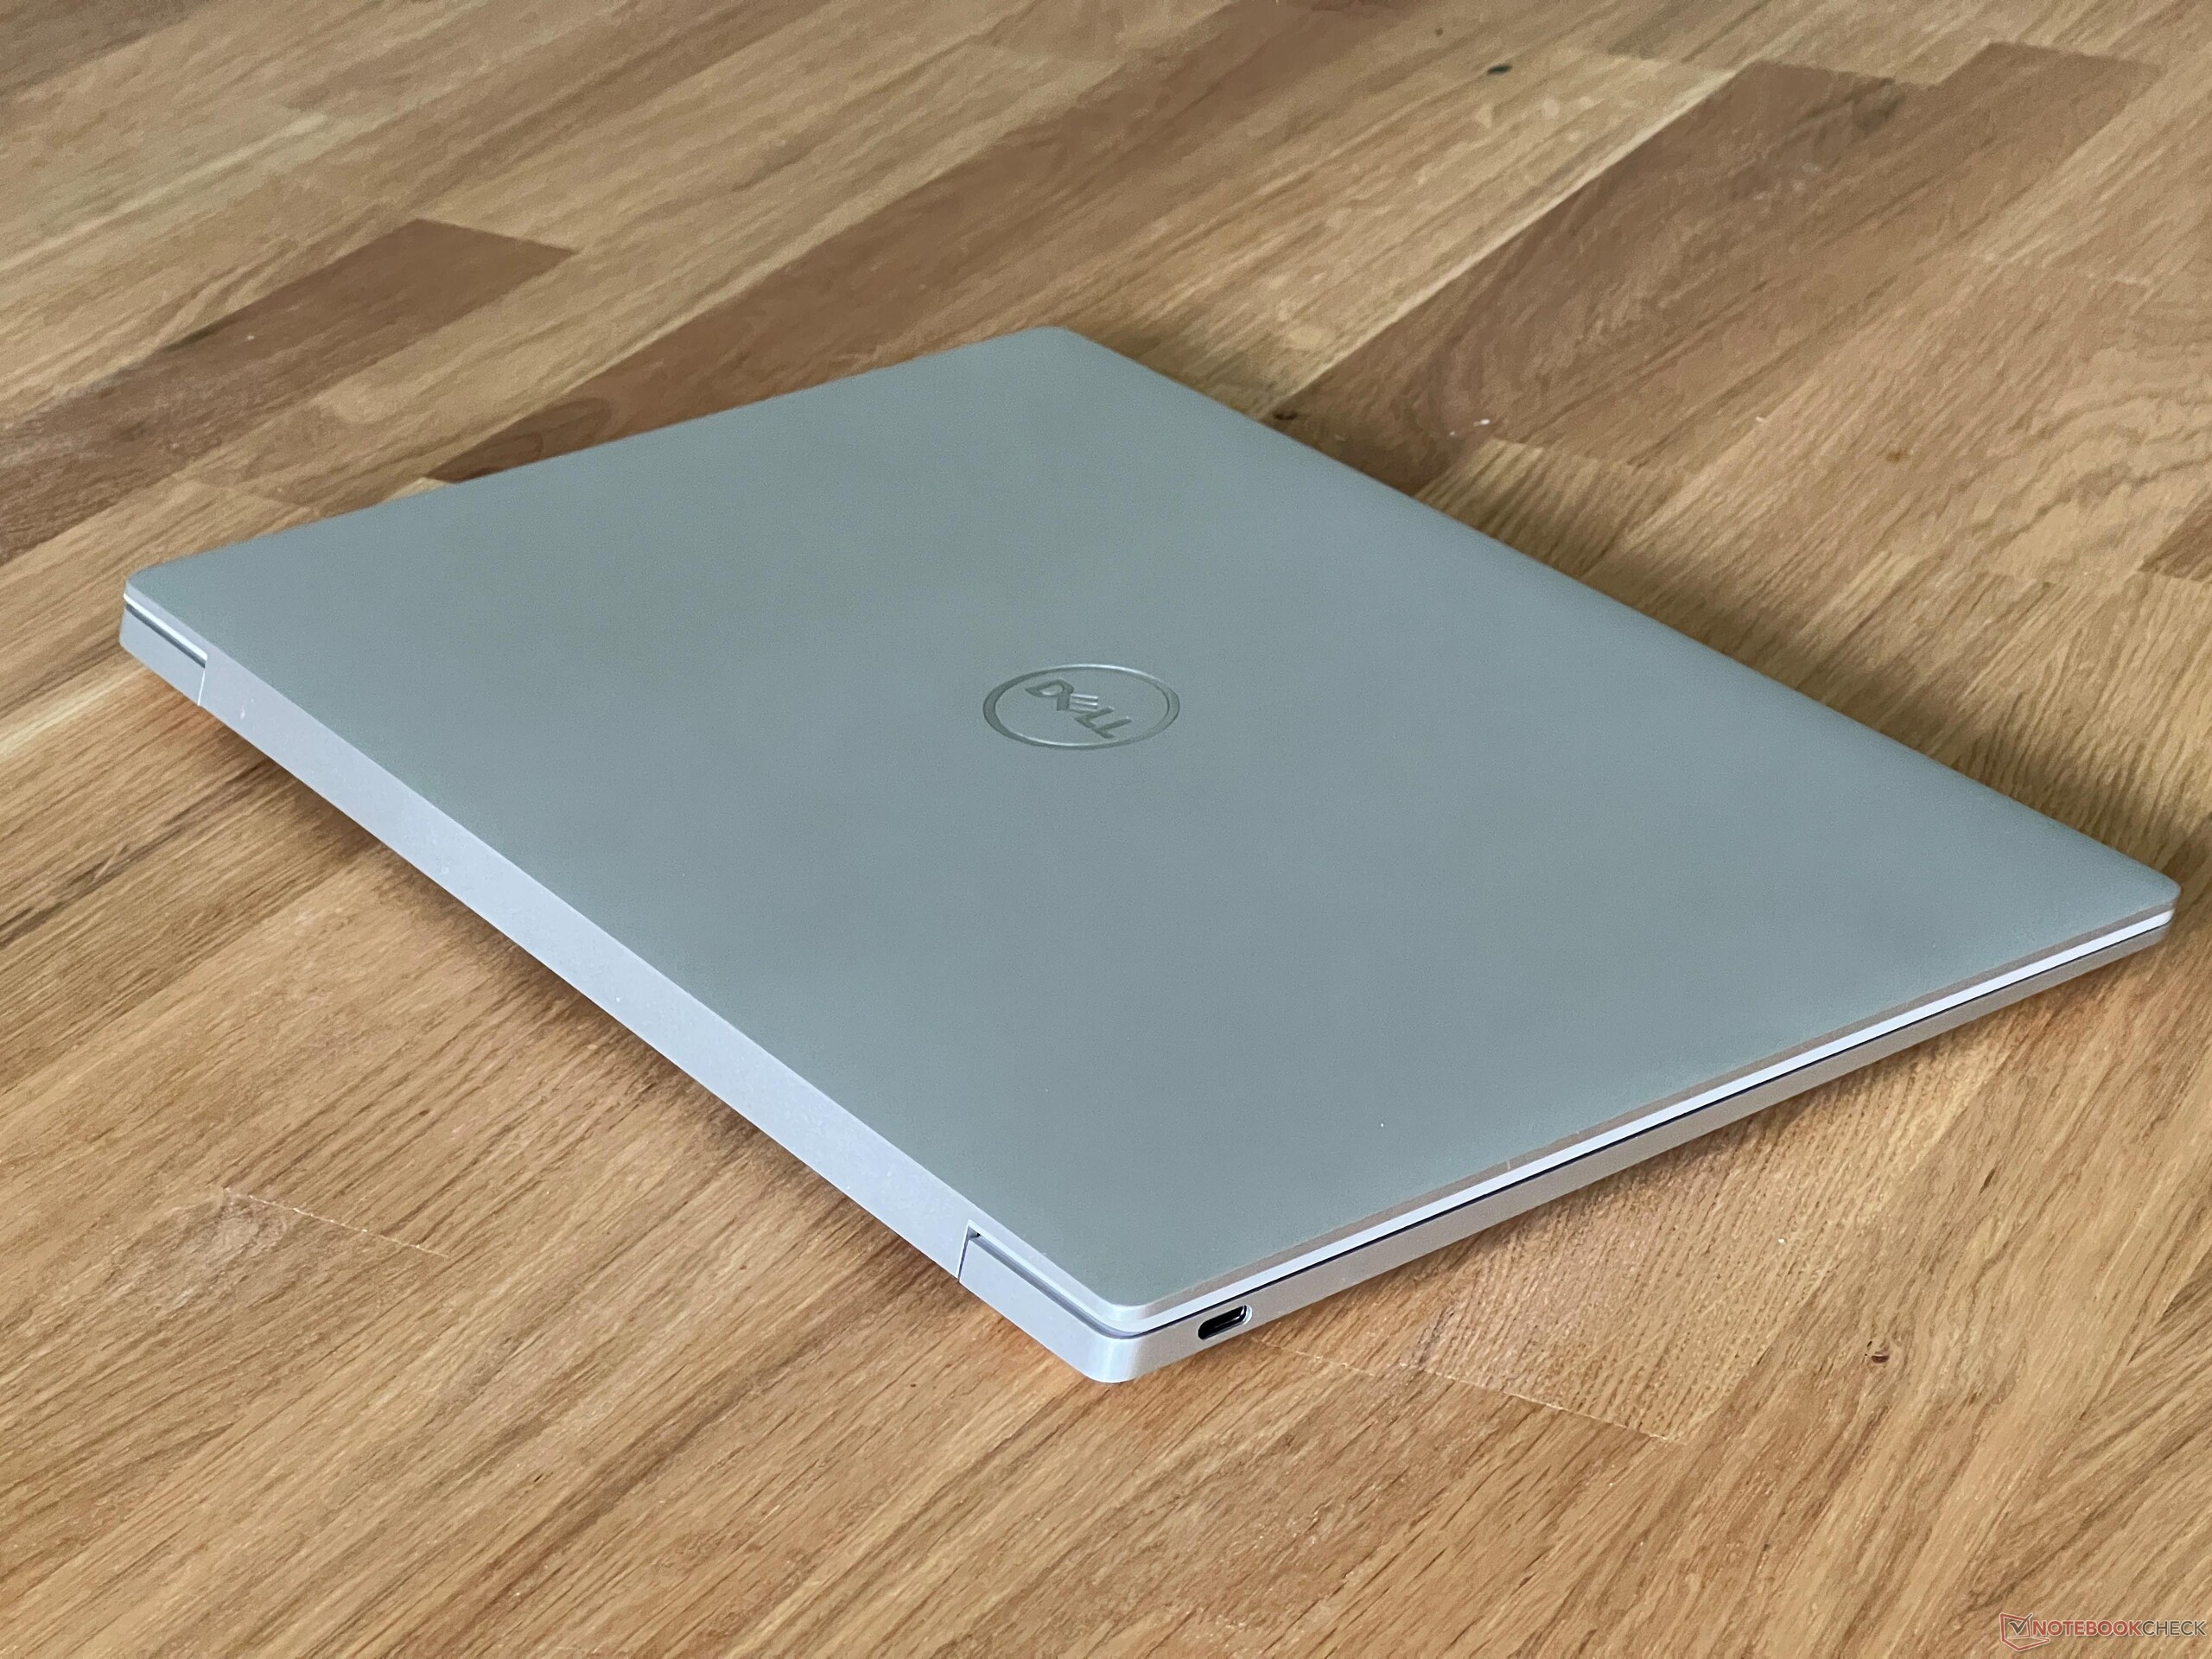
The XPS 13 9340 is the most compact device within our comparison group and it doesn't take up a lot of space. This is handy if you are travelling (train, airplane), for example. Weighing in at just over 1.2 kg, however, it isn't the lightest model. The supplied 60-watt power supply is also pretty compact and together with its USB-C cable, it adds another 256 grams onto the scales.
Connectivity - The XPS 13 without an audio jack
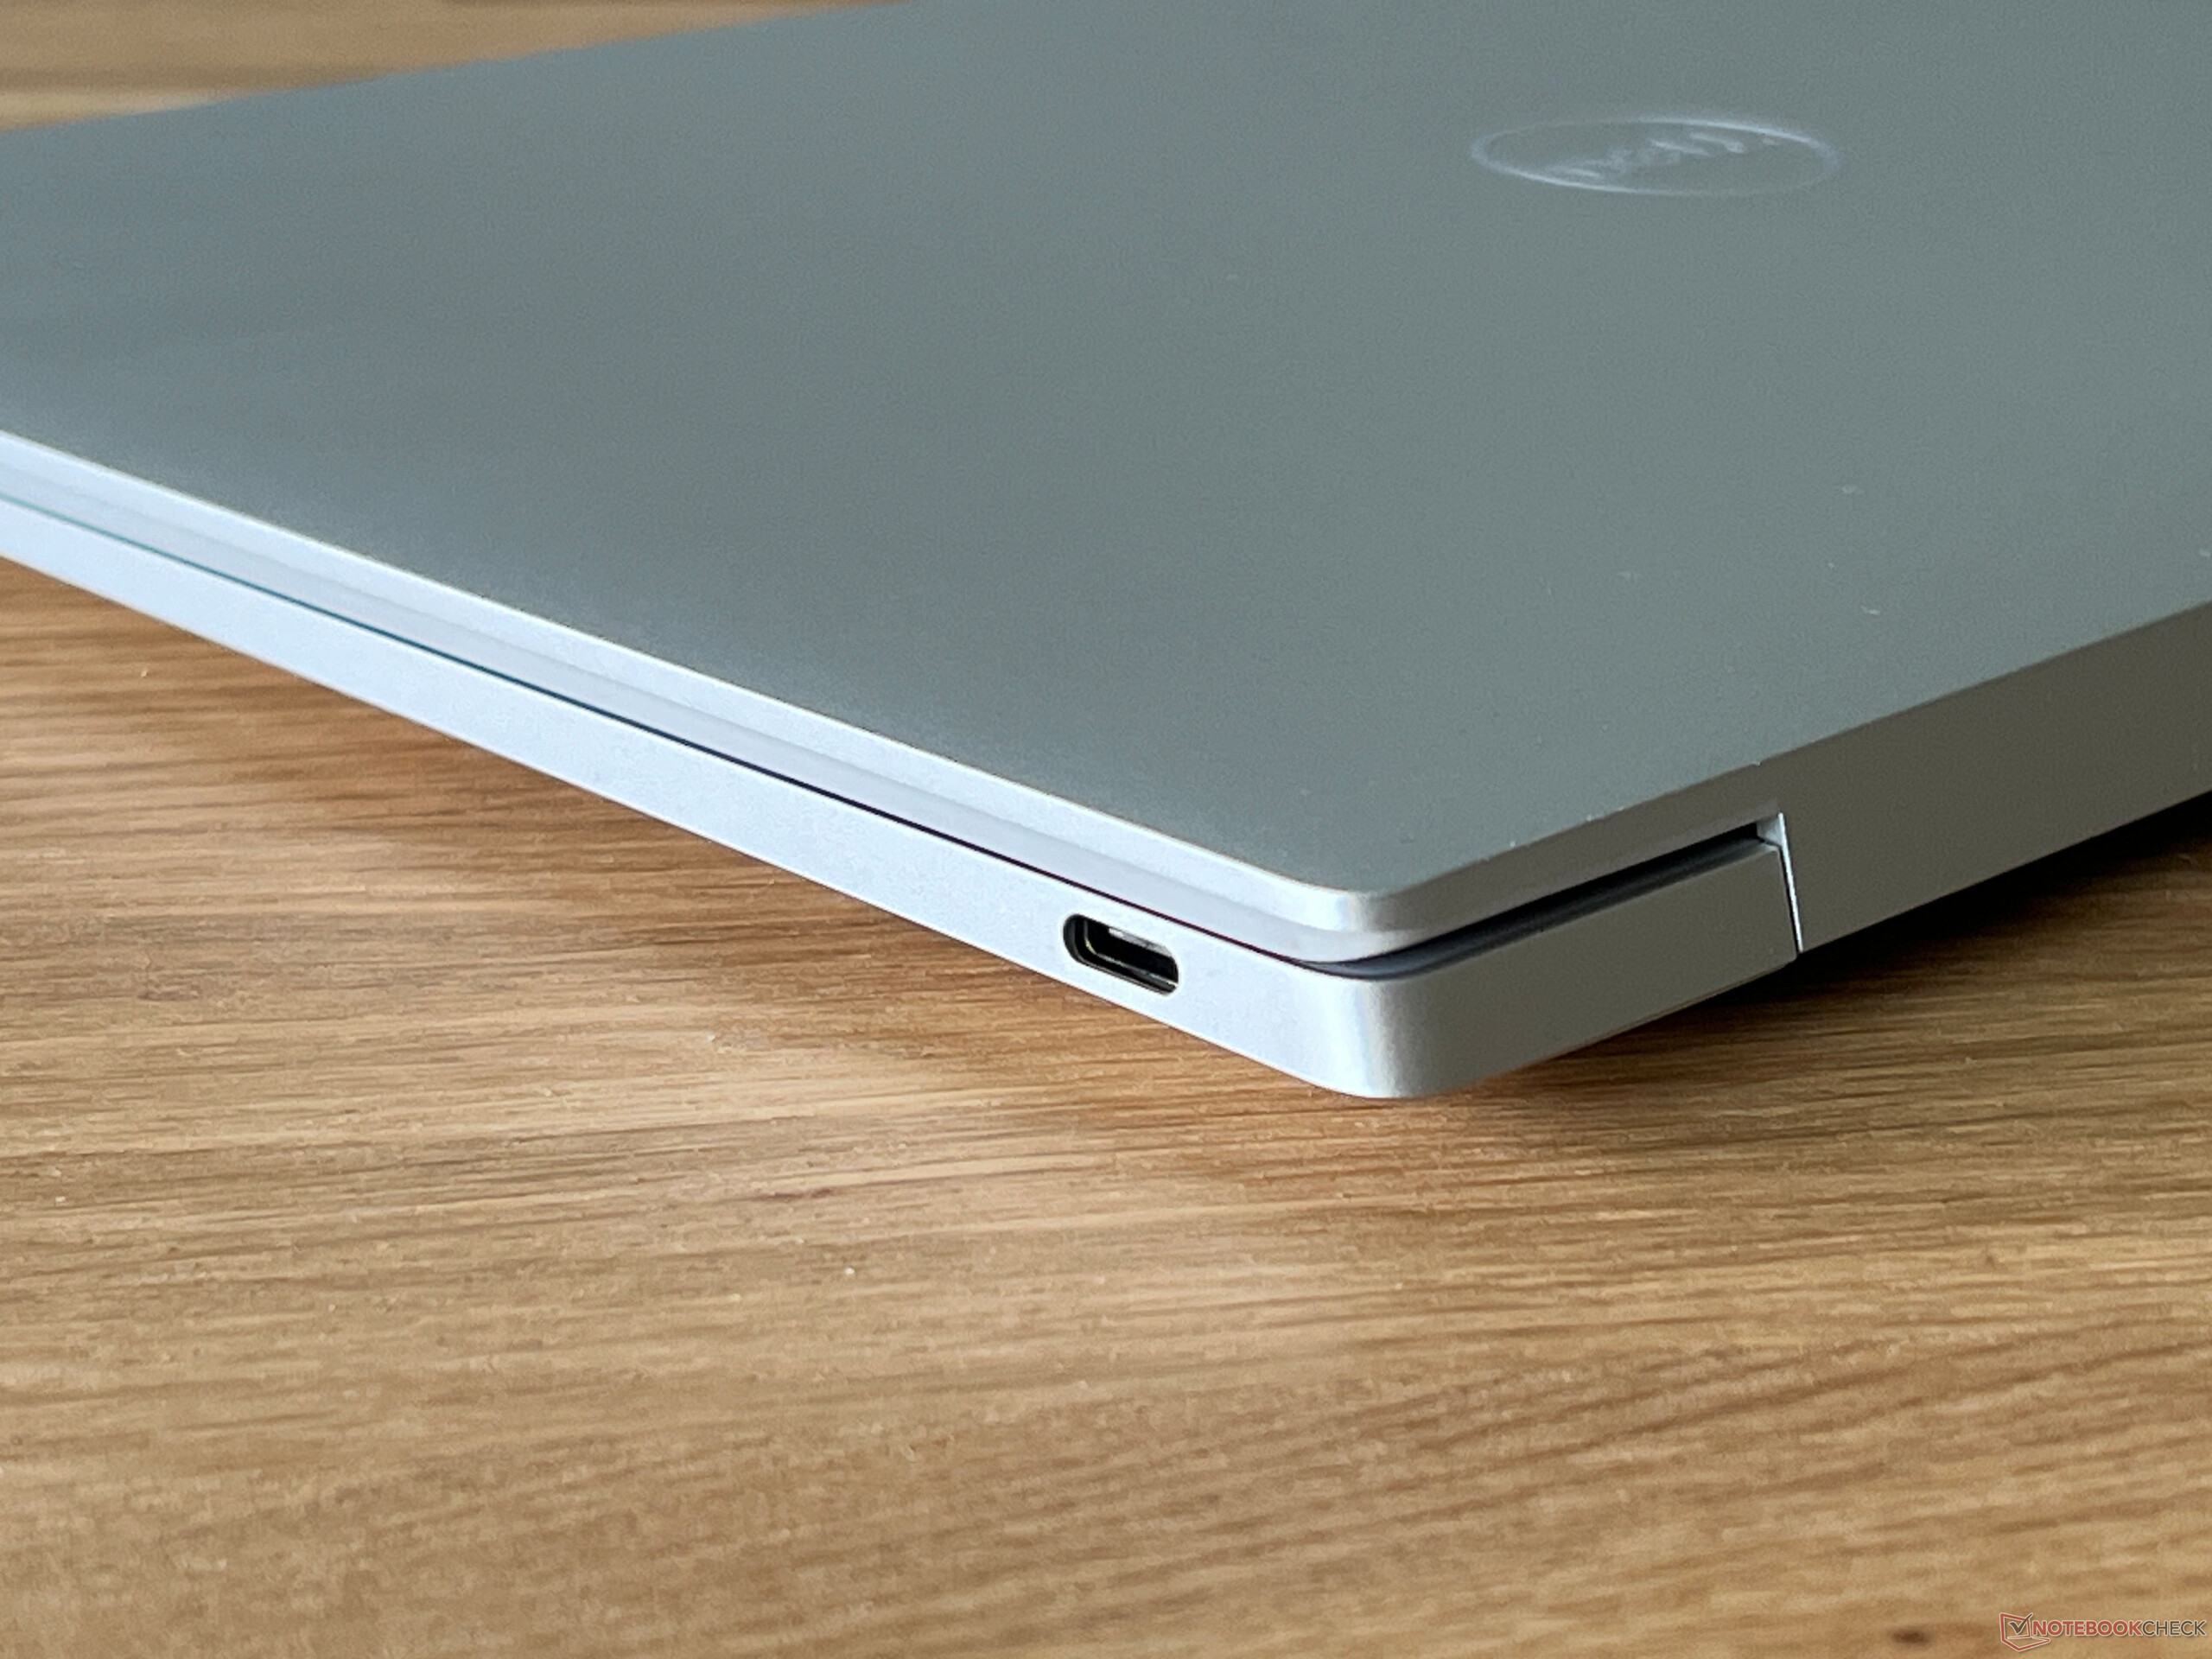
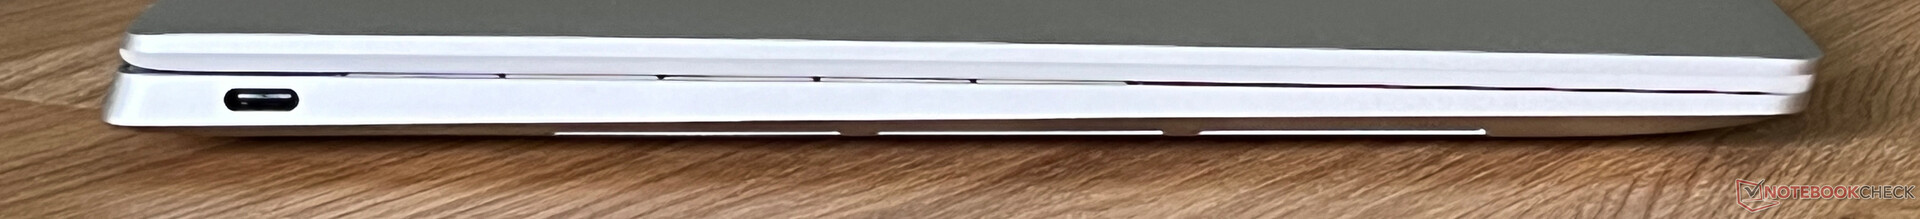
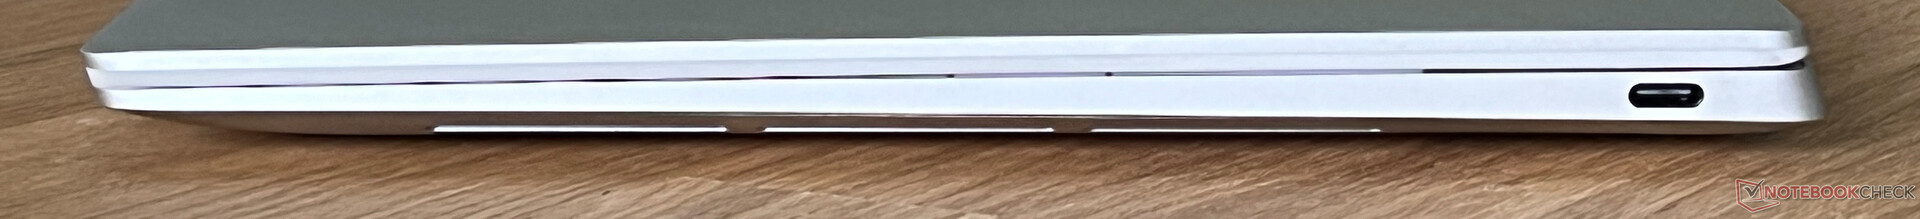
Compared to its two larger siblings, the XPS 13 has to make up a lot of ground when it comes to ports, as both the card reader and audio jack have been removed. It only has one USB-C port with Thunderbolt 4 on each side. In practice, it is nice that you can connect the power supply on both sides, but this often leaves only one port free to use.
Communication
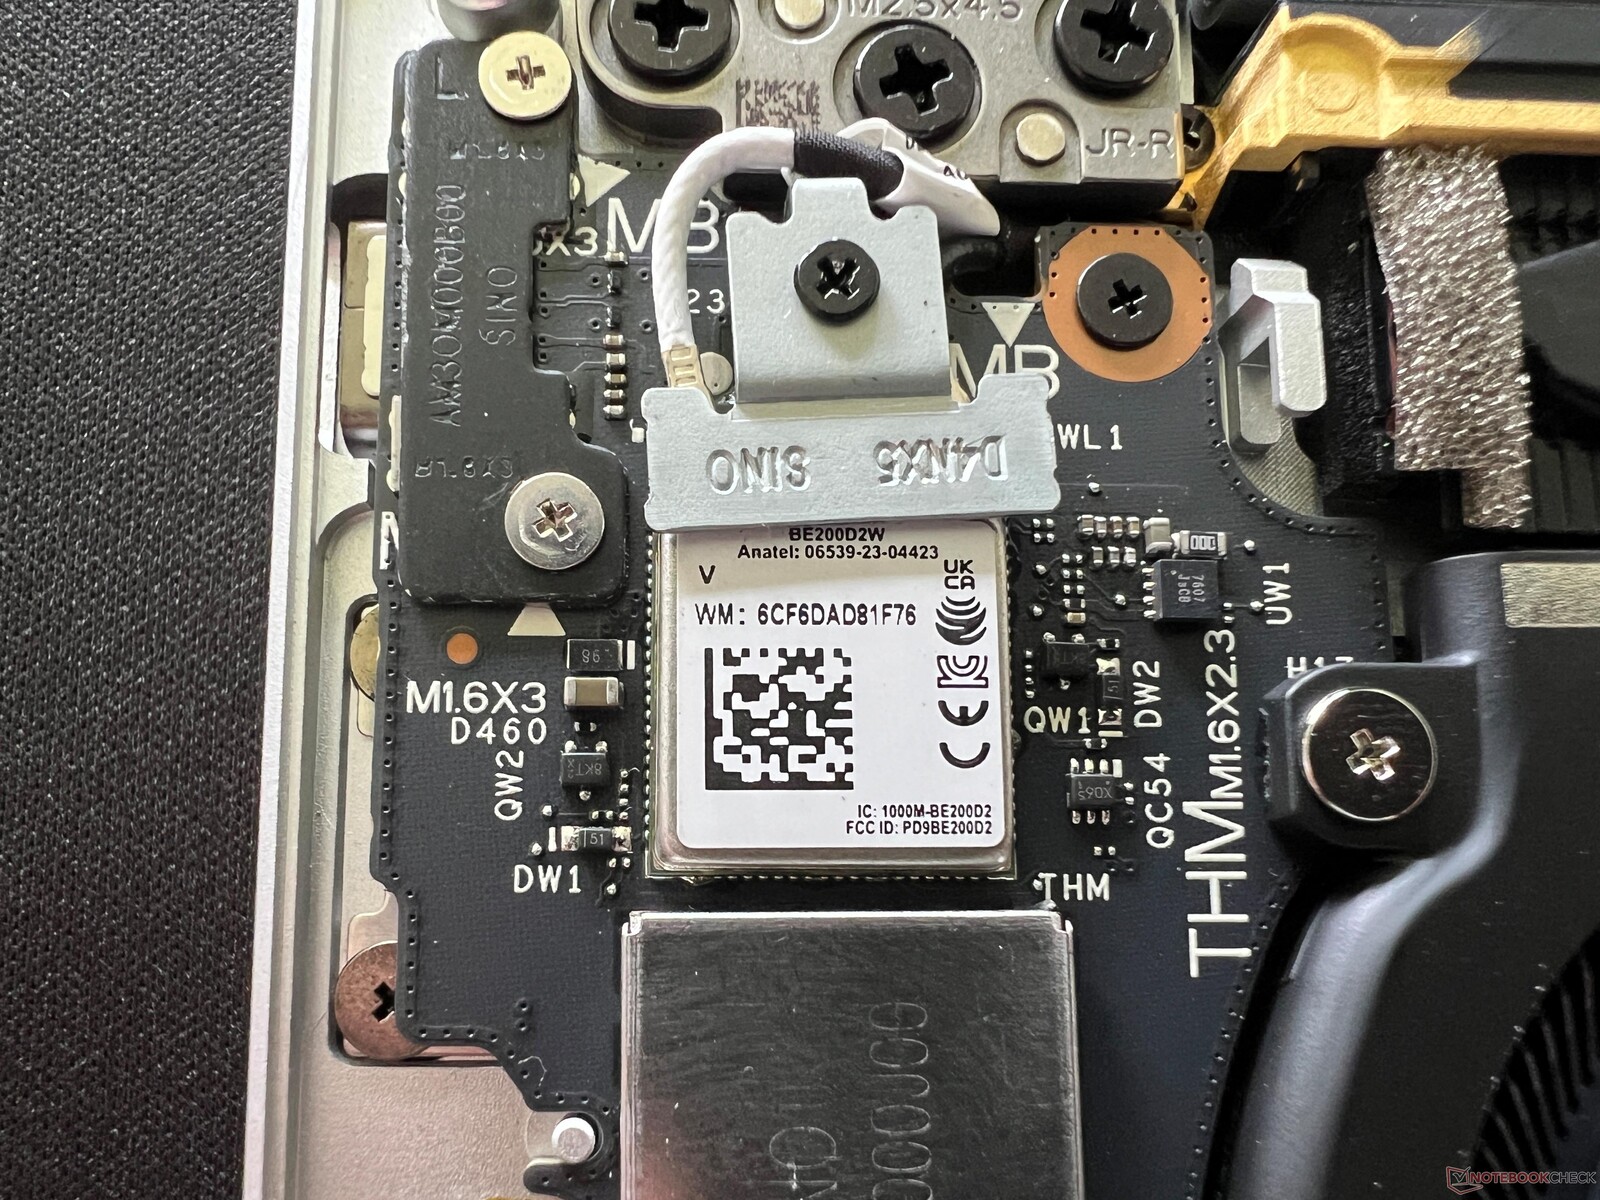
The Intel BE200 WLAN module already supports Wi-Fi 7 as well as Bluetooth 5.4. During our WLAN test, it delivered overall high and stable transfer rates in combination with our reference router from Asus. We didn't note any problems during the entirety of our test phase.
| Networking | |
| Dell XPS 13 9340 Core Ultra 7 | |
| iperf3 transmit AXE11000 | |
| iperf3 receive AXE11000 | |
| Apple MacBook Air 13 M3 10C GPU | |
| iperf3 transmit AXE11000 | |
| iperf3 receive AXE11000 | |
| Asus ZenBook S13 OLED UX5304 | |
| iperf3 transmit AXE11000 | |
| iperf3 receive AXE11000 | |
| Lenovo ThinkPad Z13 Gen 2 | |
| iperf3 transmit AXE11000 | |
| iperf3 receive AXE11000 | |
| iperf3 transmit AXE11000 6GHz | |
| iperf3 receive AXE11000 6GHz | |
| HP Dragonfly G4 | |
| iperf3 transmit AXE11000 | |
| iperf3 receive AXE11000 | |
| iperf3 transmit AXE11000 6GHz | |
| iperf3 receive AXE11000 6GHz | |
| Dell XPS 13 Plus 9320 Core i7-1360P | |
| iperf3 transmit AXE11000 | |
| iperf3 receive AXE11000 | |
| iperf3 transmit AXE11000 6GHz | |
| iperf3 receive AXE11000 6GHz | |
Webcam
The 1080p camera installed into the upper display edge takes decent photos and in combination with the Meteor Lake processor, studio effects (such as background soft focus) are supposed as part of the laptop's operating system. In addition, the device can make use of an IR camera for facial recognition via Windows Hello.


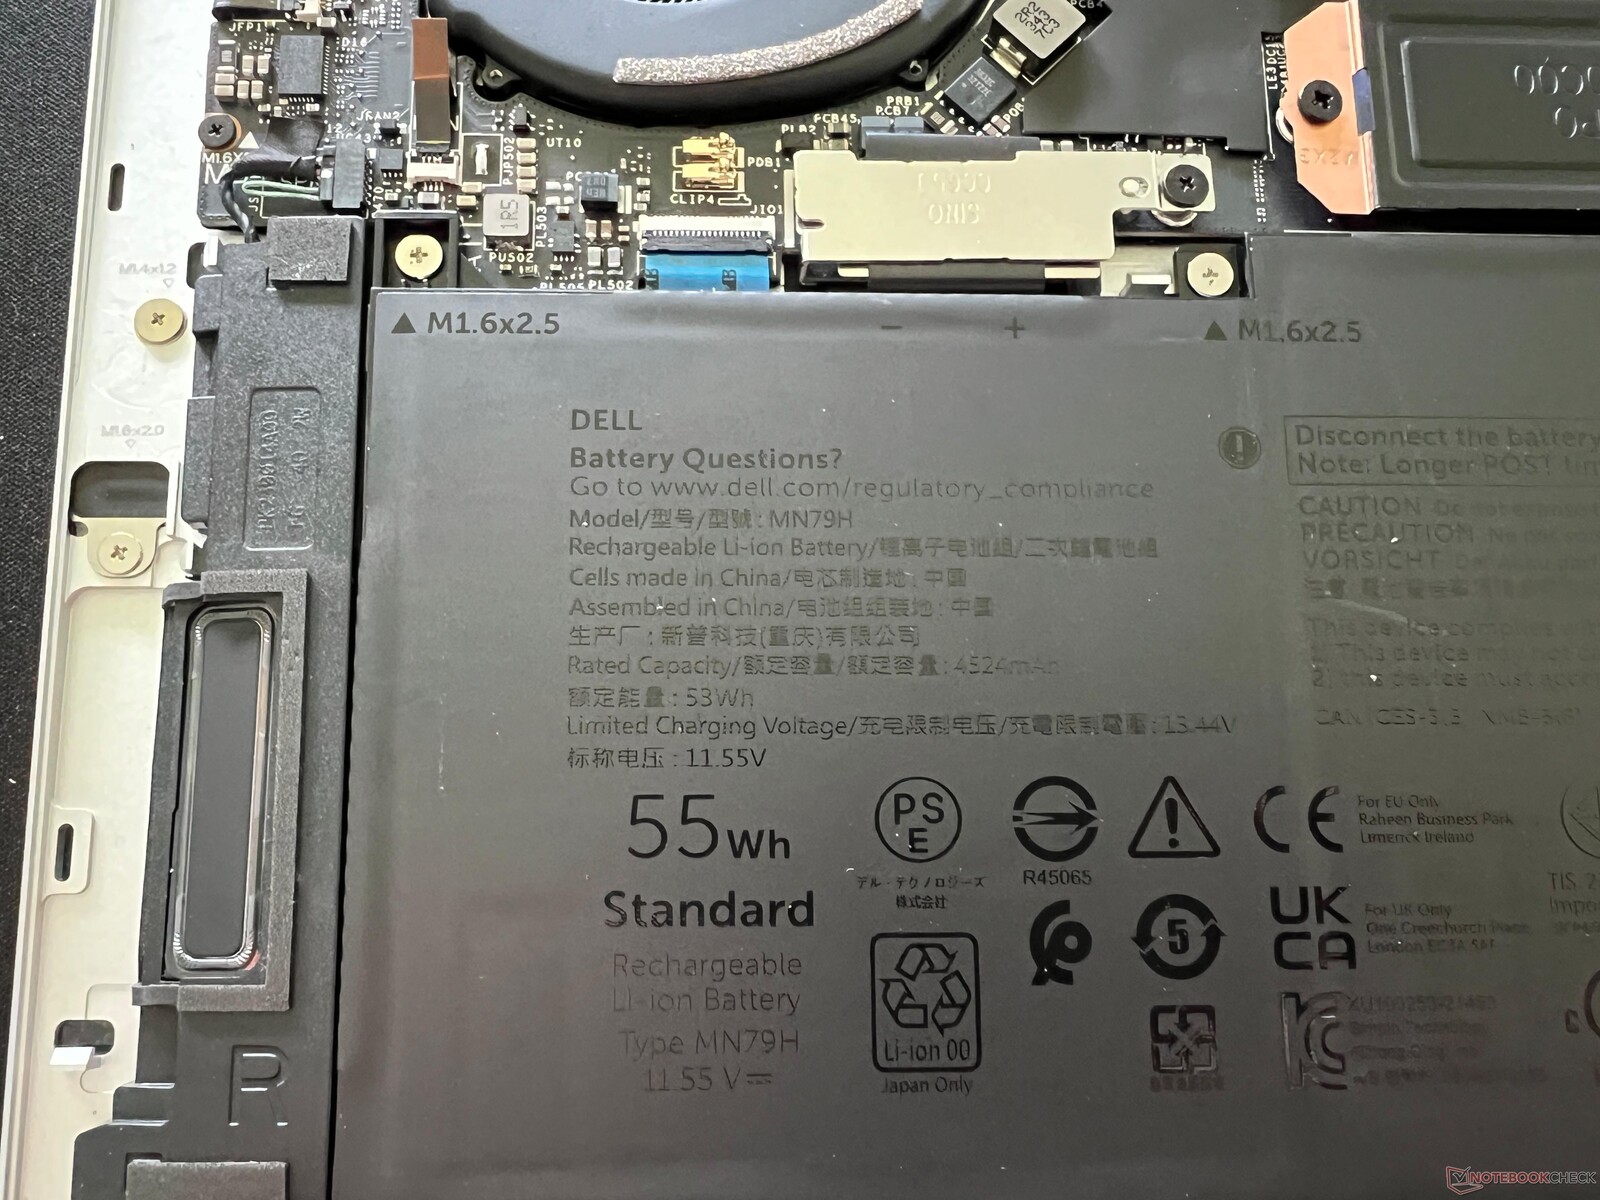
Maintenance
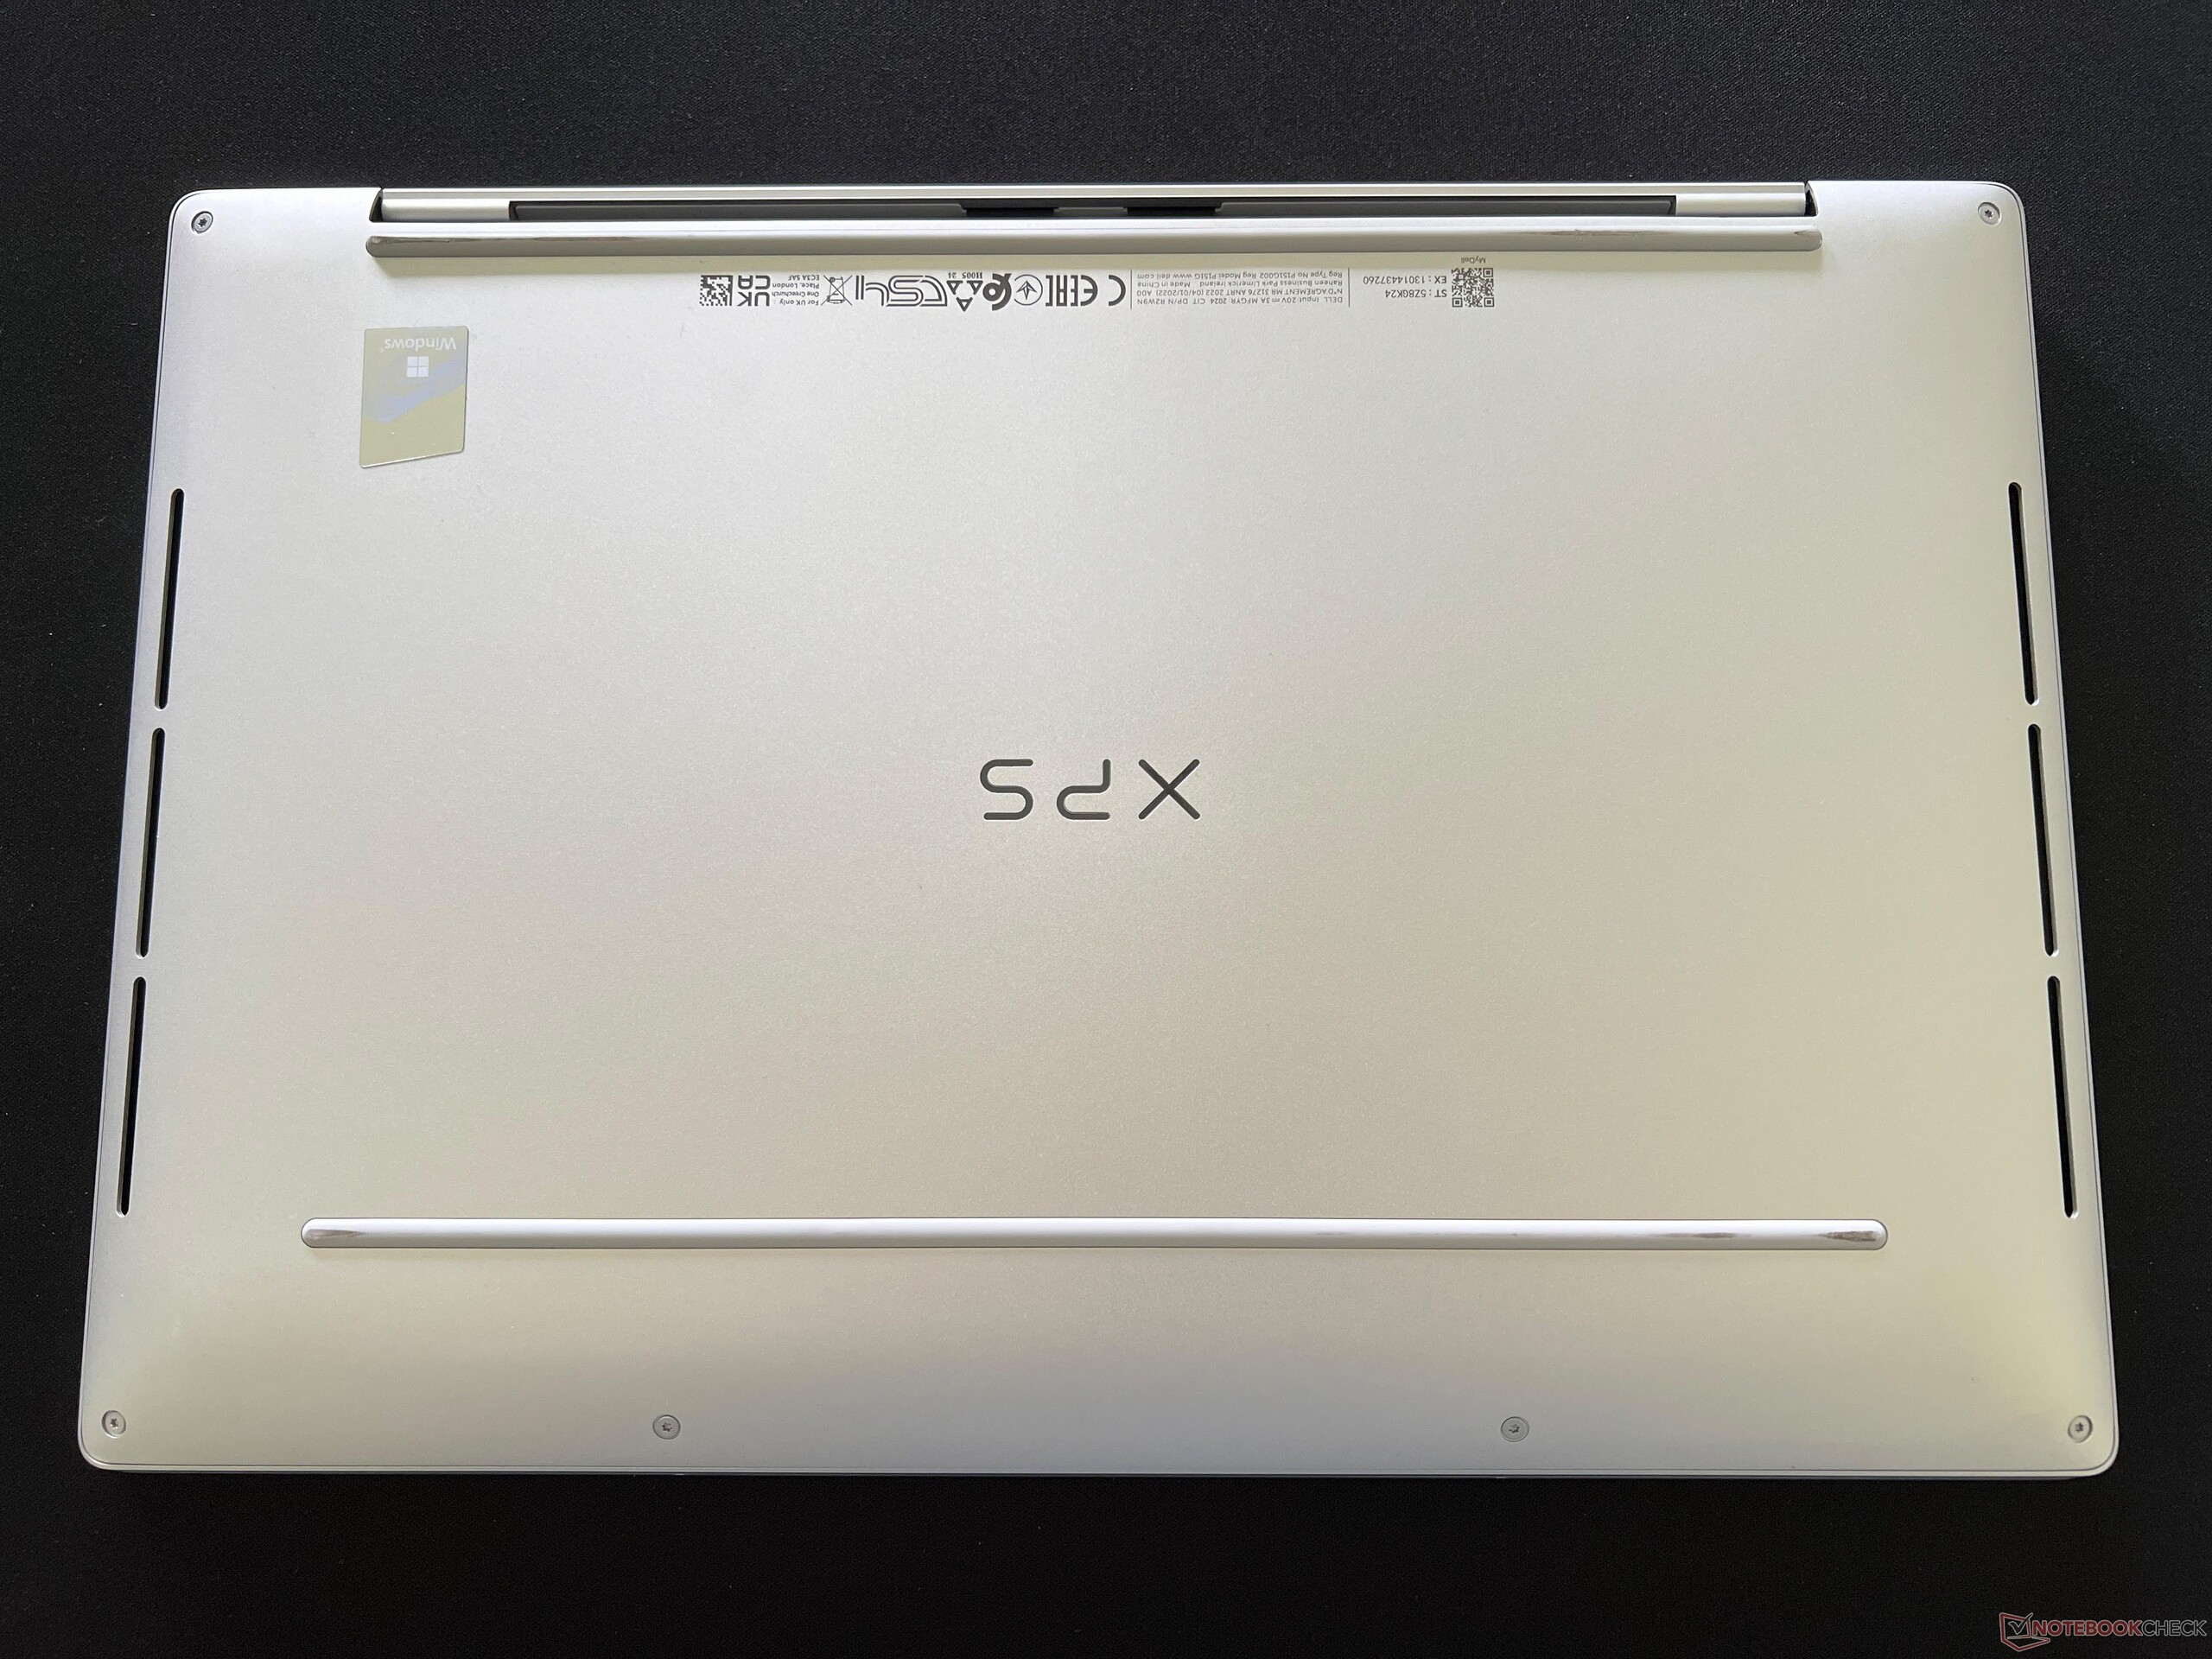
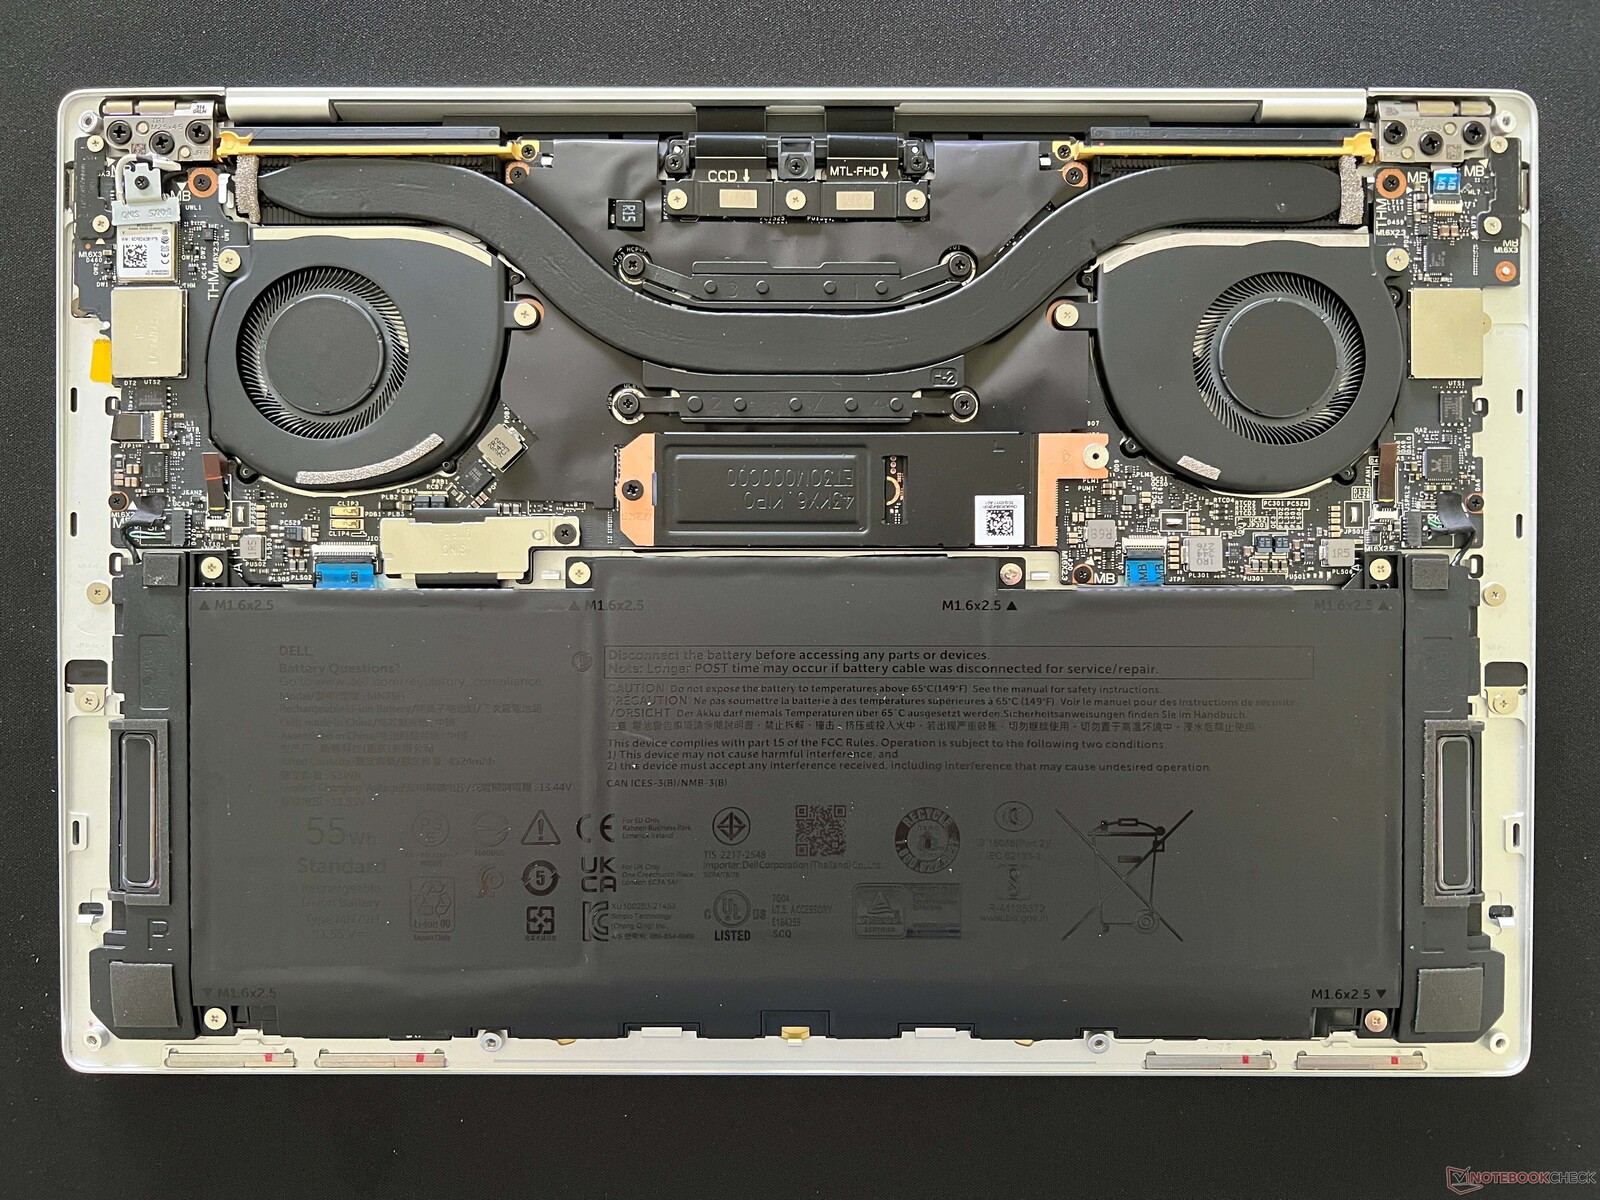
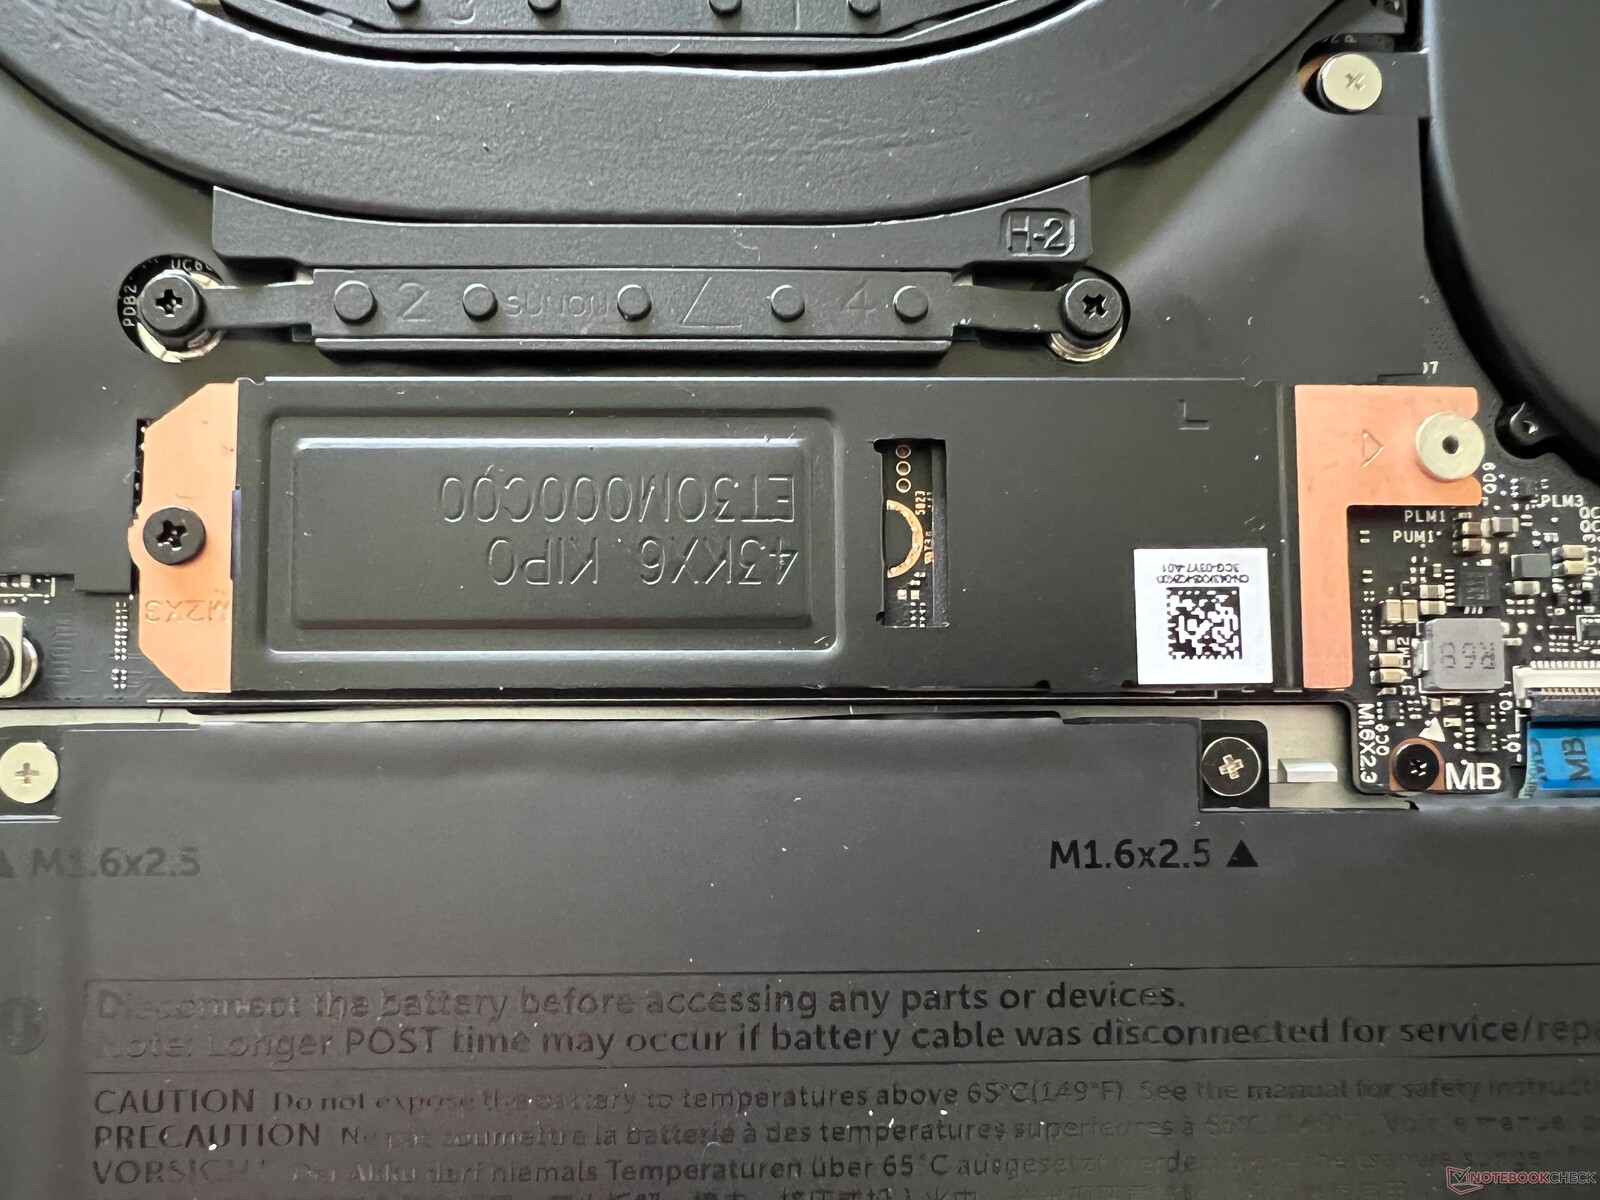
The bottom cover is secured with Torx screws (T5) and can be removed easily. On the inside, however, your maintenance options are limited to cleaning the fans and swapping out the M.2-2280 SSD that is situated beneath an additional cover. The battery is screwed in and can be replaced if needed.
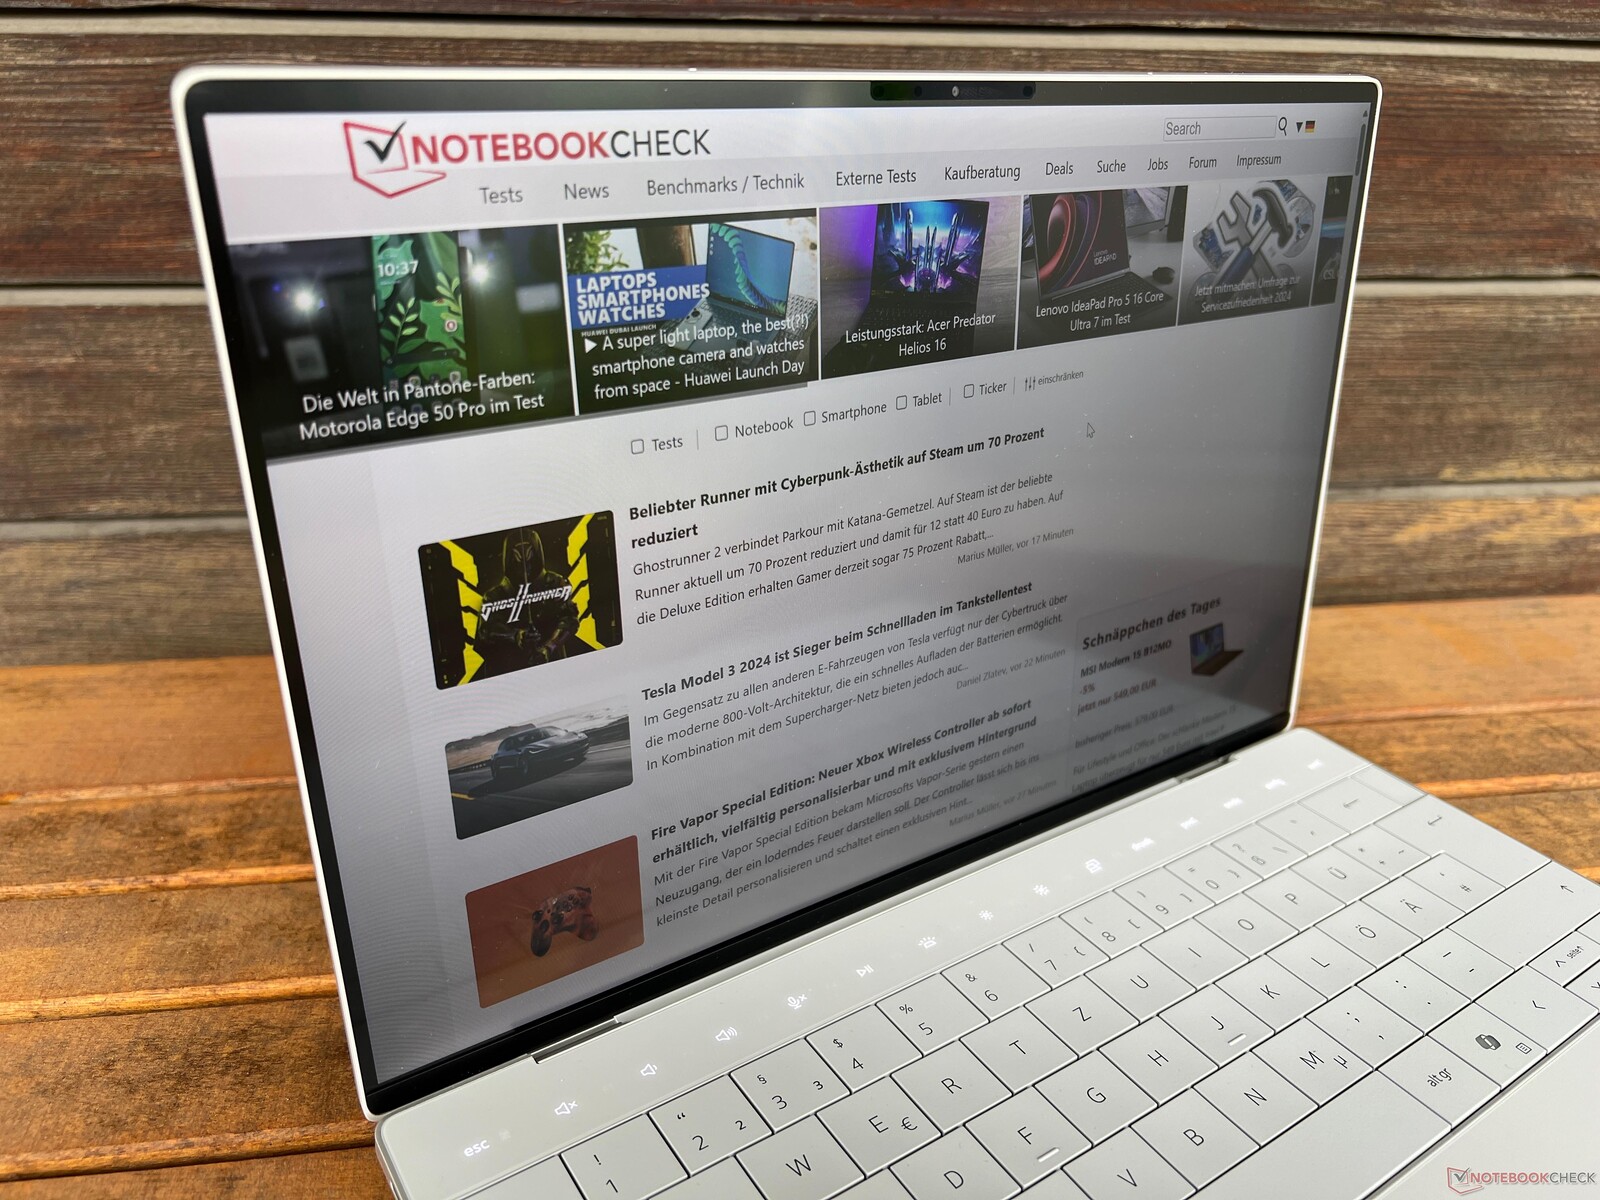
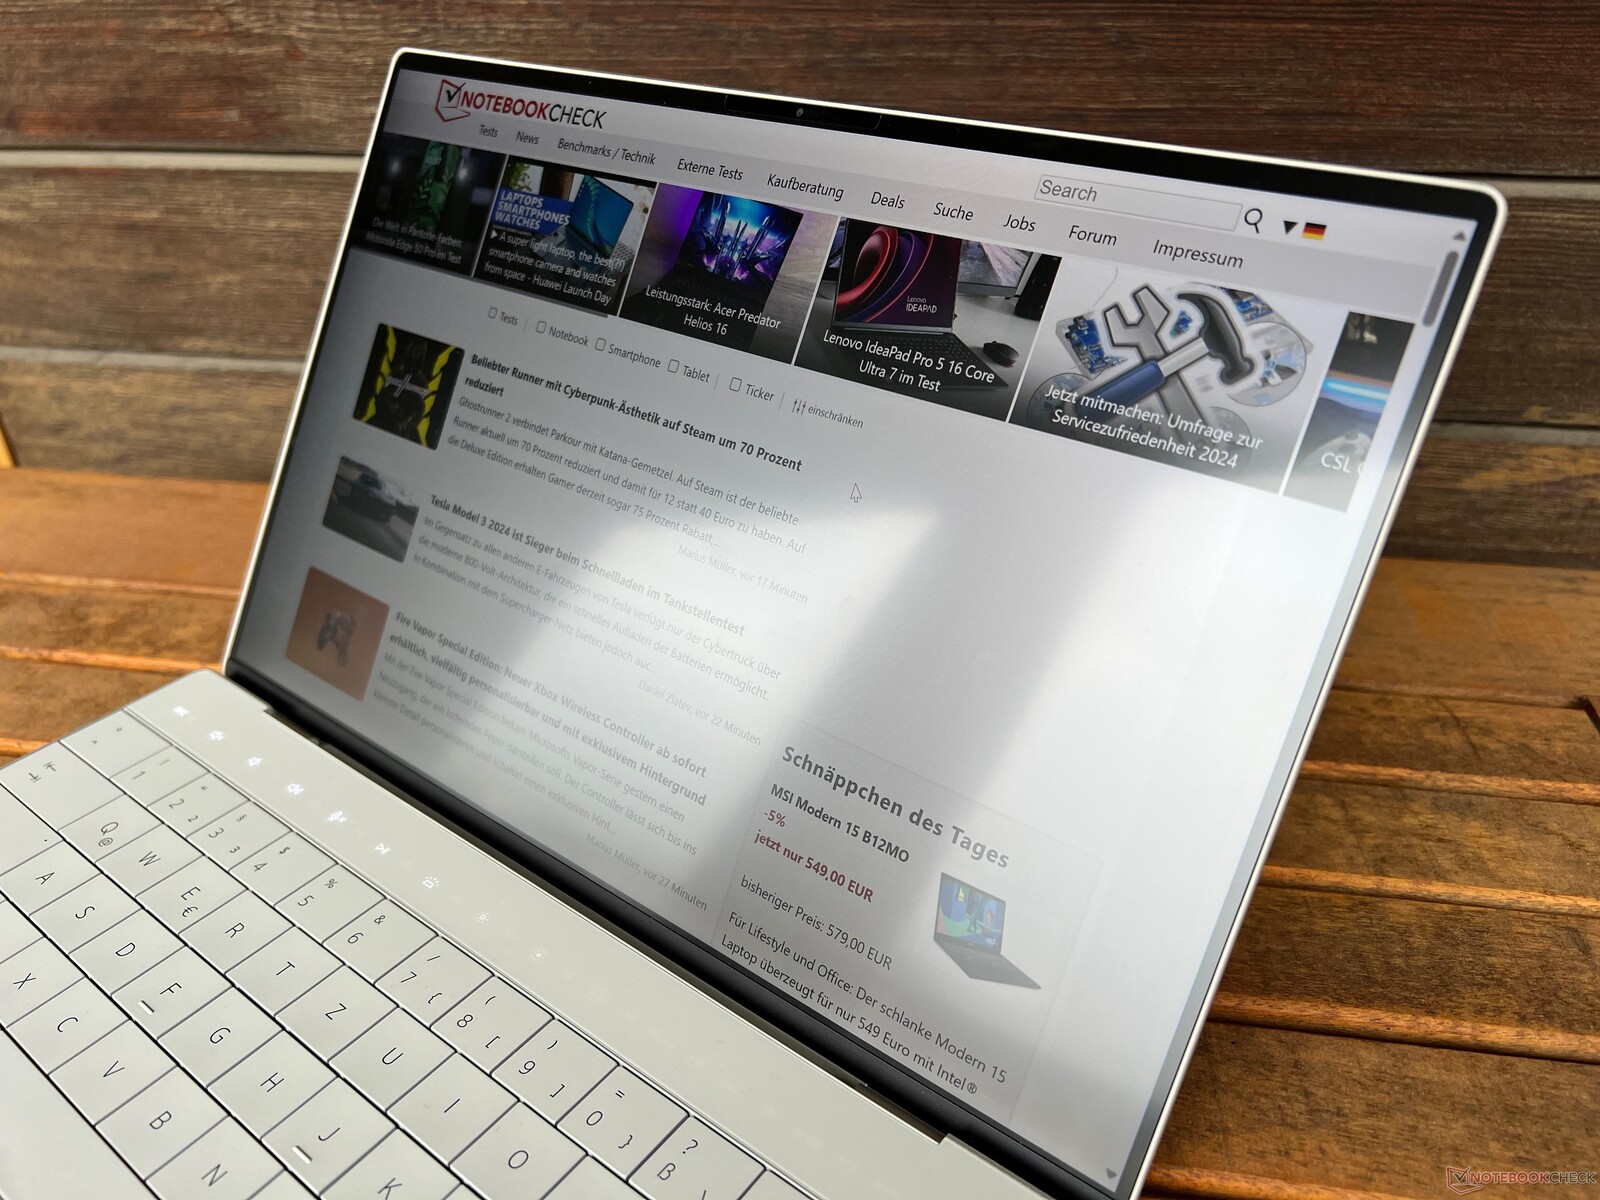
Input devices - Keyboard takes some getting used to and annoying function keys
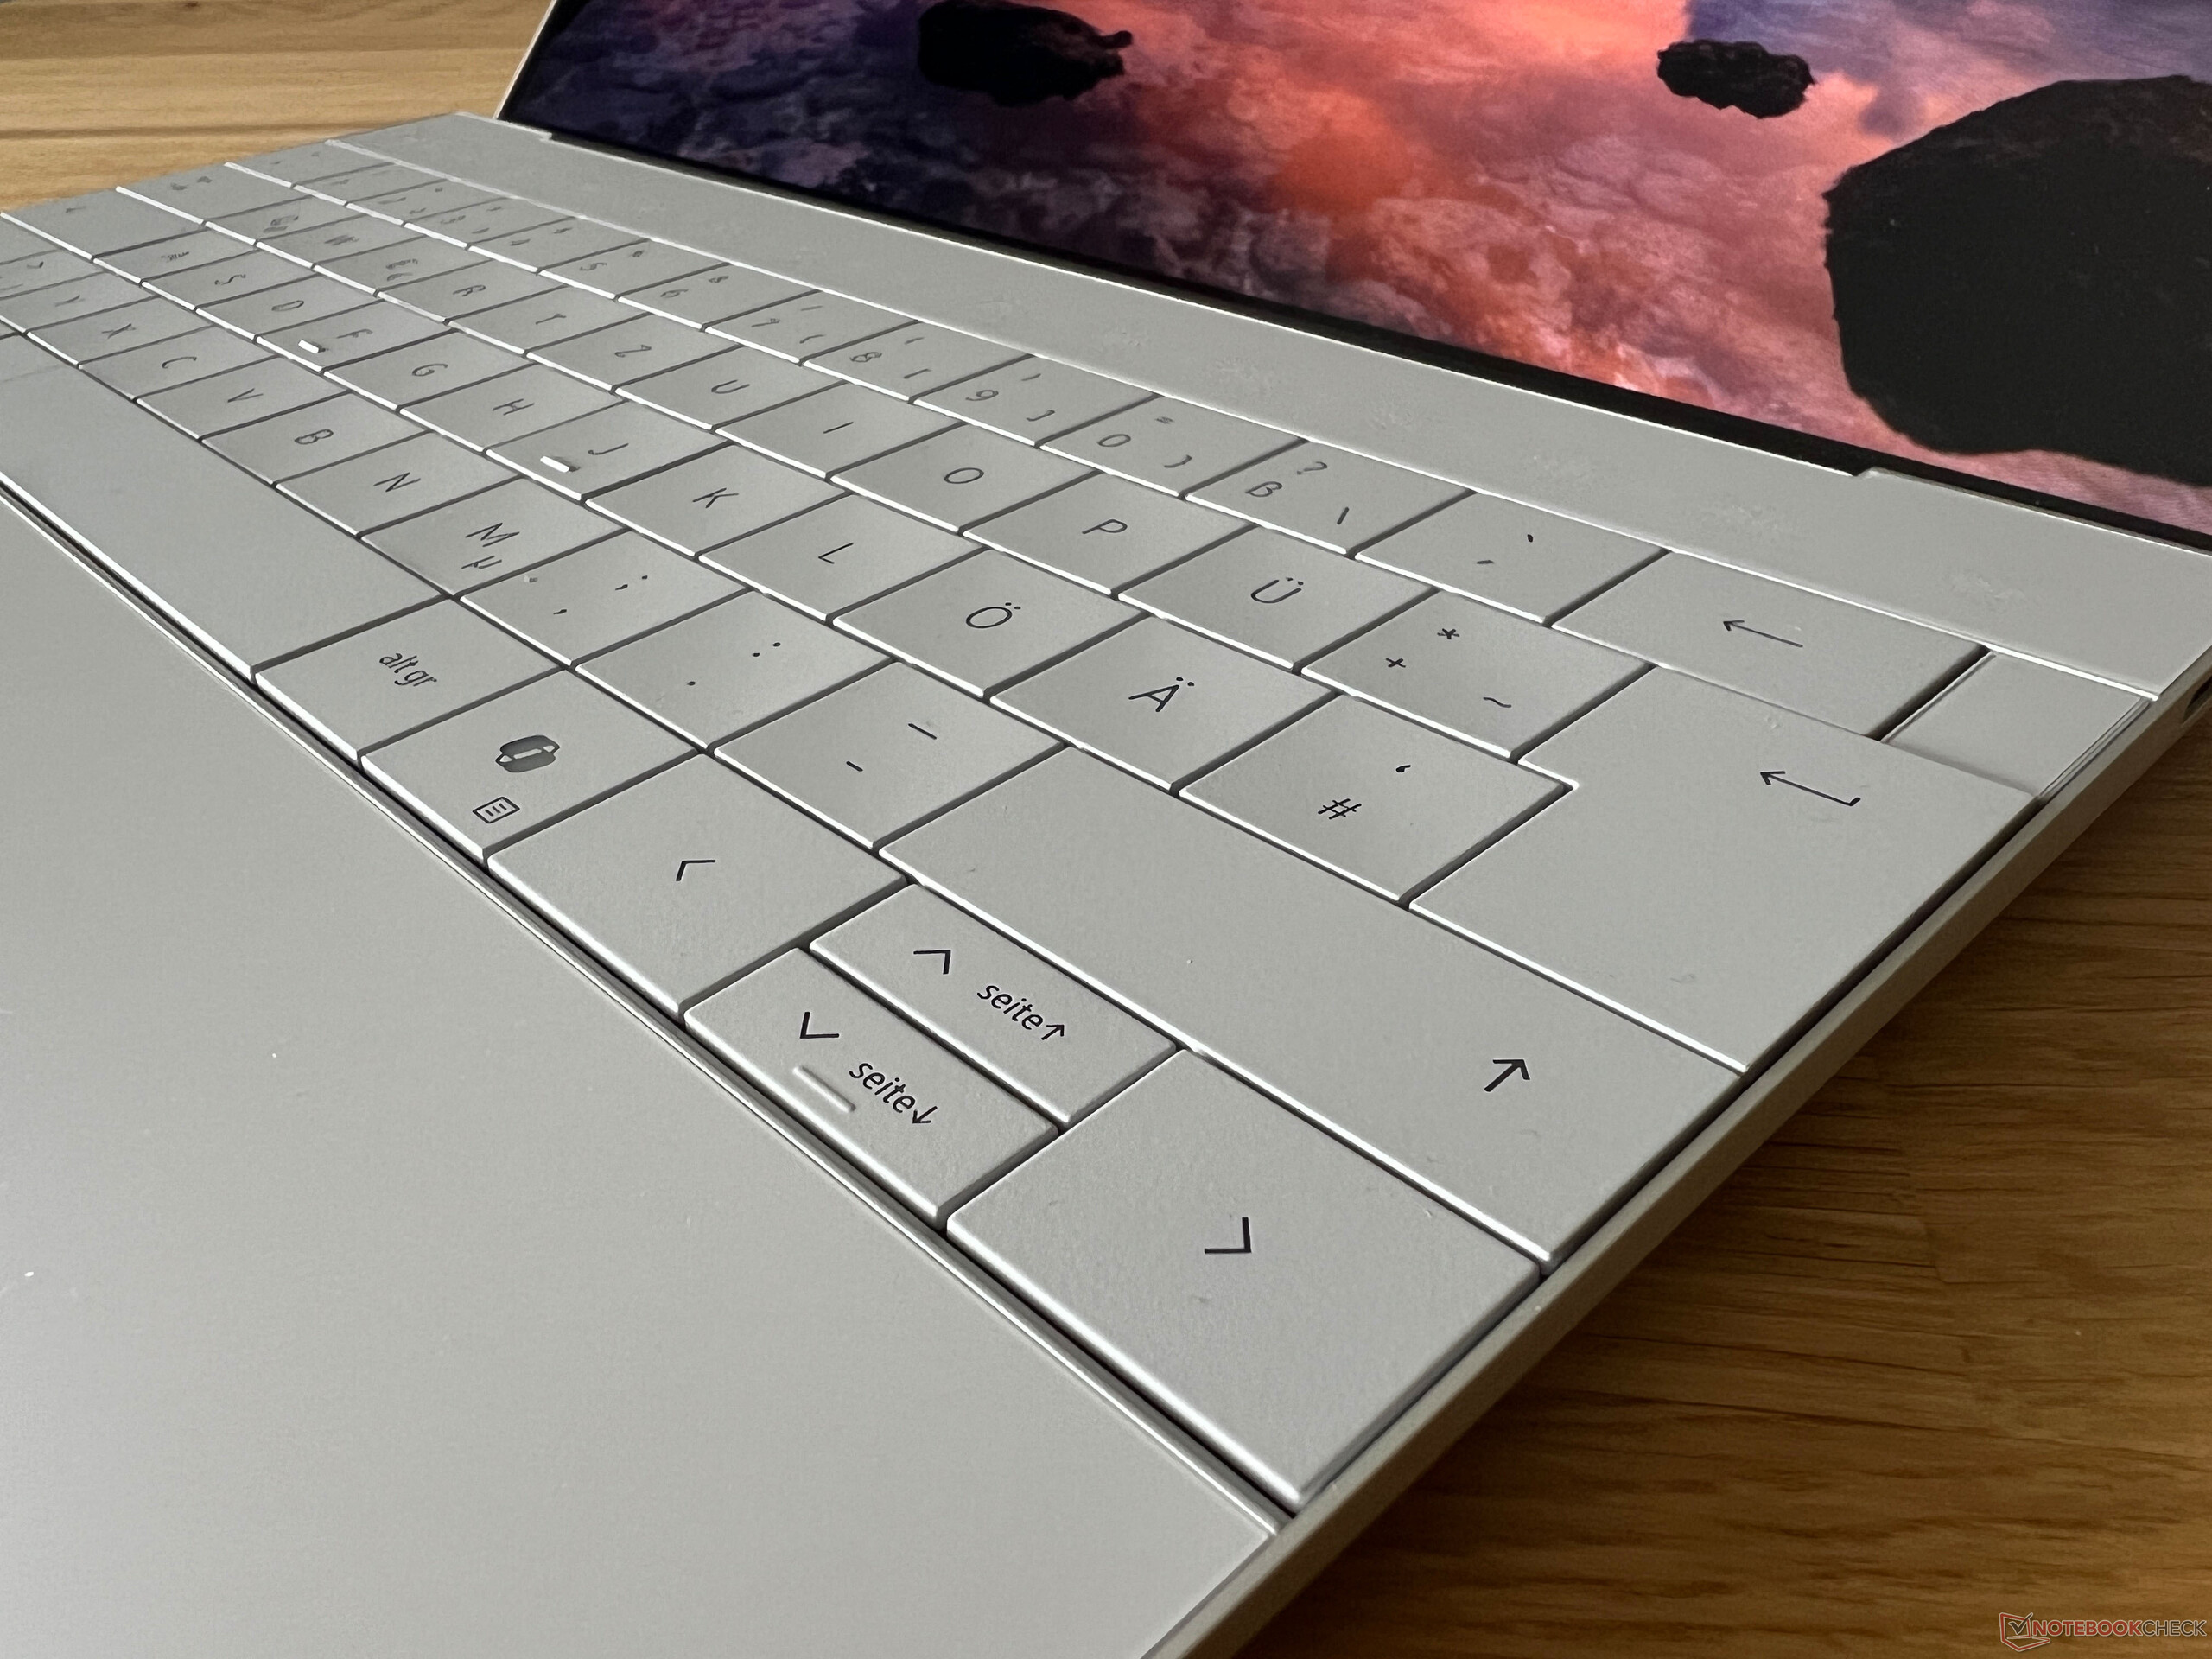
The same as on the old XPS 13 Plus, this model's keyboard design doesn't feature any spacing in between the individual keys. The keys themselves are slightly concave and they do feel generally comfortable to type on, as their keystrokes are precise. However, we noted a few issues, namely we oftentimes hit the wrong key by accident and you definitely have to get used to the keyboard. We also found the tiny vertical arrow keys a bit annoying, which you can barely hit with larger fingers. In addition, the larger keys' (space bar, enter) sound is considerably louder. The power button (including a fingerprint scanner) sits on the top right where you would usually expect the Esc key to be—and this brings us onto our next problem.
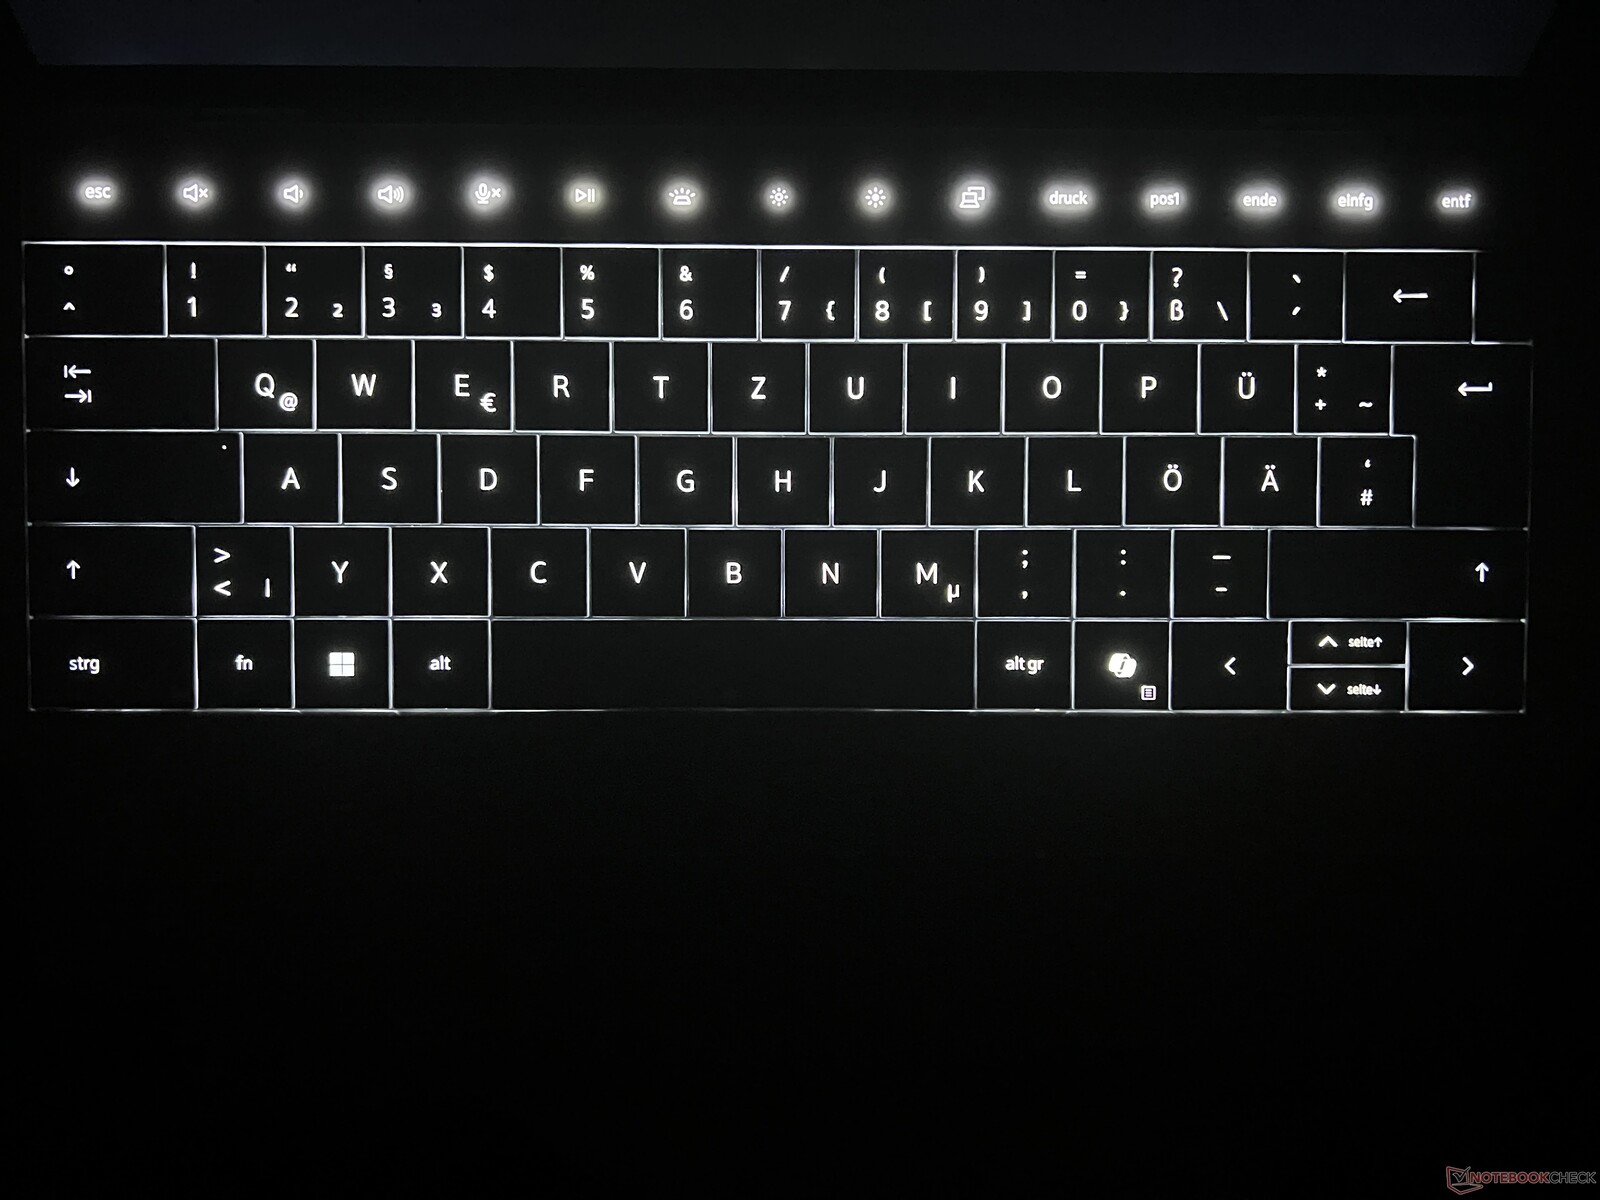
The function keys are installed as a touchbar which, in practice, doesn't add any additional value for users—instead, it's actually rather annoying. This means you can't even hit the Esc key blindly and you have to look at the keys every time. Its backlighting is also a bit of an issue, as it switches off immediately during periods of inactivity, whereas it didn't do this during hours of video playback with no inputs. Moreover, if you deactivate the keyboard's backlighting, then you don't know where you have to press, leading to users potentially hitting the wrong keys before the backlighting is switched back on. The white backlighting itself is constantly adjusted via a sensor and you can't change its intensity at all—at least we couldn't find an option to do so. The sensor also isn't interested in whether you deactivated the backlighting shortly before because as soon as the ambient lighting conditions change, the backlighting is reactivated.
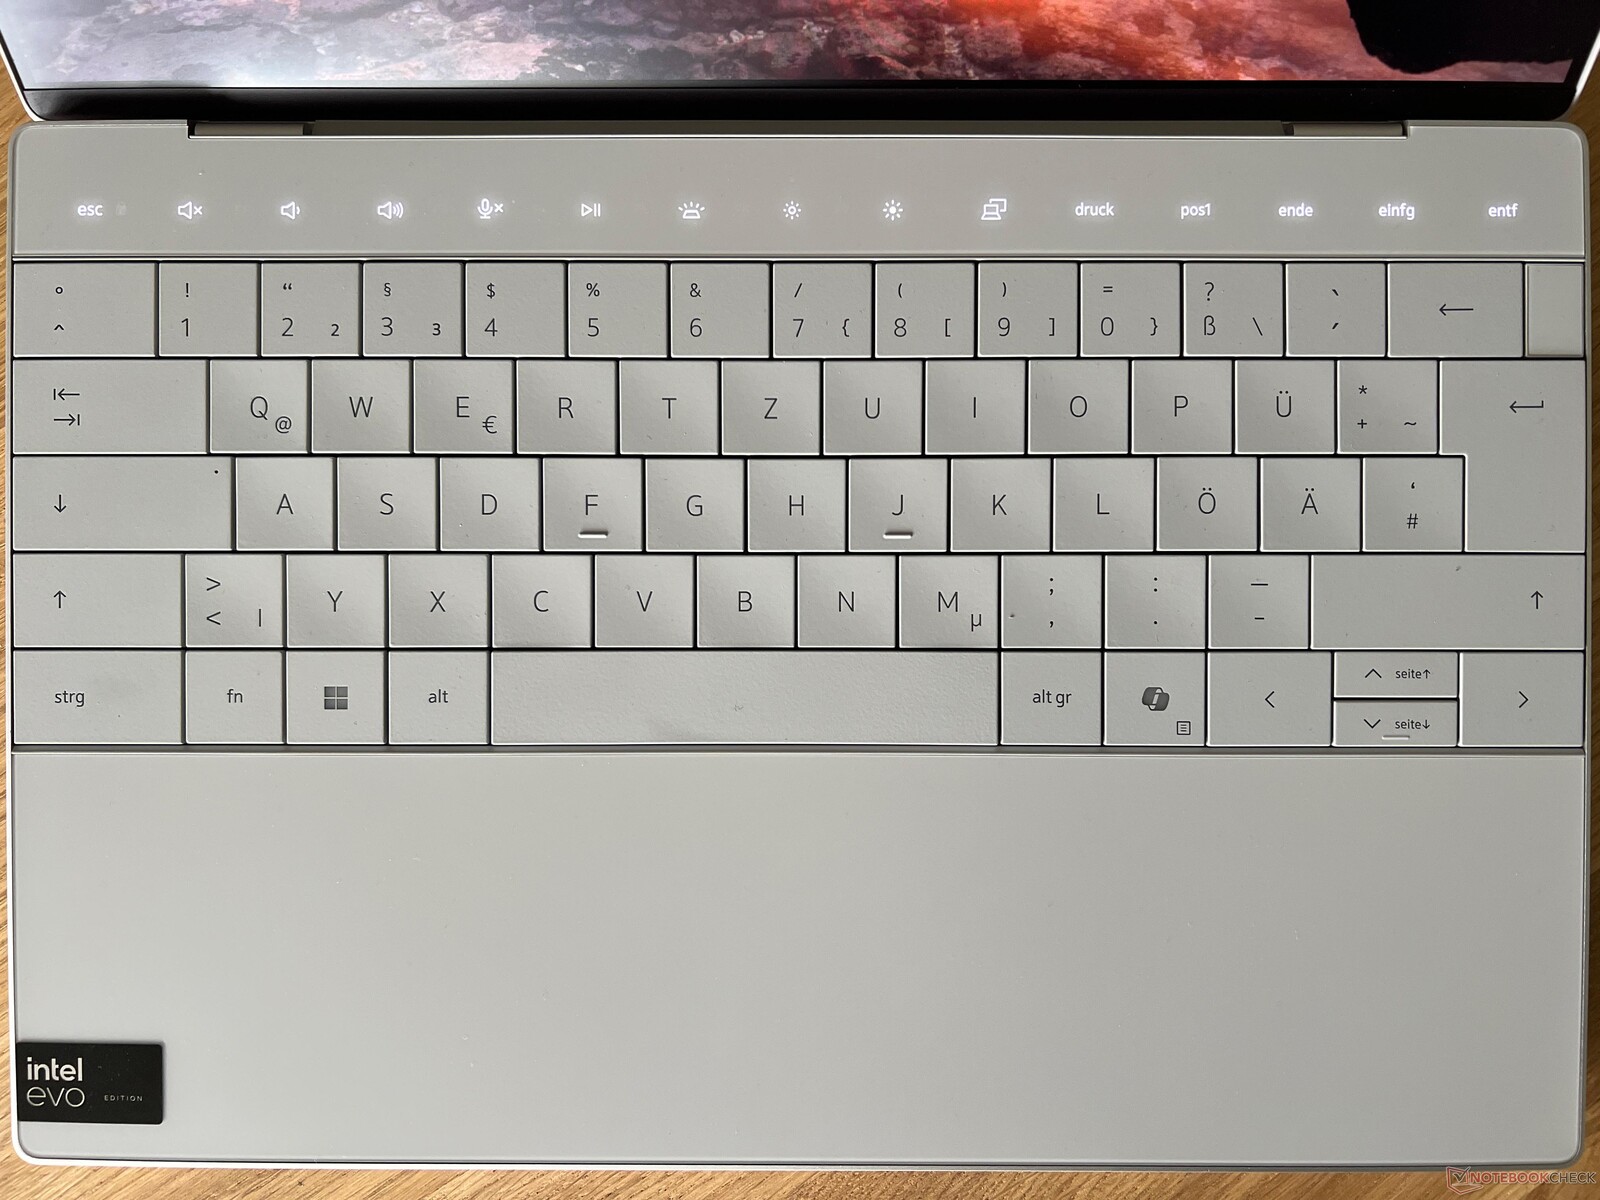
The touchpad is fully integrated into the palm rest and there are no visible boundaries. The touchpad uses the full height of the palm rest and its width extends from the middle of the left Alt key to just under the new Copilot key. In general, it works well, is nice and smooth and the haptic pad's click feel is nice. In turn, we occasionally encountered problems if you left the area or started movements slightly next to the actual touchpad area. In contrast to the touchbar, however, this is only a minor point of criticism.
Display - The base XPS with a 120-Hz refresh rate
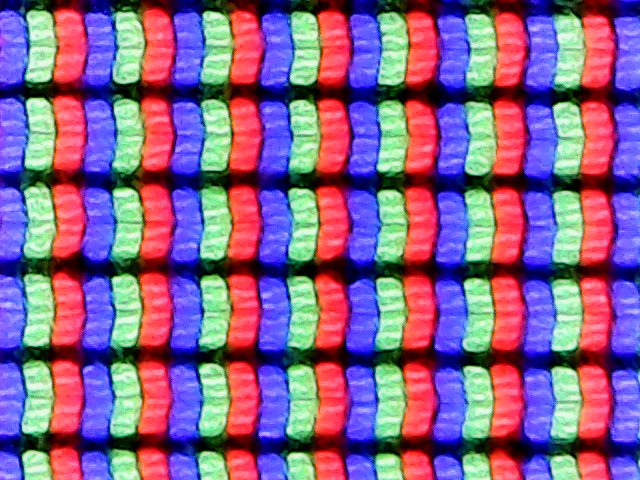
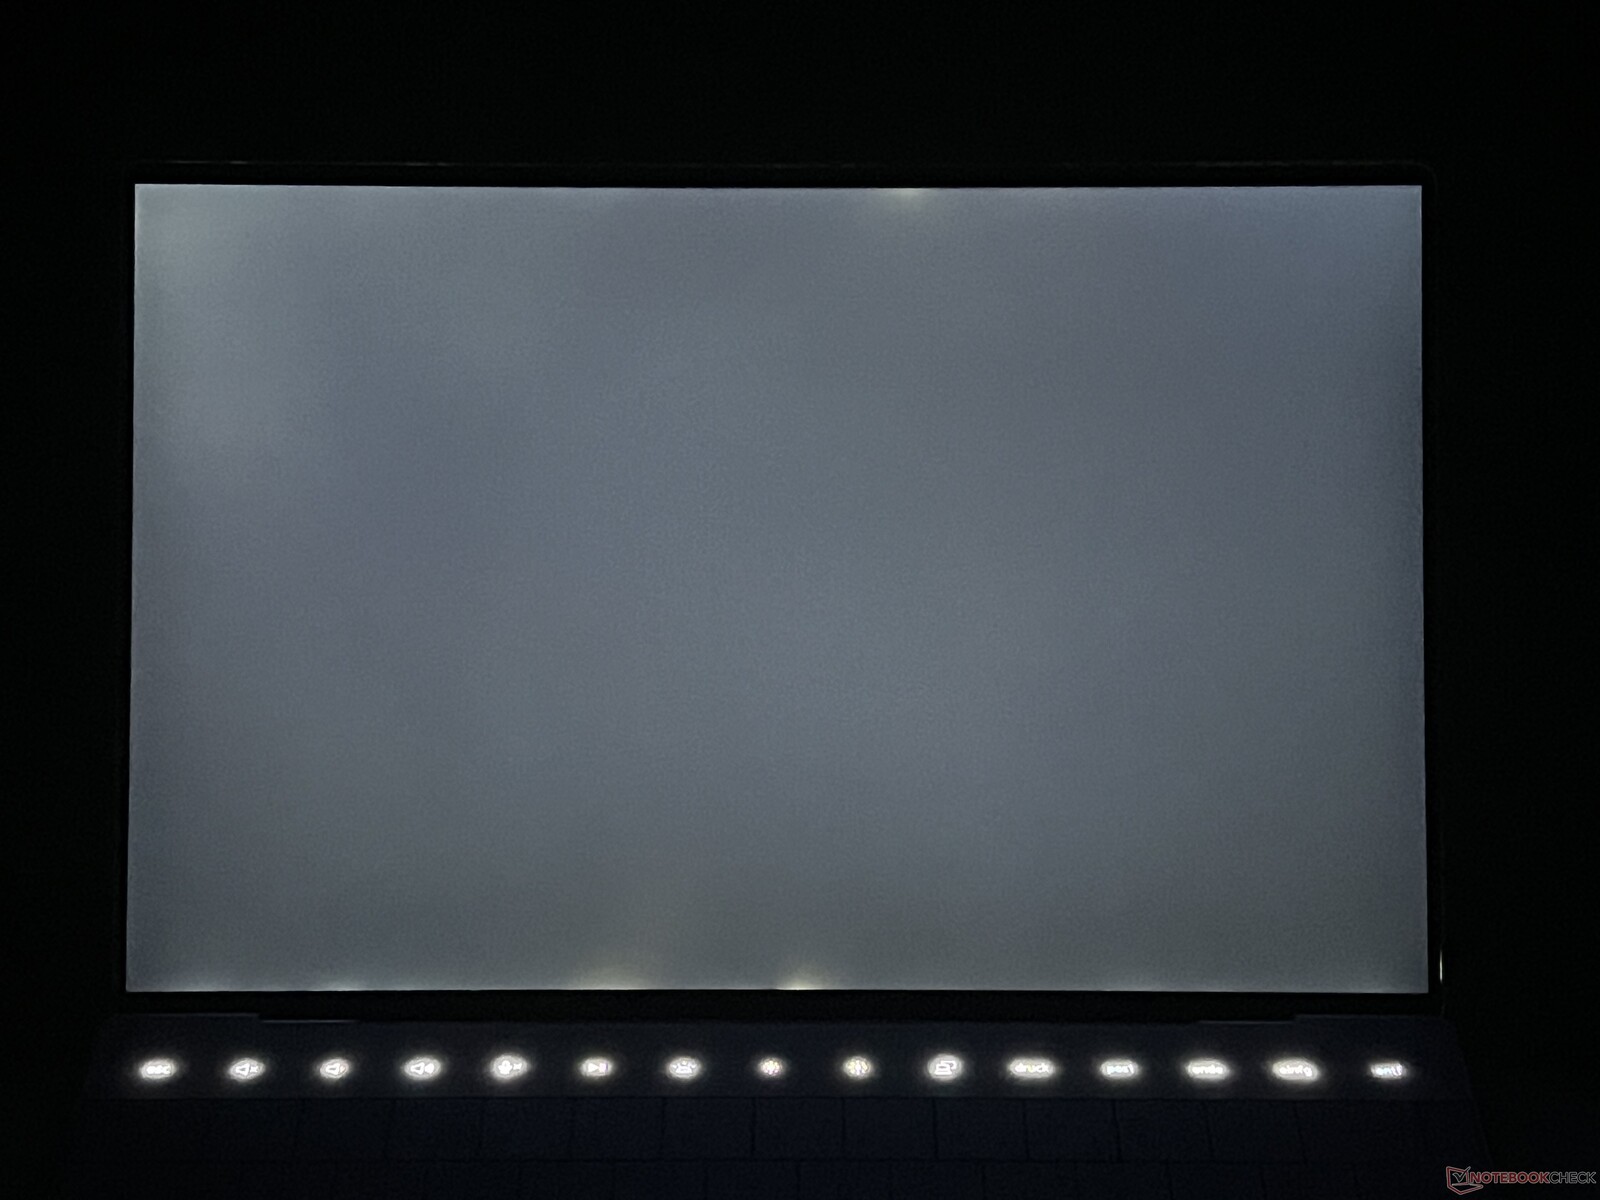
The new XPS 13 9340 is available with three different 13.4-inch IPS displays. You can optionally select a 3K panel with a 60-Hz refresh rate (400 cd/m², US$300 surcharge) as well as a QHD+ touchscreen with a 120-Hz refresh rate (500 cd/m², US$300 surcharge). Our test sample, however, is fitted with the base panel with a resolution of 1,920 x 1,200 and without a touch function. Subjectively, its picture quality benefits from the higher 120-Hz frequency, leading to movements looking very smooth. In addition, content is depicted sharp enough, but colors don't look as vivid as on OLED panels. Moreover, light areas look a little grainy. The display doesn't use PWM flickering, but its response times are a little slow. Backlight bleeding isn't too big an issue and its brightness is adjusted automatically via a sensor.
Dell states a brightness of 500 cd/m², which our test sample failed to achieve. We measured a maximum of 429 cd/m² and an average of only just over 400 cd/m². Its black value is decent at 0.28 and this does at least lead to a very good maximum contrast ratio of ~1,500:1. One further problem its minimum brightness of almost 45 cd/m², which is simply far too high.
| |||||||||||||||||||||||||
Brightness Distribution: 90 %
Center on Battery: 429 cd/m²
Contrast: 1532:1 (Black: 0.28 cd/m²)
ΔE ColorChecker Calman: 2.6 | ∀{0.5-29.43 Ø4.72}
calibrated: 1.4
ΔE Greyscale Calman: 4 | ∀{0.09-98 Ø4.97}
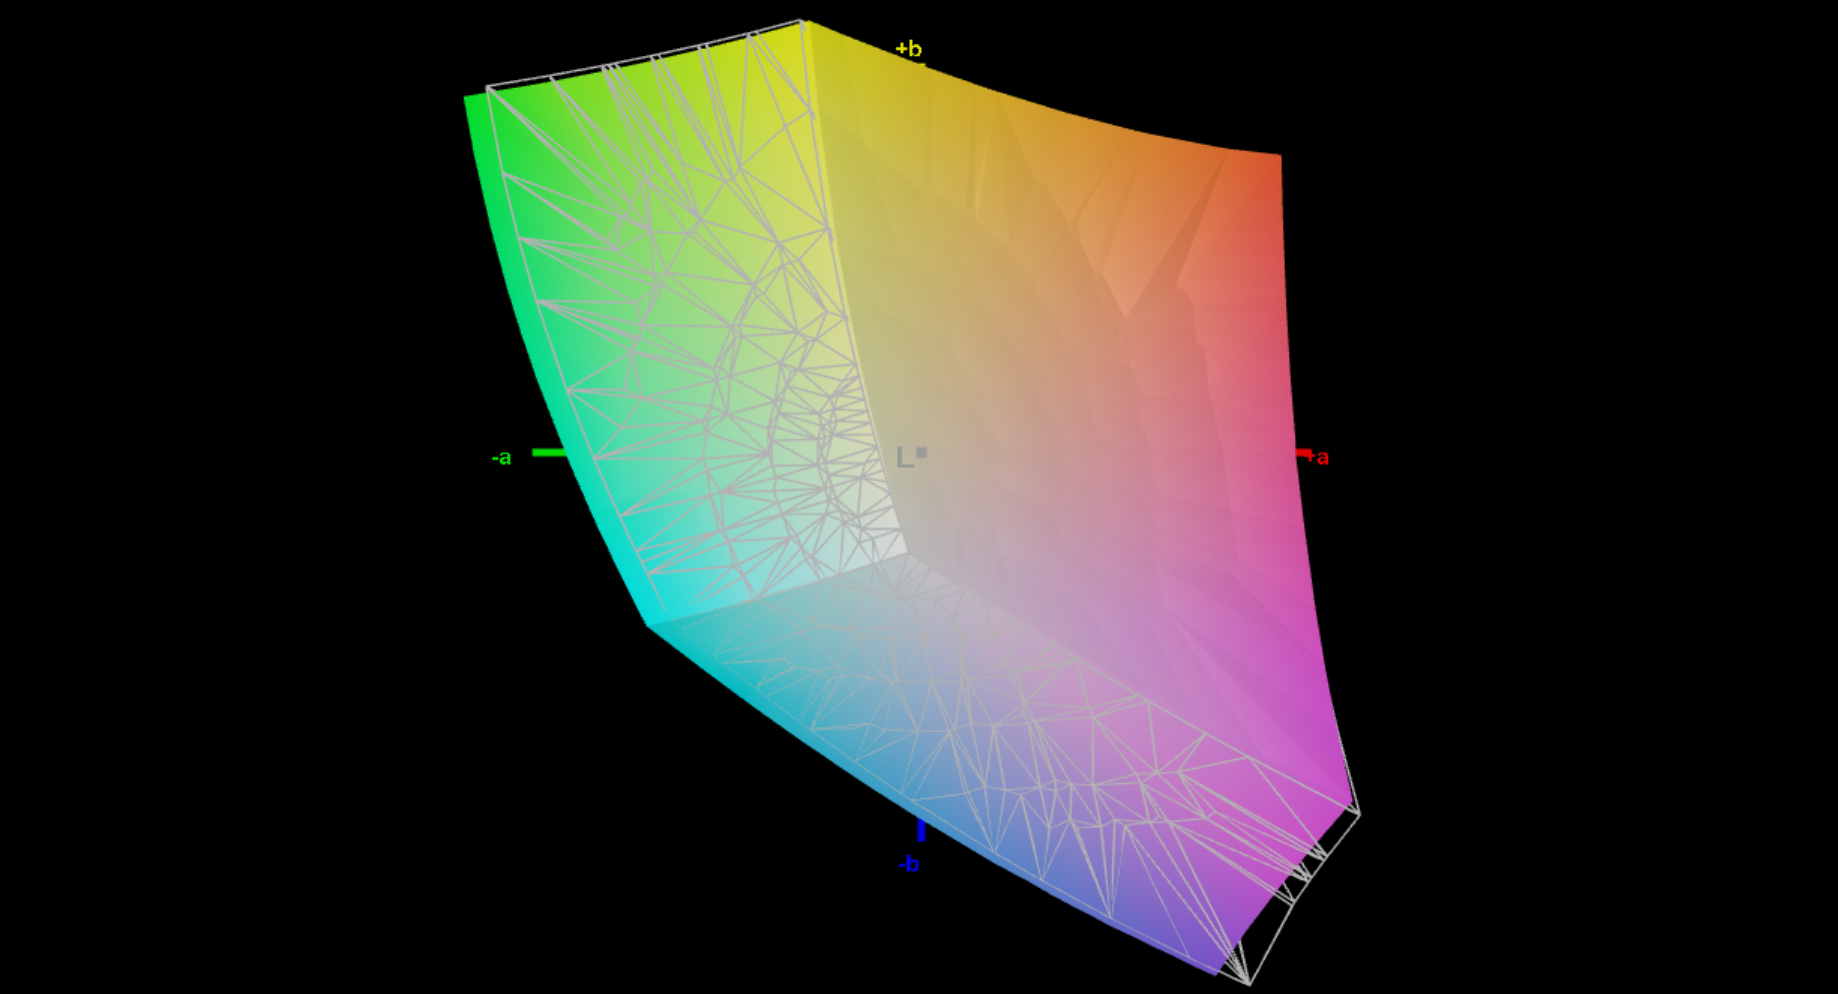
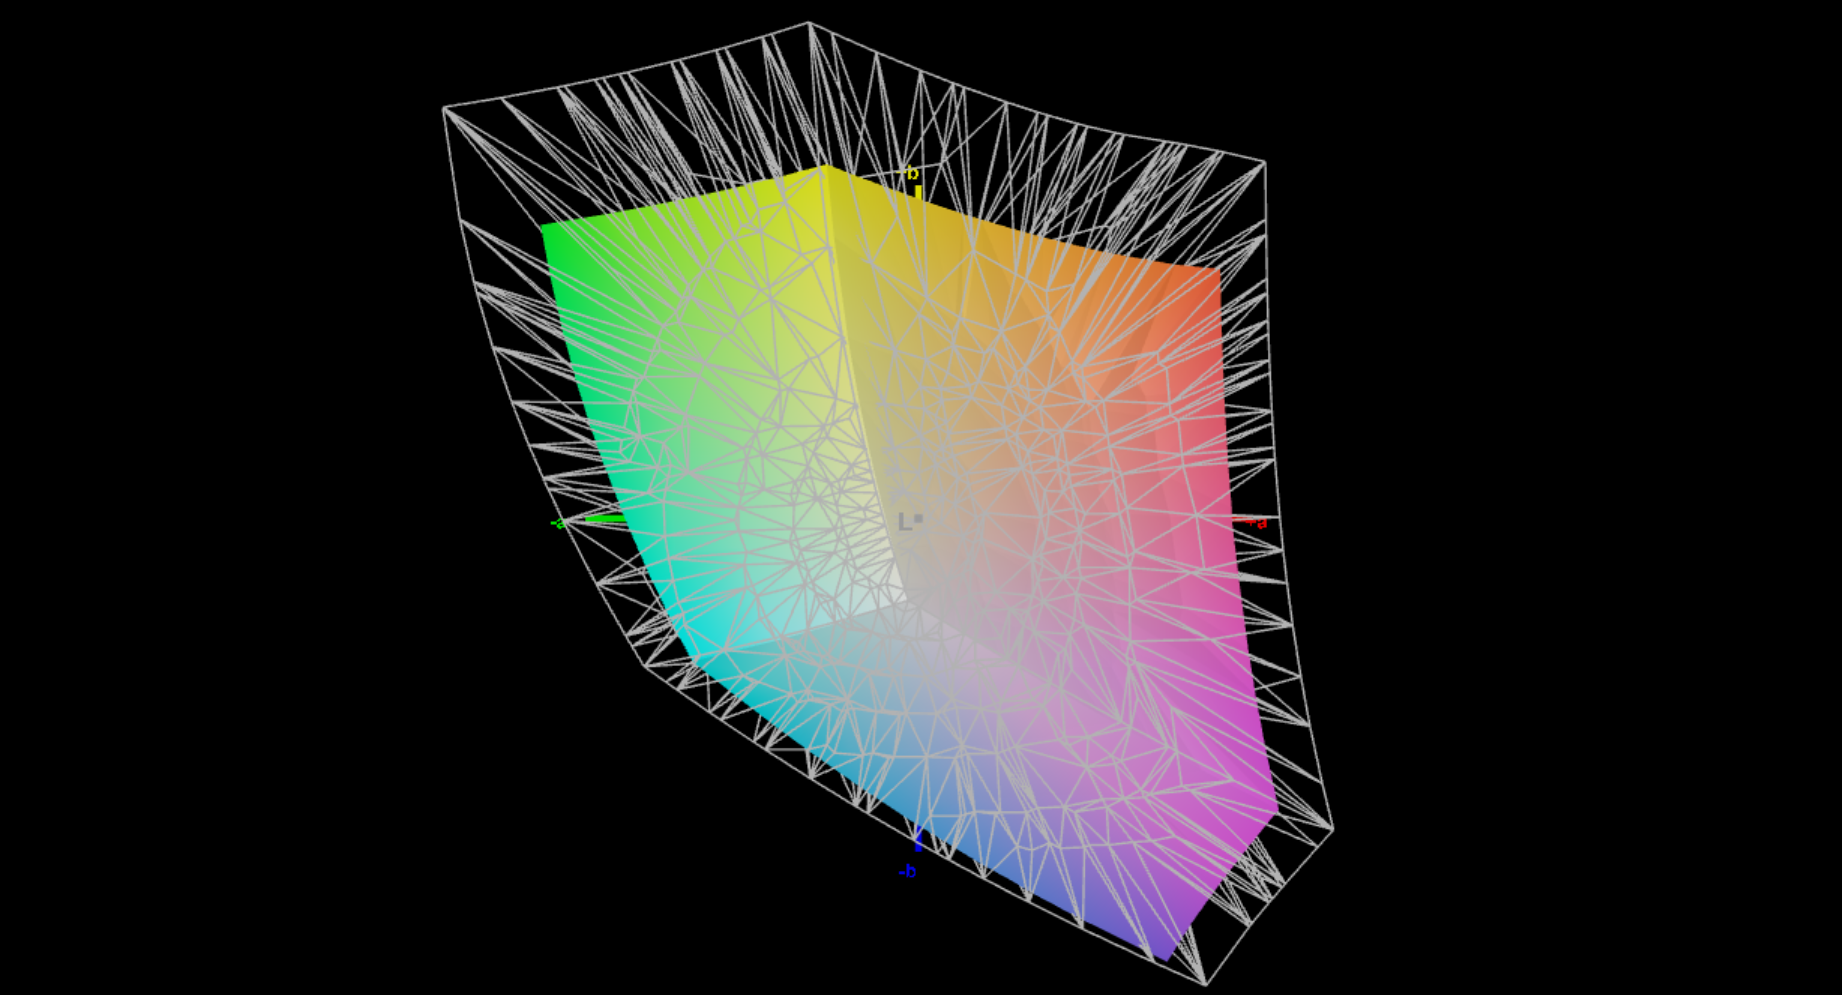
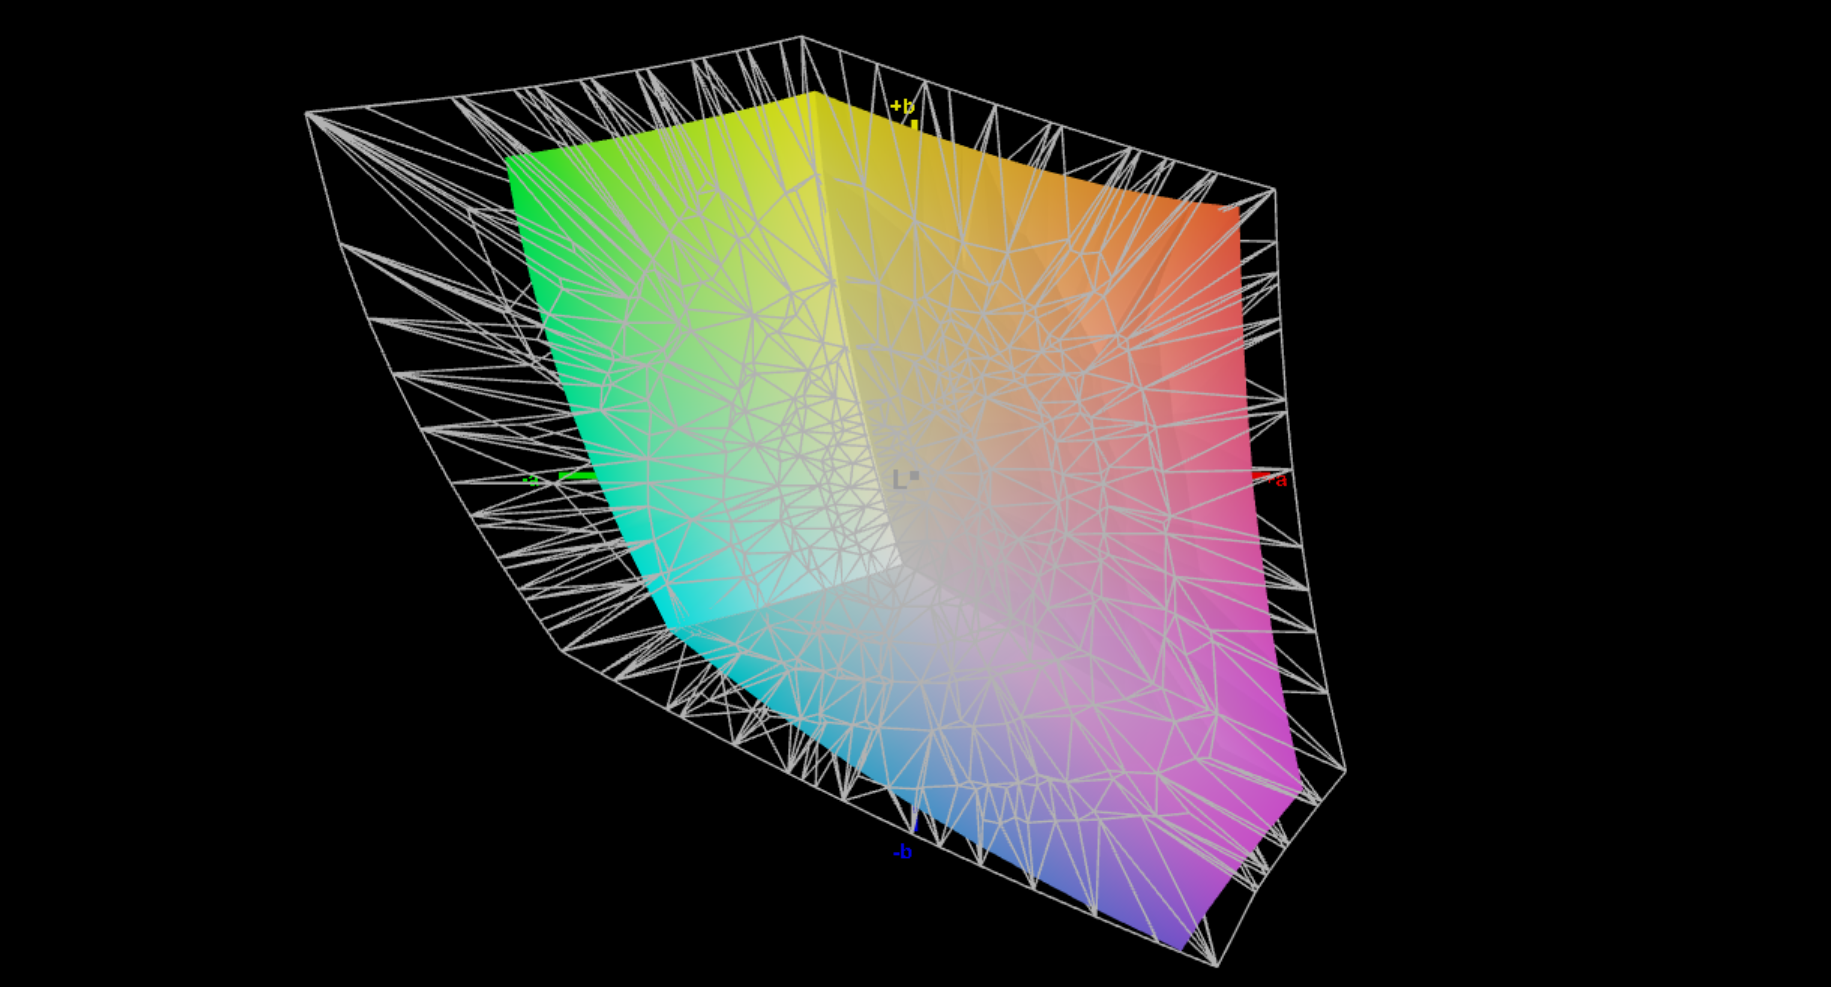
71.7% AdobeRGB 1998 (Argyll 3D)
97.8% sRGB (Argyll 3D)
69.4% Display P3 (Argyll 3D)
Gamma: 2.23
CCT: 7332 K
| Dell XPS 13 9340 Core Ultra 7 SHP1593, IPS, 1920x1200, 13.4" | Apple MacBook Air 13 M3 10C GPU IPS, 2560x1664, 13.6" | Asus ZenBook S13 OLED UX5304 SDC417B, OLED, 2880x1800, 13.3" | Lenovo ThinkPad Z13 Gen 2 ATNA33AA02-0, OLED, 2880x1800, 13.3" | HP Dragonfly G4 Chi Mei CMN13C0, IPS, 1920x1280, 13.5" | Dell XPS 13 Plus 9320 Core i7-1360P Samsung 134XK04, OLED, 3456x2160, 13.4" | |
|---|---|---|---|---|---|---|
| Display | 22% | 27% | 27% | -1% | 27% | |
| Display P3 Coverage (%) | 69.4 | 98.4 42% | 99.7 44% | 99.7 44% | 68.4 -1% | 99.7 44% |
| sRGB Coverage (%) | 97.8 | 99.9 2% | 100 2% | 100 2% | 98.3 1% | 100 2% |
| AdobeRGB 1998 Coverage (%) | 71.7 | 87.9 23% | 96.9 35% | 97.3 36% | 70.4 -2% | 96.8 35% |
| Response Times | 11% | 95% | 94% | -13% | 94% | |
| Response Time Grey 50% / Grey 80% * (ms) | 43.2 ? | 34.5 ? 20% | 2 ? 95% | 2.1 ? 95% | 48.8 ? -13% | 2.18 ? 95% |
| Response Time Black / White * (ms) | 27.6 ? | 27.2 ? 1% | 1.6 ? 94% | 2.2 ? 92% | 31.3 ? -13% | 2.08 ? 92% |
| PWM Frequency (Hz) | 240 ? | 60.1 ? | 238.6 ? | |||
| Screen | 17% | 30% | 29% | 14% | -39% | |
| Brightness middle (cd/m²) | 429 | 525 22% | 361 -16% | 372 -13% | 408.8 -5% | 361.7 -16% |
| Brightness (cd/m²) | 407 | 506 24% | 365 -10% | 375 -8% | 399 -2% | 367 -10% |
| Brightness Distribution (%) | 90 | 92 2% | 98 9% | 99 10% | 90 0% | 96 7% |
| Black Level * (cd/m²) | 0.28 | 0.42 -50% | 0.32 -14% | |||
| Contrast (:1) | 1532 | 1250 -18% | 1278 -17% | |||
| Colorchecker dE 2000 * | 2.6 | 1.4 46% | 1.2 54% | 0.88 66% | 2.02 22% | 4.83 -86% |
| Colorchecker dE 2000 max. * | 6.6 | 2.8 58% | 1.9 71% | 3.22 51% | 3.84 42% | 9.34 -42% |
| Colorchecker dE 2000 calibrated * | 1.4 | 0.61 56% | 3.97 -184% | |||
| Greyscale dE 2000 * | 4 | 2 50% | 1.2 70% | 1.2 70% | 2.3 43% | 1.8 55% |
| Gamma | 2.23 99% | 2.2 100% | 2.27 97% | 2.18 101% | 2.2 100% | 2.33 94% |
| CCT | 7332 89% | 6876 95% | 6486 100% | 6326 103% | 6203 105% | 6438 101% |
| Total Average (Program / Settings) | 17% /
17% | 51% /
41% | 50% /
40% | 0% /
7% | 27% /
-1% |
* ... smaller is better
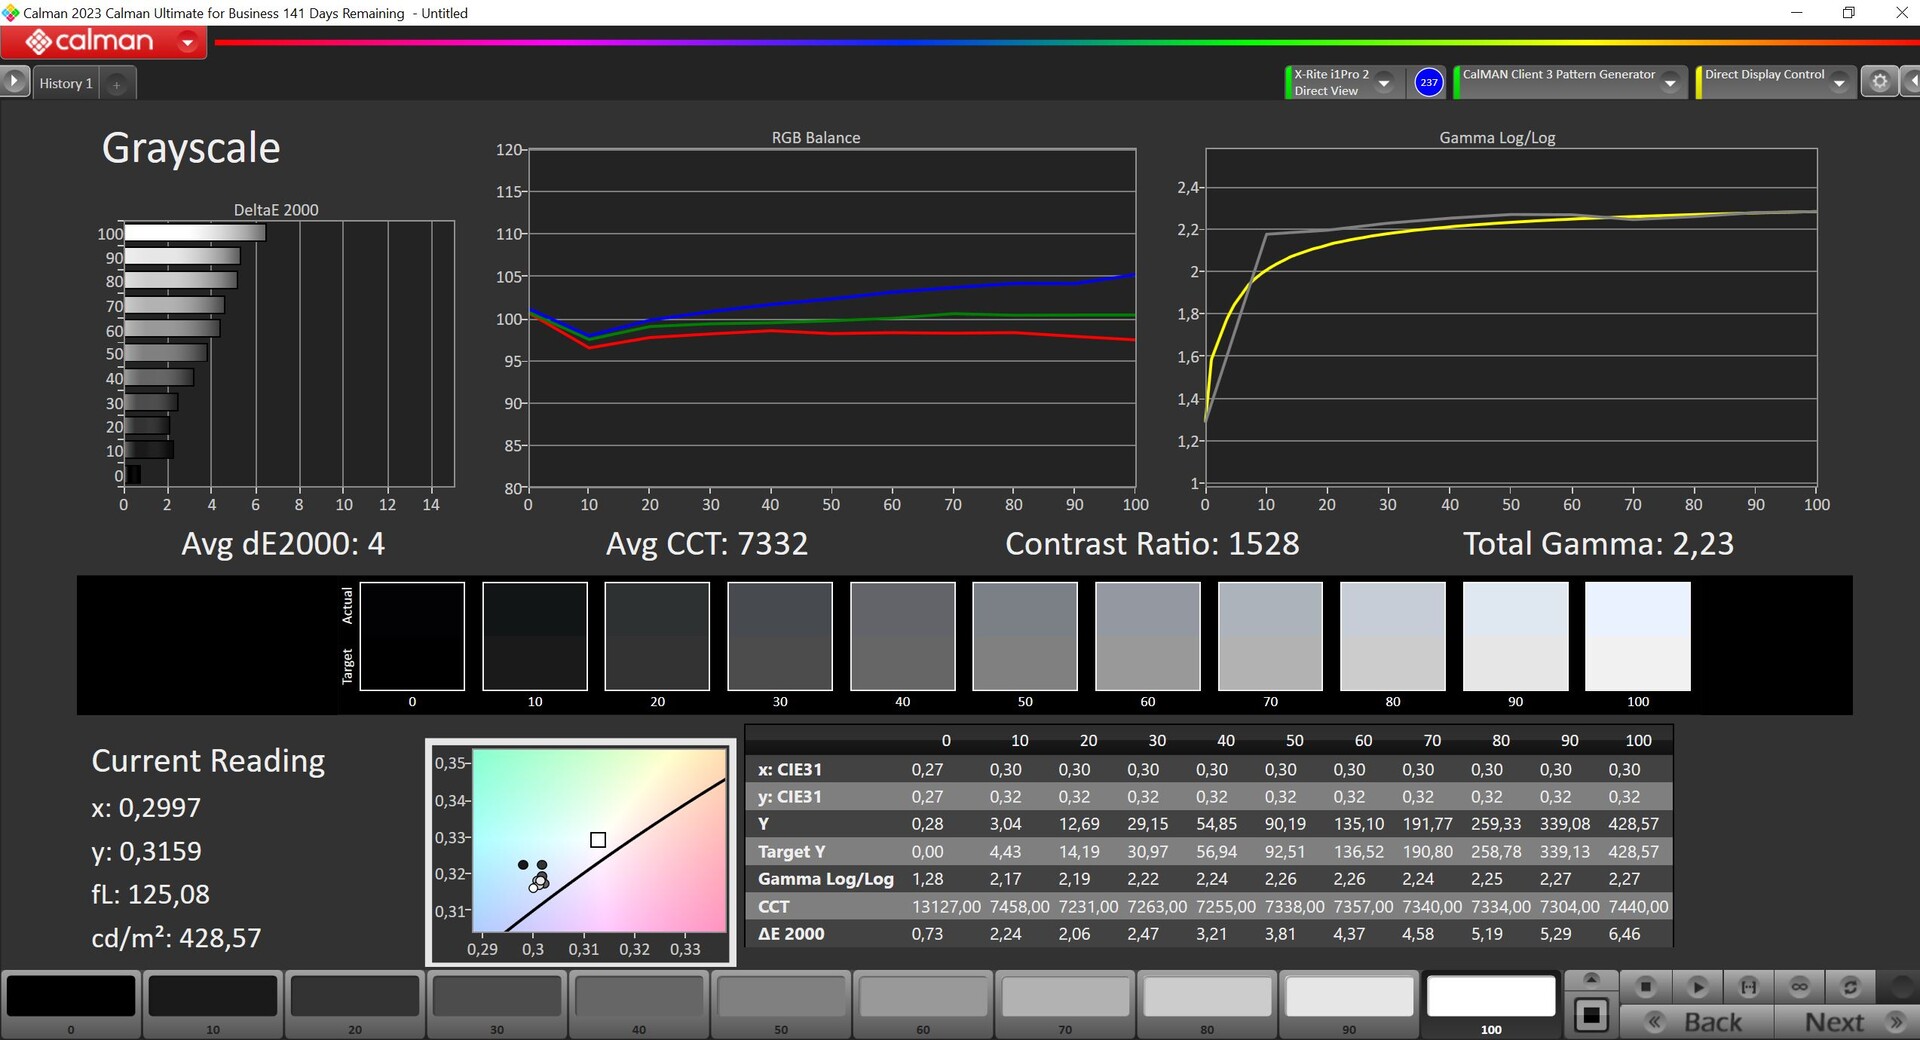
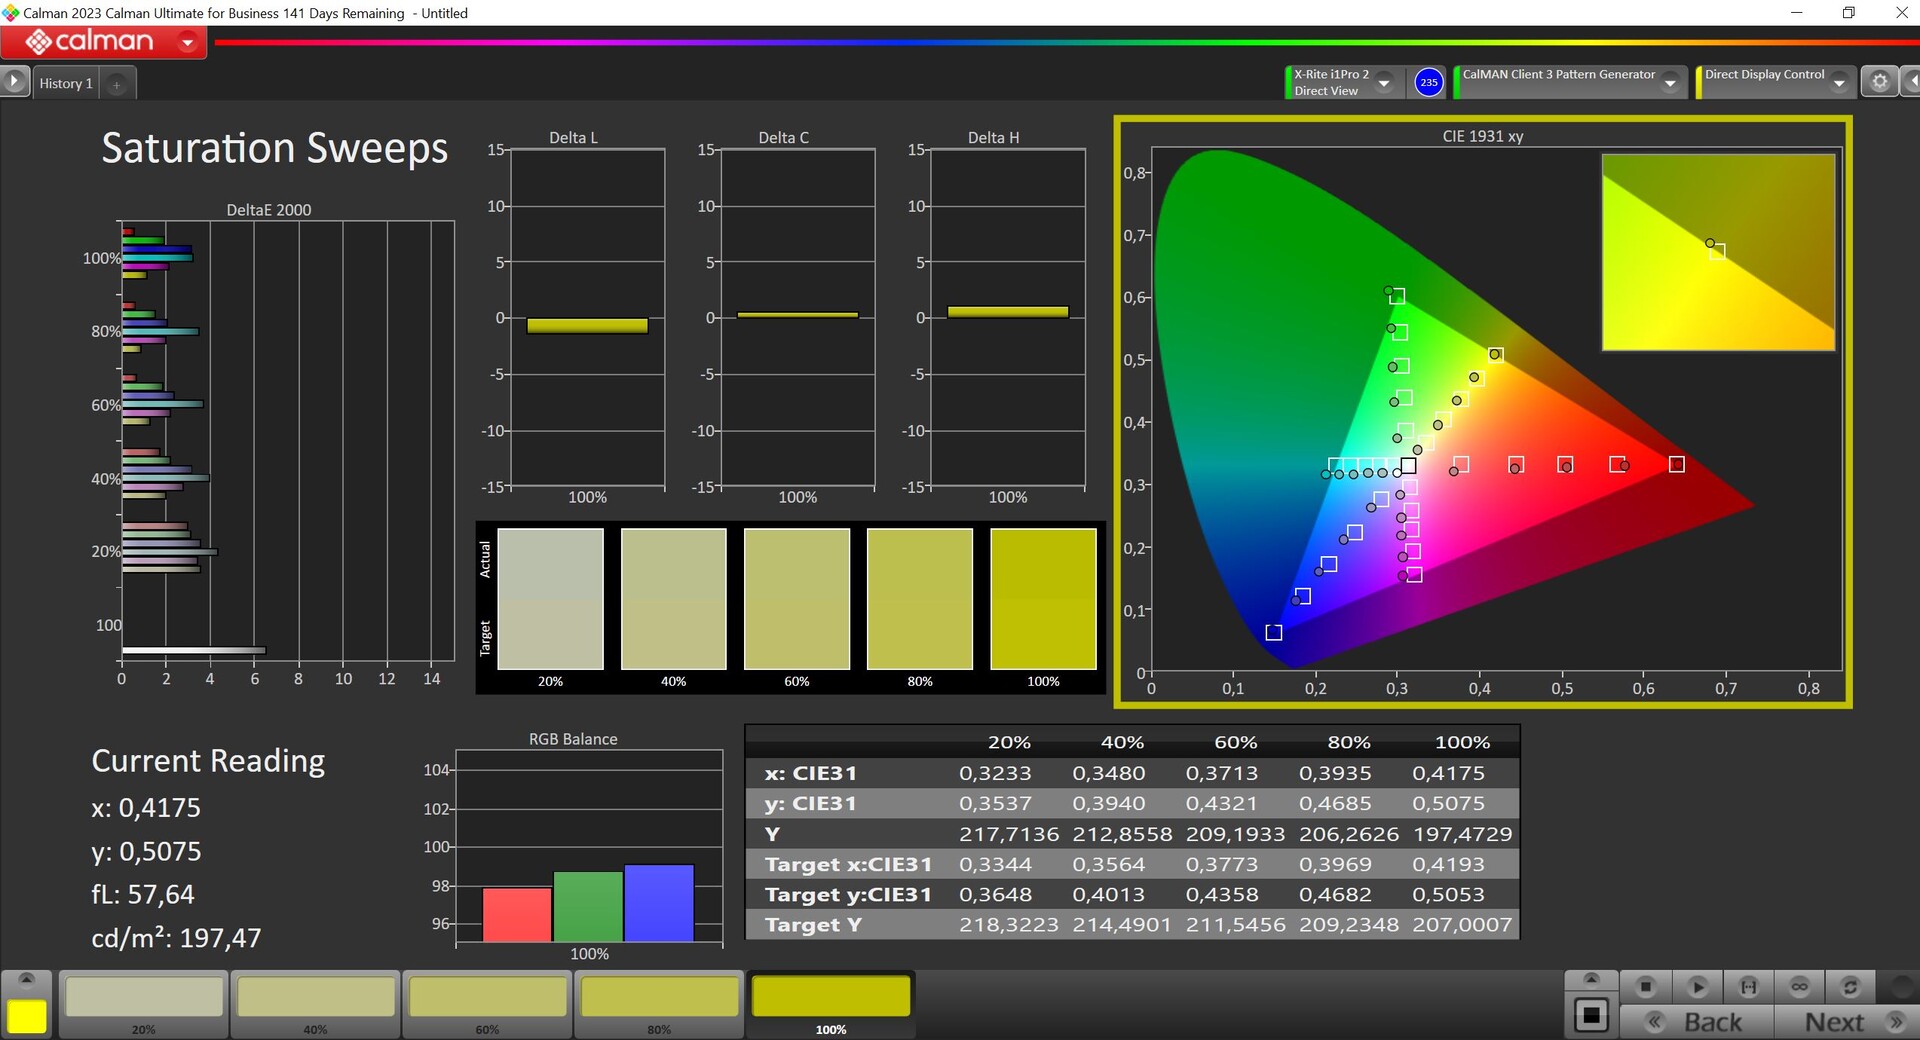
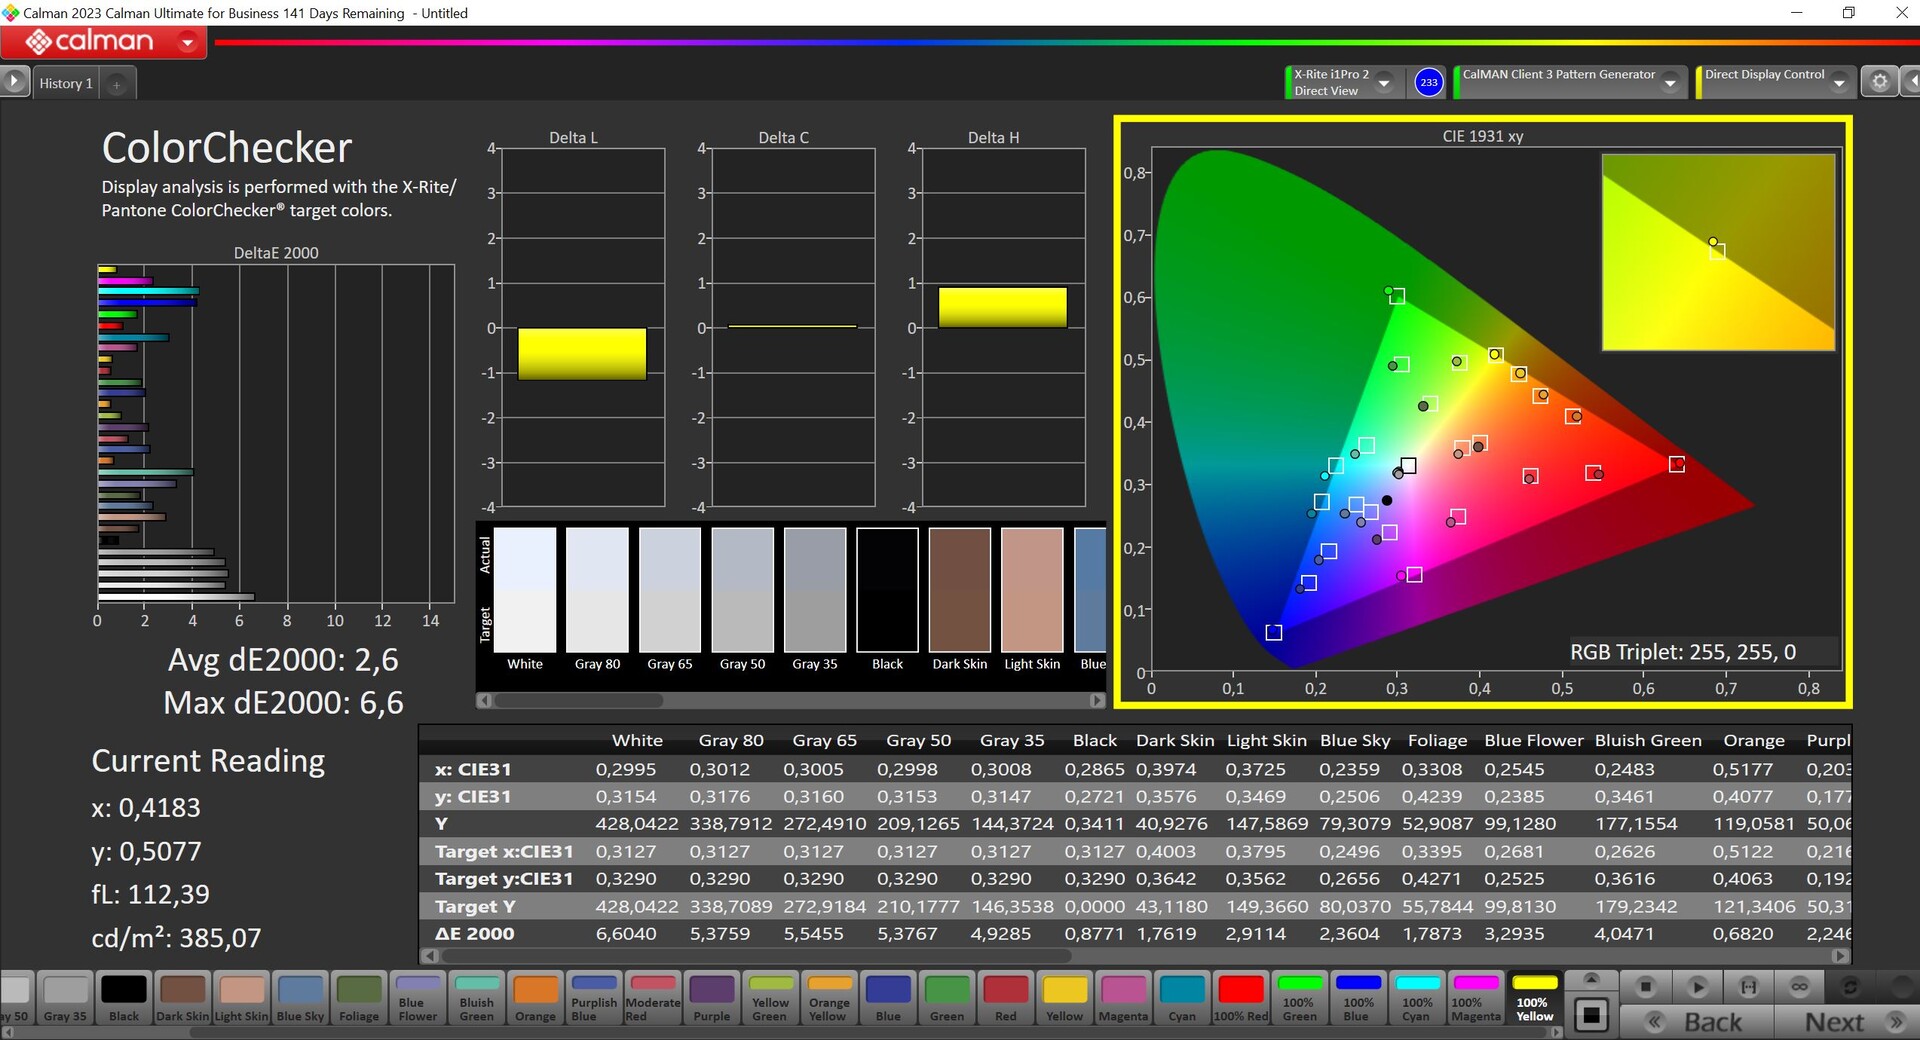
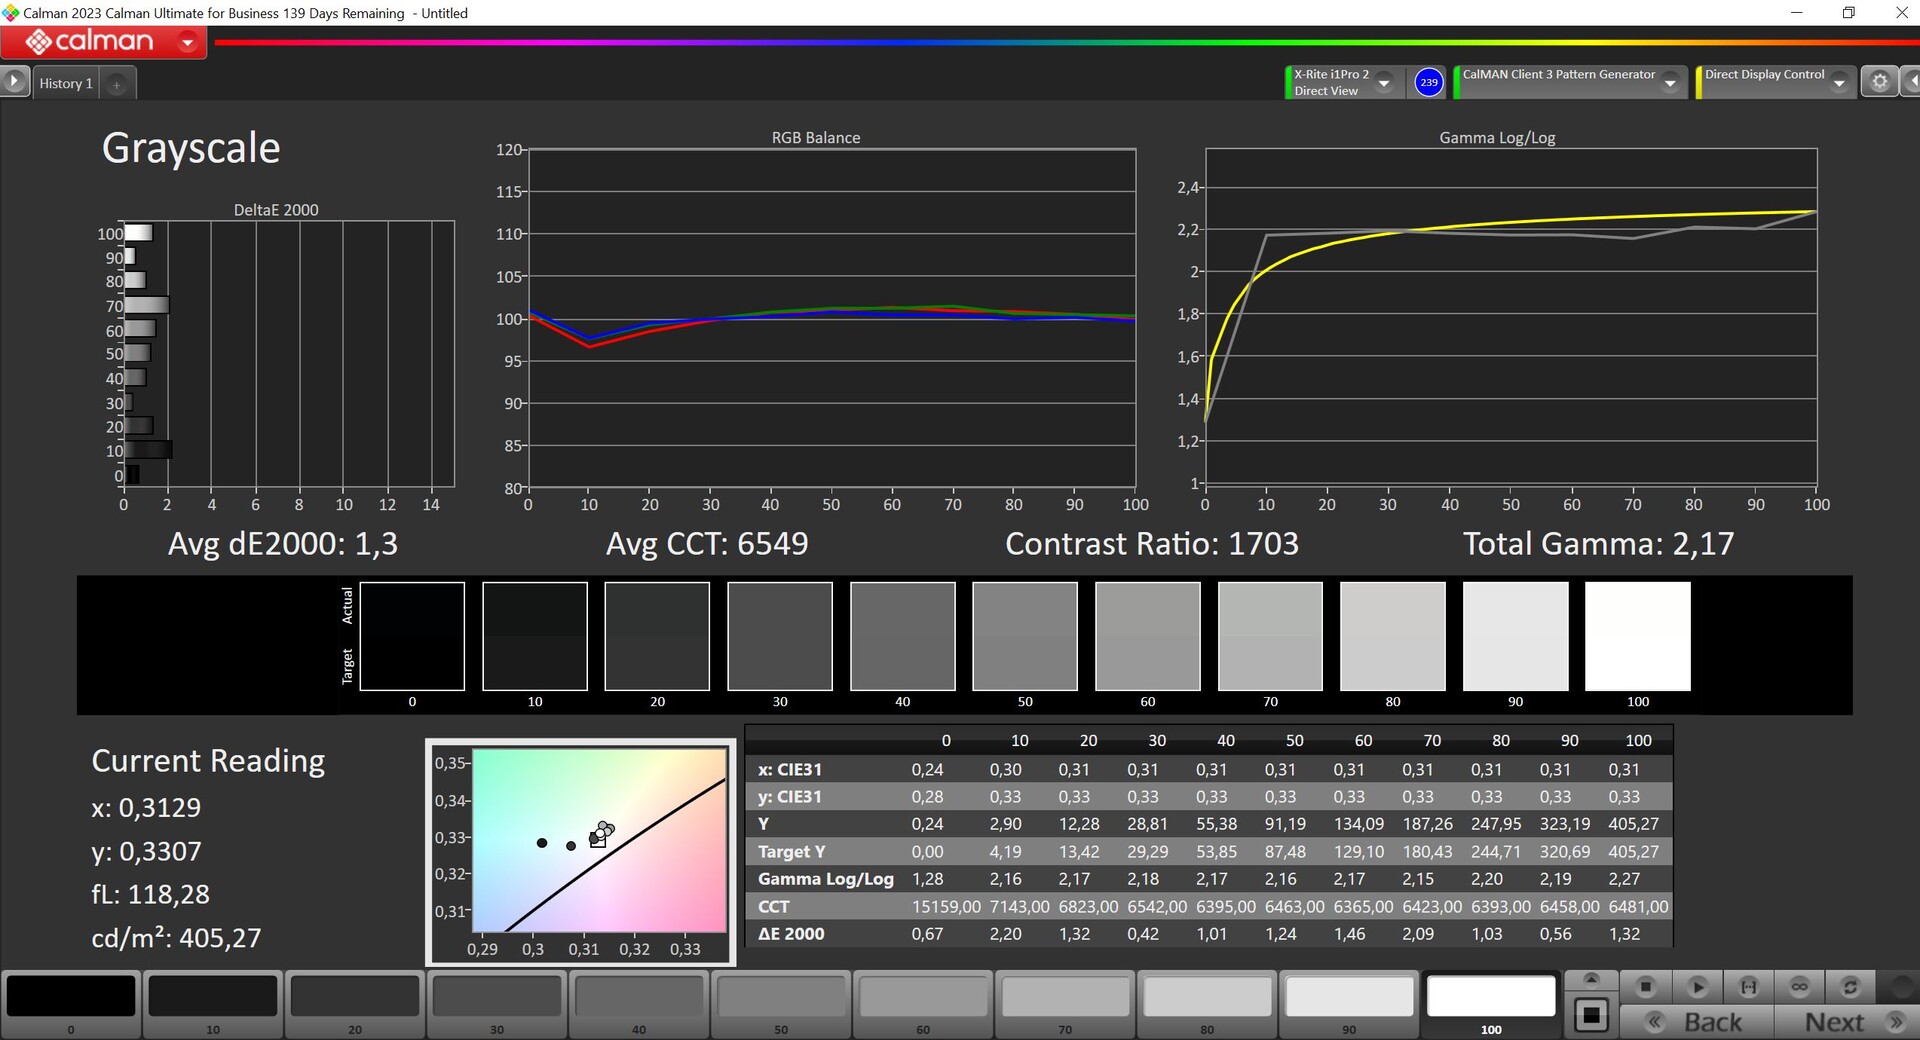


We measured the panel using the professional CalMAN software (X-Rite i1 Pro 2) and straight out of the box, its calibration isn't particularly good. We noted a considerable blue tint and its color temperature is too cool. Furthermore, its grayscale deviations and quite a few color deviations are above the target value of 3. Using our own calibration (profile can be downloaded for free above), we were able to improve its depiction considerably, however, this reduces the screen's maximum brightness by around 25 cd/m². The small sRGB color space is almost completely covered, so you can also use the panel to edit pictures.
Display Response Times
| ↔ Response Time Black to White | ||
|---|---|---|
| 27.6 ms ... rise ↗ and fall ↘ combined | ↗ 16 ms rise | 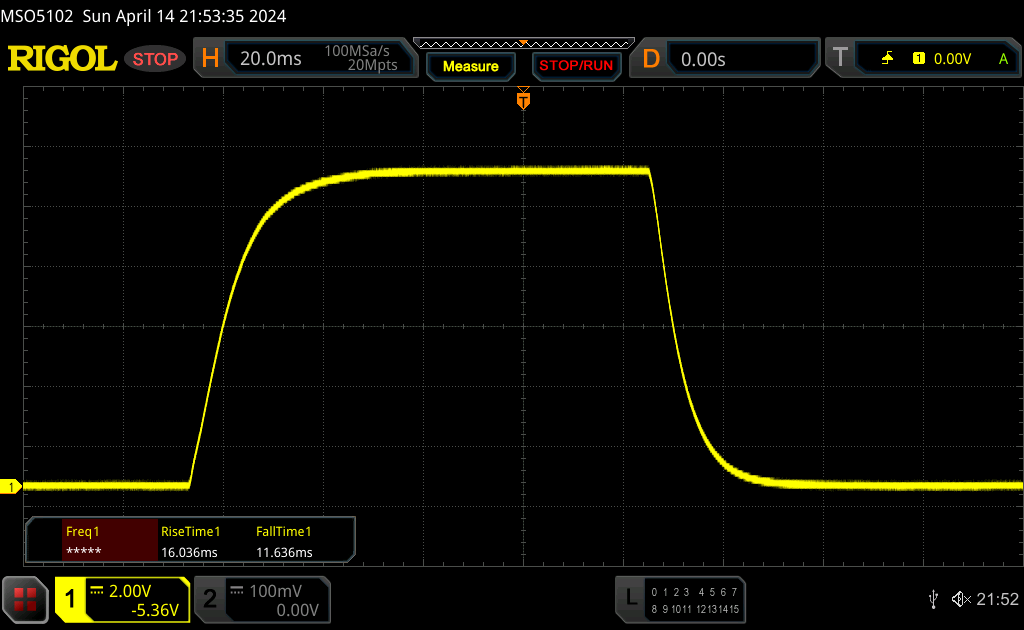 |
| ↘ 11.6 ms fall | ||
| The screen shows relatively slow response rates in our tests and may be too slow for gamers. In comparison, all tested devices range from 0.1 (minimum) to 240 (maximum) ms. » 70 % of all devices are better. This means that the measured response time is worse than the average of all tested devices (19.8 ms). | ||
| ↔ Response Time 50% Grey to 80% Grey | ||
| 43.2 ms ... rise ↗ and fall ↘ combined | ↗ 21.1 ms rise | 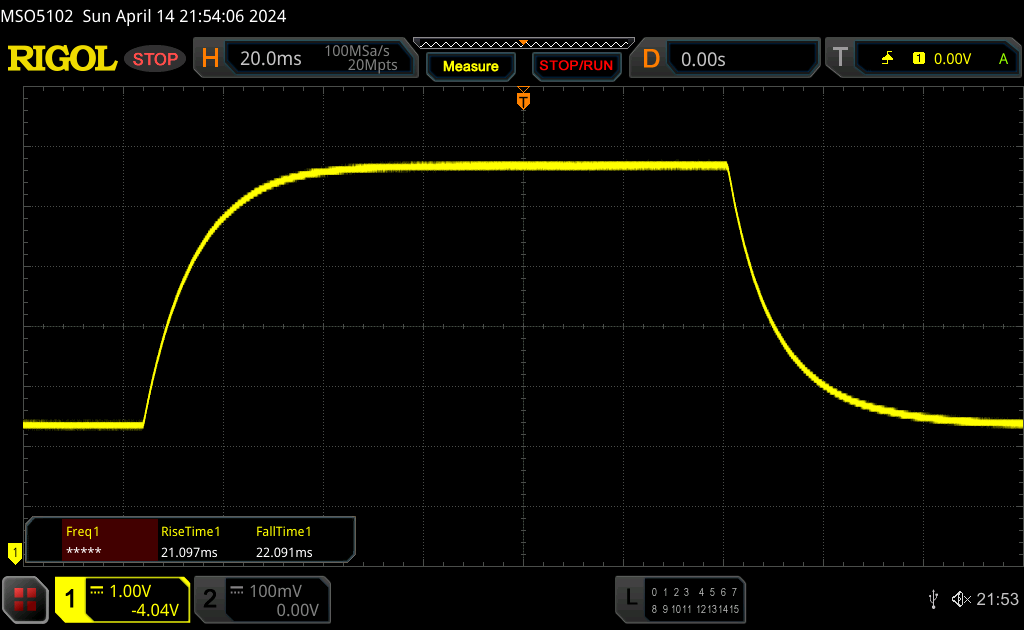 |
| ↘ 22.1 ms fall | ||
| The screen shows slow response rates in our tests and will be unsatisfactory for gamers. In comparison, all tested devices range from 0.165 (minimum) to 636 (maximum) ms. » 72 % of all devices are better. This means that the measured response time is worse than the average of all tested devices (31 ms). | ||
Screen Flickering / PWM (Pulse-Width Modulation)
| Screen flickering / PWM not detected | 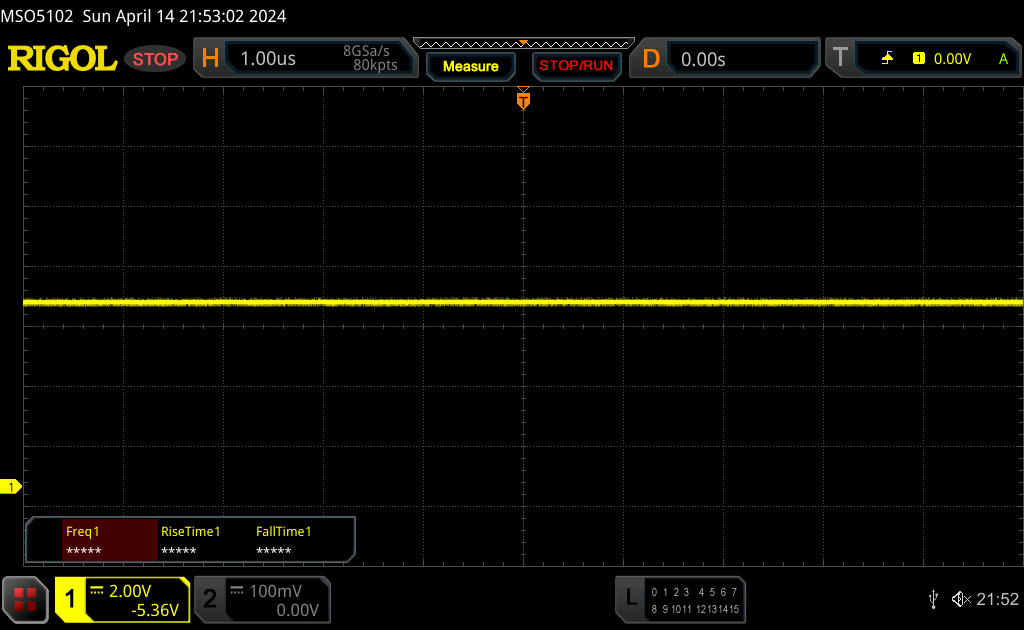 | ||
In comparison: 52 % of all tested devices do not use PWM to dim the display. If PWM was detected, an average of 7763 (minimum: 5 - maximum: 343500) Hz was measured. | |||

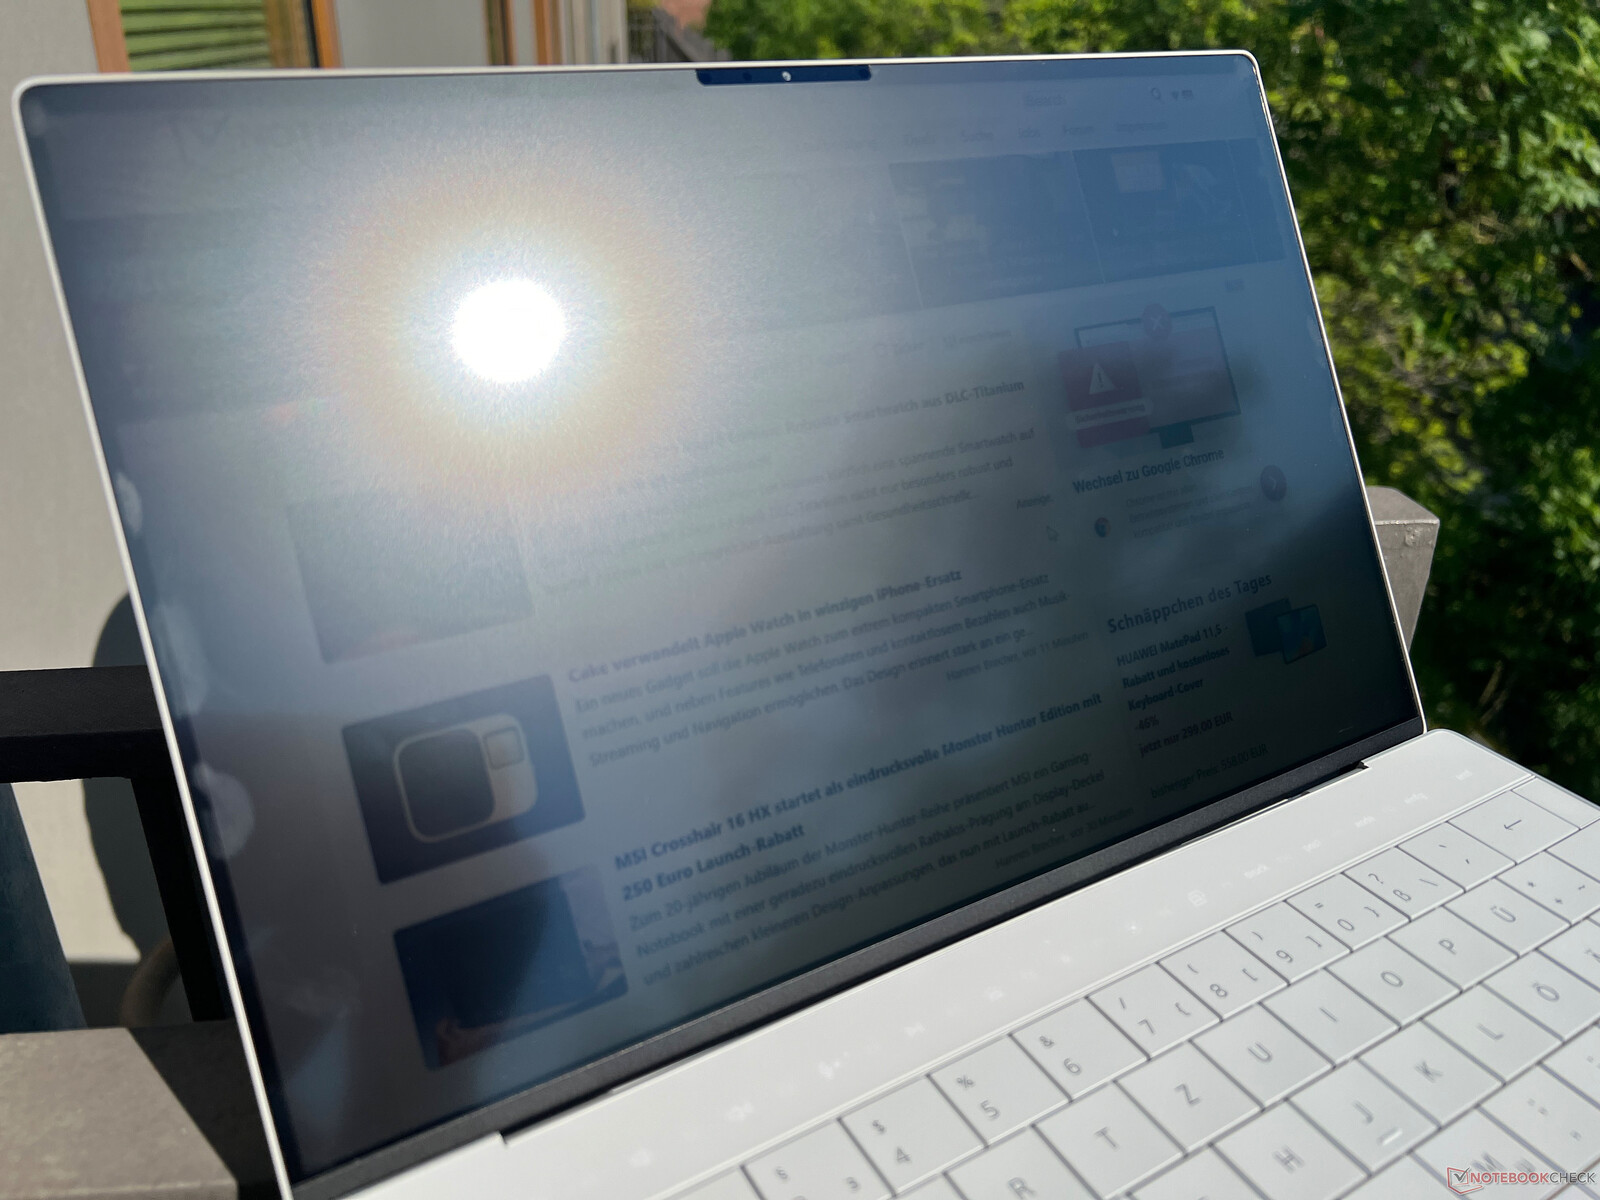
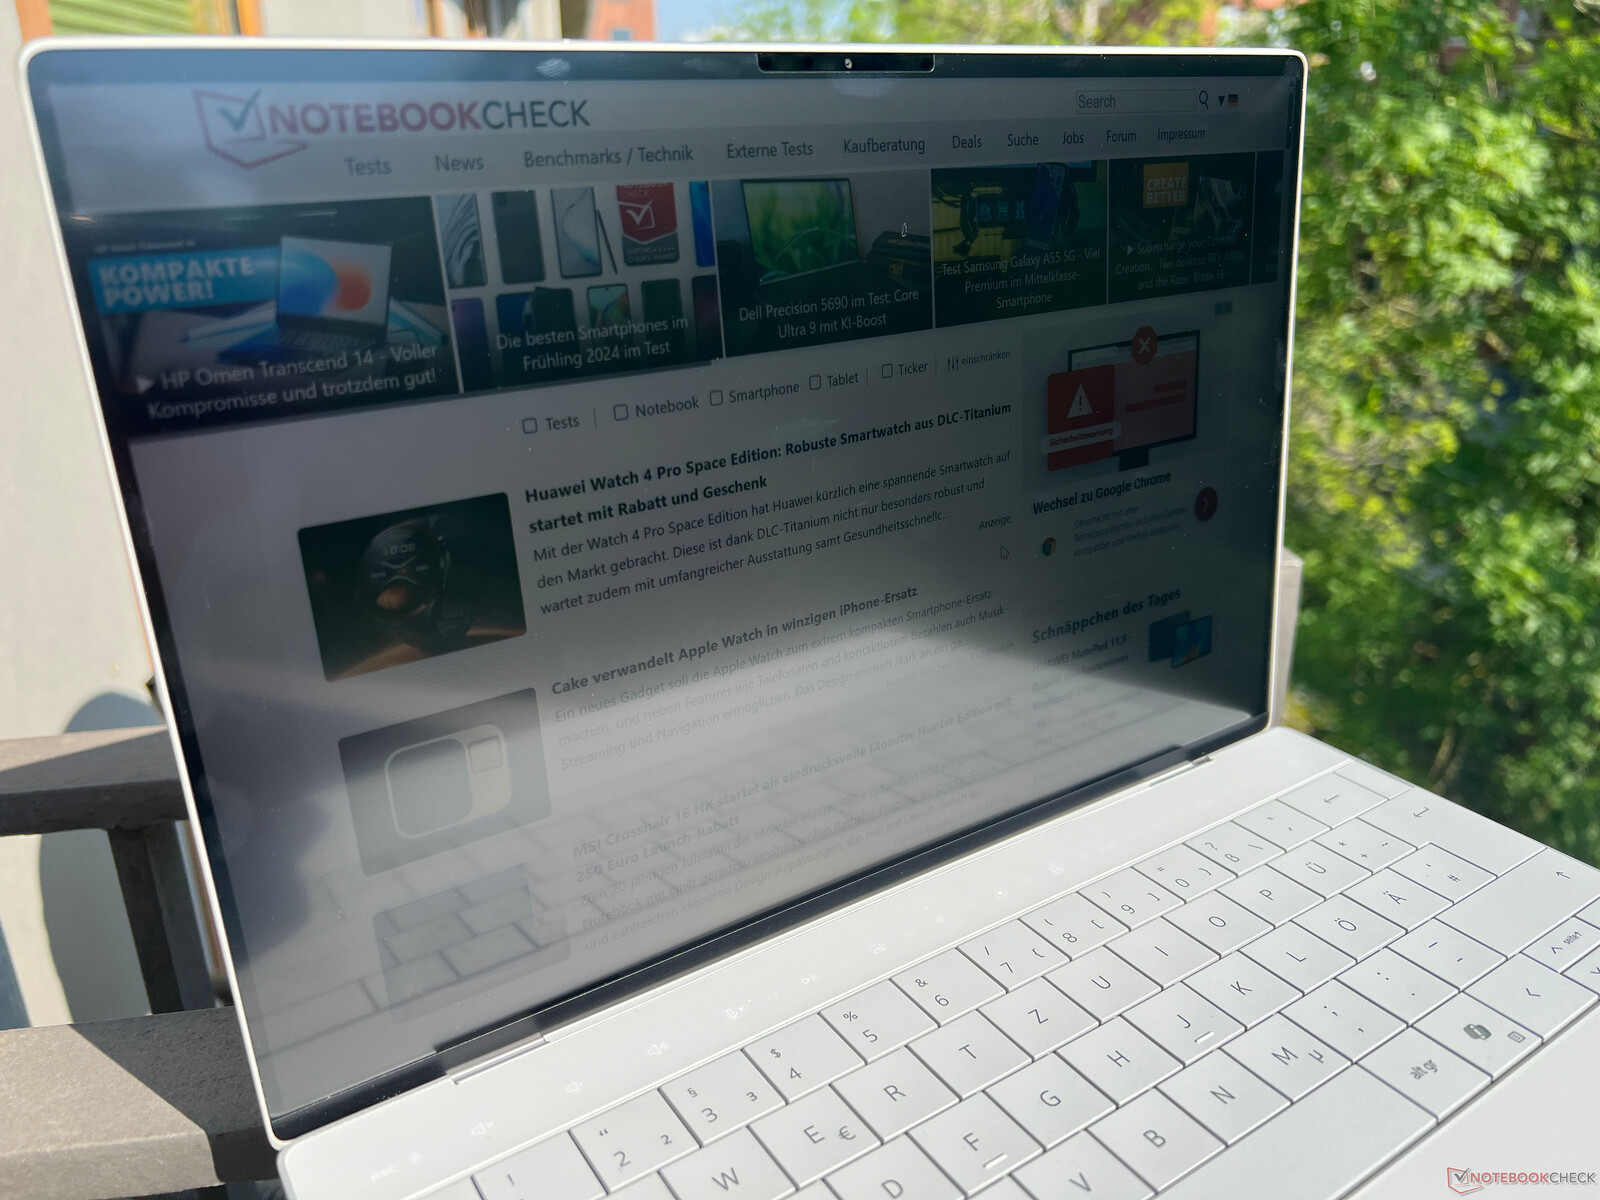

In general, the matte panel is helpful outside but on bright days, operation is slightly limited. The panel would need to be even brighter to ensure a comfortable operating experience. Its viewing-angle stability is good.

Performance - The XPS 13 with up to 64 GB RAM
Dell only offers the new XPS 13 9340 with Intel's Meteor Lake processors (Core Ultra 5/7) and there are no dedicated graphics cards. There is a choice of 8, 16, 32 or 64 GB RAM (8 GB only with the Core Ultra 7 155H, the Core Ultra 5 125H is only available with 16 GB).

Testing conditions
Various performance modes are available within the MyDell software, but these cannot be switched between via a key combination. We used the mode optimized for the following tests.
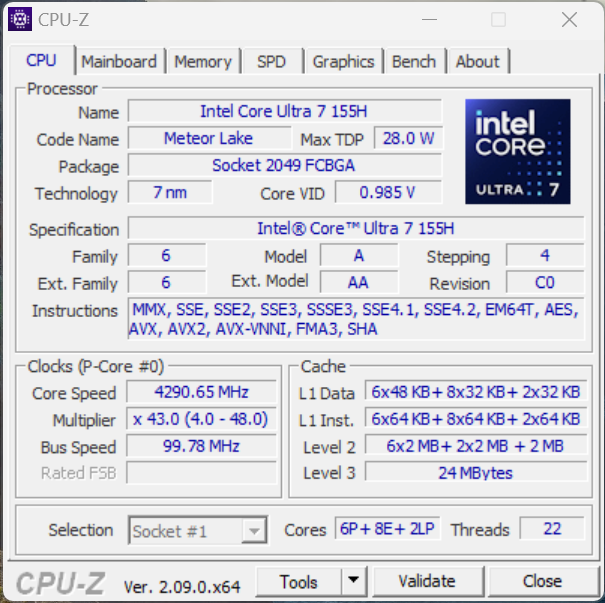
Processor - Core Ultra 7 155H
The Core Ultra 7 155H belongs to the current Meteor Lake generation from Intel and it is the successor to the old Core i7-13700H. Within the XPS 13, the processor can consume a maximum of 45 watts in short bursts but under continuous load, it balances out at around 24 watts after 5 minutes (~40 % less performance). During the beginning of the multi-core tests, its performance was decent, but not much better than the old Core i7-1360P with two performance cores fewer. Furthermore, its single-core performance is also worse than in the old XPS 13. Apple's M3 SoC was also a lot faster during the single-core tests but in the multi-core tests, it was slower. In battery use, the processor can consume 42 watts for a short while before immediately sinking to 20 watts. This means its multi-core performance away from an outlet is around 43 % reduced. Further CPU benchmarks can be found in our tech section.
Cinebench R15 Multi continuous test
Cinebench R23: Multi Core | Single Core
Cinebench R20: CPU (Multi Core) | CPU (Single Core)
Cinebench R15: CPU Multi 64Bit | CPU Single 64Bit
Blender: v2.79 BMW27 CPU
7-Zip 18.03: 7z b 4 | 7z b 4 -mmt1
Geekbench 6.7: Multi-Core | Single-Core
Geekbench 5.5: Multi-Core | Single-Core
HWBOT x265 Benchmark v2.2: 4k Preset
LibreOffice : 20 Documents To PDF
R Benchmark 2.5: Overall mean
| CPU Performance rating | |
| Average Intel Core Ultra 7 155H | |
| Lenovo ThinkPad Z13 Gen 2 | |
| Apple MacBook Air 13 M3 10C GPU -9! | |
| Dell XPS 13 9340 Core Ultra 7 | |
| Dell XPS 13 Plus 9320 Core i7-1360P -2! | |
| Average of class Subnotebook | |
| HP Dragonfly G4 -2! | |
| Asus ZenBook S13 OLED UX5304 -2! | |
| Cinebench R23 / Multi Core | |
| Average Intel Core Ultra 7 155H (9769 - 19007, n=52) | |
| Lenovo ThinkPad Z13 Gen 2 | |
| Dell XPS 13 9340 Core Ultra 7 | |
| Average of class Subnotebook (1555 - 21812, n=59, last 2 years) | |
| Dell XPS 13 Plus 9320 Core i7-1360P | |
| Apple MacBook Air 13 M3 10C GPU | |
| HP Dragonfly G4 | |
| Asus ZenBook S13 OLED UX5304 | |
| Cinebench R23 / Single Core | |
| Apple MacBook Air 13 M3 10C GPU | |
| HP Dragonfly G4 | |
| Dell XPS 13 Plus 9320 Core i7-1360P | |
| Average of class Subnotebook (358 - 2213, n=60, last 2 years) | |
| Asus ZenBook S13 OLED UX5304 | |
| Average Intel Core Ultra 7 155H (1496 - 1815, n=52) | |
| Lenovo ThinkPad Z13 Gen 2 | |
| Dell XPS 13 9340 Core Ultra 7 | |
| Cinebench R20 / CPU (Multi Core) | |
| Average Intel Core Ultra 7 155H (3798 - 7409, n=50) | |
| Lenovo ThinkPad Z13 Gen 2 | |
| Dell XPS 13 9340 Core Ultra 7 | |
| Average of class Subnotebook (579 - 8541, n=56, last 2 years) | |
| Dell XPS 13 Plus 9320 Core i7-1360P | |
| HP Dragonfly G4 | |
| Asus ZenBook S13 OLED UX5304 | |
| Cinebench R20 / CPU (Single Core) | |
| Dell XPS 13 Plus 9320 Core i7-1360P | |
| HP Dragonfly G4 | |
| Asus ZenBook S13 OLED UX5304 | |
| Lenovo ThinkPad Z13 Gen 2 | |
| Average Intel Core Ultra 7 155H (601 - 696, n=50) | |
| Average of class Subnotebook (128 - 832, n=56, last 2 years) | |
| Dell XPS 13 9340 Core Ultra 7 | |
| Cinebench R15 / CPU Multi 64Bit | |
| Average Intel Core Ultra 7 155H (1932 - 2880, n=56) | |
| Dell XPS 13 9340 Core Ultra 7 | |
| Lenovo ThinkPad Z13 Gen 2 | |
| Average of class Subnotebook (327 - 3345, n=56, last 2 years) | |
| Dell XPS 13 Plus 9320 Core i7-1360P | |
| Asus ZenBook S13 OLED UX5304 | |
| HP Dragonfly G4 | |
| Cinebench R15 / CPU Single 64Bit | |
| Dell XPS 13 Plus 9320 Core i7-1360P | |
| Lenovo ThinkPad Z13 Gen 2 | |
| Average of class Subnotebook (72.4 - 322, n=56, last 2 years) | |
| HP Dragonfly G4 | |
| Dell XPS 13 9340 Core Ultra 7 | |
| Average Intel Core Ultra 7 155H (99.6 - 268, n=52) | |
| Asus ZenBook S13 OLED UX5304 | |
| Blender / v2.79 BMW27 CPU | |
| Apple MacBook Air 13 M3 10C GPU | |
| Asus ZenBook S13 OLED UX5304 | |
| Asus ZenBook S13 OLED UX5304 | |
| HP Dragonfly G4 | |
| Average of class Subnotebook (159 - 2271, n=57, last 2 years) | |
| Dell XPS 13 Plus 9320 Core i7-1360P | |
| Dell XPS 13 9340 Core Ultra 7 | |
| Lenovo ThinkPad Z13 Gen 2 | |
| Average Intel Core Ultra 7 155H (175 - 381, n=47) | |
| 7-Zip 18.03 / 7z b 4 | |
| Average Intel Core Ultra 7 155H (41739 - 70254, n=50) | |
| Lenovo ThinkPad Z13 Gen 2 | |
| Dell XPS 13 9340 Core Ultra 7 | |
| Dell XPS 13 Plus 9320 Core i7-1360P | |
| Average of class Subnotebook (11668 - 77867, n=56, last 2 years) | |
| HP Dragonfly G4 | |
| Asus ZenBook S13 OLED UX5304 | |
| 7-Zip 18.03 / 7z b 4 -mmt1 | |
| HP Dragonfly G4 | |
| Asus ZenBook S13 OLED UX5304 | |
| Lenovo ThinkPad Z13 Gen 2 | |
| Average of class Subnotebook (2643 - 6699, n=58, last 2 years) | |
| Dell XPS 13 Plus 9320 Core i7-1360P | |
| Dell XPS 13 9340 Core Ultra 7 | |
| Average Intel Core Ultra 7 155H (4594 - 5621, n=50) | |
| Geekbench 6.7 / Multi-Core | |
| Average of class Subnotebook (2244 - 20325, n=62, last 2 years) | |
| Average Intel Core Ultra 7 155H (7732 - 13656, n=55) | |
| Lenovo ThinkPad Z13 Gen 2 | |
| Apple MacBook Air 13 M3 10C GPU | |
| Dell XPS 13 9340 Core Ultra 7 | |
| Geekbench 6.7 / Single-Core | |
| Apple MacBook Air 13 M3 10C GPU | |
| Average of class Subnotebook (960 - 4195, n=61, last 2 years) | |
| Lenovo ThinkPad Z13 Gen 2 | |
| Dell XPS 13 9340 Core Ultra 7 | |
| Average Intel Core Ultra 7 155H (1901 - 2473, n=52) | |
| Geekbench 5.5 / Multi-Core | |
| Average Intel Core Ultra 7 155H (10017 - 13556, n=52) | |
| Dell XPS 13 9340 Core Ultra 7 | |
| Lenovo ThinkPad Z13 Gen 2 | |
| Dell XPS 13 Plus 9320 Core i7-1360P | |
| Apple MacBook Air 13 M3 10C GPU | |
| Average of class Subnotebook (2557 - 17218, n=47, last 2 years) | |
| HP Dragonfly G4 | |
| Asus ZenBook S13 OLED UX5304 | |
| Geekbench 5.5 / Single-Core | |
| Apple MacBook Air 13 M3 10C GPU | |
| Average of class Subnotebook (726 - 2224, n=47, last 2 years) | |
| HP Dragonfly G4 | |
| Lenovo ThinkPad Z13 Gen 2 | |
| Dell XPS 13 Plus 9320 Core i7-1360P | |
| Asus ZenBook S13 OLED UX5304 | |
| Dell XPS 13 9340 Core Ultra 7 | |
| Average Intel Core Ultra 7 155H (1462 - 1824, n=52) | |
| HWBOT x265 Benchmark v2.2 / 4k Preset | |
| Lenovo ThinkPad Z13 Gen 2 | |
| Average Intel Core Ultra 7 155H (9.93 - 21.2, n=50) | |
| Dell XPS 13 9340 Core Ultra 7 | |
| Dell XPS 13 Plus 9320 Core i7-1360P | |
| Average of class Subnotebook (0.97 - 25.1, n=56, last 2 years) | |
| HP Dragonfly G4 | |
| Asus ZenBook S13 OLED UX5304 | |
| LibreOffice / 20 Documents To PDF | |
| Average of class Subnotebook (39.9 - 220, n=55, last 2 years) | |
| Average Intel Core Ultra 7 155H (37.5 - 79.2, n=49) | |
| Lenovo ThinkPad Z13 Gen 2 | |
| Dell XPS 13 9340 Core Ultra 7 | |
| Asus ZenBook S13 OLED UX5304 | |
| Dell XPS 13 Plus 9320 Core i7-1360P | |
| HP Dragonfly G4 | |
| R Benchmark 2.5 / Overall mean | |
| Average of class Subnotebook (0.4024 - 1.456, n=57, last 2 years) | |
| Dell XPS 13 9340 Core Ultra 7 | |
| Average Intel Core Ultra 7 155H (0.4457 - 0.53, n=49) | |
| Lenovo ThinkPad Z13 Gen 2 | |
| Asus ZenBook S13 OLED UX5304 | |
| Dell XPS 13 Plus 9320 Core i7-1360P | |
| HP Dragonfly G4 | |
* ... smaller is better
AIDA64: FP32 Ray-Trace | FPU Julia | CPU SHA3 | CPU Queen | FPU SinJulia | FPU Mandel | CPU AES | CPU ZLib | FP64 Ray-Trace | CPU PhotoWorxx
| Performance rating | |
| Lenovo ThinkPad Z13 Gen 2 | |
| Average Intel Core Ultra 7 155H | |
| Dell XPS 13 9340 Core Ultra 7 | |
| Average of class Subnotebook | |
| Dell XPS 13 Plus 9320 Core i7-1360P | |
| HP Dragonfly G4 | |
| Asus ZenBook S13 OLED UX5304 | |
| AIDA64 / FP32 Ray-Trace | |
| Lenovo ThinkPad Z13 Gen 2 | |
| Average of class Subnotebook (1135 - 32888, n=57, last 2 years) | |
| Average Intel Core Ultra 7 155H (6670 - 18470, n=50) | |
| Dell XPS 13 9340 Core Ultra 7 | |
| Dell XPS 13 Plus 9320 Core i7-1360P | |
| HP Dragonfly G4 | |
| Asus ZenBook S13 OLED UX5304 | |
| AIDA64 / FPU Julia | |
| Lenovo ThinkPad Z13 Gen 2 | |
| Average Intel Core Ultra 7 155H (40905 - 93181, n=50) | |
| Dell XPS 13 9340 Core Ultra 7 | |
| Average of class Subnotebook (5218 - 123315, n=57, last 2 years) | |
| Dell XPS 13 Plus 9320 Core i7-1360P | |
| HP Dragonfly G4 | |
| Asus ZenBook S13 OLED UX5304 | |
| AIDA64 / CPU SHA3 | |
| Lenovo ThinkPad Z13 Gen 2 | |
| Average Intel Core Ultra 7 155H (1940 - 4436, n=50) | |
| Average of class Subnotebook (444 - 5287, n=57, last 2 years) | |
| Dell XPS 13 9340 Core Ultra 7 | |
| Dell XPS 13 Plus 9320 Core i7-1360P | |
| HP Dragonfly G4 | |
| Asus ZenBook S13 OLED UX5304 | |
| AIDA64 / CPU Queen | |
| Lenovo ThinkPad Z13 Gen 2 | |
| Dell XPS 13 Plus 9320 Core i7-1360P | |
| Average Intel Core Ultra 7 155H (64698 - 94181, n=50) | |
| Dell XPS 13 9340 Core Ultra 7 | |
| HP Dragonfly G4 | |
| Asus ZenBook S13 OLED UX5304 | |
| Average of class Subnotebook (10579 - 95002, n=49, last 2 years) | |
| AIDA64 / FPU SinJulia | |
| Lenovo ThinkPad Z13 Gen 2 | |
| Average Intel Core Ultra 7 155H (5639 - 10647, n=50) | |
| Dell XPS 13 9340 Core Ultra 7 | |
| Dell XPS 13 Plus 9320 Core i7-1360P | |
| Average of class Subnotebook (744 - 18418, n=57, last 2 years) | |
| HP Dragonfly G4 | |
| Asus ZenBook S13 OLED UX5304 | |
| AIDA64 / FPU Mandel | |
| Lenovo ThinkPad Z13 Gen 2 | |
| Average Intel Core Ultra 7 155H (18236 - 47685, n=50) | |
| Average of class Subnotebook (3341 - 65433, n=57, last 2 years) | |
| Dell XPS 13 9340 Core Ultra 7 | |
| Dell XPS 13 Plus 9320 Core i7-1360P | |
| HP Dragonfly G4 | |
| Asus ZenBook S13 OLED UX5304 | |
| AIDA64 / CPU AES | |
| Average Intel Core Ultra 7 155H (45713 - 152179, n=50) | |
| Lenovo ThinkPad Z13 Gen 2 | |
| Dell XPS 13 9340 Core Ultra 7 | |
| Average of class Subnotebook (638 - 96917, n=57, last 2 years) | |
| Dell XPS 13 Plus 9320 Core i7-1360P | |
| HP Dragonfly G4 | |
| Asus ZenBook S13 OLED UX5304 | |
| AIDA64 / CPU ZLib | |
| Average Intel Core Ultra 7 155H (557 - 1250, n=50) | |
| Lenovo ThinkPad Z13 Gen 2 | |
| Dell XPS 13 9340 Core Ultra 7 | |
| Average of class Subnotebook (164.9 - 1379, n=57, last 2 years) | |
| Dell XPS 13 Plus 9320 Core i7-1360P | |
| HP Dragonfly G4 | |
| Asus ZenBook S13 OLED UX5304 | |
| AIDA64 / FP64 Ray-Trace | |
| Lenovo ThinkPad Z13 Gen 2 | |
| Average of class Subnotebook (610 - 17495, n=57, last 2 years) | |
| Average Intel Core Ultra 7 155H (3569 - 9802, n=50) | |
| Dell XPS 13 9340 Core Ultra 7 | |
| Dell XPS 13 Plus 9320 Core i7-1360P | |
| HP Dragonfly G4 | |
| Asus ZenBook S13 OLED UX5304 | |
| AIDA64 / CPU PhotoWorxx | |
| Dell XPS 13 9340 Core Ultra 7 | |
| Dell XPS 13 Plus 9320 Core i7-1360P | |
| Average of class Subnotebook (6569 - 85600, n=57, last 2 years) | |
| Average Intel Core Ultra 7 155H (32719 - 54223, n=50) | |
| Asus ZenBook S13 OLED UX5304 | |
| Lenovo ThinkPad Z13 Gen 2 | |
| HP Dragonfly G4 | |
System performance
The XPS 13 is a responsive device in everyday use and its benchmark results were also okay. We could not detect any stability problems during our test.
CrossMark: Overall | Productivity | Creativity | Responsiveness
WebXPRT 3: Overall
WebXPRT 4: Overall
Mozilla Kraken 1.1: Total
| PCMark 10 / Score | |
| Average of class Subnotebook (4920 - 9939, n=44, last 2 years) | |
| Lenovo ThinkPad Z13 Gen 2 | |
| Average Intel Core Ultra 7 155H, Intel Arc 8-Core iGPU (4809 - 7529, n=34) | |
| Dell XPS 13 9340 Core Ultra 7 | |
| Dell XPS 13 Plus 9320 Core i7-1360P | |
| HP Dragonfly G4 | |
| Asus ZenBook S13 OLED UX5304 | |
| PCMark 10 / Essentials | |
| Dell XPS 13 Plus 9320 Core i7-1360P | |
| Lenovo ThinkPad Z13 Gen 2 | |
| HP Dragonfly G4 | |
| Dell XPS 13 9340 Core Ultra 7 | |
| Asus ZenBook S13 OLED UX5304 | |
| Average Intel Core Ultra 7 155H, Intel Arc 8-Core iGPU (7605 - 11289, n=34) | |
| Average of class Subnotebook (8552 - 11646, n=44, last 2 years) | |
| PCMark 10 / Productivity | |
| Lenovo ThinkPad Z13 Gen 2 | |
| Average of class Subnotebook (5435 - 16606, n=44, last 2 years) | |
| Average Intel Core Ultra 7 155H, Intel Arc 8-Core iGPU (6042 - 10591, n=34) | |
| Dell XPS 13 9340 Core Ultra 7 | |
| Dell XPS 13 Plus 9320 Core i7-1360P | |
| HP Dragonfly G4 | |
| Asus ZenBook S13 OLED UX5304 | |
| PCMark 10 / Digital Content Creation | |
| Average of class Subnotebook (5722 - 13779, n=44, last 2 years) | |
| Average Intel Core Ultra 7 155H, Intel Arc 8-Core iGPU (4985 - 10709, n=34) | |
| Lenovo ThinkPad Z13 Gen 2 | |
| Dell XPS 13 9340 Core Ultra 7 | |
| Dell XPS 13 Plus 9320 Core i7-1360P | |
| HP Dragonfly G4 | |
| Asus ZenBook S13 OLED UX5304 | |
| CrossMark / Overall | |
| Apple MacBook Air 13 M3 10C GPU | |
| Dell XPS 13 Plus 9320 Core i7-1360P | |
| Dell XPS 13 9340 Core Ultra 7 | |
| Average Intel Core Ultra 7 155H, Intel Arc 8-Core iGPU (1366 - 1903, n=34) | |
| Average of class Subnotebook (365 - 2356, n=58, last 2 years) | |
| HP Dragonfly G4 | |
| Asus ZenBook S13 OLED UX5304 | |
| Lenovo ThinkPad Z13 Gen 2 | |
| CrossMark / Productivity | |
| Apple MacBook Air 13 M3 10C GPU | |
| Dell XPS 13 Plus 9320 Core i7-1360P | |
| HP Dragonfly G4 | |
| Dell XPS 13 9340 Core Ultra 7 | |
| Average Intel Core Ultra 7 155H, Intel Arc 8-Core iGPU (1291 - 1798, n=33) | |
| Average of class Subnotebook (364 - 2277, n=58, last 2 years) | |
| Asus ZenBook S13 OLED UX5304 | |
| Lenovo ThinkPad Z13 Gen 2 | |
| CrossMark / Creativity | |
| Apple MacBook Air 13 M3 10C GPU | |
| Dell XPS 13 Plus 9320 Core i7-1360P | |
| Average of class Subnotebook (372 - 2743, n=58, last 2 years) | |
| Dell XPS 13 9340 Core Ultra 7 | |
| Lenovo ThinkPad Z13 Gen 2 | |
| Average Intel Core Ultra 7 155H, Intel Arc 8-Core iGPU (1519 - 1929, n=33) | |
| HP Dragonfly G4 | |
| Asus ZenBook S13 OLED UX5304 | |
| CrossMark / Responsiveness | |
| Dell XPS 13 Plus 9320 Core i7-1360P | |
| Average Intel Core Ultra 7 155H, Intel Arc 8-Core iGPU (939 - 1802, n=33) | |
| Dell XPS 13 9340 Core Ultra 7 | |
| Asus ZenBook S13 OLED UX5304 | |
| HP Dragonfly G4 | |
| Apple MacBook Air 13 M3 10C GPU | |
| Average of class Subnotebook (312 - 1854, n=58, last 2 years) | |
| Lenovo ThinkPad Z13 Gen 2 | |
| WebXPRT 3 / Overall | |
| Apple MacBook Air 13 M3 10C GPU | |
| Average of class Subnotebook (156 - 530, n=54, last 2 years) | |
| Dell XPS 13 Plus 9320 Core i7-1360P | |
| HP Dragonfly G4 | |
| Lenovo ThinkPad Z13 Gen 2 | |
| Asus ZenBook S13 OLED UX5304 | |
| Average Intel Core Ultra 7 155H, Intel Arc 8-Core iGPU (252 - 299, n=34) | |
| Dell XPS 13 9340 Core Ultra 7 | |
| WebXPRT 4 / Overall | |
| Apple MacBook Air 13 M3 10C GPU | |
| Average of class Subnotebook (132 - 378, n=59, last 2 years) | |
| Dell XPS 13 Plus 9320 Core i7-1360P | |
| HP Dragonfly G4 | |
| Dell XPS 13 9340 Core Ultra 7 | |
| Asus ZenBook S13 OLED UX5304 | |
| Average Intel Core Ultra 7 155H, Intel Arc 8-Core iGPU (166.4 - 309, n=29) | |
| Lenovo ThinkPad Z13 Gen 2 | |
| Mozilla Kraken 1.1 / Total | |
| Lenovo ThinkPad Z13 Gen 2 | |
| Average Intel Core Ultra 7 155H, Intel Arc 8-Core iGPU (517 - 614, n=35) | |
| Dell XPS 13 9340 Core Ultra 7 | |
| Asus ZenBook S13 OLED UX5304 | |
| Dell XPS 13 Plus 9320 Core i7-1360P | |
| HP Dragonfly G4 | |
| Average of class Subnotebook (234 - 1104, n=59, last 2 years) | |
| Apple MacBook Air 13 M3 10C GPU | |
* ... smaller is better
| PCMark 10 Score | 6555 points | |
Help | ||
| AIDA64 / Memory Copy | |
| Dell XPS 13 9340 Core Ultra 7 | |
| Average of class Subnotebook (14554 - 131023, n=57, last 2 years) | |
| Average Intel Core Ultra 7 155H (62397 - 96791, n=50) | |
| Dell XPS 13 Plus 9320 Core i7-1360P | |
| Lenovo ThinkPad Z13 Gen 2 | |
| Asus ZenBook S13 OLED UX5304 | |
| HP Dragonfly G4 | |
| AIDA64 / Memory Read | |
| Dell XPS 13 9340 Core Ultra 7 | |
| Average of class Subnotebook (15948 - 127174, n=57, last 2 years) | |
| Average Intel Core Ultra 7 155H (60544 - 90647, n=50) | |
| Dell XPS 13 Plus 9320 Core i7-1360P | |
| Lenovo ThinkPad Z13 Gen 2 | |
| Asus ZenBook S13 OLED UX5304 | |
| HP Dragonfly G4 | |
| AIDA64 / Memory Write | |
| Lenovo ThinkPad Z13 Gen 2 | |
| Dell XPS 13 Plus 9320 Core i7-1360P | |
| Average of class Subnotebook (15709 - 135141, n=57, last 2 years) | |
| Dell XPS 13 9340 Core Ultra 7 | |
| Average Intel Core Ultra 7 155H (58692 - 93451, n=50) | |
| Asus ZenBook S13 OLED UX5304 | |
| HP Dragonfly G4 | |
| AIDA64 / Memory Latency | |
| Average Intel Core Ultra 7 155H (116.2 - 233, n=50) | |
| Lenovo ThinkPad Z13 Gen 2 | |
| Dell XPS 13 9340 Core Ultra 7 | |
| Dell XPS 13 Plus 9320 Core i7-1360P | |
| Average of class Subnotebook (6.1 - 159.9, n=55, last 2 years) | |
| HP Dragonfly G4 | |
| Asus ZenBook S13 OLED UX5304 | |
* ... smaller is better
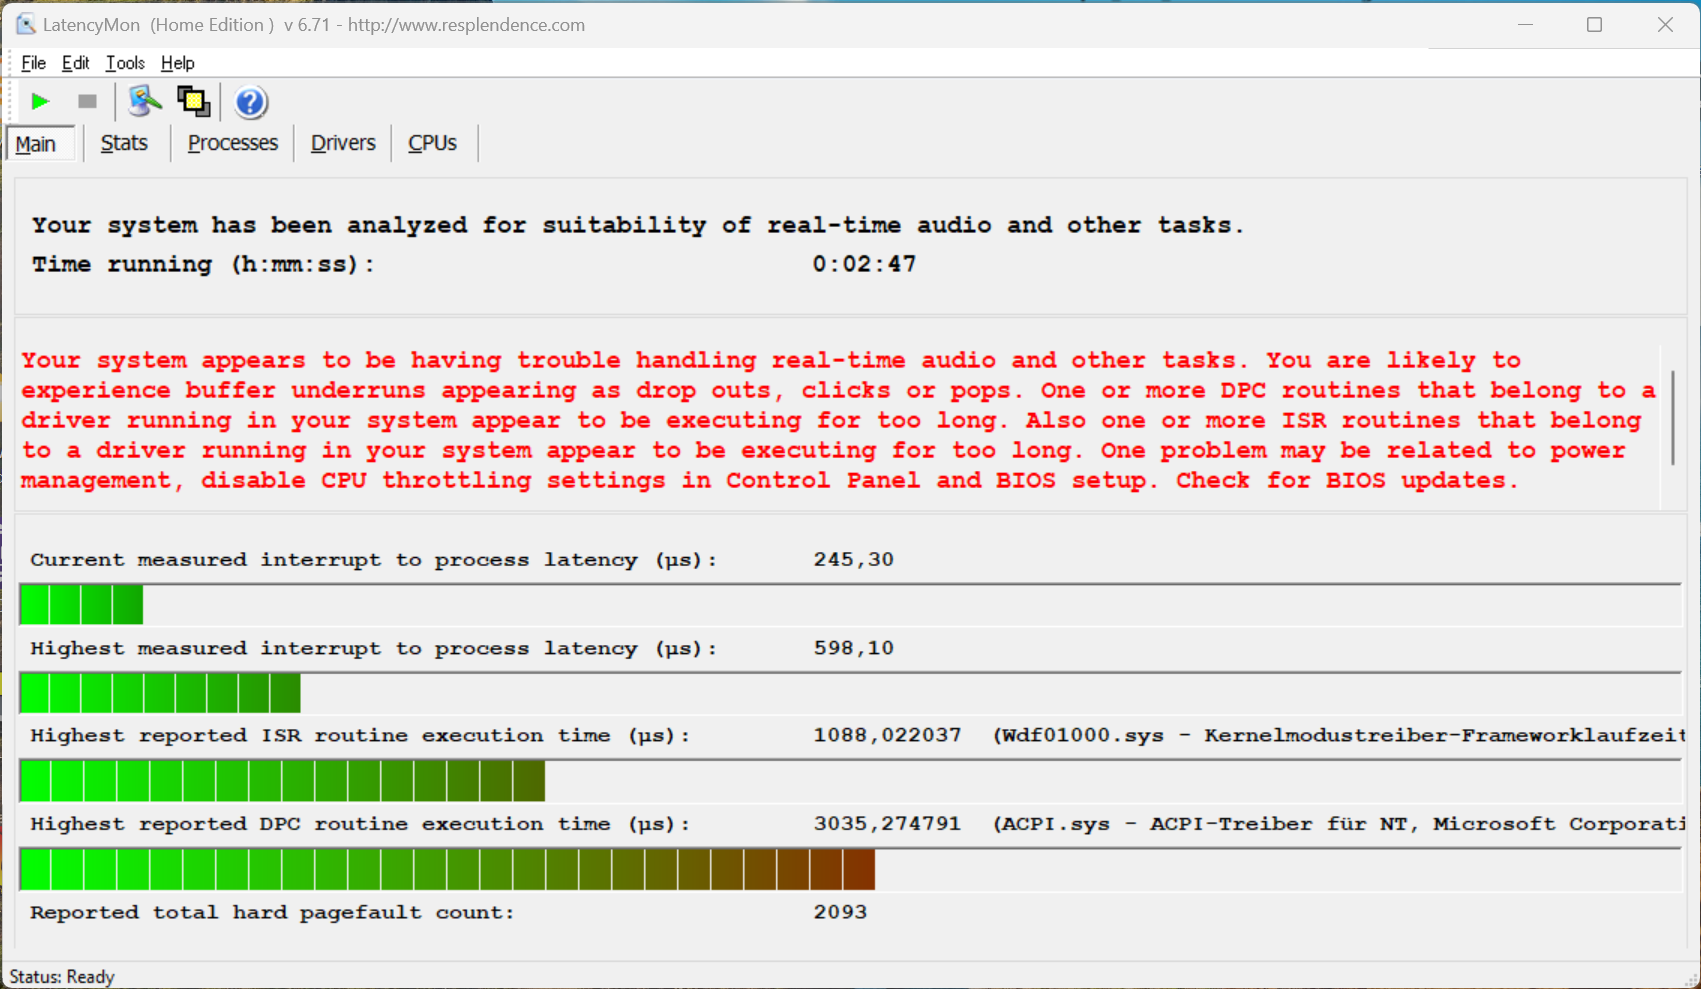
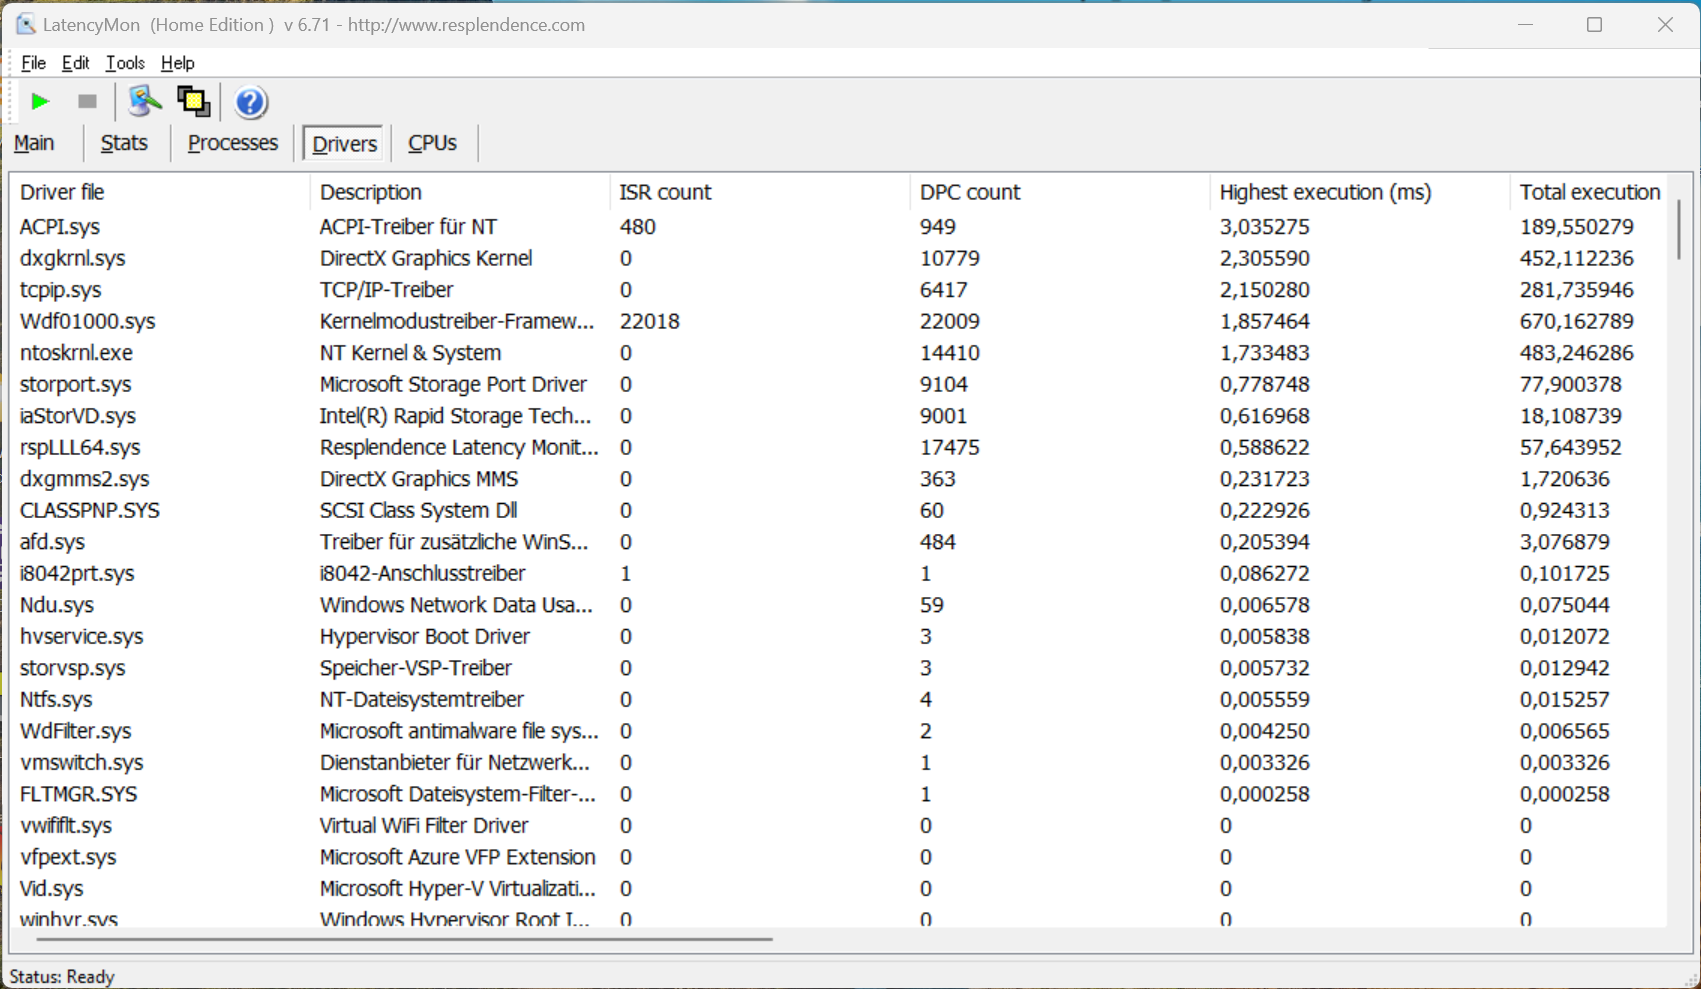
DPC latencies
In our standardized latency test (surfing the web, 4K YouTube playback, CPU load), the test device with the current BIOS version showed no limitations when using real-time audio applications. Although one driver showed a deflection, the important “interrupt-to-process-latency” value was very low.
| DPC Latencies / LatencyMon - interrupt to process latency (max), Web, Youtube, Prime95 | |
| Dell XPS 13 Plus 9320 Core i7-1360P | |
| Lenovo ThinkPad Z13 Gen 2 | |
| Asus ZenBook S13 OLED UX5304 | |
| HP Dragonfly G4 | |
| Dell XPS 13 9340 Core Ultra 7 | |
* ... smaller is better
Storage device
Our test device is quipped with the PCIe 4.0 SSD Micron 2550 with a capacity of 512 GB, of which 371 GB is still free to use after the initial start-up. Its transfer rates are perfectly fine with a maximum of more than 4 GB/s and there is no noticeable drop in performance even under prolonged load. Further SSD benchmarks are listed here.

* ... smaller is better
Reading continuous performance: DiskSpd Read Loop, Queue Depth 8
Graphics card
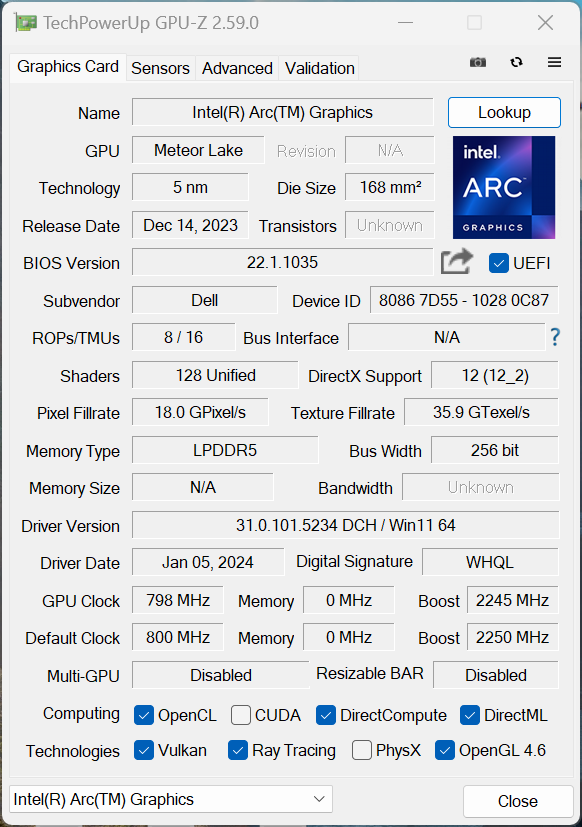
Graphics calculations are taken care of by the new Intel Arc Graphics, which is the faster version with 8 Xe cores in conjunction with the Core Ultra 7 155H. The GPU's performance is generally significantly higher than the old Iris Xe Graphics G7, and AMD's fast Radeon 780M could also be beaten in most benchmarks. During the gaming tests, on the other hand, AMD's iGPU generally still came ahead; Intel still needs to do some work on its drivers here.
In principle, its gaming performance is good enough for lots of older games with medium to high details and we also noted no dropped frames—although its performance didn't remain stable. Achieving only 70 %, it didn't pass the Time Spy stress test and our Witcher 3 test also showed a significant loss of performance after a few minutes. The GPU's performance drops minimally in battery mode (8 %). Further GPU benchmarks are available here.
| 3DMark 11 Performance | 9575 points | |
| 3DMark Fire Strike Score | 6900 points | |
| 3DMark Time Spy Score | 3106 points | |
Help | ||
* ... smaller is better
| Performance rating - Percent | |
| Average of class Subnotebook | |
| Lenovo ThinkPad Z13 Gen 2 -1! | |
| Dell XPS 13 9340 Core Ultra 7 | |
| Dell XPS 13 Plus 9320 Core i7-1360P | |
| HP Dragonfly G4 | |
| Asus ZenBook S13 OLED UX5304 | |
| The Witcher 3 - 1920x1080 Ultra Graphics & Postprocessing (HBAO+) | |
| Lenovo ThinkPad Z13 Gen 2 | |
| Average of class Subnotebook (13.9 - 34.6, n=13, last 2 years) | |
| Dell XPS 13 9340 Core Ultra 7 | |
| Dell XPS 13 Plus 9320 Core i7-1360P | |
| HP Dragonfly G4 | |
| Asus ZenBook S13 OLED UX5304 | |
| GTA V - 1920x1080 Highest AA:4xMSAA + FX AF:16x | |
| Average of class Subnotebook (10.7 - 43.7, n=55, last 2 years) | |
| Dell XPS 13 9340 Core Ultra 7 | |
| Dell XPS 13 Plus 9320 Core i7-1360P | |
| HP Dragonfly G4 | |
| Asus ZenBook S13 OLED UX5304 | |
| Final Fantasy XV Benchmark - 1920x1080 High Quality | |
| Average of class Subnotebook (11.6 - 54.5, n=53, last 2 years) | |
| Lenovo ThinkPad Z13 Gen 2 | |
| Dell XPS 13 9340 Core Ultra 7 | |
| Dell XPS 13 Plus 9320 Core i7-1360P | |
| HP Dragonfly G4 | |
| Asus ZenBook S13 OLED UX5304 | |
| Strange Brigade - 1920x1080 ultra AA:ultra AF:16 | |
| Average of class Subnotebook (19 - 101.3, n=49, last 2 years) | |
| Lenovo ThinkPad Z13 Gen 2 | |
| Dell XPS 13 9340 Core Ultra 7 | |
| Dell XPS 13 Plus 9320 Core i7-1360P | |
| HP Dragonfly G4 | |
| Asus ZenBook S13 OLED UX5304 | |
| Dota 2 Reborn - 1920x1080 ultra (3/3) best looking | |
| Lenovo ThinkPad Z13 Gen 2 | |
| Average of class Subnotebook (13 - 97, n=60, last 2 years) | |
| Dell XPS 13 9340 Core Ultra 7 | |
| Dell XPS 13 Plus 9320 Core i7-1360P | |
| HP Dragonfly G4 | |
| Asus ZenBook S13 OLED UX5304 | |
Witcher 3 FPS diagram
| low | med. | high | ultra | |
|---|---|---|---|---|
| GTA V (2015) | 157.8 | 129.8 | 32.8 | 14.7 |
| The Witcher 3 (2015) | 152 | 89 | 47 | 20.8 |
| Dota 2 Reborn (2015) | 106.2 | 89.8 | 72 | 65.2 |
| Final Fantasy XV Benchmark (2018) | 61.3 | 36.2 | 26.4 | |
| X-Plane 11.11 (2018) | 53 | 40.7 | 30.8 | |
| Far Cry 5 (2018) | 57 | 33 | 30 | 28 |
| Strange Brigade (2018) | 156 | 68 | 54 | 41 |
| F1 23 (2023) | 67.9 | 60.5 | 39.5 | 10.7 |
Emissions - Often quiet in everyday use
Noise emissions
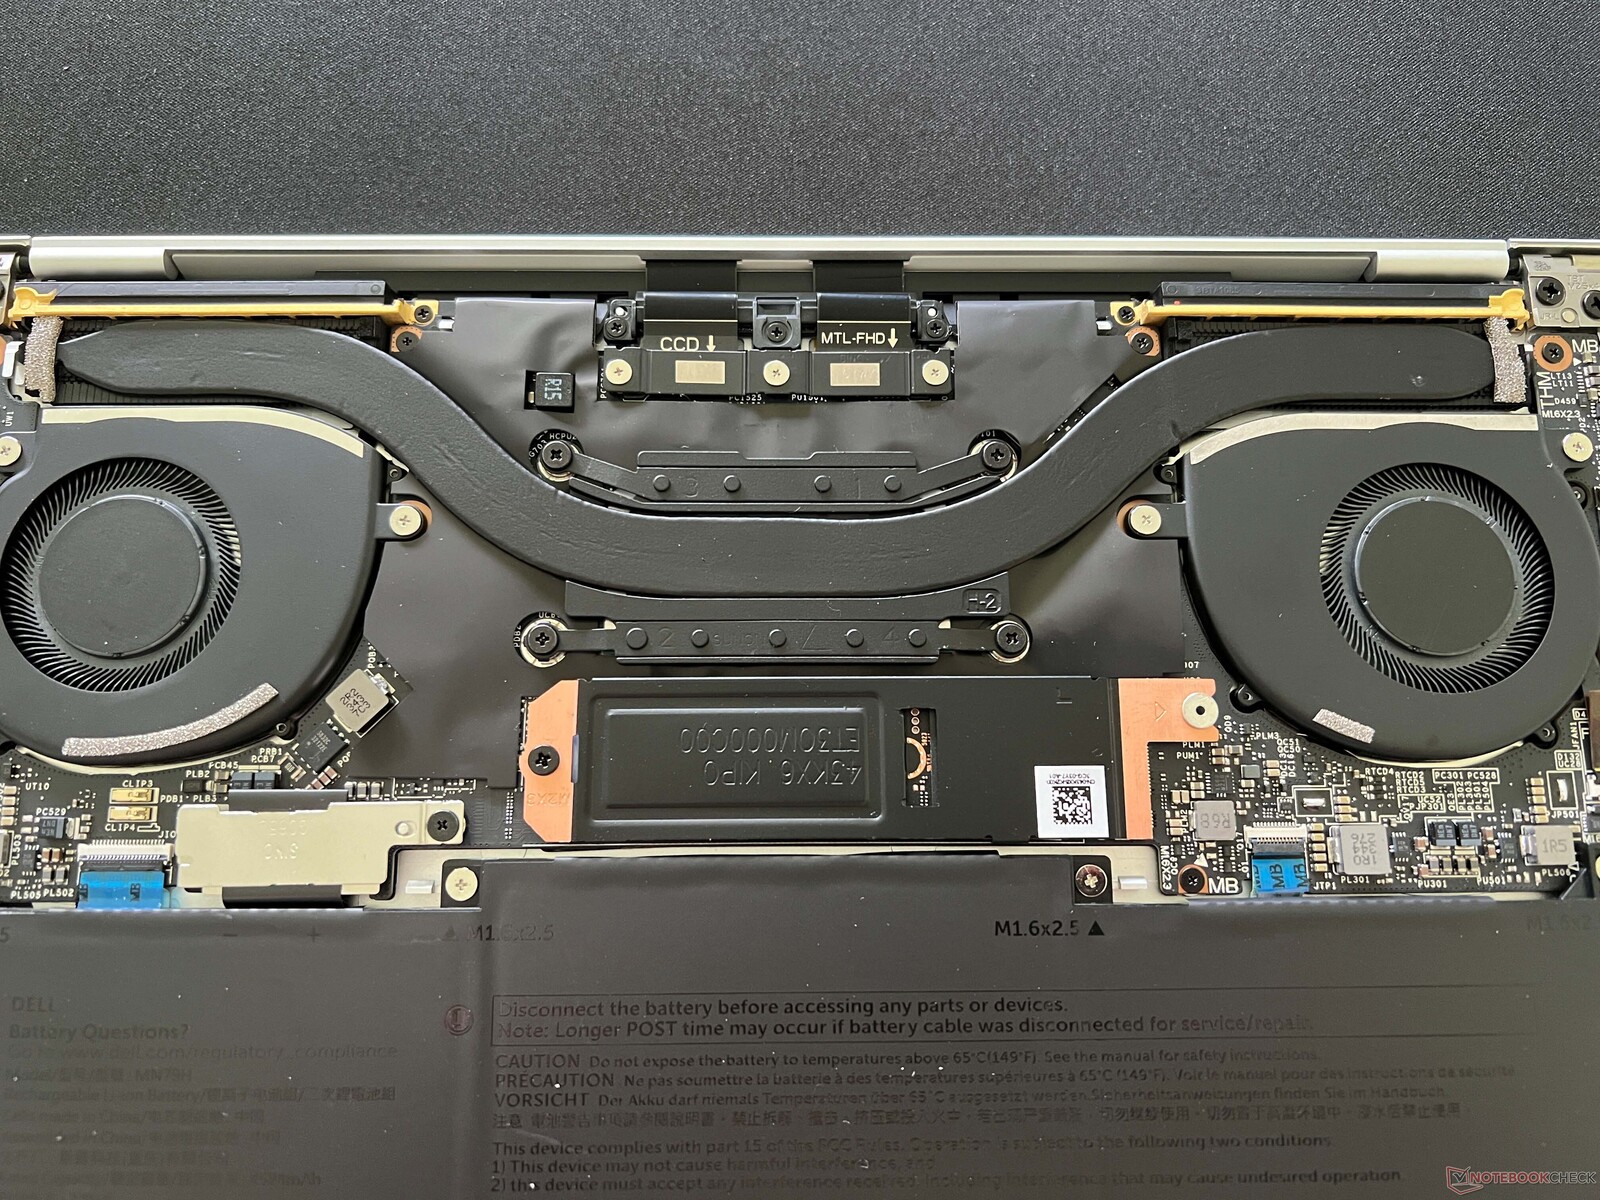
The XPS 13's cooling unit consists of two fans and a heat pipe. In idle mode and during simple tasks, the laptop generally remains silent or very quiet. As soon as you demand more from the processor or the iGPU, the cooling quickly becomes audible. We measured between 37-42 dB(A), but there were no high-pitched noises. All-in-all, the XPS 13 performs similarly to its predecessor in this aspect and is one of the louder models within the comparison field. When using the optional performance mode ultra, its noise emissions rise to 47 dB(A) and we noted 32 dB(A) using silent mode. No additional electronic noises came from our test device.
Noise level
| Idle |
| 25.1 / 25.1 / 25.1 dB(A) |
| Load |
| 37.4 / 42.5 dB(A) |
 | ||
30 dB silent 40 dB(A) audible 50 dB(A) loud |
||
min: | ||
| Dell XPS 13 9340 Core Ultra 7 Arc 8-Core, Ultra 7 155H, Micron 2550 512GB | Apple MacBook Air 13 M3 10C GPU M3 10-Core GPU, M3, Apple SSD AP0512Z | Asus ZenBook S13 OLED UX5304 Iris Xe G7 96EUs, i7-1355U, Samsung PM9A1 MZVL21T0HCLR | Lenovo ThinkPad Z13 Gen 2 Radeon 780M, R7 PRO 7840U, SK hynix BC901 HFS001TEJ4X164N | HP Dragonfly G4 Iris Xe G7 96EUs, i7-1365U, Micron 3400 MTFDKBA512TFH 512GB | Dell XPS 13 Plus 9320 Core i7-1360P Iris Xe G7 96EUs, i7-1360P, Samsung PM9A1 MZVL2512HCJQ | |
|---|---|---|---|---|---|---|
| Noise | 6% | -1% | 11% | 3% | ||
| off / environment * (dB) | 25.1 | 23.3 7% | 25.1 -0% | 23.3 7% | 23.7 6% | |
| Idle Minimum * (dB) | 25.1 | 23.3 7% | 25.8 -3% | 23.5 6% | 24 4% | |
| Idle Average * (dB) | 25.1 | 23.3 7% | 25.8 -3% | 23.5 6% | 24 4% | |
| Idle Maximum * (dB) | 25.1 | 23.3 7% | 28.3 -13% | 26.8 -7% | 24.4 3% | |
| Load Average * (dB) | 37.4 | 37.7 -1% | 28.3 24% | 27.2 27% | 37 1% | |
| Witcher 3 ultra * (dB) | 42.5 | 40.1 6% | 44.8 -5% | 32.7 23% | 42.1 1% | |
| Load Maximum * (dB) | 42.5 | 40.1 6% | 44.8 -5% | 35 18% | 42 1% |
* ... smaller is better
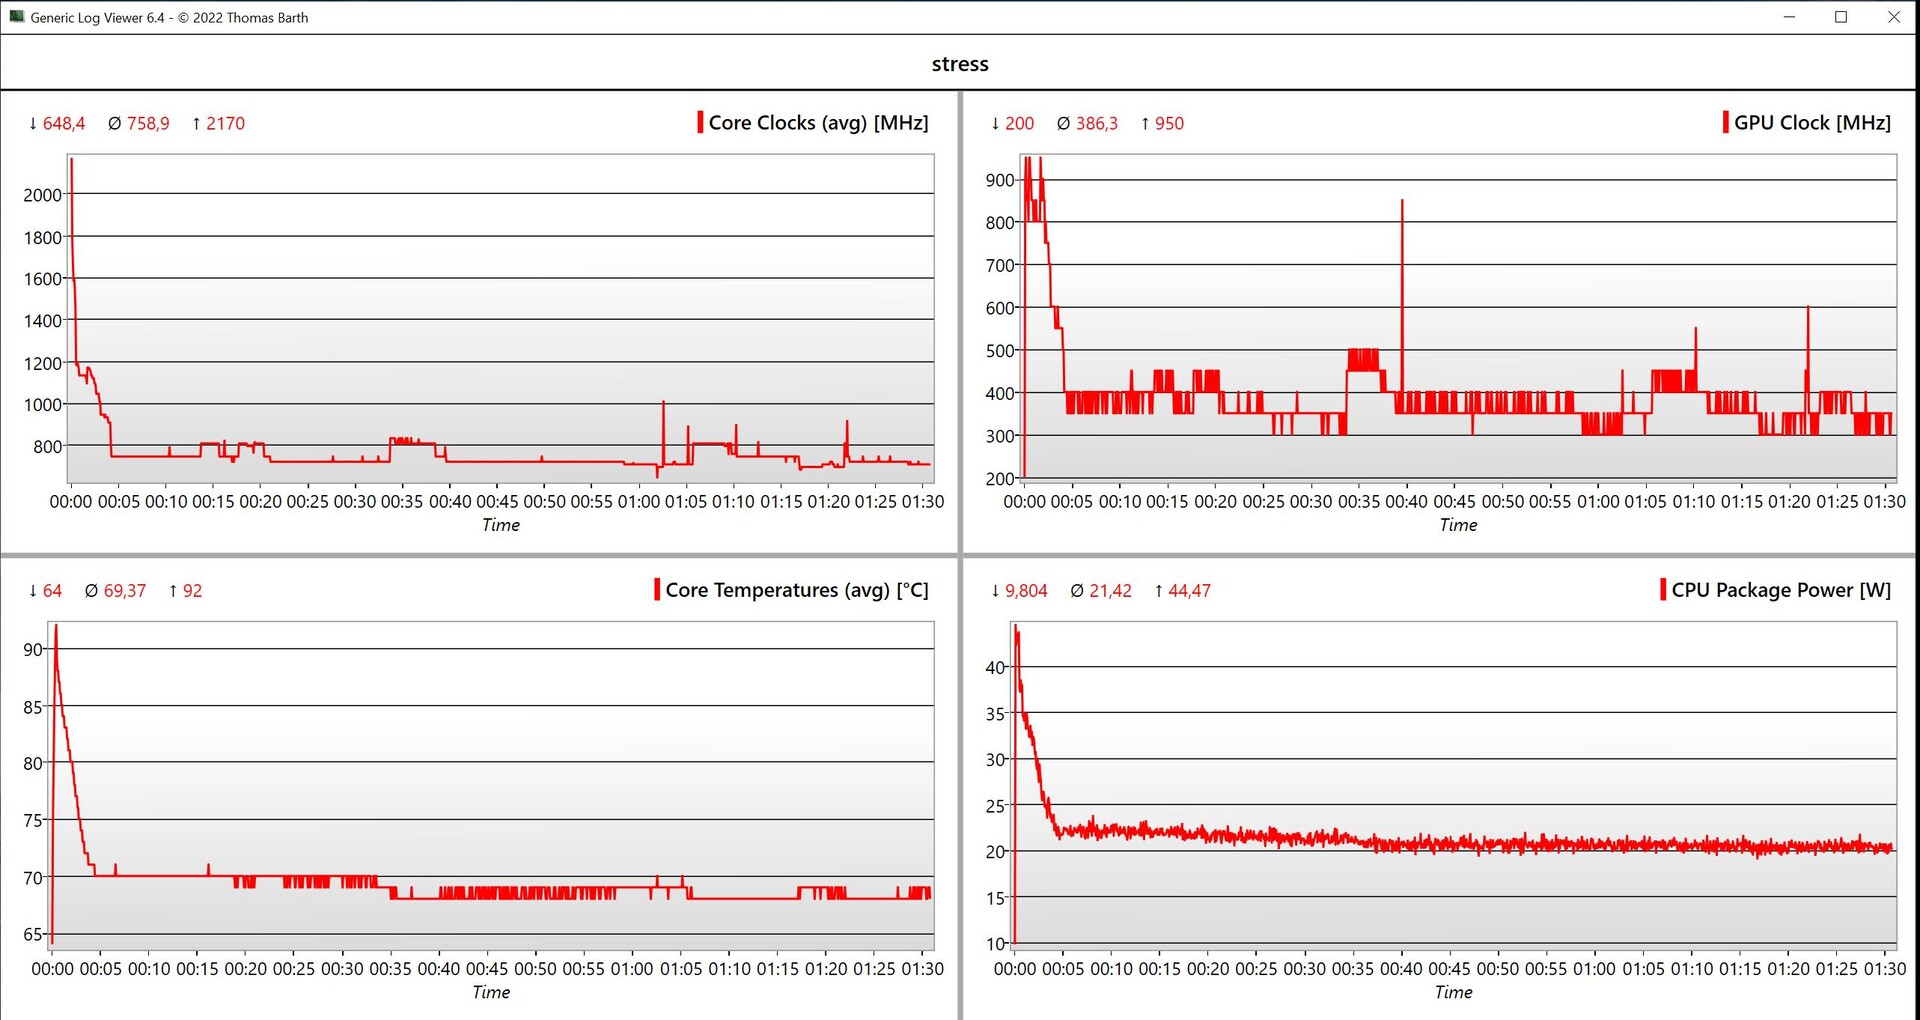
Temperature
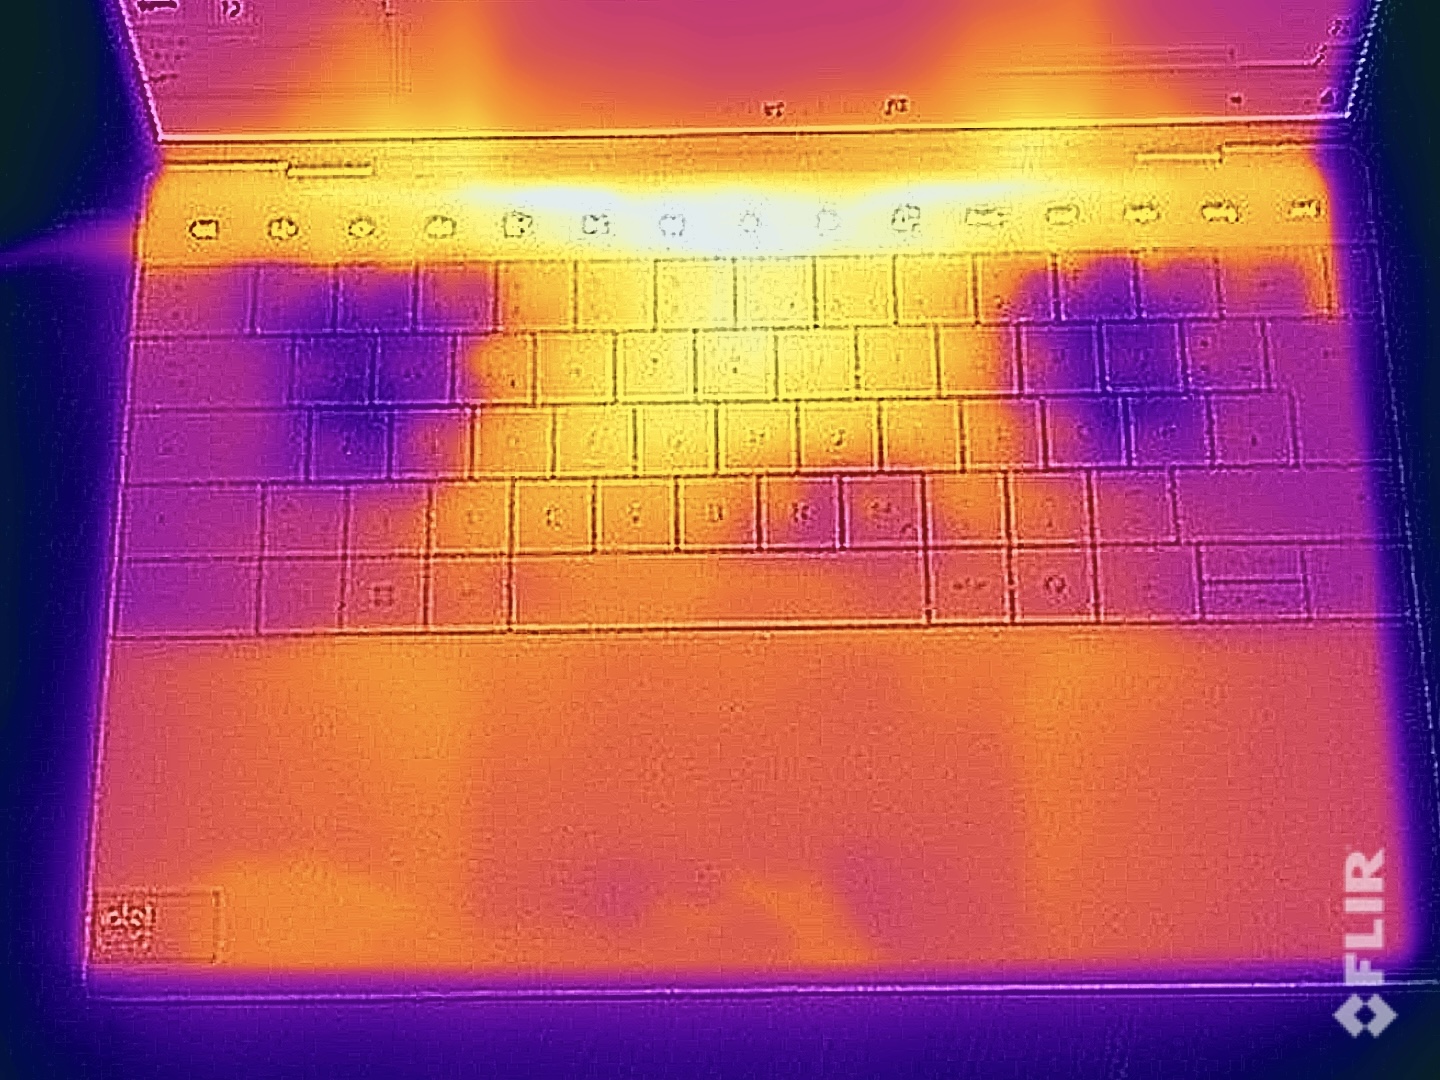
The surfaces of the XPS 13 remain very cool in idle mode and during simple tasks, and we noted no problems whatsoever. When gaming or under high load, the underside of the laptop in particular gets noticeably warm at about 110 °F (44 °C). However, there are no limitations when using the device and you don't have to worry about the keyboard, either. Only the touchbar gets very warm in the middle area. During the stress test, the processor briefly consumed up to 45 watts and then quickly dropped to around 24 watts. The XPS then remained in this range for some time before the value ultimately levelled off at around 21 watts.
(±) The maximum temperature on the upper side is 41 °C / 106 F, compared to the average of 35.9 °C / 97 F, ranging from 21.4 to 59 °C for the class Subnotebook.
(±) The bottom heats up to a maximum of 43.5 °C / 110 F, compared to the average of 39.2 °C / 103 F
(+) In idle usage, the average temperature for the upper side is 24.6 °C / 76 F, compared to the device average of 30.8 °C / 87 F.
(±) Playing The Witcher 3, the average temperature for the upper side is 33.3 °C / 92 F, compared to the device average of 30.8 °C / 87 F.
(+) The palmrests and touchpad are reaching skin temperature as a maximum (32.5 °C / 90.5 F) and are therefore not hot.
(-) The average temperature of the palmrest area of similar devices was 28.2 °C / 82.8 F (-4.3 °C / -7.7 F).

| Dell XPS 13 9340 Core Ultra 7 Intel Core Ultra 7 155H, Intel Arc 8-Core iGPU | Apple MacBook Air 13 M3 10C GPU Apple M3, Apple M3 10-Core GPU | Asus ZenBook S13 OLED UX5304 Intel Core i7-1355U, Intel Iris Xe Graphics G7 96EUs | Lenovo ThinkPad Z13 Gen 2 AMD Ryzen 7 PRO 7840U, AMD Radeon 780M | HP Dragonfly G4 Intel Core i7-1365U, Intel Iris Xe Graphics G7 96EUs | Dell XPS 13 Plus 9320 Core i7-1360P Intel Core i7-1360P, Intel Iris Xe Graphics G7 96EUs | |
|---|---|---|---|---|---|---|
| Heat | 4% | -6% | -2% | -3% | -1% | |
| Maximum Upper Side * (°C) | 41 | 44.3 -8% | 43.1 -5% | 46.2 -13% | 38.6 6% | 43.8 -7% |
| Maximum Bottom * (°C) | 43.5 | 43.4 -0% | 45 -3% | 48.4 -11% | 40.4 7% | 44.4 -2% |
| Idle Upper Side * (°C) | 25.3 | 22.3 12% | 27.3 -8% | 23.2 8% | 28.2 -11% | 24 5% |
| Idle Bottom * (°C) | 25.5 | 22.1 13% | 27.8 -9% | 23 10% | 29 -14% | 25.2 1% |
* ... smaller is better
Speakers
The XPS features a sound system with four speakers and its overall performance is pretty good, with the modules only falling a little short when it comes to bass. Even so, the speakers are usually sufficient for some background music or streaming from Netflix.
Dell XPS 13 9340 Core Ultra 7 audio analysis
(+) | speakers can play relatively loud (83.2 dB)
Bass 100 - 315 Hz
(-) | nearly no bass - on average 17% lower than median
(±) | linearity of bass is average (9.3% delta to prev. frequency)
Mids 400 - 2000 Hz
(+) | balanced mids - only 2.1% away from median
(+) | mids are linear (4.7% delta to prev. frequency)
Highs 2 - 16 kHz
(+) | balanced highs - only 2.5% away from median
(+) | highs are linear (4.6% delta to prev. frequency)
Overall 100 - 16.000 Hz
(+) | overall sound is linear (11.6% difference to median)
Compared to same class
» 12% of all tested devices in this class were better, 3% similar, 84% worse
» The best had a delta of 5%, average was 18%, worst was 53%
Compared to all devices tested
» 8% of all tested devices were better, 2% similar, 90% worse
» The best had a delta of 4%, average was 23%, worst was 134%
Apple MacBook Air 13 M3 10C GPU audio analysis
(+) | speakers can play relatively loud (83.2 dB)
Bass 100 - 315 Hz
(±) | reduced bass - on average 13.3% lower than median
(±) | linearity of bass is average (11.3% delta to prev. frequency)
Mids 400 - 2000 Hz
(+) | balanced mids - only 0.4% away from median
(+) | mids are linear (1.6% delta to prev. frequency)
Highs 2 - 16 kHz
(+) | balanced highs - only 4.5% away from median
(+) | highs are linear (1.9% delta to prev. frequency)
Overall 100 - 16.000 Hz
(+) | overall sound is linear (10.7% difference to median)
Compared to same class
» 9% of all tested devices in this class were better, 3% similar, 88% worse
» The best had a delta of 5%, average was 18%, worst was 53%
Compared to all devices tested
» 6% of all tested devices were better, 2% similar, 93% worse
» The best had a delta of 4%, average was 23%, worst was 134%
Power management - Long runtimes at 60 Hz
Power consumption
With a maximum idle consumption of less than 8 watts, the new XPS 13 is very frugal. We measured a maximum of 62.7 watts, but this is the limit of the 60-watt power supply. The laptop's consumption may drop again after a short time, but the battery has to make up this difference in the meantime. Over the course of the test, its consumption then stabilized at around 37 watts.
| Off / Standby | |
| Idle | |
| Load |
|
Key:
min: | |
| Dell XPS 13 9340 Core Ultra 7 Ultra 7 155H, Arc 8-Core, Micron 2550 512GB, IPS, 1920x1200, 13.4" | Apple MacBook Air 13 M3 10C GPU M3, M3 10-Core GPU, Apple SSD AP0512Z, IPS, 2560x1664, 13.6" | Asus ZenBook S13 OLED UX5304 i7-1355U, Iris Xe G7 96EUs, Samsung PM9A1 MZVL21T0HCLR, OLED, 2880x1800, 13.3" | Lenovo ThinkPad Z13 Gen 2 R7 PRO 7840U, Radeon 780M, SK hynix BC901 HFS001TEJ4X164N, OLED, 2880x1800, 13.3" | HP Dragonfly G4 i7-1365U, Iris Xe G7 96EUs, Micron 3400 MTFDKBA512TFH 512GB, IPS, 1920x1280, 13.5" | Dell XPS 13 Plus 9320 Core i7-1360P i7-1360P, Iris Xe G7 96EUs, Samsung PM9A1 MZVL2512HCJQ, OLED, 3456x2160, 13.4" | Average Intel Arc 8-Core iGPU | Average of class Subnotebook | |
|---|---|---|---|---|---|---|---|---|
| Power Consumption | 18% | -5% | -18% | 0% | -31% | -32% | 3% | |
| Idle Minimum * (Watt) | 3.8 | 1.95 49% | 5.8 -53% | 5.8 -53% | 4.1 -8% | 6.9 -82% | 5.36 ? -41% | 3.78 ? 1% |
| Idle Average * (Watt) | 7 | 8.7 -24% | 8.5 -21% | 6.2 11% | 7.5 -7% | 7.4 -6% | 8.53 ? -22% | 6.57 ? 6% |
| Idle Maximum * (Watt) | 7.3 | 8.9 -22% | 8.8 -21% | 12.7 -74% | 8.2 -12% | 13.6 -86% | 11.8 ? -62% | 7.94 ? -9% |
| Load Average * (Watt) | 52.6 | 34.3 35% | 35.1 33% | 27.2 48% | 35.5 33% | 43.5 17% | 53.7 ? -2% | 41.9 ? 20% |
| Witcher 3 ultra * (Watt) | 38.3 | 28.6 25% | 27.6 28% | 54.1 -41% | 37.5 2% | 48 -25% | ||
| Load Maximum * (Watt) | 62.7 | 35.4 44% | 59.5 5% | 61.4 2% | 66.5 -6% | 63.3 -1% | 84.4 ? -35% | 64.4 ? -3% |
* ... smaller is better
Power consumption Witcher 3 / stress test
Power consumption with external monitor
Runtimes
The device's 55-Wh battery enables good runtimes. In our WLAN test at 150 cd/m² (corresponds to 51% of our test device's maximum brightness), we measured a very good runtime of almost 13 hours at 60 Hz (just under 11 hours at 120 Hz), which means that the XPS 13 could only be beaten by the MacBook Air 13 M3 and the HP Dragonfly G4. The old XPS 13 with its high-resolution OLED panel achieved just over 7 hours. At maximum brightness, the WLAN test still ran for almost 9 hours (60 Hz) and the higher refresh rate hardly impacted the results (only 10 minutes less at 120 Hz). During the video test at 150 cd/m², the new Meteor Lake processor with its tile design made itself noticeable once again, as the two efficiency cores on the SoC tile did all the work here. The result is an outstanding 17.5 hours, which even narrowly beat the MacBook Air 13. In the worst-case scenario, the laptop can go out after just over 2 hours.
You can select different charging modes and using the standard setting, it takes 2.5 hours to charge the battery from 0 with the device switched on (80 % after 95 minutes). Using express mode, the time is reduced to just under 2 hours (80 % after 64 minutes).
| Dell XPS 13 9340 Core Ultra 7 Ultra 7 155H, Arc 8-Core, 55 Wh | Apple MacBook Air 13 M3 10C GPU M3, M3 10-Core GPU, 52.6 Wh | Asus ZenBook S13 OLED UX5304 i7-1355U, Iris Xe G7 96EUs, 63 Wh | Lenovo ThinkPad Z13 Gen 2 R7 PRO 7840U, Radeon 780M, 51.5 Wh | HP Dragonfly G4 i7-1365U, Iris Xe G7 96EUs, 68 Wh | Dell XPS 13 Plus 9320 Core i7-1360P i7-1360P, Iris Xe G7 96EUs, 55 Wh | Average of class Subnotebook | |
|---|---|---|---|---|---|---|---|
| Battery runtime | 17% | -8% | -39% | 35% | -43% | -4% | |
| H.264 (h) | 17.6 | 17.4 -1% | 13.8 -22% | 15.4 ? -12% | |||
| WiFi v1.3 (h) | 12.8 | 15.2 19% | 11.3 -12% | 7.8 -39% | 15.9 24% | 7.3 -43% | 13.9 ? 9% |
| Load (h) | 2.2 | 2.9 32% | 2.4 9% | 3.2 45% | 1.969 ? -10% |
Pros
Cons
Verdict - The XPS 13 remains a compact companion, but the basic display and touchbar are disappointing

The new XPS 13 uses the old XPS 13 Plus's design, the same as the one Dell now also uses on the larger XPS 14 and XPS 16. Especially in comparison to the hefty XPS 14, the 13-inch model feels very compact and with its slim bezels, it is one of the slimmest devices within the comparison field, too. In terms of quality, we barely have anything to complain about, however, at 1.2 kg, it isn't particularly light. A further plus point is its great battery life—at least in combination with the base display.
This is where it gets a little more difficult for the XPS 13, as the base panel isn't really that impressive at all. Although the matte IPS panel's picture looks fine and its 120-Hz refresh rate helps with movement, the test device's panel clearly missed the manufacturer's stated brightness of 500 cd/m² during our test—plus, it isn't calibrated all too well (blue tint in delivered state). Higher brightness values would be helpful outside in particular. Its connectivity situation is just as tricky, as it only has 2x USB-C. The RAM can't be upgraded but you can at least select the XPS with up to 64 GB RAM.
The XPS 13 9340 impresses with its compact size and long runtimes—at least in combination with the base display. However, its meagre connectivity options are a problem and so is the annoying touchbar with its function keys.
The laptop's input devices are a little more problematic. The frameless touchpad works well in practice, but the keyboard is more of an issue. Due to its design not featuring any space in between the keys, you can't feel for them well at all, leading to lots of accidental typos. This is a shame, as the keyboard actually feels quite comfortable to type on apart from this. Furthermore, the intensity of its backlighting can't be adjusted and the sensor activates it during the smallest of lighting changes—whether you want it to or not. In turn, we can't say anything positive about the device's touchbar, as it is simply annoying in everyday use. You can't use it blindly, you can't tell which key is which with the backlighting deactivated (often leading to you pressing the wrong one by mistake), and the function keys remained constantly illuminated when playing videos during our test, which is super annoying.
The new Meteor Lake processor's CPU performance is only better than its predecessor in short bursts. Its graphics performance also shows an improvement, however, it doesn't remain stable—for example when gaming. Even so, its performance is of course totally sufficient for everyday tasks. Compared to its competitors, however, the new XPS 13 doesn't have it easy. One of its main competitors is the MacBook Air which continues to impress with its passive cooling and larger number of ports. The ThinkPad Z13 with its AMD processor offers higher and more stable performance. In addition, we are currently testing the new ThinkBook 13x G4, another competitor of the XPS 13 which boasts a high-resolution IPS display.
Price and availability
The new XPS 13 9340 can be purchased directly via Dell's website. Prices start from US$1,149 for the base variant.
Dell XPS 13 9340 Core Ultra 7
- 05/14/2024 v7 (old)
Andreas Osthoff

