Apple MacBook Air 13 M3 review - A lot faster and with Wi-Fi 6E
The MacBook Air M2 was presented 1.5 years ago and at the time, Apple unveiled an entirely new design. In the meantime, the series has been extended by a larger 15-inch model. After Apple already introduced its new M3-SoC generation inside the MacBook Pro models at the end of last year, now the MacBook Air 13's M3 update follows suit. Unsurprisingly, not much has changed about its design—but it does now support Wi-Fi 6E, too.
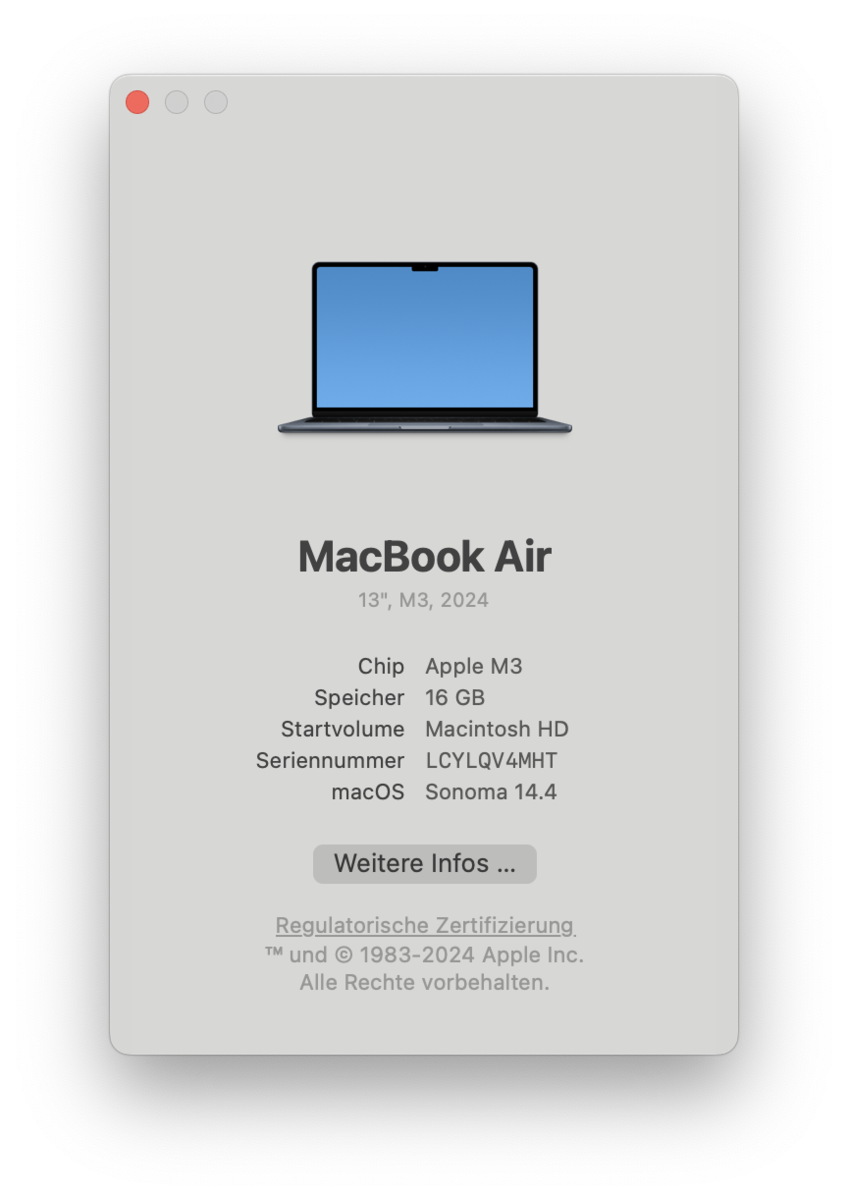
The old MacBook Air 13 M2 still remains available to purchase (MRSP from US$999), replacing the old MacBook Air M1 as the manufacturer's cheapest MacBook. The new MacBook Air M3's prices start from US$1,099, making it US$200 cheaper than the M2 model at launch. In turn, it still only features a mere 8 GB RAM and a 256-GB SSD. Our test device is the variant with the faster 10-core GPU, 16 GB RAM and a 512-GB SSD for US$1,499. As the device remains unchanged in many areas, we would additionally recommend taking a look at our previous reviews of the MacBook Air M2 as well as our analysis of the M3 SoC:
Possible competitors compared
Rating | Date | Model | Weight | Height | Size | Resolution | Price |
|---|---|---|---|---|---|---|---|
| 92.4 % v7 (old) | 03 / 2024 | Apple MacBook Air 13 M3 10C GPU M3, M3 10-Core GPU | 1.2 kg | 11.3 mm | 13.60" | 2560x1664 | |
| 92 % v7 (old) | 08 / 2022 | Apple MacBook Air M2 10C GPU M2, M2 10-Core GPU | 1.2 kg | 11.3 mm | 13.60" | 2560x1664 | |
| 86.7 % v7 (old) | 02 / 2024 | Asus ZenBook 14 UX3405MA Ultra 7 155H, Arc 8-Core | 1.2 kg | 14.9 mm | 14.00" | 2880x1800 | |
| 89.5 % v7 (old) | 01 / 2024 | Lenovo ThinkPad Z13 Gen 2 R7 PRO 7840U, Radeon 780M | 1.2 kg | 13.99 mm | 13.30" | 2880x1800 | |
| 91.9 % v7 (old) | 07 / 2023 | HP Dragonfly G4 i7-1365U, Iris Xe G7 96EUs | 1.1 kg | 16.3 mm | 13.50" | 1920x1280 | |
| 87.4 % v7 (old) | 07 / 2023 | Dell XPS 13 Plus 9320 Core i7-1360P i7-1360P, Iris Xe G7 96EUs | 1.3 kg | 15.3 mm | 13.40" | 3456x2160 | |
| 89.6 % v7 (old) | 06 / 2023 | Huawei MateBook X Pro 2023 i7-1360P, Iris Xe G7 96EUs | 1.3 kg | 15.6 mm | 14.20" | 3120x2080 |
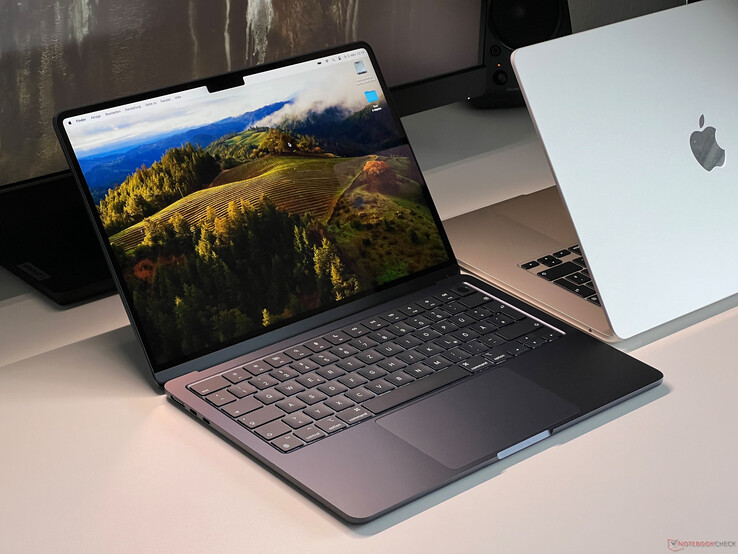
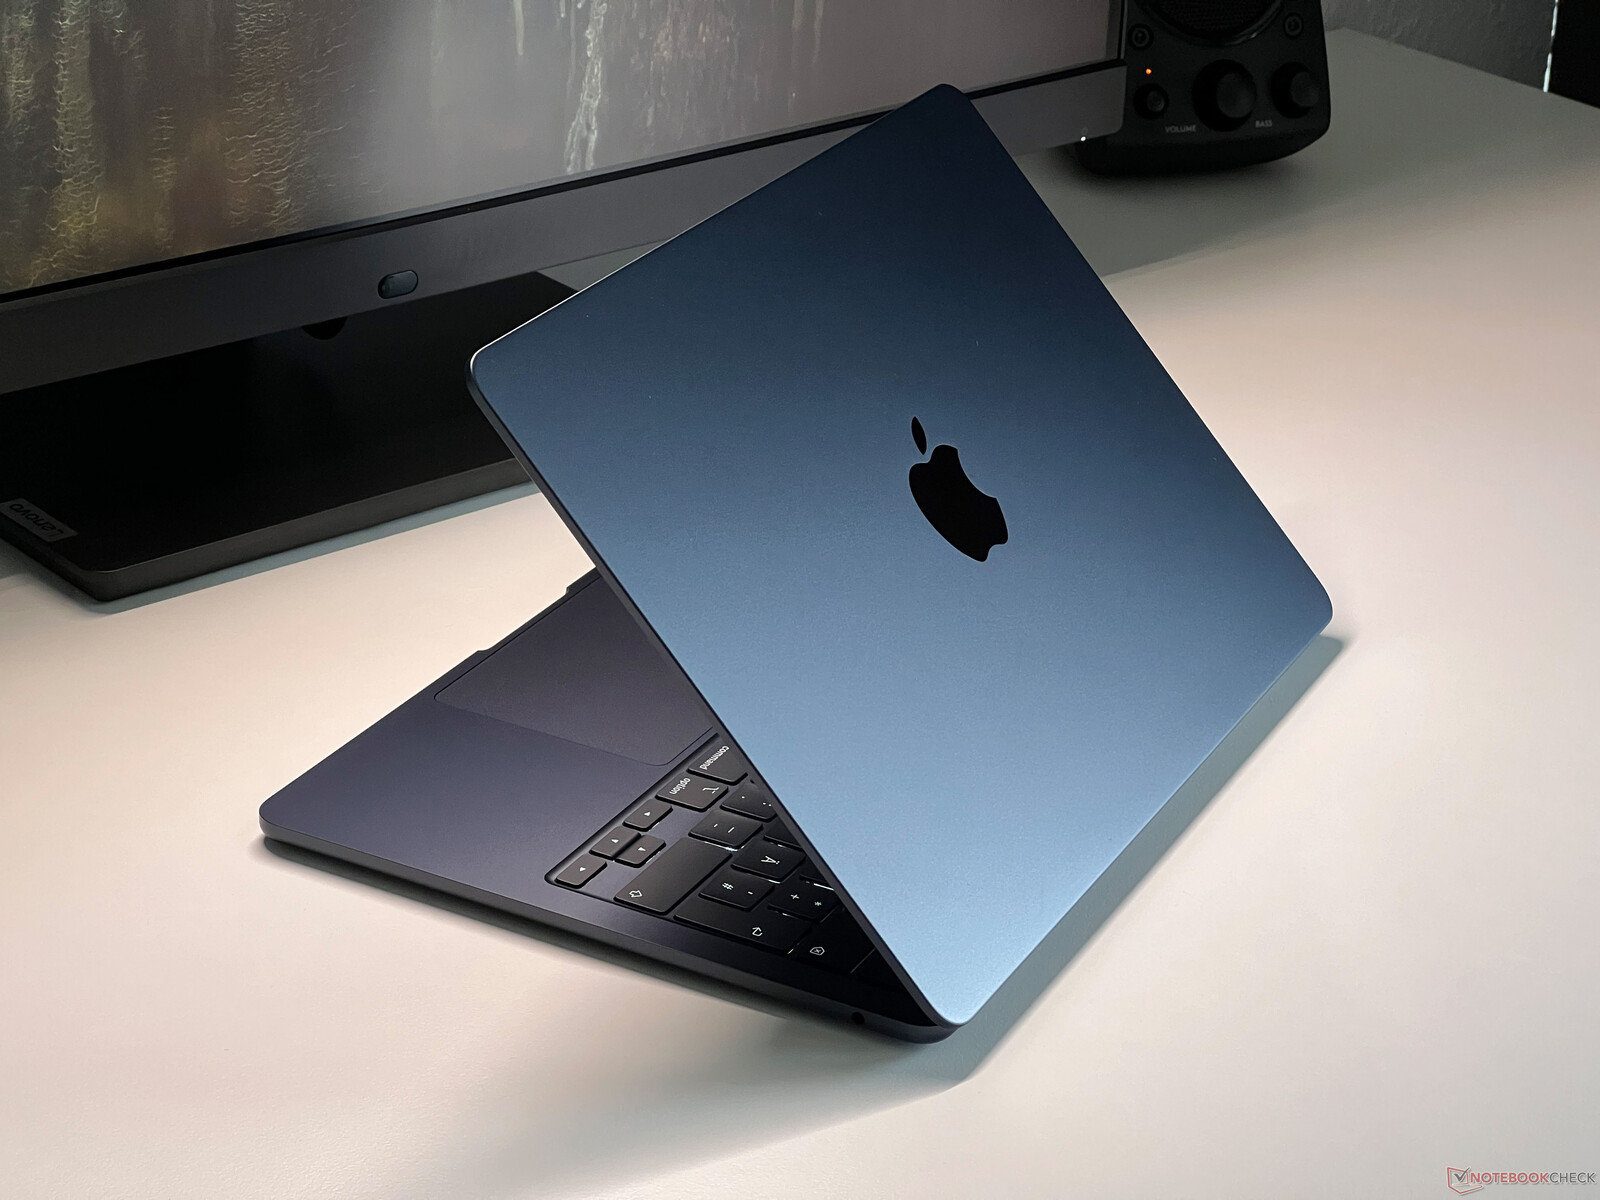
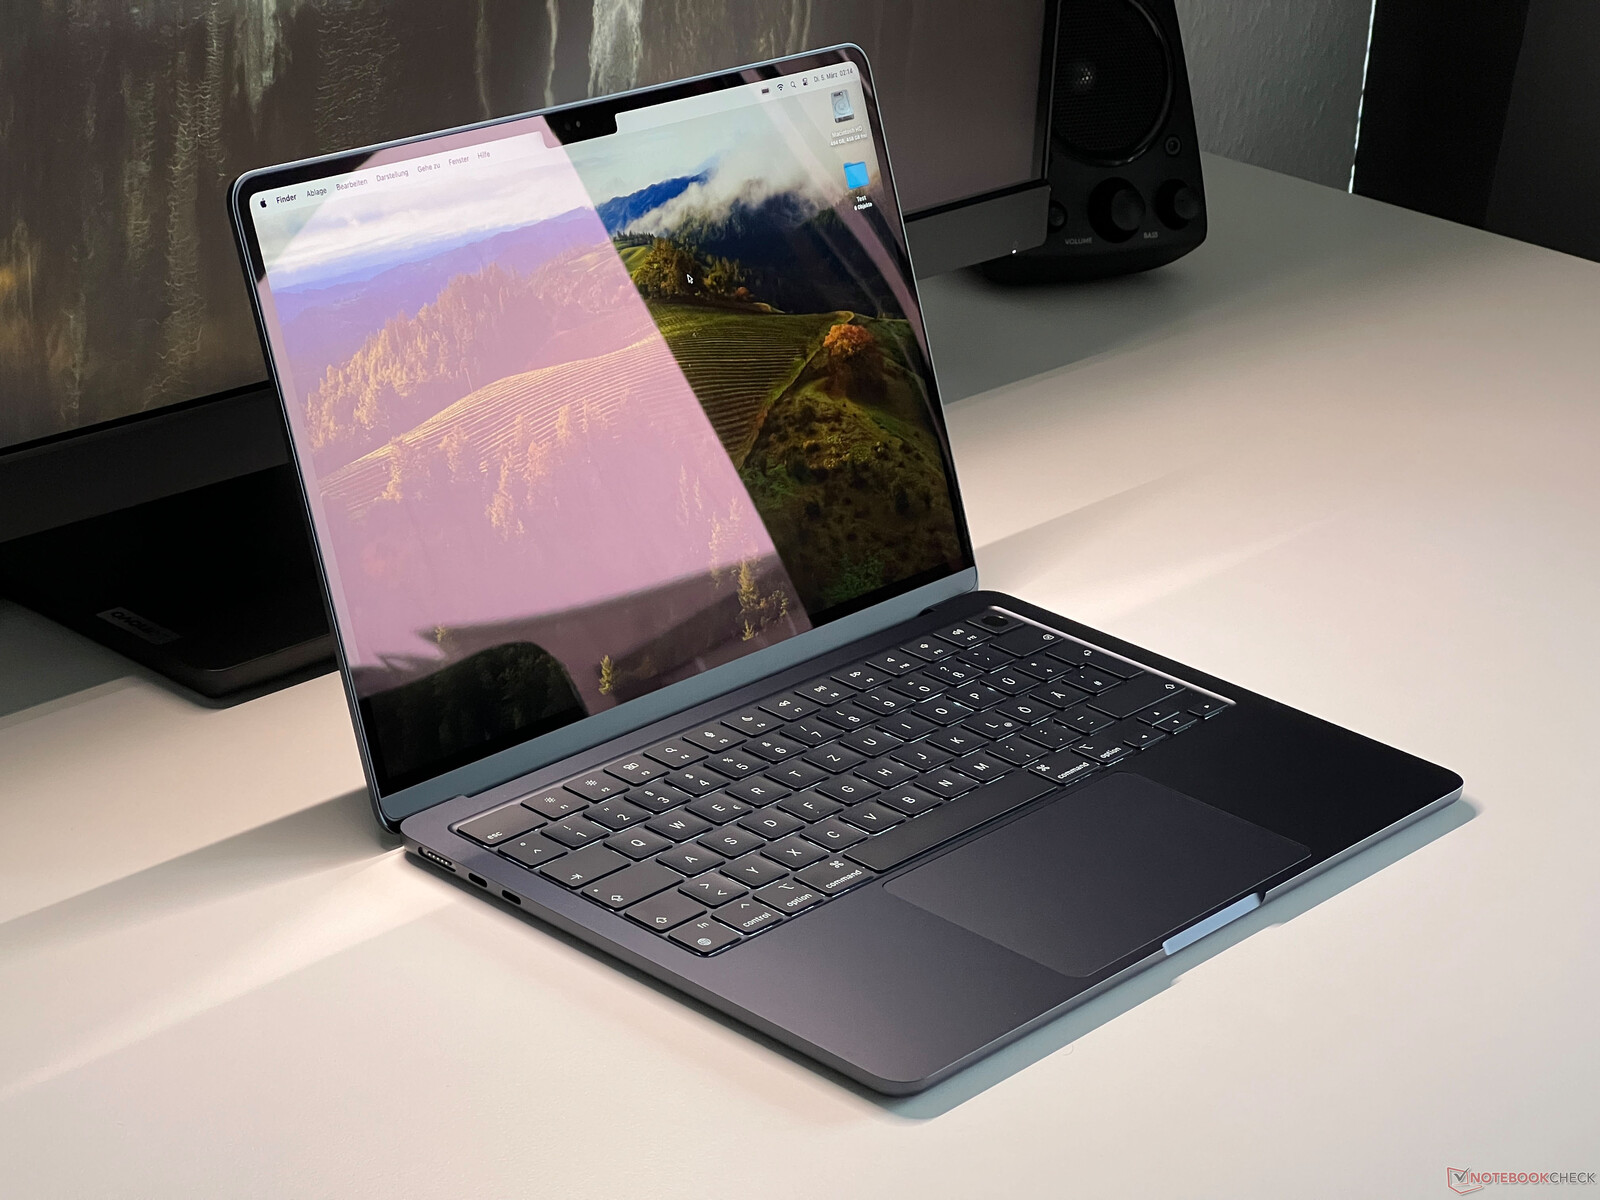
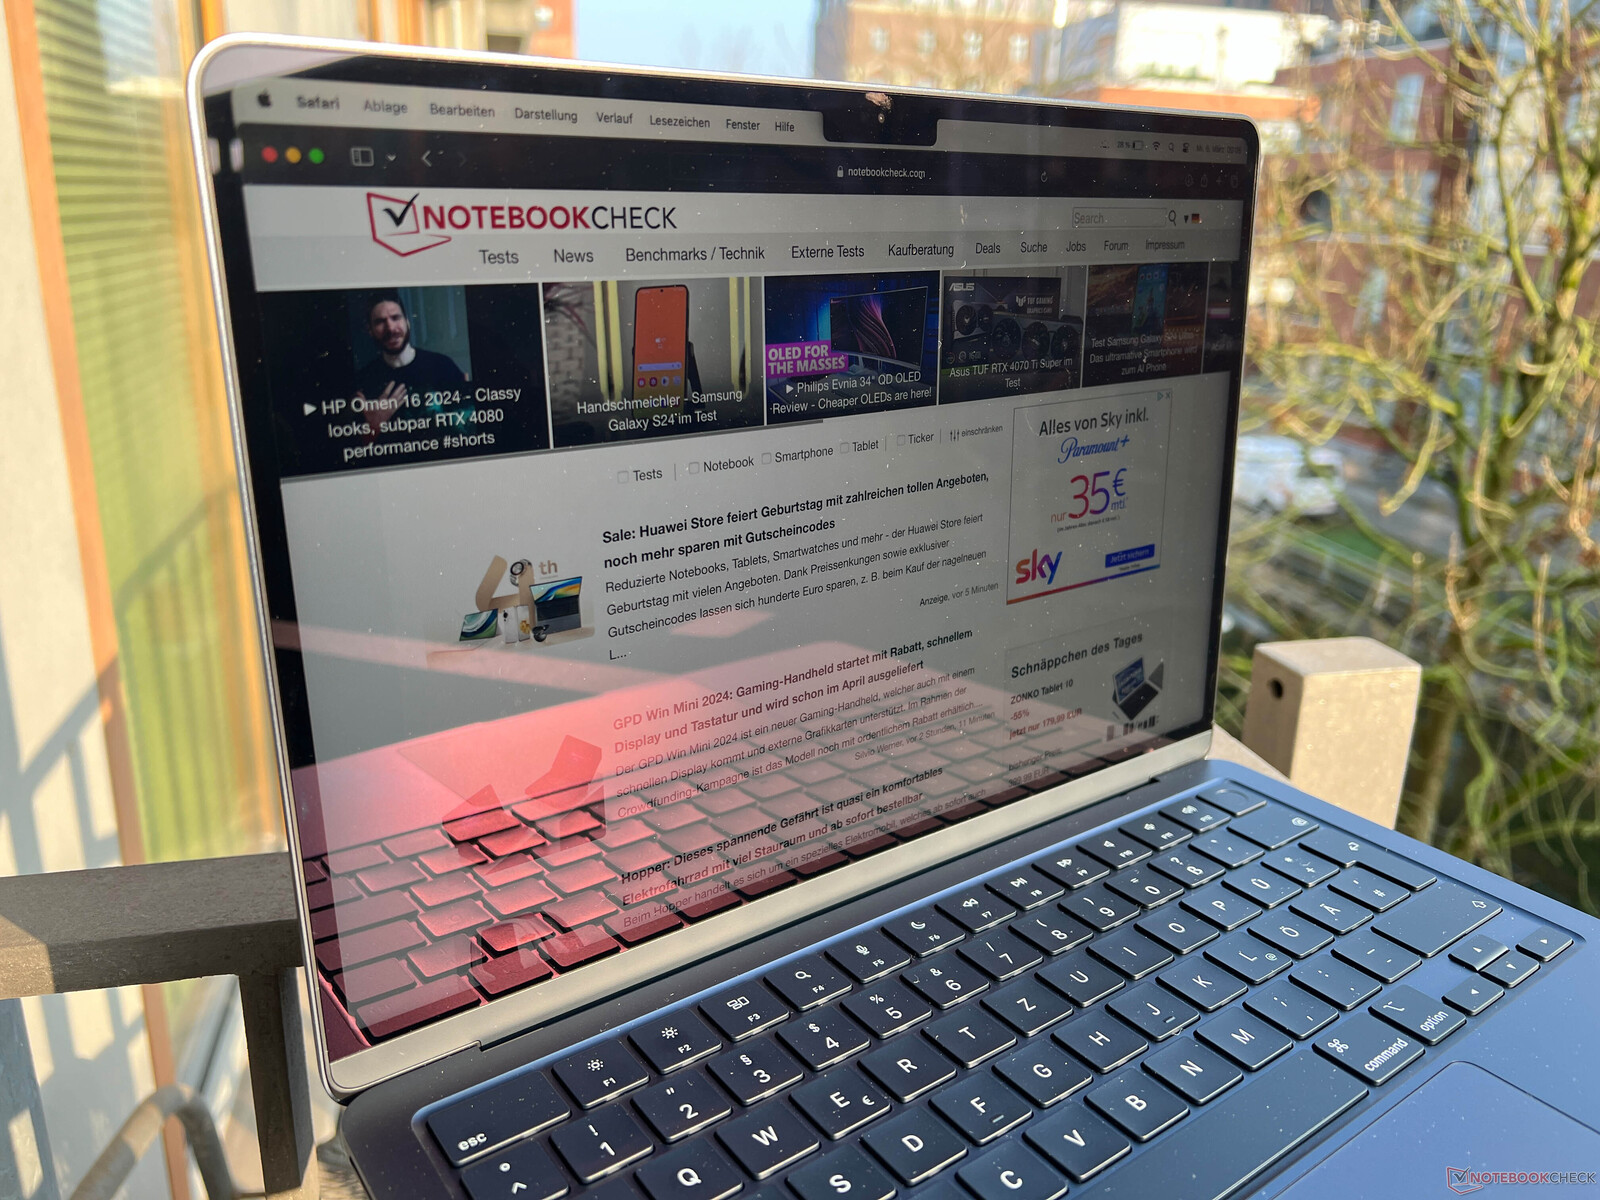
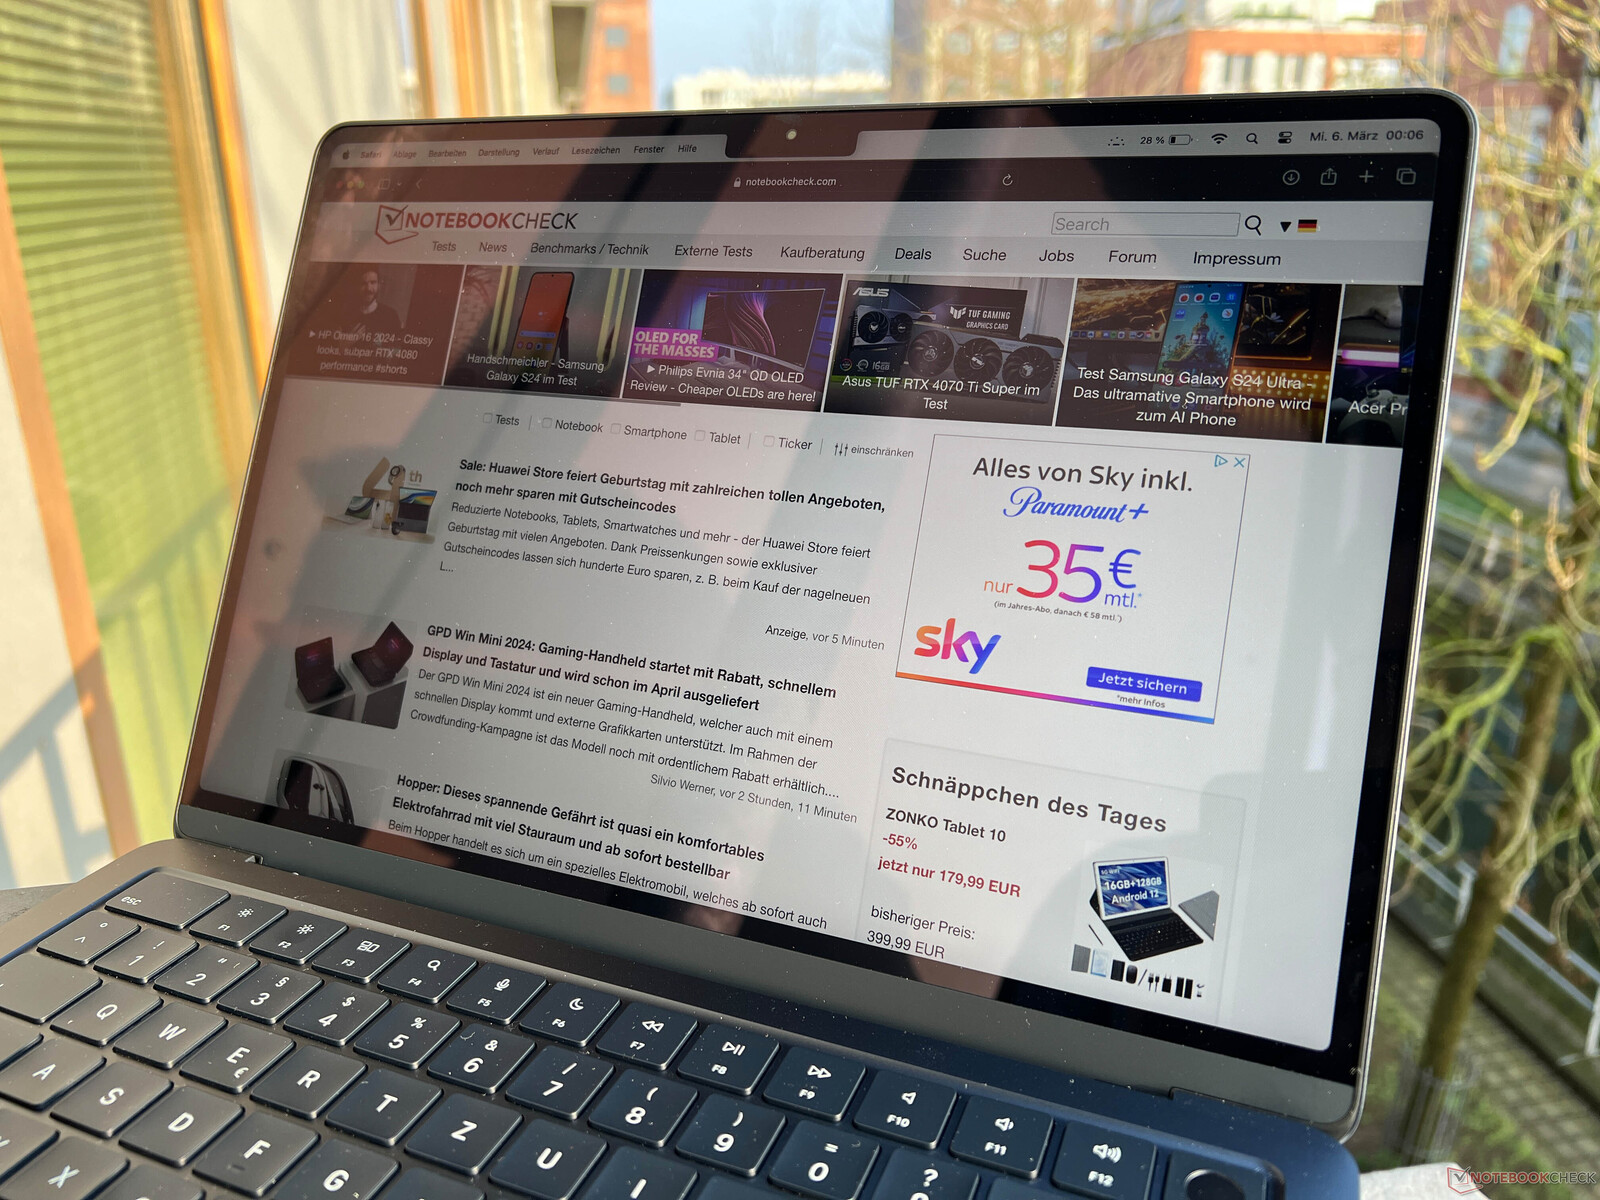
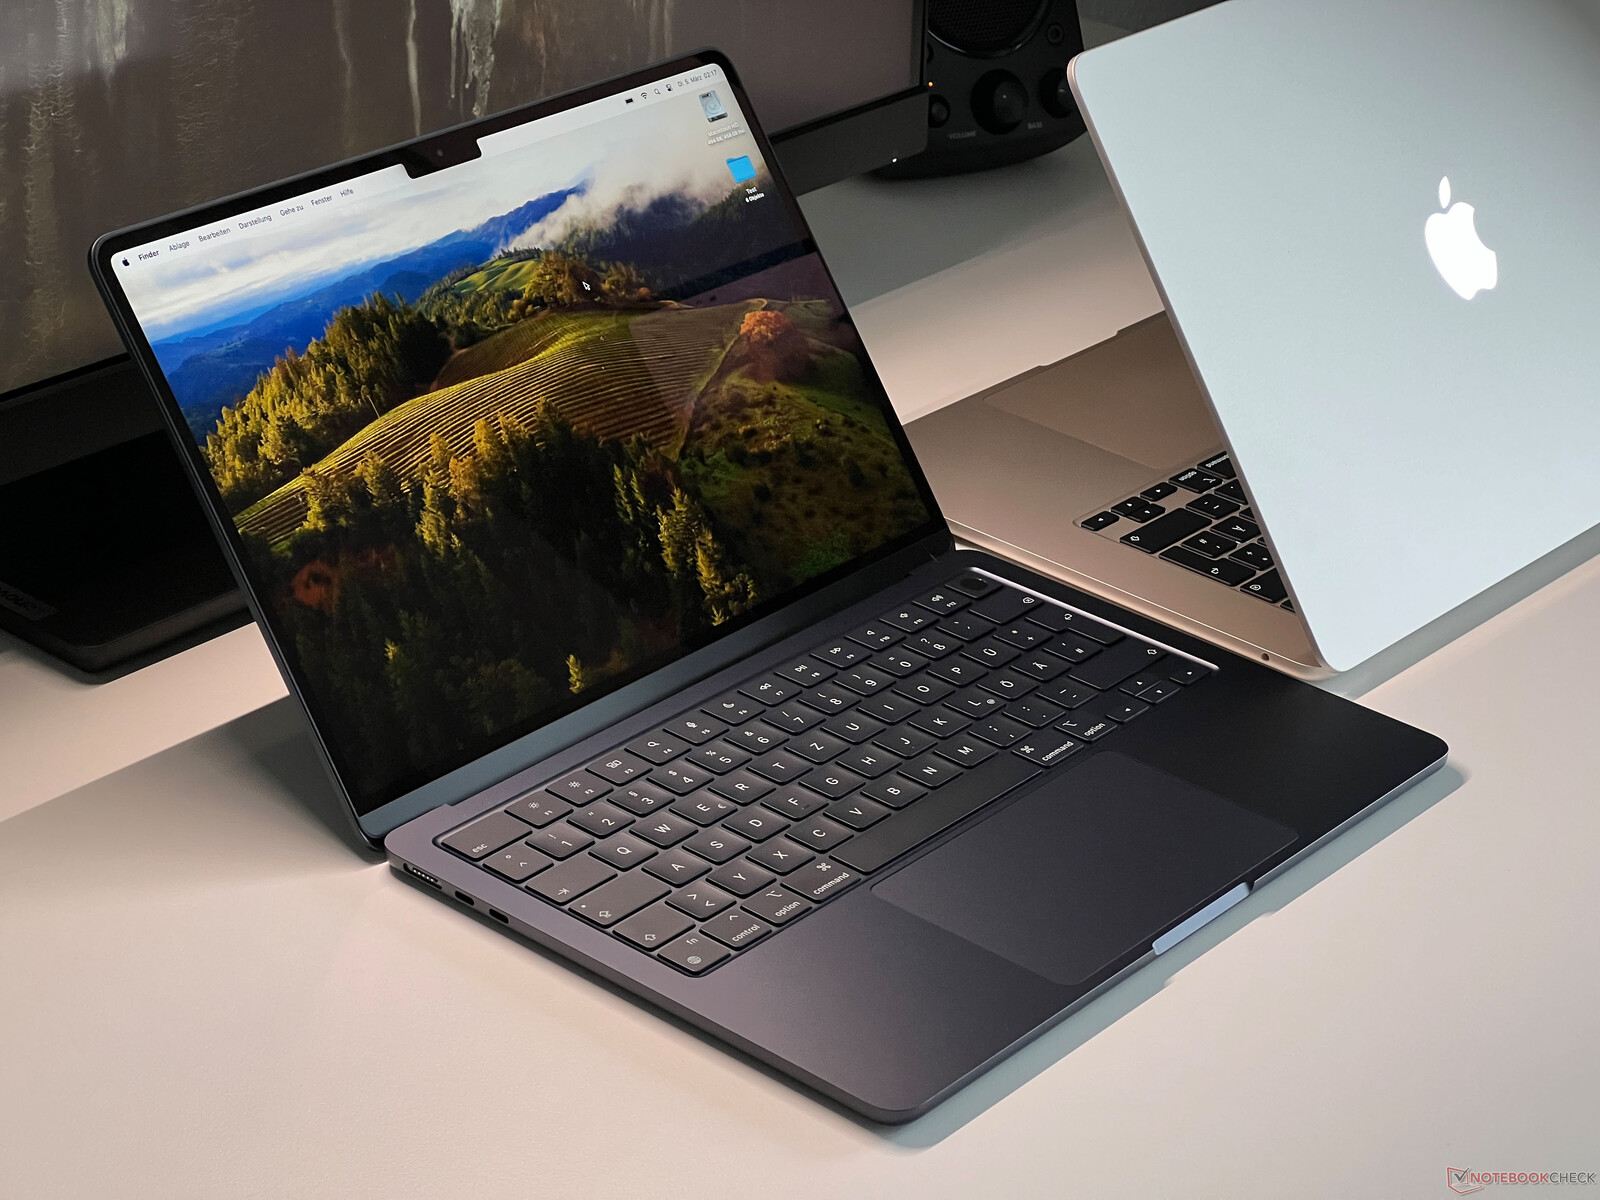
Case - The Midnight MacBook now with a new coating
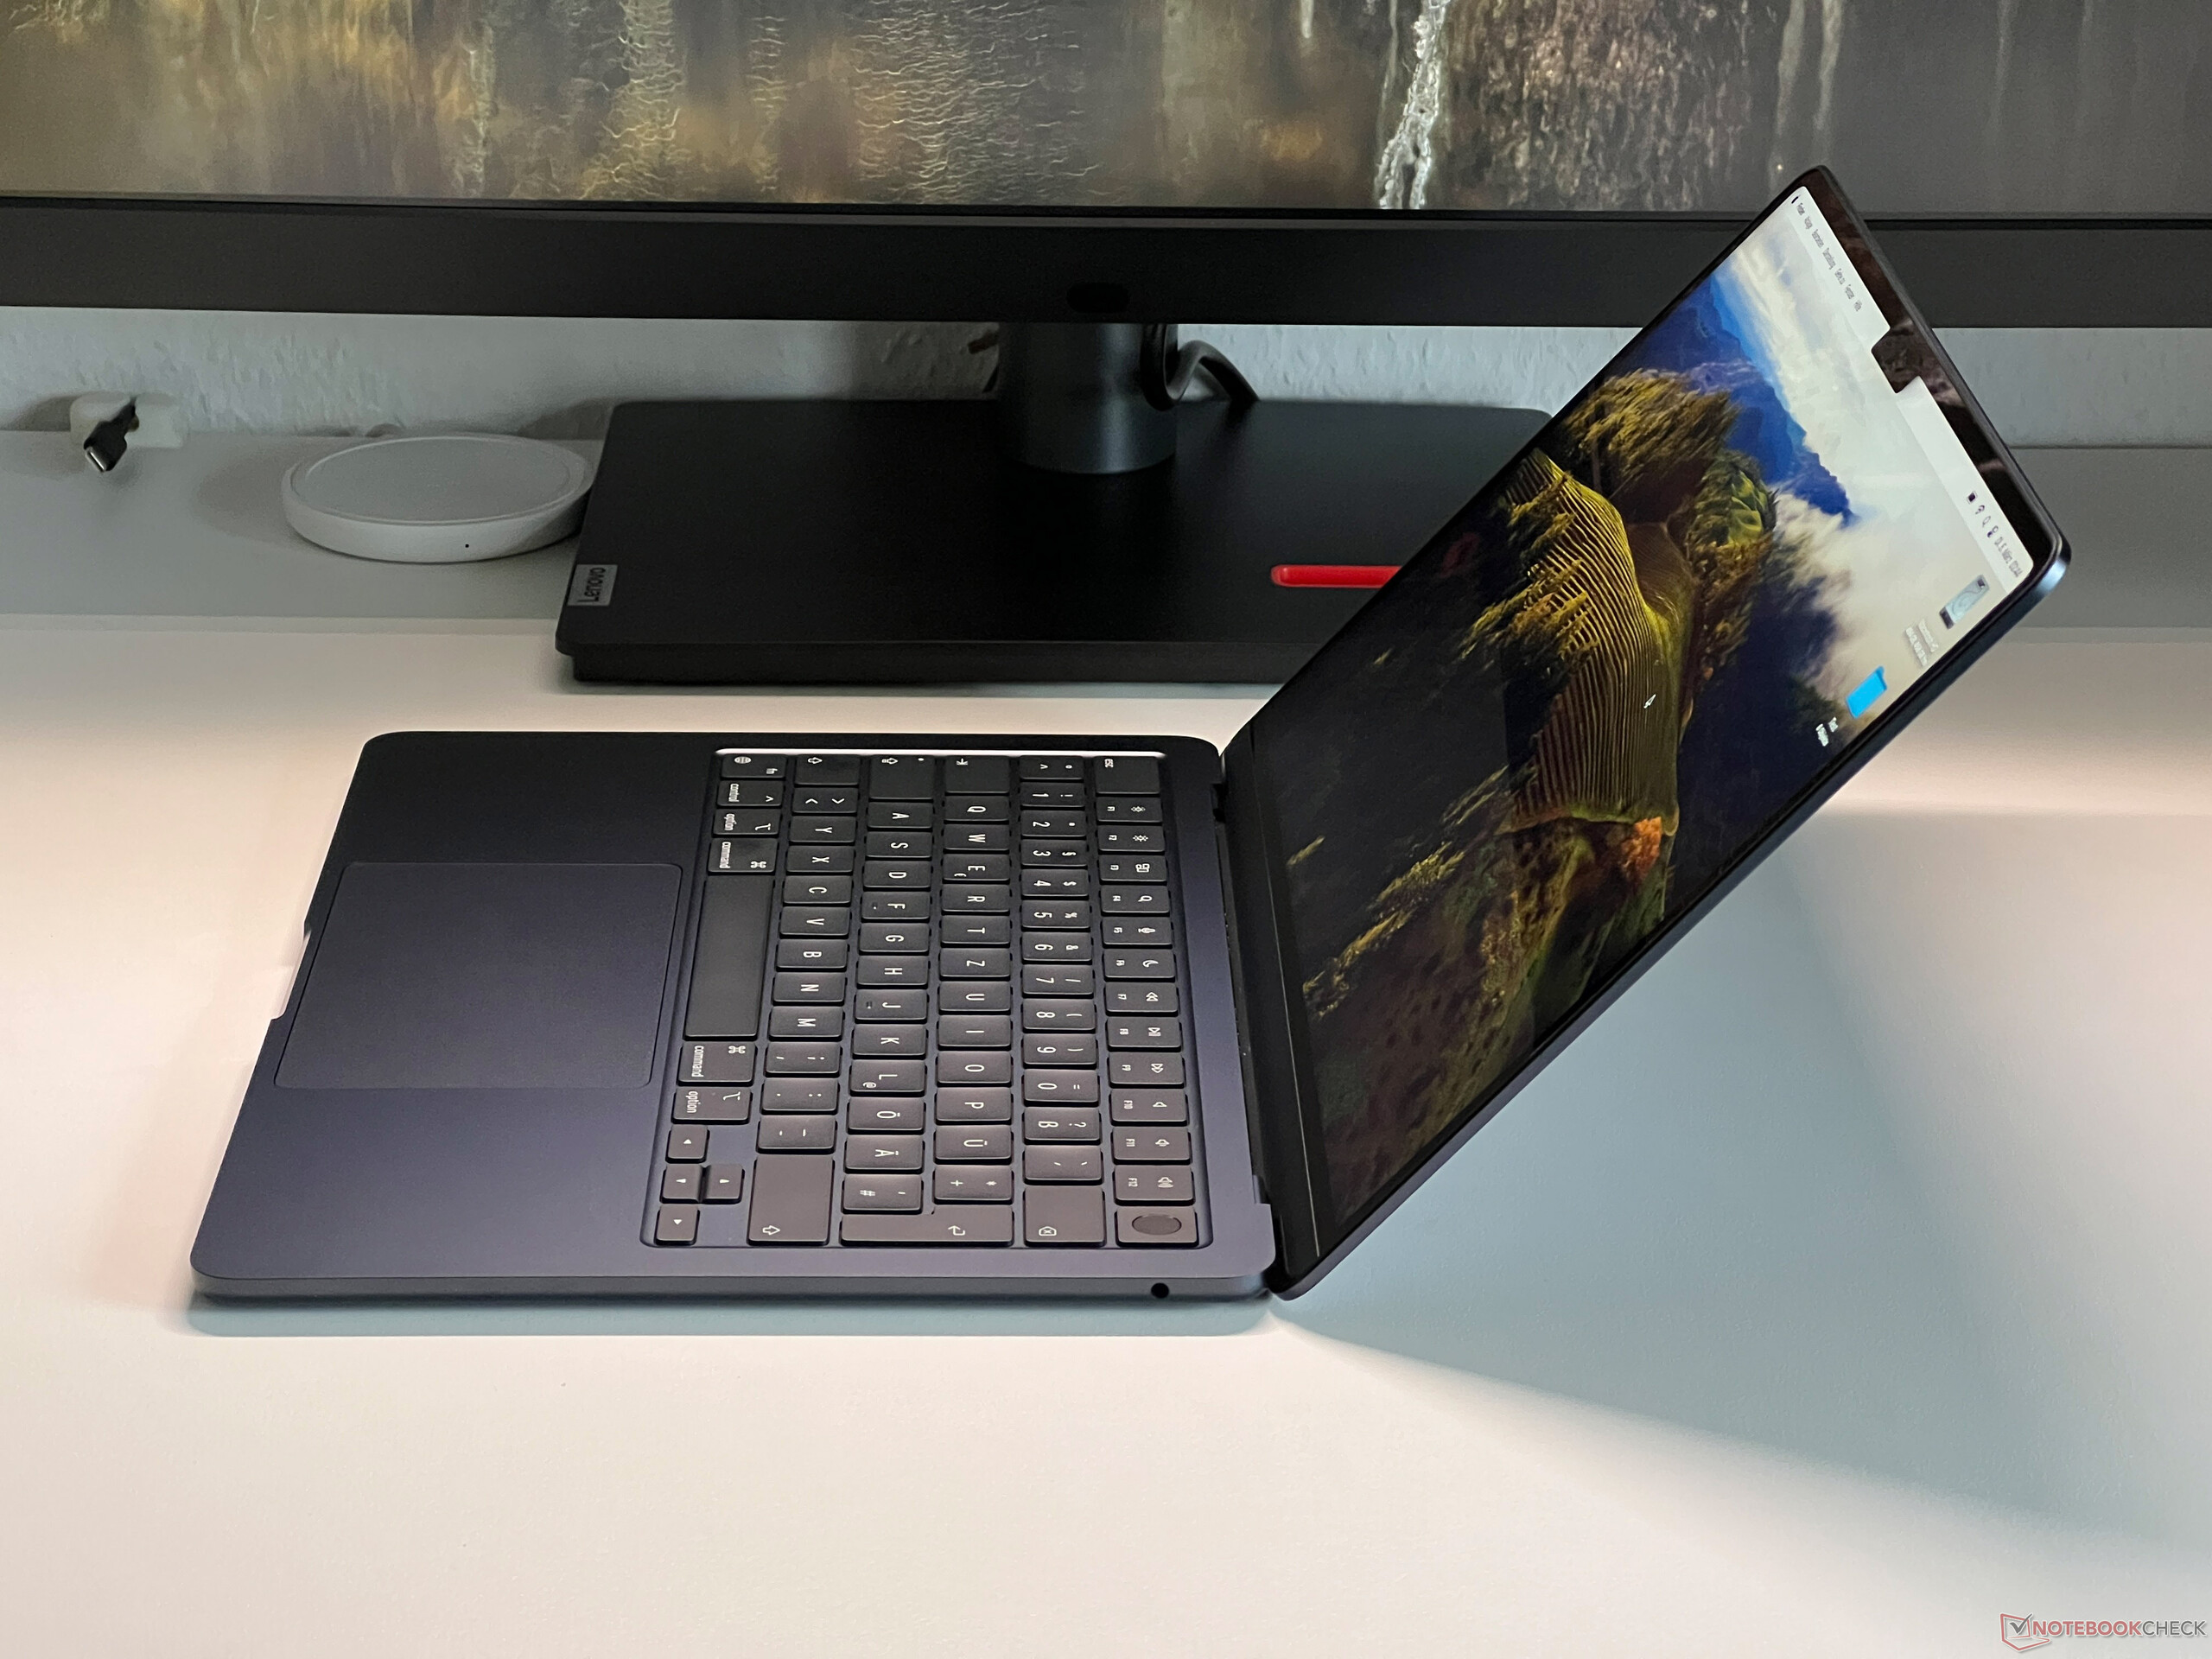
In general, nothing has changed about the MacBook Air 13's design and case quality. Compared to the old MacBook Air M1, the current design doesn't make use of a wedge-shaped base unit. In practical use, this isn't an issue despite its hard front edge, as the base unit is simply too flat to be annoying for your wrists. Its build remains excellent and the same can be said for its stability. Its maximum opening angle is 135 degrees.
With the release of the M2 generation, Apple extended its well-known color variants Silver and Space Gray to include two new options: Starlight and Midnight. The dark blue variant Midnight looked especially good on the product photos but it quickly turned out to be quite the fingerprint magnet and it was nearly impossible to keep its surfaces clean. Subsequently, the new M3 model (Midnight) comes with an anodized coating—the same as the black version of the MacBook Pro 14/16—to help mitigate this. As a result, fingerprint marks are a lot less of an issue. As was already the case with the black MBP 14, marks do become visible after longer periods of time, but the surfaces can be cleaned much easier using a cloth.
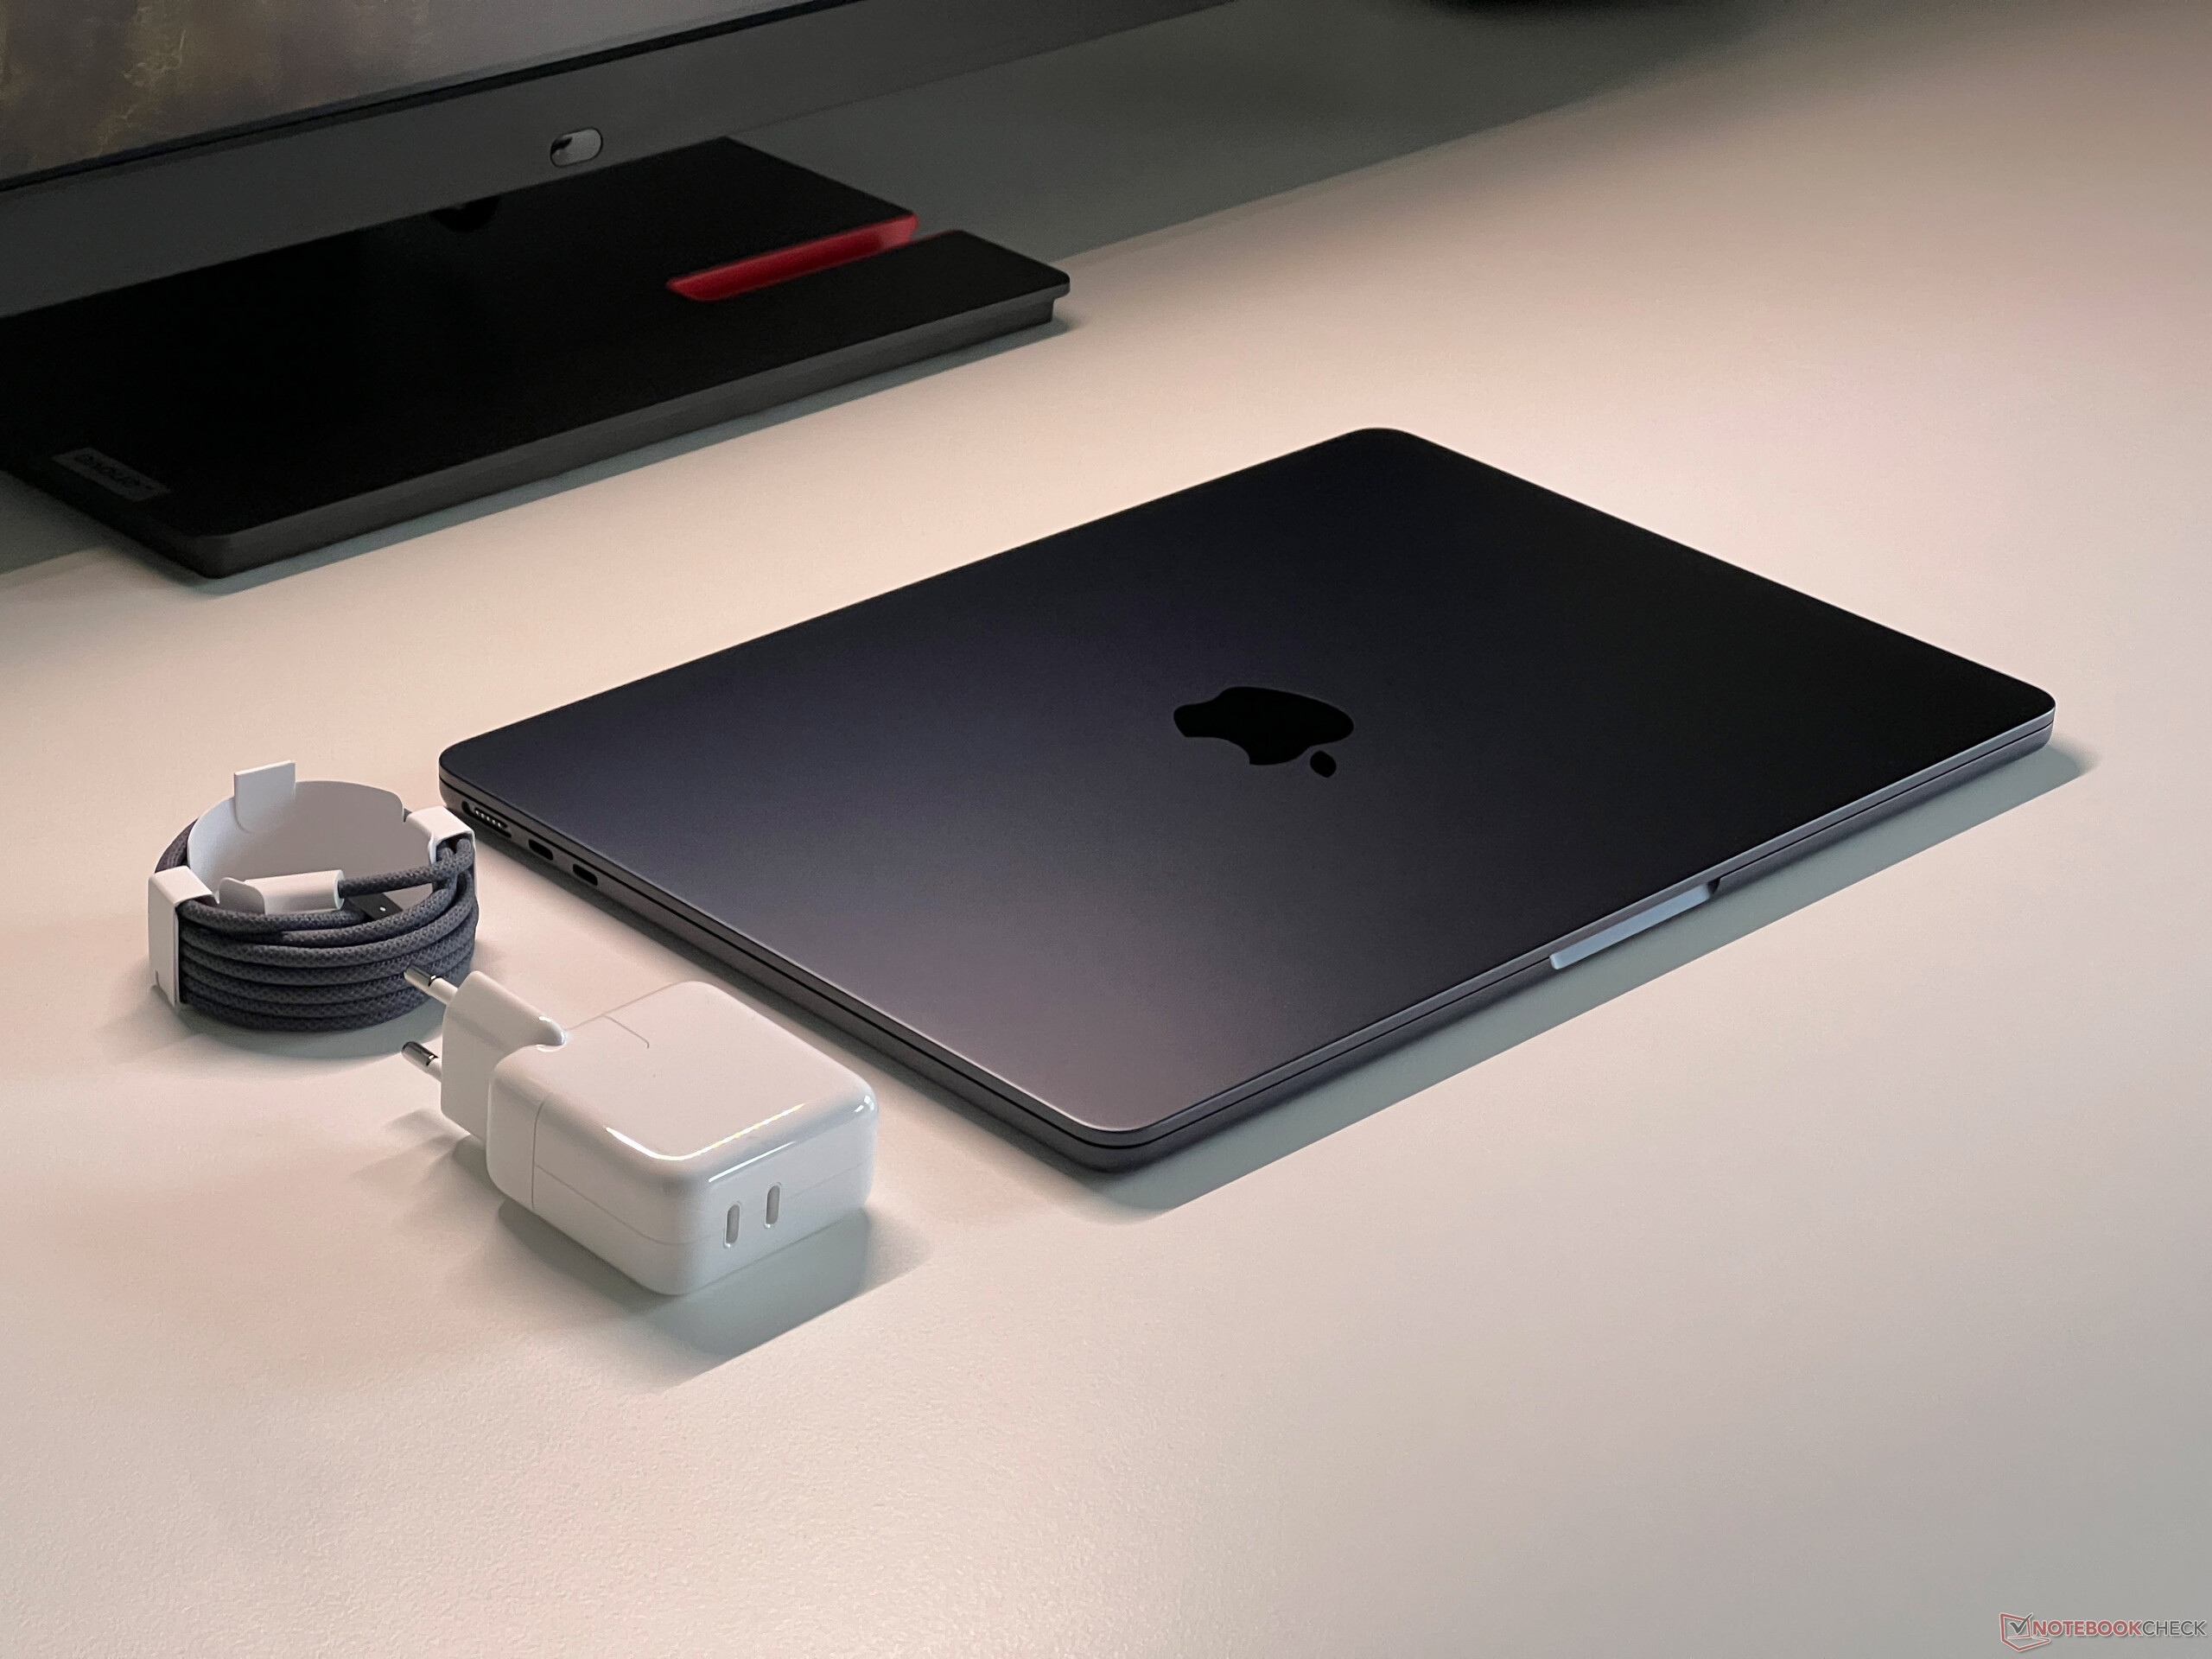
Measuring 11.3 mm in thickness, the MacBook Air 13 continues to be very slim, whereby its footprint is considerably larger than the Dell XPS 13 or the ThinkPad Z13, for example—almost as large as 14-inch devices such as the Zenbook 14 OLED. It weighs 1.237 kg and the 35-watt power supply (with 2x USB-C) weighs 184 grams including the MagSafe cable.
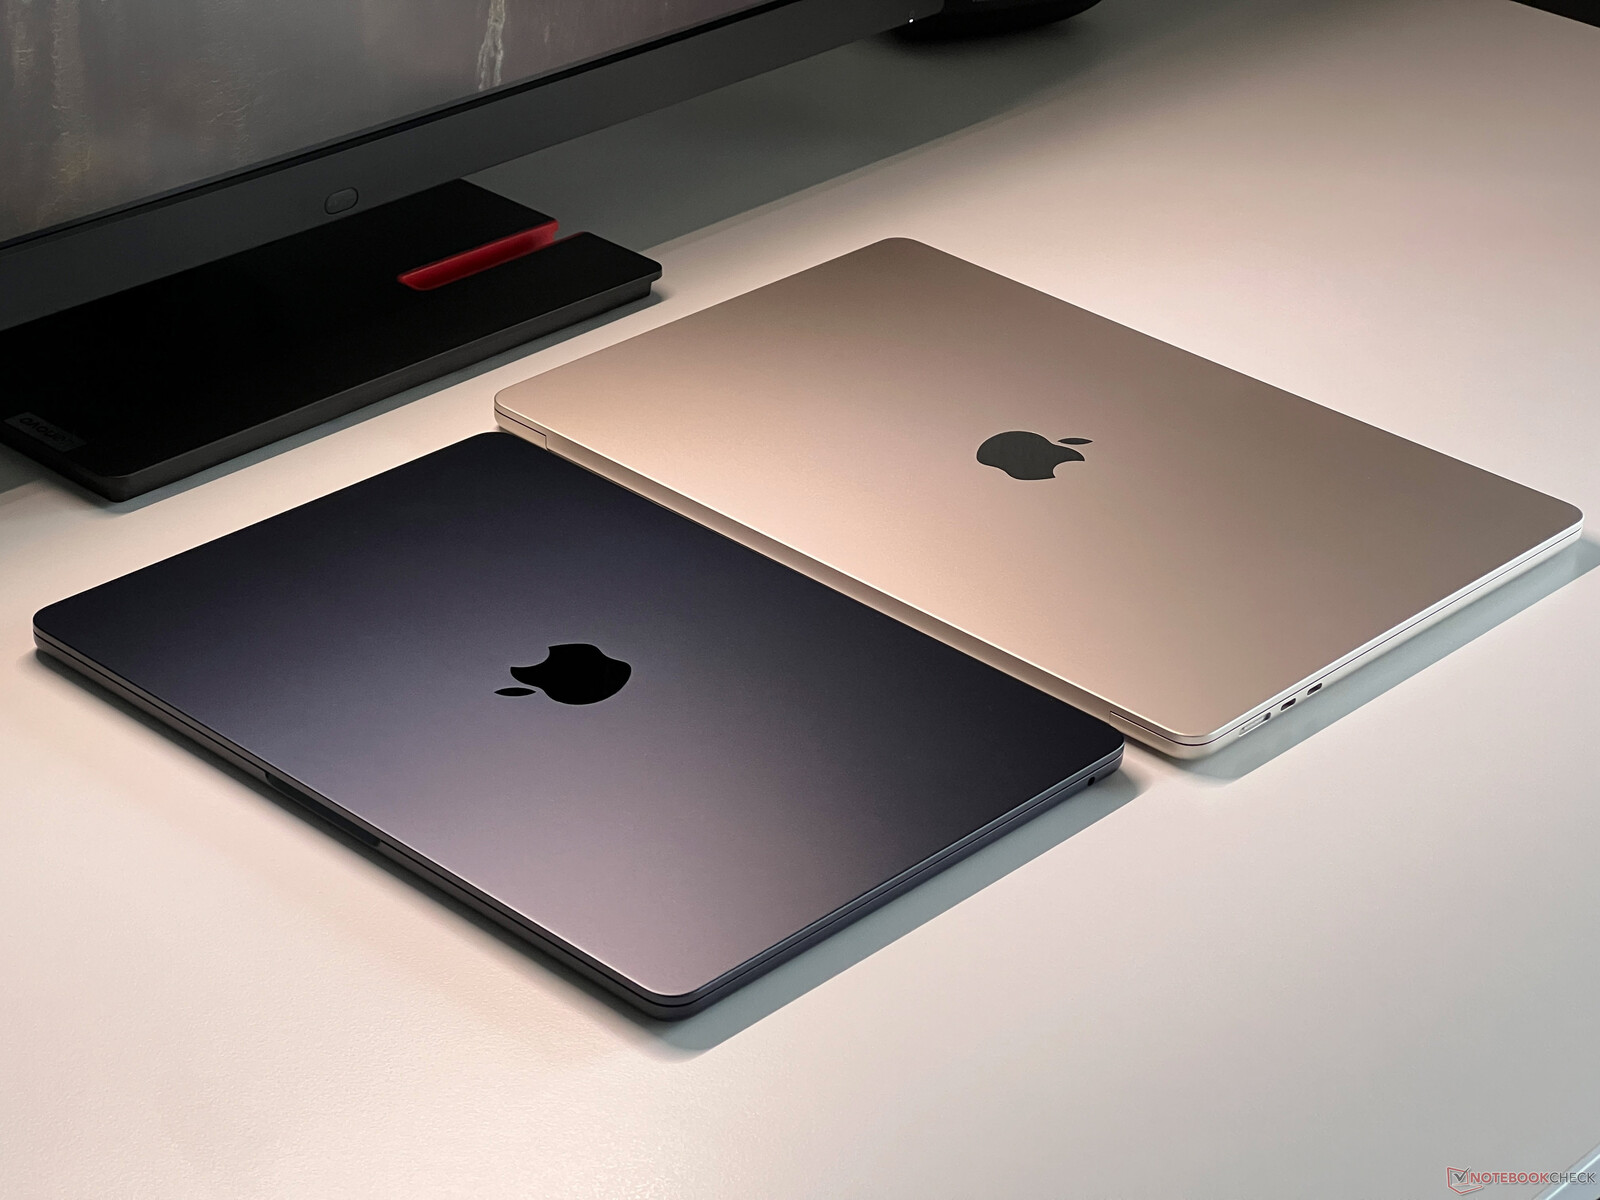
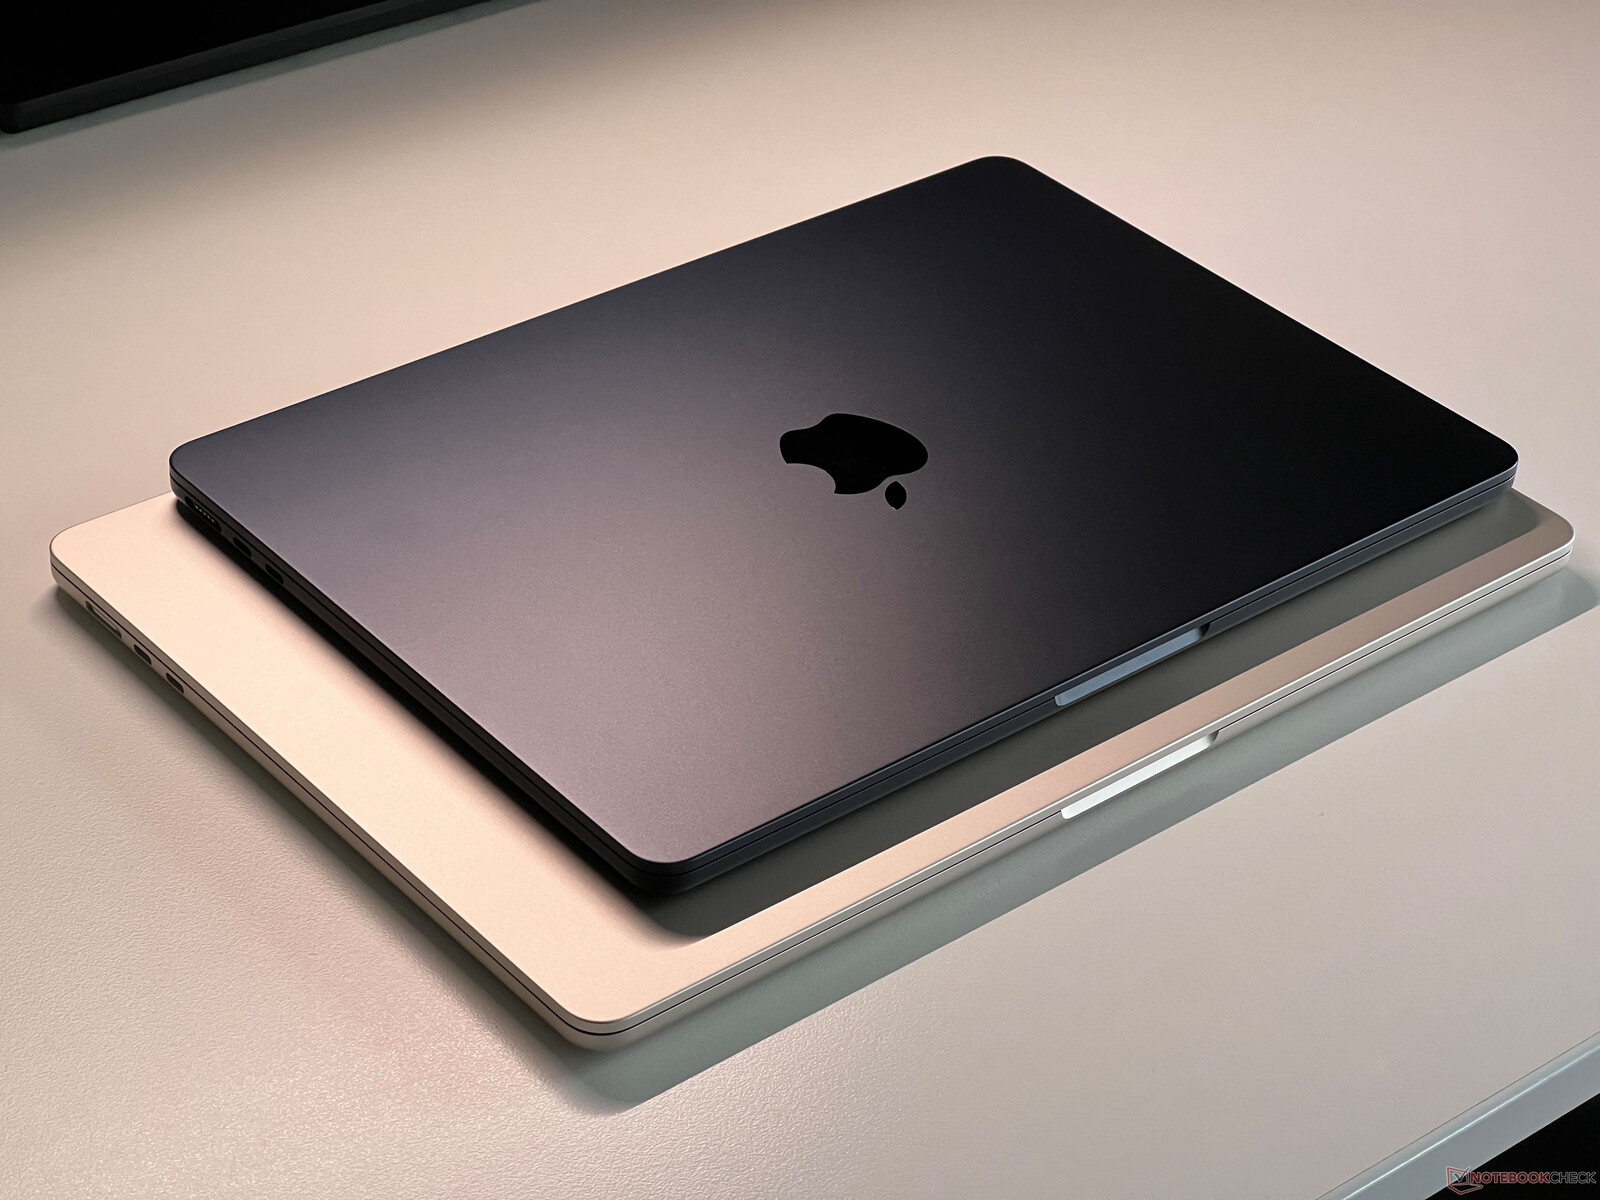
We additionally added some comparison photos with the larger MacBook Air 15 M3 so you can get a better idea of its size.
Connectivity - Two external displays now supported
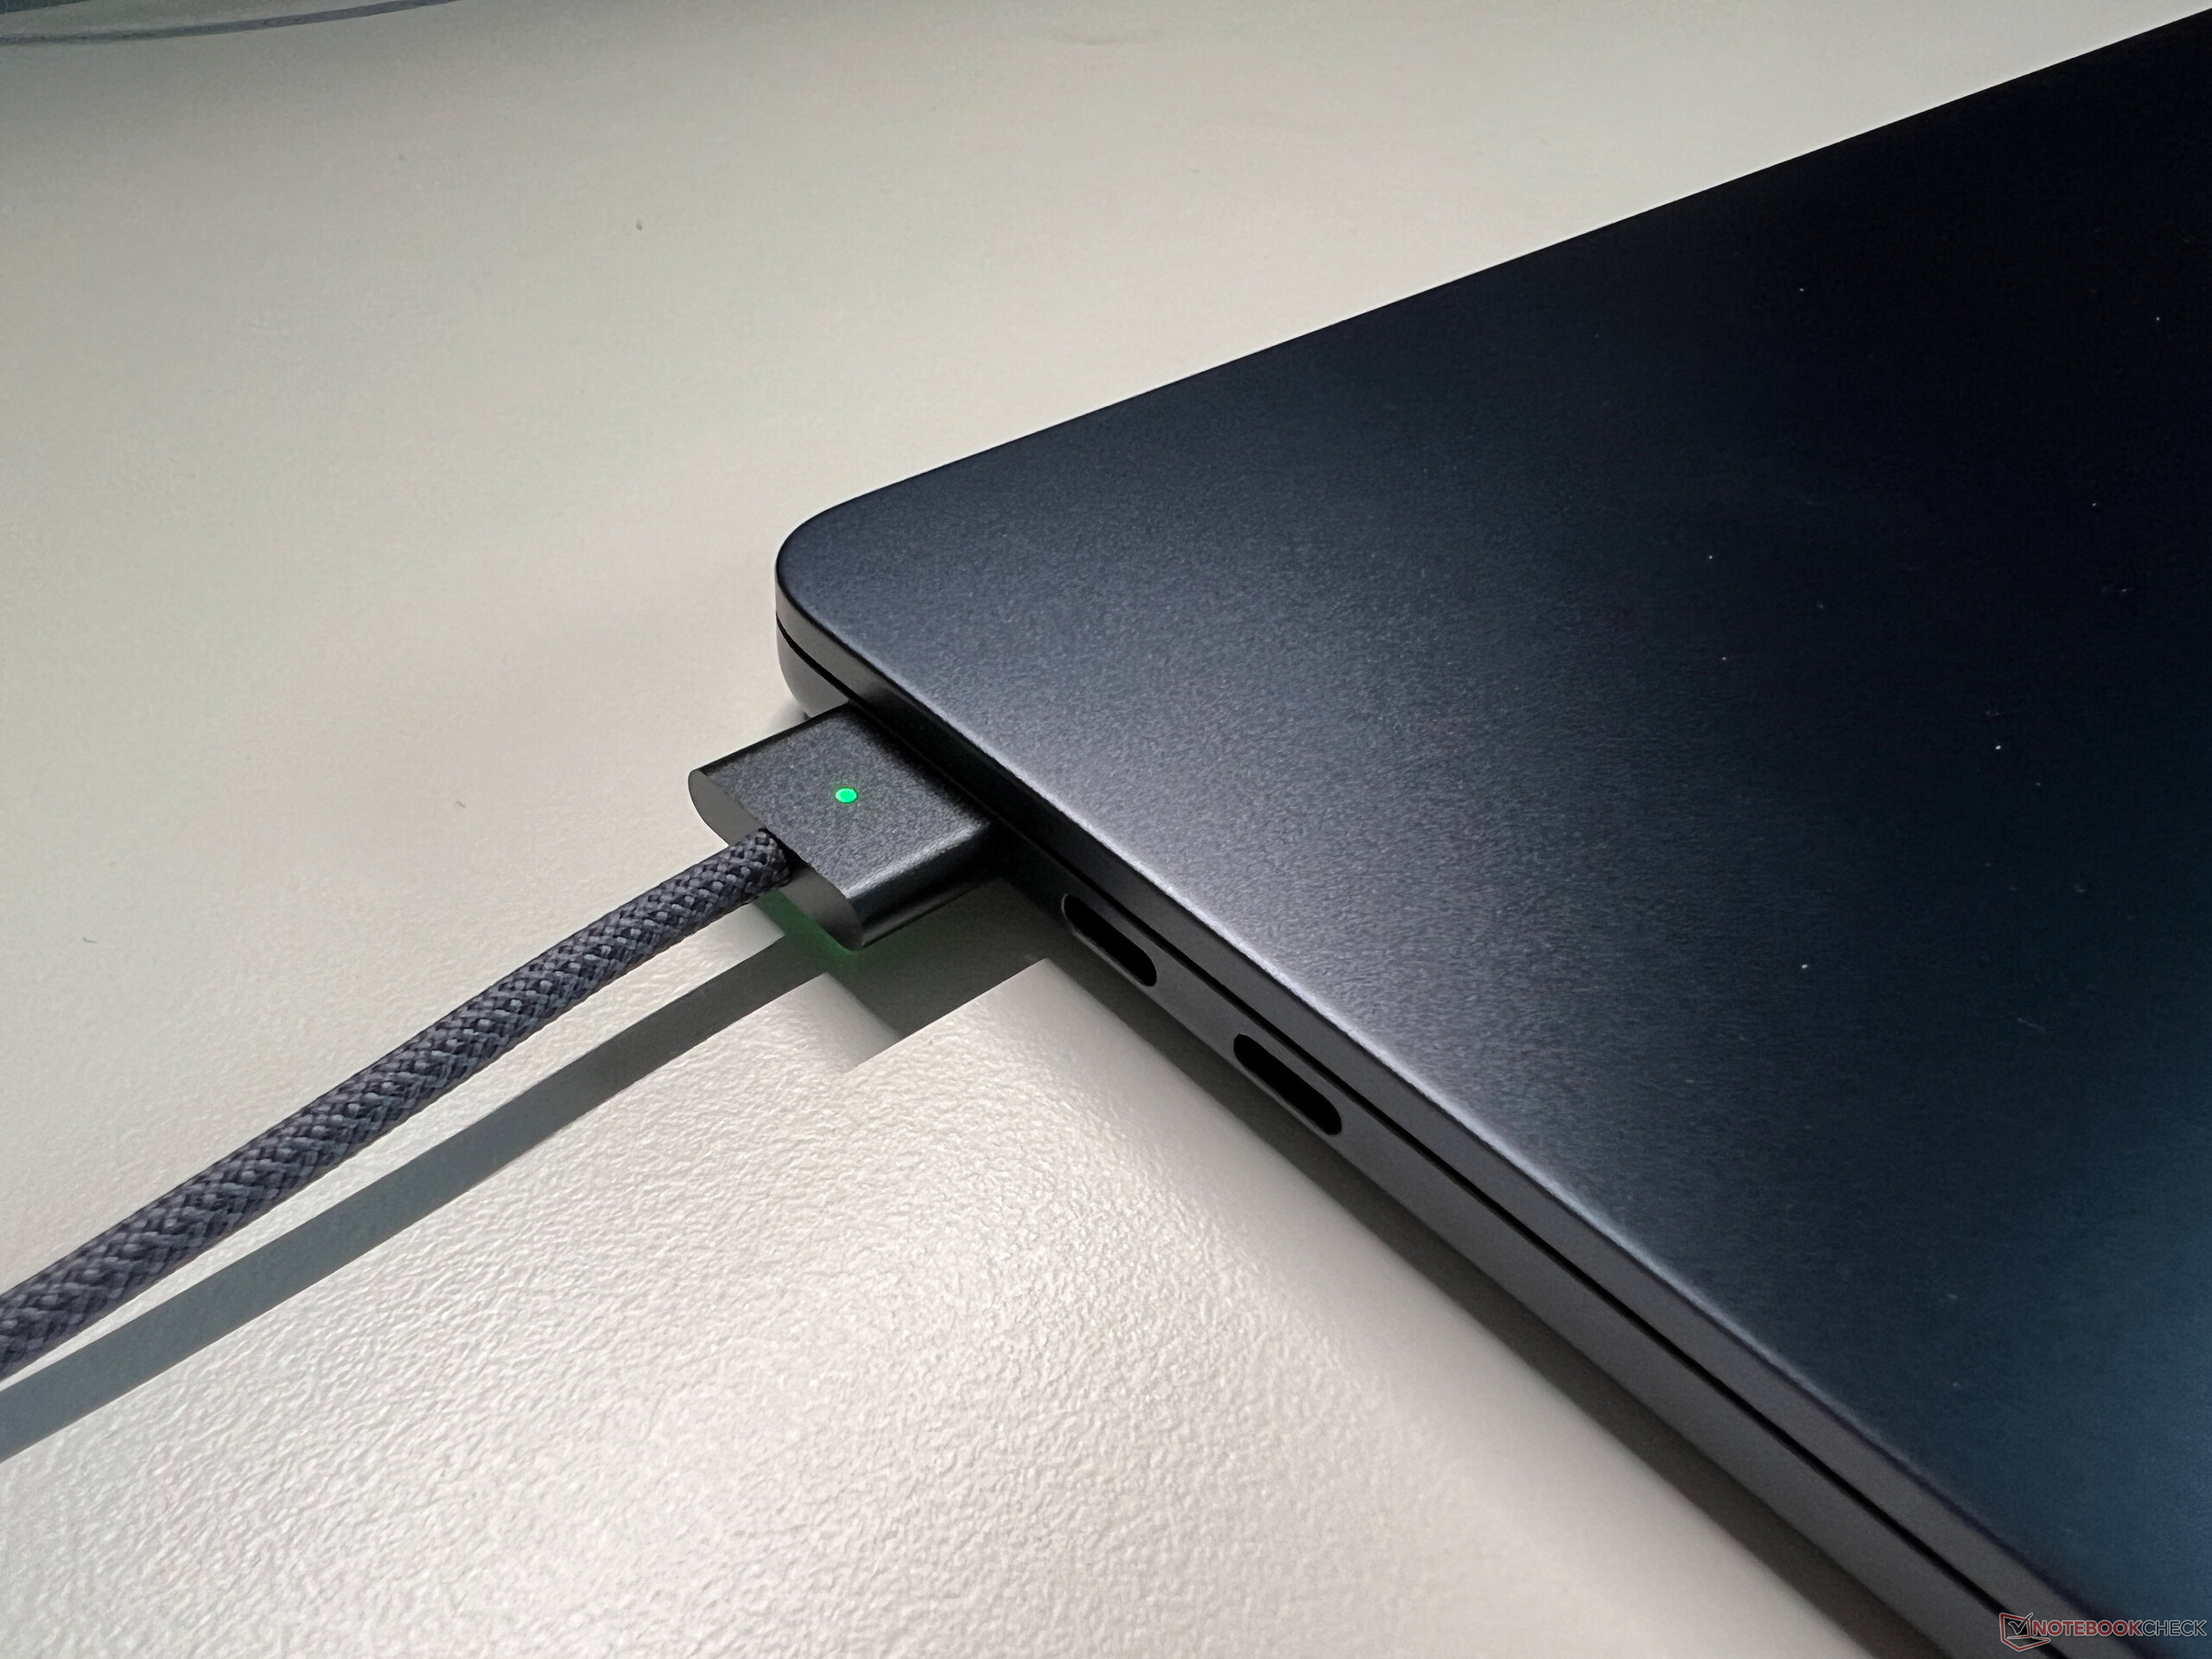
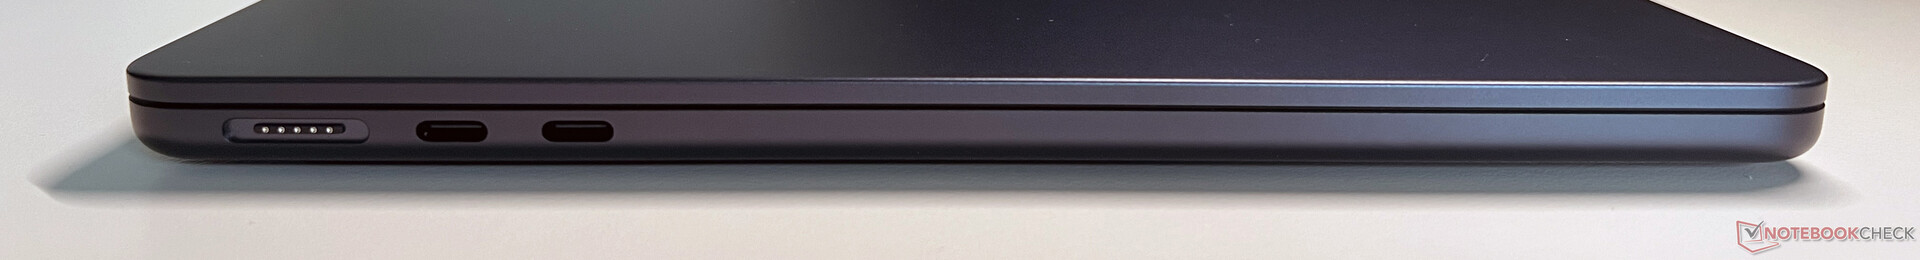
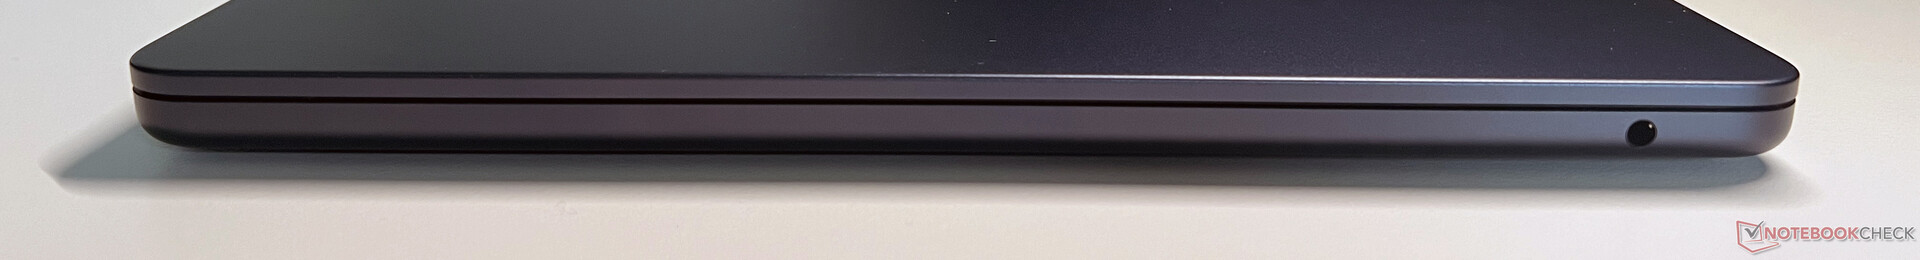
In terms of connectivity options, nothing has changed, as aside from a MagSafe connection for the power supply, it continues to feature two USB-C ports (4.0) on the left, which both still only support Thunderbolt 3. The right side only houses the 3.5-mm audio jack and we would have liked to see at least one further USB connection.
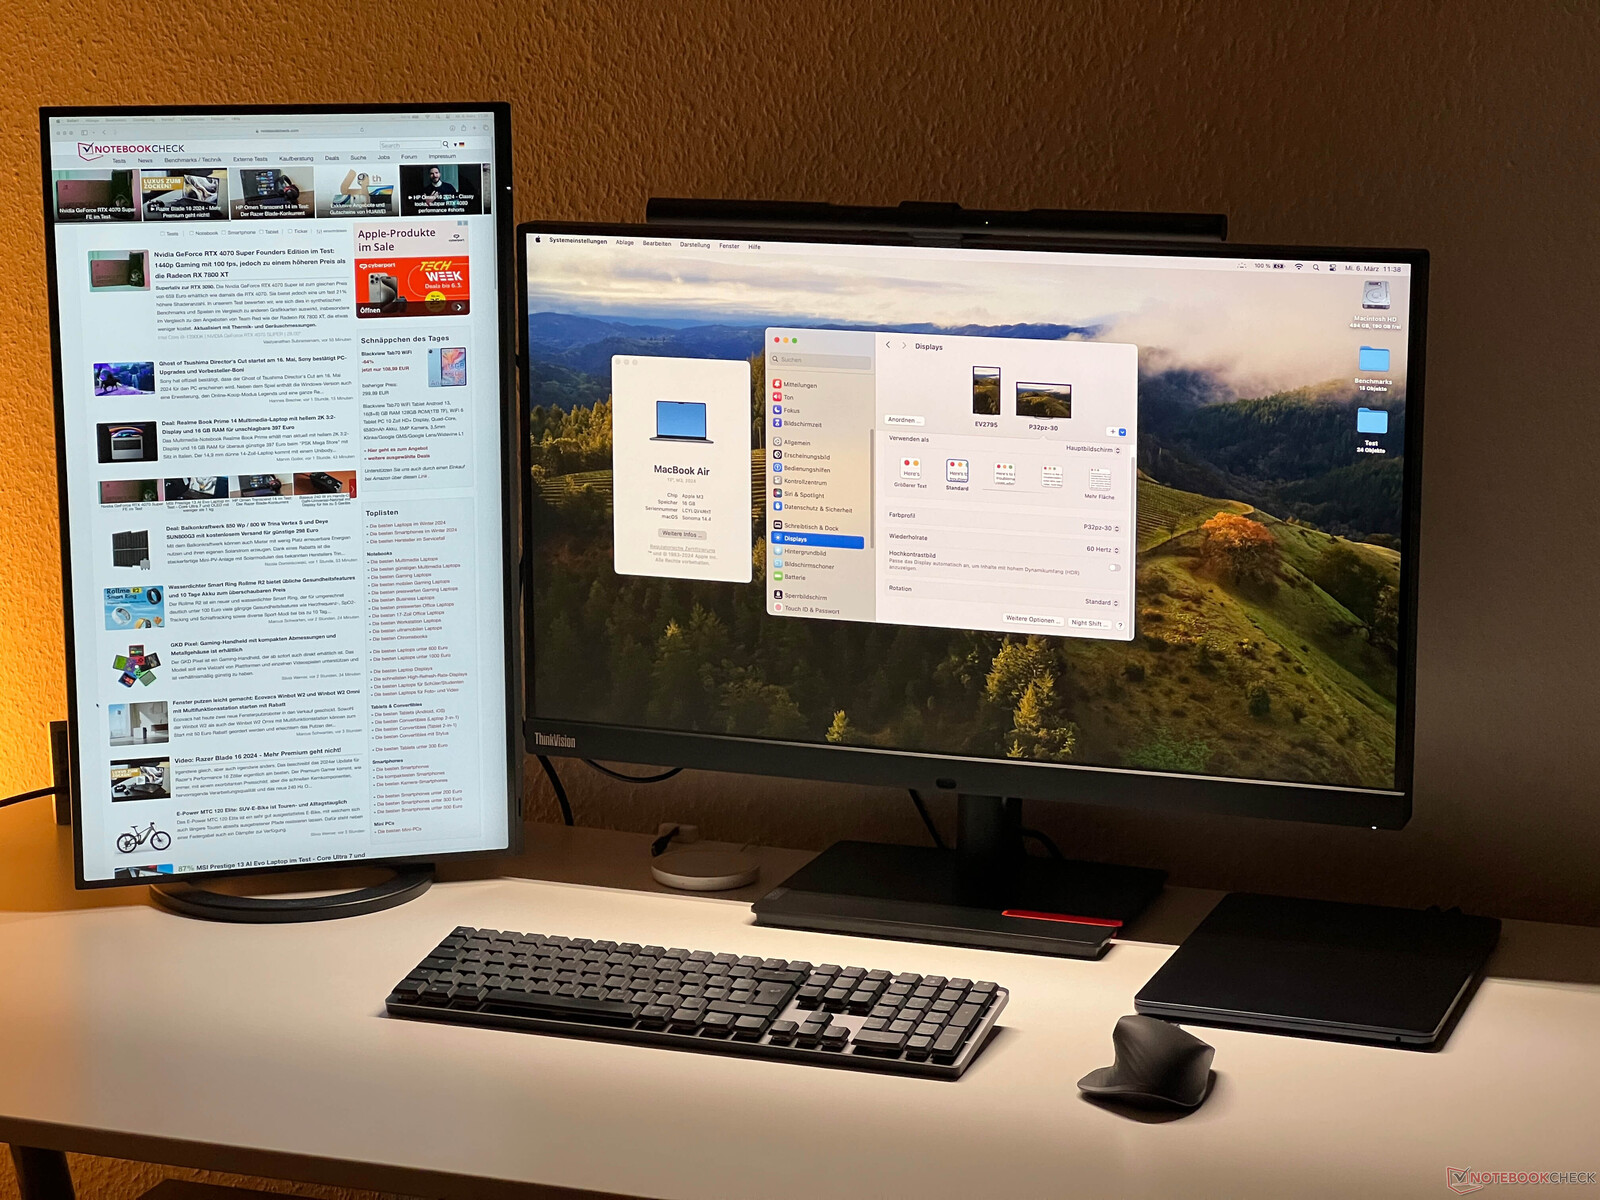
One feature is new, however, as previously, the MacBook Air M2 could only power one external monitor aside from its internal panel. The hardware requirements for the M3 SoC are identical, so it is still only possible to control two displays, but if you close the screen lid, you can now also use two external monitors (1x up to 6K/60 Hz, 1x up to 5K/60 Hz). Of course, this still isn't totally ideal but it is a clear step in the right direction and could make all the difference if you are looking to use two monitors.
We tested the new function with two external screens (one via USB-C and the other via USB-C/HDMI adapter), which worked perfectly. The MacBook Pro 14 M3 is also set to receive this function at a later date via a software update.
Communication
Apple has updated the WLAN module and it now supports Wi-Fi 6E at 160 MHz as well as Bluetooth 5.3. In combination with our reference router from Asus, you can see the result immediately, as the new MacBook Air M3 is twice as fast as its predecessor and just as fast as the larger MacBook Pro models.
| Networking | |
| Apple MacBook Air 13 M3 10C GPU | |
| iperf3 transmit AXE11000 | |
| iperf3 receive AXE11000 | |
| Asus ZenBook 14 UX3405MA | |
| iperf3 transmit AXE11000 | |
| iperf3 receive AXE11000 | |
| Lenovo ThinkPad Z13 Gen 2 | |
| iperf3 transmit AXE11000 | |
| iperf3 receive AXE11000 | |
| iperf3 transmit AXE11000 6GHz | |
| iperf3 receive AXE11000 6GHz | |
| HP Dragonfly G4 | |
| iperf3 transmit AXE11000 | |
| iperf3 receive AXE11000 | |
| iperf3 transmit AXE11000 6GHz | |
| iperf3 receive AXE11000 6GHz | |
| Dell XPS 13 Plus 9320 Core i7-1360P | |
| iperf3 transmit AXE11000 | |
| iperf3 receive AXE11000 | |
| iperf3 transmit AXE11000 6GHz | |
| iperf3 receive AXE11000 6GHz | |
| Huawei MateBook X Pro 2023 | |
| iperf3 transmit AXE11000 | |
| iperf3 receive AXE11000 | |
| iperf3 transmit AXE11000 6GHz | |
| iperf3 receive AXE11000 6GHz | |
| Apple MacBook Air M2 Entry | |
| iperf3 transmit AXE11000 | |
| iperf3 receive AXE11000 | |
Webcam
Its 1080p webcam continues to take decent photos in good lighting conditions and we have no complaints about its microphones, either. You can optionally use your iPhone as a webcam.


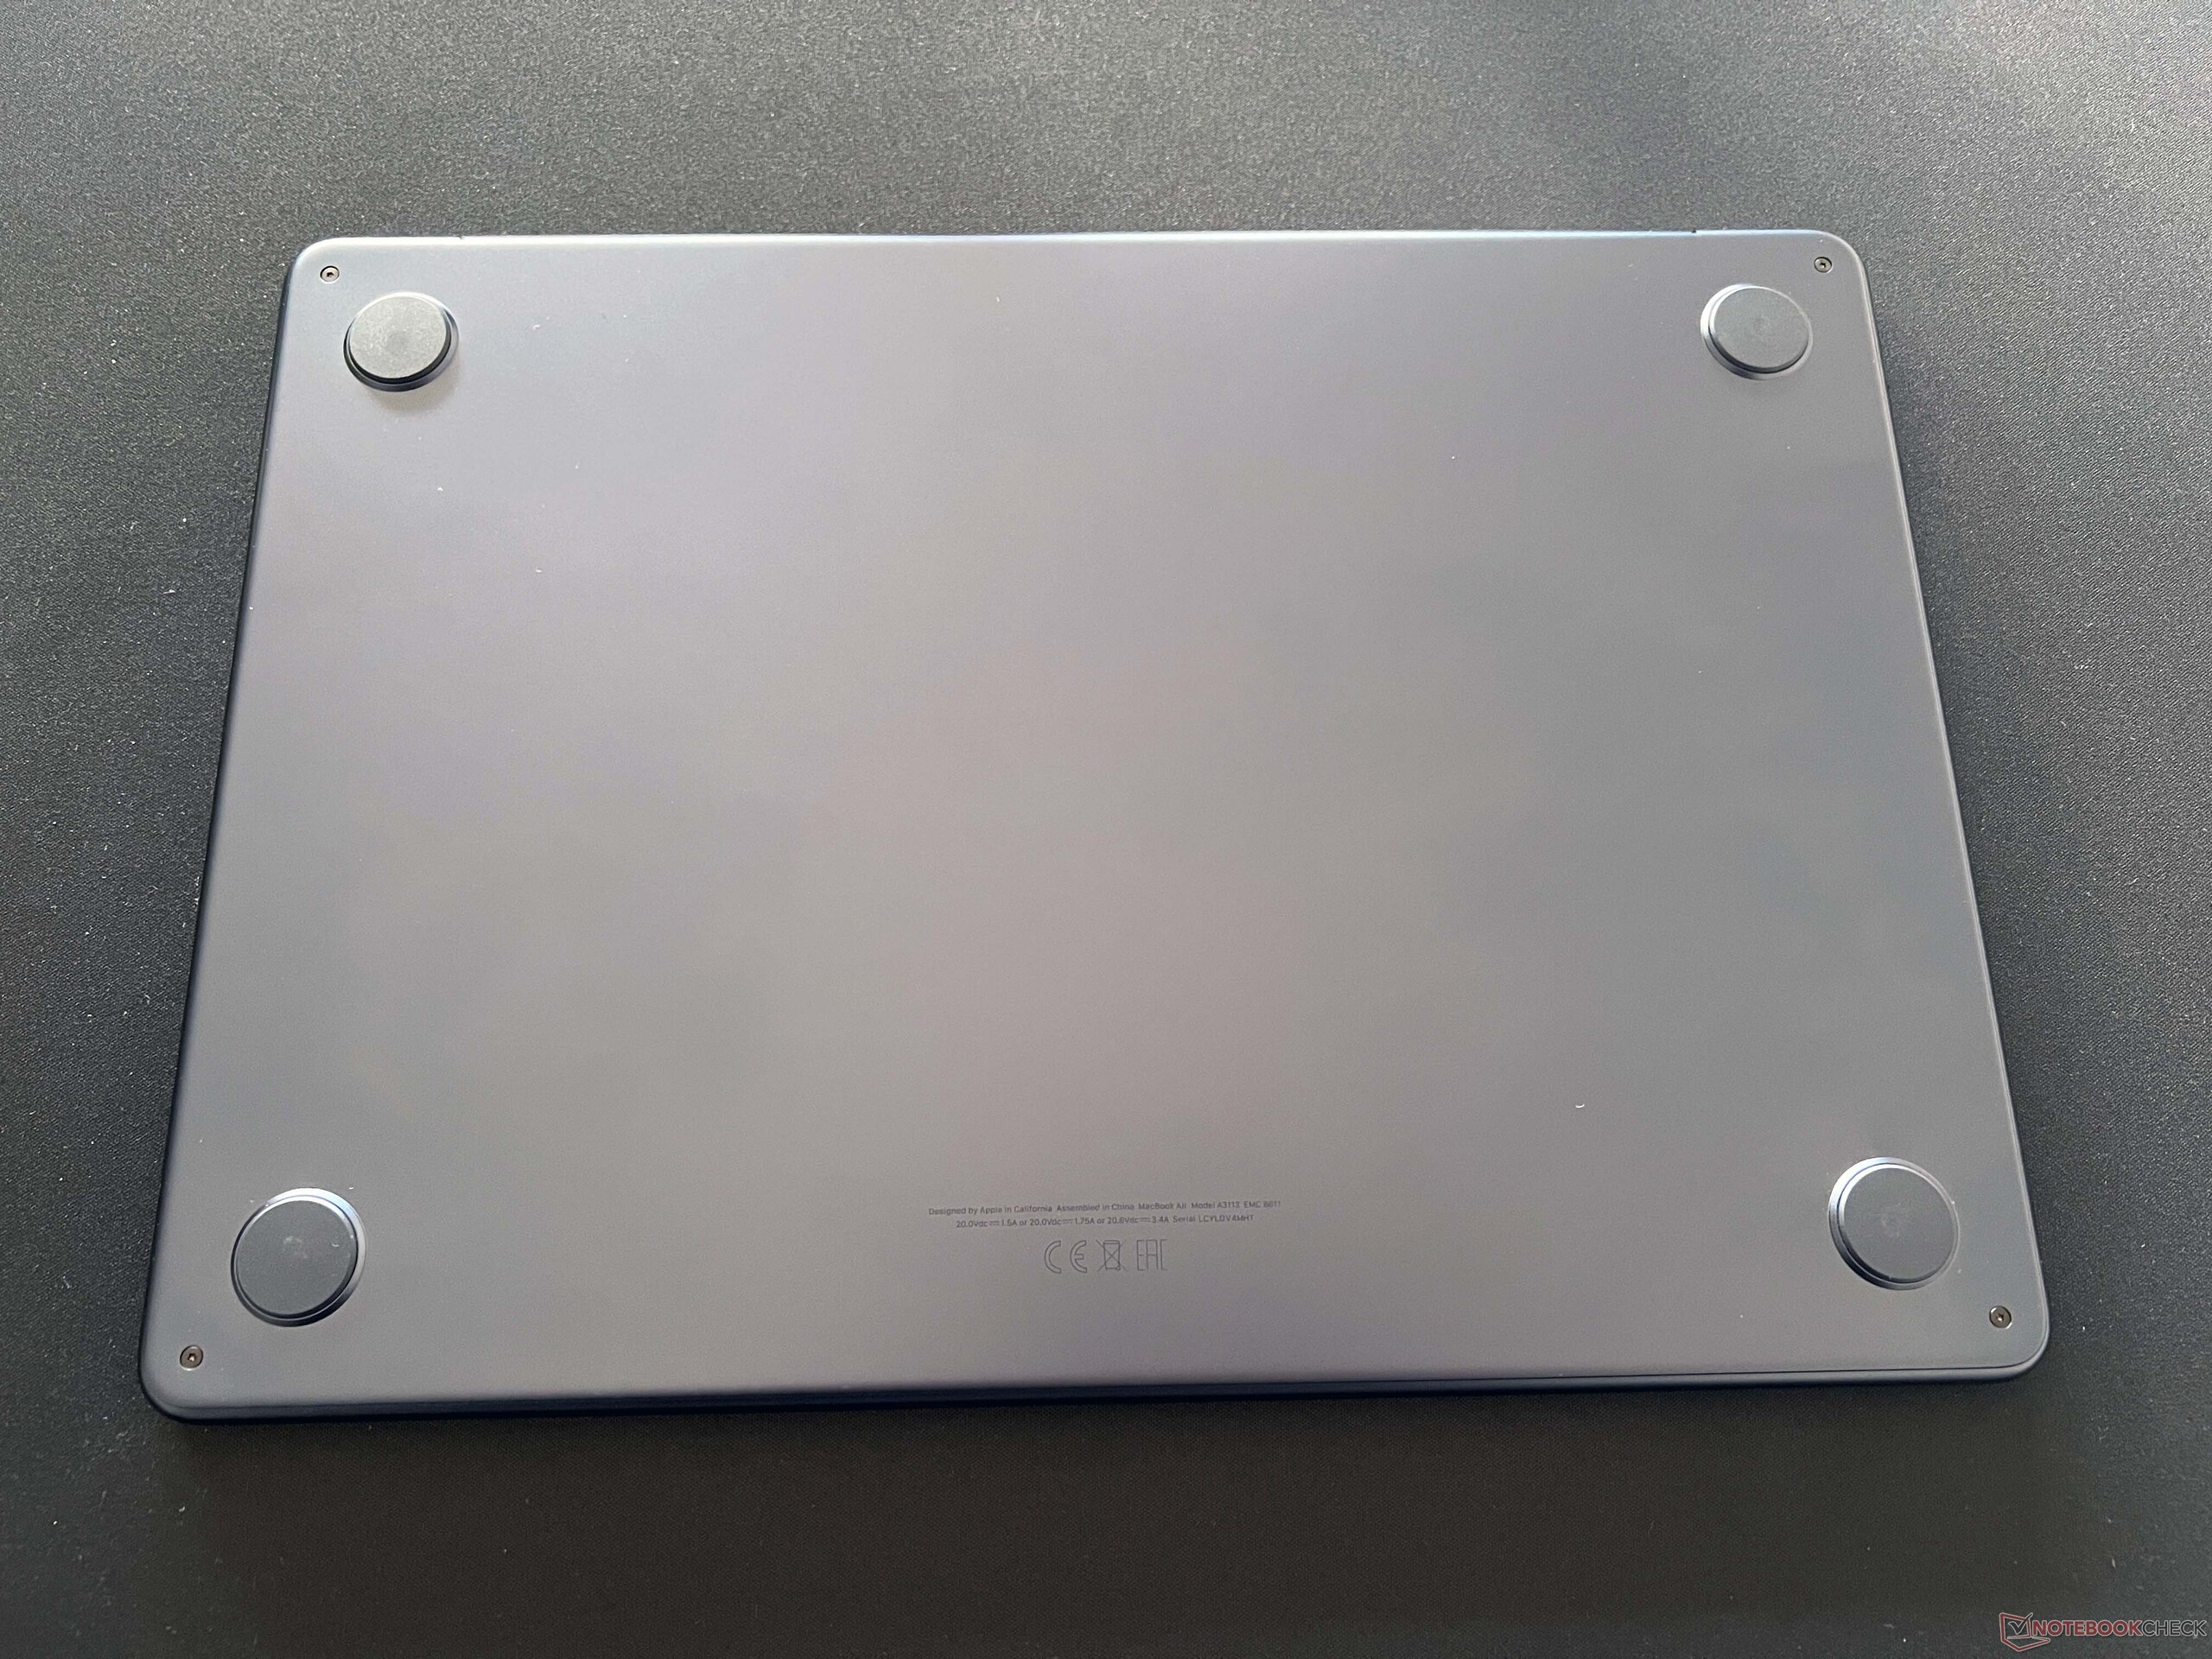
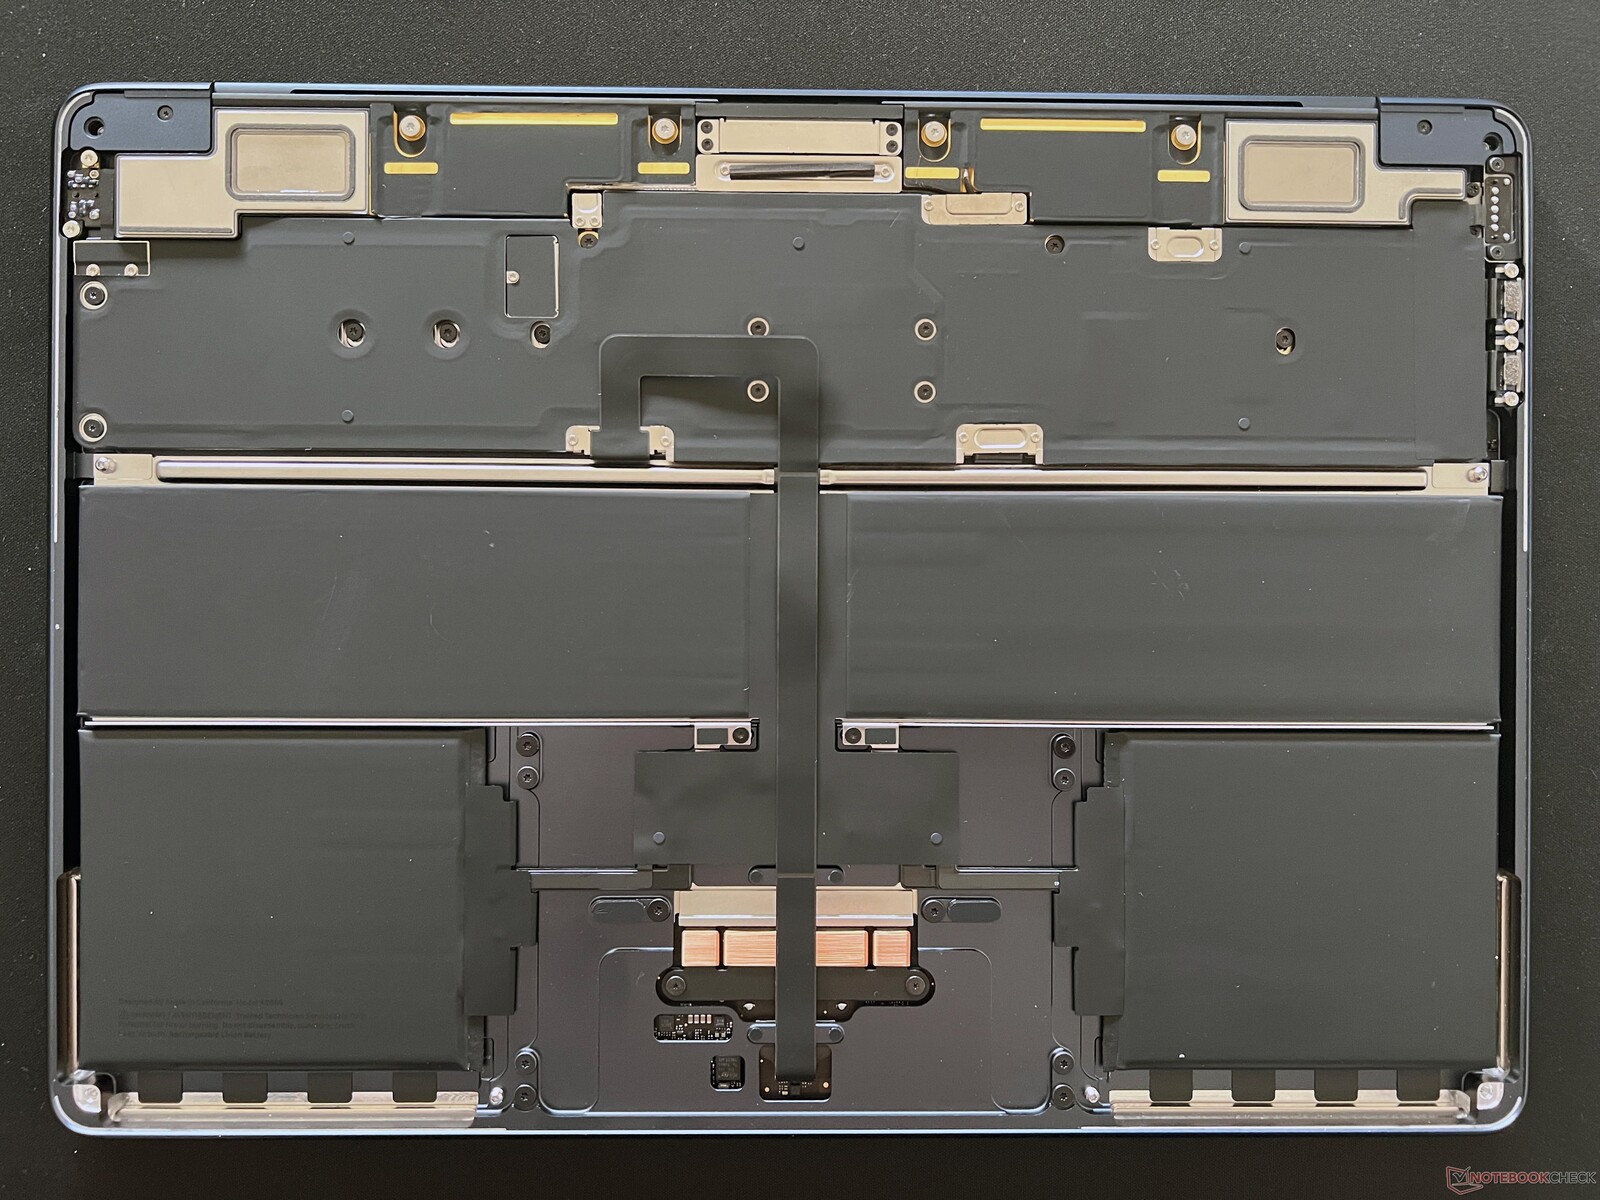
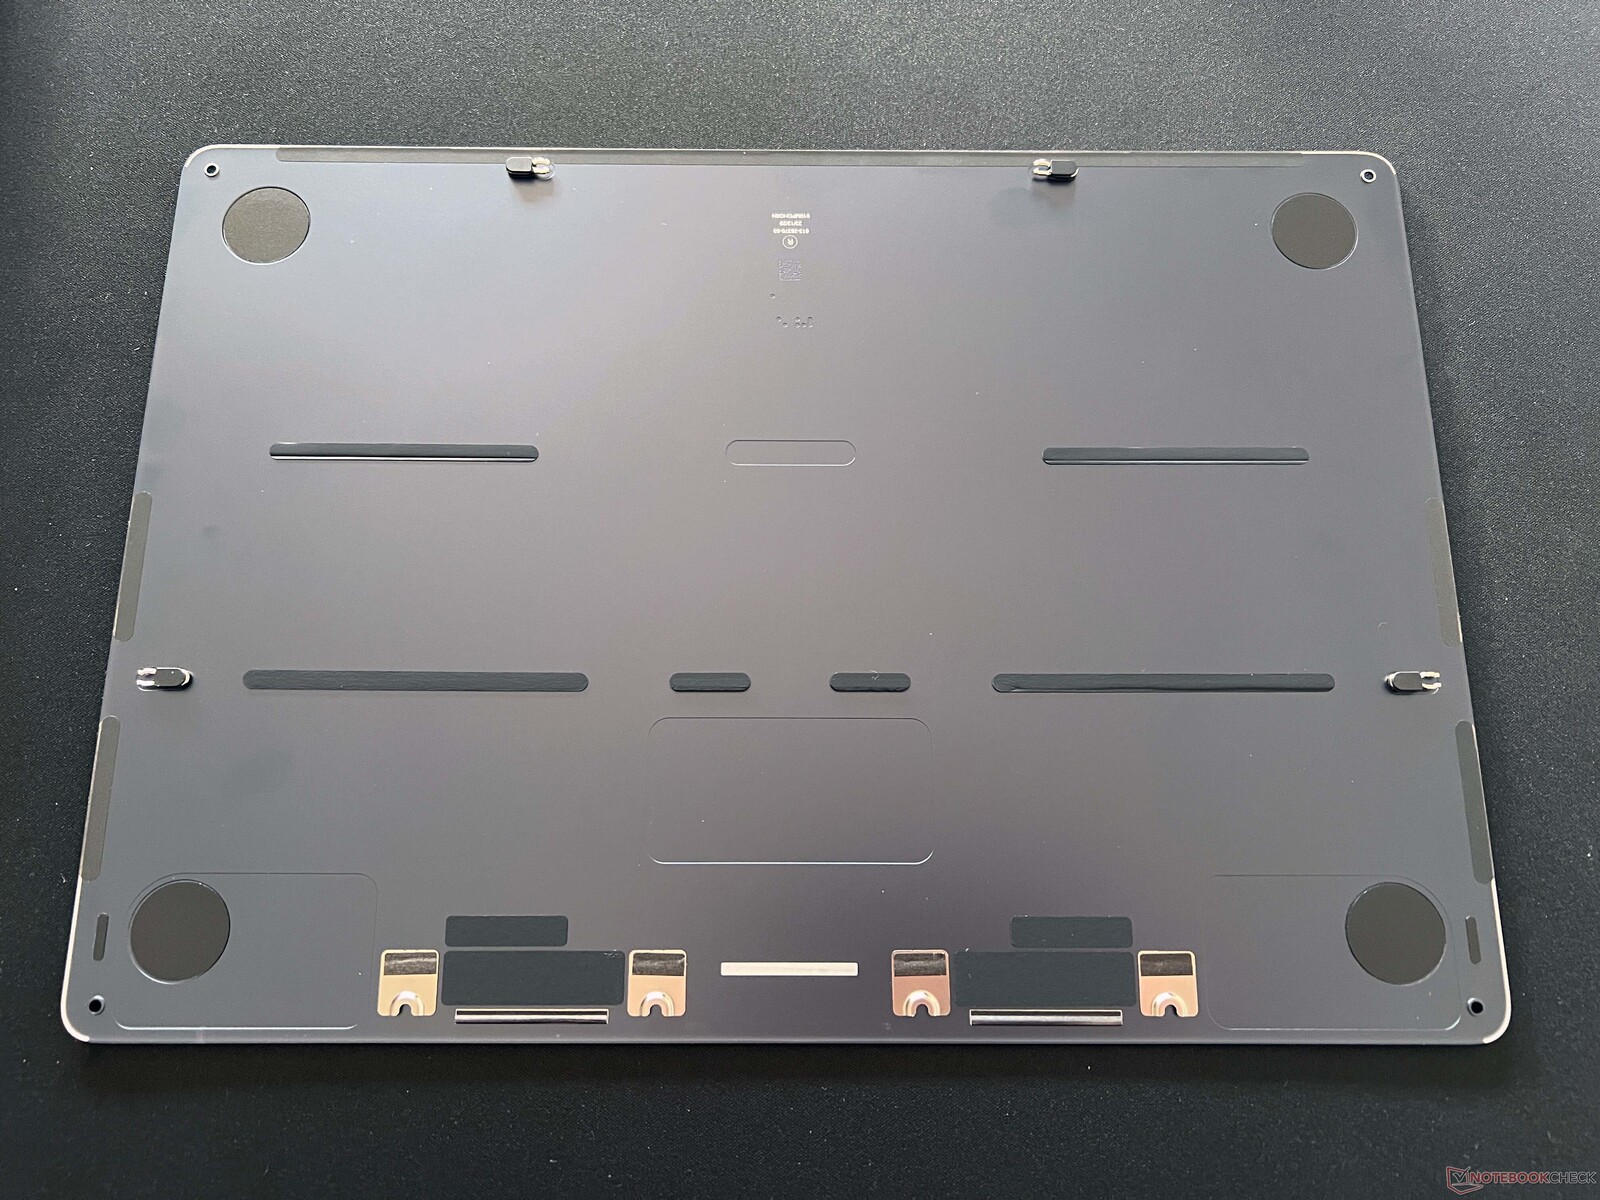
Maintenance
The bottom cover can be removed as long as you have a fitting pentalobe screwdriver. However, you can probably save yourself the hassle, as there is no fan and all of the components are soldered on. The glued-in battery can be replaced if needed, but this should only be done by qualified service personnel.
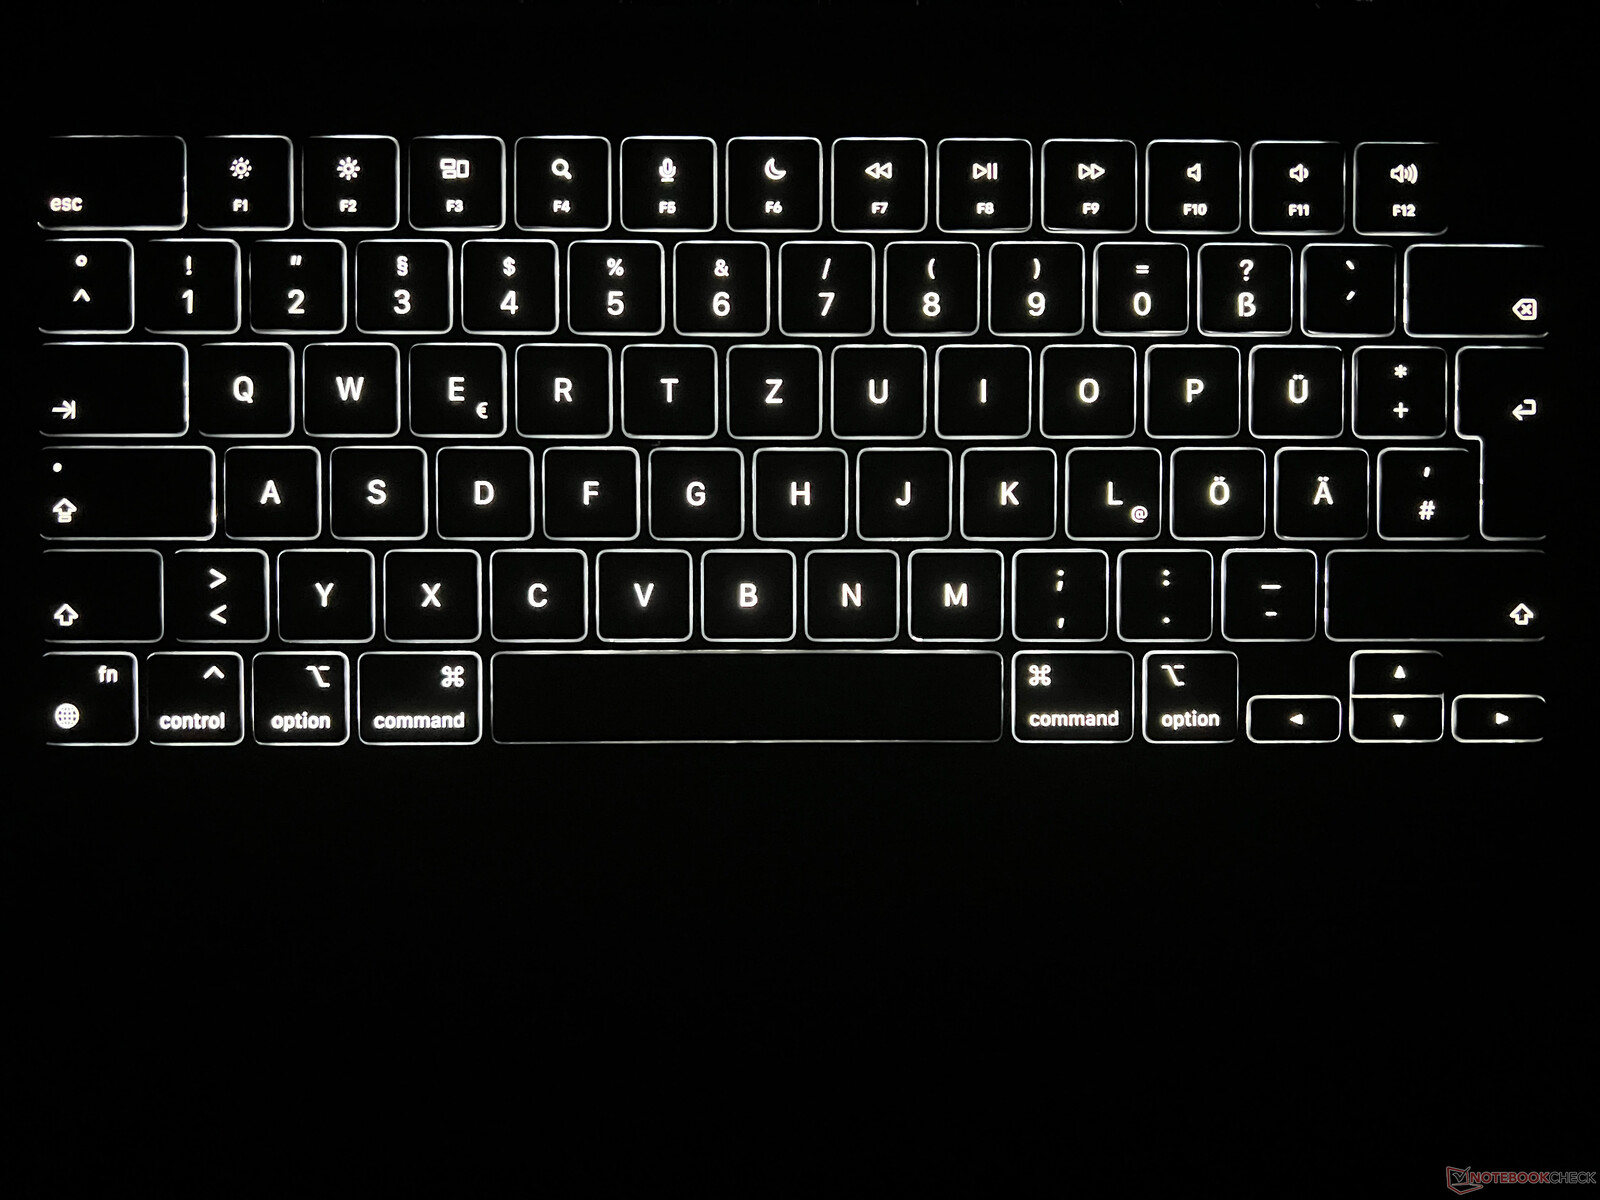
Input devices - Superb trackpad
In terms of input devices, nothing has changed compared to the MacBook Air M2. The keyboard's quality doesn't quite live up to the standard of business laptops but all-in-all, it is precise and typing on it feels comfortable. Its Touch-ID fingerprint scanner works perfectly and when it comes to white keyboard backlighting, Apple has led the way for years, as its intensity is adjusted very precisely and automatically to the surrounding ambient light.
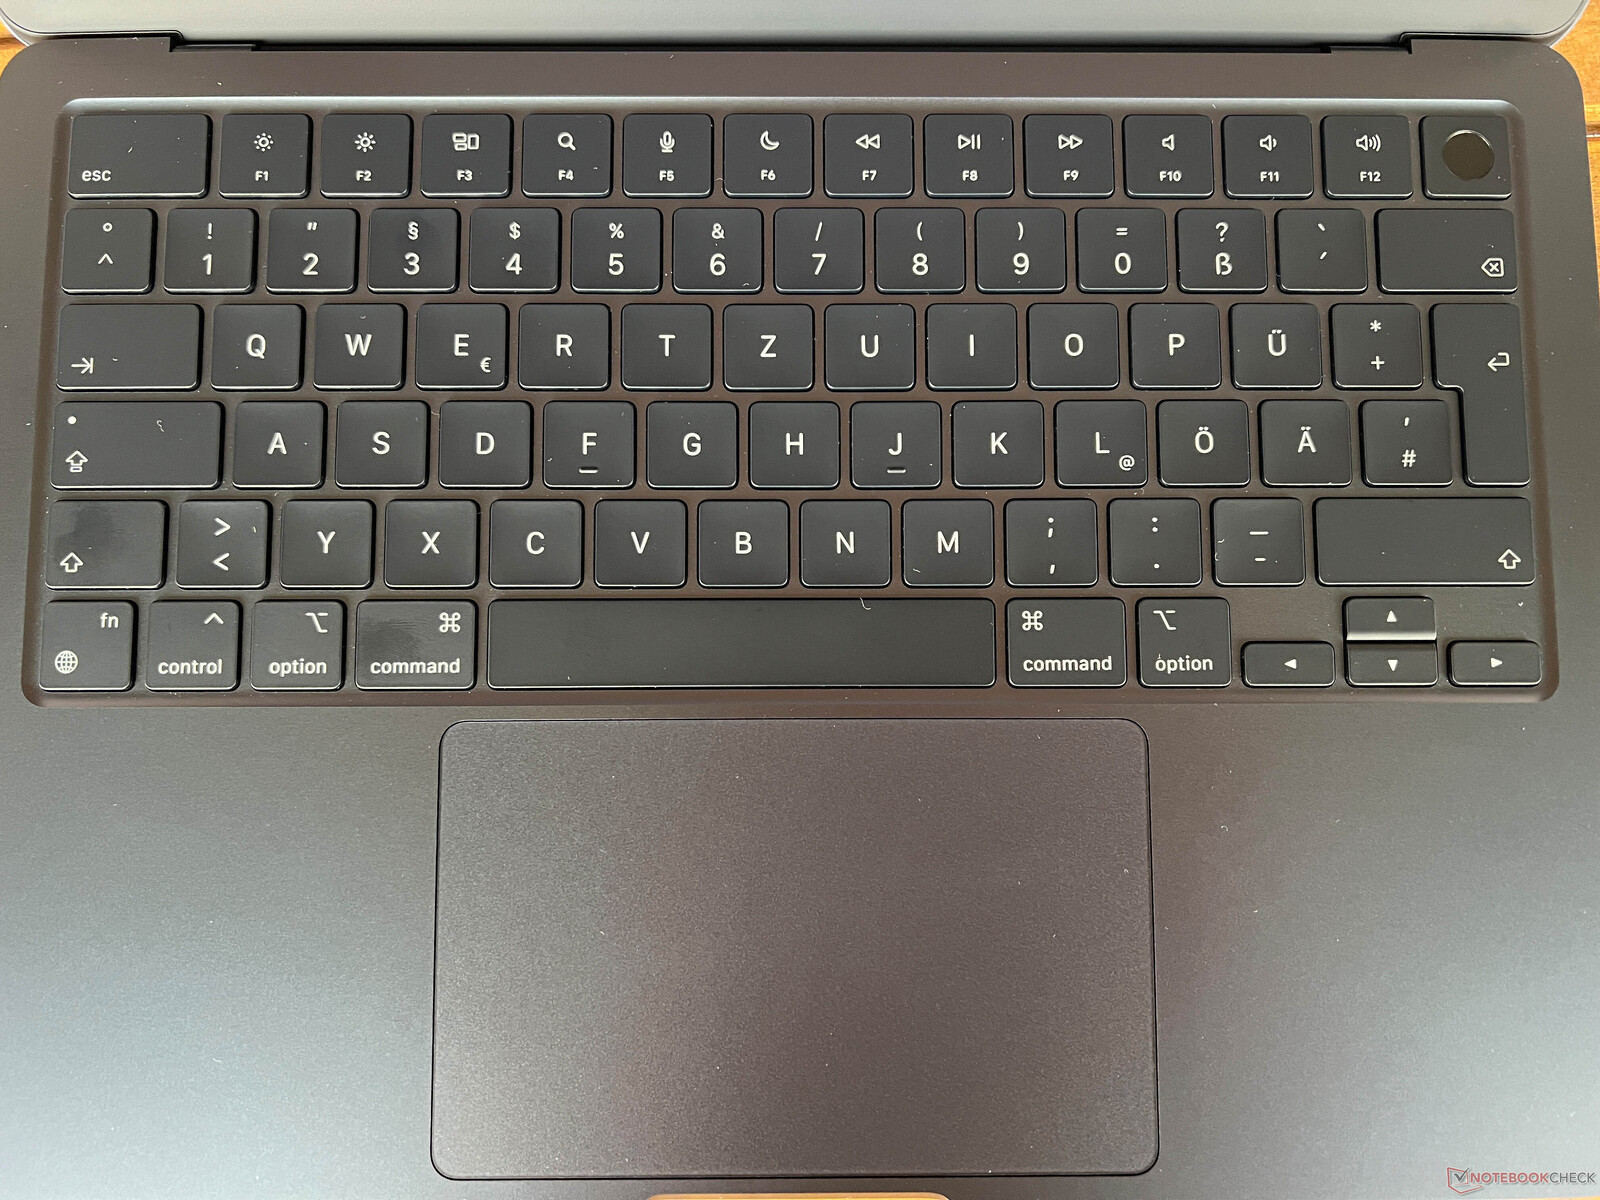
Its large trackpad is still the one to beat when it comes to mobile devices and its integration into macOS is flawless. Thanks to Force Touch, its clicks are even across the whole pad and they aren't too loud. Furthermore, gestures are input perfectly. As always, the MacBook Air doesn't feature a touchscreen.
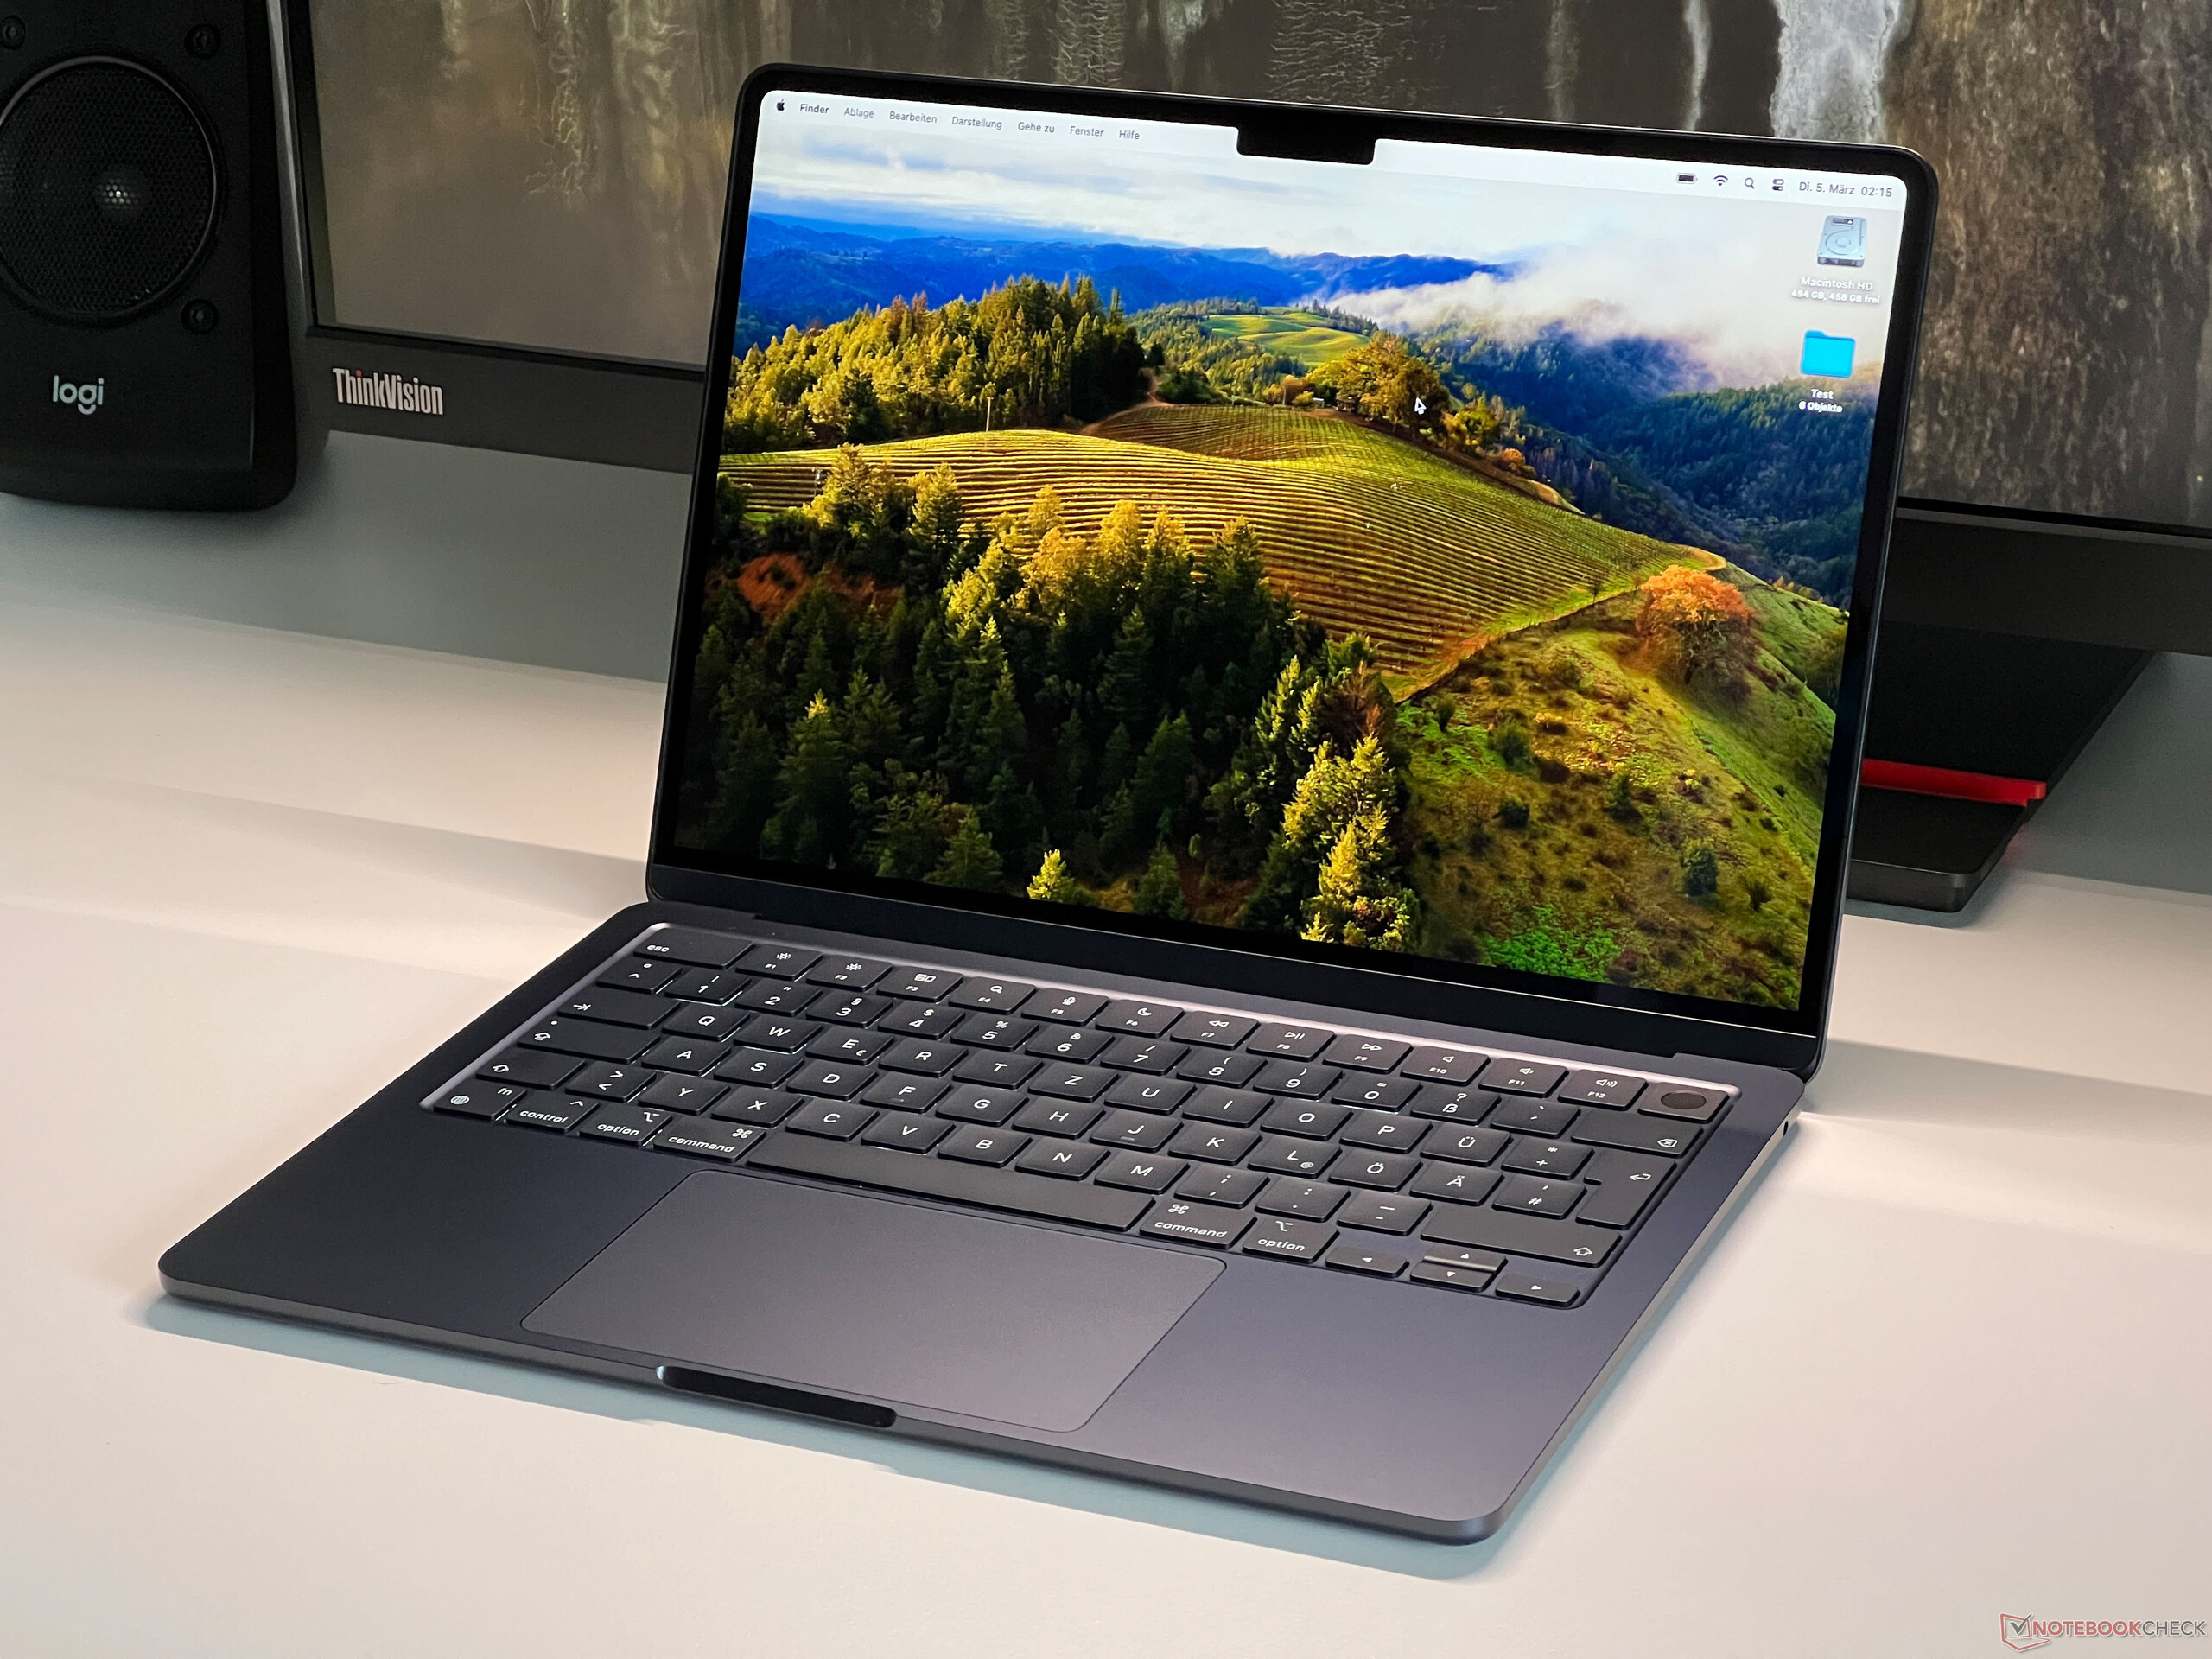
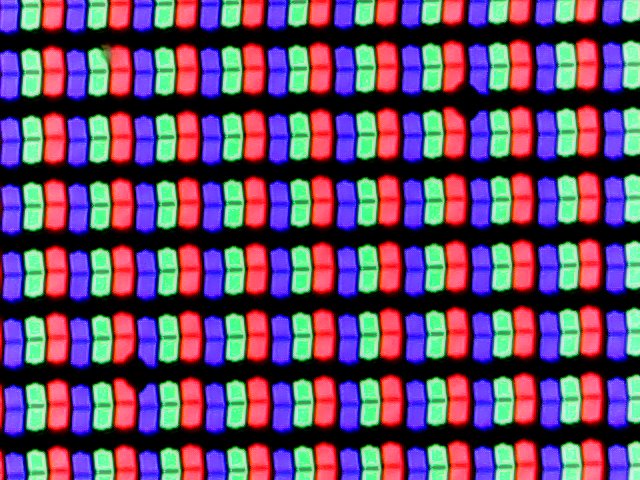
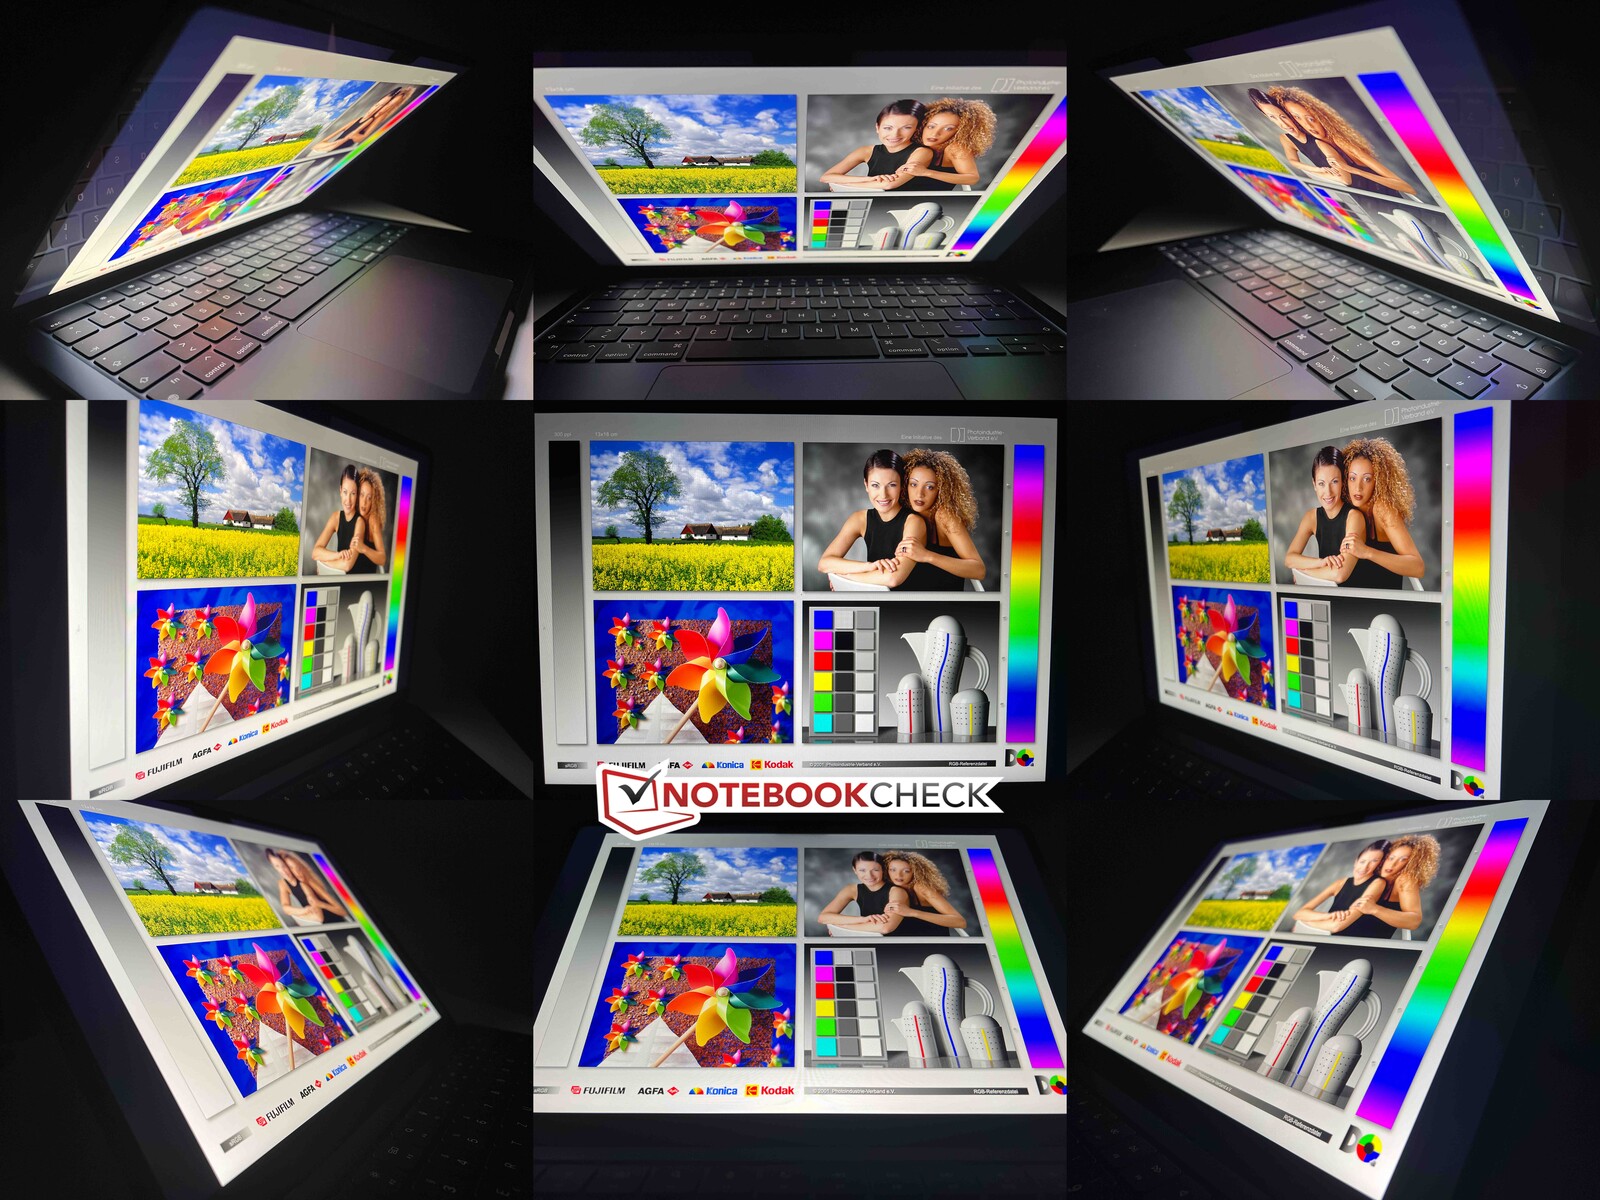
Display - IPS with P3 coverage
Apple continues to rely on a 13.6-inch IPS screen within the Air. Its resolution is slightly crooked at 2,560 x 1,664 pixels. The 64 additional vertical pixels are used for the area next to the notch. As always, it doesn't look the best, but it also doesn't take any space away from the actual 16:10 panel.
Subjectively, the panel's picture quality remains impressive. Colors look intense and content is sharp; in addition, macOS still shows no scaling issues. We would, however, like to start seeing an update to 120 Hz, as this model continues to feature a 60-Hz panel. Its response times aren't particularly quick but they also aren't noticeably slow—in everyday use, you won't notice any ghosting. PWM isn't used and its screen brightness and color temperature are adapted automatically depending on the ambient light.
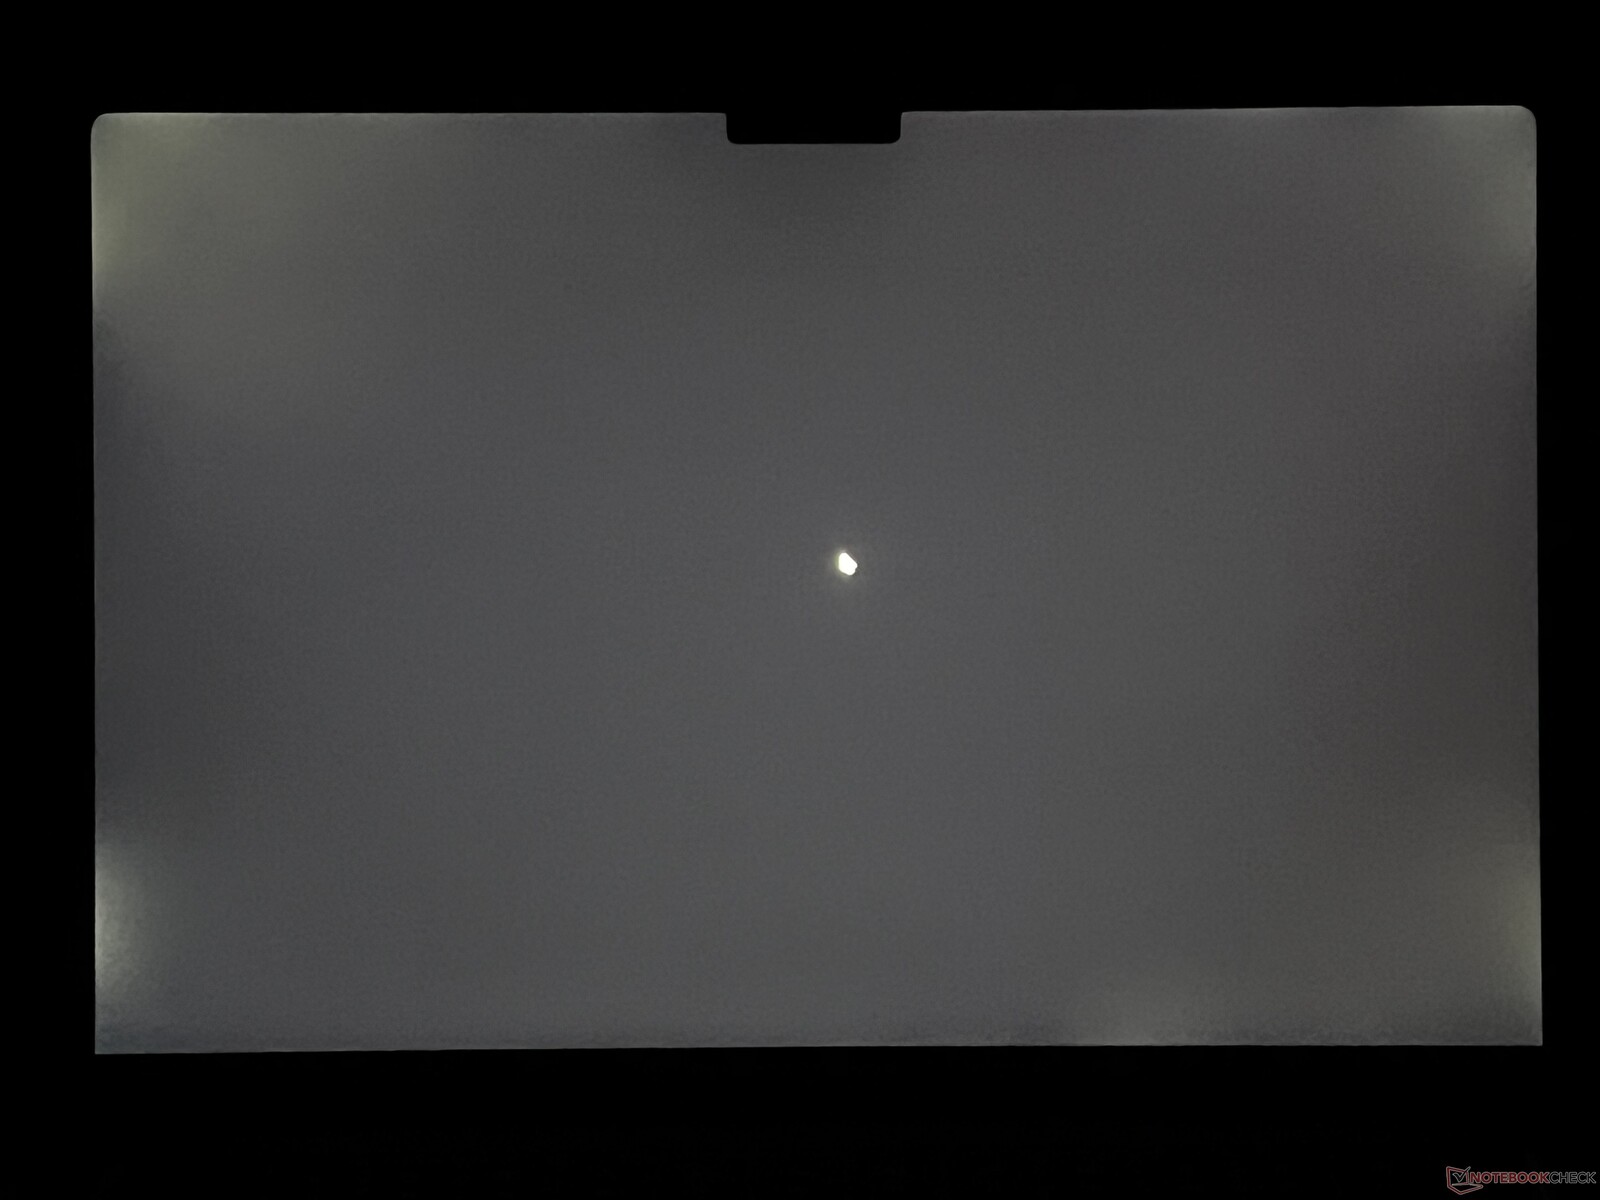
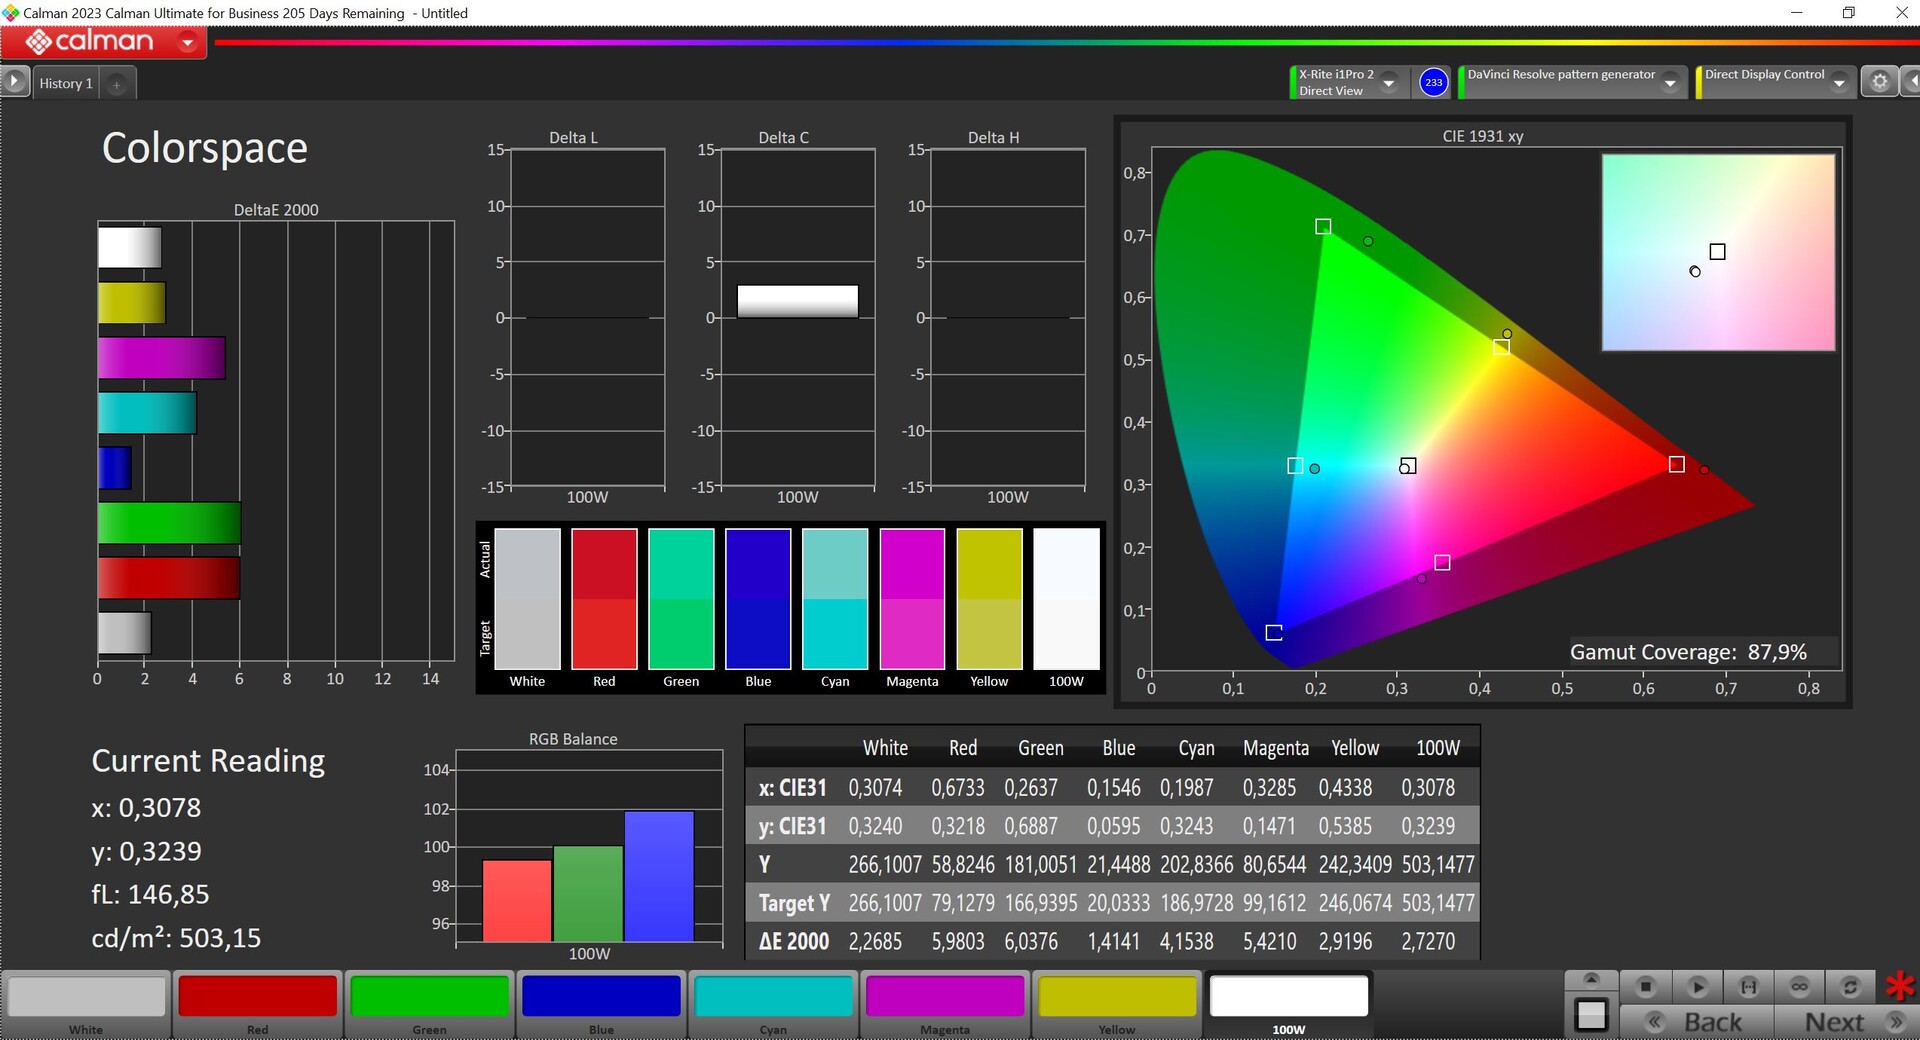
We measured a maximum brightness of 525 cd/m² in the middle of the screen and an average of just over 500 cd/m². The display's black value of 0.42 cd/m² is unfortunately quite high, leading to dark content not looking totally black compared to OLED or Mini-LED panels. This also makes itself known in the screen's contrast ratio, which is "only" ~1,300:1. We noticed some backlight bleeding in the corners when depicting dark images at high brightness levels.
| |||||||||||||||||||||||||
Brightness Distribution: 92 %
Center on Battery: 525 cd/m²
Contrast: 1250:1 (Black: 0.42 cd/m²)
ΔE ColorChecker Calman: 1.4 | ∀{0.5-29.43 Ø4.72}
ΔE Greyscale Calman: 2 | ∀{0.09-98 Ø4.97}
87.9% AdobeRGB 1998 (Argyll 3D)
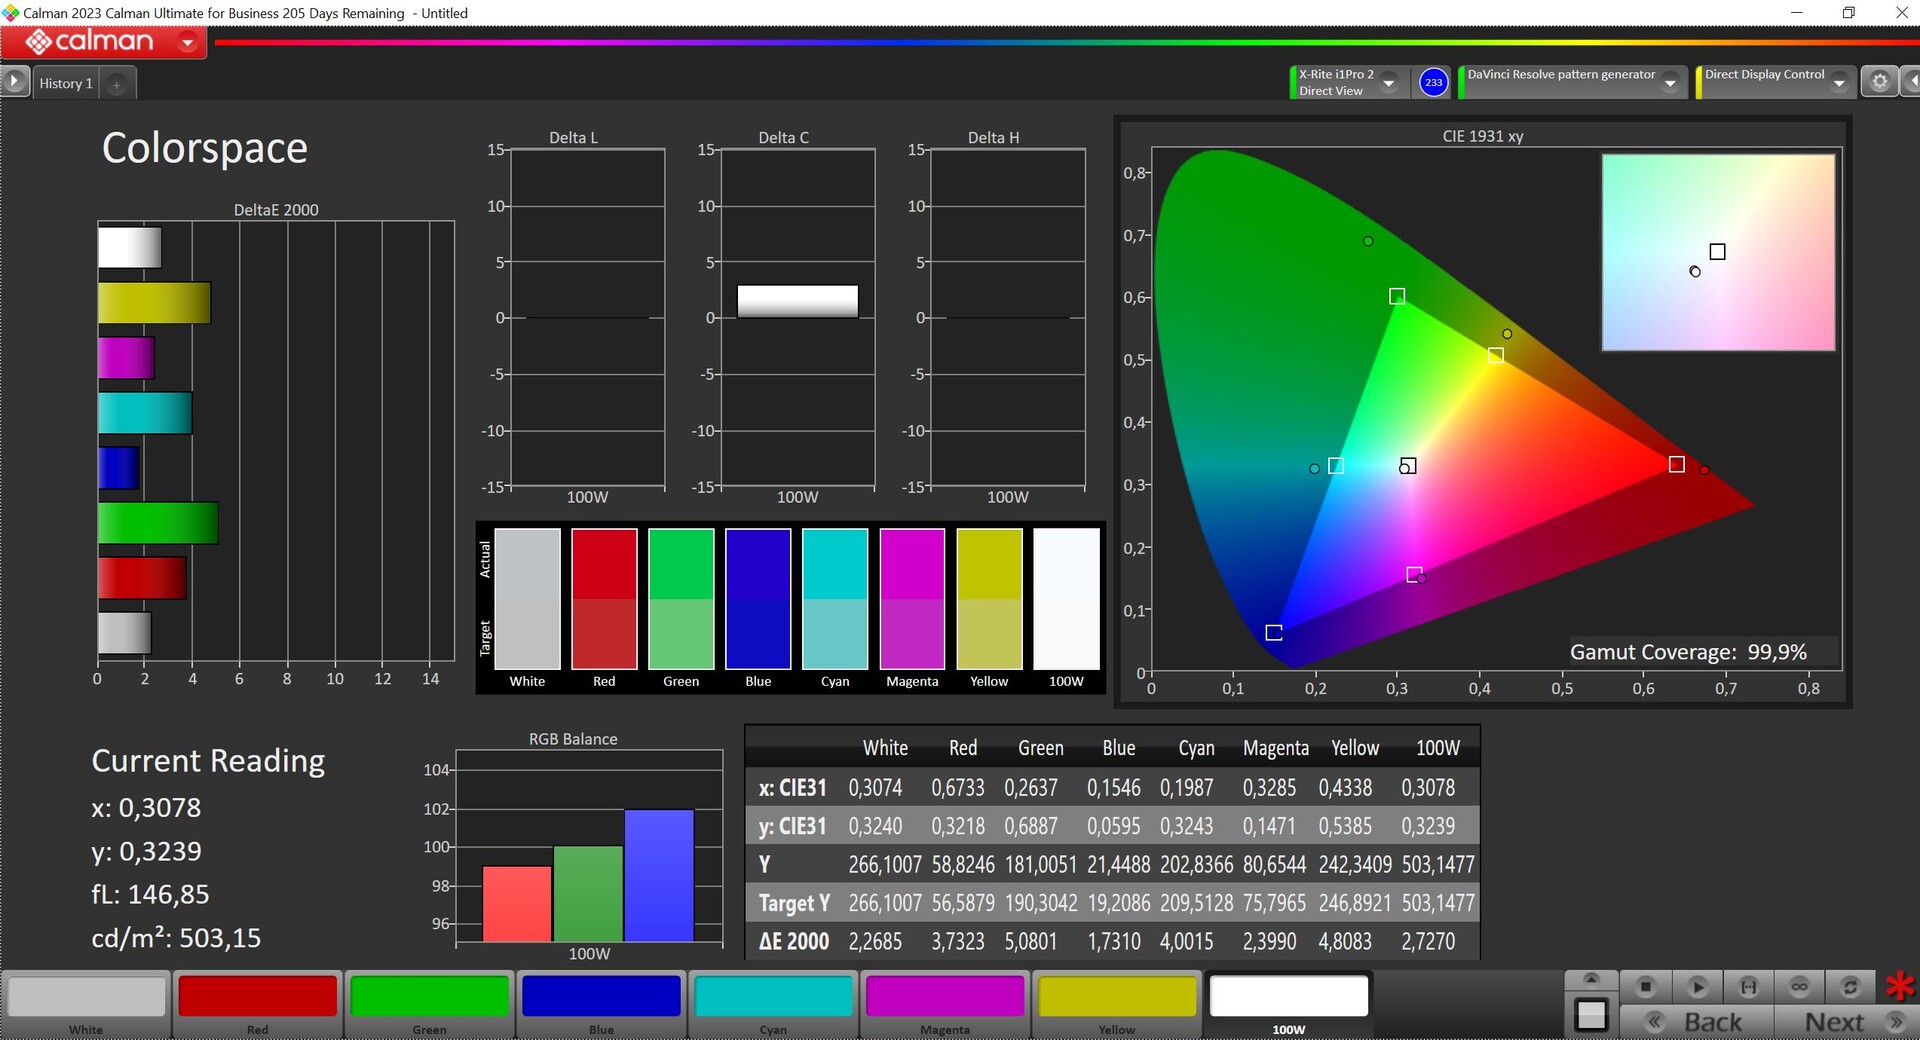
99.9% sRGB (Argyll 3D)
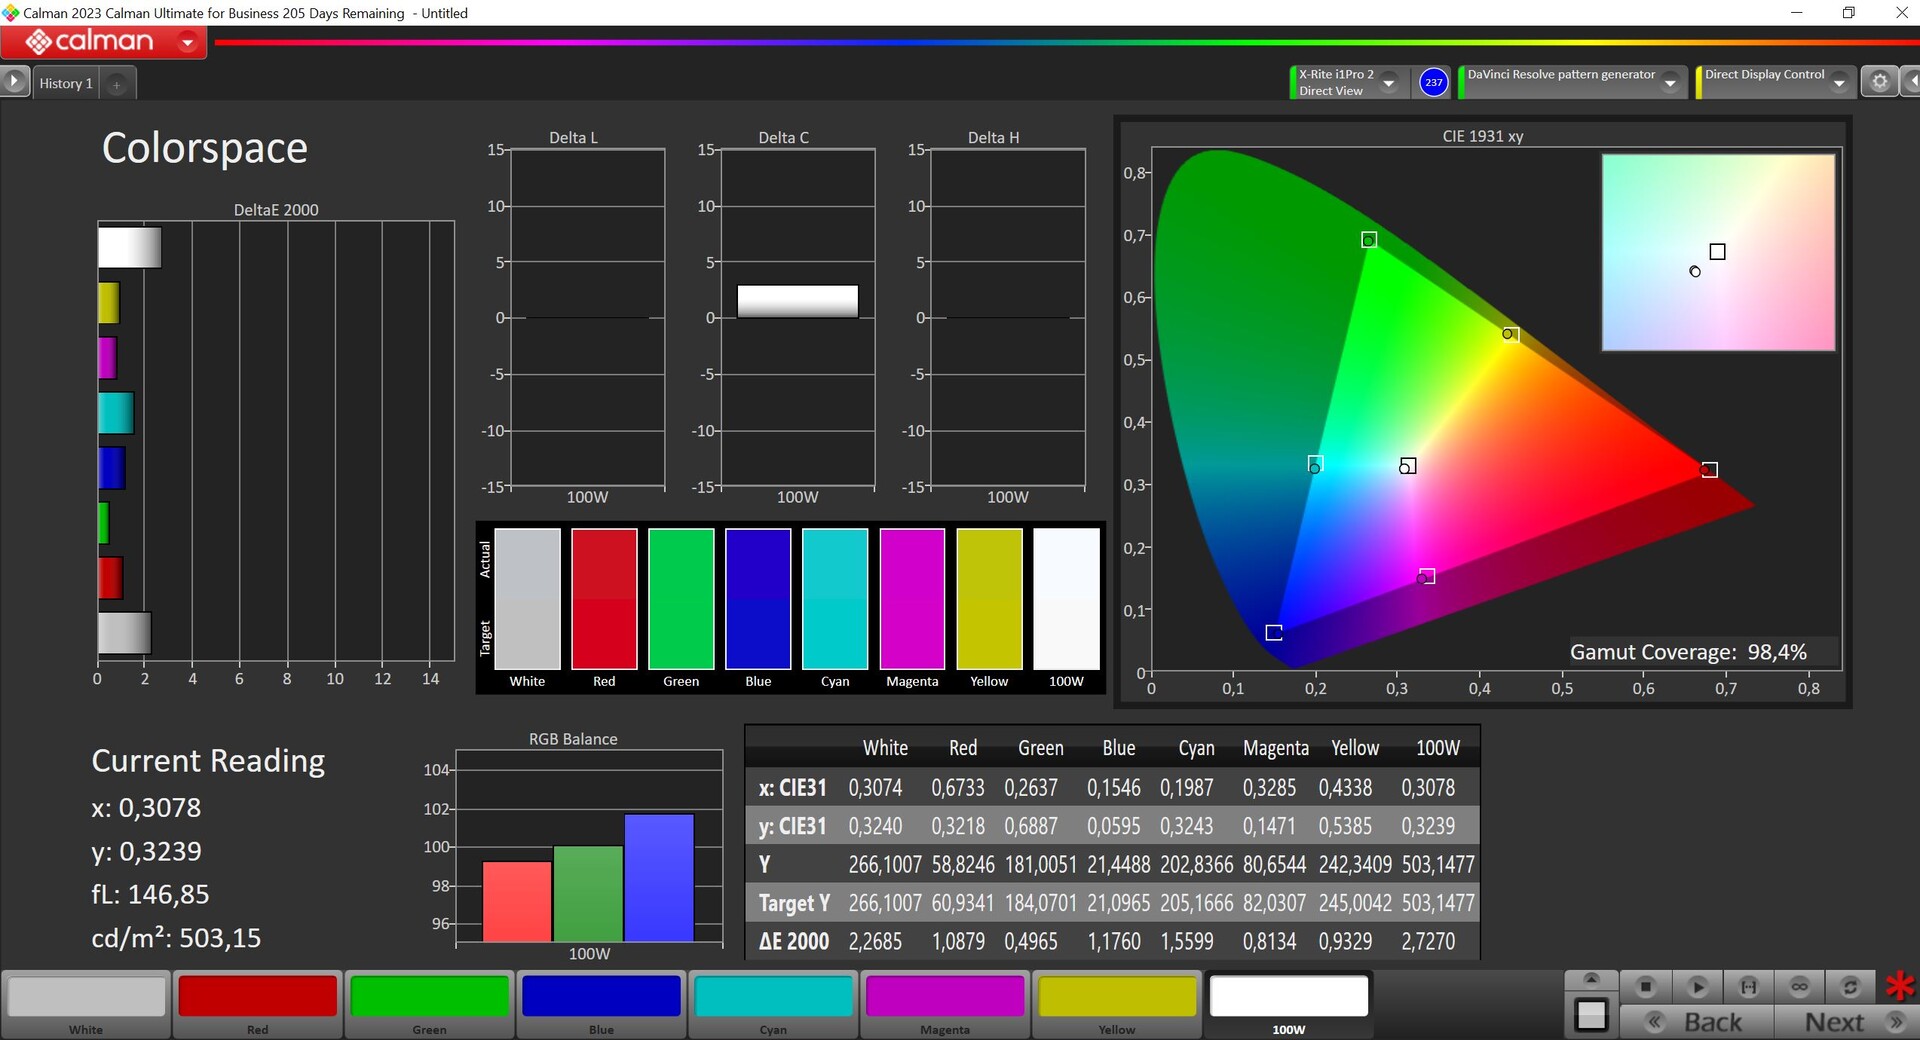
98.4% Display P3 (Argyll 3D)
Gamma: 2.2
CCT: 6876 K
| Apple MacBook Air 13 M3 10C GPU IPS, 2560x1664, 13.6" | Apple MacBook Air M2 Entry IPS, 2560x1664, 13.6" | Asus ZenBook 14 UX3405MA ATNA40CU06-0, OLED, 2880x1800, 14" | Lenovo ThinkPad Z13 Gen 2 ATNA33AA02-0, OLED, 2880x1800, 13.3" | HP Dragonfly G4 Chi Mei CMN13C0, IPS, 1920x1280, 13.5" | Dell XPS 13 Plus 9320 Core i7-1360P Samsung 134XK04, OLED, 3456x2160, 13.4" | Huawei MateBook X Pro 2023 TMX1422, IPS, 3120x2080, 14.2" | |
|---|---|---|---|---|---|---|---|
| Display | 0% | 4% | 4% | -17% | 4% | -5% | |
| Display P3 Coverage (%) | 98.4 | 98.4 0% | 99.8 1% | 99.7 1% | 68.4 -30% | 99.7 1% | 89.8 -9% |
| sRGB Coverage (%) | 99.9 | 99.9 0% | 100 0% | 100 0% | 98.3 -2% | 100 0% | 99.4 -1% |
| AdobeRGB 1998 Coverage (%) | 87.9 | 87.6 0% | 97.6 11% | 97.3 11% | 70.4 -20% | 96.8 10% | 84.2 -4% |
| Response Times | 7% | 98% | 93% | -28% | 93% | 58% | |
| Response Time Grey 50% / Grey 80% * (ms) | 34.5 ? | 32.9 ? 5% | 0.69 ? 98% | 2.1 ? 94% | 48.8 ? -41% | 2.18 ? 94% | 20 ? 42% |
| Response Time Black / White * (ms) | 27.2 ? | 24.9 ? 8% | 0.71 ? 97% | 2.2 ? 92% | 31.3 ? -15% | 2.08 ? 92% | 7 ? 74% |
| PWM Frequency (Hz) | 480 ? | 60.1 ? | 238.6 ? | 156000 ? | |||
| Screen | 3% | 198% | 3% | -14% | -87% | -10% | |
| Brightness middle (cd/m²) | 525 | 526 0% | 391 -26% | 372 -29% | 408.8 -22% | 361.7 -31% | 595 13% |
| Brightness (cd/m²) | 506 | 486 -4% | 392 -23% | 375 -26% | 399 -21% | 367 -27% | 550 9% |
| Brightness Distribution (%) | 92 | 87 -5% | 98 7% | 99 8% | 90 -2% | 96 4% | 85 -8% |
| Black Level * (cd/m²) | 0.42 | 0.38 10% | 0.02 95% | 0.32 24% | 0.25 40% | ||
| Contrast (:1) | 1250 | 1384 11% | 19550 1464% | 1278 2% | 2380 90% | ||
| Colorchecker dE 2000 * | 1.4 | 1.3 7% | 1.1 21% | 0.88 37% | 2.02 -44% | 4.83 -245% | 2.01 -44% |
| Colorchecker dE 2000 max. * | 2.8 | 2.7 4% | 2.4 14% | 3.22 -15% | 3.84 -37% | 9.34 -234% | 6.9 -146% |
| Greyscale dE 2000 * | 2 | 2 -0% | 1.3 35% | 1.2 40% | 2.3 -15% | 1.8 10% | 2.74 -37% |
| Gamma | 2.2 100% | 2.25 98% | 2.17 101% | 2.18 101% | 2.2 100% | 2.33 94% | 2.4 92% |
| CCT | 6876 95% | 6858 95% | 6336 103% | 6326 103% | 6203 105% | 6438 101% | 6319 103% |
| Colorchecker dE 2000 calibrated * | 0.7 | 0.61 | 3.97 | 1.22 | |||
| Total Average (Program / Settings) | 3% /
3% | 100% /
138% | 33% /
19% | -20% /
-17% | 3% /
-30% | 14% /
1% |
* ... smaller is better
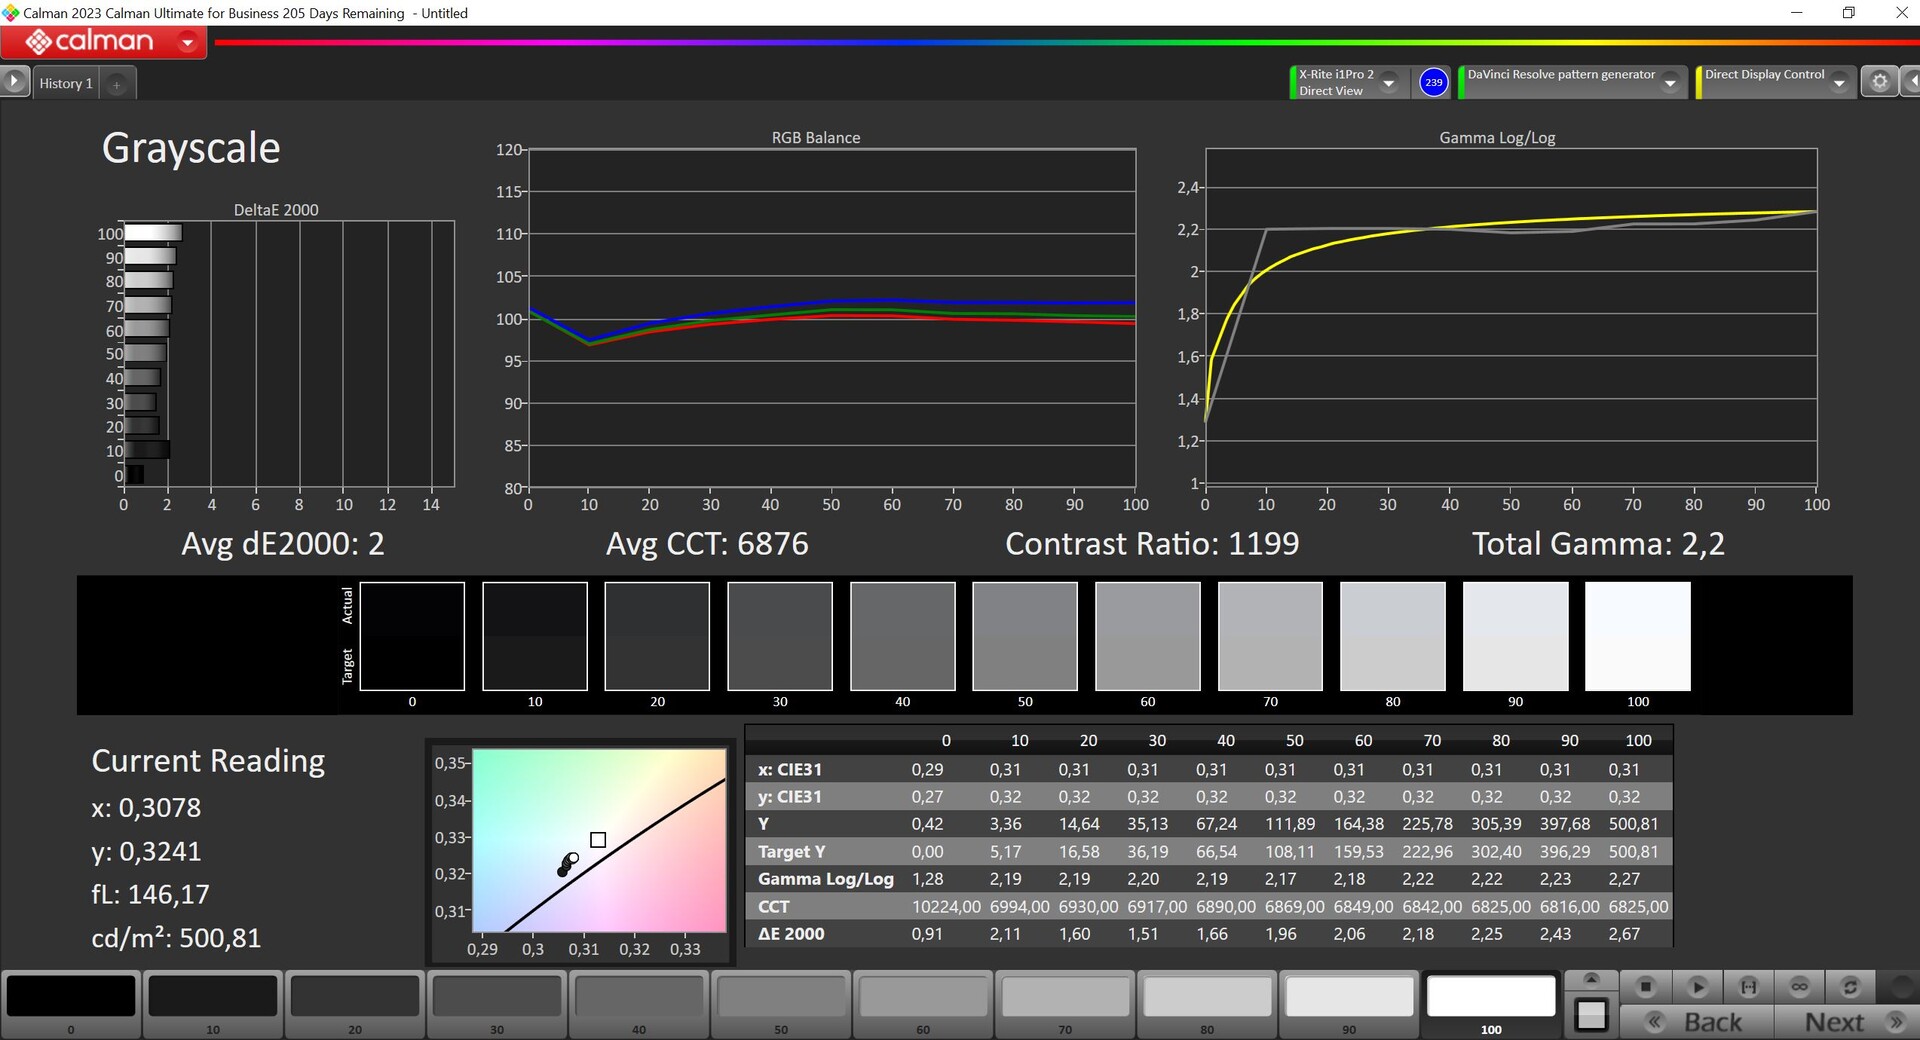
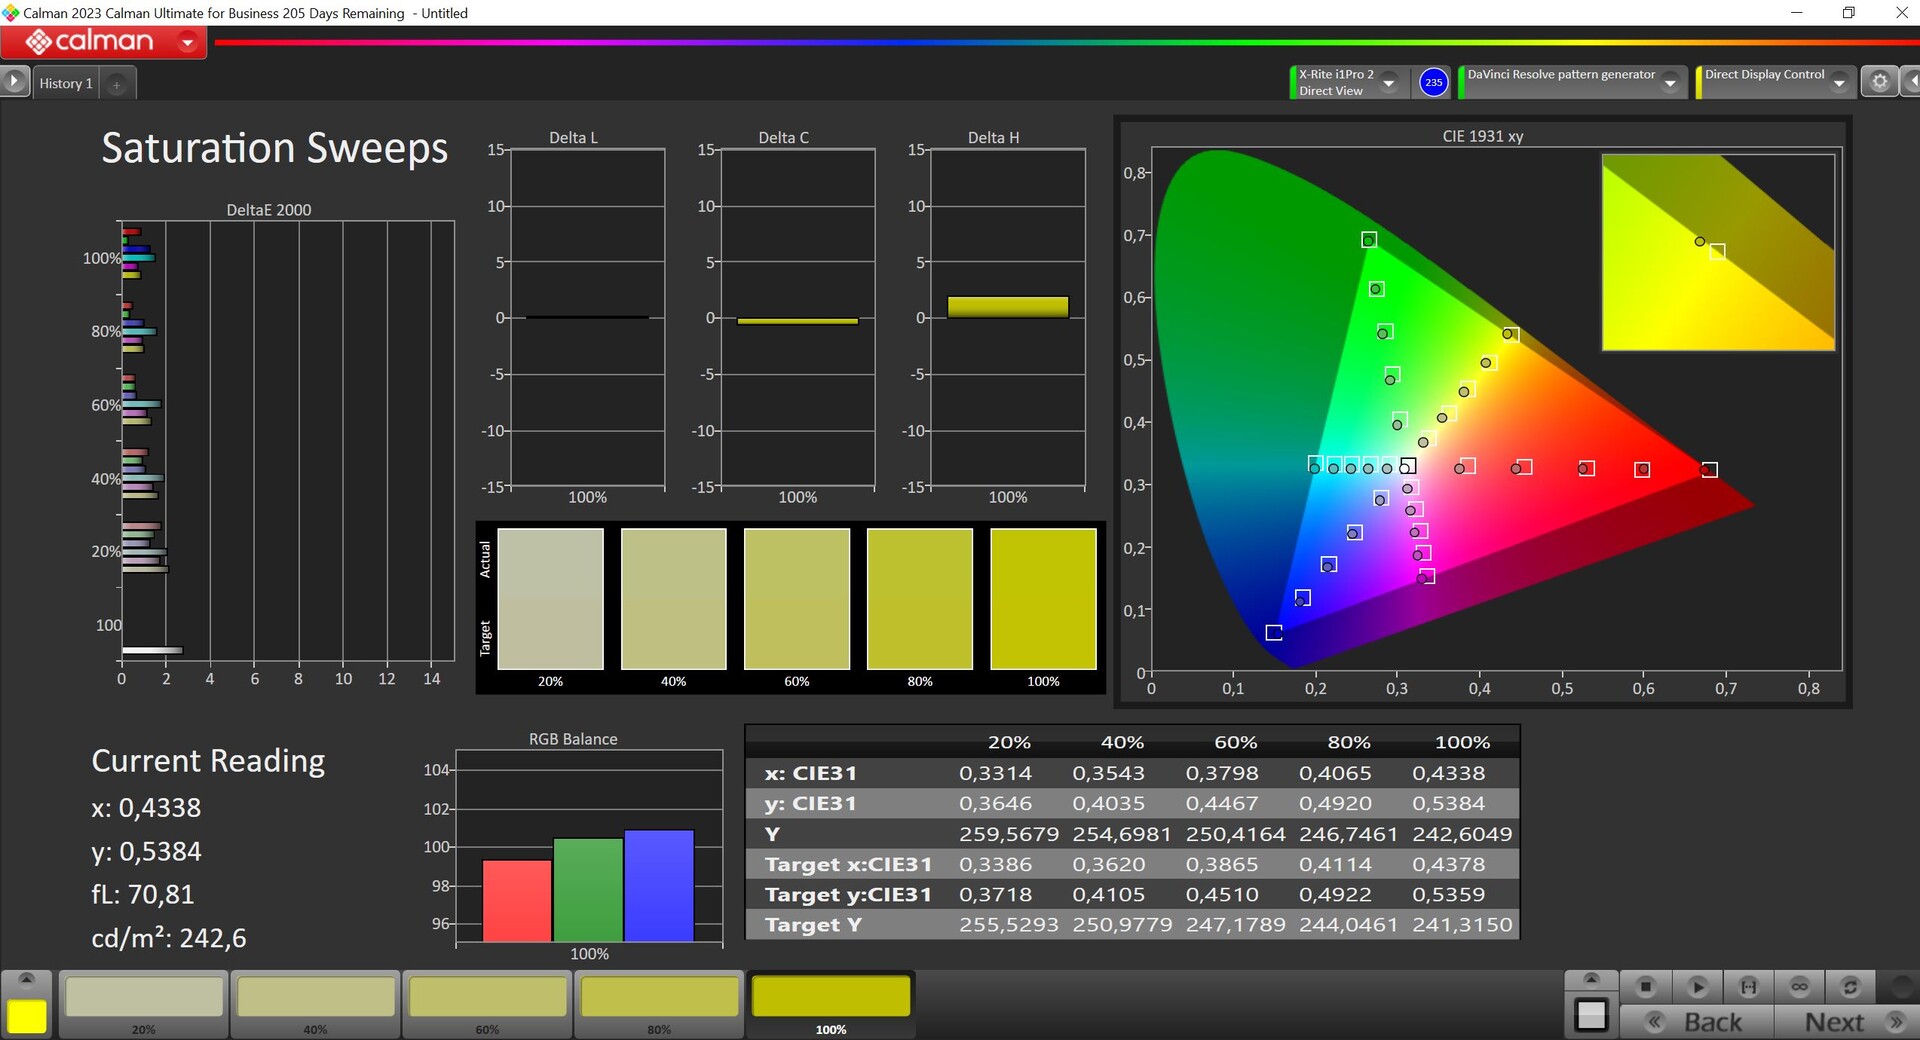

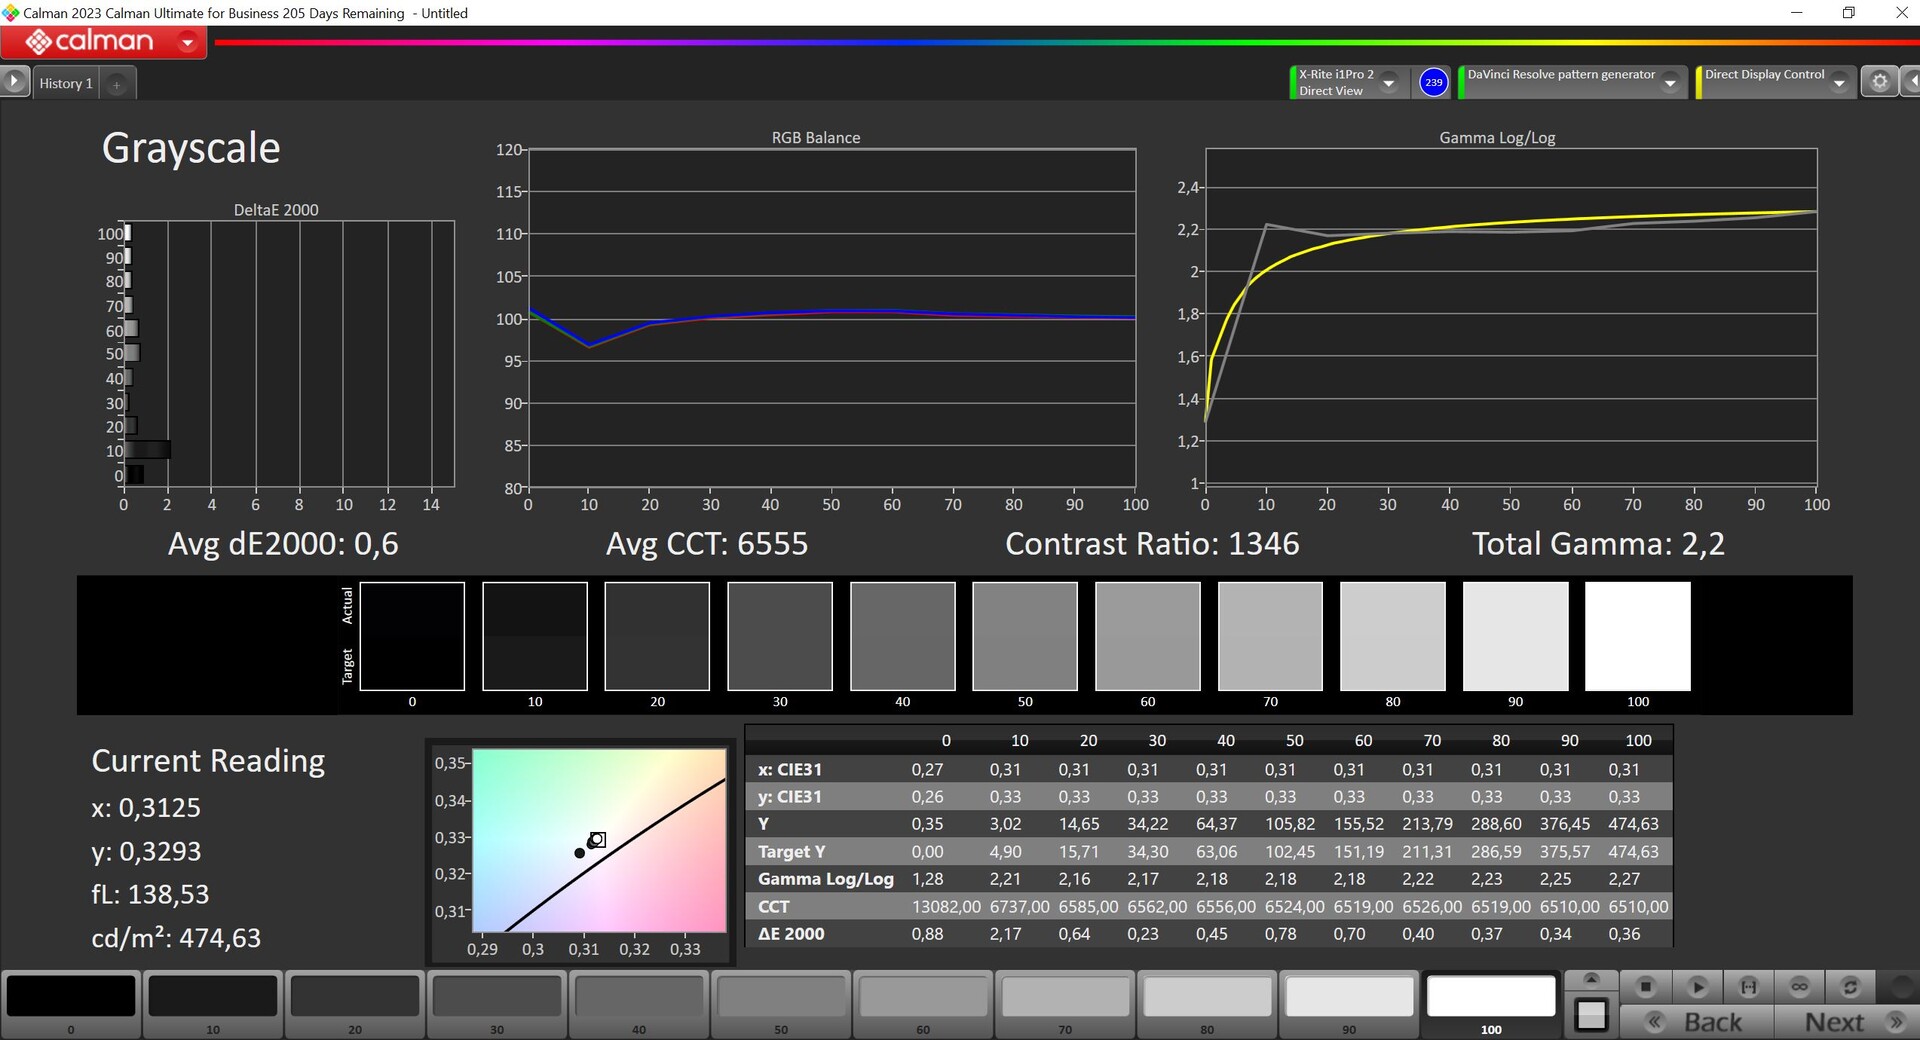


Straight out of the box, the panel is already calibrated fine and its grayscale and color DeltaE-2000 deviations (compared to the P3 reference) are below 3. However, our analysis using the professional CalMAN software (X-Rite i1 Pro 2) revealed a slight blue tint in combination with a slightly too-cool color temperature. Using our own calibration (the corresponding profile can be downloaded for free above), we managed to get both of these issues in check, lowering the deviations even further in total. In turn, its maximum brightness ended up being around 25 cd/m² less. The P3 color space is covered completely.
Display Response Times
| ↔ Response Time Black to White | ||
|---|---|---|
| 27.2 ms ... rise ↗ and fall ↘ combined | ↗ 15.5 ms rise | 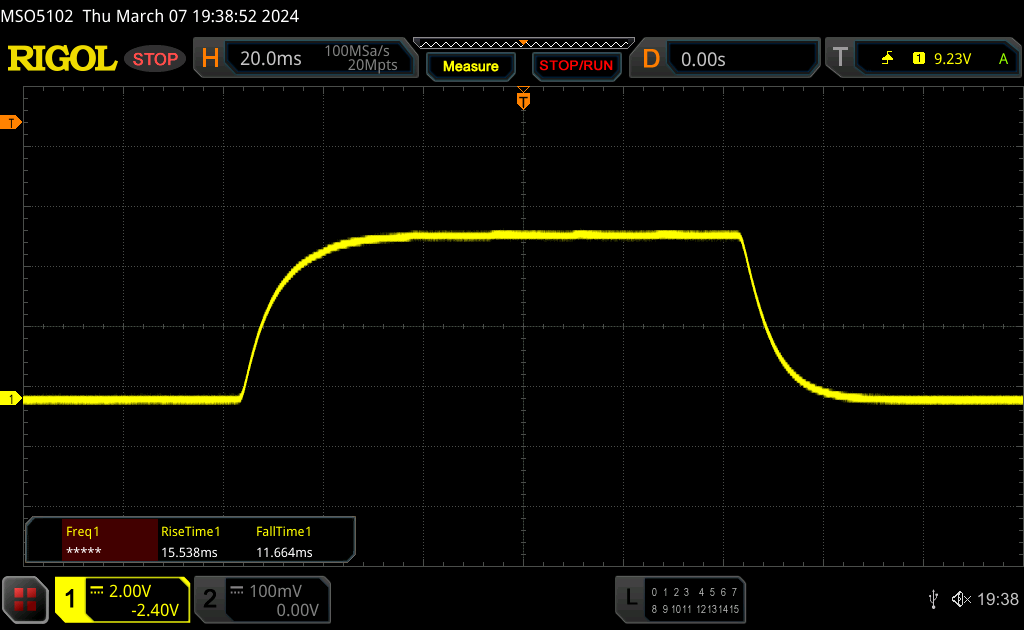 |
| ↘ 11.7 ms fall | ||
| The screen shows relatively slow response rates in our tests and may be too slow for gamers. In comparison, all tested devices range from 0.1 (minimum) to 240 (maximum) ms. » 69 % of all devices are better. This means that the measured response time is worse than the average of all tested devices (19.8 ms). | ||
| ↔ Response Time 50% Grey to 80% Grey | ||
| 34.5 ms ... rise ↗ and fall ↘ combined | ↗ 16.9 ms rise | 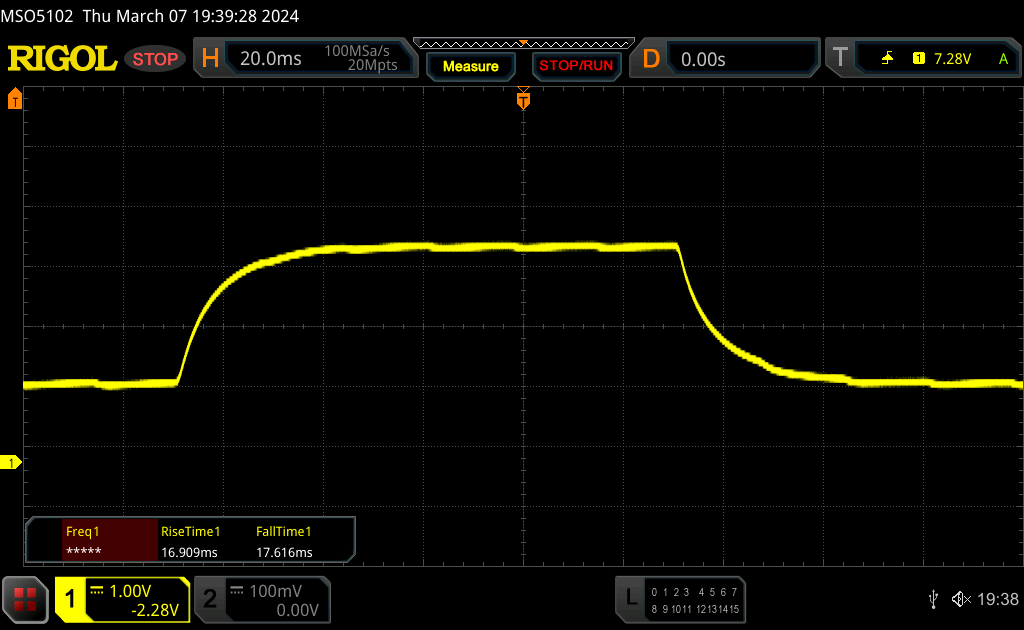 |
| ↘ 17.6 ms fall | ||
| The screen shows slow response rates in our tests and will be unsatisfactory for gamers. In comparison, all tested devices range from 0.165 (minimum) to 636 (maximum) ms. » 48 % of all devices are better. This means that the measured response time is worse than the average of all tested devices (31 ms). | ||
Screen Flickering / PWM (Pulse-Width Modulation)
| Screen flickering / PWM not detected | 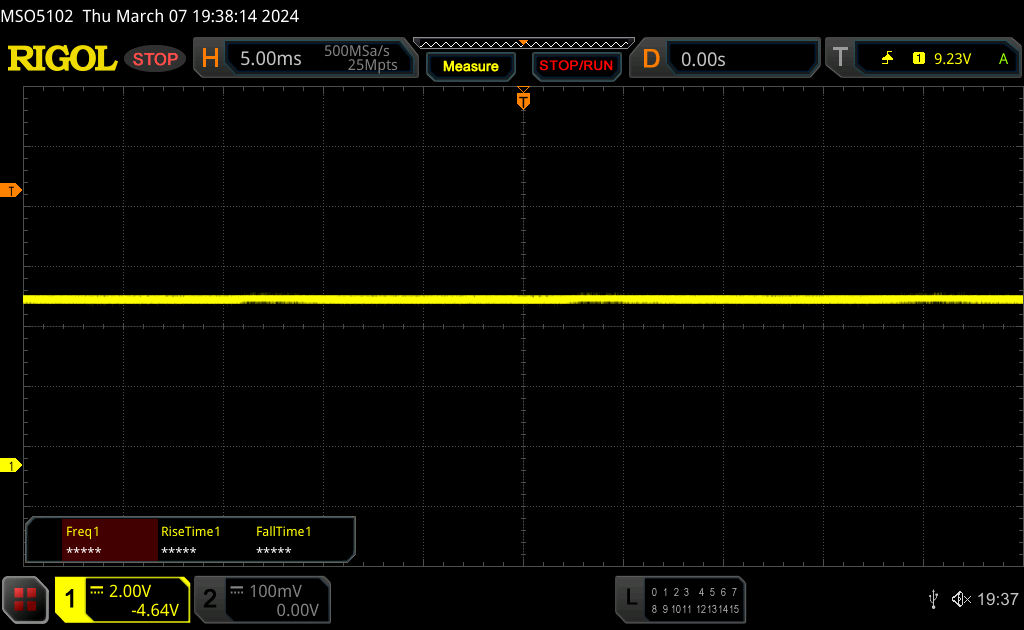 | ||
In comparison: 52 % of all tested devices do not use PWM to dim the display. If PWM was detected, an average of 7763 (minimum: 5 - maximum: 343500) Hz was measured. | |||
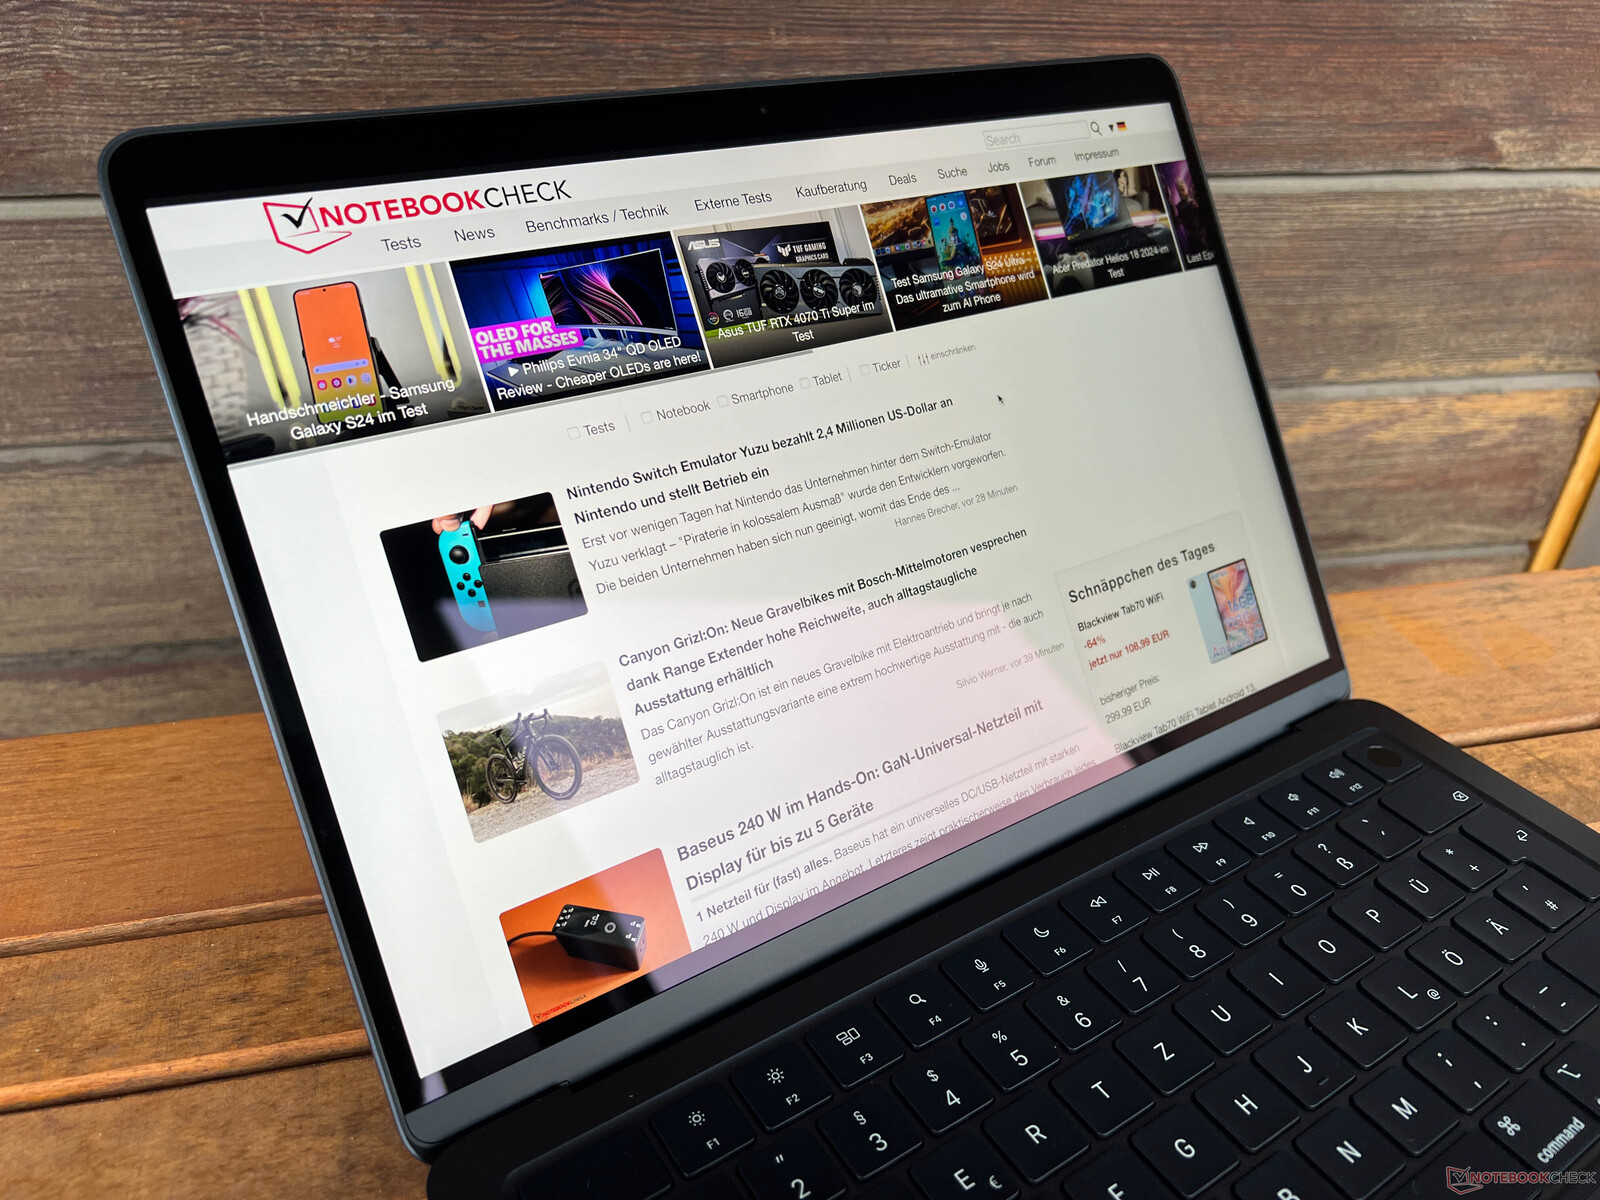
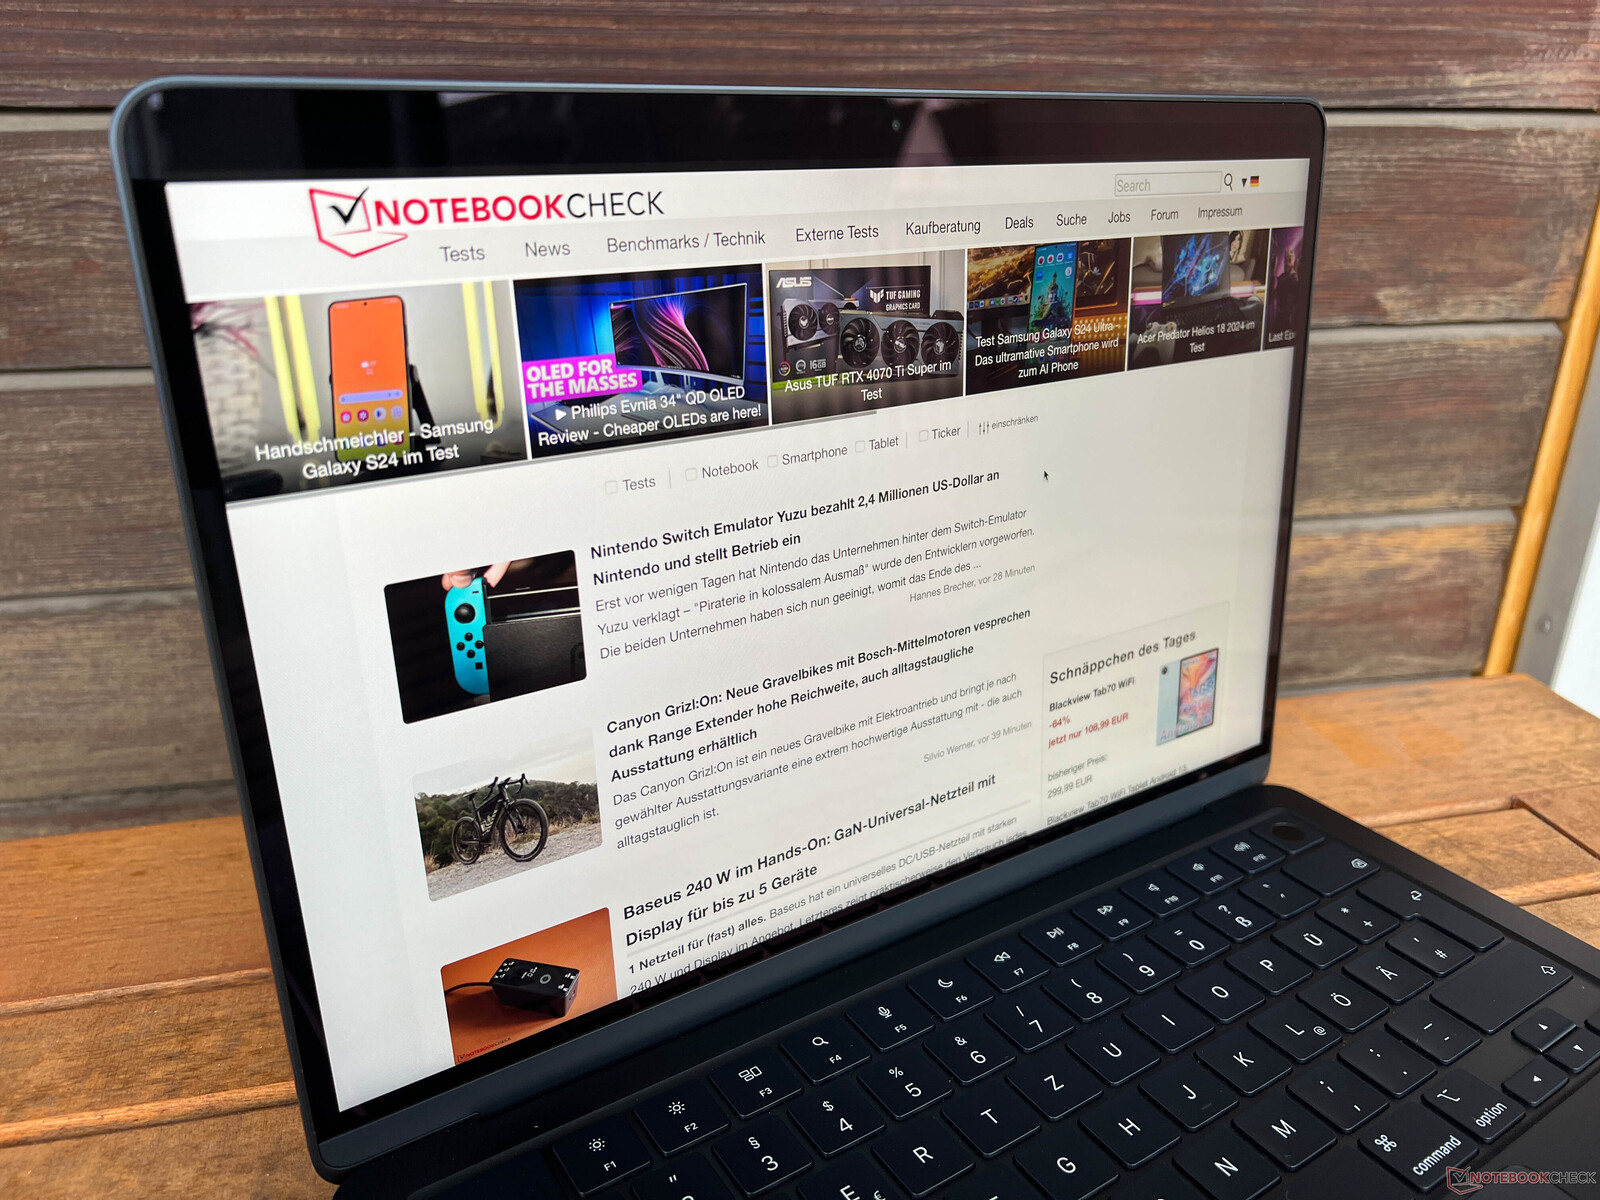
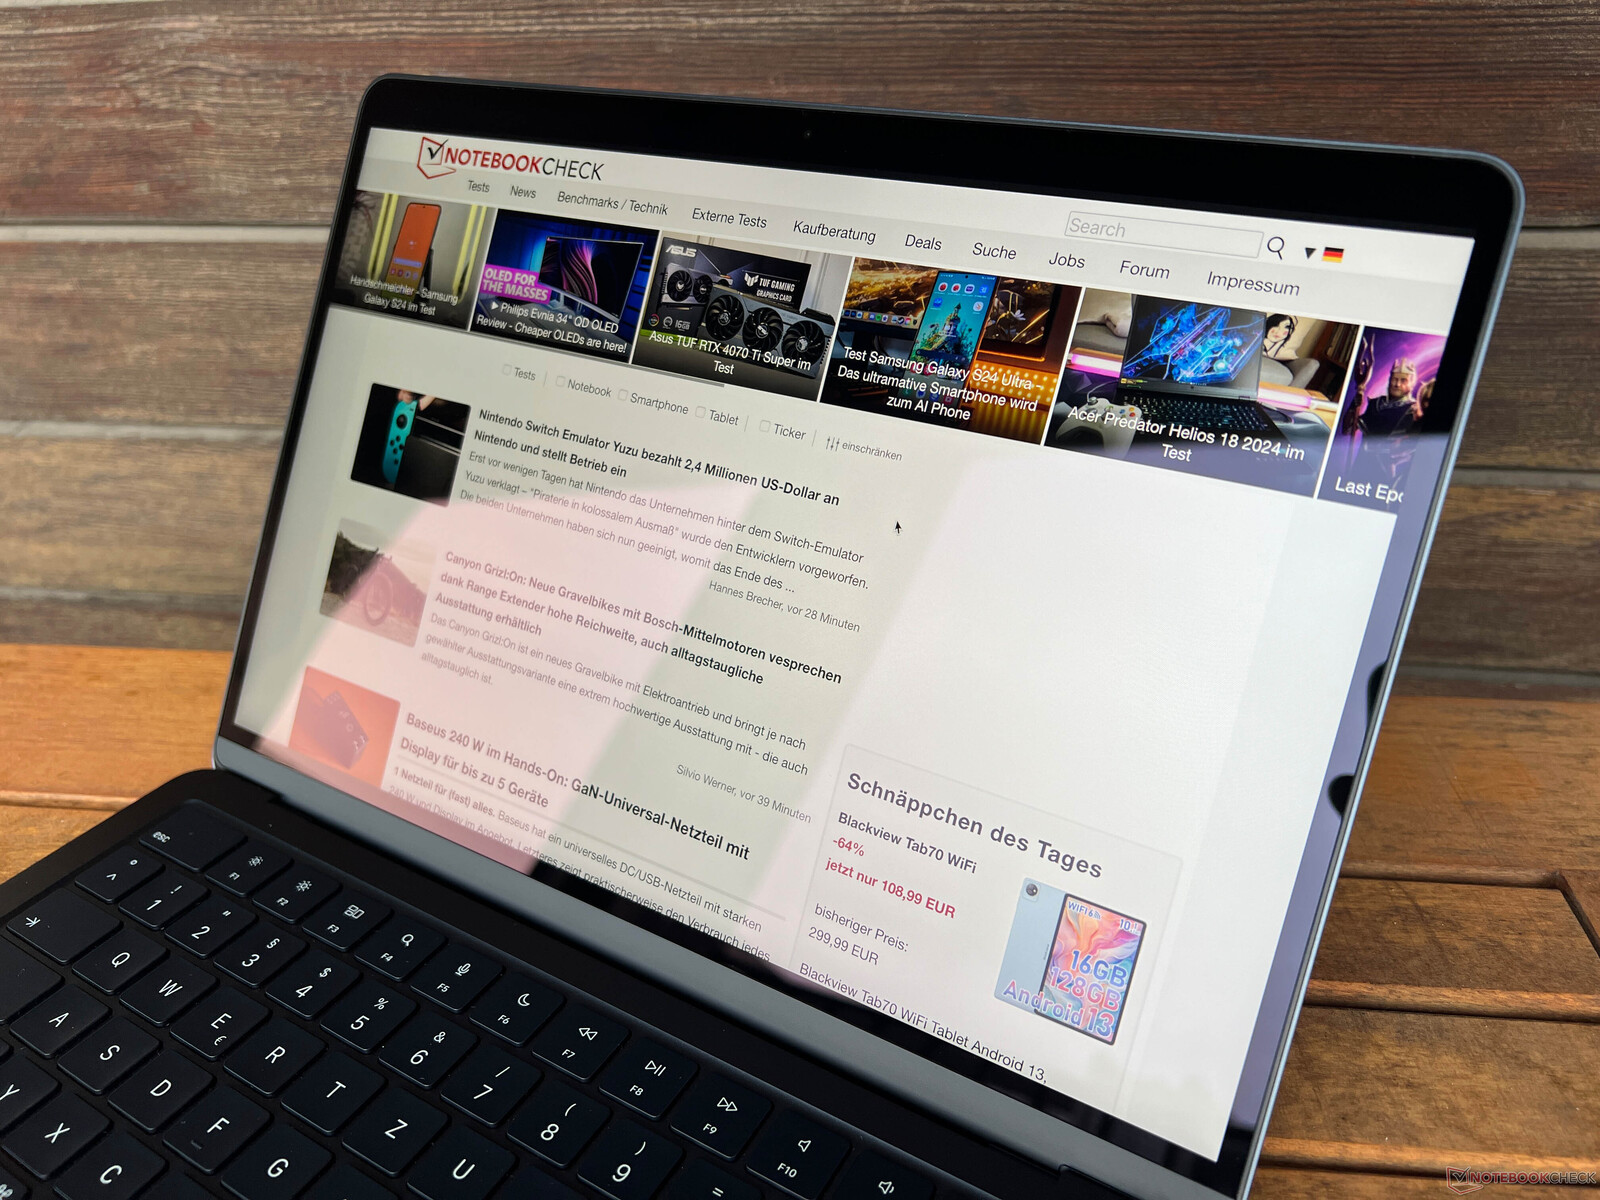
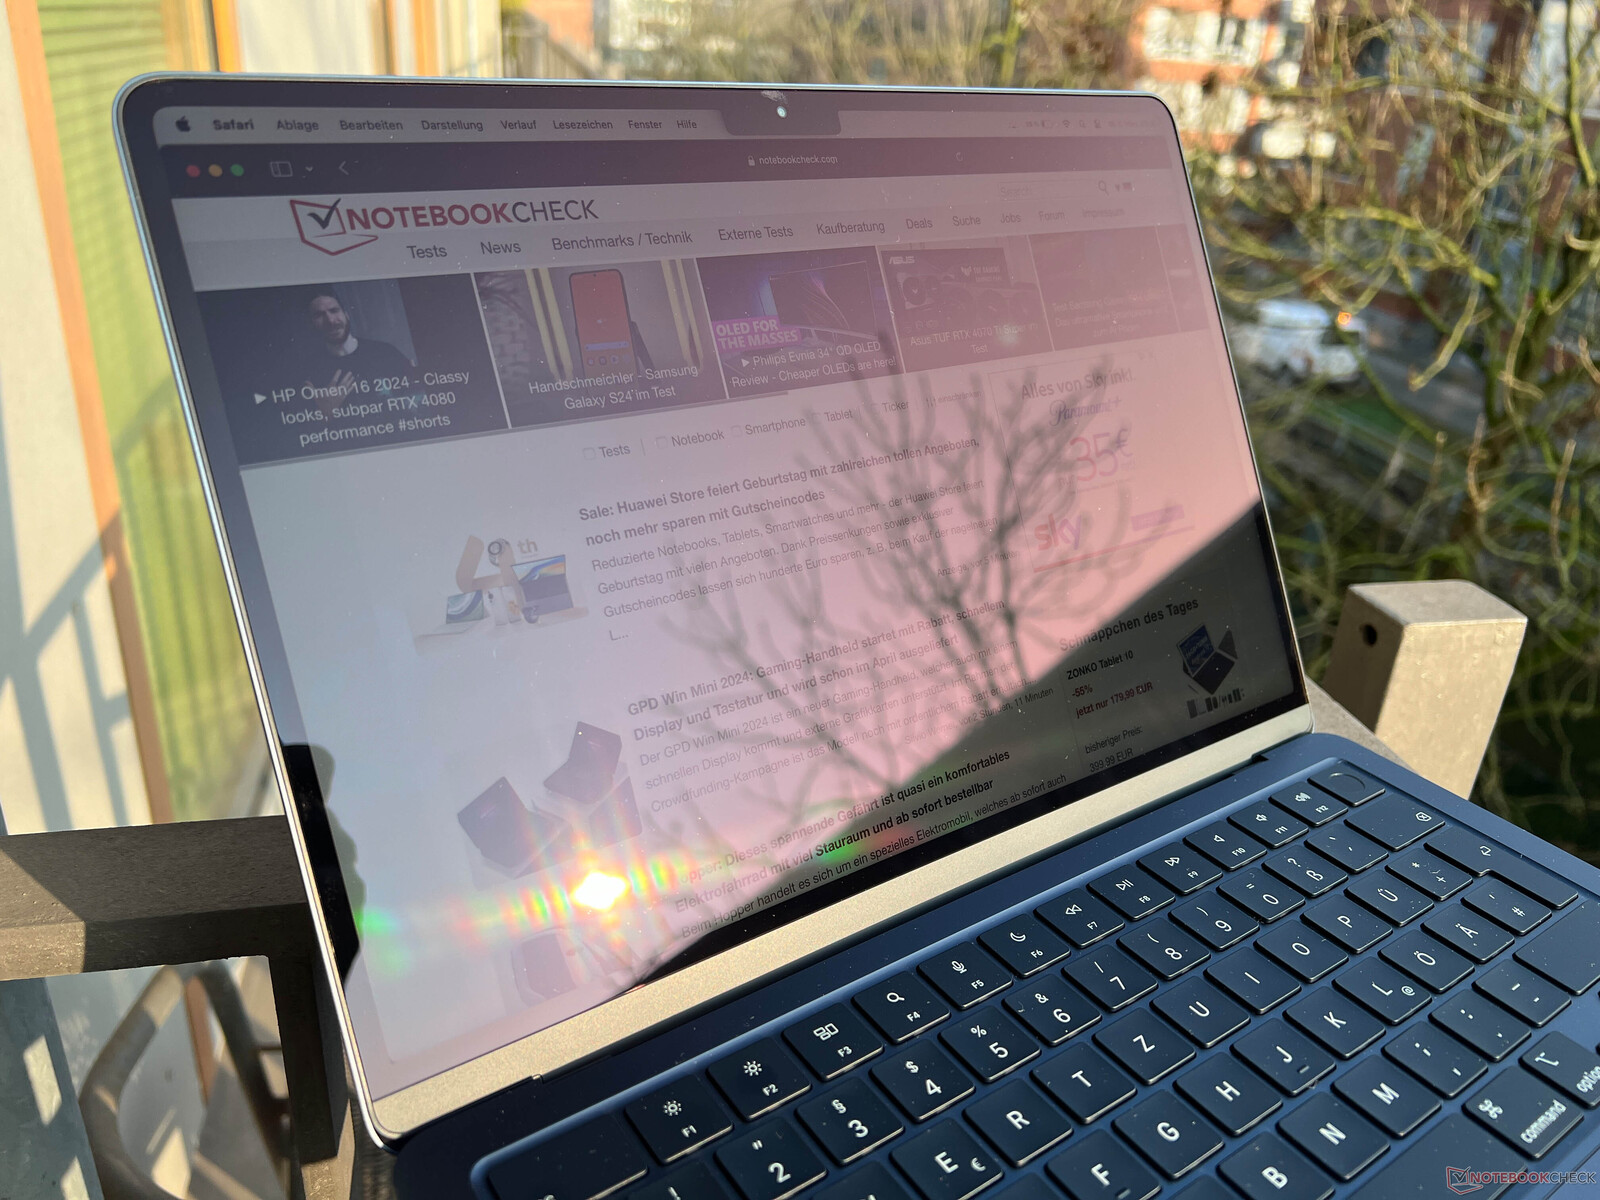
Although the Macbook Air's display is generally shiny, it isn't quite as reflective as most Windows laptops with OLED panels or touchscreens. As a result, you can still work in bright surroundings as long as you avoid direct sunlight. Its viewing-angle stability is great.
Performance - M3 SoC in 3nm
The MacBook Air 13 is available with two different M3 SoCs. The CPU part with 8 cores is identical, while the base model continues to have 8 GPU cores and can optionally be had with a faster 10-core GPU as already seen in the MacBook Pro 14 M3. You can choose between 8, 16 and 24 GB RAM. By the way, your choice of power supply doesn't have any impact on the device's performance.
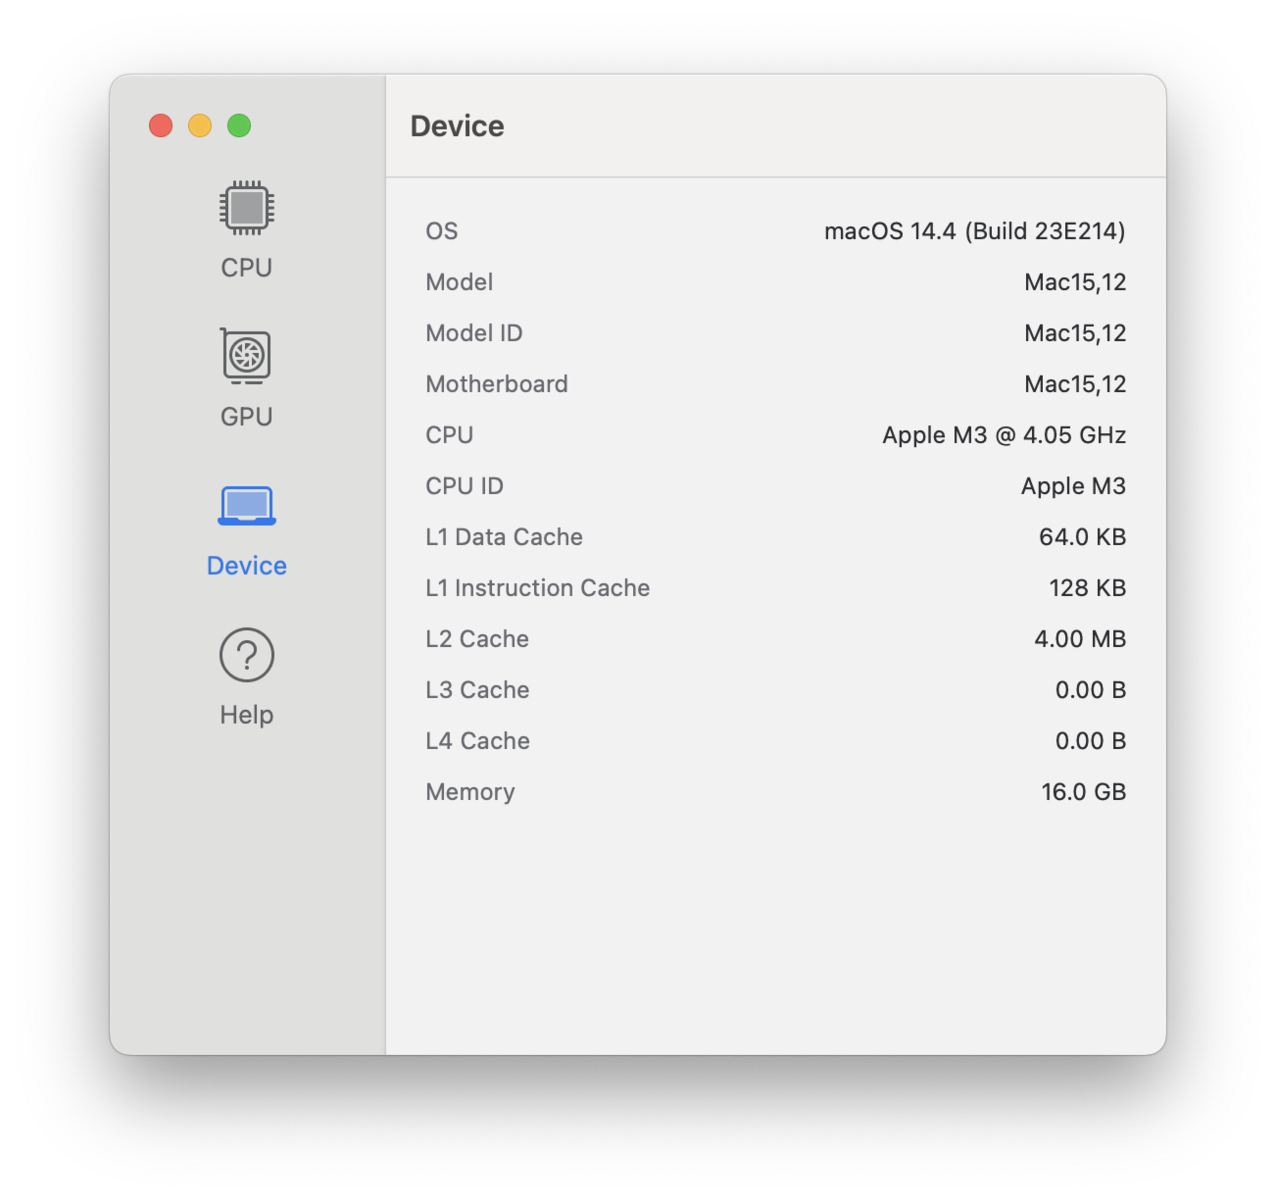
Processor - Apple M3 in 3 nm
The Apple M3 SoC is Apple's first chip manufactured using the 3-nm process. Its core configuration is the same as the old M2 SoC but thanks to its improved manufacturing process, Apple has been able to raise its clock rates without it using that much more energy. Its four performance cores now reach a maximum of 4.056 GHz (or ~3.6 GHz with all cores loaded) and the four efficiency cores clock at a maximum of 2.748 GHz. During the multi-core tests, the processor consumed ~21 watts for a short while, after which it steadily decreased and balanced out at 10.5 watts during 12 minutes of continuous load (R23 Multi: 8,237 points, so ~19 % less). In general, its performance during short tests is comparable with the MacBook Pro 14 M3, whose performance remains stable, however, thanks to its active cooling.
Compared to the old M2 SoC, its performance is now around 20 % higher on average. This means the M3 SoC ran just below the level of a Ryzen 7 7840U or the Core Ultra 7 155H within the ThinkPad X1 Carbon G12 during the multi-core tests—however, both of those models also consume a lot more energy.
In the single-core tests, Apple was again able to improve performance by a whopping 20 % compared to the M2, giving it a head start in front of the competition from AMD and Intel. These are impressive results, especially if you consider its low single-core consumption of just over 5 watts. We already took a look at the new M3 SoC's efficiency in our analysis article. In battery use, the MacBook Air 13 M3's CPU performance remains constant. Further CPU benchmarks can be found here.
Cinebench R23: Multi Core | Single Core
Geekbench 6.7: Multi-Core | Single-Core
Geekbench 5.5: Multi-Core | Single-Core
| Cinebench 2024 / CPU Multi Core | |
| Apple M3 Pro 12-Core | |
| Apple M3 Pro 11-Core | |
| Average of class Subnotebook (148 - 1471, n=65, last 2 years) | |
| Apple M3 | |
| Intel Core Ultra 7 155H | |
| Average Apple M3 (576 - 712, n=4) | |
| AMD Ryzen 7 7840U | |
| Apple M3 | |
| Cinebench 2024 / CPU Single Core | |
| Apple M3 Pro 11-Core | |
| Apple M3 Pro 12-Core | |
| Apple M3 | |
| Average Apple M3 (140 - 142, n=4) | |
| Apple M3 | |
| Average of class Subnotebook (35 - 200, n=54, last 2 years) | |
| AMD Ryzen 7 7840U | |
| Cinebench R23 / Multi Core | |
| Apple M3 Pro 12-Core | |
| Apple M2 Pro | |
| Intel Core Ultra 7 155H | |
| AMD Ryzen 7 PRO 7840U | |
| Apple M3 Pro 11-Core | |
| Intel Core Ultra 7 155H | |
| Average of class Subnotebook (1555 - 21812, n=59, last 2 years) | |
| Apple M2 Pro 10-Core | |
| AMD Ryzen 7 7840U | |
| Intel Core i7-1360P | |
| Intel Core i7-1360P | |
| Apple M3 | |
| Average Apple M3 (10074 - 10454, n=3) | |
| Apple M3 | |
| Apple M2 | |
| Intel Core i7-1365U | |
| Cinebench R23 / Single Core | |
| Apple M3 Pro 12-Core | |
| Apple M3 Pro 11-Core | |
| Apple M3 | |
| Average Apple M3 (1900 - 1904, n=3) | |
| Apple M3 | |
| Intel Core i7-1365U | |
| Intel Core i7-1360P | |
| Intel Core i7-1360P | |
| Intel Core Ultra 7 155H | |
| AMD Ryzen 7 7840U | |
| Average of class Subnotebook (358 - 2213, n=60, last 2 years) | |
| Intel Core Ultra 7 155H | |
| AMD Ryzen 7 PRO 7840U | |
| Apple M2 Pro | |
| Apple M2 Pro 10-Core | |
| Apple M2 | |
| Geekbench 6.7 / Multi-Core | |
| Apple M3 Pro 12-Core | |
| Apple M3 Pro 11-Core | |
| Intel Core Ultra 7 155H | |
| Average of class Subnotebook (2244 - 20325, n=62, last 2 years) | |
| Intel Core Ultra 7 155H | |
| AMD Ryzen 7 PRO 7840U | |
| Apple M3 | |
| Apple M3 | |
| Average Apple M3 (11752 - 12066, n=7) | |
| AMD Ryzen 7 7840U | |
| Geekbench 6.7 / Single-Core | |
| Apple M3 Pro 12-Core | |
| Apple M3 Pro 11-Core | |
| Apple M3 | |
| Average Apple M3 (2994 - 3130, n=7) | |
| Apple M3 | |
| Average of class Subnotebook (960 - 4195, n=61, last 2 years) | |
| AMD Ryzen 7 PRO 7840U | |
| Intel Core Ultra 7 155H | |
| Intel Core Ultra 7 155H | |
| AMD Ryzen 7 7840U | |
| Geekbench 5.5 / Multi-Core | |
| Apple M3 Pro 12-Core | |
| Apple M2 Pro | |
| Apple M3 Pro 11-Core | |
| Intel Core Ultra 7 155H | |
| Apple M2 Pro 10-Core | |
| Intel Core Ultra 7 155H | |
| AMD Ryzen 7 PRO 7840U | |
| Intel Core i7-1360P | |
| Apple M3 | |
| Apple M3 | |
| Average Apple M3 (10402 - 10774, n=5) | |
| Average of class Subnotebook (2557 - 17218, n=47, last 2 years) | |
| AMD Ryzen 7 7840U | |
| Apple M2 | |
| Intel Core i7-1360P | |
| Intel Core i7-1365U | |
| Geekbench 5.5 / Single-Core | |
| Apple M3 | |
| Apple M3 Pro 11-Core | |
| Apple M3 Pro 12-Core | |
| Apple M3 | |
| Average Apple M3 (1286 - 2350, n=5) | |
| Apple M2 Pro | |
| Apple M2 Pro 10-Core | |
| Apple M2 | |
| Average of class Subnotebook (726 - 2224, n=47, last 2 years) | |
| Intel Core i7-1365U | |
| AMD Ryzen 7 PRO 7840U | |
| Intel Core i7-1360P | |
| Intel Core Ultra 7 155H | |
| Intel Core i7-1360P | |
| AMD Ryzen 7 7840U | |
| Intel Core Ultra 7 155H | |
Cinebench R23: Multi Core | Single Core
Geekbench 6.7: Multi-Core | Single-Core
Geekbench 5.5: Multi-Core | Single-Core
System performance
The old MacBook Air M2 was already a super fast device in everyday use and this is the same with the new M3 SoC. Especially when running native applications, its performance is great and in the synthetic benchmarks, the new MacBook Air 13 M3 almost always came ahead of its Windows competitors.
Applications for Intel-based Macs can be emulated via Rosetta 2, which works very well. There may be a slight difference in speed (especially during complex applications) but in general, it works absolutely fine. The topic surrounding AI is a total trend at the moment, and Apple too has already installed an NPU in the form of its Neural Engine since the release of the M1 chips. This is used, for example, to predict words when writing messages. If you like to use Microsoft's Office Suite including Co-Pilot, then you won't have to worry, as this function is made available via the Cloud, meaning there shouldn't be any difference to Windows devices.
WebXPRT 3: Overall
WebXPRT 4: Overall
Mozilla Kraken 1.1: Total
Jetstream 2: 2.0 Total
| CrossMark / Overall | |
| Huawei MateBook X Pro 2023 | |
| Average Apple M3, Apple M3 10-Core GPU (1847 - 1857, n=3) | |
| Apple MacBook Pro 14 2023 M3 | |
| Apple MacBook Air 13 M3 10C GPU | |
| Dell XPS 13 Plus 9320 Core i7-1360P | |
| Average of class Subnotebook (365 - 2356, n=59, last 2 years) | |
| HP Dragonfly G4 | |
| Asus ZenBook 14 UX3405MA | |
| Lenovo ThinkPad Z13 Gen 2 | |
| Apple MacBook Air M2 10C GPU | |
| CrossMark / Productivity | |
| Huawei MateBook X Pro 2023 | |
| Apple MacBook Pro 14 2023 M3 | |
| Average Apple M3, Apple M3 10-Core GPU (1716 - 1729, n=3) | |
| Apple MacBook Air 13 M3 10C GPU | |
| Dell XPS 13 Plus 9320 Core i7-1360P | |
| HP Dragonfly G4 | |
| Average of class Subnotebook (364 - 2277, n=59, last 2 years) | |
| Asus ZenBook 14 UX3405MA | |
| Lenovo ThinkPad Z13 Gen 2 | |
| Apple MacBook Air M2 10C GPU | |
| CrossMark / Creativity | |
| Apple MacBook Air 13 M3 10C GPU | |
| Average Apple M3, Apple M3 10-Core GPU (2183 - 2210, n=3) | |
| Apple MacBook Pro 14 2023 M3 | |
| Dell XPS 13 Plus 9320 Core i7-1360P | |
| Huawei MateBook X Pro 2023 | |
| Asus ZenBook 14 UX3405MA | |
| Average of class Subnotebook (372 - 2743, n=59, last 2 years) | |
| Lenovo ThinkPad Z13 Gen 2 | |
| Apple MacBook Air M2 10C GPU | |
| HP Dragonfly G4 | |
| CrossMark / Responsiveness | |
| Huawei MateBook X Pro 2023 | |
| Dell XPS 13 Plus 9320 Core i7-1360P | |
| HP Dragonfly G4 | |
| Apple MacBook Pro 14 2023 M3 | |
| Average Apple M3, Apple M3 10-Core GPU (1364 - 1367, n=3) | |
| Apple MacBook Air 13 M3 10C GPU | |
| Average of class Subnotebook (312 - 1854, n=59, last 2 years) | |
| Asus ZenBook 14 UX3405MA | |
| Apple MacBook Air M2 10C GPU | |
| Lenovo ThinkPad Z13 Gen 2 | |
| WebXPRT 3 / Overall | |
| Apple MacBook Air 13 M3 10C GPU | |
| Average Apple M3, Apple M3 10-Core GPU (423 - 448, n=3) | |
| Apple MacBook Pro 14 2023 M3 | |
| Apple MacBook Air M2 10C GPU | |
| Average of class Subnotebook (156 - 530, n=55, last 2 years) | |
| Dell XPS 13 Plus 9320 Core i7-1360P | |
| HP Dragonfly G4 | |
| Lenovo ThinkPad Z13 Gen 2 | |
| Asus ZenBook 14 UX3405MA | |
| WebXPRT 4 / Overall | |
| Average Apple M3, Apple M3 10-Core GPU (313 - 315, n=2) | |
| Apple MacBook Air 13 M3 10C GPU | |
| Average of class Subnotebook (132 - 378, n=60, last 2 years) | |
| Dell XPS 13 Plus 9320 Core i7-1360P | |
| HP Dragonfly G4 | |
| Asus ZenBook 14 UX3405MA | |
| Huawei MateBook X Pro 2023 | |
| Lenovo ThinkPad Z13 Gen 2 | |
| Apple MacBook Air M2 10C GPU | |
| Mozilla Kraken 1.1 / Total | |
| Huawei MateBook X Pro 2023 | |
| Lenovo ThinkPad Z13 Gen 2 | |
| Asus ZenBook 14 UX3405MA | |
| Dell XPS 13 Plus 9320 Core i7-1360P | |
| HP Dragonfly G4 | |
| Average of class Subnotebook (234 - 1104, n=60, last 2 years) | |
| Apple MacBook Air M2 10C GPU | |
| Apple MacBook Air 13 M3 10C GPU | |
| Average Apple M3, Apple M3 10-Core GPU (363 - 373, n=3) | |
| Apple MacBook Pro 14 2023 M3 | |
| Jetstream 2 / 2.0 Total | |
| Average of class Subnotebook (117 - 476, n=27, last 2 years) | |
| Apple MacBook Air 13 M3 10C GPU | |
| Average Apple M3, Apple M3 10-Core GPU (305 - 318, n=3) | |
| Asus ZenBook 14 UX3405MA | |
| Apple MacBook Pro 14 2023 M3 | |
| Dell XPS 13 Plus 9320 Core i7-1360P | |
| HP Dragonfly G4 | |
| Apple MacBook Air M2 10C GPU | |
* ... smaller is better
Storage devices
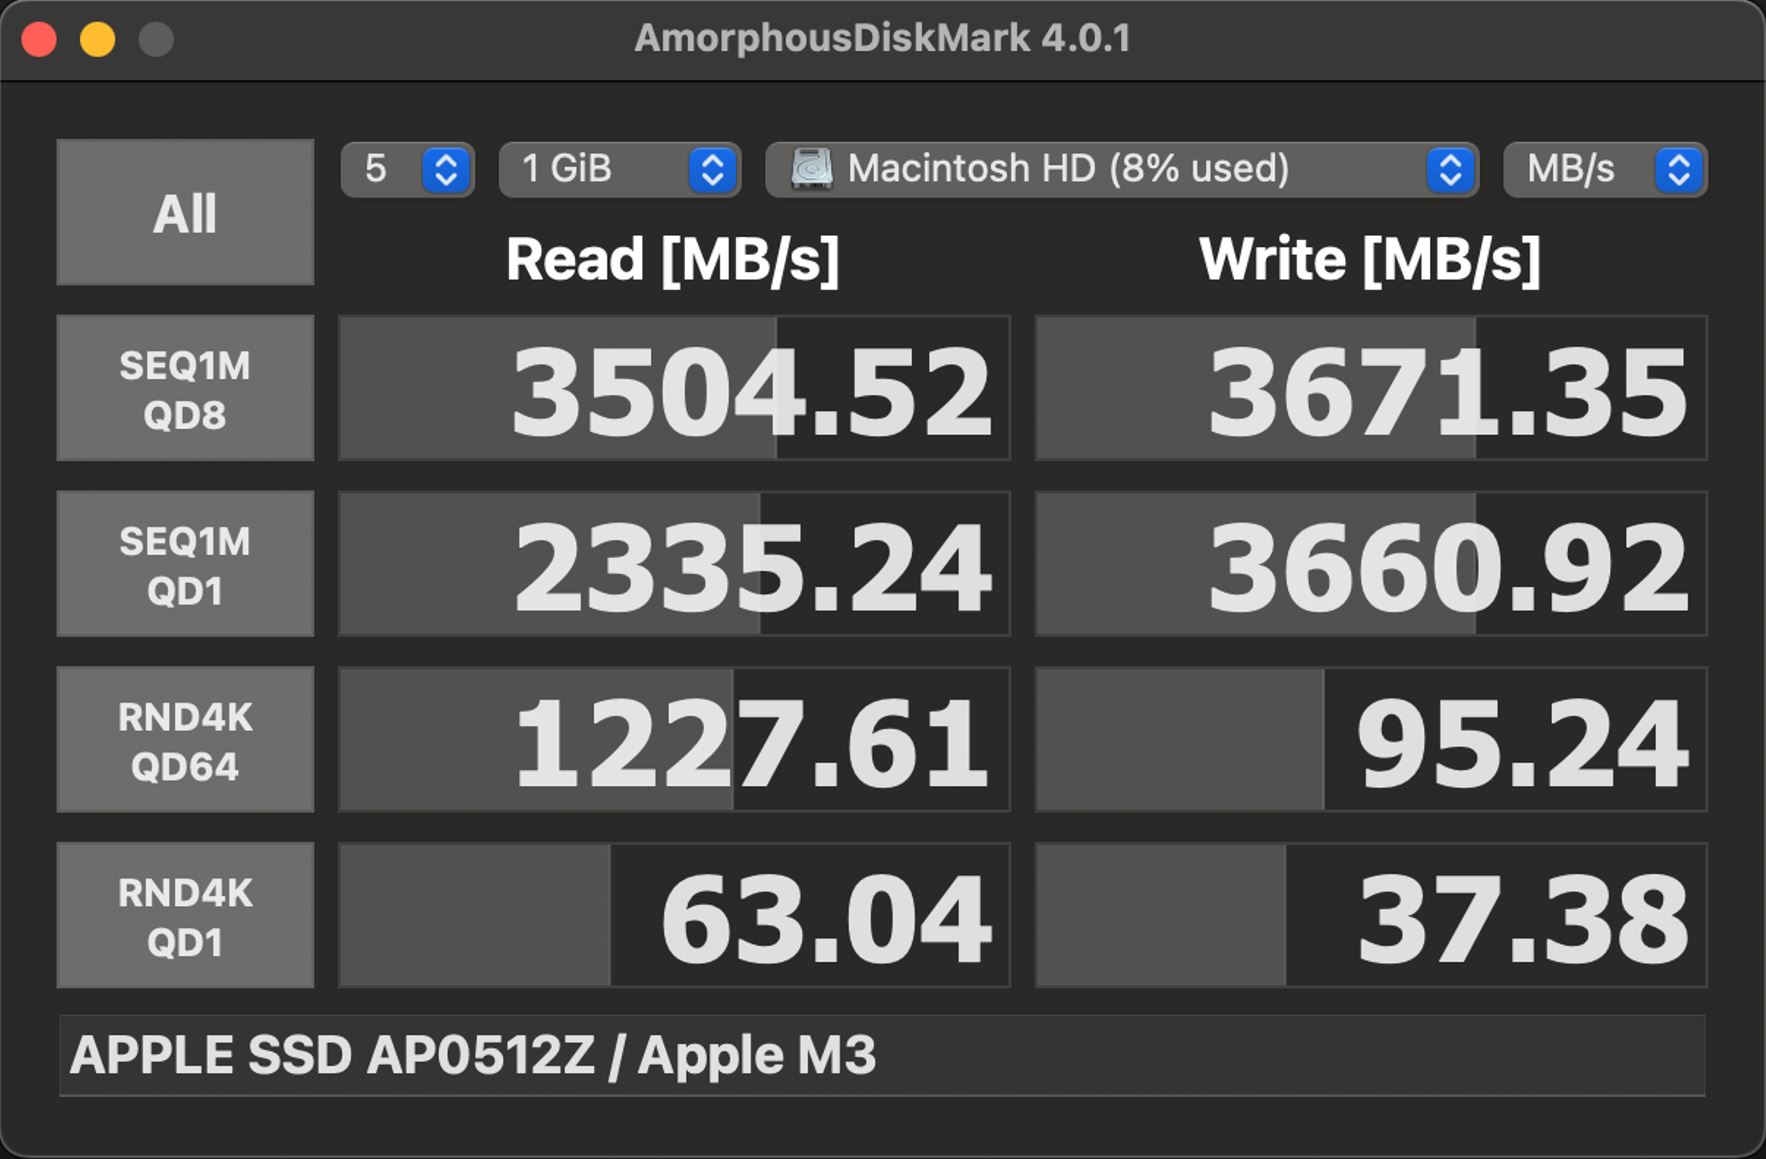
As was already the case with the MacBook Pro 14 M3, Apple has continued to only equip the MacBook Air 13 M3 with PCIe-3.0 SSDs. The 512-GB version (AP0512Z) is installed into our test device and its transfer rates were as expected, namely ~3.5 GB/s. As a result, you won't be faced with any limitations during everyday use. We again expect a much lower performance when it comes to the 256-GB model (~50 %) and we will check this as soon as possible. After first booting up the device, users have 465 GB free to use. The Air M3 can be fitted with a 2-TB SSD at most. Further SSD benchmarks can be found here.
Graphics card
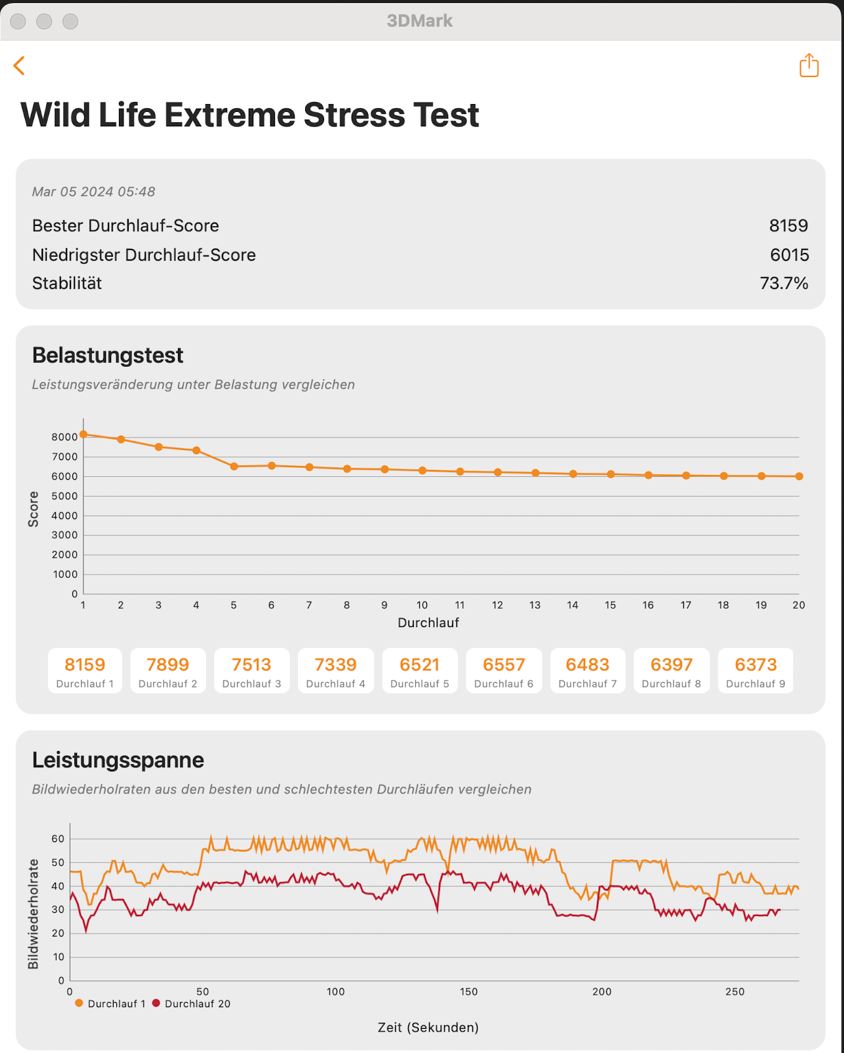
The M3 GPU with 10 cores is installed into our test sample, which we already know from the MacBook Pro 14 M3. Its maximum power consumption is around 15 watts and in total, its performance is on the same level as the MacBook Pro—although the Air has to slow down under permanent load here, too. During the 3DMark WildLife-Extreme stress test, its result fell by about 25 % after 20 runs. Its GPU performance also offers an advantage of 20 % compared to the old M2 GPU with 10 cores. In battery use, its graphics performance remains constant and further benchmarks can be found here.
Gaming on the MacBook is slowly picking up speed and games such as Total War: Pharaoh or Baldur's Gate 3 run natively on the MacBook. However, Baldur's Gate 3 is too demanding with high details, so you'll have to activate FSR in order to achieve about 35fps in 1080p/High. When it comes to FSR, you should at least choose the setting quality because if you don't, the laptop's graphics performance suffers dramatically. Emulated games such as Shadow of the Tomb Raider or The Witcher 3 also run on the MacBook but depending on the game, there may be some limitations and their performance is a little limited, too.
| Blender / v3.3 Classroom METAL | |
| Apple MacBook Air 13 M3 10C GPU | |
| Apple MacBook Pro 14 2023 M2 Pro Entry | |
| Average Apple M3 10-Core GPU (121 - 134, n=3) | |
| Average of class Subnotebook (76.3 - 227, n=5, last 2 years) | |
| Apple MacBook Pro 14 2023 M3 | |
| Apple MacBook Pro 14 2023 M2 Pro | |
| Apple MacBook Pro 14 2023 M3 Pro | |
| Apple MacBook Pro 16 2023 M3 Pro | |
* ... smaller is better
| low | med. | high | ultra | |
|---|---|---|---|---|
| The Witcher 3 (2015) | 36 | 24 | ||
| Shadow of the Tomb Raider (2018) | 103 | 38 | 34 | 30 |
| Baldur's Gate 3 (2023) | 31 | 26 | 21 | 19 |
| Total War Pharaoh (2023) | 123 | 67 | 43 | 28 |
Emissions - The MacBook Air is always silent
Noise emissions
A huge advantage that the MacBook Air 13 offers compared to its similarly speedy Windows counterparts continues to be its passive cooling. No matter what you do on the device (even when powering two external monitors), it is always silent and doesn't emit any sort of electronic noises.
| Apple MacBook Air 13 M3 10C GPU M3 10-Core GPU, M3, Apple SSD AP0512Z | Apple MacBook Air M2 10C GPU M2 10-Core GPU, M2, Apple SSD AP1024Z | Asus ZenBook 14 UX3405MA Arc 8-Core, Ultra 7 155H, Micron 2400 MTFDKBA1T0QFM | Lenovo ThinkPad Z13 Gen 2 Radeon 780M, R7 PRO 7840U, SK hynix BC901 HFS001TEJ4X164N | HP Dragonfly G4 Iris Xe G7 96EUs, i7-1365U, Micron 3400 MTFDKBA512TFH 512GB | Dell XPS 13 Plus 9320 Core i7-1360P Iris Xe G7 96EUs, i7-1360P, Samsung PM9A1 MZVL2512HCJQ | Huawei MateBook X Pro 2023 Iris Xe G7 96EUs, i7-1360P | Apple MacBook Pro 14 2023 M3 M3 10-Core GPU, M3, Apple SSD AP1024Z | |
|---|---|---|---|---|---|---|---|---|
| Noise | ||||||||
| off / environment * (dB) | 23.4 | 25.1 | 23.3 | 23.7 | 25.4 | 24.2 | ||
| Idle Minimum * (dB) | 23.4 | 25.8 | 23.5 | 24 | 25.4 | 24.2 | ||
| Idle Average * (dB) | 23.4 | 25.8 | 23.5 | 24 | 25.4 | 24.2 | ||
| Idle Maximum * (dB) | 24.5 | 28.3 | 26.8 | 24.4 | 29.6 | 24.2 | ||
| Load Average * (dB) | 39.3 | 28.3 | 27.2 | 37 | 42 | 25.1 | ||
| Witcher 3 ultra * (dB) | 35.9 | 44.8 | 32.7 | 42.1 | 25.1 | |||
| Load Maximum * (dB) | 39.3 | 44.8 | 35 | 42 | 40.9 | 48.5 |
* ... smaller is better
Temperature
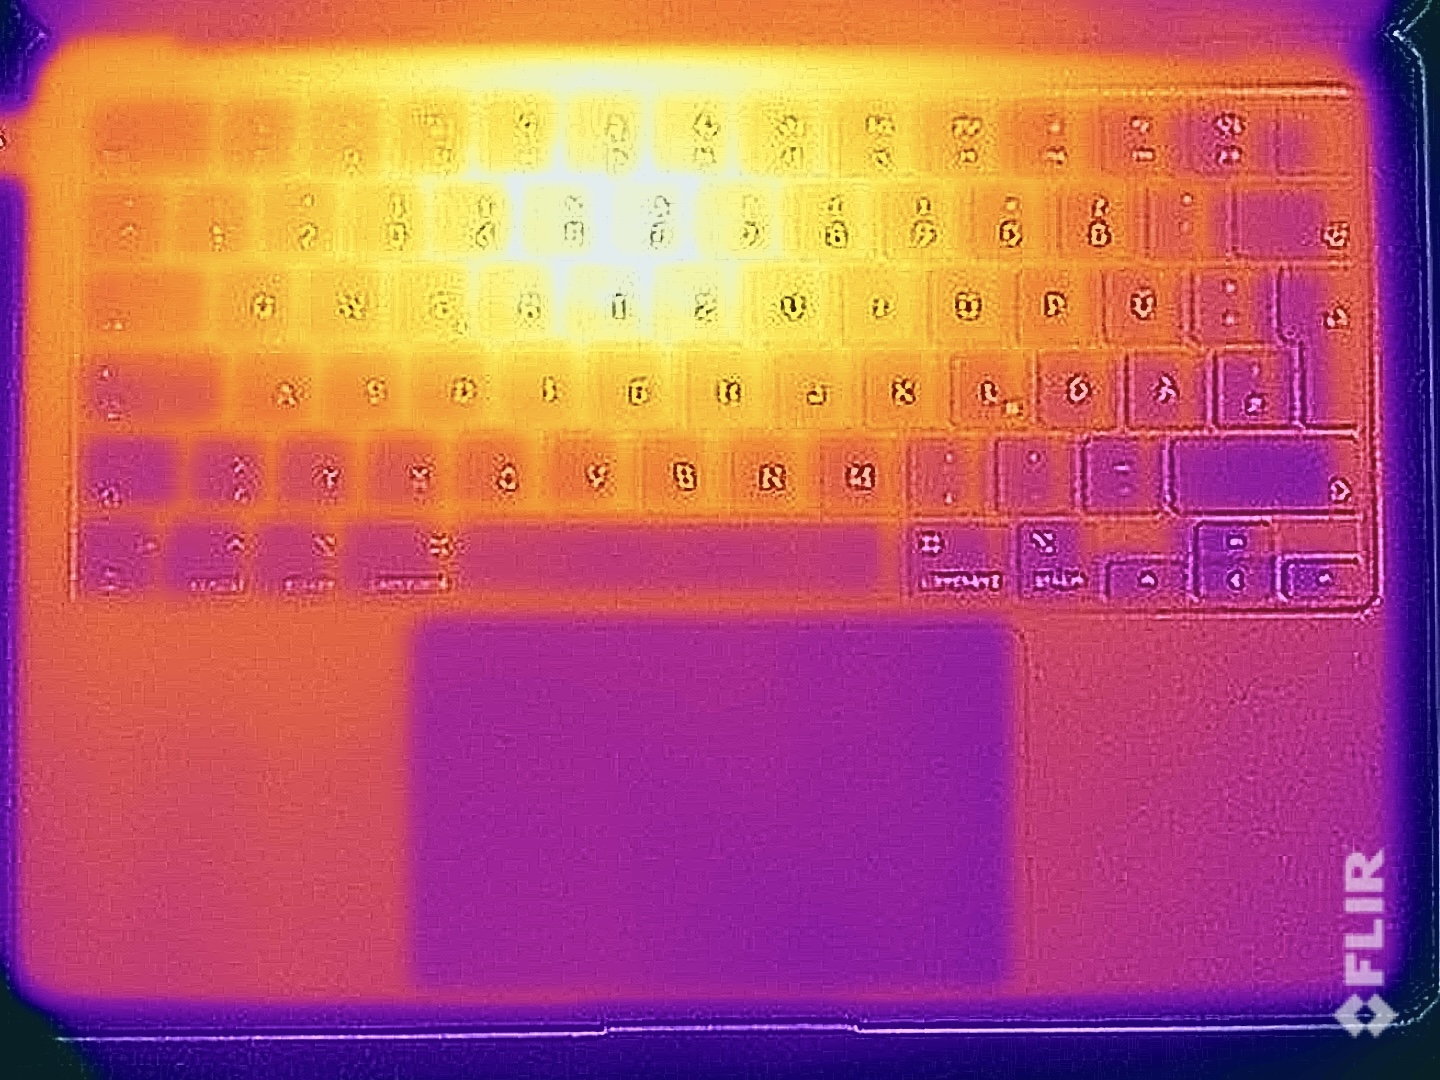
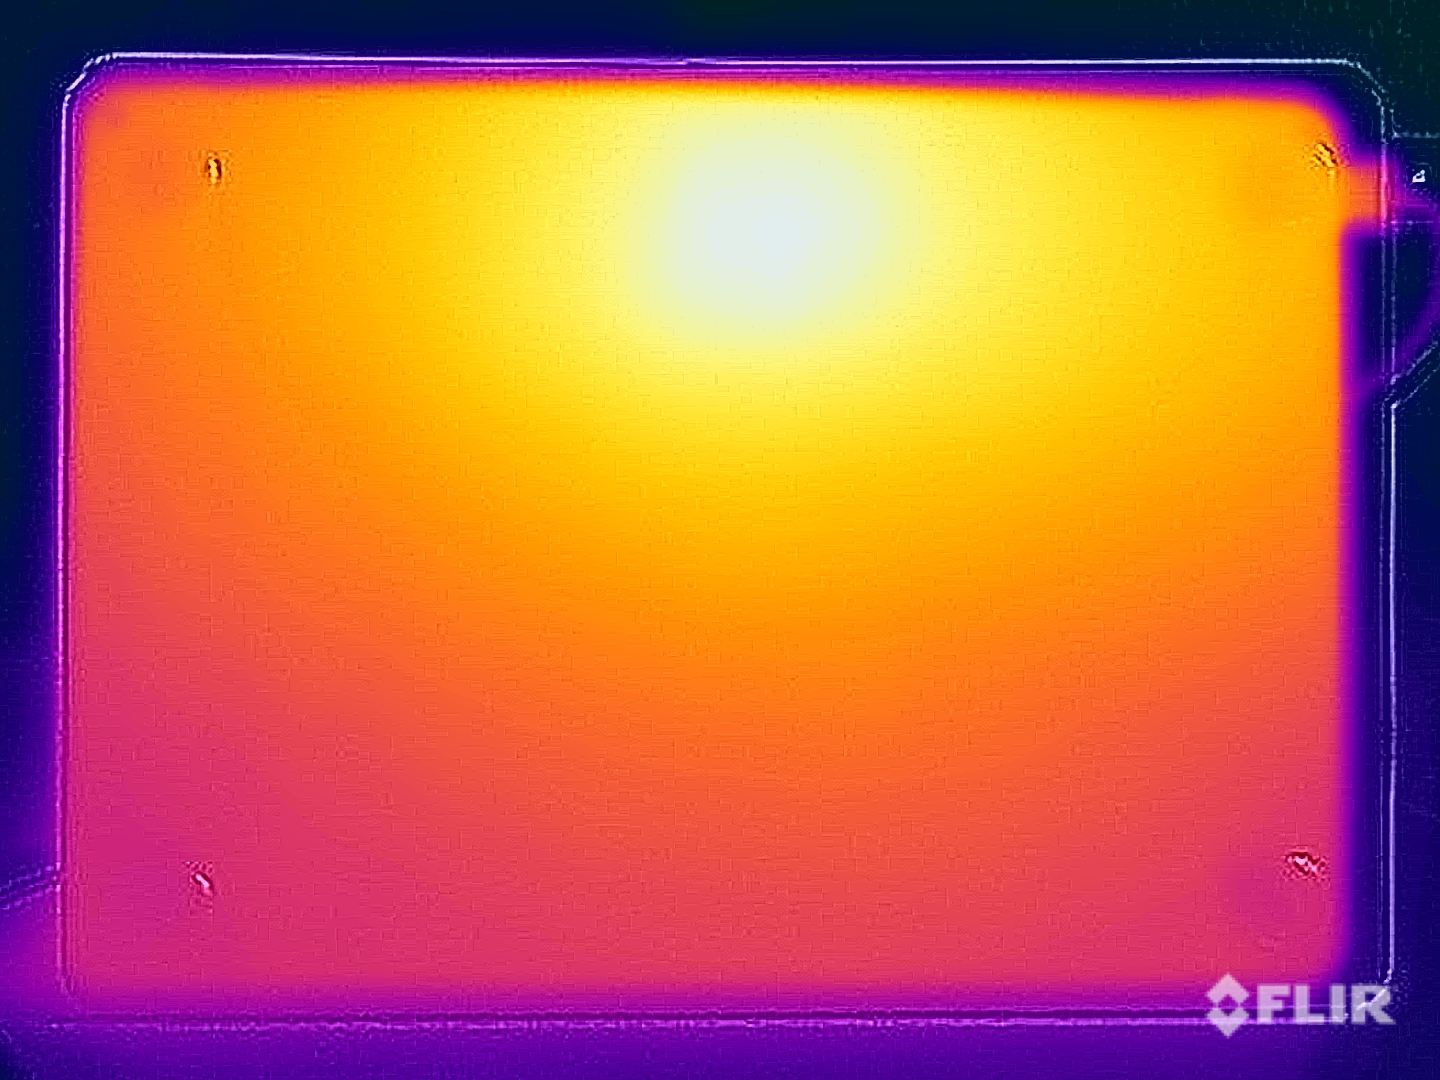
Despite its passive cooling, Apple still has the case's temperatures in check and in idle mode/during simple tasks, the device barely heats up. After our one-hour stress test, we noted a hot spot of 44 °C on the top middle area of the top and bottom of the base unit. Of course, this is noticeable but it doesn't limit the laptop's use.
(±) The maximum temperature on the upper side is 44.3 °C / 112 F, compared to the average of 35.9 °C / 97 F, ranging from 21.4 to 59 °C for the class Subnotebook.
(±) The bottom heats up to a maximum of 43.4 °C / 110 F, compared to the average of 39.2 °C / 103 F
(+) In idle usage, the average temperature for the upper side is 21.8 °C / 71 F, compared to the device average of 30.8 °C / 87 F.
(+) The palmrests and touchpad are reaching skin temperature as a maximum (32.9 °C / 91.2 F) and are therefore not hot.
(-) The average temperature of the palmrest area of similar devices was 28.2 °C / 82.8 F (-4.7 °C / -8.4 F).
| Apple MacBook Air 13 M3 10C GPU Apple M3, Apple M3 10-Core GPU | Apple MacBook Air M2 10C GPU Apple M2, Apple M2 10-Core GPU | Asus ZenBook 14 UX3405MA Intel Core Ultra 7 155H, Intel Arc 8-Core iGPU | Lenovo ThinkPad Z13 Gen 2 AMD Ryzen 7 PRO 7840U, AMD Radeon 780M | HP Dragonfly G4 Intel Core i7-1365U, Intel Iris Xe Graphics G7 96EUs | Dell XPS 13 Plus 9320 Core i7-1360P Intel Core i7-1360P, Intel Iris Xe Graphics G7 96EUs | Huawei MateBook X Pro 2023 Intel Core i7-1360P, Intel Iris Xe Graphics G7 96EUs | |
|---|---|---|---|---|---|---|---|
| Heat | -8% | -5% | -6% | -9% | -6% | -29% | |
| Maximum Upper Side * (°C) | 44.3 | 44.7 -1% | 40.9 8% | 46.2 -4% | 38.6 13% | 43.8 1% | 46.5 -5% |
| Maximum Bottom * (°C) | 43.4 | 44.6 -3% | 46.8 -8% | 48.4 -12% | 40.4 7% | 44.4 -2% | 44.7 -3% |
| Idle Upper Side * (°C) | 22.3 | 25.1 -13% | 24.1 -8% | 23.2 -4% | 28.2 -26% | 24 -8% | 34.9 -57% |
| Idle Bottom * (°C) | 22.1 | 25.3 -14% | 24.6 -11% | 23 -4% | 29 -31% | 25.2 -14% | 32.9 -49% |
* ... smaller is better
Stress test
During the stress test, the M3 SoC was allowed to consume up to 33 watts for a short while but these values then quickly decreased. Here, the MacBook Pro 14 M3 has a clear advantage thanks to its active cooler, although it couldn't keep its maximum value for long, either.
During combined CPU/GPU load, the processor's consumption balanced out at around 8.5-9 watts—the same as its predecessor. However, in the case of the new MacBook Air M3, the GPU is prioritized.
Speakers
The sound system with its four speakers still offers very good sound in view of the device's thin base unit and in many situations, you won't even need external speakers. However, the sound systems within the larger MacBook Pro models are even better and the Windows competition (e.g. the Asus Zenbook 14 or HP Dragonfly G4) has also caught up—or some cases even overtaken the MacBook Air.
Apple MacBook Air 13 M3 10C GPU audio analysis
(+) | speakers can play relatively loud (83.2 dB)
Bass 100 - 315 Hz
(±) | reduced bass - on average 13.3% lower than median
(±) | linearity of bass is average (11.3% delta to prev. frequency)
Mids 400 - 2000 Hz
(+) | balanced mids - only 0.4% away from median
(+) | mids are linear (1.6% delta to prev. frequency)
Highs 2 - 16 kHz
(+) | balanced highs - only 4.5% away from median
(+) | highs are linear (1.9% delta to prev. frequency)
Overall 100 - 16.000 Hz
(+) | overall sound is linear (10.7% difference to median)
Compared to same class
» 9% of all tested devices in this class were better, 3% similar, 88% worse
» The best had a delta of 5%, average was 18%, worst was 53%
Compared to all devices tested
» 6% of all tested devices were better, 2% similar, 93% worse
» The best had a delta of 4%, average was 23%, worst was 134%
Asus ZenBook 14 UX3405MA audio analysis
(±) | speaker loudness is average but good (81.2 dB)
Bass 100 - 315 Hz
(±) | reduced bass - on average 8.6% lower than median
(±) | linearity of bass is average (7% delta to prev. frequency)
Mids 400 - 2000 Hz
(+) | balanced mids - only 1.4% away from median
(+) | mids are linear (3.1% delta to prev. frequency)
Highs 2 - 16 kHz
(+) | balanced highs - only 1.9% away from median
(+) | highs are linear (3.5% delta to prev. frequency)
Overall 100 - 16.000 Hz
(+) | overall sound is linear (7.3% difference to median)
Compared to same class
» 1% of all tested devices in this class were better, 1% similar, 98% worse
» The best had a delta of 5%, average was 18%, worst was 53%
Compared to all devices tested
» 1% of all tested devices were better, 0% similar, 99% worse
» The best had a delta of 4%, average was 23%, worst was 134%
HP Dragonfly G4 audio analysis
(+) | speakers can play relatively loud (84.4 dB)
Bass 100 - 315 Hz
(±) | reduced bass - on average 8.4% lower than median
(±) | linearity of bass is average (11.6% delta to prev. frequency)
Mids 400 - 2000 Hz
(+) | balanced mids - only 2.3% away from median
(+) | mids are linear (4.8% delta to prev. frequency)
Highs 2 - 16 kHz
(+) | balanced highs - only 3.2% away from median
(+) | highs are linear (4.6% delta to prev. frequency)
Overall 100 - 16.000 Hz
(+) | overall sound is linear (9.1% difference to median)
Compared to same class
» 4% of all tested devices in this class were better, 1% similar, 95% worse
» The best had a delta of 5%, average was 18%, worst was 53%
Compared to all devices tested
» 3% of all tested devices were better, 1% similar, 96% worse
» The best had a delta of 4%, average was 23%, worst was 134%
Power management - Good battery life
Power consumption
When idling at full brightness, the MacBook Air 13 M3 has become slightly more frugal than its predecessor. Under load, the 35-watt power supply remains the limiting factor. Using a more powerful 65-watt power supply, we measured a short peak consumption of 66 watts which decreased over the course of a few minutes and fell below 35 watts. During the further course, its consumption balanced out at ~23 watts. When using the 35-watt power supply in this scenario, the battery ends up being tapped into in order to cover the additional power requirement. This is unfortunately a problem currently shared by almost all Intel subnotebooks.
| Off / Standby | |
| Idle | |
| Load |
|
Key:
min: | |
| Apple MacBook Air 13 M3 10C GPU M3, M3 10-Core GPU, Apple SSD AP0512Z, IPS, 2560x1664, 13.6" | Apple MacBook Air M2 10C GPU M2, M2 10-Core GPU, Apple SSD AP1024Z, IPS, 2560x1664, 13.6" | Asus ZenBook 14 UX3405MA Ultra 7 155H, Arc 8-Core, Micron 2400 MTFDKBA1T0QFM, OLED, 2880x1800, 14" | Lenovo ThinkPad Z13 Gen 2 R7 PRO 7840U, Radeon 780M, SK hynix BC901 HFS001TEJ4X164N, OLED, 2880x1800, 13.3" | HP Dragonfly G4 i7-1365U, Iris Xe G7 96EUs, Micron 3400 MTFDKBA512TFH 512GB, IPS, 1920x1280, 13.5" | Dell XPS 13 Plus 9320 Core i7-1360P i7-1360P, Iris Xe G7 96EUs, Samsung PM9A1 MZVL2512HCJQ, OLED, 3456x2160, 13.4" | Huawei MateBook X Pro 2023 i7-1360P, Iris Xe G7 96EUs, , IPS, 3120x2080, 14.2" | Average Apple M3 10-Core GPU | Average of class Subnotebook | |
|---|---|---|---|---|---|---|---|---|---|
| Power Consumption | -3% | -73% | -59% | -35% | -78% | -67% | -17% | -33% | |
| Idle Minimum * (Watt) | 1.95 | 1.9 3% | 6.1 -213% | 5.8 -197% | 4.1 -110% | 6.9 -254% | 4.1 -110% | 2.1 ? -8% | 3.78 ? -94% |
| Idle Average * (Watt) | 8.7 | 9.6 -10% | 10 -15% | 6.2 29% | 7.5 14% | 7.4 15% | 6.6 24% | 10.6 ? -22% | 6.57 ? 24% |
| Idle Maximum * (Watt) | 8.9 | 9.7 -9% | 10.3 -16% | 12.7 -43% | 8.2 8% | 13.6 -53% | 8 10% | 10.9 ? -22% | 7.94 ? 11% |
| Load Average * (Watt) | 34.3 | 32.4 6% | 53.3 -55% | 27.2 21% | 35.5 -3% | 43.5 -27% | 61 -78% | 35.5 ? -3% | 41.9 ? -22% |
| Witcher 3 ultra * (Watt) | 28.6 | 30.8 -8% | 42 -47% | 54.1 -89% | 37.5 -31% | 48 -68% | 56 -96% | ||
| Load Maximum * (Watt) | 35.4 | 35.7 -1% | 67 -89% | 61.4 -73% | 66.5 -88% | 63.3 -79% | 90 -154% | 46.4 ? -31% | 64.4 ? -82% |
* ... smaller is better
Power consumption Witcher 3 / stress test
Power consumption with external monitor
Runtimes
Its battery capacity of 56.2 Wh remains unchanged and we also saw similar results in our battery test. During the WLAN test with an adapted brightness of 150 cd/m² (7 large steps and 2 small steps reduced from its maximum brightness), we measured just over 15 hours, meaning it lasted half an hour longer than its M2 predecessor. The HP Dragonfly G4 with its larger 68-Wh battery lasted for 40 minutes longer still, whereas all the other Windows competitors trailed behind. At full screen brightness, the WLAN test only ran for about 7 hours, so one hour longer than the old model managed (which also matches the lower idle consumption). We will provide the results of the rest of the battery tests as soon as possible.
The MacBook Air still doesn't charge its battery particularly quickly and using the 35-watt power supply, it takes about 2.5 hours to recharge the device with it switched on. In our review of the MacBook Air M2, we added additional results for its charging times using different power supplies.
| Apple MacBook Air 13 M3 10C GPU M3, M3 10-Core GPU, 52.6 Wh | Apple MacBook Air M2 10C GPU M2, M2 10-Core GPU, 52.6 Wh | Asus ZenBook 14 UX3405MA Ultra 7 155H, Arc 8-Core, 75 Wh | Lenovo ThinkPad Z13 Gen 2 R7 PRO 7840U, Radeon 780M, 51.5 Wh | HP Dragonfly G4 i7-1365U, Iris Xe G7 96EUs, 68 Wh | Dell XPS 13 Plus 9320 Core i7-1360P i7-1360P, Iris Xe G7 96EUs, 55 Wh | Huawei MateBook X Pro 2023 i7-1360P, Iris Xe G7 96EUs, 60 Wh | Average of class Subnotebook | |
|---|---|---|---|---|---|---|---|---|
| Battery runtime | -6% | -16% | -49% | 8% | -52% | -38% | -17% | |
| H.264 (h) | 17.4 | 15.8 -9% | 16.8 -3% | 8.8 -49% | 15.4 ? -11% | |||
| WiFi v1.3 (h) | 15.2 | 14.7 -3% | 11.8 -22% | 7.8 -49% | 15.9 5% | 7.3 -52% | 9.7 -36% | 14 ? -8% |
| Load (h) | 2.9 | 2.2 -24% | 3.2 10% | 2.1 -28% | 1.969 ? -32% |
Pros
Cons
Verdict - The MacBook Air 13 is even better with an M3 SoC
After the MacBook Pro 14 with the new M3 SoC was released at the end of last year, we already knew what to expect from the MacBook Air M3. As the new 3-nm chips' power consumption has remained practically the same as on the M2 SoC, the MacBook Air is also able to make use of the new M3's full potential—which results in a 20 % lead over the M2.
Although its passive cooling leads to the laptop's performance dropping a little during permanent load (by about 20 %), this is the norm for current Intel models especially (at least when it comes to multi-core performance)—even with active cooling. Its excellent single-core performance, on the other hand, remains constant and in this aspect, Apple is able to leave the competition—in the form of the AMD Ryzen-8000 processors and Intel's Meteor Lake chips—in the dust. And this all inside a passively cooled device. There are currently simply no comparable Windows alternatives that offer such strong performance without any annoying fan noises.
Even in the other categories, the MacBook Air M3 doesn't suffer any major blunders and thanks to its Wi-Fi 6E (160 MHz), Apple has caught up in terms of WLAN performance. Its connectivity situation is, as always, likely the device's major flaw—although it missing Thunderbolt 4 should be less of an issue during everyday use than it being limited to 2x USB-C on the left side. As always, its runtimes are astounding, even if the Windows competition is slowly gaining on Apple. The 35-watt power supply with both of the USB-C ports may be practical, but it is actually slightly too weak if you are looking to use the M3 to its full potential. Its performance isn't impacted but the deficit does have to be absorbed by the laptop's battery for a few minutes. The new Midnight color variant has now received an additional coating which leads to it not being as big a fingerprint magnet as before.
Better performance and faster WLAN: With the new M3 SoC, Apple's MacBook Air 13 has become even better, and simply no Windows alternatives are able to offer a better total package. Its silent operation in particular is an immense advantage of the MacBook Air.
The device's 13.6-inch IPS panel continues to offer good picture quality with accurate colors and good brightness levels, but we would slowly like to start seeing an upgrade to 120 Hz. However, its advantage over Mini-LED and OLED panels is that no PWM is used. The new Air M3 can also now accommodate two external displays if you shut its display lid. This is, of course, less than ideal but for users who wish to use two monitors on their desk, this may well be useful. Its biggest problem continues to be its price, as for US$1,099, you still only get 8 GB RAM and a slow 256-GB SSD. There do still seem to be enough buyers about and at least for casual users, this configuration is surely still sufficient.
Price and availability
Currently, the new MacBook Air 13 M3 can be purchased from many online retailers. On Amazon, for example, the base model can be had for US$1,099.
Apple MacBook Air 13 M3 10C GPU
- 03/07/2024 v7 (old)
Andreas Osthoff
Transparency
The selection of devices to be reviewed is made by our editorial team. The test sample was provided to the author as a loan by the manufacturer or retailer for the purpose of this review. The lender had no influence on this review, nor did the manufacturer receive a copy of this review before publication. There was no obligation to publish this review. As an independent media company, Notebookcheck is not subjected to the authority of manufacturers, retailers or publishers.
This is how Notebookcheck is testing
Every year, Notebookcheck independently reviews hundreds of laptops and smartphones using standardized procedures to ensure that all results are comparable. We have continuously developed our test methods for around 20 years and set industry standards in the process. In our test labs, high-quality measuring equipment is utilized by experienced technicians and editors. These tests involve a multi-stage validation process. Our complex rating system is based on hundreds of well-founded measurements and benchmarks, which maintains objectivity. Further information on our test methods can be found here.
Price comparison
Zusätzlich haben wir noch Vergleichsbilder mit dem größeren MacBook Air 15 M3 hinzugefügt, damit man einen besseren Eindruck der Größenverhältnisse bekommt.

