

Apple MacBook Pro 14 2023 M3 Pro review - Improved runtimes and better performance
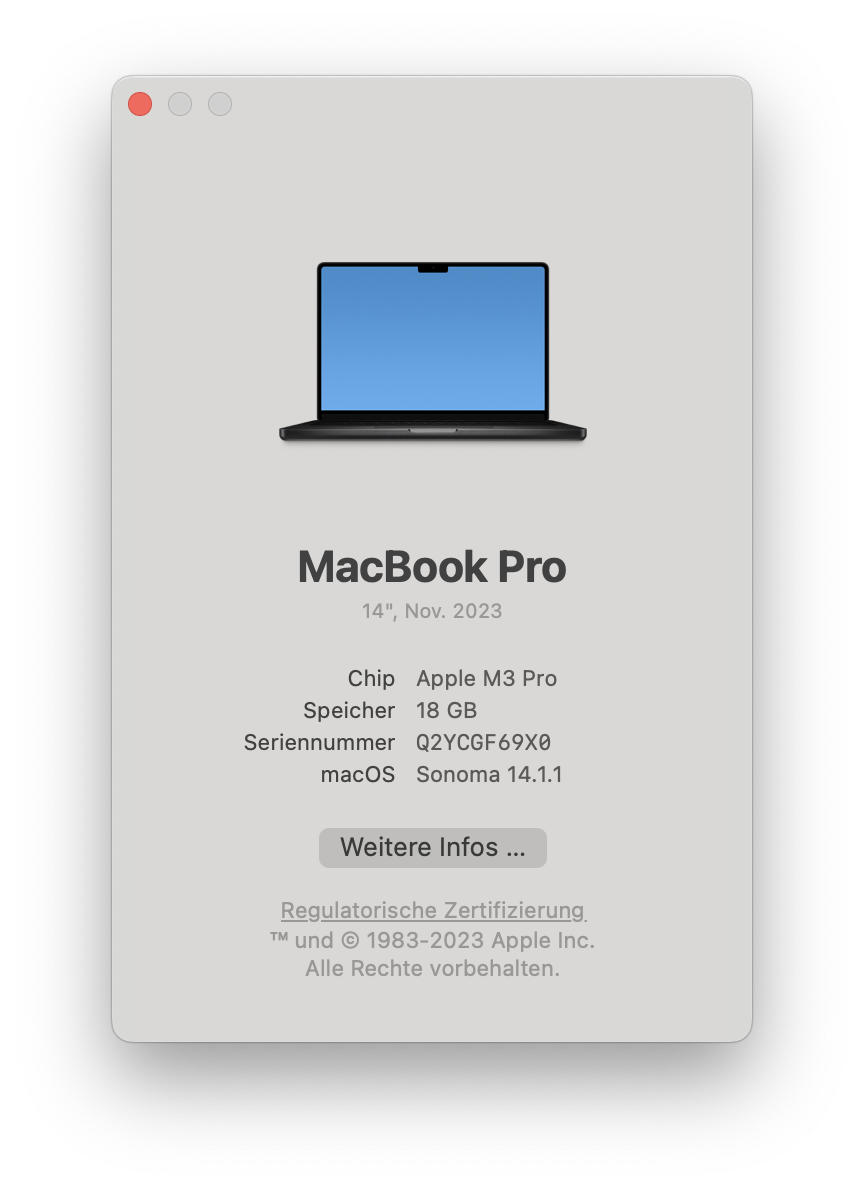
The new MacBook Pro 14 now comes in even more variants and as a customer, it isn't always easy to keep a good overview of them all. We have already tested two, namely the new base model with the regular M3 SoC and the high-end version with the M3 Max. Now, we are taking a look at the model with the slimmed-down M3 Pro for US$2,499. Aside from its M3 Pro, this model features a 14-core GPU, 18 GB RAM and a 512-GB SSD. This variant will likely be the most interesting option for lots of customers, as it is the cheapest MBP 14 with a Pro SoC.
| MBP 14 M3 | MBP 14 M3 Pro | MBP 14 M3 Pro | MBP 14 M3 Max | MBP 14 M3 Max | |
|---|---|---|---|---|---|
| CPU | Apple M3 8 CPU cores (4P & 4E) |
Apple M3 Pro 11 CPU cores (5P & 6E) |
Apple M3 Pro 12 CPU cores (6P & 6 E) |
Apple M3 Max 14 CPU cores (10P & 4E) |
Apple M3 Max 16 CPU cores (12P & 4E) |
| GPU | 10 GPU cores | 14 GPU cores | 18 GPU cores | 30 GPU cores | 40 GPU cores |
| RAM | 8 GB (16/24 GB) | 18 GB (36 GB) | 18 GB (36 GB) | 36 GB (96 GB) | 48 GB (64/128 GB) |
| SSD | 512 GB (1/2 TB) | 512 GB (1/2/4 TB) | 1 TB (2/4 TB) | 1 TB (2/4/8 TB) | 1 TB (2/4/8 TB) |
| Memory bandwidth | 100 GB/s | 150 GB/s | 150 GB/s | 300 GB/s | 400 GB/s |
| Connections | 2x USB-C 4.0 with Thunderbolt 3 HDMI, SD card reader |
3x USB-C 4.0 with Thunderbolt 4 HDMI, SD card reader |
3x USB-C 4.0 with Thunderbolt 4 HDMI, SD card reader |
3x USB-C 4.0 with Thunderbolt 4 HDMI, SD card reader |
3x USB-C 4.0 with Thunderbolt 4 HDMI, SD card reader |
| Price | from US$1,999 | from US$2,499 | from US$2,999 | from US$3,999 | from US$4,574 |
The small MacBook Pro 14 can, of course, also be had with the full version of the M3 Pro (6 performance cores instead of 5, 18 GPU cores instead of 14) and we already had a chance to test this chip inside the bigger MacBook Pro 16. As our test device's case, connectivity and input devices aren't any different to those on the MBP 14 with the M3 Max, we have predominantly focussed on the laptop's performance, emissions and runtimes in this review. For further information on these topics, you can read our detailed review of the MBP 14 M3 Max:
Possible competitors compared
Rating | Date | Model | Weight | Height | Size | Resolution | Price |
|---|---|---|---|---|---|---|---|
| 93.2 % v7 (old) | 12 / 2023 | Apple MacBook Pro 14 2023 M3 Pro Apple M3 Pro 11-Core, M3 Pro 14-Core GPU | 1.6 kg | 15.5 mm | 14.20" | 3024x1964 | |
| 90.4 % v7 (old) | 11 / 2023 | Apple MacBook Pro 14 2023 M3 M3, M3 10-Core GPU | 1.5 kg | 15.5 mm | 14.20" | 3024x1964 | |
| 93.4 % v7 (old) | 03 / 2023 | Apple MacBook Pro 14 2023 M2 Pro Entry M2 Pro 10-Core, M2 Pro 16-Core GPU | 1.6 kg | 15.5 mm | 14.20" | 3024x1964 | |
| 89.6 % v7 (old) | 06 / 2023 | Huawei MateBook X Pro 2023 i7-1360P, Iris Xe G7 96EUs | 1.3 kg | 15.6 mm | 14.20" | 3120x2080 | |
| 89.8 % v7 (old) | 07 / 2023 | Lenovo Yoga Pro 9-14IRP G8 i7-13705H, GeForce RTX 4050 Laptop GPU | 1.7 kg | 17.6 mm | 14.50" | 3072x1920 | |
| 89.4 % v7 (old) | 05 / 2023 | Gigabyte Aero 14 OLED BMF i7-13700H, GeForce RTX 4050 Laptop GPU | 1.4 kg | 17 mm | 14.00" | 2880x1800 | |
| 88.9 % v7 (old) | 10 / 2023 | Schenker Vision 14 2023 i7-13700H, Iris Xe G7 96EUs | 1.3 kg | 16.6 mm | 14.00" | 2880x1800 | |
| 88.2 % v7 (old) | 10 / 2023 | Lenovo Yoga Slim 7 14APU G8 R7 7840S, Radeon 780M | 1.3 kg | 13.9 mm | 14.50" | 2944x1840 |
Differences to the MacBook Pro 14 M3
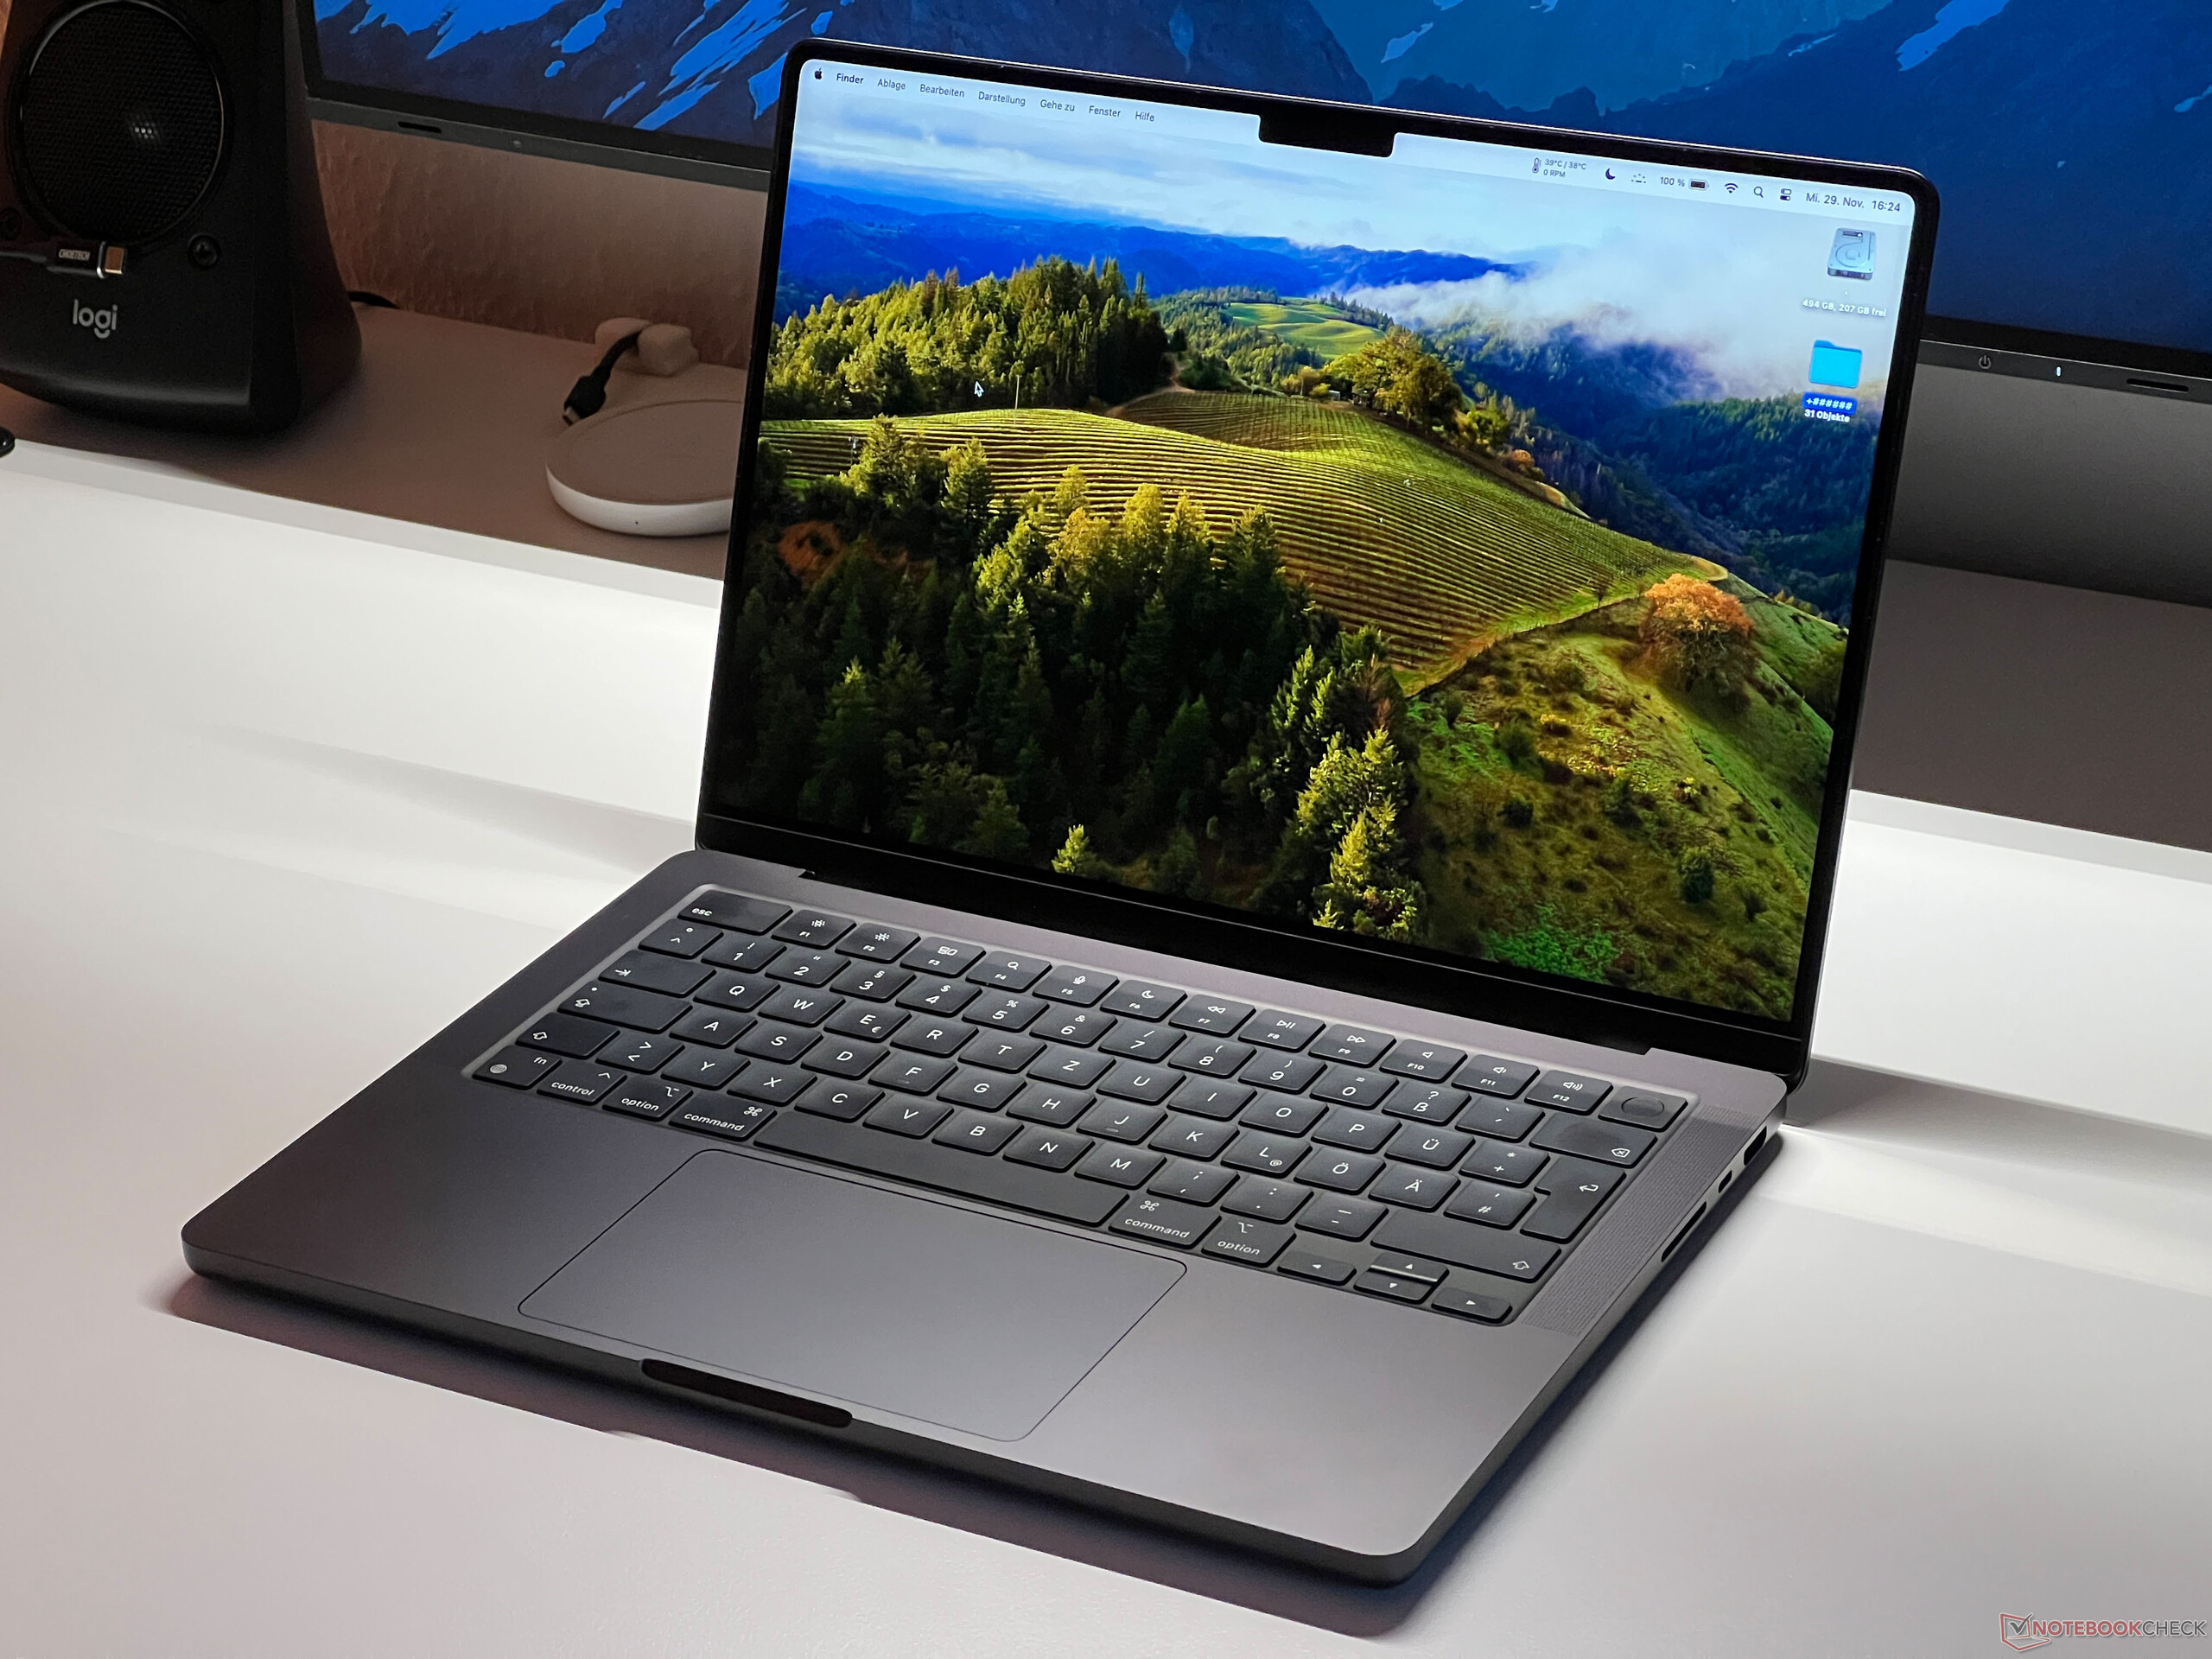
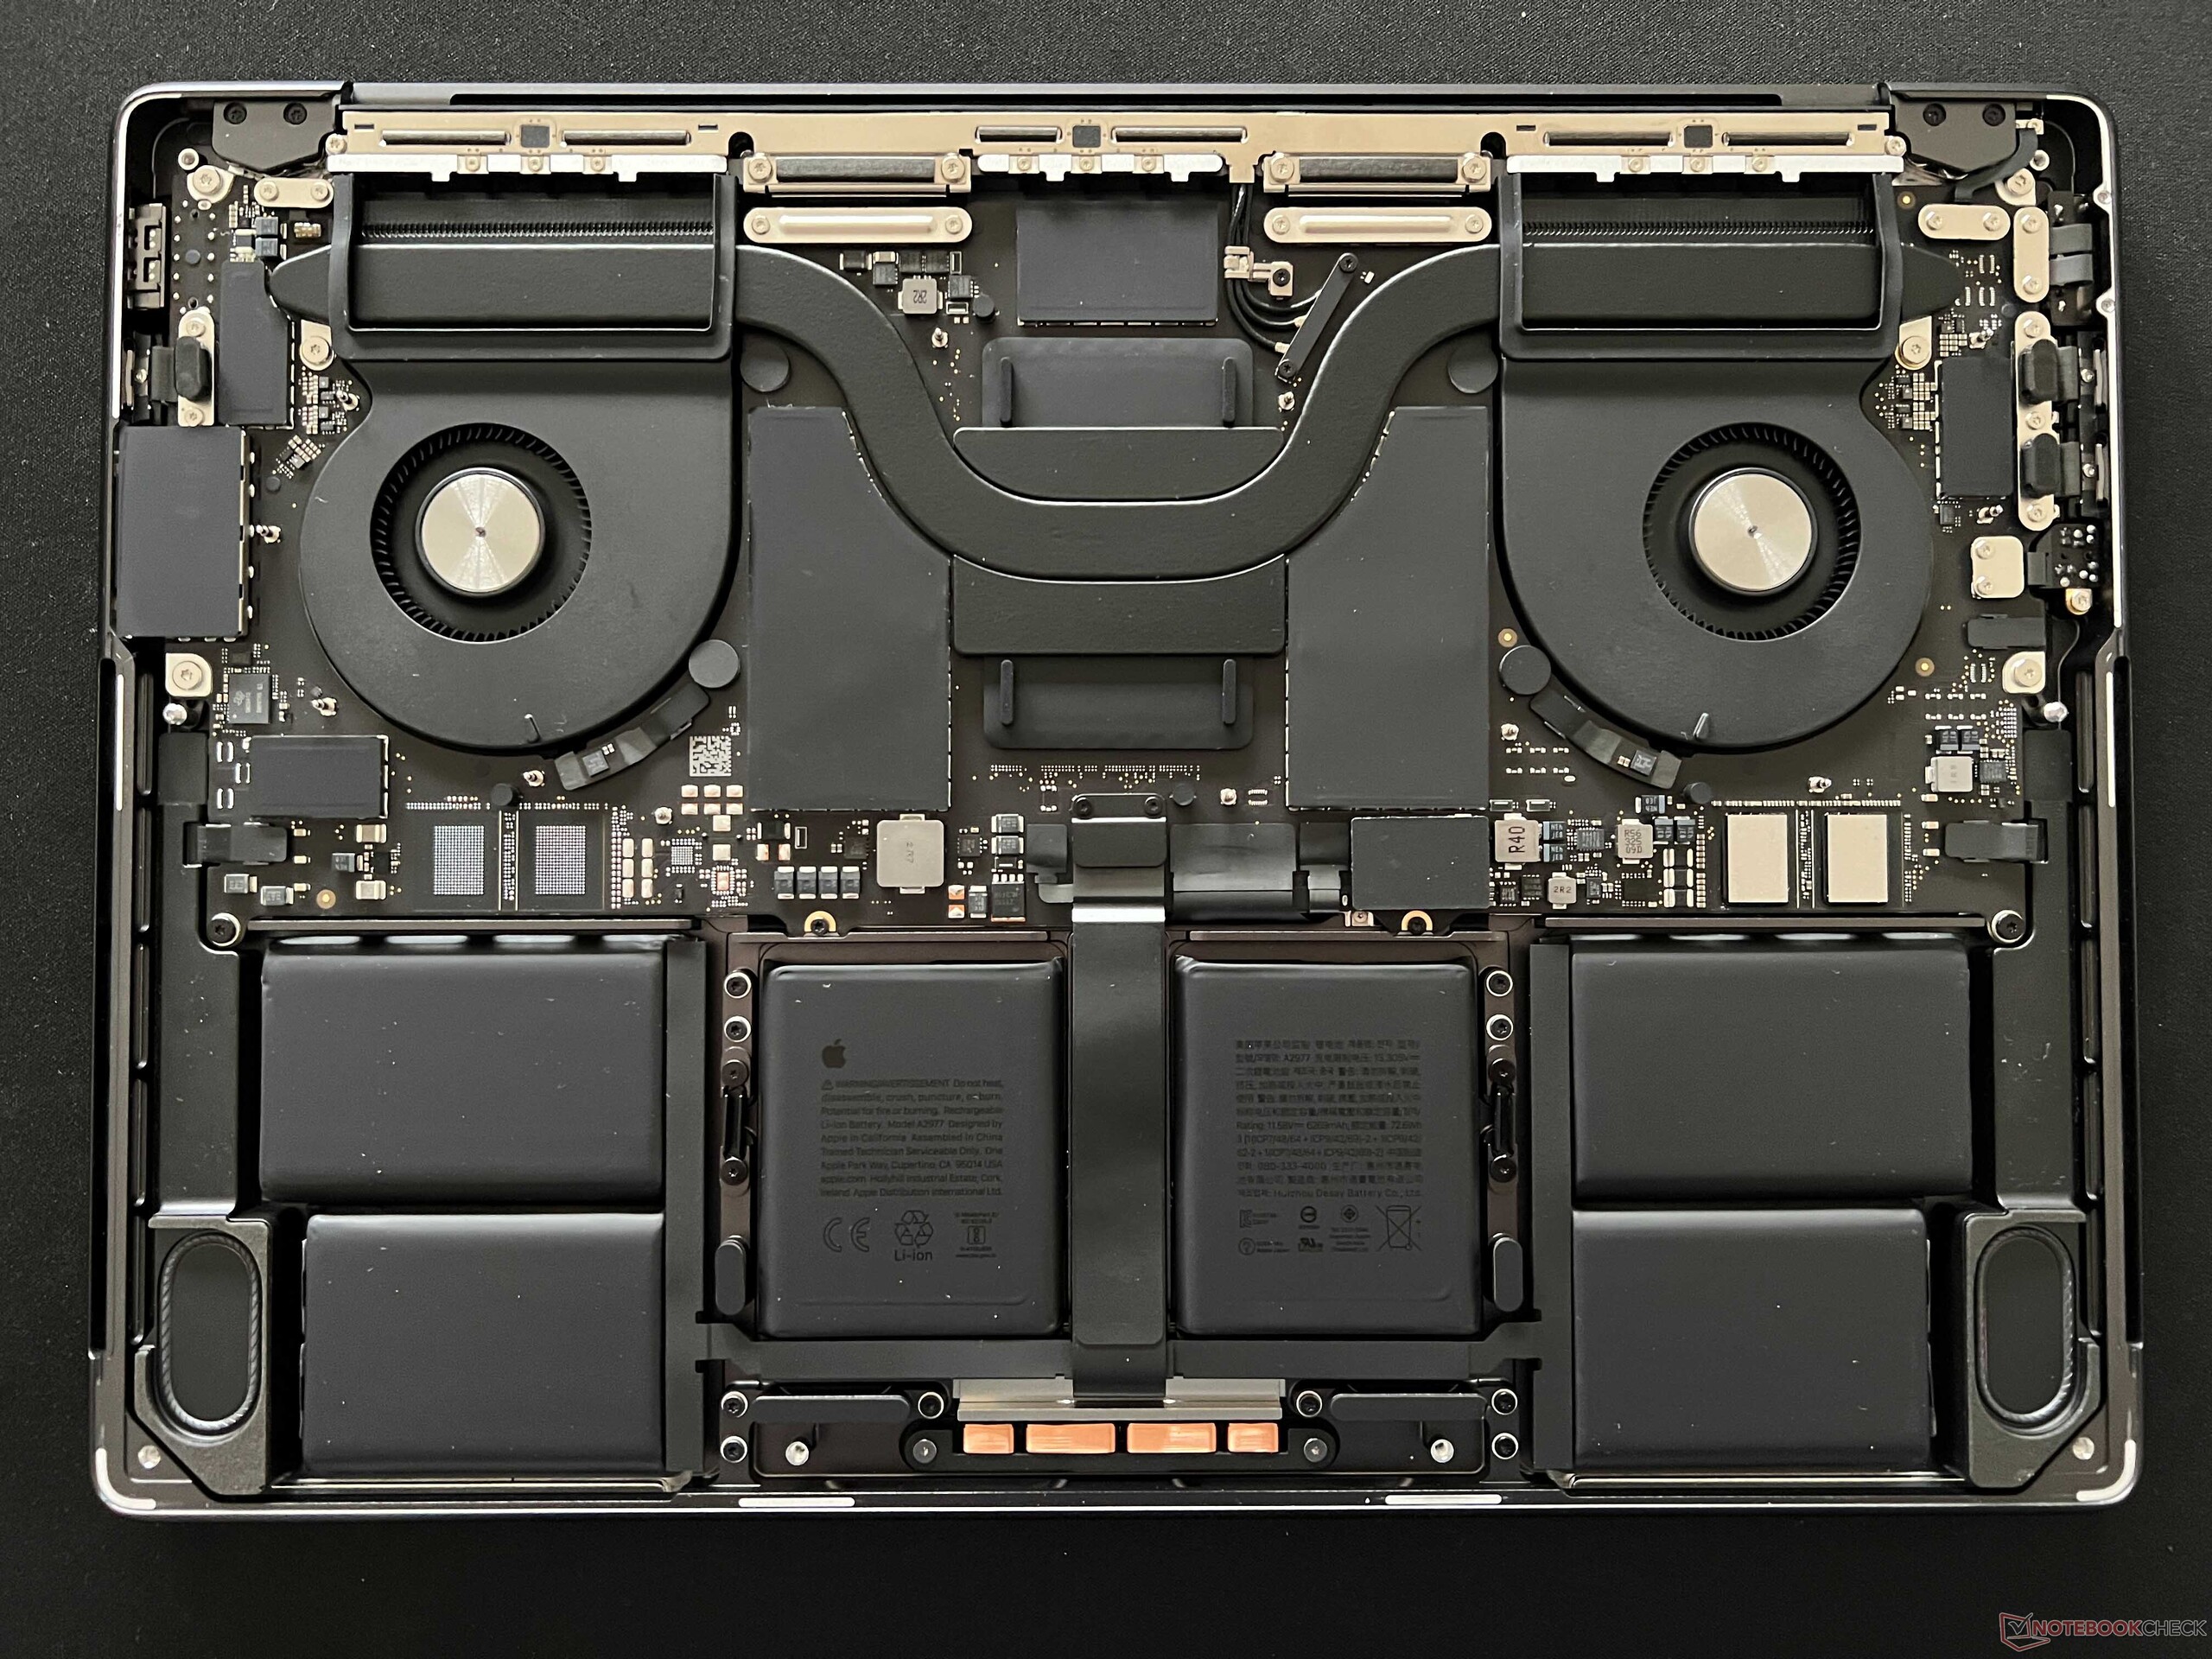
The MacBook Pro 14 with the M3 Pro features the same connections and cooling unit as the configuration with the M3 Max which we already tested thoroughly. This means it has two fans and three USB-C 4.0 ports including Thunderbolt 4, while the new base model of the MacBook Pro 14 with the M3 SoC only has one fan and two USB-C 4.0 ports which are limited to Thunderbolt 3.
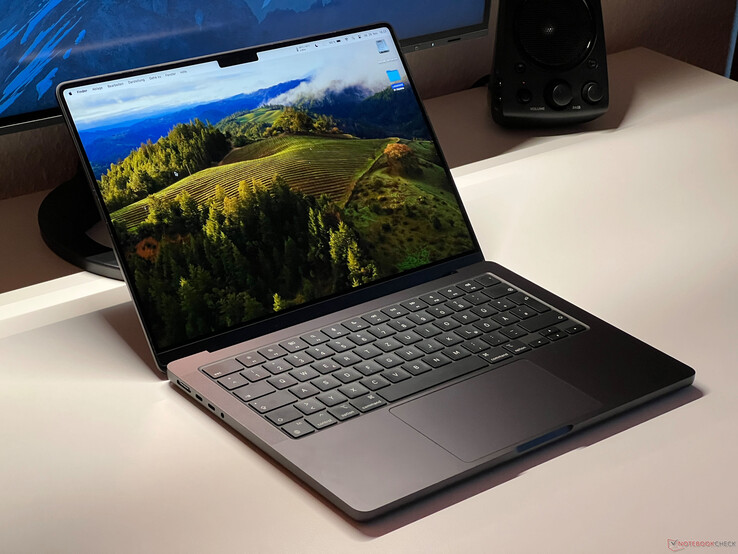
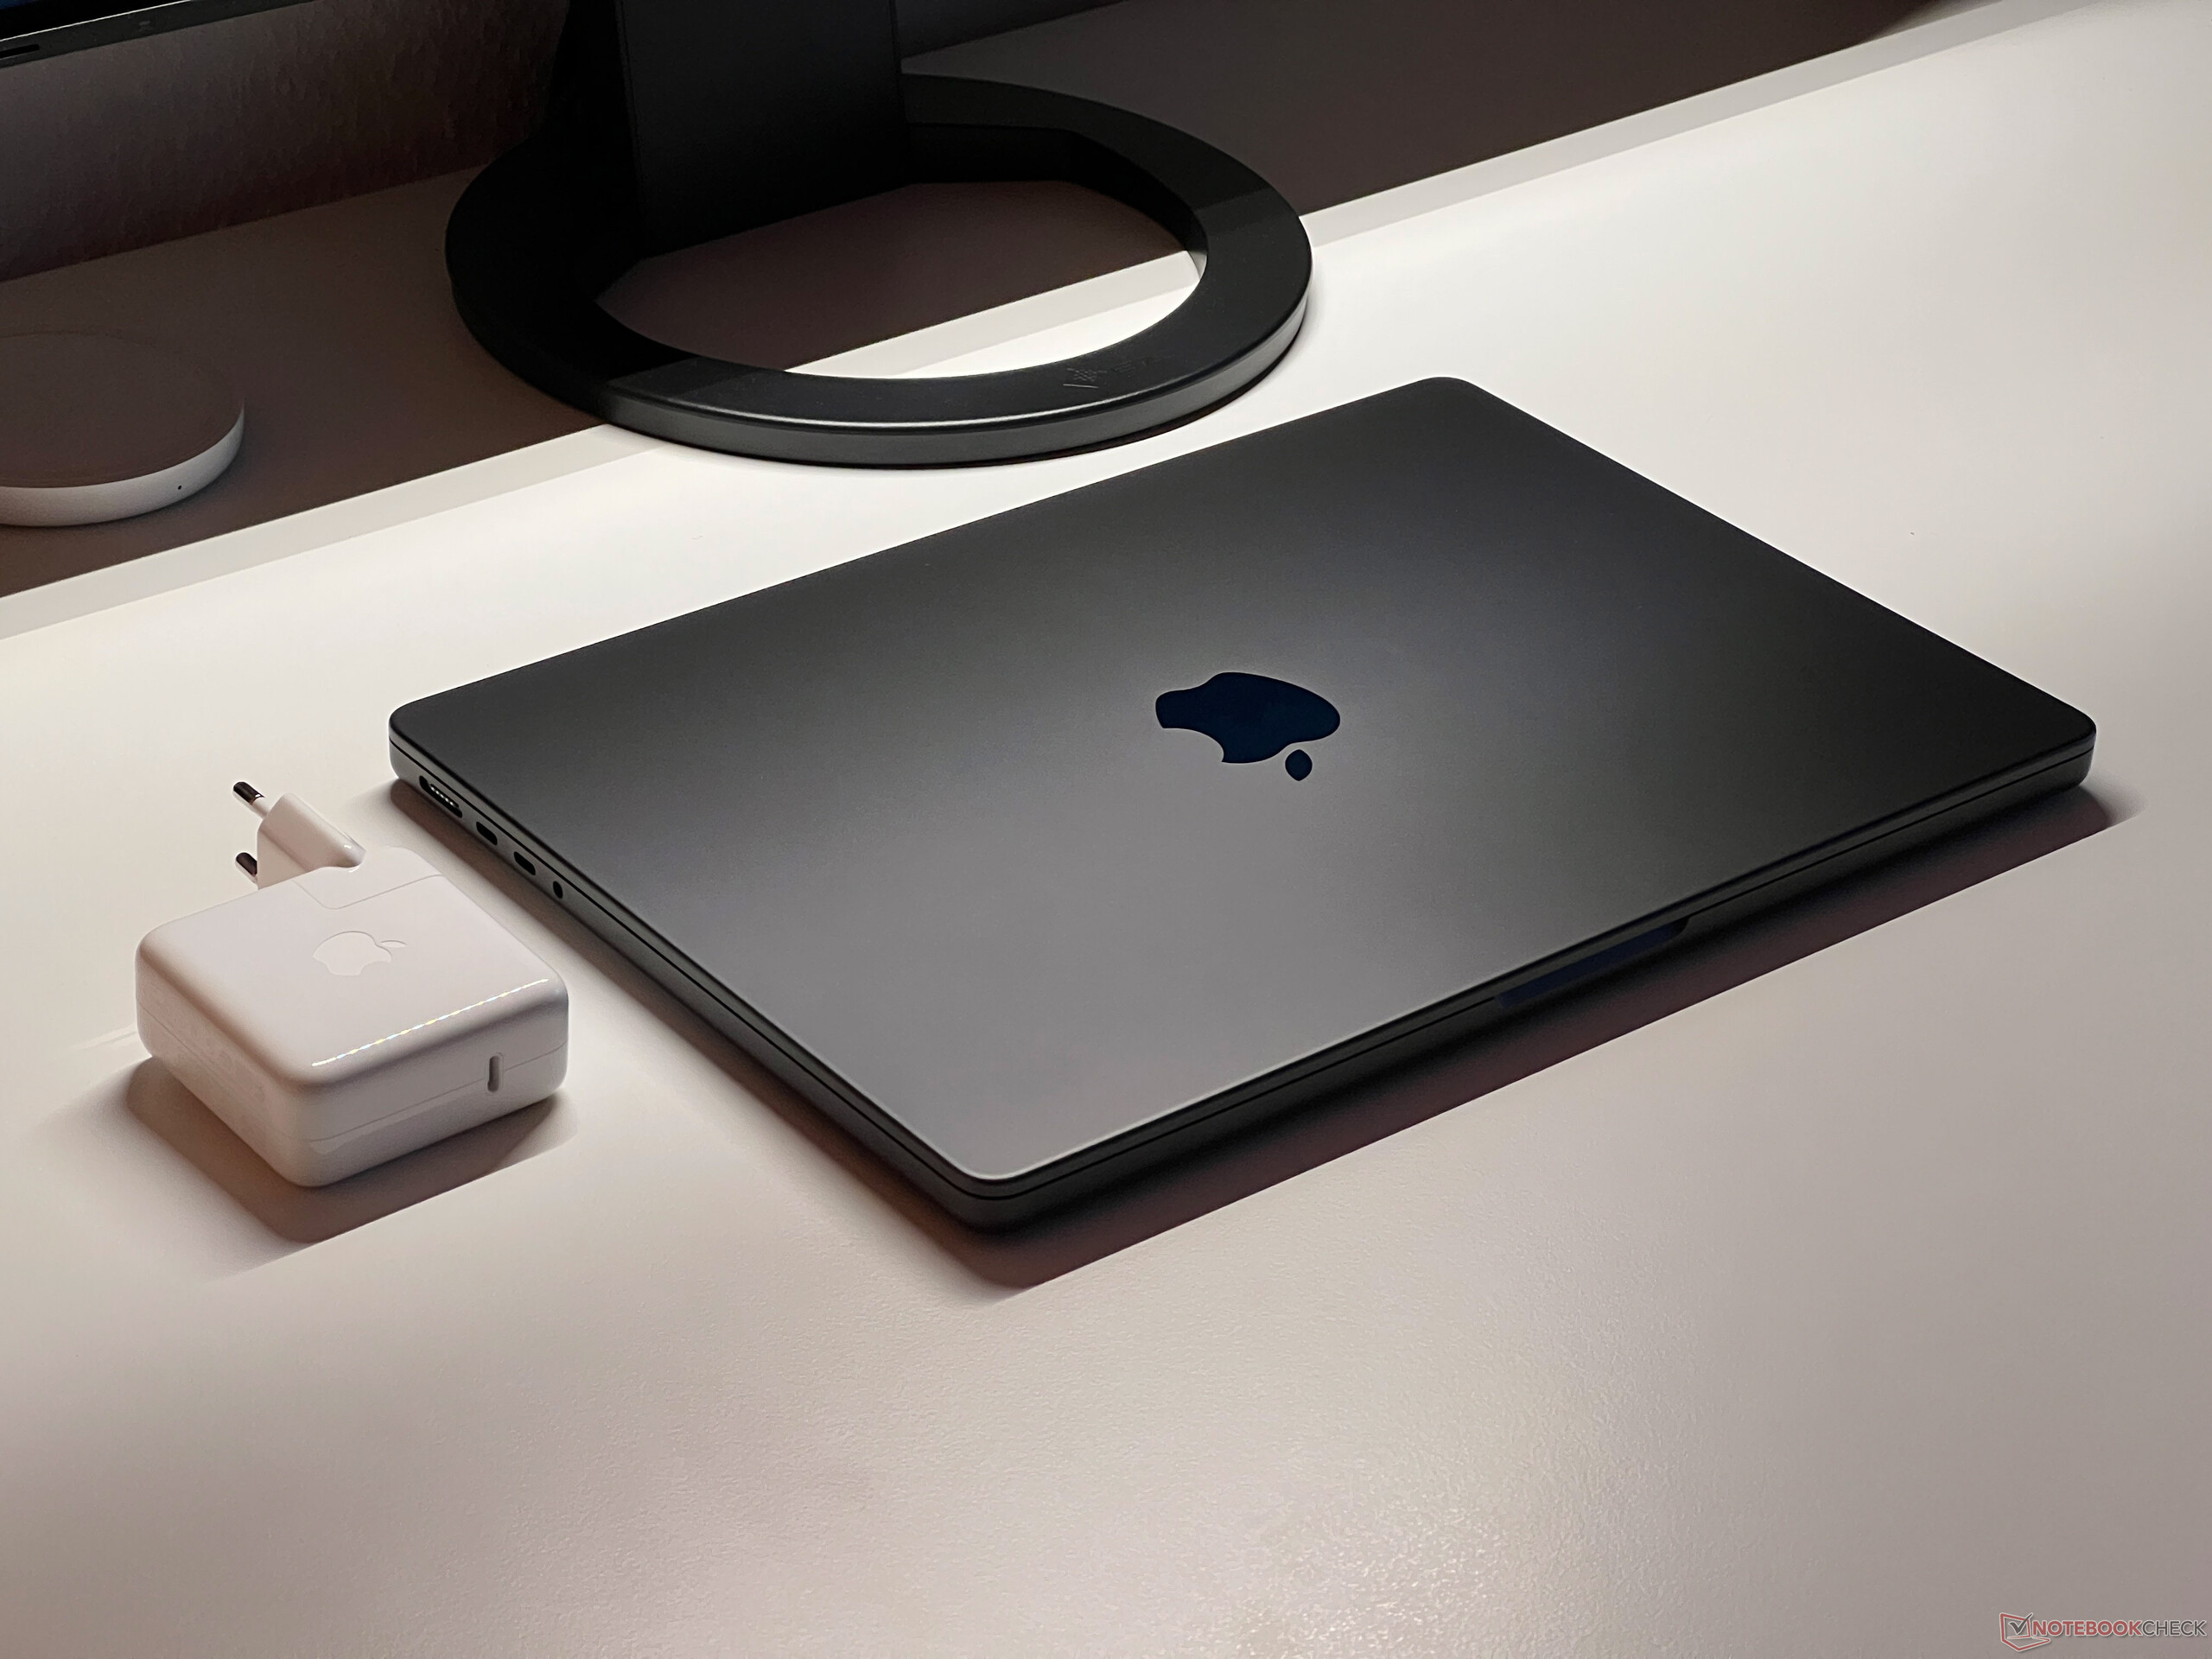
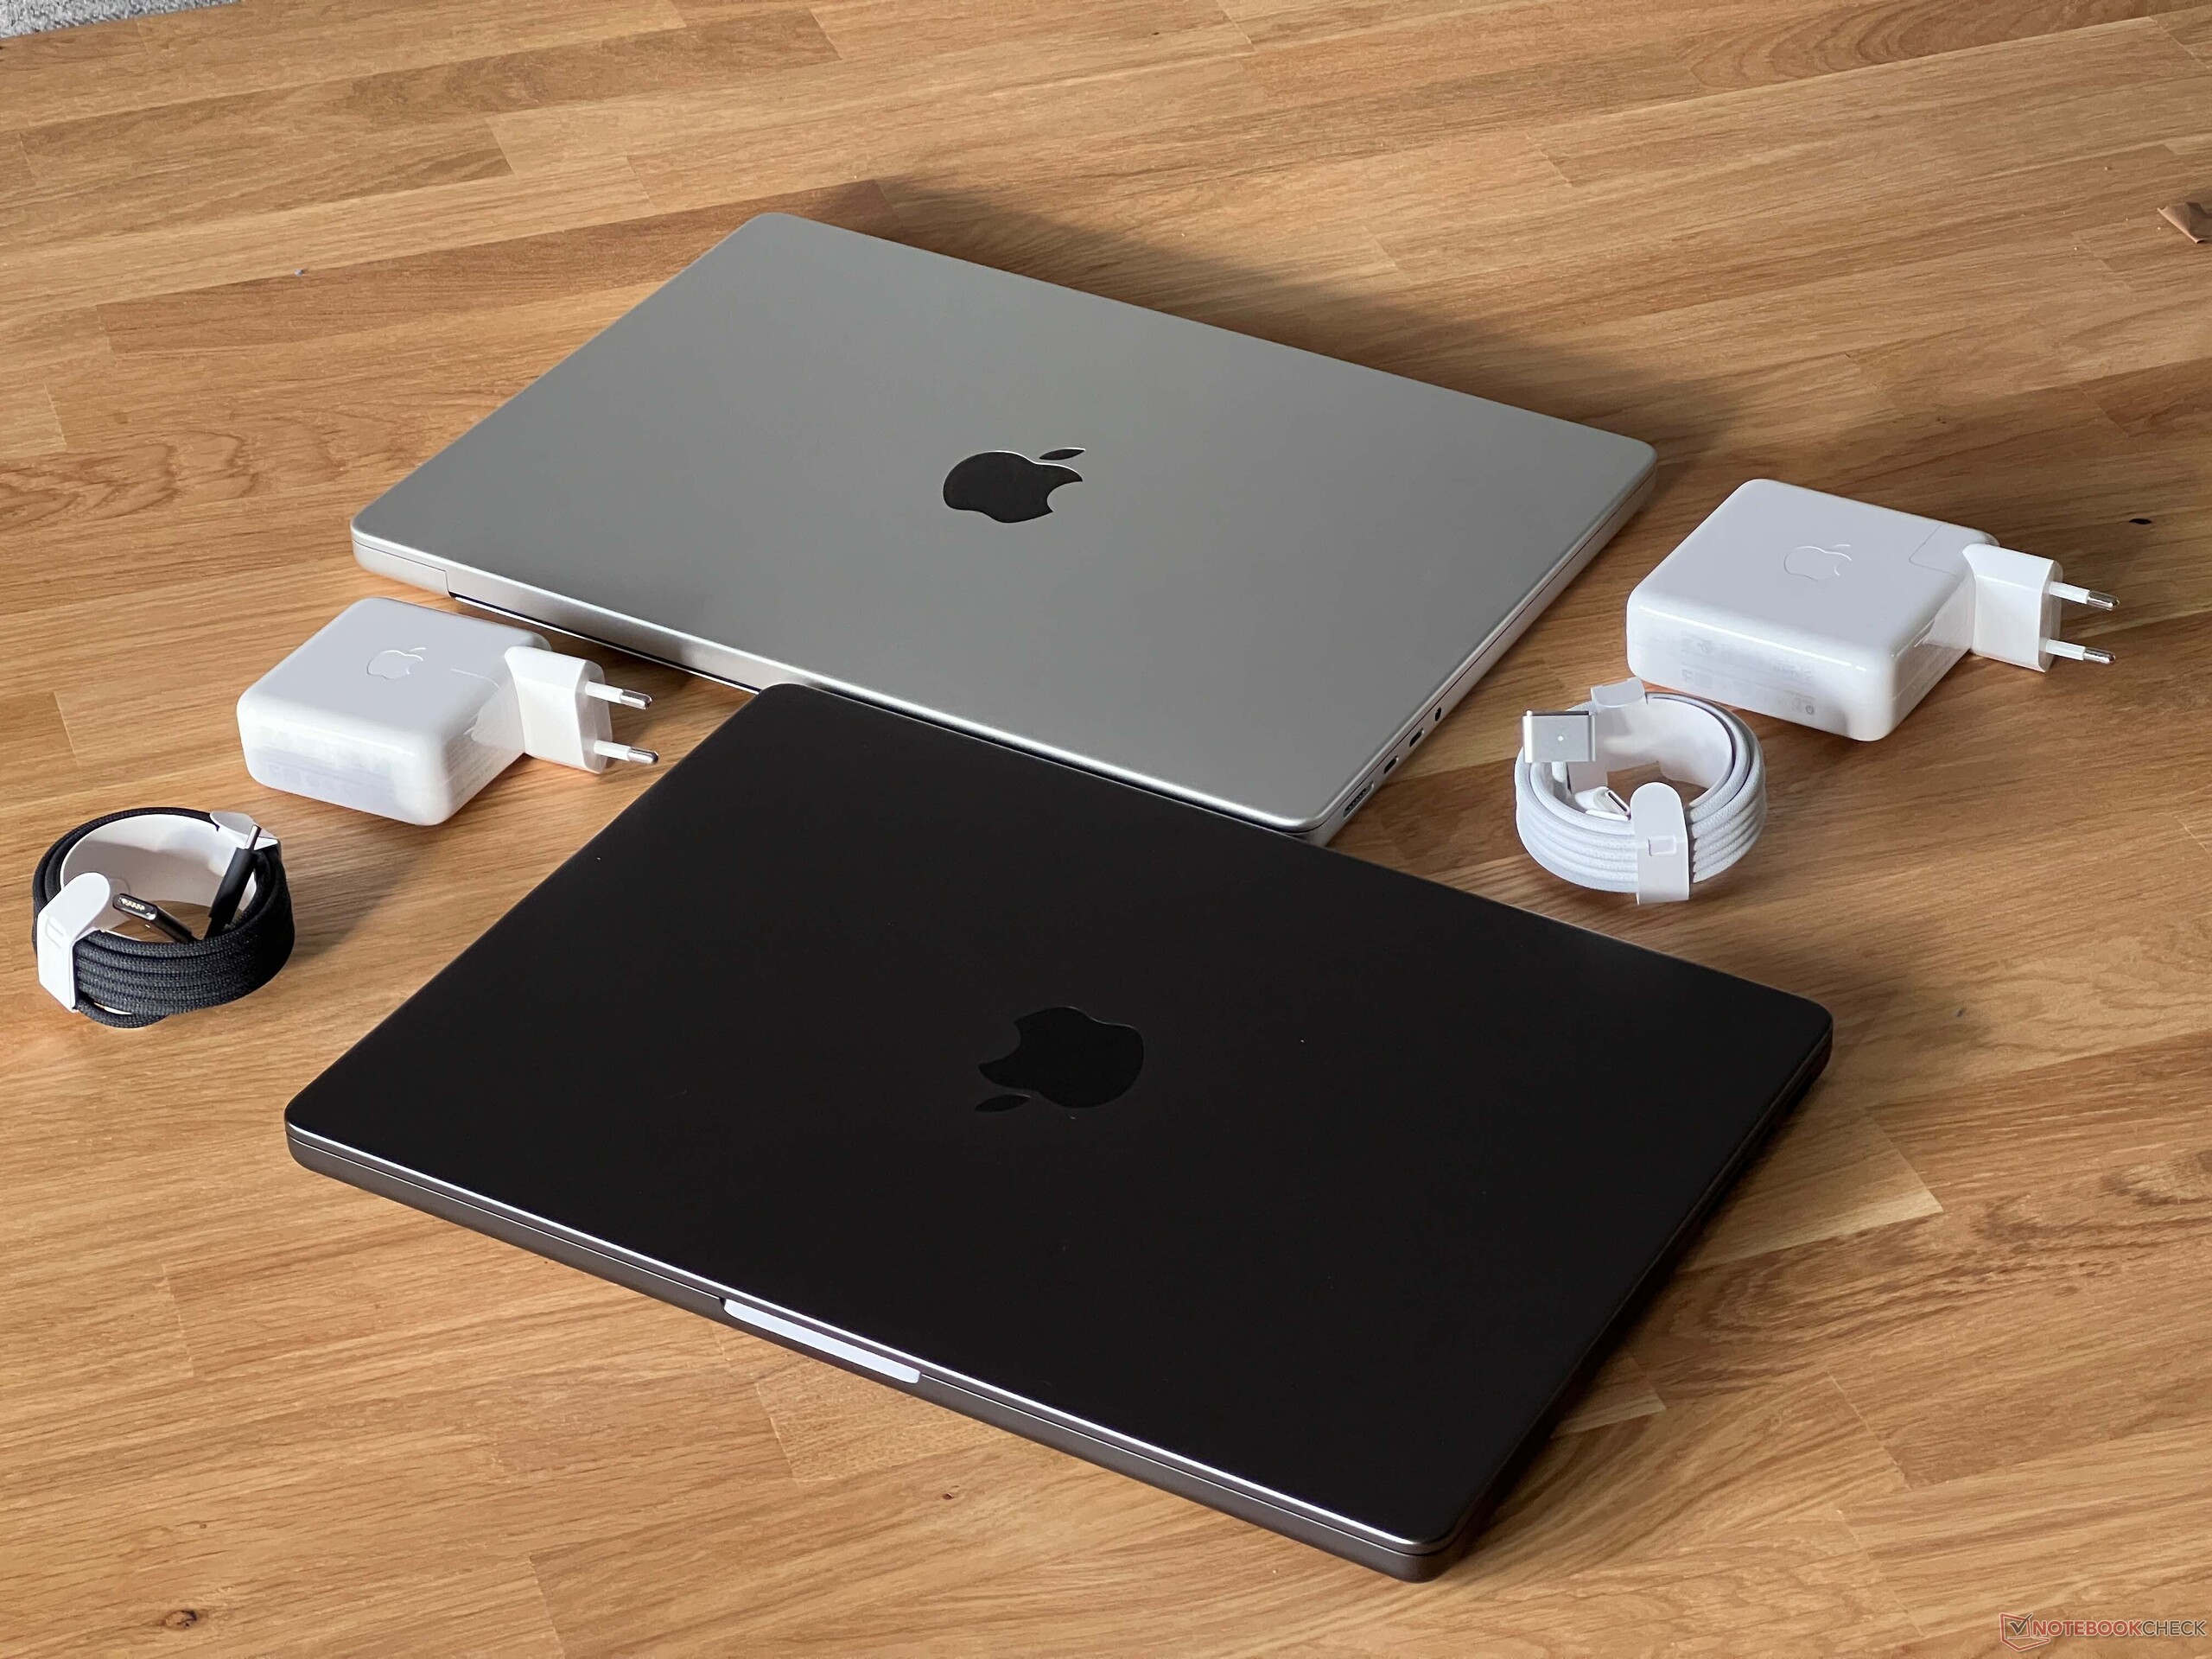
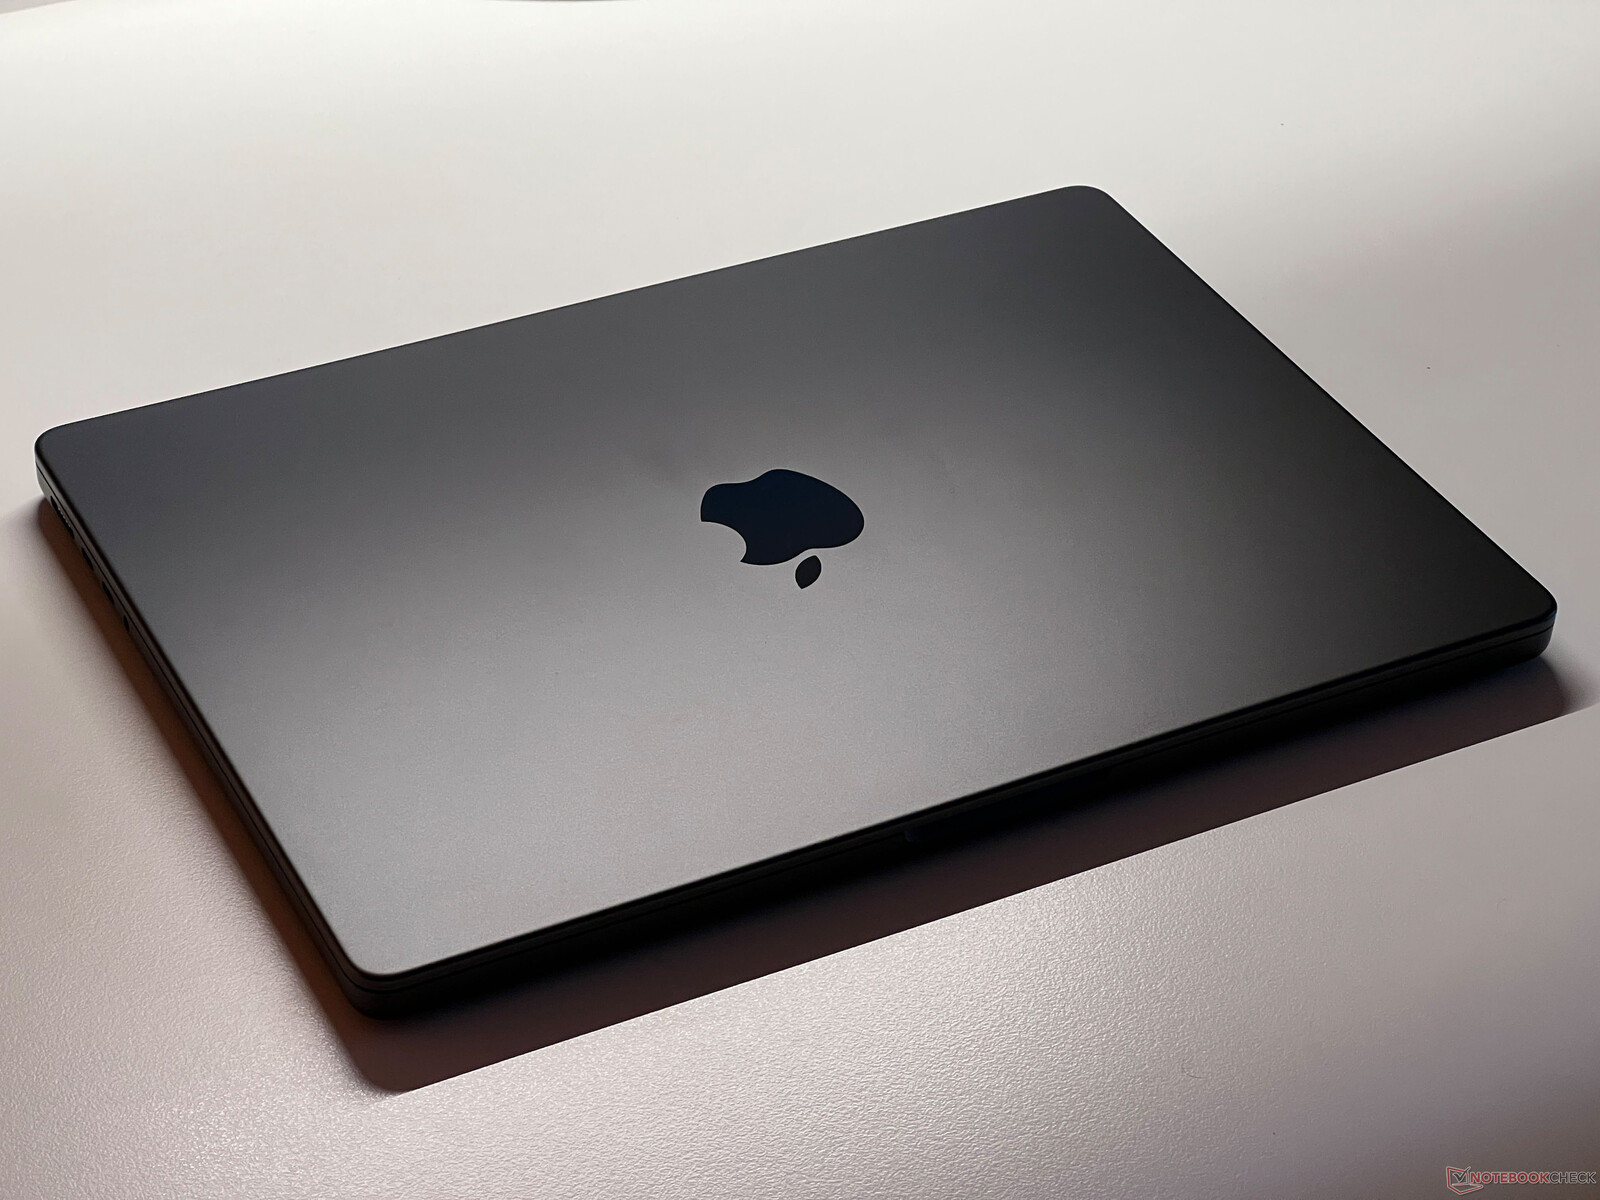
The case can be had in either silver or the new Space Black — although the latter is more a very dark gray and still contrasts quite a lot with the black keyboard. Its surface isn't quite as bad a fingerprint magnet as the current MacBook Air M2 in the dark blue "Midnight" colorway but even so, you will have to wipe it down regularly. The MBP 14 with the M3 Pro can power two external displays at once, which is an advantage over the base model with the regular M3 SoC.
Performance - 3 nm results in better performance and efficiency
Processor - M3 Pro with 5 performance cores
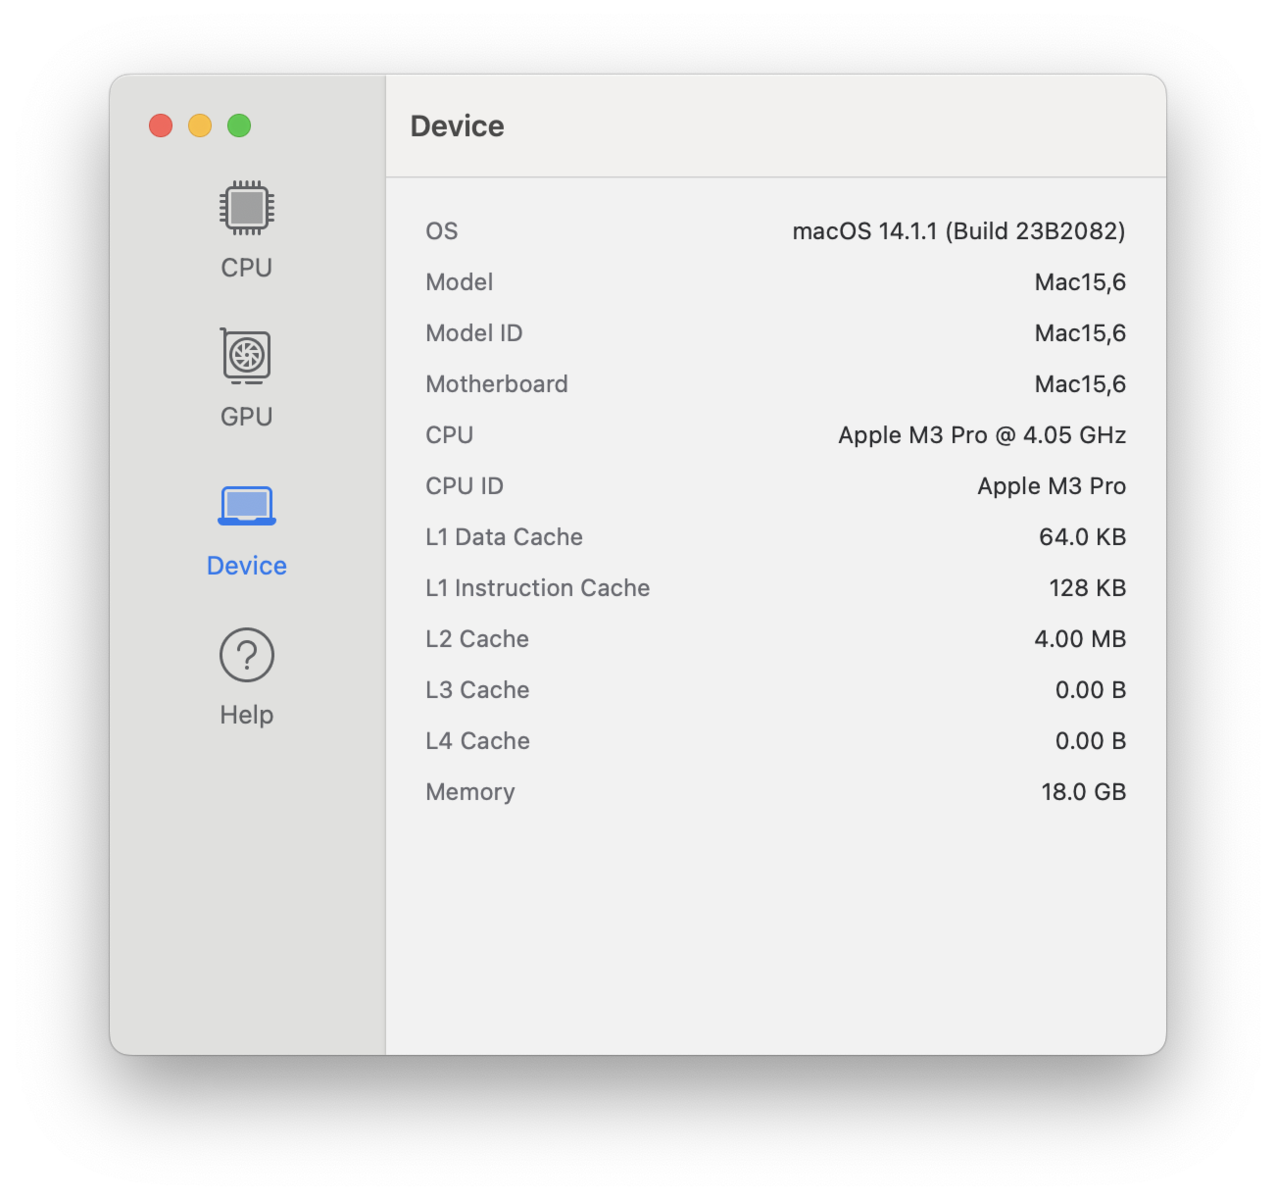
The new M3 Pro's core configuration has changed compared to the old M2 Pro. The M2 Pro's clusters (performance and efficiency) consisted of 4 cores and on the smaller 10-core model, only three of the four P cores were active per cluster — together with the 4 E cores, this resulted in a total of 10 cores. On the new M3 Pro, there are now two clusters with 6 cores each — although on our smaller variant, only 5 of the 6 P cores are active. Together with the 6 E cores, this means it is an 11-core CPU. The cores themselves have the same tech specs as the other M3 SoCs, as the performance cores are capable of reaching up to 4.056 GHz and the efficiency cores can reach up to 2.748 GHz. This was confirmed in practical use. Furthermore, its memory interface speed has been reduced from 256 bits on the M2 Pro to 192 bits. As a result, its maximum memory bandwidth is now 150 GB/s instead of 200 GB/s.
While the full version of the M3 Pro with 12 cores uses 26-27 watts under maximum load, the smaller 11-core model only uses ~23-24 watts. The old M2 with 10 cores also consumed about 27 watts. During the multi-core tests, the "small" M3 Pro did very well and came between the old M2 Pro with 10 cores and the M2 Pro with 12 cores and even so, the distance between them was never larger than 10 % in both cases. In contrast, the large M3 Pro with all 6 P cores was around 12 % faster and in practical use, it achieved the same performance levels as the old M2 Pro with 12 cores.
Cinebench 2024: CPU Multi Core | CPU Single Core
Geekbench 5.5: Multi-Core | Single-Core
Geekbench 6.5: Multi-Core | Single-Core
Blender: v3.3 Classroom CPU
| Cinebench 2024 / CPU Multi Core | |
| Apple MacBook Pro 14 2023 M3 Max | |
| Apple MacBook Pro 16 2023 M3 Pro | |
| Apple MacBook Pro 14 2023 M2 Pro | |
| Average of class Multimedia (327 - 2069, n=65, last 2 years) | |
| Apple MacBook Pro 14 2023 M3 Pro | |
| Average Apple M3 Pro 11-Core (n=1) | |
| Lenovo Yoga Slim 7 14APU G8 | |
| Apple MacBook Pro 14 2023 M3 | |
| Lenovo ThinkPad T14s G4-21F8002TGE | |
| Cinebench 2024 / CPU Single Core | |
| Apple MacBook Pro 14 2023 M3 Pro | |
| Average Apple M3 Pro 11-Core (n=1) | |
| Apple MacBook Pro 16 2023 M3 Pro | |
| Apple MacBook Pro 14 2023 M3 | |
| Apple MacBook Pro 14 2023 M3 Max | |
| Apple MacBook Pro 14 2023 M2 Pro | |
| Average of class Multimedia (72.5 - 200, n=48, last 2 years) | |
| Lenovo Yoga Slim 7 14APU G8 | |
| Lenovo ThinkPad T14s G4-21F8002TGE | |
| Geekbench 6.5 / Multi-Core | |
| Apple MacBook Pro 14 2023 M3 Max | |
| Apple MacBook Pro 16 2023 M3 Pro | |
| Apple MacBook Pro 14 2023 M2 Pro | |
| Lenovo Yoga Pro 9-14IRP G8 | |
| Lenovo Yoga Pro 9-14IRP G8 | |
| Apple MacBook Pro 14 2023 M3 Pro | |
| Average Apple M3 Pro 11-Core (n=1) | |
| Average of class Multimedia (4983 - 25760, n=75, last 2 years) | |
| Lenovo Yoga Slim 7 14APU G8 | |
| Apple MacBook Pro 14 2023 M3 | |
| Schenker Vision 14 2023 | |
| Lenovo ThinkPad T14s G4-21F8002TGE | |
| Geekbench 6.5 / Single-Core | |
| Apple MacBook Pro 14 2023 M3 Max | |
| Apple MacBook Pro 16 2023 M3 Pro | |
| Apple MacBook Pro 14 2023 M3 Pro | |
| Average Apple M3 Pro 11-Core (n=1) | |
| Apple MacBook Pro 14 2023 M3 | |
| Average of class Multimedia (1534 - 4326, n=71, last 2 years) | |
| Apple MacBook Pro 14 2023 M2 Pro | |
| Lenovo Yoga Pro 9-14IRP G8 | |
| Lenovo Yoga Pro 9-14IRP G8 | |
| Schenker Vision 14 2023 | |
| Lenovo Yoga Slim 7 14APU G8 | |
| Lenovo ThinkPad T14s G4-21F8002TGE | |
| Blender / v3.3 Classroom CPU | |
| Apple MacBook Pro 14 2023 M3 | |
| Huawei MateBook X Pro 2023 | |
| Lenovo ThinkPad T14s G4-21F8002TGE | |
| Apple MacBook Pro 14 2023 M2 Pro Entry | |
| Schenker Vision 14 2023 | |
| Average of class Multimedia (160 - 1042, n=64, last 2 years) | |
| Gigabyte Aero 14 OLED BMF | |
| Apple MacBook Pro 14 2023 M3 Pro | |
| Average Apple M3 Pro 11-Core (n=1) | |
| Lenovo Yoga Slim 7 14APU G8 | |
| Lenovo Yoga Pro 9-14IRP G8 | |
| Apple MacBook Pro 16 2023 M3 Pro | |
| Apple MacBook Pro 14 2023 M3 Max | |
Cinebench 2024: CPU Multi Core | CPU Single Core
Geekbench 5.5: Multi-Core | Single-Core
Geekbench 6.5: Multi-Core | Single-Core
Blender: v3.3 Classroom CPU
* ... smaller is better
Compared to Intel and AMD, you will have to select chips from the 45-watt range to achieve better multi-core performance. The Core i7-13700H in the Schenker Vision 14 with a comparatively low consumption of 45/40 watts is still slower. AMD's Ryzen 7 7840S in the Lenovo Yoga Slim 7 14 (52/42 watts) is faster, however, the U and P models from AMD and Intel lost out.
During the single-core tests, the situation became even clearer, as Apple triumphed with its new P cores (+20 % compared to M2 generation) and left its AMD and Intel competitors in the dust. Here, you will currently need Core-i9 CPUs with extreme single-core turbo clock rates to achieve even better single-core performance rates.
As usual, its CPU performance remains totally constant when you aren't plugged into the mains. We ran our usual Cinebench R15 multi loop but you have to keep in mind that its performance is a little reduced due to it being emulated. Still, we noted a slight advantage compared to the old M2 Pro — the loop showed us very clearly that its CPU performance remains stable under permanent load. Further CPU benchmarks can be found here.
Cinebench R15 Multi continuous test
System performance
Every MacBook Pro with an Apple M SoC (regardless of whether M1, M2 or M3) offers extremely high subjective performance and the new M3 Pro's improved single-core performance further supports this statement. All uses were started very quickly (even complex apps) and native apps run very well. During the cross-platform CrossMark test, the MBP 14 M3 Pro only had to admit defeat to the MBP 16 with the faster M3 Pro — it overtook its Windows competitors. In general, the smallest MacBook Pro 14 is very well suited to video and photo editing.
Thanks to Rosetta 2, programs for Intel Macs can be emulated and all-in-all, this works well. It does come at the expense of a little performance, which you notice in particular during more complex uses. Even so, we ran the PugetBench test for Adobe Photoshop and the laptop's results were very respectable. Unfortunately, the PugetBench test for Premier Pro didn't run very smoothly and it crashed consistently.
Blackmagic RAW Speed Test: 12:1 8K CPU | 12:1 8K Metal
Photoshop PugetBench: Overall Score | GPU Score | General Score | Filter Score
Jetstream 2: 2.0 Total Score
Speedometer 2.0: Result 2.0
WebXPRT 3: Overall
| CrossMark / Overall | |
| Apple MacBook Pro 16 2023 M3 Pro | |
| Apple MacBook Pro 14 2023 M3 Pro | |
| Average Apple M3 Pro 11-Core, Apple M3 Pro 14-Core GPU (n=1) | |
| Huawei MateBook X Pro 2023 | |
| Lenovo Yoga Pro 9-14IRP G8 | |
| Apple MacBook Pro 14 2023 M3 | |
| Gigabyte Aero 14 OLED BMF | |
| Apple MacBook Pro 14 2023 M2 Pro Entry | |
| Average of class Multimedia (866 - 2426, n=63, last 2 years) | |
| Lenovo Yoga Slim 7 14APU G8 | |
| Schenker Vision 14 2023 | |
| CrossMark / Productivity | |
| Huawei MateBook X Pro 2023 | |
| Apple MacBook Pro 14 2023 M3 Pro | |
| Average Apple M3 Pro 11-Core, Apple M3 Pro 14-Core GPU (n=1) | |
| Gigabyte Aero 14 OLED BMF | |
| Apple MacBook Pro 16 2023 M3 Pro | |
| Lenovo Yoga Pro 9-14IRP G8 | |
| Apple MacBook Pro 14 2023 M3 | |
| Average of class Multimedia (913 - 2344, n=63, last 2 years) | |
| Lenovo Yoga Slim 7 14APU G8 | |
| Apple MacBook Pro 14 2023 M2 Pro Entry | |
| Schenker Vision 14 2023 | |
| CrossMark / Creativity | |
| Apple MacBook Pro 16 2023 M3 Pro | |
| Apple MacBook Pro 14 2023 M3 Pro | |
| Average Apple M3 Pro 11-Core, Apple M3 Pro 14-Core GPU (n=1) | |
| Apple MacBook Pro 14 2023 M2 Pro Entry | |
| Apple MacBook Pro 14 2023 M3 | |
| Lenovo Yoga Pro 9-14IRP G8 | |
| Average of class Multimedia (907 - 2820, n=63, last 2 years) | |
| Gigabyte Aero 14 OLED BMF | |
| Huawei MateBook X Pro 2023 | |
| Lenovo Yoga Slim 7 14APU G8 | |
| Schenker Vision 14 2023 | |
| CrossMark / Responsiveness | |
| Huawei MateBook X Pro 2023 | |
| Gigabyte Aero 14 OLED BMF | |
| Lenovo Yoga Pro 9-14IRP G8 | |
| Schenker Vision 14 2023 | |
| Apple MacBook Pro 16 2023 M3 Pro | |
| Apple MacBook Pro 14 2023 M3 Pro | |
| Average Apple M3 Pro 11-Core, Apple M3 Pro 14-Core GPU (n=1) | |
| Average of class Multimedia (605 - 2094, n=63, last 2 years) | |
| Lenovo Yoga Slim 7 14APU G8 | |
| Apple MacBook Pro 14 2023 M3 | |
| Apple MacBook Pro 14 2023 M2 Pro Entry | |
| Blackmagic RAW Speed Test / 12:1 8K CPU | |
| Average of class Multimedia (44 - 91, n=5, last 2 years) | |
| Apple MacBook Pro 16 2023 M3 Pro | |
| Apple MacBook Pro 14 2023 M3 Pro | |
| Average Apple M3 Pro 11-Core, Apple M3 Pro 14-Core GPU (n=1) | |
| Apple MacBook Pro 14 2023 M2 Pro Entry | |
| Apple MacBook Pro 14 2023 M3 | |
| Blackmagic RAW Speed Test / 12:1 8K Metal | |
| Average of class Multimedia (78 - 379, n=5, last 2 years) | |
| Apple MacBook Pro 14 2023 M2 Pro Entry | |
| Apple MacBook Pro 16 2023 M3 Pro | |
| Apple MacBook Pro 14 2023 M3 Pro | |
| Average Apple M3 Pro 11-Core, Apple M3 Pro 14-Core GPU (n=1) | |
| Apple MacBook Pro 14 2023 M3 | |
| Photoshop PugetBench / Overall Score | |
| Apple MacBook Pro 16 2023 M3 Pro | |
| Apple MacBook Pro 14 2023 M3 Pro | |
| Average Apple M3 Pro 11-Core, Apple M3 Pro 14-Core GPU (n=1) | |
| Apple MacBook Pro 14 2023 M3 | |
| Apple MacBook Pro 14 2023 M2 Pro Entry | |
| Photoshop PugetBench / GPU Score | |
| Apple MacBook Pro 16 2023 M3 Pro | |
| Apple MacBook Pro 14 2023 M3 Pro | |
| Average Apple M3 Pro 11-Core, Apple M3 Pro 14-Core GPU (n=1) | |
| Apple MacBook Pro 14 2023 M3 | |
| Apple MacBook Pro 14 2023 M2 Pro Entry | |
| Photoshop PugetBench / General Score | |
| Apple MacBook Pro 16 2023 M3 Pro | |
| Apple MacBook Pro 14 2023 M3 Pro | |
| Average Apple M3 Pro 11-Core, Apple M3 Pro 14-Core GPU (n=1) | |
| Apple MacBook Pro 14 2023 M3 | |
| Apple MacBook Pro 14 2023 M2 Pro Entry | |
| Photoshop PugetBench / Filter Score | |
| Apple MacBook Pro 16 2023 M3 Pro | |
| Apple MacBook Pro 14 2023 M3 Pro | |
| Average Apple M3 Pro 11-Core, Apple M3 Pro 14-Core GPU (n=1) | |
| Apple MacBook Pro 14 2023 M3 | |
| Apple MacBook Pro 14 2023 M2 Pro Entry | |
| Jetstream 2 / 2.0 Total Score | |
| Average of class Multimedia (261 - 476, n=35, last 2 years) | |
| Lenovo Yoga Slim 7 14APU G8 | |
| Average Apple M3 Pro 11-Core, Apple M3 Pro 14-Core GPU (n=1) | |
| Apple MacBook Pro 14 2023 M3 Pro | |
| Schenker Vision 14 2023 | |
| Apple MacBook Pro 14 2023 M3 | |
| Apple MacBook Pro 16 2023 M3 Pro | |
| Lenovo Yoga Pro 9-14IRP G8 | |
| Apple MacBook Pro 14 2023 M2 Pro Entry | |
| Speedometer 2.0 / Result 2.0 | |
| Apple MacBook Pro 14 2023 M3 | |
| Apple MacBook Pro 16 2023 M3 Pro | |
| Apple MacBook Pro 14 2023 M3 Pro | |
| Average Apple M3 Pro 11-Core, Apple M3 Pro 14-Core GPU (n=1) | |
| Average of class Multimedia (337 - 946, n=34, last 2 years) | |
| Apple MacBook Pro 14 2023 M2 Pro Entry | |
| Schenker Vision 14 2023 | |
| Lenovo Yoga Pro 9-14IRP G8 | |
| Lenovo Yoga Slim 7 14APU G8 | |
| WebXPRT 3 / Overall | |
| Apple MacBook Pro 14 2023 M3 Pro | |
| Average Apple M3 Pro 11-Core, Apple M3 Pro 14-Core GPU (n=1) | |
| Apple MacBook Pro 16 2023 M3 Pro | |
| Apple MacBook Pro 14 2023 M3 | |
| Apple MacBook Pro 14 2023 M2 Pro Entry | |
| Average of class Multimedia (136.4 - 545, n=66, last 2 years) | |
| Lenovo Yoga Pro 9-14IRP G8 | |
| Lenovo Yoga Slim 7 14APU G8 | |
| Schenker Vision 14 2023 | |
| Gigabyte Aero 14 OLED BMF | |
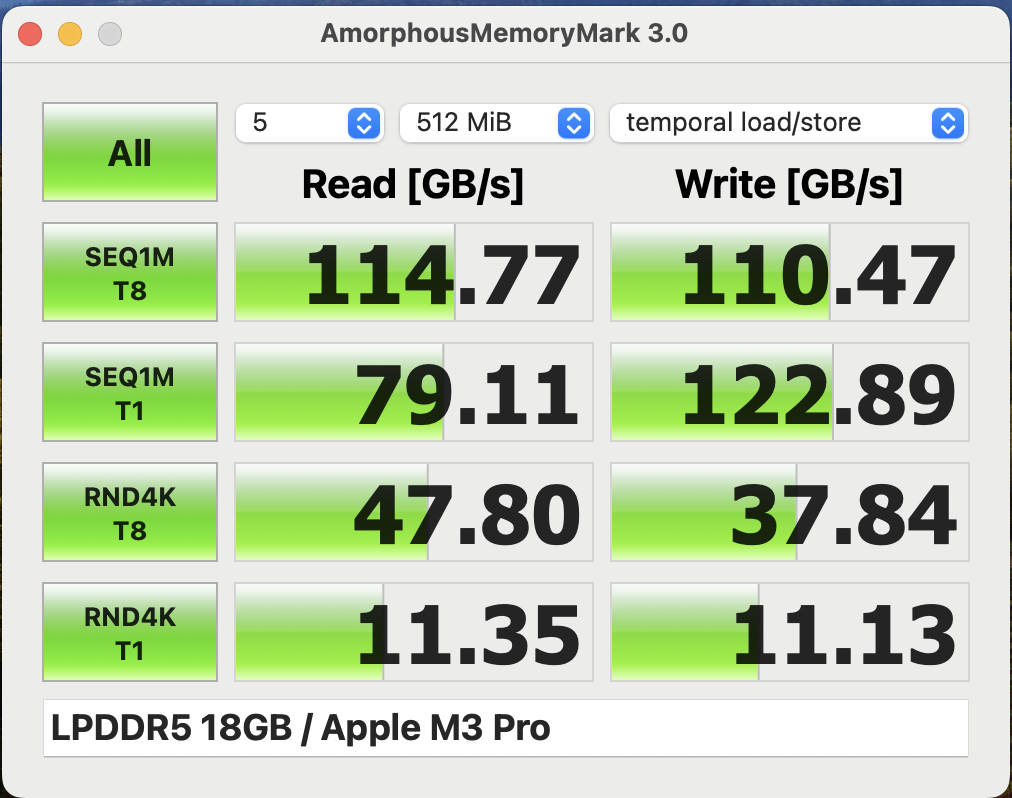
Storage devices
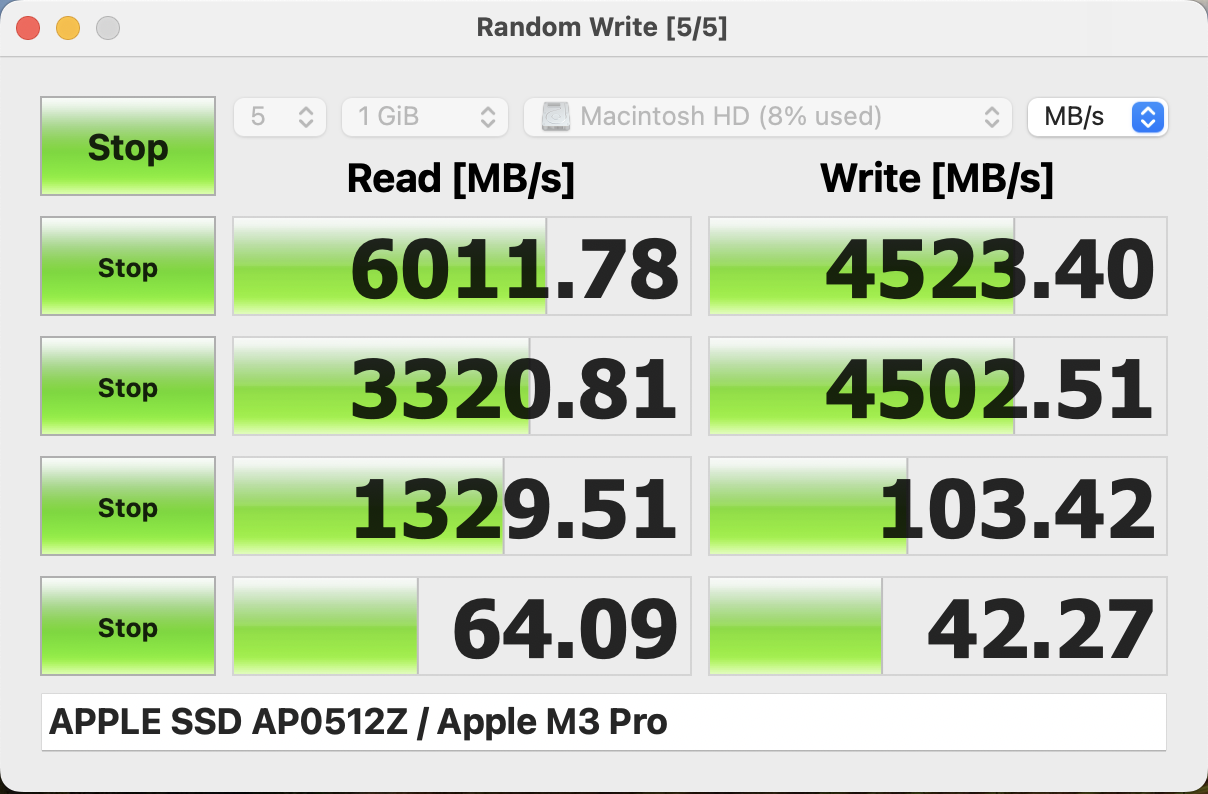
The MacBook Pro 14 is usually still delivered with a 512-GB SSD as standard (AP0512Z). Fewer NAND chips were used on the MacBook Pro 14 with the M2 Pro as previously, which had a negative impact on its transfer rates. As a result, it surprises us even more that this version has four NAND chips installed again, which we already saw on the bigger MacBook Pro 16. Its transfer rates have increased again and we noted a maximum read rate of about 6 GB/s and a write rate of ~4.5 GB/s. Users have access to 458 GB of the 512 GB after first booting up the device. Further SSD benchmarks can be found in our tech section.
Graphics card
The smaller M3 Pro SoC also comes delivered with a weaker graphics card installed — instead of 18 GPU cores, this variant is limited to 14 GPU cores. We can't read its clock rate, however, we can assume an increase over the old M2 Pro, as its performance was better than the 16-core GPU of the old M2 Pro in most of the tests. As we already determined when looking at its multi-core CPU performance, the new M3 Pro GPU again came pretty much right in between the two versions of the M2 Pro during 3DMark WildLife Extreme Unlimited. The only exception proved to be during the GFX Bench tests, where both GPUs did practically the same. Compared to the MBP 14 with the normal M3, however, its advantage is considerable and depending on the benchmark, we noted a 40-50 % improvement. The same as on the processor, the GPU's maximum consumption is around 24 watts, so less than on the M2 Pro (~26-27 watts).
Compared to the iGPUs from AMD and Intel, the new M3 Pro GPU quite clearly came out on top and during the WildLife test, the GPU came between the GeForce RTX 3050 Ti in the Schenker Vision 14 and the RTX 4050 Laptop in the Lenovo Yoga Pro 9 14.
As is typical for Apple, its performance remains totally stable when you rely on the battery and even under continuous load, we noted no performance loss. Further GPU benchmarks can be found here.
* ... smaller is better
Gaming performance
In our other reviews, we already mentioned that there are a few different ways you can play games on the MacBook. Aside from emulated games or additional software such as CrossOver, you can manage to run quite a lot these days (for example, GTA V or The Witcher 3). However, the hardware can't always make use of its full potential and of course, it is missing a few optimizations.
As expected, native games run the best — nowadays, this includes a lot of AAA games such as Baldur's Gate 3 or No Man's Sky. They run very well on the MacBook Pro and usually, you can even use the highest settings. Unfortunately, when compared to Windows devices, its gaming performance is already well below a GeForce RTX 4050 Laptop and the older GeForce RTX 3050 Ti. If you are looking to play some games on the MacBook every now and again, then you will get along just fine with its somewhat limited selection and you definitely won't be disappointed. Nevertheless, you just have to be aware of the fact that this isn't a gaming laptop.
| low | med. | high | ultra | QHD | |
|---|---|---|---|---|---|
| GTA V (2015) | 79 | 50 | |||
| The Witcher 3 (2015) | 39 | ||||
| Shadow of the Tomb Raider (2018) | 66 | 60 | 53 | 34 | |
| Total War: Three Kingdoms (2019) | 75 | 49.5 | 35.9 | 22.5 | |
| Baldur's Gate 3 (2023) | 42 | 39 | |||
| Total War Pharaoh (2023) | 193 | 125 | 67 | 53 | 35 |
Emissions - Only loud under maximum load
Noise emissions
In almost every situation, the MacBook Pro 14 proves to be a quiet companion. During normal uses such as surfing the web (even using lots of tabs) and playing video, you will likely never hear the fans and even under full CPU or GPU load, the fans spin at a maximum of 2,400-2,800 rotations per minute. At these speeds, the fans are still barely audible — we measured a mere 25.1-25.6 dB(A). However, it does sometimes take a few minutes for the fans to even spring into action, as the chip temperature has to reach over 100 °C for them to activate.
When playing games, it largely depends on what you're playing. In most cases, you can expect speeds between 2,400 and 2,800 rotations/minute — only Baldur's Gate 3 led to 3,400. The laptop only really got properly loud during our stress test, where we put the processor and the graphics card under maximum load. Here, we noted rotations of 6,200-6,300 per minute and at 49.4 dB(A), this was clearly audible. In contrast to the MacBook Pro 14 with the M3 Max, we noted no coil whining.
Noise level
| Idle |
| 24.1 / 24.1 / 24.1 dB(A) |
| Load |
| 25.1 / 49.4 dB(A) |
 | ||
30 dB silent 40 dB(A) audible 50 dB(A) loud |
||
min: | ||
| Apple MacBook Pro 14 2023 M3 Pro M3 Pro 14-Core GPU, Apple M3 Pro 11-Core, Apple SSD AP0512Z | Apple MacBook Pro 14 2023 M3 M3 10-Core GPU, M3, Apple SSD AP1024Z | Apple MacBook Pro 14 2023 M2 Pro Entry M2 Pro 16-Core GPU, M2 Pro 10-Core, Apple SSD AP0512Z | Huawei MateBook X Pro 2023 Iris Xe G7 96EUs, i7-1360P | Lenovo Yoga Pro 9-14IRP G8 GeForce RTX 4050 Laptop GPU, i7-13705H, Samsung PM9A1 MZVL21T0HCLR | Gigabyte Aero 14 OLED BMF GeForce RTX 4050 Laptop GPU, i7-13700H, Gigabyte AG470S1TB-SI B10 | Schenker Vision 14 2023 Iris Xe G7 96EUs, i7-13700H, Samsung 990 Pro 1 TB | Lenovo Yoga Slim 7 14APU G8 Radeon 780M, R7 7840S, Samsung PM9A1 MZVL21T0HCLR | Apple MacBook Pro 14 2023 M3 Max M3 Max 40-Core GPU, Apple M3 Max 16-Core, Apple SSD AP2048Z | |
|---|---|---|---|---|---|---|---|---|---|
| Noise | 0% | 3% | -15% | -31% | -19% | -21% | -25% | -11% | |
| off / environment * (dB) | 24.1 | 24.2 -0% | 23.6 2% | 25.4 -5% | 24.8 -3% | 24 -0% | 24.5 -2% | 24.5 -2% | 24.8 -3% |
| Idle Minimum * (dB) | 24.1 | 24.2 -0% | 23.6 2% | 25.4 -5% | 24.8 -3% | 24 -0% | 24.5 -2% | 24.5 -2% | 24.8 -3% |
| Idle Average * (dB) | 24.1 | 24.2 -0% | 23.6 2% | 25.4 -5% | 24.8 -3% | 24 -0% | 24.5 -2% | 24.5 -2% | 24.8 -3% |
| Idle Maximum * (dB) | 24.1 | 24.2 -0% | 23.6 2% | 29.6 -23% | 24.8 -3% | 35.71 -48% | 30.4 -26% | 27.7 -15% | 24.8 -3% |
| Load Average * (dB) | 25.1 | 25.1 -0% | 24.2 4% | 42 -67% | 47.4 -89% | 39.5 -57% | 45.5 -81% | 25.8 -3% | |
| Witcher 3 ultra * (dB) | 25.1 | 25.1 -0% | 52.9 -111% | 40.22 -60% | 41.7 -66% | 45.5 -81% | 43.4 -73% | ||
| Load Maximum * (dB) | 49.4 | 48.5 2% | 47.5 4% | 40.9 17% | 52.9 -7% | 51.93 -5% | 44.9 9% | 45.5 8% | 43.4 12% |
* ... smaller is better
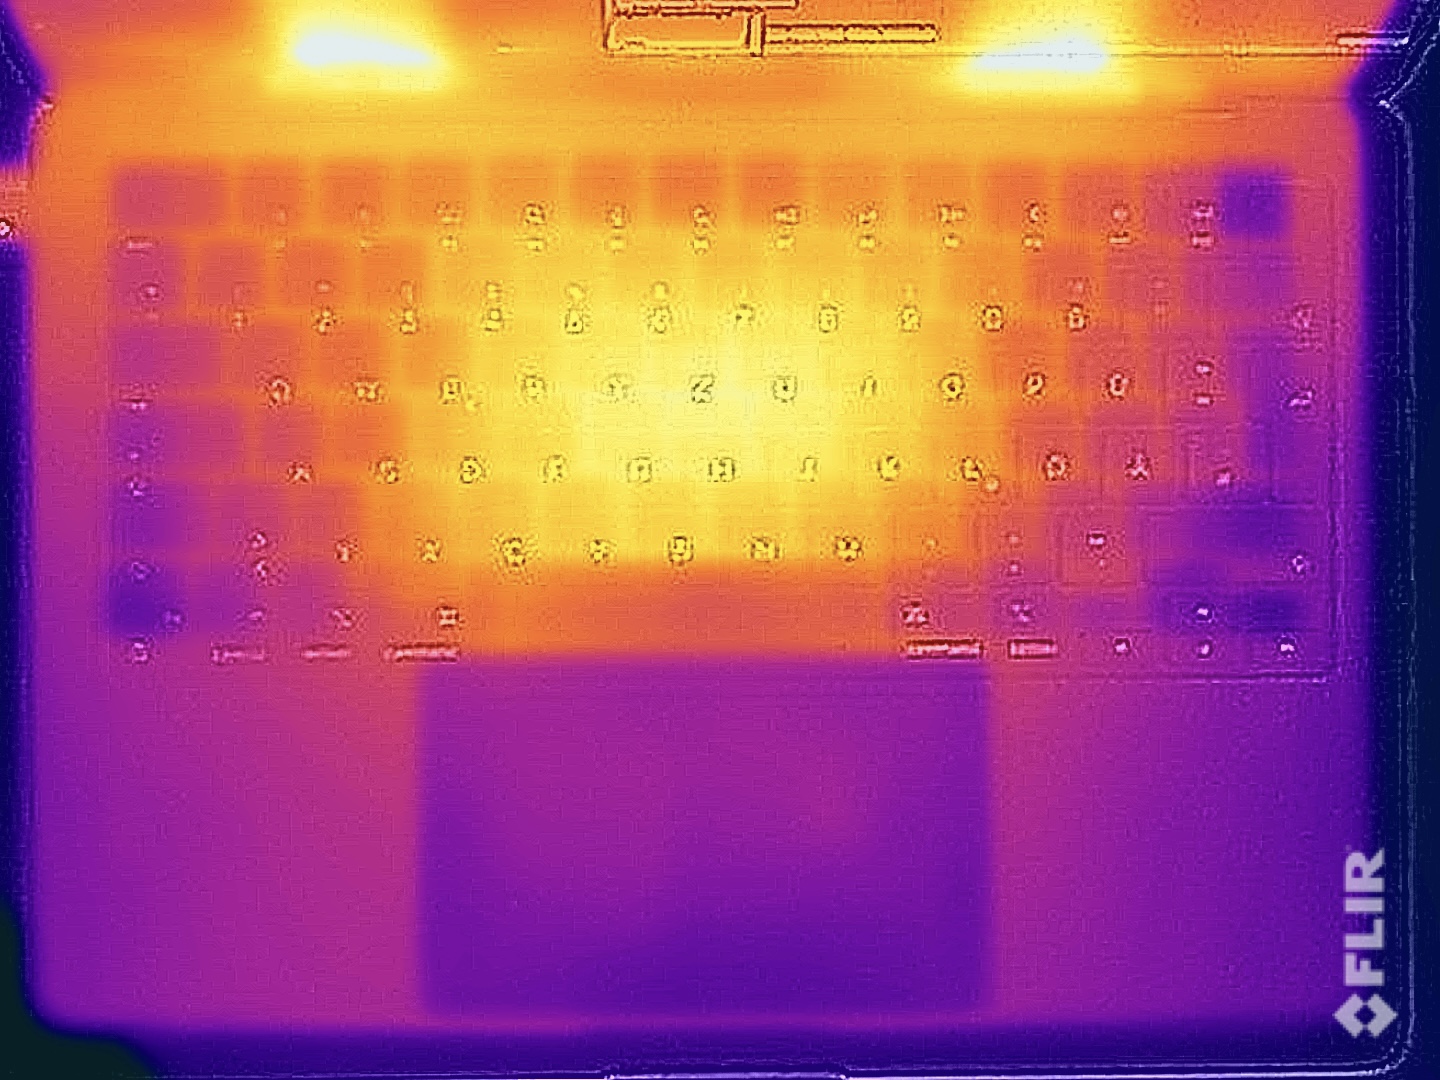
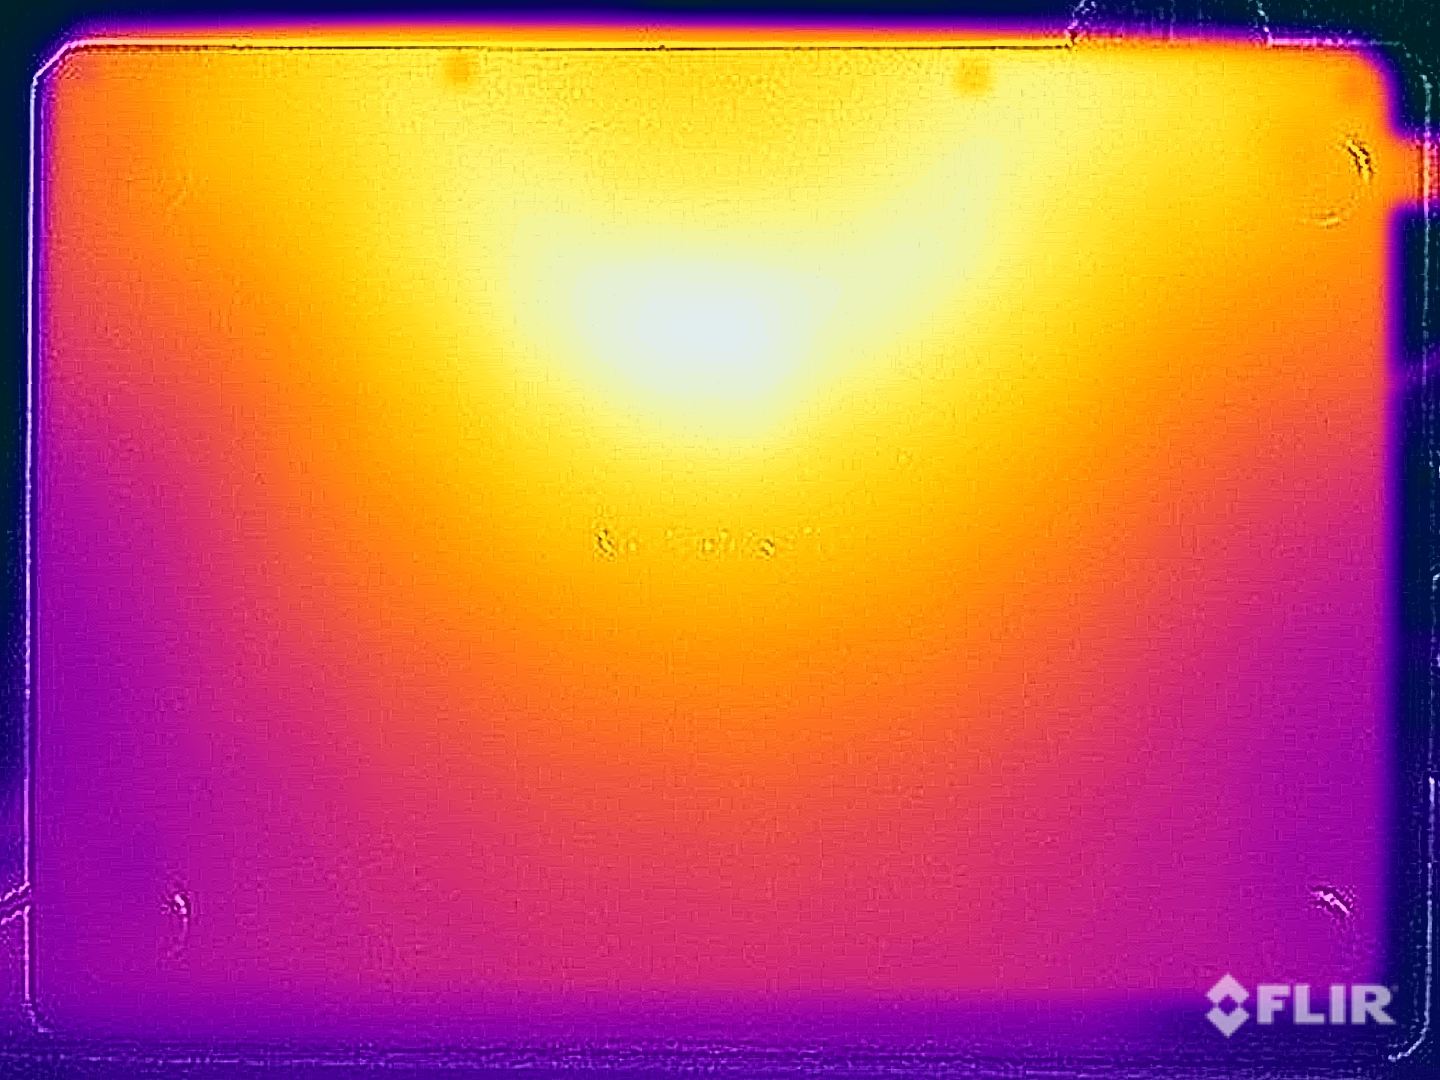
Temperature
Inside the MBP 14 can get quite hot, as the M3 Pro regularly reaches temperatures over 100 °C under periods of load. Apple has its surface temperatures well under control and even during the stress test, we had no issues placing the laptop onto our thighs. In this scenario, we measured a maximum of 38 °C on the bottom and 42 °C around the top middle of the keyboard. This means your fingers might get a little warm as you're typing. Our Witcher 3 test showed the laptop's worst-case-scenario, as neither of the fans were particularly active, which led to a much warmer device in total — we measured over 40 °C on quite a few spots. Even so, the laptop never suffered any limitations. During simple tasks, its case barely heats up.
(±) The maximum temperature on the upper side is 42 °C / 108 F, compared to the average of 36.9 °C / 98 F, ranging from 21.1 to 71 °C for the class Multimedia.
(+) The bottom heats up to a maximum of 38.3 °C / 101 F, compared to the average of 39.2 °C / 103 F
(+) In idle usage, the average temperature for the upper side is 22.6 °C / 73 F, compared to the device average of 31.3 °C / 88 F.
(-) Playing The Witcher 3, the average temperature for the upper side is 39 °C / 102 F, compared to the device average of 31.3 °C / 88 F.
(+) The palmrests and touchpad are reaching skin temperature as a maximum (35.4 °C / 95.7 F) and are therefore not hot.
(-) The average temperature of the palmrest area of similar devices was 28.7 °C / 83.7 F (-6.7 °C / -12 F).
| Apple MacBook Pro 14 2023 M3 Pro Apple M3 Pro 11-Core, Apple M3 Pro 14-Core GPU | Apple MacBook Pro 14 2023 M3 Apple M3, Apple M3 10-Core GPU | Apple MacBook Pro 14 2023 M2 Pro Entry Apple M2 Pro 10-Core, Apple M2 Pro 16-Core GPU | Huawei MateBook X Pro 2023 Intel Core i7-1360P, Intel Iris Xe Graphics G7 96EUs | Lenovo Yoga Pro 9-14IRP G8 Intel Core i7-13705H, NVIDIA GeForce RTX 4050 Laptop GPU | Gigabyte Aero 14 OLED BMF Intel Core i7-13700H, NVIDIA GeForce RTX 4050 Laptop GPU | Schenker Vision 14 2023 Intel Core i7-13700H, Intel Iris Xe Graphics G7 96EUs | Lenovo Yoga Slim 7 14APU G8 AMD Ryzen 7 7840S, AMD Radeon 780M | Apple MacBook Pro 14 2023 M3 Max Apple M3 Max 16-Core, Apple M3 Max 40-Core GPU | |
|---|---|---|---|---|---|---|---|---|---|
| Heat | -1% | -4% | -31% | -23% | -17% | -15% | -19% | -6% | |
| Maximum Upper Side * (°C) | 42 | 41.3 2% | 47 -12% | 46.5 -11% | 41 2% | 42 -0% | 45.8 -9% | 43.8 -4% | 45.9 -9% |
| Maximum Bottom * (°C) | 38.3 | 39.6 -3% | 42.8 -12% | 44.7 -17% | 56.7 -48% | 52 -36% | 42 -10% | 56 -46% | 42.1 -10% |
| Idle Upper Side * (°C) | 23 | 23.2 -1% | 22.3 3% | 34.9 -52% | 27.4 -19% | 26 -13% | 27.5 -20% | 25.3 -10% | 23.4 -2% |
| Idle Bottom * (°C) | 22.8 | 23.3 -2% | 21.7 5% | 32.9 -44% | 29.1 -28% | 27 -18% | 27.1 -19% | 26.7 -17% | 23.8 -4% |
* ... smaller is better
Stress test
During our stress test with combined CPU/GPU load, the MacBook Pro 14 suffered a small performance drop at the beginning and then it was able to use the M3 Pro's full power — this is due to the fans' delayed activation. After this drop, the laptop's performance remained completely stable and we noted no performance difference between the supplied 70-watt power supply and the 96-watt one. To compare, we also included the larger MacBook Pro 16 with the full M3 Pro. At this stage, we can't quite determine whether the more compact MBP 14 can use the faster M3 Pro to its full advantage during the stress test.
Speakers
Apple MacBook Pro 14 2023 M3 Max audio analysis
(+) | speakers can play relatively loud (85 dB)
Bass 100 - 315 Hz
(+) | good bass - only 4.9% away from median
(±) | linearity of bass is average (8.4% delta to prev. frequency)
Mids 400 - 2000 Hz
(+) | balanced mids - only 1.2% away from median
(+) | mids are linear (2.8% delta to prev. frequency)
Highs 2 - 16 kHz
(+) | balanced highs - only 2.6% away from median
(+) | highs are linear (2.6% delta to prev. frequency)
Overall 100 - 16.000 Hz
(+) | overall sound is linear (5.6% difference to median)
Compared to same class
» 2% of all tested devices in this class were better, 1% similar, 97% worse
» The best had a delta of 5%, average was 17%, worst was 45%
Compared to all devices tested
» 0% of all tested devices were better, 0% similar, 100% worse
» The best had a delta of 4%, average was 24%, worst was 134%
Huawei MateBook X Pro 2023 audio analysis
(+) | speakers can play relatively loud (94 dB)
Bass 100 - 315 Hz
(±) | reduced bass - on average 9.2% lower than median
(+) | bass is linear (4.9% delta to prev. frequency)
Mids 400 - 2000 Hz
(+) | balanced mids - only 1.8% away from median
(+) | mids are linear (3.7% delta to prev. frequency)
Highs 2 - 16 kHz
(±) | higher highs - on average 6.5% higher than median
(±) | linearity of highs is average (8.1% delta to prev. frequency)
Overall 100 - 16.000 Hz
(+) | overall sound is linear (10.3% difference to median)
Compared to same class
» 7% of all tested devices in this class were better, 2% similar, 91% worse
» The best had a delta of 5%, average was 18%, worst was 53%
Compared to all devices tested
» 5% of all tested devices were better, 1% similar, 94% worse
» The best had a delta of 4%, average was 24%, worst was 134%
Lenovo Yoga Pro 9-14IRP G8 audio analysis
(±) | speaker loudness is average but good (81.8 dB)
Bass 100 - 315 Hz
(±) | reduced bass - on average 5.9% lower than median
(±) | linearity of bass is average (7.8% delta to prev. frequency)
Mids 400 - 2000 Hz
(+) | balanced mids - only 2.3% away from median
(+) | mids are linear (3.2% delta to prev. frequency)
Highs 2 - 16 kHz
(+) | balanced highs - only 2.5% away from median
(+) | highs are linear (3.4% delta to prev. frequency)
Overall 100 - 16.000 Hz
(+) | overall sound is linear (7.3% difference to median)
Compared to same class
» 5% of all tested devices in this class were better, 1% similar, 95% worse
» The best had a delta of 5%, average was 17%, worst was 45%
Compared to all devices tested
» 1% of all tested devices were better, 0% similar, 99% worse
» The best had a delta of 4%, average was 24%, worst was 134%
Power management - Improved runtimes
Power consumption
The MacBook's maximum idle consumption is 13 watts — slightly higher than the new MBP 14 with the M3. In general, the M3 Pro is very efficient as well and at highest SDR brightness, its consumption during pure CPU/GPU load remains well below 50 watts. During our stress test, we did note over 70 watts, meaning the supplied 70-watt power supply can't deliver the necessary power. If you put both components under load permanently, then it will slowly drain the battery. During our one-hour stress test, we noted 3 per cent. Using a more powerful power supply, we noted a maximum consumption of 80 watts which then balanced out at around 76 watts.
This is very clearly one unnecessary step Apple has taken to save money. After all, this is no longer the base model of the MacBook Pro 14, so you should really be able to take advantage of the M3 Pro's full performance without having to dip into the battery's power.
| Off / Standby | |
| Idle | |
| Load |
|
Key:
min: | |
| Apple MacBook Pro 14 2023 M3 Pro Apple M3 Pro 11-Core, M3 Pro 14-Core GPU, Apple SSD AP0512Z, Mini-LED, 3024x1964, 14.2" | Apple MacBook Pro 14 2023 M3 M3, M3 10-Core GPU, Apple SSD AP1024Z, Mini-LED, 3024x1964, 14.2" | Apple MacBook Pro 14 2023 M2 Pro Entry M2 Pro 10-Core, M2 Pro 16-Core GPU, Apple SSD AP0512Z, Mini-LED, 3024x1964, 14.2" | Huawei MateBook X Pro 2023 i7-1360P, Iris Xe G7 96EUs, , IPS, 3120x2080, 14.2" | Lenovo Yoga Pro 9-14IRP G8 i7-13705H, GeForce RTX 4050 Laptop GPU, Samsung PM9A1 MZVL21T0HCLR, Mini-LED, 3072x1920, 14.5" | Gigabyte Aero 14 OLED BMF i7-13700H, GeForce RTX 4050 Laptop GPU, Gigabyte AG470S1TB-SI B10, OLED, 2880x1800, 14" | Schenker Vision 14 2023 i7-13700H, Iris Xe G7 96EUs, Samsung 990 Pro 1 TB, IPS, 2880x1800, 14" | Lenovo Yoga Slim 7 14APU G8 R7 7840S, Radeon 780M, Samsung PM9A1 MZVL21T0HCLR, OLED, 2944x1840, 14.5" | Average Apple M3 Pro 14-Core GPU | Average of class Multimedia | |
|---|---|---|---|---|---|---|---|---|---|---|
| Power Consumption | 13% | -1% | -12% | -143% | -59% | -1% | -52% | 0% | -48% | |
| Idle Minimum * (Watt) | 2.3 | 2.2 4% | 2.5 -9% | 4.1 -78% | 10.9 -374% | 7.4 -222% | 4.2 -83% | 8.7 -278% | 2.3 ? -0% | 6 ? -161% |
| Idle Average * (Watt) | 13.1 | 12 8% | 12.1 8% | 6.6 50% | 17.7 -35% | 8.3 37% | 7.4 44% | 11.3 14% | 13.1 ? -0% | 10.5 ? 20% |
| Idle Maximum * (Watt) | 13.3 | 12.2 8% | 12.3 8% | 8 40% | 19.3 -45% | 8.7 35% | 8 40% | 12 10% | 13.3 ? -0% | 12.6 ? 5% |
| Load Average * (Watt) | 47.4 | 36.4 23% | 49.8 -5% | 61 -29% | 93.3 -97% | 76 -60% | 42.8 10% | 58.6 -24% | 47.4 ? -0% | 69.3 ? -46% |
| Witcher 3 ultra * (Watt) | 42.8 | 31.9 25% | 46.6 -9% | 56 -31% | 129.5 -203% | 70 -64% | 47.9 -12% | 61.6 -44% | ||
| Load Maximum * (Watt) | 73.6 | 66.7 9% | 71.4 3% | 90 -22% | 150.2 -104% | 132 -79% | 76 -3% | 66.2 10% | 73.6 ? -0% | 115.2 ? -57% |
* ... smaller is better
Power consumption Witcher 3 / stress test
Power consumption with external monitor
Runtimes
The device's battery capacity is now 72.6 Wh and together with its low consumption values, this makes for extremely long runtimes. We noted quite a big improvement over the old M2 model. At a brightness of 150 cd/m² (reduce maximum SDR brightness by 7 big steps and 3 small steps), our video test ran for slightly more than 20 hours — 3.5 hours longer than on its predecessor. An HDR video ran for about 7 hours at maximum brightness. During the WLAN test, we noted 16.5 hours which is, again, 3.5 hours longer than on the M2 Pro MBP 14. The new model only did worse during the WLAN test at full SDR brightness, coming in at 6:21 hours (half an hour shorter). However, this is mostly due to its increased SDR brightness from 500 to 600 cd/m².
This leads the MacBook Pro 14 M3 Pro to compare to the base model with the M3 SoC and it did better than the M3 Max variant. Its Windows competitors also couldn't keep up with these results. You can only properly drain the laptop's battery in slightly more than an hour when you make use of the SoC's full performance in combination with full SDR brightness. In turn, you have to note that its performance isn't even reduced until the battery reaches 3 %. You can't say the same for its Windows competitors (especially those with dGPUs). It takes about 2 hours to charge the device fully and it already hits 80 % after about an hour.
| Apple MacBook Pro 14 2023 M3 Pro Apple M3 Pro 11-Core, M3 Pro 14-Core GPU, 72.6 Wh | Apple MacBook Pro 14 2023 M3 M3, M3 10-Core GPU, 70 Wh | Apple MacBook Pro 14 2023 M2 Pro Entry M2 Pro 10-Core, M2 Pro 16-Core GPU, 70 Wh | Huawei MateBook X Pro 2023 i7-1360P, Iris Xe G7 96EUs, 60 Wh | Lenovo Yoga Pro 9-14IRP G8 i7-13705H, GeForce RTX 4050 Laptop GPU, 75 Wh | Gigabyte Aero 14 OLED BMF i7-13700H, GeForce RTX 4050 Laptop GPU, 63 Wh | Schenker Vision 14 2023 i7-13700H, Iris Xe G7 96EUs, 99 Wh | Lenovo Yoga Slim 7 14APU G8 R7 7840S, Radeon 780M, 70 Wh | Apple MacBook Pro 14 2023 M3 Max Apple M3 Max 16-Core, M3 Max 40-Core GPU, 72.6 Wh | Average of class Multimedia | |
|---|---|---|---|---|---|---|---|---|---|---|
| Battery runtime | 5% | -20% | -11% | -38% | -19% | -16% | -33% | -9% | -9% | |
| H.264 (h) | 20.2 | 19.1 -5% | 16.4 -19% | 8.8 -56% | 9.1 -55% | 11.5 -43% | 18 -11% | 15.8 ? -22% | ||
| WiFi v1.3 (h) | 16.3 | 15.9 -2% | 12.9 -21% | 9.7 -40% | 8 -51% | 7.6 -53% | 13.7 -16% | 9.5 -42% | 15.2 -7% | 11.3 ? -31% |
| Load (h) | 1.3 | 1.6 23% | 2.1 62% | 1.2 -8% | 1.5 15% | 1.1 -15% | 1.2 -8% | 1.653 ? 27% |
Pros
Cons
Verdict - The MBP 14 is better with the M3 Pro

The new MacBook Pro 14 with its slimmed-down M3 Pro SoC may no longer be the base model of the MacBook 14, however, it makes a much better impression than the cheaper variant featuring the regular M3 processor. In particular, its additional USB-C port, 18 GB RAM and faster SSD are clear reasons to buy the M3 Pro model. The laptop's multi-core performance as well as its graphics performance are some great advantages over the M3 base configuration.
In contrast, when it comes to comparing this model to the M2 Pro variants, things get a little more difficult. Here, its considerably better single-core performance and its longer runtimes stand out — but these surely aren't urgent reasons to upgrade. We can't even entirely recommend that users of the MacBook Pro 14 with the M1 Pro should go for this new update — the new MacBook Pro 14 M3 Pro is much more interesting if you are currently still using an old Intel MacBook or if this is going to be your first MBP 14 purchase.
More performance and longer runtimes: The MacBook Pro 14 has been improved again with the help of the M3 Pro and all-in-all, it is the better choice when compared to the new base model of the MacBook Pro 14 featuring the regular M3 SoC.
If you decide to purchase, you will receive one of the best multimedia laptops whose total package unites great performance with quiet fans, a high-quality case, a great display with the best HDR implementation, impressive speakers and very long runtimes. Of course, there are some Windows laptops that offer better performance in isolated areas, and devices featuring dedicated GeForce GPUs certainly take the lead when it comes to gaming. In turn, you'll also have to make a few compromises when it comes to fans and runtimes.
The MacBook Pro 14 is by no means perfect and we have the same points to criticize as on all the other configurations. One of its biggest issues includes its near to non-existent maintenance and expansion options in combination with Apple's enormous surcharges for bigger SSDs and more RAM. Its keyboard could also be a little better and we still have to do without Face ID. Furthermore, you could criticize the manufacturer's decision to only give the model a 70-watt power supply. This was sufficient for the M3 variant but in an extreme scenario, this isn't enough for the M3 Pro and the laptop has to dip into its battery to ensure it gets enough power. Admittedly, this is only in extreme cases and its performance isn't impacted negatively, however, with it no longer being a base model and at US$2,500, you would at least expect to receive a power supply that delivers enough energy.
Price and availability
The version of the MacBook Pro 14 with the M3 Pro and a 1 TB SSD can currently be found for US$2,598.96 on Amazon.
Apple MacBook Pro 14 2023 M3 Pro
- 12/06/2023 v7 (old)
Andreas Osthoff
Transparency
The selection of devices to be reviewed is made by our editorial team. The test sample was provided to the author as a loan by the manufacturer or retailer for the purpose of this review. The lender had no influence on this review, nor did the manufacturer receive a copy of this review before publication. There was no obligation to publish this review. As an independent media company, Notebookcheck is not subjected to the authority of manufacturers, retailers or publishers.
This is how Notebookcheck is testing
Every year, Notebookcheck independently reviews hundreds of laptops and smartphones using standardized procedures to ensure that all results are comparable. We have continuously developed our test methods for around 20 years and set industry standards in the process. In our test labs, high-quality measuring equipment is utilized by experienced technicians and editors. These tests involve a multi-stage validation process. Our complex rating system is based on hundreds of well-founded measurements and benchmarks, which maintains objectivity. Further information on our test methods can be found here.
Price comparison

