Notebookcheck Logo

Apple M3 SoC analyzed: Increased performance and improved efficiency

The first 3 nm chip is here. Apple's new M3 SoC is the first chip to be manufactured in a 3 nm process. We've already seen the performance increases in our review of the new MacBook Pro 14, but what about the efficiency of the processor and the graphics card? We also compare the results with the new Snapdragon X Elite from Qualcomm.
Apple M3: overview (Image: Apple)

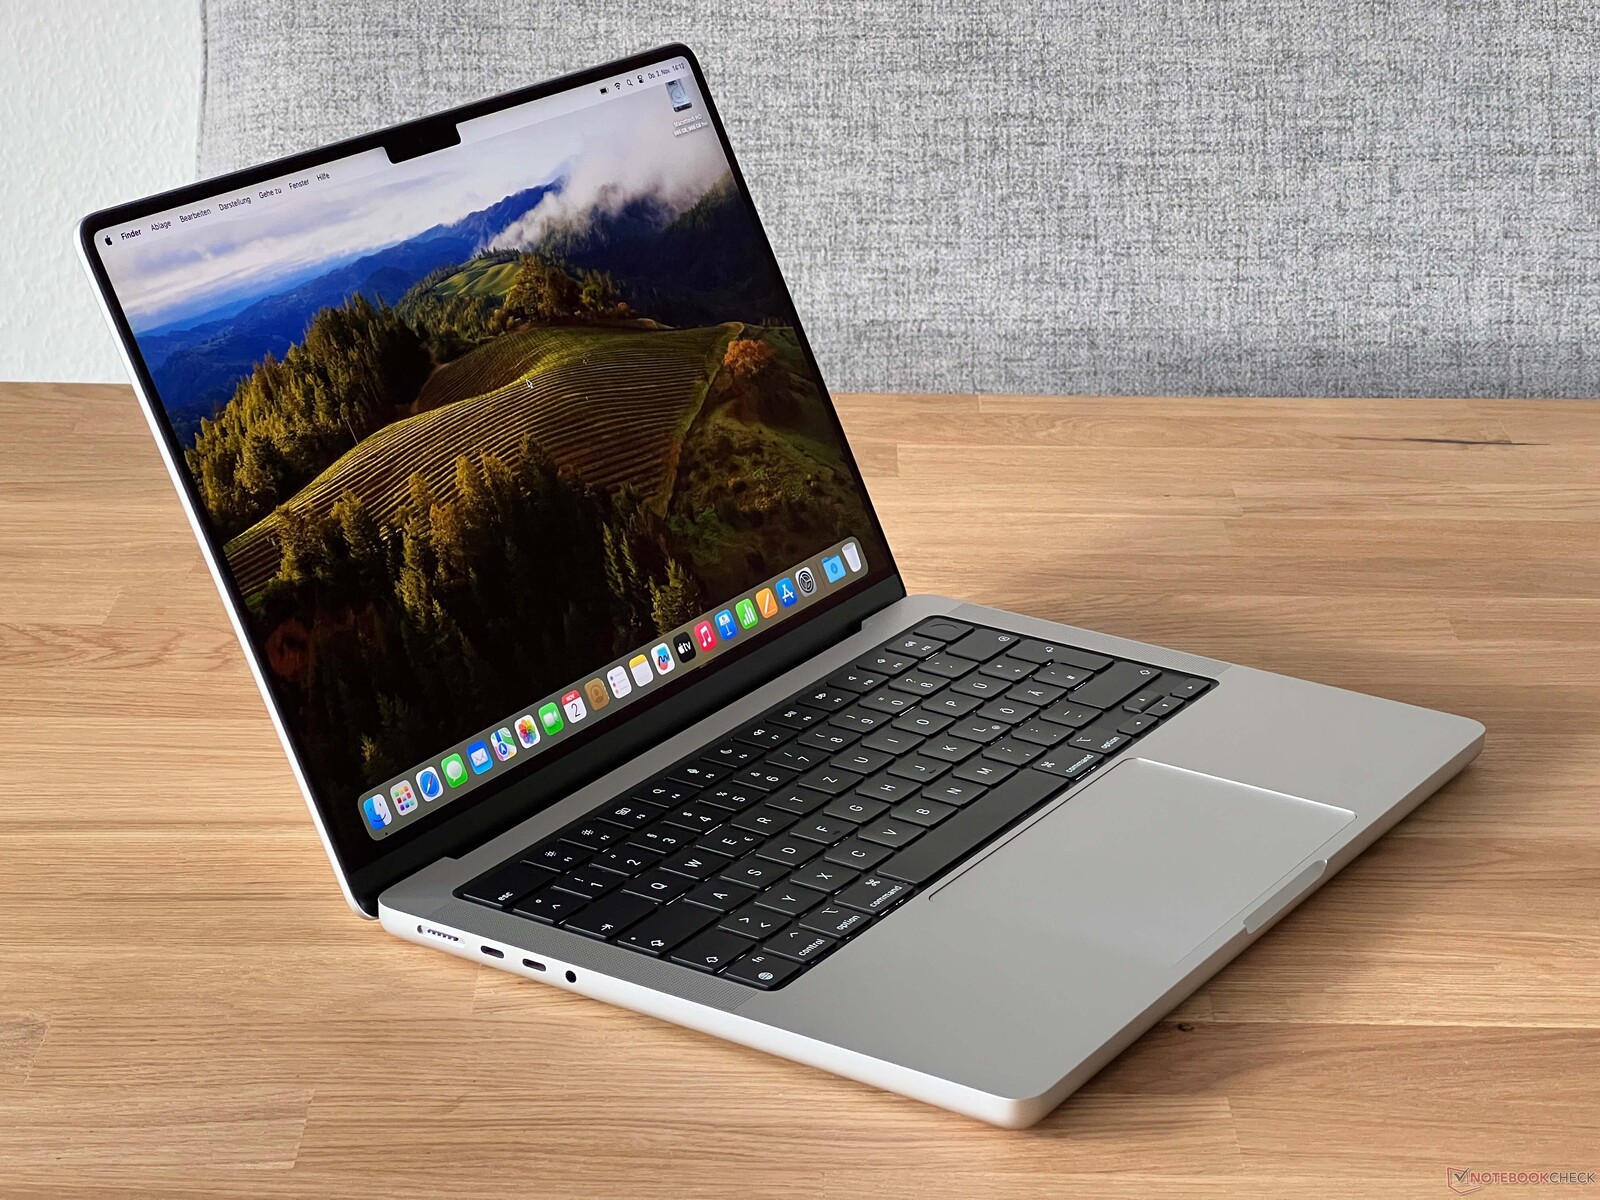
Last week, Apple presented the new M3 SoCs (M3, M3 Pro & M3 Max), which are produced via a modern 3 nm process. We've already reviewed the new entry-level model of the MacBook Pro 14 with its new M3 SoC (as a replacement for the old MacBook Pro 13 with the Touch Bar) in detail. Now we take a closer look at the new M3, which will also be used in the upcoming generation of the popular MacBook Air models. We also compare its performance and efficiency with CPUs/GPUs from AMD, Intel and Nvidia. Lastly, we draw a comparison with the new Snapdragon X Elite, which Qualcomm recently presented to the public. An analysis article on the M3 Pro/M3 Max will also appear shortly.

Apple M3 at a glance

Apple M3 (Bild: Apple)

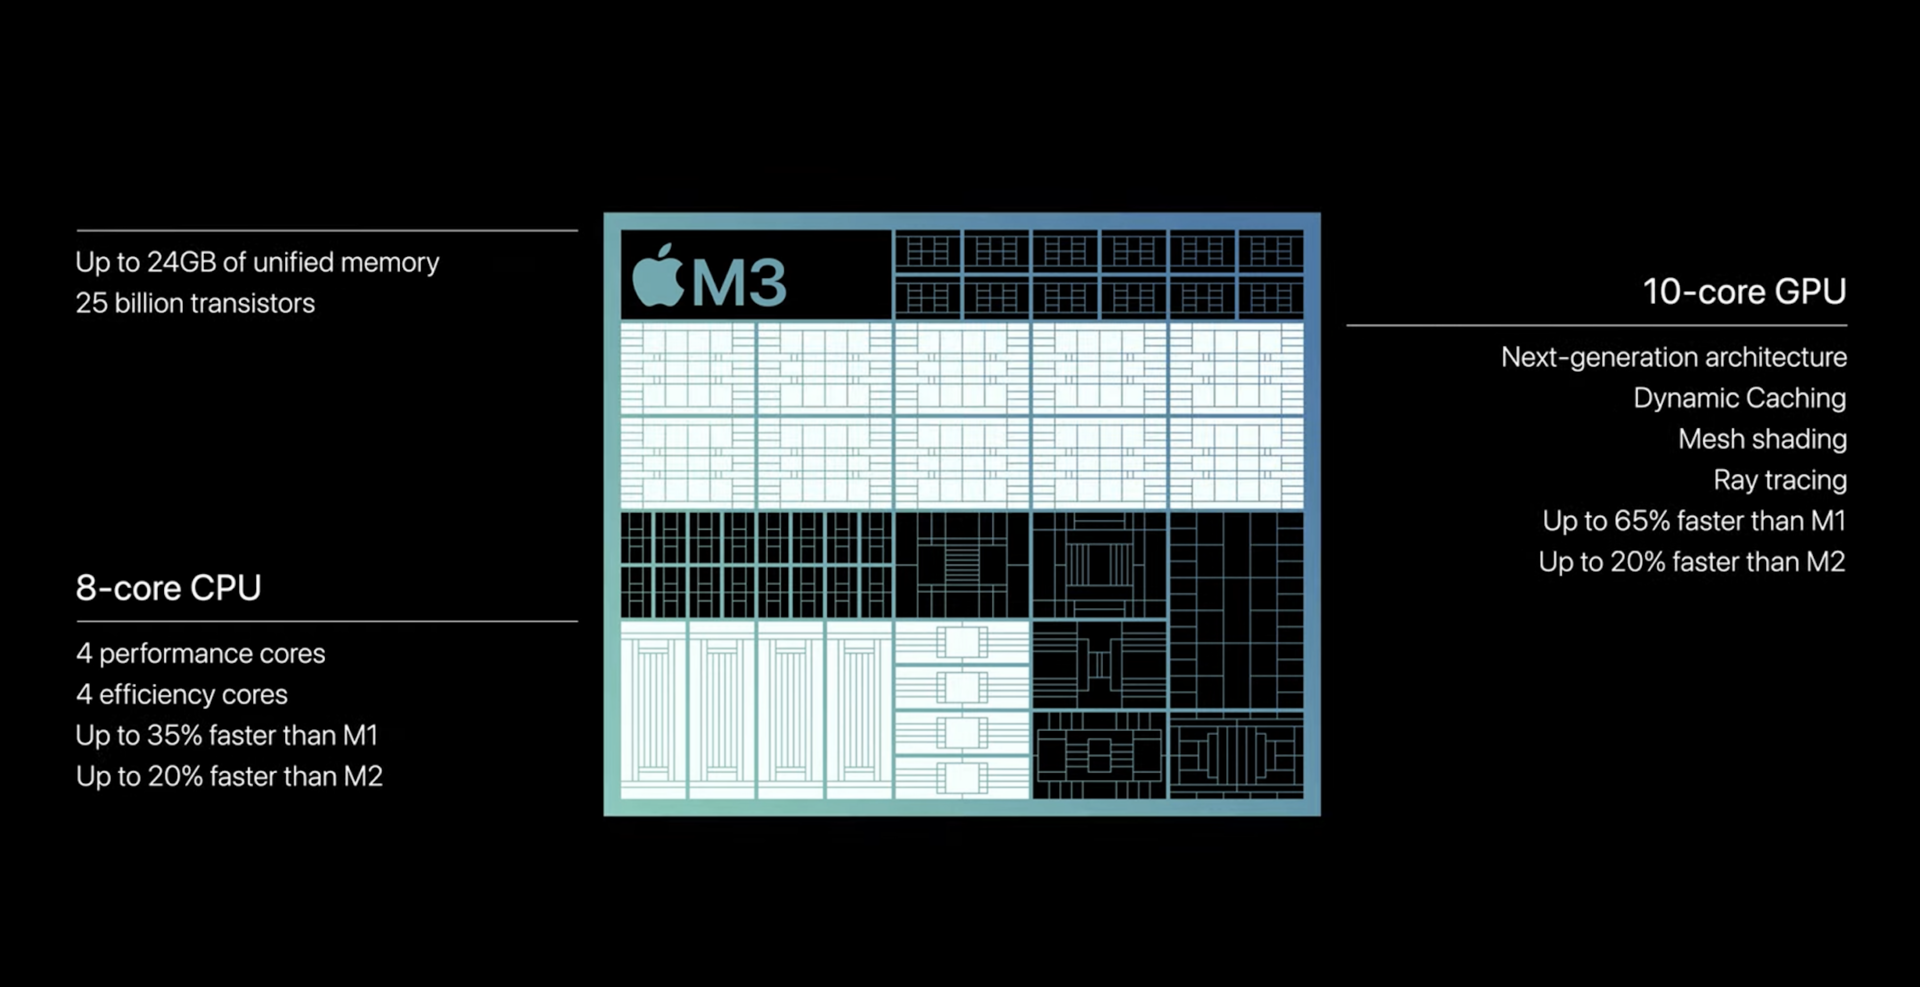
The M3 SoC is Apple's new entry-level chip and, like its predecessor, will be used in both the MacBook Pro and the desktop computers (with active cooling) as well as the MacBook Air with passive cooling, as was the case in the last two generations. While the configuration of the cores has changed in the faster M3 Pro/M3 Max, the configuration of the base M3 remains the same.

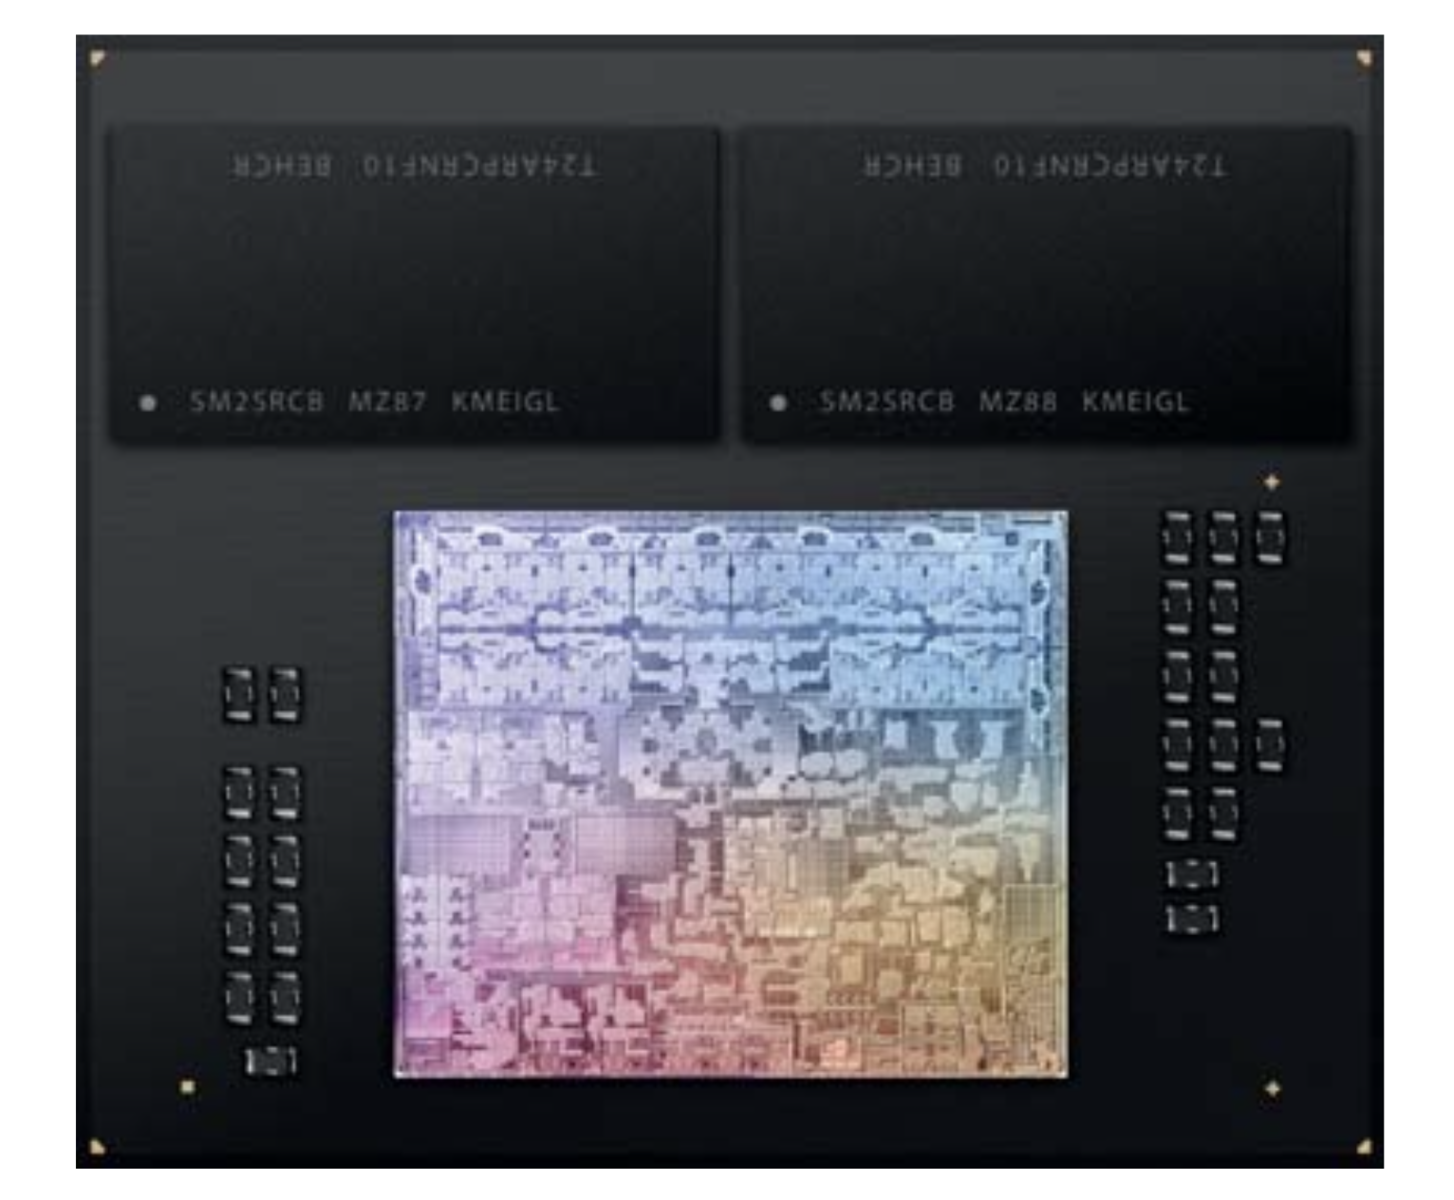
On the CPU side, there is a performance cluster with 4 cores that reach a maximum of 4.056 GHz (or ~3.6 GHz when all cores are loaded) and an efficiency cluster with 4 cores that reach a maximum of 2.748 GHz. Thanks to the new 3 nm production (presumably N3B process at TSMC), Apple has been able to significantly increase the clock speeds without making any major compromises in terms of power consumption. In addition, the number of transistors has been increased from 20 billion in the M2 to 25 billion.

There have been some major changes to the integrated graphics card. The M3 still comes in versions with 8 GPU cores (used in the iMac and presumably in the base model of the upcoming MacBook Air models) as well as in more powerful versions with 10 GPU cores, like in the MacBook Pro 14. However, Apple has overhauled the entire architecture of the GPU and now uses dynamic caching, where cache and memory are allocated dynamically based on the actual requirements of applications. In addition, the M3 now supports hardware-based ray tracing, mesh shading and AV1 decoding. However, only two displays can be used at a time.

Like the old M2 SoC, the M3 SoC can be equipped with either 8 GB, 16 GB or a maximum of 24 GB of RAM.

Testing procedure

So that we can make a meaningful comparison between the different laptops, we not only look at pure performance in the synthetic benchmarks, but also the power consumption, from which we then determine the efficiency. The consumption measurements are always carried out on an external display so that we can eliminate the different internal displays as influencing factors. Nevertheless, we measure the overall consumption of the system here and do not just rely on the displayed values for the CPU and GPU.

Single-core performance

Apple has been able to increase the single-core performance of the new M3 processor by around 20% over the old M2 and around 18% compared to the M2 Pro. Compared to the old M1 processor, the M3 is 30% more powerful. The power consumption of the CPU itself (according to Power Metrics) was around 6.5 watts at the beginning of benchmark testing before increasing to 5.5 watts later on, which is why the power consumption has increased slightly compared to the old M2. Despite the significantly higher performance, Apple has still been able to increase efficiency by around 18% compared to the M2 in the MacBook Pro 13, which is an excellent result. However, the lead over the passively cooled MacBook Air models is smaller.

Single-Core Performance Rating - Percent
Apple M3
Apple MacBook Pro 14 2023 M3
100 pt
Apple M2 Pro
Apple MacBook Pro 14 2023 M2 Pro
85.1 pt
Apple M2 Pro 10-Core
Apple MacBook Pro 14 2023 M2 Pro Entry
84.3 pt
Apple M2
Apple MacBook Pro 13 2022 M2
82.9 pt
Apple M2
Apple MacBook Air M2 Entry
82.5 pt
Apple M1 Pro
Apple MacBook Pro 16 2021 M1 Pro
78 pt
Apple M1 Pro 8-Core
Apple MacBook Pro 14 2021 M1 Pro Entry
78 pt
Apple M1
Apple MacBook Pro 13 Late 2020 M1 Entry (8 / 256 GB)
76.9 pt
Apple M1
Apple MacBook Air 2020 M1 Entry
76.2 pt
Cinebench R23 - Single Core
Apple M3
Apple MacBook Pro 14 2023 M3
1904 Points
Apple M2 Pro
Apple MacBook Pro 14 2023 M2 Pro
1647 Points -13%
Apple M2 Pro 10-Core
Apple MacBook Pro 14 2023 M2 Pro Entry
1643 Points -14%
Apple M2
Apple MacBook Air M2 Entry
1585 Points -17%
Apple M2
Apple MacBook Pro 13 2022 M2
1581 Points -17%
Apple M1 Pro
Apple MacBook Pro 16 2021 M1 Pro
1534 Points -19%
Apple M1 Pro 8-Core
Apple MacBook Pro 14 2021 M1 Pro Entry
1531 Points -20%
Apple M1
Apple MacBook Pro 13 Late 2020 M1 Entry (8 / 256 GB)
1513 Points -21%
Apple M1
Apple MacBook Air 2020 M1 Entry
1496 Points -21%
Geekbench 5.5 - Single-Core
Apple M3
Apple MacBook Pro 14 2023 M3
2342 Points
Apple M2 Pro
Apple MacBook Pro 14 2023 M2 Pro
1961 Points -16%
Apple M2
Apple MacBook Pro 13 2022 M2
1937 Points -17%
Apple M2 Pro 10-Core
Apple MacBook Pro 14 2023 M2 Pro Entry
1926 Points -18%
Apple M2
Apple MacBook Air M2 Entry
1914 Points -18%
Apple M1 Pro 8-Core
Apple MacBook Pro 14 2021 M1 Pro Entry
1769 Points -24%
Apple M1 Pro
Apple MacBook Pro 16 2021 M1 Pro
1768 Points -25%
Apple M1
Apple MacBook Pro 13 Late 2020 M1 Entry (8 / 256 GB)
1740 Points -26%
Apple M1
Apple MacBook Air 2020 M1 Entry
1727 Points -26%
Power Consumption / Cinebench R23 Single Power Efficiency - external Monitor
Apple M3
Apple MacBook Pro 14 2023 M3
190.4 Points per Watt
Apple M2
Apple MacBook Air M2 Entry
179.3 Points per Watt -6%
Apple M1
Apple MacBook Air 2020 M1 Entry
165.1 Points per Watt -13%
Apple M2
Apple MacBook Pro 13 2022 M2
161.7 Points per Watt -15%
Apple M2 Pro
Apple MacBook Pro 14 2023 M2 Pro
140.8 Points per Watt -26%
Apple M2 Pro 10-Core
Apple MacBook Pro 14 2023 M2 Pro Entry
118.2 Points per Watt -38%
Apple M1 Pro
Apple MacBook Pro 16 2021 M1 Pro
110.4 Points per Watt -42%
Power Consumption / Cinebench R23 Single (external Monitor)
Apple M1 Pro
Apple MacBook Pro 16 2021 M1 Pro
13.9 (12.3min, 13.3P1 - 22.1max) Watt * -39%
Apple M2 Pro 10-Core
Apple MacBook Pro 14 2023 M2 Pro Entry
13.9 (12.2min, 12.7P1 - 16.5max) Watt * -39%
Apple M2 Pro
Apple MacBook Pro 14 2023 M2 Pro
11.7 (9.94min, 10.7P1 - 13.6max) Watt * -17%
Apple M3
Apple MacBook Pro 14 2023 M3
10 (9.53min, 9.57P1 - 12.8max) Watt *
Apple M2
Apple MacBook Pro 13 2022 M2
9.78 (9.13min, 9.21P1 - 11.2max) Watt * +2%
Apple M1
Apple MacBook Air 2020 M1 Entry
9.06 (8.41min, 8.57P1 - 19max) Watt * +9%
Apple M2
Apple MacBook Air M2 Entry
8.84 (8.3min, 8.37P1 - 9.82max) Watt * +12%

* ... smaller is better

Multicore performance

Multicore performance has also increased by around 20% compared to the old M2 in the MacBook Pro 13, although the power consumption of the CPU cores has increased slightly too. The M2 consumes just under 20 watts, while the M3 needs 20-21 watts at full load. This puts the new M3 just ahead of the old entry-level 8-core M1 Pro, but all other MacBook Pro CPUs are still faster. On the other hand, efficiency has also increased here, but the lead of 8% over the M2 in the MBP 13 is not quite as high as in single-core load.

Multi-Core Performance Rating - Percent
Apple M2 Pro
Apple MacBook Pro 14 2023 M2 Pro
100 pt
Apple M1 Pro
Apple MacBook Pro 16 2021 M1 Pro
83.9 pt
Apple M2 Pro 10-Core
Apple MacBook Pro 14 2023 M2 Pro Entry
81 pt
Apple M3
Apple MacBook Pro 14 2023 M3
71.6 pt
Apple M1 Pro 8-Core
Apple MacBook Pro 14 2021 M1 Pro Entry
65.9 pt
Apple M2
Apple MacBook Pro 13 2022 M2
59.7 pt
Apple M2
Apple MacBook Air M2 Entry
59.4 pt
Apple M1
Apple MacBook Pro 13 Late 2020 M1 Entry (8 / 256 GB)
52 pt
Apple M1
Apple MacBook Air 2020 M1 Entry
50.6 pt
Cinebench R23 - Multi Core
Apple M2 Pro
Apple MacBook Pro 14 2023 M2 Pro
14787 Points +41%
Apple M1 Pro
Apple MacBook Pro 16 2021 M1 Pro
12370 Points +18%
Apple M2 Pro 10-Core
Apple MacBook Pro 14 2023 M2 Pro Entry
11811 Points +13%
Apple M3
Apple MacBook Pro 14 2023 M3
10454 Points
Apple M1 Pro 8-Core
Apple MacBook Pro 14 2021 M1 Pro Entry
9581 Points -8%
Apple M2
Apple MacBook Pro 13 2022 M2
8745 Points -16%
Apple M2
Apple MacBook Air M2 Entry
8667 Points -17%
Apple M1
Apple MacBook Pro 13 Late 2020 M1 Entry (8 / 256 GB)
7811 Points -25%
Apple M1
Apple MacBook Air 2020 M1 Entry
7409 (6401.39min - 7409.31max) Points -29%
Geekbench 5.5 - Multi-Core
Apple M2 Pro
Apple MacBook Pro 14 2023 M2 Pro
14859 Points +38%
Apple M1 Pro
Apple MacBook Pro 16 2021 M1 Pro
12499 Points +16%
Apple M2 Pro 10-Core
Apple MacBook Pro 14 2023 M2 Pro Entry
12189 Points +13%
Apple M3
Apple MacBook Pro 14 2023 M3
10774 Points
Apple M1 Pro 8-Core
Apple MacBook Pro 14 2021 M1 Pro Entry
9942 Points -8%
Apple M2
Apple MacBook Pro 13 2022 M2
8962 Points -17%
Apple M2
Apple MacBook Air M2 Entry
8951 Points -17%
Apple M1
Apple MacBook Pro 13 Late 2020 M1 Entry (8 / 256 GB)
7590 Points -30%
Apple M1
Apple MacBook Air 2020 M1 Entry
7578 Points -30%
Power Consumption / Cinebench R23 Multi Power Efficiency - external Monitor
Apple M3
Apple MacBook Pro 14 2023 M3
375 (27.4min, 28P1 - 30.7max) Points per Watt
Apple M2
Apple MacBook Pro 13 2022 M2
346 Points per Watt -8%
Apple M2
Apple MacBook Air M2 Entry
343 Points per Watt -9%
Apple M1
Apple MacBook Air 2020 M1 Entry
337 Points per Watt -10%
Apple M1 Pro
Apple MacBook Pro 16 2021 M1 Pro
290 Points per Watt -23%
Apple M2 Pro
Apple MacBook Pro 14 2023 M2 Pro
275 Points per Watt -27%
Apple M2 Pro 10-Core
Apple MacBook Pro 14 2023 M2 Pro Entry
250 Points per Watt -33%
Power Consumption / Cinebench R23 Multi (external Monitor)
Apple M2 Pro
Apple MacBook Pro 14 2023 M2 Pro
53.7 (50.8min, 51.2P1 - 60.8max) Watt * -92%
Apple M2 Pro 10-Core
Apple MacBook Pro 14 2023 M2 Pro Entry
47.2 (45.8min, 46.1P1 - 48.5max) Watt * -69%
Apple M1 Pro
Apple MacBook Pro 16 2021 M1 Pro
42.7 (16.4min, 25.7P1 - 50.1max) Watt * -53%
Apple M3
Apple MacBook Pro 14 2023 M3
27.9 (26.6min, 27P1 - 30max) Watt *
Apple M2
Apple MacBook Pro 13 2022 M2
25.3 (24.4min, 24.5P1 - 27.2max) Watt * +9%
Apple M2
Apple MacBook Air M2 Entry
25.3 (23.2min, 23.5P1 - 27.5max) Watt * +9%
Apple M1
Apple MacBook Air 2020 M1 Entry
22 (18.7min, 18.8P1 - 25.2max) Watt * +21%

* ... smaller is better

Apple M3 vs. AMD, Intel & Qualcomm

Now we compare the Apple M3 with the current mobile processors from AMD, Intel and Qualcomm. In selecting the comparison devices, we focused primarily on the U series chips from AMD and the U/P series from Intel. We've also included individual H45 and HS chips with comparatively low TDP values (max. 50 watts) in for comparison, even if these do not represent direct competition for the M3. We have also included the Snapdragon 8cx Gen3 in the Microsoft Surface Pro 9 in the tables.

Starting with single-core performance, we can clearly see what progress Apple has made with the M3. Despite lower power consumption, the M3's performance core can easily keep up with the performance cores of the current Raptor Lake CPUs from Intel, which require significantly more power. Even the most efficient Intel chip in our comparison, the Core i7-1355U, falls behind by a factor of 3. The current AMD Zen4 chips "only" fall behind by a factor of two in terms of efficiency, but do not match the performance of the M3 either. The Snapdragon 8cx Gen3 can only keep up to a certain extent in the Geekbench test (-28%), but falls far behind in the significantly longer R23 single test (-68%) and only just comes in ahead of the Intel CPUs in terms of efficiency.

Cinebench R23 - Single Core
Intel Core i7-13700H
SCHENKER Vision 14 2023
1912 Points 0%
Apple M3
Apple MacBook Pro 14 2023 M3
1904 Points
Intel Core i7-1360P
Lenovo Yoga 9 14IRP G8
1877 Points -1%
Intel Core i7-1365U
Lenovo ThinkPad X1 Carbon G11-21HNS00000
1877 Points -1%
AMD Ryzen 7 7840S
Lenovo Yoga Slim 7 14APU G8
1761 Points -8%
Intel Core i7-1355U
Asus ExpertBook B9 B9403CVA-KM0153X
1687 Points -11%
AMD Ryzen 7 7840U
HP EliteBook 845 G10 5Z4X0ES
1581 Points -17%
AMD Ryzen 9 PRO 7940HS
HP EliteBook 845 G10 818N0EA
1568 Points -18%
Qualcomm Snapdragon 8cx Gen 3
Microsoft Surface Pro 9, ARM
608 Points -68%
Geekbench 5.5 - Single-Core
Apple M3
Apple MacBook Pro 14 2023 M3
2342 Points
AMD Ryzen 7 7840S
Lenovo Yoga Slim 7 14APU G8
1939 Points -17%
Intel Core i7-1365U
Lenovo ThinkPad X1 Carbon G11-21HNS00000
1938 Points -17%
Intel Core i7-13700H
SCHENKER Vision 14 2023
1830 Points -22%
Intel Core i7-1360P
Lenovo Yoga 9 14IRP G8
1790 Points -24%
AMD Ryzen 9 PRO 7940HS
HP EliteBook 845 G10 818N0EA
1758 Points -25%
Intel Core i7-1355U
Asus ExpertBook B9 B9403CVA-KM0153X
1740 Points -26%
AMD Ryzen 7 7840U
HP EliteBook 845 G10 5Z4X0ES
1723 Points -26%
Qualcomm Snapdragon 8cx Gen 3
Microsoft Surface Pro 9, ARM
1690 Points -28%
Power Consumption - Cinebench R23 Single Power Efficiency - external Monitor
Apple M3
Apple MacBook Pro 14 2023 M3
190.4 Points per Watt
AMD Ryzen 7 7840U
HP EliteBook 845 G10 5Z4X0ES
100.7 Points per Watt -47%
AMD Ryzen 9 PRO 7940HS
HP EliteBook 845 G10 818N0EA
92.2 Points per Watt -52%
Qualcomm Snapdragon 8cx Gen 3
Microsoft Surface Pro 9, ARM
66.7 Points per Watt -65%
Intel Core i7-1355U
Asus ExpertBook B9 B9403CVA-KM0153X
64.7 Points per Watt -66%
Intel Core i7-13700H
SCHENKER Vision 14 2023
53.3 Points per Watt -72%
Intel Core i7-1365U
Lenovo ThinkPad X1 Carbon G11-21HNS00000
49.4 Points per Watt -74%
AMD Ryzen 7 7840S
Lenovo Yoga Slim 7 14APU G8
48.2 Points per Watt -75%
Intel Core i7-1360P
Lenovo Yoga 9 14IRP G8
48 Points per Watt -75%

The tide turns a little in the multicore tests, as some competitors from AMD and Intel offer better performance, especially in the Cinebench R23 test. Since the M3 does not support hyperthreading, the result is nevertheless still very good. However, the two U-series processors from Intel (only two performance cores) fall behind and the Qualcomm chip once again has no chance at all (-68%). In the short Geekbench test, the Apple chip is significantly better and is only narrowly surpassed by the AMD Ryzen 7 7840S.

In terms of efficiency, the differences are significantly smaller than in the single-core load and the Ryzen 7 7840U is practically on par. The other CPUs from AMD and Intel fall behind and the Qualcomm chip once again stands no chance here.

Cinebench R23: Multi Core | Geekbench 5.5: Multi-Core | Power Consumption: Cinebench R23 Multi Power Efficiency - external Monitor
Cinebench R23 / Multi Core
AMD Ryzen 7 7840S
Lenovo Yoga Slim 7 14APU G8
15102 Points +44%
AMD Ryzen 9 PRO 7940HS
HP EliteBook 845 G10 818N0EA
14919 Points +43%
AMD Ryzen 7 7840U
HP EliteBook 845 G10 5Z4X0ES
12385 Points +18%
Intel Core i7-13700H
SCHENKER Vision 14 2023
12275 Points +17%
Intel Core i7-1360P
Lenovo Yoga 9 14IRP G8
11922 Points +14%
Apple M3
Apple MacBook Pro 14 2023 M3
10454 Points
Intel Core i7-1365U
Lenovo ThinkPad X1 Carbon G11-21HNS00000
9343 Points -11%
Intel Core i7-1355U
Asus ExpertBook B9 B9403CVA-KM0153X
7733 Points -26%
Qualcomm Snapdragon 8cx Gen 3
Microsoft Surface Pro 9, ARM
3567 Points -66%
Geekbench 5.5 / Multi-Core
AMD Ryzen 7 7840S
Lenovo Yoga Slim 7 14APU G8
11288 Points +5%
Intel Core i7-1360P
Lenovo Yoga 9 14IRP G8
10785 Points 0%
Apple M3
Apple MacBook Pro 14 2023 M3
10774 Points
Intel Core i7-13700H
SCHENKER Vision 14 2023
10515 Points -2%
AMD Ryzen 9 PRO 7940HS
HP EliteBook 845 G10 818N0EA
9897 Points -8%
AMD Ryzen 7 7840U
HP EliteBook 845 G10 5Z4X0ES
9864 Points -8%
Intel Core i7-1365U
Lenovo ThinkPad X1 Carbon G11-21HNS00000
8709 Points -19%
Intel Core i7-1355U
Asus ExpertBook B9 B9403CVA-KM0153X
7635 Points -29%
Qualcomm Snapdragon 8cx Gen 3
Microsoft Surface Pro 9, ARM
7522 Points -30%
Power Consumption / Cinebench R23 Multi Power Efficiency - external Monitor
Apple M3
Apple MacBook Pro 14 2023 M3
375 (27.4min, 28P1 - 30.7max) Points per Watt
AMD Ryzen 7 7840U
HP EliteBook 845 G10 5Z4X0ES
369 Points per Watt -2%
AMD Ryzen 9 PRO 7940HS
HP EliteBook 845 G10 818N0EA
254 Points per Watt -32%
AMD Ryzen 7 7840S
Lenovo Yoga Slim 7 14APU G8
235 Points per Watt -37%
Intel Core i7-1355U
Asus ExpertBook B9 B9403CVA-KM0153X
209 Points per Watt -44%
Intel Core i7-1365U
Lenovo ThinkPad X1 Carbon G11-21HNS00000
208 Points per Watt -45%
Intel Core i7-13700H
SCHENKER Vision 14 2023
184.9 Points per Watt -51%
Intel Core i7-1360P
Lenovo Yoga 9 14IRP G8
183.7 Points per Watt -51%
Qualcomm Snapdragon 8cx Gen 3
Microsoft Surface Pro 9, ARM
111.5 Points per Watt -70%

GPU performance & efficiency

In all graphics tests, the new 10-core M3 GPU has a 10-22% lead over the old 10-core M2 GPU, but maximum power consumption has also increased from ~13.5 watts for the M2 to ~15 watts for the M3. However, all past Pro GPUs from Apple (whether M1 or M2) are even faster, even the base 14-core M14 Pro

Compared to the Windows competition, the M3 GPU clearly outperforms the AMD Radeon 780M and the Iris Xe Graphics G7 in particular in both 3DMark Wildlife Extreme Unlimited and GFXBench, but the Apple GPU has to concede defeat to the Radeon 780M in the Geekbench OpenCL test. Dedicated mid-range Nvidia GPUs (from RTX 3050 upwards) are significantly more powerful and naturally also consume much more power (from 35 watts upwards). We have also included these results for better classification.

3DMark / Wild Life Extreme Unlimited
NVIDIA GeForce RTX 4050 Laptop GPU
Lenovo Yoga Pro 9-14IRP G8
15208 Points +83%
Apple M2 Pro 19-Core GPU
Apple MacBook Pro 14 2023 M2 Pro
12968 Points +56%
Apple M2 Pro 16-Core GPU
Apple MacBook Pro 14 2023 M2 Pro Entry
11224 Points +35%
Apple M1 Pro 16-Core GPU
Apple MacBook Pro 16 2021 M1 Pro
10352 Points +25%
NVIDIA GeForce RTX 3050 Ti Laptop GPU
SCHENKER Vision 14 2022 RTX 3050 Ti
9340 Points +13%
Apple M1 Pro 14-Core GPU
Apple MacBook Pro 14 2021 M1 Pro Entry
9267 Points +12%
Apple M3 10-Core GPU
Apple MacBook Pro 14 2023 M3
8302 Points
Apple M2 10-Core GPU
Apple MacBook Air M2 10C GPU
6824 Points -18%
Apple M2 8-Core GPU
Apple MacBook Air M2 Entry
5689 Points -31%
AMD Radeon 780M
Lenovo Yoga Slim 7 14APU G8
5465 Points -34%
Apple M1 8-Core GPU
Apple MacBook Pro 13 Late 2020 M1 Entry (8 / 256 GB)
4997 Points -40%
AMD Radeon 780M
Asus ROG Zephyrus G14 GA402XY
4663 Points -44%
Apple M1 7-Core GPU
Apple MacBook Air 2020 M1 Entry
4515 Points -46%
AMD Radeon 780M
Lenovo ThinkPad T14s G4-21F8002TGE
4332 Points -48%
Intel Iris Xe Graphics G7 96EUs
SCHENKER Vision 14 2023
4304 Points -48%
Intel Iris Xe Graphics G7 96EUs
Lenovo Yoga 9 14IRP G8
4221 Points -49%
Intel Iris Xe Graphics G7 96EUs
Lenovo ThinkPad X1 Carbon G11-21HNS00000
3520 Points -58%
Geekbench 5.5 / Metal Score
Apple M2 Pro 19-Core GPU
Apple MacBook Pro 14 2023 M2 Pro
52054 Points +51%
Apple M2 Pro 16-Core GPU
Apple MacBook Pro 14 2023 M2 Pro Entry
46834 Points +36%
Apple M1 Pro 16-Core GPU
Apple MacBook Pro 16 2021 M1 Pro
42115 Points +22%
Apple M1 Pro 14-Core GPU
Apple MacBook Pro 14 2021 M1 Pro Entry
37319 Points +8%
Apple M3 10-Core GPU
Apple MacBook Pro 14 2023 M3
34398 Points
Apple M2 10-Core GPU
Apple MacBook Air M2 10C GPU
30269 Points -12%
Apple M2 8-Core GPU
Apple MacBook Air M2 Entry
26079 Points -24%
Apple M1 8-Core GPU
Apple MacBook Pro 13 Late 2020 M1 Entry (8 / 256 GB)
21951 Points -36%
Apple M1 7-Core GPU
Apple MacBook Air 2020 M1 Entry
19064 Points -45%
Geekbench 5.5 / OpenCL Score
NVIDIA GeForce RTX 4050 Laptop GPU
Lenovo Yoga Pro 9-14IRP G8
86275 Points +165%
NVIDIA GeForce RTX 3050 6GB Laptop GPU
Lenovo Slim Pro 7 14ARP8
62409 Points +92%
NVIDIA GeForce RTX 3050 Ti Laptop GPU
SCHENKER Vision 14 2022 RTX 3050 Ti
61067 Points +88%
Apple M2 Pro 19-Core GPU
Apple MacBook Pro 14 2023 M2 Pro
46941 Points +44%
Apple M2 Pro 16-Core GPU
Apple MacBook Pro 14 2023 M2 Pro Entry
42483 Points +31%
Apple M1 Pro 16-Core GPU
Apple MacBook Pro 16 2021 M1 Pro
37867 Points +16%
AMD Radeon 780M
Lenovo Yoga Slim 7 14APU G8
36162 Points +11%
Apple M1 Pro 14-Core GPU
Apple MacBook Pro 14 2021 M1 Pro Entry
35173 Points +8%
AMD Radeon 780M
Lenovo ThinkPad T14s G4-21F8002TGE
34161 Points +5%
AMD Radeon 780M
Asus ROG Zephyrus G14 GA402XY
33853 Points +4%
Apple M3 10-Core GPU
Apple MacBook Pro 14 2023 M3
32540 Points
Apple M2 10-Core GPU
Apple MacBook Air M2 10C GPU
27489 Points -16%
Apple M2 8-Core GPU
Apple MacBook Air M2 Entry
23633 Points -27%
Intel Iris Xe Graphics G7 96EUs
Lenovo Yoga 9 14IRP G8
20890 Points -36%
Intel Iris Xe Graphics G7 96EUs
SCHENKER Vision 14 2023
20765 Points -36%
Apple M1 8-Core GPU
Apple MacBook Pro 13 Late 2020 M1 Entry (8 / 256 GB)
19078 Points -41%
Intel Iris Xe Graphics G7 96EUs
Lenovo ThinkPad X1 Carbon G11-21HNS00000
19004 Points -42%
Apple M1 7-Core GPU
Apple MacBook Air 2020 M1 Entry
17029 Points -48%
GFXBench / Aztec Ruins High Tier Offscreen
Apple M2 Pro 19-Core GPU
Apple MacBook Pro 14 2023 M2 Pro
210.4 fps +74%
Apple M2 Pro 16-Core GPU
Apple MacBook Pro 14 2023 M2 Pro Entry
181.1 fps +50%
Apple M1 Pro 16-Core GPU
Apple MacBook Pro 16 2021 M1 Pro
166 fps +37%
Apple M1 Pro 14-Core GPU
Apple MacBook Pro 14 2021 M1 Pro Entry
147 fps +21%
Apple M3 10-Core GPU
Apple MacBook Pro 14 2023 M3
121 fps
Apple M2 10-Core GPU
Apple MacBook Air M2 10C GPU
110 fps -9%
Apple M2 8-Core GPU
Apple MacBook Air M2 Entry
91 fps -25%
Apple M1 8-Core GPU
Apple MacBook Pro 13 Late 2020 M1 Entry (8 / 256 GB)
78.2 fps -35%
Apple M1 7-Core GPU
Apple MacBook Air 2020 M1 Entry
72.4 fps -40%
AMD Radeon 780M
Asus ROG Zephyrus G14 GA402XY
58.3 fps -52%

When examining efficiency, we more or less have to use Witcher 3, as we have the most comparative values for this stored in our database and the CPU load is quite low. Of course, this is not an optimal starting point for the MacBooks and the values are not completely comparable with the Windows laptops, since only the emulated version runs on the Macs via CrossOver, which also costs some performance. We carried out this test on MacBooks for the first time last year, namely on the M2 Pro models, and they took top place in the comparison field and were later only overtaken by the M2 MacBook Air 15. The new MacBook Pro 14 M3 is 8% more efficient.

Power Consumption - Witcher 3 ultra Efficiency (external Monitor)
Apple M3 10-Core GPU
Apple MacBook Pro 14 2023 M3
1.207 fps per Watt
Apple M2 10-Core GPU
Apple MacBook Air 15 2023 M2 16 GB
1.116 fps per Watt -8%
Apple M2 Pro 19-Core GPU
Apple MacBook Pro 14 2023 M2 Pro
1.028 fps per Watt -15%
Apple M2 Pro 16-Core GPU
Apple MacBook Pro 14 2023 M2 Pro Entry
0.941 fps per Watt -22%
NVIDIA GeForce RTX 4060 Laptop GPU
Lenovo Legion Slim 7 16APH8
0.773 fps per Watt -36%
NVIDIA GeForce RTX 4060 Laptop GPU
Microsoft Surface Laptop Studio 2 RTX 4060
0.764 fps per Watt -37%
NVIDIA GeForce RTX 4050 Laptop GPU
Asus VivoBook Pro 16 K6602VU
0.703 fps per Watt -42%
AMD Radeon 780M
Lenovo ThinkPad T14s G4-21F8002TGE
0.658 fps per Watt -45%
NVIDIA GeForce RTX 4050 Laptop GPU
SCHENKER XMG Apex 15 (Late 23)
0.616 fps per Watt -49%
NVIDIA GeForce RTX 3050 6GB Laptop GPU
Lenovo Slim Pro 7 14ARP8
0.614 fps per Watt -49%
AMD Radeon RX 6600M
Minisforum Neptune Series HX77G
0.587 fps per Watt -51%
NVIDIA GeForce RTX 2050 Mobile
Acer Aspire 5 A515-57G-53N8
0.57 fps per Watt -53%
AMD Radeon 780M
Lenovo Yoga Slim 7 14APU G8
0.495 fps per Watt -59%
NVIDIA GeForce RTX 3050 Ti Laptop GPU
SCHENKER Vision 14 2022 RTX 3050 Ti
0.4933 fps per Watt -59%
Intel Iris Xe Graphics G7 96EUs
Lenovo ThinkPad X1 Carbon G11 21HNS54T00
0.2782 fps per Watt -77%
Intel Iris Xe Graphics G7 96EUs
Lenovo ThinkPad E14 G5 i7-1355U
0.2569 fps per Watt -79%

Apple M3 vs. Qualcomm Snapdragon X Elite

Shortly before the announcement of Apple's new M3 processors, Qualcomm presented the Snapdragon X Elite and showed benchmarks for two reference designs with 23 and 80 watts. Of course, we also compare these results with the new Apple M3, for which we employed the Cinebench 2024, Geekbench 6.2 and GFXBench benchmarks (Aztec Ruins Normal Tier Offscreen) used by Qualcomm.

Cinebench 2024: CPU Multi Core | CPU Single Core | Geekbench 6.2: Multi-Core | Single-Core
Cinebench 2024 / CPU Multi Core
SD X Elite Reference 80W
SD X Elite Adreno GPU , Snapdragon X Elite
1220 Points +71%
SD X Elite Reference 23W
SD X Elite Adreno GPU , Snapdragon X Elite
950 Points +33%
Lenovo Yoga Slim 7 14APU G8
Radeon 780M, R7 7840S, Samsung PM9A1 MZVL21T0HCLR
853 Points +20%
Apple MacBook Pro 14 2023 M3
M3 10-Core GPU, M3, Apple SSD AP1024Z
712 Points
Lenovo ThinkPad T14s G4-21F8002TGE
Radeon 780M, R7 7840U, Samsung PM9A1a MZVL21T0HDLU
609 Points -14%
Lenovo ThinkPad X1 Carbon G11 21HNS54T00
Iris Xe G7 96EUs, i7-1370P, WDC PC SN810 2TB
366 Points -49%
Cinebench 2024 / CPU Single Core
Apple MacBook Pro 14 2023 M3
M3 10-Core GPU, M3, Apple SSD AP1024Z
140 Points
SD X Elite Reference 80W
SD X Elite Adreno GPU , Snapdragon X Elite
133 Points -5%
SD X Elite Reference 23W
SD X Elite Adreno GPU , Snapdragon X Elite
124 Points -11%
Lenovo Yoga Slim 7 14APU G8
Radeon 780M, R7 7840S, Samsung PM9A1 MZVL21T0HCLR
103 Points -26%
Lenovo ThinkPad T14s G4-21F8002TGE
Radeon 780M, R7 7840U, Samsung PM9A1a MZVL21T0HDLU
97 Points -31%
Lenovo ThinkPad X1 Carbon G11 21HNS54T00
Iris Xe G7 96EUs, i7-1370P, WDC PC SN810 2TB
90 Points -36%
Geekbench 6.2 / Multi-Core
SD X Elite Reference 80W
SD X Elite Adreno GPU , Snapdragon X Elite
15239 Points +27%
SD X Elite Reference 23W
SD X Elite Adreno GPU , Snapdragon X Elite
14056 Points +17%
Lenovo ThinkPad X1 Carbon G11 21HNS54T00
Iris Xe G7 96EUs, i7-1370P, WDC PC SN810 2TB
12891 Points +8%
Lenovo Yoga Slim 7 14APU G8
Radeon 780M, R7 7840S, Samsung PM9A1 MZVL21T0HCLR
12598 Points +5%
Apple MacBook Pro 14 2023 M3
M3 10-Core GPU, M3, Apple SSD AP1024Z
11966 Points
Lenovo ThinkPad T14s G4-21F8002TGE
Radeon 780M, R7 7840U, Samsung PM9A1a MZVL21T0HDLU
10893 Points -9%
Geekbench 6.2 / Single-Core
Apple MacBook Pro 14 2023 M3
M3 10-Core GPU, M3, Apple SSD AP1024Z
3099 Points
SD X Elite Reference 80W
SD X Elite Adreno GPU , Snapdragon X Elite
2966 Points -4%
SD X Elite Reference 23W
SD X Elite Adreno GPU , Snapdragon X Elite
2777 Points -10%
Lenovo ThinkPad X1 Carbon G11 21HNS54T00
Iris Xe G7 96EUs, i7-1370P, WDC PC SN810 2TB
2644 Points -15%
Lenovo Yoga Slim 7 14APU G8
Radeon 780M, R7 7840S, Samsung PM9A1 MZVL21T0HCLR
2605 Points -16%
Lenovo ThinkPad T14s G4-21F8002TGE
Radeon 780M, R7 7840U, Samsung PM9A1a MZVL21T0HDLU
2399 Points -23%

Qualcomm has a noticeable advantage in multicore performance with both reference systems (depending on the test, between 17-33% with 23 watts or 27-71% with 80 watts). However, this is a comparison with the slowest of the new M3 chips and we can already reveal that the M3 Pro (12 cores) with 28 watts is faster than the Qualcomm reference design with 80 watts, at least in Geekbench Multi.

In single-core tests, the Apple M3 easily outperforms the strong-performing Snapdragon X Elite. It will be interesting to see how much power the Qualcomm chip actually needs under single-core load.

GFXBench - 1920x1080 Aztec Ruins Normal Tier Offscreen
Apple MacBook Pro 14 2023 M2 Pro Entry
M2 Pro 16-Core GPU, M2 Pro 10-Core, Apple SSD AP0512Z
493 fps +50%
SD X Elite Reference 80W
SD X Elite Adreno GPU , Snapdragon X Elite
356 fps +8%
Apple MacBook Pro 14 2023 M3
M3 10-Core GPU, M3, Apple SSD AP1024Z
329.6 fps
SD X Elite Reference 23W
SD X Elite Adreno GPU , Snapdragon X Elite
294 fps -11%
Apple Mac Mini M2
M2 10-Core GPU, M2, Apple SSD AP0512Z
289.5 fps -12%
Asus ROG Zephyrus G14 GA402XY
Radeon 780M, R9 7940HS
141 fps -57%
HP ZBook Firefly 14 G10 A
Radeon 760M, R5 PRO 7640HS, Samsung PM9B1 512GB MZVL4512HBLU
123.2 fps -63%
Asus Zenbook S 13 OLED
Radeon 680M, R7 6800U, Samsung PM9A1 MZVL21T0HCLR
120 fps -64%
Asus Chromebook Flip CX5 CX5601FB
Iris Xe G7 96EUs, i7-1255U, Intel SSD 670p SSDPEKNU512GZ
84 fps -75%

In the GPU benchmark from Qualcomm, the result is quite clear, as the 10-core M3 GPU (with a maximum consumption of 15 watts) is able to outperform Qualcomm's small reference system by 12% and is only 7% behind the 80-watt system. However, the 18-core GPU of the new M3 Pro is clearly superior at 580 FPS.

Verdict - Apple's first 3 nm chip is a complete success

Apple M3 SoC in the MacBook Pro 14 2023

Upon switching from the M1 to the M2, Apple improved the performance of the chips through higher clock speeds, but at the cost of higher power consumption due to the same manufacturing process (5 nm). With the M3, the basic core configuration remains identical for both the CPU and the GPU, but clock speeds are once again higher. Thanks to the modern 3 nm manufacturing process, this only has a minimal impact on power consumption and so Apple has been able to improve both performance and efficiency.

Apple was able to improve processor performance by almost 20% in both the single-core and multicore tests. Single-core performance in particular is now on par with the fast performance cores from Intel's current Raptor Lake generation, which consume a lot more power. The advantage over AMD's Zen4 processors is also clear here, as they are unable to compete with the M3 in terms of efficiency or pure performance. In the multi-core tests, however, things change and both the Zen4 processors (from the Ryzen 7 U series) and the Raptor Lake P processors from Intel offer more performance, but the Intel CPUs are much less efficient. Intel's U series, such as the current Core i7-1365U, also fall behind in multi-core performance. AMD's Zen4 chips, such as the Ryzen 7 7840U, are practically on par in terms of multi-core efficiency. AMD may well overtake Apple with the upcoming Ryzen 8000 chips at the beginning of 2024.

More performance with higher efficiency - Apple delivers with the new M3 and the upcoming MacBook Air models will also benefit from the performance boost.

In terms of graphics performance, there is an advantage of up to 20% compared to the M2. Even though power consumption has increased slightly, we still see a slight improvement in efficiency and the current iGPUs from AMD (Radeon 780M) and Intel (Iris Xe Graphics G7) fall significantly behind. Only in the OpenCL test can the Radeon 780M easily hold its own against the M3 GPU.

The comparisons with the new Qualcomm Snapdragon X Elite are also very interesting because the Snapdragon seems to have an advantage, especially in terms of multicore performance. However, graphics performance is weaker than the Apple M3, at least in the small reference design with 23 watts, and we only have a very limited number of benchmarks presented by Qualcomm. The numbers show a massive improvement over the previous 8cx Gen3 chips, but we'll have to wait and see when the first devices come onto the market and how performance values actually turn out in the end.

Read all 20 comments / answer
static version load dynamic
Loading comments
Comment on this article
Please share our article, every link counts!
> Expert Reviews and News on Laptops, Smartphones and Tech Innovations > Reviews > Apple M3 SoC analyzed: Increased performance and improved efficiency
Andreas Osthoff, 2023-11-12 (Update: 2023-11-12)