Microsoft Surface Pro 9 ARM review - The high-end ARM convertible disappoints
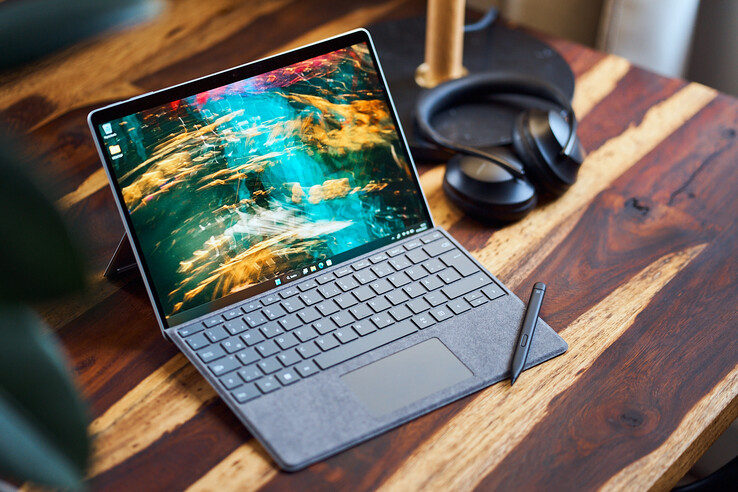
Microsoft has mothballed the old Surface Pro X product line with ARM processors, and now offers two versions of the new Surface Pro 9 instead. We already tested the Intel model recently, and now we take a look at the model with the ARM processor from Qualcomm. At first glance, the most obvious differences are the integrated 5G modem of the ARM version and the lack of the fan, which ensures that the Surface Pro 9 ARM always runs quietly.
In terms of the price, the ARM model with 8 GB of RAM and a small 128-GB SSD starts at 1,549 Euros (~$1,648), which makes it more expensive than the Core-i5 version with 8 GB of RAM and 256-GB SSD for 1,299 Euros (~$1,382; convertible only, input devices cost extra). While the ARM-version of course offers 5G, with 256 GB of storage it becomes about 350 Euros (~$372) more expensive than the comparable i5 model. With the more expensive price, Microsoft suggests a product that is at least as good, but is this really the case?
Our test unit is the version with 256 SSD storage for 1,659 Euros (~$1,765) with an additional 280 Euros (~$298) for the keyboard together with the input pen, resulting in a total of ~1,940 Euros (~$2,063) for the whole package. Since many areas are identical to the recently tested Intel model, in this review we will only discuss the differences, focusing mainly on the performance and compatibility of the ARM SoC. You can find detailed information on the case, input devices, display, and speakers in our review of the Surface Pro 9 with the Core-i7 processor.
Possible Competitors in Comparison
Rating | Date | Model | Weight | Height | Size | Resolution | Price |
|---|---|---|---|---|---|---|---|
| 86.9 % v7 (old) | 03 / 2023 | Microsoft Surface Pro 9, ARM SD 8cx Gen 3, Adreno 690 | 883 g | 9.3 mm | 13.00" | 2880x1920 | |
| 88.4 % v7 (old) | 01 / 2023 | Microsoft Surface Pro 9, i7-1255U i7-1255U, Iris Xe G7 96EUs | 877 g | 9.3 mm | 13.00" | 2880x1920 | |
| 84.4 % v7 (old) | 03 / 2021 | Microsoft Surface Pro X SQ1, Adreno 685 | 1 kg | 7.3 mm | 13.00" | 2880x1920 | |
| 86.7 % v7 (old) | 10 / 2022 | Lenovo ThinkPad X13s Gen 1 21BX000QGE SD 8cx Gen 3, Adreno 690 | 1.1 kg | 13.4 mm | 13.30" | 1920x1200 | |
| 84 % v7 (old) | 08 / 2021 | HP EliteBook Folio 13.5-3G2L2EA SD 8cx Gen 2 5G, Adreno 680 | 1.3 kg | 16 mm | 13.50" | 1920x1280 | |
| 91.8 % v7 (old) | 11 / 2022 | Apple iPad Pro 12.9 2022 M2, M2 10-Core GPU | 682 g | 6.4 mm | 12.90" | 2732x2048 |
Differences to the Intel version of the Surface Pro 9
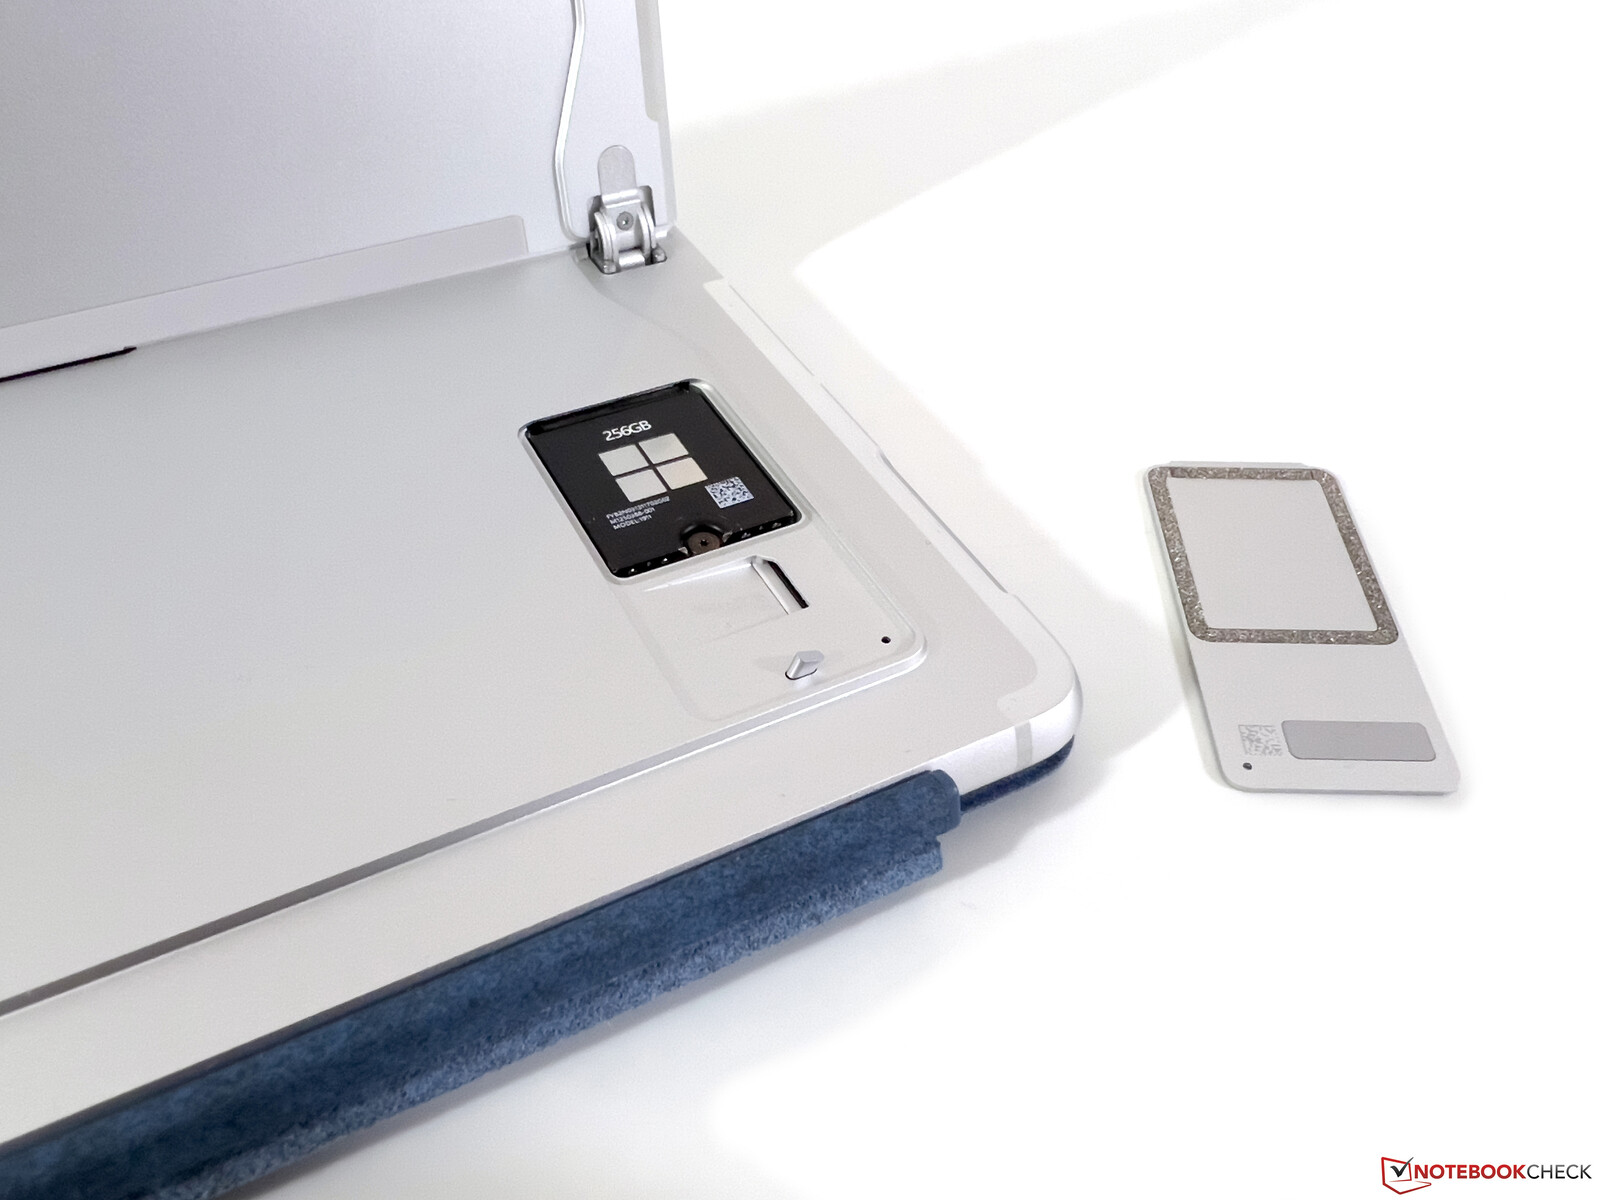
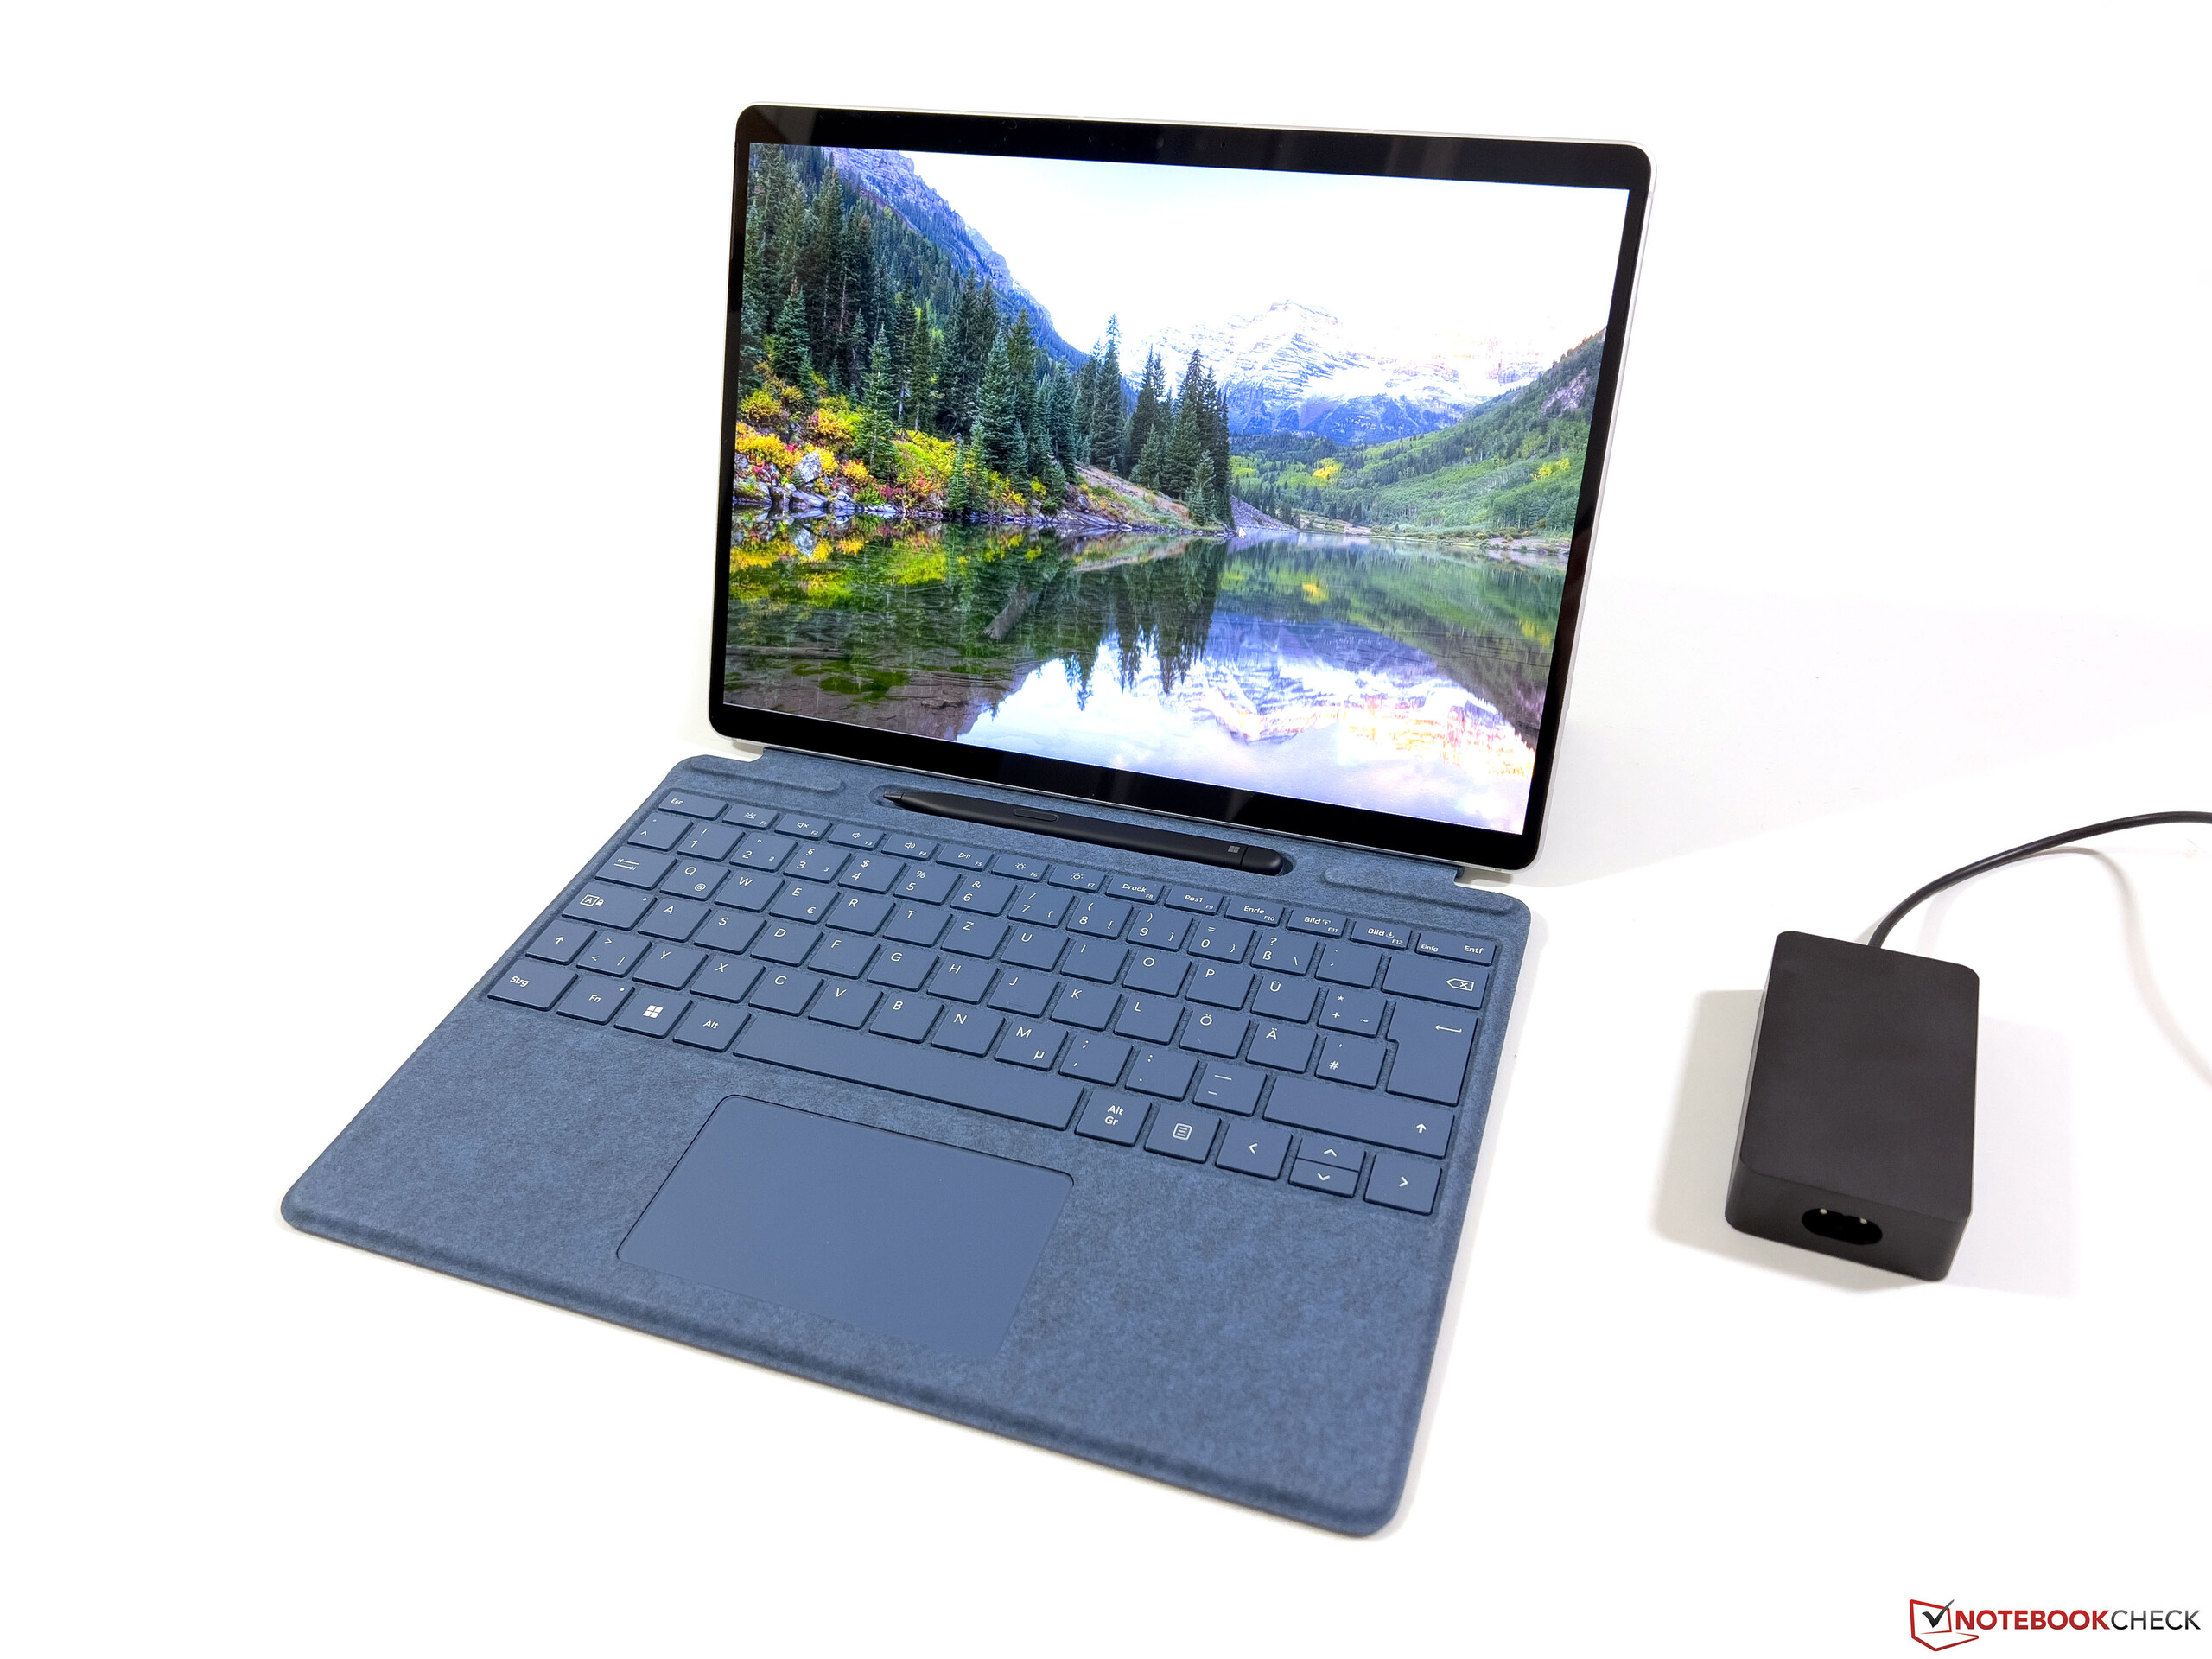
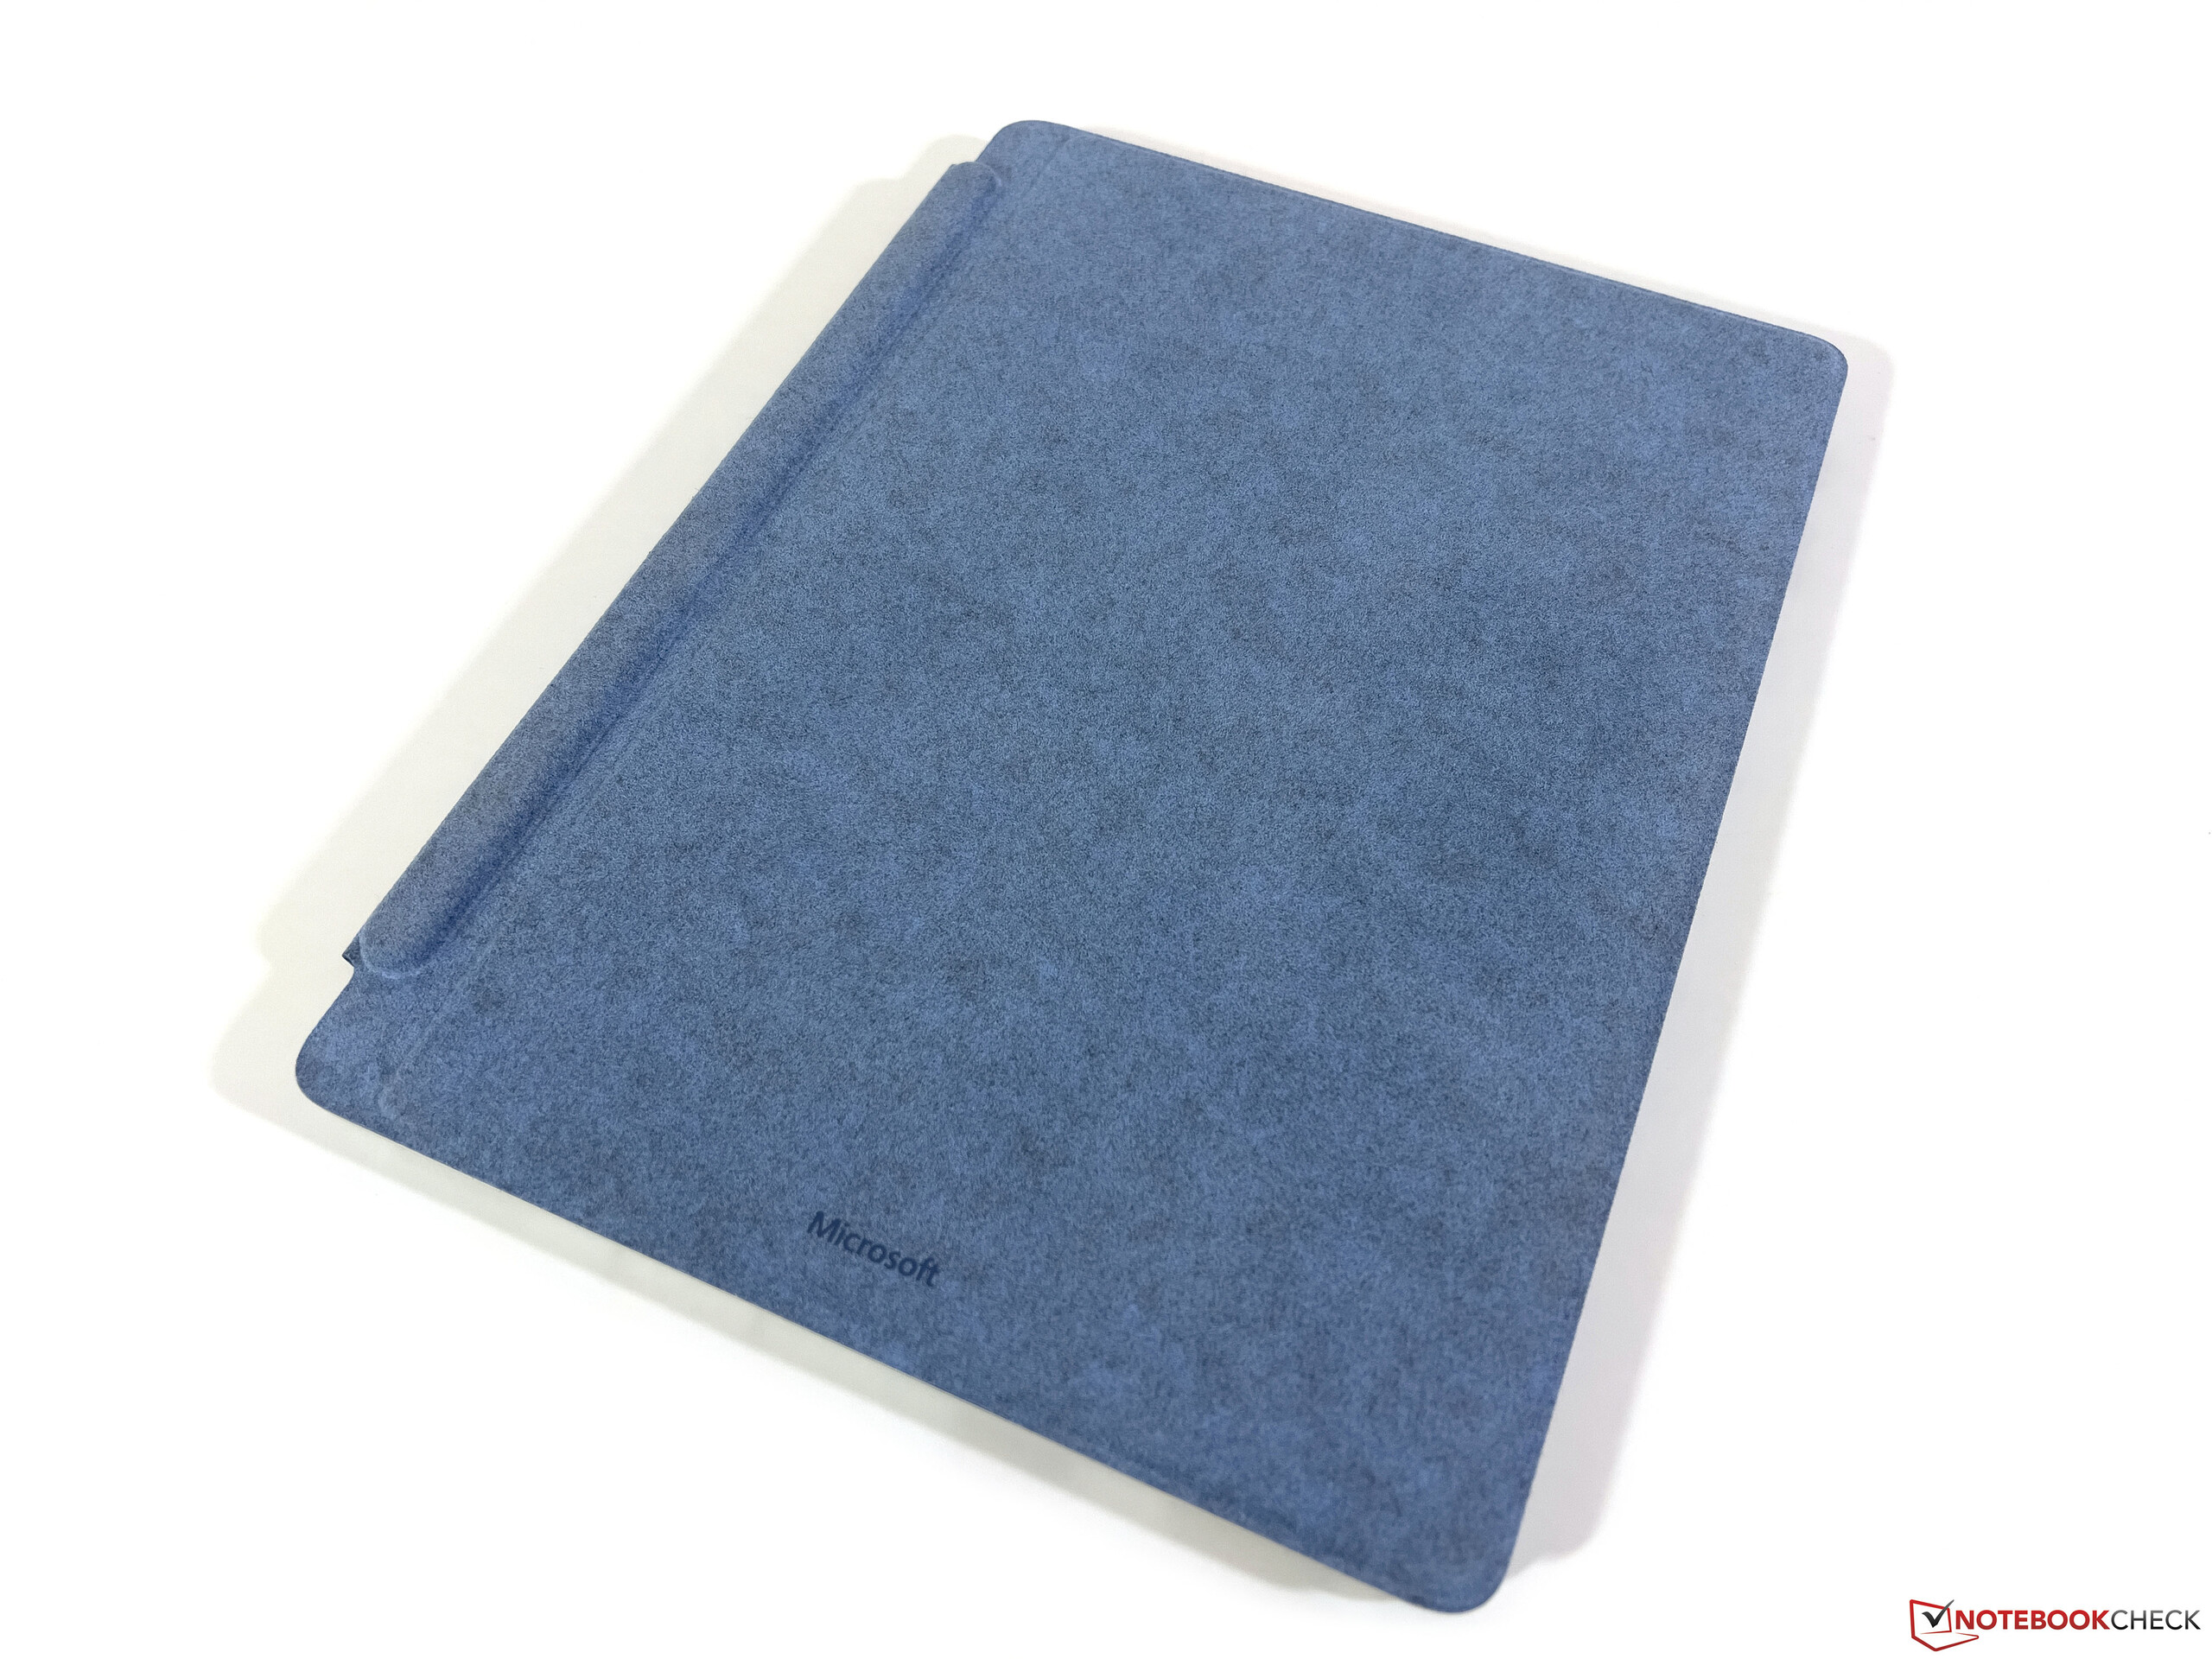
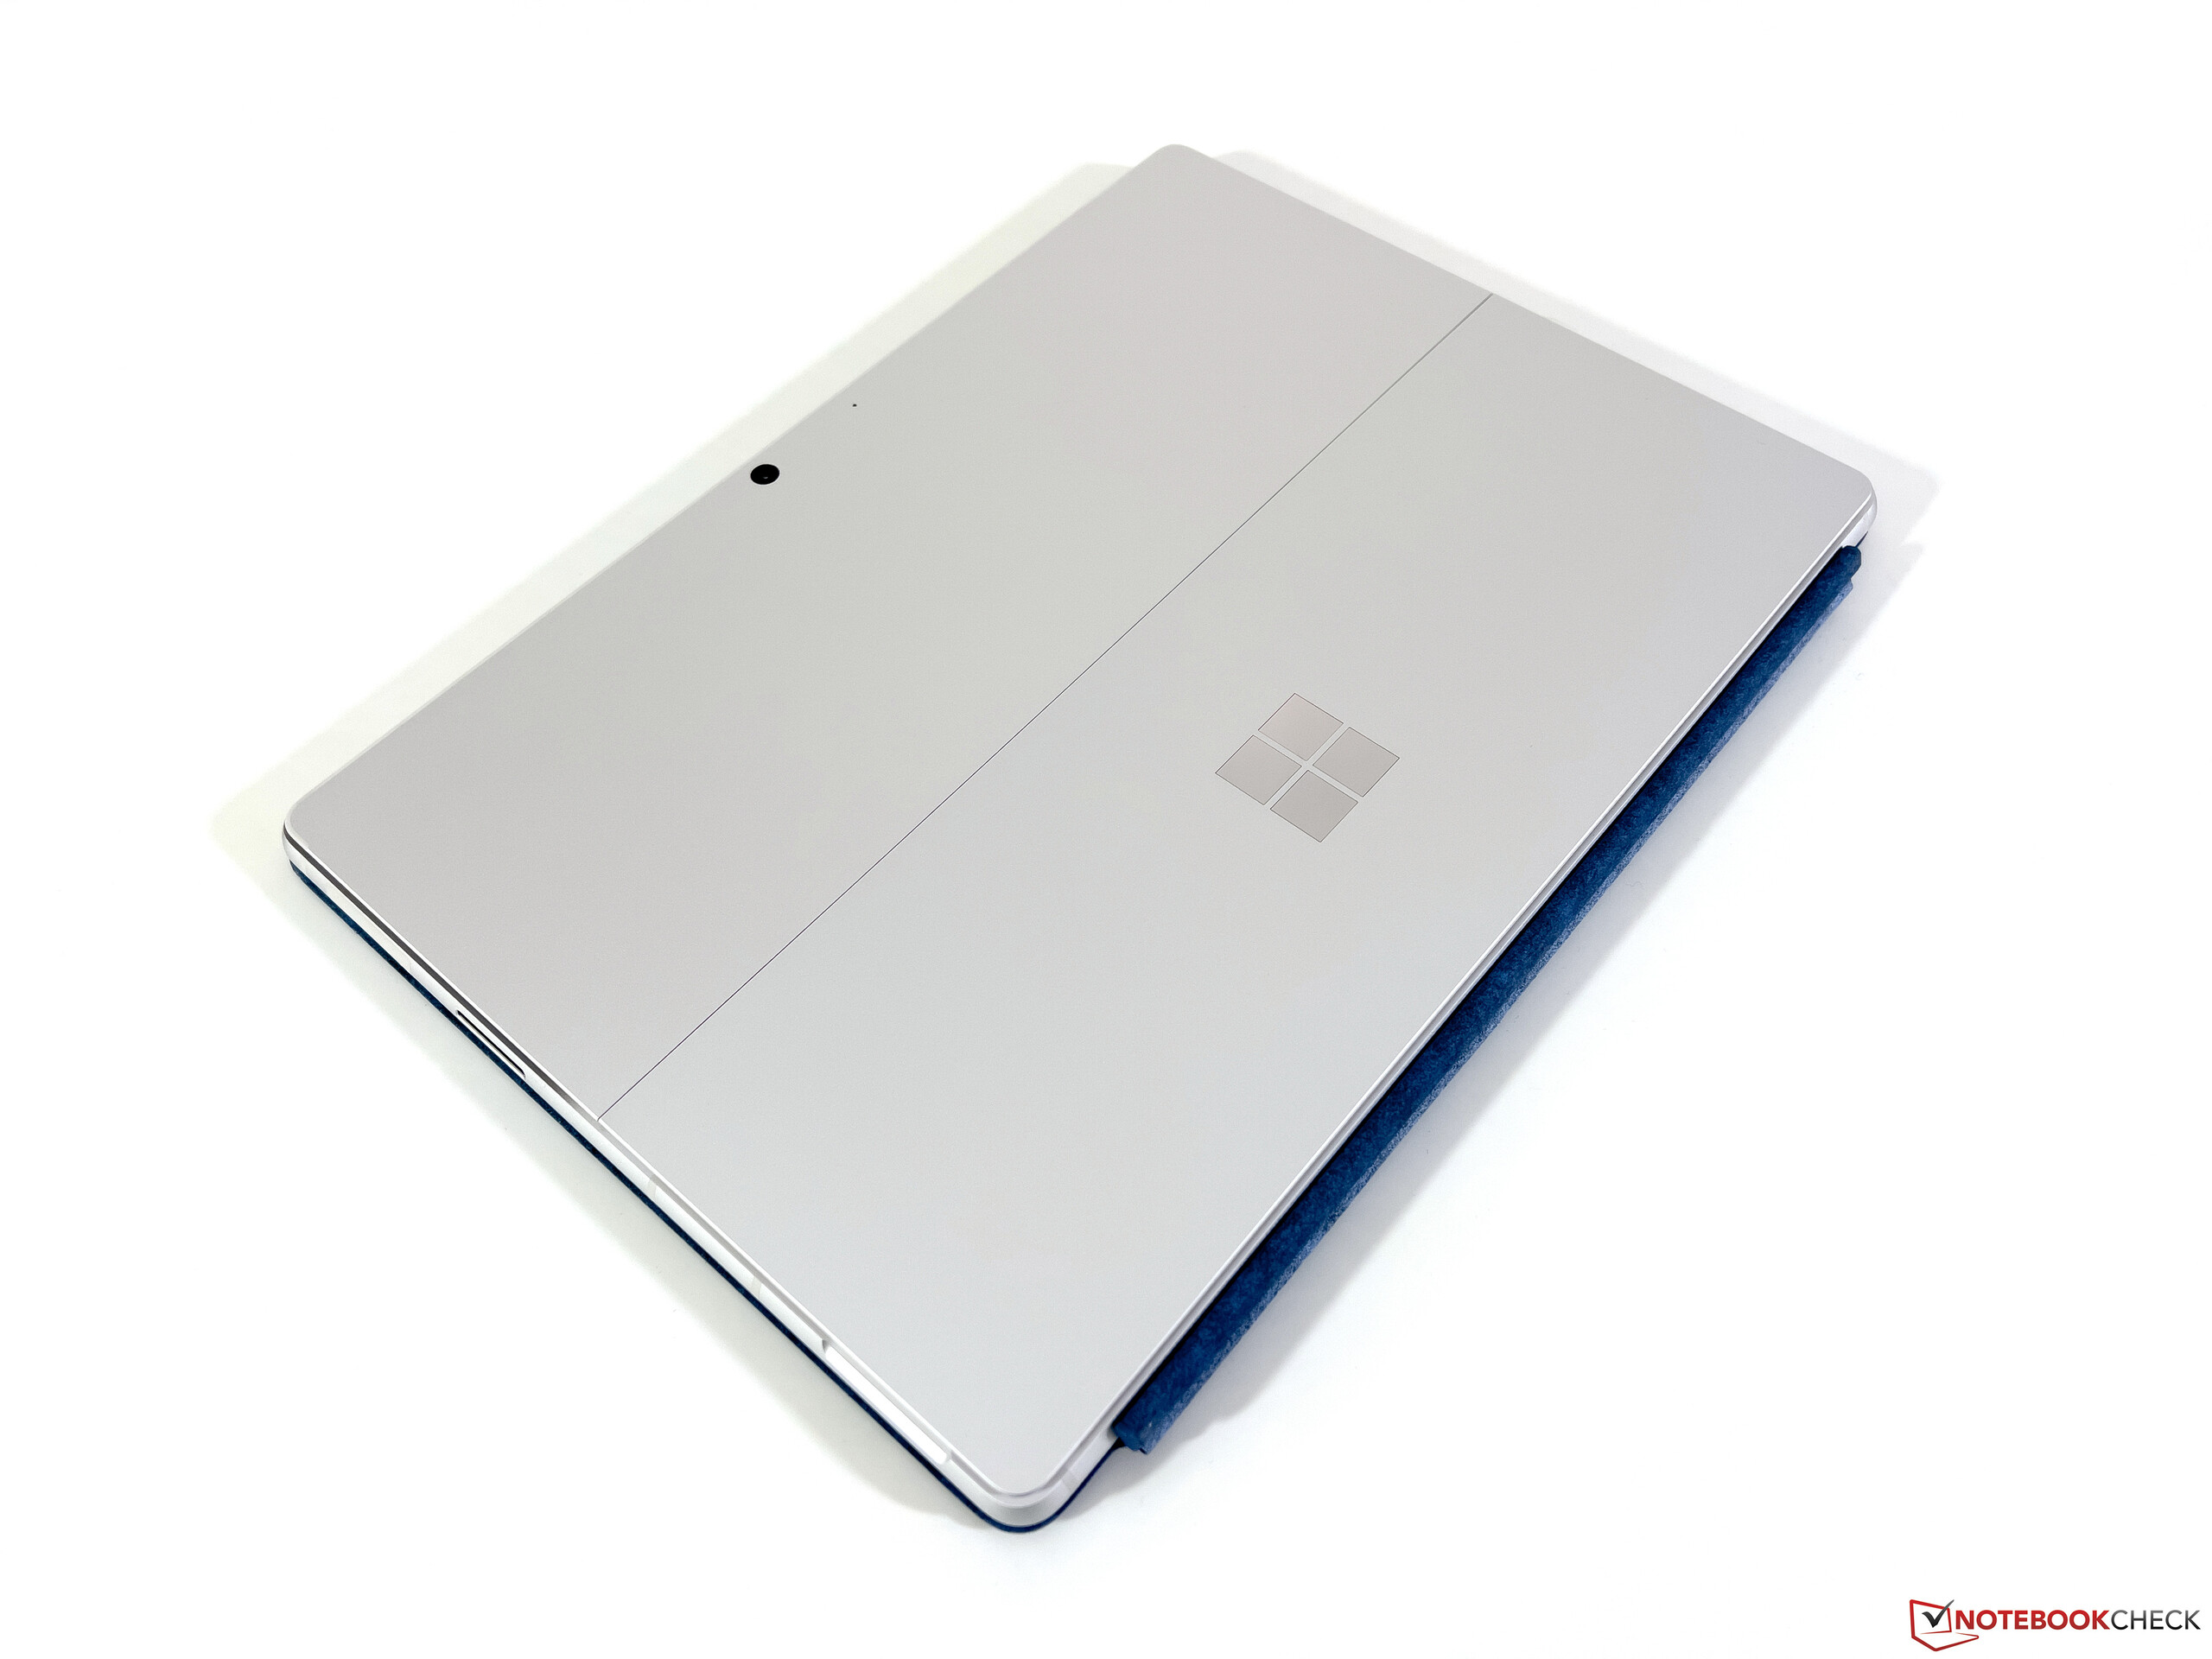
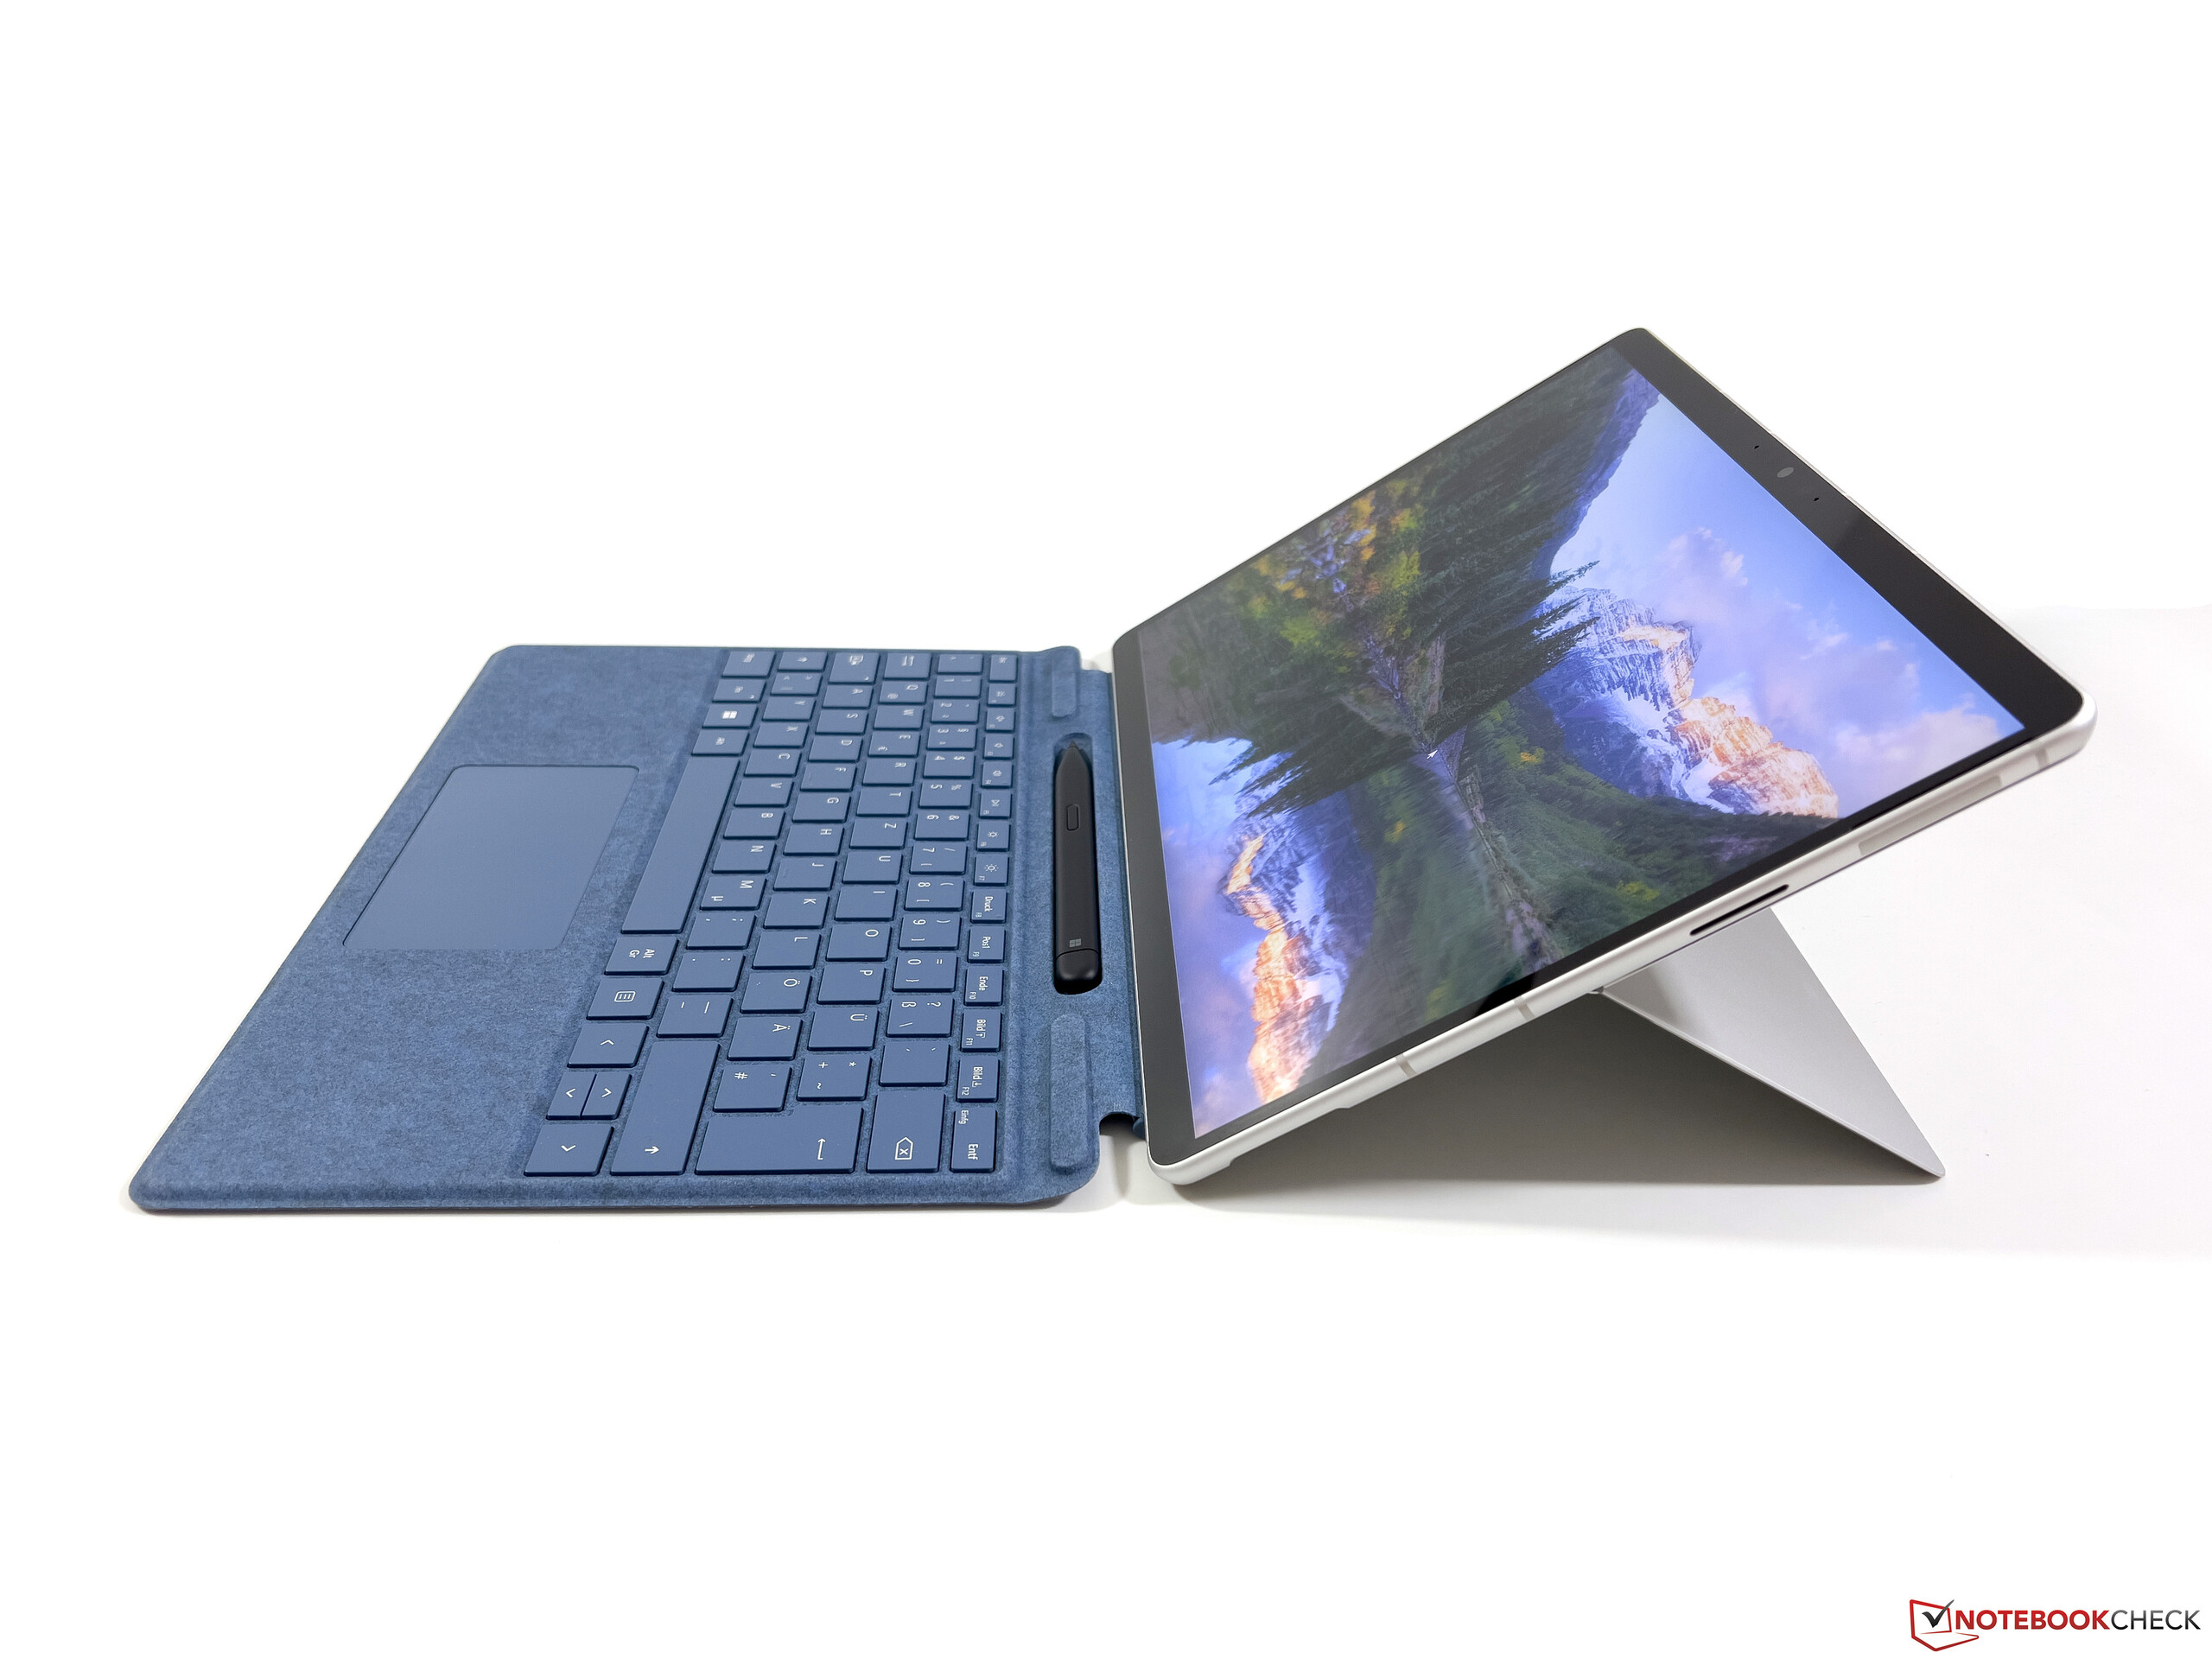
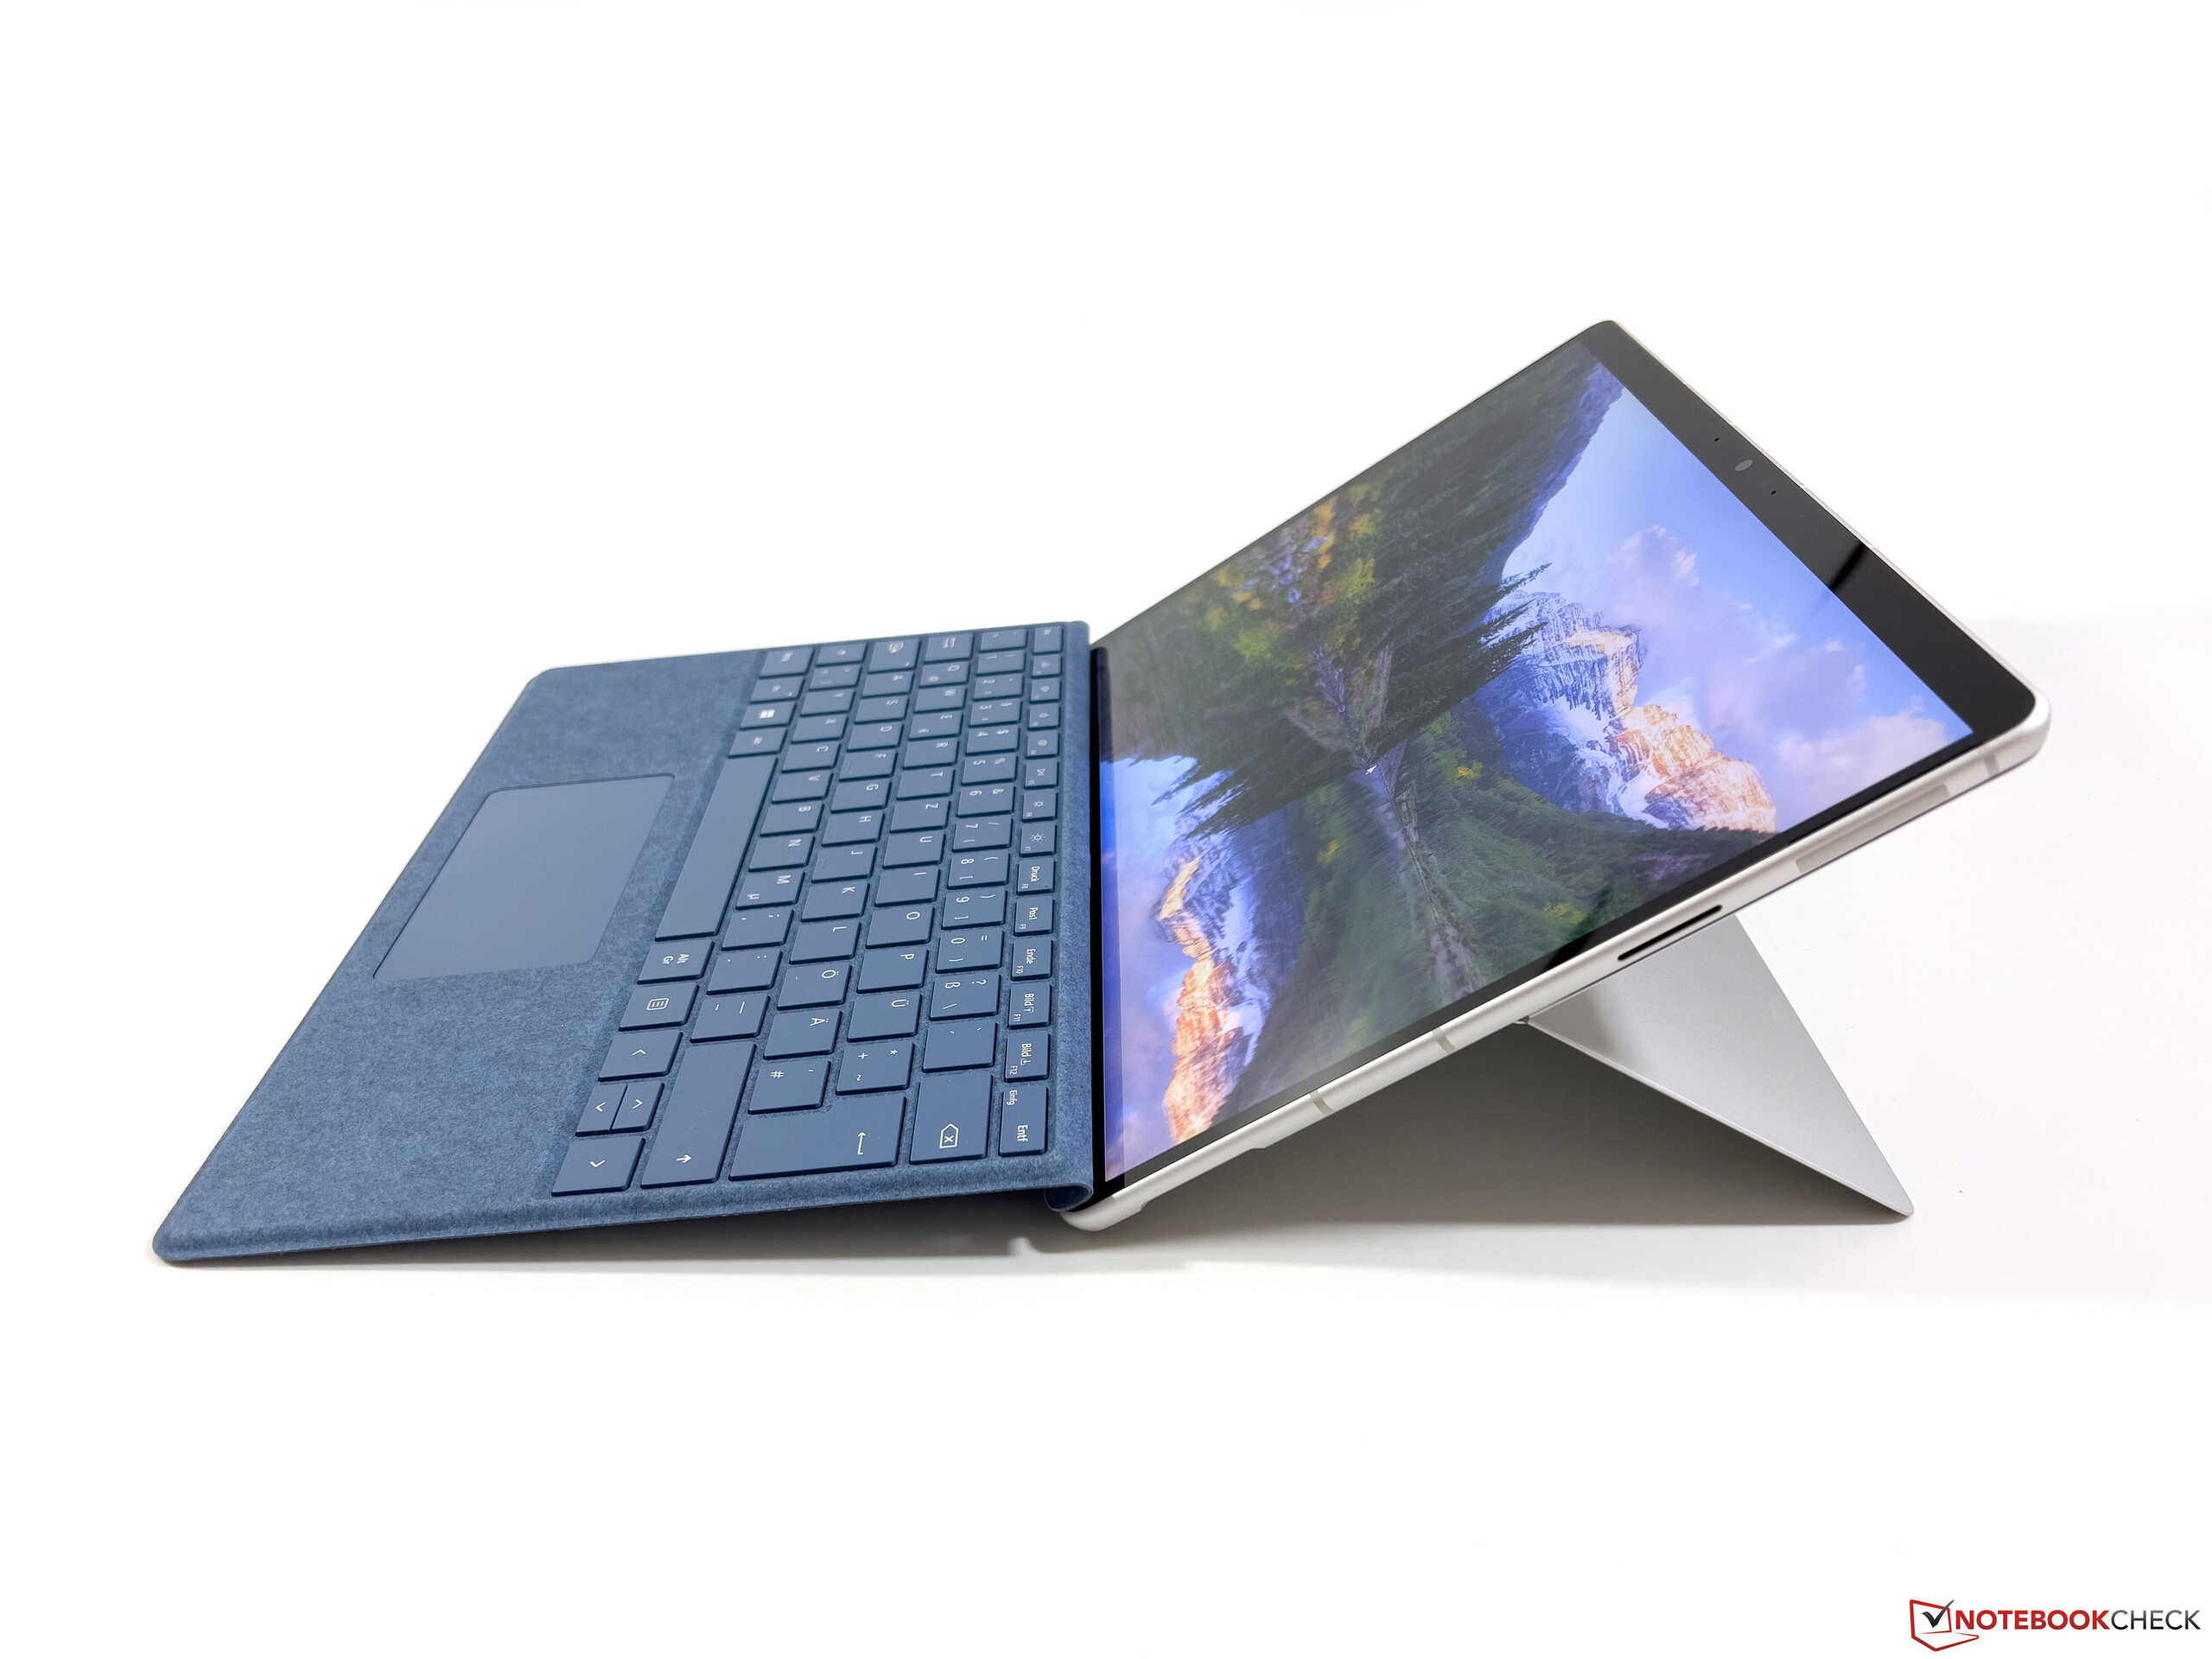
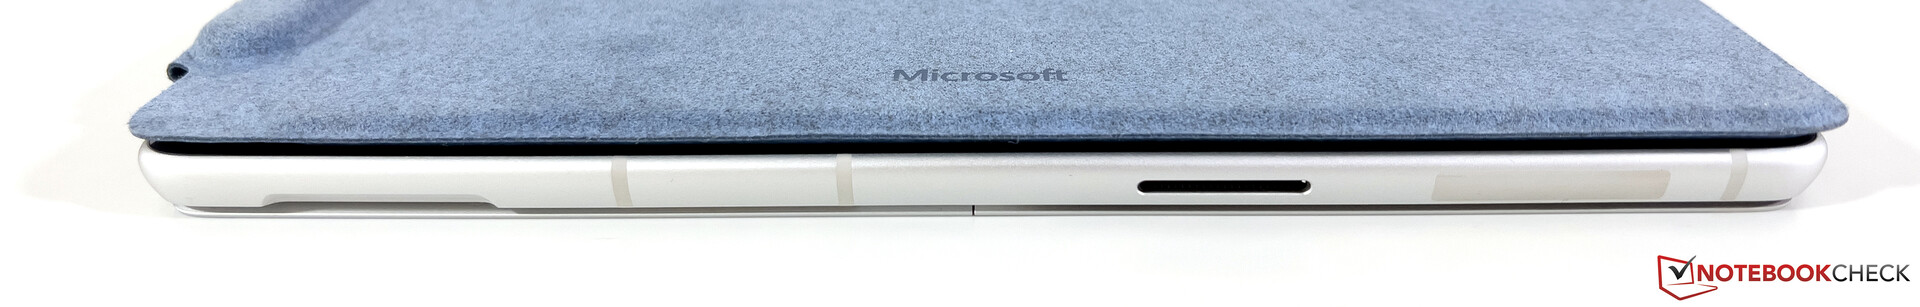
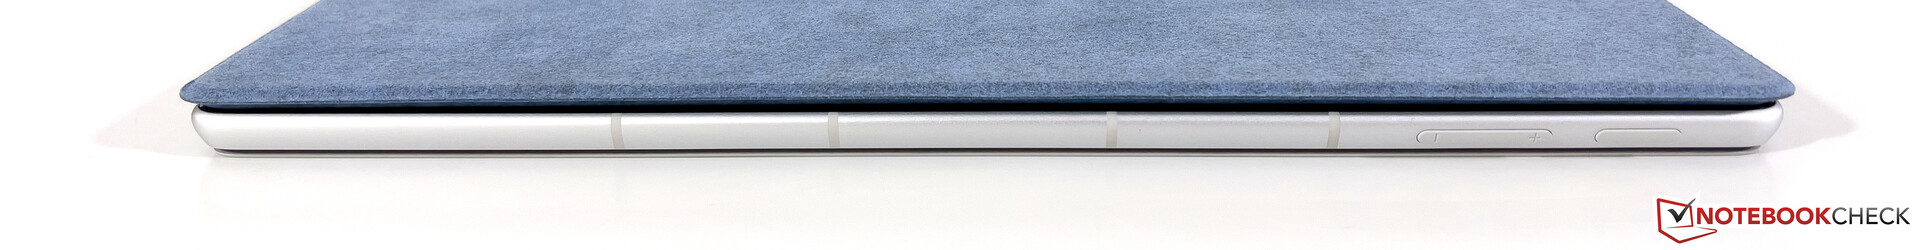
Basically, the two versions of the Surface Pro 9 look practically identical in terms of their exterior. Since it is cooled passively, the ARM model only lacks the fan vents. It is also only available in dark gray or silver color. The size of the case is identical, so that the same keyboards can be used. The ARM model is only 6 grams (~0.2 oz) heavier. In addition, the charger is weaker at 39 watts but also slightly lighter (210 vs. 260 grams, ~7.4 vs. 9.2 oz). The maintenance flap on the back, which is very easy to open in the Intel model, requires a SIM tool again in the ARM model.
The built-in 5G module is another significant difference between the two models, since in contrast to earlier generations, Microsoft doesn't offer a WWAN module for the Intel model anymore. The Surface Pro 9 with the Qualcomm SoC can support either a NanoSIM or an eSIM. To test this, we used a NanoSIM from Telekom and were able to connect to the 5G net without any problems.
Like the AX211 module of the Intel version, the WLAN module (Qualcomm WCN685x) supports the current Wi-Fi 6E standard, and we were able to connect to the 6-GHz network of our Asus reference router without any problems. The transfer rates are stable, but the sending performance is slightly weaker overall. However, you should not encounter any limitations here in everyday operation.
Finally, the Qualcomm SoC also offers some studio effects for the built-in cameras. For example, you can change the background, or the camera can keep the person focused in the center of the image, which works acceptably well.
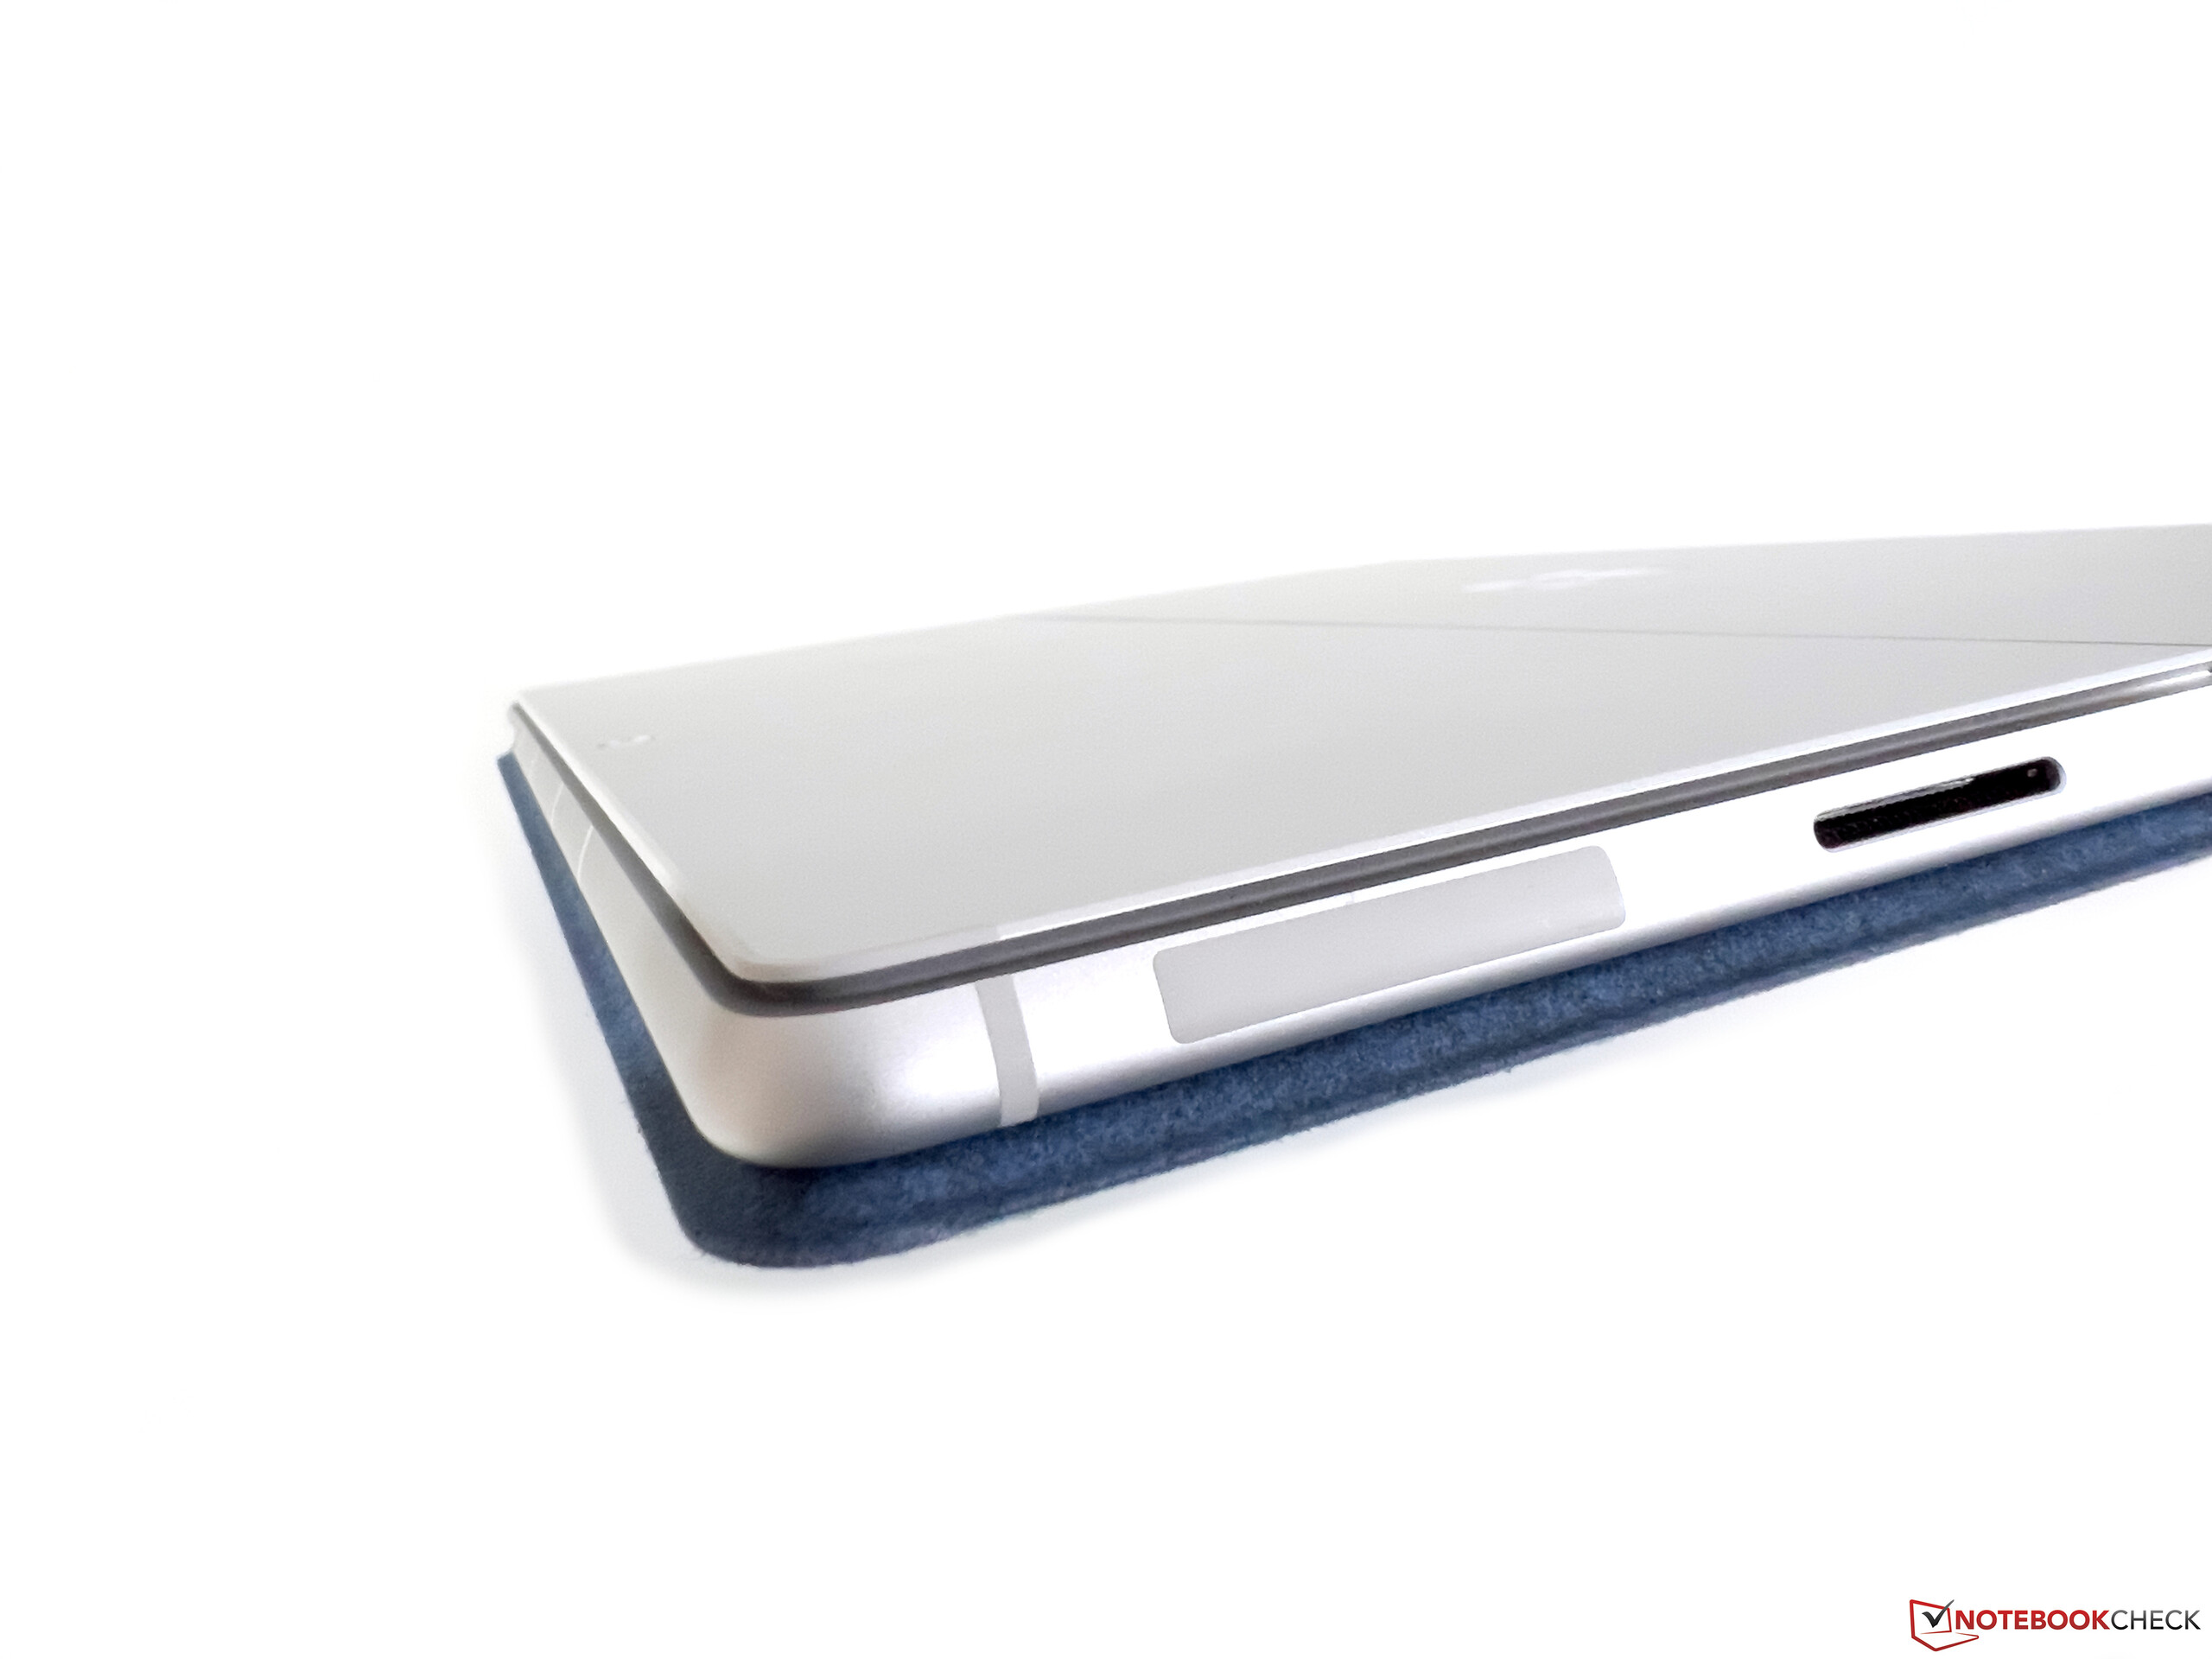
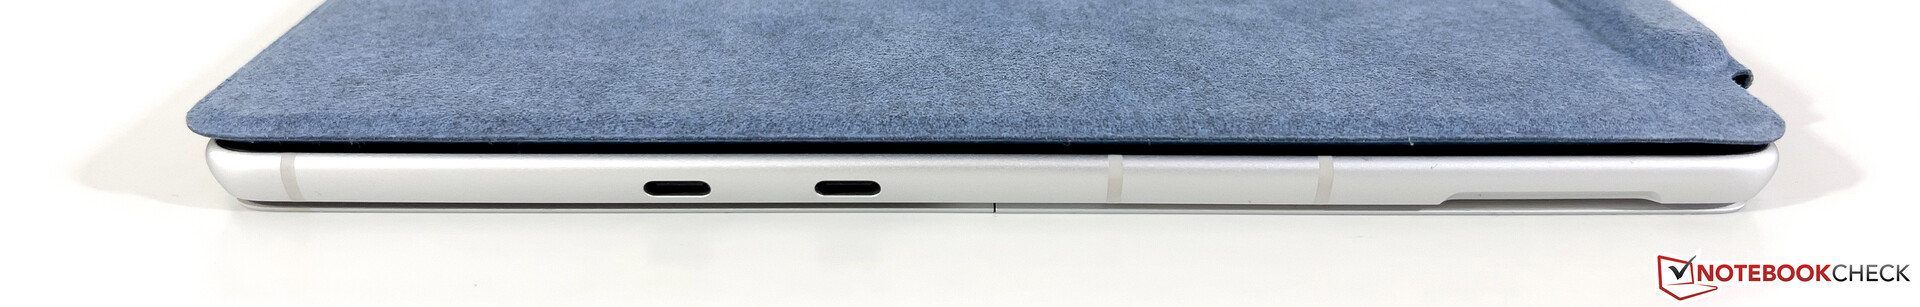
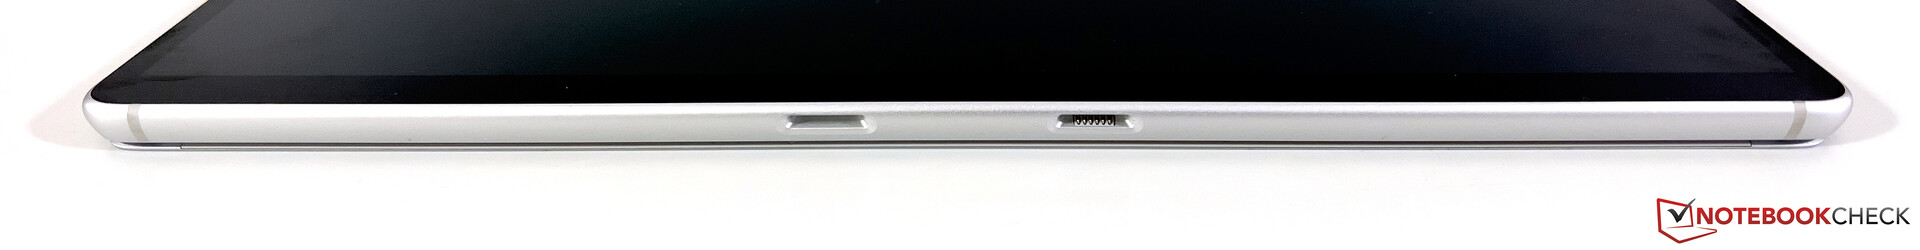
The ARM model also offers the Surface Connect port for Microsoft's own accessories, but the Thunderbolt 4 support is missing here. The two USB-C ports only support the USB-3.2 standard including the charging function and image output.
| Networking | |
| Microsoft Surface Pro 9, ARM | |
| iperf3 transmit AXE11000 6GHz | |
| iperf3 receive AXE11000 6GHz | |
| Microsoft Surface Pro 9, i7-1255U | |
| iperf3 transmit AXE11000 6GHz | |
| iperf3 receive AXE11000 6GHz | |
| Microsoft Surface Pro X | |
| iperf3 transmit AX12 | |
| iperf3 receive AX12 | |
| Lenovo ThinkPad X13s Gen 1 21BX000QGE | |
| iperf3 transmit AXE11000 | |
| iperf3 receive AXE11000 | |
| HP EliteBook Folio 13.5-3G2L2EA | |
| iperf3 transmit AX12 | |
| iperf3 receive AX12 | |
| Apple iPad Pro 12.9 2022 | |
| iperf3 transmit AXE11000 | |
| iperf3 receive AXE11000 | |
| iperf3 transmit AXE11000 6GHz | |
| iperf3 receive AXE11000 6GHz | |
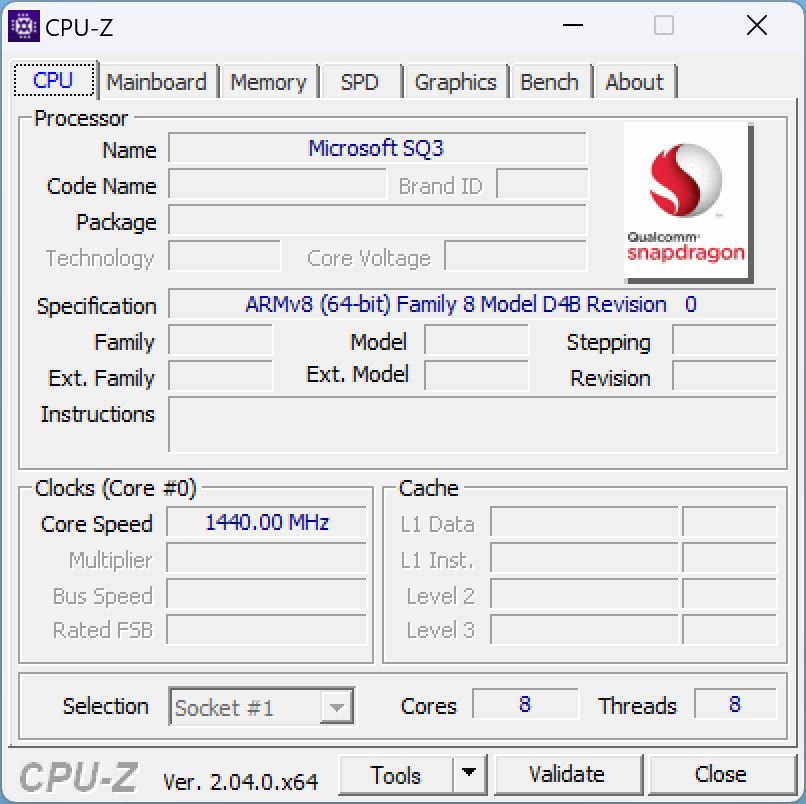
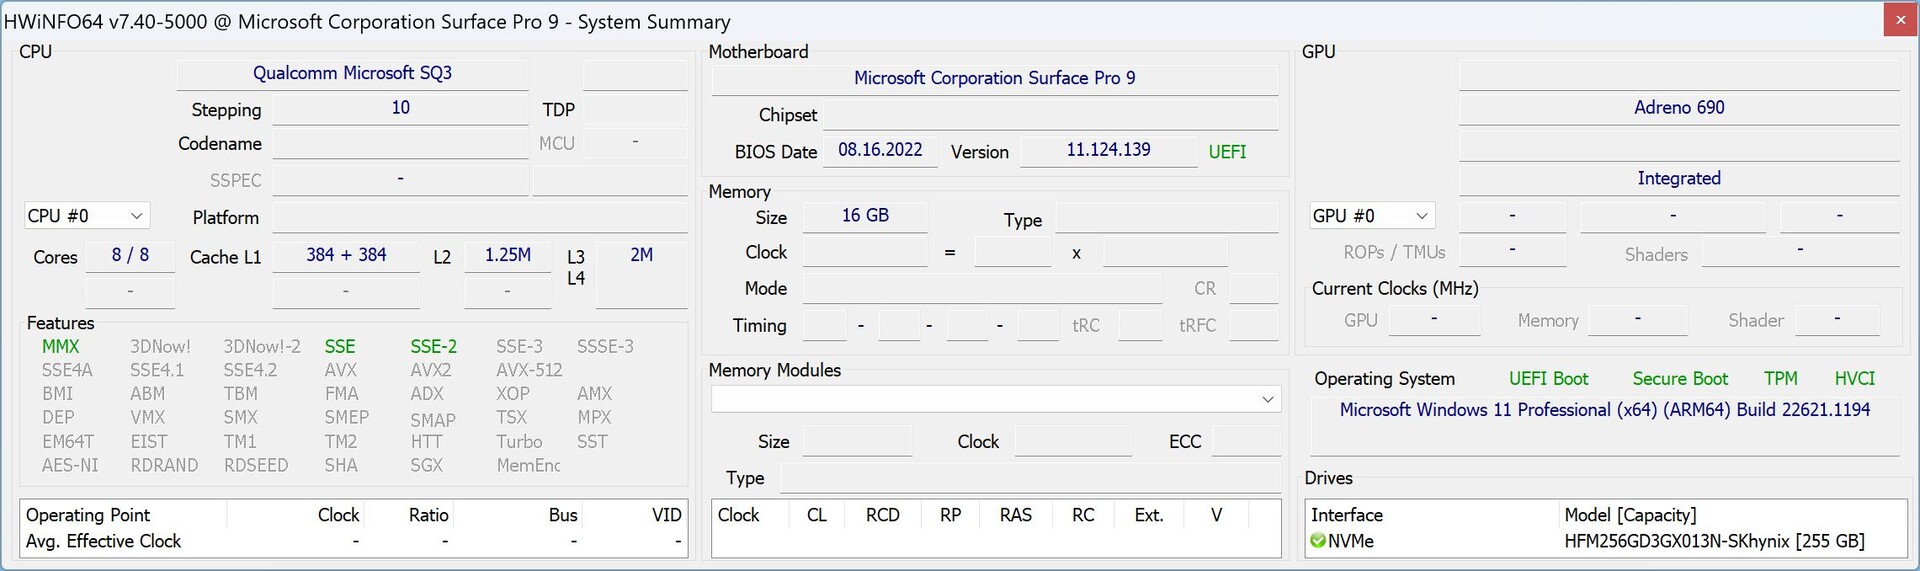
Performance - Microsoft SQ3 alias Snapdragon 8cx Gen 3
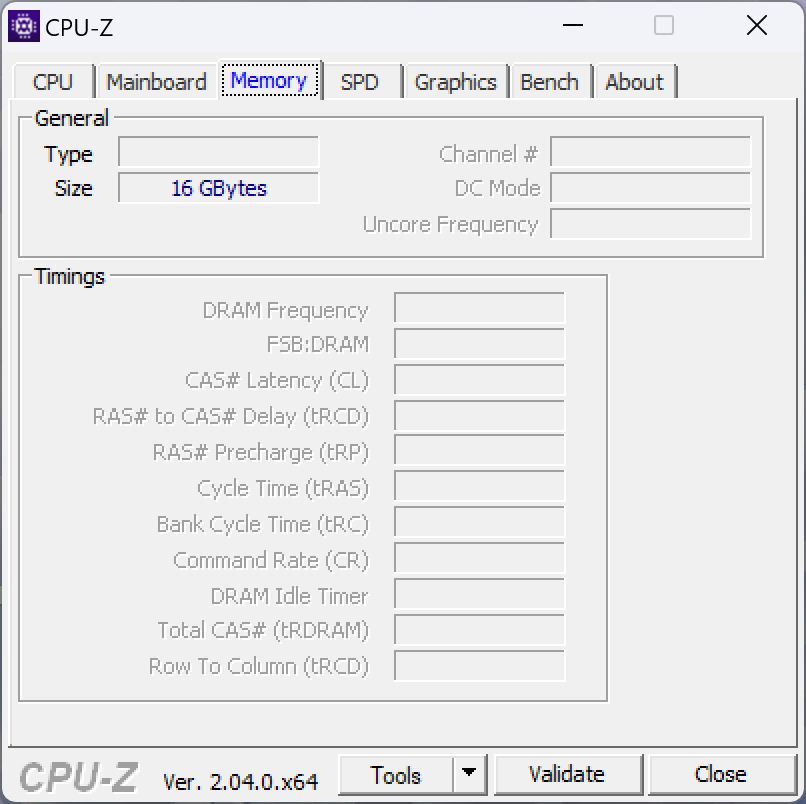
In the new Surface Pro 9 ARM, Microsoft uses the SQ3 SoC, which is another name for a Qualcomm Snapdragon 8cx Gen 3 that is also used in the Lenovo ThinkPad X13s, for example. The Adreno 690 GPU serves as the graphics card, and the SoC can be supported by either 8 or 16 GB of RAM. For the SSD, you can choose from 128 GB up to 512 GB, but it is also possible to replace the compact M.2-2230 SSD later as well.
Test Conditions
There are no specific power modes, and we are also unable to reliably measure neither the clock speed nor the TDP of the processor. According to Qualcomm, the consumption lies at 7 watts. However, under load that should increase to almost 30 watts, judging from the power consumption of the device.
Compared to our earlier test of the Surface Pro X with the SQ1 SoC, Microsoft now supports the emulation of 64-bit applications, allowing us to also run significantly more benchmarks. But as before, it still doesn't support all applications.
Processor - Qualcomm 8cx Gen 3
The Qualcomm 8cx Gen 3 chip is an ARM processor with four performance (up to 3 GHz) and four efficiency cores (up to 2.4 GHz), which roughly corresponds to the design concepts of the Apple M2 and the current Intel mobile processors.
The multicore performance of the 8cx Gen 3 is basically not bad at all, corresponding to the approximate level of the old Surface Pro 7 with Core i7-1065G7. However, the problem is the weak single-core performance, which is also easily noticeable in everyday operation. The Surface Pro 9 simply has no chance against the modern Intel CPUs or even Apple's own ARM processors such as the Apple M2 here.
The CPU performance is not reduced in battery operation. You can find additional CPU benchmarks in our technical section.
Cinebench R15 Multi Constant Load Test
Cinebench R20: CPU (Multi Core) | CPU (Single Core)
Cinebench R15: CPU Multi 64Bit | CPU Single 64Bit
Blender: v2.79 BMW27 CPU
7-Zip 18.03: 7z b 4 | 7z b 4 -mmt1
Geekbench 5.5: Multi-Core | Single-Core
HWBOT x265 Benchmark v2.2: 4k Preset
LibreOffice : 20 Documents To PDF
R Benchmark 2.5: Overall mean
| Cinebench R23 / Multi Core | |
| Average of class Convertible (1317 - 30959, n=51, last 2 years) | |
| Microsoft Surface Pro 9, i7-1255U | |
| Apple MacBook Air M2 Entry | |
| Microsoft Surface Pro 8, i7-1185G7 | |
| Microsoft Surface Pro 7 Plus | |
| Average Qualcomm Snapdragon 8cx Gen 3 (3534 - 3709, n=3) | |
| Microsoft Surface Pro 9, ARM | |
| Lenovo ThinkPad X13s Gen 1 21BX000QGE | |
| Cinebench R23 / Single Core | |
| Average of class Convertible (740 - 2188, n=51, last 2 years) | |
| Microsoft Surface Pro 9, i7-1255U | |
| Apple MacBook Air M2 Entry | |
| Microsoft Surface Pro 8, i7-1185G7 | |
| Microsoft Surface Pro 7 Plus | |
| Microsoft Surface Pro 9, ARM | |
| Lenovo ThinkPad X13s Gen 1 21BX000QGE | |
| Average Qualcomm Snapdragon 8cx Gen 3 (559 - 608, n=3) | |
| Cinebench R20 / CPU (Multi Core) | |
| Average of class Convertible (595 - 12102, n=51, last 2 years) | |
| Microsoft Surface Pro 9, i7-1255U | |
| Apple MacBook Air M2 Entry | |
| Microsoft Surface Pro 8, i7-1185G7 | |
| Microsoft Surface Pro 7 Plus | |
| Microsoft Surface Pro 9, ARM | |
| Average Qualcomm Snapdragon 8cx Gen 3 (810 - 1258, n=3) | |
| Lenovo ThinkPad X13s Gen 1 21BX000QGE | |
| Cinebench R20 / CPU (Single Core) | |
| Average of class Convertible (273 - 834, n=51, last 2 years) | |
| Microsoft Surface Pro 9, i7-1255U | |
| Microsoft Surface Pro 8, i7-1185G7 | |
| Microsoft Surface Pro 7 Plus | |
| Lenovo ThinkPad X13s Gen 1 21BX000QGE | |
| Apple MacBook Air M2 Entry | |
| Average Qualcomm Snapdragon 8cx Gen 3 (199 - 222, n=3) | |
| Microsoft Surface Pro 9, ARM | |
| Cinebench R15 / CPU Multi 64Bit | |
| Average of class Convertible (478 - 4940, n=50, last 2 years) | |
| Microsoft Surface Pro 9, i7-1255U | |
| Apple MacBook Air M2 Entry | |
| Microsoft Surface Pro 8, i7-1185G7 | |
| Microsoft Surface Pro 7 Plus | |
| Microsoft Surface Pro 9, ARM | |
| Average Qualcomm Snapdragon 8cx Gen 3 (723 - 774, n=2) | |
| Cinebench R15 / CPU Single 64Bit | |
| Average of class Convertible (149.8 - 317, n=50, last 2 years) | |
| Microsoft Surface Pro 8, i7-1185G7 | |
| Apple MacBook Air M2 Entry | |
| Microsoft Surface Pro 9, i7-1255U | |
| Microsoft Surface Pro 7 Plus | |
| Microsoft Surface Pro 9, ARM | |
| Average Qualcomm Snapdragon 8cx Gen 3 (119 - 119.1, n=2) | |
| Blender / v2.79 BMW27 CPU | |
| Lenovo ThinkPad X13s Gen 1 21BX000QGE | |
| Average Qualcomm Snapdragon 8cx Gen 3 (1059 - 1600, n=3) | |
| Microsoft Surface Pro 9, ARM | |
| Microsoft Surface Pro 7 Plus | |
| Apple MacBook Air M2 Entry | |
| Microsoft Surface Pro 8, i7-1185G7 | |
| Microsoft Surface Pro 9, i7-1255U | |
| Average of class Convertible (105 - 1051, n=50, last 2 years) | |
| 7-Zip 18.03 / 7z b 4 | |
| Average of class Convertible (12977 - 121368, n=50, last 2 years) | |
| Microsoft Surface Pro 9, i7-1255U | |
| Microsoft Surface Pro 8, i7-1185G7 | |
| Microsoft Surface Pro 9, ARM | |
| Microsoft Surface Pro 7 Plus | |
| Average Qualcomm Snapdragon 8cx Gen 3 (16223 - 24505, n=3) | |
| Lenovo ThinkPad X13s Gen 1 21BX000QGE | |
| 7-Zip 18.03 / 7z b 4 -mmt1 | |
| Average of class Convertible (3672 - 6655, n=50, last 2 years) | |
| Microsoft Surface Pro 8, i7-1185G7 | |
| Microsoft Surface Pro 9, i7-1255U | |
| Microsoft Surface Pro 7 Plus | |
| Microsoft Surface Pro 9, ARM | |
| Average Qualcomm Snapdragon 8cx Gen 3 (3874 - 3946, n=3) | |
| Lenovo ThinkPad X13s Gen 1 21BX000QGE | |
| Geekbench 5.5 / Multi-Core | |
| Average of class Convertible (1608 - 22023, n=50, last 2 years) | |
| Apple MacBook Air M2 Entry | |
| Microsoft Surface Pro 9, i7-1255U | |
| Apple iPad Pro 12.9 2022 | |
| Microsoft Surface Pro 9, ARM | |
| Average Qualcomm Snapdragon 8cx Gen 3 (4457 - 7522, n=2) | |
| Microsoft Surface Pro 8, i7-1185G7 | |
| Microsoft Surface Pro 7 Plus | |
| Lenovo ThinkPad X13s Gen 1 21BX000QGE | |
| HP EliteBook Folio 13.5-3G2L2EA | |
| Microsoft Surface Pro X | |
| Geekbench 5.5 / Single-Core | |
| Apple MacBook Air M2 Entry | |
| Apple iPad Pro 12.9 2022 | |
| Average of class Convertible (806 - 2275, n=50, last 2 years) | |
| Microsoft Surface Pro 9, i7-1255U | |
| Microsoft Surface Pro 9, ARM | |
| Average Qualcomm Snapdragon 8cx Gen 3 (1486 - 1690, n=2) | |
| Microsoft Surface Pro 8, i7-1185G7 | |
| Lenovo ThinkPad X13s Gen 1 21BX000QGE | |
| Microsoft Surface Pro 7 Plus | |
| HP EliteBook Folio 13.5-3G2L2EA | |
| Microsoft Surface Pro X | |
| HWBOT x265 Benchmark v2.2 / 4k Preset | |
| Average of class Convertible (3.43 - 36.2, n=50, last 2 years) | |
| Microsoft Surface Pro 9, i7-1255U | |
| Microsoft Surface Pro 8, i7-1185G7 | |
| Microsoft Surface Pro 7 Plus | |
| Microsoft Surface Pro 9, ARM | |
| Average Qualcomm Snapdragon 8cx Gen 3 (1.5 - 2.68, n=3) | |
| Lenovo ThinkPad X13s Gen 1 21BX000QGE | |
| LibreOffice / 20 Documents To PDF | |
| Microsoft Surface Pro 9, ARM | |
| Average Qualcomm Snapdragon 8cx Gen 3 (115.5 - 121.5, n=3) | |
| Lenovo ThinkPad X13s Gen 1 21BX000QGE | |
| Microsoft Surface Pro 7 Plus | |
| Average of class Convertible (42.5 - 84.3, n=50, last 2 years) | |
| Microsoft Surface Pro 9, i7-1255U | |
| Microsoft Surface Pro 8, i7-1185G7 | |
| R Benchmark 2.5 / Overall mean | |
| Microsoft Surface Pro 9, ARM | |
| Average Qualcomm Snapdragon 8cx Gen 3 (1.011 - 1.013, n=3) | |
| Lenovo ThinkPad X13s Gen 1 21BX000QGE | |
| Microsoft Surface Pro 7 Plus | |
| Microsoft Surface Pro 8, i7-1185G7 | |
| Microsoft Surface Pro 9, i7-1255U | |
| Average of class Convertible (0.3915 - 0.84, n=50, last 2 years) | |
* ... smaller is better
AIDA64: FP32 Ray-Trace | FPU Julia | CPU SHA3 | CPU Queen | FPU SinJulia | FPU Mandel | CPU AES | CPU ZLib | FP64 Ray-Trace | CPU PhotoWorxx
| Performance rating | |
| Average of class Convertible | |
| Microsoft Surface Pro 9, i7-1255U | |
| Microsoft Surface Pro 8, i7-1185G7 | |
| Microsoft Surface Pro 7 Plus | |
| Microsoft Surface Pro 9, ARM | |
| Average Qualcomm Snapdragon 8cx Gen 3 | |
| Lenovo ThinkPad X13s Gen 1 21BX000QGE | |
| AIDA64 / FP32 Ray-Trace | |
| Average of class Convertible (1480 - 64158, n=50, last 2 years) | |
| Microsoft Surface Pro 9, i7-1255U | |
| Microsoft Surface Pro 8, i7-1185G7 | |
| Microsoft Surface Pro 7 Plus | |
| Microsoft Surface Pro 9, ARM | |
| Average Qualcomm Snapdragon 8cx Gen 3 (343 - 2627, n=3) | |
| Lenovo ThinkPad X13s Gen 1 21BX000QGE | |
| AIDA64 / FPU Julia | |
| Average of class Convertible (11392 - 184800, n=50, last 2 years) | |
| Microsoft Surface Pro 9, i7-1255U | |
| Microsoft Surface Pro 8, i7-1185G7 | |
| Microsoft Surface Pro 7 Plus | |
| Lenovo ThinkPad X13s Gen 1 21BX000QGE | |
| Average Qualcomm Snapdragon 8cx Gen 3 (13729 - 14650, n=3) | |
| Microsoft Surface Pro 9, ARM | |
| AIDA64 / CPU SHA3 | |
| Average of class Convertible (797 - 8291, n=50, last 2 years) | |
| Microsoft Surface Pro 9, i7-1255U | |
| Microsoft Surface Pro 8, i7-1185G7 | |
| Microsoft Surface Pro 7 Plus | |
| Microsoft Surface Pro 9, ARM | |
| Average Qualcomm Snapdragon 8cx Gen 3 (453 - 1144, n=3) | |
| Lenovo ThinkPad X13s Gen 1 21BX000QGE | |
| AIDA64 / CPU Queen | |
| Microsoft Surface Pro 9, i7-1255U | |
| Average of class Convertible (14686 - 148874, n=41, last 2 years) | |
| Microsoft Surface Pro 8, i7-1185G7 | |
| Microsoft Surface Pro 7 Plus | |
| Microsoft Surface Pro 9, ARM | |
| Average Qualcomm Snapdragon 8cx Gen 3 (15447 - 27474, n=3) | |
| Lenovo ThinkPad X13s Gen 1 21BX000QGE | |
| AIDA64 / FPU SinJulia | |
| Average of class Convertible (1120 - 29155, n=50, last 2 years) | |
| Microsoft Surface Pro 9, i7-1255U | |
| Microsoft Surface Pro 8, i7-1185G7 | |
| Microsoft Surface Pro 7 Plus | |
| Microsoft Surface Pro 9, ARM | |
| Lenovo ThinkPad X13s Gen 1 21BX000QGE | |
| Average Qualcomm Snapdragon 8cx Gen 3 (1161 - 1257, n=3) | |
| AIDA64 / FPU Mandel | |
| Average of class Convertible (4929 - 97193, n=50, last 2 years) | |
| Microsoft Surface Pro 9, i7-1255U | |
| Microsoft Surface Pro 8, i7-1185G7 | |
| Microsoft Surface Pro 7 Plus | |
| Lenovo ThinkPad X13s Gen 1 21BX000QGE | |
| Average Qualcomm Snapdragon 8cx Gen 3 (7085 - 7704, n=3) | |
| Microsoft Surface Pro 9, ARM | |
| AIDA64 / CPU AES | |
| Average of class Convertible (5271 - 190280, n=50, last 2 years) | |
| Microsoft Surface Pro 9, i7-1255U | |
| Microsoft Surface Pro 8, i7-1185G7 | |
| Microsoft Surface Pro 7 Plus | |
| Microsoft Surface Pro 9, ARM | |
| Average Qualcomm Snapdragon 8cx Gen 3 (638 - 1279, n=3) | |
| Lenovo ThinkPad X13s Gen 1 21BX000QGE | |
| AIDA64 / CPU ZLib | |
| Average of class Convertible (218 - 2017, n=50, last 2 years) | |
| Microsoft Surface Pro 9, i7-1255U | |
| Microsoft Surface Pro 9, ARM | |
| Average Qualcomm Snapdragon 8cx Gen 3 (398 - 412, n=3) | |
| Lenovo ThinkPad X13s Gen 1 21BX000QGE | |
| Microsoft Surface Pro 8, i7-1185G7 | |
| Microsoft Surface Pro 7 Plus | |
| AIDA64 / FP64 Ray-Trace | |
| Average of class Convertible (1169 - 34297, n=50, last 2 years) | |
| Microsoft Surface Pro 9, i7-1255U | |
| Microsoft Surface Pro 8, i7-1185G7 | |
| Microsoft Surface Pro 7 Plus | |
| Microsoft Surface Pro 9, ARM | |
| Average Qualcomm Snapdragon 8cx Gen 3 (204 - 1379, n=3) | |
| Lenovo ThinkPad X13s Gen 1 21BX000QGE | |
| AIDA64 / CPU PhotoWorxx | |
| Average of class Convertible (14193 - 85327, n=50, last 2 years) | |
| Microsoft Surface Pro 9, i7-1255U | |
| Microsoft Surface Pro 7 Plus | |
| Microsoft Surface Pro 8, i7-1185G7 | |
| Microsoft Surface Pro 9, ARM | |
| Average Qualcomm Snapdragon 8cx Gen 3 (7622 - 14660, n=3) | |
| Lenovo ThinkPad X13s Gen 1 21BX000QGE | |
In addition, we also want to take a brief look at the efficiency of the Qualcomm processor. While the 8cx Gen 3 is able to place just barely ahead of the competitors from Intel and AMD in the single-core efficiency, this doesn't help much, since the single-core performance is very low overall, which has an effect on the subjective performance of the device.
The efficiency is really bad in the multi-core test. We can confirm this, since despite its mediocre performance, the device pulls 40 watts from the outlet under full load, so around 30 watts go to the processor. We cannot really call this efficient at all.
| Power Consumption | |
| Cinebench R23 Multi Power Efficiency - external Monitor | |
| Apple MacBook Air M2 Entry | |
| Apple MacBook Air M2 10C GPU | |
| Lenovo ThinkPad T14 G3-21CF004NGE | |
| Lenovo Yoga 9 14IRP G8 | |
| Microsoft Surface Pro 9, i7-1255U | |
| Lenovo ThinkPad X13s Gen 1 21BX000QGE | |
| Microsoft Surface Pro 9, ARM | |
| Cinebench R23 Single Power Efficiency - external Monitor | |
| Apple MacBook Air M2 Entry | |
| Apple MacBook Air M2 10C GPU | |
| Microsoft Surface Pro 9, ARM | |
| Microsoft Surface Pro 9, i7-1255U | |
| Lenovo ThinkPad T14 G3-21CF004NGE | |
| Lenovo Yoga 9 14IRP G8 | |
System Performance
We were limited in terms of the synthetic tests, since even the cross-platform CrossMark crashed repeatedly. Instead, we show the browser benchmarks, but the performance is also very weak overall here as well, reflecting also the subjective performance impression. While the operation is basically smooth, even with simple tasks such as opening the settings, there can be some significant stutters, and the device is quickly overtaxed by complex applications. Those who are familiar with the MacBook Air with the M1/M2 SoC, for example, expecting a similar performance here, will definitely be disappointed.
| WebXPRT 4 / Overall | |
| Microsoft Surface Pro 9, i7-1255U | |
| Apple iPad Pro 12.9 2022 | |
| Lenovo ThinkPad X13s Gen 1 21BX000QGE | |
| Microsoft Surface Pro 9, ARM | |
| WebXPRT 3 / Overall | |
| Apple iPad Pro 12.9 2022 | |
| Microsoft Surface Pro 9, i7-1255U | |
| HP EliteBook Folio 13.5-3G2L2EA | |
| Microsoft Surface Pro X | |
| Microsoft Surface Pro 9, ARM | |
| Speedometer 2.0 / Result 2.0 | |
| Apple iPad Pro 12.9 2022 | |
| Microsoft Surface Pro 9, i7-1255U | |
| Microsoft Surface Pro 9, ARM | |
| HP EliteBook Folio 13.5-3G2L2EA | |
| Microsoft Surface Pro X | |
| AIDA64 / Memory Copy | |
| Average of class Convertible (23880 - 161475, n=50, last 2 years) | |
| Microsoft Surface Pro 9, i7-1255U | |
| Average Qualcomm Snapdragon 8cx Gen 3 (40599 - 42710, n=3) | |
| Lenovo ThinkPad X13s Gen 1 21BX000QGE | |
| Microsoft Surface Pro 9, ARM | |
| AIDA64 / Memory Read | |
| Average of class Convertible (19931 - 131960, n=50, last 2 years) | |
| Microsoft Surface Pro 9, i7-1255U | |
| Lenovo ThinkPad X13s Gen 1 21BX000QGE | |
| Average Qualcomm Snapdragon 8cx Gen 3 (33013 - 33757, n=3) | |
| Microsoft Surface Pro 9, ARM | |
| AIDA64 / Memory Write | |
| Average of class Convertible (17473 - 216896, n=50, last 2 years) | |
| Microsoft Surface Pro 9, i7-1255U | |
| Microsoft Surface Pro 9, ARM | |
| Average Qualcomm Snapdragon 8cx Gen 3 (49100 - 49815, n=3) | |
| Lenovo ThinkPad X13s Gen 1 21BX000QGE | |
| AIDA64 / Memory Latency | |
| Average of class Convertible (6.9 - 536, n=49, last 2 years) | |
| Microsoft Surface Pro 9, i7-1255U | |
| Lenovo ThinkPad X13s Gen 1 21BX000QGE | |
| Average Qualcomm Snapdragon 8cx Gen 3 (10.2 - 18.8, n=3) | |
| Microsoft Surface Pro 9, ARM | |
* ... smaller is better
Storage Solution
The compact M.2-2230 SSD comes from SK Hynix and offers a storage capacity of 256 GB, 180 GB of which are still available after running the device for the first time. The transfer rates of the PCIe 3.0 SSd are okay and sufficient in everyday operation, particularly considering the low CPU performance. In addition, the transfer rates remain constant even after longer loads. You can find additional SSD benchmarks here.

* ... smaller is better
Disk Throttling: DiskSpd Read Loop, Queue Depth 8
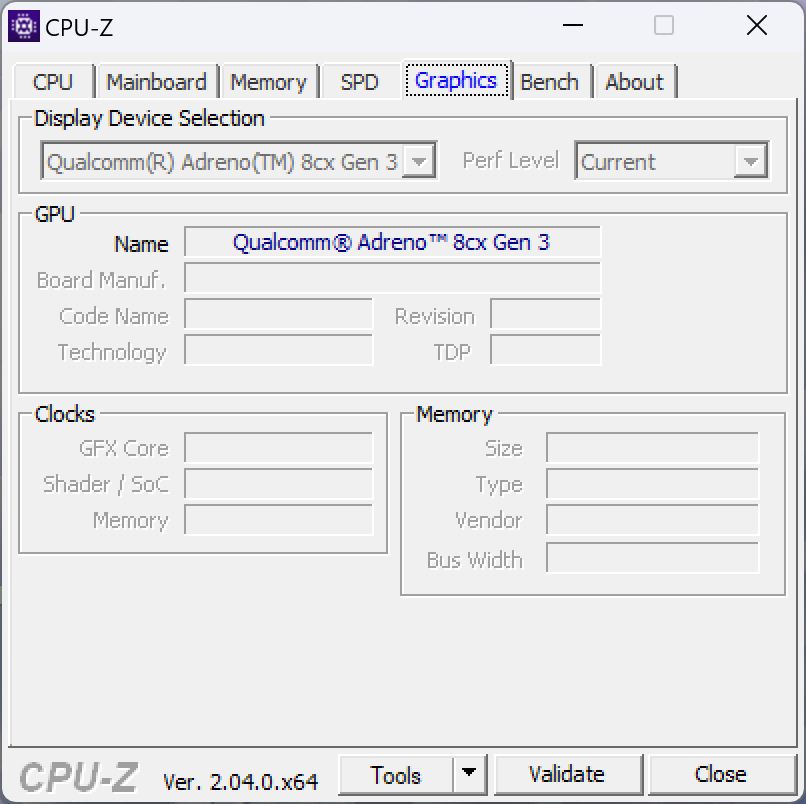
Graphics Card
The graphics computations are handled by the integrated Adreno-690 GPU of the processor, which is able to reproduce high-resolution videos in everyday operation without any problems. Looking at the pure performance, we see an advantage of around 25% compared to the old Adreno 680, but the dusty aged Iris Xe Graphics G7 of the Intel CPUs is still significantly more powerful. The M2 GPU of the current iPad Pro 12.9 plays in a completely different league anyways.
The Surface Pro 9 ARM is hardly suited for gaming, since many regular games hardly run or don't start at all. Instead, you should limit yourself to very simple games from the Windows Store (such as card games, chess, or Mahjong). But at least the graphics performance of the Adreno 690 remains stable in battery operation as well as under longer load. You can find additional GPU benchmarks here.
| 3DMark 11 Performance | 3077 points | |
| 3DMark Cloud Gate Standard Score | 8602 points | |
| 3DMark Fire Strike Score | 2911 points | |
Help | ||
| low | med. | high | ultra | |
|---|---|---|---|---|
| The Witcher 3 (2015) | 35 | |||
| Dota 2 Reborn (2015) | 57.1 | 54.5 | 47 | 40.7 |
| X-Plane 11.11 (2018) | 20.7 | 18 | 16.3 |
Emissions and Power Management
Noise Levels
As already with the other ARM devices in the comparison group, the passive cooling is of course an advantage, since the operation of the convertible always remains completely silent. We did not detect any other electronic noises either.
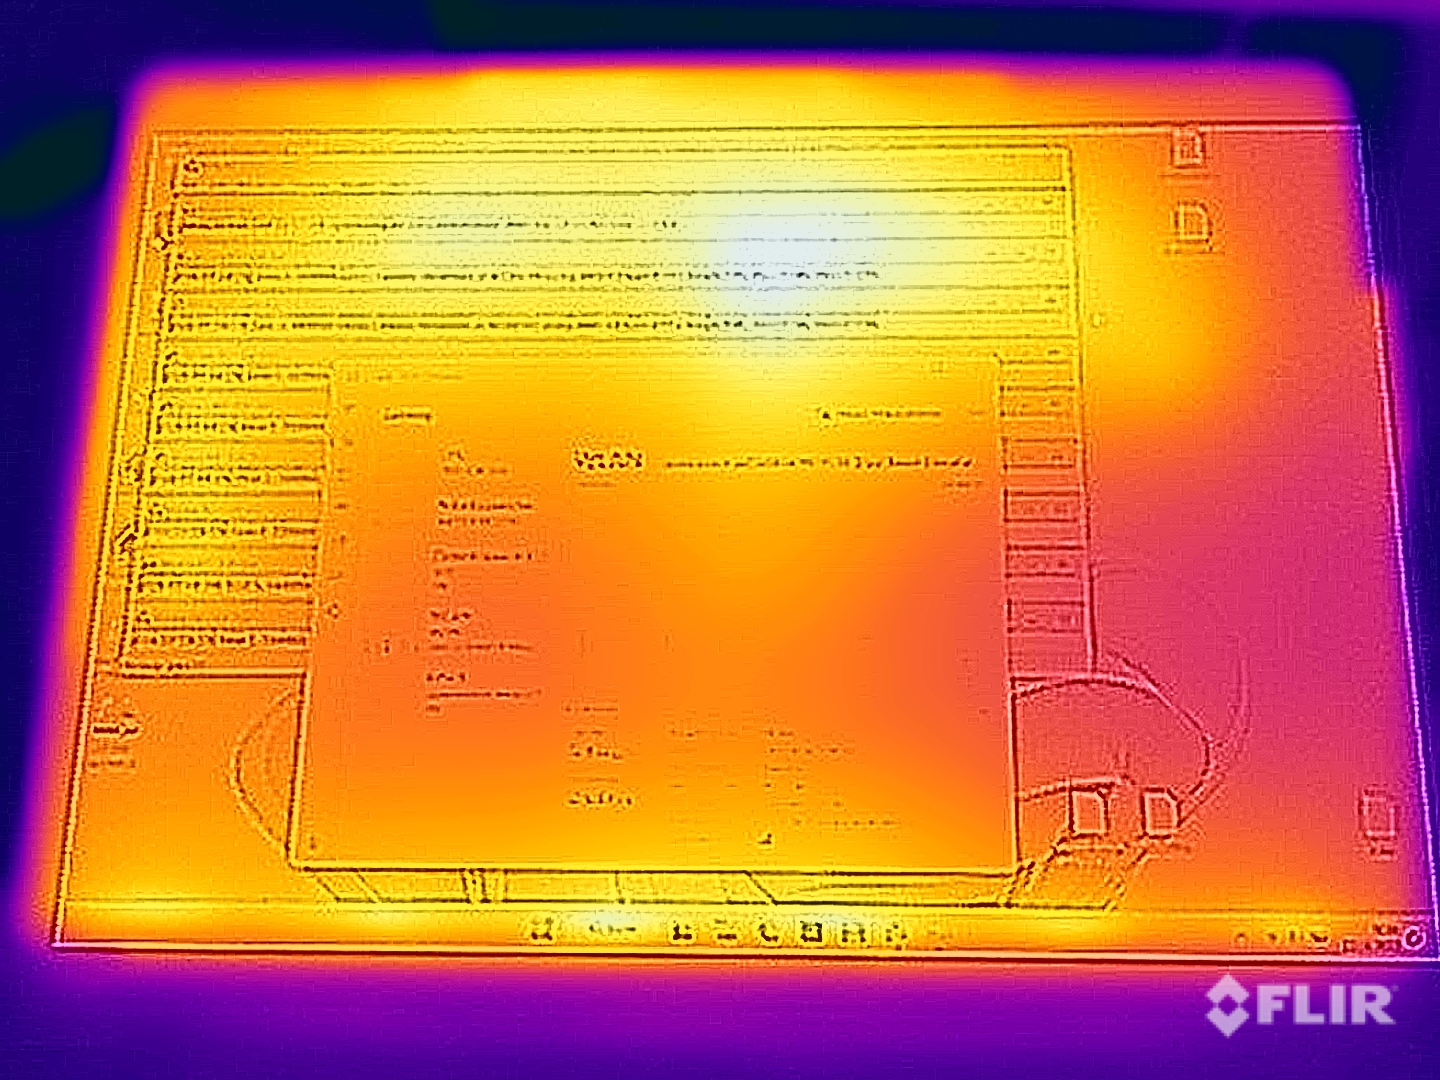
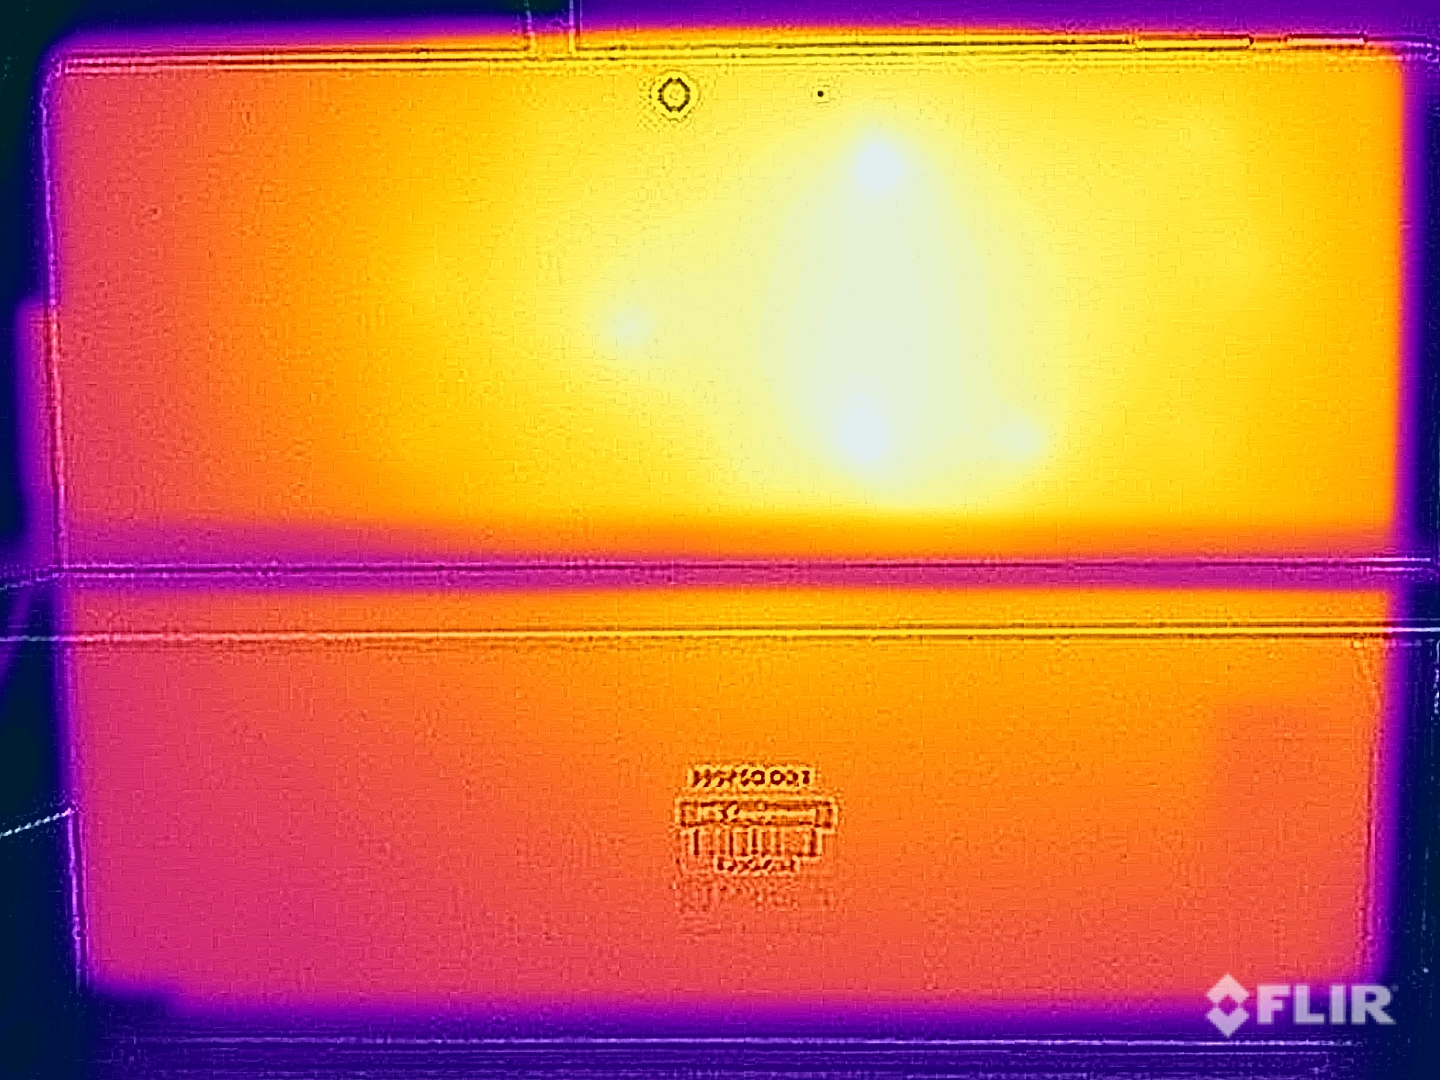
Temperatures
In everyday operation, the convertible practically doesn't heat up at all. Only if you really increase the demands on the processor does the heat become noticeable, due to the metal case at times even feeling uncomfortably warm when holding the convertible in the hands. For example, we measure surface temperatures up to 44 °C (111 °F) at the back. We just have to ask, why the ARM processor is run at such high power here.
(±) The maximum temperature on the upper side is 40.8 °C / 105 F, compared to the average of 35.4 °C / 96 F, ranging from 19.6 to 60 °C for the class Convertible.
(±) The bottom heats up to a maximum of 43.4 °C / 110 F, compared to the average of 36.9 °C / 98 F
(+) In idle usage, the average temperature for the upper side is 23 °C / 73 F, compared to the device average of 30.3 °C / 87 F.
(±) The palmrests and touchpad can get very hot to the touch with a maximum of 36.4 °C / 97.5 F.
(-) The average temperature of the palmrest area of similar devices was 28 °C / 82.4 F (-8.4 °C / -15.1 F).
| Microsoft Surface Pro 9, ARM Qualcomm Snapdragon 8cx Gen 3, Qualcomm Adreno 690 | Microsoft Surface Pro 9, i7-1255U Intel Core i7-1255U, Intel Iris Xe Graphics G7 96EUs | Microsoft Surface Pro X Microsoft SQ1, Qualcomm Adreno 685 | Lenovo ThinkPad X13s Gen 1 21BX000QGE Qualcomm Snapdragon 8cx Gen 3, Qualcomm Adreno 690 | HP EliteBook Folio 13.5-3G2L2EA Qualcomm Snapdragon 8cx Gen 2 5G, Qualcomm Adreno 680 | Apple iPad Pro 12.9 2022 Apple M2, Apple M2 10-Core GPU | |
|---|---|---|---|---|---|---|
| Heat | -9% | -9% | -32% | 3% | -11% | |
| Maximum Upper Side * (°C) | 40.8 | 44.6 -9% | 41.8 -2% | 59 -45% | 34.3 16% | 36.9 10% |
| Maximum Bottom * (°C) | 43.4 | 45.9 -6% | 45.7 -5% | 64.4 -48% | 35.4 18% | 37.6 13% |
| Idle Upper Side * (°C) | 23.2 | 24.8 -7% | 26.3 -13% | 26.5 -14% | 25.7 -11% | 31.9 -38% |
| Idle Bottom * (°C) | 22.6 | 25.3 -12% | 25.8 -14% | 26.8 -19% | 25.1 -11% | 29.4 -30% |
* ... smaller is better
Power Consumption
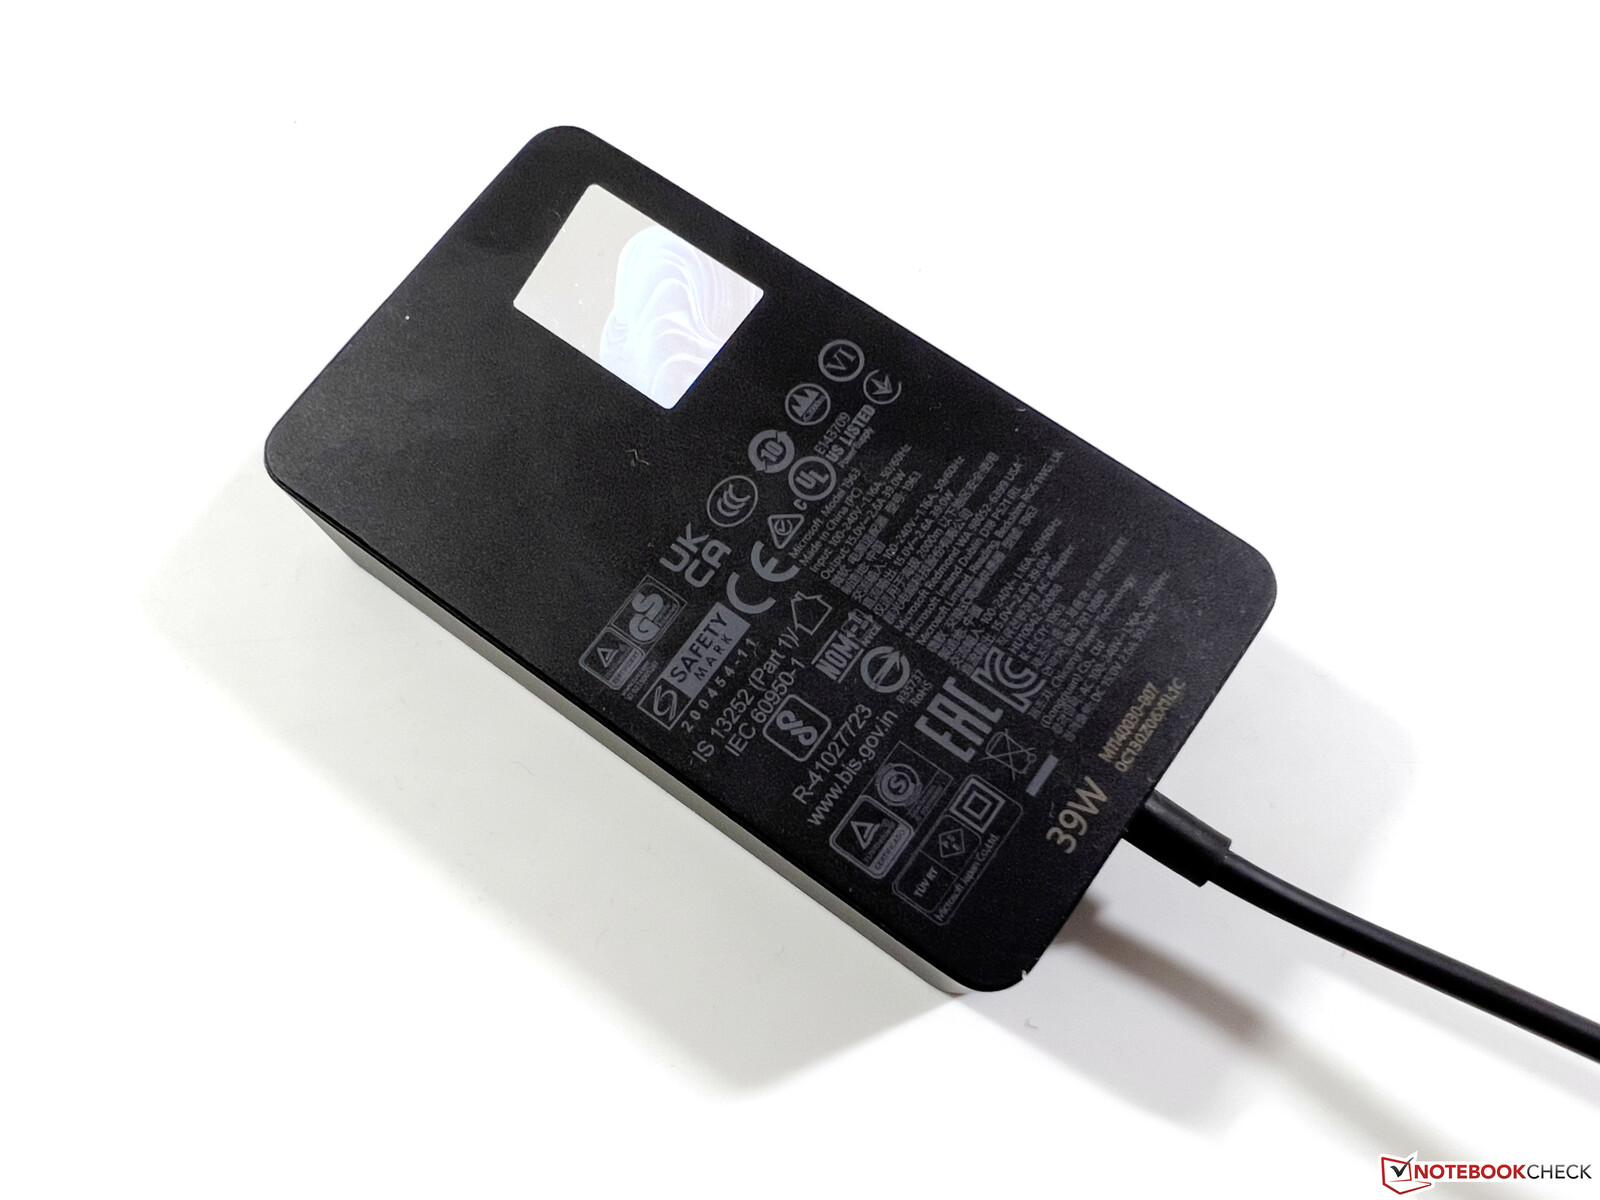
The idle measurements are slightly high overall for an ARM device, but this might be due to a bug. Even though we were able to switch the 120-Hz mode of the display to 60 Hz, this had no effect (the display also did not briefly turn black, as is usually the case when switching). Under load, the device pulls a maximum of 40 watts from the outlet, so it makes full use of the included 39-Watt charger. We would have preferred if it had included the 60-Watt charger of the Intel version, which also offers an additional USB-A connection for charging.
| Off / Standby | |
| Idle | |
| Load |
|
Key:
min: | |
| Microsoft Surface Pro 9, ARM Adreno 690, SD 8cx Gen 3 | Microsoft Surface Pro 9, i7-1255U Iris Xe G7 96EUs, i7-1255U, Samsung MZ9L4512HBLU-00BMV | Microsoft Surface Pro X Adreno 685, SQ1, 256 GB NVMe | Lenovo ThinkPad X13s Gen 1 21BX000QGE Adreno 690, SD 8cx Gen 3, Lenovo UMIS AM630 RPJTJ512MGE1QDQ | HP EliteBook Folio 13.5-3G2L2EA Adreno 680, SD 8cx Gen 2 5G, Toshiba XG6 KXG60ZNV512G | Apple iPad Pro 12.9 2022 M2 10-Core GPU, M2, 128 GB NVMe | |
|---|---|---|---|---|---|---|
| Power Consumption | -67% | -0% | 11% | 36% | 1% | |
| Idle Minimum * (Watt) | 2.8 | 5.1 -82% | 3.2 -14% | 2.6 7% | 2.3 18% | 2.54 9% |
| Idle Average * (Watt) | 6.8 | 9.8 -44% | 8.5 -25% | 4.9 28% | 3.7 46% | 11.24 -65% |
| Idle Maximum * (Watt) | 8.1 | 11.3 -40% | 9.6 -19% | 5.2 36% | 5.6 31% | 11.48 -42% |
| Load Average * (Watt) | 23.8 | 47.5 -100% | 19.8 17% | 21.5 10% | 13 45% | 12.97 46% |
| Load Maximum * (Watt) | 40.2 | 68.5 -70% | 24.7 39% | 49.8 -24% | 25 38% | 16.6 59% |
| Witcher 3 ultra * (Watt) | 36 |
* ... smaller is better
Power Consumption The Witcher 3 / Stress Test
Power Consumption with External Monitor
Battery Life
The battery life also suffers from the 120-Hz bug, turning out a bit short overall. Even though the Intel model of the Surface Pro 9 is surpassed, the disadvantage behind the ThinkPad X13s with the same Snapdragon SoC is still significant. We measure 10 hours in the WLAN test at 150 cd/m² brightness, and only about 6 hours at full display brightness. Under load, it lasts for 140 minutes. In the 60-Hz mode, a longer battery life should be possible.
Pros
Cons
Verdict - The ARM model of the Surface Pro 9 doesn't get a recommendation

The ARM model of the Microsoft Surface Pro 9 offers two clear advantages compared to the Intel version. The first advantage is the passive cooling, ensuring always silent operation of the convertible. On the other hand, we also have to say that the performance overall is at a low level. The second advantage is the integrated 5G modem, but we also find it extremely unfortunate that Microsoft forces the customers to get the ARM version here, by not also offering an Intel model with LTE/5G as has been the case in the past.
We think that it is a mistake to now offer the ARM model under the label Surface Pro 9. With this, Microsoft suggests a similar level product, but this is simply not the case in everyday operation (despite its higher price compared to the Core-i5 model).
Overall, there is surely a good reason for the Surface Pro with ARM processor to exist, and thanks to the improved 64-bit emulation, now significantly more apps can run. However, it still isn't a full-fledged alternative to the models with x86 processors. In everyday operation, the device is simply not as fast, and there continue to be some smaller stutters or delays, even during simple tasks. Those who expect the performance of an Apple MacBook with ARM SoC will definitely be disappointed here. In this context, we also think that Microsoft's decision to offer the ARM version now simply as Surface Pro 9 is problematic. In addition, customers are forced to get the ARM model if they want an integrated LTE/5G modem.
Despite the improved compatibility with 64-bit applications, the Surface Pro 9 with the ARM processor is still not a full-fledged Windows device, since not all applications are compatible. It does not fulfill the demands that users connect with the Surface "Pro" label.
The ARM model also offers a stable case, a good display, and good speakers. Looking just at that by itself, it is a good device, but considering the high price, we have difficulties recommending the ARM model compared to the Intel version of the Surface Pro 9. Of course, the SP9 with the Qualcomm SoC is also suited for simple tasks, but that also goes for the Apple iPad Pro 12.9, which has advantages in almost all areas with its M2 SoC.
Price and Availability
The Surface Pro 9 ARM is available from the Microsoft Store starting from $1,169.99, including the keyboard and input pen. Amazon lists models starting from $1,299.99.
Microsoft Surface Pro 9, ARM
- 03/04/2023 v7 (old)
Andreas Osthoff
Transparency
The selection of devices to be reviewed is made by our editorial team. The test sample was provided to the author as a loan by the manufacturer or retailer for the purpose of this review. The lender had no influence on this review, nor did the manufacturer receive a copy of this review before publication. There was no obligation to publish this review. As an independent media company, Notebookcheck is not subjected to the authority of manufacturers, retailers or publishers.
This is how Notebookcheck is testing
Every year, Notebookcheck independently reviews hundreds of laptops and smartphones using standardized procedures to ensure that all results are comparable. We have continuously developed our test methods for around 20 years and set industry standards in the process. In our test labs, high-quality measuring equipment is utilized by experienced technicians and editors. These tests involve a multi-stage validation process. Our complex rating system is based on hundreds of well-founded measurements and benchmarks, which maintains objectivity. Further information on our test methods can be found here.
Price comparison

