Microsoft Surface Pro X Review - Microsoft's ARM-based tablet with poor compatibility
mögliche Konkurrenten im Vergleich
Rating | Date | Model | Weight | Height | Size | Resolution | Price |
|---|---|---|---|---|---|---|---|
| 84.4 % v7 (old) | 03 / 2021 | Microsoft Surface Pro X SQ1, Adreno 685 | 1 kg | 7.3 mm | 13.00" | 2880x1920 | |
| 88.5 % v7 (old) | 03 / 2021 | Microsoft Surface Pro 7 Plus i5-1135G7, Iris Xe G7 80EUs | 796 g | 8.5 mm | 12.30" | 2736x1824 | |
| 87.1 % v7 (old) | 11 / 2020 | Lenovo Yoga Duet 7 13IML05-82AS000WGE i5-10210U, UHD Graphics 620 | 1.2 kg | 9.2 mm | 13.00" | 2160x1350 | |
| 89.3 % v7 (old) | 05 / 2020 | Apple iPad Pro 12.9 2020 A12Z Bionic, A12Z Bionic GPU | 641 g | 5.9 mm | 12.90" | 2732x2048 | |
| 88.3 % v7 (old) | 01 / 2019 | Lenovo ThinkPad X1 Tablet G3-20KJ001NGE i5-8250U, UHD Graphics 620 | 1.3 kg | 8.9 mm | 13.00" | 3000x2000 |
Case, Connectivity and Input Devices
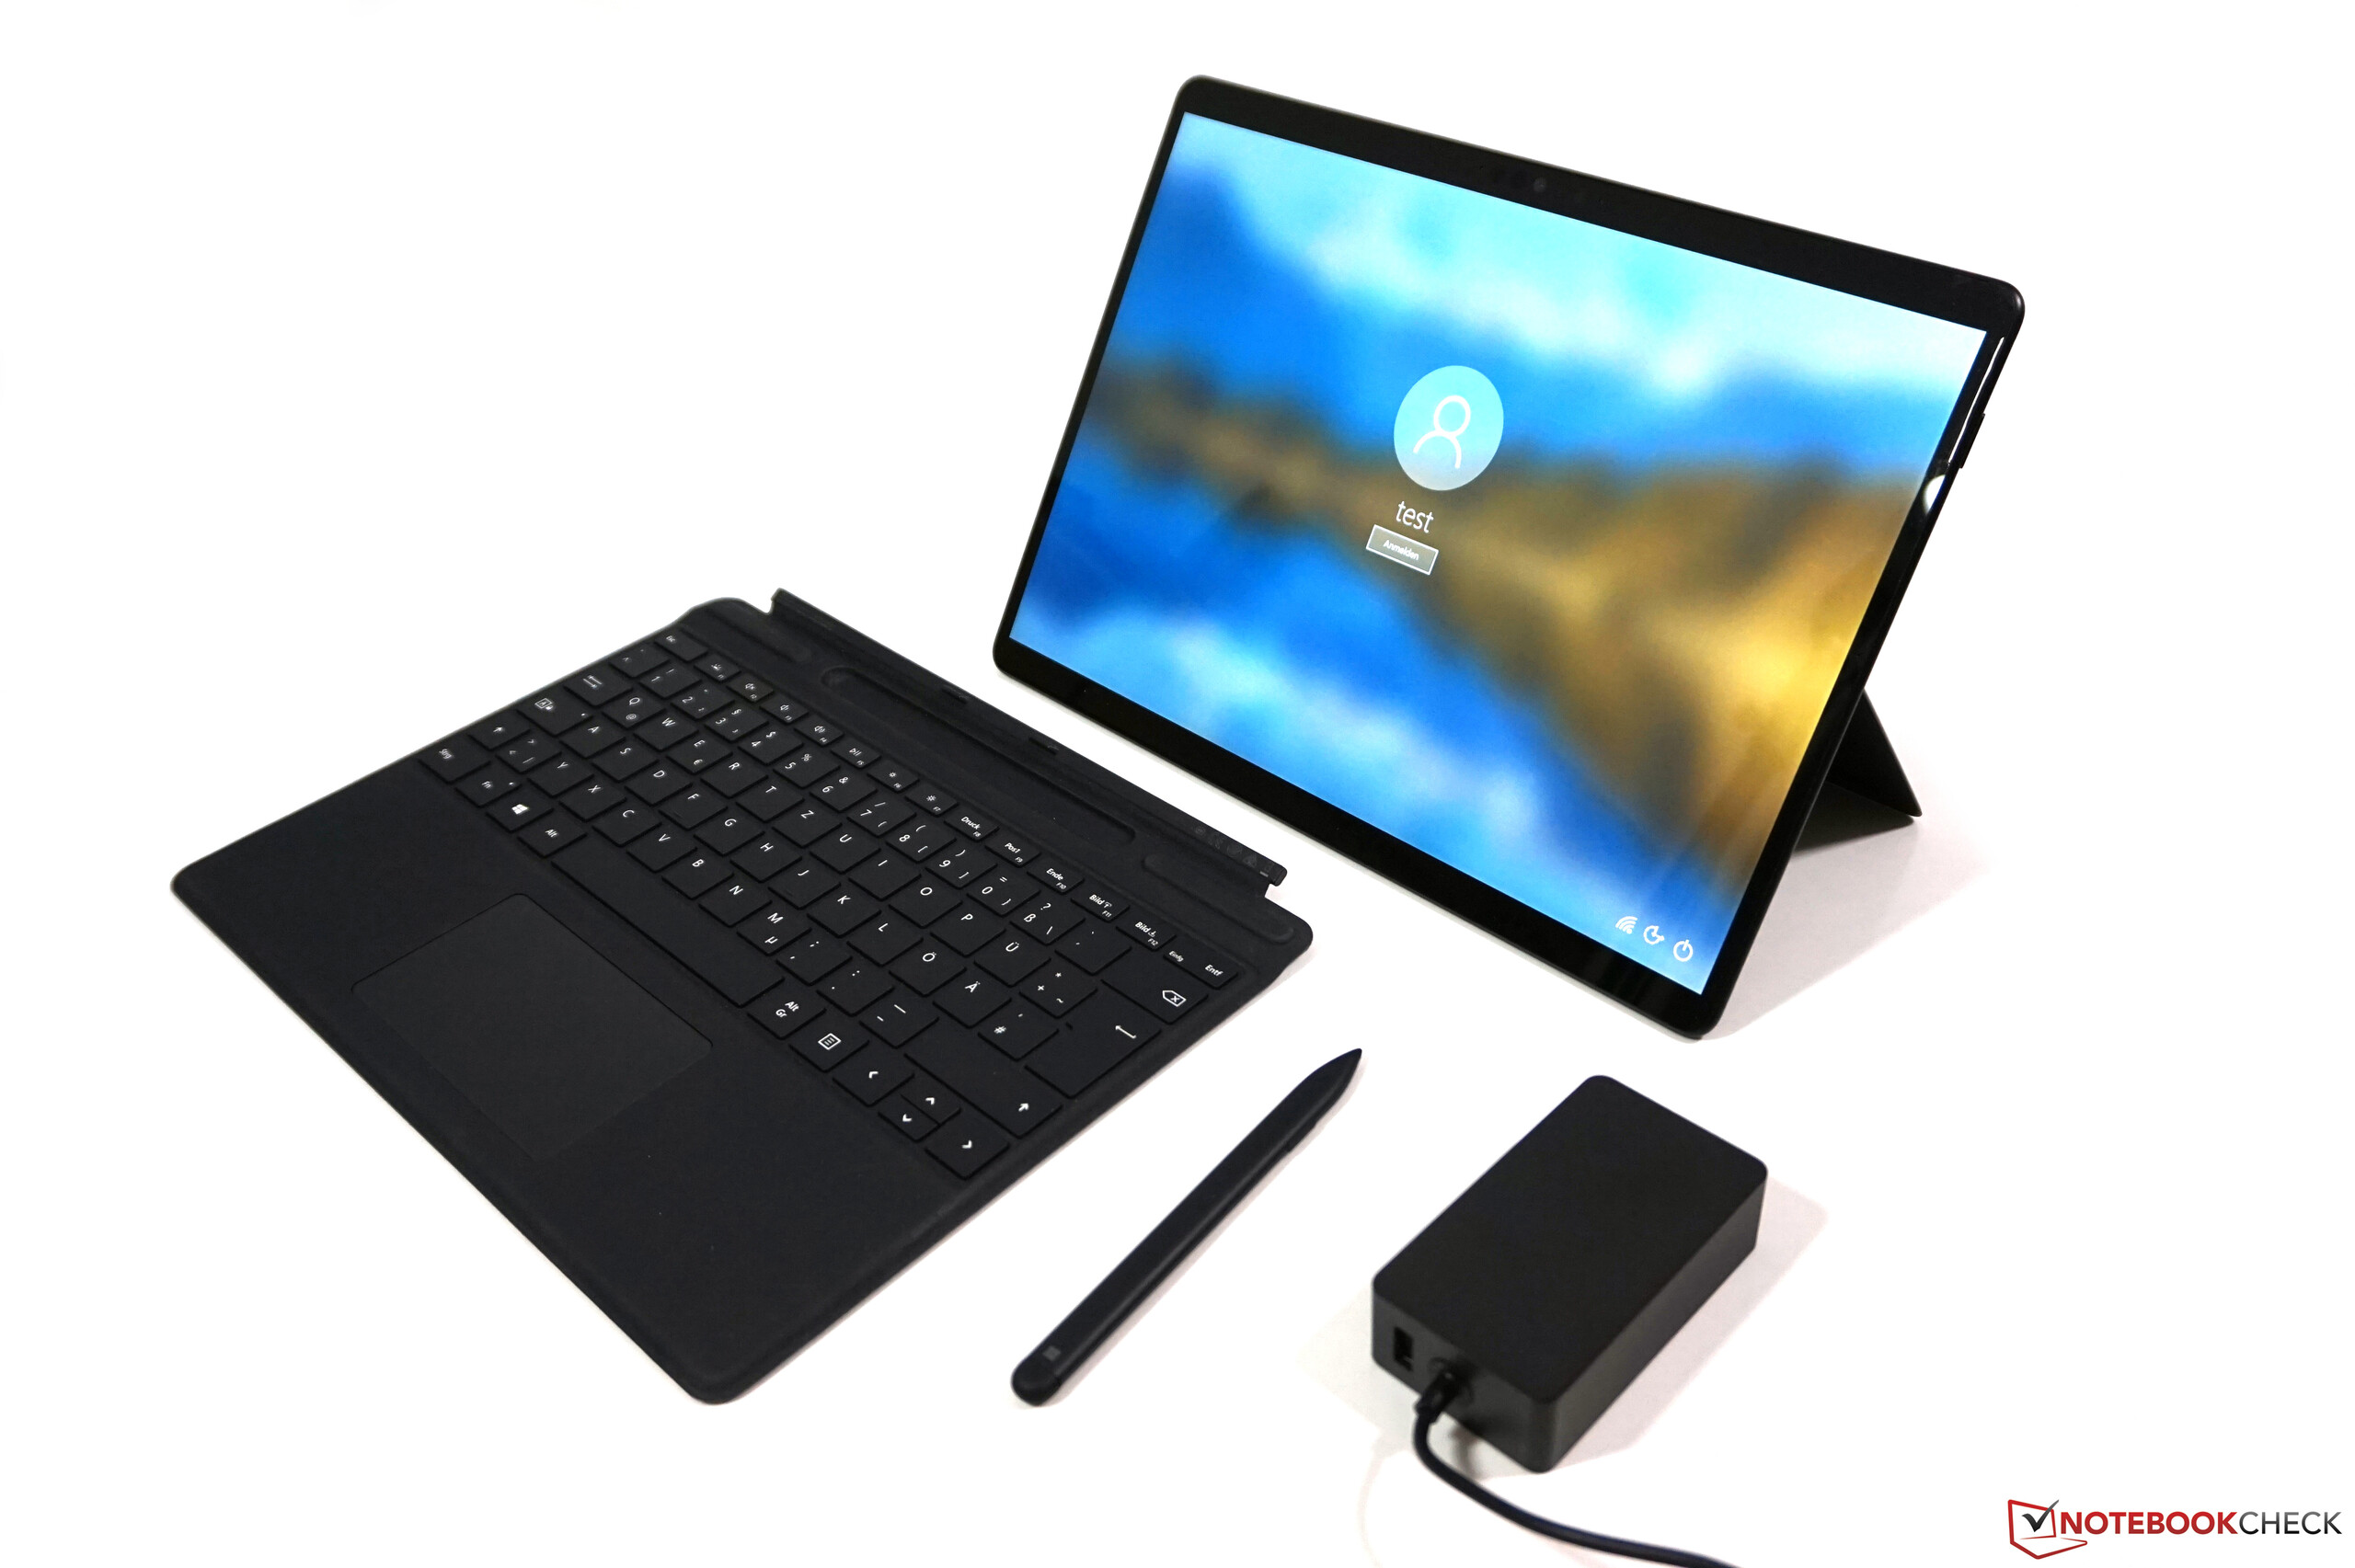
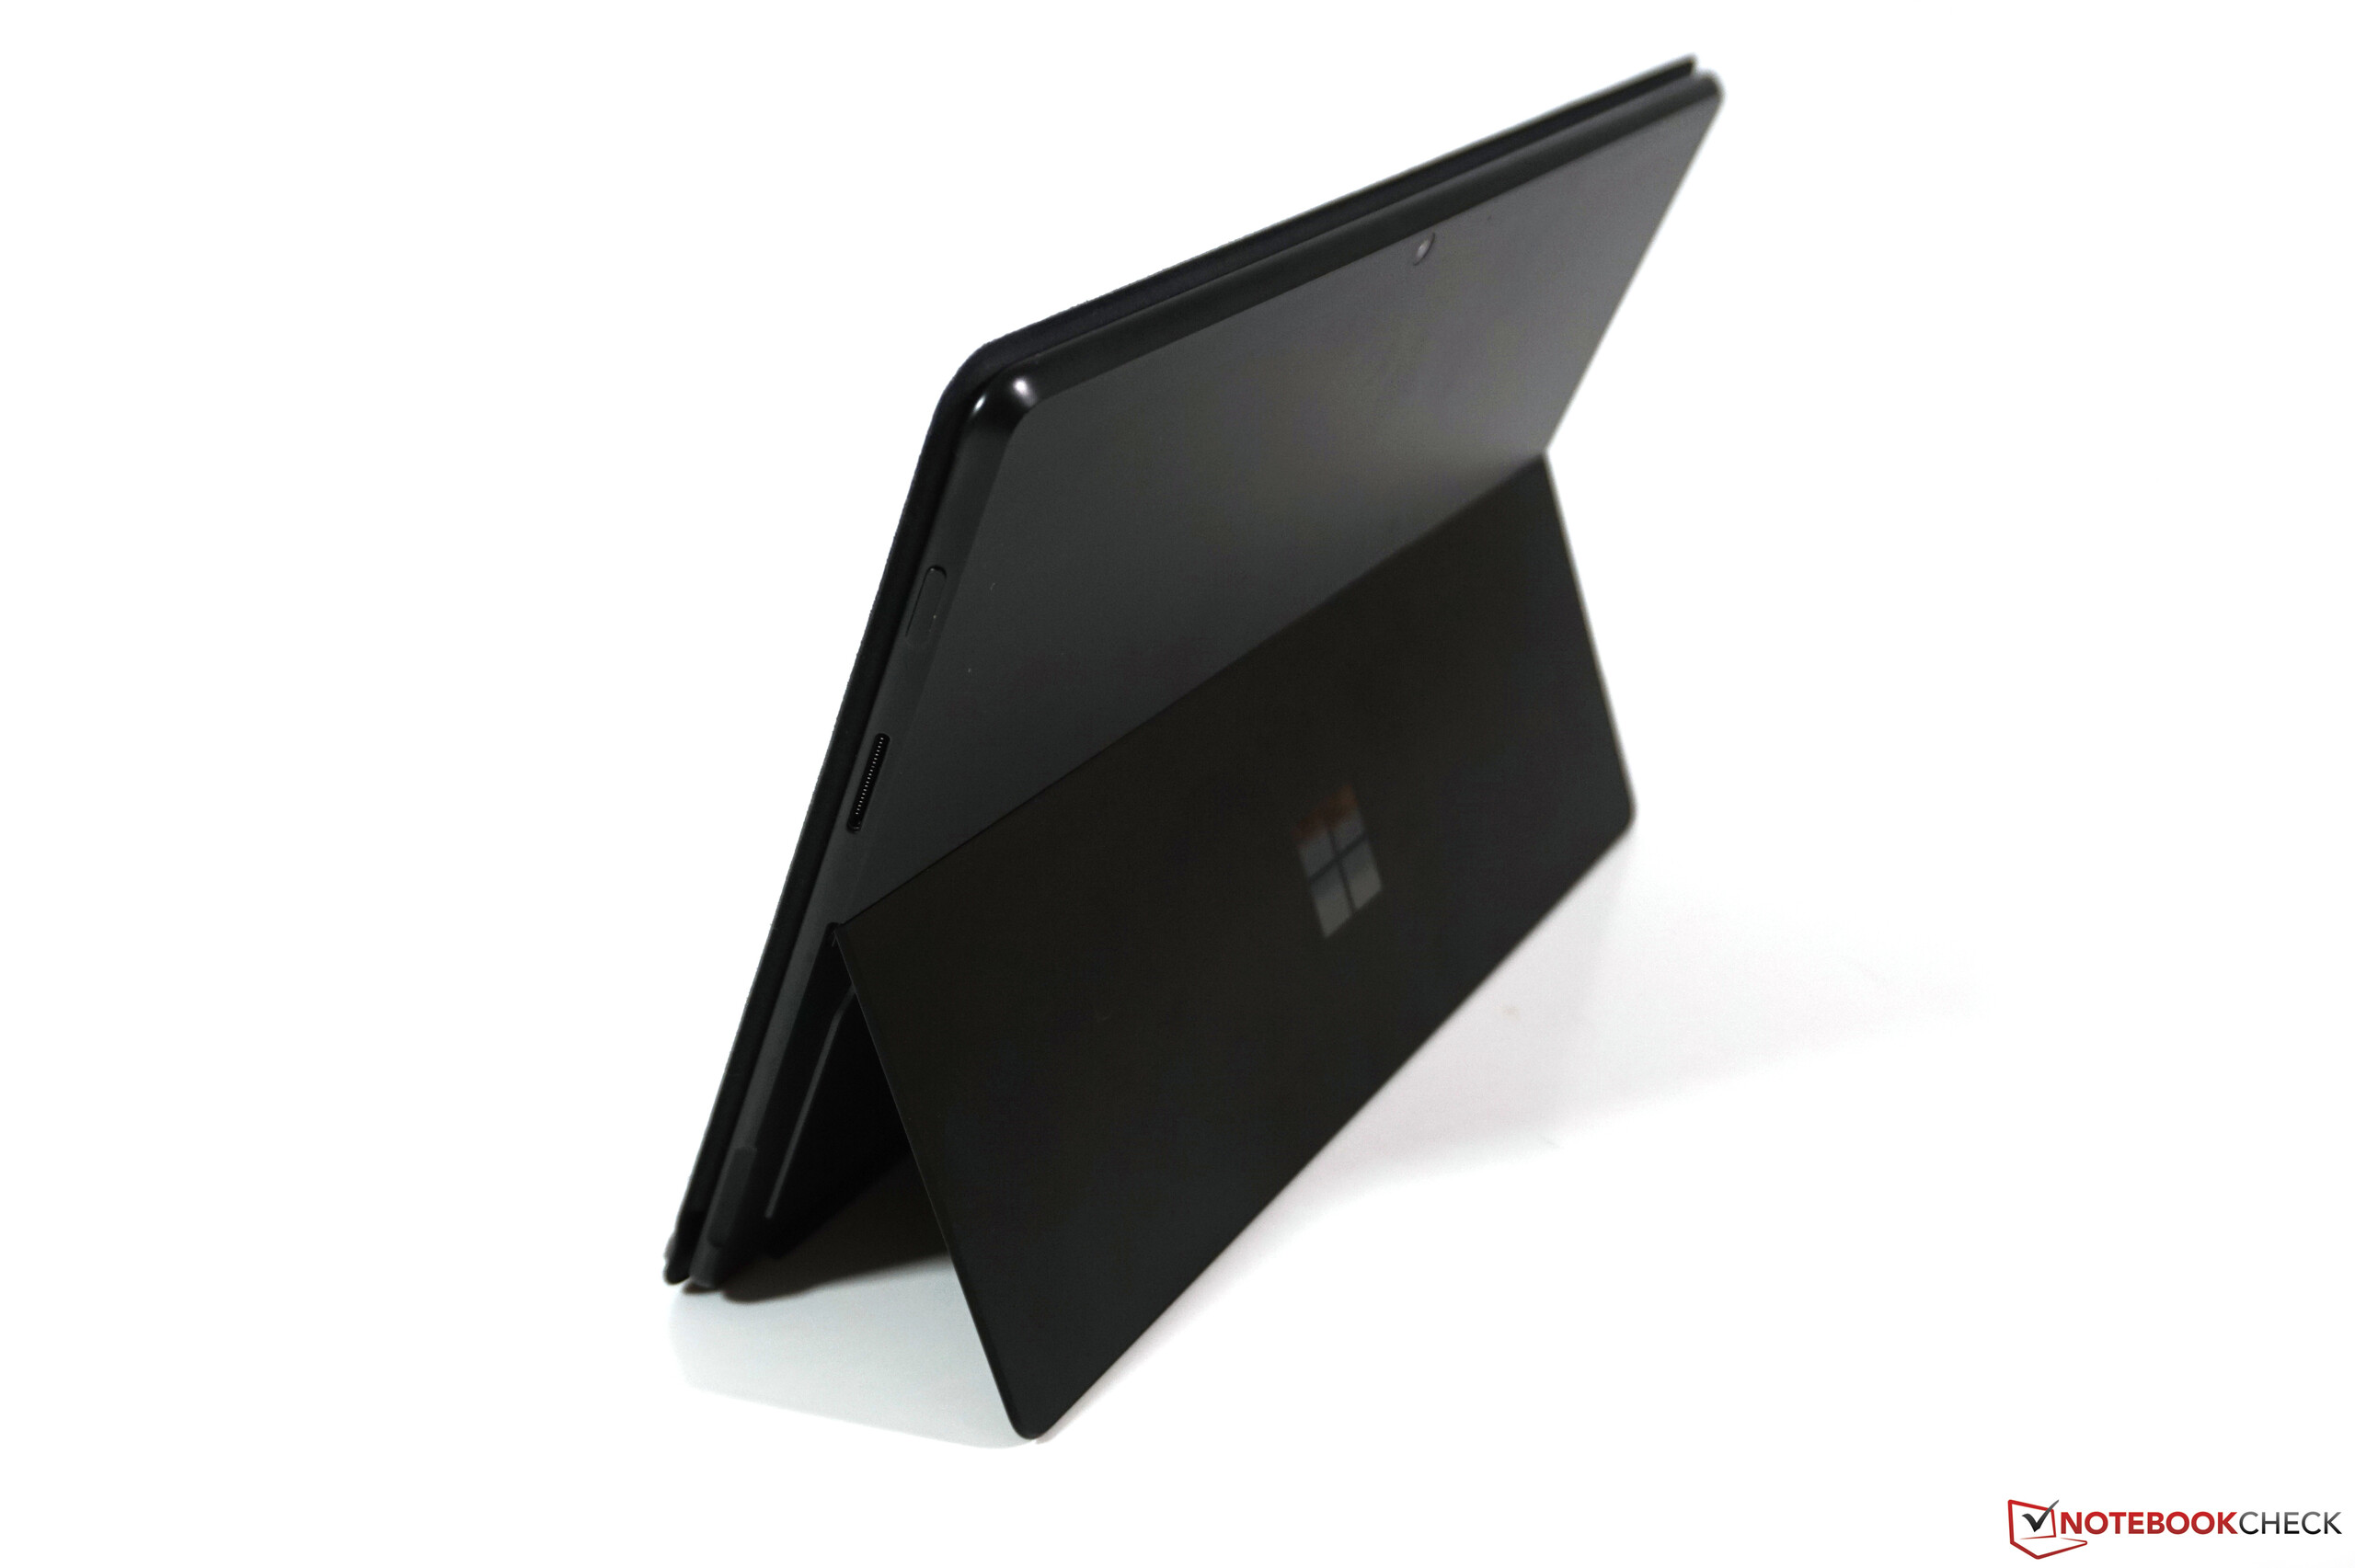
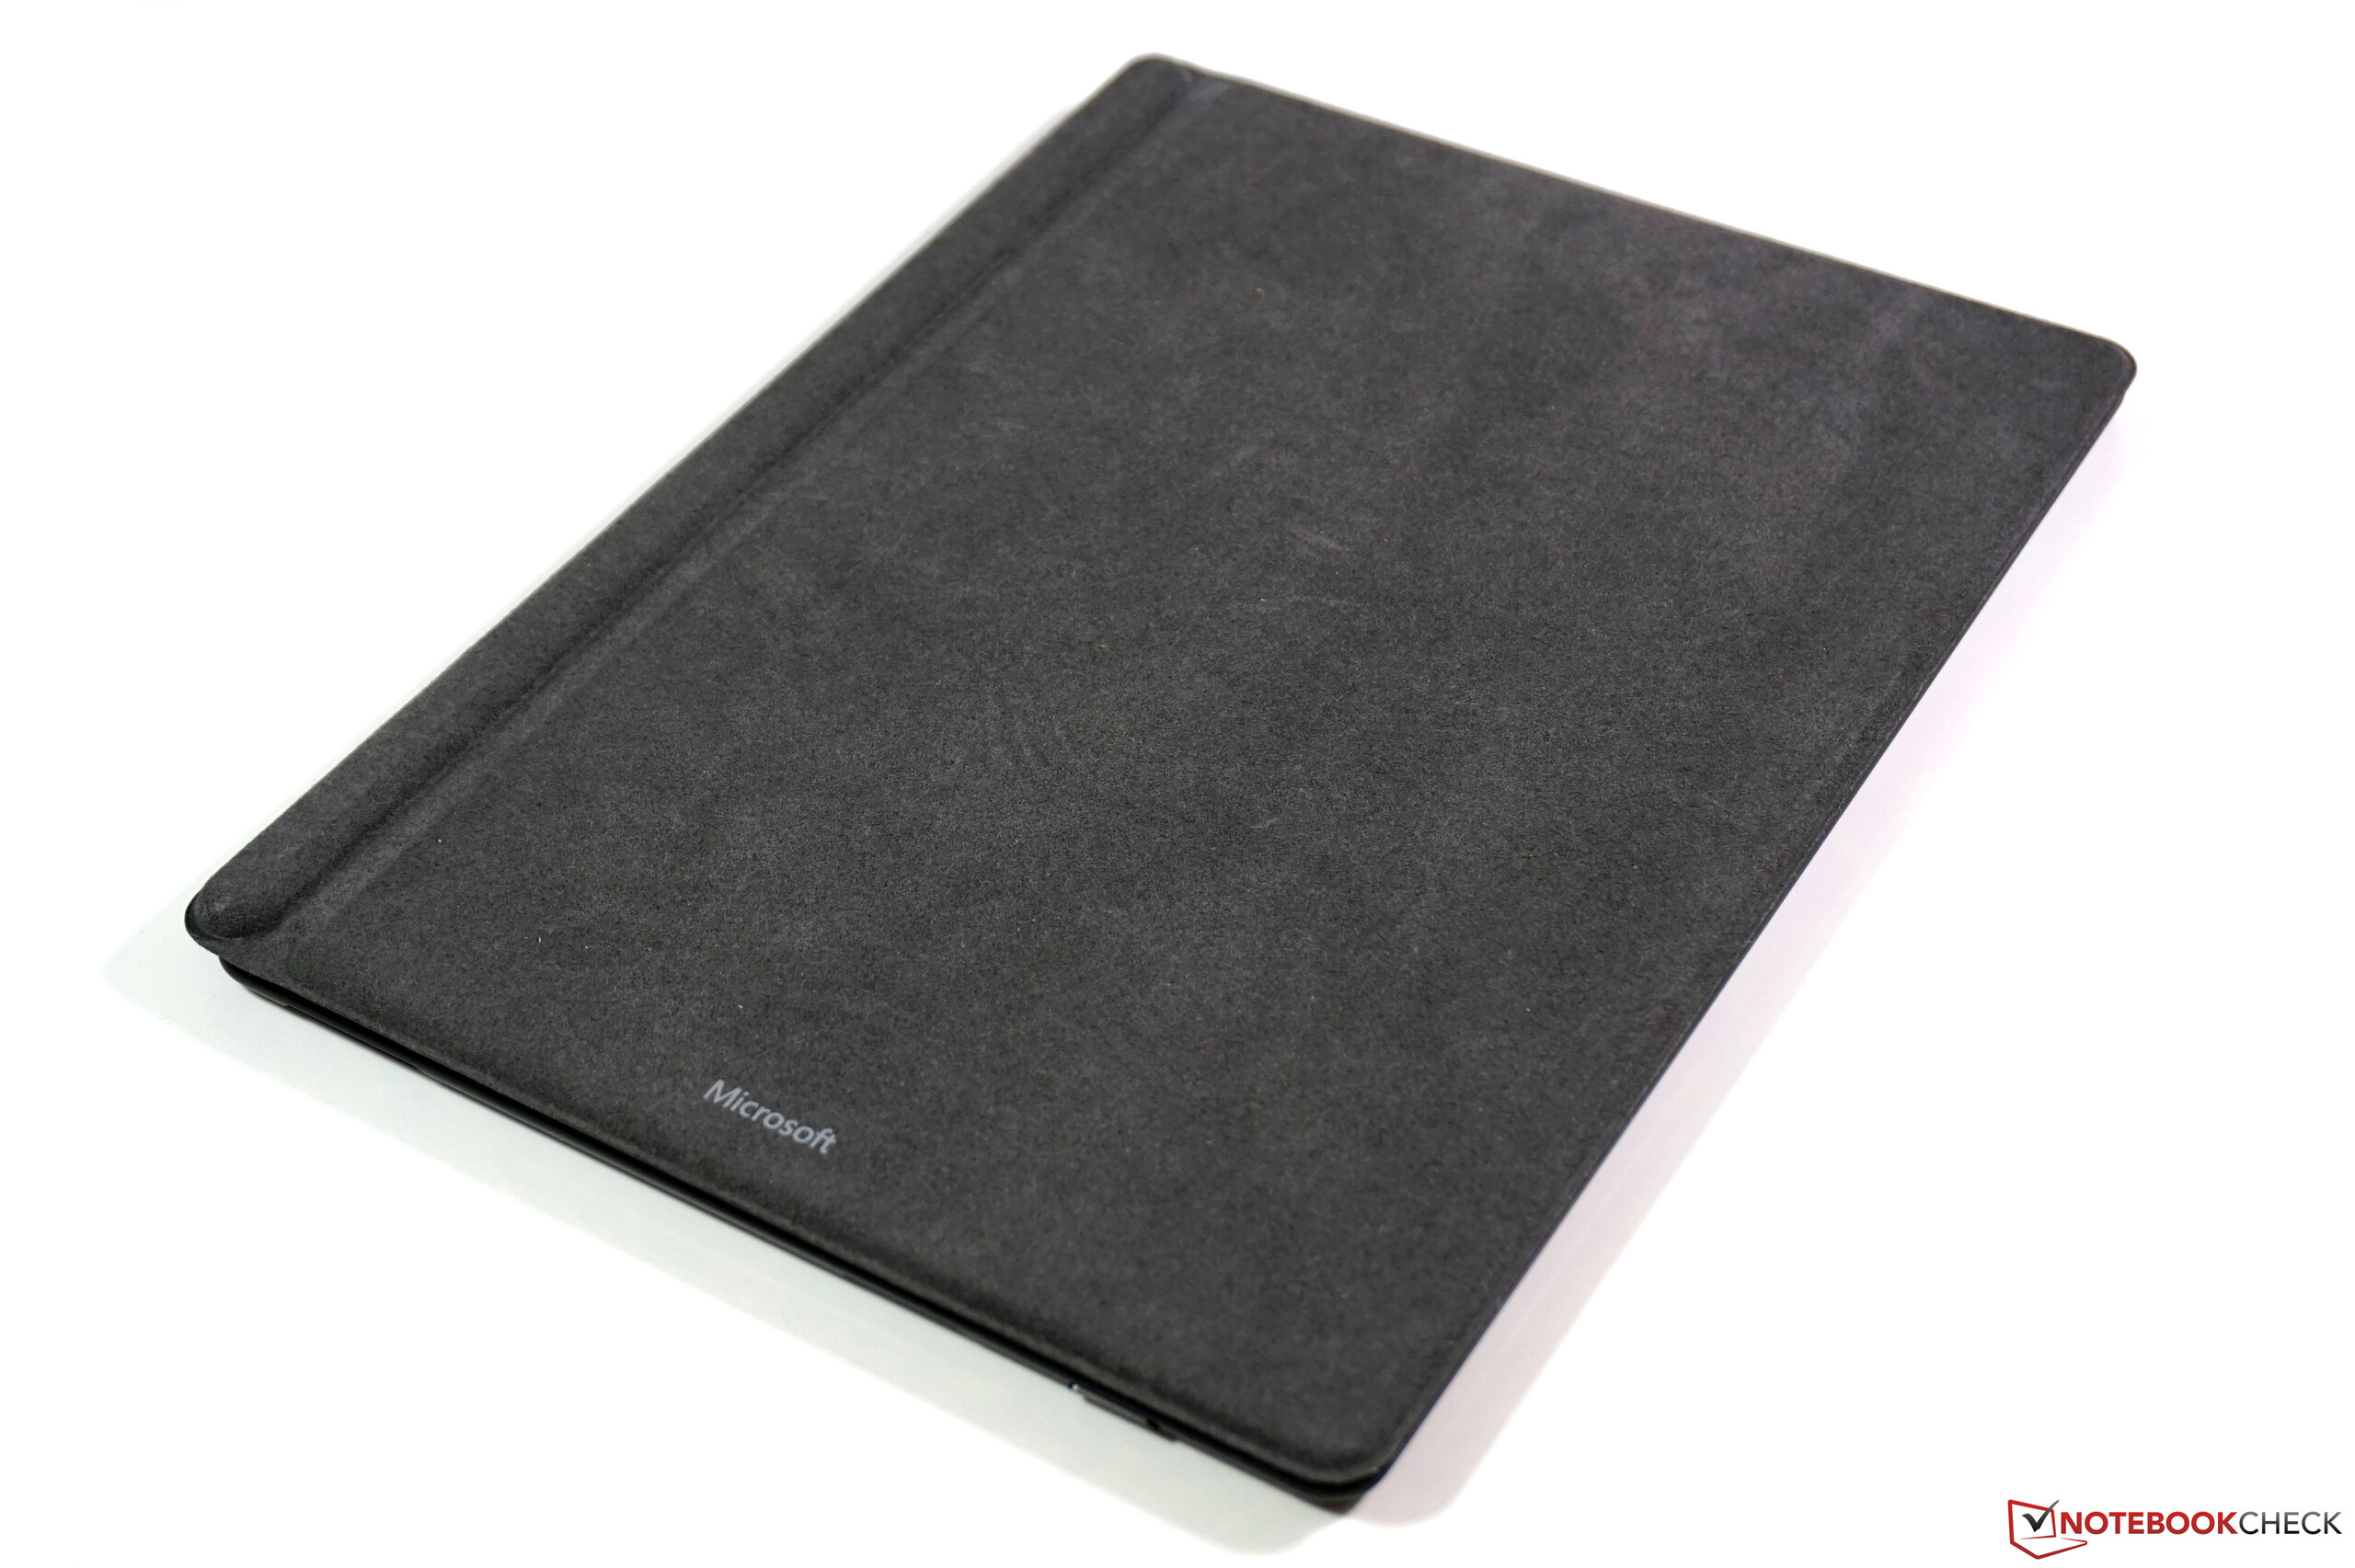
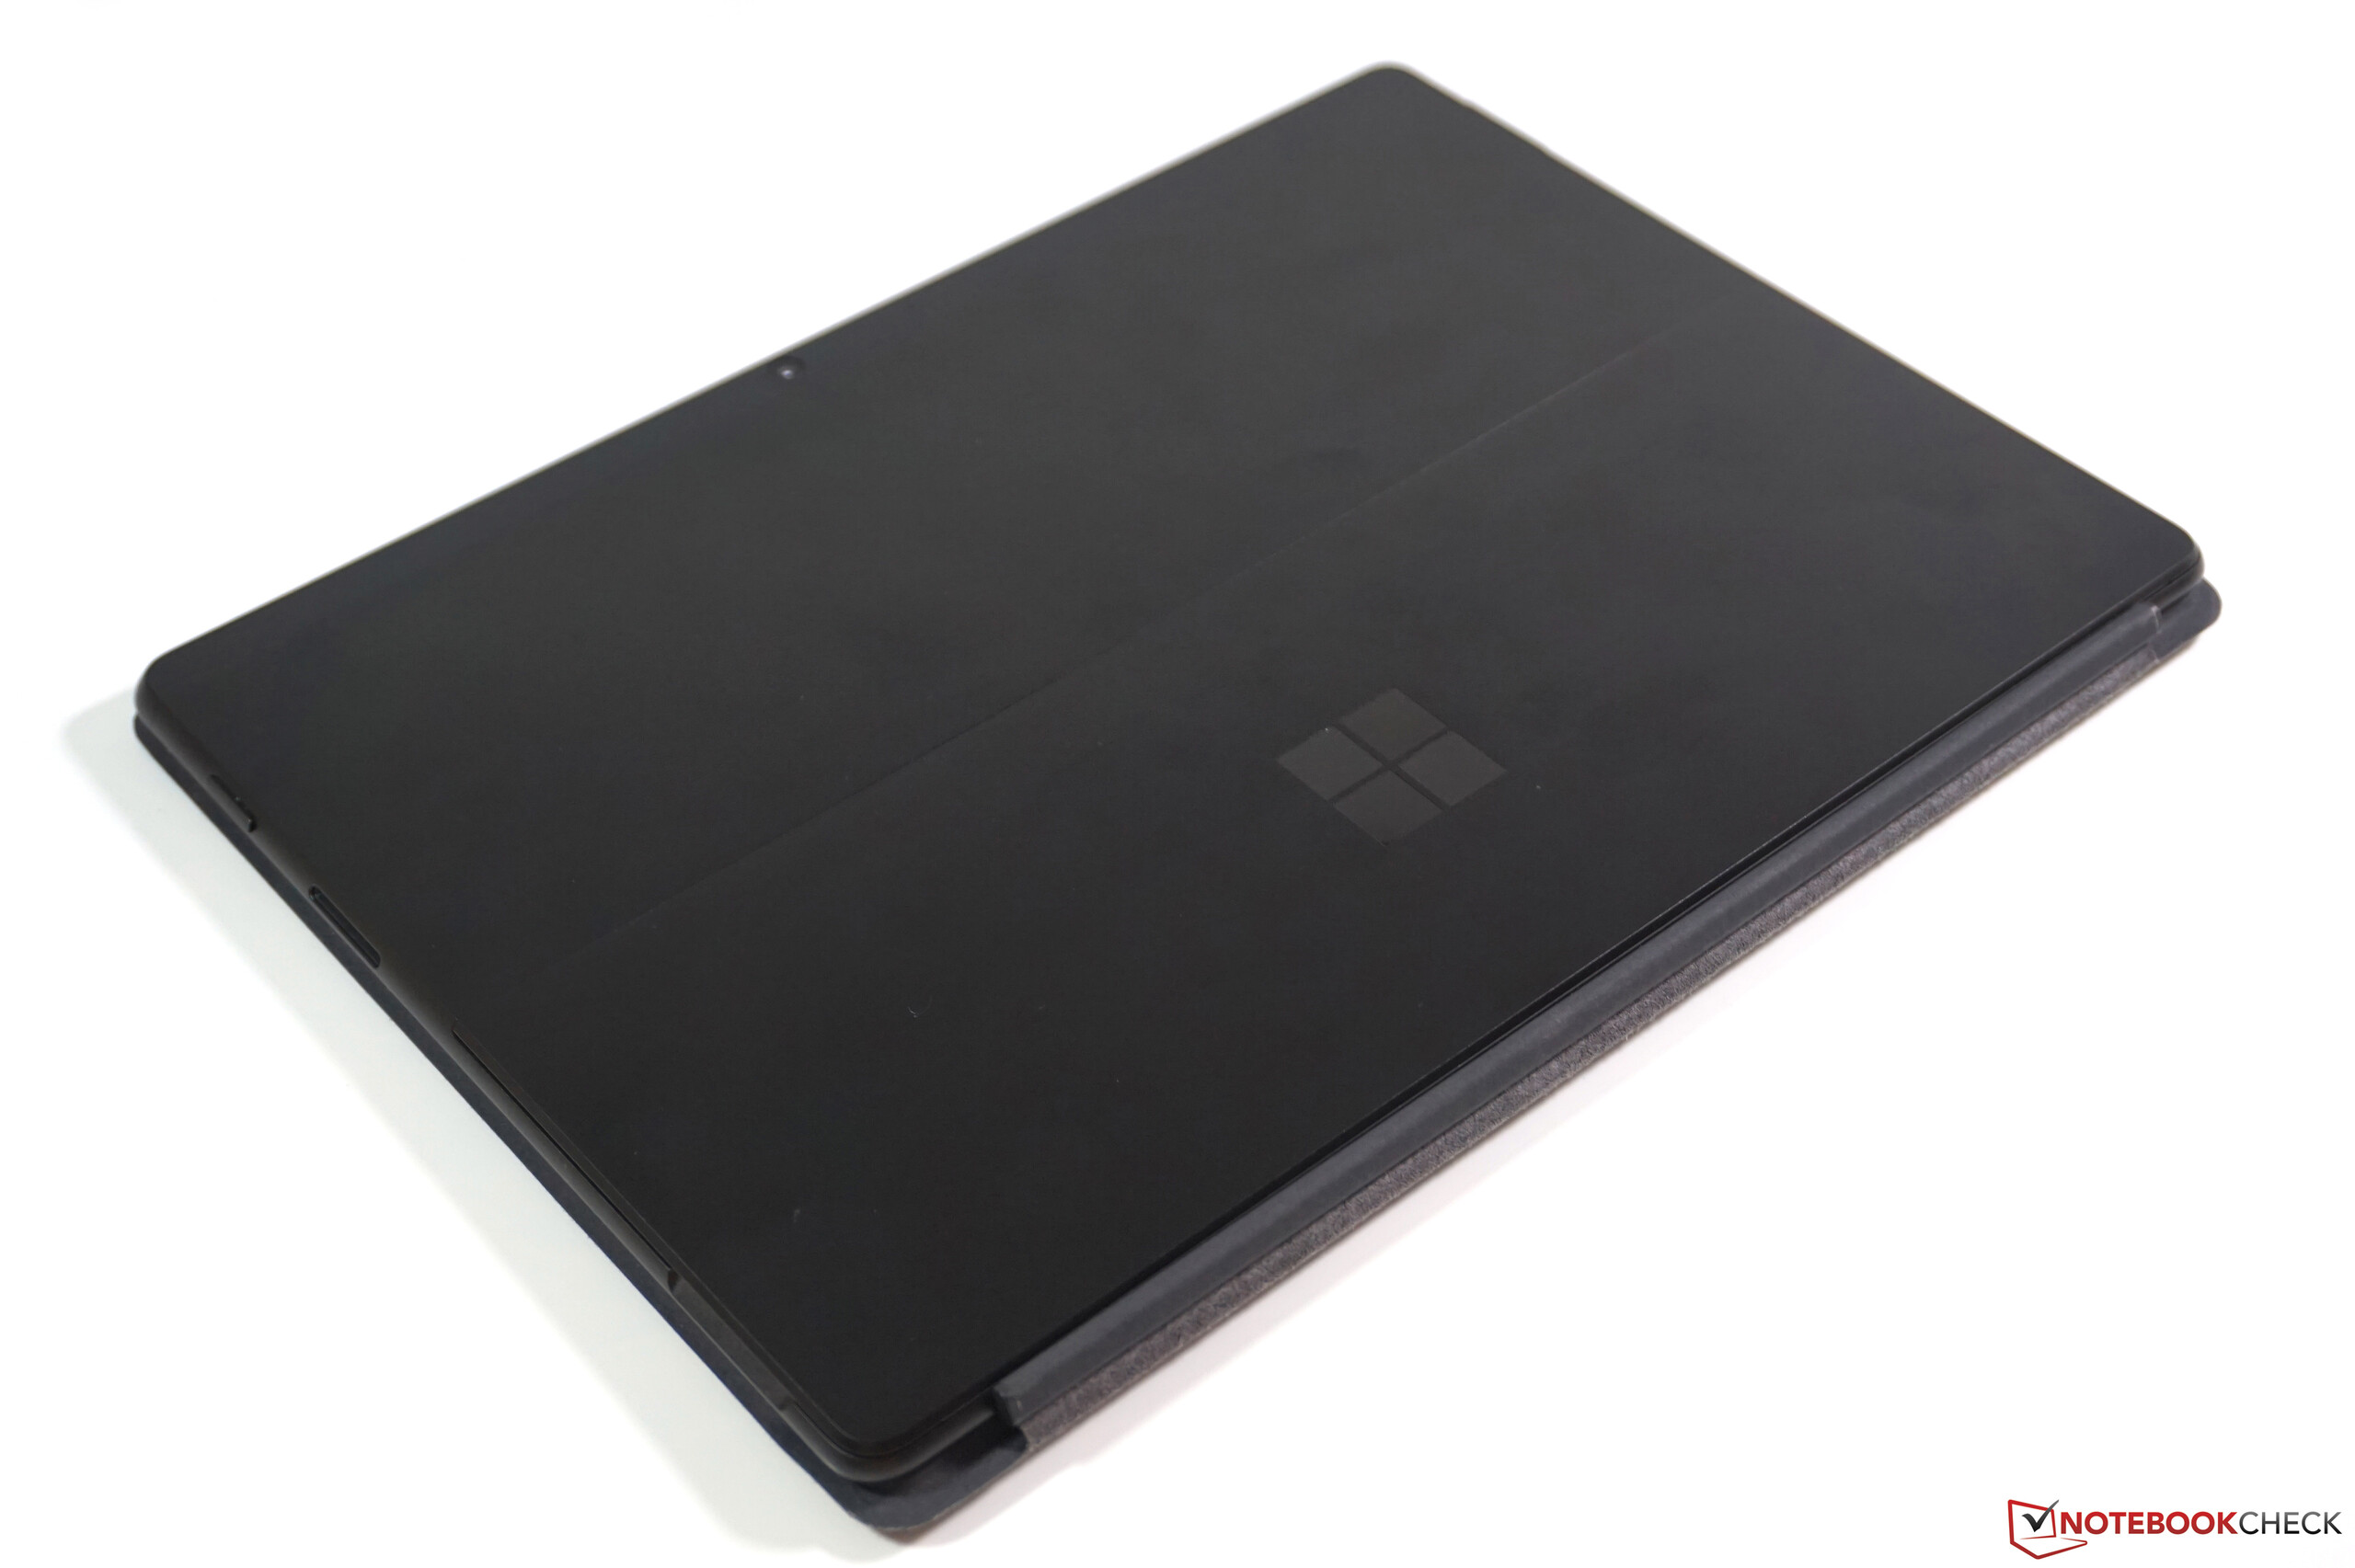
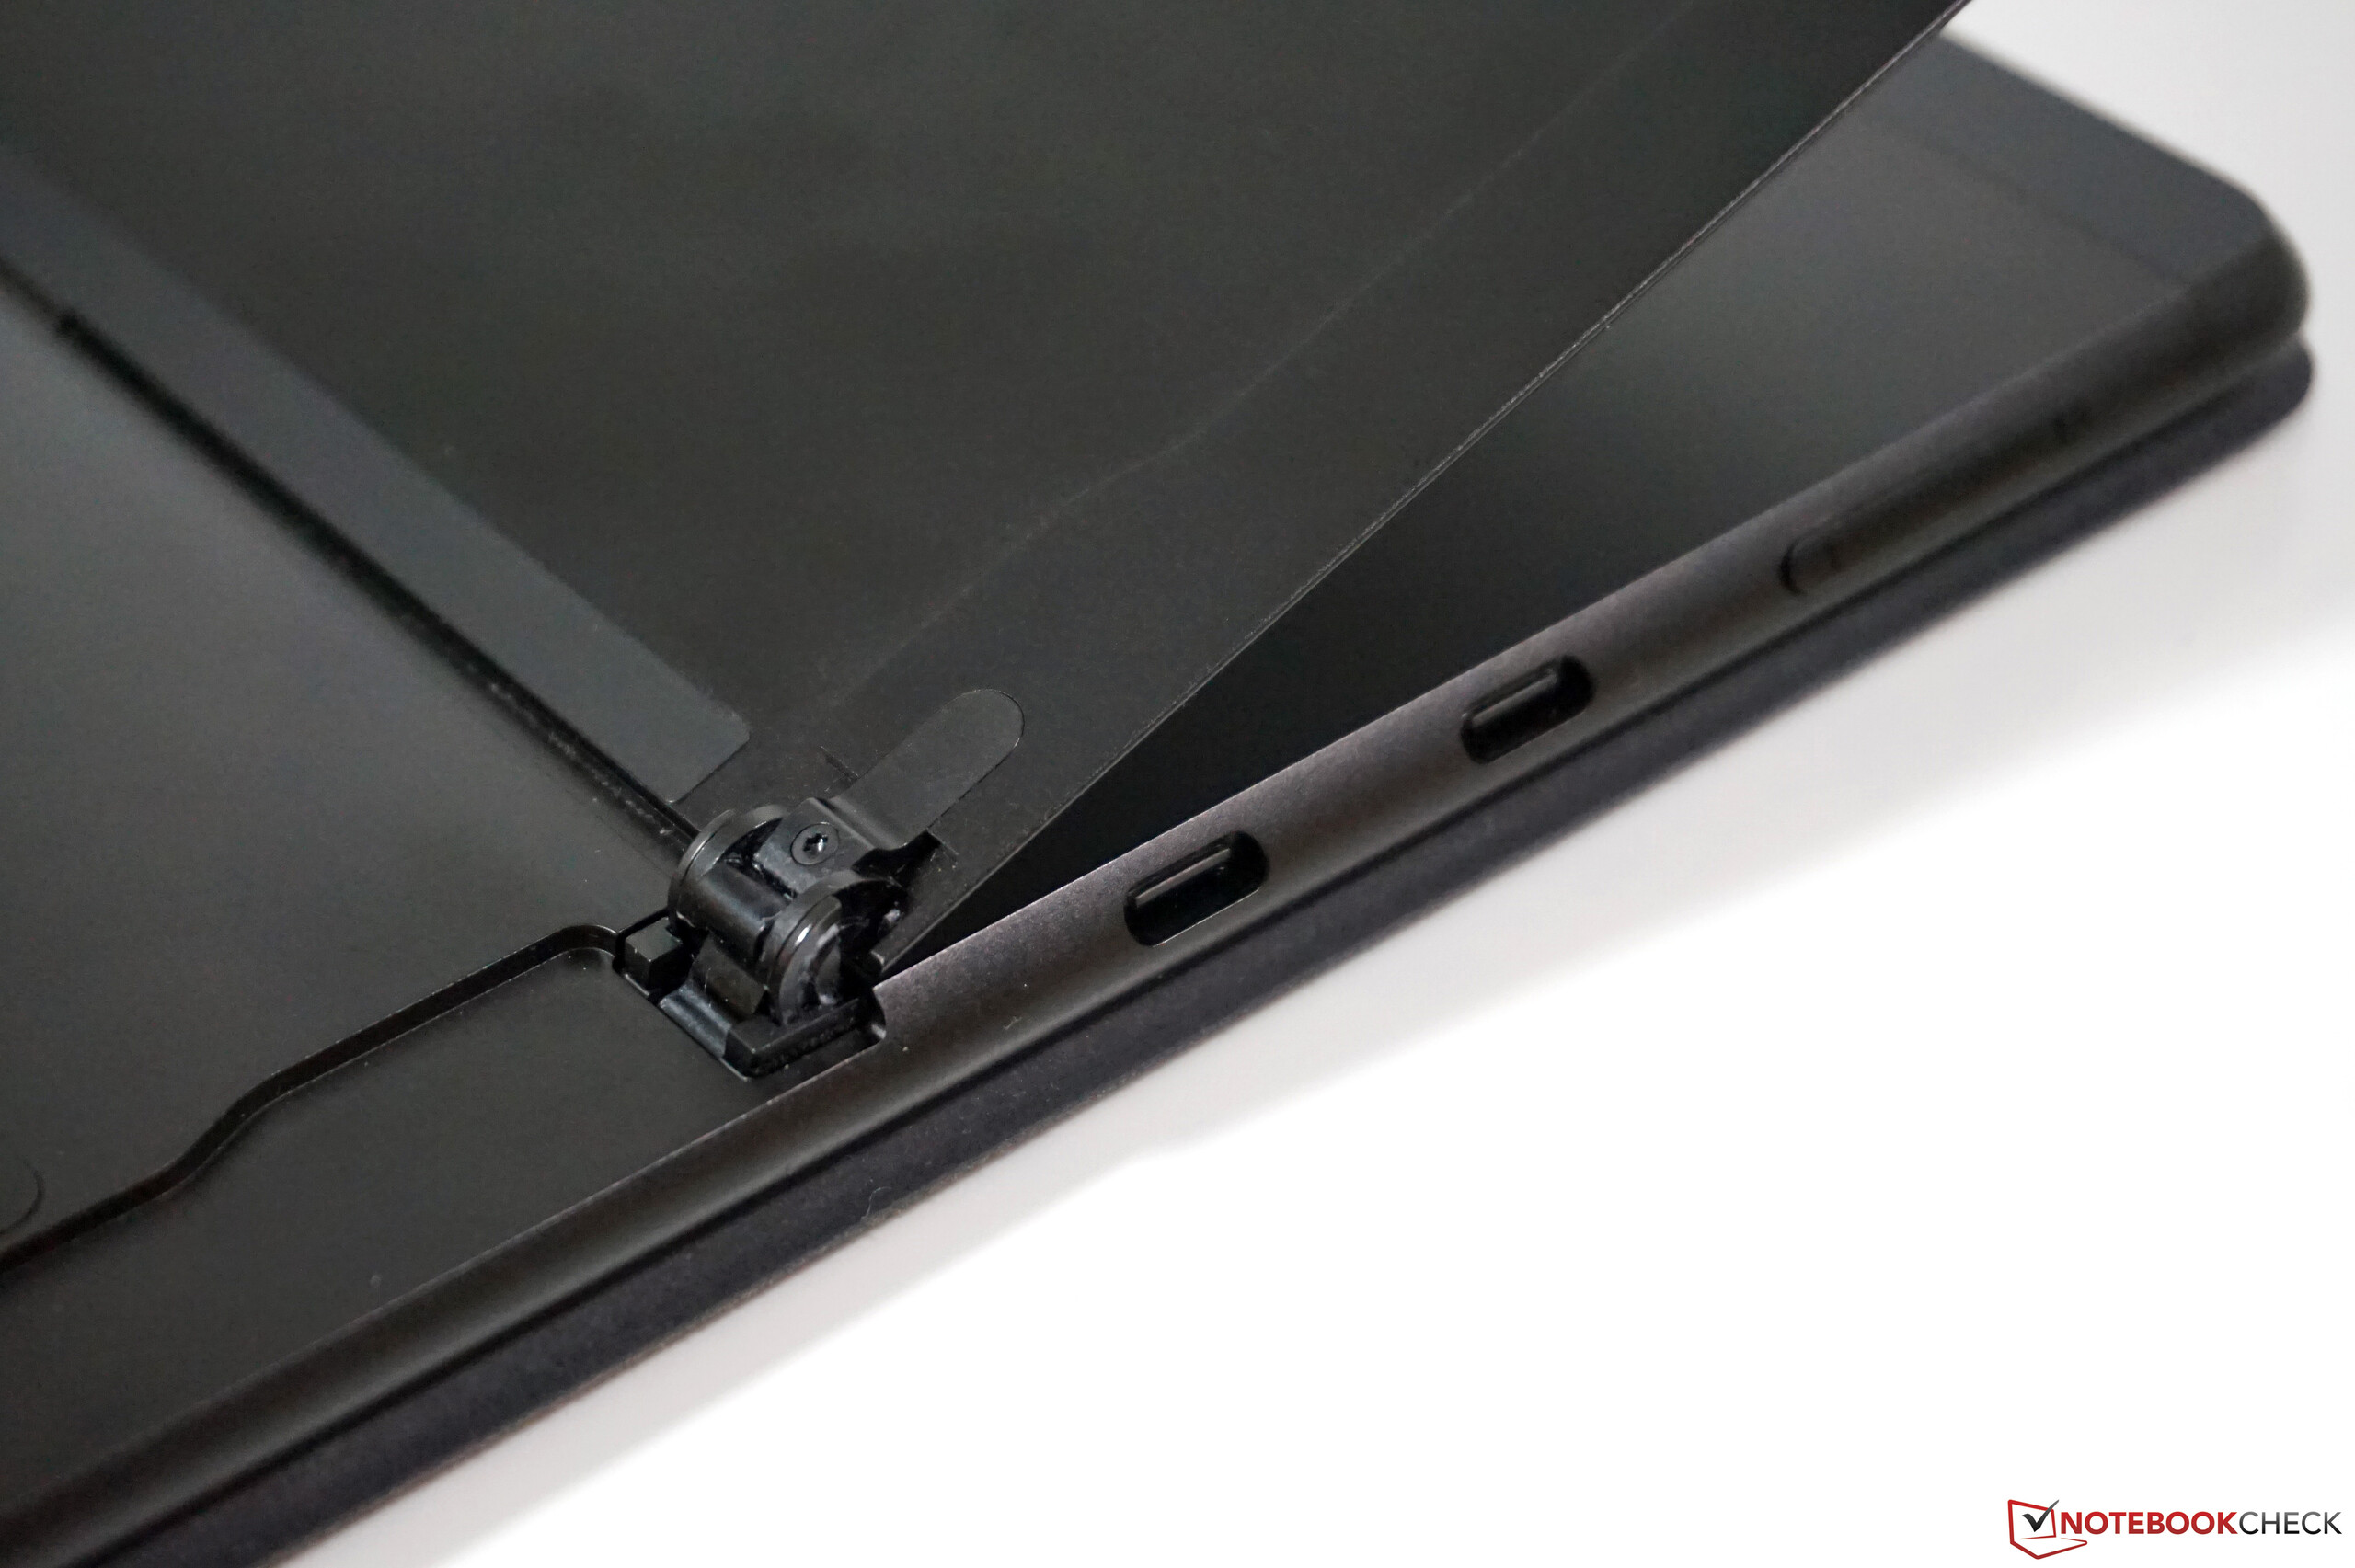
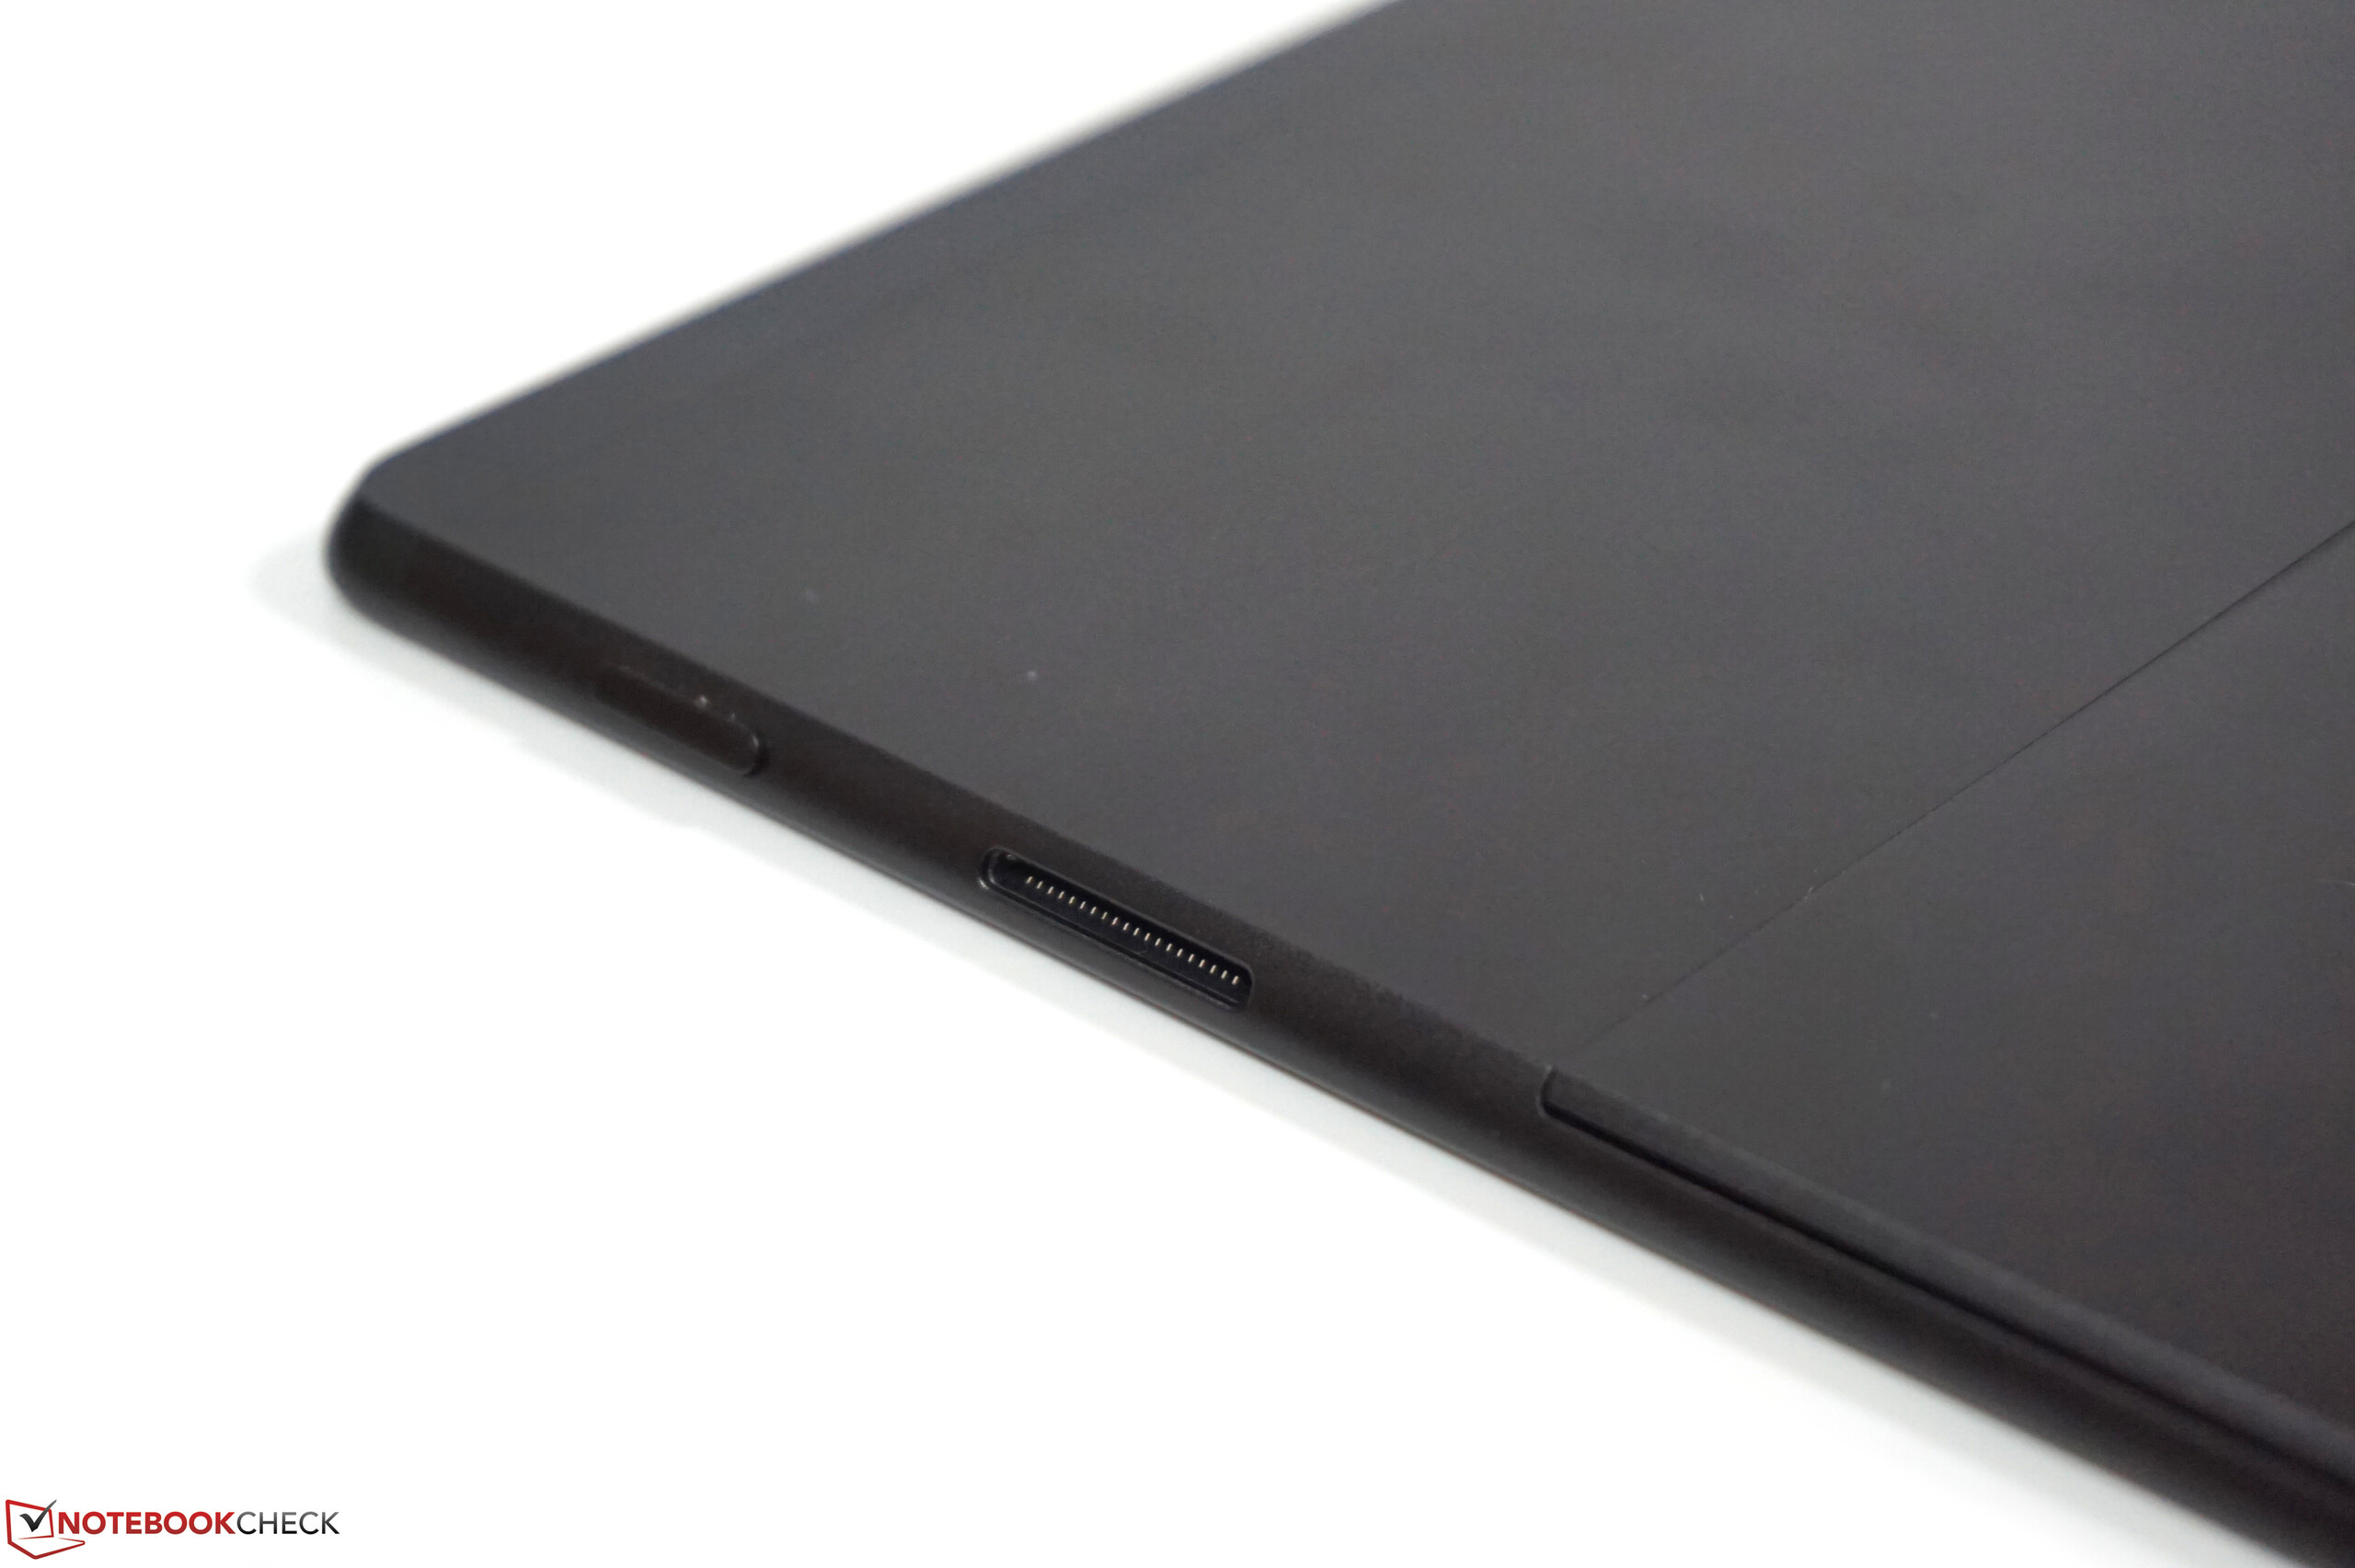
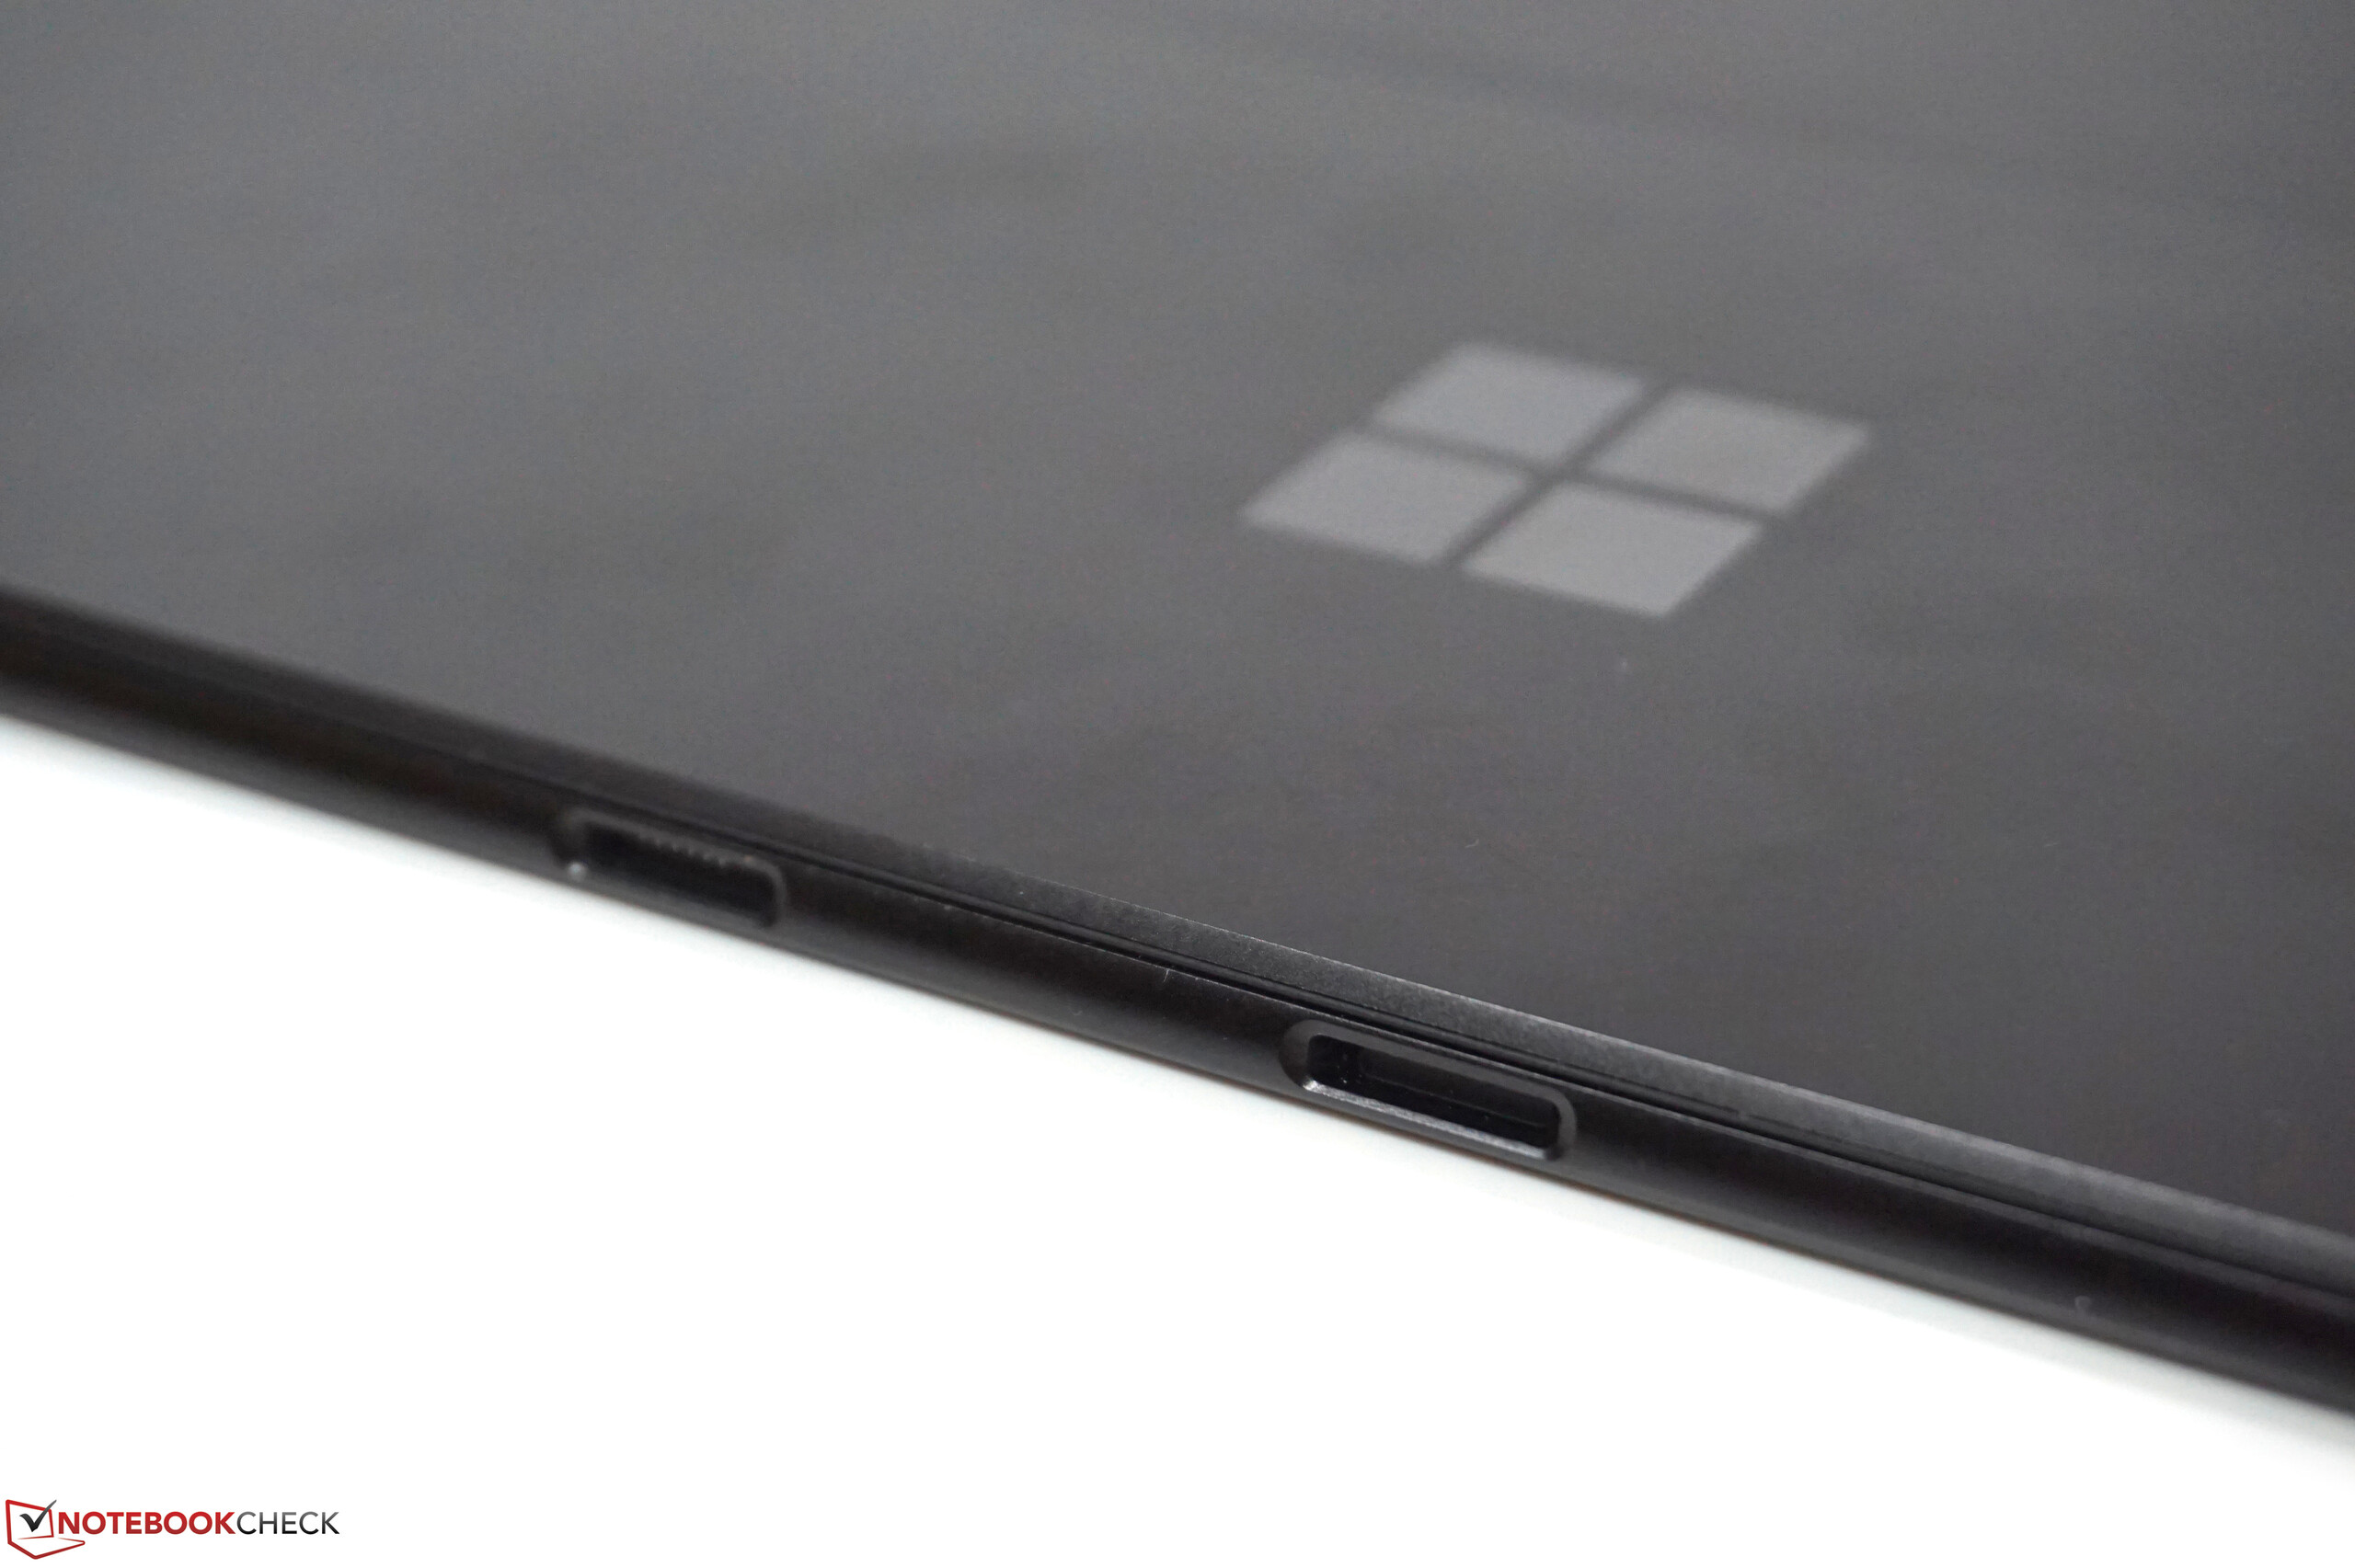
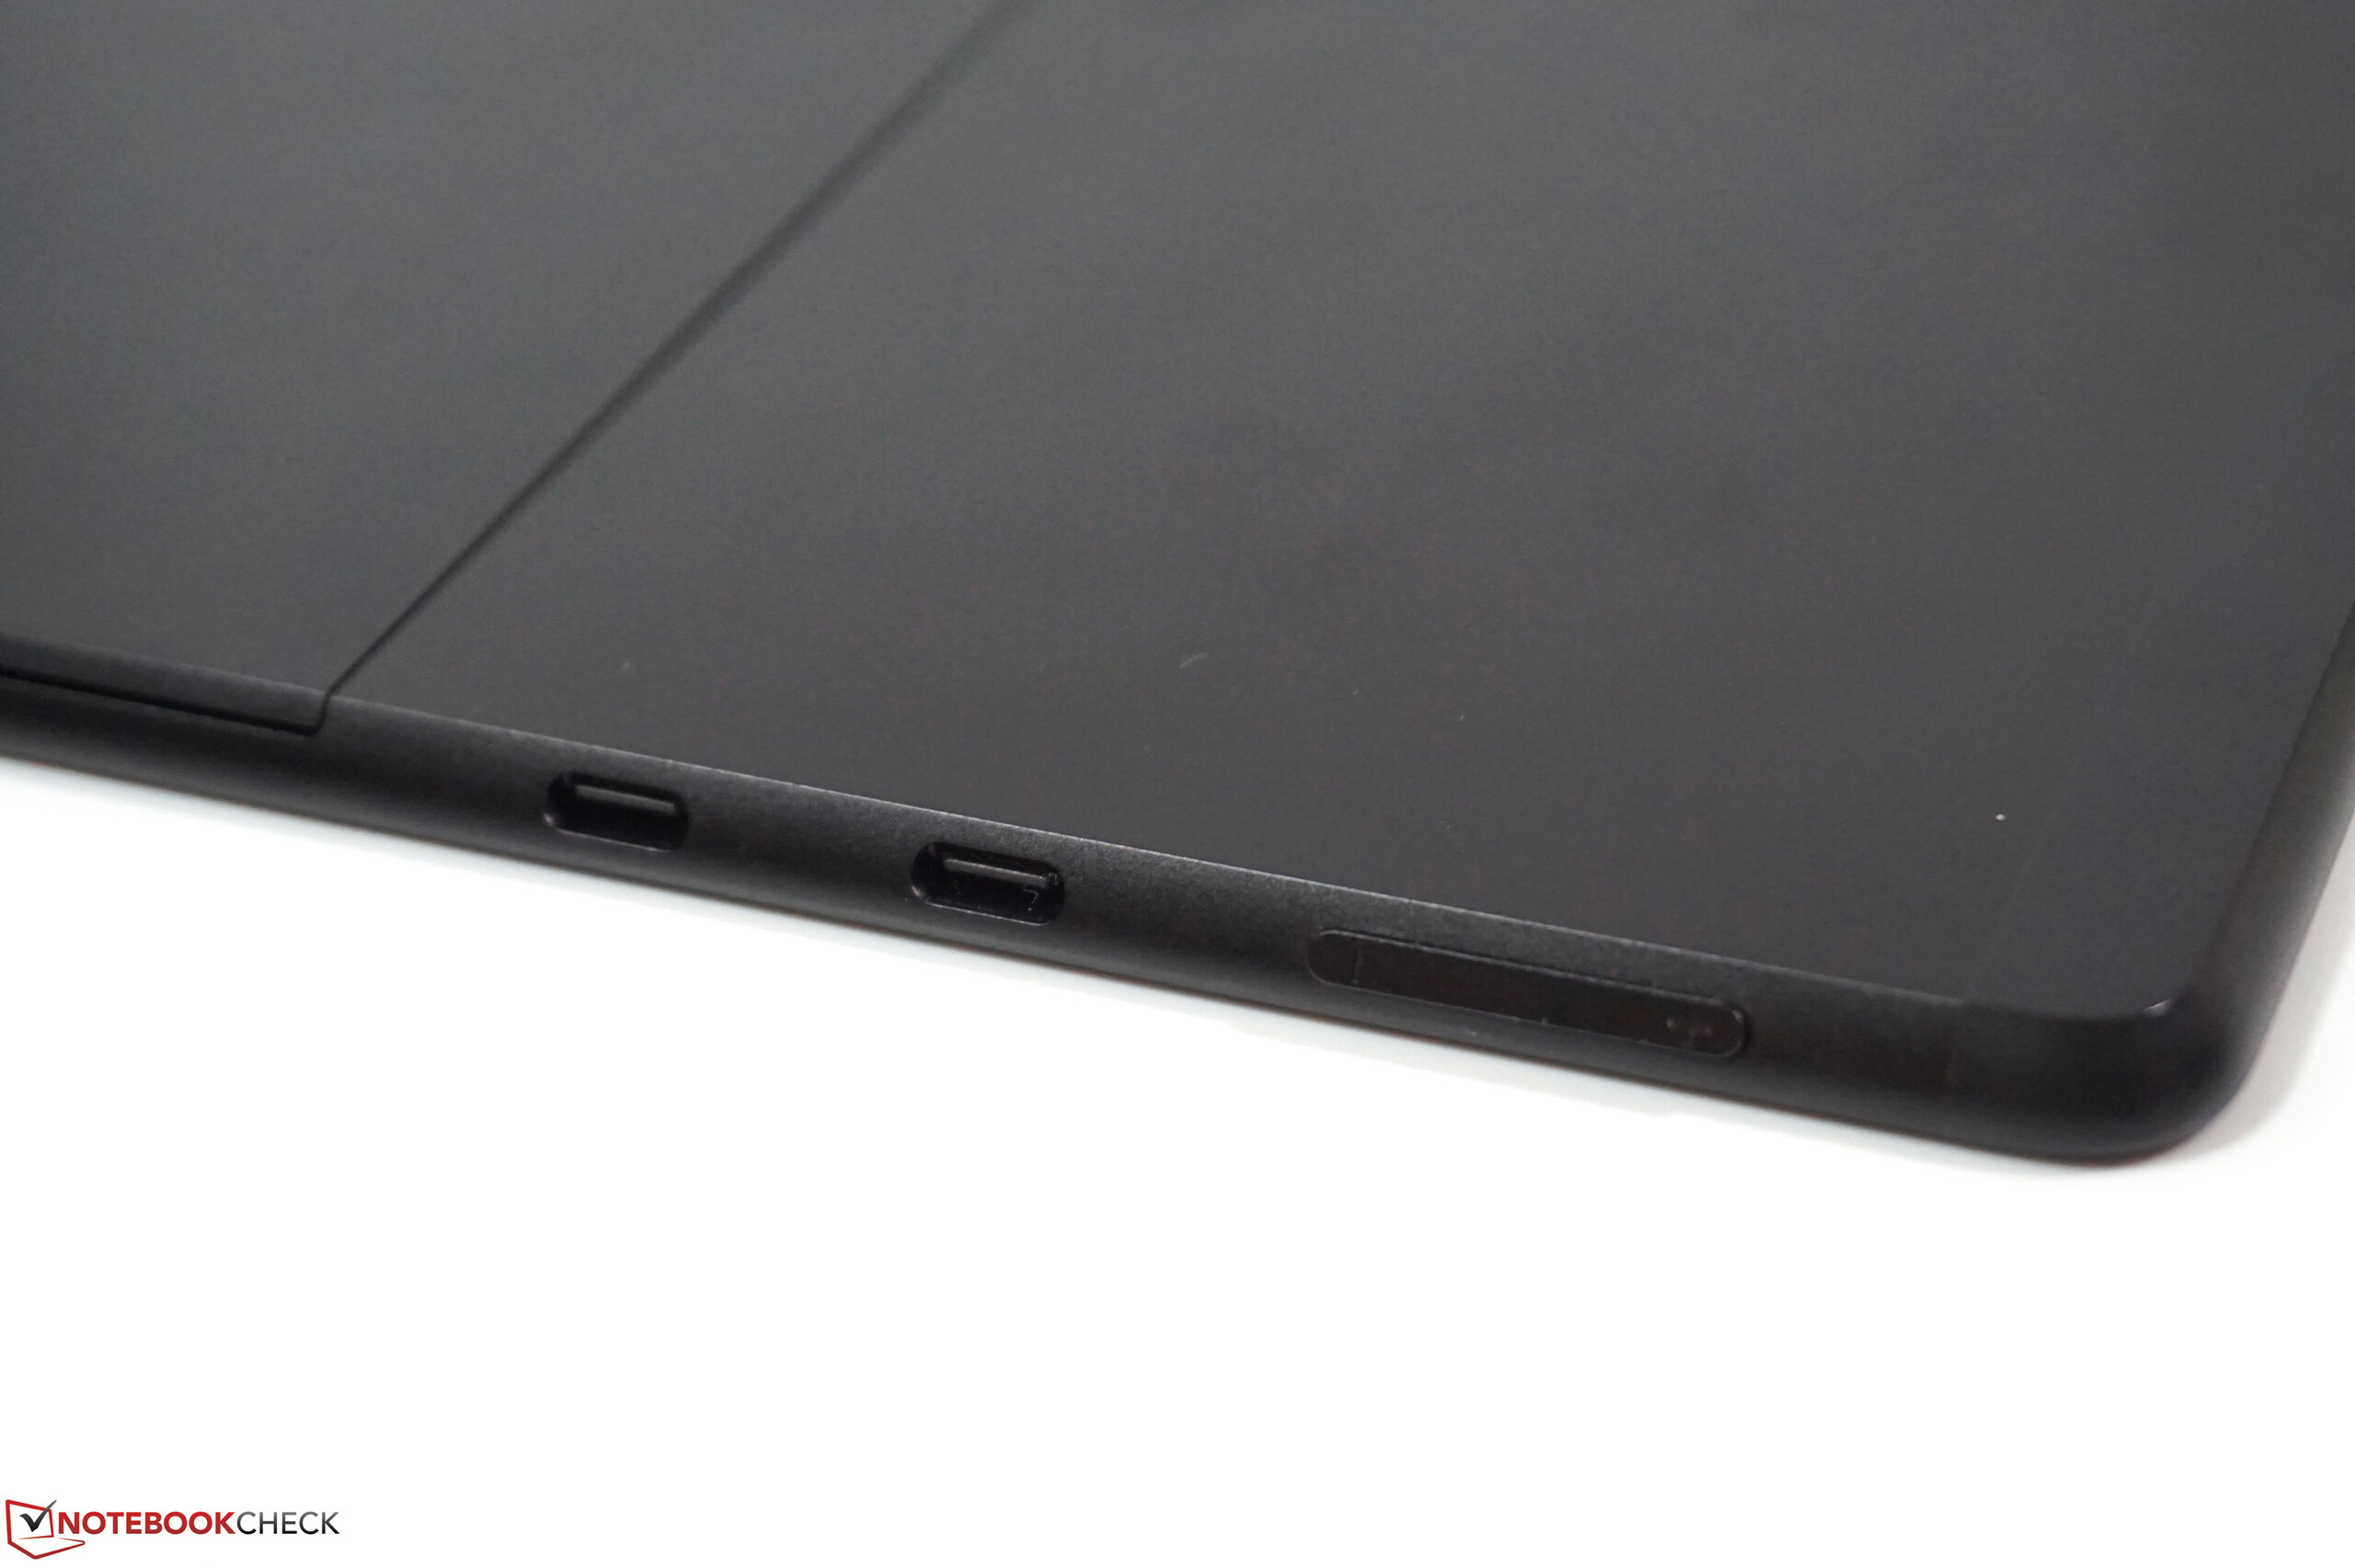
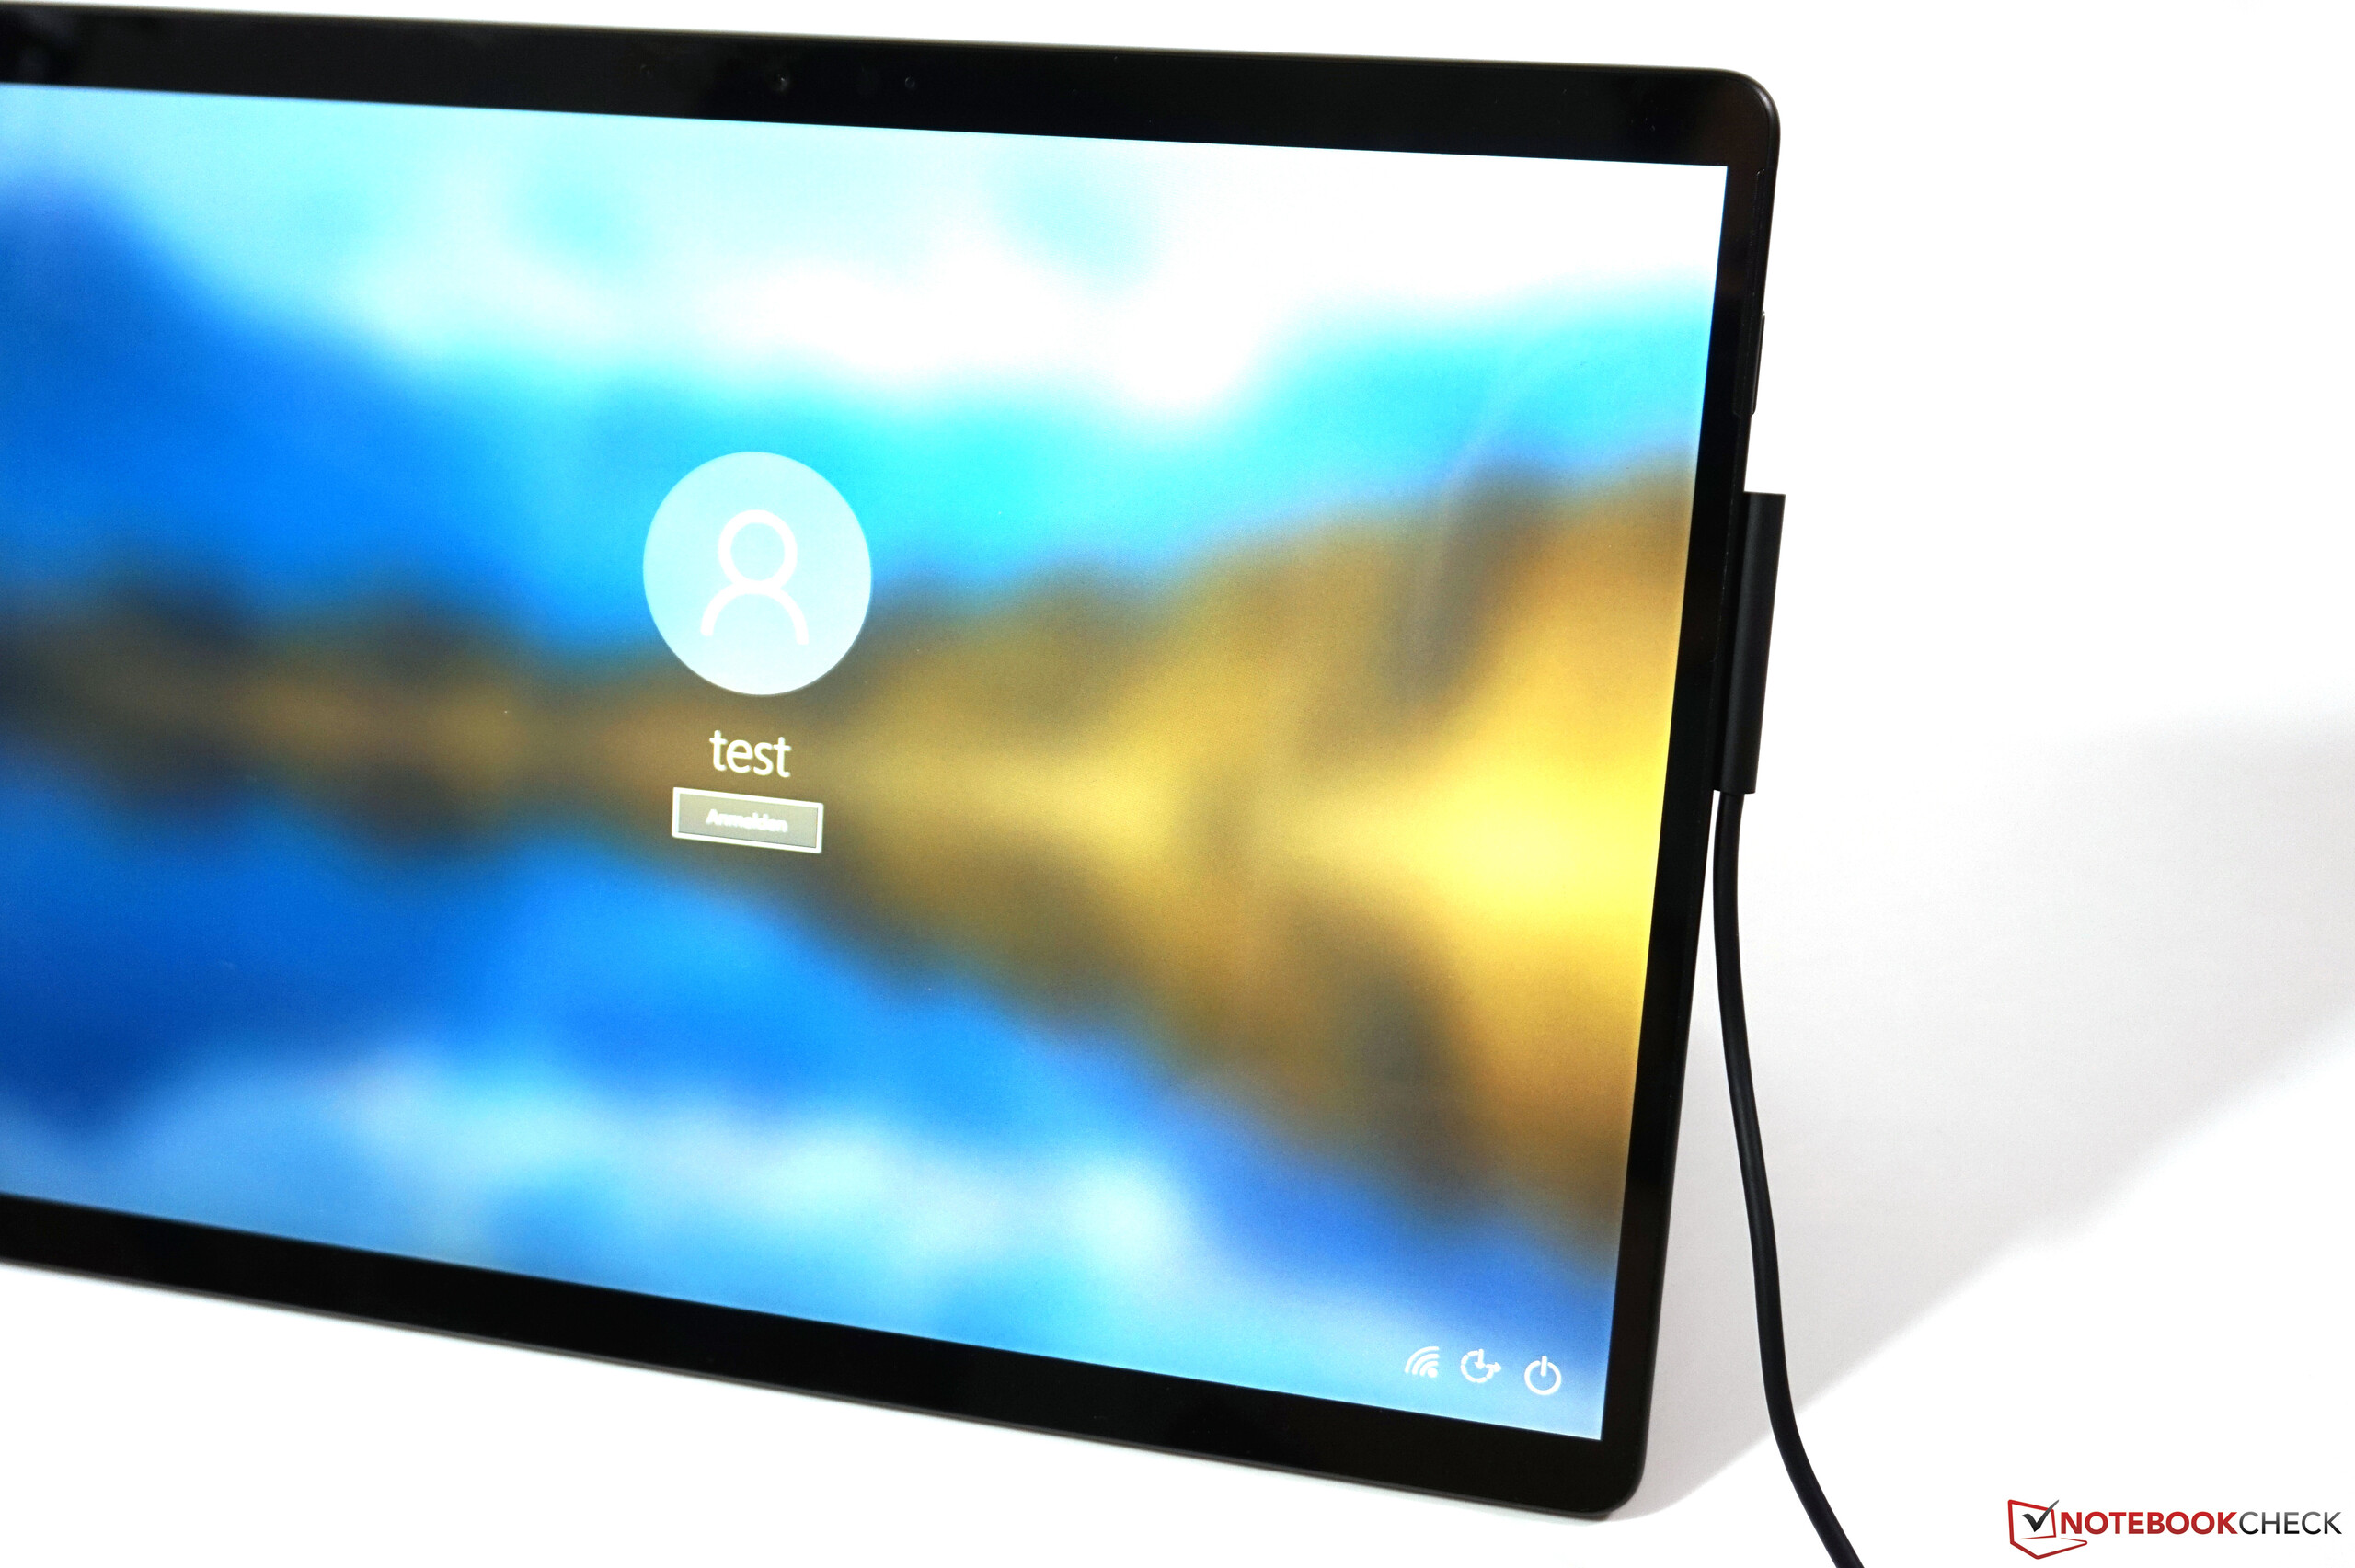
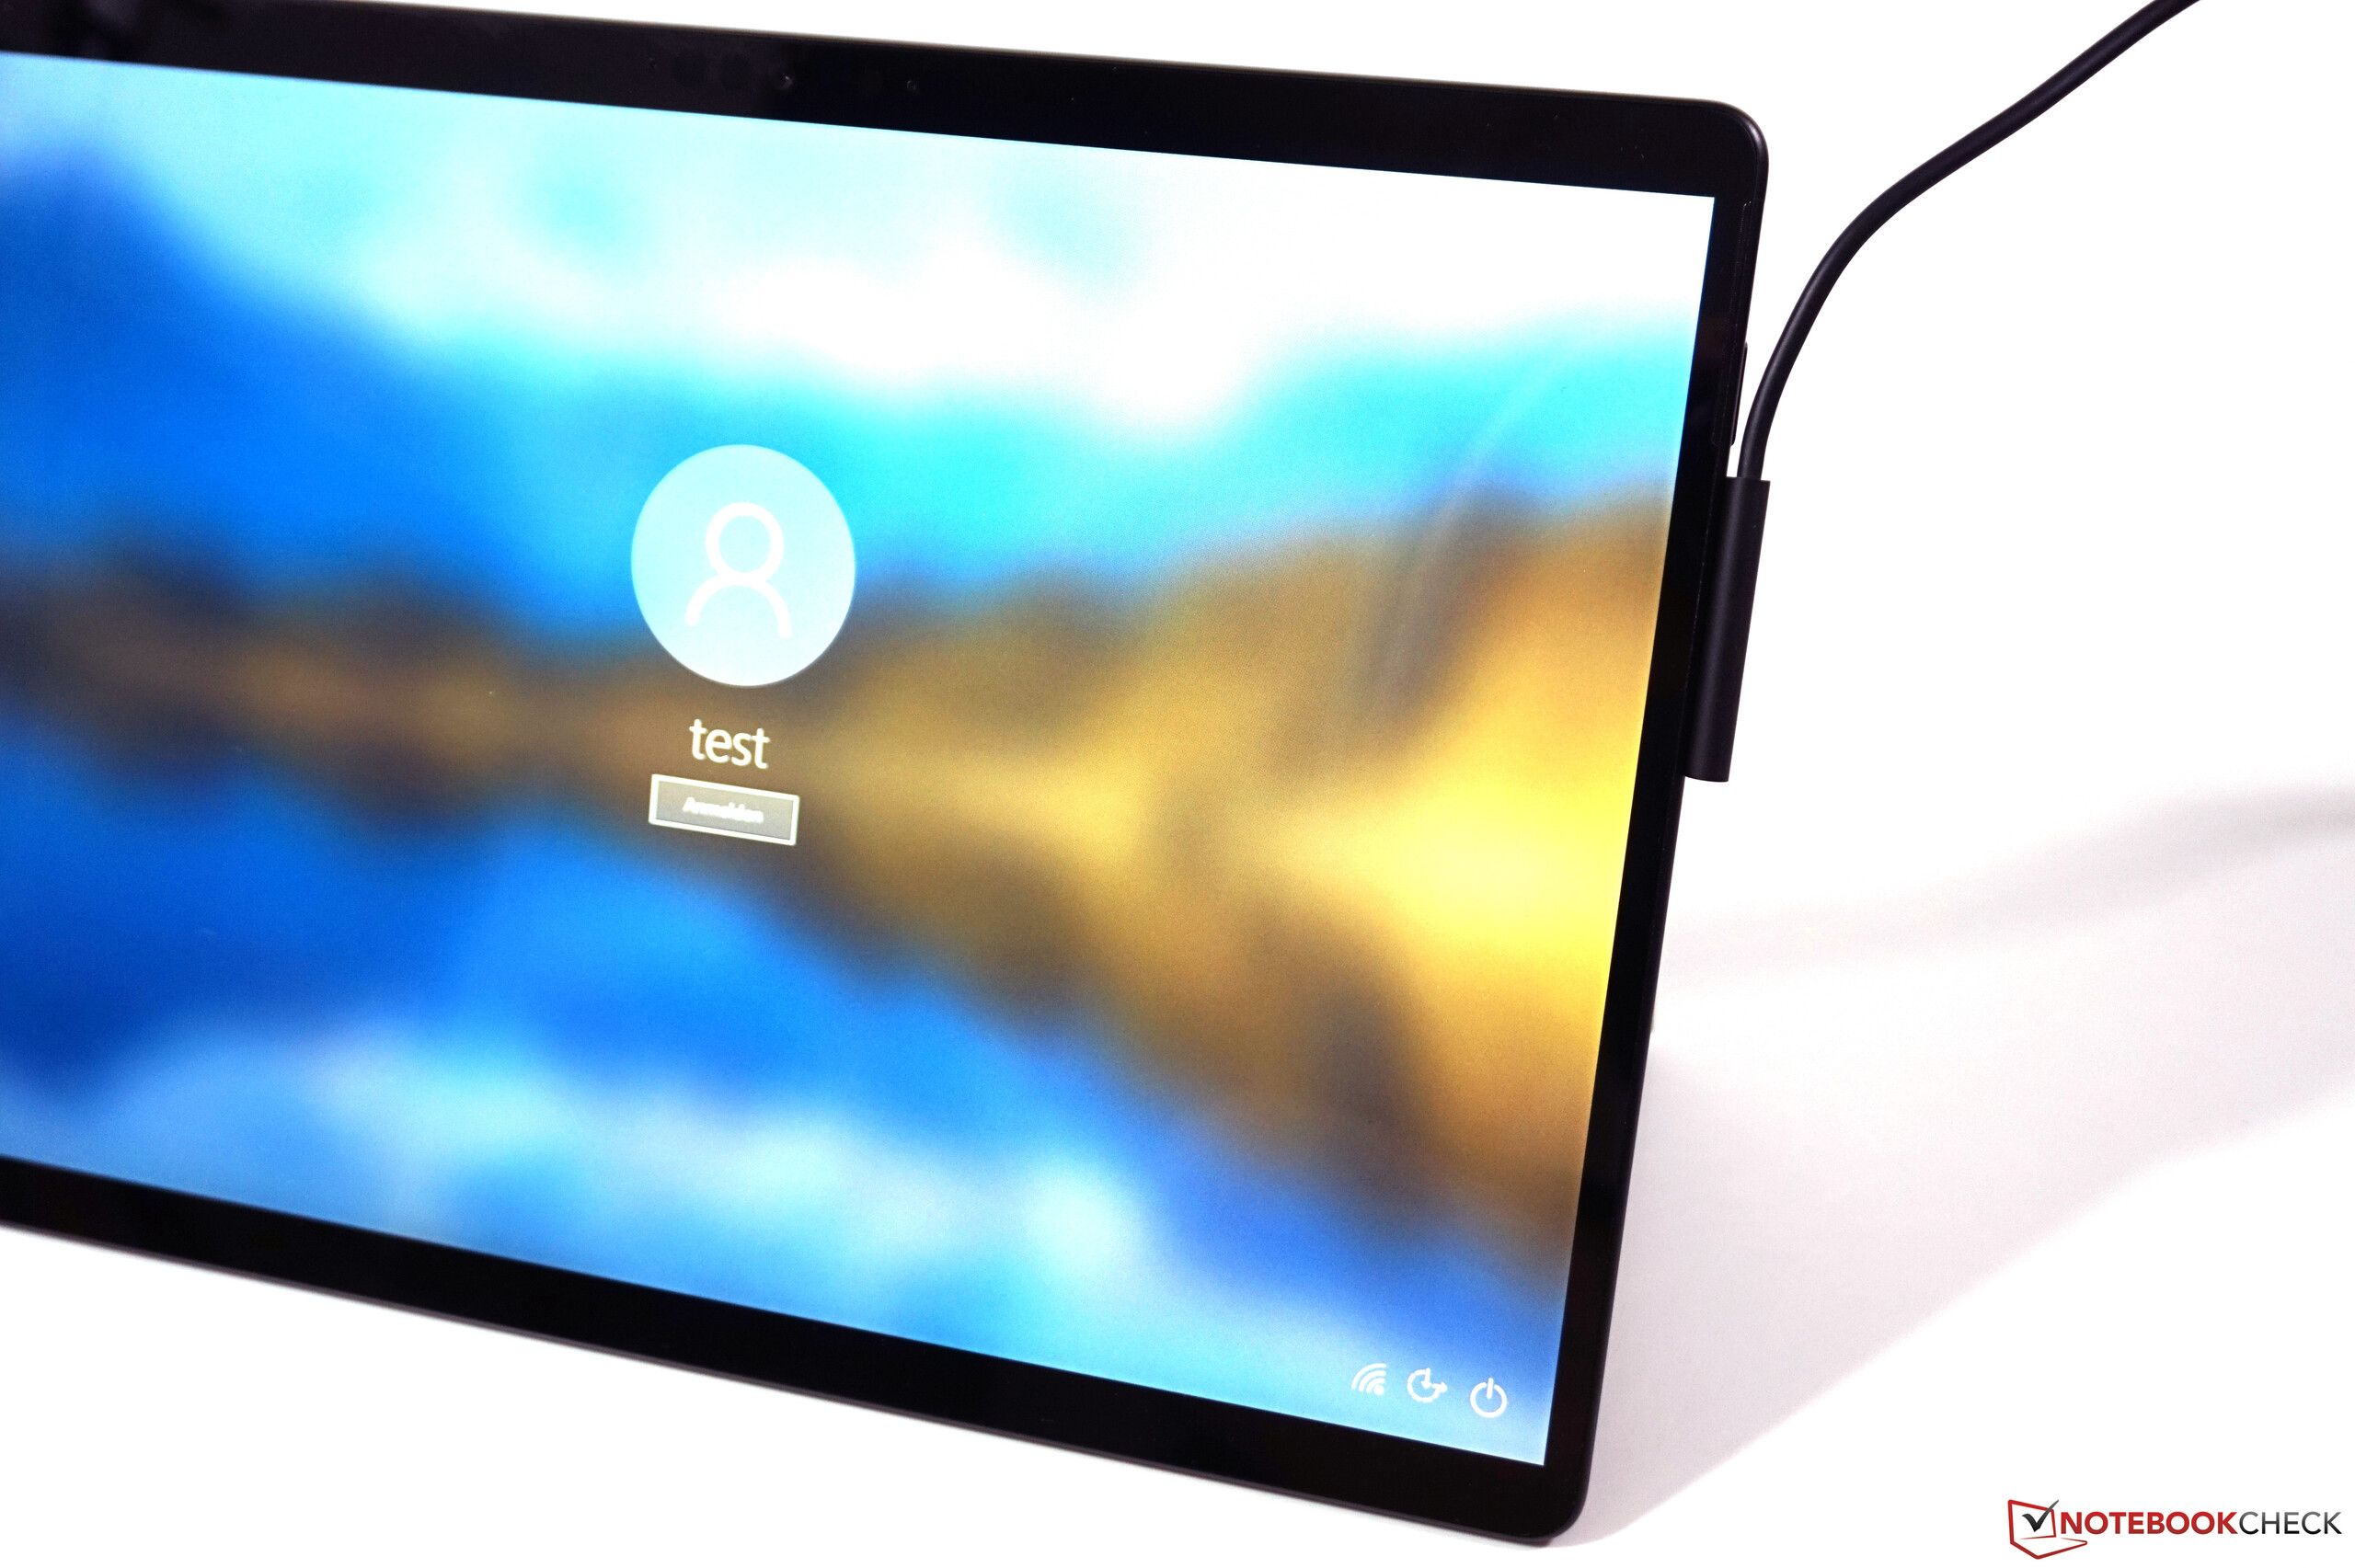
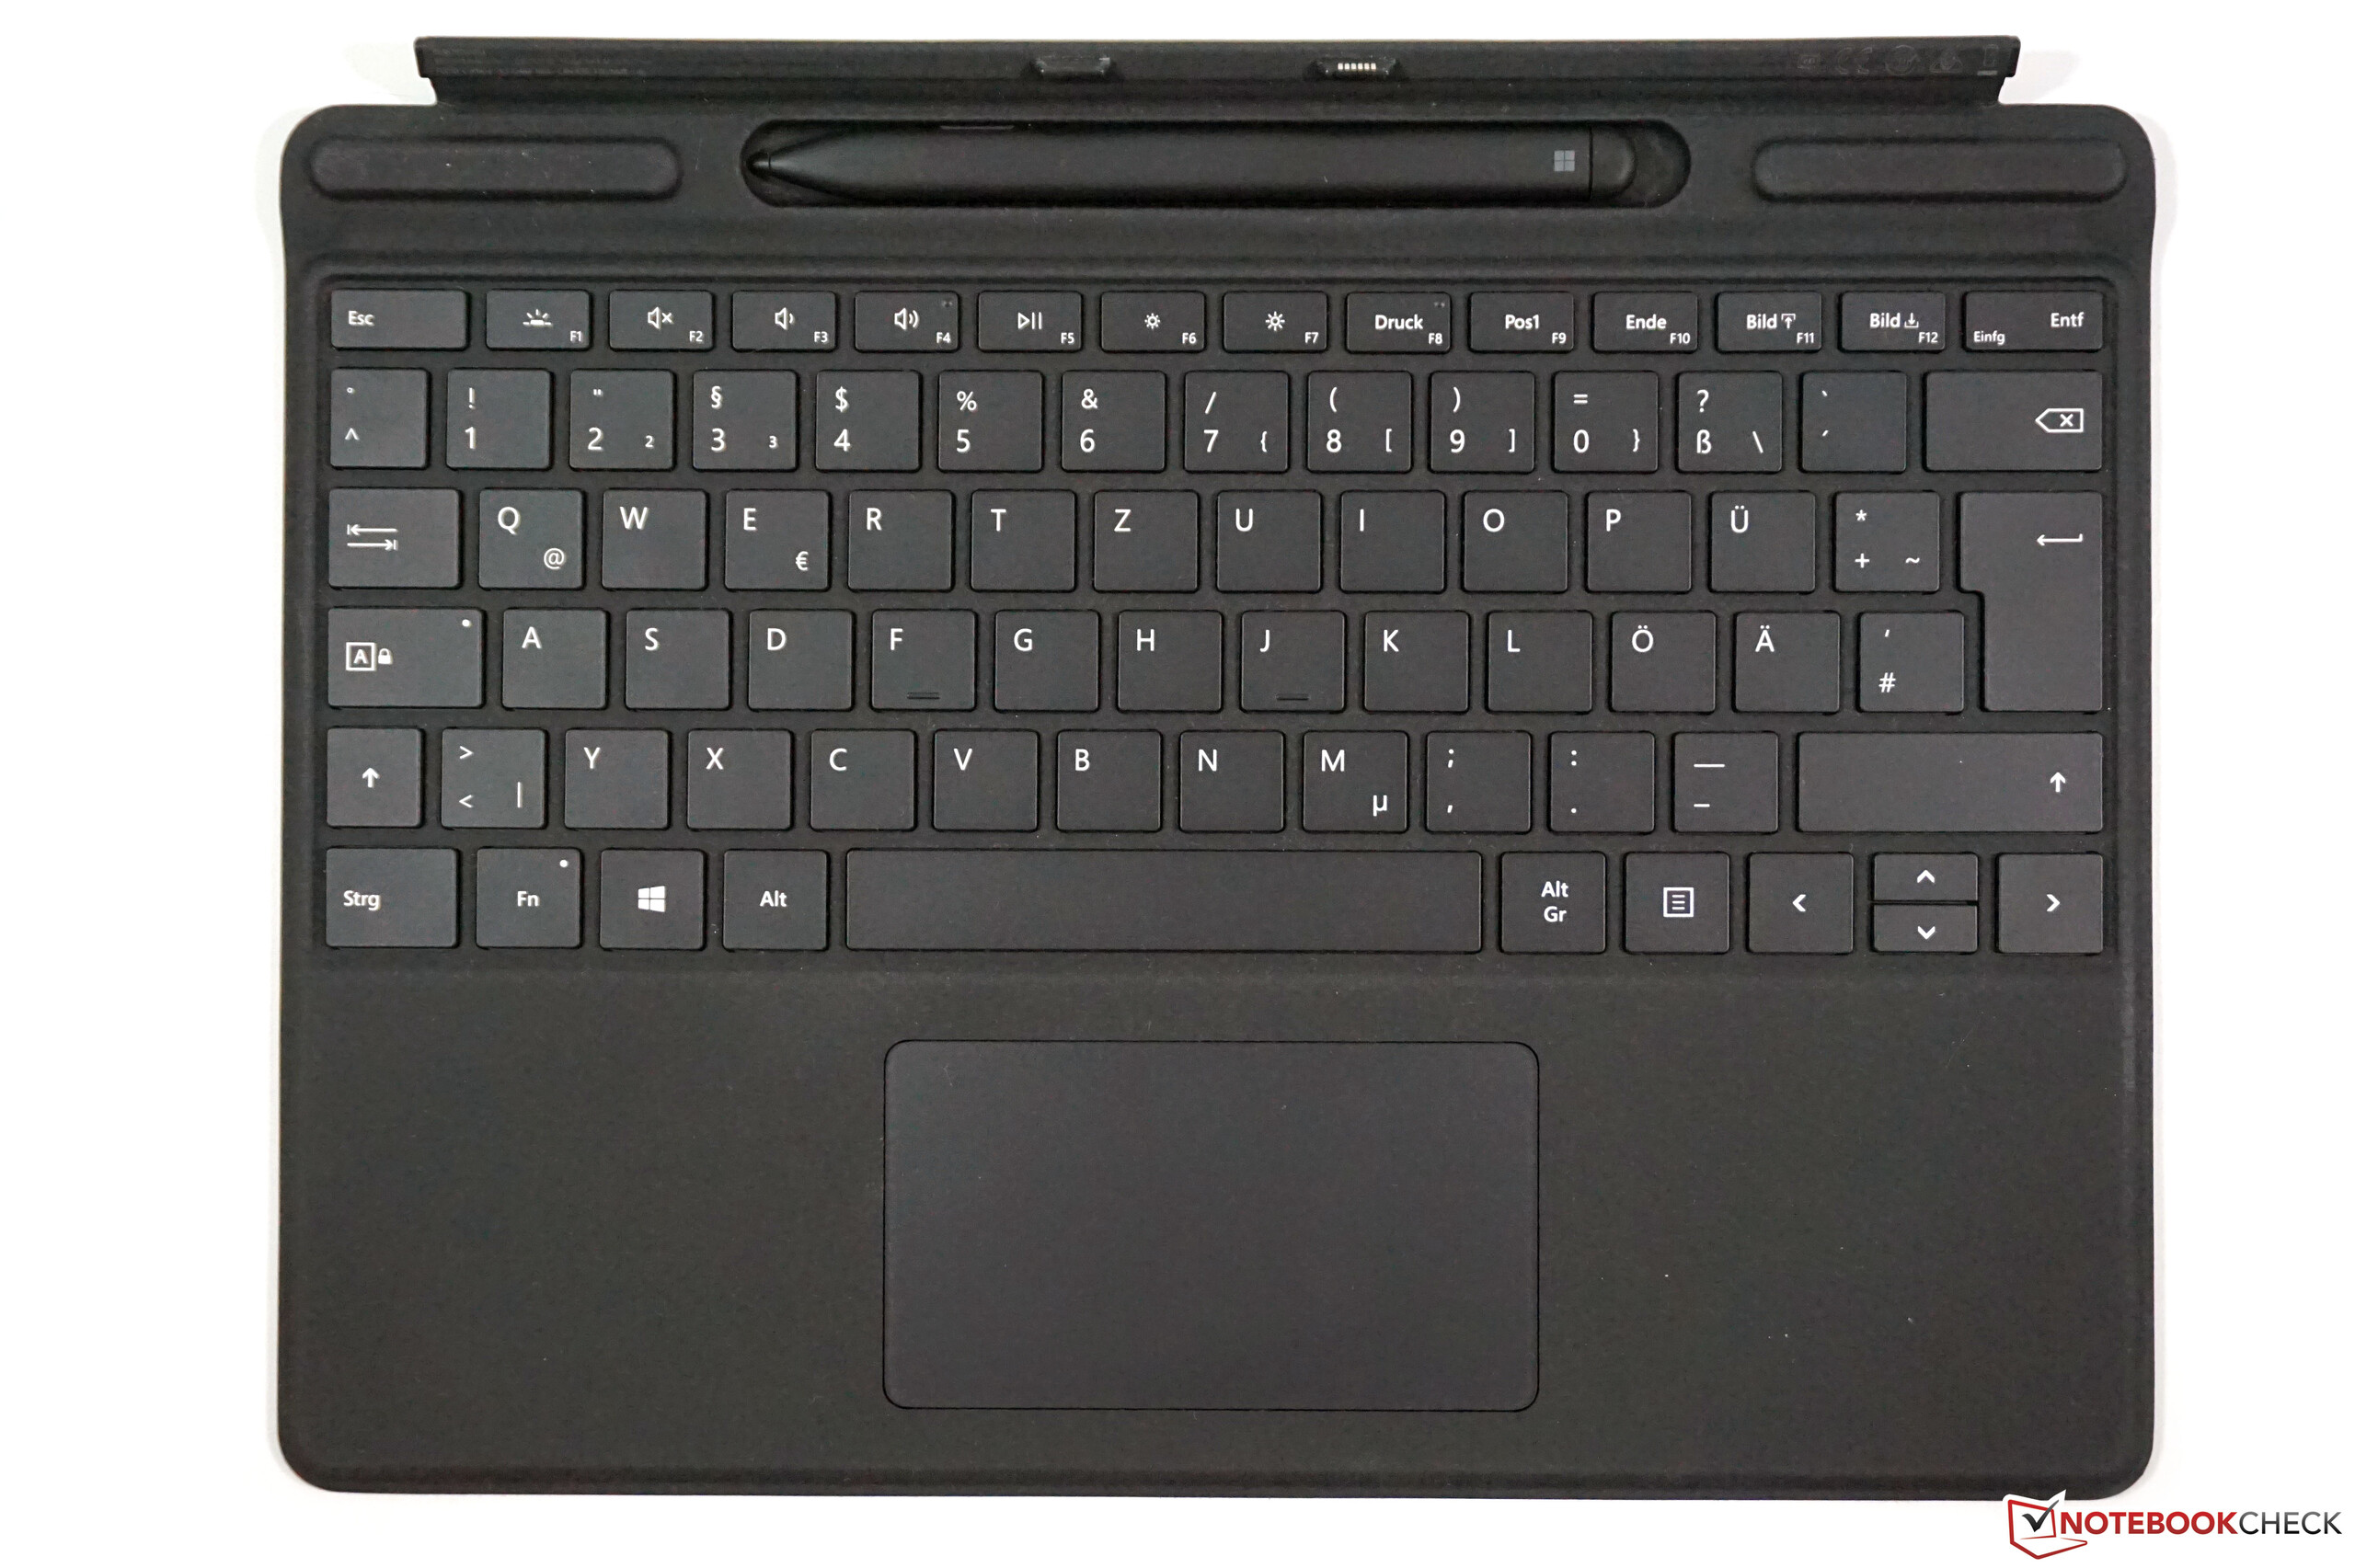
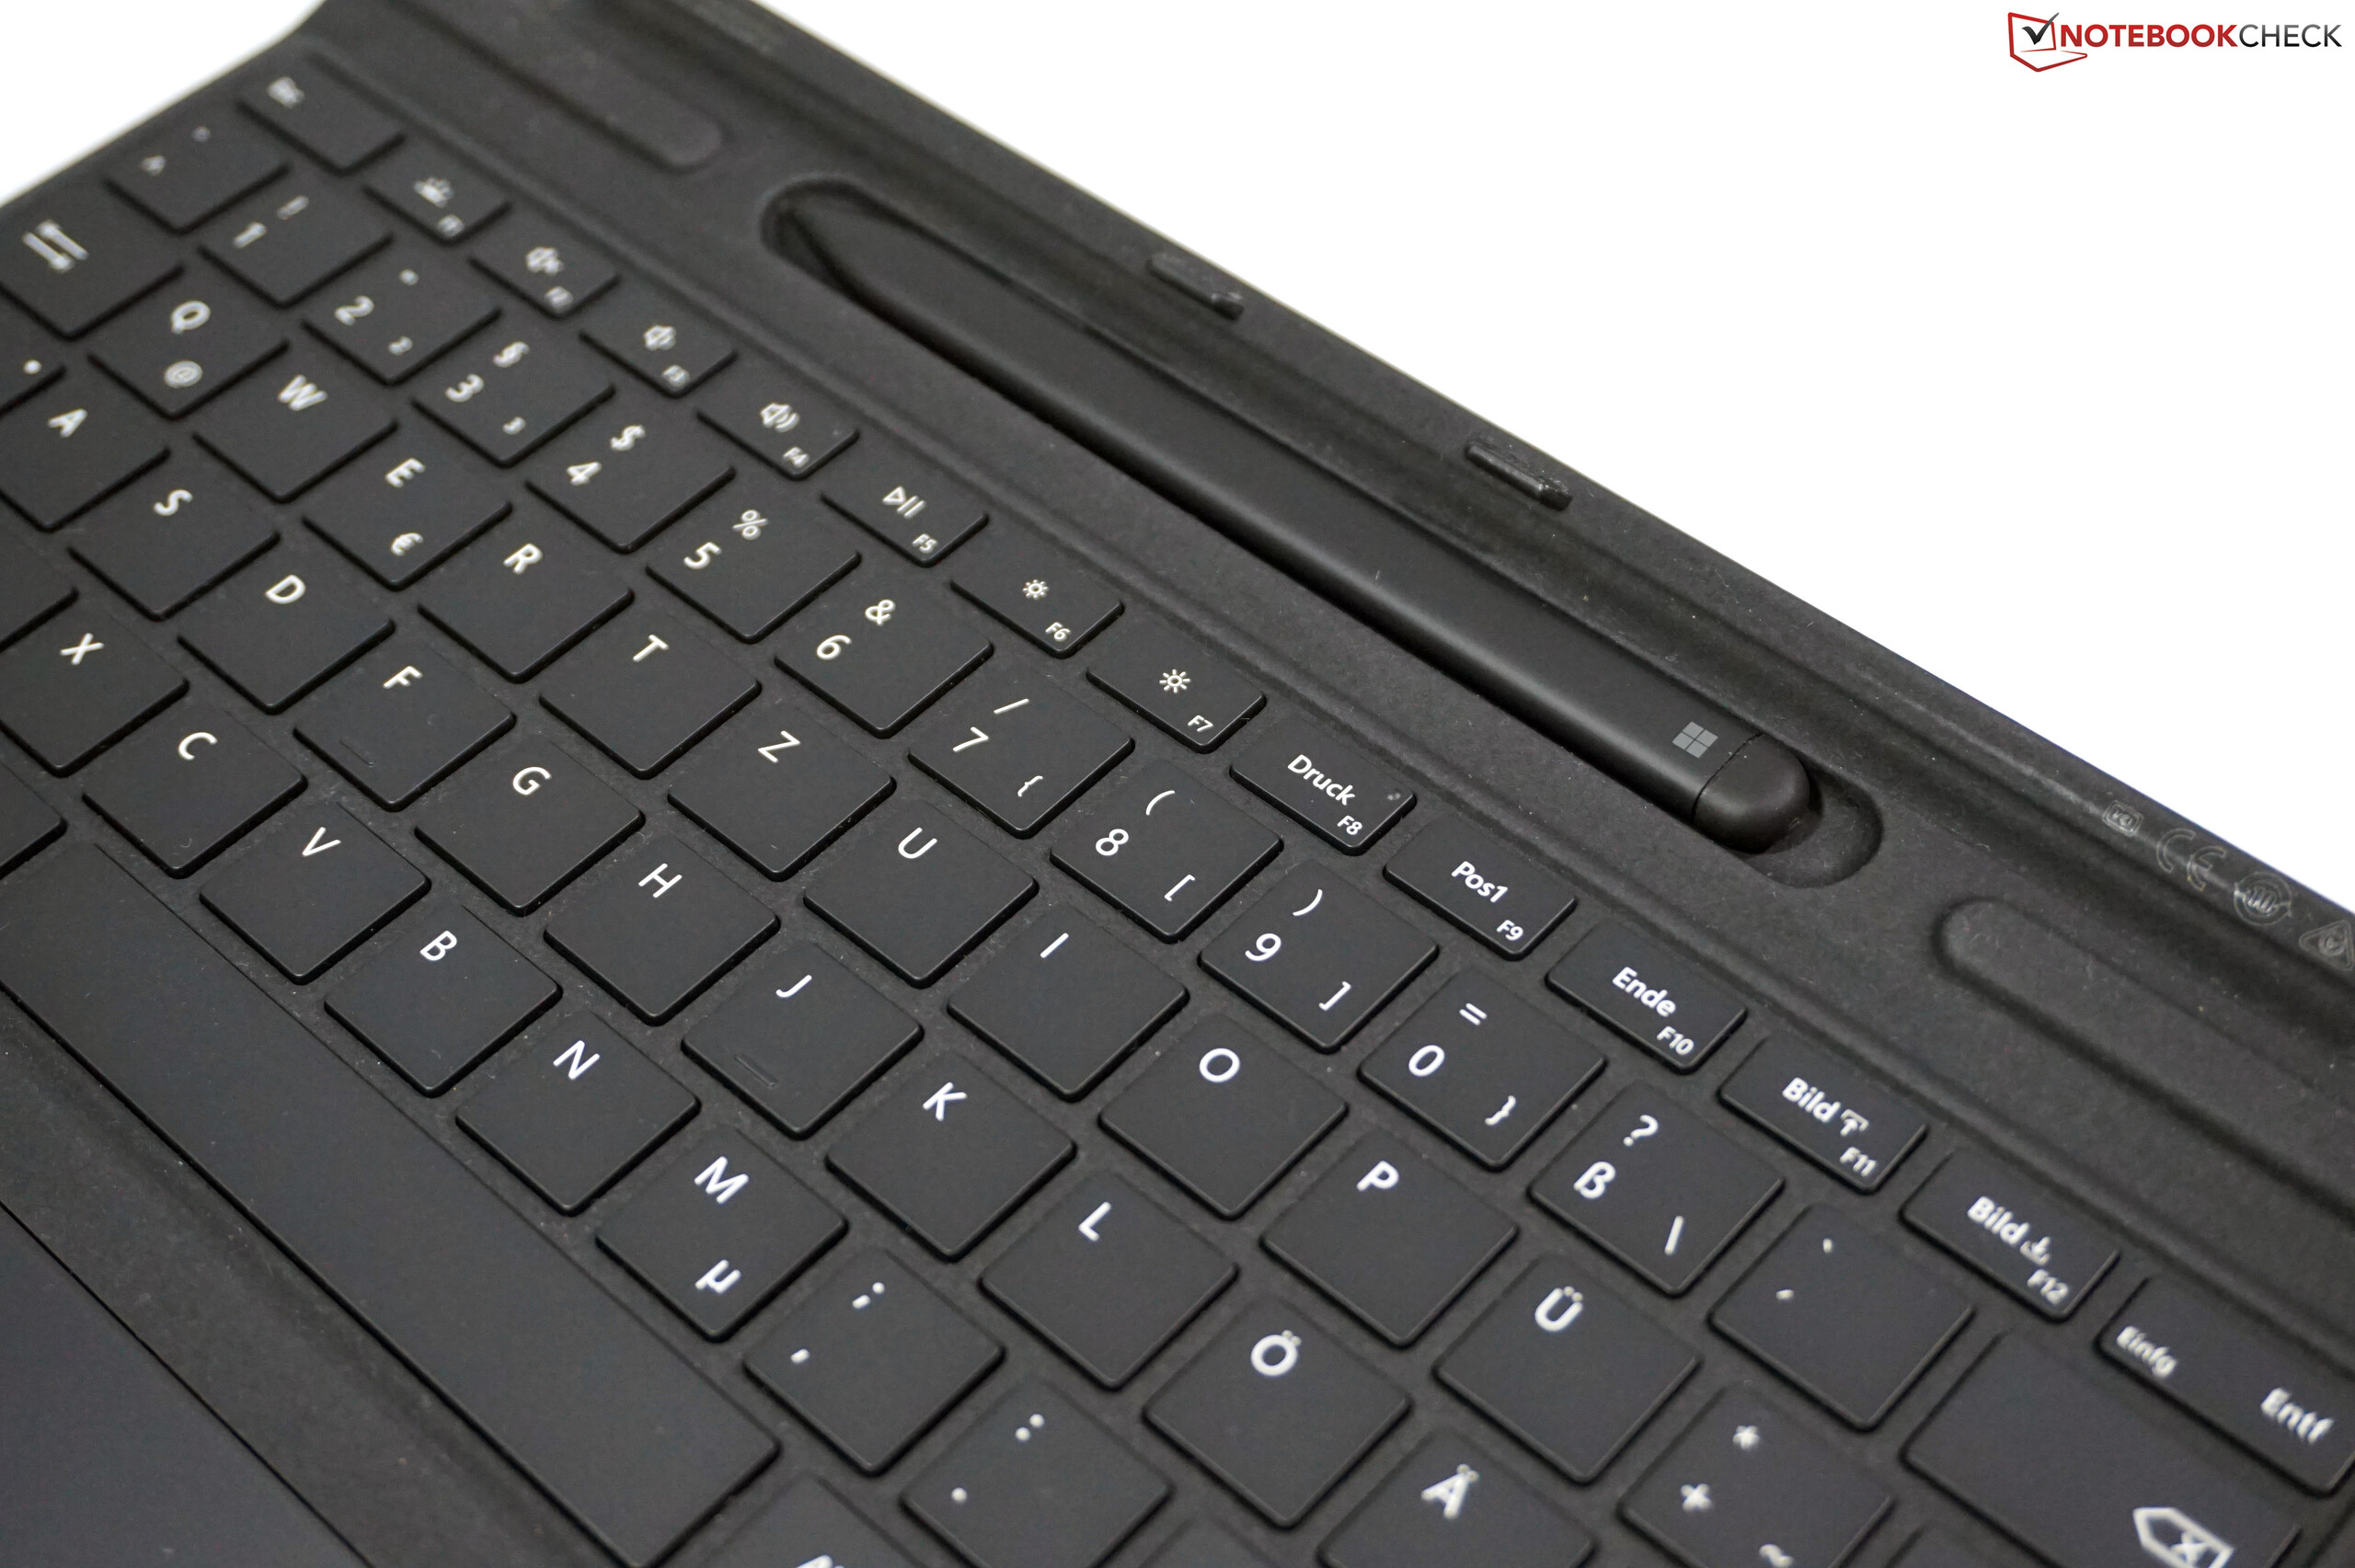
The Surface Pro X is a high-end tablet. Its housing is made of aluminium. The kickstand on the back is really thin, and the hinge is not particularly stable. Our review device is the matte black variant. There is also a silver version of the slate. The optional Alcantara keyboard doubles as a screen protector and provides good tactile feedback when typing. In addition, it also features a slot for the Slim Pen. The backlit keyboard offers a short travel distance and a satisfactory typing experience.
In our Wi-Fi test, the Microsoft Surface Pro X achieves surprisingly poor data transfer speeds. However, in day-to-day use, the slate functions very well. Thanks to the Snapdragon X24 modem, the Surface Pro X supports LTE.
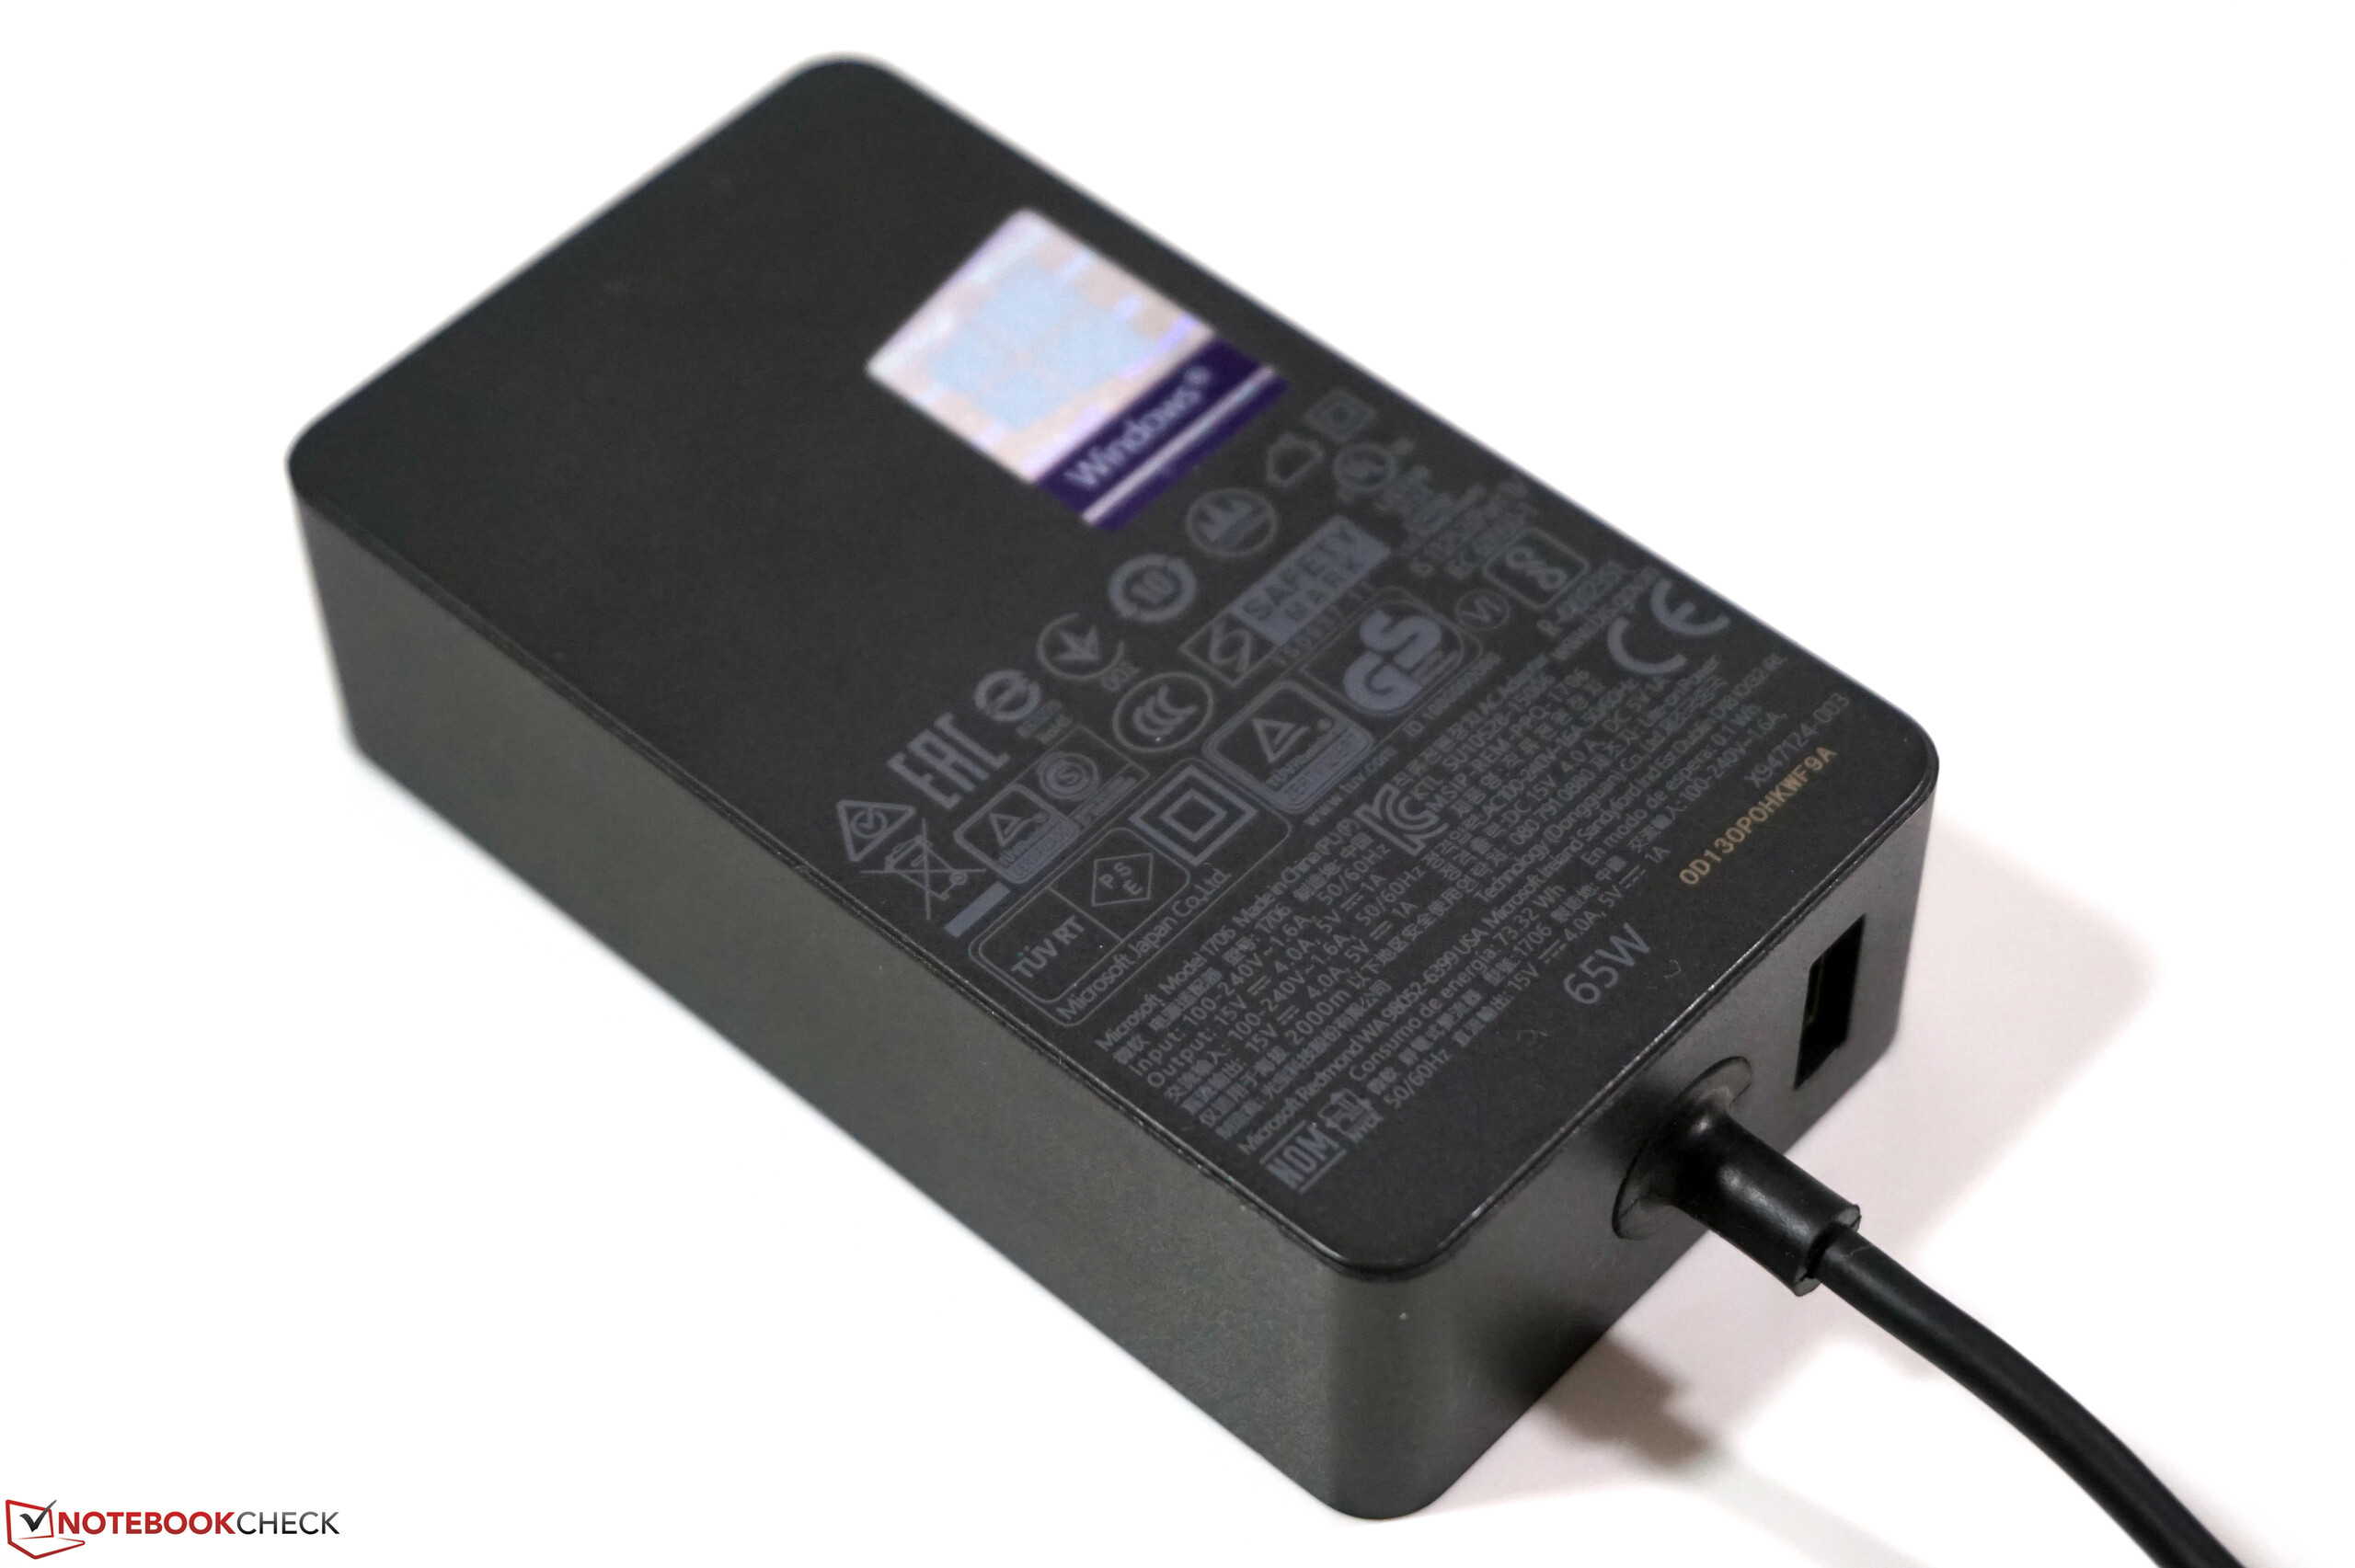
Microsoft’s slate offers two USB-C ports and a special Surface Connector, which can be used to connect additional accessories from Microsoft to the device. Moreover, it can also be used to charge the tablet (USB-C ports can also be used for charging). However, in everyday use, the charging cable proves to be rather clunky.
The two good cameras are a big strength of the Surface Pro X. The front-facing shooter comes with a 5-MP sensor and the rear-camera features a 10-MP sensor.
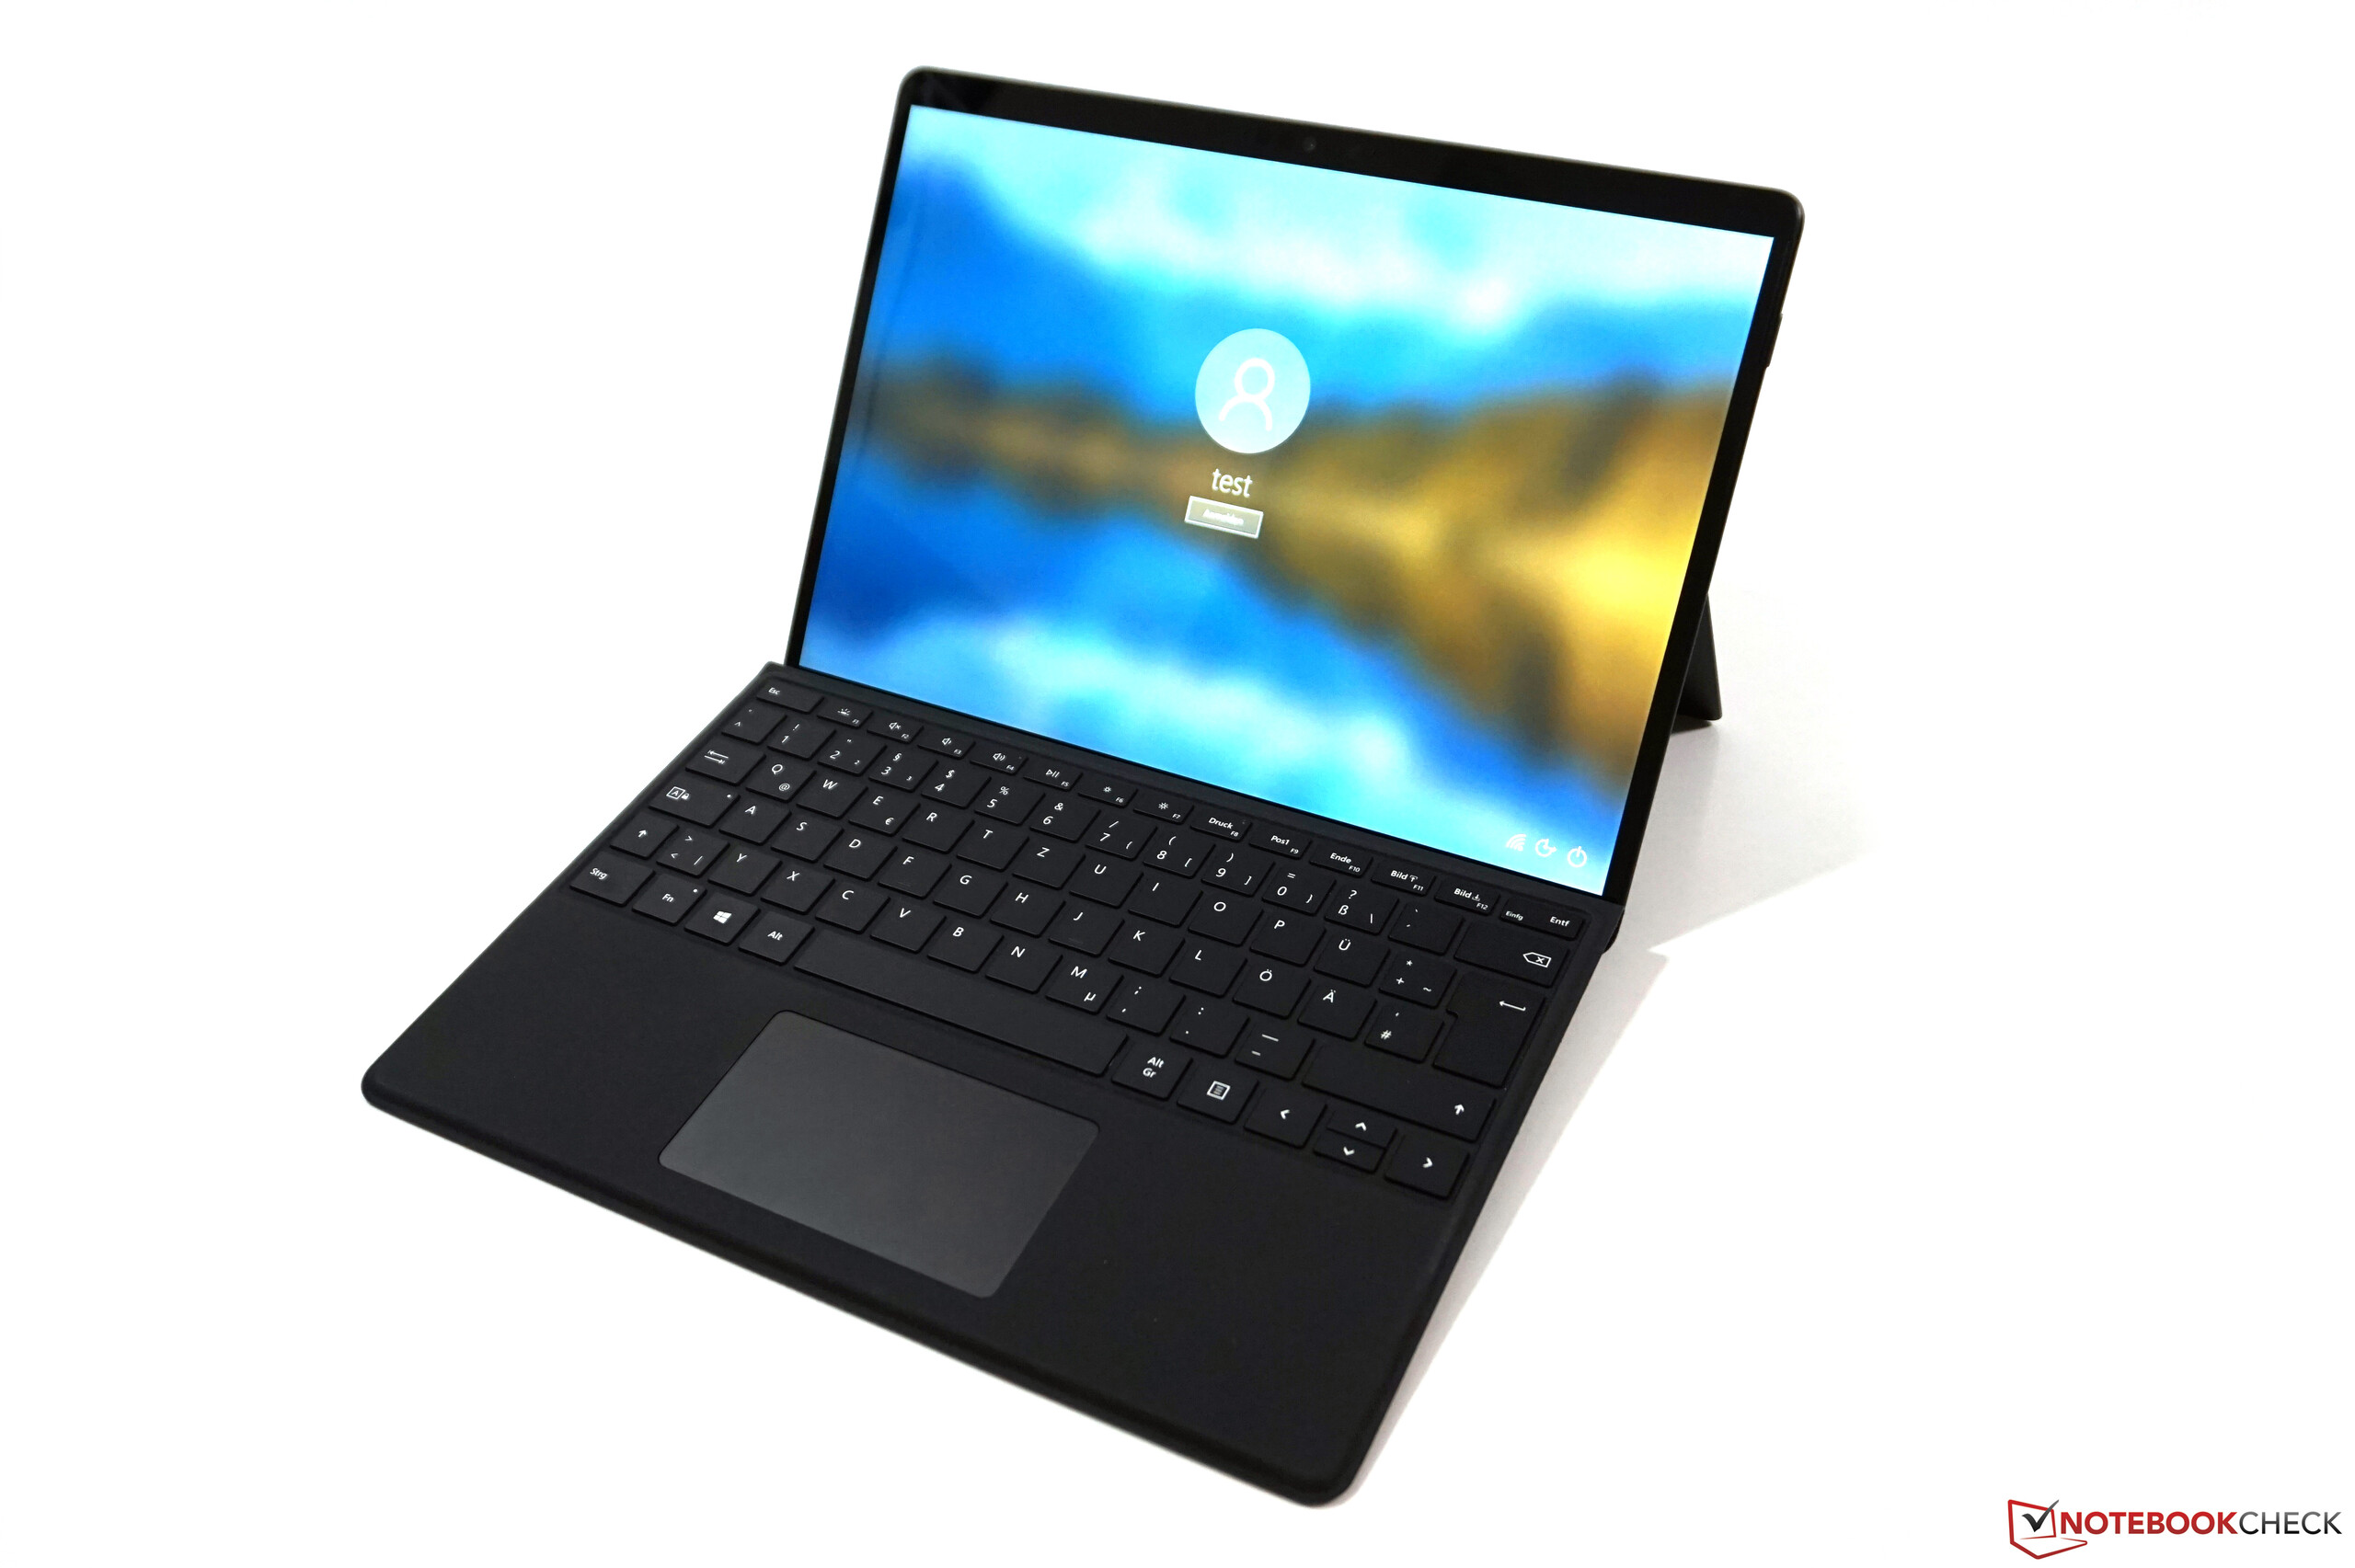
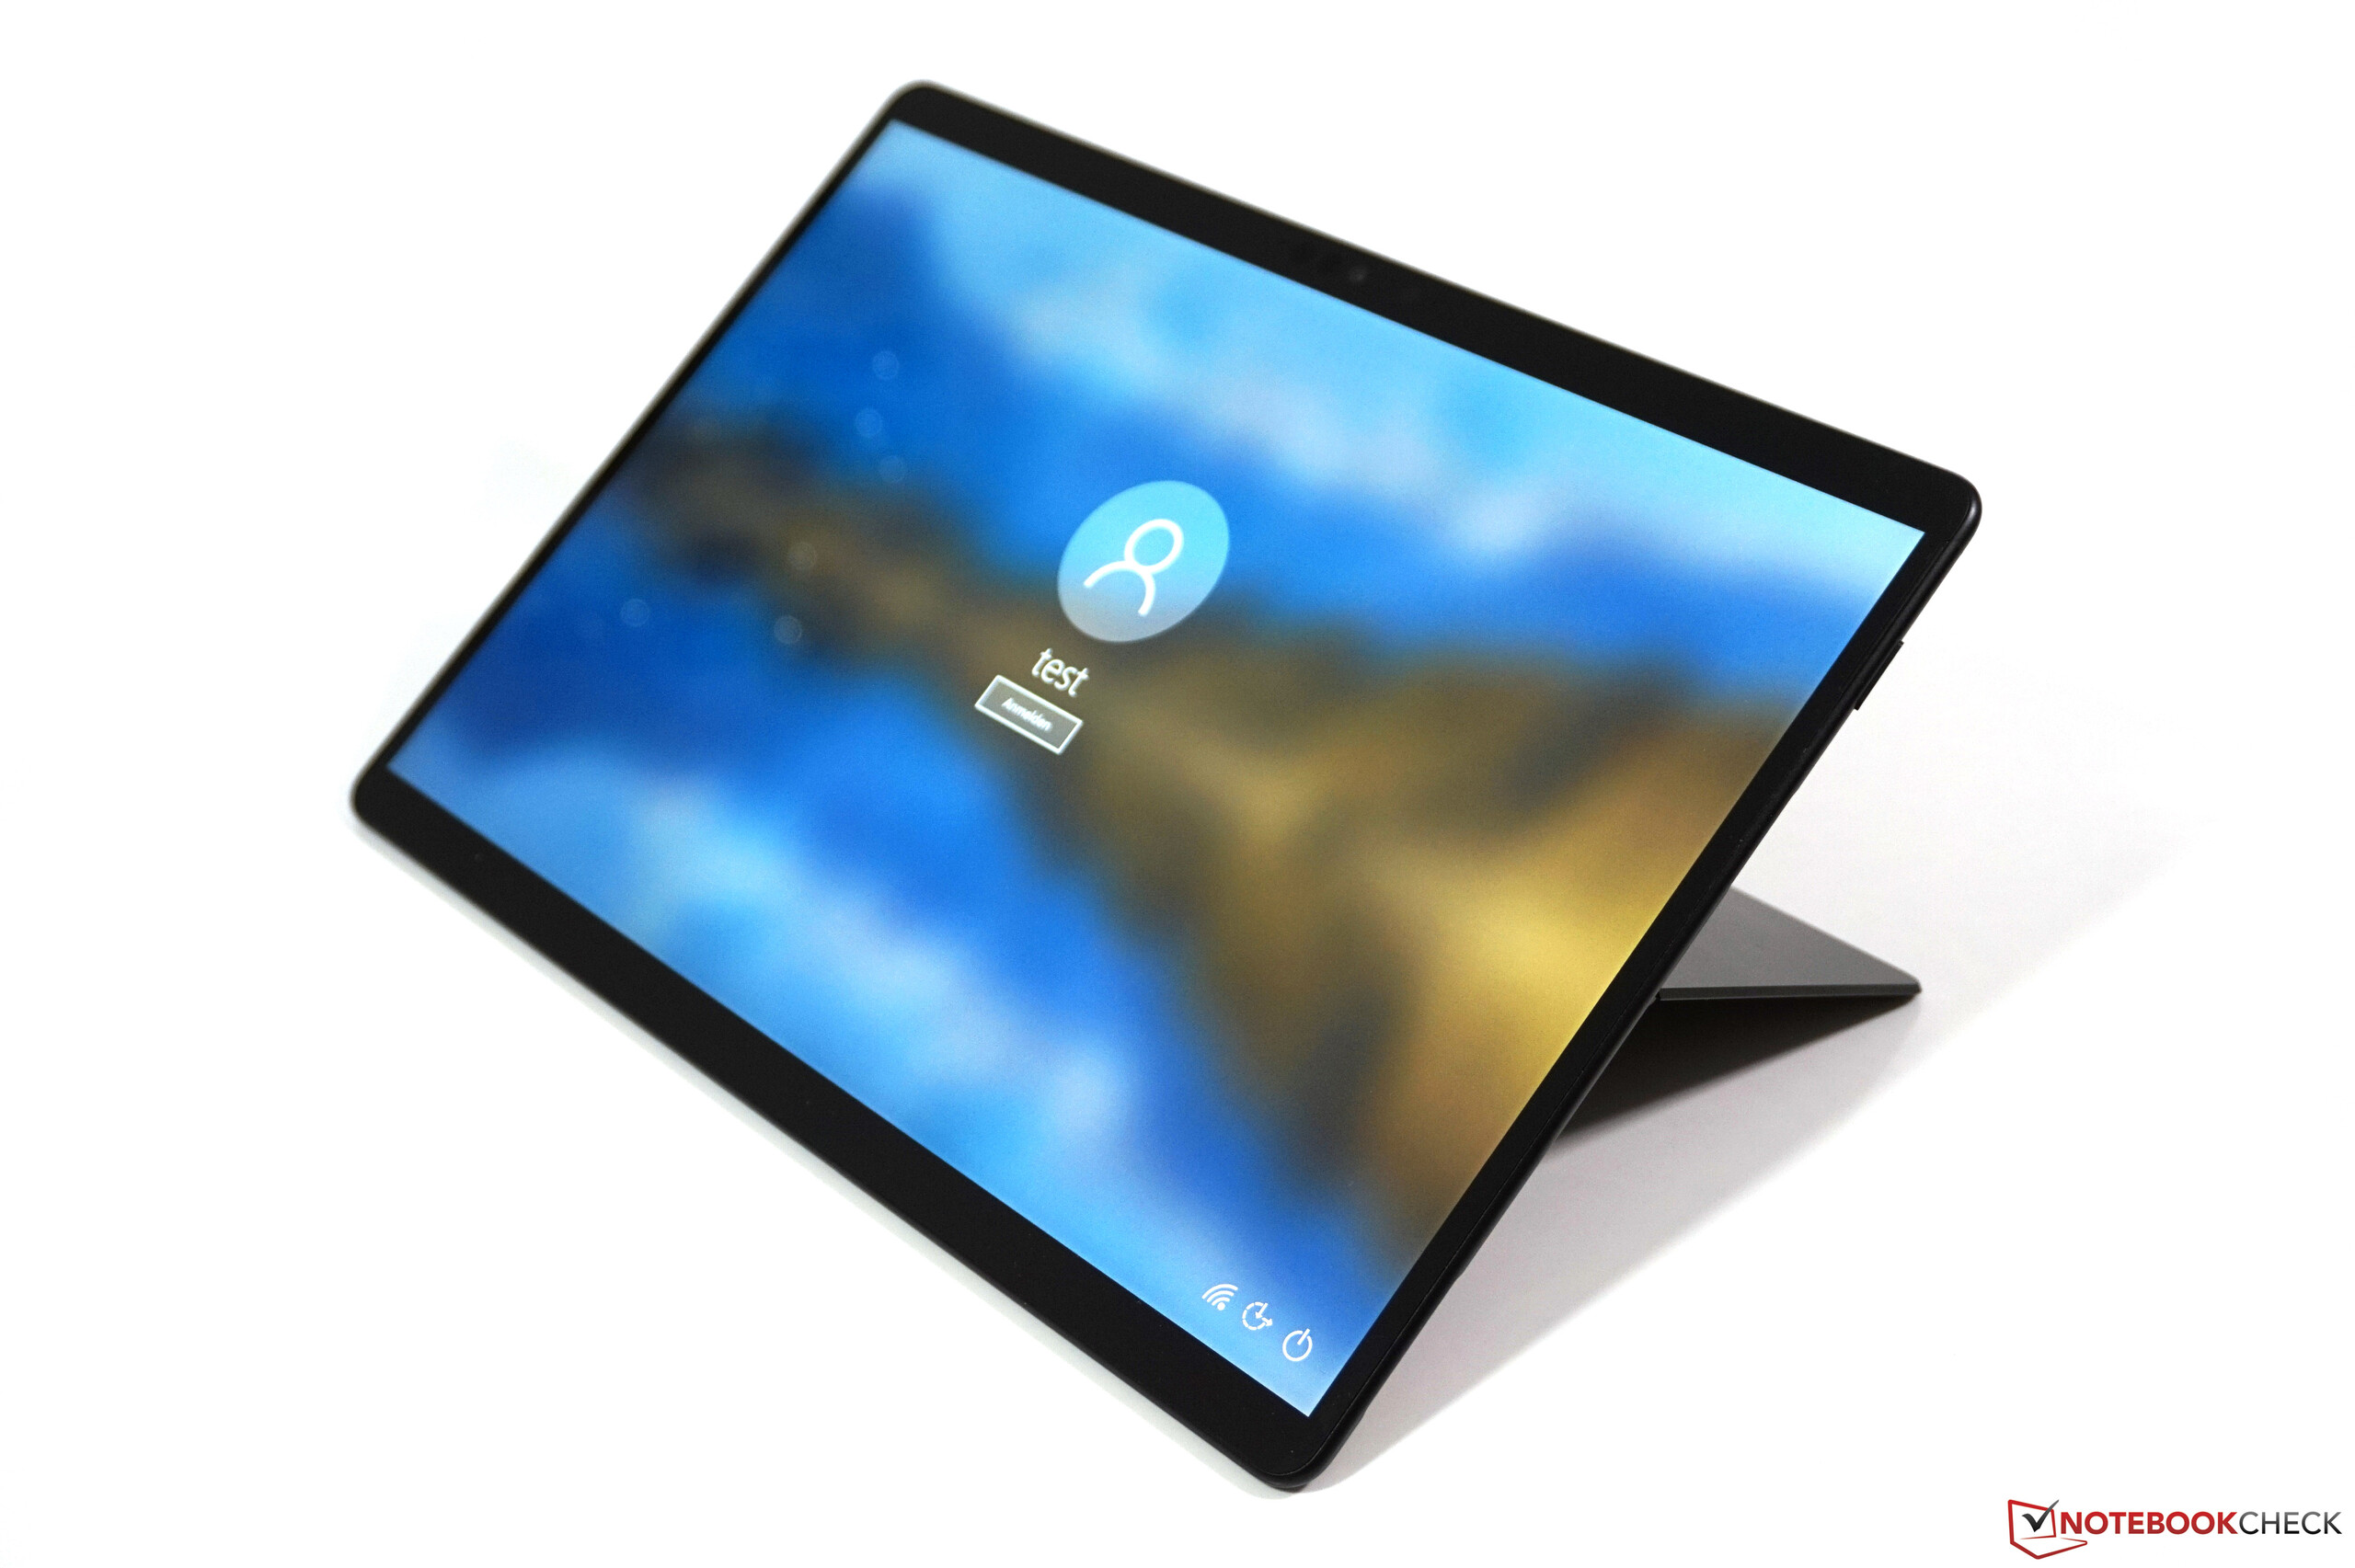


Display - 3:2 touchscreen

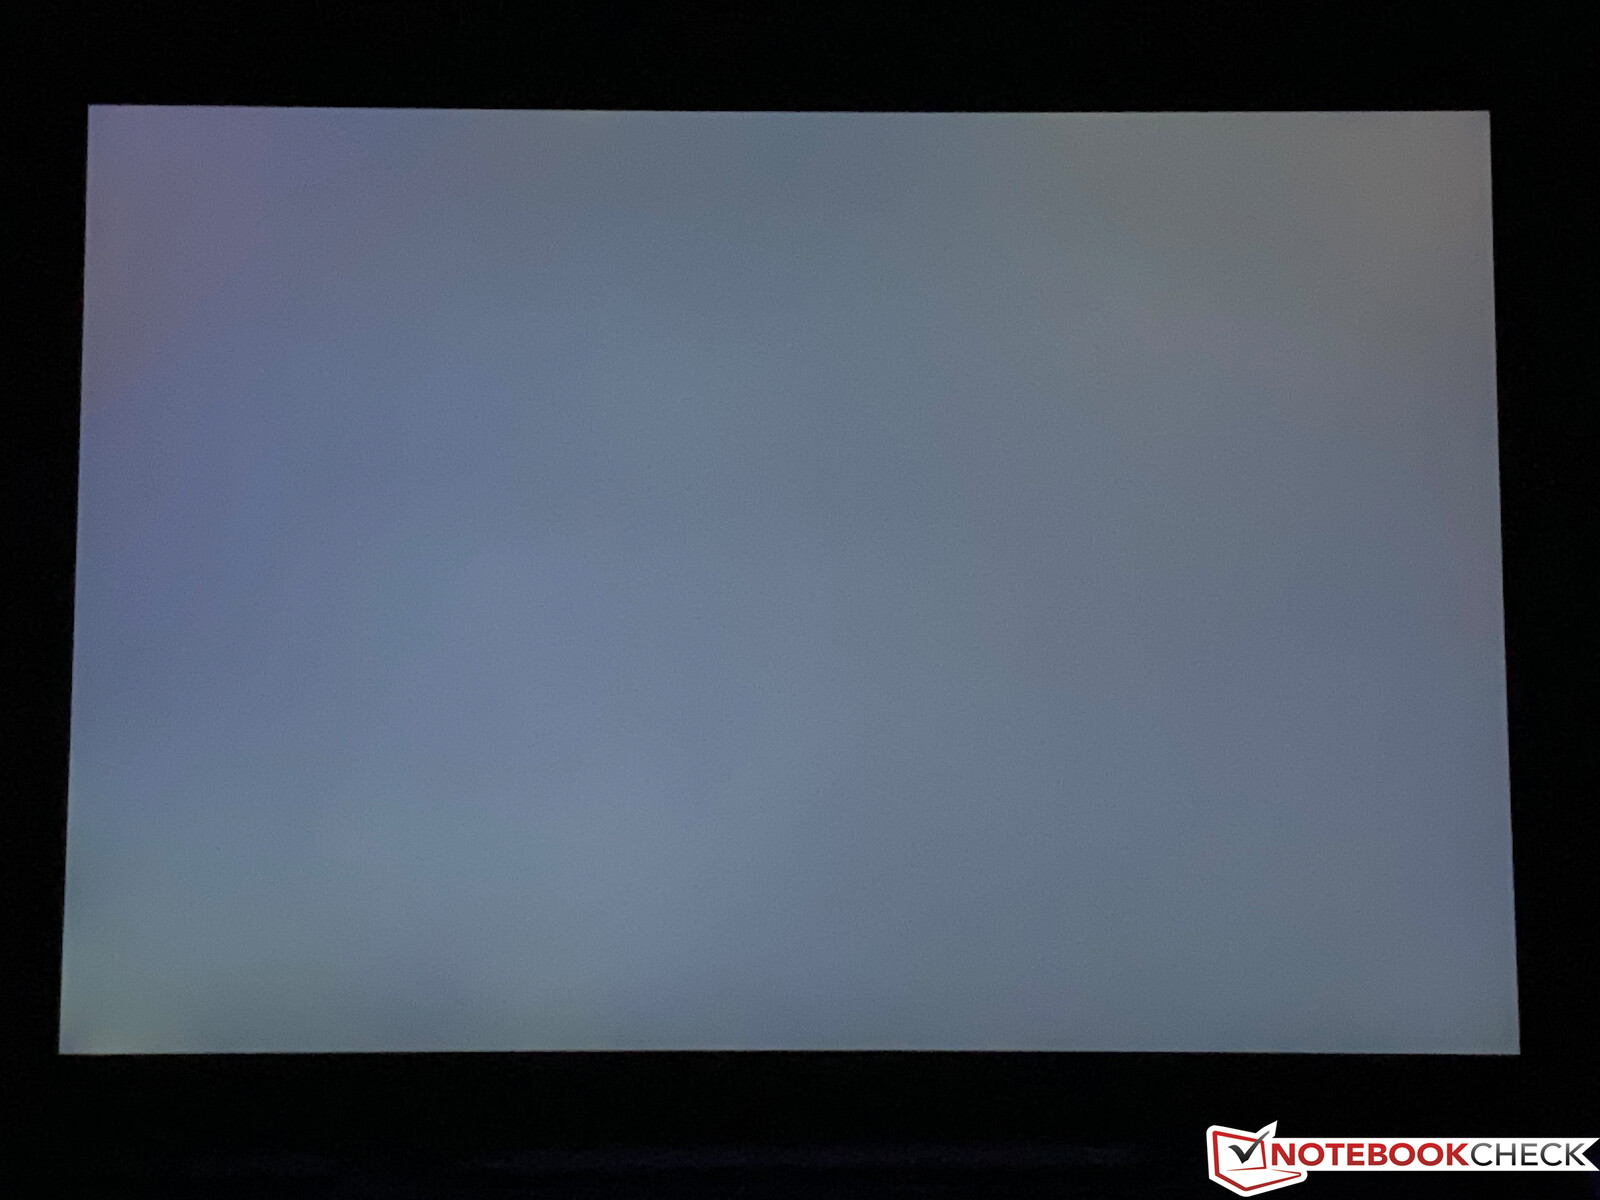
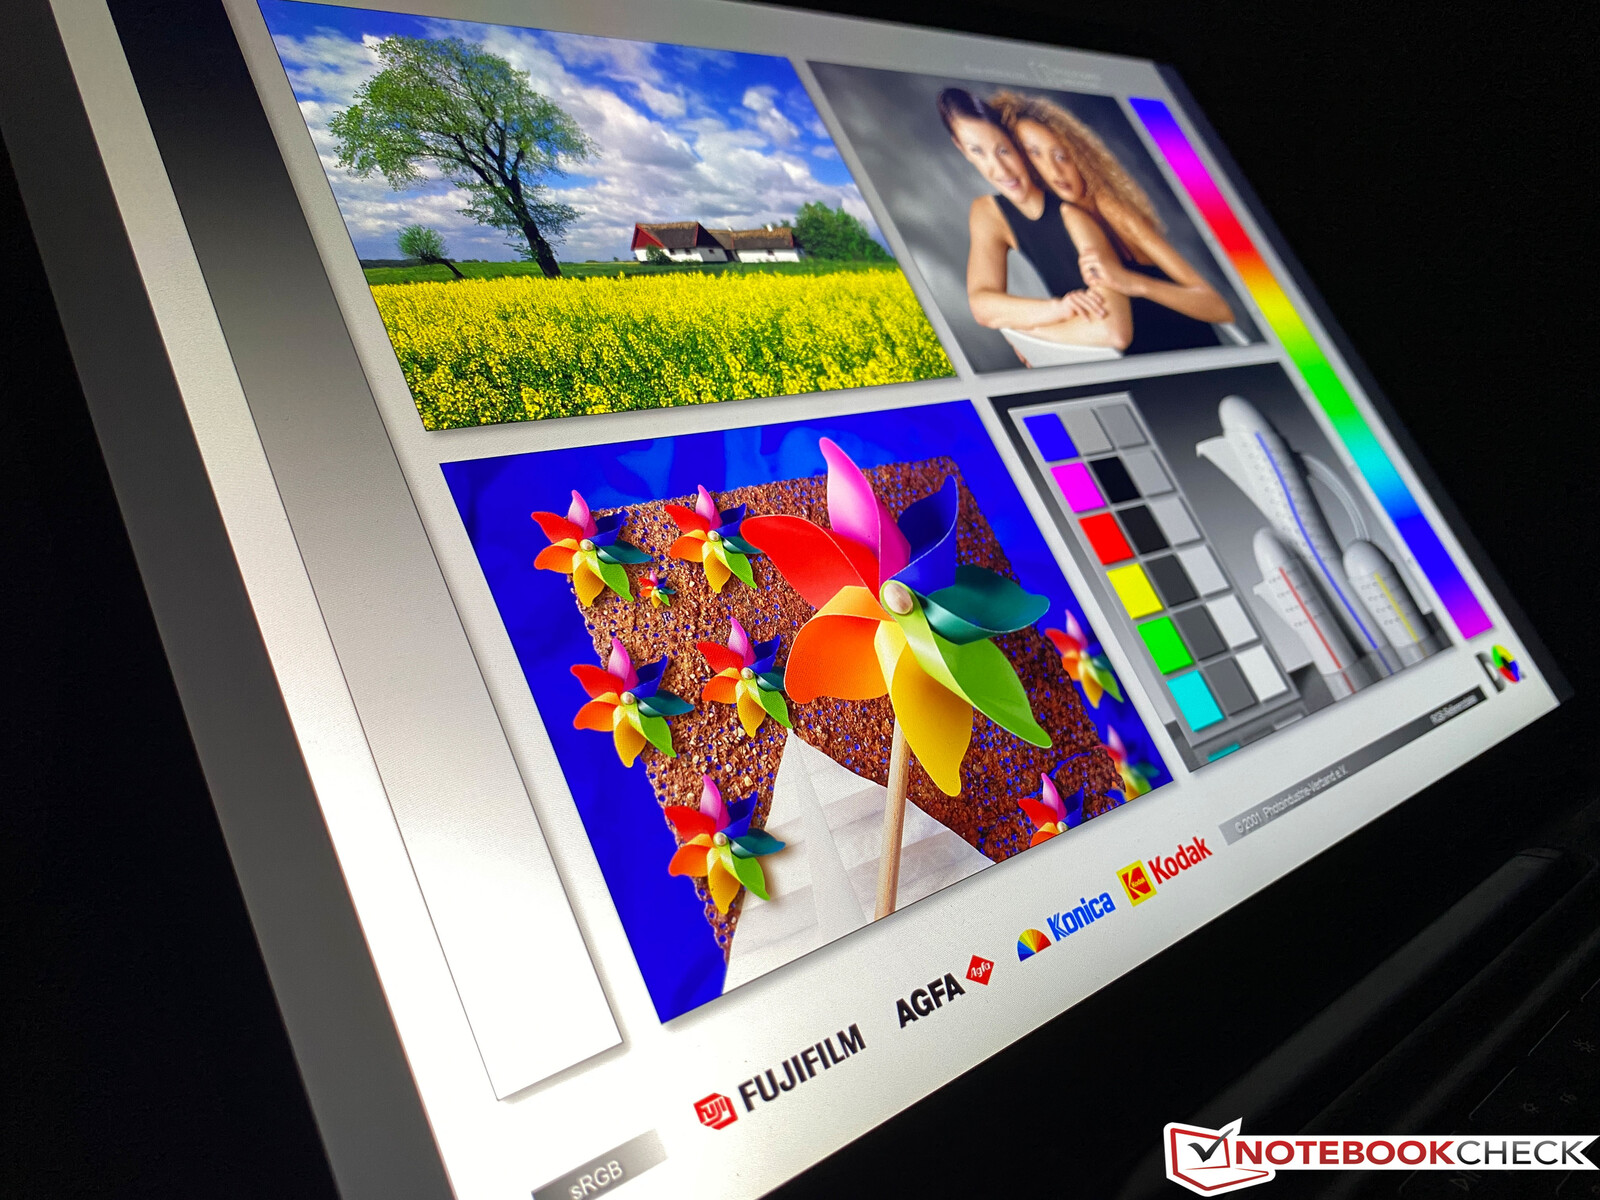
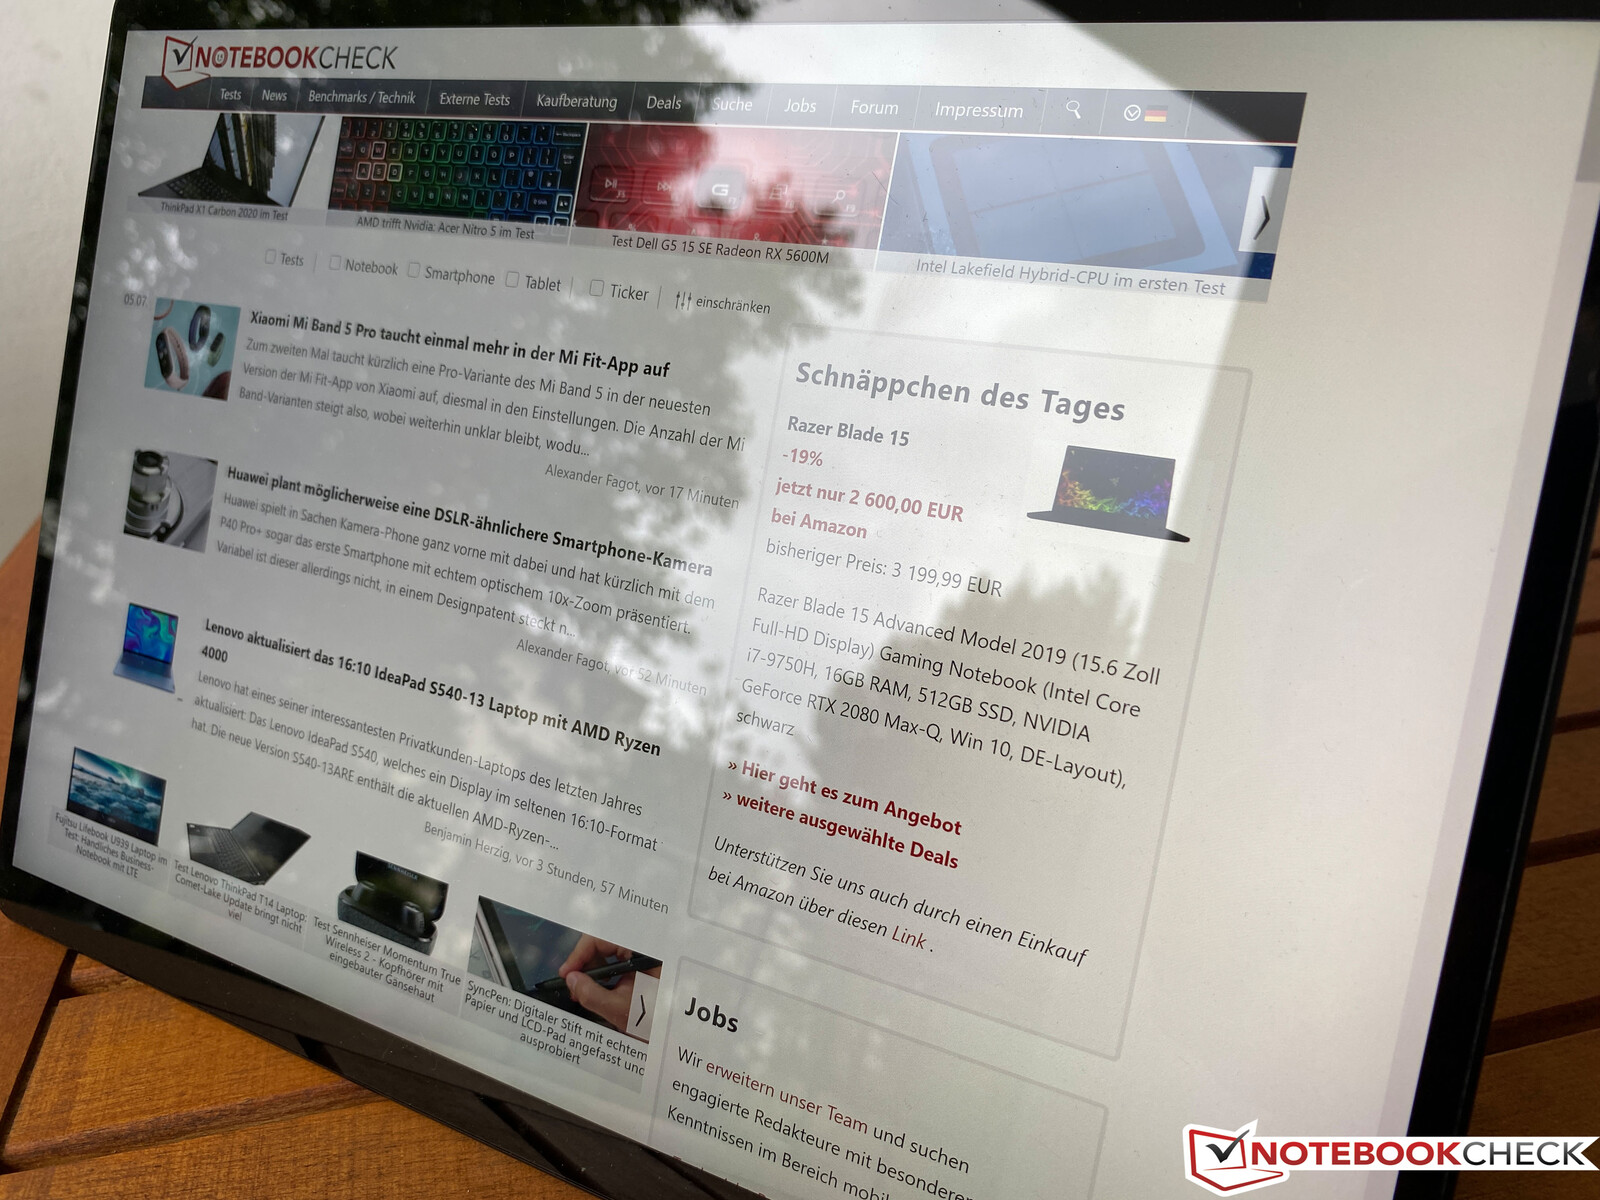
The 13-inch touchscreen has a native resolution of 2880x1920 pixels and a 3:2 aspect ratio. Subjectively speaking, everything looks good on this screen. Text appears sharp and the colours seem natural. The average brightness amounts to 470 cd/m². The black value is slightly elevated (0.44 cd/m²). However, the tablet still offers a contrast ratio of more than 1000:1. Nevertheless, the contrast ratio could have been higher. Outdoors, users will have to deal with strong reflections.
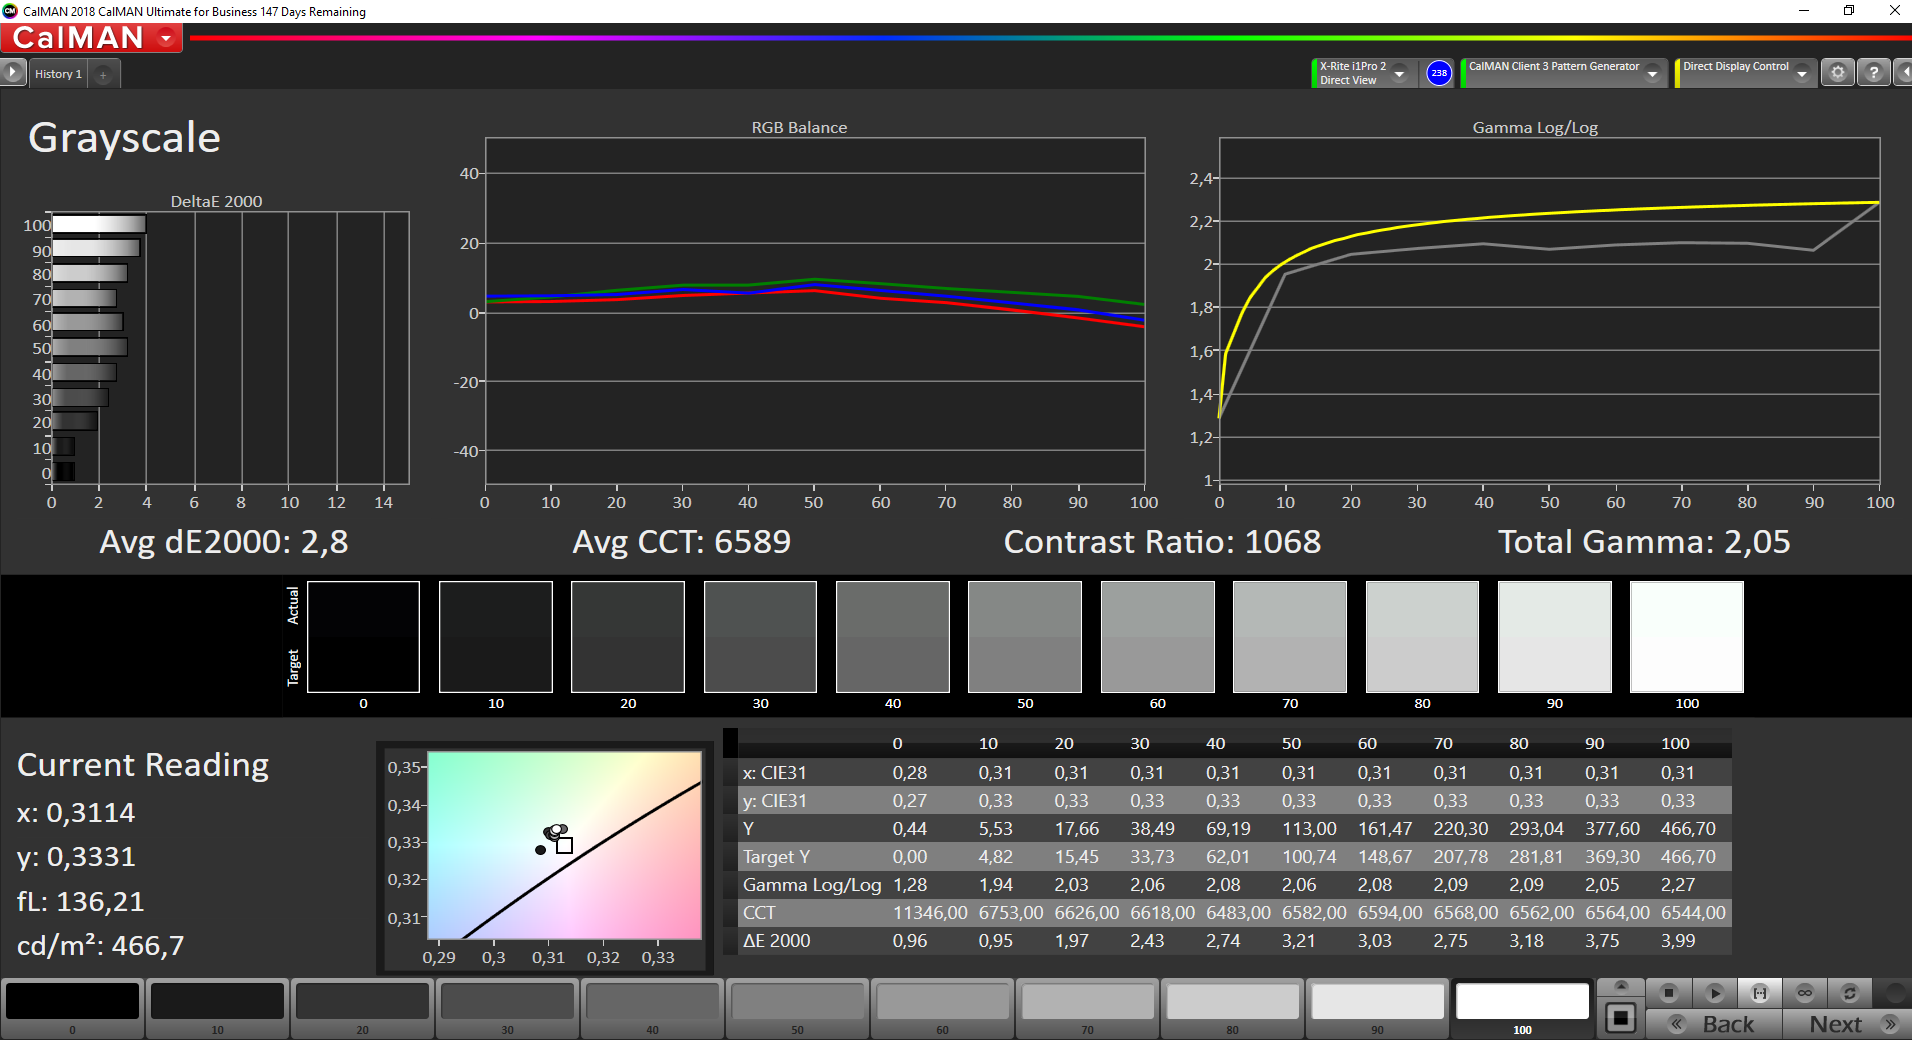
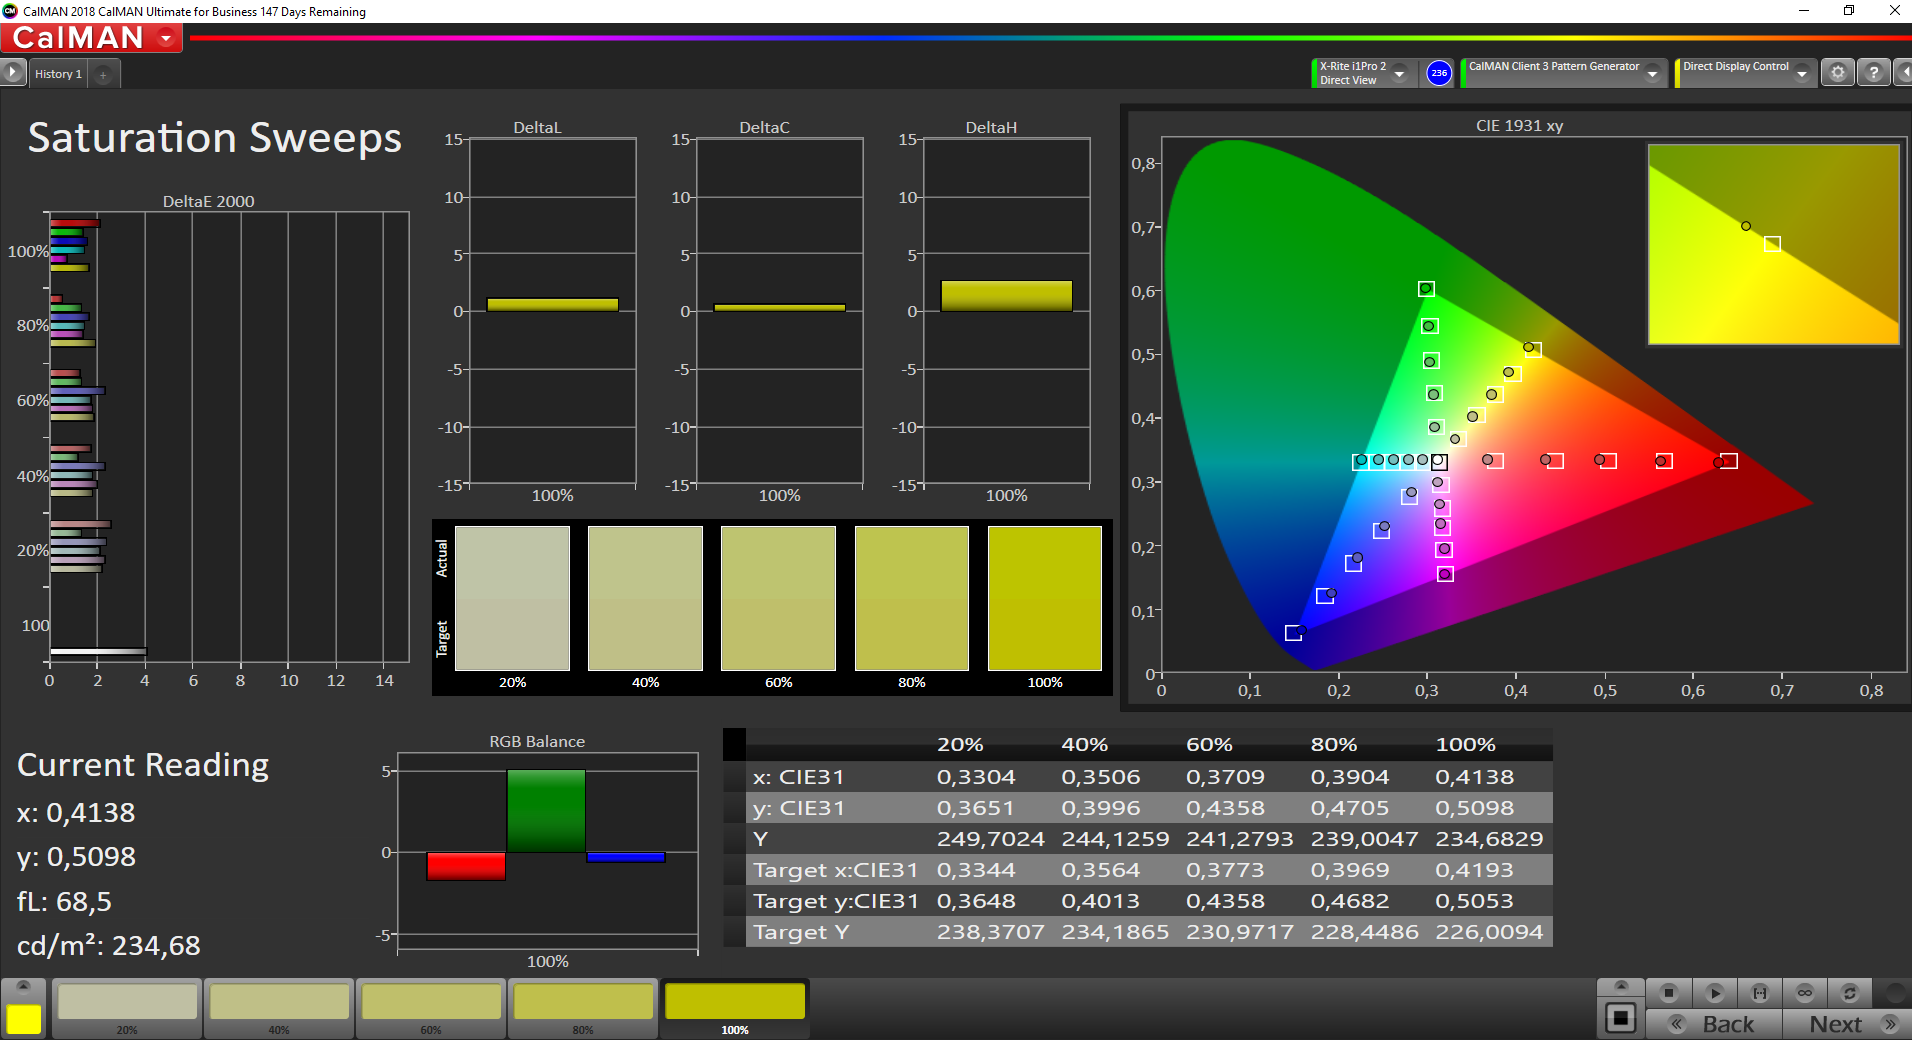
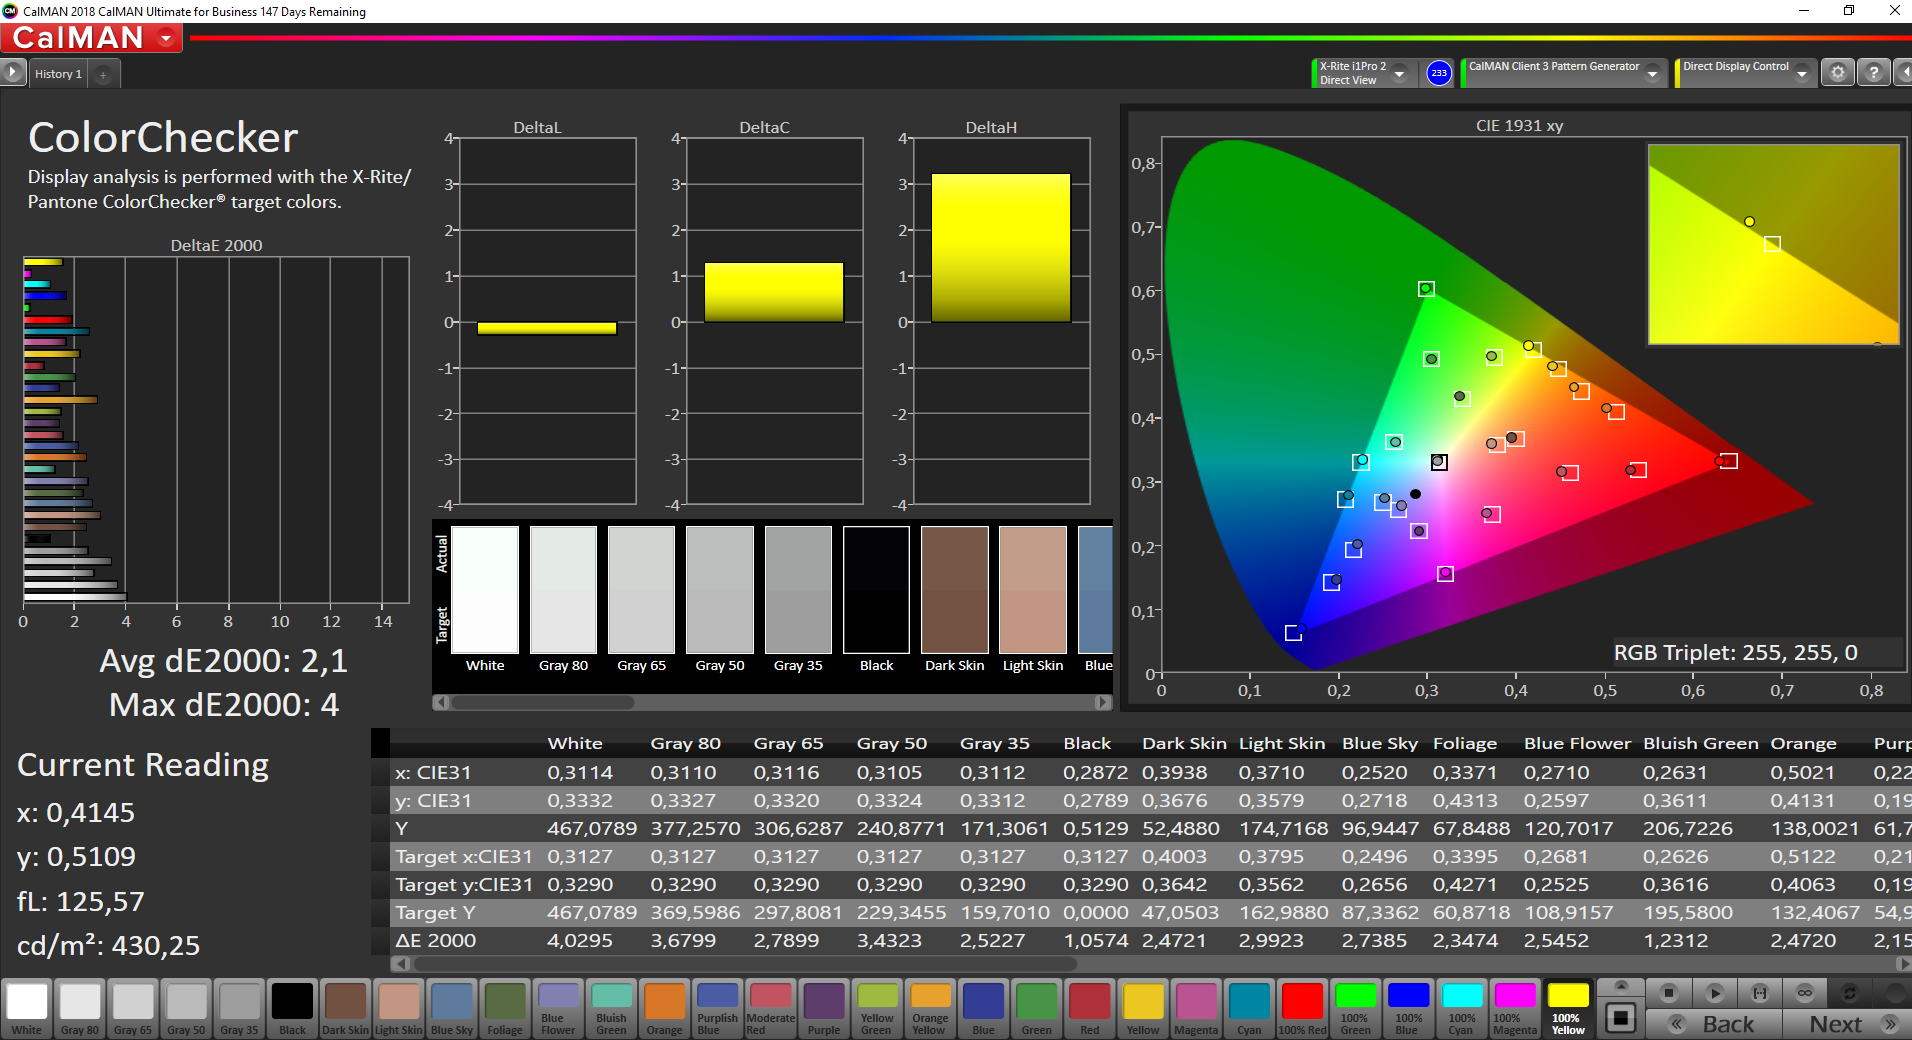
The screen comes with a good factory calibration. The colour temperature is very good and the colours are reproduced faithfully. We could not calibrate the screen because the Microsoft slate does not support our calibration software.
There is no screen bleeding. However, the panel exhibits low-frequency PWM flickering at 50% brightness and below. This is why individuals who are sensitive to PWM flickering should avoid the Surface Pro X.
| |||||||||||||||||||||||||
Brightness Distribution: 92 %
Center on Battery: 473 cd/m²
Contrast: 1059:1 (Black: 0.44 cd/m²)
ΔE ColorChecker Calman: 2.1 | ∀{0.5-29.43 Ø4.72}
ΔE Greyscale Calman: 2.8 | ∀{0.09-98 Ø4.97}
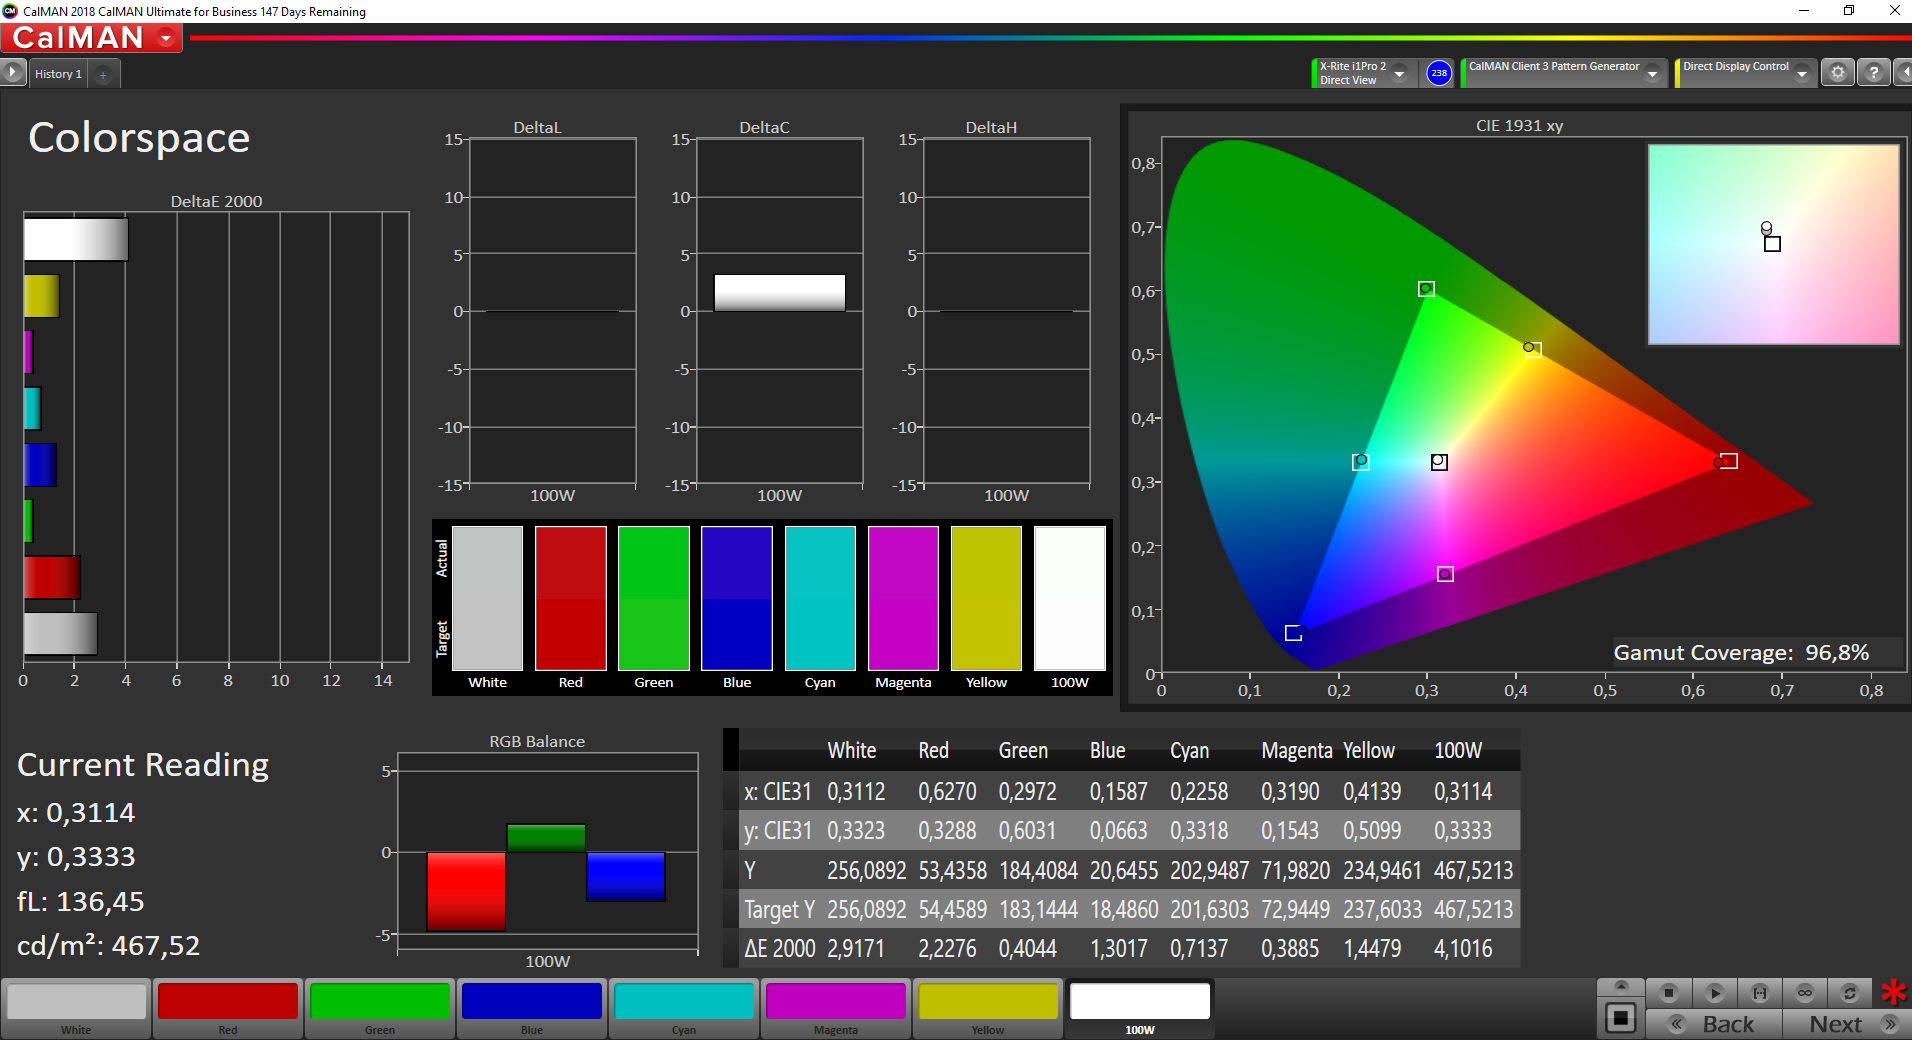
96.8% sRGB (Argyll 1.6.3 3D)
72.1% AdobeRGB 1998 (Argyll 1.6.3 3D)
Gamma: 2.05
CCT: 6589 K
| Microsoft Surface Pro X LP129WT112684, IPS, 2880x1920, 13" | Microsoft Surface Pro 7 Plus LG Philips LP123WQ332684, IPS, 2736x1824, 12.3" | Lenovo Yoga Duet 7 13IML05-82AS000WGE CSOT T3 LEN8290, IPS, 2160x1350, 13" | Apple iPad Pro 12.9 2020 Liquid Retina Display, IPS, 2732x2048, 12.9" | Lenovo ThinkPad X1 Tablet G3-20KJ001NGE LP130QP1-SPA1, IPS, 3000x2000, 13" | |
|---|---|---|---|---|---|
| Display | |||||
| Display P3 Coverage (%) | 66.9 | 68.9 | 68.1 67.8 | ||
| sRGB Coverage (%) | 96.7 | 98.2 | 99.4 99.1 | ||
| AdobeRGB 1998 Coverage (%) | 69.1 | 71.1 | 69.9 69.3 | ||
| Response Times | -7% | -2% | 13% | -17% | |
| Response Time Grey 50% / Grey 80% * (ms) | 49.6 ? | 50.8 ? -2% | 58 ? -17% | 46.8 ? 6% | 47.2 ? 5% |
| Response Time Black / White * (ms) | 30.4 ? | 33.6 ? -11% | 26 ? 14% | 24.4 ? 20% | 42.4 ? -39% |
| PWM Frequency (Hz) | 201.6 ? | 199.2 ? | 58820 ? | ||
| Screen | 10% | -32% | 23% | -14% | |
| Brightness middle (cd/m²) | 466 | 408 -12% | 450 -3% | 625 34% | 474 2% |
| Brightness (cd/m²) | 470 | 425 -10% | 411 -13% | 599 27% | 418 -11% |
| Brightness Distribution (%) | 92 | 85 -8% | 83 -10% | 87 -5% | 76 -17% |
| Black Level * (cd/m²) | 0.44 | 0.34 23% | 0.22 50% | 0.47 -7% | 0.33 25% |
| Contrast (:1) | 1059 | 1200 13% | 2045 93% | 1330 26% | 1436 36% |
| Colorchecker dE 2000 * | 2.1 | 1.5 29% | 4.15 -98% | 1.3 38% | 3.2 -52% |
| Colorchecker dE 2000 max. * | 4 | 2.5 37% | 11.49 -187% | 2.7 32% | 6.1 -53% |
| Greyscale dE 2000 * | 2.8 | 1.6 43% | 6.66 -138% | 1.8 36% | 4.5 -61% |
| Gamma | 2.05 107% | 2.05 107% | 2.42 91% | 2.23 99% | 2.07 106% |
| CCT | 6589 99% | 6432 101% | 6043 108% | 6765 96% | 5881 111% |
| Color Space (Percent of AdobeRGB 1998) (%) | 72.1 | 63.7 -12% | 65 -10% | 64 -11% | |
| Color Space (Percent of sRGB) (%) | 96.8 | 96.8 0% | 98 1% | 99.4 3% | |
| Colorchecker dE 2000 calibrated * | 1.4 | 1.09 | 0.9 | ||
| Total Average (Program / Settings) | 2% /
8% | -17% /
-27% | 18% /
21% | -16% /
-14% |
* ... smaller is better
Display Response Times
| ↔ Response Time Black to White | ||
|---|---|---|
| 30.4 ms ... rise ↗ and fall ↘ combined | ↗ 18 ms rise | 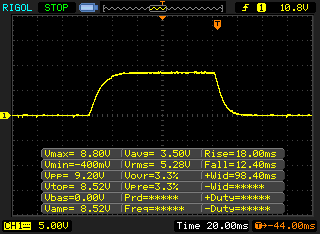 |
| ↘ 12.4 ms fall | ||
| The screen shows slow response rates in our tests and will be unsatisfactory for gamers. In comparison, all tested devices range from 0.1 (minimum) to 240 (maximum) ms. » 82 % of all devices are better. This means that the measured response time is worse than the average of all tested devices (19.8 ms). | ||
| ↔ Response Time 50% Grey to 80% Grey | ||
| 49.6 ms ... rise ↗ and fall ↘ combined | ↗ 25.2 ms rise | 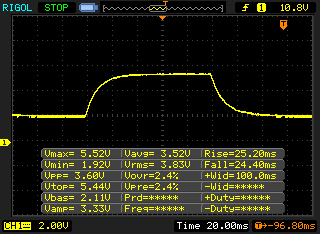 |
| ↘ 24.4 ms fall | ||
| The screen shows slow response rates in our tests and will be unsatisfactory for gamers. In comparison, all tested devices range from 0.165 (minimum) to 636 (maximum) ms. » 86 % of all devices are better. This means that the measured response time is worse than the average of all tested devices (31 ms). | ||
Screen Flickering / PWM (Pulse-Width Modulation)
| Screen flickering / PWM detected | 201.6 Hz | ≤ 50 % brightness setting | 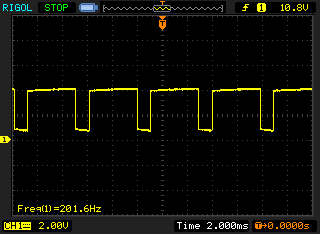 |
The display backlight flickers at 201.6 Hz (worst case, e.g., utilizing PWM) Flickering detected at a brightness setting of 50 % and below. There should be no flickering or PWM above this brightness setting. The frequency of 201.6 Hz is relatively low, so sensitive users will likely notice flickering and experience eyestrain at the stated brightness setting and below. In comparison: 52 % of all tested devices do not use PWM to dim the display. If PWM was detected, an average of 7747 (minimum: 5 - maximum: 343500) Hz was measured. | |||
Performance, Emissions and Battery Life
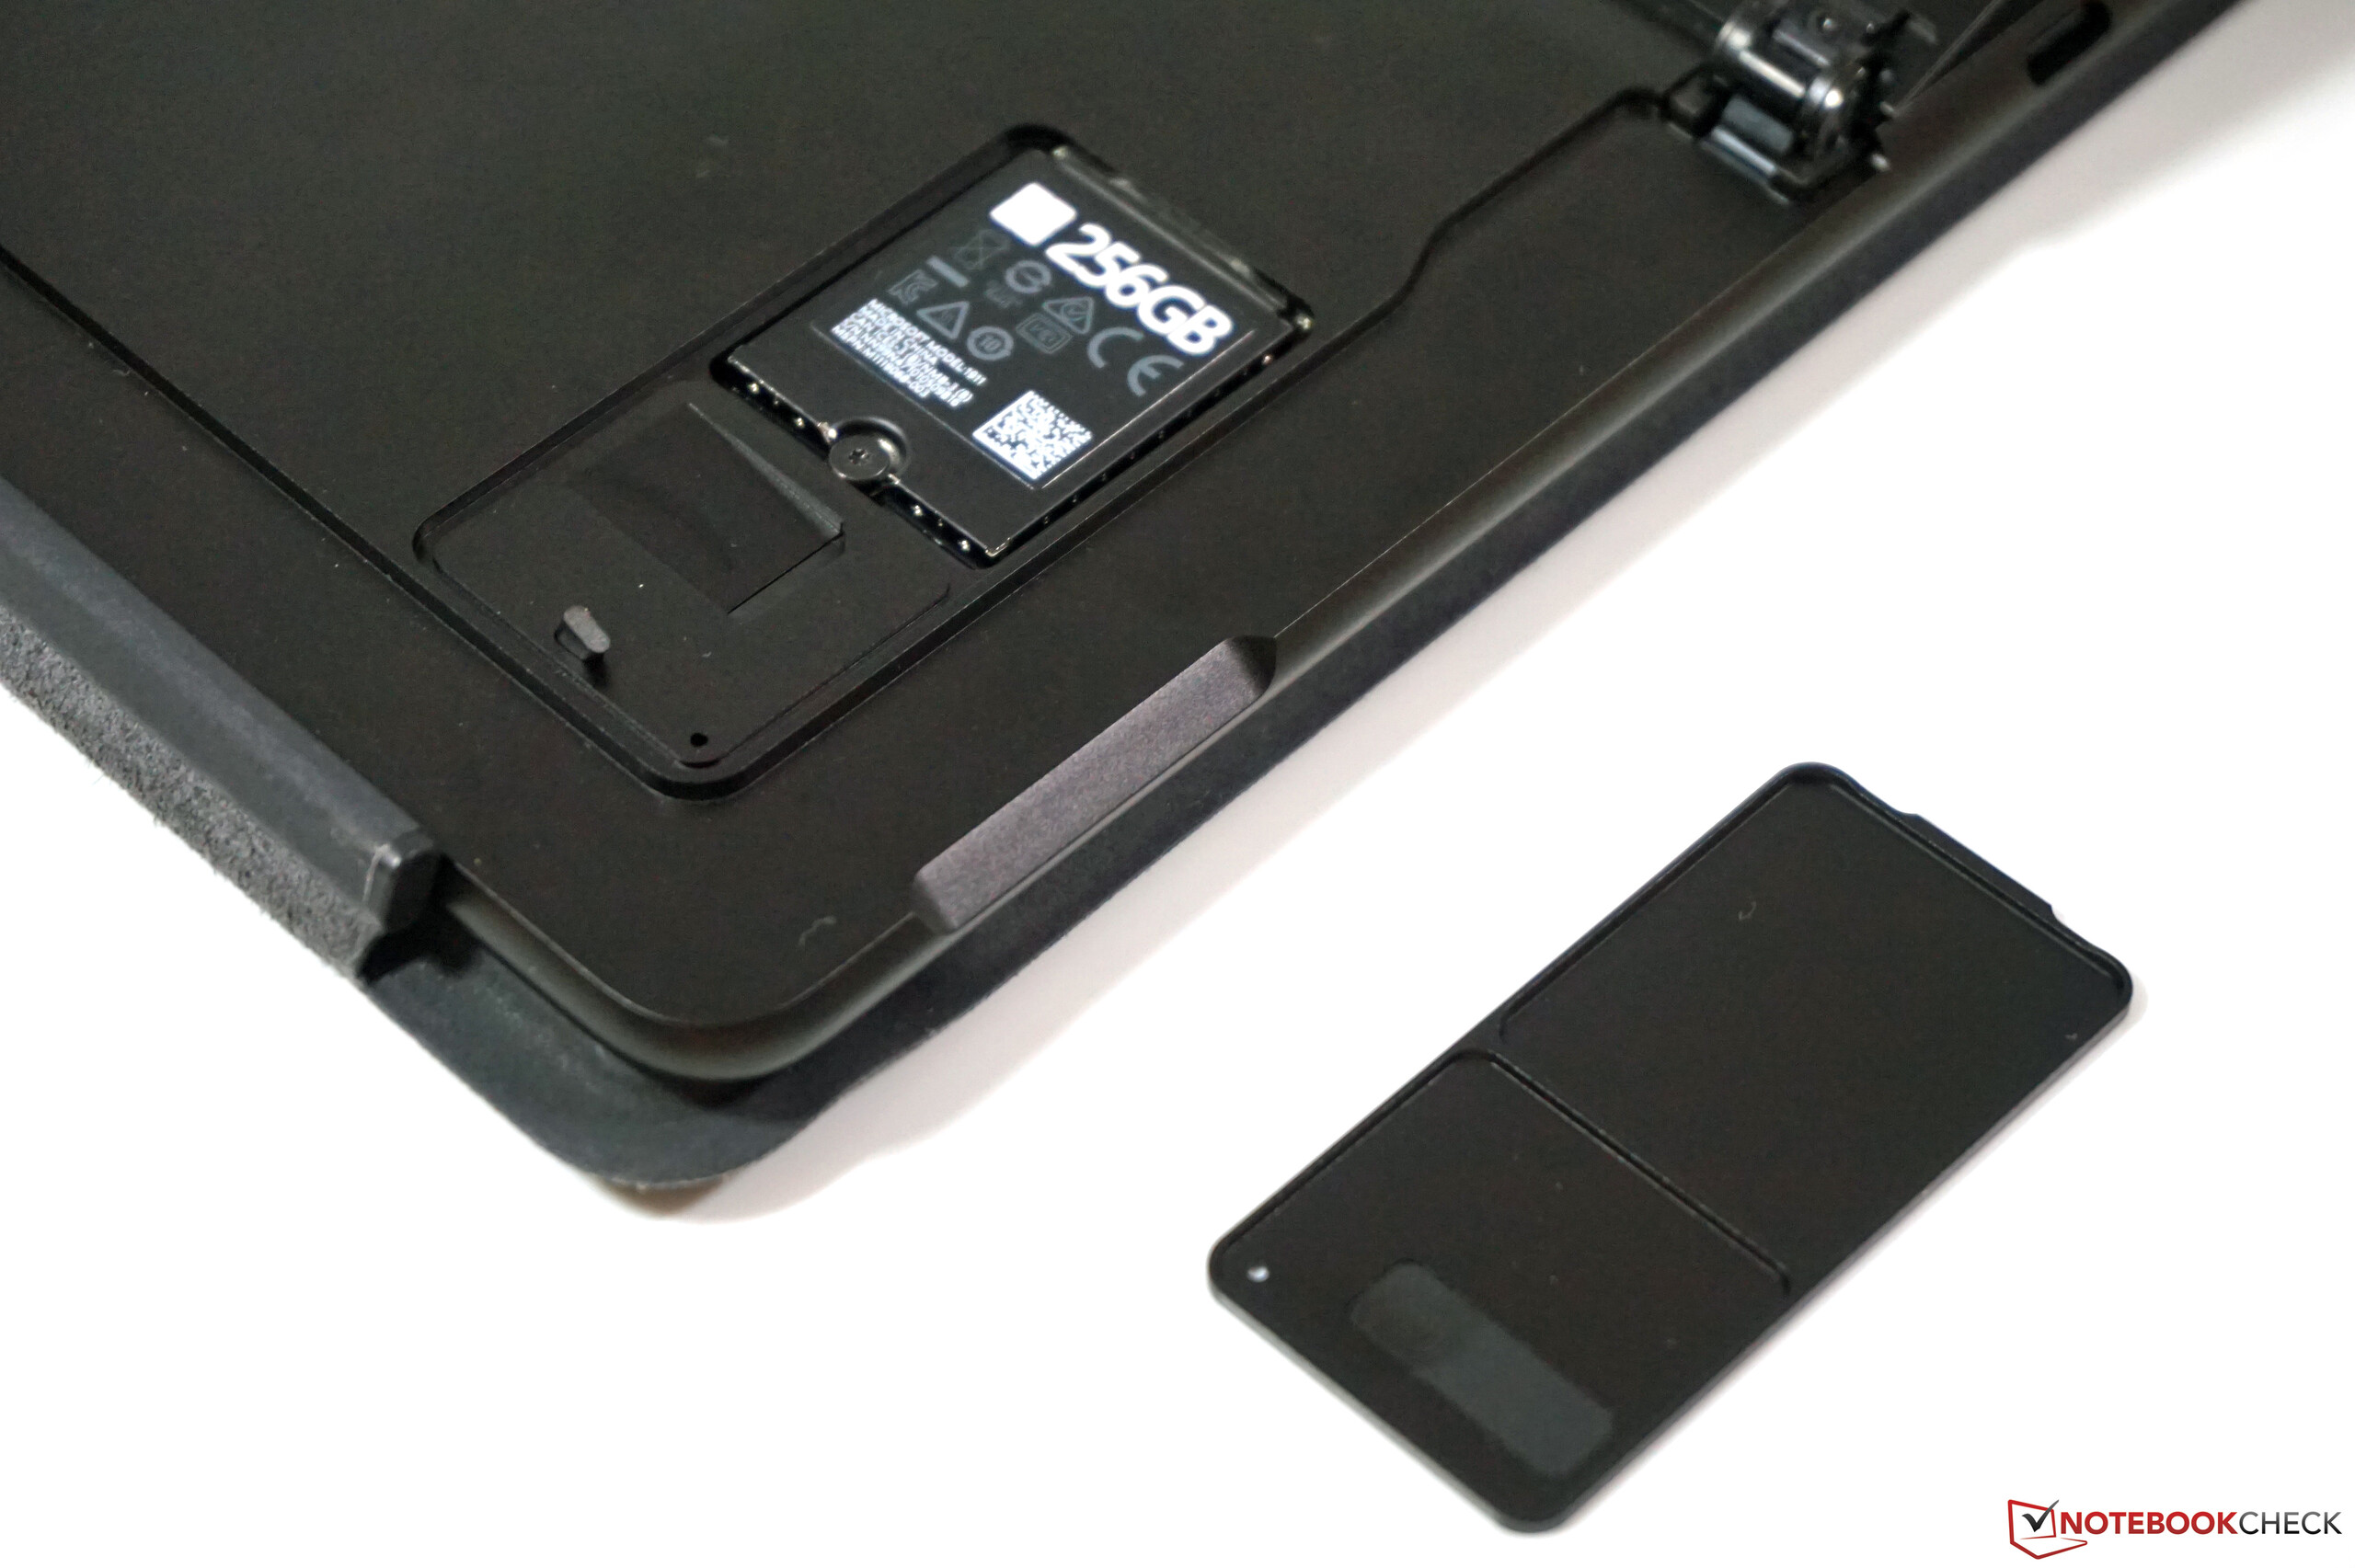
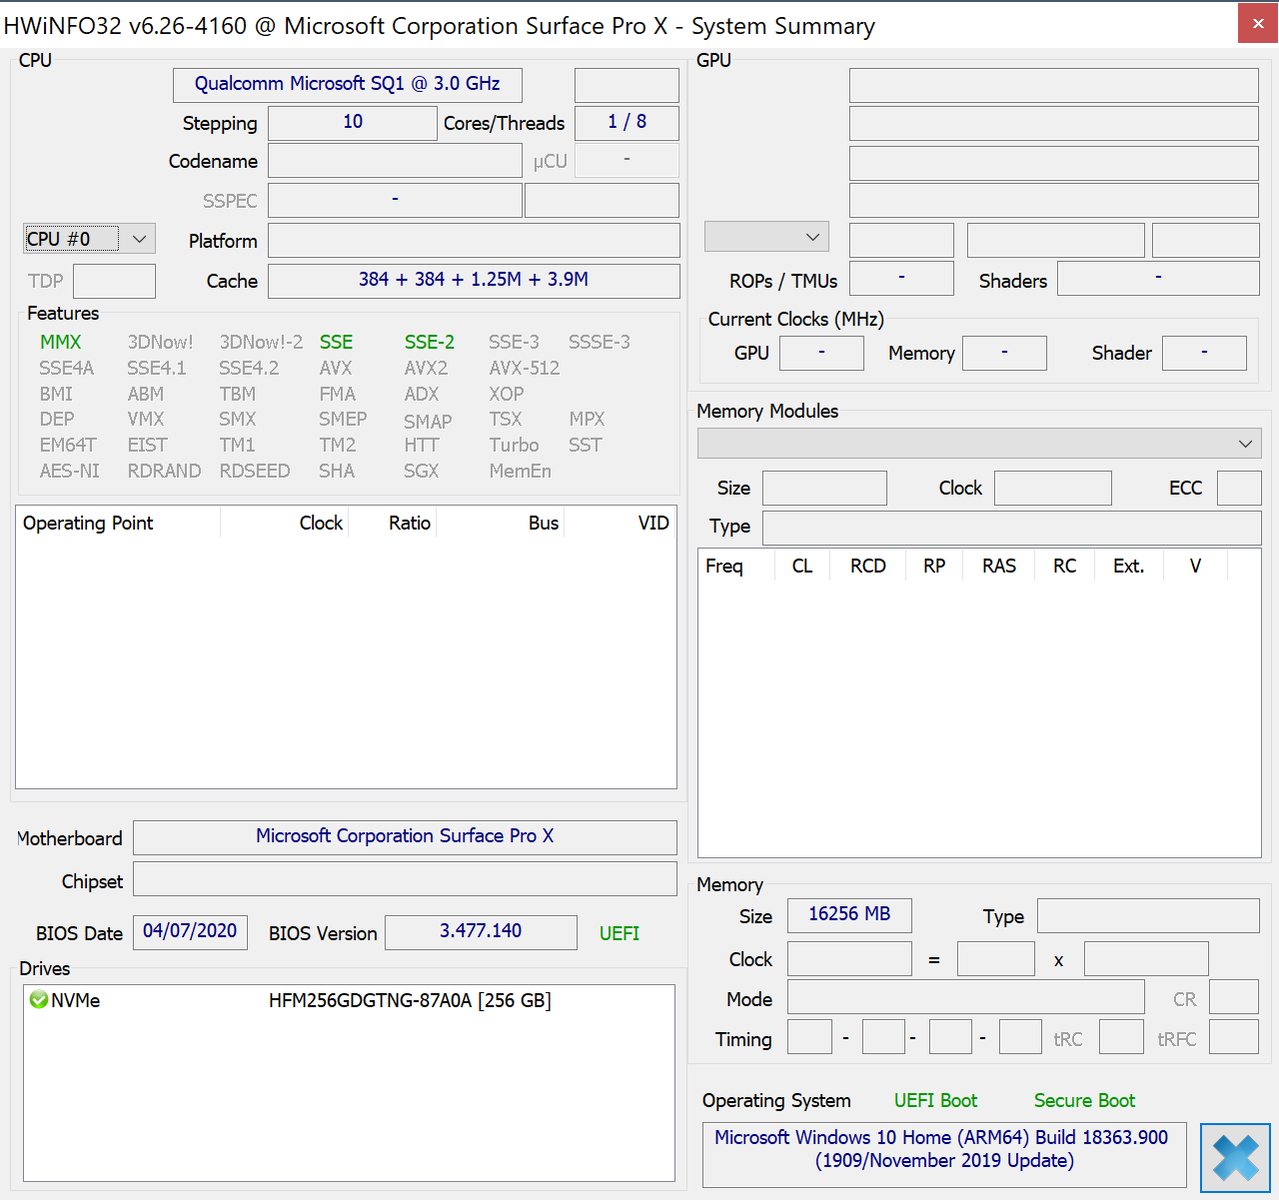
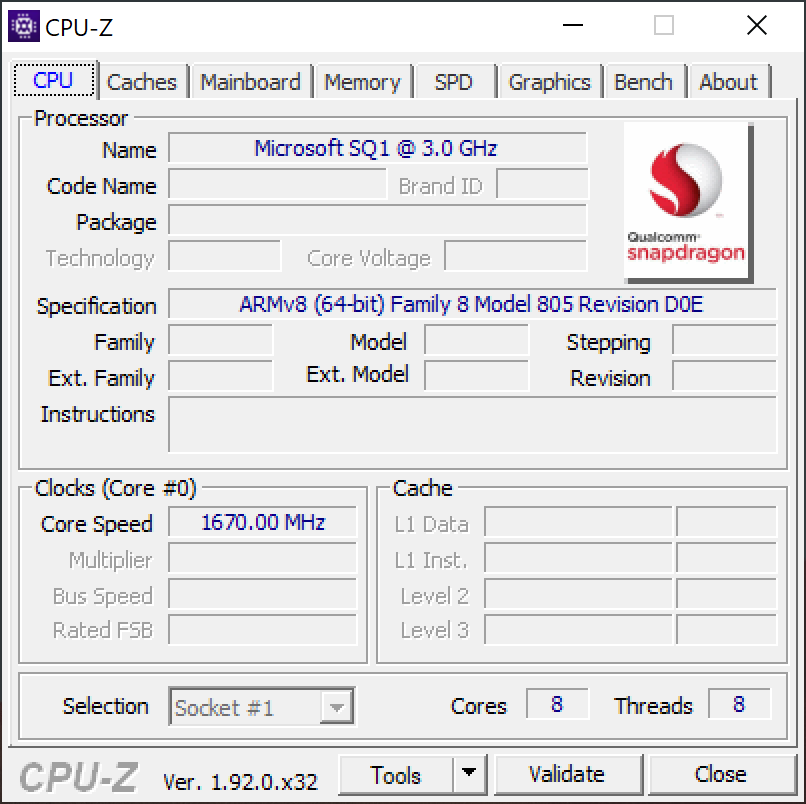
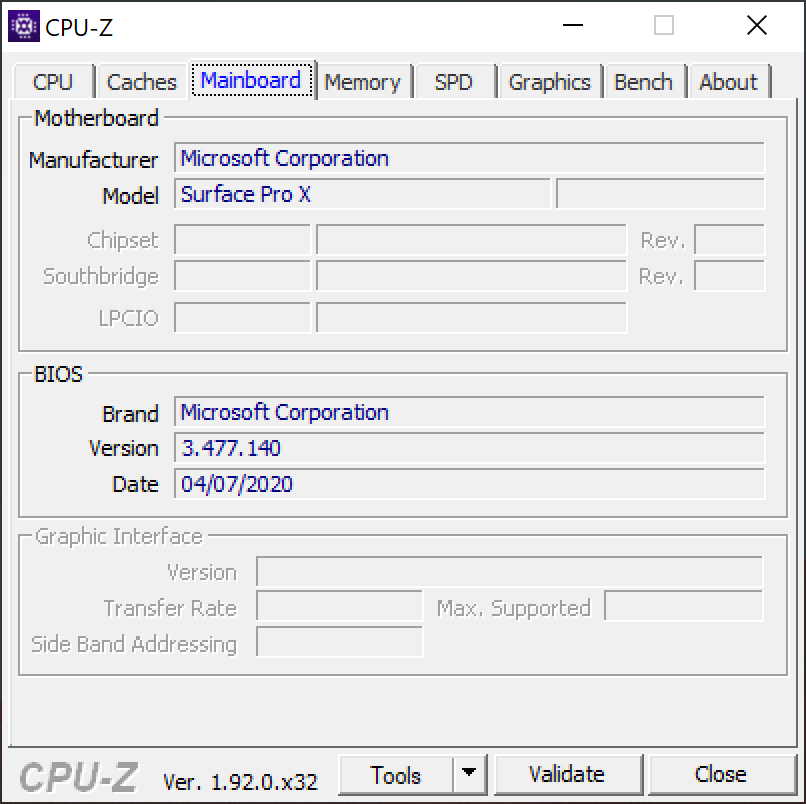
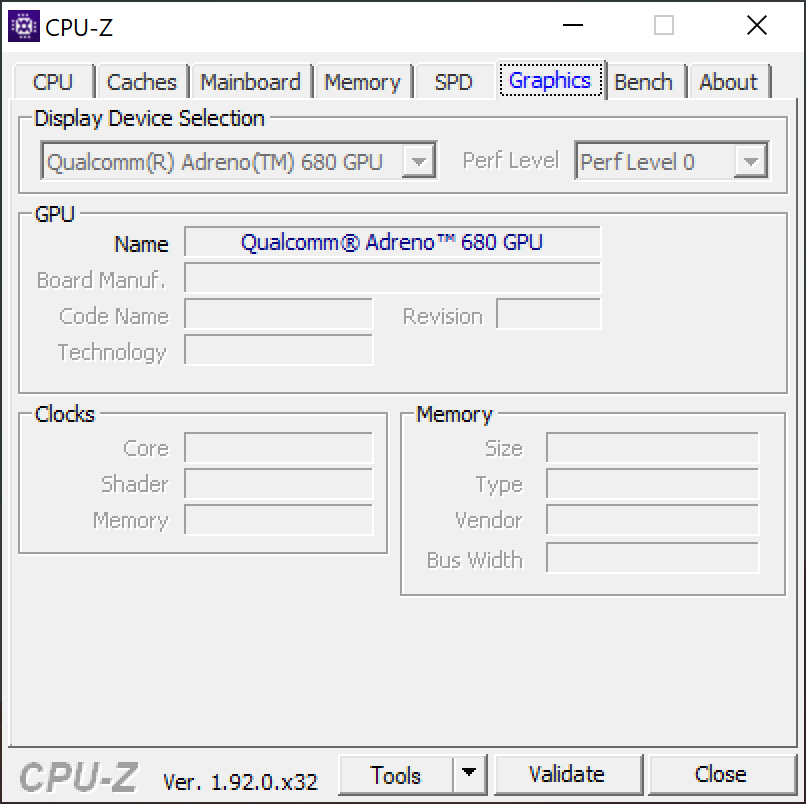
Microsoft offers the Surface Pro X with either the SQ1 or the somewhat more powerful SQ2 processor (both from Qualcomm). Our review device uses the SQ1 SoC, which offers a very good level of performance, subjectively speaking. Windows 10 feels very responsive. However, the main issue is the app compatibility. The slate only supports applications from the Microsoft Store and 32-bit programmes, which, in practice, can lead to severe limitations. This is why we were unable to conduct many of our usual benchmarks. The small NVMe SSD can be replaced. Howbeit, there are not many M.2-2230 SSDs out there.
Those who only use Microsoft’s office programmes or do most of their work in the browser will be satisfied with the level of performance that the Surface Pro X provides. However, in most cases, the Surface Pro 7 Plus with a normal x86 CPU is a significantly better choice. Microsoft has been working on 64-bit emulation for a while now. Nevertheless, there is still no official release date for this feature. Here, Apple’s M1 MacBooks are a much better choice, because they offer very good x86 emulation.
The Surface Pro X is passively cooled, which is why it is always silent (no coil whine). We are disappointed by the battery life. Microsoft promises 15 hours of battery life. However, in our web-browsing battery test, the Microsoft slate lasted about 8 hours, and less than 5 hours with the brightness maxed out.
| Jetstream 2 / 2.0 Total | |
| Average of class Convertible (127.2 - 454, n=15, last 2 years) | |
| Apple iPad Pro 12.9 2020 | |
| Microsoft Surface Pro X | |
| Average Microsoft SQ1 (n=1) | |
| Speedometer 2.0 / Result 2.0 | |
| Average of class Convertible (168.2 - 644, n=12, last 2 years) | |
| Apple iPad Pro 12.9 2020 | |
| Microsoft Surface Pro X | |
| Average Microsoft SQ1 (n=1) | |
| WebXPRT 3 / Overall | |
| Average of class Convertible (171 - 426, n=49, last 2 years) | |
| Microsoft Surface Pro 7 Plus | |
| Lenovo Yoga Duet 7 13IML05-82AS000WGE | |
| Apple iPad Pro 12.9 2020 | |
| Microsoft Surface Pro X | |
| Average Microsoft SQ1 (n=1) | |
| Octane V2 / Total Score | |
| Average of class Convertible (50984 - 123023, n=12, last 2 years) | |
| Apple iPad Pro 12.9 2020 | |
| Microsoft Surface Pro X | |
| Average Microsoft SQ1 (n=1) | |
| Lenovo ThinkPad X1 Tablet G3-20KJ001NGE | |
| Microsoft Surface Pro X 256 GB NVMe | Microsoft Surface Pro 7 Plus Samsung PM991 MZ9LQ256HBJQ | Lenovo Yoga Duet 7 13IML05-82AS000WGE Lenovo UMIS RPJTJ256MEE1OWX | Lenovo ThinkPad X1 Tablet G3-20KJ001NGE Samsung PM961 MZVLW256HEHP | Average 256 GB NVMe | Average of class Convertible | |
|---|---|---|---|---|---|---|
| CrystalDiskMark 5.2 / 6 | 391% | 350% | 342% | 13% | 642% | |
| Write 4K (MB/s) | 24.27 | 165.3 581% | 118 386% | 95.4 293% | 35.8 ? 48% | 144.6 ? 496% |
| Read 4K (MB/s) | 13.57 | 42.95 217% | 53 291% | 39.19 189% | 16.2 ? 19% | 67.2 ? 395% |
| Write Seq (MB/s) | 429.3 | 955 122% | 1208 181% | 362 ? -16% | 2553 ? 495% | |
| Read Seq (MB/s) | 665 | 867 30% | 1625 144% | 726 ? 9% | 2965 ? 346% | |
| Write 4K Q32T1 (MB/s) | 63.4 | 423.5 568% | 431 580% | 399.2 530% | 63.1 ? 0% | 452 ? 613% |
| Read 4K Q32T1 (MB/s) | 31.62 | 479.2 1415% | 356 1026% | 260.7 724% | 62.7 ? 98% | 582 ? 1741% |
| Write Seq Q32T1 (MB/s) | 729 | 1060 45% | 1278 75% | 1287 77% | 455 ? -38% | 4383 ? 501% |
| Read Seq Q32T1 (MB/s) | 894 | 2251 152% | 1949 118% | 3025 238% | 761 ? -15% | 5831 ? 552% |
| Write 4K Q8T8 (MB/s) | 381 | 826 ? | ||||
| Read 4K Q8T8 (MB/s) | 750 | 1239 ? |
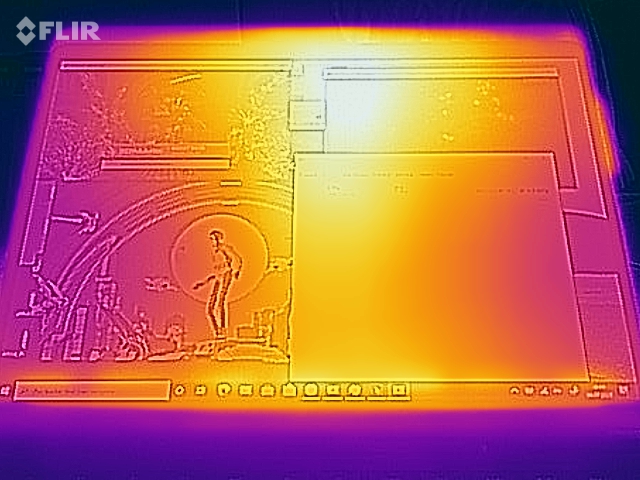
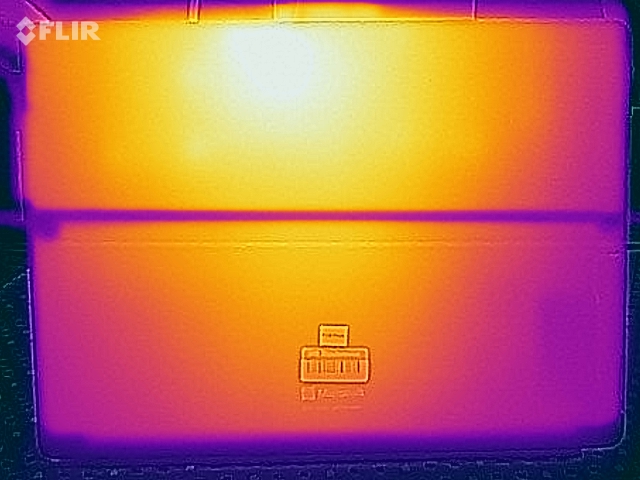
Temperature
(±) The maximum temperature on the upper side is 41.8 °C / 107 F, compared to the average of 35.4 °C / 96 F, ranging from 19.6 to 60 °C for the class Convertible.
(-) The bottom heats up to a maximum of 45.7 °C / 114 F, compared to the average of 36.9 °C / 98 F
(+) In idle usage, the average temperature for the upper side is 25.1 °C / 77 F, compared to the device average of 30.3 °C / 87 F.
(±) The palmrests and touchpad can get very hot to the touch with a maximum of 38.3 °C / 100.9 F.
(-) The average temperature of the palmrest area of similar devices was 28 °C / 82.4 F (-10.3 °C / -18.5 F).
Speakers
Microsoft Surface Pro X audio analysis
(±) | speaker loudness is average but good (78.1 dB)
Bass 100 - 315 Hz
(±) | reduced bass - on average 11.5% lower than median
(±) | linearity of bass is average (13.2% delta to prev. frequency)
Mids 400 - 2000 Hz
(±) | higher mids - on average 5.2% higher than median
(+) | mids are linear (5.3% delta to prev. frequency)
Highs 2 - 16 kHz
(±) | higher highs - on average 5.2% higher than median
(+) | highs are linear (4.3% delta to prev. frequency)
Overall 100 - 16.000 Hz
(±) | linearity of overall sound is average (18.1% difference to median)
Compared to same class
» 39% of all tested devices in this class were better, 7% similar, 54% worse
» The best had a delta of 6%, average was 20%, worst was 57%
Compared to all devices tested
» 38% of all tested devices were better, 8% similar, 54% worse
» The best had a delta of 4%, average was 23%, worst was 134%
Apple iPad Pro 12.9 2020 audio analysis
(±) | speaker loudness is average but good (81 dB)
Bass 100 - 315 Hz
(±) | reduced bass - on average 6.6% lower than median
(±) | linearity of bass is average (10.6% delta to prev. frequency)
Mids 400 - 2000 Hz
(+) | balanced mids - only 4.2% away from median
(+) | mids are linear (4.6% delta to prev. frequency)
Highs 2 - 16 kHz
(+) | balanced highs - only 4.1% away from median
(+) | highs are linear (5.5% delta to prev. frequency)
Overall 100 - 16.000 Hz
(+) | overall sound is linear (11.2% difference to median)
Compared to same class
» 11% of all tested devices in this class were better, 4% similar, 85% worse
» The best had a delta of 7%, average was 20%, worst was 129%
Compared to all devices tested
» 7% of all tested devices were better, 2% similar, 91% worse
» The best had a delta of 4%, average was 23%, worst was 134%
Energy Management
| Off / Standby | |
| Idle | |
| Load |
|
Key:
min: | |
Battery Life
Pros
Cons
Verdict - Windows and ARM do not mix

The Surface Pro X could have been an exciting device, but it is not, because of severe limitations, which Microsoft has been unable to resolve thus far. This is why we cannot recommend the Surface Pro X. Meanwhile, Microsoft offers the Surface Pro 7 Plus with an LTE modem, which makes the device significantly more compelling. It is very disappointing that it is taking Microsoft so long to come up with a decent emulation solution. With its impressive M1 MacBooks, Apple has shown the world what good emulation looks like. From day one, Apple’s x86 emulation worked well and did not incur a massive performance penalty.
The battery life should have been great, because the slate features an energy-efficient ARM chip. However, this is not the case in practice. The Microsoft slate lasts 5 to 8 hours depending on the screen brightness. This is why it offers worse battery life than the Surface Pro 7.
The 3:2 screen leaves a better impression. However, it comes with the same limitations as the Surface Pro 7. At 50% brightness and below, the panel exhibits PWM flickering with a very low frequency. This is why individuals who are susceptible to PWM flickering should not get the Surface Pro X.
Too expensive and too many limitations: We cannot recommend the Surface Pro X. The normal Surface Pro 7 is a much, much better choice.
All in all, the device is just too expensive, given the whole host of limitations that it comes saddled with. You would be much better off getting the normal Surface Pro 7 or the Surface Pro 7 Plus with an LTE modem.
Price and Availability
Our review model retails for $1085 on Amazon without the keyboard attachment. The new model with the SQ2 chip retails for $1499 on bestbuy.com. On Amazon, US-based users can get the Surface Pro X for as little as $899.97.
Microsoft Surface Pro X
- 03/24/2021 v7 (old)
Andreas Osthoff
Price comparison

