Microsoft Surface Pro 7 Core i5 Review: More Like a Surface Pro 6.5
The Surface Pro series needs no introduction. Microsoft's premier lineup has become so successful in its category that the words "Windows tablet" is now essentially synonymous with Surface. Consequently, direct competitors like the HP Elite x2 1013, Lenovo Miix 520, or the Dell Latitude 5290 2-in-1 have all had a tough time breaking out of the Surface's shadow.
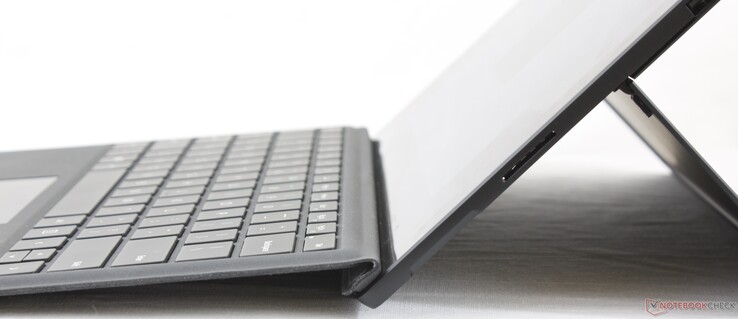
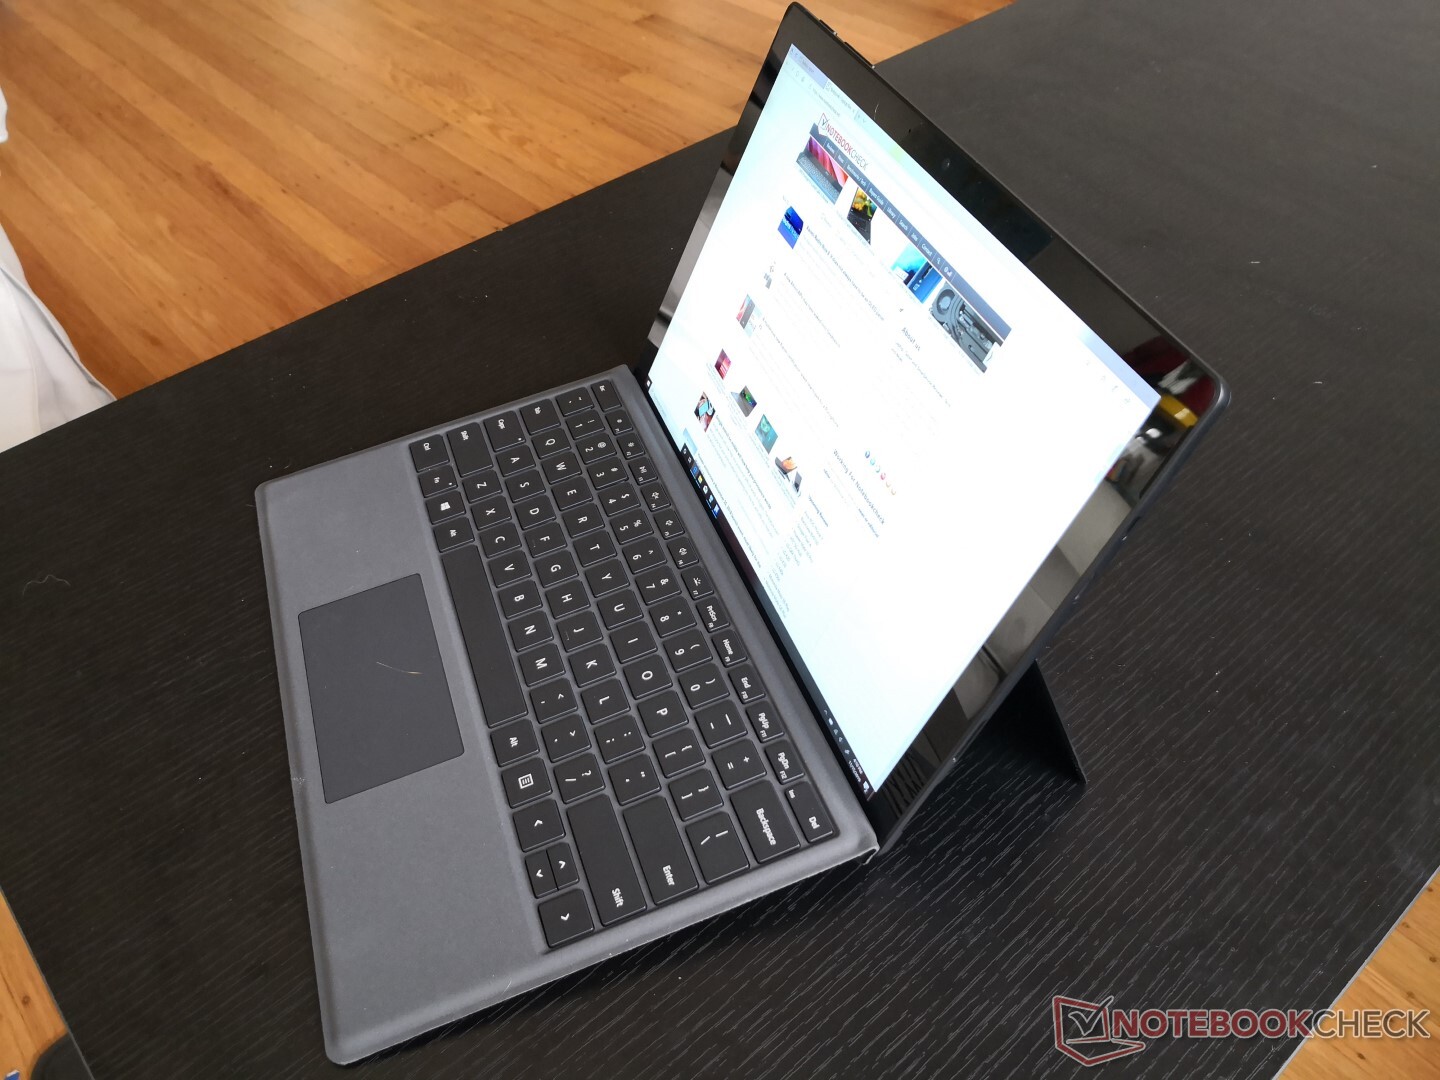
Unveiled early last month, the Surface Pro 7 shares the same detachable Type Cover keyboard and nearly the same chassis design as the Surface Pro 6. We therefore recommend checking out our existing review on last year's model since our comments on chassis rigidity, key feedback, display quality, and other physical features still apply here on the Surface Pro 7. The biggest updates are largely internal; the Surface Pro 7 ships with Intel's new Ice Lake-U processor which should offer significantly faster integrated graphics performance than the outdated UHD Graphics 620.
The unit we have today is the mid-range quad-core Core i5-1035G4 SKU for $900 to $1400 depending on RAM and storage. The lesser dual-core Core i3-1005G1 and higher-end quad-core Core i7-1065G7 are also available for $750 and $1500, respectively.
More Microsoft Surface reviews:
Rating | Date | Model | Weight | Height | Size | Resolution | Price |
|---|---|---|---|---|---|---|---|
| 88.4 % v7 (old) | 11 / 2019 | Microsoft Surface Pro 7 Core i5-1035G4 i5-1035G4, Iris Plus Graphics G4 (Ice Lake 48 EU) | 1.1 kg | 8.5 mm | 12.30" | 2736x1824 | |
| 89.1 % v7 (old) | 10 / 2018 | Microsoft Surface Pro 6, Core i7, 512 GB i7-8650U, UHD Graphics 620 | 1.1 kg | 8.5 mm | 12.30" | 2736x1824 | |
| 86.3 % v7 (old) | 10 / 2019 | Dell XPS 13 7390 2-in-1 Core i7 i7-1065G7, Iris Plus Graphics G7 (Ice Lake 64 EU) | 1.3 kg | 13 mm | 13.40" | 1920x1200 | |
| 87 % v7 (old) | 10 / 2018 | HP Elite x2 1013 G3-2TT14EA i5-8350U, UHD Graphics 620 | 1.2 kg | 7.9 mm | 13.00" | 3000x2000 | |
| 83.3 % v6 (old) | 02 / 2018 | Lenovo Miix 520-12IKB 20M3000LGE i5-8550U, UHD Graphics 620 | 1.3 kg | 9.9 mm | 12.20" | 1920x1200 |
Case
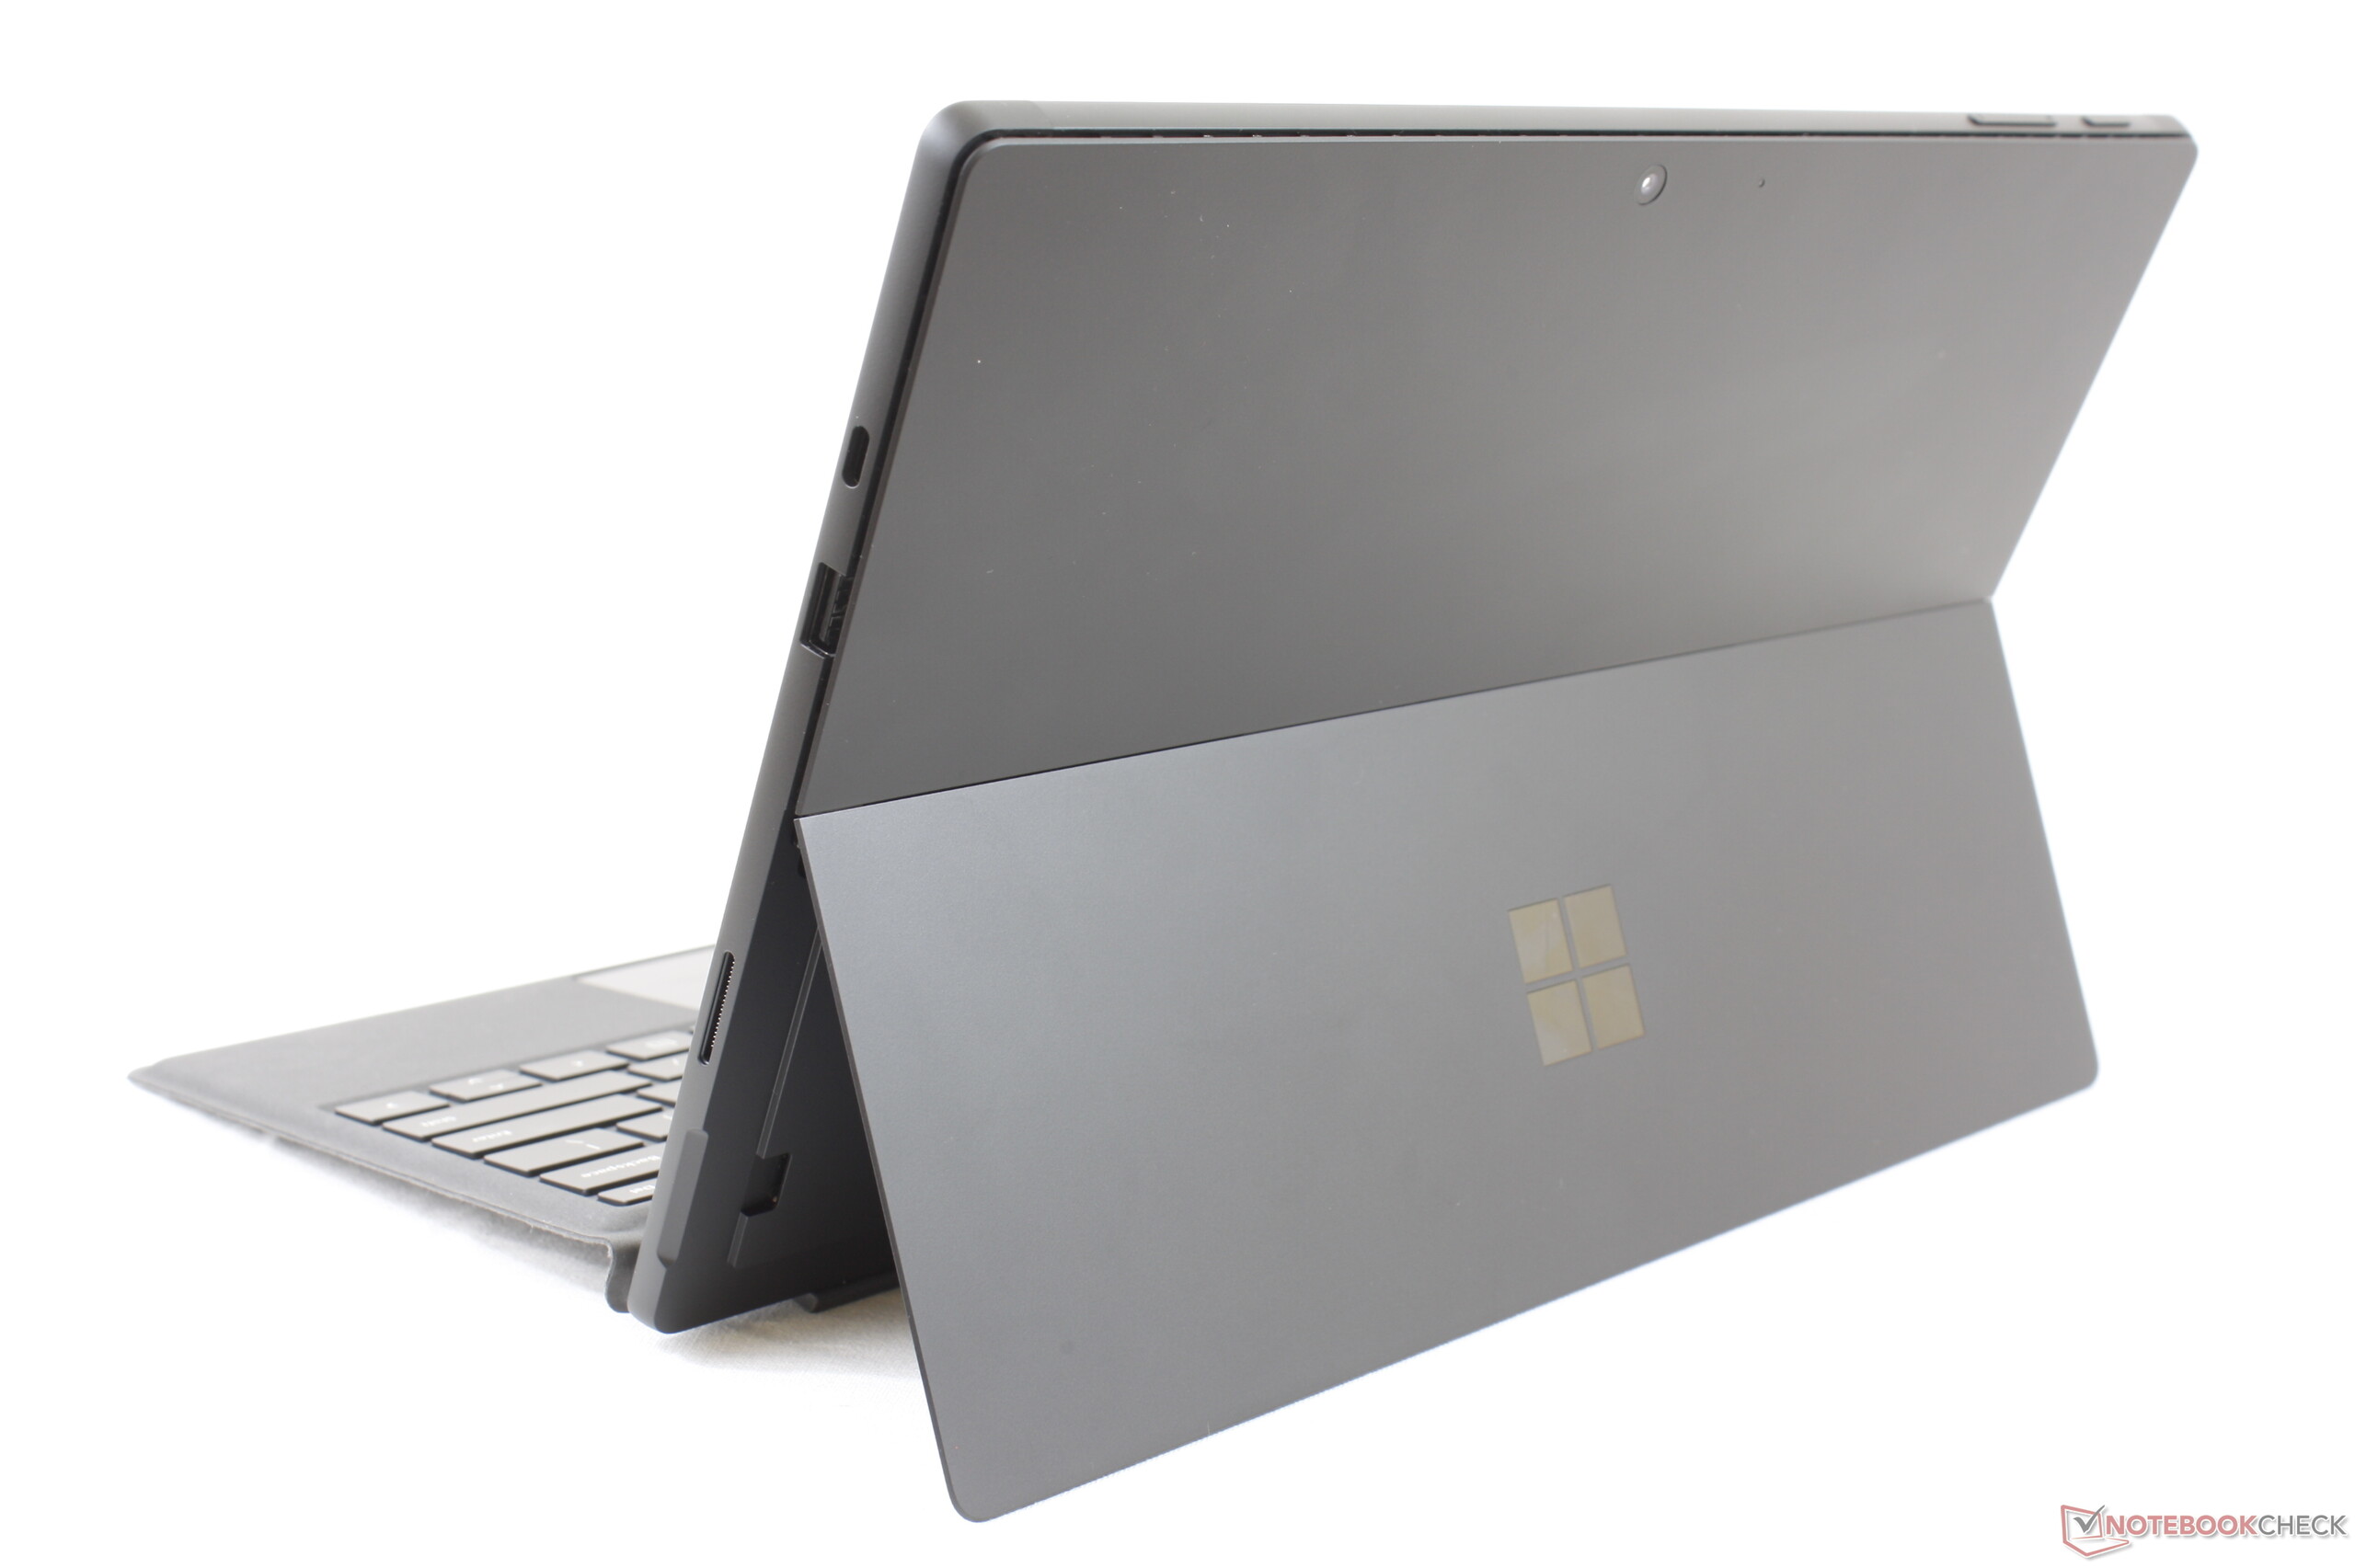
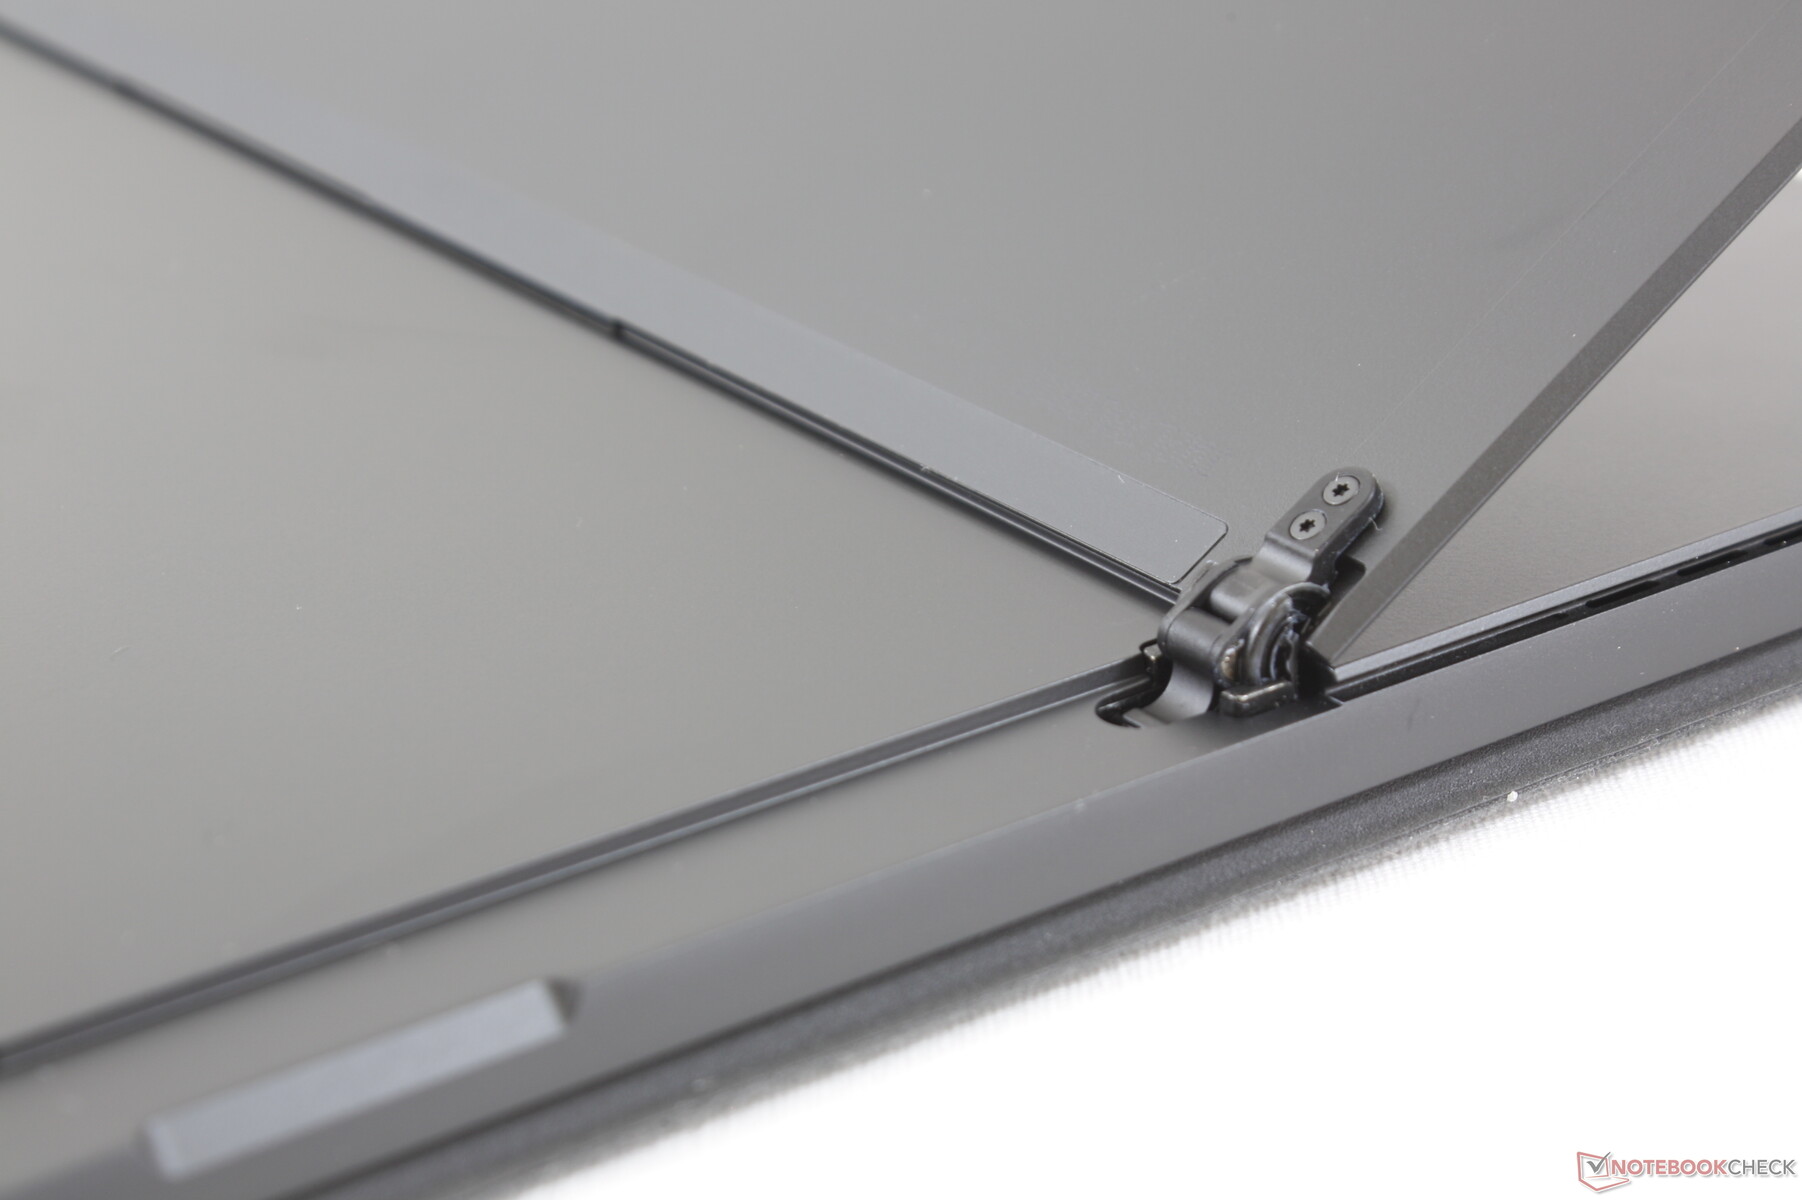
Since the Surface Pro 7 uses the same chassis design as the Surface Pro 6, we refer to our existing Surface Pro 6 review for more information on its physical features. The major physical differences from last year's model include the following:
- Intel AX201 now comes standard for Wi-Fi 6 connectivity
- Ice Lake-U options across all SKUs to replace Kaby Lake-R
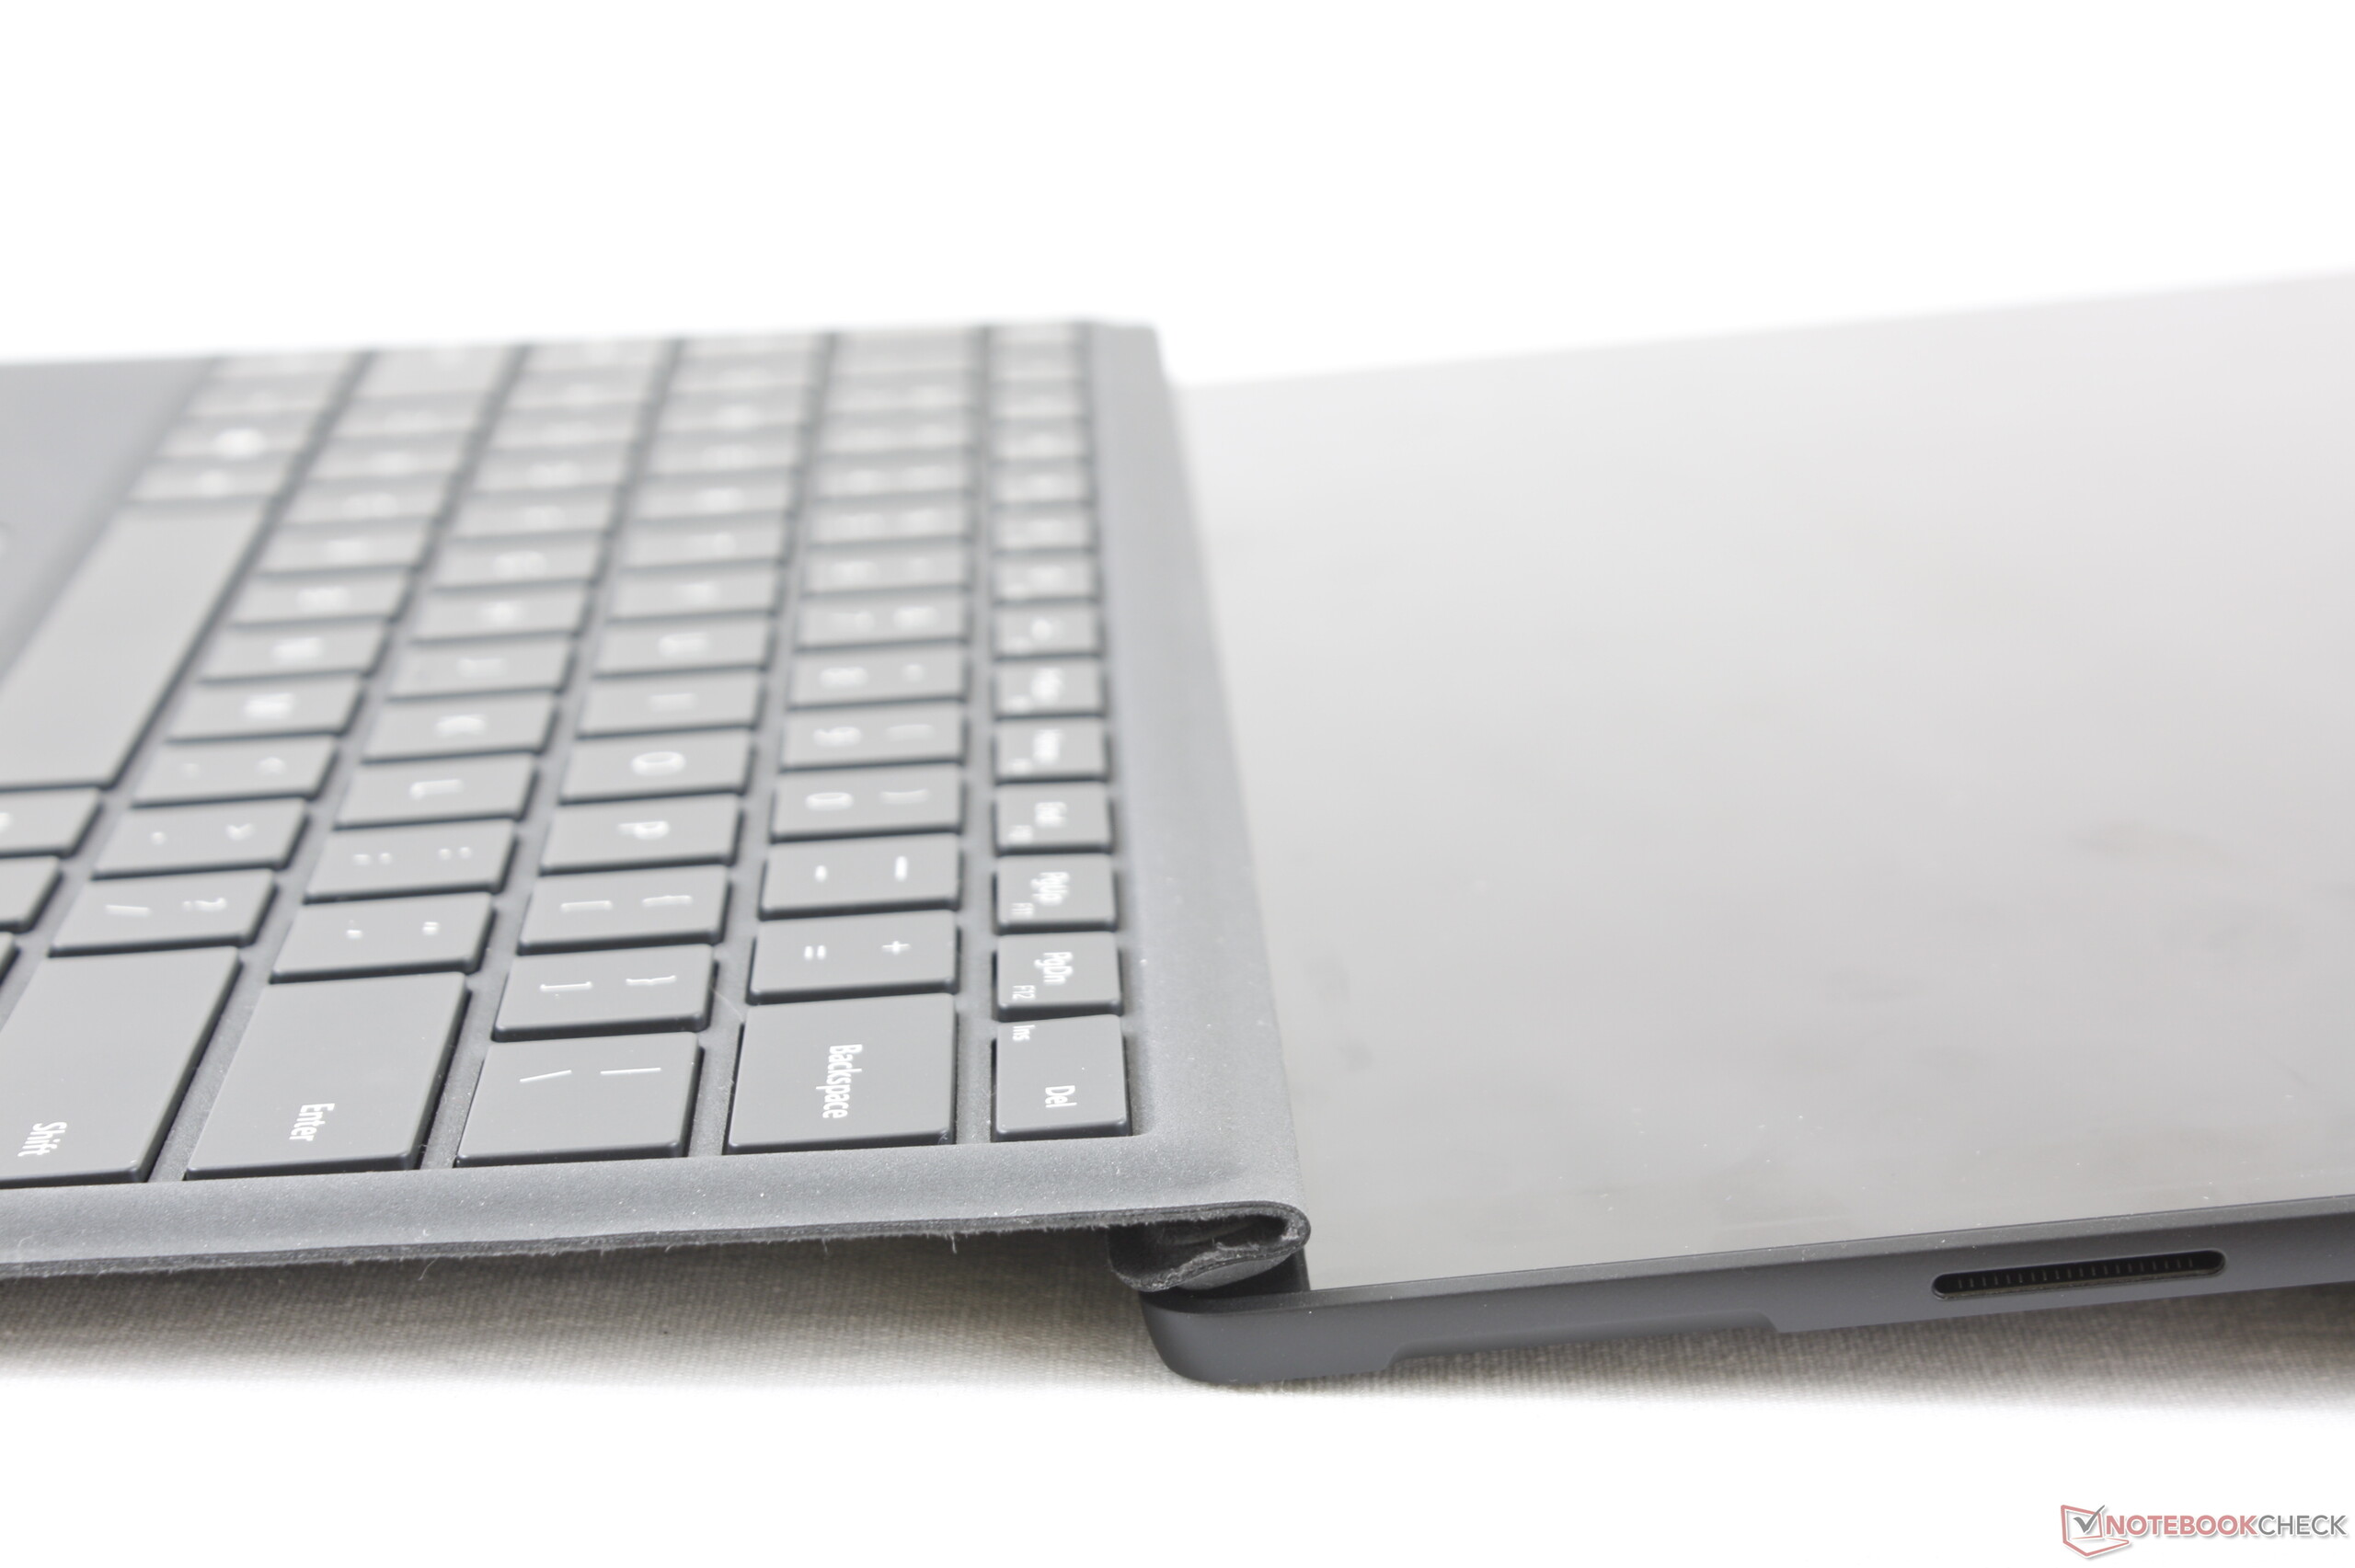
- Mini-DisplayPort has been dropped in favor of USB Type-C PD
- Internal storage uses the newer and faster Toshiba BG4 series to replace last year's Toshiba BG3
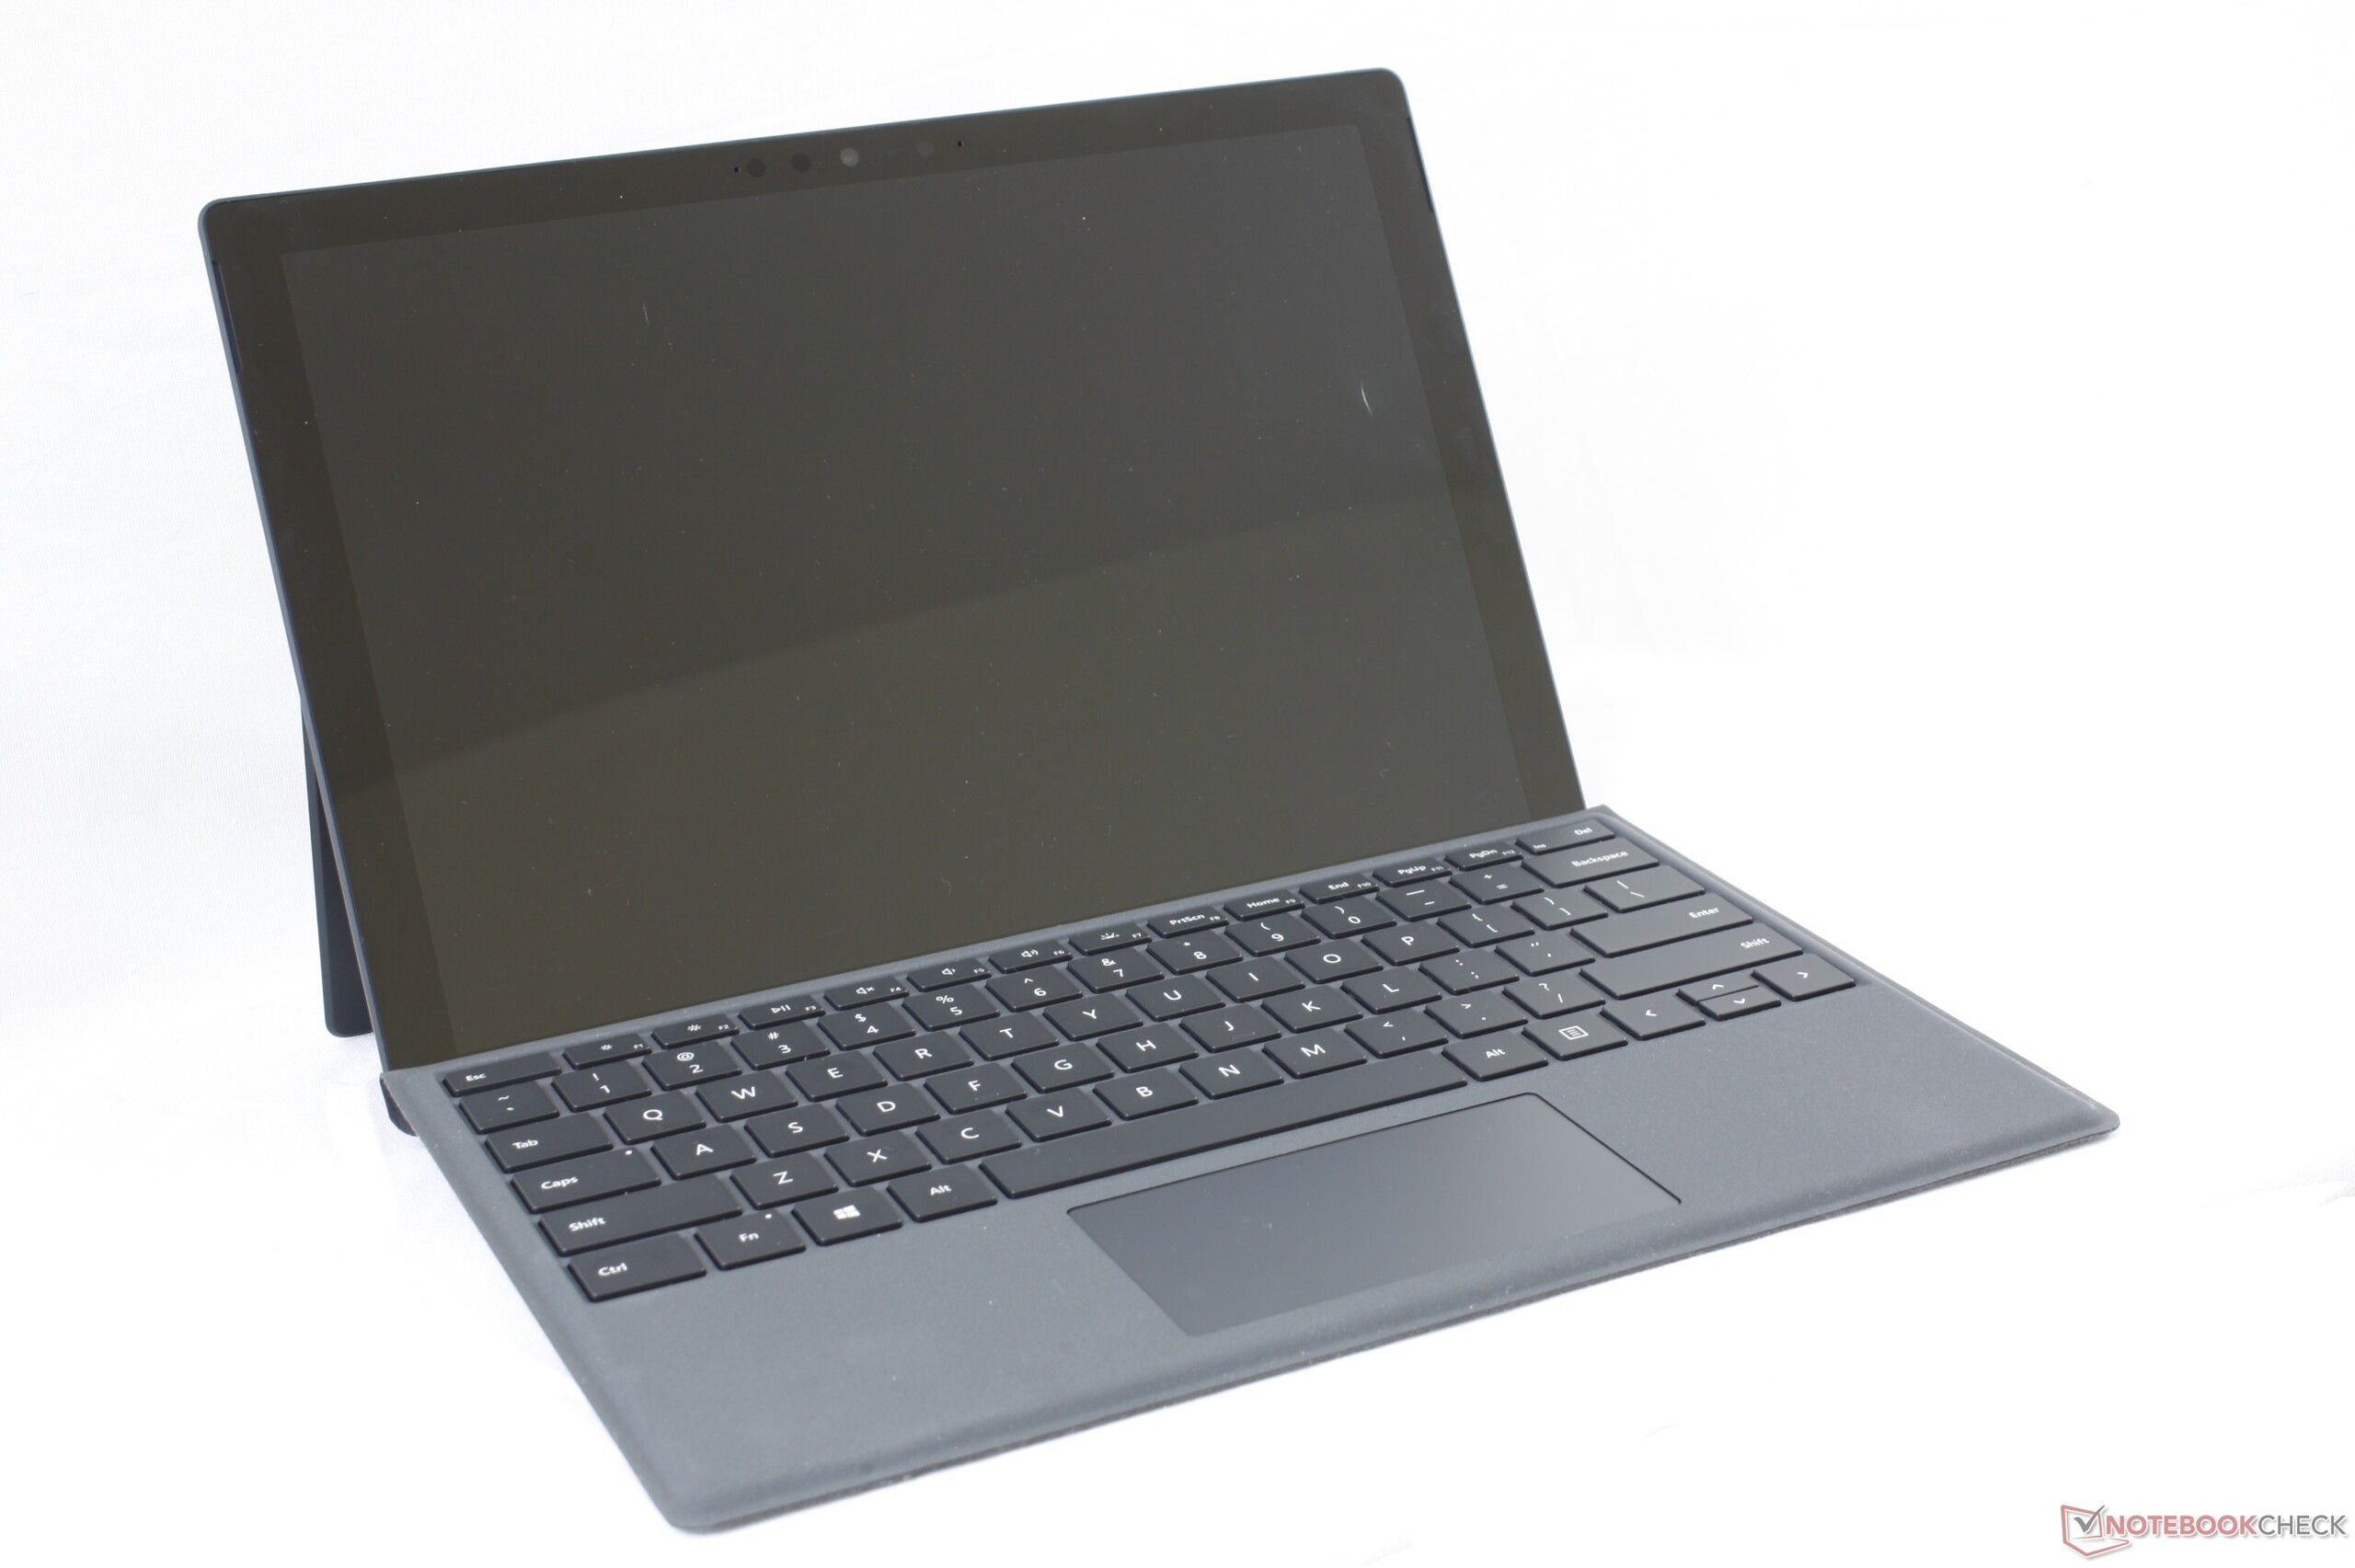
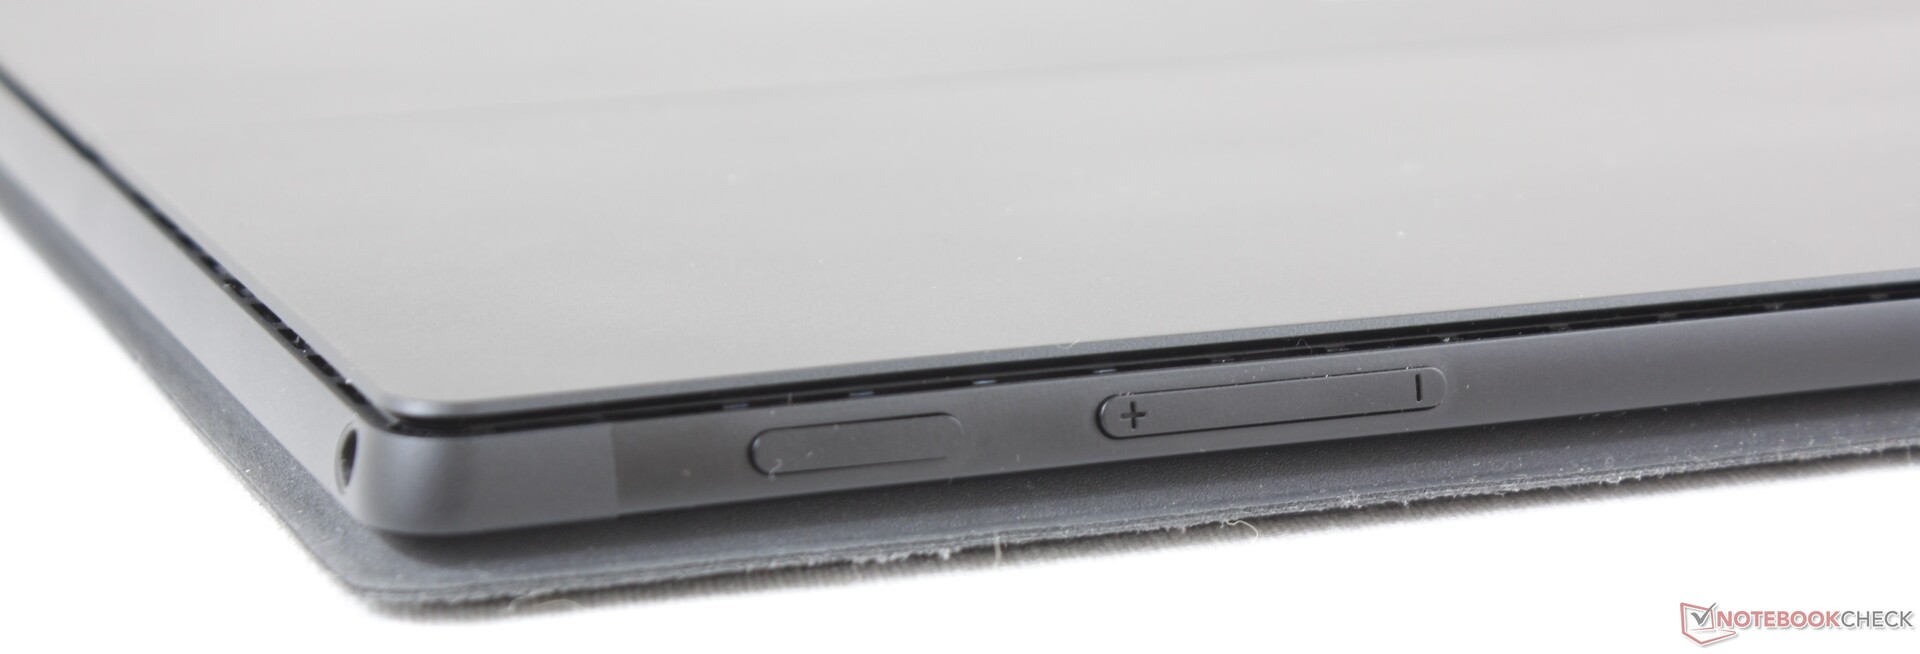
By itself, the tablet weighs 775 g or slightly heavier for the Core i7 SKU. The combined weight of both the tablet and detachable Type Cover is about 1.1 kg.
Connectivity
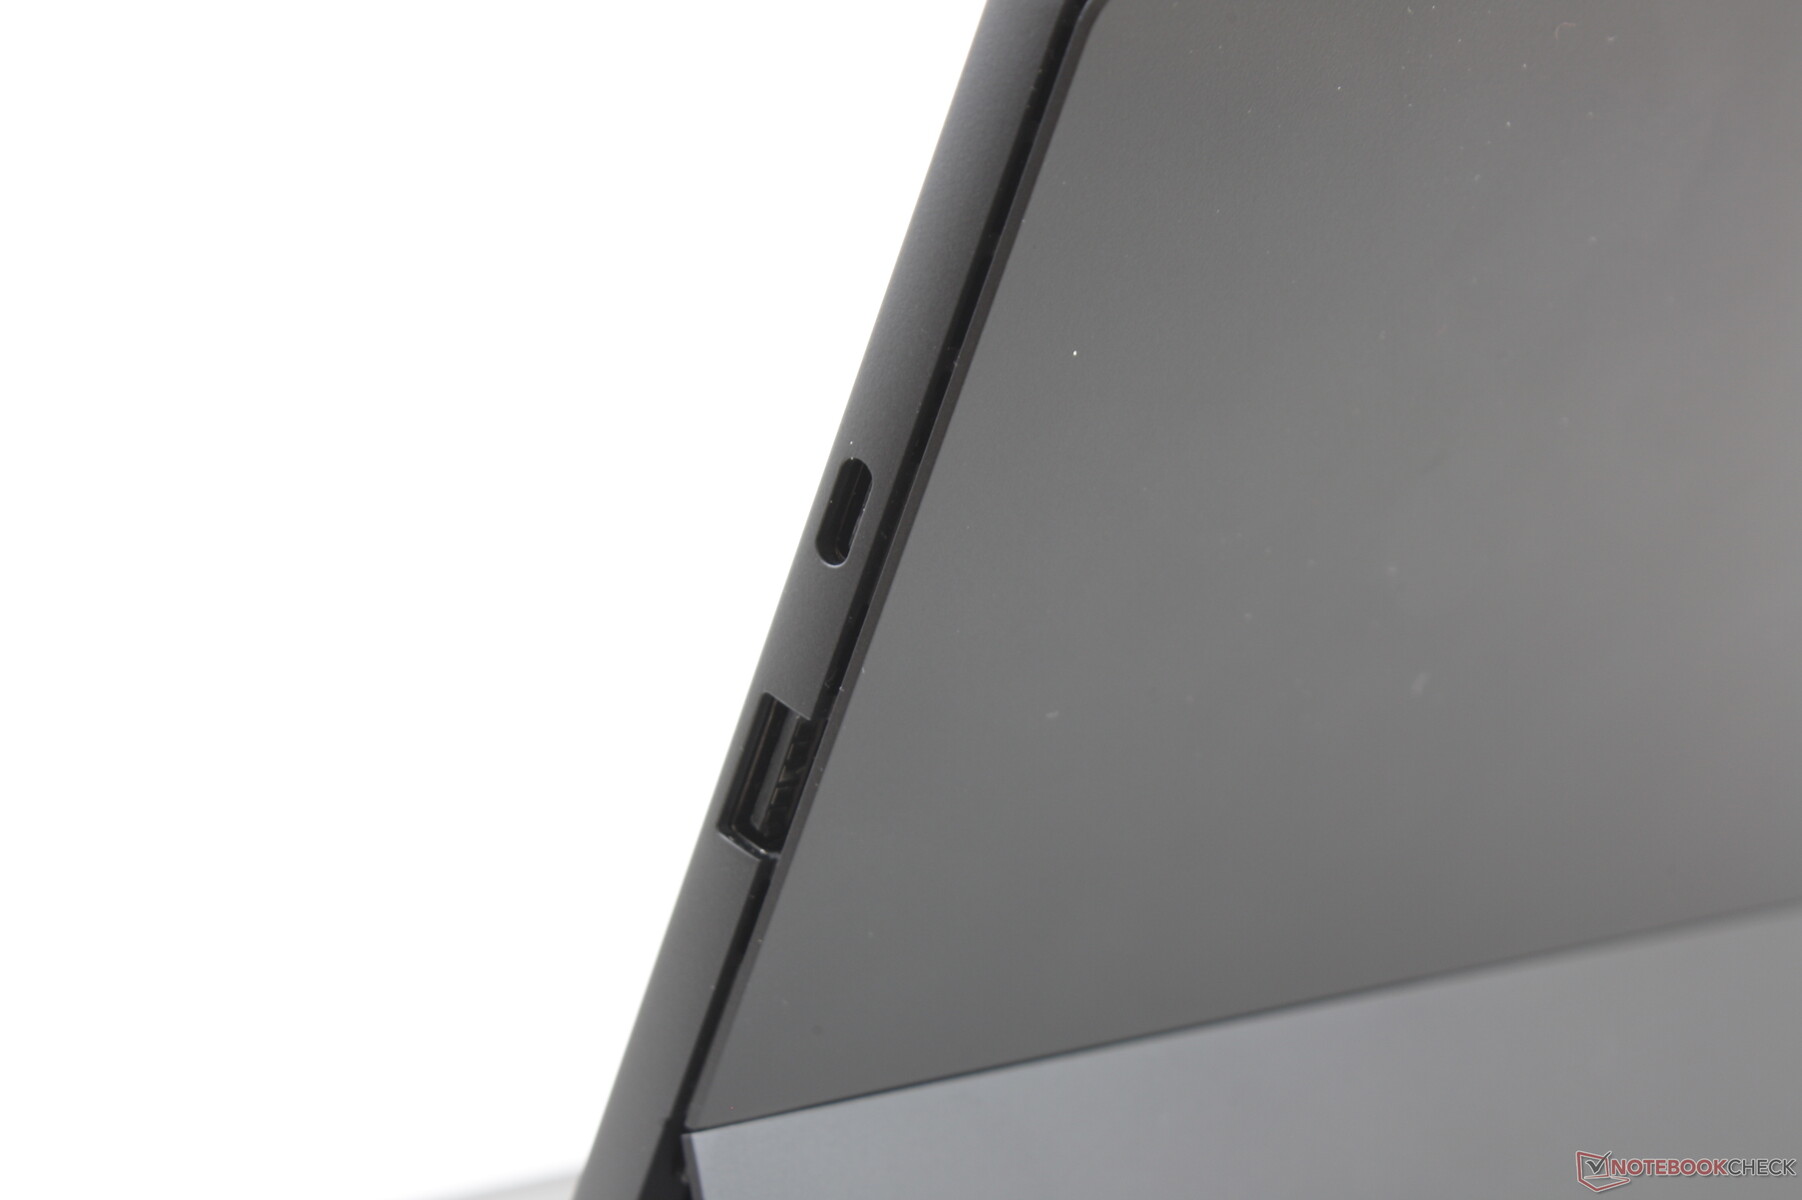
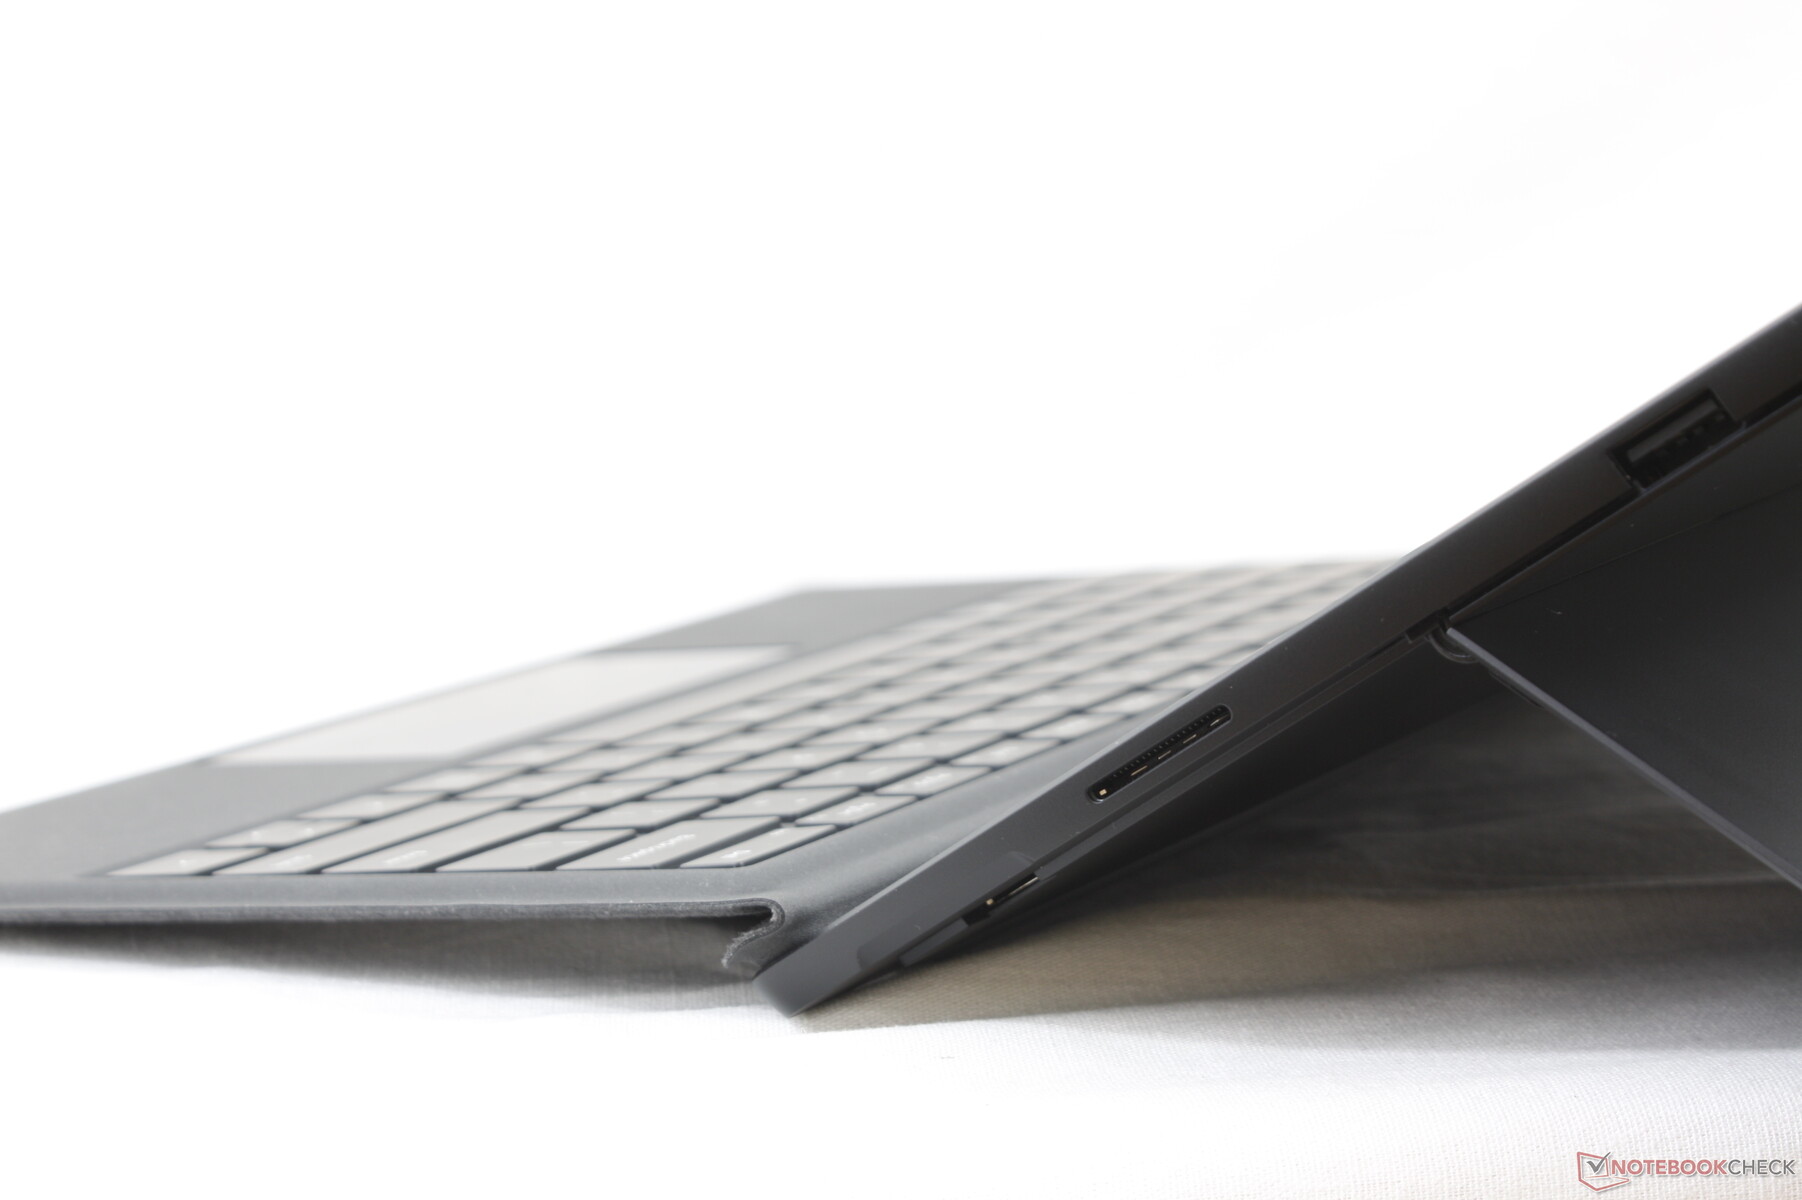
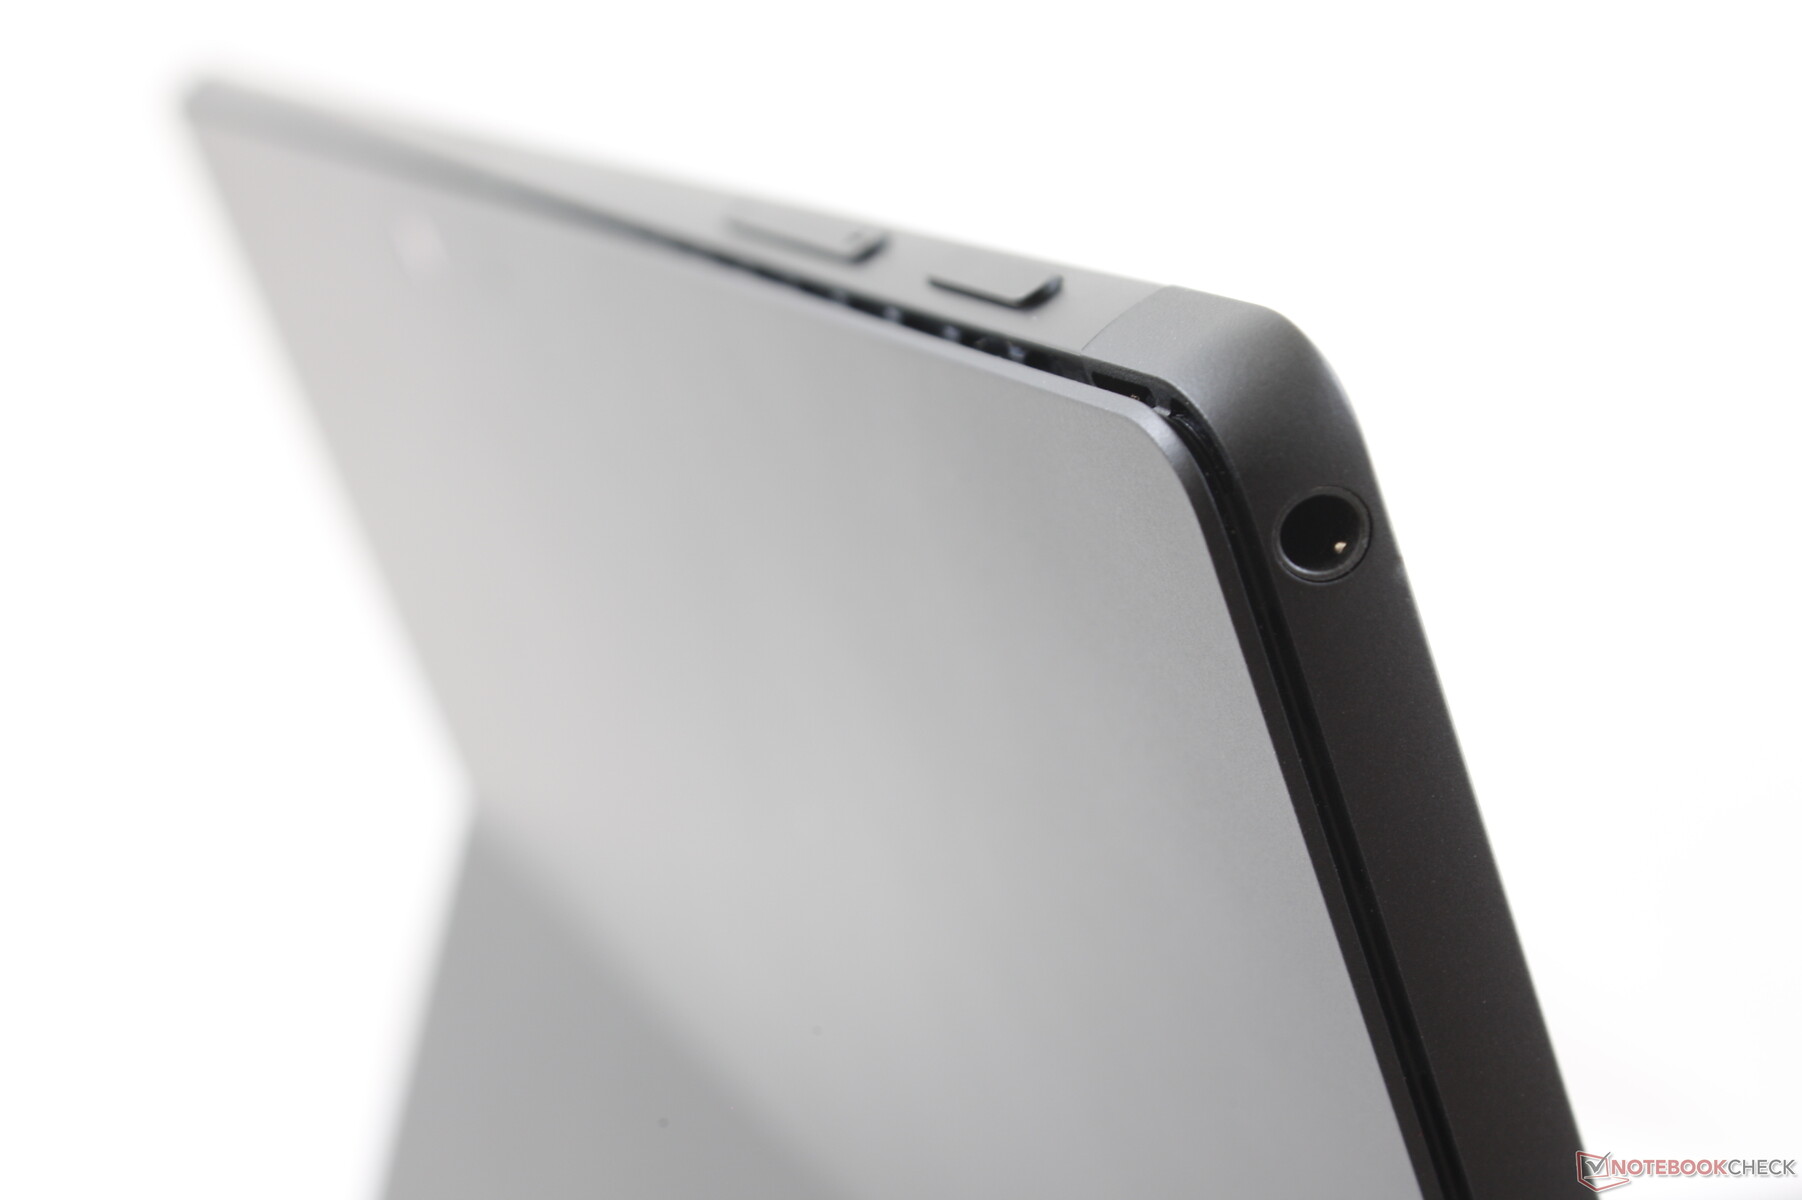
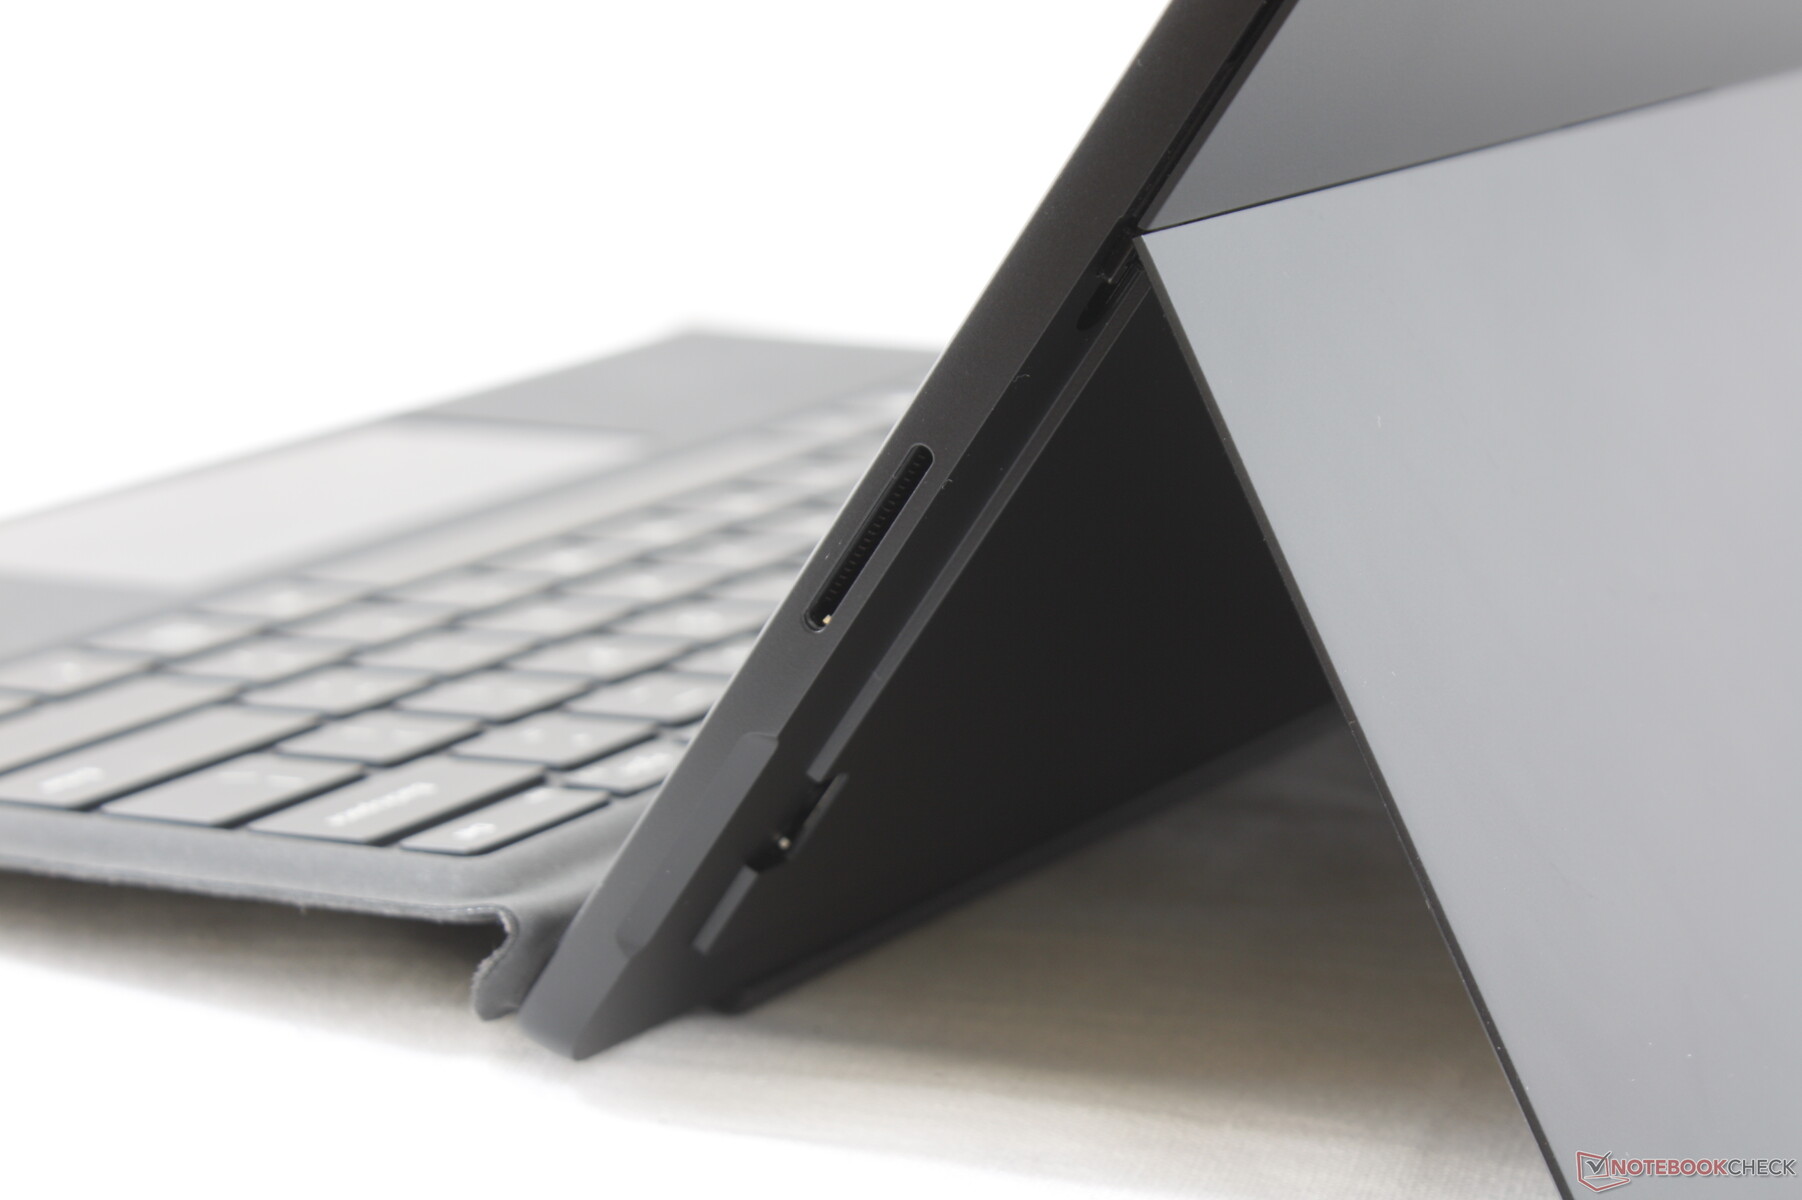
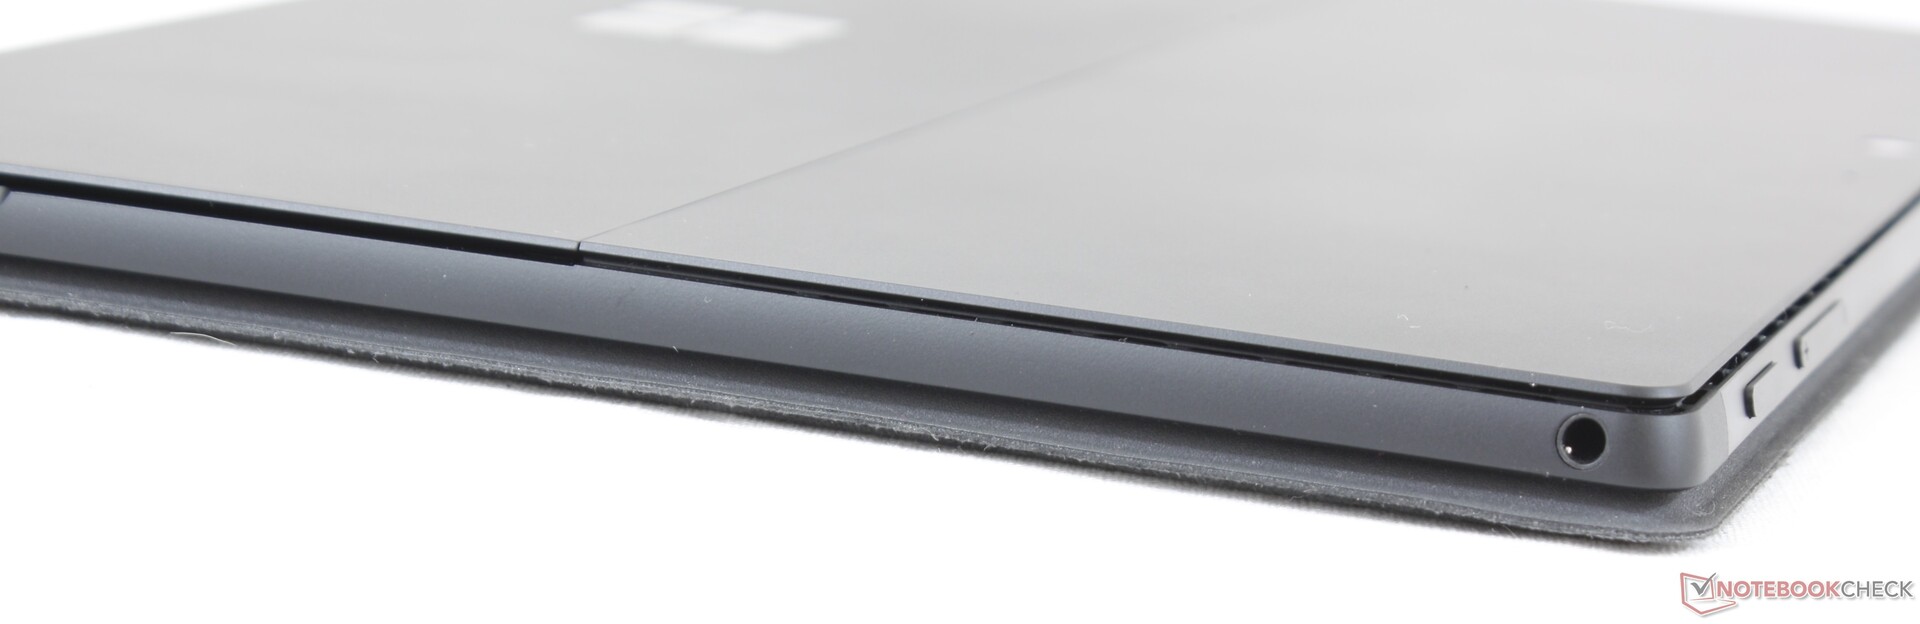
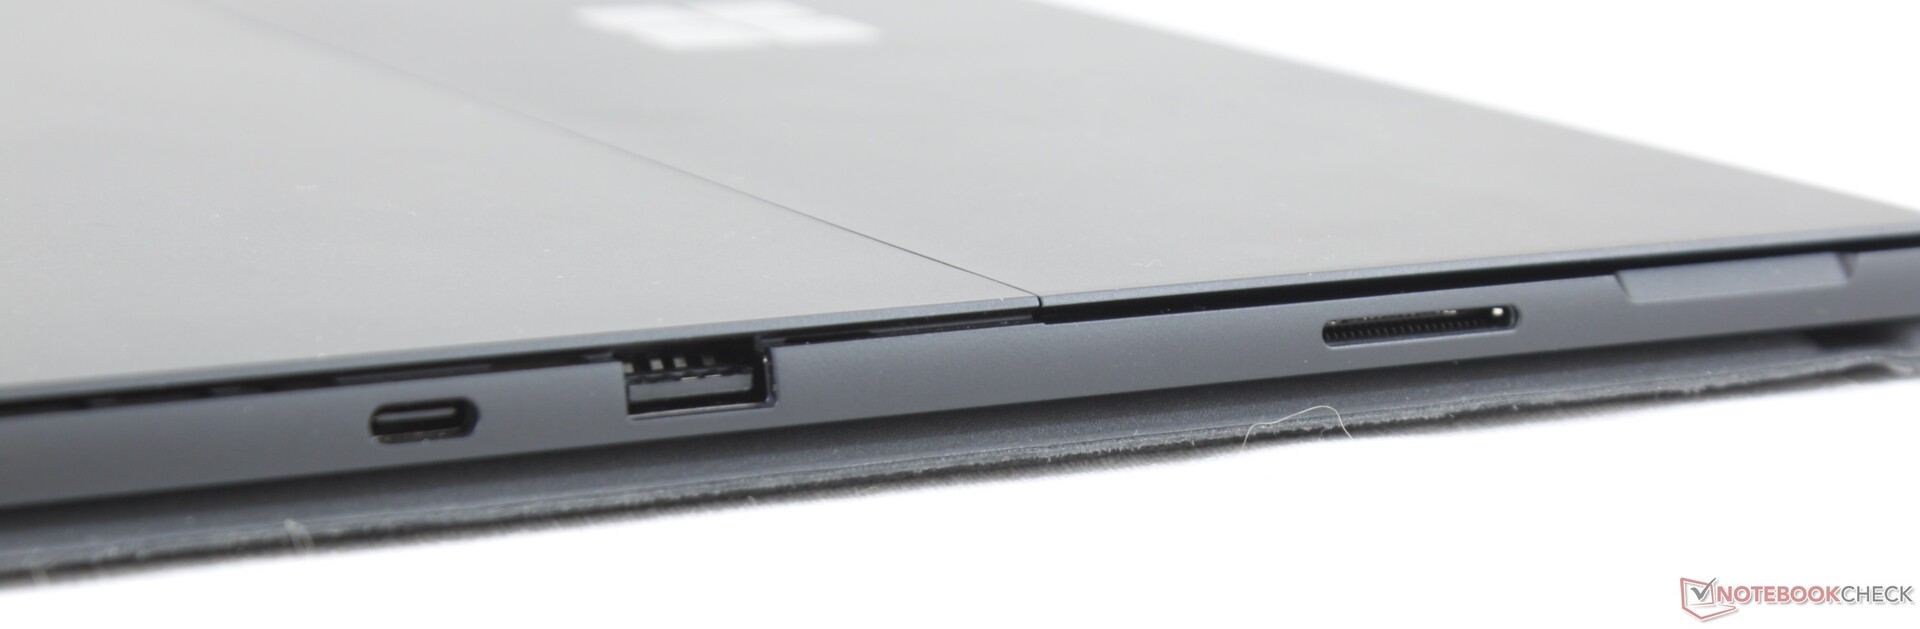
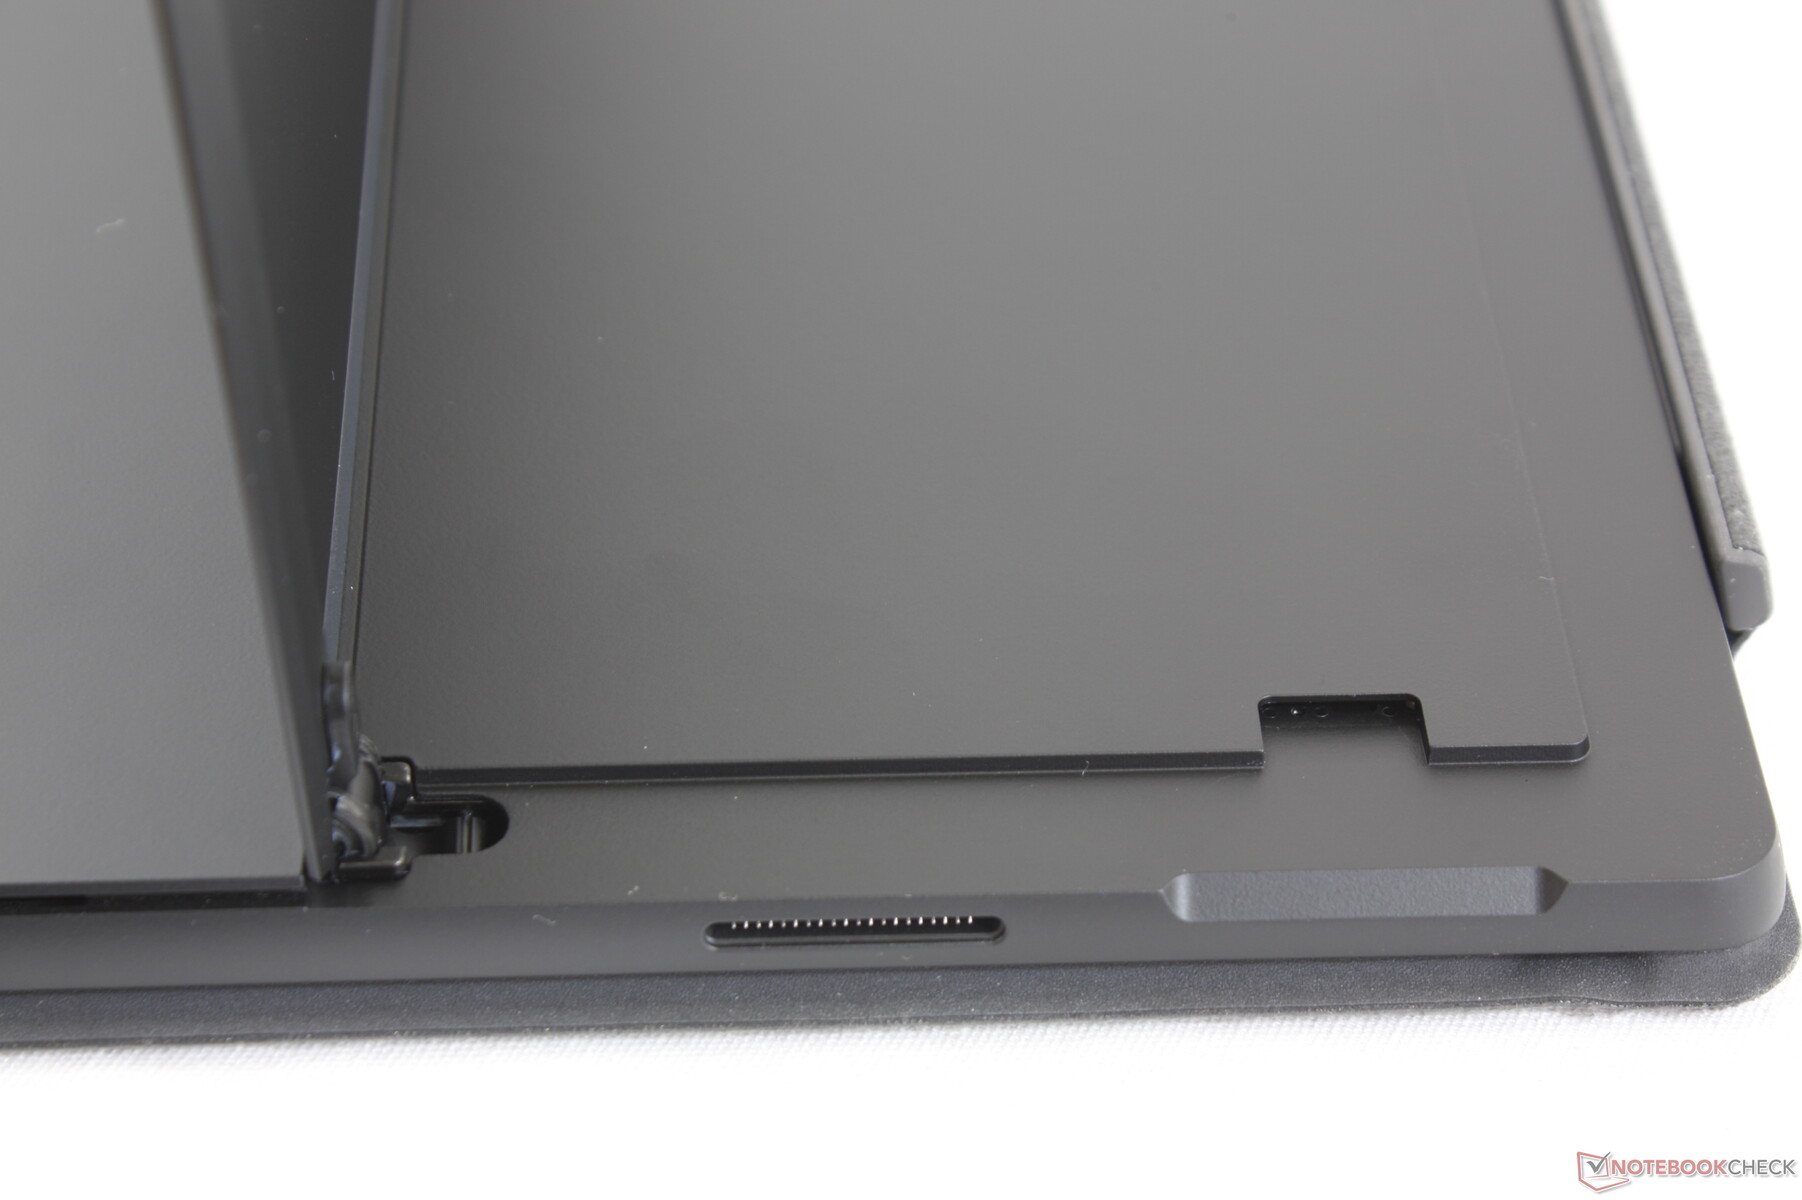
Microsoft has replaced the mini-DisplayPort with the more versatile USB Type-C port. Owners can now connect external monitors or recharge the tablet via USB Type-C. Thunderbolt 3 is still not supported likely because Microsoft wants to push its dedicated (and expensive) Surface Dock instead. Users who have been clamoring for at least one more USB Type-A port will be out of luck.
SD Card Reader
The spring-loaded MicroSD readers still sits under the kickstand for better or worse. Transfer rates have not improved over last year's model.
| SD Card Reader | |
| average JPG Copy Test (av. of 3 runs) | |
| Microsoft Surface Book 2 (Toshiba Exceria Pro SDXC 64 GB UHS-II) | |
| Dell XPS 13 7390 2-in-1 Core i7 (Toshiba Exceria Pro M501 64 GB UHS-II) | |
| Microsoft Surface Pro 6, Core i7, 512 GB (Toshiba Exceria Pro M501 microSDXC 64GB) | |
| Microsoft Surface Pro 7 Core i5-1035G4 (Toshiba Exceria Pro M501 64 GB UHS-II) | |
| Chuwi UBook Pro (Toshiba Exceria Pro M501 64 GB UHS-II) | |
| Microsoft Surface Go MHN-00003 (Toshiba Exceria Pro M501) | |
| Microsoft Surface Pro (2017) i7 (Toshiba Exceria Pro M401 64 GB) | |
| maximum AS SSD Seq Read Test (1GB) | |
| Microsoft Surface Book 2 (Toshiba Exceria Pro SDXC 64 GB UHS-II) | |
| Dell XPS 13 7390 2-in-1 Core i7 (Toshiba Exceria Pro M501 64 GB UHS-II) | |
| Microsoft Surface Pro (2017) i7 (Toshiba Exceria Pro M401 64 GB) | |
| Microsoft Surface Pro 6, Core i7, 512 GB (Toshiba Exceria Pro M501 microSDXC 64GB) | |
| Microsoft Surface Pro 7 Core i5-1035G4 (Toshiba Exceria Pro M501 64 GB UHS-II) | |
| Microsoft Surface Go MHN-00003 (Toshiba Exceria Pro M501) | |
| Chuwi UBook Pro (Toshiba Exceria Pro M501 64 GB UHS-II) | |
Communication
Instead of the Marvell AVASTAR 802.11ac Wi-Fi 5 module on last year's Surface Pro 6, the Surface Pro 7 ships with the newer Intel AX201 module for 802.11ax Wi-Fi 6 connectivity. Transfer rates can reach up to 2.4 Gbps should you have a Wi-Fi 6 router to support such speeds.
Accessories and Warranty
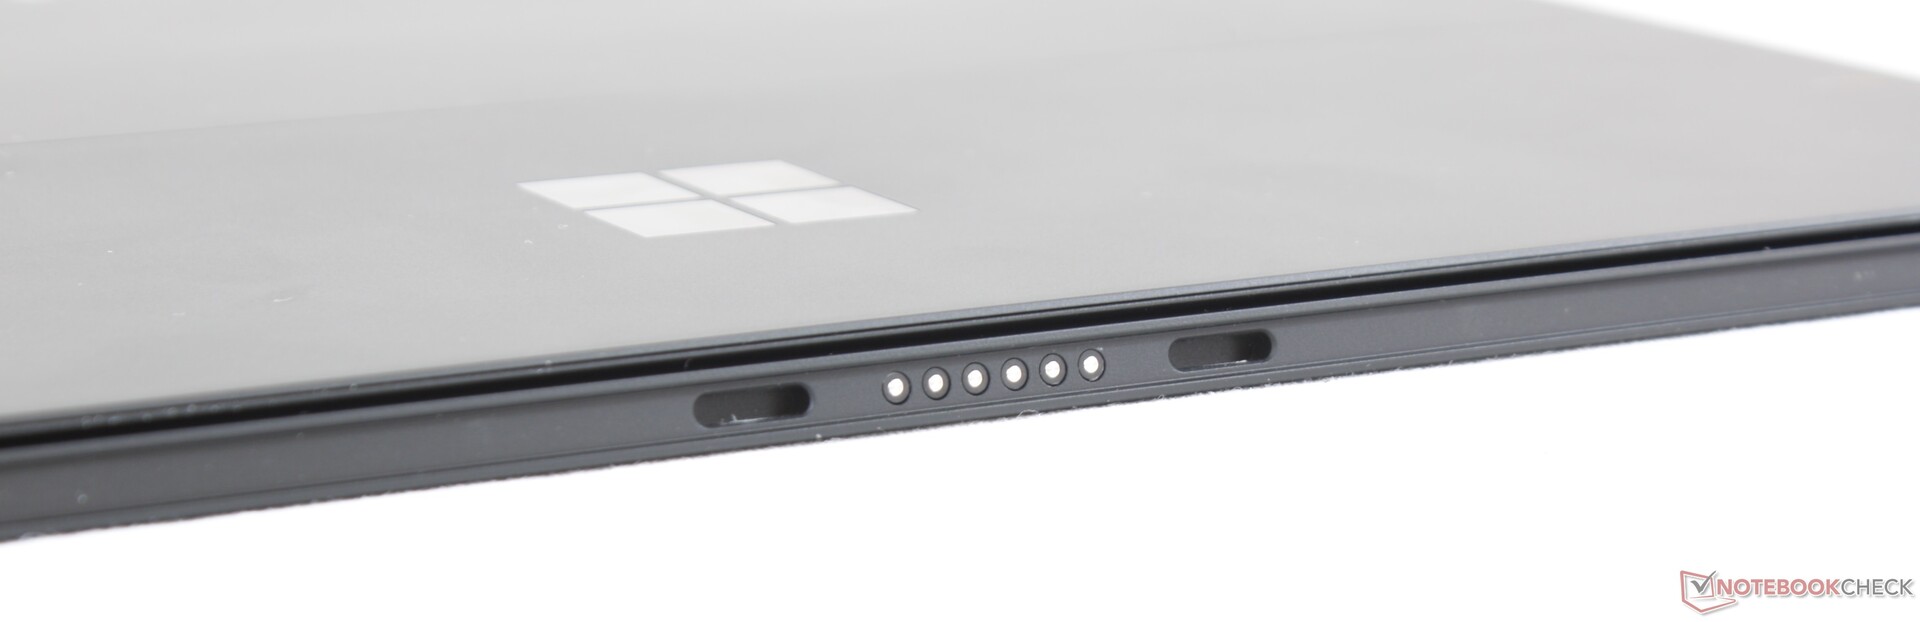
Included extras are the Surface Pen (model 1776) and the usual manuals. The Type Cover keyboard continues to be sold separately at a starting price of $130 USD to $160 USD for the "Signature" version.
The standard one-year limited warranty applies.
Input Devices
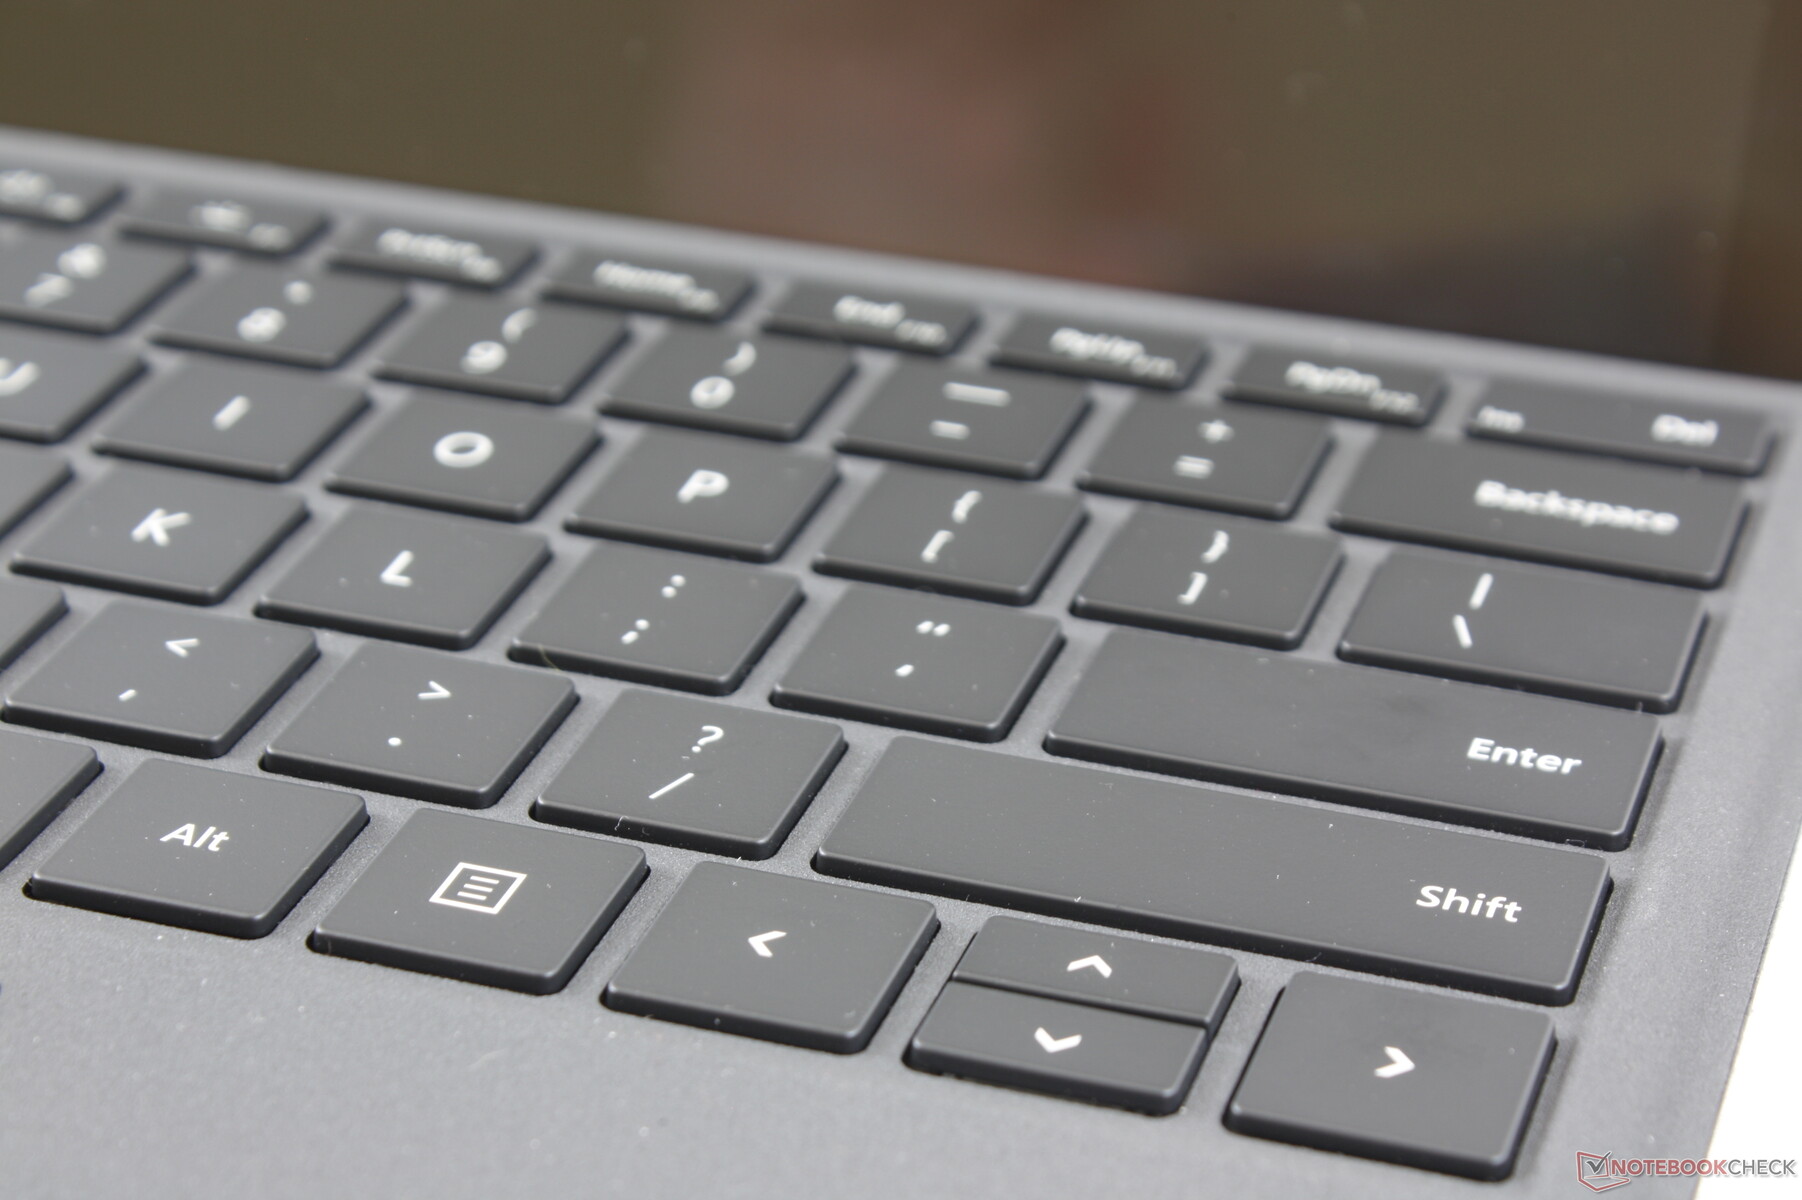
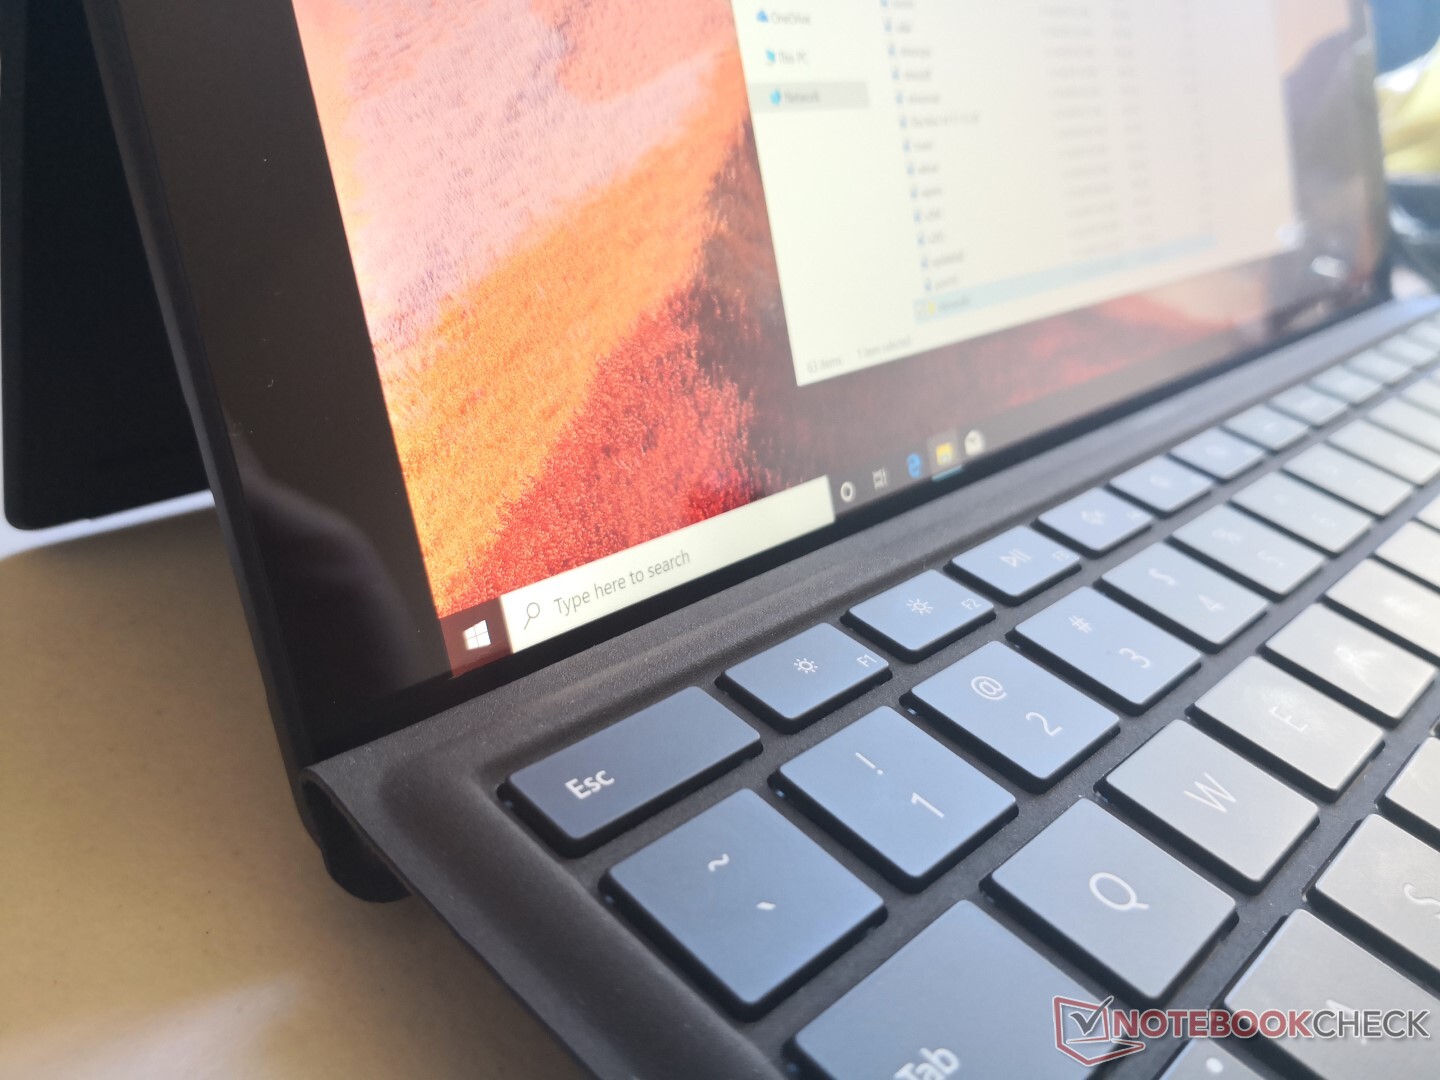
Keyboard and Touchpad
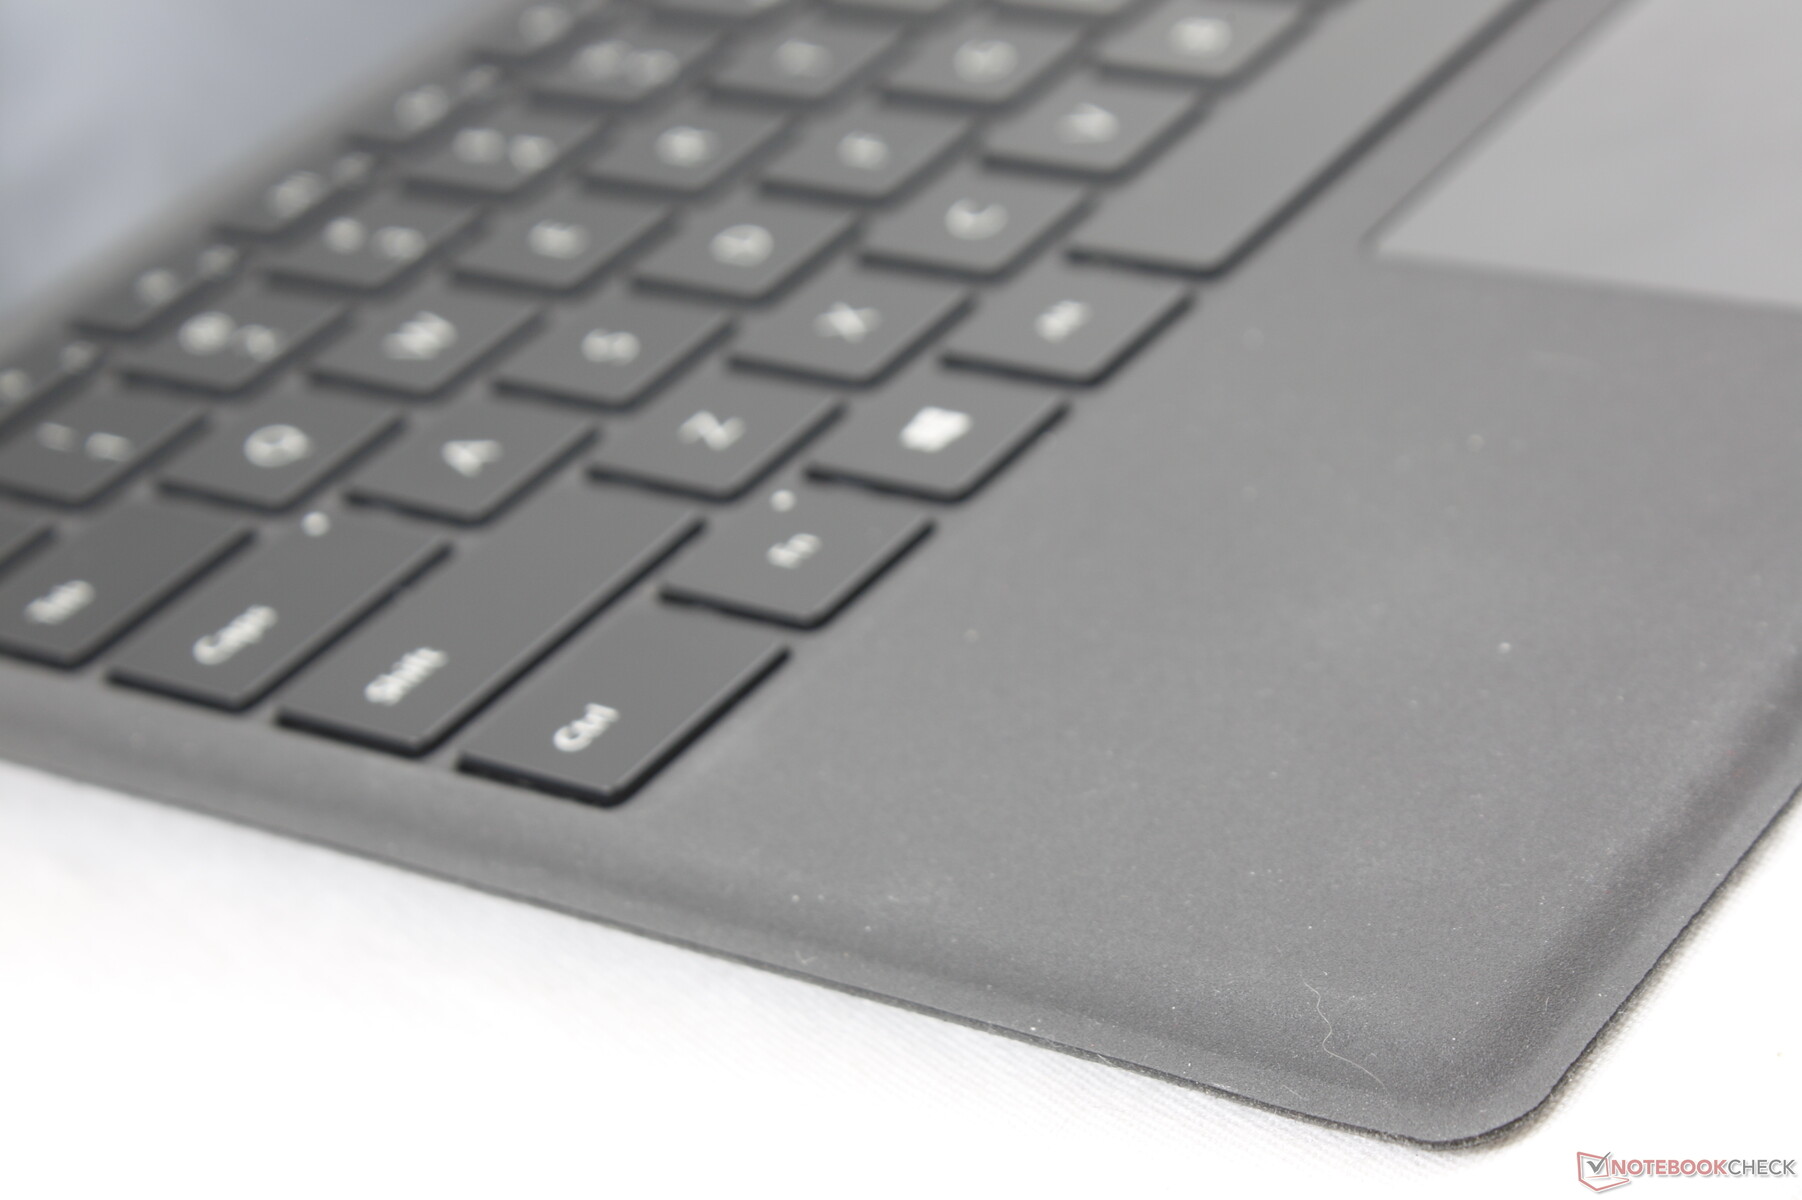
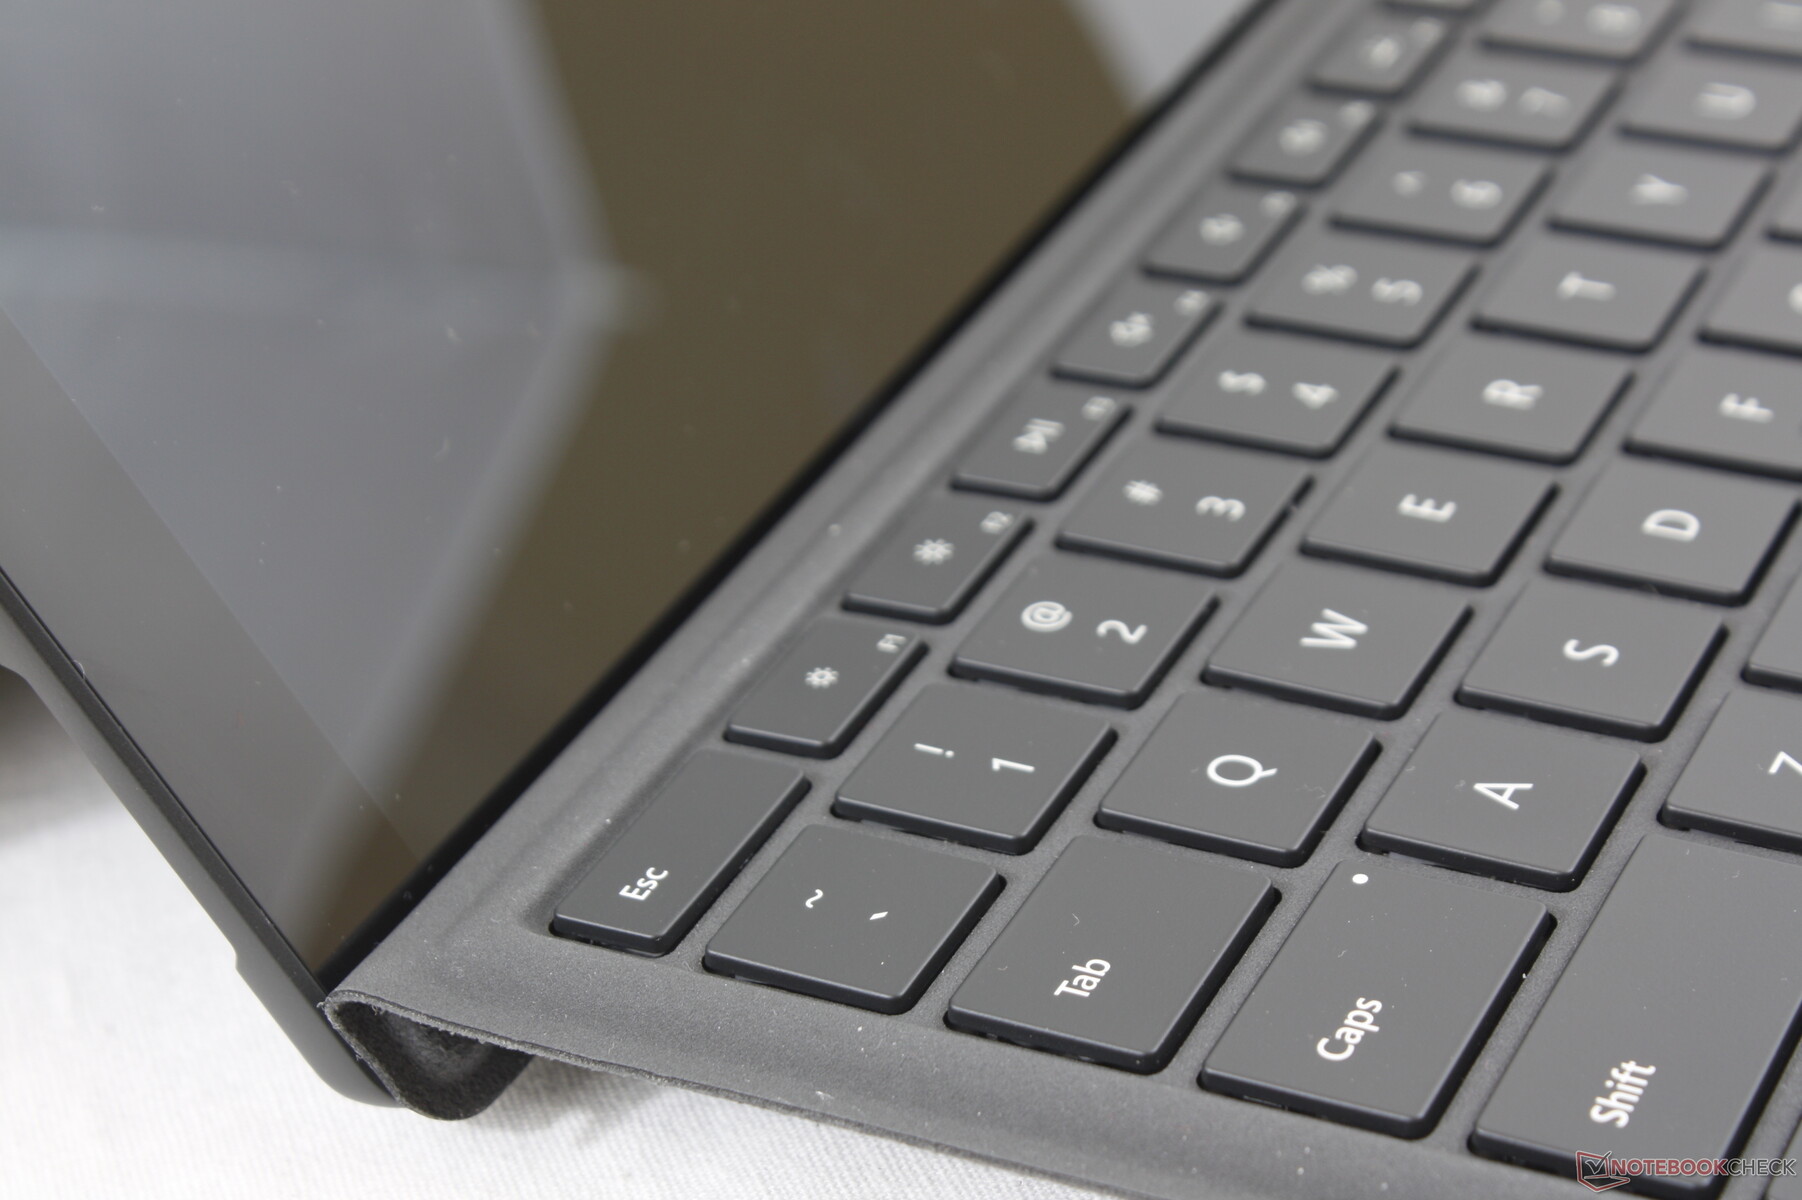
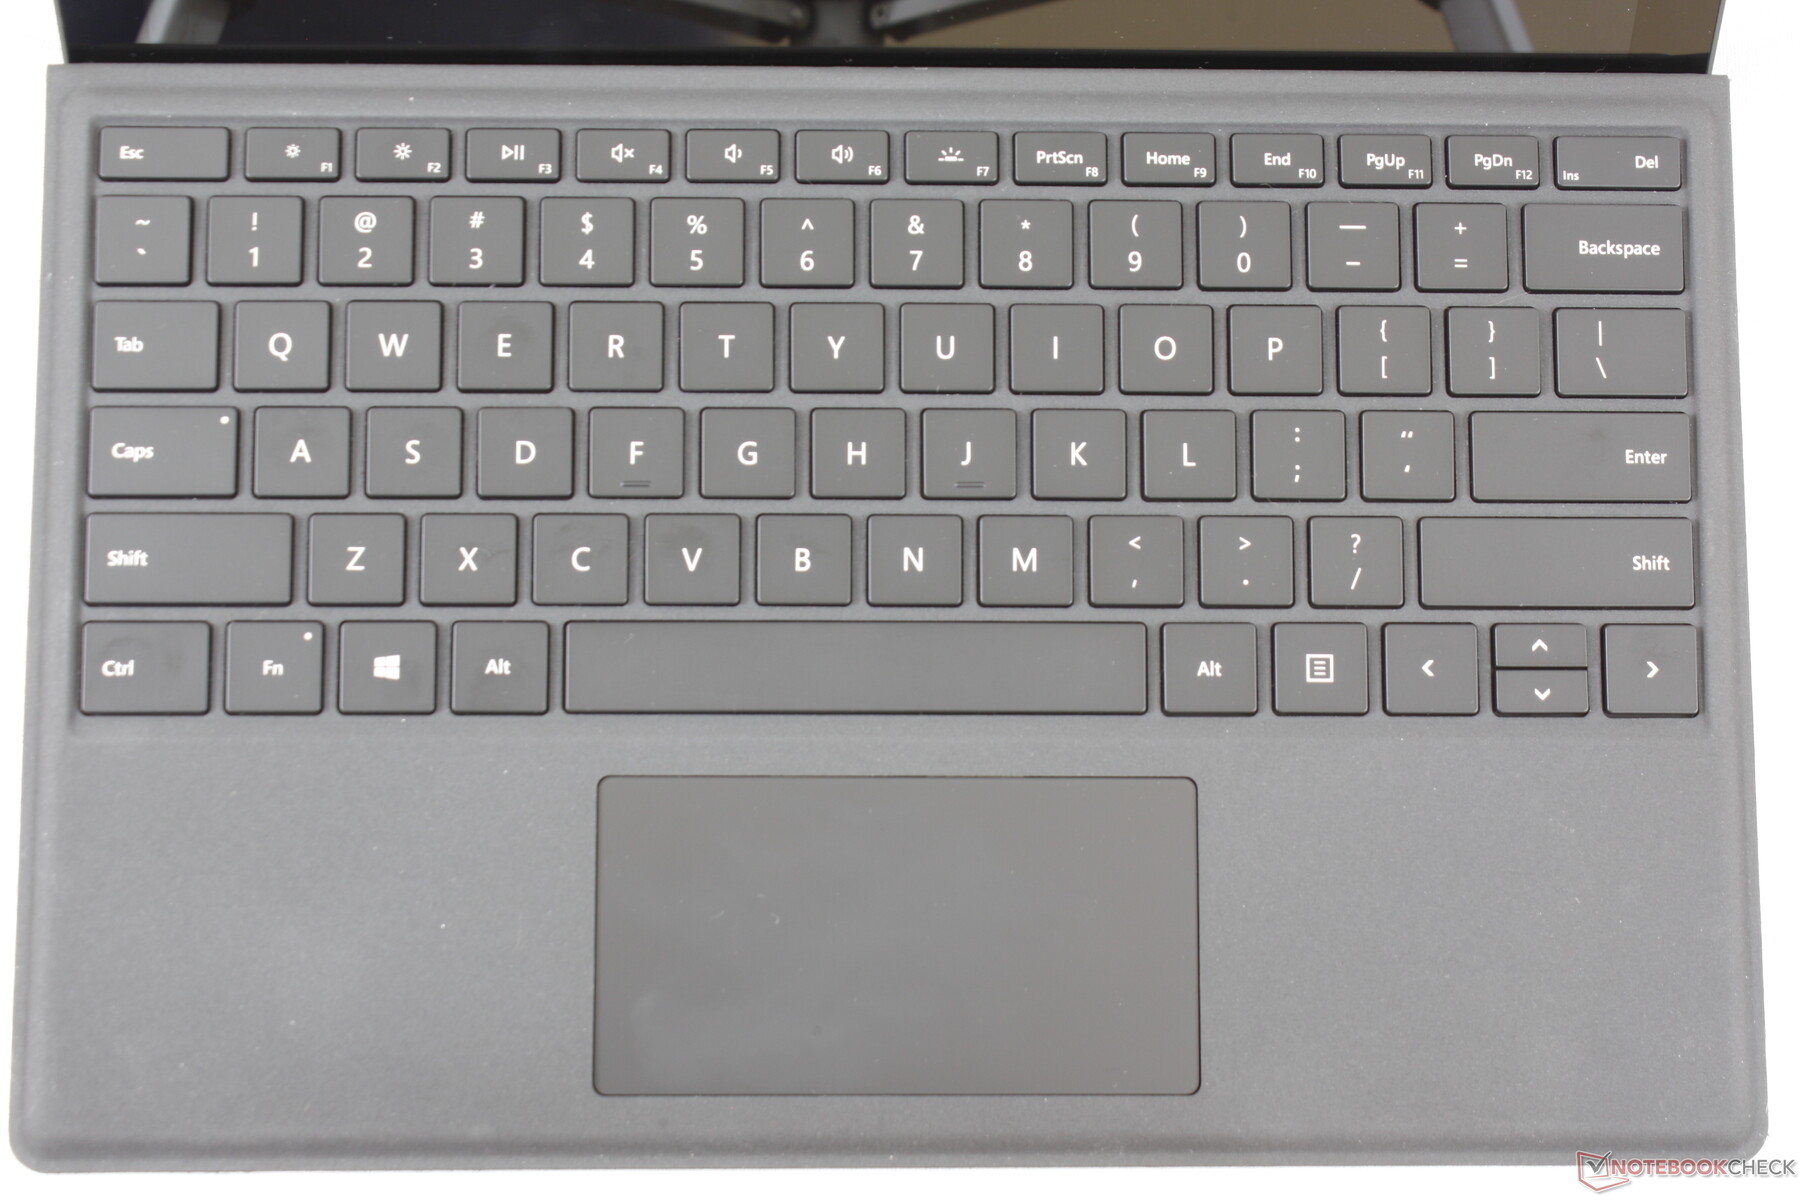
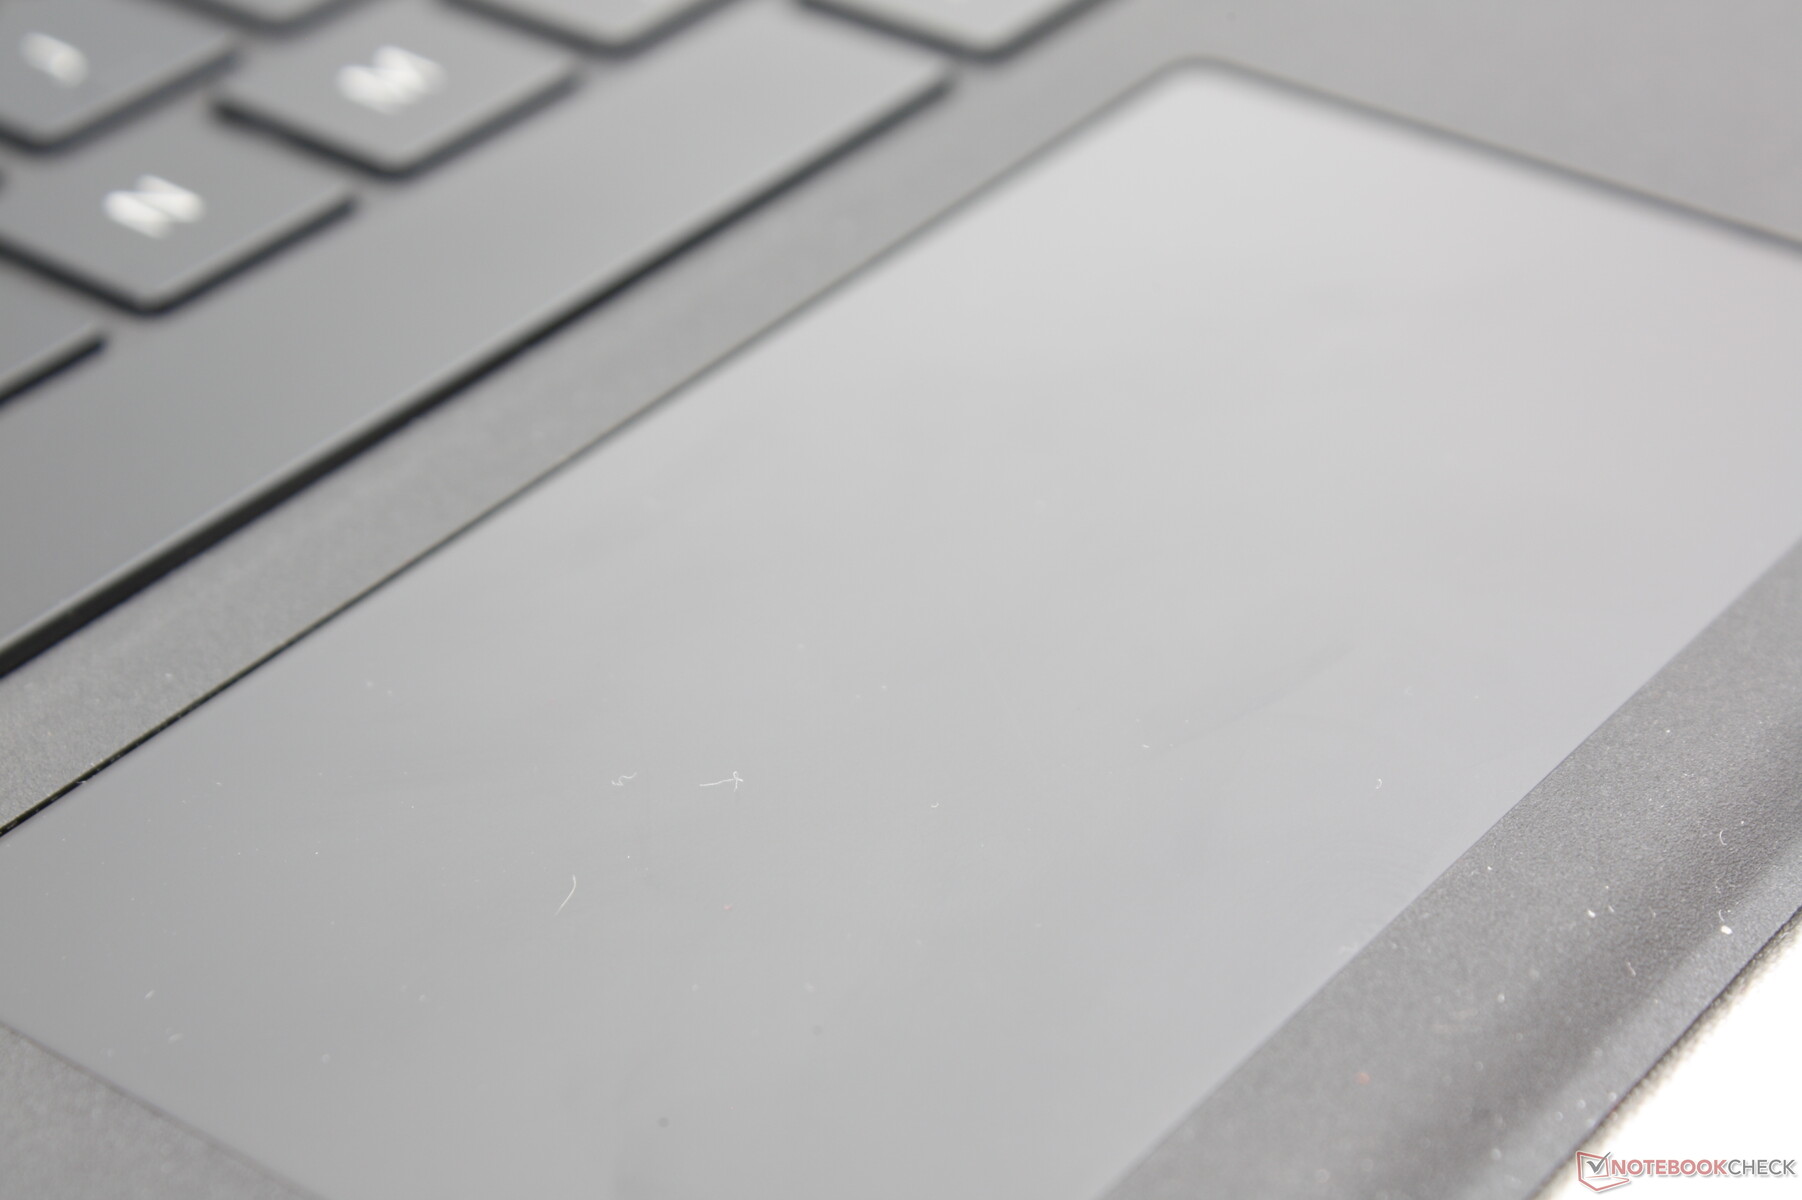
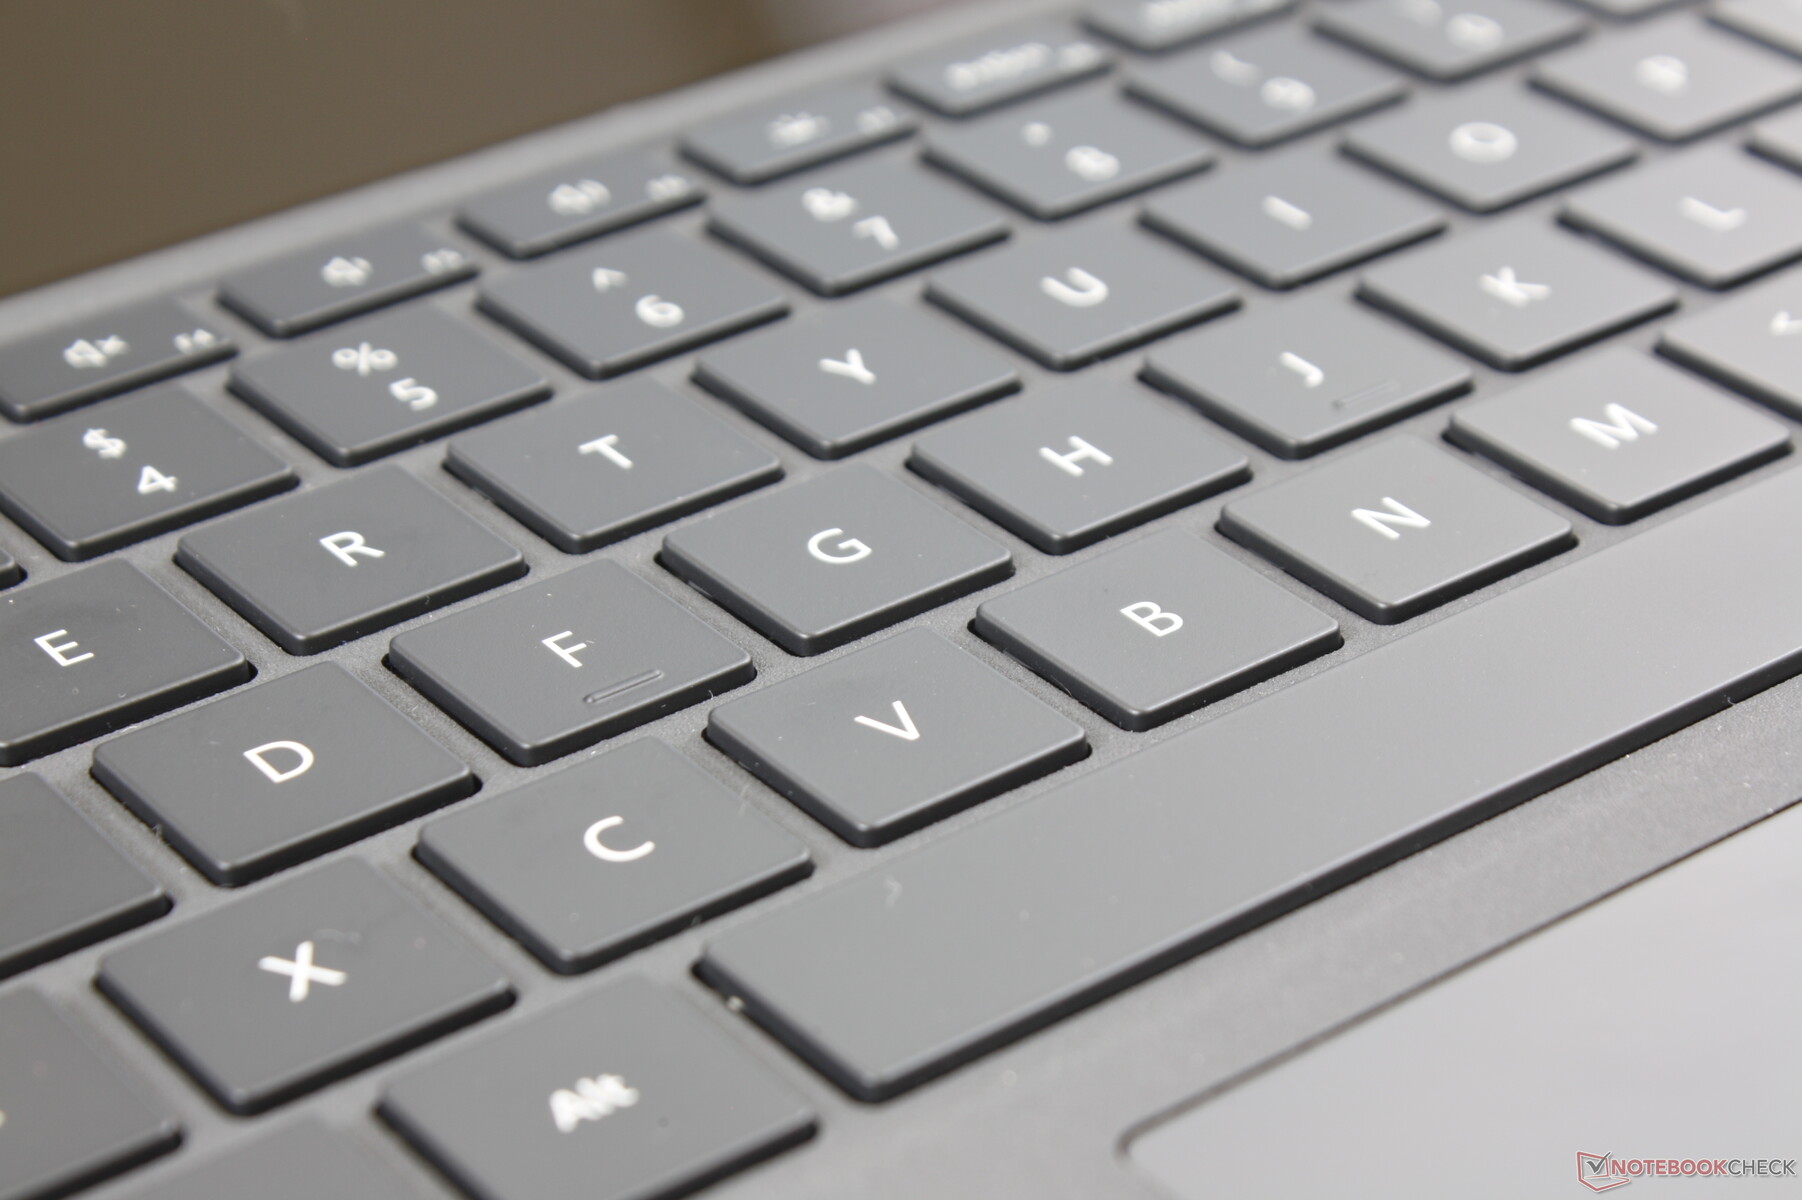
The detachable Type Cover keyboard and clickpad (~10.2 x 5.3 cm) are back with no changes from previous generation models aside from some new color options. Thus, our existing comments on the typing experience apply here. We find key feedback to be softer than on most Ultrabooks especially since the base flexes more easily whilst typing, but this is not uncommon on detachable keyboards. Like any new laptop, it'll take a few days to become accustomed to the feel of the keyboard keys and small clickpad.
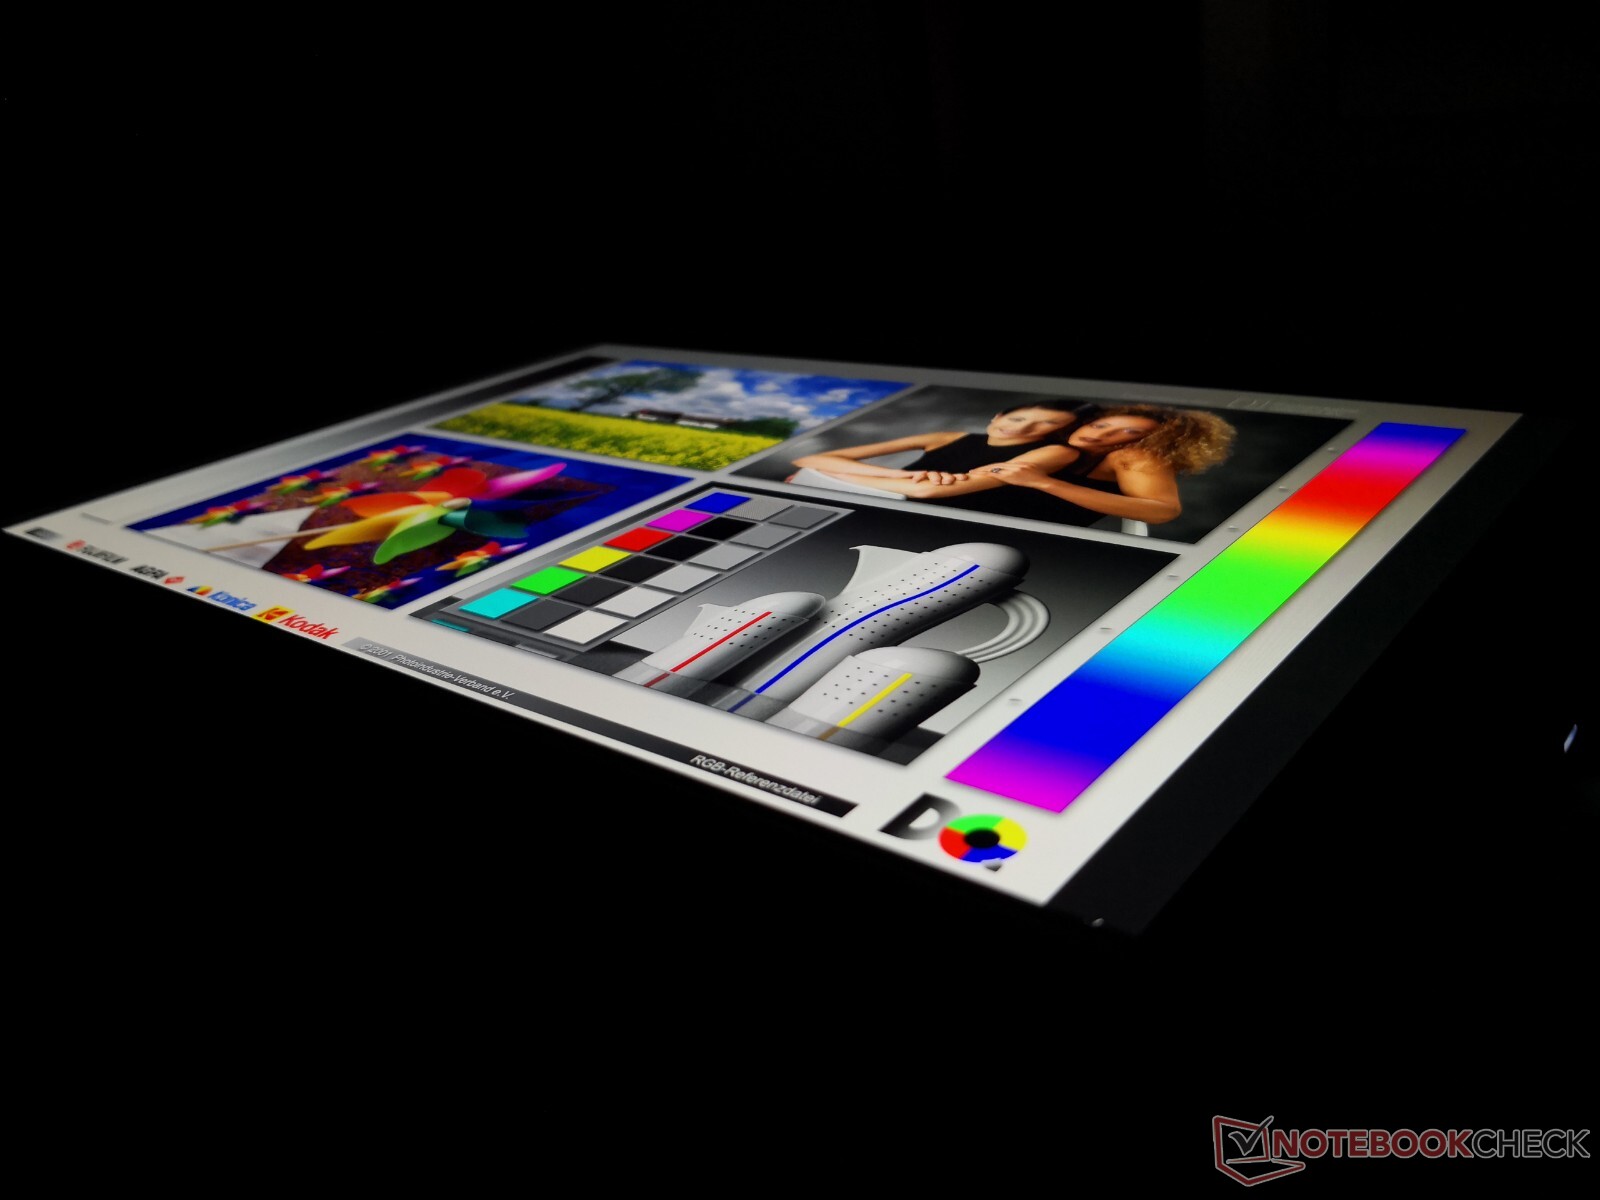
Display
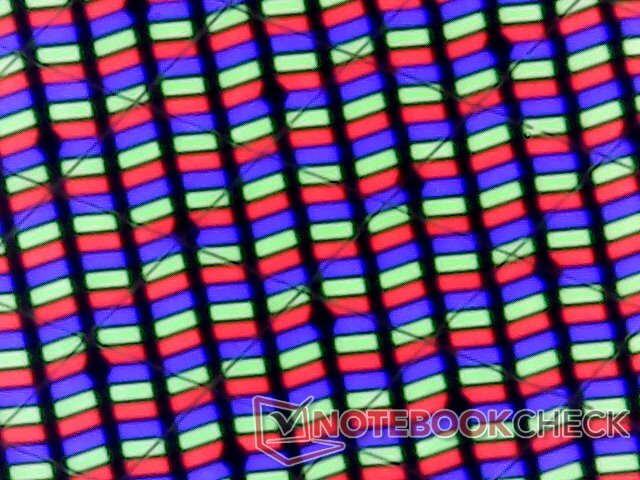
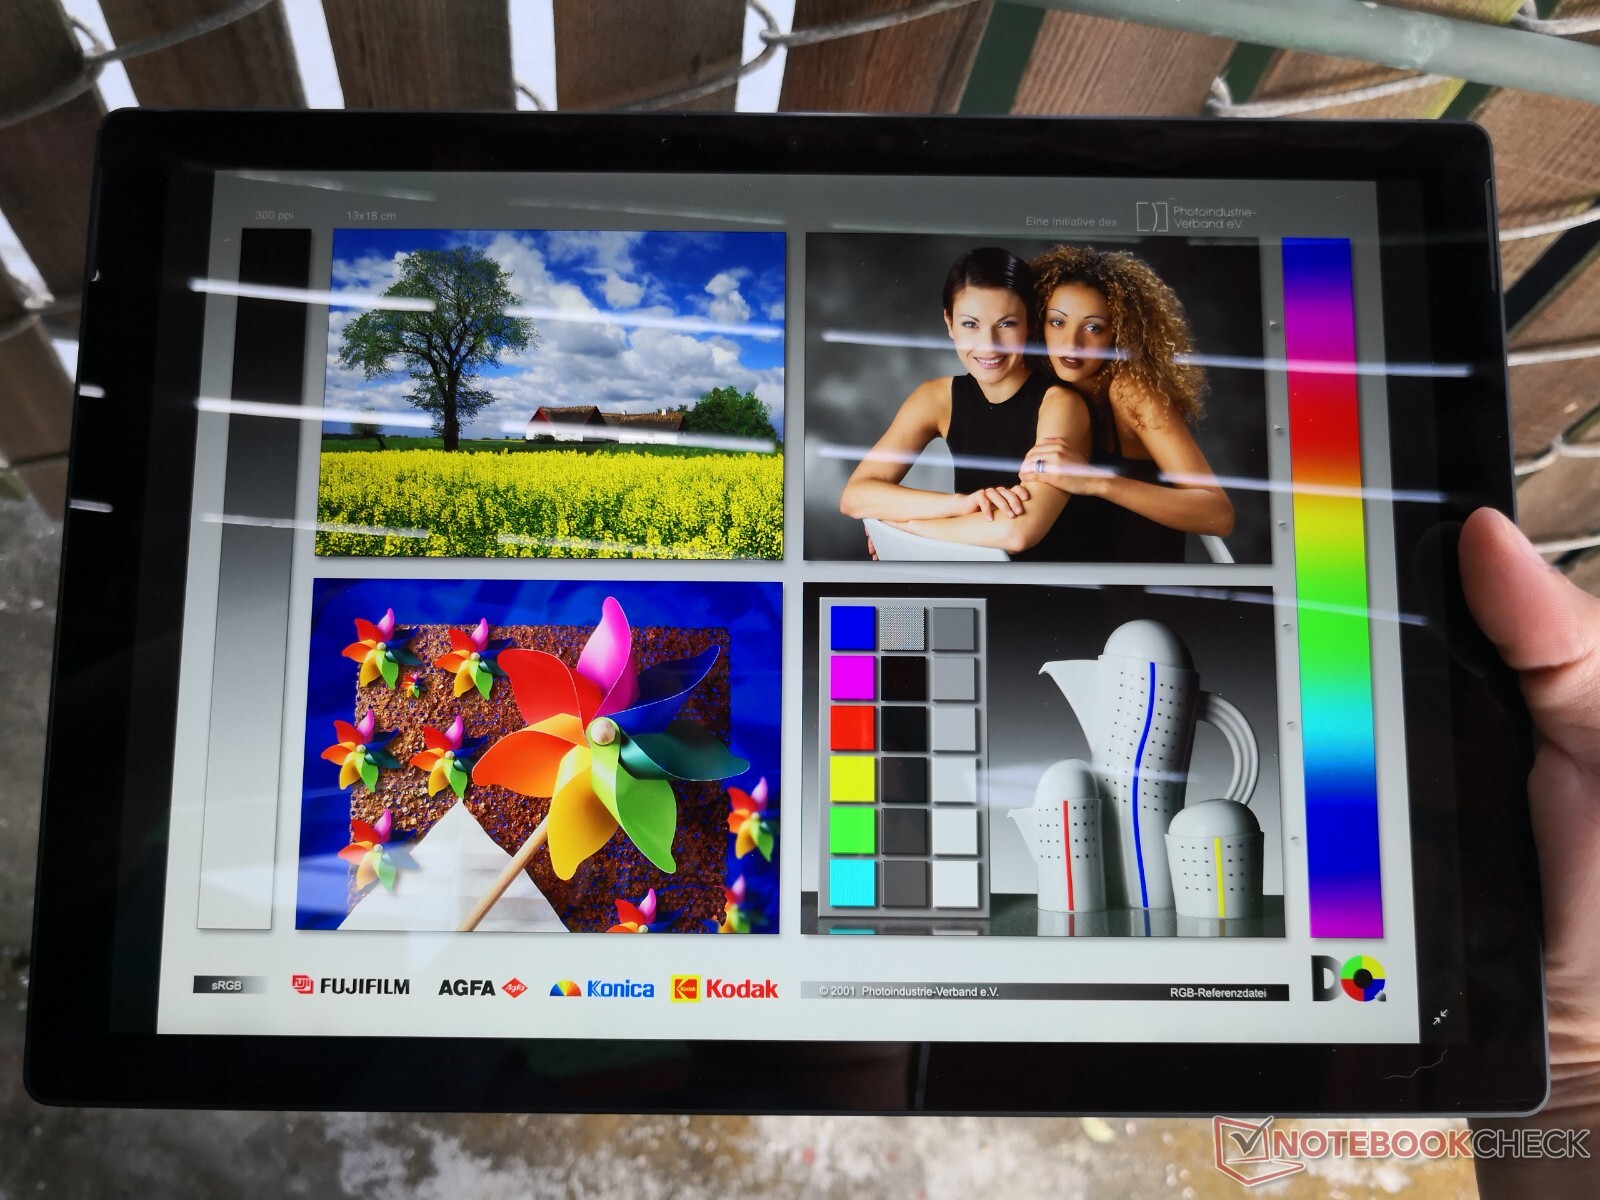
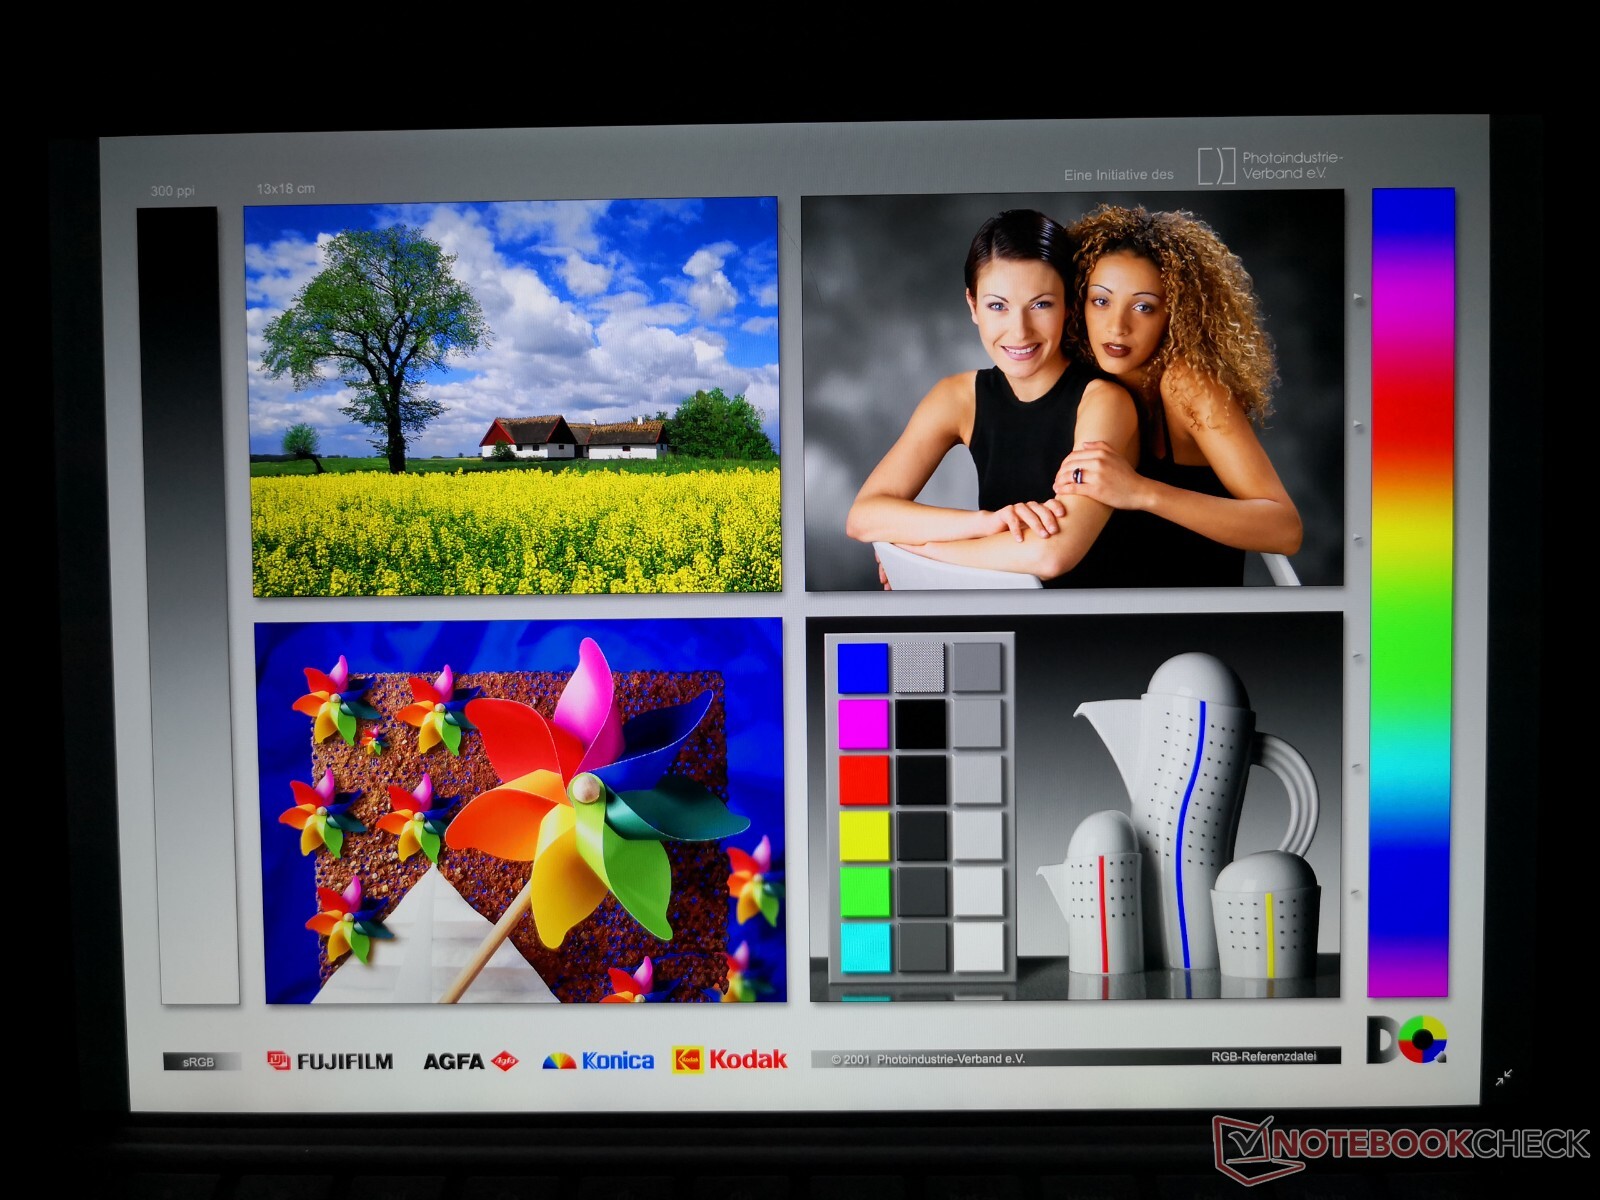
The Surface Pro 7 uses the exact same LG Philips LP123WQ112604 IPS panel as the Surface Pro 6 and Surface Pro 5. In other words, users are getting the same visual experience on Microsoft's latest Surface Pro as the two-year old Surface Pro 5. From a glass half full perspective, this is great to see because the Surface Pro already offers an excellent visual experience with its ~95 percent sRGB coverage, respectable contrast ratio, and relatively bright backlight. On the other hand, it's disappointing that Microsoft hasn't put any effort into making the display even better to one up competitors. Faster response times, faster refresh rates, and factory calibration options would have made the Surface Pro 7 a more lucrative carrot for existing Surface Pro owners.
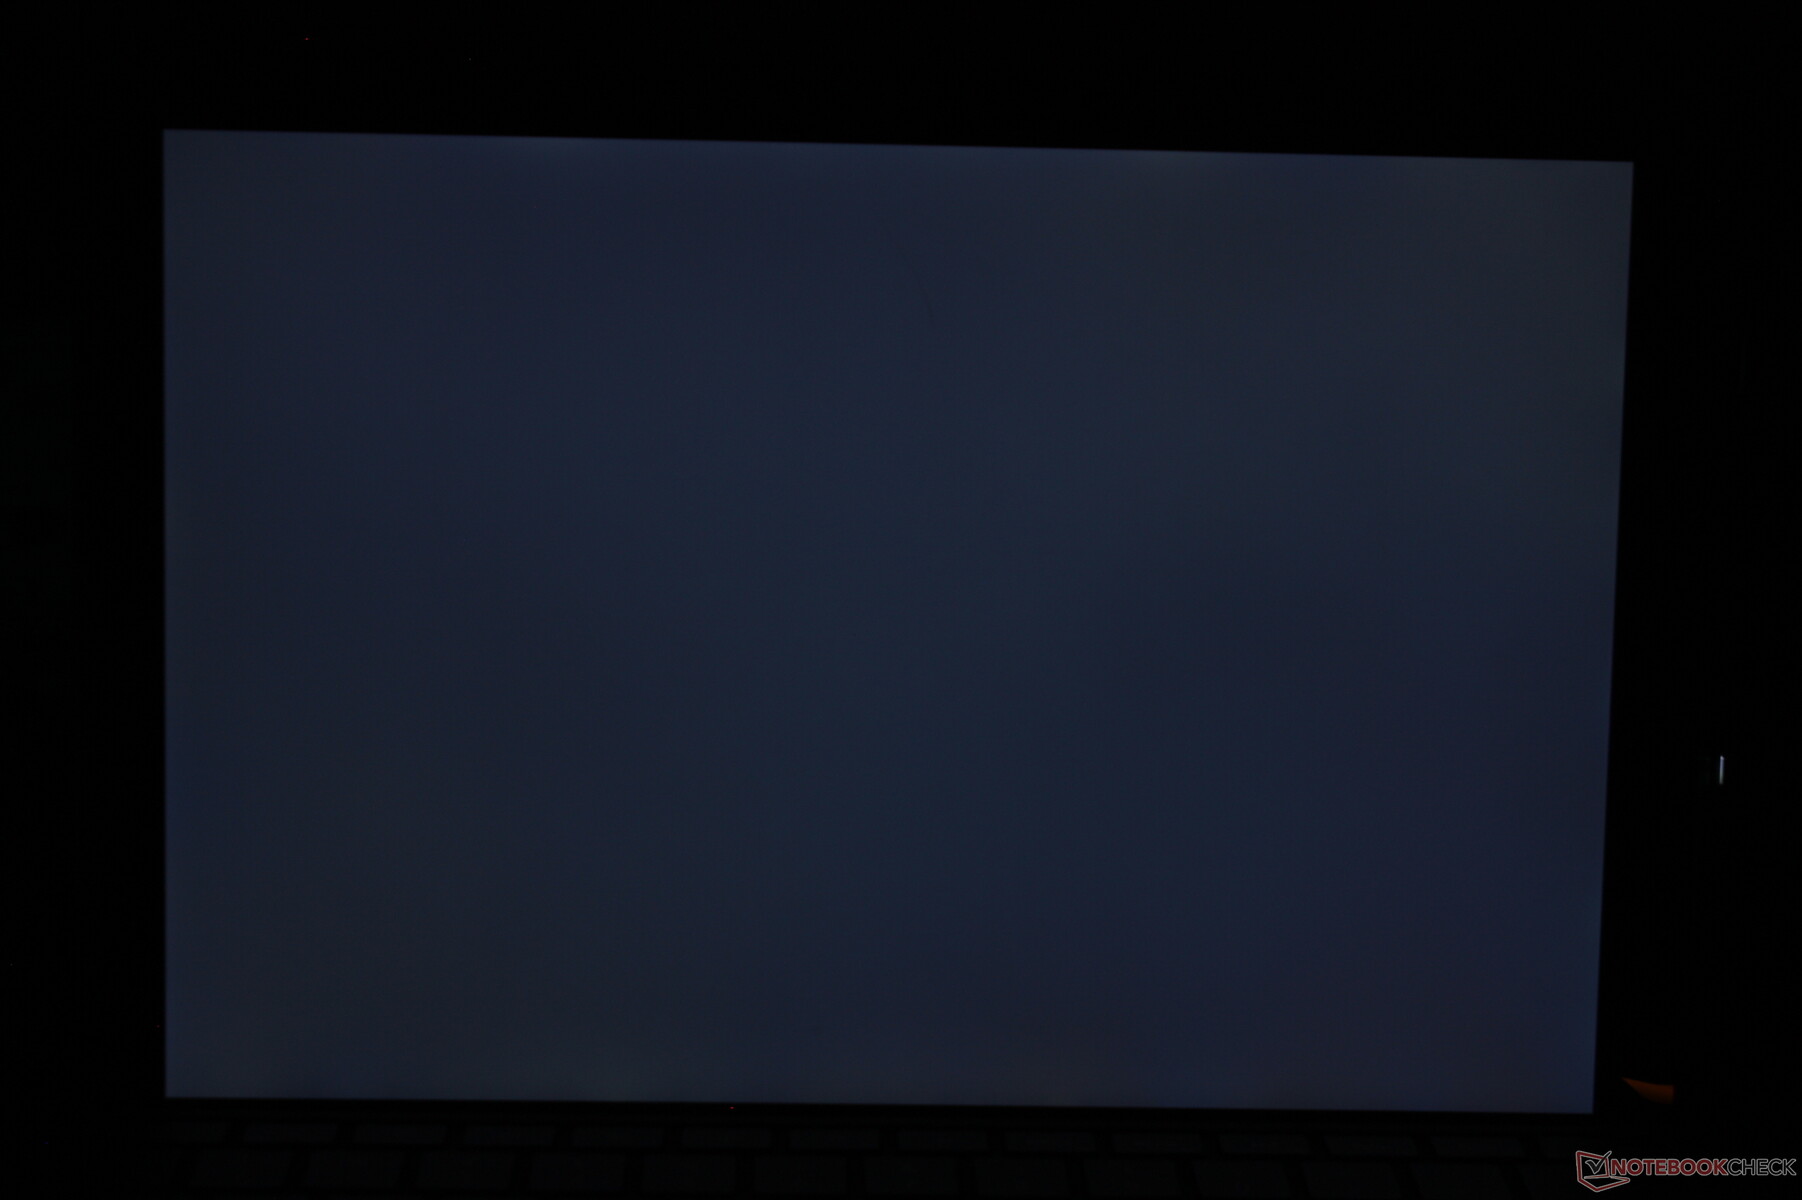
There is only minor uneven backlight bleeding on our test unit.
| |||||||||||||||||||||||||
Brightness Distribution: 91 %
Center on Battery: 480.4 cd/m²
Contrast: 1001:1 (Black: 0.48 cd/m²)
ΔE ColorChecker Calman: 5 | ∀{0.5-29.43 Ø4.71}
calibrated: 2.44
ΔE Greyscale Calman: 5.9 | ∀{0.09-98 Ø4.96}
93.2% sRGB (Argyll 1.6.3 3D)
60.3% AdobeRGB 1998 (Argyll 1.6.3 3D)
66.9% AdobeRGB 1998 (Argyll 3D)
93.8% sRGB (Argyll 3D)
66% Display P3 (Argyll 3D)
Gamma: 2.38
CCT: 7805 K
| Microsoft Surface Pro 7 Core i5-1035G4 LG Philips LP123WQ112604, IPS, 12.3", 2736x1824 | Microsoft Surface Pro 6, Core i7, 512 GB LGPhilips LP123WQ112604, IPS, 12.3", 2736x1824 | Microsoft Surface Go MHN-00003 Sharp SHP14A6, IPS, 10", 1800x1200 | Microsoft Surface Pro (2017) i7 LG Display LP123WQ112604, IPS, 12.3", 2736x1824 | Microsoft Surface Pro 4 Core i7 Samsung 123YL01-001 ID: SDC3853, IPS, 12.3", 2736x1824 | Microsoft Surface Pro 3 SEC3542, IPS, 12", 2160x1440 | |
|---|---|---|---|---|---|---|
| Display | 2% | 2% | 2% | 3% | -4% | |
| Display P3 Coverage (%) | 66 | 67.1 2% | 66.5 1% | 66.6 1% | 66.9 1% | 63.6 -4% |
| sRGB Coverage (%) | 93.8 | 95.5 2% | 97.5 4% | 96.5 3% | 97.5 4% | 88.8 -5% |
| AdobeRGB 1998 Coverage (%) | 66.9 | 67.9 1% | 67.5 1% | 67.8 1% | 68.6 3% | 65.6 -2% |
| Response Times | -10% | -12% | -1% | -37% | ||
| Response Time Grey 50% / Grey 80% * (ms) | 34.8 ? | 43 ? -24% | 44 ? -26% | 37 ? -6% | 48.4 ? -39% | |
| Response Time Black / White * (ms) | 26.4 ? | 25 ? 5% | 25.6 ? 3% | 25 ? 5% | 35.6 ? -35% | |
| PWM Frequency (Hz) | 21550 ? | 22000 ? | 1020 ? | 22130 ? | 10420 | |
| Screen | 17% | 30% | 7% | 21% | -3% | |
| Brightness middle (cd/m²) | 480.4 | 484 1% | 456 -5% | 482 0% | 436.7 -9% | 355.3 -26% |
| Brightness (cd/m²) | 485 | 473 -2% | 426 -12% | 466 -4% | 433 -11% | 338 -30% |
| Brightness Distribution (%) | 91 | 91 0% | 88 -3% | 92 1% | 87 -4% | 91 0% |
| Black Level * (cd/m²) | 0.48 | 0.33 31% | 0.31 35% | 0.395 18% | 0.326 32% | 0.33 31% |
| Contrast (:1) | 1001 | 1467 47% | 1471 47% | 1220 22% | 1340 34% | 1077 8% |
| Colorchecker dE 2000 * | 5 | 4.29 14% | 1.3 74% | 4 20% | 1.82 64% | 4.72 6% |
| Colorchecker dE 2000 max. * | 7.72 | 6.46 16% | 3 61% | 7.2 7% | ||
| Colorchecker dE 2000 calibrated * | 2.44 | 1.34 45% | 1.1 55% | |||
| Greyscale dE 2000 * | 5.9 | 4.3 27% | 1.4 76% | 5.7 3% | 1.44 76% | 6.53 -11% |
| Gamma | 2.38 92% | 2.51 88% | 2.24 98% | 2.28 96% | 2.1 105% | 2.17 101% |
| CCT | 7805 83% | 7315 89% | 6687 97% | 7950 82% | 6560 99% | 6707 97% |
| Color Space (Percent of AdobeRGB 1998) (%) | 60.3 | 62 3% | 62.3 3% | 62 3% | 62.3 3% | 59.37 -2% |
| Color Space (Percent of sRGB) (%) | 93.2 | 95 2% | 96.8 4% | 96 3% | 97.5 5% | |
| Total Average (Program / Settings) | 3% /
11% | 7% /
20% | 3% /
5% | -4% /
9% | -4% /
-3% |
* ... smaller is better
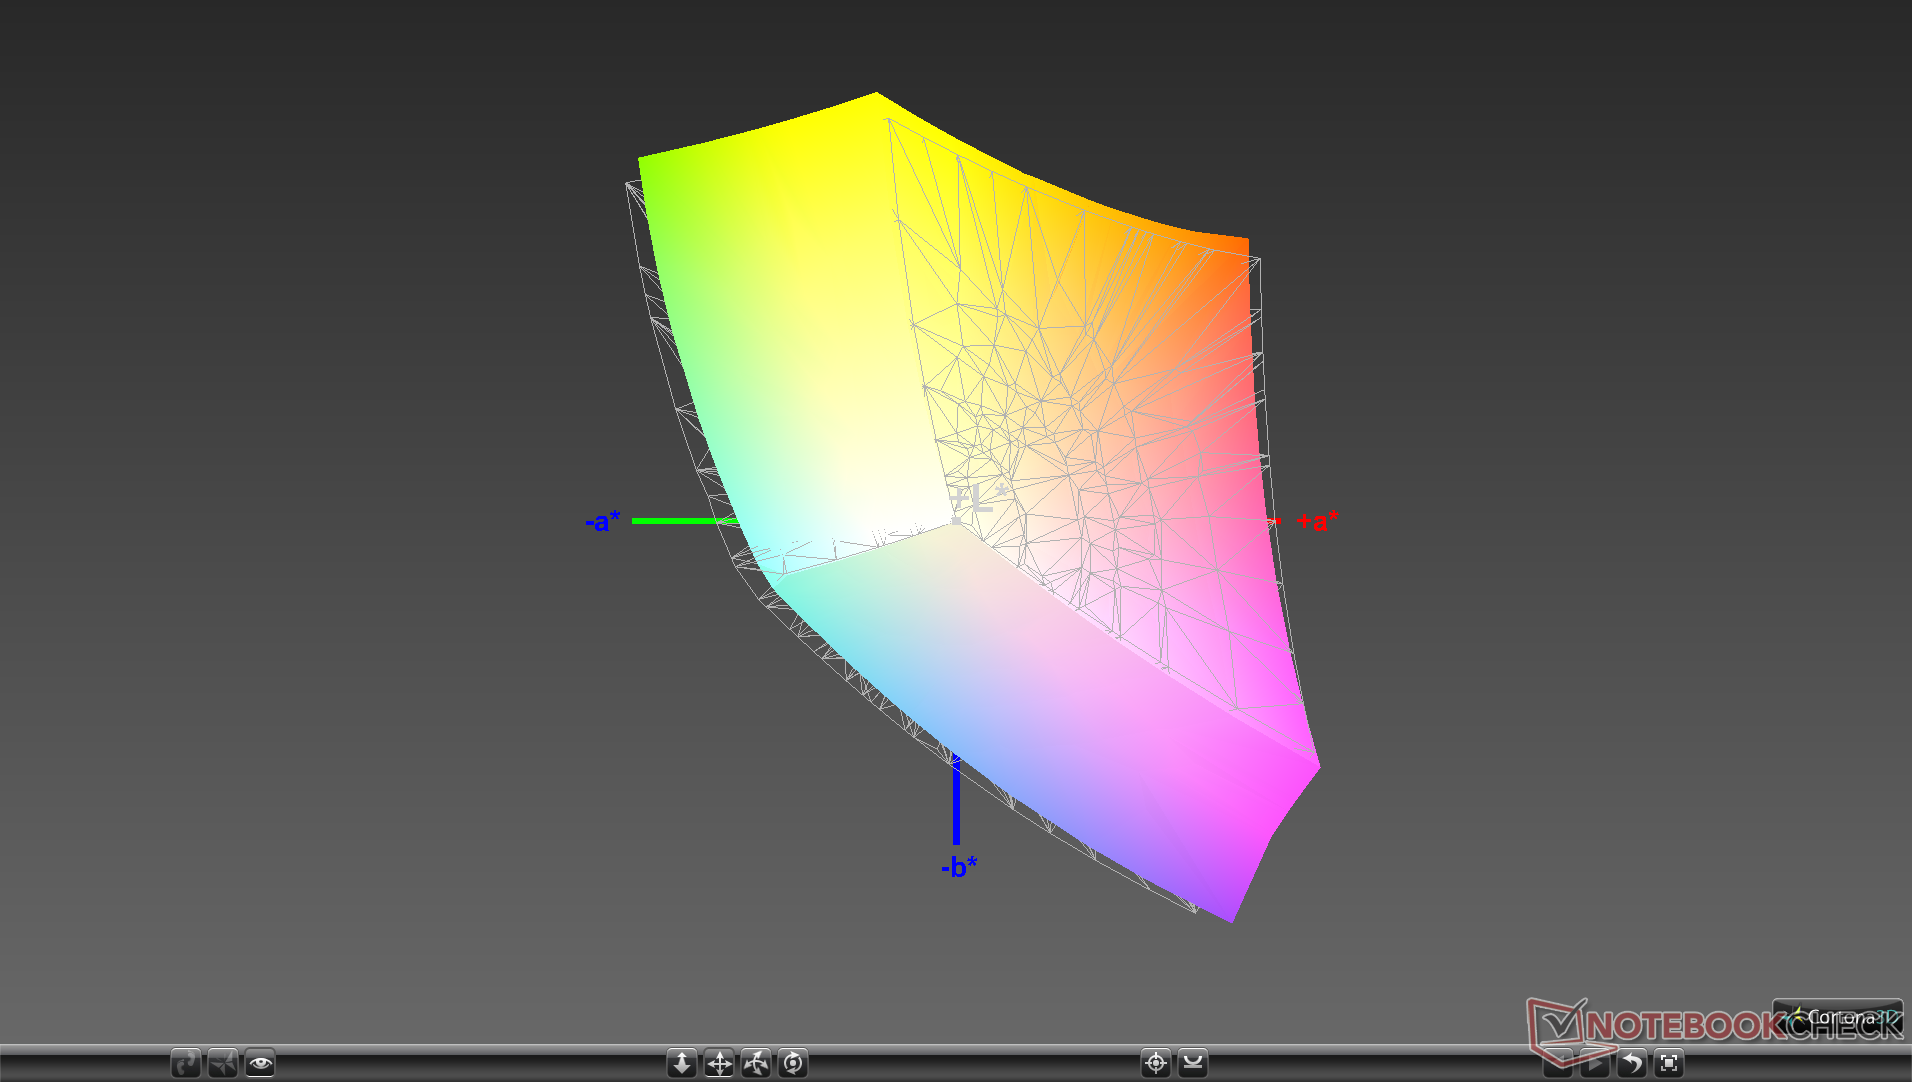
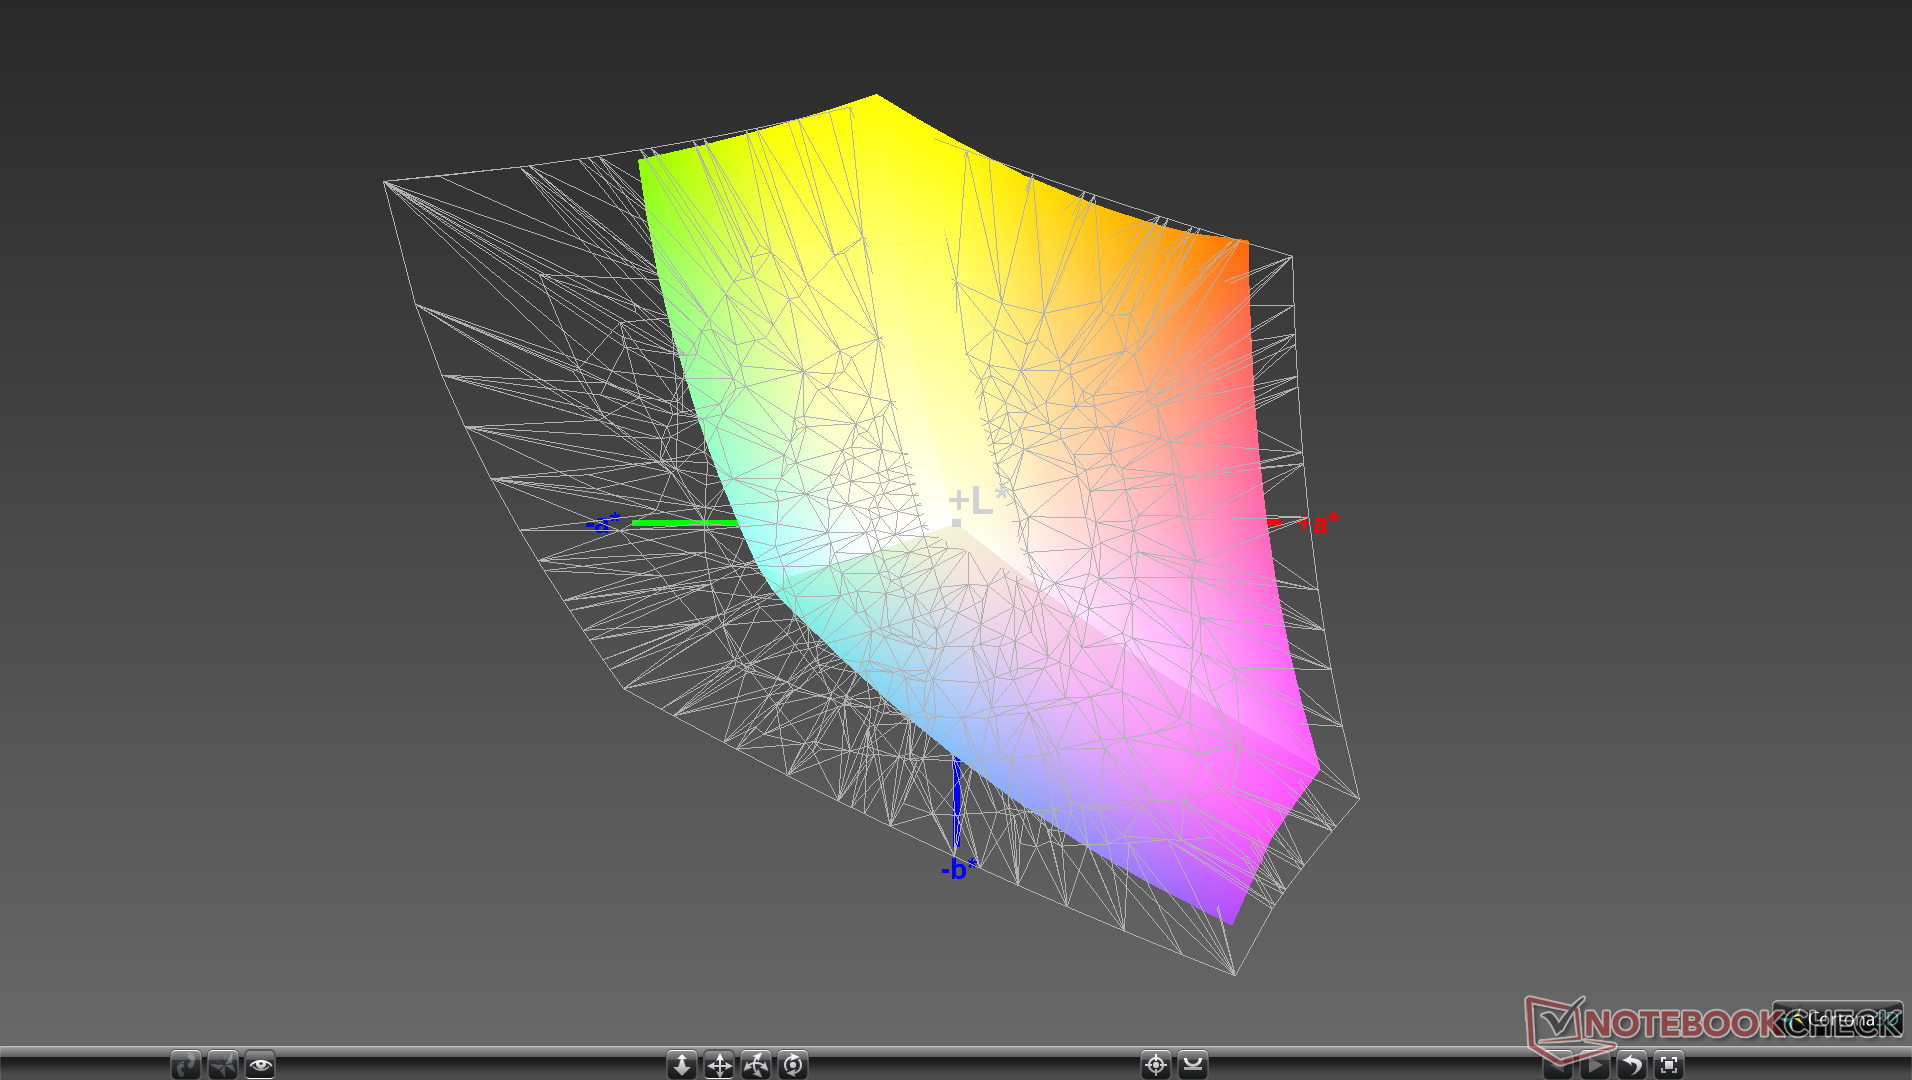
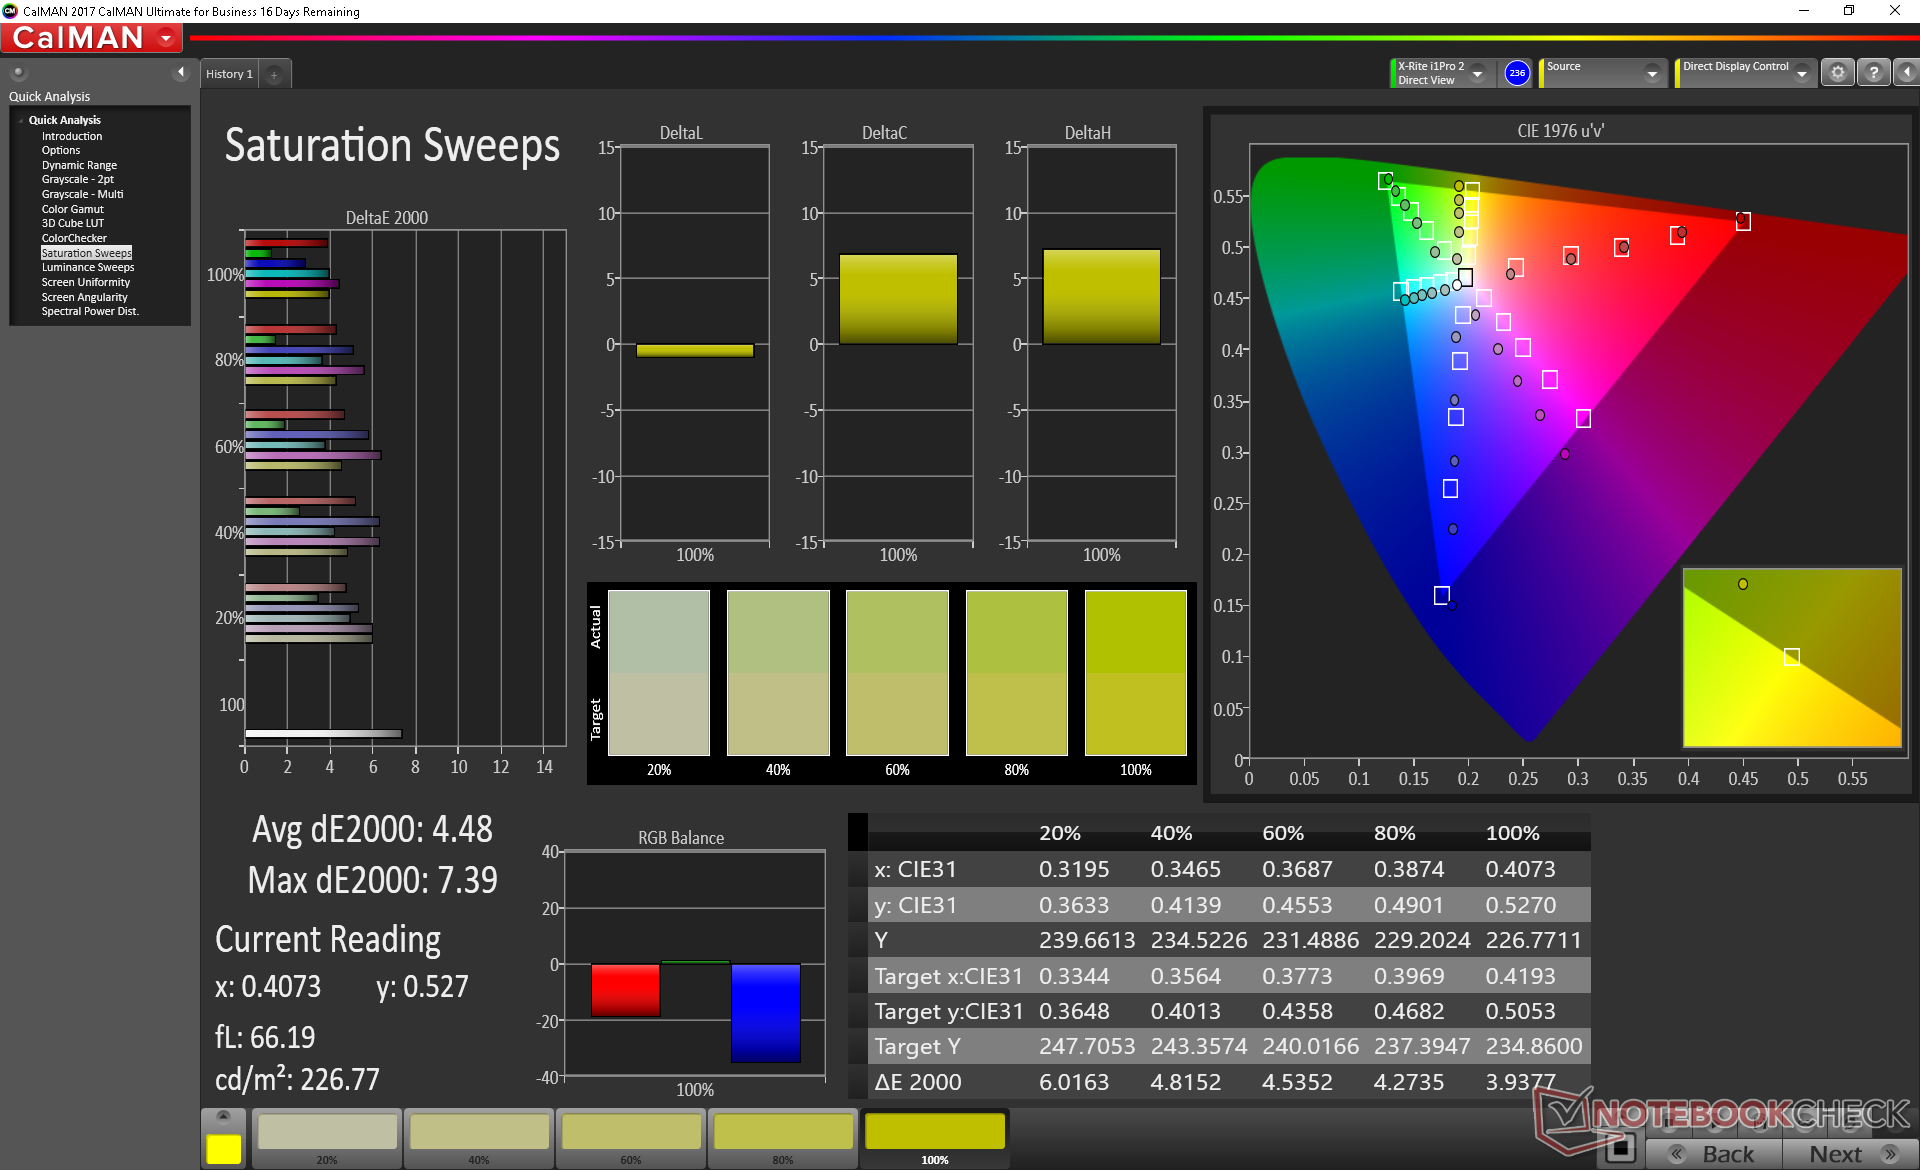
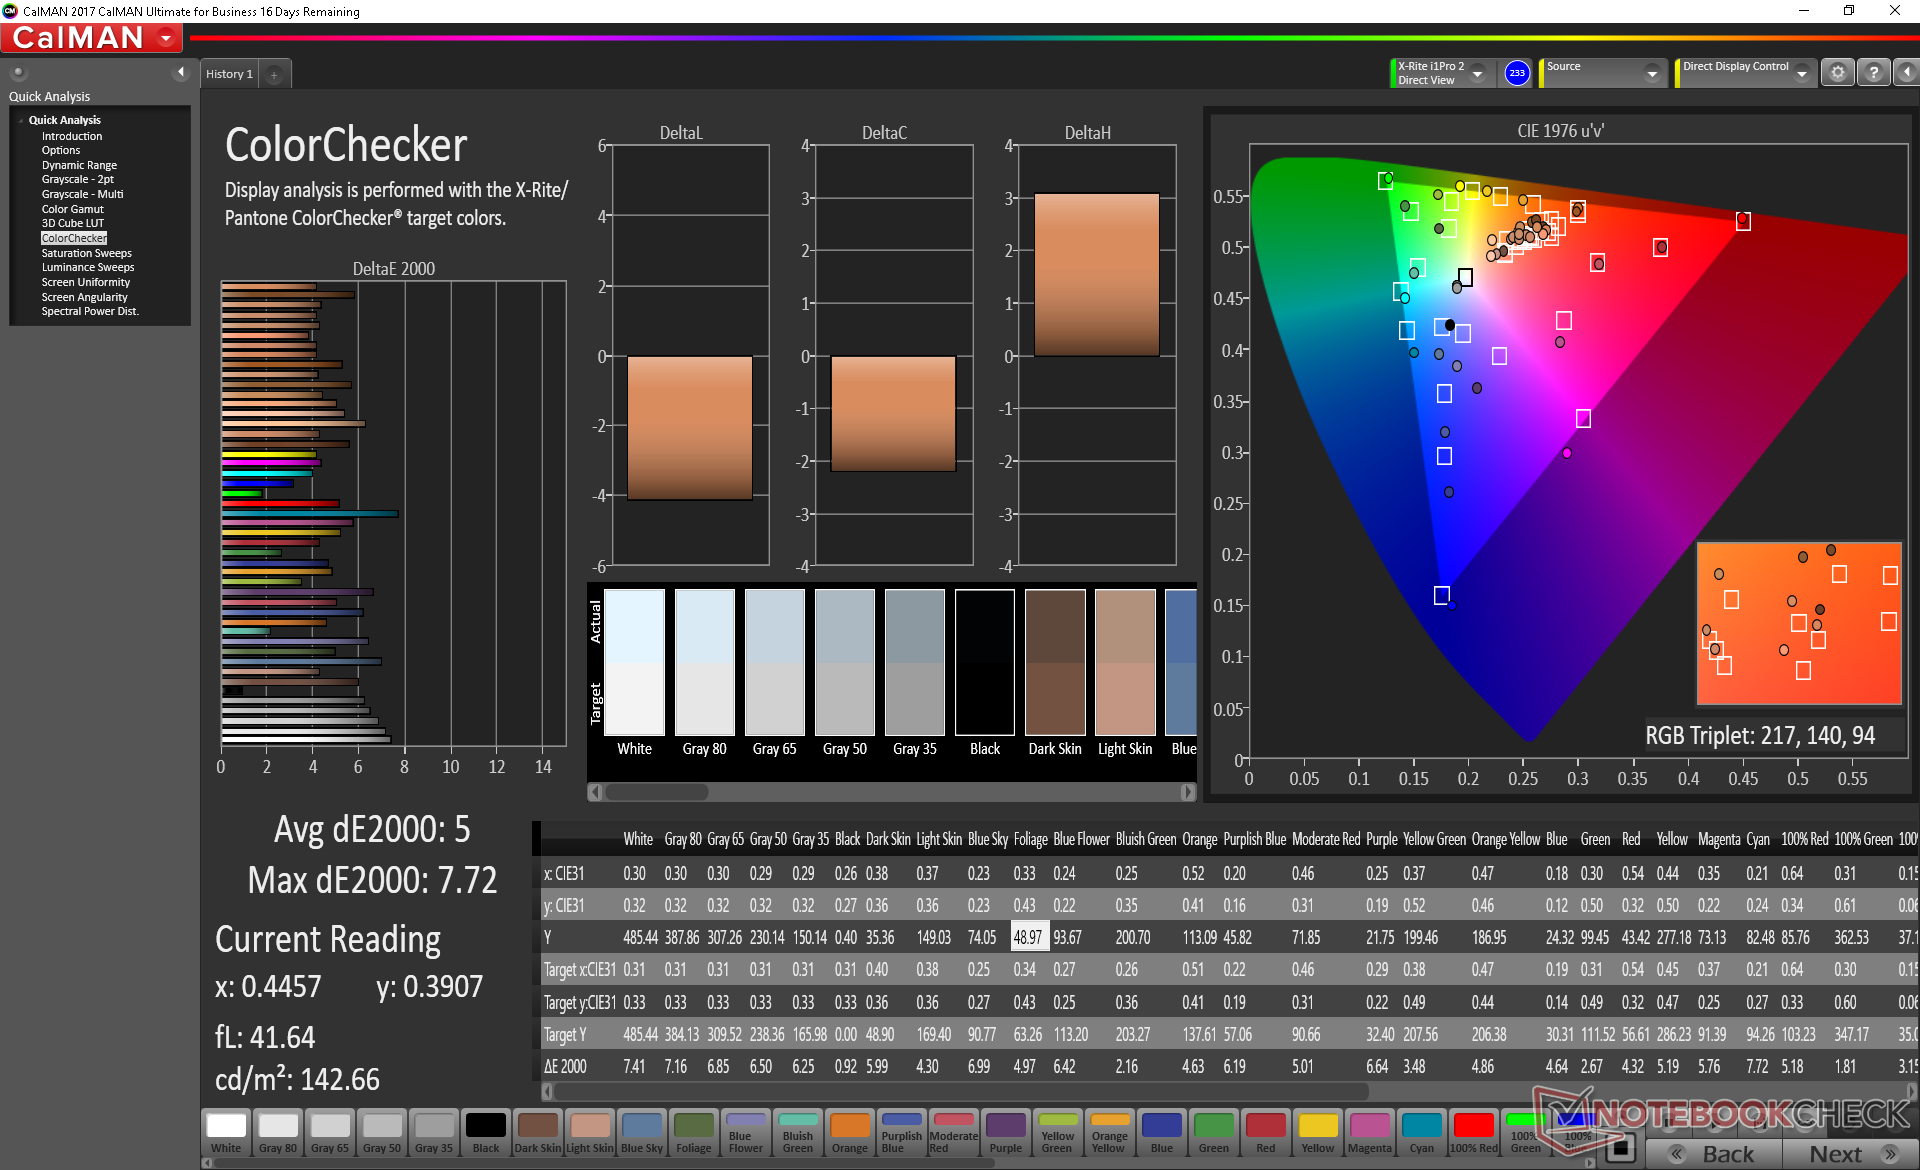
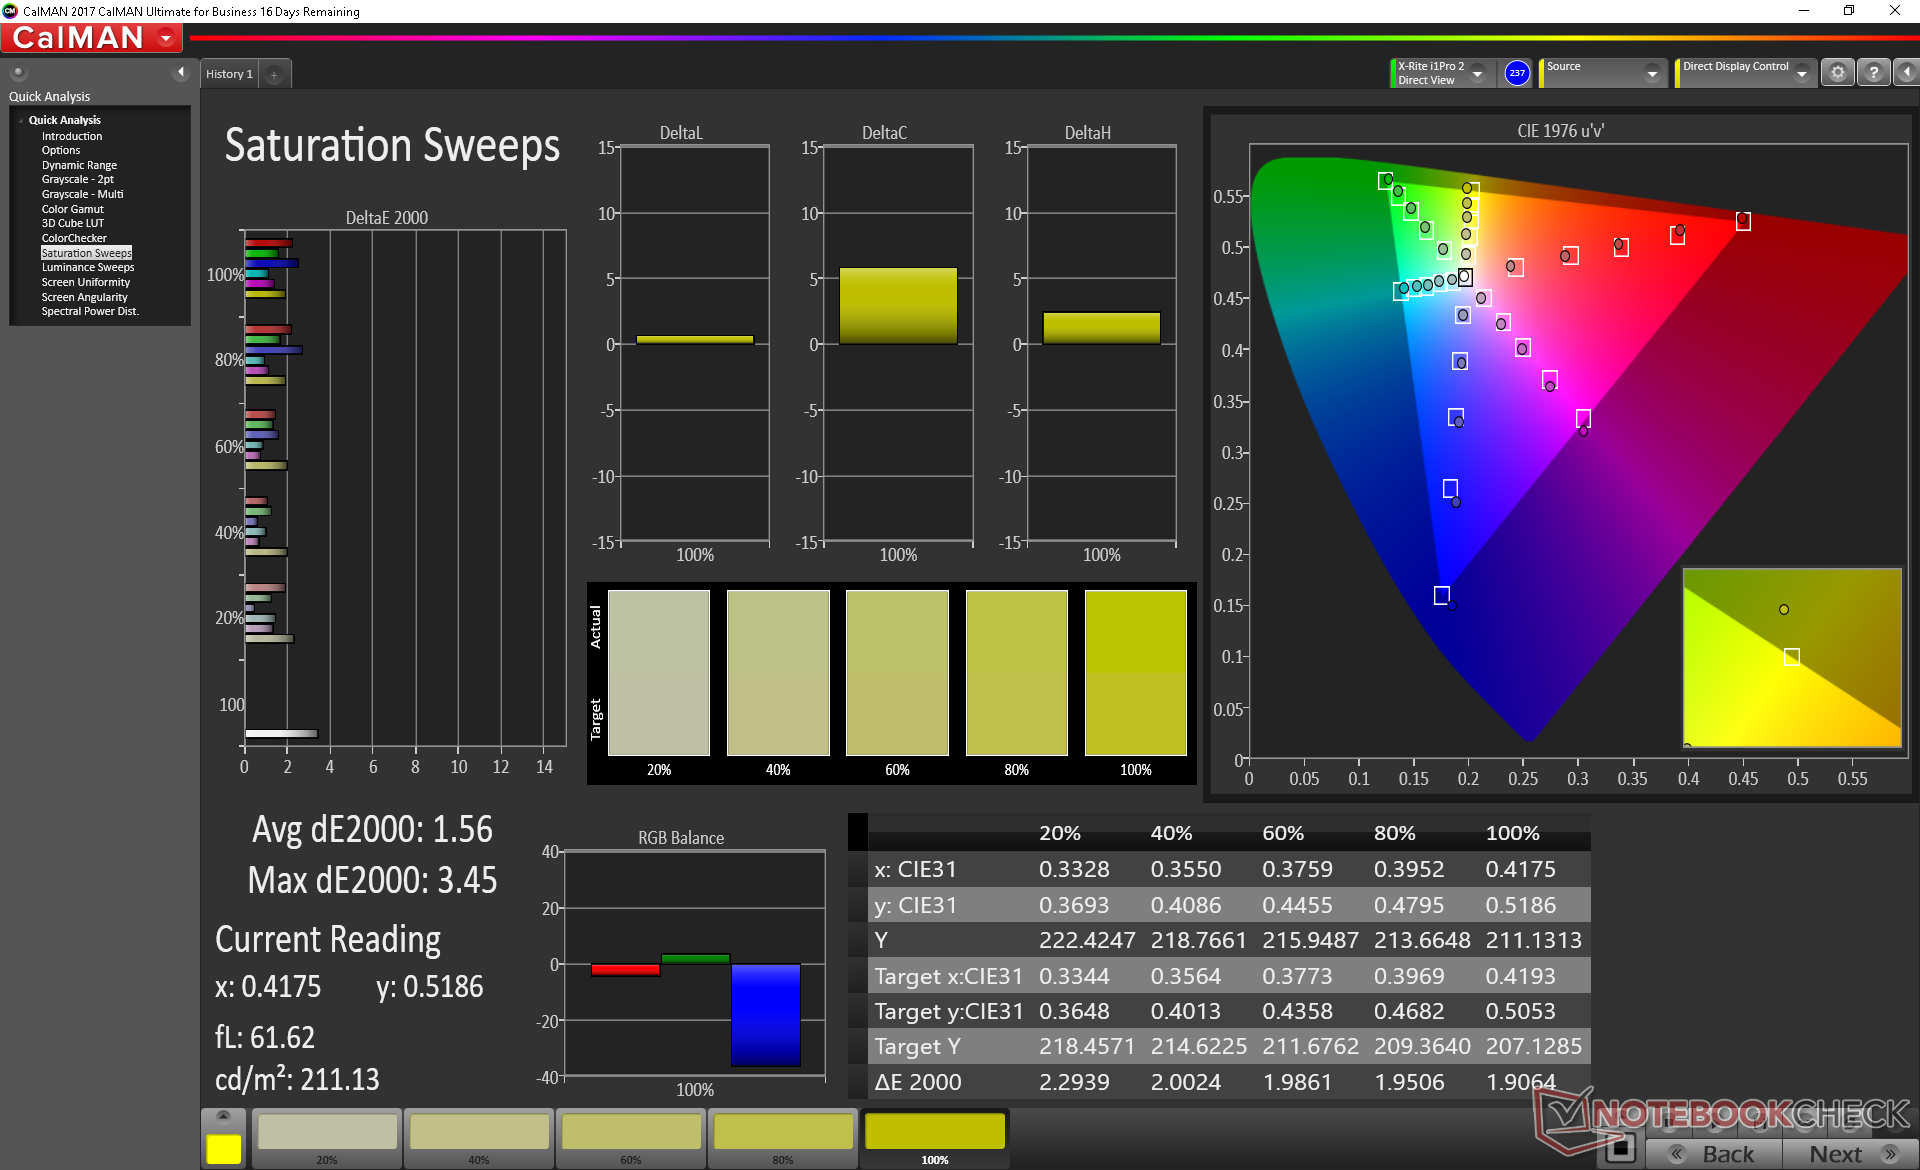
Color space covers approximately 93 percent and 60 percent of the sRGB and AdobeRGB standards, respectively. Users looking for full AdobeRGB coverage will have to consider Ultrabooks from other manufacturers like the XPS 13, Blade Stealth, or Gigabyte Aero series. Even the latest Surface Laptop 3 offers about the same color coverage as the Surface Pro 7.
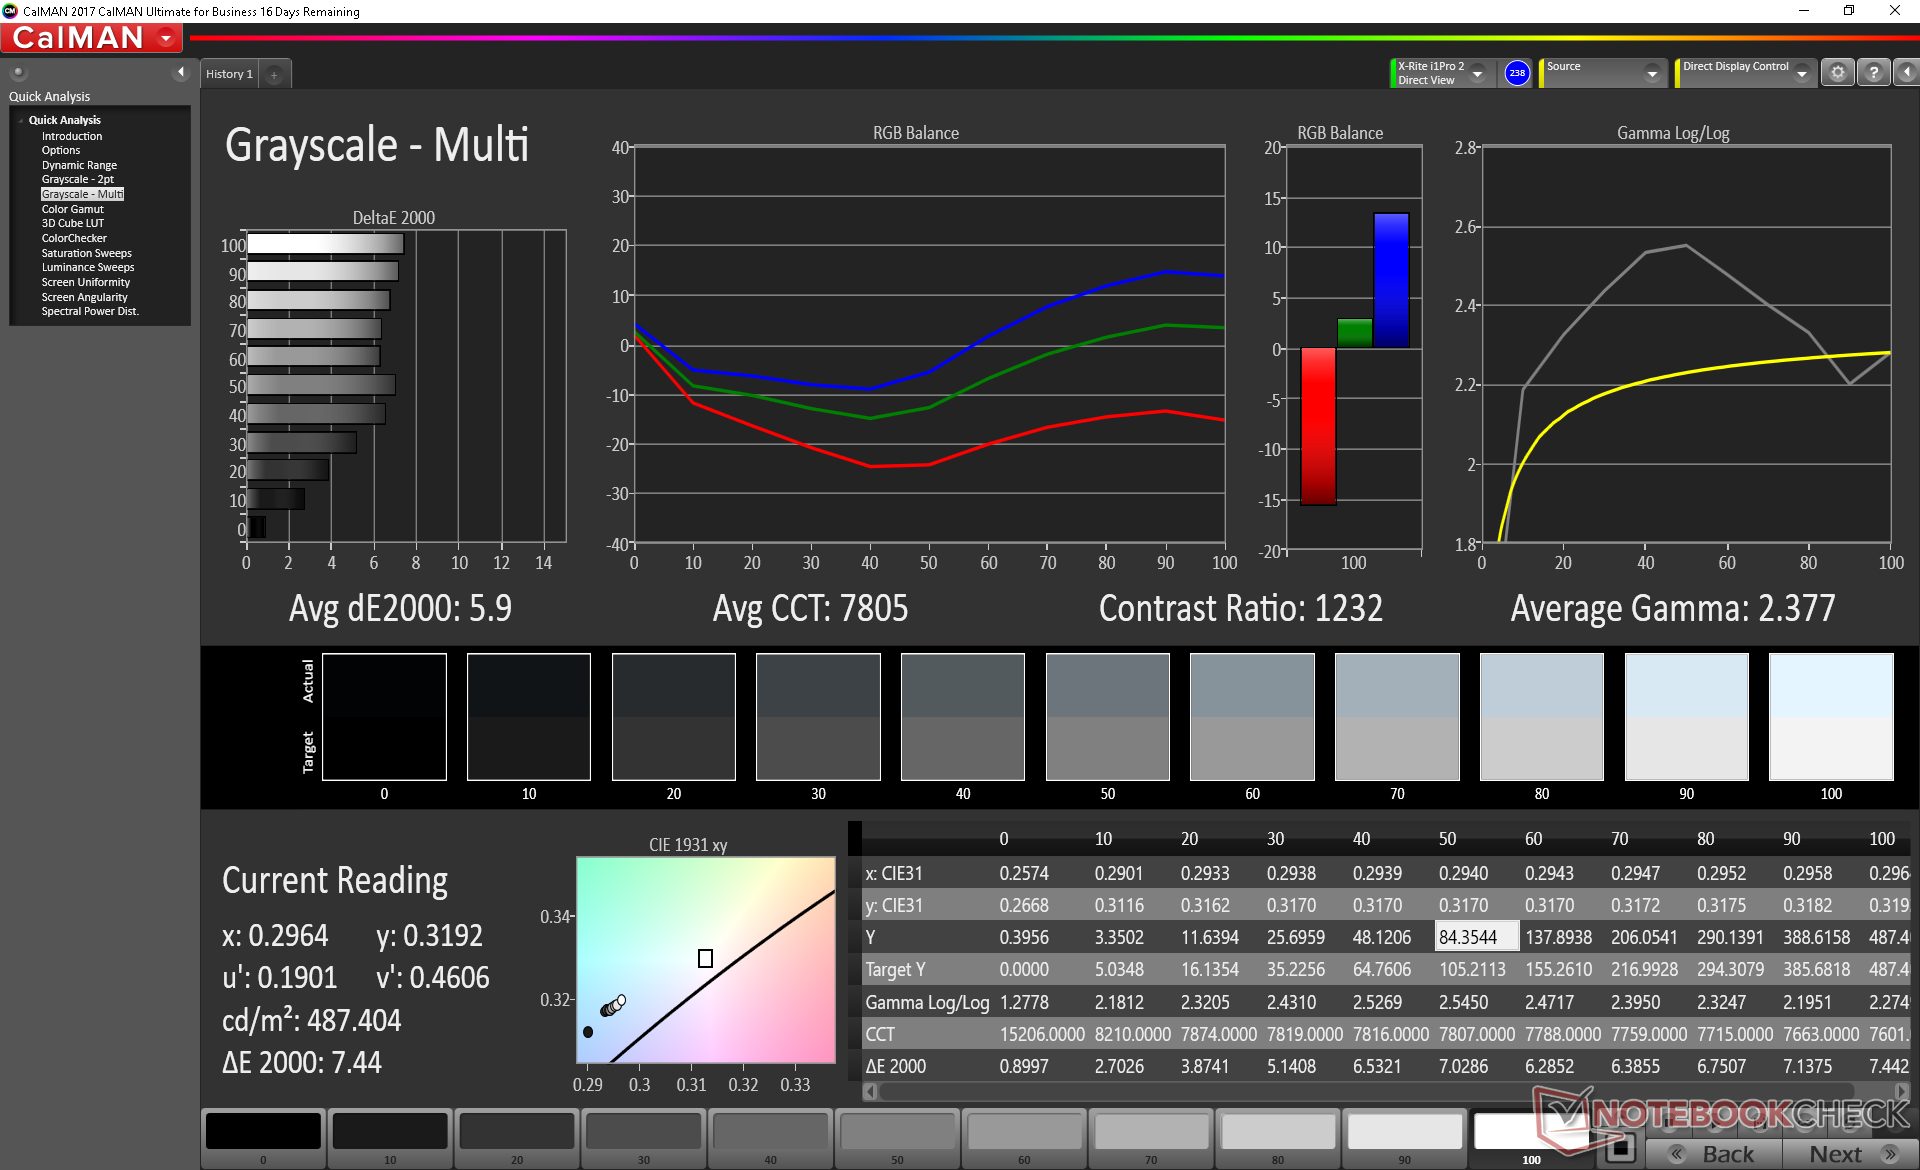
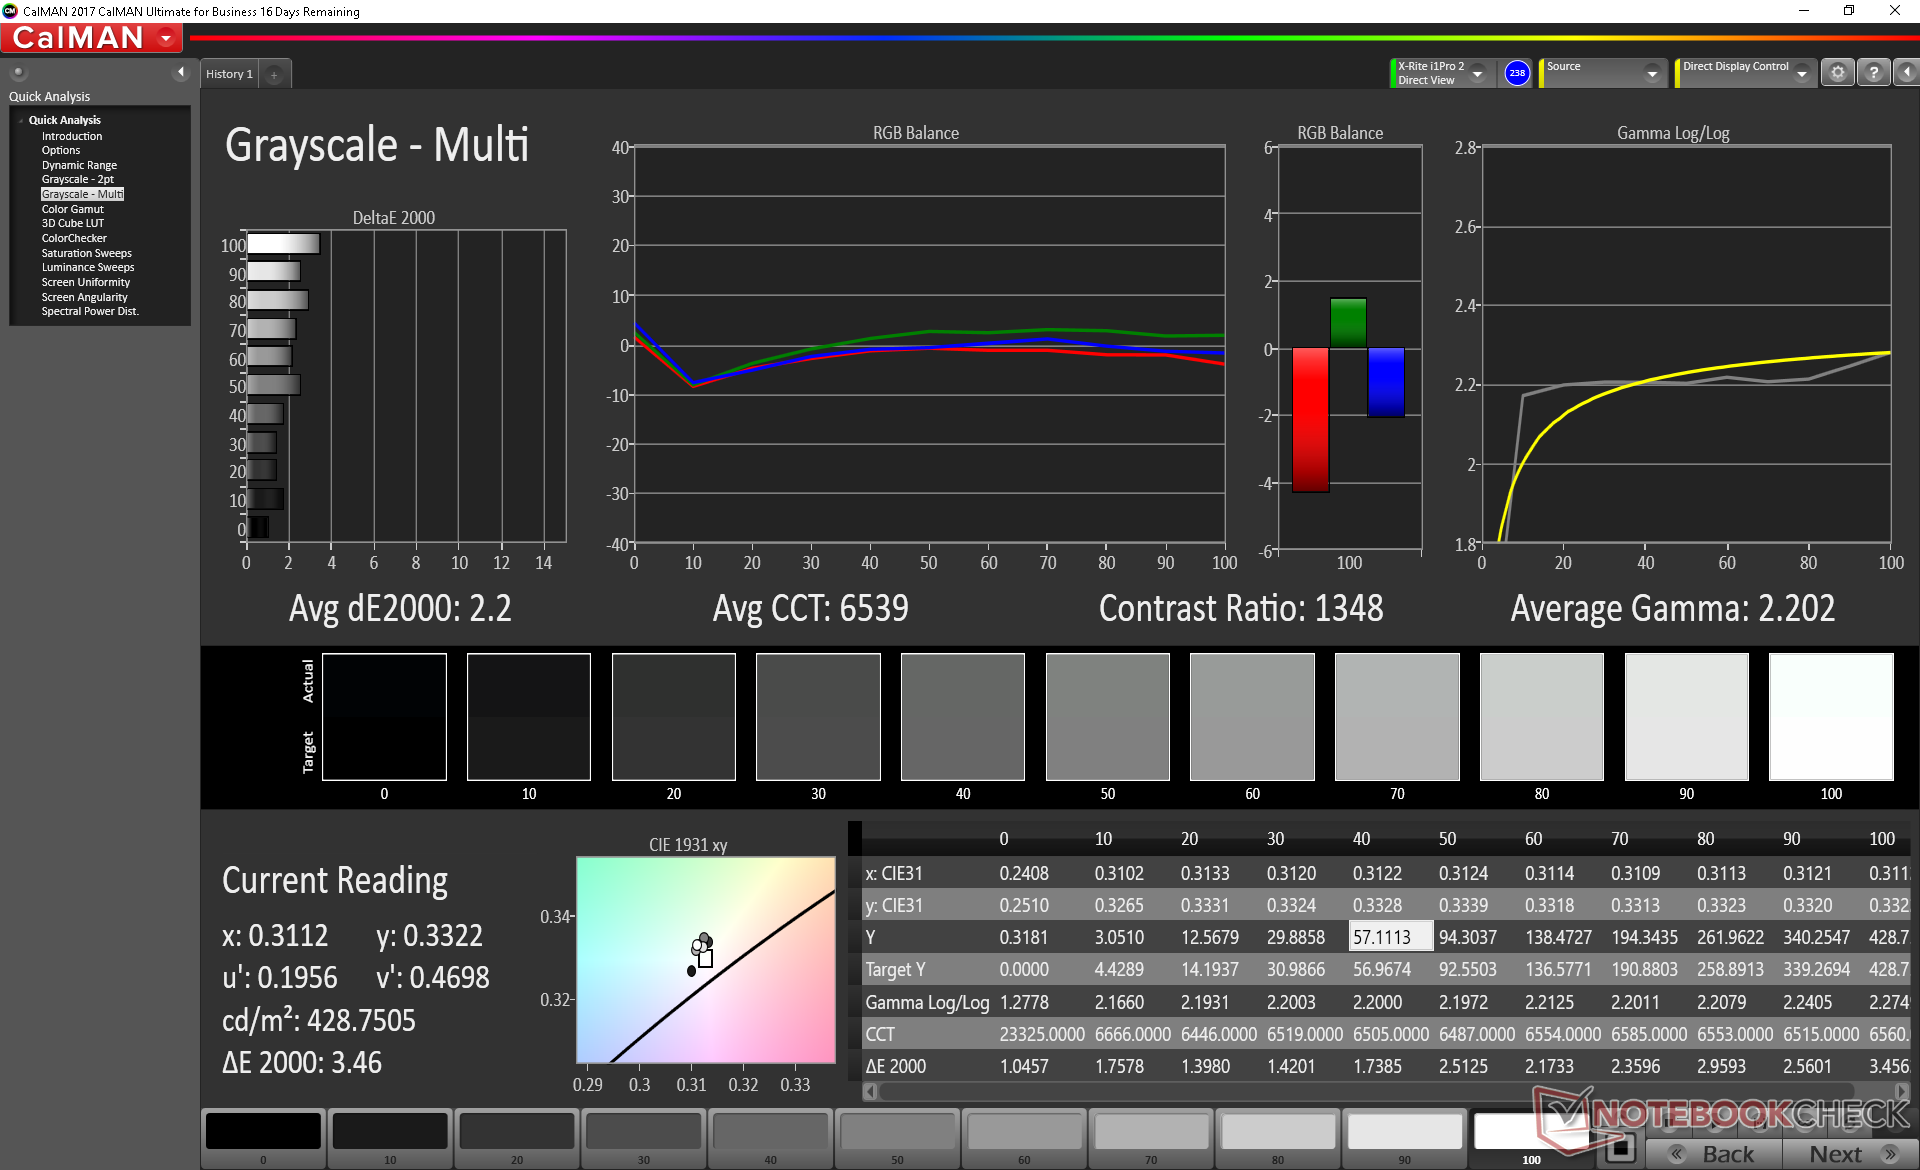
Further measurements with an X-Rite colorimeter reveal an inaccurate grayscale with an overly cool color temperature. Our calibration attempt improves the display noticeably with average grayscale and ColorChecker deltaE values jumping from 5.9 and 5 to just 2.2 and 2.4, respectively. We recommend applying our calibrated ICM profile above if you're unable to calibrate the Surface Pro 7 yourself.

Display Response Times
| ↔ Response Time Black to White | ||
|---|---|---|
| 26.4 ms ... rise ↗ and fall ↘ combined | ↗ 13.2 ms rise | 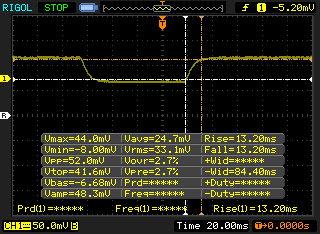 |
| ↘ 13.2 ms fall | ||
| The screen shows relatively slow response rates in our tests and may be too slow for gamers. In comparison, all tested devices range from 0.1 (minimum) to 240 (maximum) ms. » 66 % of all devices are better. This means that the measured response time is worse than the average of all tested devices (19.8 ms). | ||
| ↔ Response Time 50% Grey to 80% Grey | ||
| 34.8 ms ... rise ↗ and fall ↘ combined | ↗ 16.8 ms rise | 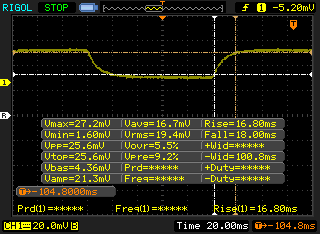 |
| ↘ 18 ms fall | ||
| The screen shows slow response rates in our tests and will be unsatisfactory for gamers. In comparison, all tested devices range from 0.165 (minimum) to 636 (maximum) ms. » 49 % of all devices are better. This means that the measured response time is worse than the average of all tested devices (30.9 ms). | ||
Screen Flickering / PWM (Pulse-Width Modulation)
| Screen flickering / PWM detected | 21550 Hz | ≤ 24 % brightness setting | 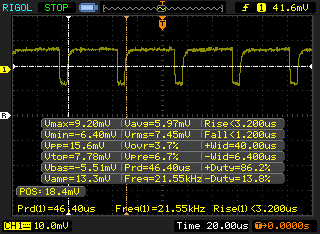 |
The display backlight flickers at 21550 Hz (worst case, e.g., utilizing PWM) Flickering detected at a brightness setting of 24 % and below. There should be no flickering or PWM above this brightness setting. The frequency of 21550 Hz is quite high, so most users sensitive to PWM should not notice any flickering. In comparison: 52 % of all tested devices do not use PWM to dim the display. If PWM was detected, an average of 7744 (minimum: 5 - maximum: 343500) Hz was measured. | |||
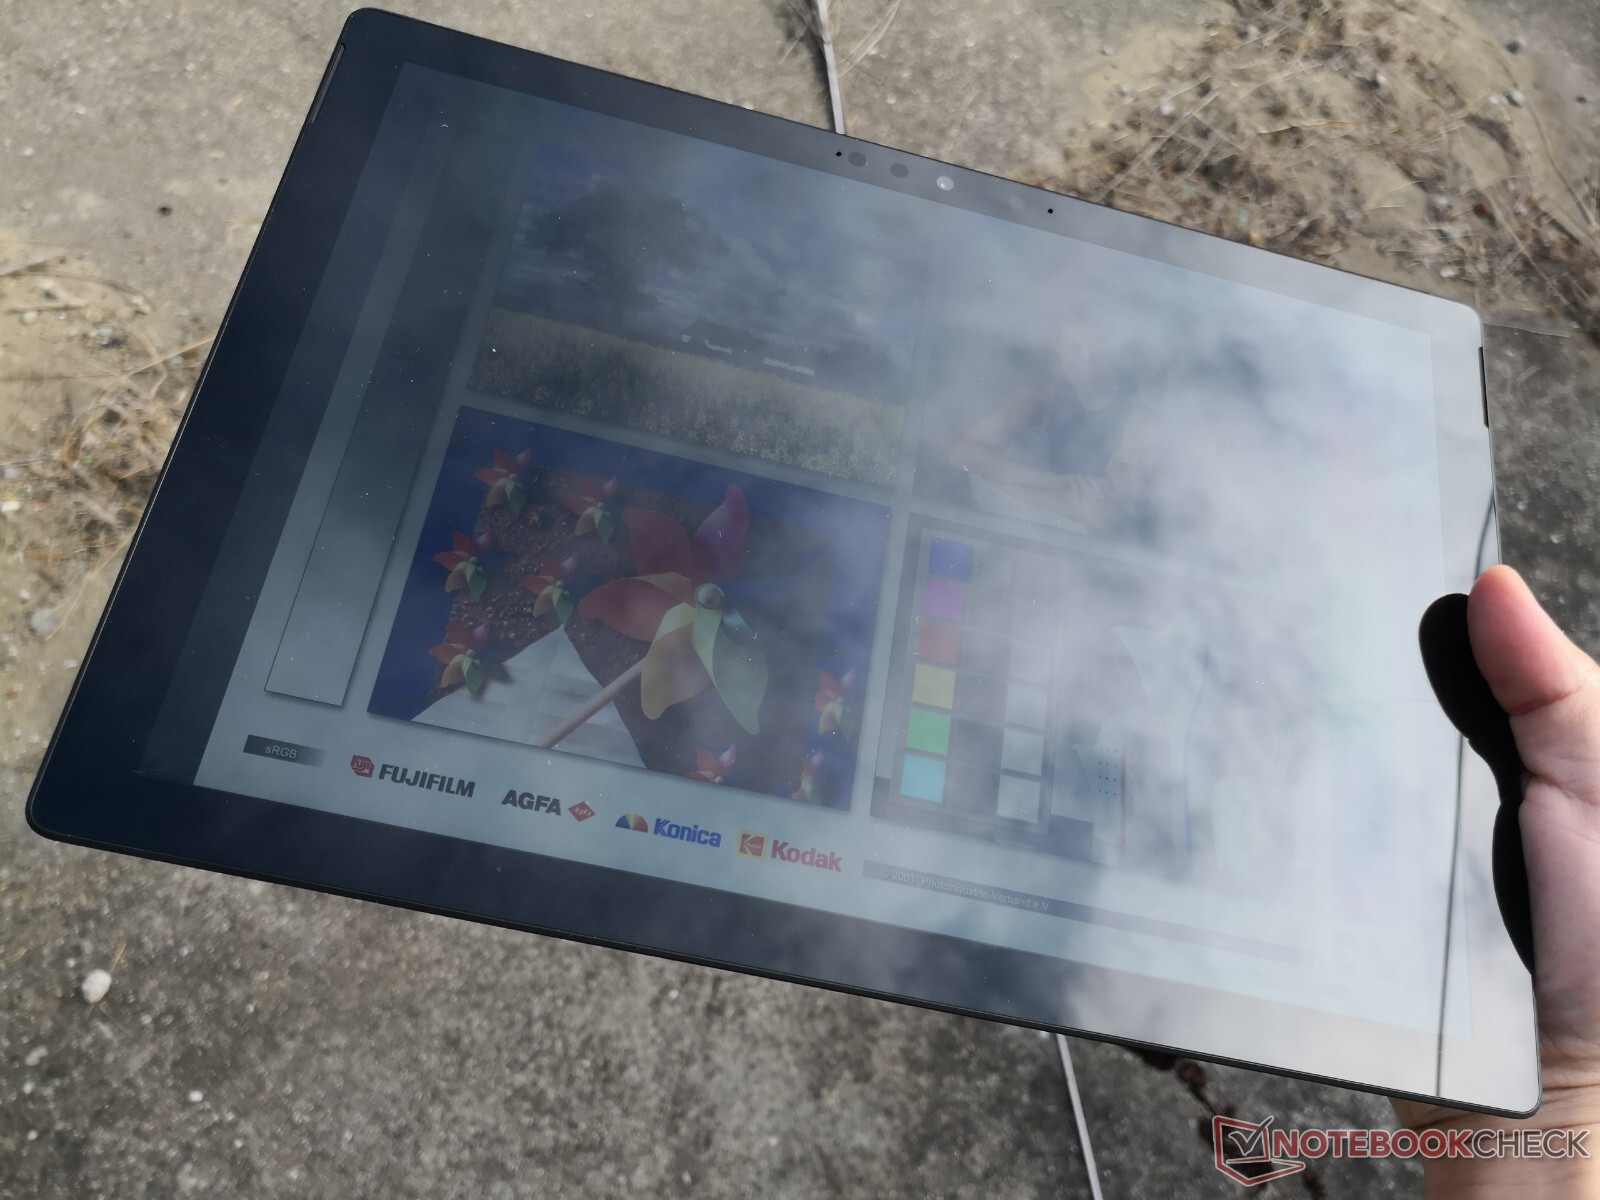
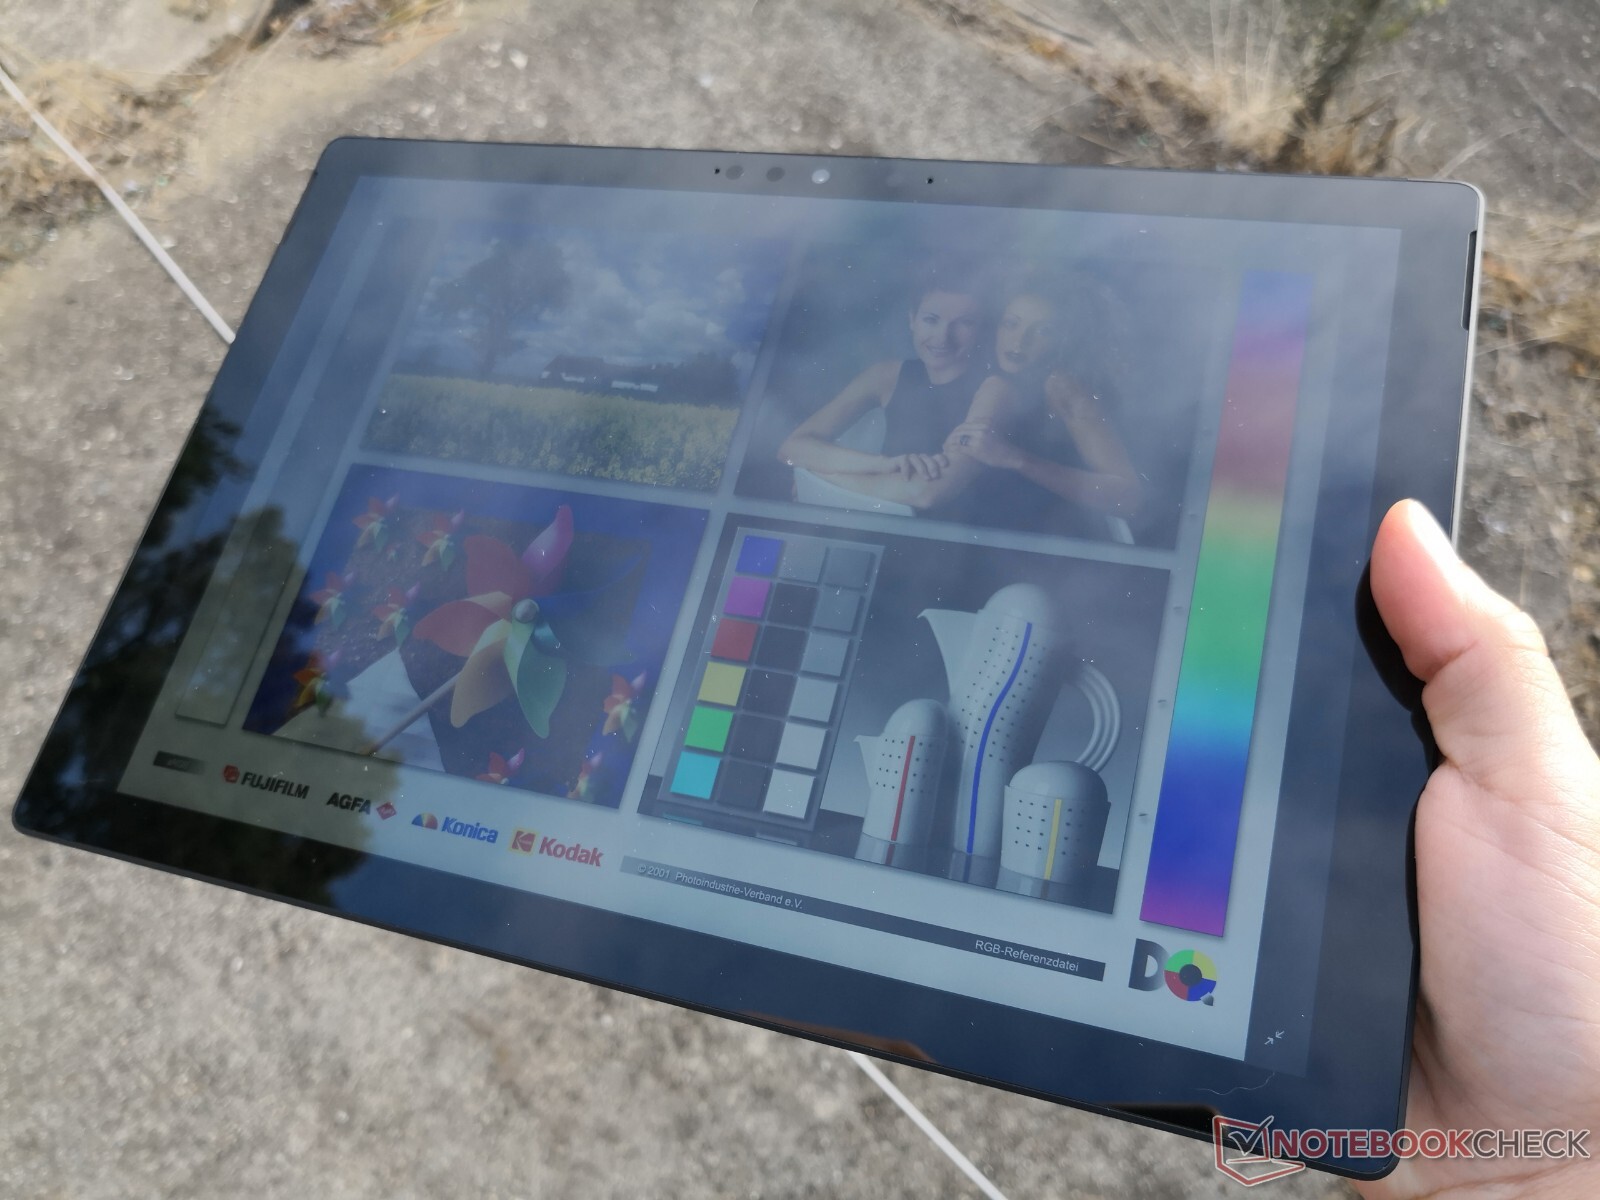
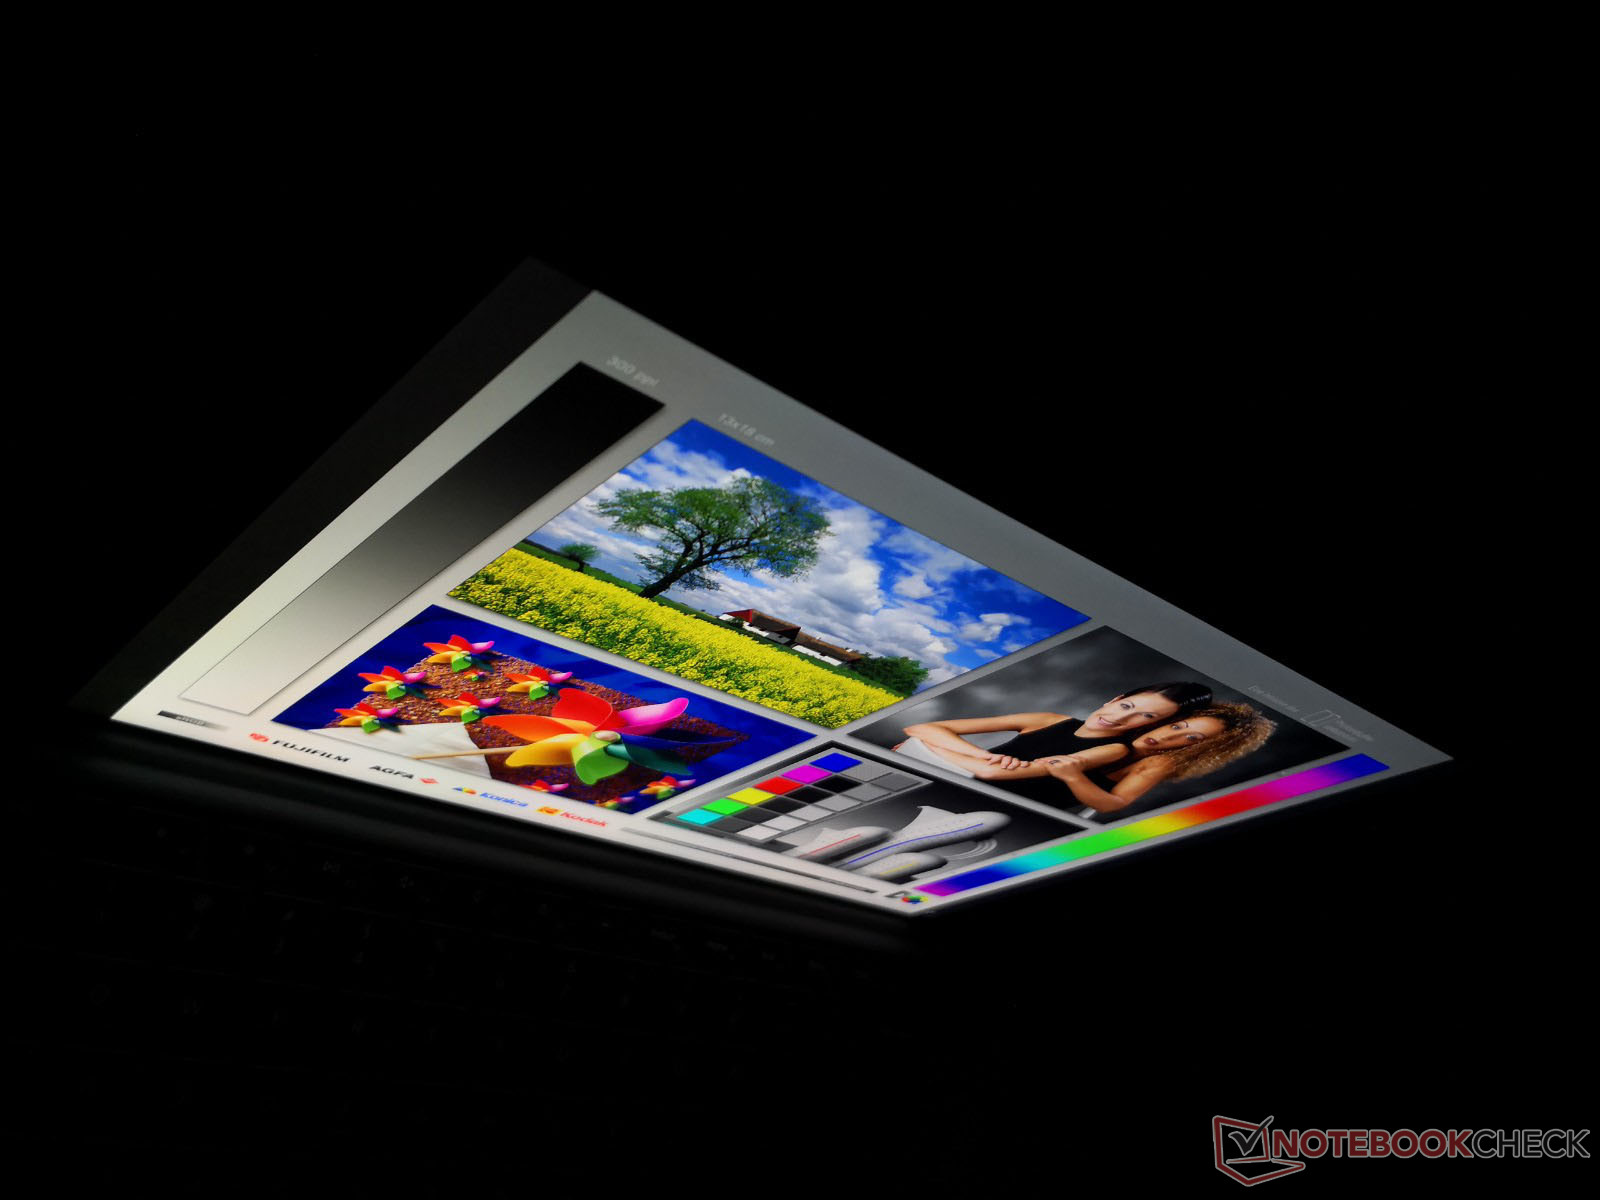
Outdoor visibility and viewing angles are exactly the same as on the Surface Pro 6 and Surface Pro 5 since they all share the same LG Philips IPS panel. The HP EliteBook x360 and even the Chuwi UBook Pro Surface clone offer brighter screens for improved visibility under sunlight.
Performance
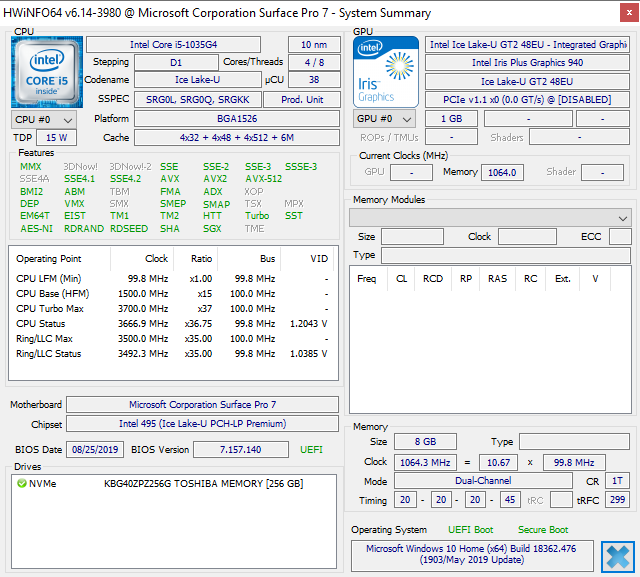
The big differentiator between the Surface Pro 6 and Surface Pro 7 is the new 10 nm Intel Ice Lake-U series that supercedes last year's 12 nm Whiskey Lake-U/Kaby Lake-R series. On paper, Intel designed Ice Lake-U to offer significantly faster integrated GPU performance than the aging UHD Graphics 620 as detailed here. In practice, however, the advantages can be inconsistent as graphics driver support has been slow for Intel's newest platform. Keep in mind that the Core i3 and Core i5 SKUs are passively cooled while the Core i7 SKU includes an internal fan.
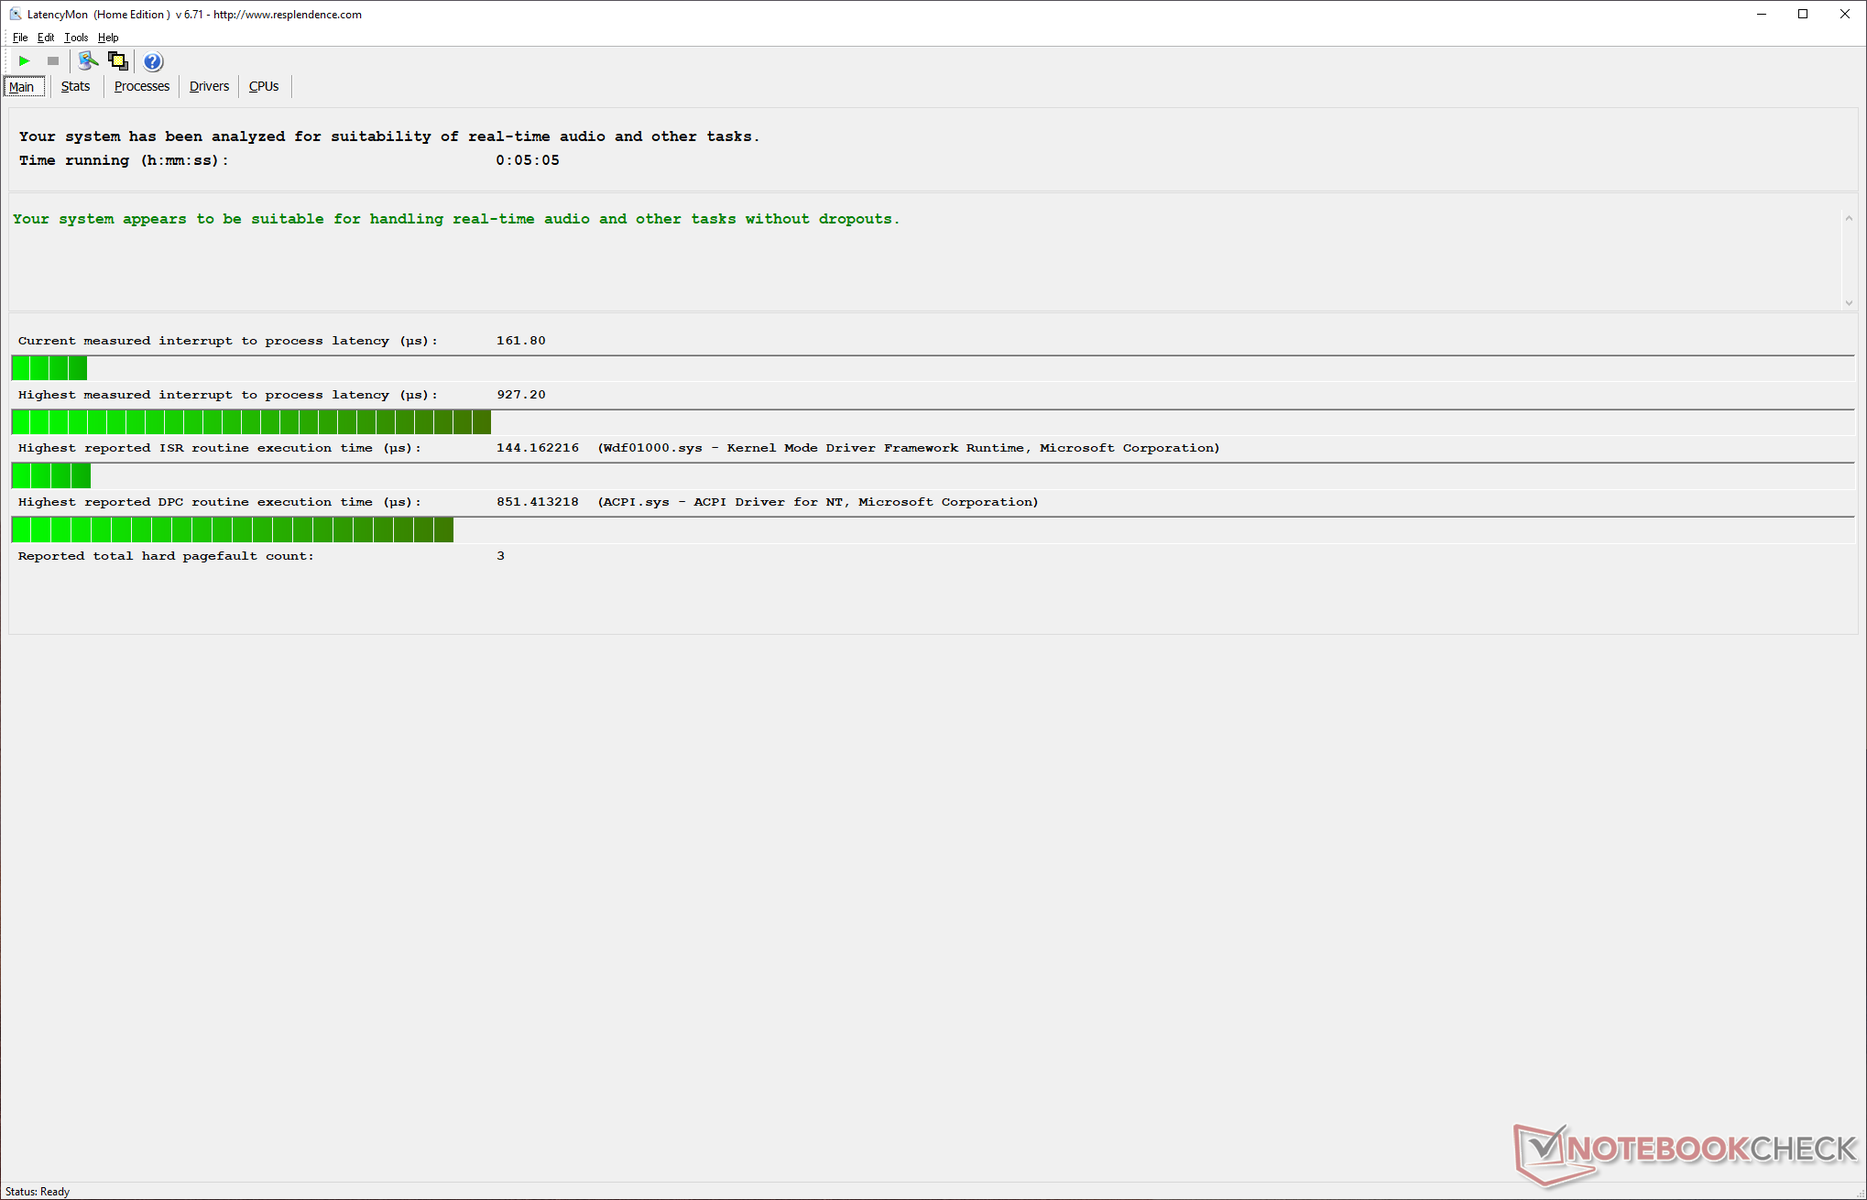
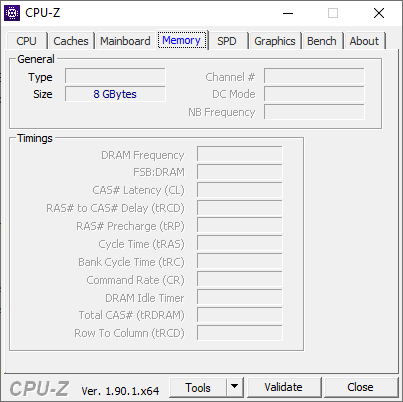
8 GB of dual-channel RAM comes standard with options to extend up to 16 GB. LatencyMon shows no DPC latency issues when wireless is enabled or disabled.
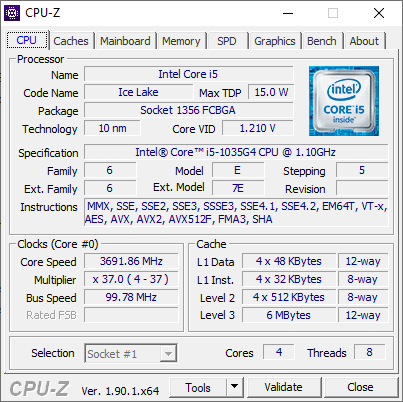
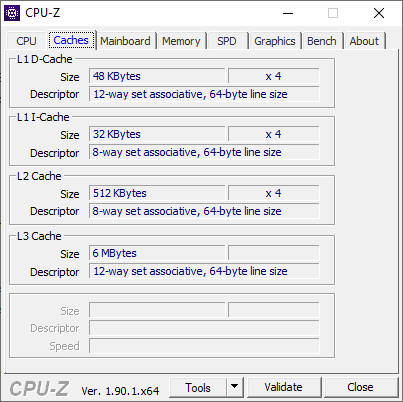
Processor
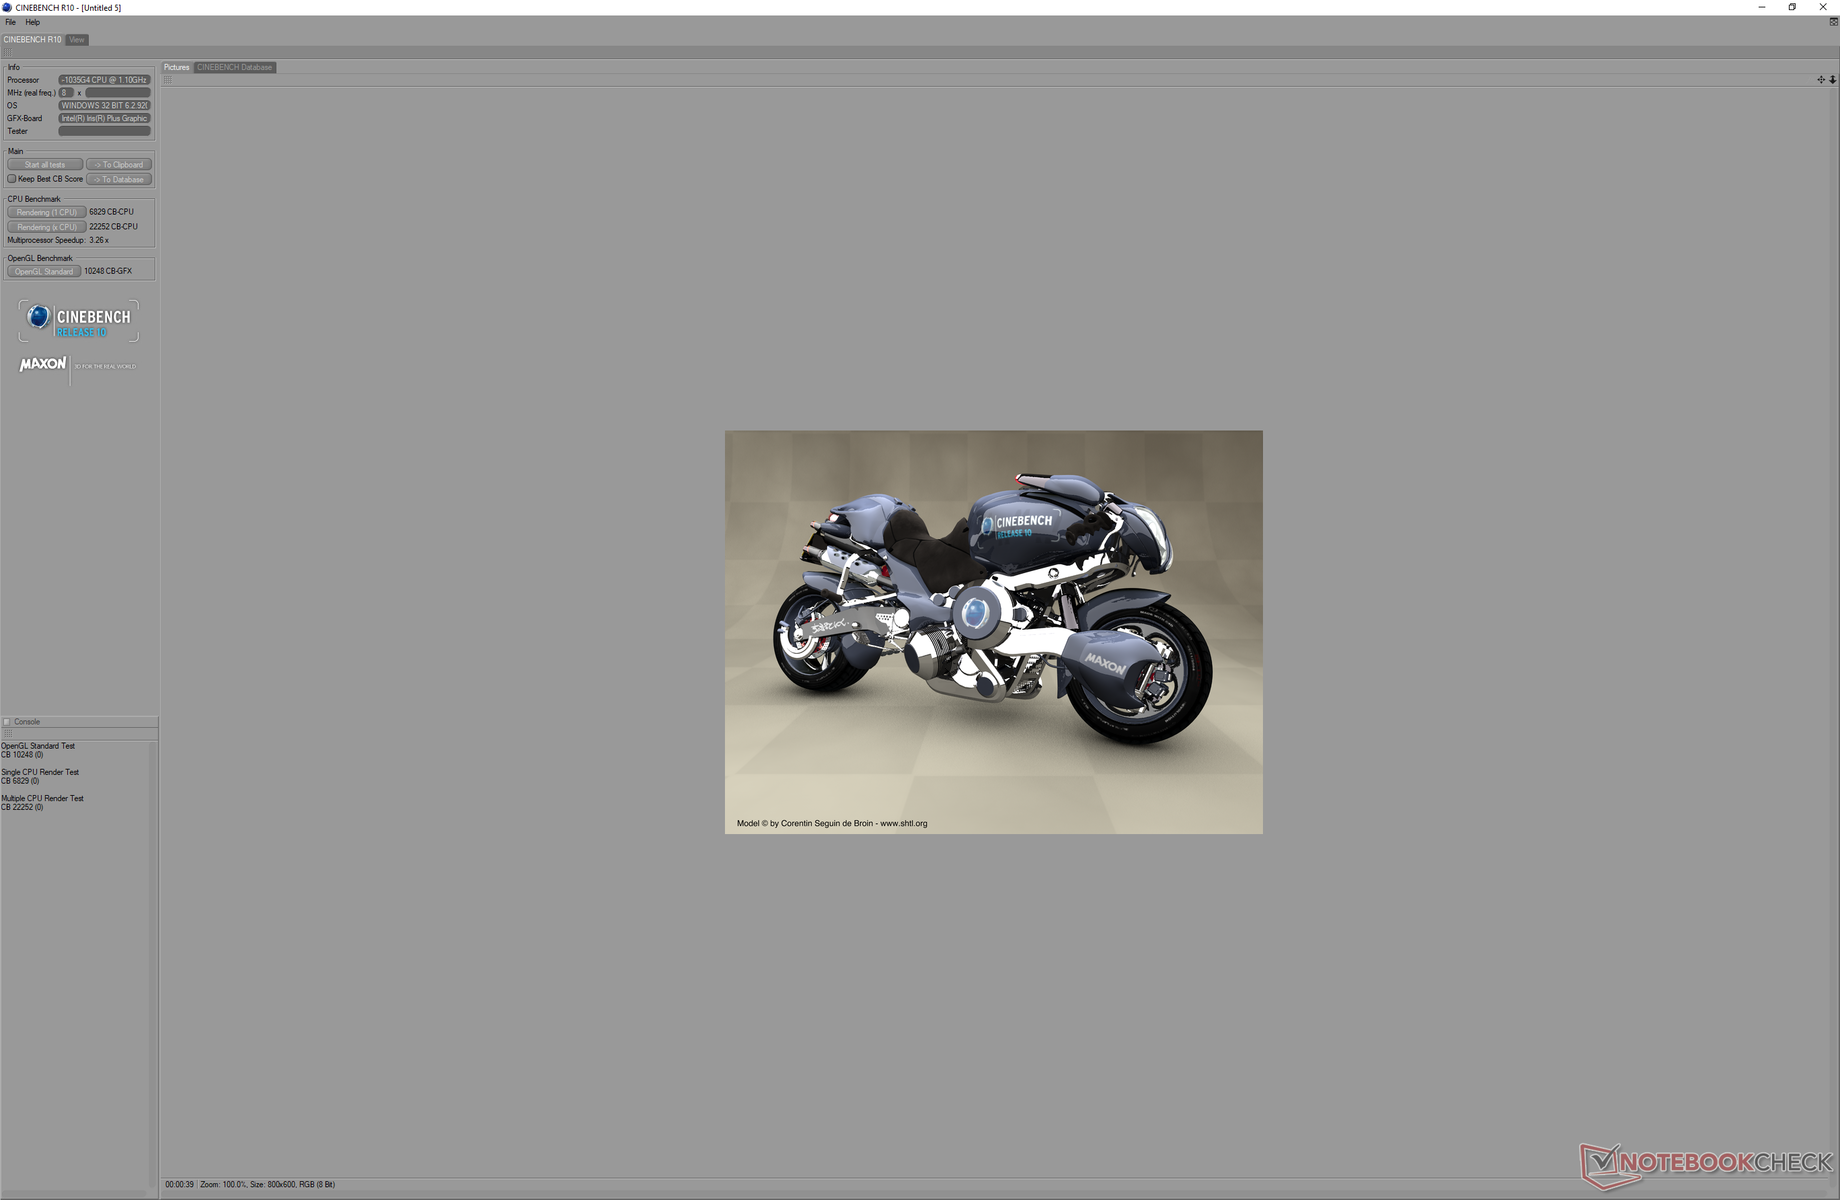
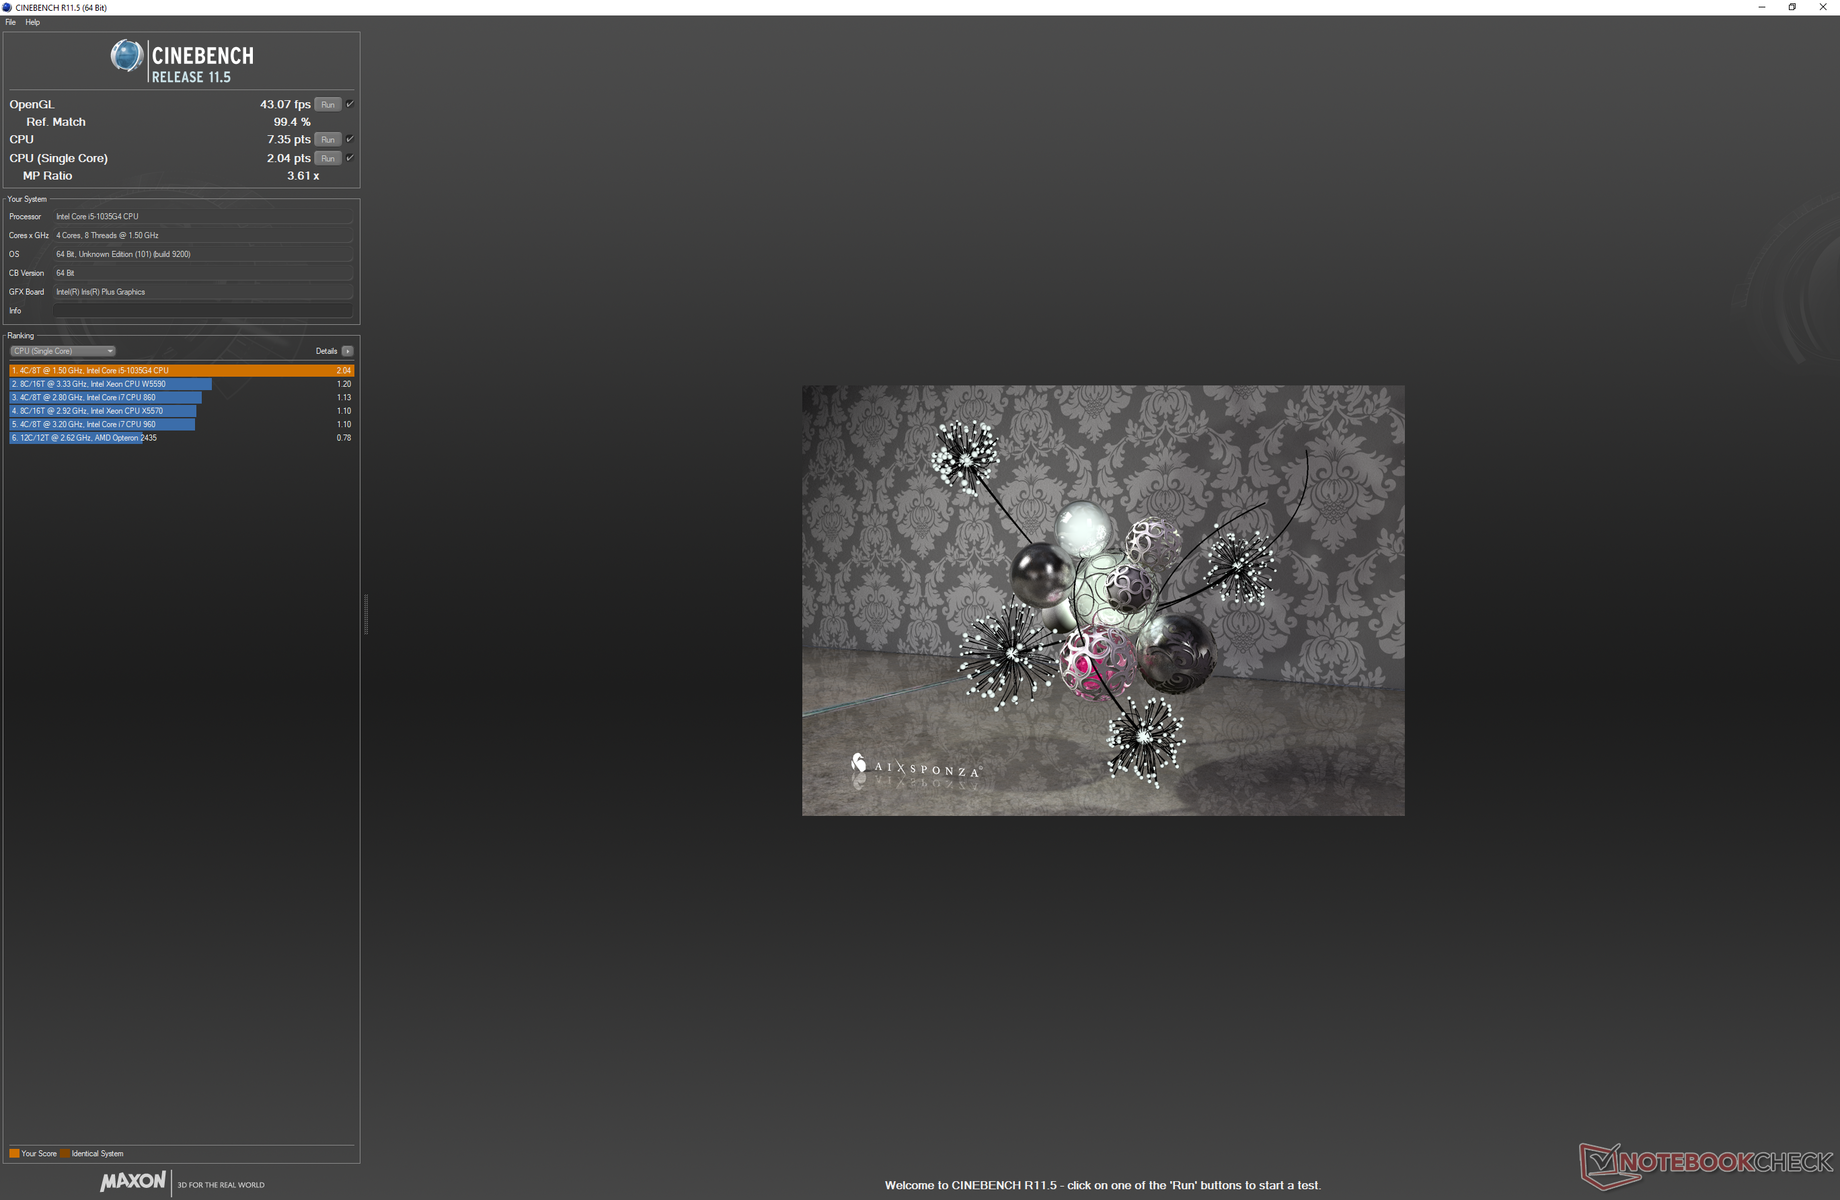
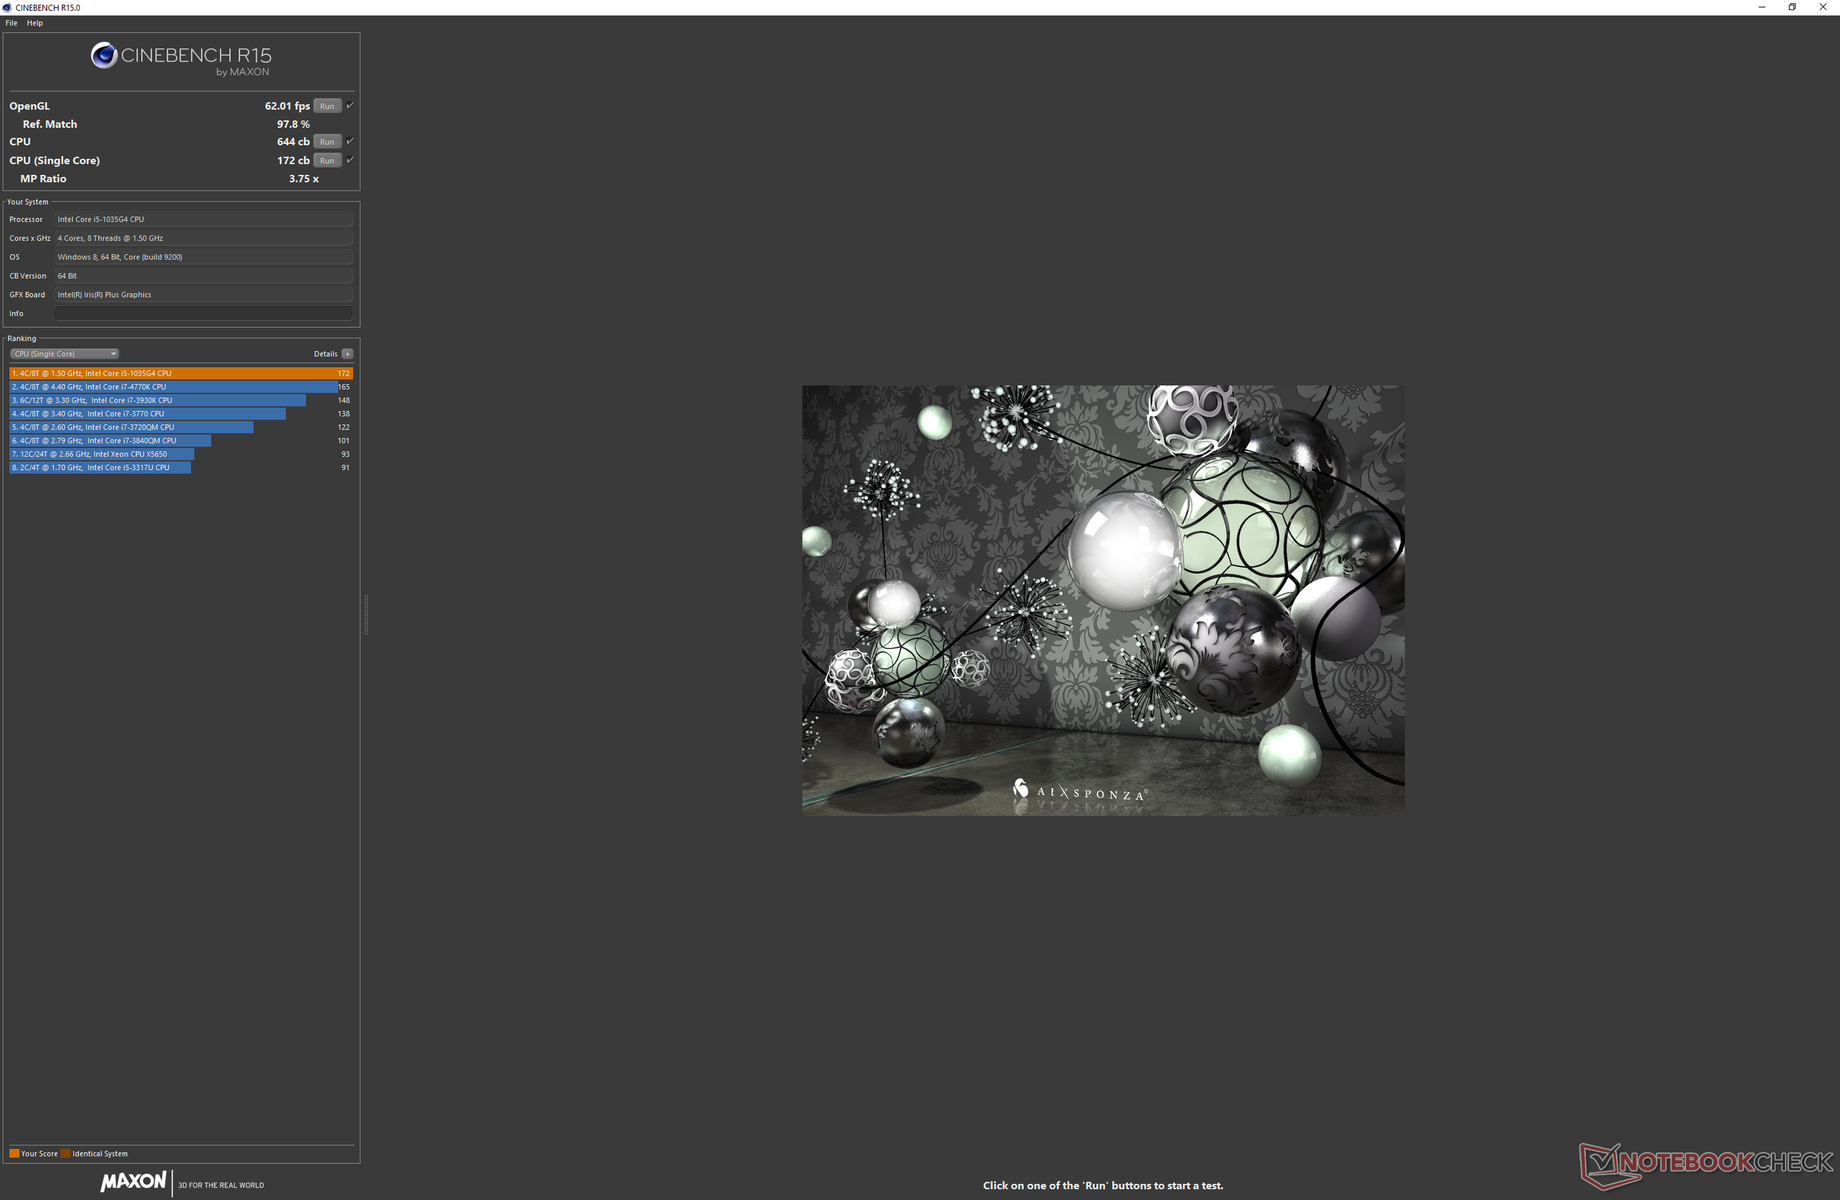
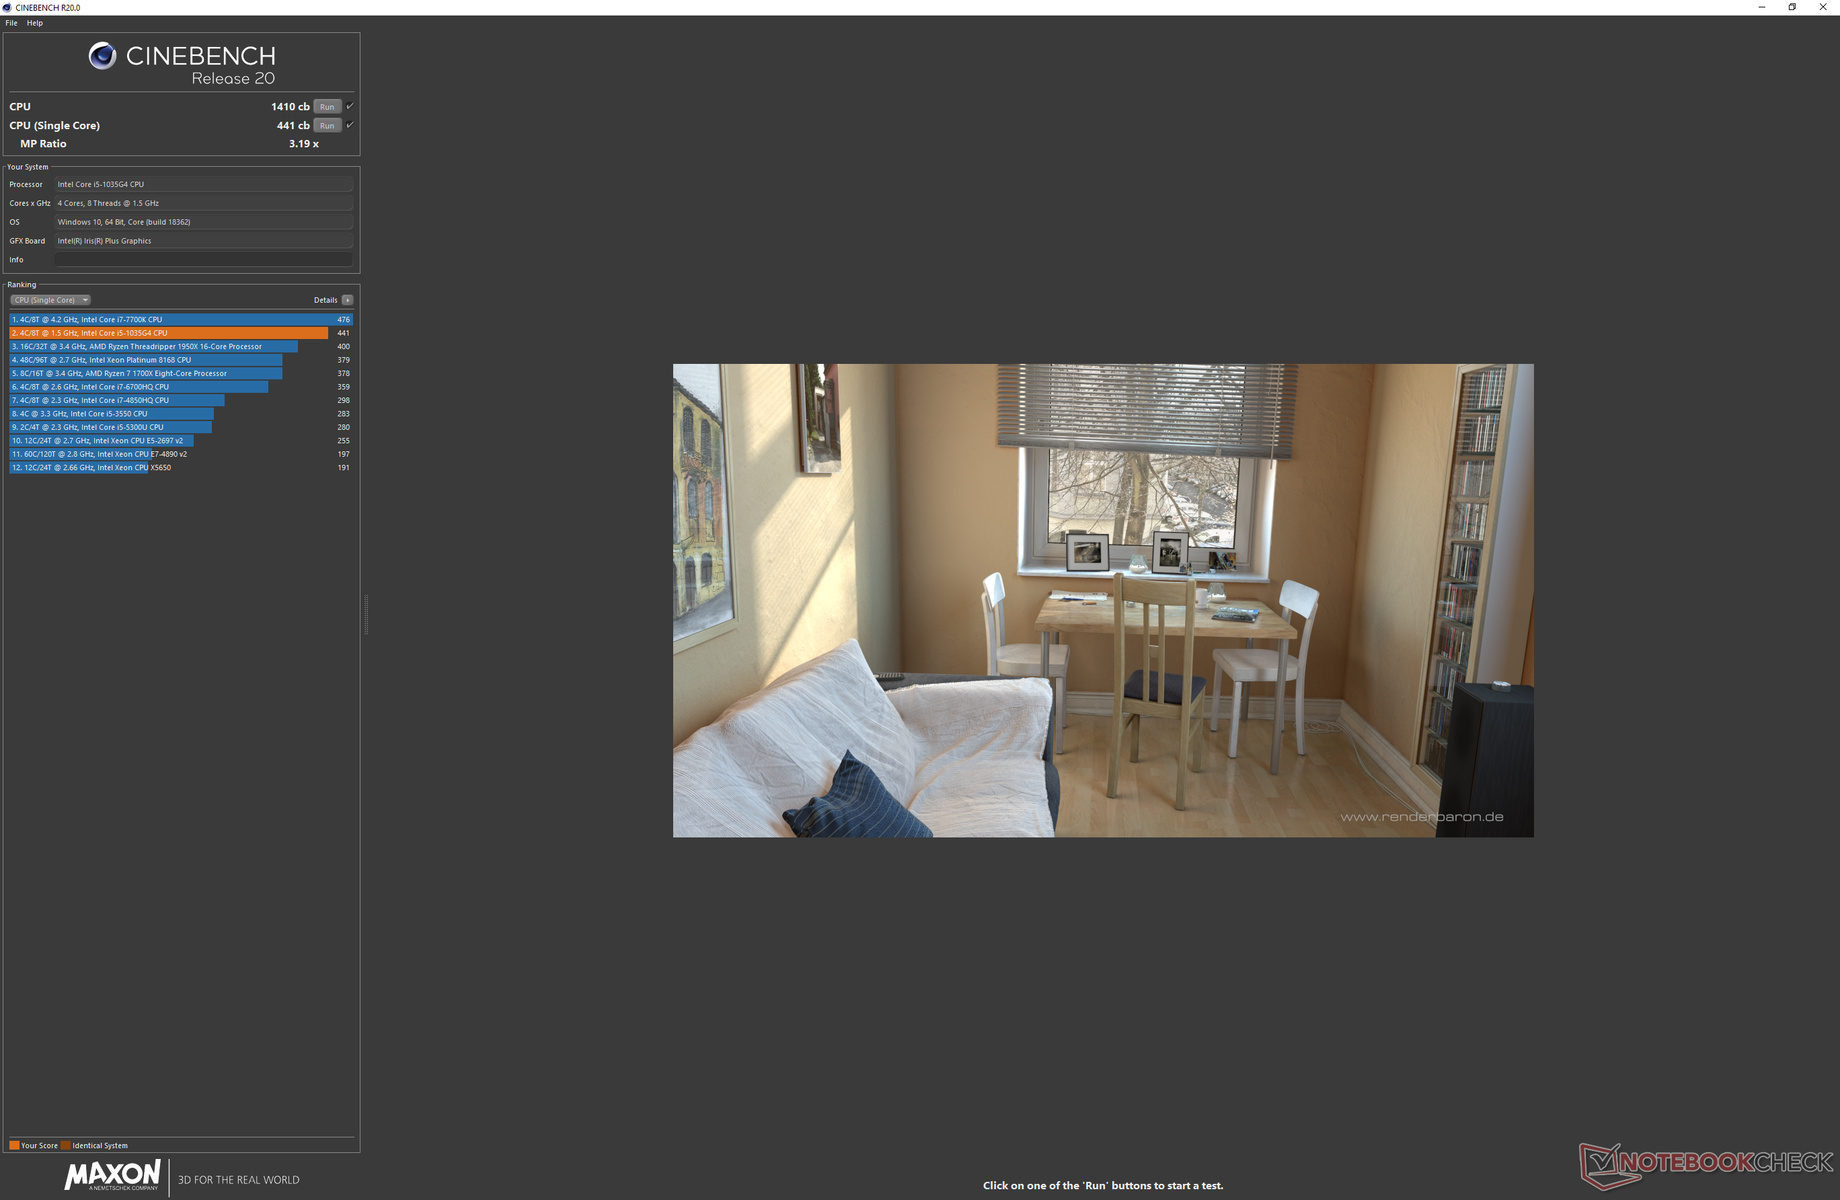
You can't expect very much from a passively-cooled processor. When running CineBench R15 Multi-Thread in a loop, scores start out strong at 685 points. When looping the test 50 times, however, scores steadily decline over time to as low as 497 points as shown by our graph below to represent a performance dip of about 27 percent. Thus, running CineBench R15 just once would give an inaccurate picture of the performance of the Surface Pro 7 since the processor is unable to maintain fast Turbo Boost clock rates indefinitely. Multi-thread performance becomes comparable to the Core i5-8350U at worst when accounting for throttling and just slightly better than the Core i7-8650U at best. We explore this further in our Stress Test section below. Had Microsoft included a fan in the Core i5 SKU, then the system would have likely been able to maintain faster Turbo Boost clock rates for longer.
Upgrading from the cheaper Core i3-1005G1 SKU will bring roughly 40 to 60 percent faster raw performance while upgrading to the Core i7-1065G7 SKU can boost performance by another 20 to 40 percent based on our experiences with the XPS 13 7390 2-in-1.
The high initial Turbo Boost performance is still useful for launching applications more quickly or for a smoother multi-tasking experience. Just don't expect that level of performance when under higher sustained loads.
See our dedicated page on the Core i5-1035G4 for more technical details and benchmark comparisons.
* ... smaller is better
System Performance
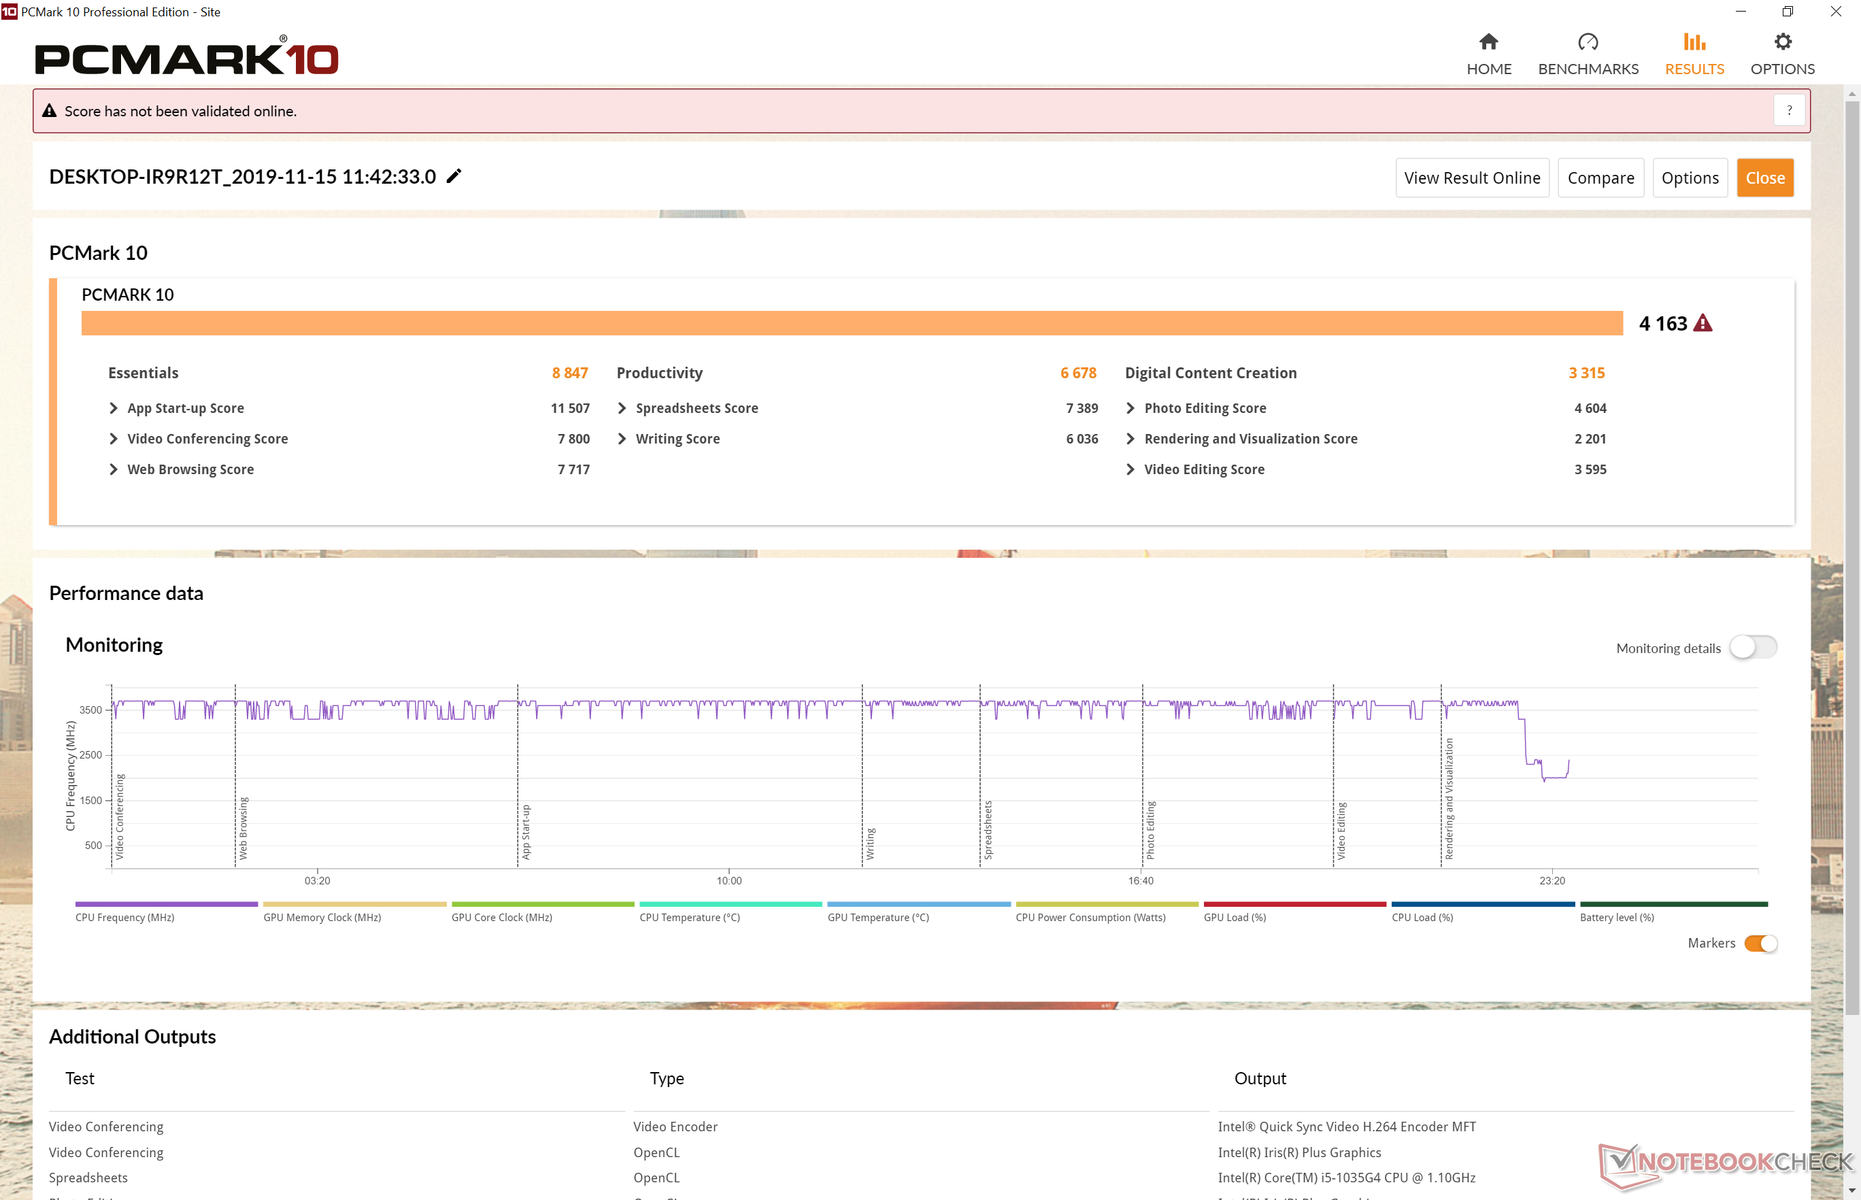
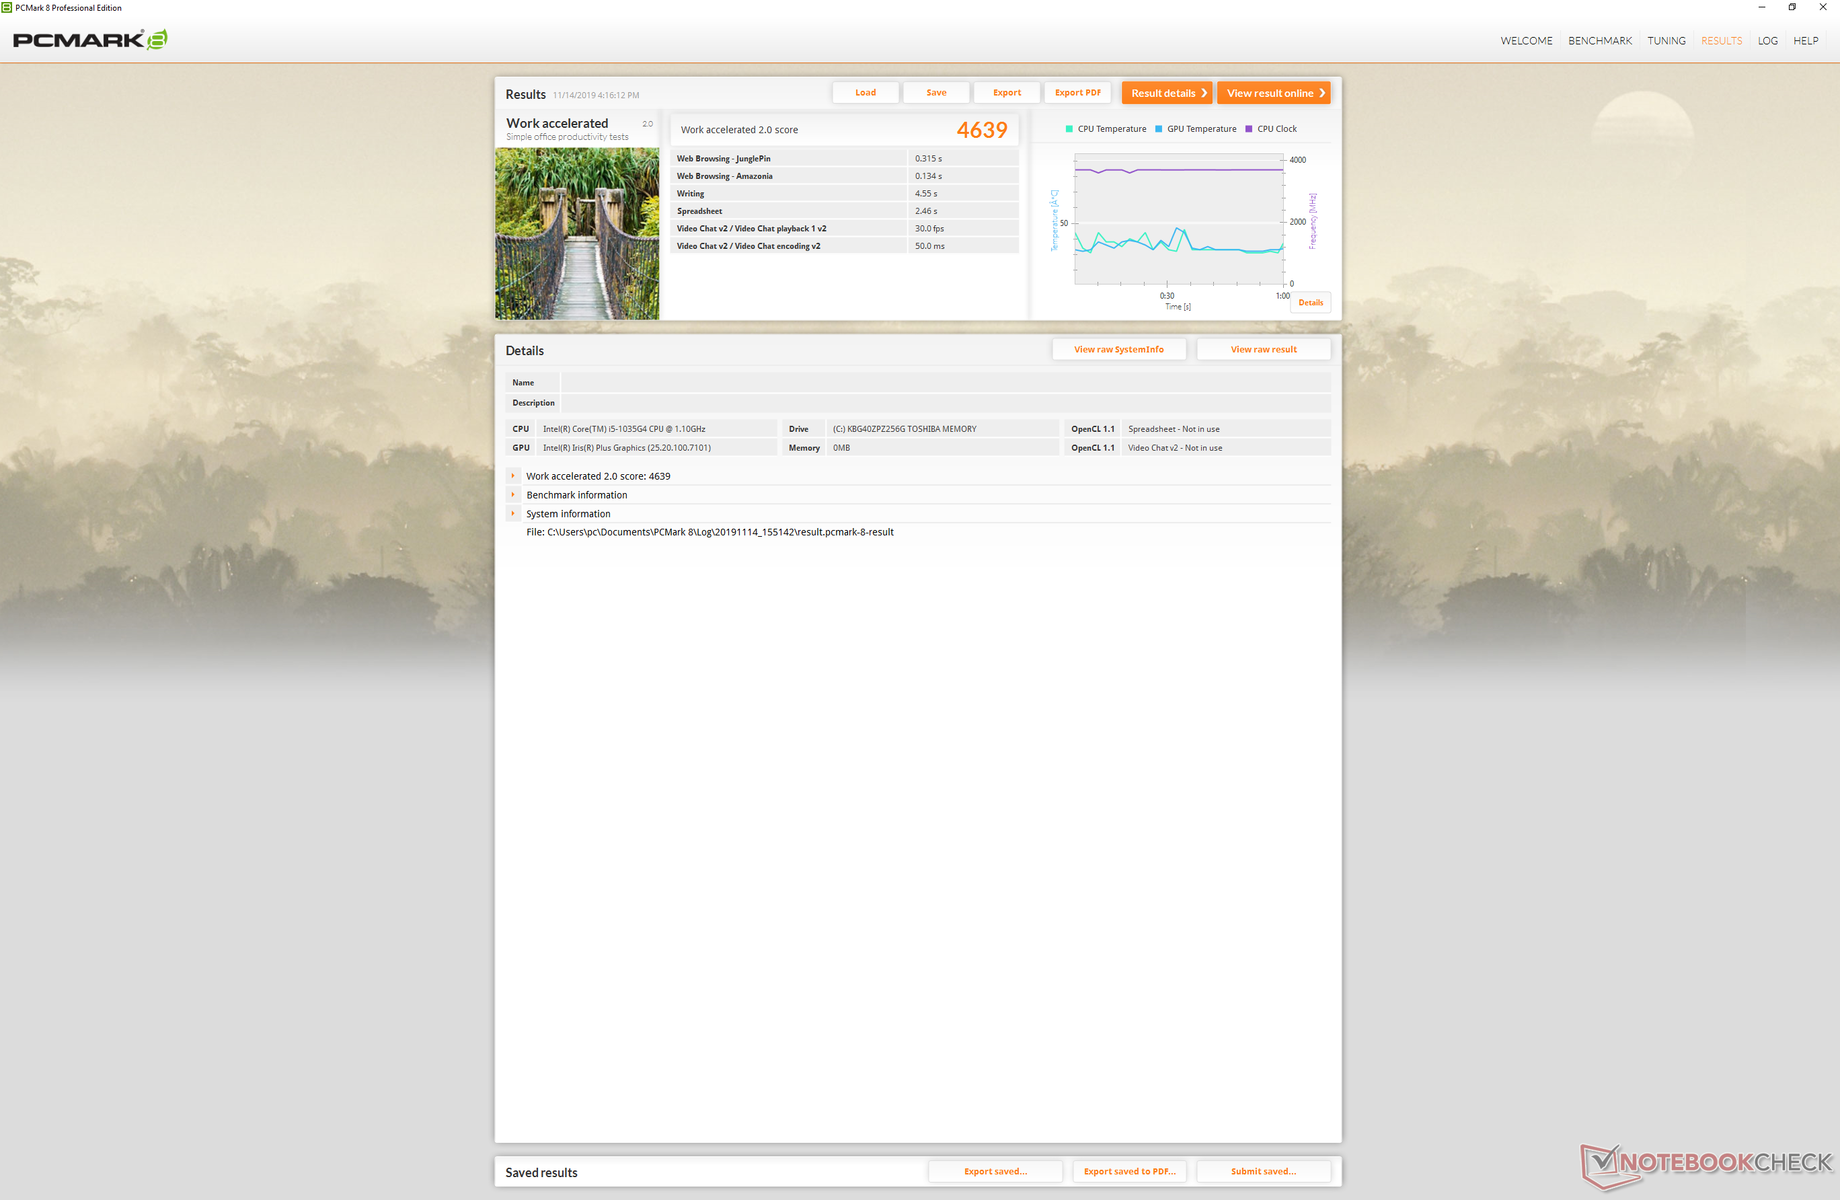
PCMark benchmarks rank our Core i5 Surface Pro 7 higher than any other Surface Pro model in our database including the Kaby Lake SKUs with the older Iris Plus 640 GPU. We experienced no issues during our time with the test unit save for some loose charging connection issues that we were unable to reliably reproduce.
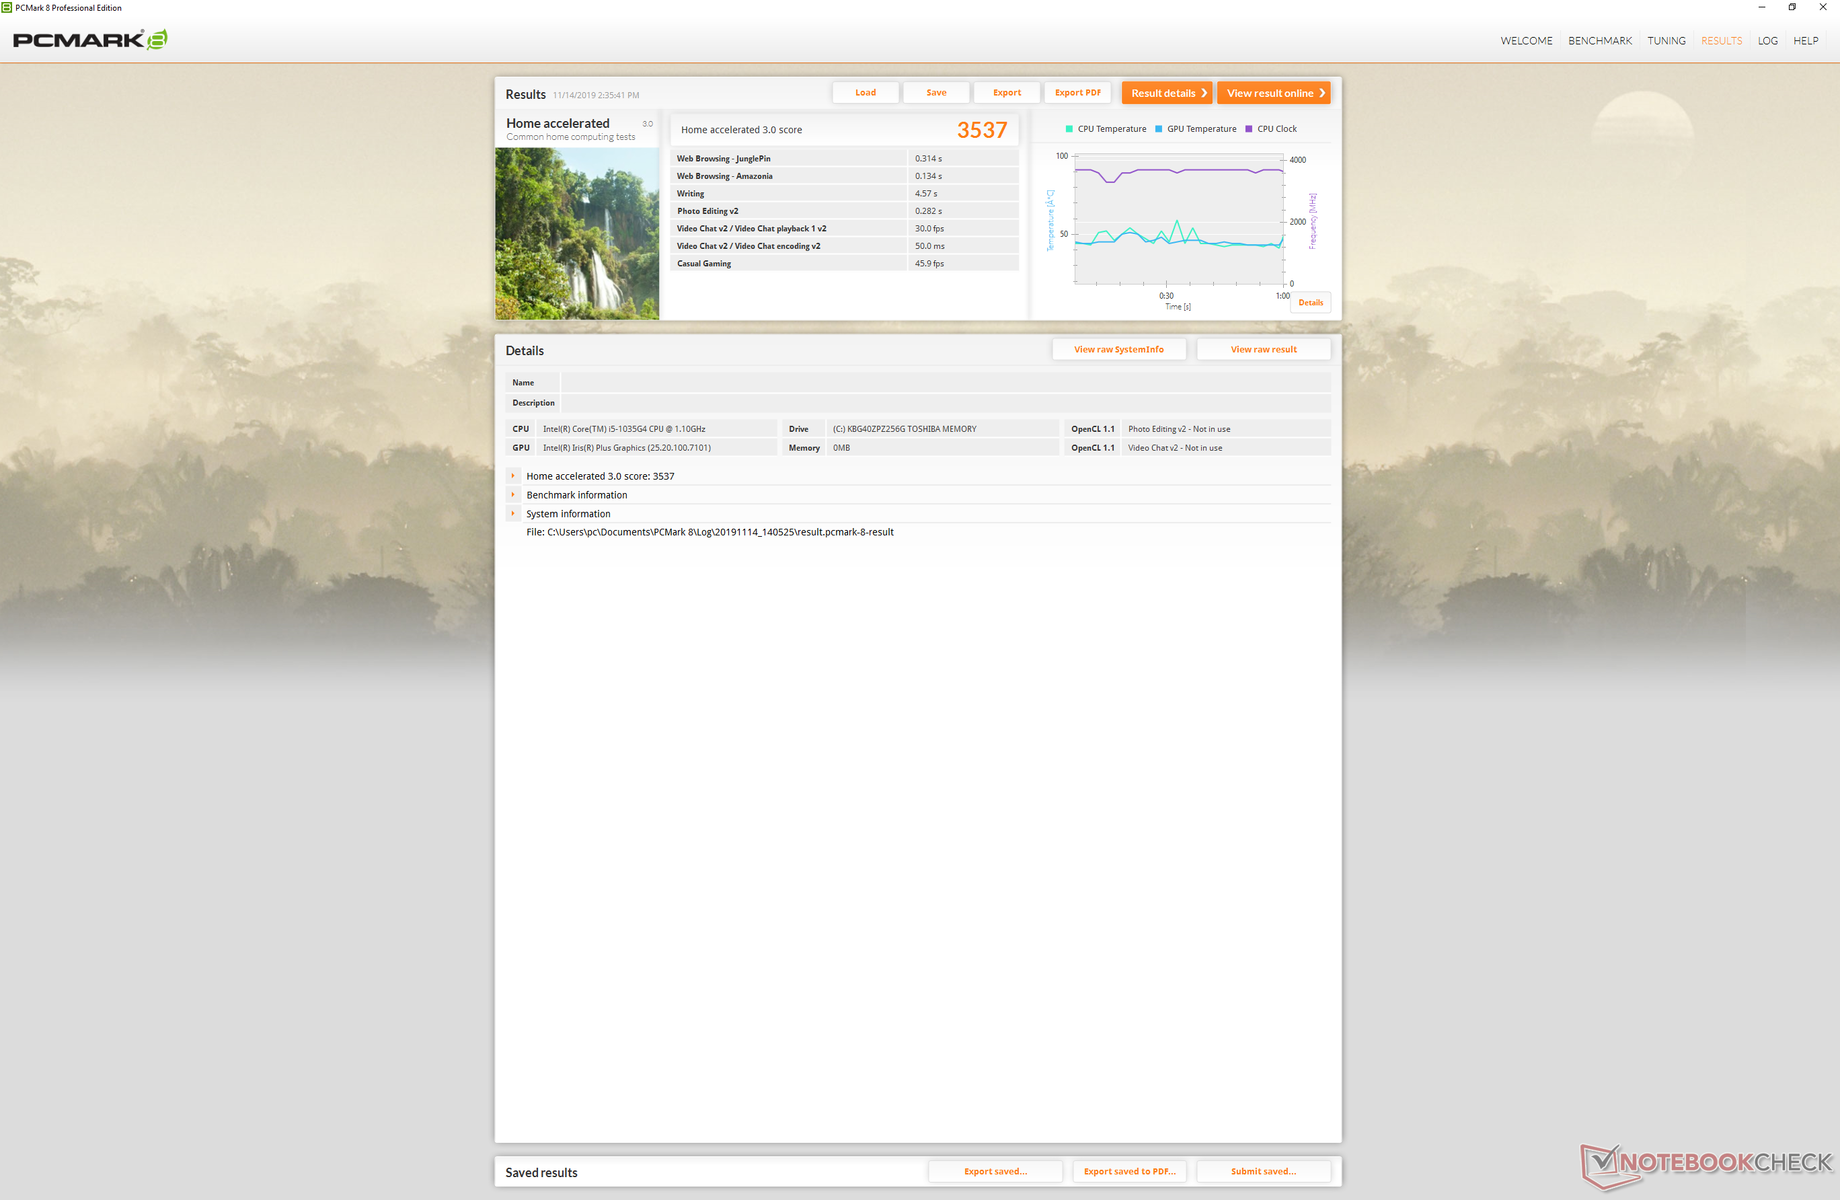
| PCMark 8 Home Score Accelerated v2 | 3537 points | |
| PCMark 8 Work Score Accelerated v2 | 4639 points | |
| PCMark 10 Score | 4163 points | |
Help | ||
Storage Devices
Microsoft has updated the internal M.2 SSD from the Toshiba BG3 on last year's Surface Pro 6 to the new Toshiba BG4 on this year's Surface Pro 7. Both read and write rates have improved across the board with sequential write rates in particular being almost twice as fast. Even so, laptops with the Samsung PM981 like the Razer Blade 15 will still handily outperform the Toshiba BG4 series.
See our table of HDDs and SSDs for more benchmark comparisons.
| Microsoft Surface Pro 7 Core i5-1035G4 Toshiba BG4 KBG40ZPZ256G | Microsoft Surface Pro 6, Core i7, 512 GB Toshiba KBG30ZPZ512G | Microsoft Surface Go MHN-00003 64 GB eMMC Flash | Microsoft Surface Pro (2017) i7 Samsung PM971 KUS040202M | Microsoft Surface Pro 4 Core i7 Samsung MZFLV256 NVMe | Microsoft Surface Laptop 3 15 Ryzen 5 3580U SK hynix BC501 HFM256GDGTNG | |
|---|---|---|---|---|---|---|
| AS SSD | -45% | -77% | -101% | -10% | -18% | |
| Seq Read (MB/s) | 1590 | 1154 -27% | 289.8 -82% | 1070 -33% | 1312 -17% | 1122 -29% |
| Seq Write (MB/s) | 714 | 393.6 -45% | 126.7 -82% | 171 -76% | 274.8 -62% | 514 -28% |
| 4K Read (MB/s) | 50.7 | 34.42 -32% | 18.29 -64% | 41 -19% | 33.47 -34% | 34.98 -31% |
| 4K Write (MB/s) | 109.4 | 68.9 -37% | 35.07 -68% | 0.2 -100% | 89.2 -18% | 96.8 -12% |
| 4K-64 Read (MB/s) | 924 | 494.1 -47% | 40.27 -96% | 1015 10% | 1280 39% | 492 -47% |
| 4K-64 Write (MB/s) | 294.6 | 171.3 -42% | 44.48 -85% | 34 -88% | 268.7 -9% | 339.9 15% |
| Access Time Read * (ms) | 0.066 | 0.213 -223% | 0.151 -129% | 0.04 39% | 0.047 29% | 0.056 15% |
| Access Time Write * (ms) | 0.697 | 0.3 57% | 0.233 67% | 7.6 -990% | 0.036 95% | 0.11 84% |
| Score Read (Points) | 1133 | 644 -43% | 88 -92% | 1164 3% | 1445 28% | 639 -44% |
| Score Write (Points) | 475 | 280 -41% | 92 -81% | 52 -89% | 385 -19% | 488 3% |
| Score Total (Points) | 2157 | 1225 -43% | 225 -90% | 1774 -18% | 2518 17% | 1434 -34% |
| Copy ISO MB/s (MB/s) | 1177 | 985 -16% | 99.1 -92% | 1036 -12% | 409.9 -65% | 828 -30% |
| Copy Program MB/s (MB/s) | 406 | 143.1 -65% | 44.34 -89% | 386 -5% | 209.8 -48% | 200.5 -51% |
| Copy Game MB/s (MB/s) | 923 | 676 -27% | 76.5 -92% | 582 -37% | 273.9 -70% | 387.4 -58% |
* ... smaller is better

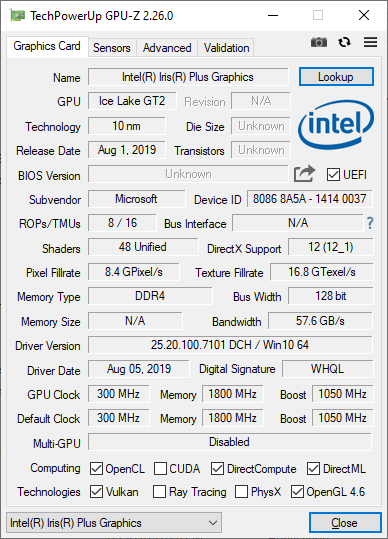
GPU Performance
At the time of this review, the latest Ice Lake-U Iris Plus driver from Intel was released on November 14, 2019 (26.20.100.7463). Our Surface Pro 7 test unit shipped with a graphics driver dating back to August 6 (25.20.100.7101). Attempts to update the driver or run certain 3DMark benchmarks would fail as detailed here. While Microsoft has acknowledged that they are working on newer graphics drivers, the Surface Pro 7 will be stuck on outdated drivers for the time being and so our GPU benchmark results below should be taken with a grain of salt.
Both 3DMark 11 and Time Spy rank the Iris Plus G4 to be about 25 to 30 percent slower than the Iris Plus G7 that ships with the faster Core i7-1065G7 configuration. Even so, graphics performance is still about 25 to 40 percent faster than the Iris Plus 640 as found on the Surface Pro 5. Popular undemanding games like Overwatch, Rocket League, Starcraft II, and Fortnite can all run at decent frame rates above 30 FPS when on the lowest settings. We recommend engaging v-sync since frame rates will fluctuate and stutter wildly.
See our dedicated page on the Iris Plus G4 for more technical information and benchmark comparisons.
| 3DMark 06 Standard Score | 13031 points | |
| 3DMark 11 Performance | 3485 points | |
| 3DMark Time Spy Score | 699 points | |
Help | ||
| Fortnite | |
| 1280x720 Low Preset | |
| Microsoft Surface Laptop 3 15 Ryzen 5 3580U | |
| Microsoft Surface Pro 7 Core i5-1035G4 | |
| 1920x1080 Medium Preset | |
| Microsoft Surface Laptop 3 15 Ryzen 5 3580U | |
| Microsoft Surface Pro 7 Core i5-1035G4 | |
| low | med. | high | ultra | |
|---|---|---|---|---|
| StarCraft II: Heart of the Swarm (2013) | 247.2 | 29.9 | 29.8 | 16.5 |
| BioShock Infinite (2013) | 87.3 | 50.8 | 42.9 | 15.2 |
| The Witcher 3 (2015) | 39.4 | 24.5 | 12.6 | 6.7 |
| Overwatch (2016) | 54.6 | 33.8 | 17.7 | 12.7 |
| Rocket League (2017) | 45.9 | 29.8 | 20.3 | |
| Fortnite (2018) | 39.5 | 12.3 | 11.6 | 7 |
| Shadow of the Tomb Raider (2018) | 18 | |||
| Borderlands 3 (2019) | 25.3 | 8.3 | 5.1 | 3.5 |
Emissions
System Noise
The Core i3/i5 SKUs are silent since they do not have internal fans. Nonetheless, we're able to notice slight coil whine or electronic noise from our test unit.
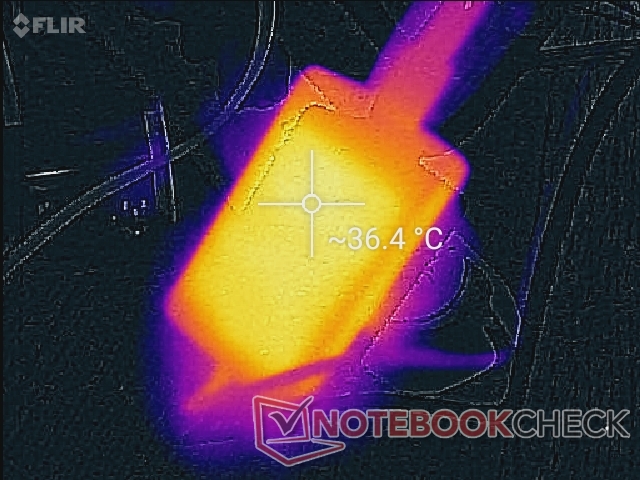
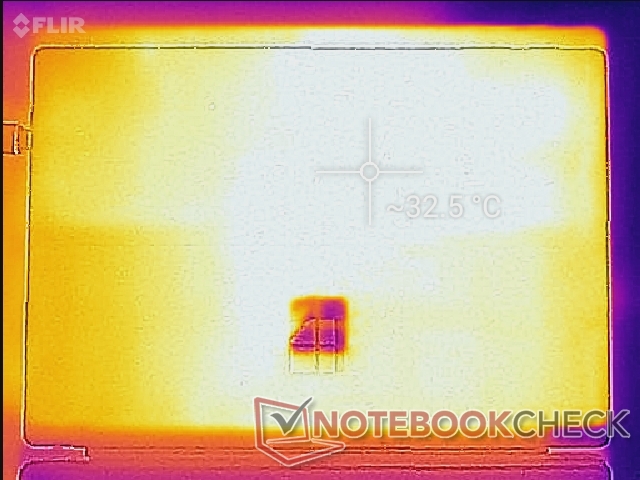
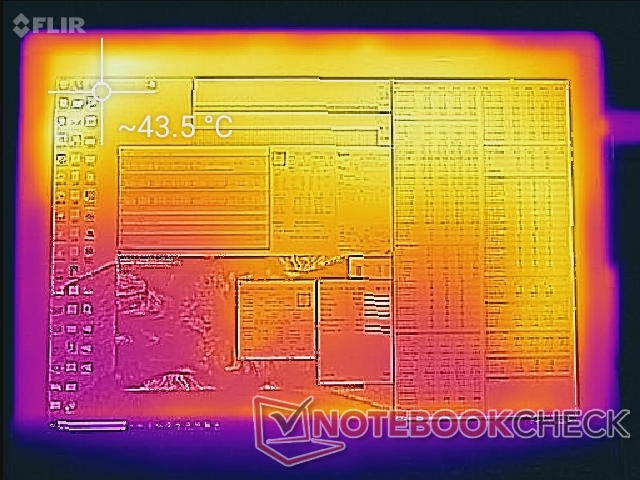
Temperature
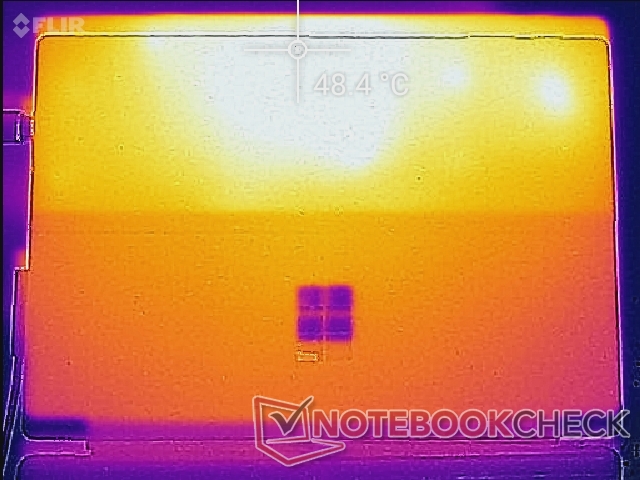
Surface temperatures will always be a few degrees C warmer on the back than on the front. When under high processing loads, the top half of the tablet can be as warm as 48 C. We recommend using the tablet in laptop mode if running such heavy loads. On the plus side, you won't have to worry about blocking any vents on these fanless SKUs.
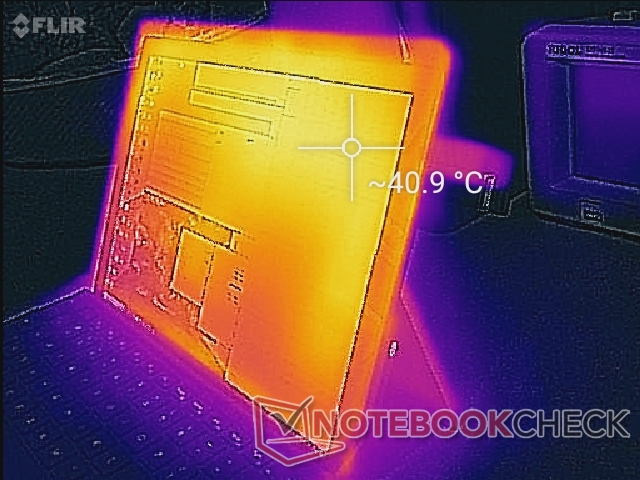
(±) The maximum temperature on the upper side is 43.6 °C / 110 F, compared to the average of 35.4 °C / 96 F, ranging from 19.6 to 60 °C for the class Convertible.
(-) The bottom heats up to a maximum of 47.8 °C / 118 F, compared to the average of 36.9 °C / 98 F
(+) In idle usage, the average temperature for the upper side is 29.8 °C / 86 F, compared to the device average of 30.3 °C / 87 F.
(±) The palmrests and touchpad can get very hot to the touch with a maximum of 39.4 °C / 102.9 F.
(-) The average temperature of the palmrest area of similar devices was 28 °C / 82.4 F (-11.4 °C / -20.5 F).

Stress Test
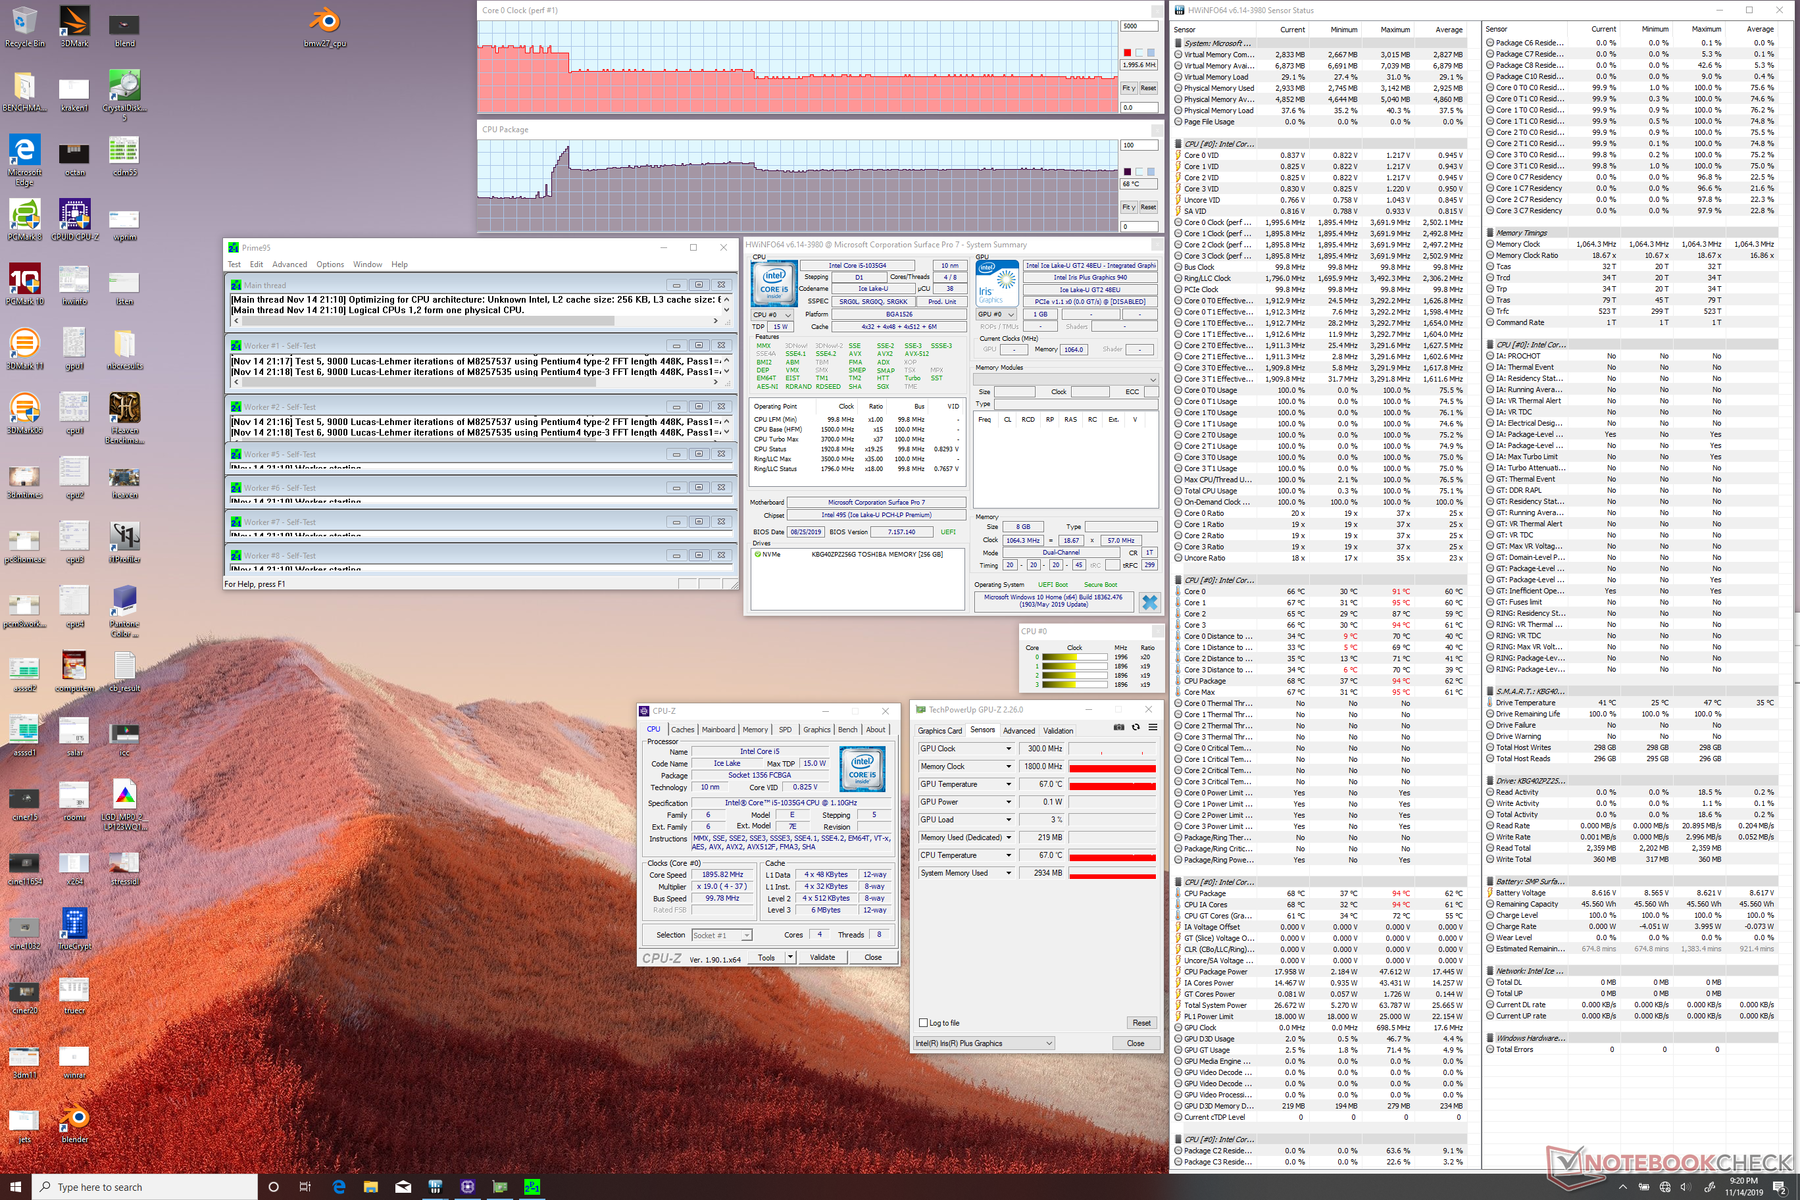
We stress the tablet with synthetic loads to identify for any potential throttling or stability issues. When running Prime95, the CPU can be observed boosting up to 3.3 GHz for the first few seconds until hitting a core temperature of 94 C. Thereafter, clock rates and temperature drop to 2.3 GHz and 67 C, respectively. Since there is no fan, however, core temperature steadily rises again. Once the CPU reaches 76 C, clock rates drop for a third and final time to 2 GHz to maintain at a steady 68 C. Our screenshot below illustrates this entire process and the results confirm the stair step-like graph of our CineBench loop test above.
Running on battery power will not limit performance. A 3DMark 11 run on batteries returns Physics and Graphics scores of 8534 and 3365 points, respectively, compared to 8319 and 3228 points when on mains.
| CPU Clock (GHz) | GPU Clock (MHz) | Average CPU Temperature (°C) | |
| System Idle | -- | -- | 37 |
| Prime95 Stress | 1.9 - 2.0 | -- | 68 |
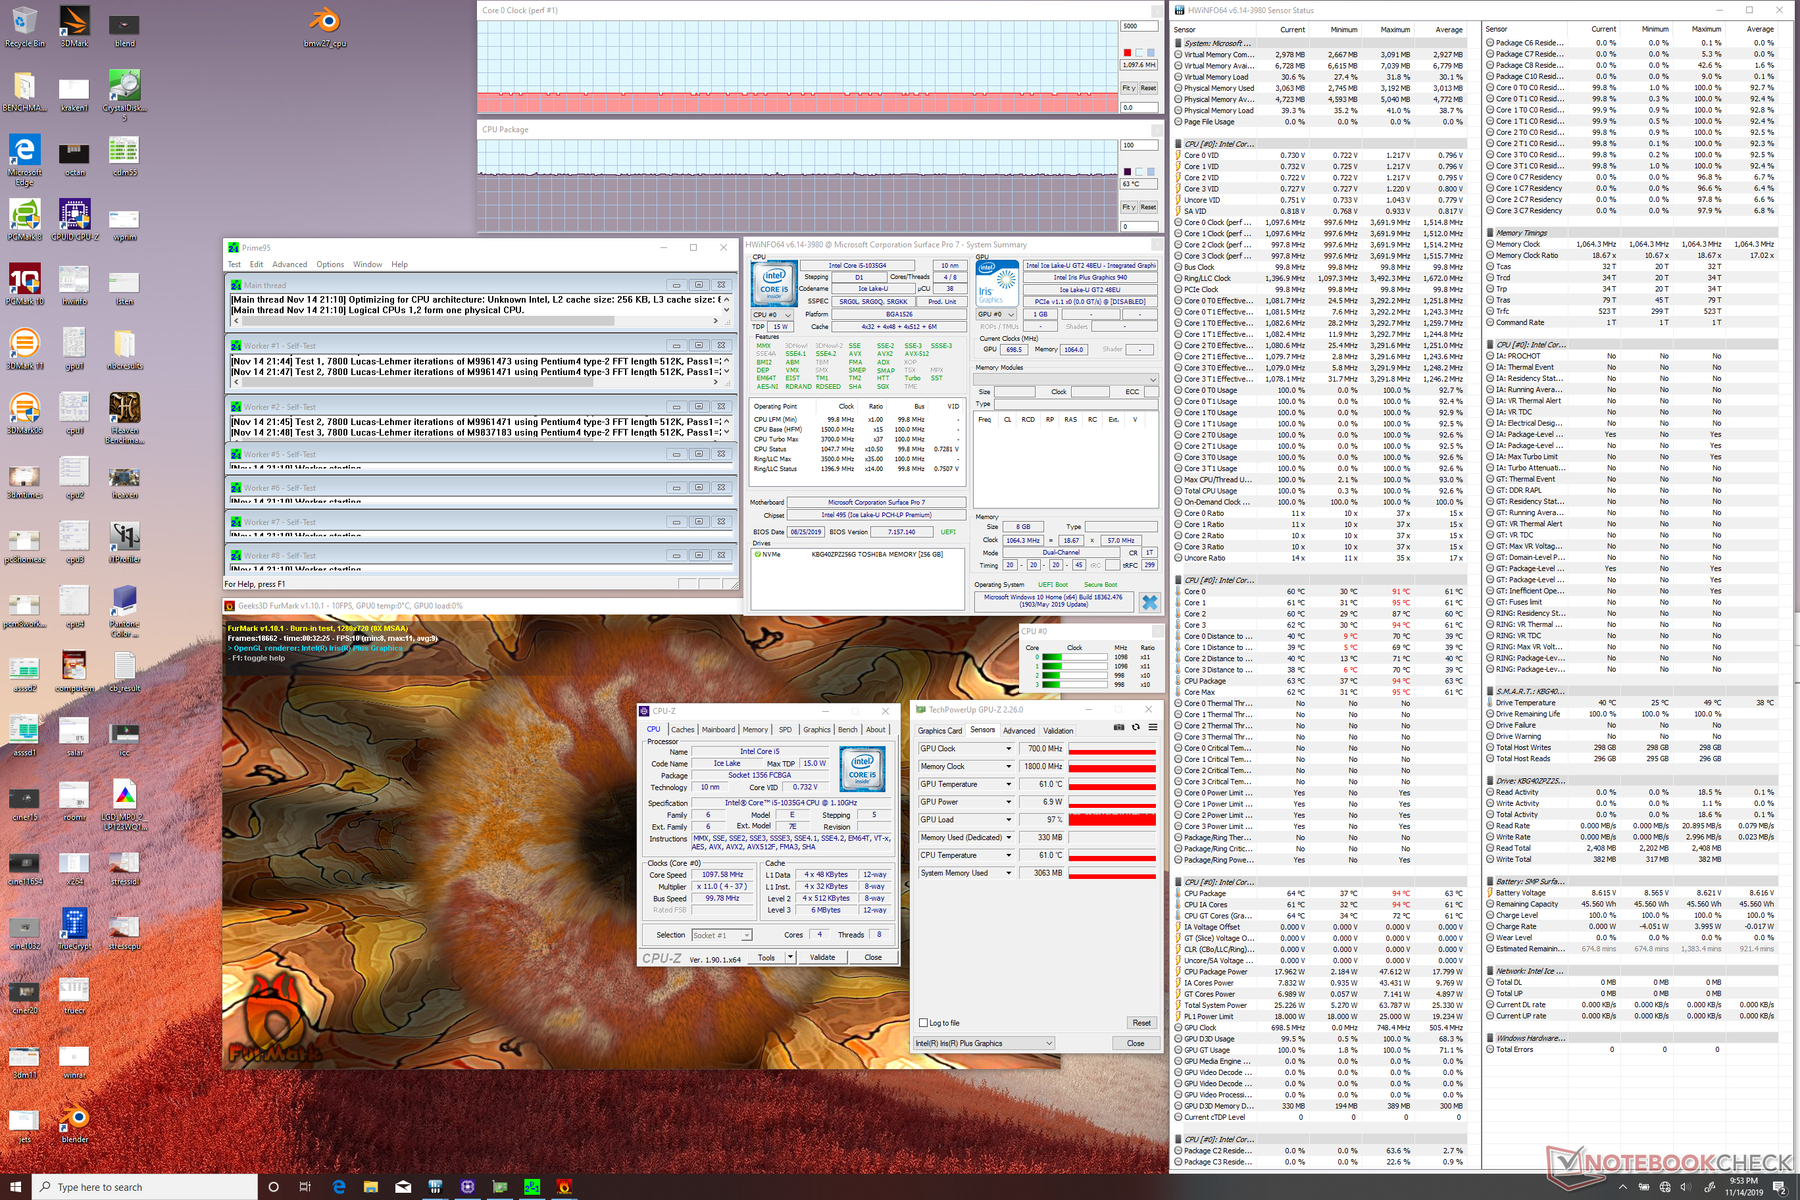
| Prime95 + FurMark Stress | 1.1 | 700 | 63 |
Speakers

Microsoft Surface Pro 7 Core i5-1035G4 audio analysis
(±) | speaker loudness is average but good (78.4 dB)
Bass 100 - 315 Hz
(±) | reduced bass - on average 10.6% lower than median
(±) | linearity of bass is average (11.3% delta to prev. frequency)
Mids 400 - 2000 Hz
(+) | balanced mids - only 4.8% away from median
(+) | mids are linear (4.1% delta to prev. frequency)
Highs 2 - 16 kHz
(±) | higher highs - on average 5.4% higher than median
(±) | linearity of highs is average (7.9% delta to prev. frequency)
Overall 100 - 16.000 Hz
(±) | linearity of overall sound is average (24.9% difference to median)
Compared to same class
» 75% of all tested devices in this class were better, 7% similar, 18% worse
» The best had a delta of 6%, average was 20%, worst was 57%
Compared to all devices tested
» 76% of all tested devices were better, 5% similar, 19% worse
» The best had a delta of 4%, average was 23%, worst was 134%
Apple MacBook 12 (Early 2016) 1.1 GHz audio analysis
(+) | speakers can play relatively loud (83.6 dB)
Bass 100 - 315 Hz
(±) | reduced bass - on average 11.3% lower than median
(±) | linearity of bass is average (14.2% delta to prev. frequency)
Mids 400 - 2000 Hz
(+) | balanced mids - only 2.4% away from median
(+) | mids are linear (5.5% delta to prev. frequency)
Highs 2 - 16 kHz
(+) | balanced highs - only 2% away from median
(+) | highs are linear (4.5% delta to prev. frequency)
Overall 100 - 16.000 Hz
(+) | overall sound is linear (10.2% difference to median)
Compared to same class
» 7% of all tested devices in this class were better, 2% similar, 90% worse
» The best had a delta of 5%, average was 18%, worst was 53%
Compared to all devices tested
» 5% of all tested devices were better, 1% similar, 94% worse
» The best had a delta of 4%, average was 23%, worst was 134%
Energy Management
Power Consumption
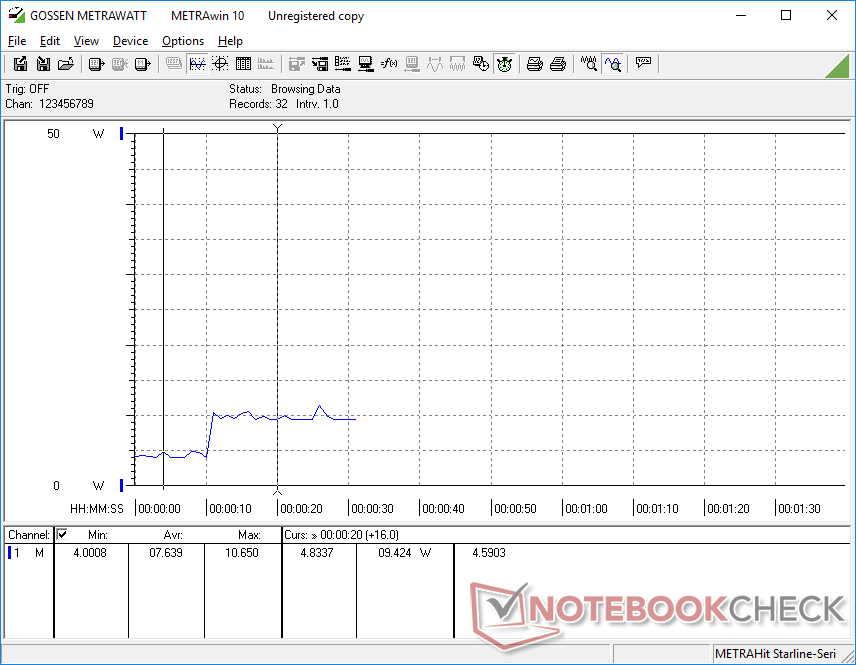
Idling on desktop demands anywhere between 4 W and 10 W which is not all that different from what we recorded on last year's Surface Pro 6. Jumping from the minimum brightness level to the maximum brightness level incurs about 5 W.
Running 3DMark 06 draws about 42 W or 44 percent more than on last year's Surface Pro 7 Core i7 when under similar conditions. Thus, the faster graphics performance will come at the cost of higher power consumption.
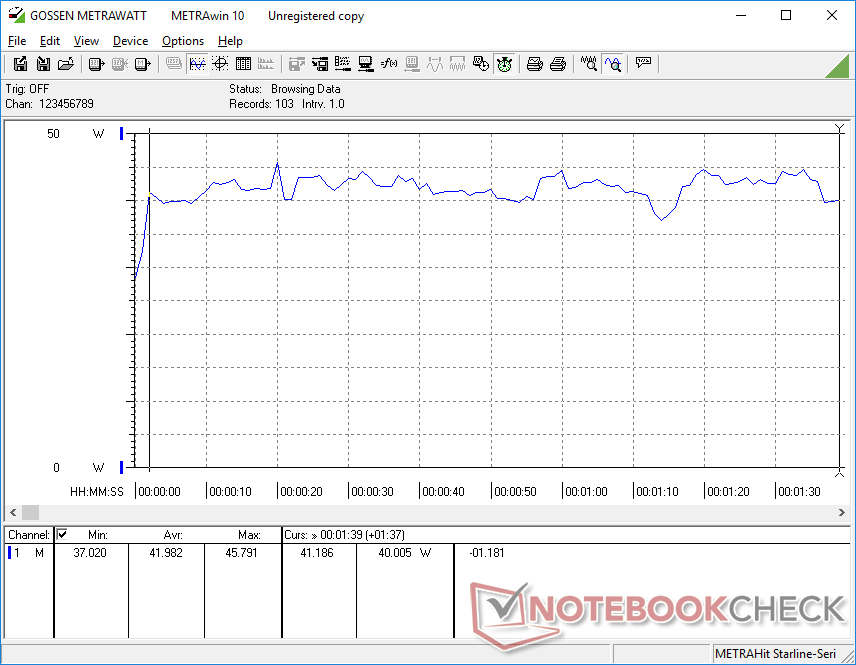
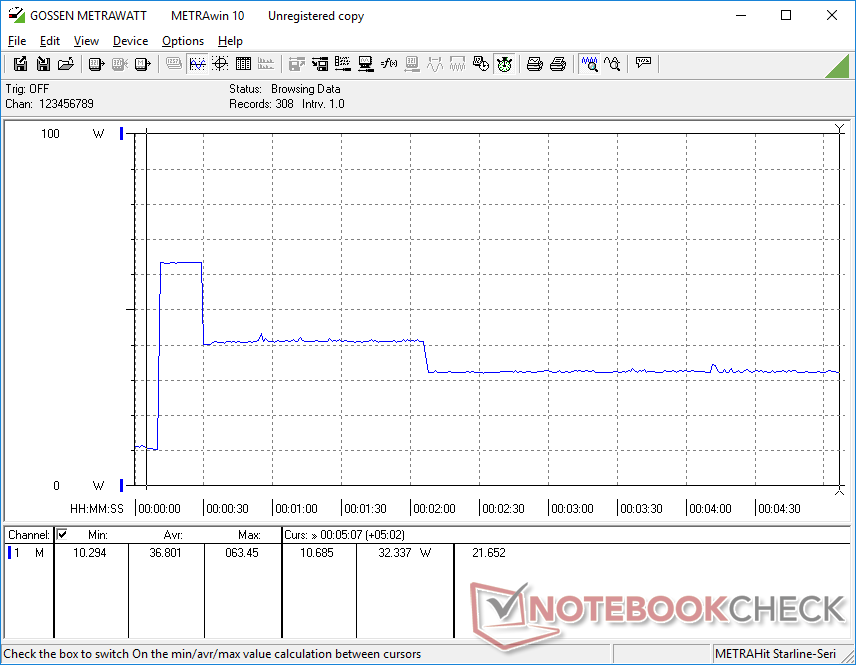
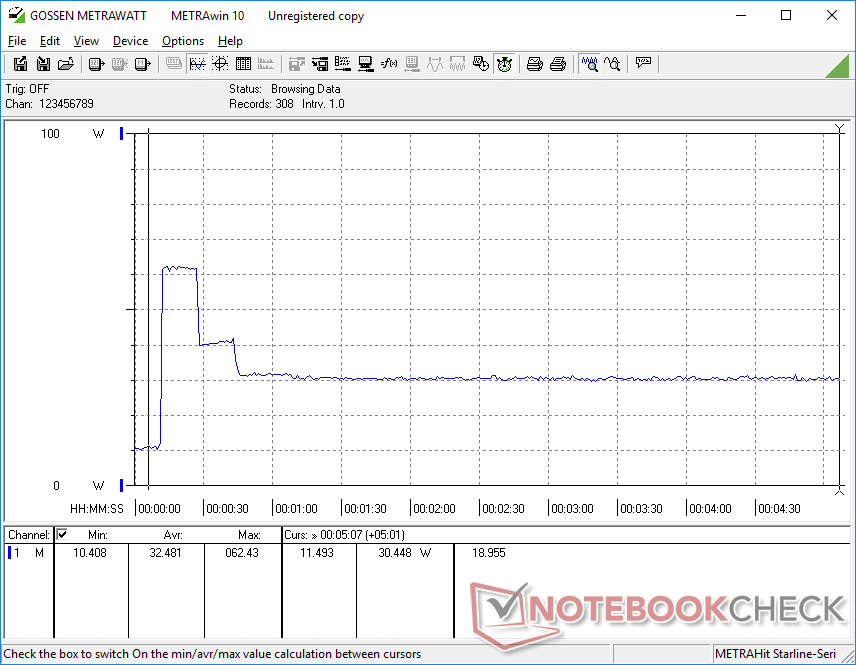
We're able to record a maximum consumption of 63.5 W when running Prime95 from the small (9 x 5 x 2.5 cm) 65 W AC adapter. This spike is higher than what we recorded on last year's Surface Pro 6 by over 20 W to suggest that the Surface Pro 7 is able to offer higher boost clock rates for short periods. The spike is only temporary as consumption eventually falls to 41 W and then finally to 32 W after about 90 seconds as shown by our graph below. This behavior mirrors our CineBench loop test and Prime95 observations above.
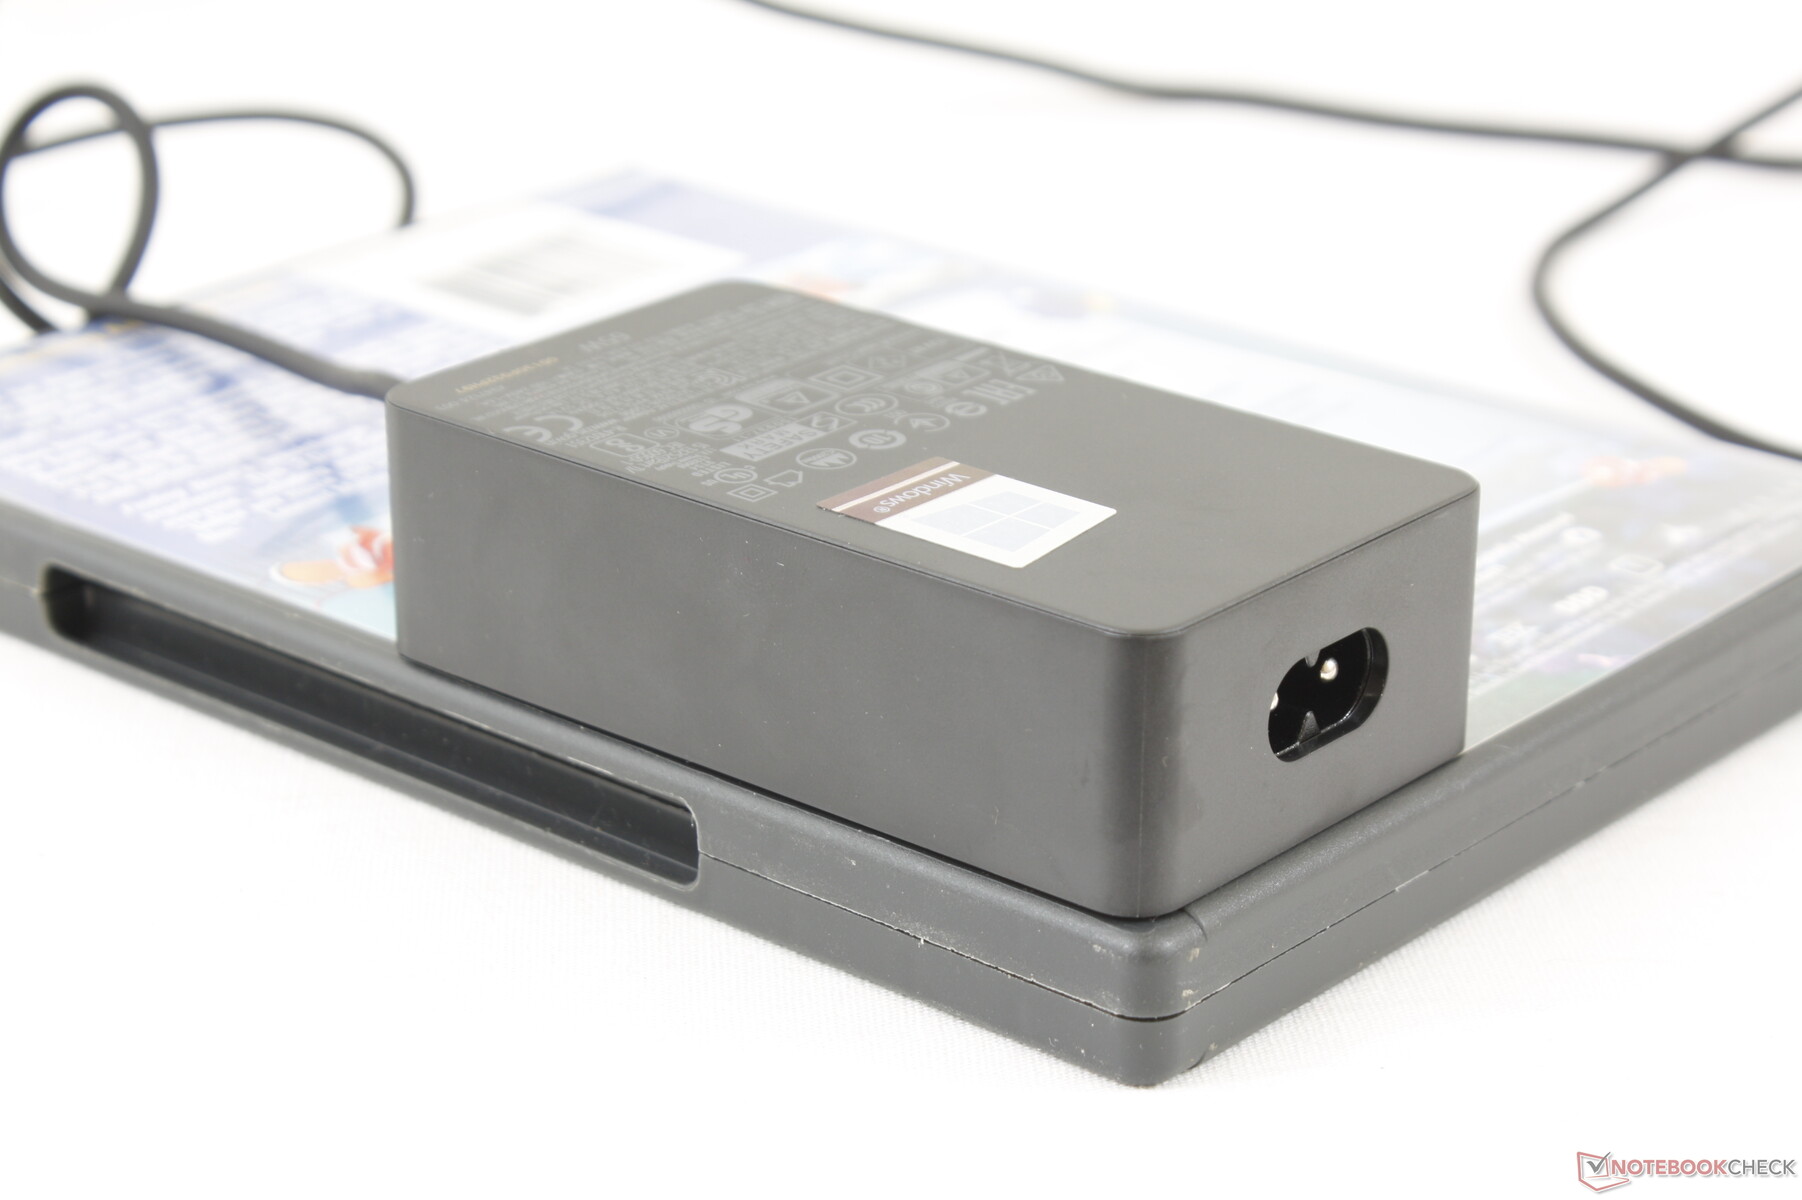
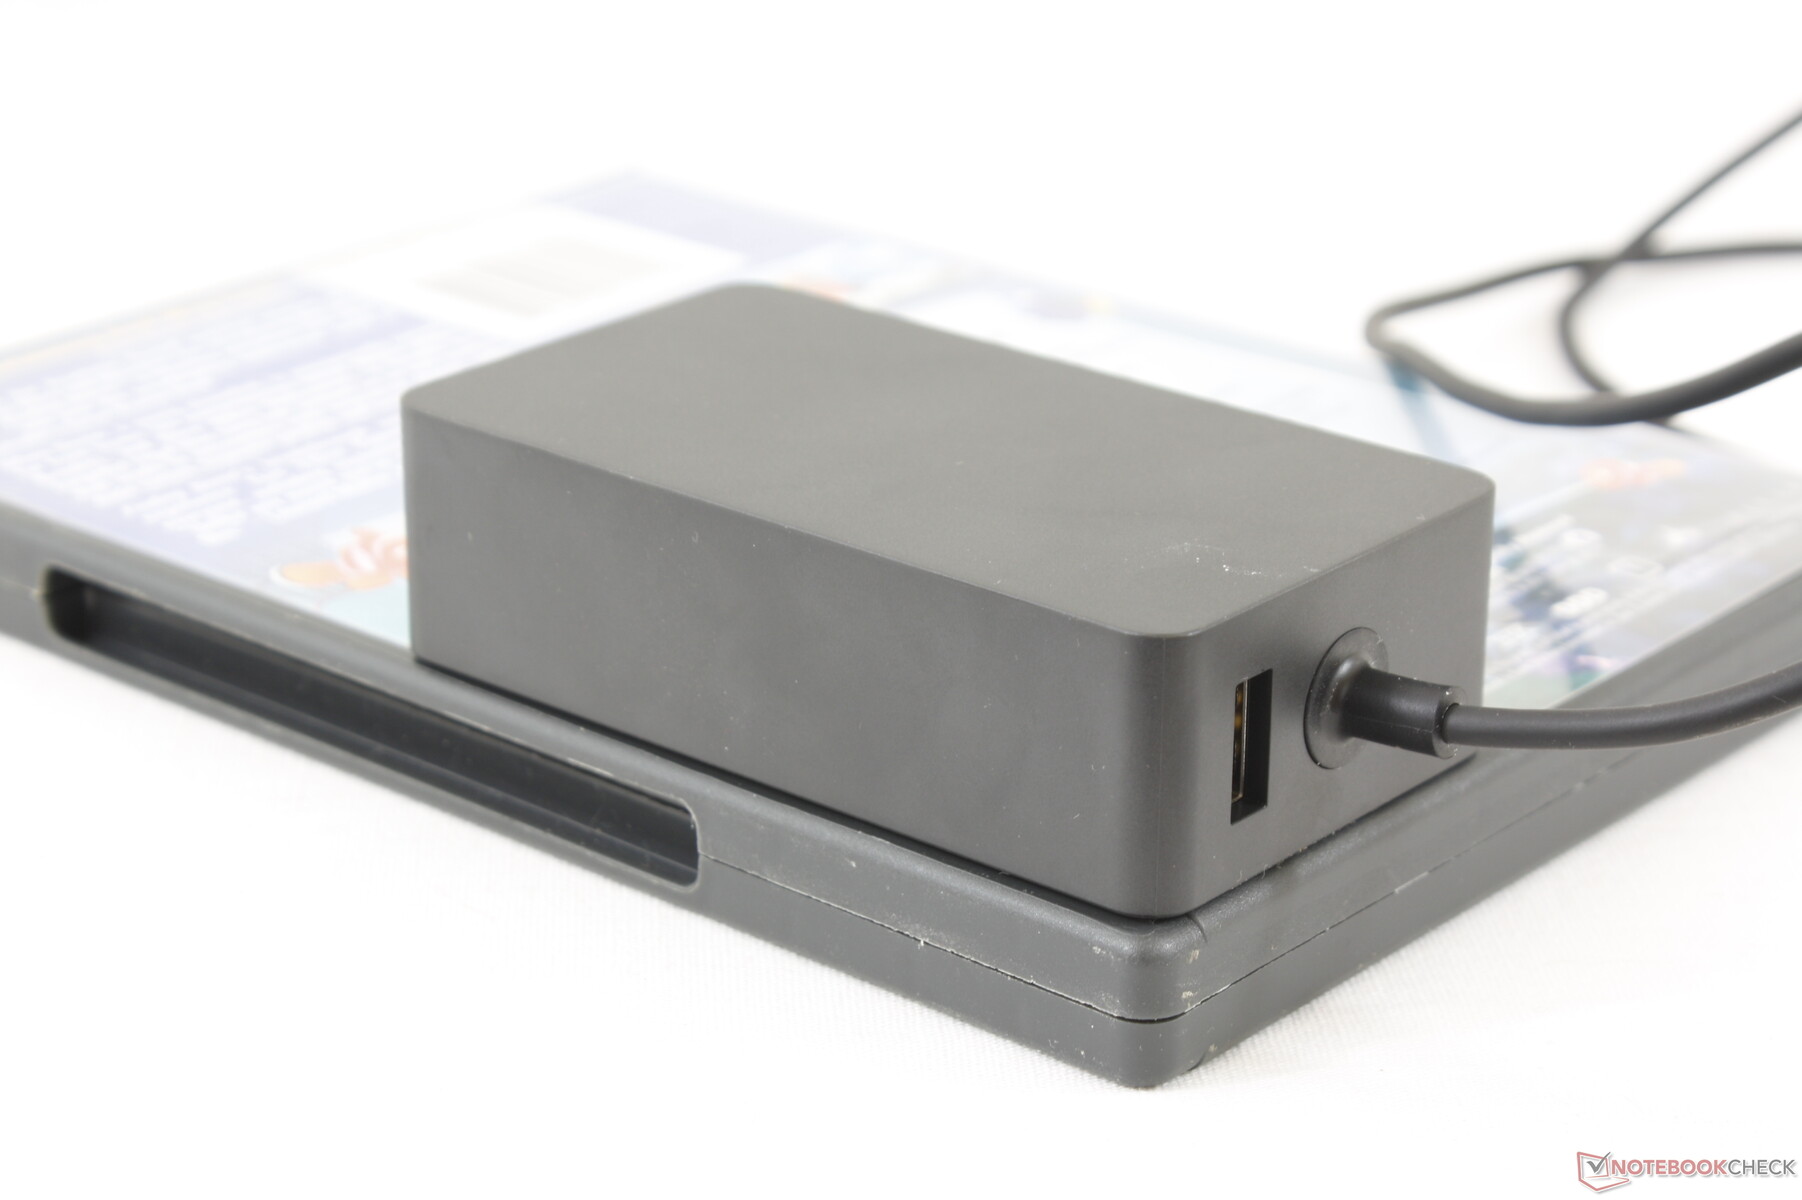
It's worth noting that the Surface Pro 7 ships with the same size AC adapter as on the 15-inch Surface Laptop 3.
| Off / Standby | |
| Idle | |
| Load |
|
Key:
min: | |
| Microsoft Surface Pro 7 Core i5-1035G4 i5-1035G4, Iris Plus Graphics G4 (Ice Lake 48 EU), Toshiba BG4 KBG40ZPZ256G, IPS, 2736x1824, 12.3" | Microsoft Surface Pro 6, Core i7, 512 GB i7-8650U, UHD Graphics 620, Toshiba KBG30ZPZ512G, IPS, 2736x1824, 12.3" | Microsoft Surface Go MHN-00003 Pentium 4415Y, UHD Graphics 615, 64 GB eMMC Flash, IPS, 1800x1200, 10" | Microsoft Surface Pro (2017) i7 i7-7660U, Iris Plus Graphics 640, Samsung PM971 KUS040202M, IPS, 2736x1824, 12.3" | Microsoft Surface Pro (2017) i5 i5-7300U, HD Graphics 620, Samsung PM971 KUS030202M, IPS, 2736x1824, 12.3" | HP Elite x2 1013 G3-2TT14EA i5-8350U, UHD Graphics 620, Samsung PM961 MZVLW256HEHP, IPS, 3000x2000, 13" | |
|---|---|---|---|---|---|---|
| Power Consumption | 18% | 46% | 2% | 29% | 9% | |
| Idle Minimum * (Watt) | 4.5 | 3.2 29% | 2.88 36% | 4.2 7% | 3.6 20% | 4.9 -9% |
| Idle Average * (Watt) | 9.2 | 8.7 5% | 4.8 48% | 10.1 -10% | 8.1 12% | 8.9 3% |
| Idle Maximum * (Watt) | 9.6 | 10.4 -8% | 7.5 22% | 14 -46% | 8.7 9% | 11 -15% |
| Load Average * (Watt) | 42 | 29.2 30% | 16.9 60% | 37.4 11% | 25.5 39% | 32 24% |
| Load Maximum * (Watt) | 63.5 | 40.8 36% | 23.8 63% | 34 46% | 23.5 63% | 36 43% |
| Witcher 3 ultra * (Watt) | 38.1 |
* ... smaller is better
Battery Life
While battery capacity remains the same as it was on the Surface Pro 6, we're able to record longer runtimes on the Surface Pro 7 by about 1.5 hours. Users can expect almost 10 hours of real-world WLAN use out of the latest Surface Pro tablet when the brightness is set to 150 nits (or 30 percent).
Recharging from empty to full takes about 1.5 hours not unlike on most Ultrabooks.
| Microsoft Surface Pro 7 Core i5-1035G4 i5-1035G4, Iris Plus Graphics G4 (Ice Lake 48 EU), 45 Wh | Microsoft Surface Pro 6, Core i7, 512 GB i7-8650U, UHD Graphics 620, 45 Wh | Microsoft Surface Go MHN-00003 Pentium 4415Y, UHD Graphics 615, 28 Wh | Microsoft Surface Pro 4 Core i7 6650U, Iris Graphics 540, 38 Wh | Microsoft Surface Pro 3 4300U, HD Graphics 4400, 42 Wh | HP Elite x2 1013 G3-2TT14EA i5-8350U, UHD Graphics 620, 50 Wh | Microsoft Surface Pro (2017) i5 i5-7300U, HD Graphics 620, 45 Wh | |
|---|---|---|---|---|---|---|---|
| Battery runtime | -6% | -3% | -45% | -4% | -15% | 17% | |
| Reader / Idle (h) | 22.3 | 18.1 -19% | 12.9 -42% | 10.9 -51% | 18.3 -18% | 13 -42% | 17.6 -21% |
| WiFi v1.3 (h) | 10 | 8.5 -15% | 7.5 -25% | 4.9 -51% | 7.7 -23% | 12.4 24% | |
| Load (h) | 1.9 | 2.2 16% | 3 58% | 1.3 -32% | 2.1 11% | 2.3 21% | 2.8 47% |
| WiFi (h) | 8.4 |
Pros
Cons
Verdict

If you're a content owner of a Surface Pro 5 or Surface Pro 6, then there is little reason to upgrade to the Surface Pro 7. It's tough to recommend Microsoft's latest iteration when it offers the exact same display as the two-year old Surface Pro 5 and roughly the same CPU performance as the Surface Pro 6 Core i7. It all comes down to how much you value the integrated USB Type-C port and the faster integrated graphics performance of the Iris Plus G4 or G7. The latter in particular can certainly aid in light photo editing and image processing tasks, but if your intention is to use the tablet primarily for word processing, emailing, browsing, or video streaming, then the Surface Pro 6 Core i5 or Core i7 SKUs can offer essentially the same experience for less.
The numbered Surface Pro series has felt stagnant since the 2017 Surface Pro 5. While these SKUs are still some of the better Windows tablets in the market, we're crossing our fingers than the 2020 Surface Pro will be more of an evolution for the series rather than yet another marginal iteration.
The Surface Pro 7 feels more like a SKU of the Surface Pro 6 rather than a full on numbered successor. Its upgrades are minor and mostly unnoticeable to most users who are only interested in basic office tasks like word processing, browsing, and video streaming.
Microsoft Surface Pro 7 Core i5-1035G4
- 11/19/2019 v7 (old)
Allen Ngo
Price comparison
