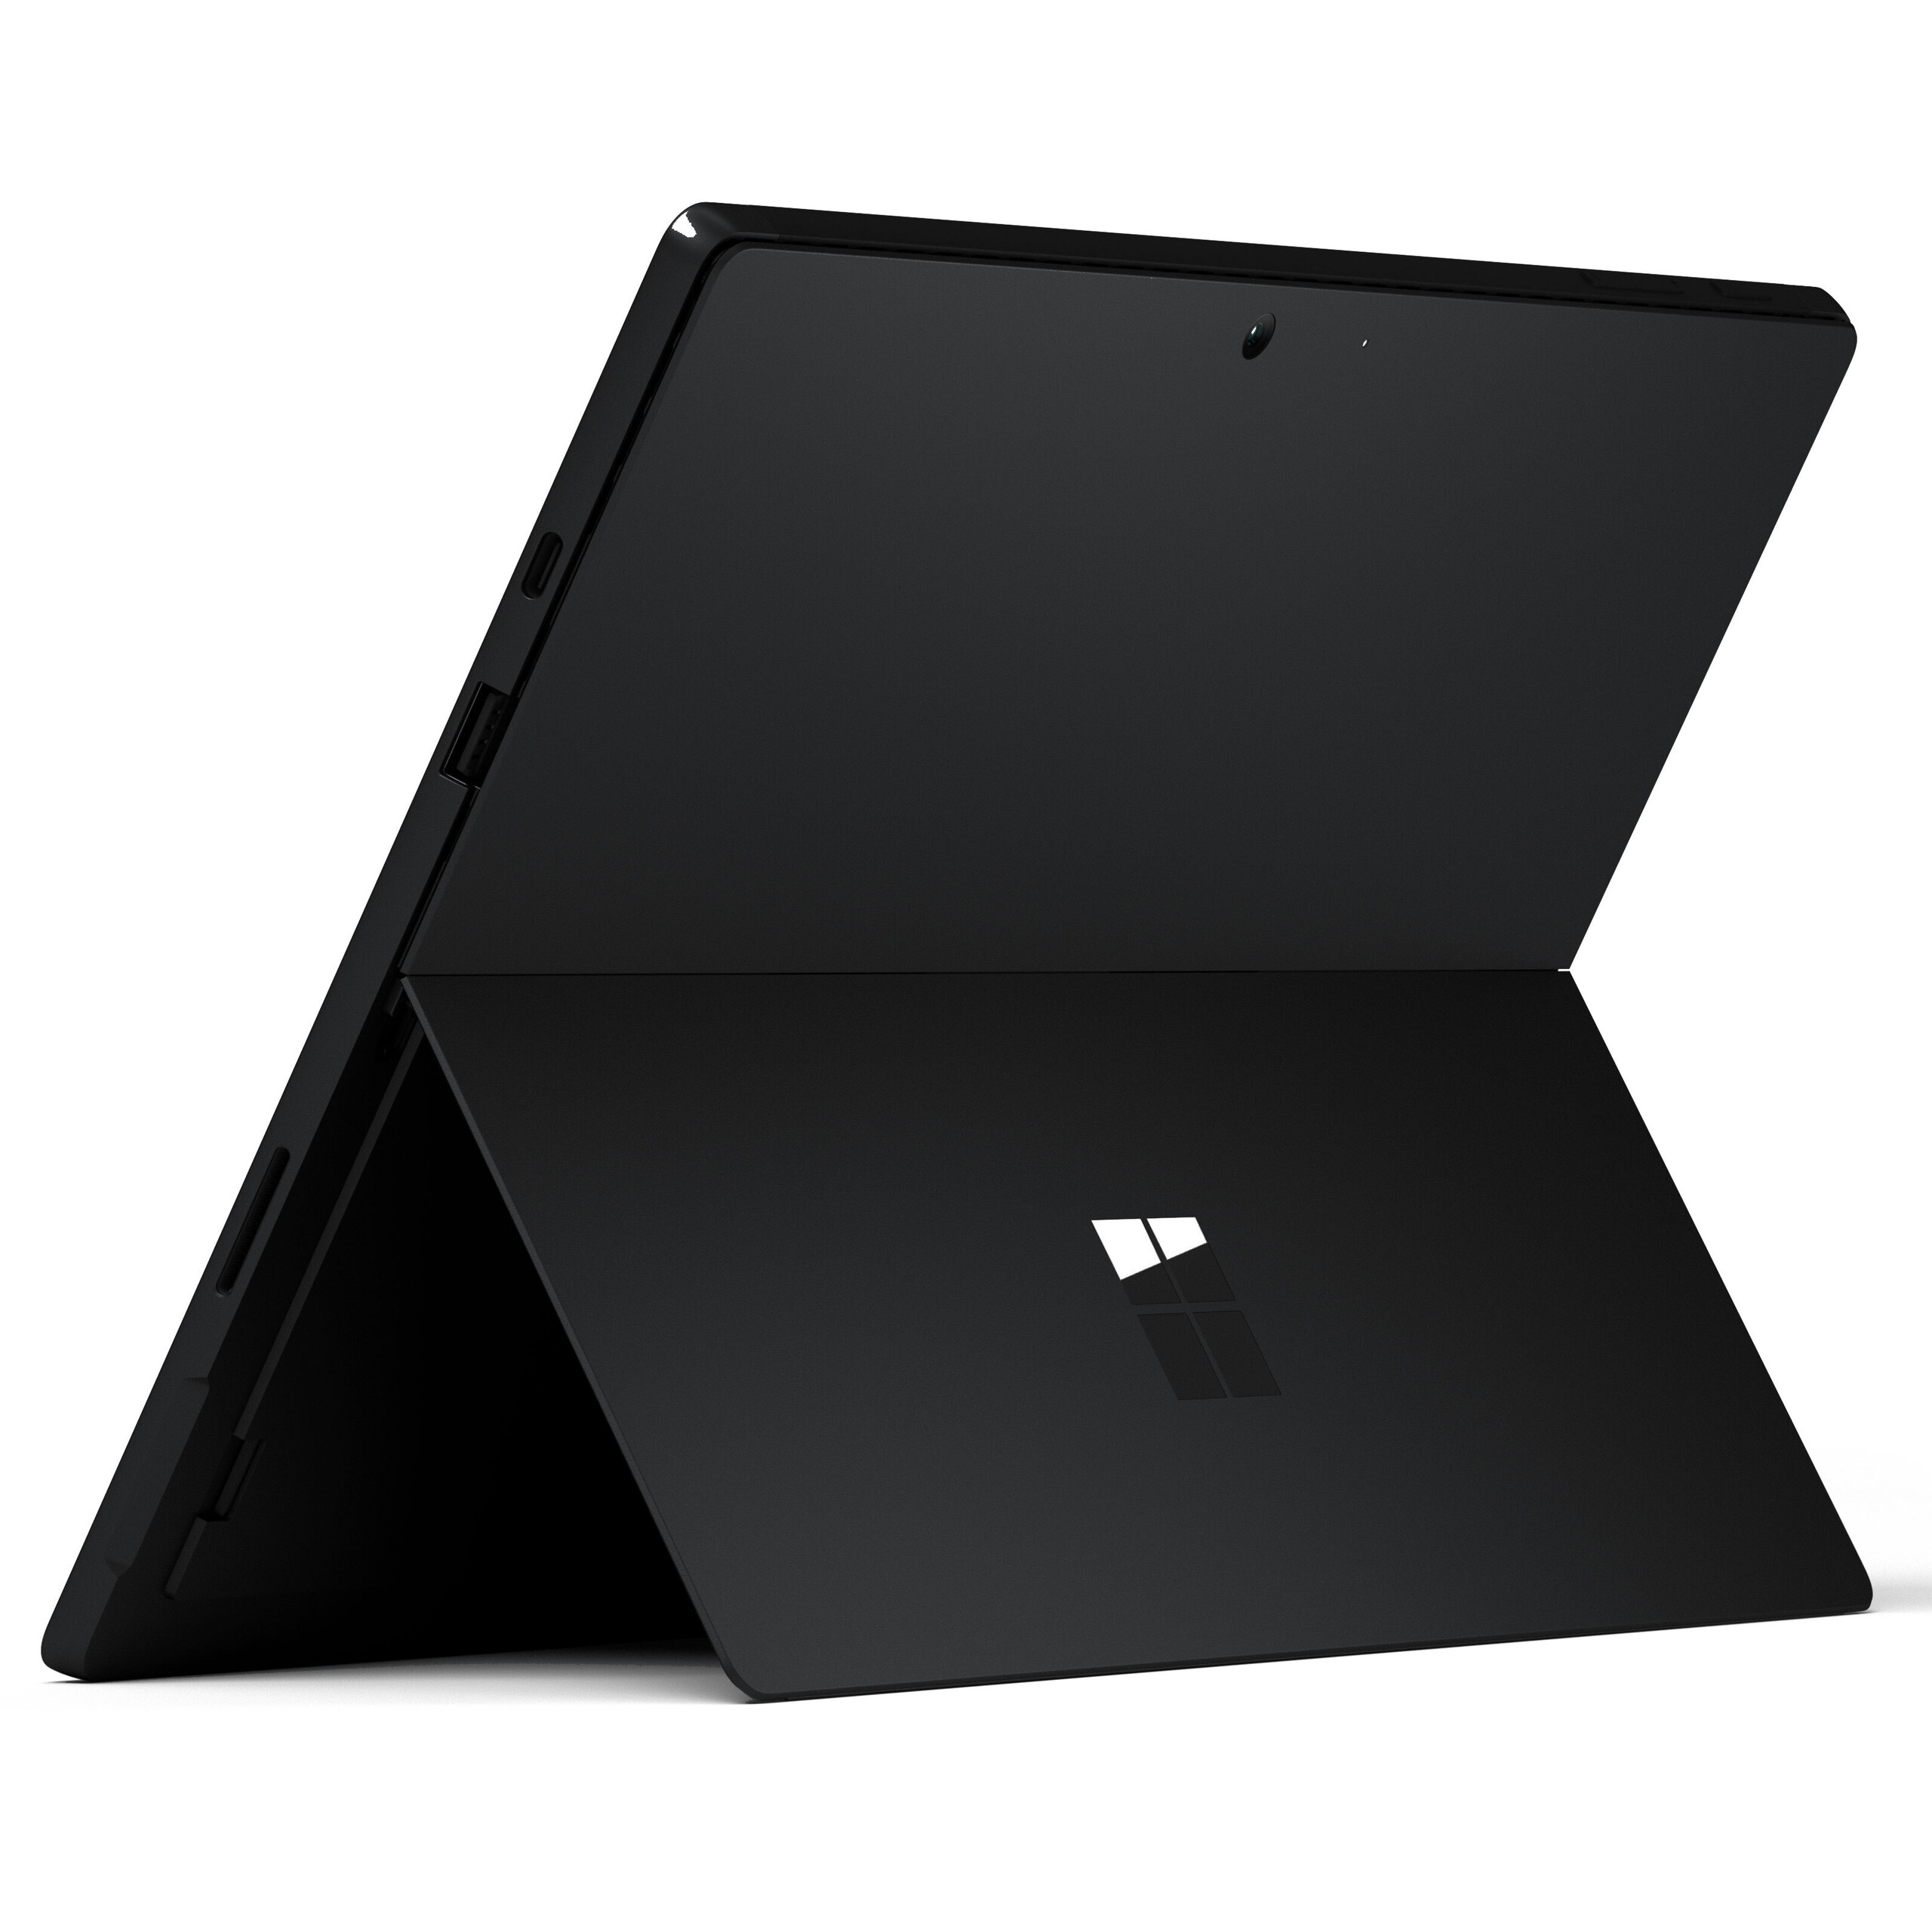
Microsoft Surface Pro 7 Review: An i7 Upgrade with Extra GPU Performance
If you happen to be in the market for a Surface Pro 7 you will inevitably ask yourself what processor to get. Is the extra charge for the i7 CPU justified? Let’s find out in our review.
Today’s review unit is the almost fully loaded configuration, equipped with 16 GB of RAM, an Intel Core i7-1065G7, and a 256 GB SSD. Just a few months ago we had the i5 SKU of said Surface Pro 7 in review. In this article, we want to compare the two in order to help prospective buyers to make an informed decision. What exactly do you get if you opt for the more expensive model? Our 256 GB review unit is the cheapest i7 SKU currently available and was priced at $1,499 at the time of writing. Compare that to the various Intel-Core-i5-1035G4 SKUs starting at $899 and going all the way up to $1,399.
In this review we are going to focus on the differences between the i5 and the i7 SKU. Further details can be found in our extensive Surface Pro 7 i5 review.
Rating | Date | Model | Weight | Height | Size | Resolution | Price |
|---|---|---|---|---|---|---|---|
| 88.1 % v7 (old) | 02 / 2020 | Microsoft Surface Pro 7 i7-1065G7, Iris Plus Graphics G7 (Ice Lake 64 EU) | 790 g | 8.5 mm | 12.30" | 2736x1824 | |
| 88.4 % v7 (old) | 11 / 2019 | Microsoft Surface Pro 7 Core i5-1035G4 i5-1035G4, Iris Plus Graphics G4 (Ice Lake 48 EU) | 1.1 kg | 8.5 mm | 12.30" | 2736x1824 | |
| 89.6 % v6 (old) | 07 / 2017 | Microsoft Surface Pro (2017) i7 i7-7660U, Iris Plus Graphics 640 | 1.1 kg | 8.5 mm | 12.30" | 2736x1824 | |
| 86.3 % v7 (old) | 10 / 2019 | Dell XPS 13 7390 2-in-1 Core i7 i7-1065G7, Iris Plus Graphics G7 (Ice Lake 64 EU) | 1.3 kg | 13 mm | 13.40" | 1920x1200 | |
| 88.4 % v7 (old) | 12 / 2019 | HP Spectre x360 13-aw0013dx i7-1065G7, Iris Plus Graphics G7 (Ice Lake 64 EU) | 1.2 kg | 16.9 mm | 13.30" | 1920x1080 |
SD Card Reader
When benchmarked with our 64 GB Toshiba Exceria Pro SDXC UHS-II reference card the Surface Pro 7 managed the same speeds as its i5 sibling and previous generation Surface models. Overall, transfer rates can be considered to be somewhere between average and good.
| SD Card Reader | |
| average JPG Copy Test (av. of 3 runs) | |
| Microsoft Surface Book 2 15 (Toshiba Exceria Pro SDXC 64 GB UHS-II) | |
| Dell XPS 13 7390 2-in-1 Core i7 (Toshiba Exceria Pro M501 64 GB UHS-II) | |
| Microsoft Surface Pro 6, Core i7, 512 GB (Toshiba Exceria Pro M501 microSDXC 64GB) | |
| Microsoft Surface Pro 7 (Toshiba Exceria Pro M501 microSDXC 64GB) | |
| Chuwi UBook Pro (Toshiba Exceria Pro M501 64 GB UHS-II) | |
| Microsoft Surface Go MHN-00003 (Toshiba Exceria Pro M501) | |
| Average of class Convertible (29.4 - 141, n=21, last 2 years) | |
| Microsoft Surface Pro (2017) i7 (Toshiba Exceria Pro M401 64 GB) | |
| maximum AS SSD Seq Read Test (1GB) | |
| Microsoft Surface Book 2 15 (Toshiba Exceria Pro SDXC 64 GB UHS-II) | |
| Dell XPS 13 7390 2-in-1 Core i7 (Toshiba Exceria Pro M501 64 GB UHS-II) | |
| Average of class Convertible (67.5 - 254, n=20, last 2 years) | |
| Microsoft Surface Pro 7 (Toshiba Exceria Pro M501 microSDXC 64GB) | |
| Microsoft Surface Pro (2017) i7 (Toshiba Exceria Pro M401 64 GB) | |
| Microsoft Surface Pro 6, Core i7, 512 GB (Toshiba Exceria Pro M501 microSDXC 64GB) | |
| Microsoft Surface Go MHN-00003 (Toshiba Exceria Pro M501) | |
| Chuwi UBook Pro (Toshiba Exceria Pro M501 64 GB UHS-II) | |
Communication
Intel’s Wi-Fi 6 AX201 modem managed transfer speeds of 634 to 836 Mbps in our tests. Accordingly, it was very close to the theoretical maximum of 866 Mbps. Competing convertibles are incapable of keeping up with the Surface Pro 7.
Display
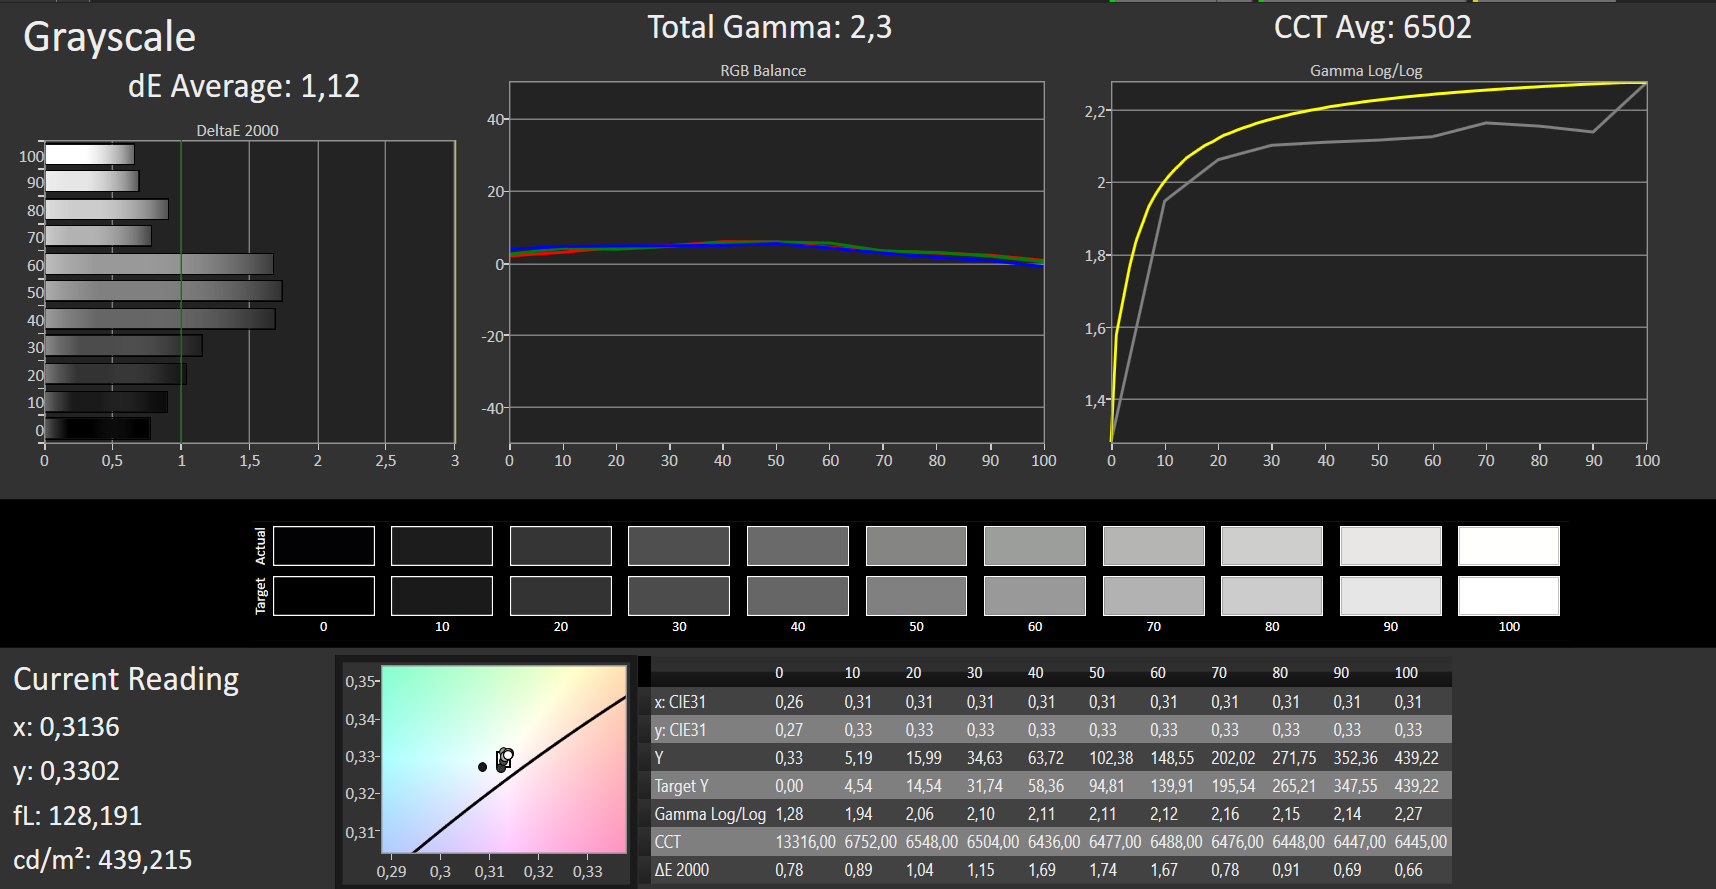
No news in this category. The i7 SKU features the same display panel as our previously reviewed i5 SKU. Nevertheless, today’s review unit showed a slightly reduced maximum display brightness of 60 nits less than its i5 sibling. At around 420 nits the IPS display remains very bright and certainly more than bright enough for most use cases.
| |||||||||||||||||||||||||
Brightness Distribution: 90 %
Center on Battery: 435 cd/m²
Contrast: 1359:1 (Black: 0.32 cd/m²)
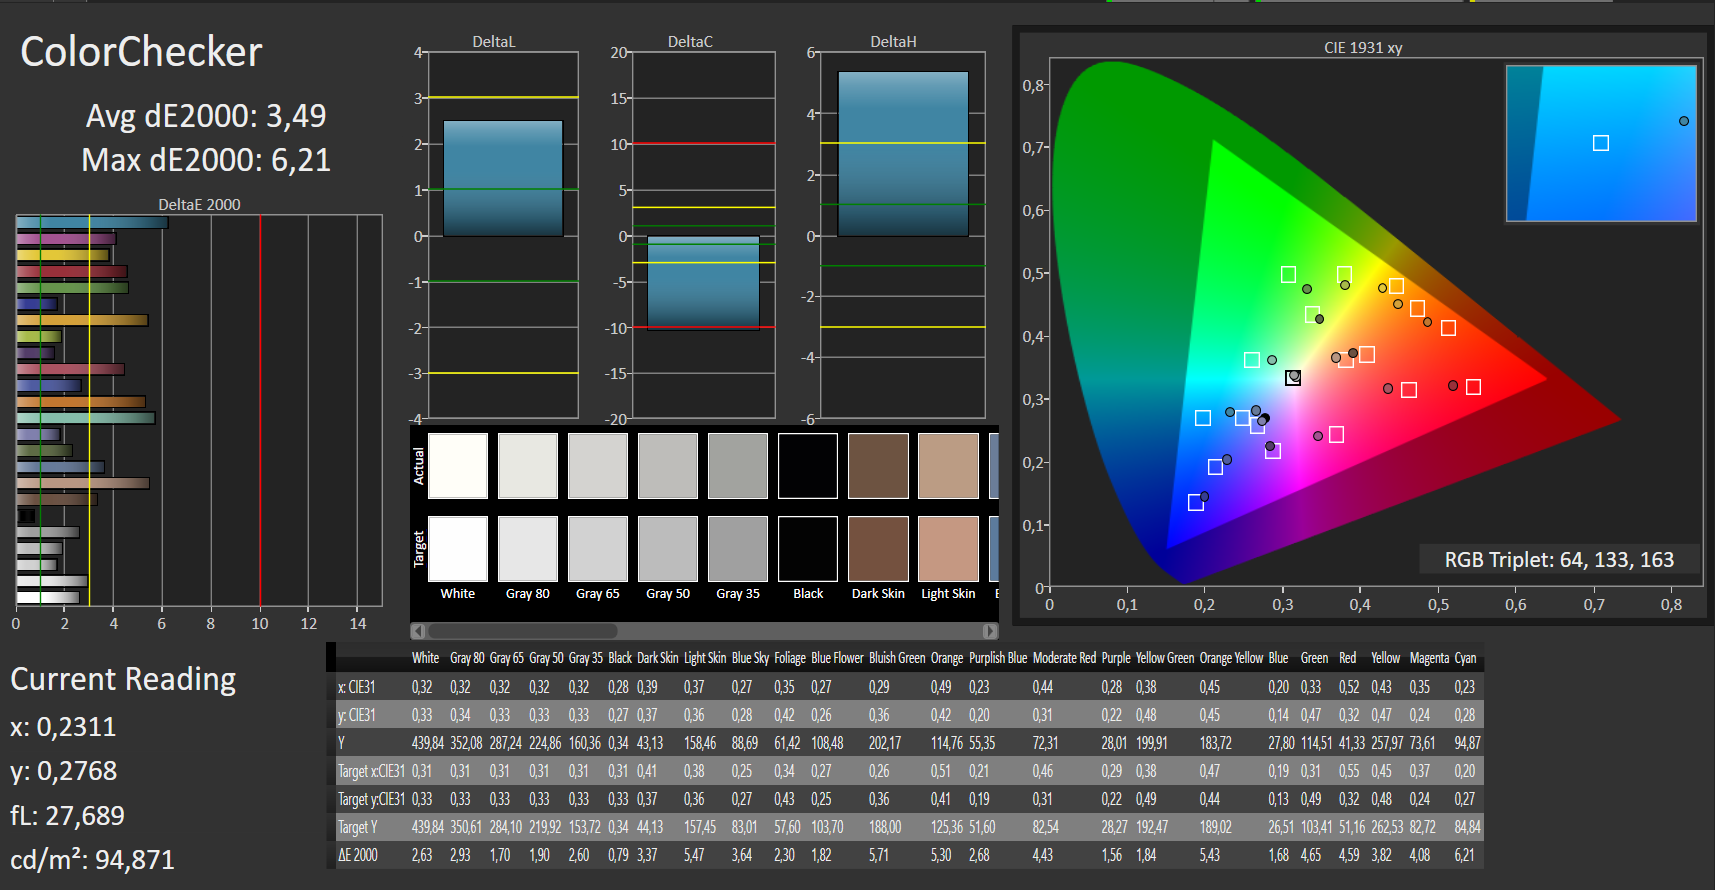
ΔE ColorChecker Calman: 1.18 | ∀{0.5-29.43 Ø4.72}
calibrated: 3.49
ΔE Greyscale Calman: 1.12 | ∀{0.09-98 Ø4.97}
96% sRGB (Argyll 1.6.3 3D)
60% AdobeRGB 1998 (Argyll 1.6.3 3D)
65.7% AdobeRGB 1998 (Argyll 3D)
95.8% sRGB (Argyll 3D)
63.7% Display P3 (Argyll 3D)
Gamma: 2.3
CCT: 6502 K
| Microsoft Surface Pro 7 LG Philips LP123WQ112604, IPS, 2736x1824, 12.3" | Microsoft Surface Pro 7 Core i5-1035G4 LG Philips LP123WQ112604, IPS, 2736x1824, 12.3" | Dell XPS 13 7390 2-in-1 Core i7 Sharp LQ134N1, IPS, 1920x1200, 13.4" | Chuwi UBook Pro BOE TV123WAM-ND0, IPS, 1920x1280, 12.3" | Microsoft Surface Pro 6, Core i7, 512 GB LGPhilips LP123WQ112604, IPS, 2736x1824, 12.3" | |
|---|---|---|---|---|---|
| Display | 1% | 8% | -1% | 3% | |
| Display P3 Coverage (%) | 63.7 | 66 4% | 69.9 10% | 63.3 -1% | 67.1 5% |
| sRGB Coverage (%) | 95.8 | 93.8 -2% | 99.2 4% | 94 -2% | 95.5 0% |
| AdobeRGB 1998 Coverage (%) | 65.7 | 66.9 2% | 71.5 9% | 65.1 -1% | 67.9 3% |
| Response Times | 10% | -12% | 14% | 2% | |
| Response Time Grey 50% / Grey 80% * (ms) | 40 ? | 34.8 ? 13% | 47.6 ? -19% | 30.8 ? 23% | 43 ? -8% |
| Response Time Black / White * (ms) | 28 ? | 26.4 ? 6% | 29.2 ? -4% | 26.8 ? 4% | 25 ? 11% |
| PWM Frequency (Hz) | 250 ? | 21550 ? | 2500 ? | 22000 ? | |
| Screen | -92% | -16% | -90% | -58% | |
| Brightness middle (cd/m²) | 435 | 480.4 10% | 549.8 26% | 867.6 99% | 484 11% |
| Brightness (cd/m²) | 422 | 485 15% | 520 23% | 818 94% | 473 12% |
| Brightness Distribution (%) | 90 | 91 1% | 86 -4% | 83 -8% | 91 1% |
| Black Level * (cd/m²) | 0.32 | 0.48 -50% | 0.39 -22% | 0.78 -144% | 0.33 -3% |
| Contrast (:1) | 1359 | 1001 -26% | 1410 4% | 1112 -18% | 1467 8% |
| Colorchecker dE 2000 * | 1.18 | 5 -324% | 2.12 -80% | 4.64 -293% | 4.29 -264% |
| Colorchecker dE 2000 max. * | 2.27 | 7.72 -240% | 3.66 -61% | 9.22 -306% | 6.46 -185% |
| Colorchecker dE 2000 calibrated * | 3.49 | 2.44 30% | 1.37 61% | 2.31 34% | 1.34 62% |
| Greyscale dE 2000 * | 1.12 | 5.9 -427% | 2.6 -132% | 6.1 -445% | 4.3 -284% |
| Gamma | 2.3 96% | 2.38 92% | 2.3 96% | 2.22 99% | 2.51 88% |
| CCT | 6502 100% | 7805 83% | 6884 94% | 7346 88% | 7315 89% |
| Color Space (Percent of AdobeRGB 1998) (%) | 60 | 60.3 0% | 65.4 9% | 59 -2% | 62 3% |
| Color Space (Percent of sRGB) (%) | 96 | 93.2 -3% | 99.7 4% | 93.7 -2% | 95 -1% |
| Total Average (Program / Settings) | -27% /
-62% | -7% /
-11% | -26% /
-61% | -18% /
-39% |
* ... smaller is better
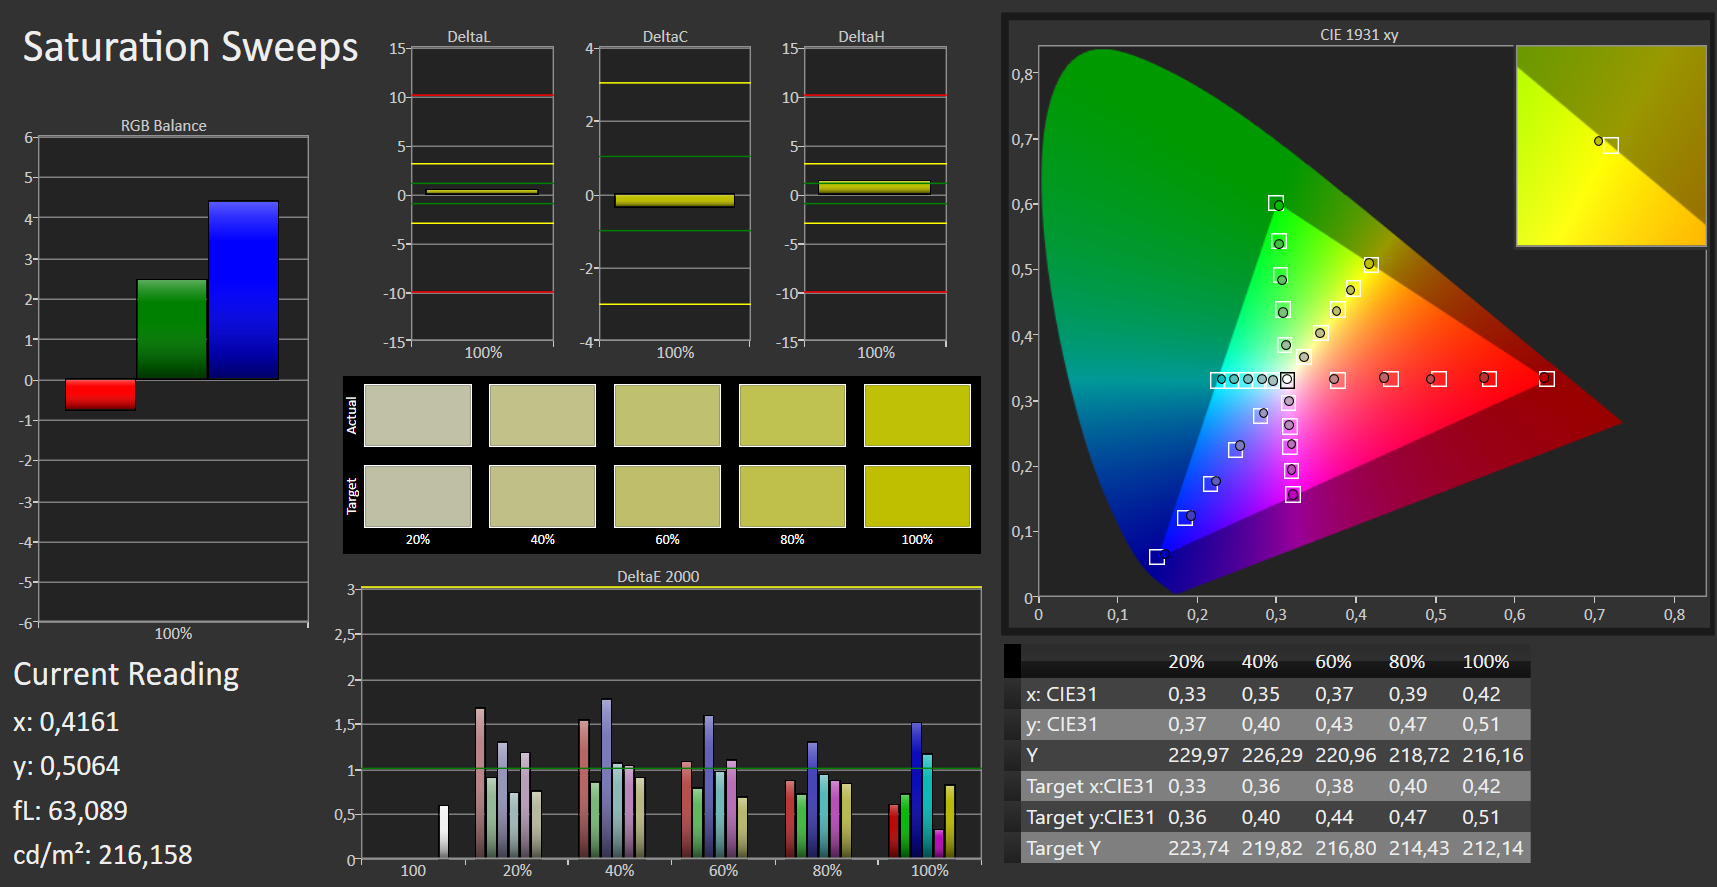
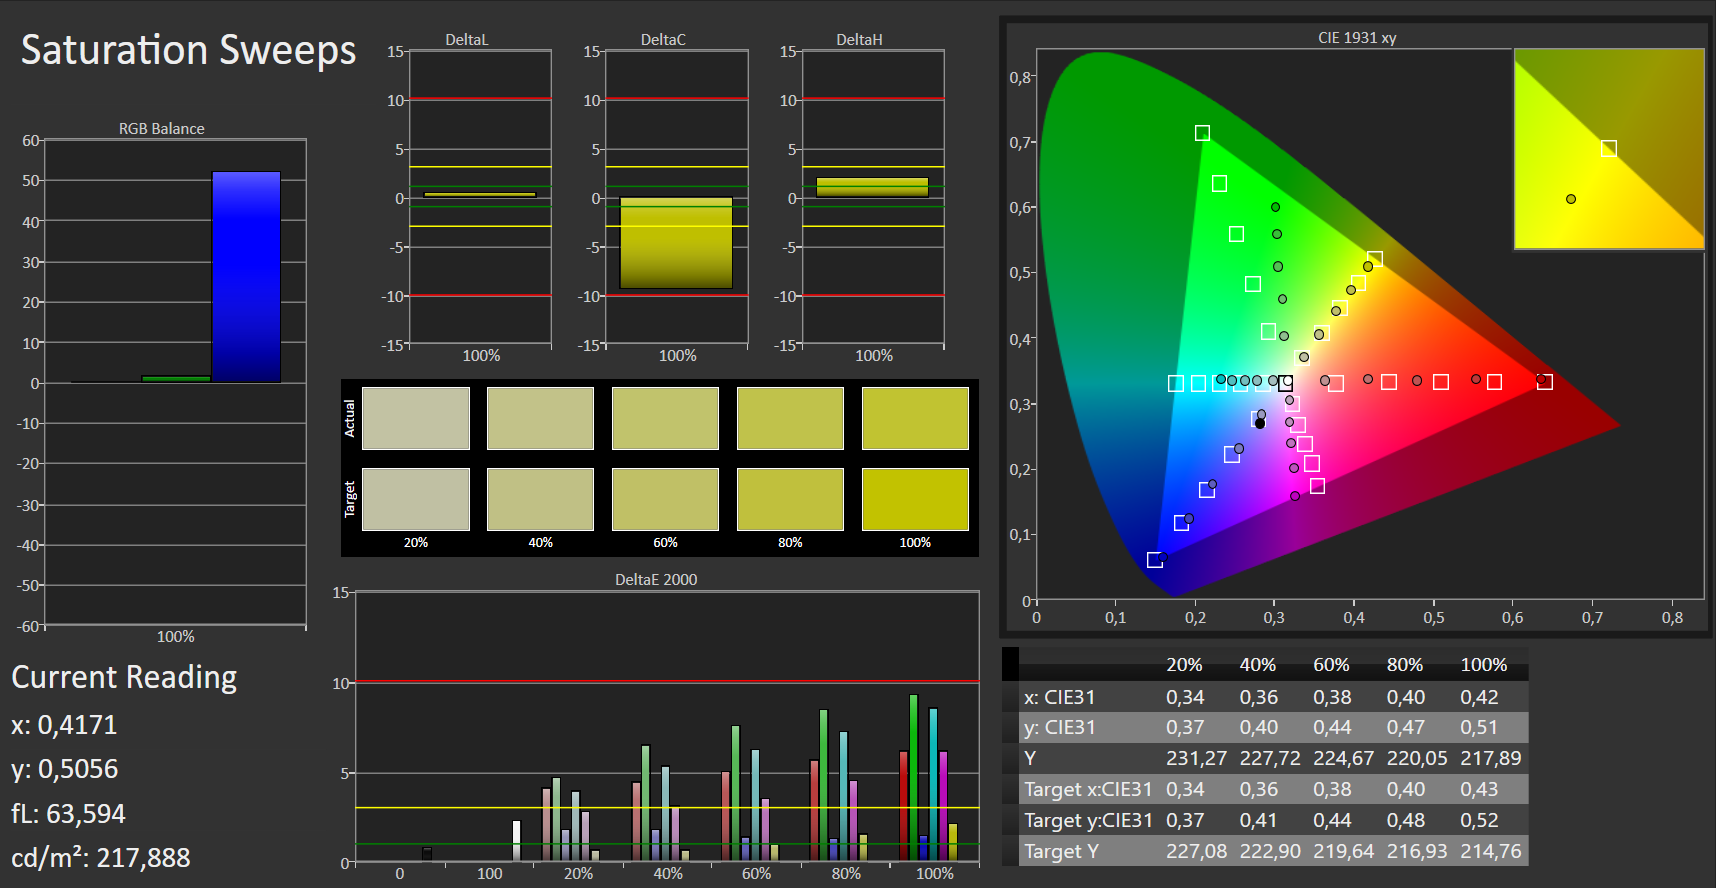
As expected of a high-quality IPS panel colors and grayscale were fairly accurate overall. Color space coverage was measured at 96% sRGB and 60% AdobeRGB.

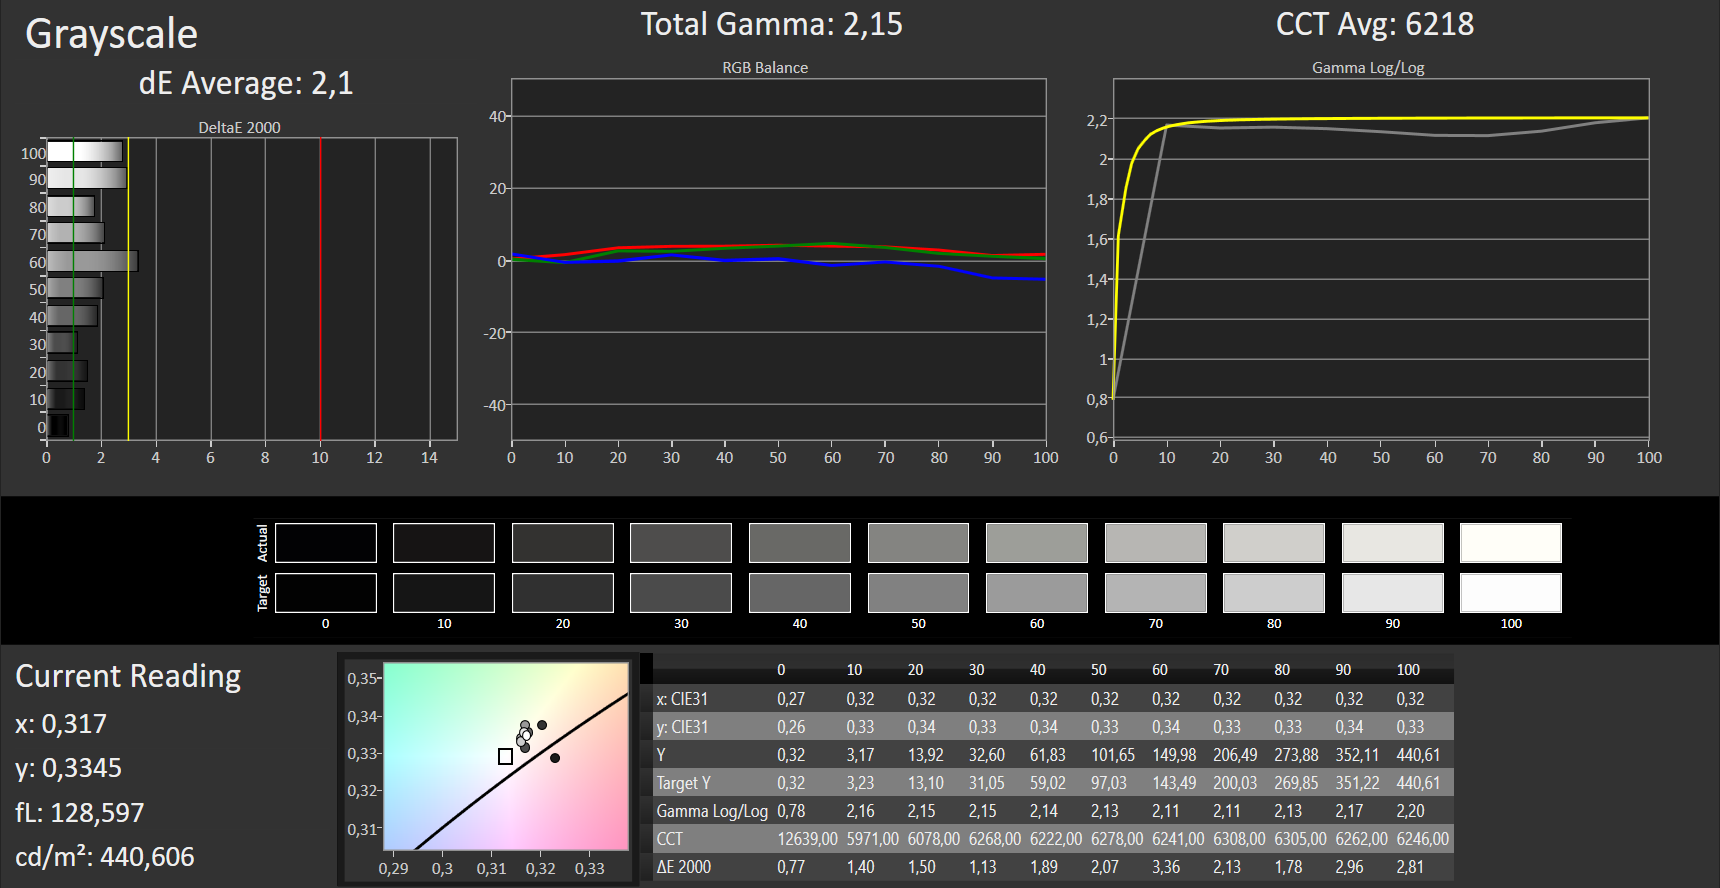
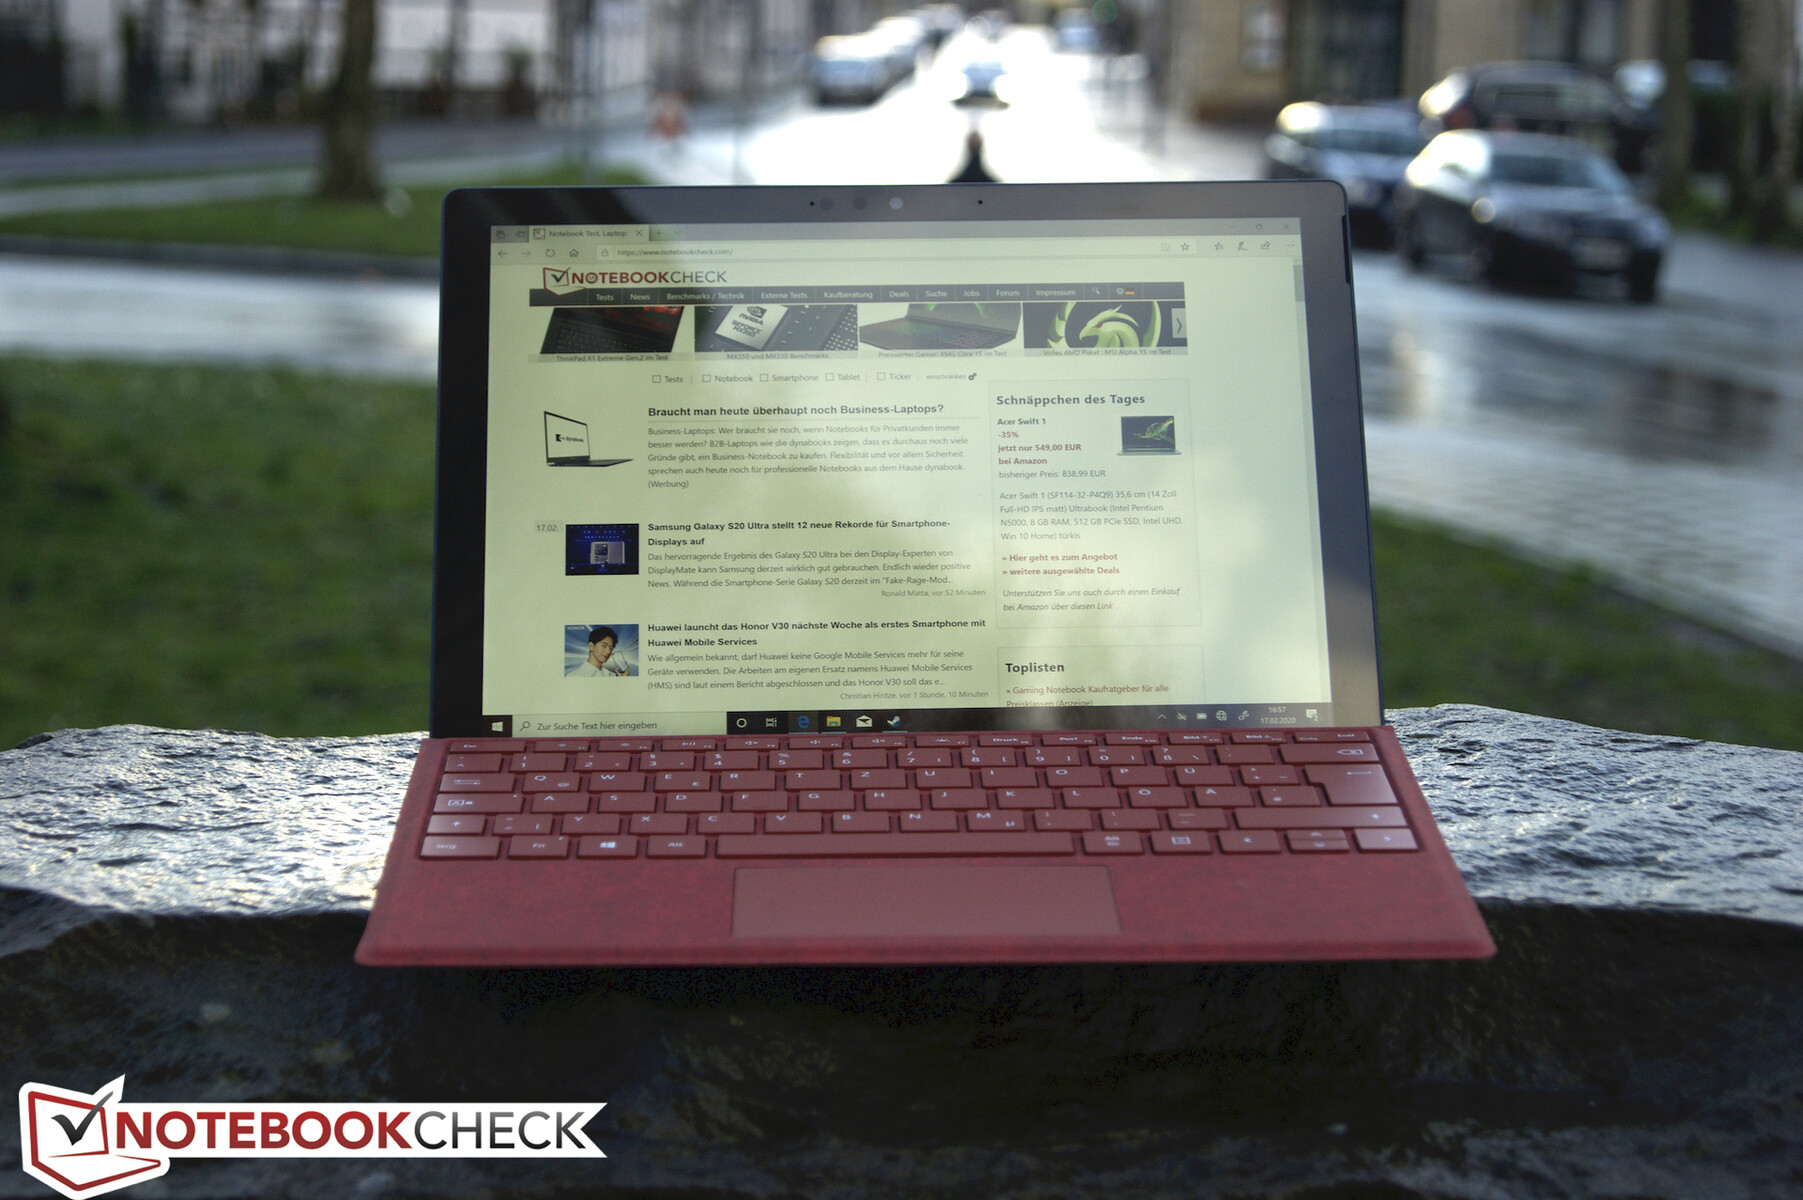
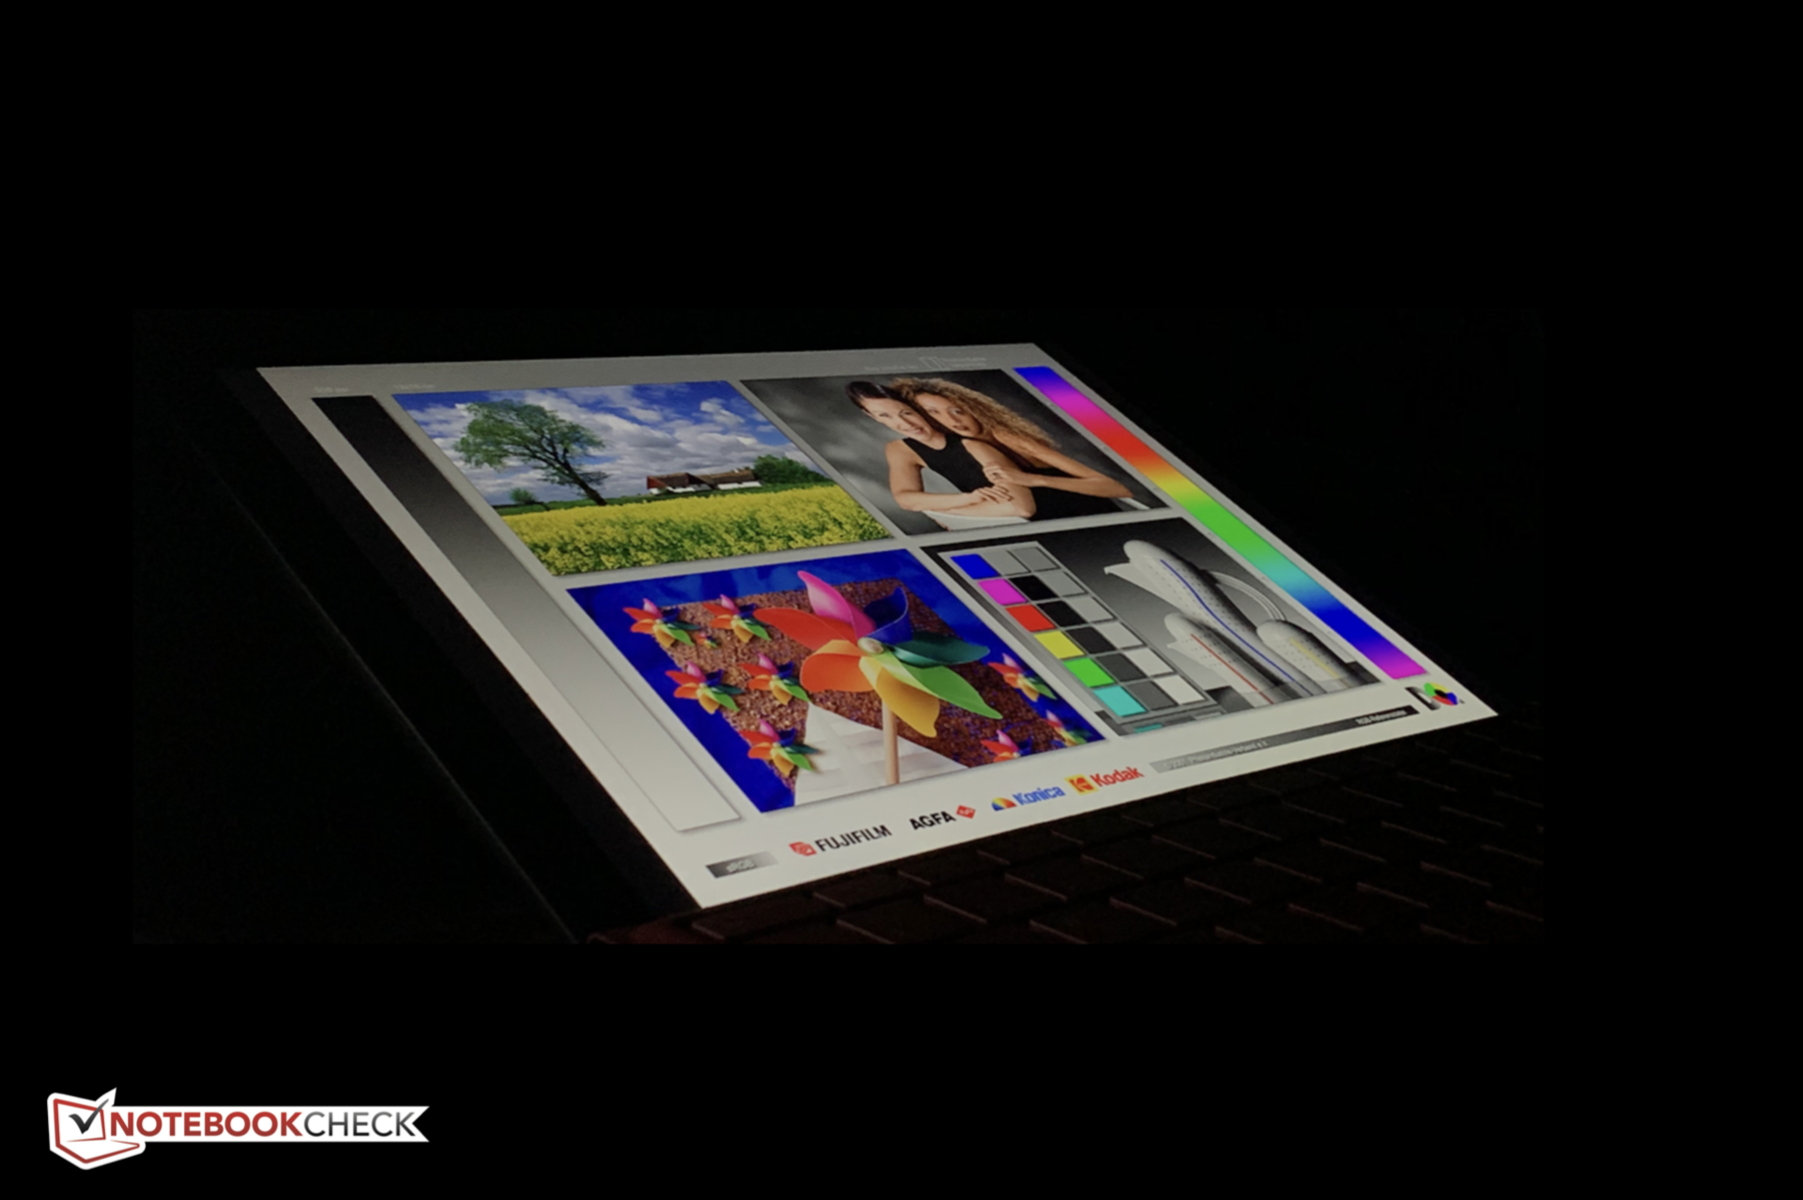
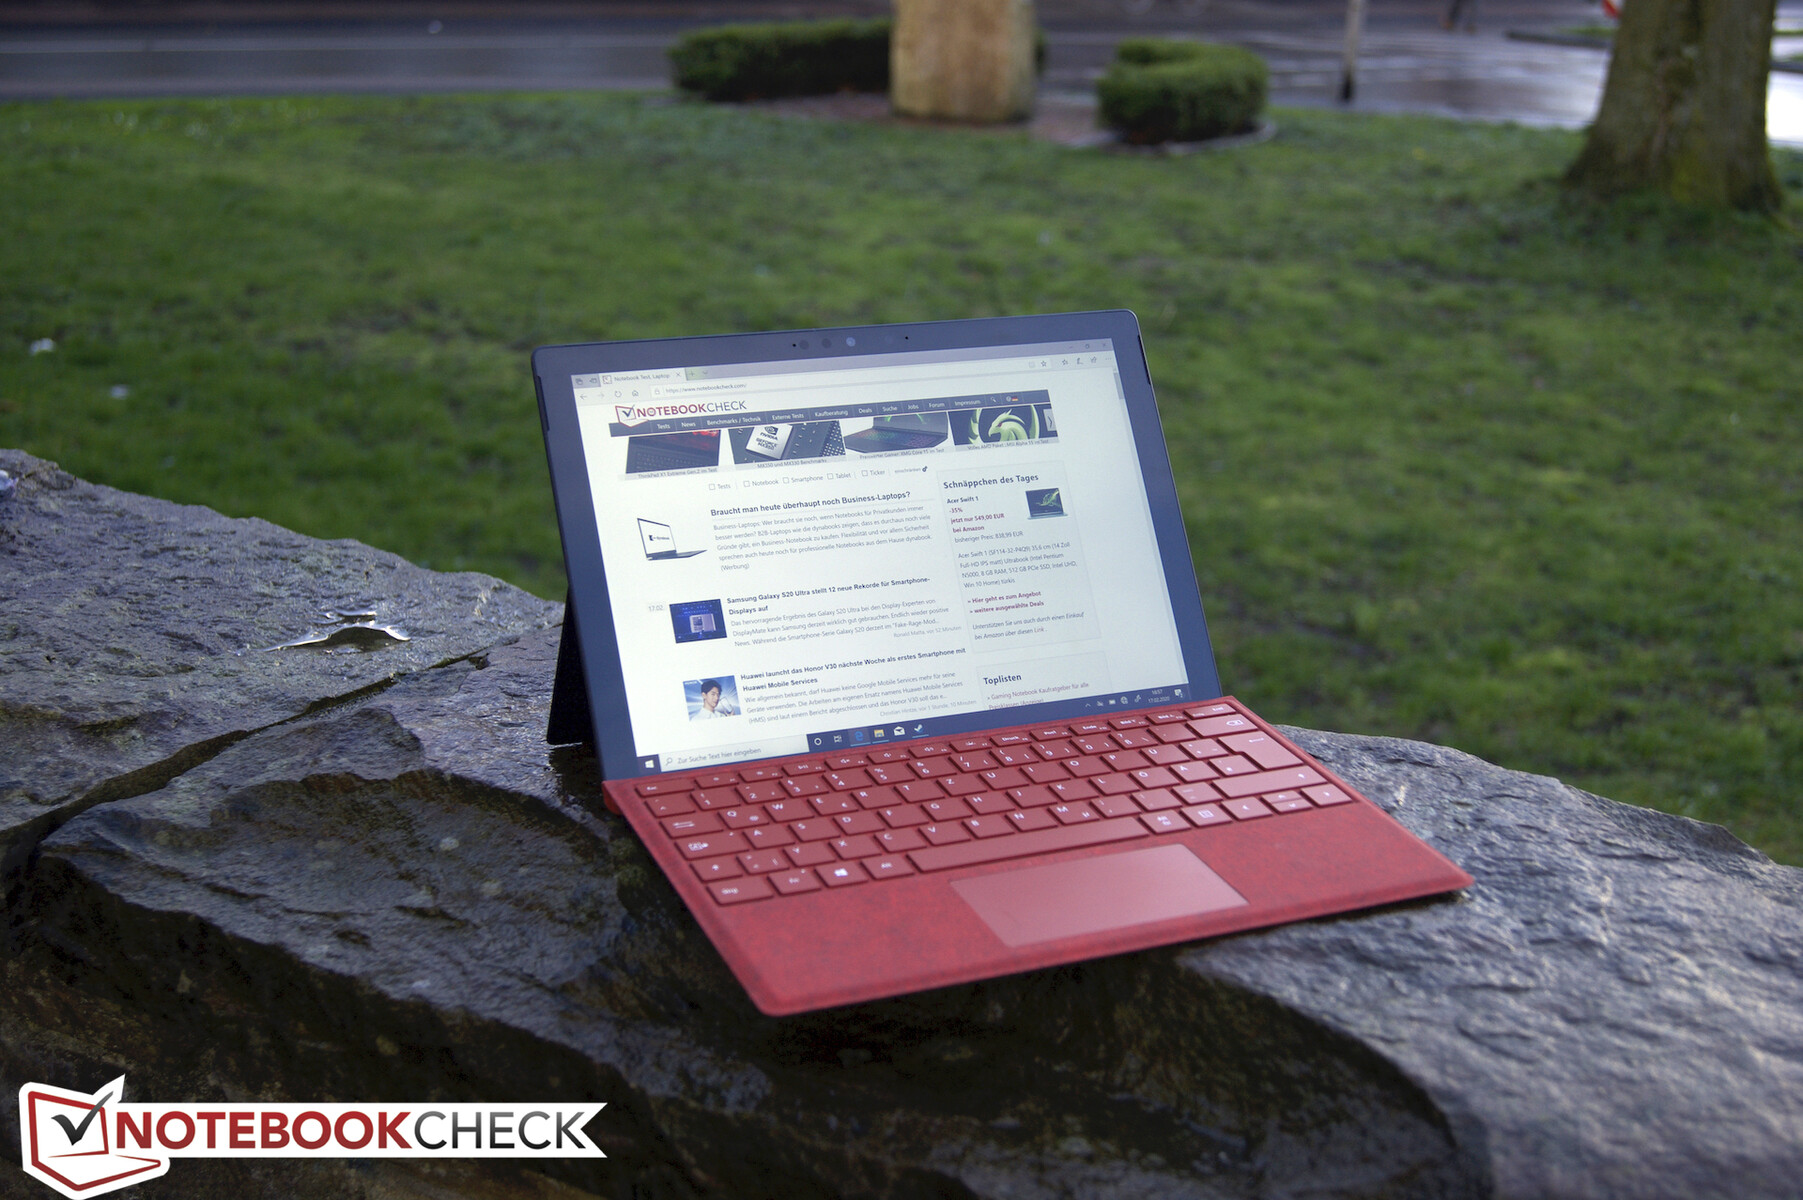
Outdoors, we found ourselves annoyed by the reflective display. Fortunately, its backlight was bright enough to overpower the reflections and render it usable in shady or darker environments.
Display Response Times
| ↔ Response Time Black to White | ||
|---|---|---|
| 28 ms ... rise ↗ and fall ↘ combined | ↗ 16 ms rise | 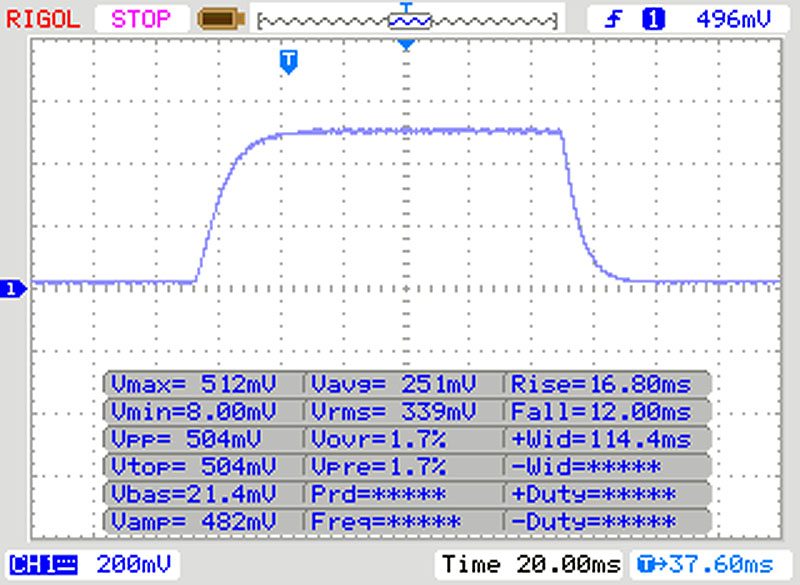 |
| ↘ 12 ms fall | ||
| The screen shows relatively slow response rates in our tests and may be too slow for gamers. In comparison, all tested devices range from 0.1 (minimum) to 240 (maximum) ms. » 71 % of all devices are better. This means that the measured response time is worse than the average of all tested devices (19.8 ms). | ||
| ↔ Response Time 50% Grey to 80% Grey | ||
| 40 ms ... rise ↗ and fall ↘ combined | ↗ 19 ms rise | 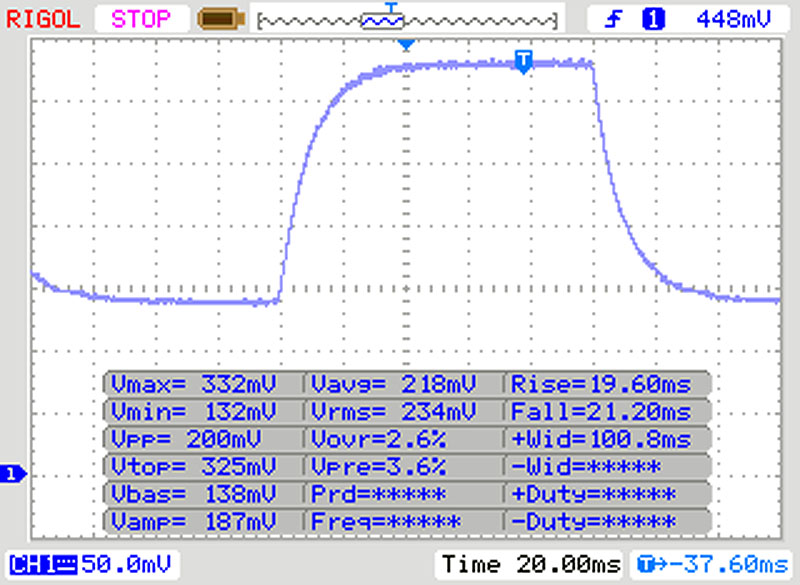 |
| ↘ 21 ms fall | ||
| The screen shows slow response rates in our tests and will be unsatisfactory for gamers. In comparison, all tested devices range from 0.165 (minimum) to 636 (maximum) ms. » 61 % of all devices are better. This means that the measured response time is worse than the average of all tested devices (31 ms). | ||
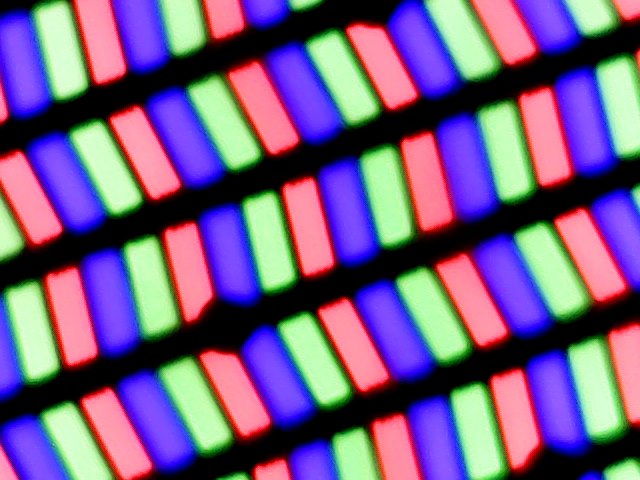
Screen Flickering / PWM (Pulse-Width Modulation)
| Screen flickering / PWM detected | 250 Hz | ≤ 50 % brightness setting | 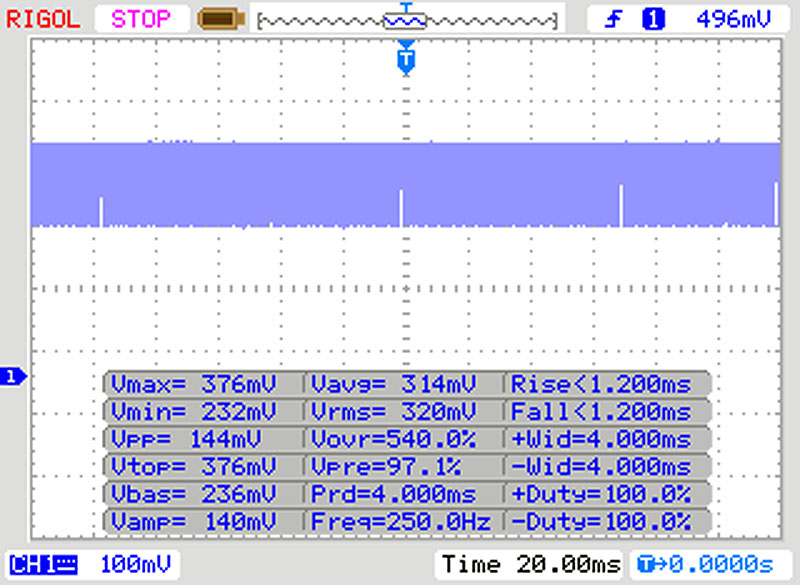 |
The display backlight flickers at 250 Hz (worst case, e.g., utilizing PWM) Flickering detected at a brightness setting of 50 % and below. There should be no flickering or PWM above this brightness setting. The frequency of 250 Hz is relatively low, so sensitive users will likely notice flickering and experience eyestrain at the stated brightness setting and below. In comparison: 52 % of all tested devices do not use PWM to dim the display. If PWM was detected, an average of 7747 (minimum: 5 - maximum: 343500) Hz was measured. | |||
Brightness regulation is achieved through PWM, which was measured at 250 Hz frequency at brightness levels of 50% and below. Sensitive users might thus run into issues on long workdays.
Performance
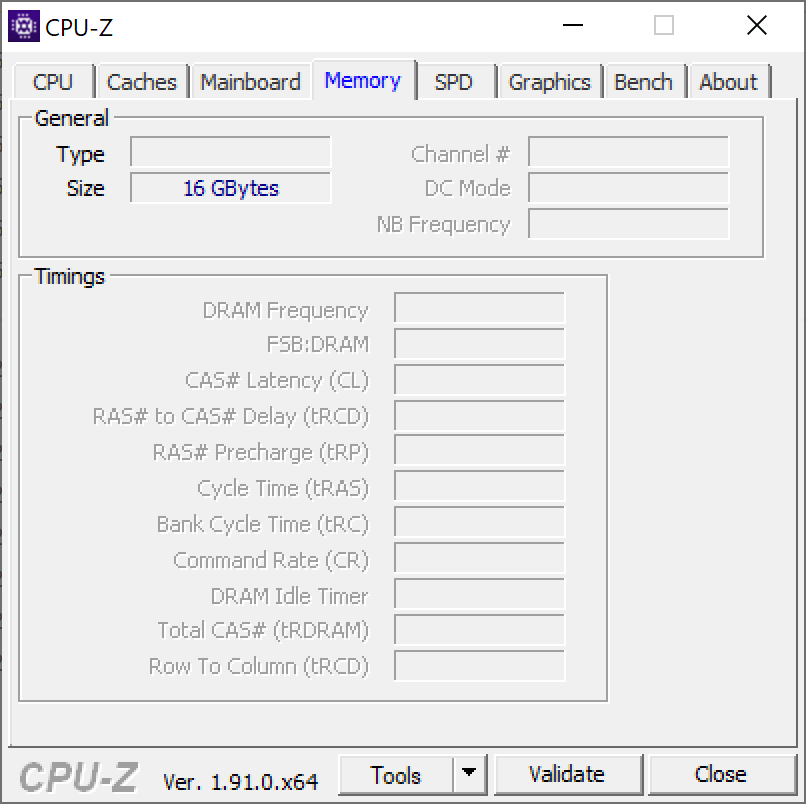
When it comes to raw performance our review model features everything Microsoft has to offer right now: an Intel Core i7-1065G7 with access to 16 GB of DDR4 RAM. According to Microsoft, this combination should be powerful enough to easily master every business and personal challenge you can throw at it.
In addition, our review model was also equipped with a 256 GB SSD. In this configuration, the device is currently priced at $1,499. If you require more storage space you can purchase a model equipped with a 512 GB SSD for $1,899 or a 1 TB SSD for $2,299.
More affordable SKUs are also available, and prices start at $749 for a Core i3 SKU with 4 GB of RAM and a 128 GB SSD.
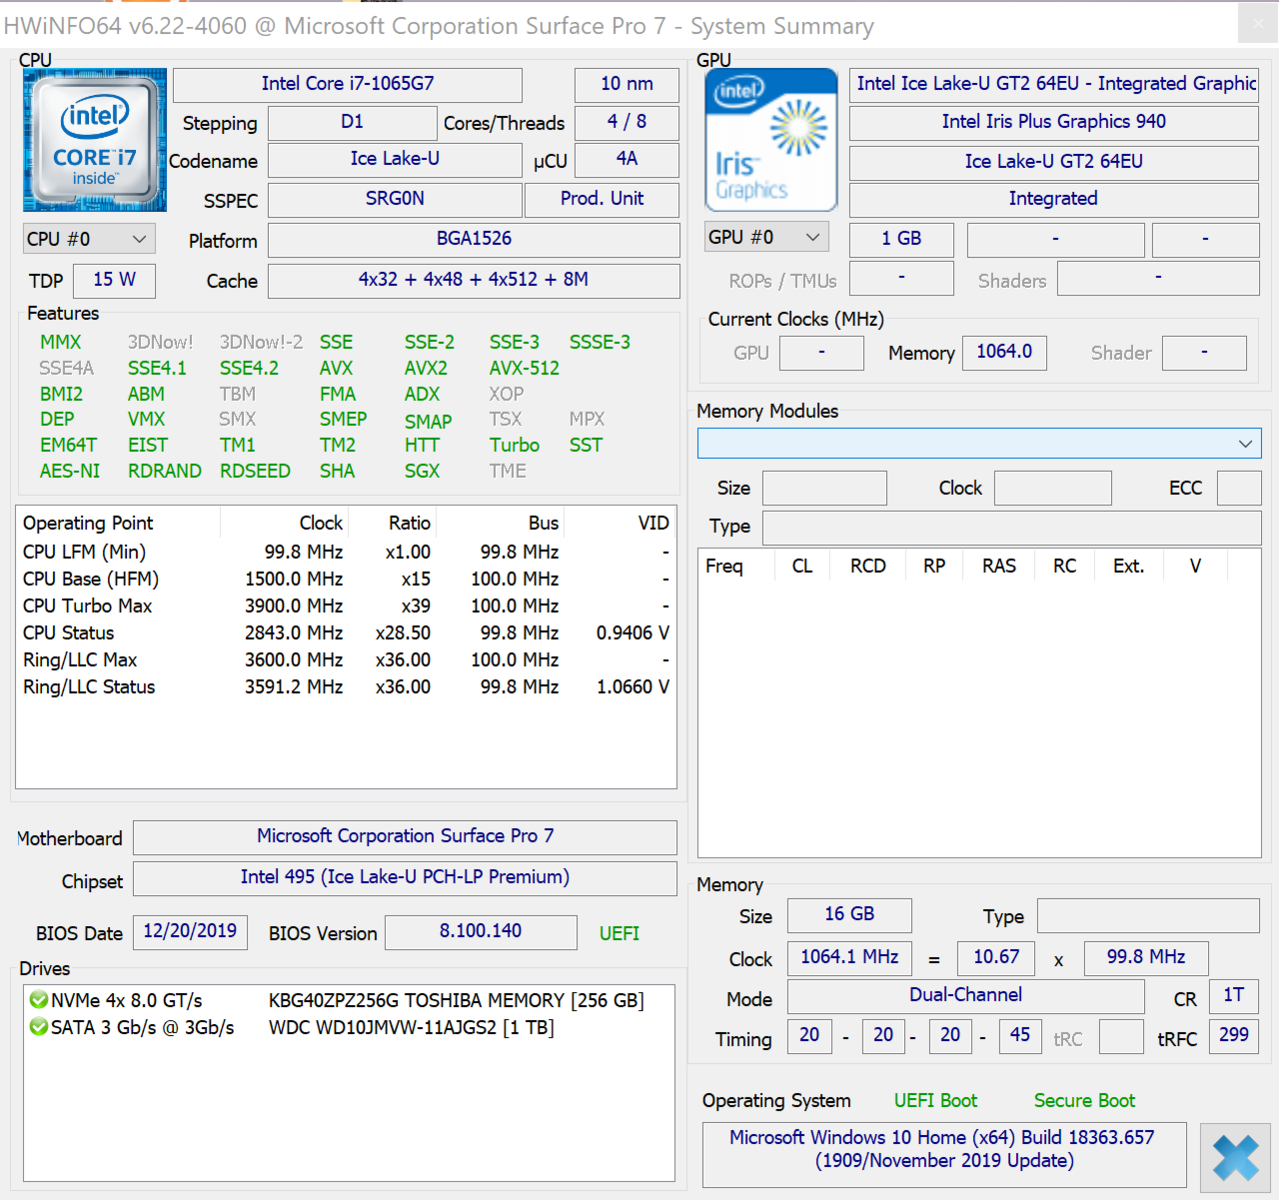
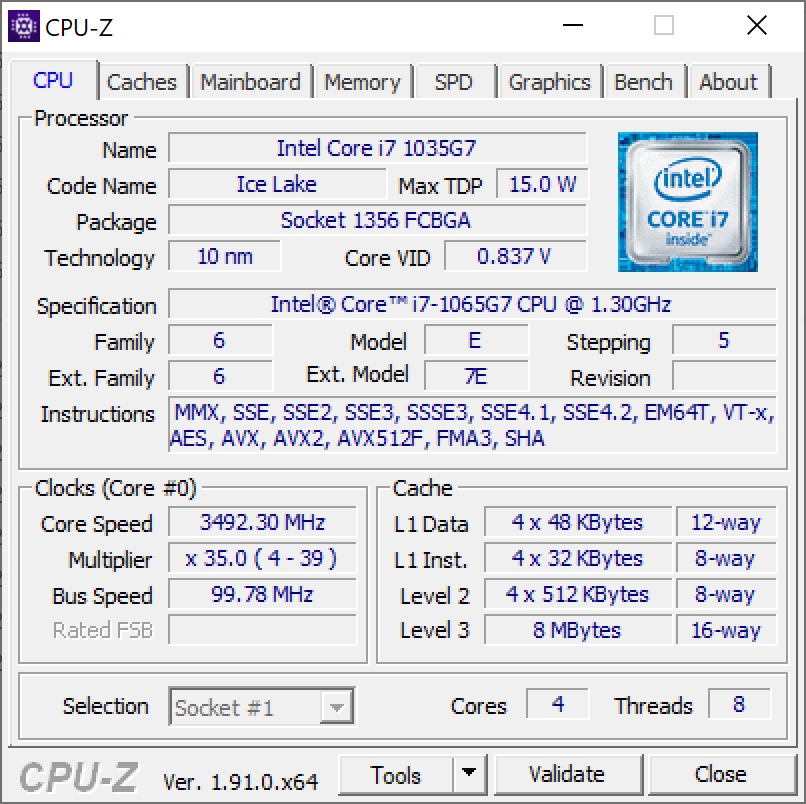
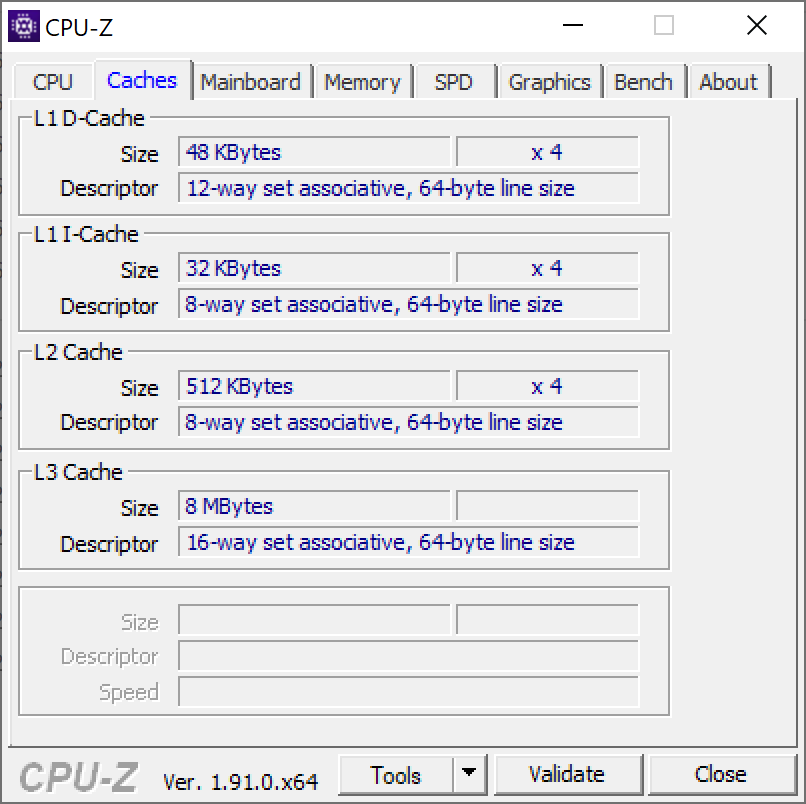
Processor
Since we already benchmarked the Intel Core i5-1035G4 Surface Pro 7 recently we are now eager to find out how much faster the i7 SKU is going to be.
Our review unit is powered by an Intel Core i7-1065G7 with four cores running at 1.3 GHz and a turbo-boost of 3.5 GHz on all four or up to 3.9 GHz on two cores, and thus around 200 MHz faster than the i5 SKU. The 8 MB L3 cache has also been increased in size by 2 MB.
Accordingly, the device should be quite a bit faster. In order to find out whether the premium of $300, depending on SKU, is worth it or not we ran Cinebench R15.
After a cold start our review unit scored 783 point, or 20% more than the more affordable i5 SKU. However, it was incapable of maintaining this high level of performance over long periods of time. The CPU started out at 3.5 GHz at the beginning but only managed 2.8 GHz at the end of the first Cinebench R15 run. During the fourth run clock speeds were further reduced to just 2.4 GHz, and scores settled at around 560 points, or 12% higher than on the recently reviewed i5 SKU.
Please note that CPU performance was severely throttled on battery. The multi-core score dropped from 783 to just 262 points, and the single-core score to a meager 49 points. Average clock speeds were around 2.4 to 2.5 GHz.
Additional details and benchmarks for this CPU can be found in this separate article.
System Performance
During the review period we experienced a very pronounced willingness to perform. The combination of dual-channel RAM and PCIe storage were very beneficial for everyday work. This subjective impression was further corroborated by PCMark 10, although the difference to the i5 SKU is negligible.
Please note that once again the device scored significantly lower on battery. PCMark 10 scores were around 30% worse when compared to results obtained on mains.
| PCMark 8 Home Score Accelerated v2 | 3660 points | |
| PCMark 8 Work Score Accelerated v2 | 3440 points | |
| PCMark 10 Score | 4367 points | |
Help | ||
Storage Devices
As noted before the amount of available storage space can make a huge price difference of up to $800. Our particular unit was the i7 SKU with the lowest amount of storage space available. The 256 GB SSD supports PCIe and managed average sequential transfer rates of more than 1,500 MB/s.
| Microsoft Surface Pro 7 Toshiba KBG40ZNS256G NVMe | Microsoft Surface Pro 7 Core i5-1035G4 Toshiba BG4 KBG40ZPZ256G | Microsoft Surface Pro (2017) i7 Samsung PM971 KUS040202M | Microsoft Surface Pro 6, Core i7, 512 GB Toshiba KBG30ZPZ512G | Average Toshiba KBG40ZNS256G NVMe | |
|---|---|---|---|---|---|
| CrystalDiskMark 5.2 / 6 | -5% | -16% | -39% | -13% | |
| Write 4K (MB/s) | 131.3 | 118.5 -10% | 131.6 0% | 83.2 -37% | 112.1 ? -15% |
| Read 4K (MB/s) | 52.4 | 54.1 3% | 43.34 -17% | 43.84 -16% | 50.6 ? -3% |
| Write Seq (MB/s) | 1613 | 1166 -28% | 905 -44% | 636 -61% | 961 ? -40% |
| Read Seq (MB/s) | 1613 | 1676 4% | 985 -39% | 900 -44% | 1562 ? -3% |
| Write 4K Q32T1 (MB/s) | 411.6 | 330.5 -20% | 421.6 2% | 192.9 -53% | 299 ? -27% |
| Read 4K Q32T1 (MB/s) | 415.6 | 393.1 -5% | 498.9 20% | 247.4 -40% | 359 ? -14% |
| Write Seq Q32T1 (MB/s) | 2340 | 1569 -33% | 970 -59% | 861 -63% | 1366 ? -42% |
| Read Seq Q32T1 (MB/s) | 1568 | 2390 52% | 1670 7% | 1615 3% | 2170 ? 38% |
| Write 4K Q8T8 (MB/s) | 410.9 | 380 ? -8% | |||
| Read 4K Q8T8 (MB/s) | 1033 | 852 ? -18% | |||
| AS SSD | -31% | -275% | -60% | -23% | |
| Seq Read (MB/s) | 1881 | 1590 -15% | 1070 -43% | 1154 -39% | 1752 ? -7% |
| Seq Write (MB/s) | 703 | 714 2% | 171 -76% | 393.6 -44% | 720 ? 2% |
| 4K Read (MB/s) | 52.3 | 50.7 -3% | 41 -22% | 34.42 -34% | 47.3 ? -10% |
| 4K Write (MB/s) | 154.1 | 109.4 -29% | 0.2 -100% | 68.9 -55% | 118.6 ? -23% |
| 4K-64 Read (MB/s) | 1048 | 924 -12% | 1015 -3% | 494.1 -53% | 866 ? -17% |
| 4K-64 Write (MB/s) | 703 | 294.6 -58% | 34 -95% | 171.3 -76% | 402 ? -43% |
| Access Time Read * (ms) | 0.069 | 0.066 4% | 0.04 42% | 0.213 -209% | 0.1034 ? -50% |
| Access Time Write * (ms) | 0.221 | 0.697 -215% | 7.6 -3339% | 0.3 -36% | 0.3076 ? -39% |
| Score Read (Points) | 1288 | 1133 -12% | 1164 -10% | 644 -50% | 1088 ? -16% |
| Score Write (Points) | 927 | 475 -49% | 52 -94% | 280 -70% | 592 ? -36% |
| Score Total (Points) | 2826 | 2157 -24% | 1774 -37% | 1225 -57% | 2197 ? -22% |
| Copy ISO MB/s (MB/s) | 1160 | 1177 1% | 1036 -11% | 985 -15% | 926 ? -20% |
| Copy Program MB/s (MB/s) | 454.7 | 406 -11% | 386 -15% | 143.1 -69% | 372 ? -18% |
| Copy Game MB/s (MB/s) | 991 | 923 -7% | 582 -41% | 676 -32% | 714 ? -28% |
| Total Average (Program / Settings) | -18% /
-21% | -146% /
-181% | -50% /
-52% | -18% /
-19% |
* ... smaller is better

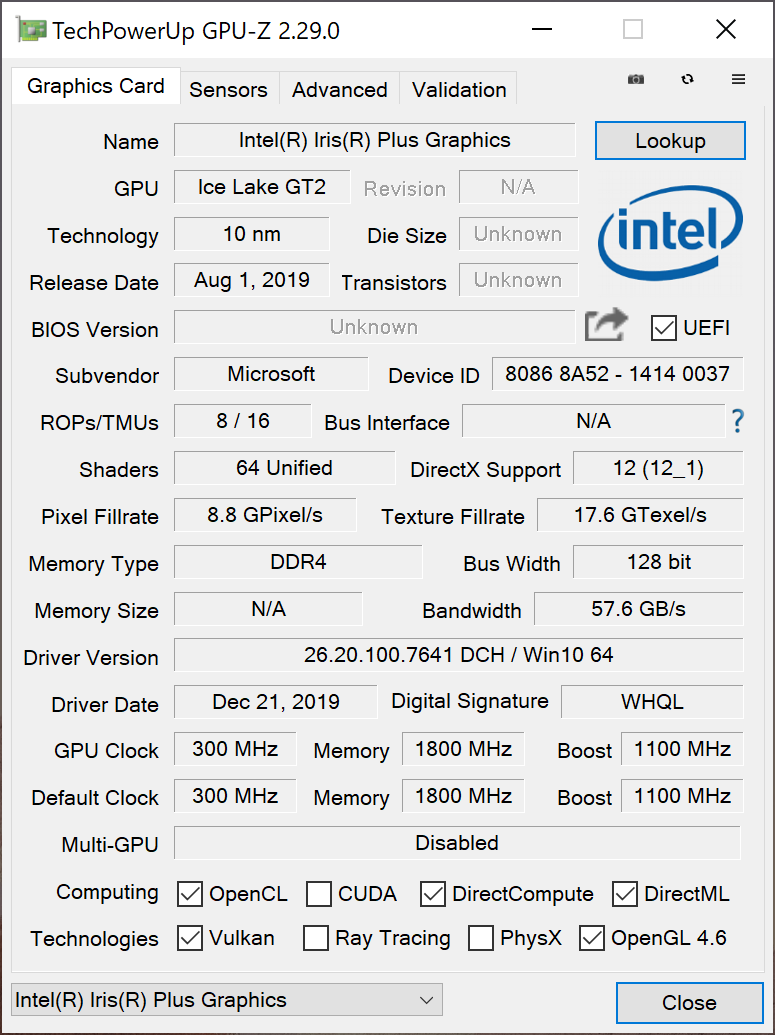
GPU Performance
The more powerful convertible features the exact same Intel Iris Plus Graphics G4 GPU as its more affordable sibling. The major and quite possibly crucial differences are a slightly higher clock speed (1,100 vs. 1,050 MHz) as well as higher pixel and texture fill rates.
When running our usual benchmarks, we noticed a significant difference. The i7 SKU scored 30% higher in 3DMark 11 and 14% higher in the more modern Time Spy test.
Unfortunately, this extra performance is not available on battery where 3DMark performance decreased by 25-33%.
More details and additional benchmarks can be found on our list of current notebook GPUs.
| 3DMark 11 Performance | 4504 points | |
| 3DMark Cloud Gate Standard Score | 14315 points | |
| 3DMark Fire Strike Score | 2833 points | |
| 3DMark Time Spy Score | 793 points | |
Help | ||
Gaming Performance
This increased GPU performance carried over to our gaming benchmarks as well, where the i7 SKU managed significantly smoother frame rates.
More details and additional benchmarks can be found in our separate gaming article.
| Rocket League | |
| 1920x1080 Quality AA:Medium FX | |
| Microsoft Surface Pro 7 | |
| Dell XPS 13 7390 2-in-1 Core i7 | |
| HP Spectre x360 13-aw0013dx | |
| Microsoft Surface Pro (2017) i7 | |
| Microsoft Surface Pro 7 Core i5-1035G4 | |
| 1920x1080 High Quality AA:High FX | |
| Microsoft Surface Pro 7 | |
| Dell XPS 13 7390 2-in-1 Core i7 | |
| HP Spectre x360 13-aw0013dx | |
| Microsoft Surface Pro (2017) i7 | |
| Microsoft Surface Pro 7 Core i5-1035G4 | |
| Shadow of the Tomb Raider - 1280x720 Lowest Preset | |
| Microsoft Surface Pro 7 | |
| Dell XPS 13 7390 2-in-1 Core i7 | |
| HP Spectre x360 13-aw0013dx | |
| Microsoft Surface Pro 7 Core i5-1035G4 | |
| Microsoft Surface Pro 6, Core i7, 512 GB | |
| low | med. | high | ultra | |
|---|---|---|---|---|
| BioShock Infinite (2013) | 112.5 | 72.8 | 60.2 | 21.96 |
| Rise of the Tomb Raider (2016) | 49.16 | 30 | 15.97 | 12.56 |
| Rocket League (2017) | 95.7 | 67.5 | 44.7 | |
| Shadow of the Tomb Raider (2018) | 33 | 14 | 13 |
Emissions
System Noise
Microsoft’s Surface Pro 7 is an overall very quiet companion even though unlike the i3 and i5 SKU it is not passively cooled. Even under load noise emissions peaked at just 33.7 dB(A), and thus remained fairly unobtrusive and quiet.
Noise level
| Idle |
| 30.3 / 30.3 / 30.3 dB(A) |
| Load |
| 31.4 / 33.7 dB(A) |
 | ||
30 dB silent 40 dB(A) audible 50 dB(A) loud |
||
min: | ||
Temperature
More performance and a cooler case. Our review unit was exactly as large as the previously reviewed i5 SKU, yet despite its more powerful i7 processor its surface temperatures peaked at just 41 °C (105.8 °F) and thus 7 °C (12.6 °F) lower than on the i5 model, most likely due to the fan.
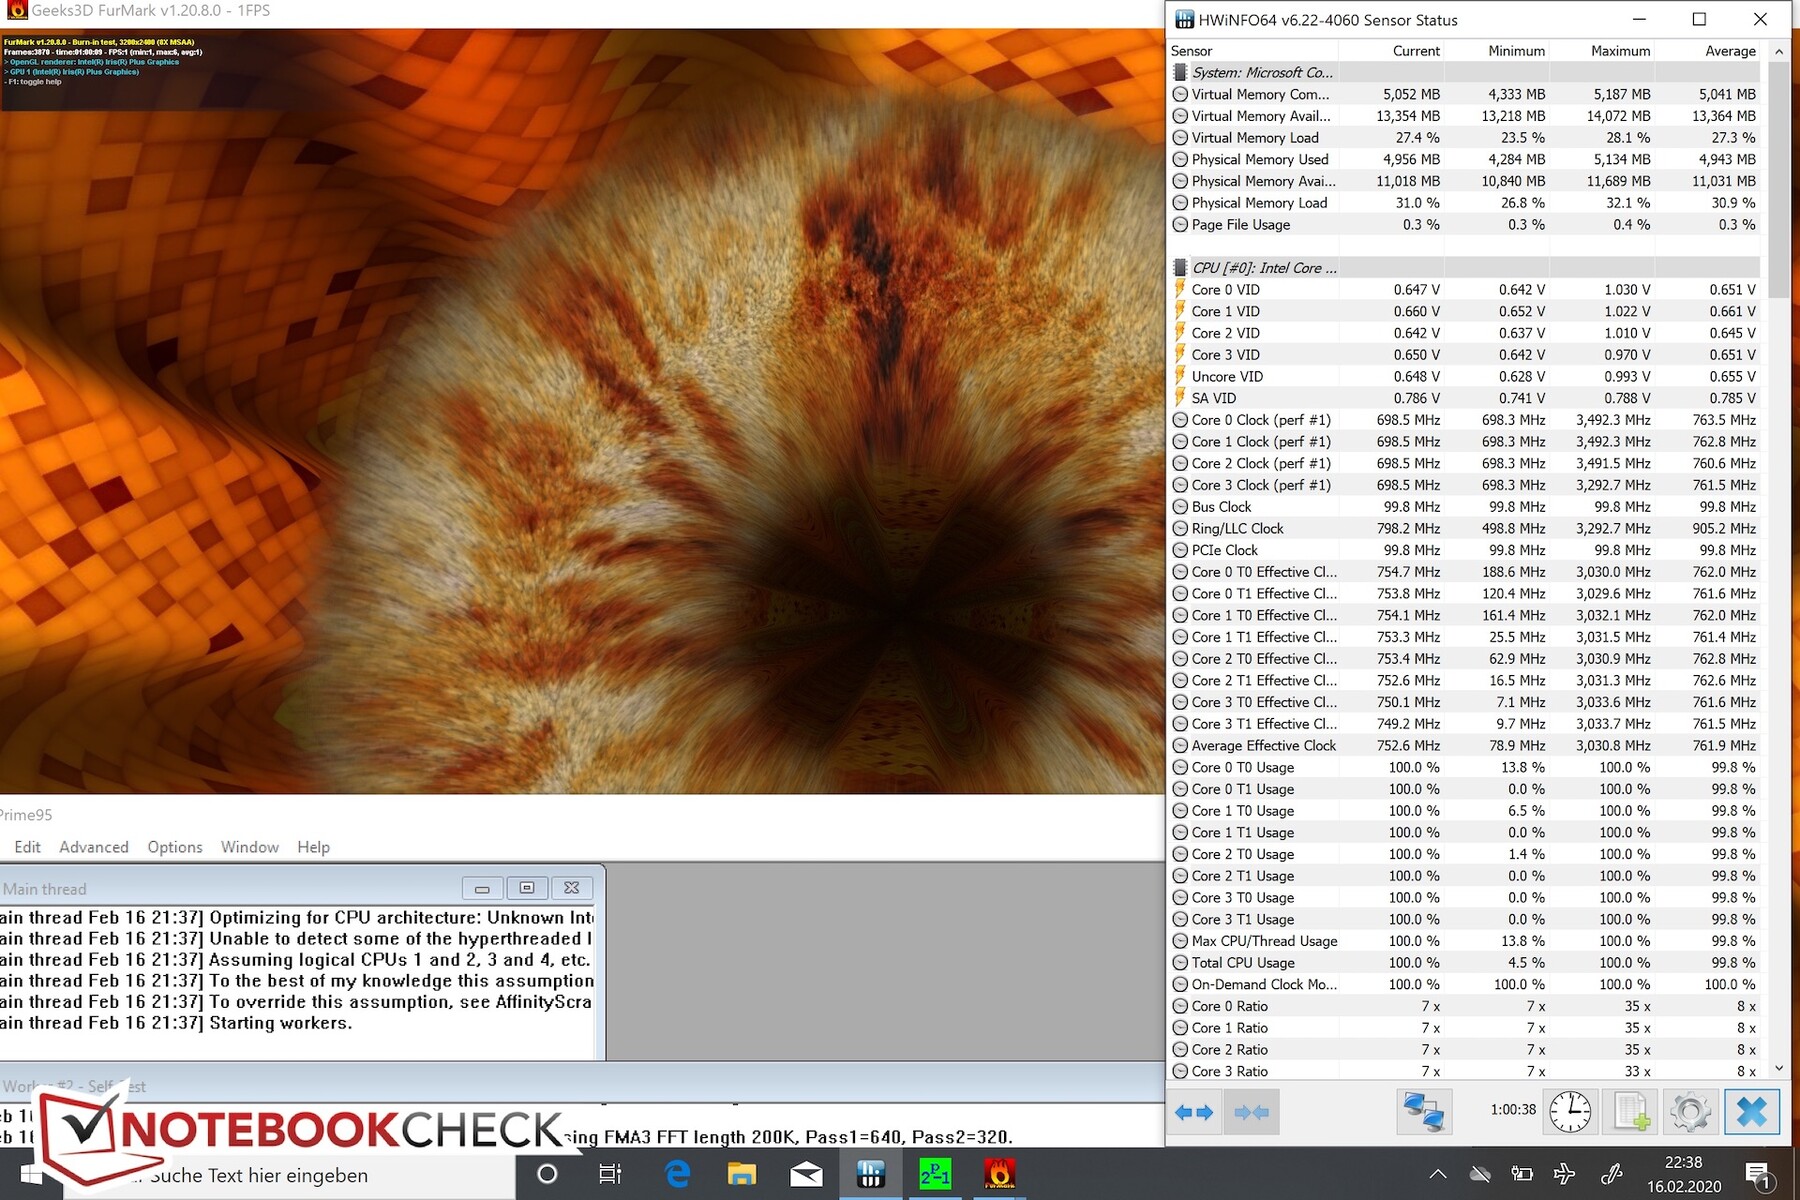
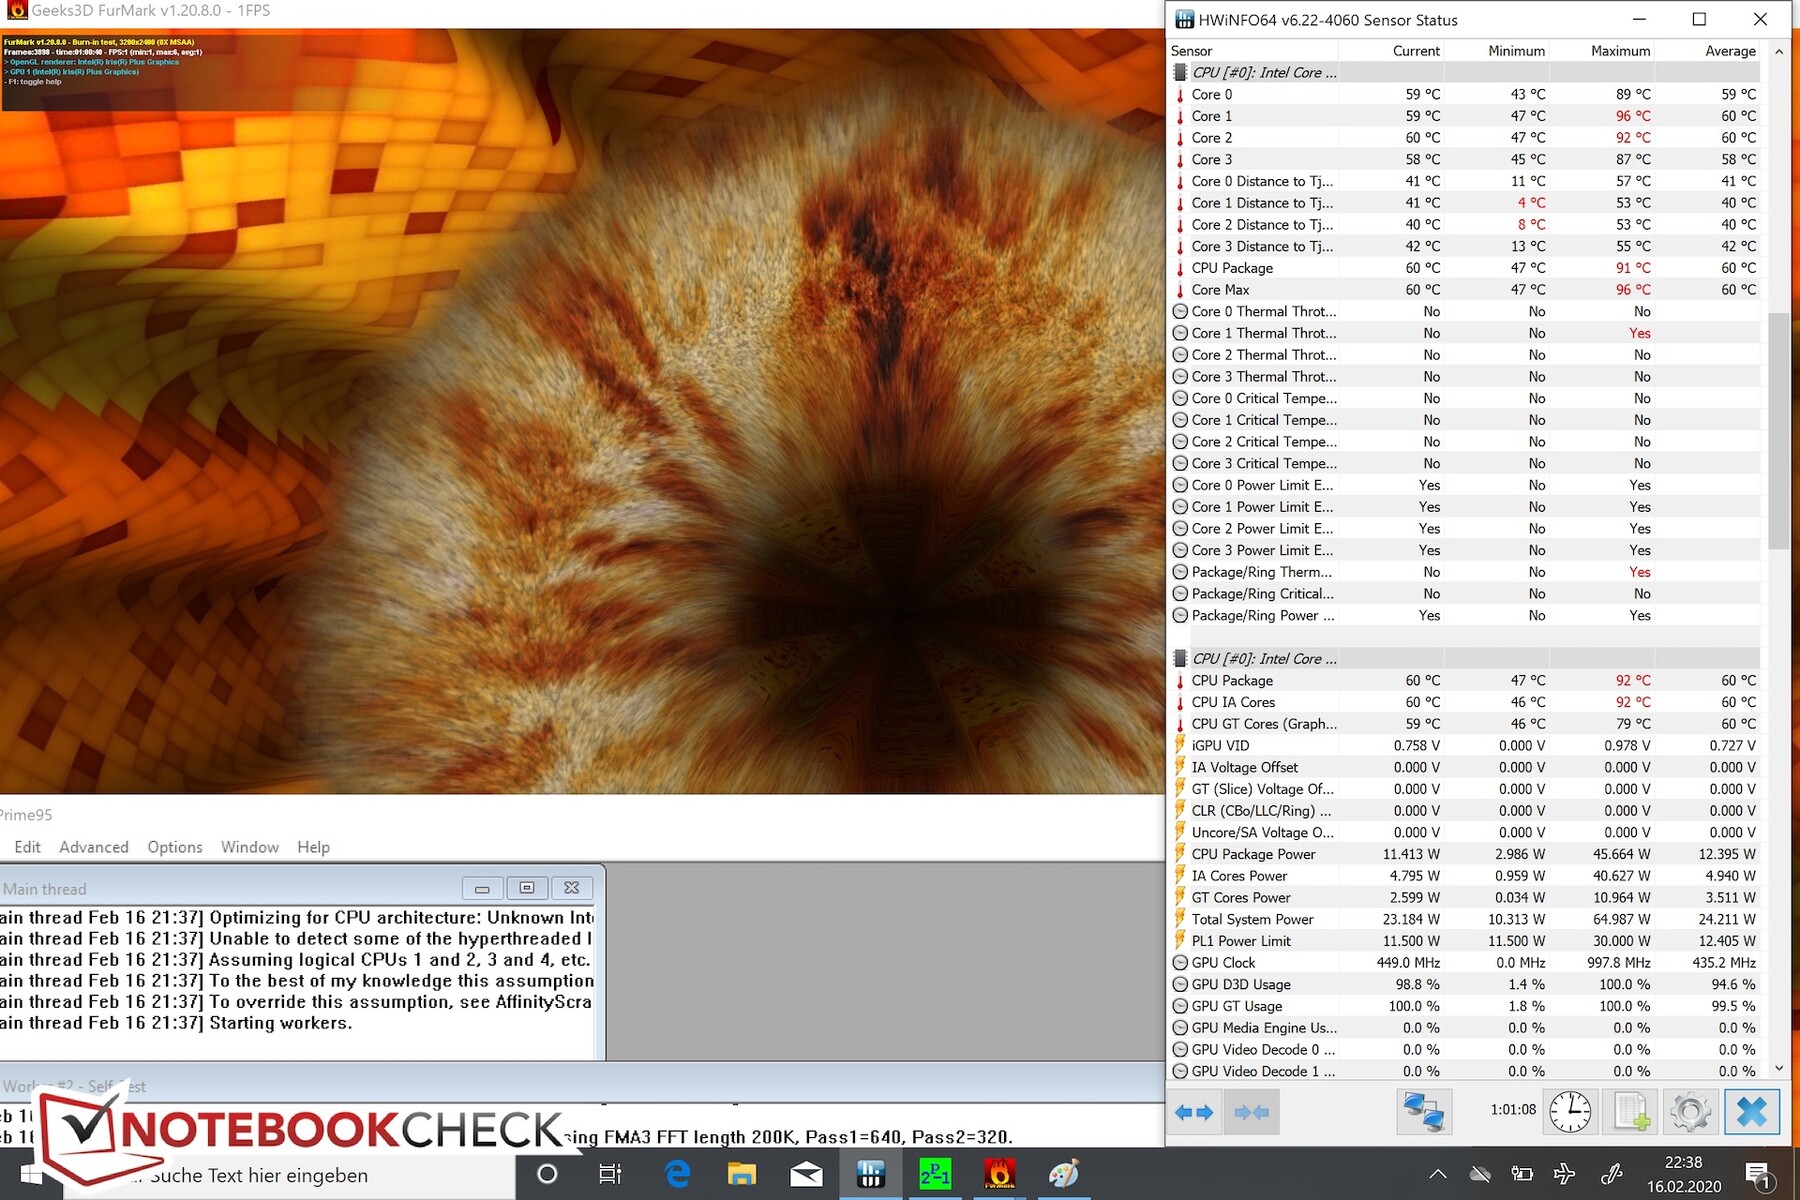
In order to determine the reason for these lower temperatures we have to examine internal temperatures during our stress test.
As soon as we begin our stress test running FurMark and Prime95 simultaneously clock speeds drop to 1.4 GHz practically instantaneously. Core temperatures reach 90 °C (194 °F) after two minutes, and the device starts to throttle reducing clocks speeds to just 800 MHz. That is how the Surface Pro 7 i7 manages to keep surface temperatures low. During the remainder of the stress test core temperatures settled at around 60 °C (140 °F). In other words: there is sufficient headroom for more oomph.
The device had to cool off after our stress test before it was able to deliver peak performance again. 3DMark scores were around a third of what they used to be immediately following our stress test.
(±) The maximum temperature on the upper side is 40.1 °C / 104 F, compared to the average of 35.4 °C / 96 F, ranging from 19.6 to 60 °C for the class Convertible.
(±) The bottom heats up to a maximum of 41 °C / 106 F, compared to the average of 36.9 °C / 98 F
(+) In idle usage, the average temperature for the upper side is 28.7 °C / 84 F, compared to the device average of 30.3 °C / 87 F.
(±) The palmrests and touchpad can get very hot to the touch with a maximum of 39.4 °C / 102.9 F.
(-) The average temperature of the palmrest area of similar devices was 28 °C / 82.4 F (-11.4 °C / -20.5 F).
Lautsprecher
Microsoft Surface Pro 7 audio analysis
(-) | not very loud speakers (65.2 dB)
Bass 100 - 315 Hz
(±) | reduced bass - on average 10.2% lower than median
(±) | linearity of bass is average (12.1% delta to prev. frequency)
Mids 400 - 2000 Hz
(+) | balanced mids - only 4.6% away from median
(±) | linearity of mids is average (10.2% delta to prev. frequency)
Highs 2 - 16 kHz
(+) | balanced highs - only 3.1% away from median
(+) | highs are linear (6.8% delta to prev. frequency)
Overall 100 - 16.000 Hz
(±) | linearity of overall sound is average (21.5% difference to median)
Compared to same class
» 58% of all tested devices in this class were better, 10% similar, 31% worse
» The best had a delta of 6%, average was 20%, worst was 57%
Compared to all devices tested
» 61% of all tested devices were better, 7% similar, 32% worse
» The best had a delta of 4%, average was 23%, worst was 134%
Apple MacBook 12 (Early 2016) 1.1 GHz audio analysis
(+) | speakers can play relatively loud (83.6 dB)
Bass 100 - 315 Hz
(±) | reduced bass - on average 11.3% lower than median
(±) | linearity of bass is average (14.2% delta to prev. frequency)
Mids 400 - 2000 Hz
(+) | balanced mids - only 2.4% away from median
(+) | mids are linear (5.5% delta to prev. frequency)
Highs 2 - 16 kHz
(+) | balanced highs - only 2% away from median
(+) | highs are linear (4.5% delta to prev. frequency)
Overall 100 - 16.000 Hz
(+) | overall sound is linear (10.2% difference to median)
Compared to same class
» 7% of all tested devices in this class were better, 2% similar, 90% worse
» The best had a delta of 5%, average was 18%, worst was 53%
Compared to all devices tested
» 5% of all tested devices were better, 1% similar, 94% worse
» The best had a delta of 4%, average was 23%, worst was 134%
Energy Management
Power Consumption
Power consumption when idle was practically identical to the more affordable i5 SKU, and it was overall very similar under load. Due to aforementioned thermal throttling and the somewhat scarcely dimensioned 65 W power supply maximum power consumption peaked at 61 W.
| Off / Standby | |
| Idle | |
| Load |
|
Key:
min: | |
| Microsoft Surface Pro 7 i7-1065G7, Iris Plus Graphics G7 (Ice Lake 64 EU), Toshiba KBG40ZNS256G NVMe, IPS, 2736x1824, 12.3" | Microsoft Surface Pro 6, Core i7, 512 GB i7-8650U, UHD Graphics 620, Toshiba KBG30ZPZ512G, IPS, 2736x1824, 12.3" | Microsoft Surface Pro (2017) i7 i7-7660U, Iris Plus Graphics 640, Samsung PM971 KUS040202M, IPS, 2736x1824, 12.3" | Microsoft Surface Pro 7 Core i5-1035G4 i5-1035G4, Iris Plus Graphics G4 (Ice Lake 48 EU), Toshiba BG4 KBG40ZPZ256G, IPS, 2736x1824, 12.3" | Dell XPS 13 7390 2-in-1 Core i7 i7-1065G7, Iris Plus Graphics G7 (Ice Lake 64 EU), Toshiba BG4 KBG40ZPZ512G, IPS, 1920x1200, 13.4" | Average Intel Iris Plus Graphics G7 (Ice Lake 64 EU) | Average of class Convertible | |
|---|---|---|---|---|---|---|---|
| Power Consumption | 17% | 0% | -1% | 26% | 12% | 6% | |
| Idle Minimum * (Watt) | 4.4 | 3.2 27% | 4.2 5% | 4.5 -2% | 2.6 41% | 3.91 ? 11% | 4.2 ? 5% |
| Idle Average * (Watt) | 8.7 | 8.7 -0% | 10.1 -16% | 9.2 -6% | 5.3 39% | 7.33 ? 16% | 6.87 ? 21% |
| Idle Maximum * (Watt) | 9.6 | 10.4 -8% | 14 -46% | 9.6 -0% | 7 27% | 9.16 ? 5% | 8.57 ? 11% |
| Load Average * (Watt) | 44 | 29.2 34% | 37.4 15% | 42 5% | 43.1 2% | 39.2 ? 11% | 44.1 ? -0% |
| Load Maximum * (Watt) | 61 | 40.8 33% | 34 44% | 63.5 -4% | 49 20% | 49.8 ? 18% | 66.4 ? -9% |
| Witcher 3 ultra * (Watt) | 38.1 | 43.1 |
* ... smaller is better
Battery Life
Battery life was not any worse on the i7 SKU. In our real-world Wi-Fi test the Surface convertible easily lasted a long workday.
Please note that for some reason unbeknownst to us the i7 SKU lasted just 11.5 hours in the idle test, and thus significantly shorter than the i5 SKU. We ran the test twice but were unable to determine the culprit.
| Microsoft Surface Pro 7 i7-1065G7, Iris Plus Graphics G7 (Ice Lake 64 EU), 45 Wh | Microsoft Surface Pro 7 Core i5-1035G4 i5-1035G4, Iris Plus Graphics G4 (Ice Lake 48 EU), 45 Wh | Microsoft Surface Pro (2017) i7 i7-7660U, Iris Plus Graphics 640, 45 Wh | Dell XPS 13 7390 2-in-1 Core i7 i7-1065G7, Iris Plus Graphics G7 (Ice Lake 64 EU), 51 Wh | Average of class Convertible | |
|---|---|---|---|---|---|
| Battery runtime | 32% | 12% | -8% | 72% | |
| Reader / Idle (h) | 11.5 | 22.3 94% | 28.7 ? 150% | ||
| H.264 (h) | 6.7 | 10.2 52% | 15 ? 124% | ||
| WiFi v1.3 (h) | 9.8 | 10 2% | 8.2 -16% | 9 -8% | 12.1 ? 23% |
| Load (h) | 1.9 | 1.9 0% | 1.9 0% | 1.748 ? -8% | |
| Witcher 3 ultra (h) | 1.9 |
Pros
Cons
Verdict
After our initial extensive review of the i5 SKU of Microsoft Surface Pro 7 (Core i5, 8 GB) we were now able to review the most powerful model as well, and we very quickly noticed that the faster model is not much different from its more affordable sibling. Especially when looking at sustained CPU load capabilities. GPU performance, on the other hand, was a big hit as it improved significantly. And on top of that neither low temperatures nor battery life had to be sacrificed for the extra oomph.
The question is: is it worth it?
The Intel Core i7-equipped Surface Pro 7 is designed for power users who need that extra little bit of performance, especially when it comes to graphics power.
As we were able to prove in our system benchmarks it is not CPU performance that sets the i7 SKU apart. Graphics performance is where it really shines, and where the extra cost yields the most obvious return of investment. For more details on the Surface series please see our previous review.
Microsoft Surface Pro 7
- 02/20/2020 v7 (old)
Nino Ricchizzi
Price comparison

