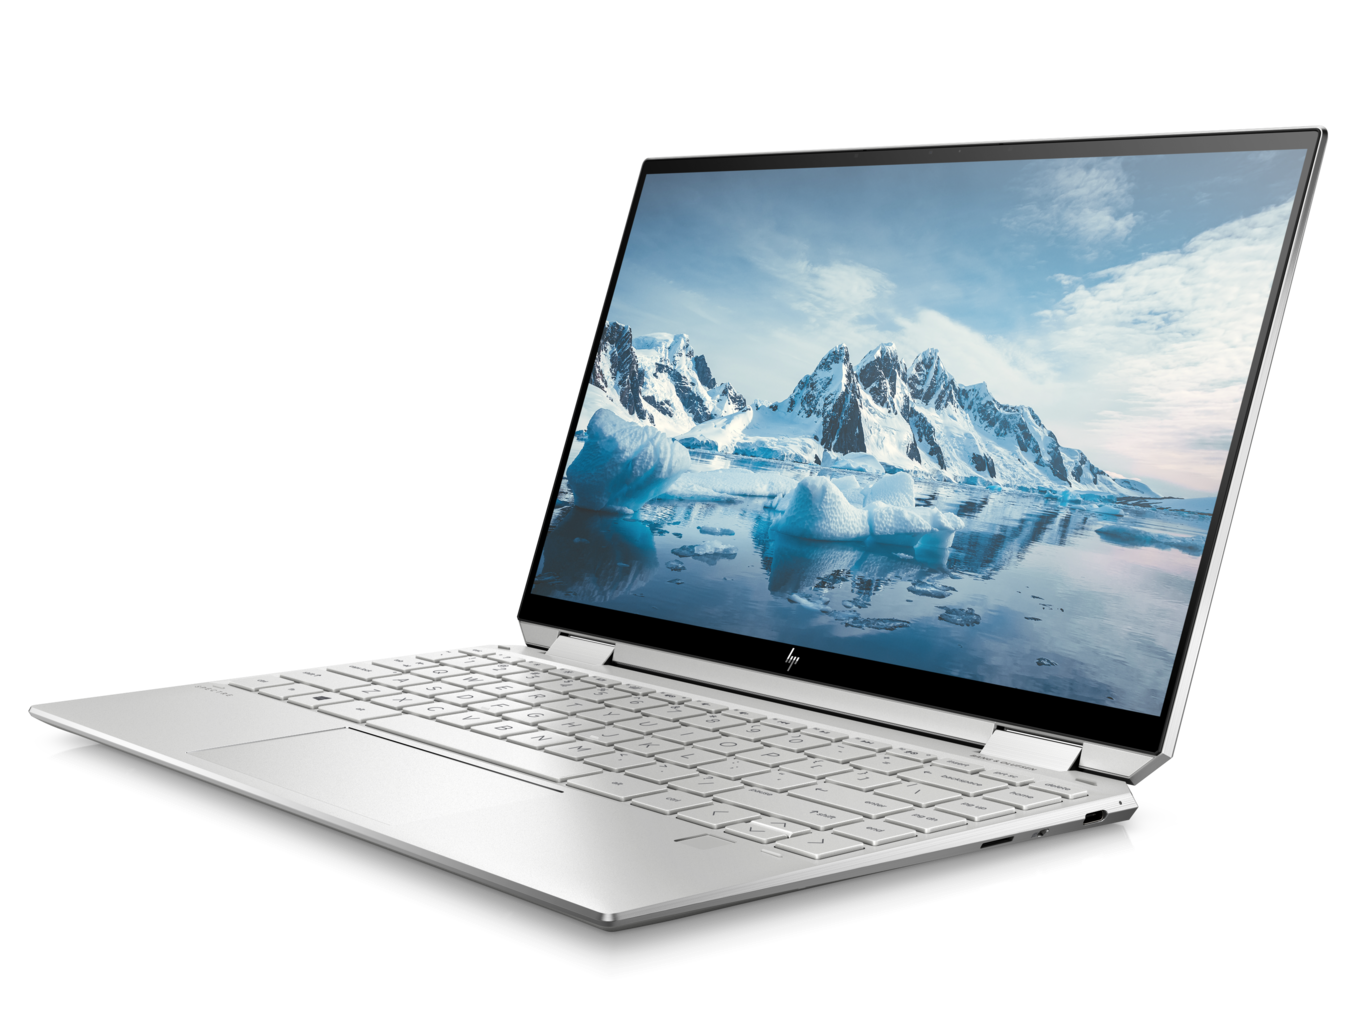
HP Spectre x360 13-aw0013dx Convertible Review: Powered by Intel Ice Lake
The late 2019 HP Spectre x360 13 Ice Lake model directly replaces the early 2019 HP Spectre x360 13 Whiskey Lake-U models with new processor options and a new smaller chassis. Users can now choose between the Core i5-1035G4 or i7-1065G7 CPU, FHD IPS or 4K UHD AMOLED touchscreen, 8 GB to 16 GB of soldered RAM, and up to 2 TB of PCIe NVMe storage with prices ranging from $1000 to $1900 USD. Our unit today comes equipped with the Core i7 CPU and FHD display to represent the middle SKU. For this review, we'll be exploring the differences between this laptop and the older Whiskey Lake-U Spectre x360 13 as well as other Ice Lake laptops already in market.
The Spectre x360 13 competes directly with other flagship subnotebooks or Ultrabooks including the Dell XPS 13 7390 2-in-1, Lenovo Yoga C940-14, Asus ZenBook Flip, Huawei MateBook X Pro, Microsoft Surface Laptop 3 13.5, and Razer Blade Stealth. Users who find the Spectre series too pricey can go one step down to HP's mid-range Envy series instead.
More HP reviews:
Rating | Date | Model | Weight | Height | Size | Resolution | Price |
|---|---|---|---|---|---|---|---|
| 88.4 % v7 (old) | 12 / 2019 | HP Spectre x360 13-aw0013dx i7-1065G7, Iris Plus Graphics G7 (Ice Lake 64 EU) | 1.2 kg | 16.9 mm | 13.30" | 1920x1080 | |
| 86.3 % v7 (old) | 10 / 2019 | Dell XPS 13 7390 2-in-1 Core i7 i7-1065G7, Iris Plus Graphics G7 (Ice Lake 64 EU) | 1.3 kg | 13 mm | 13.40" | 1920x1200 | |
| 81.2 % v7 (old) | 09 / 2019 | Asus ZenBook Flip 14 UM462DA-AI023T R7 3700U, Vega 10 | 1.6 kg | 18.9 mm | 14.00" | 1920x1080 | |
| 86.3 % v7 (old) | 10 / 2019 | Razer Blade Stealth i7-1065G7 Iris Plus i7-1065G7, Iris Plus Graphics G7 (Ice Lake 64 EU) | 1.4 kg | 15.3 mm | 13.30" | 1920x1080 | |
| 87 % v7 (old) | 12 / 2019 | Lenovo Yoga C940-14IIL 81Q9 i7-1065G7, Iris Plus Graphics G7 (Ice Lake 64 EU) | 1.4 kg | 15.7 mm | 14.00" | 3840x2160 |
Case
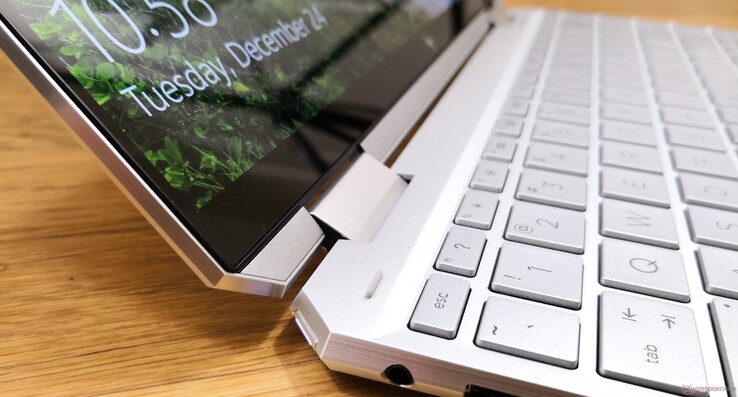
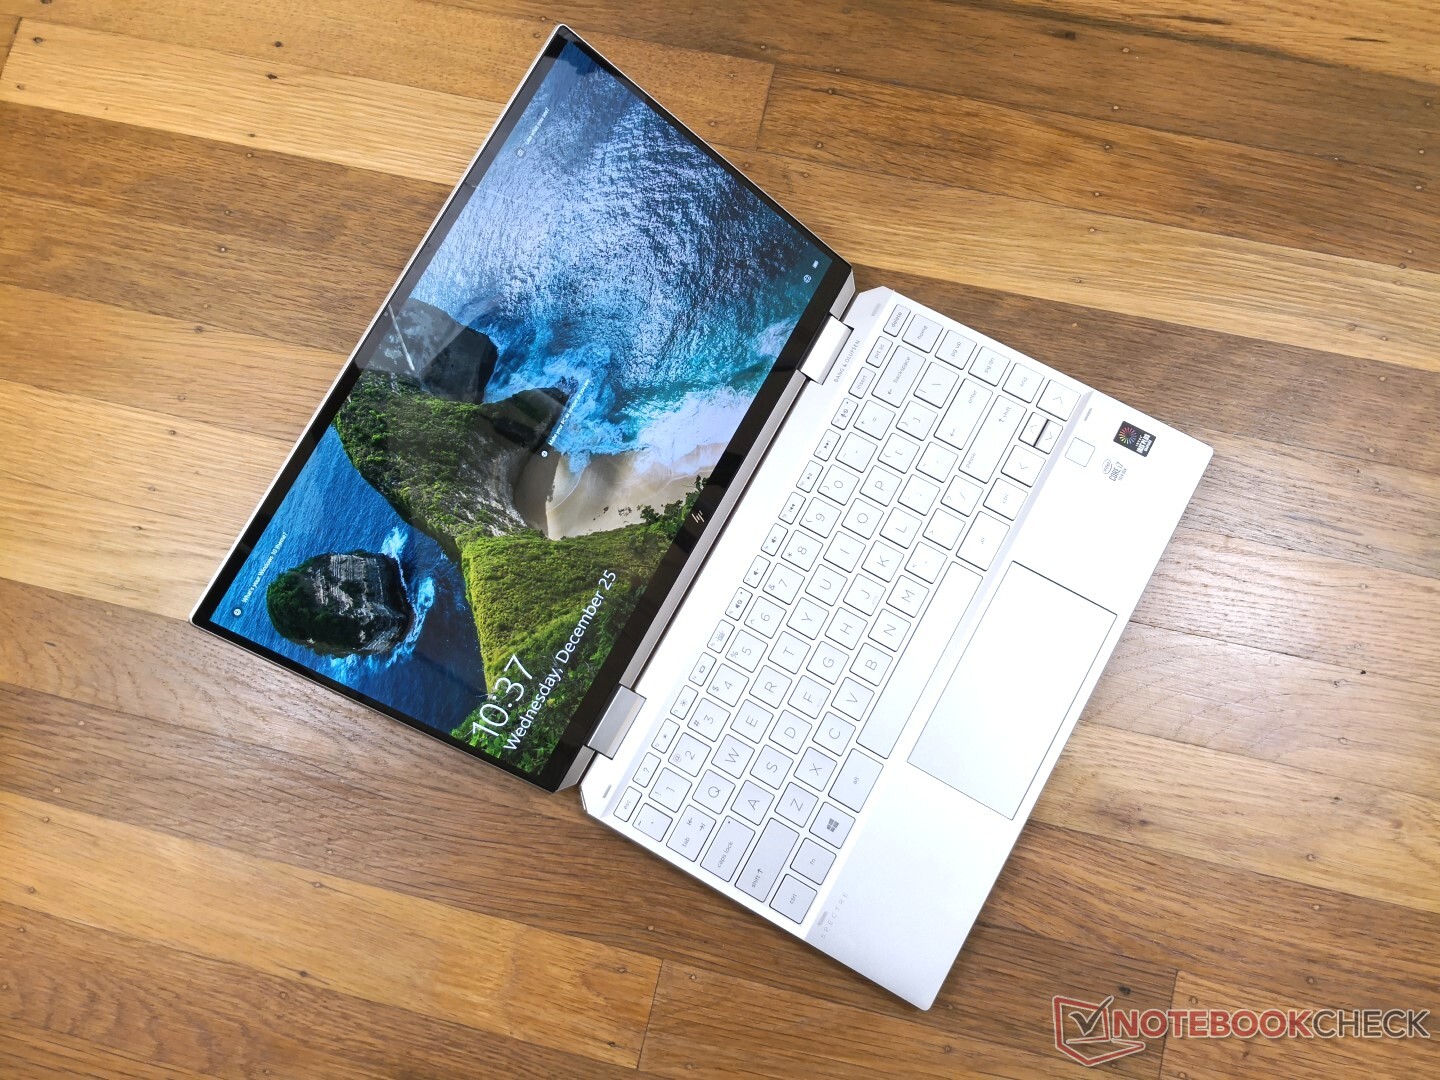
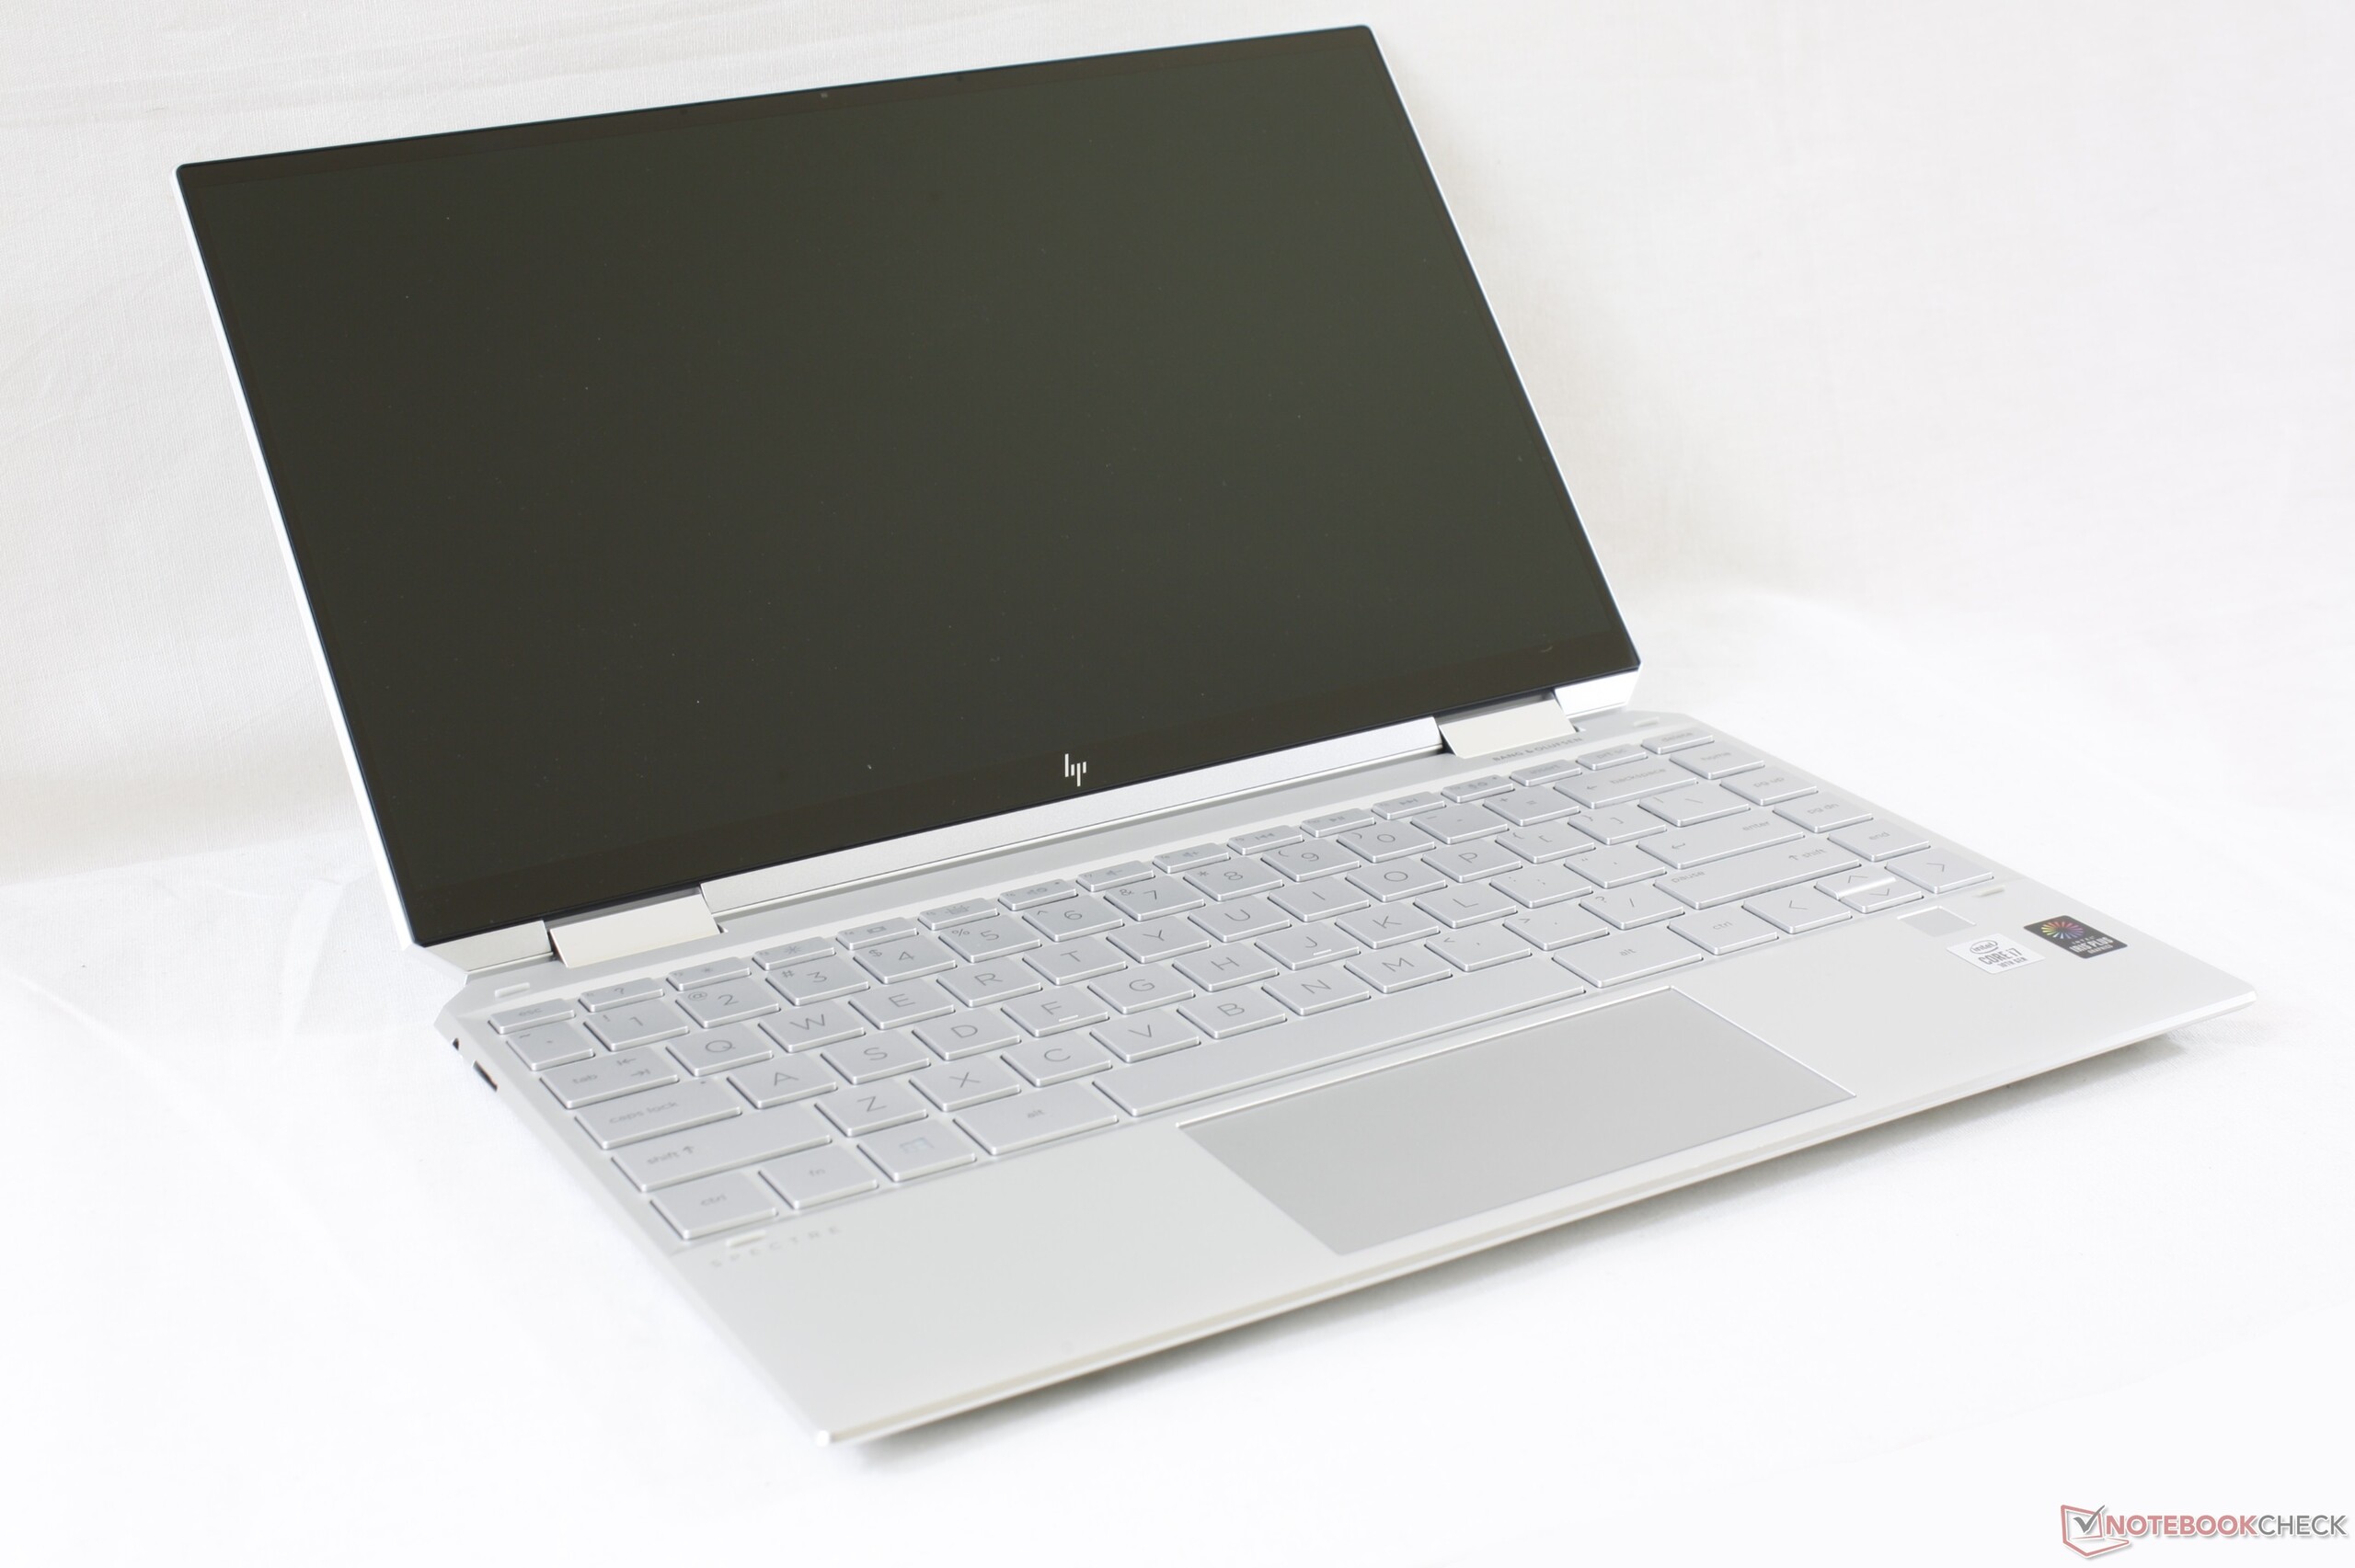
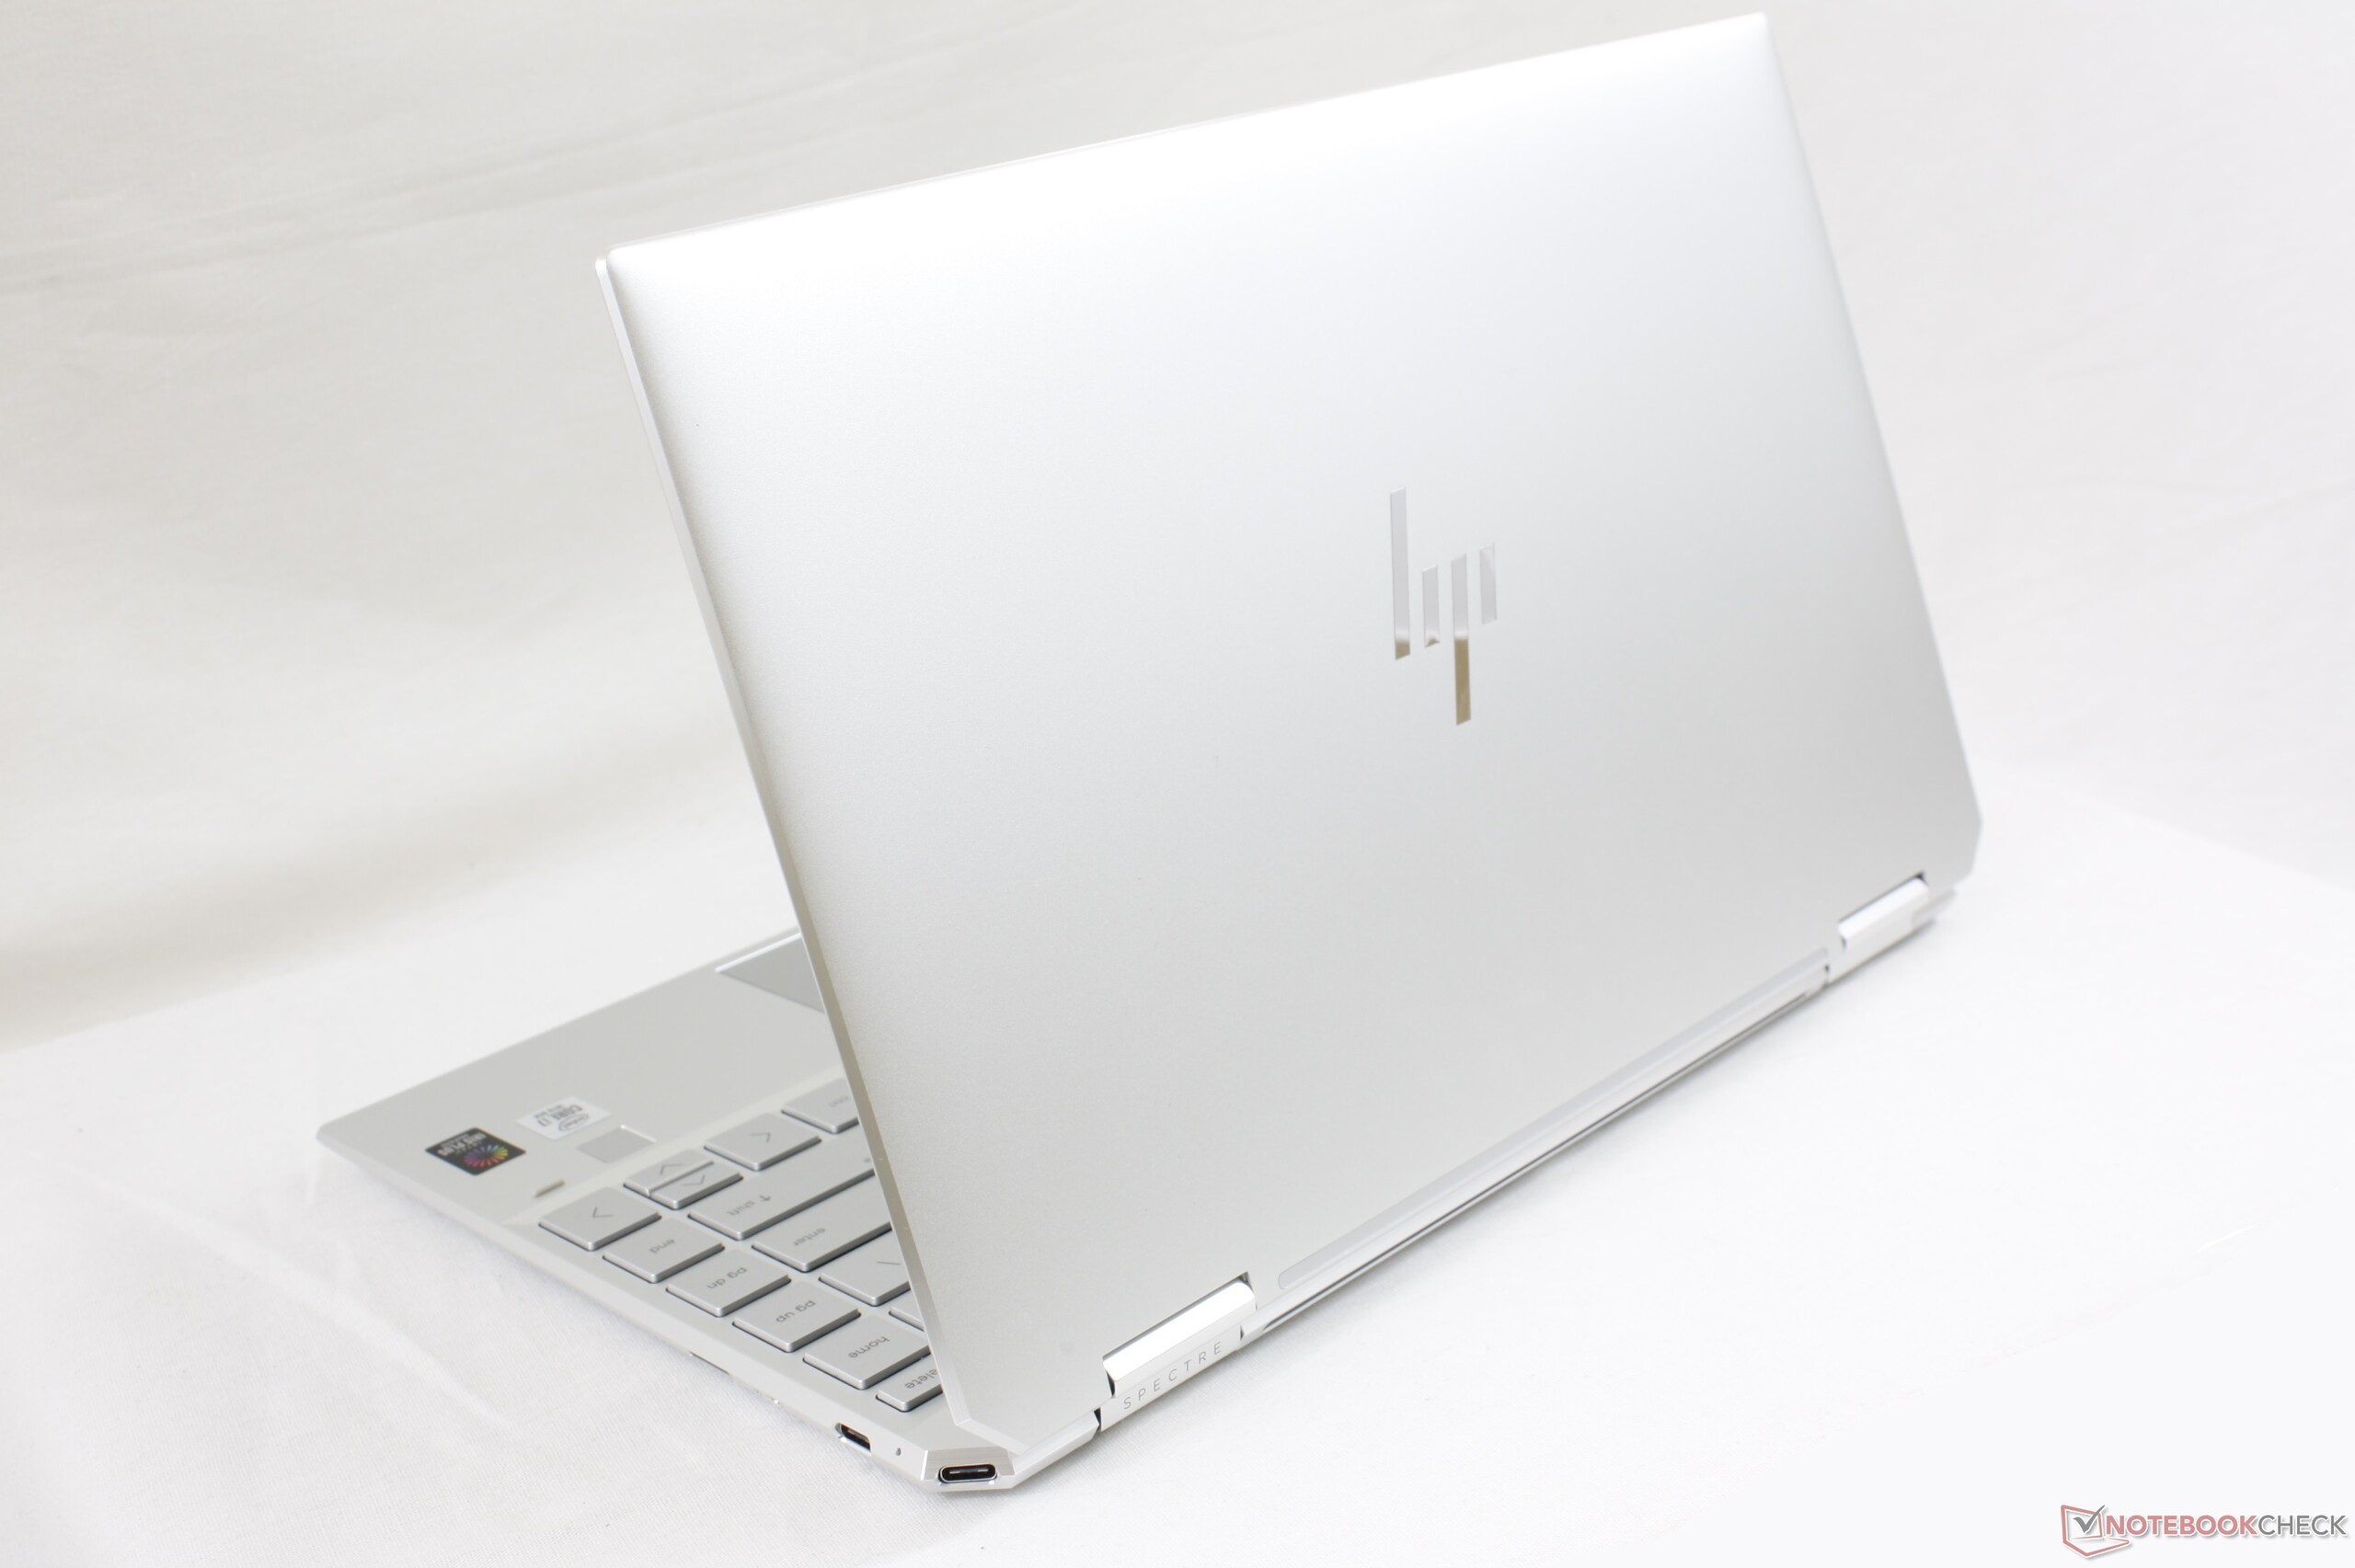
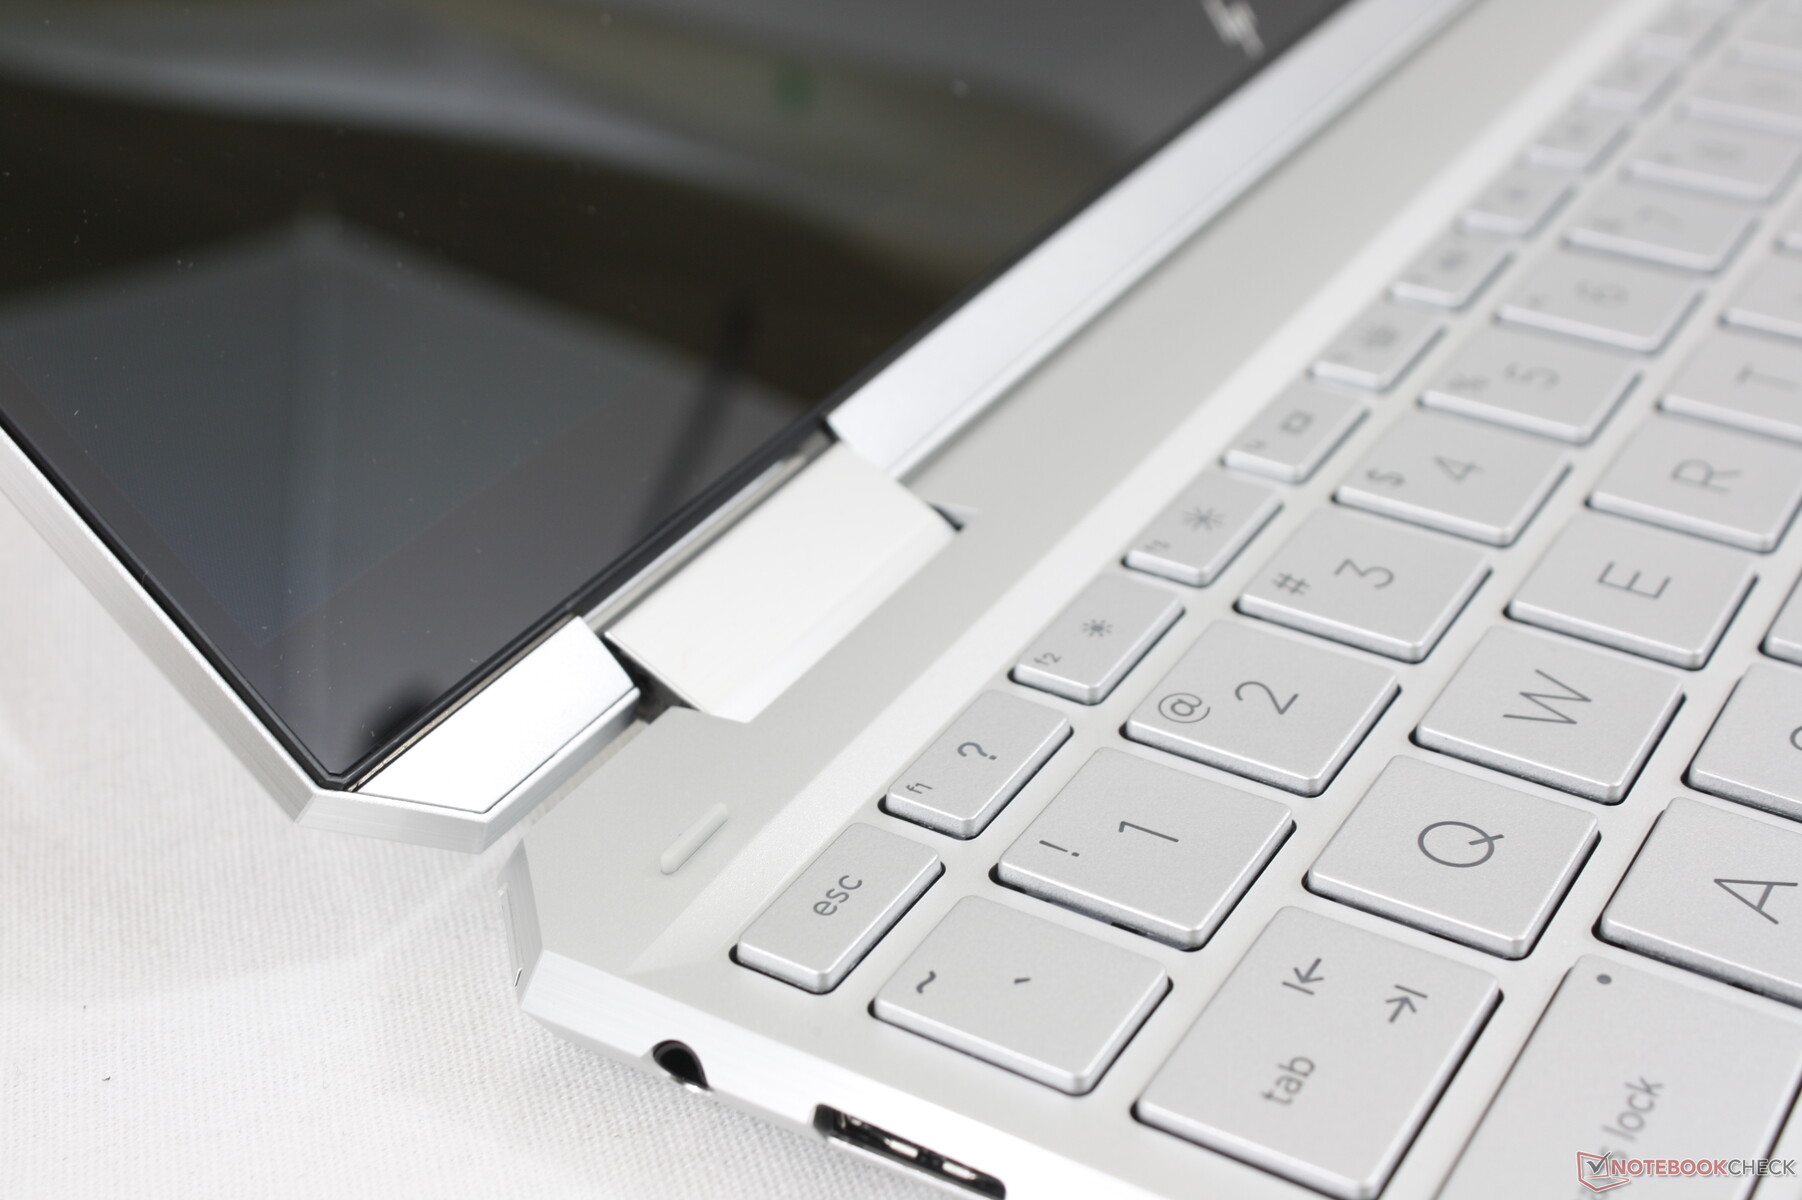
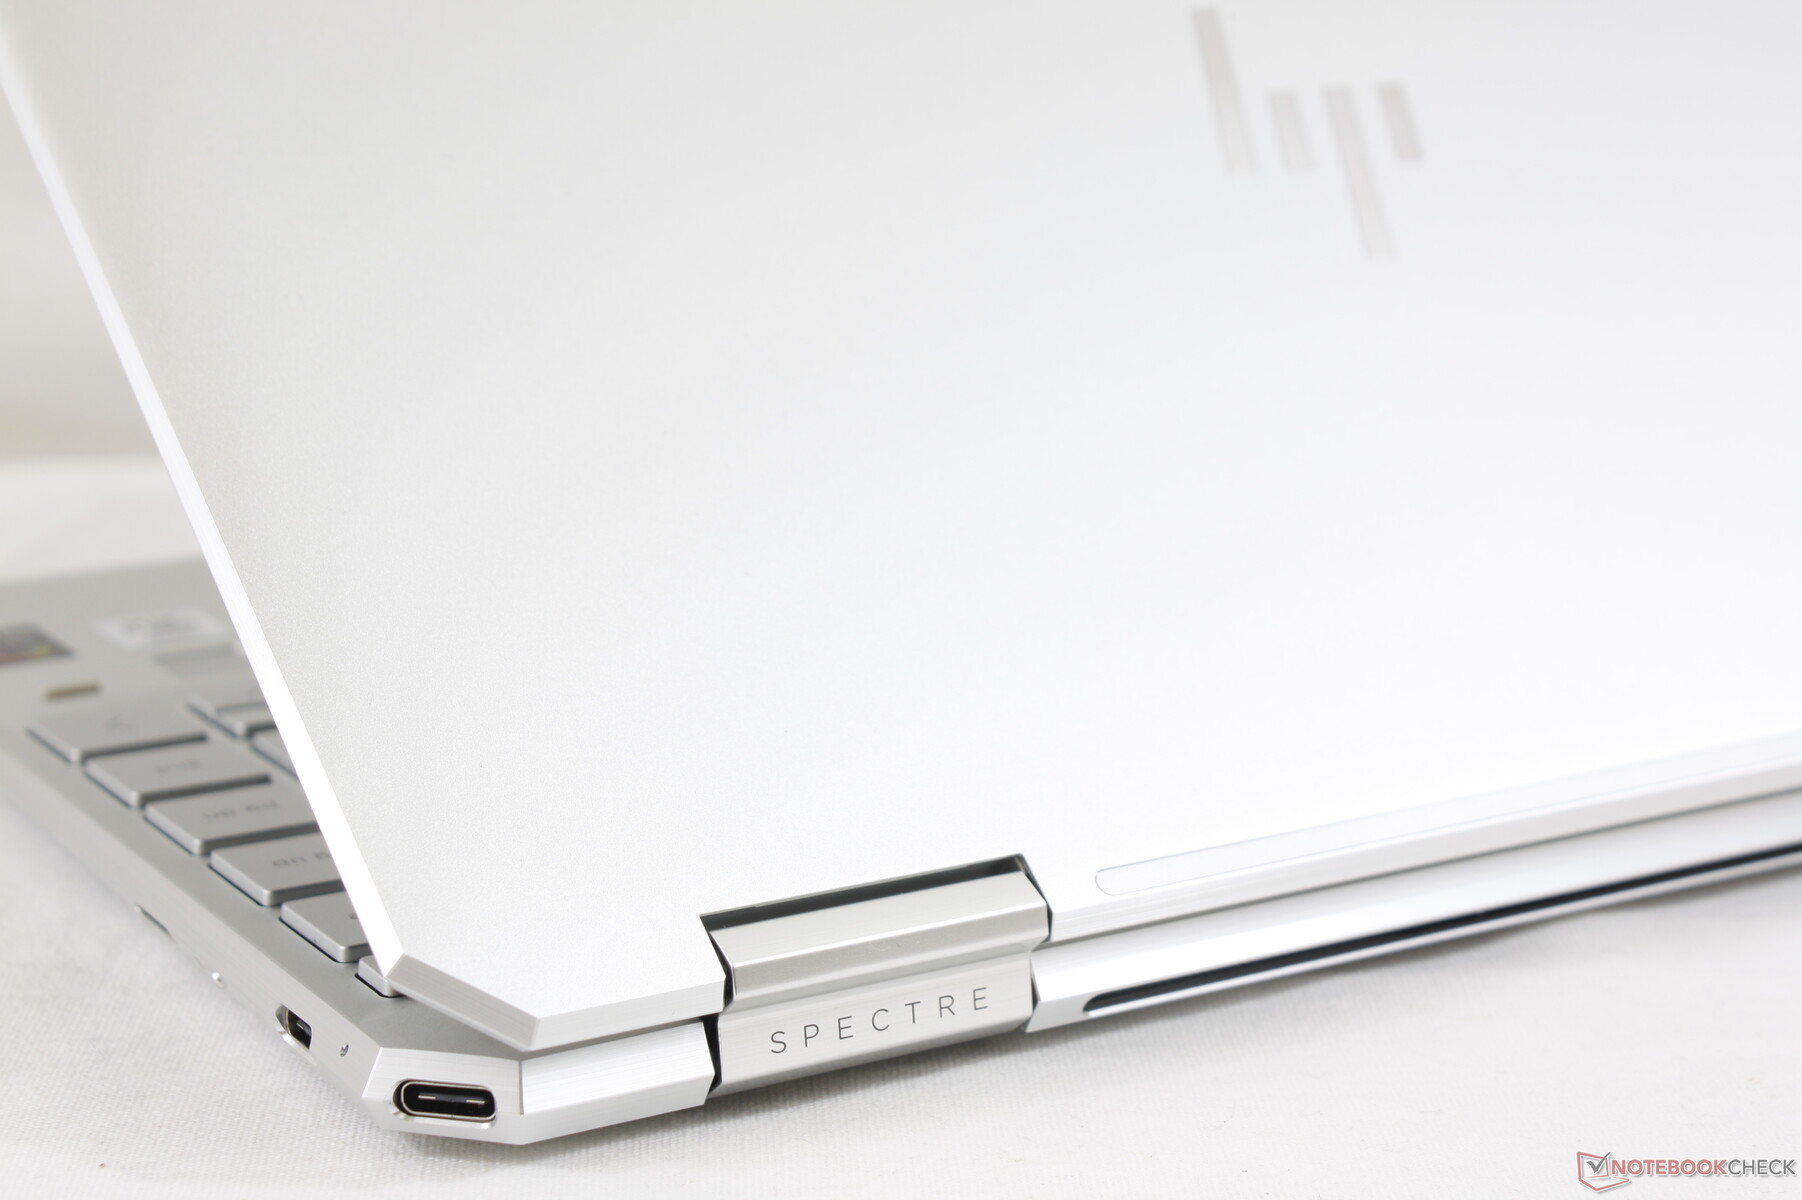
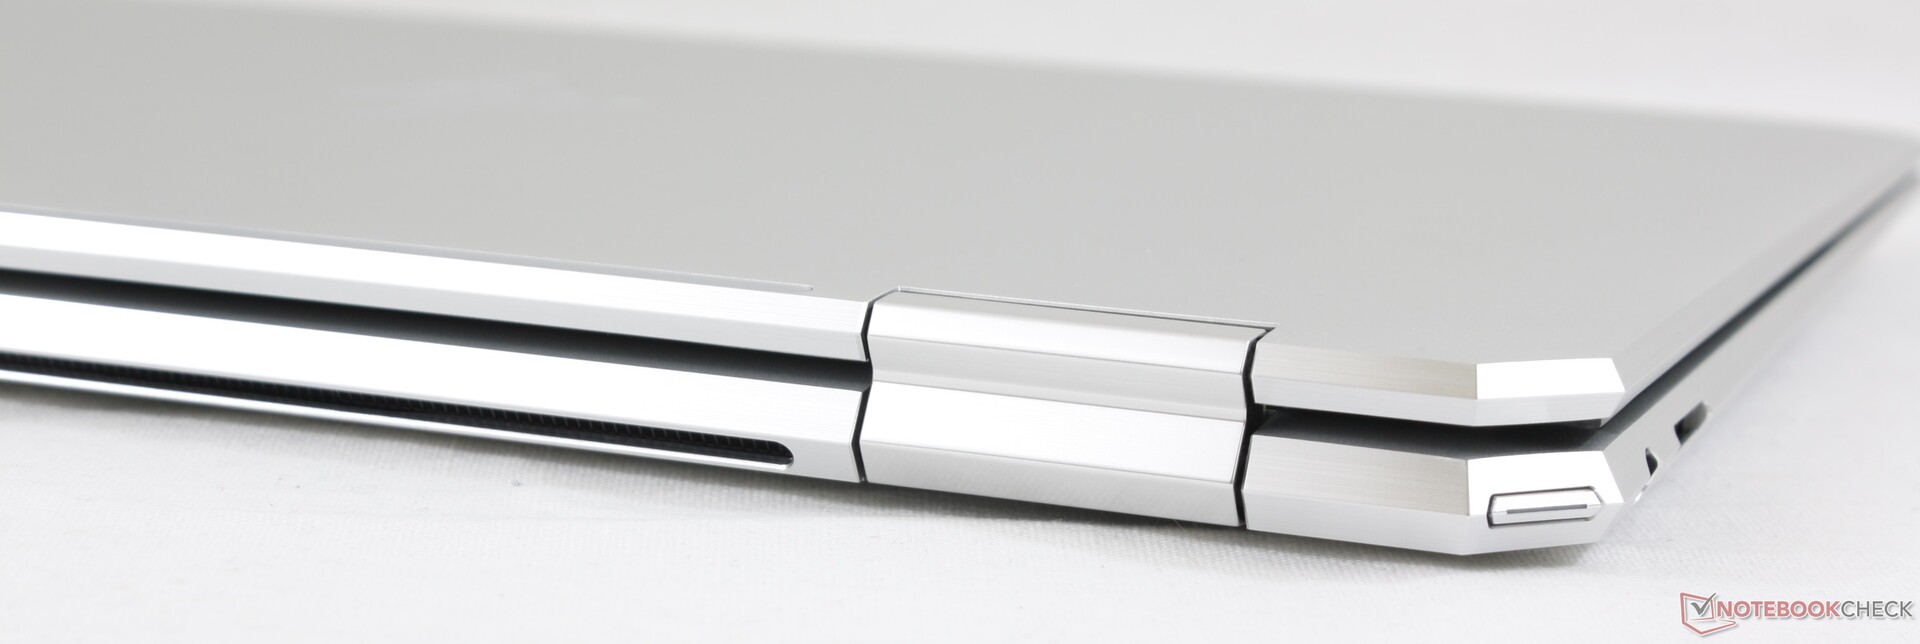
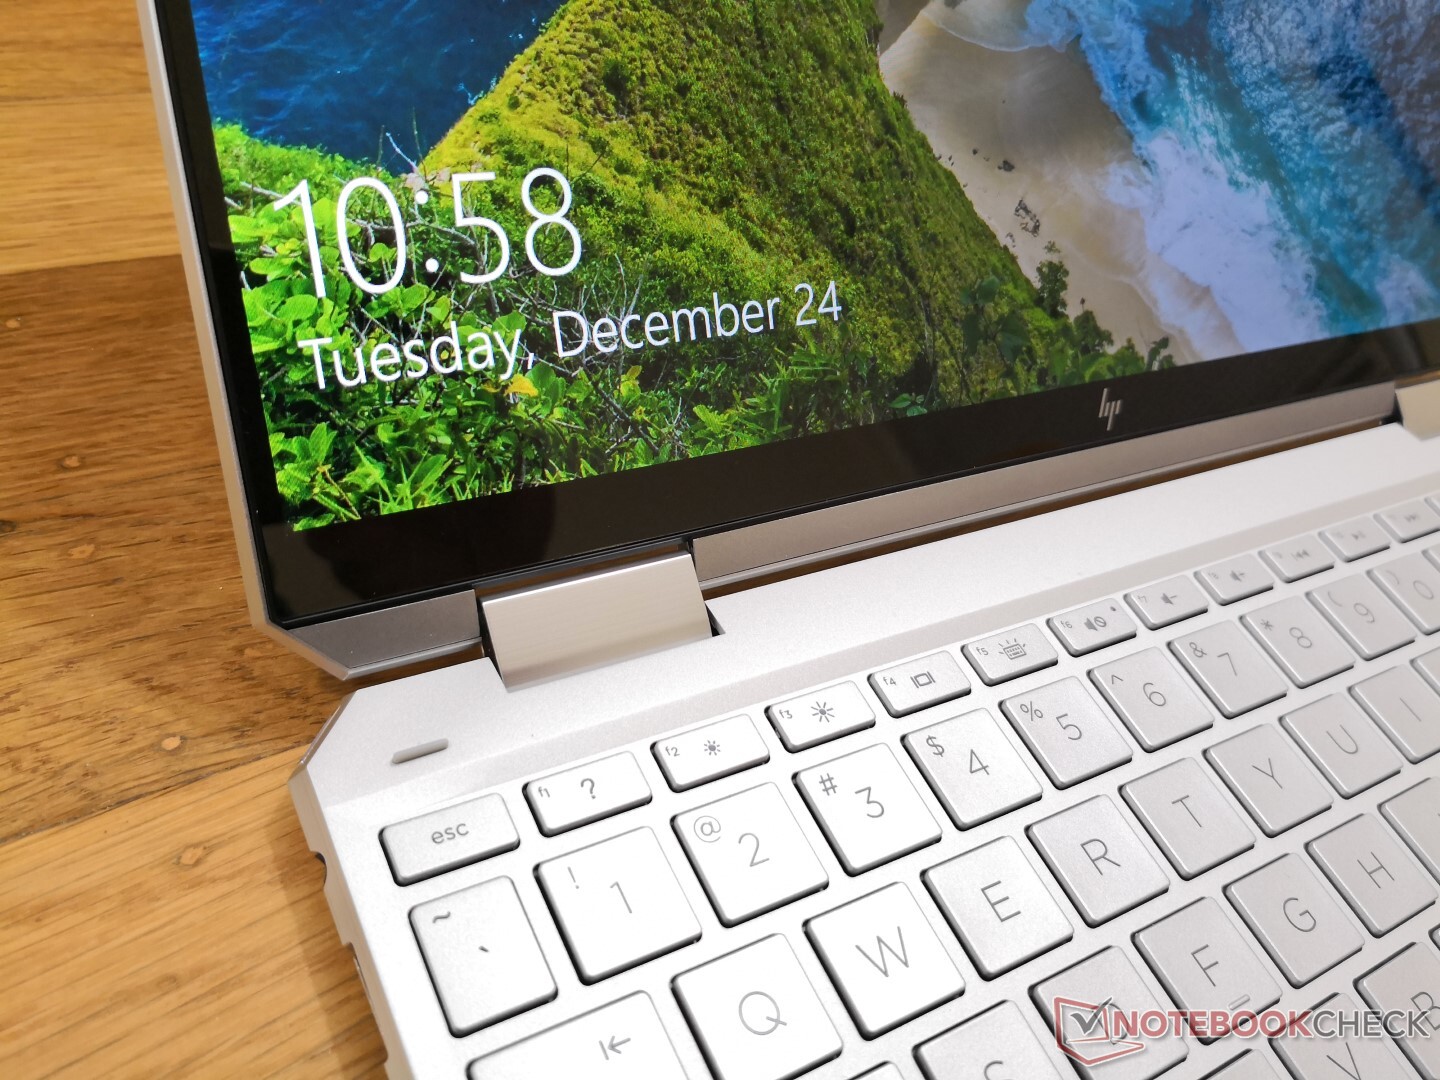
HP has carefully reduced the size of the bezels without impacting the overall quality of the chassis. This means that the latest Spectre x360 13 feels just like last year's model while being noticeably more portable at the same time. Both the lid and base remain rigid with only minimal twisting and almost no creaking as any flagship Ultrabook should be.
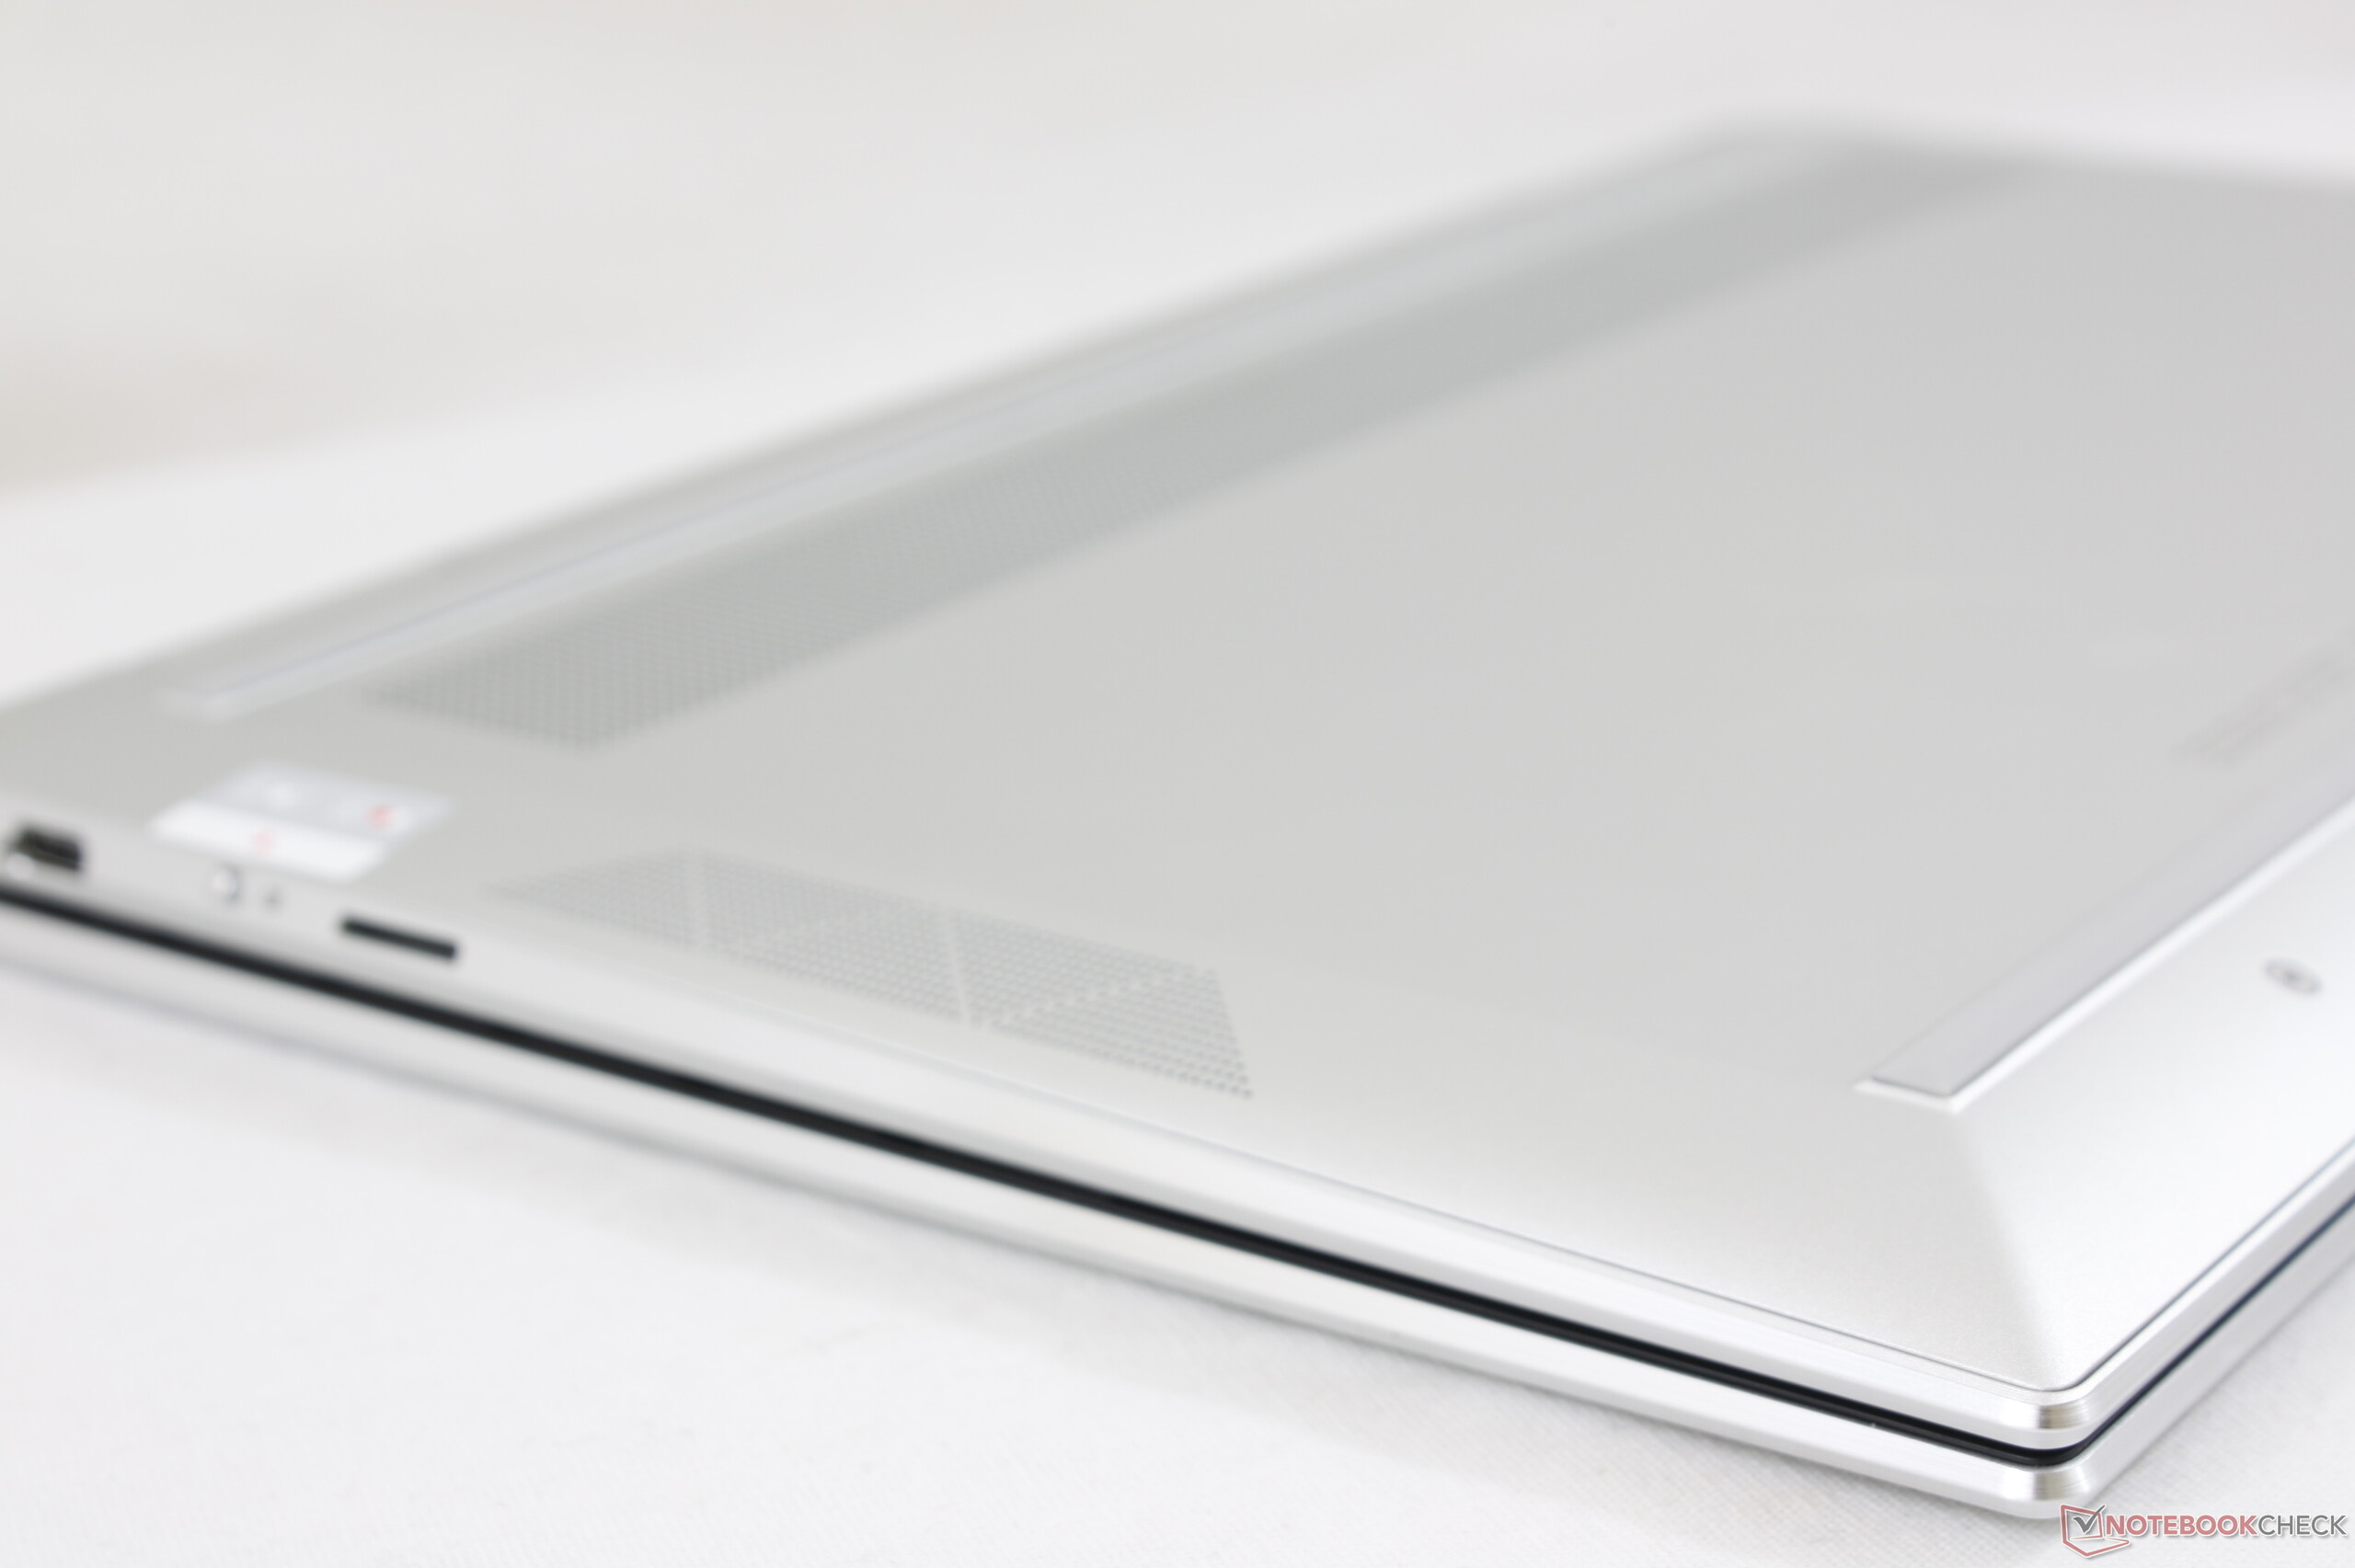
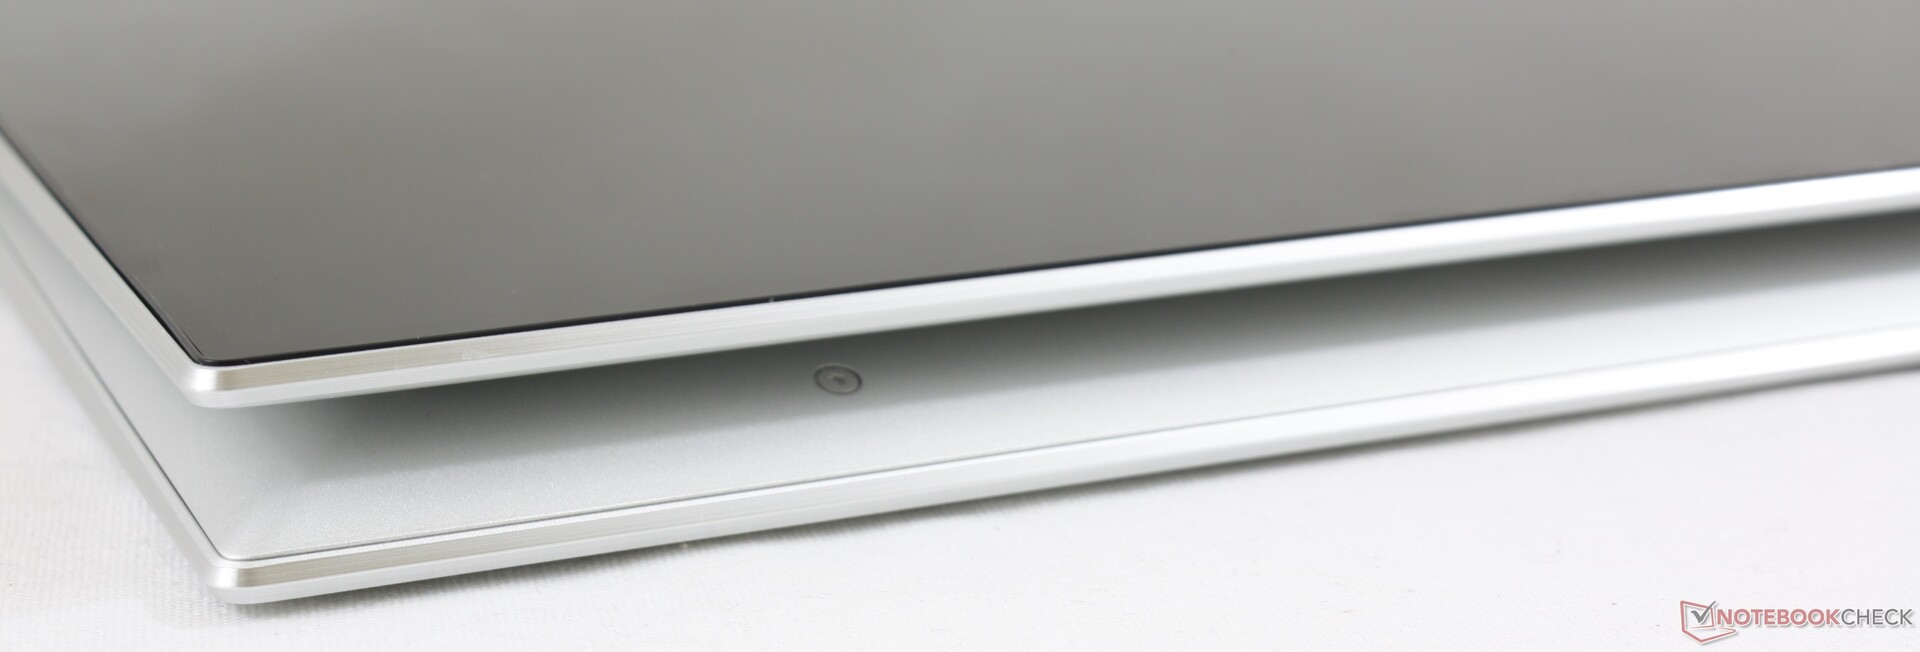
The most notable gen-to-gen visual change is the reduction in length from 217.9 mm to 194.5 mm. Even so, the newer model is actually slightly thicker this time around at 16.9 mm compared to 14.7 mm on last year's model to be one of the thicker 13.3-inch flagship subnotebooks. Overall volume is still smaller than the outgoing Spectre x360 13 and with a slightly lighter weight as well.
If we are to have one complaint, we think the hinges could be stiffer to give a better sense of longevity.
Connectivity
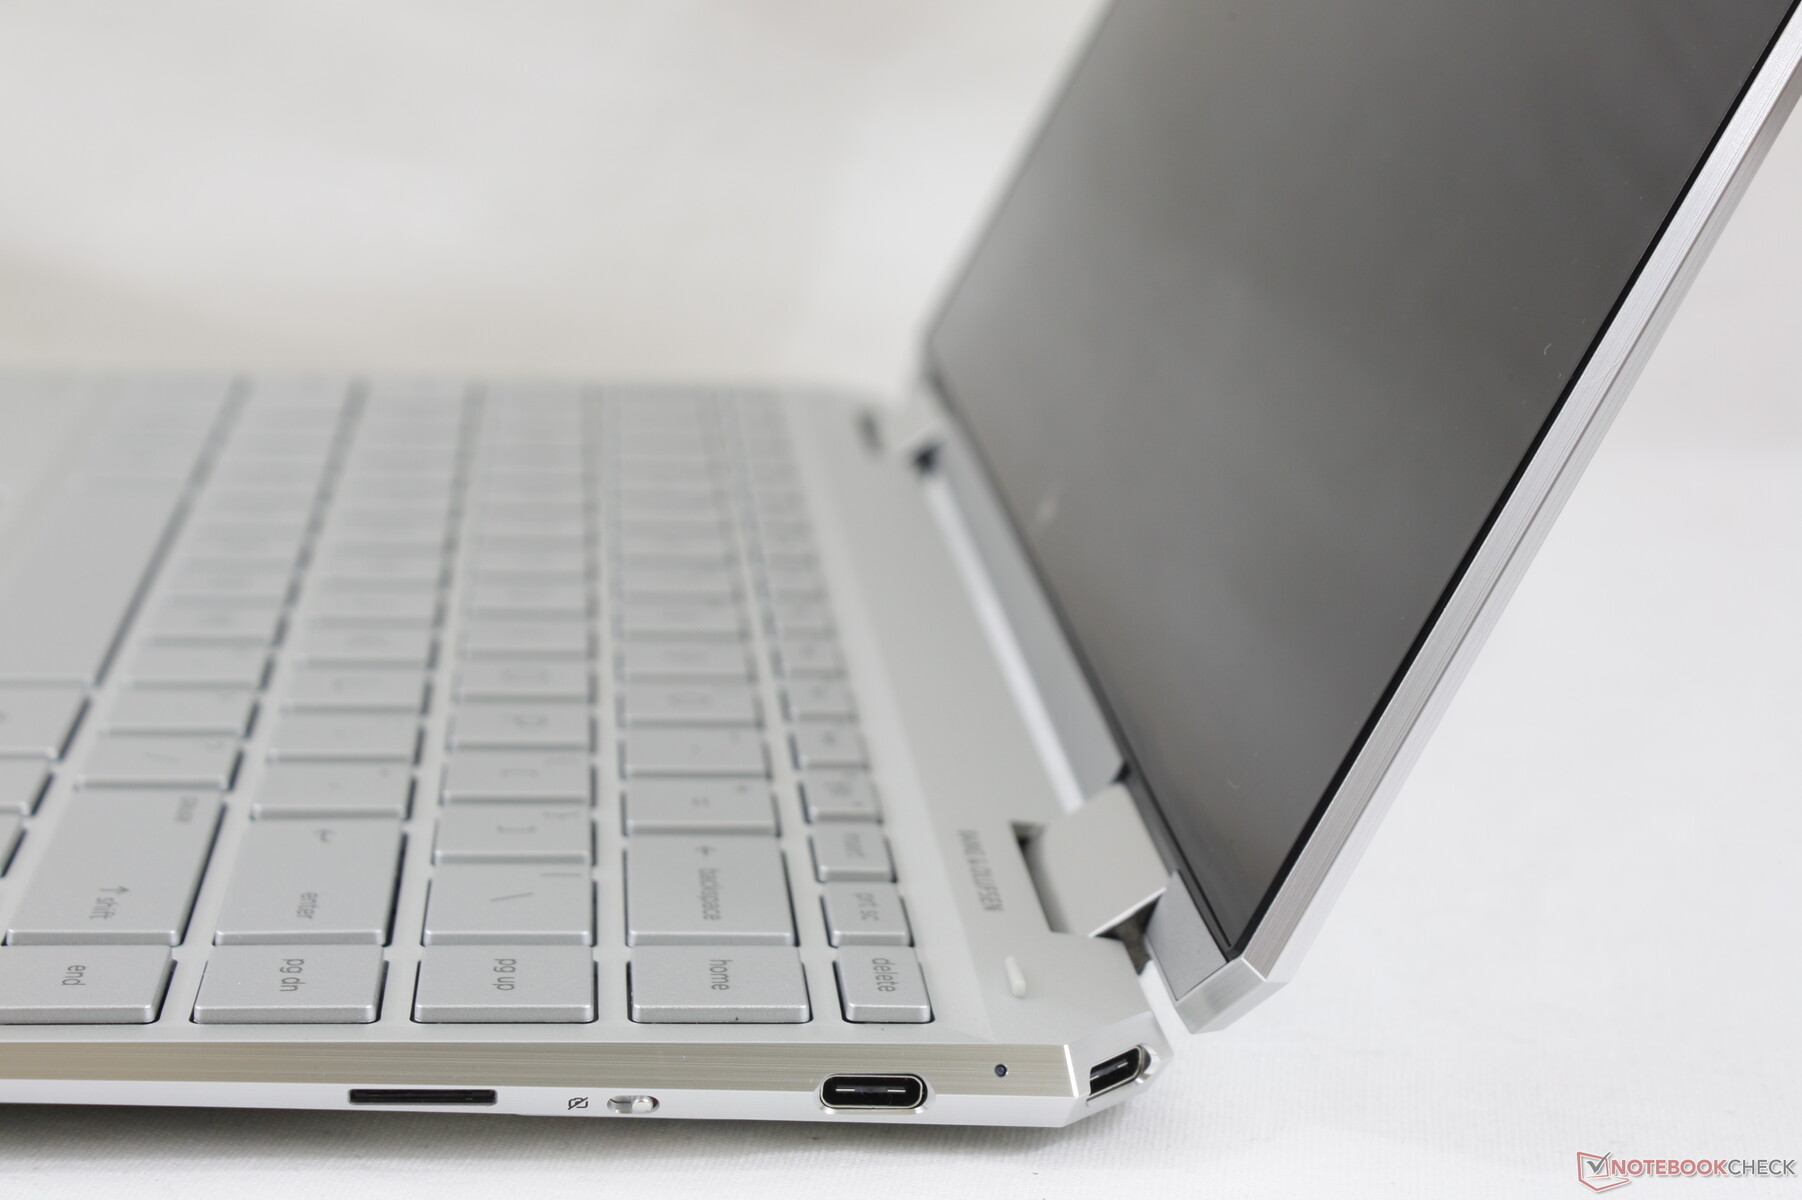
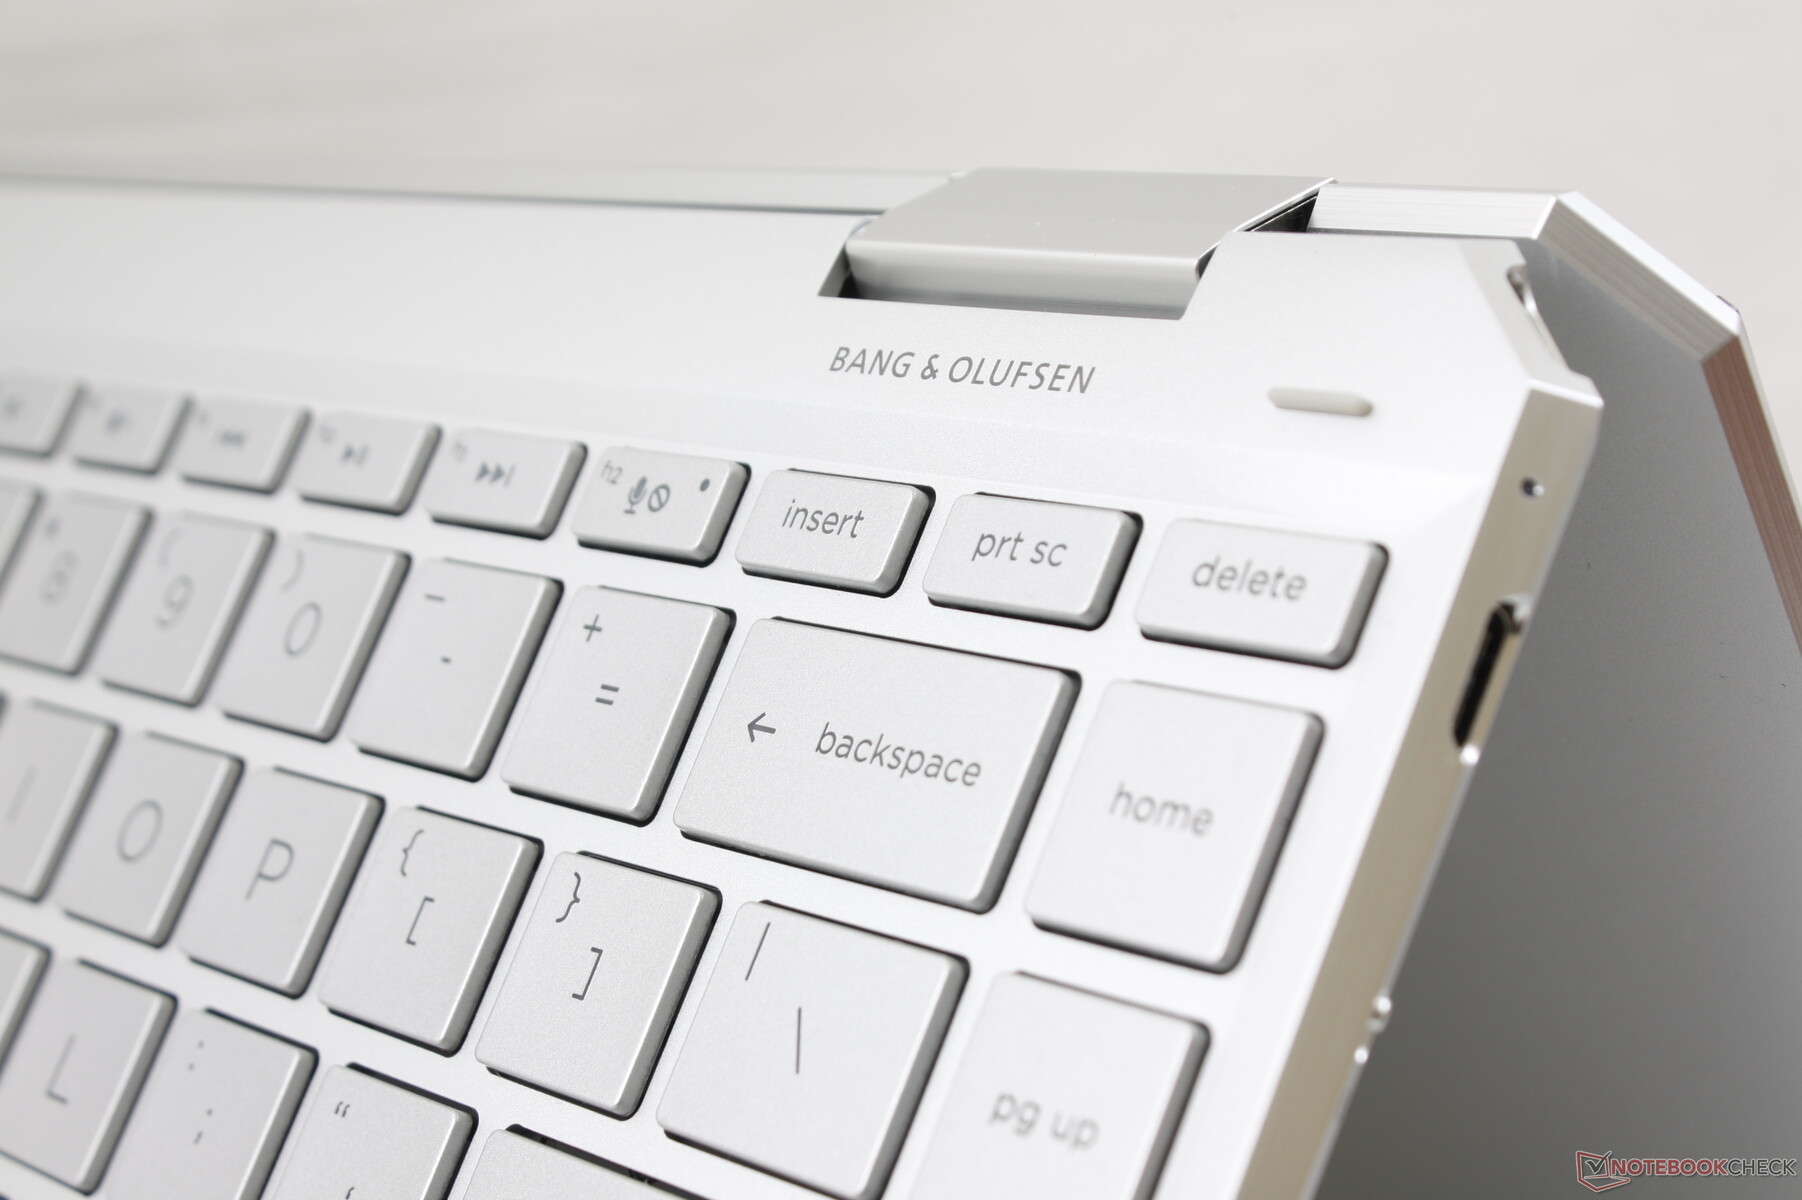
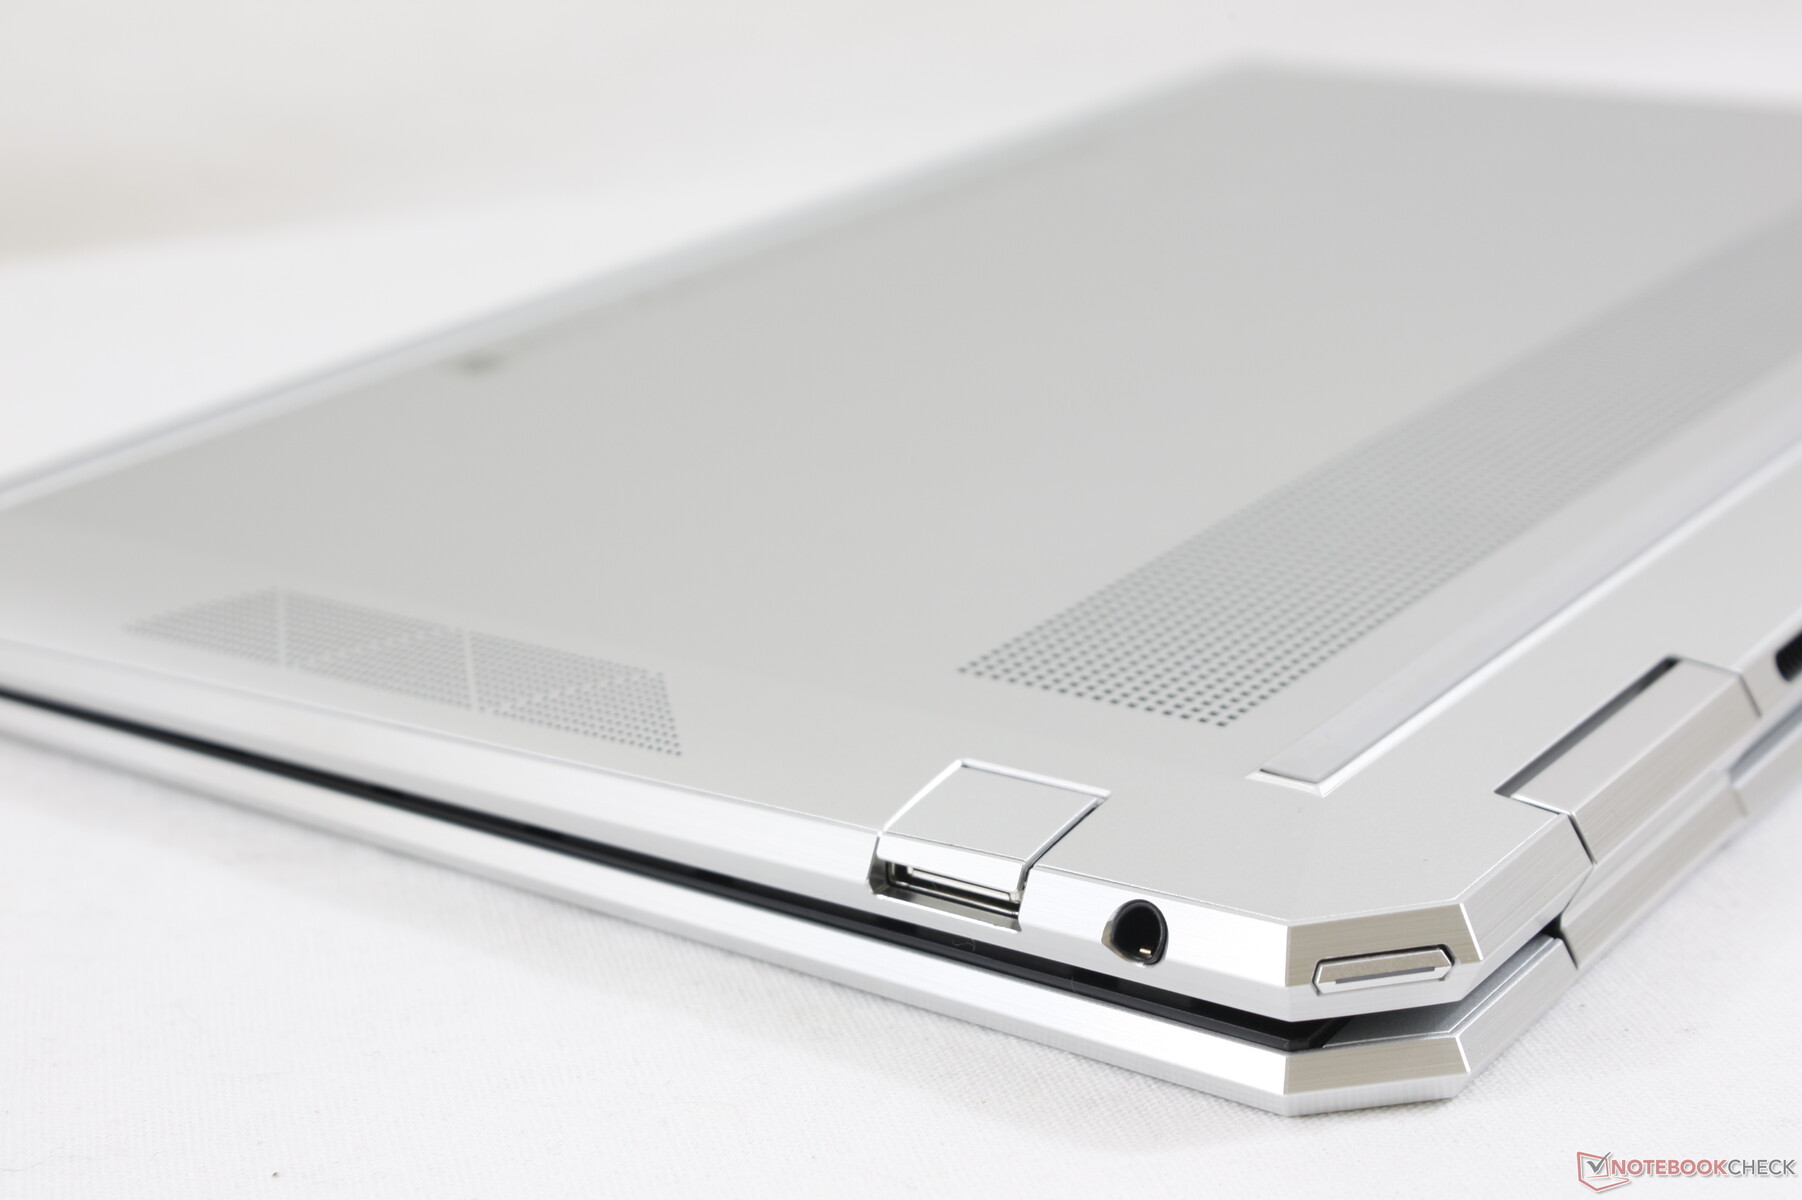
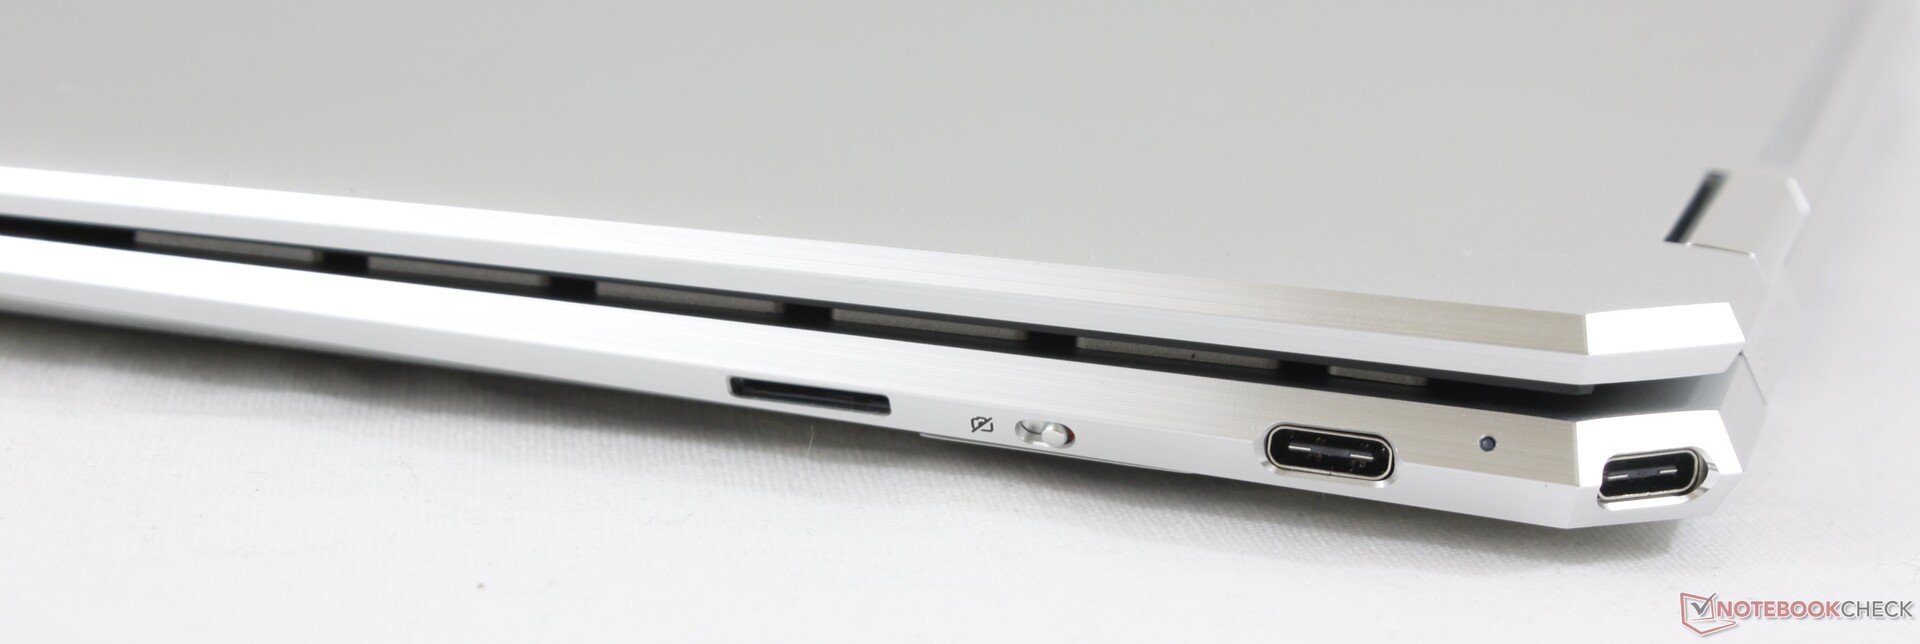
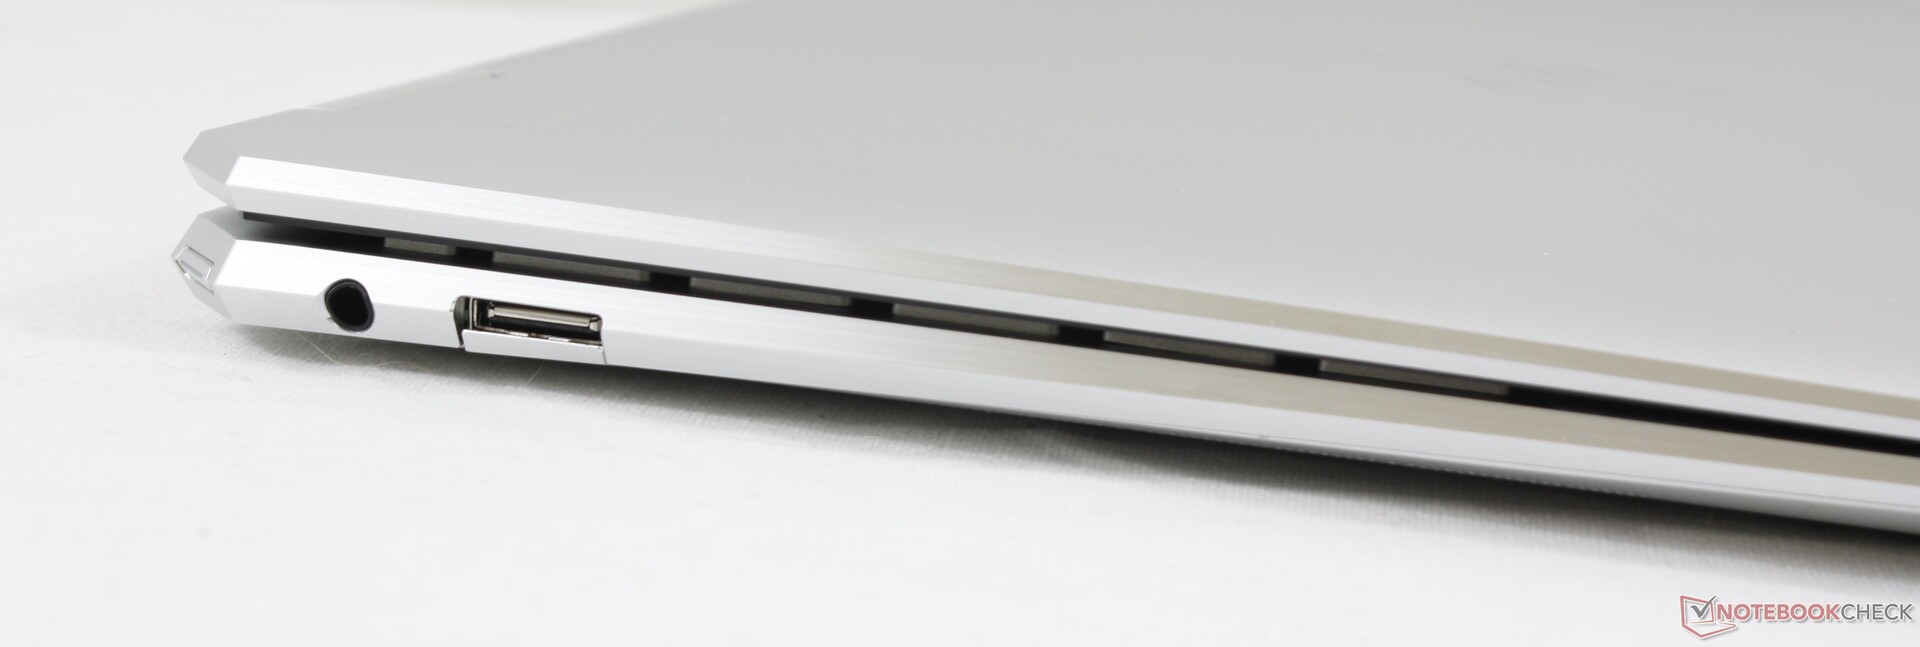
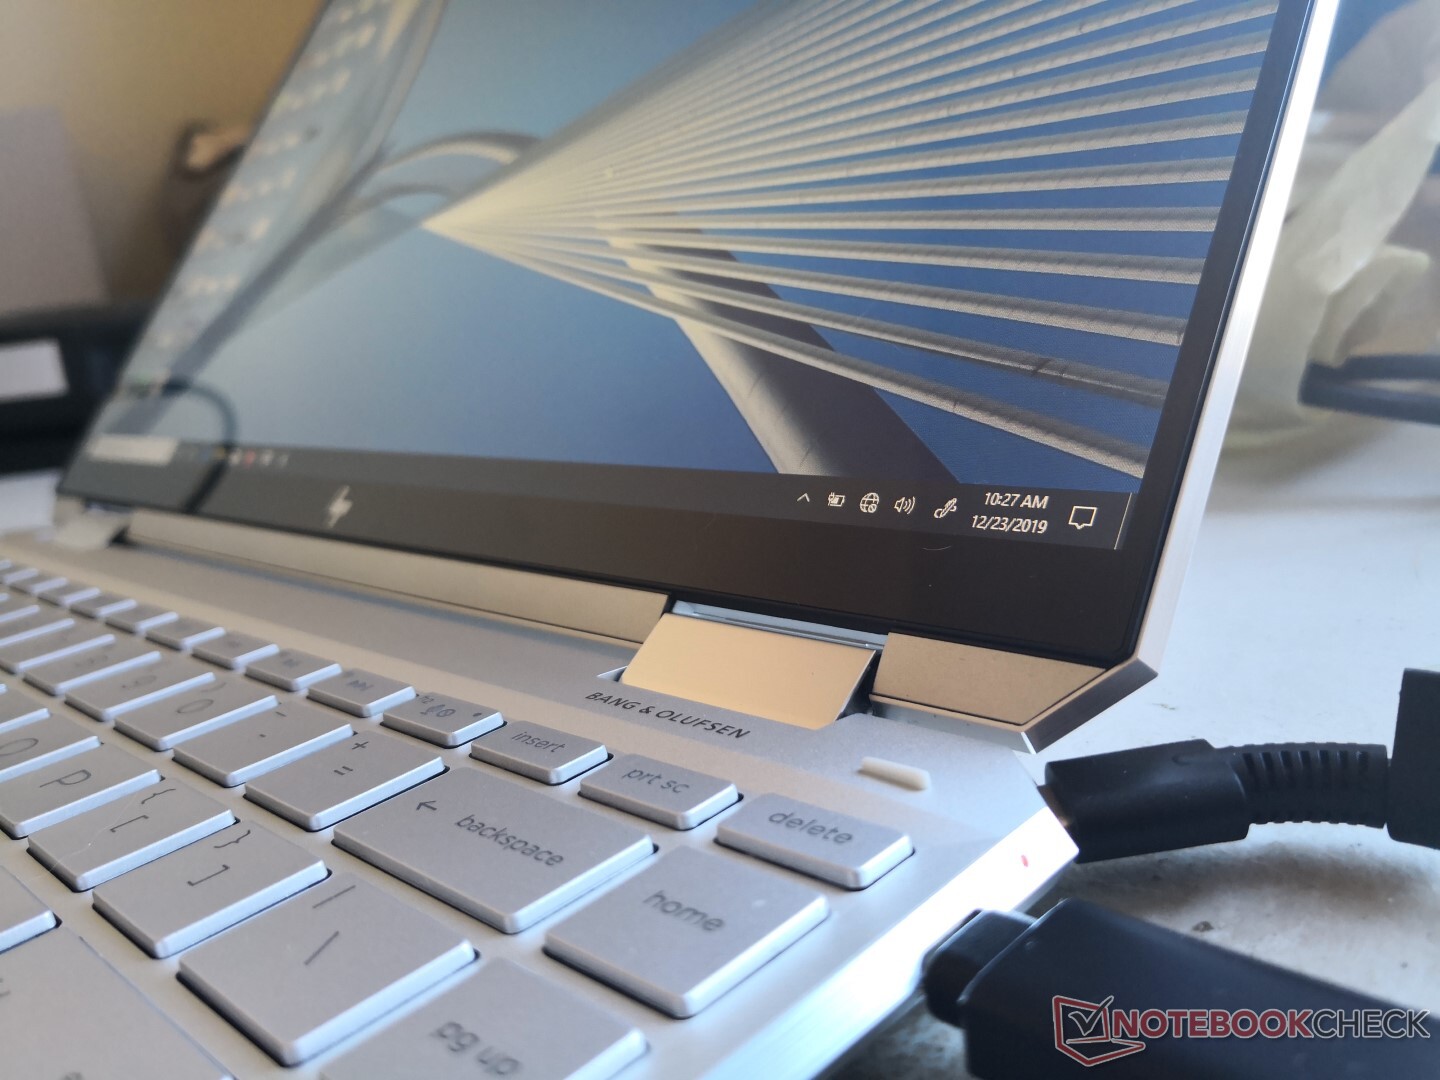
Port options remain identical to last year's model albeit with the 3.5 mm headphone jack now on the left edge instead of the right. The USB Type-A port is also slightly different because of the change in chassis thickness. The lack of any HDMI ports means owners will have to rely on adapters, DisplayPort over USB Type-C, or Thunderbolt 3 for connecting external monitors.
SD Card Reader
We can appreciate HP keeping the spring-loaded SD card reader even if it's MicroSD only. The competing Lenovo Yoga C940, for example, integrates no SD reader at all. Transferring 1 GB worth of images from our UHS-II card to desktop takes just under 7 seconds much like on the XPS 13.
| SD Card Reader | |
| average JPG Copy Test (av. of 3 runs) | |
| HP Spectre x360 13-ap0312ng (Toshiba Exceria Pro M501 64 GB UHS-II) | |
| HP Spectre x360 13-aw0013dx (Toshiba Exceria Pro M501 microSDXC 64GB) | |
| Dell XPS 13 7390 2-in-1 Core i7 (Toshiba Exceria Pro M501 64 GB UHS-II) | |
| Asus ZenBook Flip 14 UM462DA-AI023T (Toshiba Exceria Pro M501 microSDXC 64GB) | |
| maximum AS SSD Seq Read Test (1GB) | |
| HP Spectre x360 13-ap0312ng (Toshiba Exceria Pro M501 64 GB UHS-II) | |
| Dell XPS 13 7390 2-in-1 Core i7 (Toshiba Exceria Pro M501 64 GB UHS-II) | |
| HP Spectre x360 13-aw0013dx (Toshiba Exceria Pro M501 microSDXC 64GB) | |
| Asus ZenBook Flip 14 UM462DA-AI023T (Toshiba Exceria Pro M501 microSDXC 64GB) | |
Communication
The Intel AX201 comes standard for Wi-Fi 6 (802.11ax) connectivity and Bluetooth 5; any less and this laptop wouldn't be compliant with Intel Athena. The AX201 is functionally identical to the AX200 save for some minor chipset differences. We experienced no connectivity issues during our time with the test unit.
Though our specific test unit doesn't support it, HP offers SKUs with WWAN and Micro-SIM options unlike on the competing XPS, Yoga, Aspire, or ZenBook lineups.
| Networking | |
| iperf3 transmit AX12 | |
| MSI Prestige 15 A10SC | |
| HP Spectre x360 13-ap0312ng | |
| Asus ZenBook Flip 14 UM462DA-AI023T | |
| iperf3 receive AX12 | |
| MSI Prestige 15 A10SC | |
| HP Spectre x360 13-ap0312ng | |
| Asus ZenBook Flip 14 UM462DA-AI023T | |
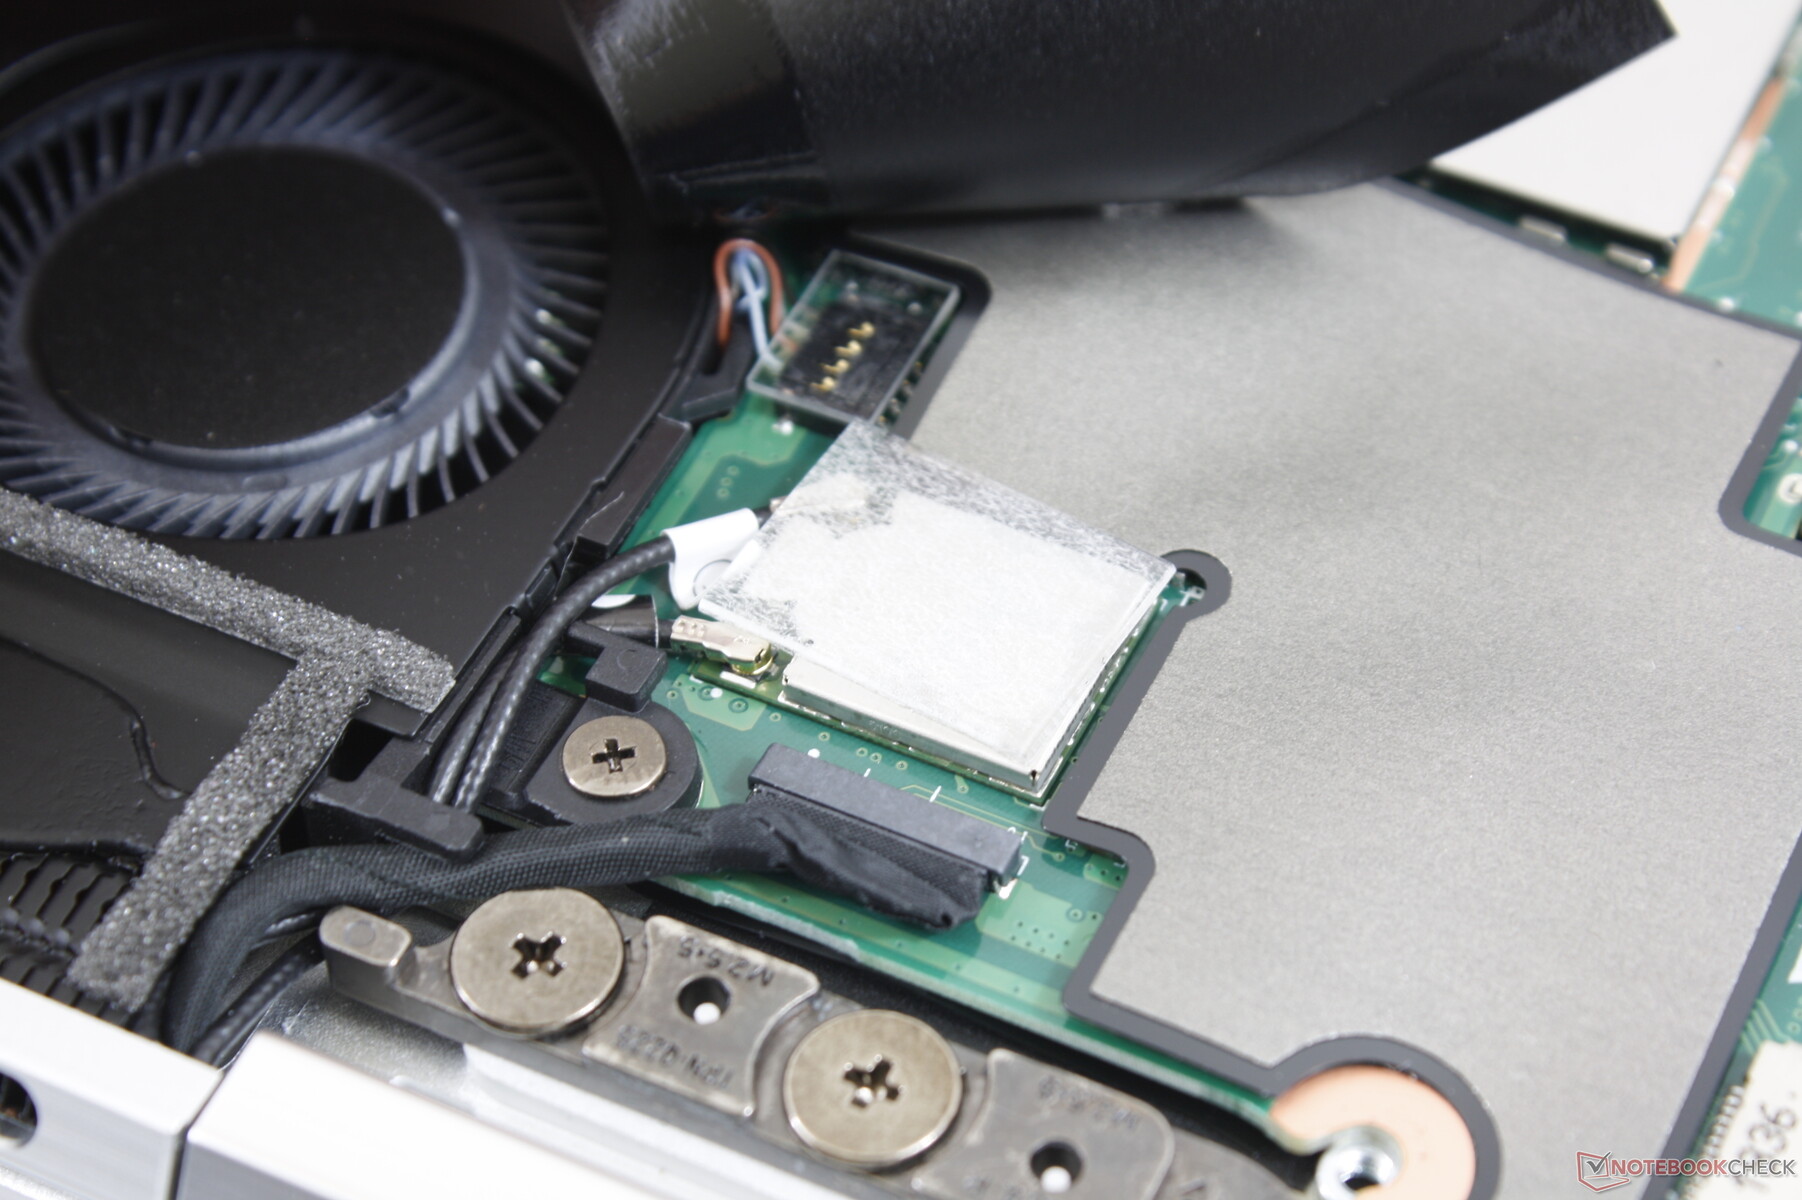
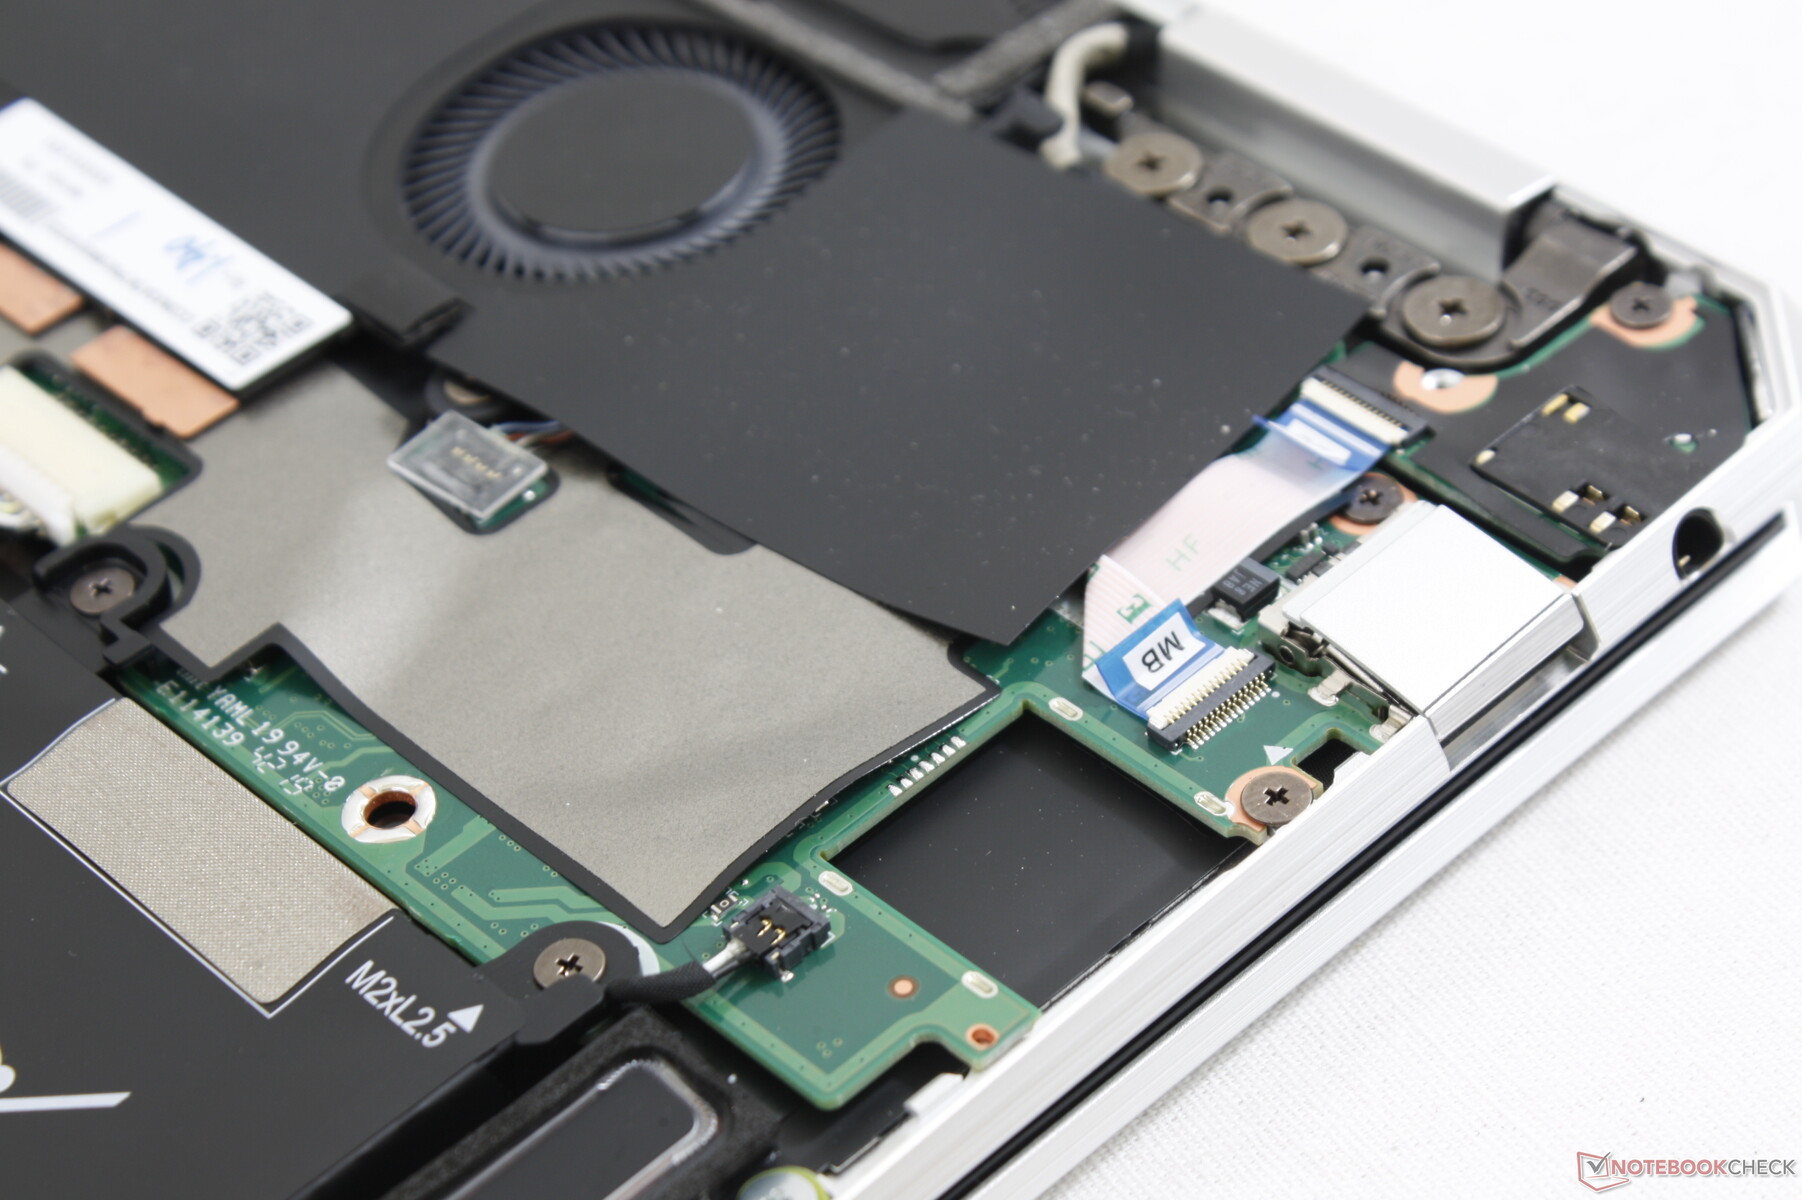
Maintenance
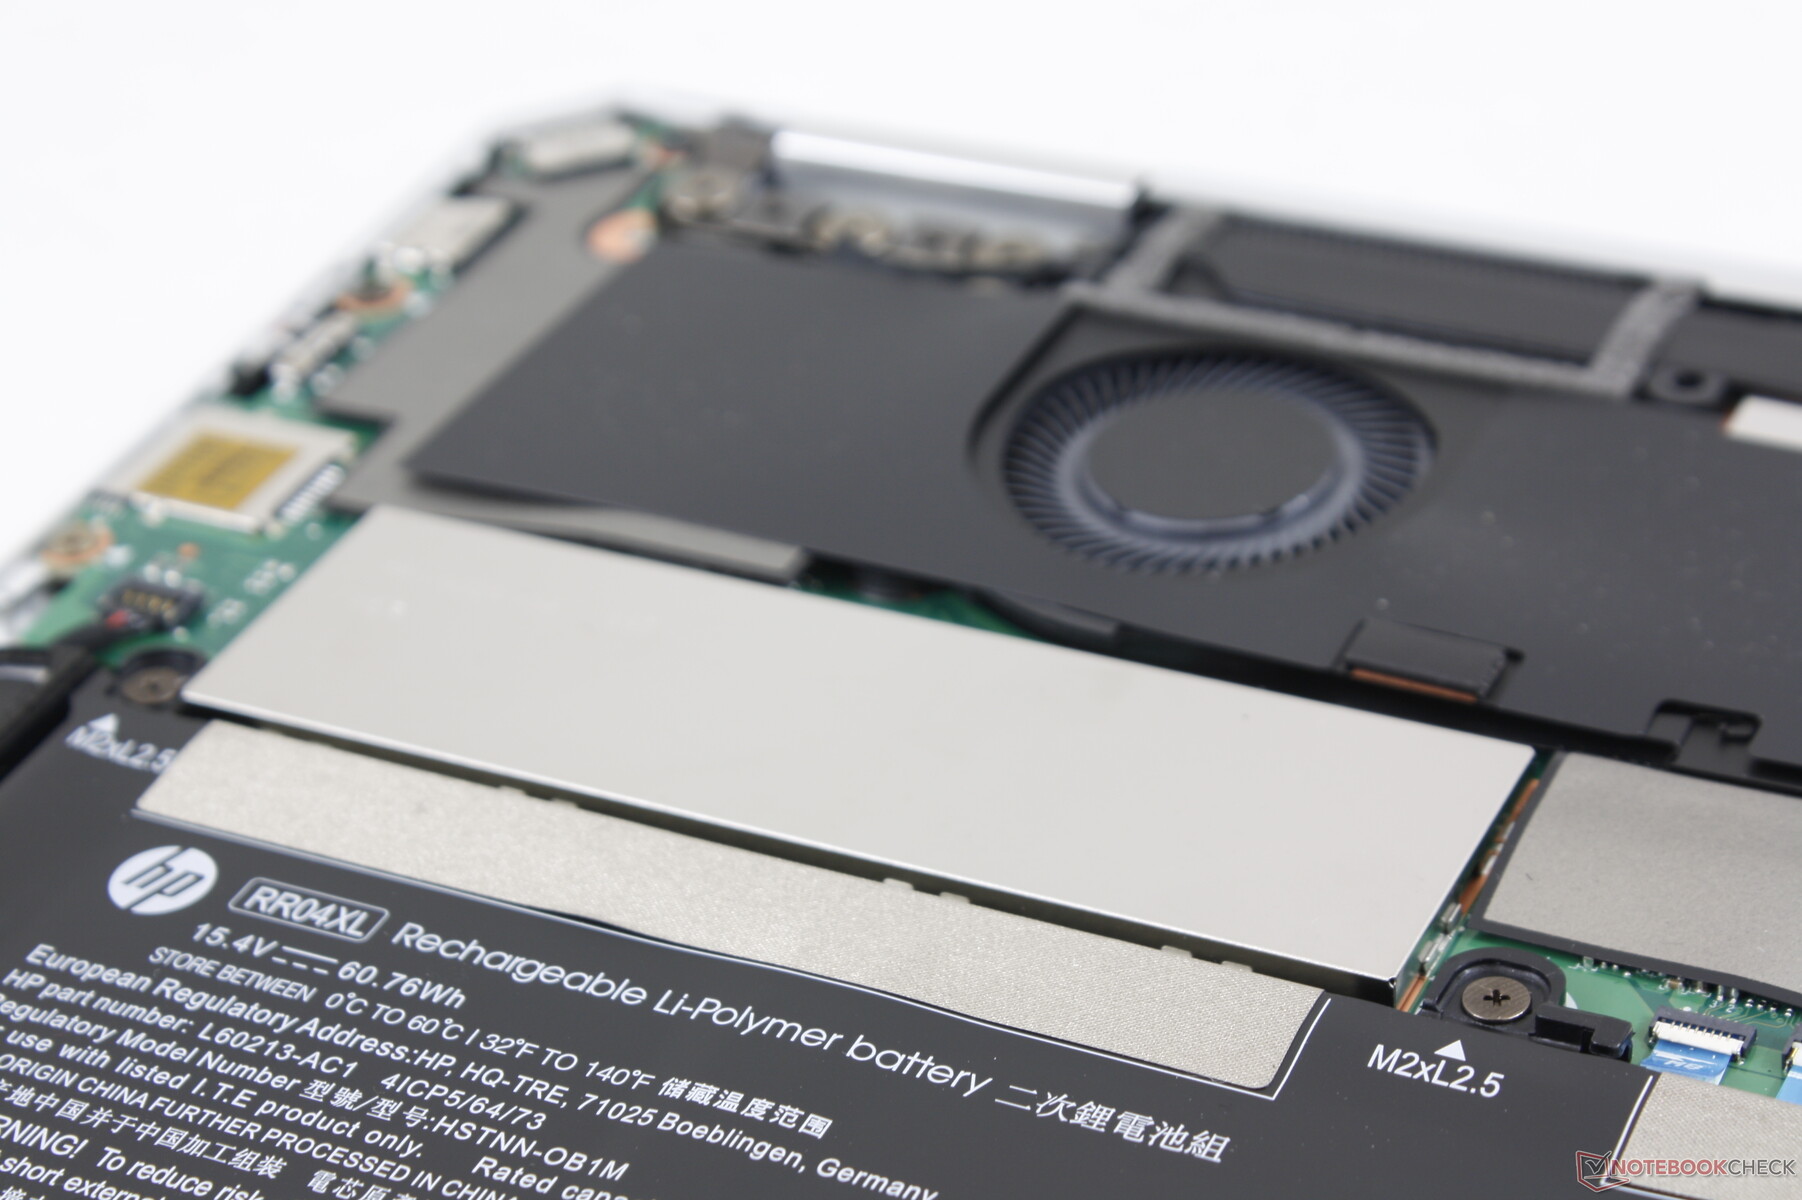
Servicing the system can be tricky at first because the bottom panel is secured by two T5 Torx screws and four more hidden Philips screws underneath the rear rubber footing. After popping off the bottom panel with a sharp edge, there's not much to upgrade save for the M.2 2280 SSD protected under an aluminum plate.
Accessories and Warranty
HP includes a faux leather carrying sleeve, two AAAA batteries, and an active stylus pen (model 905512-001) in the box. The pen is thicker and thus easier to grip than the pen for the Lenovo Yoga C940, but it requires a battery to use.
The standard one-year limited warranty applies with options to extend up to 3 years.
Input Devices
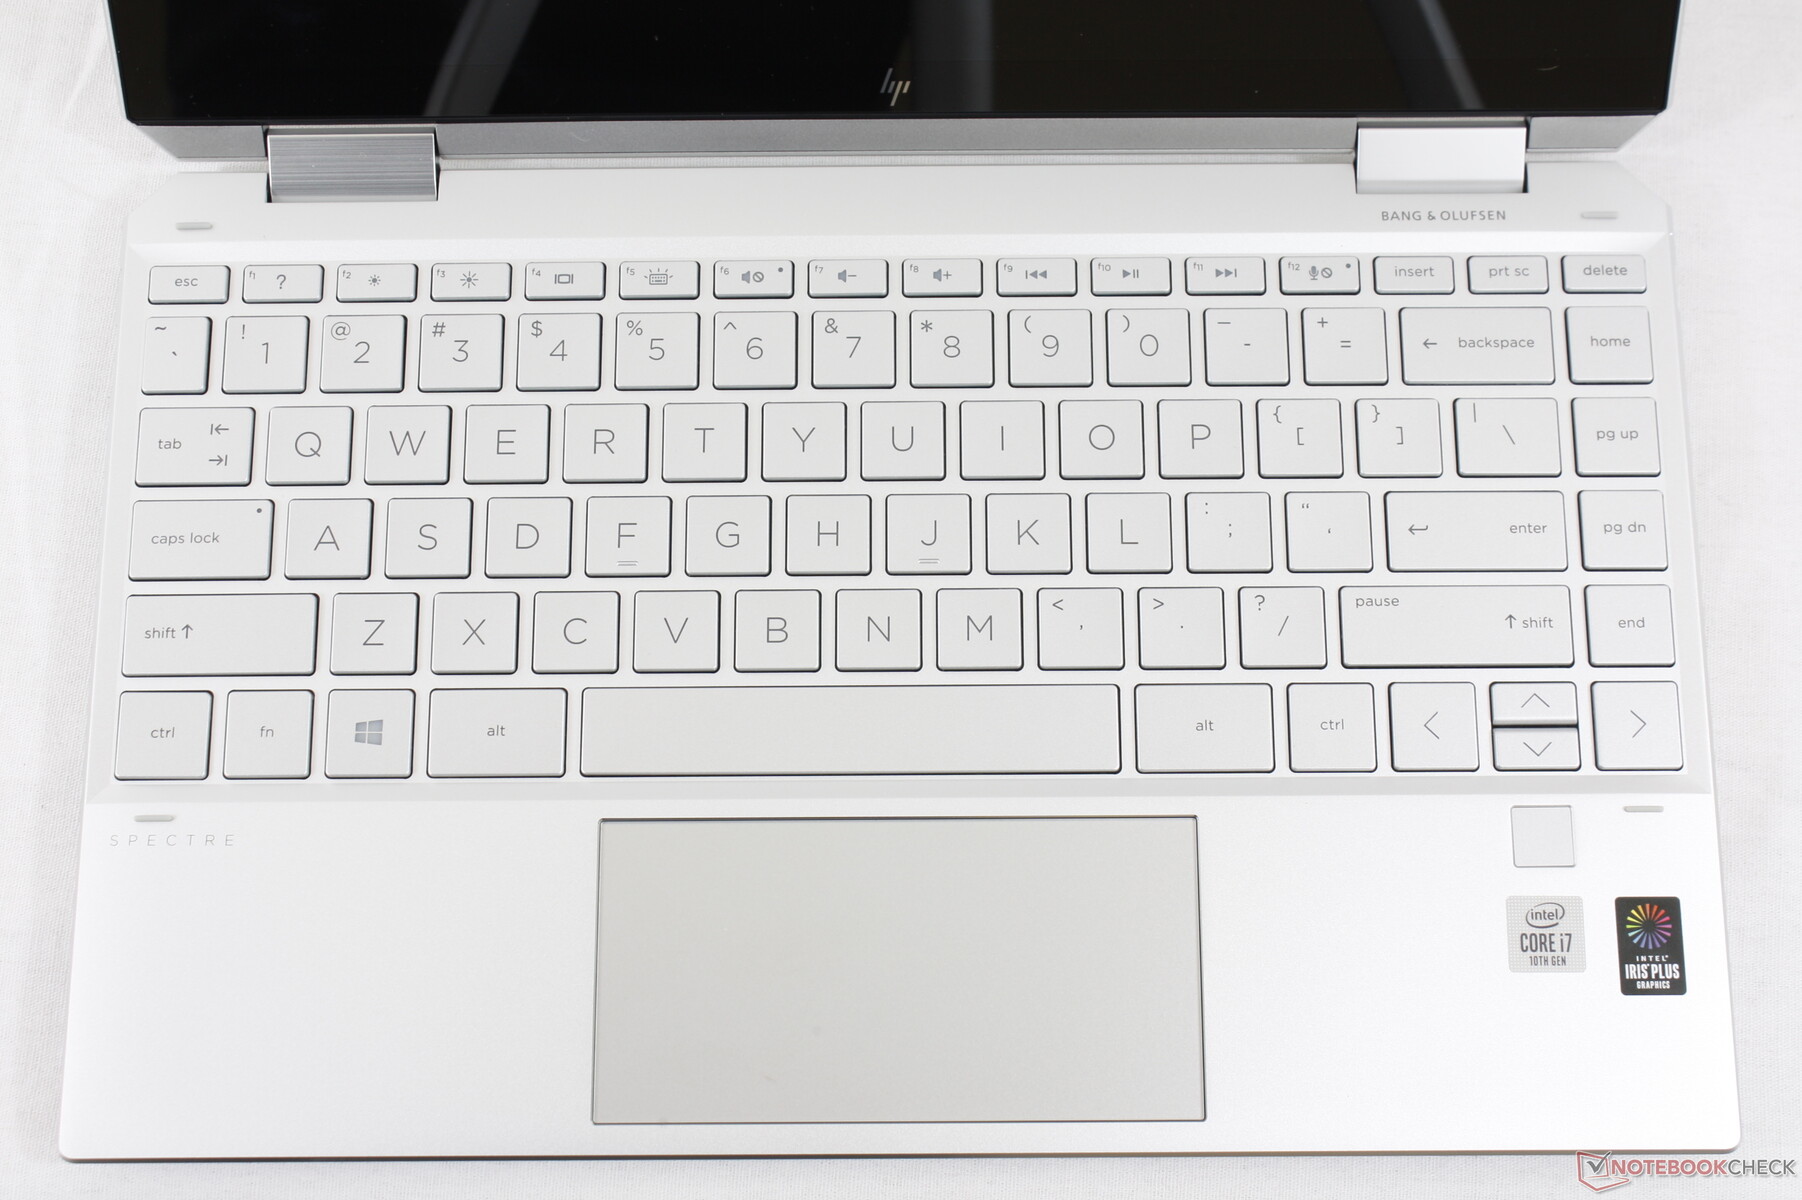
Keyboard
Key feedback and layout remain identical to the outgoing Spectre x360 13 despite the overall reduction in chassis size. We find the typing experience to be crisper and firmer than on the XPS 13, ZenBook 13, or Lenovo Yoga C940 and one of our favorite Ultrabooks for composing long drafts or emails. You'll have to get used to the cramped Arrow keys, however.
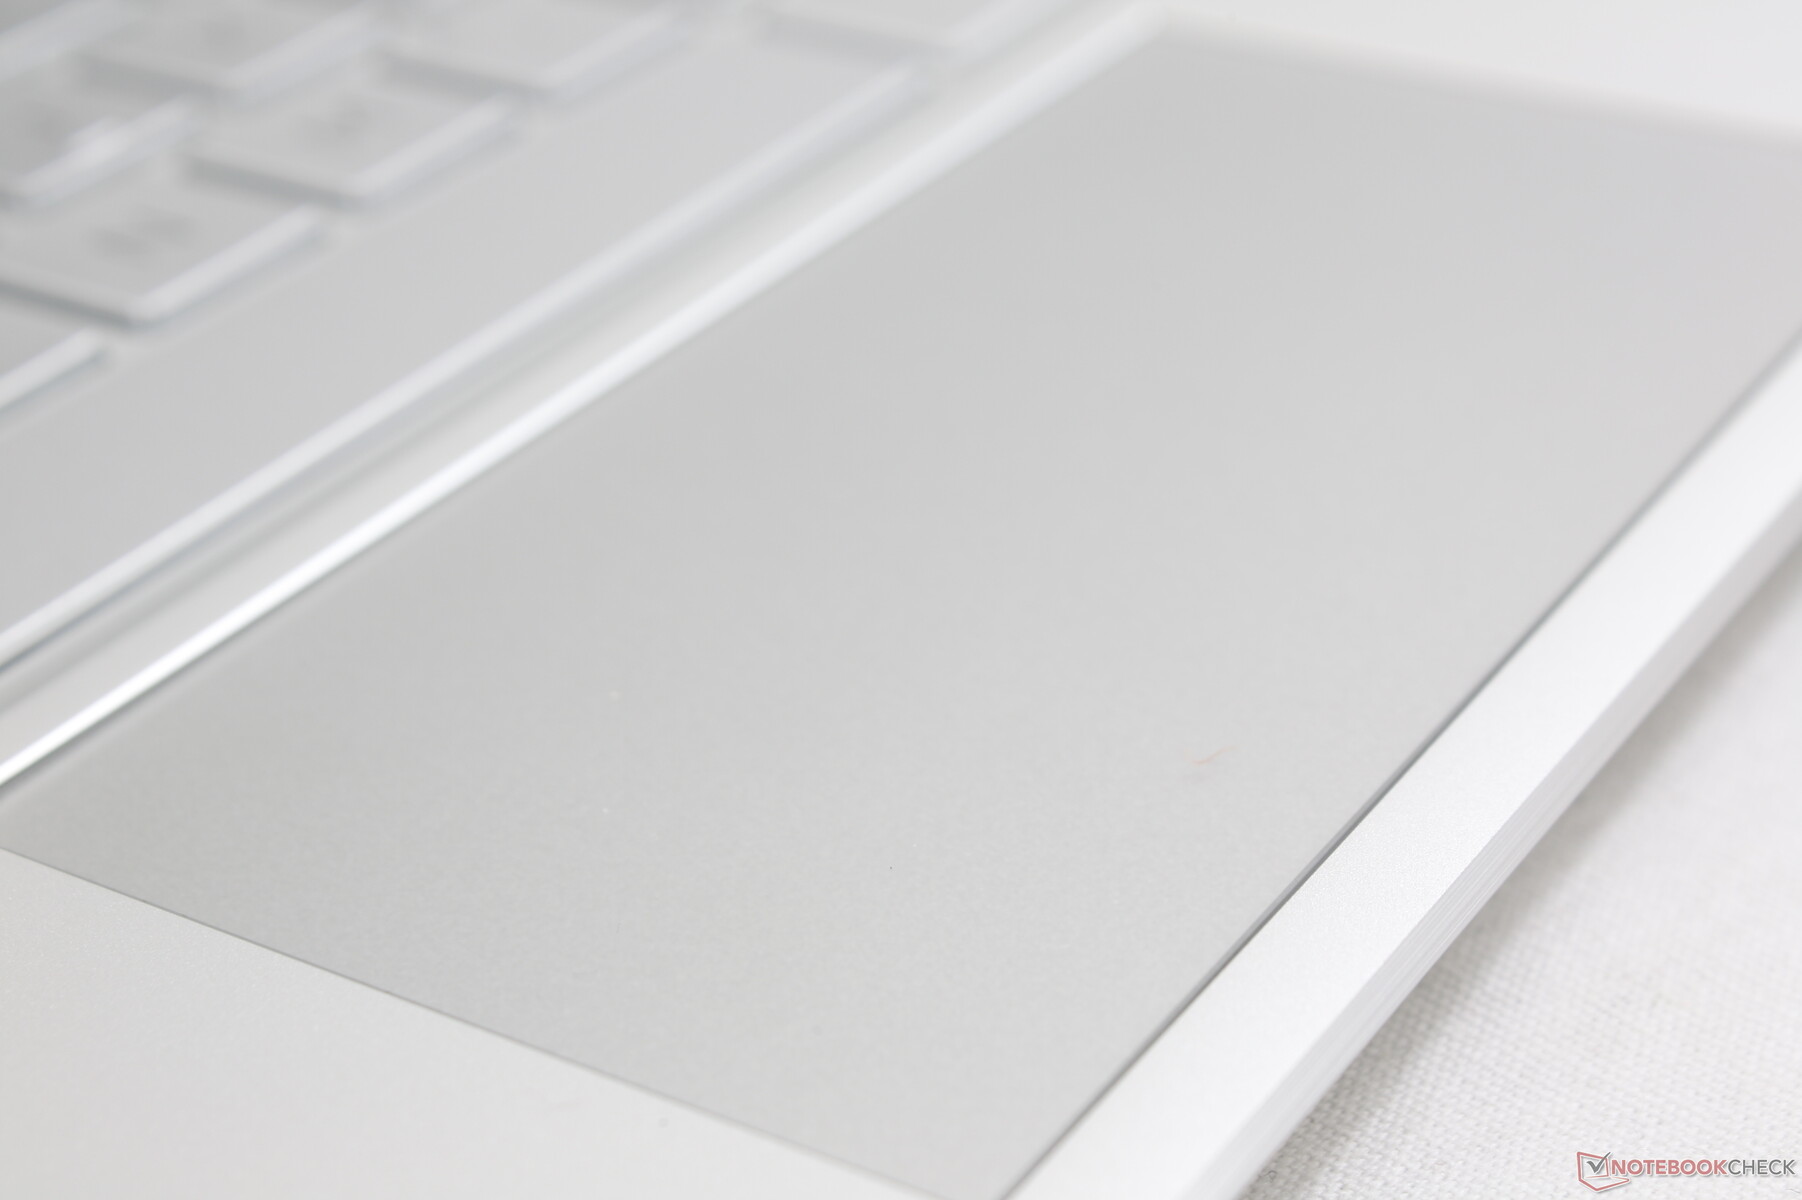
Touchpad
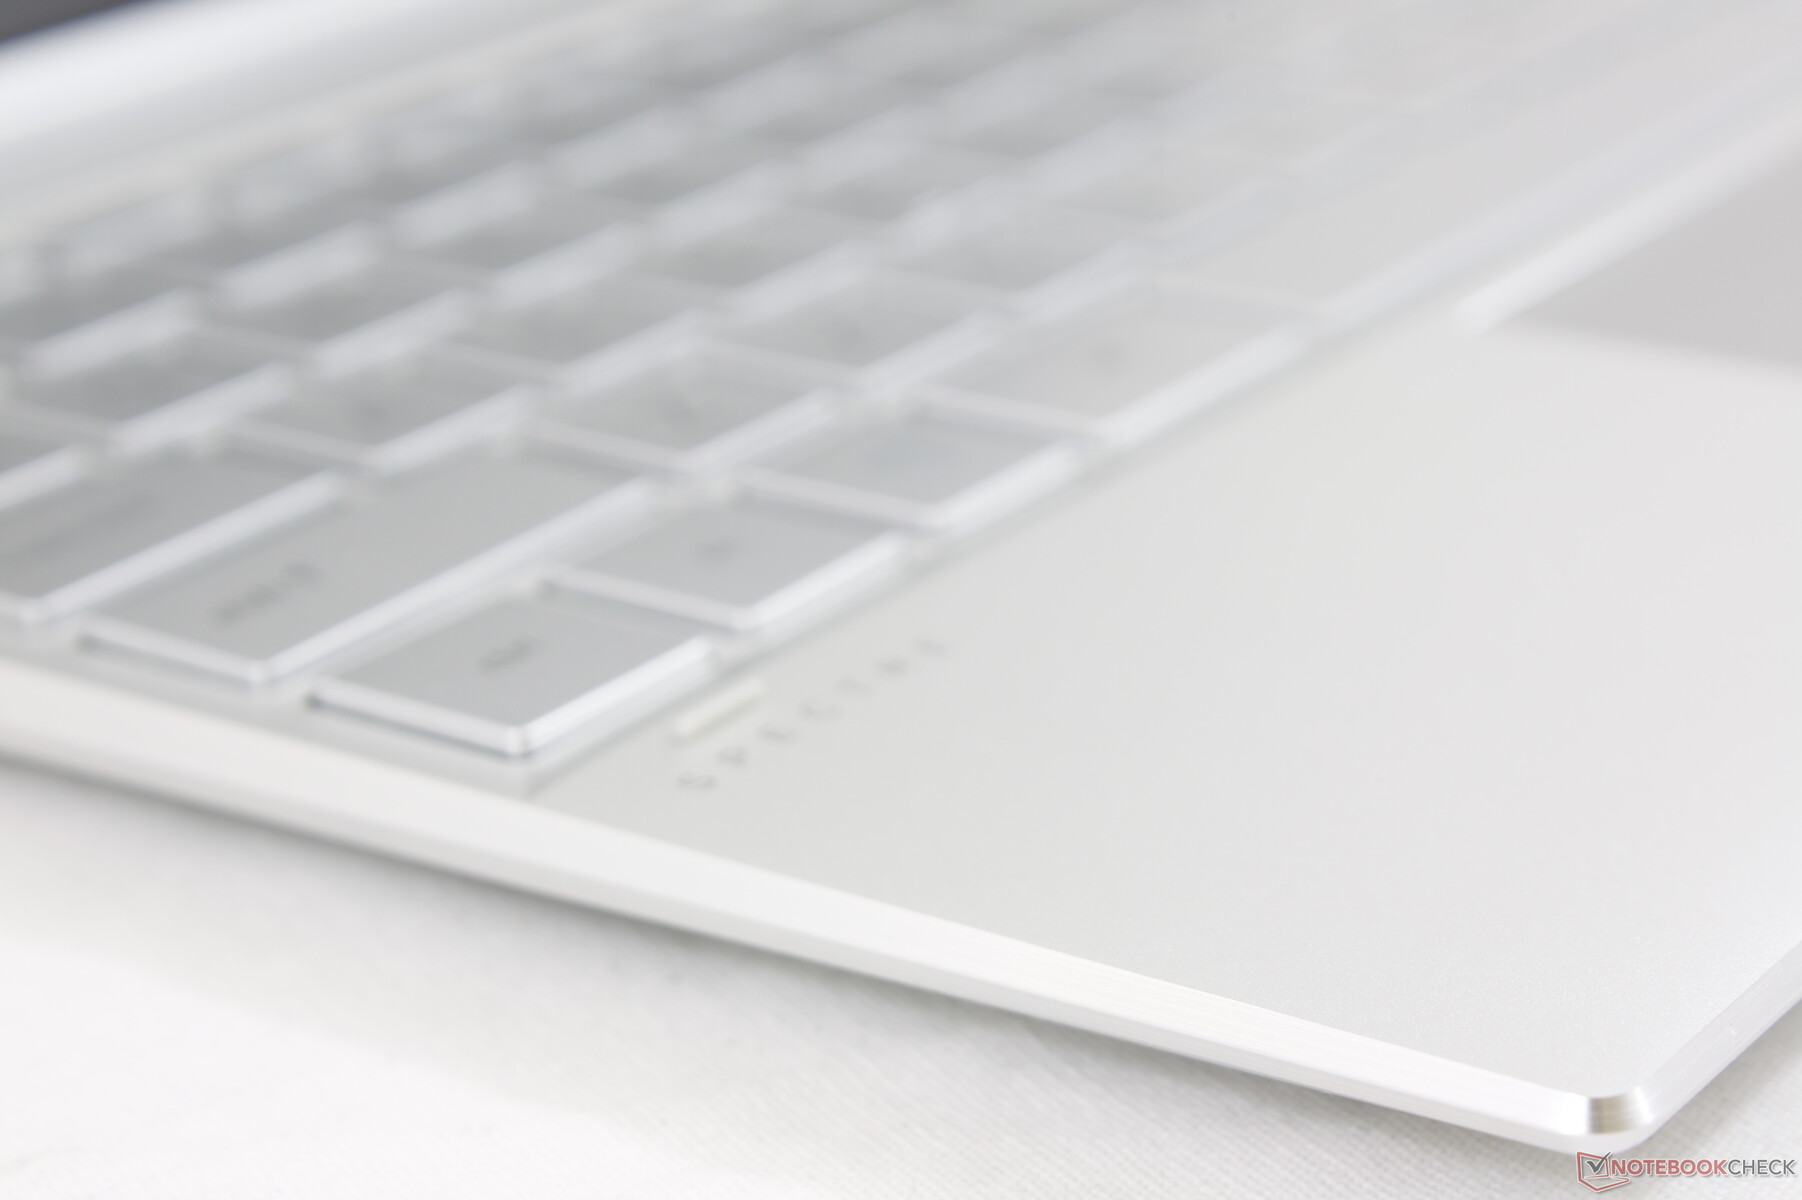
The clickpad is smaller this time around at ~11.1 x 5.6 cm compared to ~12.1 x 6.1 cm on the older Whiskey Lake-U model likely due to the smaller chassis size. Though cursor control is smooth at all speeds and free of jitters, vertical movement can feel cramped on the wide surface area. To be fair, this is more of a general limitation of subnotebooks than a fault of the manufacturer.
The integrated mouse keys offer shallow travel with clicky feedback and moderate clatter. The main problem is that clicking takes quite a bit of force from the finger which can feel tiring after a while.


Display
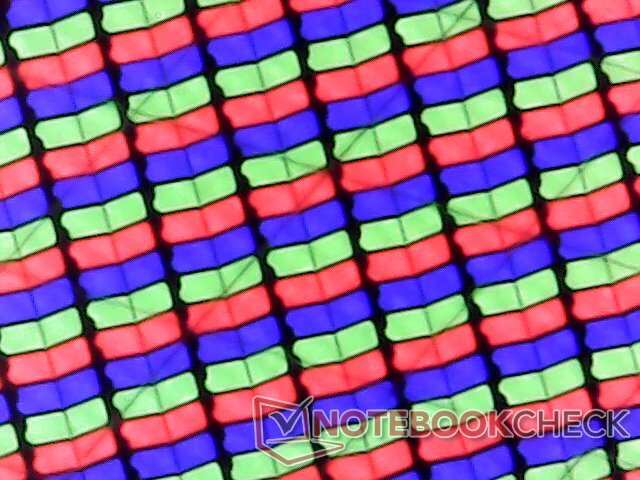
HP doesn't explicitly state it, but the display on the latest Spectre is one of the biggest changes from last year's model. The AU Optronics panel here differs significantly from the JinSheng M133NVF3 panel on the Whiskey Lake-U Spectre x360 13 in terms of brightness, contrast, and response times as shown by our table below. Pulse-width modulation in particular is no longer present to imply that HP is utilizing a different backlight this time around which coincides with the overall brighter display. The dim display on last year's model was one of our main criticisms and so it's good to see it addressed here on this Ice Lake SKU.
Unfortunately, response times are now slower meaning ghosting is more noticeable. The difference can be jarring especially when compared to the latest 144 Hz or 240 Hz gaming panels where response times can be as fast as 3 ms. Interestingly, HWiNFO is unable to pull the panel name even though it is able to detect the AU Optronics AUO5E2D controller. The latest Dell XPS 13 utilizes a similar AUO5B2D controller with almost equally slow black-white and gray-gray response times.
The end result is a touchscreen that's just as crisp as before but with deeper black levels and a brighter backlight at the cost of more ghosting.

| |||||||||||||||||||||||||
Brightness Distribution: 85 %
Center on Battery: 447.4 cd/m²
Contrast: 1443:1 (Black: 0.31 cd/m²)
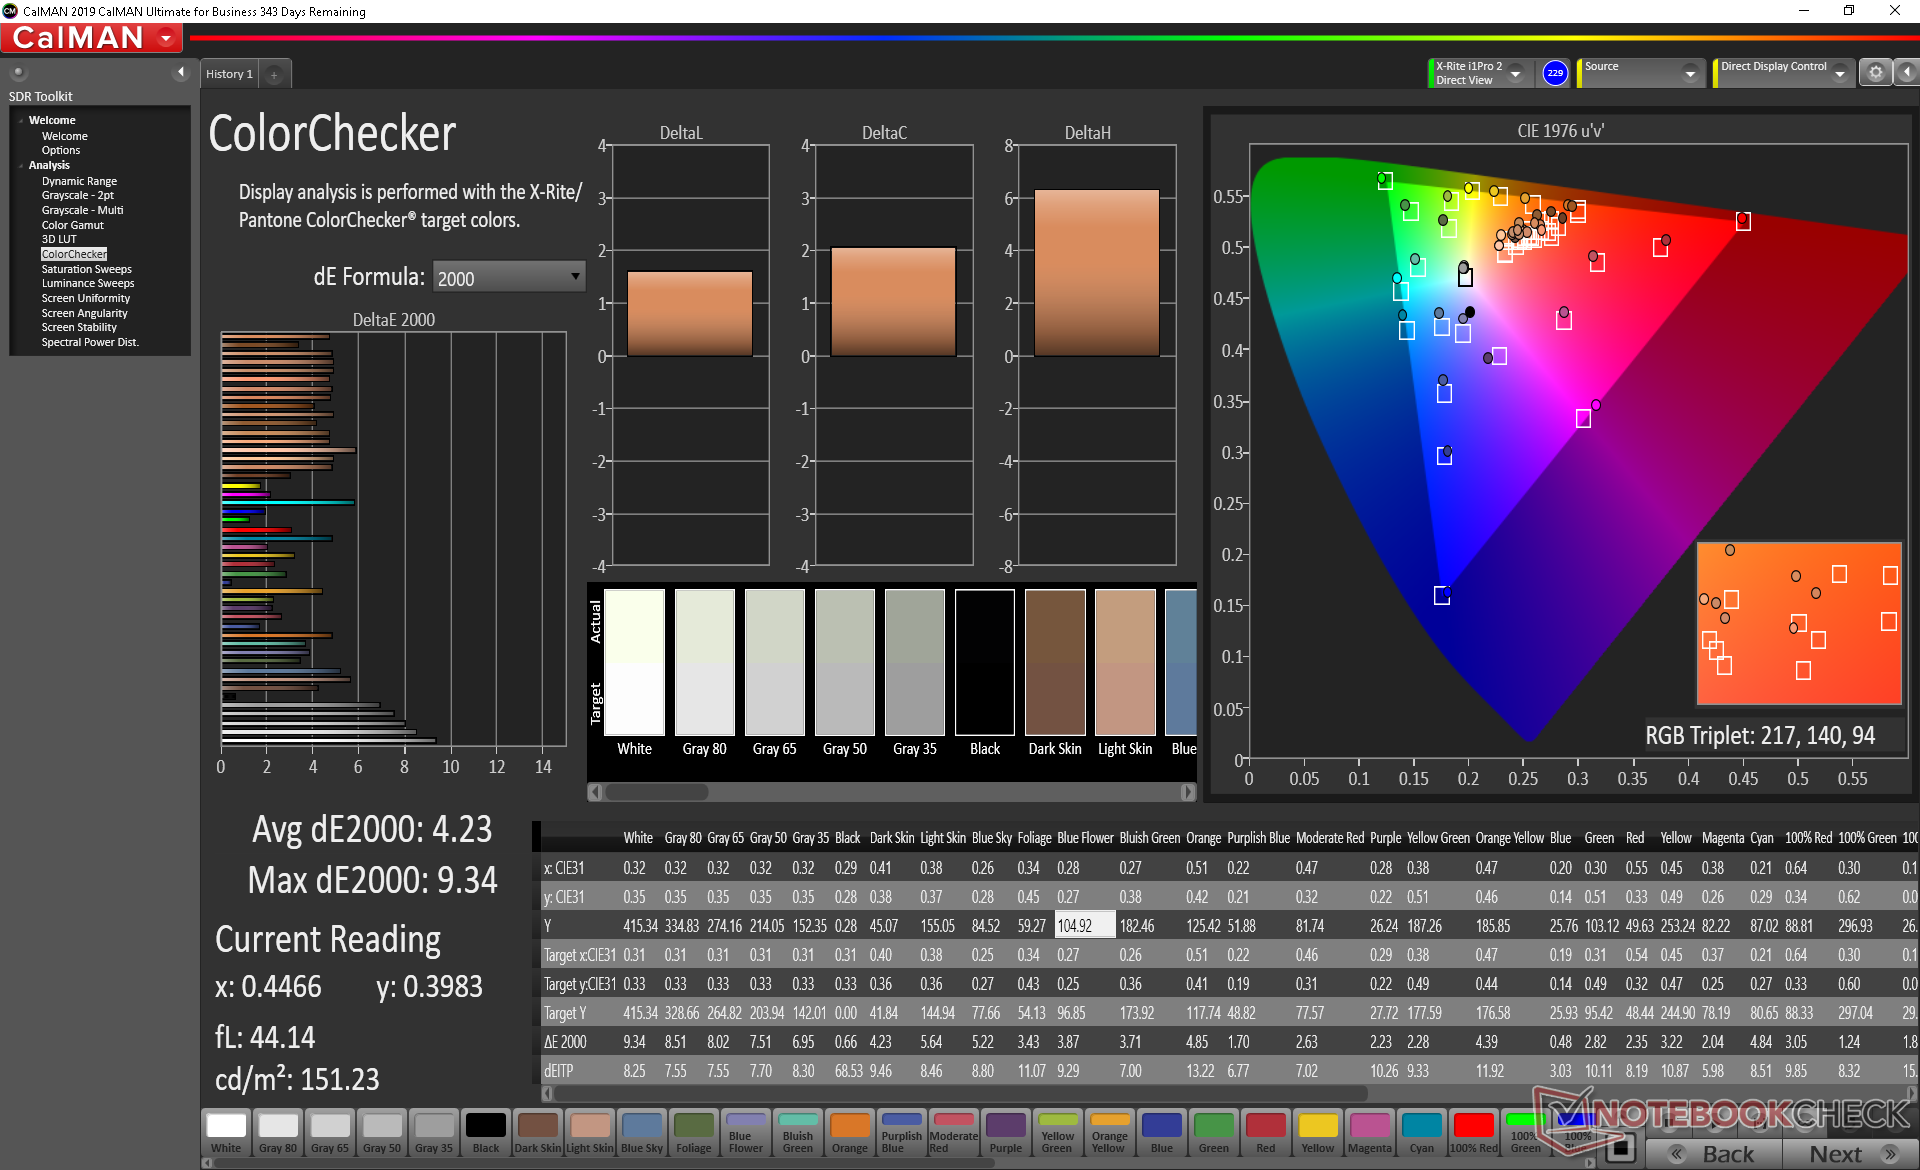
ΔE ColorChecker Calman: 4.23 | ∀{0.5-29.43 Ø4.71}
calibrated: 1.32
ΔE Greyscale Calman: 6.1 | ∀{0.09-98 Ø4.96}
98.9% sRGB (Argyll 1.6.3 3D)
64.8% AdobeRGB 1998 (Argyll 1.6.3 3D)
71.5% AdobeRGB 1998 (Argyll 3D)
98.9% sRGB (Argyll 3D)
69.6% Display P3 (Argyll 3D)
Gamma: 2.11
CCT: 6136 K
| HP Spectre x360 13-aw0013dx AU Optronics AUO5E2D, IPS, 13.3", 1920x1080 | HP Spectre x360 13-ap0312ng M133NVF3, IPS, 13.3", 1920x1080 | Dell XPS 13 7390 2-in-1 Core i7 Sharp LQ134N1, IPS, 13.4", 1920x1200 | Razer Blade Stealth i7-1065G7 Iris Plus Sharp LQ133M1JW41, IPS, 13.3", 1920x1080 | Lenovo Yoga C940-14IIL 81Q9 BOE HF NV140QUM-N54, IPS, 14", 3840x2160 | Asus ZenBook Flip 14 UM462DA-AI023T IPS, 14", 1920x1080 | |
|---|---|---|---|---|---|---|
| Display | -9% | 0% | -4% | 13% | -11% | |
| Display P3 Coverage (%) | 69.6 | 63 -9% | 69.9 0% | 66.2 -5% | 83.8 20% | 65.5 -6% |
| sRGB Coverage (%) | 98.9 | 89.8 -9% | 99.2 0% | 97.2 -2% | 99.9 1% | 85.2 -14% |
| AdobeRGB 1998 Coverage (%) | 71.5 | 64.1 -10% | 71.5 0% | 67.1 -6% | 83.3 17% | 62.2 -13% |
| Response Times | 49% | 22% | 18% | 27% | 20% | |
| Response Time Grey 50% / Grey 80% * (ms) | 60.8 ? | 29.2 ? 52% | 47.6 ? 22% | 45.2 ? 26% | 44.4 ? 27% | 42 ? 31% |
| Response Time Black / White * (ms) | 36.8 ? | 20 ? 46% | 29.2 ? 21% | 33.2 ? 10% | 27.2 ? 26% | 34 ? 8% |
| PWM Frequency (Hz) | 1000 ? | 2500 ? | 22730 ? | |||
| Screen | -20% | 17% | 19% | -8% | -29% | |
| Brightness middle (cd/m²) | 447.4 | 272 -39% | 549.8 23% | 422.6 -6% | 501.7 12% | 306 -32% |
| Brightness (cd/m²) | 420 | 298 -29% | 520 24% | 404 -4% | 501 19% | 294 -30% |
| Brightness Distribution (%) | 85 | 84 -1% | 86 1% | 87 2% | 82 -4% | 81 -5% |
| Black Level * (cd/m²) | 0.31 | 0.39 -26% | 0.39 -26% | 0.35 -13% | 0.32 -3% | 0.39 -26% |
| Contrast (:1) | 1443 | 697 -52% | 1410 -2% | 1207 -16% | 1568 9% | 785 -46% |
| Colorchecker dE 2000 * | 4.23 | 4.3 -2% | 2.12 50% | 1.02 76% | 5.48 -30% | 5.16 -22% |
| Colorchecker dE 2000 max. * | 9.34 | 9 4% | 3.66 61% | 3.06 67% | 10.03 -7% | 9.9 -6% |
| Colorchecker dE 2000 calibrated * | 1.32 | 2.4 -82% | 1.37 -4% | 0.95 28% | 2.22 -68% | 3.07 -133% |
| Greyscale dE 2000 * | 6.1 | 4.4 28% | 2.6 57% | 1 84% | 8.1 -33% | 5.86 4% |
| Gamma | 2.11 104% | 1.97 112% | 2.3 96% | 2.21 100% | 2.07 106% | 2.31 95% |
| CCT | 6136 106% | 5825 112% | 6884 94% | 6502 100% | 6730 97% | 6349 102% |
| Color Space (Percent of AdobeRGB 1998) (%) | 64.8 | 58.9 -9% | 65.4 1% | 62.1 -4% | 74.1 14% | 56 -14% |
| Color Space (Percent of sRGB) (%) | 98.9 | 89.8 -9% | 99.7 1% | 97.1 -2% | 100 1% | 85 -14% |
| Total Average (Program / Settings) | 7% /
-9% | 13% /
14% | 11% /
15% | 11% /
0% | -7% /
-20% |
* ... smaller is better
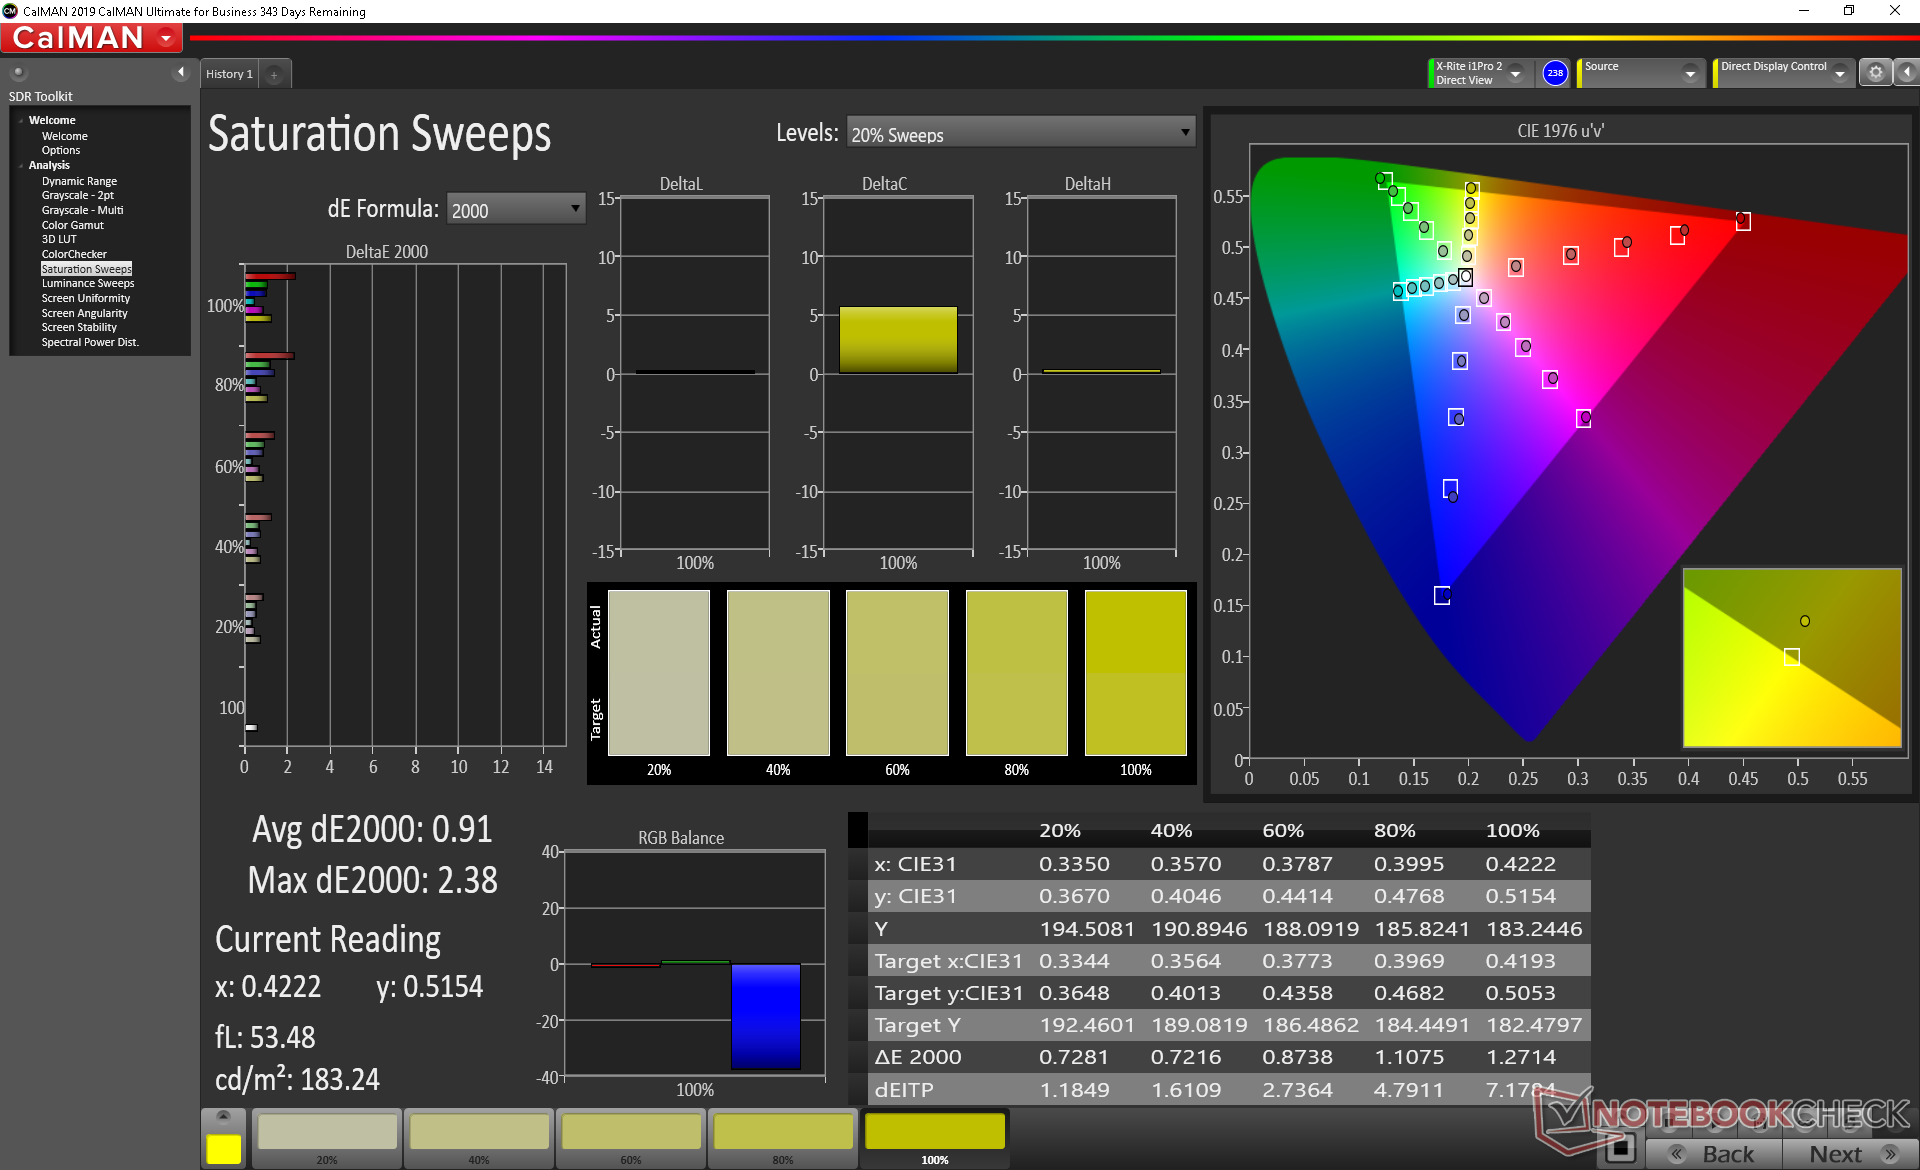
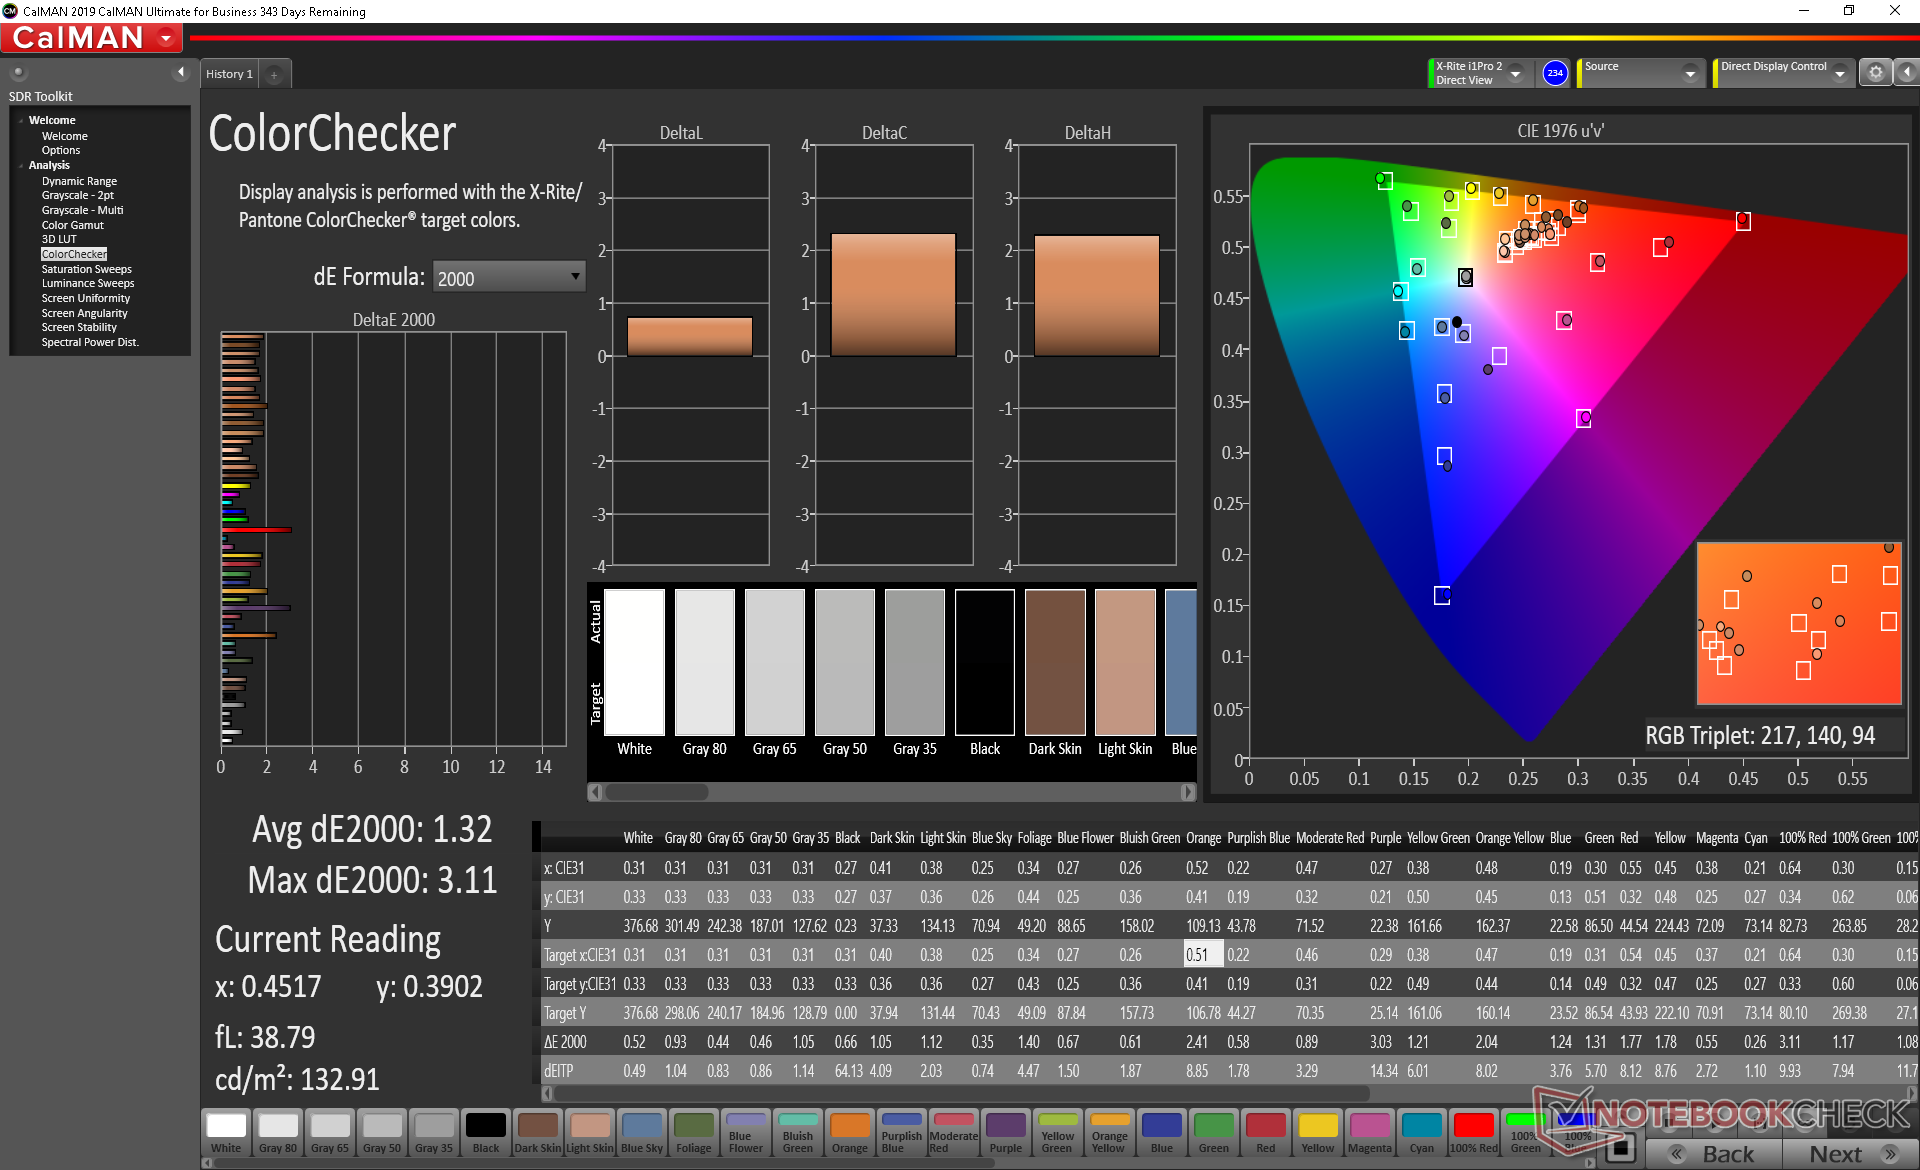
Color space covers approximately 99 percent of sRGB and 65 percent of AdobeRGB to be in line with most other flagship Ultrabooks and even gaming laptops. The 4K UHD AMOLED SKU of this same laptop will likely have a wider color gamut than our 1080p IPS SKU.
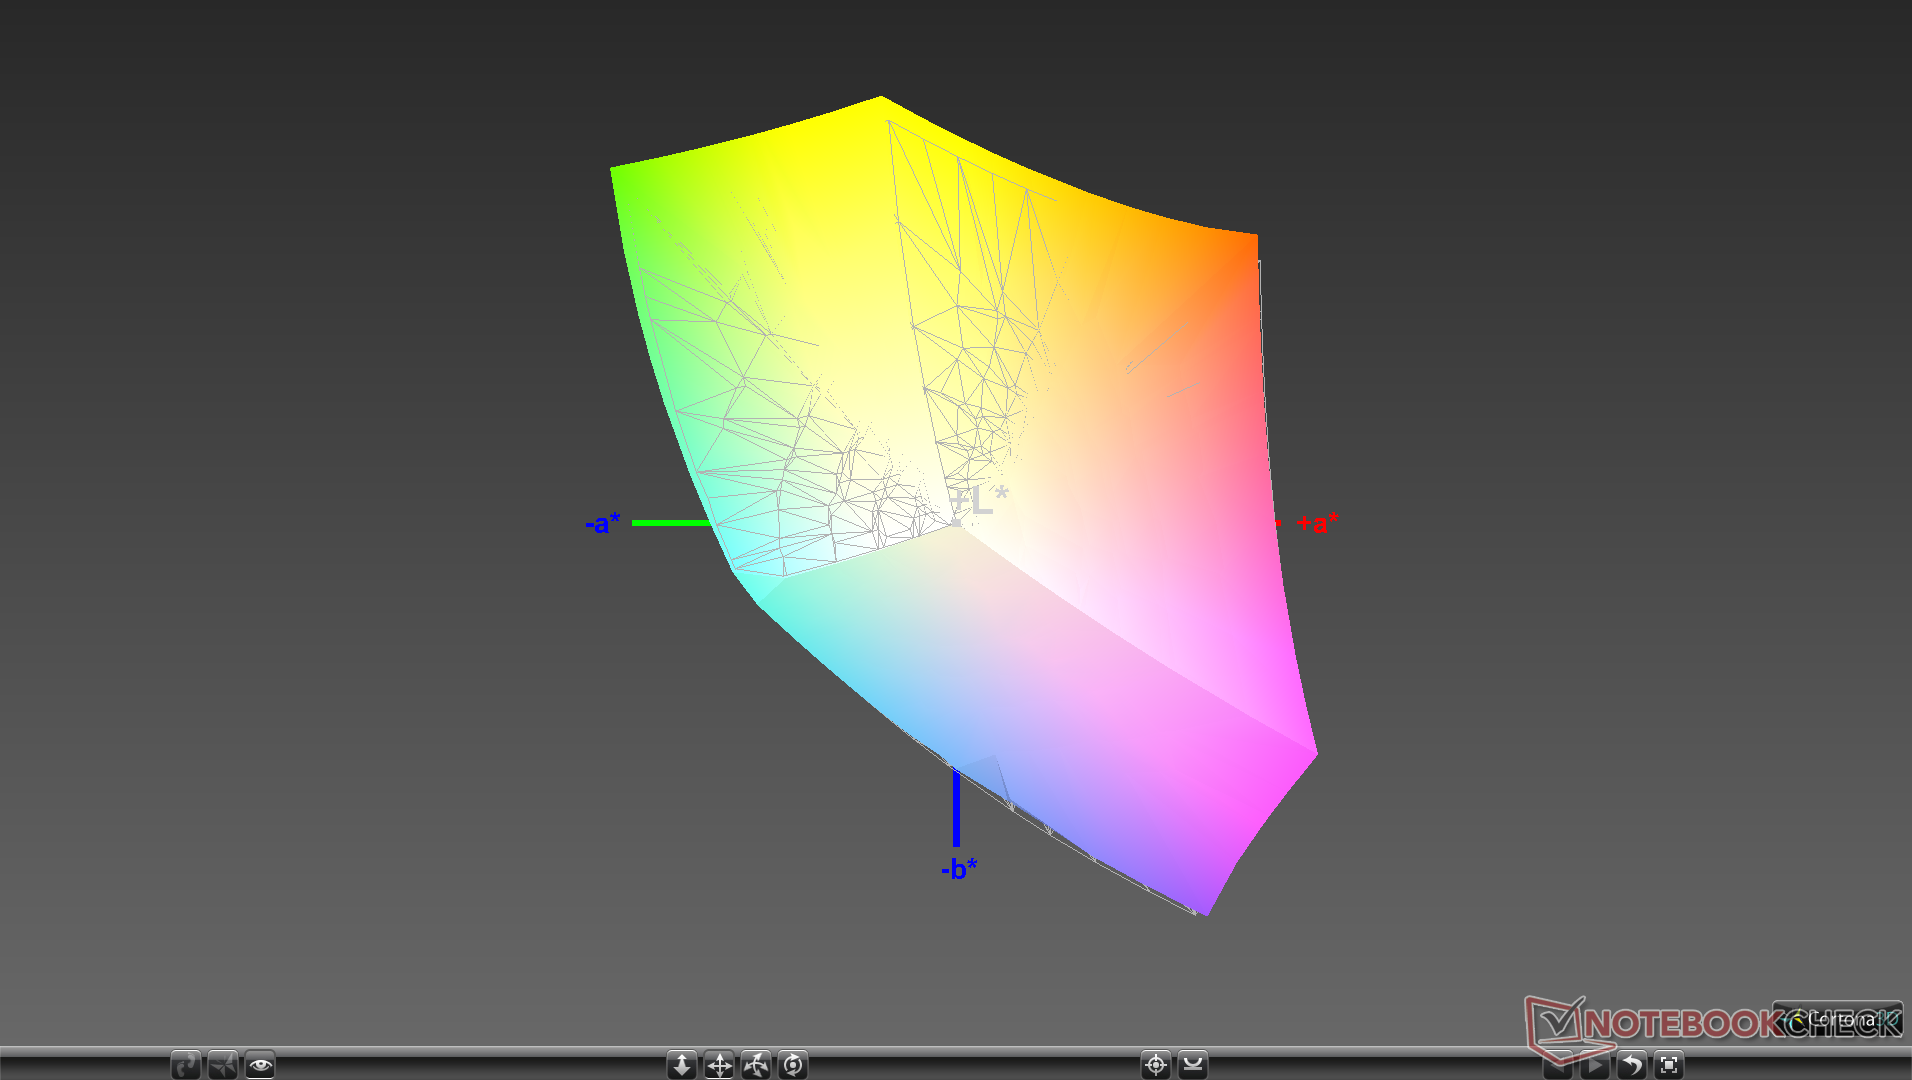
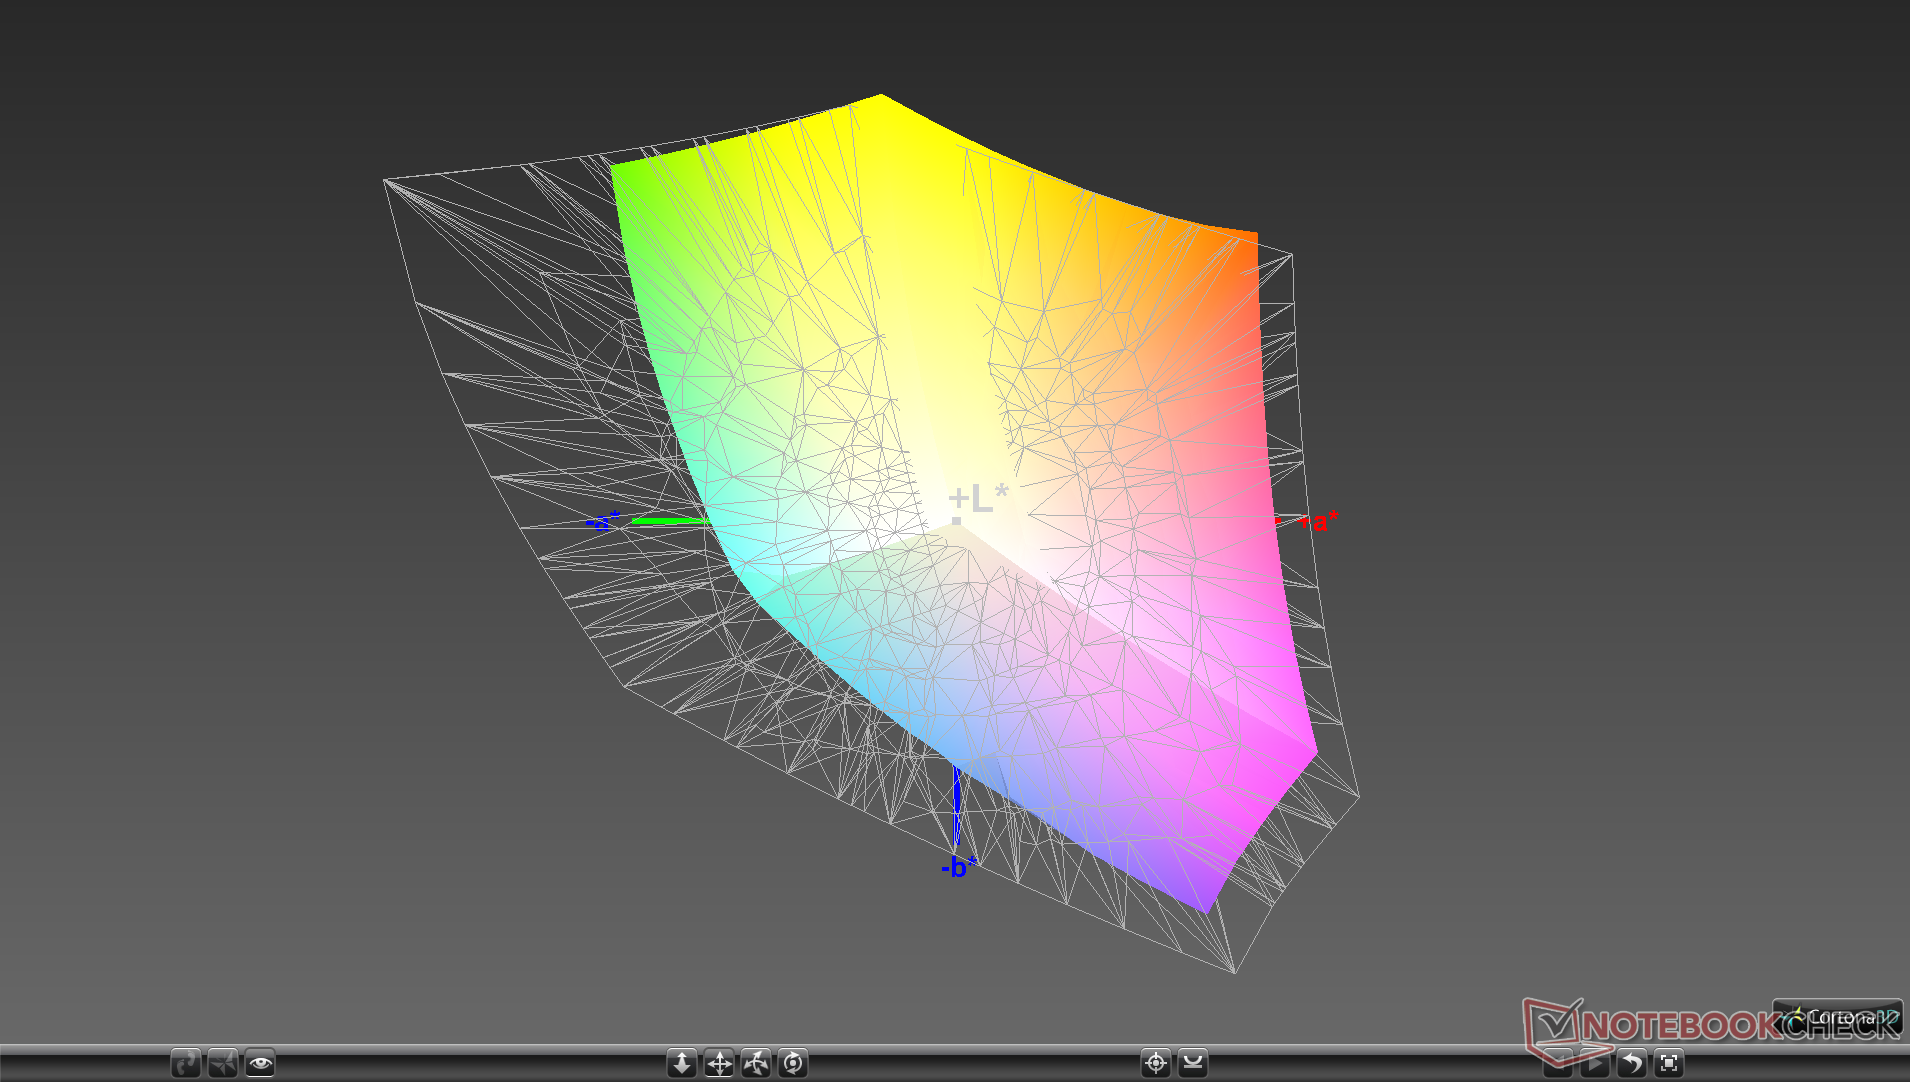
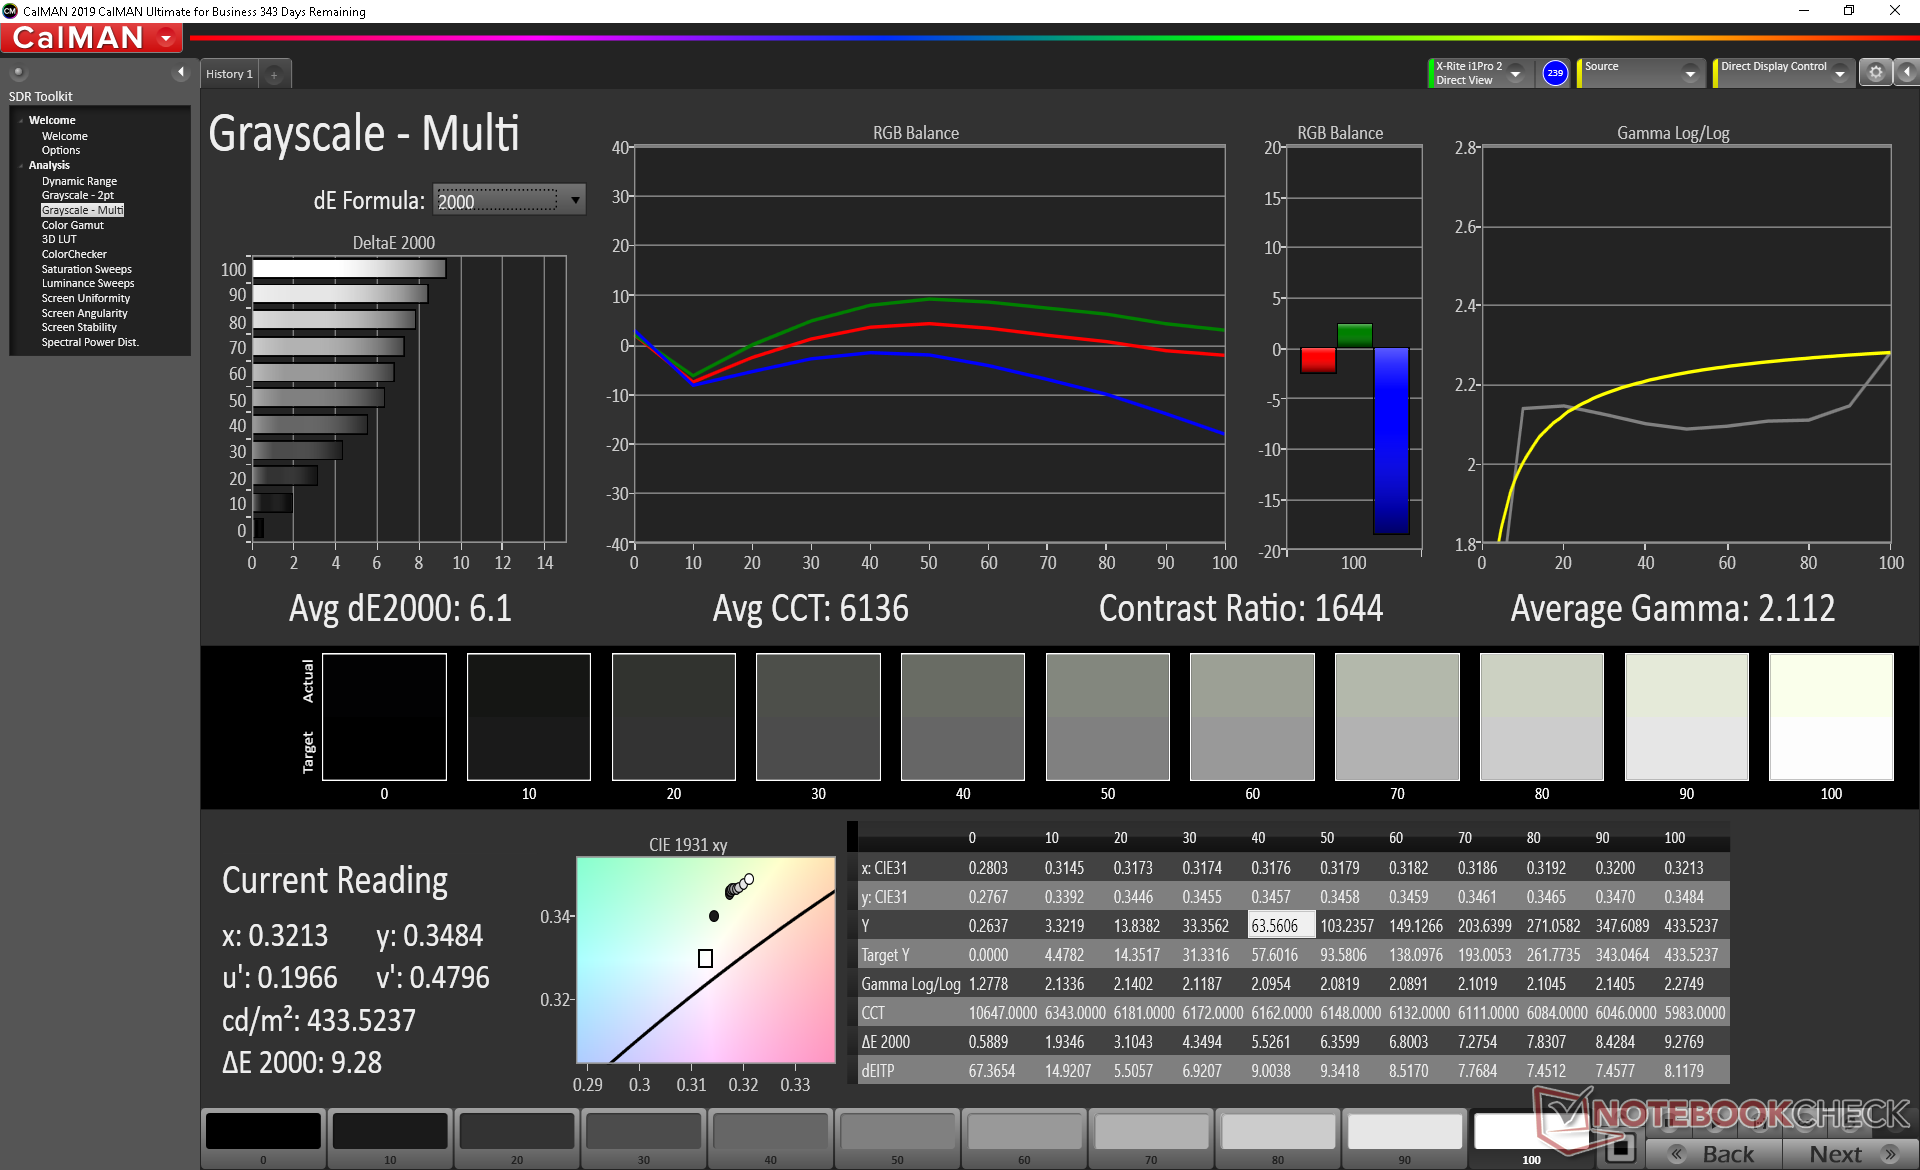
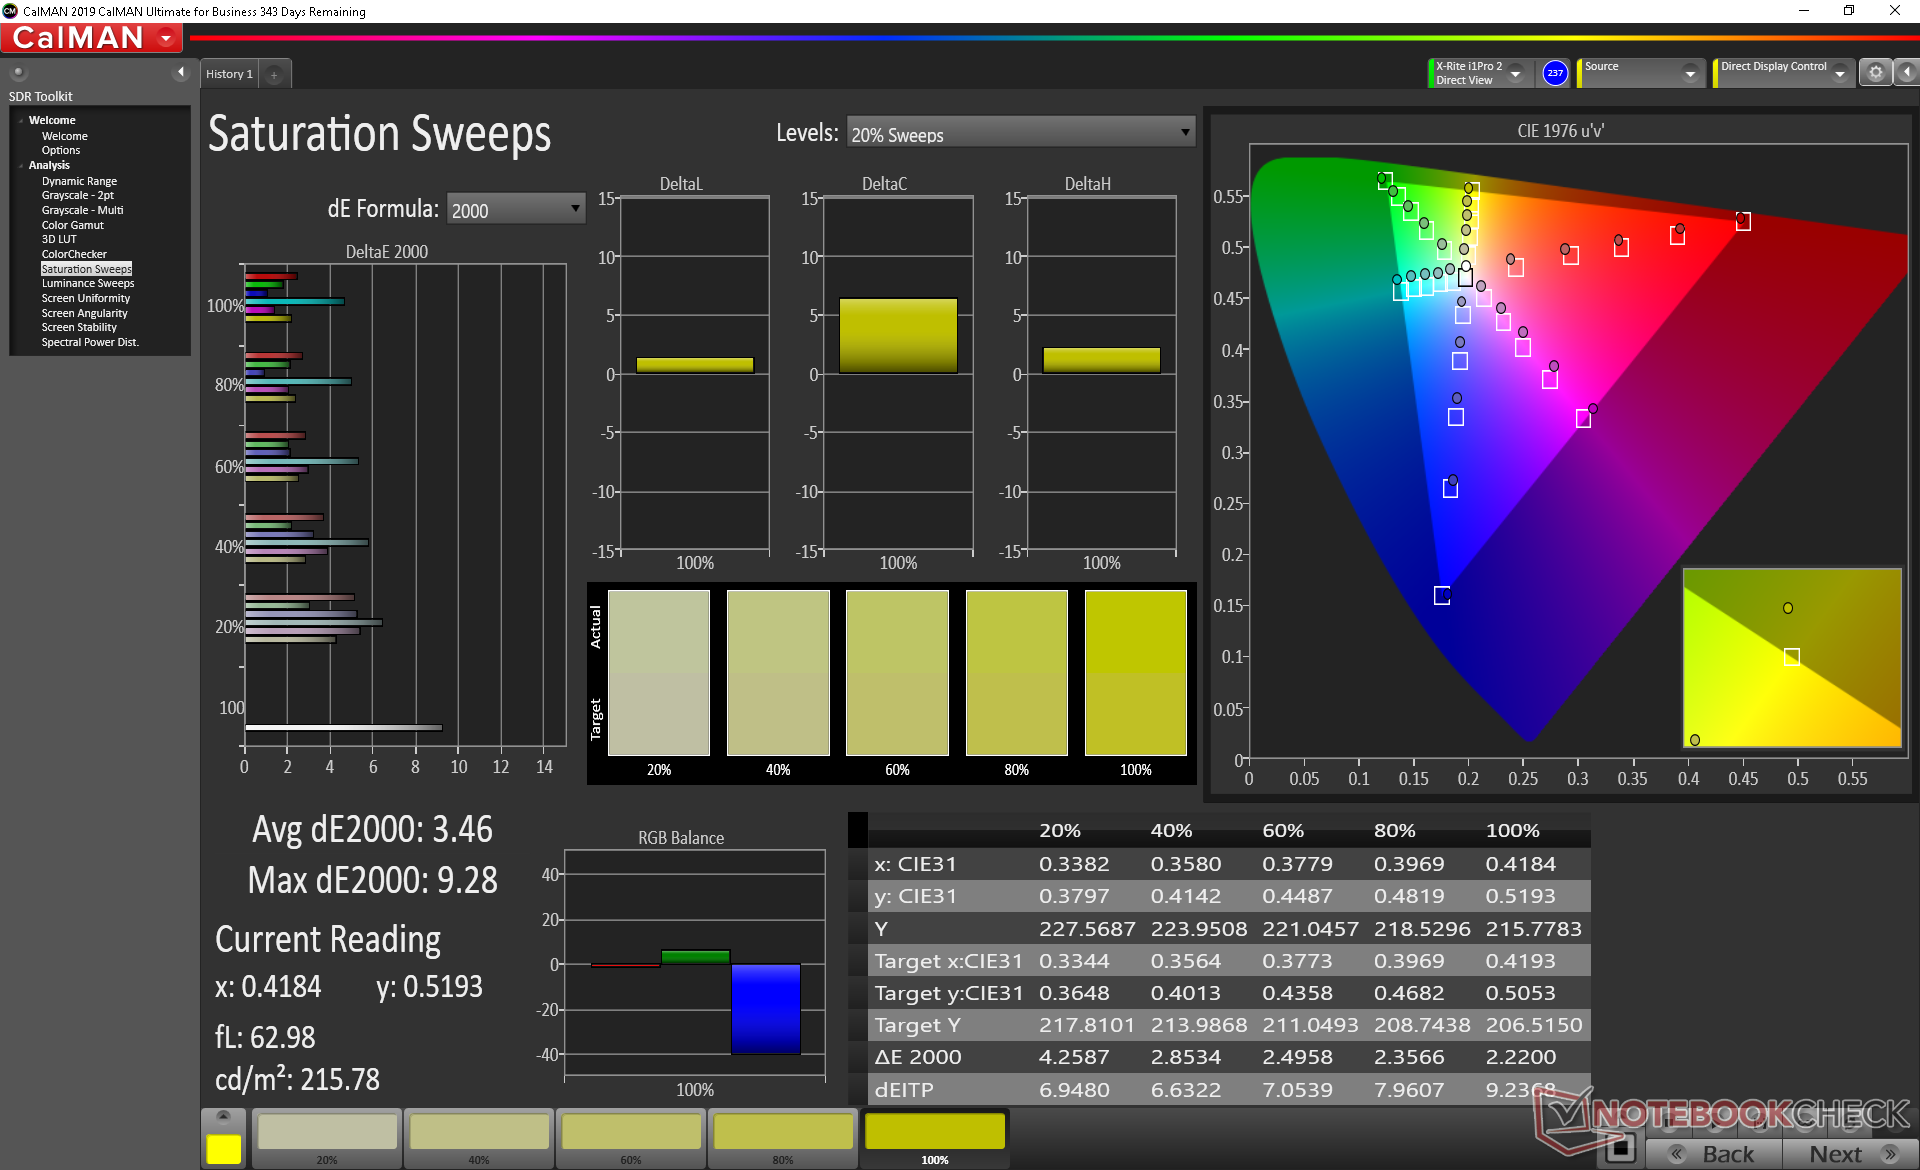
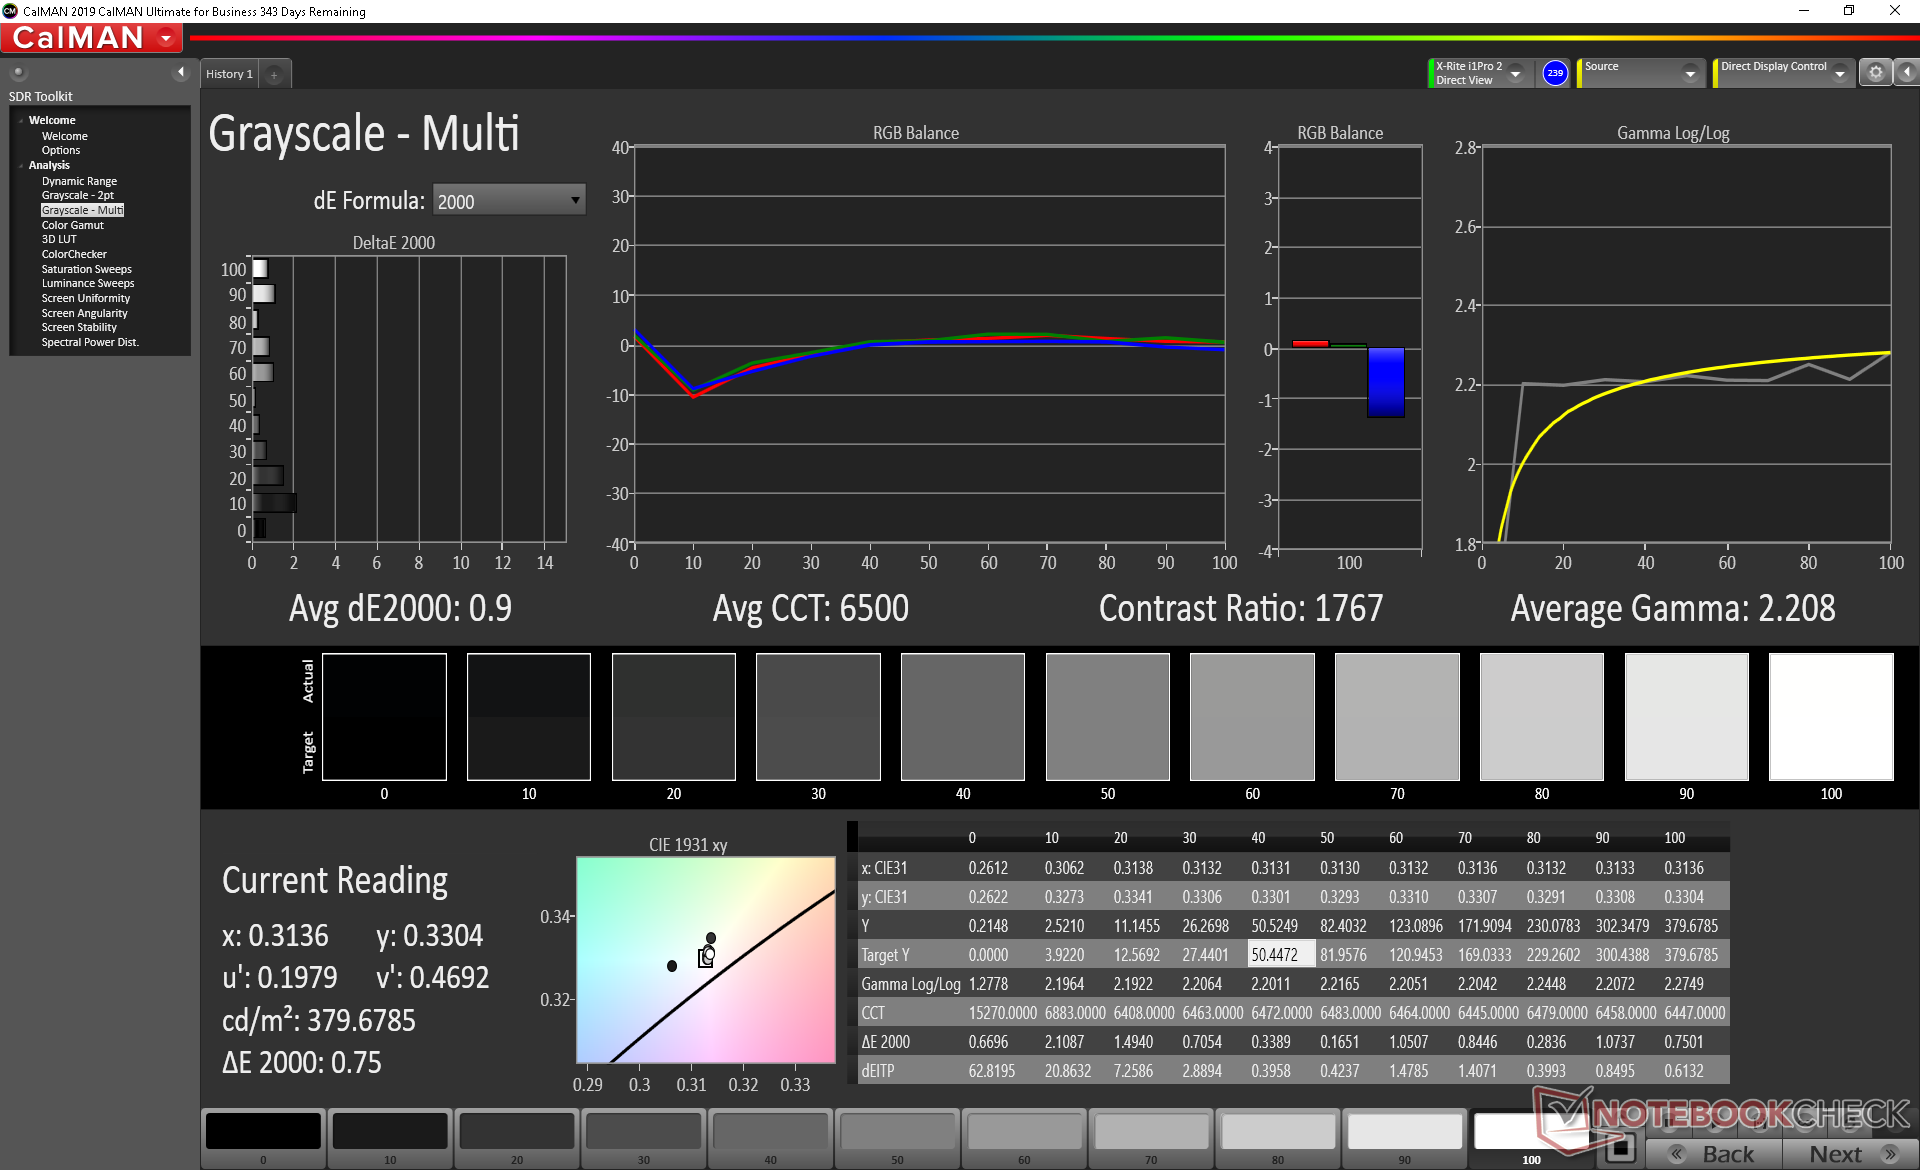
The display is not very well calibrated out of the box. Color temperature is slightly too warm with average DeltaE grayscale and color values of 6.1 and 3.46, respectively. After calibrating the panel ourselves against the sRGB standard, color accuracy improves significantly. We recommend applying our ICM profile above or calibrating the display yourself to get the most out of the display.
Display Response Times
| ↔ Response Time Black to White | ||
|---|---|---|
| 36.8 ms ... rise ↗ and fall ↘ combined | ↗ 15.6 ms rise | 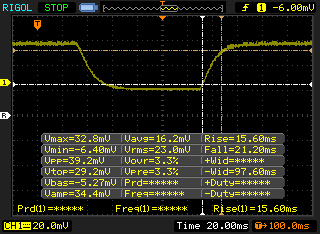 |
| ↘ 21.2 ms fall | ||
| The screen shows slow response rates in our tests and will be unsatisfactory for gamers. In comparison, all tested devices range from 0.1 (minimum) to 240 (maximum) ms. » 95 % of all devices are better. This means that the measured response time is worse than the average of all tested devices (19.8 ms). | ||
| ↔ Response Time 50% Grey to 80% Grey | ||
| 60.8 ms ... rise ↗ and fall ↘ combined | ↗ 26 ms rise | 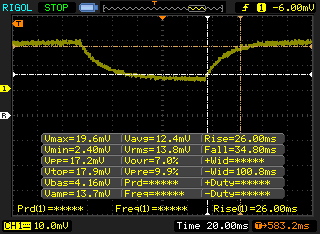 |
| ↘ 34.8 ms fall | ||
| The screen shows slow response rates in our tests and will be unsatisfactory for gamers. In comparison, all tested devices range from 0.165 (minimum) to 636 (maximum) ms. » 96 % of all devices are better. This means that the measured response time is worse than the average of all tested devices (31 ms). | ||
Screen Flickering / PWM (Pulse-Width Modulation)
| Screen flickering / PWM not detected | 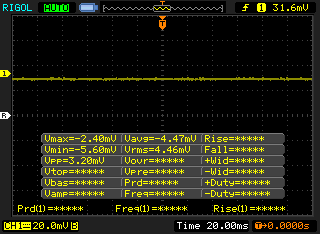 | ||
In comparison: 52 % of all tested devices do not use PWM to dim the display. If PWM was detected, an average of 7757 (minimum: 5 - maximum: 343500) Hz was measured. | |||
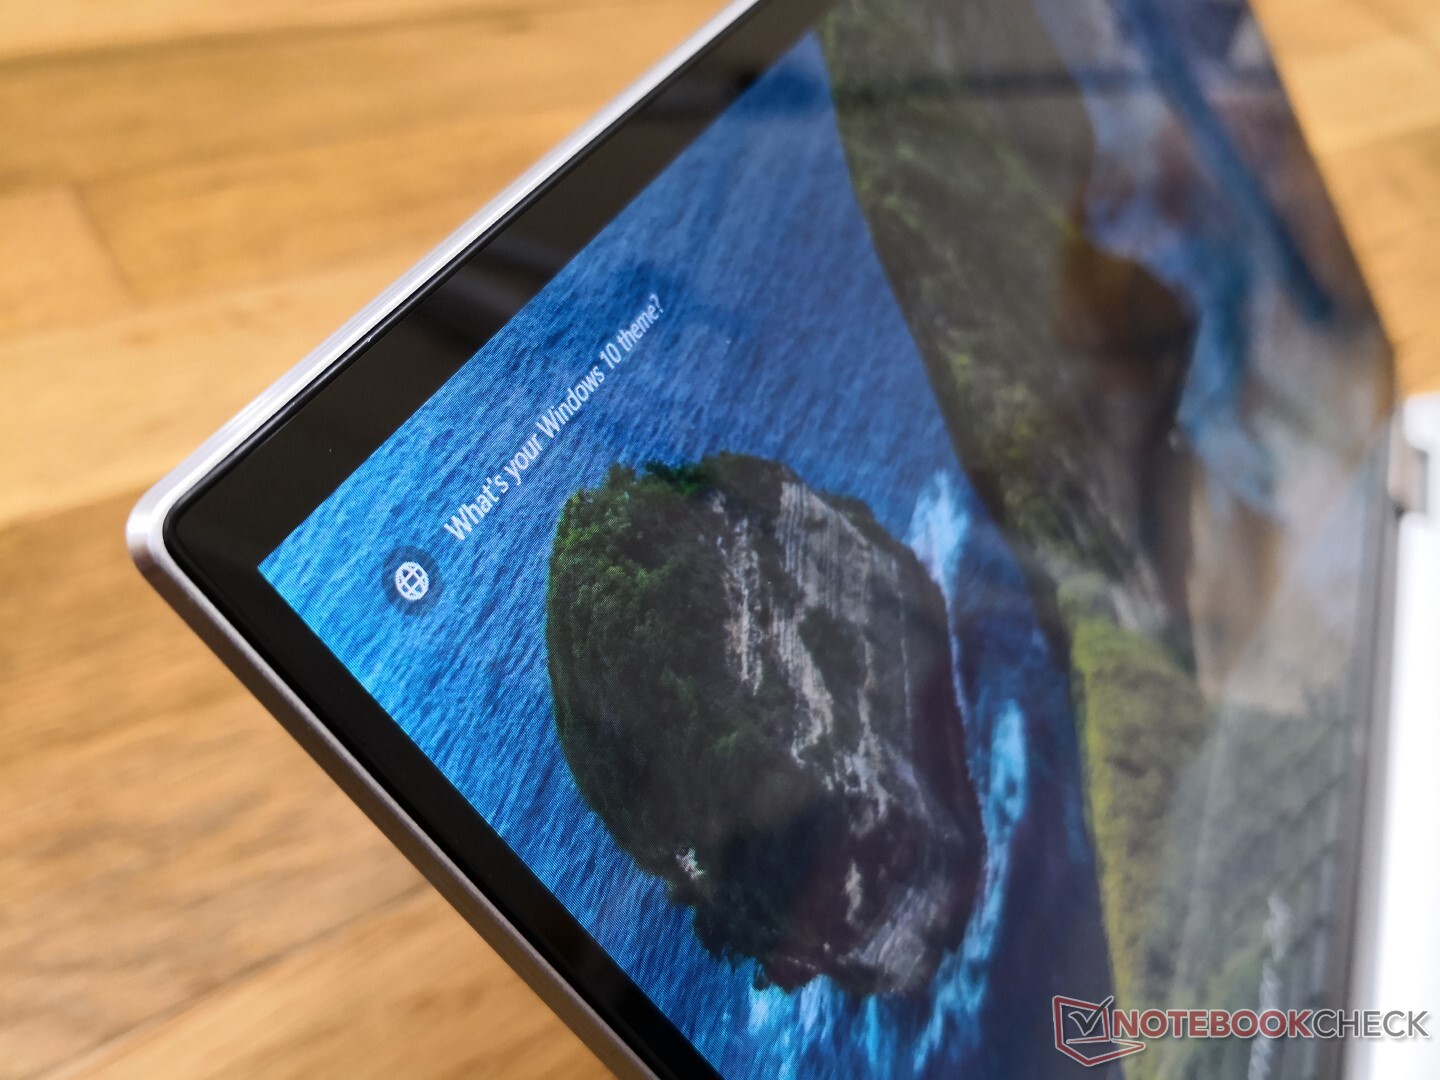
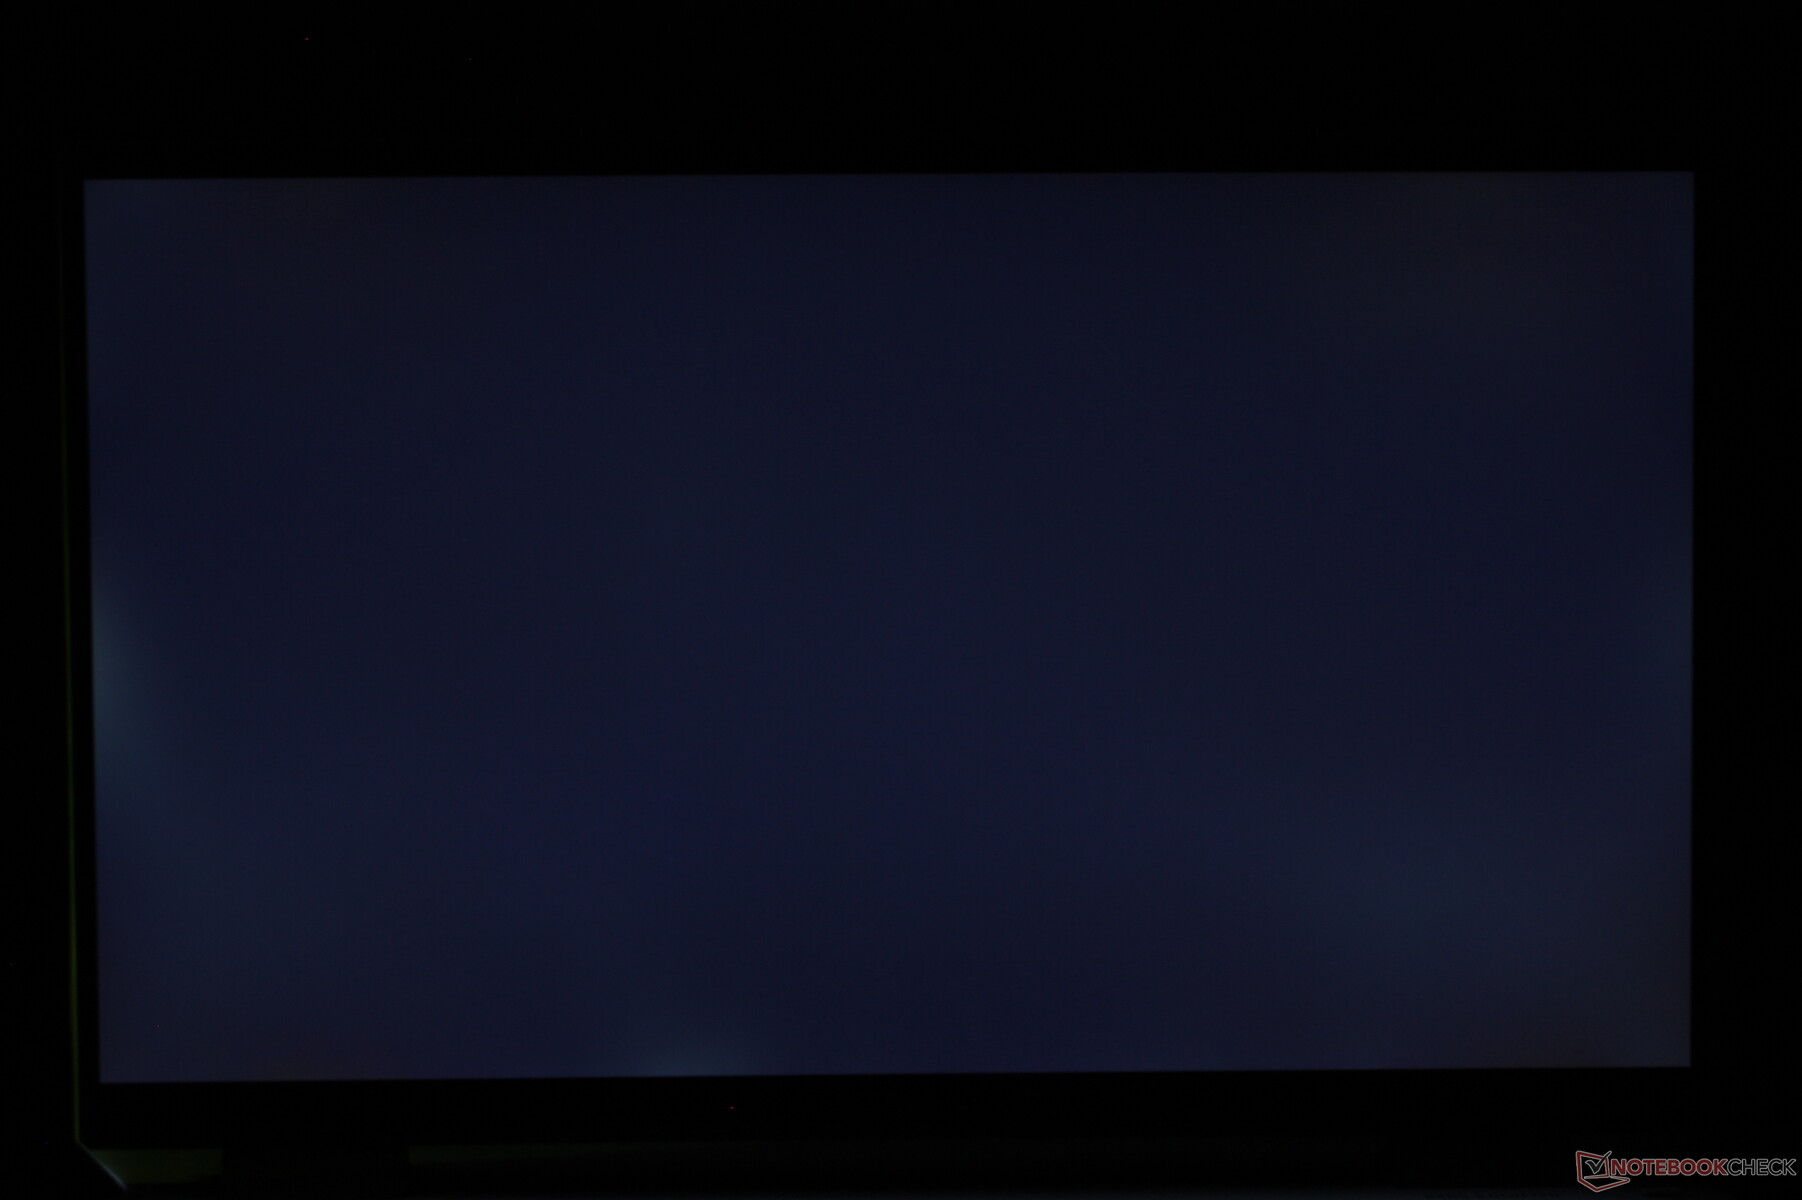
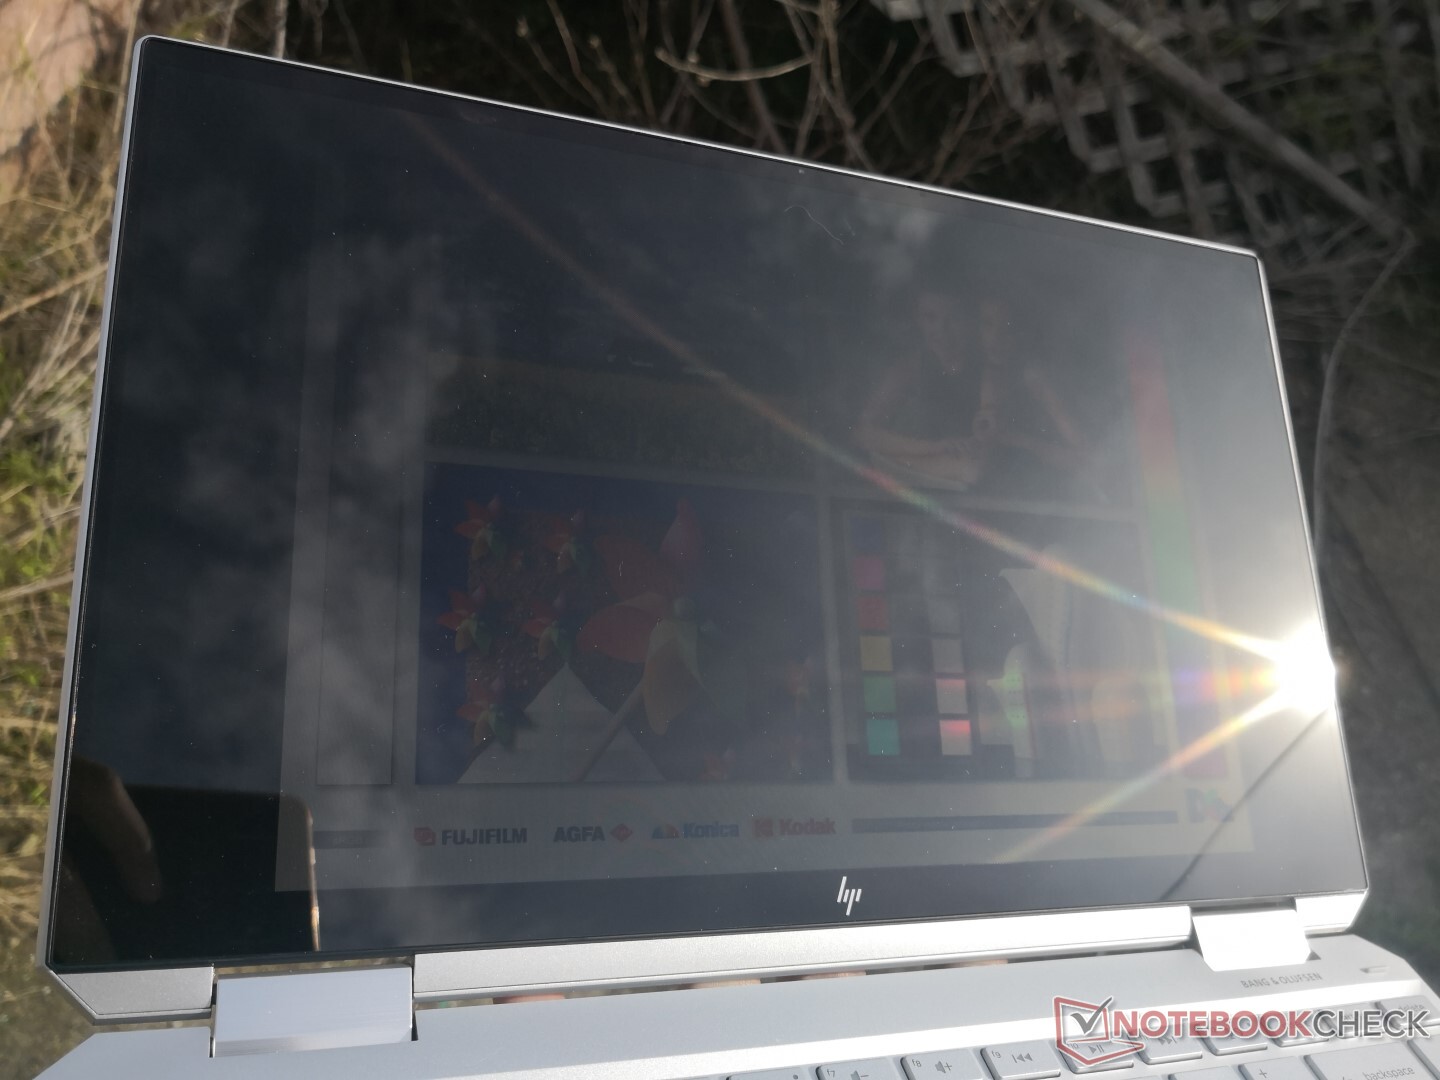
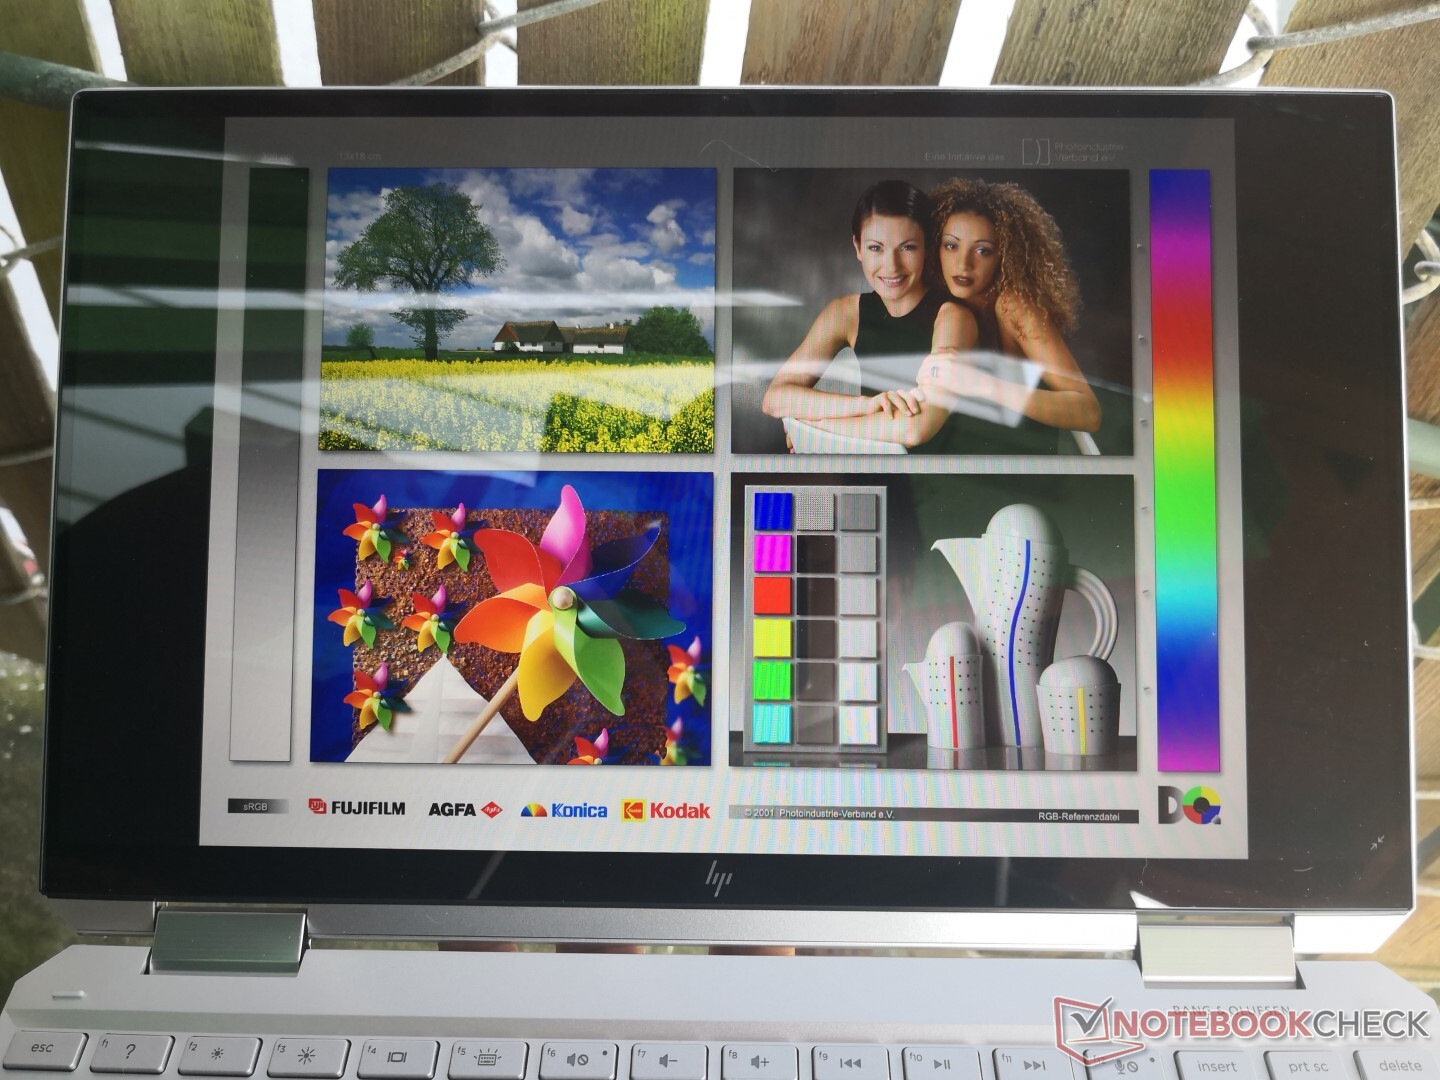
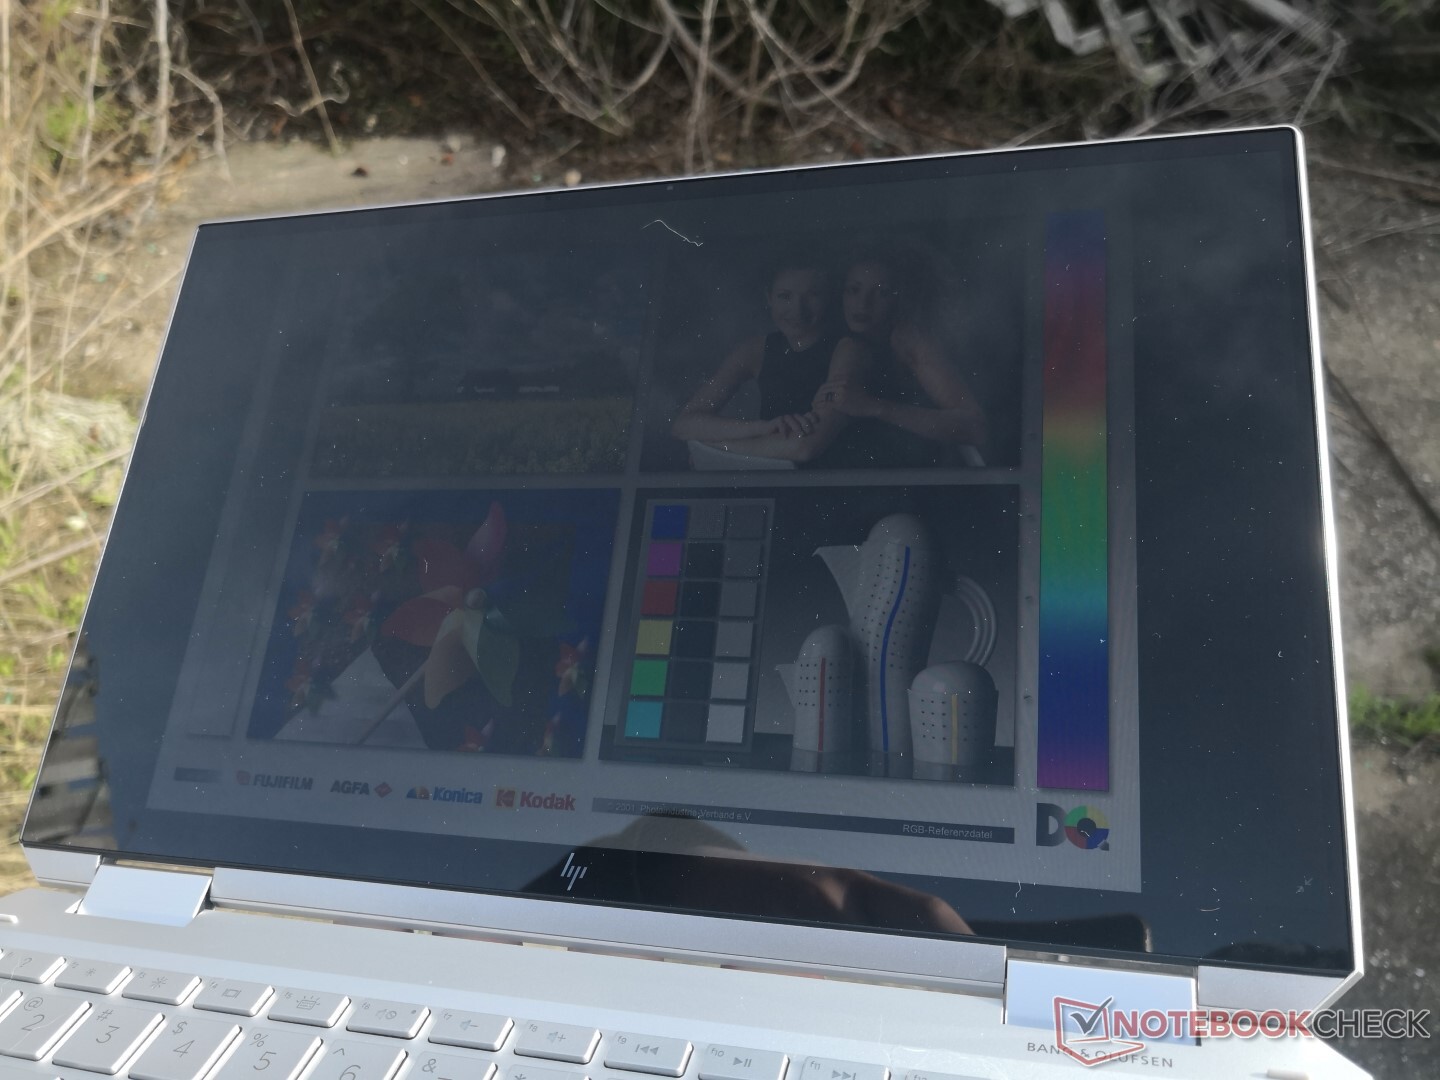
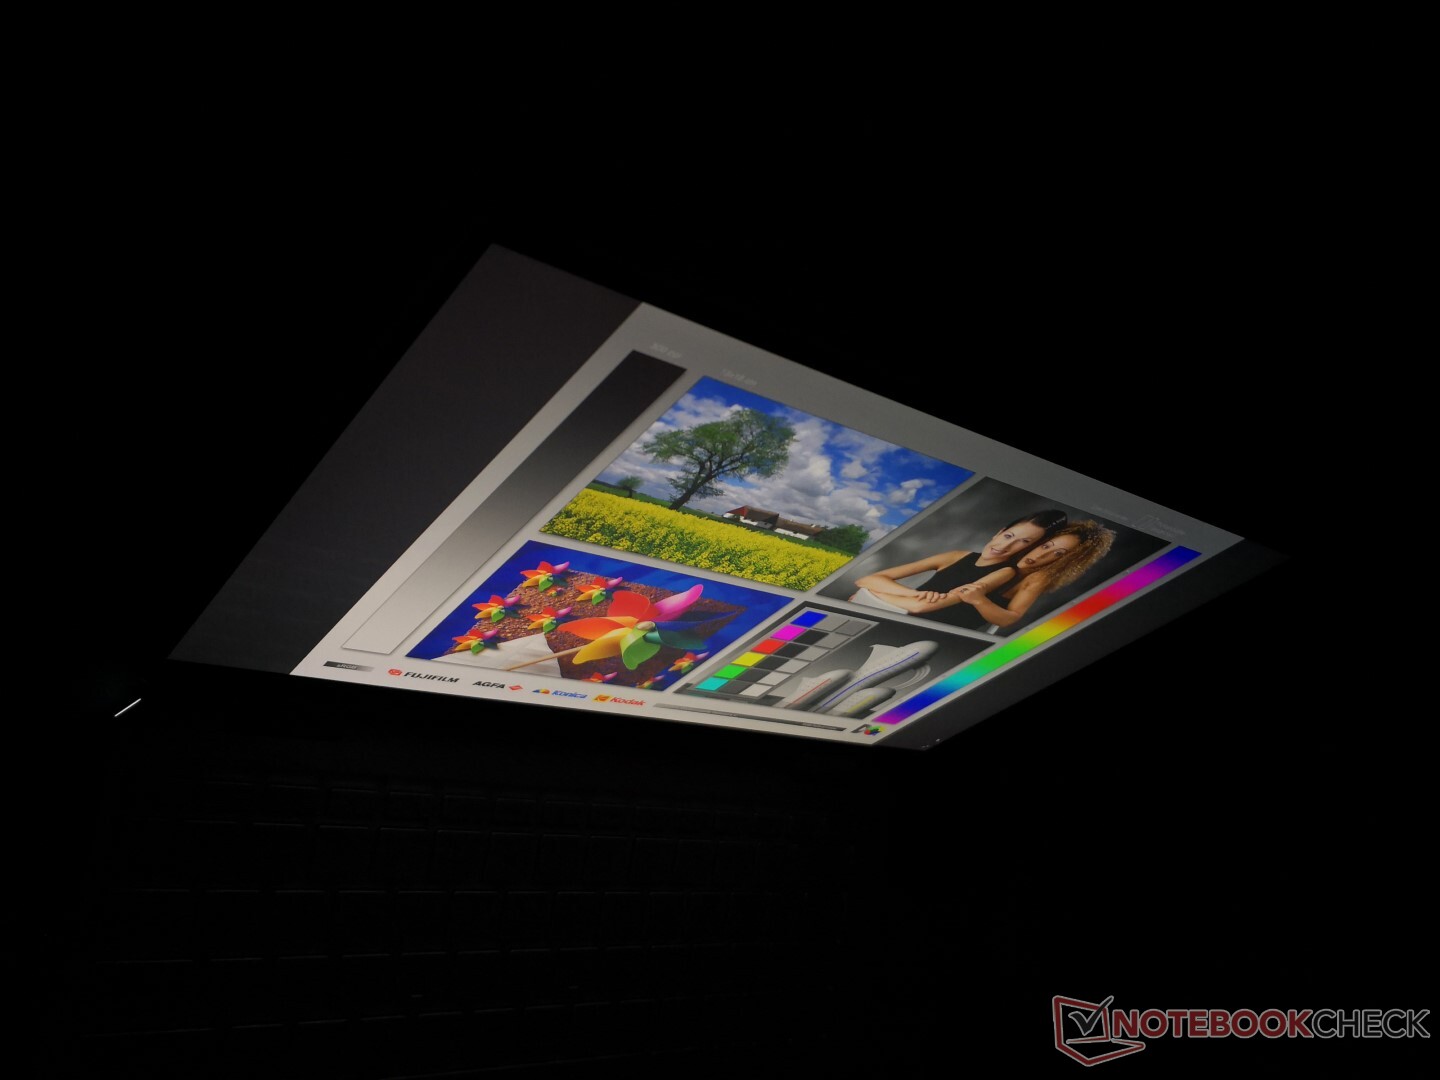
Outdoor visibility is better than on last year's model since the display is now almost 65 percent brighter. Be sure to disable the Display Power Saving Technology feature via the Intel Graphics Control Panel software or else maximum brightness will dip to 373 nits from 447 nits when on battery power. For even better outdoor visibility with less glare, we recommend the HP EliteBook x360 1040 as it offers 1000-nit display options.
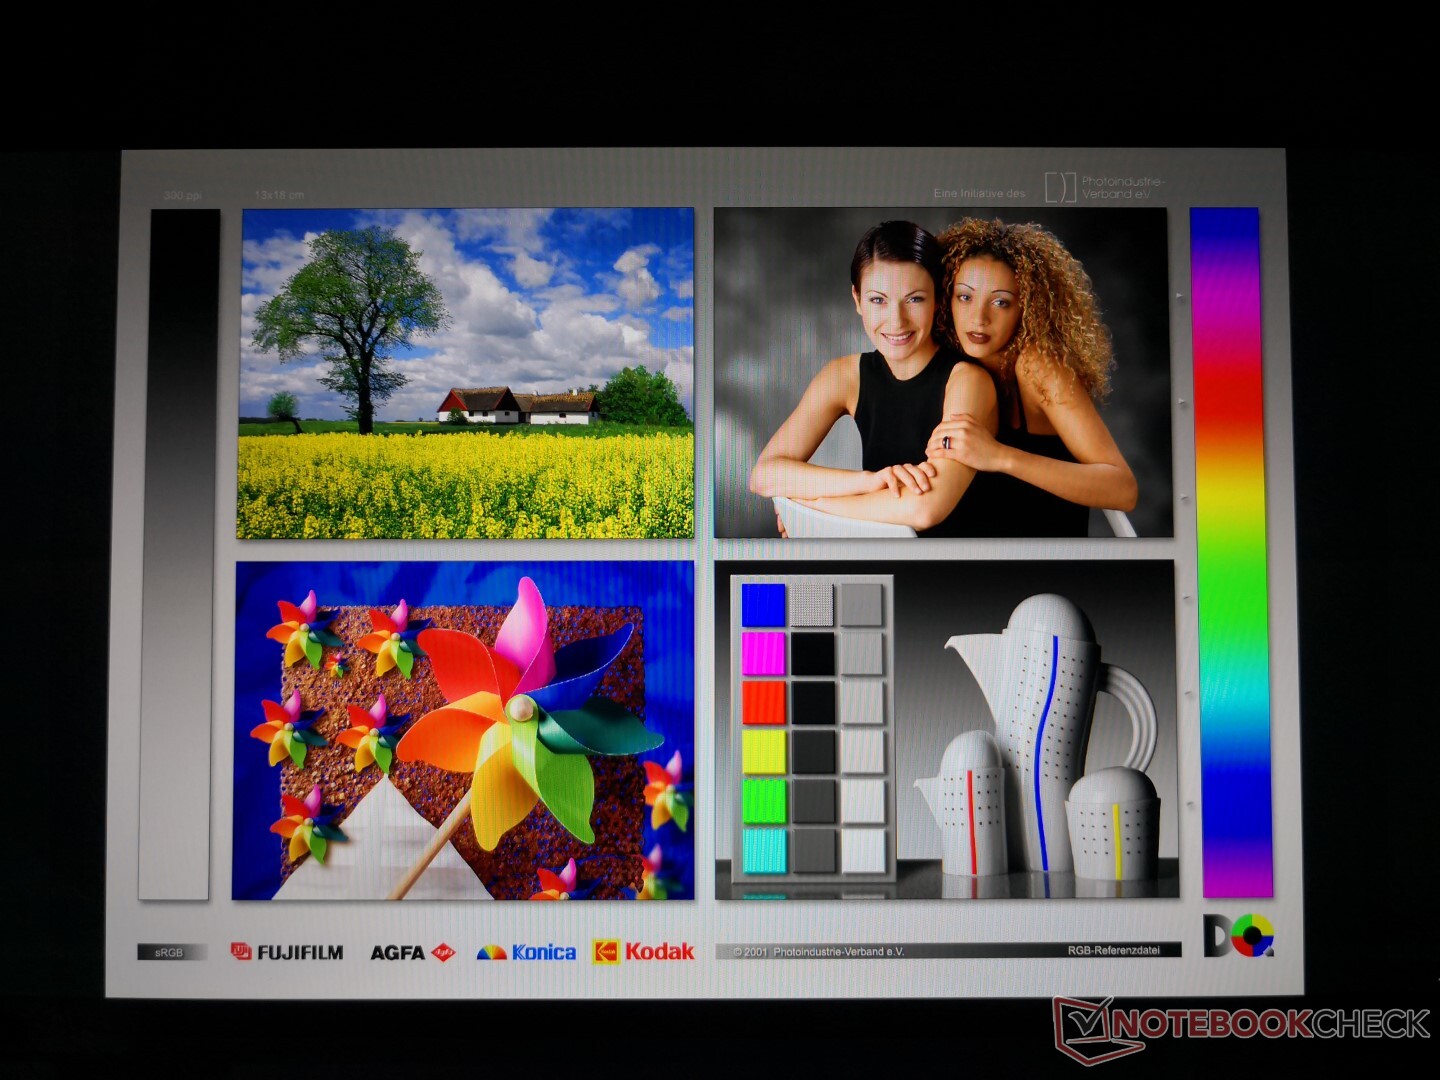
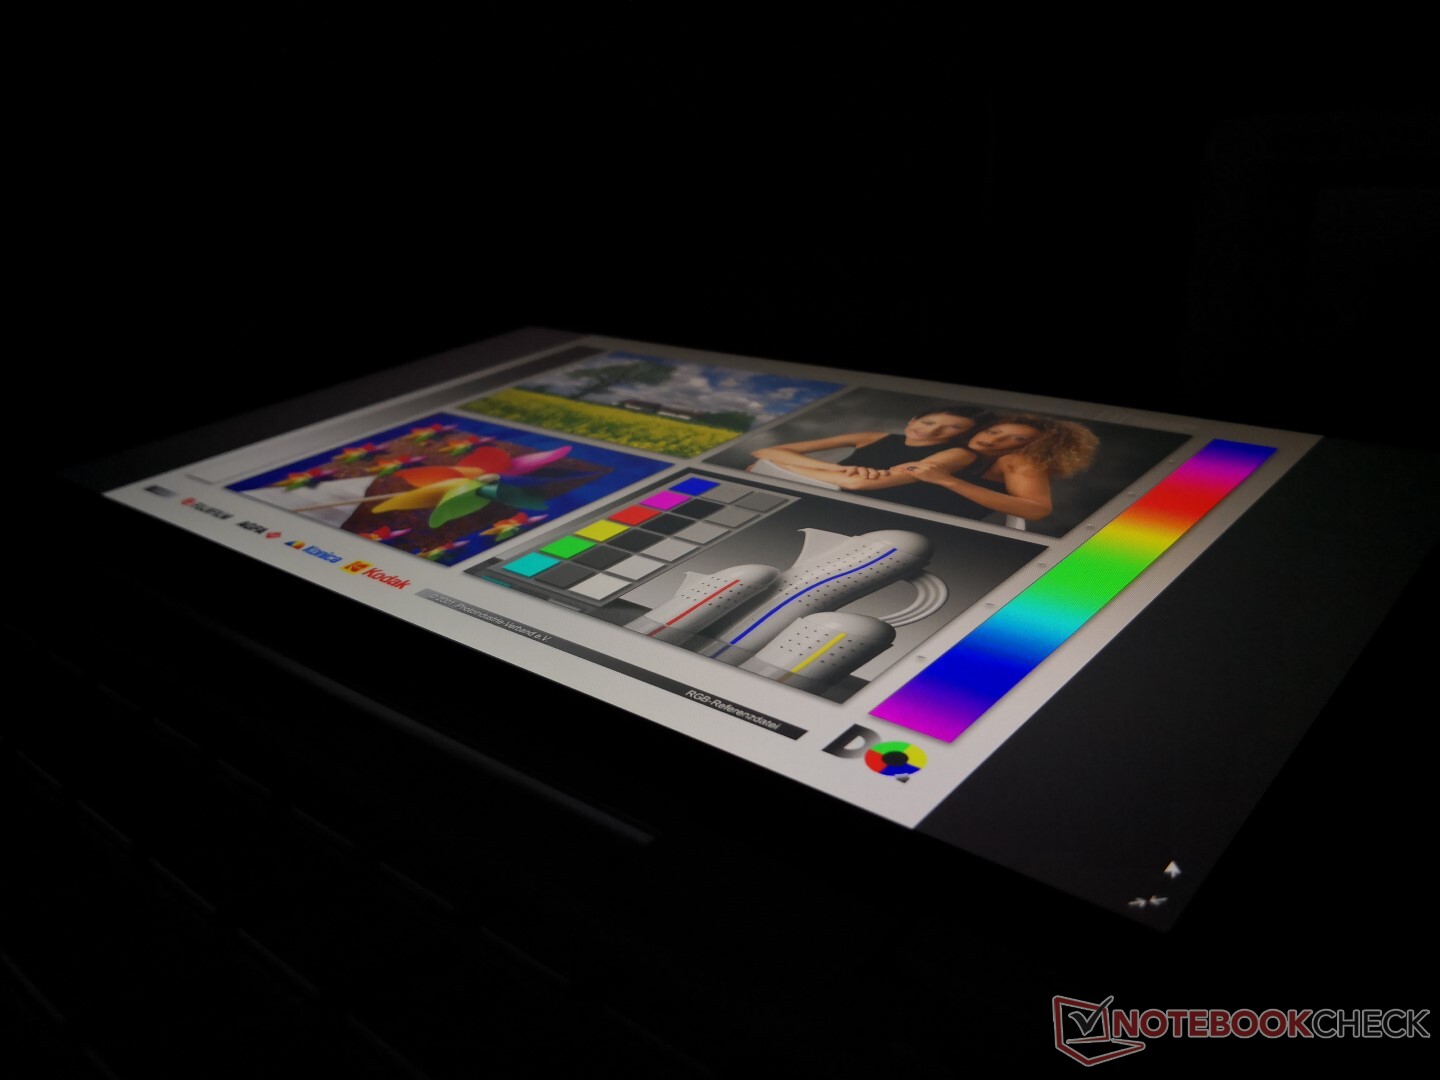
Viewing angles are excellent with slight contrast changes if viewing from extreme angles as expected.
Performance
There are no Core i3 SKUs since HP is positioning its Spectre series as high-end consumer machines. Expect more Ultrabooks to carry the same Core i5-1035G4 and Core i7-1065G7 CPUs with Iris Plus graphics in 2020. If you want discrete graphics options, then you'll have to look at the larger Spectre x360 15 series instead.
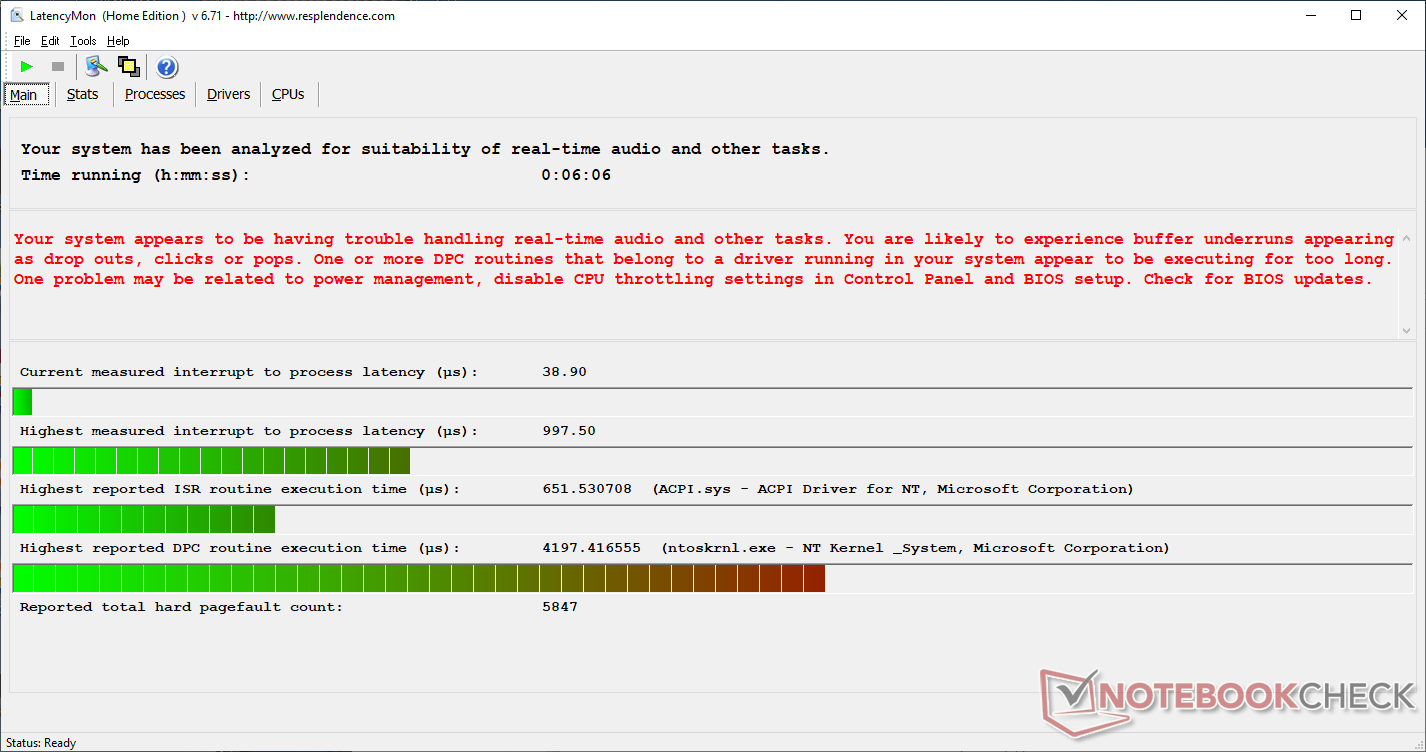
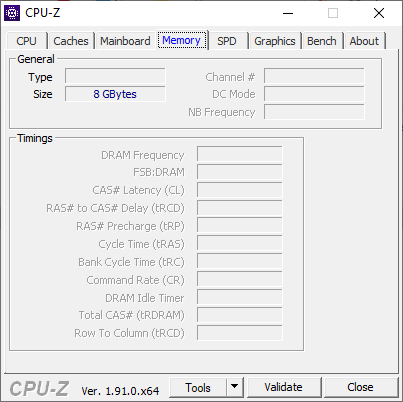
RAM is soldered much like on the competing XPS 13 7390 2-in-1 and Lenovo Yoga C940. LatencyMon shows DPC latency issues even when the wireless is disabled.
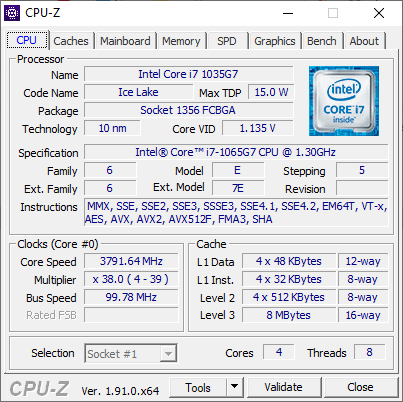
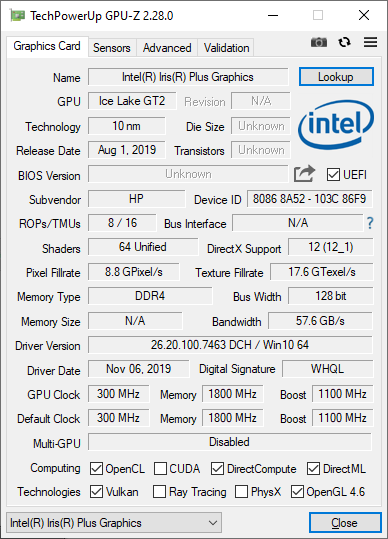
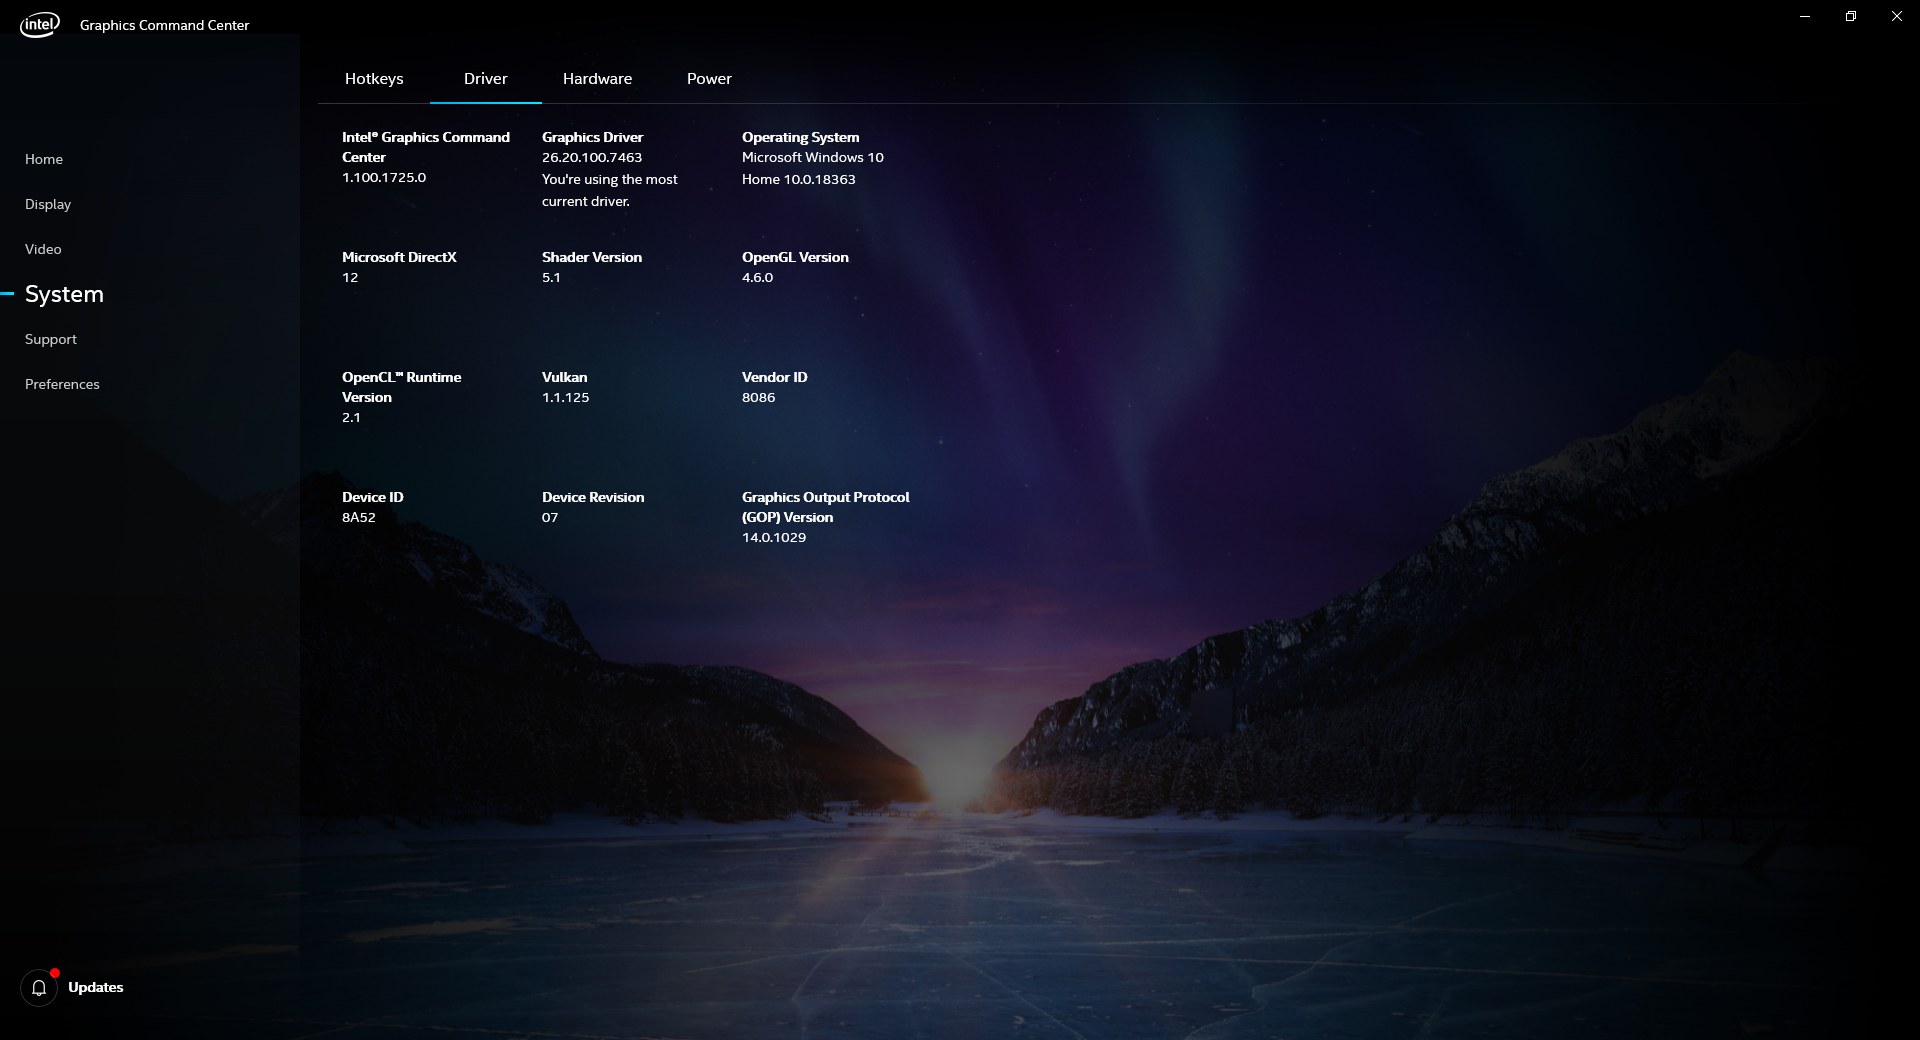
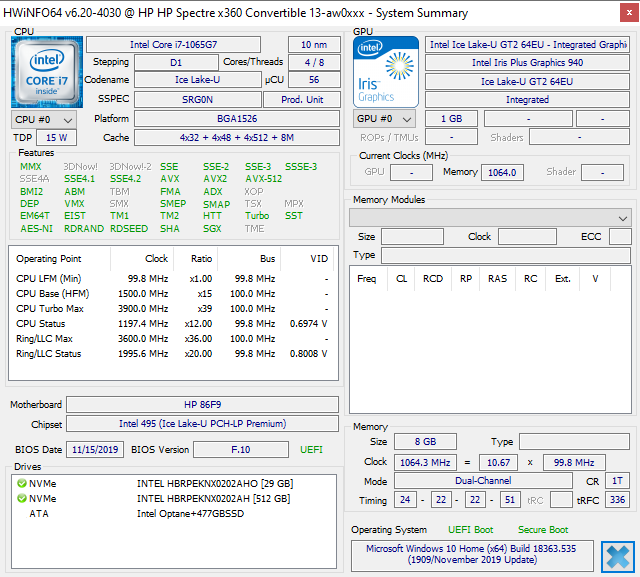
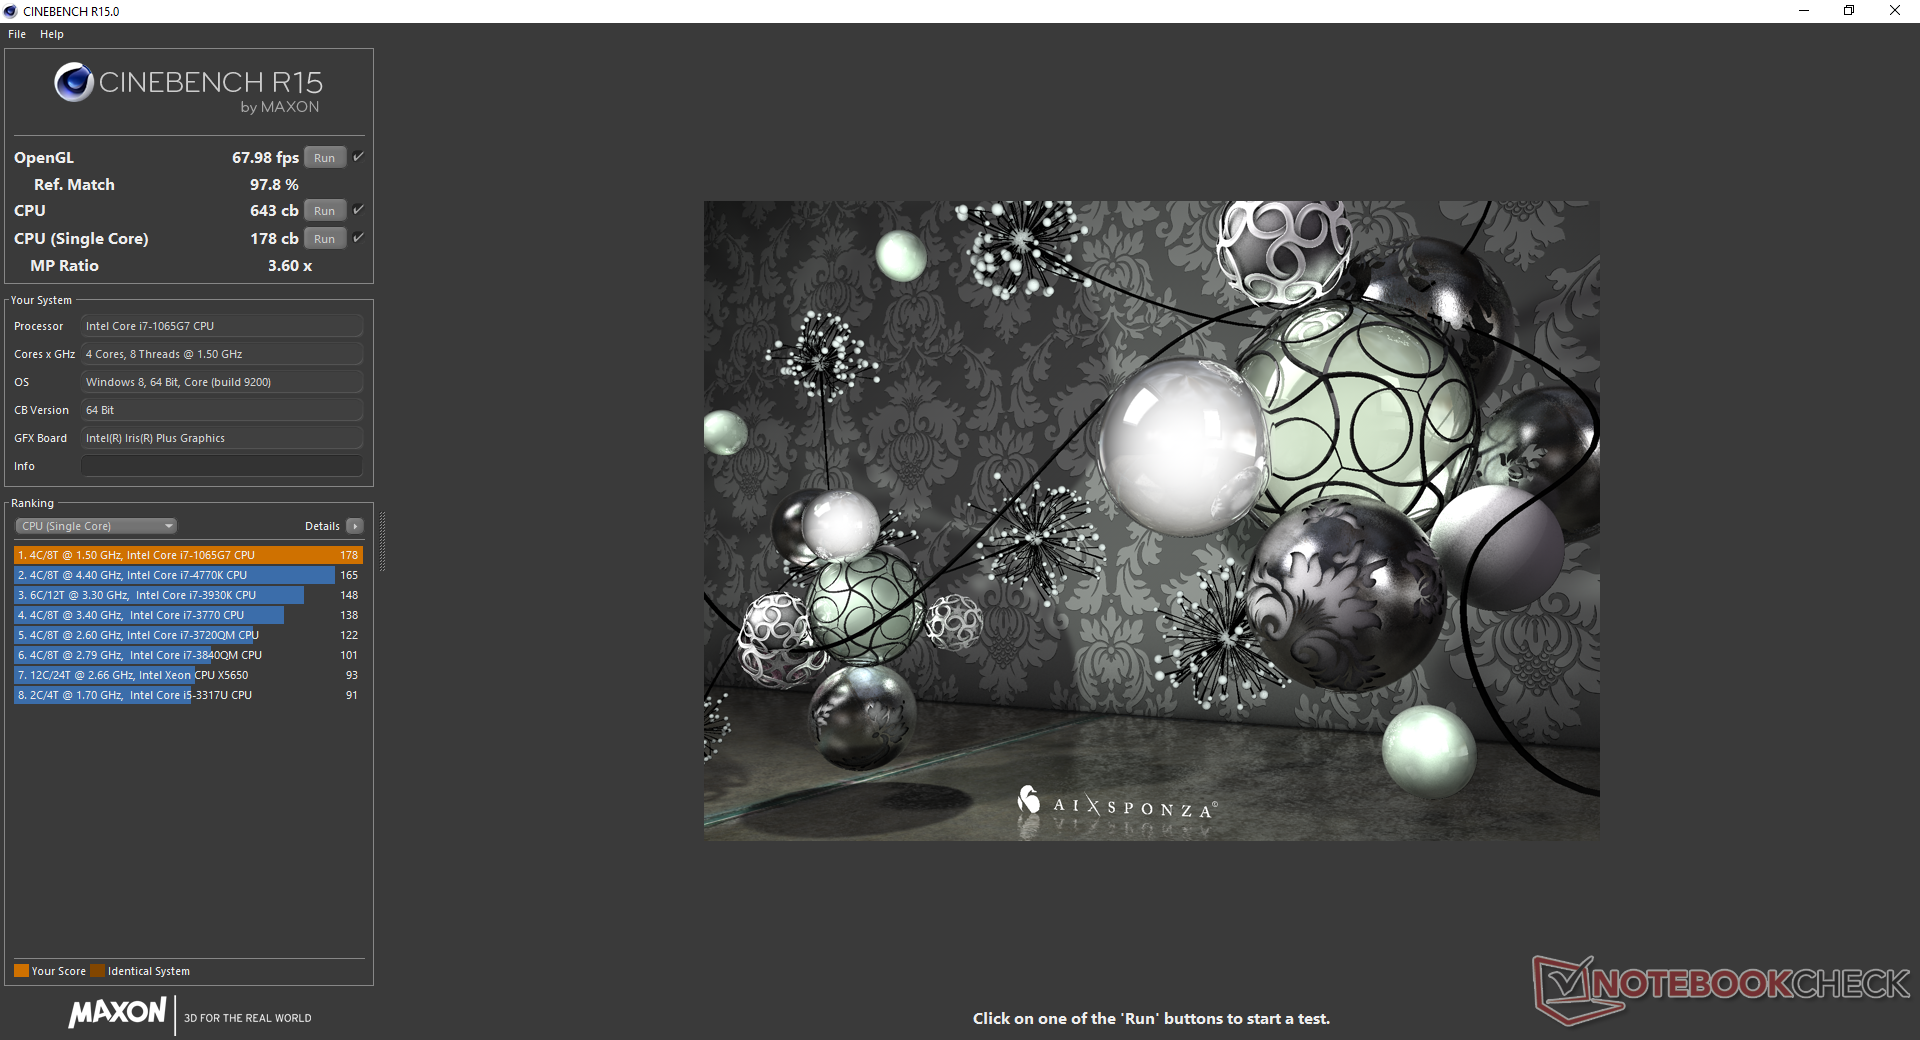
Processor
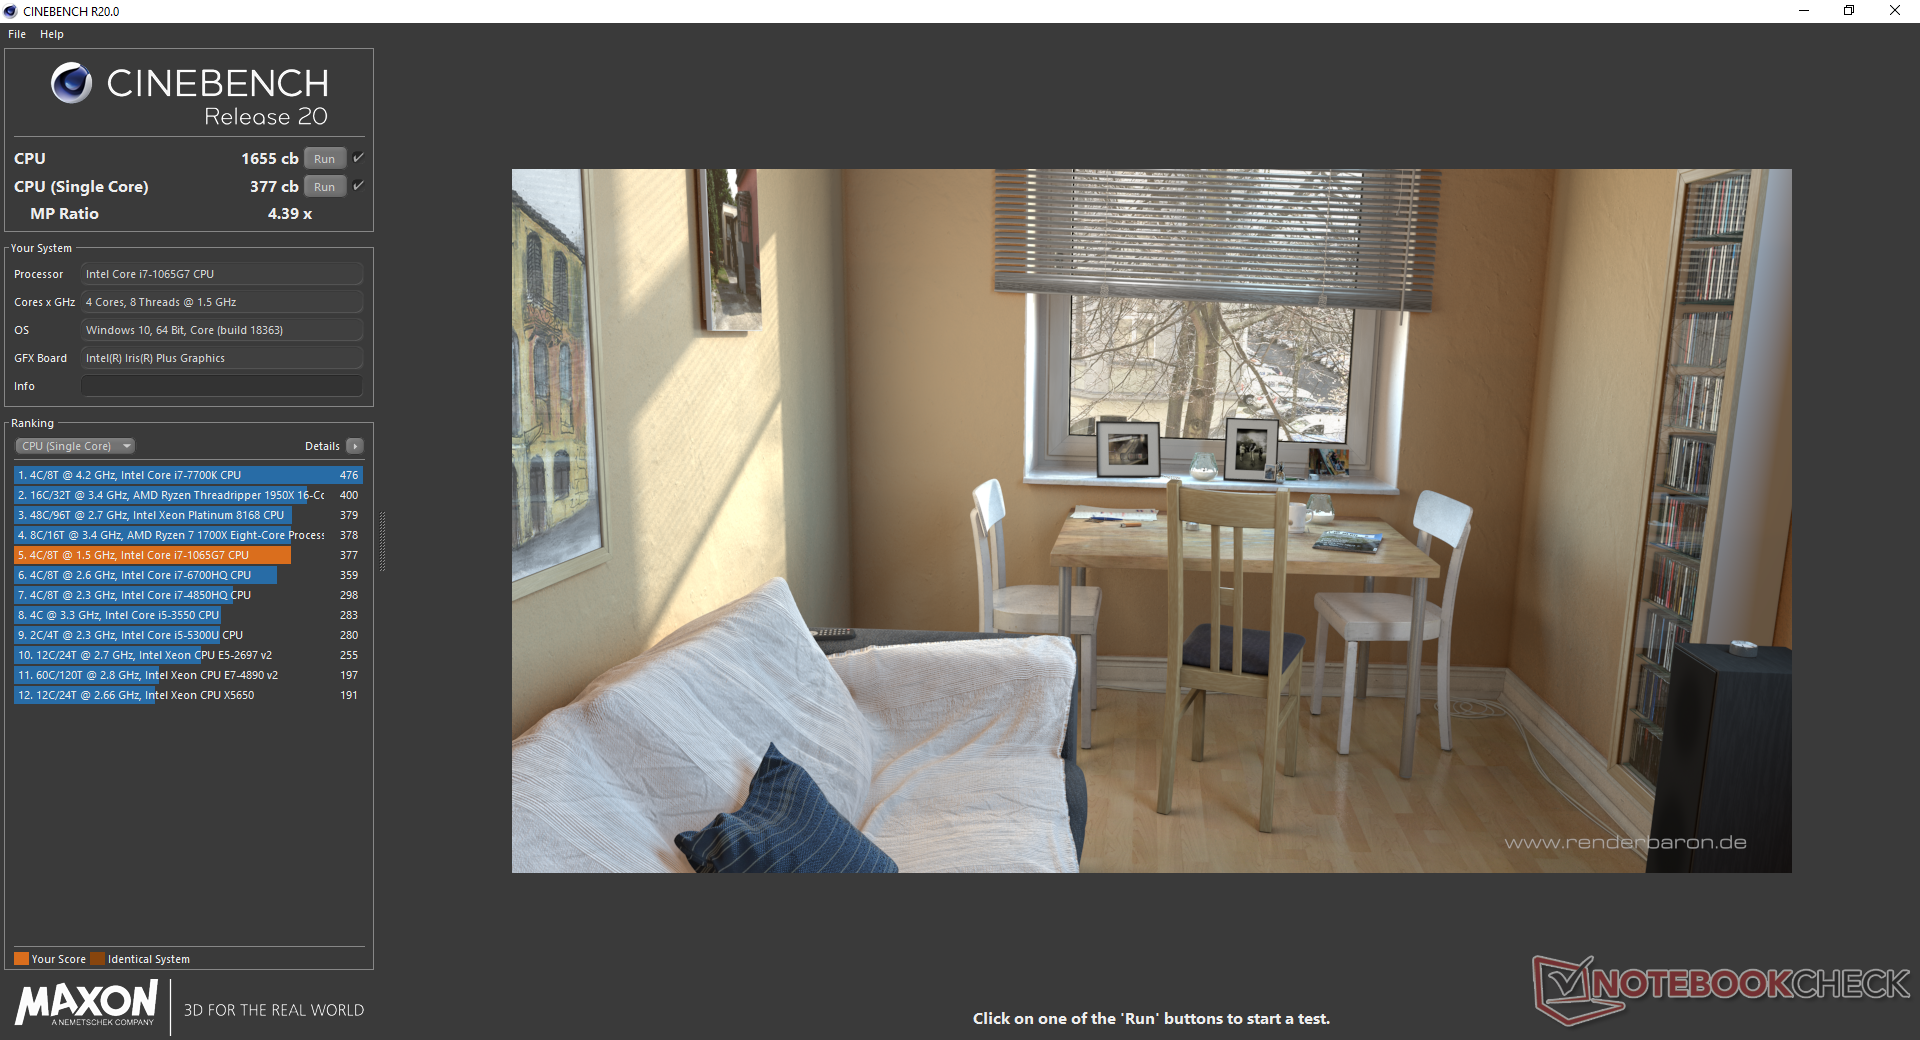
CPU performance is a mixed bag in relation to other Core i7-1065G7 laptops already available. While its CineBench multi-core scores are within 2 to 7 percent of the average, running CineBench R15 Multi-Thread in a loop reveals the poor performance sustainability and cycling behavior of the Spectre. As shown by our graph below, its initial score of 640 points can drop to 530 points over time to represent a performance dip of 17 percent. Furthermore, scores will cycle between 520 and 560 points due to the cycling clock rates of the HP whereas other Ice Lake laptops remain more stable.
Expect a performance dip of about 15 percent if opting for the lesser Core i5-1035G5 SKU.
Overall CPU performance is still an improvement over the Core i7-8565U on last year's Spectre despite the subpar implementation of Ice Lake.
System Performance
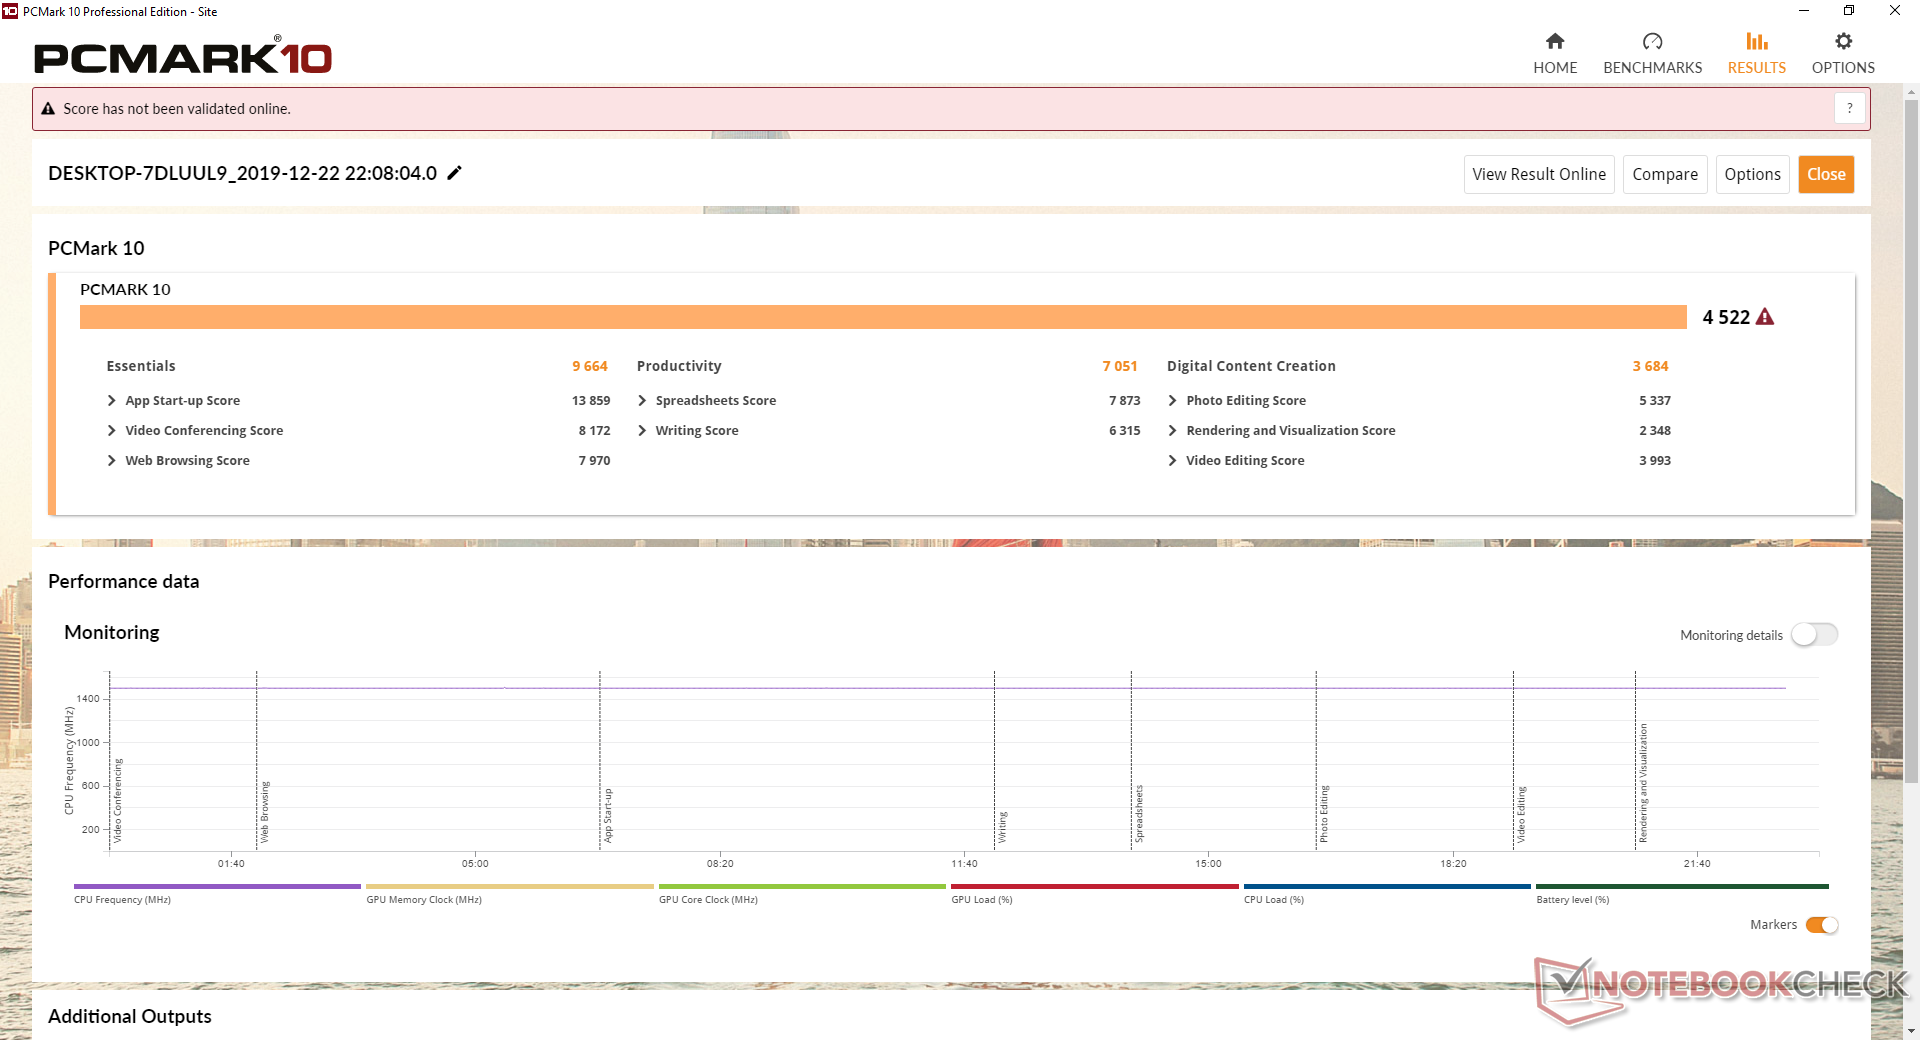
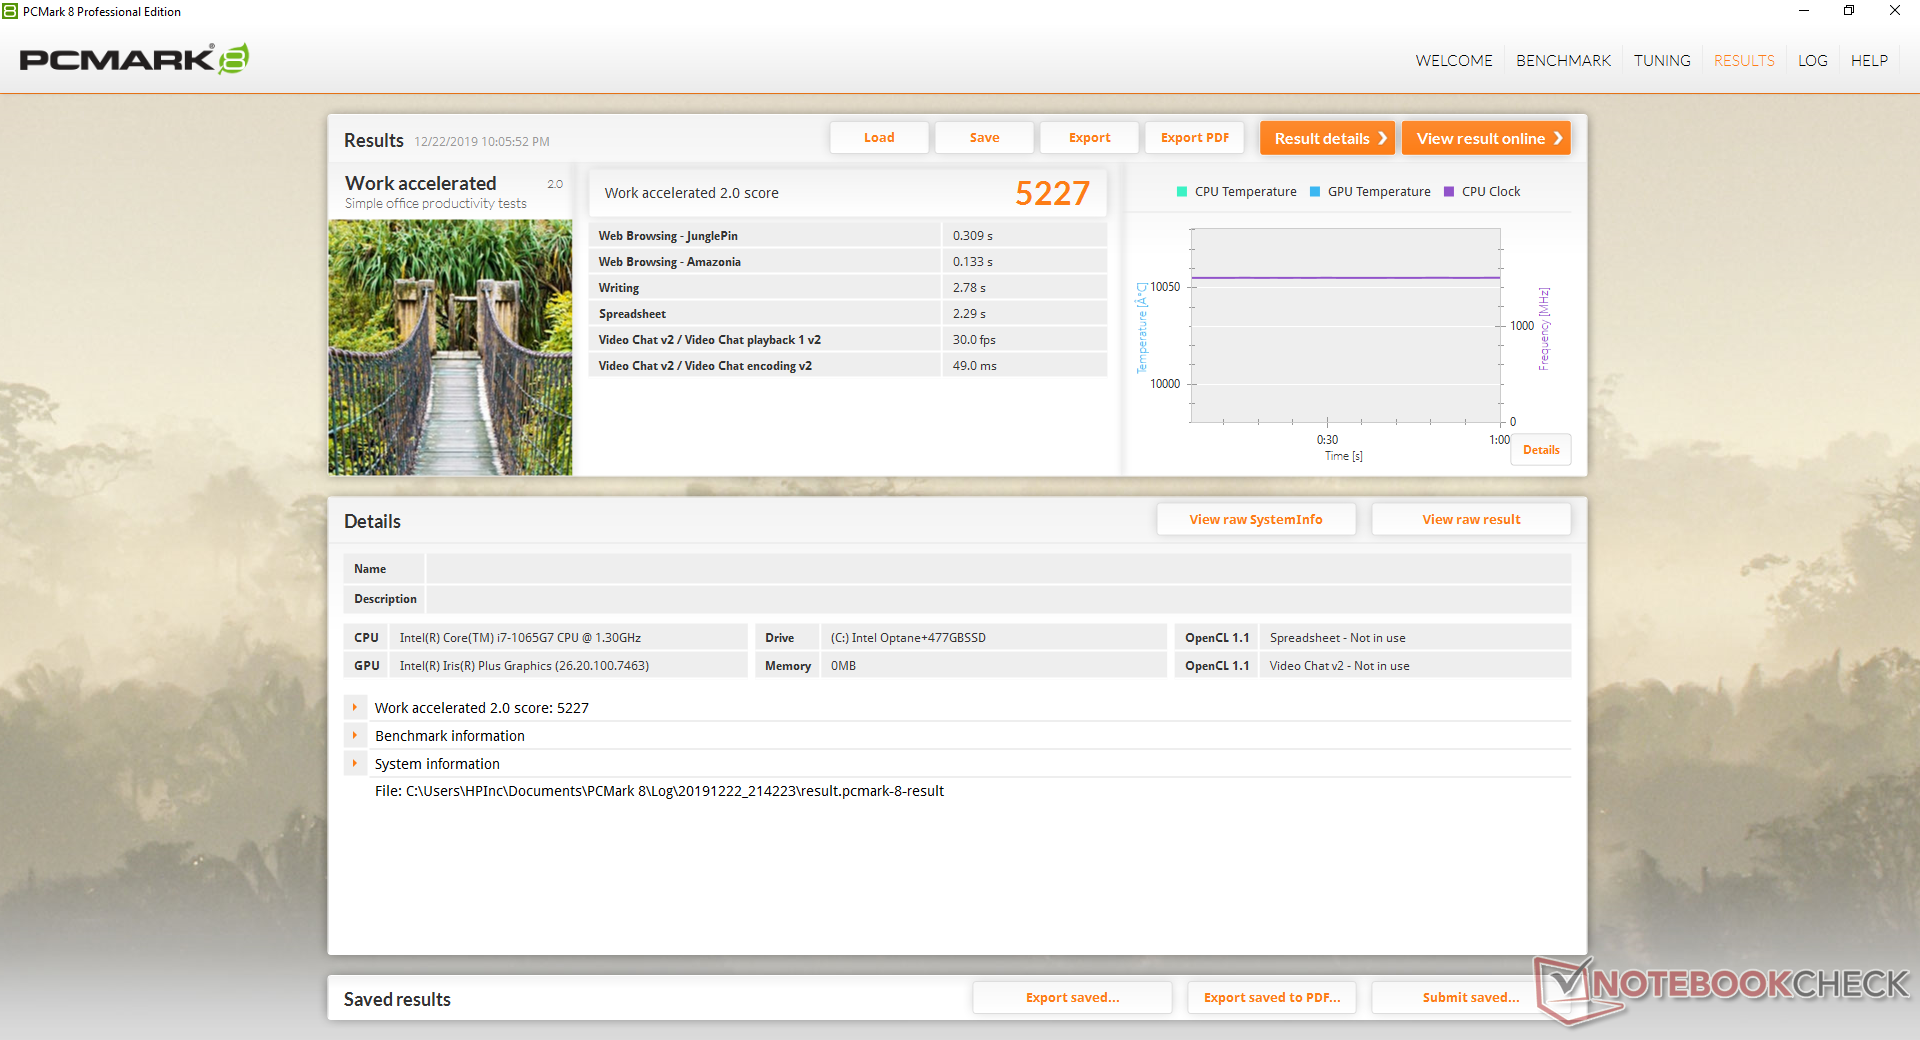
PCMark scores are within just a few percentage points of the average Core i7-1065G7 laptop albeit still consistently behind the XPS 13 7390 2-in-1. Even so, the system is an improvement over the older Whiskey Lake-U-powered model that it's meant to replace.
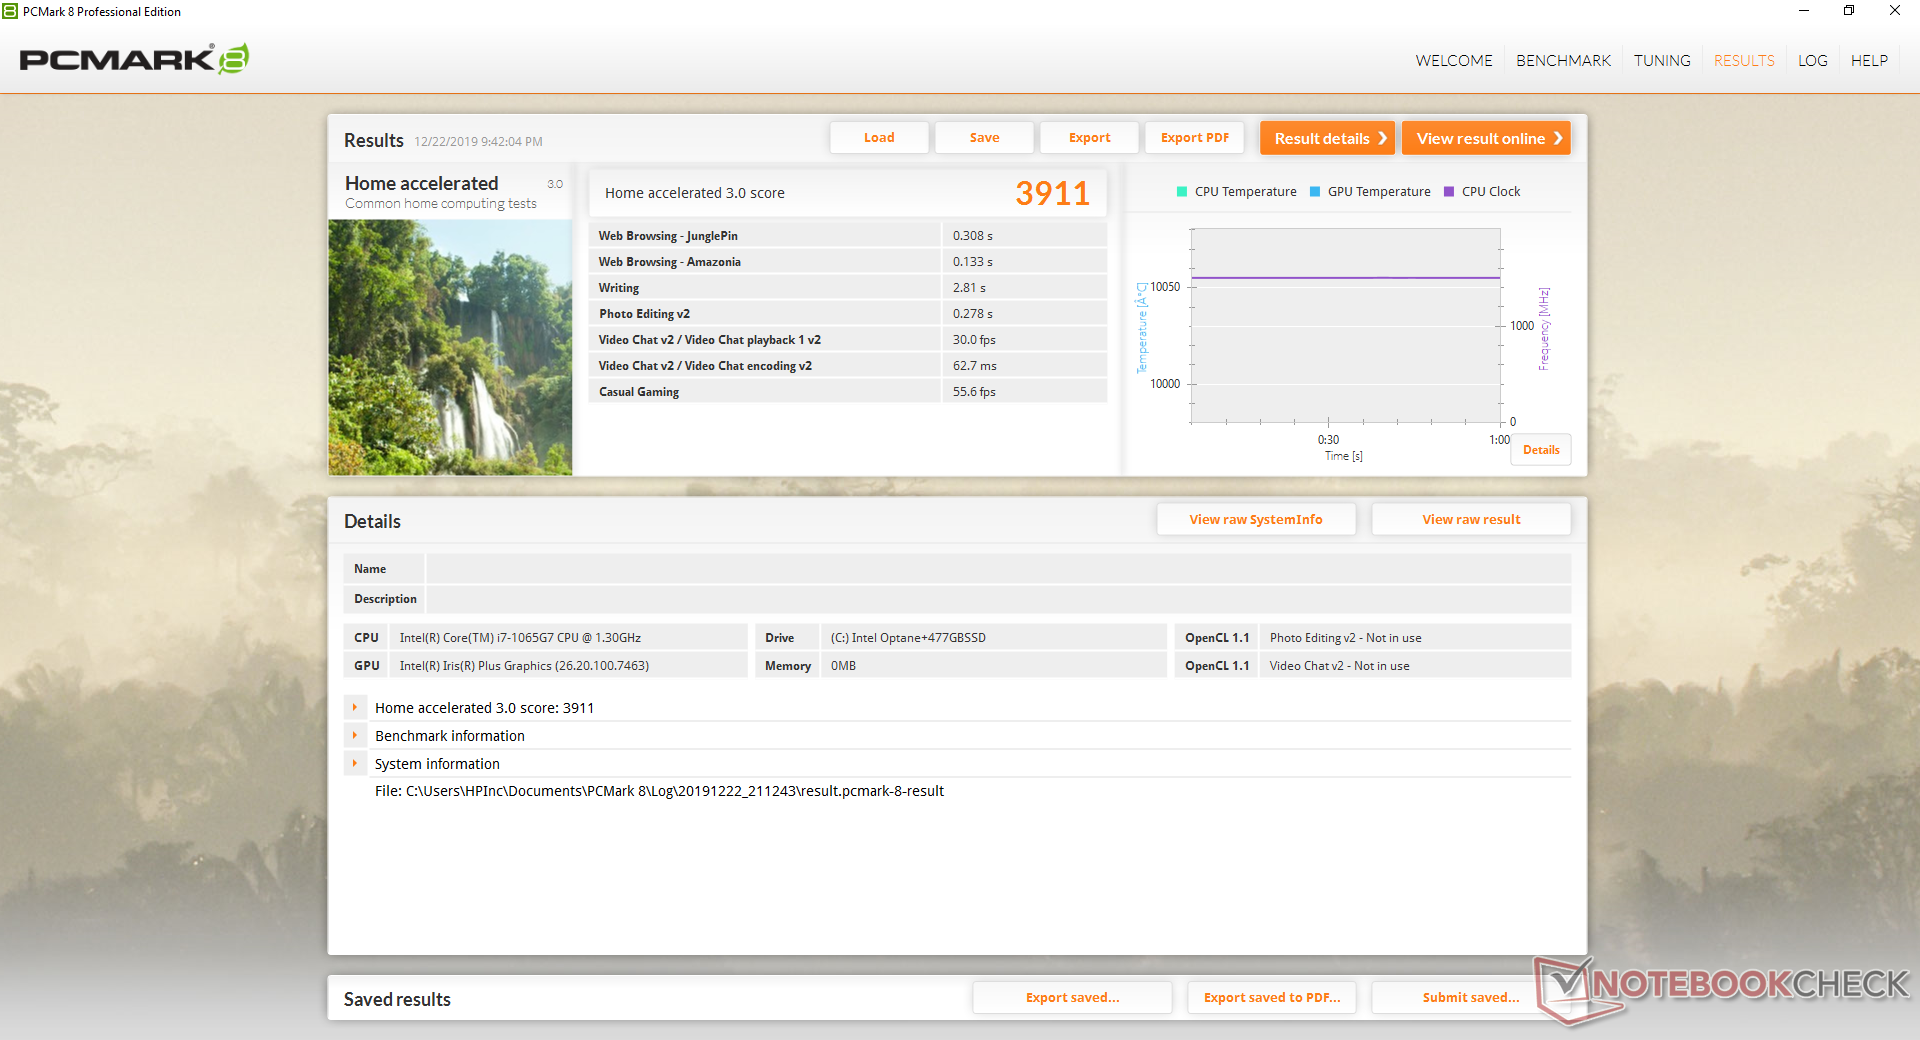
| PCMark 8 Home Score Accelerated v2 | 3911 points | |
| PCMark 8 Work Score Accelerated v2 | 5227 points | |
| PCMark 10 Score | 4522 points | |
Help | ||
Storage Devices
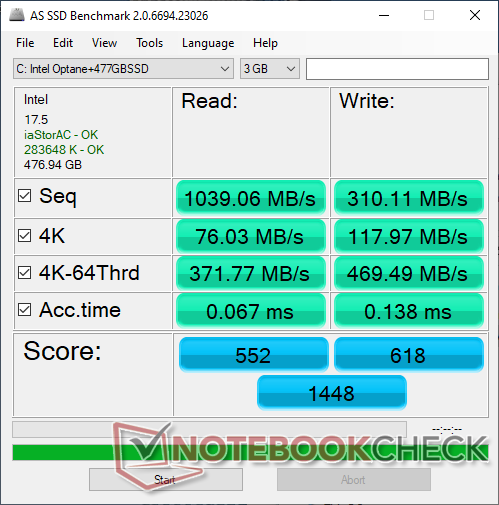
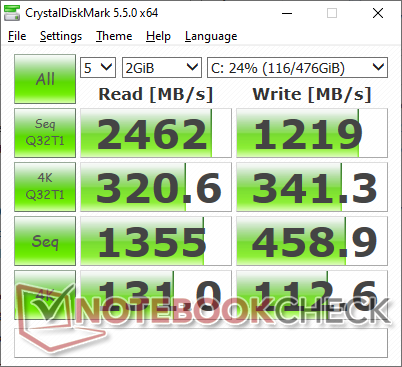
Unsurprisingly, only one internal storage bay is available. The 512 GB HP HBRPEKNX0202AH M.2 PCIe SSD integrates 32 GB of Intel Optane H10 memory with mixed results. Sequential read and write rates according to AS SSD, for example, average only about 1000 MB/s and 300 MB/s, respectively, compared to 1800 MB/s and 1100 MB/s on the Toshiba BG4 KBG40ZPZ512G as found on the XPS 13 7390 2-in-1. The price premium for Optane technology has yet to become competitive against traditional NVMe SSDs.
See our table of HDDs and SSDs for more benchmark comparisons.
| HP Spectre x360 13-aw0013dx Intel Optane Memory H10 with Solid State Storage 32GB + 512GB HBRPEKNX0202A(L/H) | HP Spectre x360 13-ap0312ng Toshiba XG5 KXG50ZNV512G | Dell XPS 13 7390 2-in-1 Core i7 Toshiba BG4 KBG40ZPZ512G | Asus ZenBook Flip 14 UM462DA-AI023T | Razer Blade Stealth i7-1065G7 Iris Plus Samsung SSD PM981 MZVLB256HAHQ | Lenovo Yoga C940-14IIL 81Q9 Samsung PM981a MZVLB1T0HBLR | |
|---|---|---|---|---|---|---|
| AS SSD | 27% | 28% | -25% | 21% | 115% | |
| Seq Read (MB/s) | 1039 | 2197 111% | 1801 73% | 424.5 -59% | 1989 91% | 2213 113% |
| Seq Write (MB/s) | 310.1 | 493 59% | 1125 263% | 374.5 21% | 827 167% | 1401 352% |
| 4K Read (MB/s) | 76 | 31.4 -59% | 39.7 -48% | 19.38 -74% | 40.12 -47% | 55.2 -27% |
| 4K Write (MB/s) | 118 | 123.9 5% | 67 -43% | 34.69 -71% | 135.1 14% | 130.3 10% |
| 4K-64 Read (MB/s) | 371.8 | 674 81% | 1253 237% | 430.2 16% | 531 43% | 878 136% |
| 4K-64 Write (MB/s) | 469.5 | 479.3 2% | 209 -55% | 377.2 -20% | 309.9 -34% | 1478 215% |
| Access Time Read * (ms) | 0.067 | 0.117 -75% | 0.069 -3% | 0.13 -94% | 0.085 -27% | 0.036 46% |
| Access Time Write * (ms) | 0.138 | 0.049 64% | 0.625 -353% | 0.084 39% | 0.09 35% | 0.086 38% |
| Score Read (Points) | 552 | 925 68% | 1472 167% | 492 -11% | 770 39% | 1154 109% |
| Score Write (Points) | 618 | 653 6% | 388 -37% | 449 -27% | 528 -15% | 1748 183% |
| Score Total (Points) | 1448 | 1971 36% | 2583 78% | 1194 -18% | 1644 14% | 3467 139% |
| Copy ISO MB/s (MB/s) | 764 | 1293 69% | 1024 34% | 1418 86% | 2161 183% | |
| Copy Program MB/s (MB/s) | 465.8 | 560 20% | 203.6 -56% | 382.7 -18% | 572 23% | |
| Copy Game MB/s (MB/s) | 764 | 927 21% | 552 -28% | 334.2 -56% | 1433 88% | |
| CrystalDiskMark 5.2 / 6 | -1% | 24% | -12% | 43% | 75% | |
| Write 4K (MB/s) | 112.6 | 105.1 -7% | 106.7 -5% | 142.1 26% | 176.8 57% | 128.6 14% |
| Read 4K (MB/s) | 131 | 42.3 -68% | 49.94 -62% | 44.75 -66% | 48.38 -63% | 45.25 -65% |
| Write Seq (MB/s) | 458.9 | 677 48% | 1223 167% | 1332 190% | 1949 325% | |
| Read Seq (MB/s) | 1355 | 2092 54% | 1801 33% | 1644 21% | 2359 74% | |
| Write 4K Q32T1 (MB/s) | 341.3 | 378.8 11% | 325.3 -5% | 252.4 -26% | 440.6 29% | 445 30% |
| Read 4K Q32T1 (MB/s) | 320.6 | 271.3 -15% | 551 72% | 340.9 6% | 559 74% | 404.5 26% |
| Write Seq Q32T1 (MB/s) | 1219 | 527 -57% | 1224 0% | 1457 20% | 1104 -9% | 3019 148% |
| Read Seq Q32T1 (MB/s) | 2462 | 3175 29% | 2350 -5% | 1723 -30% | 3481 41% | 3564 45% |
| Write 4K Q8T8 (MB/s) | 1164 | |||||
| Read 4K Q8T8 (MB/s) | 1103 | |||||
| Total Average (Program / Settings) | 13% /
15% | 26% /
27% | -19% /
-21% | 32% /
29% | 95% /
100% |
* ... smaller is better

GPU Performance
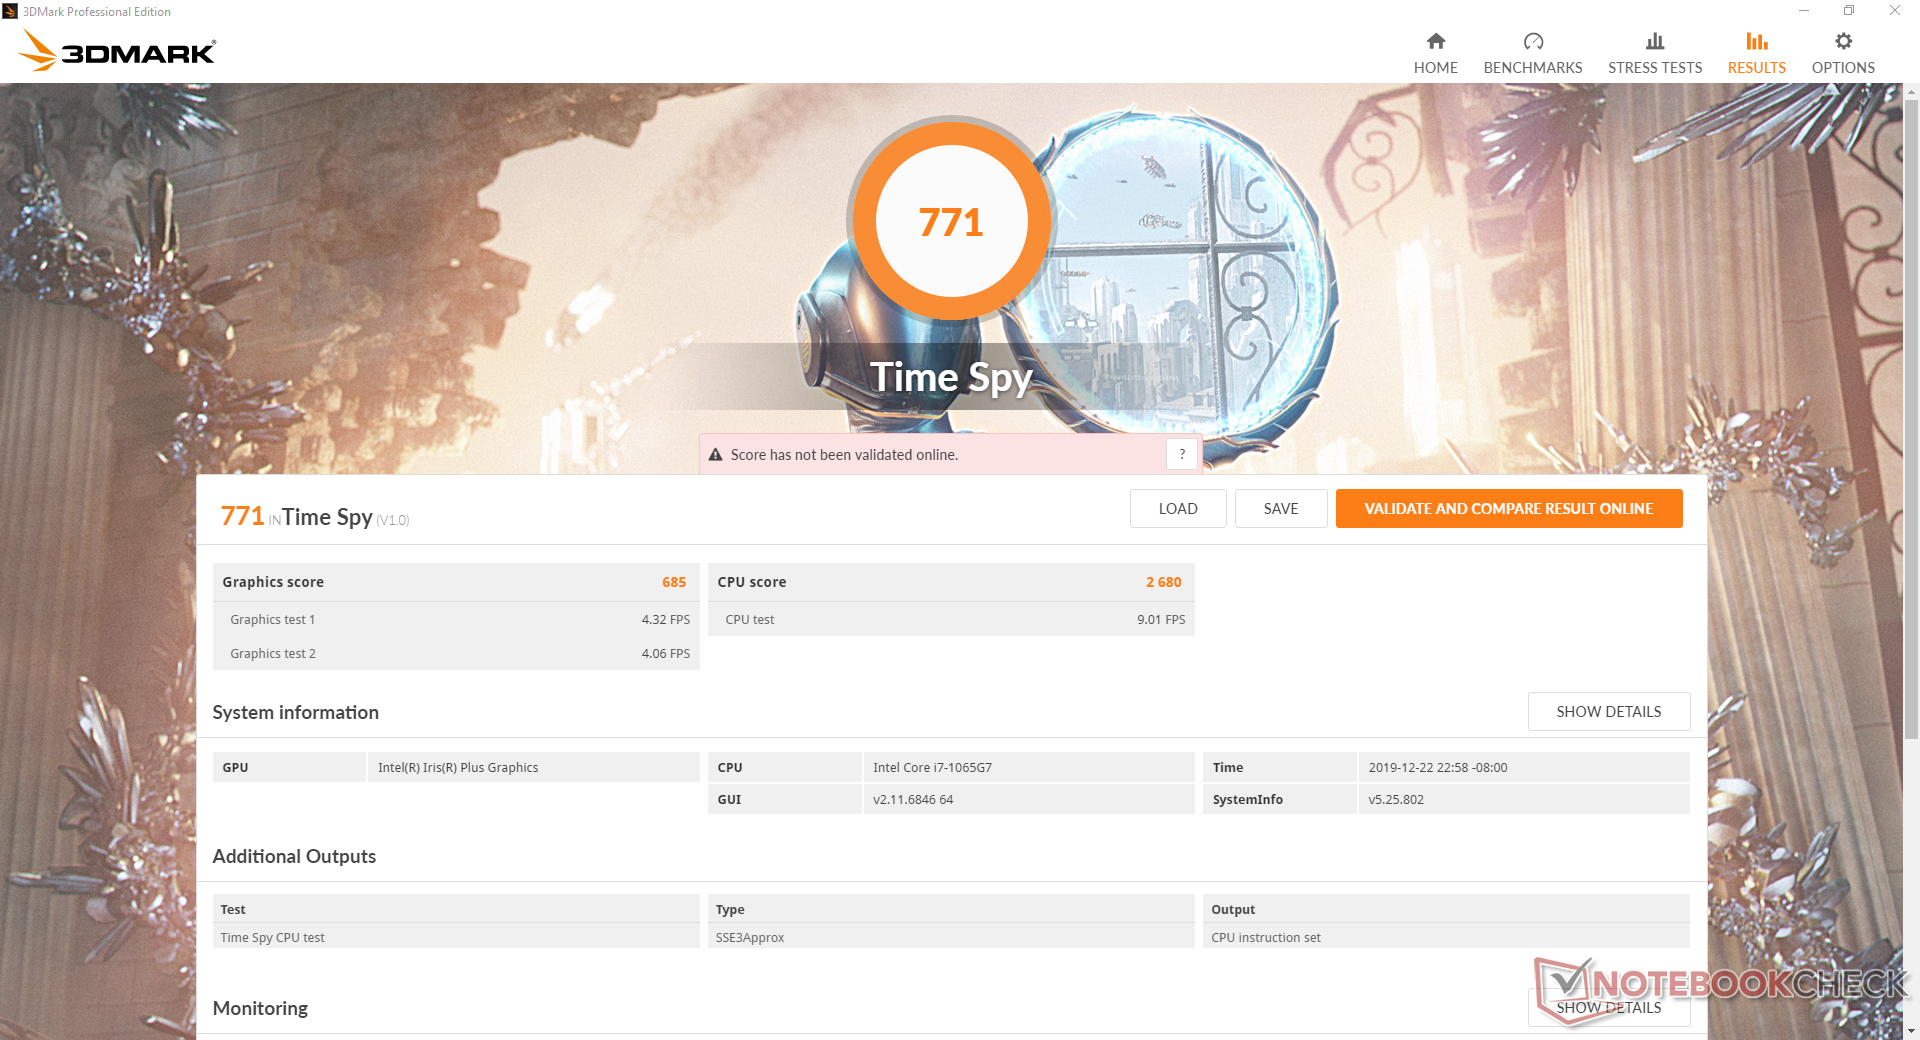
3DMark Time Spy results are 15 percent slower than the average Core i7-1065G7 in our database while Fire Strike results are within 2 percent of the average. The inconsistent scores reflect the inconsistent frame rate and stress test results in our next sections. Even so, 3DMark has been a poor indicator of real-world gaming performance for Ice Lake systems thus far.
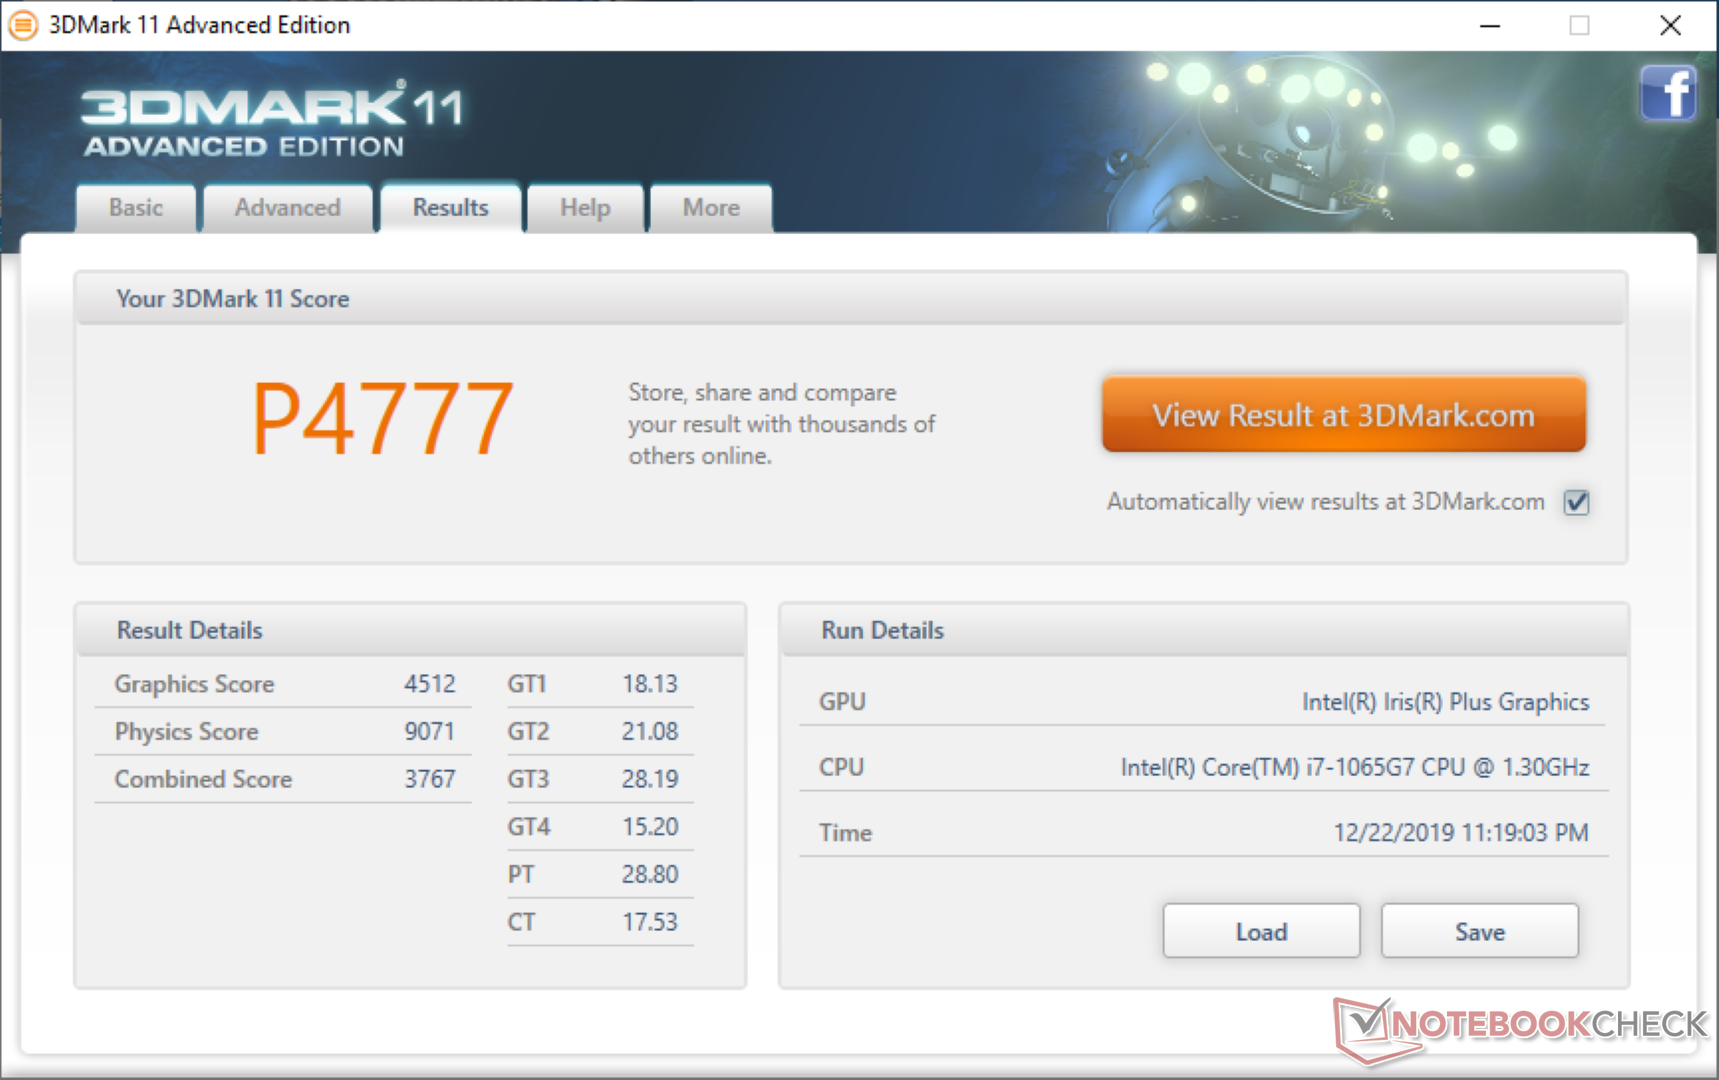
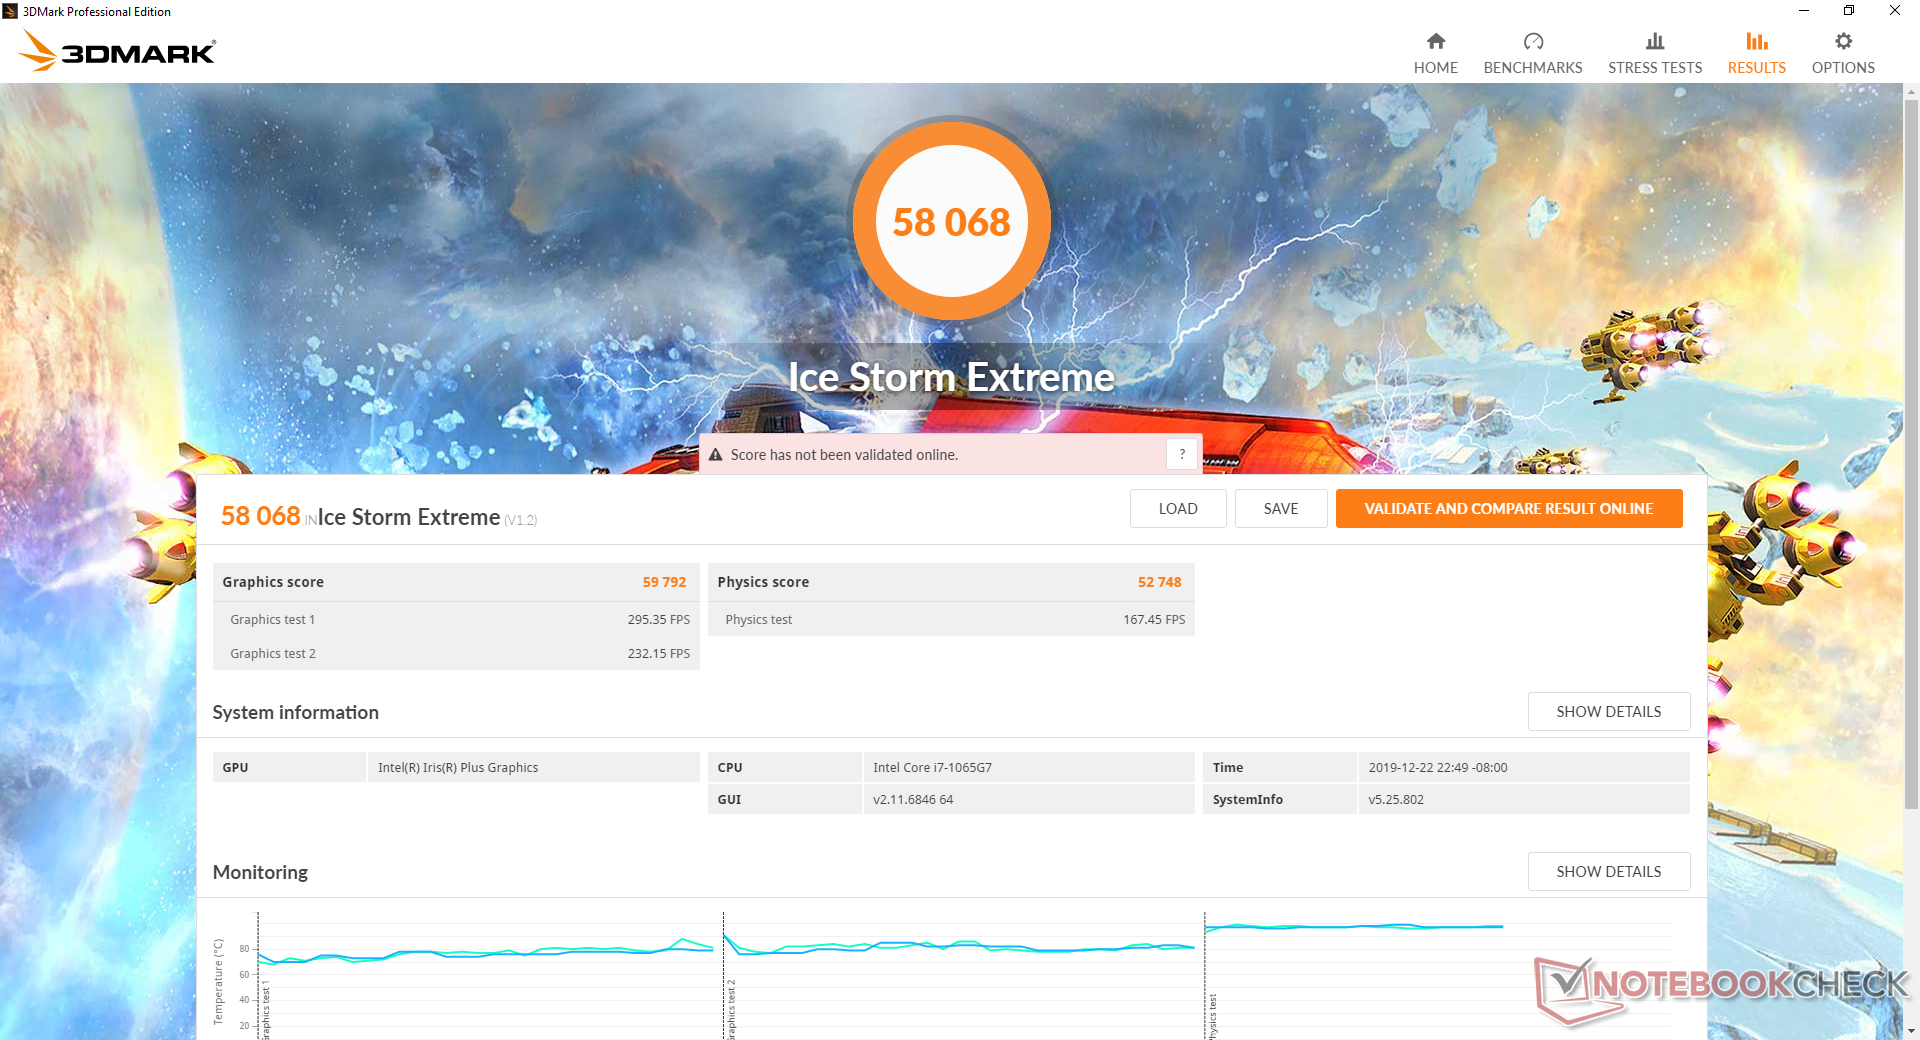
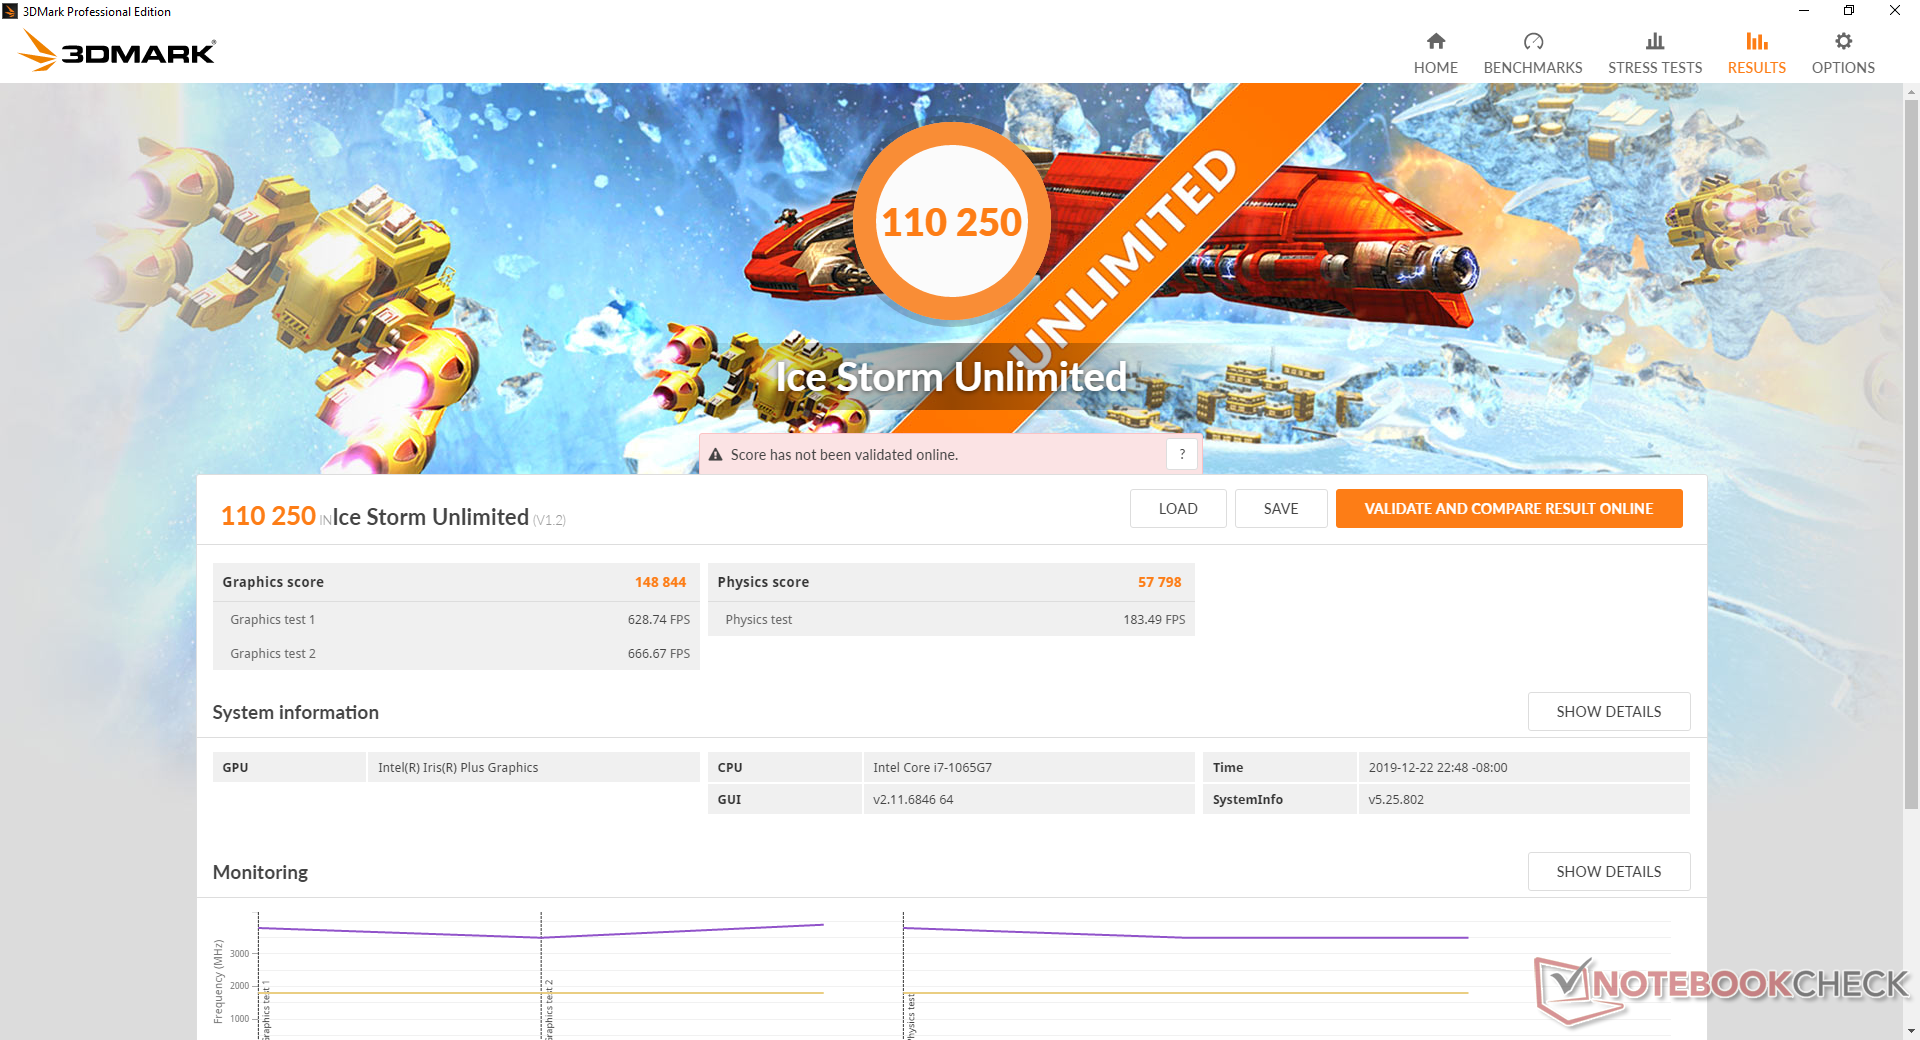
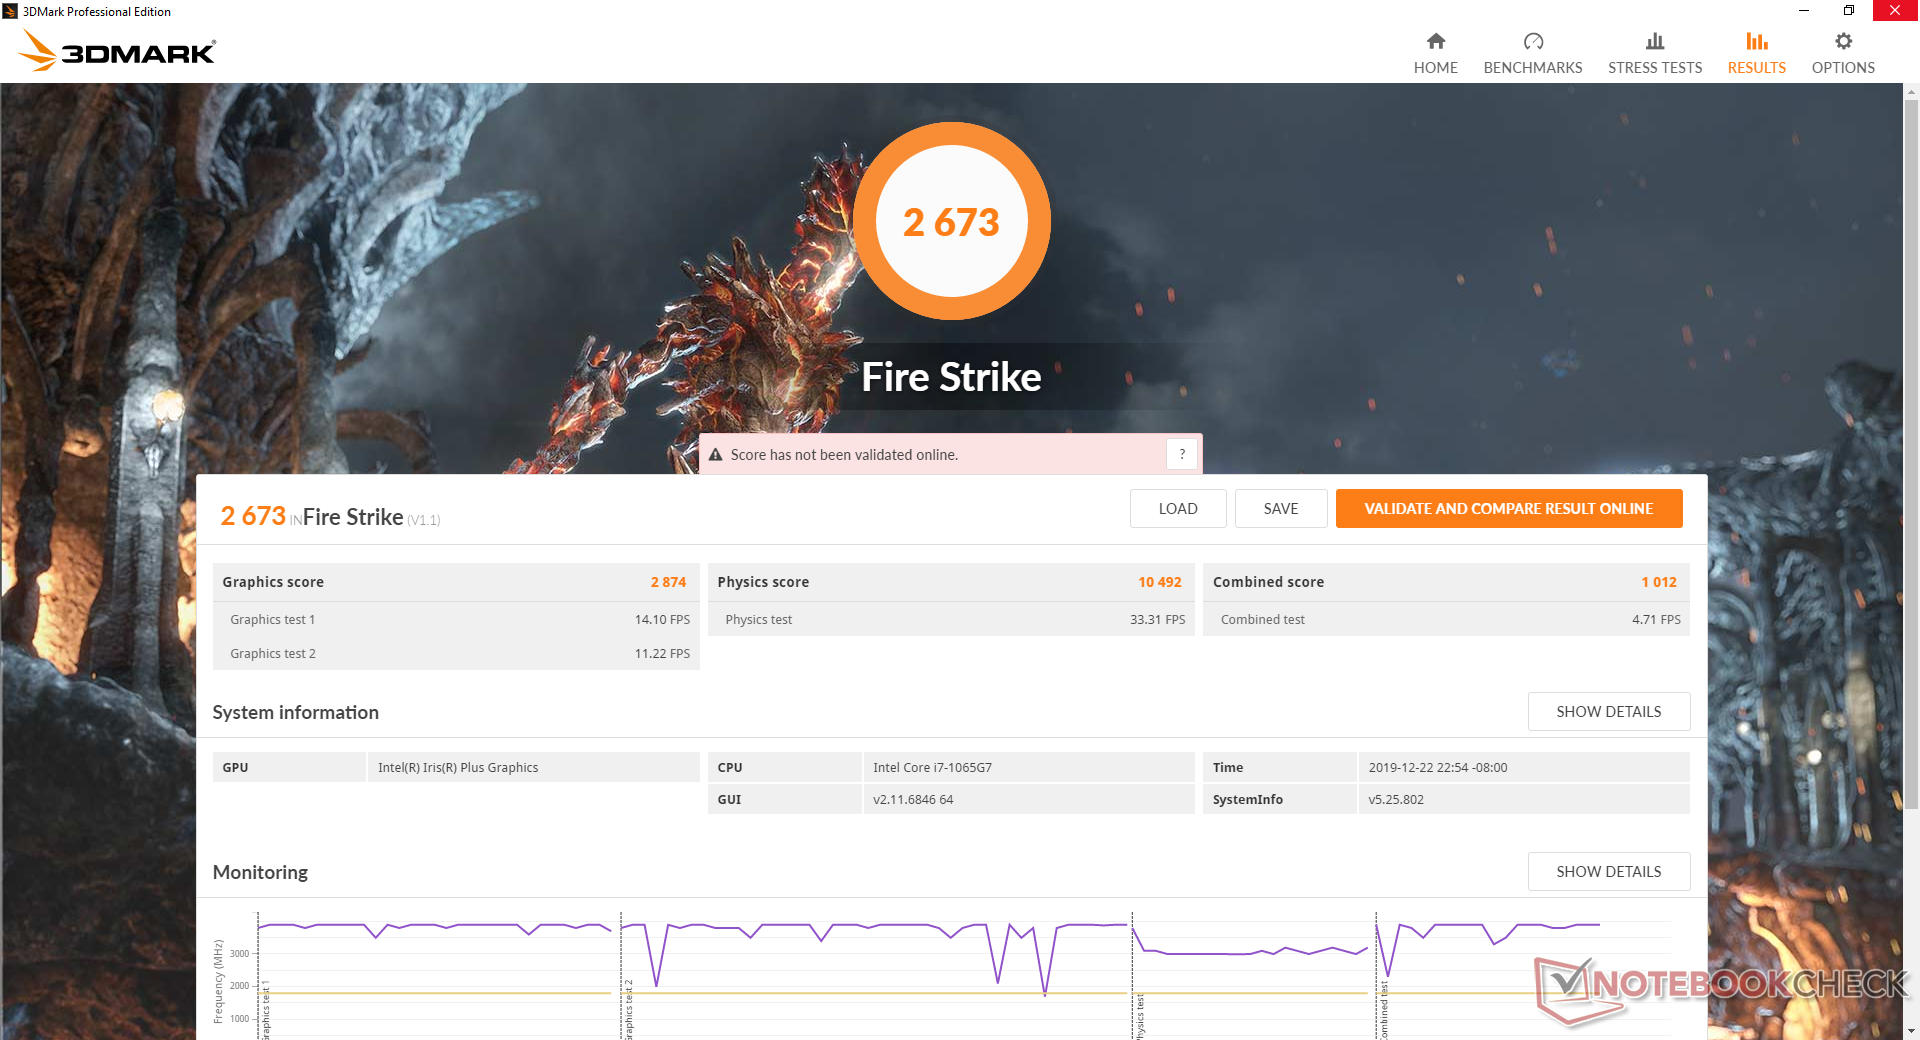
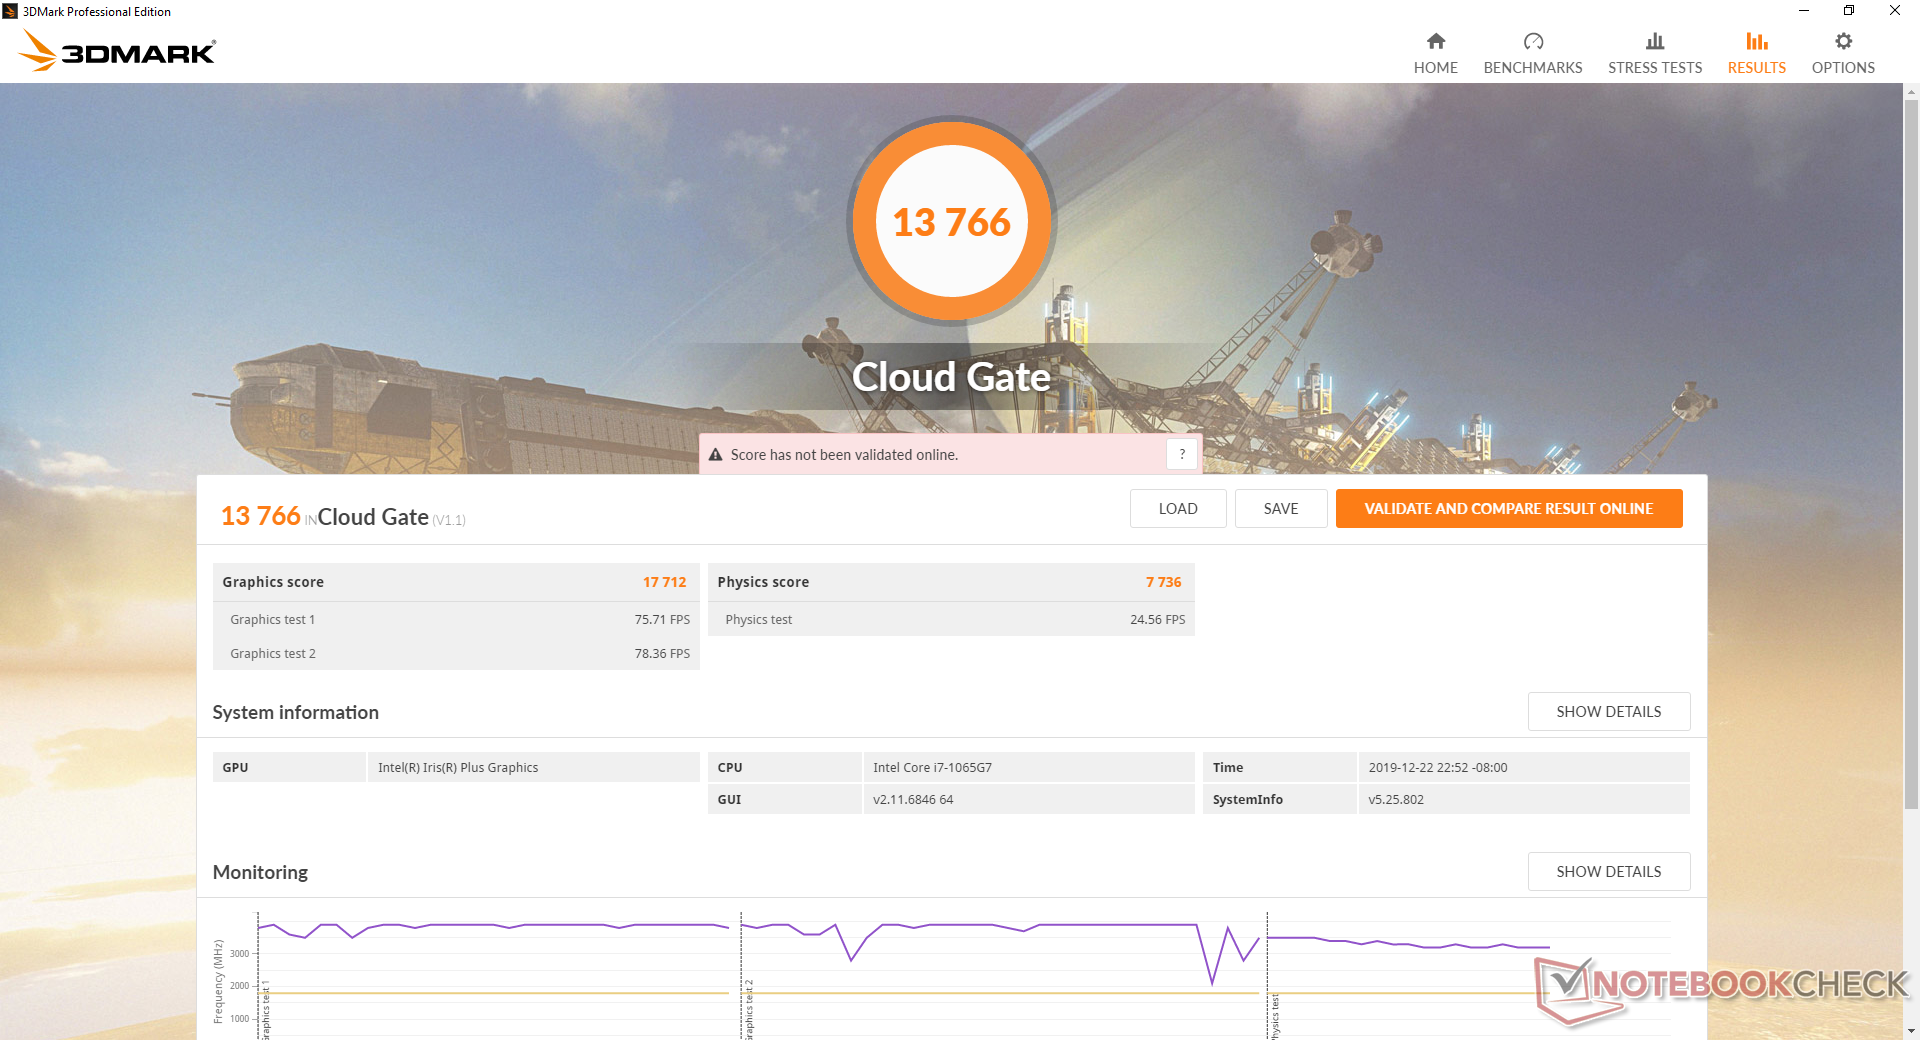
| 3DMark 11 Performance | 4777 points | |
| 3DMark Ice Storm Standard Score | 70068 points | |
| 3DMark Cloud Gate Standard Score | 13766 points | |
| 3DMark Fire Strike Score | 2673 points | |
| 3DMark Time Spy Score | 771 points | |
Help | ||
Gaming Performance
Average frame rates are 20 to 30 percent slower than the average Core i7-1065G7 in our database due to the clock rate cycling behavior of the CPU and GPU that we will detail in the next few sections. In short, frame rates fluctuate far more than usual for an inconsistent level of gaming performance. Rocket League on high quality 1080p settings, for example, is nearly 25 percent slower than the RX Vega 10 in the Dell Latitude 5585 or 37 percent slower than the Nvidia GeForce MX150.
See our page on the Iris Plus G7 for more technical information and benchmark comparisons.
| Shadow of the Tomb Raider - 1280x720 Lowest Preset | |
| Asus GL753VD | |
| MSI PE60 2QD | |
| Acer Aspire 5 A515-52G-723L | |
| Acer Aspire 5 A515-52G-53PU | |
| Dell Inspiron 15 5000 5585 | |
| Average Intel Iris Plus Graphics G7 (Ice Lake 64 EU) (15.6 - 33, n=13) | |
| Acer Nitro 5 | |
| HP Spectre x360 13-aw0013dx | |
| Dell XPS 13 7390 Core i7-10710U | |
| Dell Inspiron 14 5000 5482 2-in-1 | |
Idling on Witcher 3 confirms our suspicion of unsteady frame rates and noticeable tearing. When on the lowest graphical settings, frame rates would cycle between 19 FPS and 41 FPS instead of remaining steady throughout. This undesirable behavior has not been observed on any other Core i7 Ice Lake laptop thus far including the Dell XPS 13 7390 2-in-1, Razer Blade Stealth, Lenovo Yoga C940, or Microsoft Surface Laptop 3 15.
| low | med. | high | ultra | |
|---|---|---|---|---|
| BioShock Infinite (2013) | 89.4 | 47.9 | 47.3 | 17.3 |
| The Witcher 3 (2015) | 43.9 | 28.9 | 13.8 | 7.2 |
| Rocket League (2017) | 87.9 | 44 | 29.7 | |
| Shadow of the Tomb Raider (2018) | 21 |
Emissions
System Noise
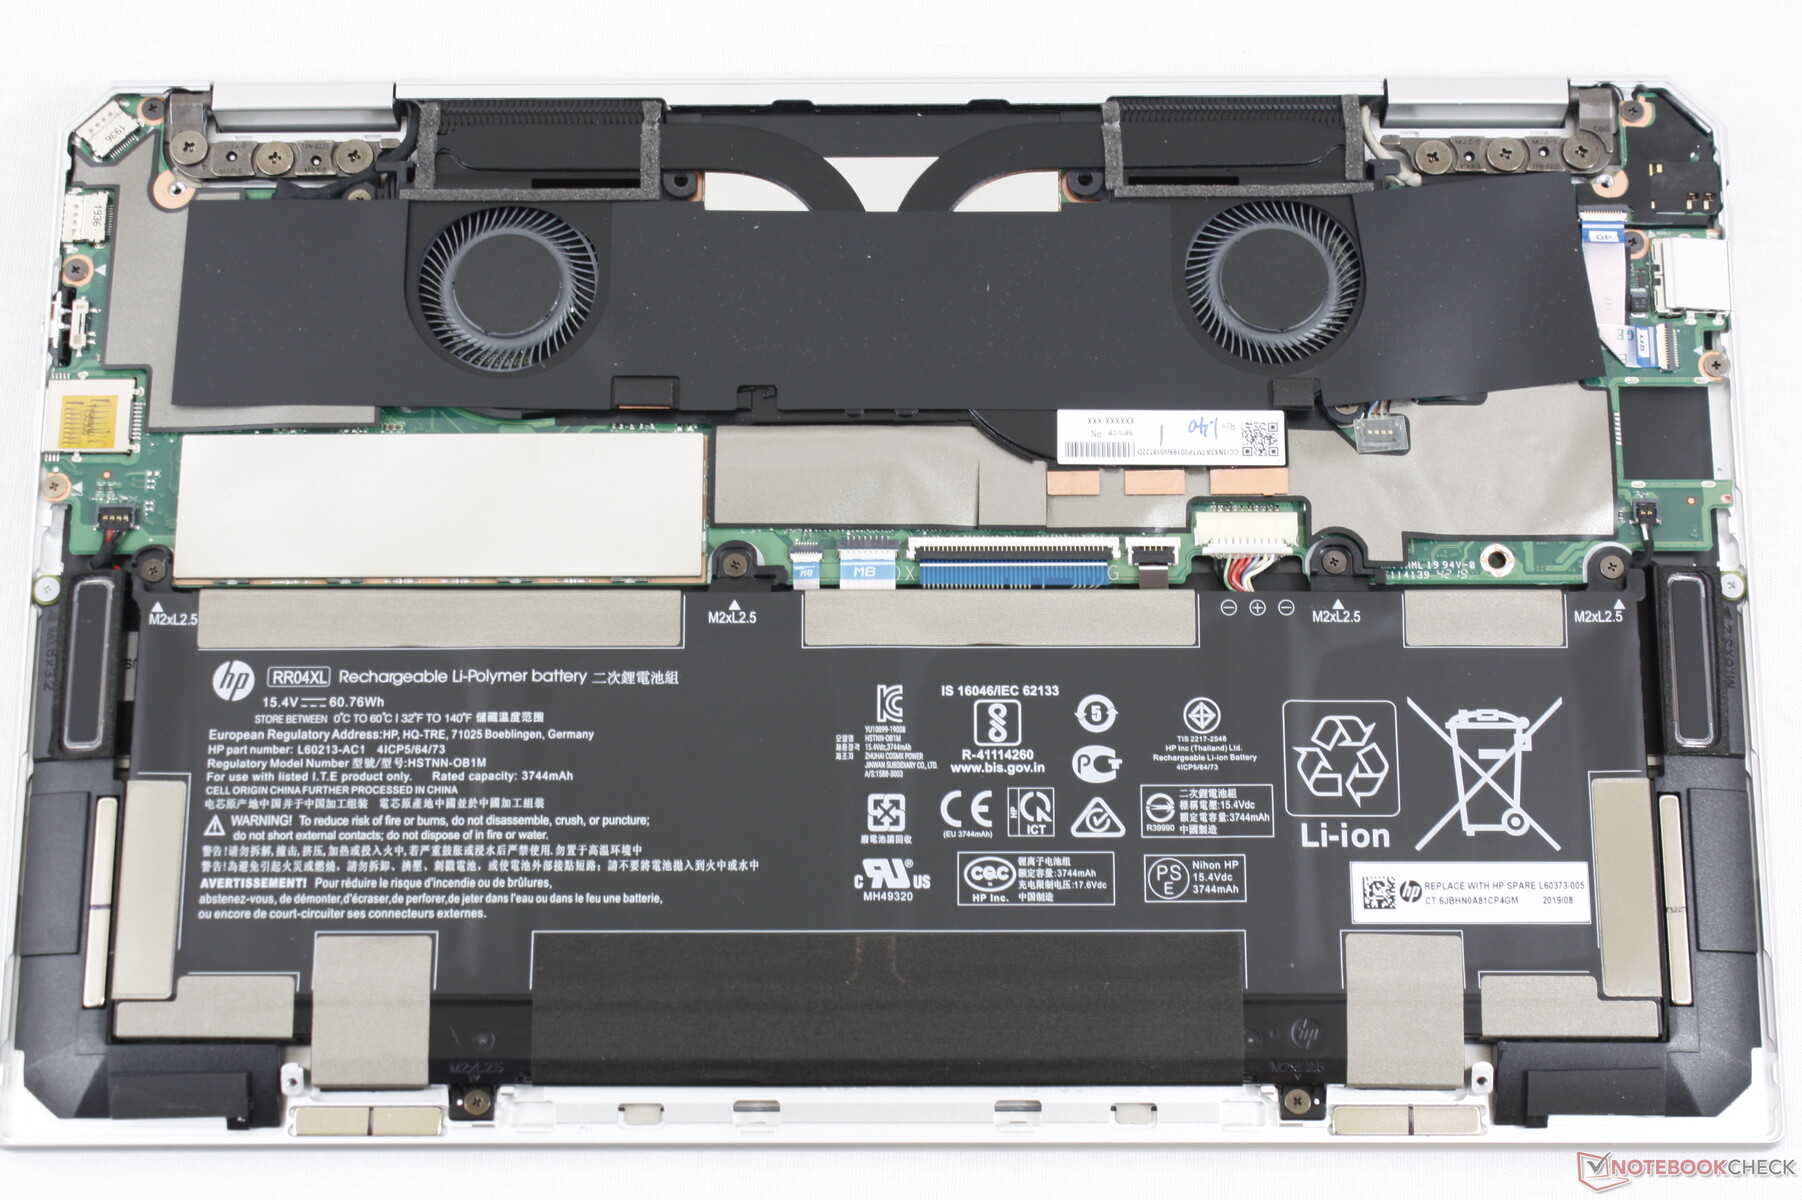
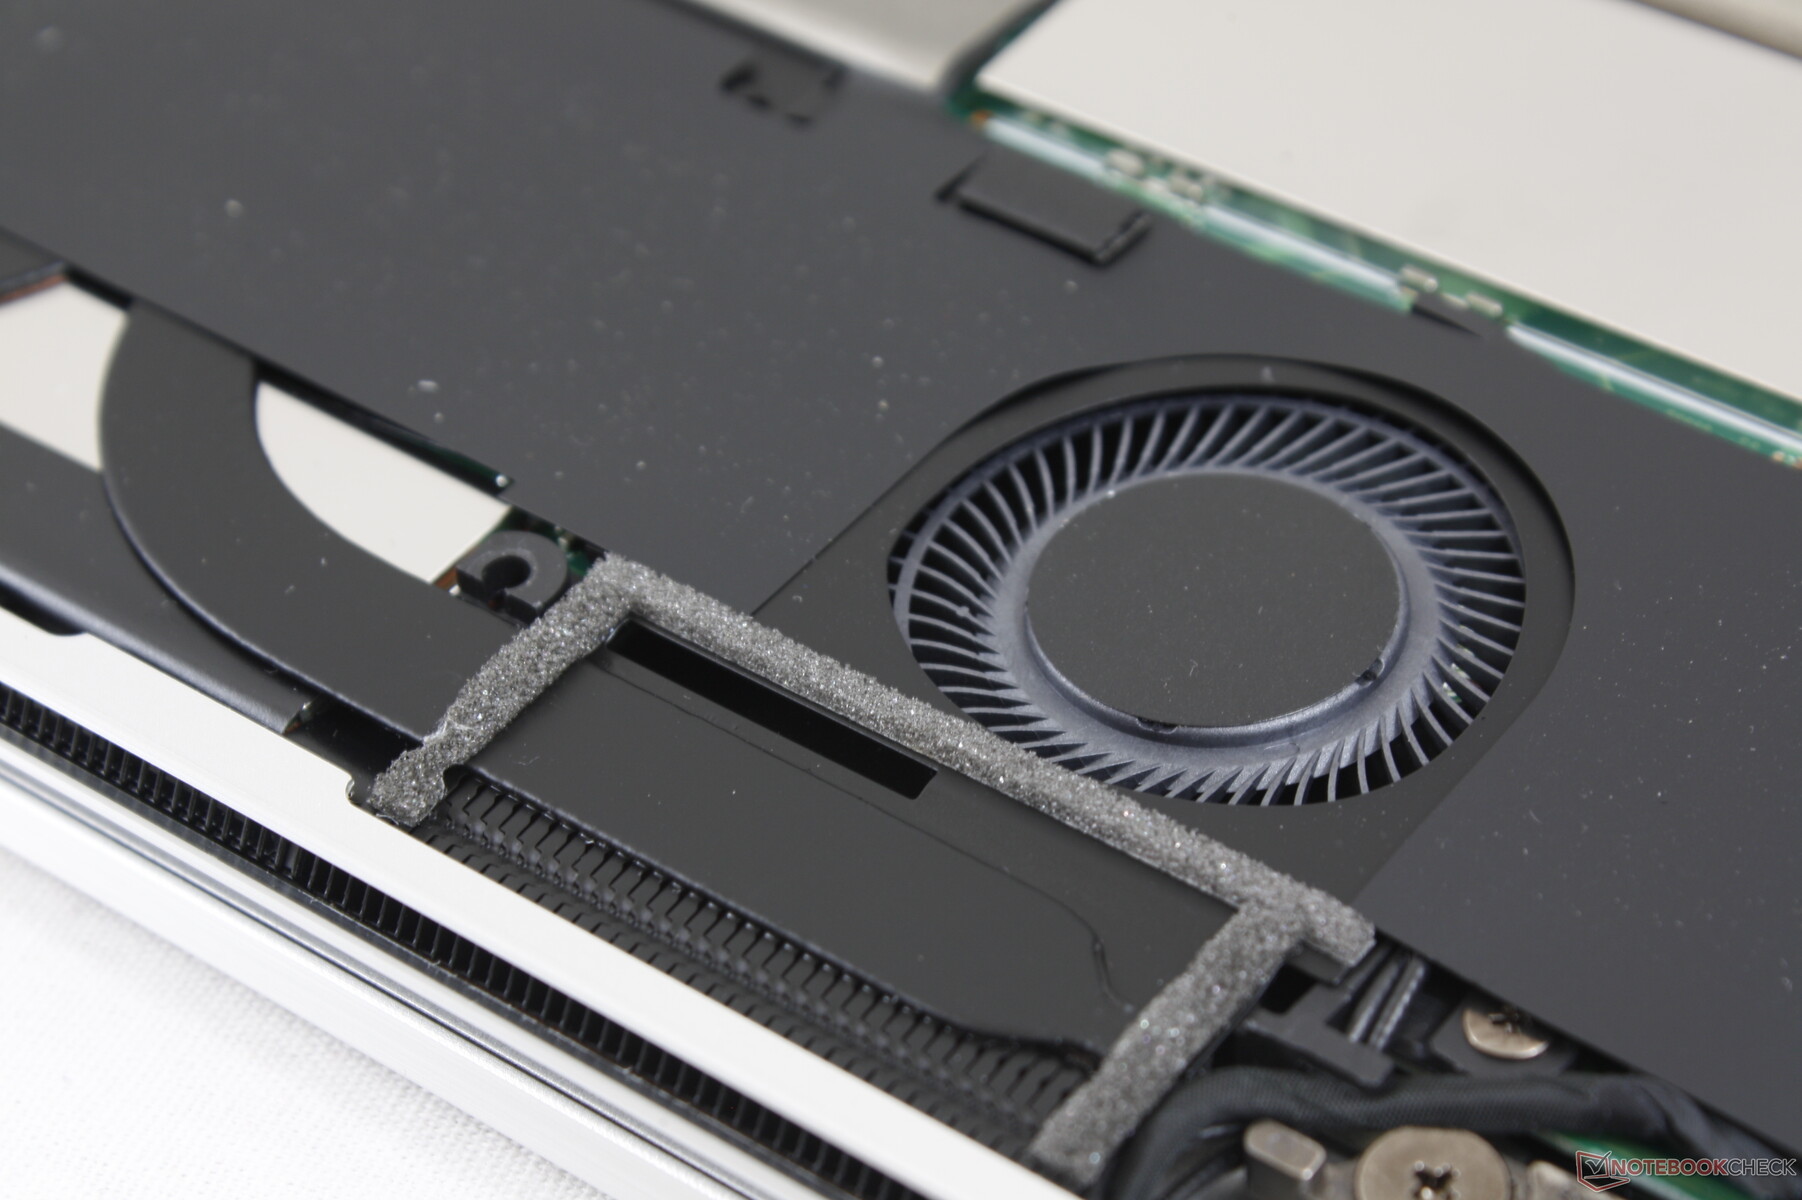
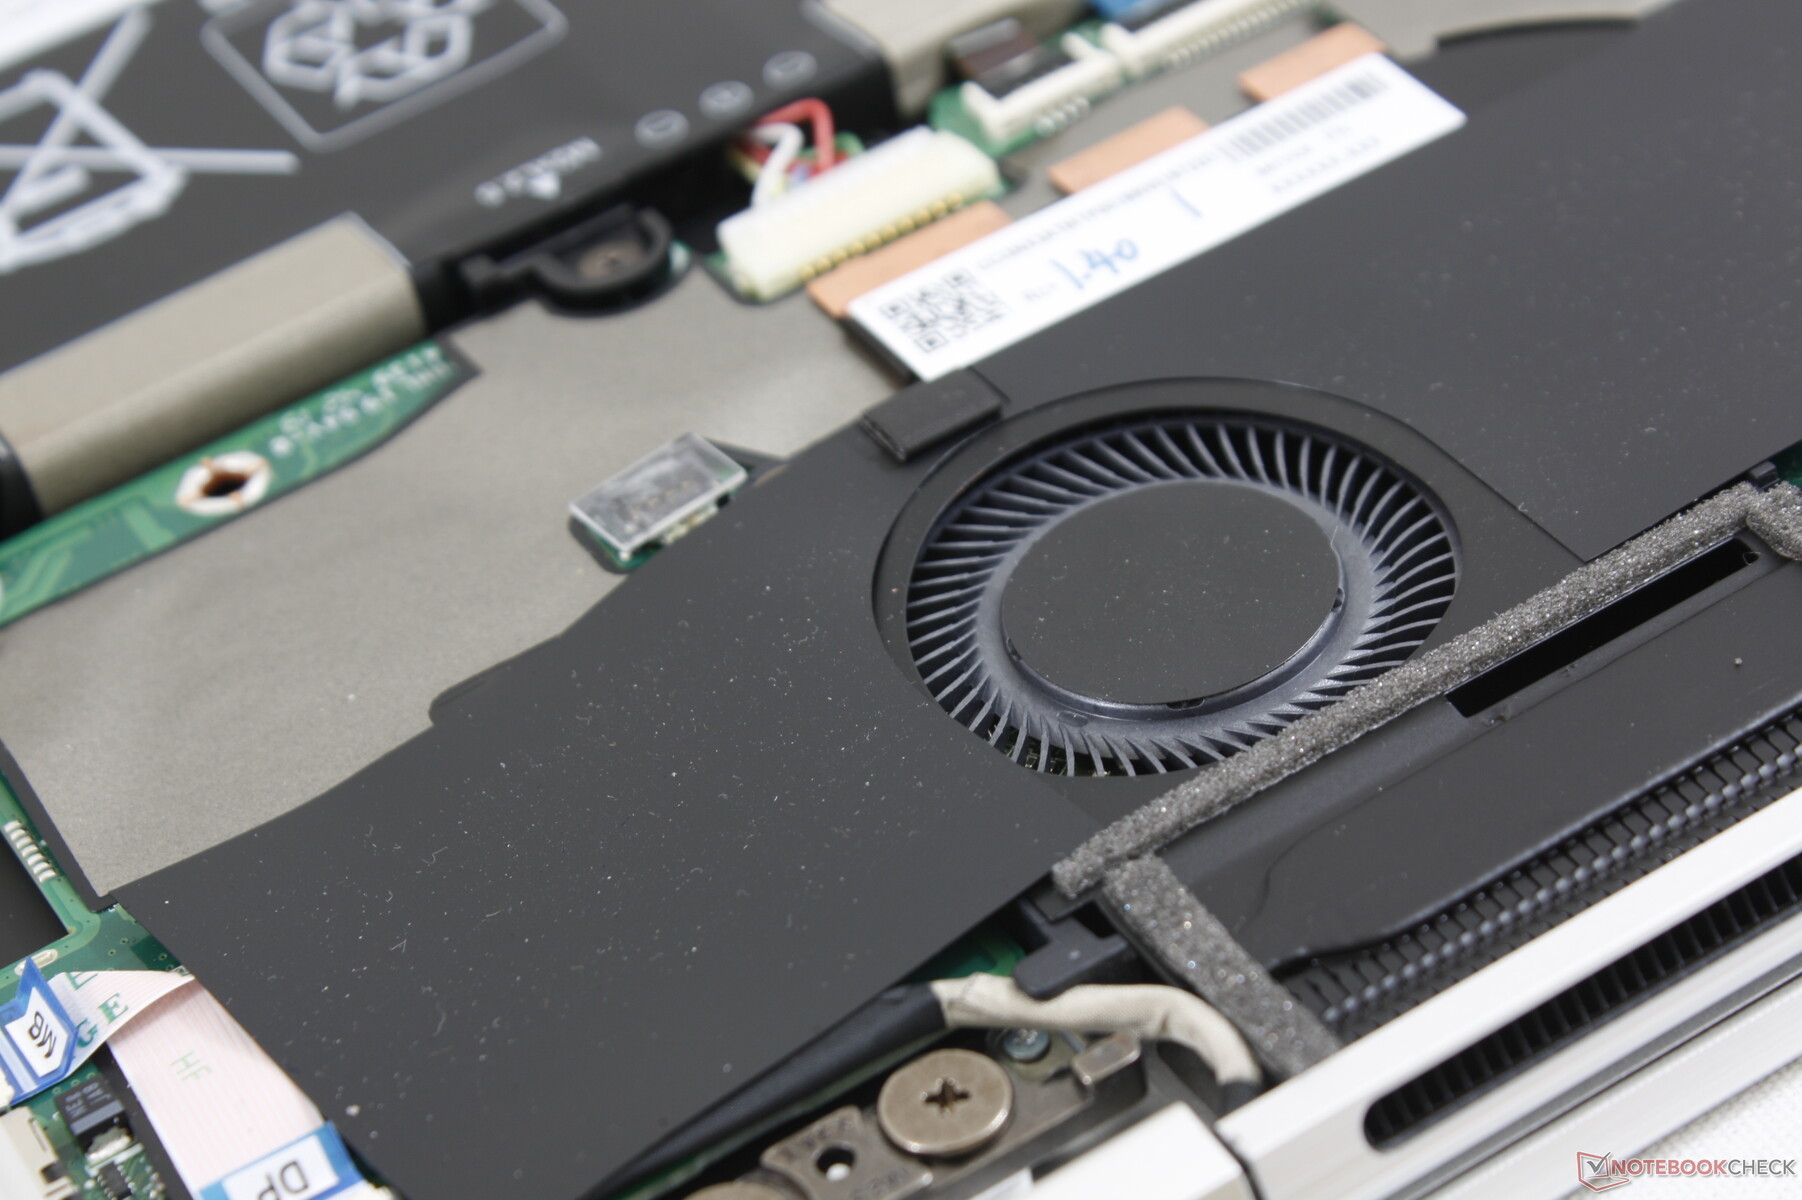
The cooling solution consists of twin 35 mm or 40 mm fans with two heat pipes between them. Fan noise, however, is essentially non-existent when browsing or video streaming. In fact, the fans remain idle even when running the first benchmark scene of 3DMark 06 on the High Performance setting.
Running Witcher 3 induces a cycling fan noise between 31.9 dB(A) and 35.3 dB(A) whereas most other laptops will stabilize at a specific RPM. The Lenovo Yoga C940 with the same Ice Lake CPU, for example, stabilizes at 40.7 dB(A) when running the same game. The atypical behavior on the HP backs up our stress test observations below where CPU temperatures and clock rates would cycle when under load as well.
We can notice no electronic noise or coil whine from our test unit.
| HP Spectre x360 13-aw0013dx Iris Plus Graphics G7 (Ice Lake 64 EU), i7-1065G7, Intel Optane Memory H10 with Solid State Storage 32GB + 512GB HBRPEKNX0202A(L/H) | HP Spectre x360 13-ap0312ng UHD Graphics 620, i7-8565U, Toshiba XG5 KXG50ZNV512G | Dell XPS 13 7390 2-in-1 Core i7 Iris Plus Graphics G7 (Ice Lake 64 EU), i7-1065G7, Toshiba BG4 KBG40ZPZ512G | Asus ZenBook Flip 14 UM462DA-AI023T Vega 10, R7 3700U | Razer Blade Stealth i7-1065G7 Iris Plus Iris Plus Graphics G7 (Ice Lake 64 EU), i7-1065G7, Samsung SSD PM981 MZVLB256HAHQ | Lenovo Yoga C940-14IIL 81Q9 Iris Plus Graphics G7 (Ice Lake 64 EU), i7-1065G7, Samsung PM981a MZVLB1T0HBLR | |
|---|---|---|---|---|---|---|
| Noise | -2% | -8% | -8% | -7% | -6% | |
| off / environment * (dB) | 28.5 | 29.2 -2% | 28.1 1% | 30 -5% | 28.3 1% | 28.5 -0% |
| Idle Minimum * (dB) | 28.5 | 29.2 -2% | 28.1 1% | 30 -5% | 28.3 1% | 28.5 -0% |
| Idle Average * (dB) | 28.5 | 29.2 -2% | 28.1 1% | 30 -5% | 28.3 1% | 28.5 -0% |
| Idle Maximum * (dB) | 28.5 | 30.4 -7% | 28.1 1% | 30 -5% | 28.3 1% | 29 -2% |
| Load Average * (dB) | 28.5 | 31 -9% | 31.7 -11% | 34.2 -20% | 33.5 -18% | 33 -16% |
| Witcher 3 ultra * (dB) | 35.3 | 43.4 -23% | 34.5 2% | 40.7 -15% | ||
| Load Maximum * (dB) | 35.3 | 32.1 9% | 43.4 -23% | 37.5 -6% | 49.4 -40% | 39.5 -12% |
* ... smaller is better
Noise level
| Idle |
| 28.5 / 28.5 / 28.5 dB(A) |
| HDD |
| 28.5 dB(A) |
| Load |
| 28.5 / 35.3 dB(A) |
 | ||
30 dB silent 40 dB(A) audible 50 dB(A) loud |
||
min: | ||
Temperature
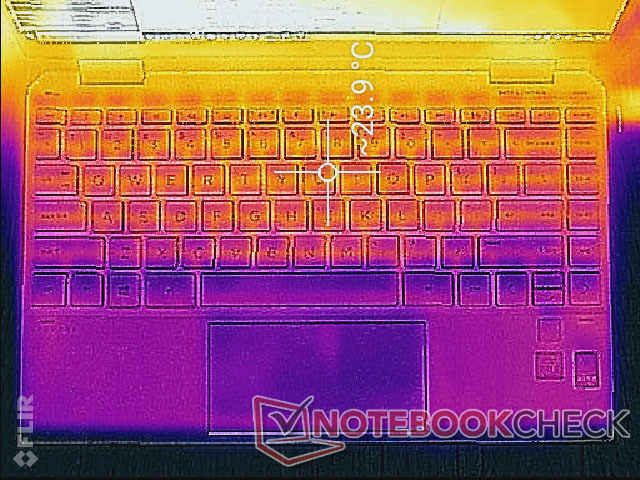
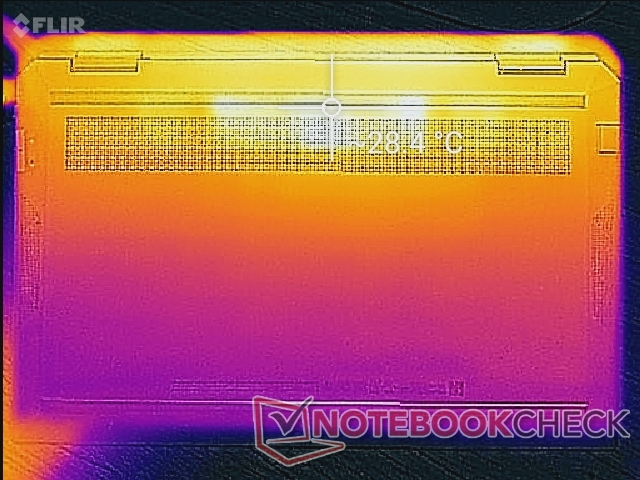
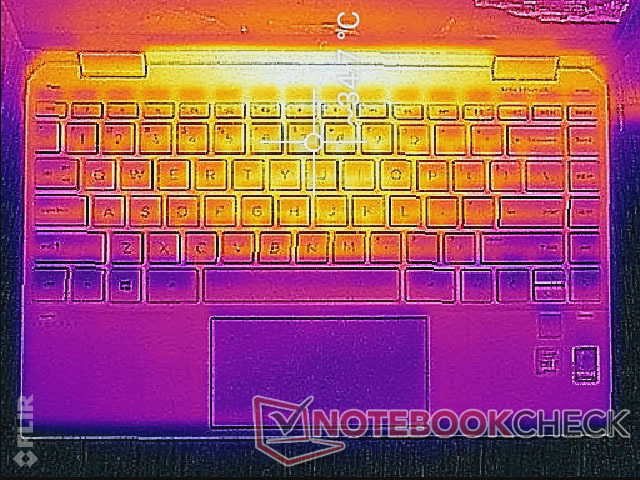
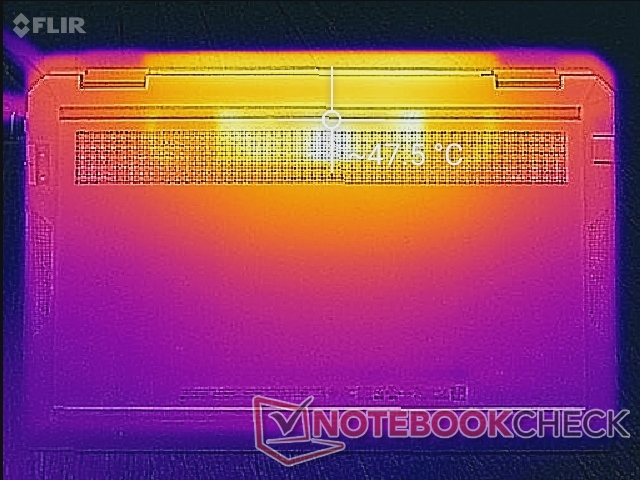
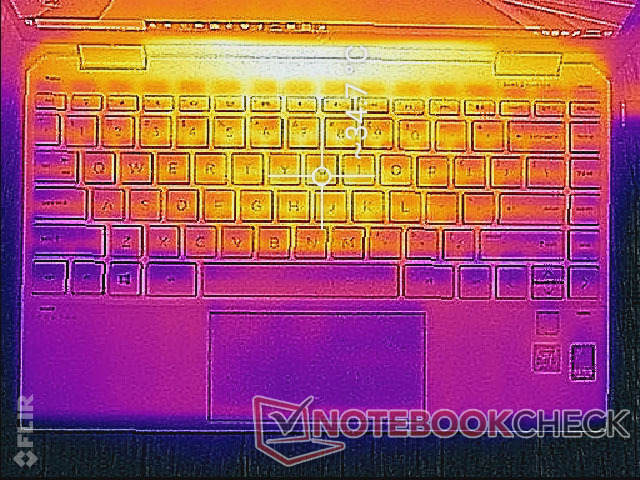
Surface temperature development is symmetrical and always warmer towards the rear because of the layout of the cooling solution and CPU underneath. At worst, we're able to record a maximum temperature of 35 C on the center of the keyboard and 47 C on the rear compared to 50 C on the XPS 13 7390 2-in-1.
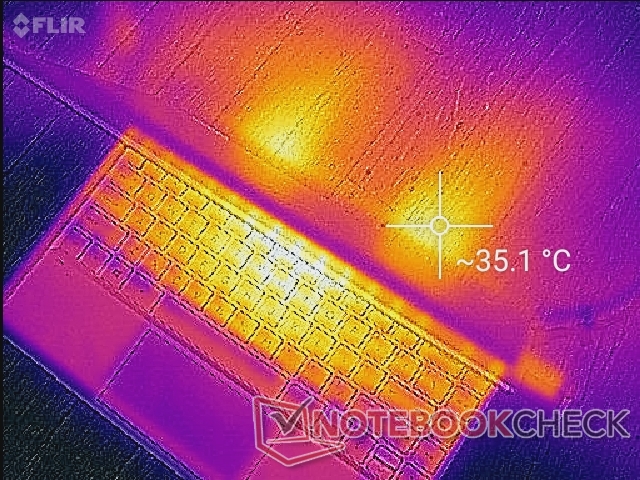
(+) The maximum temperature on the upper side is 37.2 °C / 99 F, compared to the average of 35.4 °C / 96 F, ranging from 19.6 to 60 °C for the class Convertible.
(±) The bottom heats up to a maximum of 42.2 °C / 108 F, compared to the average of 36.9 °C / 98 F
(+) In idle usage, the average temperature for the upper side is 23.5 °C / 74 F, compared to the device average of 30.3 °C / 87 F.
(+) The palmrests and touchpad are cooler than skin temperature with a maximum of 24.6 °C / 76.3 F and are therefore cool to the touch.
(+) The average temperature of the palmrest area of similar devices was 28 °C / 82.4 F (+3.4 °C / 6.1 F).

Stress Test
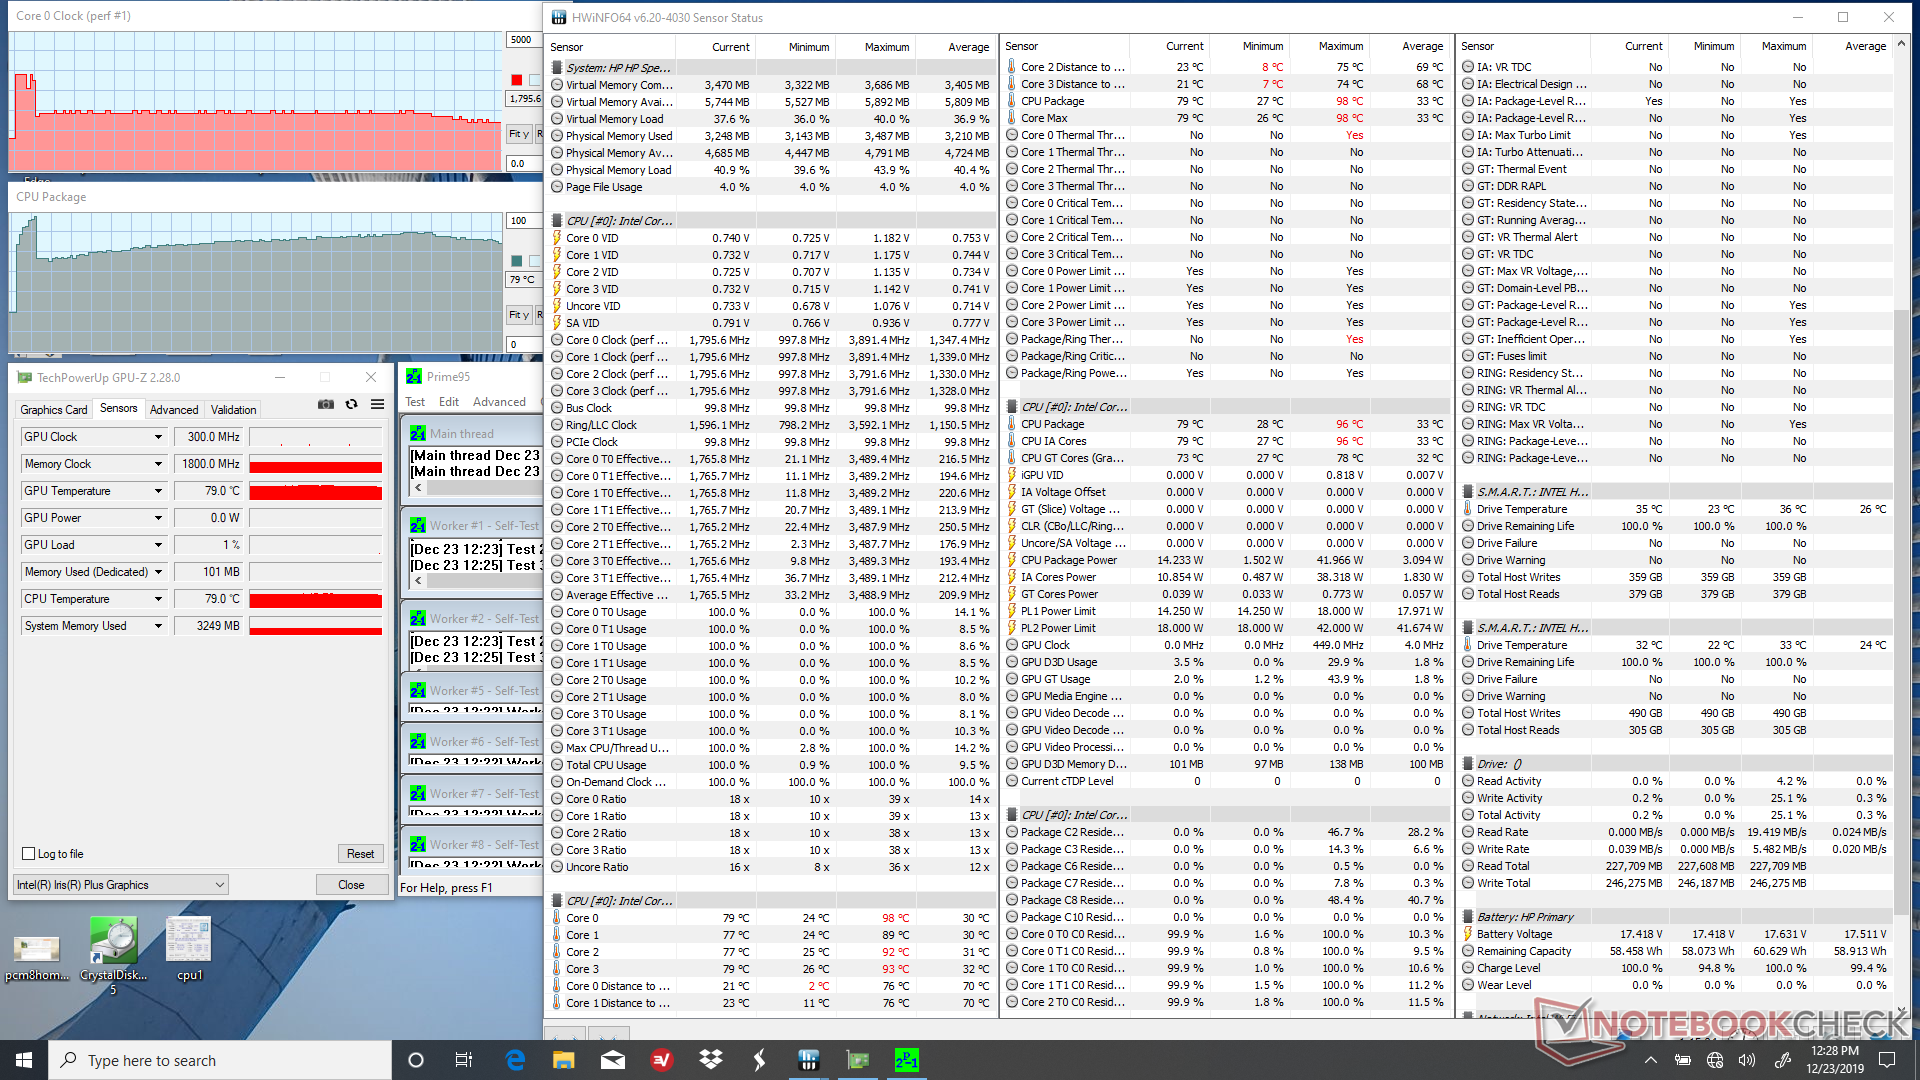
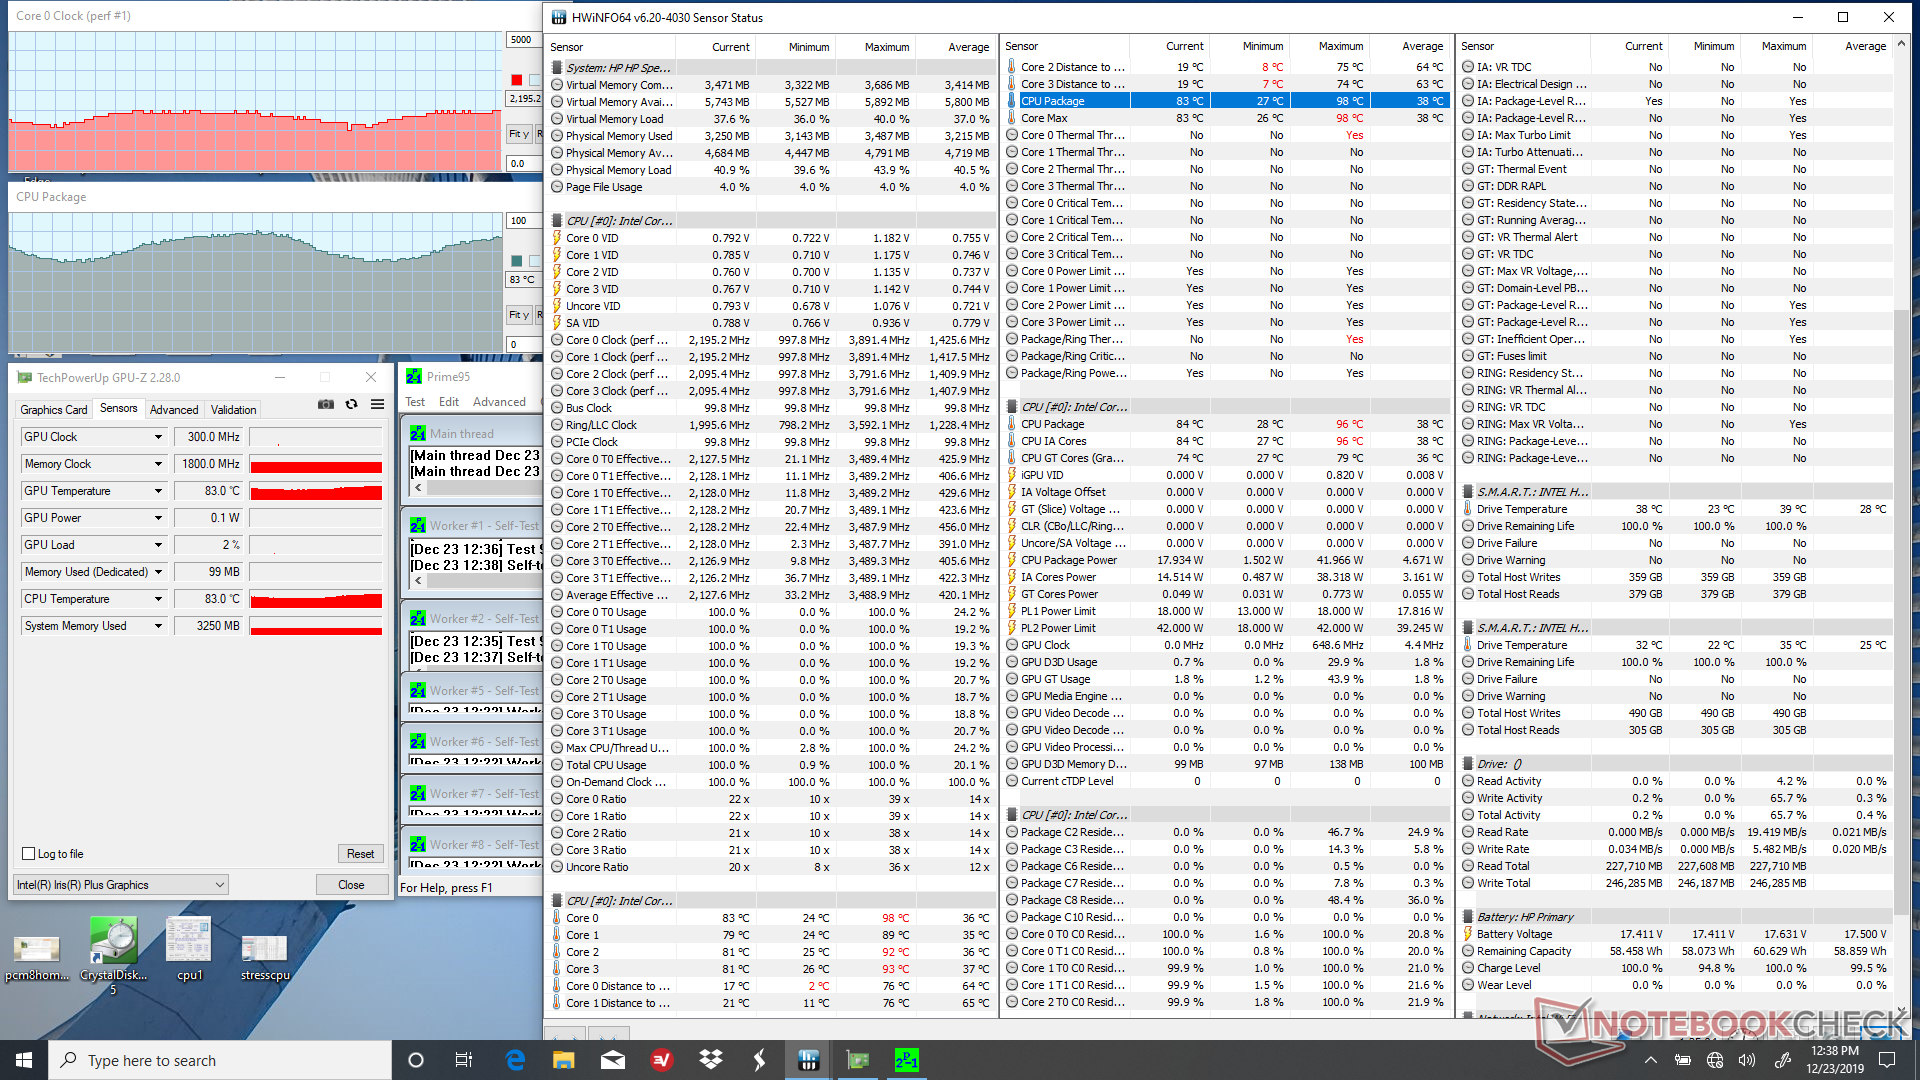
The unsteady fan noise, CineBench results, and frame rates recorded above make sense once we look closer at how the HP system handles stressful loads. When running Prime95, for example, clock rates would spike to 3.5 GHz for just a few seconds before falling and stabilizing at the wide 1.6 to 2.2 GHz range. In contrast, the Yoga C940 with the same CPU stabilizes at the narrower 2.3 to 2.4 GHz range instead when running Prime95 for a more consistent level of performance. The wide clock rate and core temperature cycling behavior can be observed when running Witcher 3 as well.
Running on battery power will limit performance just slightly. A 3DMark 11 run returns Physics and Graphics scores of 8840 and 4525 points, respectively, compared to 9377 and 4630 points when on mains.
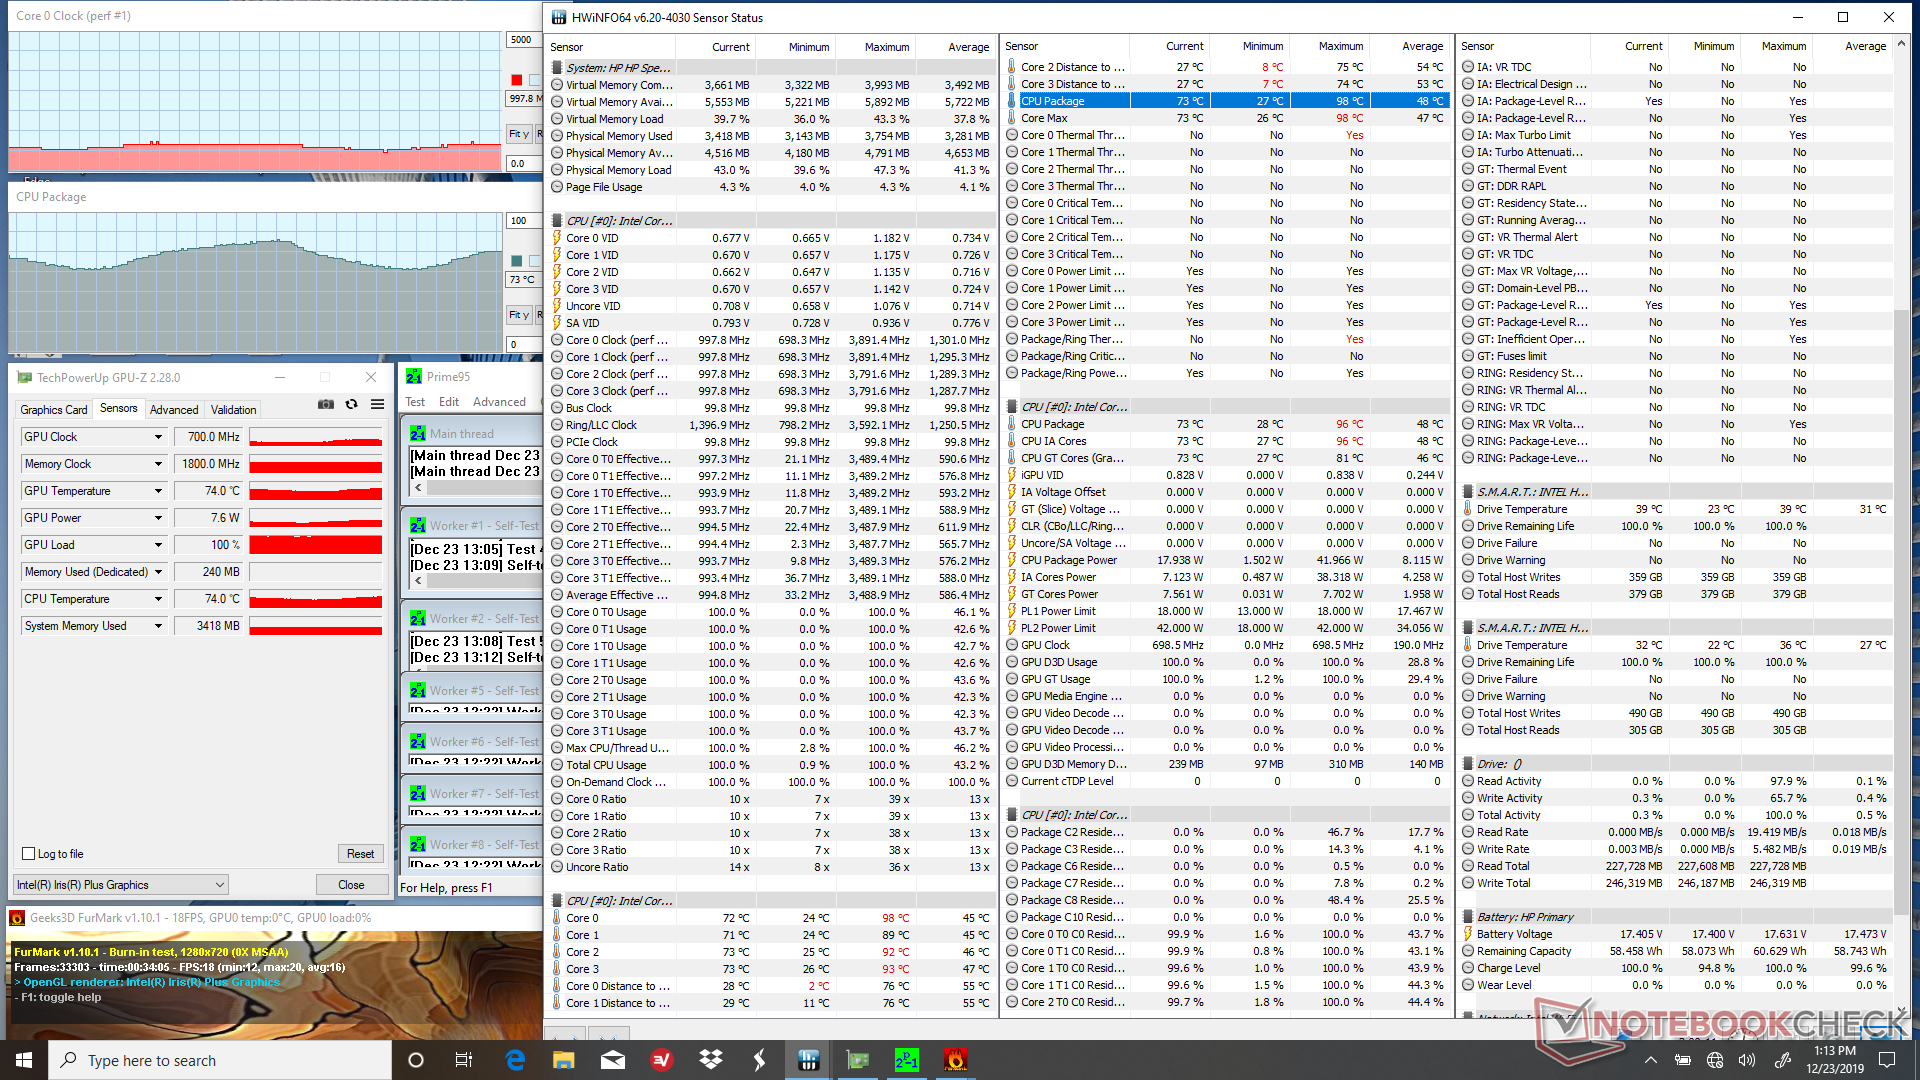
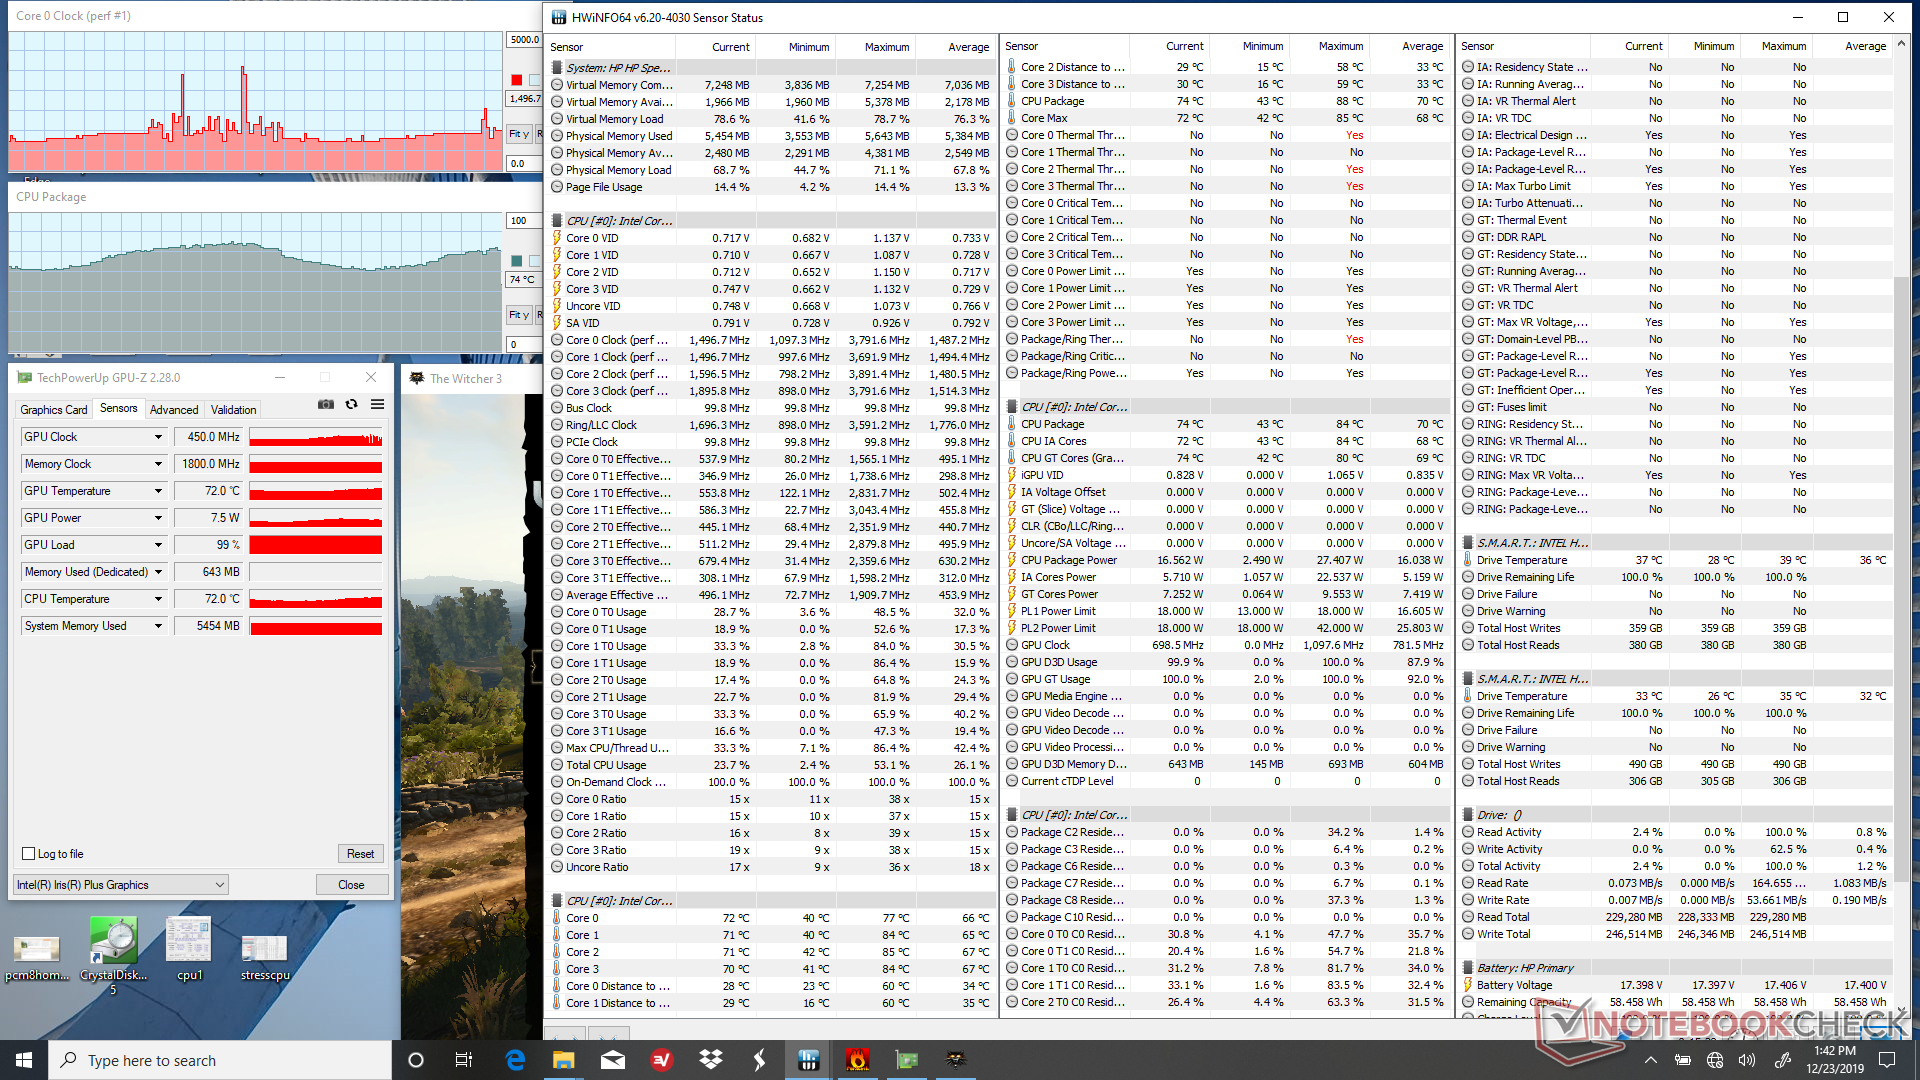
| CPU Clock (GHz) | GPU Clock (MHz) | Average CPU Temperature (°C) | |
| System Idle | -- | -- | 30 |
| Prime95 Stress | 1.6 - 2.2 | -- | 66 - 87 |
| Prime95 + FurMark Stress | 0.7 - 1.0 | 450 - 700 | 60 - 80 |
| Witcher 3 Stress | 1.1 - 2.3 | 750 - 900 | 60 - 80 |
Speakers
Spectre laptops have always had good audio for the size and the latest Spectre x360 13 is no different. Roll-off begins at just above 250 Hz for decent bass reproduction and the pink noise graph is broad for a more balanced audio experience. The speakers are no longer along the edges of the keyboard, however, as they have been repositioned.


HP Spectre x360 13-aw0013dx audio analysis
(±) | speaker loudness is average but good (81.6 dB)
Bass 100 - 315 Hz
(±) | reduced bass - on average 13.2% lower than median
(±) | linearity of bass is average (12.8% delta to prev. frequency)
Mids 400 - 2000 Hz
(+) | balanced mids - only 2.3% away from median
(+) | mids are linear (3.6% delta to prev. frequency)
Highs 2 - 16 kHz
(+) | balanced highs - only 2.7% away from median
(+) | highs are linear (6.9% delta to prev. frequency)
Overall 100 - 16.000 Hz
(±) | linearity of overall sound is average (16.7% difference to median)
Compared to same class
» 31% of all tested devices in this class were better, 5% similar, 64% worse
» The best had a delta of 6%, average was 20%, worst was 57%
Compared to all devices tested
» 29% of all tested devices were better, 7% similar, 64% worse
» The best had a delta of 4%, average was 23%, worst was 134%
Apple MacBook 12 (Early 2016) 1.1 GHz audio analysis
(+) | speakers can play relatively loud (83.6 dB)
Bass 100 - 315 Hz
(±) | reduced bass - on average 11.3% lower than median
(±) | linearity of bass is average (14.2% delta to prev. frequency)
Mids 400 - 2000 Hz
(+) | balanced mids - only 2.4% away from median
(+) | mids are linear (5.5% delta to prev. frequency)
Highs 2 - 16 kHz
(+) | balanced highs - only 2% away from median
(+) | highs are linear (4.5% delta to prev. frequency)
Overall 100 - 16.000 Hz
(+) | overall sound is linear (10.2% difference to median)
Compared to same class
» 7% of all tested devices in this class were better, 2% similar, 90% worse
» The best had a delta of 5%, average was 18%, worst was 53%
Compared to all devices tested
» 5% of all tested devices were better, 1% similar, 94% worse
» The best had a delta of 4%, average was 23%, worst was 134%
Energy Management
Power Consumption
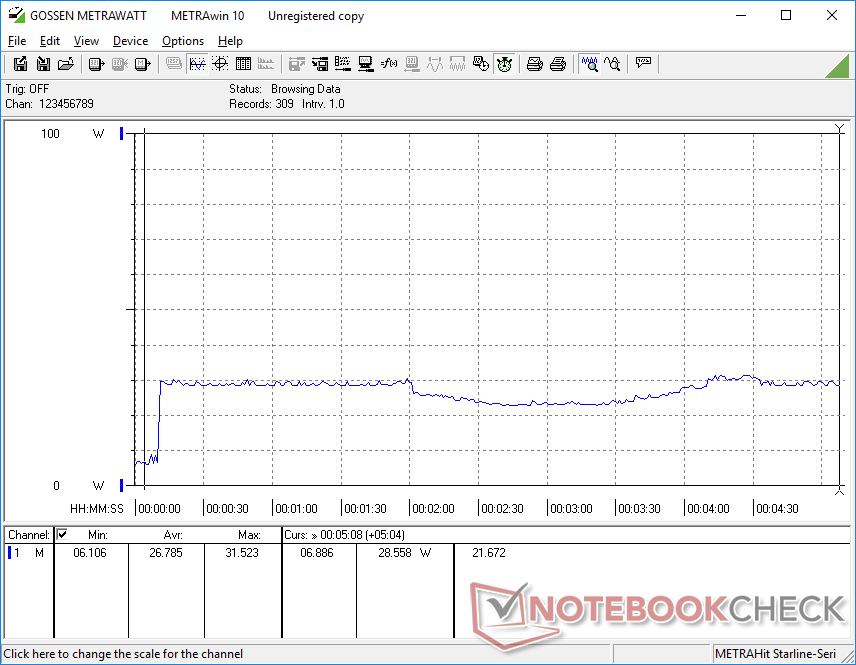
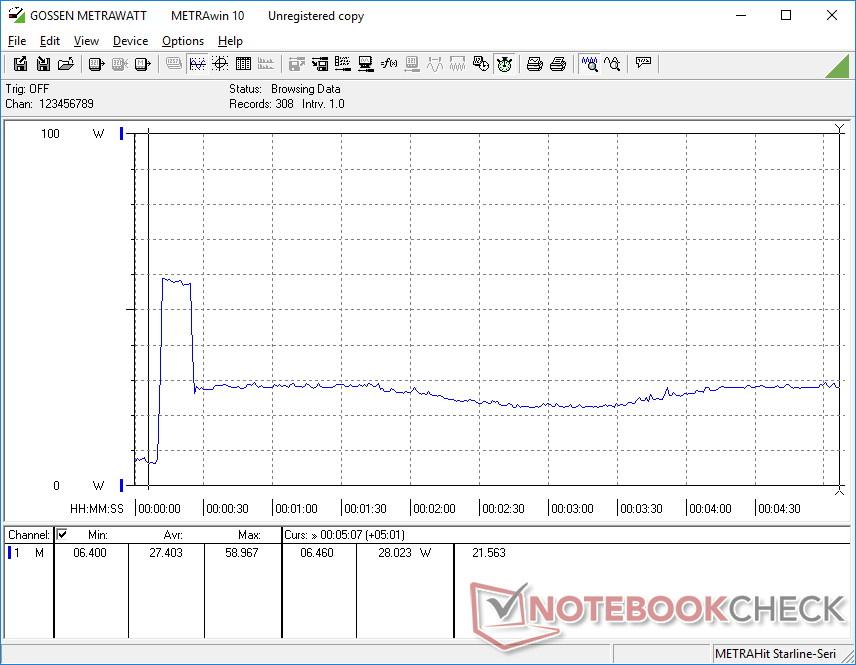
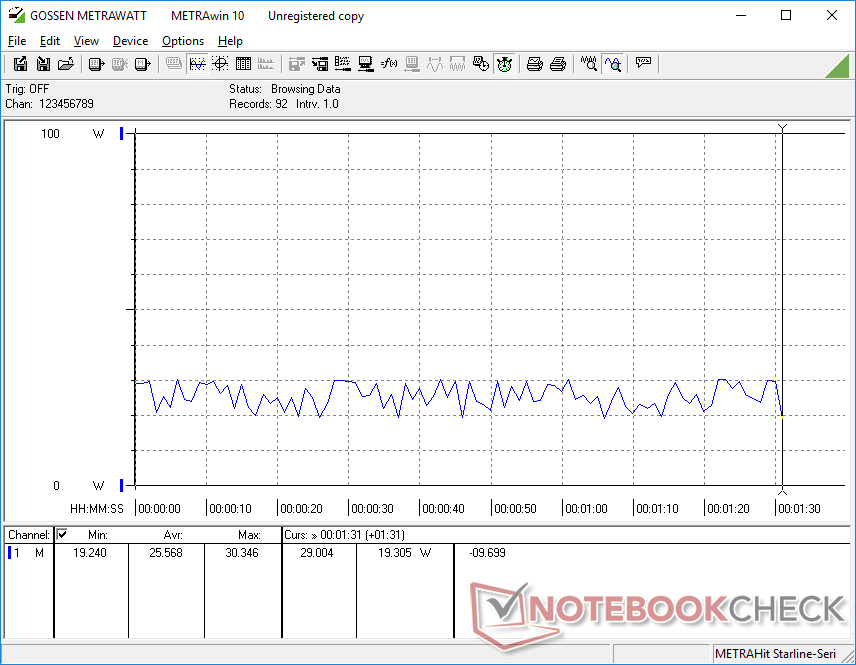
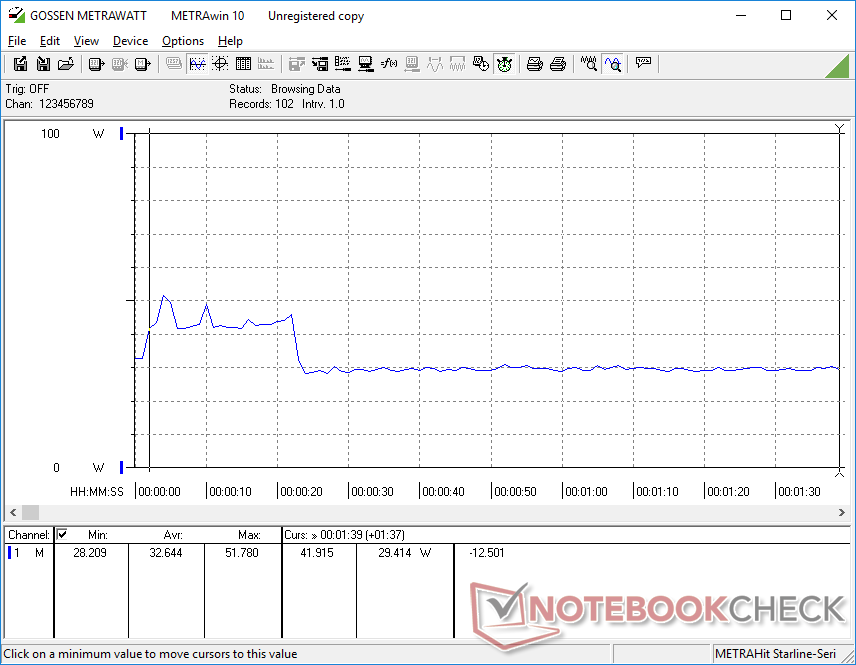
Idling on desktop demands between 3 W and 7 W depending on the brightness setting and power profile to be not unlike last year's Whiskey Lake-U model. However, the more interesting findings come when running higher loads like gaming. Running 3DMark 06 or Witcher 3 draws only 33 W and 25 W on average, respectively, compared to 44 W and 42 W on other laptops powered by the same Core i7-1065G7 CPU and Iris Plus GPU. The lower-than-expected power consumption on the Spectre is in line with our lower average frame rates when gaming as recorded above.
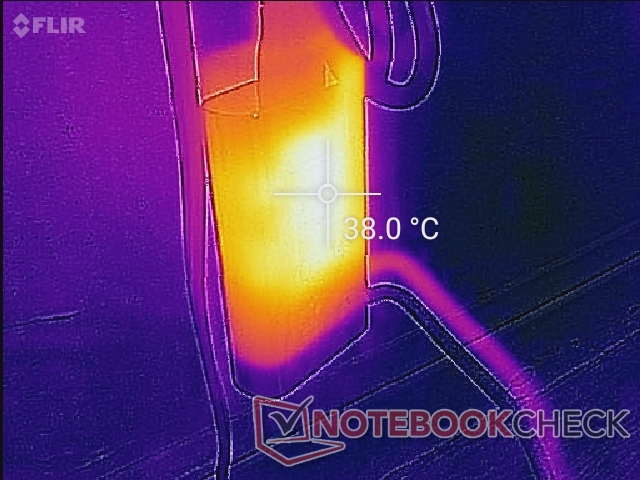
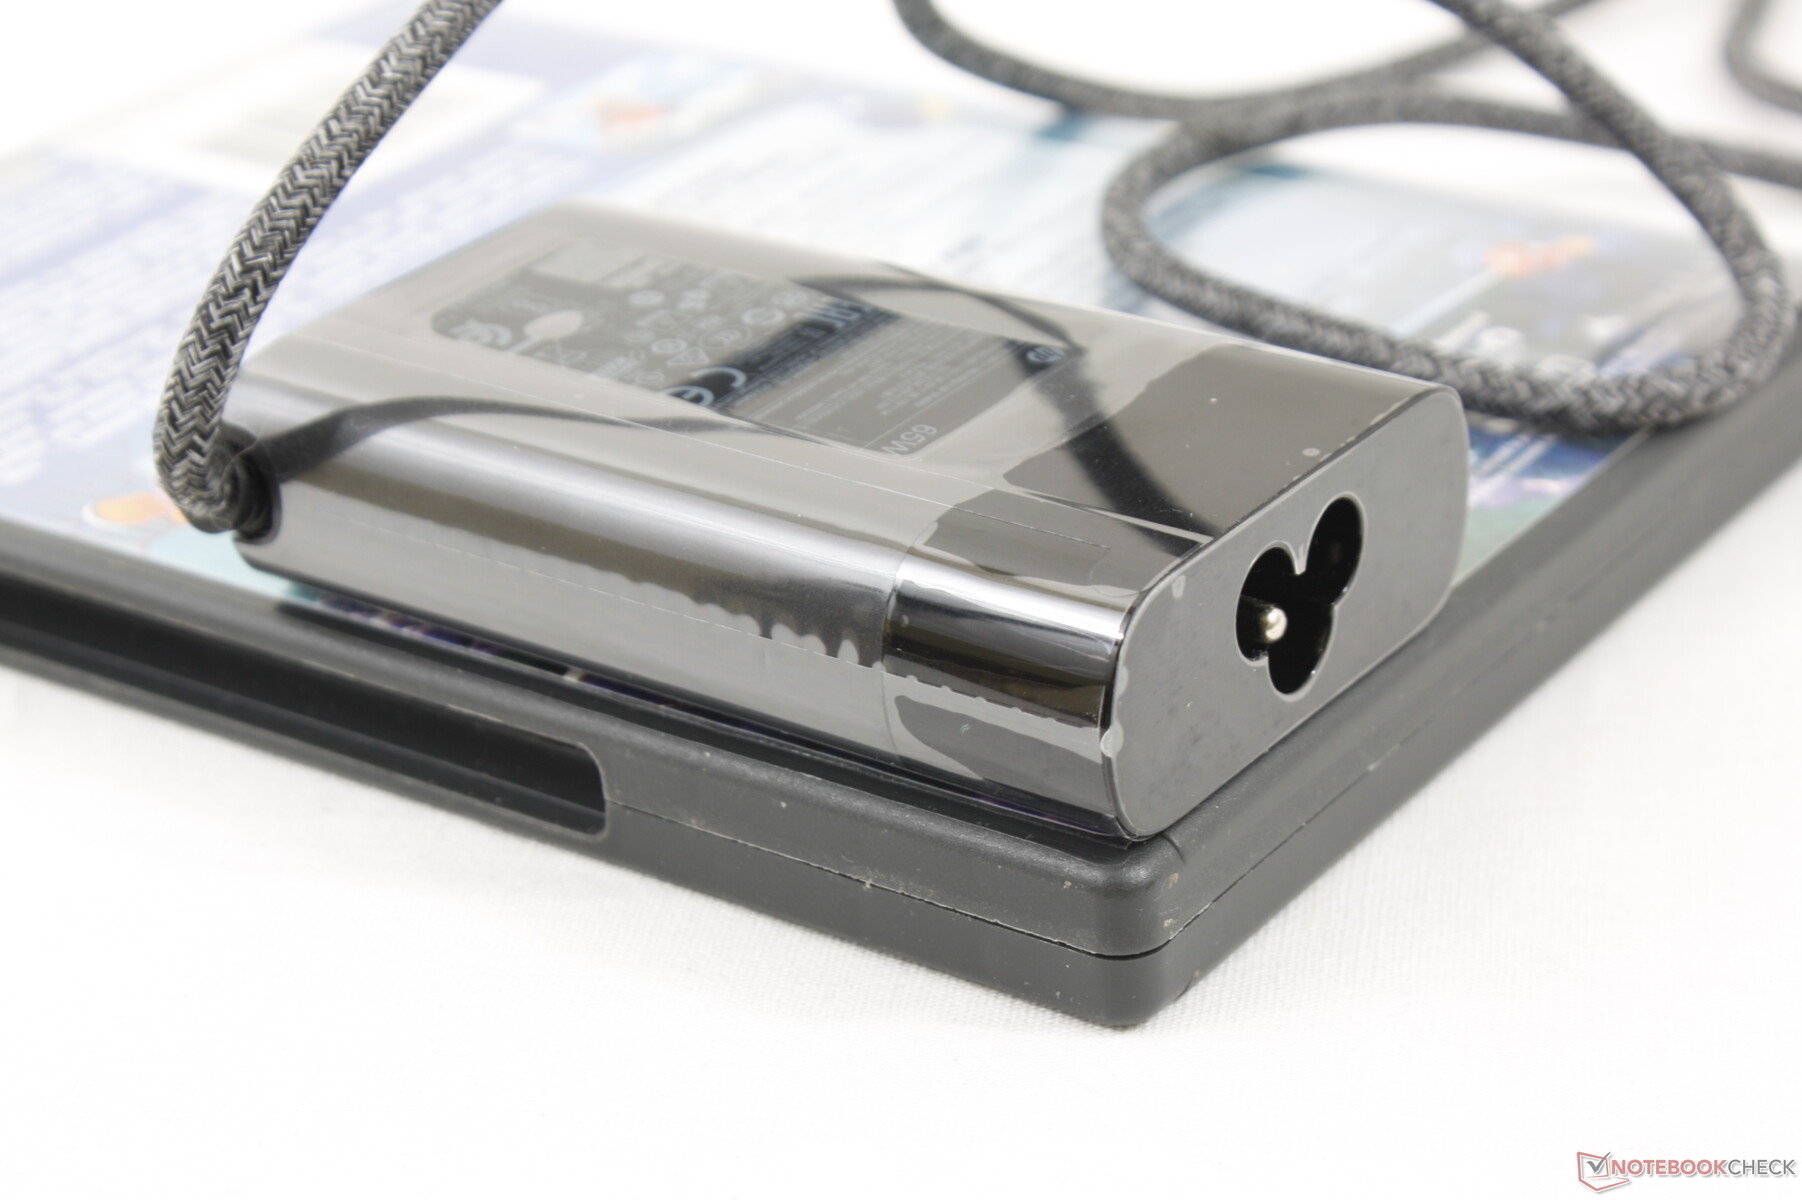
We're able to measure a maximum draw of 59 W from the small (8.8 x 5.3 x 2.1 cm) 65 W USB Type-C AC adapter. This high of a consumption is only temporary before falling and stabilizing at around 30 W.
| Off / Standby | |
| Idle | |
| Load |
|
Key:
min: | |
| HP Spectre x360 13-aw0013dx i7-1065G7, Iris Plus Graphics G7 (Ice Lake 64 EU), Intel Optane Memory H10 with Solid State Storage 32GB + 512GB HBRPEKNX0202A(L/H), IPS, 1920x1080, 13.3" | HP Spectre x360 13-ap0312ng i7-8565U, UHD Graphics 620, Toshiba XG5 KXG50ZNV512G, IPS, 1920x1080, 13.3" | Dell XPS 13 7390 2-in-1 Core i7 i7-1065G7, Iris Plus Graphics G7 (Ice Lake 64 EU), Toshiba BG4 KBG40ZPZ512G, IPS, 1920x1200, 13.4" | Asus ZenBook Flip 14 UM462DA-AI023T R7 3700U, Vega 10, , IPS, 1920x1080, 14" | Razer Blade Stealth i7-1065G7 Iris Plus i7-1065G7, Iris Plus Graphics G7 (Ice Lake 64 EU), Samsung SSD PM981 MZVLB256HAHQ, IPS, 1920x1080, 13.3" | Lenovo Yoga C940-14IIL 81Q9 i7-1065G7, Iris Plus Graphics G7 (Ice Lake 64 EU), Samsung PM981a MZVLB1T0HBLR, IPS, 3840x2160, 14" | |
|---|---|---|---|---|---|---|
| Power Consumption | -7% | -6% | -4% | -38% | -57% | |
| Idle Minimum * (Watt) | 3.9 | 4.32 -11% | 2.6 33% | 3.7 5% | 5.9 -51% | 5.6 -44% |
| Idle Average * (Watt) | 6.3 | 6.84 -9% | 5.3 16% | 6.9 -10% | 8.1 -29% | 10.5 -67% |
| Idle Maximum * (Watt) | 6.8 | 8.64 -27% | 7 -3% | 9.4 -38% | 11.2 -65% | 12 -76% |
| Load Average * (Watt) | 32.6 | 31.8 2% | 43.1 -32% | 34 -4% | 44.3 -36% | 53.3 -63% |
| Witcher 3 ultra * (Watt) | 25.6 | 43.1 -68% | 41.9 -64% | 46.9 -83% | ||
| Load Maximum * (Watt) | 59 | 53 10% | 49 17% | 44 25% | 50.2 15% | 64.6 -9% |
* ... smaller is better
Battery Life
Runtimes are slightly longer than last year's Whiskey Lake-U model despite having no major differences in battery capacity. Our real-world WLAN test results in just under 10 hours of use compared to 9 hours on the XPS 13 7390 2-in-1 or outgoing Spectre x360 13.
Charging from empty to full capacity takes about 1.5 hours. Either of the two USB Type-C ports can be used to recharge the system.
| HP Spectre x360 13-aw0013dx i7-1065G7, Iris Plus Graphics G7 (Ice Lake 64 EU), 60 Wh | HP Spectre x360 13-ap0312ng i7-8565U, UHD Graphics 620, 61 Wh | Dell XPS 13 7390 2-in-1 Core i7 i7-1065G7, Iris Plus Graphics G7 (Ice Lake 64 EU), 51 Wh | Asus ZenBook Flip 14 UM462DA-AI023T R7 3700U, Vega 10, 42 Wh | Razer Blade Stealth i7-1065G7 Iris Plus i7-1065G7, Iris Plus Graphics G7 (Ice Lake 64 EU), 53.1 Wh | Lenovo Yoga C940-14IIL 81Q9 i7-1065G7, Iris Plus Graphics G7 (Ice Lake 64 EU), 60 Wh | |
|---|---|---|---|---|---|---|
| Battery runtime | -13% | -9% | -24% | -2% | -26% | |
| Reader / Idle (h) | 37.1 | |||||
| WiFi v1.3 (h) | 9.9 | 8.9 -10% | 9 -9% | 7.5 -24% | 9.7 -2% | 7.3 -26% |
| Load (h) | 2.7 | 2.3 -15% |
Pros
Cons
Verdict
If you're looking for a high-end 13-inch convertible laptop with the latest Intel 10th gen CPU, then you currently have two major options: the HP Spectre x360 13 or the Dell XPS 13 7390 2-in-1. The HP feels stronger in the hand with removable M.2 storage, larger battery, optional WWAN, and a full-size USB Type-A port — features that are all missing on the Dell alternative. If you value these extras the most, then you'll find more value out of the Spectre x360 13.
The HP laptop falls flat on its face when it comes to exploiting the most performance possible out of the Ice Lake processor. The fluctuating CPU clock rates, GPU clock rates, fan noise, power consumption, and frame rates when gaming are poor representations of what Intel Ice Lake is capable of. We know the Core i7-1065G7 can do better as exemplified by the XPS 13 7390 2-in-1 or Yoga C940 and their more consistent performance numbers. It's still an upgrade over the Whiskey Lake-U Spectre x360 13 especially in terms of portability and display brightness, but the performance delta between them is smaller than we were expecting.
Excellent chassis that's now even smaller than before and with more features than most other consumer convertibles. However, HP's implementation of Ice Lake is below average and definitely one to avoid if you're a casual gamer.
HP Spectre x360 13-aw0013dx
- 12/27/2019 v7 (old)
Allen Ngo
Price comparison
