Asus TUF FX504GD (Core i5-8300H, GTX 1050) Laptop Review
The Asus TUF FX504 is the first laptop to carry the TUF name. The branding is designed to cater towards entry-level gamers who may not want to spend more on a "proper" Republic of Gamers (ROG) system. As a result, the budget TUF FX504 sits right below the cheapest ROG laptop available in the class hierarchy.
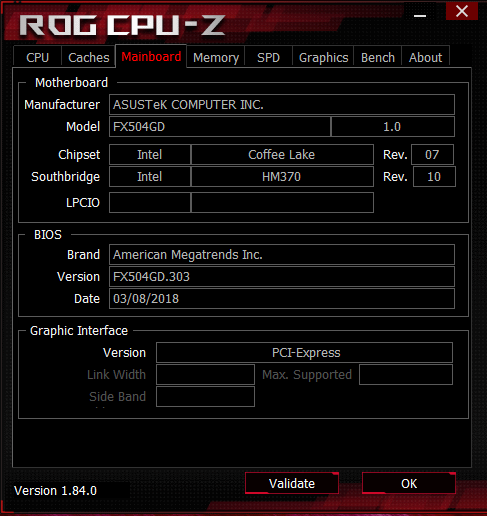
Our test system today is the 15.6-inch FX504GD that represents a small update to last year's FX503 series. The new model incorporates Coffee Lake-H (i5-8300H, i7-8750H), entry level GTX GPUs (GTX 1050, GTX 1050 Ti), and only FHD display options (TN, IPS, or 120 Hz) whereas last year's FX503 could go up to the GTX 1060. The $700 starting price, however, is quite attractive and comparable to the entry-level Lenovo Legion Y520, Dell Inspiron 7577, Gigabyte Sabre 15, HP Pavilion 15 Power, and the Acer Aspire series. Unfortunately, our review below will show that the FX504GD sacrifices a bit too much for that low asking price.
We recommend checking out our existing review on the FX503VM as they share very similar external and internal features.
Case
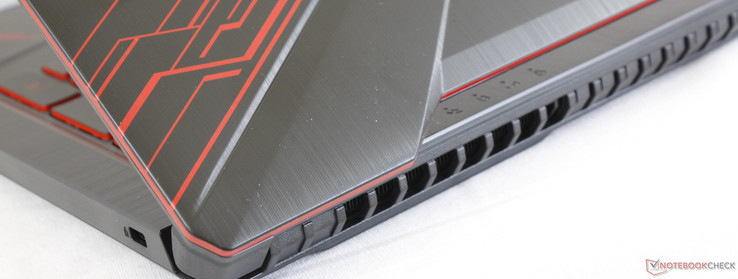
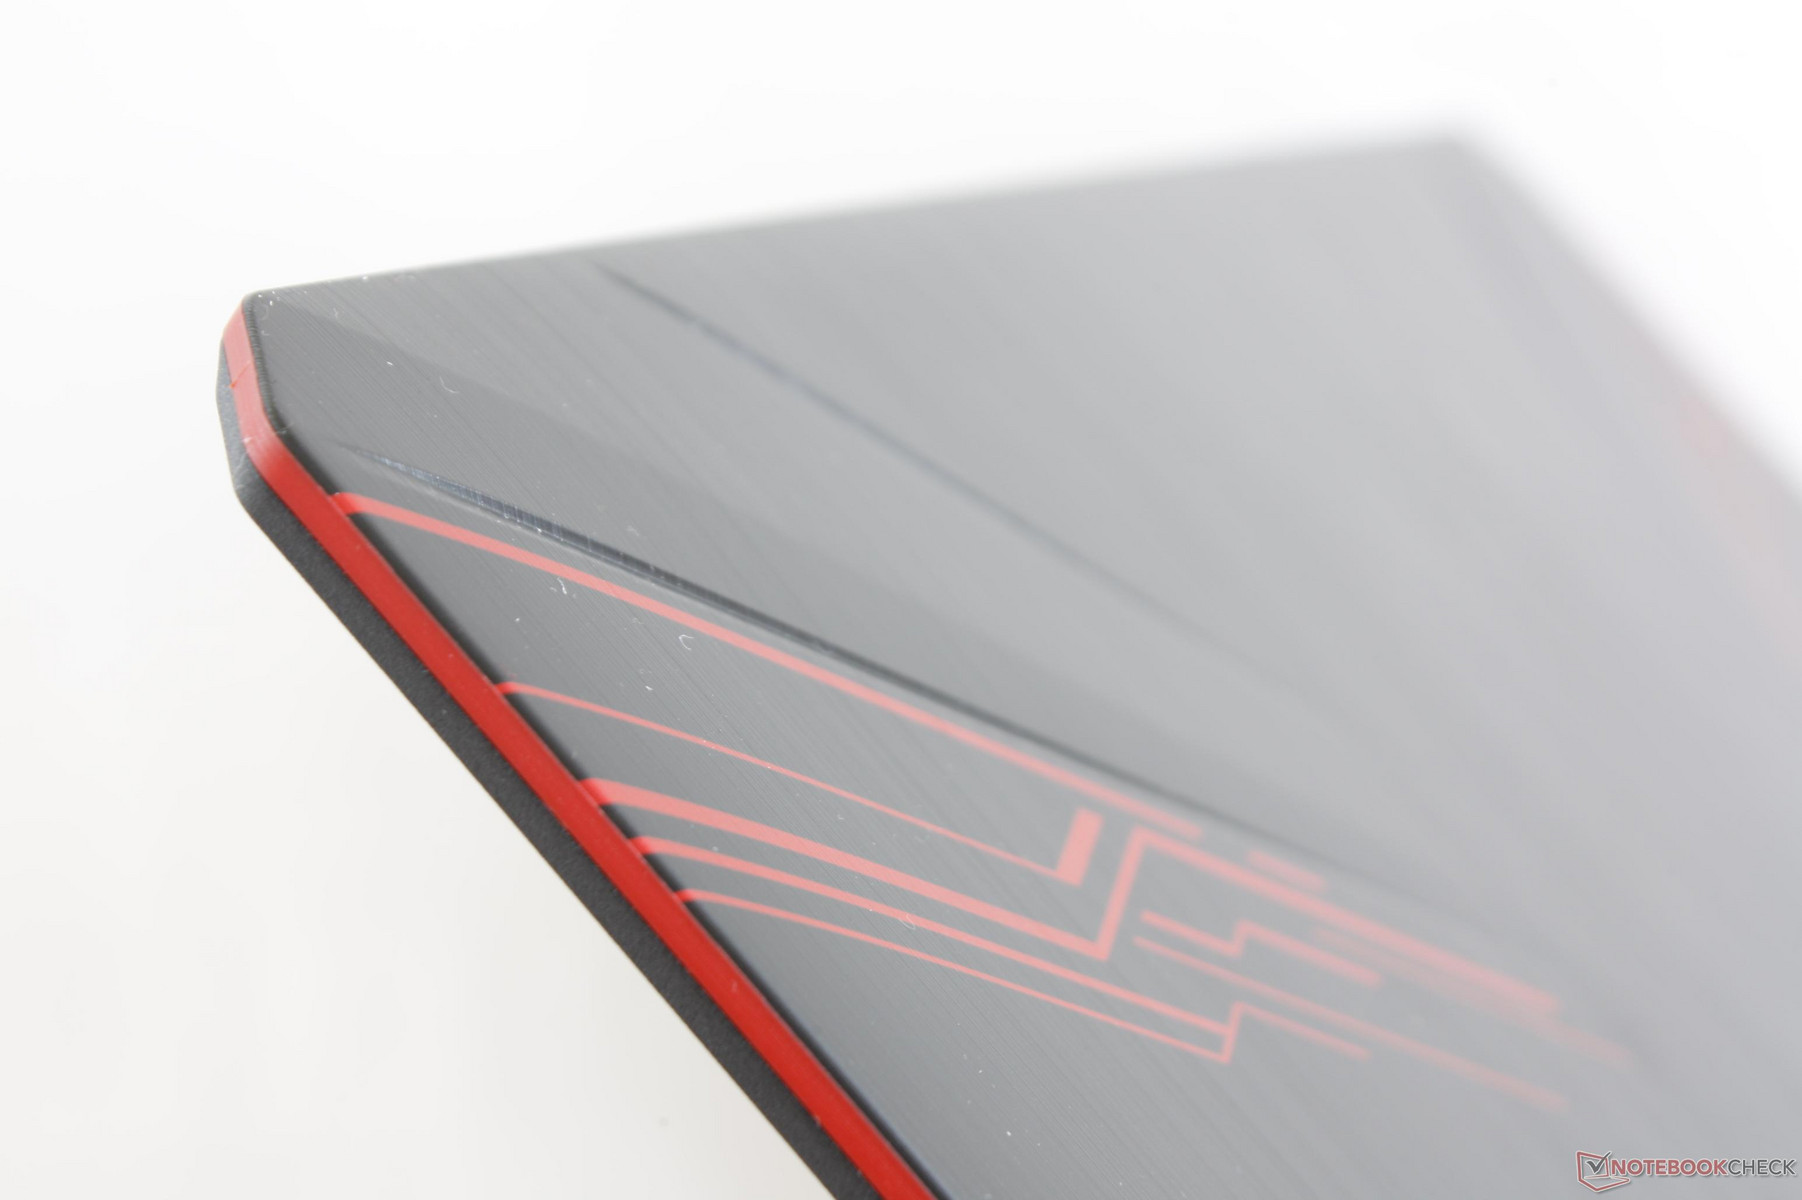
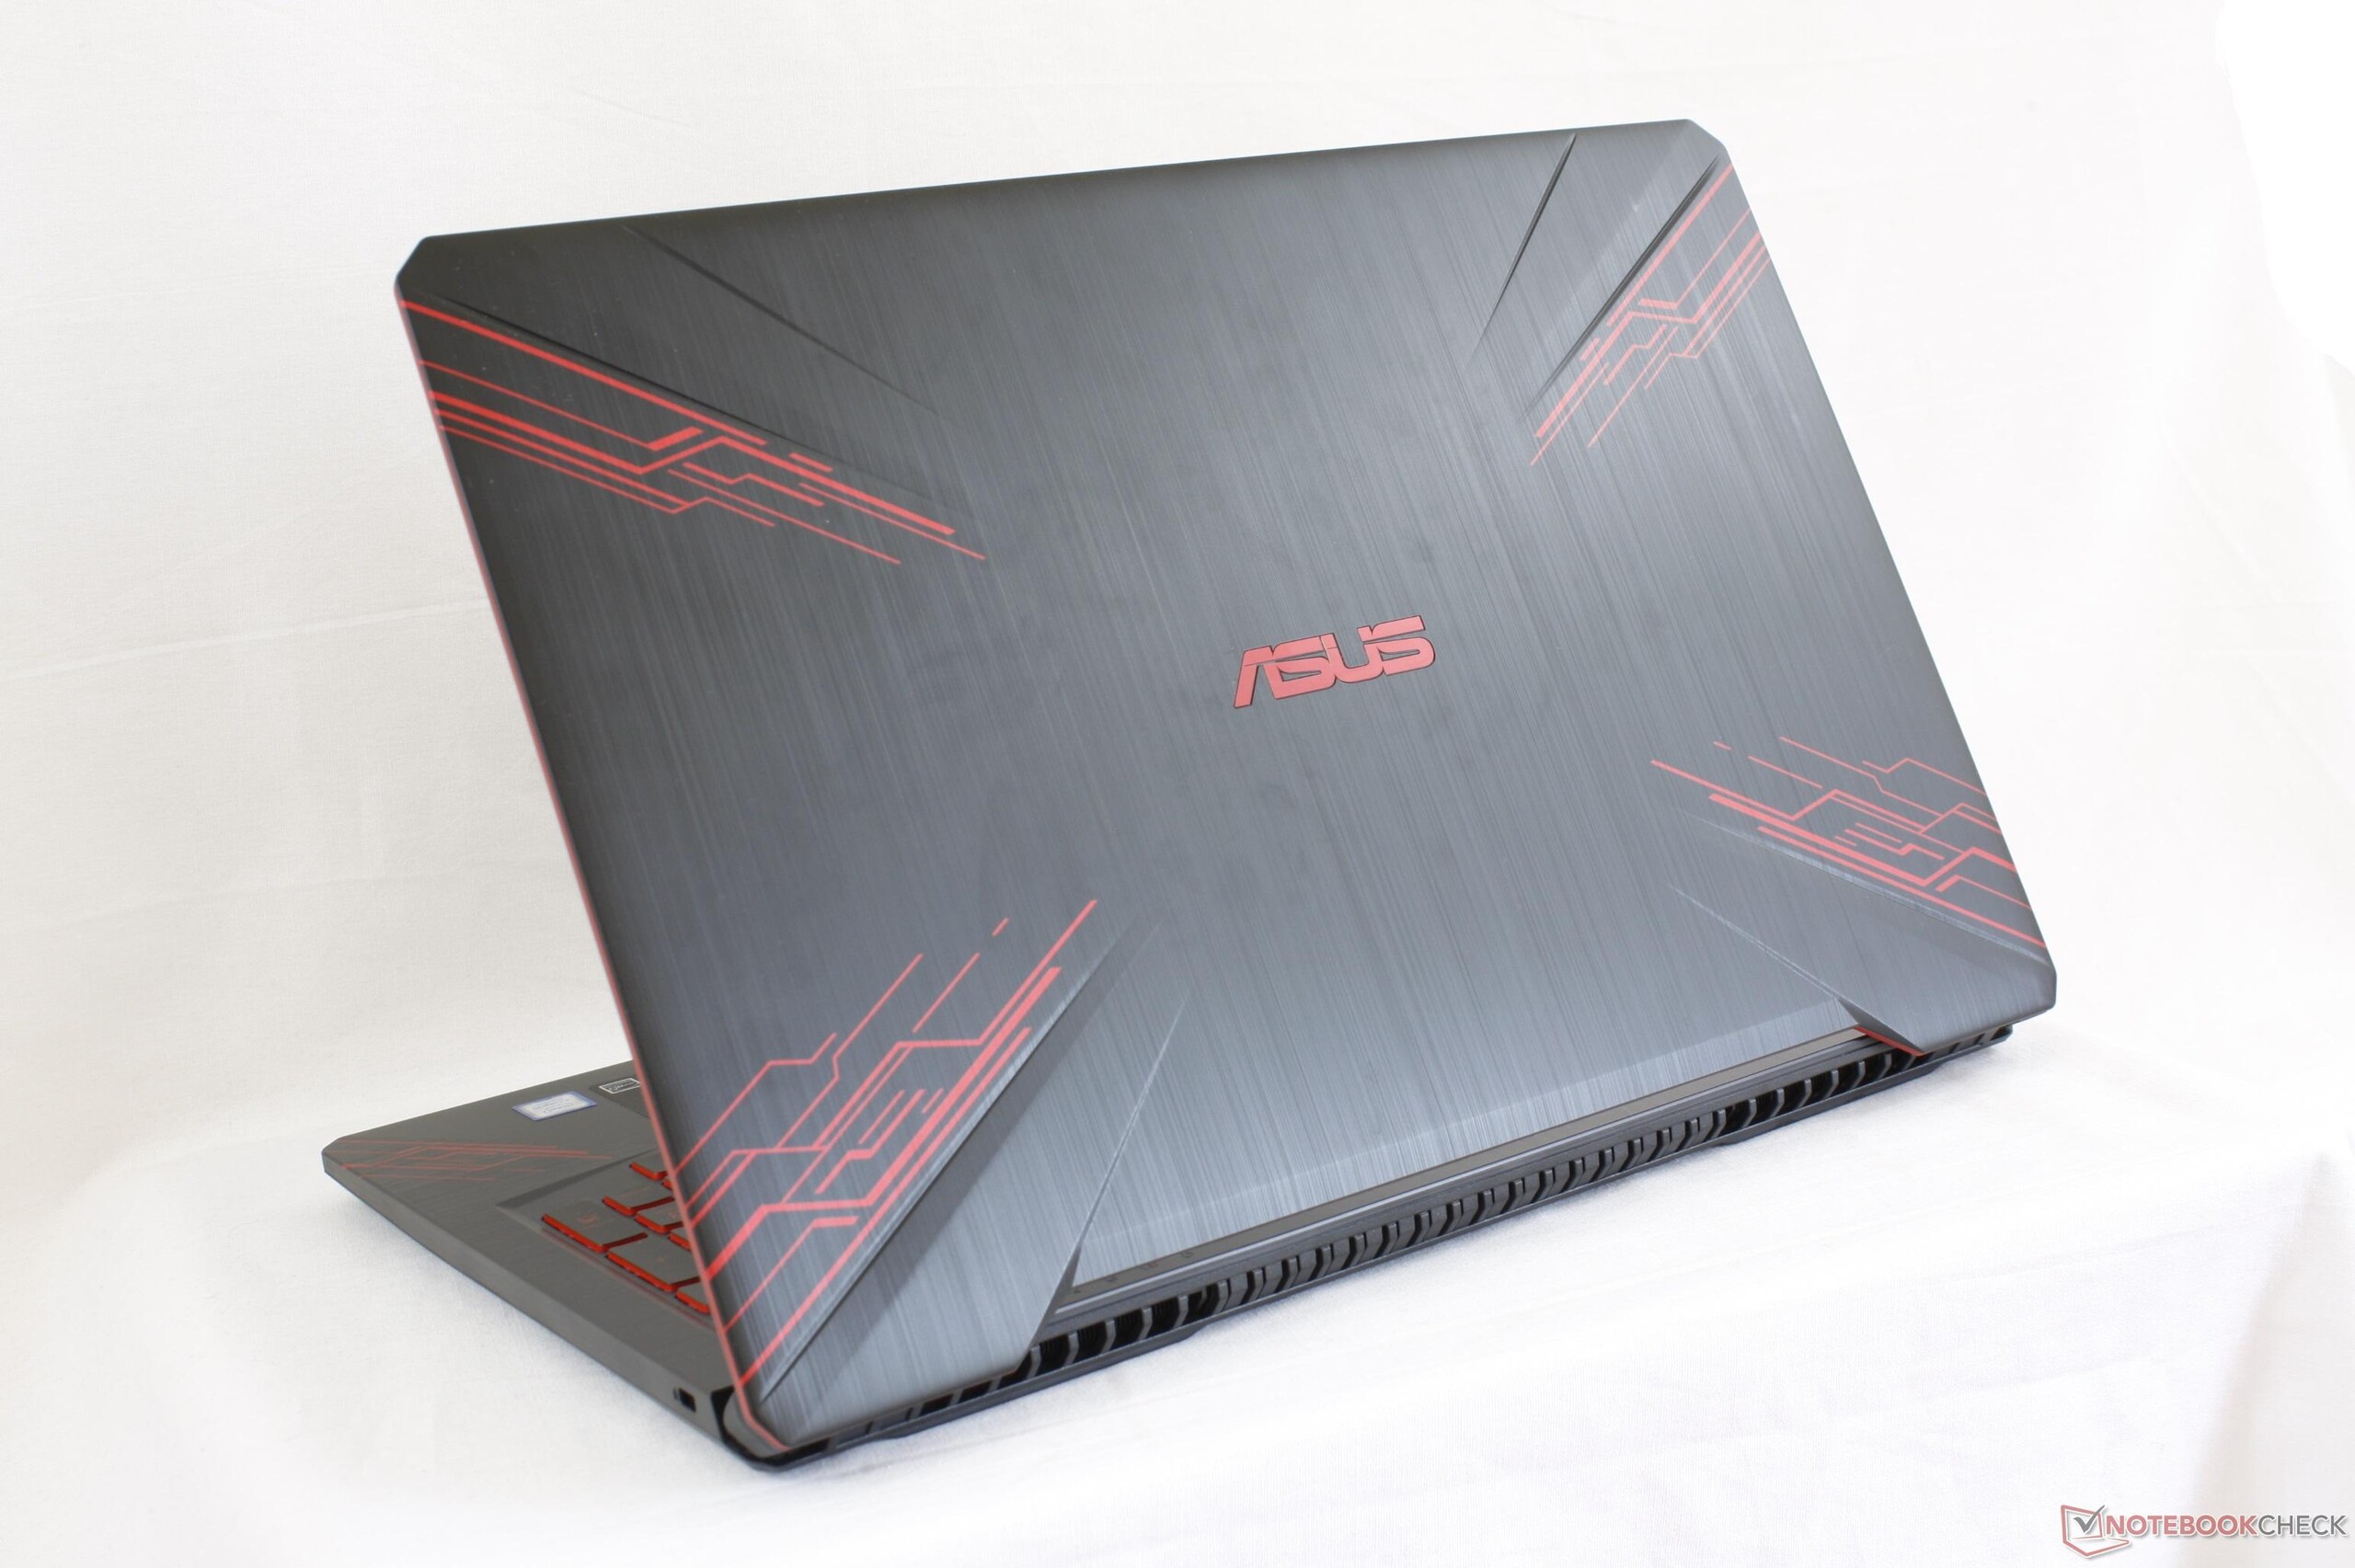
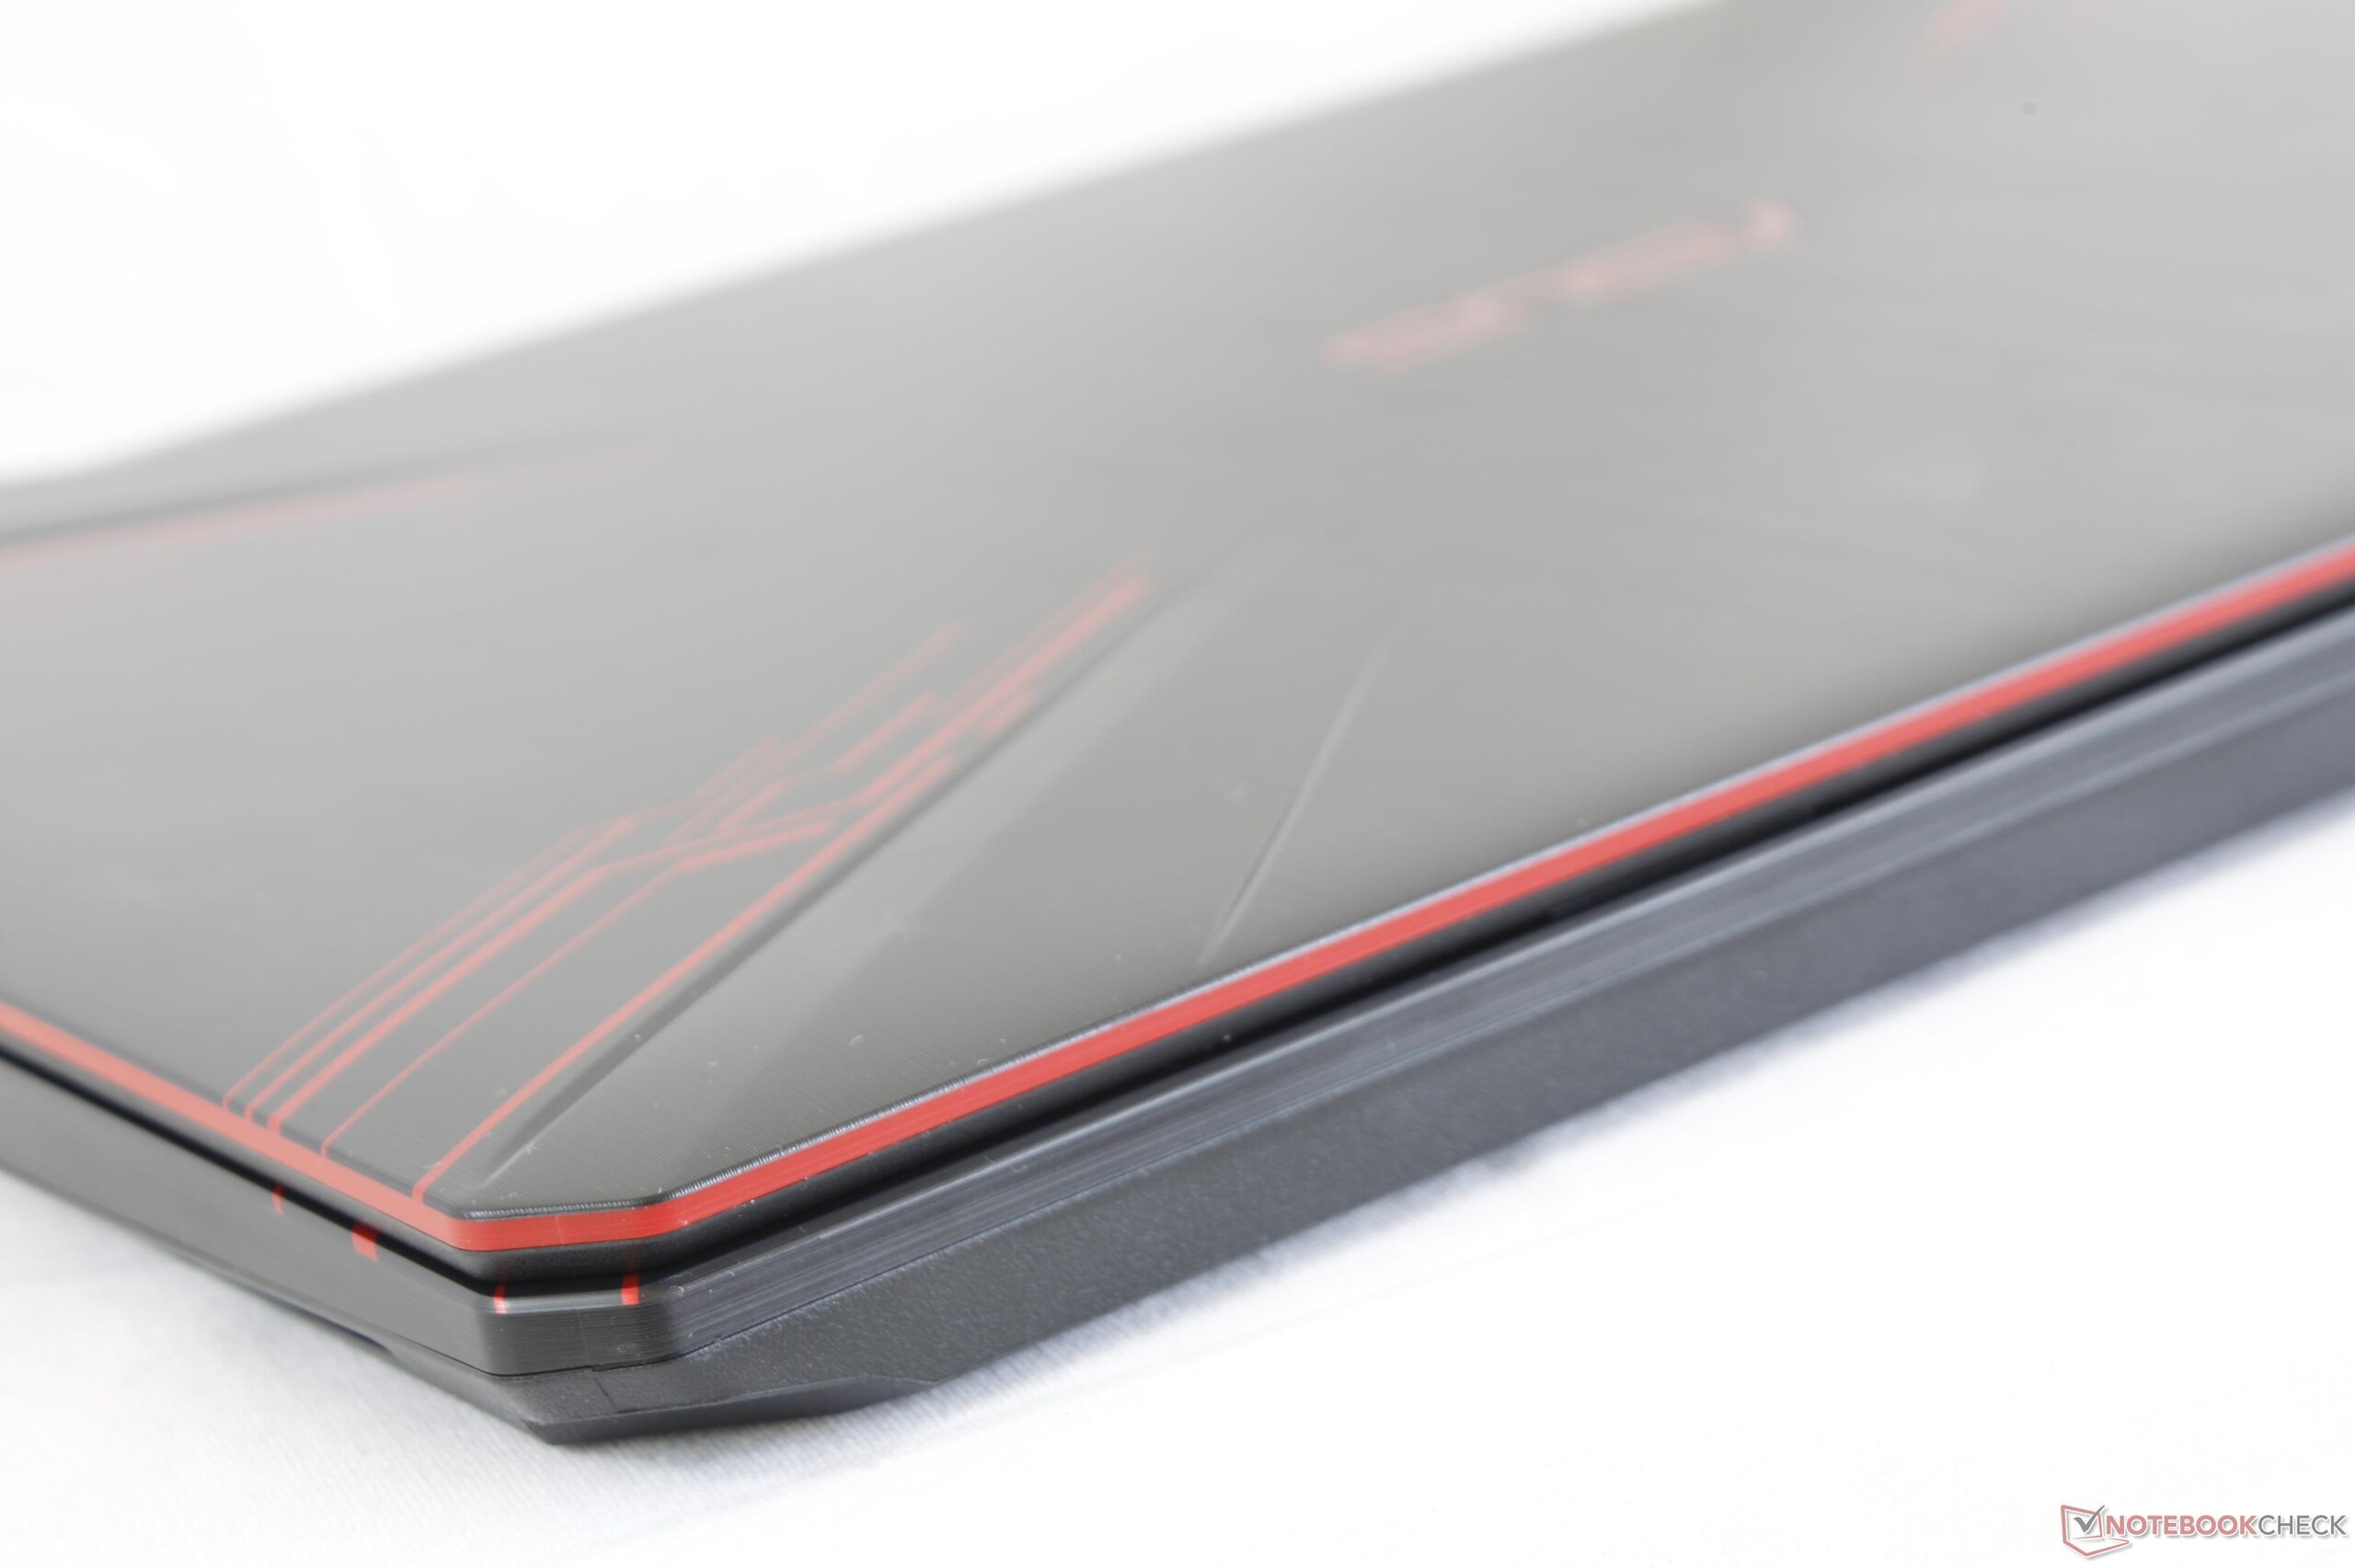
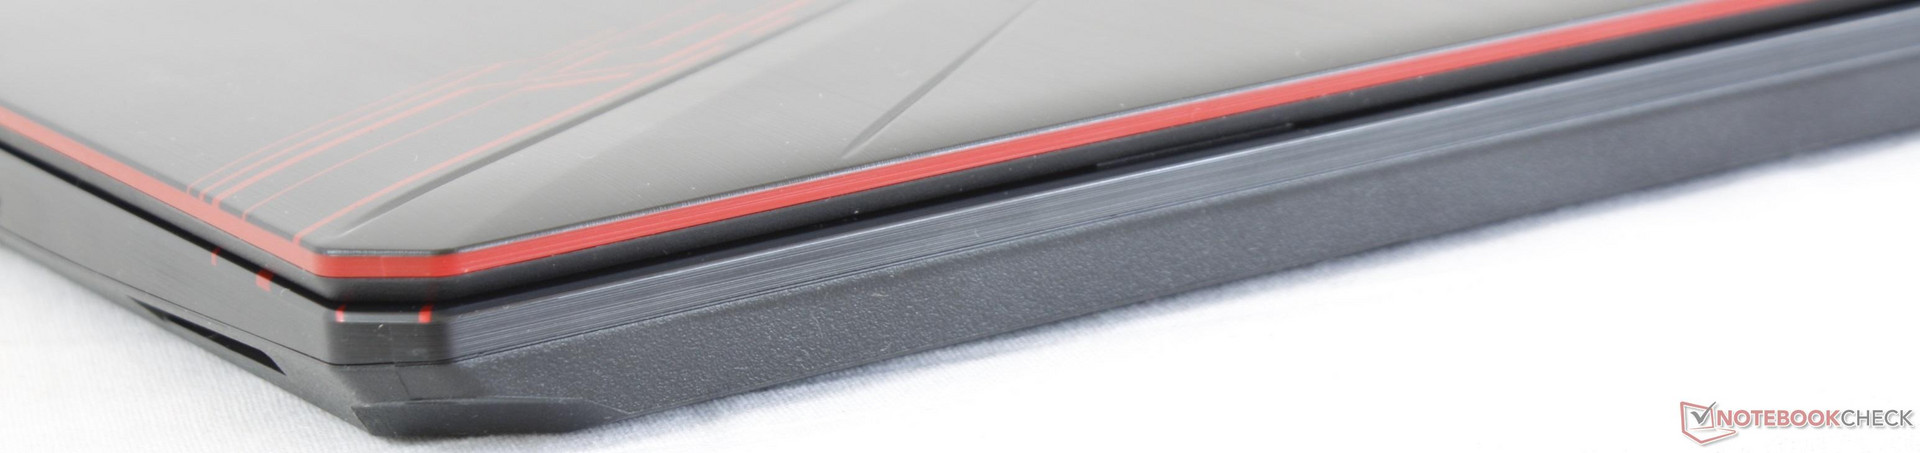
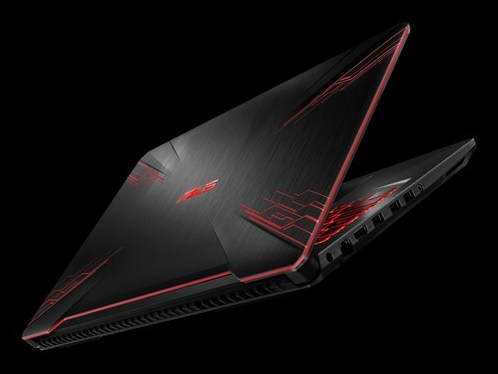
The chassis is nearly the same as the FX503 save for some purely aesthetic changes on the outer lid and corners. Asus has added slight accent marks on the outer surface while shaving off the rounded corners for a sharper look. Otherwise, chassis rigidity is essentially identical. In short, the base is strong considering the price, but the lid could have been more rigid especially down its center. The base of the Inspiron 7577 is even stronger and heavier due to its internal aluminum reinforcement.
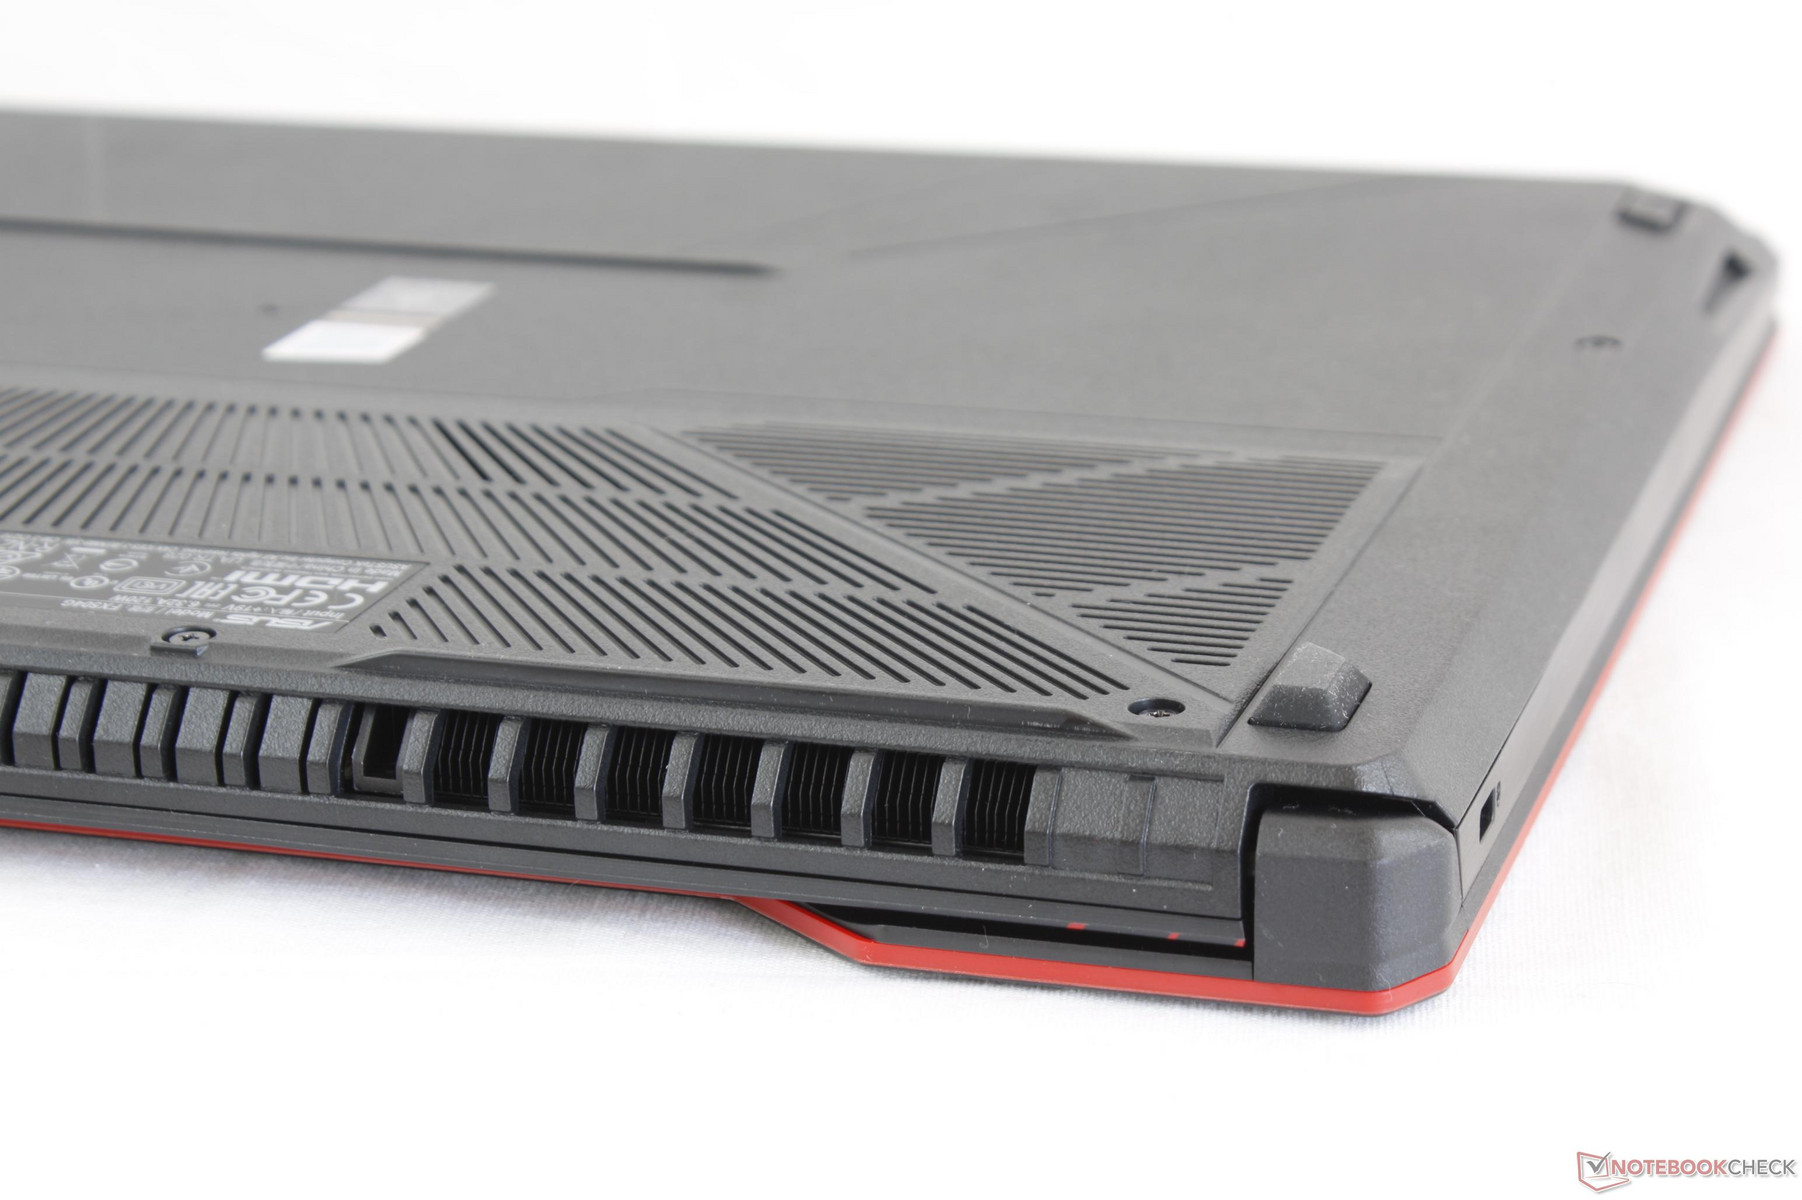
Note that the bottom side of the notebook is now one piece whereas last year's FX503 had a removable section for exposing the drive bays and SODIMM slots.
Connectivity
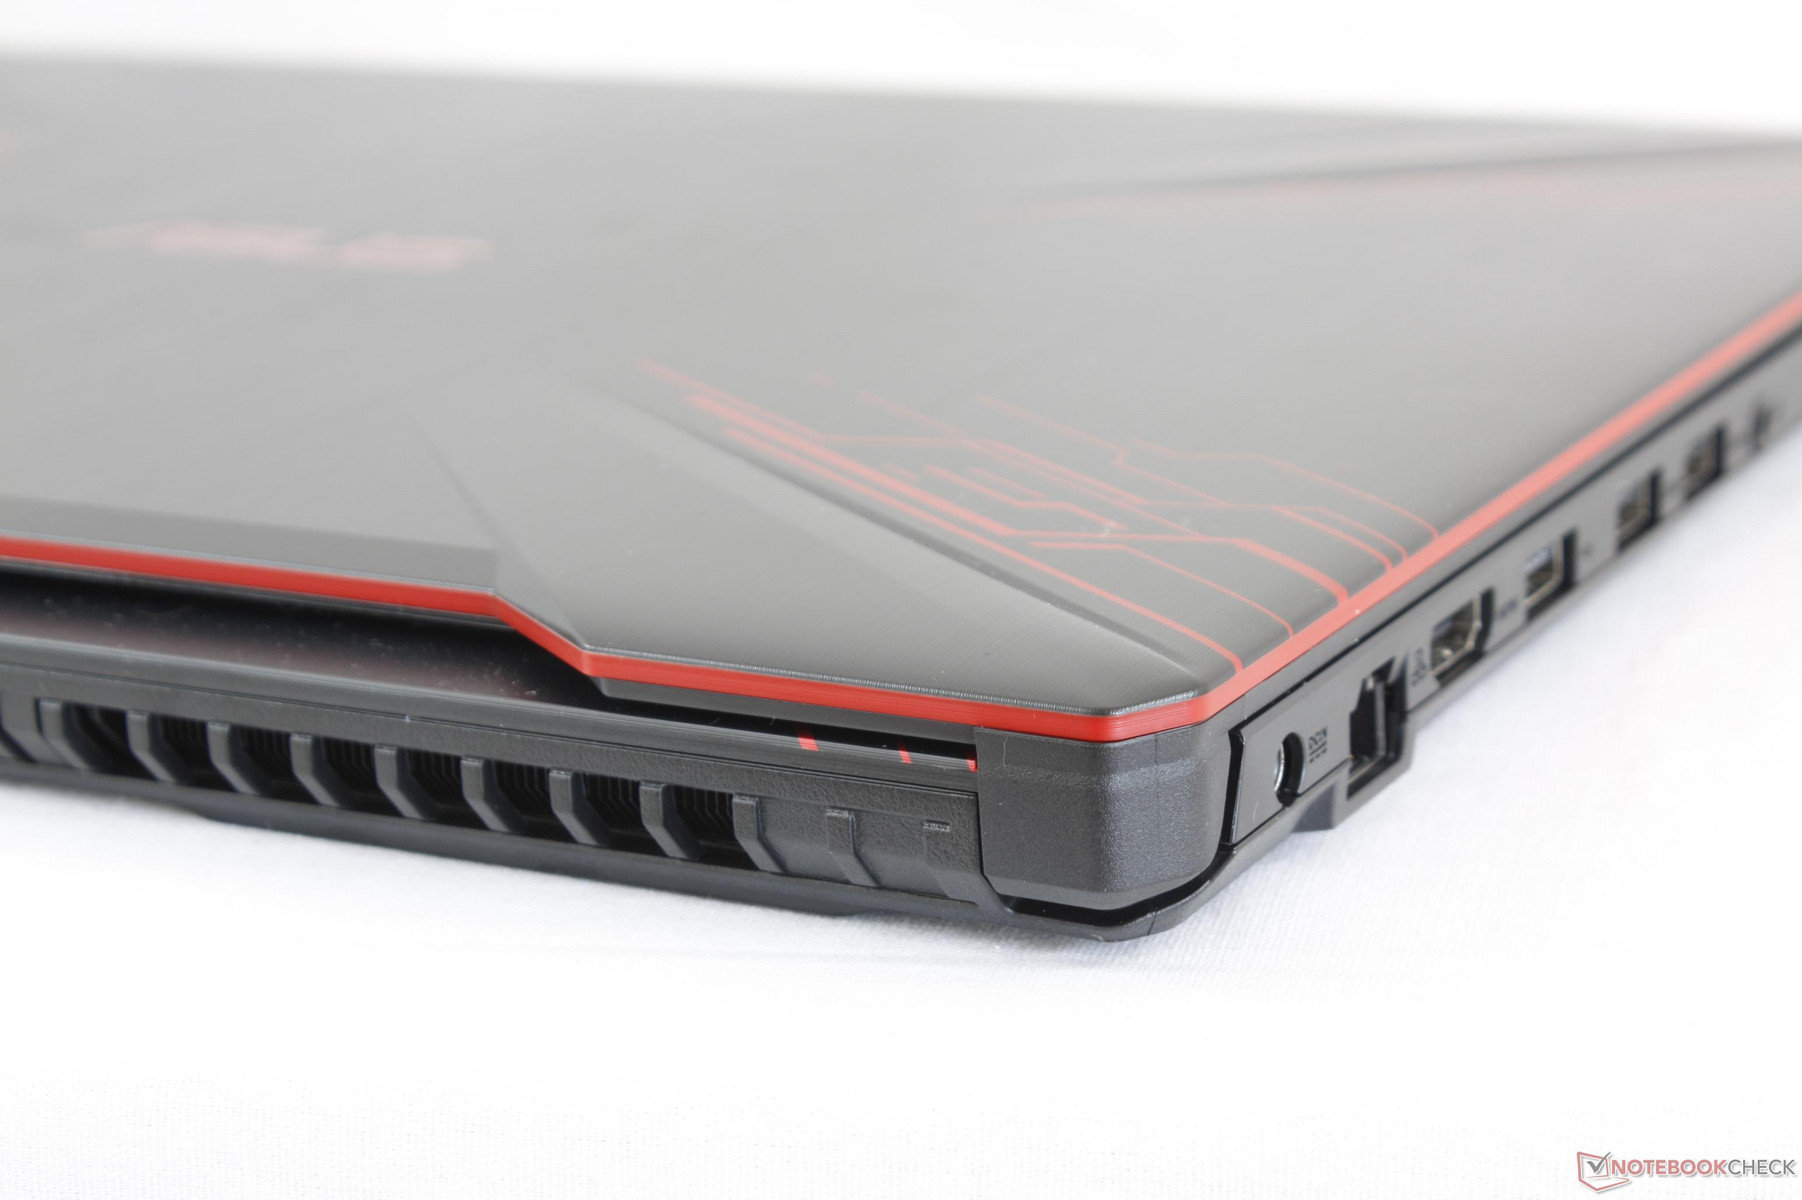
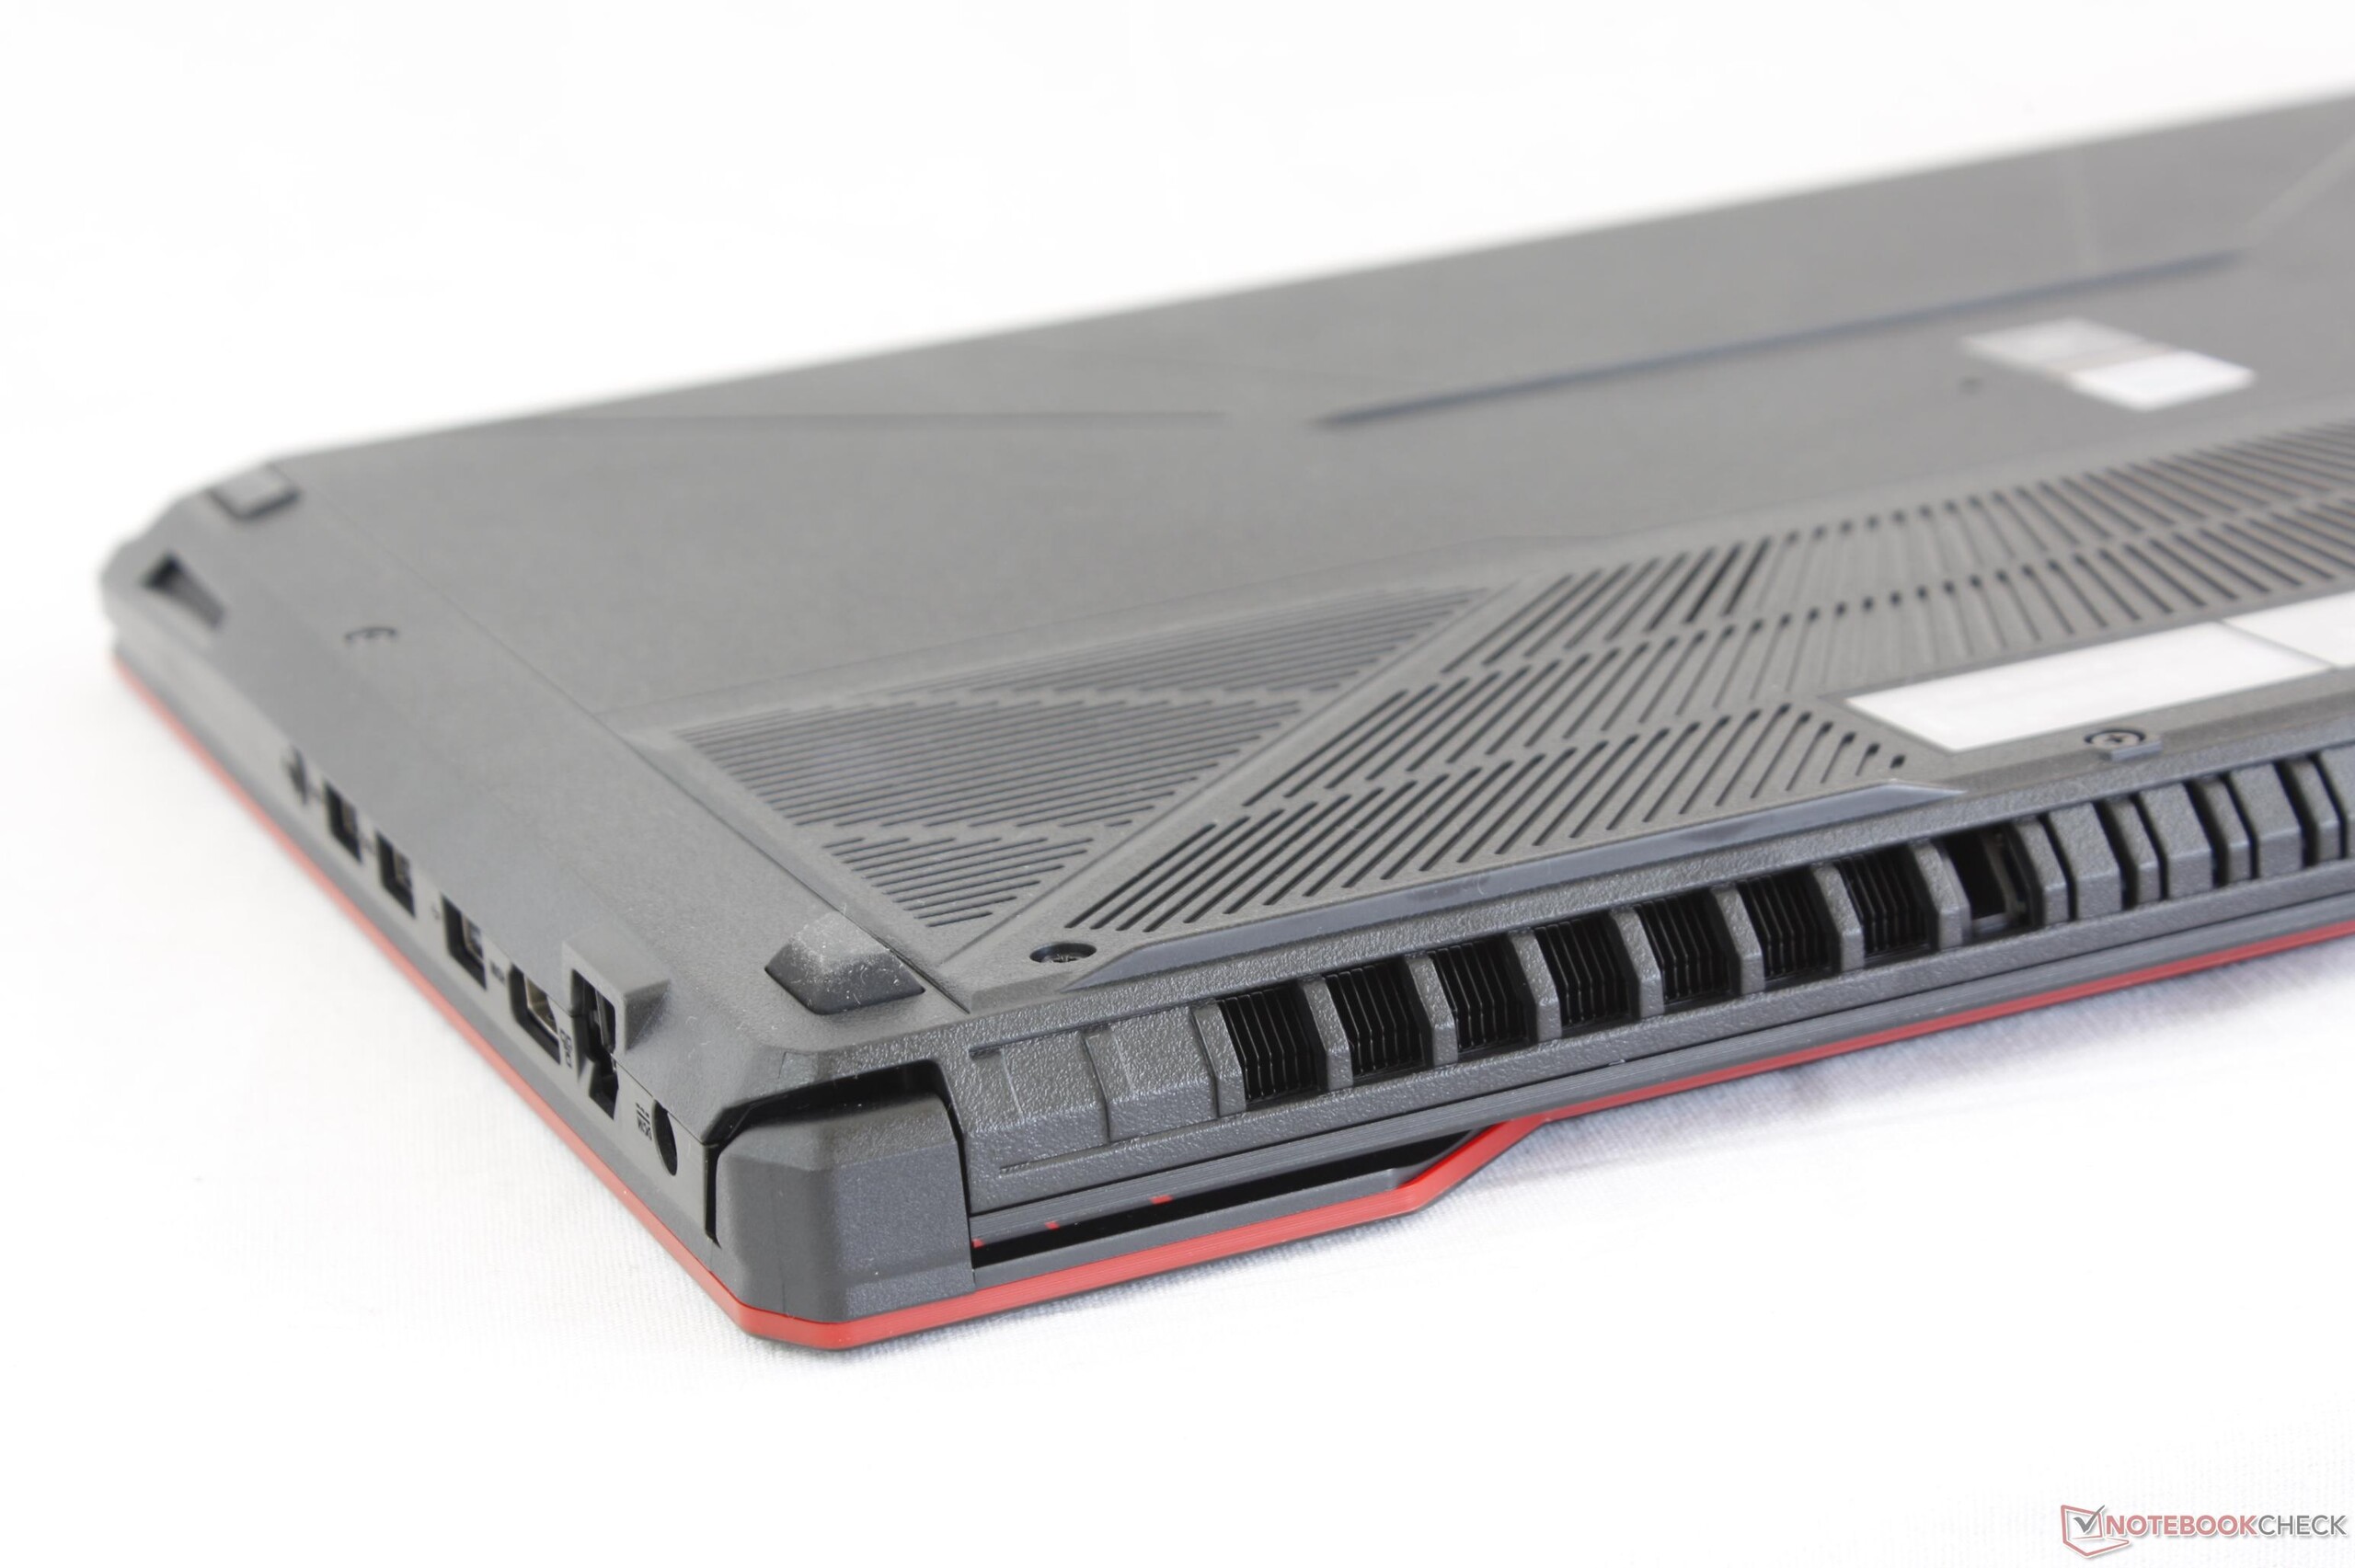
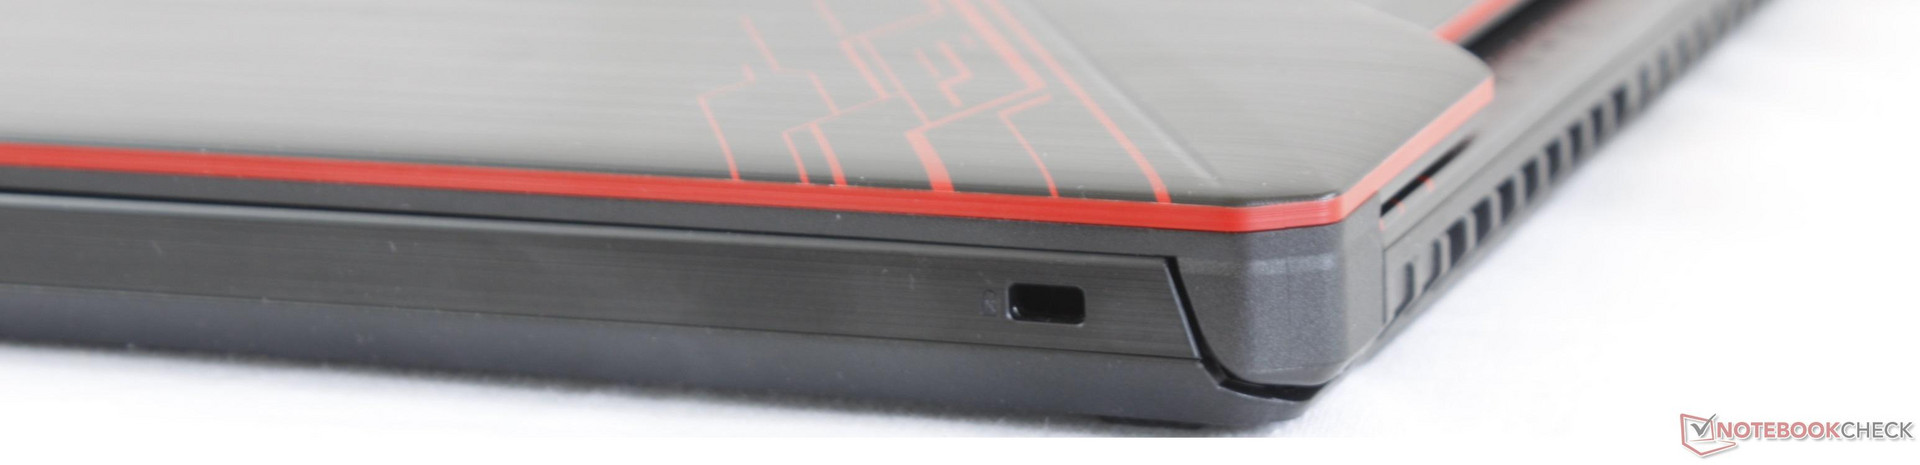
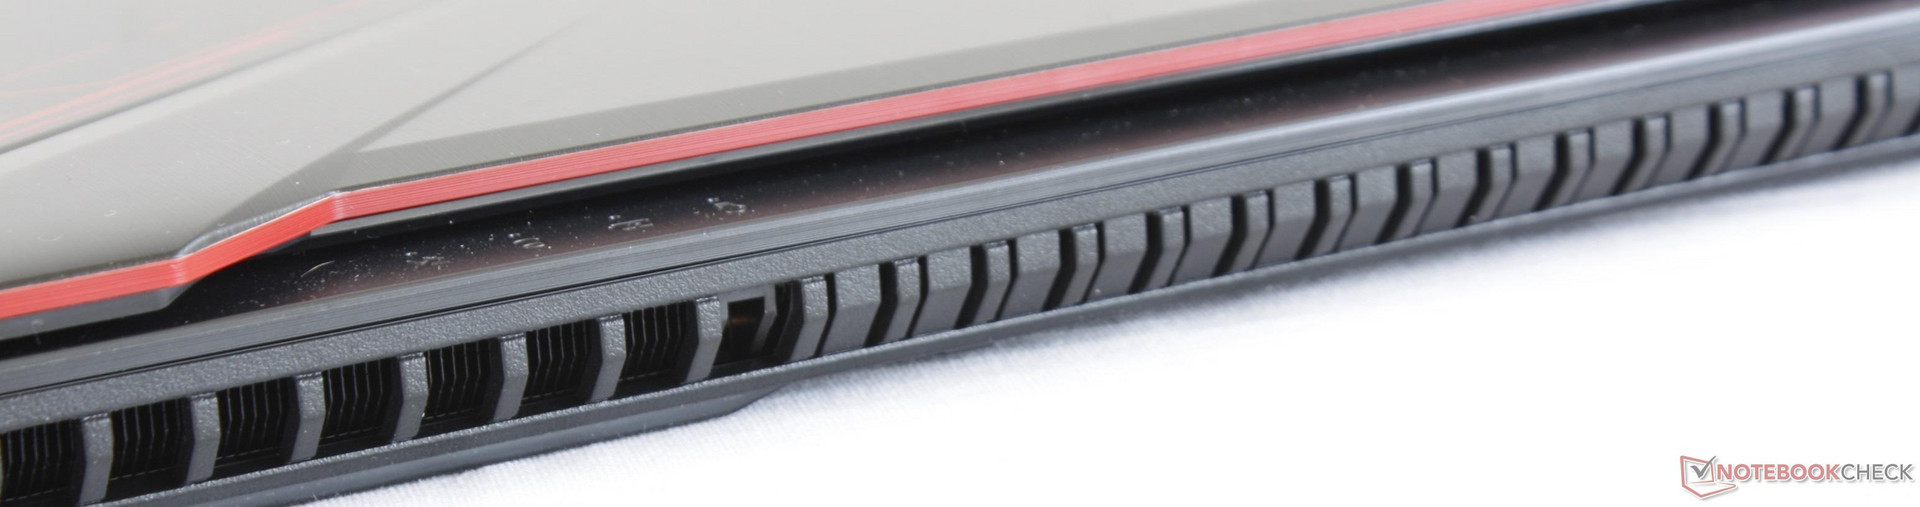
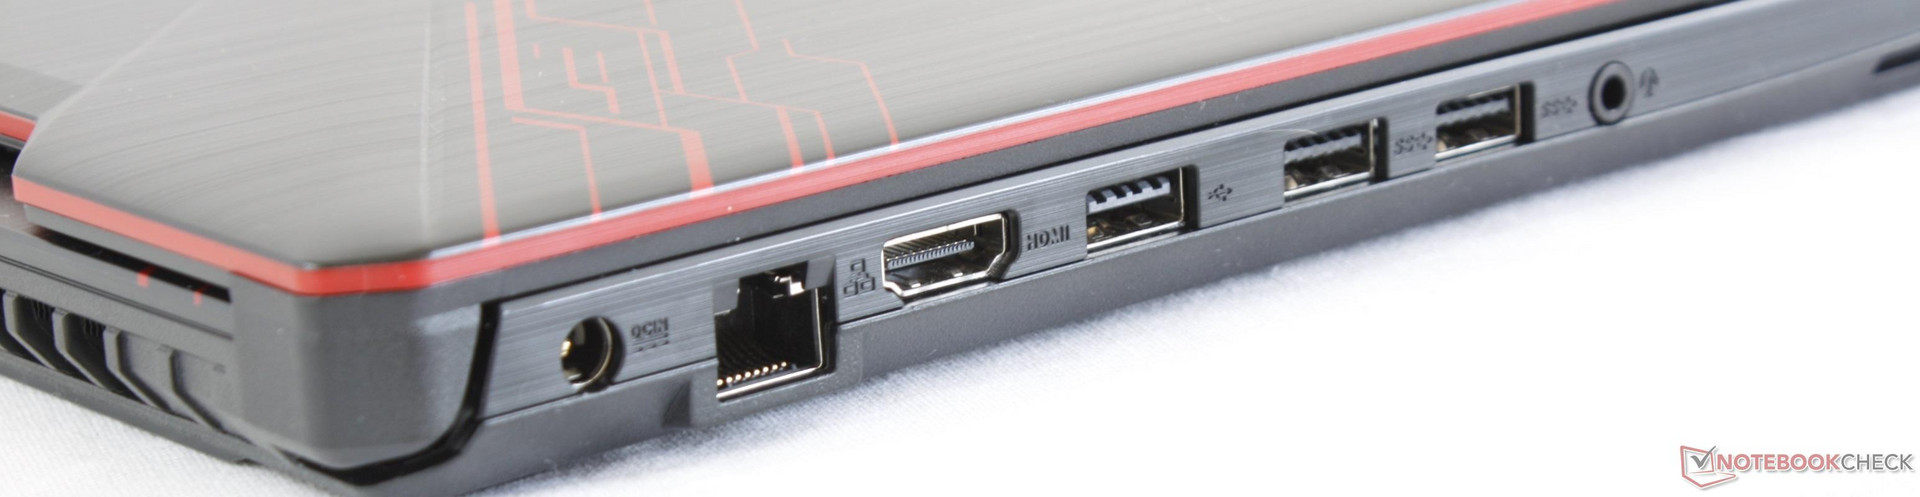
We're not expecting Thunderbolt 3 since this is a budget gaming system. Nonetheless, there are glaring omissions potential buyers should be aware of. The lack of both USB Type-C and a card reader feels strange on a thick 15-inch chassis. Furthermore, there are no ports on the right edge of the system that can potentially be an inconvenience for users. Even last year's FX503 included USB ports on both sides of the notebook.
| Networking | |
| iperf3 transmit AX12 | |
| Asus FX504GD | |
| Asus FX503VM-EH73 | |
| MSI GP62 7REX-1045US | |
| iperf3 receive AX12 | |
| Asus FX504GD | |
| Asus FX503VM-EH73 | |
| MSI GP62 7REX-1045US | |
Accessories
There are no included extras outside of the AC adapter and Warranty card.
Maintenance
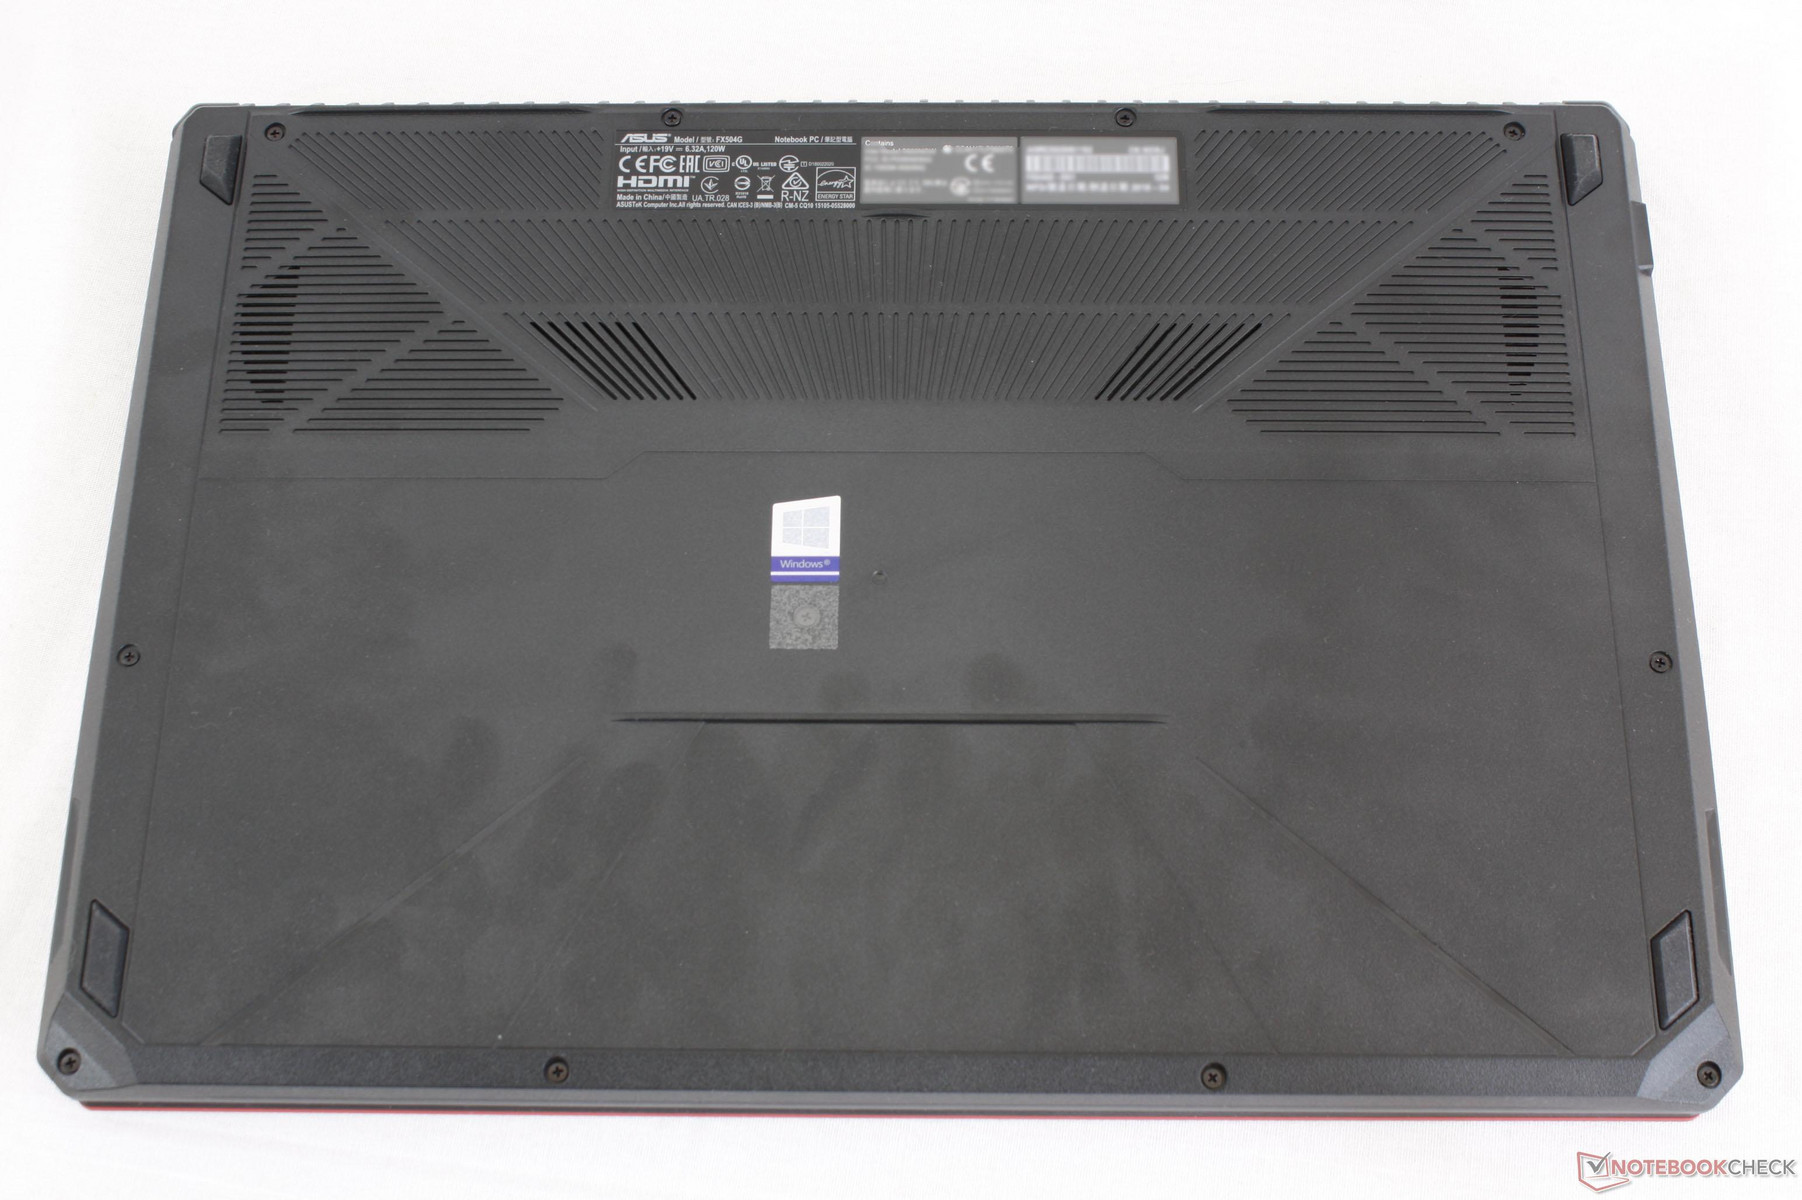
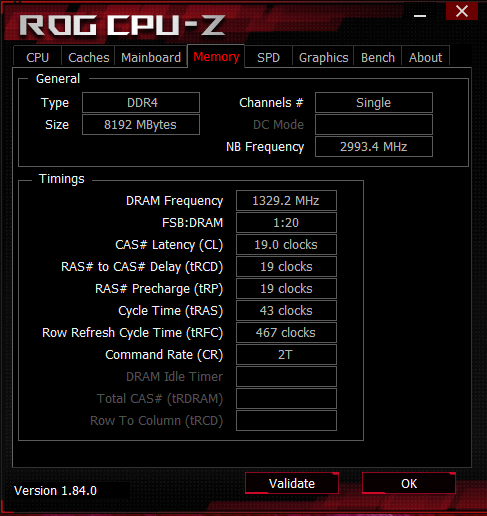
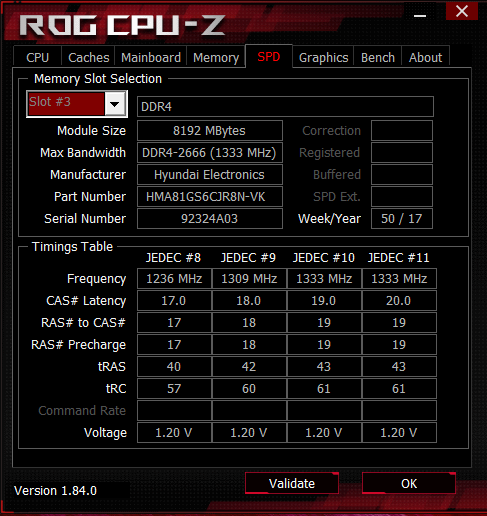
As mentioned earlier, Asus has made it harder to service the notebook when compared to the FX503. Removing the screws from the bottom will require tearing a plastic cover to indicate tampering from the end user. Users will find 2x SODIMM slots and 2x storage bays. Intel Optane is supported.
Warranty
The standard 12-month warranty applies. Please see our Guarantees, Return policies and Warranties FAQ for country-specific information.
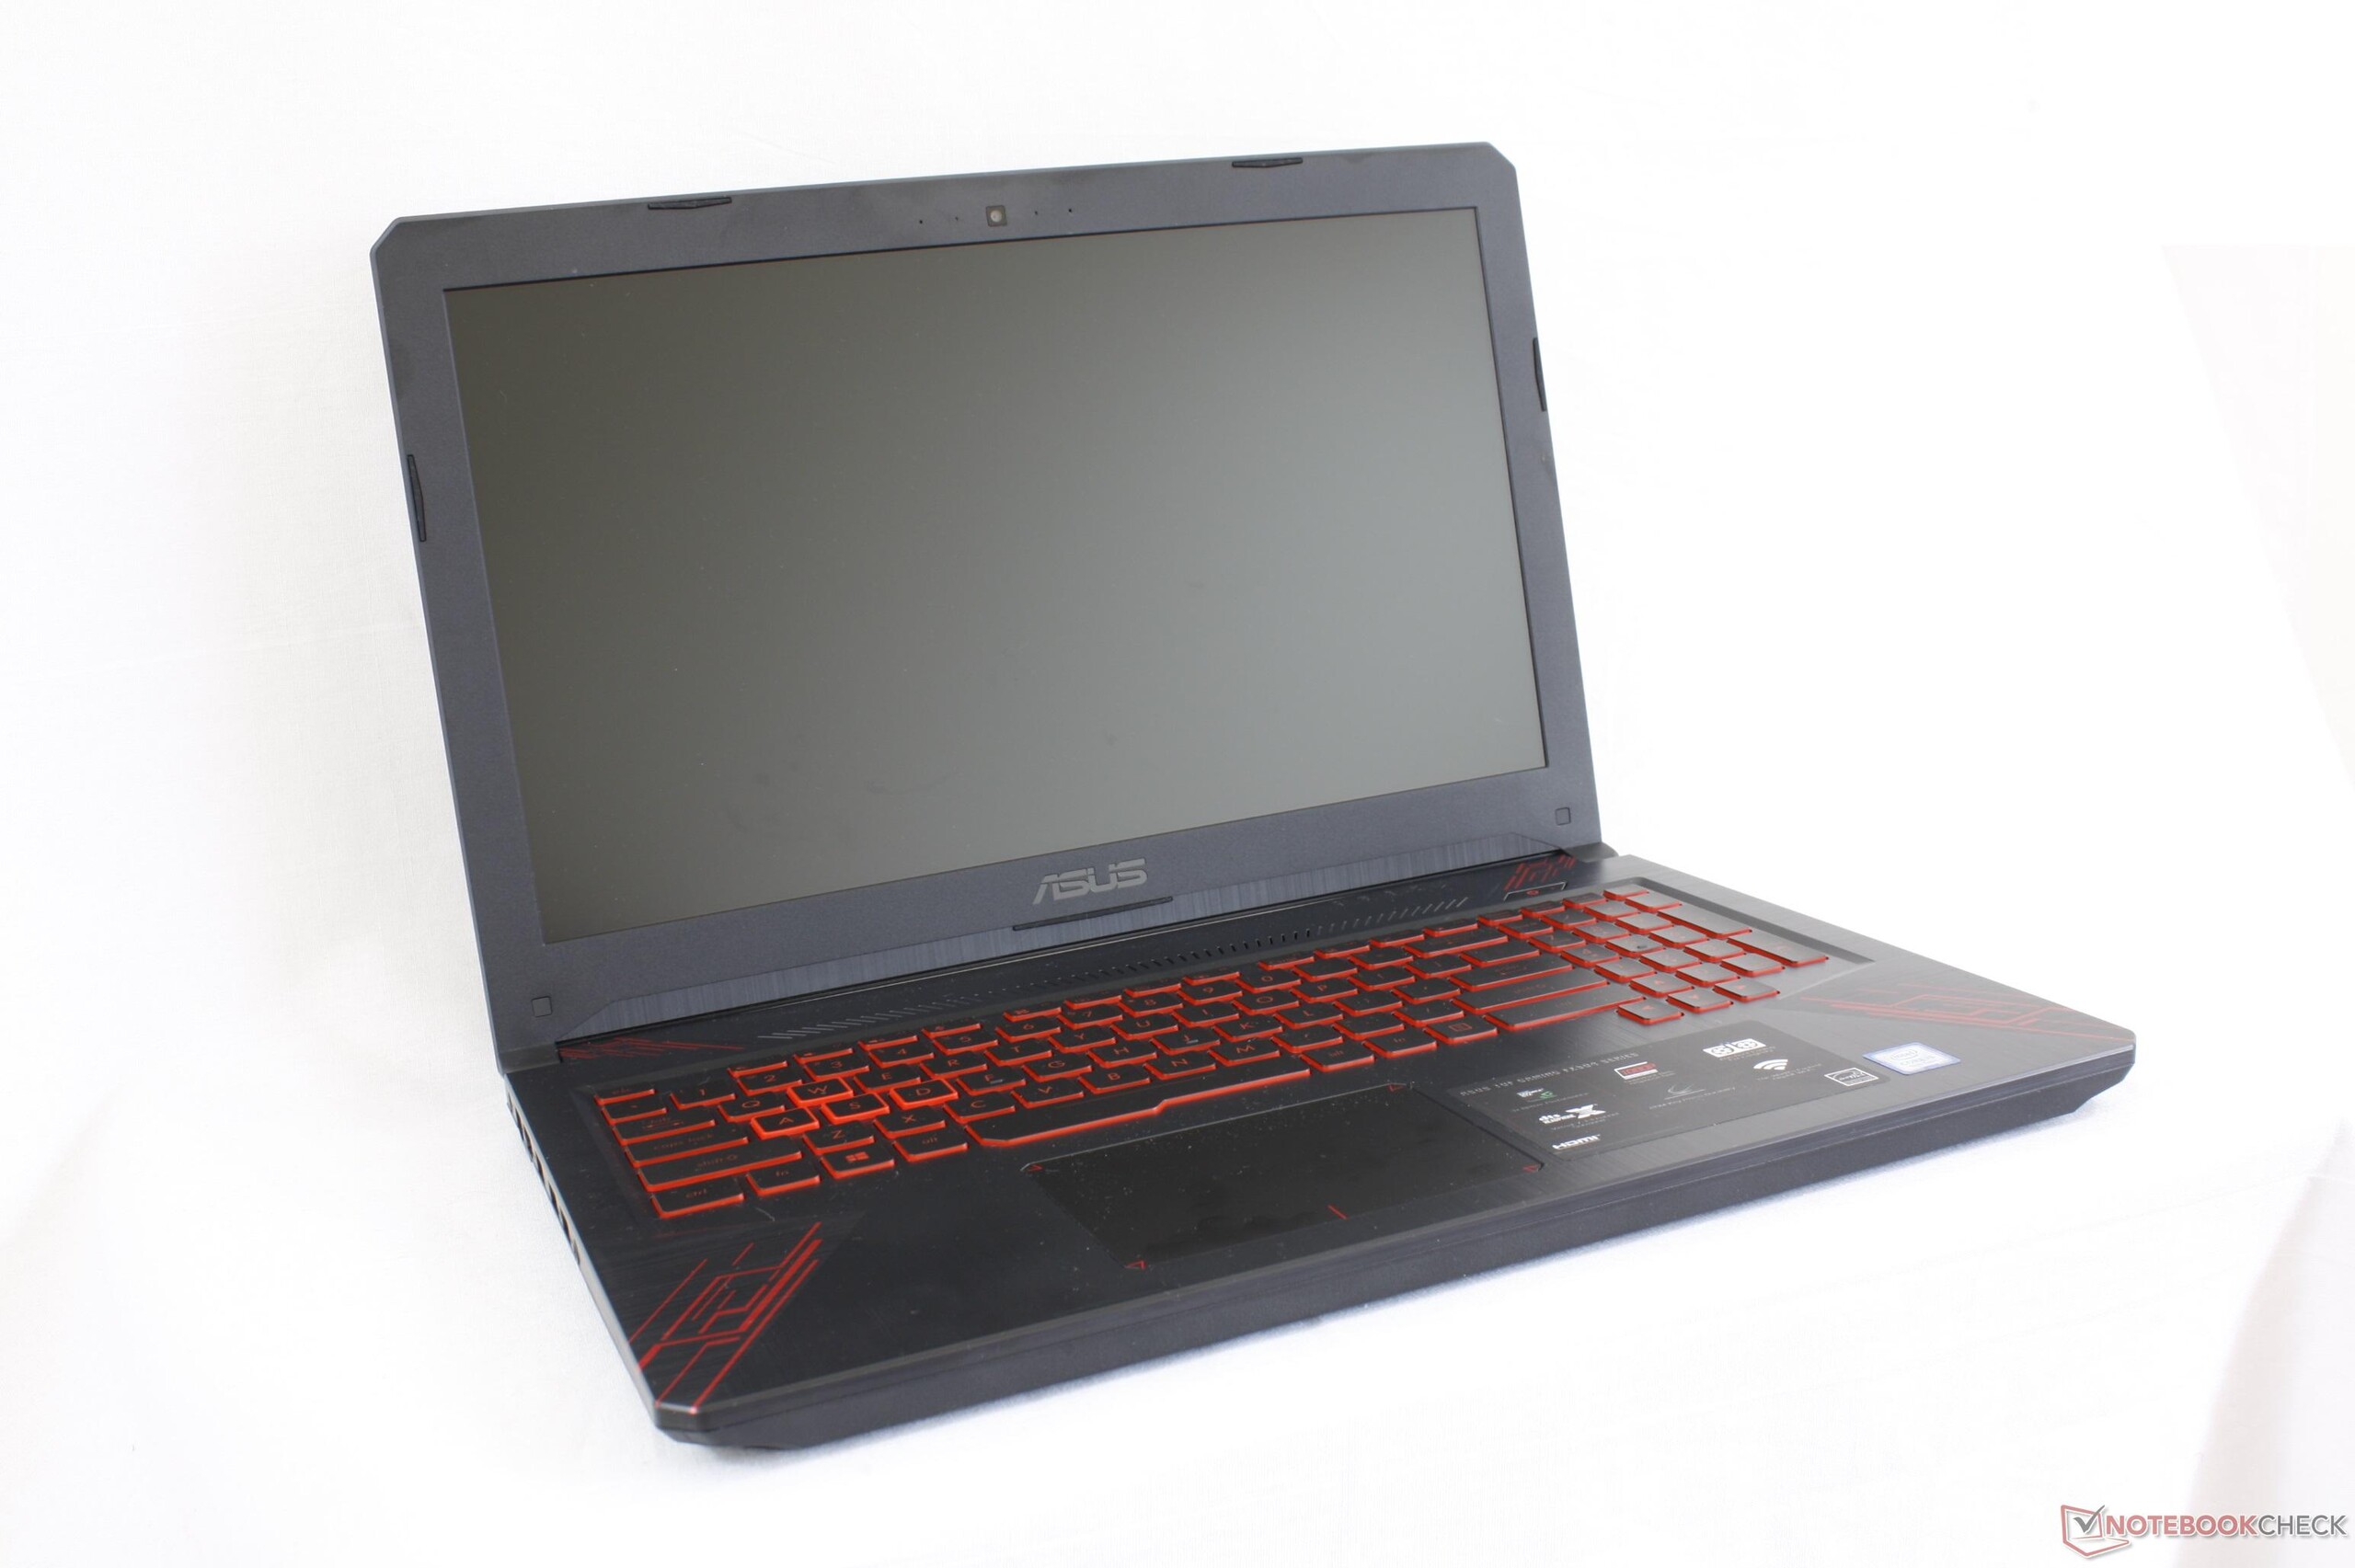
Input Devices
Keyboard and Touchpad
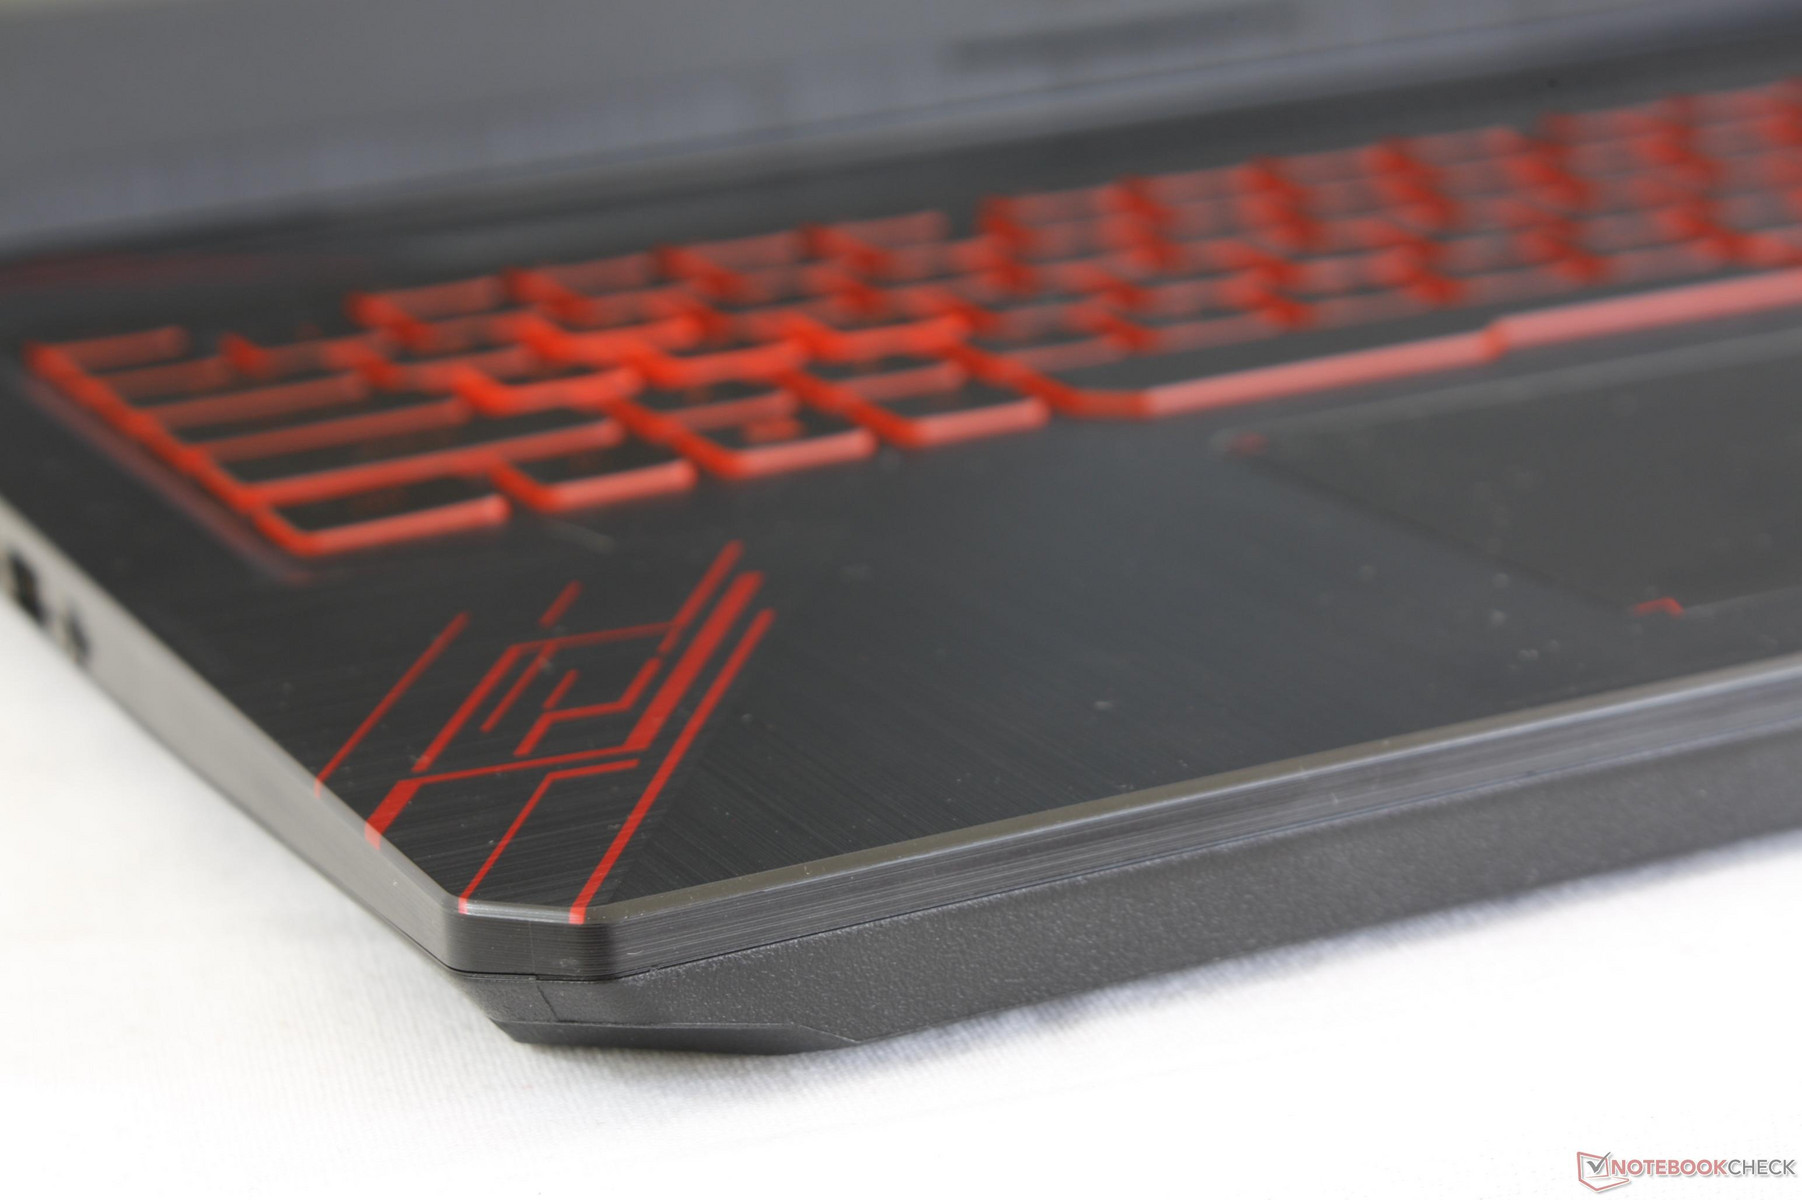
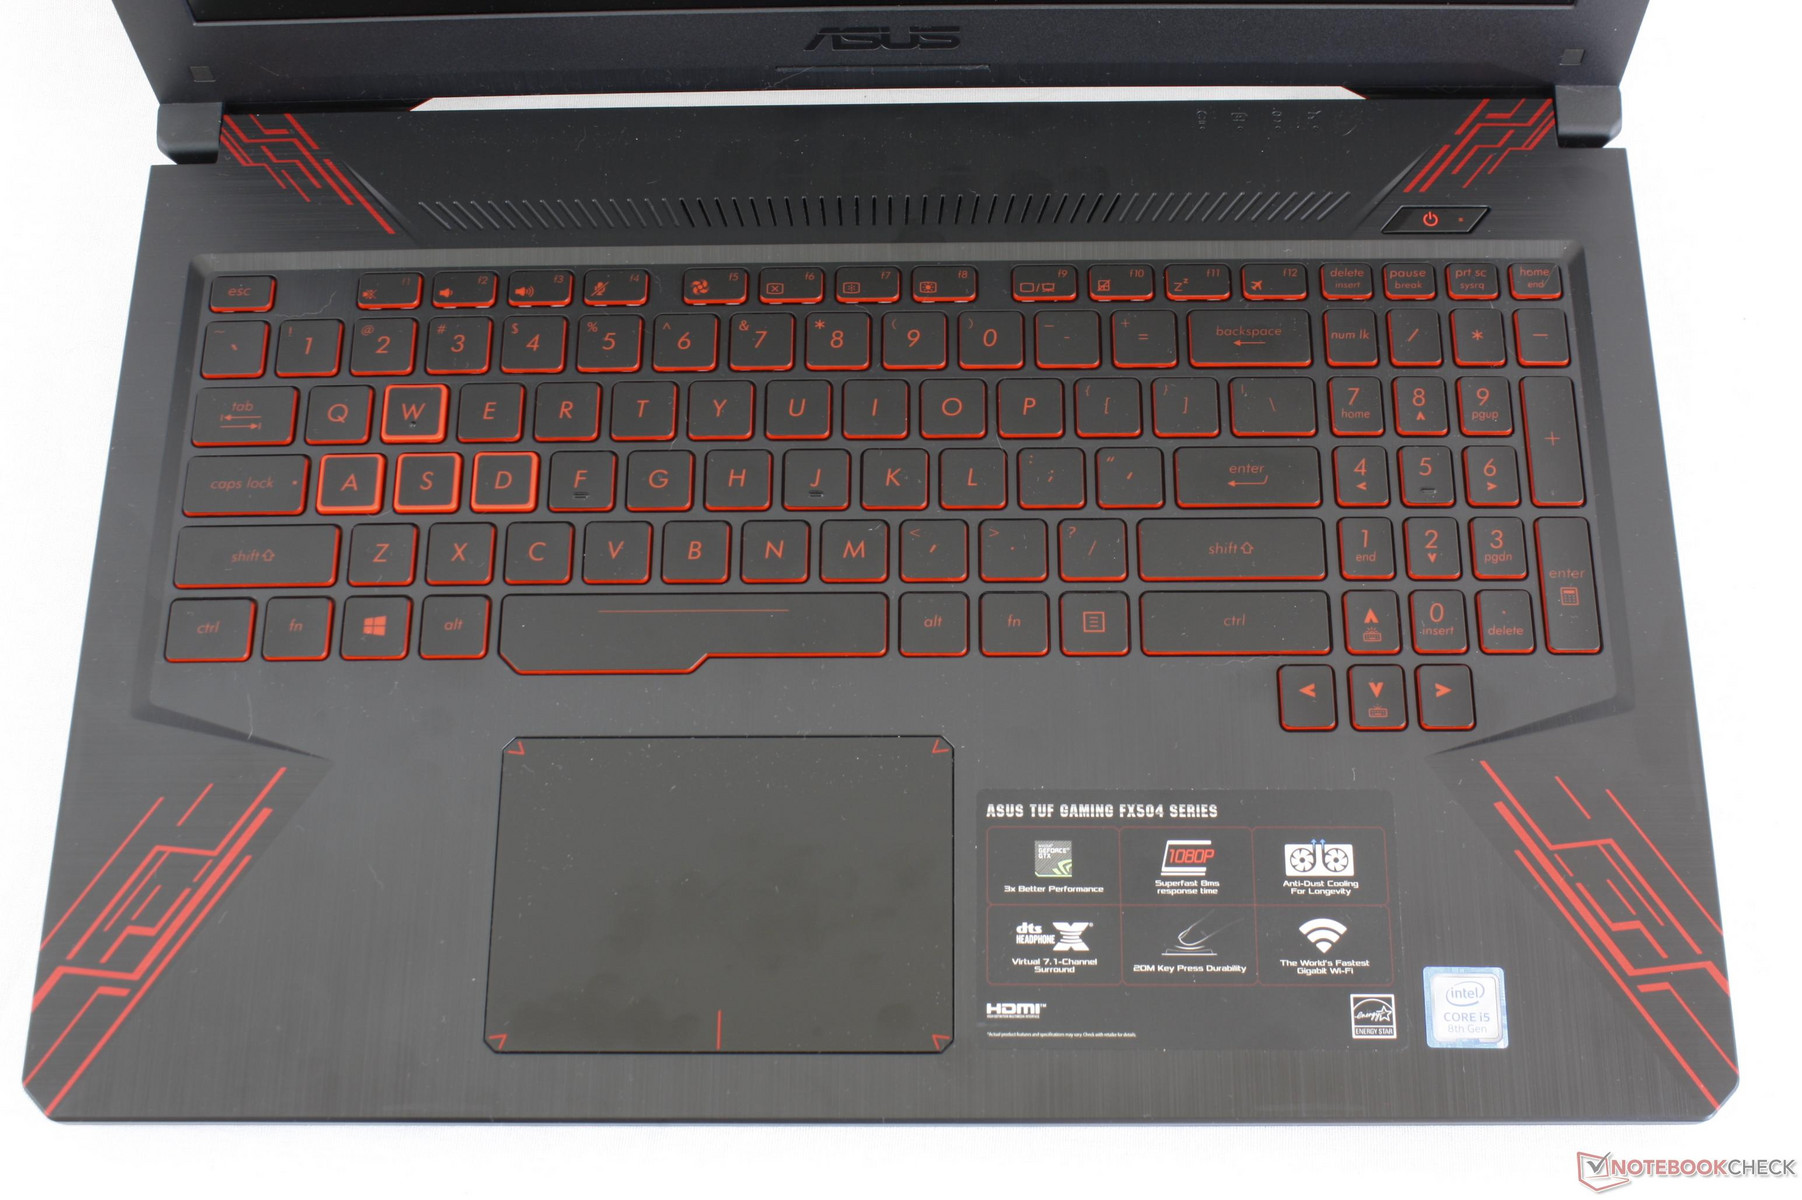
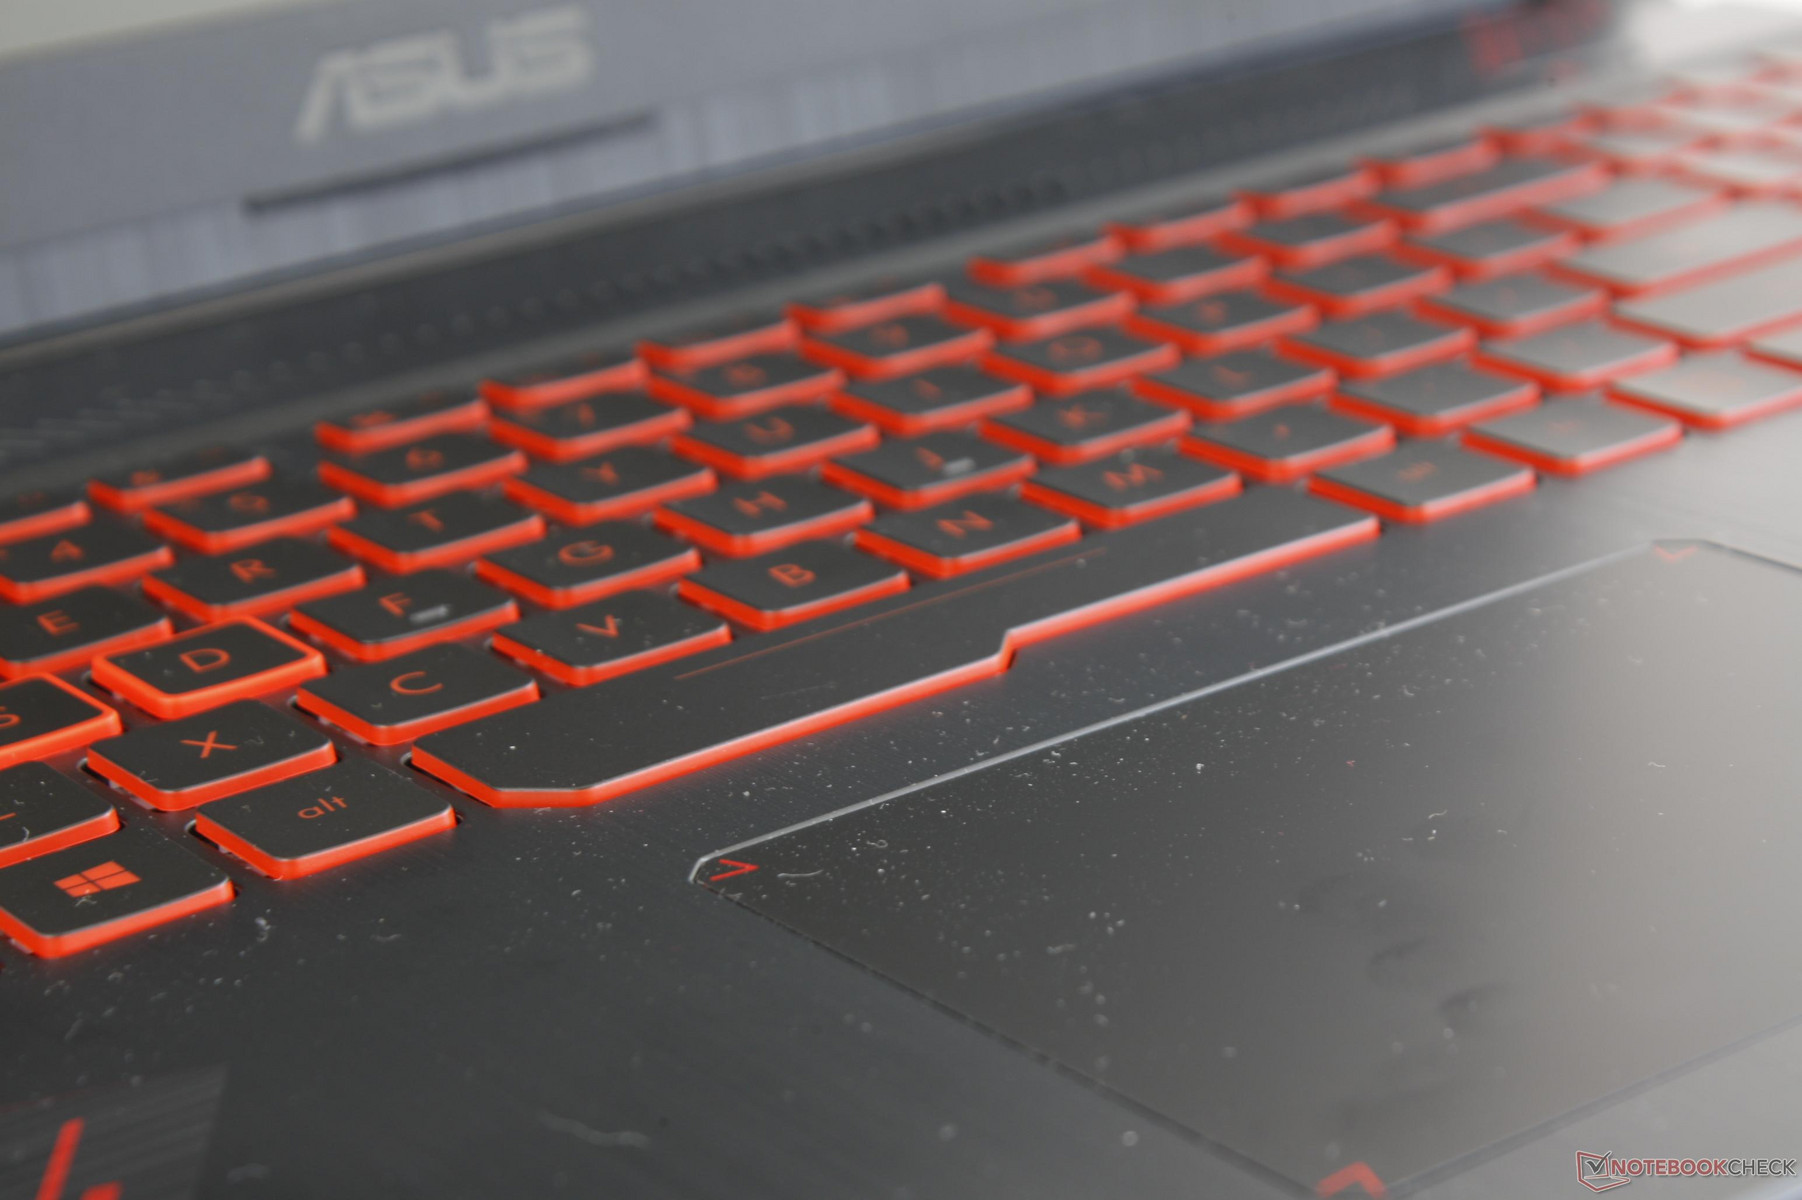
The keyboard (~34.3 cm x 10.4 cm) and trackpad (10.3 cm x 7.3 cm) are identical to the ones on the FX503 save for some aesthetic changes around the edges. We refer to our existing review for more information on the feedback and feel of the keys. In short, key feedback is acceptable while the integrated trackpad keys continue to be soft and on the spongy side. Its smooth plastic surface will accumulate grease much more quickly than the rest of the notebook as well.
Display
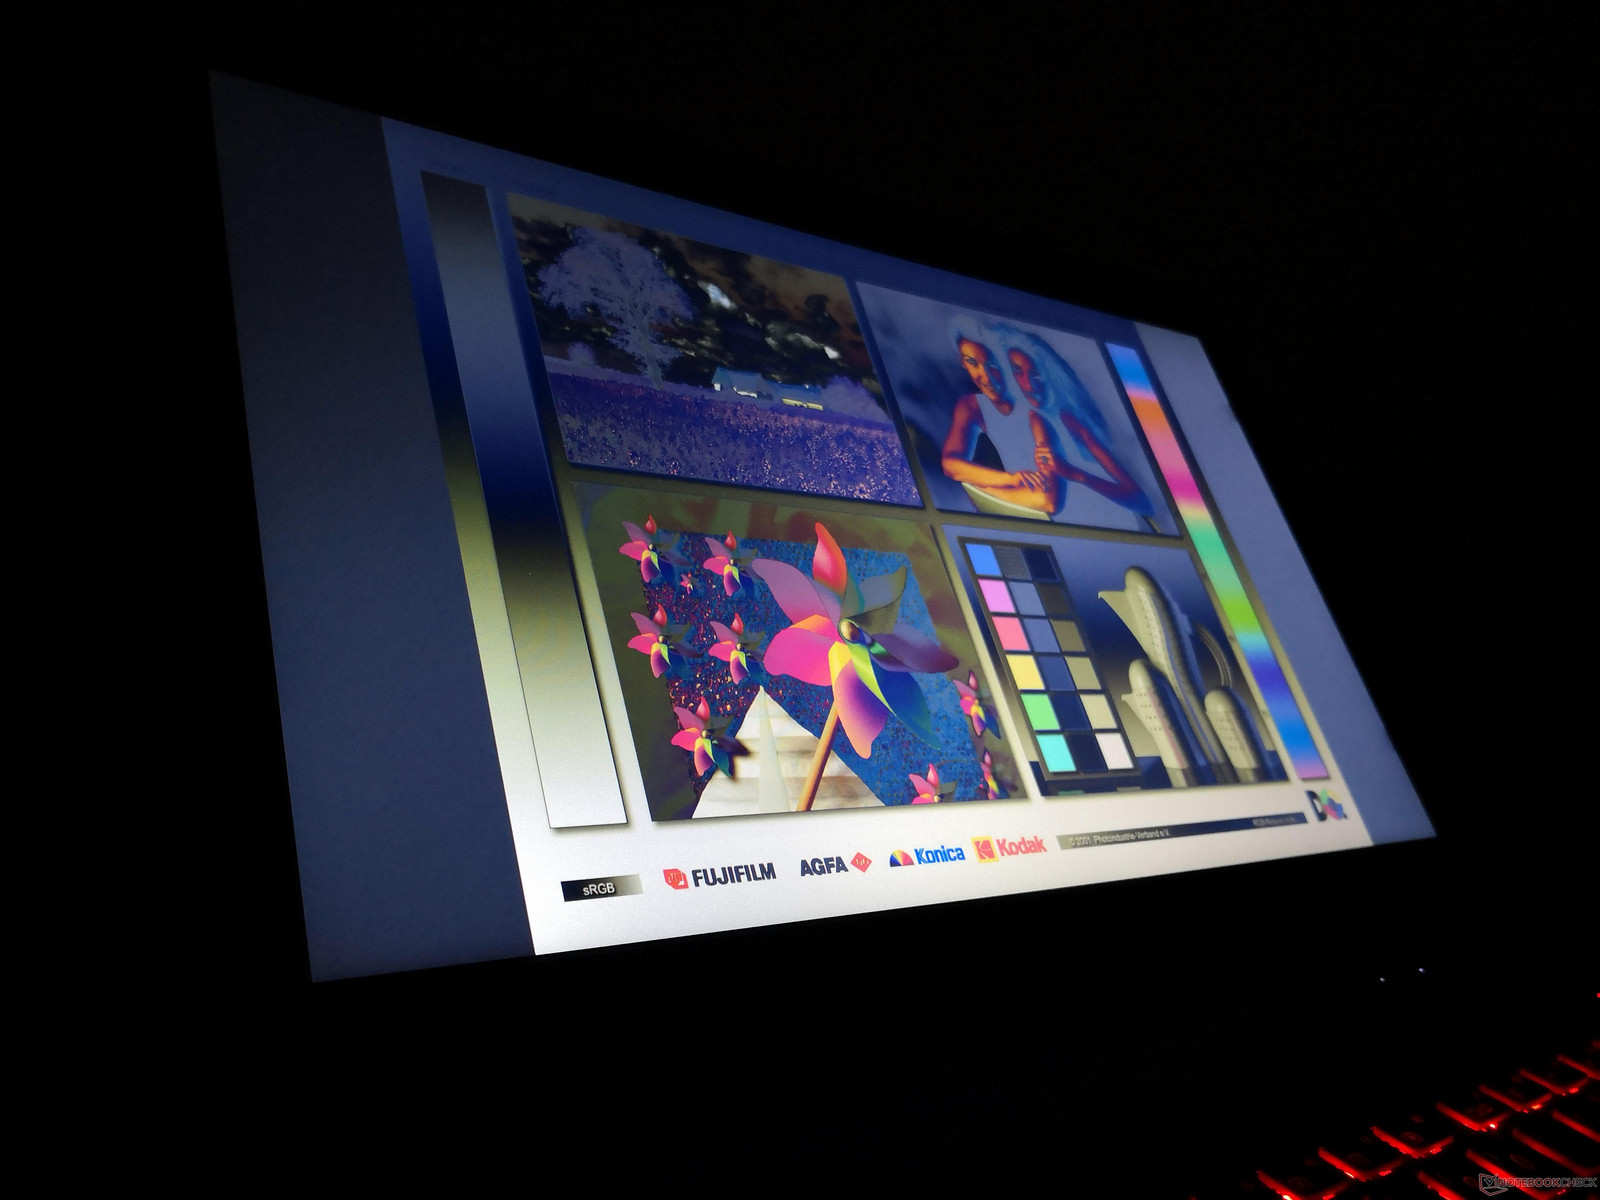
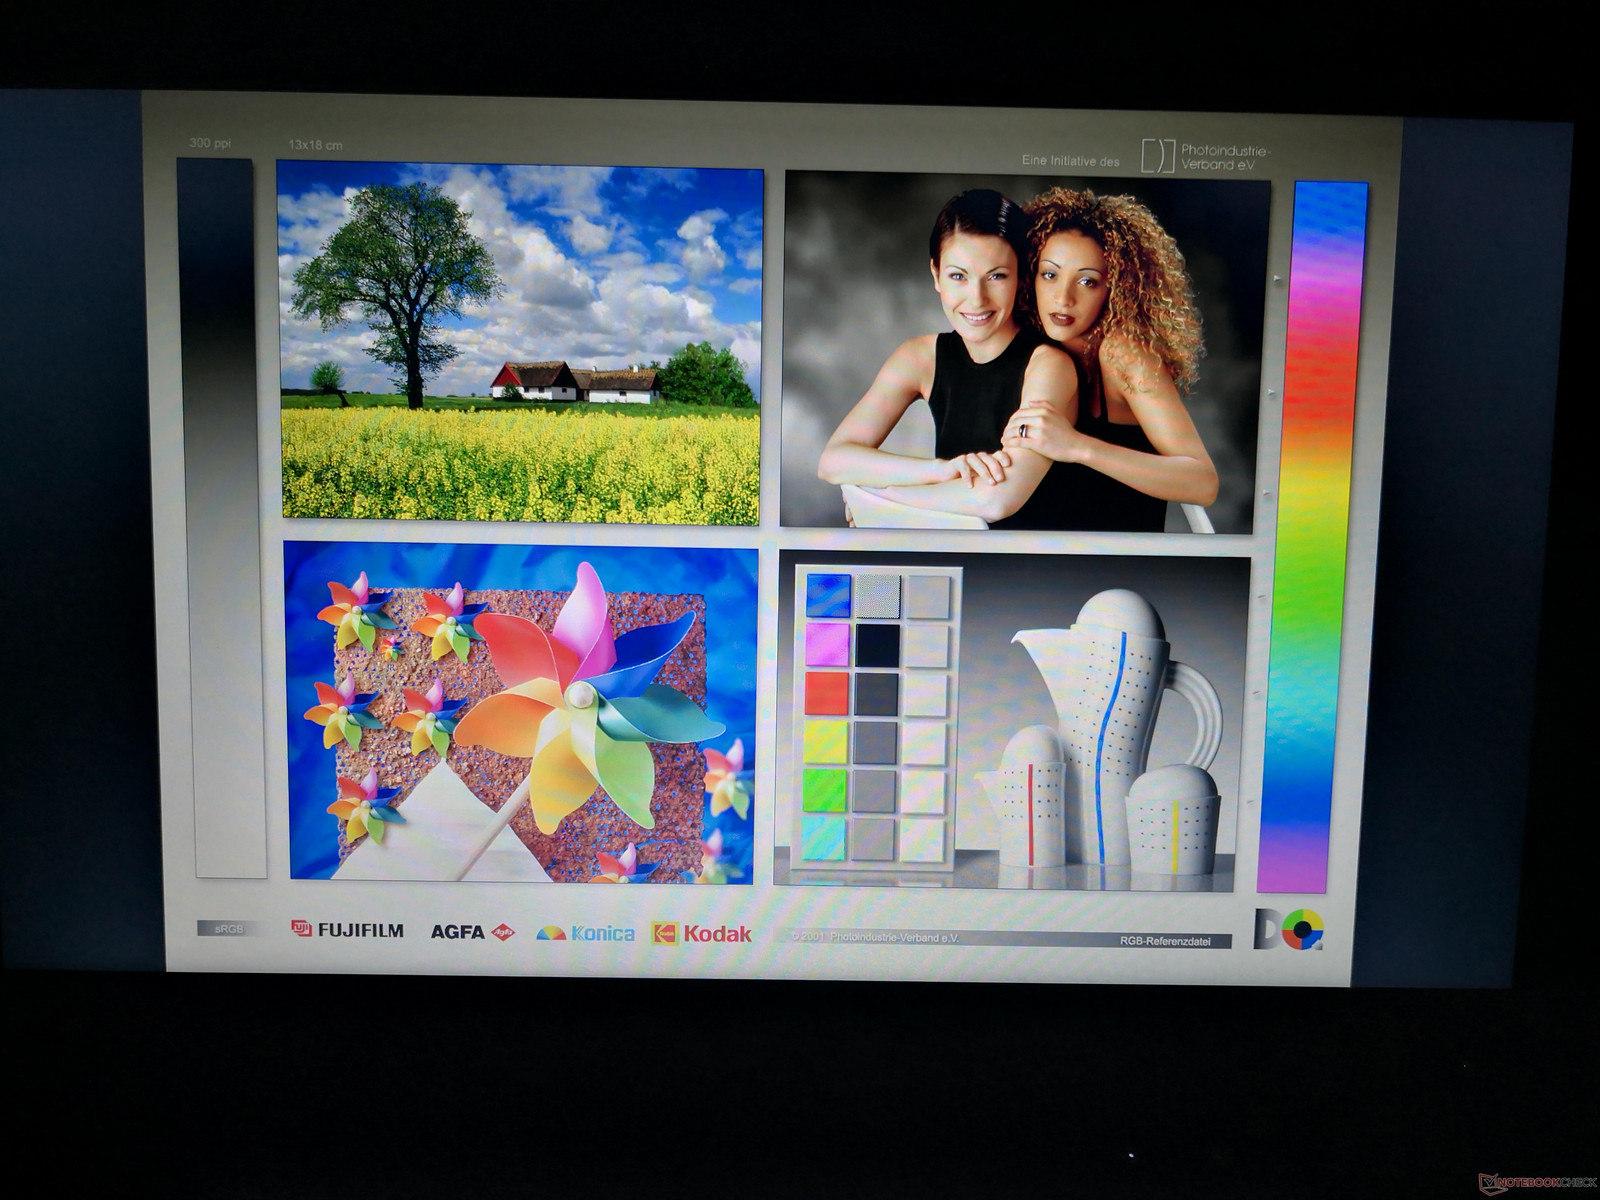
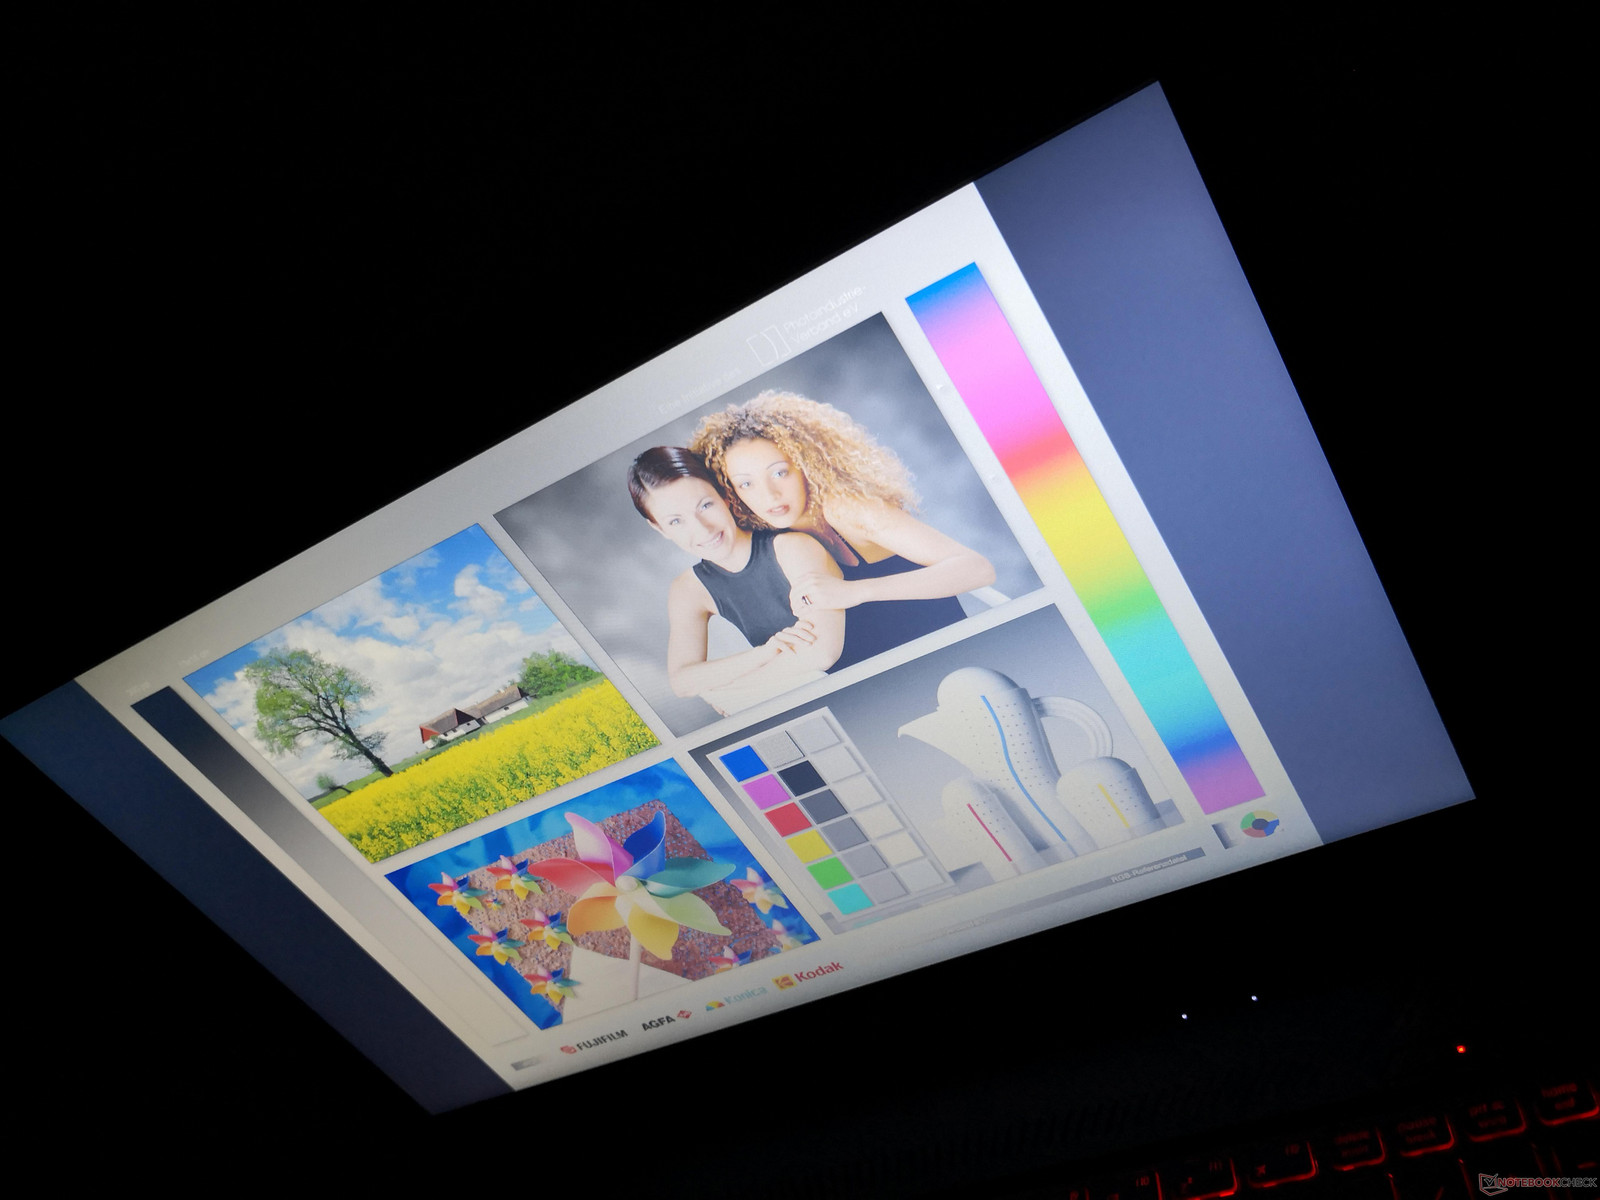
Three 1080p display options are available distinguished by the panel type (TN or IPS), refresh rate (60 Hz or 120 Hz), and color coverage (45 percent vs. 94 percent NTSC). Our test unit is equipped with the low-end 60 Hz TN option and its middling quality shows through our measurements below. Contrast is poor and colors appear muted and not very deep. Furthermore, the overlying matte panel is slightly grainy and so texts do not appear as sharp as they would on a glossy panel. This same AU Optronics B156HTN03.8 panel can also be found on the Asus X555DA and Acer Aspire E5-552G.
Benefits of TN include the lack of uneven backlight edge bleeding and faster black-white response times when compared to most IPS panels.
| |||||||||||||||||||||||||
Brightness Distribution: 85 %
Center on Battery: 260 cd/m²
Contrast: 473:1 (Black: 0.55 cd/m²)
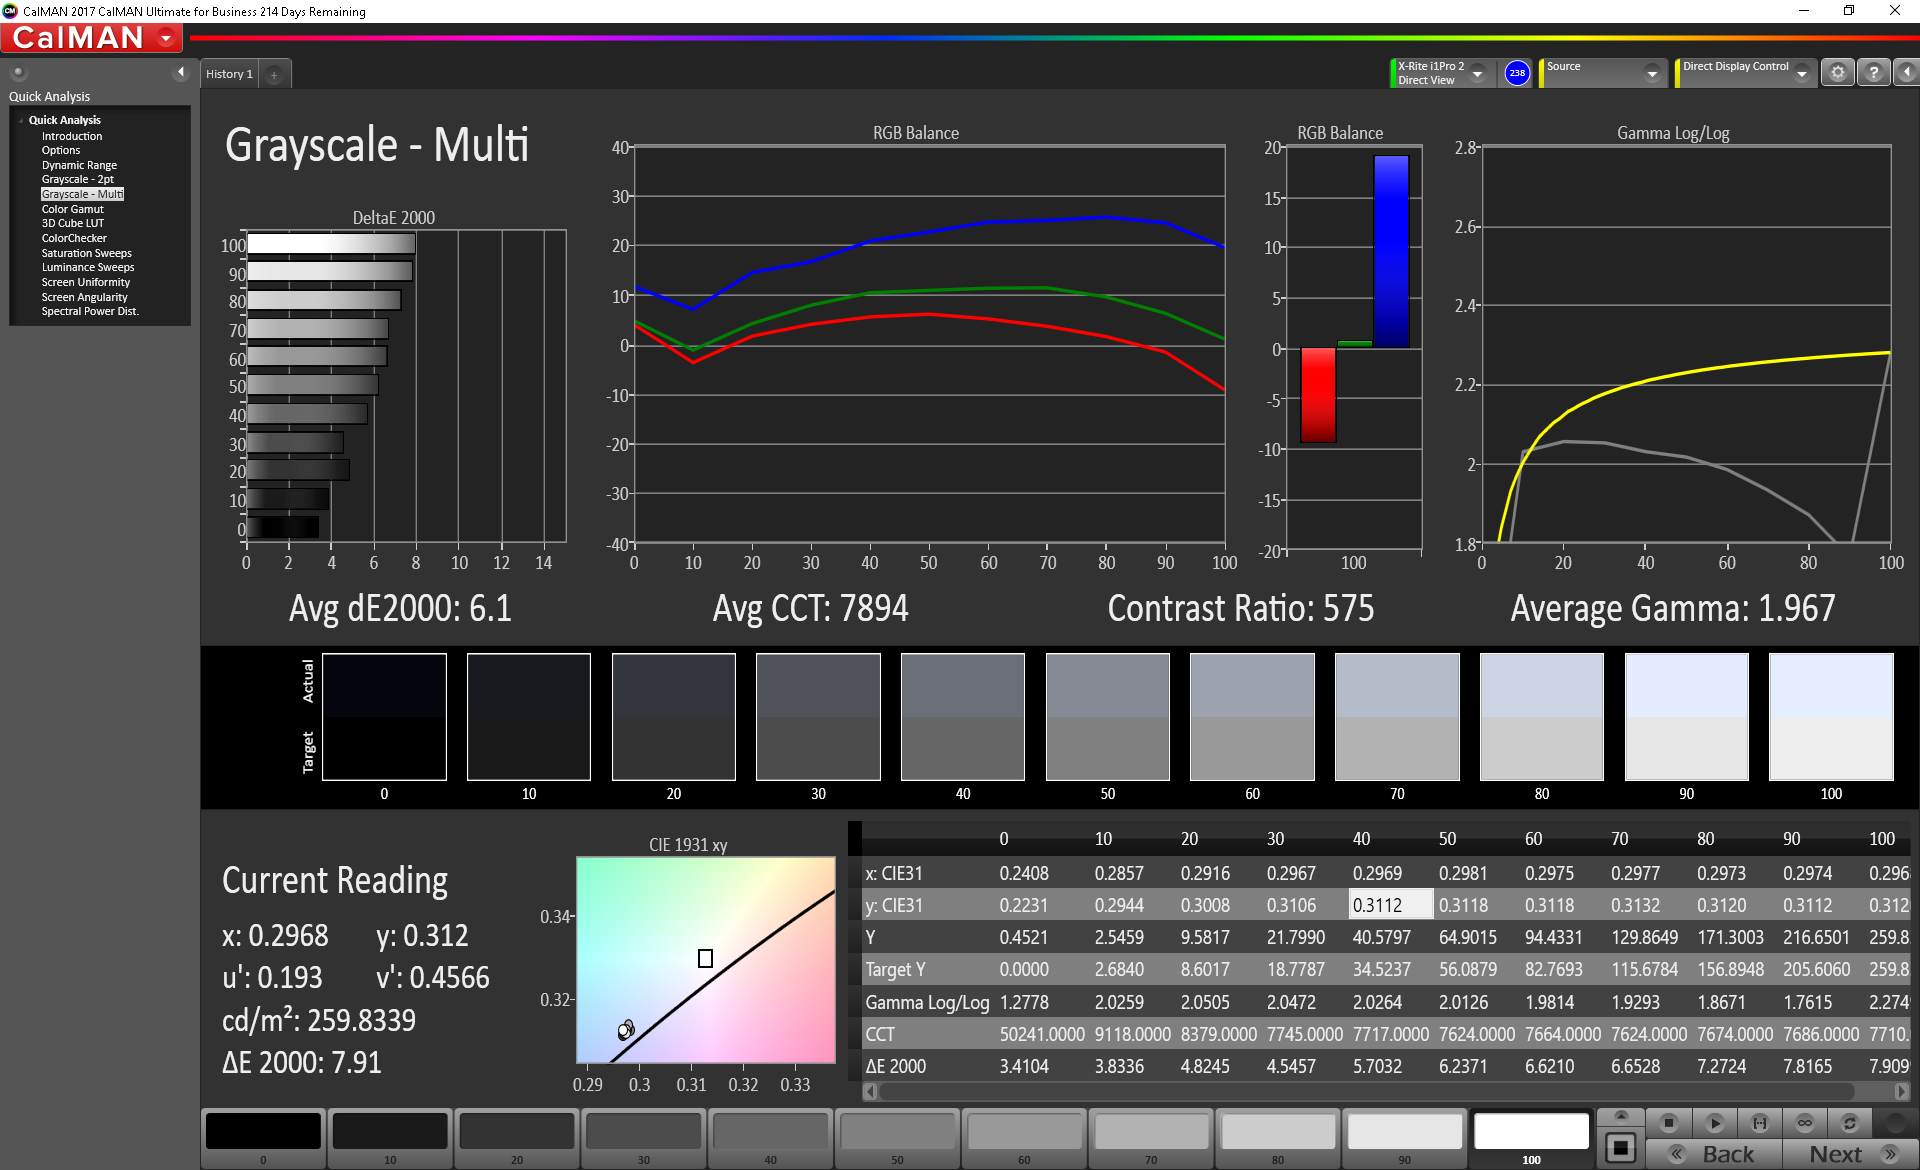
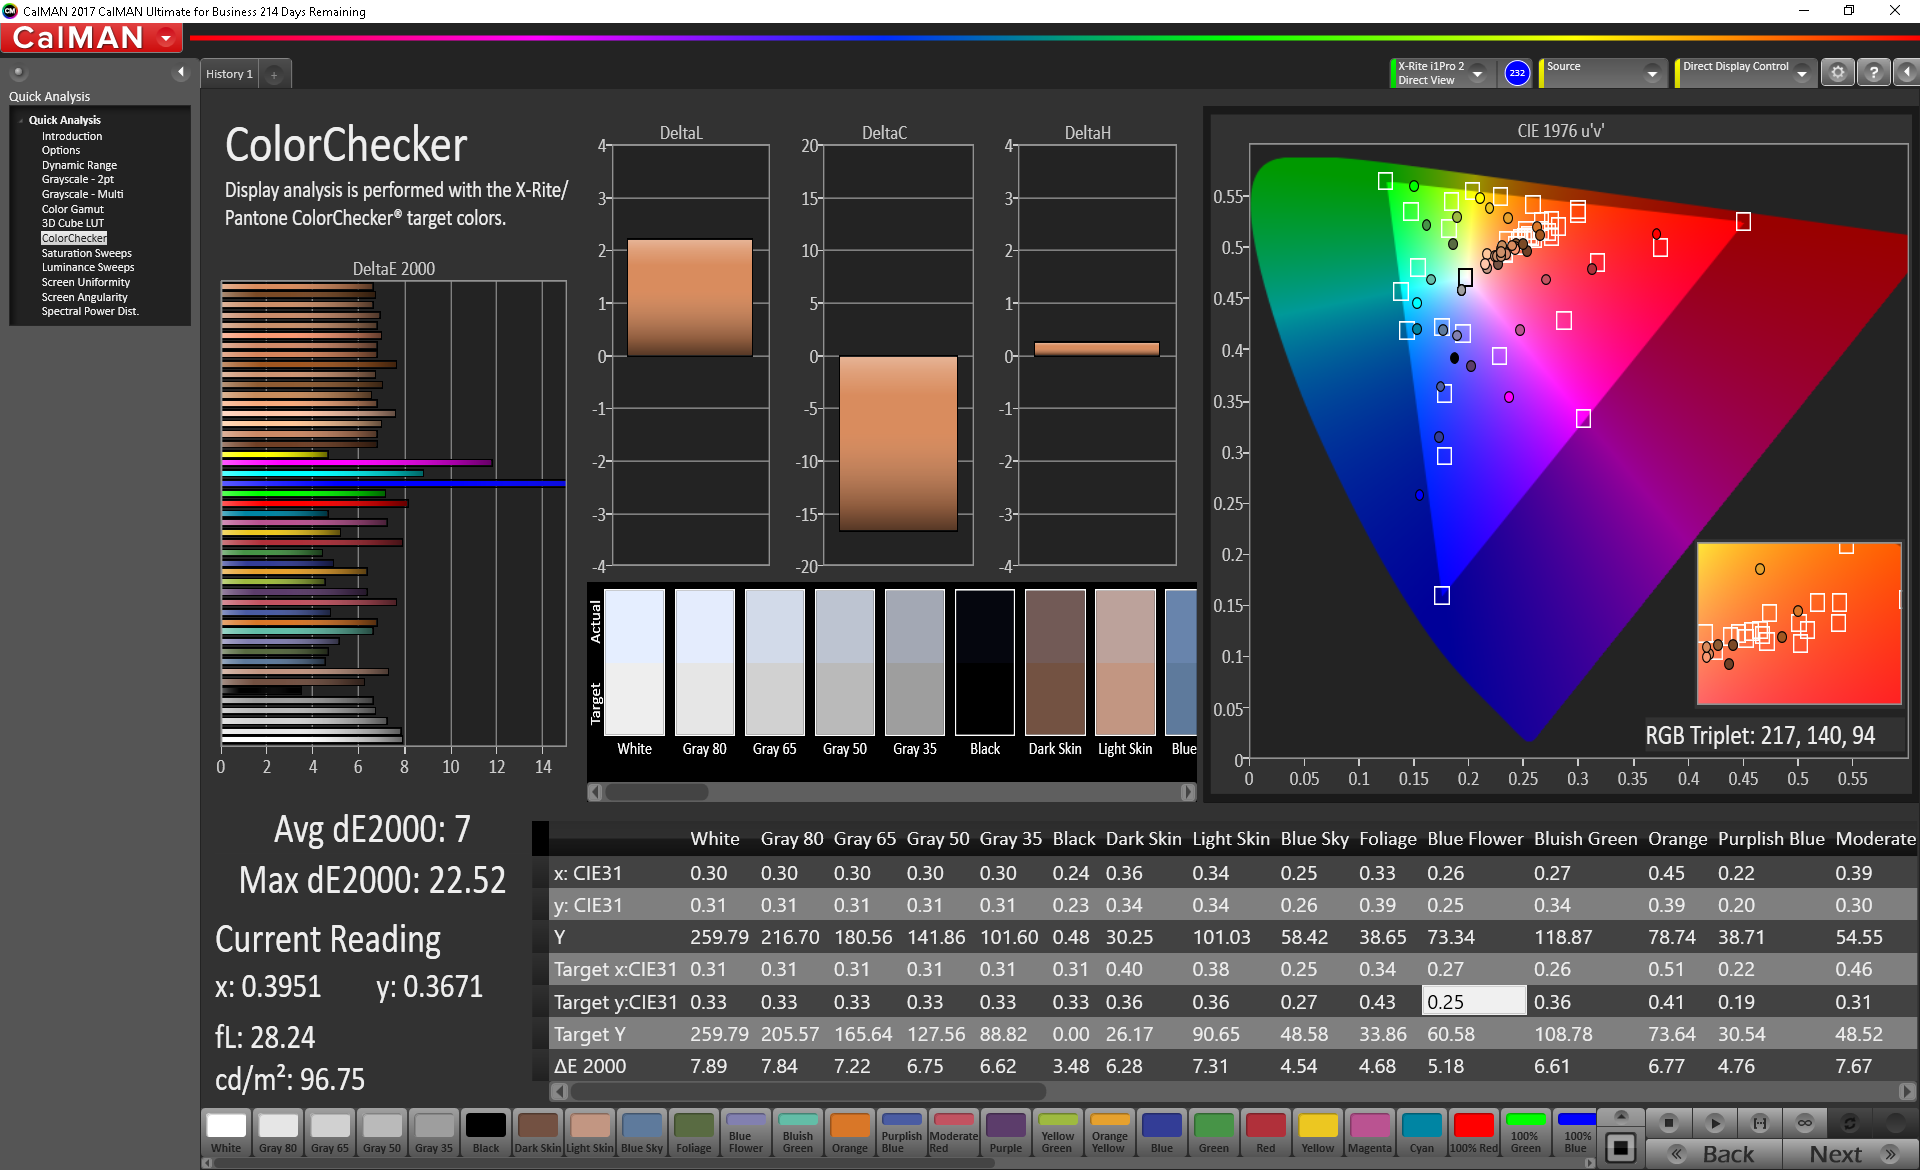
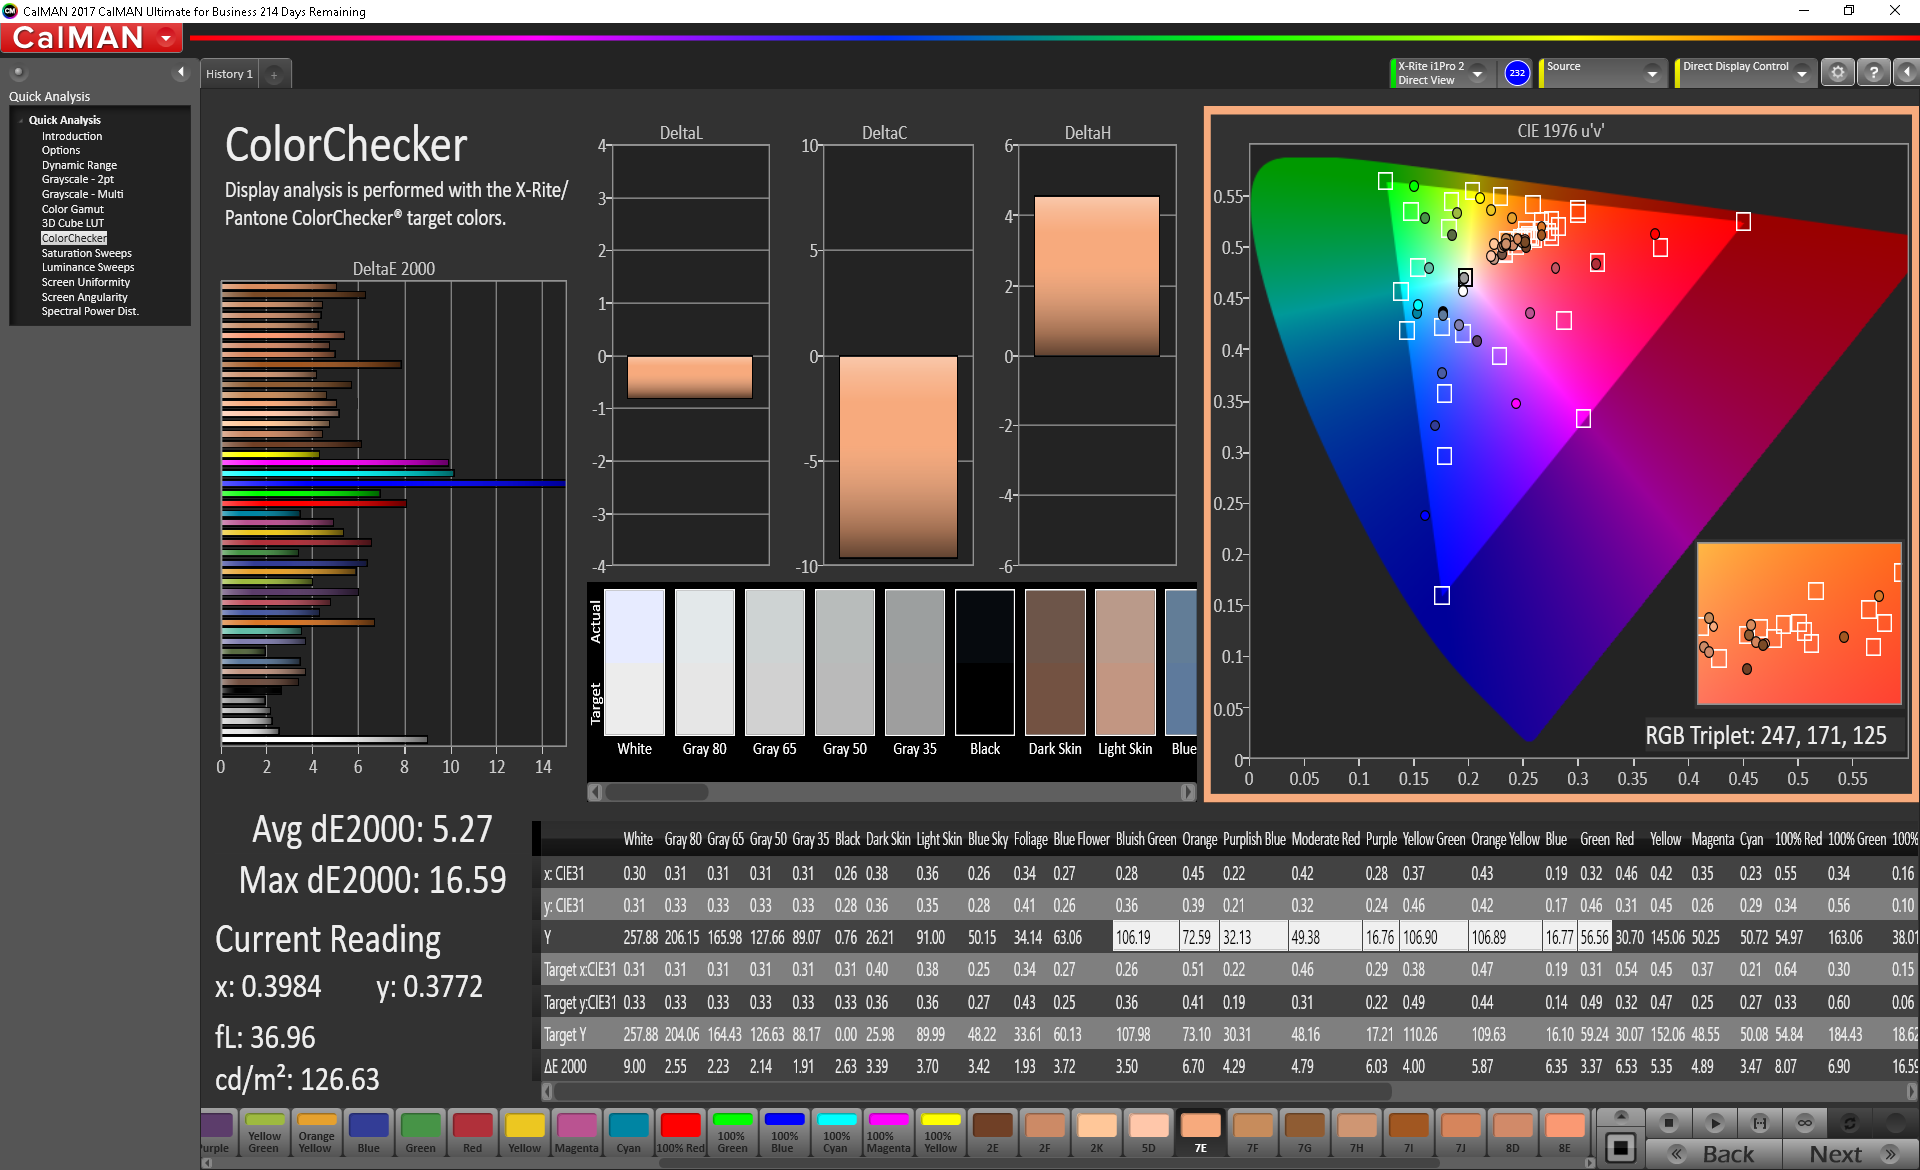
ΔE ColorChecker Calman: 7 | ∀{0.5-29.43 Ø4.71}
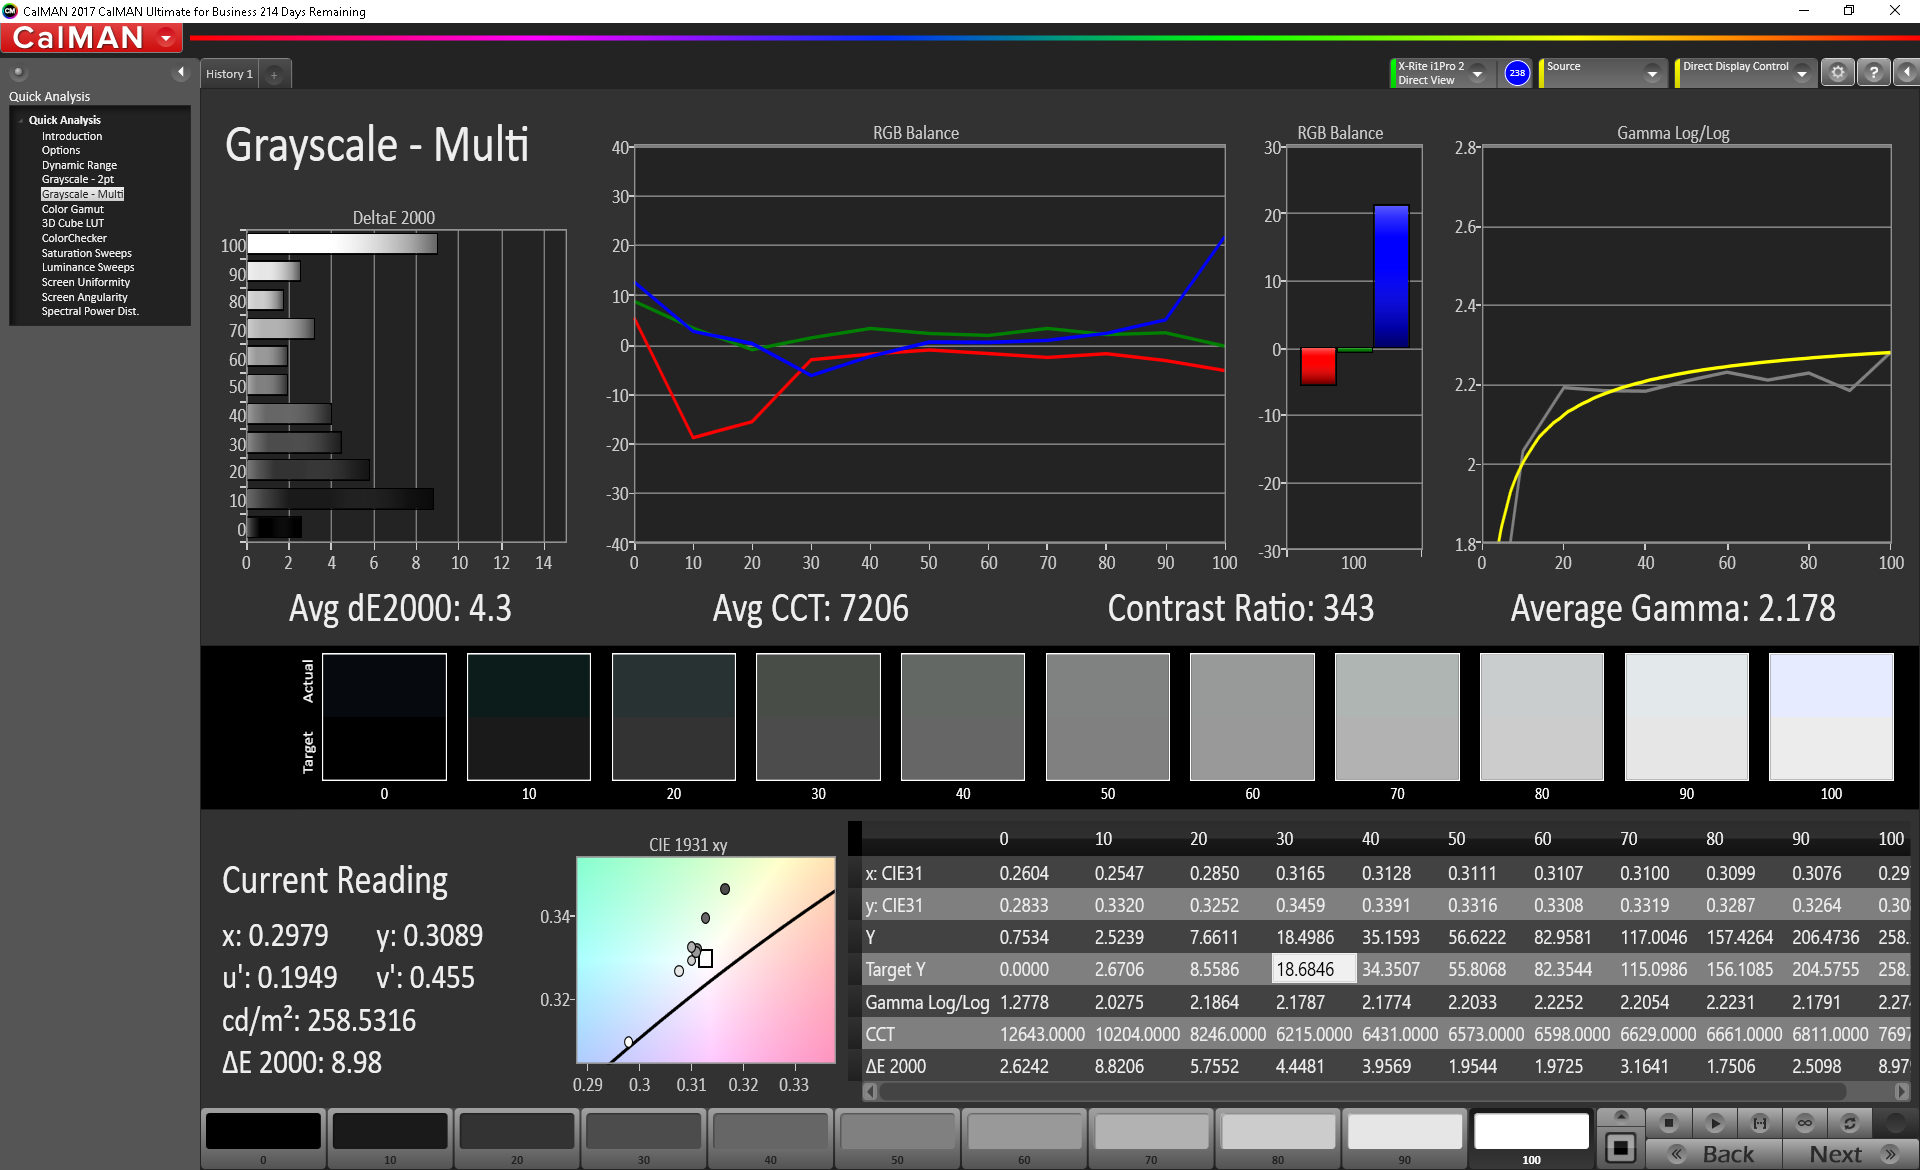
calibrated: 5.27
ΔE Greyscale Calman: 6.1 | ∀{0.09-98 Ø4.96}
61% sRGB (Argyll 1.6.3 3D)
35.5% AdobeRGB 1998 (Argyll 1.6.3 3D)
38.34% AdobeRGB 1998 (Argyll 3D)
55.8% sRGB (Argyll 3D)
37.09% Display P3 (Argyll 3D)
Gamma: 1.97
CCT: 7894 K
| Asus FX504GD AU Optronics B156HTN03.8, TN LED, 15.6", 1920x1080 | Lenovo Legion Y520-15IKBN 80WK0042GE LG Philips LP156WF6-SPK3, IPS, 15.6", 1920x1080 | Asus FX503VM-EH73 AU Optronics B156HAN06.1, IPS, 15.6", 1920x1080 | Dell Inspiron 15 7000 7577 ID: LG Philips LGD053F, Name: 156WF6, Dell P/N: 4XK13, IPS, 15.6", 1920x1080 | MSI GP62 7REX-1045US CMN N156HGE-EAL, TN LED, 15.6", 1920x1080 | Gigabyte Aero 15X v8 LGD05C0, IPS, 15.6", 1920x1080 | |
|---|---|---|---|---|---|---|
| Display | 5% | 1% | 9% | 110% | 69% | |
| Display P3 Coverage (%) | 37.09 | 39.01 5% | 37.48 1% | 40.4 9% | 85.8 131% | 63.6 71% |
| sRGB Coverage (%) | 55.8 | 58.4 5% | 56.3 1% | 60.5 8% | 100 79% | 93.8 68% |
| AdobeRGB 1998 Coverage (%) | 38.34 | 40.34 5% | 38.72 1% | 41.77 9% | 84.2 120% | 64.9 69% |
| Response Times | -43% | -48% | -42% | -27% | 43% | |
| Response Time Grey 50% / Grey 80% * (ms) | 41.6 ? | 39 ? 6% | 36.8 ? 12% | 41 ? 1% | 34.4 ? 17% | 16.8 ? 60% |
| Response Time Black / White * (ms) | 15.2 ? | 29 ? -91% | 31.6 ? -108% | 28 ? -84% | 26 ? -71% | 11.2 ? 26% |
| PWM Frequency (Hz) | 21000 ? | 200 ? | ||||
| Screen | 19% | 21% | 39% | 3% | 56% | |
| Brightness middle (cd/m²) | 260 | 283 9% | 235.9 -9% | 257 -1% | 265.7 2% | 313 20% |
| Brightness (cd/m²) | 241 | 281 17% | 235 -2% | 229 -5% | 243 1% | 300 24% |
| Brightness Distribution (%) | 85 | 91 7% | 91 7% | 84 -1% | 87 2% | 78 -8% |
| Black Level * (cd/m²) | 0.55 | 0.39 29% | 0.27 51% | 0.17 69% | 0.63 -15% | 0.33 40% |
| Contrast (:1) | 473 | 726 53% | 874 85% | 1512 220% | 422 -11% | 948 100% |
| Colorchecker dE 2000 * | 7 | 6.1 13% | 4.81 31% | 5.34 24% | 9.6 -37% | 1.29 82% |
| Colorchecker dE 2000 max. * | 22.52 | 11.08 51% | 21.55 4% | 9.99 56% | 18.5 18% | 2.04 91% |
| Colorchecker dE 2000 calibrated * | 5.27 | |||||
| Greyscale dE 2000 * | 6.1 | 5.69 7% | 3.1 49% | 4.82 21% | 12.7 -108% | 0.69 89% |
| Gamma | 1.97 112% | 2.44 90% | 2.31 95% | 2.46 89% | 2.01 109% | 2.43 91% |
| CCT | 7894 82% | 6702 97% | 6984 93% | 6587 99% | 13654 48% | 6550 99% |
| Color Space (Percent of AdobeRGB 1998) (%) | 35.5 | 37 4% | 36 1% | 38 7% | 76 114% | 60 69% |
| Color Space (Percent of sRGB) (%) | 61 | 58 -5% | 56 -8% | 60 -2% | 100 64% | 94 54% |
| Total Average (Program / Settings) | -6% /
8% | -9% /
8% | 2% /
22% | 29% /
20% | 56% /
57% |
* ... smaller is better
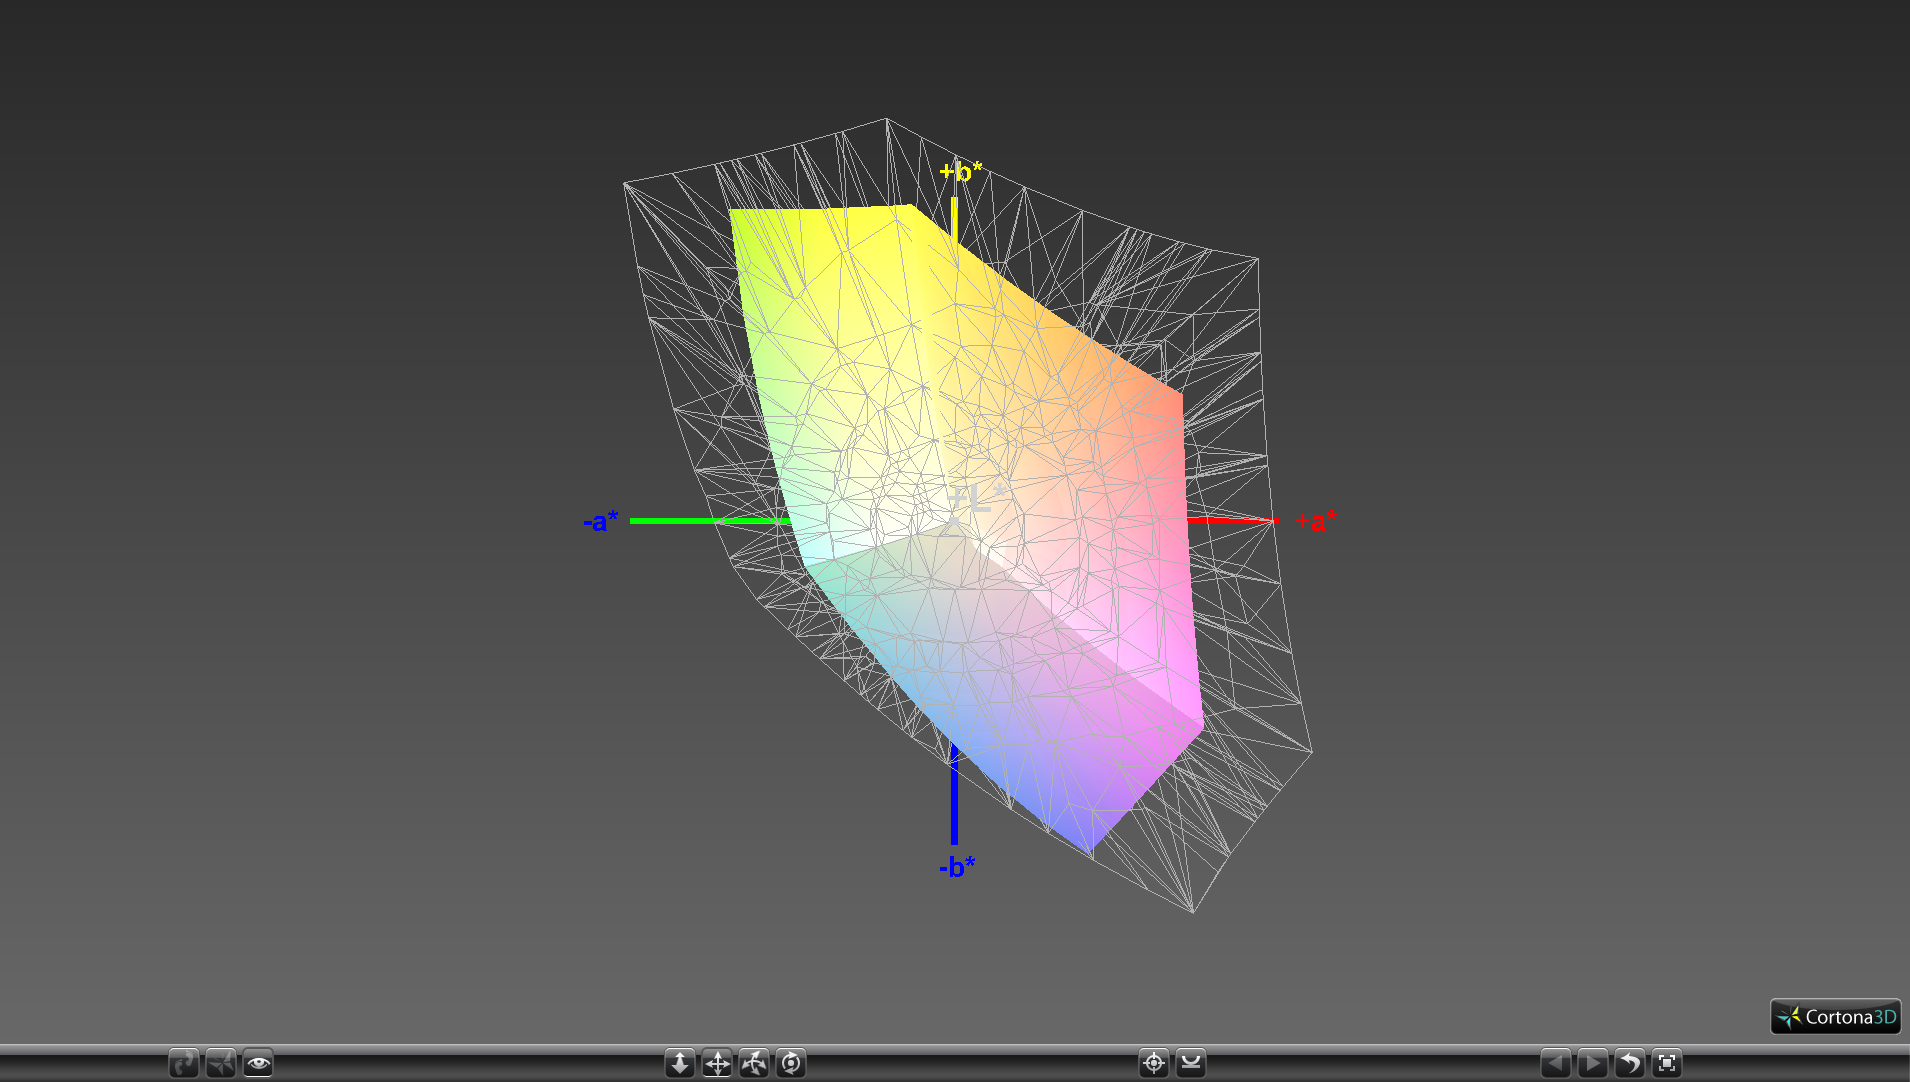
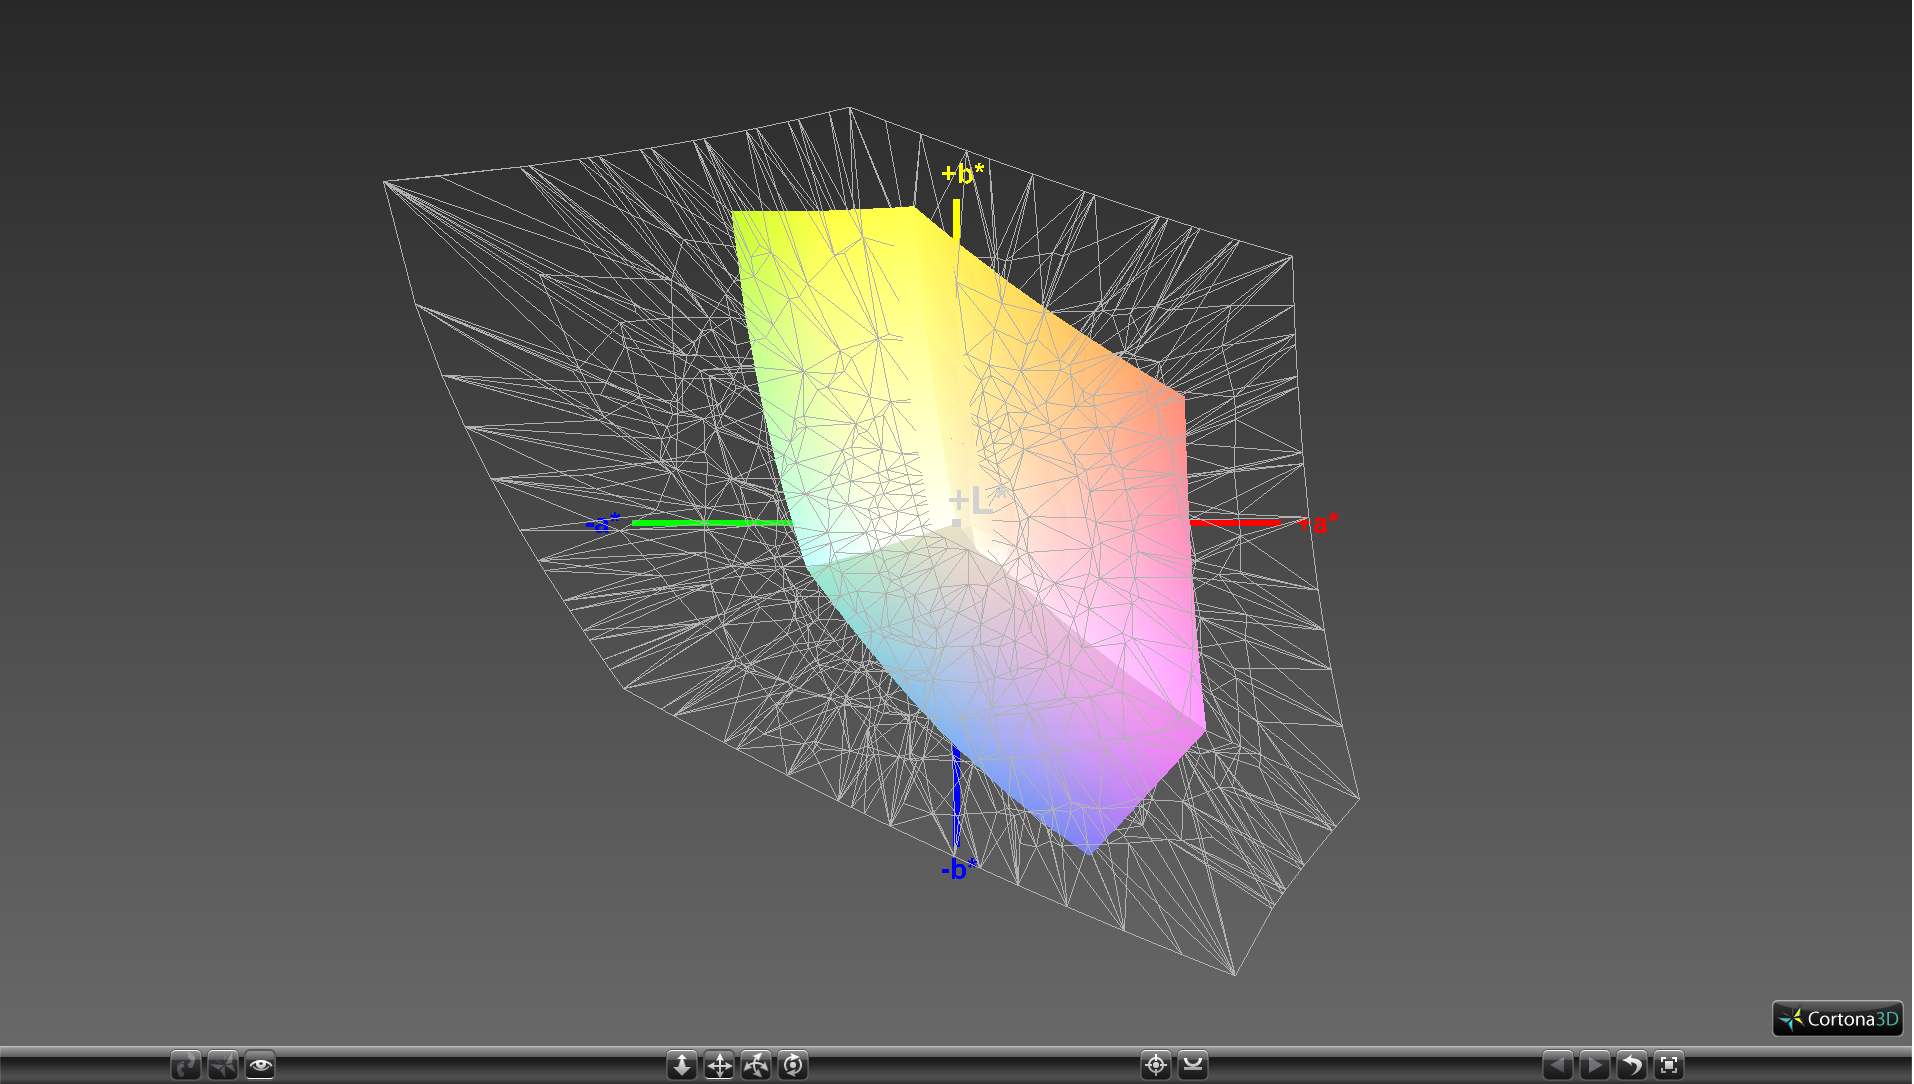
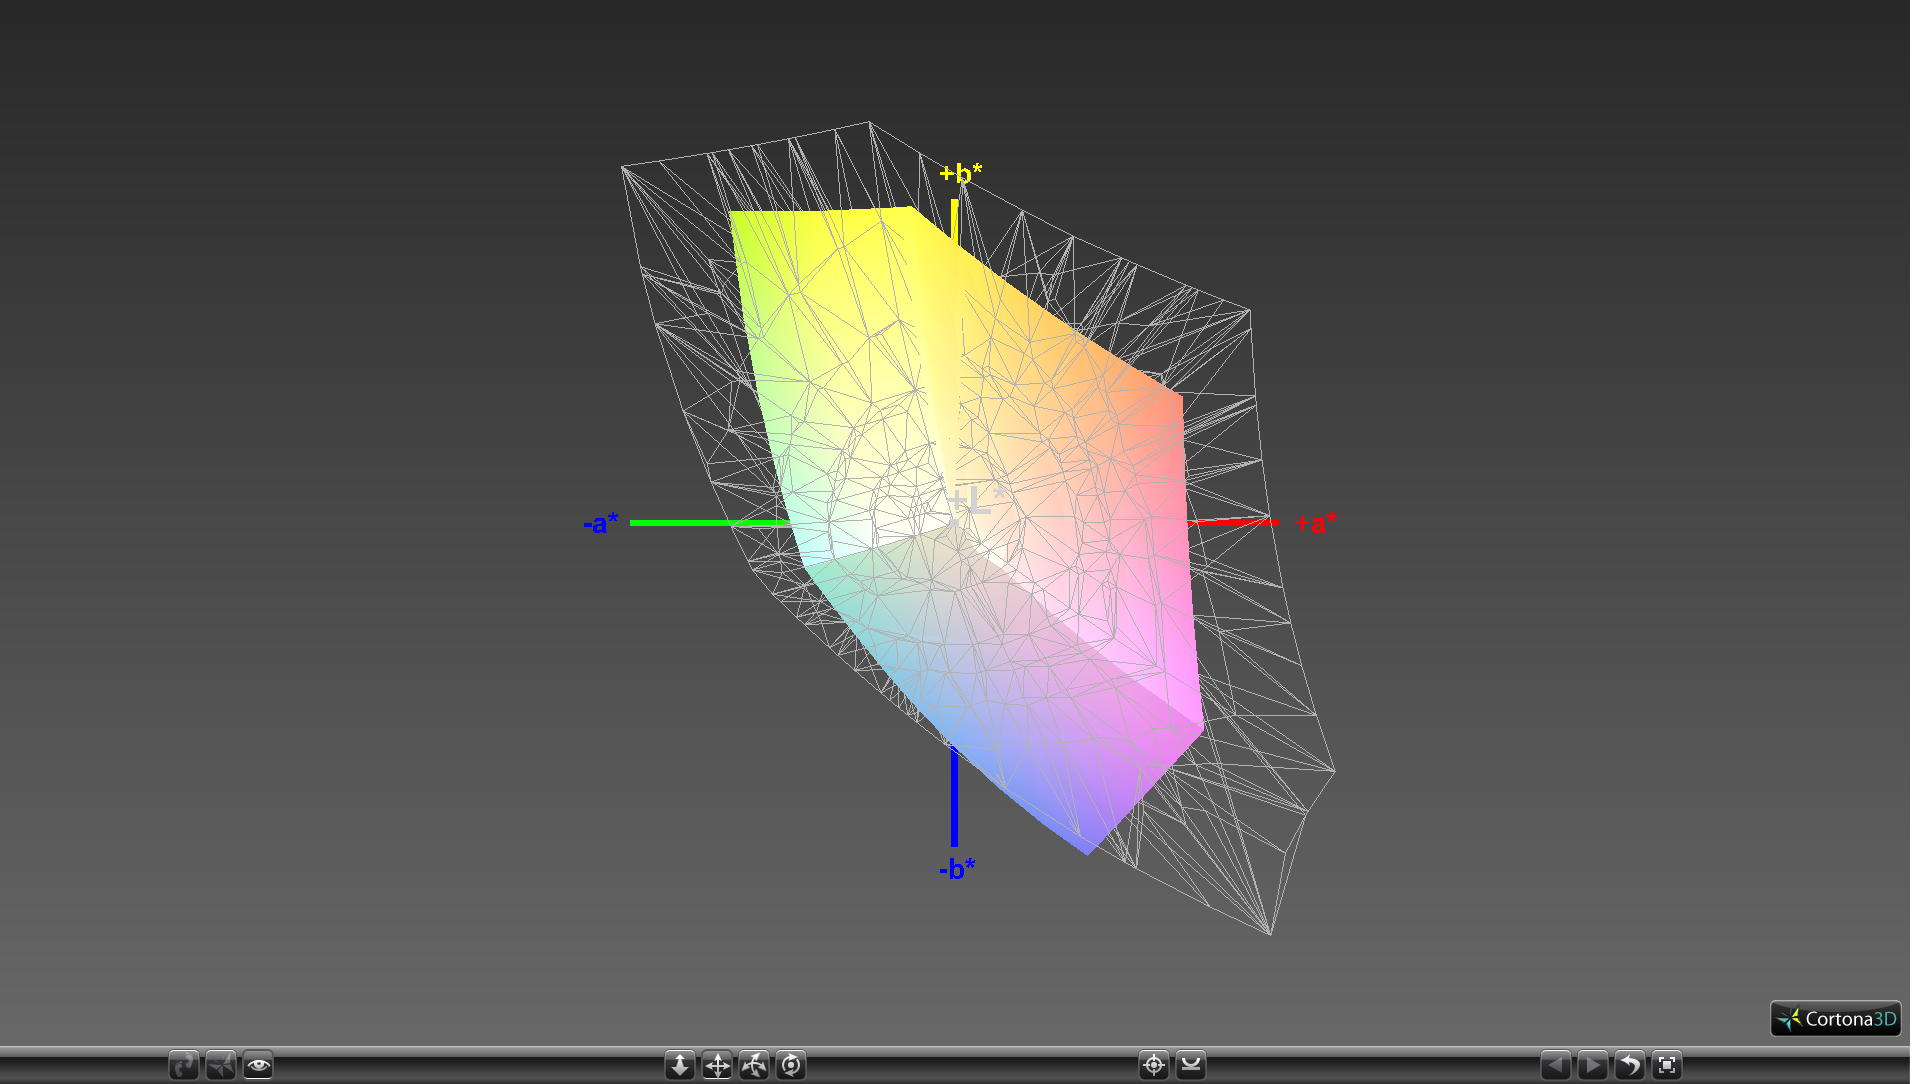
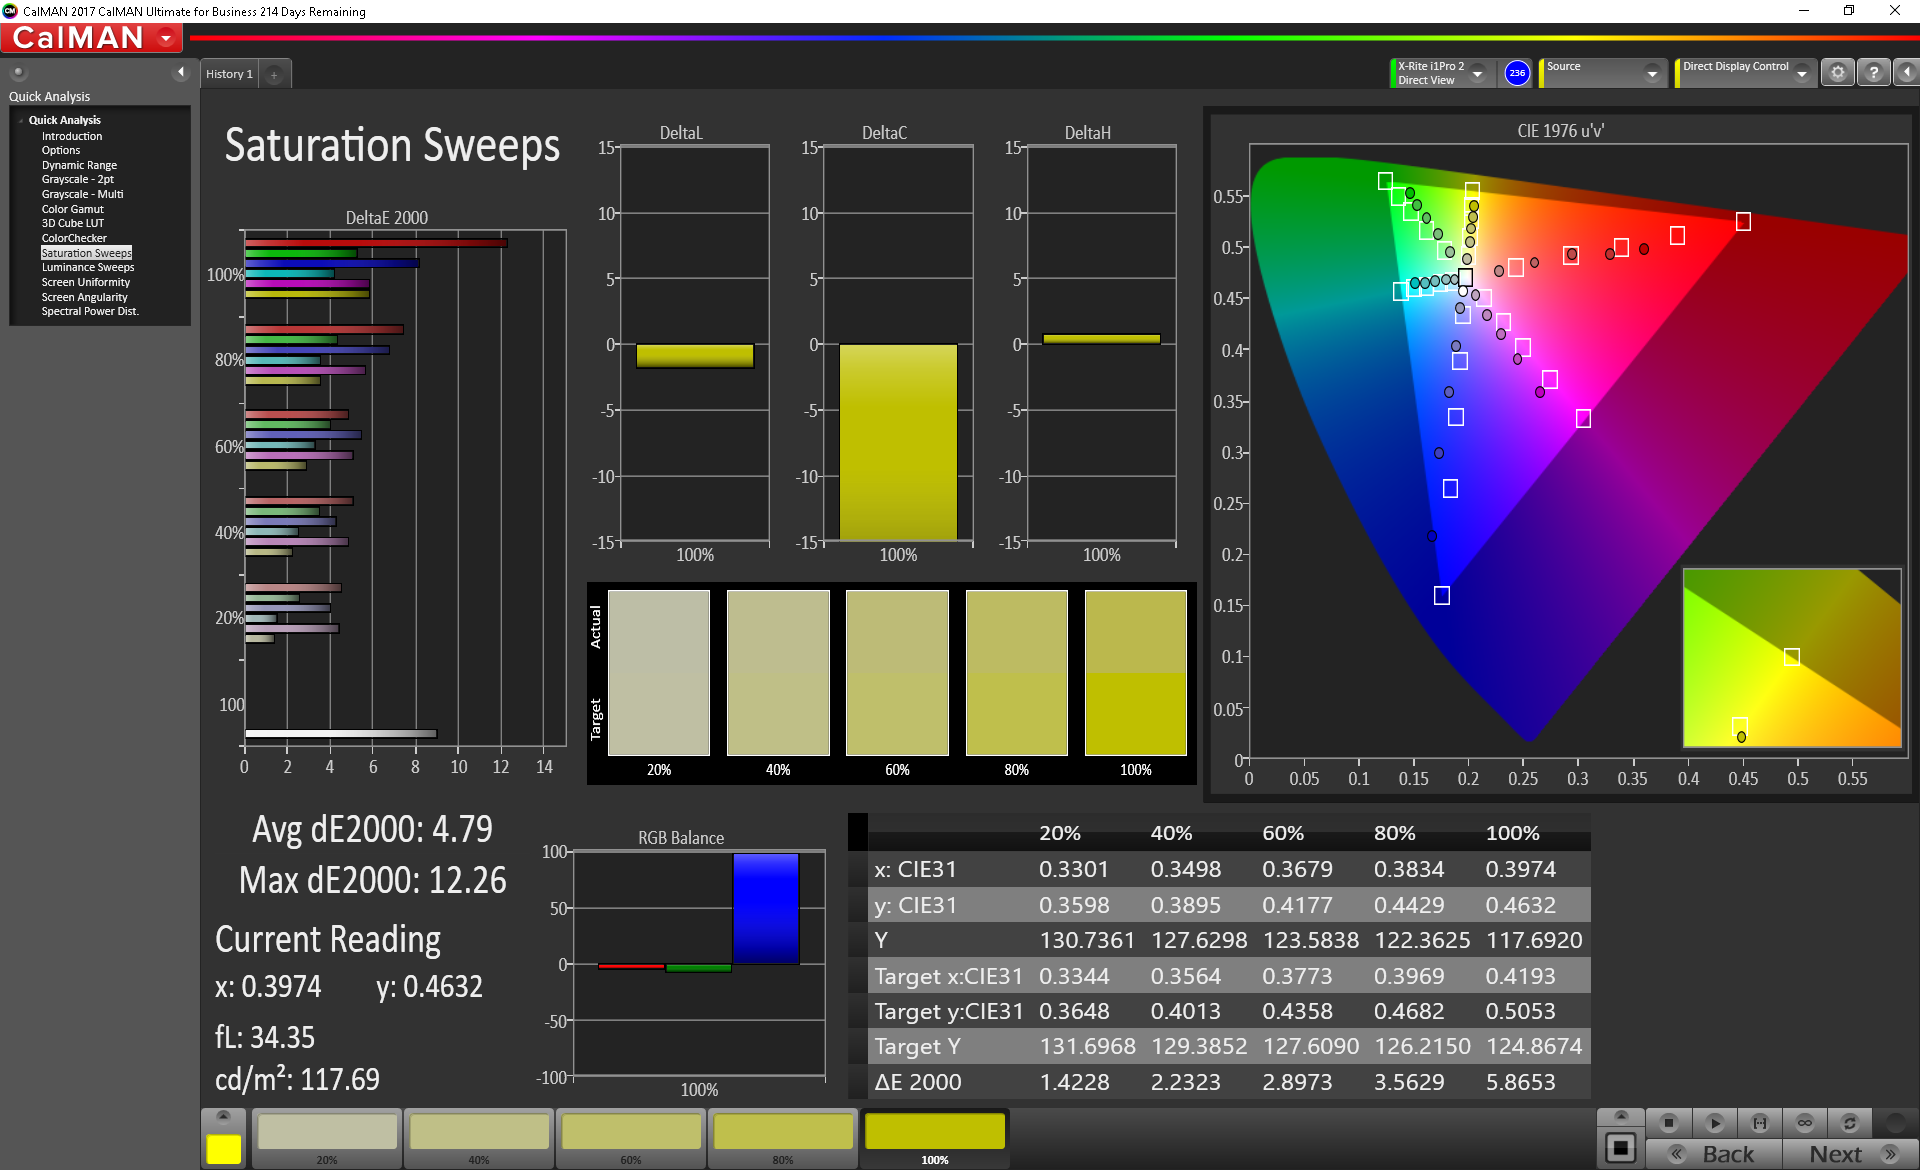
Reproducible color space is limited to only 36 percent and 61 percent of the AdobeRGB and sRGB standards, respectively, which is typical of cheap TN panels. The narrow gamut is responsible for the muted colors as mentioned above. Digital artists may want to consider the more color-accurate panel option for the FX504 or a different notebook altogether.
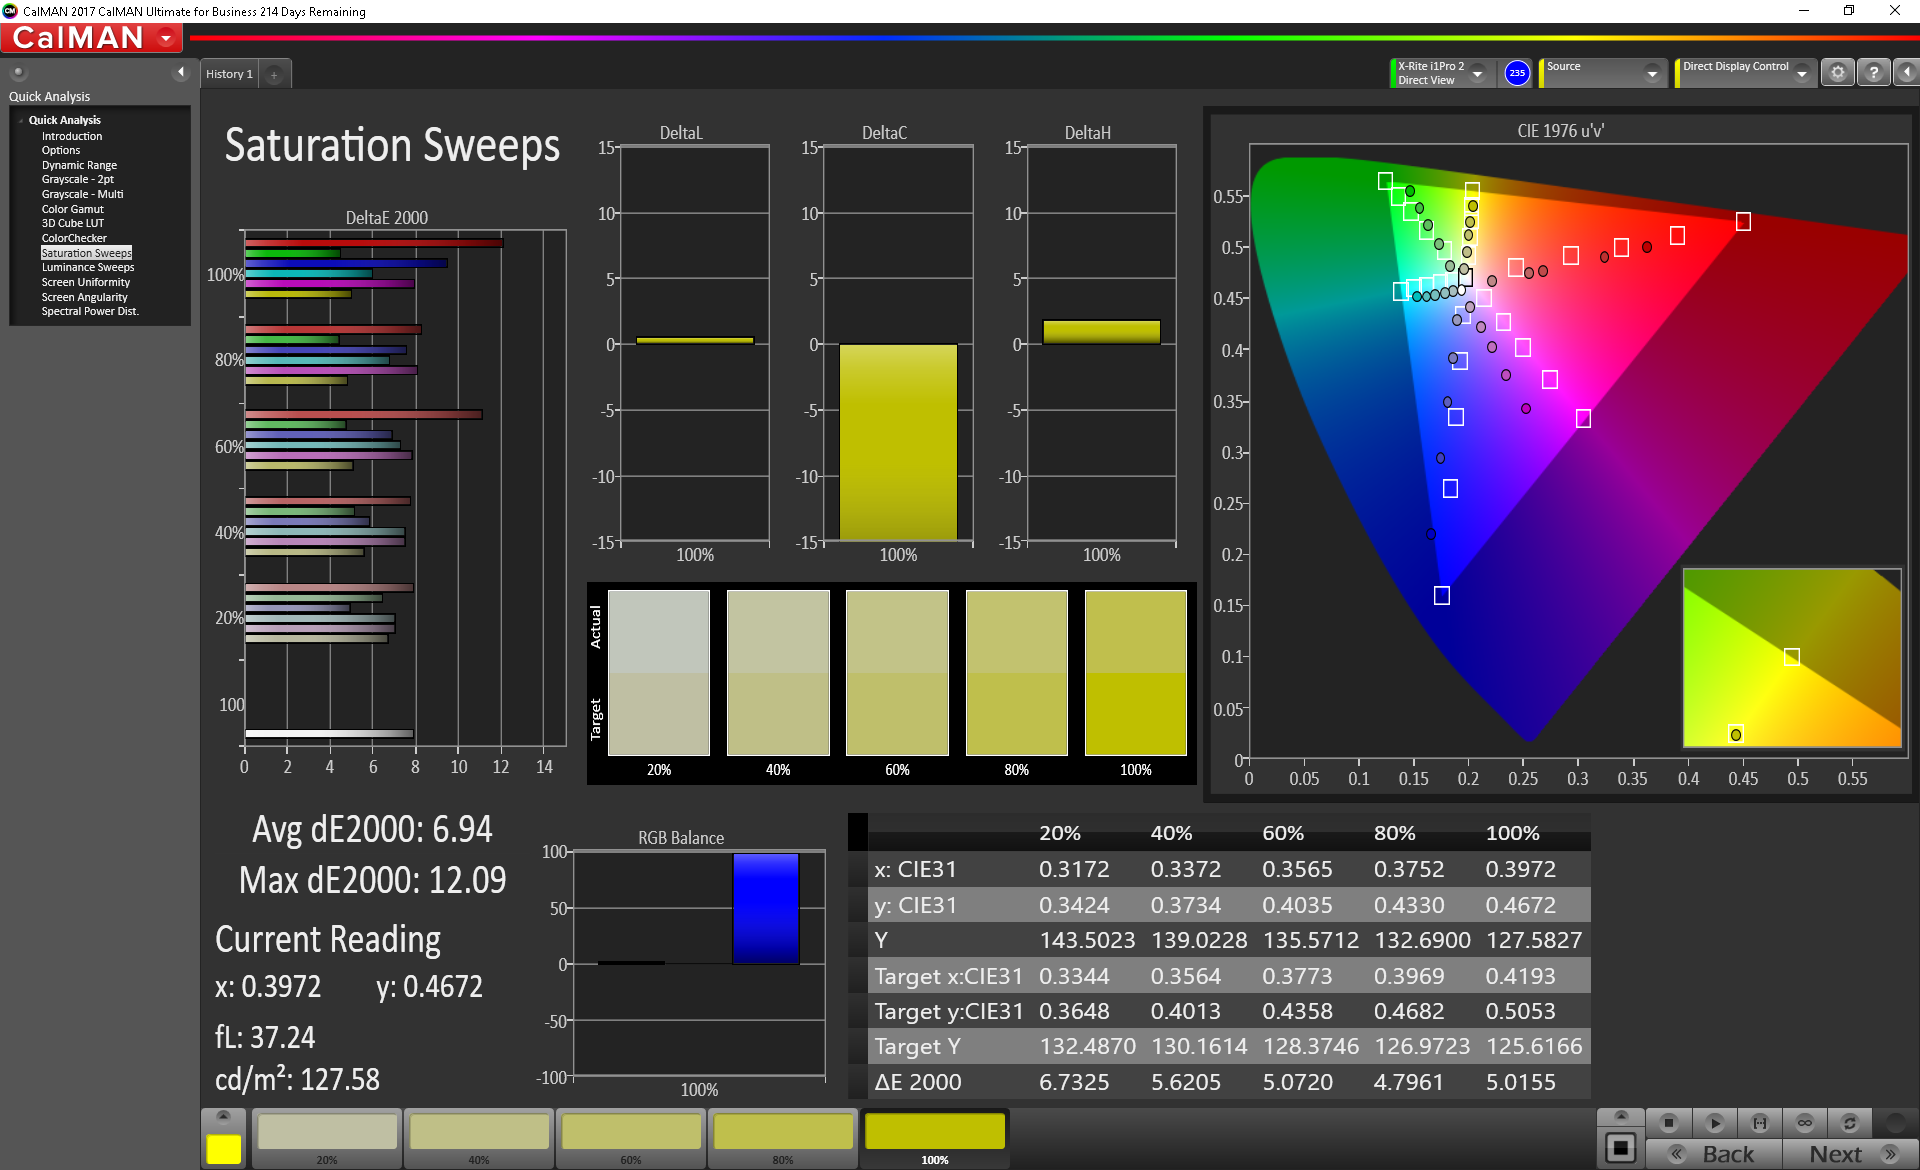
Further measurements with a X-Rite spectrophotometer reveal generally inaccurate colors and grayscale out of the box. Color temperature is much too cool and RGB is off balance to indicate a budget panel. Our calibration efforts improve grayscale and RGB balance to a degree, but calibrations can only go so far when the gamut is so narrow. Colors become increasingly inaccurate the higher the saturation level due to the limited sRGB coverage.
Display Response Times
| ↔ Response Time Black to White | ||
|---|---|---|
| 15.2 ms ... rise ↗ and fall ↘ combined | ↗ 10 ms rise | 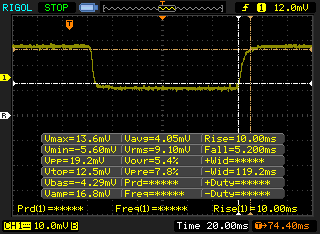 |
| ↘ 5.2 ms fall | ||
| The screen shows good response rates in our tests, but may be too slow for competitive gamers. In comparison, all tested devices range from 0.1 (minimum) to 240 (maximum) ms. » 37 % of all devices are better. This means that the measured response time is better than the average of all tested devices (19.8 ms). | ||
| ↔ Response Time 50% Grey to 80% Grey | ||
| 41.6 ms ... rise ↗ and fall ↘ combined | ↗ 19.6 ms rise | 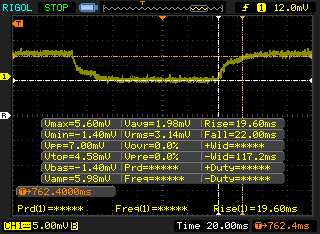 |
| ↘ 22 ms fall | ||
| The screen shows slow response rates in our tests and will be unsatisfactory for gamers. In comparison, all tested devices range from 0.165 (minimum) to 636 (maximum) ms. » 67 % of all devices are better. This means that the measured response time is worse than the average of all tested devices (30.9 ms). | ||
Screen Flickering / PWM (Pulse-Width Modulation)
| Screen flickering / PWM not detected |  | ||
In comparison: 52 % of all tested devices do not use PWM to dim the display. If PWM was detected, an average of 7741 (minimum: 5 - maximum: 343500) Hz was measured. | |||
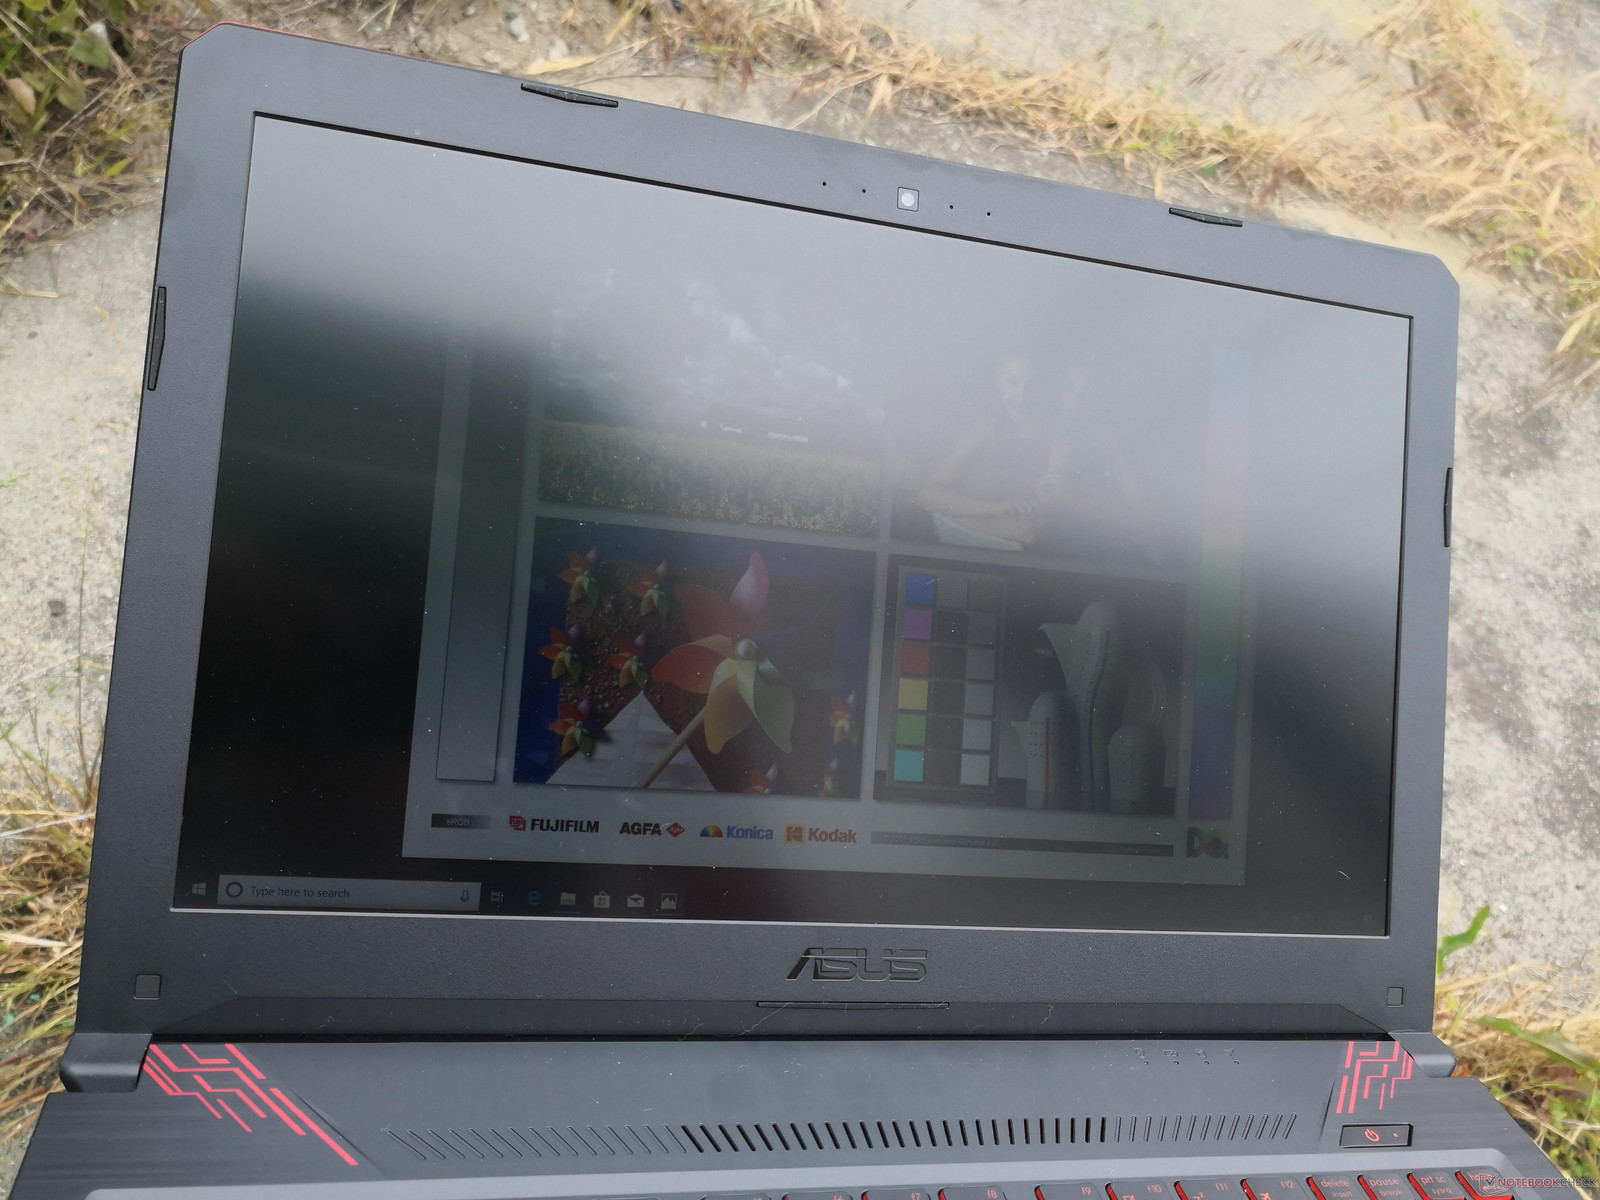
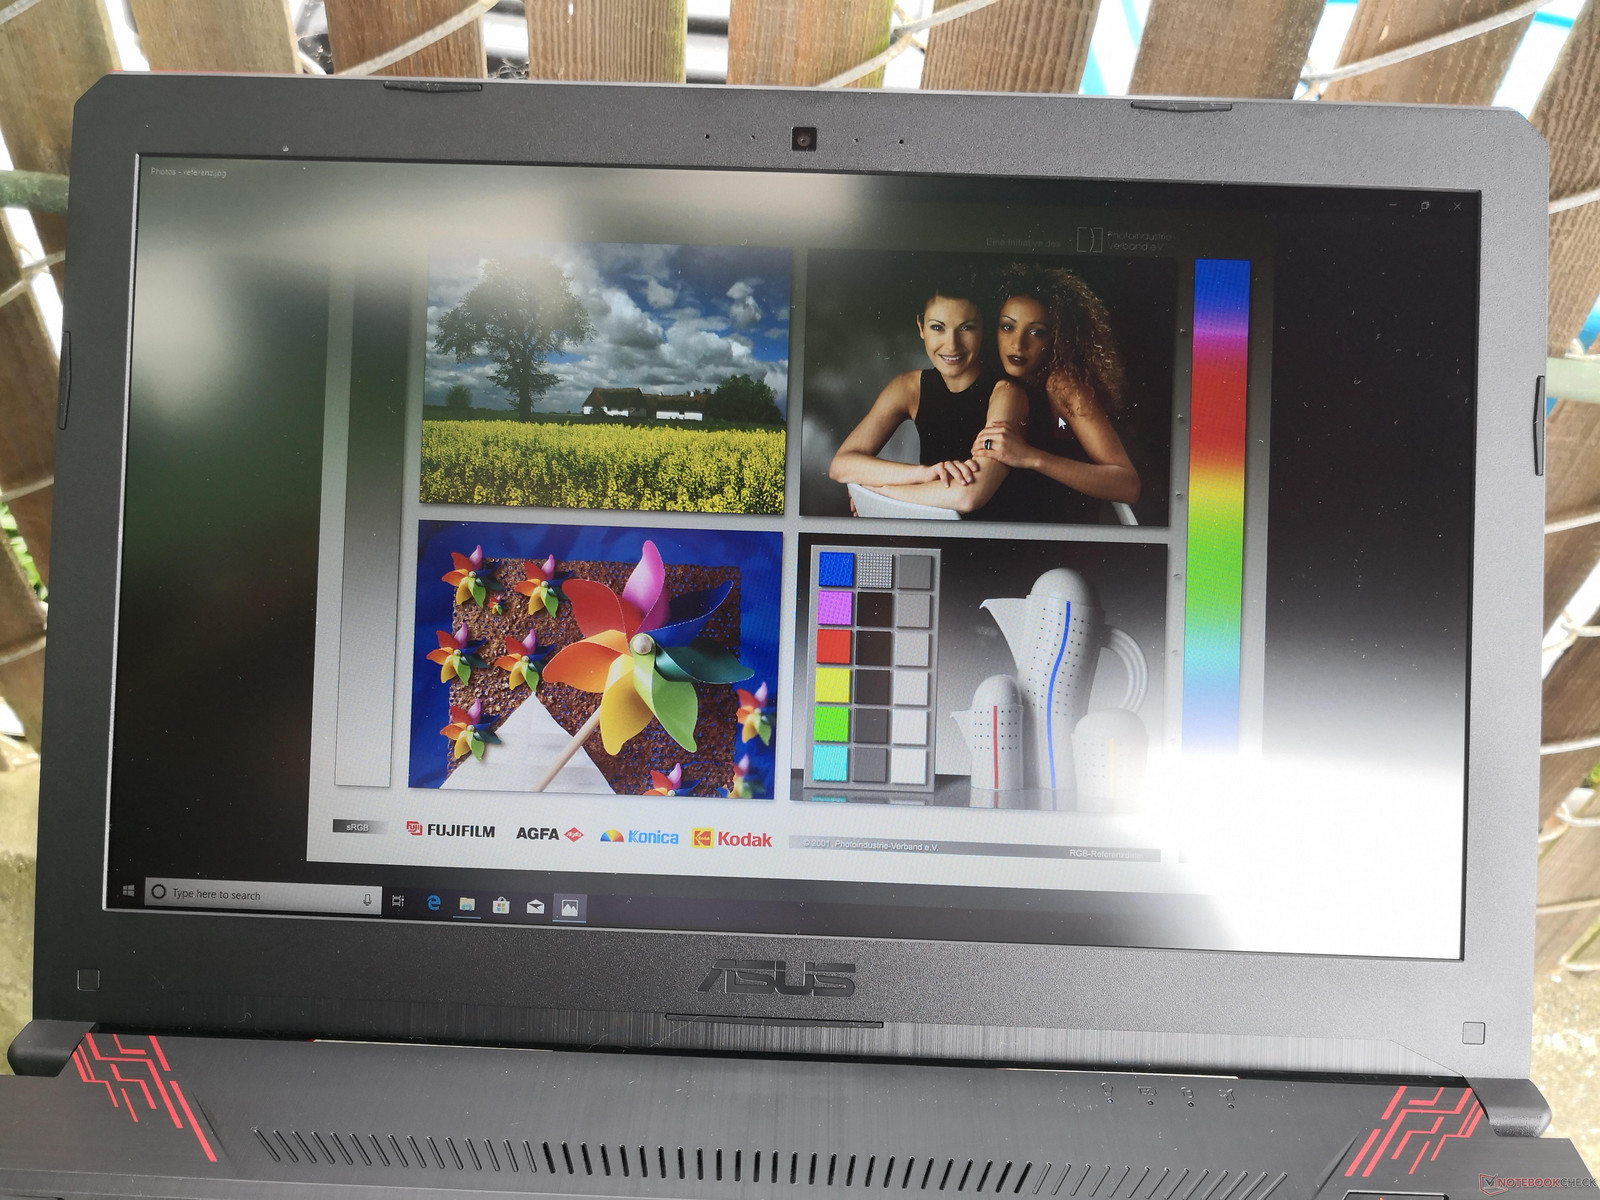
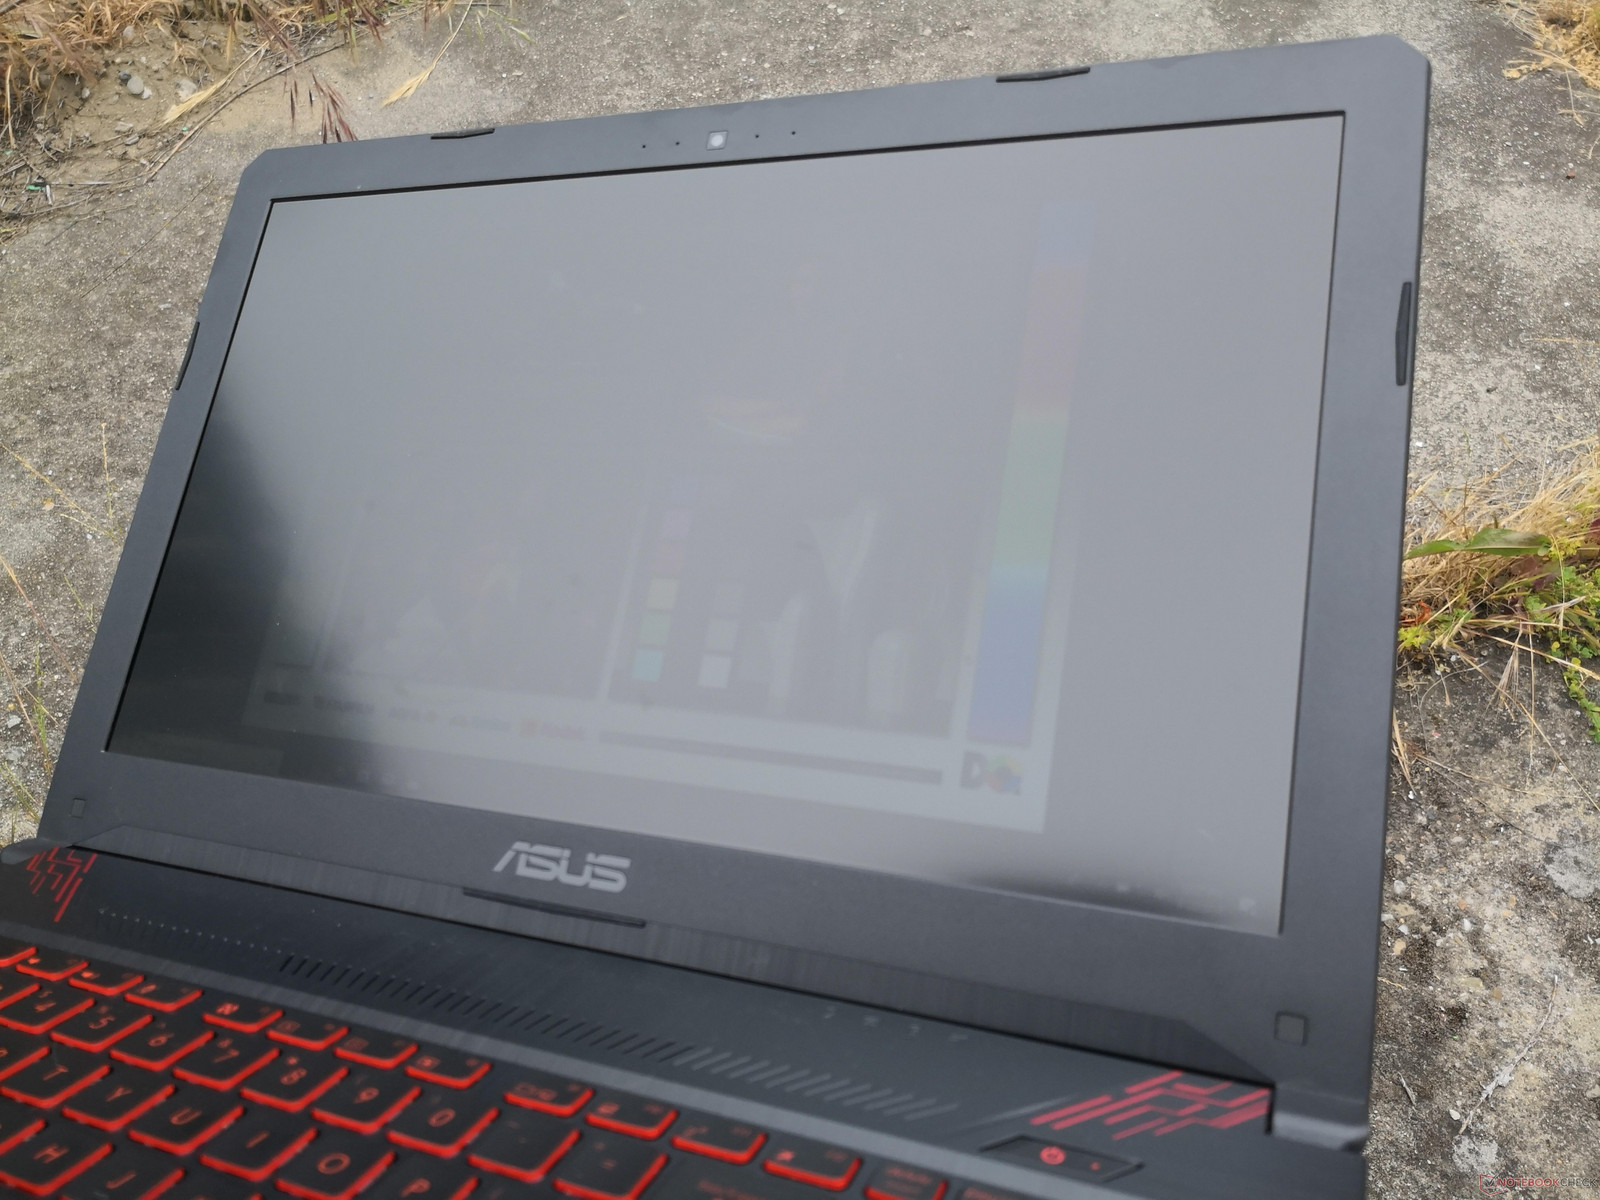
Outdoor visibility is poor when under sunlight or overcast sky due to the limited brightness of the backlight. The system is simply not designed for long periods of outdoor use. To its credit, the matte panel helps in reducing glare, but this advantage is somewhat mitigated by the limited viewing angles of the TN panel.
Performance
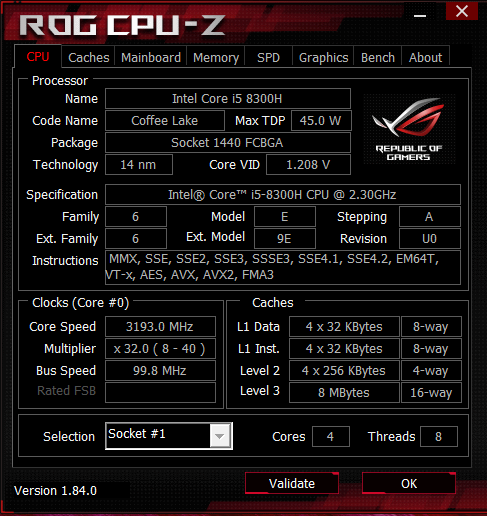
Unlike the hexa-core Core i7-8750H that is making the rounds on higher-end laptops like the Aero 15X, GS65, and Asus' own GM501, the Core i5-8300H is merely a quad-core offering meant to supplant the quad-core i5-7300HQ. The most notable change in the i5-8300H when compared to the i5-7300HQ is its inclusion of Hyper-Threading for 8 simultaneous threads. This fact alone puts the i5-8300H more in line with the Core i7-7700HQ of yesteryear in terms of horsepower.
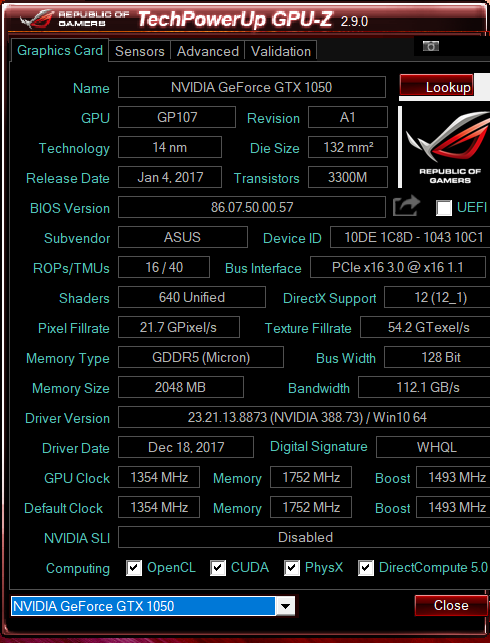
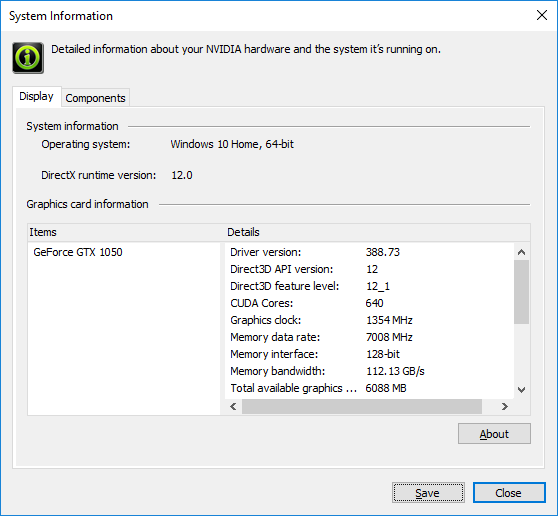
For graphics, the mid-range GTX 1050 is a common find on less expensive gaming systems like the FX504. Optimus is supported for switching to the integrated UHD Graphics 630 if needed.

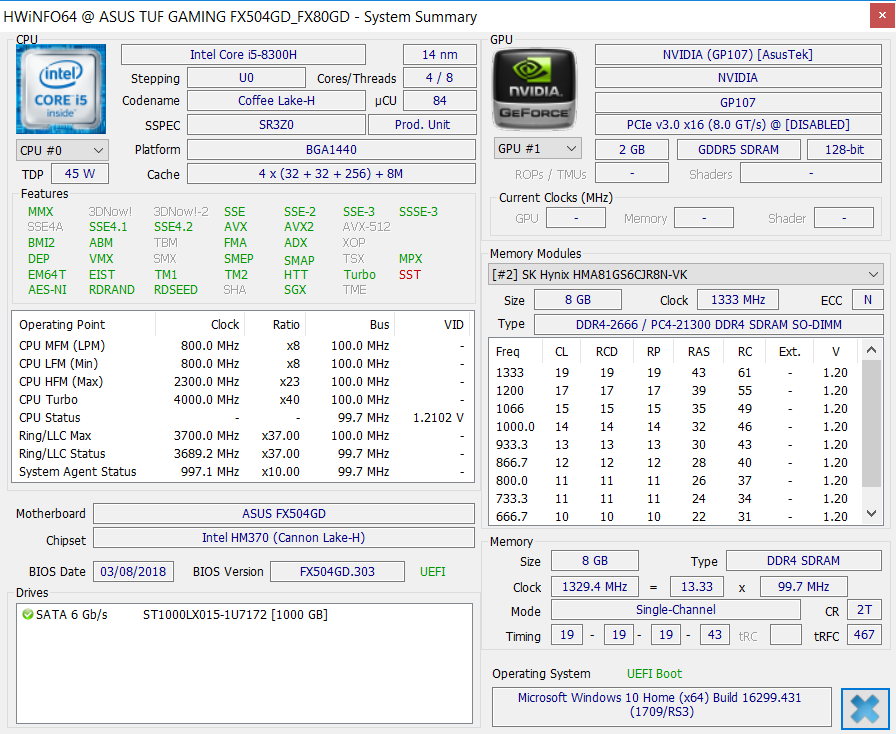
Processor
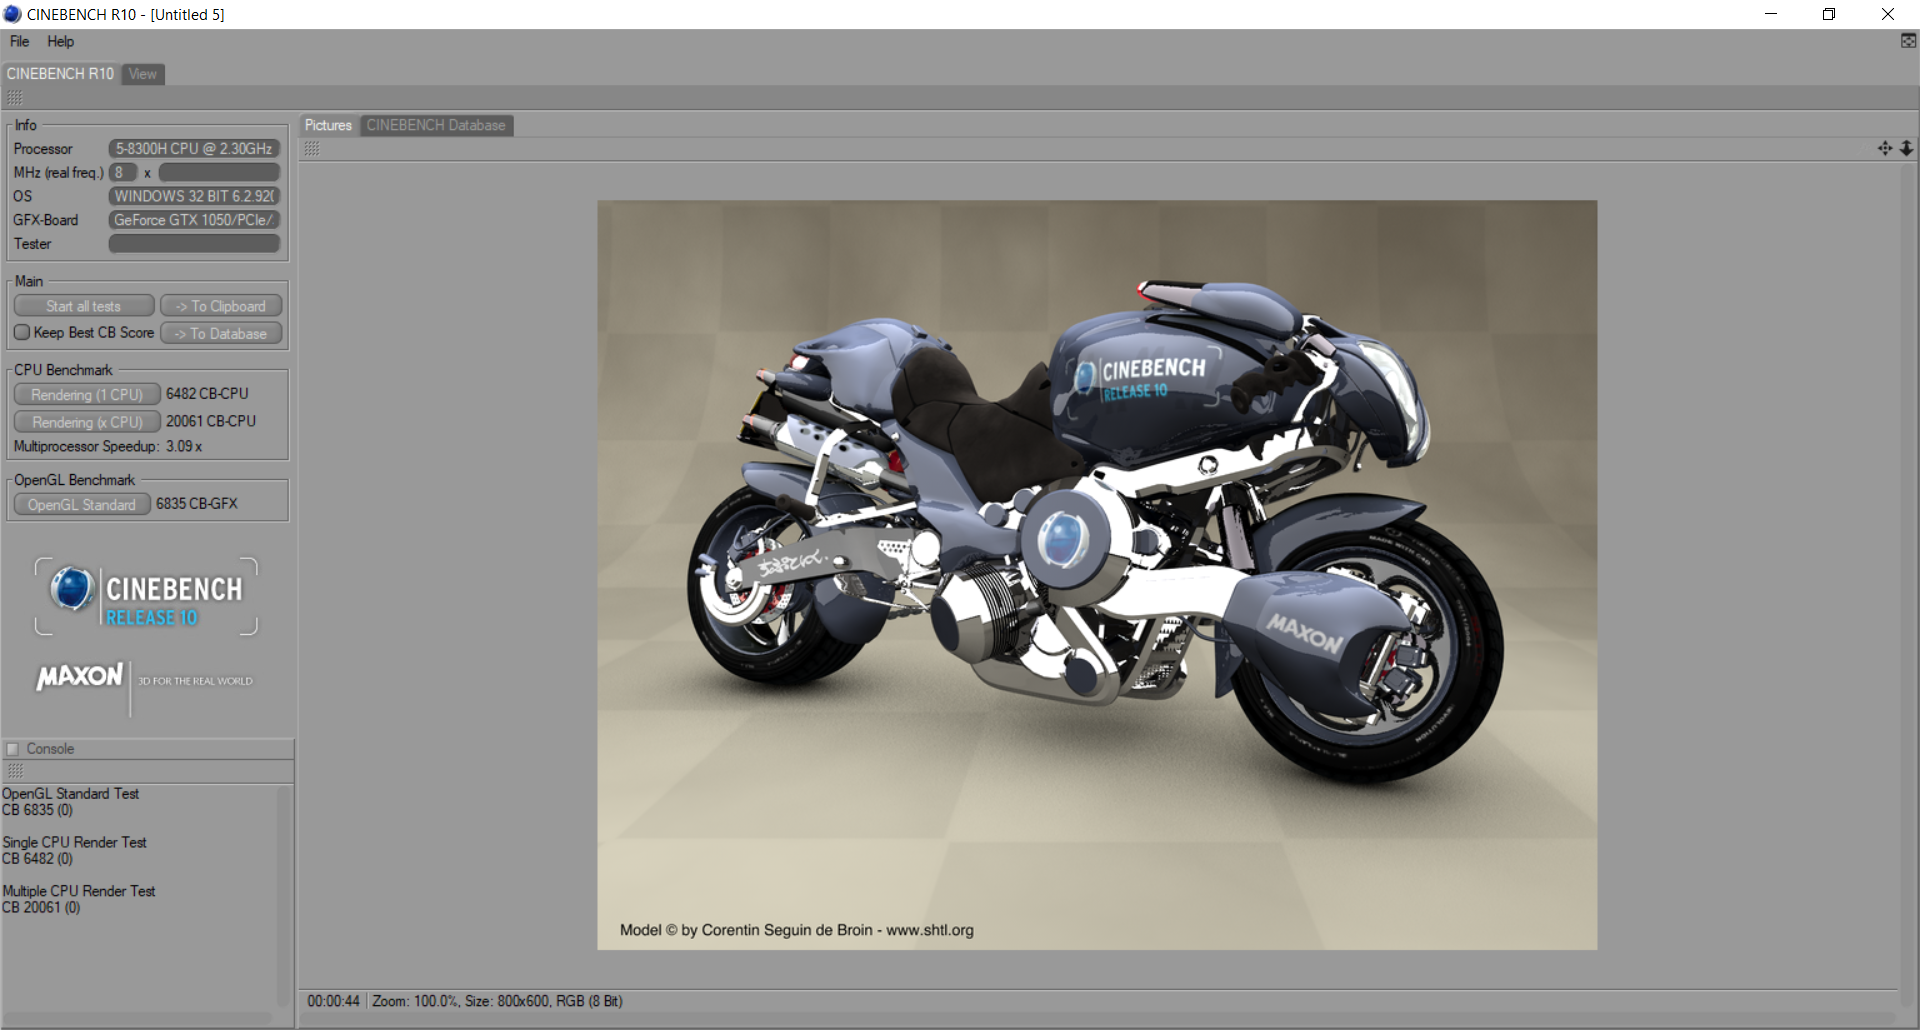
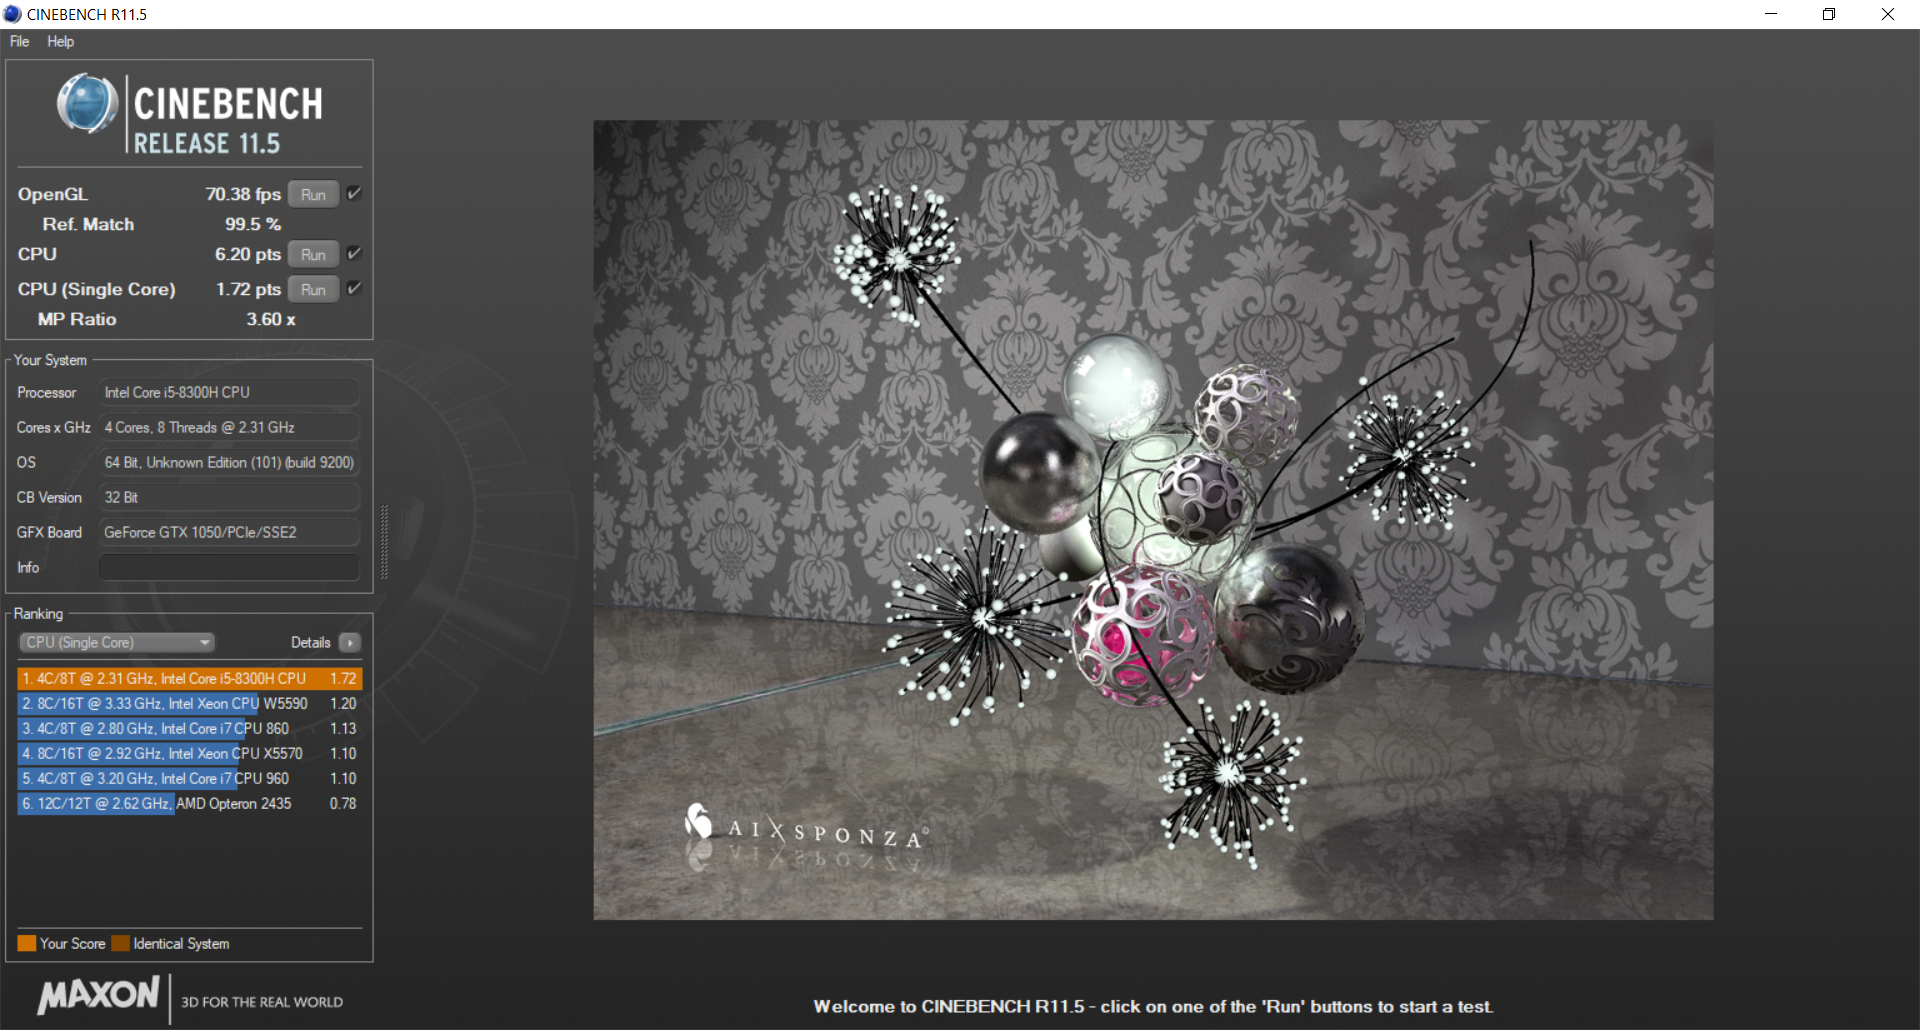
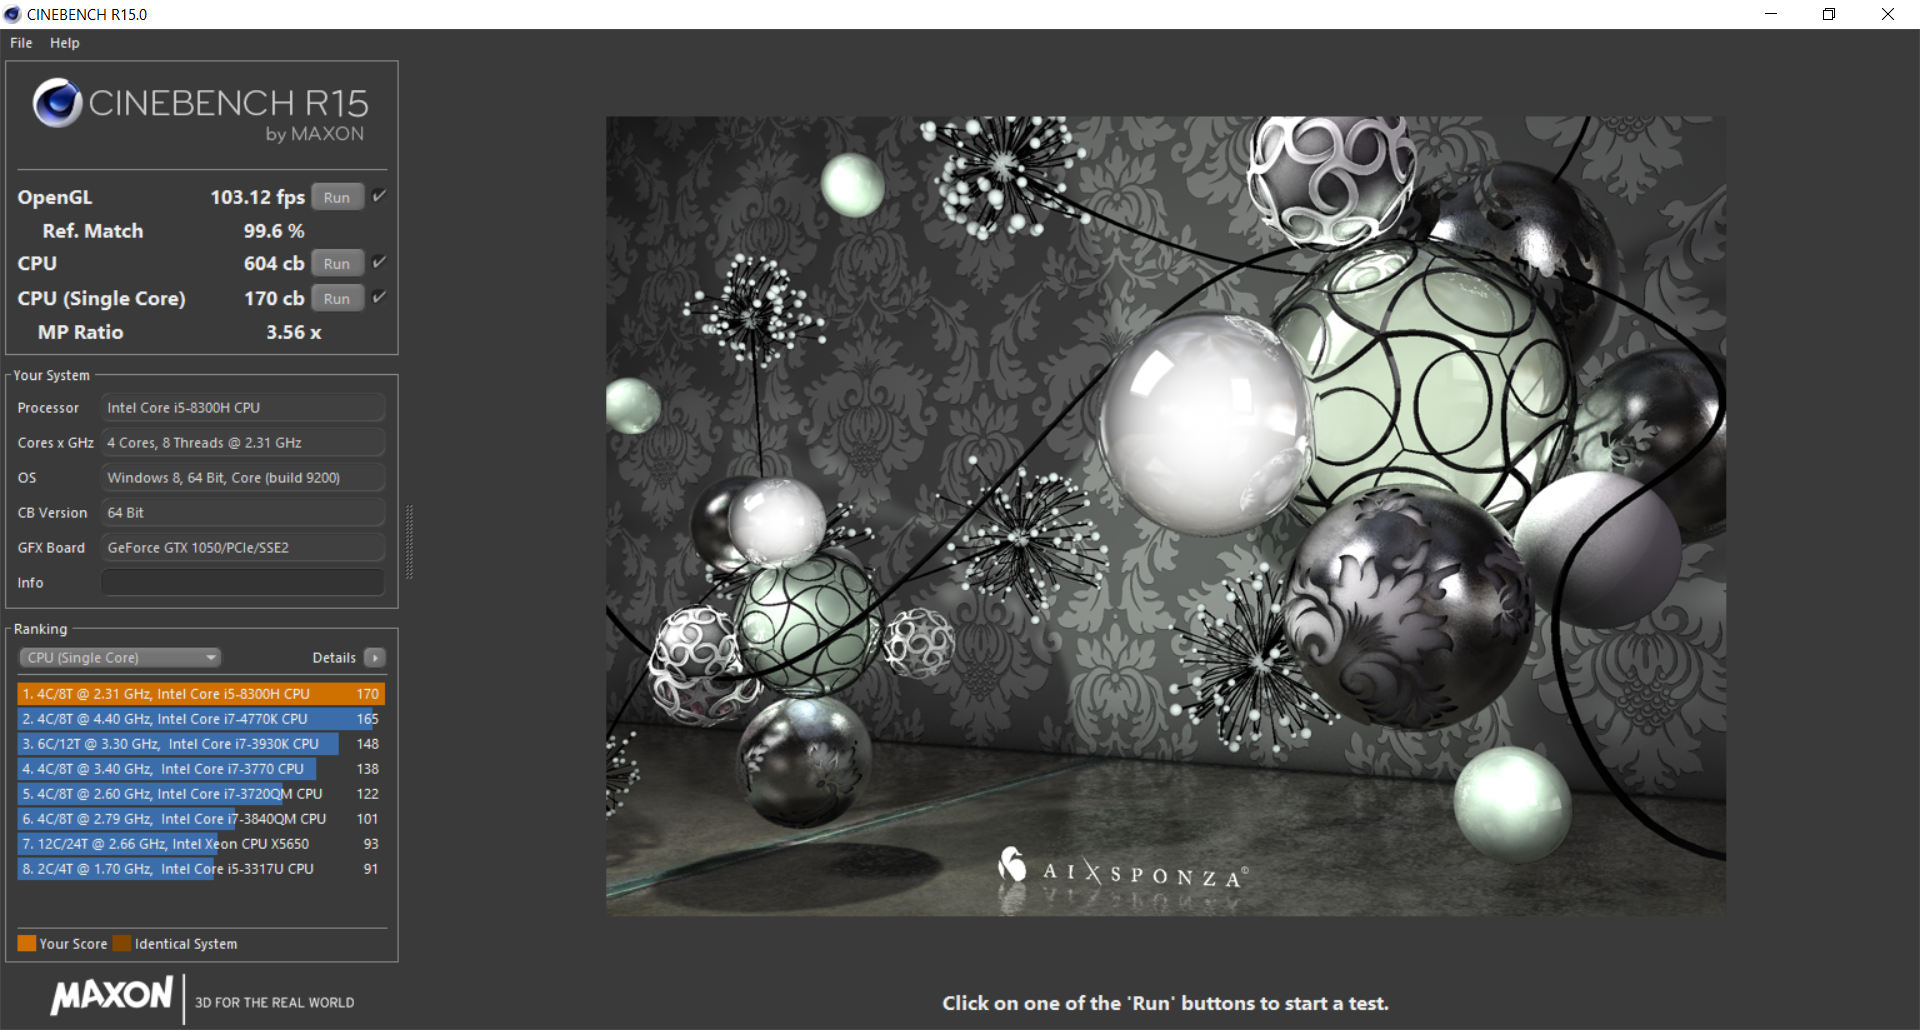
CPU performance is a mixed bag. While single-thread performance is excellent and where we expect it to be for an i5-8300H, multi-thread performance is about 20 percent slower than the average i5-8300H. Even the two-generations old i7-6700HQ in the MSI GE72VR is able to handily outperform the i5-8300H in our FX504 according to CineBench benchmarks. We double-checked that the High Performance profile was in place and repeated the tests to be sure, but scores would never improve.
On the bright side, performance is at least consistent. Running CineBench R15 Multi-Thread in a loop results in very consistent scores throughout the entire run. Thus, we can at least expect the i5-8300H in the FX504 to not throttle even if it is unable to reach the higher clock rates that we know the CPU is capable of.
See our dedicated page on the Core i5-8300H CPU for more technical information.
System Performance
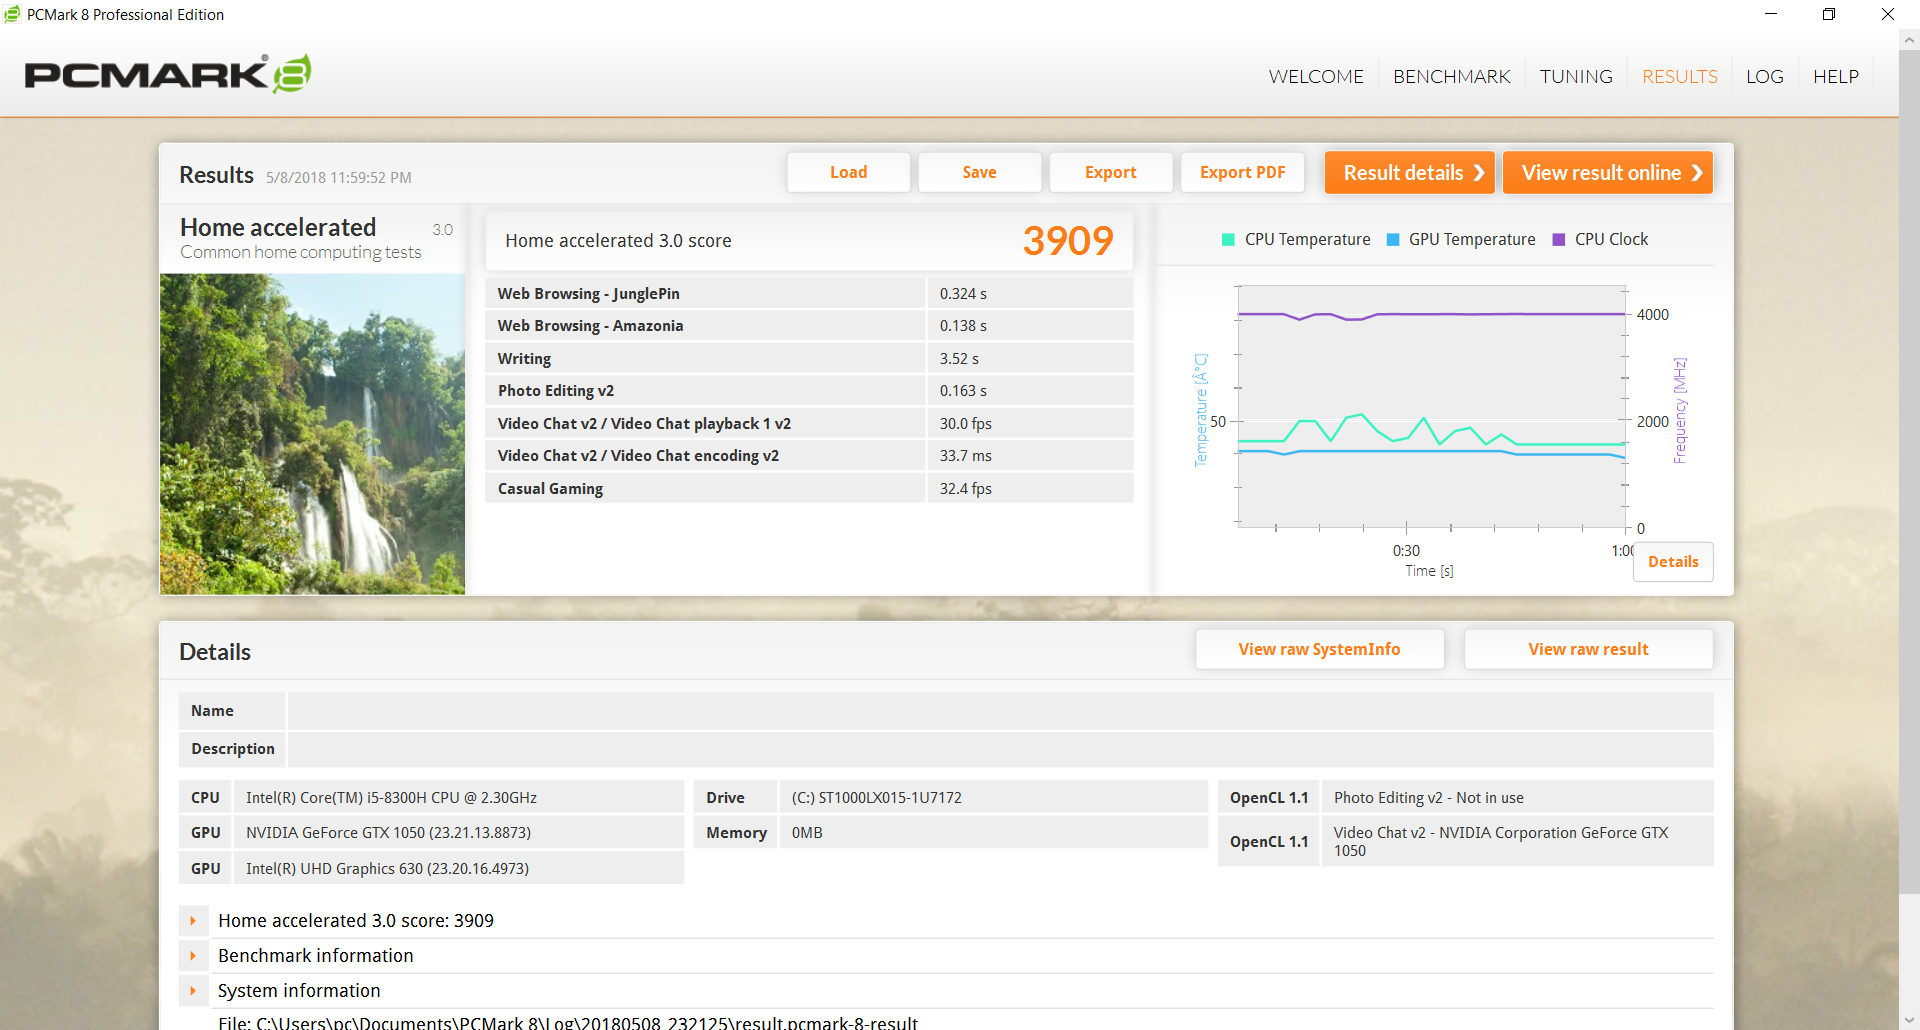
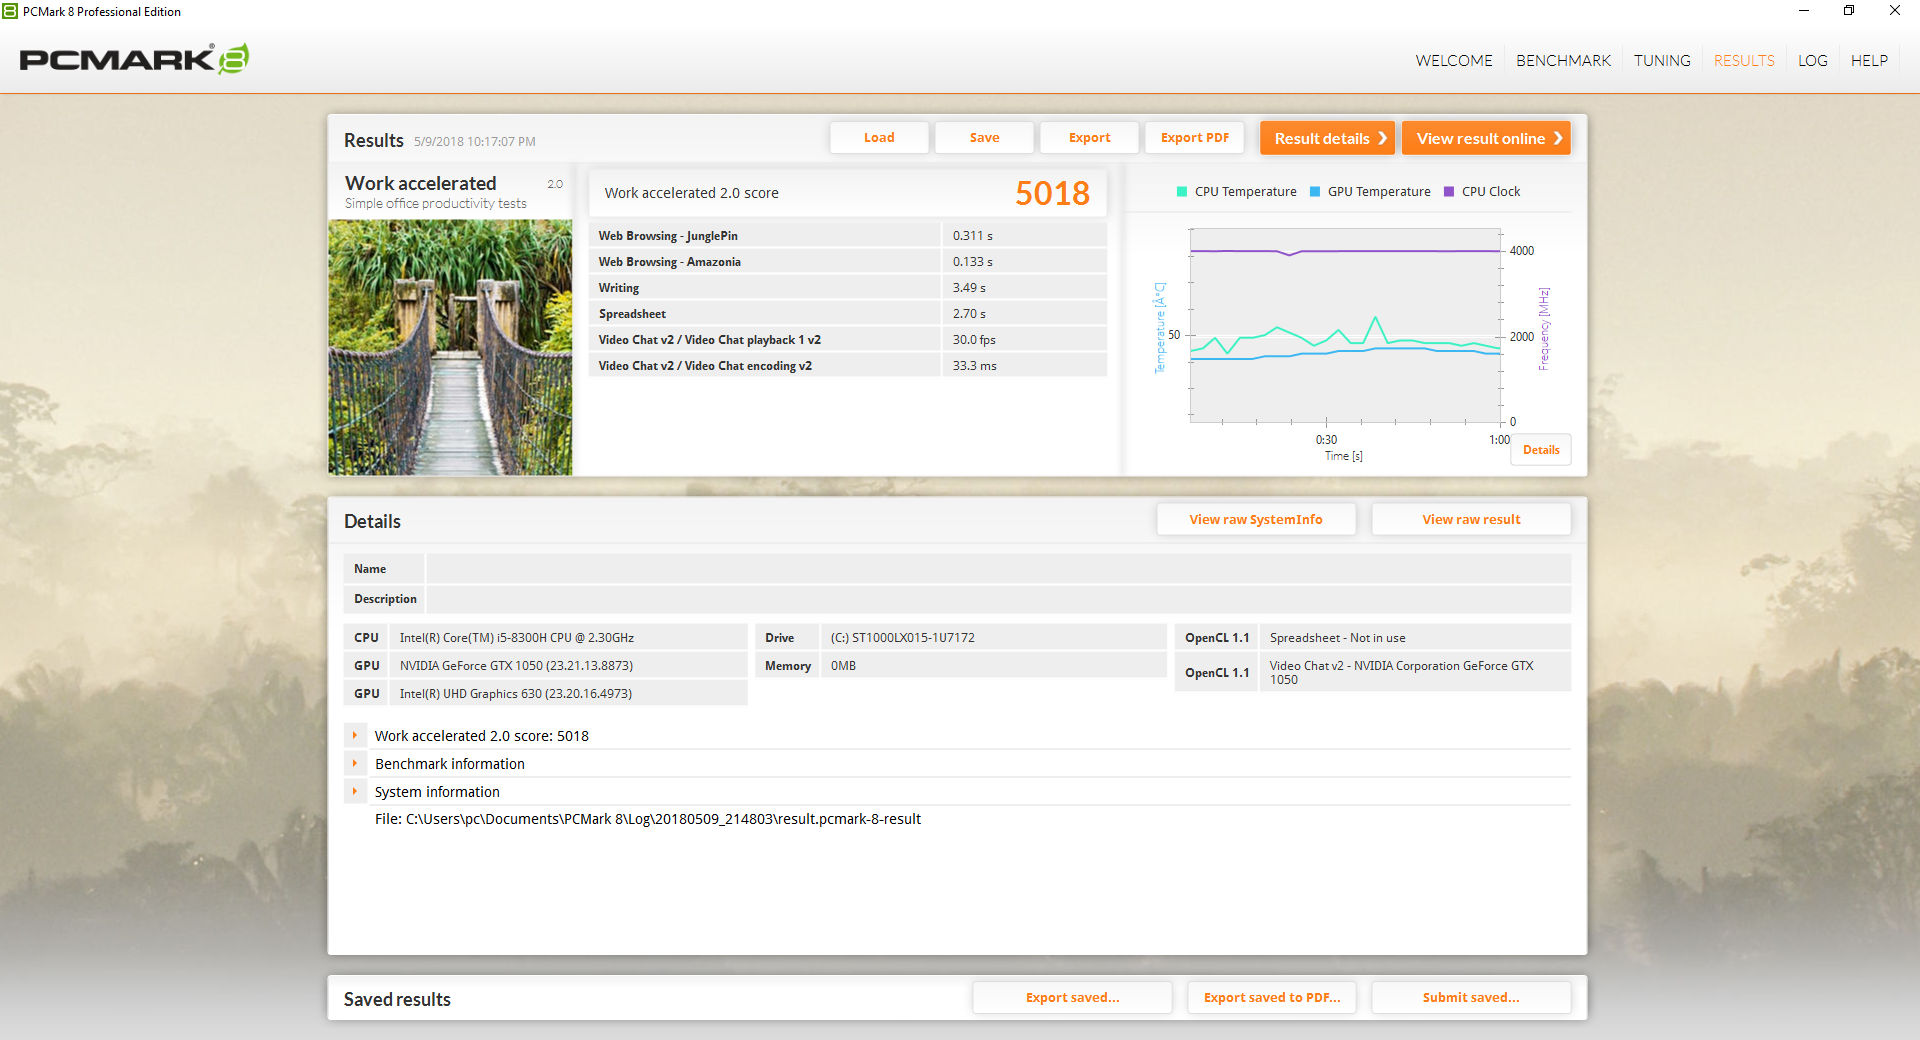
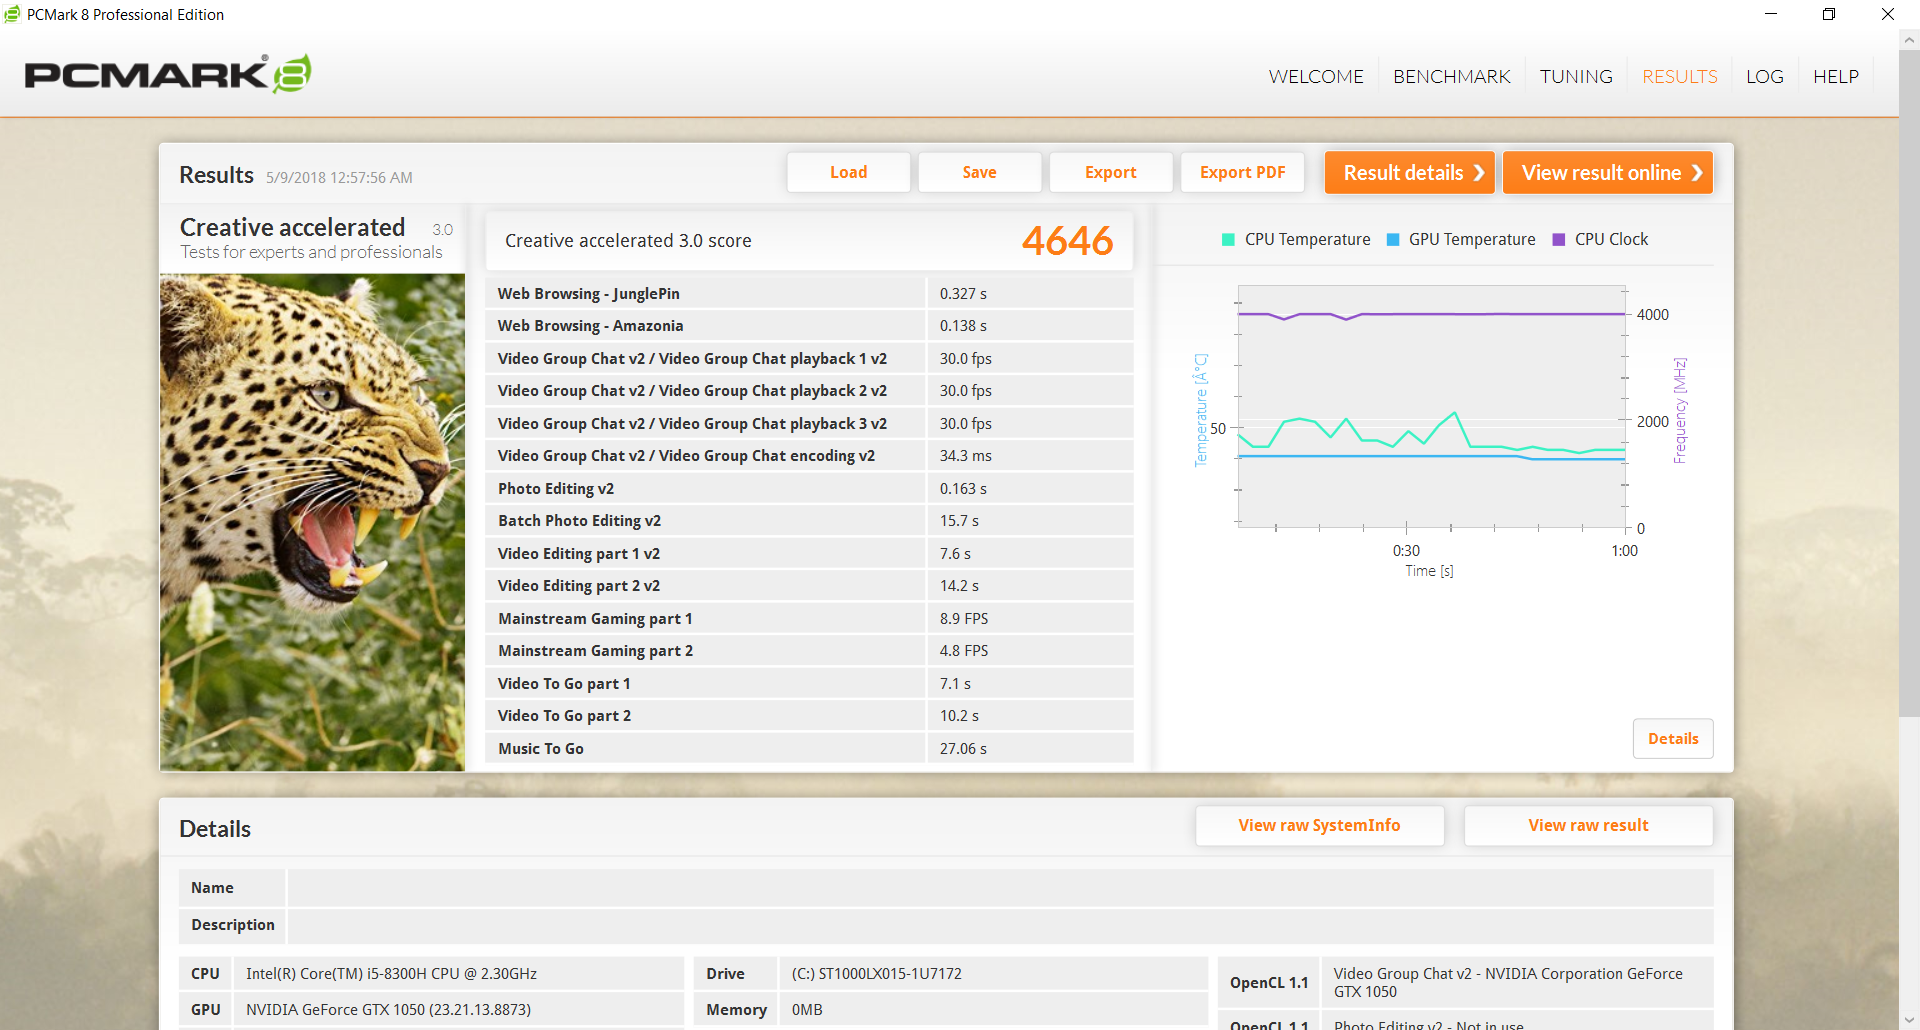
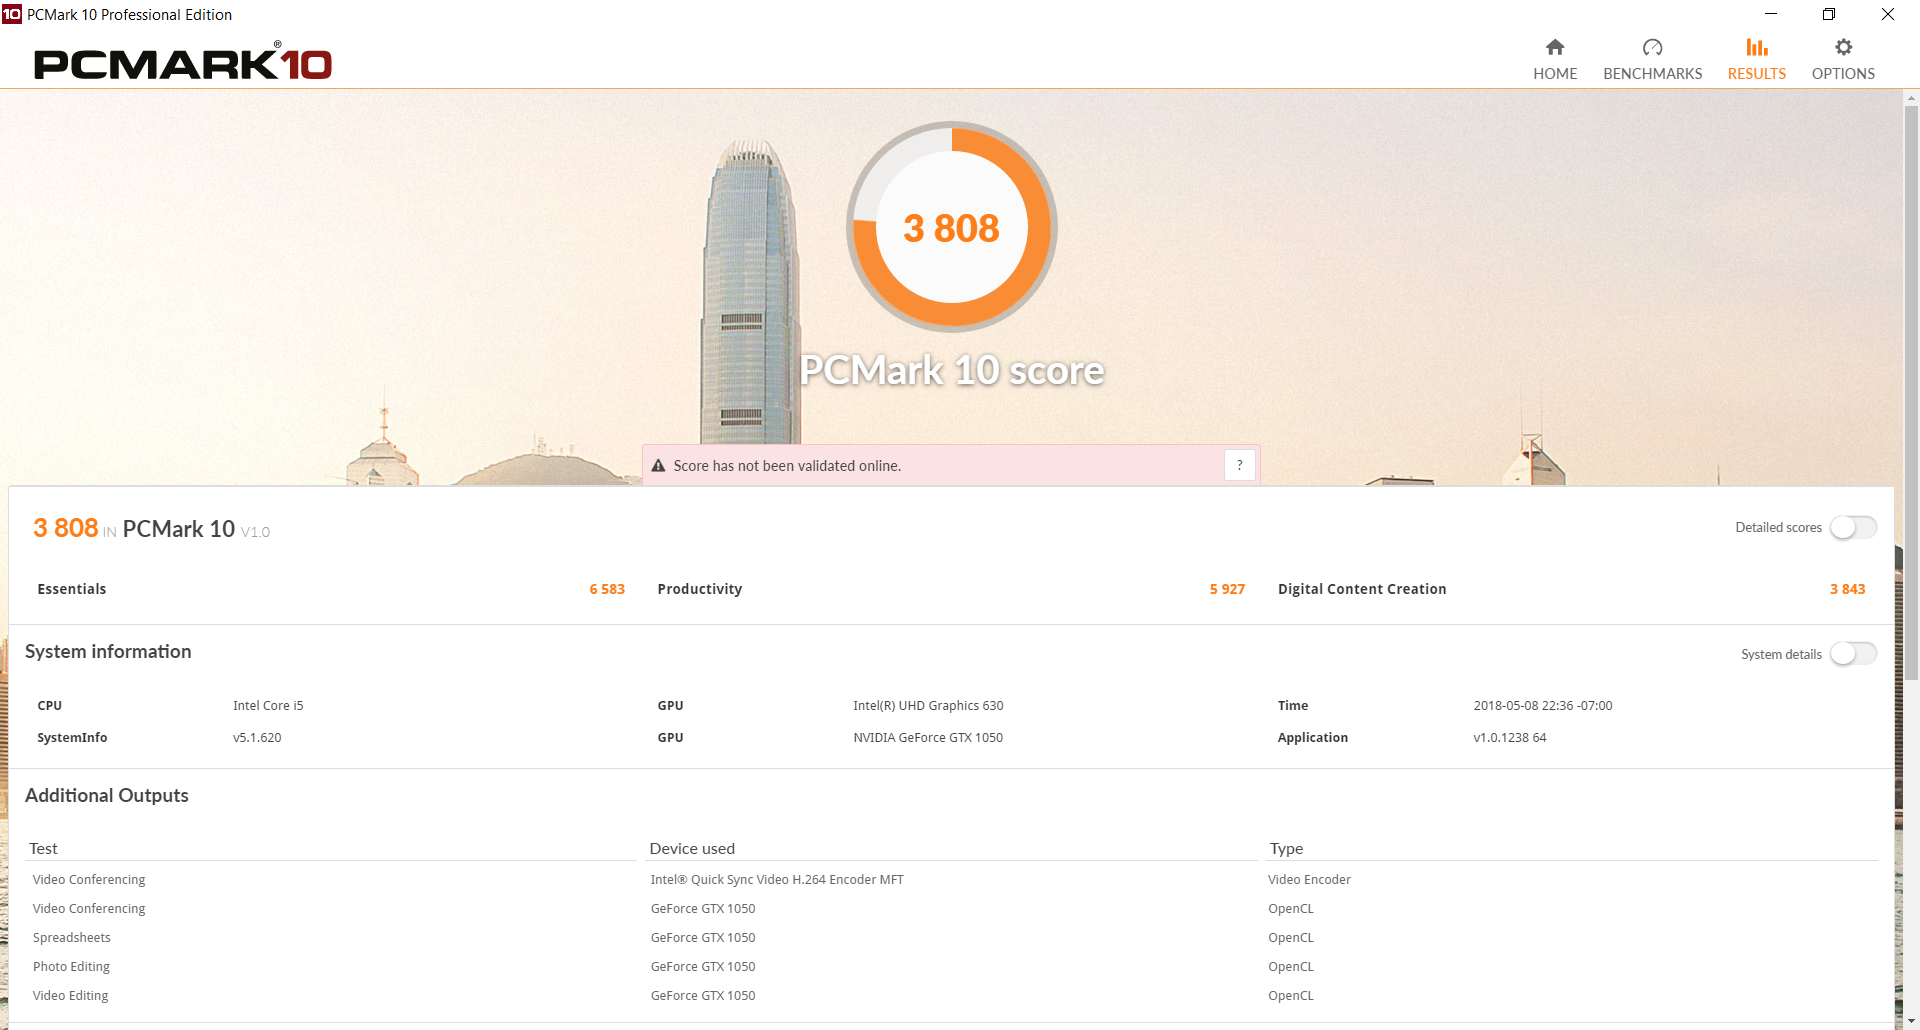
PCMark benchmarks rank the FX504GD within just a few percentage points of the Lenovo Legion Y520 and Inspiron 15 7577. We were hoping for a bigger difference because of the new CPU, but systems with the Core i7-7700HQ and GTX 1050 Ti can still outscore our configured Asus.
We experienced no hardware or software issues during our time with the unit.
| PCMark 10 - Score | |
| Gigabyte Aero 15X v8 | |
| Asus FX503VM-EH73 | |
| MSI GP62 7REX-1045US | |
| Lenovo Legion Y520-15IKBN 80WK0042GE | |
| Asus FX504GD | |
| Dell Inspiron 15 7000 7577 | |
| PCMark 8 Home Score Accelerated v2 | 3909 points | |
| PCMark 8 Creative Score Accelerated v2 | 4646 points | |
| PCMark 8 Work Score Accelerated v2 | 5018 points | |
| PCMark 10 Score | 3808 points | |
Help | ||
Storage Devices
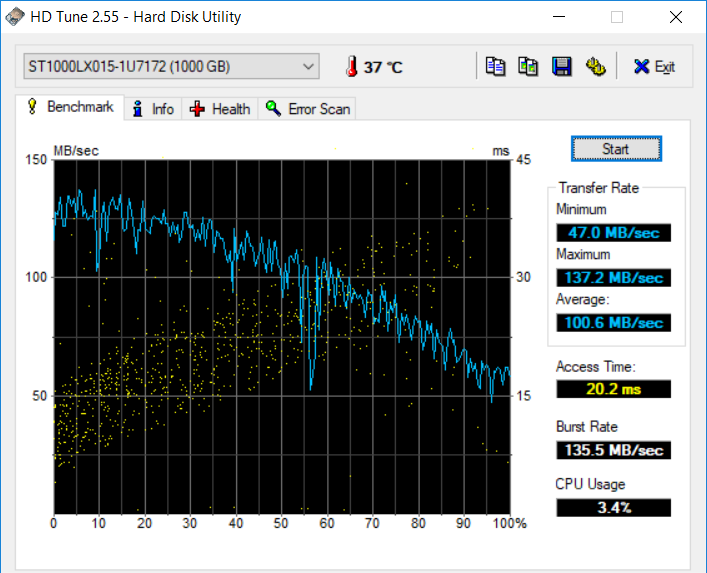
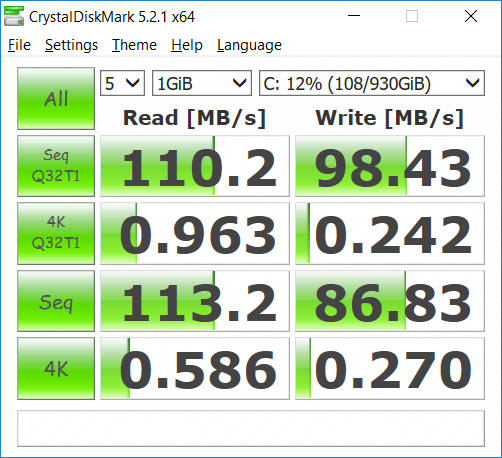
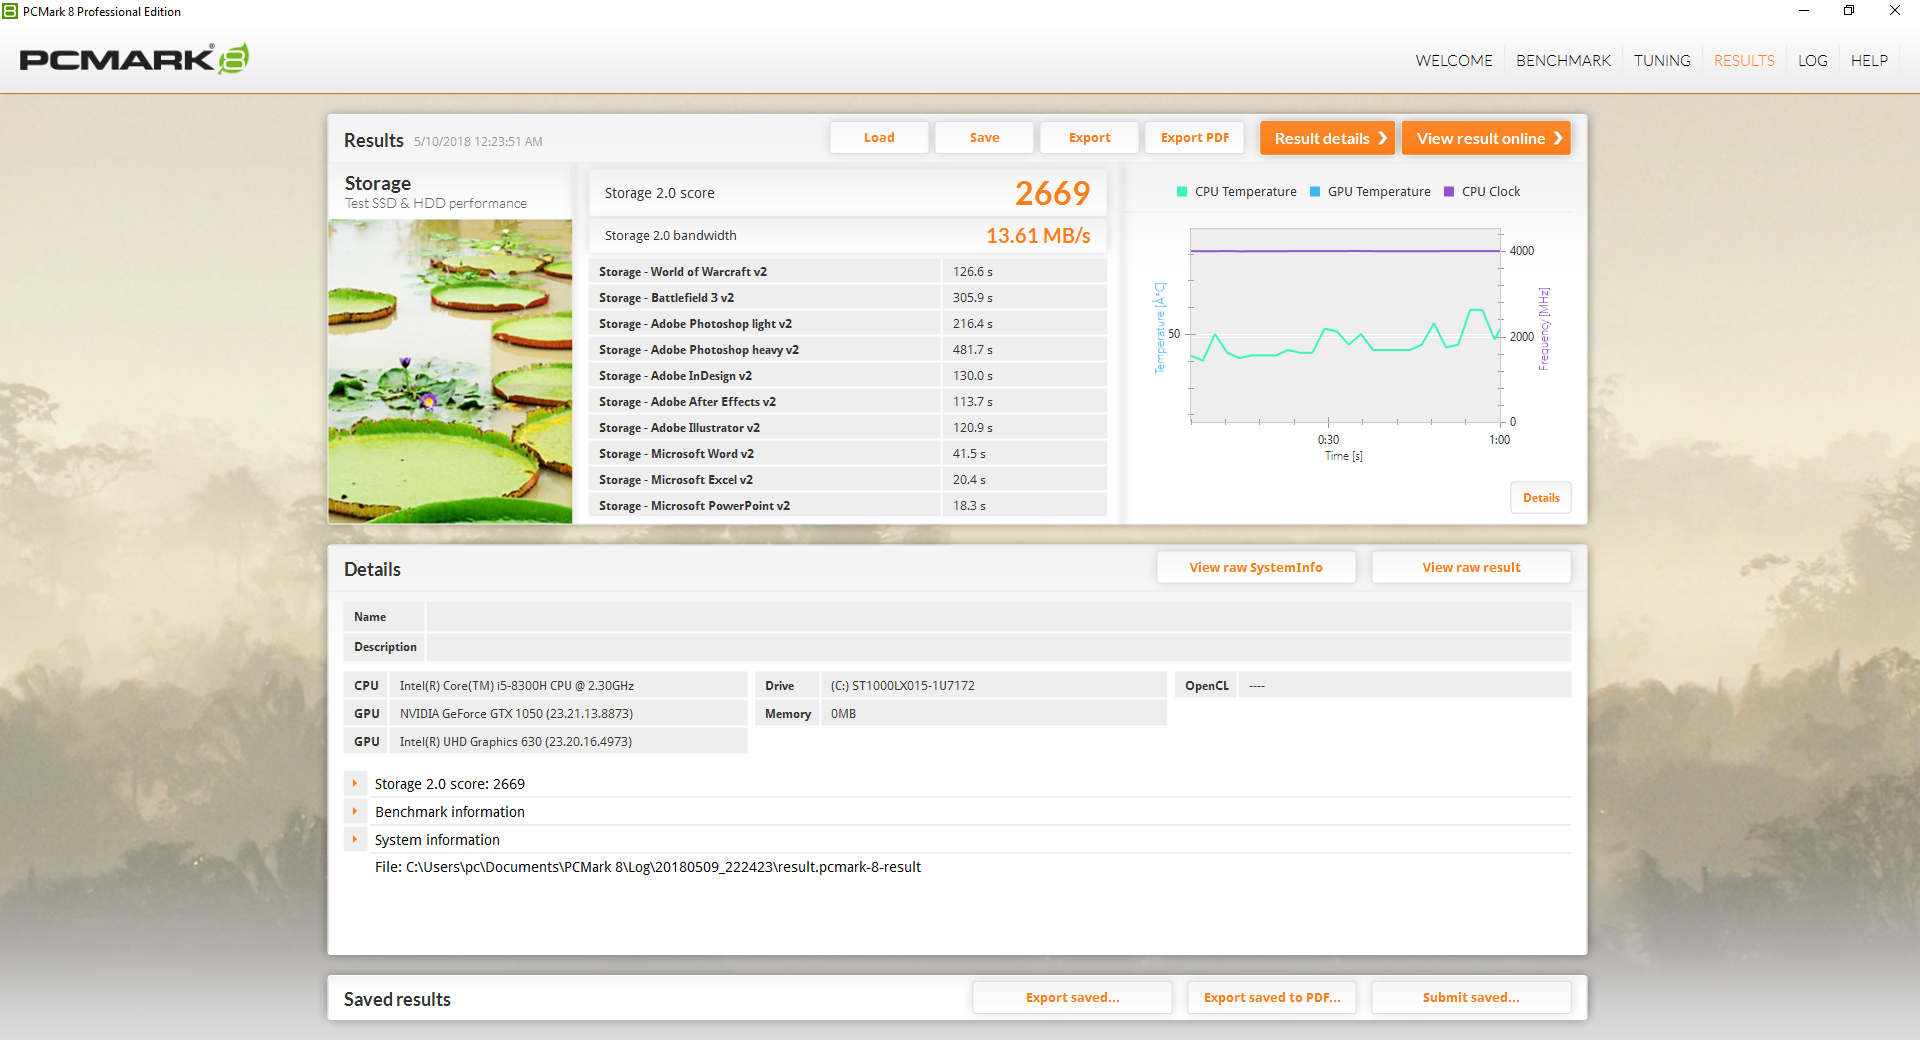
Our test model utilizes a 5400 RPM Seagate ST1000LX015 HDD. Fortunately, there is a PCIe M.2 slot should users want to install secondary NVMe SSDs for faster system performance. HD Tune returns an average transfer rate of 101 MB/s which pales in comparison to even the cheapest SATA III SSDs in the market. We highly recommend investing in a small primary SSD with a large secondary HDD for a significantly better gaming experience.
See our table of HDDs and SSDs for more benchmark comparisons.
| Asus FX504GD Seagate Mobile HDD 1TB ST1000LX015-1U7172 | Asus FX503VM-EH73 SanDisk SD8SN8U128G1002 | Dell Inspiron 15 7000 7577 Seagate Mobile HDD 1TB ST1000LX015-1U7172 | MSI GP62 7REX-1045US Toshiba NVMe THNSN5128GP | Gigabyte Aero 15X v8 Toshiba NVMe THNSN5512GPU7 | Average Seagate Mobile HDD 1TB ST1000LX015-1U7172 | |
|---|---|---|---|---|---|---|
| CrystalDiskMark 5.2 / 6 | 17375% | -10% | 38865% | 24087% | 25% | |
| Write 4K (MB/s) | 0.27 | 51.2 18863% | 0.42 56% | 158.4 58567% | 94.4 34863% | 0.4682 ? 73% |
| Read 4K (MB/s) | 0.586 | 24.82 4135% | 0.41 -30% | 45.04 7586% | 37.65 6325% | 0.533 ? -9% |
| Write Seq (MB/s) | 86.8 | 313.1 261% | 55.6 -36% | 622 617% | 1335 1438% | 75.6 ? -13% |
| Read Seq (MB/s) | 113.2 | 458.3 305% | 114.3 1% | 1592 1306% | 1404 1140% | 116.1 ? 3% |
| Write 4K Q32T1 (MB/s) | 0.242 | 208.1 85892% | 0.238 -2% | 434.2 179321% | 268.6 110892% | 0.643 ? 166% |
| Read 4K Q32T1 (MB/s) | 0.963 | 279.3 28903% | 0.942 -2% | 590 61167% | 332.8 34459% | 1.067 ? 11% |
| Write Seq Q32T1 (MB/s) | 98.4 | 337.9 243% | 68.2 -31% | 630 540% | 1375 1297% | 81.9 ? -17% |
| Read Seq Q32T1 (MB/s) | 110.2 | 545 395% | 69.6 -37% | 2108 1813% | 2627 2284% | 97 ? -12% |

GPU Performance
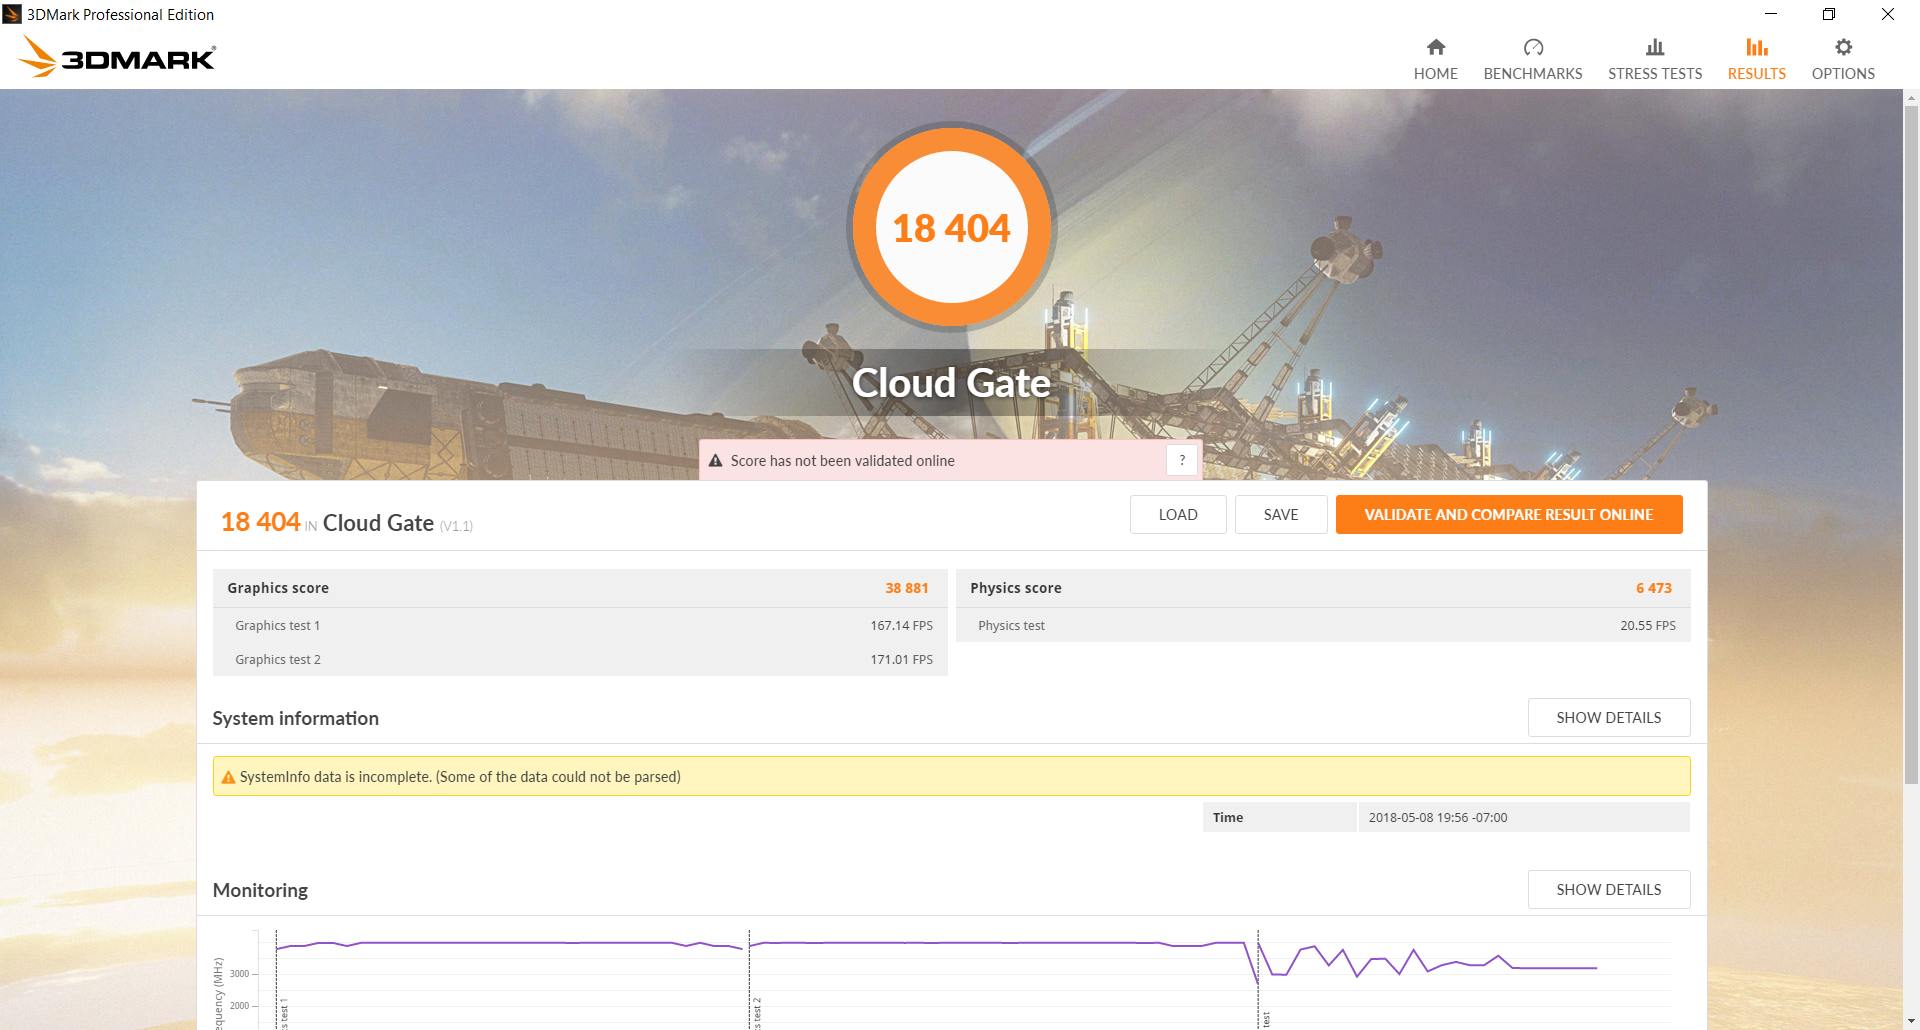
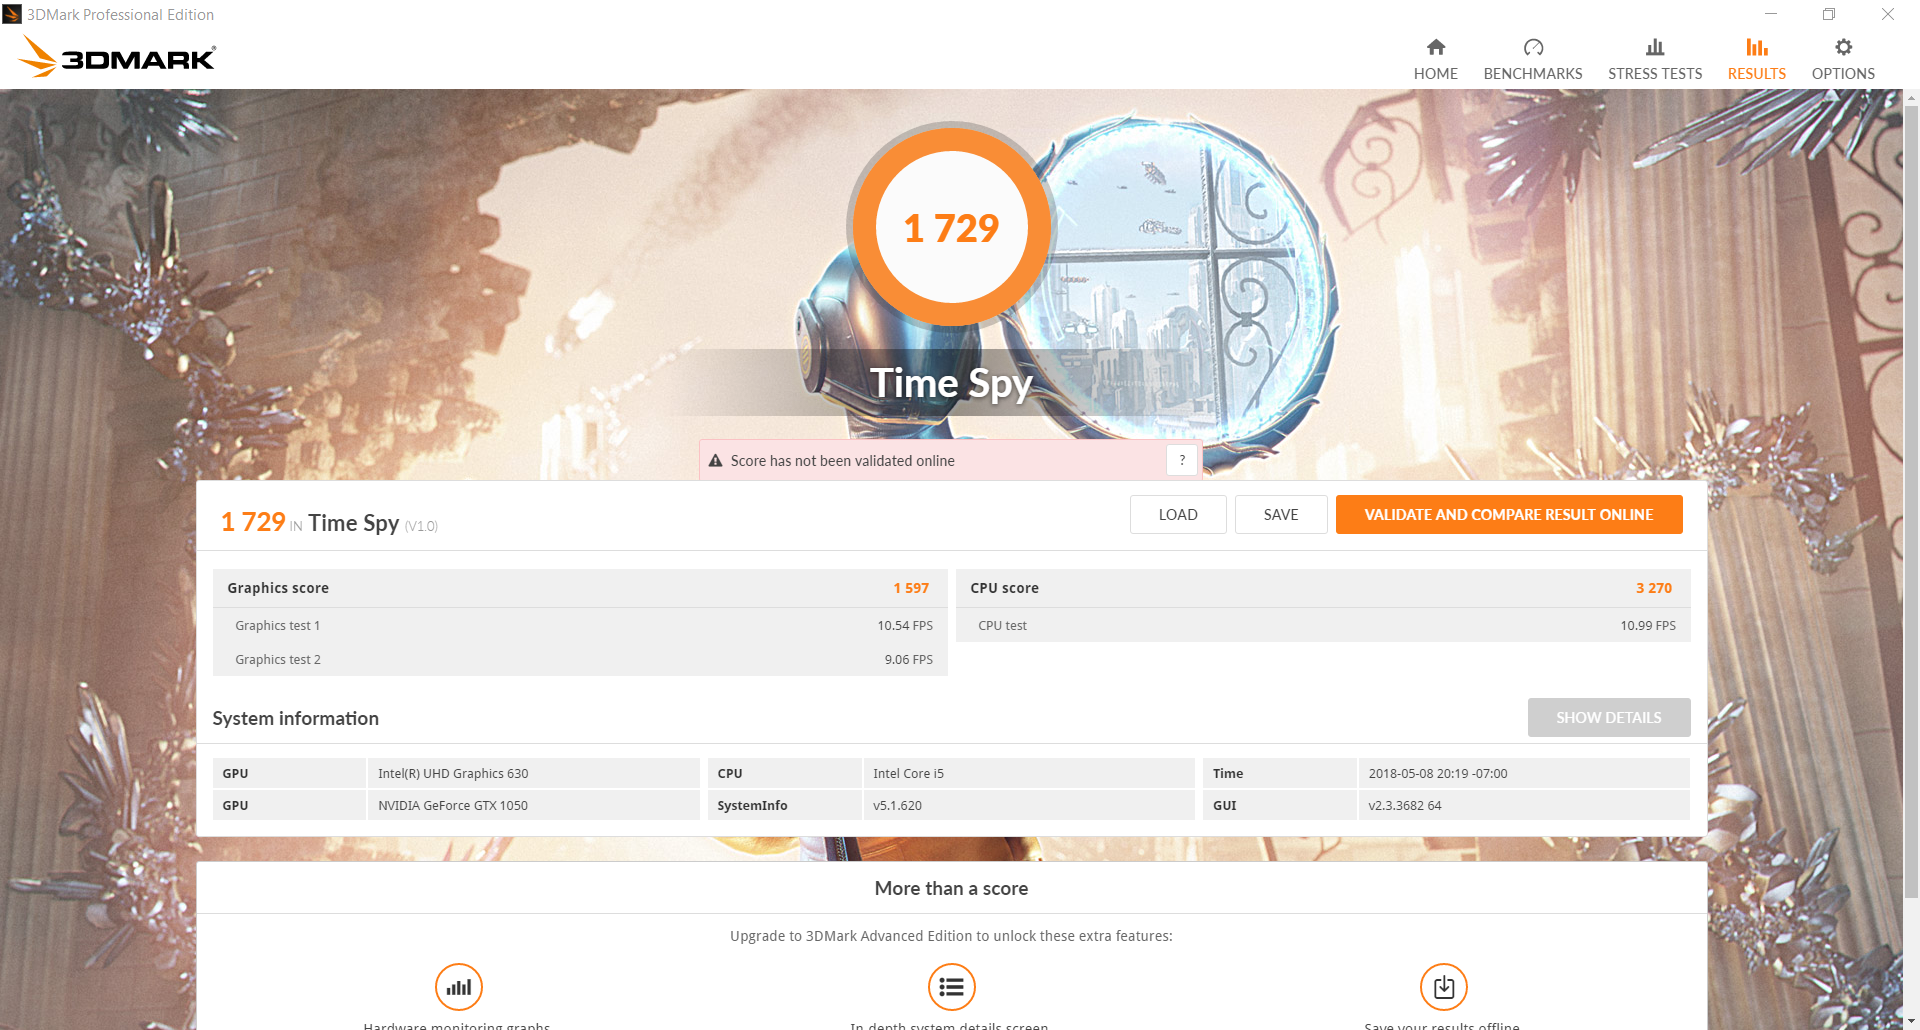
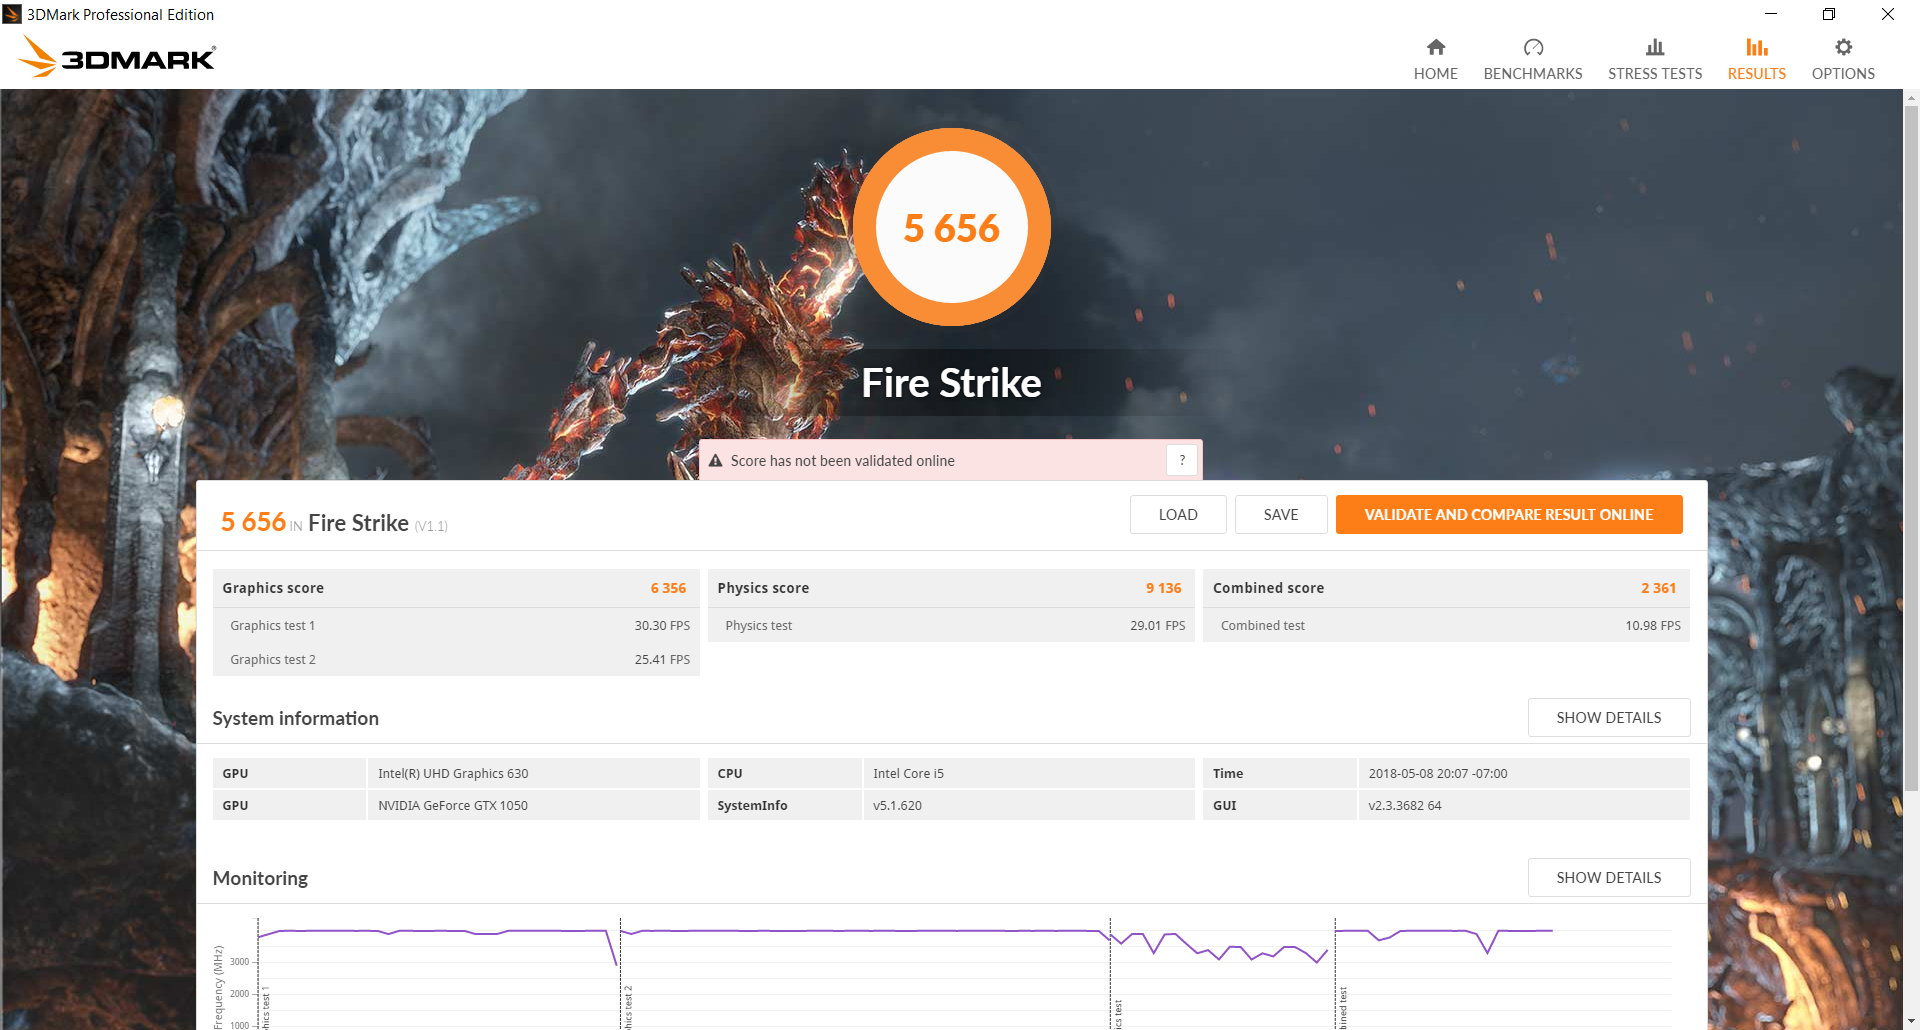
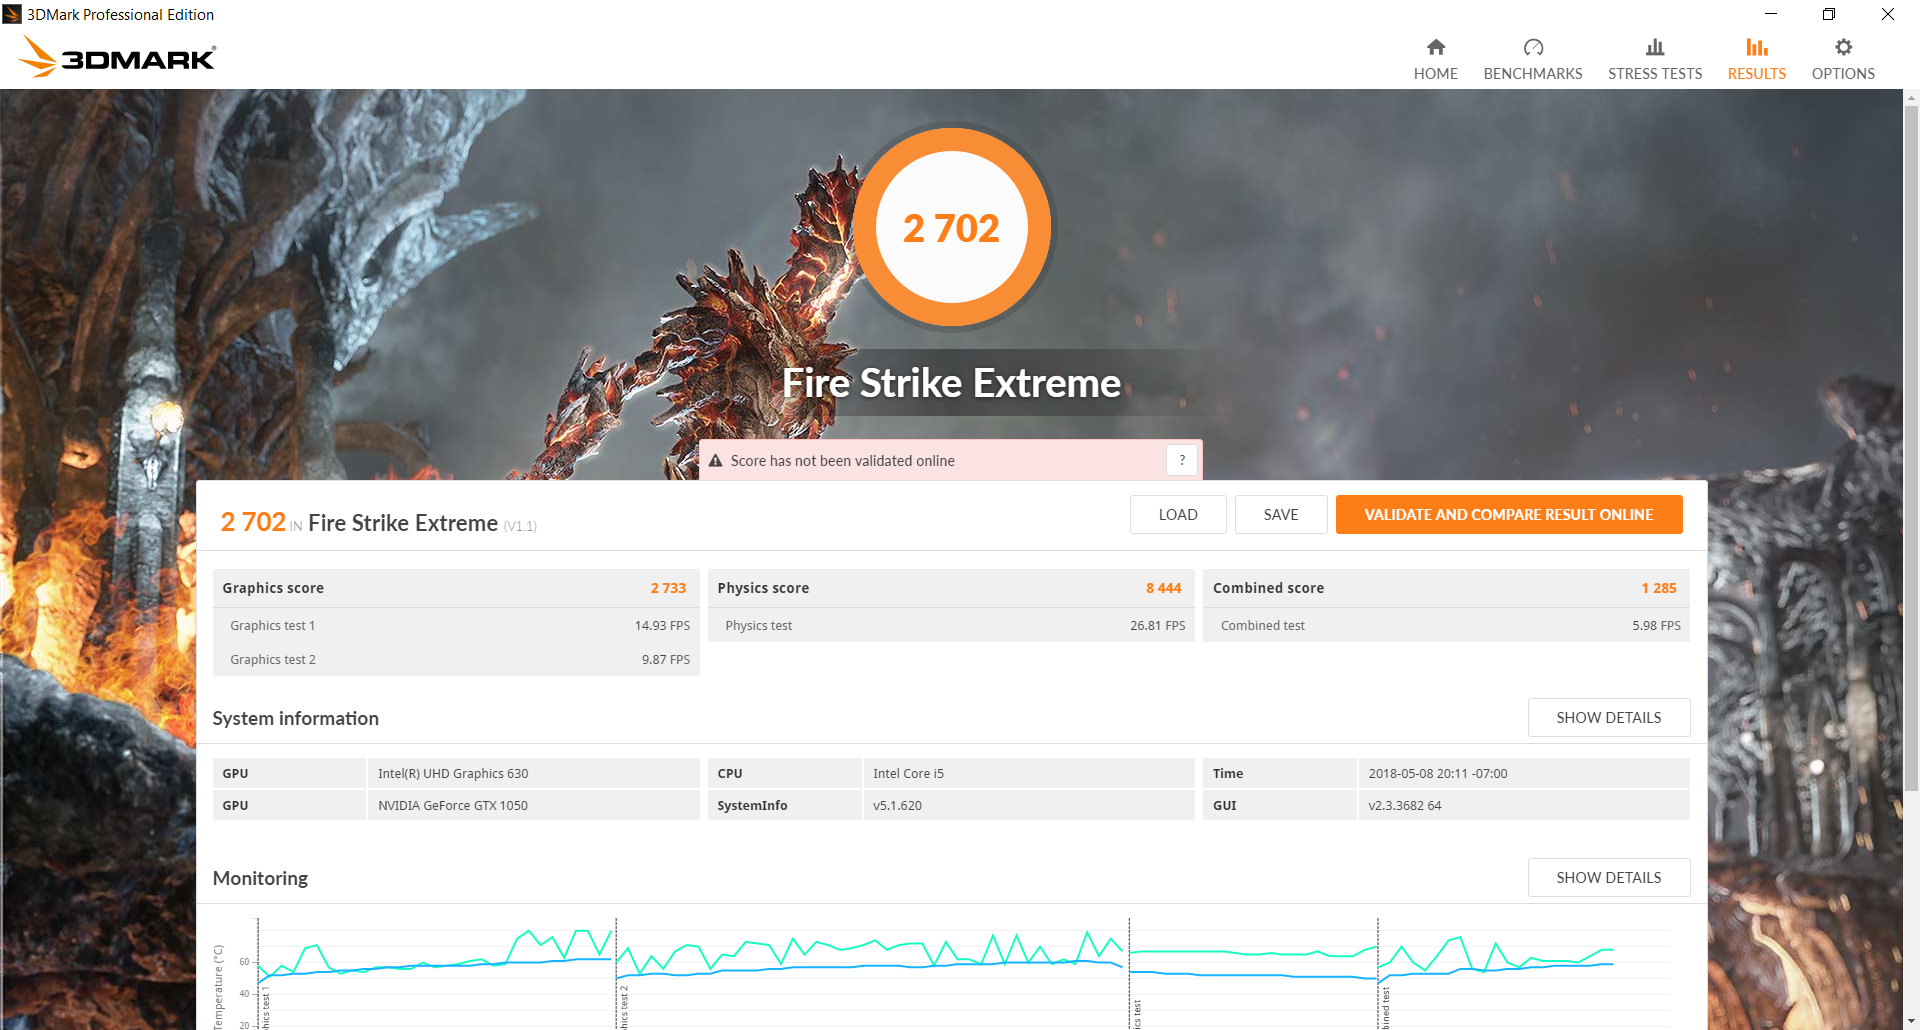
The FX504 brings nothing new to the table with its GTX 1050 even when taking the Coffee Lake-H CPU into consideration. 3DMark scores reveal it to be in line with the average GTX 1050 in our database. Fire Strike Physics is almost 40 percent higher than the i5-7300HQ to bring the system closer to i7-7700HQ laptops in terms of raw CPU power. For gaming, however, the CPU boost is more marginal. Don't expect steep rises in frame rates just because the i5-8300H is newer than the i7-7700HQ.
See our dedicated page on the GTX 1050 for more benchmark comparisons. Note that our configuration utilizes 2 GB of VRAM whereas some SKUs may have 4 GB of VRAM with the GTX 1050 instead.
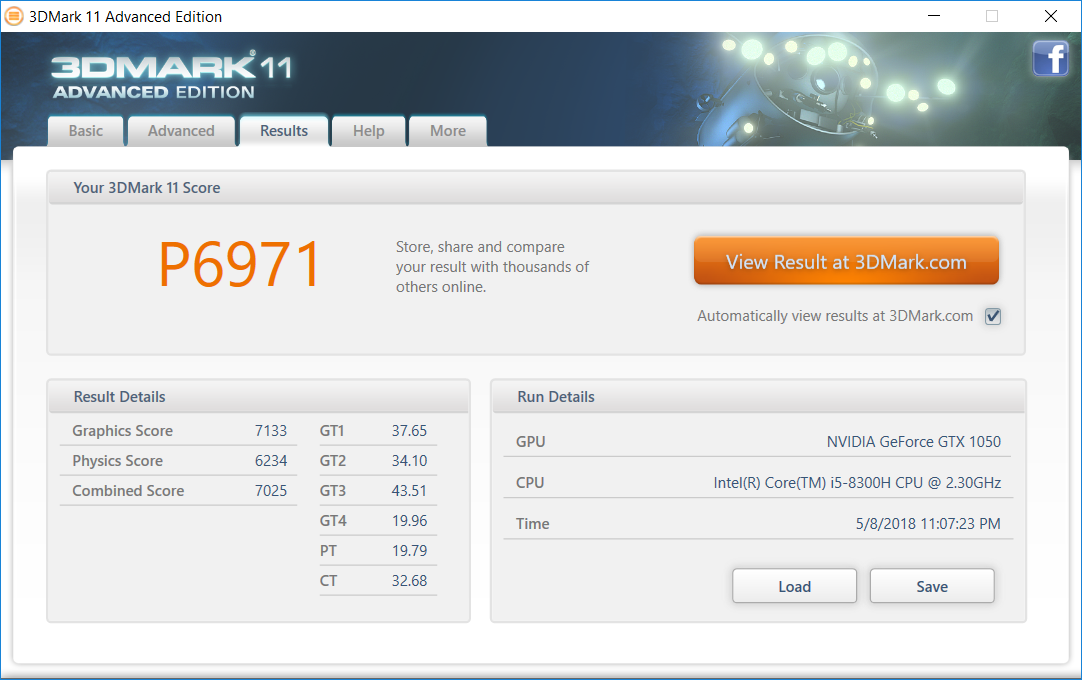
| 3DMark 11 Performance | 6971 points | |
| 3DMark Ice Storm Standard Score | 128216 points | |
| 3DMark Cloud Gate Standard Score | 18404 points | |
| 3DMark Fire Strike Score | 5656 points | |
| 3DMark Fire Strike Extreme Score | 2702 points | |
| 3DMark Time Spy Score | 1729 points | |
Help | ||
| BioShock Infinite - 1920x1080 Ultra Preset, DX11 (DDOF) | |
| Alienware 13 R3 (i5-7300HQ, GTX 1050 Ti) | |
| Asus Strix GL502VT-DS74 | |
| Asus GL503VD-DB74 | |
| Dell Inspiron 15 7000 7577 | |
| Asus FX504GD | |
| Asus ZenBook Flip 15 UX561UD | |
| Huawei Matebook X Pro i5 | |
| low | med. | high | ultra | |
|---|---|---|---|---|
| BioShock Infinite (2013) | 192.7 | 167.8 | 151.5 | 63 |
| The Witcher 3 (2015) | 119.9 | 72.2 | 40.9 | 22.2 |
| Rise of the Tomb Raider (2016) | 85.9 | 71.8 | 38.2 | 31.9 |
Stress Test
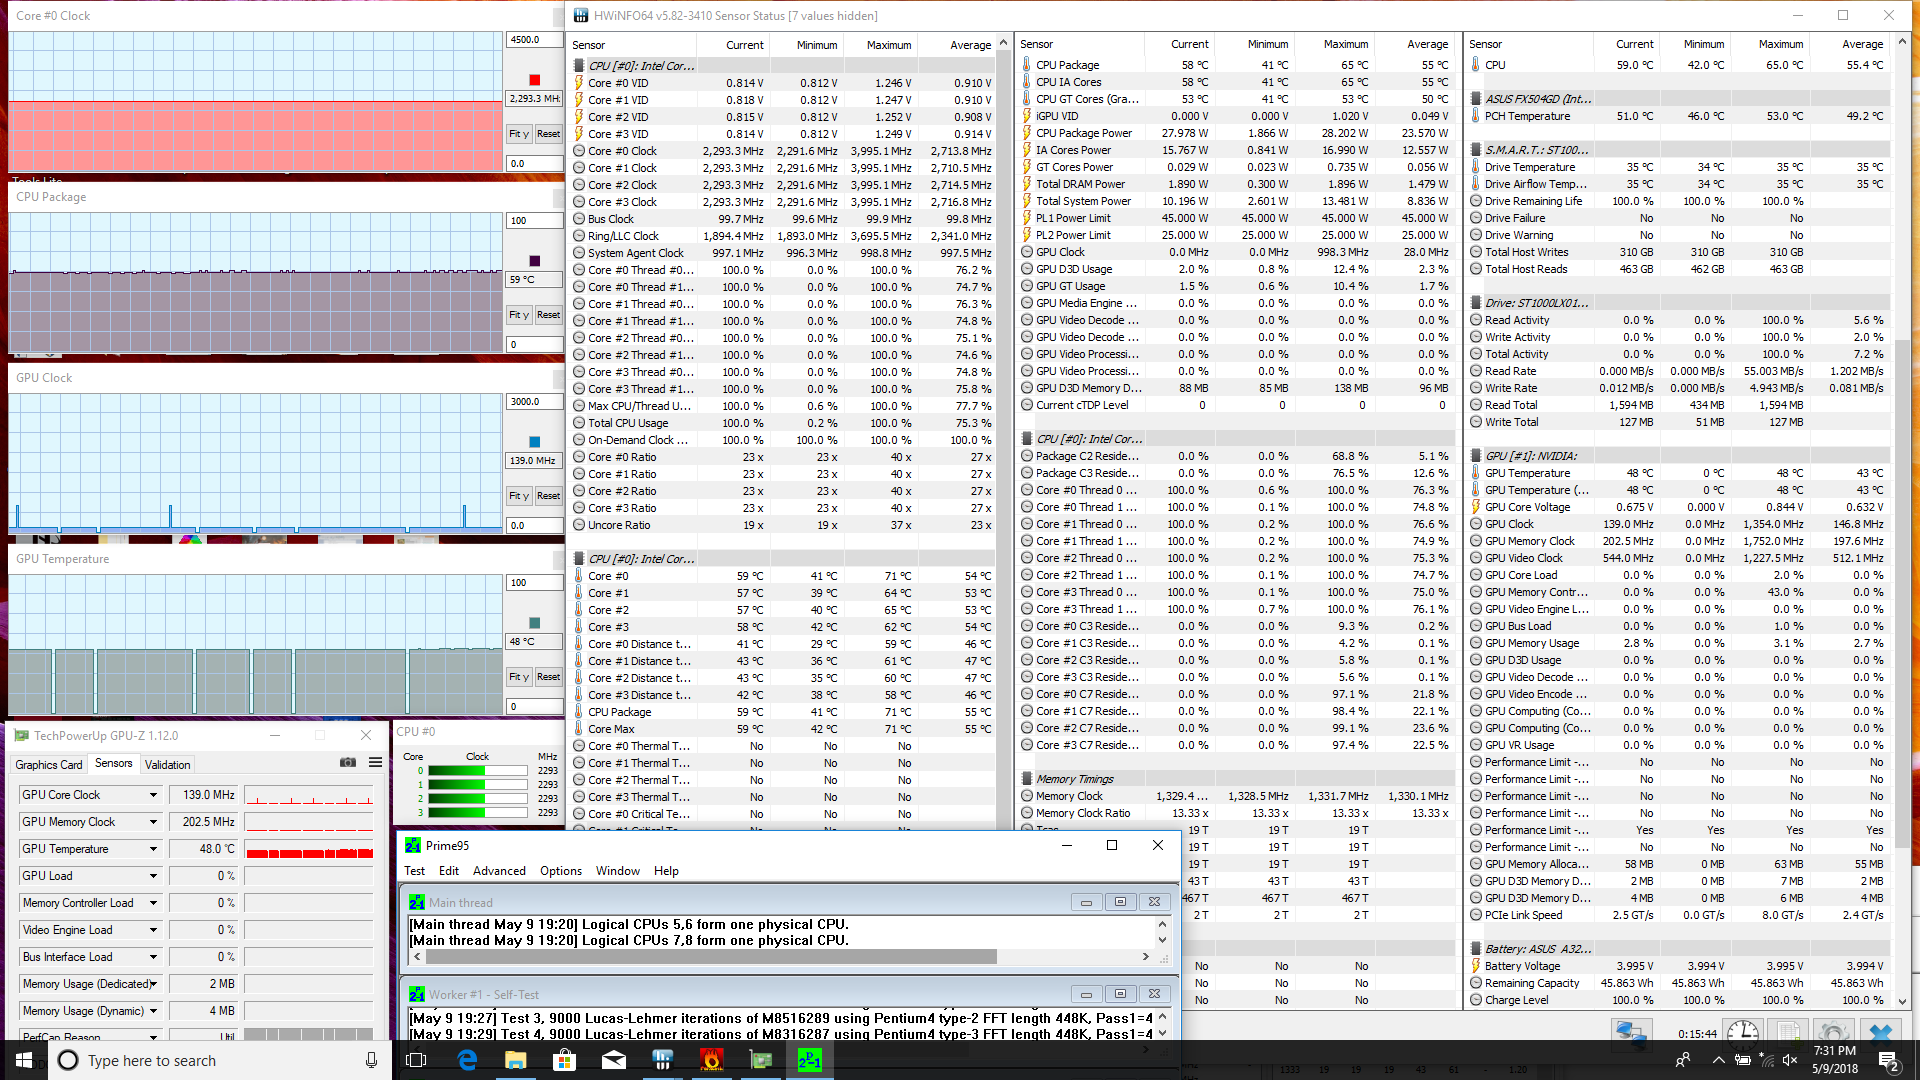
We stress the system to identify for any potential throttling or stability issues. When subjected to Prime95 load, the CPU can be observed running at a steady 2.3 GHz and an unusually low CPU temperature of 59 C. The base clock rate for the i5-8300H is 2.3 GHz, so the system is strangely not benefiting from any Turbo Boost when under such conditions. Our findings mirror the CineBench results above where the Multi-Thread score was much lower than expected. The CPU is clearly capable of sustaining faster clocks and there is a high core temperature ceiling to support it, but this does not occur for whatever reason when under extreme CPU stress.
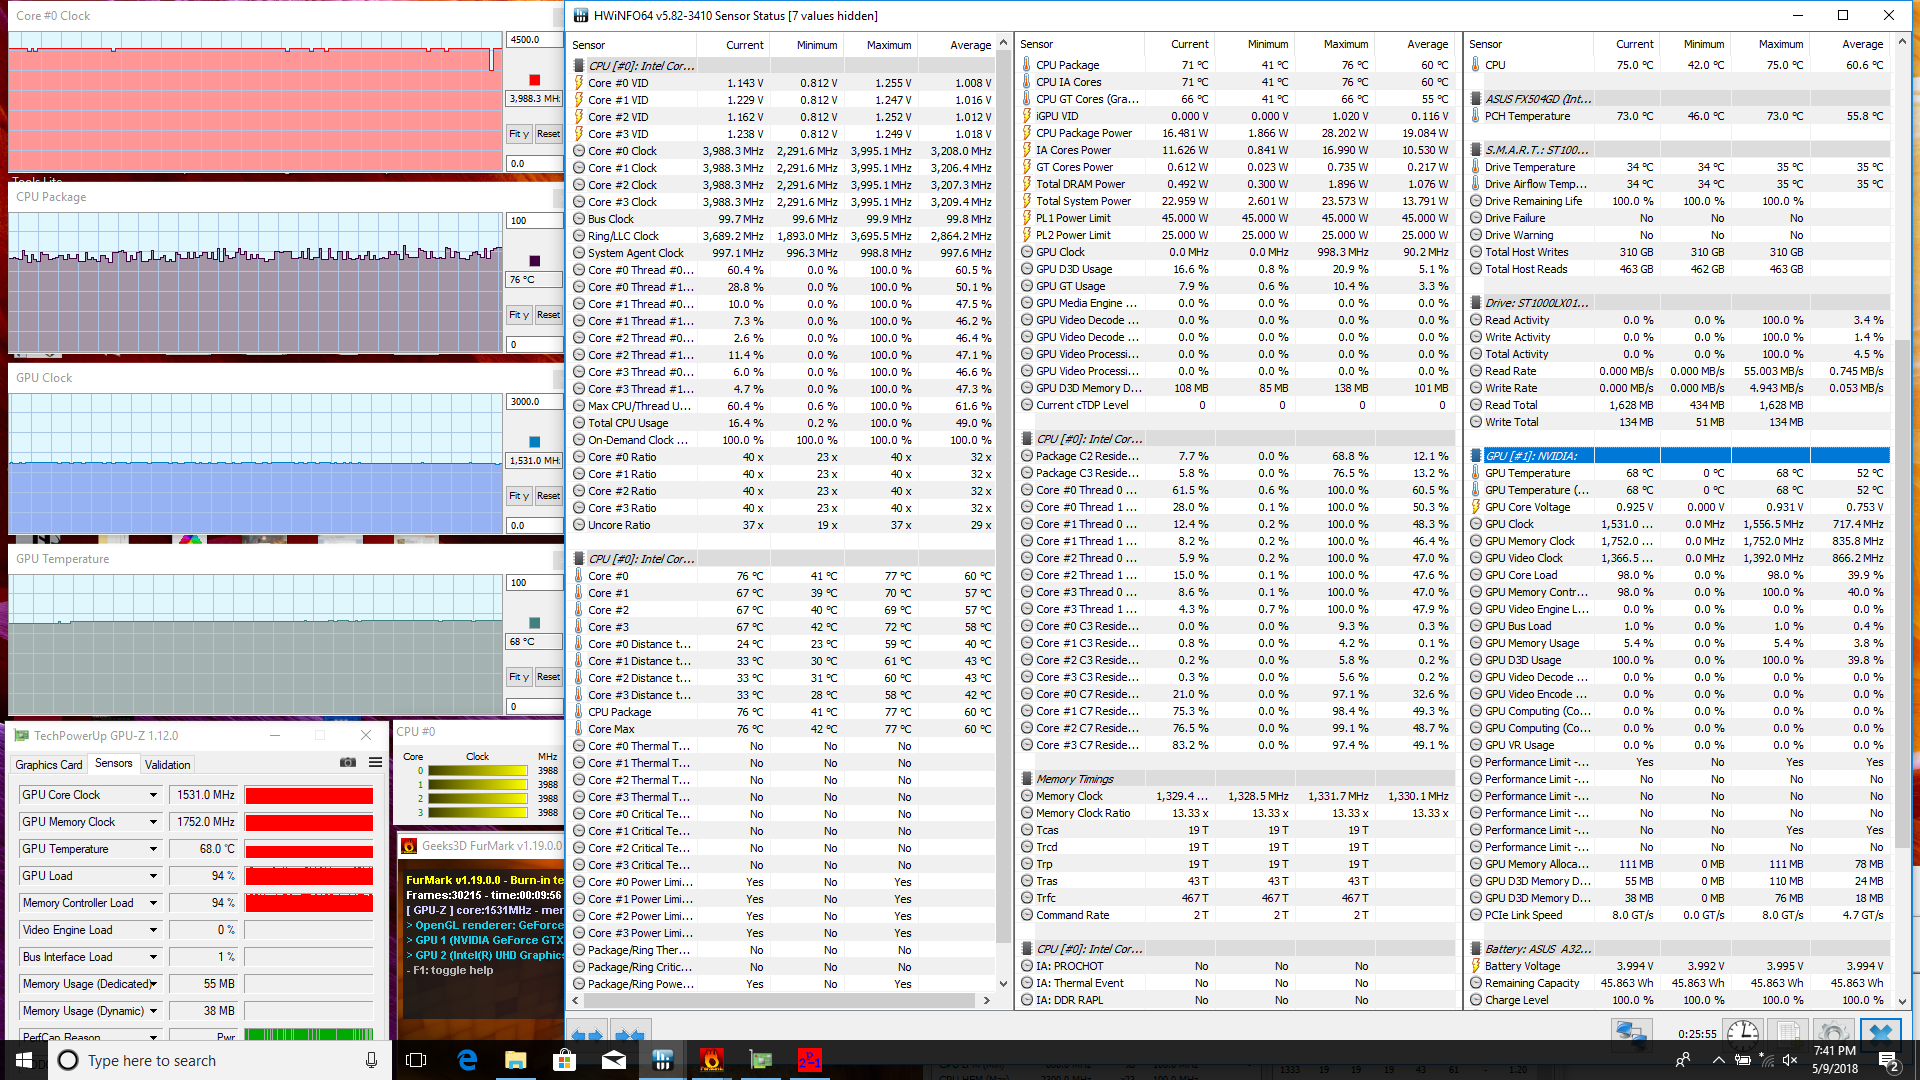
The results become even stranger when running Prime95 and FurMark simultaneously as the CPU can be observed running steady at 2.8 GHz. CPU and GPU clock rates remain in the low to mid 70 C range when gaming as is typical of most thicker gaming notebooks.
Running on battery power will impact GPU performance while the CPU remains unaffected. A 3DMark 11 run on batteries returns Physics and Graphics scores of 6213 and 5803 points, respectively, compared to 6234 and 7133 when on mains.
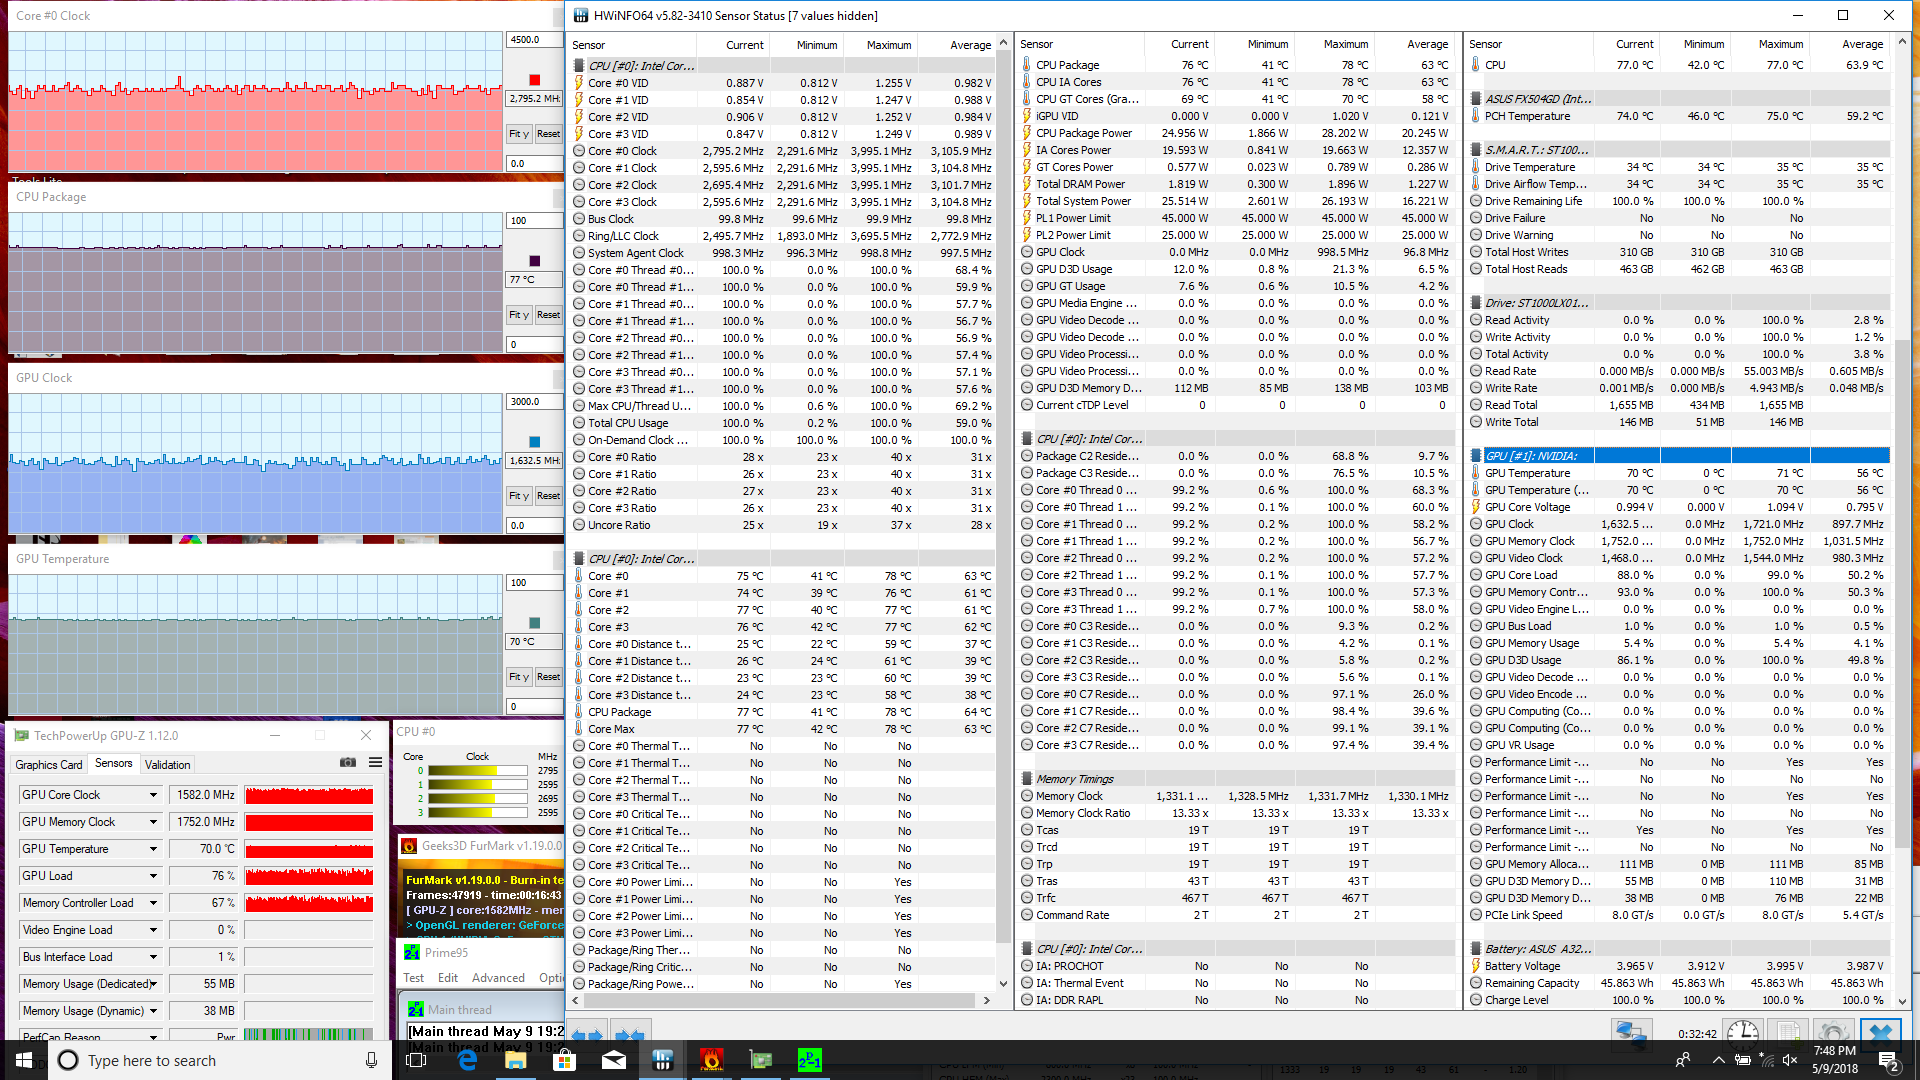
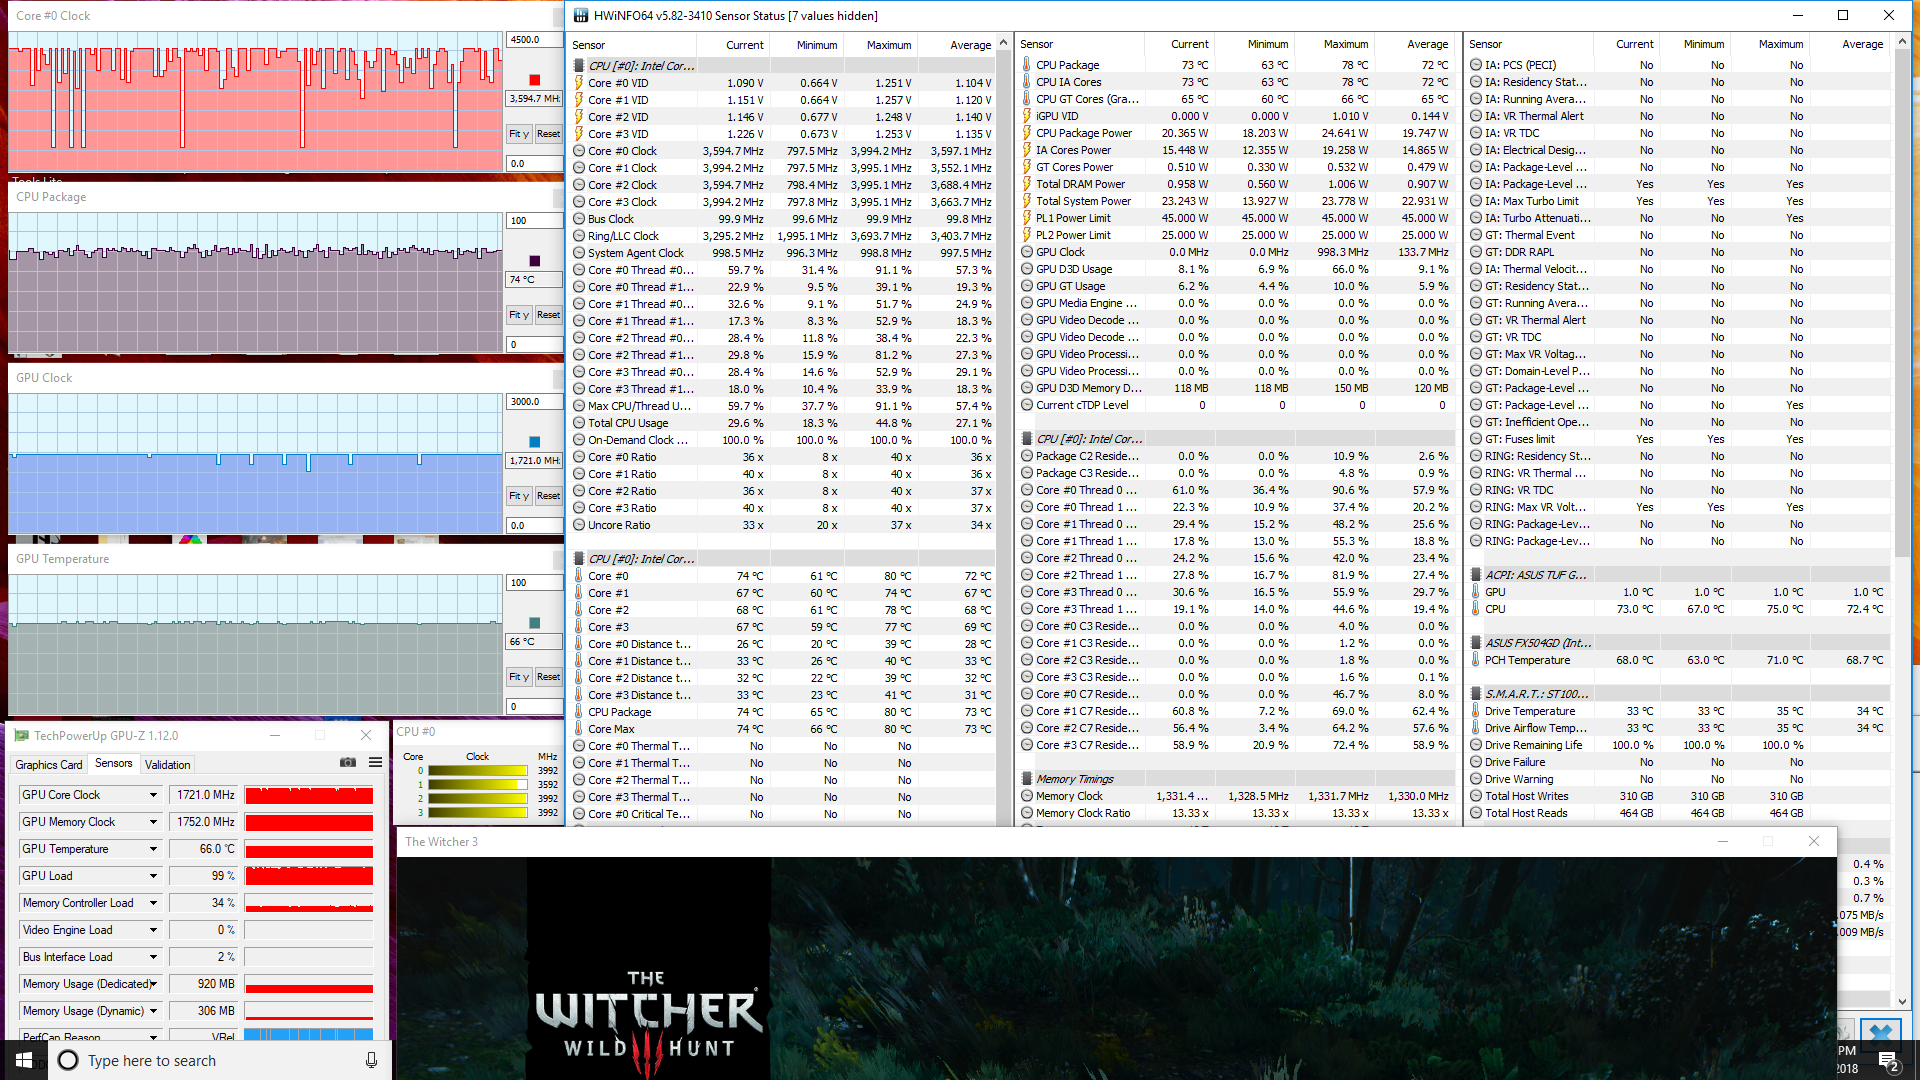
| CPU Clock (GHz) | GPU Clock (MHz) | Average CPU Temperature (°C) | Average GPU Temperature (°C) | |
| Prime95 Stress | 2.3 | -- | 59 | 48 |
| FurMark Stress | -- | 1531 | 76 | 68 |
| Prime95 + FurMark Stress | 2.8 | 1633 | 77 | 70 |
| Witcher 3 Stress | ~3.6 | 1721 | 74 | 66 |
Emissions
System Noise
The dual system fans are always active no matter the load. Thankfully, they are barely audible in a typical classroom or library environment during low loads like browsing. Fans become very loud very quickly when subjected to average (3DMark06) loads. Users can expect a 40 to 44 dB(A) range when gaming to be quieter than most super-thin gaming notebooks like the Razer series. The fans are generally steady and will not pulsate frequently.
We can notice no electronic noise or coil whine on our test unit.
Noise level
| Idle |
| 29 / 29.2 / 29.7 dB(A) |
| Load |
| 44.3 / 47.7 dB(A) |
 | ||
30 dB silent 40 dB(A) audible 50 dB(A) loud |
||
min: | ||
| Asus FX504GD GeForce GTX 1050 Mobile, i5-8300H, Seagate Mobile HDD 1TB ST1000LX015-1U7172 | Lenovo Legion Y520-15IKBN 80WK0042GE GeForce GTX 1050 Ti Mobile, i5-7300HQ, Samsung PM961 NVMe MZVLW128HEGR | Asus FX503VM-EH73 GeForce GTX 1060 Mobile, i7-7700HQ, SanDisk SD8SN8U128G1002 | Dell Inspiron 15 7000 7577 GeForce GTX 1050 Mobile, i5-7300HQ, Seagate Mobile HDD 1TB ST1000LX015-1U7172 | MSI GP62 7REX-1045US GeForce GTX 1050 Ti Mobile, i7-7700HQ, Toshiba NVMe THNSN5128GP | Gigabyte Aero 15X v8 GeForce GTX 1070 Max-Q, i7-8750H, Toshiba NVMe THNSN5512GPU7 | |
|---|---|---|---|---|---|---|
| Noise | 0% | -3% | -3% | -5% | -11% | |
| off / environment * (dB) | 28.1 | 30.6 -9% | 27.8 1% | 31 -10% | 28 -0% | 29 -3% |
| Idle Minimum * (dB) | 29 | 31.9 -10% | 29.6 -2% | 32.7 -13% | 32.2 -11% | 30 -3% |
| Idle Average * (dB) | 29.2 | 31.9 -9% | 29.6 -1% | 32.7 -12% | 32.2 -10% | 31 -6% |
| Idle Maximum * (dB) | 29.7 | 31.9 -7% | 29.6 -0% | 32.7 -10% | 32.2 -8% | 35 -18% |
| Load Average * (dB) | 44.3 | 34.6 22% | 37.3 16% | 38.7 13% | 40.9 8% | 49 -11% |
| Witcher 3 ultra * (dB) | 40.7 | 39.3 3% | 49.8 -22% | 39 4% | 45.4 -12% | 51 -25% |
| Load Maximum * (dB) | 47.7 | 41.7 13% | 53.7 -13% | 44.6 6% | 48.6 -2% | 54 -13% |
* ... smaller is better
Temperature
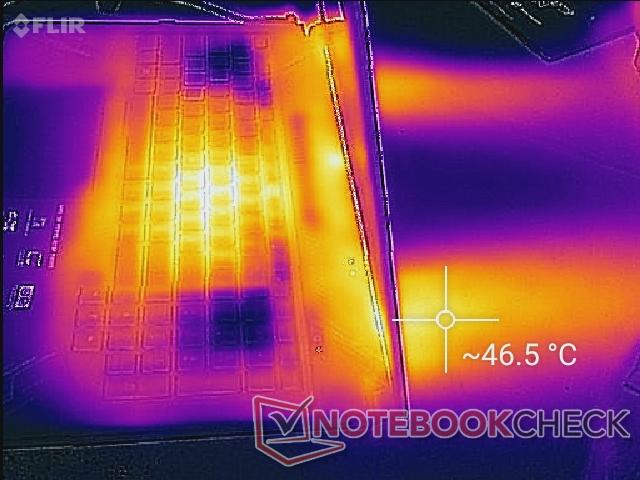
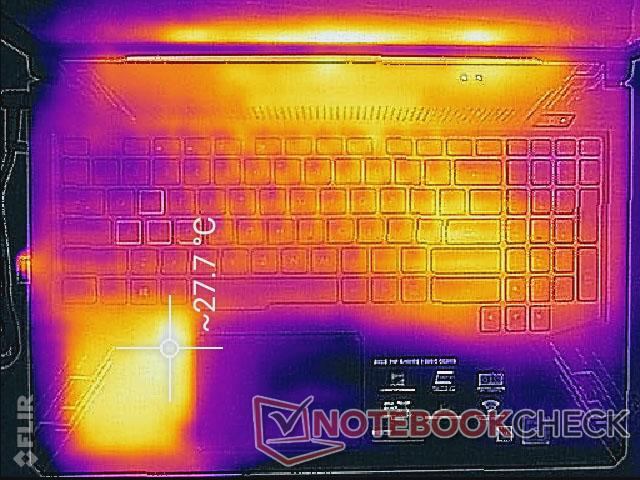
Surface temperatures are generally cool in the mid to high 20 C range when idling save for the left palm rest. As shown by the temperature maps below, the HDD will warm the left palm rest to as much as 5 degrees higher than the right palm rest. It's not enough to be uncomfortable, but the temperature difference is certainly noticeable when typing.
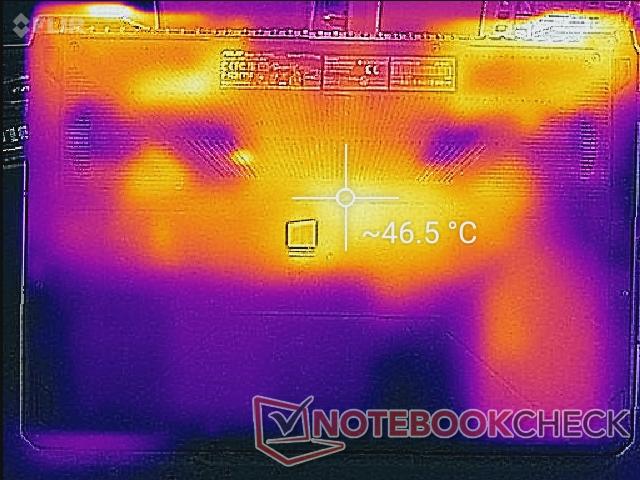
Higher loads like gaming can induce a surface temperature of 54 C near the center of the keyboard and 47 C on the opposite side. It's clear where the processors are located simply by identifying the hot spots of the notebook. Luckily, the important WASD and Arrow keys are kept comfortably cool for gaming because of the system fans directly underneath.
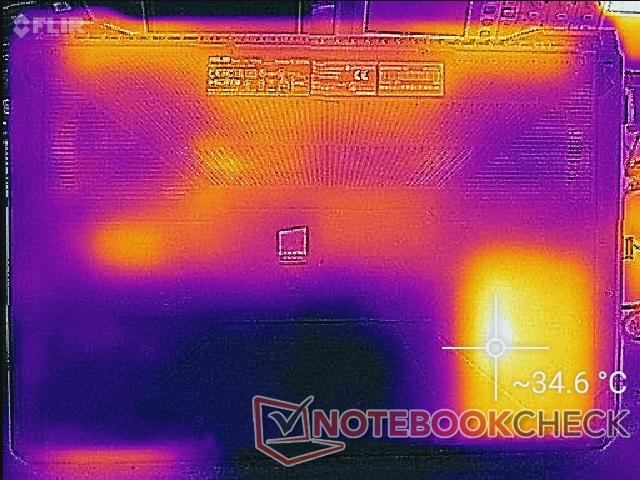
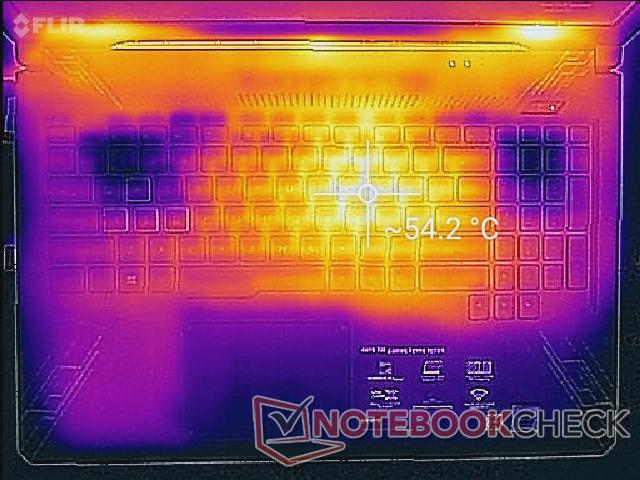
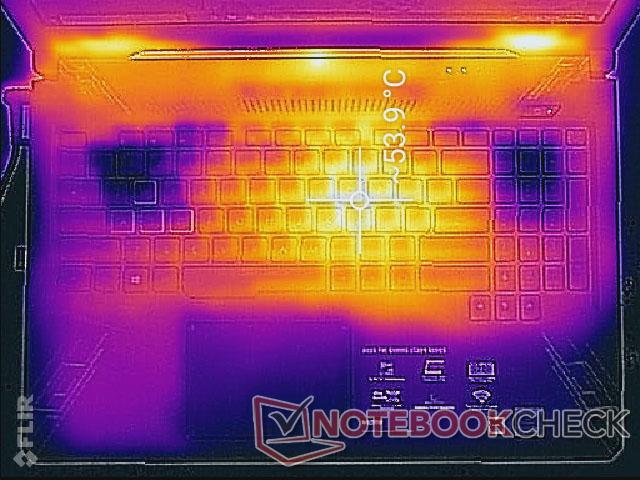
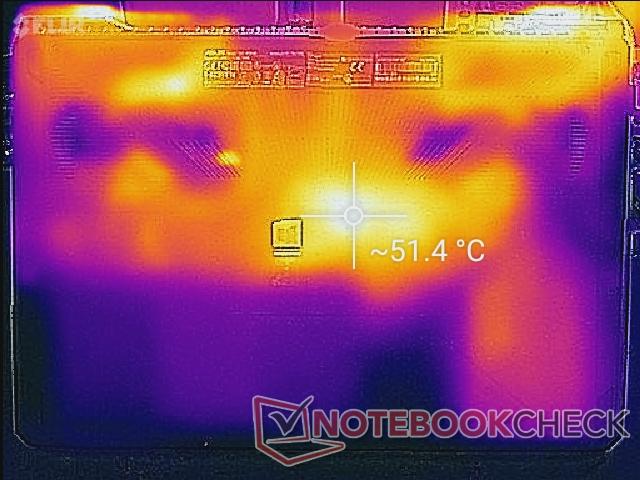
(-) The maximum temperature on the upper side is 55.8 °C / 132 F, compared to the average of 40.4 °C / 105 F, ranging from 21.2 to 68.8 °C for the class Gaming.
(-) The bottom heats up to a maximum of 51.4 °C / 125 F, compared to the average of 43.2 °C / 110 F
(+) In idle usage, the average temperature for the upper side is 25.3 °C / 78 F, compared to the device average of 33.9 °C / 93 F.
(±) Playing The Witcher 3, the average temperature for the upper side is 37.3 °C / 99 F, compared to the device average of 33.9 °C / 93 F.
(+) The palmrests and touchpad are reaching skin temperature as a maximum (32.4 °C / 90.3 F) and are therefore not hot.
(-) The average temperature of the palmrest area of similar devices was 28.8 °C / 83.8 F (-3.6 °C / -6.5 F).
Speakers
Sound quality from the stereo speakers are subpar. As graph pink graph below shows, bass is poorly represented while higher frequencies are exaggerated similar to cheap netbooks. Maximum volume is sufficiently loud but no particularly ideal for movies or gaming. We recommend earphones if possible. Higher volume settings do not reverberate or rattle the chassis.


Asus FX504GD audio analysis
(-) | not very loud speakers (70.4 dB)
Bass 100 - 315 Hz
(-) | nearly no bass - on average 17.6% lower than median
(±) | linearity of bass is average (10.9% delta to prev. frequency)
Mids 400 - 2000 Hz
(+) | balanced mids - only 3.9% away from median
(±) | linearity of mids is average (7.7% delta to prev. frequency)
Highs 2 - 16 kHz
(±) | higher highs - on average 5.3% higher than median
(±) | linearity of highs is average (9.8% delta to prev. frequency)
Overall 100 - 16.000 Hz
(±) | linearity of overall sound is average (25% difference to median)
Compared to same class
» 90% of all tested devices in this class were better, 3% similar, 7% worse
» The best had a delta of 6%, average was 18%, worst was 132%
Compared to all devices tested
» 76% of all tested devices were better, 5% similar, 19% worse
» The best had a delta of 4%, average was 23%, worst was 134%
Apple MacBook 12 (Early 2016) 1.1 GHz audio analysis
(+) | speakers can play relatively loud (83.6 dB)
Bass 100 - 315 Hz
(±) | reduced bass - on average 11.3% lower than median
(±) | linearity of bass is average (14.2% delta to prev. frequency)
Mids 400 - 2000 Hz
(+) | balanced mids - only 2.4% away from median
(+) | mids are linear (5.5% delta to prev. frequency)
Highs 2 - 16 kHz
(+) | balanced highs - only 2% away from median
(+) | highs are linear (4.5% delta to prev. frequency)
Overall 100 - 16.000 Hz
(+) | overall sound is linear (10.2% difference to median)
Compared to same class
» 7% of all tested devices in this class were better, 2% similar, 90% worse
» The best had a delta of 5%, average was 18%, worst was 53%
Compared to all devices tested
» 5% of all tested devices were better, 1% similar, 94% worse
» The best had a delta of 4%, average was 23%, worst was 134%
Energy Management
Power Consumption
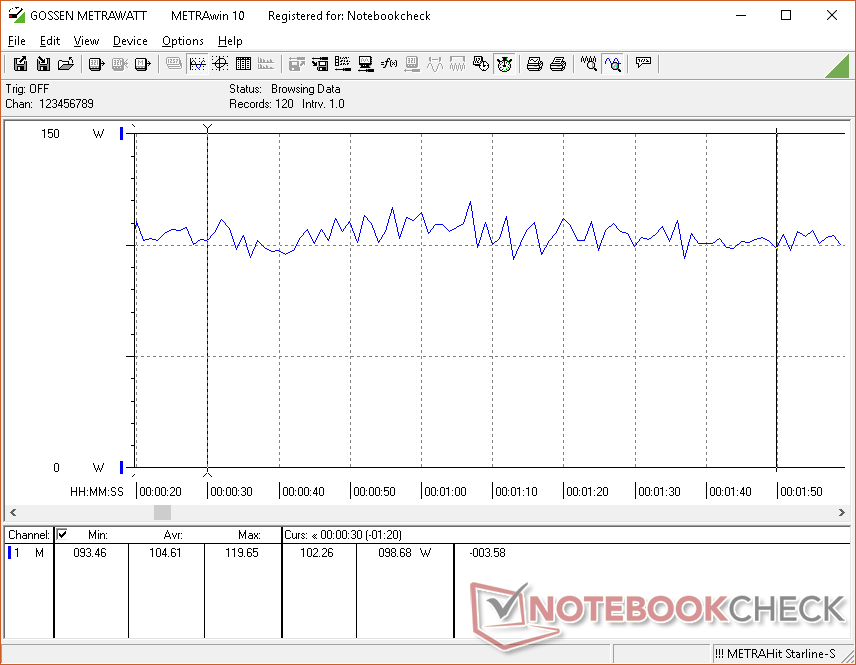
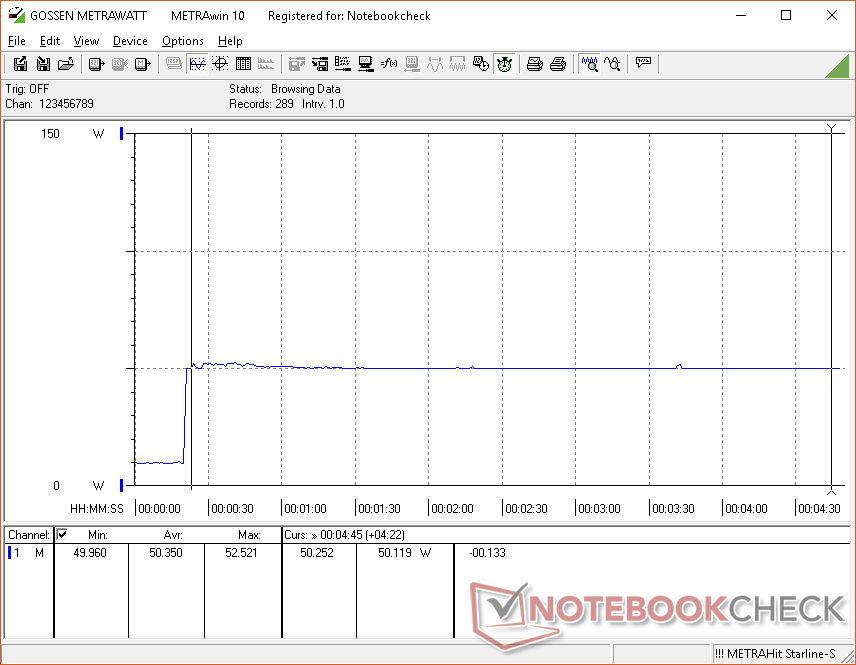
Idling will draw anywhere from 7 W to 11 W depending on the brightness setting and Windows Power profile. Gaming demands about 96 W to be very comparable to the Lenovo Legion Y520 and Dell Inspiron 15 7577 with the GTX 1050 Ti and GTX 1060 Max-Q, respectively. The FX503VM is the more graphically powerful notebook but with slightly higher power consumption during most loads.
Maximum load will draw about 103 W from a medium-sized (~16 x 7.5 x 2.5 cm) 120 W AC adapter. The rough 15 percent overhead is sufficient for running even extremely demanding applications.
| Off / Standby | |
| Idle | |
| Load |
|
Key:
min: | |
| Asus FX504GD i5-8300H, GeForce GTX 1050 Mobile, Seagate Mobile HDD 1TB ST1000LX015-1U7172, TN LED, 1920x1080, 15.6" | Lenovo Legion Y520-15IKBN 80WK0042GE i5-7300HQ, GeForce GTX 1050 Ti Mobile, Samsung PM961 NVMe MZVLW128HEGR, IPS, 1920x1080, 15.6" | Asus FX503VM-EH73 i7-7700HQ, GeForce GTX 1060 Mobile, SanDisk SD8SN8U128G1002, IPS, 1920x1080, 15.6" | MSI GP62 7REX-1045US i7-7700HQ, GeForce GTX 1050 Ti Mobile, Toshiba NVMe THNSN5128GP, TN LED, 1920x1080, 15.6" | Gigabyte Aero 15X v8 i7-8750H, GeForce GTX 1070 Max-Q, Toshiba NVMe THNSN5512GPU7, IPS, 1920x1080, 15.6" | Dell Inspiron 15 7000 7577 4K i7-7700HQ, GeForce GTX 1060 Max-Q, SK hynix SC311 M.2, IPS, 3840x2160, 15.6" | |
|---|---|---|---|---|---|---|
| Power Consumption | 15% | -35% | -44% | -65% | 3% | |
| Idle Minimum * (Watt) | 7.2 | 5.2 28% | 12.8 -78% | 14.6 -103% | 14 -94% | 5.5 24% |
| Idle Average * (Watt) | 10.2 | 8.3 19% | 15.4 -51% | 17.2 -69% | 18 -76% | 10.5 -3% |
| Idle Maximum * (Watt) | 10.9 | 10.1 7% | 15.9 -46% | 17.3 -59% | 22 -102% | 10.9 -0% |
| Load Average * (Watt) | 93.3 | 62.7 33% | 78 16% | 82.7 11% | 91 2% | 72 23% |
| Witcher 3 ultra * (Watt) | 95.8 | 94 2% | 107.3 -12% | 107 -12% | 142 -48% | 97.4 -2% |
| Load Maximum * (Watt) | 102.5 | 100 2% | 143.4 -40% | 136.7 -33% | 173 -69% | 130.4 -27% |
* ... smaller is better
Battery Life
Runtimes are average at best from the non-removable 48 Wh battery. Competing systems like the Inspiron 15 7577 and even the older FX503 have larger batteries for longer runtimes. There is definitely room for optimization as the Lenovo Legion Y520 is able to outlast our Asus by at least an hour longer under WLAN loads with a smaller 45 Wh battery pack.
Charging from near empty to full capacity will take about 2 hours.
| Asus FX504GD i5-8300H, GeForce GTX 1050 Mobile, 48 Wh | Lenovo Legion Y520-15IKBN 80WK0042GE i5-7300HQ, GeForce GTX 1050 Ti Mobile, 45 Wh | Asus FX503VM-EH73 i7-7700HQ, GeForce GTX 1060 Mobile, 64 Wh | Dell Inspiron 15 7000 7577 i5-7300HQ, GeForce GTX 1050 Mobile, 56 Wh | MSI GP62 7REX-1045US i7-7700HQ, GeForce GTX 1050 Ti Mobile, 41 Wh | Gigabyte Aero 15X v8 i7-8750H, GeForce GTX 1070 Max-Q, 94.24 Wh | |
|---|---|---|---|---|---|---|
| Battery runtime | 46% | 7% | 77% | -29% | 130% | |
| Reader / Idle (h) | 7.5 | 10.6 41% | 5.7 -24% | 11.1 48% | 4.3 -43% | 12.7 69% |
| WiFi v1.3 (h) | 3.7 | 5.2 41% | 4.6 24% | 6.8 84% | 2.9 -22% | 8.6 132% |
| Load (h) | 0.9 | 1.4 56% | 1.1 22% | 1.8 100% | 0.7 -22% | 2.6 189% |
Pros
Cons
Verdict
We welcome cheaper and more affordable gaming notebooks so long as they preserve core features and offer a balanced experience. Cut too many corners and the drawbacks can become distracting. For $700 USD, the FX504 sacrifices display quality and includes no SSD for a poorer overall experience. Users are better off investing $100 to $200 more on a small primary SSD and a quality IPS display.
Existing notebook gamers with i5-7300HQ or i7-7700HQ systems need not upgrade to the i5-8300H if gaming is a priority. Instead, investing in a system with the older i7-7700HQ and GTX 1060 would be tremendously more fruitful than a system with the newer i5-8300H and GTX 1050 or 1050 Ti.
The FX504 falters when compared to other budget gaming systems as well. Alternatives like the Legion Y520, Sabre 15, and Inspiron 7577 have longer battery life and more port features including USB Type-C and SD card readers. Gamers on a budget may want to consider the FX503 instead of the FX504 since the former is essentially the same system but with easier serviceability, larger battery, and more balanced CPU and GPU options.
The FX504GD is one of the cheapest gaming notebooks available with the GTX 1050. Nonetheless, we recommend spending a bit more on the higher-end SKUs with IPS and SSD options or even the older GTX 1060-powered FX503 for about the same price.
Asus FX504GD
- 05/24/2018 v6 (old)
Allen Ngo
Price comparison
