Asus VivoBook Pro 16 (2023) Laptop Review: Core i9-13900H, RTX 4050, and 3.2K OLED augur well for hobbyist creators

Asus has refreshed its VivoBook lineup with several new models in 2023. After reviewing the Asus VivoBook 14X, VivoBook 15X, and the VivoBook Pro 16X K6604, we now turn our attention to the latest addition, the VivoBook Pro 16 K6602VU.
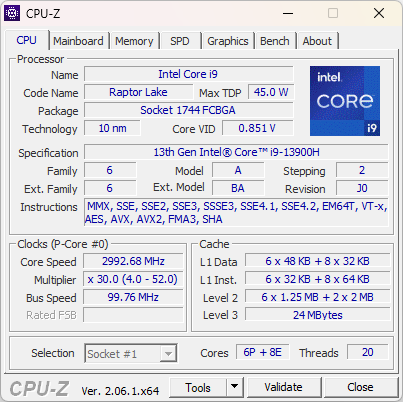
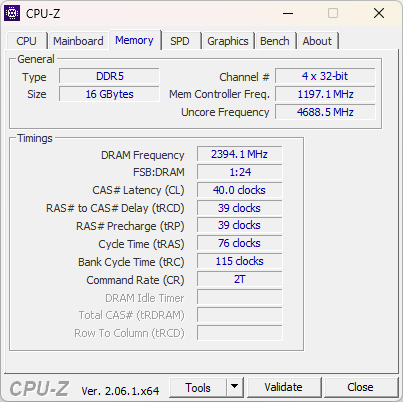
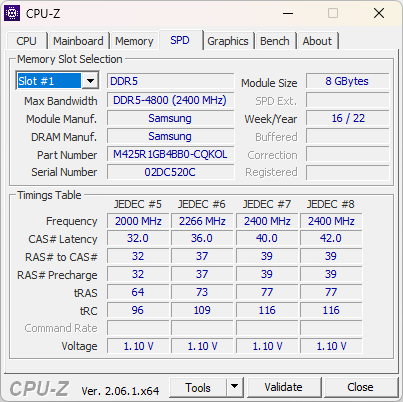
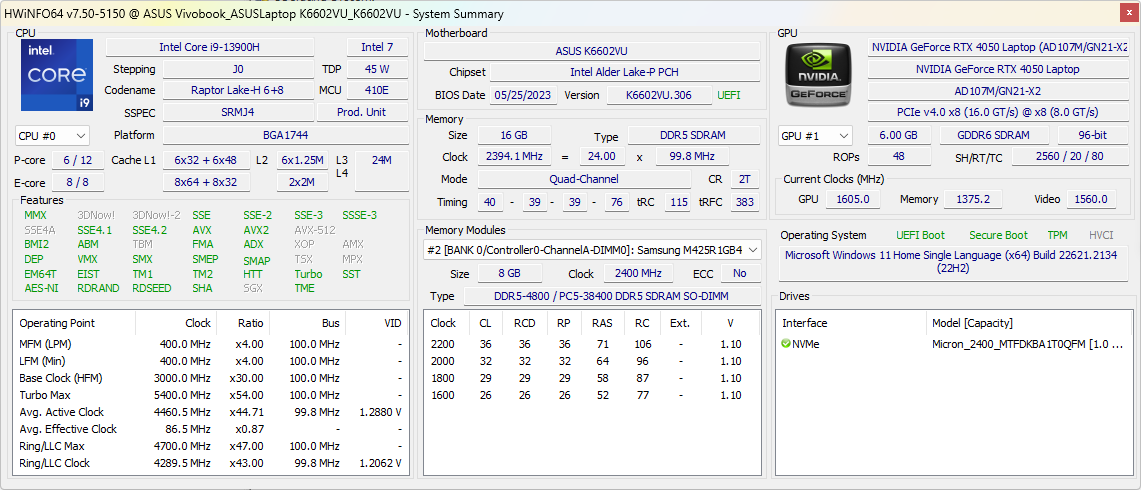
The 2023 VivoBook Pro 16 offers several key upgrades compared to the last generation. It packs some powerful components, including an Intel Core i9-13900H CPU and Nvidia GeForce RTX 4050 graphics. Our test unit also came equipped with 16 GB of fast DDR5-4800 RAM, a 1TB PCIe Gen4 SSD, and a vibrant 120 Hz 16:10 3.2K OLED display with Dolby Vision support.
This well-appointed setup doesn't come cheap, however — our VivoBook Pro 16 config rings the cash registers at ₹1,54,990 (€2,199 incl. VAT) in the Indian market. We put the VivoBook Pro 16 through its paces to see if it lives up to the lofty price tag.
Potential competitors in comparison
Rating | Date | Model | Weight | Height | Size | Resolution | Price |
|---|---|---|---|---|---|---|---|
| 87.6 % v7 (old) | 11 / 2023 | Asus VivoBook Pro 16 K6602VU i9-13900H, GeForce RTX 4050 Laptop GPU | 1.9 kg | 19 mm | 16.00" | 3200x2000 | |
| 86.2 % v7 (old) | 07 / 2023 | Asus Vivobook Pro 16X K6604JV-MX016W i9-13980HX, GeForce RTX 4060 Laptop GPU | 2.1 kg | 22.8 mm | 16.00" | 3200x2000 | |
| 89.7 % v7 (old) | 06 / 2023 | Asus ROG Flow X16 GV601V i9-13900H, GeForce RTX 4060 Laptop GPU | 2.1 kg | 19.4 mm | 16.00" | 2560x1600 | |
| 89 % v7 (old) | 08 / 2023 | Lenovo Legion Pro 5 16ARX8 (R5 7645HX, RTX 4050) R5 7645HX, GeForce RTX 4050 Laptop GPU | 2.5 kg | 27.3 mm | 16.00" | 2560x1600 | |
| 86.9 % v7 (old) | 06 / 2023 | Asus TUF Gaming A16 FA617XS R9 7940HS, Radeon RX 7600S | 2.2 kg | 22.1 mm | 16.00" | 1920x1200 | |
| 86.3 % v7 (old) | 05 / 2023 | Asus VivoBook Pro 16 i7-12700H, GeForce RTX 3050 Ti Laptop GPU | 1.9 kg | 20 mm | 16.00" | 2560x1600 | |
| 86.2 % v7 (old) | 03 / 2023 | Gigabyte AERO 16 OLED BSF i9-13900H, GeForce RTX 4070 Laptop GPU | 2.1 kg | 18 mm | 16.00" | 3840x2400 |
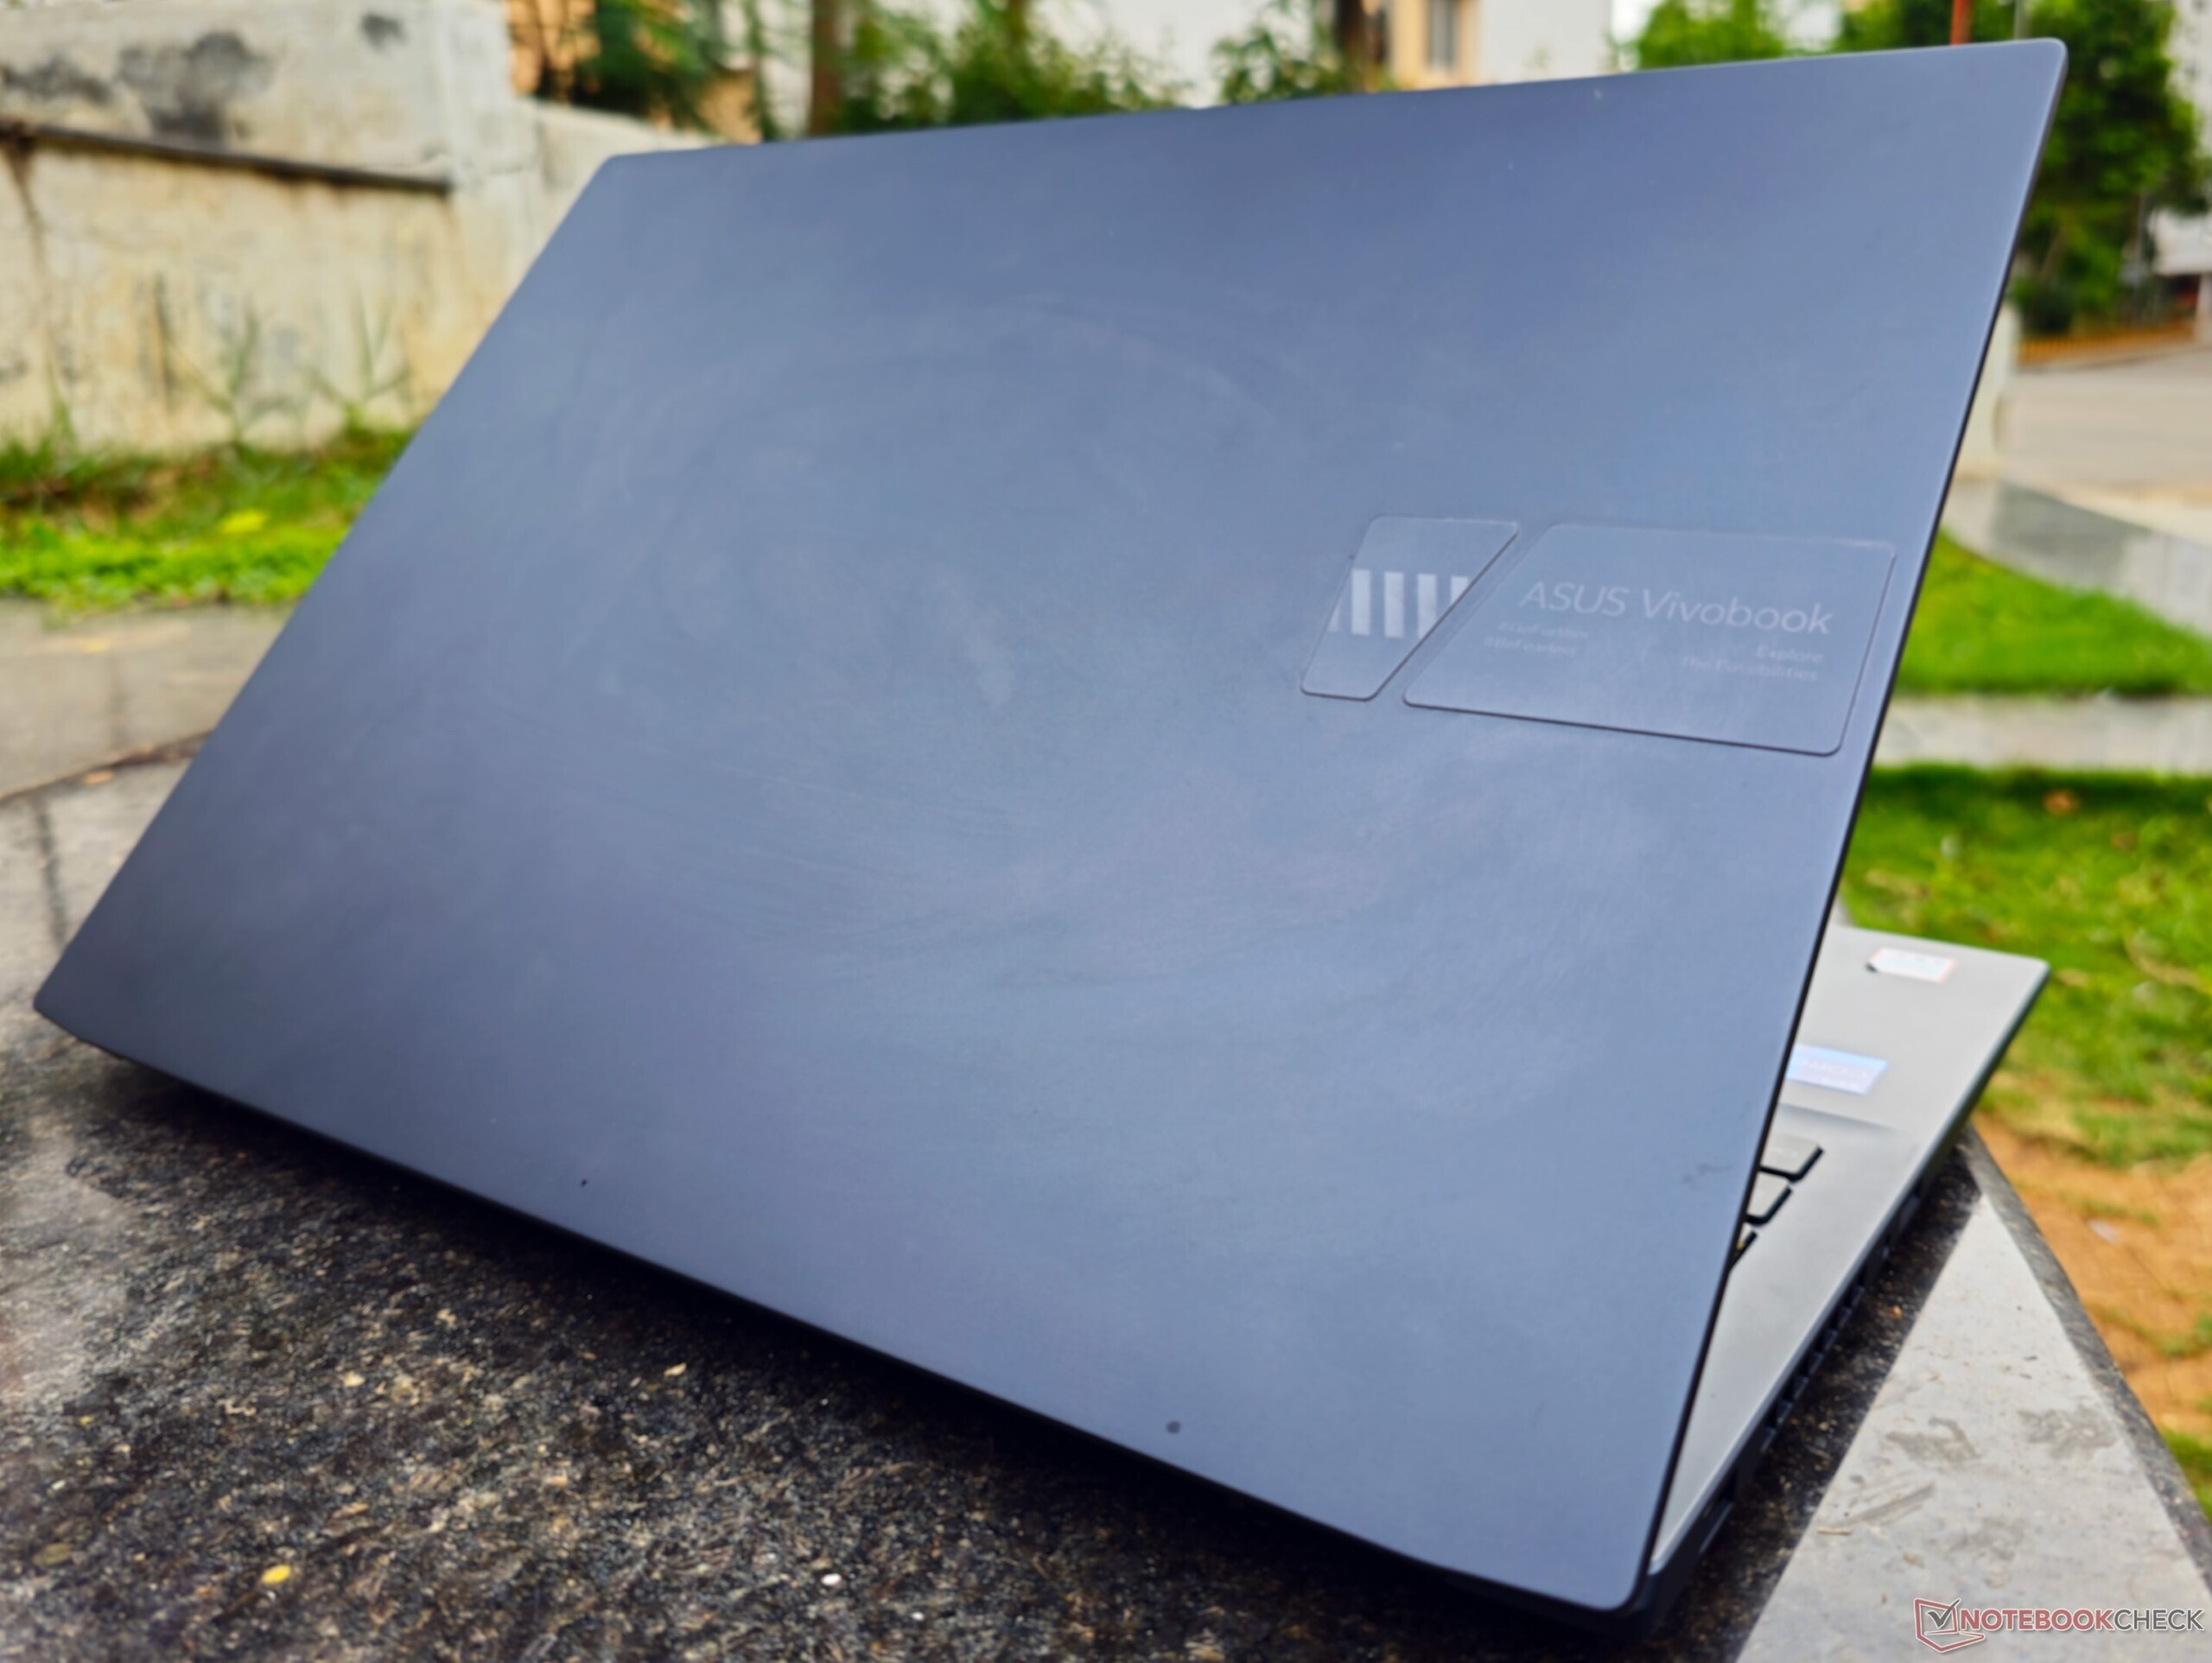
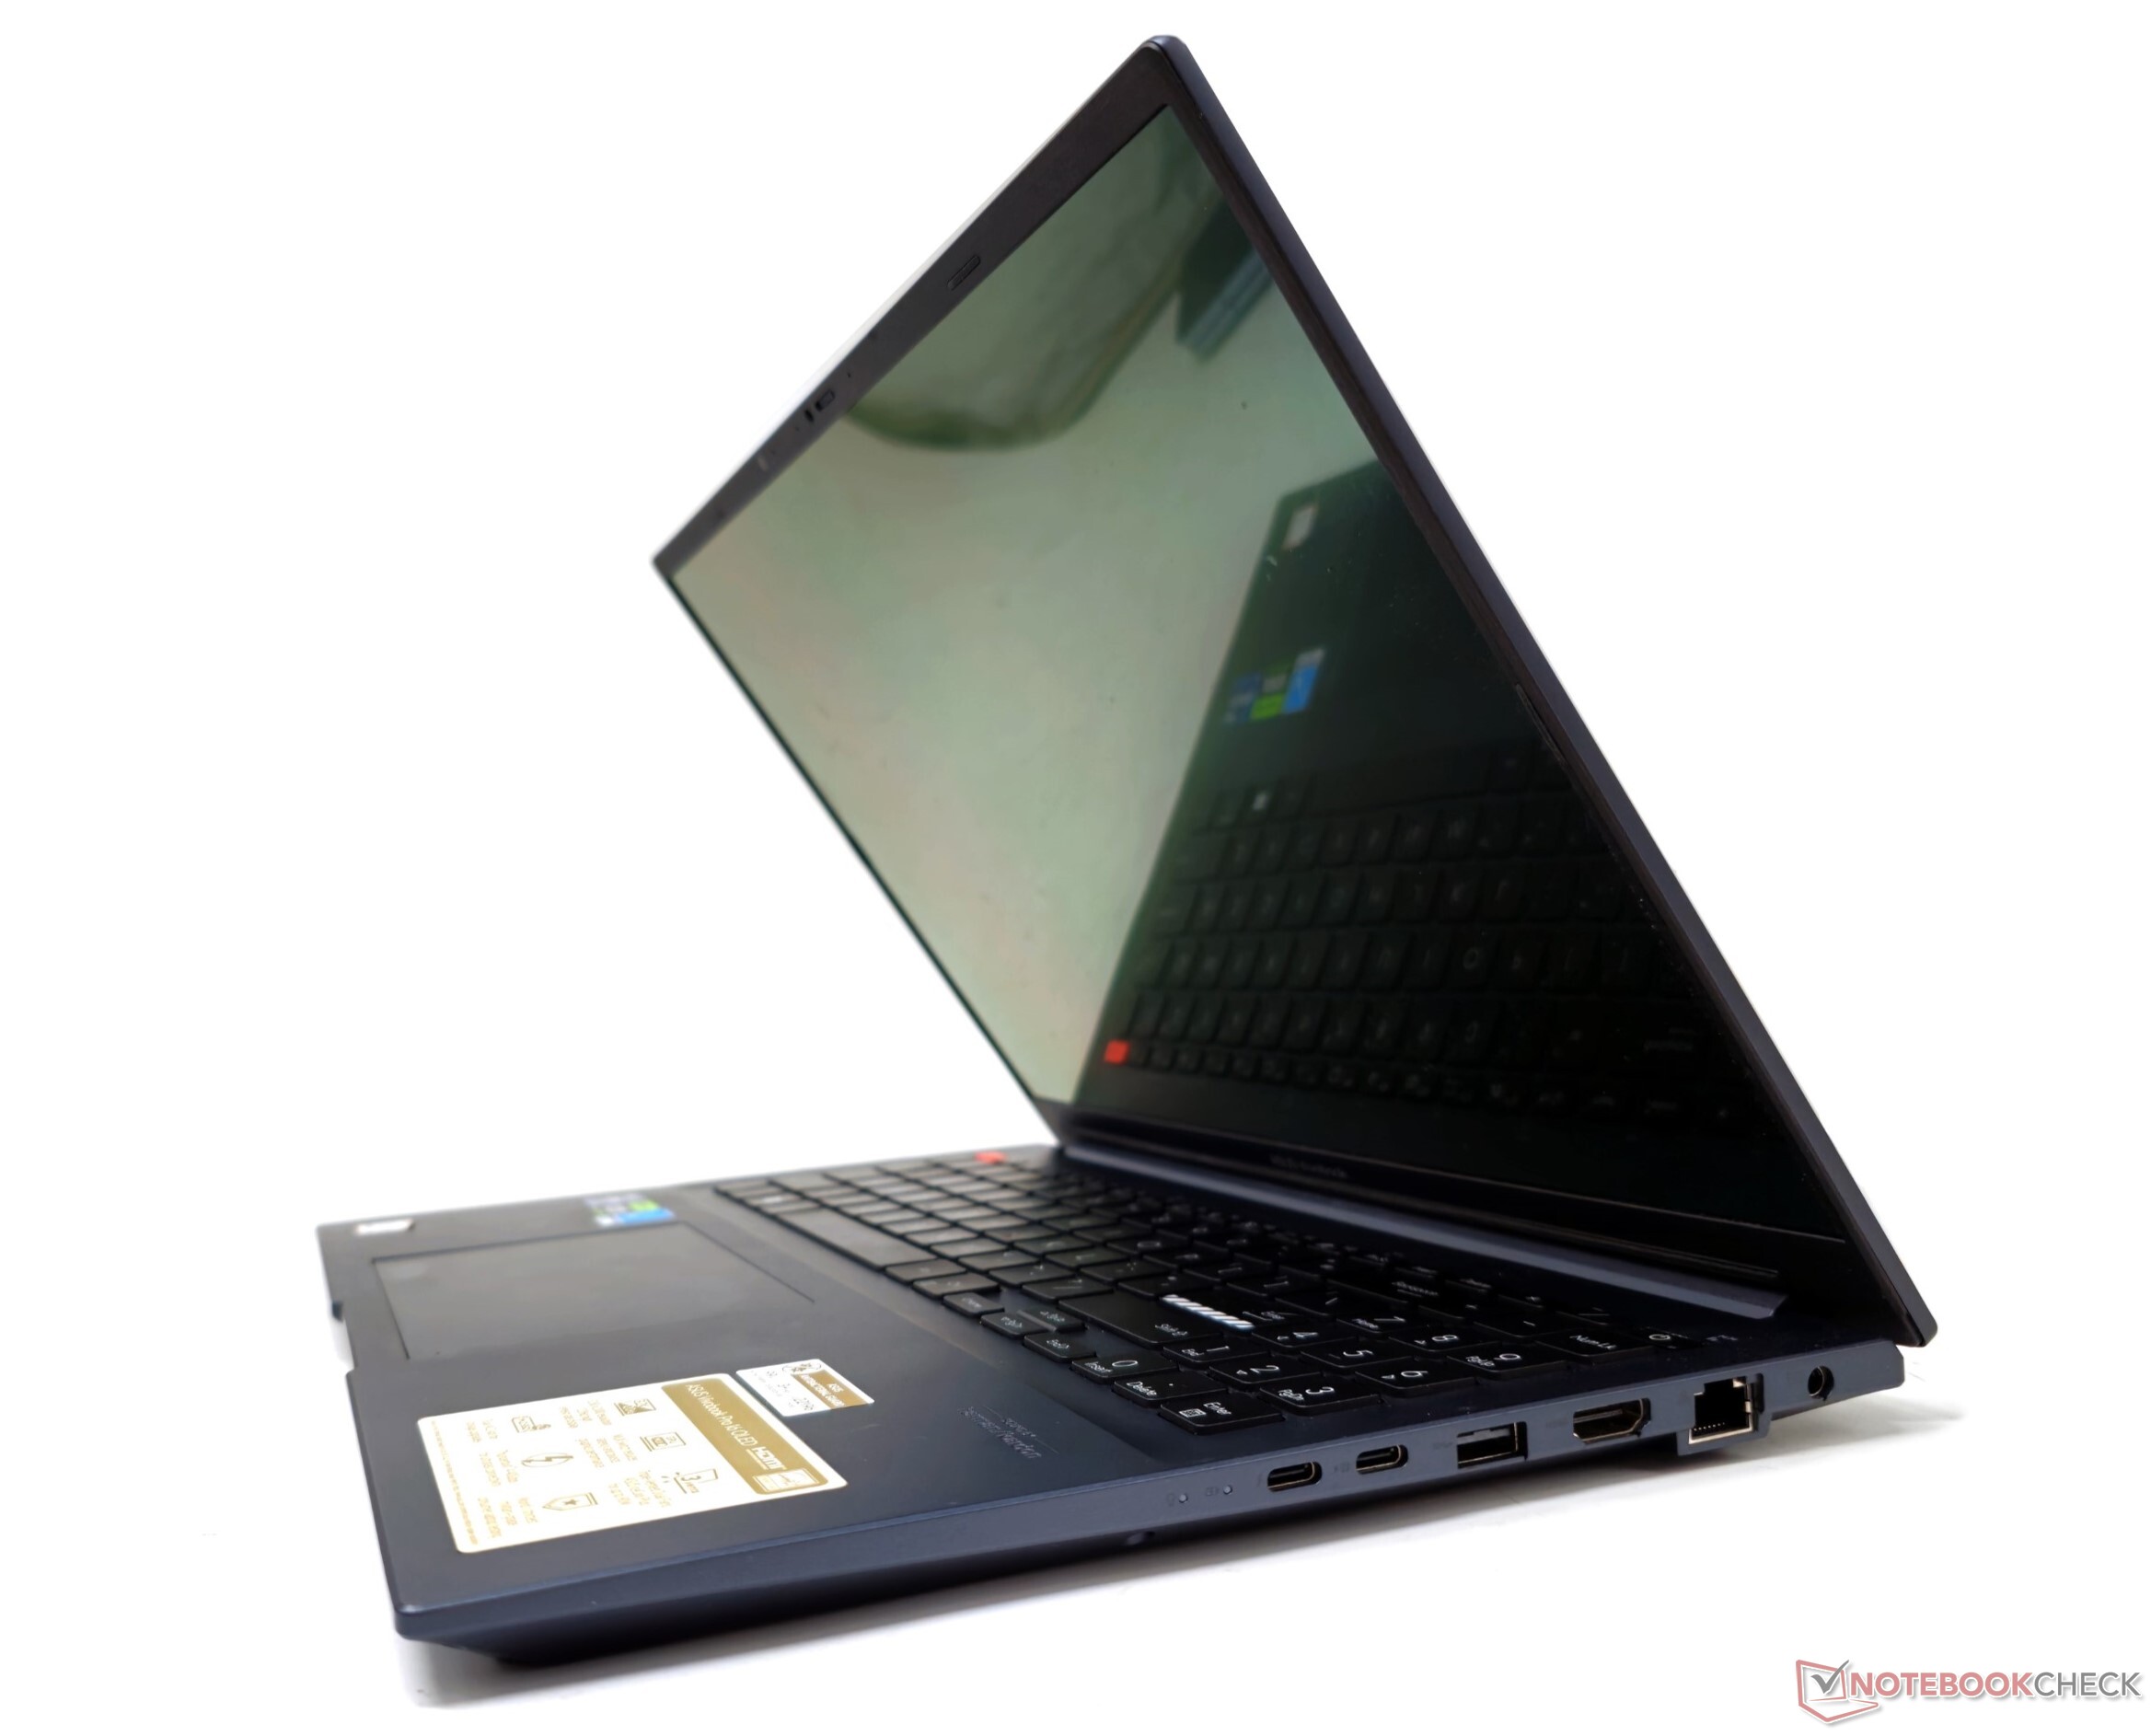
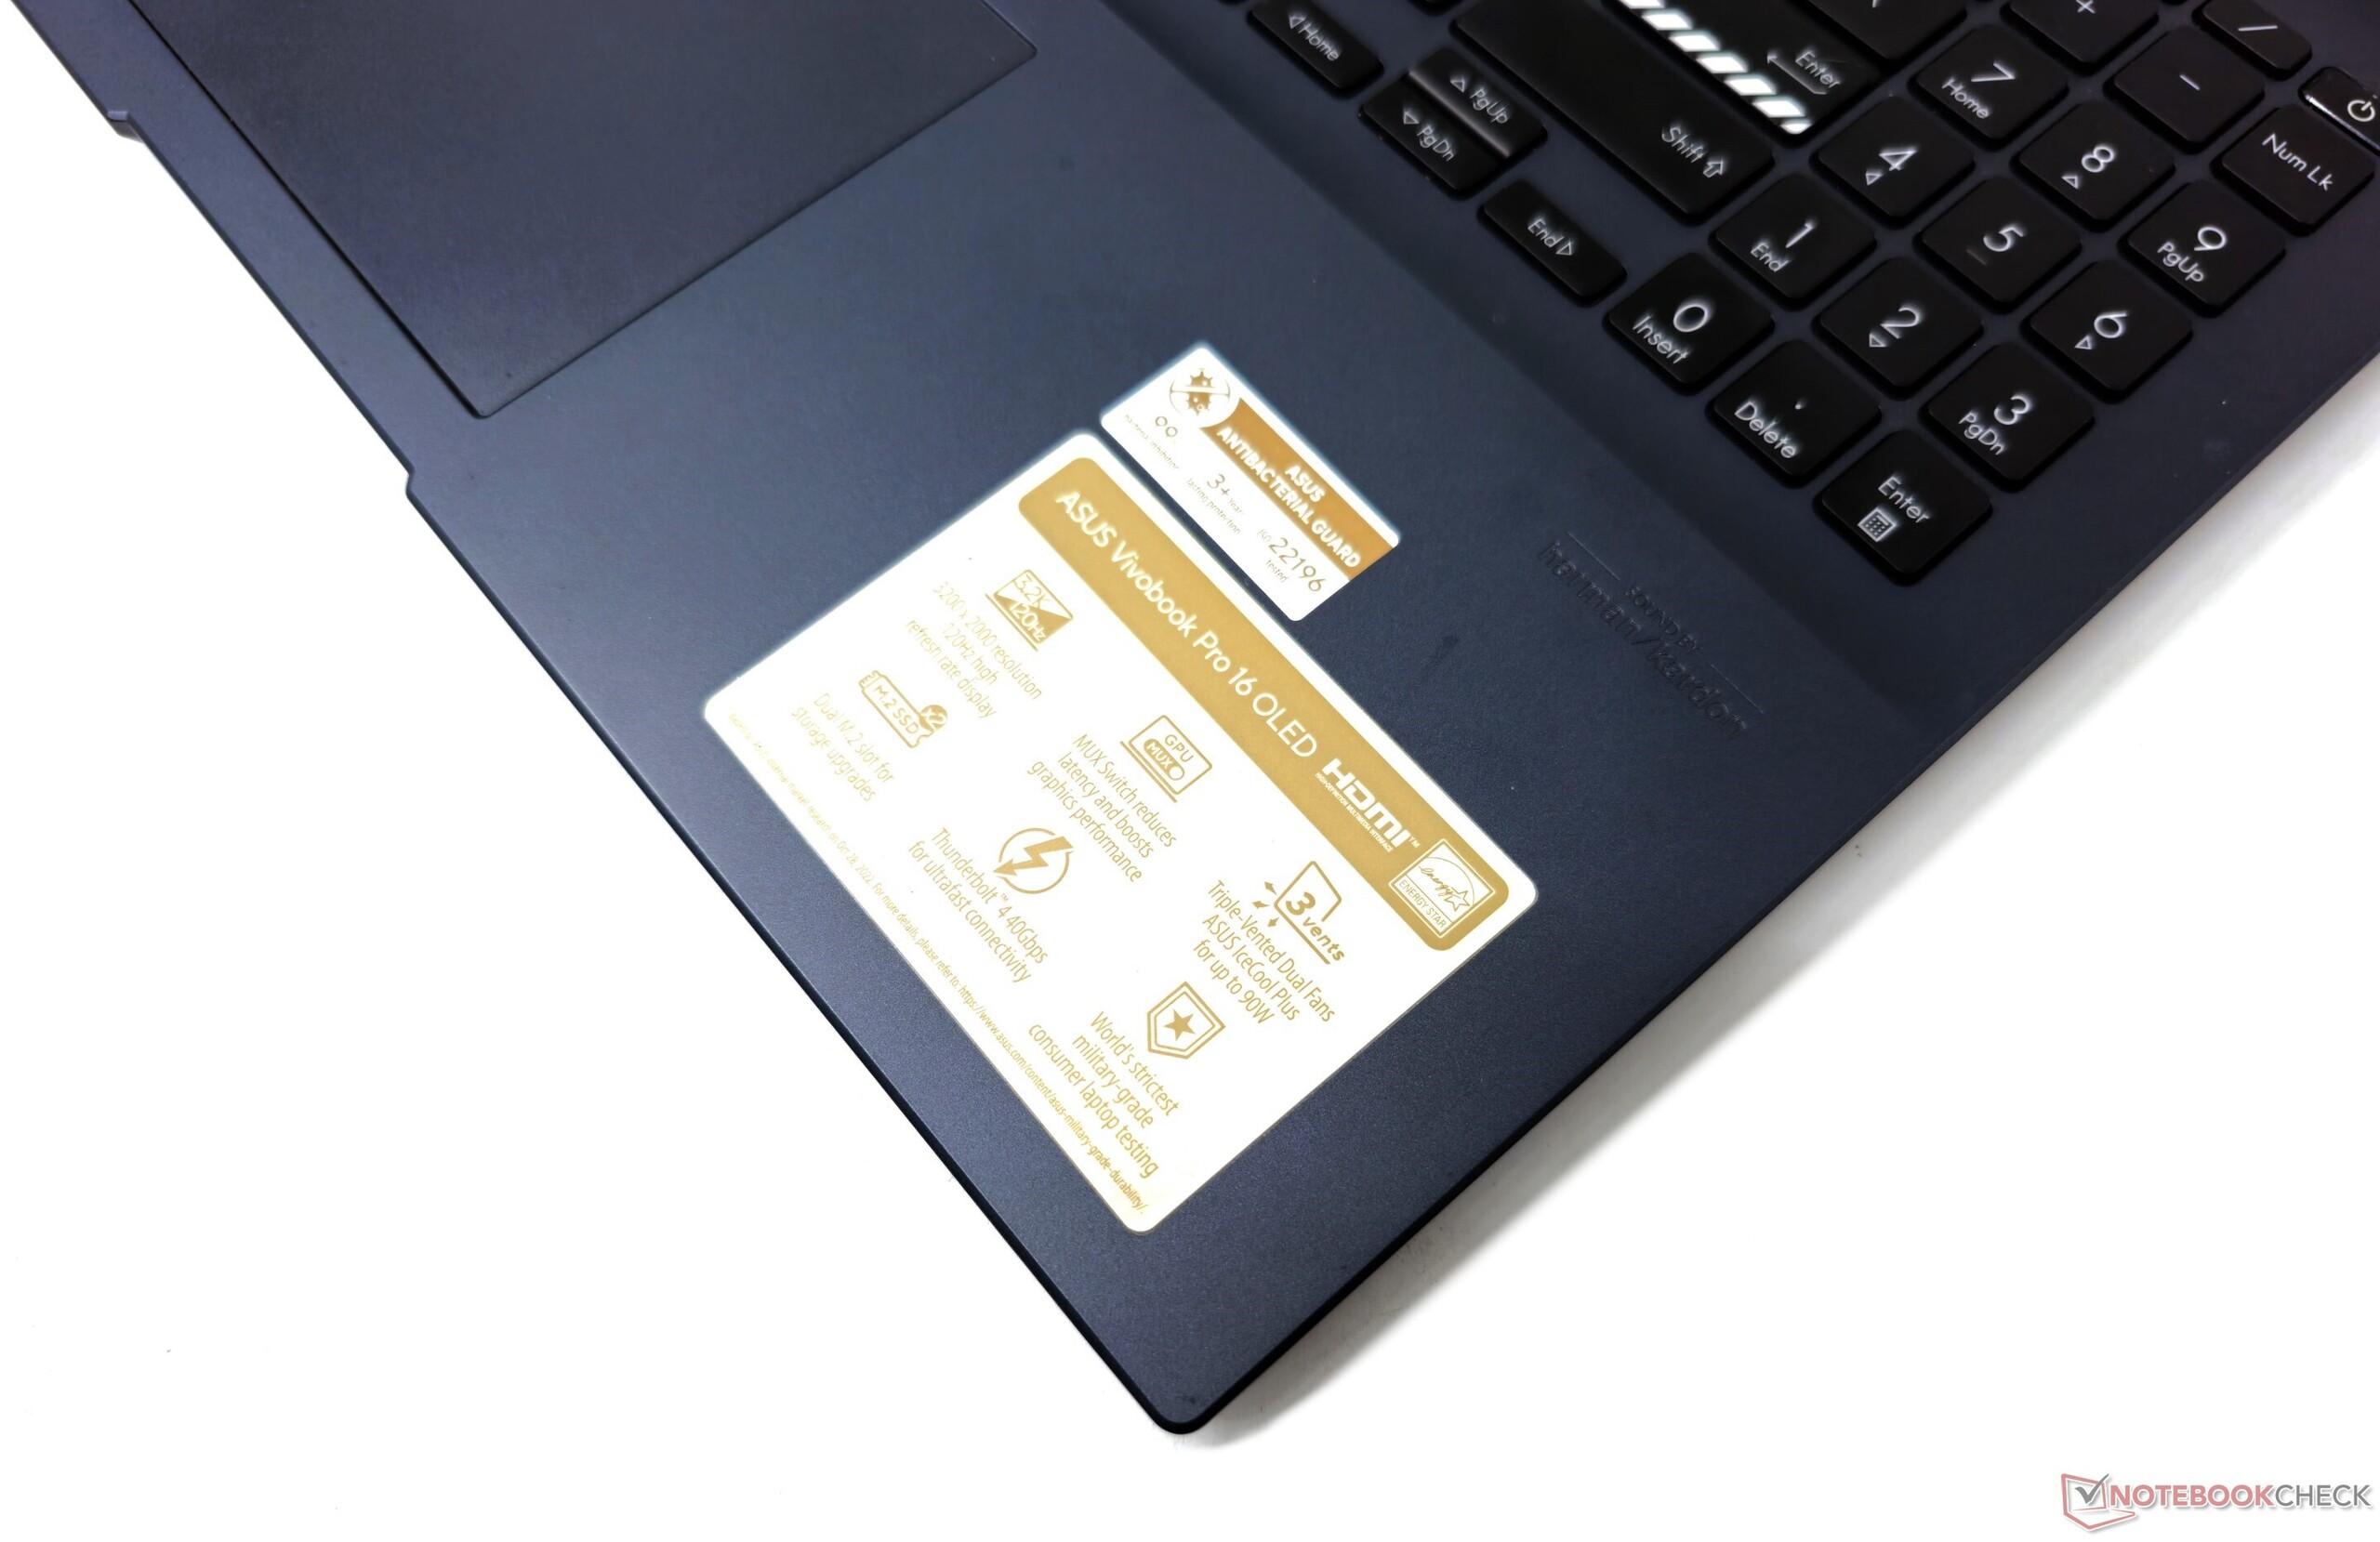
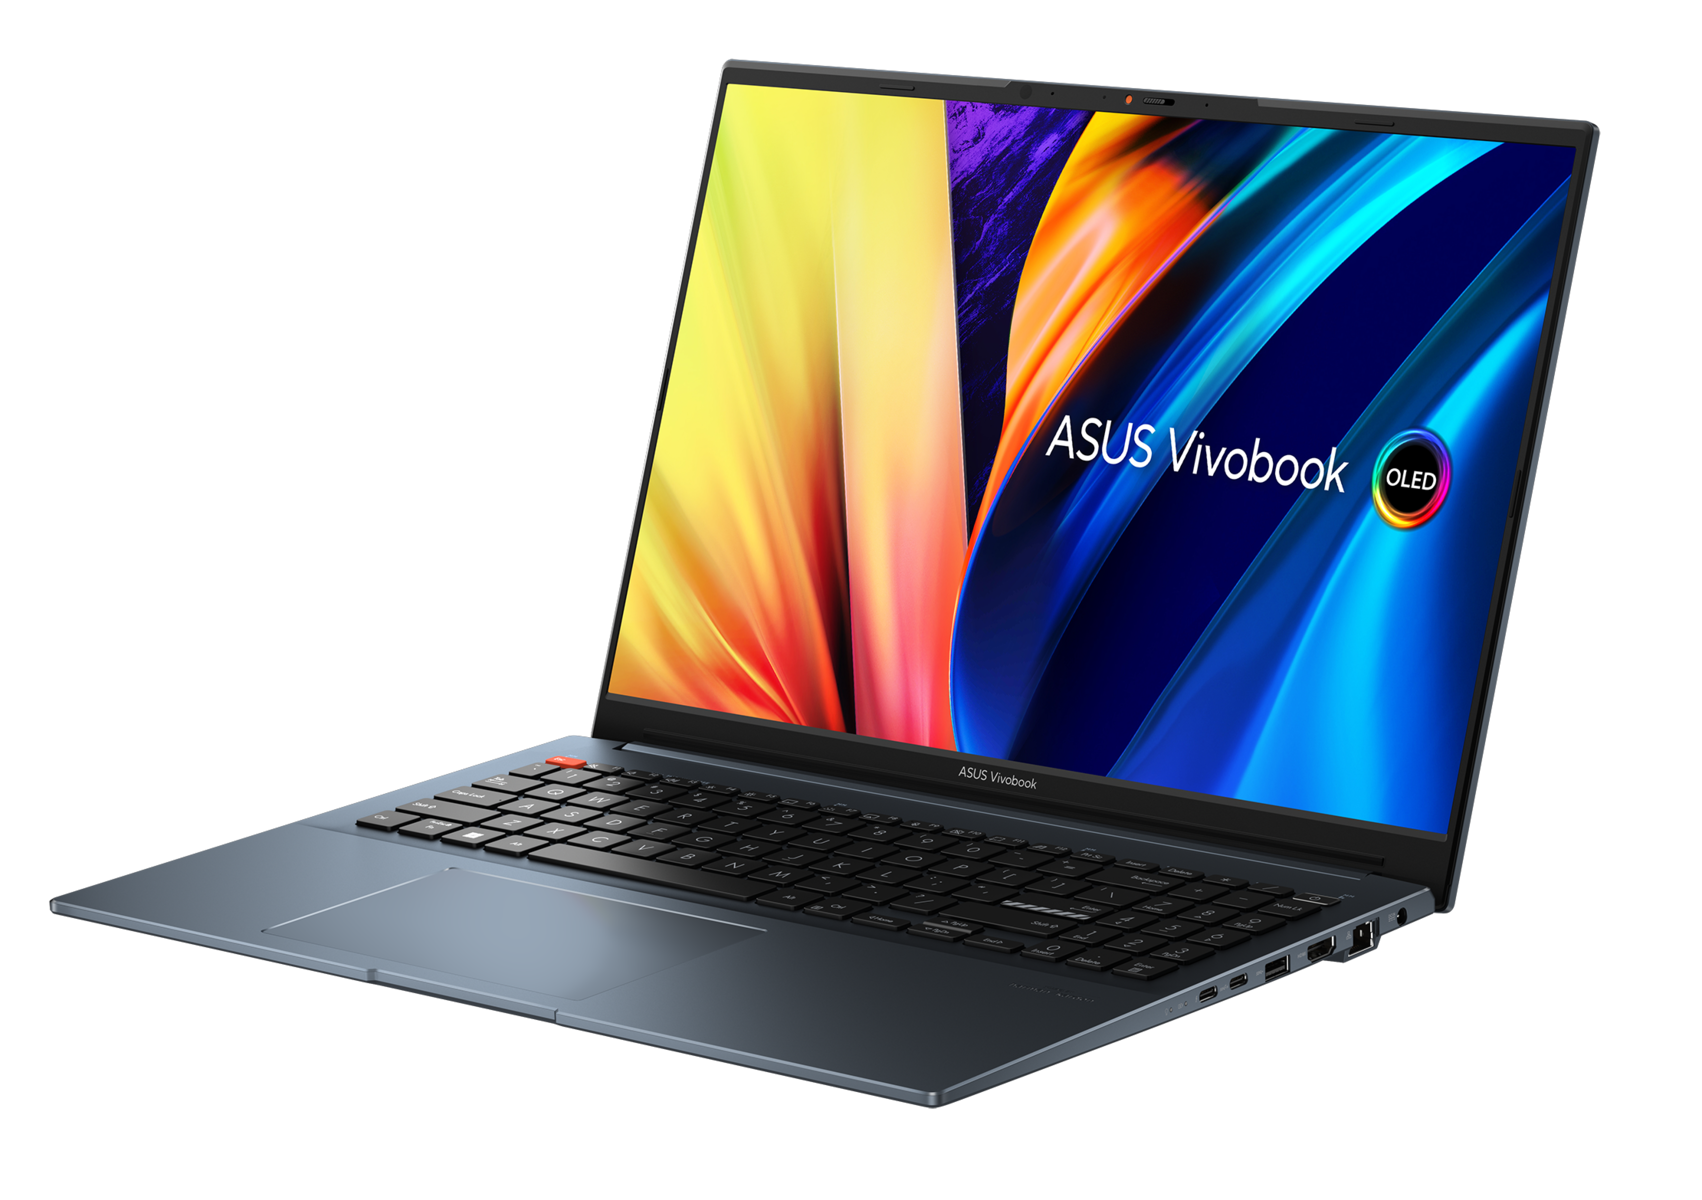
Chassis: Plastic construction with a 180° metallic lid
The VivoBook Pro 16 chassis comes in Cool Silver and Quiet Blue (our review unit) color options, weighing 1.9 kg. As with other VivoBooks, the construction is primarily plastic with a metal lid that can lay completely flat at 180 degrees and is easy to open one-handed without sliding the laptop base.
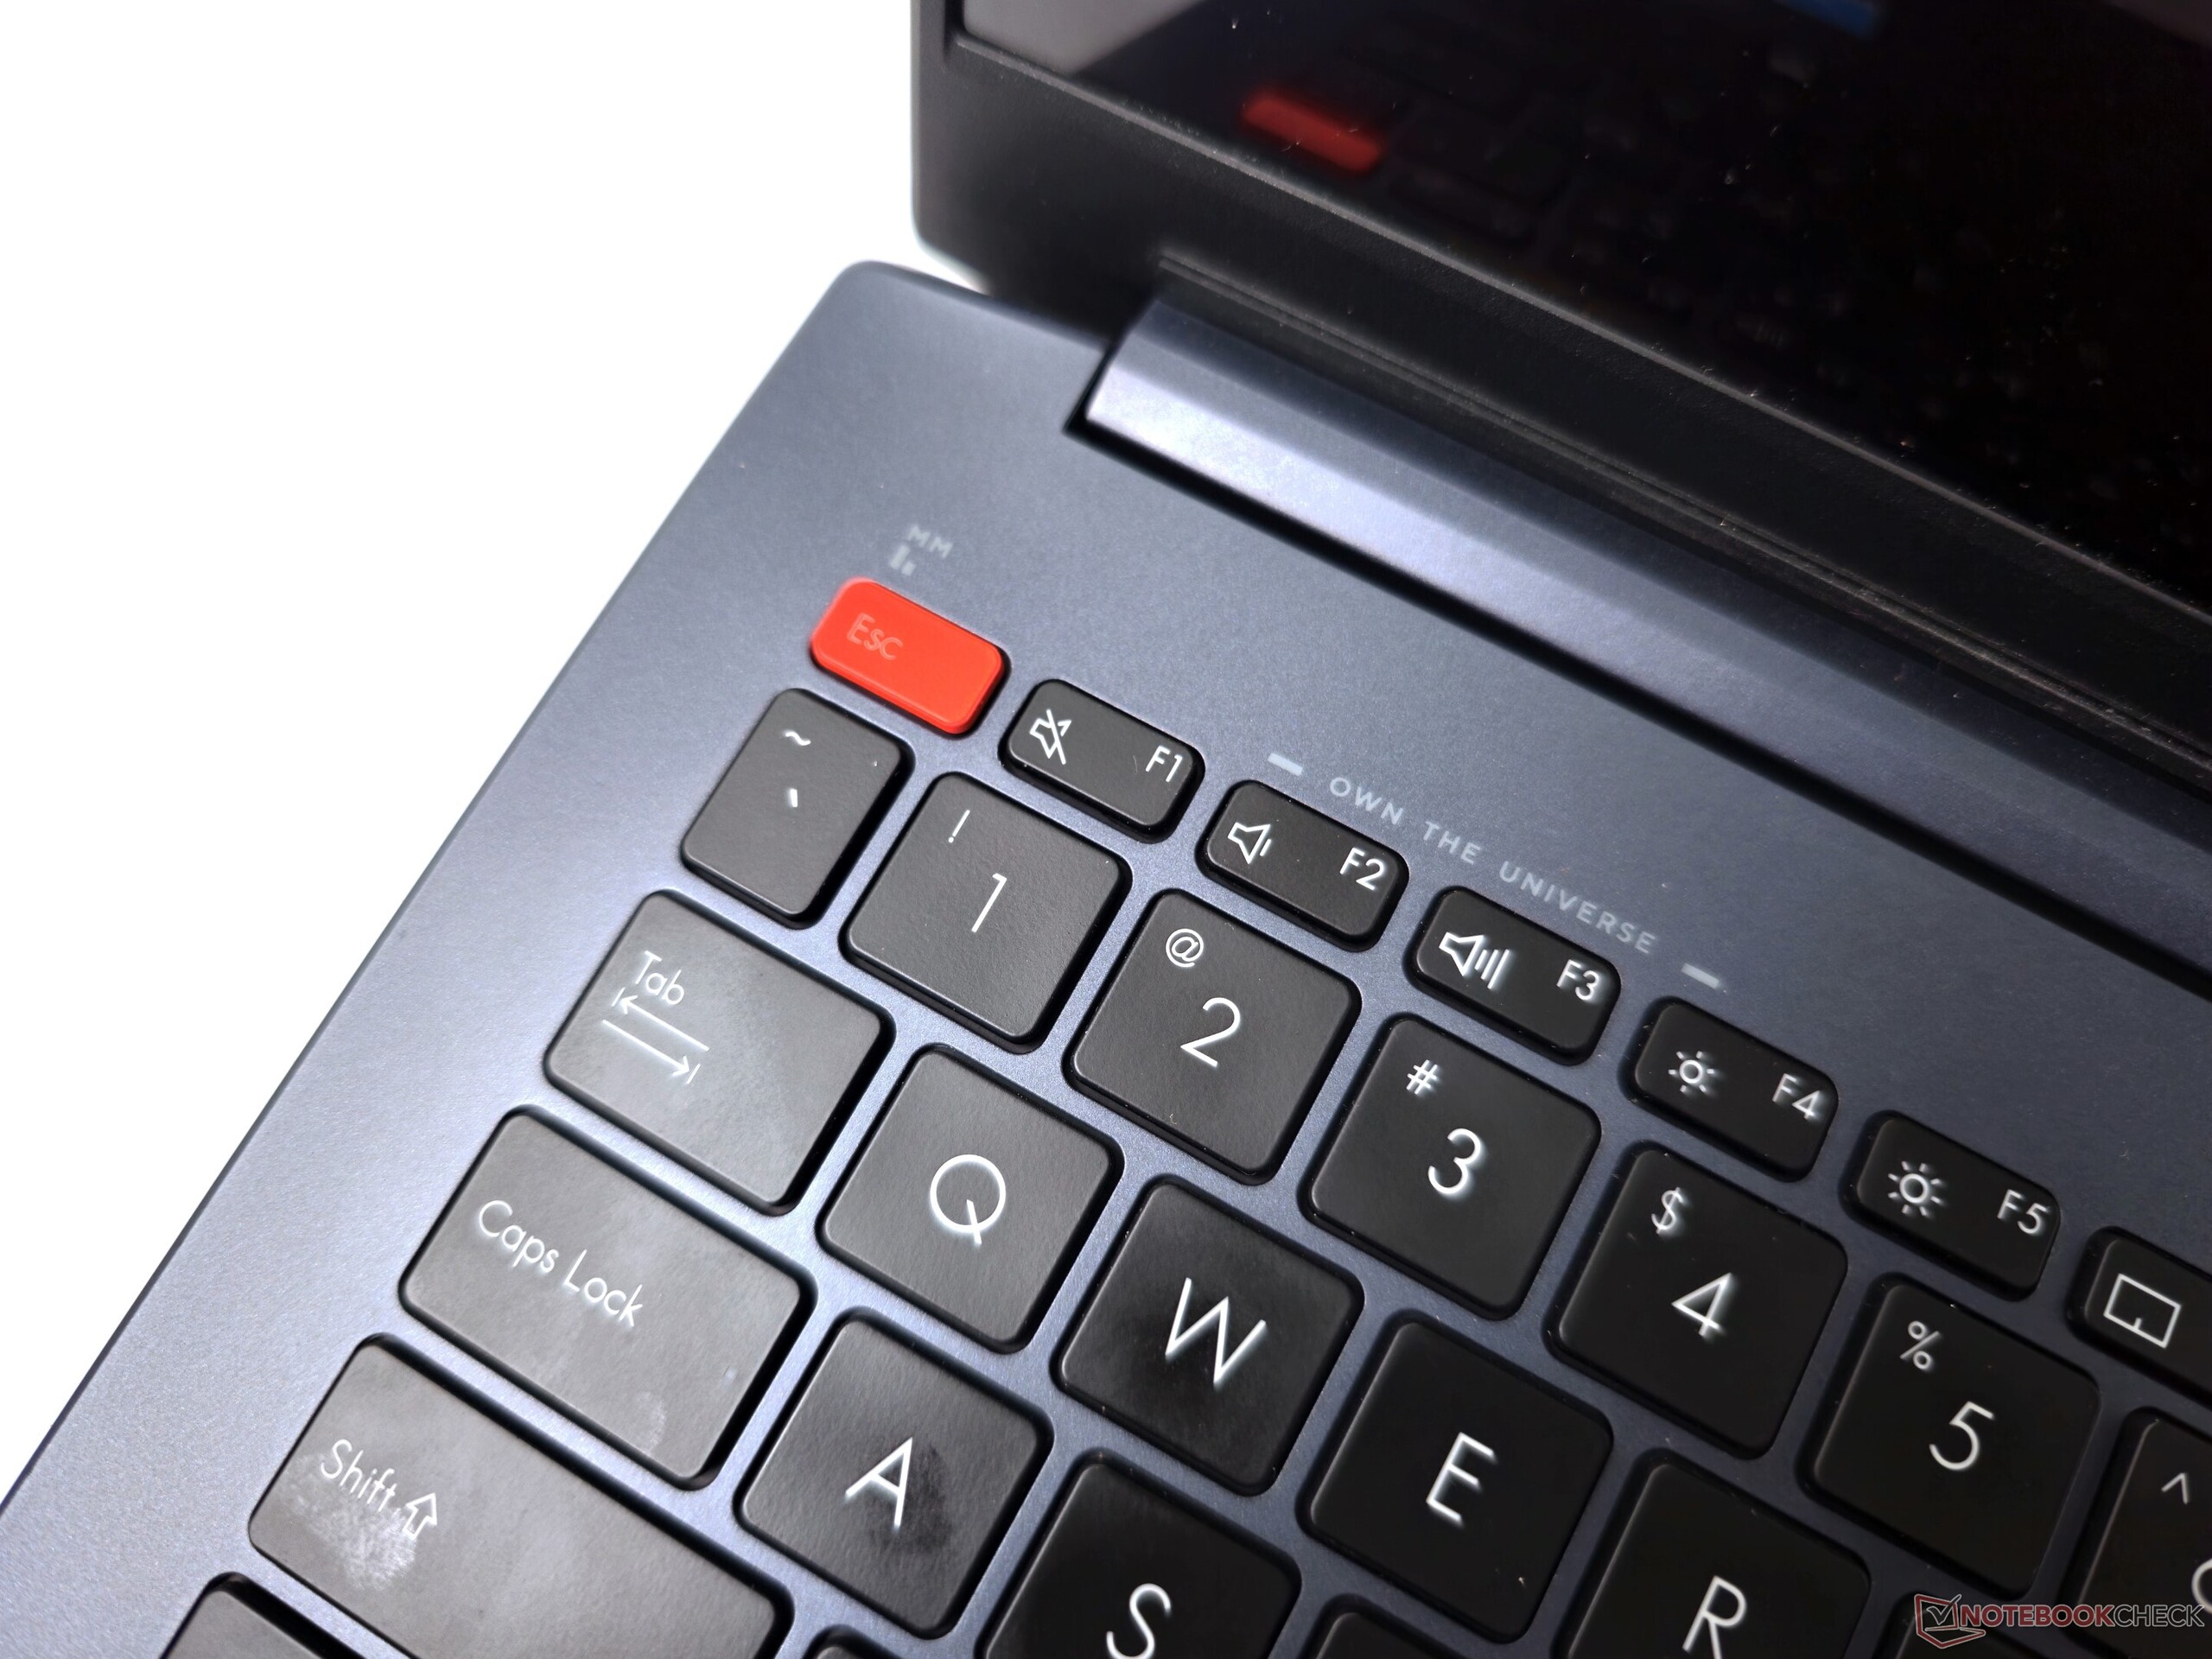
The matte, smooth surfaces present a subtle yet attractive aesthetic. VivoBook design hallmarks like the logo on the lid and striped Enter key accent are present. An orange-painted Esc key provides another splash of color similar to the VivoBook Pro 16X.
Build quality is decent overall with some flex in the keyboard deck and display, but nothing concerning in regular use. The hinges are sturdy-enough to hold the screen firmly at any angle without creaking.
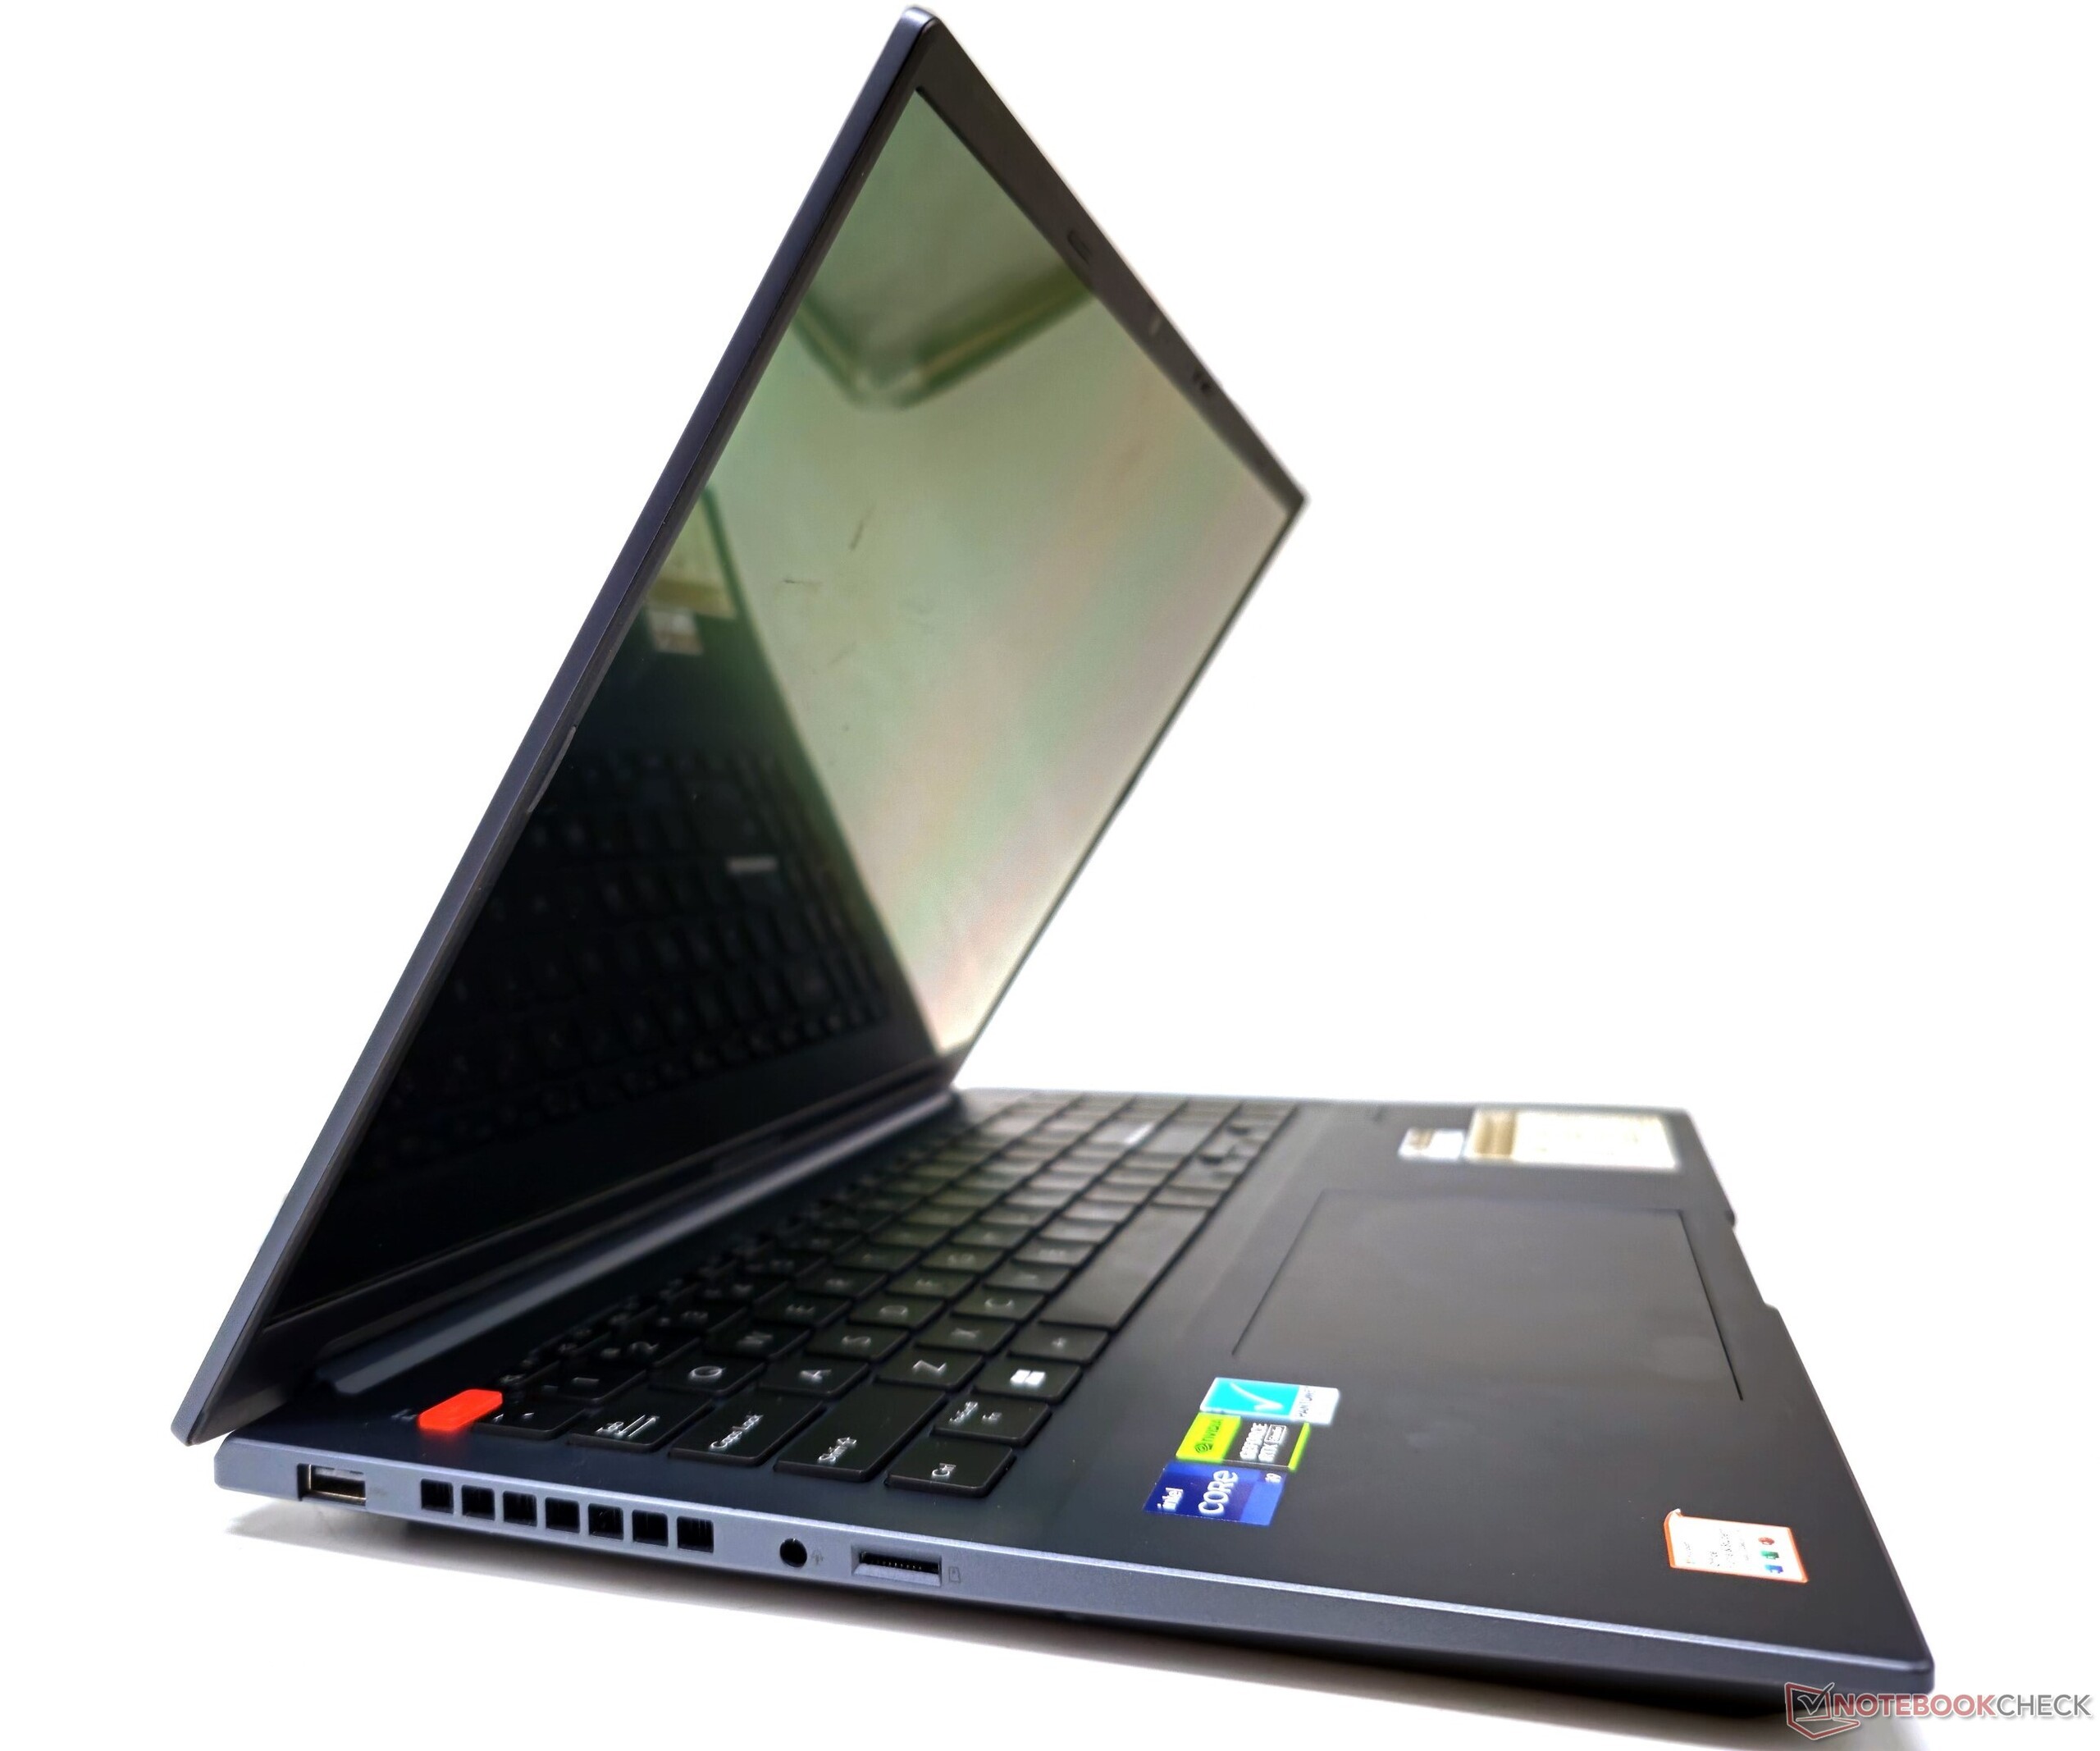

Connectivity: Wi-Fi 6E throughput can use some fine-tuning
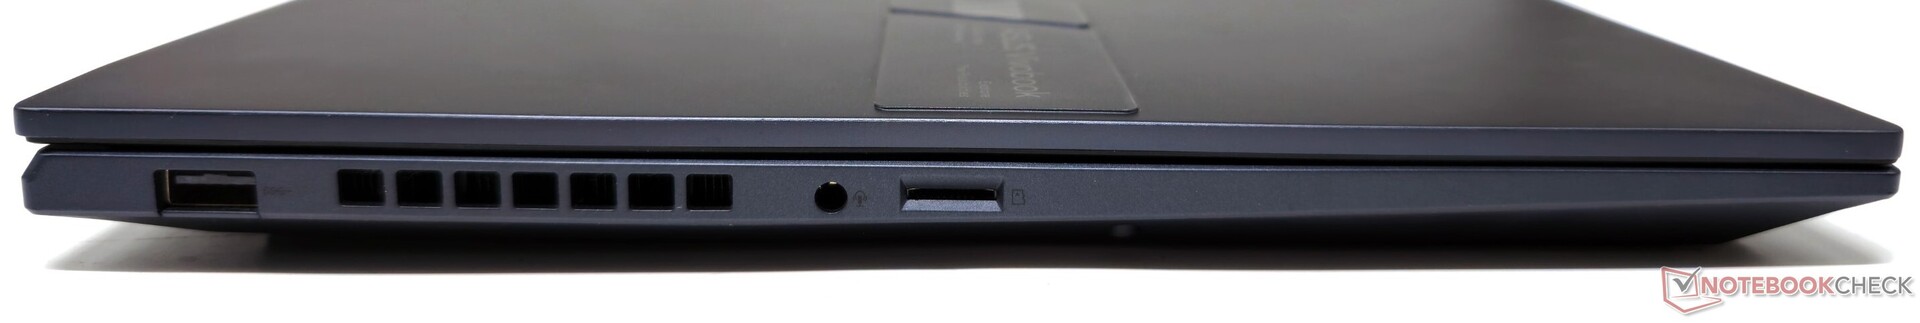
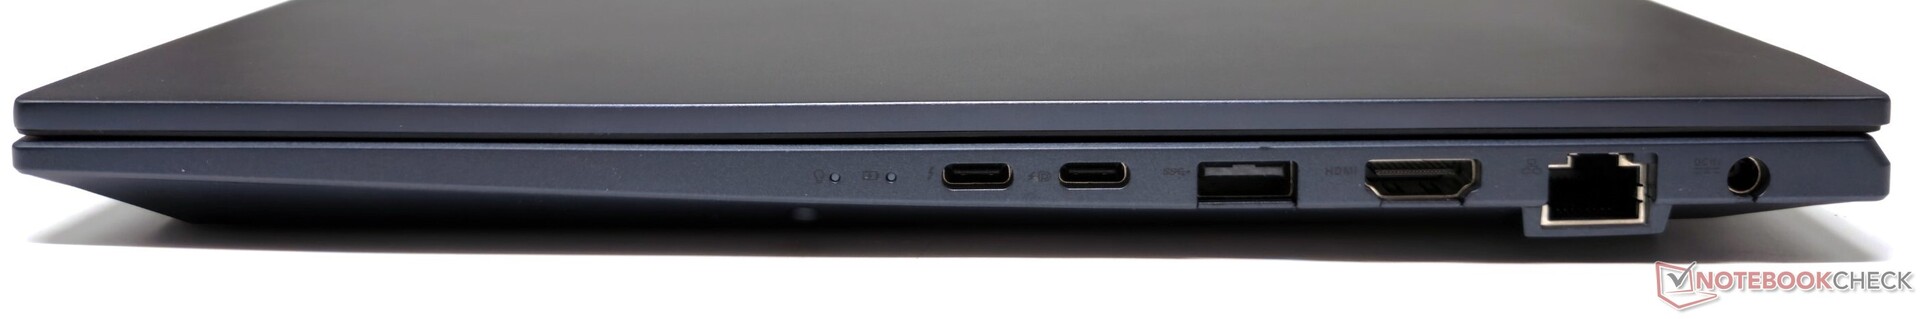
Asus has endowed the VivoBook Pro 16 with a decent set of ports, including Thunderbolt 4. The USB 3.2 Gen2 Type-C port supports both DisplayPort-out and Power Delivery.
Like other VivoBooks we've seen this year, the port distribution favors the right side of the device which may be irksome while using a wired mouse. Thankfully, all ports can be used simultaneously without interference.
SD Card Reader
According to Asus, the VivoBook Pro 16's built-in microSD card reader supports peak transfer speeds up to 312 MB/s. In our testing with an Angelbird AV Pro V60 microSD card, we recorded sequential read speeds of up to 232 MB/s in the AS-SSD sequential read benchmark. Copying assorted JPG files from the card topped out at 163.5 MB/s.
While somewhat below Asus' claimed maximum, the card reader speeds are significantly higher compared to the previous generation model.
| SD Card Reader | |
| average JPG Copy Test (av. of 3 runs) | |
| Gigabyte AERO 16 OLED BSF | |
| Asus VivoBook Pro 16 K6602VU (Angelbird AV Pro V60) | |
| Average of class Multimedia (23 - 531, n=36, last 2 years) | |
| Asus Vivobook Pro 16X K6604JV-MX016W | |
| Asus ROG Flow X16 GV601V | |
| Asus VivoBook Pro 16 (AV Pro SD microSD 128 GB V60) | |
| maximum AS SSD Seq Read Test (1GB) | |
| Asus ROG Flow X16 GV601V | |
| Asus VivoBook Pro 16 K6602VU (Angelbird AV Pro V60) | |
| Average of class Multimedia (37.3 - 1455, n=35, last 2 years) | |
| Gigabyte AERO 16 OLED BSF | |
| Asus Vivobook Pro 16X K6604JV-MX016W | |
| Asus VivoBook Pro 16 (AV Pro SD microSD 128 GB V60) | |
Communication
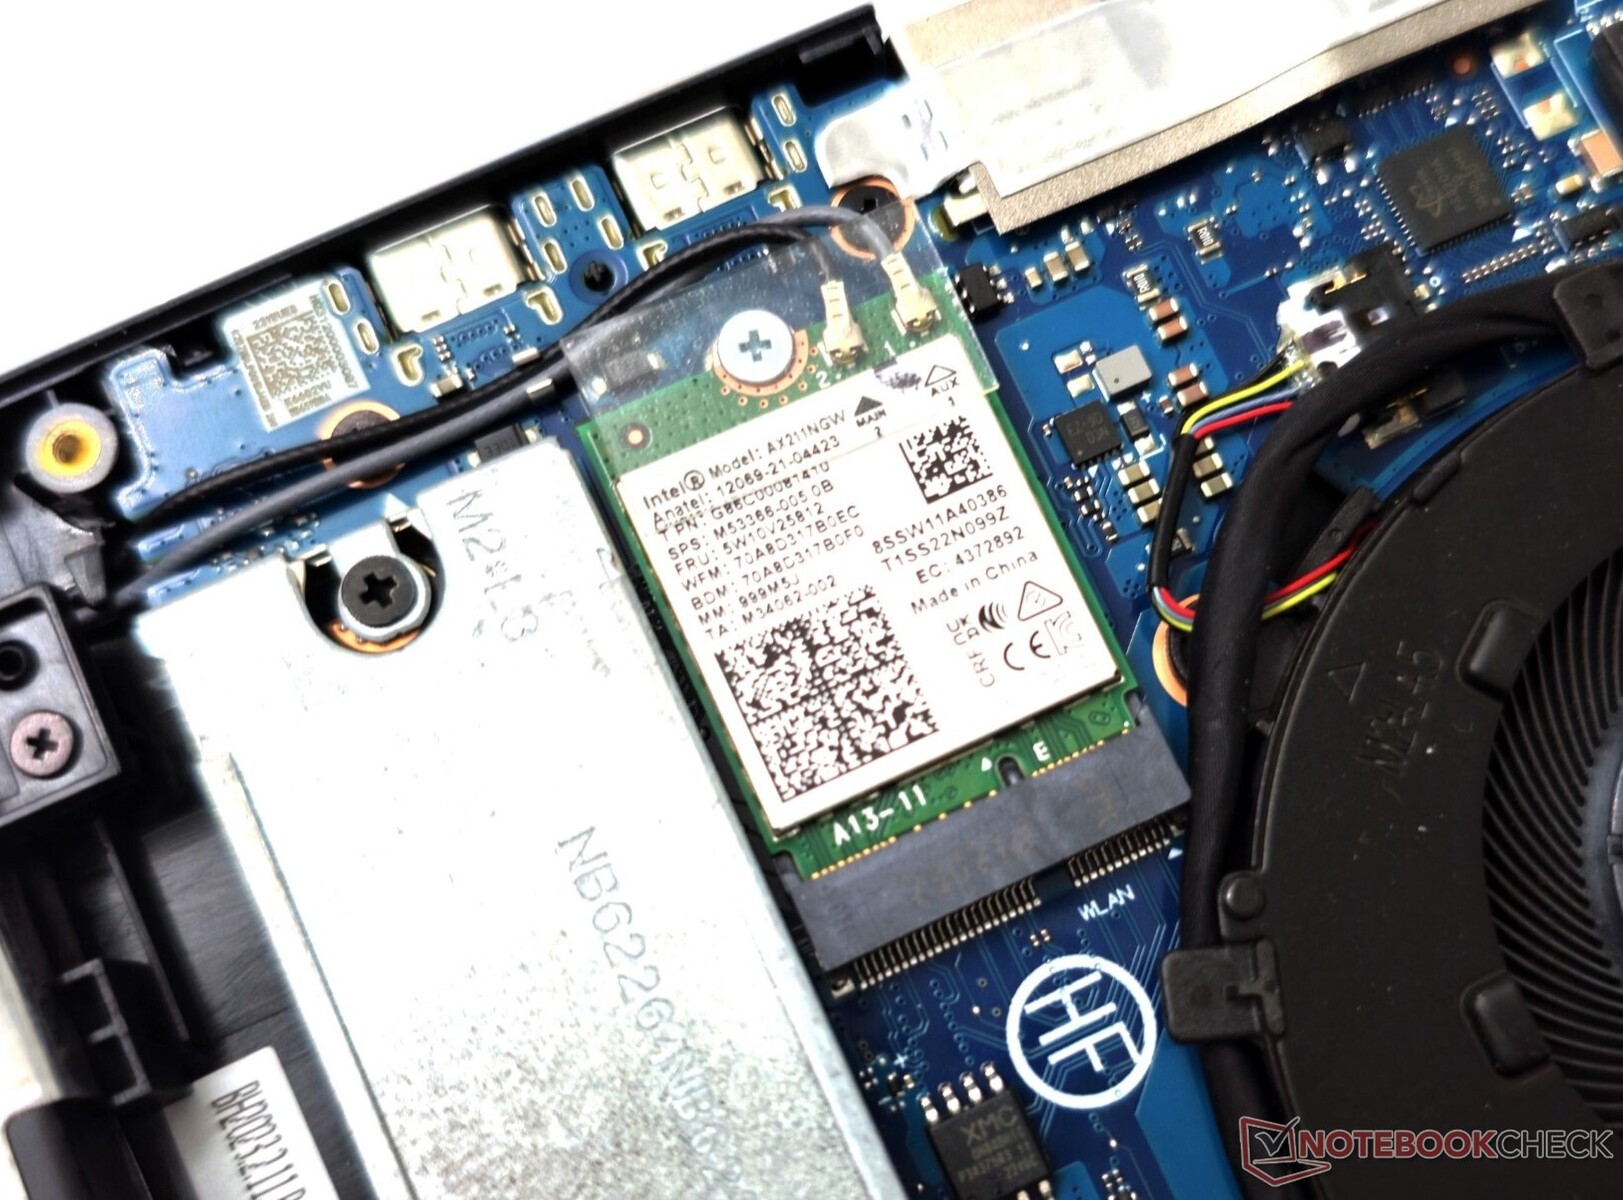
The VivoBook Pro 16 comes equipped with an Intel Wi-Fi 6E AX211 wireless card. In testing, we recorded strong transmit and receive speeds over 5 GHz Wi-Fi.
Performance in the 6 GHz band was decent, though not quite as fast as 5 GHz, in our setup using an Asus ROG Rapture GT-AXE11000 reference router.
In comparison, the Lenovo Legion Pro 5 offers a good, relatively stable 6 GHz throughput with its MediaTek Wi-Fi 6E MT7922 card.
| Networking / iperf3 transmit AXE11000 | |
| Lenovo Legion Pro 5 16ARX8 (R5 7645HX, RTX 4050) | |
| Asus VivoBook Pro 16 K6602VU | |
| Asus VivoBook Pro 16 | |
| Asus Vivobook Pro 16X K6604JV-MX016W | |
| Average of class Multimedia (606 - 1978, n=53, last 2 years) | |
| Average Intel Wi-Fi 6E AX211 (64 - 1921, n=276) | |
| Asus ROG Flow X16 GV601V | |
| Asus TUF Gaming A16 FA617XS | |
| Networking / iperf3 receive AXE11000 | |
| Asus Vivobook Pro 16X K6604JV-MX016W | |
| Asus VivoBook Pro 16 K6602VU | |
| Lenovo Legion Pro 5 16ARX8 (R5 7645HX, RTX 4050) | |
| Average Intel Wi-Fi 6E AX211 (582 - 1890, n=276) | |
| Average of class Multimedia (682 - 1818, n=53, last 2 years) | |
| Asus ROG Flow X16 GV601V | |
| Asus TUF Gaming A16 FA617XS | |
| Networking / iperf3 transmit AXE11000 6GHz | |
| Lenovo Legion Pro 5 16ARX8 (R5 7645HX, RTX 4050) | |
| Asus ROG Flow X16 GV601V | |
| Asus Vivobook Pro 16X K6604JV-MX016W | |
| Average of class Multimedia (869 - 2373, n=23, last 2 years) | |
| Gigabyte AERO 16 OLED BSF | |
| Asus VivoBook Pro 16 K6602VU | |
| Average Intel Wi-Fi 6E AX211 (385 - 1851, n=226) | |
| Networking / iperf3 receive AXE11000 6GHz | |
| Asus Vivobook Pro 16X K6604JV-MX016W | |
| Asus VivoBook Pro 16 | |
| Lenovo Legion Pro 5 16ARX8 (R5 7645HX, RTX 4050) | |
| Average of class Multimedia (1212 - 2361, n=23, last 2 years) | |
| Asus ROG Flow X16 GV601V | |
| Asus VivoBook Pro 16 K6602VU | |
| Gigabyte AERO 16 OLED BSF | |
| Average Intel Wi-Fi 6E AX211 (700 - 1857, n=226) | |
Webcam
The 1080p webcam with a physical privacy shutter shows large color deviations, but the overall image quality is serviceable for basic video calls and conferencing. Details are fairly well-preserved, but the clarity and sharpness can use a lot of improvements.


Security
The VivoBook Pro 16 offers a fingerprint reader in the power button for Windows Hello-based logins. The fingerprint reader works fast and is quite responsive. A TPM 2.0 module is available to meet Windows 11's requirements.
Accessories and Warranty
Our unit came with no additional accessories in the box apart from the 150 W power adapter and the usual paperwork.
In India, Asus offers a standard one-year warranty for the VivoBook Pro 16. Additionally, buyers can choose from several warranty and accidental damage protection options ranging from ₹999 to ₹2,999, provided they register their purchase within 15 calendar days.
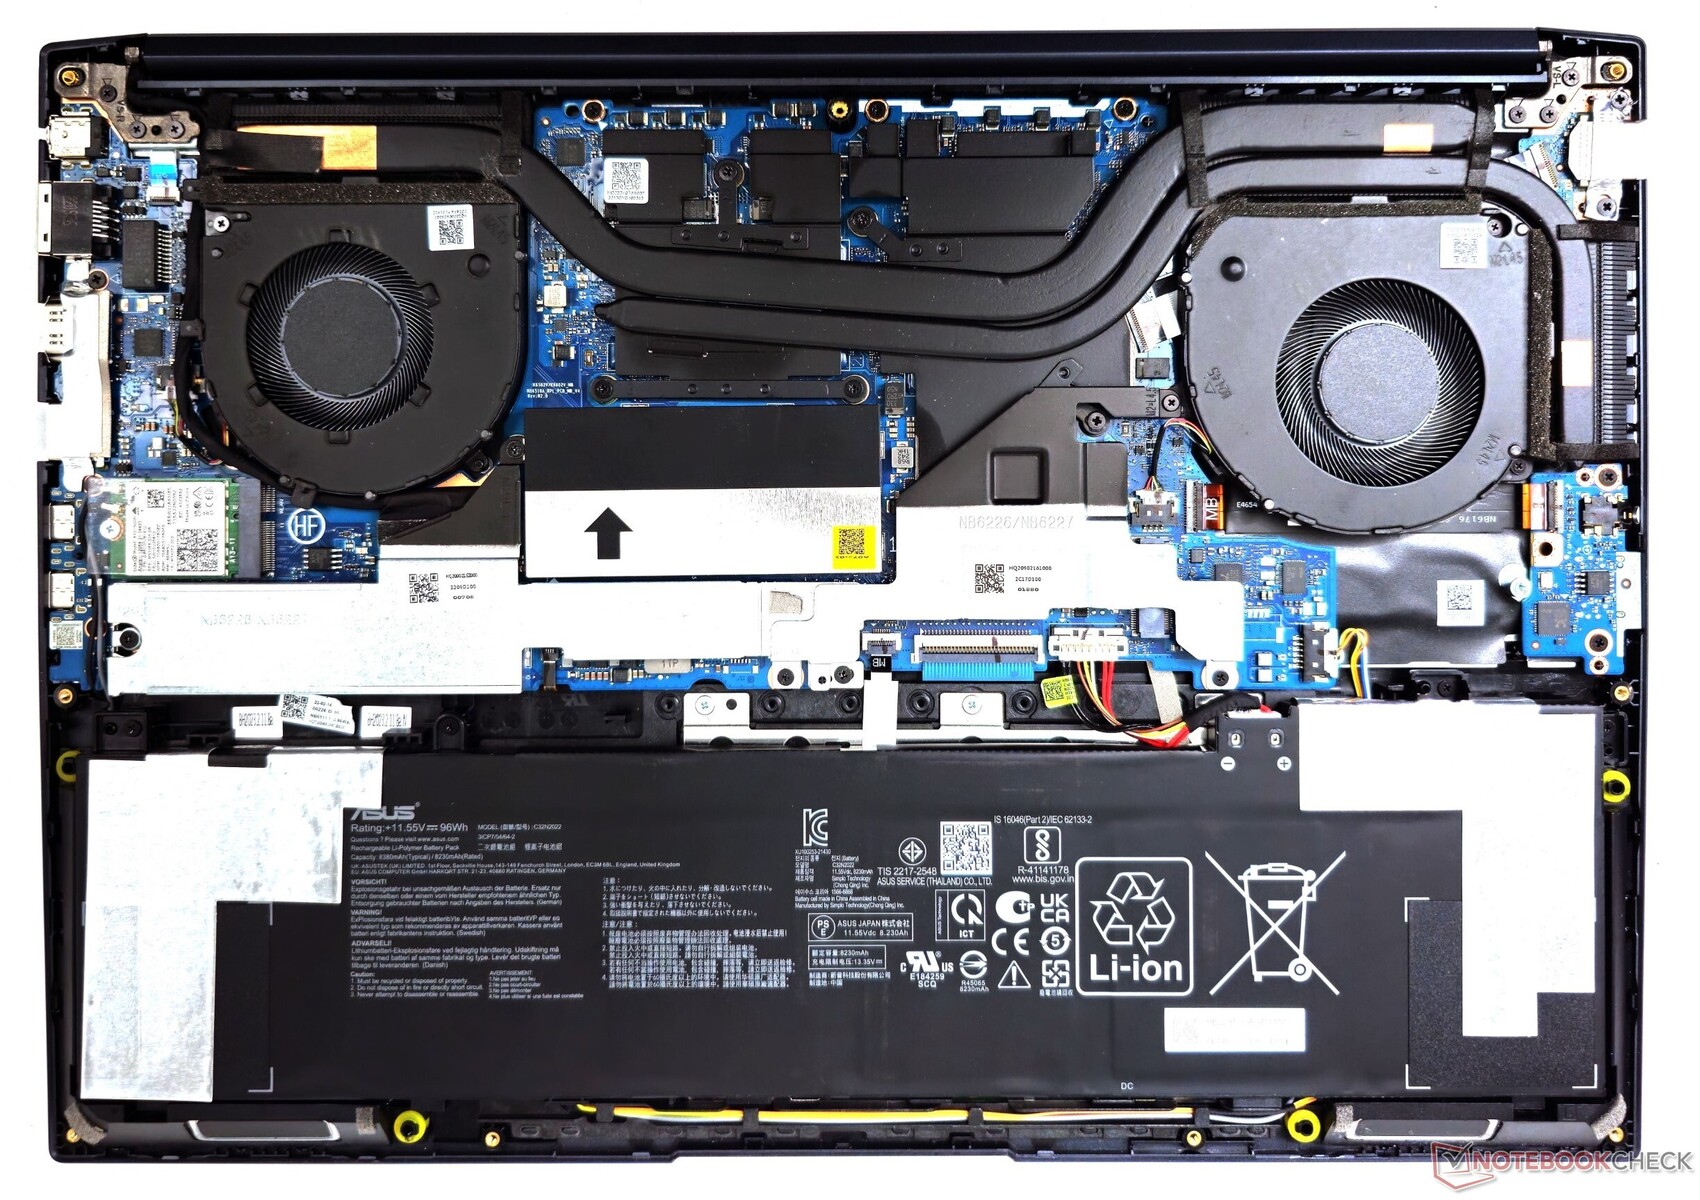
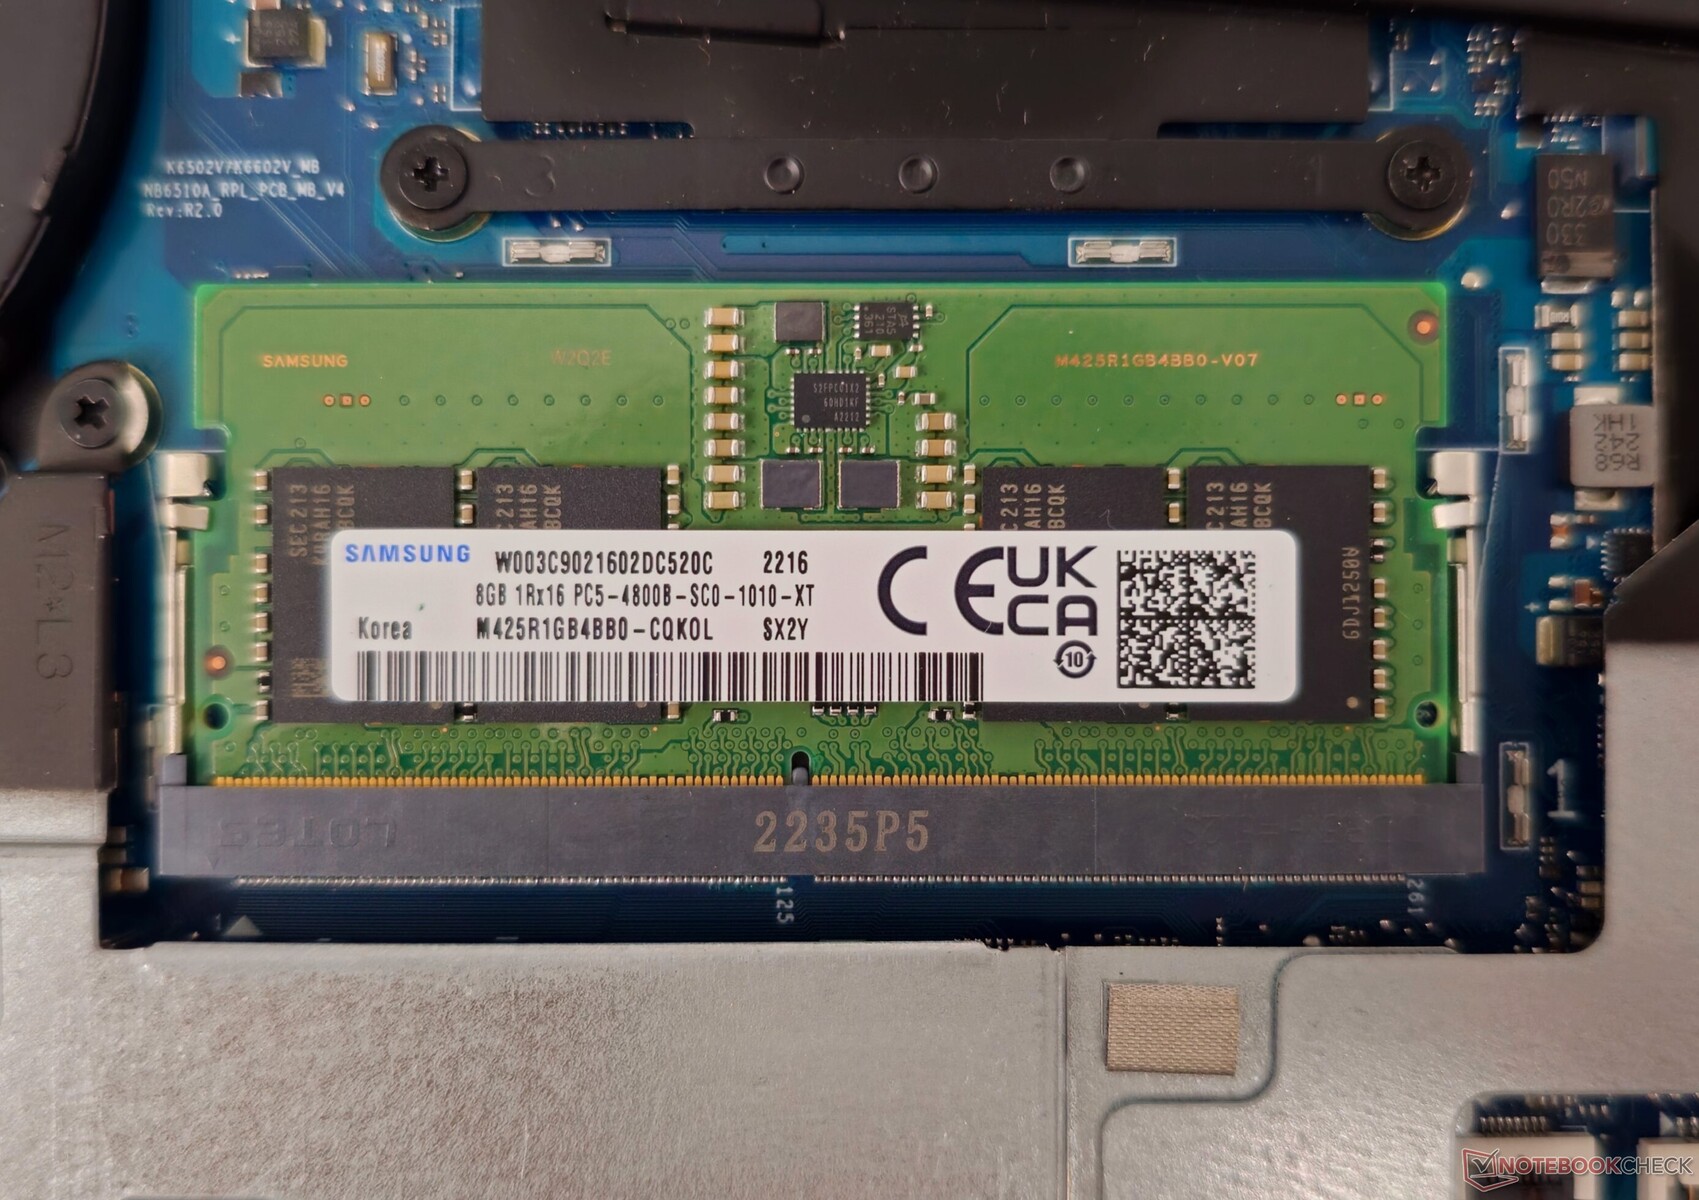
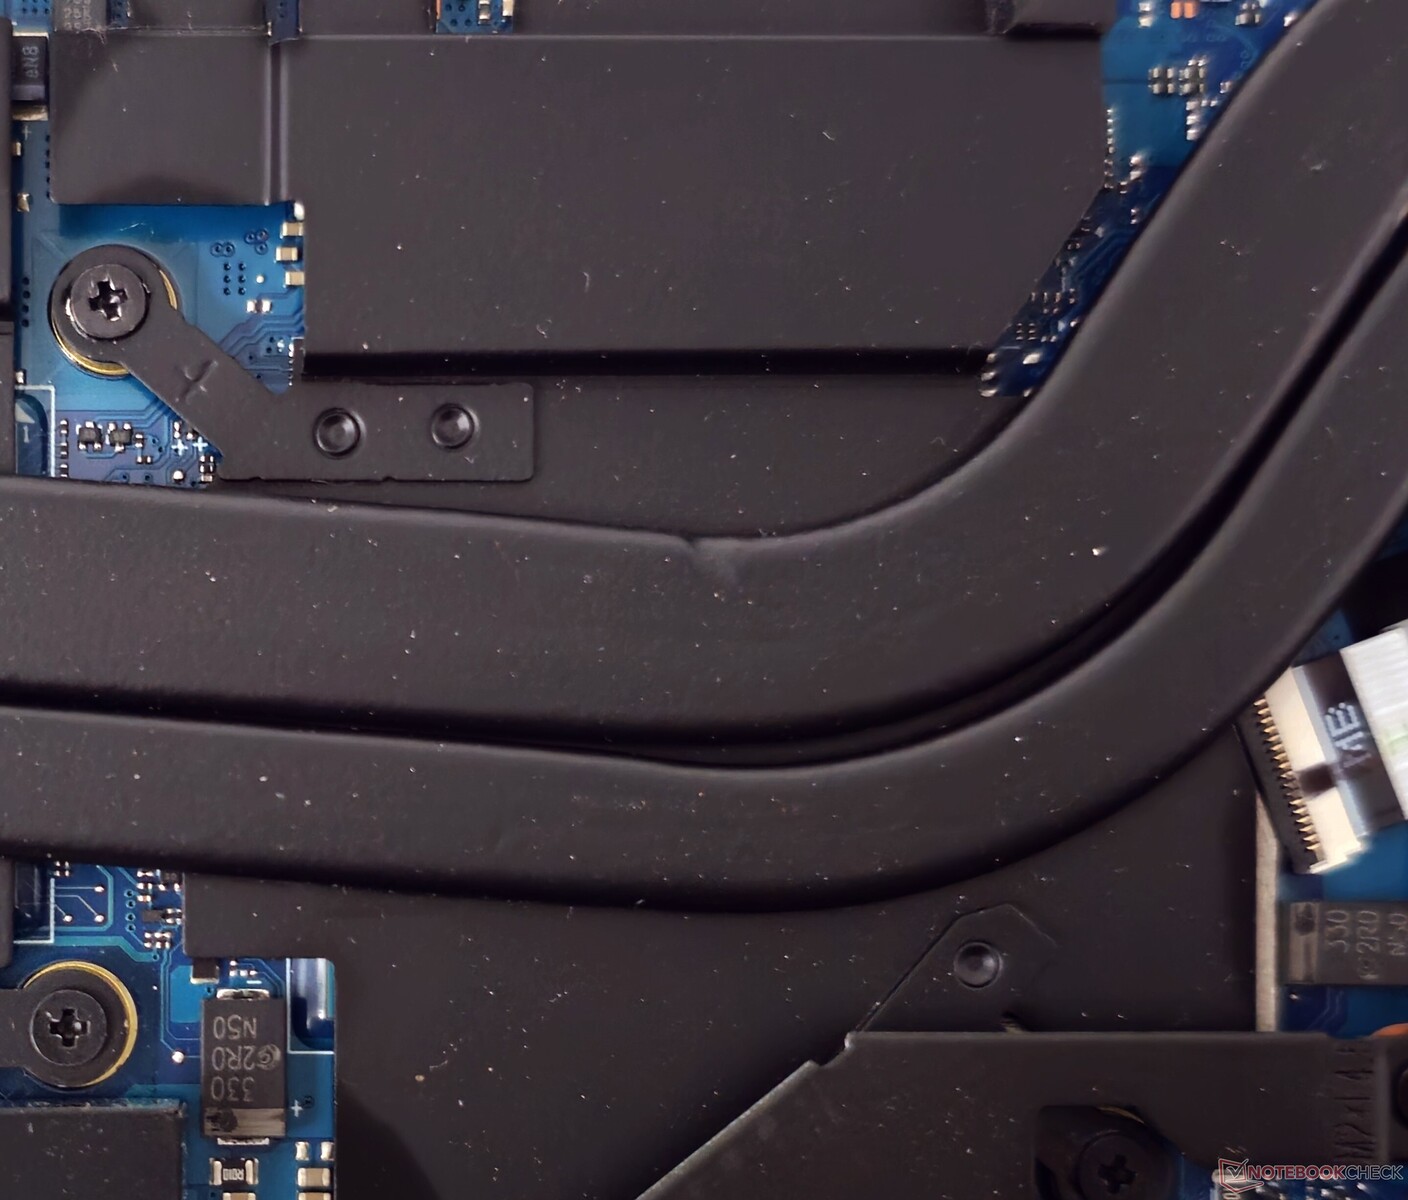
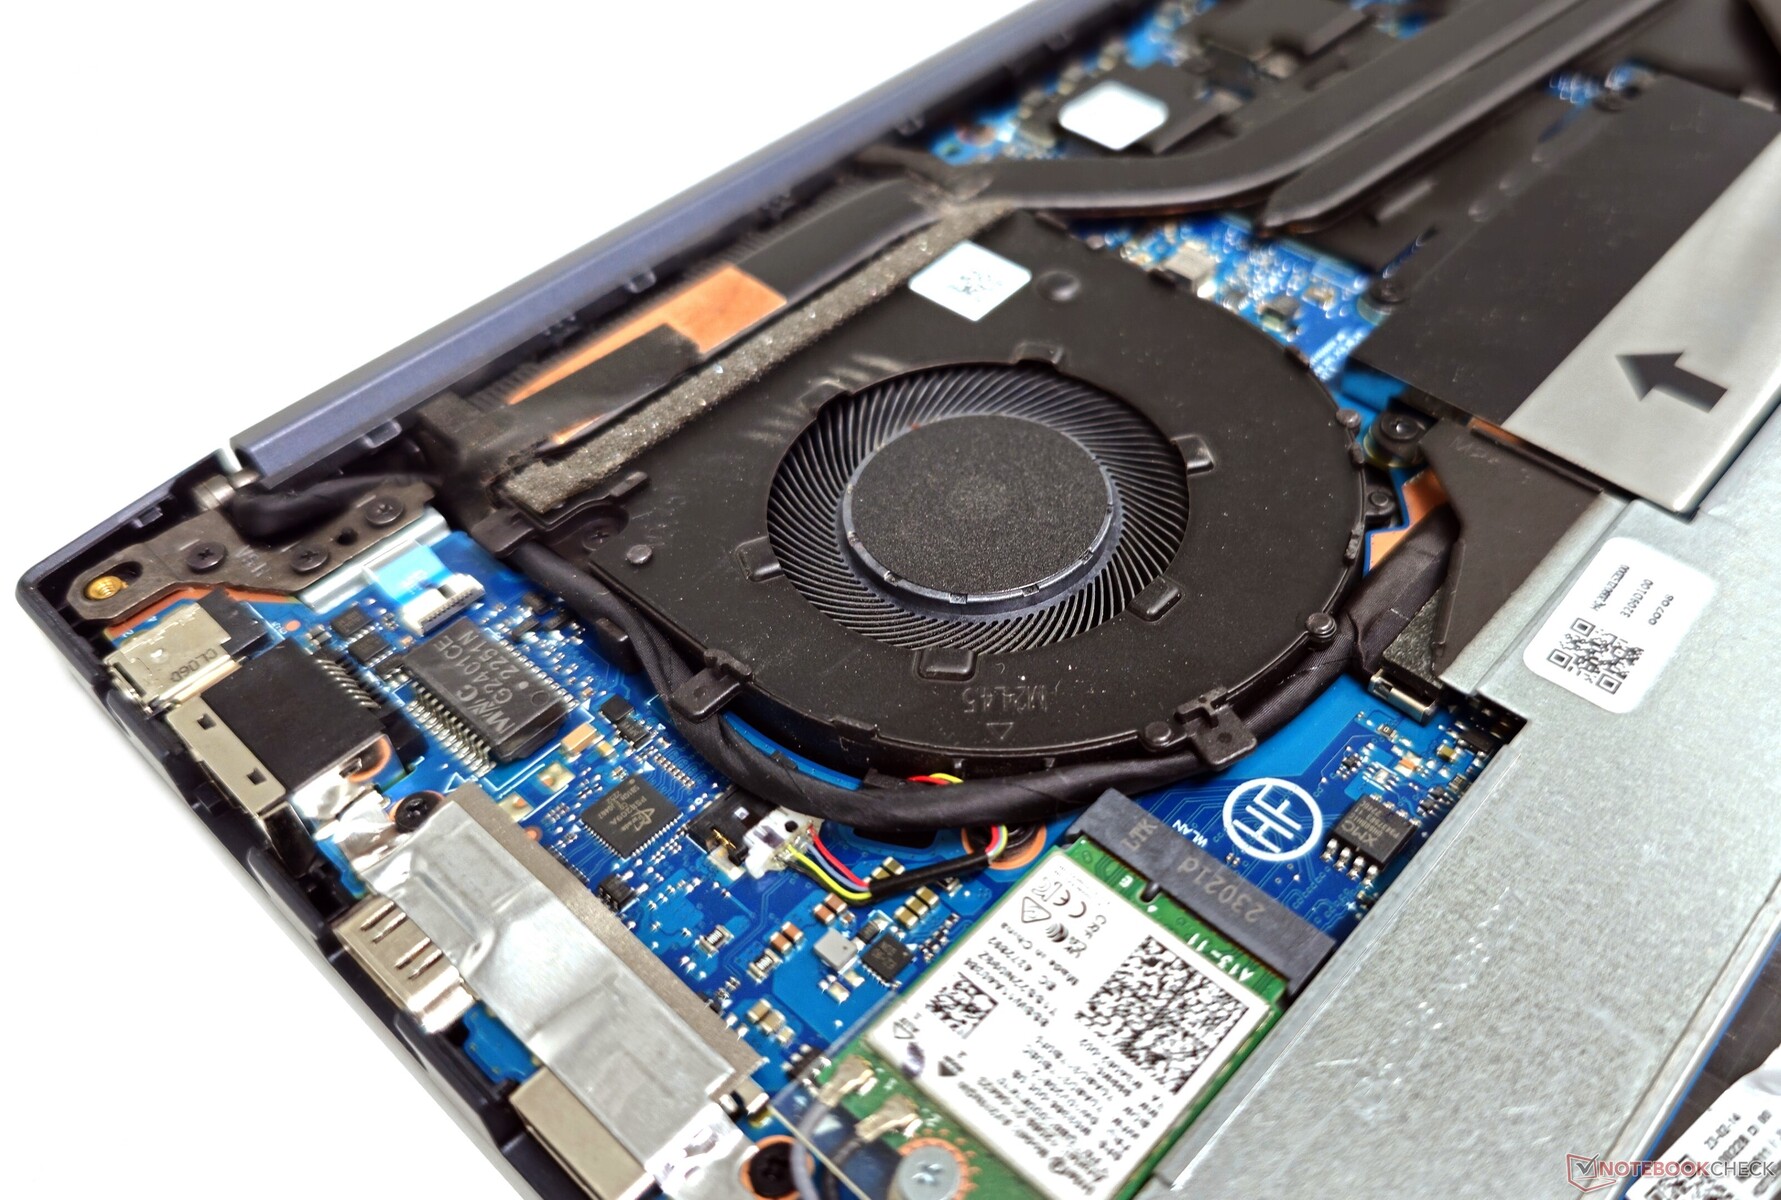
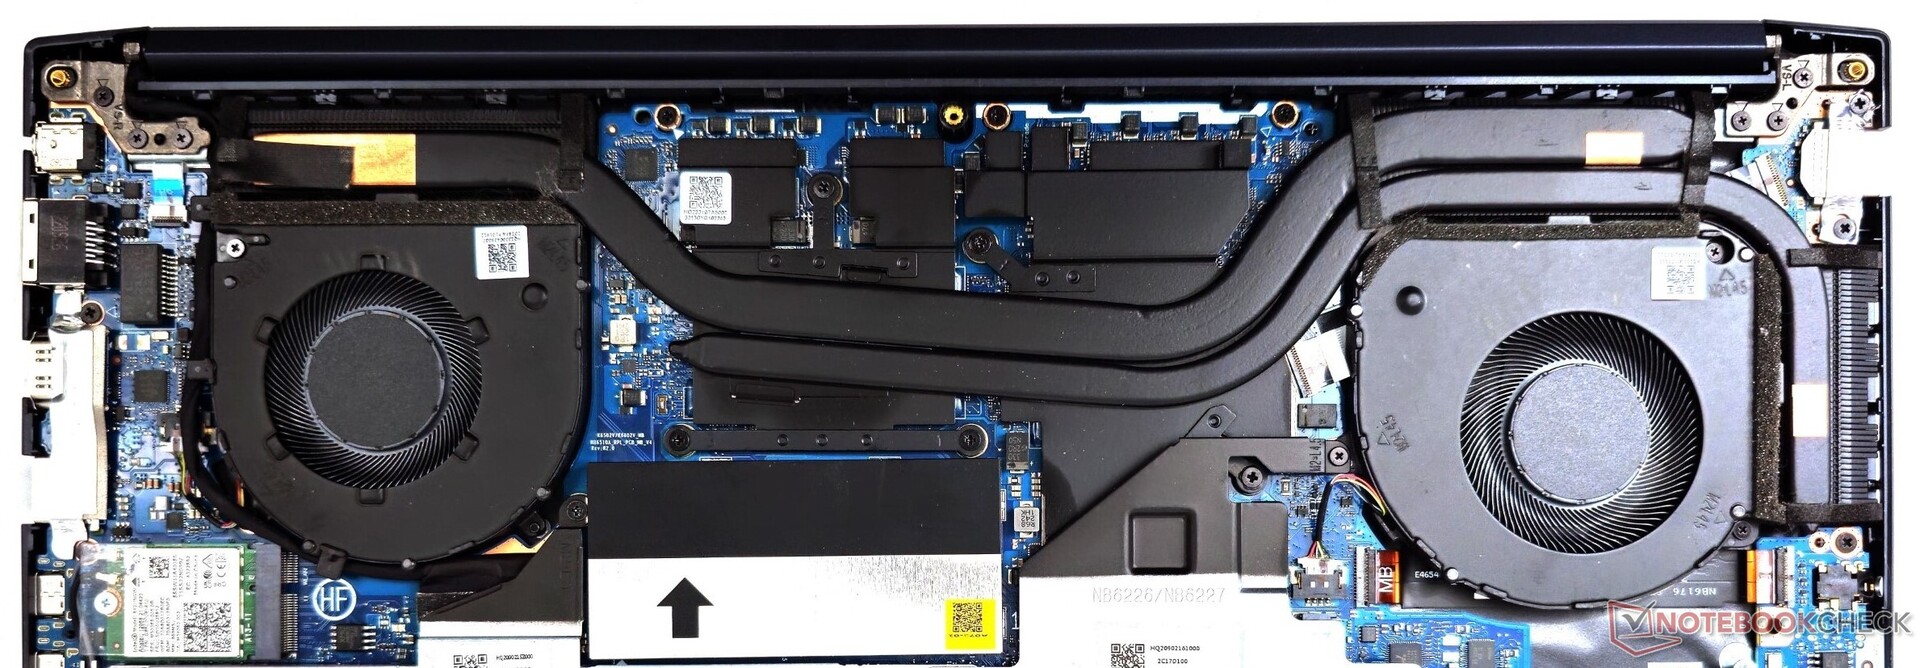
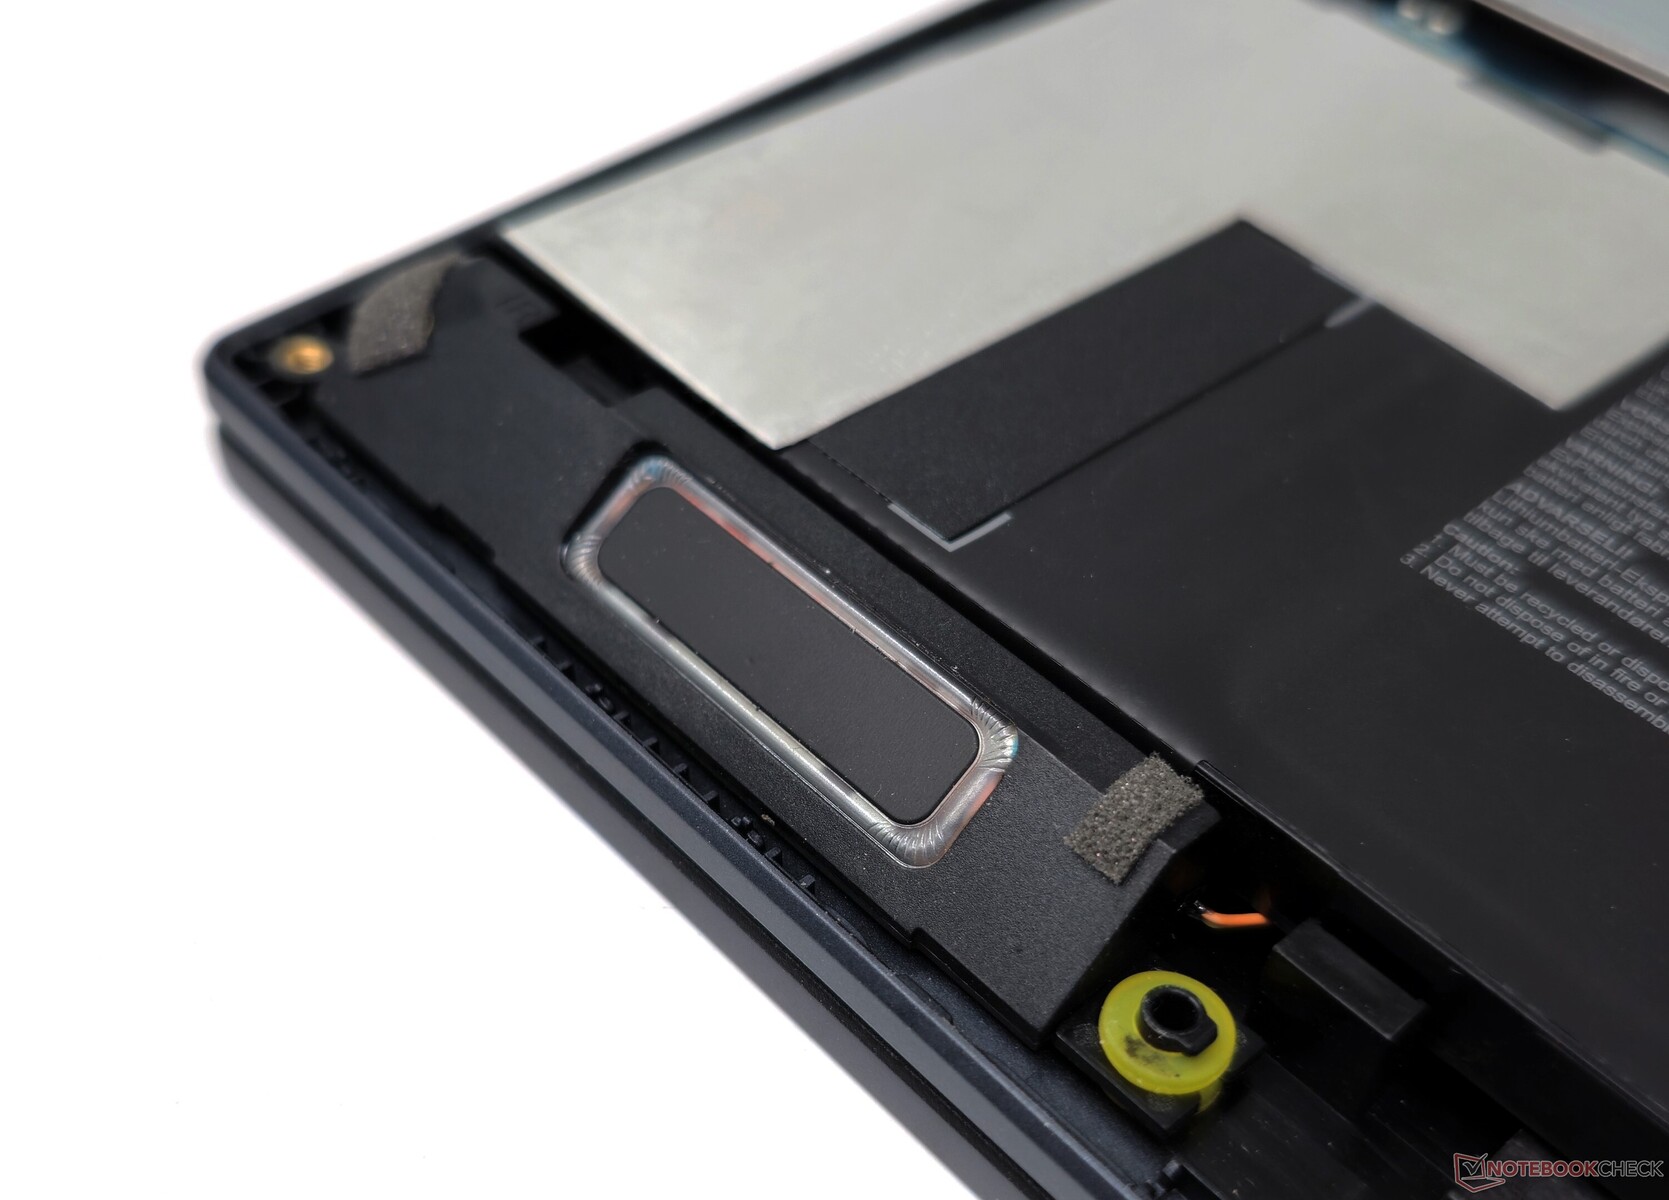
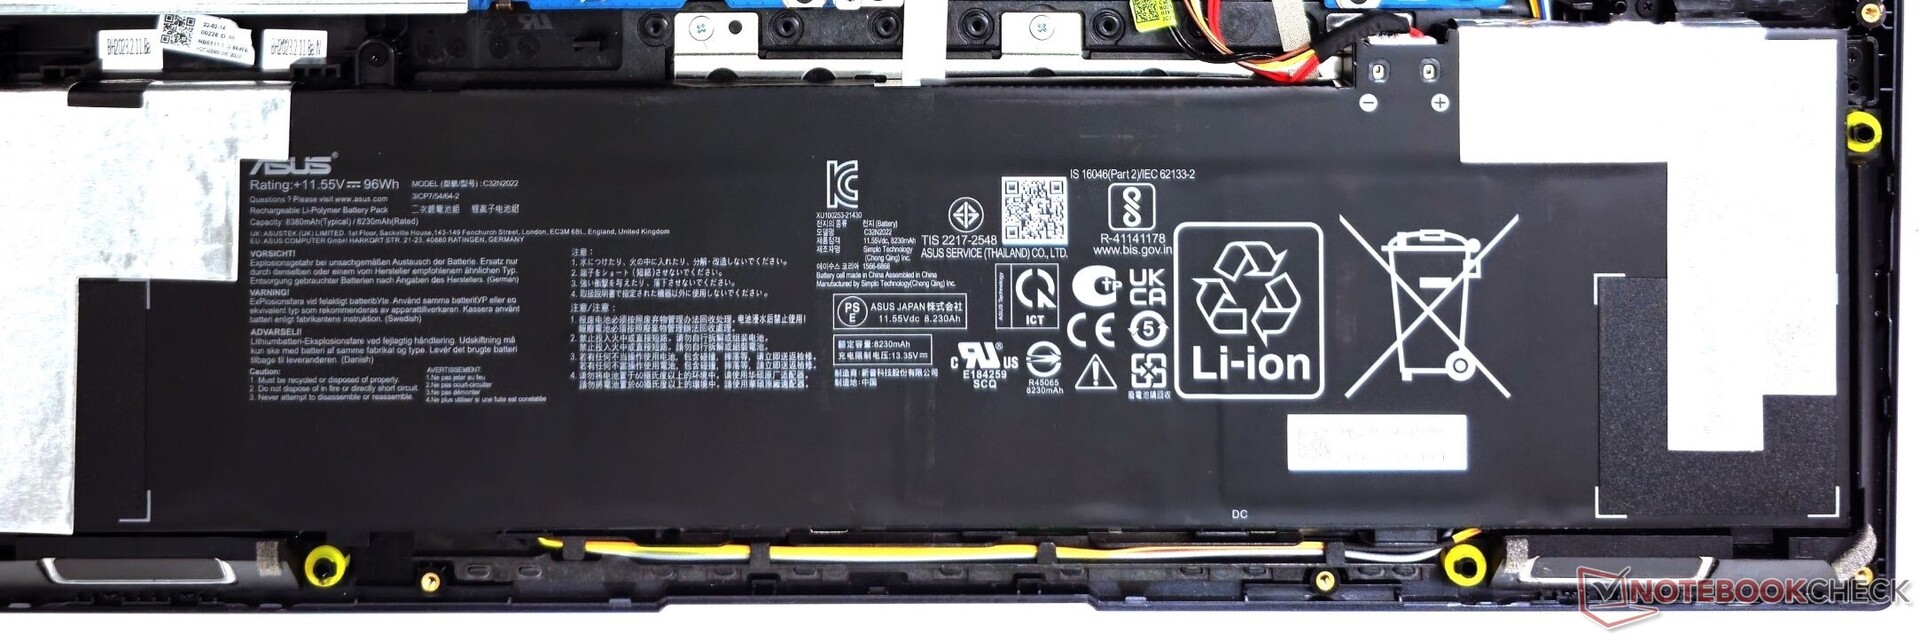
Maintenance
Getting inside the VivoBook Pro 16 requires removing nine Torx screws to detach the bottom panel. Inside, key components like the RAM, NVMe SSD, and Wi-Fi card can be accessed for upgrades. The battery can also be replaced if needed by unscrewing it.
RAM expansion is limited to 24 GB maximum as 8 GB of DDR5 memory comes soldered onto the motherboard and only one SO-DIMM slot is available for adding more RAM.
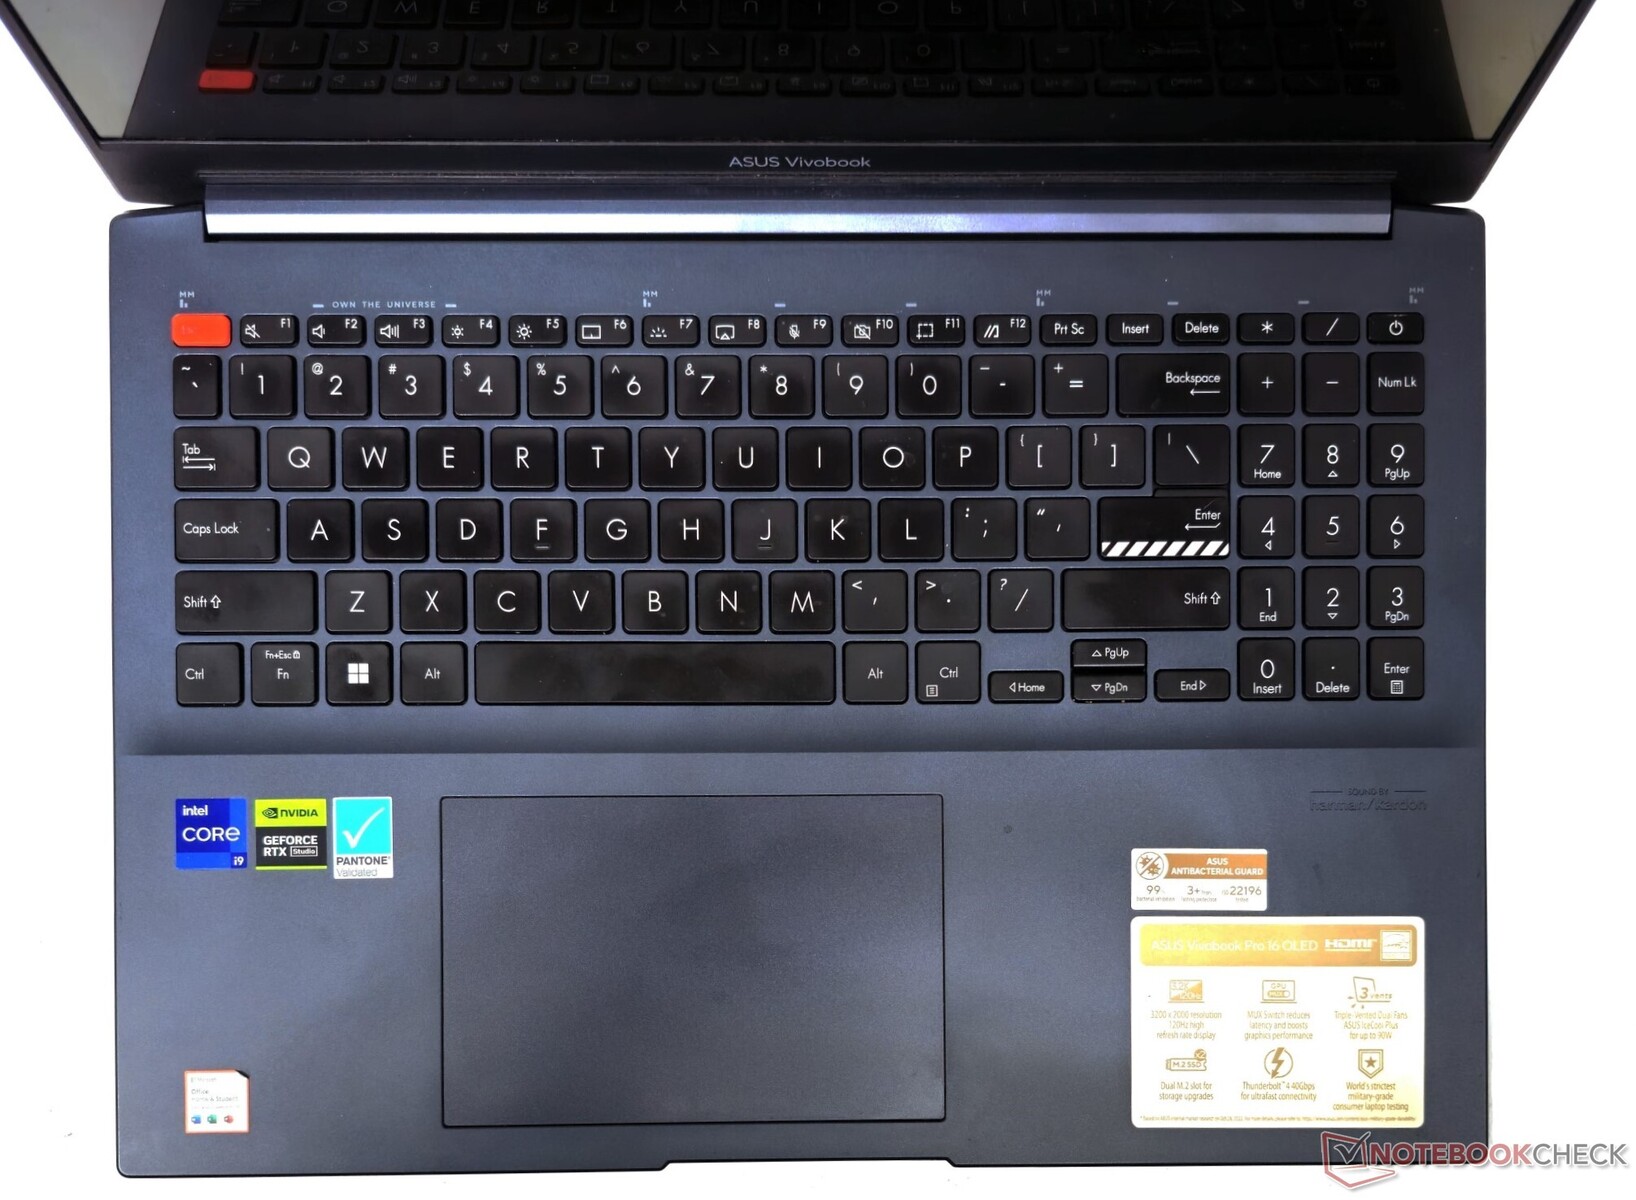
Input Devices: Full-size keyboard with cramped arrow keys
Keyboard
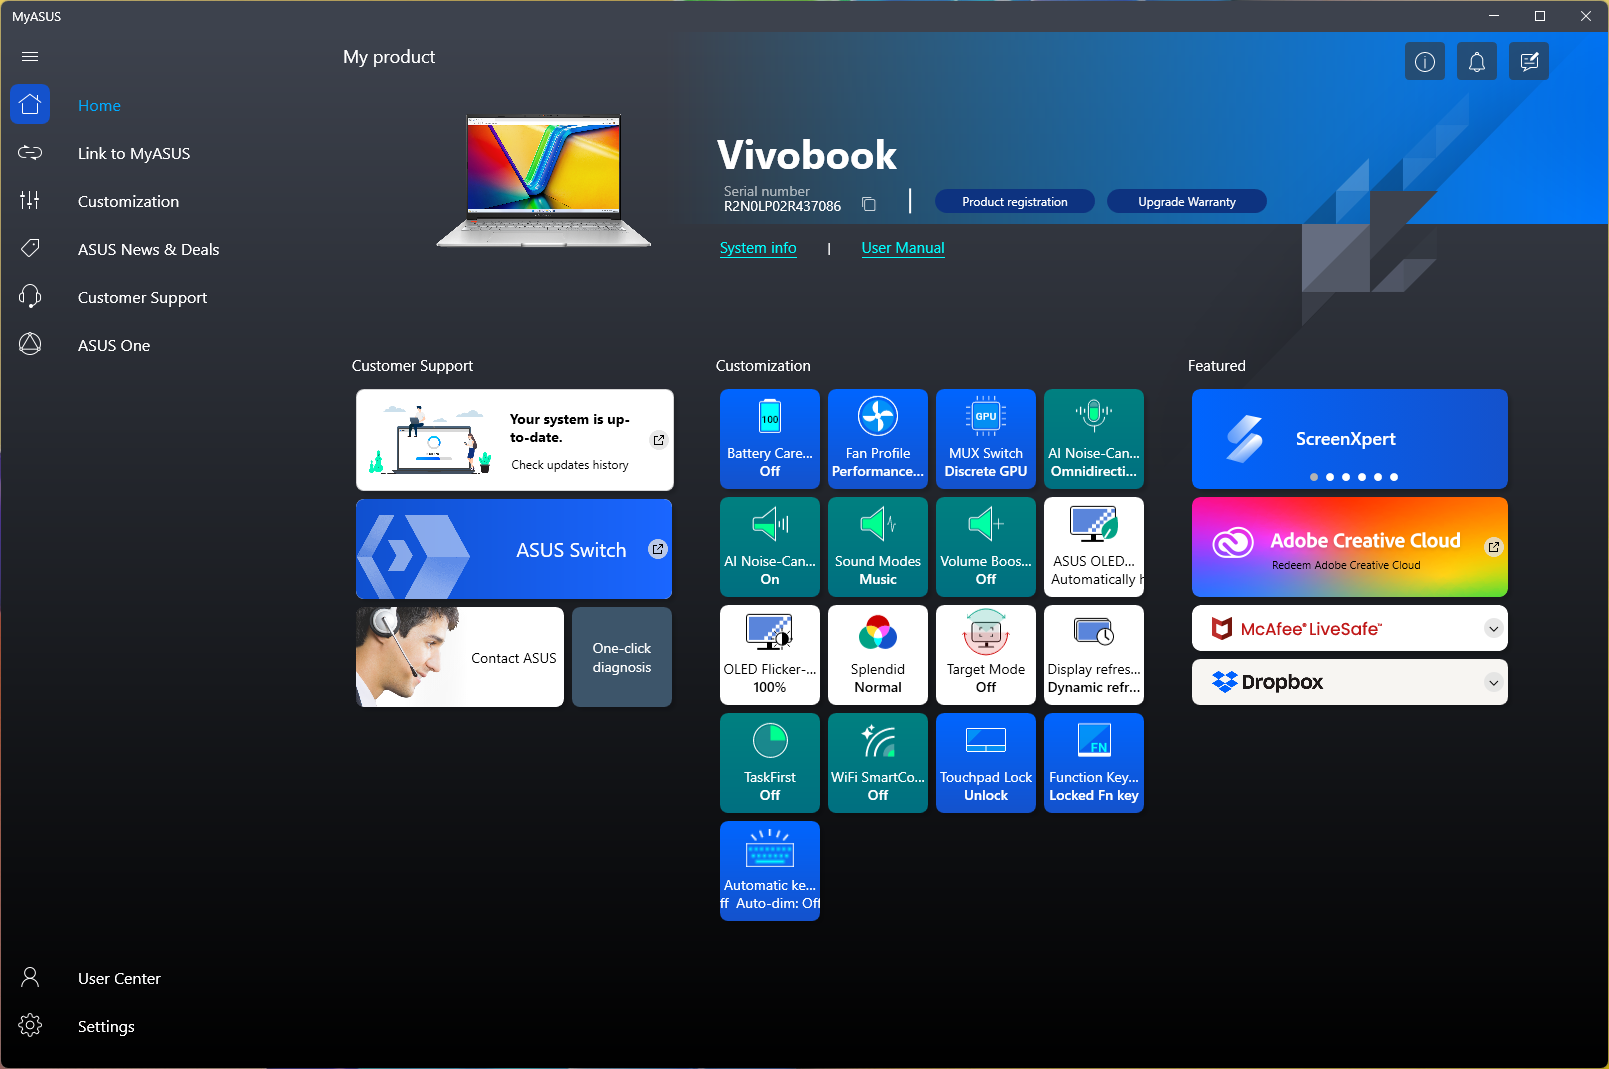
Asus outfits the VivoBook Pro 16 with its signature ErgoSense keyboard, similar to what we've seen with the VivoBook 15X and Pro 16X models. The keyboard provides a responsive typing experience a with 1.4 mm key travel. The MyAsus app allows setting the primary function of the top row keys for F1-F12 or special shortcuts.
The typing feels comfortable for daily productivity, though the arrow keys feel cramped. A three-level white backlighting aids typing in the dark.
Touchpad
The 9 cm x 13 cm offers smooth, responsive gliding, with the whole surface acting as the left mouse button. Windows Precision gestures are fully supported. There is no built-in Asus Dial unlike what we've seen with the VivoBook Pro 16X.
Display: 3.2K Dolby Vision HDR OLED with 240 Hz DC dimming
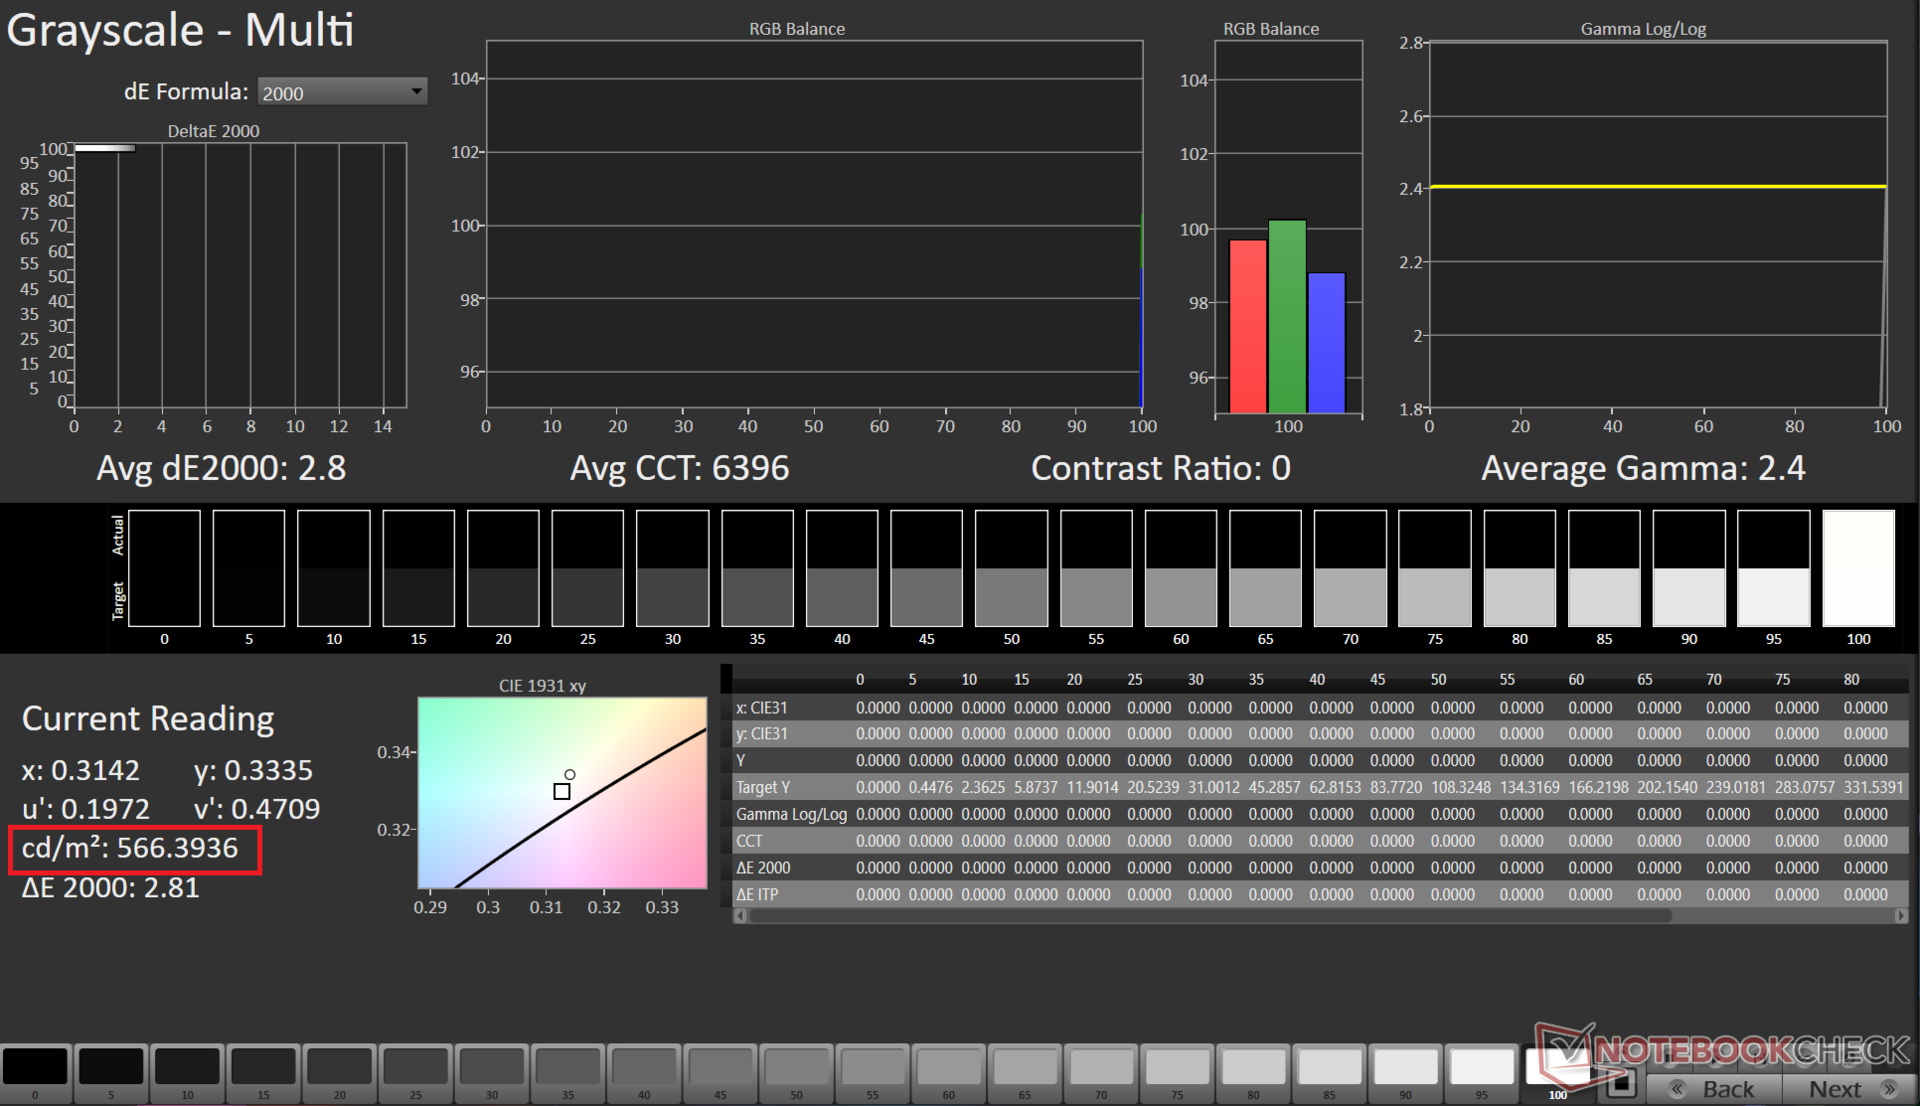
The VivoBook Pro 16 utilizes the same 16:10 Samsung ATNA60BX01 OLED panel as the Pro 16X and ProArt StudioBook 16, with a 3200 x 2000 resolution and 120 Hz refresh rate. As expected from an OLED panel, it delivers a near-infinite contrast ratio with deep blacks and without any backlight bleed. Brightness distribution is also highly uniform.
In SDR mode, we recorded a peak brightness of 358 nits. With HDR enabled, the display can reach up to 566 nits, close to the VESA DisplayHDR 600 spec. The MyAsus app provides several adjustments like DC dimming, color gamut, and OLED pixel shift that prevents burn-in.
While maximum SDR brightness is somewhat lower than ideal, the OLED panel's perfect blacks create an immersive viewing experience regardless.

| |||||||||||||||||||||||||
Brightness Distribution: 98 %
Center on Battery: 348 cd/m²
Contrast: ∞:1 (Black: 0 cd/m²)
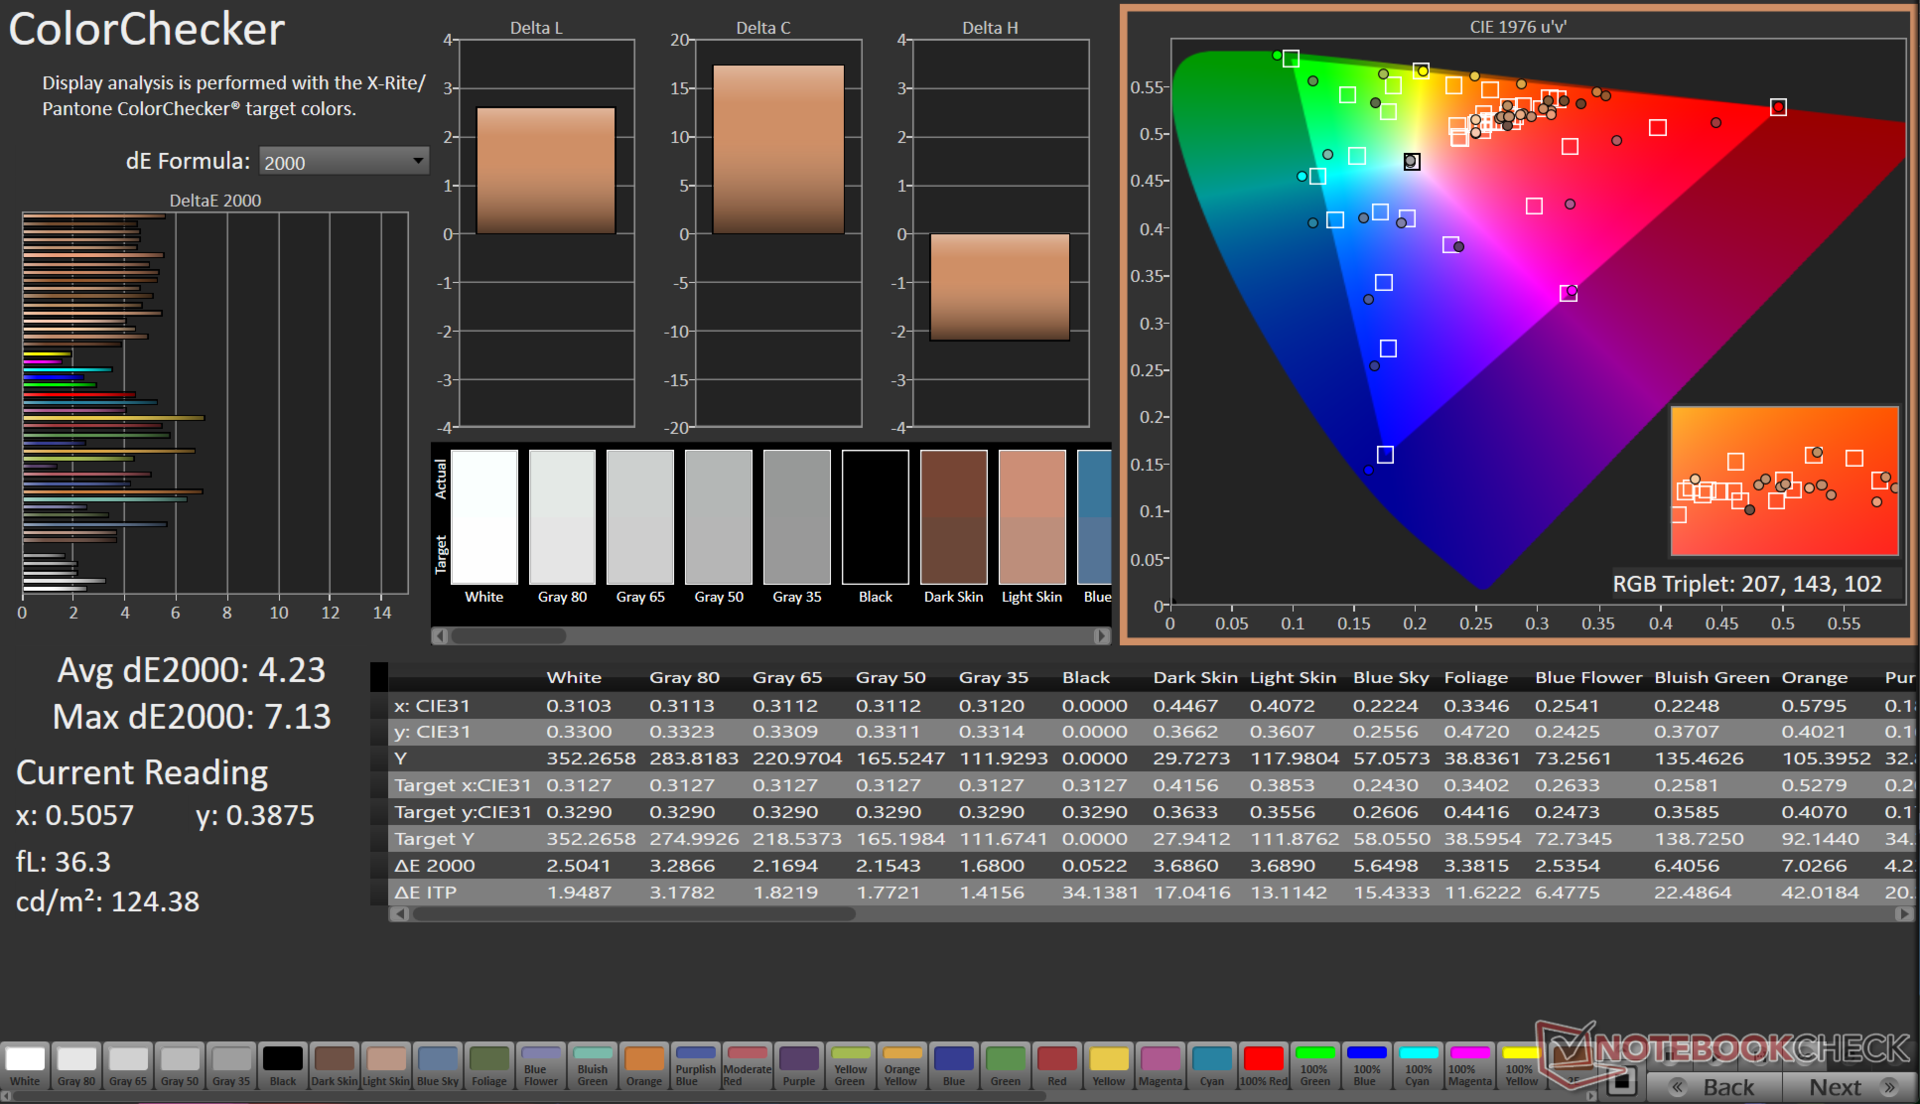
ΔE ColorChecker Calman: 4.23 | ∀{0.5-29.43 Ø4.71}
calibrated: 2.42
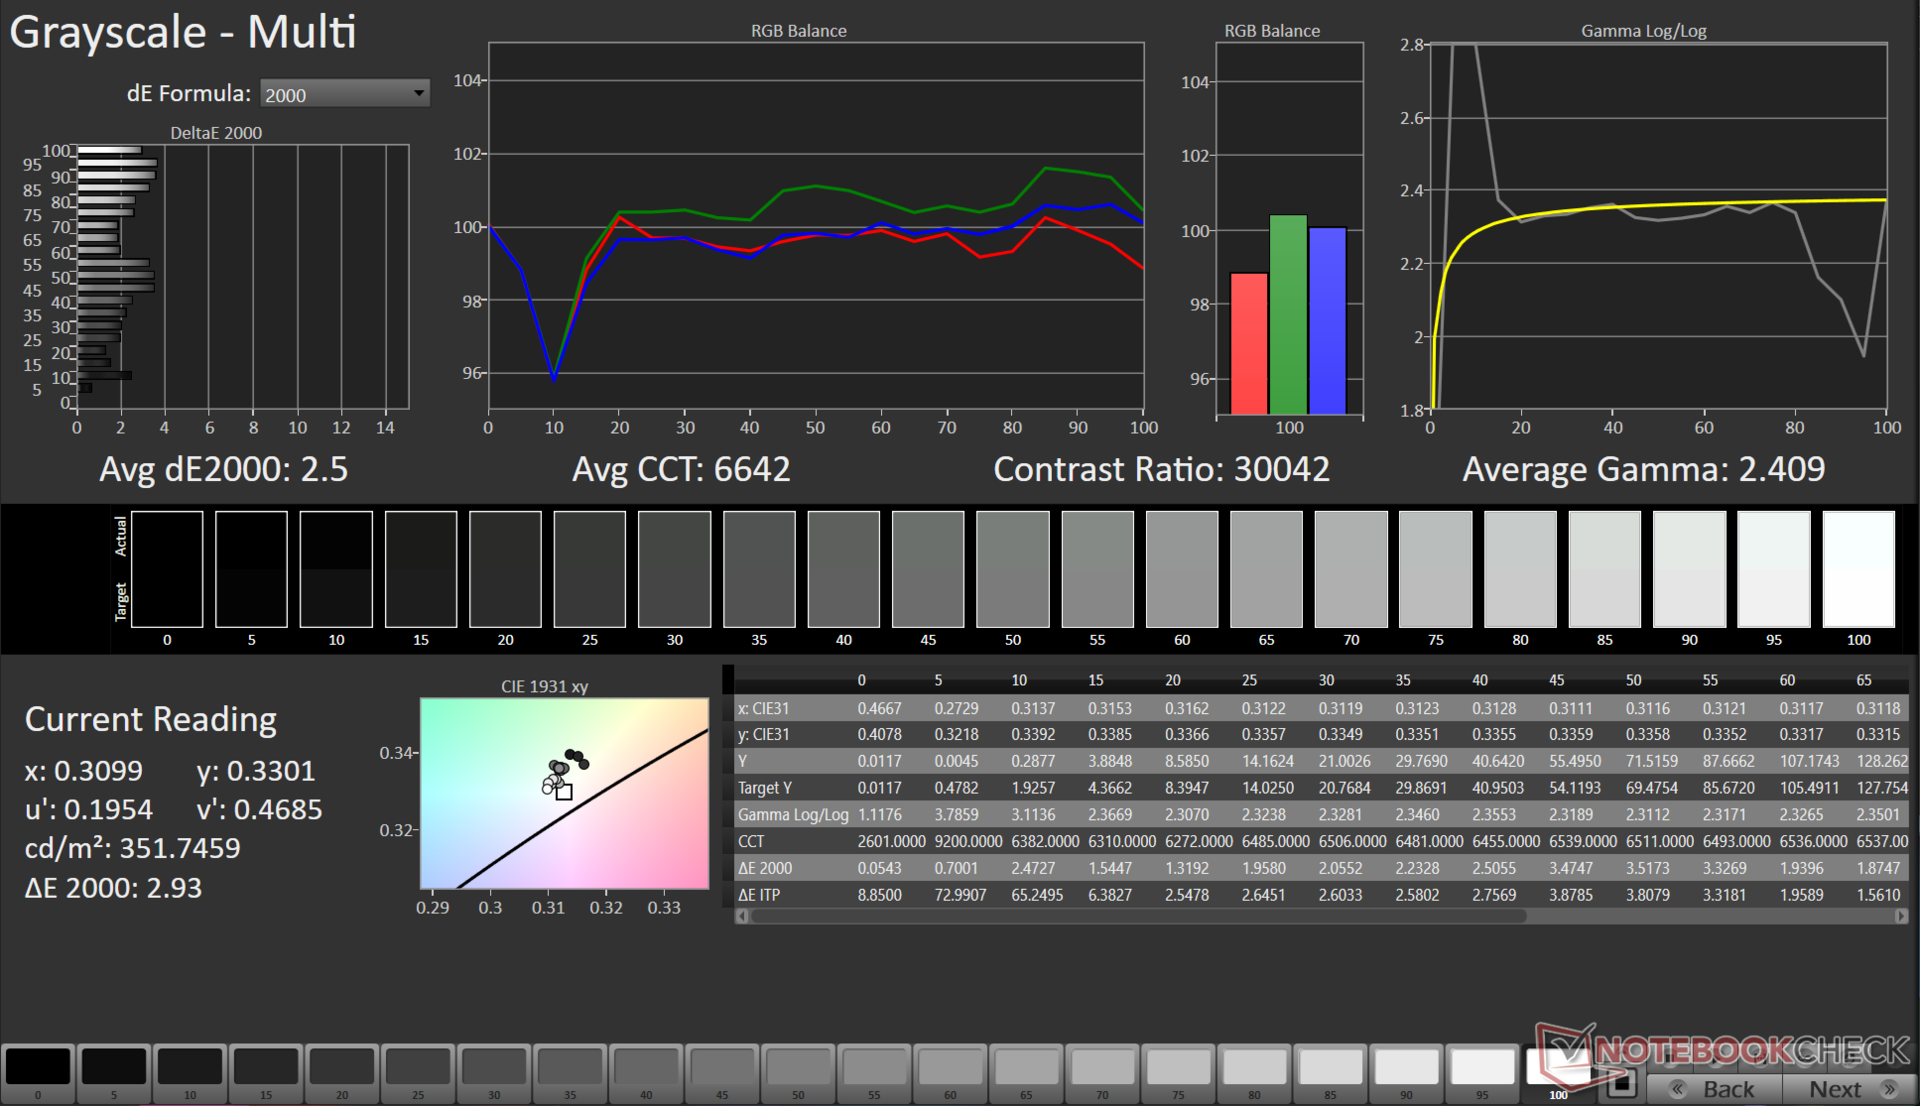
ΔE Greyscale Calman: 2.5 | ∀{0.09-98 Ø4.96}
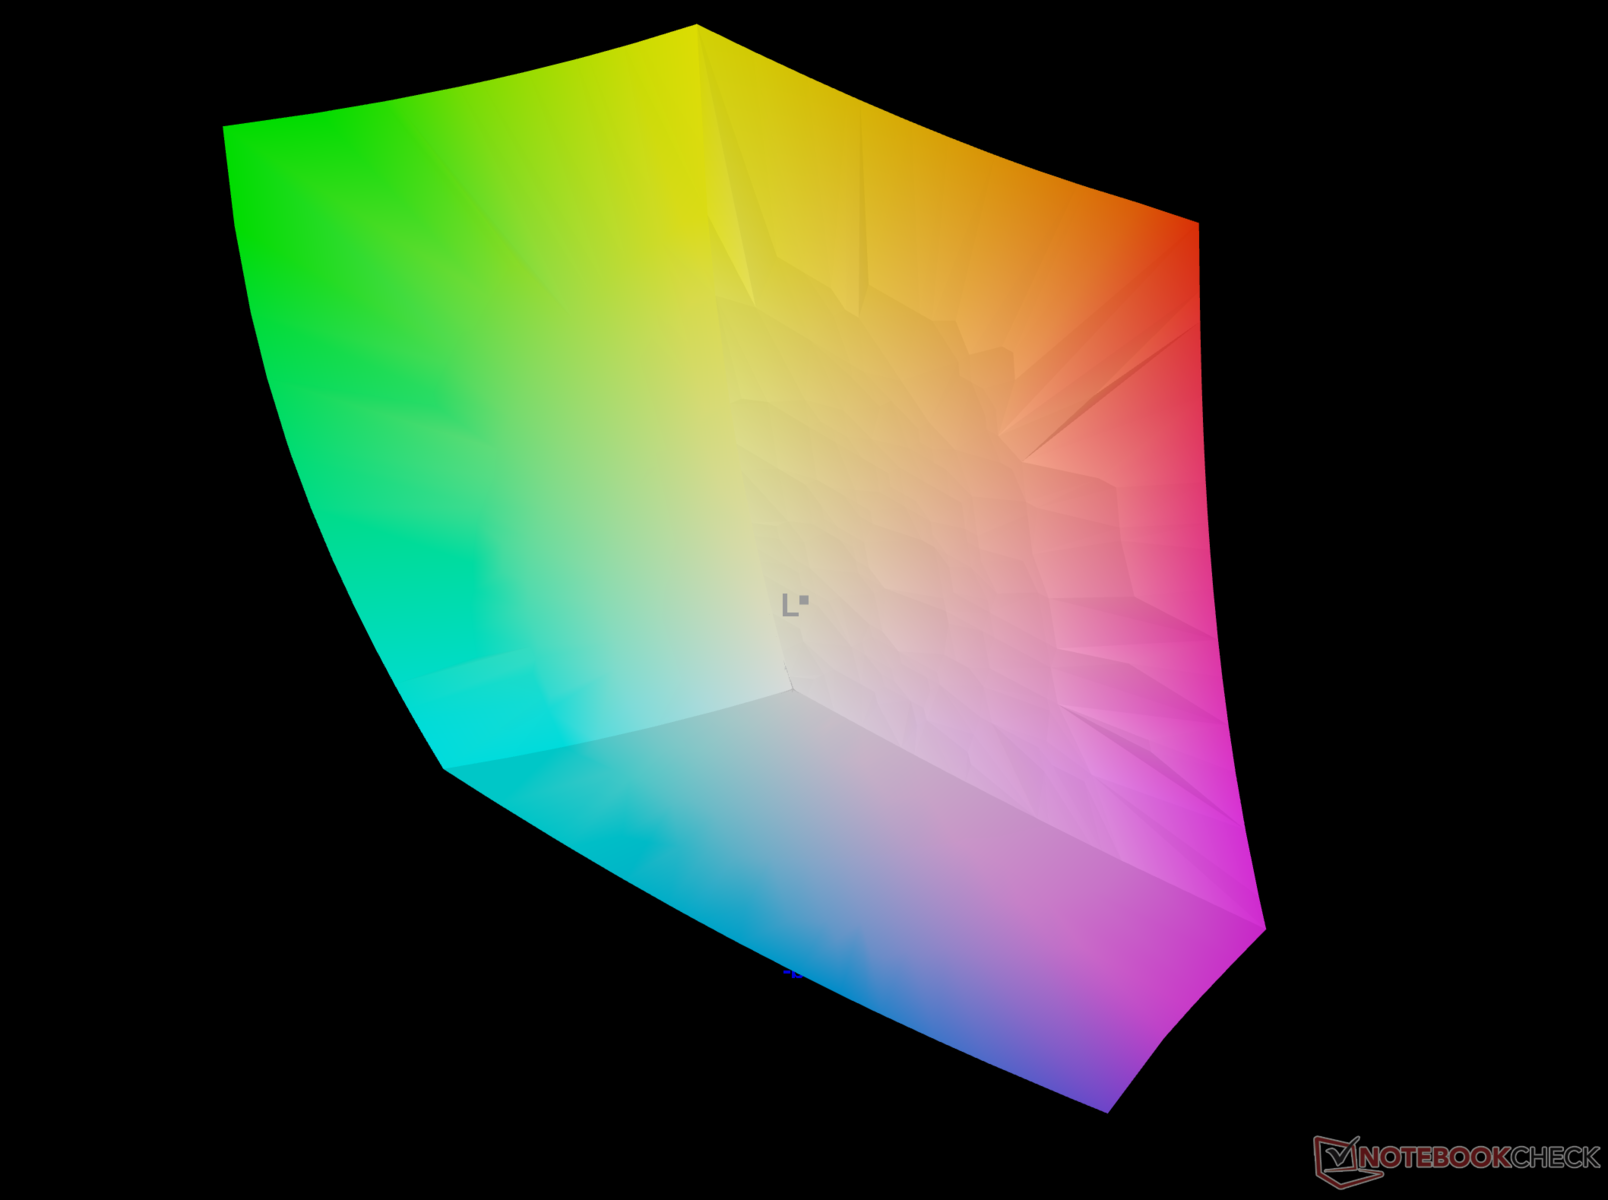
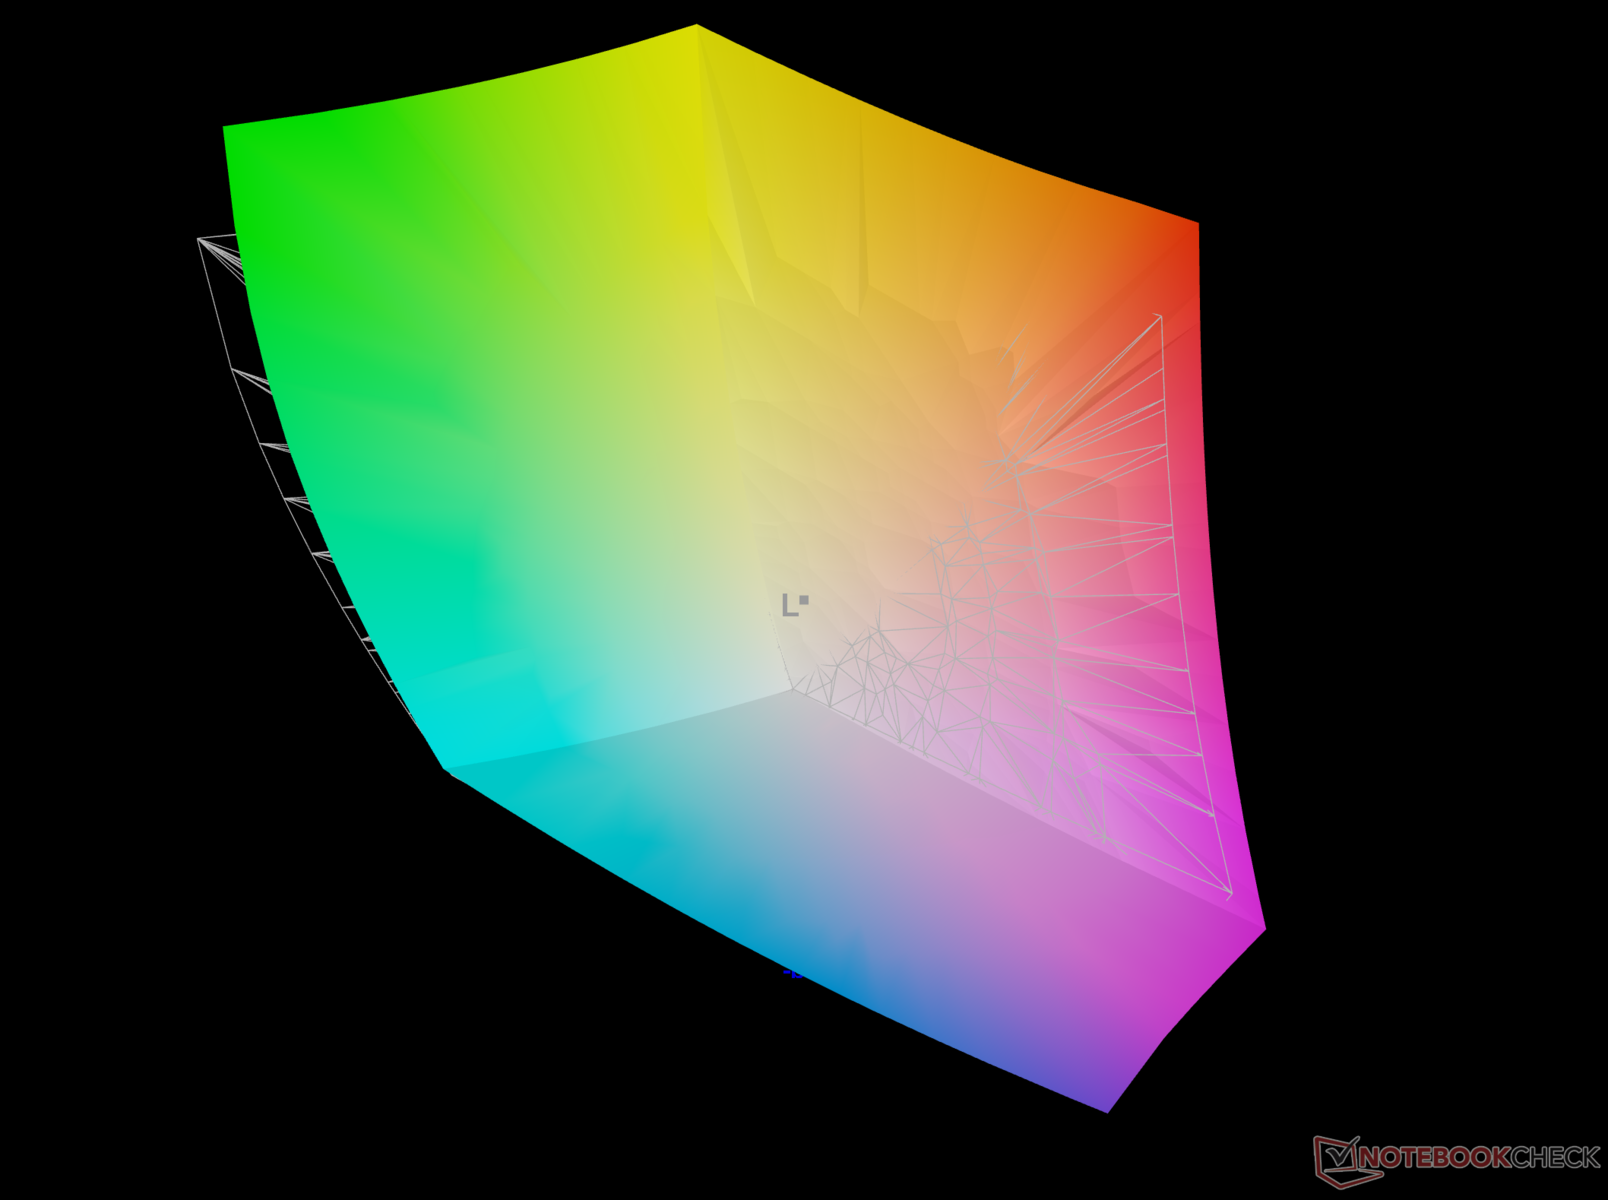
96.5% AdobeRGB 1998 (Argyll 3D)
99.7% sRGB (Argyll 3D)
98.7% Display P3 (Argyll 3D)
Gamma: 2.4
CCT: 6642 K
| Asus VivoBook Pro 16 K6602VU Samsung ATNA60BX01-1, OLED, 3200x2000, 16" | Asus Vivobook Pro 16X K6604JV-MX016W Samsung SDC4178 ATNA60BX01-1, OLED, 3200x2000, 16" | Gigabyte AERO 16 OLED BSF Samsung SDC4191 (ATNA60YV09-0, OLED, 3840x2400, 16" | Asus ROG Flow X16 GV601V TMX1603 (TL160ADMP03-0), IPS, 2560x1600, 16" | Lenovo Legion Pro 5 16ARX8 (R5 7645HX, RTX 4050) CSOT T3 MNG007DA2-2, IPS, 2560x1600, 16" | Asus TUF Gaming A16 FA617XS BOE NE160WUM-NX2, IPS, 1920x1200, 16" | Asus VivoBook Pro 16 Au Optronics B160QAN02.L, IPS, 2560x1600, 16" | |
|---|---|---|---|---|---|---|---|
| Display | -0% | 0% | -5% | -17% | -20% | -4% | |
| Display P3 Coverage (%) | 98.7 | 98.4 0% | 99.9 1% | 96.61 -2% | 71.6 -27% | 69.3 -30% | 98.5 0% |
| sRGB Coverage (%) | 99.7 | 99.7 0% | 100 0% | 99.92 0% | 99.8 0% | 97.3 -2% | 99.9 0% |
| AdobeRGB 1998 Coverage (%) | 96.5 | 95.8 -1% | 96.4 0% | 84.63 -12% | 72.9 -24% | 70.7 -27% | 86.1 -11% |
| Response Times | -23% | -55% | -209% | -802% | -1085% | -78% | |
| Response Time Grey 50% / Grey 80% * (ms) | 0.68 ? | 1.6 ? -135% | 2 ? -194% | 3.8 ? -459% | 12 ? -1665% | 15.6 ? -2194% | 2 ? -194% |
| Response Time Black / White * (ms) | 13.2 ? | 1.4 ? 89% | 1.98 ? 85% | 7.6 ? 42% | 5.2 ? 61% | 10 ? 24% | 8 ? 39% |
| PWM Frequency (Hz) | 240 ? | 120 ? | 60 | ||||
| Screen | 23% | 23% | 24% | 45% | 18% | 24% | |
| Brightness middle (cd/m²) | 353 | 347 -2% | 389.97 10% | 486 38% | 543 54% | 301 -15% | 504 43% |
| Brightness (cd/m²) | 354 | 346 -2% | 395 12% | 469 32% | 516 46% | 294 -17% | 465 31% |
| Brightness Distribution (%) | 98 | 97 -1% | 97 -1% | 91 -7% | 87 -11% | 94 -4% | 87 -11% |
| Black Level * (cd/m²) | 0.06 | 0.03 | 0.39 | 0.58 | 0.21 | 0.35 | |
| Colorchecker dE 2000 * | 4.23 | 1.89 55% | 2 53% | 2.27 46% | 1.35 68% | 1.79 58% | 1.83 57% |
| Colorchecker dE 2000 max. * | 7.13 | 3.26 54% | 4.1 42% | 5.73 20% | 3.22 55% | 3.48 51% | 5.51 23% |
| Colorchecker dE 2000 calibrated * | 2.42 | 1.97 19% | 1.68 31% | 0.6 75% | 1.31 46% | 1.2 50% | 1.34 45% |
| Greyscale dE 2000 * | 2.5 | 1.55 38% | 2.23 11% | 3.36 -34% | 1.03 59% | 2.5 -0% | 3.02 -21% |
| Gamma | 2.4 92% | 2.39 92% | 2.41 91% | 2.46 89% | 2.38 92% | 2.265 97% | 2.39 92% |
| CCT | 6642 98% | 6458 101% | 6323 103% | 6625 98% | 6452 101% | 6157 106% | 6688 97% |
| Contrast (:1) | 5783 | 12999 | 1246 | 936 | 1433 | 1440 | |
| Total Average (Program / Settings) | 0% /
10% | -11% /
4% | -63% /
-22% | -258% /
-112% | -362% /
-176% | -19% /
0% |
* ... smaller is better
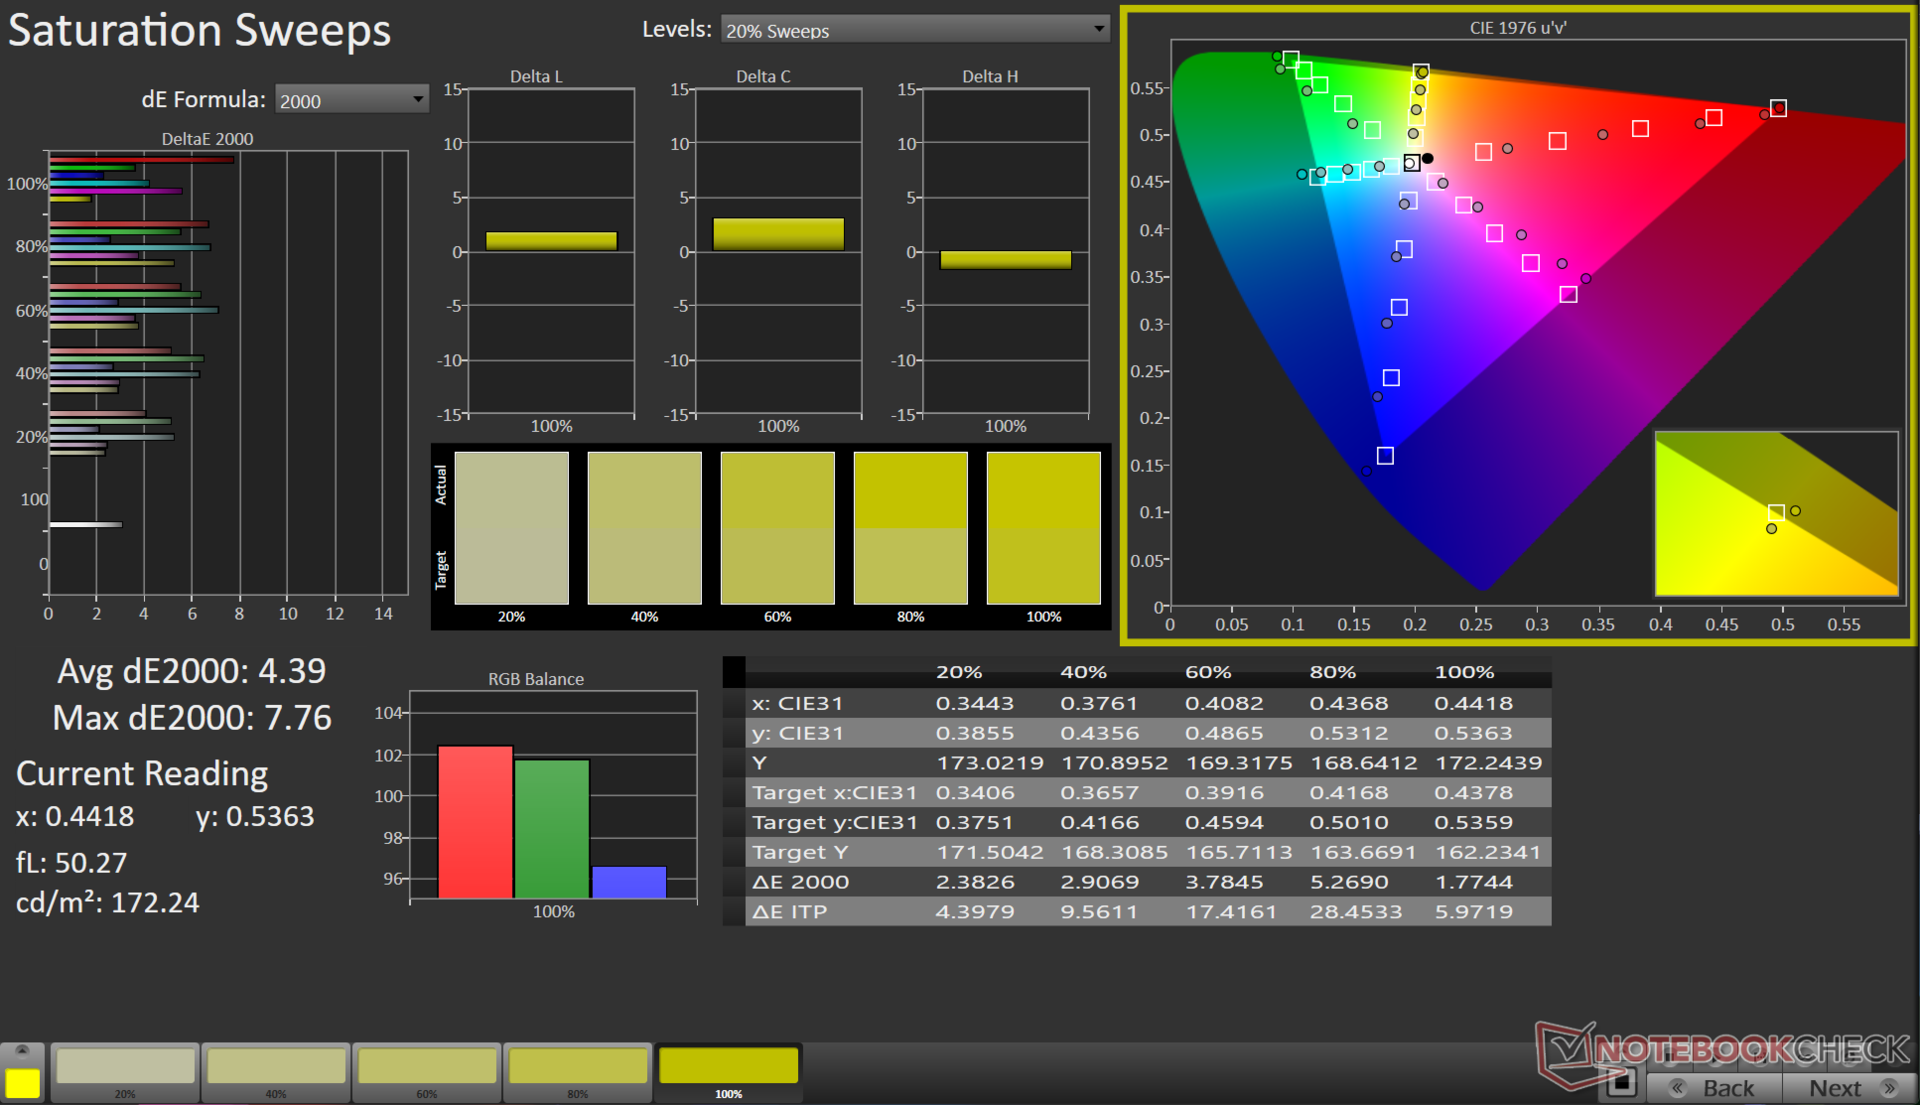
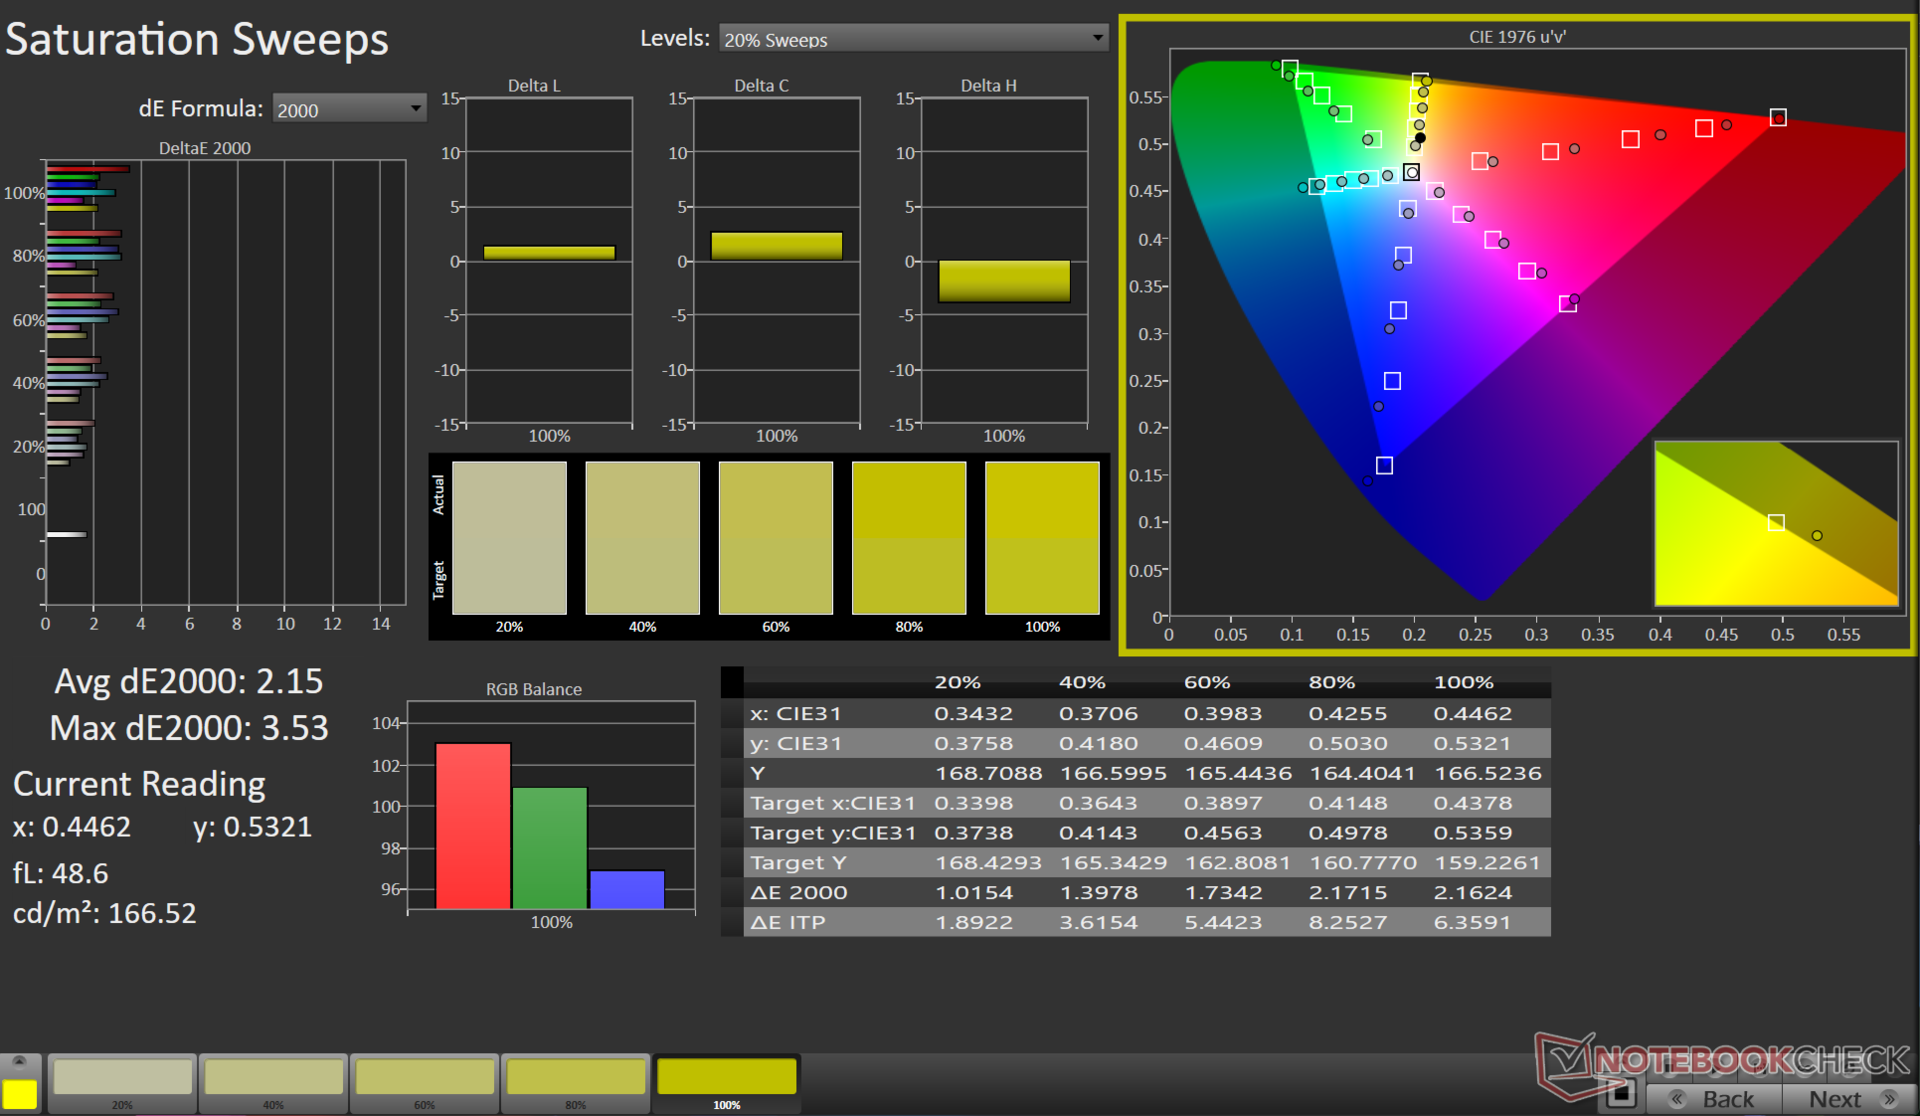
Color measurements and calibration were performed in the Normal mode with a native color profile and in the Display P3 color space.
The panel more or less covers the entirety of sRGB and Display P3 color gamuts along with an impressive 96.5% Adobe RGB coverage. The wide gamut support makes the VivoBook Pro 16's display highly amenable for both multimedia consumption and content creation alike.

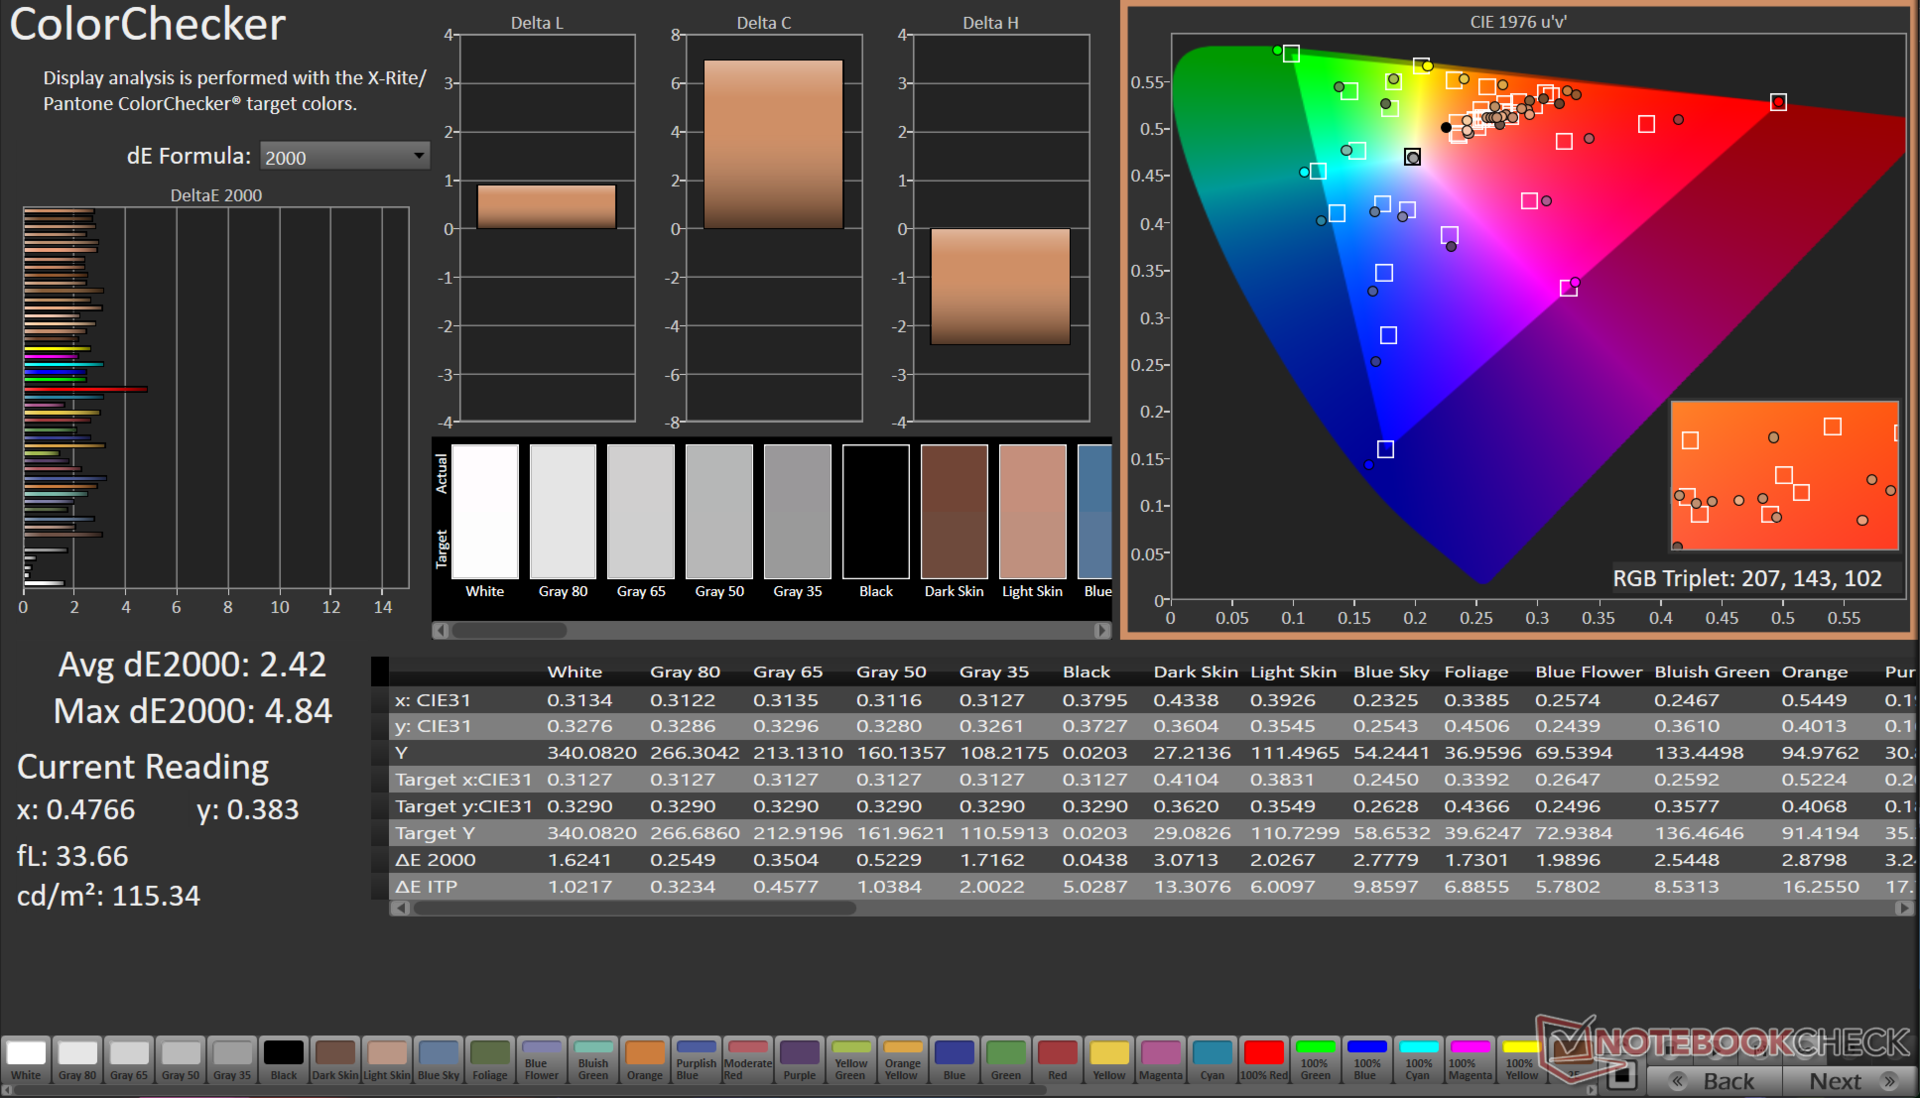
Out of the box, the VivoBook Pro 16's color accuracy shows room for improvement, with higher than ideal average Delta E values in our ColorChecker test.
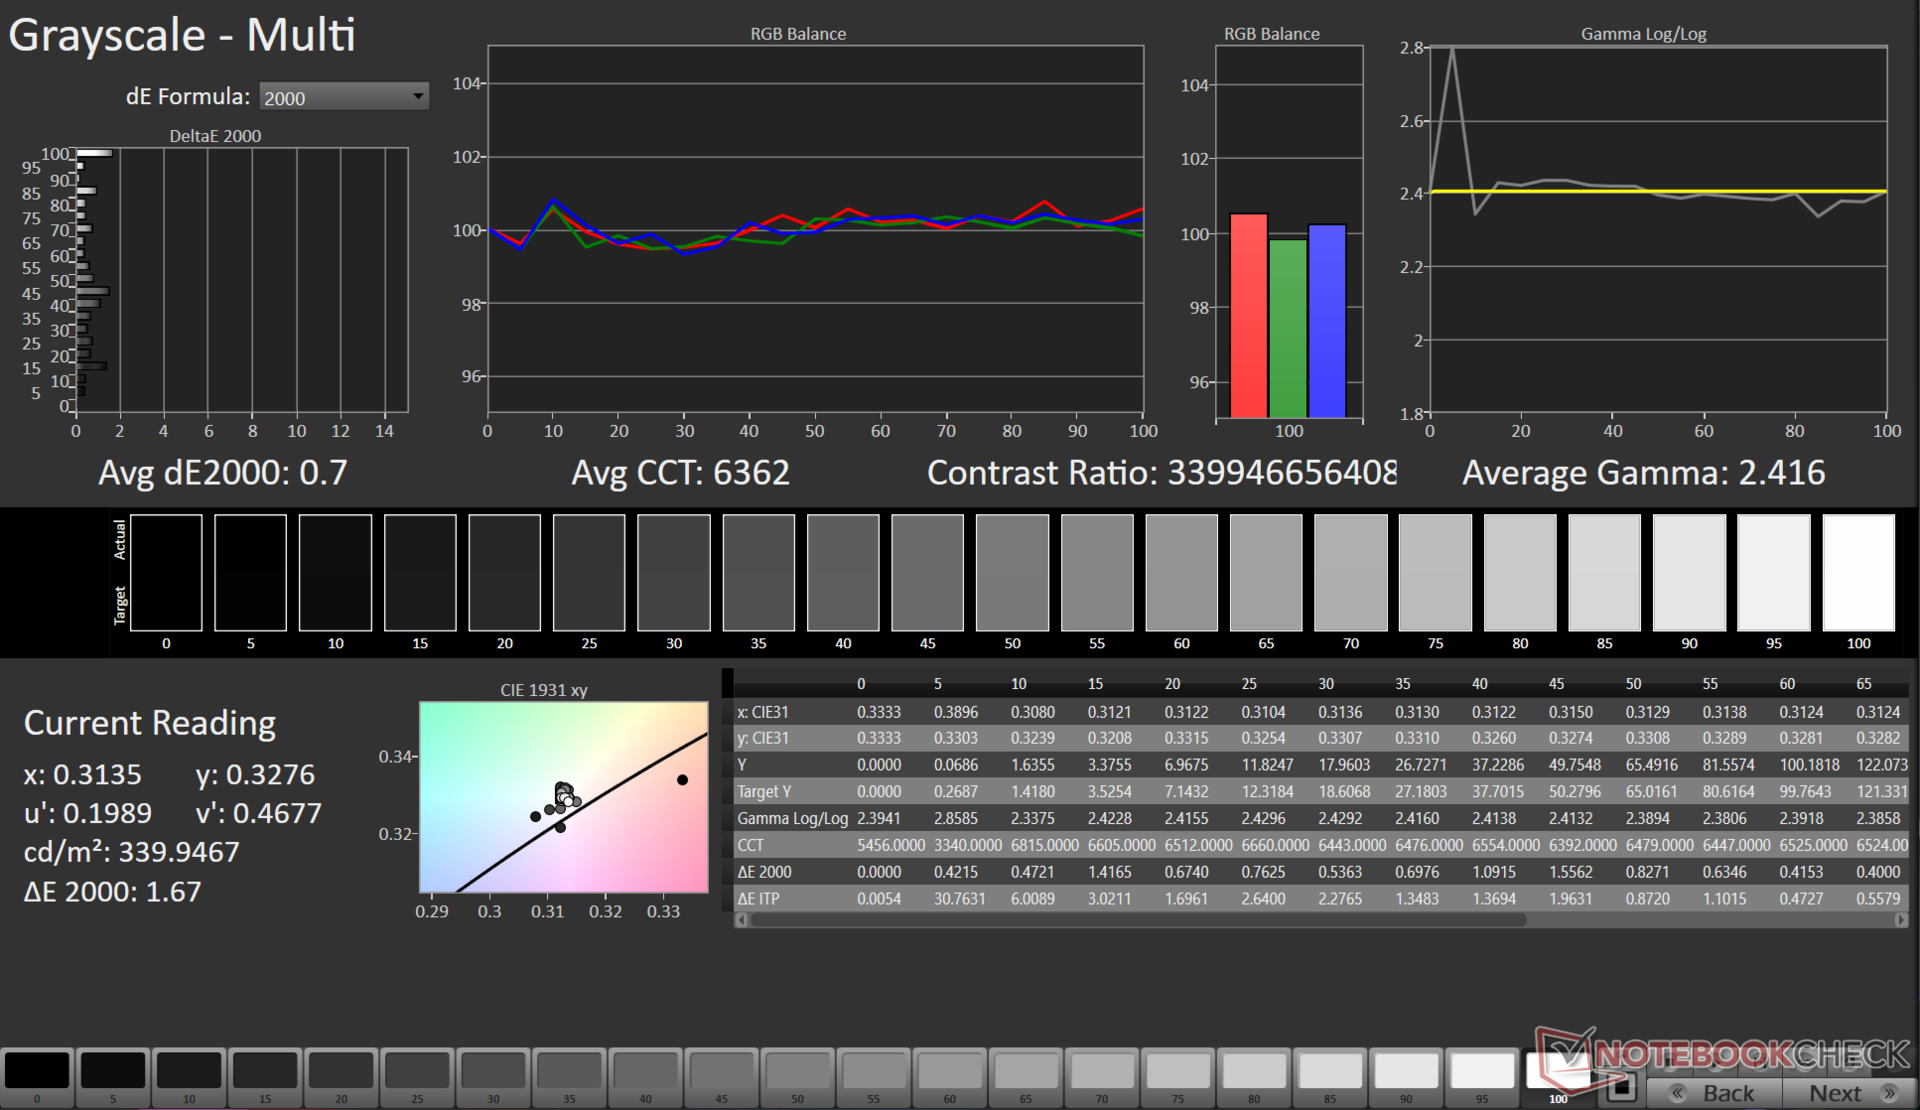
Our calibration routine using the X-Rite i1Basic Pro 3 spectrophotometer and Portrait Displays' Calman Ultimate software significantly improves Grayscale (0.7) and ColorChecker Delta E 2000 (2.42) values.
Some minor color rendition issues remain though, particularly with fully saturated red hues and certain skin tones.
The calibrated ICC file can be downloaded from the link above.
Display Response Times
| ↔ Response Time Black to White | ||
|---|---|---|
| 13.2 ms ... rise ↗ and fall ↘ combined | ↗ 10.8 ms rise | 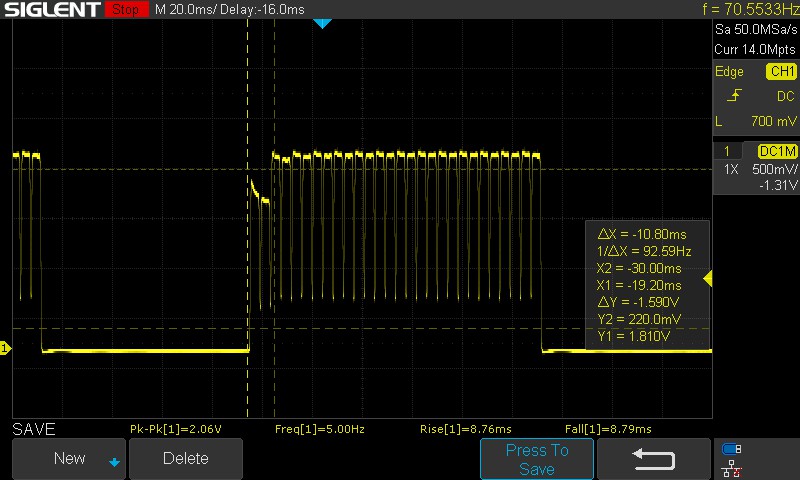 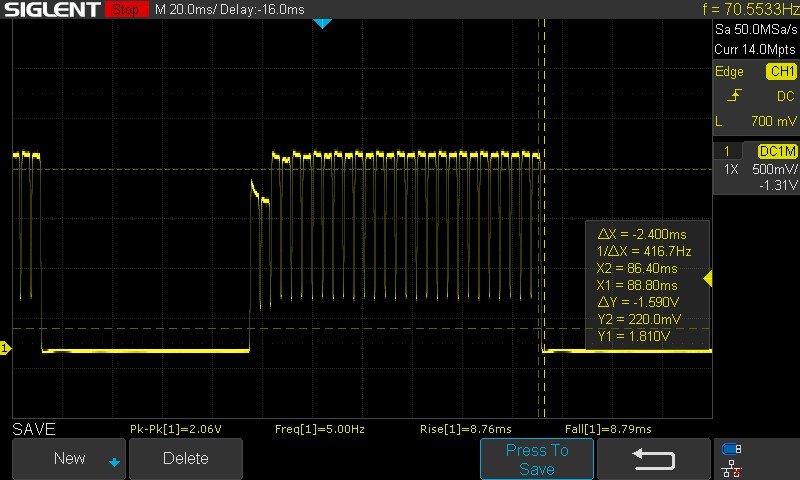 |
| ↘ 2.4 ms fall | ||
| The screen shows good response rates in our tests, but may be too slow for competitive gamers. In comparison, all tested devices range from 0.1 (minimum) to 240 (maximum) ms. » 34 % of all devices are better. This means that the measured response time is better than the average of all tested devices (19.8 ms). | ||
| ↔ Response Time 50% Grey to 80% Grey | ||
| 0.68 ms ... rise ↗ and fall ↘ combined | ↗ 0.32 ms rise | 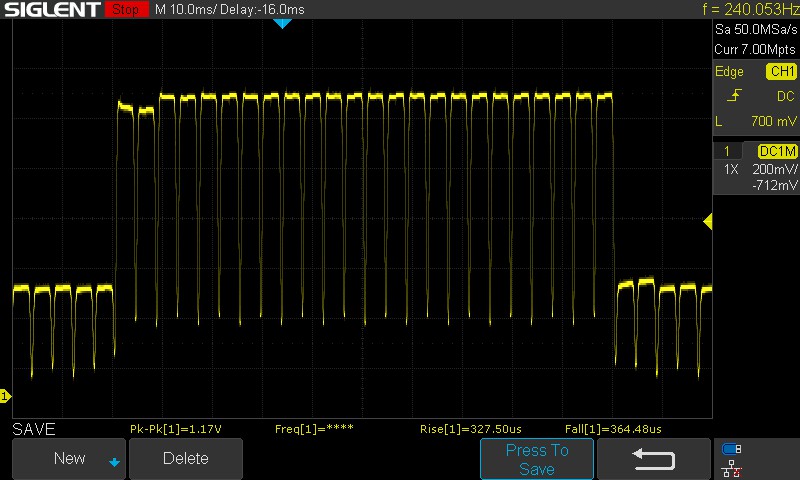 |
| ↘ 0.36 ms fall | ||
| The screen shows very fast response rates in our tests and should be very well suited for fast-paced gaming. In comparison, all tested devices range from 0.165 (minimum) to 636 (maximum) ms. » 2 % of all devices are better. This means that the measured response time is better than the average of all tested devices (31 ms). | ||
The 100% black to 100% white transition takes about 13.2 ms by manual estimation, which is not too bad. The 50% grey to 80% grey shifts are a lot faster at just about 0.68 ms.
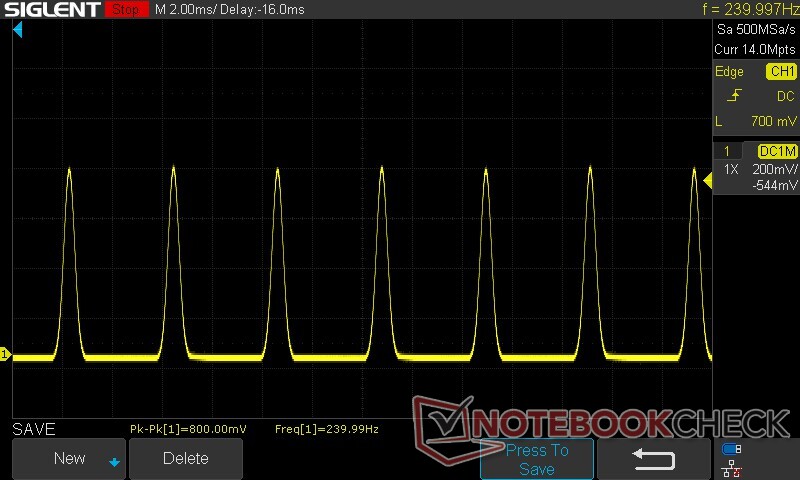
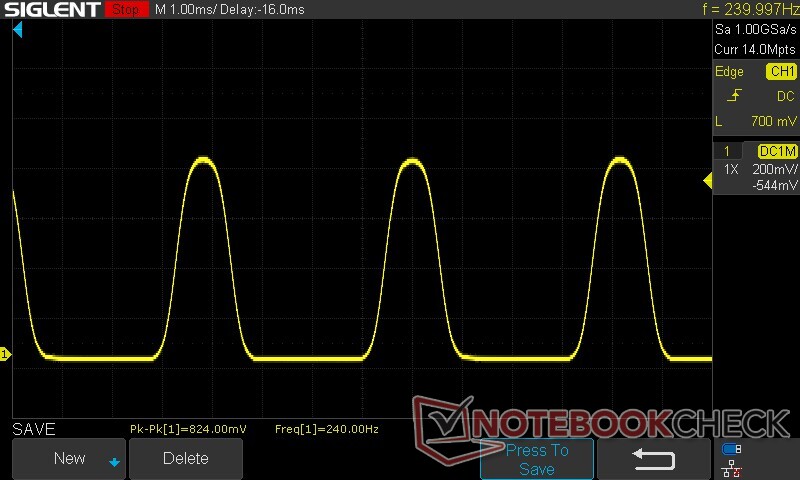
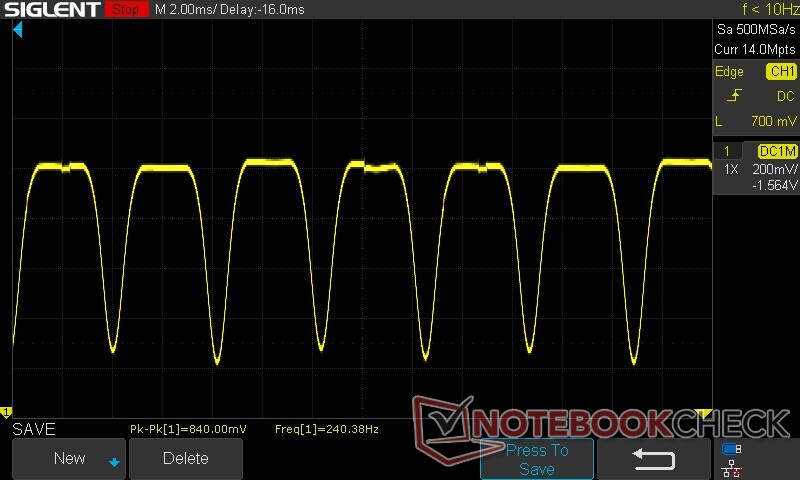
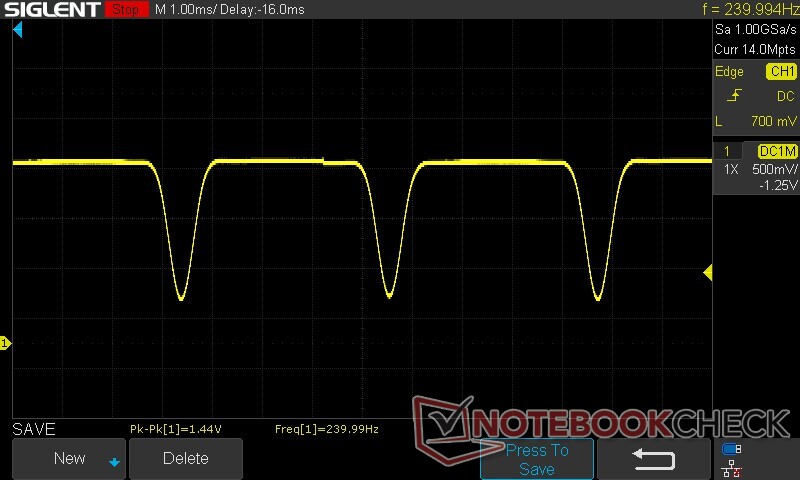
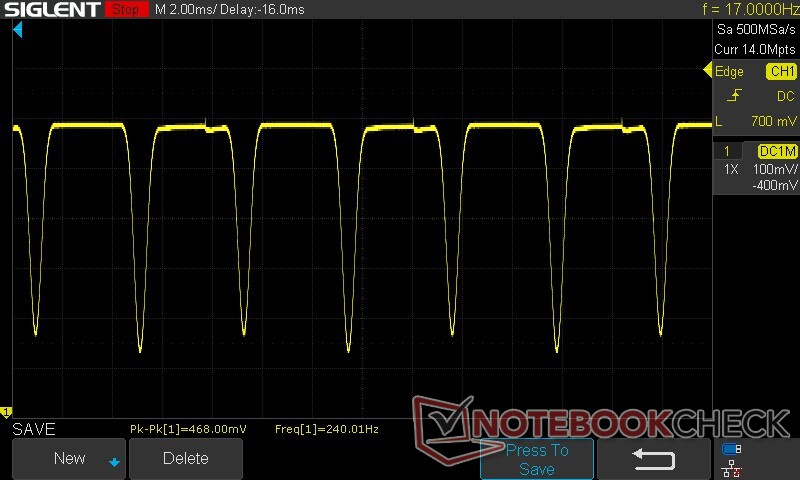
Screen Flickering / PWM (Pulse-Width Modulation)
| Screen flickering / PWM detected | 240 Hz | ≤ 100 % brightness setting | 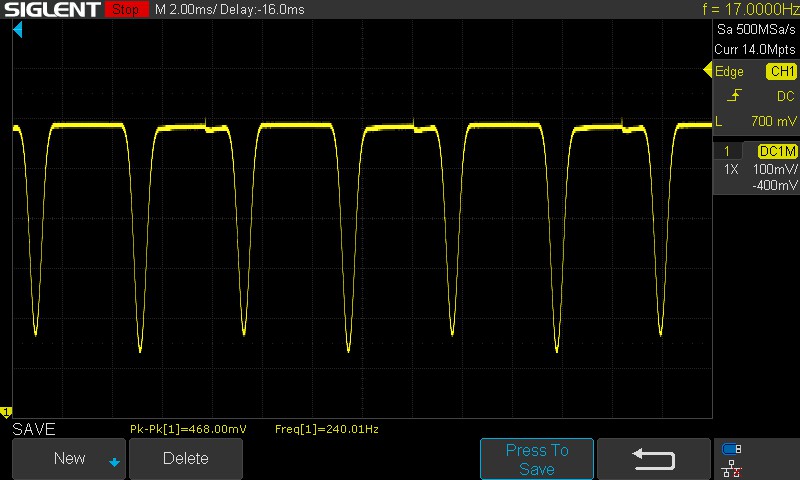 |
The display backlight flickers at 240 Hz (worst case, e.g., utilizing PWM) Flickering detected at a brightness setting of 100 % and below. There should be no flickering or PWM above this brightness setting. The frequency of 240 Hz is relatively low, so sensitive users will likely notice flickering and experience eyestrain at the stated brightness setting and below. In comparison: 52 % of all tested devices do not use PWM to dim the display. If PWM was detected, an average of 7754 (minimum: 5 - maximum: 343500) Hz was measured. | |||
The VivoBook Pro 16's OLED panel implements 240 Hz PWM below 60% brightness, switching to 240 Hz DC dimming above that threshold. While less fatiguing than PWM, a higher frequency DC dimming would have been preferable.
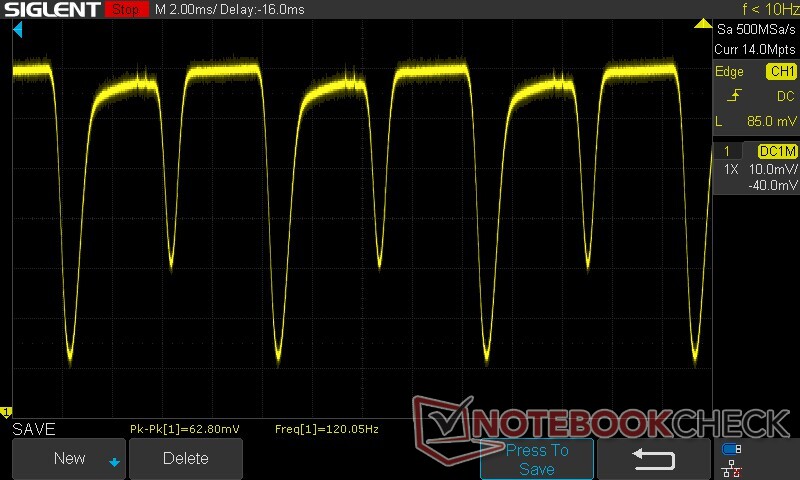
At a 60 Hz refresh rate, the DC dimming frequency drops to 120 Hz. To reduce potential eyestrain, we recommend setting the brightness above 60%.
More information can be found in our articles, "Why PWM is such a headache" and "Analysis: DC Dimming vs. PWM — Can you dim AMOLED displays without the flickering". You can also get an overview of measured PWM across reviewed devices in our PWM Ranking table.
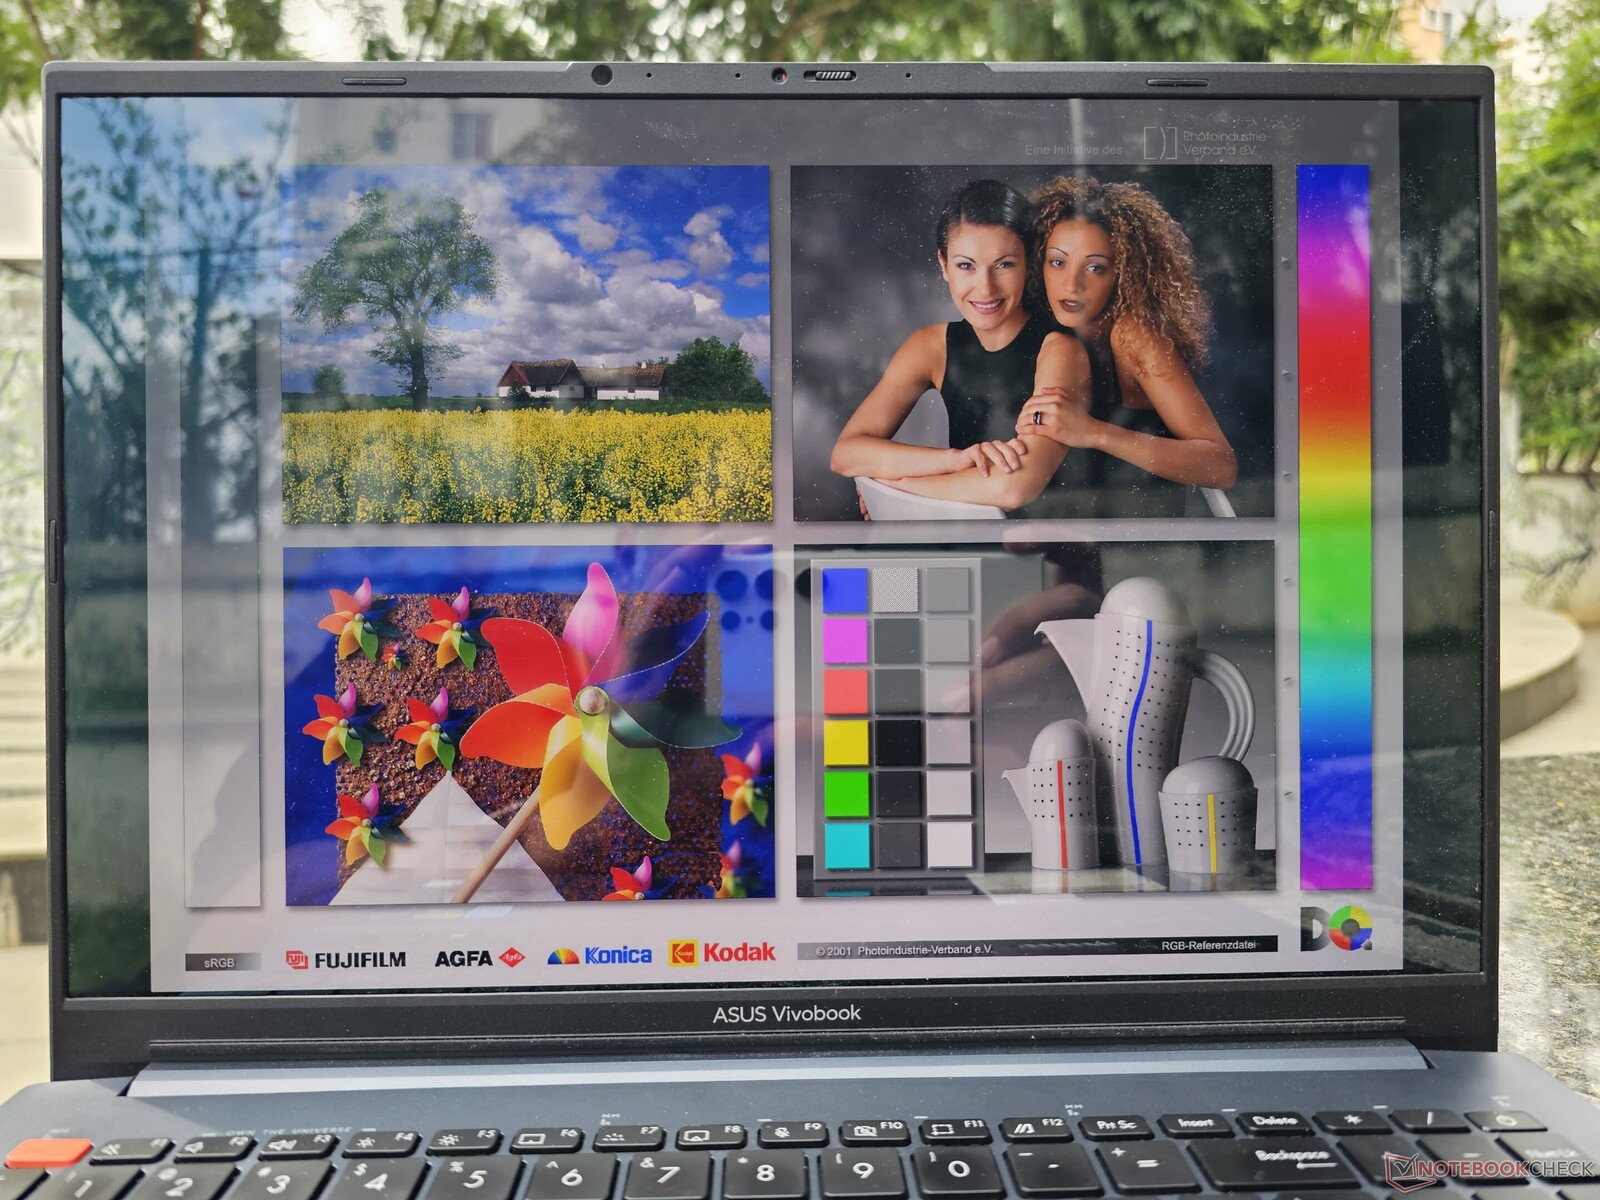
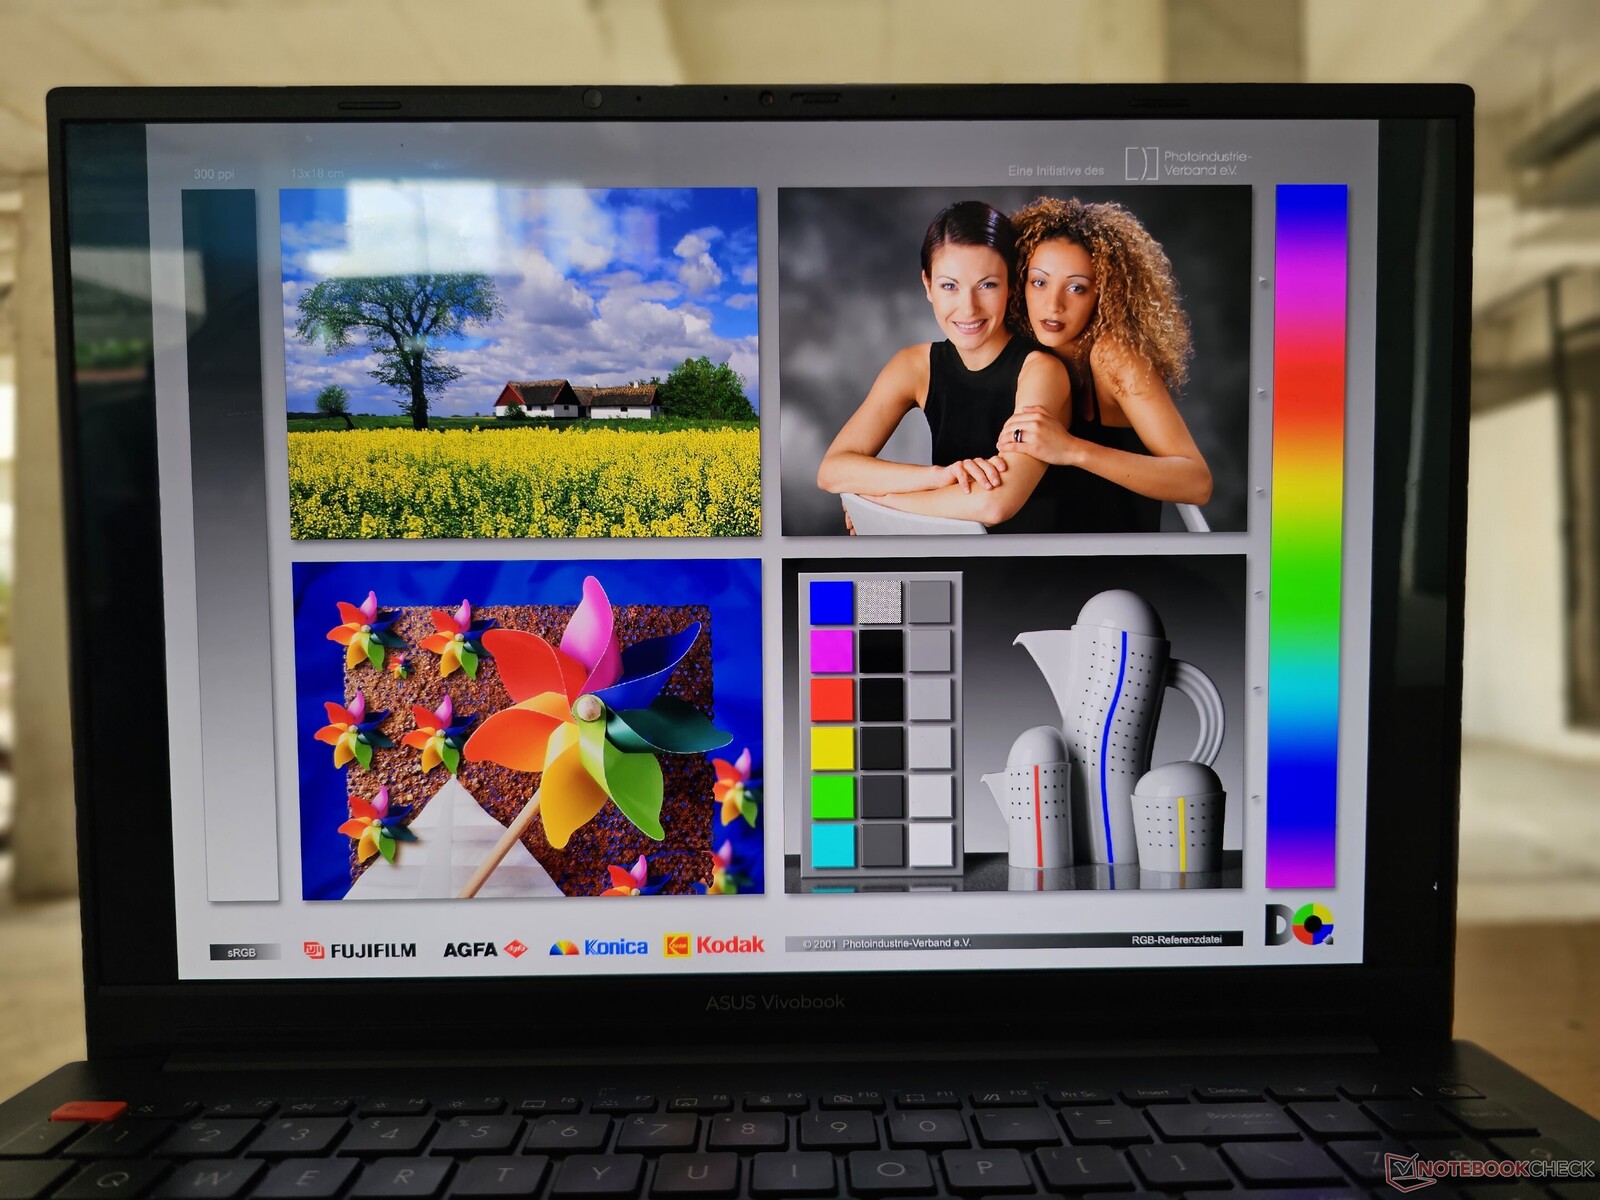
The glossy screen makes outdoor viewing under direct sunlight irksome. Viewing angles are stable, but we do observe some green tinting at extreme angles as is commonplace with OLED displays.

Performance: Core i9-13900H and RTX 4050 combo not utilized to full potential
Asus offers the VivoBook Pro 16 K6602VU in Intel 13th gen Core i5-13500H and Core i9-13900H options, both with Nvidia GeForce RTX 4050 graphics. There's also a VivoBook Pro 16 K6602HC available with the older Core i9-11900H, RTX 3050 Laptop GPU, and an FHD+ 120 Hz display.
Testing Conditions
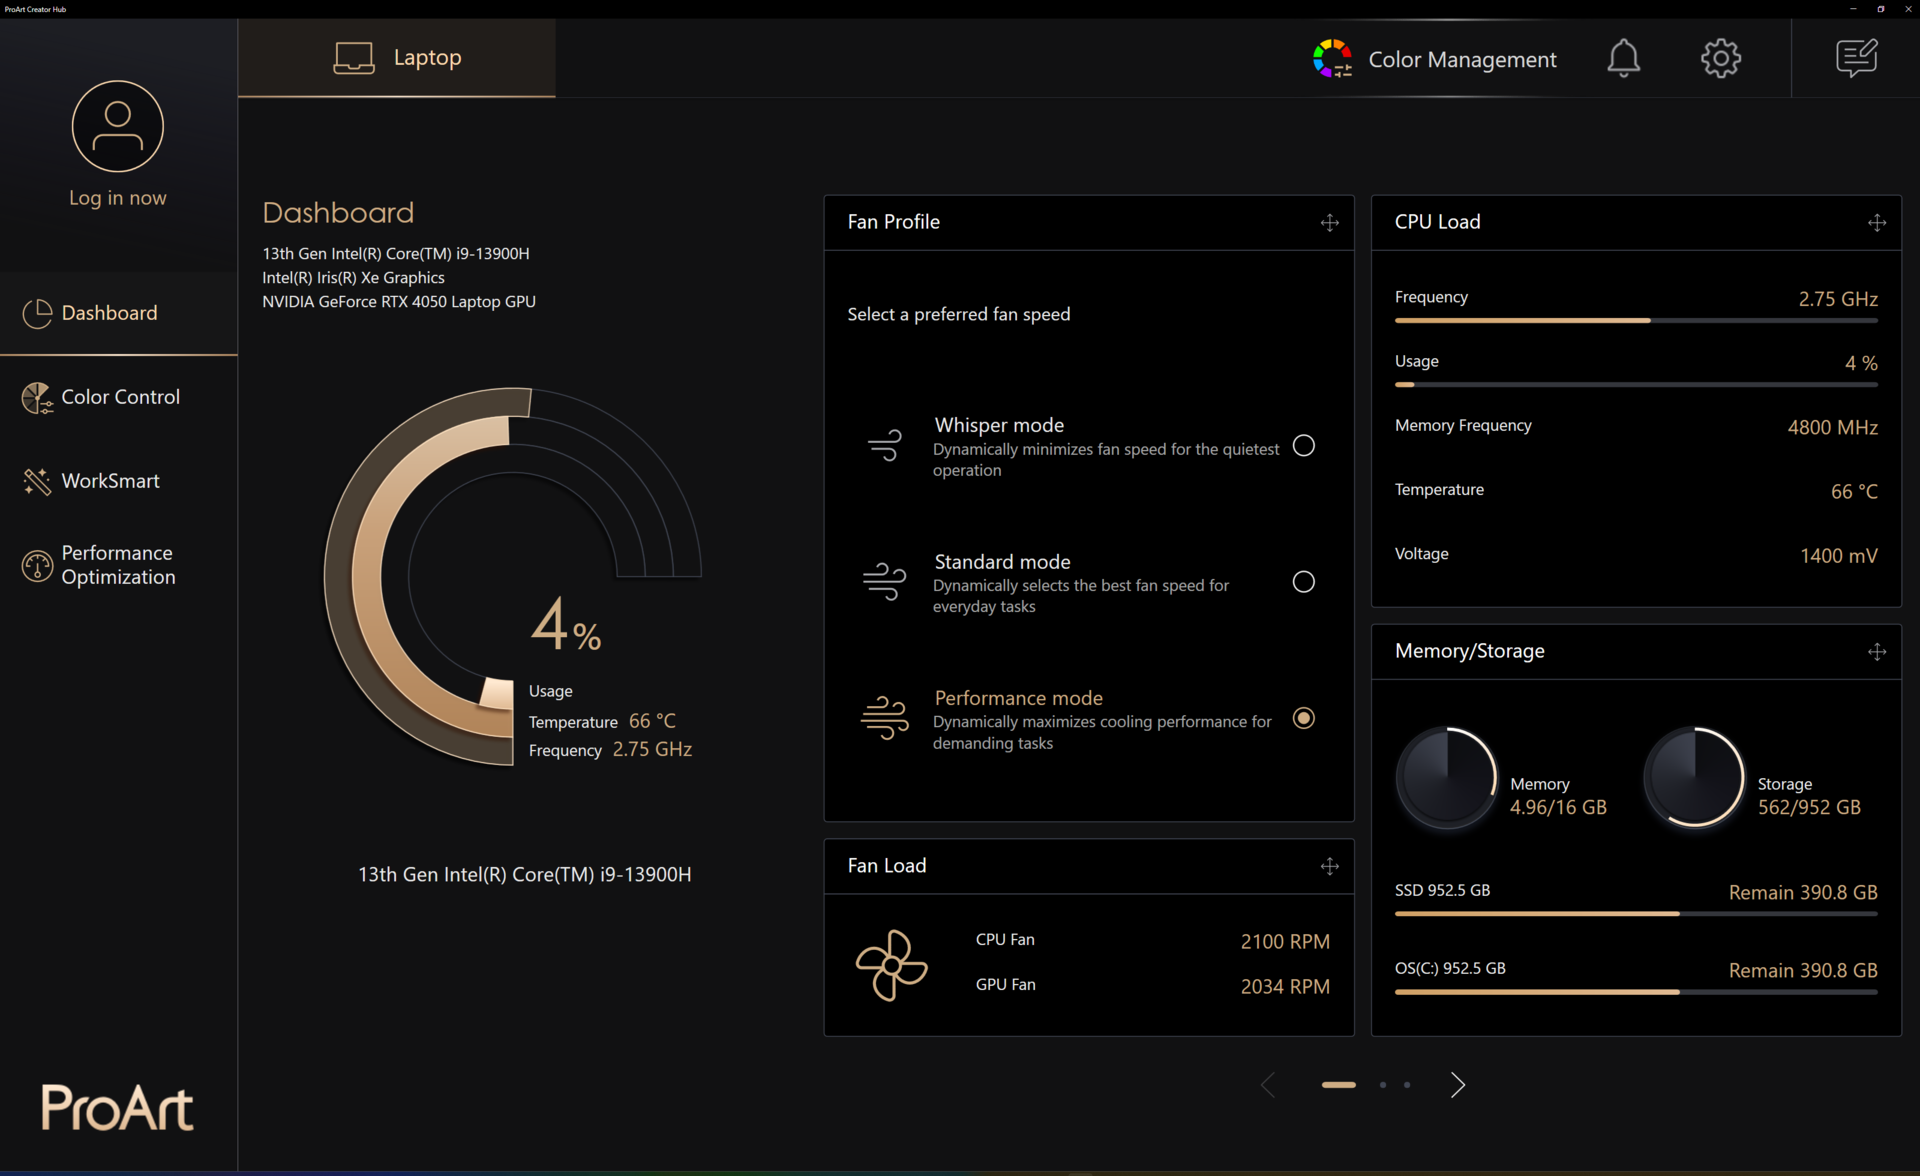
Performance settings are repeated in both MyAsus and the ProArt Creator Hub apps. We used the Performance mode with the MUX switched to the discrete RTX 4050 GPU for all benchmarks. Battery tests were run in the Whisper setting in MSHybrid mode.
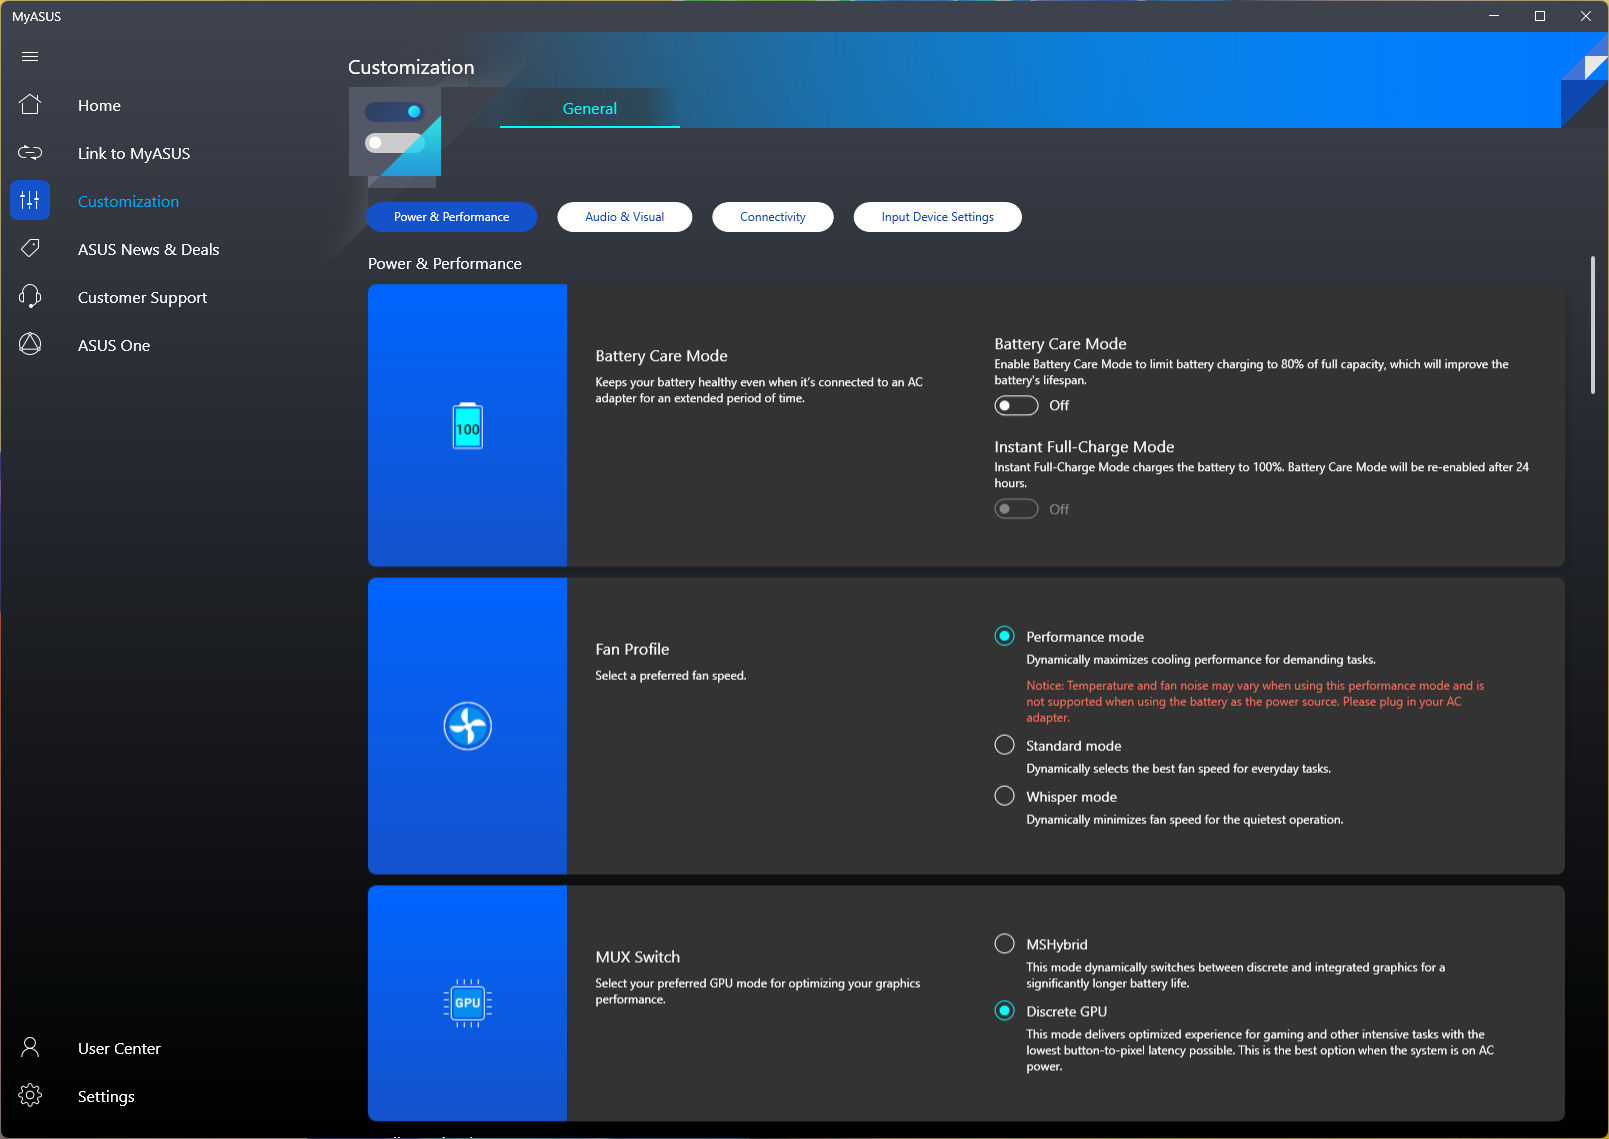
Power limits are the same in both Standard and Performance modes. However, the latter allows for better sustained performance owing to better cooling.
| Performance mode | PL1 (PBP) / Tau | PL2 (MTP) / Tau | Cinebench R15 Multi score | Cinebench R15 Multi score (30 loops) |
|---|---|---|---|---|
| Whisper | 25 W / 56 s | 115 W / 2.44 ms | 1584 (-36%) | 766 (-63%) |
| Standard | 50 W / 56 s | 115 W / 2.44 ms | 2445 (-1.1%) | 1748 (-16%) |
| Performance | 50 W / 56 s | 115 W / 2.44 ms | 2473 (100%) | 2084 (100%) |
Processor
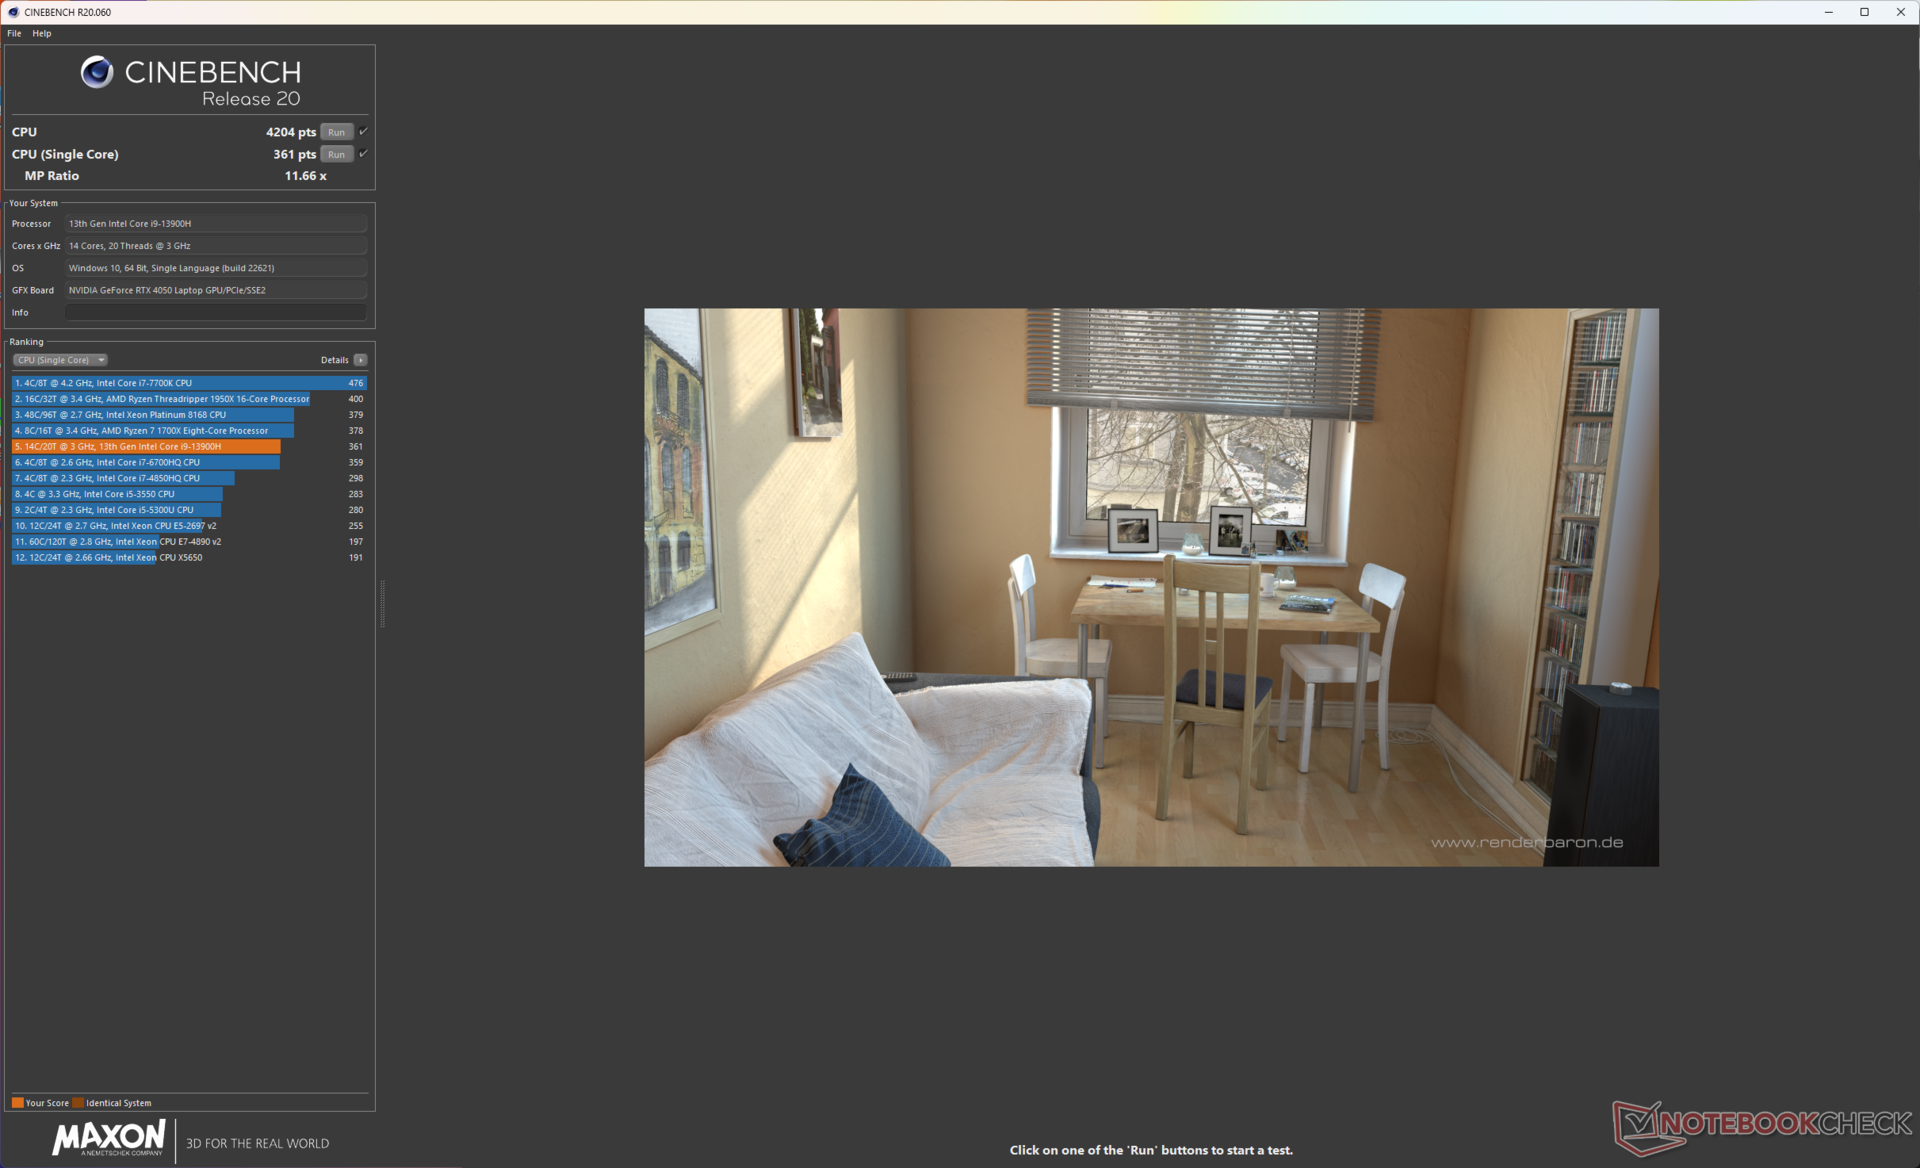
The Intel Core i9-13900H is a 14-core 20-thread processor with six P-cores, eight E-cores, and a maximum single-core boost of 5.4 GHz. This is not the fastest Core i9-13900H we've seen, though.
Overall CPU performance is just a tad better than the last gen VivoBook Pro 16's Core i7-12700H, trailing even the Ryzen 5 7645HX in the Lenovo Legion Pro 5 by 6%. The limited power budget in our test device hinders the Core i9-13900H's performance versus laptops such as the Gigabyte Aero 16 OLED and the Asus ROG Flow X16 with the same processor.
The performance is no match for the Core i9-13980HX found in the VivoBook Pro 16X, which leads by a massive 46% margin cumulatively.
That being said, the VivoBook Pro 16's cooling seems to be doing a good job as evident from the fairly consistent Cinebench R15 multi-core loop graph.
Cinebench R15 Multi Loop
Cinebench R23: Multi Core | Single Core
Cinebench R20: CPU (Multi Core) | CPU (Single Core)
Cinebench R15: CPU Multi 64Bit | CPU Single 64Bit
Blender: v2.79 BMW27 CPU
7-Zip 18.03: 7z b 4 | 7z b 4 -mmt1
Geekbench 5.5: Multi-Core | Single-Core
HWBOT x265 Benchmark v2.2: 4k Preset
LibreOffice : 20 Documents To PDF
R Benchmark 2.5: Overall mean
| CPU Performance rating | |
| Asus Vivobook Pro 16X K6604JV-MX016W | |
| Asus ROG Flow X16 GV601V | |
| Asus TUF Gaming A16 FA617XS | |
| Average Intel Core i9-13900H | |
| Gigabyte AERO 16 OLED BSF | |
| Average of class Multimedia | |
| Lenovo Legion Pro 5 16ARX8 (R5 7645HX, RTX 4050) | |
| Asus VivoBook Pro 16 K6602VU | |
| Asus VivoBook Pro 16 | |
| Cinebench R23 / Multi Core | |
| Asus Vivobook Pro 16X K6604JV-MX016W | |
| Asus ROG Flow X16 GV601V | |
| Gigabyte AERO 16 OLED BSF | |
| Asus TUF Gaming A16 FA617XS | |
| Average Intel Core i9-13900H (11997 - 20385, n=28) | |
| Average of class Multimedia (4861 - 33362, n=65, last 2 years) | |
| Asus VivoBook Pro 16 K6602VU | |
| Asus VivoBook Pro 16 | |
| Lenovo Legion Pro 5 16ARX8 (R5 7645HX, RTX 4050) | |
| Cinebench R23 / Single Core | |
| Asus ROG Flow X16 GV601V | |
| Average of class Multimedia (1128 - 2459, n=64, last 2 years) | |
| Average Intel Core i9-13900H (1297 - 2054, n=26) | |
| Asus Vivobook Pro 16X K6604JV-MX016W | |
| Lenovo Legion Pro 5 16ARX8 (R5 7645HX, RTX 4050) | |
| Asus TUF Gaming A16 FA617XS | |
| Asus VivoBook Pro 16 K6602VU | |
| Asus VivoBook Pro 16 | |
| Gigabyte AERO 16 OLED BSF | |
| Cinebench R20 / CPU (Multi Core) | |
| Asus Vivobook Pro 16X K6604JV-MX016W | |
| Asus ROG Flow X16 GV601V | |
| Gigabyte AERO 16 OLED BSF | |
| Asus TUF Gaming A16 FA617XS | |
| Average Intel Core i9-13900H (4935 - 7716, n=25) | |
| Average of class Multimedia (1887 - 12912, n=56, last 2 years) | |
| Asus VivoBook Pro 16 K6602VU | |
| Asus VivoBook Pro 16 | |
| Lenovo Legion Pro 5 16ARX8 (R5 7645HX, RTX 4050) | |
| Cinebench R20 / CPU (Single Core) | |
| Asus ROG Flow X16 GV601V | |
| Average of class Multimedia (425 - 853, n=56, last 2 years) | |
| Average Intel Core i9-13900H (428 - 792, n=25) | |
| Asus Vivobook Pro 16X K6604JV-MX016W | |
| Asus TUF Gaming A16 FA617XS | |
| Lenovo Legion Pro 5 16ARX8 (R5 7645HX, RTX 4050) | |
| Asus VivoBook Pro 16 K6602VU | |
| Asus VivoBook Pro 16 | |
| Gigabyte AERO 16 OLED BSF | |
| Cinebench R15 / CPU Multi 64Bit | |
| Asus Vivobook Pro 16X K6604JV-MX016W | |
| Asus ROG Flow X16 GV601V | |
| Gigabyte AERO 16 OLED BSF | |
| Average Intel Core i9-13900H (2061 - 3100, n=26) | |
| Asus TUF Gaming A16 FA617XS | |
| Average of class Multimedia (856 - 5224, n=60, last 2 years) | |
| Asus VivoBook Pro 16 K6602VU | |
| Asus VivoBook Pro 16 | |
| Lenovo Legion Pro 5 16ARX8 (R5 7645HX, RTX 4050) | |
| Cinebench R15 / CPU Single 64Bit | |
| Lenovo Legion Pro 5 16ARX8 (R5 7645HX, RTX 4050) | |
| Asus Vivobook Pro 16X K6604JV-MX016W | |
| Asus ROG Flow X16 GV601V | |
| Asus TUF Gaming A16 FA617XS | |
| Average of class Multimedia (184.8 - 326, n=58, last 2 years) | |
| Average Intel Core i9-13900H (211 - 297, n=26) | |
| Asus VivoBook Pro 16 | |
| Asus VivoBook Pro 16 K6602VU | |
| Gigabyte AERO 16 OLED BSF | |
| Blender / v2.79 BMW27 CPU | |
| Average of class Multimedia (100 - 557, n=57, last 2 years) | |
| Asus VivoBook Pro 16 | |
| Lenovo Legion Pro 5 16ARX8 (R5 7645HX, RTX 4050) | |
| Asus VivoBook Pro 16 K6602VU | |
| Average Intel Core i9-13900H (166 - 268, n=24) | |
| Asus TUF Gaming A16 FA617XS | |
| Asus ROG Flow X16 GV601V | |
| Gigabyte AERO 16 OLED BSF | |
| Asus Vivobook Pro 16X K6604JV-MX016W | |
| 7-Zip 18.03 / 7z b 4 | |
| Asus Vivobook Pro 16X K6604JV-MX016W | |
| Gigabyte AERO 16 OLED BSF | |
| Asus ROG Flow X16 GV601V | |
| Asus TUF Gaming A16 FA617XS | |
| Average Intel Core i9-13900H (45045 - 79032, n=25) | |
| Asus VivoBook Pro 16 K6602VU | |
| Lenovo Legion Pro 5 16ARX8 (R5 7645HX, RTX 4050) | |
| Average of class Multimedia (26062 - 130368, n=54, last 2 years) | |
| Asus VivoBook Pro 16 | |
| 7-Zip 18.03 / 7z b 4 -mmt1 | |
| Lenovo Legion Pro 5 16ARX8 (R5 7645HX, RTX 4050) | |
| Asus Vivobook Pro 16X K6604JV-MX016W | |
| Asus TUF Gaming A16 FA617XS | |
| Asus ROG Flow X16 GV601V | |
| Average Intel Core i9-13900H (3665 - 6600, n=25) | |
| Average of class Multimedia (3666 - 7545, n=55, last 2 years) | |
| Asus VivoBook Pro 16 K6602VU | |
| Asus VivoBook Pro 16 | |
| Gigabyte AERO 16 OLED BSF | |
| Geekbench 5.5 / Multi-Core | |
| Asus Vivobook Pro 16X K6604JV-MX016W | |
| Asus ROG Flow X16 GV601V | |
| Gigabyte AERO 16 OLED BSF | |
| Average of class Multimedia (4652 - 20422, n=55, last 2 years) | |
| Average Intel Core i9-13900H (9094 - 15410, n=26) | |
| Asus TUF Gaming A16 FA617XS | |
| Asus VivoBook Pro 16 K6602VU | |
| Lenovo Legion Pro 5 16ARX8 (R5 7645HX, RTX 4050) | |
| Asus VivoBook Pro 16 | |
| Geekbench 5.5 / Single-Core | |
| Asus TUF Gaming A16 FA617XS | |
| Asus Vivobook Pro 16X K6604JV-MX016W | |
| Asus ROG Flow X16 GV601V | |
| Lenovo Legion Pro 5 16ARX8 (R5 7645HX, RTX 4050) | |
| Average of class Multimedia (805 - 2974, n=55, last 2 years) | |
| Average Intel Core i9-13900H (1140 - 2043, n=26) | |
| Asus VivoBook Pro 16 K6602VU | |
| Gigabyte AERO 16 OLED BSF | |
| Asus VivoBook Pro 16 | |
| HWBOT x265 Benchmark v2.2 / 4k Preset | |
| Asus Vivobook Pro 16X K6604JV-MX016W | |
| Asus ROG Flow X16 GV601V | |
| Gigabyte AERO 16 OLED BSF | |
| Asus TUF Gaming A16 FA617XS | |
| Lenovo Legion Pro 5 16ARX8 (R5 7645HX, RTX 4050) | |
| Average Intel Core i9-13900H (14.1 - 22.3, n=25) | |
| Average of class Multimedia (5.26 - 36.1, n=55, last 2 years) | |
| Asus VivoBook Pro 16 K6602VU | |
| Asus VivoBook Pro 16 | |
| LibreOffice / 20 Documents To PDF | |
| Gigabyte AERO 16 OLED BSF | |
| Asus VivoBook Pro 16 K6602VU | |
| Lenovo Legion Pro 5 16ARX8 (R5 7645HX, RTX 4050) | |
| Asus Vivobook Pro 16X K6604JV-MX016W | |
| Average of class Multimedia (23.9 - 146.7, n=56, last 2 years) | |
| Average Intel Core i9-13900H (34.4 - 82.8, n=25) | |
| Asus VivoBook Pro 16 | |
| Asus TUF Gaming A16 FA617XS | |
| Asus ROG Flow X16 GV601V | |
| R Benchmark 2.5 / Overall mean | |
| Gigabyte AERO 16 OLED BSF | |
| Asus VivoBook Pro 16 | |
| Asus VivoBook Pro 16 K6602VU | |
| Average of class Multimedia (0.3604 - 0.947, n=55, last 2 years) | |
| Average Intel Core i9-13900H (0.4052 - 0.723, n=25) | |
| Lenovo Legion Pro 5 16ARX8 (R5 7645HX, RTX 4050) | |
| Asus TUF Gaming A16 FA617XS | |
| Asus ROG Flow X16 GV601V | |
| Asus Vivobook Pro 16X K6604JV-MX016W | |
* ... smaller is better
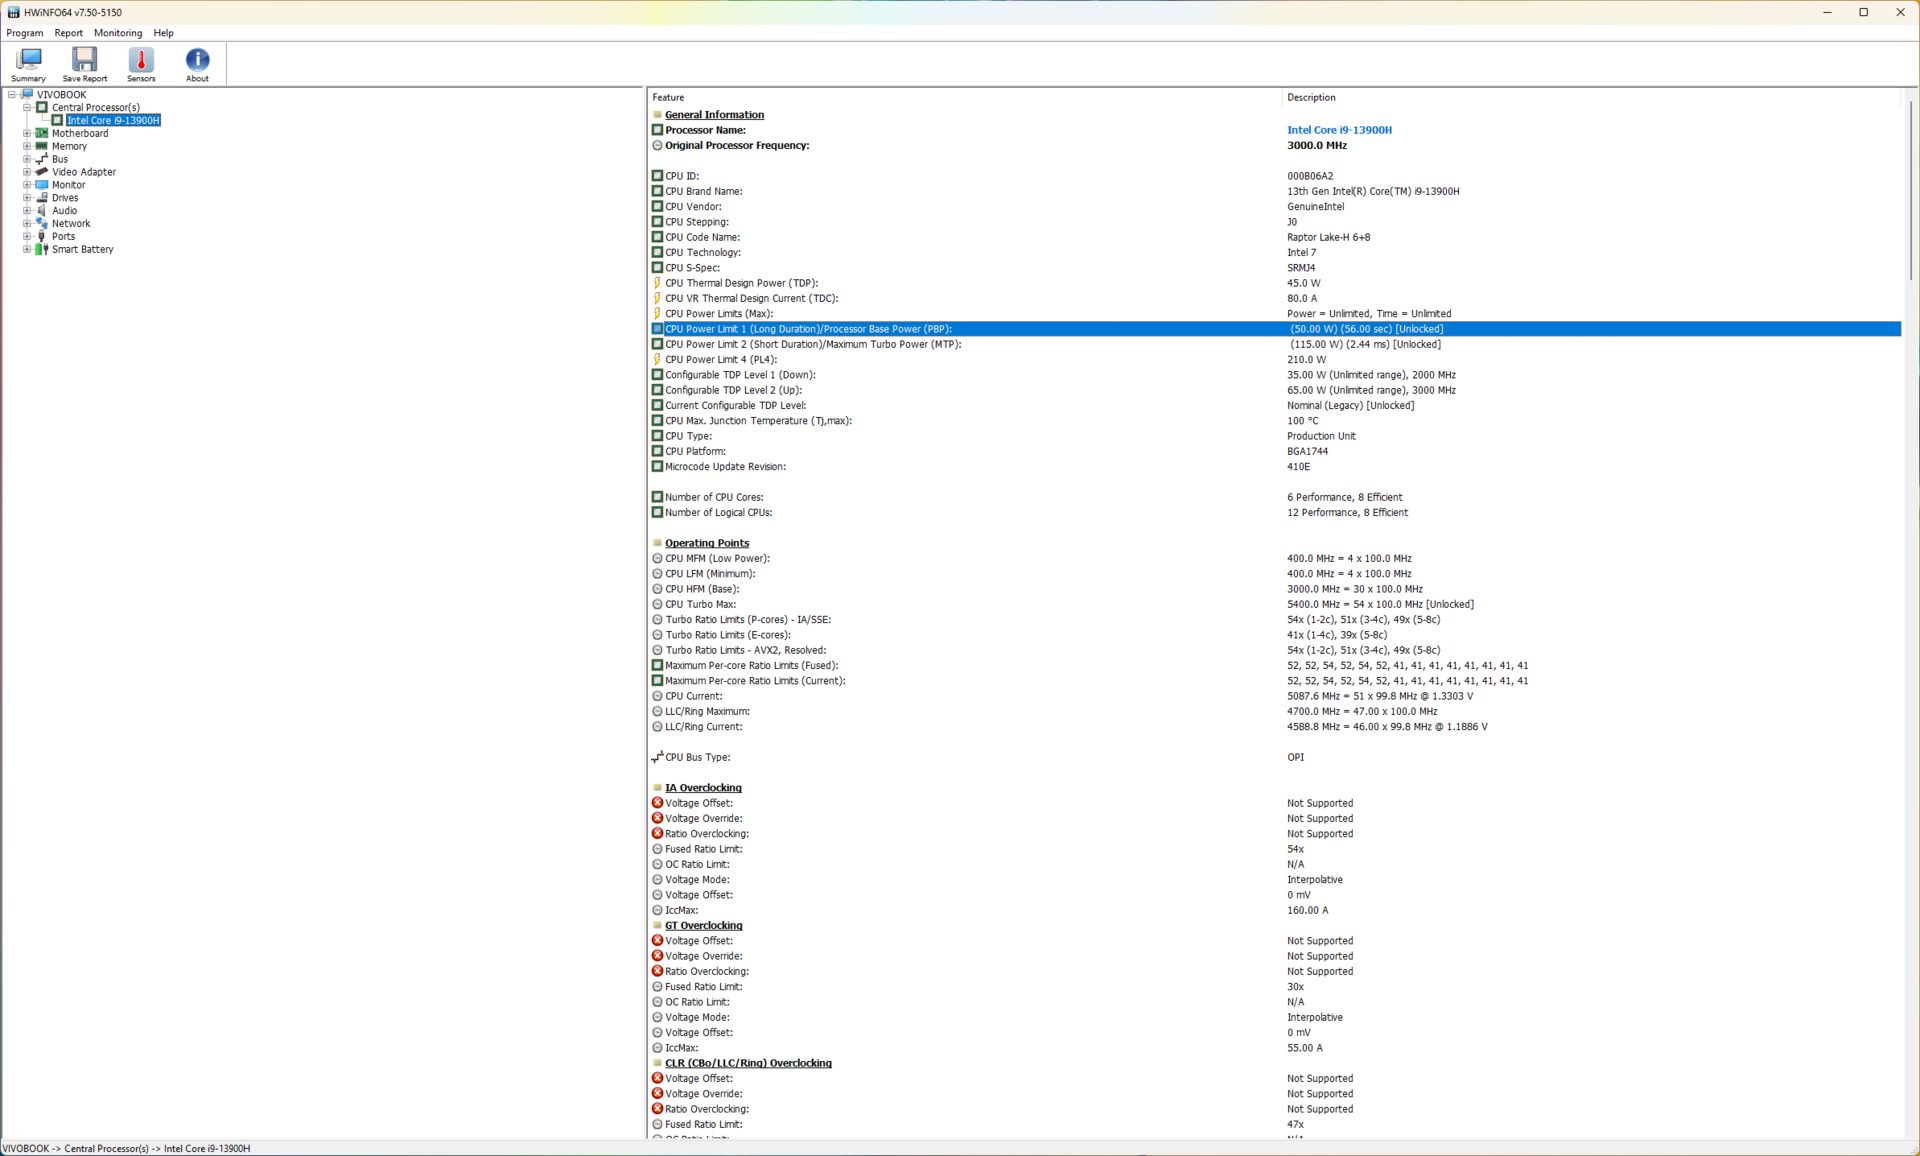
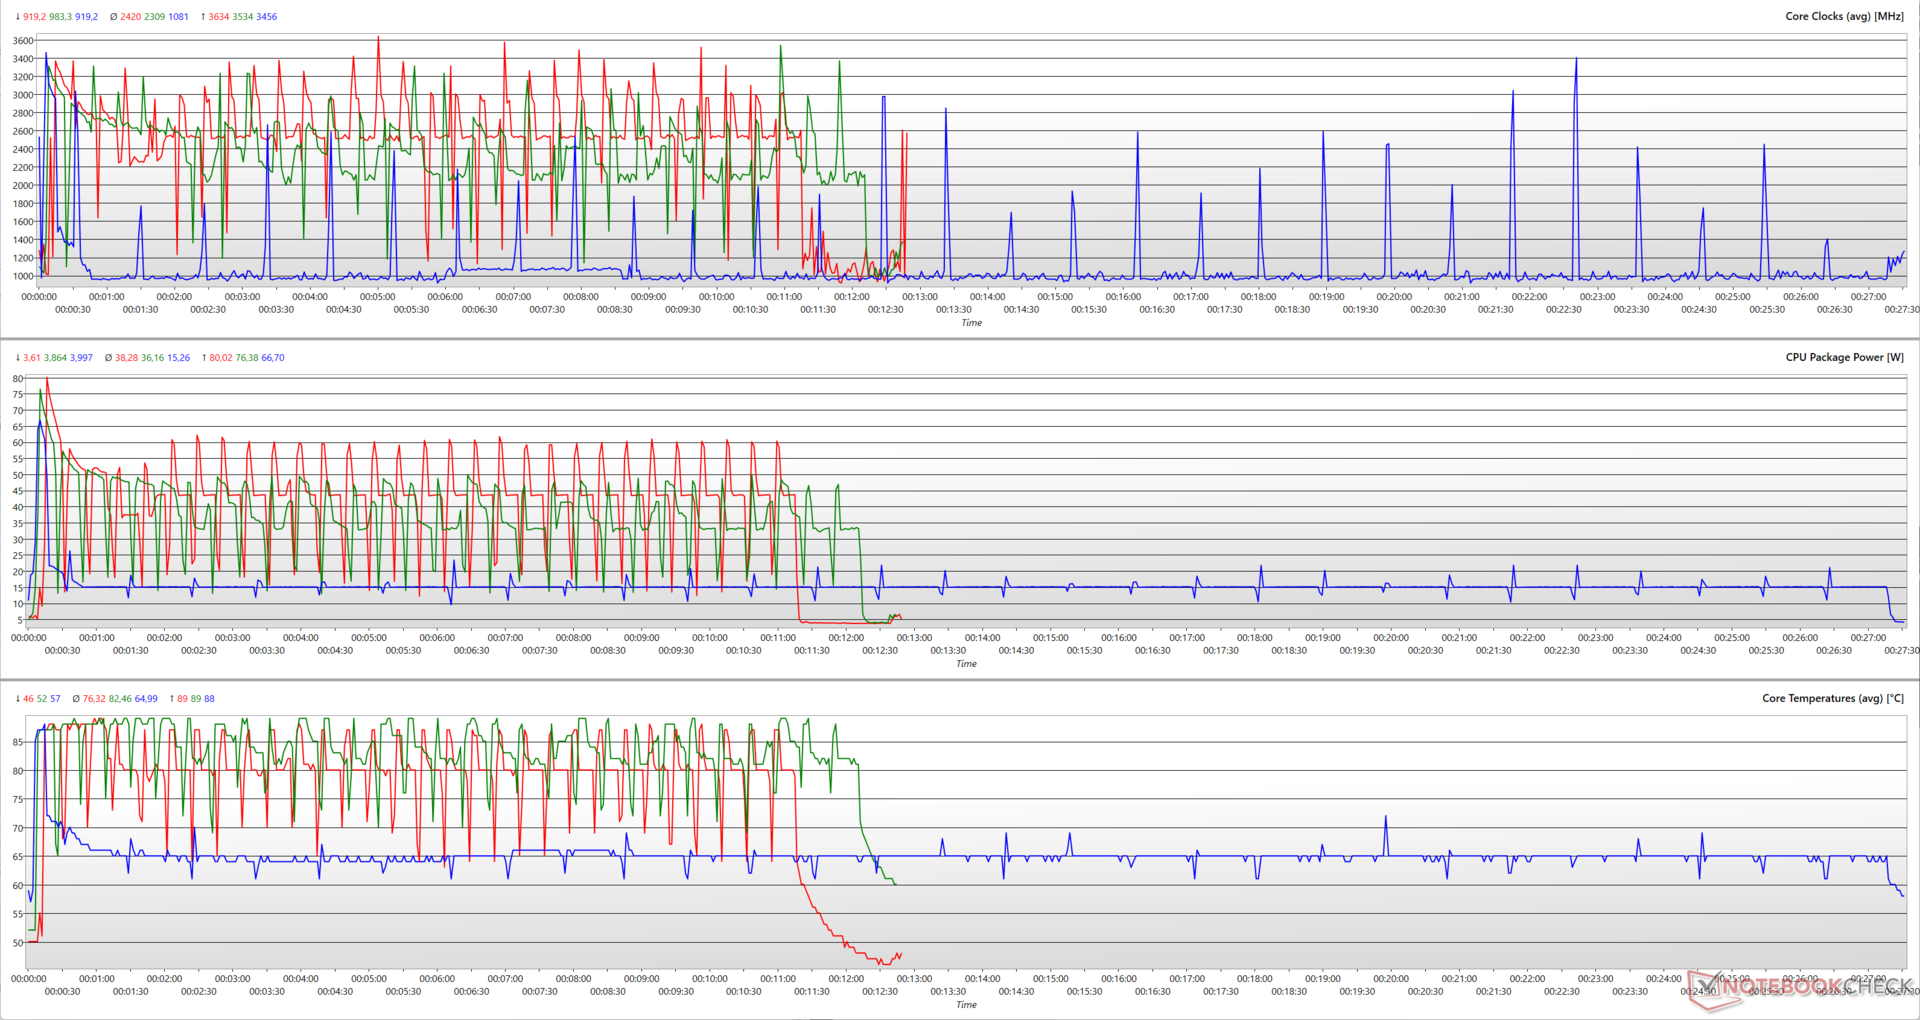
Cinebench R15 multi-core testing sees the VivoBook Pro 16 struggling to fully utilize the Core i9-13900H's 115 W power limit, even in Performance mode. We recorded a peak CPU package power of just 80 W in Performance, with max boost clocks reaching only 3.6 GHz.
The Standard mode is slightly more conservative with a 76 W peak package power and 3.5 GHz boost clocks.
In Whisper, the VivoBook Pro 16 hits a 66.7 W maximum but coasts at an average CPU package power of just about 15 W. This results in maximum clocks of 3.45 GHz that average out at just about 1 GHz during the run.
Performance is further limited on battery, with Cinebench R20 scores dropping by 46.3% in single-core and by 27% in multi-core versus AC power.
AIDA64: FP32 Ray-Trace | FPU Julia | CPU SHA3 | CPU Queen | FPU SinJulia | FPU Mandel | CPU AES | CPU ZLib | FP64 Ray-Trace | CPU PhotoWorxx
| Performance rating | |
| Asus TUF Gaming A16 FA617XS | |
| Asus Vivobook Pro 16X K6604JV-MX016W | |
| Gigabyte AERO 16 OLED BSF | |
| Asus ROG Flow X16 GV601V | |
| Lenovo Legion Pro 5 16ARX8 (R5 7645HX, RTX 4050) | |
| Average of class Multimedia | |
| Average Intel Core i9-13900H | |
| Asus VivoBook Pro 16 K6602VU | |
| Asus VivoBook Pro 16 | |
| AIDA64 / FP32 Ray-Trace | |
| Asus TUF Gaming A16 FA617XS | |
| Lenovo Legion Pro 5 16ARX8 (R5 7645HX, RTX 4050) | |
| Asus Vivobook Pro 16X K6604JV-MX016W | |
| Gigabyte AERO 16 OLED BSF | |
| Average of class Multimedia (2214 - 50388, n=53, last 2 years) | |
| Average Intel Core i9-13900H (6788 - 19557, n=25) | |
| Asus VivoBook Pro 16 | |
| Asus VivoBook Pro 16 K6602VU | |
| Asus ROG Flow X16 GV601V | |
| AIDA64 / FPU Julia | |
| Asus TUF Gaming A16 FA617XS | |
| Asus Vivobook Pro 16X K6604JV-MX016W | |
| Lenovo Legion Pro 5 16ARX8 (R5 7645HX, RTX 4050) | |
| Gigabyte AERO 16 OLED BSF | |
| Asus ROG Flow X16 GV601V | |
| Average of class Multimedia (12867 - 201874, n=53, last 2 years) | |
| Average Intel Core i9-13900H (22551 - 95579, n=25) | |
| Asus VivoBook Pro 16 | |
| Asus VivoBook Pro 16 K6602VU | |
| AIDA64 / CPU SHA3 | |
| Asus Vivobook Pro 16X K6604JV-MX016W | |
| Asus TUF Gaming A16 FA617XS | |
| Asus ROG Flow X16 GV601V | |
| Gigabyte AERO 16 OLED BSF | |
| Average of class Multimedia (626 - 8623, n=53, last 2 years) | |
| Lenovo Legion Pro 5 16ARX8 (R5 7645HX, RTX 4050) | |
| Average Intel Core i9-13900H (2491 - 4270, n=25) | |
| Asus VivoBook Pro 16 | |
| Asus VivoBook Pro 16 K6602VU | |
| AIDA64 / CPU Queen | |
| Asus Vivobook Pro 16X K6604JV-MX016W | |
| Asus TUF Gaming A16 FA617XS | |
| Asus ROG Flow X16 GV601V | |
| Average Intel Core i9-13900H (65121 - 120936, n=25) | |
| Asus VivoBook Pro 16 | |
| Lenovo Legion Pro 5 16ARX8 (R5 7645HX, RTX 4050) | |
| Gigabyte AERO 16 OLED BSF | |
| Asus VivoBook Pro 16 K6602VU | |
| Average of class Multimedia (13483 - 181505, n=40, last 2 years) | |
| AIDA64 / FPU SinJulia | |
| Asus TUF Gaming A16 FA617XS | |
| Asus Vivobook Pro 16X K6604JV-MX016W | |
| Lenovo Legion Pro 5 16ARX8 (R5 7645HX, RTX 4050) | |
| Asus ROG Flow X16 GV601V | |
| Gigabyte AERO 16 OLED BSF | |
| Average Intel Core i9-13900H (6108 - 11631, n=25) | |
| Asus VivoBook Pro 16 | |
| Asus VivoBook Pro 16 K6602VU | |
| Average of class Multimedia (886 - 28794, n=53, last 2 years) | |
| AIDA64 / FPU Mandel | |
| Asus TUF Gaming A16 FA617XS | |
| Asus Vivobook Pro 16X K6604JV-MX016W | |
| Lenovo Legion Pro 5 16ARX8 (R5 7645HX, RTX 4050) | |
| Gigabyte AERO 16 OLED BSF | |
| Asus ROG Flow X16 GV601V | |
| Average of class Multimedia (6395 - 105740, n=53, last 2 years) | |
| Average Intel Core i9-13900H (11283 - 48474, n=25) | |
| Asus VivoBook Pro 16 | |
| Asus VivoBook Pro 16 K6602VU | |
| AIDA64 / CPU AES | |
| Gigabyte AERO 16 OLED BSF | |
| Asus VivoBook Pro 16 K6602VU | |
| Asus Vivobook Pro 16X K6604JV-MX016W | |
| Average Intel Core i9-13900H (3691 - 149377, n=25) | |
| Asus TUF Gaming A16 FA617XS | |
| Asus ROG Flow X16 GV601V | |
| Asus VivoBook Pro 16 | |
| Average of class Multimedia (8171 - 126790, n=53, last 2 years) | |
| Lenovo Legion Pro 5 16ARX8 (R5 7645HX, RTX 4050) | |
| AIDA64 / CPU ZLib | |
| Asus Vivobook Pro 16X K6604JV-MX016W | |
| Asus ROG Flow X16 GV601V | |
| Gigabyte AERO 16 OLED BSF | |
| Asus TUF Gaming A16 FA617XS | |
| Average Intel Core i9-13900H (789 - 1254, n=25) | |
| Asus VivoBook Pro 16 K6602VU | |
| Average of class Multimedia (143.8 - 2022, n=53, last 2 years) | |
| Asus VivoBook Pro 16 | |
| Lenovo Legion Pro 5 16ARX8 (R5 7645HX, RTX 4050) | |
| AIDA64 / FP64 Ray-Trace | |
| Asus TUF Gaming A16 FA617XS | |
| Lenovo Legion Pro 5 16ARX8 (R5 7645HX, RTX 4050) | |
| Asus Vivobook Pro 16X K6604JV-MX016W | |
| Gigabyte AERO 16 OLED BSF | |
| Asus ROG Flow X16 GV601V | |
| Average of class Multimedia (1014 - 26875, n=53, last 2 years) | |
| Average Intel Core i9-13900H (3655 - 10716, n=25) | |
| Asus VivoBook Pro 16 | |
| Asus VivoBook Pro 16 K6602VU | |
| AIDA64 / CPU PhotoWorxx | |
| Average of class Multimedia (8187 - 88154, n=53, last 2 years) | |
| Gigabyte AERO 16 OLED BSF | |
| Asus Vivobook Pro 16X K6604JV-MX016W | |
| Average Intel Core i9-13900H (10871 - 50488, n=25) | |
| Asus VivoBook Pro 16 K6602VU | |
| Asus ROG Flow X16 GV601V | |
| Asus TUF Gaming A16 FA617XS | |
| Lenovo Legion Pro 5 16ARX8 (R5 7645HX, RTX 4050) | |
| Asus VivoBook Pro 16 | |
Our dedicated Intel Core i9-13900H page offers more information and benchmark comparisons.
System Performance
A similar trend is seen in PCMark 10 and CrossMark tests as well. The Core i9-13980HX-powered VivoBook Pro 16X virtually ties with our test model in overall PCMark 10 scores while achieving a 19% in combined CrossMark tests.
That being said, we did not find anything concerning in day-to-day usage for the usual productivity, multimedia, or web browsing tasks.
CrossMark: Overall | Productivity | Creativity | Responsiveness
AIDA64: Memory Copy | Memory Read | Memory Write | Memory Latency
| PCMark 10 / Score | |
| Lenovo Legion Pro 5 16ARX8 (R5 7645HX, RTX 4050) | |
| Gigabyte AERO 16 OLED BSF | |
| Asus TUF Gaming A16 FA617XS | |
| Asus ROG Flow X16 GV601V | |
| Average of class Multimedia (4325 - 10386, n=51, last 2 years) | |
| Asus VivoBook Pro 16 K6602VU | |
| Average Intel Core i9-13900H, NVIDIA GeForce RTX 4050 Laptop GPU (n=1) | |
| Asus Vivobook Pro 16X K6604JV-MX016W | |
| Asus VivoBook Pro 16 | |
| PCMark 10 / Essentials | |
| Lenovo Legion Pro 5 16ARX8 (R5 7645HX, RTX 4050) | |
| Asus ROG Flow X16 GV601V | |
| Gigabyte AERO 16 OLED BSF | |
| Asus TUF Gaming A16 FA617XS | |
| Asus Vivobook Pro 16X K6604JV-MX016W | |
| Average of class Multimedia (8025 - 11664, n=50, last 2 years) | |
| Asus VivoBook Pro 16 K6602VU | |
| Average Intel Core i9-13900H, NVIDIA GeForce RTX 4050 Laptop GPU (n=1) | |
| Asus VivoBook Pro 16 | |
| PCMark 10 / Productivity | |
| Average of class Multimedia (7323 - 18233, n=50, last 2 years) | |
| Lenovo Legion Pro 5 16ARX8 (R5 7645HX, RTX 4050) | |
| Asus TUF Gaming A16 FA617XS | |
| Asus ROG Flow X16 GV601V | |
| Gigabyte AERO 16 OLED BSF | |
| Asus Vivobook Pro 16X K6604JV-MX016W | |
| Asus VivoBook Pro 16 | |
| Asus VivoBook Pro 16 K6602VU | |
| Average Intel Core i9-13900H, NVIDIA GeForce RTX 4050 Laptop GPU (n=1) | |
| PCMark 10 / Digital Content Creation | |
| Gigabyte AERO 16 OLED BSF | |
| Asus TUF Gaming A16 FA617XS | |
| Asus ROG Flow X16 GV601V | |
| Lenovo Legion Pro 5 16ARX8 (R5 7645HX, RTX 4050) | |
| Asus VivoBook Pro 16 K6602VU | |
| Average Intel Core i9-13900H, NVIDIA GeForce RTX 4050 Laptop GPU (n=1) | |
| Average of class Multimedia (3651 - 16240, n=50, last 2 years) | |
| Asus Vivobook Pro 16X K6604JV-MX016W | |
| Asus VivoBook Pro 16 | |
| CrossMark / Overall | |
| Asus Vivobook Pro 16X K6604JV-MX016W | |
| Asus ROG Flow X16 GV601V | |
| Lenovo Legion Pro 5 16ARX8 (R5 7645HX, RTX 4050) | |
| Gigabyte AERO 16 OLED BSF | |
| Average of class Multimedia (866 - 2728, n=59, last 2 years) | |
| Asus TUF Gaming A16 FA617XS | |
| Asus VivoBook Pro 16 K6602VU | |
| Average Intel Core i9-13900H, NVIDIA GeForce RTX 4050 Laptop GPU (n=1) | |
| Asus VivoBook Pro 16 | |
| CrossMark / Productivity | |
| Asus Vivobook Pro 16X K6604JV-MX016W | |
| Lenovo Legion Pro 5 16ARX8 (R5 7645HX, RTX 4050) | |
| Asus ROG Flow X16 GV601V | |
| Gigabyte AERO 16 OLED BSF | |
| Average of class Multimedia (931 - 2489, n=59, last 2 years) | |
| Asus TUF Gaming A16 FA617XS | |
| Asus VivoBook Pro 16 | |
| Asus VivoBook Pro 16 K6602VU | |
| Average Intel Core i9-13900H, NVIDIA GeForce RTX 4050 Laptop GPU (n=1) | |
| CrossMark / Creativity | |
| Asus Vivobook Pro 16X K6604JV-MX016W | |
| Asus ROG Flow X16 GV601V | |
| Average of class Multimedia (907 - 3465, n=59, last 2 years) | |
| Lenovo Legion Pro 5 16ARX8 (R5 7645HX, RTX 4050) | |
| Asus TUF Gaming A16 FA617XS | |
| Gigabyte AERO 16 OLED BSF | |
| Asus VivoBook Pro 16 K6602VU | |
| Average Intel Core i9-13900H, NVIDIA GeForce RTX 4050 Laptop GPU (n=1) | |
| Asus VivoBook Pro 16 | |
| CrossMark / Responsiveness | |
| Gigabyte AERO 16 OLED BSF | |
| Lenovo Legion Pro 5 16ARX8 (R5 7645HX, RTX 4050) | |
| Asus ROG Flow X16 GV601V | |
| Asus VivoBook Pro 16 | |
| Asus Vivobook Pro 16X K6604JV-MX016W | |
| Average of class Multimedia (605 - 2024, n=59, last 2 years) | |
| Asus VivoBook Pro 16 K6602VU | |
| Average Intel Core i9-13900H, NVIDIA GeForce RTX 4050 Laptop GPU (n=1) | |
| Asus TUF Gaming A16 FA617XS | |
| AIDA64 / Memory Copy | |
| Average of class Multimedia (11299 - 132135, n=53, last 2 years) | |
| Asus Vivobook Pro 16X K6604JV-MX016W | |
| Gigabyte AERO 16 OLED BSF | |
| Asus ROG Flow X16 GV601V | |
| Asus TUF Gaming A16 FA617XS | |
| Asus VivoBook Pro 16 K6602VU | |
| Average Intel Core i9-13900H, NVIDIA GeForce RTX 4050 Laptop GPU (n=1) | |
| Lenovo Legion Pro 5 16ARX8 (R5 7645HX, RTX 4050) | |
| Asus VivoBook Pro 16 | |
| AIDA64 / Memory Read | |
| Average of class Multimedia (11624 - 174586, n=53, last 2 years) | |
| Asus Vivobook Pro 16X K6604JV-MX016W | |
| Gigabyte AERO 16 OLED BSF | |
| Asus ROG Flow X16 GV601V | |
| Asus VivoBook Pro 16 K6602VU | |
| Average Intel Core i9-13900H, NVIDIA GeForce RTX 4050 Laptop GPU (n=1) | |
| Asus TUF Gaming A16 FA617XS | |
| Lenovo Legion Pro 5 16ARX8 (R5 7645HX, RTX 4050) | |
| Asus VivoBook Pro 16 | |
| AIDA64 / Memory Write | |
| Average of class Multimedia (11755 - 134998, n=53, last 2 years) | |
| Asus TUF Gaming A16 FA617XS | |
| Gigabyte AERO 16 OLED BSF | |
| Asus Vivobook Pro 16X K6604JV-MX016W | |
| Asus ROG Flow X16 GV601V | |
| Asus VivoBook Pro 16 K6602VU | |
| Average Intel Core i9-13900H, NVIDIA GeForce RTX 4050 Laptop GPU (n=1) | |
| Lenovo Legion Pro 5 16ARX8 (R5 7645HX, RTX 4050) | |
| Asus VivoBook Pro 16 | |
| AIDA64 / Memory Latency | |
| Average of class Multimedia (7 - 535, n=52, last 2 years) | |
| Gigabyte AERO 16 OLED BSF | |
| Asus VivoBook Pro 16 K6602VU | |
| Average Intel Core i9-13900H, NVIDIA GeForce RTX 4050 Laptop GPU (n=1) | |
| Asus ROG Flow X16 GV601V | |
| Asus VivoBook Pro 16 | |
| Asus TUF Gaming A16 FA617XS | |
| Asus Vivobook Pro 16X K6604JV-MX016W | |
| Lenovo Legion Pro 5 16ARX8 (R5 7645HX, RTX 4050) | |
* ... smaller is better
| PCMark 8 Home Score Accelerated v2 | 4484 points | |
| PCMark 8 Work Score Accelerated v2 | 5200 points | |
| PCMark 10 Score | 7054 points | |
Help | ||
DPC Latency
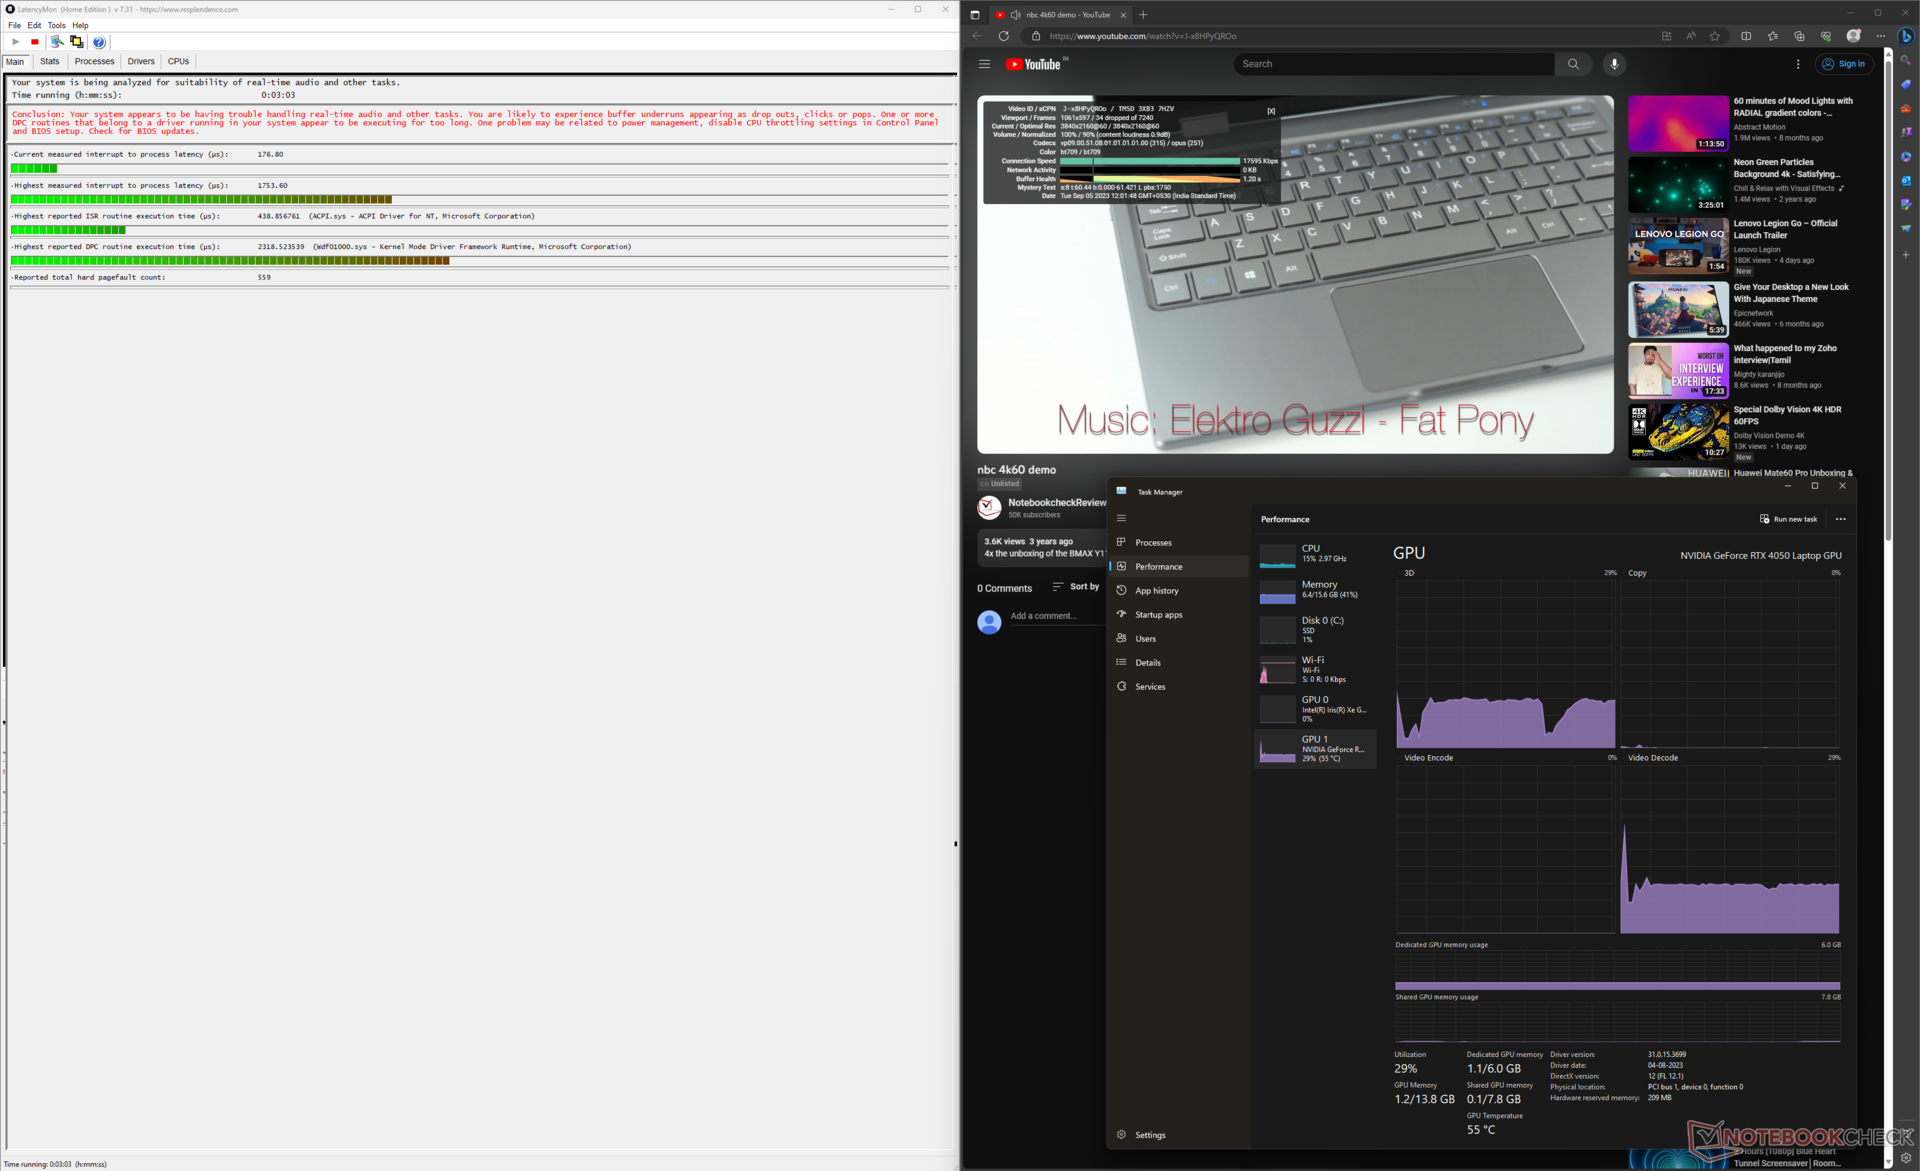
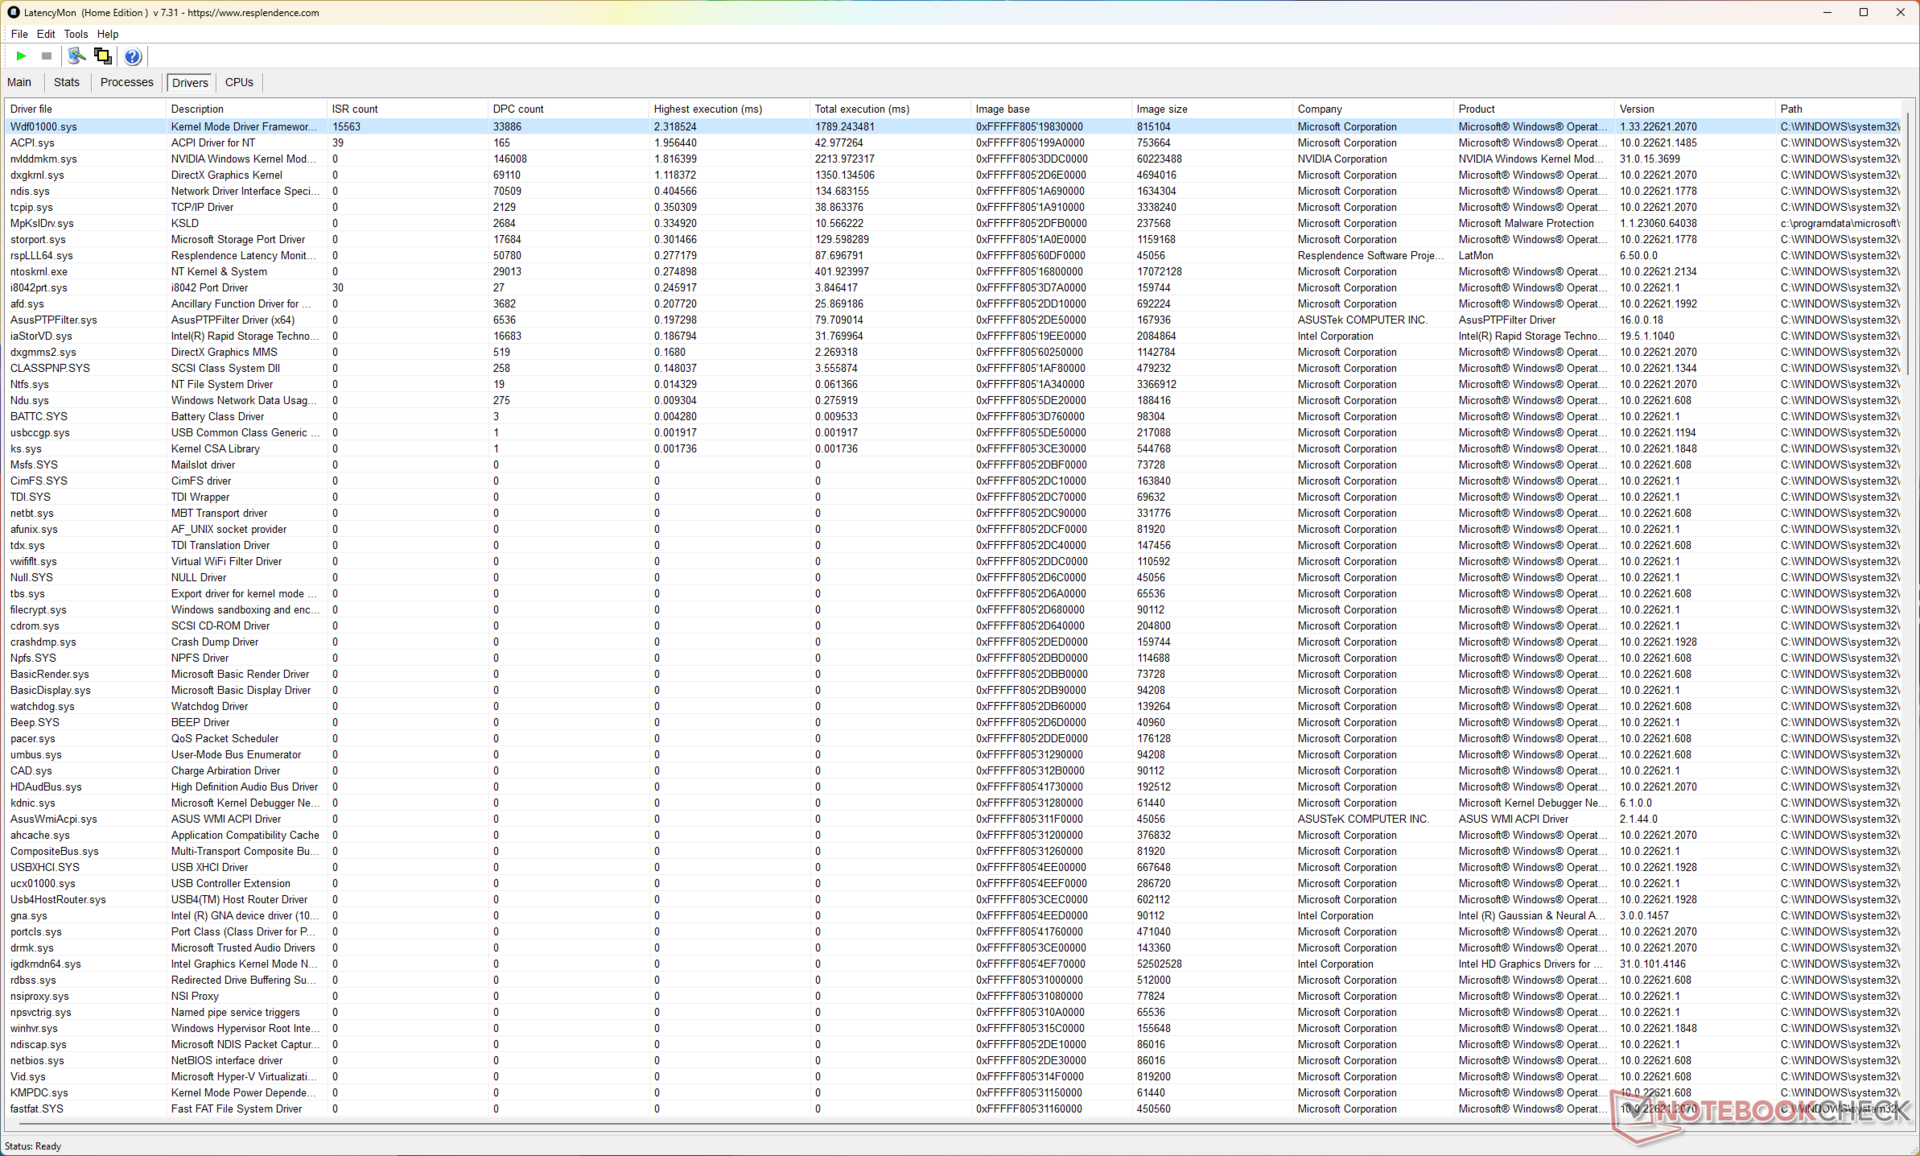
We measured the highest interrupt to process latency to be about 1,753.6 µs, which can potentially lead to problems with real-time audio/video editing workflows.
| DPC Latencies / LatencyMon - interrupt to process latency (max), Web, Youtube, Prime95 | |
| Asus Vivobook Pro 16X K6604JV-MX016W | |
| Asus VivoBook Pro 16 K6602VU | |
| Asus VivoBook Pro 16 | |
| Asus ROG Flow X16 GV601V | |
| Asus TUF Gaming A16 FA617XS | |
| Gigabyte AERO 16 OLED BSF | |
| Lenovo Legion Pro 5 16ARX8 (R5 7645HX, RTX 4050) | |
* ... smaller is better
More DPC latency comparisons can be found in our DPC Latency Ranking page.
Storage Devices
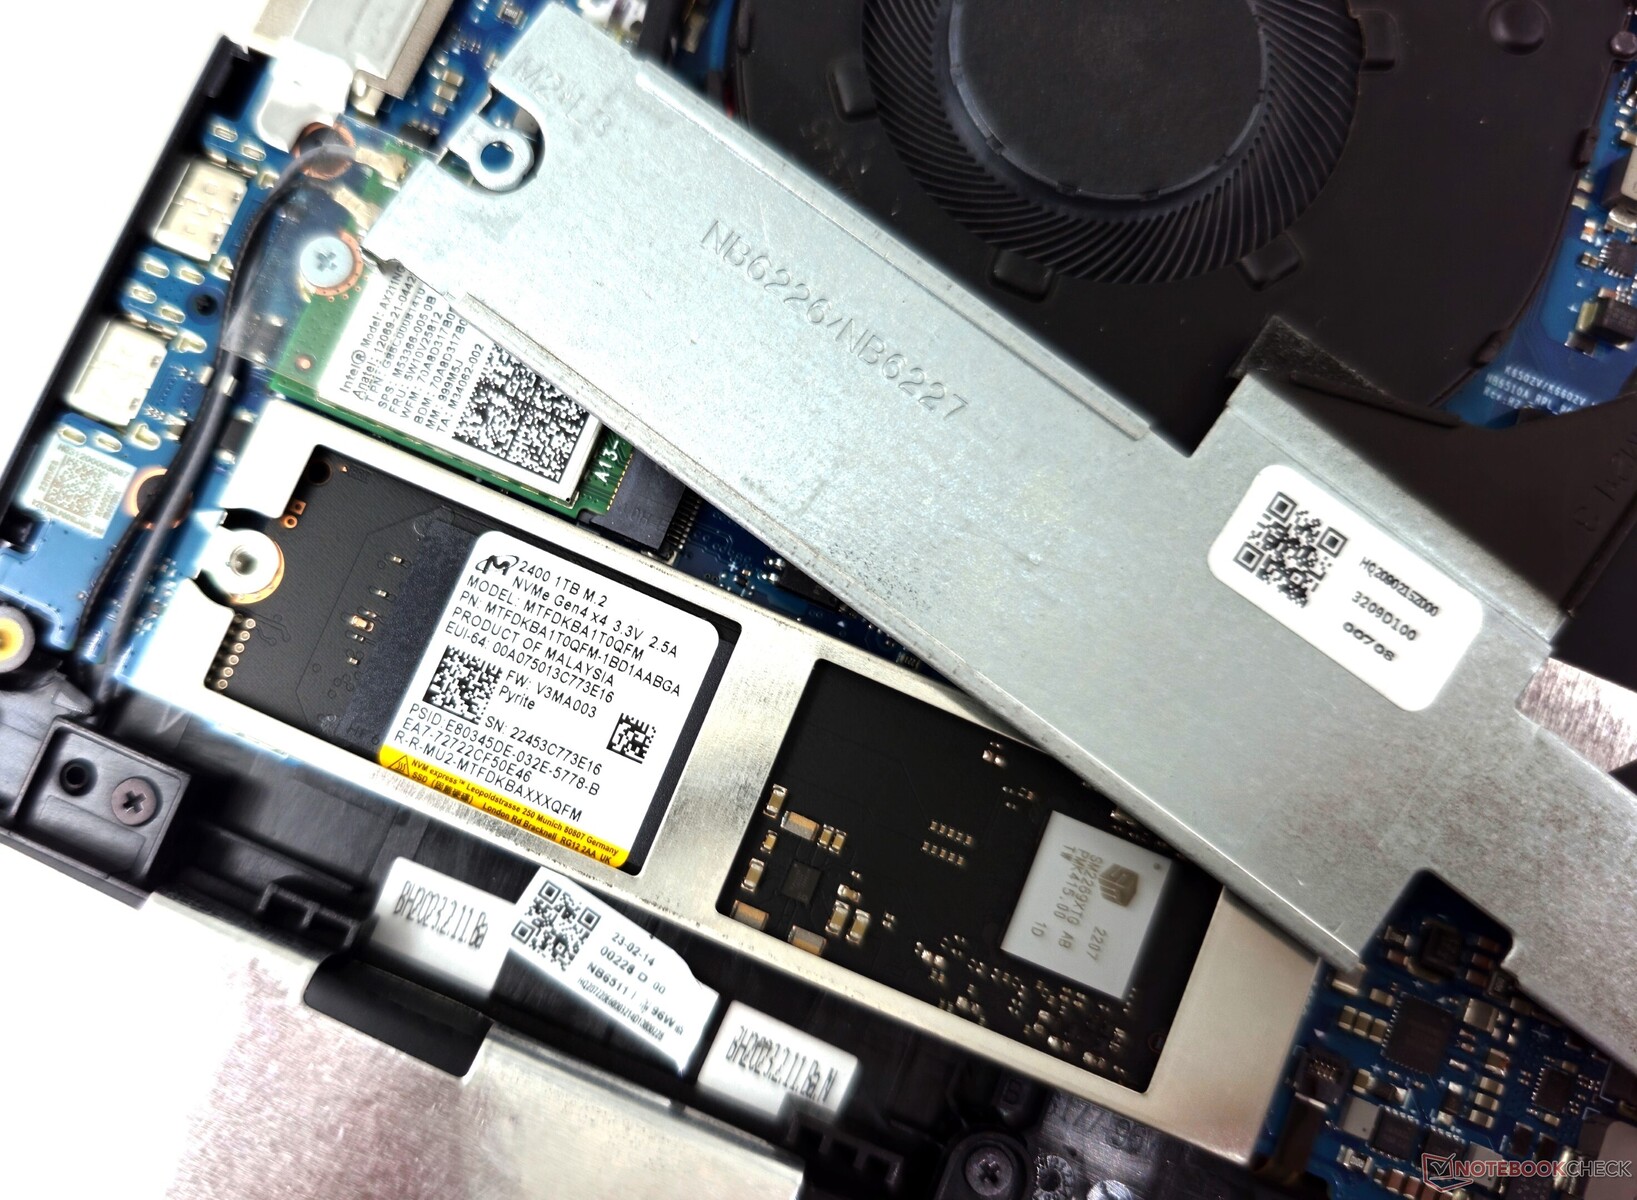
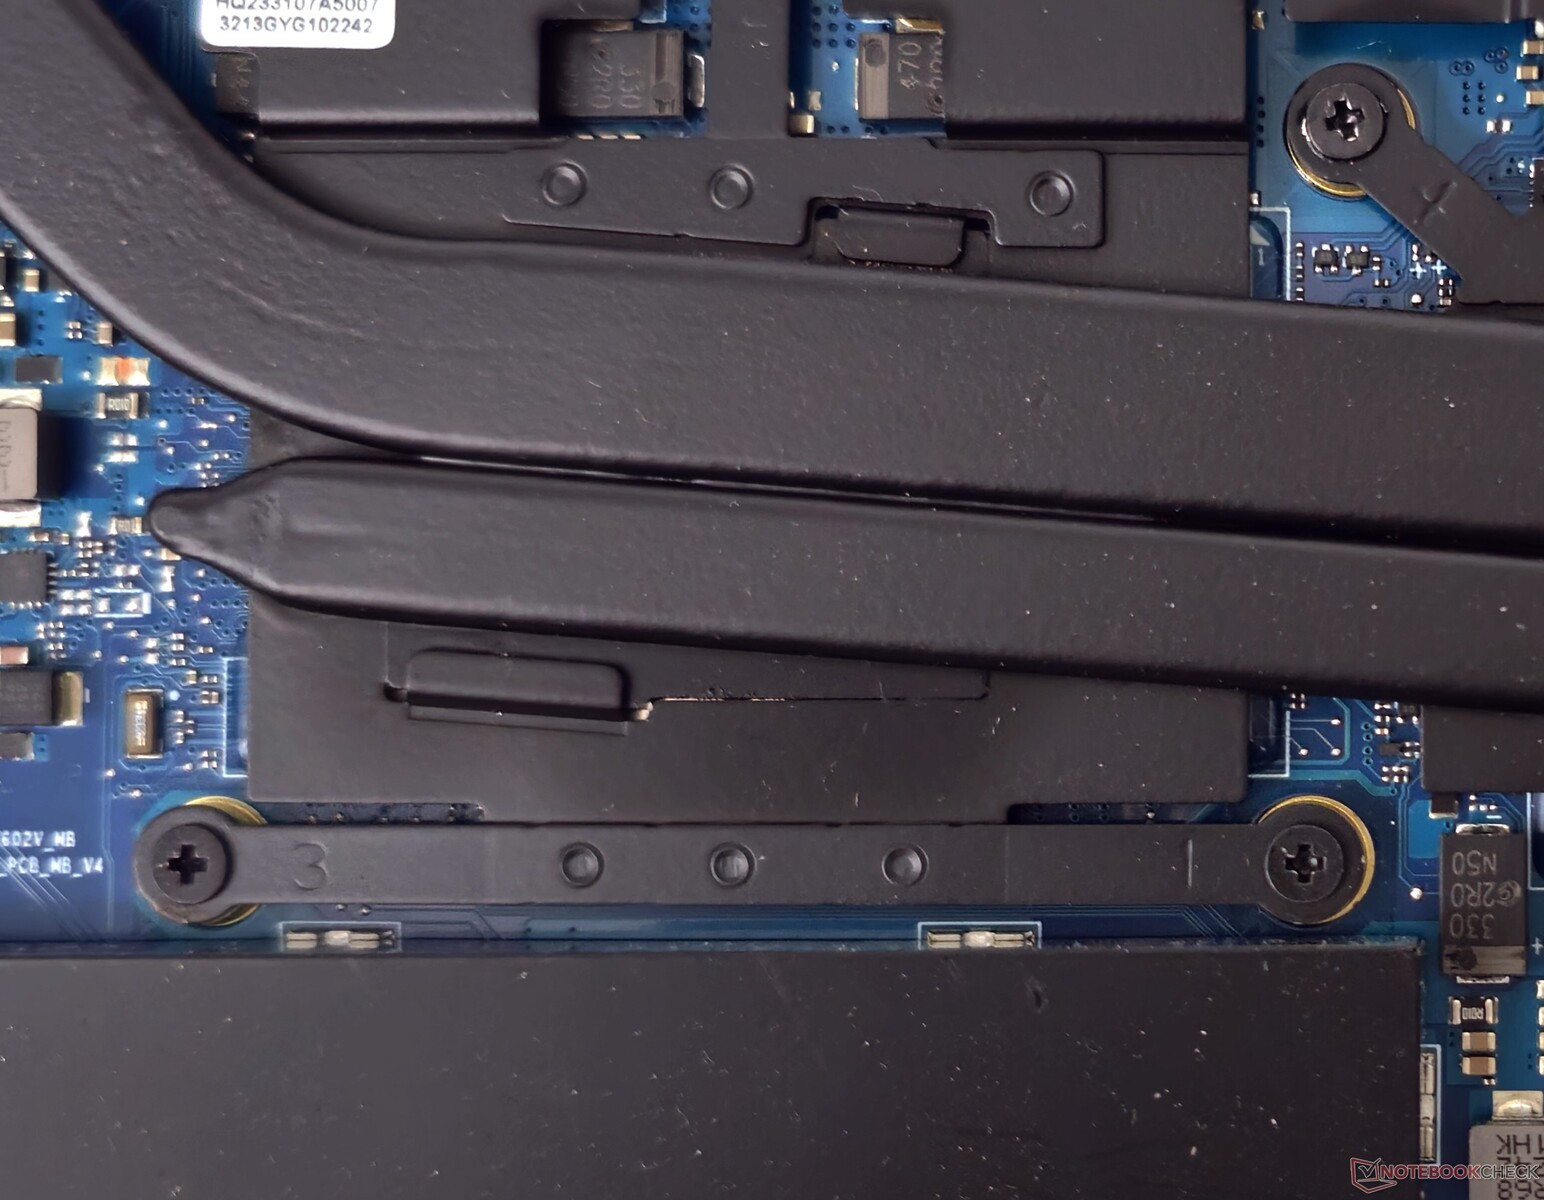
The Micron 2400 1 TB PCIe Gen4 M.2 SSD is ensconced under a lengthy aluminum cover, which is a tad cumbersome to remove. The overall drive performance is somewhat better than a Micron 2400 512 GB drive but lags significantly behind the WD SN560, Gigabyte, and SK Hynix PC801 offerings found in the competition.
The Micron 2400 takes the maximum hit in 4K reads at a queue depth of 1, though it fares much better in 4K Q32 reads.
A spare M.2 slot is available for storage expansion. There is no scope for adding 2.5-inch SATA drives.

* ... smaller is better
We did not observe any disk performance throttling with a continuous DiskSpd read loop at a queue depth of 8.
Disk Throttling: DiskSpd Read Loop, Queue Depth 8
Check out our HDD and SSD benchmarks page for more storage performance comparisons.
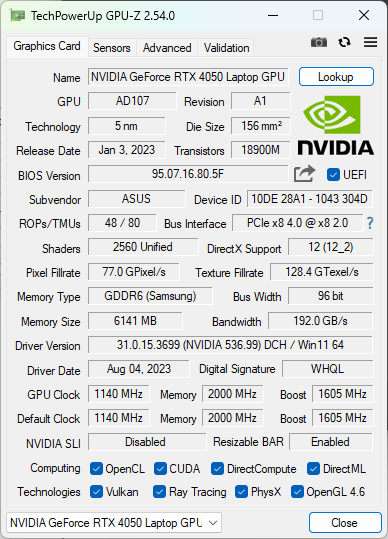
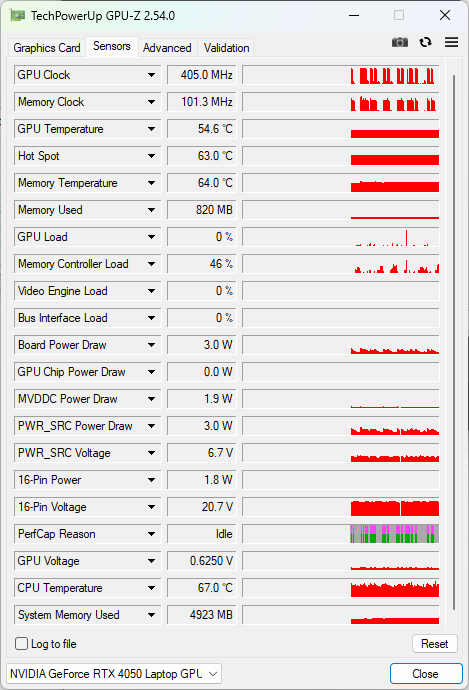
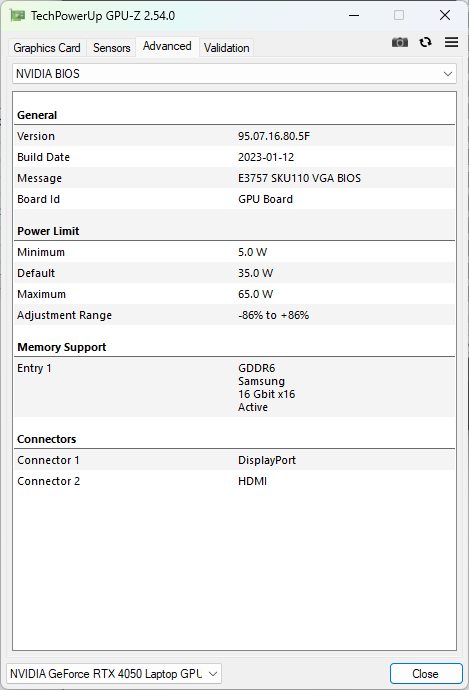
GPU Performance
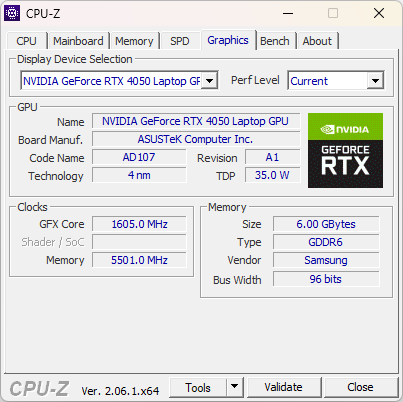
The VivoBook Pro 16 makes use of a 60 W Nvidia GeForce RTX 4050 Laptop GPU that can boost up to 1,605 MHz.
The GPU's cumulative 3DMark performance is 58% higher than the RTX 3050 Ti in last year's VivoBook Pro 16. However, it lags 16% behind the 140 W RTX 4050 in the Legion Pro 5.
Compared to the VivoBook Pro 16X and its 140 W RTX 4060, our unit's 60 W RTX 4050 only trails by 7% in overall 3DMark metrics.
3DMark Time Spy Graphics scores can drop by 21% on battery power.
| 3DMark 11 Performance | 25180 points | |
| 3DMark Ice Storm Standard Score | 232668 points | |
| 3DMark Cloud Gate Standard Score | 40077 points | |
| 3DMark Fire Strike Score | 18333 points | |
| 3DMark Fire Strike Extreme Score | 8859 points | |
| 3DMark Time Spy Score | 7458 points | |
Help | ||
| Blender / v3.3 Classroom OPTIX/RTX | |
| Asus VivoBook Pro 16 | |
| Average of class Multimedia (12 - 105, n=21, last 2 years) | |
| Asus VivoBook Pro 16 K6602VU | |
| Average NVIDIA GeForce RTX 4050 Laptop GPU (25 - 37, n=40) | |
| Lenovo Legion Pro 5 16ARX8 (R5 7645HX, RTX 4050) | |
| Asus Vivobook Pro 16X K6604JV-MX016W | |
| Asus ROG Flow X16 GV601V | |
| Gigabyte AERO 16 OLED BSF | |
| Blender / v3.3 Classroom CUDA | |
| Asus VivoBook Pro 16 | |
| Average of class Multimedia (20 - 186, n=21, last 2 years) | |
| Average NVIDIA GeForce RTX 4050 Laptop GPU (47 - 68, n=39) | |
| Asus VivoBook Pro 16 K6602VU | |
| Lenovo Legion Pro 5 16ARX8 (R5 7645HX, RTX 4050) | |
| Asus Vivobook Pro 16X K6604JV-MX016W | |
| Asus ROG Flow X16 GV601V | |
| Gigabyte AERO 16 OLED BSF | |
| Blender / v3.3 Classroom CPU | |
| Average of class Multimedia (134.5 - 1042, n=61, last 2 years) | |
| Average NVIDIA GeForce RTX 4050 Laptop GPU (243 - 907, n=40) | |
| Asus VivoBook Pro 16 | |
| Asus VivoBook Pro 16 K6602VU | |
| Lenovo Legion Pro 5 16ARX8 (R5 7645HX, RTX 4050) | |
| Asus ROG Flow X16 GV601V | |
| Gigabyte AERO 16 OLED BSF | |
| Asus TUF Gaming A16 FA617XS | |
| Asus Vivobook Pro 16X K6604JV-MX016W | |
* ... smaller is better
Gaming Performance
The VivoBook Pro 16's RTX 4050 ties with the Asus TUF Gaming A16's Radeon RX 7600S in combined 1080p Ultra gaming performance. However, the Legion Pro 5's higher wattage RTX 4050 gains perceivable leads here.
That being said, this year's Pro 16 iteration does offer an impressive 44% uplift over the previous generation with an RTX 3050 Ti.
| The Witcher 3 - 1920x1080 Ultra Graphics & Postprocessing (HBAO+) | |
| Gigabyte AERO 16 OLED BSF | |
| Asus ROG Flow X16 GV601V | |
| Asus TUF Gaming A16 FA617XS | |
| Asus Vivobook Pro 16X K6604JV-MX016W | |
| Lenovo Legion Pro 5 16ARX8 (R5 7645HX, RTX 4050) | |
| Asus VivoBook Pro 16 K6602VU | |
| Asus VivoBook Pro 16 | |
| Average of class Multimedia (11 - 107, n=5, last 2 years) | |
It is possible to achieve playable frame rates at QHD Ultra native settings with the RTX 4050 in older titles. For more modern games, you will need a helping hand from upscalers such as Nvidia DLSS, AMD FSR, or Intel XeSS.
| The Witcher 3 | |
| 1920x1080 Ultra Graphics & Postprocessing (HBAO+) | |
| Gigabyte AERO 16 OLED BSF | |
| Asus ROG Flow X16 GV601V | |
| Asus TUF Gaming A16 FA617XS | |
| Asus Vivobook Pro 16X K6604JV-MX016W | |
| Lenovo Legion Pro 5 16ARX8 (R5 7645HX, RTX 4050) | |
| Asus VivoBook Pro 16 K6602VU | |
| Average NVIDIA GeForce RTX 4050 Laptop GPU (18.5 - 94.7, n=40) | |
| Asus VivoBook Pro 16 | |
| Average of class Multimedia (11 - 107, n=5, last 2 years) | |
| 2560x1440 Ultra Graphics & Postprocessing (HBAO+) | |
| Average of class Multimedia (n=1last 2 years) | |
| Asus VivoBook Pro 16 K6602VU | |
| Average NVIDIA GeForce RTX 4050 Laptop GPU (39 - 61.3, n=8) | |
| Cyberpunk 2077 1.6 | |
| 1920x1080 Ultra Preset | |
| Gigabyte AERO 16 OLED BSF | |
| Asus ROG Flow X16 GV601V | |
| Average NVIDIA GeForce RTX 4050 Laptop GPU (44.4 - 79.4, n=14) | |
| Asus VivoBook Pro 16 K6602VU | |
| 2560x1440 Ultra Preset | |
| Gigabyte AERO 16 OLED BSF | |
| Asus ROG Flow X16 GV601V | |
| Asus VivoBook Pro 16 K6602VU | |
| Average NVIDIA GeForce RTX 4050 Laptop GPU (27.2 - 43.1, n=10) | |
The Witcher 3 FPS Chart
We observed a relatively stable frame rate while stressing with The Witcher 3 at 1080p Ultra indicating adequate GPU cooling.
| low | med. | high | ultra | QHD | 4K | |
|---|---|---|---|---|---|---|
| GTA V (2015) | 184.8 | 180.2 | 163.2 | 89 | 65.1 | |
| The Witcher 3 (2015) | 356 | 258 | 138.7 | 76.6 | 56.1 | 44.7 |
| Dota 2 Reborn (2015) | 169.6 | 153.7 | 140.1 | 126 | ||
| Final Fantasy XV Benchmark (2018) | 167 | 107.2 | 75.6 | 53.6 | ||
| X-Plane 11.11 (2018) | 159.2 | 134.6 | 108.4 | |||
| Far Cry 5 (2018) | 147 | 114 | 107 | 104 | 68 | |
| Strange Brigade (2018) | 449 | 187.4 | 151.6 | 132 | ||
| Cyberpunk 2077 1.6 (2022) | 97.5 | 74.4 | 62.2 | 57.4 | 43.1 | |
| F1 22 (2022) | 182.4 | 193.1 | 152.1 | 47.5 | 29.6 | |
| F1 23 (2023) | 197 | 200 | 140.7 | 39.7 | 25.6 |
More benchmark and gaming comparisons can be found in our dedicated Nvidia GeForce RTX 4050 Laptop GPU page.
Emissions: Falls short of claimed 90 W combined TDP
System Noise
Asus enforces pre-set fan noise limits for each VivoBook Pro 16 performance profile, similar to what we've seen with other VivoBooks before.
The Standard profile aims for less than 40 dB(A) sound pressure level (SPL) based on Asus's specs, which our testing confirms. Whisper mode cuts the SPL further to under 30 dB(A).
Performance mode ramps the fans to their peak, resulting in significantly higher noise levels up to 52 dB (A) in our measurements.
Since Standard and Performance modes have similar power limits, we recommend going with the former for more tolerable acoustics without the distracting fan din.
Noise level
| Idle |
| 25.28 / 25.28 / 25.28 dB(A) |
| Load |
| 51.88 / 51.8 dB(A) |
 | ||
30 dB silent 40 dB(A) audible 50 dB(A) loud |
||
min: | ||
| Performance mode | Idle dB(A) | Load average dB(A) | Load maximum dB(A) | The Witcher 3 1080p Ultra dB(A) |
|---|---|---|---|---|
| Whisper | 22.22 | 27.73 | 28.47 | 28.17 |
| Standard | 25.08 | 37.63 | 38.81 | 39.12 |
| Performance | 25.28 | 51.88 | 51.80 | 49.03 |
| Asus VivoBook Pro 16 K6602VU i9-13900H, GeForce RTX 4050 Laptop GPU | Asus Vivobook Pro 16X K6604JV-MX016W i9-13980HX, GeForce RTX 4060 Laptop GPU | Asus ROG Flow X16 GV601V i9-13900H, GeForce RTX 4060 Laptop GPU | Lenovo Legion Pro 5 16ARX8 (R5 7645HX, RTX 4050) R5 7645HX, GeForce RTX 4050 Laptop GPU | Asus TUF Gaming A16 FA617XS R9 7940HS, Radeon RX 7600S | Asus VivoBook Pro 16 i7-12700H, GeForce RTX 3050 Ti Laptop GPU | Gigabyte AERO 16 OLED BSF i9-13900H, GeForce RTX 4070 Laptop GPU | |
|---|---|---|---|---|---|---|---|
| Noise | -10% | 4% | 8% | -3% | -8% | -6% | |
| off / environment * (dB) | 20.96 | 25.2 -20% | 24 -15% | 23 -10% | 25 -19% | 25.2 -20% | 23 -10% |
| Idle Minimum * (dB) | 25.28 | 26.6 -5% | 24 5% | 23 9% | 25 1% | 25.2 -0% | 23 9% |
| Idle Average * (dB) | 25.28 | 26.6 -5% | 24 5% | 23 9% | 26 -3% | 25.2 -0% | 23 9% |
| Idle Maximum * (dB) | 25.28 | 29.2 -16% | 24 5% | 24.42 3% | 28 -11% | 25.2 -0% | 33.64 -33% |
| Load Average * (dB) | 51.88 | 53.4 -3% | 36.71 29% | 34.94 33% | 43 17% | 55.1 -6% | 51.49 1% |
| Witcher 3 ultra * (dB) | 49 | 50.92 -4% | 43.79 11% | 51 -4% | 55.27 -13% | ||
| Load Maximum * (dB) | 51.8 | 56.9 -10% | 50.92 2% | 50 3% | 53 -2% | 61.5 -19% | 55.24 -7% |
* ... smaller is better
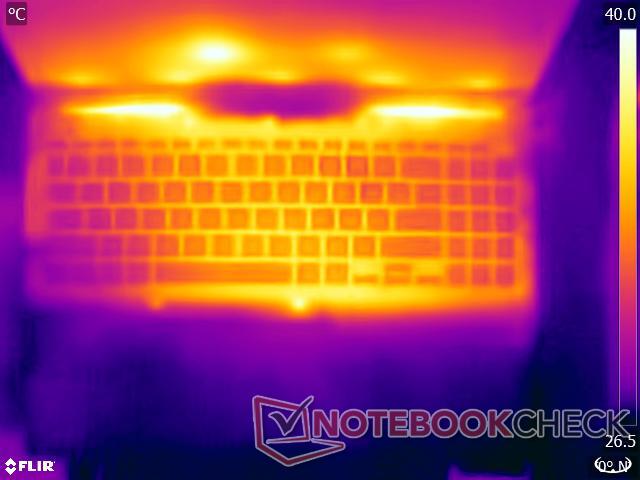
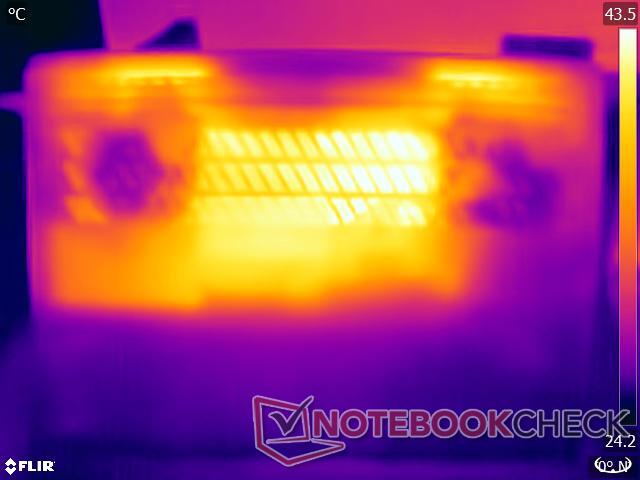
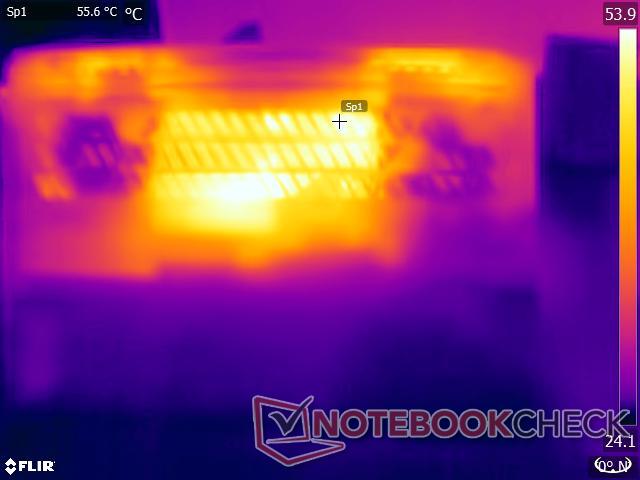
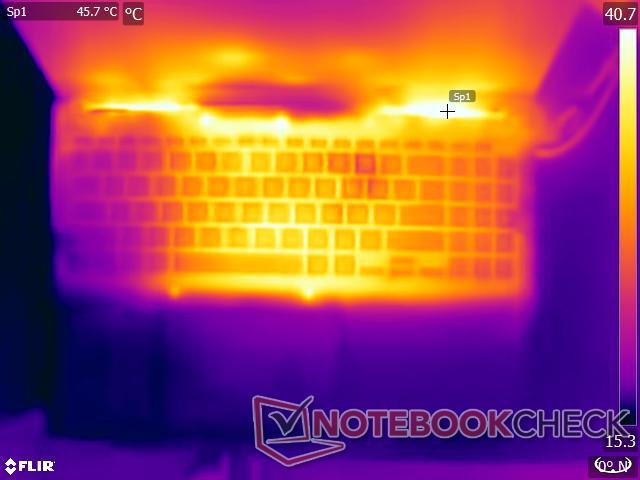
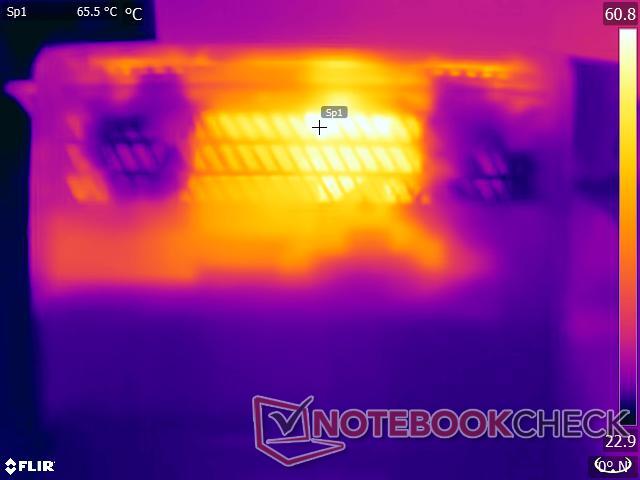
Temperature
In the Performance mode, we recorded temperatures of up to 42.6 °C and 48.4 °C on the top and bottom surfaces, respectively under max load. During The Witcher 3 stress at 1080p Ultra, the bottom temperature hot spot hit 63.6 °C.
While these temperatures occur in demanding test scenarios, lap use is still not advisable when running heavy workloads. Anything beyond light productivity can potentially result in noticeable heat buildup and discomfort.
The touchpad and palm rest areas remain relatively cool even under full load.
(±) The maximum temperature on the upper side is 42.6 °C / 109 F, compared to the average of 36.8 °C / 98 F, ranging from 21 to 71 °C for the class Multimedia.
(-) The bottom heats up to a maximum of 48.4 °C / 119 F, compared to the average of 39.1 °C / 102 F
(±) In idle usage, the average temperature for the upper side is 33.2 °C / 92 F, compared to the device average of 31.3 °C / 88 F.
(-) Playing The Witcher 3, the average temperature for the upper side is 39.3 °C / 103 F, compared to the device average of 31.3 °C / 88 F.
(+) The palmrests and touchpad are cooler than skin temperature with a maximum of 29.4 °C / 84.9 F and are therefore cool to the touch.
(±) The average temperature of the palmrest area of similar devices was 28.7 °C / 83.7 F (-0.7 °C / -1.2 F).

| Asus VivoBook Pro 16 K6602VU Intel Core i9-13900H, NVIDIA GeForce RTX 4050 Laptop GPU | Asus Vivobook Pro 16X K6604JV-MX016W Intel Core i9-13980HX, NVIDIA GeForce RTX 4060 Laptop GPU | Asus ROG Flow X16 GV601V Intel Core i9-13900H, NVIDIA GeForce RTX 4060 Laptop GPU | Lenovo Legion Pro 5 16ARX8 (R5 7645HX, RTX 4050) AMD Ryzen 5 7645HX, NVIDIA GeForce RTX 4050 Laptop GPU | Asus TUF Gaming A16 FA617XS AMD Ryzen 9 7940HS, AMD Radeon RX 7600S | Asus VivoBook Pro 16 Intel Core i7-12700H, NVIDIA GeForce RTX 3050 Ti Laptop GPU | Gigabyte AERO 16 OLED BSF Intel Core i9-13900H, NVIDIA GeForce RTX 4070 Laptop GPU | |
|---|---|---|---|---|---|---|---|
| Heat | 5% | 8% | -1% | 7% | 2% | 23% | |
| Maximum Upper Side * (°C) | 42.6 | 39.7 7% | 46 -8% | 45 -6% | 53 -24% | 44.2 -4% | 41 4% |
| Maximum Bottom * (°C) | 48.4 | 60 -24% | 41 15% | 54 -12% | 48 1% | 53 -10% | 47 3% |
| Idle Upper Side * (°C) | 39.4 | 30.9 22% | 36 9% | 36 9% | 30 24% | 32.1 19% | 23 42% |
| Idle Bottom * (°C) | 39.8 | 34.7 13% | 33 17% | 38 5% | 30 25% | 38.4 4% | 23 42% |
* ... smaller is better
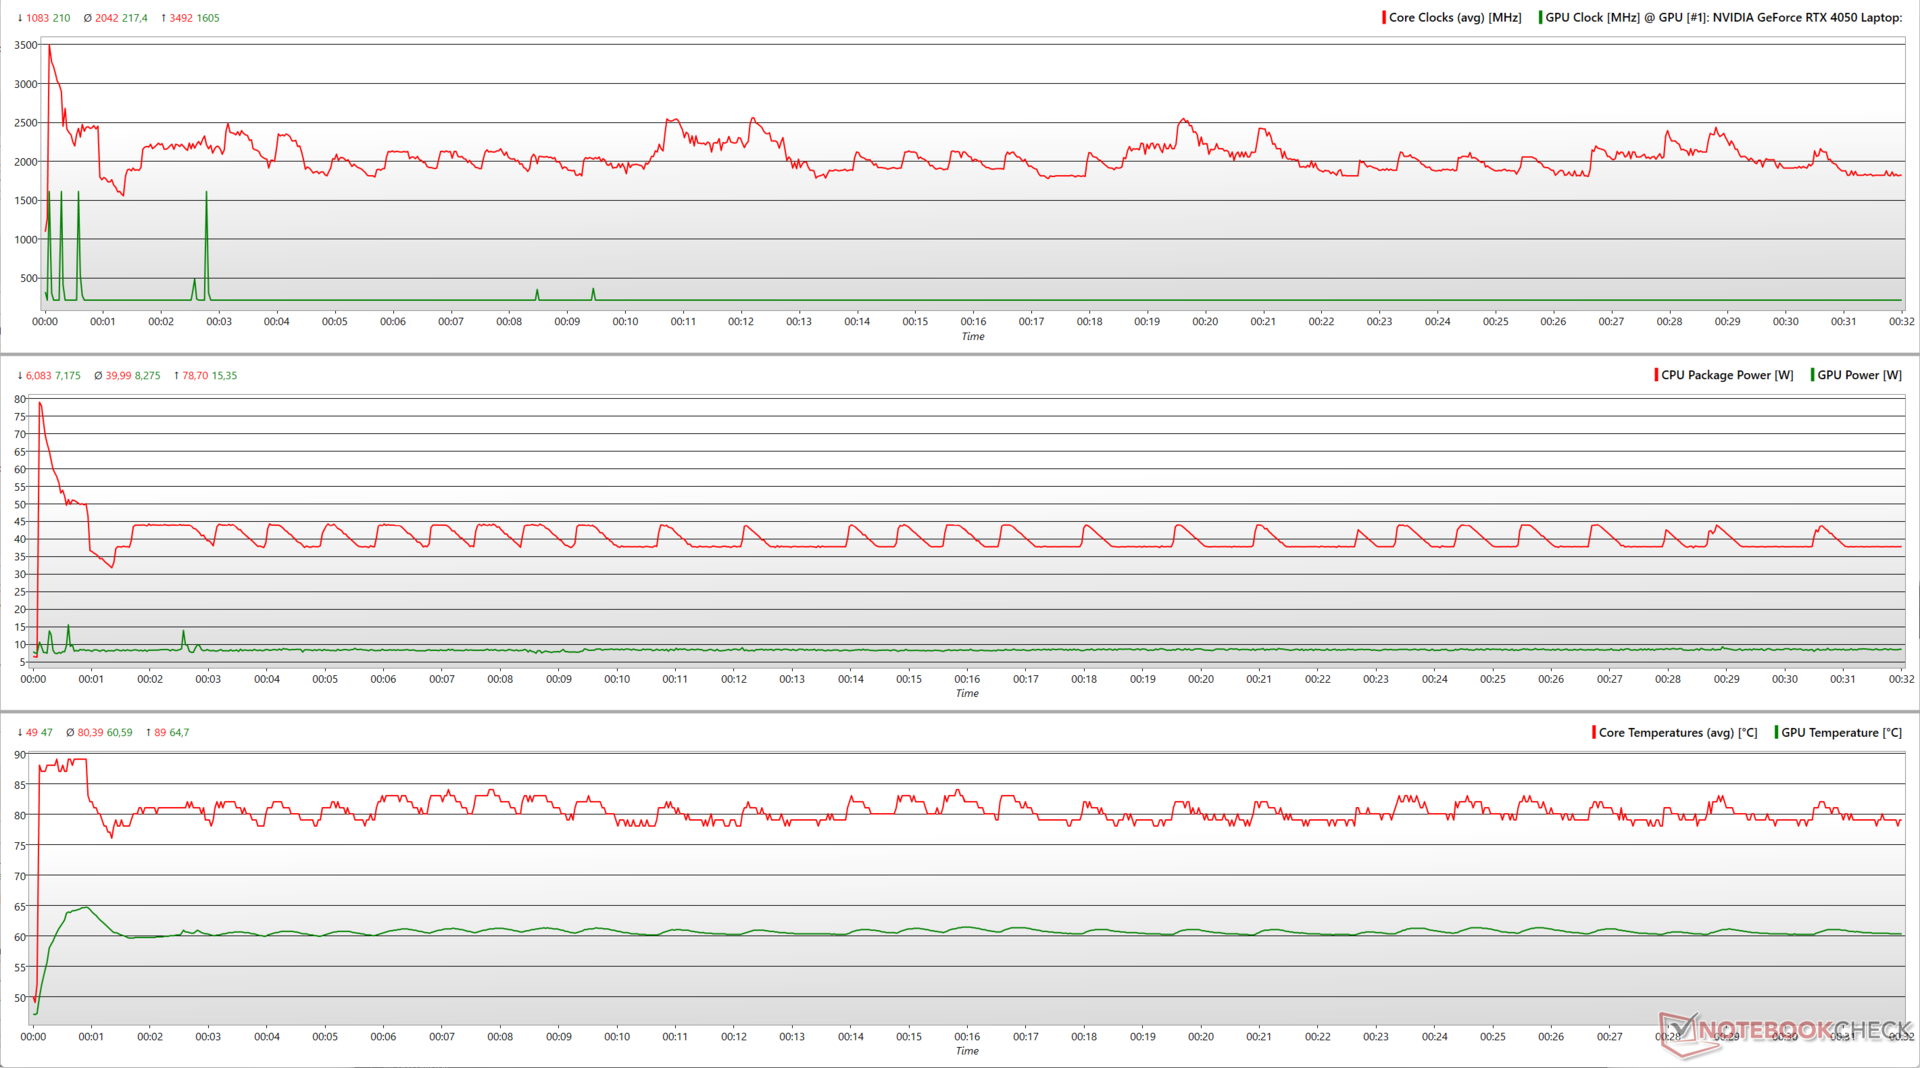
Stress Test
In Prime95 in-place large FFT stress testing, the VivoBook Pro 16's Core i9-13900H reached a peak 3.49 GHz clock speed at 78.7 W power draw. Average clocks settled around 2 GHz utilizing 40 W.
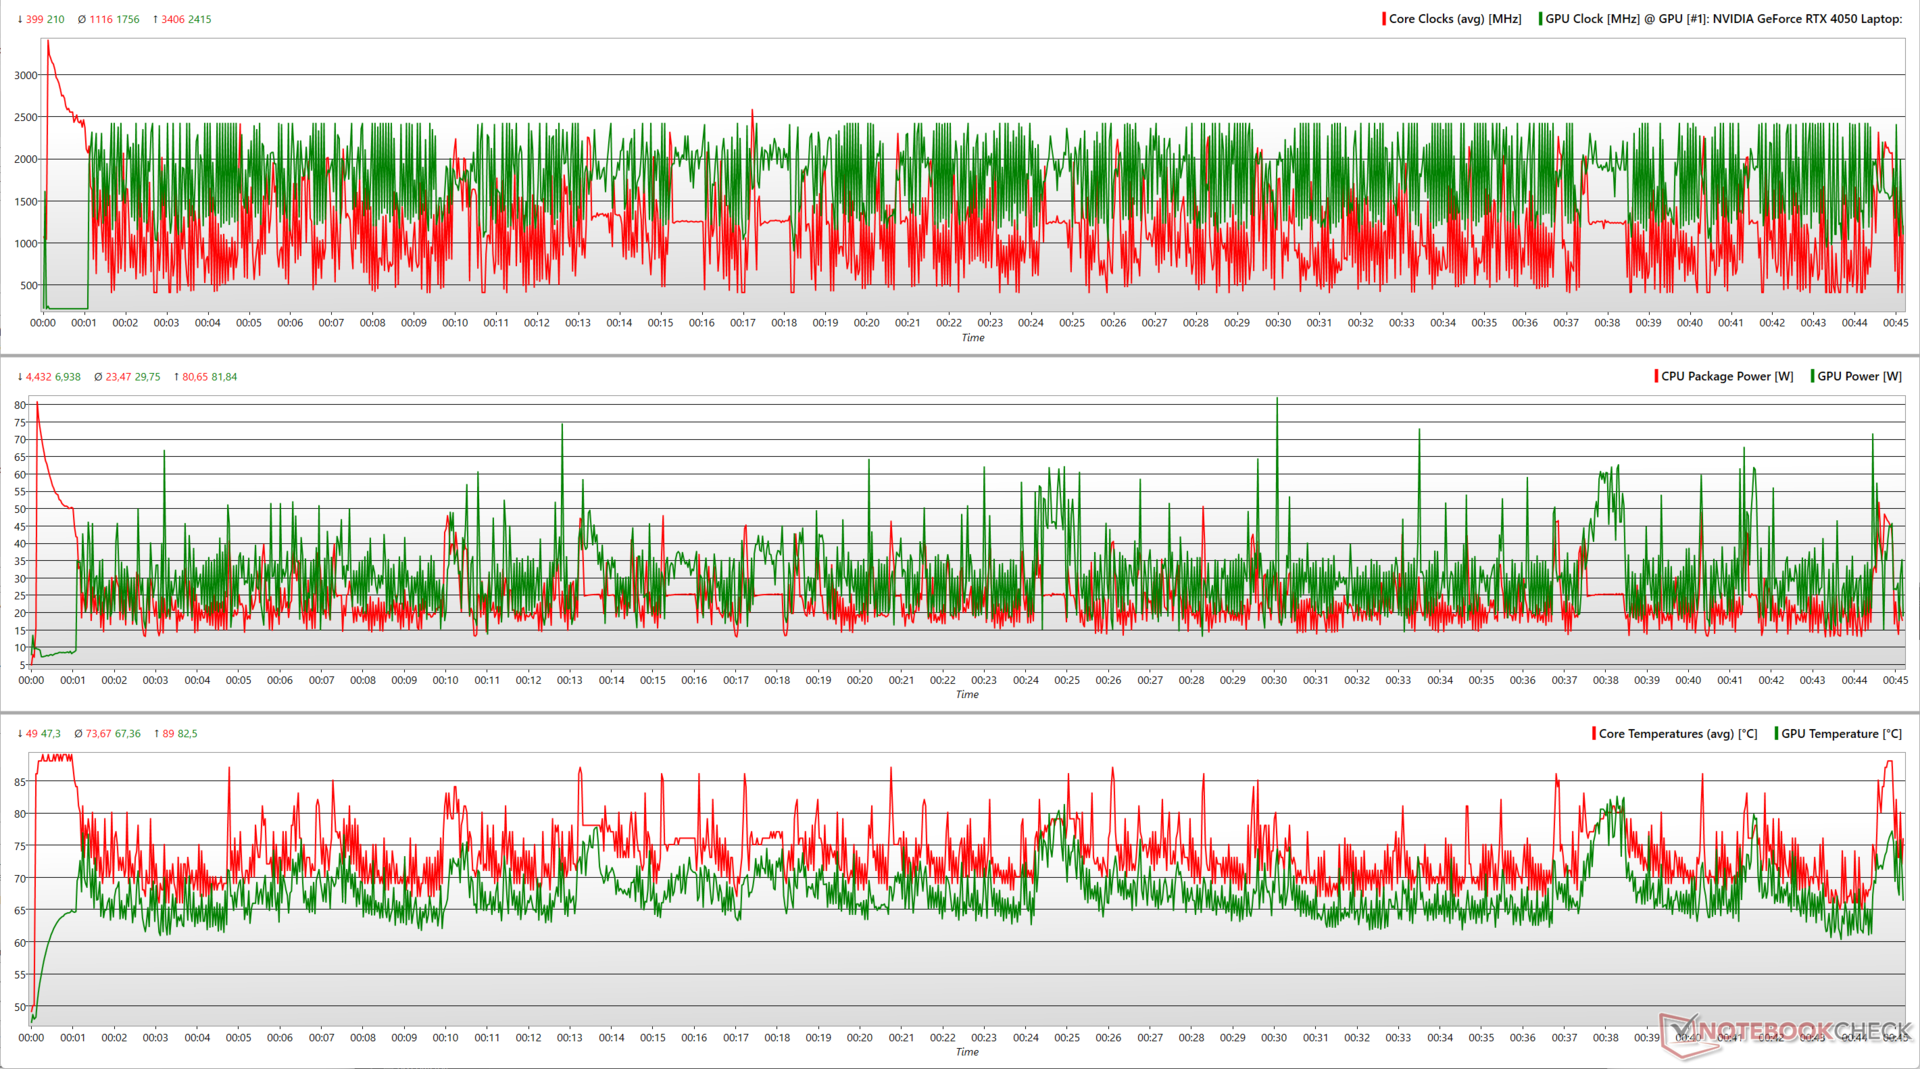
When adding FurMark GPU stress, the Core i9-13900H and RTX 4050 compete for shared thermal headroom. The CPU drops to just 1.1 GHz average at 23.5 W, while the GPU boosts up to 2,415 MHz peak using 82 W.
| Stress Test | CPU Clock (GHz) | GPU Clock (MHz) | Average CPU Temperature (°C) | Average GPU Temperature (°C) |
| System Idle | 1.7 | 210 | 49 | 46.4 |
| Prime95 | 2.01 | 210 | 79 | 60.6 |
| Prime95 + FurMark | 1.07 | 2,415 | 71 | 64.9 |
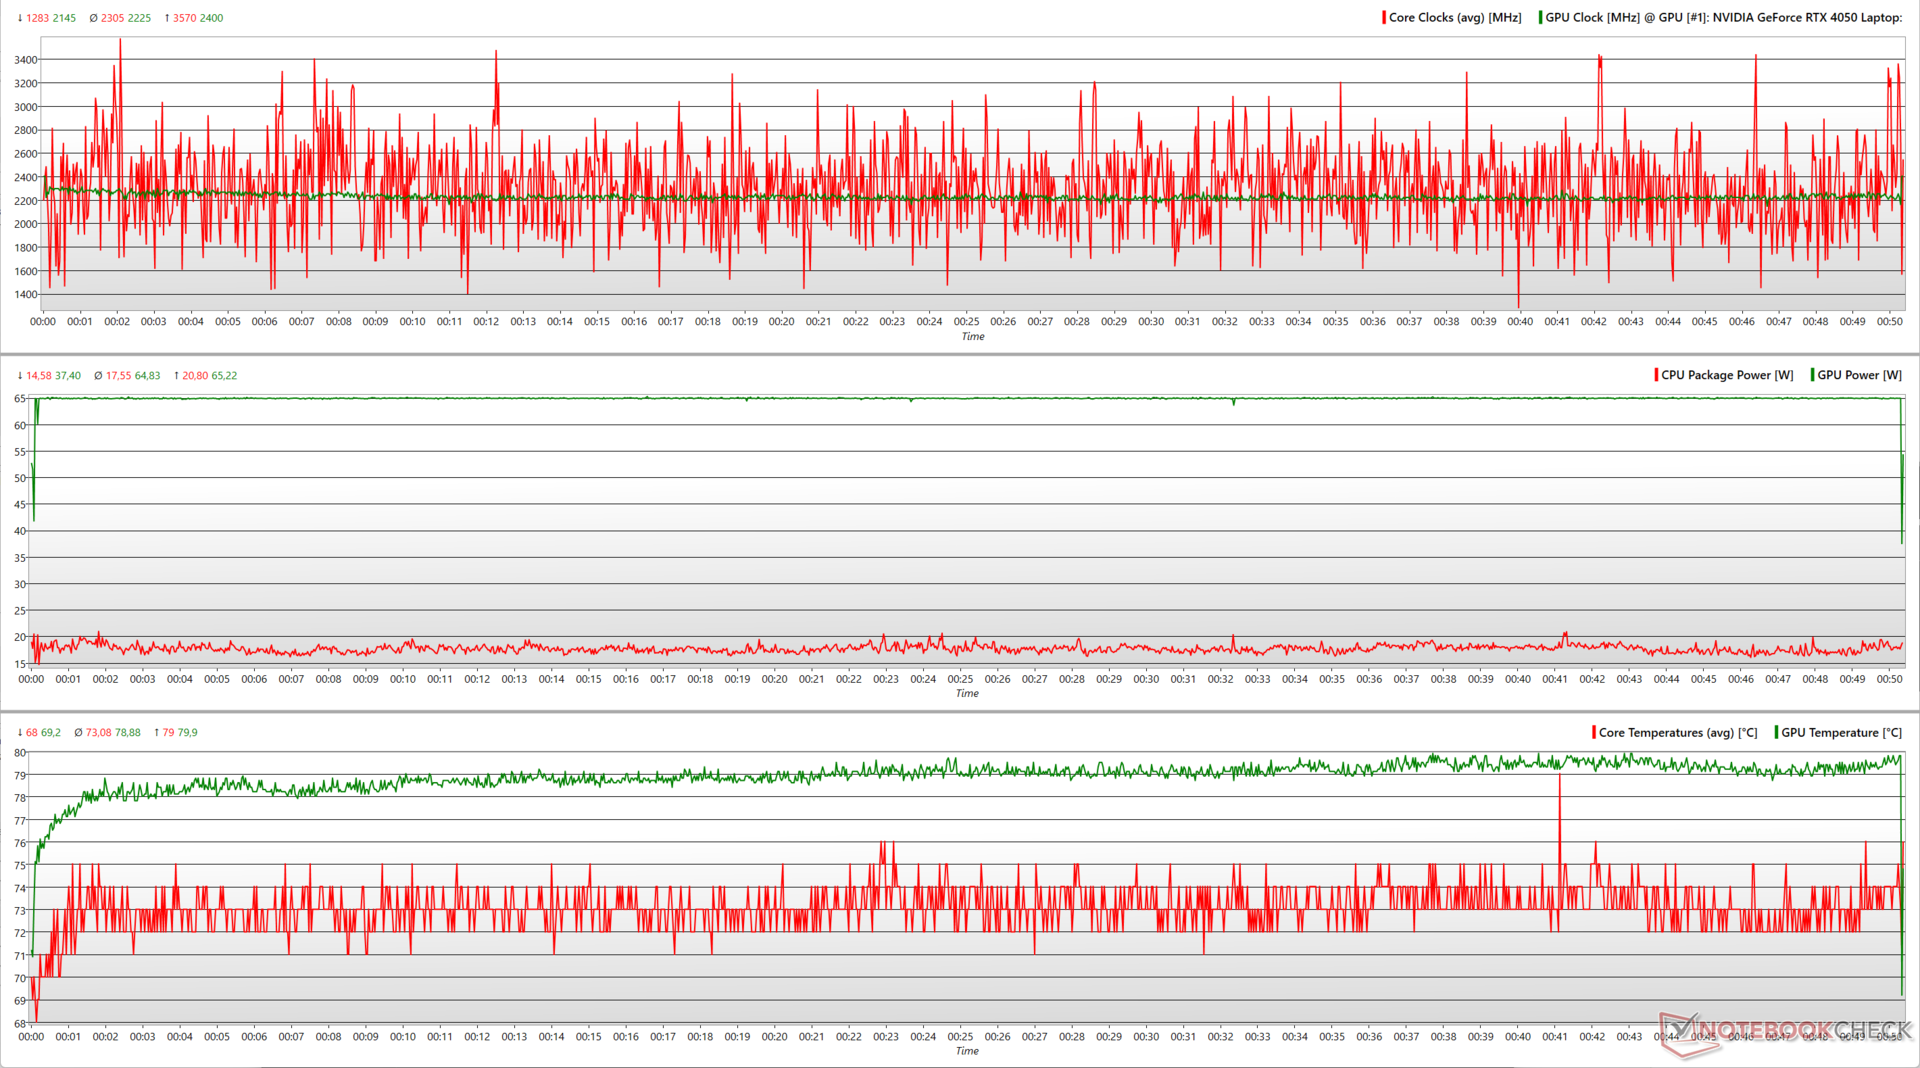
| The Witcher 3 1080p Ultra | 2.3 | 2,400 | 72 | 77.7 |
In a real-world gaming load (The Witcher 3 at 1080p Ultra), the VivoBook Pro 16 shows more reasonable power sharing between the Core i9-13900H (2.3 GHz at 17.5 W average) and RTX 4050 (2,225 MHz at 65 W average).
According to Asus, the Performance profile should allow up to 90 W combined TDP between CPU and GPU. However, our stress testing never reached that claimed value.
In Prime95 + FurMark, combined peak power topped out at 162.5 W briefly but averaged only 53 W. The laptop fared better in The Witcher 3 stress, hitting combined 86 W peak and 82 W average shared between the CPU and GPU.
Speakers
Asus offers several audio enhancements such as Smart Amp, Audio Booster, and Harman Kardon tuning. The onboard speakers reproduce mids and highs decently, but the bass is lacking.
In our testing, peak loudness reached 81.6 dB(A), which should be adequate for indoor use. External audio via the 3.5 mm jack or Bluetooth 5.3 provides a much better experience, especially for music and movies.
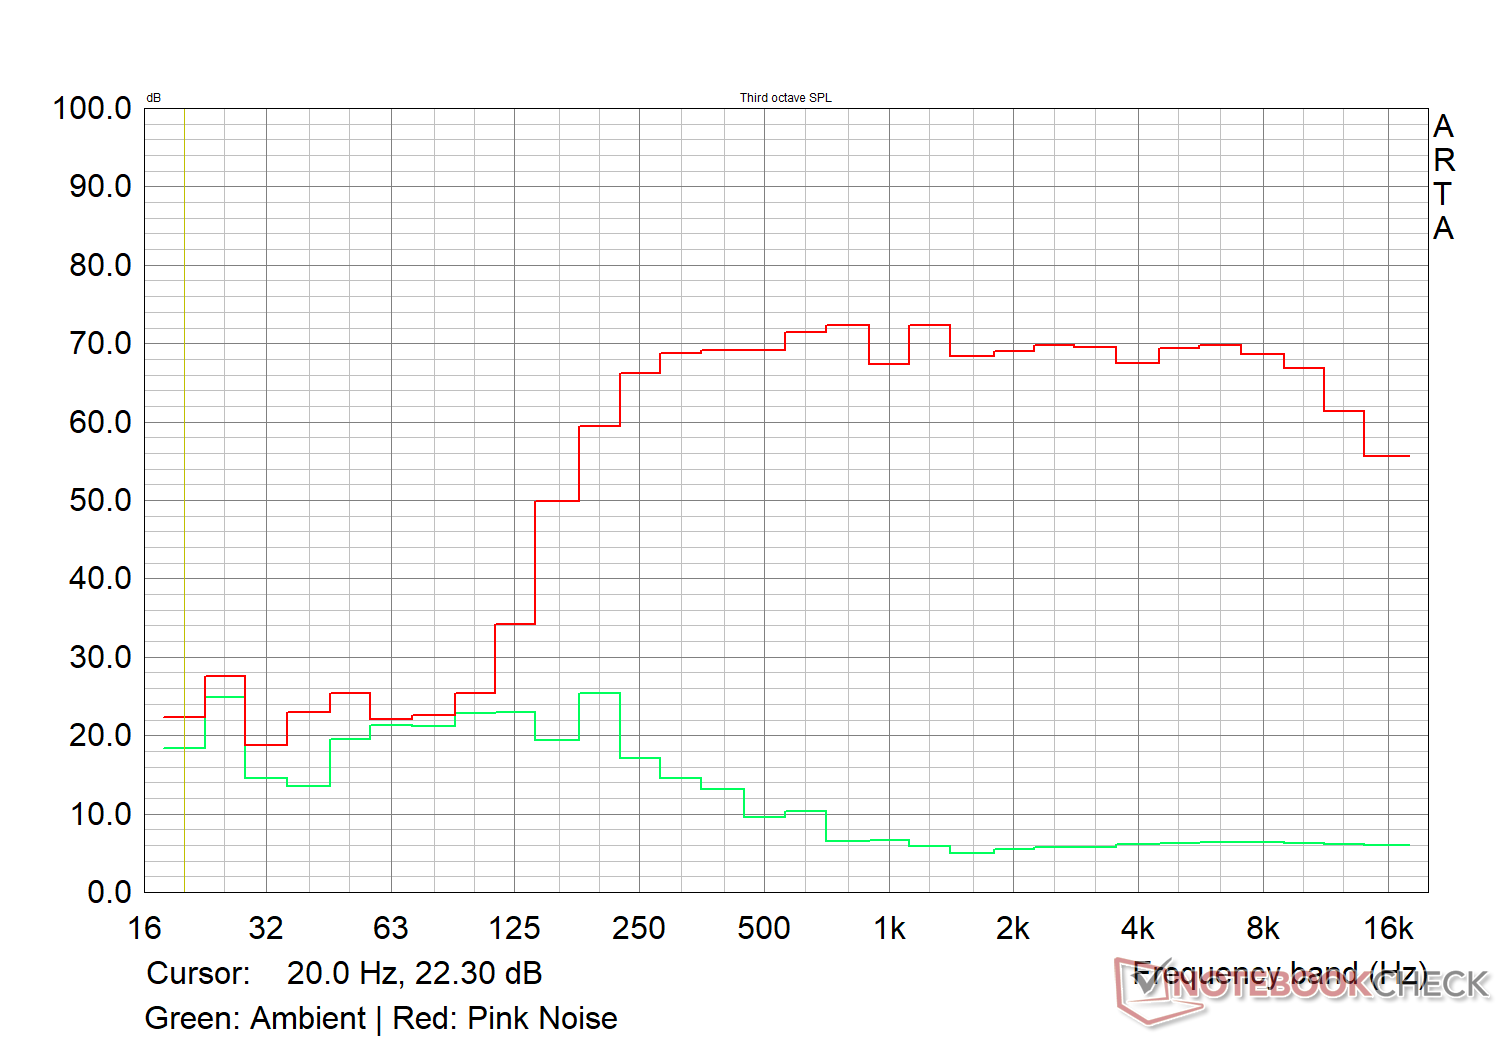
Asus VivoBook Pro 16 K6602VU audio analysis
(±) | speaker loudness is average but good (81.6 dB)
Bass 100 - 315 Hz
(-) | nearly no bass - on average 18% lower than median
(±) | linearity of bass is average (12.4% delta to prev. frequency)
Mids 400 - 2000 Hz
(+) | balanced mids - only 1.7% away from median
(+) | mids are linear (3.7% delta to prev. frequency)
Highs 2 - 16 kHz
(+) | balanced highs - only 1% away from median
(+) | highs are linear (1.9% delta to prev. frequency)
Overall 100 - 16.000 Hz
(+) | overall sound is linear (11.2% difference to median)
Compared to same class
» 17% of all tested devices in this class were better, 4% similar, 80% worse
» The best had a delta of 5%, average was 17%, worst was 45%
Compared to all devices tested
» 7% of all tested devices were better, 2% similar, 91% worse
» The best had a delta of 4%, average was 23%, worst was 134%
Apple MacBook Pro 16 2021 M1 Pro audio analysis
(+) | speakers can play relatively loud (84.7 dB)
Bass 100 - 315 Hz
(+) | good bass - only 3.8% away from median
(+) | bass is linear (5.2% delta to prev. frequency)
Mids 400 - 2000 Hz
(+) | balanced mids - only 1.3% away from median
(+) | mids are linear (2.1% delta to prev. frequency)
Highs 2 - 16 kHz
(+) | balanced highs - only 1.9% away from median
(+) | highs are linear (2.7% delta to prev. frequency)
Overall 100 - 16.000 Hz
(+) | overall sound is linear (4.6% difference to median)
Compared to same class
» 0% of all tested devices in this class were better, 0% similar, 100% worse
» The best had a delta of 5%, average was 17%, worst was 45%
Compared to all devices tested
» 0% of all tested devices were better, 0% similar, 100% worse
» The best had a delta of 4%, average was 23%, worst was 134%
Energy Management: Higher idle power draws but thrifty under load
Power Consumption
The VivoBook Pro 16's overall power consumption under load is very economical compared to the competition. However, power draws in standby and idle do seem to be a cause for concern.
The supplied 150 W power adapter is more than adequate to power the laptop under stress.
| Off / Standby | |
| Idle | |
| Load |
|
Key:
min: | |
| Asus VivoBook Pro 16 K6602VU i9-13900H, GeForce RTX 4050 Laptop GPU, OLED, 3200x2000, 16" | Asus Vivobook Pro 16X K6604JV-MX016W i9-13980HX, GeForce RTX 4060 Laptop GPU, OLED, 3200x2000, 16" | Asus ROG Flow X16 GV601V i9-13900H, GeForce RTX 4060 Laptop GPU, IPS, 2560x1600, 16" | Lenovo Legion Pro 5 16ARX8 (R5 7645HX, RTX 4050) R5 7645HX, GeForce RTX 4050 Laptop GPU, IPS, 2560x1600, 16" | Asus TUF Gaming A16 FA617XS R9 7940HS, Radeon RX 7600S, IPS, 1920x1200, 16" | Asus VivoBook Pro 16 i7-12700H, GeForce RTX 3050 Ti Laptop GPU, IPS, 2560x1600, 16" | Gigabyte AERO 16 OLED BSF i9-13900H, GeForce RTX 4070 Laptop GPU, OLED, 3840x2400, 16" | Average NVIDIA GeForce RTX 4050 Laptop GPU | Average of class Multimedia | |
|---|---|---|---|---|---|---|---|---|---|
| Power Consumption | -32% | -9% | -10% | 6% | -1% | -10% | 4% | 36% | |
| Idle Minimum * (Watt) | 21.06 | 13.8 34% | 9.6 54% | 13 38% | 7 67% | 8.7 59% | 11.8 44% | 9.95 ? 53% | 5.62 ? 73% |
| Idle Average * (Watt) | 24.27 | 16 34% | 16 34% | 17.4 28% | 10 59% | 13.1 46% | 16.1 34% | 15.8 ? 35% | 10.2 ? 58% |
| Idle Maximum * (Watt) | 25.12 | 19 24% | 16.9 33% | 21.8 13% | 15 40% | 18.3 27% | 17 32% | 20.1 ? 20% | 12.5 ? 50% |
| Load Average * (Watt) | 52.4 | 147 -181% | 104 -98% | 96.4 -84% | 86 -64% | 116 -121% | 100.6 -92% | 88 ? -68% | 65 ? -24% |
| Witcher 3 ultra * (Watt) | 110.2 | 147.8 -34% | 142 -29% | 125 -13% | 160.6 -46% | 117.6 -7% | 158 -43% | ||
| Load Maximum * (Watt) | 146 | 244 -67% | 214 -47% | 204 -40% | 172 -18% | 162 -11% | 192 -32% | 176.3 ? -21% | 111.9 ? 23% |
* ... smaller is better
Power Consumption: The Witcher 3 / Stress test
Power Consumption: External monitor
Battery Life
The 96 WHr battery is a marked improvement over the 70 WHr capacity in last year's model. The battery can afford ~10 hours of run time during web browsing and H.264 1080p video playback at 150 nits.
The supplied power adapter can fast-charge the battery to 50% in about 30 minutes.
| Asus VivoBook Pro 16 K6602VU i9-13900H, GeForce RTX 4050 Laptop GPU, 96 Wh | Asus Vivobook Pro 16X K6604JV-MX016W i9-13980HX, GeForce RTX 4060 Laptop GPU, 90 Wh | Asus ROG Flow X16 GV601V i9-13900H, GeForce RTX 4060 Laptop GPU, 90 Wh | Lenovo Legion Pro 5 16ARX8 (R5 7645HX, RTX 4050) R5 7645HX, GeForce RTX 4050 Laptop GPU, 80 Wh | Asus TUF Gaming A16 FA617XS R9 7940HS, Radeon RX 7600S, 90 Wh | Asus VivoBook Pro 16 i7-12700H, GeForce RTX 3050 Ti Laptop GPU, 70 Wh | Gigabyte AERO 16 OLED BSF i9-13900H, GeForce RTX 4070 Laptop GPU, 88 Wh | Average of class Multimedia | |
|---|---|---|---|---|---|---|---|---|
| Battery runtime | -41% | -16% | -45% | 25% | -28% | -25% | 47% | |
| H.264 (h) | 9.8 | 5.3 -46% | 8.9 -9% | 5.4 -45% | 12.4 27% | 7.4 -24% | 16.8 ? 71% | |
| WiFi v1.3 (h) | 10.1 | 6.5 -36% | 7.9 -22% | 5.6 -45% | 12.4 23% | 7.3 -28% | 7.5 -26% | 12.3 ? 22% |
| Load (h) | 1.5 | 1.5 | 0.9 | 2.1 | 1.645 ? | |||
| Witcher 3 ultra (h) | 0.8 | |||||||
| Reader / Idle (h) | 20.3 | 24.9 ? |
Pros
Cons
Verdict: First pitstop before splurging on the ProArt lineup
The 2023 Asus VivoBook Pro 16 K6602VU brings noteworthy upgrades over its predecessor. Although not luxurious, the VivoBook Pro 16 is solidly built.
The standout feature is the gorgeous 3.2K 120 Hz OLED display borrowed from Asus's pricier ProArt line, which excels for both creating and consuming content. Battery run times have also improved to around 10 hours thanks to the new 96 WHr battery.
Aimed at multimedia users and hobbyist creators, the Asus VivoBook Pro 16 K6602 hits a sweet spot before considering the more expensive ProArt StudioBook series. While the Core i9-13900H and RTX 4050 combo can get most jobs done, power users will want to look elsewhere."
Wi-Fi 6E performance could be better optimized, and port placement improved. However, our main peeve with this laptop is that Asus limits the potential of the Core i9-13900H CPU by restricting power limits below its capabilities.
The CPU and GPU combo underdelivers on Asus's claimed 90 W combined TDP target. Nevertheless, it still provides ample performance for everyday productivity and amateur creative work. The RTX 4050 even enables decent high-resolution gaming with some support from upscalers.
Despite a few shortcomings, the VivoBook Pro 16 a strong contender for buyers seeking a well-rounded multimedia laptop that can create as well as game around the ₹1,54,990 (€2,199) mark.
For those who like VivoBook aesthetics but want something even more powerful, the Asus VivoBook Pro 16X K6604 with the Core i9-13980HX should fit the bill. The Gigabyte Aero 16 OLED BSF is another viable but expensive option if you are seeking a more premium construction and a powerful GPU.
Price and Availability
The tested configuration of the Asus VivoBook Pro 16 OLED K6602VU can be had for ₹1,54,990 from the Asus India store and Amazon India.
In the US, Best Buy is currently offering the VivoBook Pro 16 K6602VV with the RTX 4060 for US$1,700 while Amazon US stocks it for US$1,673. The FHD+ variant of this SKU can be had for US$1,300 on Amazon US.
Asus VivoBook Pro 16 K6602VU
- 11/09/2023 v7 (old)
Vaidyanathan Subramaniam
Transparency
The selection of devices to be reviewed is made by our editorial team. The test sample was provided to the author as a loan by the manufacturer or retailer for the purpose of this review. The lender had no influence on this review, nor did the manufacturer receive a copy of this review before publication. There was no obligation to publish this review. As an independent media company, Notebookcheck is not subjected to the authority of manufacturers, retailers or publishers.
This is how Notebookcheck is testing
Every year, Notebookcheck independently reviews hundreds of laptops and smartphones using standardized procedures to ensure that all results are comparable. We have continuously developed our test methods for around 20 years and set industry standards in the process. In our test labs, high-quality measuring equipment is utilized by experienced technicians and editors. These tests involve a multi-stage validation process. Our complex rating system is based on hundreds of well-founded measurements and benchmarks, which maintains objectivity. Further information on our test methods can be found here.
Price comparison
