Apple MacBook Air 15 M3 review - Apple’s large everyday MacBook gets a power up
In the middle of last year, Apple launched the larger MacBook Air 15 and it was exactly what we expected: A bigger MacBook Air with more screen space and comparable performance due to the same implementation of passive cooling. The big Air is now getting the first update to the new M3 processor as well as the installation of a new Wi-Fi module but, apart from that, it's pretty much as you were.
The RRP hasn't changed and Apple continues to charge a whopping $1,299 for the entry-level model with 8 GB RAM and a 256 GB SSD. There is now an additional preconfigured model (our review device) with 16 GB of RAM and a 512 GB SSD for $1,699. The advantage of this is that in many shops the preconfigured model is often reduced in price.
Possible competitors compared
Rating | Date | Model | Weight | Height | Size | Resolution | Price |
|---|---|---|---|---|---|---|---|
| 91.6 % v7 (old) | 03 / 2024 | Apple MacBook Air 15 M3 M3, M3 10-Core GPU | 1.5 kg | 11.5 mm | 15.30" | 2880x1864 | |
| 84.9 % v7 (old) | 02 / 2024 | Asus VivoBook S15 K5504 i9-13900H, Iris Xe G7 96EUs | 1.6 kg | 19 mm | 15.60" | 2880x1620 | |
| 88.1 % v7 (old) | 12 / 2023 | MSI Prestige 16 B1MG-001US Ultra 7 155H, Arc 8-Core | 1.6 kg | 19.1 mm | 16.00" | 2560x1600 | |
| 86.6 % v7 (old) | 06 / 2023 | Acer Swift Go SFG16-71 i7-13700H, Iris Xe G7 96EUs | 1.6 kg | 19 mm | 16.00" | 3200x2000 | |
| 86 % v7 (old) | 06 / 2023 | Huawei MateBook 16s i9 i9-13900H, Iris Xe G7 96EUs | 2 kg | 17.8 mm | 16.00" | 2560x1680 | |
| 85 % v7 (old) | 07 / 2023 | LG Gram SuperSlim (2023) i7-1360P, Iris Xe G7 96EUs | 990 g | 10.9 mm | 15.60" | 1920x1080 | |
| 80.7 % v7 (old) | 06 / 2023 | Samsung Galaxy Book3 15, Core i5-1335U i5-1335U, Iris Xe G7 80EUs | 1.5 kg | 15.4 mm | 15.60" | 1920x1080 |
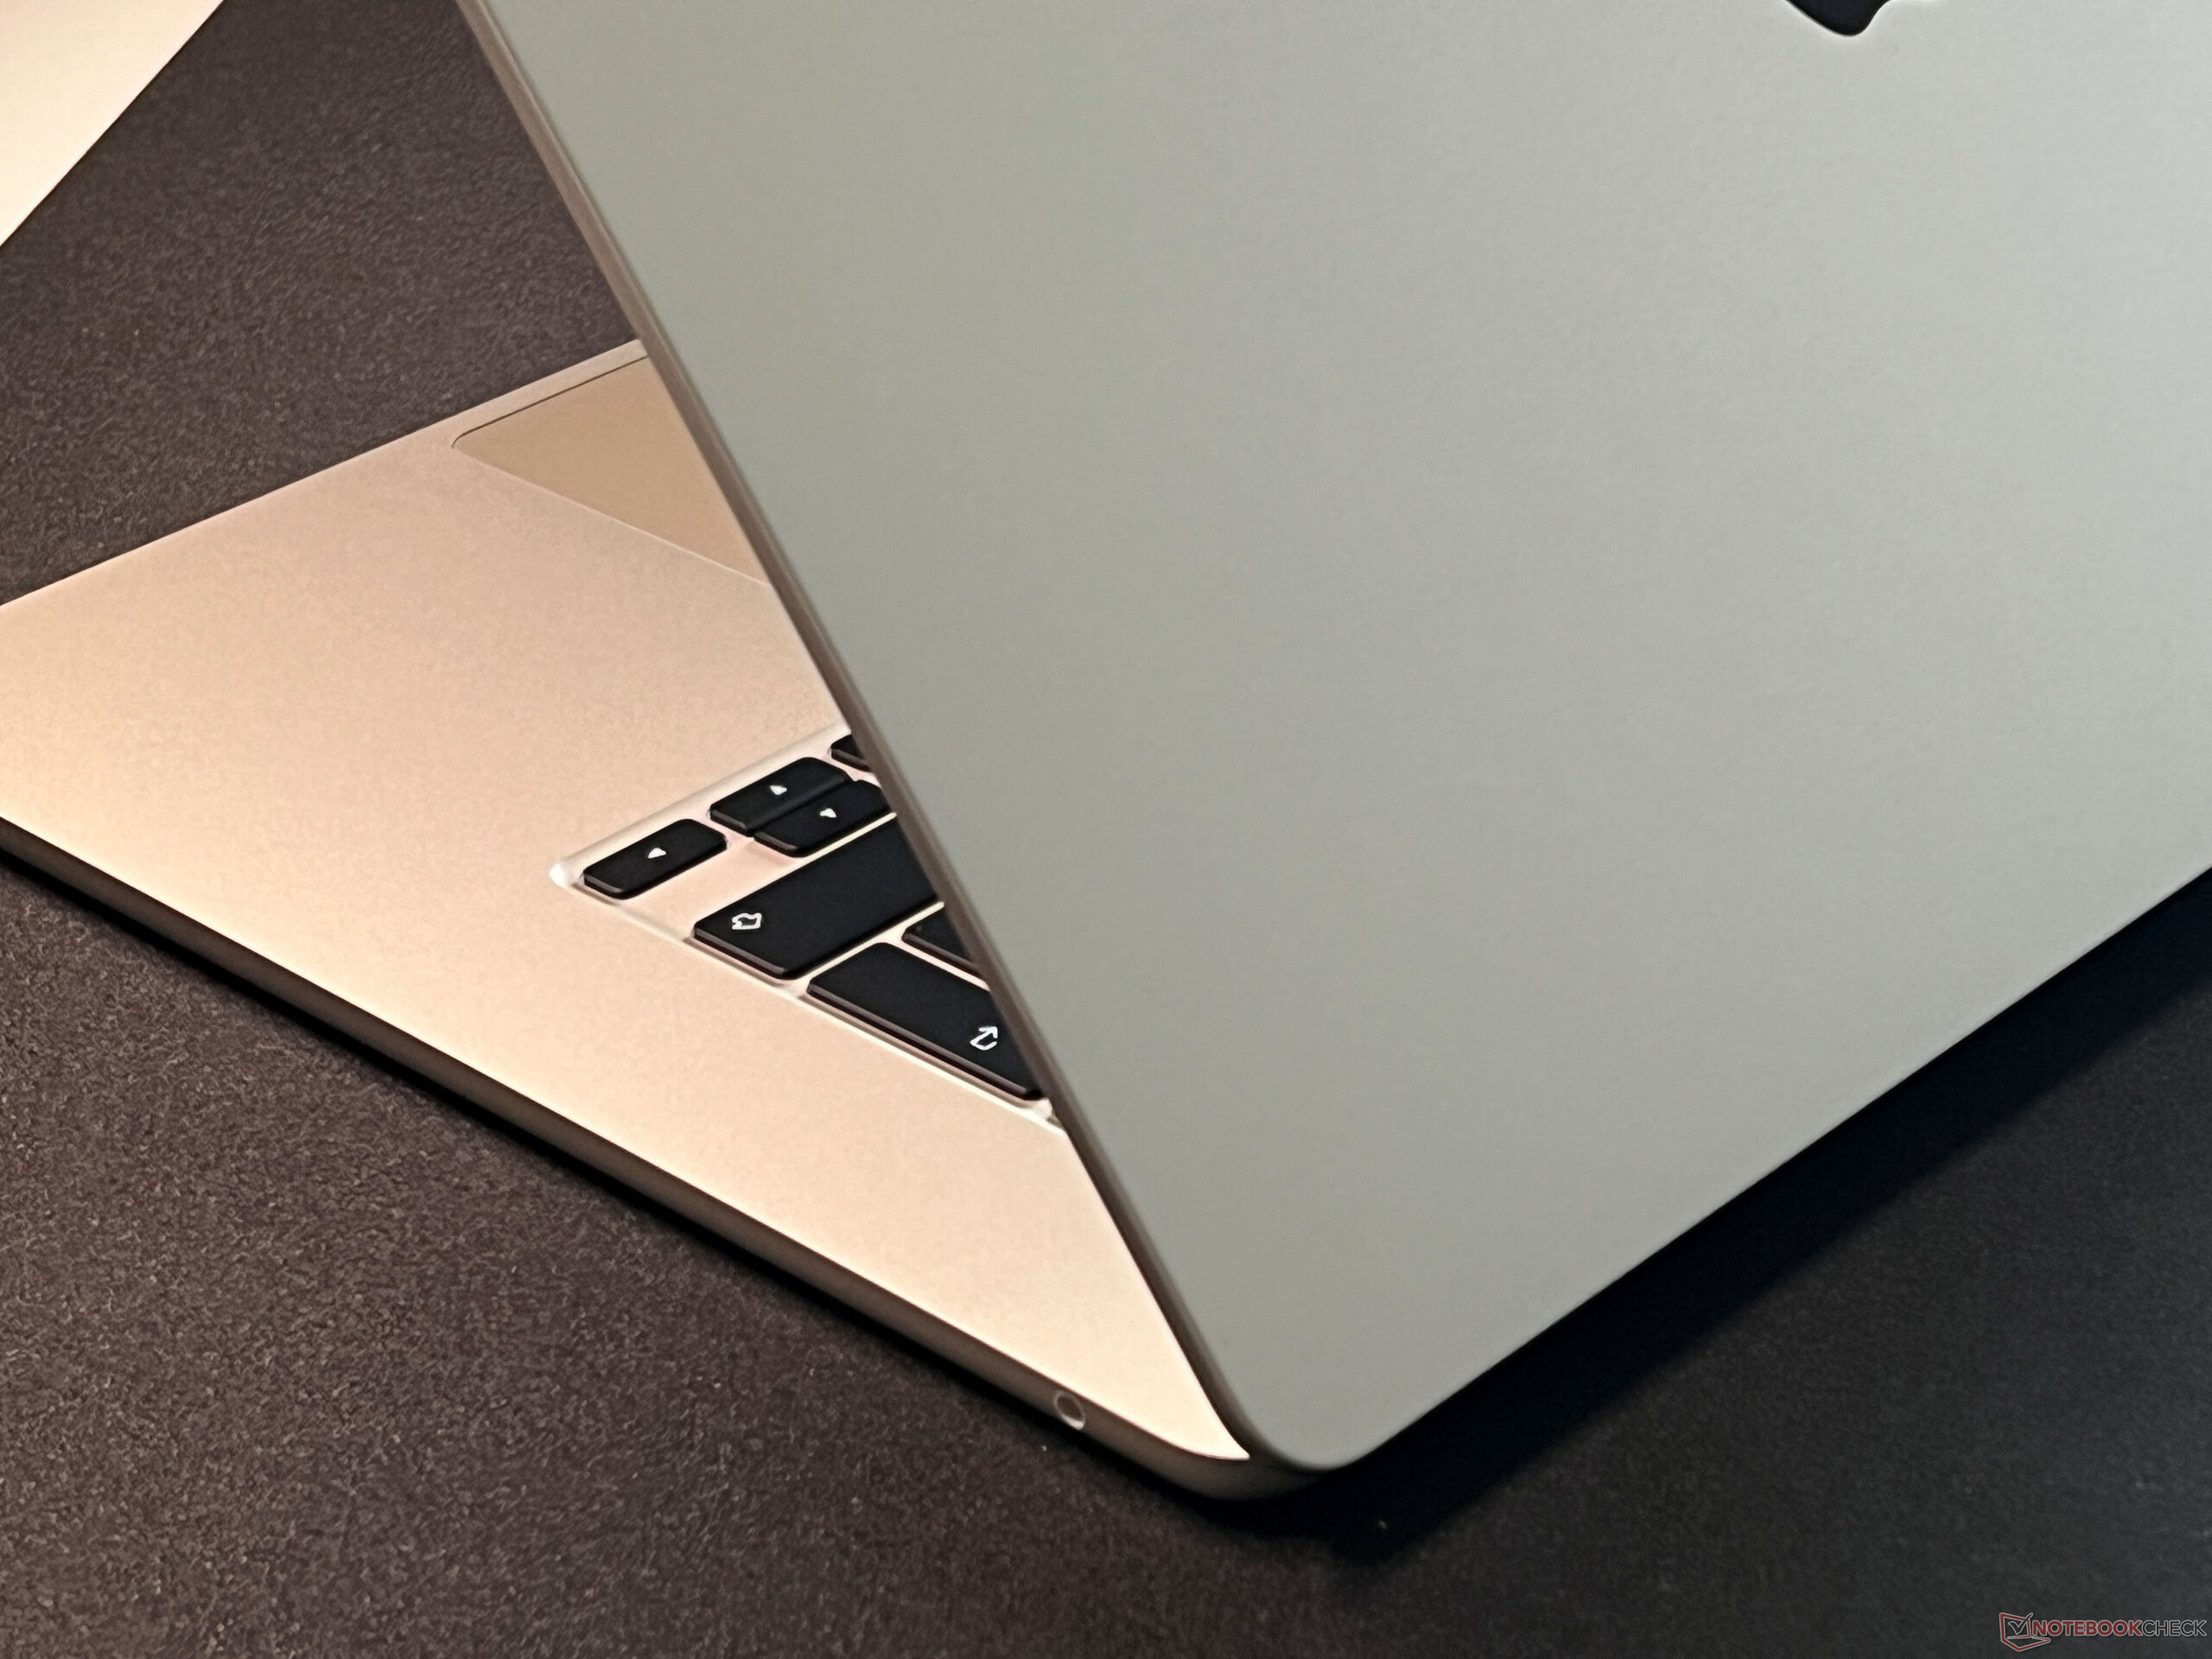
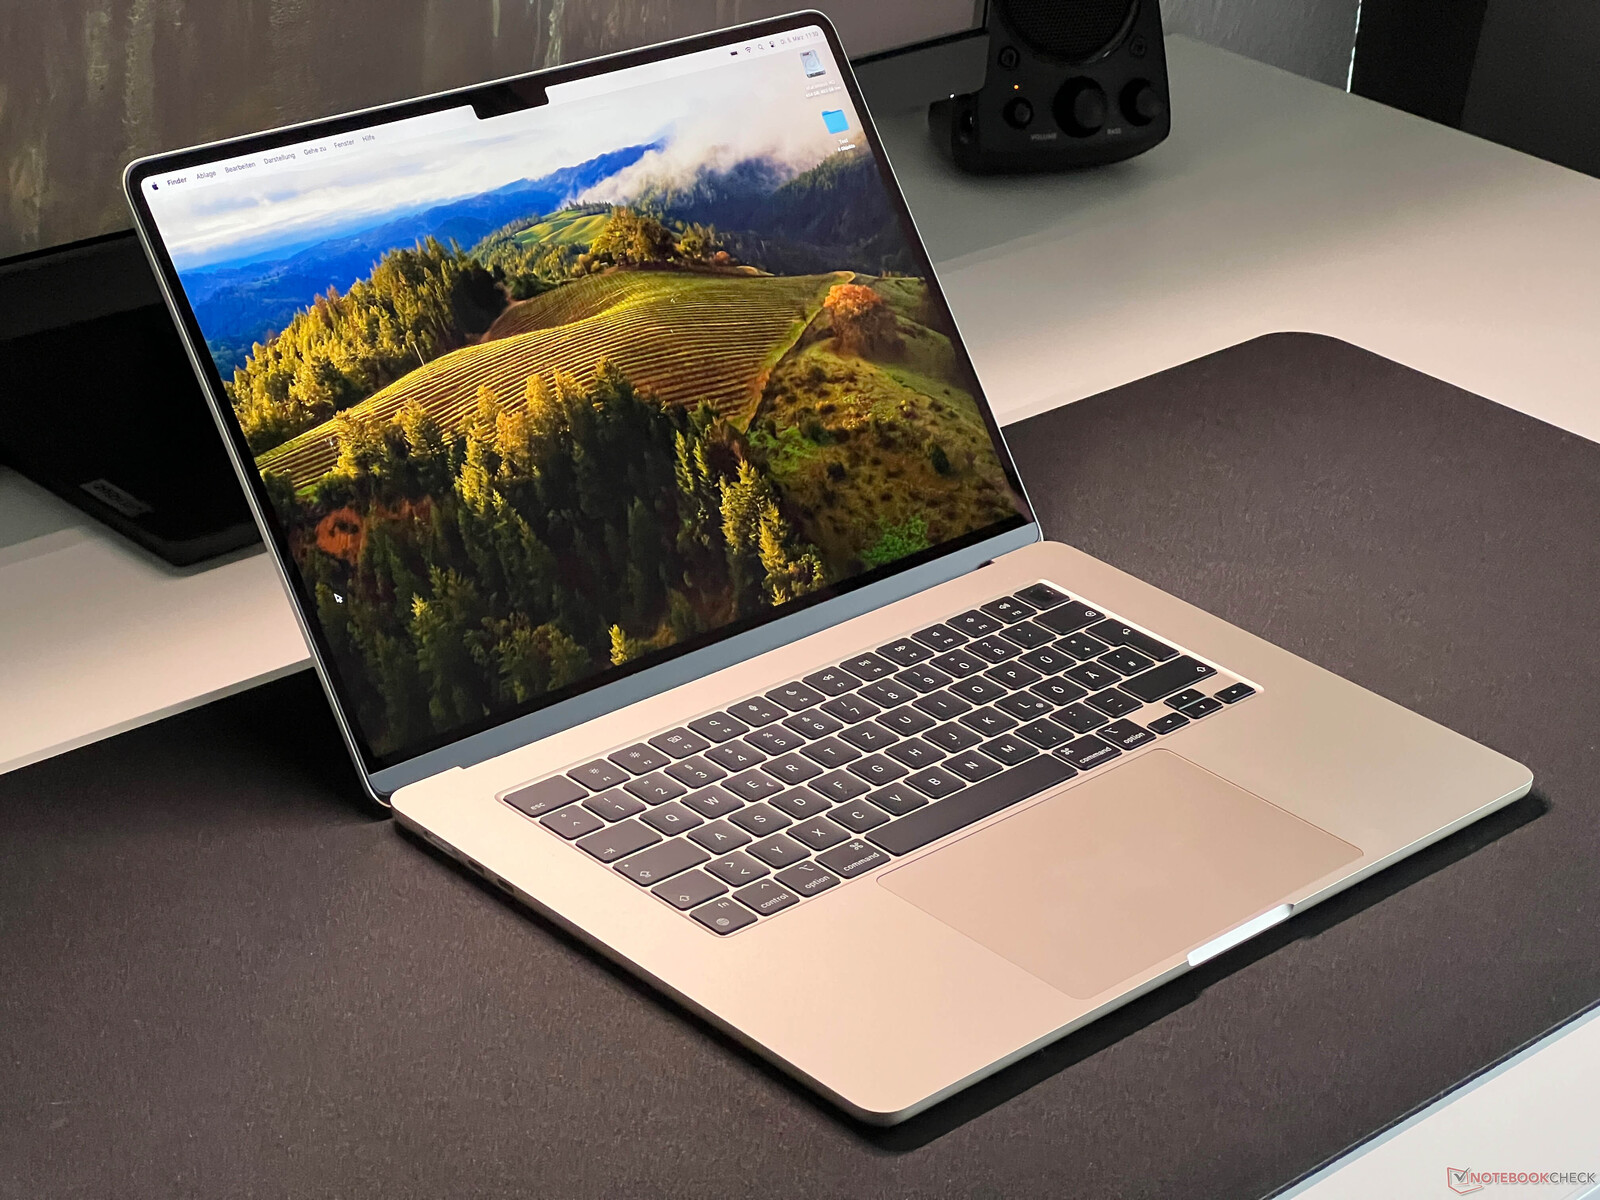
Case - The Midnight MacBook now comes with a new coating
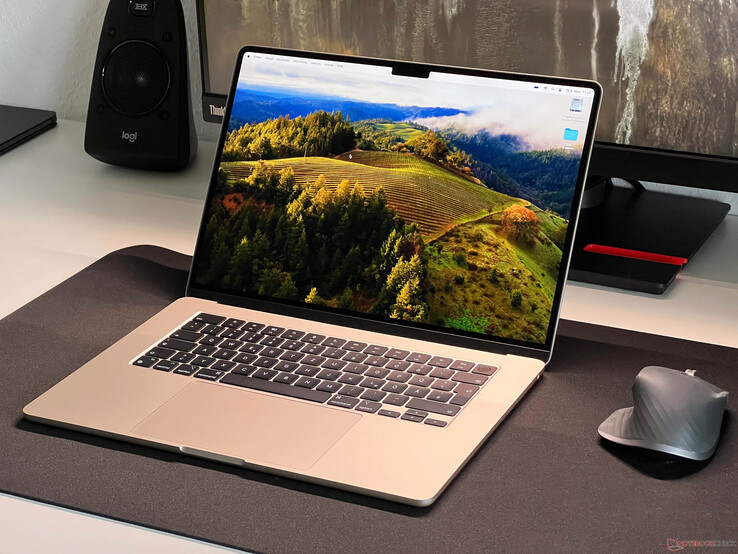
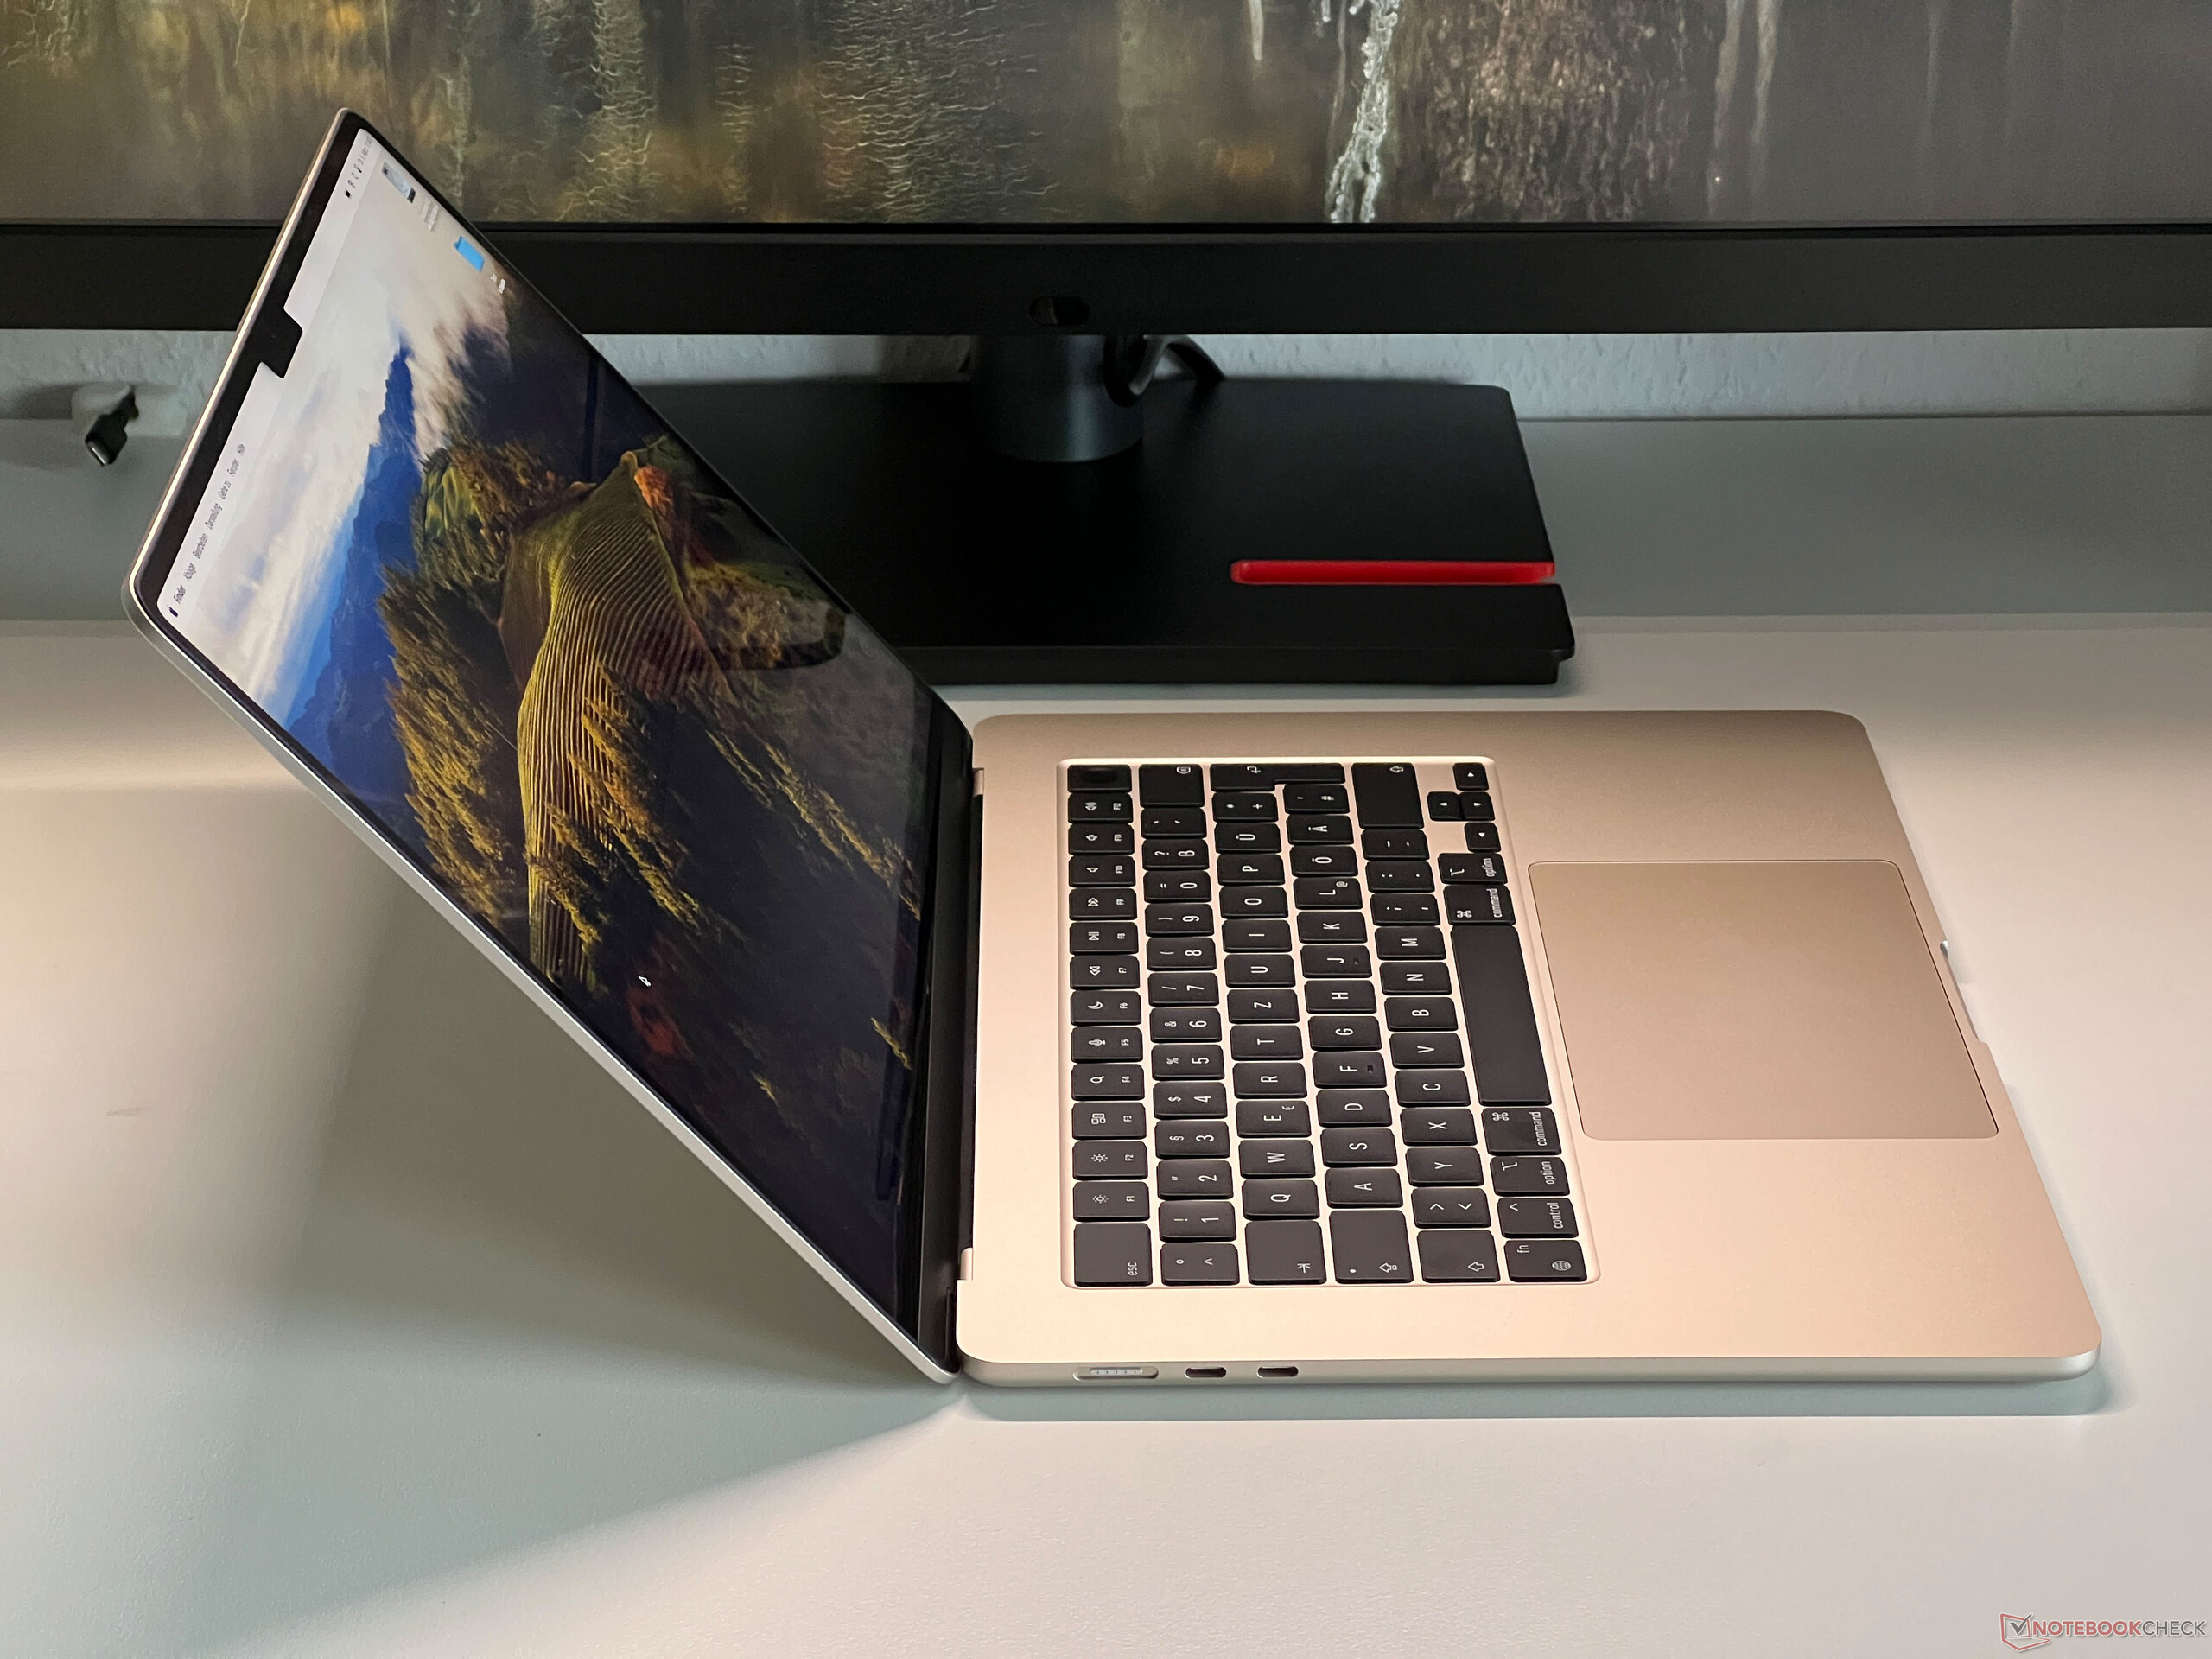
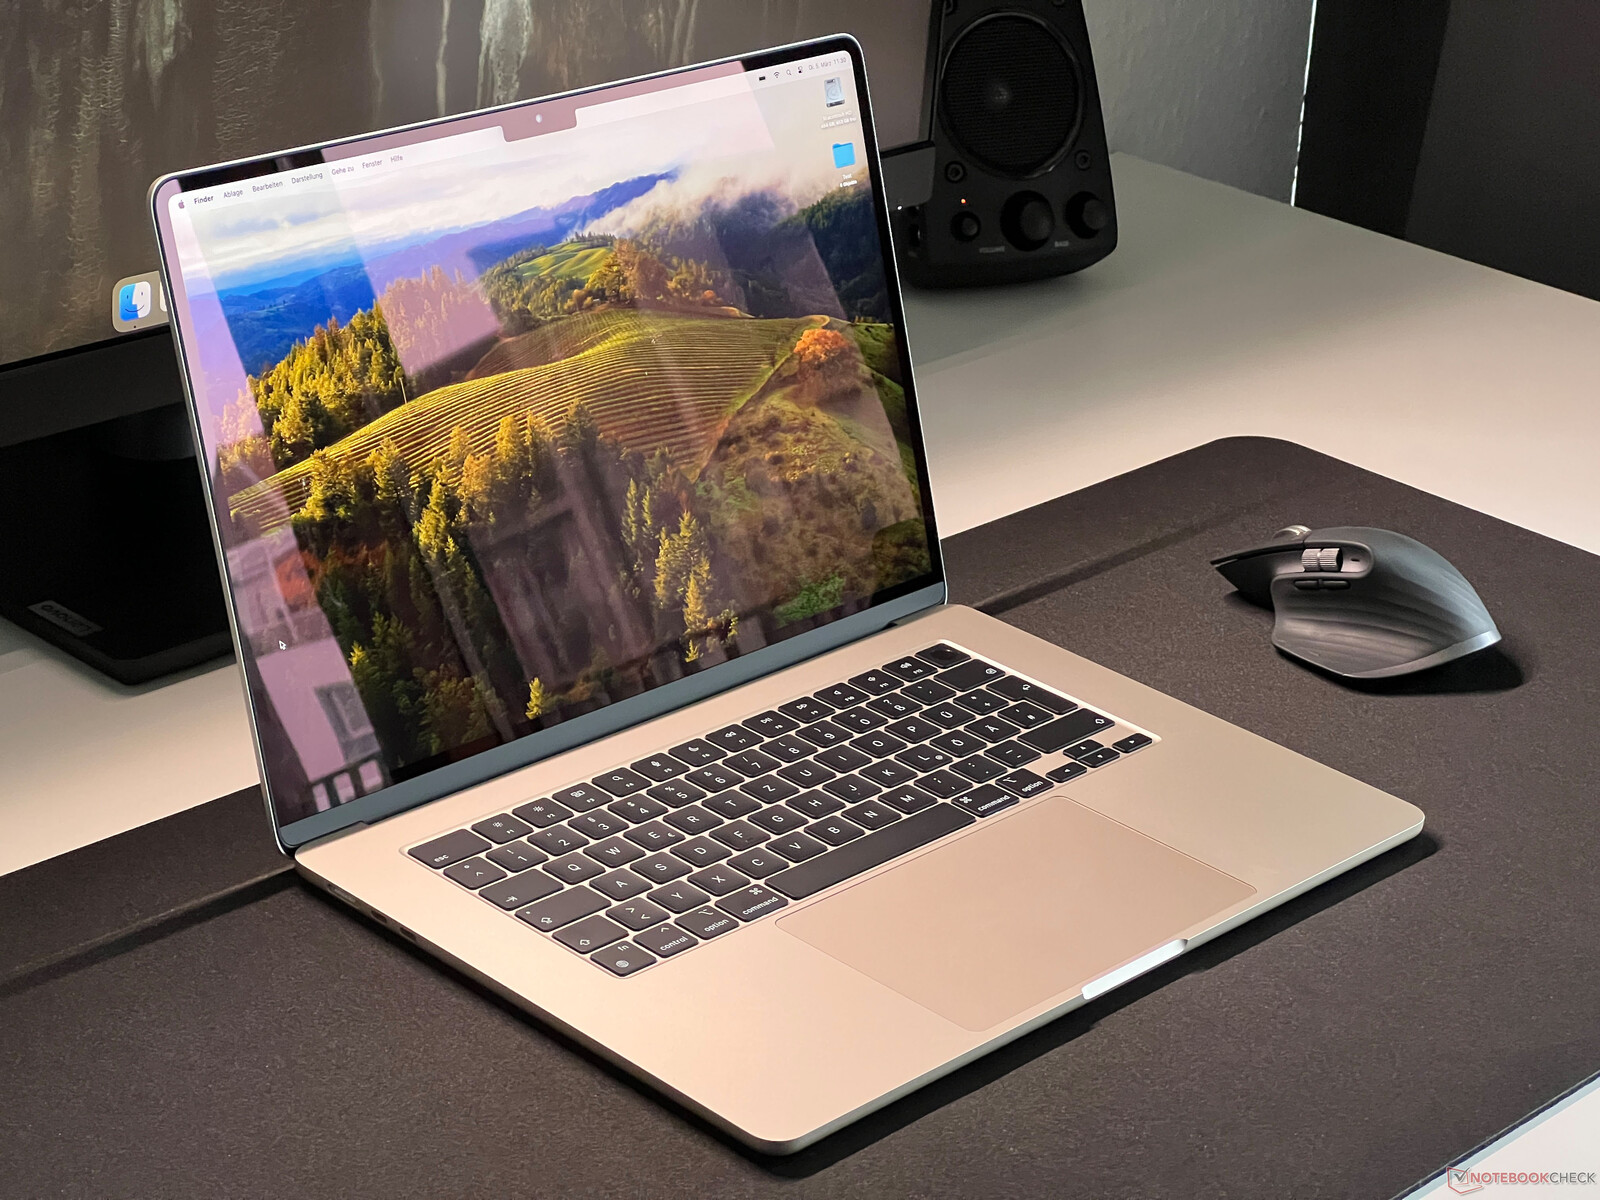
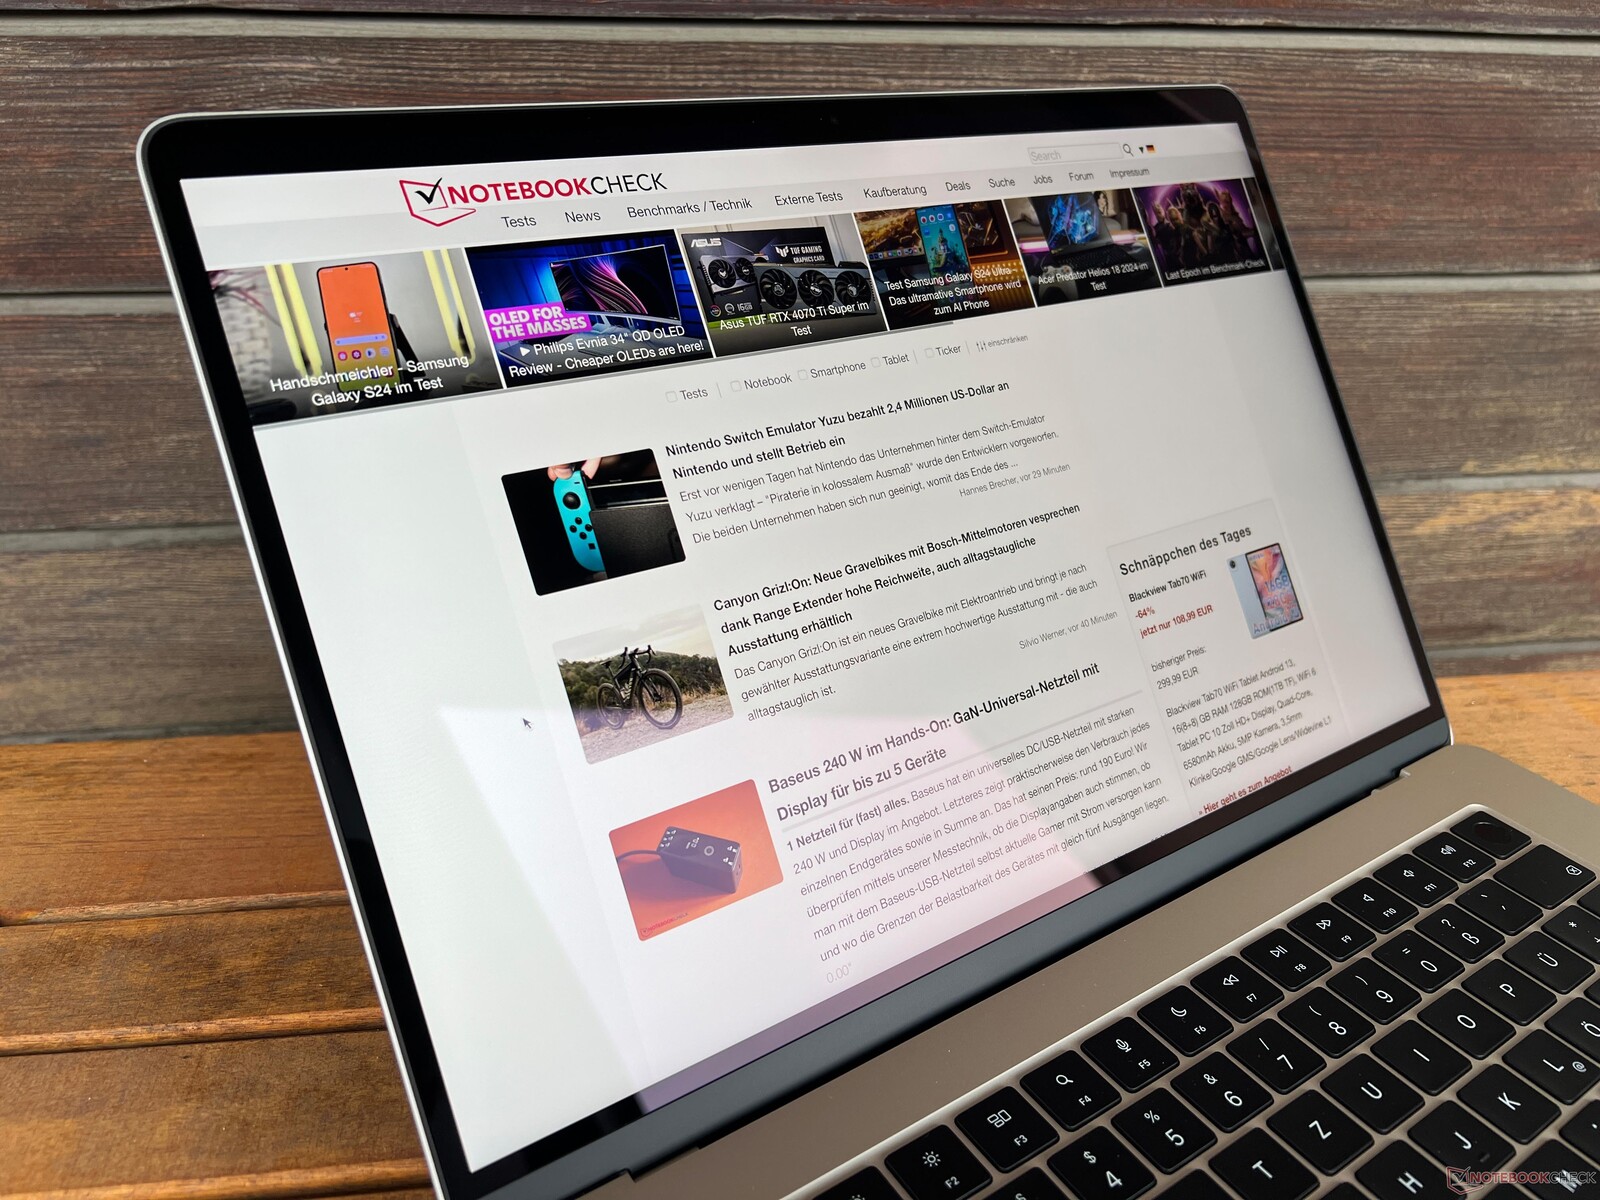
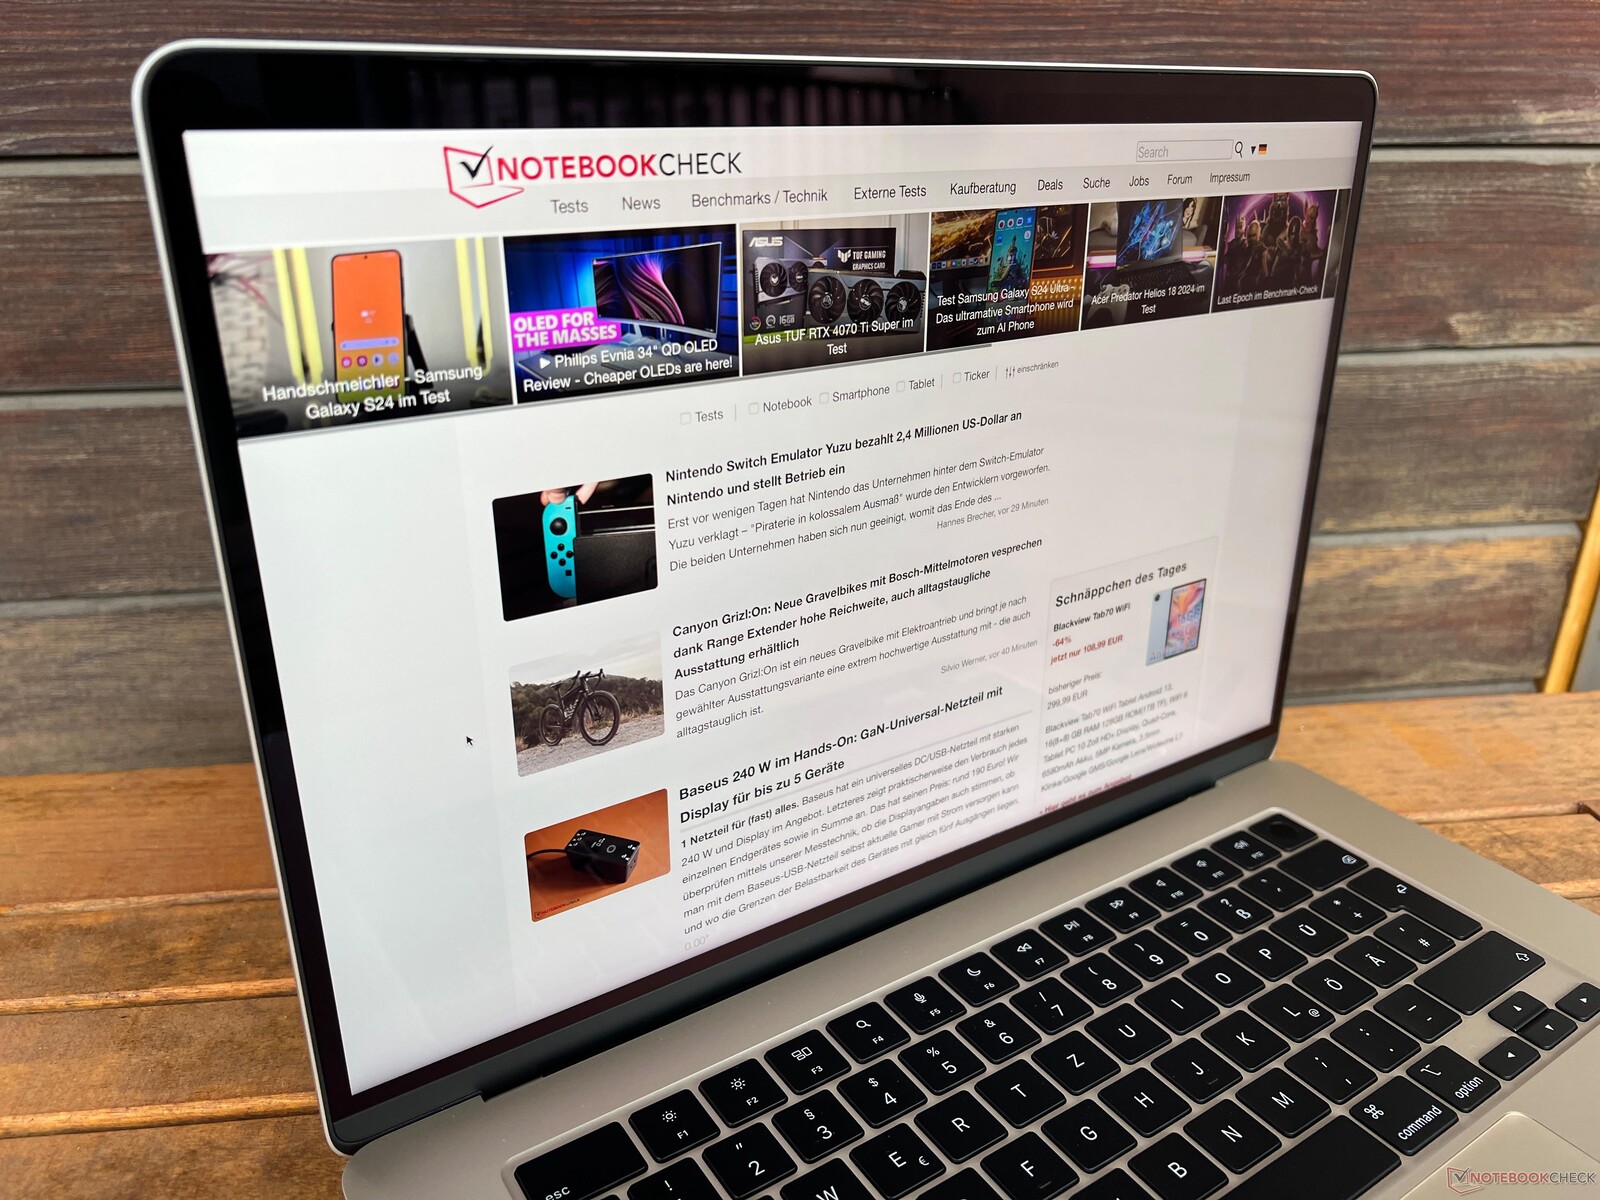
When it comes to the MacBook Air 15's design and case quality, basically nothing has changed. As with the predecessor, the larger Air is even thinner than the MBA 13 and this is why the device's weight (1.5 kg) will surprise you the first time you pick it up. In practice, the hard front edge isn't a problem since the base unit is too flat to cause discomfort to your wrists. The build quality continues to be excellent and this also applies to the stability. The maximum opening angle sits at 135 degrees.
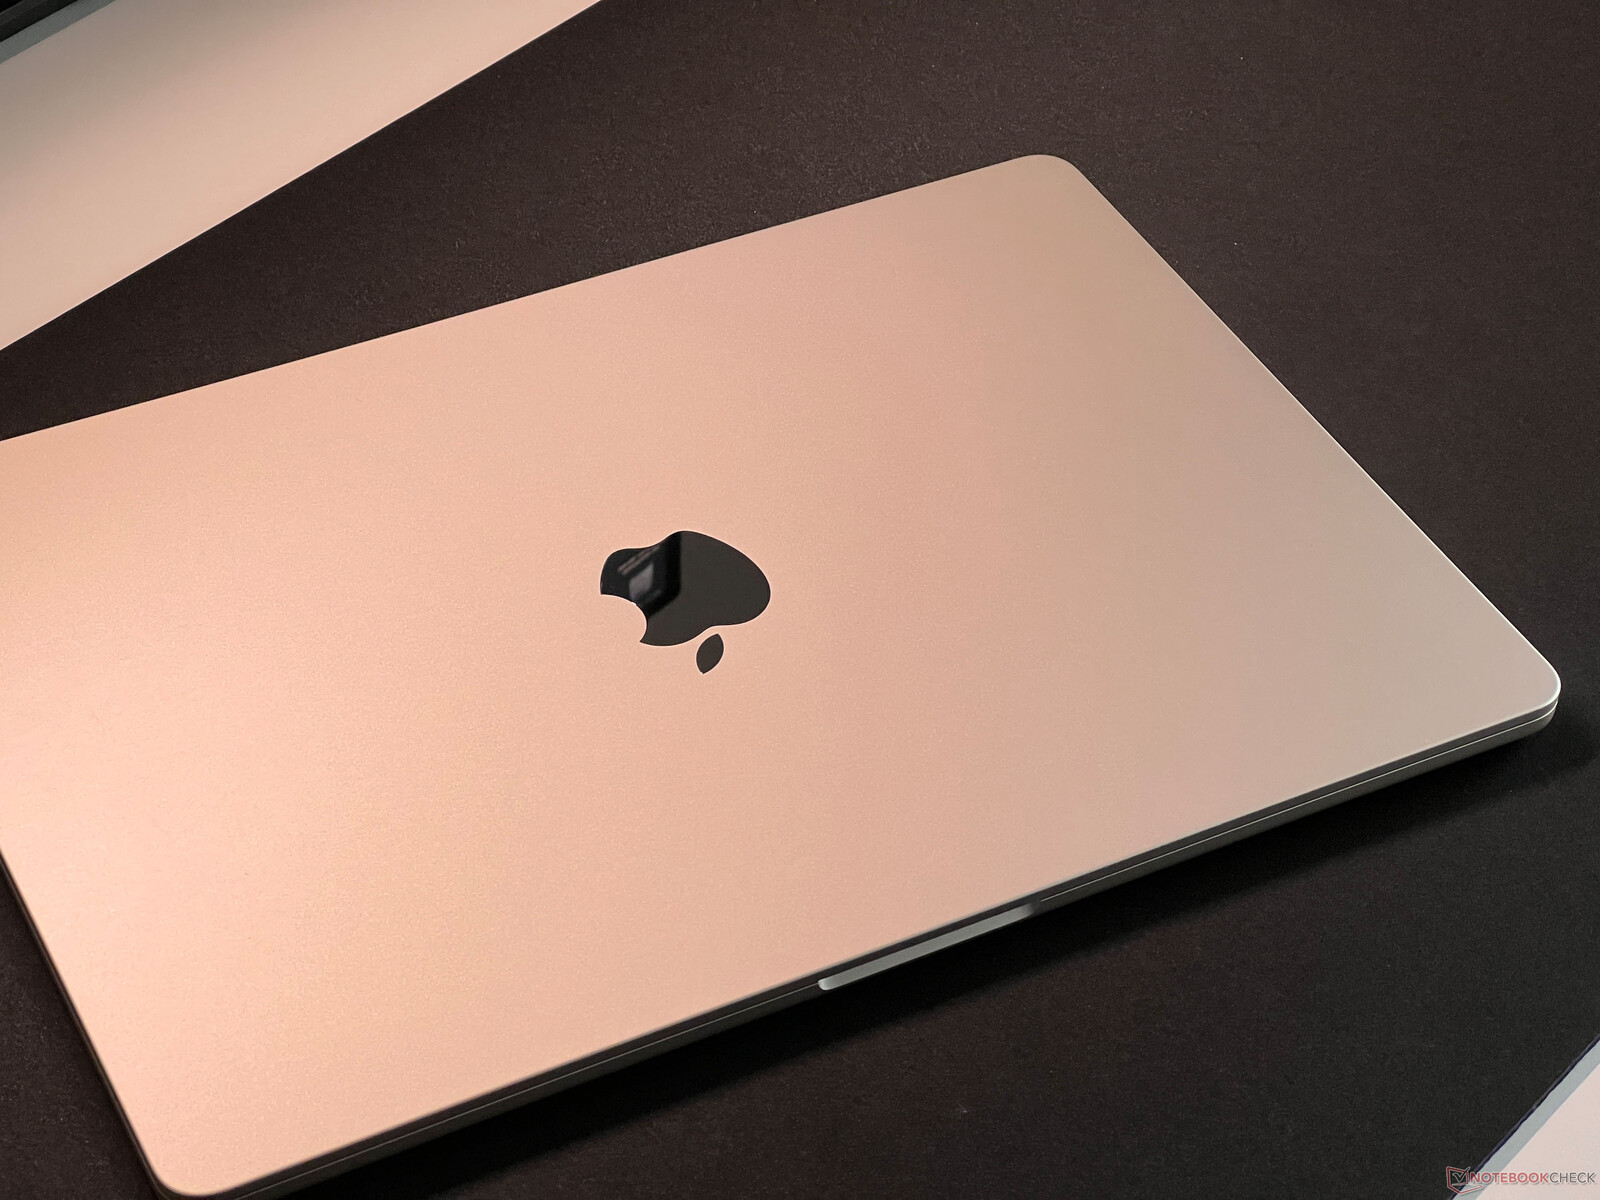
Apple has stuck with its four familiar color variants (Silver, Space Gray, Polar Star & Midnight). The dark blue Midnight variant looked particularly good in product photos, however, it very quickly revealed itself to be a fingerprint magnet and it was difficult to impossible to keep its surfaces clean. With the new M3 model (Midnight), we now have the same anodized coating at work as the one found on the black version of the MacBook Pro 14/16. This helps make fingerprints much less of a problem and this is something we observed with the new MacBook Air 13. Nevertheless, the lighter versions such as our Polar Star review sample have an advantage in this regard.
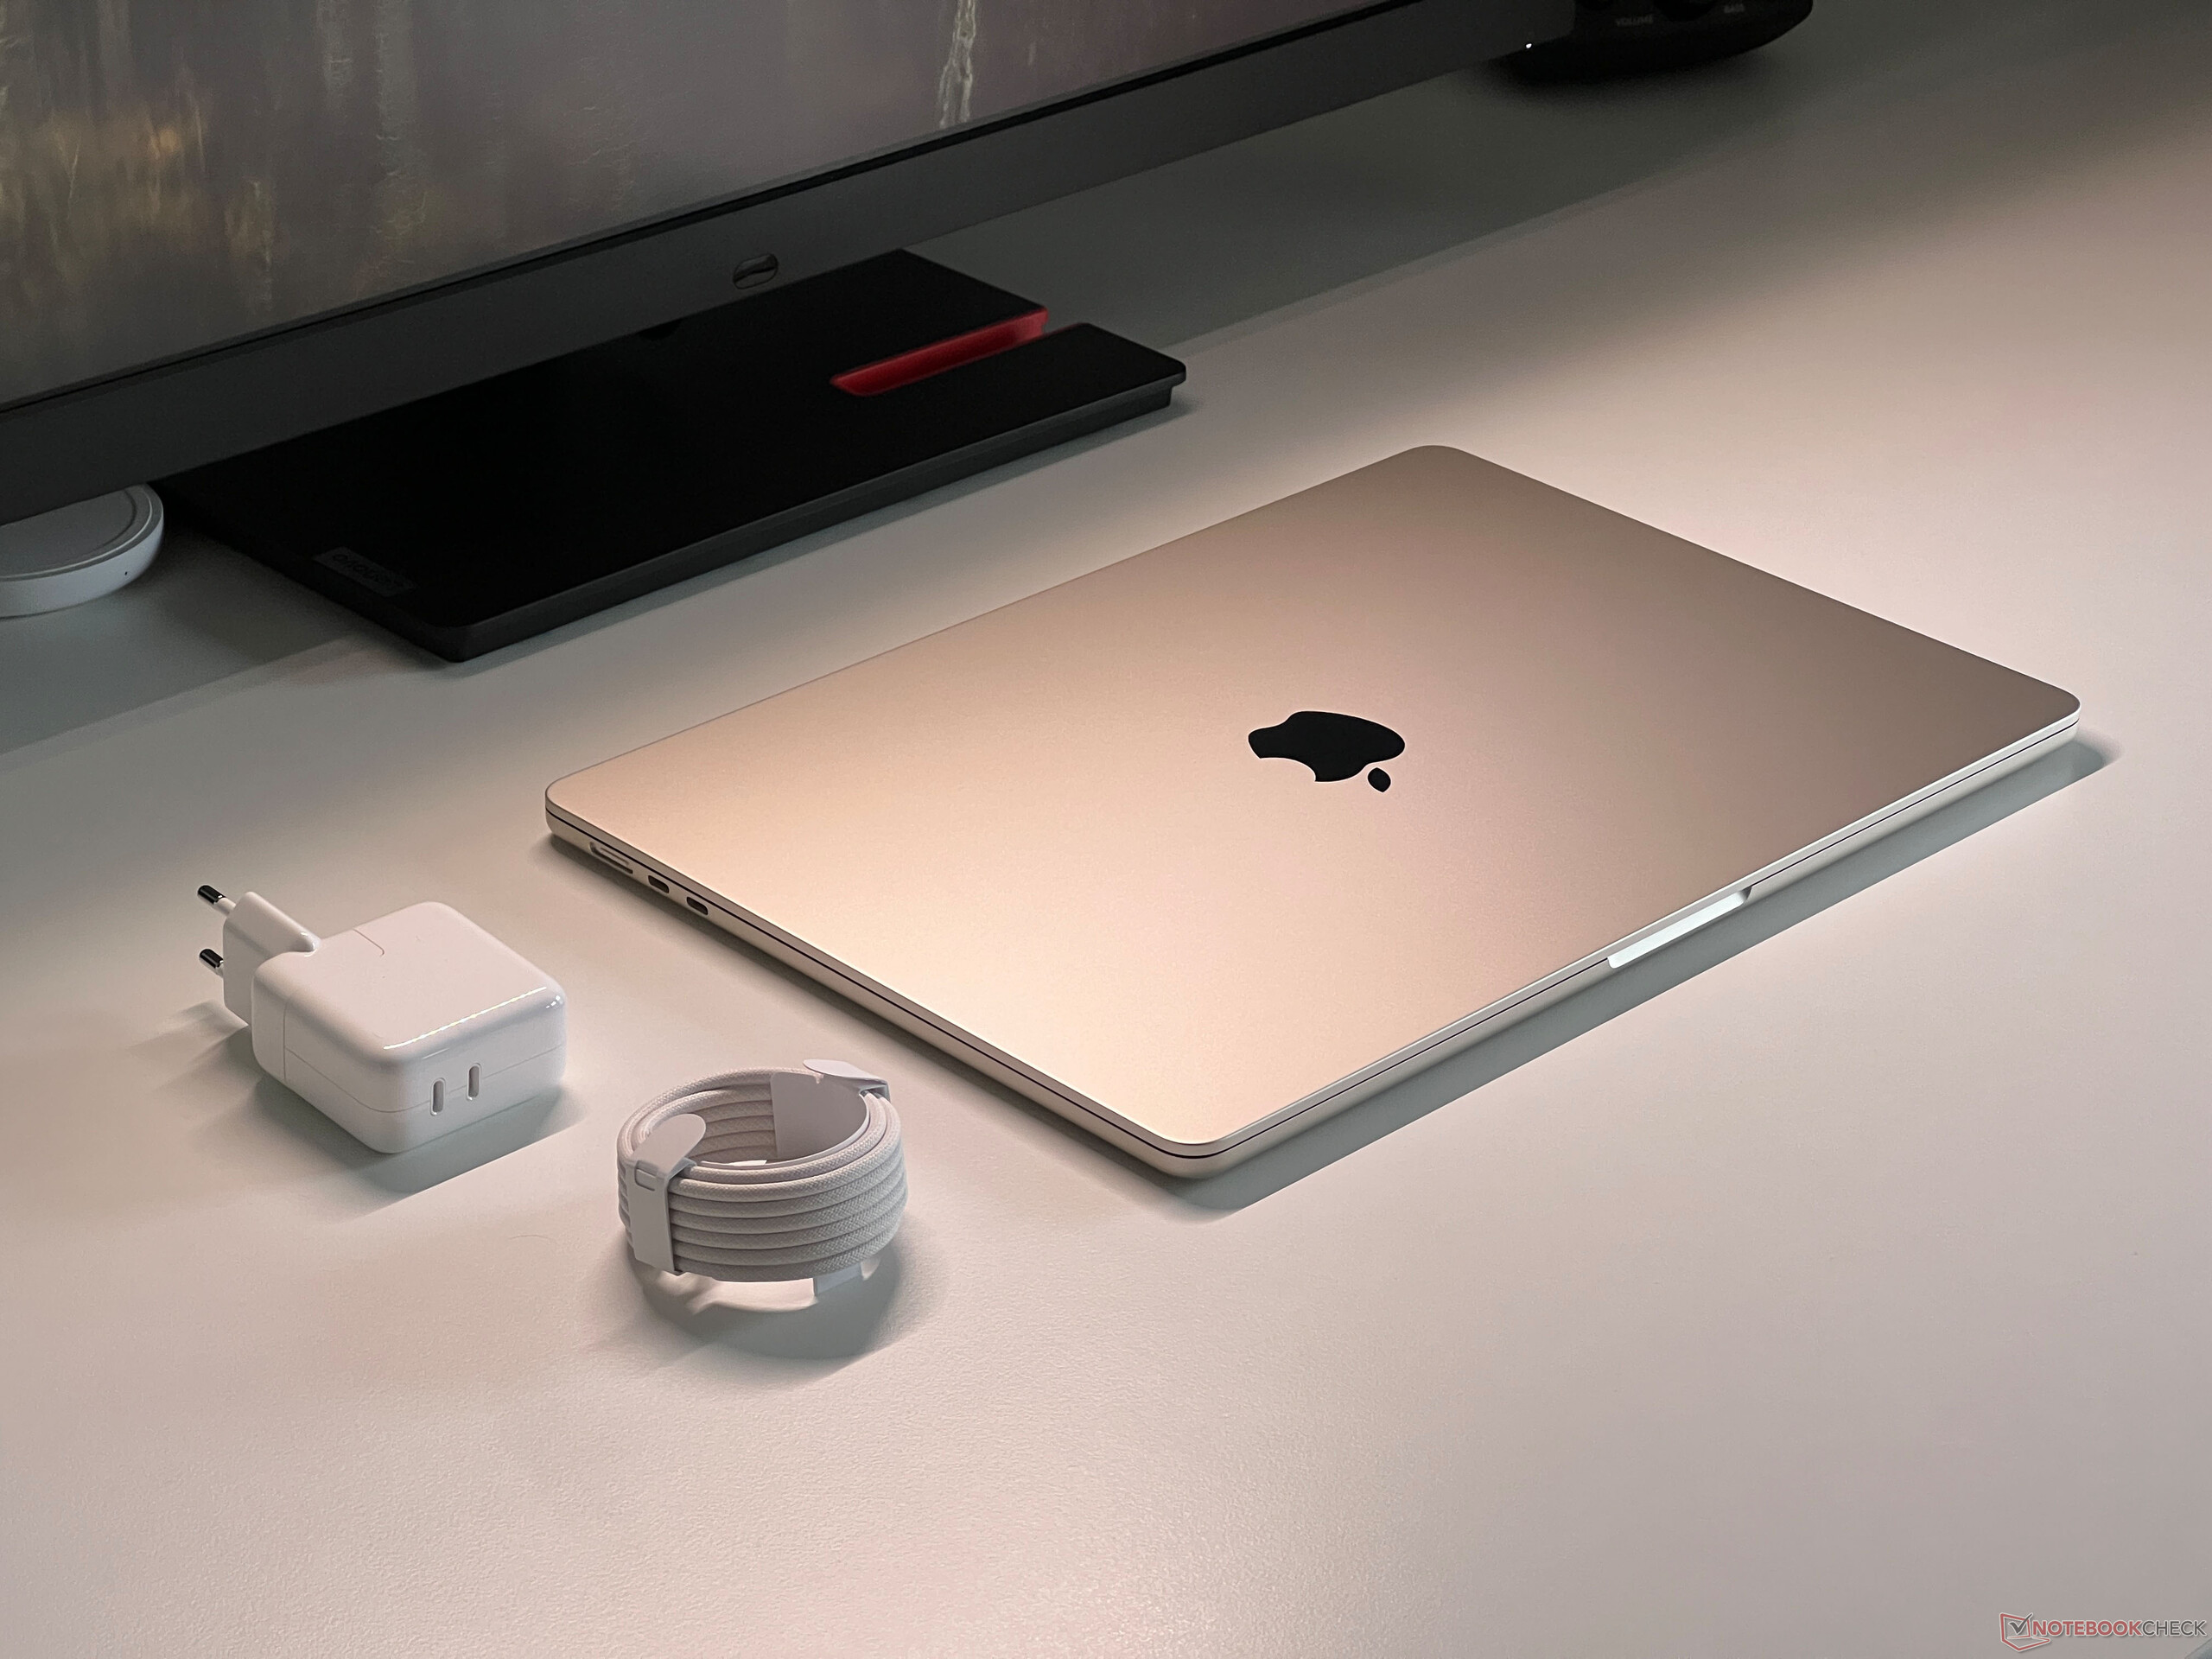
With its 1,5 kg, the Air 15 comes second only to the LG Gram (990 grams) but Apple's laptop is the thinnest device by quite some margin. The 35-watt power adapter brings another 184 grams to the scales.
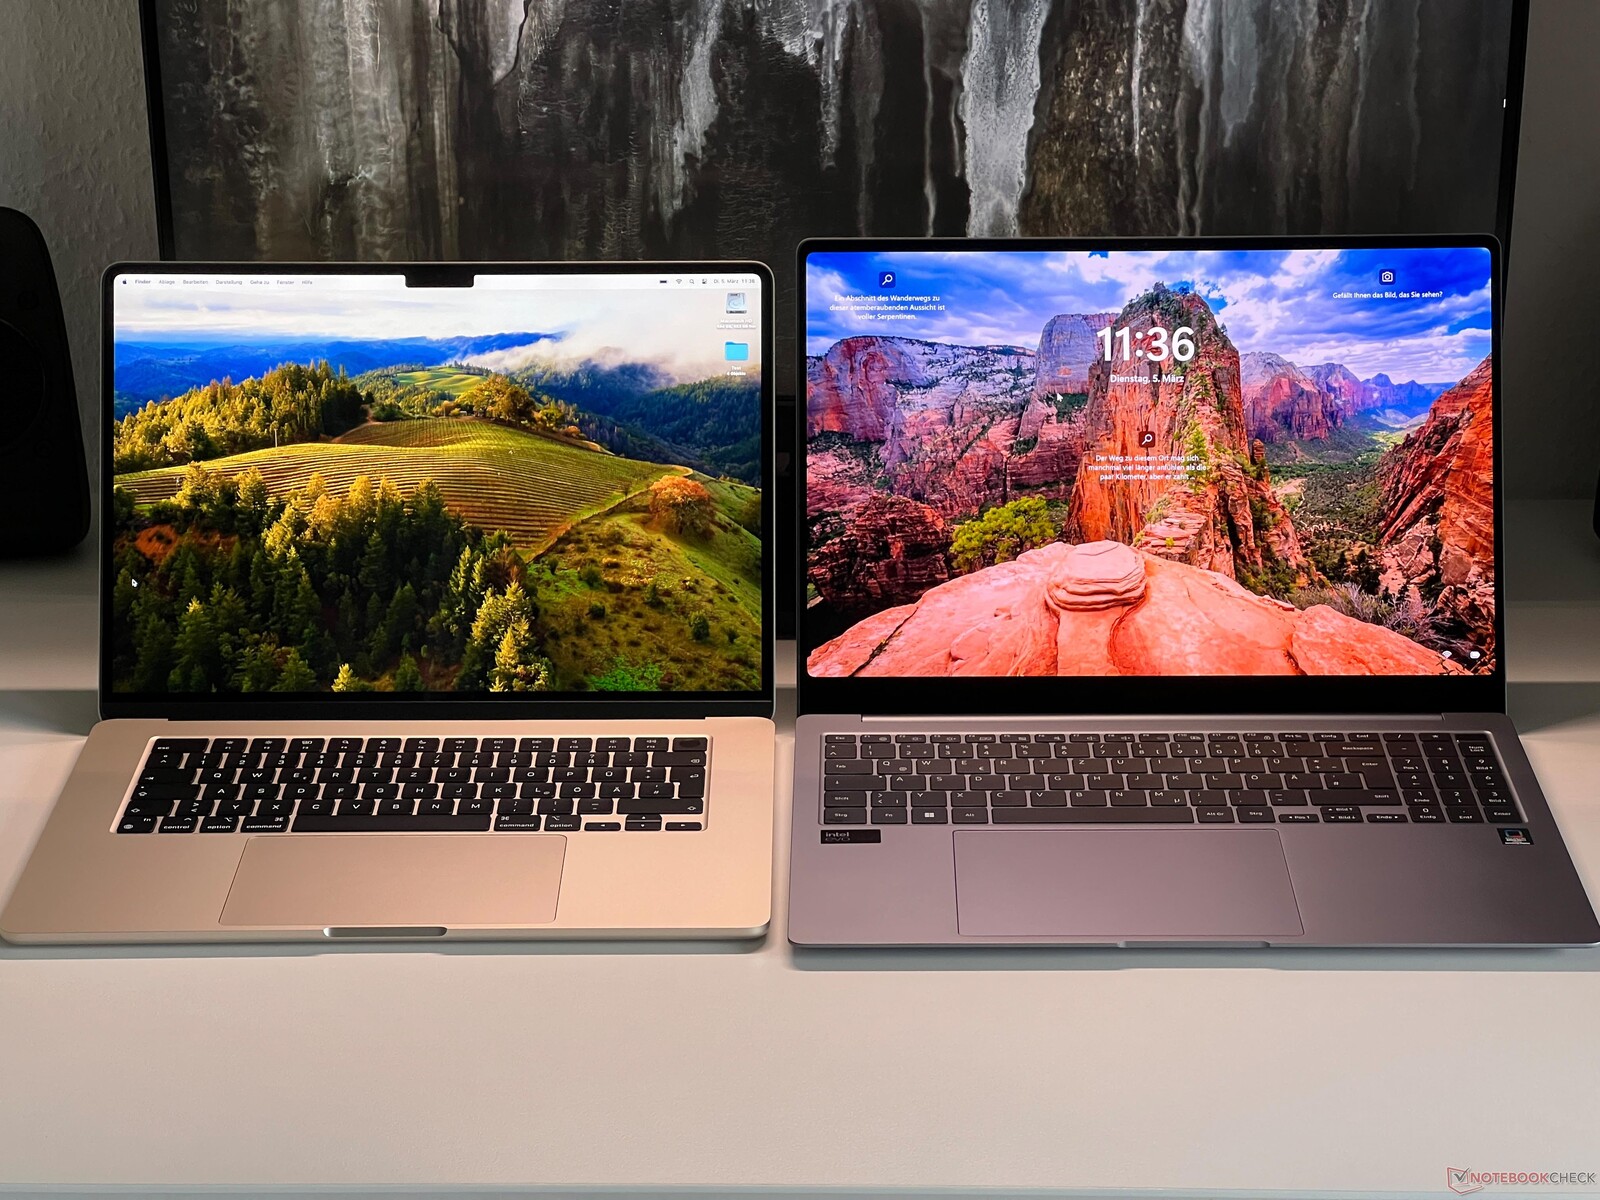
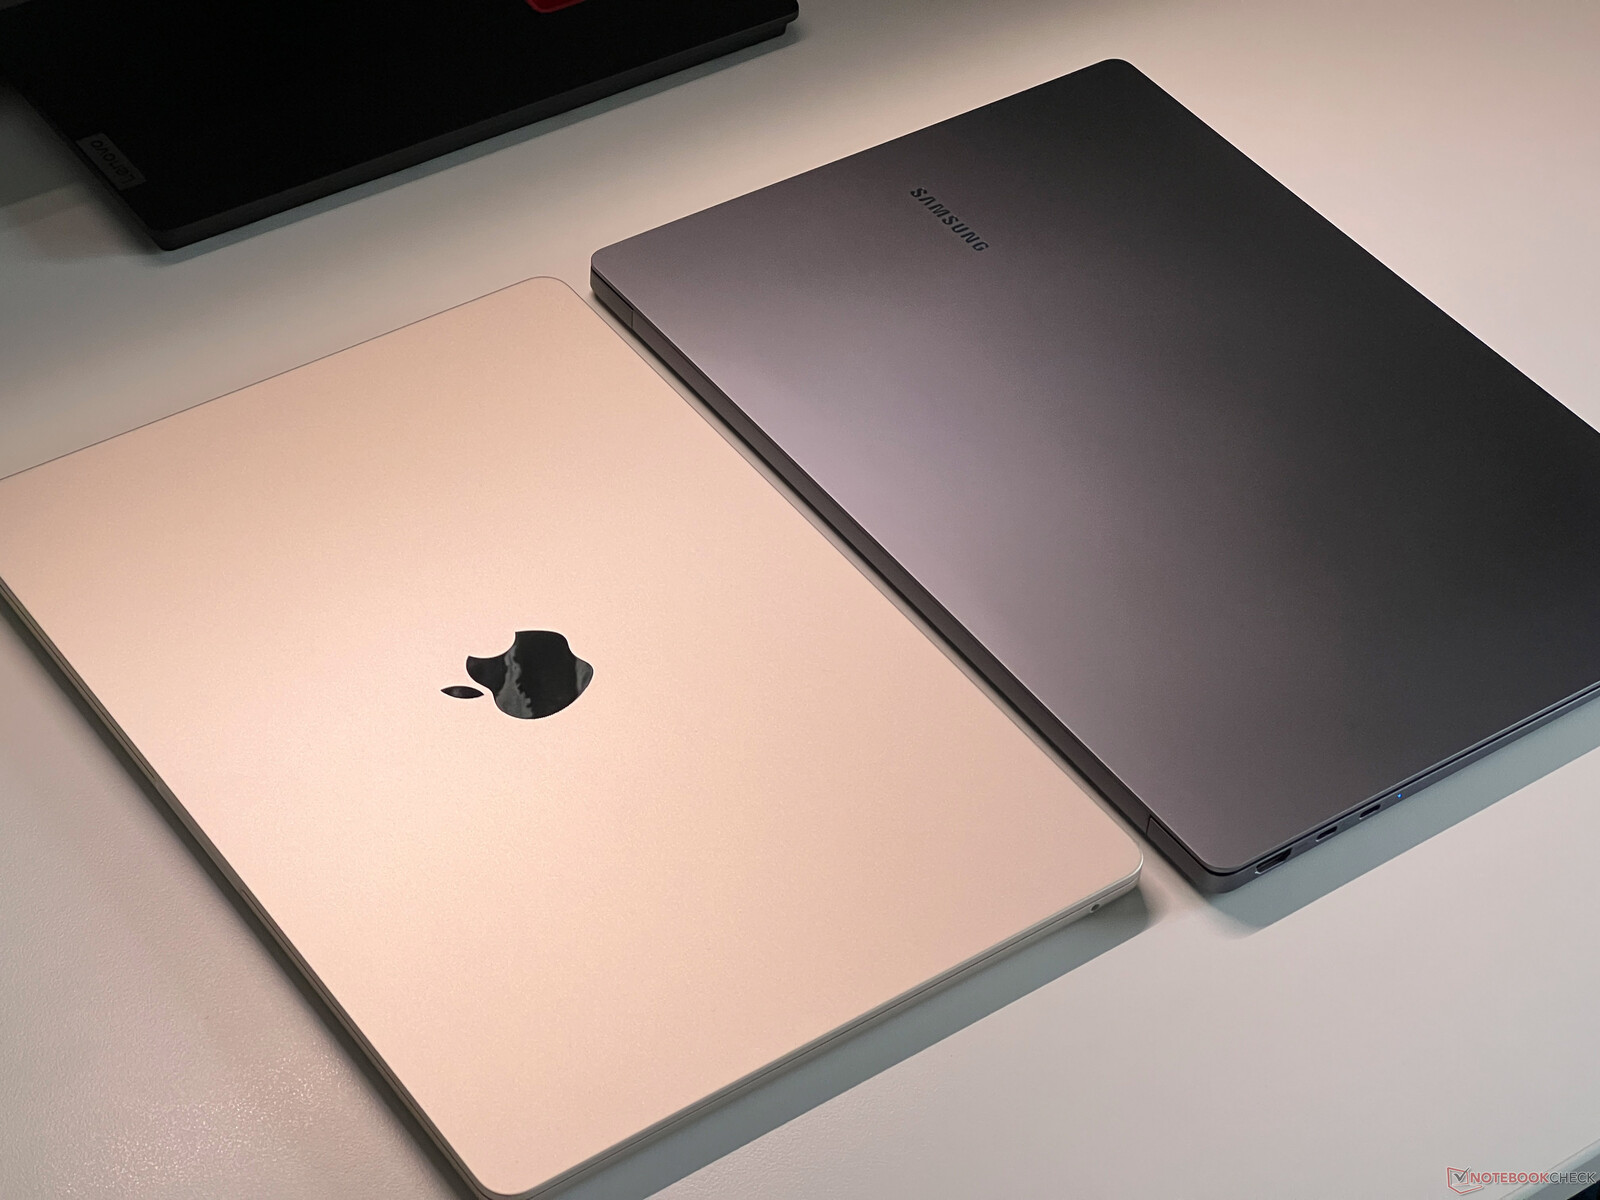
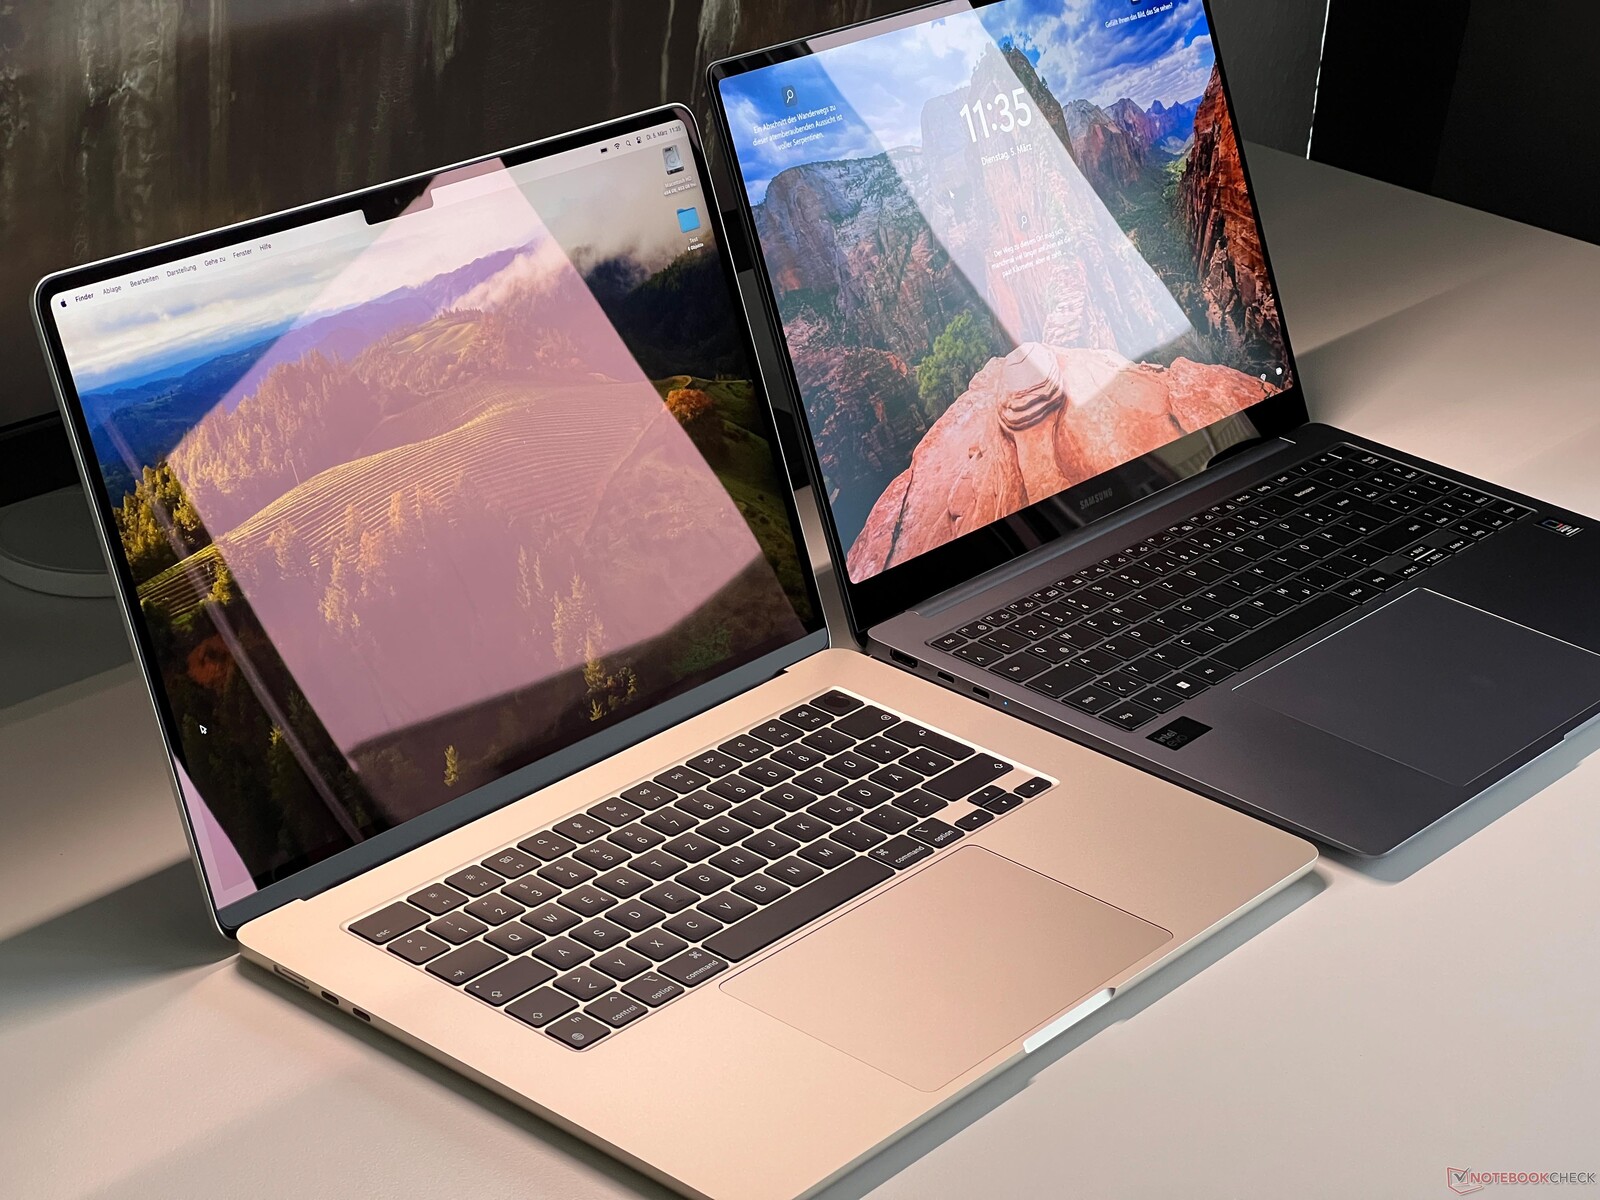
We took some additional comparison photos of the new Samsung Galaxy Book4 Pro 16 (our review will follow shortly) which is one of the current M3 MacBook Air 15's competitors. The Galaxy Book4's 16-inch OLED is a touch bigger but, in direct comparison, it's easy to see that a lot of space is wasted due to the thick, bottom screen bezel. This also makes the Samsung laptop significantly deeper; in addition, its base unit is considerably thicker than Apple's.
Features - Now you can control two displays
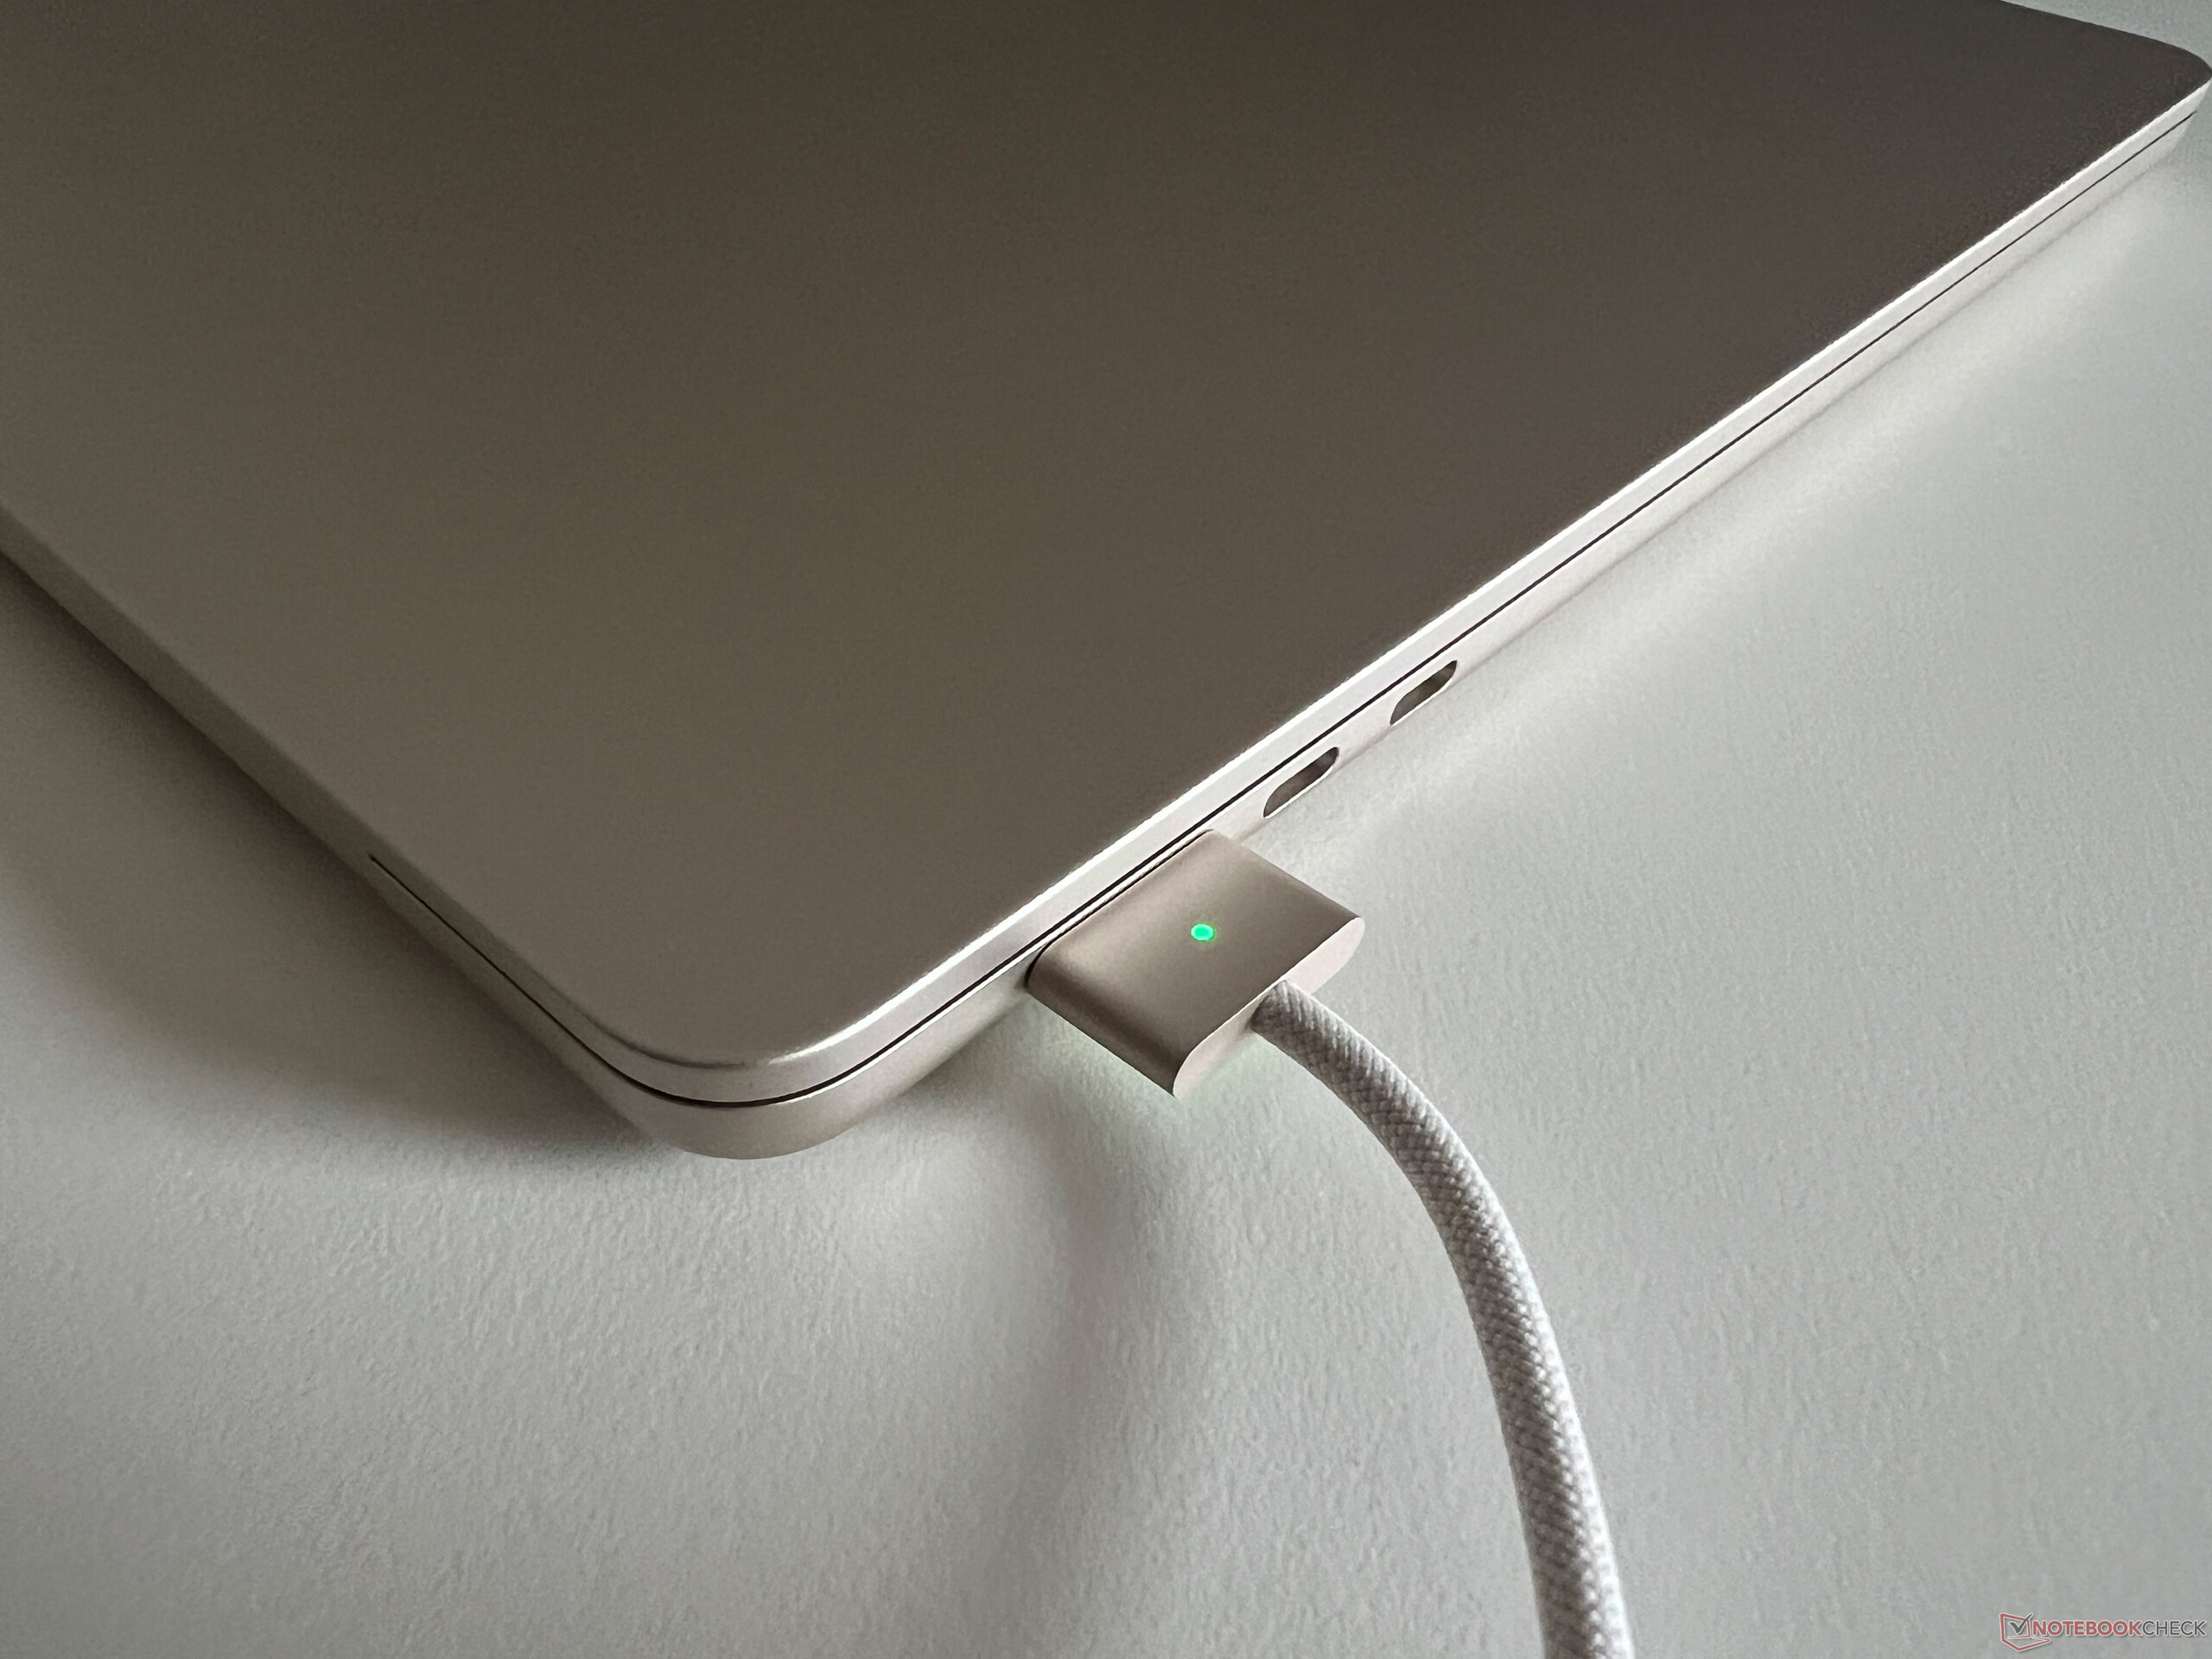
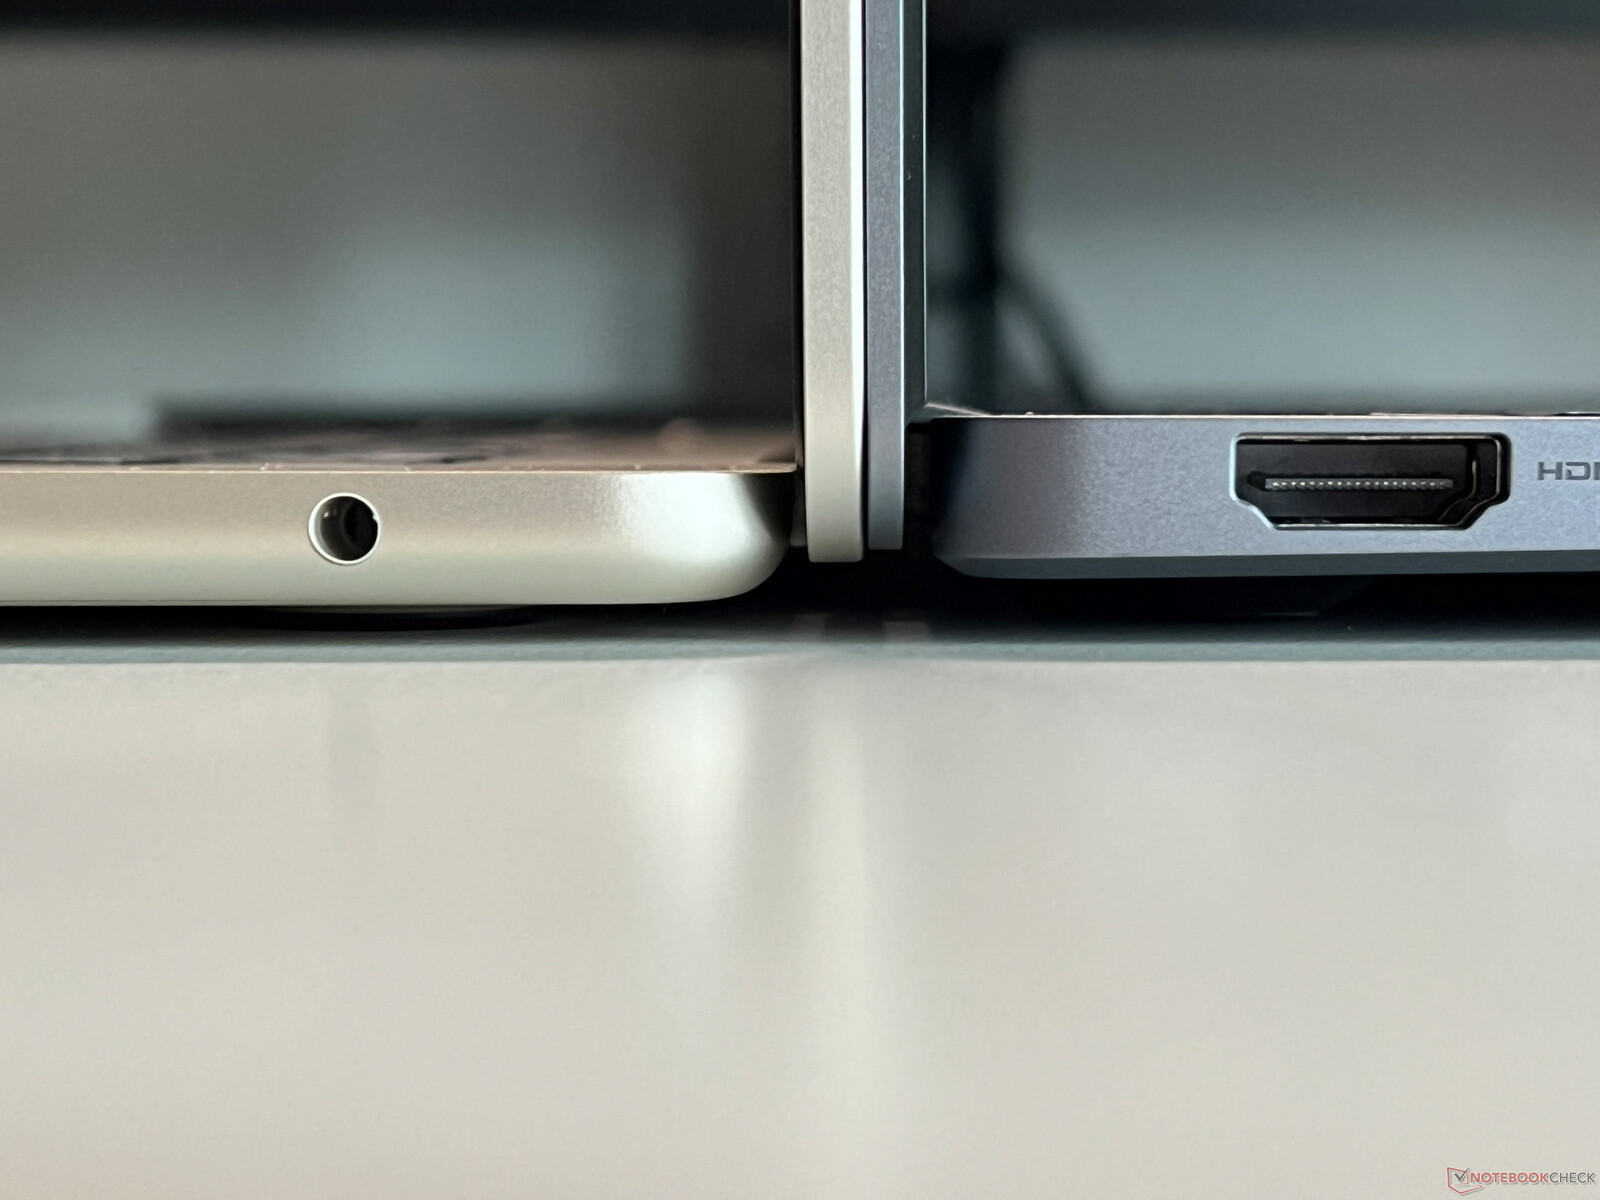
There are no changes when it comes to the ports. In addition to the MagSafe connector for the power adapter, there are still two USB-C ports (4.0) on the left-hand side, which continue to only support Thunderbolt 3. On the right-hand side, there is only the 3.5 mm audio jack and we would have liked to have seen another USB port. The unused space is even more noticeable with the 15-inch model.
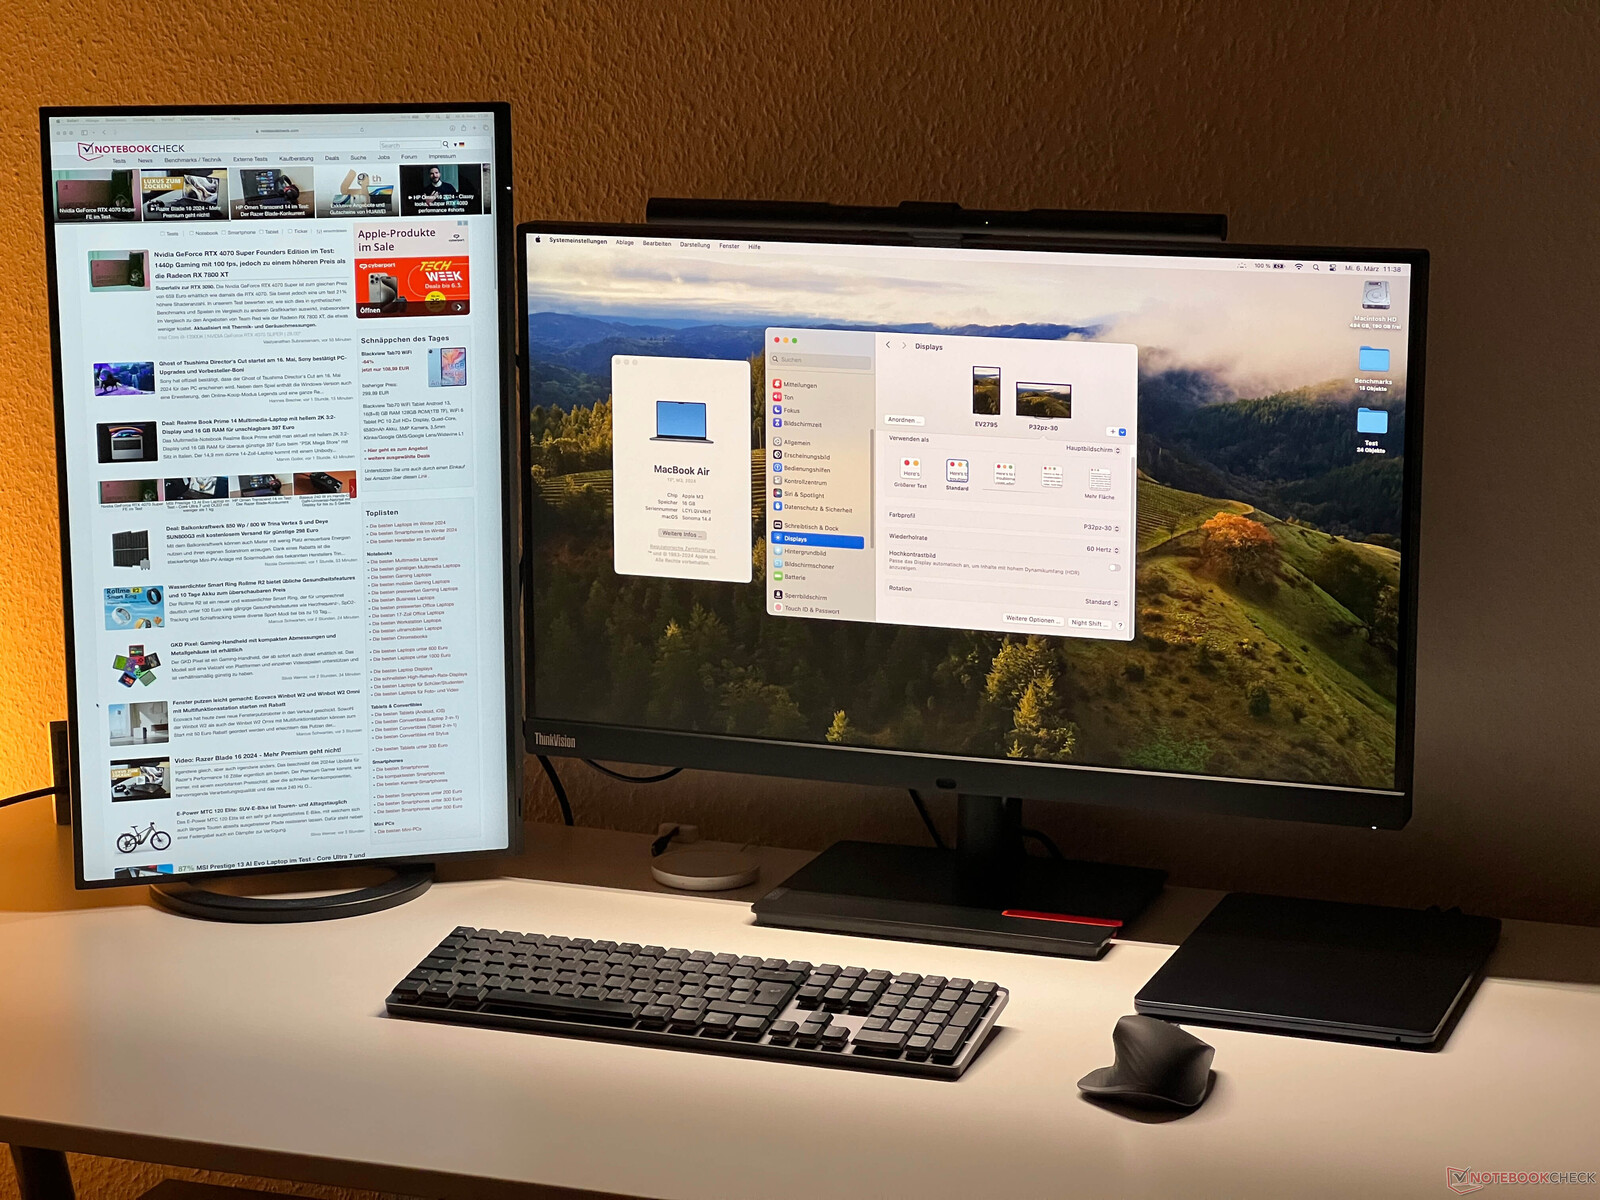
However, there is one new feature. Up to now, the MacBook Air 15 M2 could only control one external monitor in addition to the internal panel. The M3 SoC's hardware requirements are identical meaning it's only possible to control two displays but, when the display lid is closed, two external monitors can now be used (1x up to 6K/60 Hz, 1x up to 5K/60 Hz). That is, of course, still not perfect but it's definitely an improvement and it can make all the difference if you wish to use two monitors.
We tried out this new function with the MBA 13 as well as two external displays (one via USB-C and one via a USB-C/HDMI adapter) and it worked flawlessly. The MacBook Pro 14 M3 will also receive this functionality at some point in the future, likewise, via a software update.
Communication
Apple has updated the Wi-Fi module and it now supports Wi-Fi 6E at 160 MHz as well as Bluetooth 5.3. Paired with our Asus reference router, the results are immediately evident since the new MacBook Air M3 is now twice as fast as its predecessor and is on par with the bigger MacBook Pro models.
| Networking | |
| Apple MacBook Air 15 M3 | |
| iperf3 transmit AXE11000 | |
| iperf3 receive AXE11000 | |
| Asus VivoBook S15 K5504 | |
| iperf3 transmit AXE11000 | |
| iperf3 receive AXE11000 | |
| iperf3 transmit AXE11000 6GHz | |
| iperf3 receive AXE11000 6GHz | |
| MSI Prestige 16 B1MG-001US | |
| iperf3 transmit AXE11000 | |
| iperf3 receive AXE11000 | |
| iperf3 transmit AXE11000 6GHz | |
| iperf3 receive AXE11000 6GHz | |
| Acer Swift Go SFG16-71 | |
| iperf3 transmit AXE11000 | |
| iperf3 receive AXE11000 | |
| iperf3 transmit AXE11000 6GHz | |
| iperf3 receive AXE11000 6GHz | |
| Huawei MateBook 16s i9 | |
| iperf3 transmit AXE11000 | |
| iperf3 receive AXE11000 | |
| iperf3 transmit AXE11000 6GHz | |
| iperf3 receive AXE11000 6GHz | |
| LG Gram SuperSlim (2023) | |
| iperf3 transmit AXE11000 | |
| iperf3 receive AXE11000 | |
| iperf3 transmit AXE11000 6GHz | |
| iperf3 receive AXE11000 6GHz | |
| Samsung Galaxy Book3 15, Core i5-1335U | |
| iperf3 transmit AXE11000 | |
| iperf3 receive AXE11000 | |
Webcam
Under good lighting, the 1080p webcam continues to take good pictures and there are no complaints either when it comes to the microphones. Optionally, you can also use an iPhone as a webcam.


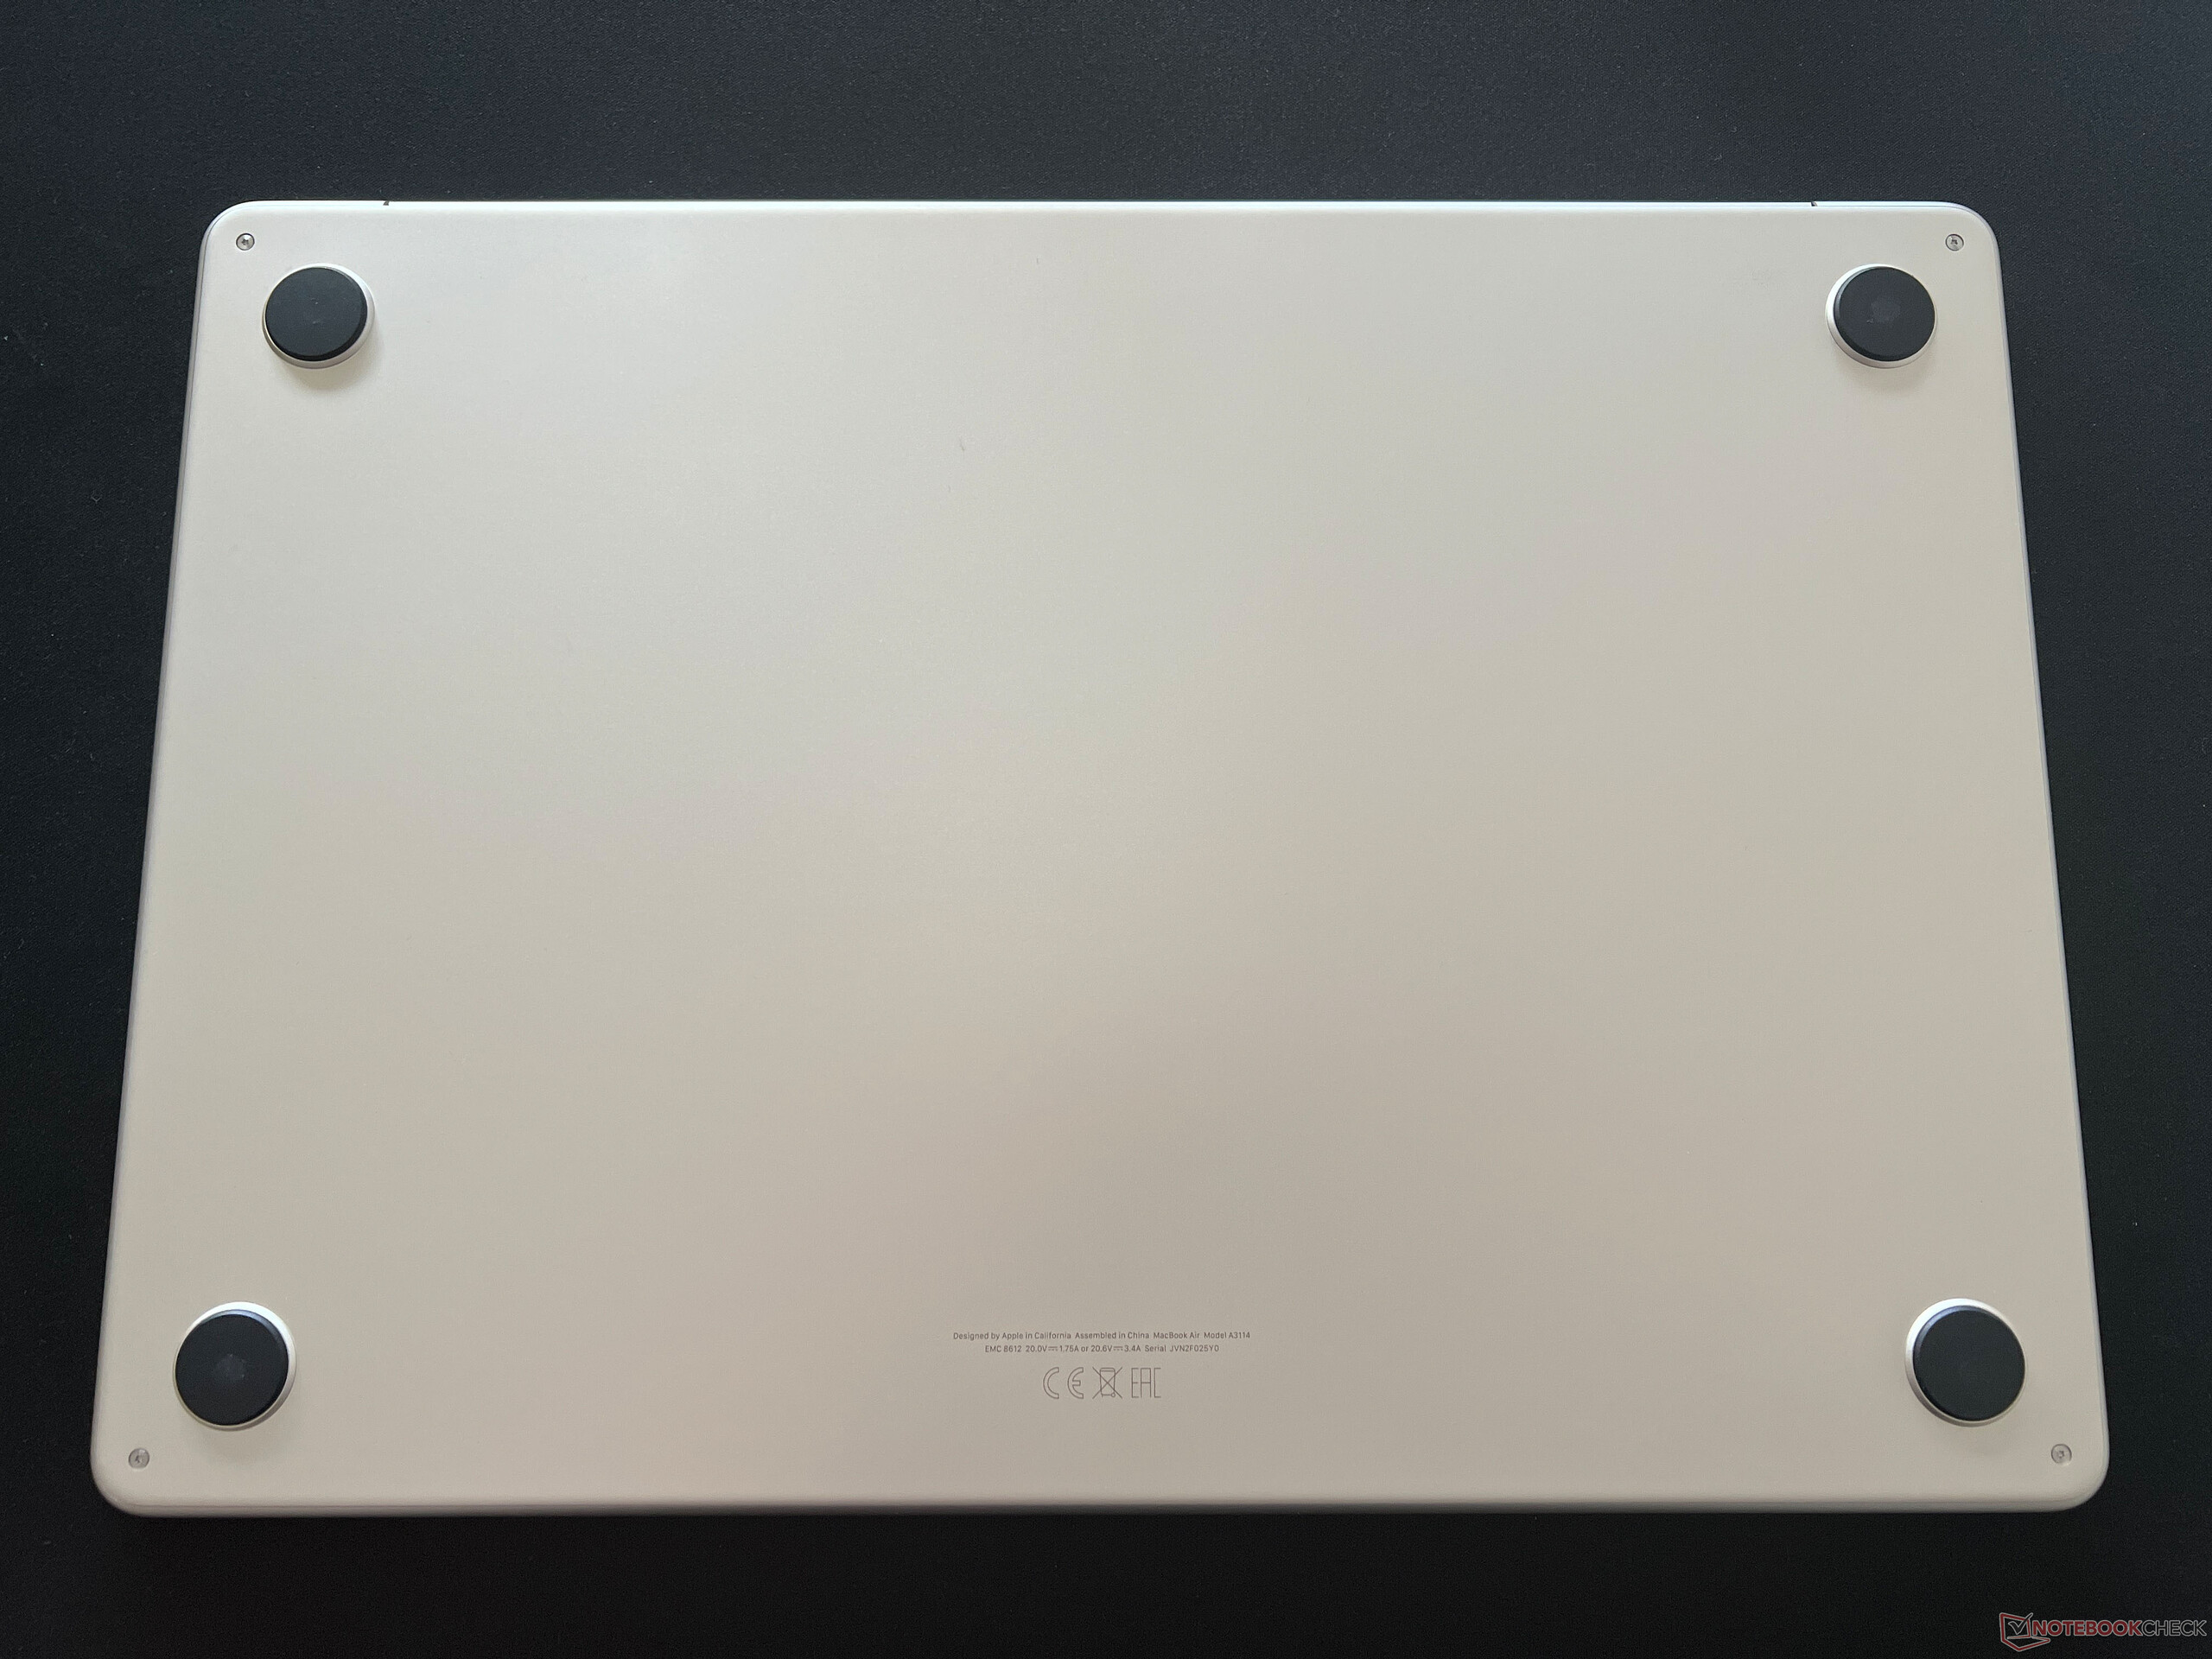
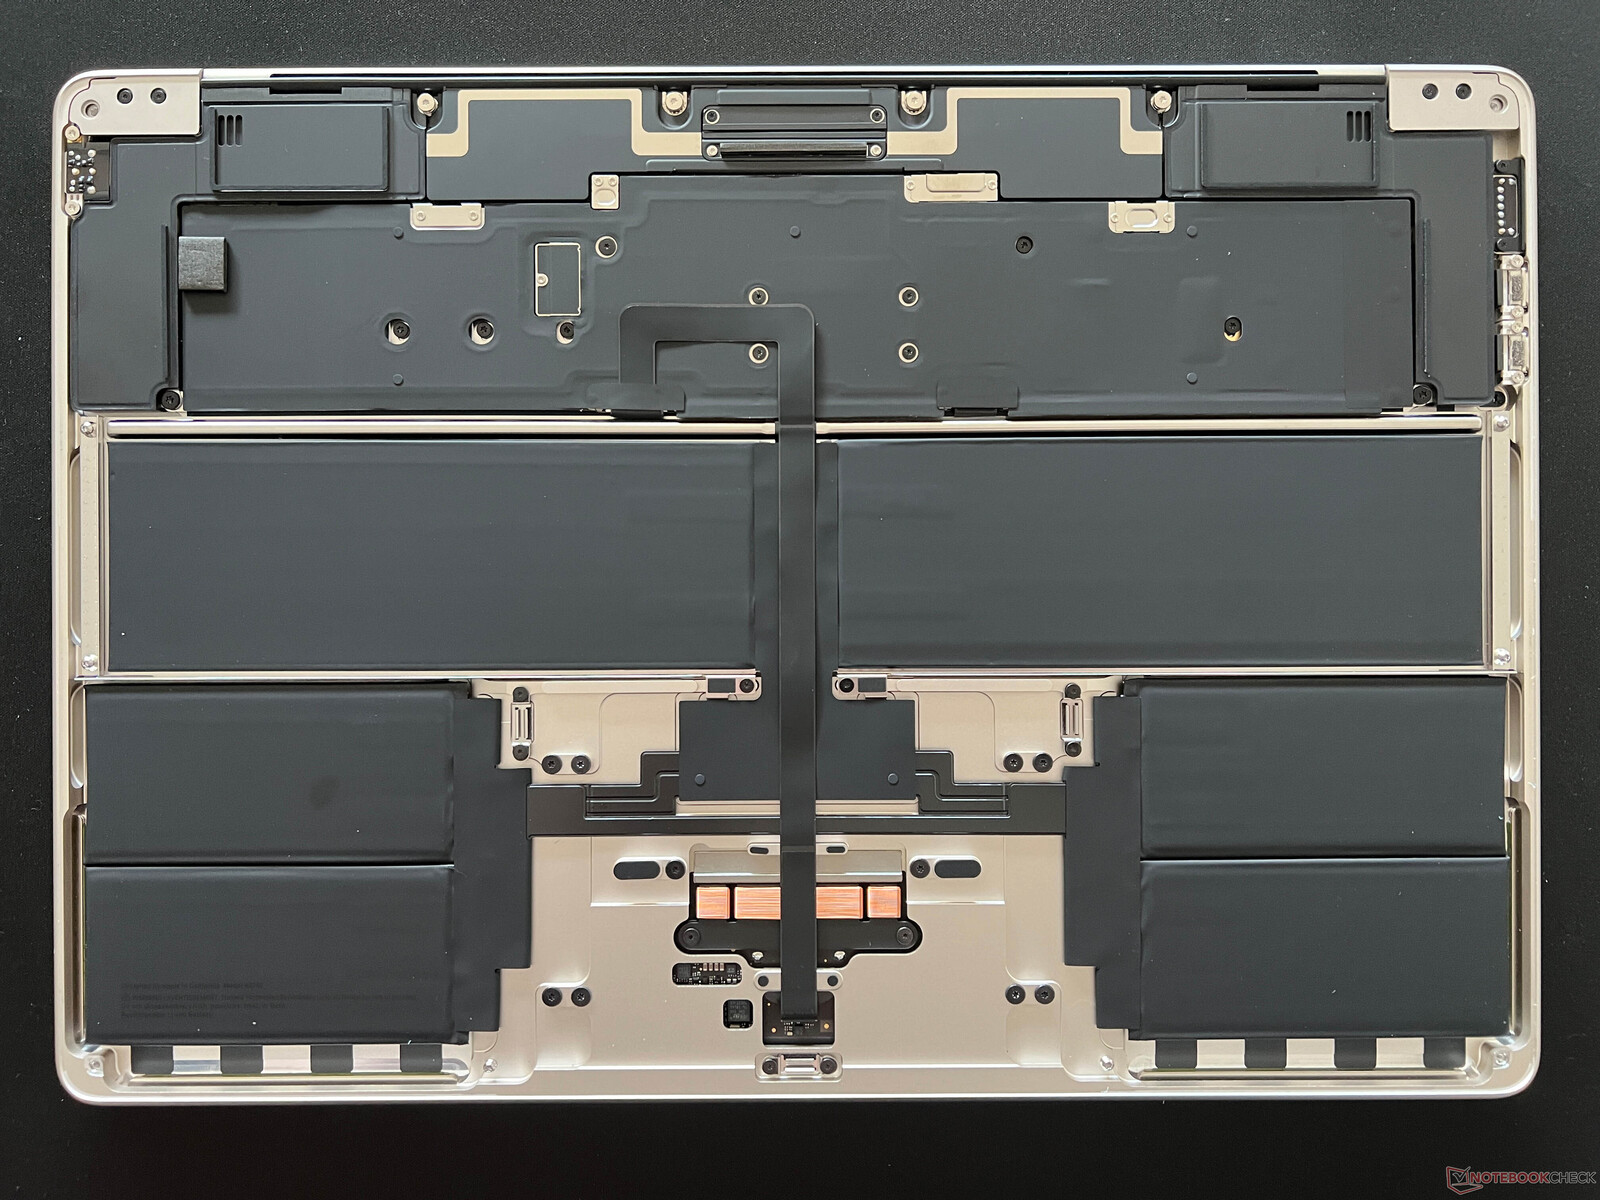
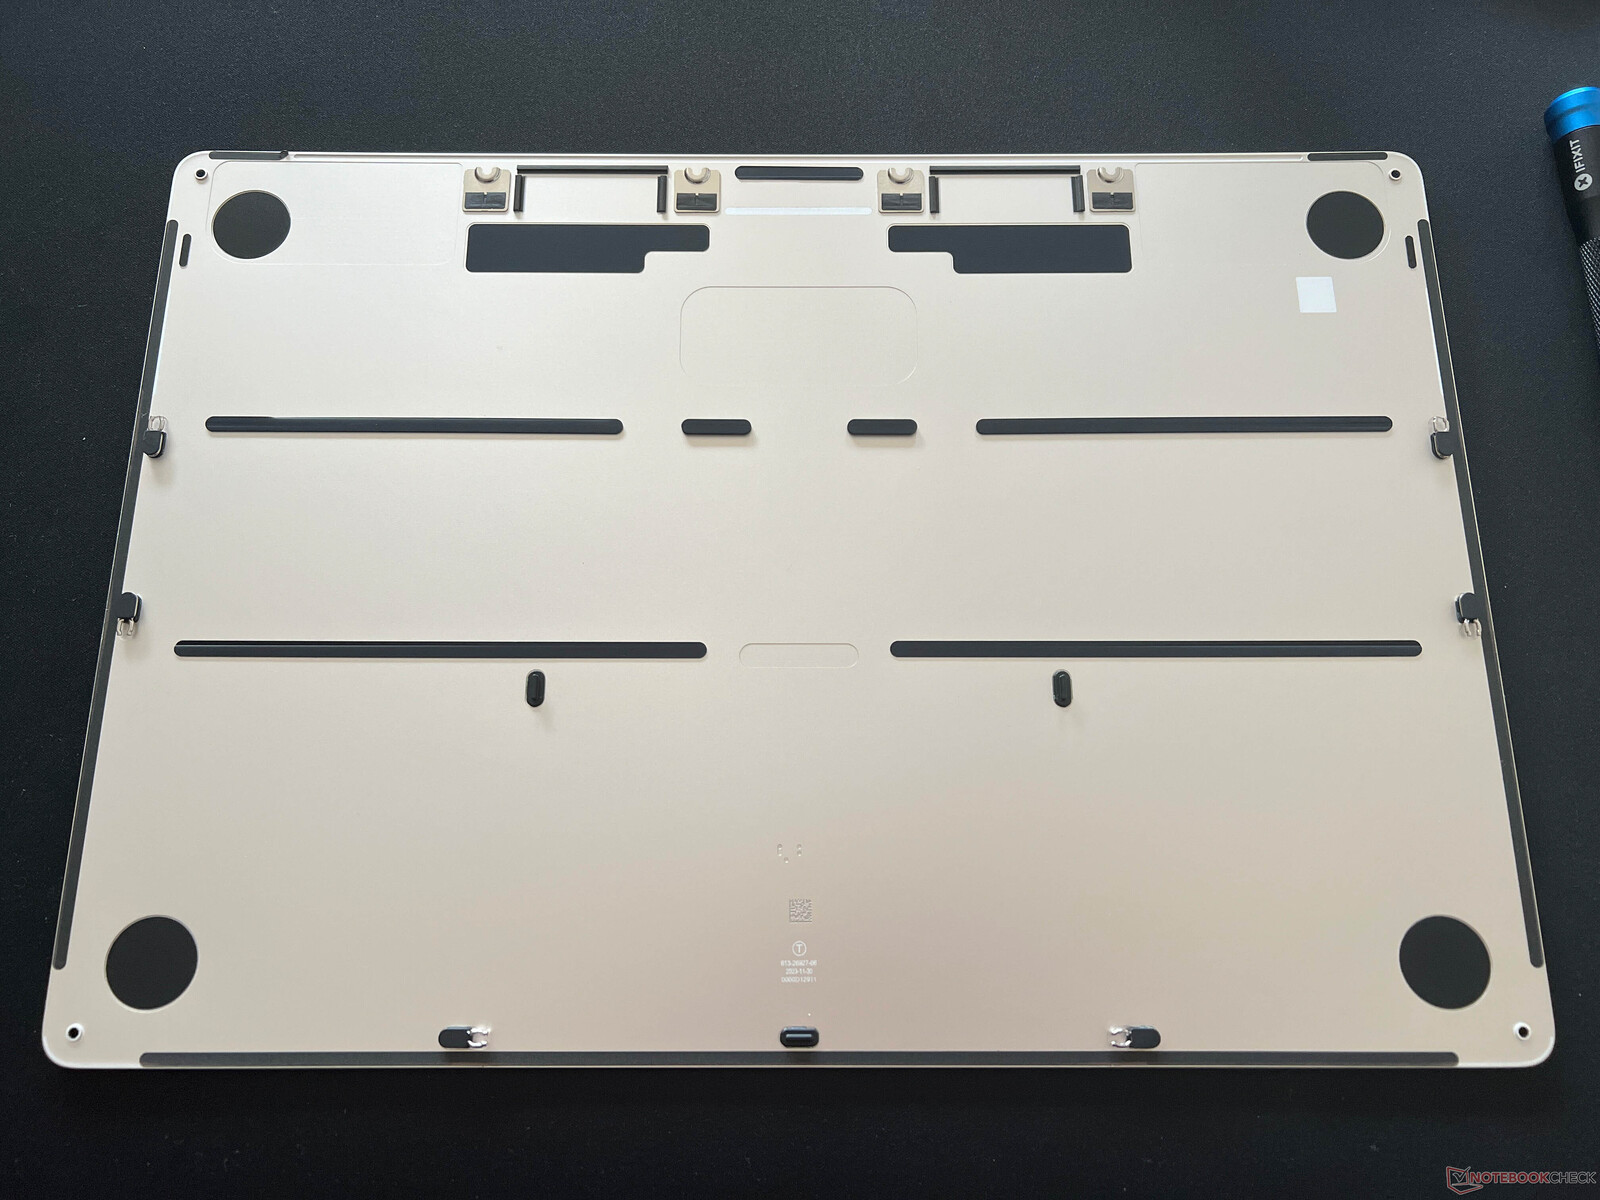
Maintenance
As was previously the case, the lower case cover can be removed as long as you use a suitable pentalobe screwdriver. At the end of the day, however, you can save yourself the effort since there are no fans and all of the components are soldered. If desired, the glued battery can be replaced but it's a bit of a hassle and should only really be done by qualified service personnel.
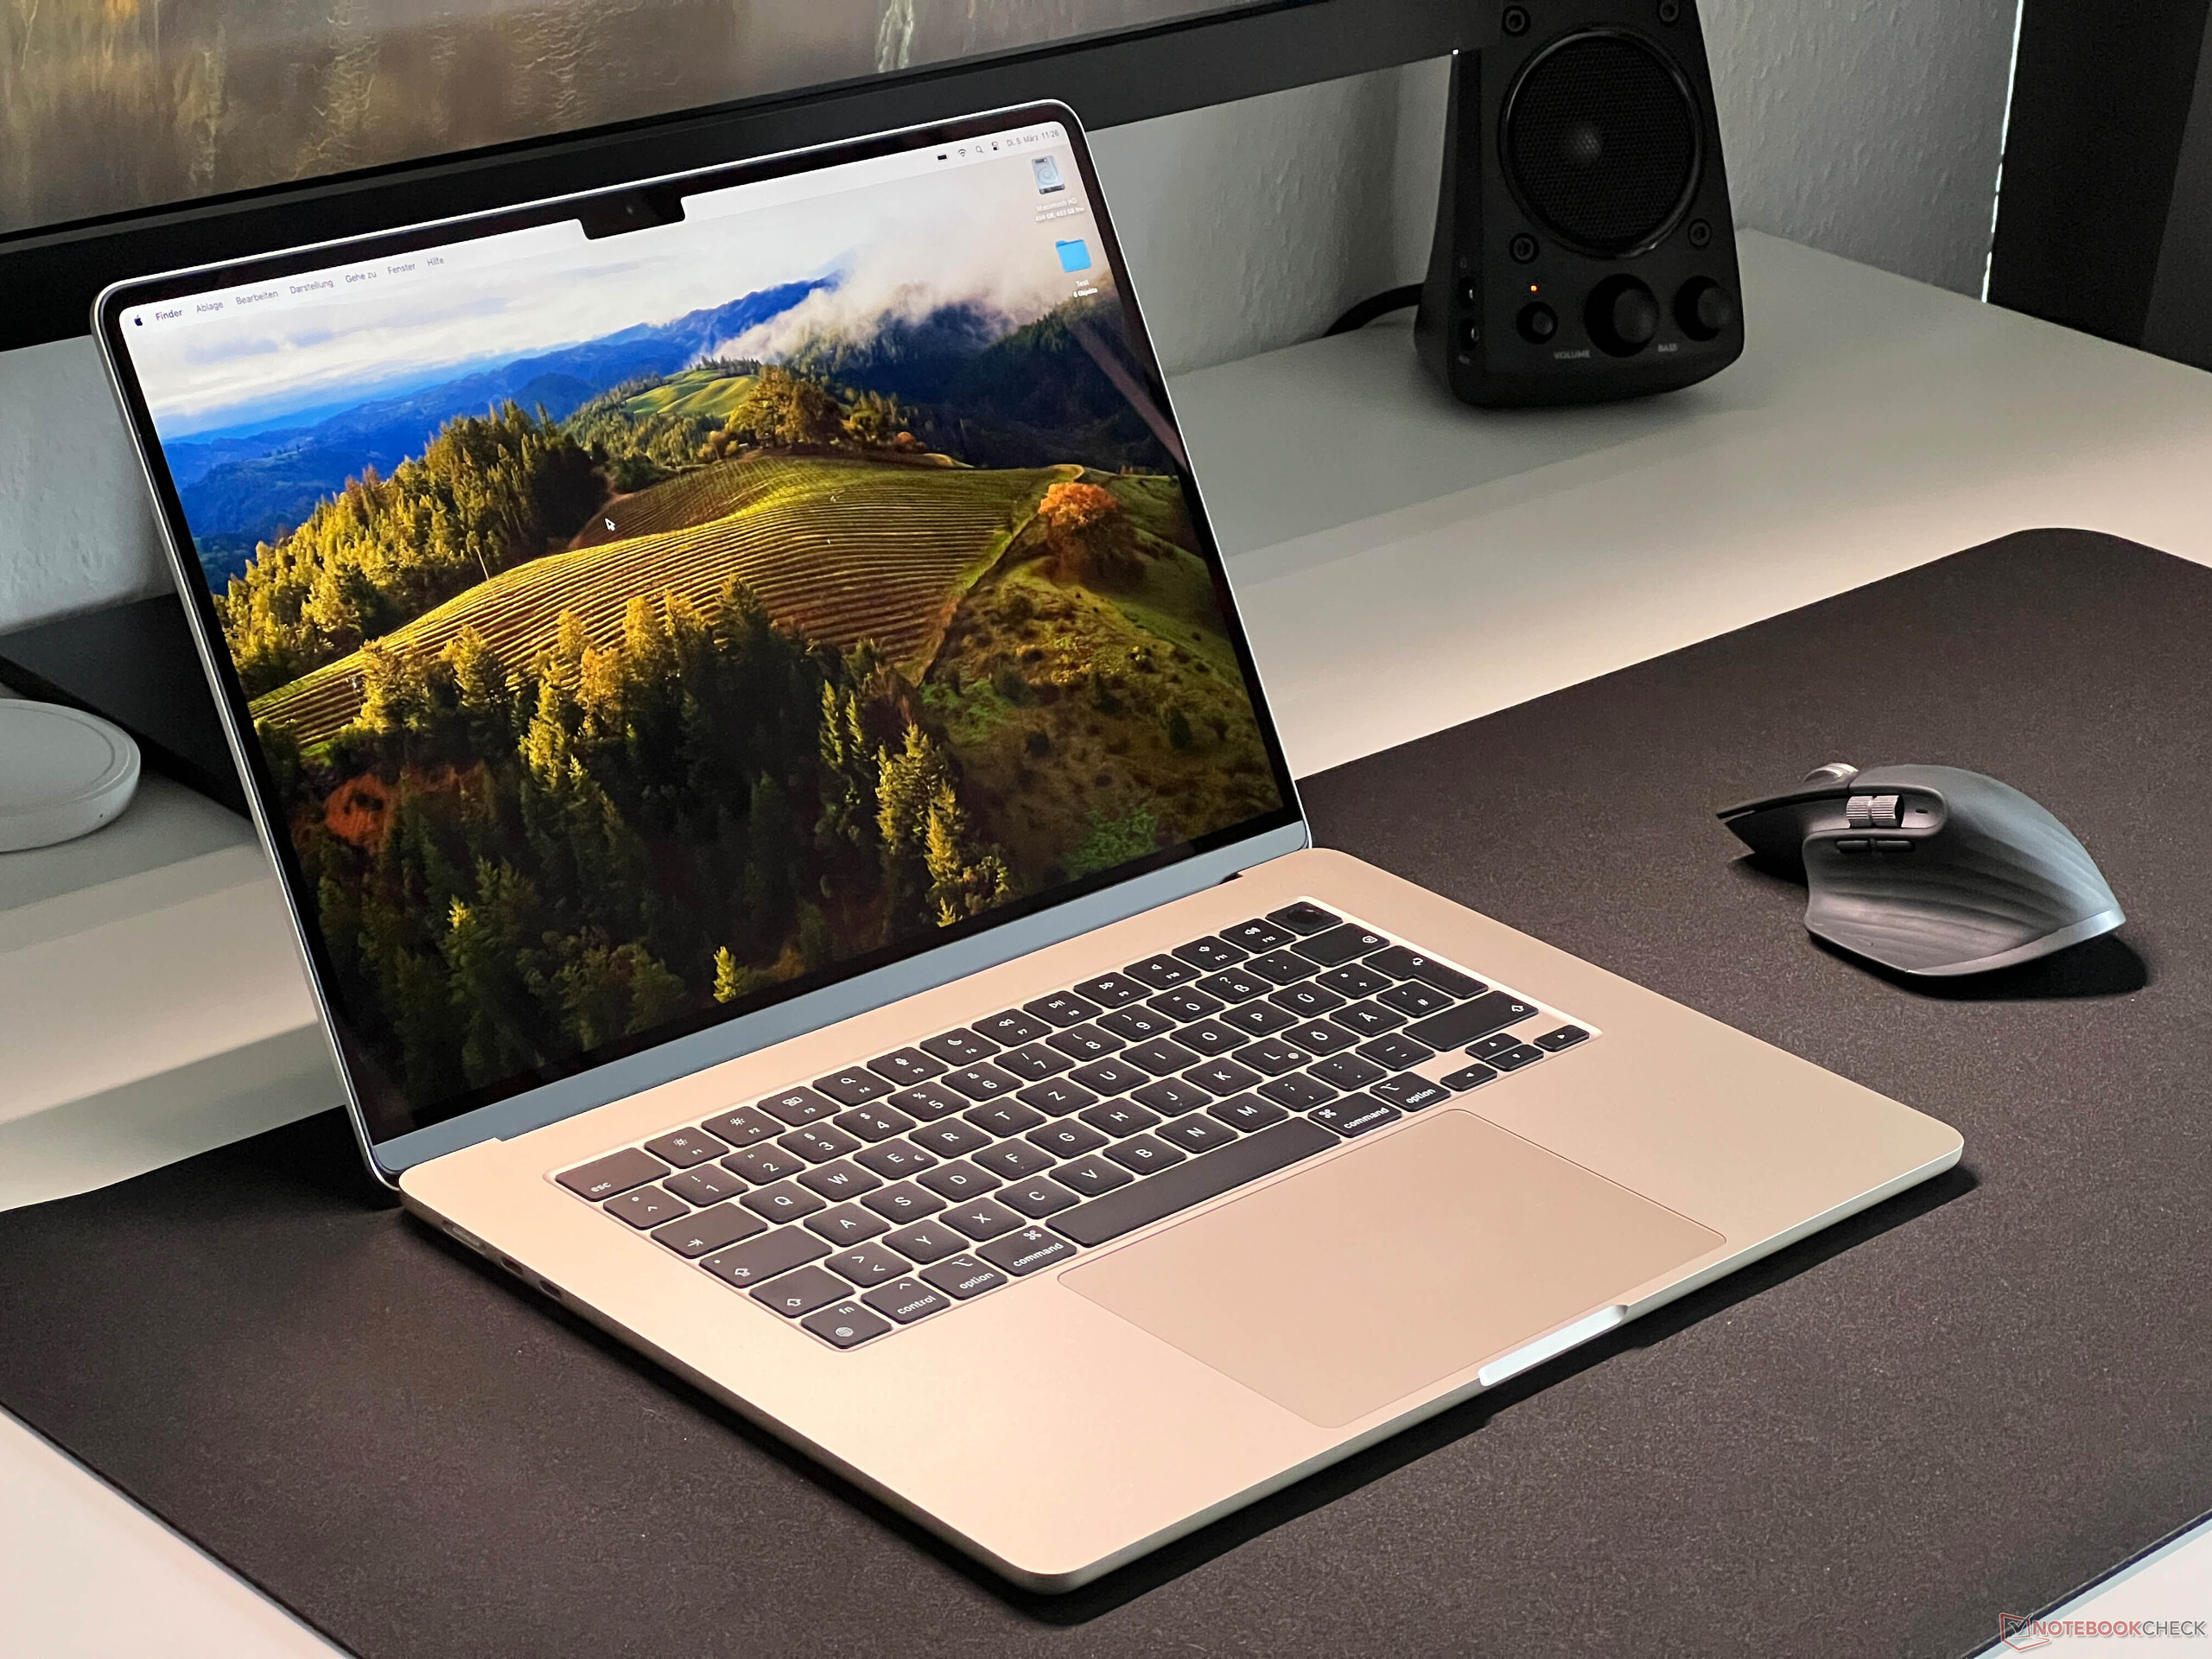
Input devices - A wonderful trackpad
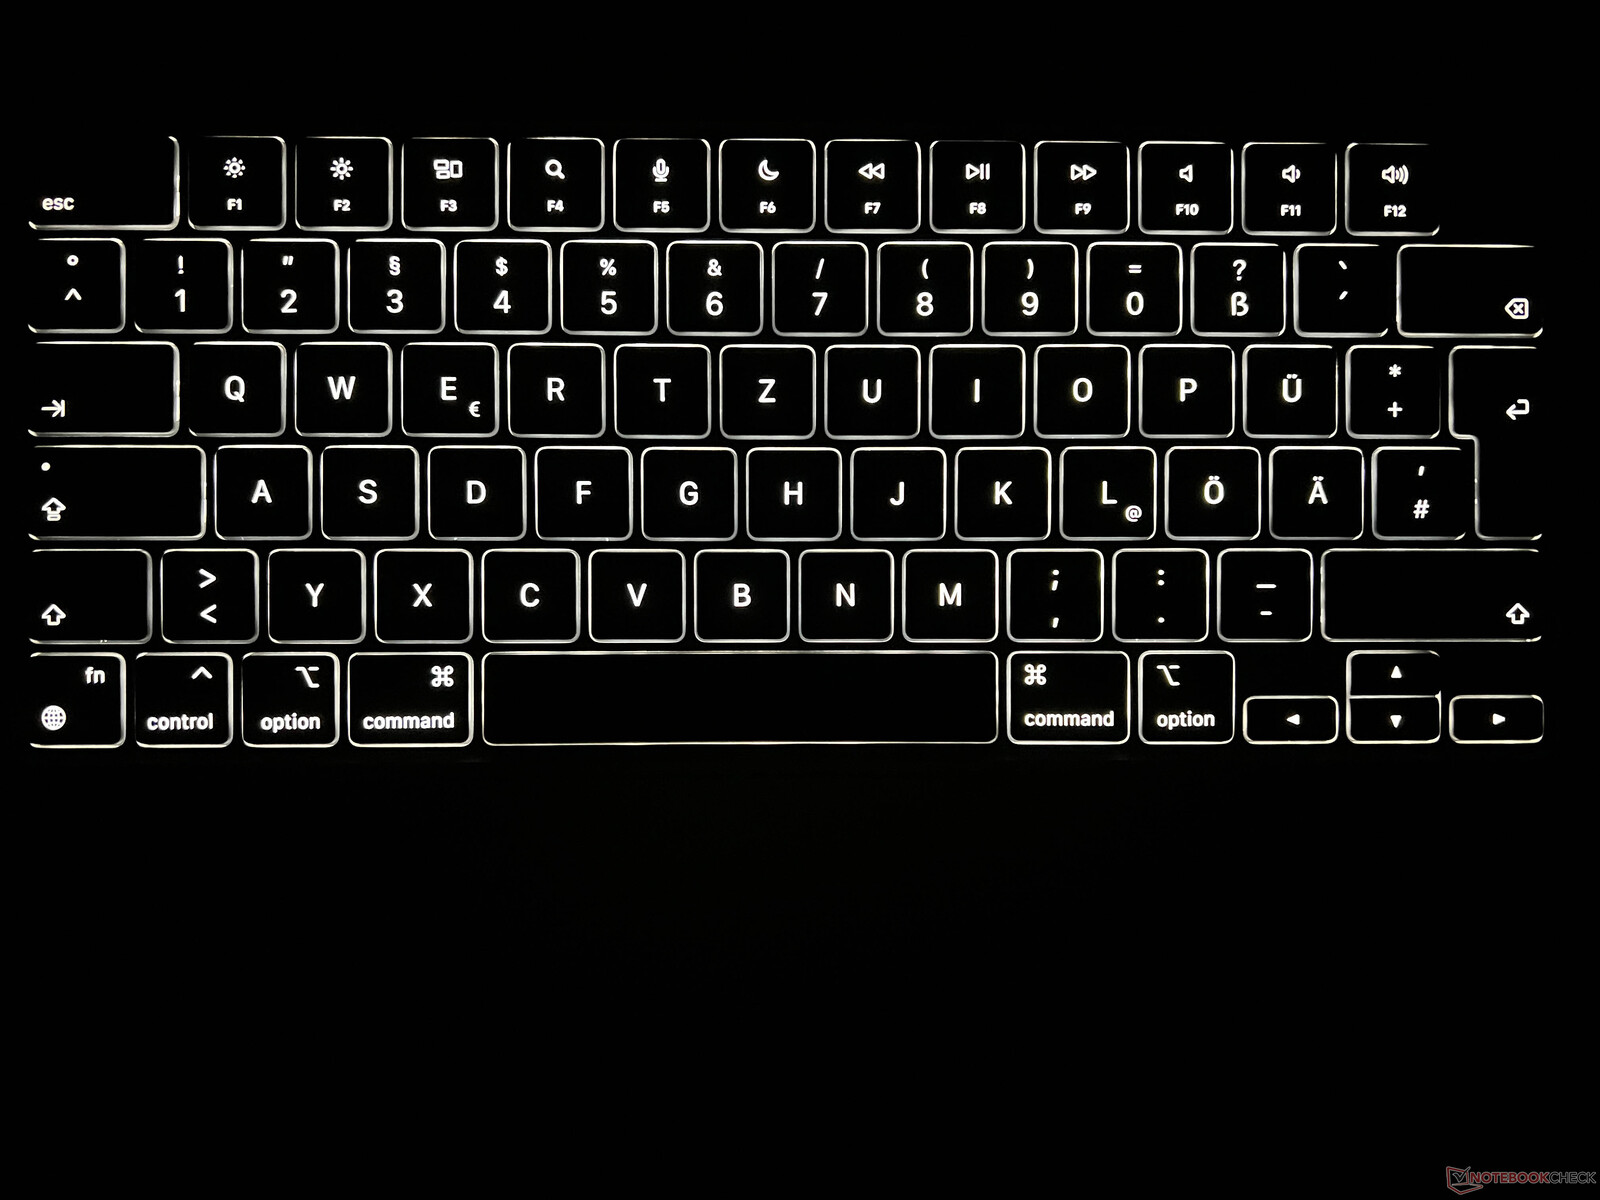
Compared to the MacBook Air M2, there are no changes to the input devices. The keyboard quality doesn't quite hit the heights of high-level business laptops but, all in all, keystrokes are implemented accurately and typing on the device is comfortable. The Touch ID fingerprint scanner still works impeccably and, for years now, Apple has remained the company to catch when it comes to white keyboard backlighting due to its multi-level brightness settings and ability to automatically adapt to ambient light.
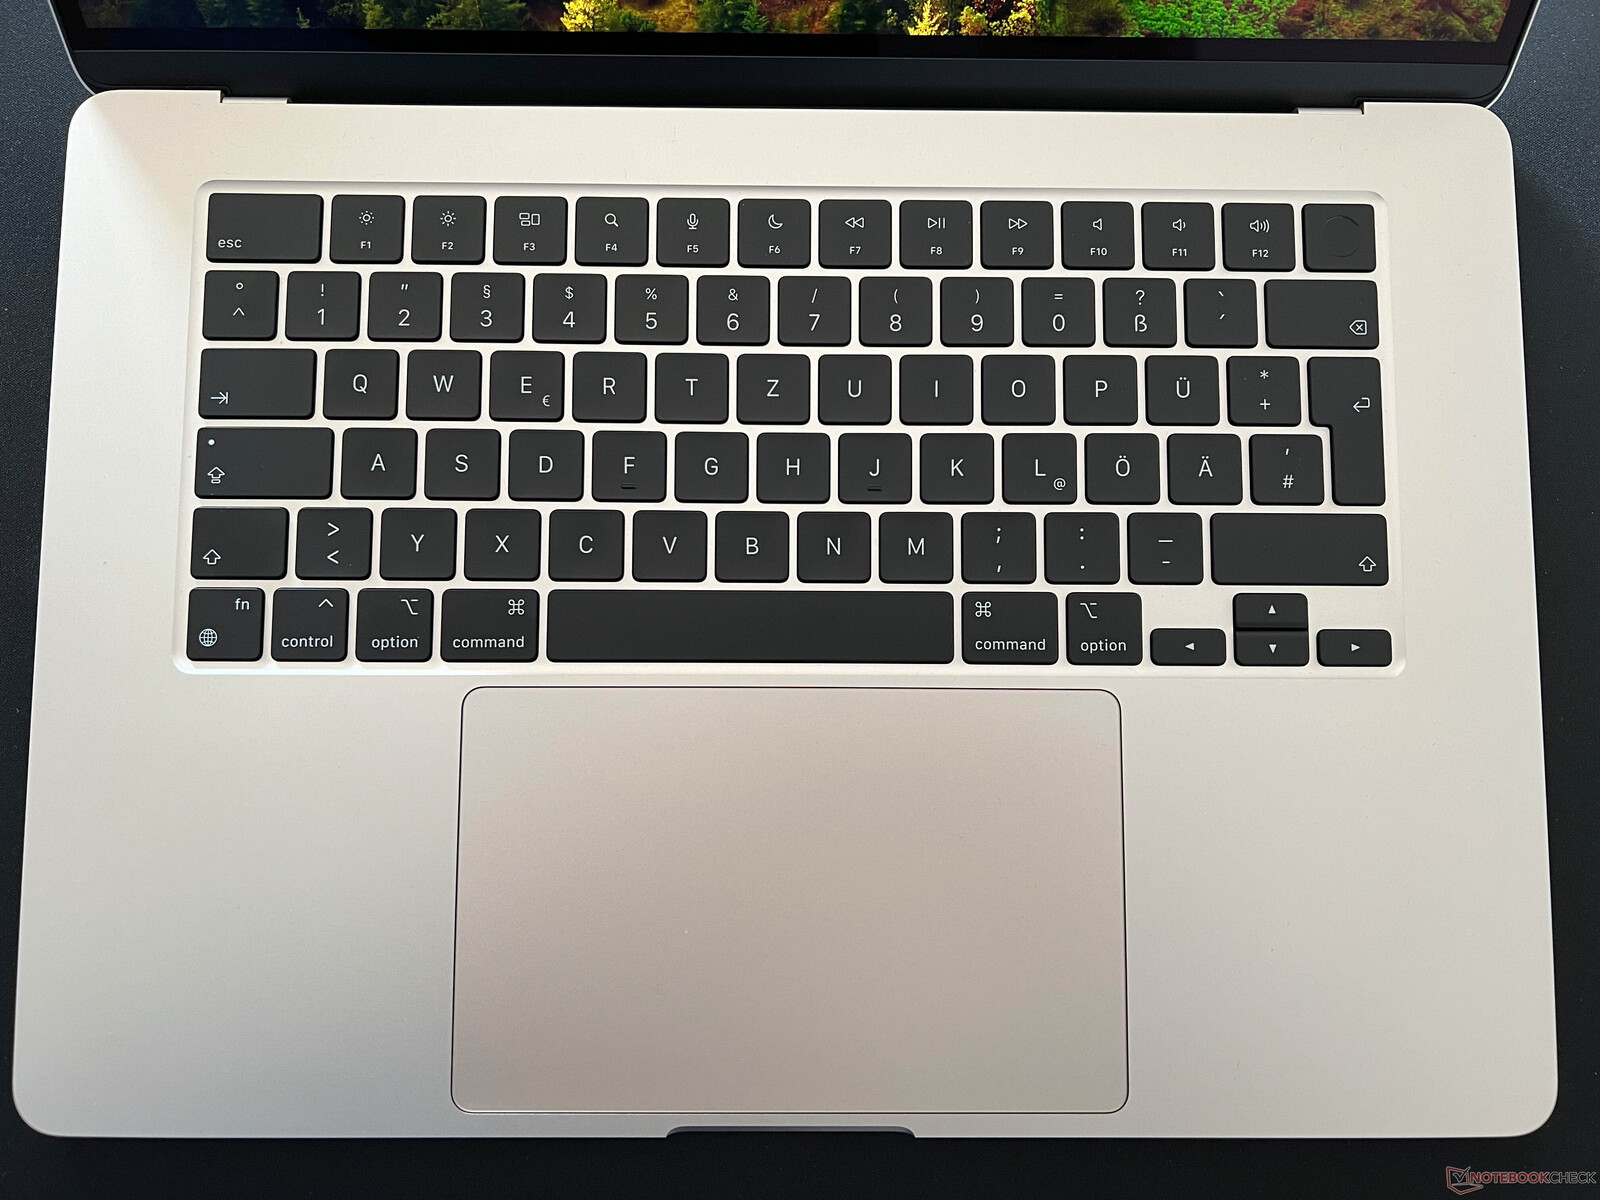
The large trackpad is still the reference in the mobile segment and its integration with macOS is also excellent. With Force Touch, clicks are the same everywhere, they're not too loud and, additionally gestures are implemented perfectly. As usual, the MacBook Air doesn't come with a touchscreen.
Display - IPS with P3 coverage
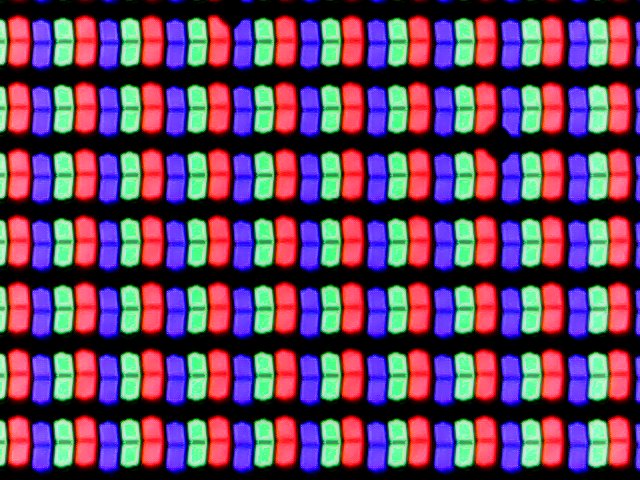
For the Air, Apple has still opted to use a 15.6-inch IPS screen. The resolution is a somewhat odd 2,880 x 1,864 pixels. The additional 64 vertical pixels are used for the area next to the notch. This still doesn't look particularly good but it doesn't eat into any of the 16:10 panel's actual space.
The panel's subjective image quality remains very good. The colors are vivid, the content is sharp and macOS also still doesn't suffer from scaling problems. However, in terms of the refresh rate, we would like to see an update to 120 Hz since we're still dealing with a 60 Hz panel. The response times are unremarkable and, in everyday use, you'll not see any evidence of ghosting. PWM is absent and both the screen brightness as well as the color temperature can automatically adapt to the ambient light.
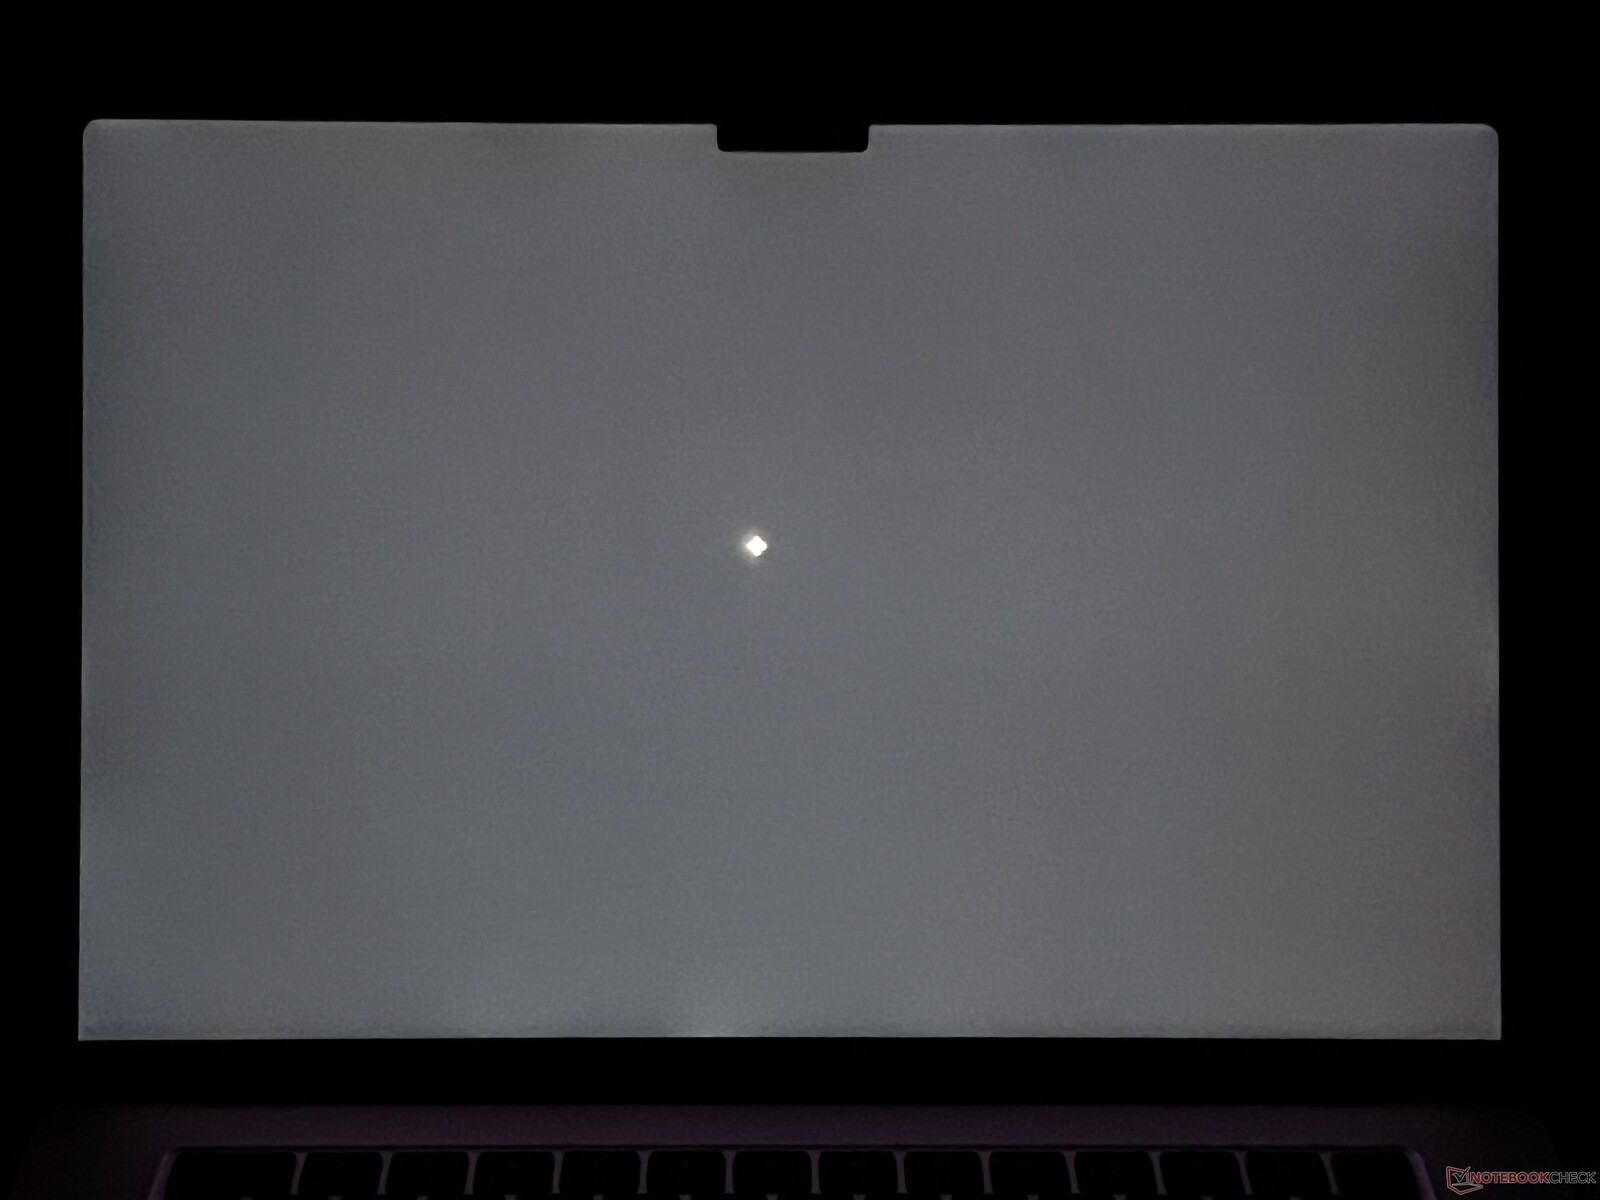
We measured a maximum brightness of 525 cd/m² in the middle of the display and an average of slightly over 500 cd/m². However, at 0.37 cd/m², the black value is very high and this is why dark content never appears completely black compared to OLED or mini LED panels. That is noticeable when it comes to the contrast which sits at ~1.400:1. Unlike the MacBook Air 13, light bleed is not a problem the larger Air 15 suffers from.
| |||||||||||||||||||||||||
Brightness Distribution: 92 %
Center on Battery: 525 cd/m²
Contrast: 1422:1 (Black: 0.37 cd/m²)
ΔE ColorChecker Calman: 1.4 | ∀{0.5-29.43 Ø4.73}
calibrated: 0.6
ΔE Greyscale Calman: 2.1 | ∀{0.09-98 Ø4.97}
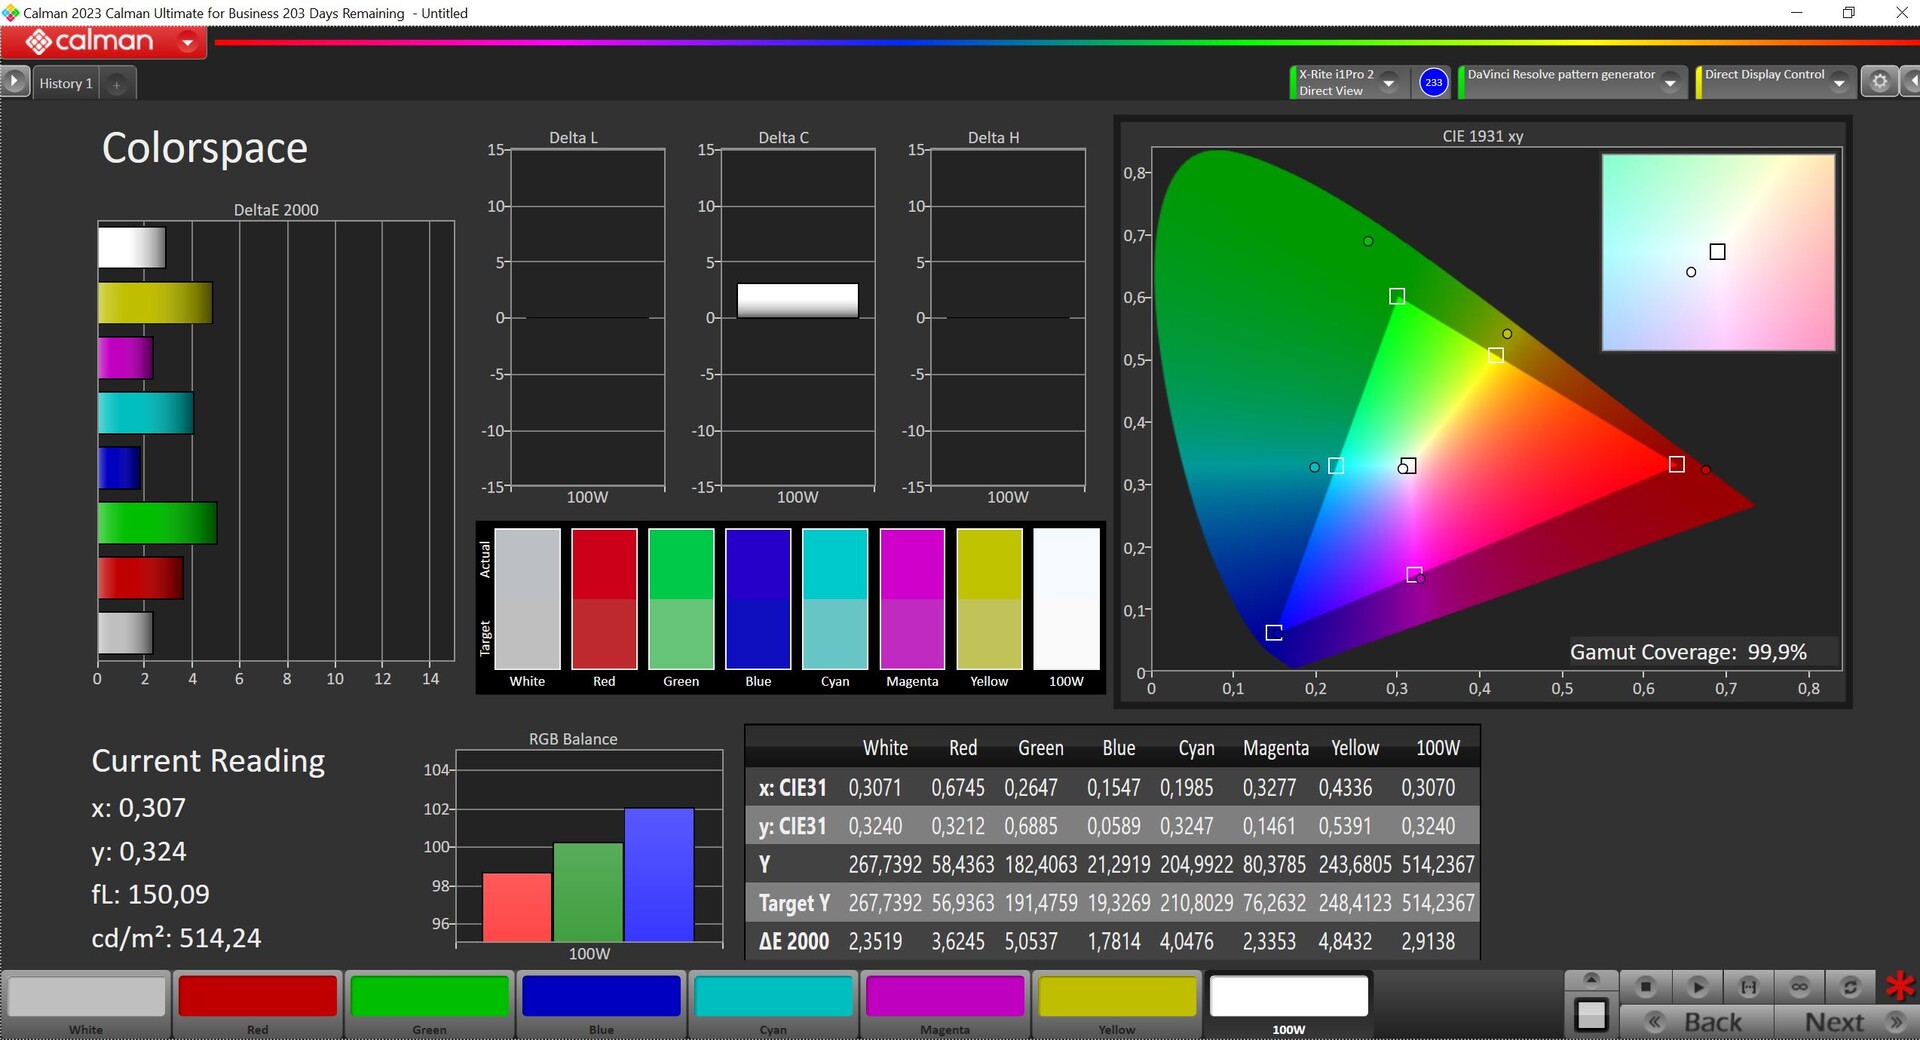
87.8% AdobeRGB 1998 (Argyll 3D)
99.9% sRGB (Argyll 3D)
98.7% Display P3 (Argyll 3D)
Gamma: 2.23
CCT: 6865 K
| Apple MacBook Air 15 M3 IPS, 2880x1864, 15.3" | Asus VivoBook S15 K5504 Samsung SDC4180, OLED, 2880x1620, 15.6" | MSI Prestige 16 B1MG-001US AU Optronics B160QAN03.R, IPS, 2560x1600, 16" | Acer Swift Go SFG16-71 Samsung SDC418D ATNA60BC03-0, OLED, 3200x2000, 16" | Huawei MateBook 16s i9 BOE0BB0 TV160DKT-NH1, IPS, 2560x1680, 16" | LG Gram SuperSlim (2023) Samsung ATNA56YX08-0, OLED, 1920x1080, 15.6" | Samsung Galaxy Book3 15, Core i5-1335U BOE 18 NE156FHM-NS0, IPS, 1920x1080, 15.6" | |
|---|---|---|---|---|---|---|---|
| Display | 3% | -2% | 5% | -22% | 4% | -47% | |
| Display P3 Coverage (%) | 98.7 | 99.93 1% | 96.7 -2% | 99.91 1% | 63 -36% | 99.8 1% | 43.17 -56% |
| sRGB Coverage (%) | 99.9 | 100 0% | 99.8 0% | 100 0% | 94.9 -5% | 100 0% | 65.03 -35% |
| AdobeRGB 1998 Coverage (%) | 87.8 | 95.52 9% | 84.6 -4% | 98.87 13% | 65.1 -26% | 98.09 12% | 44.6 -49% |
| Response Times | 91% | -79% | 91% | -3% | 91% | 36% | |
| Response Time Grey 50% / Grey 80% * (ms) | 35.3 ? | 2 ? 94% | 49.4 ? -40% | 2 ? 94% | 34 ? 4% | 2 ? 94% | 20 ? 43% |
| Response Time Black / White * (ms) | 15.6 ? | 2 ? 87% | 33.9 ? -117% | 2 ? 87% | 17 ? -9% | 2 ? 87% | 11 ? 29% |
| PWM Frequency (Hz) | 240 | 227 ? | 26 ? | ||||
| Screen | 81% | -98% | -92% | -23% | -70% | -188% | |
| Brightness middle (cd/m²) | 526 | 370.4 -30% | 473.6 -10% | 370 -30% | 448 -15% | 395 -25% | 308 -41% |
| Brightness (cd/m²) | 506 | 376 -26% | 456 -10% | 371 -27% | 436 -14% | 392 -23% | 290 -43% |
| Brightness Distribution (%) | 92 | 96 4% | 87 -5% | 98 7% | 93 1% | 97 5% | 83 -10% |
| Black Level * (cd/m²) | 0.37 | 0.02 95% | 0.19 49% | 0.35 5% | 0.1 73% | 0.425 -15% | |
| Contrast (:1) | 1422 | 18520 1202% | 2493 75% | 1280 -10% | 3950 178% | 725 -49% | |
| Colorchecker dE 2000 * | 1.4 | 1.51 -8% | 5.9 -321% | 2.77 -98% | 1.6 -14% | 2.2 -57% | 5.27 -276% |
| Colorchecker dE 2000 max. * | 2 | 2.89 -45% | 9.37 -368% | 4.08 -104% | 4.44 -122% | 4.43 -122% | 16.43 -722% |
| Colorchecker dE 2000 calibrated * | 0.6 | 3.36 -460% | 0.89 -48% | 2.83 -372% | 0.64 -7% | 4.65 -675% | 2.58 -330% |
| Greyscale dE 2000 * | 2.1 | 2.1 -0% | 7.3 -248% | 2.58 -23% | 2.78 -32% | 1.78 15% | 6.38 -204% |
| Gamma | 2.23 99% | 2.2 100% | 1.9 116% | 2.46 89% | 2.39 92% | 2.4 92% | |
| CCT | 6865 95% | 6536 99% | 7260 90% | 6241 104% | 6582 99% | 6284 103% | 7784 84% |
| Color Space (Percent of AdobeRGB 1998) (%) | 2.43 | ||||||
| Total Average (Program / Settings) | 58% /
66% | -60% /
-75% | 1% /
-38% | -16% /
-20% | 8% /
-31% | -66% /
-126% |
* ... smaller is better
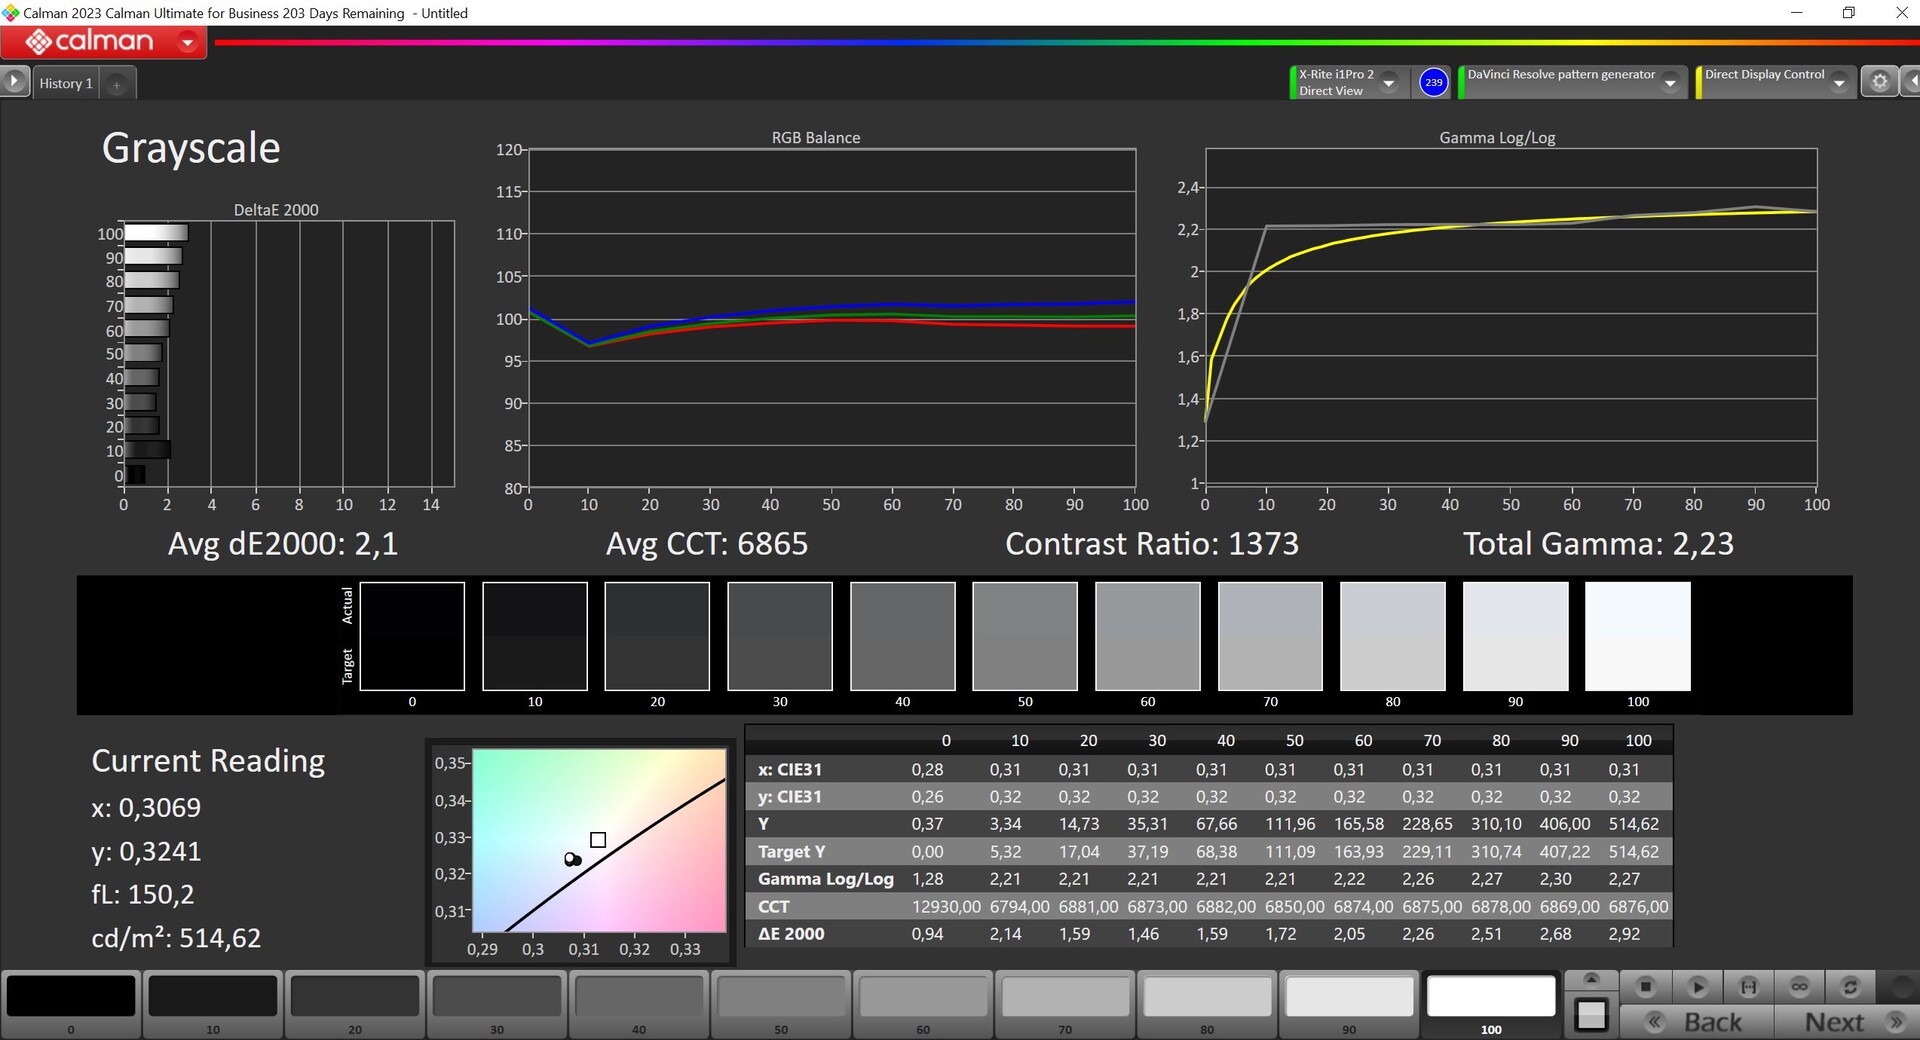
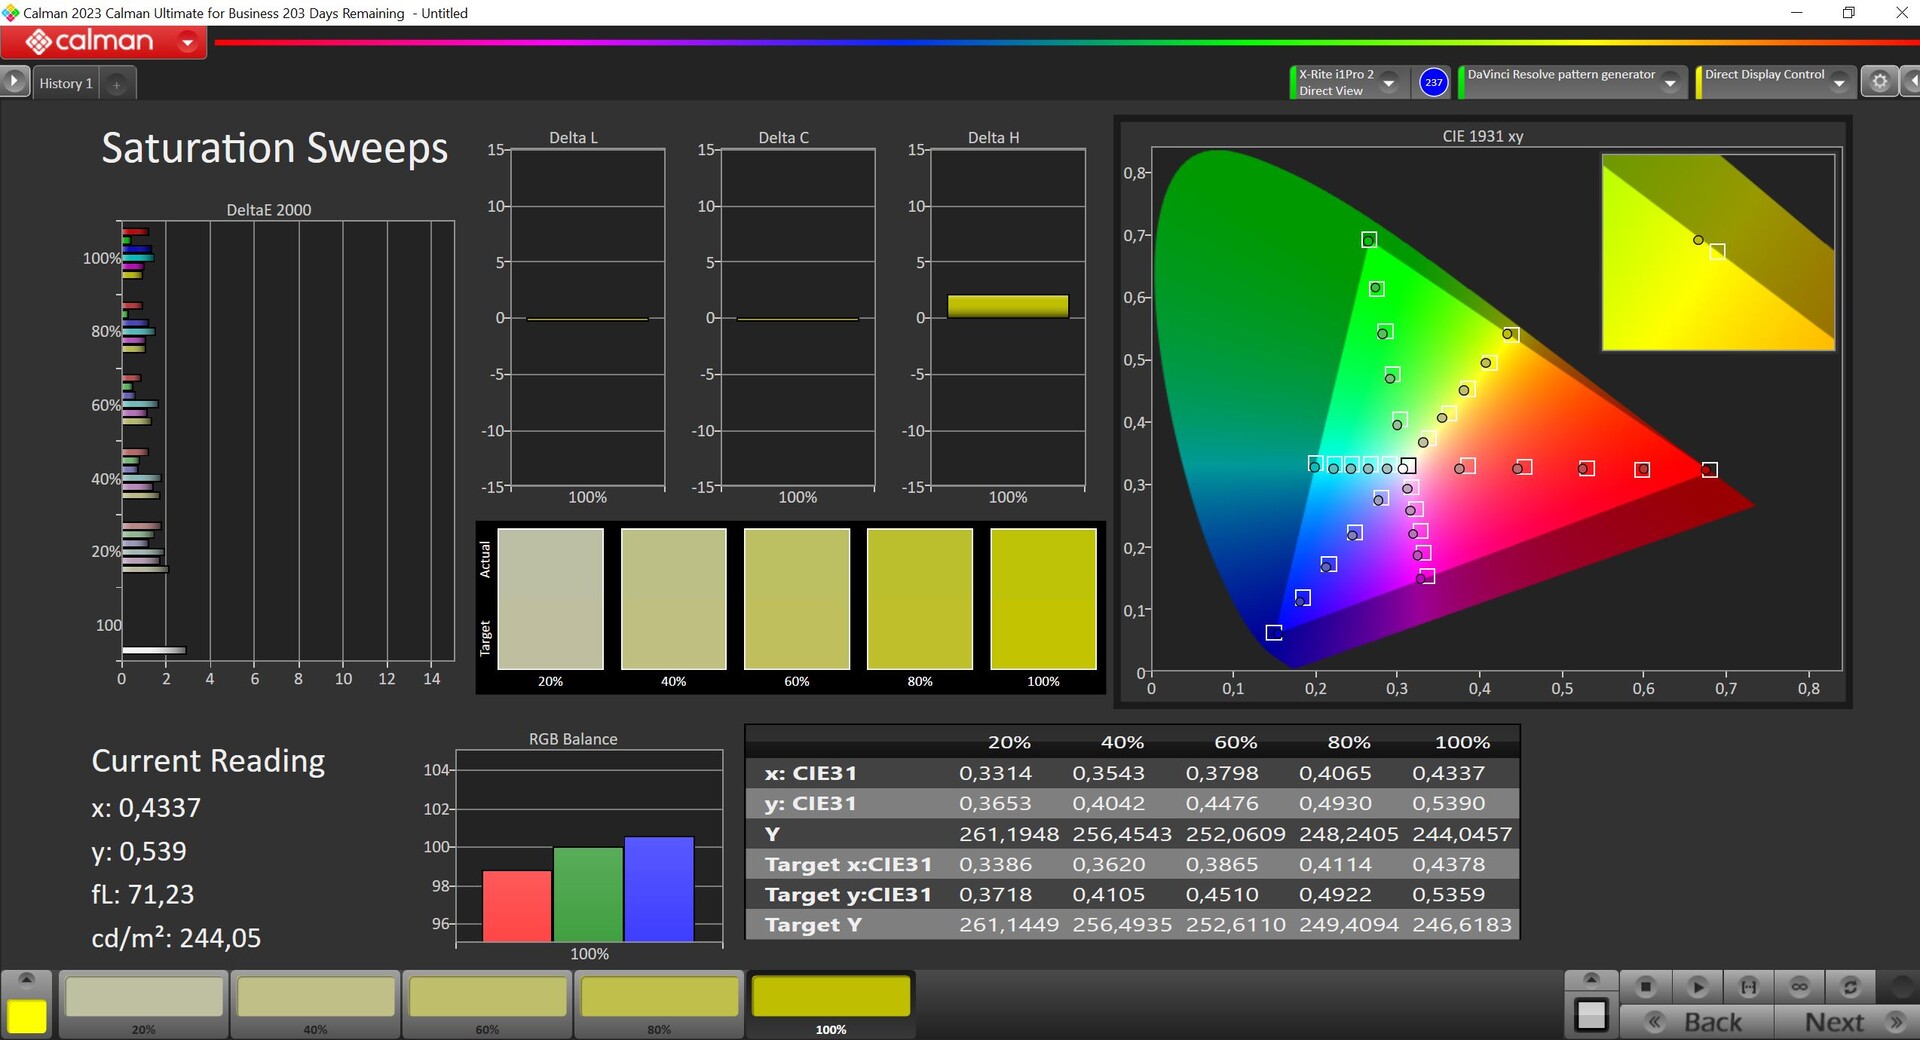

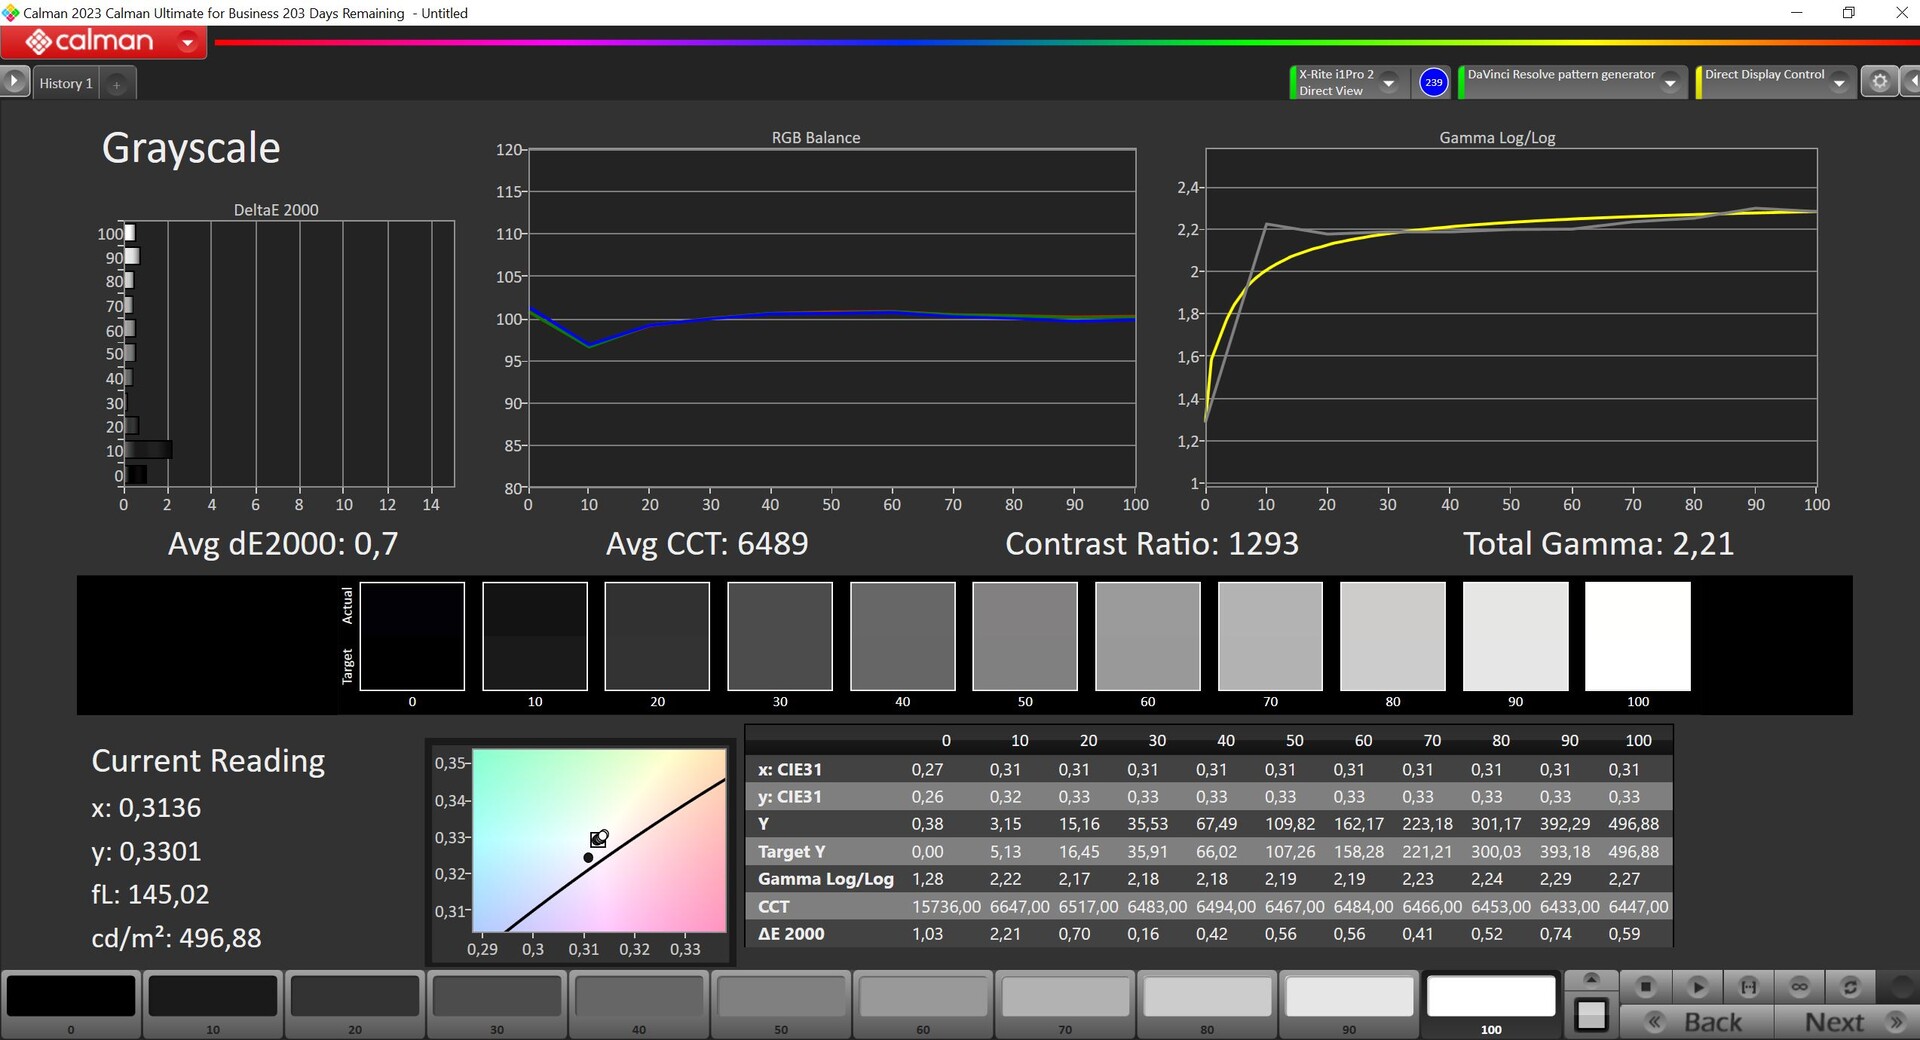


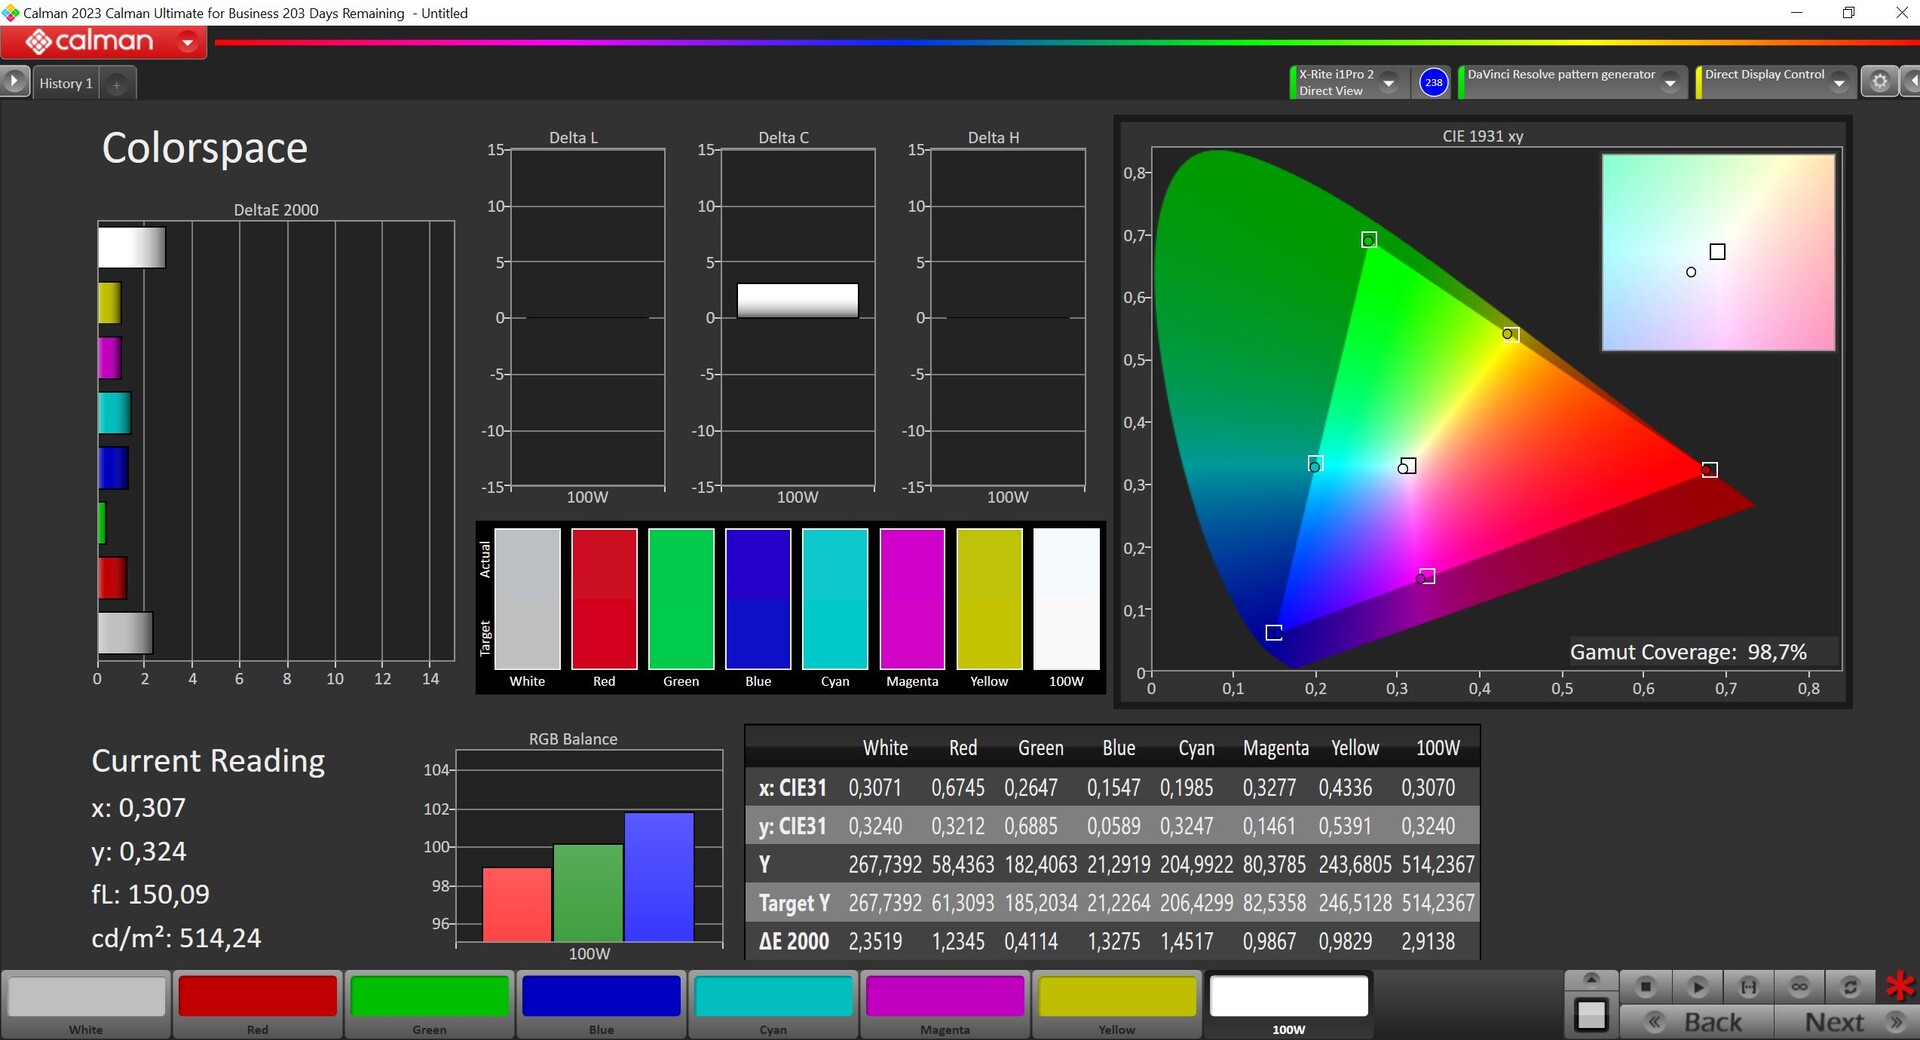
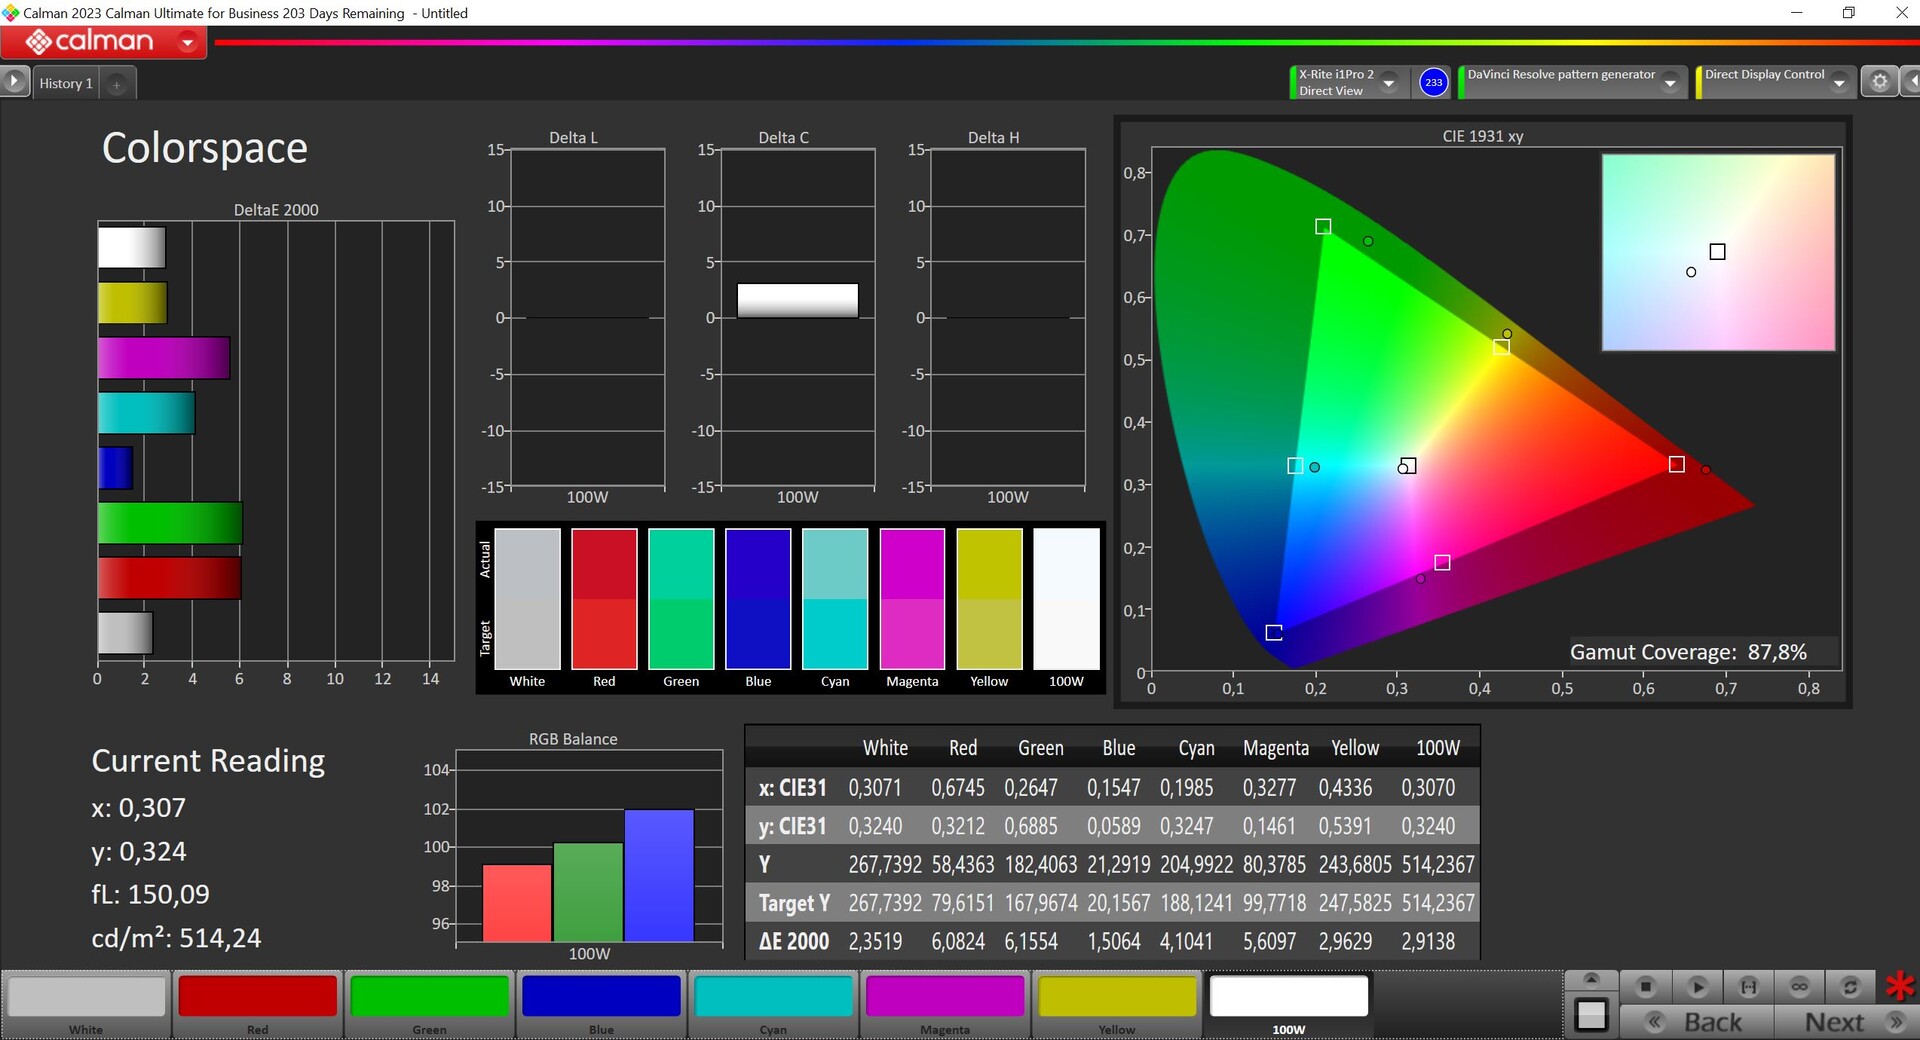
Out-of-the-box, the panel is decently calibrated and the DeltaE 2000 deviations (compared to the P3 reference) for both the gray scales and colors sit lower than 3. However, as with the smaller model, our professional CalMAN software analysis (X-Rite i1 Pro 2) recorded a slight blue tint together with a cool color temperature that verges on being too cool. With our calibration (the free download profile is available above), we got both of these things under control and the deviations were then also significantly lower. However, the maximum brightness is around 20 cd/m² lower. The P3 color space is completely covered.
Display Response Times
| ↔ Response Time Black to White | ||
|---|---|---|
| 15.6 ms ... rise ↗ and fall ↘ combined | ↗ 5.2 ms rise | 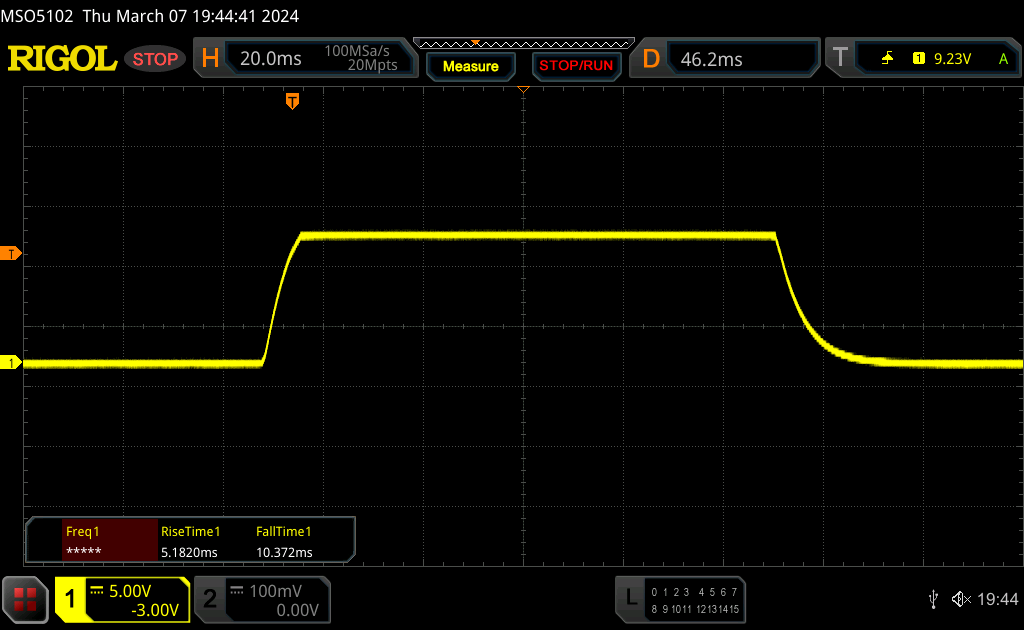 |
| ↘ 10.4 ms fall | ||
| The screen shows good response rates in our tests, but may be too slow for competitive gamers. In comparison, all tested devices range from 0.1 (minimum) to 240 (maximum) ms. » 37 % of all devices are better. This means that the measured response time is better than the average of all tested devices (19.9 ms). | ||
| ↔ Response Time 50% Grey to 80% Grey | ||
| 35.3 ms ... rise ↗ and fall ↘ combined | ↗ 16.4 ms rise | 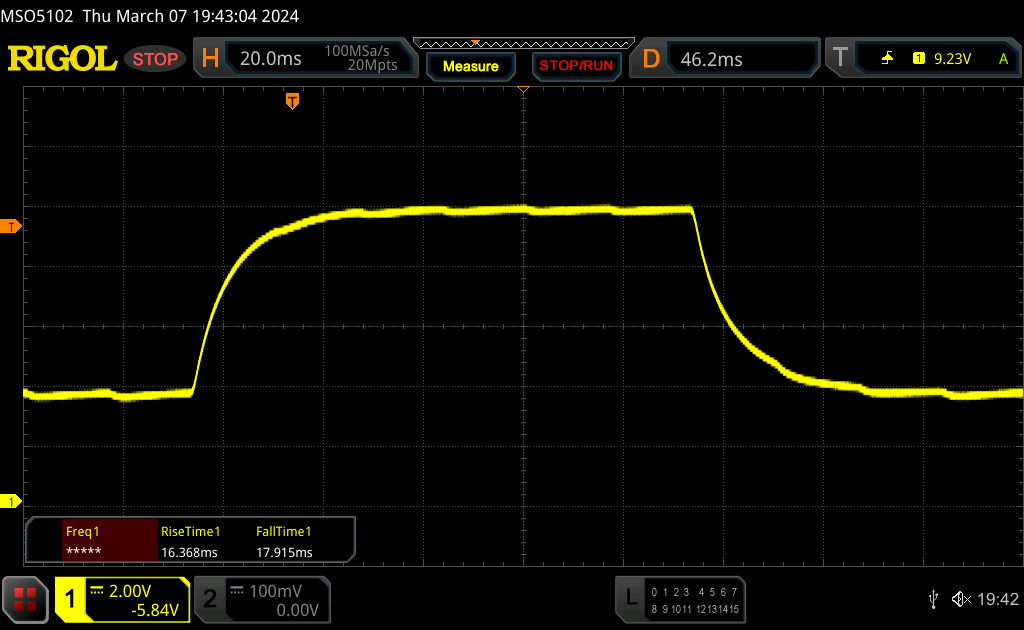 |
| ↘ 17.9 ms fall | ||
| The screen shows slow response rates in our tests and will be unsatisfactory for gamers. In comparison, all tested devices range from 0.165 (minimum) to 636 (maximum) ms. » 50 % of all devices are better. This means that the measured response time is worse than the average of all tested devices (31.1 ms). | ||
Screen Flickering / PWM (Pulse-Width Modulation)
| Screen flickering / PWM not detected |  | ||
In comparison: 52 % of all tested devices do not use PWM to dim the display. If PWM was detected, an average of 7801 (minimum: 5 - maximum: 343500) Hz was measured. | |||
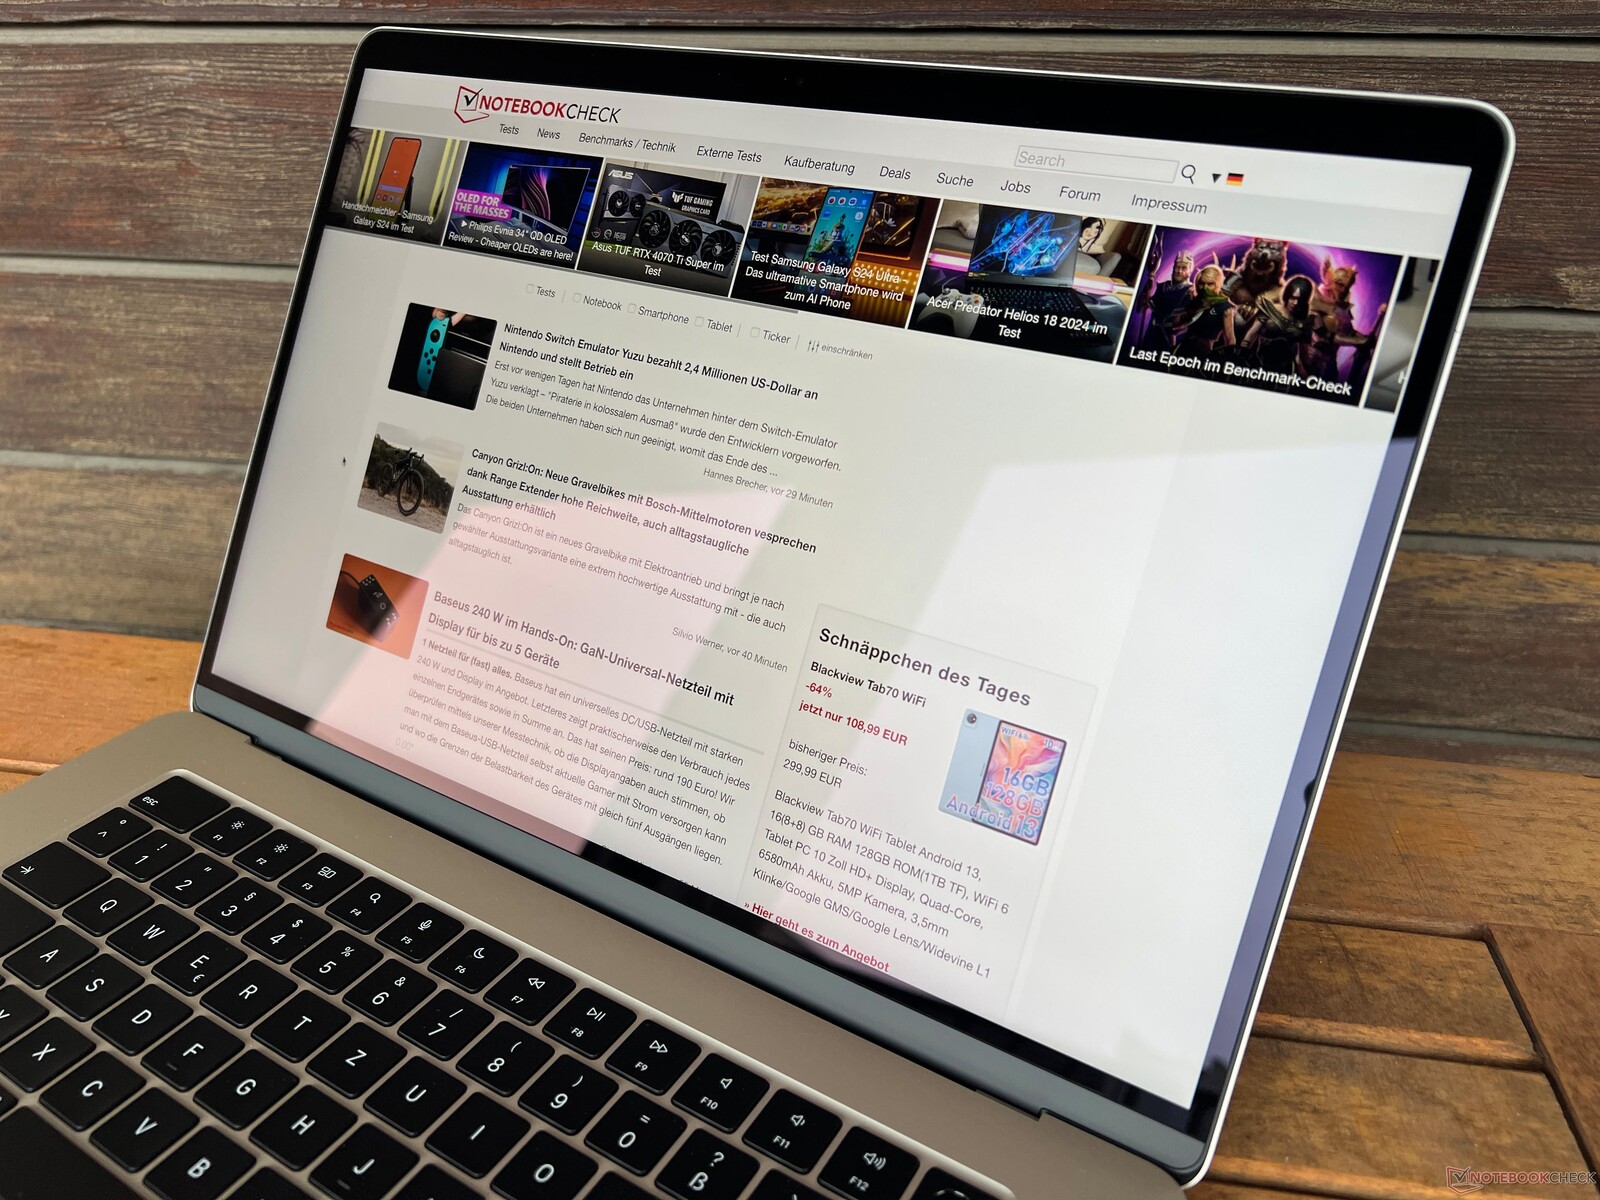
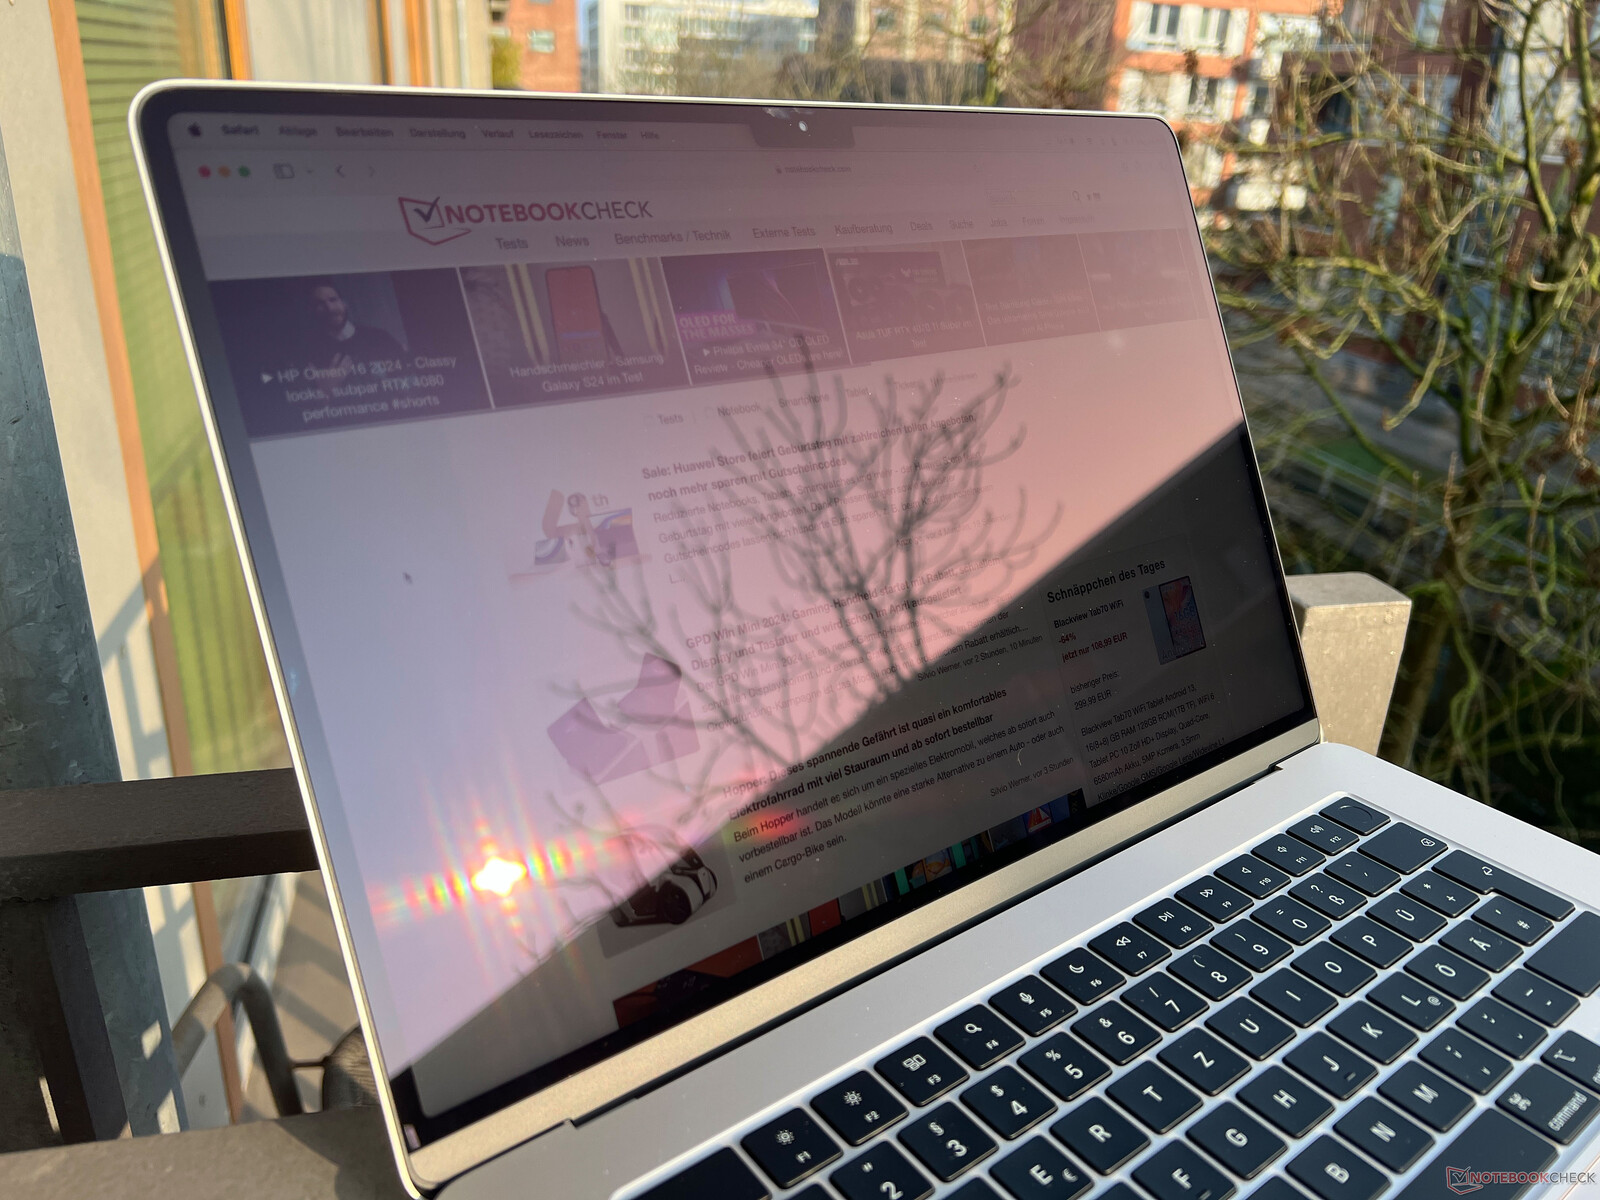
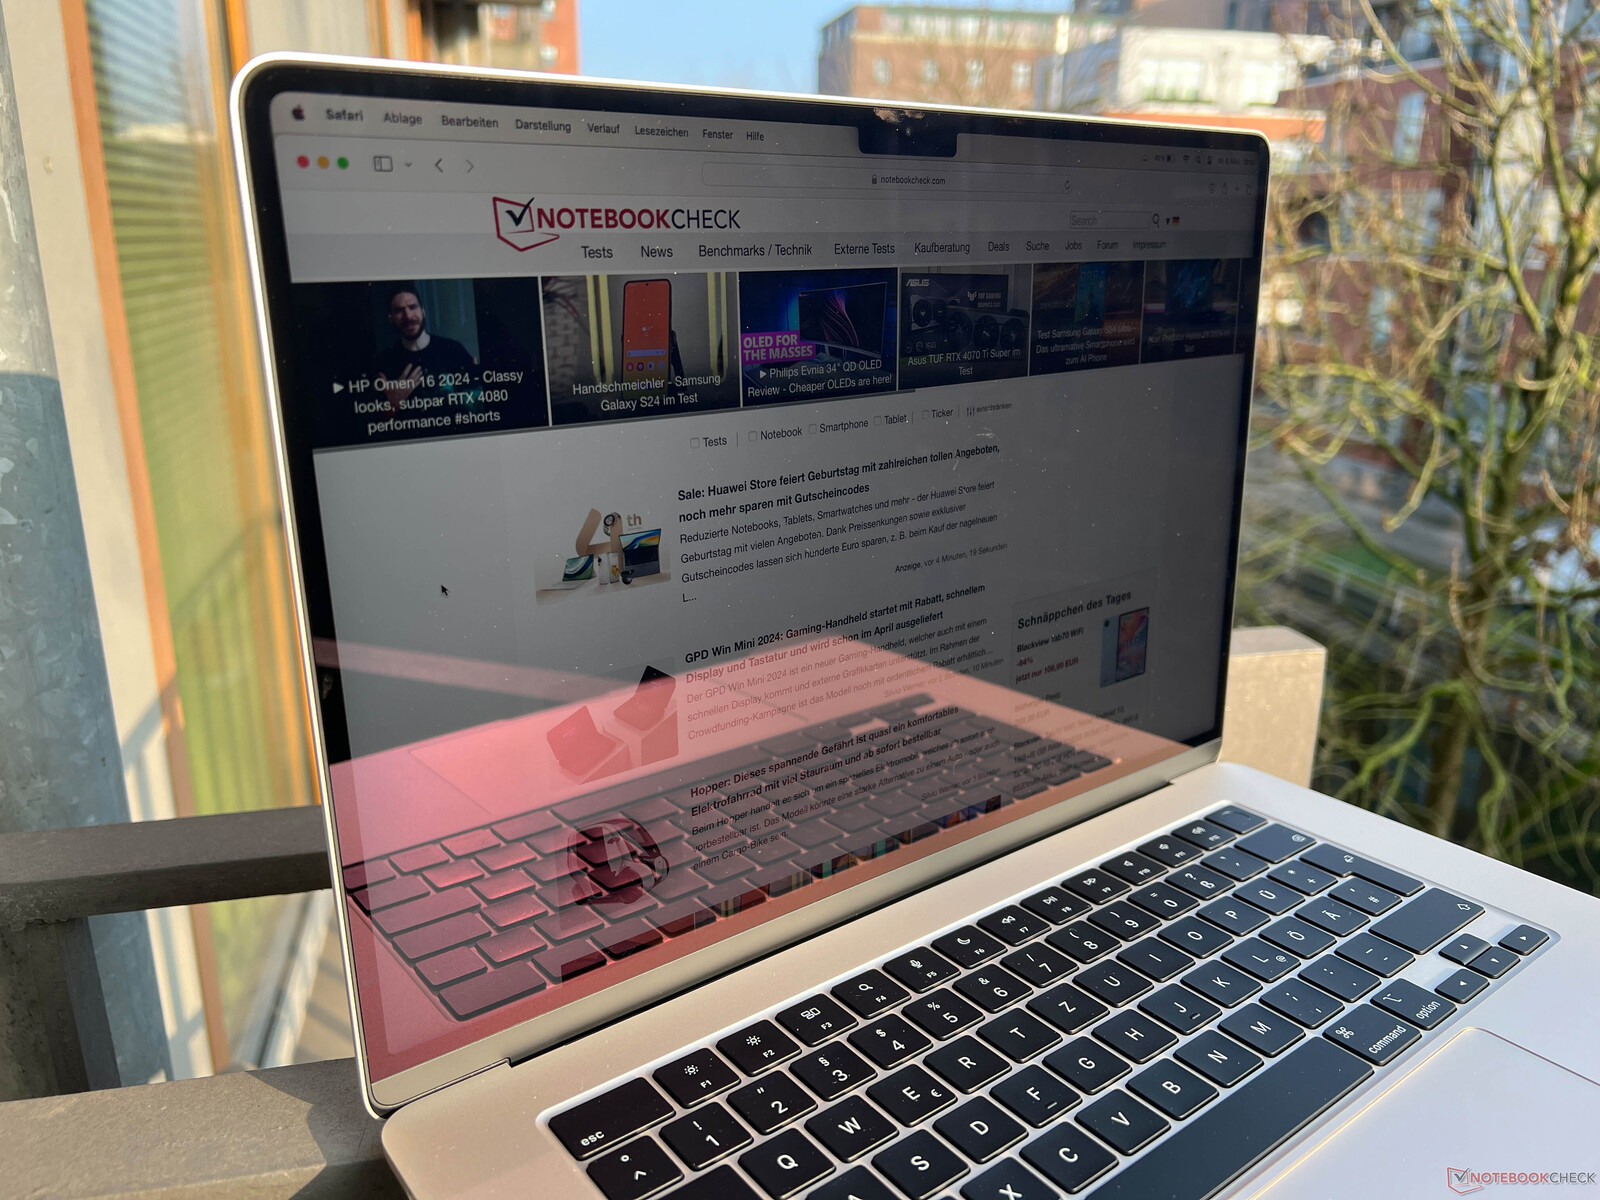
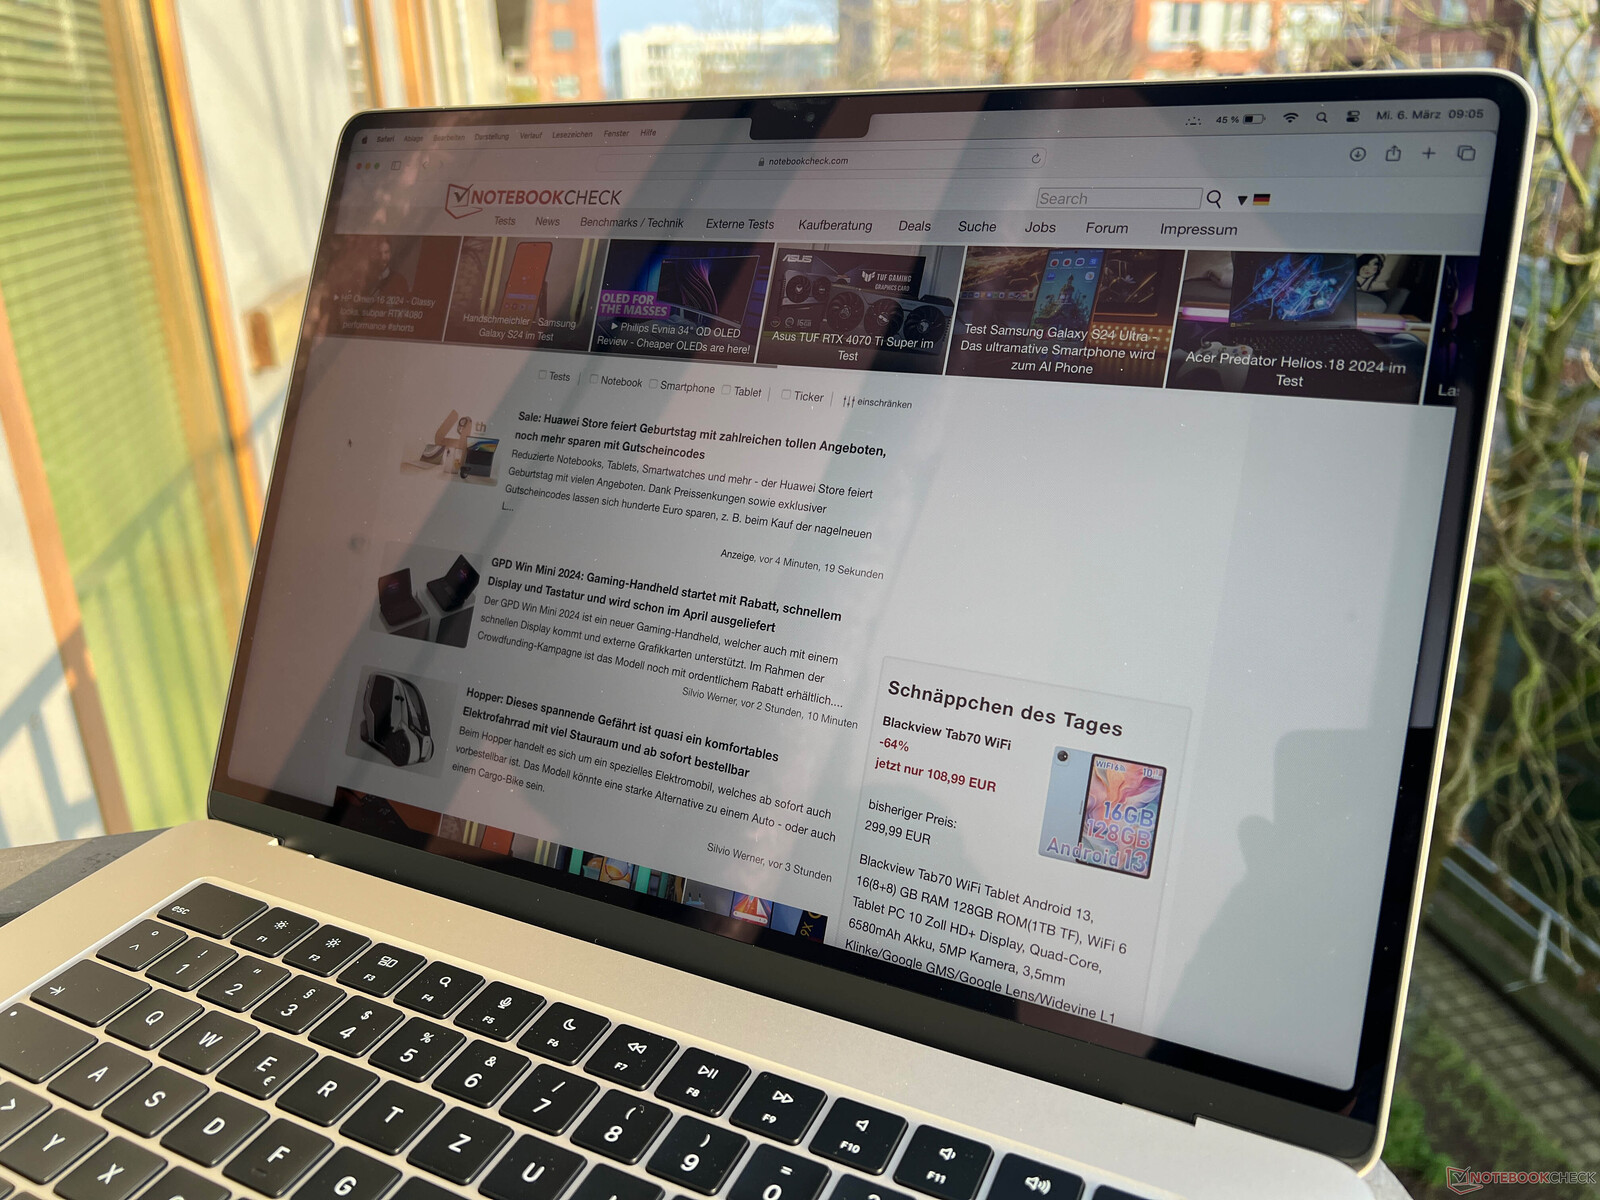
Although the Macbook Air's display is glossy, it is not as reflective as most of the Windows laptops which come with an OLED panel or touchscreen. This means you can still work reasonably successfully in bright environments as long as the sun doesn't shine directly onto the screen. The viewing angle stability is very good.

Performance - The Air 15 always has the faster M3 SoC
Unlike the smaller MacBook Air 13, the 15-inch model is only offered with the M3 SoC and its faster 10-core graphics. In addition, you can have either 8, 16 or 24 GB of soldered RAM and an SSD that tops out at a maximum of 2 TB. The choice of power adapter (35 or 70 watts) doesn't influence the MacBook Air M3's performance.
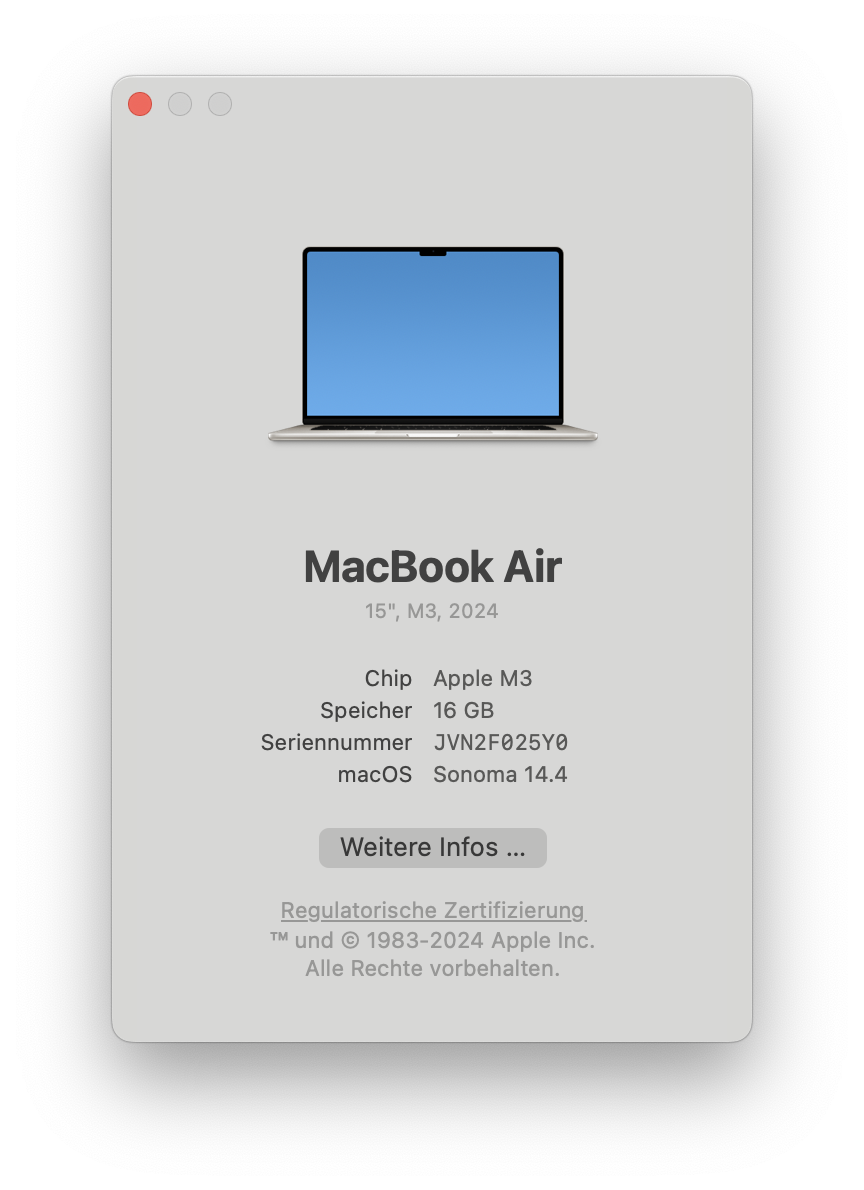
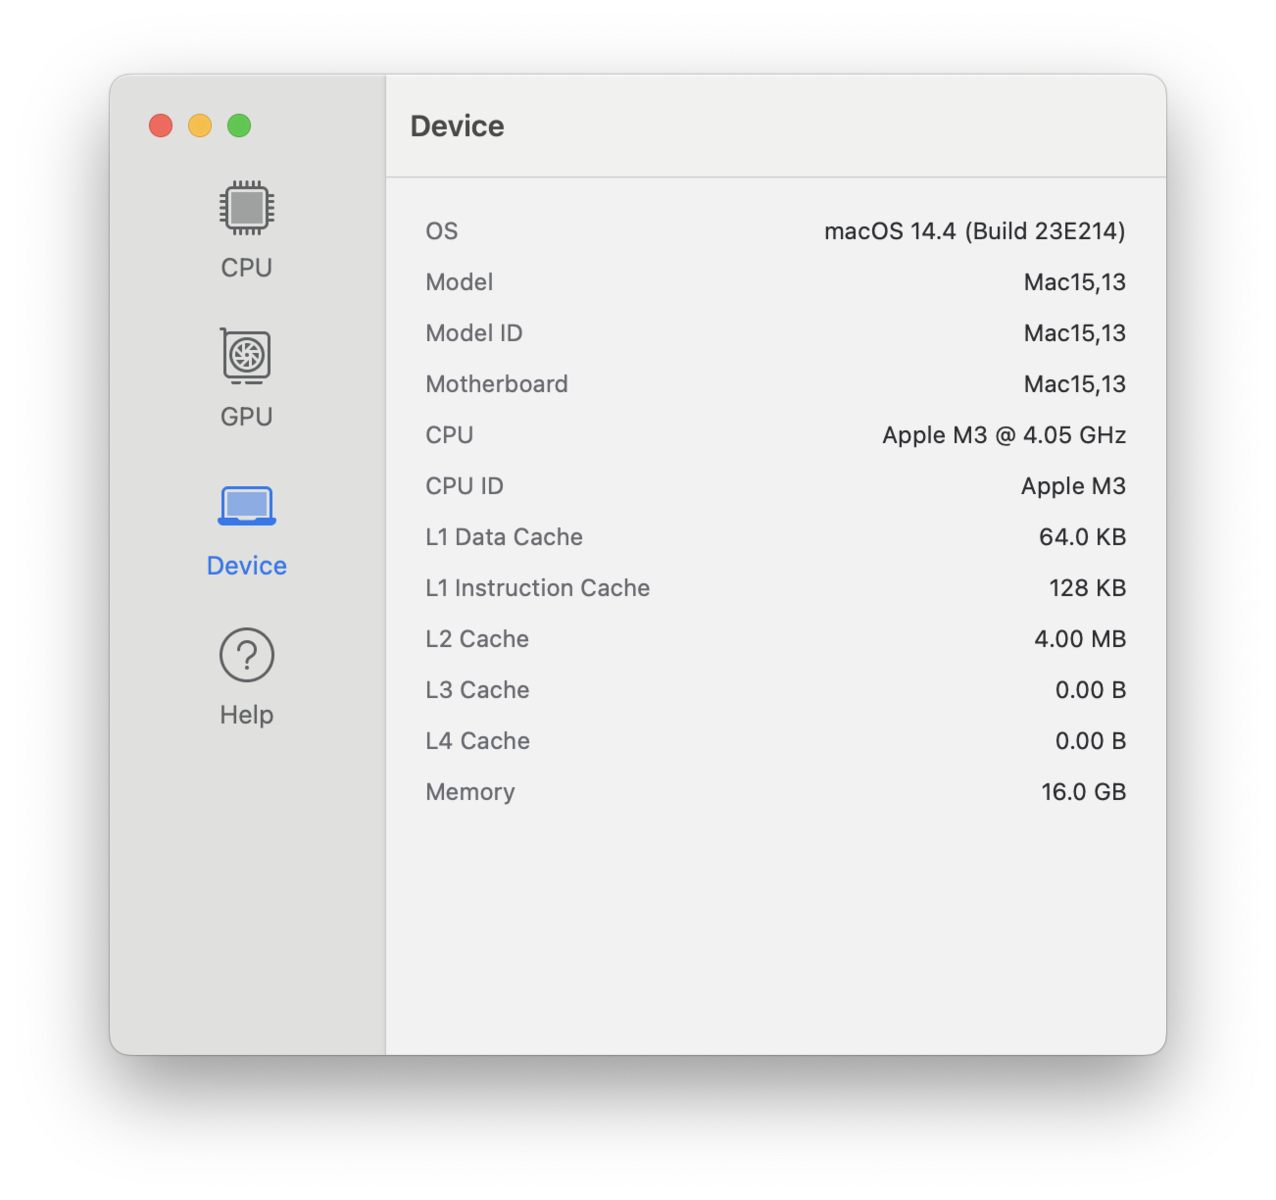
Prozessor - Apple M3 in 3 nm
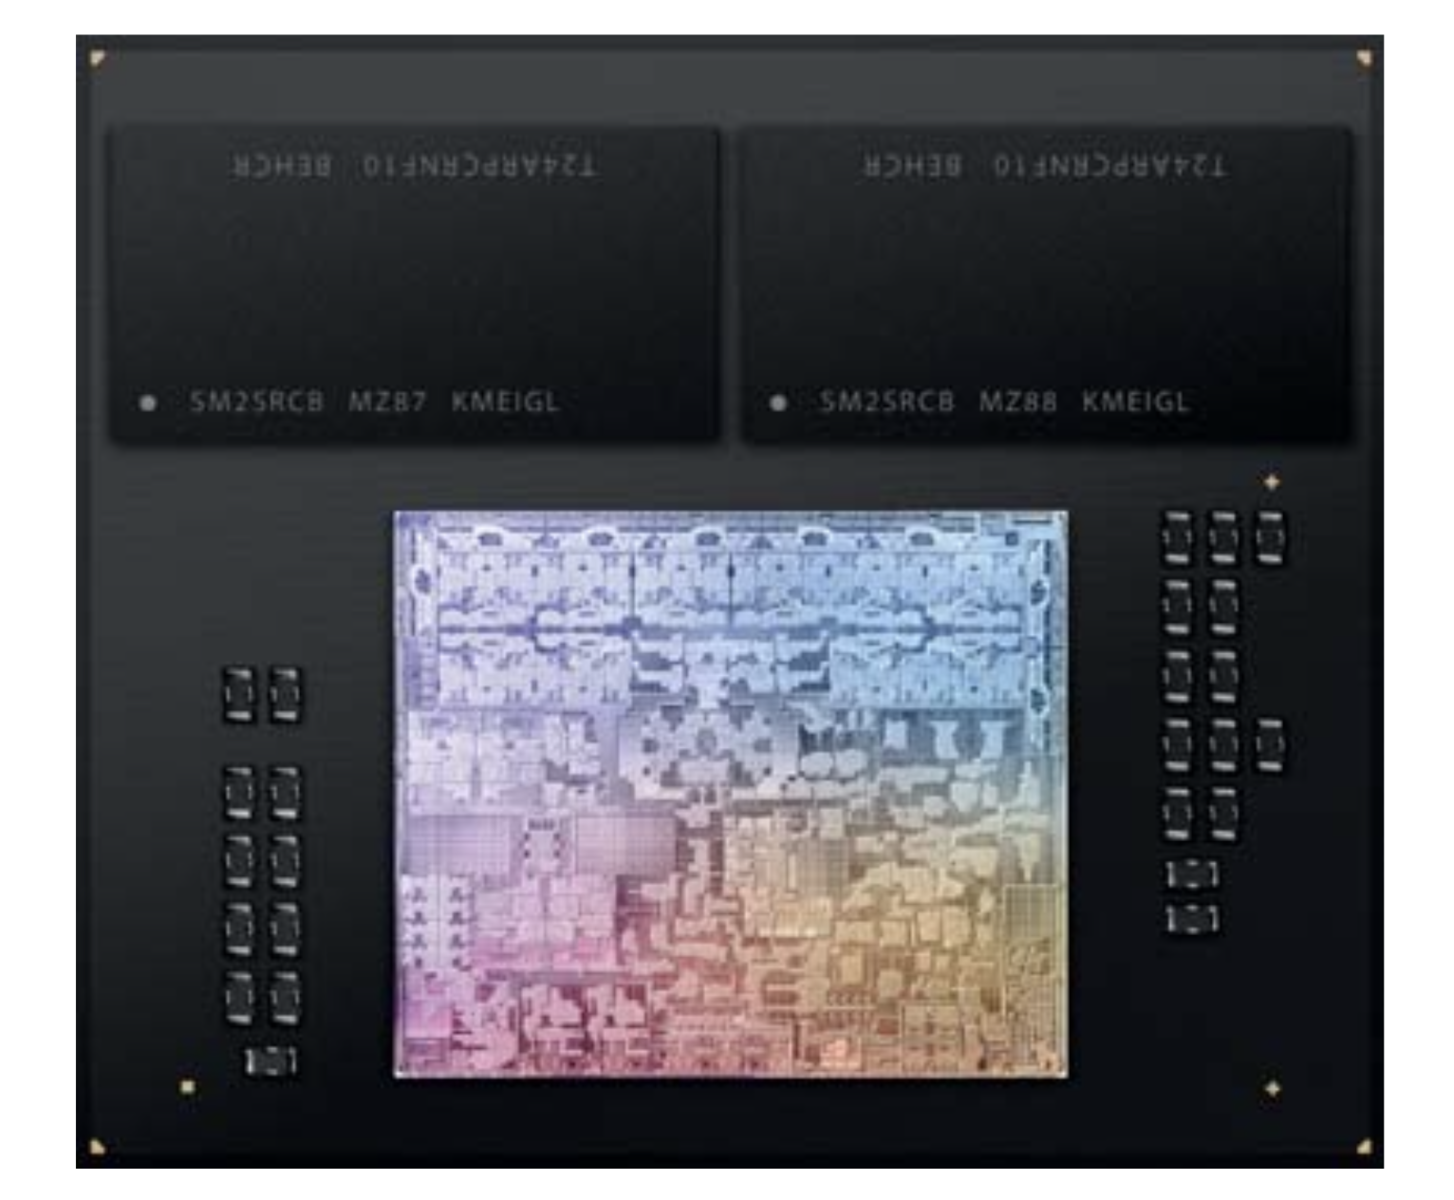
The Apple M3 SoC is Apple's first chip to be manufactured using a 3 nm process. The core configuration corresponds to the old M2 SoC but Apple was able to increase the clock speed thanks to its improved manufacturing process - without consuming considerably more power. The four performance cores now reach a maximum of 4.056 GHz (or ~3,6 GHz when all cores are stressed) and the four efficiency cores, have a maximum of 2.748 GHz. In the multi-core tests, the processor is briefly allowed to draw ~21 watts, before dropping and finally settling to ~12 watts (R23 Multi: 9,085 points means ~12 % less). This makes the performance drop lower than the MacBook Air 13. In short tests, performance is comparable to the MacBook Pro 14 M3 where, of course, the performance remains stable thanks to the active cooling.
Compared to the old M2 SoC, the performance is around 20 % higher on average. The result is that in multi-core tests, the M3 SoC is generally slower than its 16-inch competitors where the CPUs consume four times as much power.
In the single-core tests, Apple has also managed to increase the performance by a solid 20 % compared to the M2, thereby closing the gap to both Intel and AMD. Only some Core i9 CPUs still have an advantage. These are impressive results, especially when you consider the low single-core consumption of a little over 5 watts. We already took a look at the M3 SoC's efficiency in our analysis article. In battery mode, the MacBook Air 15 M3's CPU performance remains consistent. Additional CPU benchmarks can be found here.
Geekbench 6.6: Multi-Core | Single-Core
Geekbench 5.5: Multi-Core | Single-Core
Cinebench 2024: CPU Multi Core | CPU Single Core
| Geekbench 6.6 / Multi-Core | |
| Apple MacBook Pro 16 2023 M3 Pro | |
| Apple MacBook Pro 14 2023 M3 Pro | |
| MSI Prestige 16 B1MG-001US | |
| Asus VivoBook S15 K5504 | |
| Average of class Subnotebook (2244 - 20325, n=69, last 2 years) | |
| Apple MacBook Air 15 M3 | |
| Average Apple M3 (11752 - 12066, n=7) | |
| LG Gram SuperSlim (2023) | |
| Apple MacBook Air 15 2023 M2 16 GB | |
| Geekbench 6.6 / Single-Core | |
| Apple MacBook Pro 16 2023 M3 Pro | |
| Apple MacBook Air 15 M3 | |
| Apple MacBook Pro 14 2023 M3 Pro | |
| Average Apple M3 (2994 - 3130, n=7) | |
| Average of class Subnotebook (960 - 4195, n=65, last 2 years) | |
| Asus VivoBook S15 K5504 | |
| Apple MacBook Air 15 2023 M2 16 GB | |
| LG Gram SuperSlim (2023) | |
| MSI Prestige 16 B1MG-001US | |
| Cinebench 2024 / CPU Multi Core | |
| Apple MacBook Pro 16 2023 M3 Pro | |
| Apple MacBook Pro 14 2023 M3 Pro | |
| MSI Prestige 16 B1MG-001US | |
| Average of class Subnotebook (148 - 1471, n=71, last 2 years) | |
| Average Apple M3 (576 - 712, n=4) | |
| Apple MacBook Air 15 M3 | |
| Apple MacBook Air 15 2023 M2 16 GB | |
| Cinebench 2024 / CPU Single Core | |
| Apple MacBook Pro 14 2023 M3 Pro | |
| Apple MacBook Pro 16 2023 M3 Pro | |
| Apple MacBook Air 15 M3 | |
| Average Apple M3 (140 - 142, n=4) | |
| Apple MacBook Air 15 2023 M2 16 GB | |
| Average of class Subnotebook (35 - 200, n=57, last 2 years) | |
System performance
In everyday situations, the old MacBook Air 15 M2 was already a fast device and that is also the case with the M3 SoC. Above all, in native applications, the performance is very good and, in the synthetic benchmarks, the new MacBook Air 15 M3 almost always manages to be ahead of the Windows competition pack.
Applications for Intel-based Macs can be emulated via Rosetta 2 and this works very well. Although there is a speed difference (especially when it comes to complex applications) this also works flawlessly. The subject of AI is currently very trendy and, with its Neural Engine, Apple has also had an NPU installed since the M1 chips and uses these, for example, for word prediction in messages. Anyone who likes using Microsoft's Office Suite including Copilot won't have to worry about this since this functionality is provided via the Cloud meaning there is no difference to Windows devices.
WebXPRT 3: Overall
WebXPRT 4: Overall
Mozilla Kraken 1.1: Total
Jetstream 2: 2.0 Total
| CrossMark / Overall | |
| Huawei MateBook 16s i9 | |
| Acer Swift Go SFG16-71 | |
| Apple MacBook Air 15 M3 | |
| Average Apple M3, Apple M3 10-Core GPU (1847 - 1857, n=3) | |
| Asus VivoBook S15 K5504 | |
| MSI Prestige 16 B1MG-001US | |
| LG Gram SuperSlim (2023) | |
| Average of class Subnotebook (365 - 2356, n=63, last 2 years) | |
| Samsung Galaxy Book3 15, Core i5-1335U | |
| CrossMark / Productivity | |
| Huawei MateBook 16s i9 | |
| Acer Swift Go SFG16-71 | |
| Apple MacBook Air 15 M3 | |
| Average Apple M3, Apple M3 10-Core GPU (1716 - 1729, n=3) | |
| Asus VivoBook S15 K5504 | |
| MSI Prestige 16 B1MG-001US | |
| LG Gram SuperSlim (2023) | |
| Average of class Subnotebook (364 - 2277, n=63, last 2 years) | |
| Samsung Galaxy Book3 15, Core i5-1335U | |
| CrossMark / Creativity | |
| Huawei MateBook 16s i9 | |
| Apple MacBook Air 15 M3 | |
| Average Apple M3, Apple M3 10-Core GPU (2183 - 2210, n=3) | |
| Asus VivoBook S15 K5504 | |
| Acer Swift Go SFG16-71 | |
| MSI Prestige 16 B1MG-001US | |
| Average of class Subnotebook (372 - 2743, n=63, last 2 years) | |
| LG Gram SuperSlim (2023) | |
| Samsung Galaxy Book3 15, Core i5-1335U | |
| CrossMark / Responsiveness | |
| Huawei MateBook 16s i9 | |
| Acer Swift Go SFG16-71 | |
| LG Gram SuperSlim (2023) | |
| MSI Prestige 16 B1MG-001US | |
| Asus VivoBook S15 K5504 | |
| Apple MacBook Air 15 M3 | |
| Average Apple M3, Apple M3 10-Core GPU (1364 - 1367, n=3) | |
| Average of class Subnotebook (312 - 1854, n=63, last 2 years) | |
| Samsung Galaxy Book3 15, Core i5-1335U | |
| WebXPRT 3 / Overall | |
| Apple MacBook Air 15 M3 | |
| Average Apple M3, Apple M3 10-Core GPU (423 - 448, n=3) | |
| Huawei MateBook 16s i9 | |
| Average of class Subnotebook (156 - 530, n=59, last 2 years) | |
| Asus VivoBook S15 K5504 | |
| Acer Swift Go SFG16-71 | |
| MSI Prestige 16 B1MG-001US | |
| LG Gram SuperSlim (2023) | |
| Samsung Galaxy Book3 15, Core i5-1335U | |
| WebXPRT 4 / Overall | |
| Apple MacBook Air 15 M3 | |
| Average Apple M3, Apple M3 10-Core GPU (313 - 315, n=2) | |
| Huawei MateBook 16s i9 | |
| Average of class Subnotebook (132 - 378, n=64, last 2 years) | |
| Acer Swift Go SFG16-71 | |
| MSI Prestige 16 B1MG-001US | |
| Samsung Galaxy Book3 15, Core i5-1335U | |
| LG Gram SuperSlim (2023) | |
| Mozilla Kraken 1.1 / Total | |
| Samsung Galaxy Book3 15, Core i5-1335U | |
| MSI Prestige 16 B1MG-001US | |
| LG Gram SuperSlim (2023) | |
| Asus VivoBook S15 K5504 | |
| Acer Swift Go SFG16-71 | |
| Average of class Subnotebook (234 - 1104, n=64, last 2 years) | |
| Huawei MateBook 16s i9 | |
| Average Apple M3, Apple M3 10-Core GPU (363 - 373, n=3) | |
| Apple MacBook Air 15 M3 | |
| Jetstream 2 / 2.0 Total | |
| Average of class Subnotebook (117 - 476, n=30, last 2 years) | |
| Apple MacBook Air 15 M3 | |
| Average Apple M3, Apple M3 10-Core GPU (305 - 318, n=3) | |
| LG Gram SuperSlim (2023) | |
| Samsung Galaxy Book3 15, Core i5-1335U | |
* ... smaller is better
Mass storage
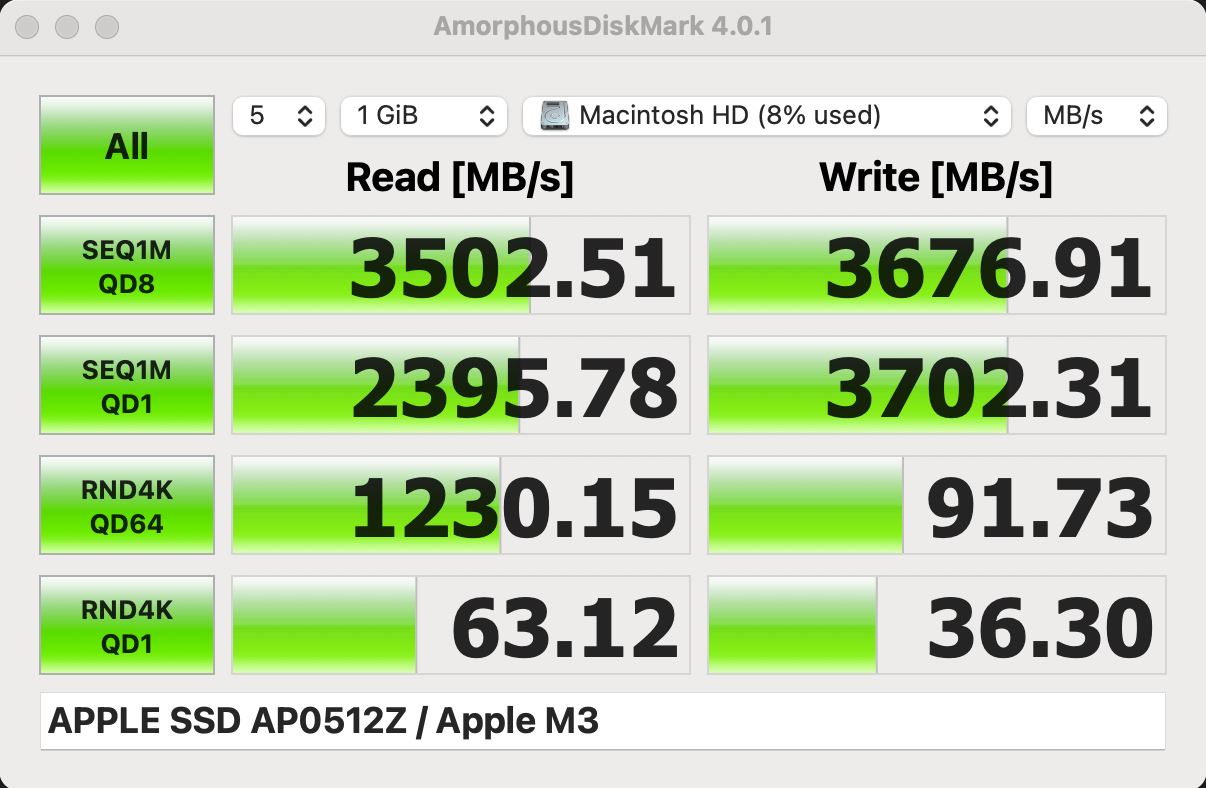
Unlike the Pro models, Apple has stuck with PCIe 3.0 SSDs for its Air. Our review device comes with a 512 GB version (AP0512Z) installed and its transfer speeds are on an expected level of a maximum of ~3,5 GB/s. In everyday use, this means there are no limitations. Once again, we expect the 256 GB model to have significantly lower performance (~50 %) and this is something we will check as soon as possible. After the first start-up, the user has an available 465 GB at their disposal. The Air M3 can be configured with an SSD with a maximum capacity of 2 TB. Additional SSD benchmarks are listed here.
Graphics card
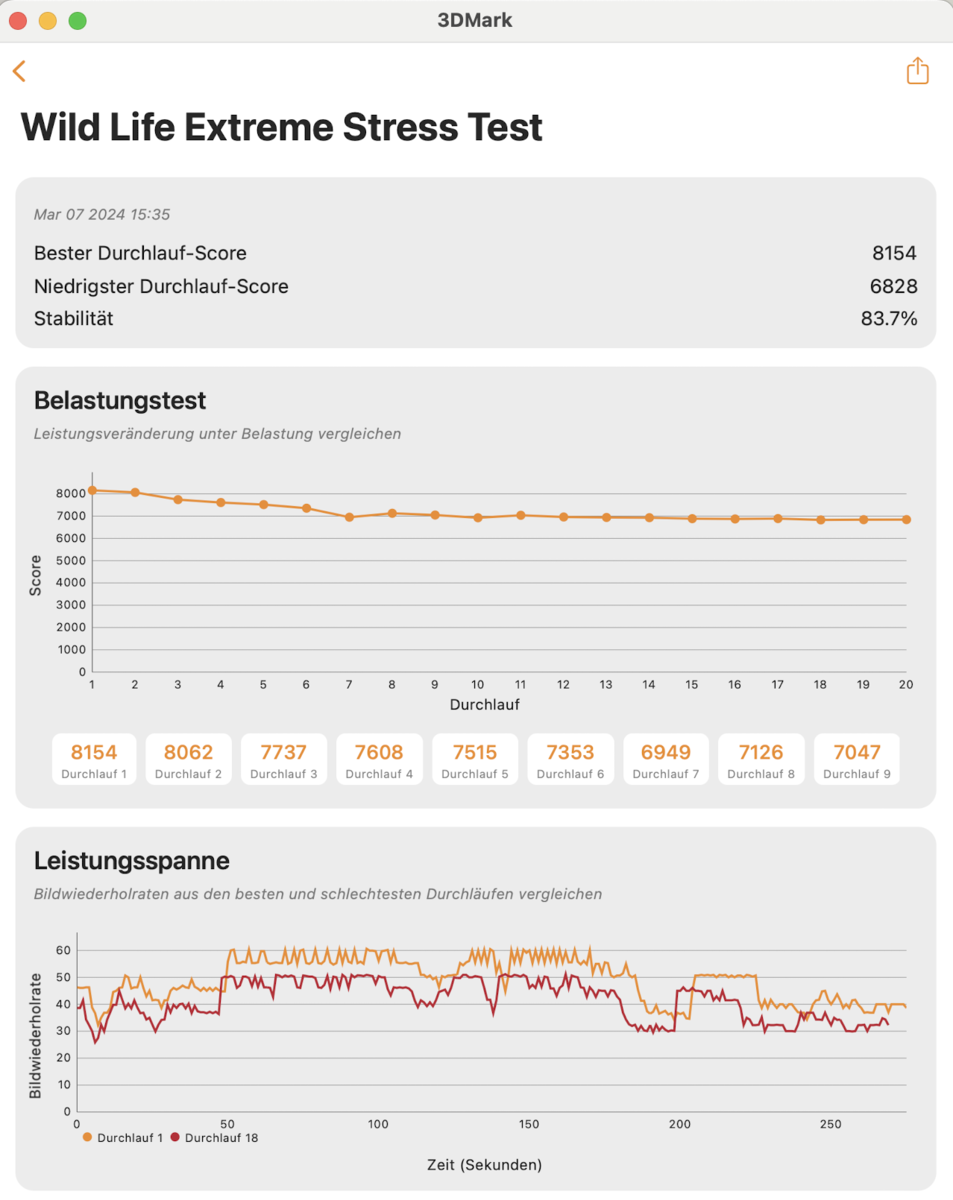
Our review device has the 10-core M3 GPU which we are already familiar with from the MacBook Pro 14 M3. The maximum power consumption sits at ~15 watts and the performance is basically on the same level as the MacBook Pro. However, under continuous load, the Air also has to drop a little. In the 3DMark WildLife Extreme stress test, the result dropped by around 17 % after 20 runs making it more stable than the smaller MBA 13. When it comes to the GPU performance, we also observed a 20 % advantage compared to the old 10-core M2 GPU. In battery mode, the graphics performance remained constant and additional benchmarks are available here.
Gaming on the MacBook is slowly picking up speed and titles such as Total War: Pharao or also Baldur's Gate 3 run natively on the MacBook. But, Baldur's Gate 3 at high details is too demanding meaning you will have to activate FSR. Doing this will allow you to hit around 35fps even in 1080p/high. However, with FSR, you should at least choose the Quality setting, otherwise the graphics quality suffers visibly. Emulated games such as Shadow of the Tomb Raider or Witcher 3 also run on the MacBook but, depending on the title, there can be some limitations and the performance is also somewhat paired back.
| Blender / v3.3 Classroom METAL | |
| Apple MacBook Air 15 2023 M2 16 GB | |
| Apple MacBook Air 15 M3 | |
| Average Apple M3 10-Core GPU (121 - 134, n=3) | |
| Average of class Subnotebook (76.3 - 227, n=5, last 2 years) | |
| Apple MacBook Pro 14 2023 M2 Pro | |
| Apple MacBook Pro 14 2023 M3 Pro | |
| Apple MacBook Pro 16 2023 M3 Pro | |
| Blender / v3.3 Classroom CPU | |
| Samsung Galaxy Book3 15, Core i5-1335U | |
| LG Gram SuperSlim (2023) | |
| Apple MacBook Air 15 2023 M2 16 GB | |
| Average Apple M3 10-Core GPU (491 - 761, n=3) | |
| Average of class Subnotebook (241 - 861, n=63, last 2 years) | |
| Apple MacBook Air 15 M3 | |
| Acer Swift Go SFG16-71 | |
| Asus VivoBook S15 K5504 | |
| MSI Prestige 16 B1MG-001US | |
| Apple MacBook Pro 14 2023 M3 Pro | |
| Huawei MateBook 16s i9 | |
| Apple MacBook Pro 14 2023 M2 Pro | |
| Apple MacBook Pro 16 2023 M3 Pro | |
* ... smaller is better
| low | med. | high | ultra | |
|---|---|---|---|---|
| The Witcher 3 (2015) | 36 | 24 | ||
| Shadow of the Tomb Raider (2018) | 113 | 44 | 38 | 32 |
| Baldur's Gate 3 (2023) | 32 | 26 | 22 | 19 |
| Total War Pharaoh (2023) | 133 | 83 | 44 | 35 |
Emissions - Silent and good speakers
Noise emissions
The huge advantage of the MacBook Air 15 compared to comparably fast Windows devices continues to be its passive cooling. It doesn't matter what you do with the device (also when using two external monitors), it is always silent and there are no electronic noises of any kind.
| Apple MacBook Air 15 M3 M3 10-Core GPU, M3, Apple SSD AP0512Z | Asus VivoBook S15 K5504 Iris Xe G7 96EUs, i9-13900H, WD PC SN560 SDDPNQE-1T00 | MSI Prestige 16 B1MG-001US Arc 8-Core, Ultra 7 155H, Samsung PM9A1 MZVL22T0HBLB | Acer Swift Go SFG16-71 Iris Xe G7 96EUs, i7-13700H, Micron 2400 MTFDKBA1T0QFM | Huawei MateBook 16s i9 Iris Xe G7 96EUs, i9-13900H, 321JN1024GB-TX01 | LG Gram SuperSlim (2023) Iris Xe G7 96EUs, i7-1360P, SK hynix PC801 HFS001TEJ9X101N | Samsung Galaxy Book3 15, Core i5-1335U Iris Xe G7 80EUs, i5-1335U, Samsung PM991a MZ9LQ512HBLU-00BD1 | |
|---|---|---|---|---|---|---|---|
| Noise | |||||||
| off / environment * (dB) | 25.3 | 24.5 | 25.7 | 25.7 | 25.2 | 25.2 | |
| Idle Minimum * (dB) | 25.3 | 24.5 | 26.1 | 25.7 | 25.2 | 25.2 | |
| Idle Average * (dB) | 25.3 | 26.3 | 26.1 | 28.4 | 25.2 | 25.2 | |
| Idle Maximum * (dB) | 25.3 | 26.3 | 27.2 | 28.4 | 25.2 | 31.6 | |
| Load Average * (dB) | 43.5 | 36.5 | 44.2 | 45.3 | 43.1 | 45.4 | |
| Load Maximum * (dB) | 50.75 | 52.9 | 47.5 | 45.6 | 43.3 | 45.4 | |
| Witcher 3 ultra * (dB) | 46.3 |
* ... smaller is better
Temperature
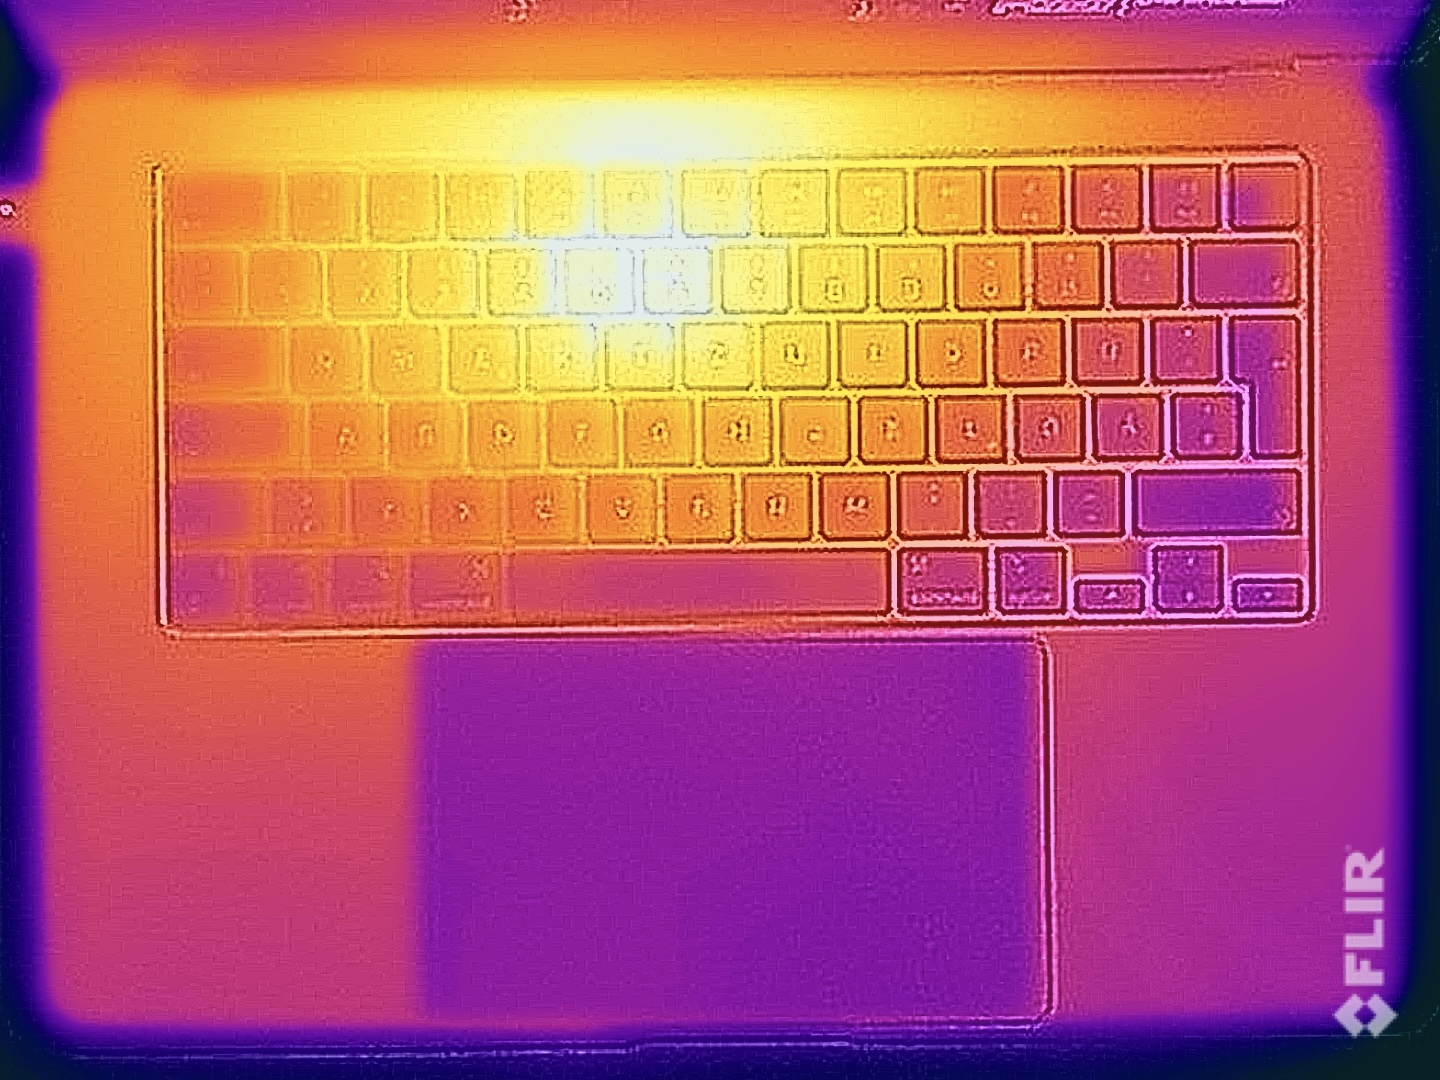
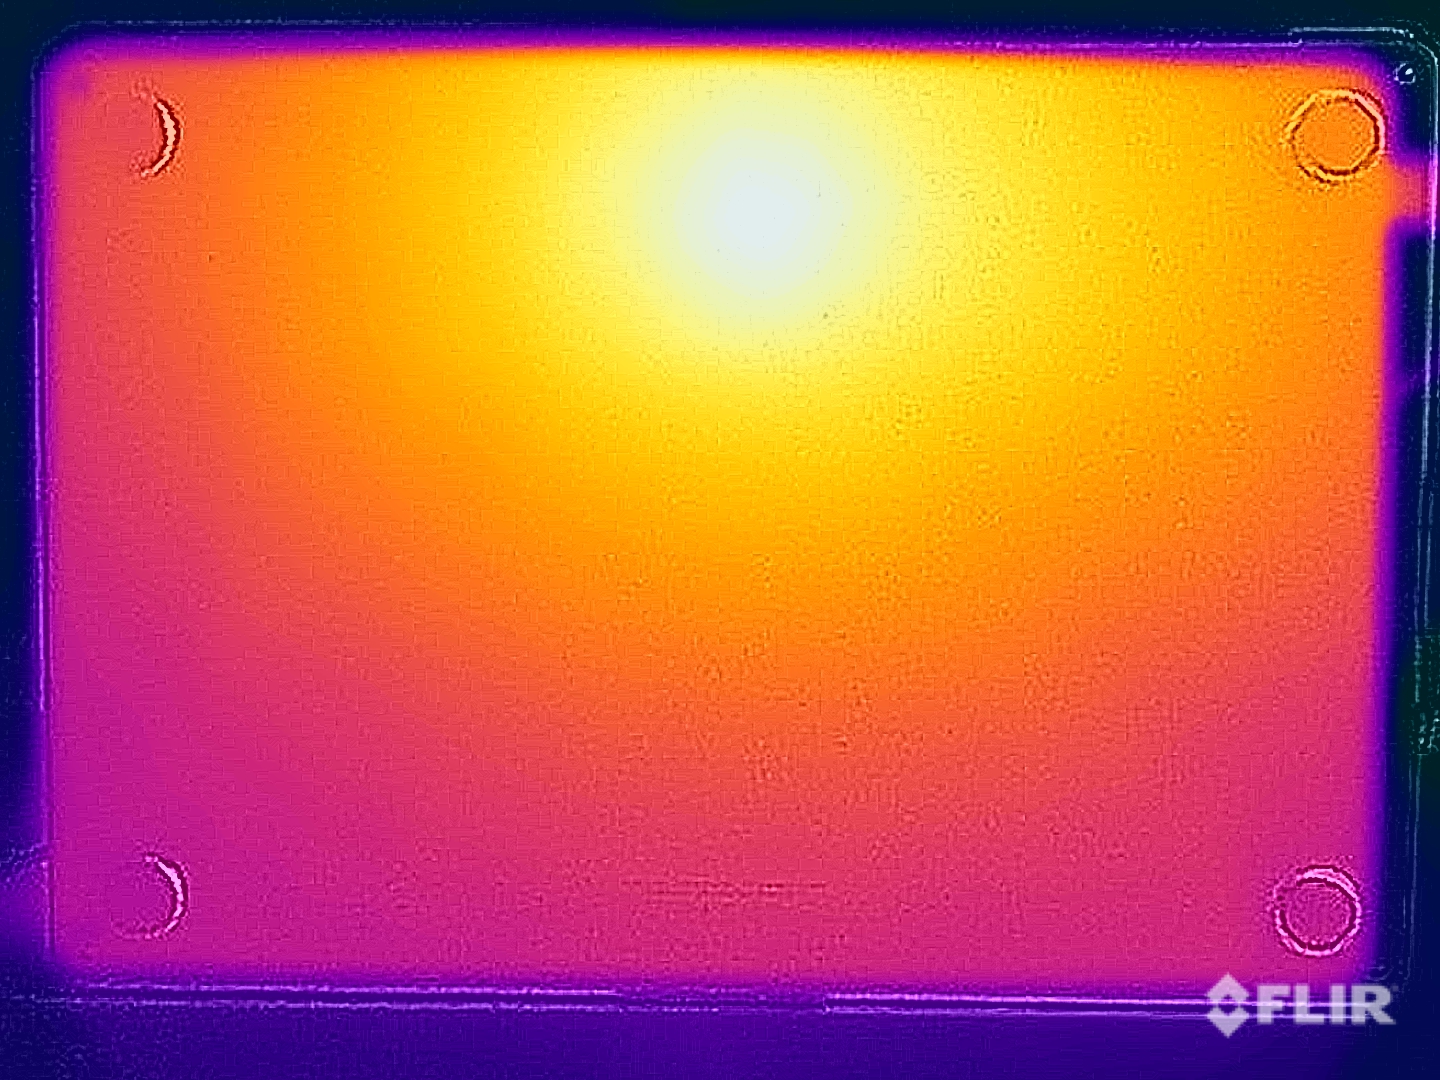
Despite the passive cooling, Apple continues to have the case temperatures under control and, running idle or when undertaking undemanding tasks, the laptop hardly heats up. After our one-hour stress test, we measured a hotspot in the upper middle area of almost 44 °C on both the upper and lower sides of the base unit. This is noticeable, of course, but it doesn't cause any limitations when using the device.
(±) The maximum temperature on the upper side is 44.3 °C / 112 F, compared to the average of 35.9 °C / 97 F, ranging from 21.4 to 59 °C for the class Subnotebook.
(±) The bottom heats up to a maximum of 43.4 °C / 110 F, compared to the average of 39.2 °C / 103 F
(+) In idle usage, the average temperature for the upper side is 22.8 °C / 73 F, compared to the device average of 30.8 °C / 87 F.
(+) The palmrests and touchpad are reaching skin temperature as a maximum (32.7 °C / 90.9 F) and are therefore not hot.
(-) The average temperature of the palmrest area of similar devices was 28.2 °C / 82.8 F (-4.5 °C / -8.1 F).
| Apple MacBook Air 15 M3 Apple M3, Apple M3 10-Core GPU | Asus VivoBook S15 K5504 Intel Core i9-13900H, Intel Iris Xe Graphics G7 96EUs | MSI Prestige 16 B1MG-001US Intel Core Ultra 7 155H, Intel Arc 8-Core iGPU | Acer Swift Go SFG16-71 Intel Core i7-13700H, Intel Iris Xe Graphics G7 96EUs | Huawei MateBook 16s i9 Intel Core i9-13900H, Intel Iris Xe Graphics G7 96EUs | LG Gram SuperSlim (2023) Intel Core i7-1360P, Intel Iris Xe Graphics G7 96EUs | Samsung Galaxy Book3 15, Core i5-1335U Intel Core i5-1335U, Intel Iris Xe Graphics G7 80EUs | |
|---|---|---|---|---|---|---|---|
| Heat | -50% | -7% | -22% | -17% | -33% | -19% | |
| Maximum Upper Side * (°C) | 44.3 | 51.5 -16% | 48.8 -10% | 44.4 -0% | 43.2 2% | 43.9 1% | 45.9 -4% |
| Maximum Bottom * (°C) | 43.4 | 62.4 -44% | 47.6 -10% | 48 -11% | 44.7 -3% | 50.4 -16% | 43.5 -0% |
| Idle Upper Side * (°C) | 23.1 | 41.7 -81% | 24.2 -5% | 31.9 -38% | 32.1 -39% | 35.8 -55% | 31.1 -35% |
| Idle Bottom * (°C) | 23.3 | 37.2 -60% | 23.6 -1% | 31.9 -37% | 30.1 -29% | 37.5 -61% | 31.6 -36% |
* ... smaller is better
Stress test
With combined loads, the new MacBook Air 15 M3 performs a little better than its predecessor and the bigger model can also maintain this performance for longer periods than its smaller brother. As with the MacBook Air 13 M3, the MacBook now priortizes the GPU performance whereas its predecessor had more of a balanced relationship between the CPU and GPU.
Speakers
The large MacBook Air continues to offer a 6-speaker sound system and the sound is still both very spacious and good. The bulkier MacBook Pro 16 offers better results in this area but, given how slim the Air's base unit is, its sound is very good.
Apple MacBook Air 15 M3 audio analysis
(+) | speakers can play relatively loud (85.1 dB)
Bass 100 - 315 Hz
(±) | reduced bass - on average 8.8% lower than median
(+) | bass is linear (5.8% delta to prev. frequency)
Mids 400 - 2000 Hz
(+) | balanced mids - only 2.3% away from median
(+) | mids are linear (3.7% delta to prev. frequency)
Highs 2 - 16 kHz
(+) | balanced highs - only 3.5% away from median
(+) | highs are linear (3.5% delta to prev. frequency)
Overall 100 - 16.000 Hz
(+) | overall sound is linear (8.4% difference to median)
Compared to same class
» 2% of all tested devices in this class were better, 1% similar, 97% worse
» The best had a delta of 5%, average was 18%, worst was 53%
Compared to all devices tested
» 2% of all tested devices were better, 1% similar, 97% worse
» The best had a delta of 4%, average was 24%, worst was 134%
Huawei MateBook 16s i9 audio analysis
(+) | speakers can play relatively loud (87.6 dB)
Bass 100 - 315 Hz
(±) | reduced bass - on average 10.5% lower than median
(±) | linearity of bass is average (10.6% delta to prev. frequency)
Mids 400 - 2000 Hz
(+) | balanced mids - only 4.1% away from median
(+) | mids are linear (5% delta to prev. frequency)
Highs 2 - 16 kHz
(±) | higher highs - on average 5.4% higher than median
(+) | highs are linear (6.1% delta to prev. frequency)
Overall 100 - 16.000 Hz
(+) | overall sound is linear (11.7% difference to median)
Compared to same class
» 19% of all tested devices in this class were better, 3% similar, 77% worse
» The best had a delta of 5%, average was 17%, worst was 45%
Compared to all devices tested
» 8% of all tested devices were better, 3% similar, 89% worse
» The best had a delta of 4%, average was 24%, worst was 134%
Apple MacBook Pro 16 2023 M3 Pro audio analysis
(+) | speakers can play relatively loud (84.3 dB)
Bass 100 - 315 Hz
(±) | reduced bass - on average 5% lower than median
(+) | bass is linear (5.6% delta to prev. frequency)
Mids 400 - 2000 Hz
(+) | balanced mids - only 1.2% away from median
(+) | mids are linear (3.1% delta to prev. frequency)
Highs 2 - 16 kHz
(+) | balanced highs - only 2.4% away from median
(+) | highs are linear (2.4% delta to prev. frequency)
Overall 100 - 16.000 Hz
(+) | overall sound is linear (5.3% difference to median)
Compared to same class
» 1% of all tested devices in this class were better, 1% similar, 98% worse
» The best had a delta of 5%, average was 17%, worst was 45%
Compared to all devices tested
» 0% of all tested devices were better, 0% similar, 100% worse
» The best had a delta of 4%, average was 24%, worst was 134%
Energy management - Long runtimes
Power consumption
At full brightness, the power consumption is a touch higher compared to the old model (~1 watt at full brightness), although the maximum brightness is only minimally higher. Once again, under load, the 35-watt power adapter is the limiting factor and, at the start of the stress test using a more powerful power adapter, we initially measured a consumption of 66 watts which then steadily dropped. When using a 35-watt power adapter, the battery has to compensate for the difference.
| Off / Standby | |
| Idle | |
| Load |
|
Key:
min: | |
| Apple MacBook Air 15 M3 M3, M3 10-Core GPU, Apple SSD AP0512Z, IPS, 2880x1864, 15.3" | Apple MacBook Air 15 2023 M2 16 GB M2, M2 10-Core GPU, Apple SSD AP1024Z, IPS, 2880x1864, 15.3" | Asus VivoBook S15 K5504 i9-13900H, Iris Xe G7 96EUs, WD PC SN560 SDDPNQE-1T00, OLED, 2880x1620, 15.6" | MSI Prestige 16 B1MG-001US Ultra 7 155H, Arc 8-Core, Samsung PM9A1 MZVL22T0HBLB, IPS, 2560x1600, 16" | Acer Swift Go SFG16-71 i7-13700H, Iris Xe G7 96EUs, Micron 2400 MTFDKBA1T0QFM, OLED, 3200x2000, 16" | Huawei MateBook 16s i9 i9-13900H, Iris Xe G7 96EUs, 321JN1024GB-TX01, IPS, 2560x1680, 16" | LG Gram SuperSlim (2023) i7-1360P, Iris Xe G7 96EUs, SK hynix PC801 HFS001TEJ9X101N, OLED, 1920x1080, 15.6" | Samsung Galaxy Book3 15, Core i5-1335U i5-1335U, Iris Xe G7 80EUs, Samsung PM991a MZ9LQ512HBLU-00BD1, IPS, 1920x1080, 15.6" | Average Apple M3 10-Core GPU | Average of class Subnotebook | |
|---|---|---|---|---|---|---|---|---|---|---|
| Power Consumption | 6% | -92% | -67% | -67% | -104% | -29% | -2% | -2% | -19% | |
| Idle Minimum * (Watt) | 2.15 | 2.2 -2% | 5.73 -167% | 3 -40% | 5.8 -170% | 5.8 -170% | 4.2 -95% | 3.5 -63% | 2.1 ? 2% | 3.78 ? -76% |
| Idle Average * (Watt) | 11.2 | 10 11% | 14.5 -29% | 9.5 15% | 6 46% | 7.7 31% | 8.9 21% | 7 37% | 10.6 ? 5% | 6.6 ? 41% |
| Idle Maximum * (Watt) | 11.5 | 10.1 12% | 15.6 -36% | 12 -4% | 6.9 40% | 10.6 8% | 10.3 10% | 7.6 34% | 10.9 ? 5% | 7.93 ? 31% |
| Load Average * (Watt) | 35.8 | 33.6 6% | 40.5 -13% | 68.3 -91% | 59 -65% | 76.9 -115% | 47 -31% | 33 8% | 35.5 ? 1% | 41.8 ? -17% |
| Witcher 3 ultra * (Watt) | 29.6 | 27.8 6% | 74.9 -153% | 59.8 -102% | 61.1 -106% | 76.7 -159% | 43.8 -48% | 32.7 -10% | ||
| Load Maximum * (Watt) | 37.2 | 37.2 -0% | 94 -153% | 104.8 -182% | 92 -147% | 118 -217% | 49 -32% | 44 -18% | 46.4 ? -25% | 64.7 ? -74% |
* ... smaller is better
Power consumption Witcher 3 / stress test
Power consumption with an external monitor
Battery life
The battery capacity is still 66.5 Wh and the Wi-Fi runtime at 150 cd/m² (reducing the maximum brightness by 7 large and 3 small levels) sits at around 17 hours making it a few minutes longer than its predecessor. The MSI Prestige 16 can top these values by around 80 minutes, however, the battery is also around 50 % bigger. At full screen brightness, we recorded 6 hours 40 minutes which is half an hour shorter than the old model and the slightly higher idle consumption at full brightness makes itself felt. We will provide further battery runtimes at a later date.
With the laptop switched on, the supplied 35-watt power adapter requires just short of 3 hours to completely recharge the device. With a more powerful power adapter, this time can be shortened to around 2 hours.
| Apple MacBook Air 15 M3 M3, M3 10-Core GPU, 66.5 Wh | Apple MacBook Air 15 2023 M2 16 GB M2, M2 10-Core GPU, 66.5 Wh | Asus VivoBook S15 K5504 i9-13900H, Iris Xe G7 96EUs, 75 Wh | MSI Prestige 16 B1MG-001US Ultra 7 155H, Arc 8-Core, 99.9 Wh | Acer Swift Go SFG16-71 i7-13700H, Iris Xe G7 96EUs, 65 Wh | Huawei MateBook 16s i9 i9-13900H, Iris Xe G7 96EUs, 84 Wh | LG Gram SuperSlim (2023) i7-1360P, Iris Xe G7 96EUs, 60 Wh | Samsung Galaxy Book3 15, Core i5-1335U i5-1335U, Iris Xe G7 80EUs, 54 Wh | Average of class Subnotebook | |
|---|---|---|---|---|---|---|---|---|---|
| Battery runtime | 3% | -24% | 6% | -40% | -17% | -9% | -50% | -20% | |
| H.264 (h) | 18.6 | 16.8 -10% | 9 -52% | 14.7 -21% | 7.1 -62% | 15.8 ? -15% | |||
| WiFi v1.3 (h) | 16.9 | 16.6 -2% | 8.5 -50% | 18.3 8% | 7.8 -54% | 13.1 -22% | 12.5 -26% | 6.6 -61% | 14 ? -17% |
| Load (h) | 2.7 | 3.3 22% | 3.5 30% | 2.8 4% | 2 -26% | 2.4 -11% | 3.2 19% | 2 -26% | 1.942 ? -28% |
Pros
Cons
Verdict - The MacBook Air 15 profits from M3 but remains expensive
The MacBook Air 15 M3 doesn't spring any surprises and although it comes with the M3 SoC and faster Wi-Fi module, it's not worth upgrading from the MacBook Air 15 M2 - despite being the better product. Unlike the smaller MacBook Air 13 M3, it also has to be said that, in general, the competition offers better multi-core performance and enjoys benefits when it comes to graphics performance as soon as a dedicated graphics card is installed. However, that is not the Air's aim and Apple continues to make the effort to maintain the distance to the Pro models. This is particularly noticeable when it comes to the limited number of ports.
But, the advantages are evident because the MacBook Air is extremely slim and the device is always silent thanks to its passive cooling. There is currently no passively-cooled Windows device which offers these performance scores. Of course, there are alternatives which offer higher performance, better screens or longer battery life but not usually in one machine. Needless to say, the Air is not ideal for every user. However, if you are looking for a device that can handle everyday tasks, you'll have your work cut out trying to find a comparably good, complete package from another manufacturer.
The Apple MacBook Air 15 gets faster thanks to the M3 processor. Anyone on the lookout for a large and continuously silent companion for everyday use will, once again, find here a very good and comprehensive package, even if the price is still very high and you'll have to make compromises in some areas (for example, ports).
When it comes to the display, slowly but surely, Apple is lagging somewhat behind the competition. The IPS panel's image quality is still good and PWM is nowhere to be seen. However, 60 Hz for a premium device can no longer be considered up-to-date and, likewise, HDR content is not supported. The M3 processor's performance also doesn't remain entirely stable but the situation here is a touch better than with the smaller MacBook Air M3. The Windows competitors also have to battle with a dip in performance after a short period, especially when it comes to multi-core scenarios.
At $1,299 for the base model with its meagre 8 GB of RAM and a 256 GB SSD, the biggest point of criticism remains the price. That might well be sufficient for simple tasks but it's no longer in keeping with the times. Our review device is significantly more interesting since it comes with 16 GB of RAM and a 512 GB SSD. Above all, it is now a preconfigured model (previously only 8/256 & 8/512 GB) and this variant will also now as a standard version which will then also be discounted. At launch, the new Air is already available at a cheaper price.
Price and availability
The new MacBook Air 15 M3 is available now. Our review configuration has an RRP of $1,699 and can be purchased on Apple.com. The base model can be had on Amazon for $1,299.
Apple MacBook Air 15 M3
- 03/09/2024 v7 (old)
Andreas Osthoff
Transparency
The selection of devices to be reviewed is made by our editorial team. The test sample was provided to the author as a loan by the manufacturer or retailer for the purpose of this review. The lender had no influence on this review, nor did the manufacturer receive a copy of this review before publication. There was no obligation to publish this review. As an independent media company, Notebookcheck is not subjected to the authority of manufacturers, retailers or publishers.
This is how Notebookcheck is testing
Every year, Notebookcheck independently reviews hundreds of laptops and smartphones using standardized procedures to ensure that all results are comparable. We have continuously developed our test methods for around 20 years and set industry standards in the process. In our test labs, high-quality measuring equipment is utilized by experienced technicians and editors. These tests involve a multi-stage validation process. Our complex rating system is based on hundreds of well-founded measurements and benchmarks, which maintains objectivity. Further information on our test methods can be found here.
Price comparison

