Lenovo IdeaPad Pro 5 16IMH G9 review: 90 W GeForce RTX 4050 almost as good as the RTX 4060

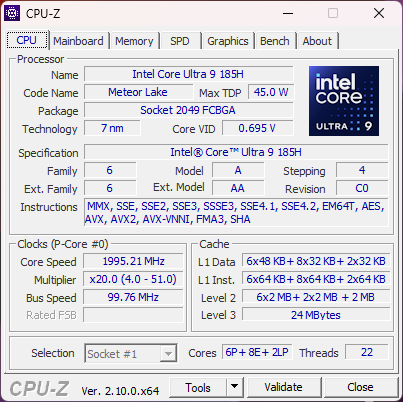
After having recently reviewed the cheaper IdeaPad Pro 5 16IMH iGPU and IPS configuration, we're now ready to check out the costlier dGPU and OLED configuration. Our specific test unit comes decked out with top-end options including the Meteor Lake Core Ultra 9 185H for $1500 at retail. It also happens to be one of the few ultra-thin multimedia laptops with a 90 W GeForce RTX 4050 as most others in the category typically target lower TGP ceilings.
The IdeaPad Pro 5 16 G9 is distinct from the flagship Yoga Pro 9i 16 G9. The latter, for example, offers mini-LED and RTX 4070 options which are unavailable on the IdeaPad.
Alternatives to the IdeaPad Pro 5 16IMH include other midrange to high-end 16-inch multimedia laptops like the Dell Inspiron 16 7640 2-in-1, Asus Zenbook S16, Samsung Galaxy Book4 Ultra, or the HP Envy series. We recommend checking out our existing review on the iGPU IdeaPad Pro 5 16IMH G9 to learn more about the physical features of the model. A smaller 14-inch version of this model is also available called the IdeaPad Pro 5 14 G9.
More Lenovo reviews:
Potential Competitors in Comparison
Rating | Version | Date | Model | Weight | Height | Size | Resolution | Price |
|---|---|---|---|---|---|---|---|---|
| 84.7 % | v8 | 09 / 2024 | Lenovo IdeaPad Pro 5 16IMH G9 RTX 4050 Ultra 9 185H, GeForce RTX 4050 Laptop GPU | 2 kg | 18.95 mm | 16.00" | 2048x1280 | |
| 87.9 % v7 (old) | v7 (old) | 05 / 2024 | Lenovo IdeaPad Pro 5 16IMH G9 Ultra 7 155H, Arc 8-Core | 1.9 kg | 17.5 mm | 16.00" | 2560x1600 | |
| 82.1 % | v8 | 07 / 2024 | Dell Inspiron 16 7640 2-in-1 Ultra 7 155H, Arc 8-Core | 2.1 kg | 18.99 mm | 16.00" | 2560x1600 | |
| 84.7 % | v8 | 07 / 2024 | Asus Zenbook S 16 UM5606-RK333W Ryzen AI 9 HX 370, Radeon 890M | 1.5 kg | 12.9 mm | 16.00" | 2880x1800 | |
| 87.2 % v7 (old) | v7 (old) | 05 / 2024 | HP Envy x360 2-in-1 16-ad0097nr R7 8840HS, Radeon 780M | 1.8 kg | 18.3 mm | 16.00" | 2880x1800 | |
| 90.4 % v7 (old) | v7 (old) | 03 / 2024 | Samsung Galaxy Book4 Ultra Ultra 7 155H, GeForce RTX 4050 Laptop GPU | 1.8 kg | 17 mm | 16.00" | 2880x1800 |
Note: We have recently updated our rating system and the results of version 8 are not comparable with the results of version 7. More information is available here .
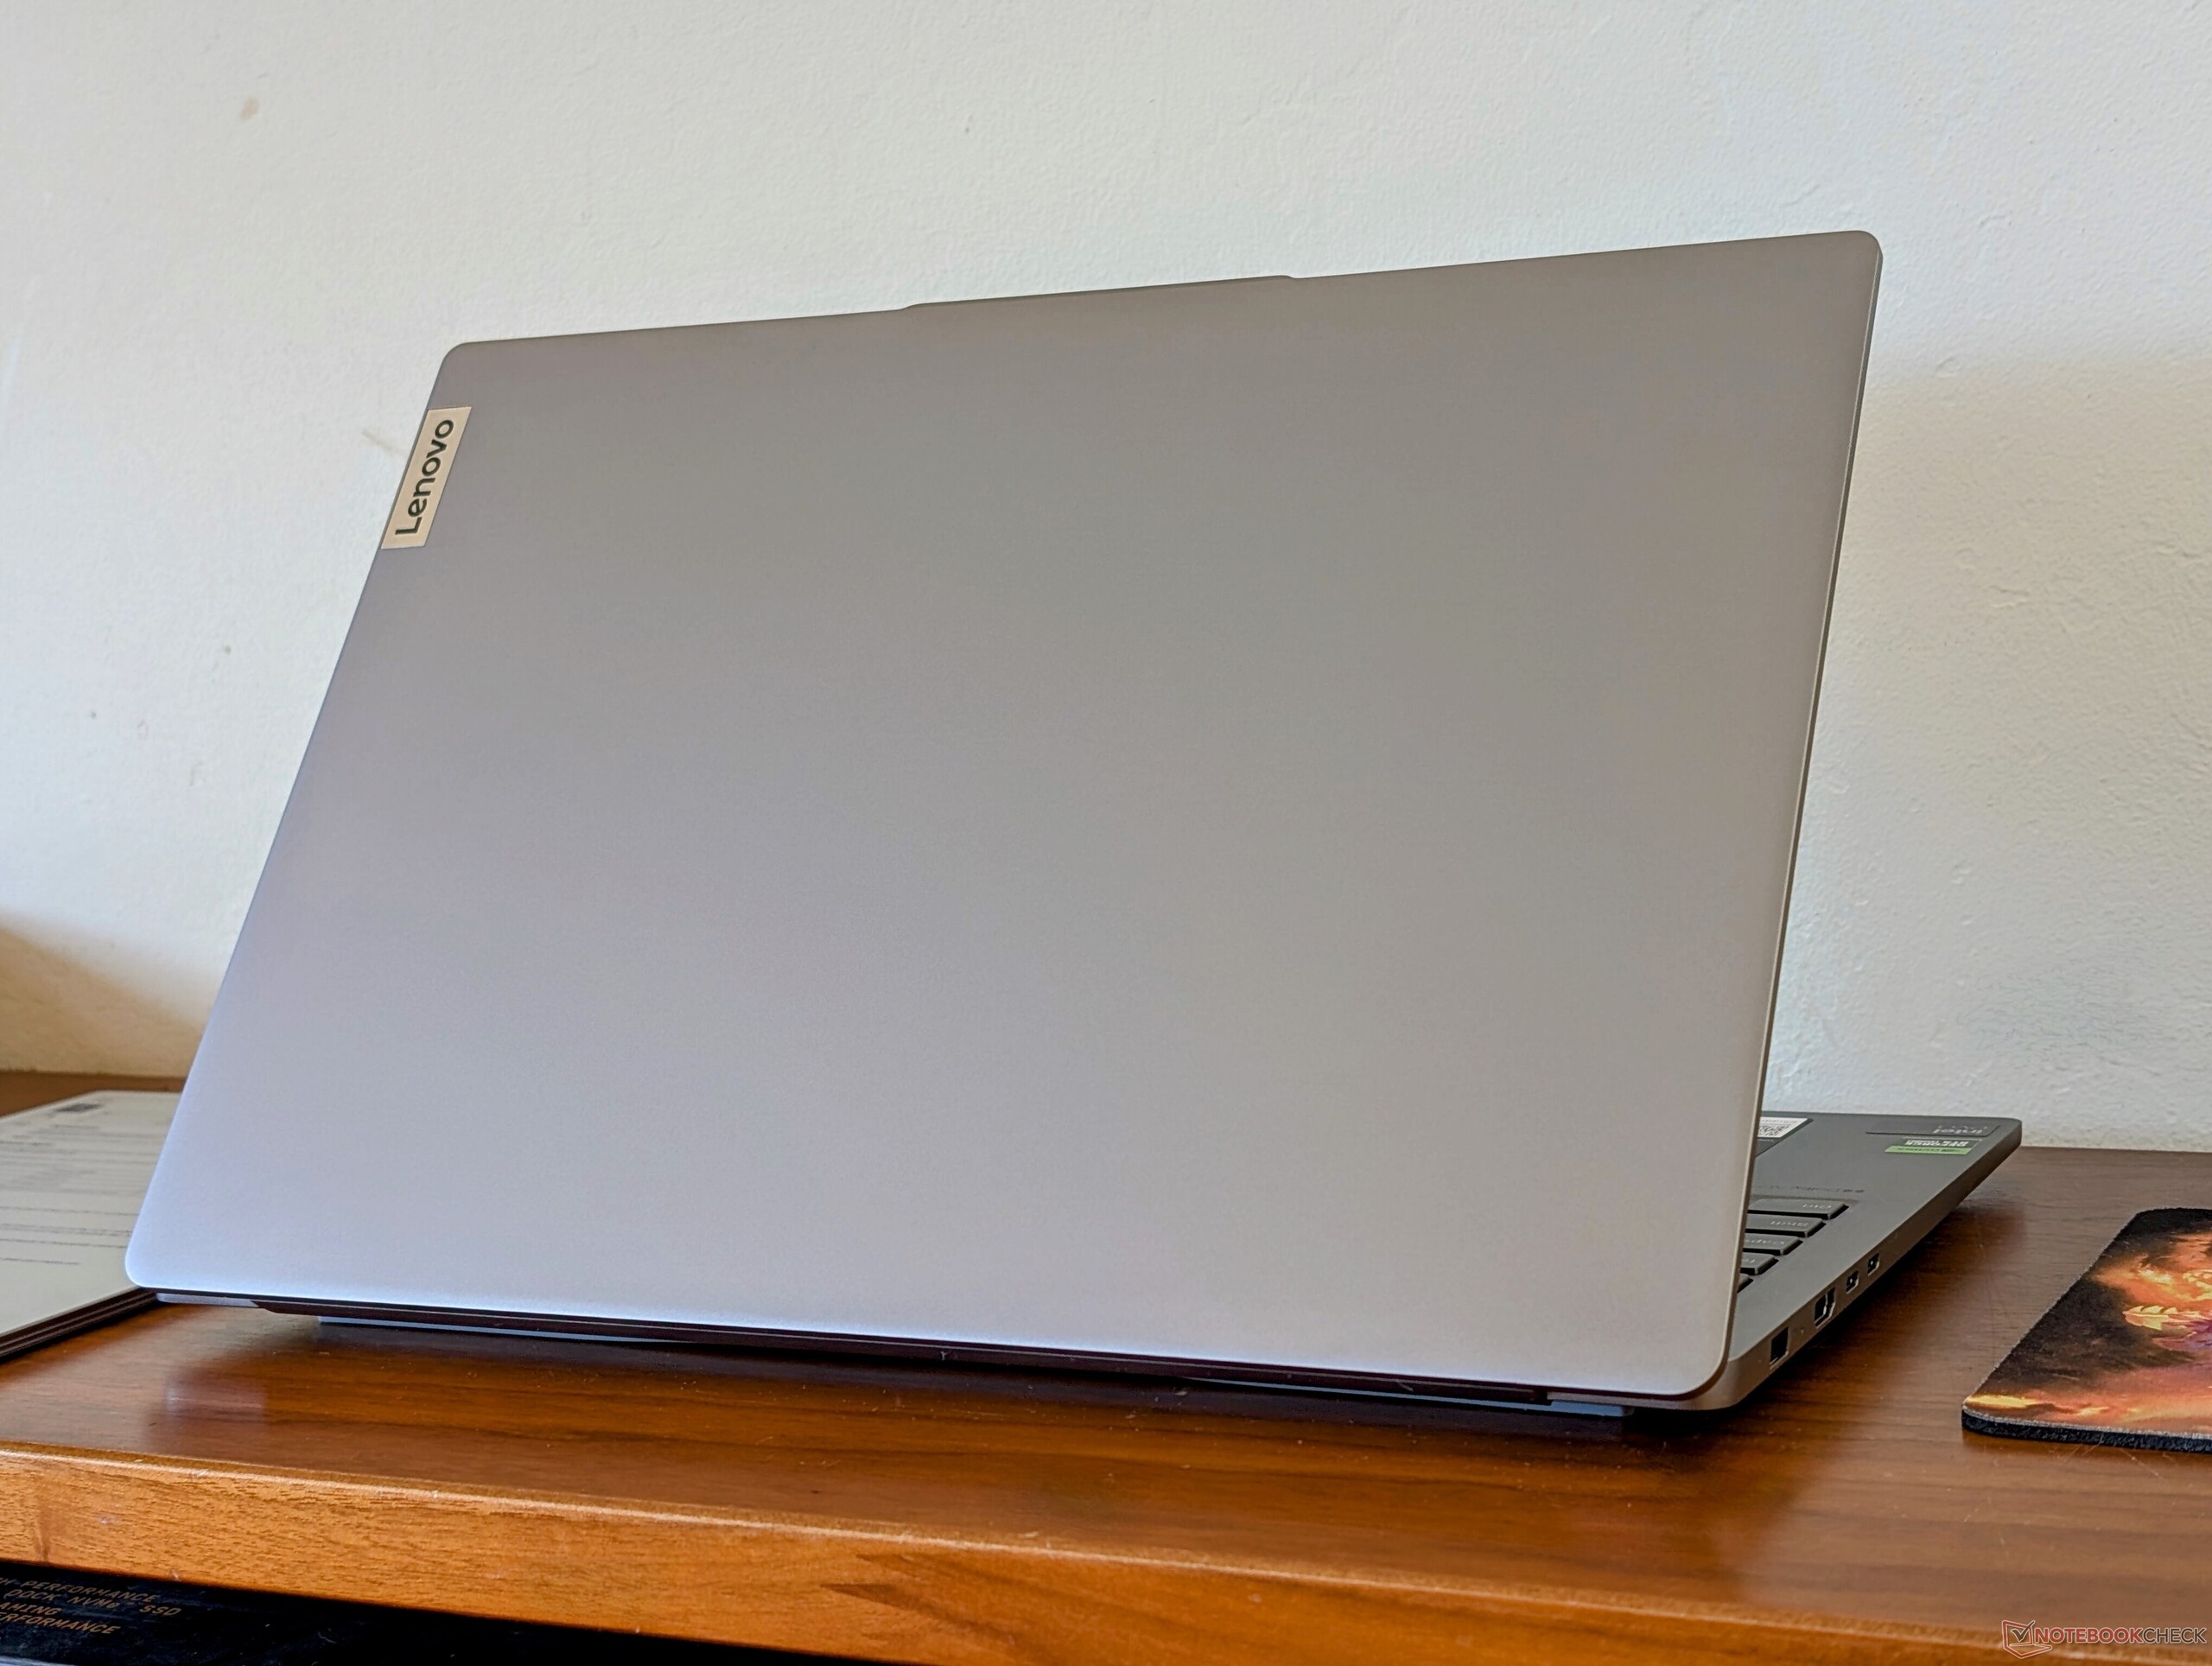
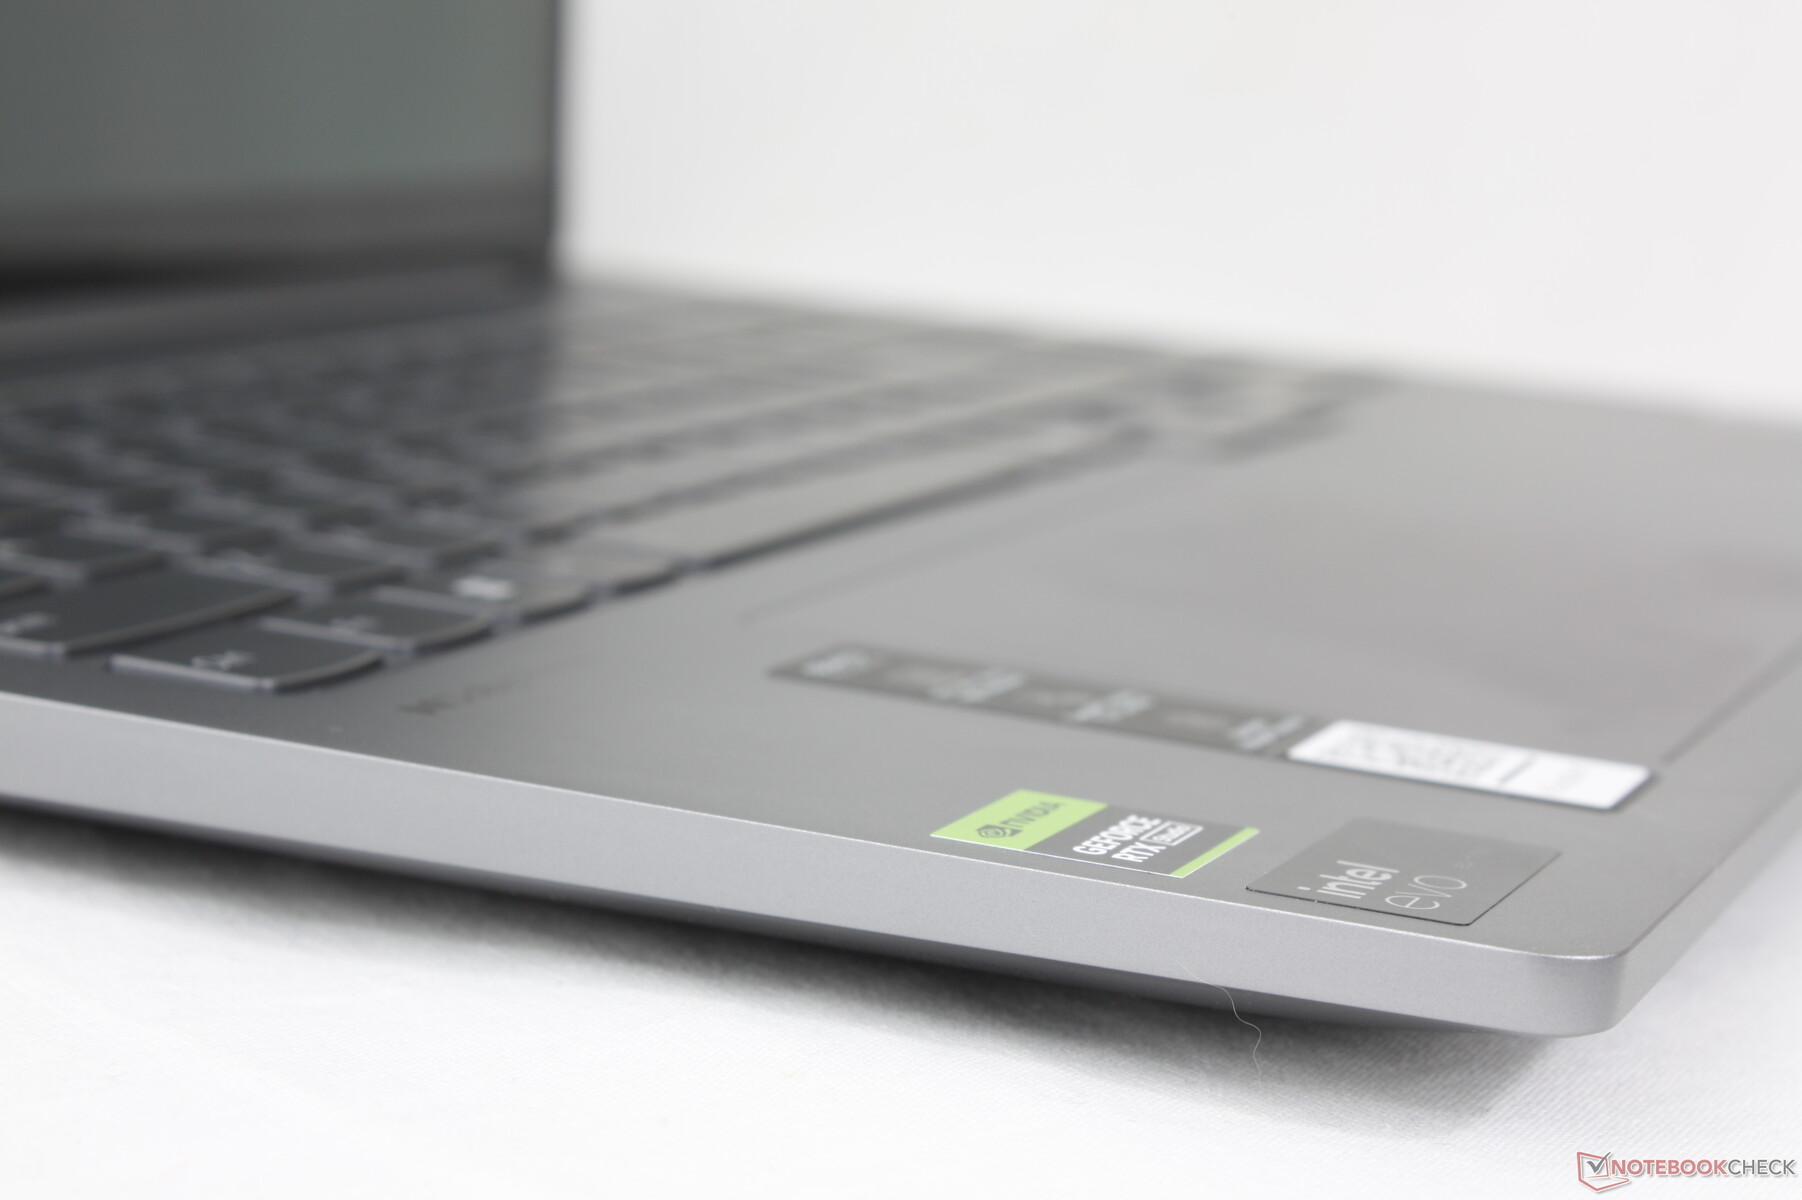
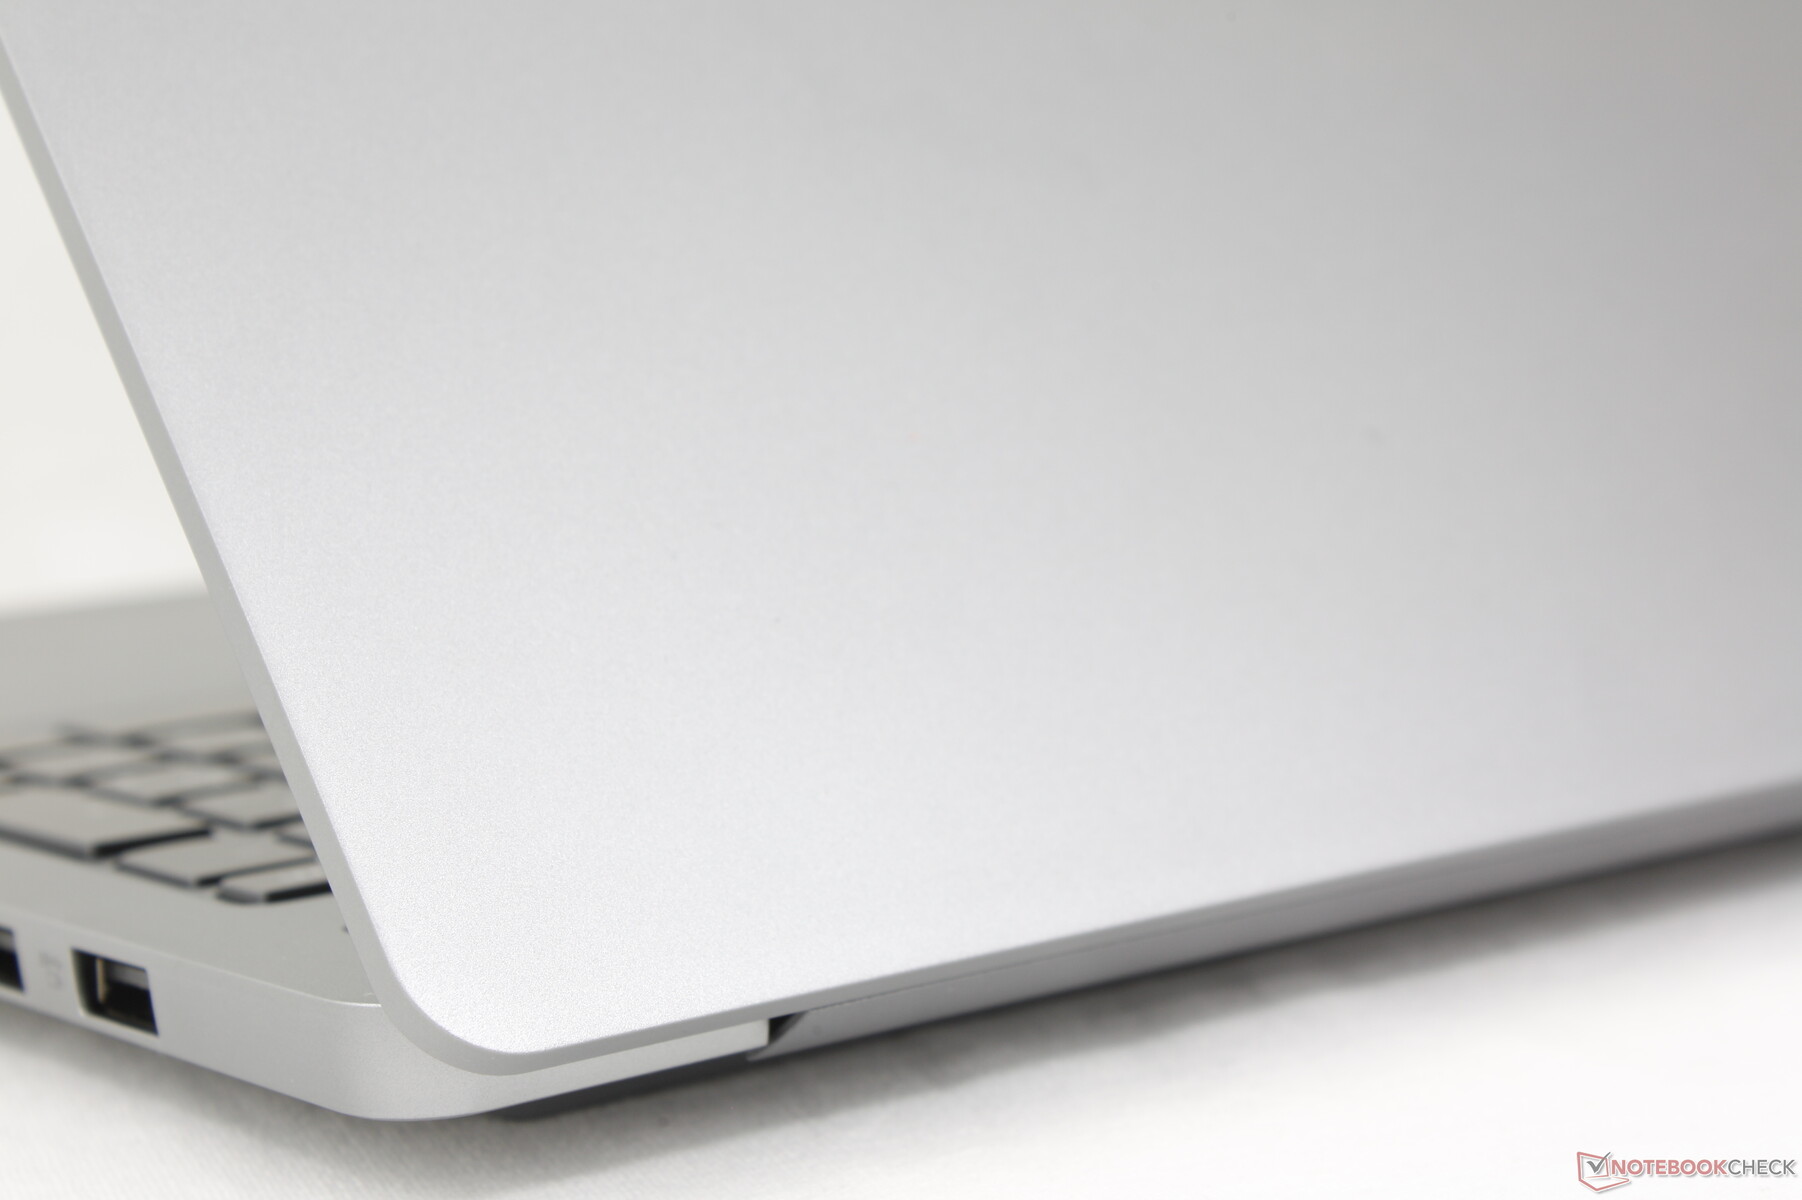
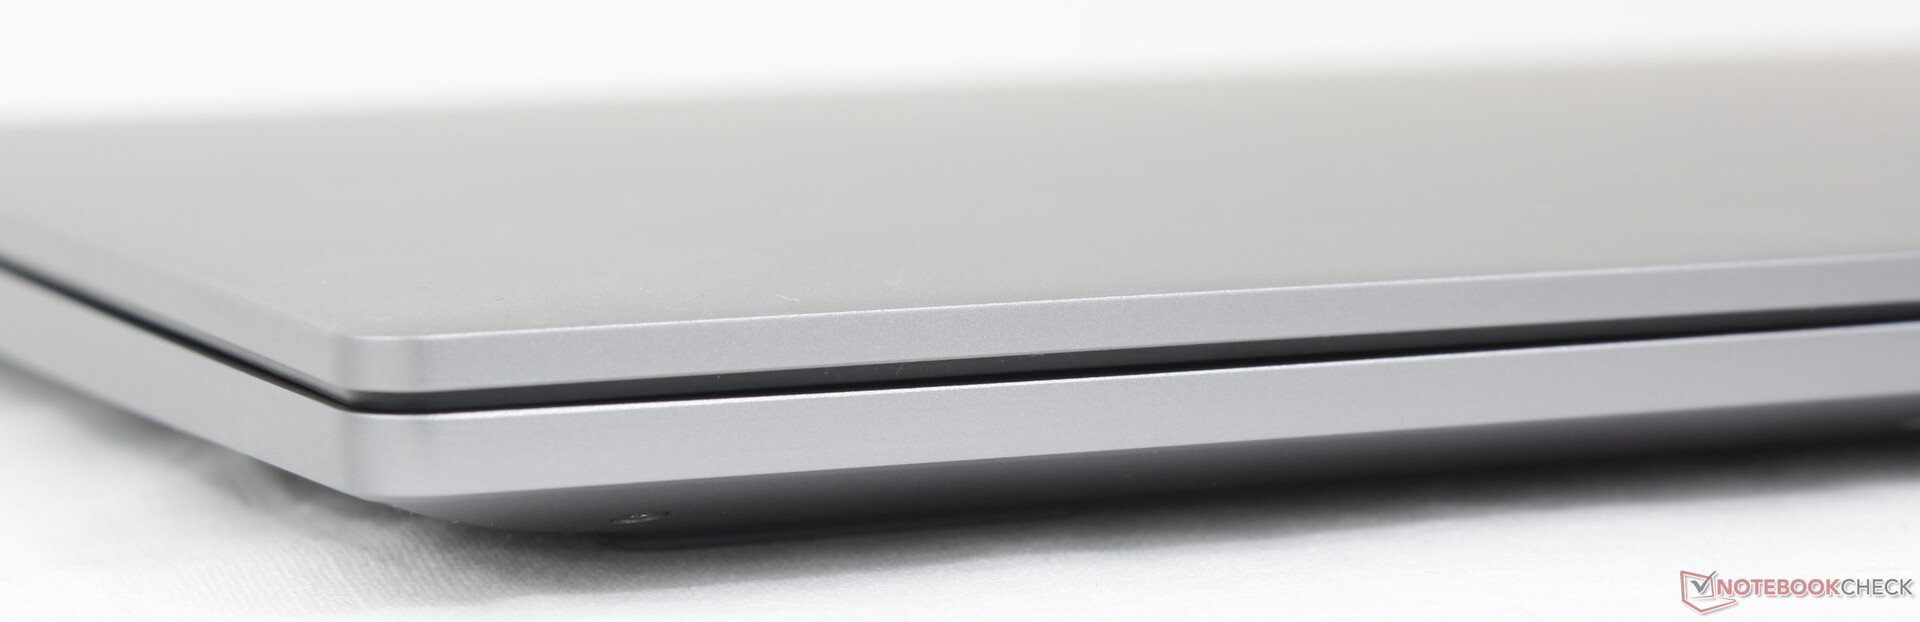
Case
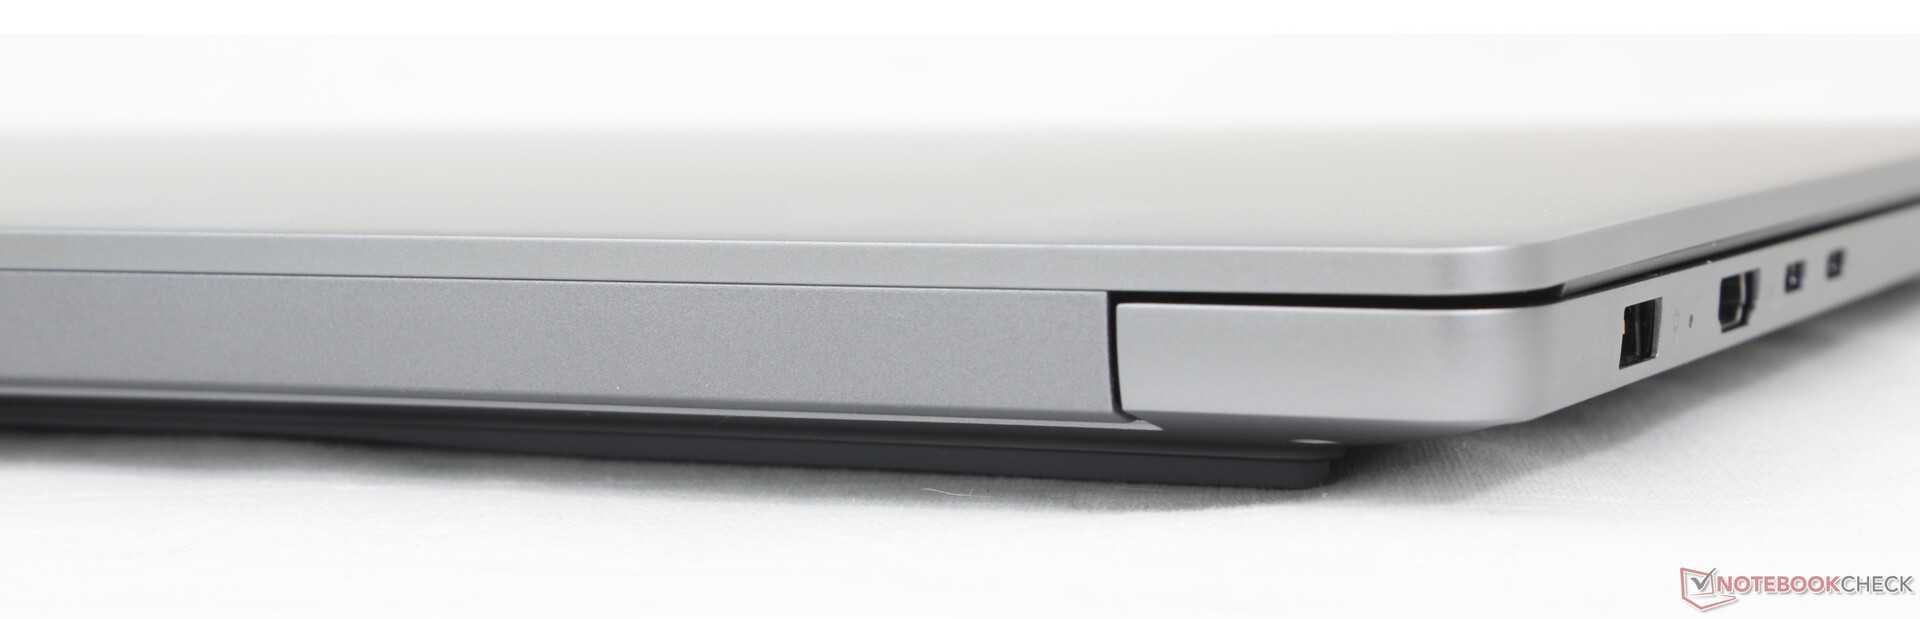
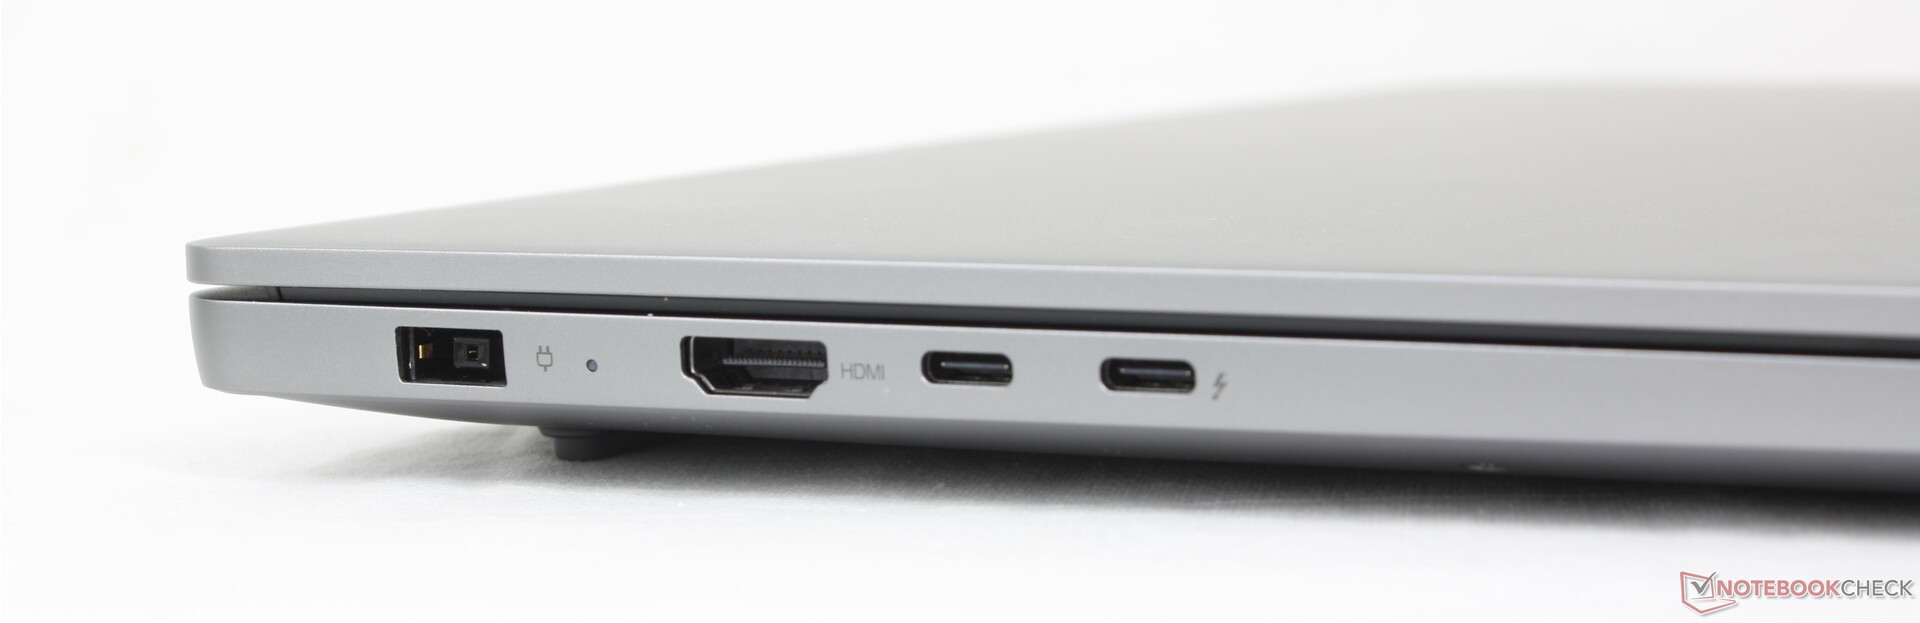
The chassis incorporates a dedicated AC adapter port along the left edge which doubles as an easy way to visually distinguish between the iGPU and dGPU configurations. The GPU and OLED panel add about 100 g to the total weight and so our unit isn't much heavier than the base iGPU option. Dimensions, design, and materials are otherwise unchanged.


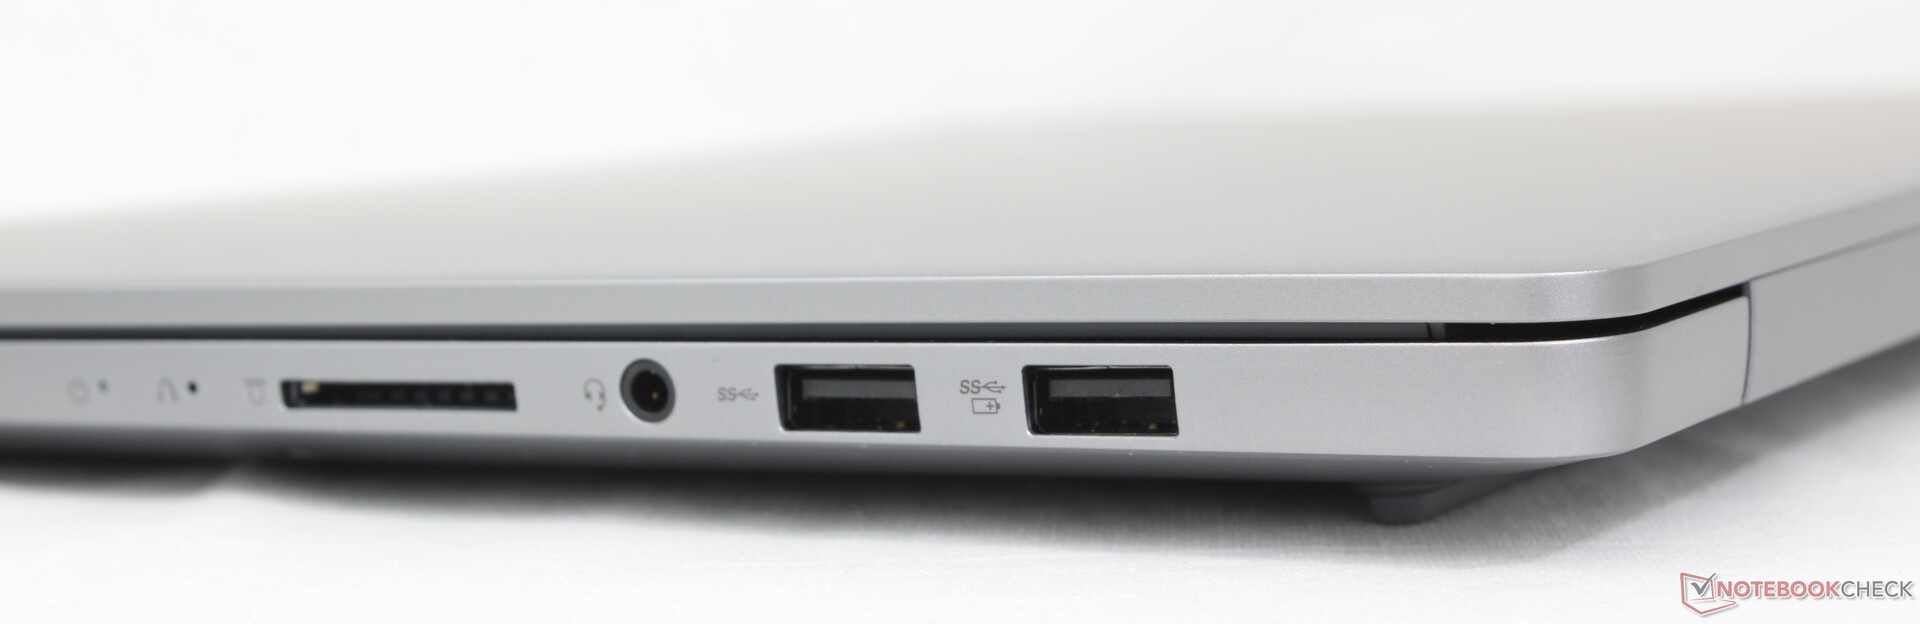
Connectivity
Our dGPU configuration supports both universal USB-C charging and proprietary AC adapter charging unlike on the iGPU configuration which only supports the former. The barrel AC adapter is necessary for powering the Core Ultra H CPU and discrete 90 W Nvidia graphics without resorting to a lower 50 W TGP ceiling which is the approach Samsung is taking with its Galaxy Book4 Ultra.
Port options are otherwise identical to the Inspiron 16 7640 2-in-1 while offering more than the Samsung.
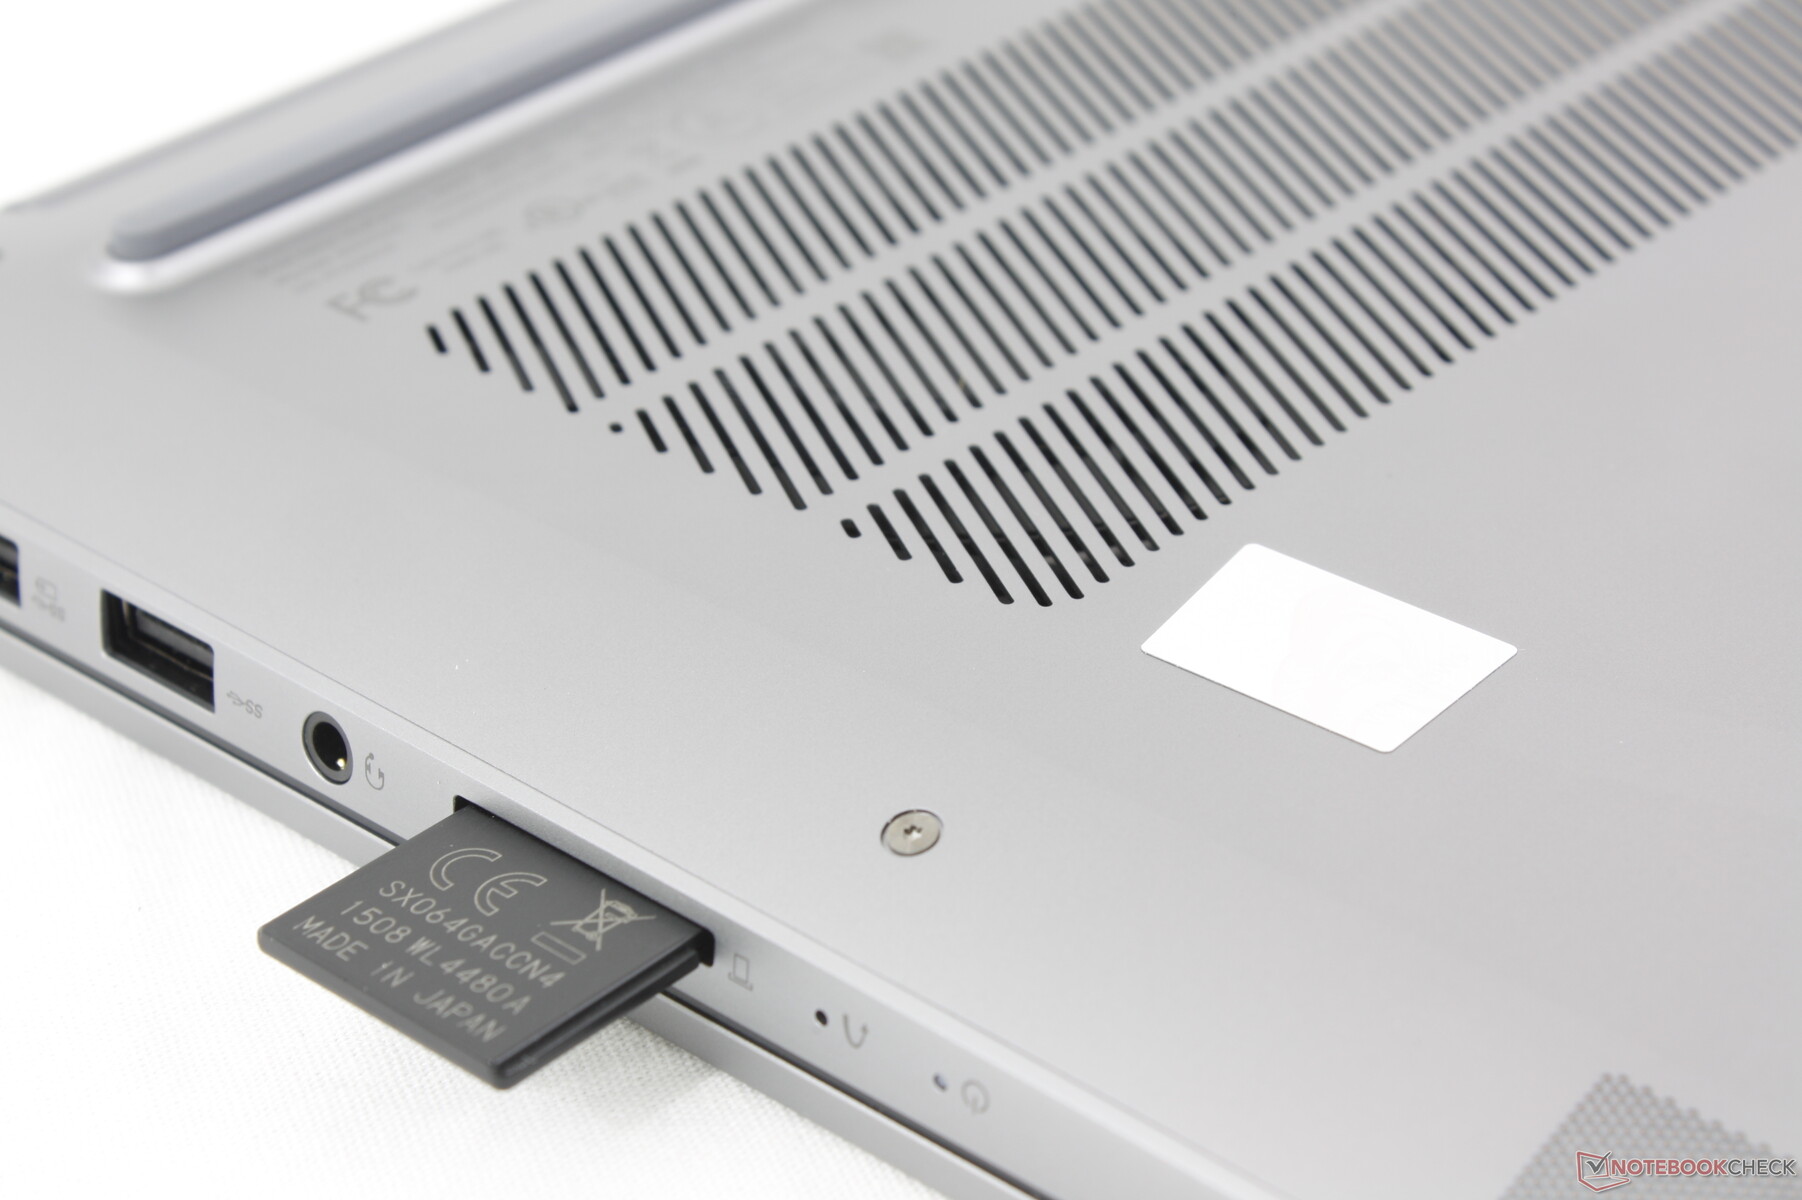
SD Card Reader
| SD Card Reader | |
| average JPG Copy Test (av. of 3 runs) | |
| Asus Zenbook S 16 UM5606-RK333W (Angelbird AV Pro V60) | |
| Samsung Galaxy Book4 Ultra (Angelbird AV Pro V60) | |
| Lenovo IdeaPad Pro 5 16IMH G9 RTX 4050 (Toshiba Exceria Pro SDXC 64 GB UHS-II) | |
| Lenovo IdeaPad Pro 5 16IMH G9 (Angelbird AV Pro V60) | |
| Dell Inspiron 16 7640 2-in-1 (Toshiba Exceria Pro SDXC 64 GB UHS-II) | |
| maximum AS SSD Seq Read Test (1GB) | |
| Asus Zenbook S 16 UM5606-RK333W (Angelbird AV Pro V60) | |
| Lenovo IdeaPad Pro 5 16IMH G9 (Angelbird AV Pro V60) | |
| Samsung Galaxy Book4 Ultra (Angelbird AV Pro V60) | |
| Lenovo IdeaPad Pro 5 16IMH G9 RTX 4050 (Toshiba Exceria Pro SDXC 64 GB UHS-II) | |
| Dell Inspiron 16 7640 2-in-1 (Toshiba Exceria Pro SDXC 64 GB UHS-II) | |
Communication
The Intel AX211 comes standard for Wi-Fi 6E and Bluetooth 5.3 support. Transfer rates are steady at over 1 Gbps when paired to our AXE11000 test router.
Webcam
The 2 MP webcam comes standard with IR and a physical shutter for privacy.


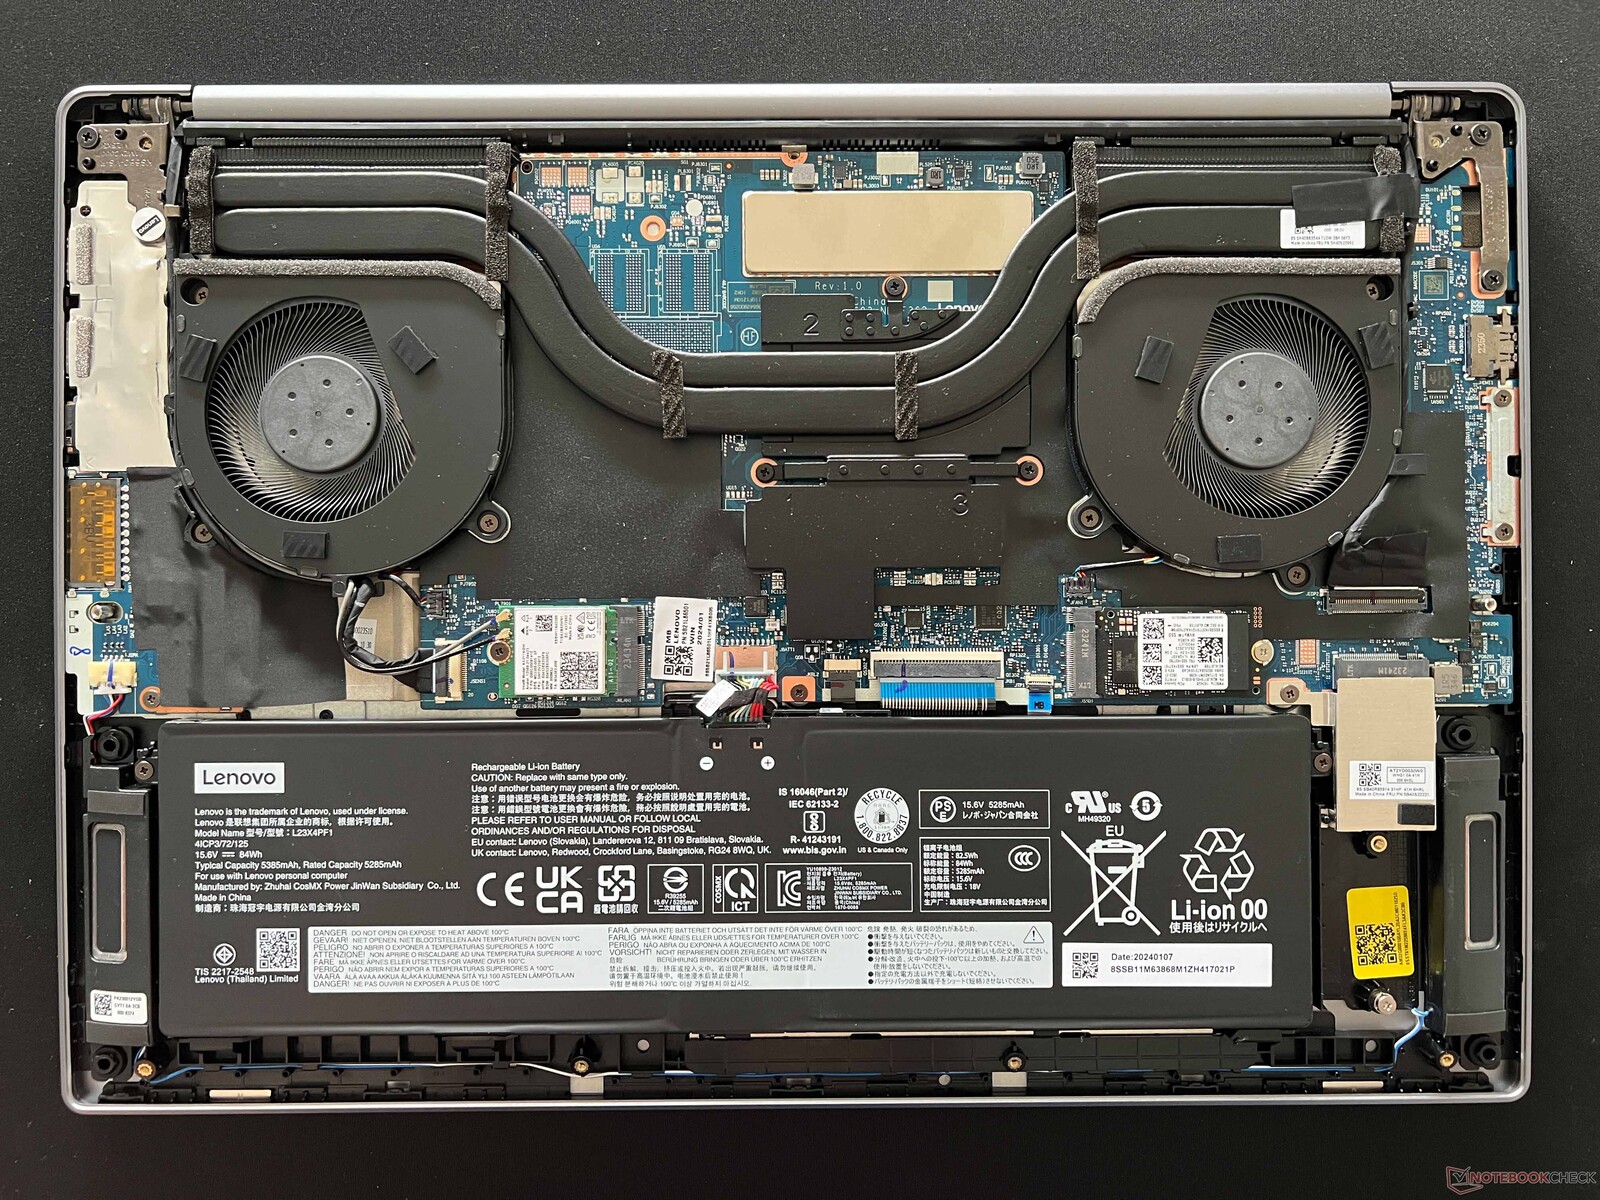
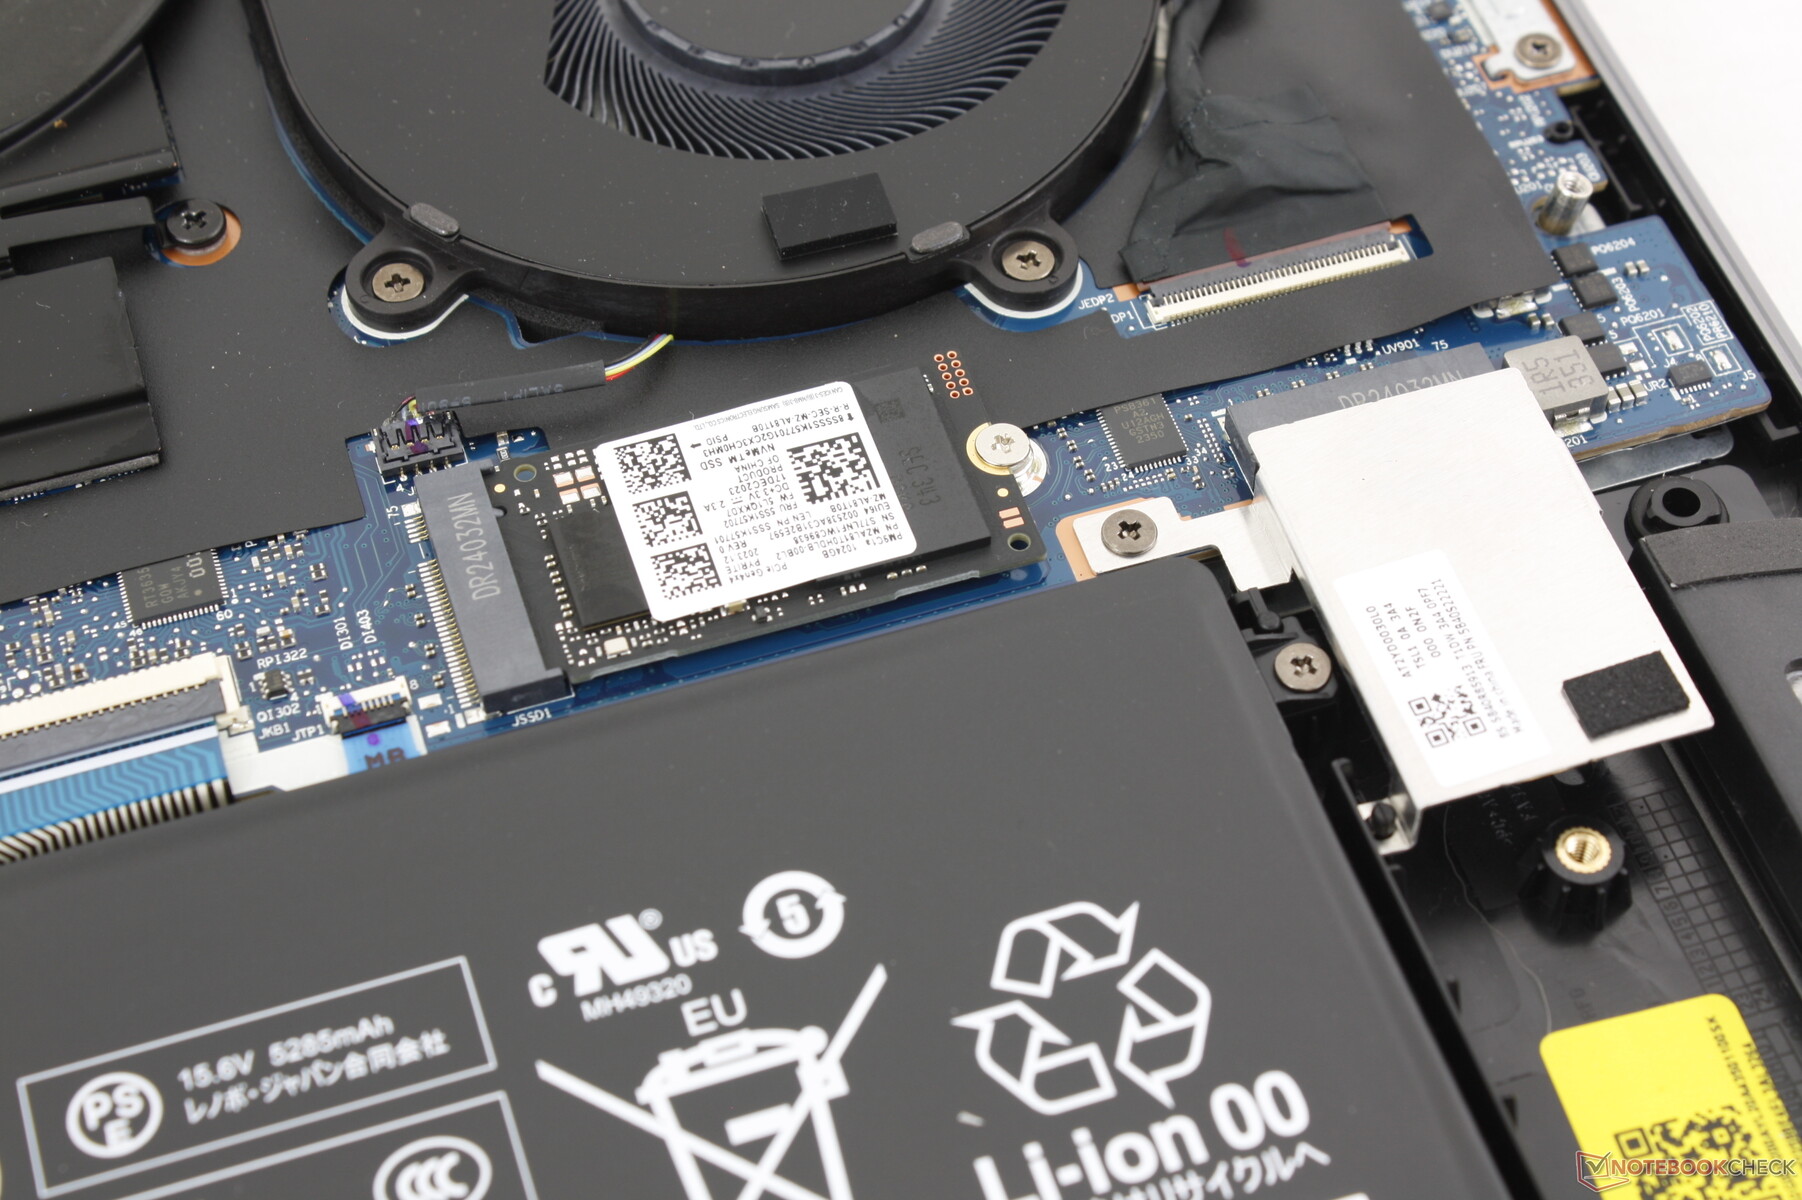
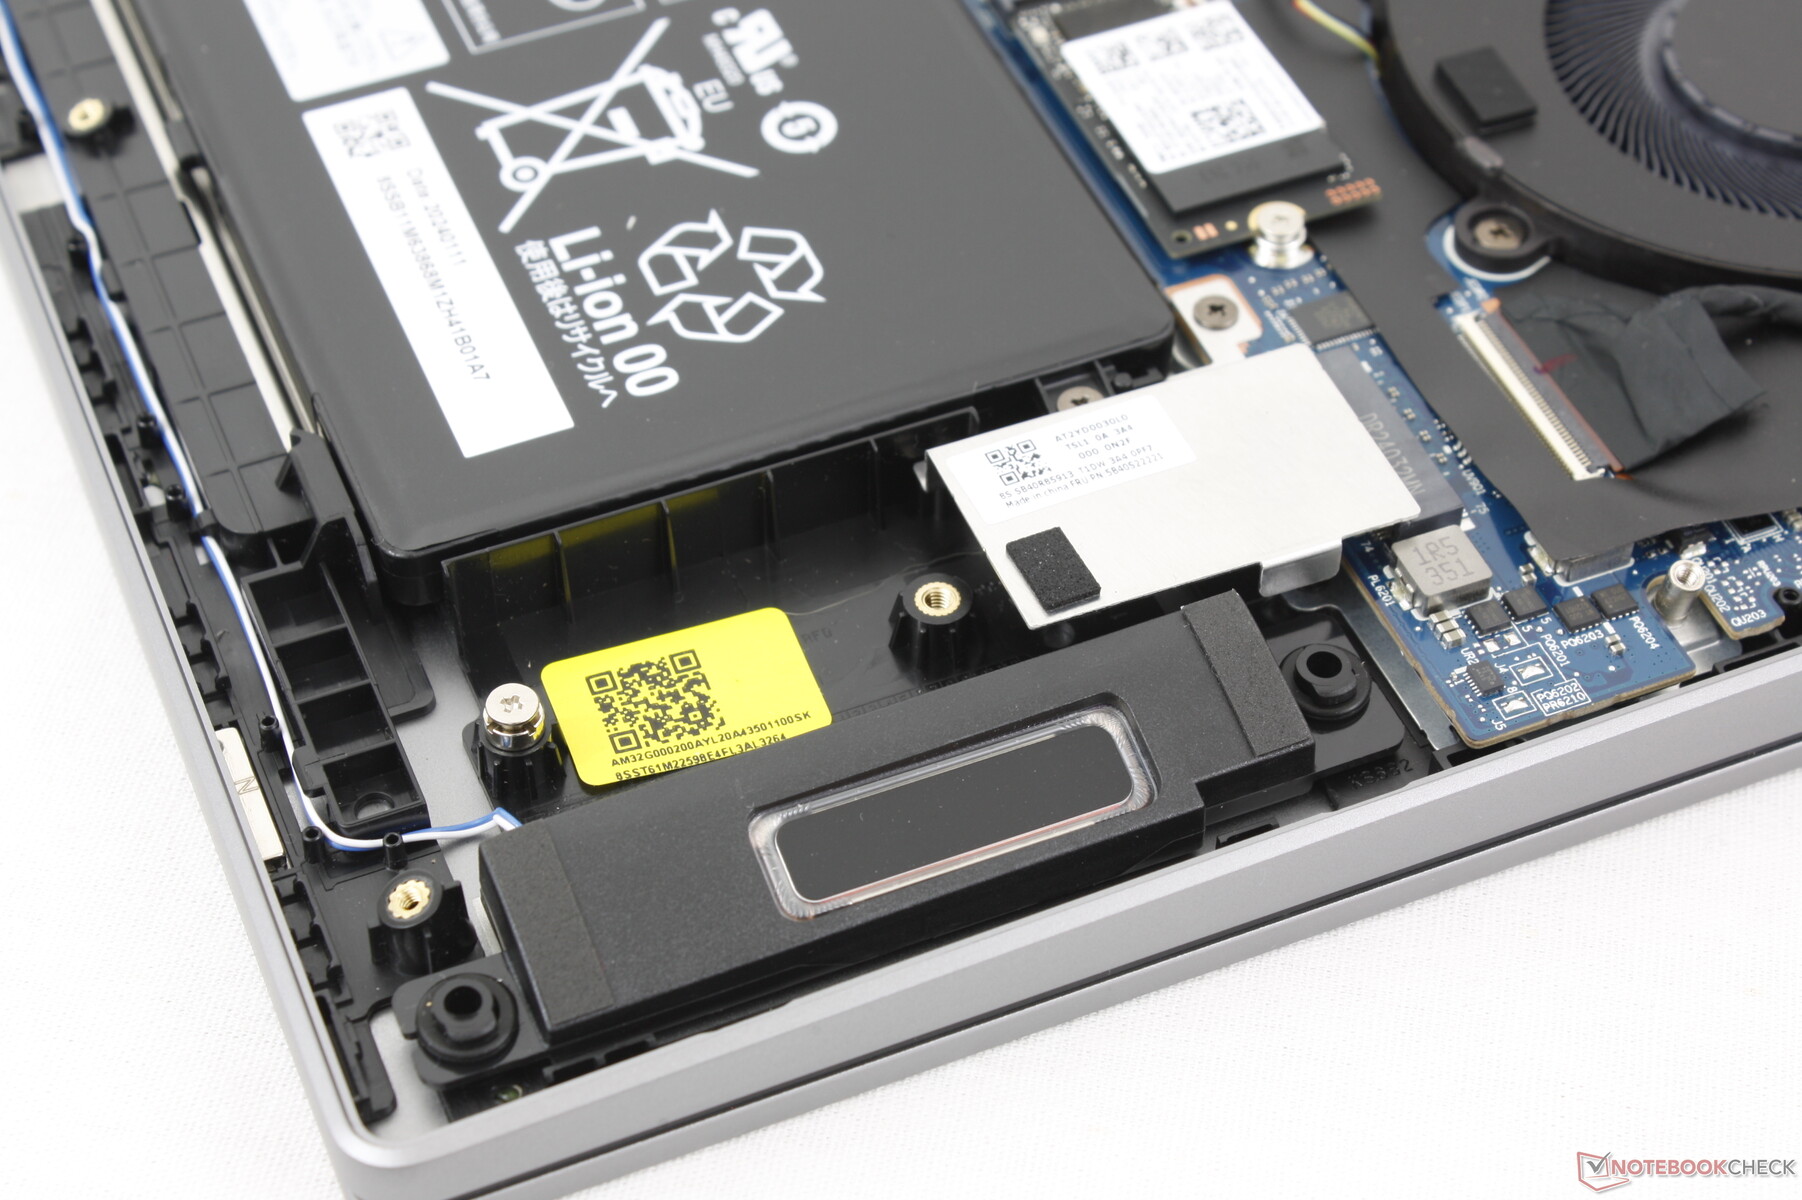
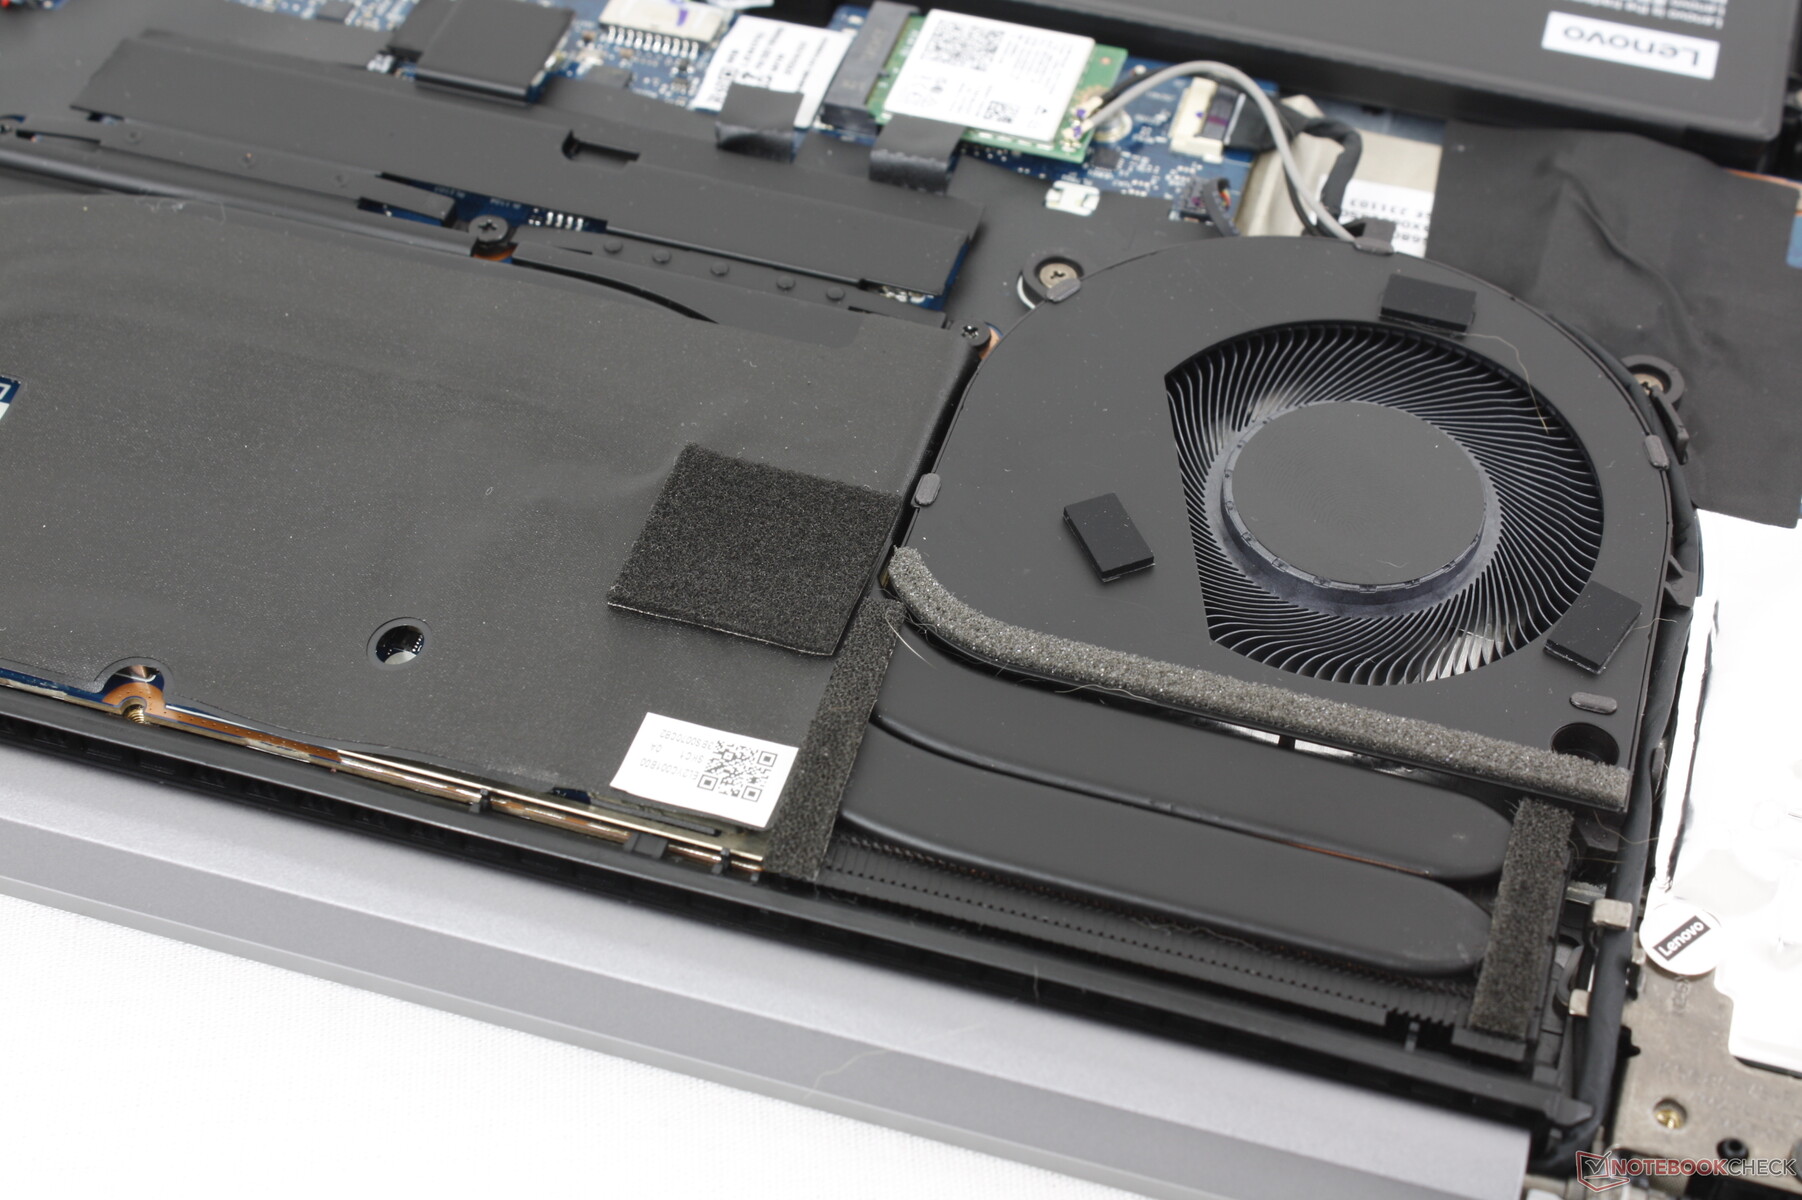
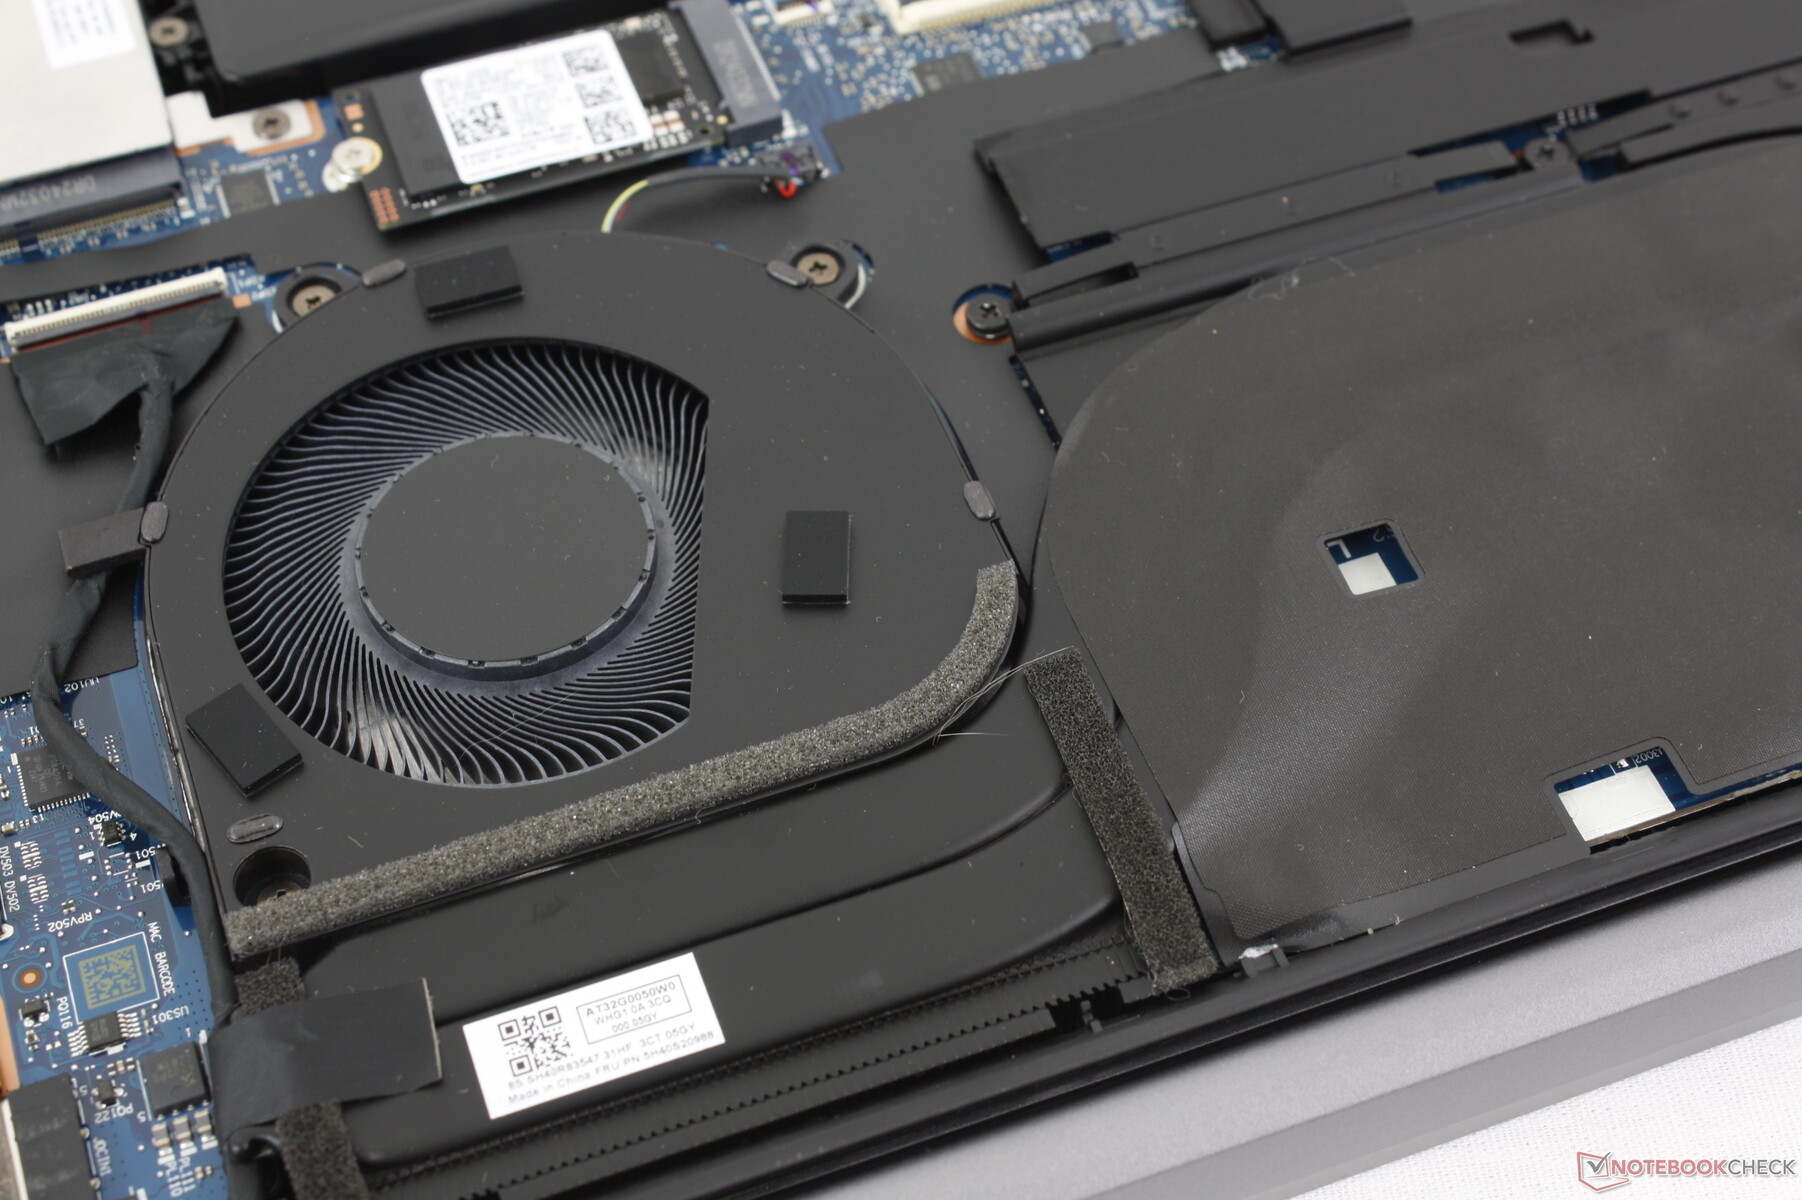
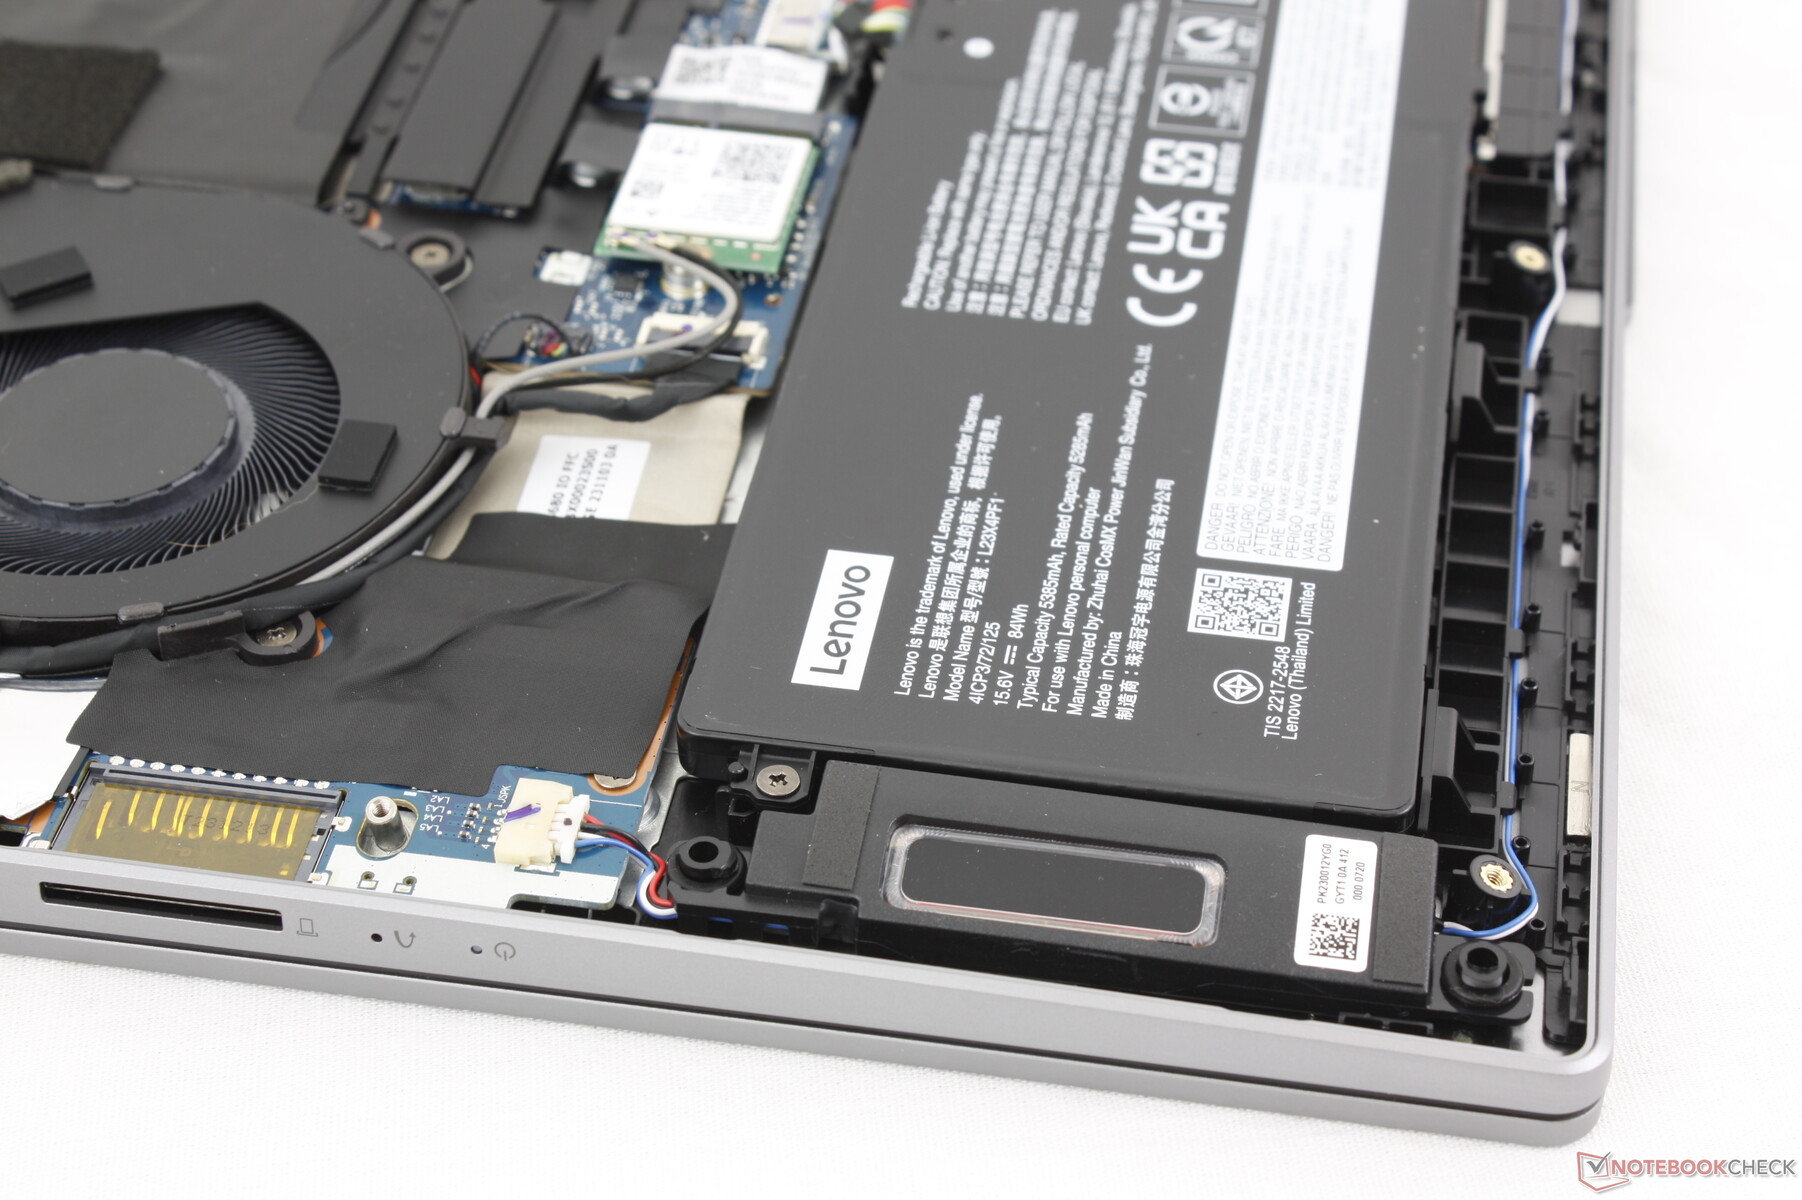
Maintenance
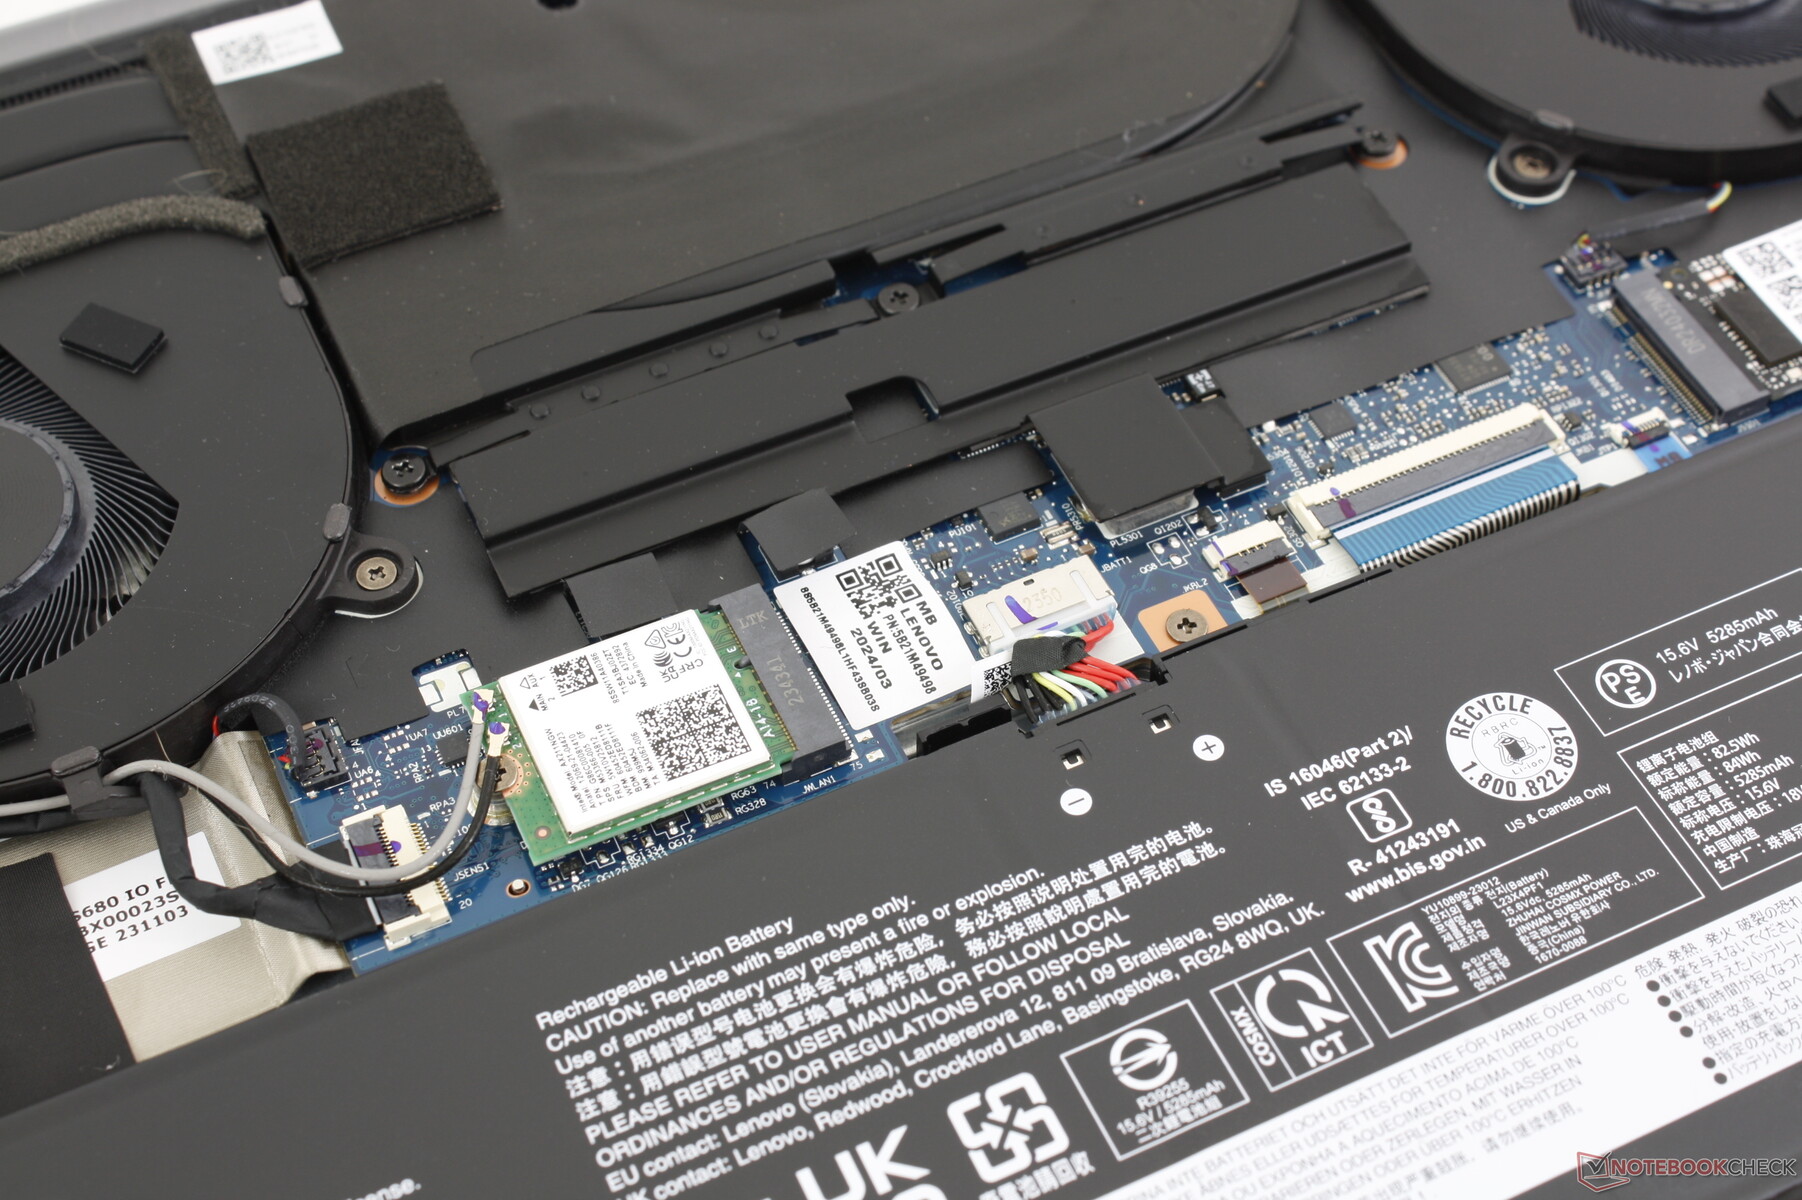
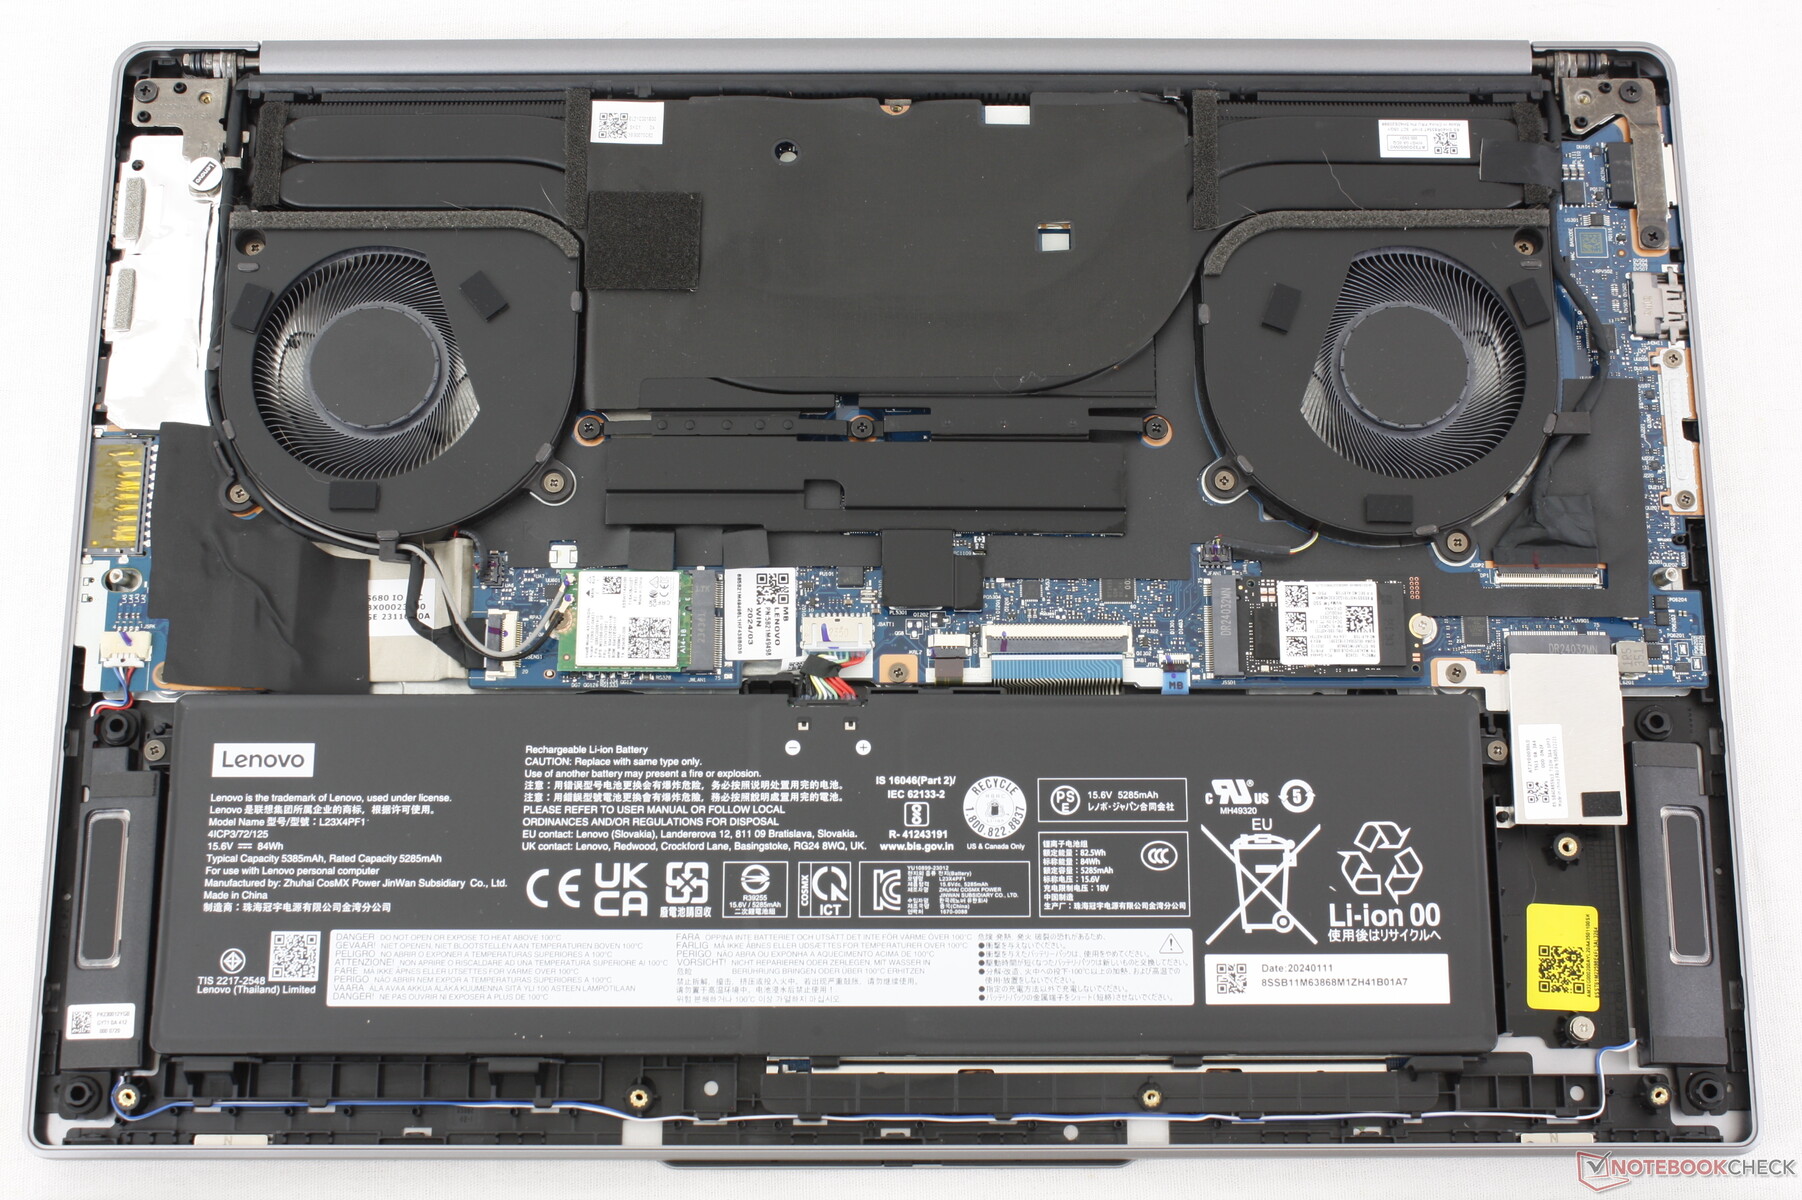
The bottom panel is secured by nine Torx screws for relatively easy servicing. The cooling solution remains unchanged from the iGPU version despite the more demanding hardware meaning we can expect both louder noise and higher temperatures on average.
Sustainability
The bottom cover consists of 50 percent recycled aluminum while the plastics in the packaging consist of 90 percent ocean-bound sources. We also appreciate that official repair guides for the model are available directly from Lenovo as free downloads.
Accessories And Warranty
There are no extras in the retail box other than the AC adapter and paperwork. The usual one-year limited warranty applies if purchased in the US.
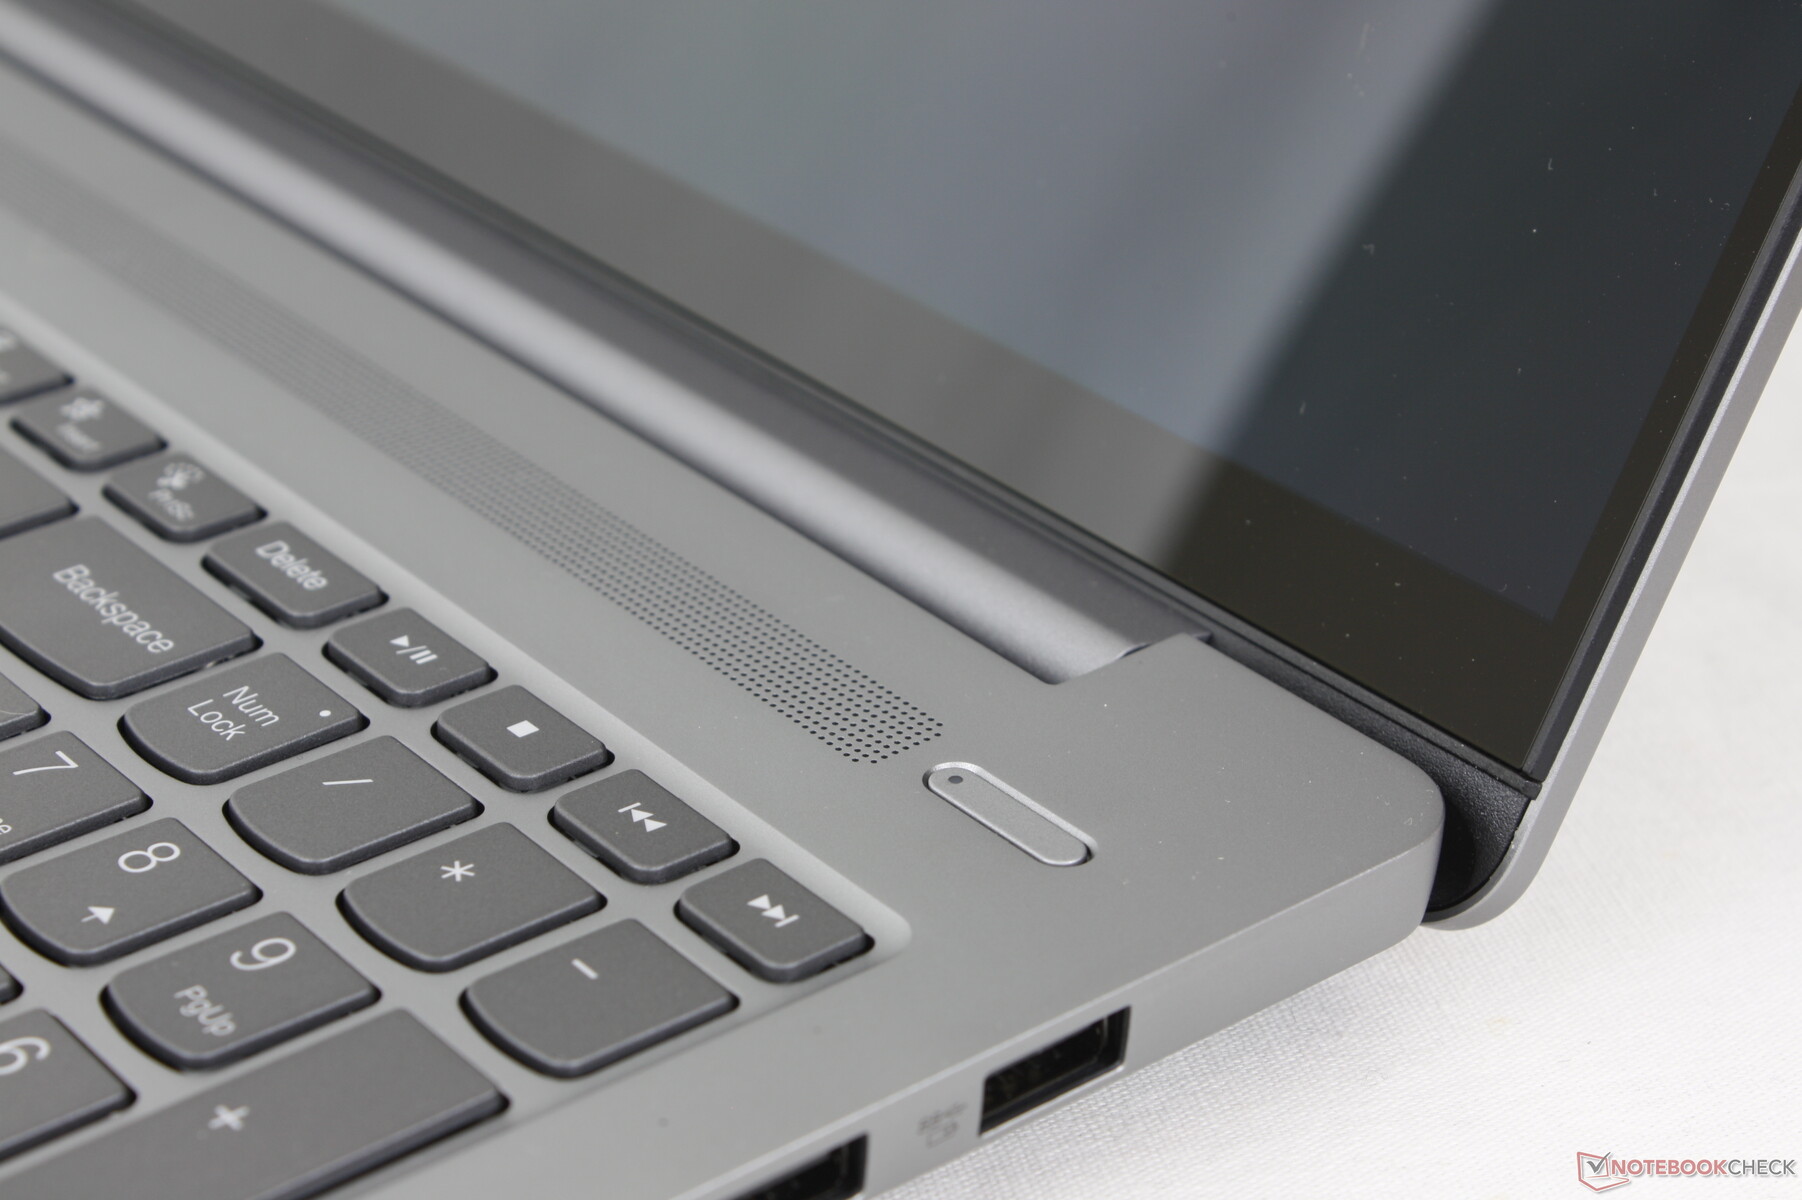
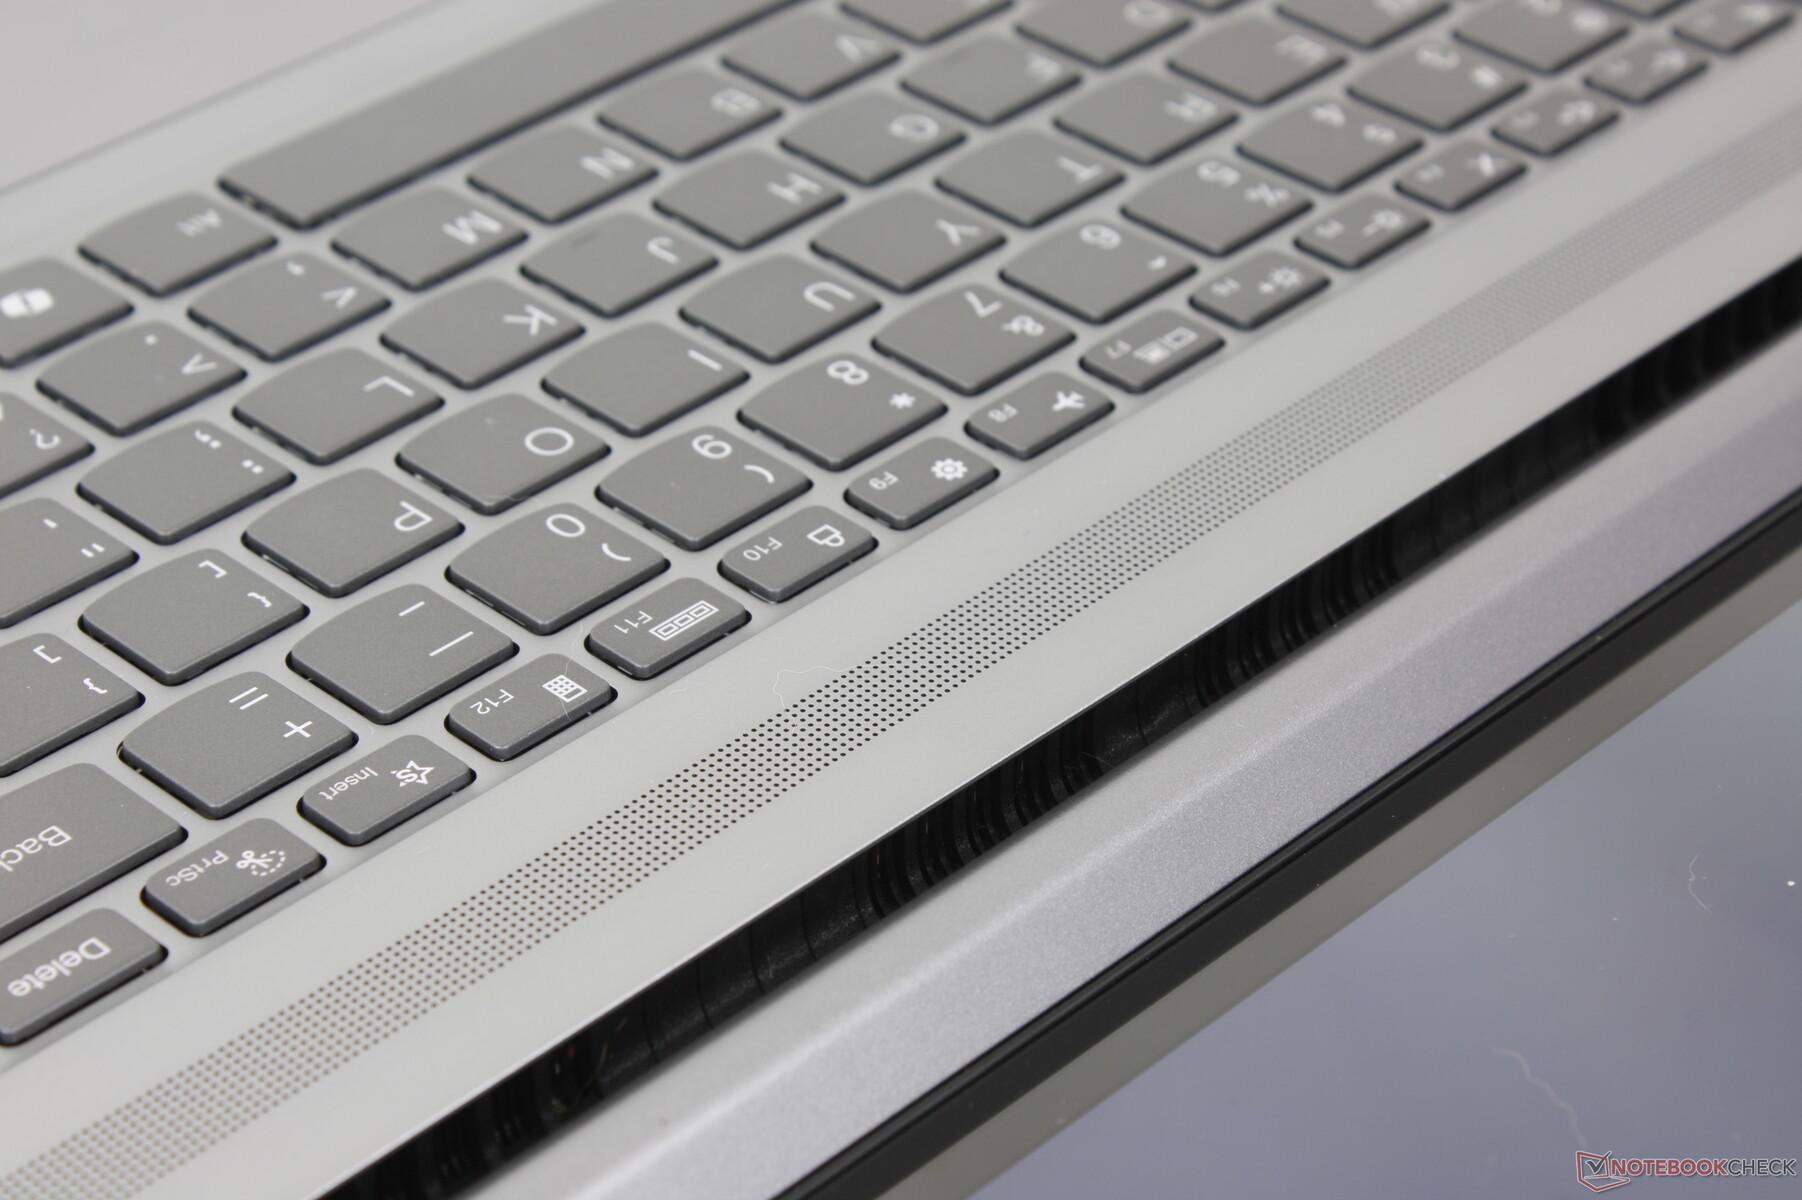
Input Devices
Keyboard And Touchpad
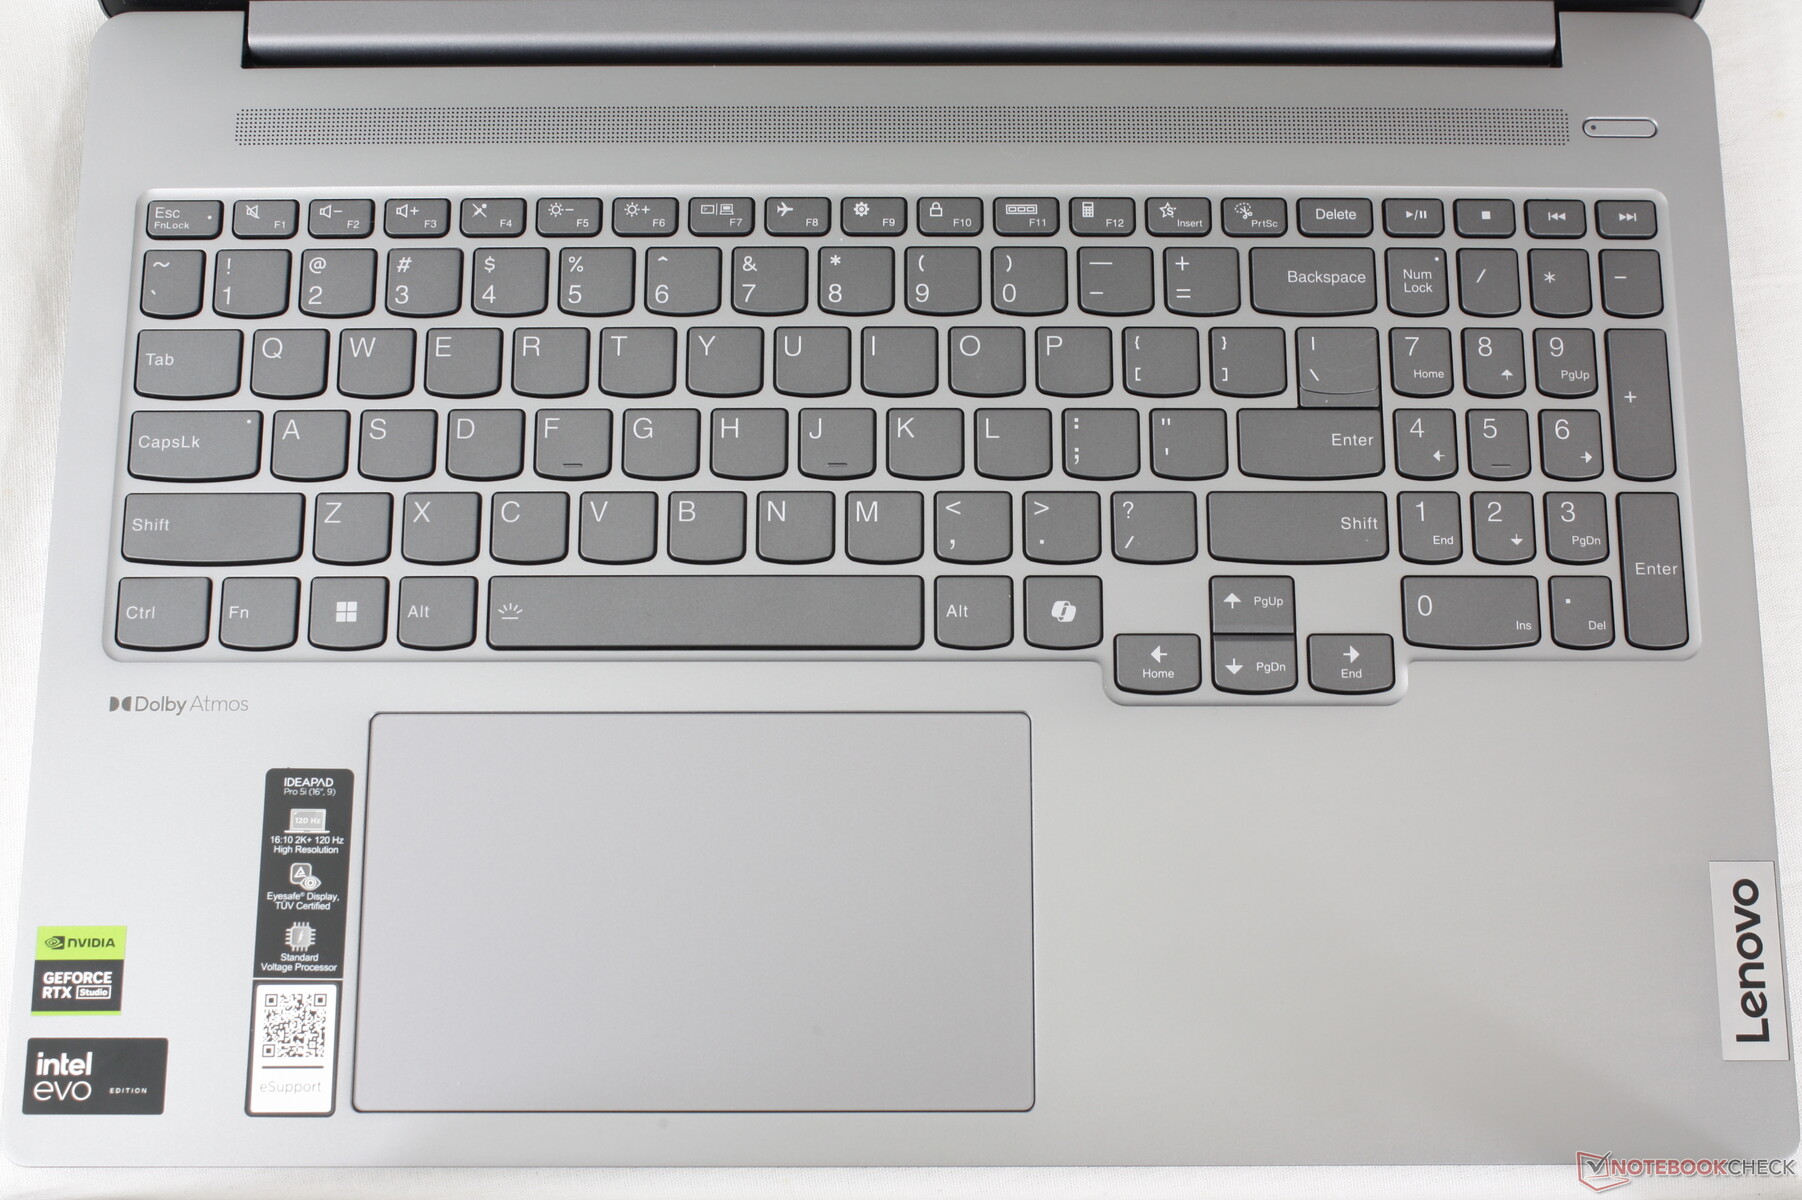
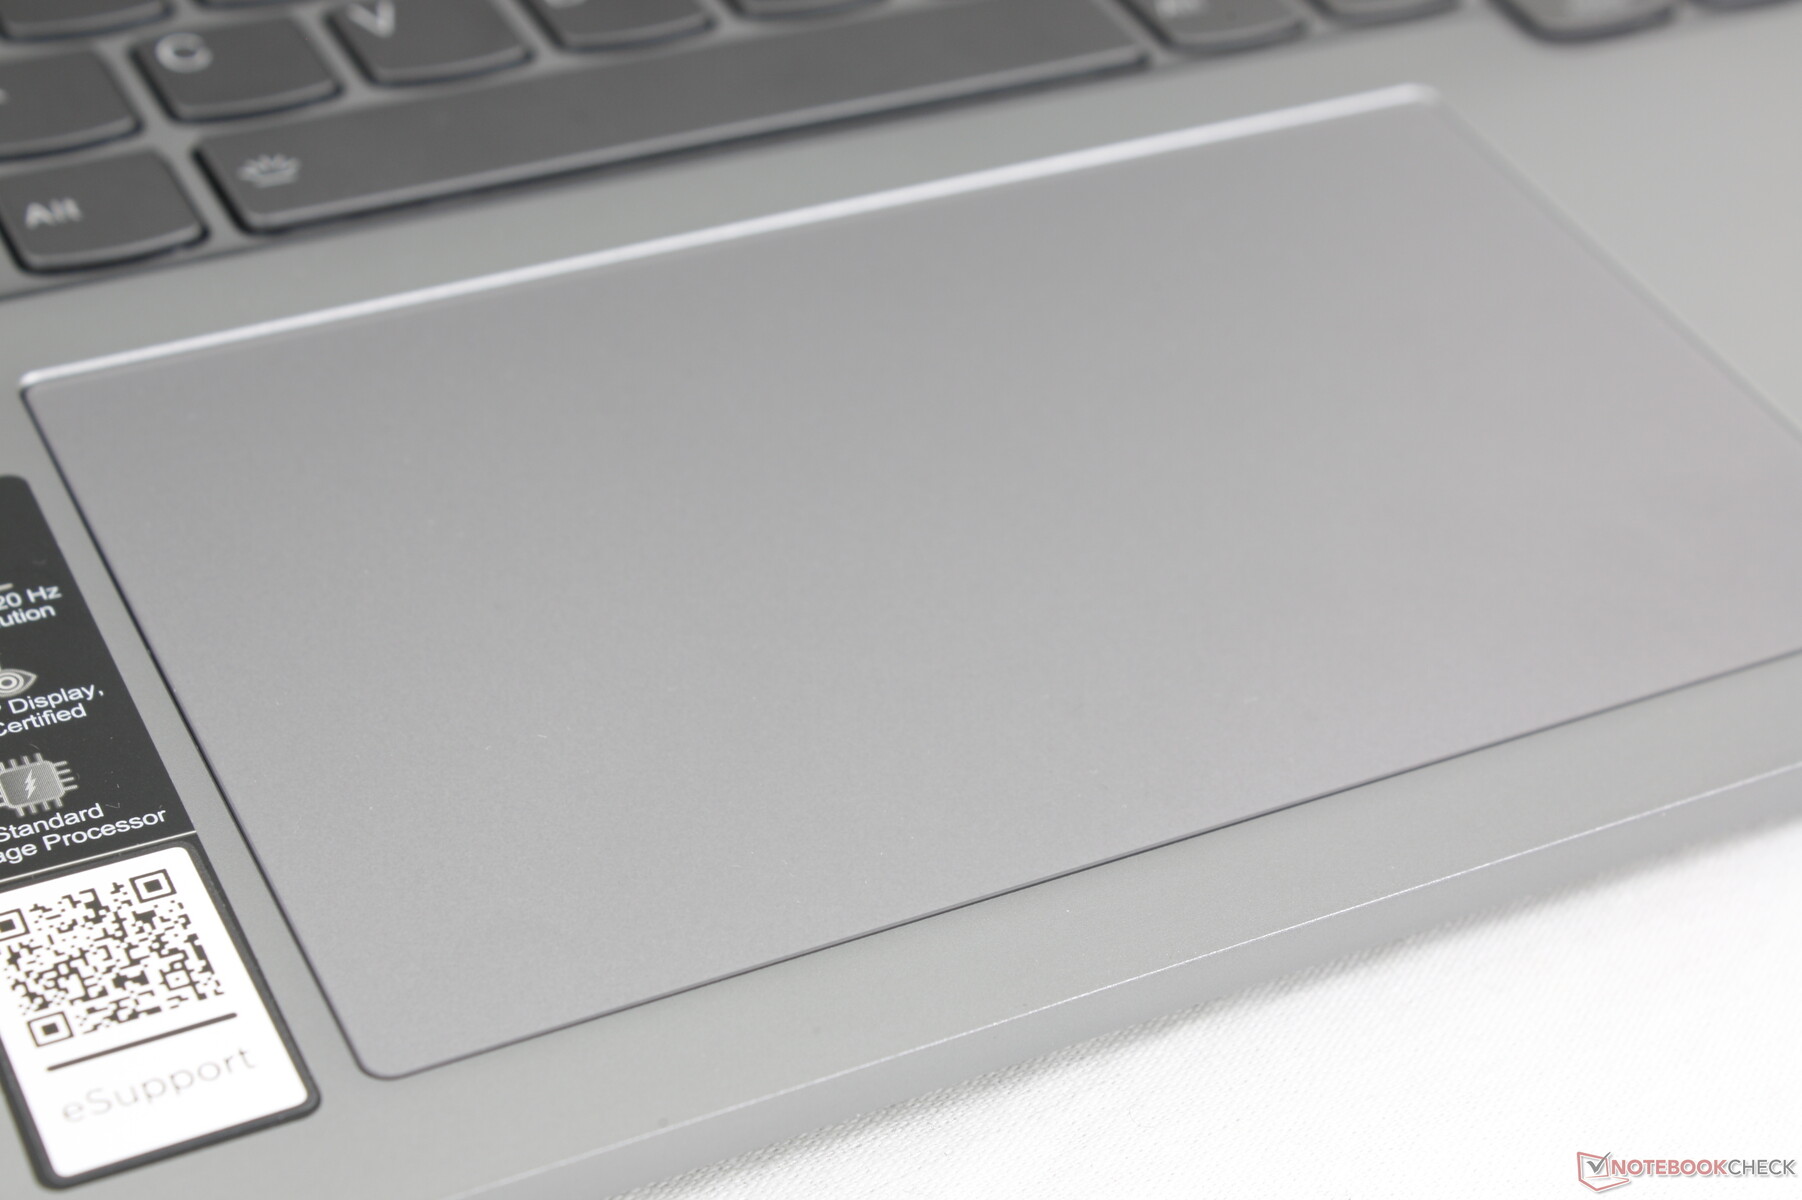
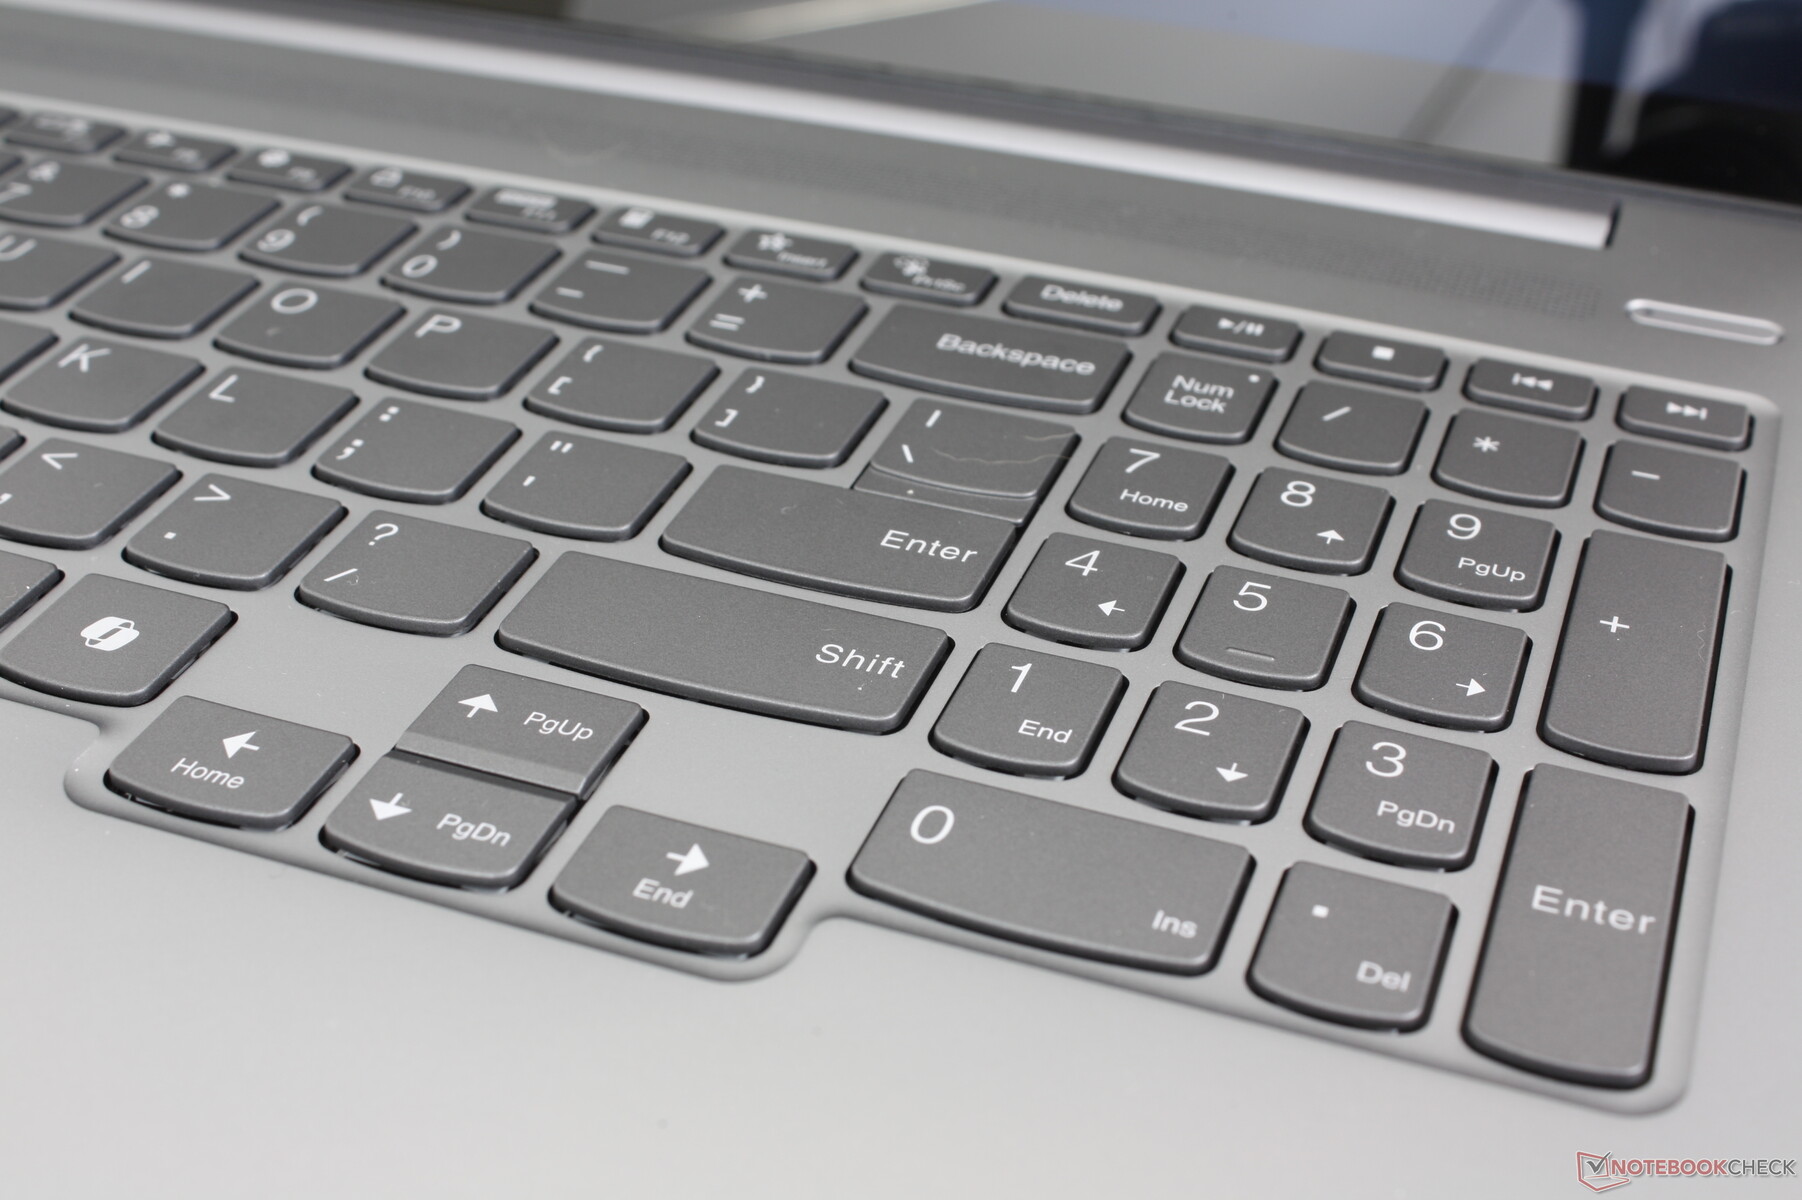
The keyboards on IdeaPad models are shallower and with weaker feedback than the keyboards on ThinkPad models. While serviceable, the typing experience is certainly a step down from Lenovo's best to be closer to cheaper systems even at the top-end $1500 configuration.

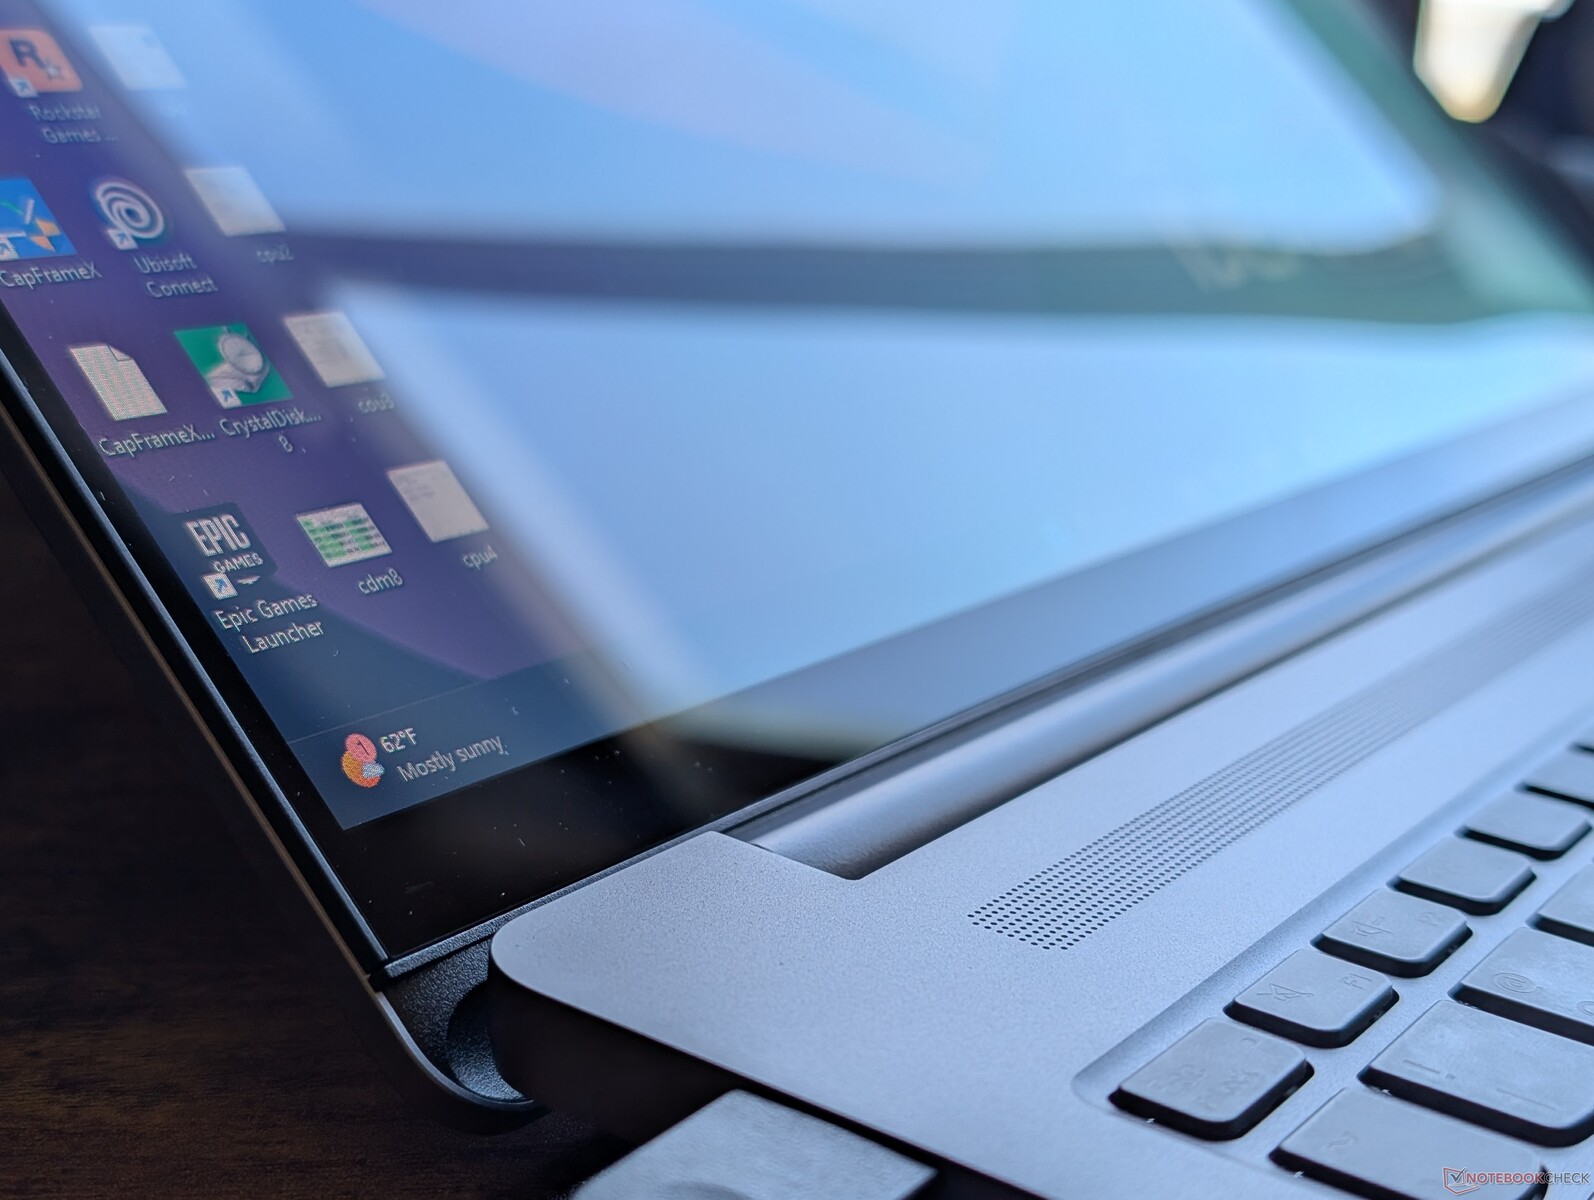
Display — From IPS To OLED

Two display options are available as follows:
- 2560 x 1600, IPS, 120 Hz, non-touch
- 2048 x 1280, OLED, 120 Hz, touch
Unlike on most other laptops, the OLED option here isn't necessarily better than the IPS option as it trades away a higher native resolution for deeper colors and better HDR support. If your workloads consist of mostly spreadsheets or window multitasking, then the higher resolution IPS panel can be more productive. For tasks such as video playback or video editing, the deeper colors and darker contrast of OLED can enhance the experience.
The 1280p resolution is nonetheless lower than on other 16-inch laptops such as the Asus Zenbook S 16, Envy x360 2-in-1 16, or Galaxy Book4 Ultra all of which ship with 1800p OLED panels. This is likely intentional as a way to encourage shoppers to consider the higher-end Yoga Pro 9 16 G9 series instead, but it still makes the IdeaPad Pro 5 16 G9 a bit less attractive when compared to its immediate competitors.

| |||||||||||||||||||||||||
Brightness Distribution: 98 %
Center on Battery: 367.6 cd/m²
Contrast: ∞:1 (Black: 0 cd/m²)
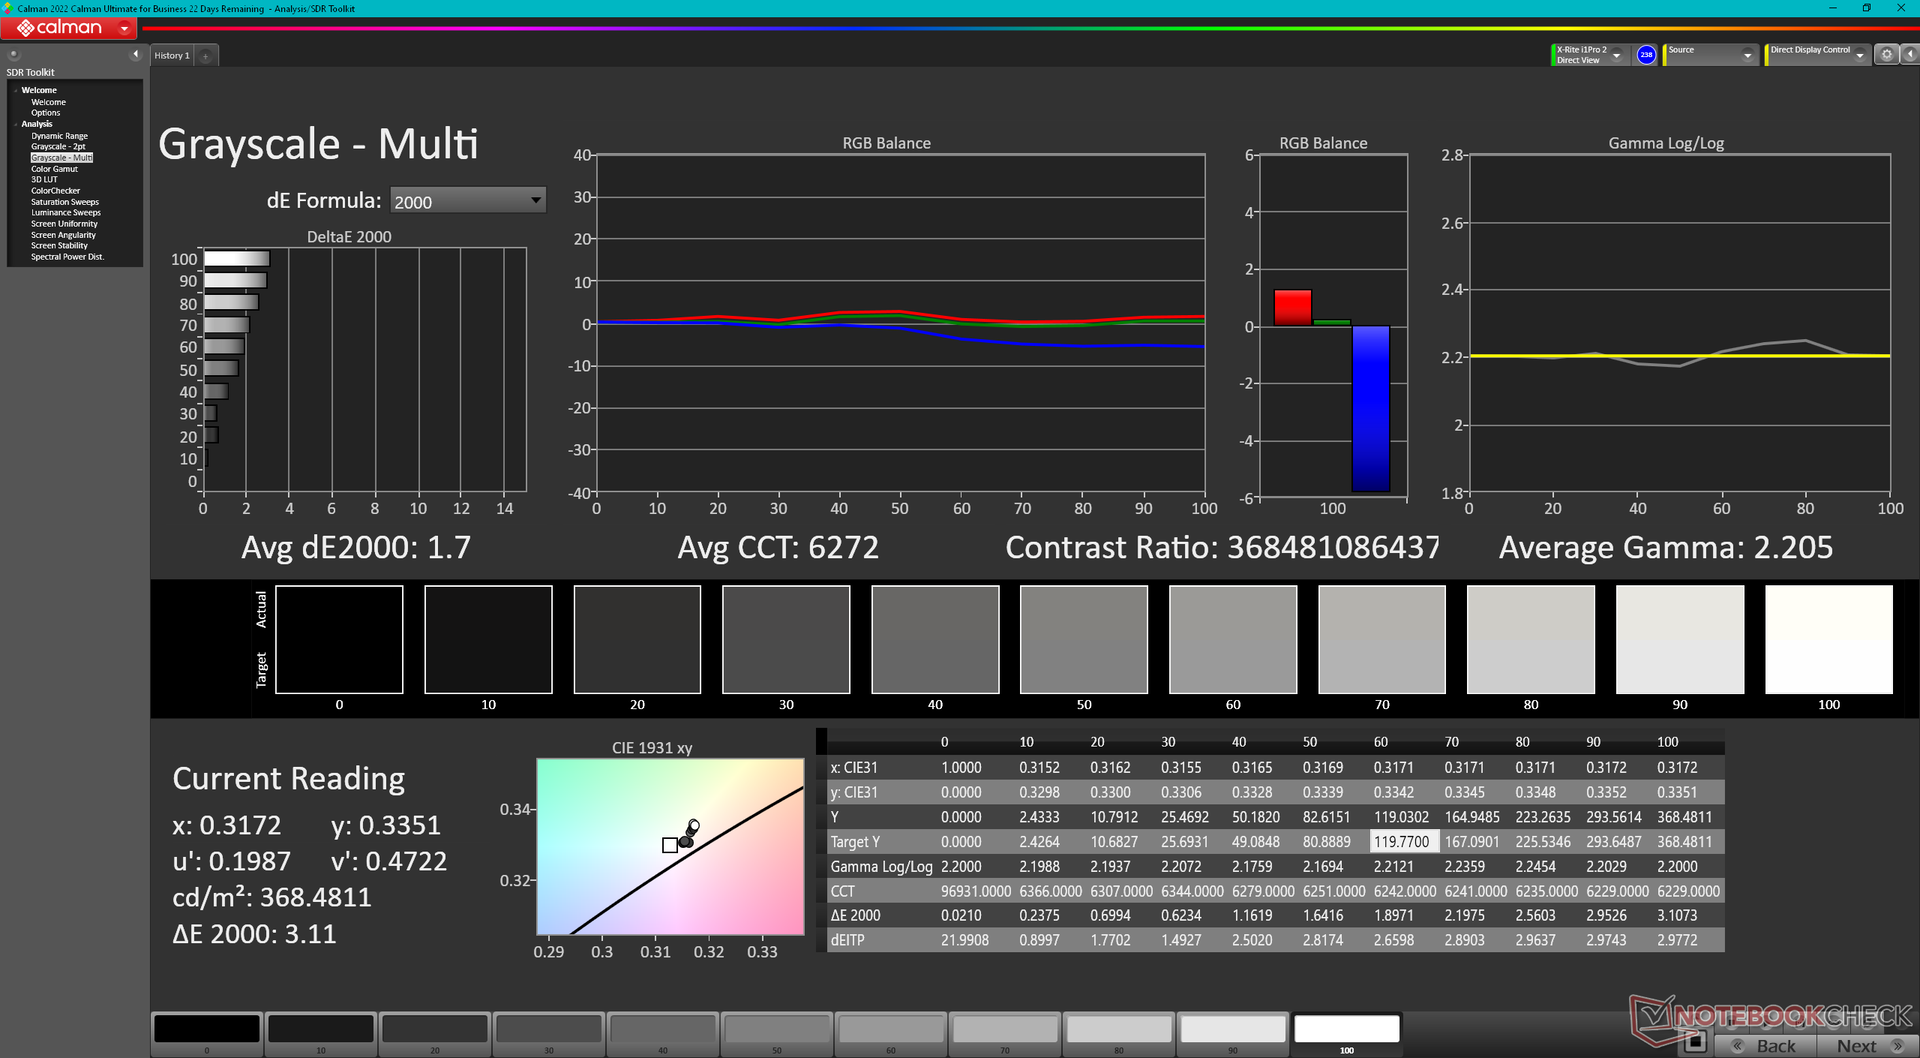
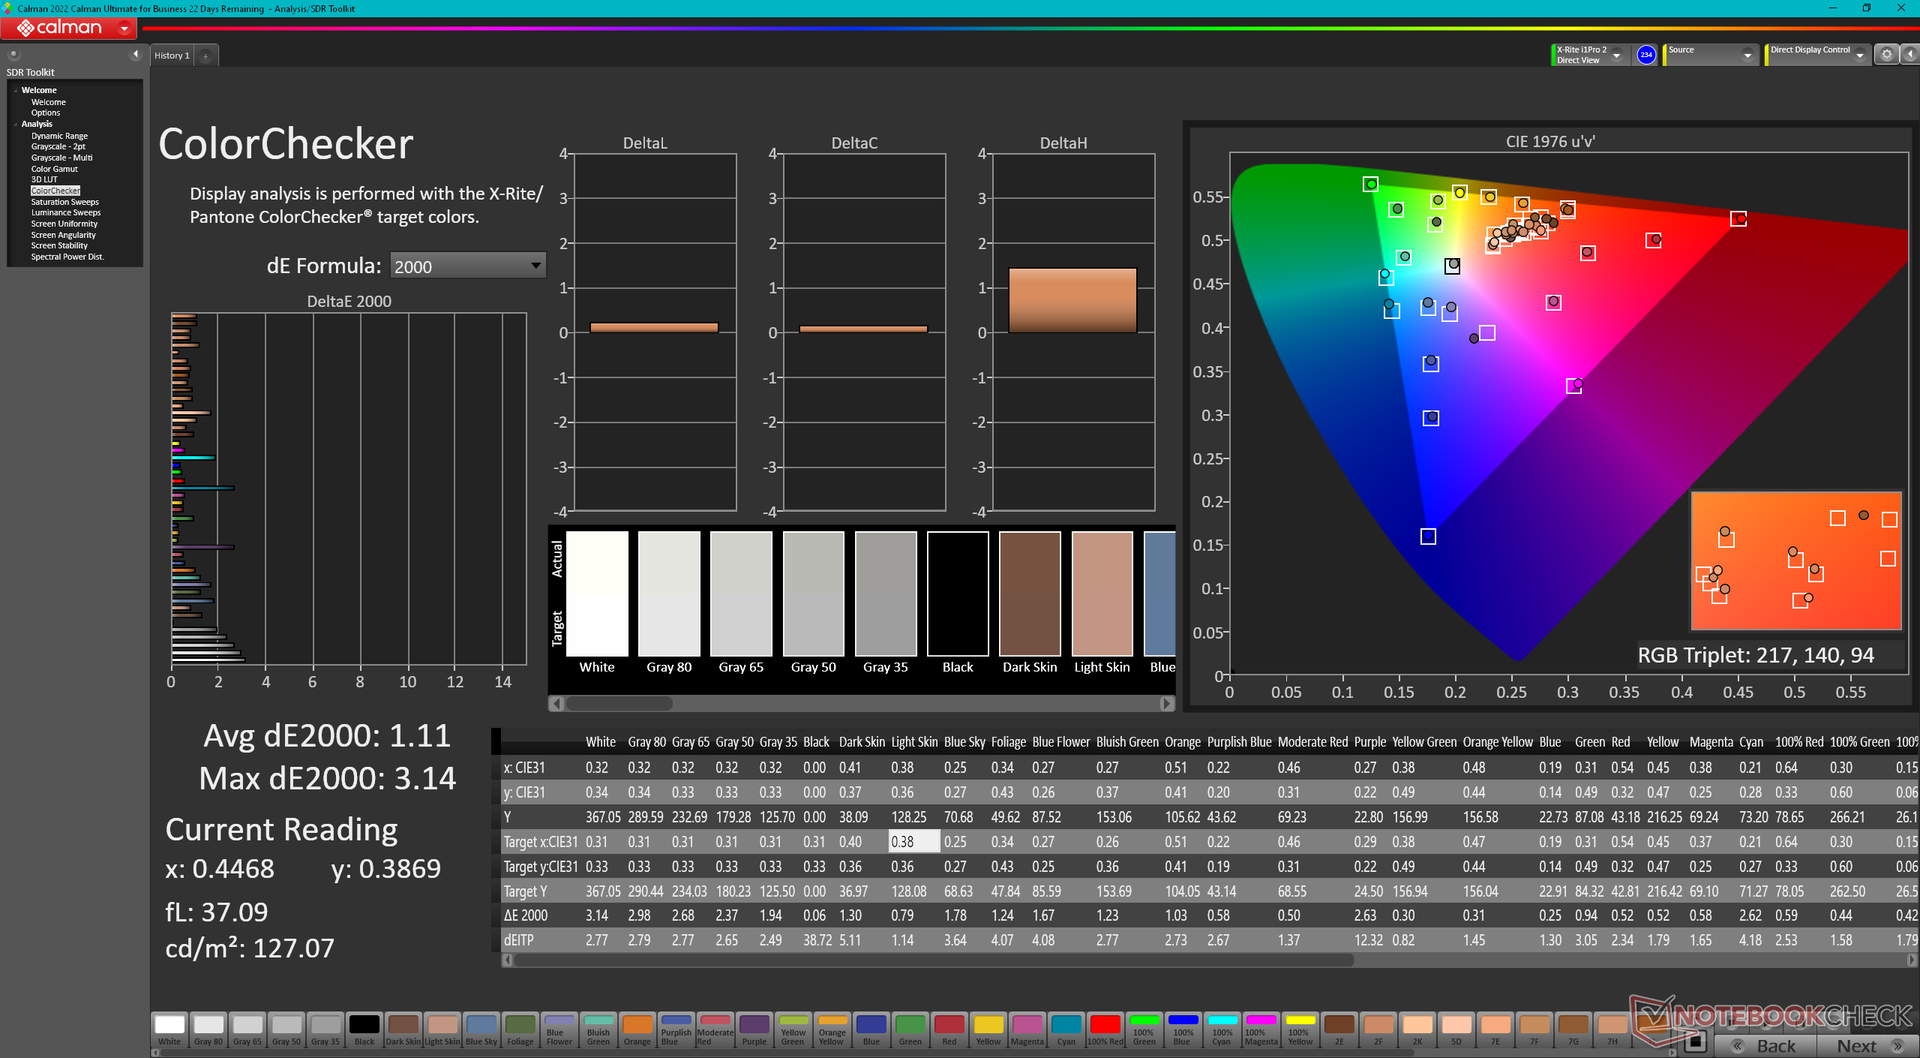
ΔE ColorChecker Calman: 4.31 | ∀{0.5-29.43 Ø4.72}
calibrated: 1.11
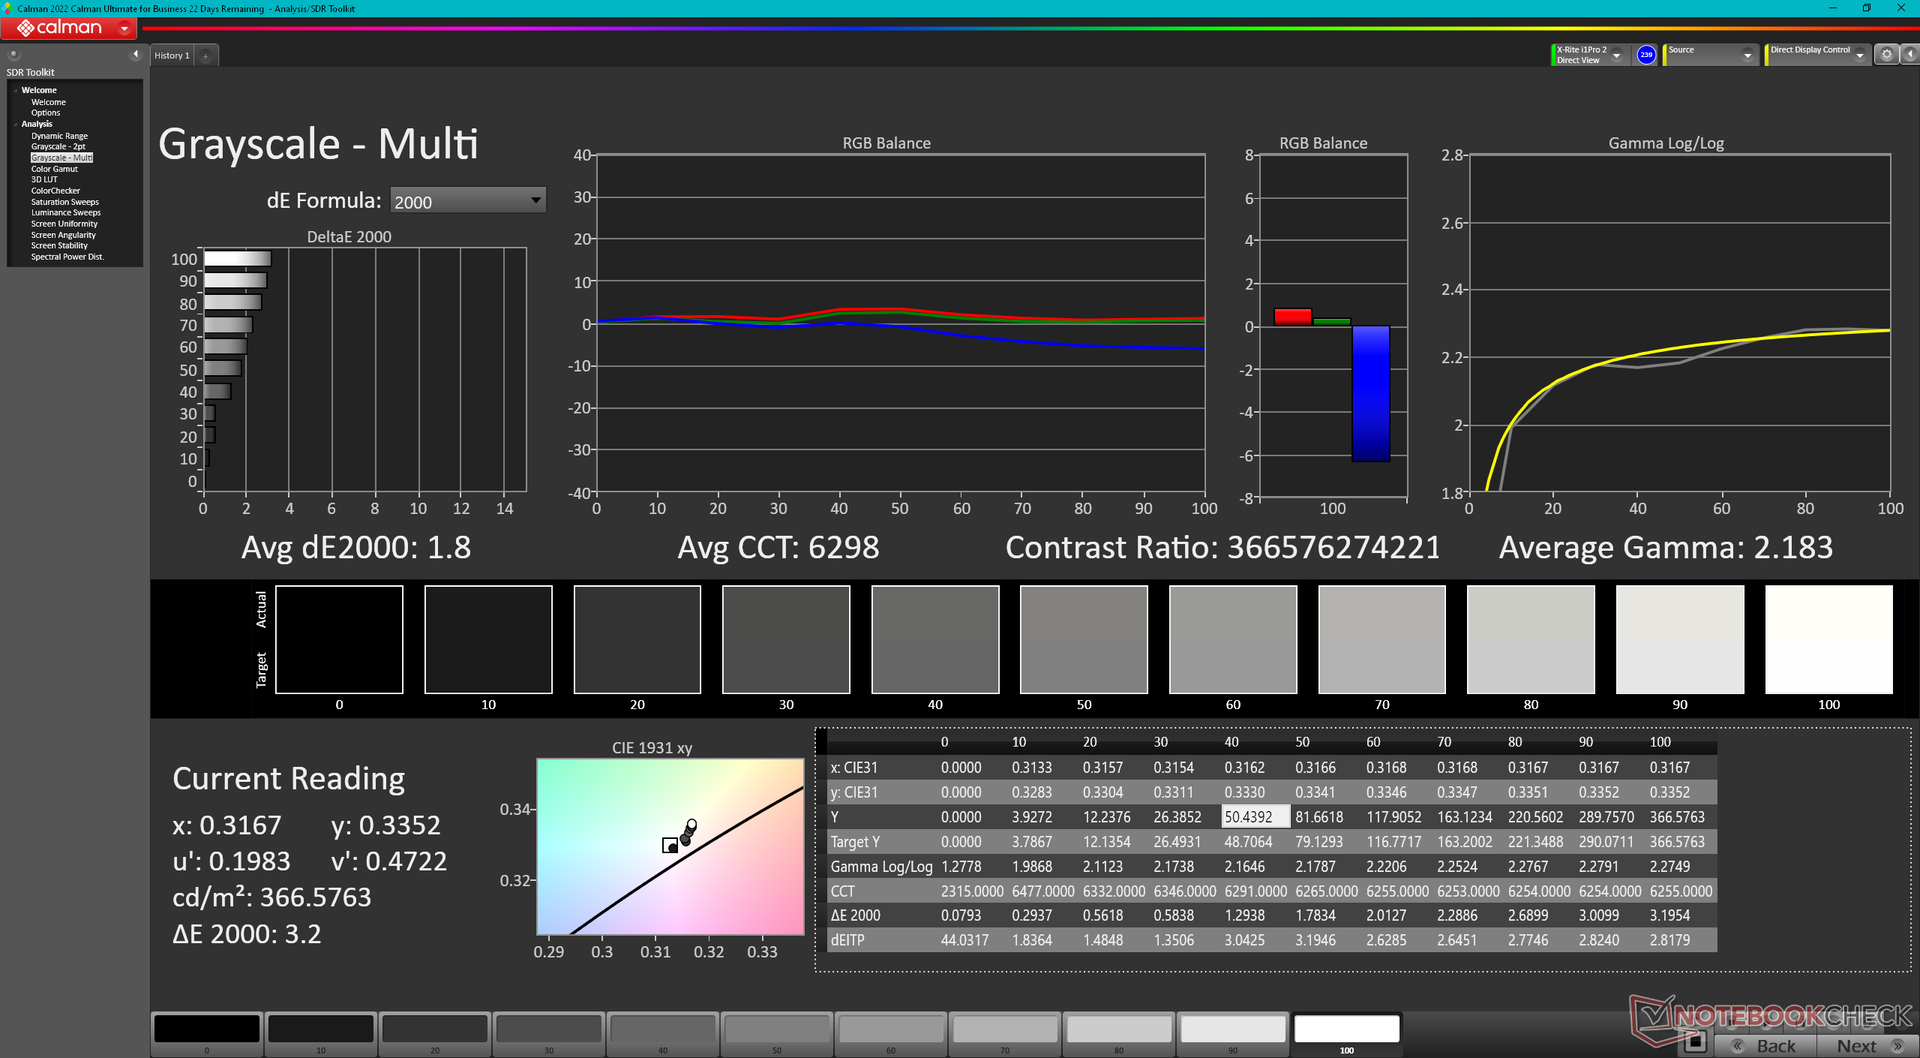
ΔE Greyscale Calman: 1.7 | ∀{0.09-98 Ø4.97}
97.8% AdobeRGB 1998 (Argyll 3D)
100% sRGB (Argyll 3D)
99.7% Display P3 (Argyll 3D)
Gamma: 2.2
CCT: 6272 K
| Lenovo IdeaPad Pro 5 16IMH G9 RTX 4050 LEN1602K, OLED, 2048x1280, 16", 120 Hz | Lenovo IdeaPad Pro 5 16IMH G9 NE160QDM-NY2, IPS, 2560x1600, 16", 120 Hz | Dell Inspiron 16 7640 2-in-1 AU Optronics B160QAT, Mini-LED, 2560x1600, 16", 90 Hz | Asus Zenbook S 16 UM5606-RK333W ATNA60CL10-0, OLED, 2880x1800, 16", 120 Hz | HP Envy x360 2-in-1 16-ad0097nr Samsung SDC41A6, OLED, 2880x1800, 16", 120 Hz | Samsung Galaxy Book4 Ultra ATNA60CL07-0, OLED, 2880x1800, 16", 120 Hz | |
|---|---|---|---|---|---|---|
| Display | -25% | -2% | -1% | -0% | -4% | |
| Display P3 Coverage (%) | 99.7 | 63.3 -37% | 99.4 0% | 99.9 0% | 99.6 0% | 98.6 -1% |
| sRGB Coverage (%) | 100 | 95.2 -5% | 100 0% | 100 0% | 100 0% | 99.9 0% |
| AdobeRGB 1998 Coverage (%) | 97.8 | 65.3 -33% | 92.5 -5% | 95.6 -2% | 96.5 -1% | 88.5 -10% |
| Response Times | -1708% | -4258% | 20% | -14% | 19% | |
| Response Time Grey 50% / Grey 80% * (ms) | 0.58 ? | 15 ? -2486% | 15.4 ? -2555% | 0.56 ? 3% | 0.8 ? -38% | 0.54 ? 7% |
| Response Time Black / White * (ms) | 1 ? | 10.3 ? -930% | 60.6 ? -5960% | 0.65 ? 35% | 0.89 ? 11% | 0.69 ? 31% |
| PWM Frequency (Hz) | 240 ? | 2753.7 ? | 480 | 491.8 ? | 240 ? | |
| PWM Amplitude * (%) | 38 | 30 21% | ||||
| Screen | -14% | -21% | 43% | 10% | 20% | |
| Brightness middle (cd/m²) | 367.6 | 368 0% | 413 12% | 407 11% | 399.4 9% | 390 6% |
| Brightness (cd/m²) | 371 | 368 -1% | 409 10% | 405 9% | 405 9% | 393 6% |
| Brightness Distribution (%) | 98 | 91 -7% | 97 -1% | 97 -1% | 98 0% | 98 0% |
| Black Level * (cd/m²) | 0.31 | 0.14 | 0.02 | |||
| Colorchecker dE 2000 * | 4.31 | 2.4 44% | 3.48 19% | 0.6 86% | 4.05 6% | 1.4 68% |
| Colorchecker dE 2000 max. * | 6.85 | 6.5 5% | 6.97 -2% | 1.2 82% | 6.69 2% | 2.7 61% |
| Colorchecker dE 2000 calibrated * | 1.11 | 0.8 28% | 1.02 8% | |||
| Greyscale dE 2000 * | 1.7 | 4.5 -165% | 4.5 -165% | 0.5 71% | 1.1 35% | 2.1 -24% |
| Gamma | 2.2 100% | 2.21 100% | 2.15 102% | 2.2 100% | 2.27 97% | 2.27 97% |
| CCT | 6272 104% | 6324 103% | 6446 101% | 6453 101% | 6419 101% | 6431 101% |
| Contrast (:1) | 1187 | 2950 | 20350 | |||
| Total Average (Program / Settings) | -582% /
-299% | -1427% /
-786% | 21% /
26% | -1% /
3% | 12% /
13% |
* ... smaller is better
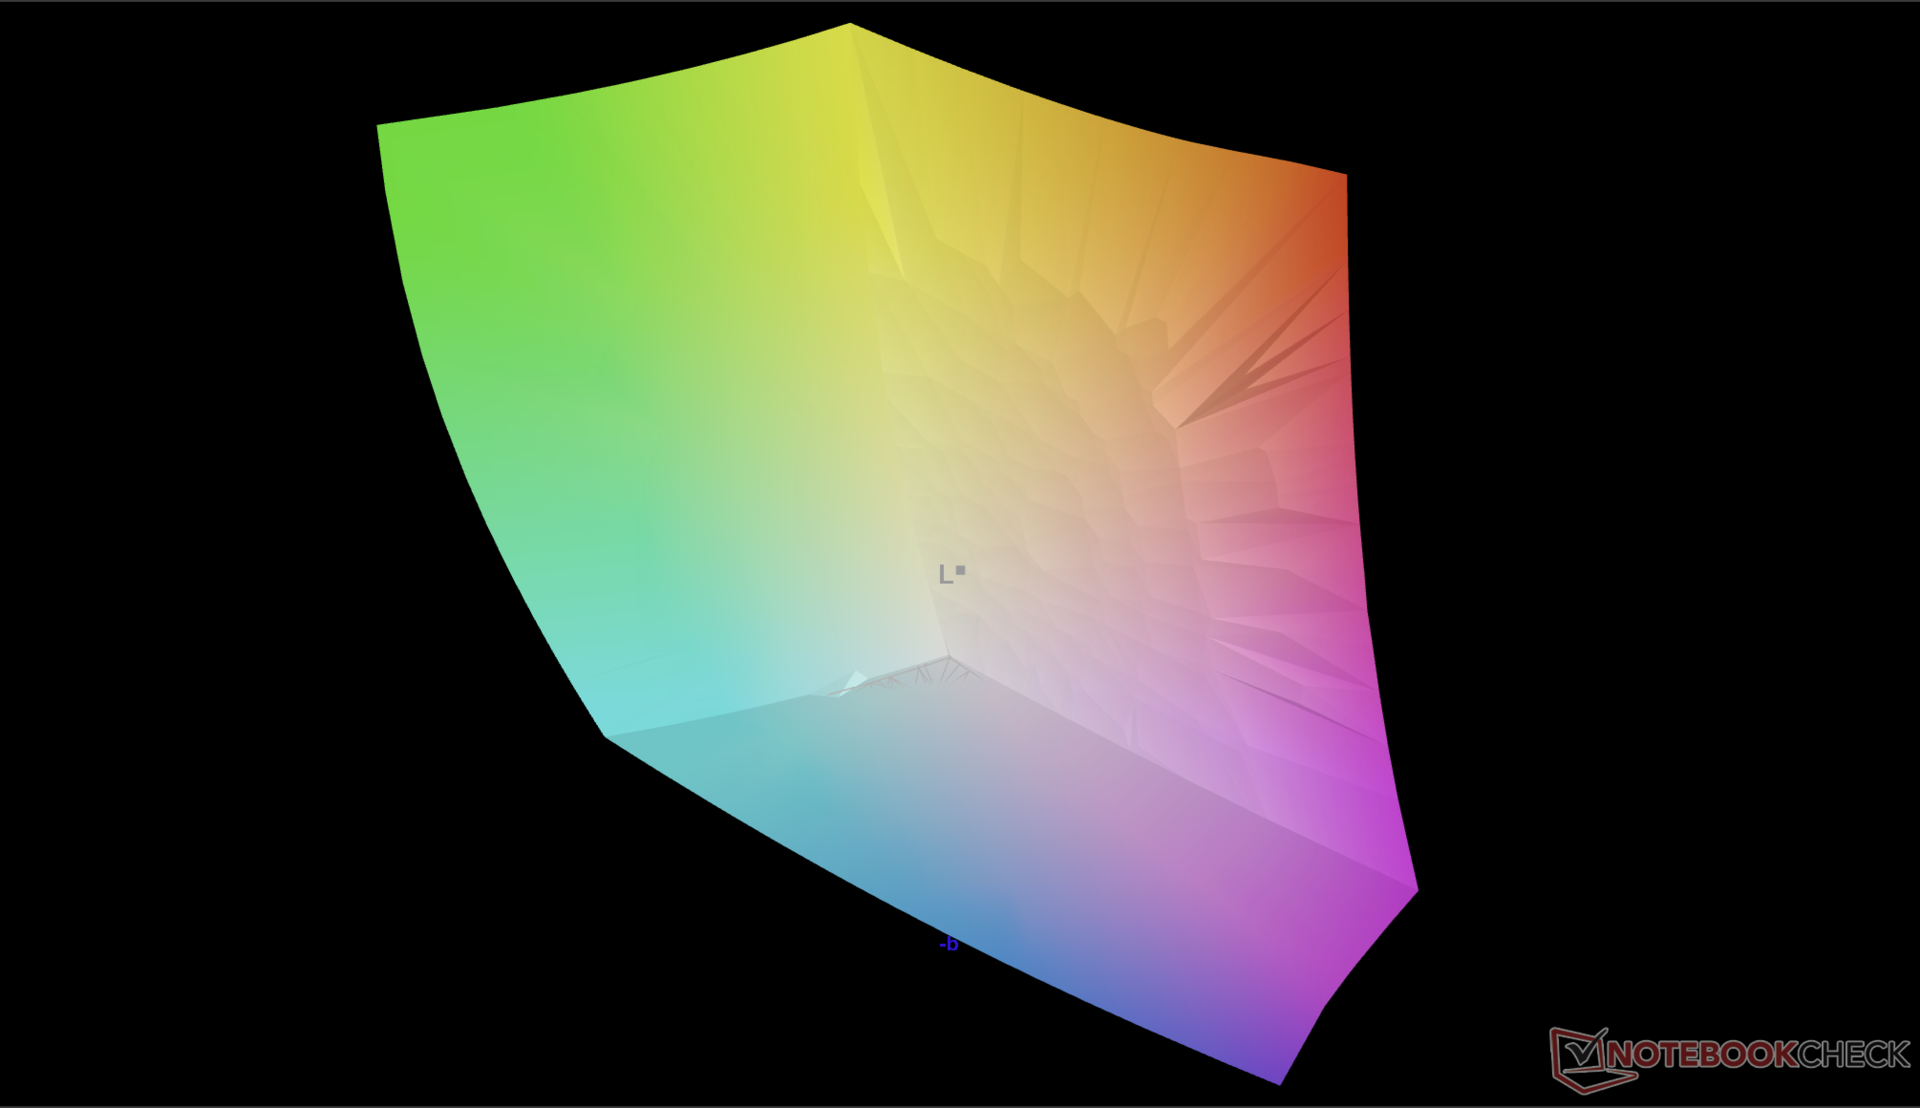

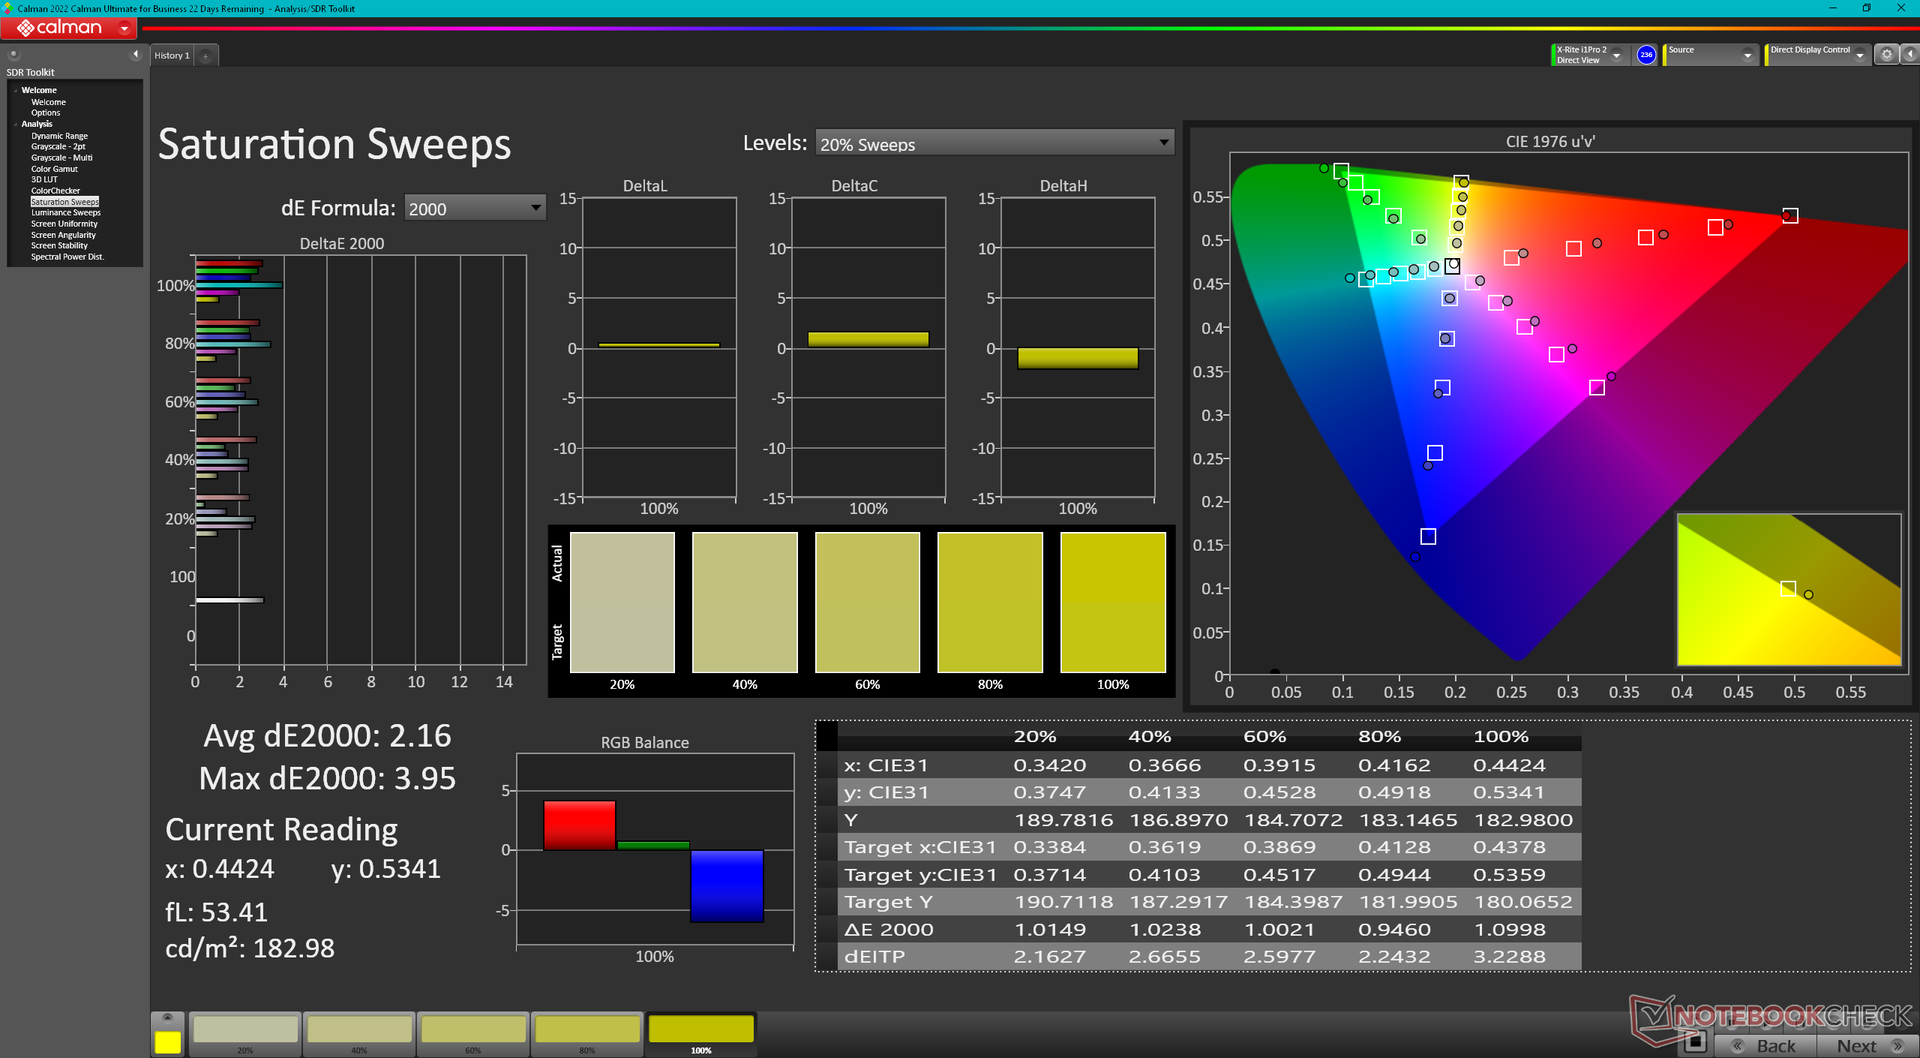
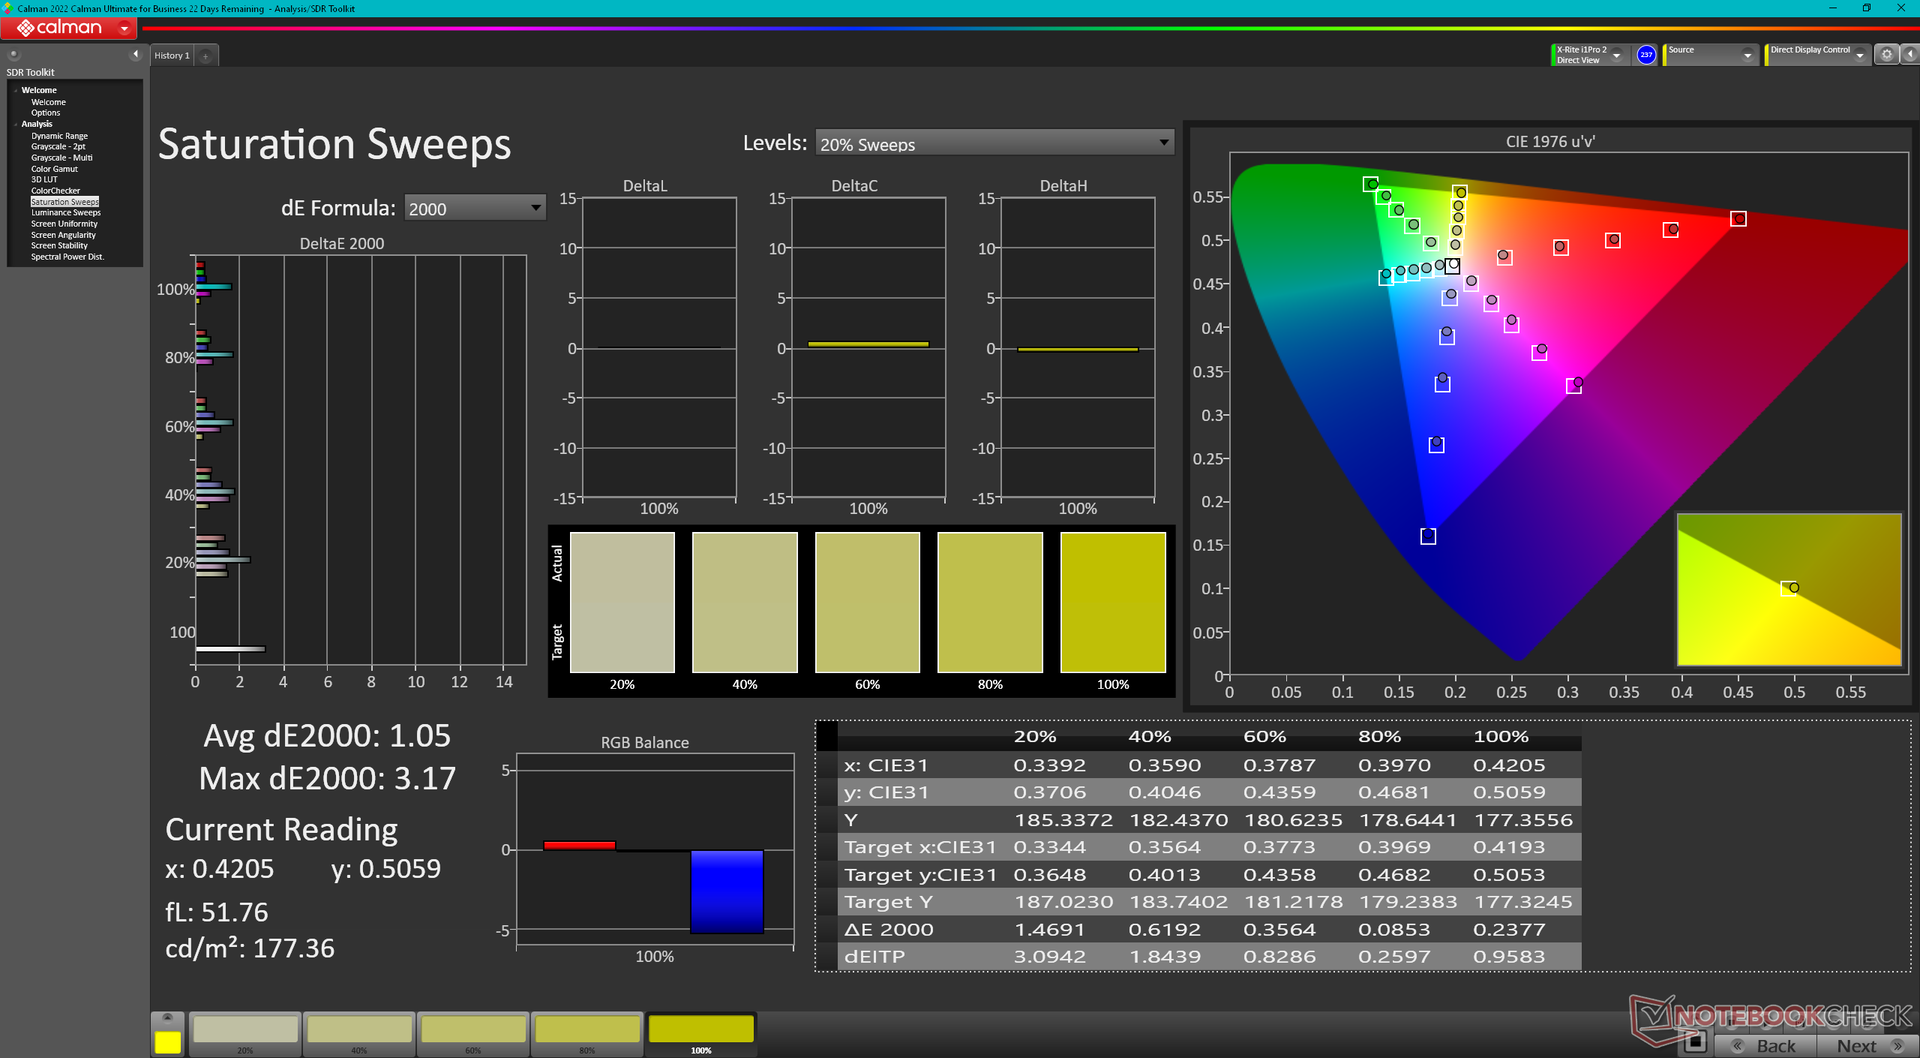
Although not calibrated at factory, the display is decently accurate against the P3 standard with average grayscale and color deltaE values of 1.7 and 4.31, respectively.

Display Response Times
| ↔ Response Time Black to White | ||
|---|---|---|
| 1 ms ... rise ↗ and fall ↘ combined | ↗ 0.56 ms rise | 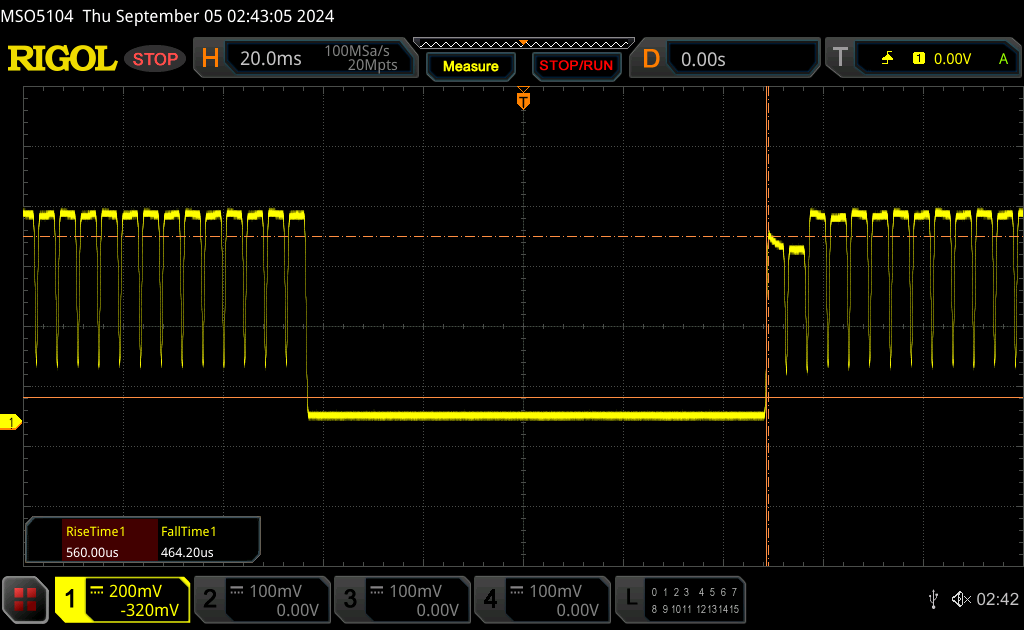 |
| ↘ 0.44 ms fall | ||
| The screen shows very fast response rates in our tests and should be very well suited for fast-paced gaming. In comparison, all tested devices range from 0.1 (minimum) to 240 (maximum) ms. » 4 % of all devices are better. This means that the measured response time is better than the average of all tested devices (19.8 ms). | ||
| ↔ Response Time 50% Grey to 80% Grey | ||
| 0.58 ms ... rise ↗ and fall ↘ combined | ↗ 0.28 ms rise | 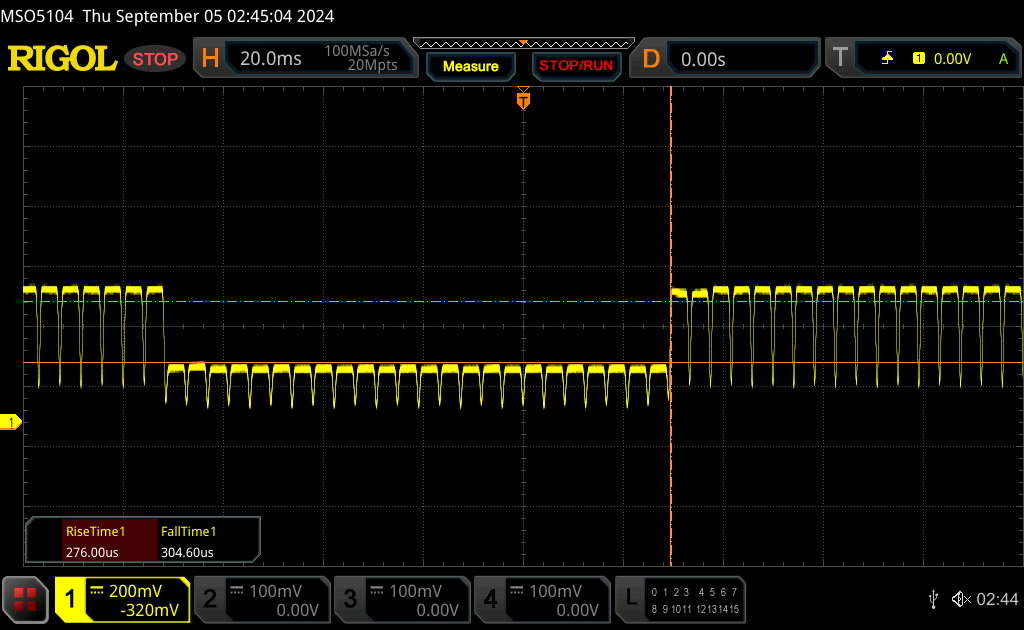 |
| ↘ 0.3 ms fall | ||
| The screen shows very fast response rates in our tests and should be very well suited for fast-paced gaming. In comparison, all tested devices range from 0.165 (minimum) to 636 (maximum) ms. » 1 % of all devices are better. This means that the measured response time is better than the average of all tested devices (31 ms). | ||
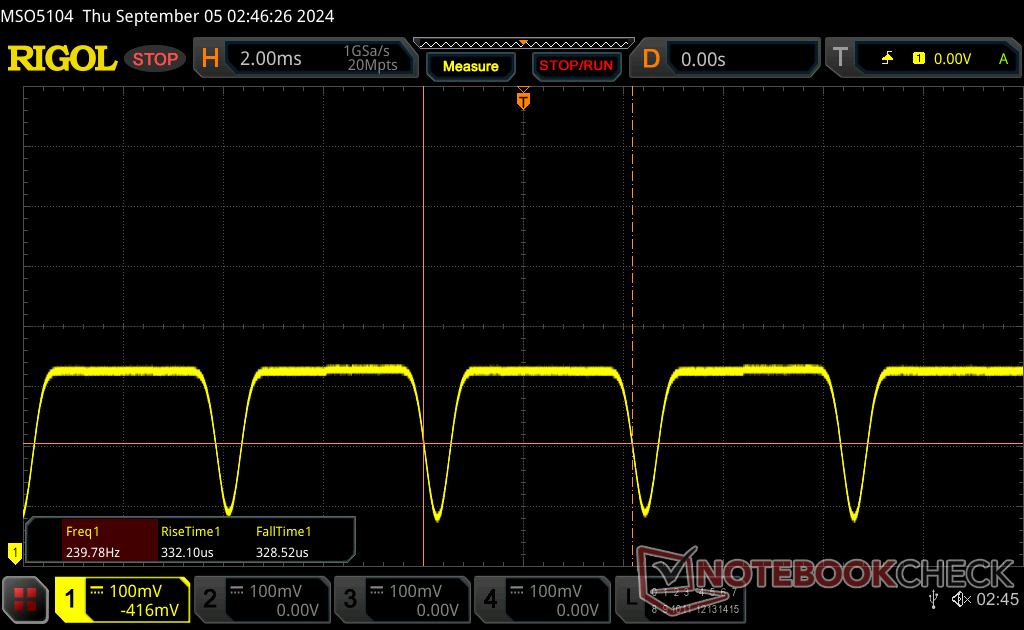
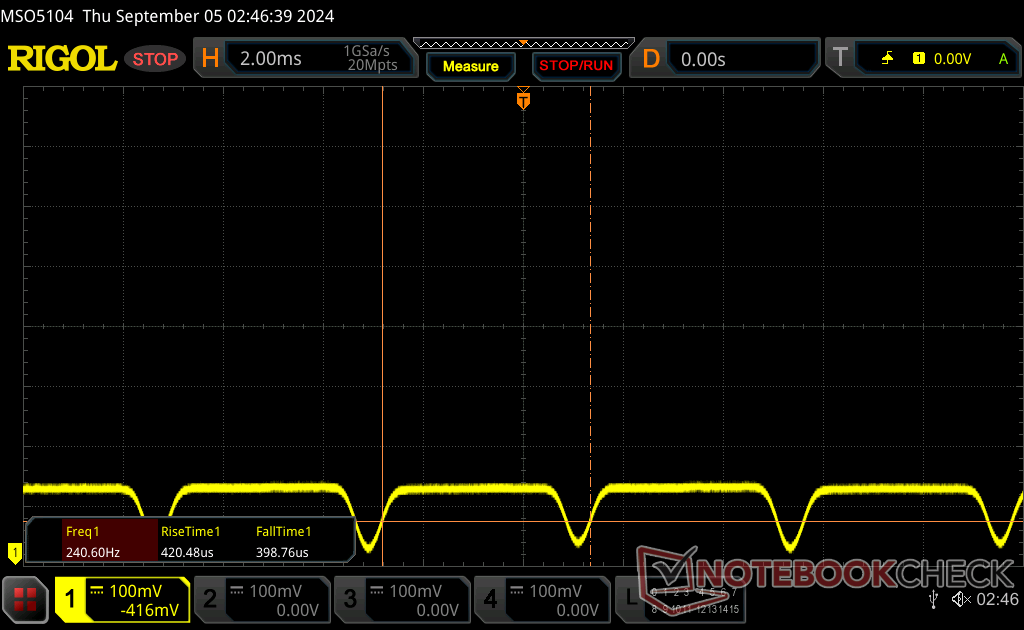
Screen Flickering / PWM (Pulse-Width Modulation)
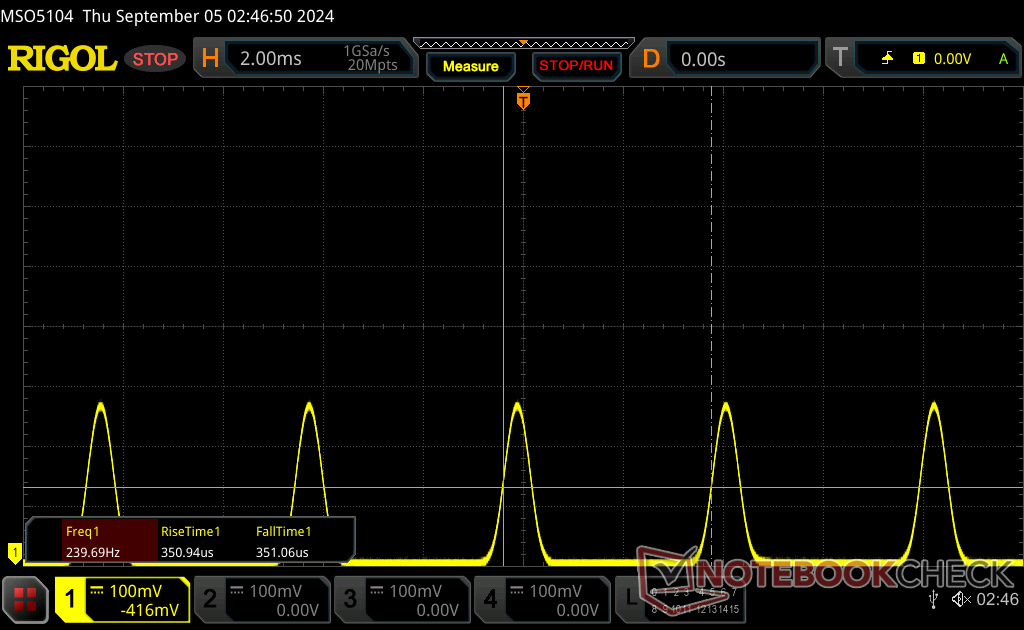
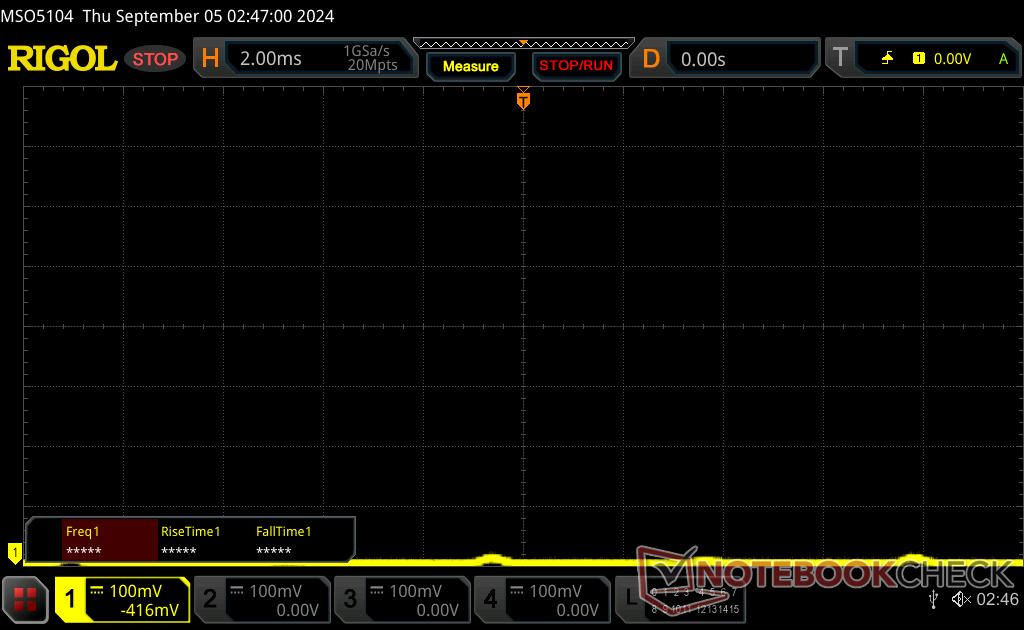
| Screen flickering / PWM detected | 240 Hz Amplitude: 38 % | ≤ 100 % brightness setting | 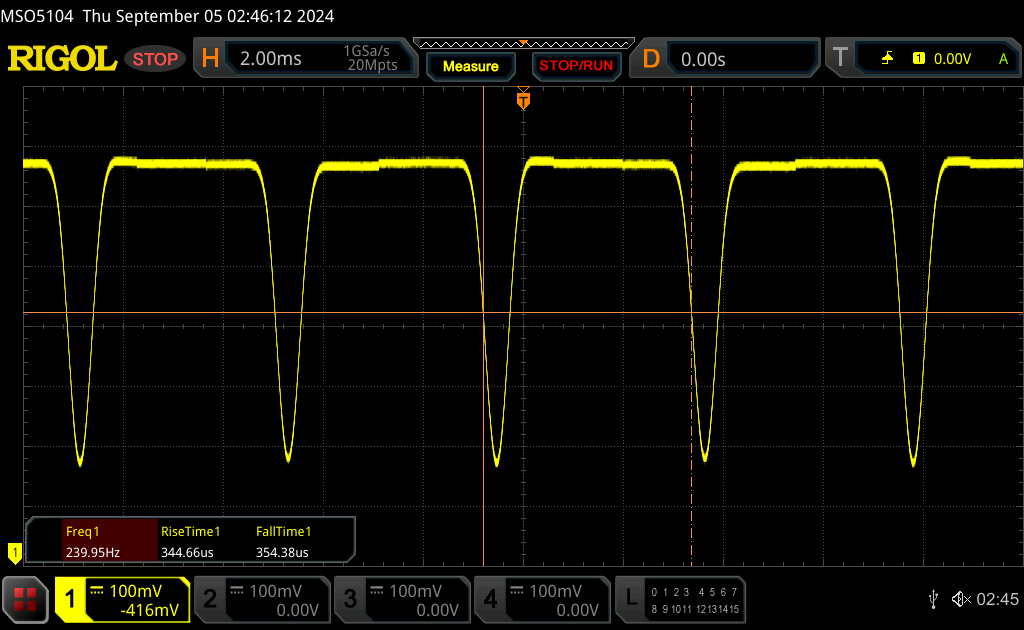 |
The display backlight flickers at 240 Hz (worst case, e.g., utilizing PWM) Flickering detected at a brightness setting of 100 % and below. There should be no flickering or PWM above this brightness setting. The frequency of 240 Hz is relatively low, so sensitive users will likely notice flickering and experience eyestrain at the stated brightness setting and below. In comparison: 52 % of all tested devices do not use PWM to dim the display. If PWM was detected, an average of 7763 (minimum: 5 - maximum: 343500) Hz was measured. | |||
A pulse-width modulation frequency of 240 Hz is detectable and consistent at all brightness levels.
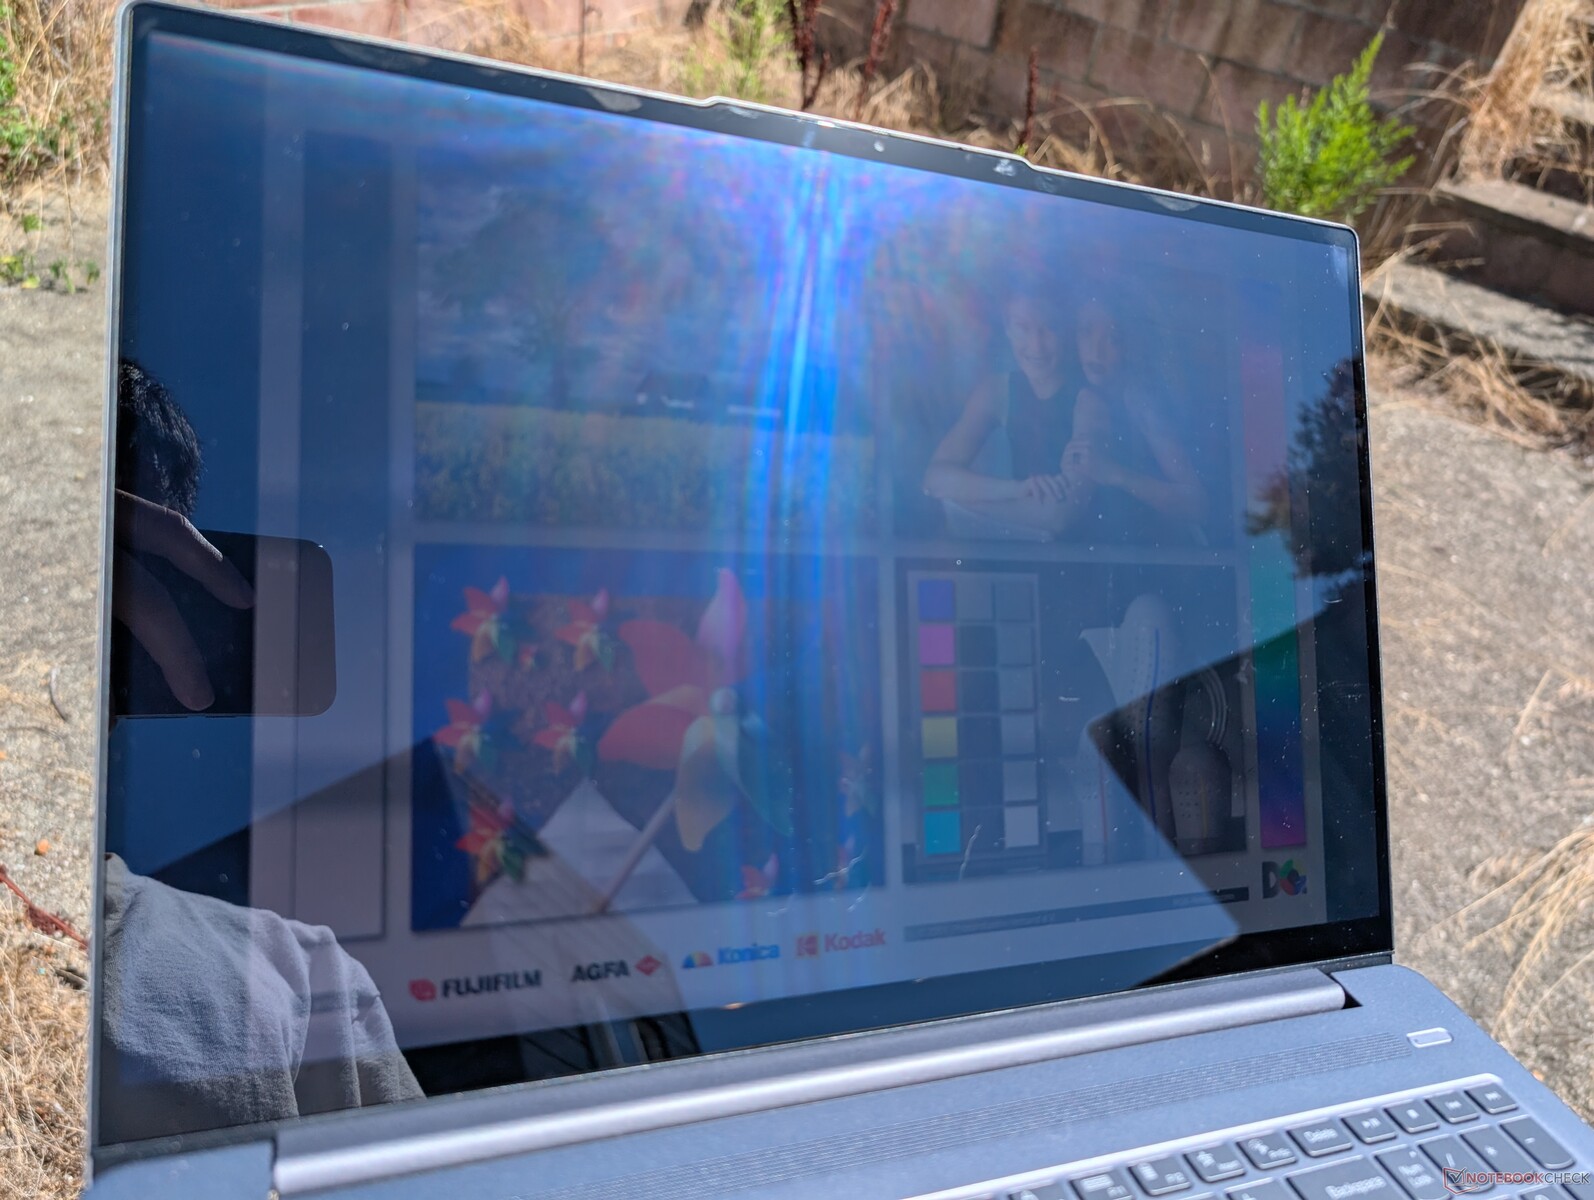
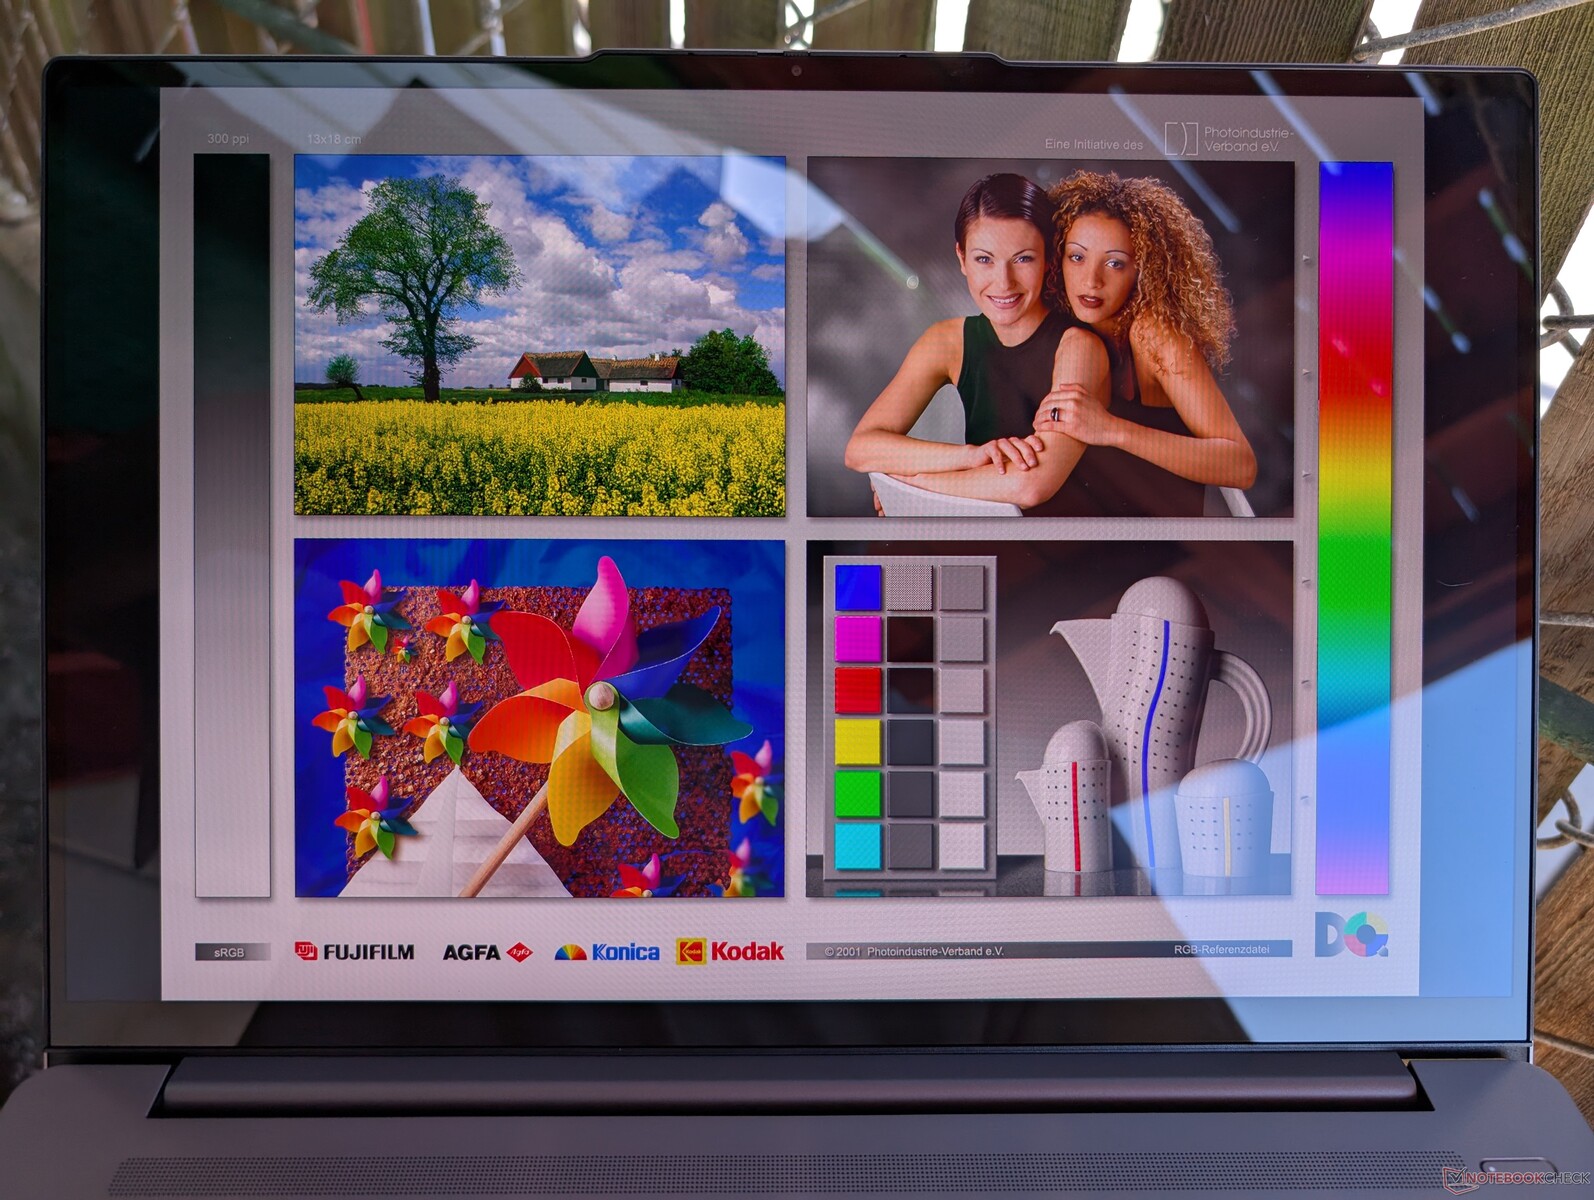
The OLED option isn't necessarily better for outdoor viewing than the IPS option as their maximum brightness levels are about the same. If anything, the OLED configuration is worse due to its glossy overlay whereas the IPS configuration is matte to reduce glare.


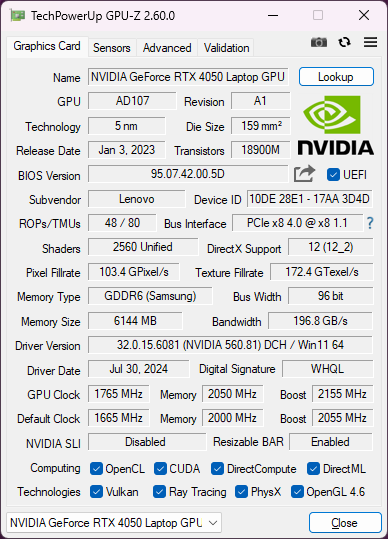
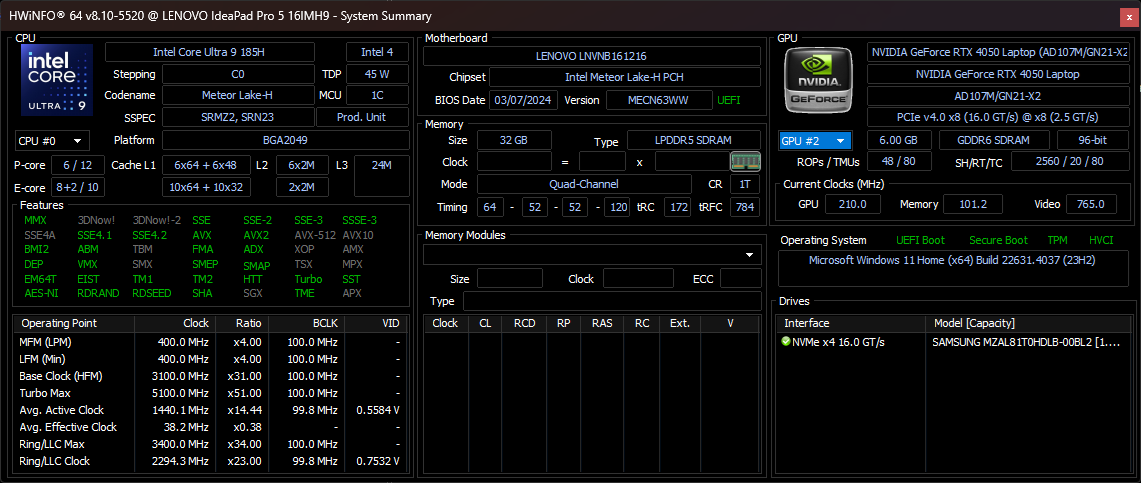
Performance — Core Ultra 9 Is A Powerhouse
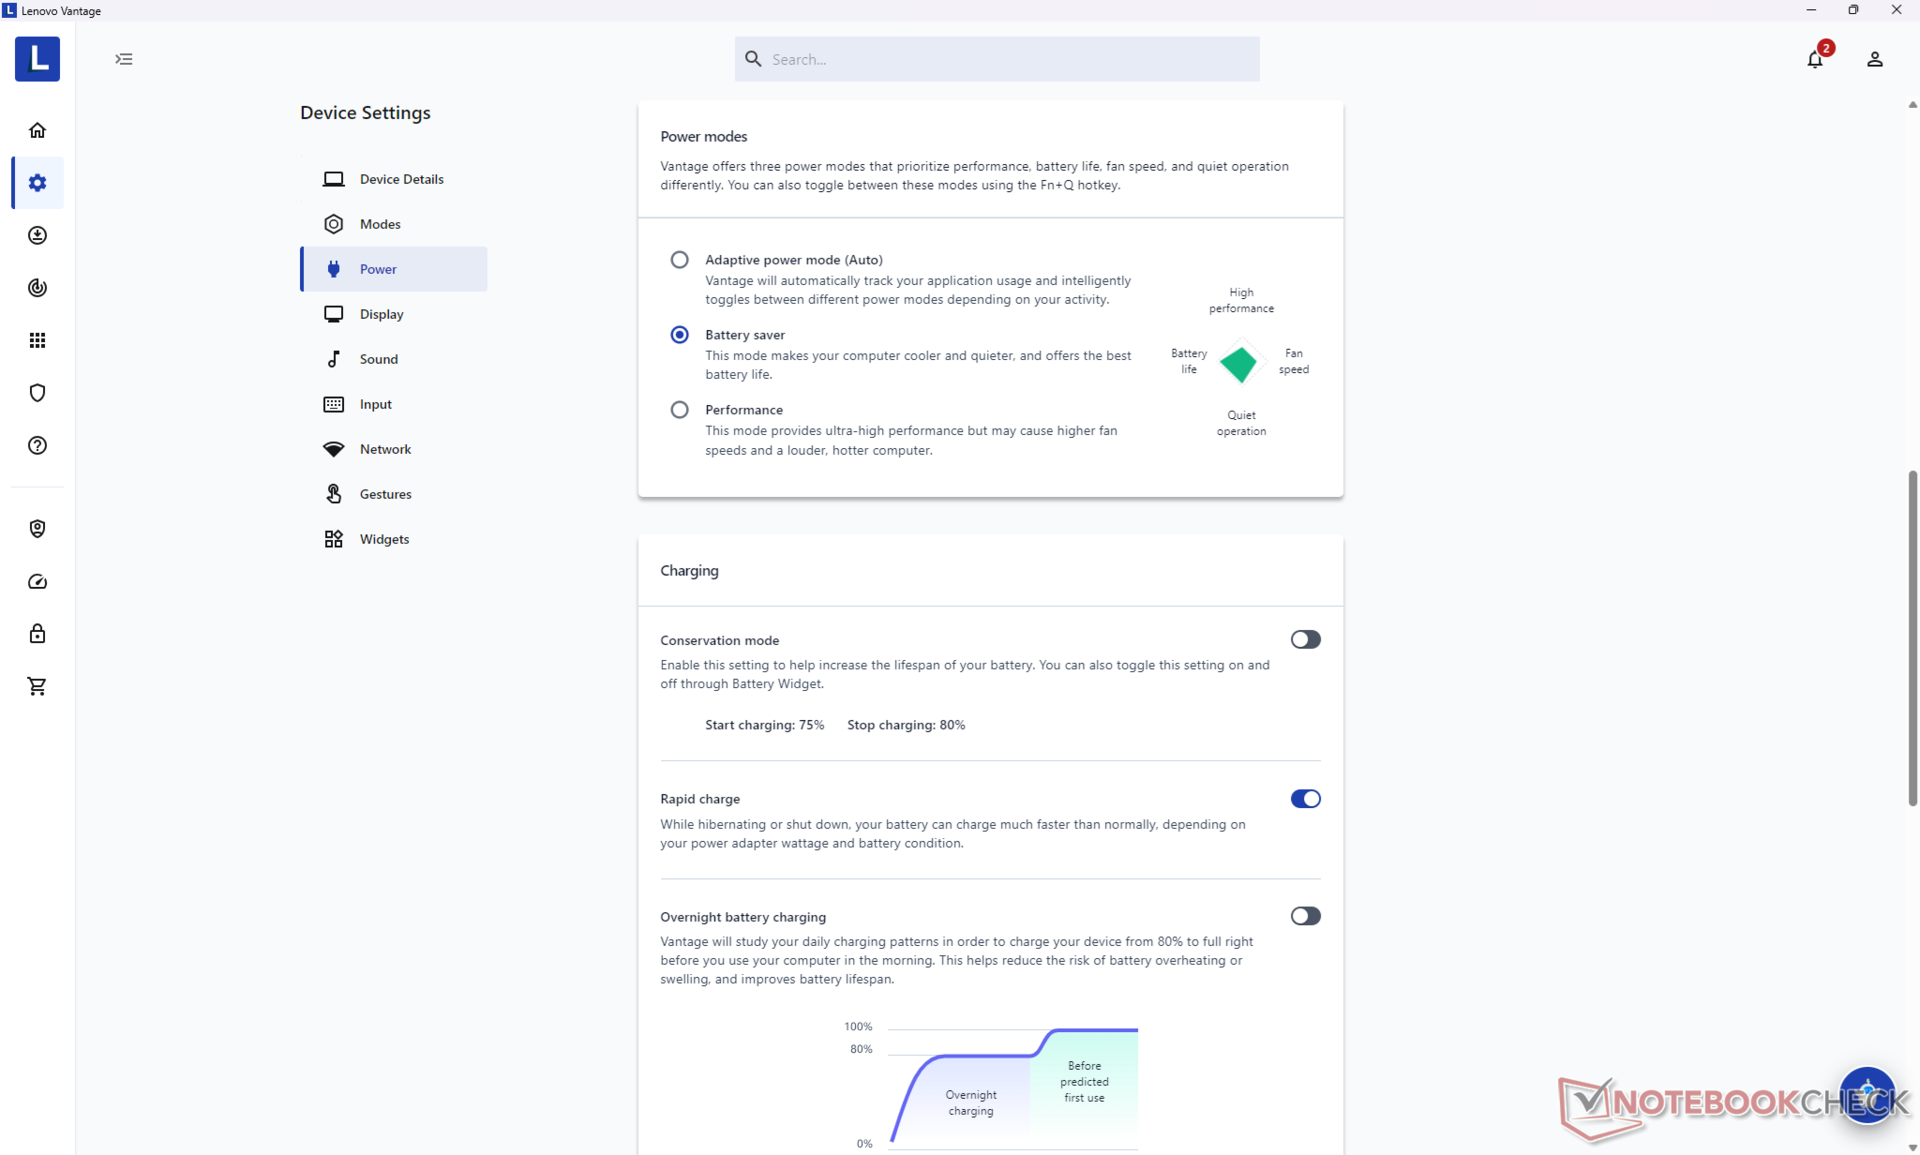
Testing Conditions
We set both Windows and Lenovo Vantage to Performance mode prior to running the benchmarks below. Only Optimus 1.0 is supported with no G-Sync, MUX, or Windows VRR options.

Processor
Three Meteor Lake CPU options are available: Core Ultra 5 125H, Core Ultra 7 155H, and Core Ultra 9 185H. Jumping from the Core Ultra 5 to the Core Ultra 7 provides a significant 80 percent boost in performance while jumping from the Core Ultra 7 to the Core Ultra 9 only adds another 5 to 10 percent which is practically imperceptible in most usage scenarios. Thus, unless if you want the best of the best at all cost, then the Core Ultra 7 option will suffice for the vast majority of users especially as it's still faster than most other options in this size category.
Raw performance comes out ahead of competing AMD CPUs including the Ryzen 7 8840HS and the latest Ryzen AI 9 HX 370. The Raptor Lake Core i7 HX series can be even faster still, but those CPUs lack an integrated NPU to accelerate compatible AI tasks. Note that Co-Pilot Plus is unfortunately not compatible with Meteor Lake processors.
Cinebench R15 Multi Loop
Cinebench R23: Multi Core | Single Core
Cinebench R20: CPU (Multi Core) | CPU (Single Core)
Cinebench R15: CPU Multi 64Bit | CPU Single 64Bit
Blender: v2.79 BMW27 CPU
7-Zip 18.03: 7z b 4 | 7z b 4 -mmt1
Geekbench 6.7: Multi-Core | Single-Core
Geekbench 5.5: Multi-Core | Single-Core
HWBOT x265 Benchmark v2.2: 4k Preset
LibreOffice : 20 Documents To PDF
R Benchmark 2.5: Overall mean
* ... smaller is better
AIDA64: FP32 Ray-Trace | FPU Julia | CPU SHA3 | CPU Queen | FPU SinJulia | FPU Mandel | CPU AES | CPU ZLib | FP64 Ray-Trace | CPU PhotoWorxx
| Performance rating | |
| Asus Zenbook S 16 UM5606-RK333W | |
| Lenovo IdeaPad Pro 5 16IMH G9 RTX 4050 | |
| Lenovo IdeaPad Pro 5 16IMH G9 | |
| Average Intel Core Ultra 9 185H | |
| HP Envy x360 2-in-1 16-ad0097nr | |
| Dell Inspiron 16 7640 2-in-1 | |
| Samsung Galaxy Book4 Ultra | |
| AIDA64 / FP32 Ray-Trace | |
| Asus Zenbook S 16 UM5606-RK333W | |
| HP Envy x360 2-in-1 16-ad0097nr | |
| Lenovo IdeaPad Pro 5 16IMH G9 RTX 4050 | |
| Lenovo IdeaPad Pro 5 16IMH G9 | |
| Average Intel Core Ultra 9 185H (9220 - 18676, n=20) | |
| Dell Inspiron 16 7640 2-in-1 | |
| Samsung Galaxy Book4 Ultra | |
| AIDA64 / FPU Julia | |
| Asus Zenbook S 16 UM5606-RK333W | |
| Lenovo IdeaPad Pro 5 16IMH G9 RTX 4050 | |
| Lenovo IdeaPad Pro 5 16IMH G9 | |
| HP Envy x360 2-in-1 16-ad0097nr | |
| Average Intel Core Ultra 9 185H (48865 - 96463, n=20) | |
| Dell Inspiron 16 7640 2-in-1 | |
| Samsung Galaxy Book4 Ultra | |
| AIDA64 / CPU SHA3 | |
| Asus Zenbook S 16 UM5606-RK333W | |
| Lenovo IdeaPad Pro 5 16IMH G9 RTX 4050 | |
| Lenovo IdeaPad Pro 5 16IMH G9 | |
| Average Intel Core Ultra 9 185H (2394 - 4534, n=20) | |
| HP Envy x360 2-in-1 16-ad0097nr | |
| Dell Inspiron 16 7640 2-in-1 | |
| Samsung Galaxy Book4 Ultra | |
| AIDA64 / CPU Queen | |
| HP Envy x360 2-in-1 16-ad0097nr | |
| Lenovo IdeaPad Pro 5 16IMH G9 RTX 4050 | |
| Dell Inspiron 16 7640 2-in-1 | |
| Average Intel Core Ultra 9 185H (66785 - 95241, n=20) | |
| Lenovo IdeaPad Pro 5 16IMH G9 | |
| Asus Zenbook S 16 UM5606-RK333W | |
| Samsung Galaxy Book4 Ultra | |
| AIDA64 / FPU SinJulia | |
| Asus Zenbook S 16 UM5606-RK333W | |
| HP Envy x360 2-in-1 16-ad0097nr | |
| Lenovo IdeaPad Pro 5 16IMH G9 RTX 4050 | |
| Lenovo IdeaPad Pro 5 16IMH G9 | |
| Average Intel Core Ultra 9 185H (7255 - 11392, n=20) | |
| Dell Inspiron 16 7640 2-in-1 | |
| Samsung Galaxy Book4 Ultra | |
| AIDA64 / FPU Mandel | |
| Asus Zenbook S 16 UM5606-RK333W | |
| Lenovo IdeaPad Pro 5 16IMH G9 RTX 4050 | |
| HP Envy x360 2-in-1 16-ad0097nr | |
| Lenovo IdeaPad Pro 5 16IMH G9 | |
| Average Intel Core Ultra 9 185H (24004 - 48020, n=20) | |
| Dell Inspiron 16 7640 2-in-1 | |
| Samsung Galaxy Book4 Ultra | |
| AIDA64 / CPU AES | |
| Lenovo IdeaPad Pro 5 16IMH G9 RTX 4050 | |
| Average Intel Core Ultra 9 185H (53116 - 154066, n=20) | |
| Lenovo IdeaPad Pro 5 16IMH G9 | |
| Dell Inspiron 16 7640 2-in-1 | |
| HP Envy x360 2-in-1 16-ad0097nr | |
| Samsung Galaxy Book4 Ultra | |
| Asus Zenbook S 16 UM5606-RK333W | |
| AIDA64 / CPU ZLib | |
| Lenovo IdeaPad Pro 5 16IMH G9 RTX 4050 | |
| Lenovo IdeaPad Pro 5 16IMH G9 | |
| Average Intel Core Ultra 9 185H (678 - 1341, n=20) | |
| Asus Zenbook S 16 UM5606-RK333W | |
| Dell Inspiron 16 7640 2-in-1 | |
| Samsung Galaxy Book4 Ultra | |
| HP Envy x360 2-in-1 16-ad0097nr | |
| AIDA64 / FP64 Ray-Trace | |
| Asus Zenbook S 16 UM5606-RK333W | |
| HP Envy x360 2-in-1 16-ad0097nr | |
| Lenovo IdeaPad Pro 5 16IMH G9 RTX 4050 | |
| Lenovo IdeaPad Pro 5 16IMH G9 | |
| Average Intel Core Ultra 9 185H (4428 - 10078, n=20) | |
| Dell Inspiron 16 7640 2-in-1 | |
| Samsung Galaxy Book4 Ultra | |
| AIDA64 / CPU PhotoWorxx | |
| Lenovo IdeaPad Pro 5 16IMH G9 | |
| Lenovo IdeaPad Pro 5 16IMH G9 RTX 4050 | |
| Samsung Galaxy Book4 Ultra | |
| Asus Zenbook S 16 UM5606-RK333W | |
| Average Intel Core Ultra 9 185H (44547 - 53918, n=20) | |
| Dell Inspiron 16 7640 2-in-1 | |
| HP Envy x360 2-in-1 16-ad0097nr | |
Stress Test
The CPU would boost to 3.2 GHz, 81 W, and 94 C when initiating Prime95 stress. After a minute or so, this would drop to 2.8 GHz and 65 W in order to maintain a slightly cooler core temperature of 87 C. The high 80 C range is still very warm to suggest that CPU performance would have likely been faster had the chassis been slightly bigger and with a more capable cooling solution.
The GPU would stabilize at 2595 MHz, 82 C, and 80 W when running Cyberpunk 2077 to represent typical gaming loads compared to just 71 C and 75 C on the Spectre x360 16 or Lenovo LOQ 15, respectively, each with the same RTX 4050 GPU. The generally warmer running temperatures are unsurprising given the thin chassis design, Core Ultra H series CPU, and relatively high 90 W TGP target.
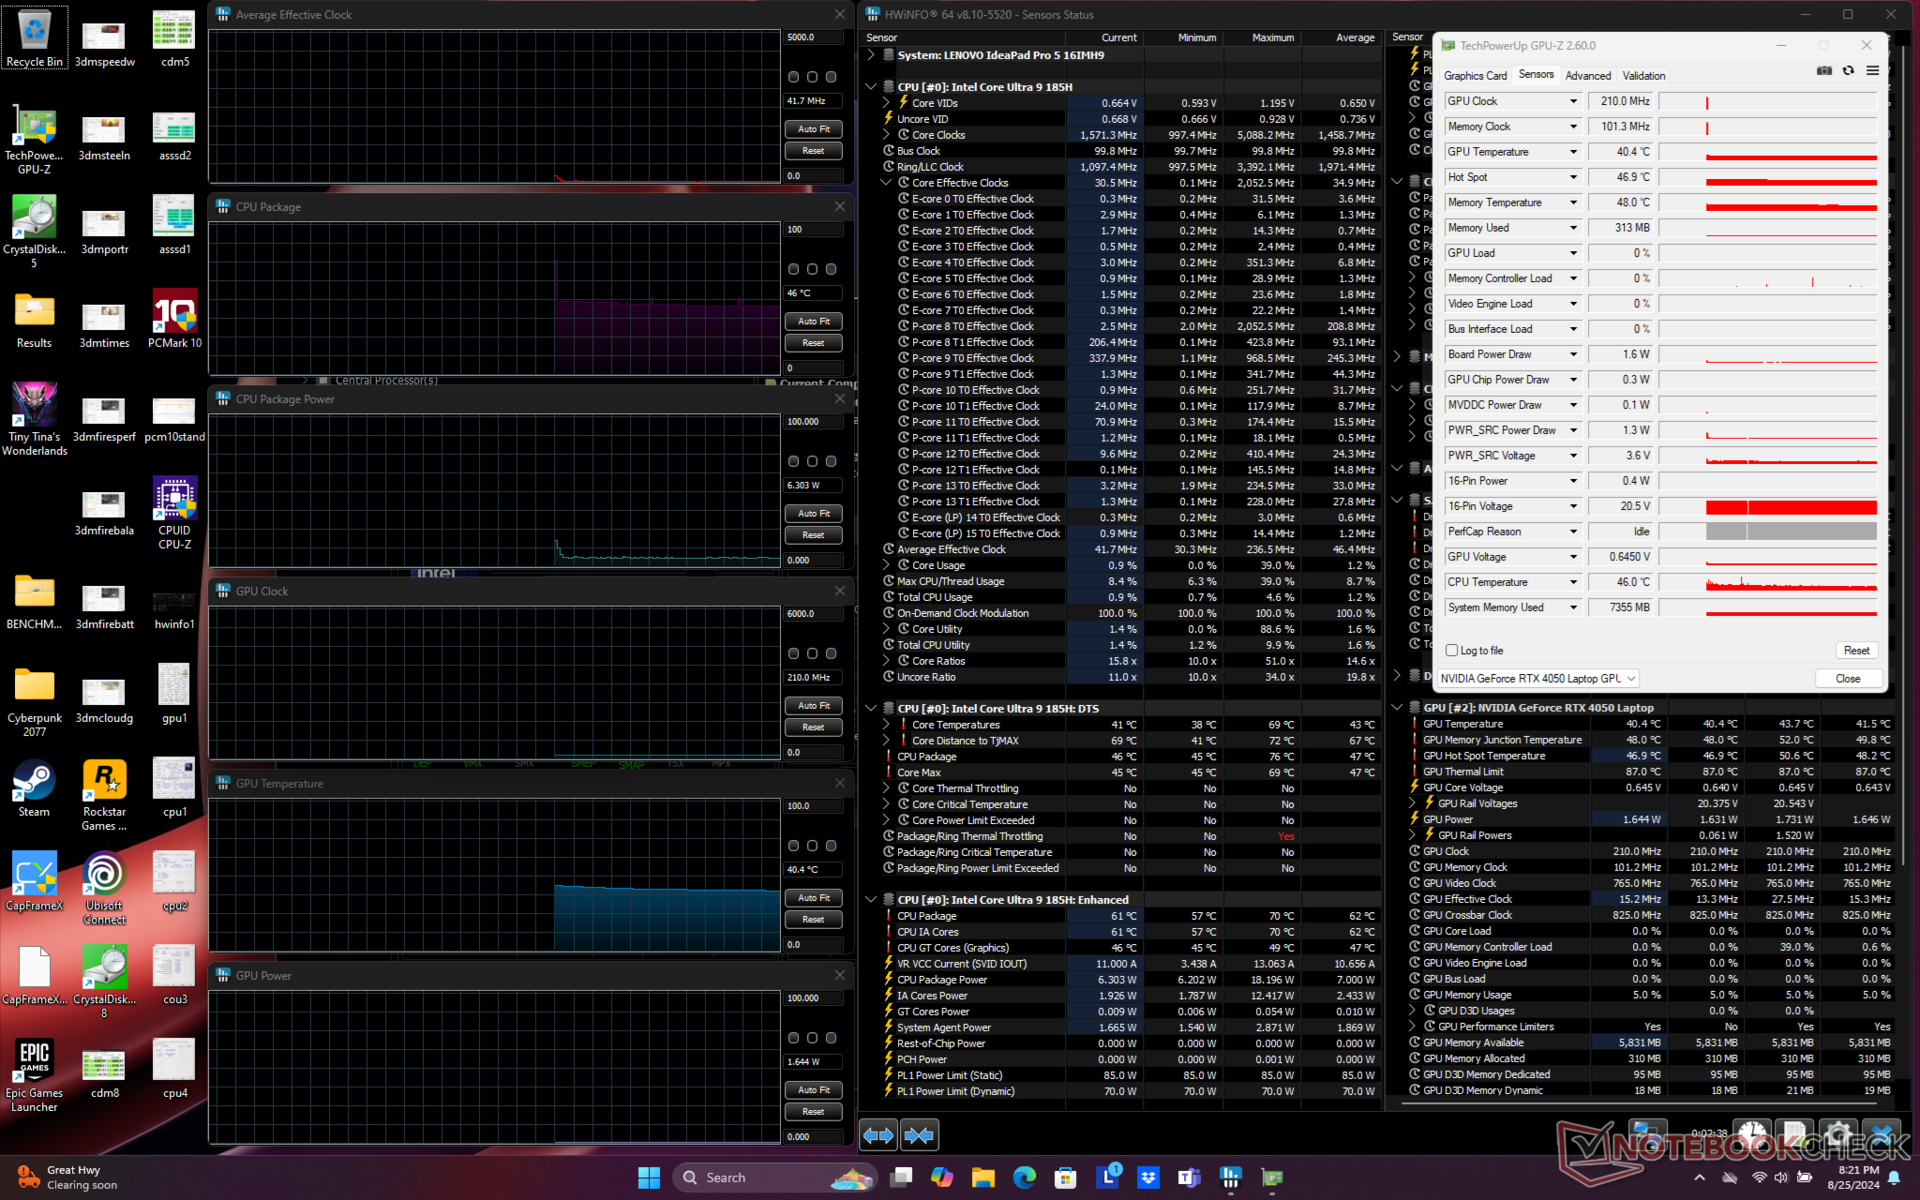
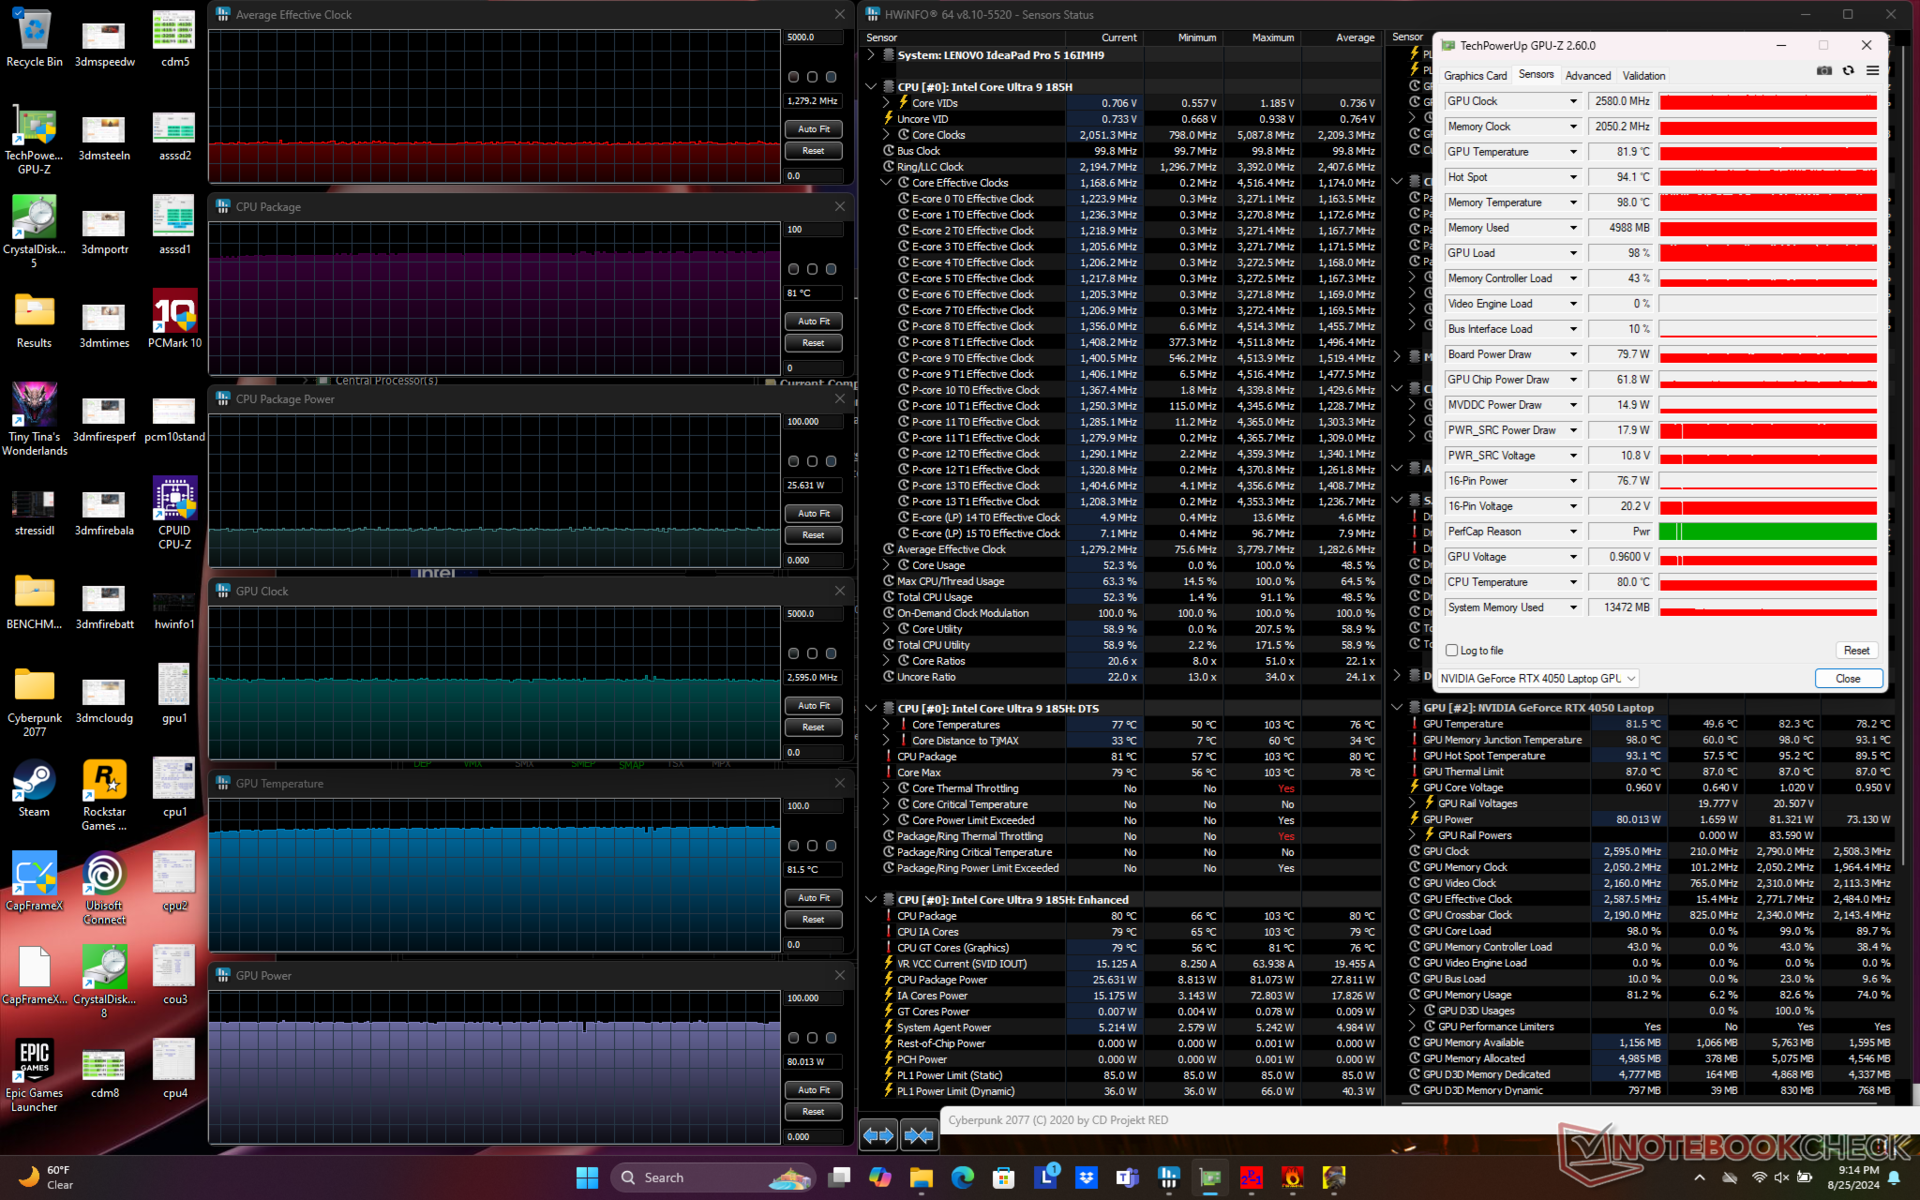
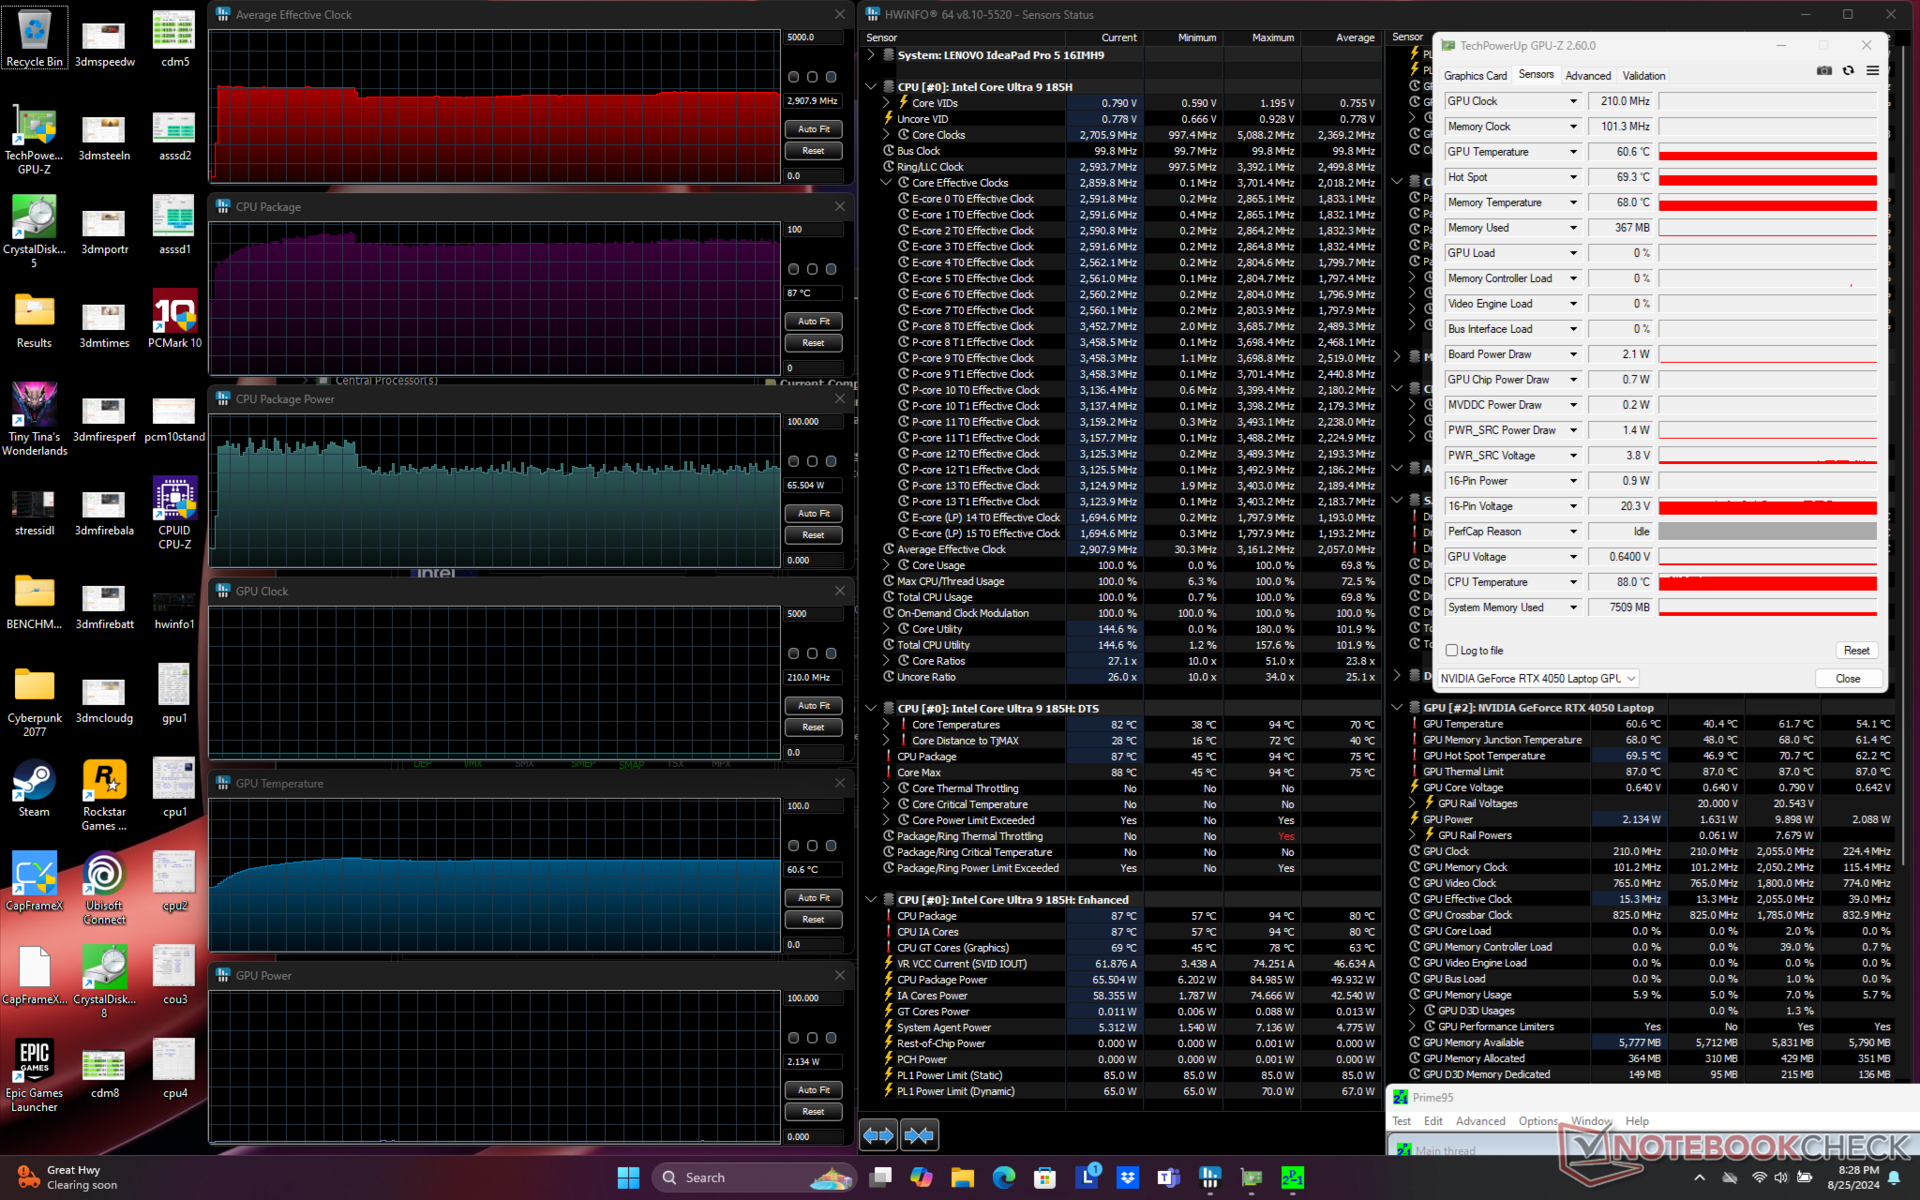
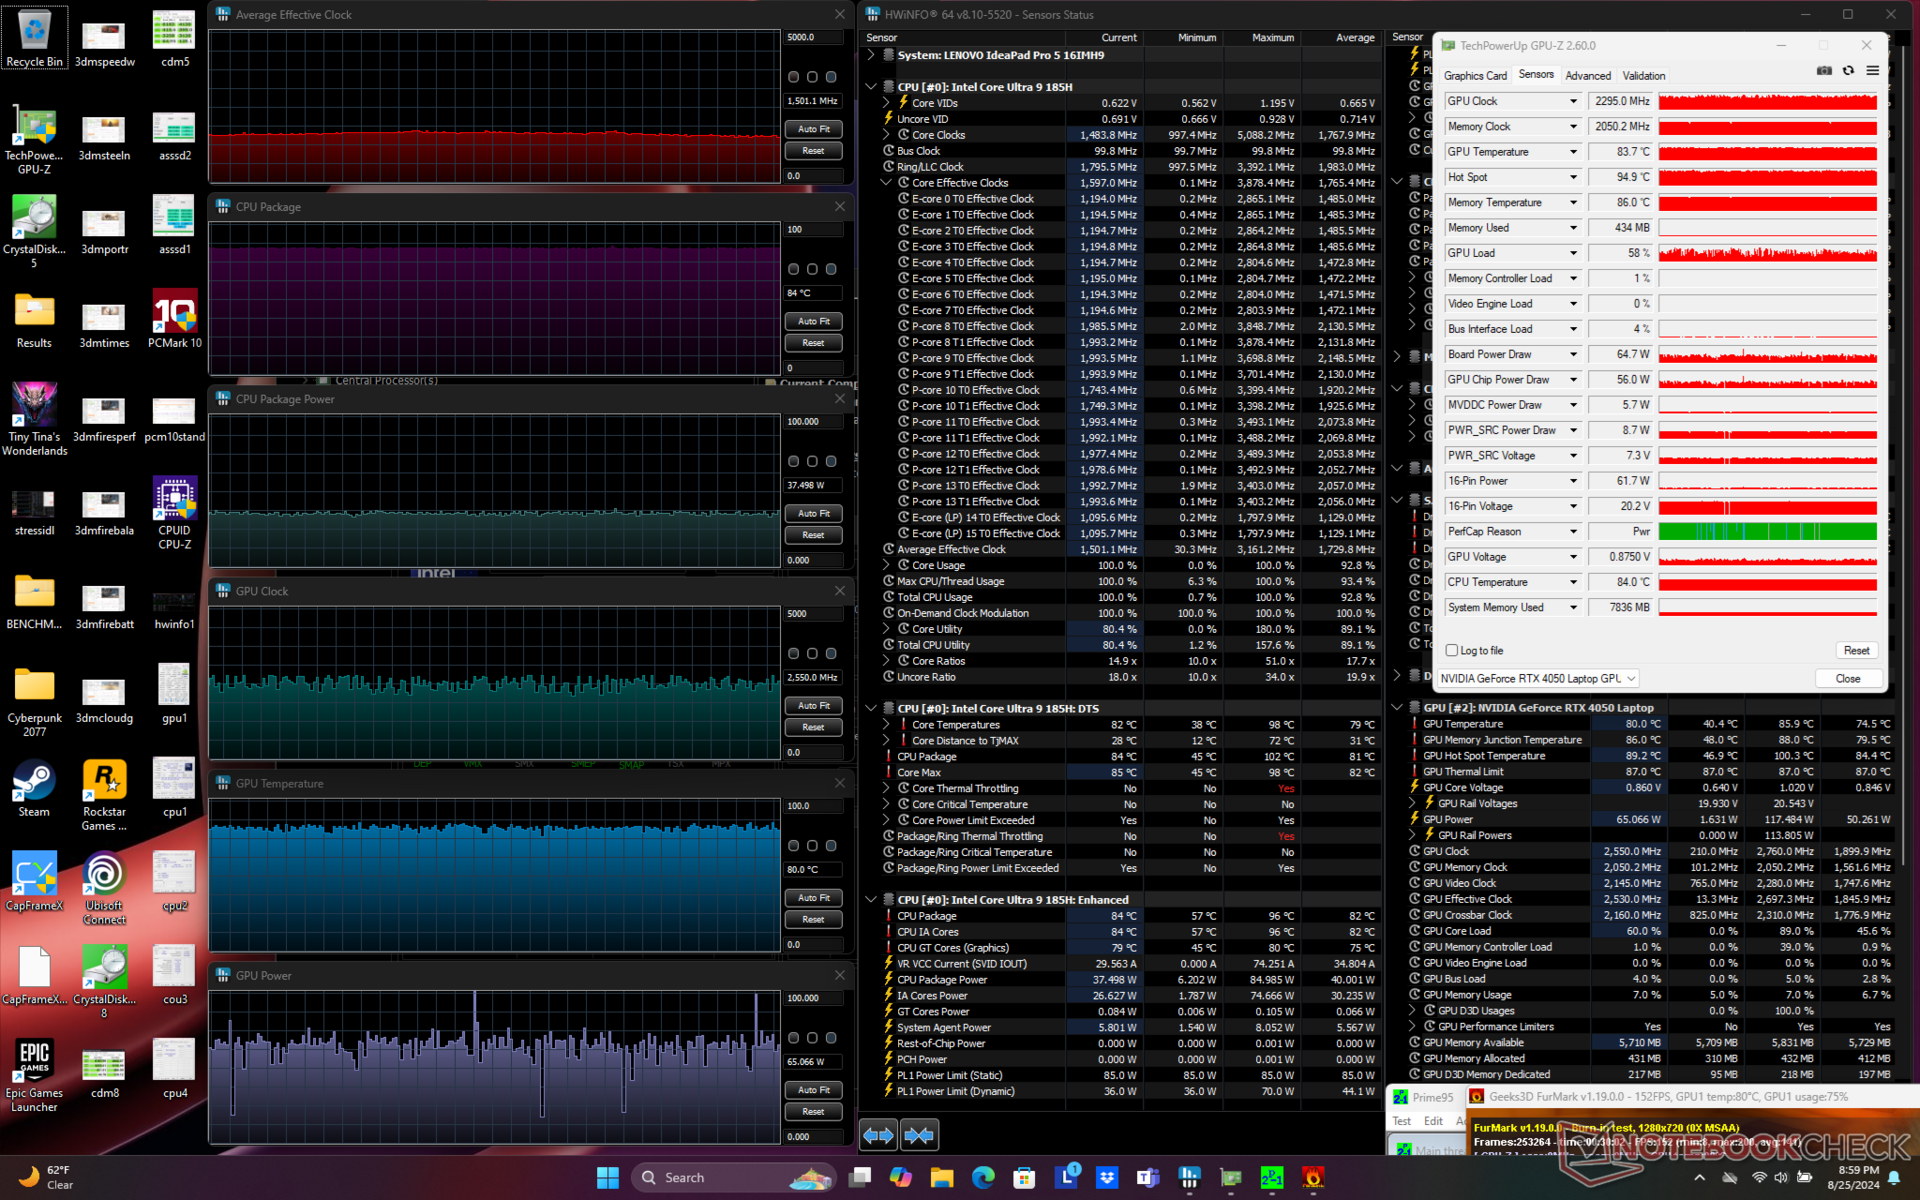
| Average CPU Clock (GHz) | GPU Clock (MHz) | Average CPU Temperature (°C) | Average GPU Temperature (°C) | |
| System Idle | -- | -- | 46 | 40 |
| Prime95 Stress | 2.9 | -- | 87 | 61 |
| Prime95 + FurMark Stress | 1.5 | 2295 - 2550 | 84 | 80 |
| Cyberpunk 2077 Stress | 1.3 | 2580 | 81 | 82 |
System Performance
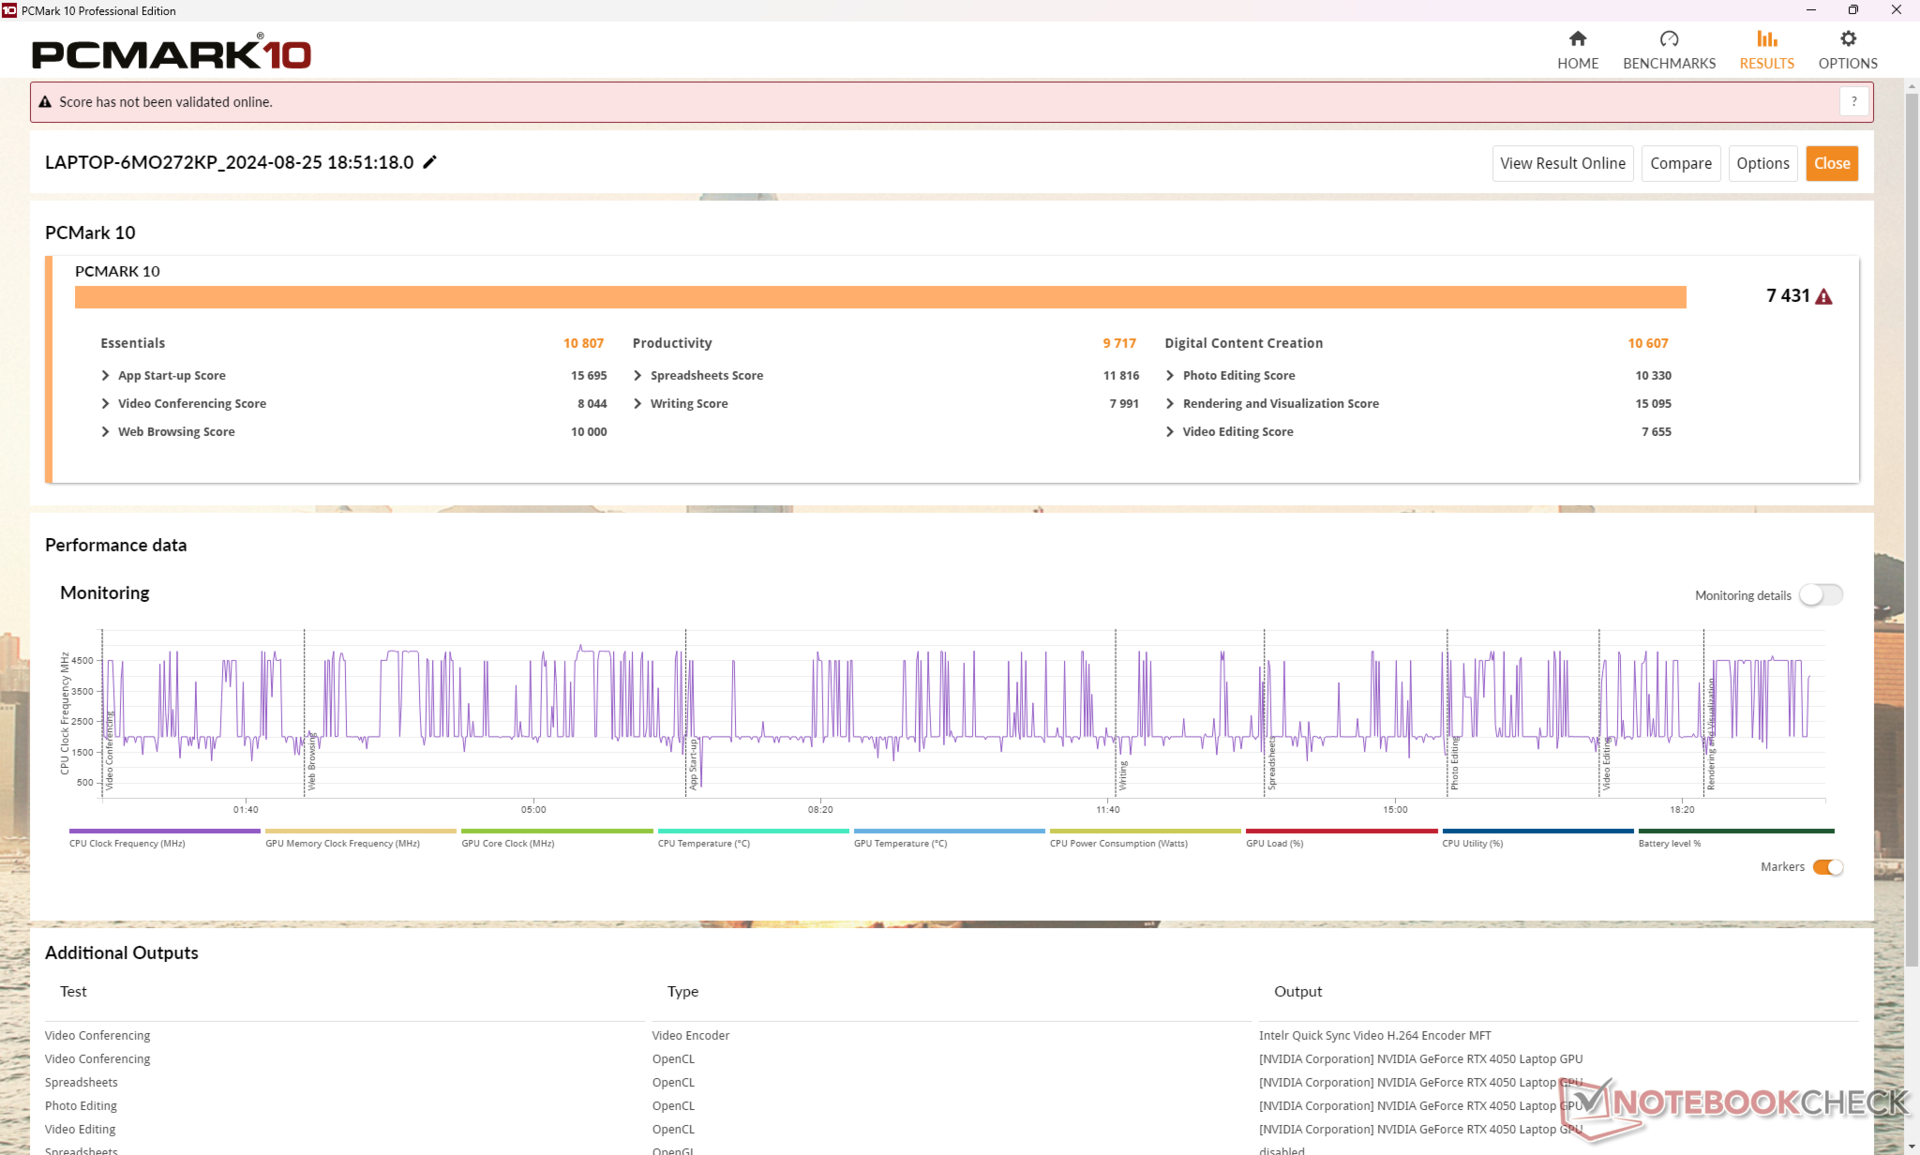
PCMark results are in line with other 16-inch multimedia laptops with slower integrated graphics. The PCMark 10 benchmark generally does a poor job at distinguishing between dGPU and iGPU laptops especially if MUX is not supported.
CrossMark: Overall | Productivity | Creativity | Responsiveness
WebXPRT 3: Overall
WebXPRT 4: Overall
Mozilla Kraken 1.1: Total
| PCMark 10 / Score | |
| Average Intel Core Ultra 9 185H, NVIDIA GeForce RTX 4050 Laptop GPU (7431 - 7846, n=2) | |
| Asus Zenbook S 16 UM5606-RK333W | |
| Lenovo IdeaPad Pro 5 16IMH G9 RTX 4050 | |
| Lenovo IdeaPad Pro 5 16IMH G9 | |
| Dell Inspiron 16 7640 2-in-1 | |
| Samsung Galaxy Book4 Ultra | |
| HP Envy x360 2-in-1 16-ad0097nr | |
| PCMark 10 / Essentials | |
| Lenovo IdeaPad Pro 5 16IMH G9 | |
| Dell Inspiron 16 7640 2-in-1 | |
| Asus Zenbook S 16 UM5606-RK333W | |
| Lenovo IdeaPad Pro 5 16IMH G9 RTX 4050 | |
| Average Intel Core Ultra 9 185H, NVIDIA GeForce RTX 4050 Laptop GPU (10672 - 10807, n=2) | |
| HP Envy x360 2-in-1 16-ad0097nr | |
| Samsung Galaxy Book4 Ultra | |
| PCMark 10 / Productivity | |
| Asus Zenbook S 16 UM5606-RK333W | |
| HP Envy x360 2-in-1 16-ad0097nr | |
| Average Intel Core Ultra 9 185H, NVIDIA GeForce RTX 4050 Laptop GPU (9717 - 9986, n=2) | |
| Lenovo IdeaPad Pro 5 16IMH G9 RTX 4050 | |
| Samsung Galaxy Book4 Ultra | |
| Lenovo IdeaPad Pro 5 16IMH G9 | |
| Dell Inspiron 16 7640 2-in-1 | |
| PCMark 10 / Digital Content Creation | |
| Average Intel Core Ultra 9 185H, NVIDIA GeForce RTX 4050 Laptop GPU (10607 - 12301, n=2) | |
| Lenovo IdeaPad Pro 5 16IMH G9 RTX 4050 | |
| Lenovo IdeaPad Pro 5 16IMH G9 | |
| Asus Zenbook S 16 UM5606-RK333W | |
| Dell Inspiron 16 7640 2-in-1 | |
| Samsung Galaxy Book4 Ultra | |
| HP Envy x360 2-in-1 16-ad0097nr | |
| CrossMark / Overall | |
| Average Intel Core Ultra 9 185H, NVIDIA GeForce RTX 4050 Laptop GPU (1790 - 1811, n=2) | |
| Lenovo IdeaPad Pro 5 16IMH G9 RTX 4050 | |
| Asus Zenbook S 16 UM5606-RK333W | |
| Samsung Galaxy Book4 Ultra | |
| Dell Inspiron 16 7640 2-in-1 | |
| HP Envy x360 2-in-1 16-ad0097nr | |
| Lenovo IdeaPad Pro 5 16IMH G9 | |
| CrossMark / Productivity | |
| Average Intel Core Ultra 9 185H, NVIDIA GeForce RTX 4050 Laptop GPU (1700 - 1717, n=2) | |
| Lenovo IdeaPad Pro 5 16IMH G9 RTX 4050 | |
| Samsung Galaxy Book4 Ultra | |
| Dell Inspiron 16 7640 2-in-1 | |
| Asus Zenbook S 16 UM5606-RK333W | |
| HP Envy x360 2-in-1 16-ad0097nr | |
| Lenovo IdeaPad Pro 5 16IMH G9 | |
| CrossMark / Creativity | |
| Lenovo IdeaPad Pro 5 16IMH G9 RTX 4050 | |
| Average Intel Core Ultra 9 185H, NVIDIA GeForce RTX 4050 Laptop GPU (2037 - 2038, n=2) | |
| Asus Zenbook S 16 UM5606-RK333W | |
| Samsung Galaxy Book4 Ultra | |
| Dell Inspiron 16 7640 2-in-1 | |
| Lenovo IdeaPad Pro 5 16IMH G9 | |
| HP Envy x360 2-in-1 16-ad0097nr | |
| CrossMark / Responsiveness | |
| Samsung Galaxy Book4 Ultra | |
| Average Intel Core Ultra 9 185H, NVIDIA GeForce RTX 4050 Laptop GPU (1419 - 1493, n=2) | |
| Lenovo IdeaPad Pro 5 16IMH G9 RTX 4050 | |
| Asus Zenbook S 16 UM5606-RK333W | |
| Dell Inspiron 16 7640 2-in-1 | |
| HP Envy x360 2-in-1 16-ad0097nr | |
| Lenovo IdeaPad Pro 5 16IMH G9 | |
| WebXPRT 3 / Overall | |
| Asus Zenbook S 16 UM5606-RK333W | |
| Lenovo IdeaPad Pro 5 16IMH G9 RTX 4050 | |
| HP Envy x360 2-in-1 16-ad0097nr | |
| Average Intel Core Ultra 9 185H, NVIDIA GeForce RTX 4050 Laptop GPU (293 - 301, n=2) | |
| Lenovo IdeaPad Pro 5 16IMH G9 | |
| Dell Inspiron 16 7640 2-in-1 | |
| Samsung Galaxy Book4 Ultra | |
| WebXPRT 4 / Overall | |
| Lenovo IdeaPad Pro 5 16IMH G9 RTX 4050 | |
| Average Intel Core Ultra 9 185H, NVIDIA GeForce RTX 4050 Laptop GPU (268 - 271, n=2) | |
| Asus Zenbook S 16 UM5606-RK333W | |
| Lenovo IdeaPad Pro 5 16IMH G9 | |
| Samsung Galaxy Book4 Ultra | |
| Dell Inspiron 16 7640 2-in-1 | |
| HP Envy x360 2-in-1 16-ad0097nr | |
| Mozilla Kraken 1.1 / Total | |
| HP Envy x360 2-in-1 16-ad0097nr | |
| Dell Inspiron 16 7640 2-in-1 | |
| Lenovo IdeaPad Pro 5 16IMH G9 | |
| Average Intel Core Ultra 9 185H, NVIDIA GeForce RTX 4050 Laptop GPU (498 - 512, n=2) | |
| Lenovo IdeaPad Pro 5 16IMH G9 RTX 4050 | |
| Asus Zenbook S 16 UM5606-RK333W | |
| Samsung Galaxy Book4 Ultra | |
* ... smaller is better
| PCMark 10 Score | 7431 points | |
Help | ||
| AIDA64 / Memory Copy | |
| Lenovo IdeaPad Pro 5 16IMH G9 RTX 4050 | |
| Lenovo IdeaPad Pro 5 16IMH G9 | |
| Samsung Galaxy Book4 Ultra | |
| Asus Zenbook S 16 UM5606-RK333W | |
| Average Intel Core Ultra 9 185H (69929 - 95718, n=20) | |
| Dell Inspiron 16 7640 2-in-1 | |
| HP Envy x360 2-in-1 16-ad0097nr | |
| AIDA64 / Memory Read | |
| Asus Zenbook S 16 UM5606-RK333W | |
| Samsung Galaxy Book4 Ultra | |
| Lenovo IdeaPad Pro 5 16IMH G9 RTX 4050 | |
| Lenovo IdeaPad Pro 5 16IMH G9 | |
| Average Intel Core Ultra 9 185H (64619 - 87768, n=20) | |
| Dell Inspiron 16 7640 2-in-1 | |
| HP Envy x360 2-in-1 16-ad0097nr | |
| AIDA64 / Memory Write | |
| Asus Zenbook S 16 UM5606-RK333W | |
| HP Envy x360 2-in-1 16-ad0097nr | |
| Dell Inspiron 16 7640 2-in-1 | |
| Lenovo IdeaPad Pro 5 16IMH G9 | |
| Samsung Galaxy Book4 Ultra | |
| Lenovo IdeaPad Pro 5 16IMH G9 RTX 4050 | |
| Average Intel Core Ultra 9 185H (51114 - 93871, n=20) | |
| AIDA64 / Memory Latency | |
| Average Intel Core Ultra 9 185H (121.4 - 259, n=20) | |
| Dell Inspiron 16 7640 2-in-1 | |
| Samsung Galaxy Book4 Ultra | |
| Lenovo IdeaPad Pro 5 16IMH G9 | |
| Lenovo IdeaPad Pro 5 16IMH G9 RTX 4050 | |
| HP Envy x360 2-in-1 16-ad0097nr | |
| Asus Zenbook S 16 UM5606-RK333W | |
* ... smaller is better
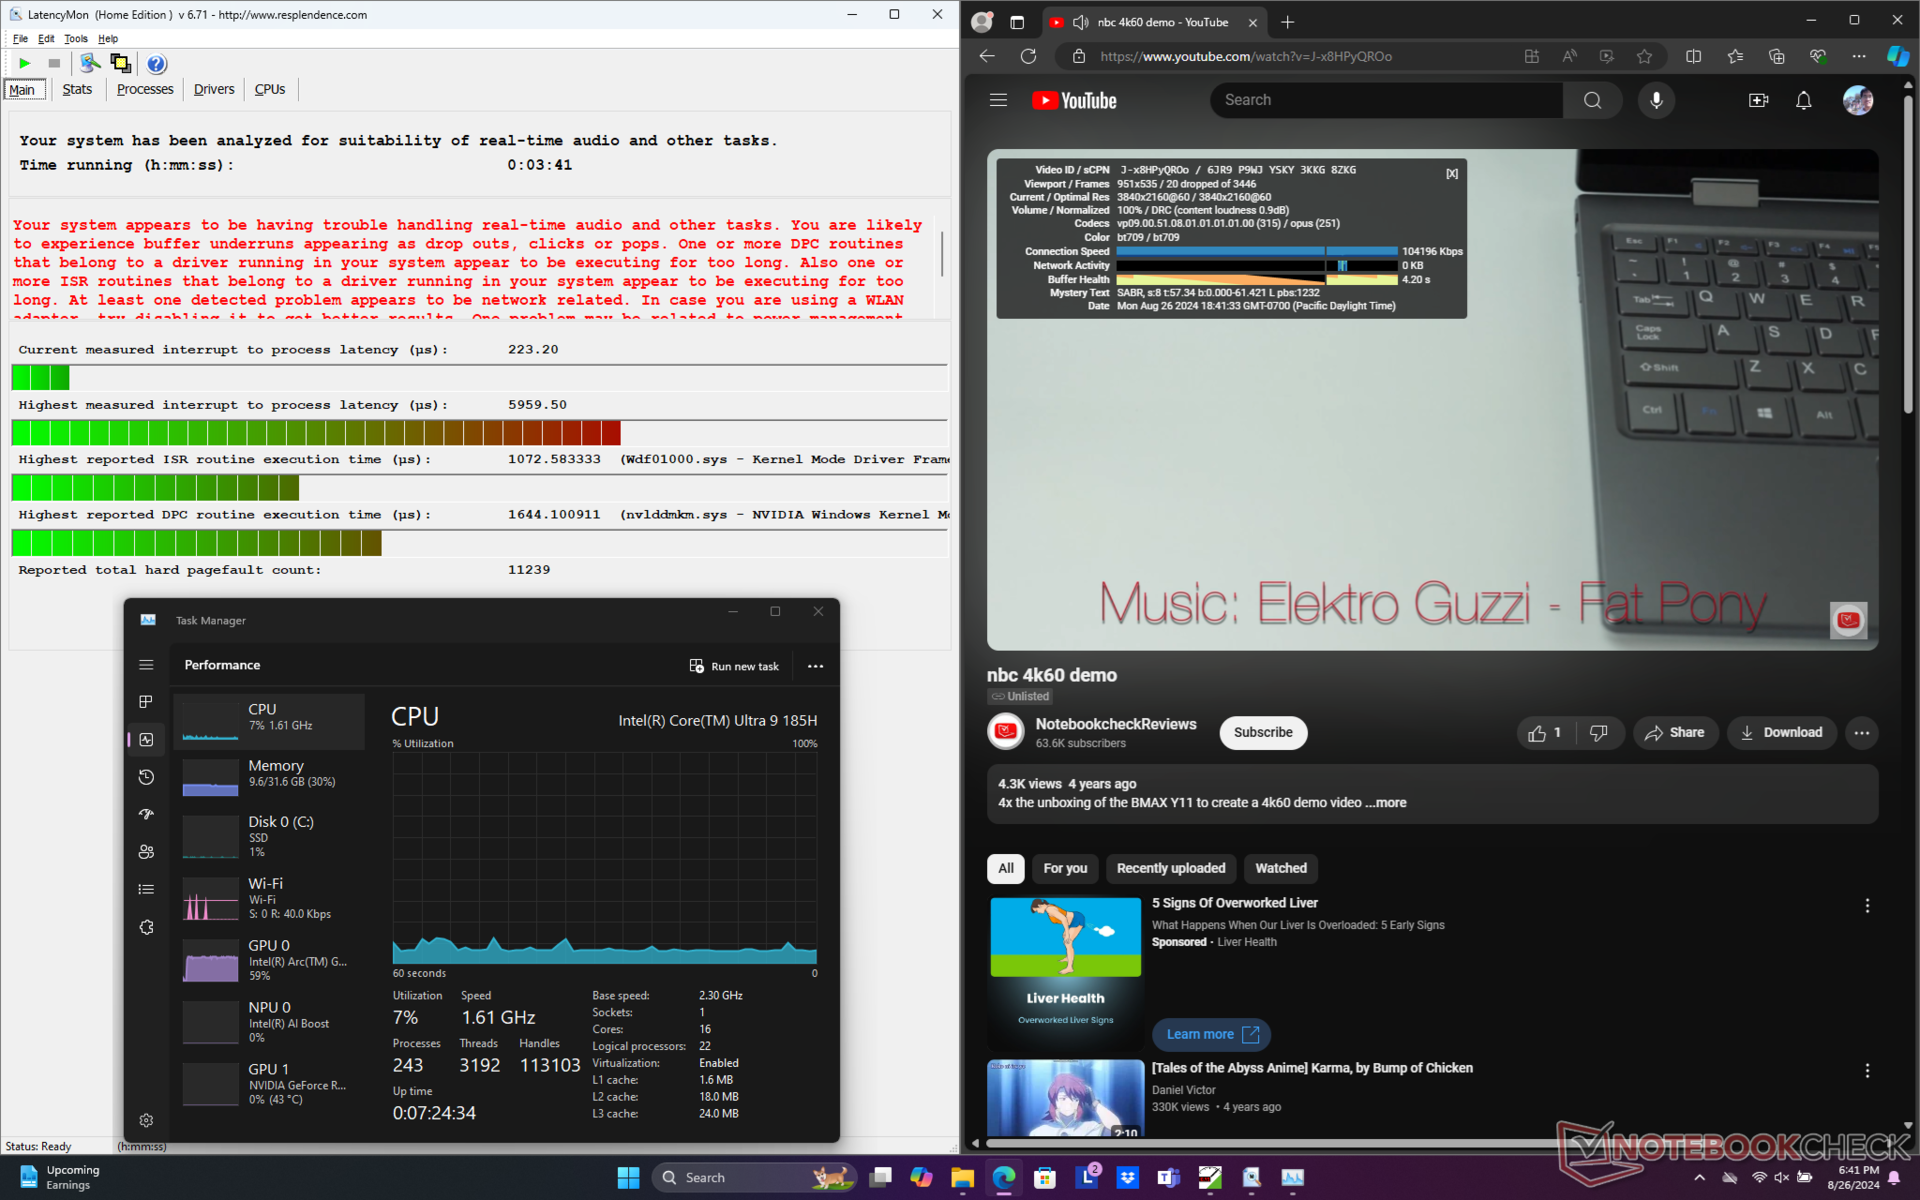
DPC Latency
LatencyMon reveals both DPC issues and imperfect 4K video playback at 60 FPS. We're able to record 20 dropped frames within a one-minute timespan which manifest as dropped frames when streaming video. This is disappointing to see as our iGPU configuration would exhibit no dropped frames in comparison.

| DPC Latencies / LatencyMon - interrupt to process latency (max), Web, Youtube, Prime95 | |
| Lenovo IdeaPad Pro 5 16IMH G9 RTX 4050 | |
| HP Envy x360 2-in-1 16-ad0097nr | |
| Dell Inspiron 16 7640 2-in-1 | |
| Lenovo IdeaPad Pro 5 16IMH G9 | |
| Samsung Galaxy Book4 Ultra | |
* ... smaller is better
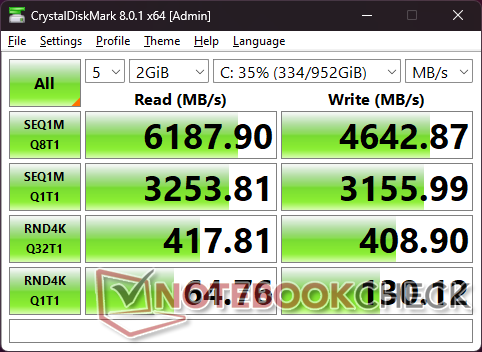
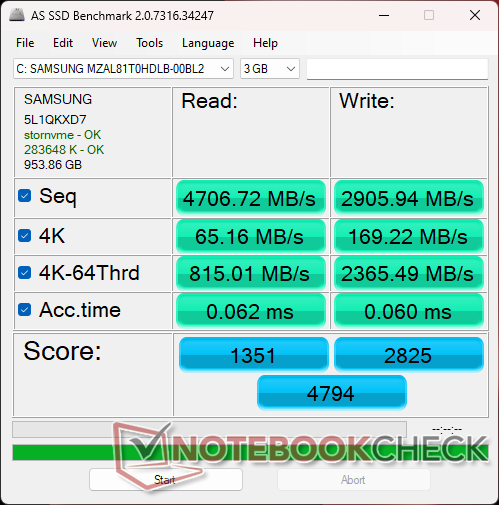
Storage Devices
The system ships with the same Samsung PM9C1a MZAL81T0HDLB drive as on the iGPU version. Interestingly, it exhibits the same transfer rate peculiarities as well where performance would jump from 5100 MB/s to 6100 MB/s after a few minutes into our DiskSpd loop test. Most other drives, such as the Samsung PM9A1 in the Galaxy Book4 Ultra, would remain steady from start to finish.
A thermal pad is included for the primary SSD to help dissipate heat onto the metal cover underneath.

* ... smaller is better
Disk Throttling: DiskSpd Read Loop, Queue Depth 8
GPU Performance — The 90 W Difference
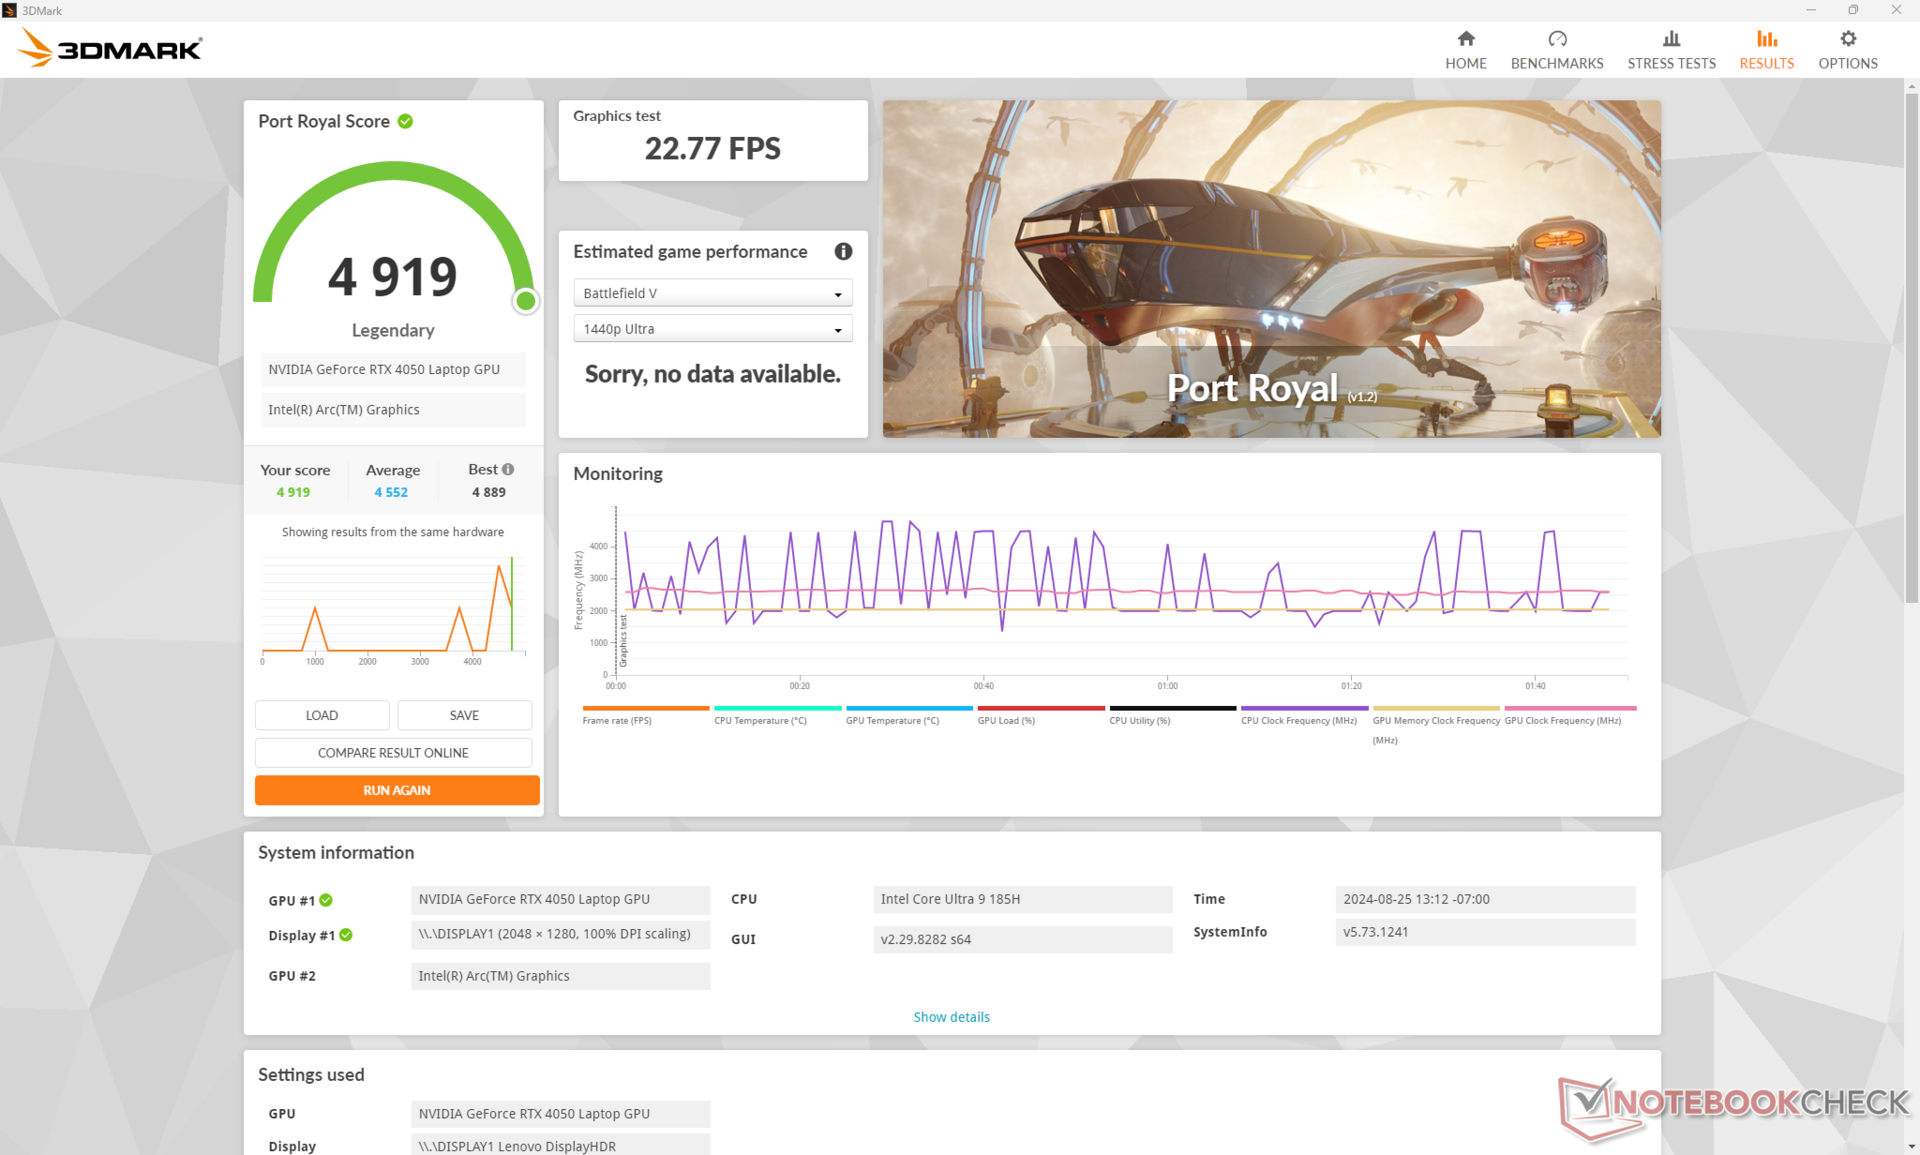
The 90 W GeForce RTX 4050 GPU targets a higher TGP ceiling than on many other non-gaming laptops with the same GPU option. The RTX 4050 in the Spectre x360 16 and Samsung Galaxy Book3 Ultra 16, for example, have lower TGP values of only 55 W and 60 W, respectively. The GPU in our IdeaPad Pro 5 16 G9 can be up to 10 percent faster than the average laptop in our database with the same RTX 4050 GPU as a result. This difference is enough to consistently outperform even the 70 W RTX 4060 in the competing Inspiron 16 Plus 7640 according to 3DMark benchmarks.
Users upgrading from the older GeForce RTX 3050, which was in the last generation IdeaPad Pro 5 16 G7 or G8, can expect a significant 70 to 80 percent boost in performance with the RTX 4050. The benefits are greater at 2x to 2.5x when upgrading from the integrated Arc 8 configuration.
| Power Profile | Graphics Score | Physics Score | Combined Score |
| Performance Mode | 23210 | 30448 | 9741 |
| Balanced Mode | 21032 (-9%) | 30008 (-1%) | 8158 (-16%) |
| Battery Power | 19718 (-15%) | 30484 (-0%) | 8216 (-16%) |
Running on Balanced mode instead of Performance mode impacts graphics performance by up to 10 percent while CPU performance remains relatively the same according to our Fire Strike results table above. Running on battery power does not impact processor performance as much as we initially expected.
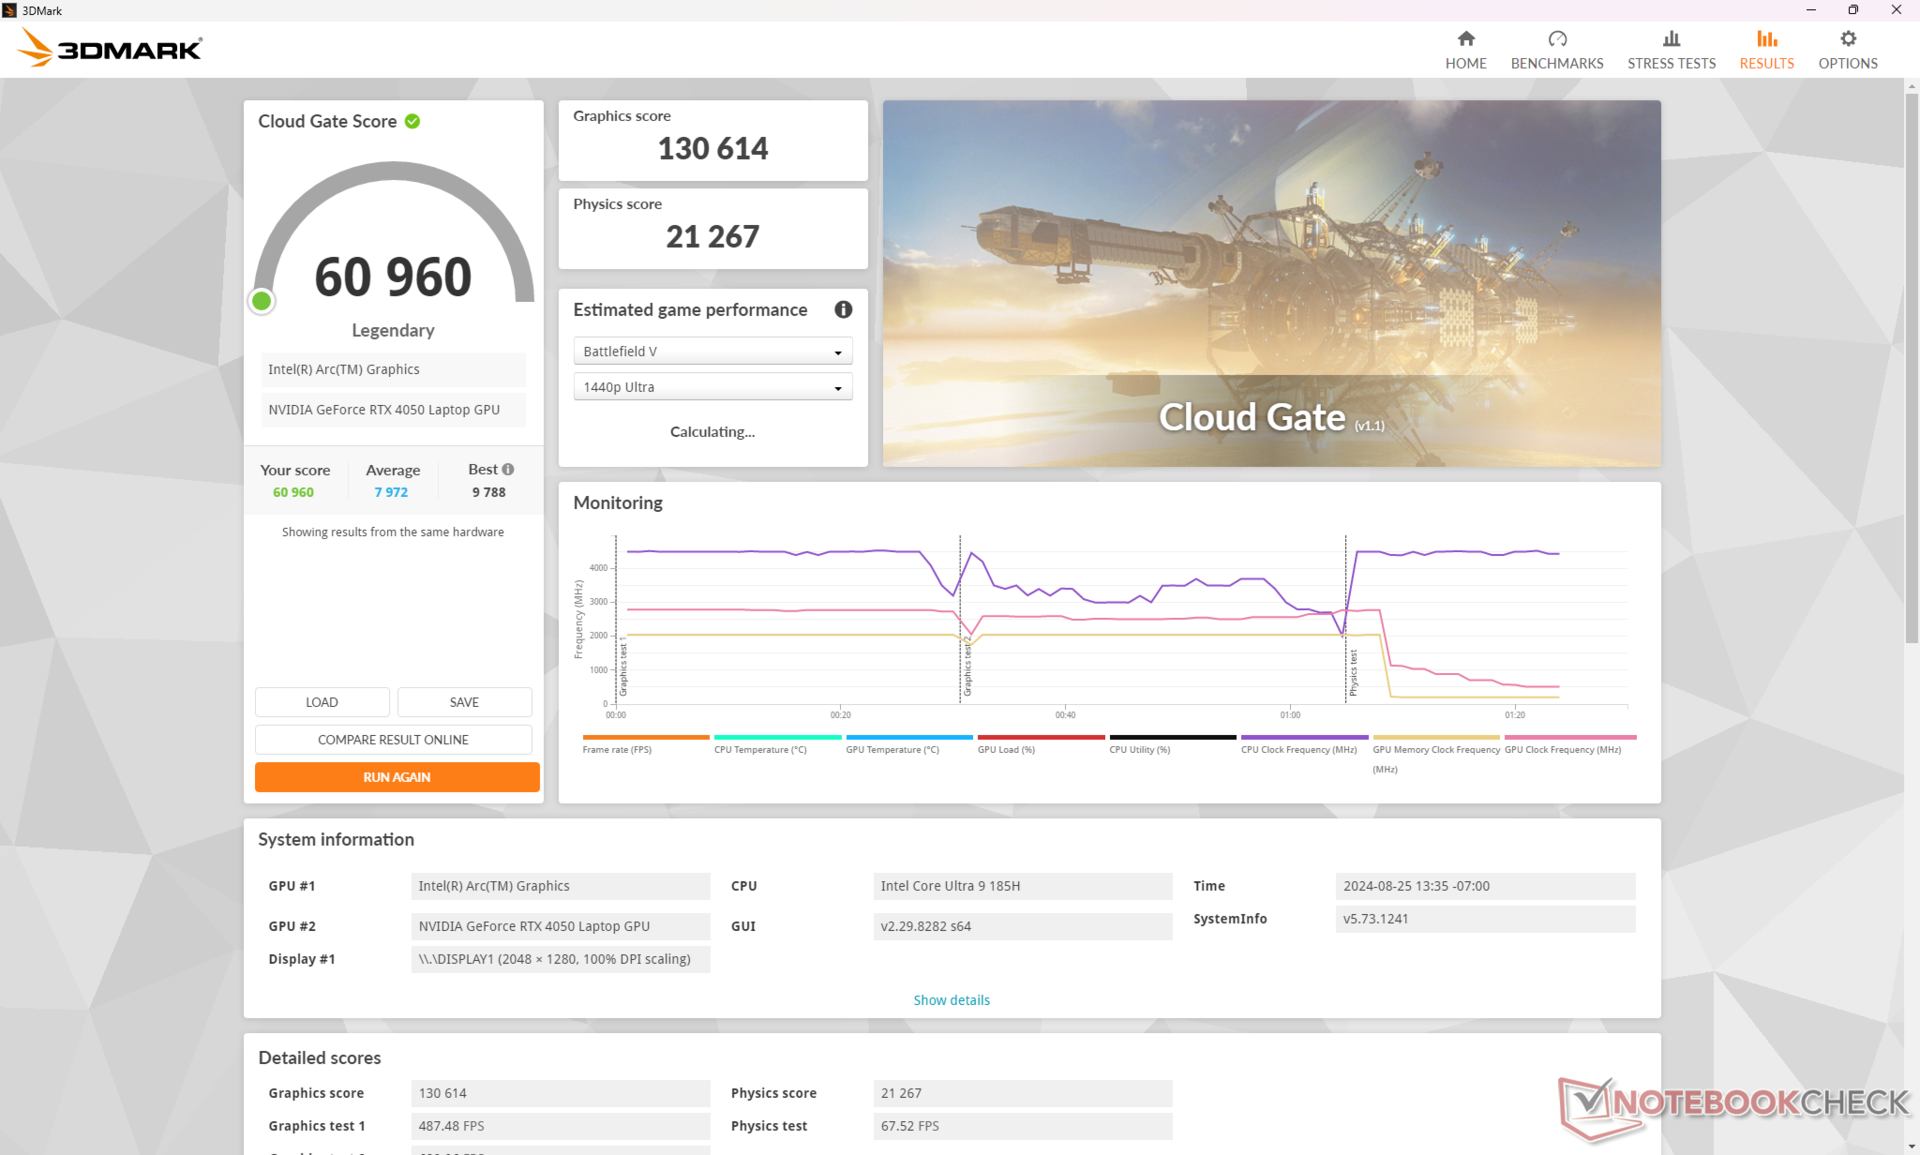

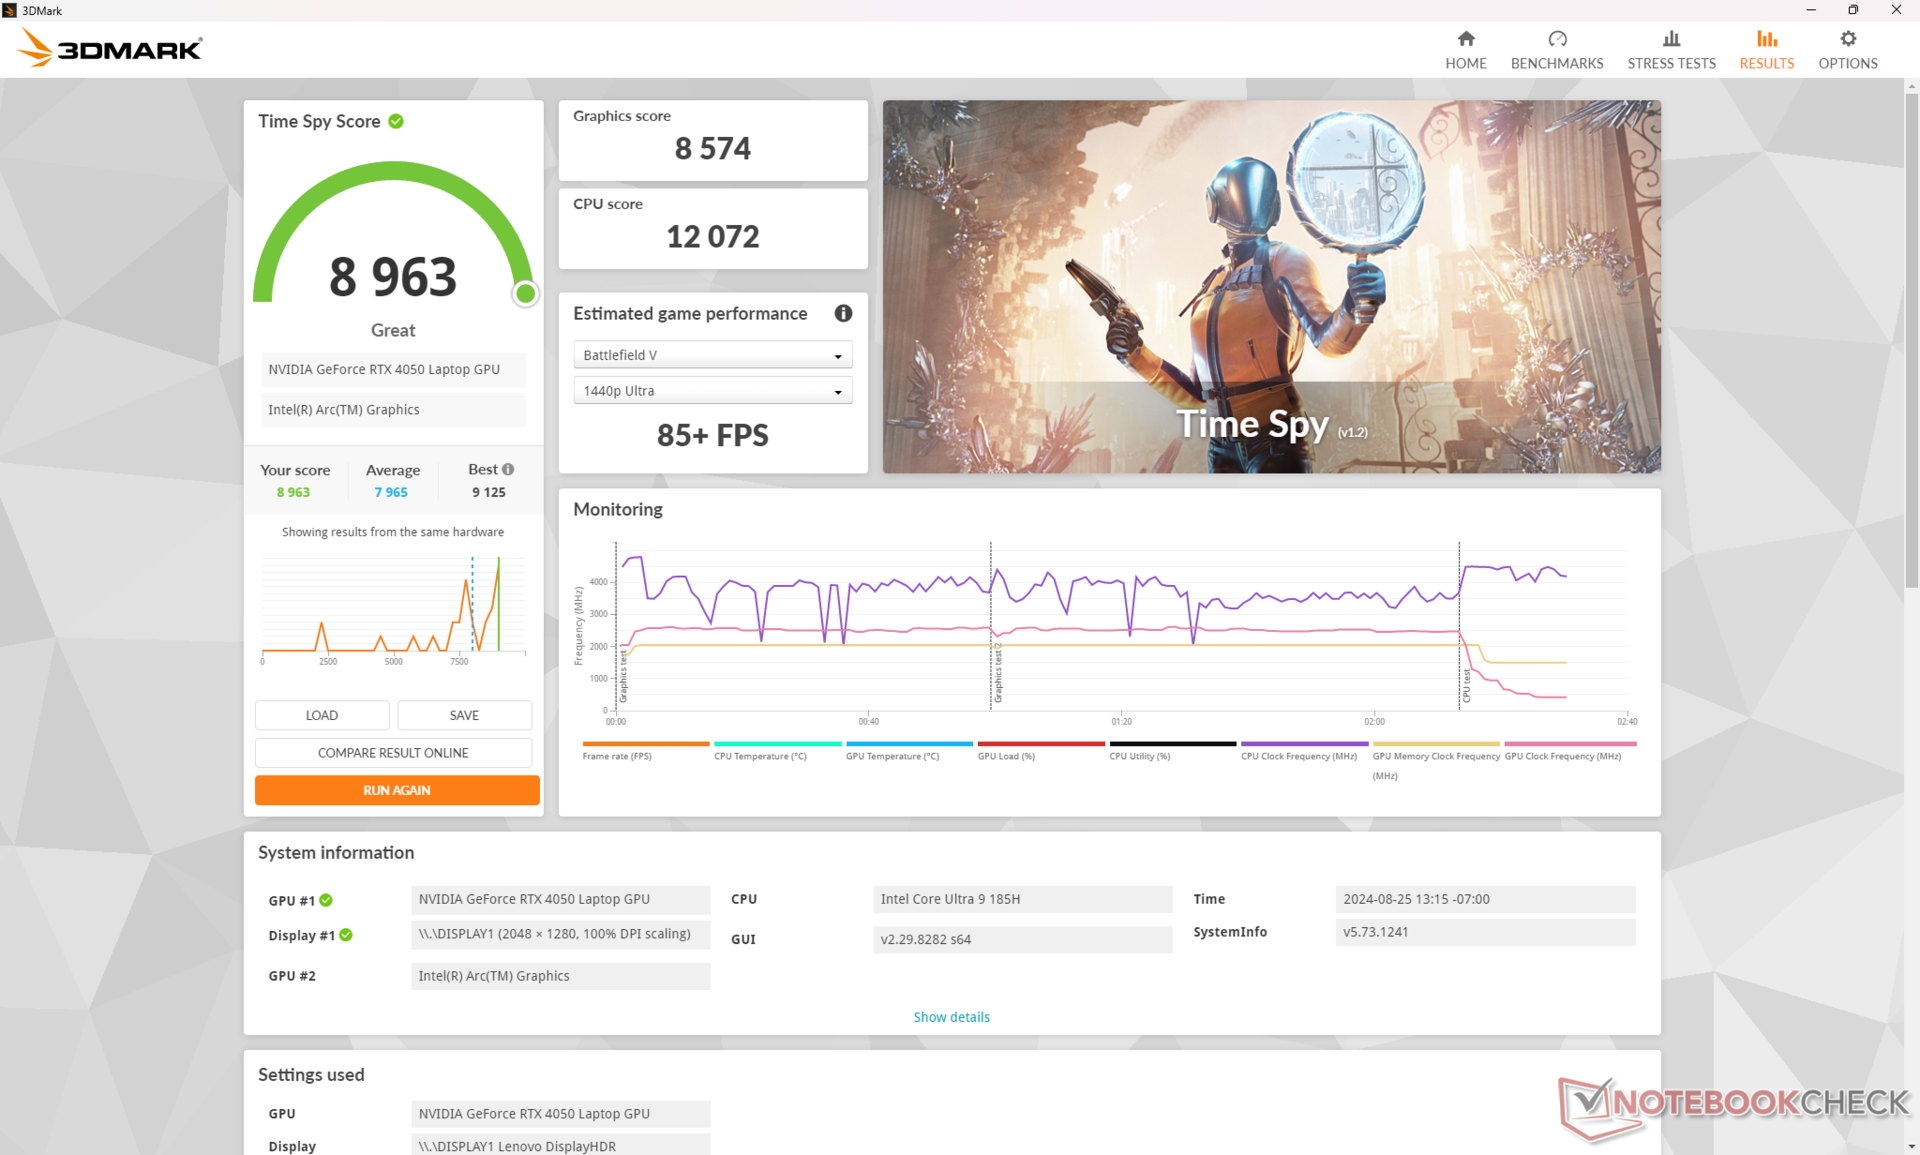

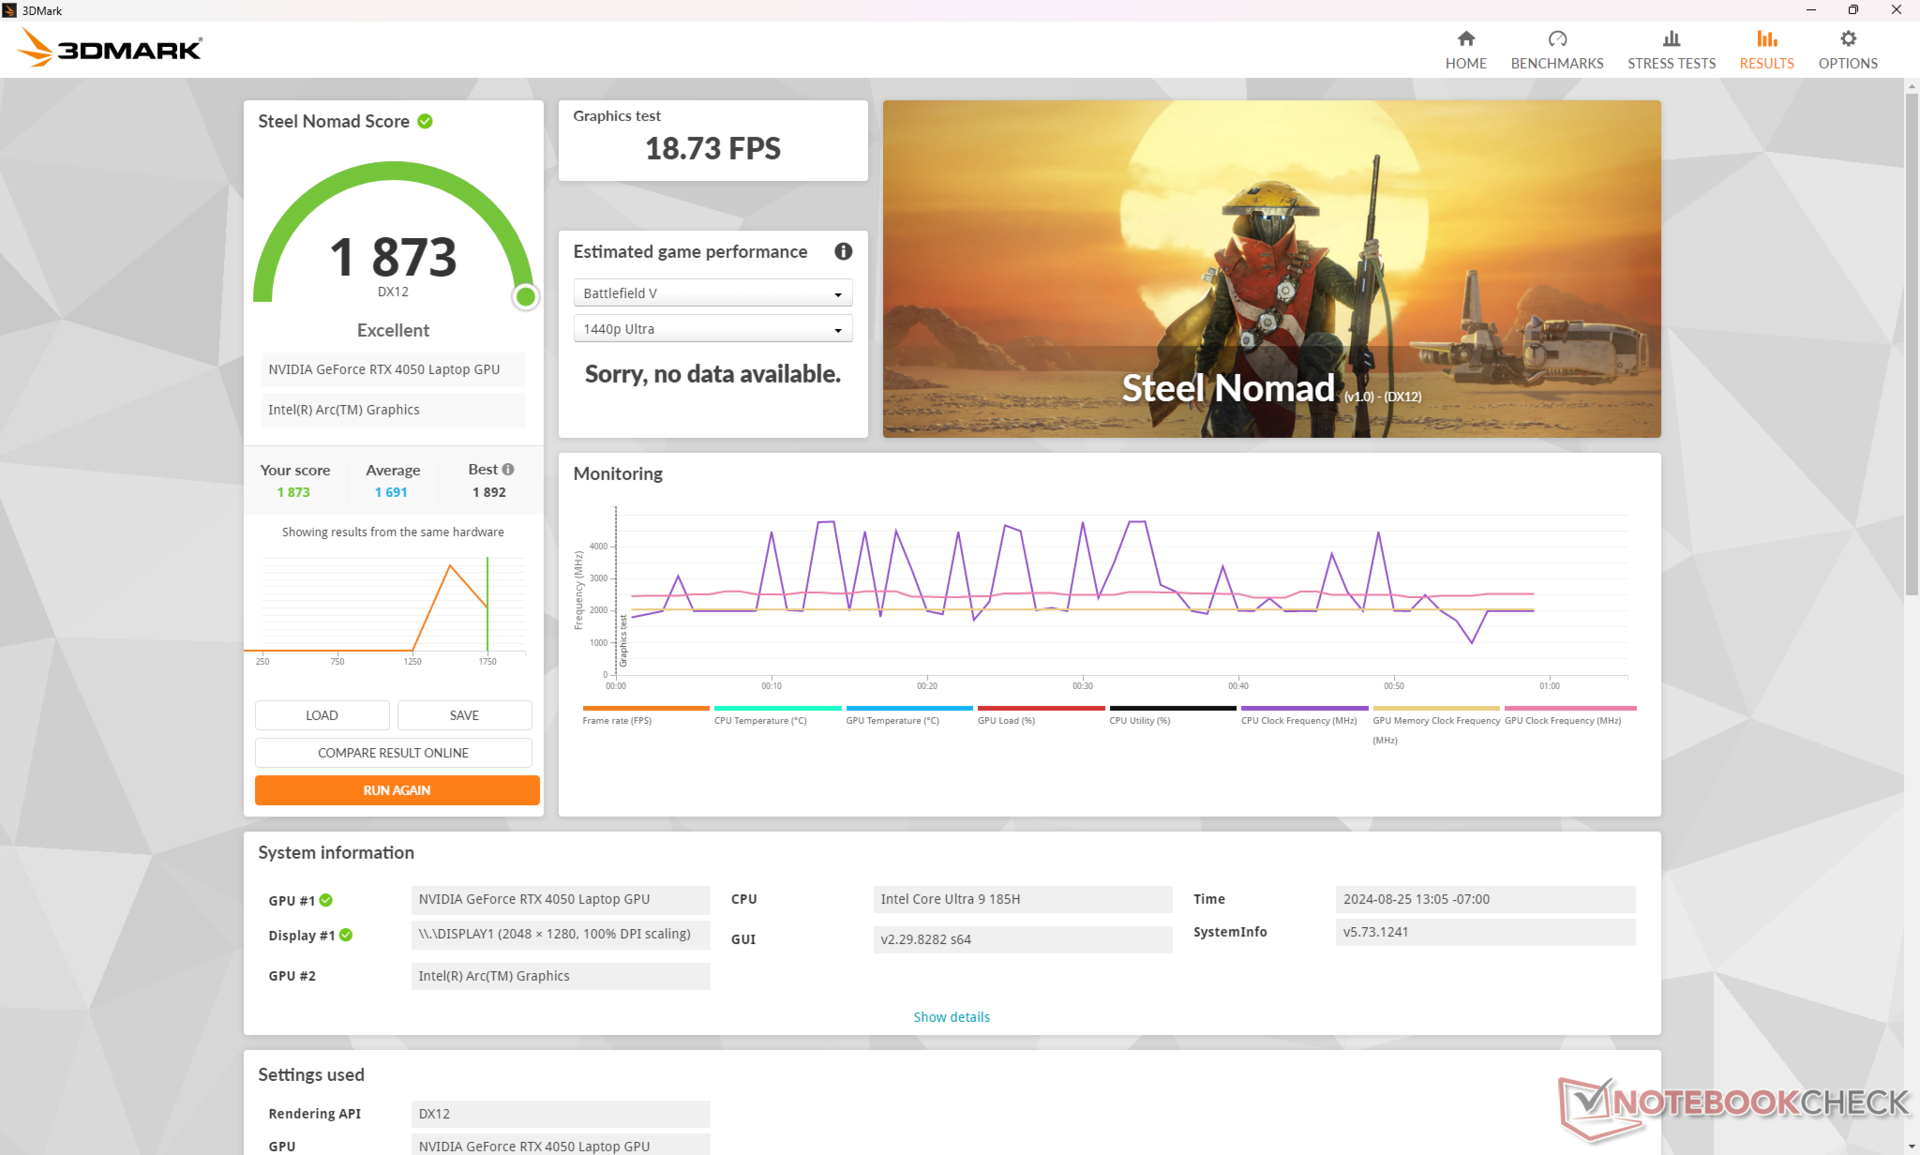
| 3DMark 11 Performance | 27986 points | |
| 3DMark Cloud Gate Standard Score | 60960 points | |
| 3DMark Fire Strike Score | 21049 points | |
| 3DMark Time Spy Score | 8963 points | |
| 3DMark Steel Nomad Score | 1873 points | |
Help | ||
* ... smaller is better
Gaming Performance
Though not explicitly a gaming laptop, the 90 W RTX 4050 allows the Lenovo to run games better than expected. In fact, titles like Final Fantasy XV, Cyberpunk 2077, Tiny Tina's Wonderlands, and more run about 25 to 30 percent faster than on the HP Spectre x360 16 with the same RTX 4050 GPU. Our system also edges out the Inspiron 16 Plus 7640 and its 70 W RTX 4060 GPU as predicted by the 3DMark scores above. In this scenario, the lower native resolution of the OLED panel is beneficial for a smoother gaming experience than the 1600p IPS panel.
| GTA V - 1920x1080 Highest AA:4xMSAA + FX AF:16x | |
| Lenovo IdeaPad Pro 5 16IMH G9 RTX 4050 | |
| Samsung Galaxy Book4 Ultra | |
| Asus Zenbook S 16 UM5606-RK333W | |
| Lenovo IdeaPad Pro 5 16IMH G9 | |
| Final Fantasy XV Benchmark - 1920x1080 High Quality | |
| Lenovo IdeaPad Pro 5 16IMH G9 RTX 4050 | |
| Samsung Galaxy Book4 Ultra | |
| Lenovo IdeaPad Pro 5 16IMH G9 | |
| Asus Zenbook S 16 UM5606-RK333W | |
| Dell Inspiron 16 7640 2-in-1 | |
| HP Envy x360 2-in-1 16-ad0097nr | |
| Strange Brigade - 1920x1080 ultra AA:ultra AF:16 | |
| Lenovo IdeaPad Pro 5 16IMH G9 RTX 4050 | |
| Samsung Galaxy Book4 Ultra | |
| Lenovo IdeaPad Pro 5 16IMH G9 | |
| Asus Zenbook S 16 UM5606-RK333W | |
| Dell Inspiron 16 7640 2-in-1 | |
| HP Envy x360 2-in-1 16-ad0097nr | |
| Dota 2 Reborn - 1920x1080 ultra (3/3) best looking | |
| Lenovo IdeaPad Pro 5 16IMH G9 RTX 4050 | |
| Samsung Galaxy Book4 Ultra | |
| Lenovo IdeaPad Pro 5 16IMH G9 | |
| Dell Inspiron 16 7640 2-in-1 | |
| HP Envy x360 2-in-1 16-ad0097nr | |
| Asus Zenbook S 16 UM5606-RK333W | |
Cyberpunk 2077 ultra FPS Chart
| low | med. | high | ultra | |
|---|---|---|---|---|
| GTA V (2015) | 183 | 178.4 | 166.9 | 98.7 |
| Dota 2 Reborn (2015) | 167.2 | 151.9 | 145.9 | 137.4 |
| Final Fantasy XV Benchmark (2018) | 171.3 | 123.3 | 87.8 | |
| X-Plane 11.11 (2018) | 127.7 | 114.1 | 89 | |
| Far Cry 5 (2018) | 155 | 129 | 120 | 113 |
| Strange Brigade (2018) | 411 | 204 | 172.9 | 149.4 |
| Tiny Tina's Wonderlands (2022) | 181.6 | 149.2 | 96 | 74 |
| F1 22 (2022) | 211 | 204 | 156.6 | 54.1 |
| Baldur's Gate 3 (2023) | 110.1 | 91.4 | 81.3 | 78.6 |
| Cyberpunk 2077 (2023) | 103.1 | 82.2 | 69.4 | 59.8 |
Emissions — Loud And Hot Under Load
System Noise
Fan noise remains quiet when running undemanding loads like browsers or Word with no annoying pulsing or spiking behavior. When running heavier loads like 3DMark 06, fan noise would be steady at around 26 dB(A) for most of the first benchmark scene before eventually rising to almost 46 dB(A) which is close to what we recorded on the iGPU configuration.
When gaming, fan noise would top out at just over 48 dB(A) to be a few decibels louder than on the iGPU configuration. This also happens to be louder than competing 16-inch laptops by decent margins including the Inspiron 16 7640 2-in-1 or Samsung Galaxy Book4 Ultra. Thus, the dGPU option isn't necessarily louder than the iGPU option until you start to introduce much more demanding loads.
Noise level
| Idle |
| 23 / 23.3 / 23.3 dB(A) |
| Load |
| 45.7 / 48.4 dB(A) |
 | ||
30 dB silent 40 dB(A) audible 50 dB(A) loud |
||
min: | ||
| Lenovo IdeaPad Pro 5 16IMH G9 RTX 4050 GeForce RTX 4050 Laptop GPU, Ultra 9 185H, Samsung PM9C1a MZAL81T0HDLB | Lenovo IdeaPad Pro 5 16IMH G9 Arc 8-Core, Ultra 7 155H, Samsung PM9C1a MZAL81T0HDLB | Dell Inspiron 16 7640 2-in-1 Arc 8-Core, Ultra 7 155H, Micron 2550 1TB | Asus Zenbook S 16 UM5606-RK333W Radeon 890M, Ryzen AI 9 HX 370, Micron 2400 MTFDKBA1T0QFM | HP Envy x360 2-in-1 16-ad0097nr Radeon 780M, R7 8840HS, KIOXIA BG5 KBG50ZNV1T02 | Samsung Galaxy Book4 Ultra GeForce RTX 4050 Laptop GPU, Ultra 7 155H, Samsung PM9A1 MZVL2512HCJQ | |
|---|---|---|---|---|---|---|
| Noise | -4% | 1% | 5% | 10% | 2% | |
| off / environment * (dB) | 23 | 24.1 -5% | 22.9 -0% | 24.7 -7% | 22.9 -0% | 24.2 -5% |
| Idle Minimum * (dB) | 23 | 24.1 -5% | 22.9 -0% | 24.7 -7% | 23 -0% | 24.2 -5% |
| Idle Average * (dB) | 23.3 | 24.1 -3% | 22.9 2% | 24.7 -6% | 23 1% | 24.2 -4% |
| Idle Maximum * (dB) | 23.3 | 28.2 -21% | 25 -7% | 26.4 -13% | 23 1% | 24.2 -4% |
| Load Average * (dB) | 45.7 | 44.4 3% | 45.1 1% | 35.7 22% | 23.8 48% | 37.9 17% |
| Cyberpunk 2077 ultra * (dB) | 48.4 | 44.9 7% | 36.8 24% | |||
| Load Maximum * (dB) | 48.4 | 44.4 8% | 44.9 7% | 36.8 24% | 43.8 10% | 41.7 14% |
| Witcher 3 ultra * (dB) | 36.5 | 43.8 | 41.7 |
* ... smaller is better
Temperature
Surface temperatures are noticeably warmer than the iGPU configuration by more than several degrees even when idling. Hot spots when gaming can reach 42 C and 52 C on the keyboard deck and bottom surface, respectively, compared to just 32 C and 38 C on the iGPU version. The hot spots are thankfully toward the keyboard center, but you'll definitely want to run demanding loads on a flat desk whenever possible for optimal airflow.
The system runs warmer than the Galaxy Book4 Ultra even though both models ship with similar Core Ultra H CPUs and GeForce RTX options.


(-) The maximum temperature on the upper side is 48.2 °C / 119 F, compared to the average of 36.8 °C / 98 F, ranging from 21 to 71 °C for the class Multimedia.
(-) The bottom heats up to a maximum of 59.4 °C / 139 F, compared to the average of 39.1 °C / 102 F
(+) In idle usage, the average temperature for the upper side is 31.2 °C / 88 F, compared to the device average of 31.3 °C / 88 F.
(±) 3: The average temperature for the upper side is 35.7 °C / 96 F, compared to the average of 31.3 °C / 88 F for the class Multimedia.
(+) The palmrests and touchpad are reaching skin temperature as a maximum (34.4 °C / 93.9 F) and are therefore not hot.
(-) The average temperature of the palmrest area of similar devices was 28.7 °C / 83.7 F (-5.7 °C / -10.2 F).


| Lenovo IdeaPad Pro 5 16IMH G9 RTX 4050 Intel Core Ultra 9 185H, NVIDIA GeForce RTX 4050 Laptop GPU | Lenovo IdeaPad Pro 5 16IMH G9 Intel Core Ultra 7 155H, Intel Arc 8-Core iGPU | Dell Inspiron 16 7640 2-in-1 Intel Core Ultra 7 155H, Intel Arc 8-Core iGPU | Asus Zenbook S 16 UM5606-RK333W AMD Ryzen AI 9 HX 370, AMD Radeon 890M | HP Envy x360 2-in-1 16-ad0097nr AMD Ryzen 7 8840HS, AMD Radeon 780M | Samsung Galaxy Book4 Ultra Intel Core Ultra 7 155H, NVIDIA GeForce RTX 4050 Laptop GPU | |
|---|---|---|---|---|---|---|
| Heat | 28% | 11% | 10% | 18% | 28% | |
| Maximum Upper Side * (°C) | 48.2 | 36.3 25% | 46.8 3% | 46.9 3% | 42.6 12% | 38.5 20% |
| Maximum Bottom * (°C) | 59.4 | 39.1 34% | 45.6 23% | 53.5 10% | 47.8 20% | 41.2 31% |
| Idle Upper Side * (°C) | 34.2 | 24.9 27% | 32.2 6% | 29.5 14% | 27.4 20% | 23.5 31% |
| Idle Bottom * (°C) | 34.8 | 26.1 25% | 31.4 10% | 30.2 13% | 27.8 20% | 24.1 31% |
* ... smaller is better
Speakers
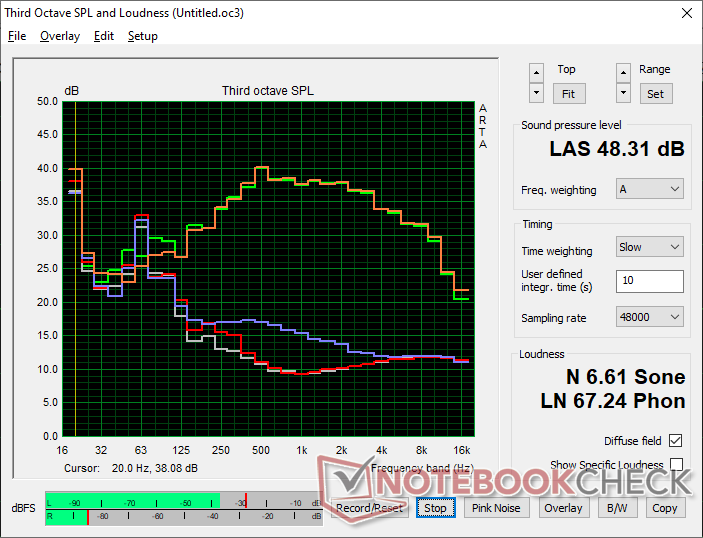
Lenovo IdeaPad Pro 5 16IMH G9 RTX 4050 audio analysis
(±) | speaker loudness is average but good (80.2 dB)
Bass 100 - 315 Hz
(-) | nearly no bass - on average 22.4% lower than median
(±) | linearity of bass is average (10.3% delta to prev. frequency)
Mids 400 - 2000 Hz
(+) | balanced mids - only 2.7% away from median
(+) | mids are linear (4% delta to prev. frequency)
Highs 2 - 16 kHz
(+) | balanced highs - only 1.5% away from median
(+) | highs are linear (4.1% delta to prev. frequency)
Overall 100 - 16.000 Hz
(+) | overall sound is linear (14.3% difference to median)
Compared to same class
» 32% of all tested devices in this class were better, 5% similar, 63% worse
» The best had a delta of 5%, average was 17%, worst was 45%
Compared to all devices tested
» 17% of all tested devices were better, 4% similar, 78% worse
» The best had a delta of 4%, average was 23%, worst was 134%
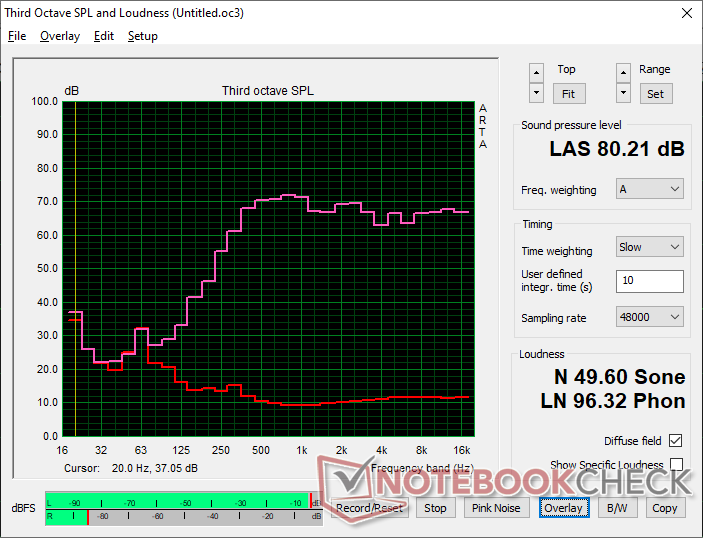
Apple MacBook Pro 16 2021 M1 Pro audio analysis
(+) | speakers can play relatively loud (84.7 dB)
Bass 100 - 315 Hz
(+) | good bass - only 3.8% away from median
(+) | bass is linear (5.2% delta to prev. frequency)
Mids 400 - 2000 Hz
(+) | balanced mids - only 1.3% away from median
(+) | mids are linear (2.1% delta to prev. frequency)
Highs 2 - 16 kHz
(+) | balanced highs - only 1.9% away from median
(+) | highs are linear (2.7% delta to prev. frequency)
Overall 100 - 16.000 Hz
(+) | overall sound is linear (4.6% difference to median)
Compared to same class
» 0% of all tested devices in this class were better, 0% similar, 100% worse
» The best had a delta of 5%, average was 17%, worst was 45%
Compared to all devices tested
» 0% of all tested devices were better, 0% similar, 100% worse
» The best had a delta of 4%, average was 23%, worst was 134%
Energy Management
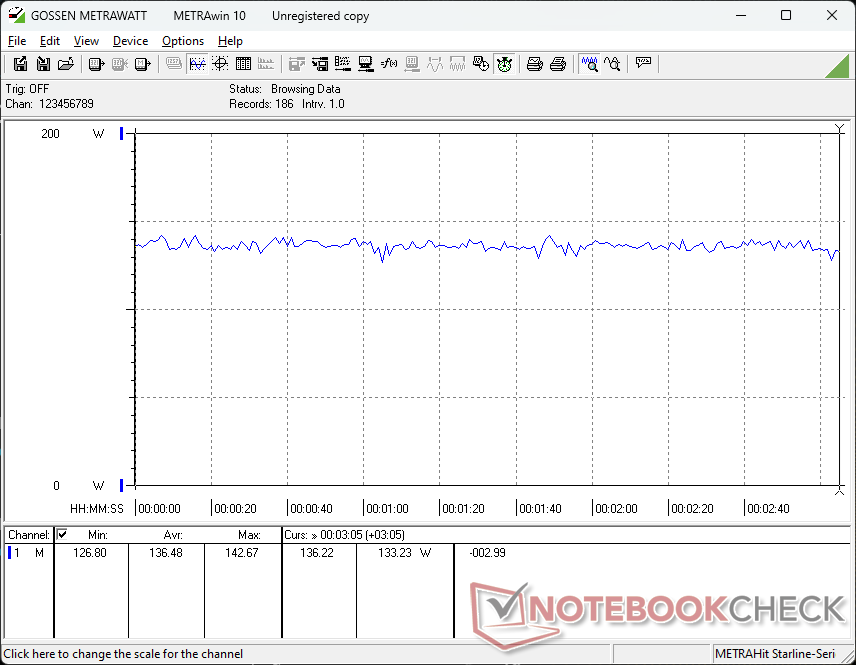
Power Consumption
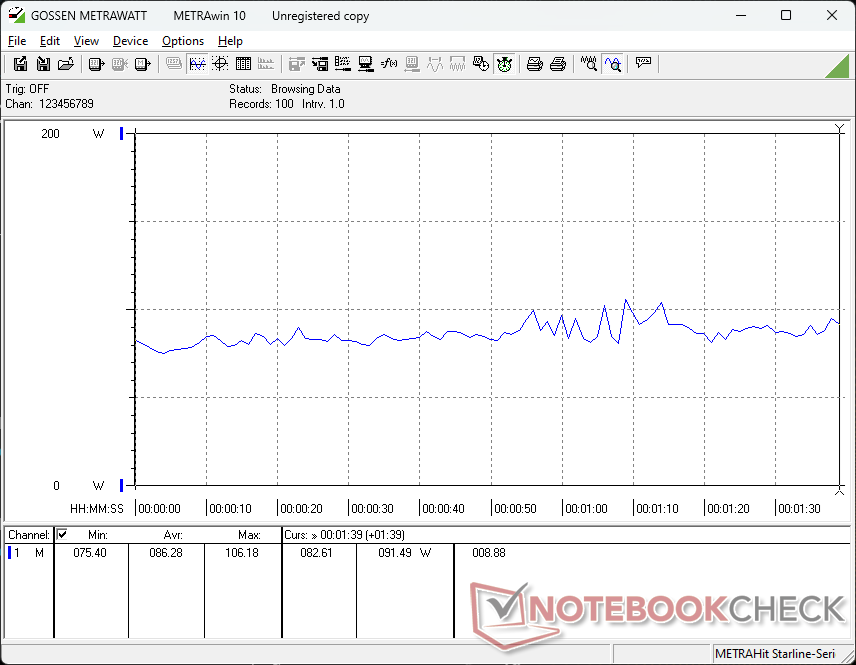
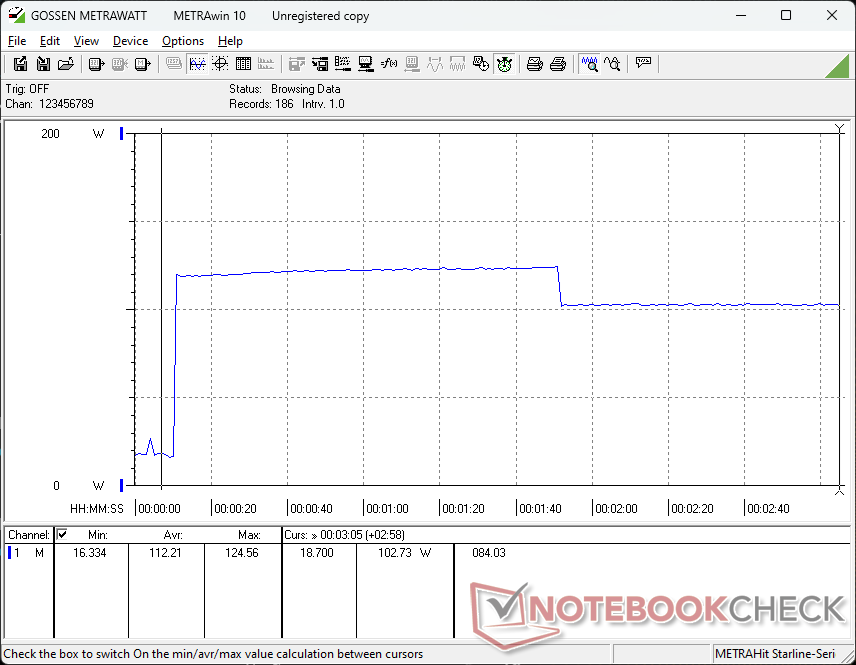
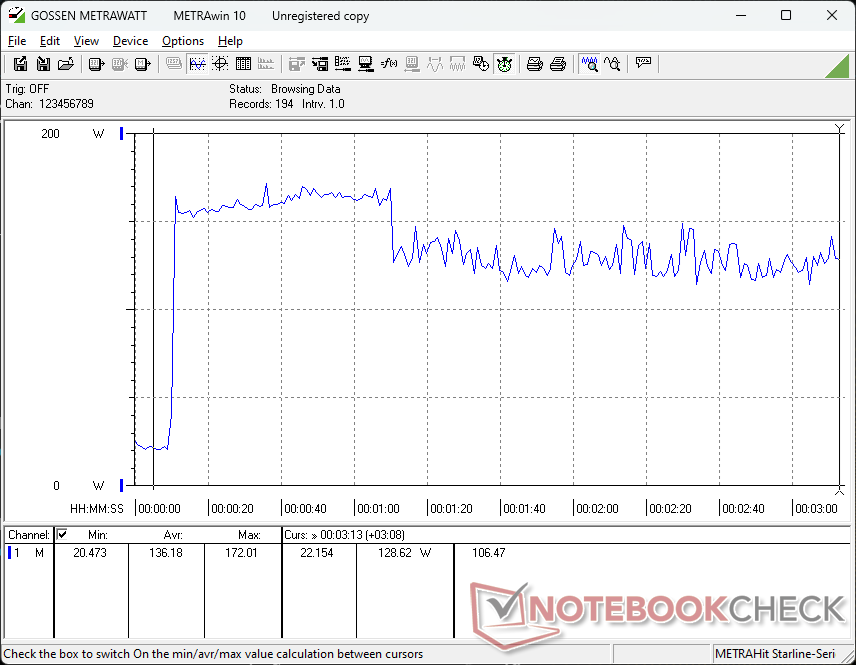
Idling on desktop demands up to 15 W compared to just 10 W on the iGPU configuration due largely to the OLED panel. The delta grows much wider by 70 W to 80 W when running demanding loads like games. It's worth noting that our RTX 4050 GPU reaches slightly above 80 W when gaming compared to just ~50 W on the Galaxy Book4 Ultra and so overall power consumption is noticeably higher on our Lenovo to be almost like an entry-level gaming laptop.
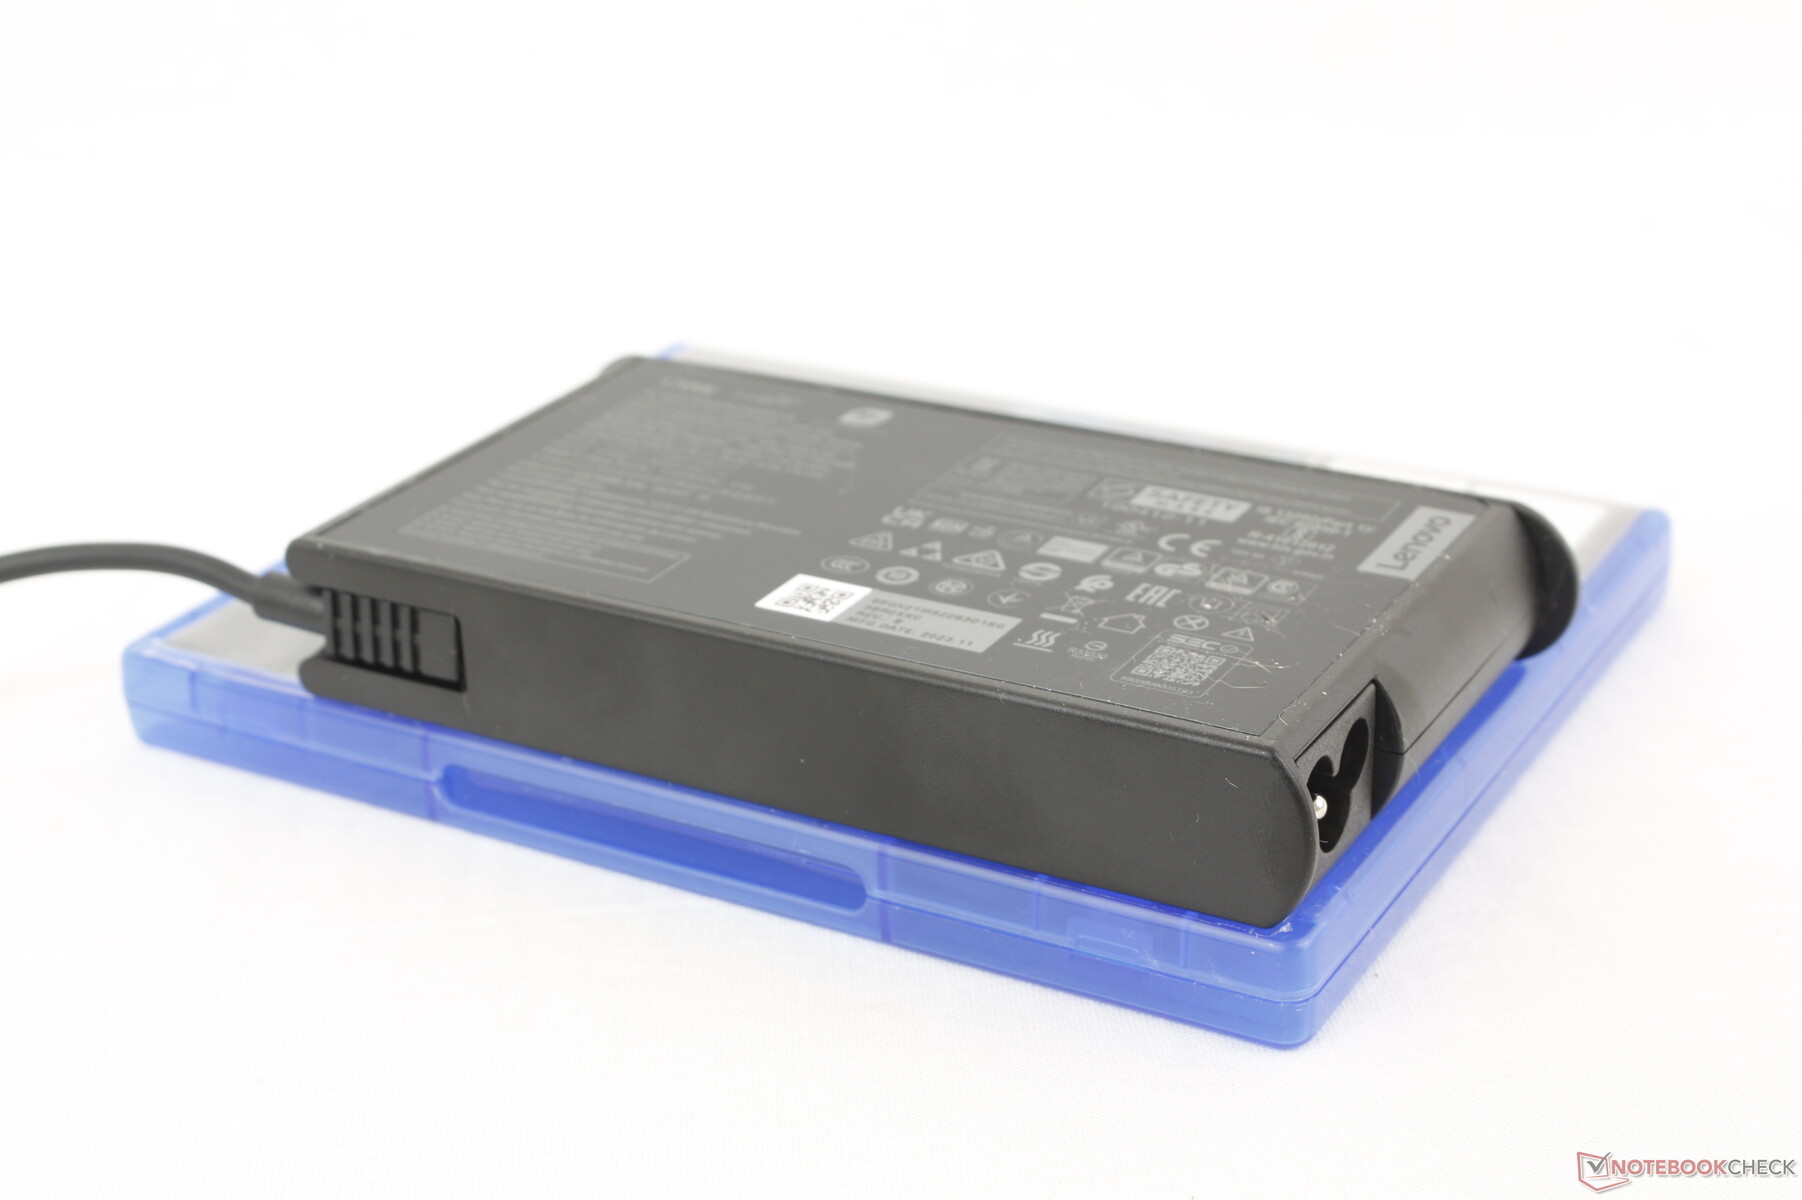
We're able to record a temporary maximum draw of 172 W from the medium-sized (~15 x 7.8 x 2.2 cm) 170 W AC adapter when the CPU and GPU are at 100 percent utilization. Consumption would hover just below 140 W when gaming and so the system can still simultaneously charge at a decent rate if needed. We're glad to see that the Lenovo system supports barrel-type AC charging instead of solely USB-C as the lower wattage of the latter would have severely impacted performance. The Galaxy Book4 Ultra, for example, supports only USB-C charging and yet our Lenovo would consistently outperform the Samsung because of our higher power ceilings.
| Off / Standby | |
| Idle | |
| Load |
|
Key:
min: | |
| Lenovo IdeaPad Pro 5 16IMH G9 RTX 4050 Ultra 9 185H, GeForce RTX 4050 Laptop GPU, Samsung PM9C1a MZAL81T0HDLB, OLED, 2048x1280, 16" | Lenovo IdeaPad Pro 5 16IMH G9 Ultra 7 155H, Arc 8-Core, Samsung PM9C1a MZAL81T0HDLB, IPS, 2560x1600, 16" | Dell Inspiron 16 7640 2-in-1 Ultra 7 155H, Arc 8-Core, Micron 2550 1TB, Mini-LED, 2560x1600, 16" | Asus Zenbook S 16 UM5606-RK333W Ryzen AI 9 HX 370, Radeon 890M, Micron 2400 MTFDKBA1T0QFM, OLED, 2880x1800, 16" | HP Envy x360 2-in-1 16-ad0097nr R7 8840HS, Radeon 780M, KIOXIA BG5 KBG50ZNV1T02, OLED, 2880x1800, 16" | Samsung Galaxy Book4 Ultra Ultra 7 155H, GeForce RTX 4050 Laptop GPU, Samsung PM9A1 MZVL2512HCJQ, OLED, 2880x1800, 16" | |
|---|---|---|---|---|---|---|
| Power Consumption | 21% | 11% | 32% | 26% | 18% | |
| Idle Minimum * (Watt) | 5.6 | 3.5 37% | 6.1 -9% | 5.4 4% | 5 11% | 4.8 14% |
| Idle Average * (Watt) | 7.3 | 9.6 -32% | 13.5 -85% | 10.5 -44% | 6.2 15% | 7.5 -3% |
| Idle Maximum * (Watt) | 14.6 | 9.9 32% | 13.8 5% | 10.9 25% | 14.7 -1% | 7.9 46% |
| Load Average * (Watt) | 86.3 | 62.7 27% | 63.6 26% | 47.8 45% | 49.9 42% | 79.3 8% |
| Cyberpunk 2077 ultra external monitor * (Watt) | 135.8 | 64.6 52% | 46.7 66% | |||
| Cyberpunk 2077 ultra * (Watt) | 136.4 | 67 51% | 49.2 64% | |||
| Load Maximum * (Watt) | 172 | 101.2 41% | 109.7 36% | 58.6 66% | 65 62% | 125 27% |
| Witcher 3 ultra * (Watt) | 55.8 | 54.5 | 79.2 |
* ... smaller is better
Power Consumption Cyberpunk / Stress Test
Power Consumption external Monitor
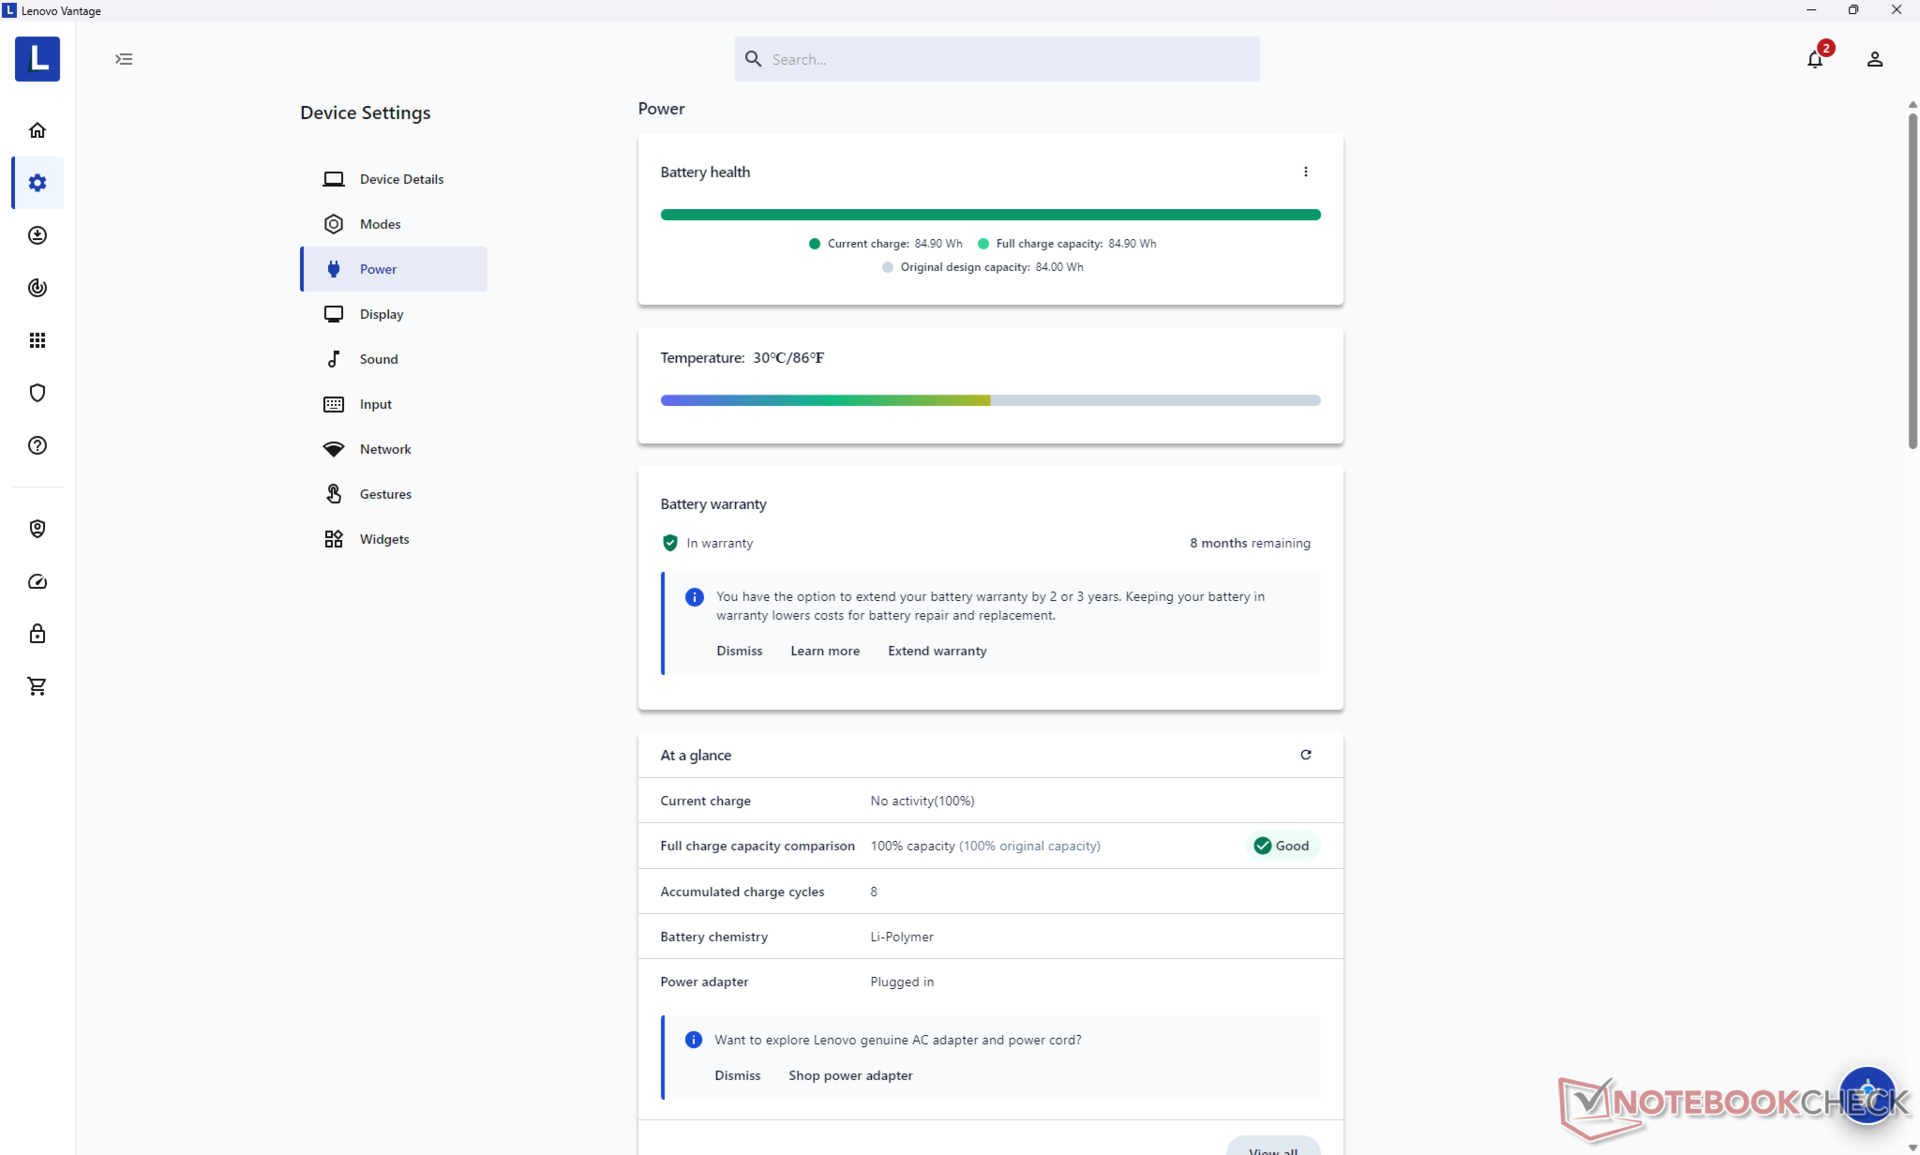
Battery Life
Runtimes are expectedly shorter than the IPS iGPU configuration due to the reasons mentioned in the section above. Even so, 10.5 hours of real-world WLAN browsing is still quite long and comparable to the Inspiron 16 7640 2-in-1 or Zenbook S 16.
Charging from empty to full capacity is very fast at about 60 minutes compared to 90 minutes on most other Ultrabooks. Charging with USB-C AC adapters will be slower.
| Lenovo IdeaPad Pro 5 16IMH G9 RTX 4050 Ultra 9 185H, GeForce RTX 4050 Laptop GPU, 84 Wh | Lenovo IdeaPad Pro 5 16IMH G9 Ultra 7 155H, Arc 8-Core, 84 Wh | Dell Inspiron 16 7640 2-in-1 Ultra 7 155H, Arc 8-Core, 90 Wh | Asus Zenbook S 16 UM5606-RK333W Ryzen AI 9 HX 370, Radeon 890M, 78 Wh | HP Envy x360 2-in-1 16-ad0097nr R7 8840HS, Radeon 780M, 68 Wh | Samsung Galaxy Book4 Ultra Ultra 7 155H, GeForce RTX 4050 Laptop GPU, 76 Wh | |
|---|---|---|---|---|---|---|
| Battery runtime | 28% | 35% | 63% | 26% | 33% | |
| Reader / Idle (h) | 22.3 | 21.8 -2% | 15.6 -30% | |||
| WiFi v1.3 (h) | 10.7 | 12.6 18% | 11.4 7% | 10.7 0% | 7.7 -28% | 10.9 2% |
| Load (h) | 0.8 | 1.1 38% | 1.6 100% | 1.8 125% | 1.9 137% | 1.3 63% |
| H.264 (h) | 16 | 20.1 | 17.9 |
Pros
Cons
Verdict — Well-Balanced For $1500
While the lower-end iGPU configuration is a respectable multimedia machine, the higher-end dGPU configuration is a borderline gaming machine. Its 90 W GeForce RTX 4050 graphics is faster than on most other multimedia laptops like the Samsung Galaxy Book4 Ultra and it even rivals many entry-level gaming laptops powered by RTX 4060 graphics like the Legion LOQ. The system packs quite a punch considering the thin profile and dull office-like design.
The IdeaPad Pro 5 16 G9 is faster than it looks when fully configured thanks to its beefy 90 W GeForce RTX 4050 GPU.
All that performance in such a thin package comes at the cost of shorter battery life, louder fans, and warmer temperatures than the lower-end iGPU option and most competitors in the 16-inch space. Lenovo could have mitigated these drawbacks by going with a slower 50 W GPU instead, but we actually like that they went with a higher 90 W ceiling to better distinguish the IdeaPad Pro 5 16 G9 from the competition. It doesn't particularly excel at office work the same way as a ThinkPad T16 or gaming the same way as a Legion Pro 5 16, but it's better than average at both to be a good jack-of-all-trades solution.
Price and Availability
Costco is now shipping the Lenovo IdeaPad Pro 5i 16 with the Core Ultra 9 185H and RTX 4050 as configured for $1500 or $1350 during limited time sale.
Note: We have recently updated our rating system and the results of version 8 are not comparable with the results of version 7. More information is available here .
Lenovo IdeaPad Pro 5 16IMH G9 RTX 4050
- 09/08/2024 v8
Allen Ngo
 Total Sustainability Score:
 Transparency
The selection of devices to be reviewed is made by our editorial team. The test sample was provided to the author as a loan by the manufacturer or retailer for the purpose of this review. The lender had no influence on this review, nor did the manufacturer receive a copy of this review before publication. There was no obligation to publish this review. As an independent media company, Notebookcheck is not subjected to the authority of manufacturers, retailers or publishers.
This is how Notebookcheck is testing
Every year, Notebookcheck independently reviews hundreds of laptops and smartphones using standardized procedures to ensure that all results are comparable. We have continuously developed our test methods for around 20 years and set industry standards in the process. In our test labs, high-quality measuring equipment is utilized by experienced technicians and editors. These tests involve a multi-stage validation process. Our complex rating system is based on hundreds of well-founded measurements and benchmarks, which maintains objectivity. Further information on our test methods can be found here.
Price comparison
