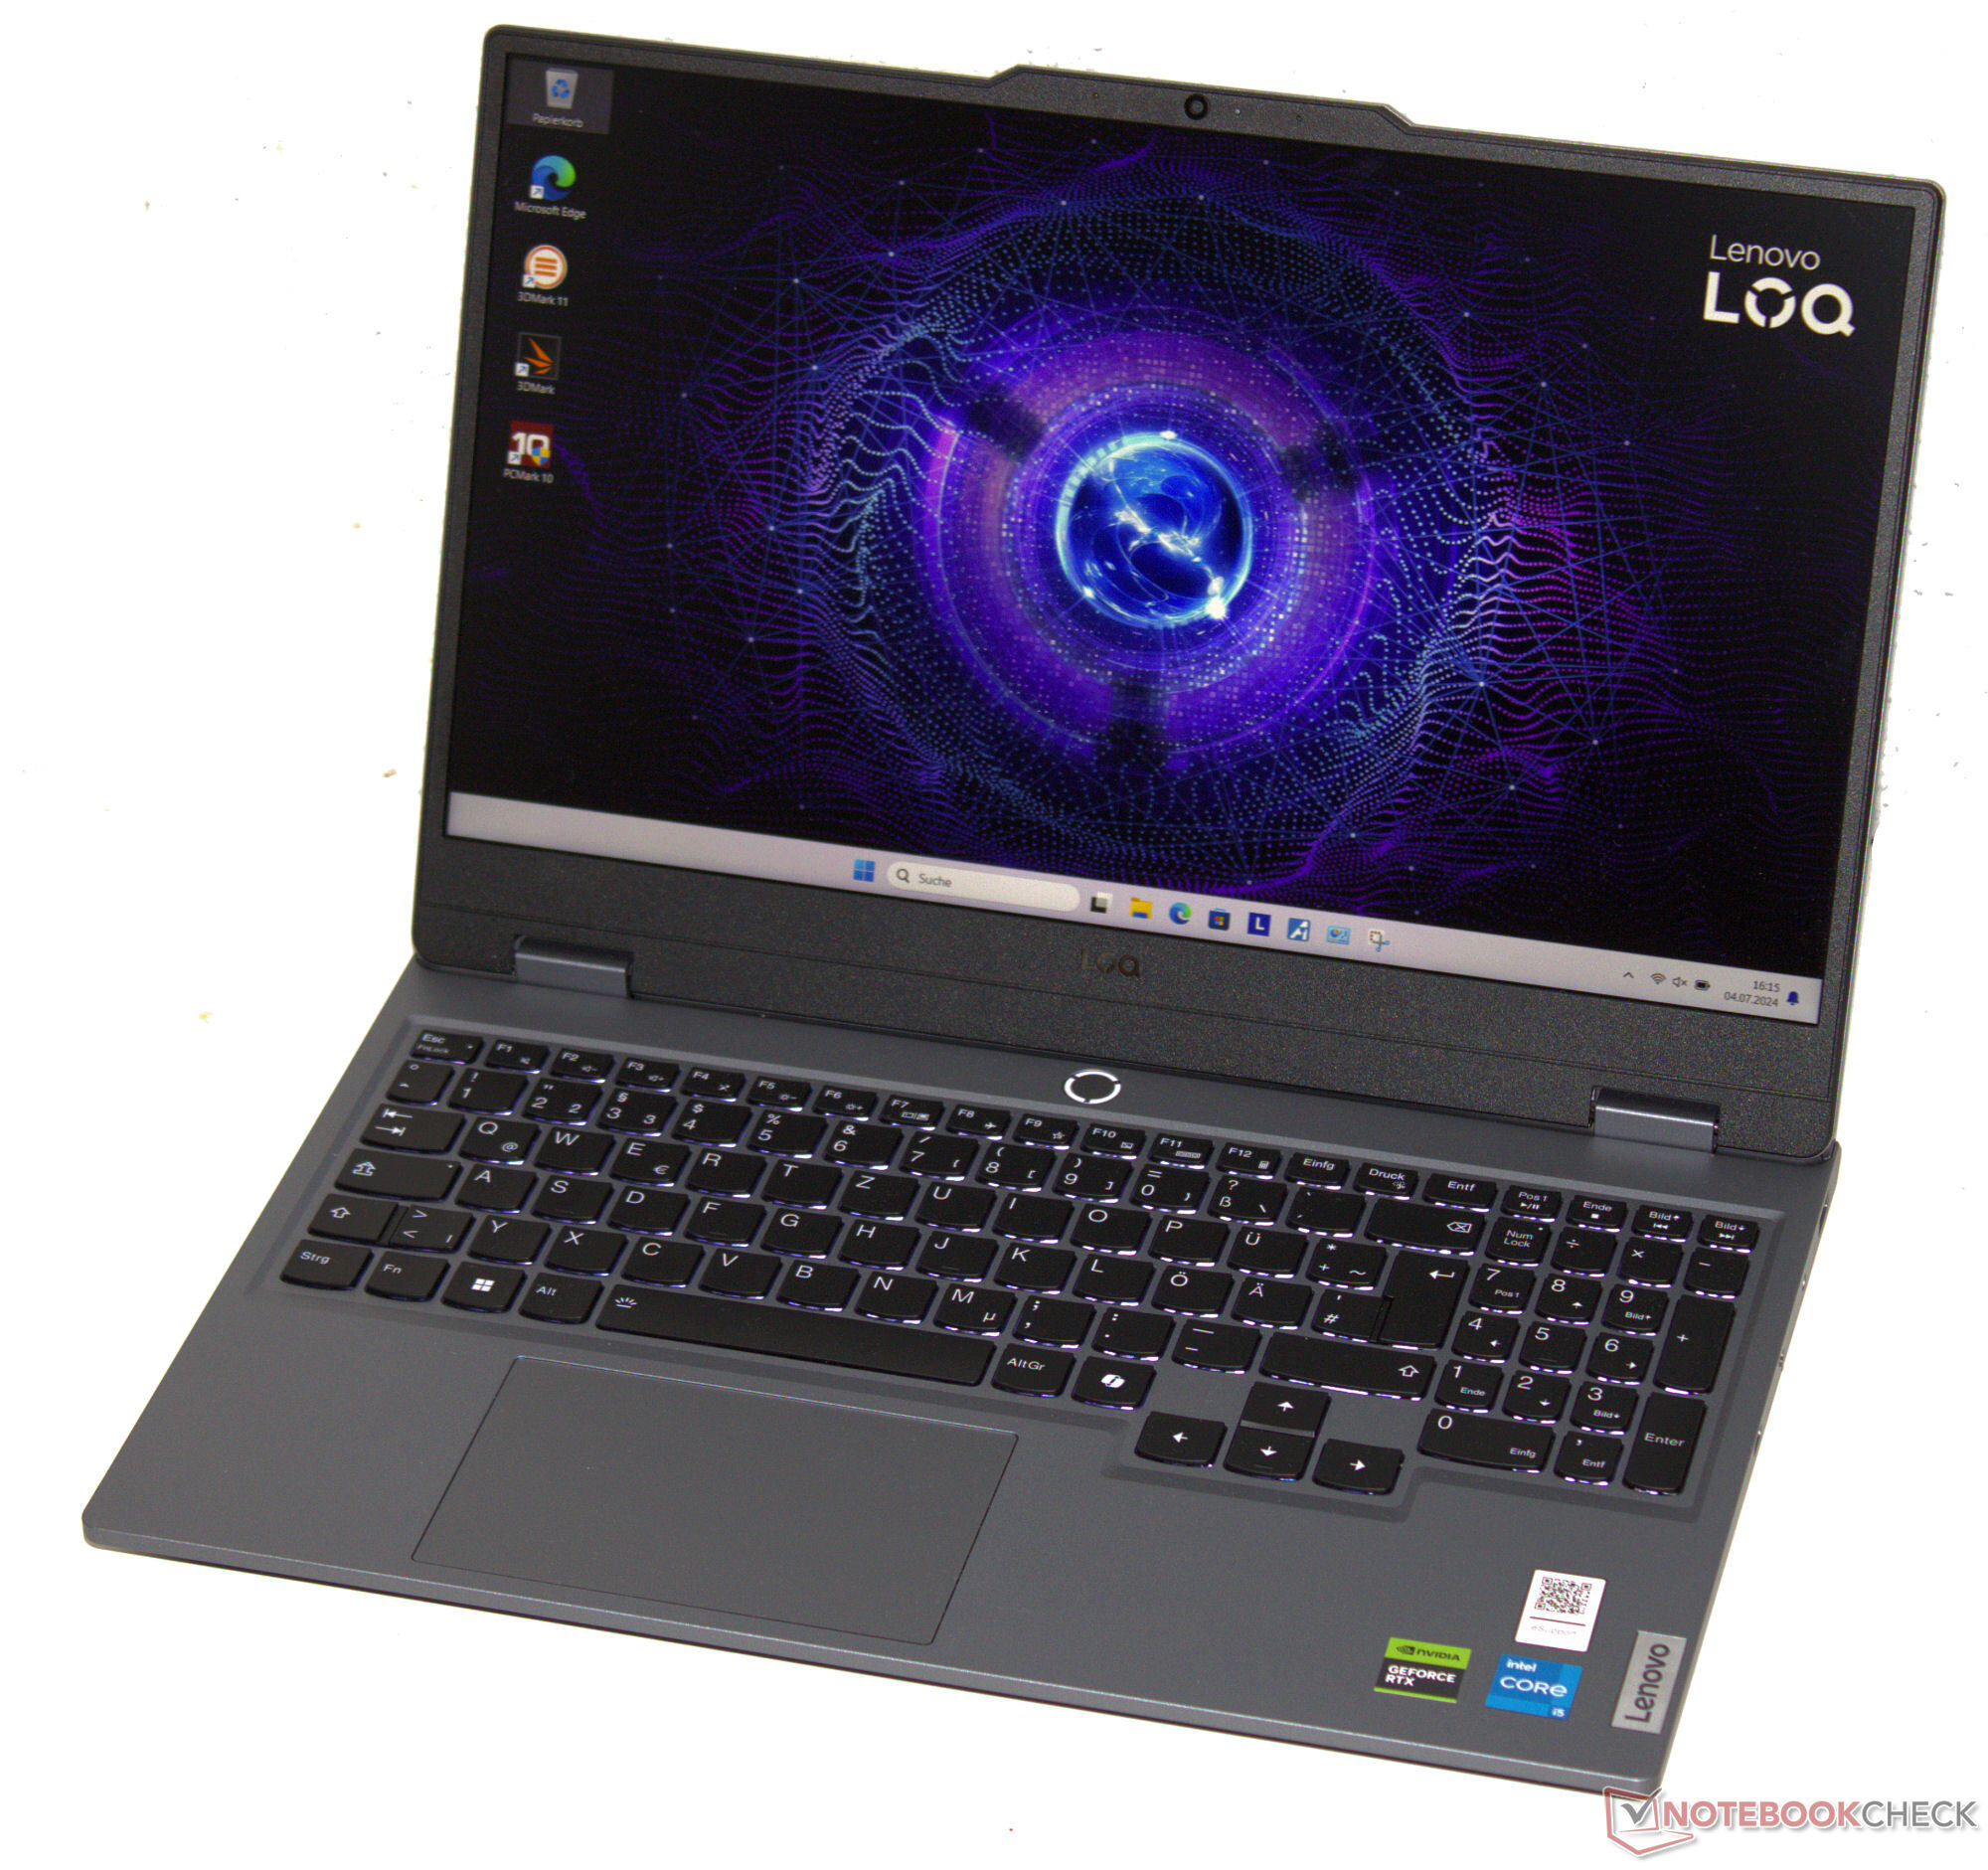
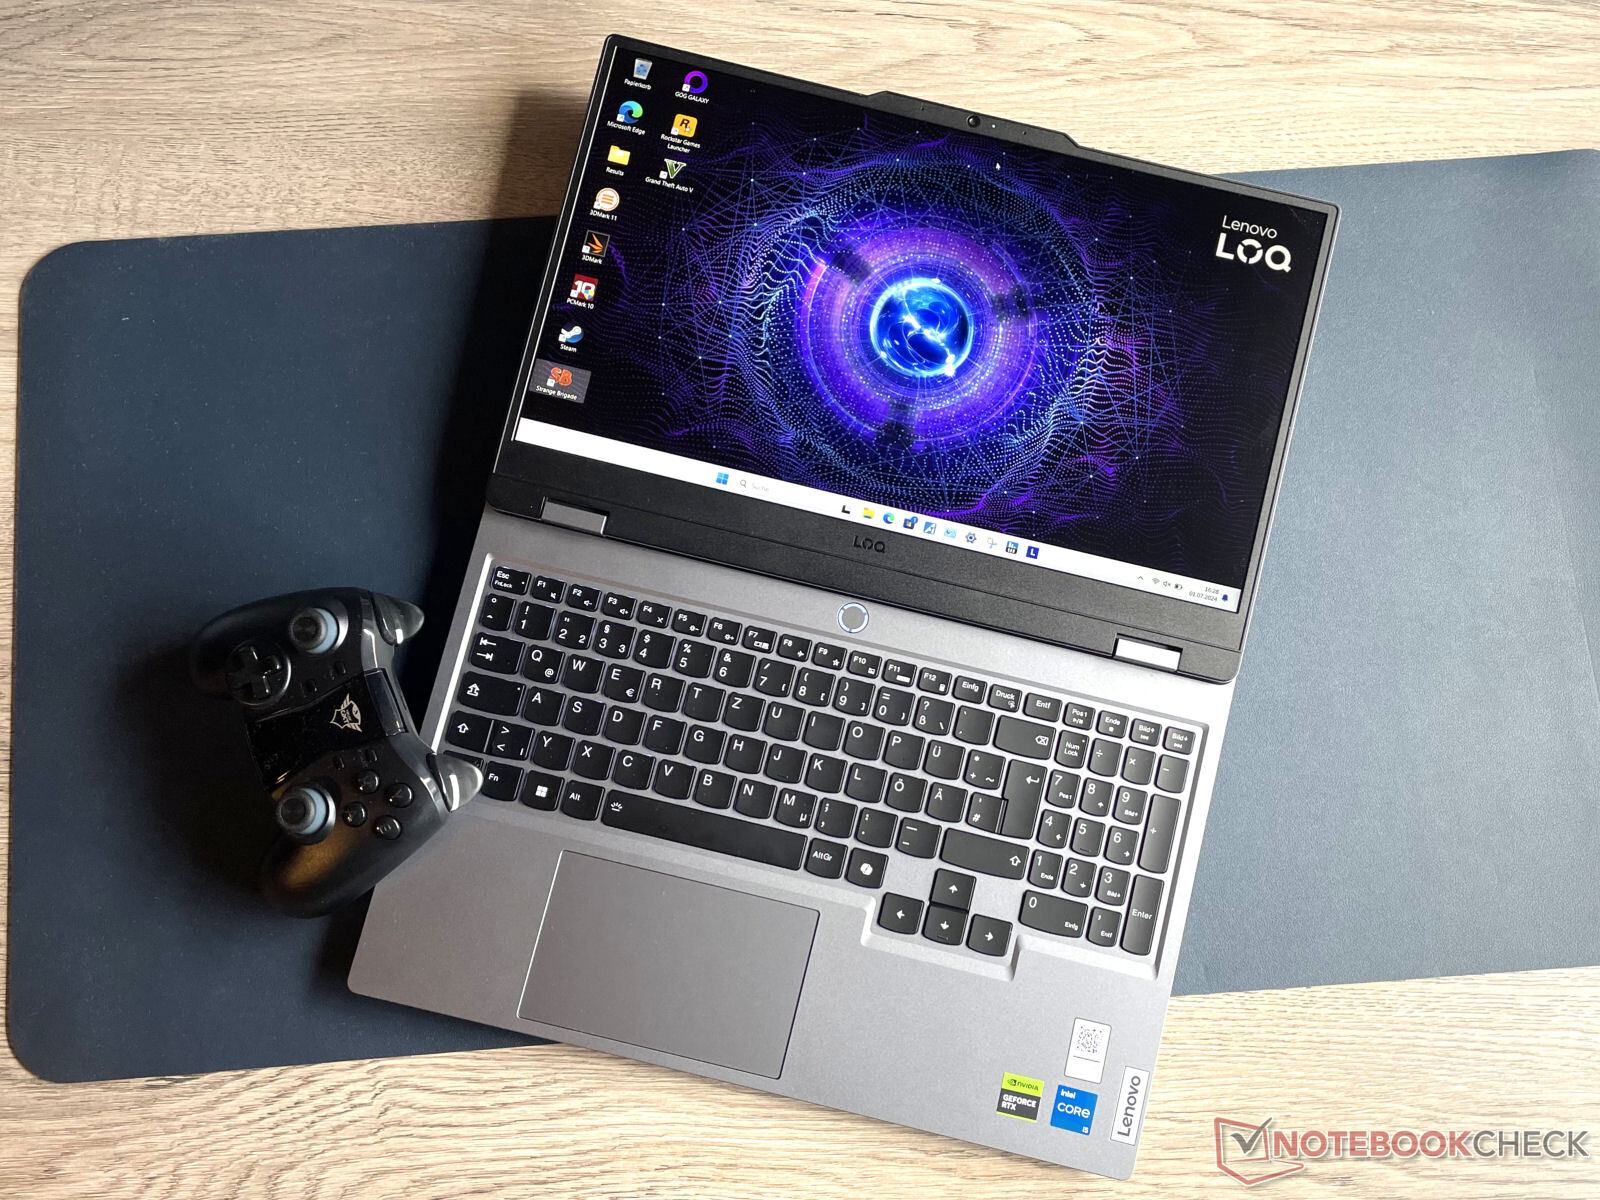
Lenovo LOQ 15 review: The FHD gaming laptop with an RTX 4060 from around US$1,000

Within Lenovo's catalogue, the LOQ series consists of budget gaming laptops. The present test device fits into this category seamlessly: The manufacturer asks for just over US$1,000 (without Windows) or US$1,300 (with Windows 11) for this package consisting of a Core i5 processor, GeForce RTX 4060, 16 GB RAM and a 1-TB SSD. The laptop's price tag takes its toll: It has a plastic case, relatively low battery capacity and no Thunderbolt 4 or USB 4. Competitors include devices like the Gigabyte G6X 9KG (2024), Dell G16, XMG Core 15 (M24) or the HP Victus 16 (2024).
The Lenovo LOQ 15IRX9's case isn't built identically to those of its sister models which we have already tested (Ryzen 7/RTX 4050, Core i7/RTX 4050).
Possible competitors compared
Rating | Version | Date | Model | Weight | Height | Size | Resolution | Price |
|---|---|---|---|---|---|---|---|---|
| 79 % | v8 | 07 / 2024 | Lenovo LOQ 15IRX9 i5-13450HX, GeForce RTX 4060 Laptop GPU | 2.4 kg | 23.9 mm | 15.60" | 1920x1080 | |
| 83.7 % | v8 | 06 / 2024 | Schenker XMG Core 15 (M24) R7 8845HS, GeForce RTX 4060 Laptop GPU | 2.1 kg | 21.9 mm | 15.30" | 2560x1600 | |
| 83.2 % v7 (old) | v7 (old) | 03 / 2024 | Gigabyte G6X 9KG (2024) i7-13650HX, GeForce RTX 4060 Laptop GPU | 2.6 kg | 25.1 mm | 16.00" | 1920x1200 | |
| 84.3 % v7 (old) | v7 (old) | 05 / 2024 | HP Victus 16 (2024) i7-14700HX, GeForce RTX 4060 Laptop GPU | 2.4 kg | 23.9 mm | 16.10" | 1920x1080 | |
| 85.5 % v7 (old) | v7 (old) | 02 / 2024 | Dell G16, i7-13650HX, RTX 4060 i7-13650HX, GeForce RTX 4060 Laptop GPU | 2.8 kg | 25.65 mm | 16.00" | 2560x1600 |
Please note: We have recently updated our rating system and the results of version 8 are not comparable with the results of version 7. More information is available here .
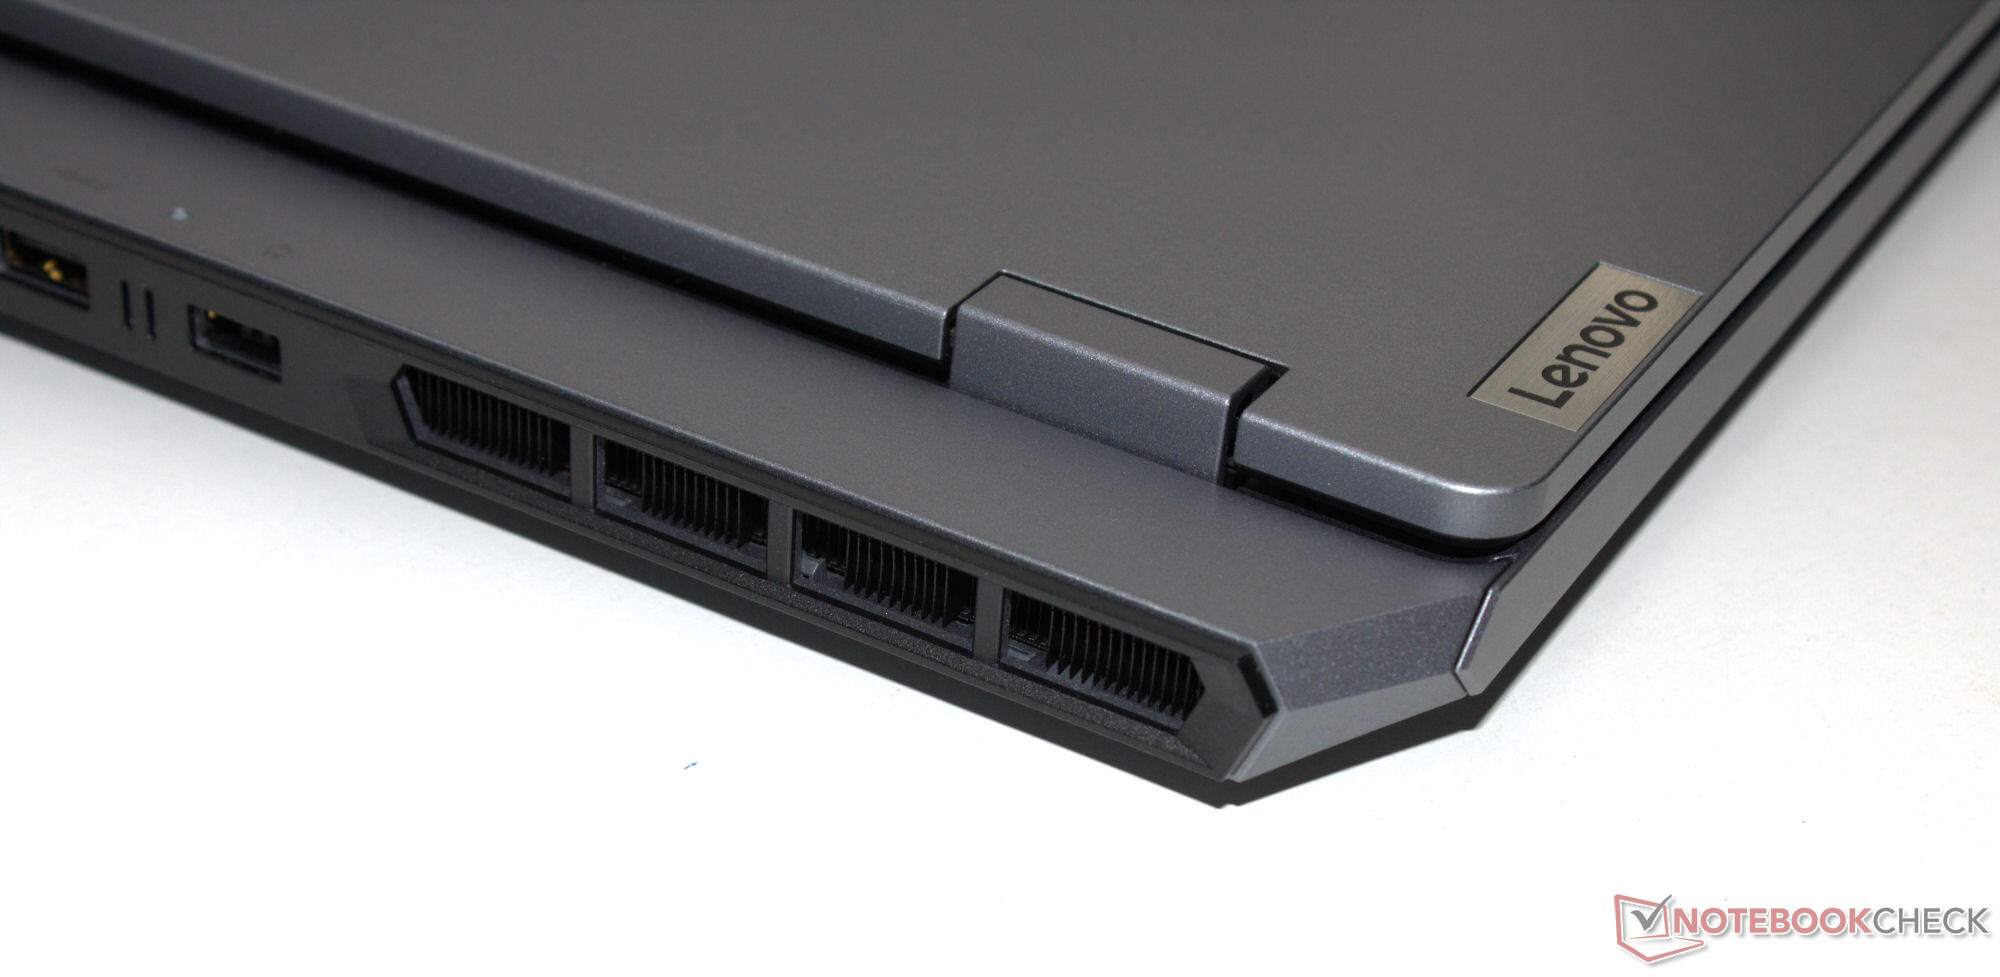
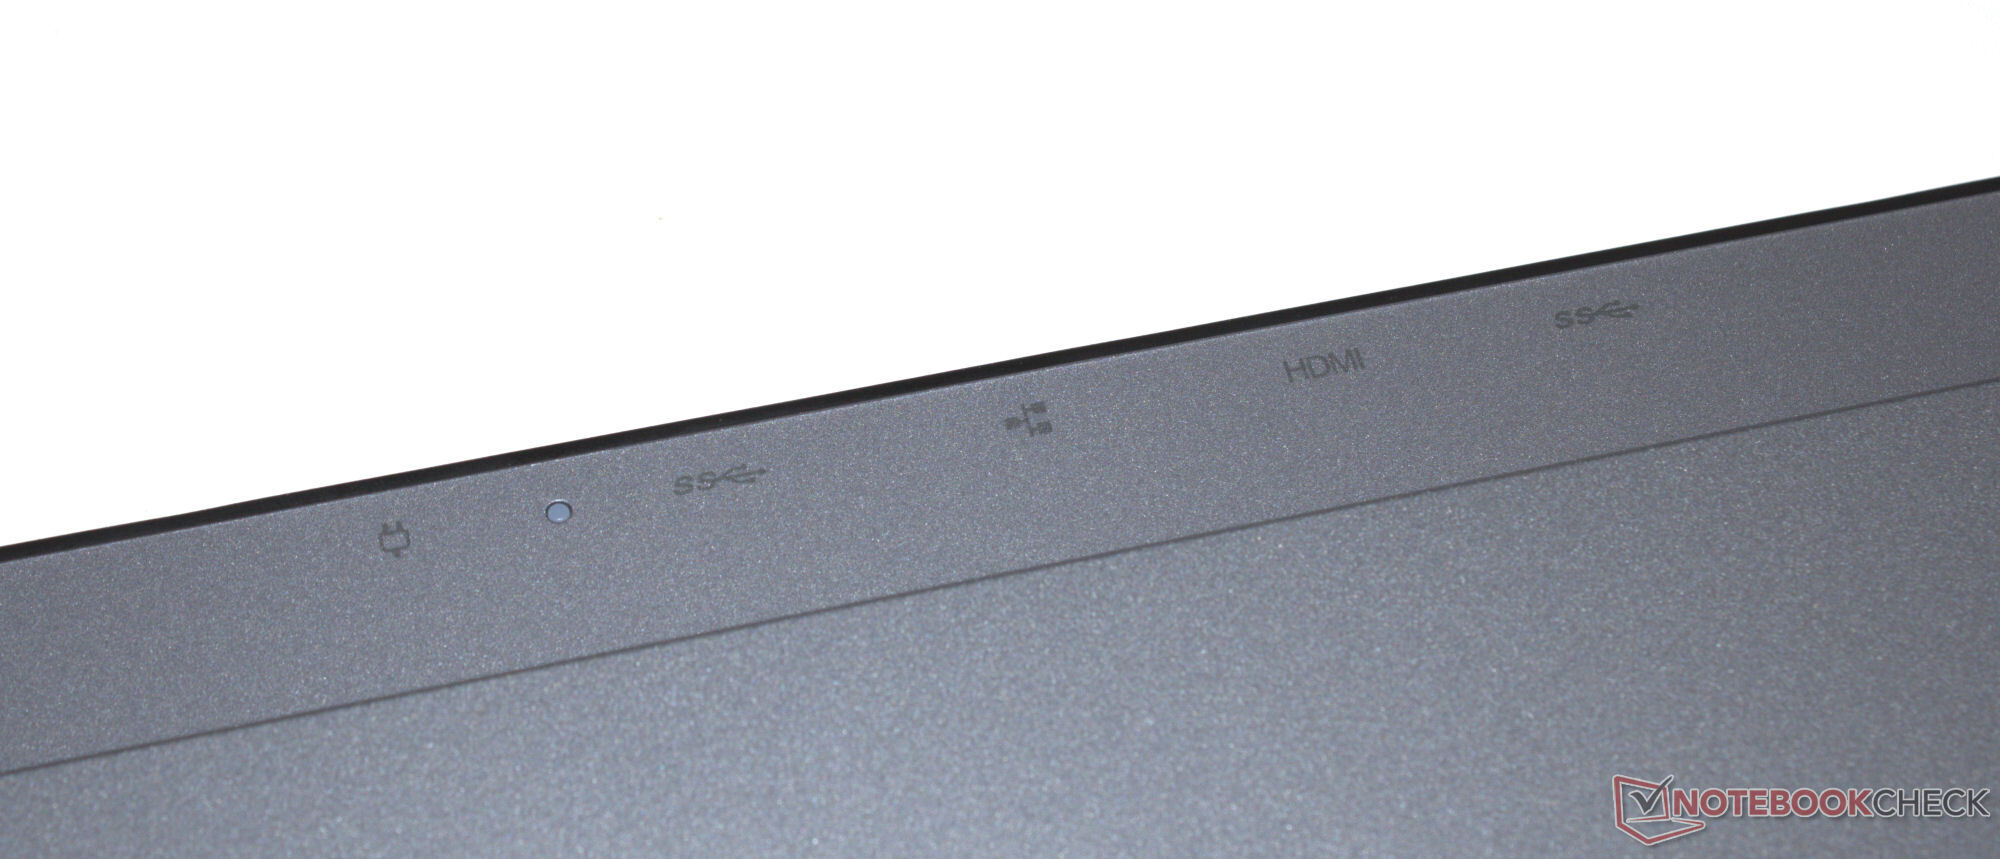
Case & connectivity - The LOQ without USB 4 but with Power Delivery
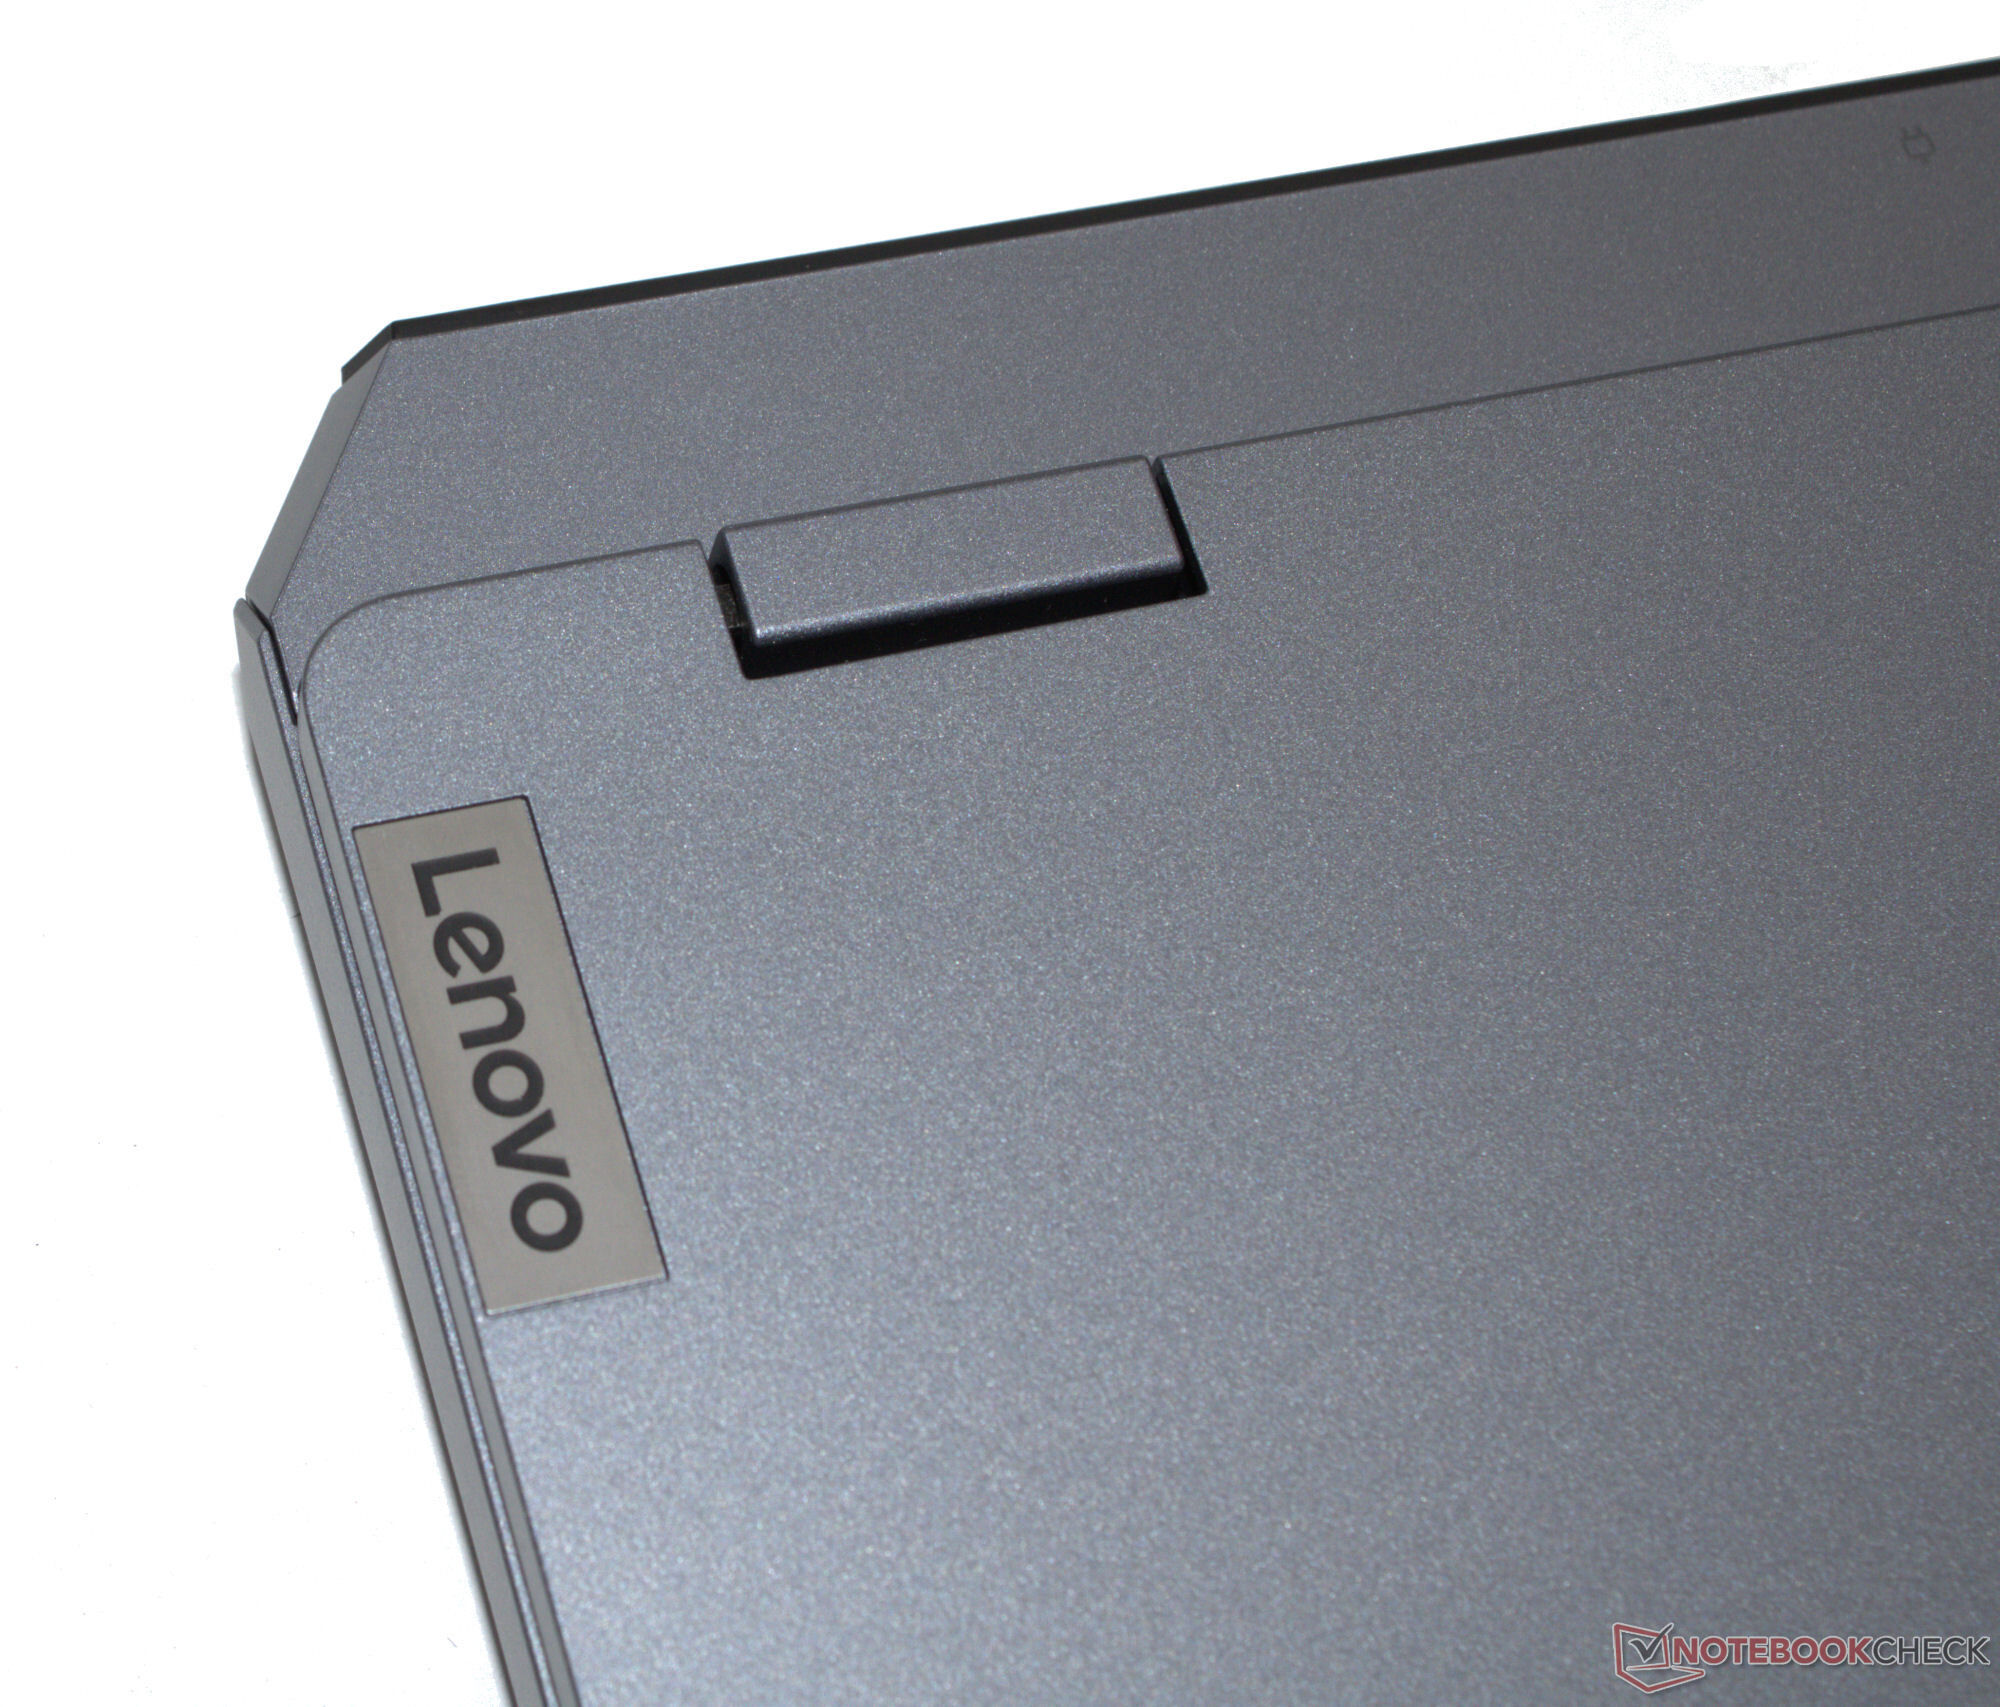
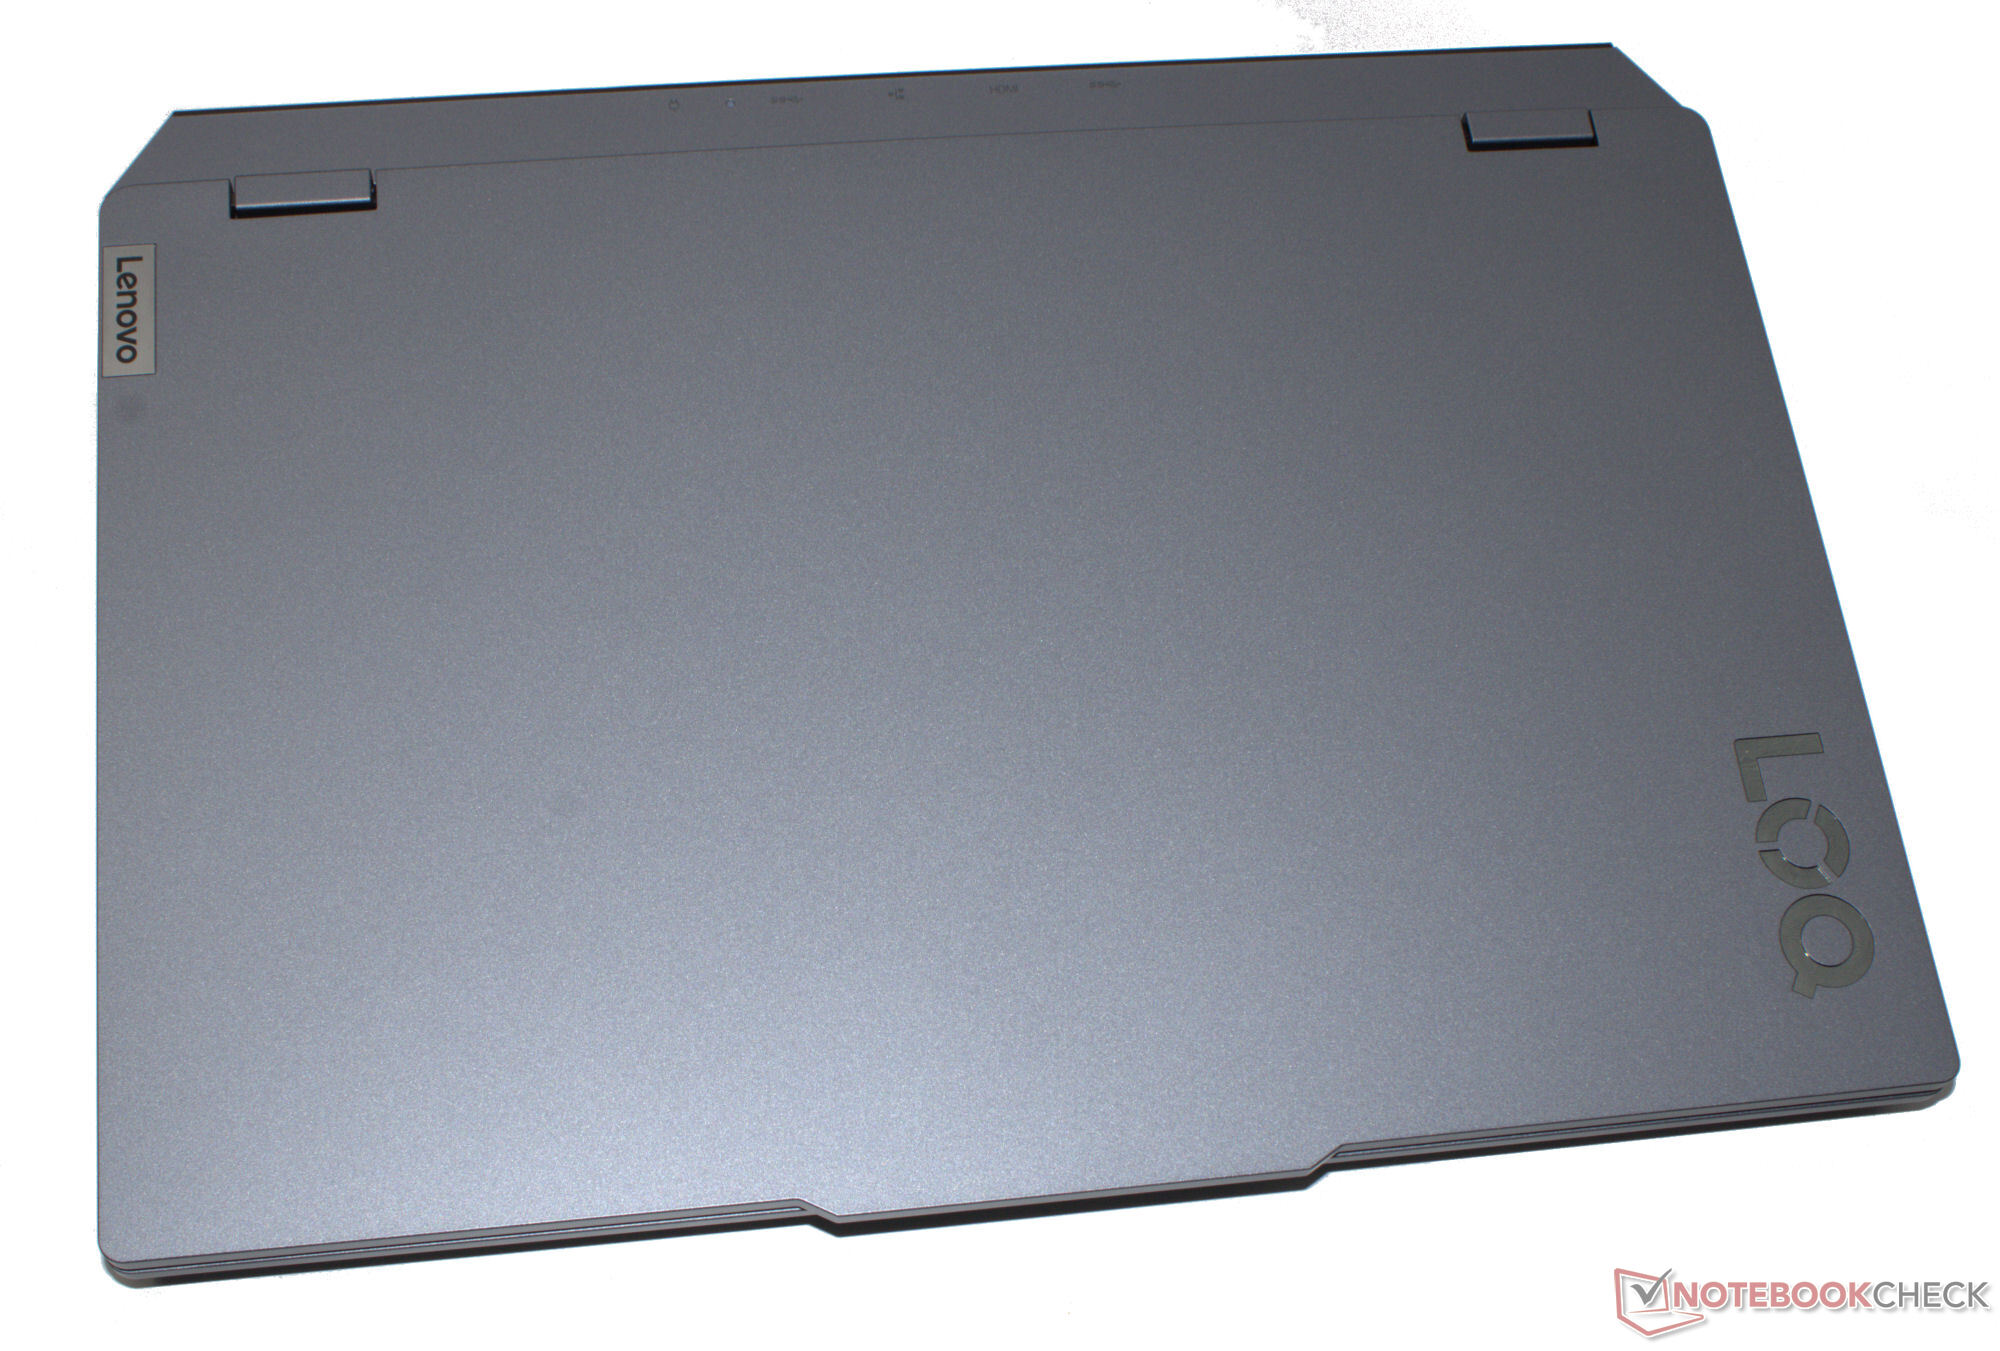
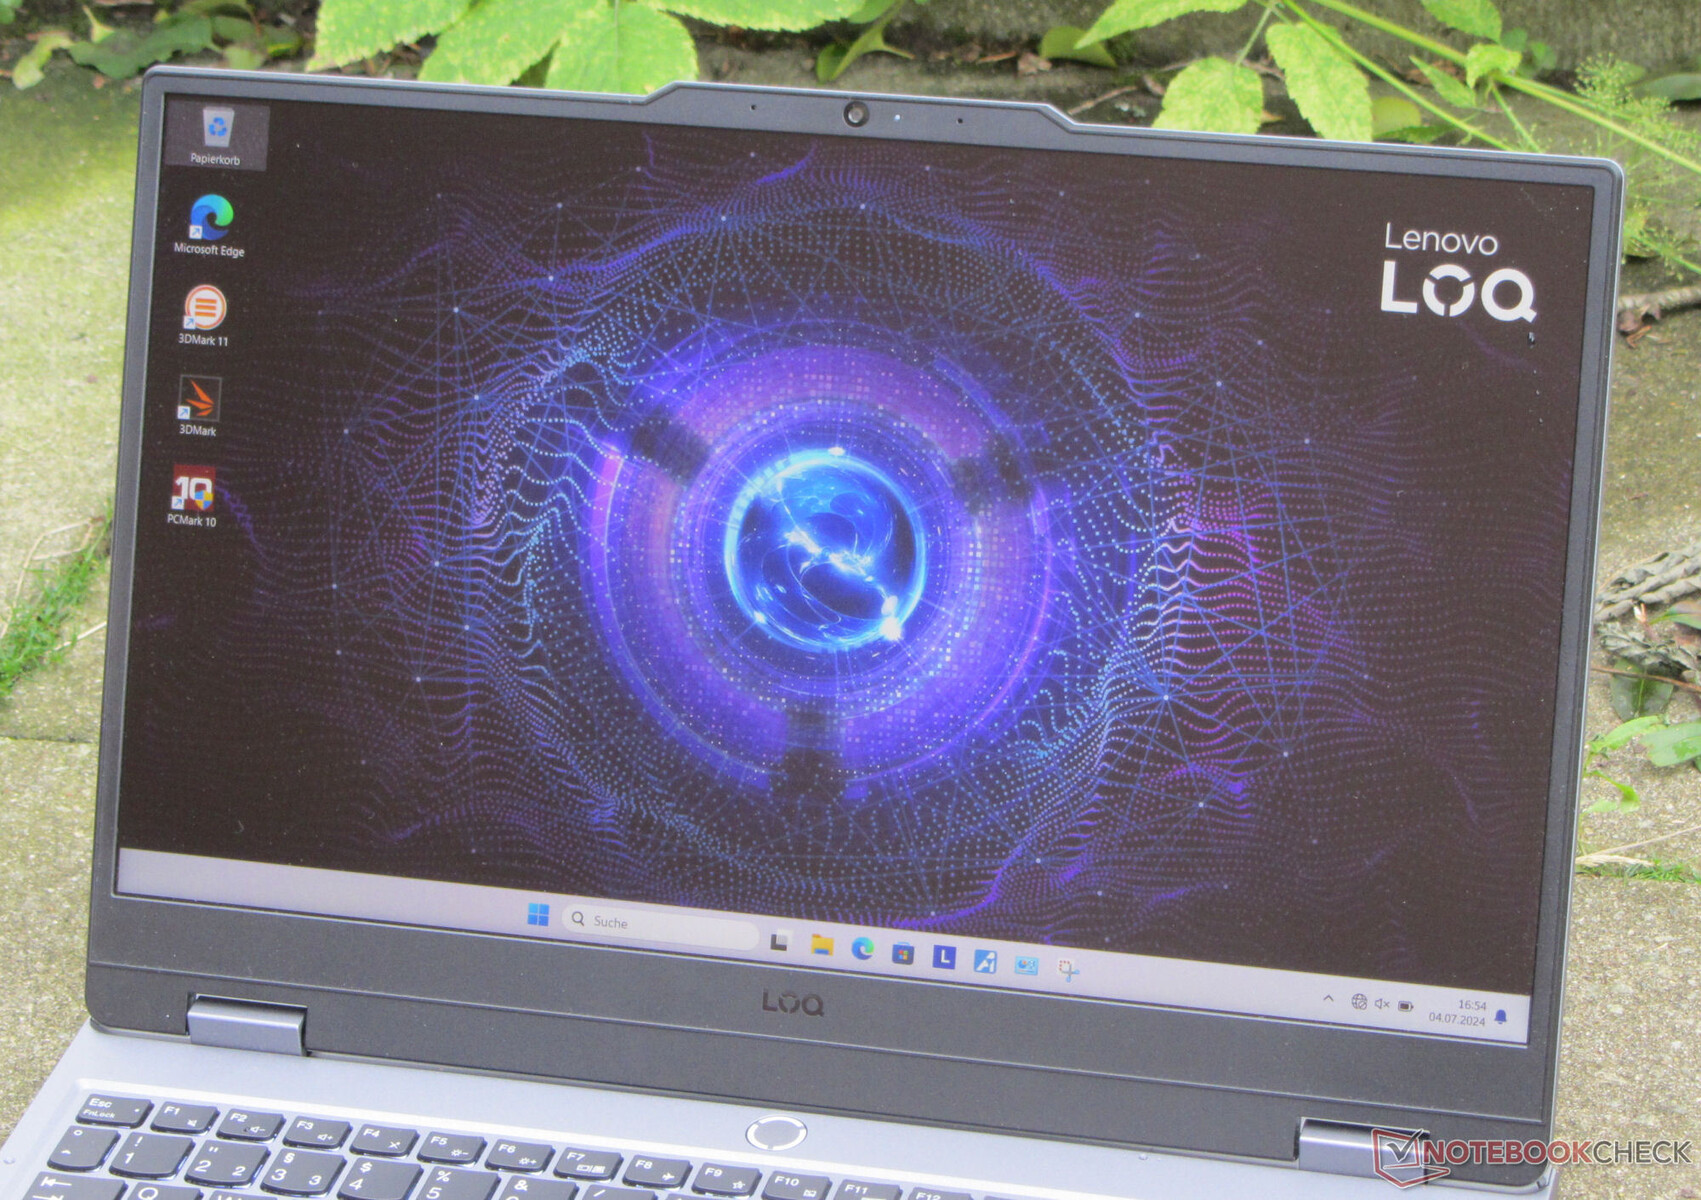
The laptop's hardware is housed inside a matte-gray (Luna Gray) plastic case that generally looks pretty sleek. The lid and base unit can be twisted ever so slightly, but this is still acceptable. Its stability is fine. The lid allows a maximum opening angle of up to 180 degrees. The LED strips that are typical for gaming laptops are nowhere to be seen on this model.
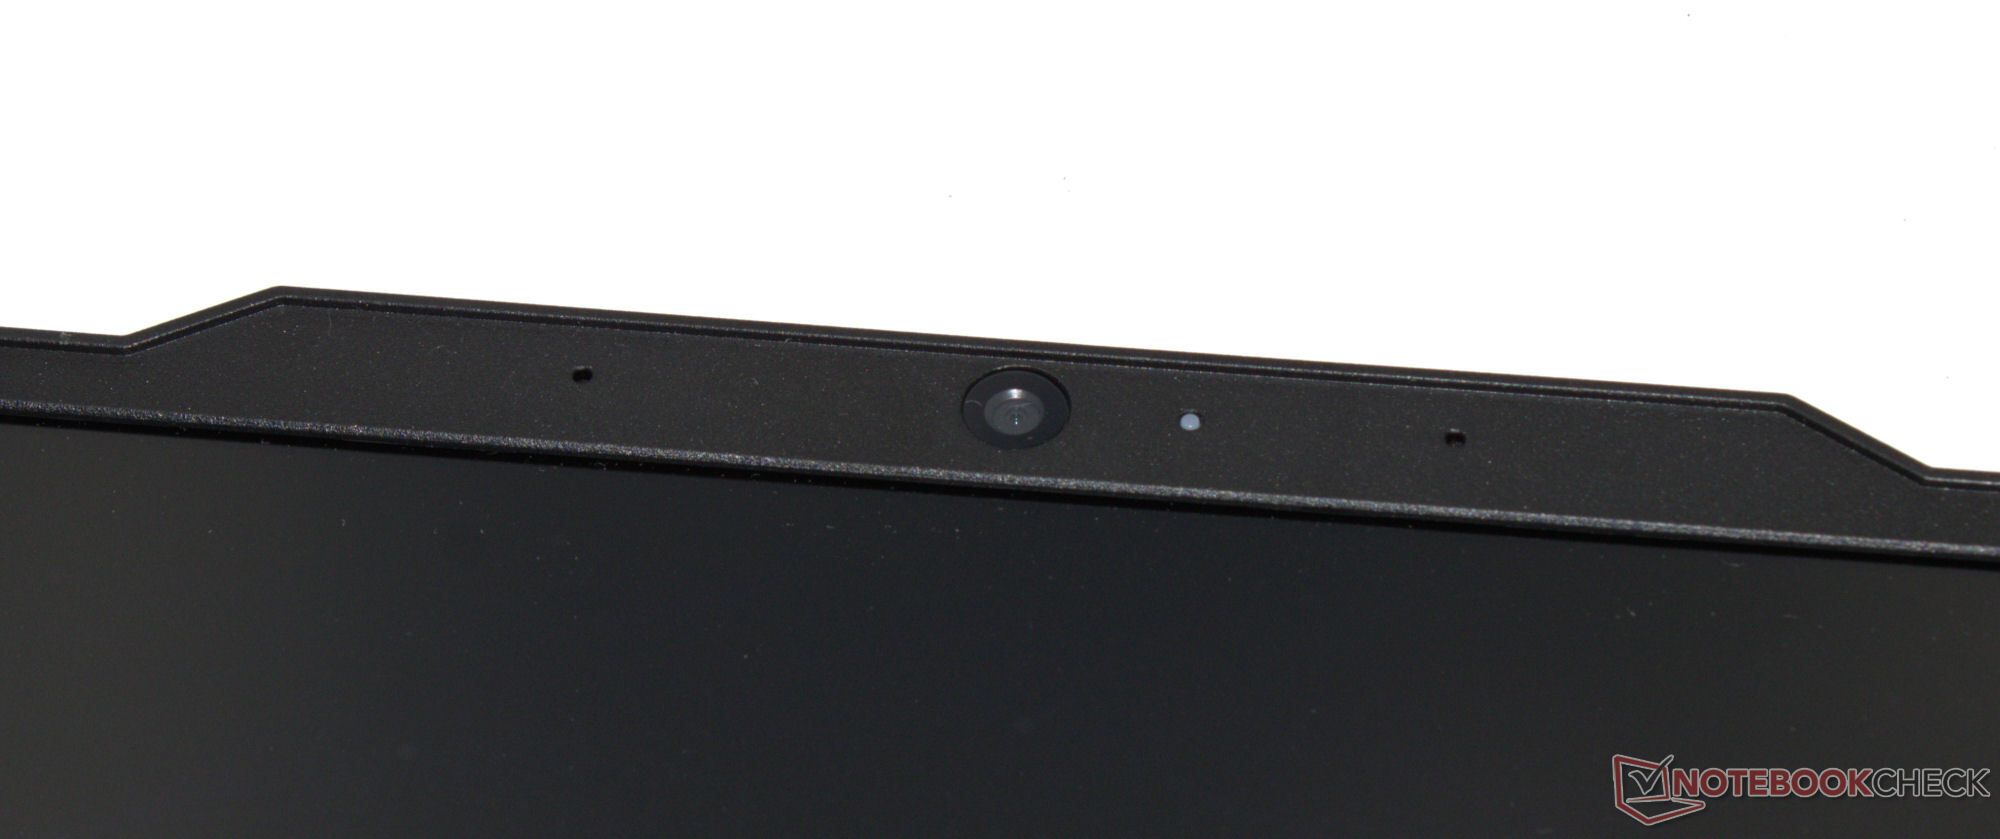
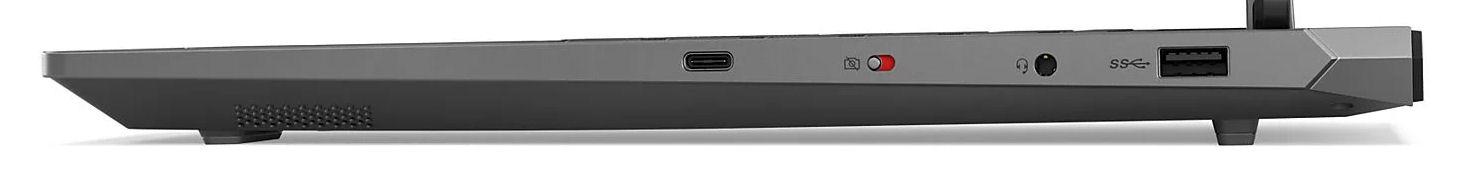
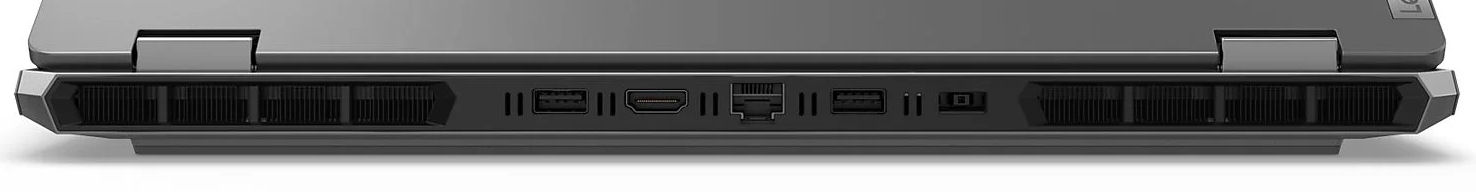
Three USB-A connections (USB 3.2 Gen 1) as well as a USB-C port (USB 3.2 Gen 2) should be enough for most users. The latter supports Power Delivery and the Display ALT mode. In total, the laptop has two video outputs (1x HDMI, 1x DP). Its webcam (2.1 MP, with on/off switch) delivers average results. Lenovo hasn't seen an SD card reader as necessary.
The WiFi data rates we measured are solid, but they trail behind what is possible nowadays. The Lenovo laptop's Realtek WiFi 6 chip (RTL8852BE) can't reach the same speeds as the Intel chips installed into lots of its competitors.


Sustainability
The laptop and power supply are packaged inside a plastic bag each, while the LOQ is protected during transmit by foam inserts. The types of plastic used are named by the manufacturer. A paper cover protects the power supply from getting scratched. All of this is housed inside a cardboard box—according to the labelling, the wood that has been used originates from sustainable forestry.
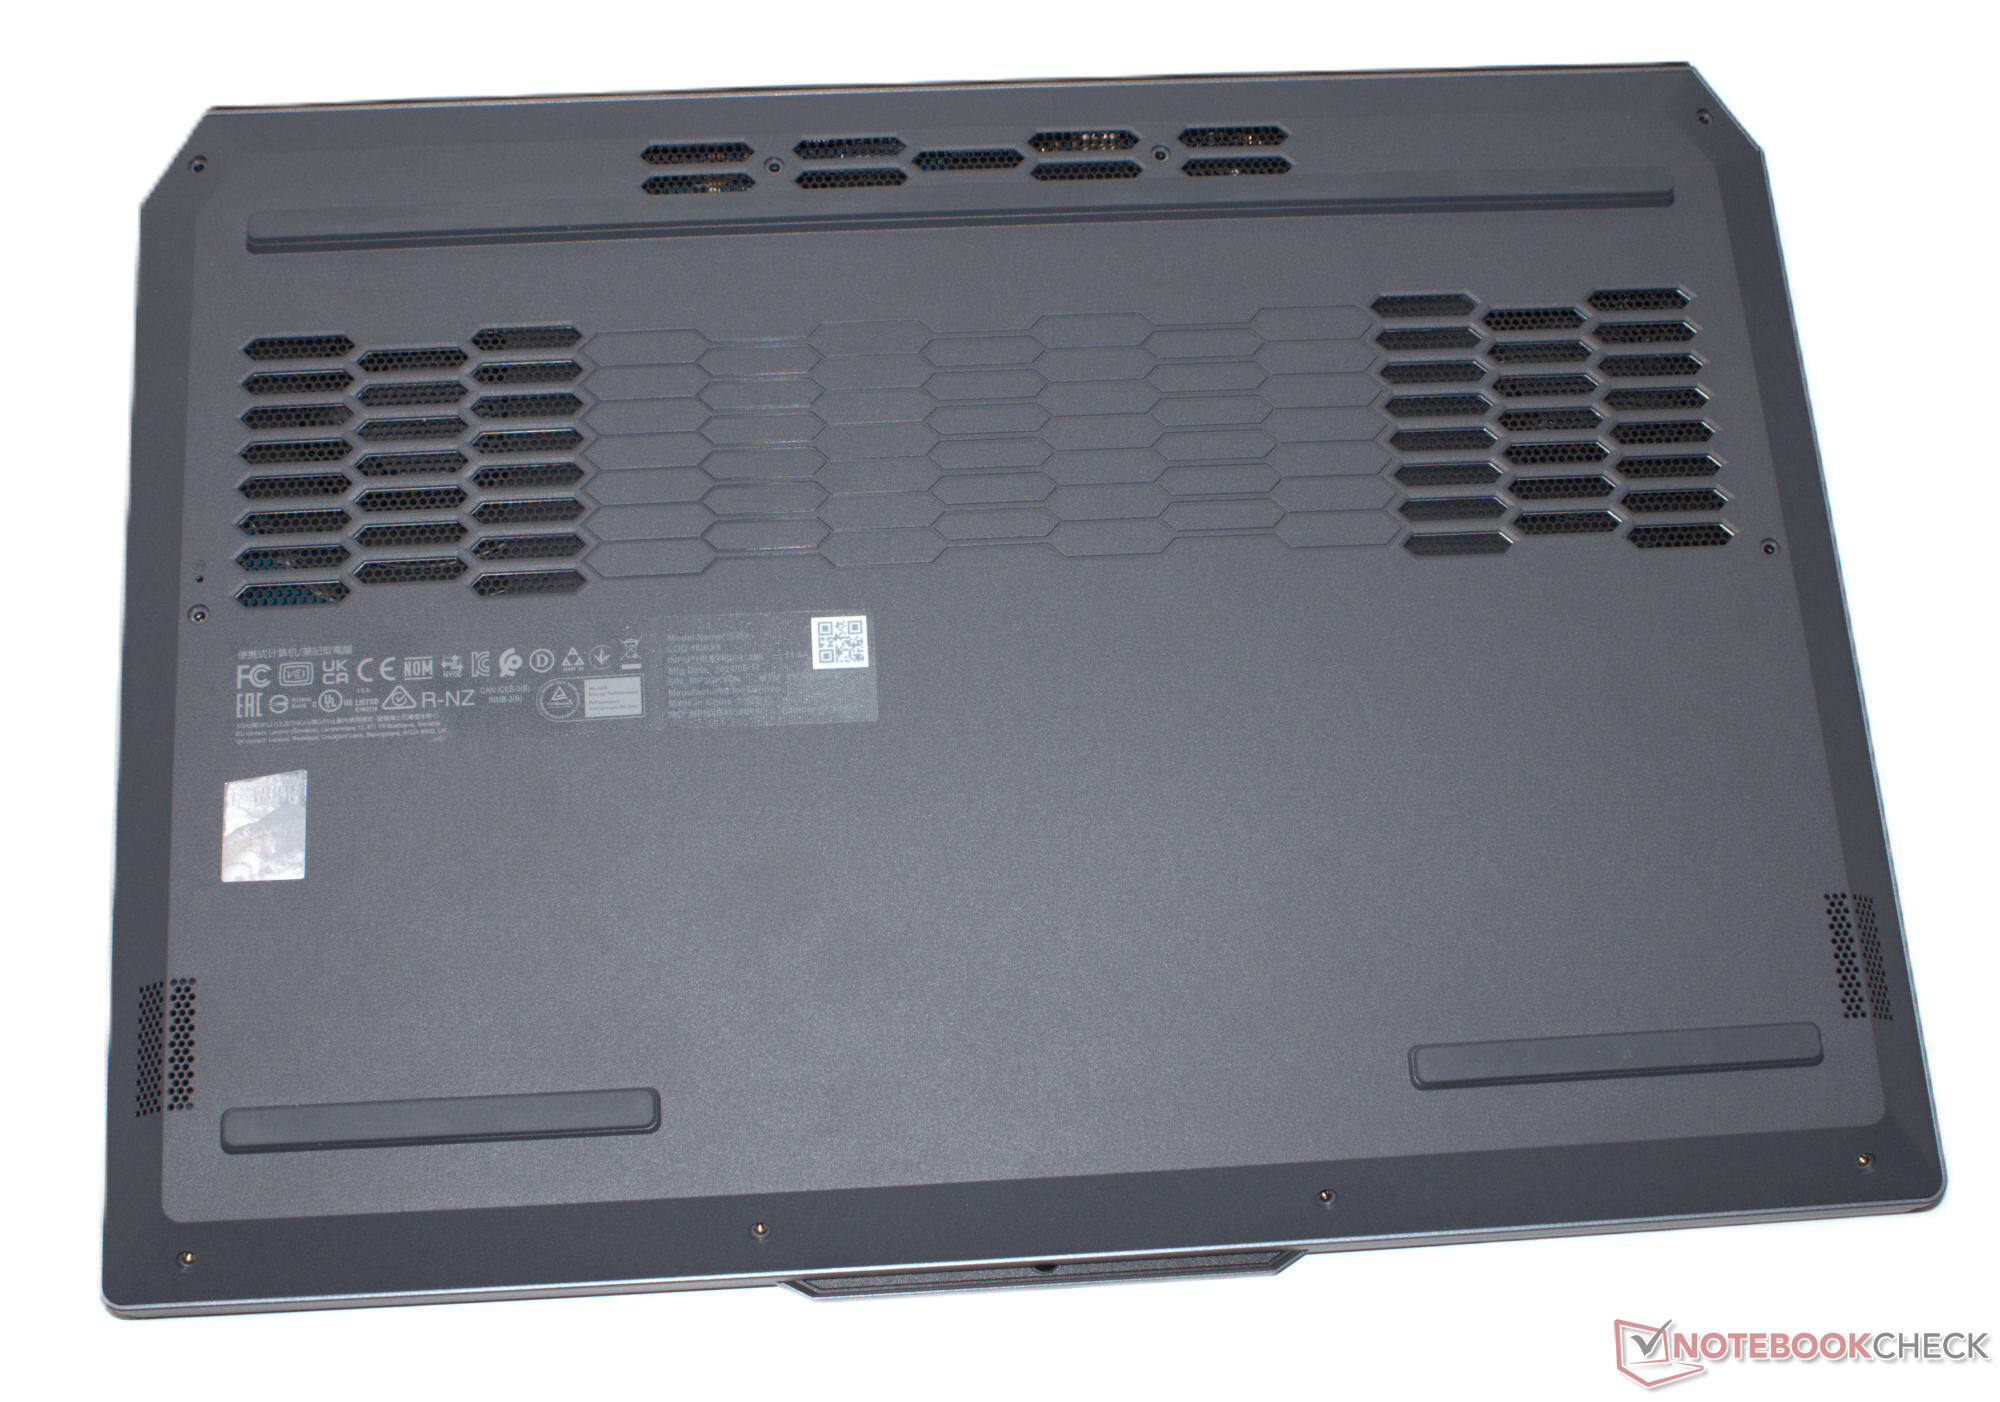
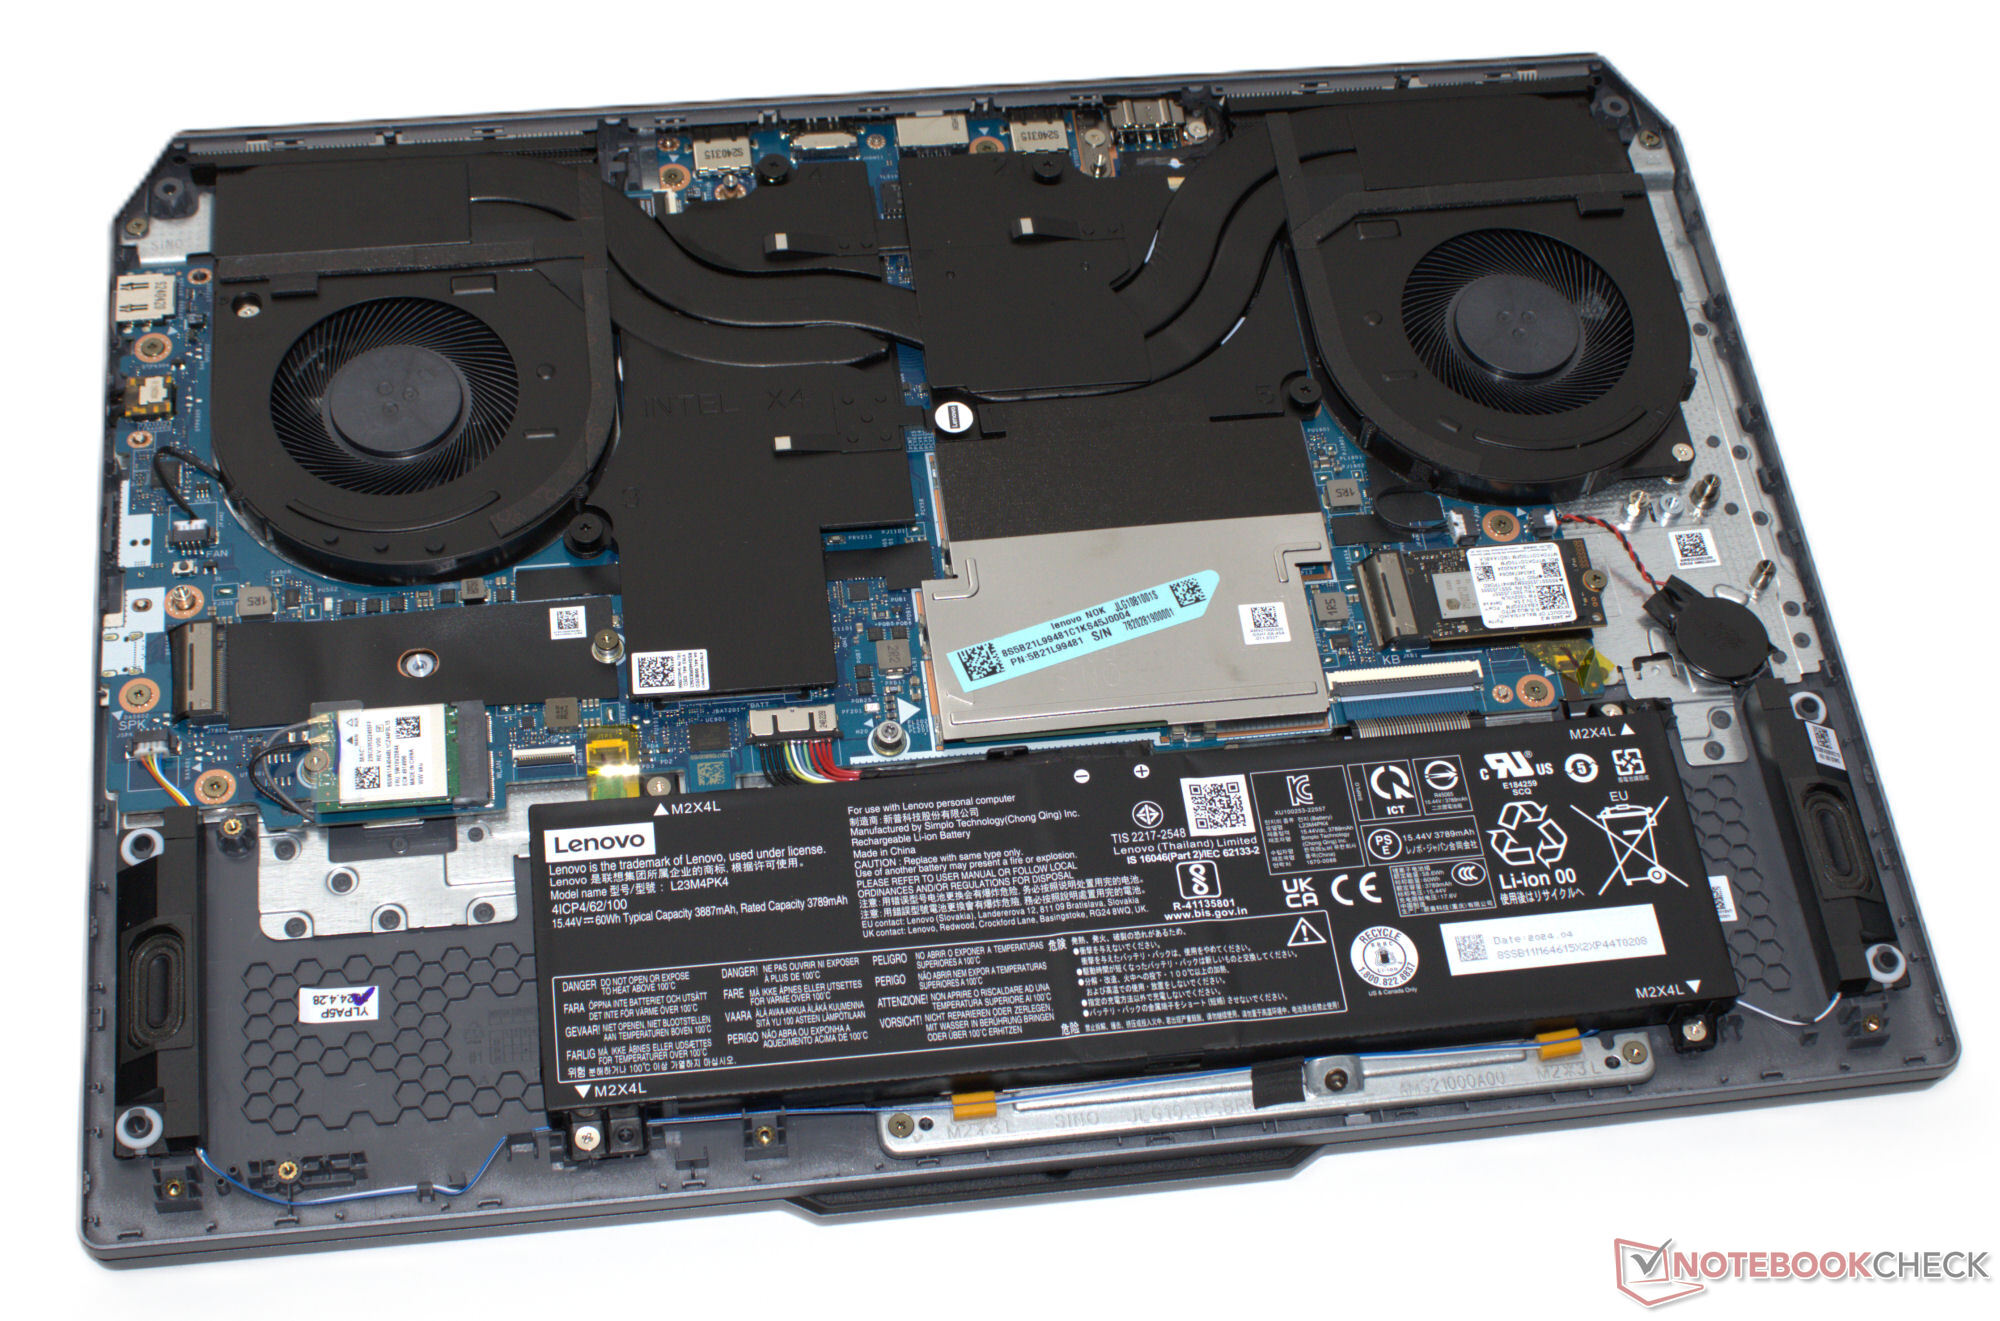
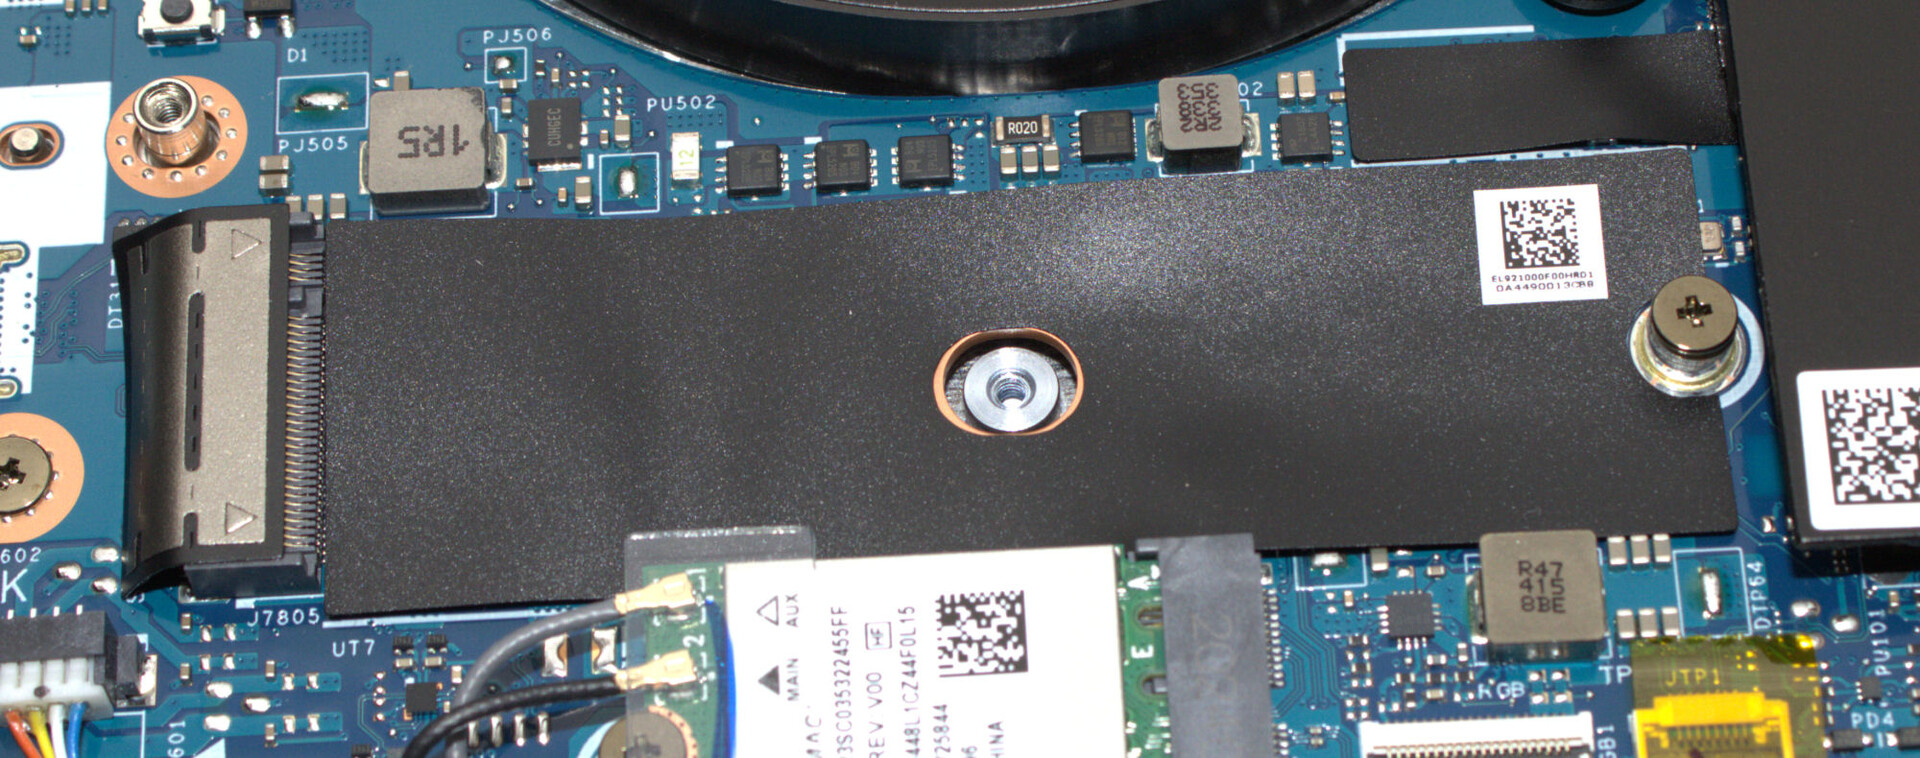
It should be quite easy to repair the device: The bottom plate can be removed with no issues, which then gives you access to all the hardware. We didn't come across any glued parts inside the case. As Windows 11 is used as an operating system, software updates should be guaranteed for the coming years. Lenovo's support ends on December 31, 2029.
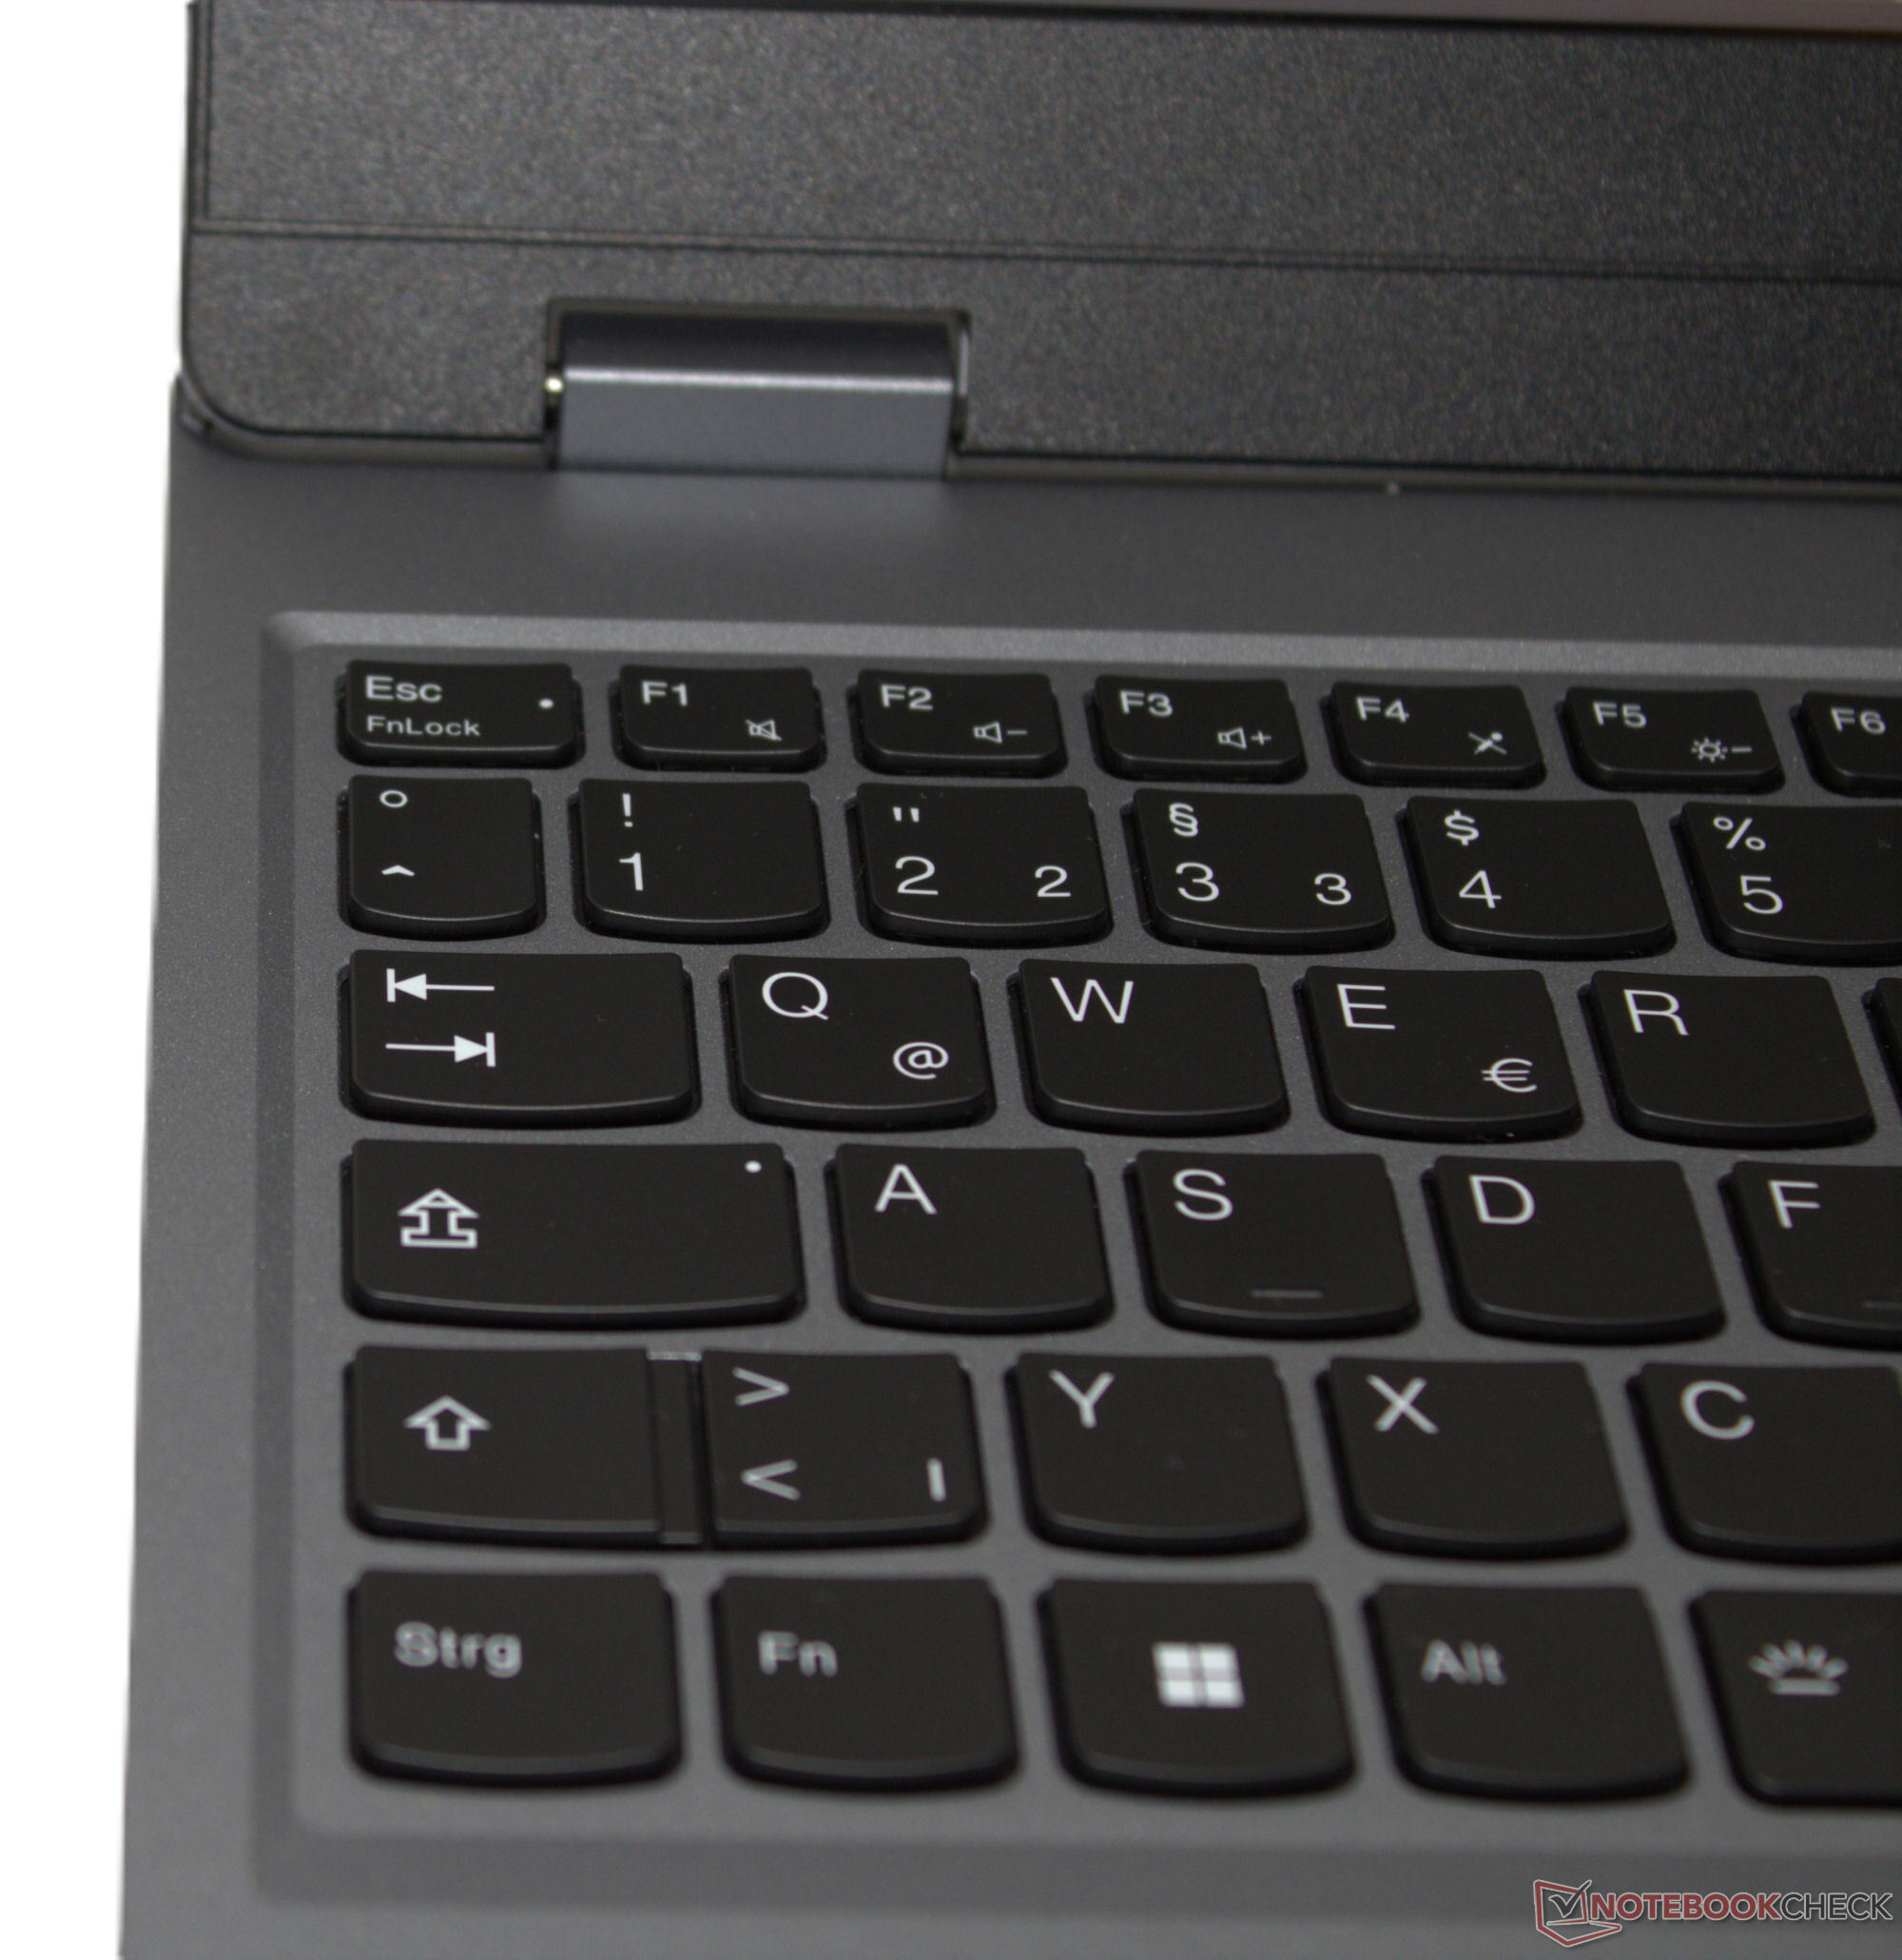
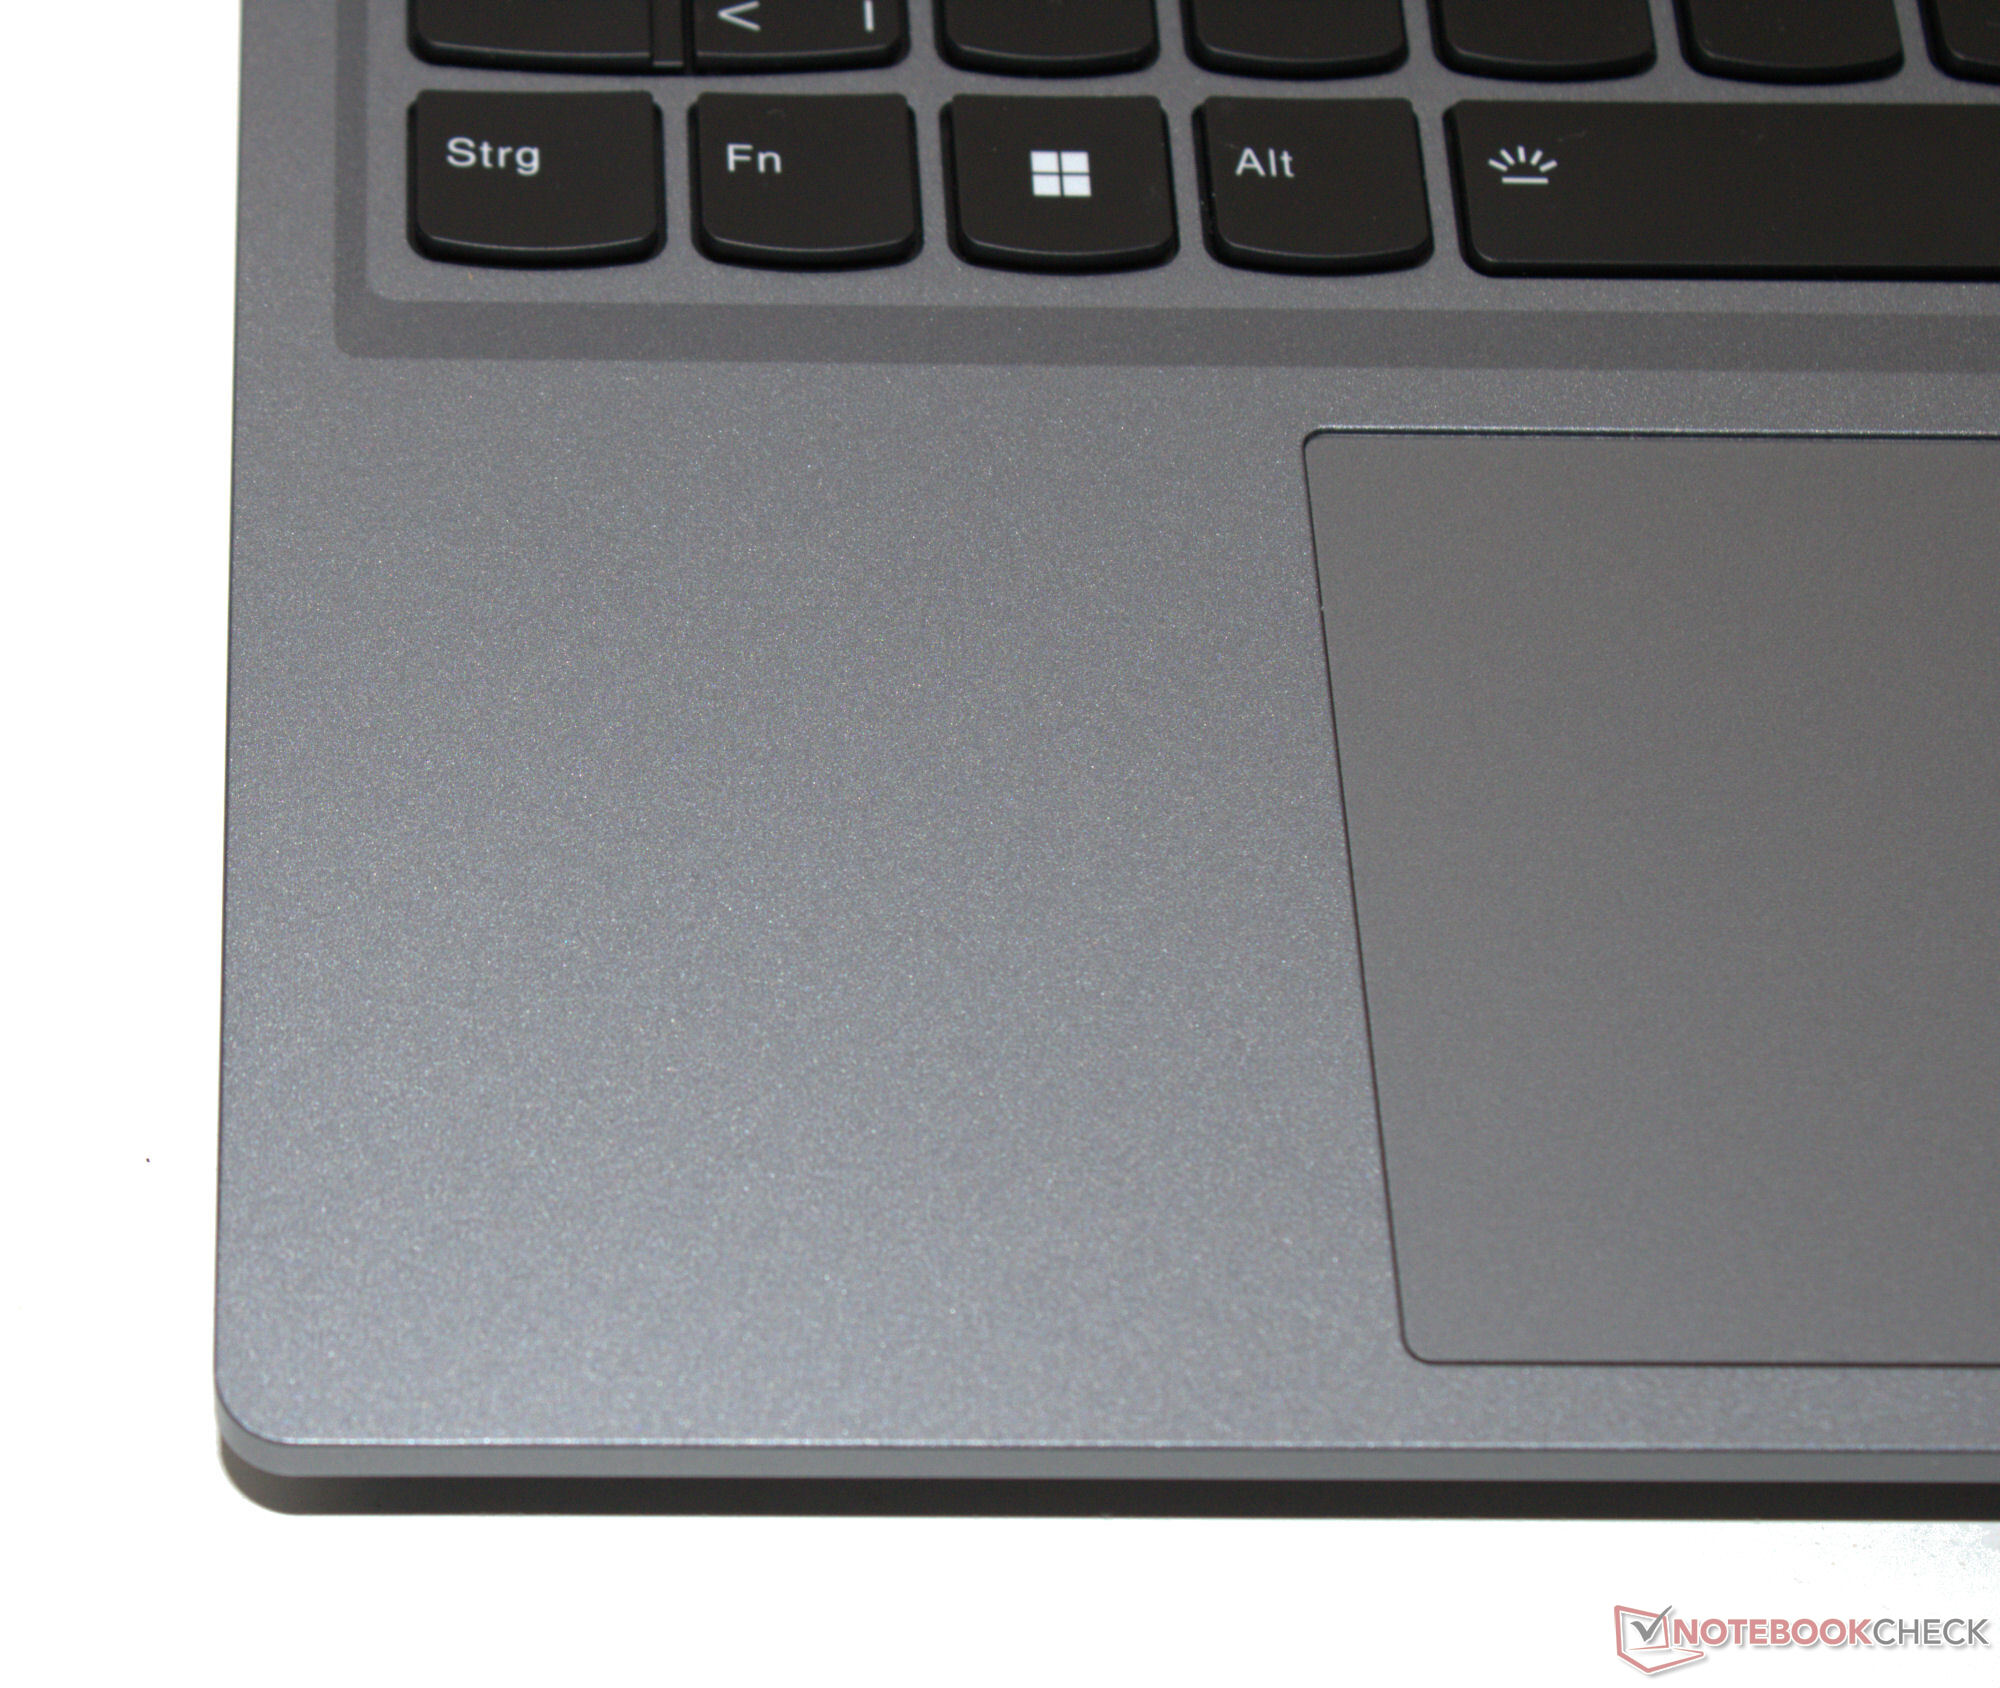
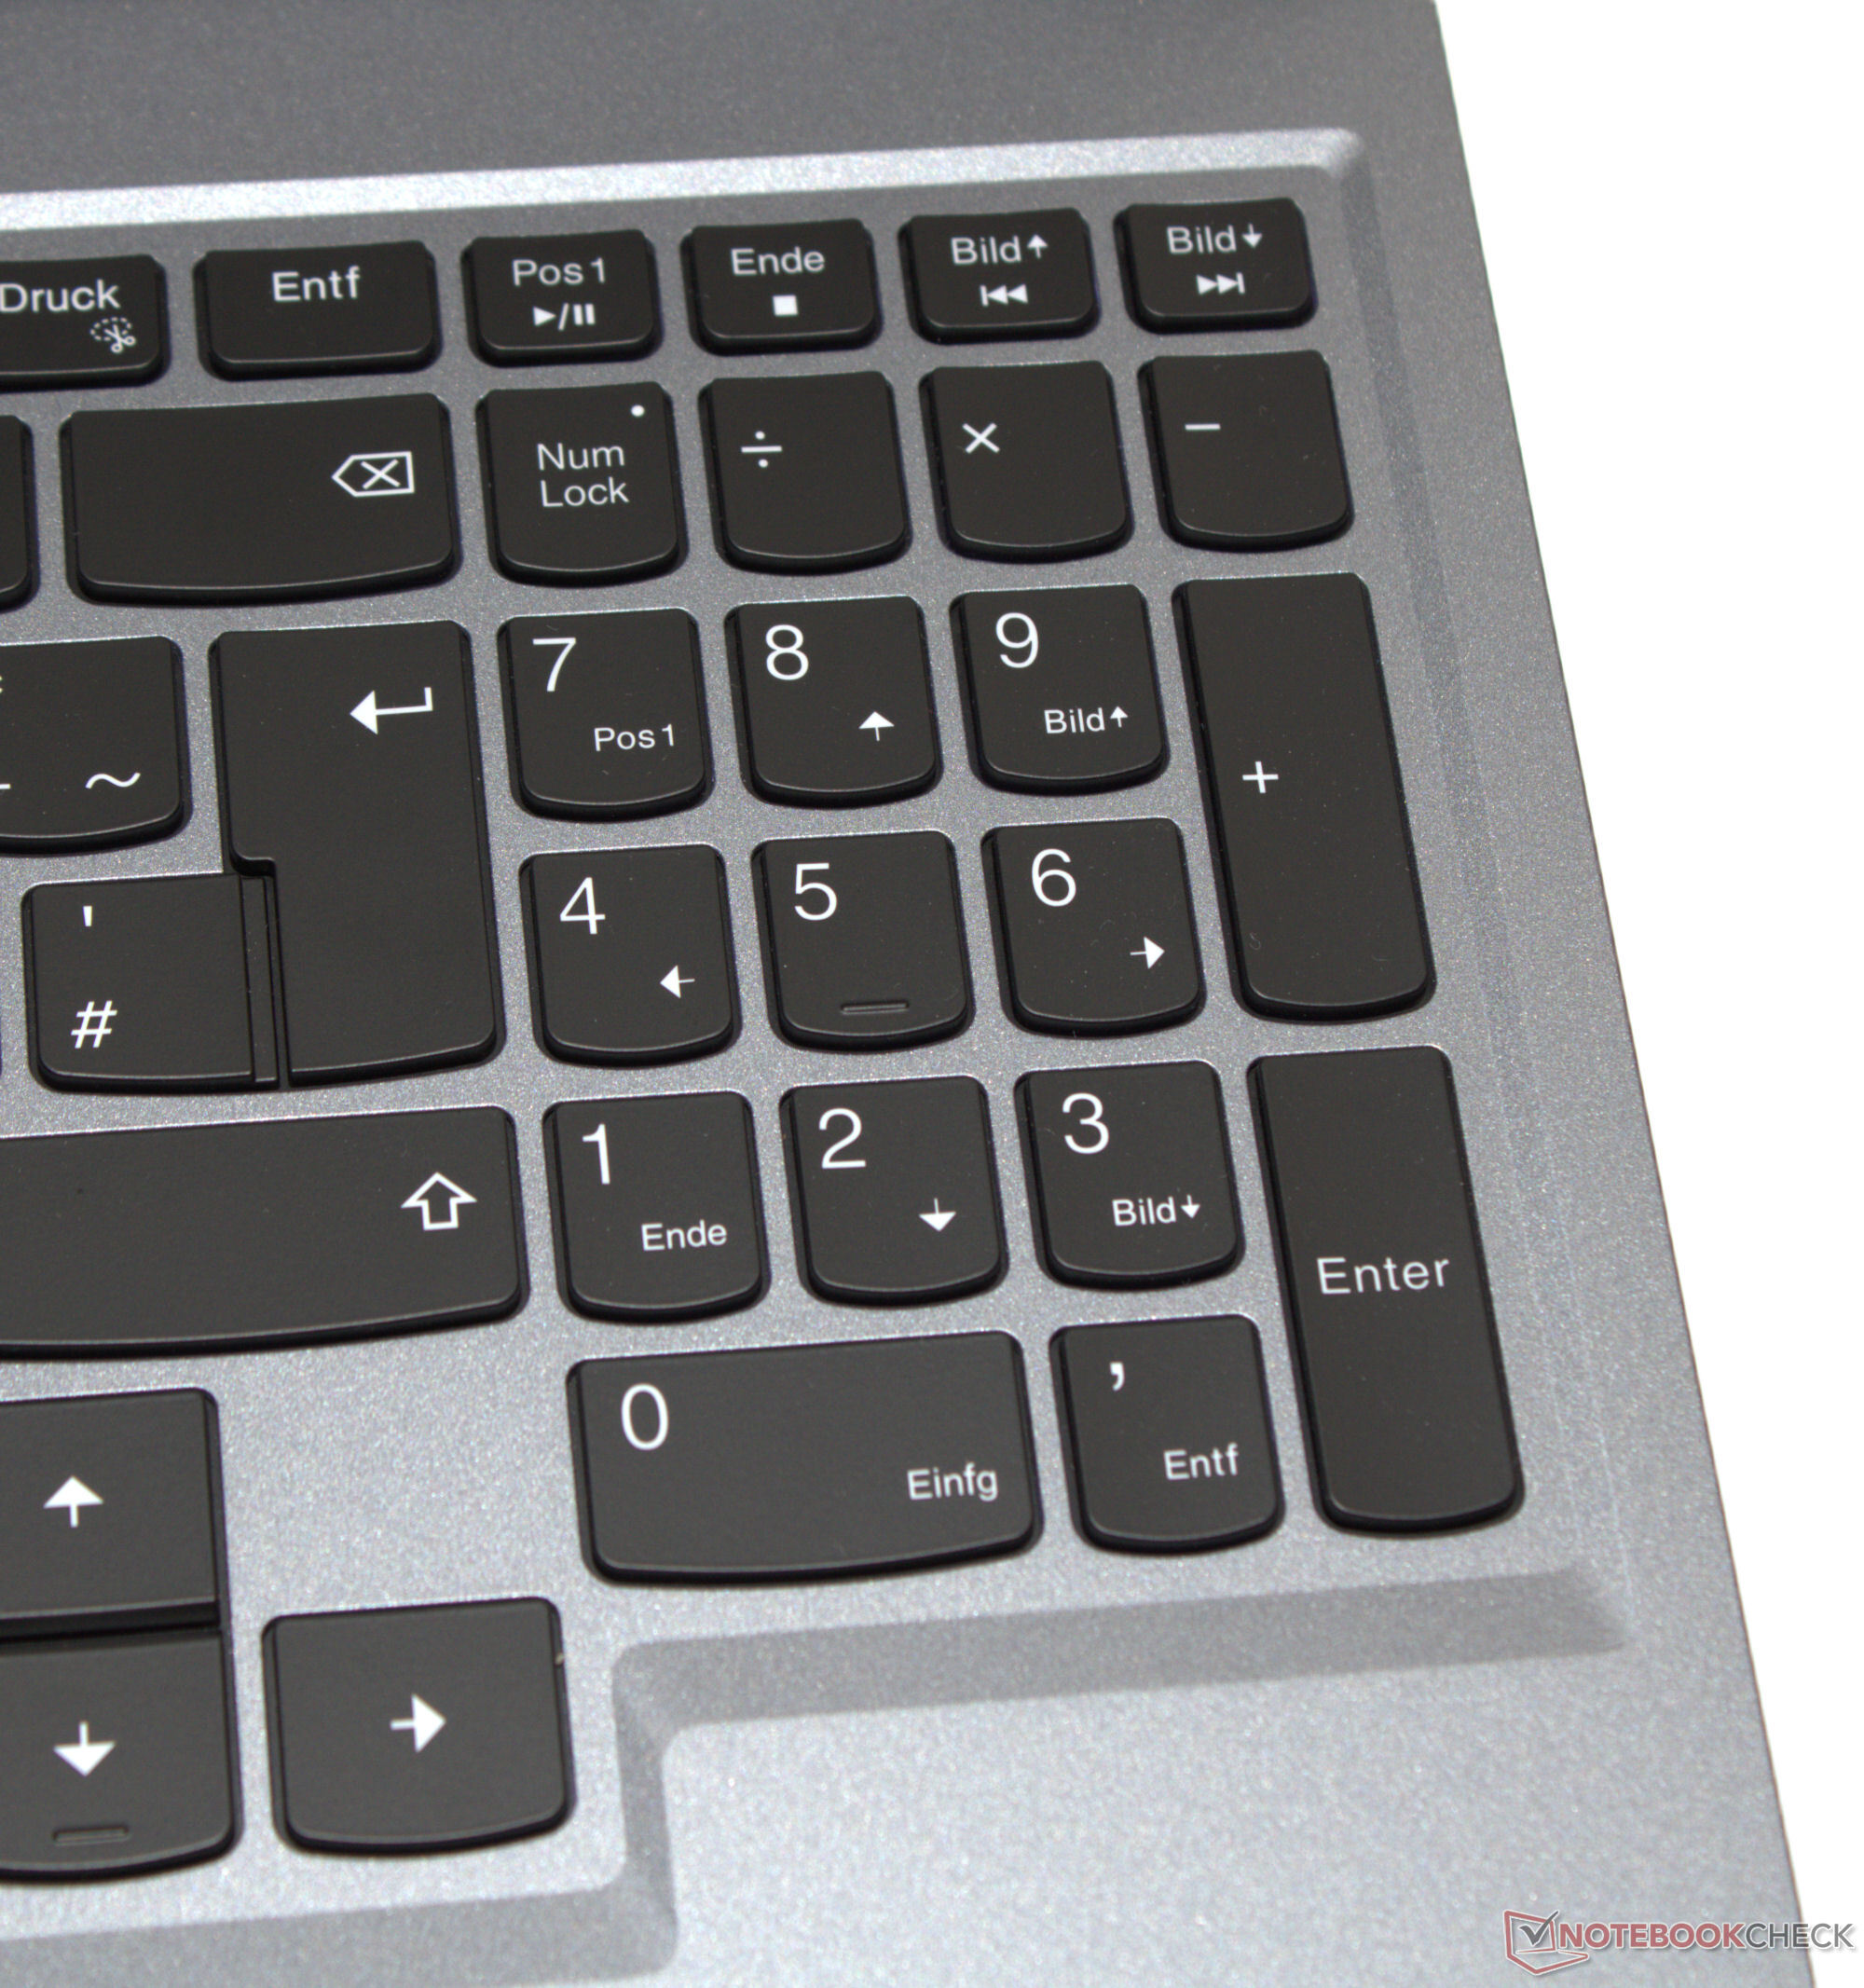
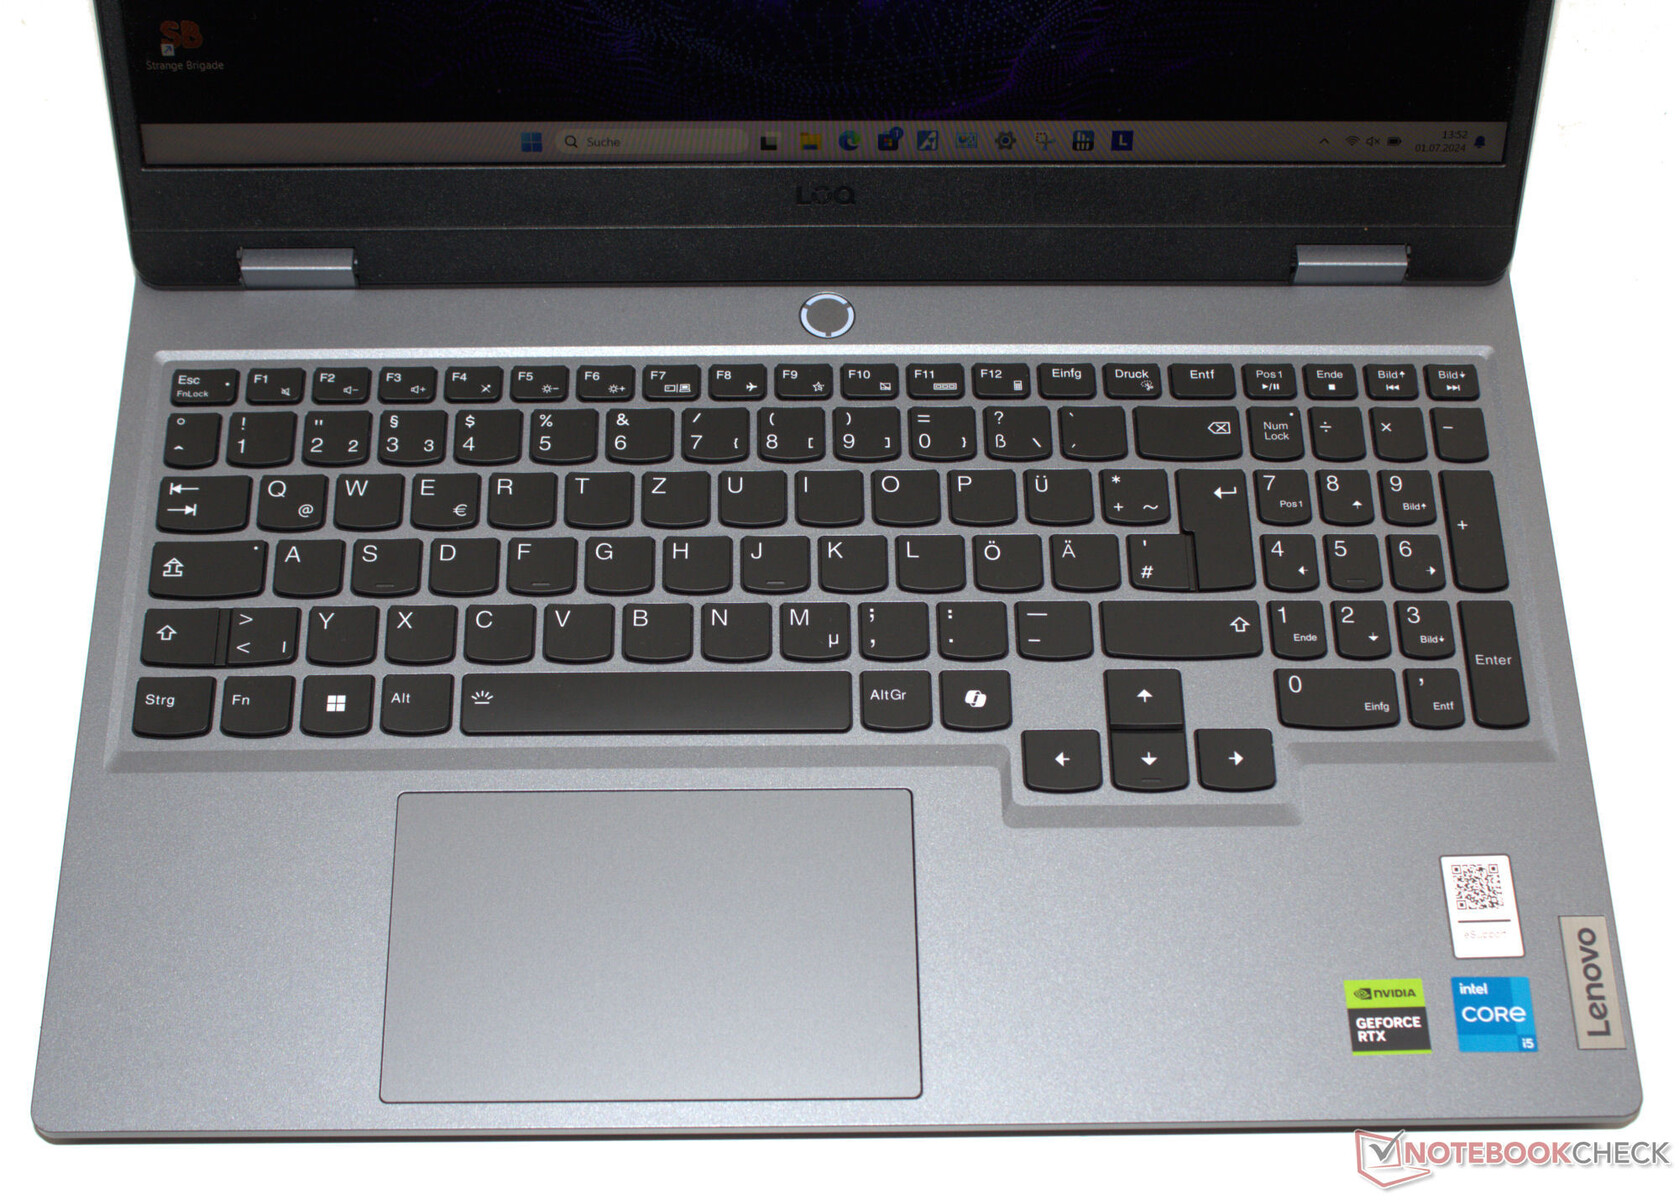
Input devices - The Lenovo laptop features large arrow keys
The chiclet keyboard with white backlighting stretches out across the entire width of the laptop—plus, it features a numeric keypad. The shape and arrangement of the keys correspond to the familiar Lenovo layout. The concave keys offer a nice resistance and a clear pressure point. The keyboard yields slightly when typing, but this is not a problem. A positive: The offset, full-sized arrow keys are comfortable to use. A multi-touch clickpad (approx. 12 x 7.5 cm) with a short lift and clear pressure point serves as a mouse replacement.
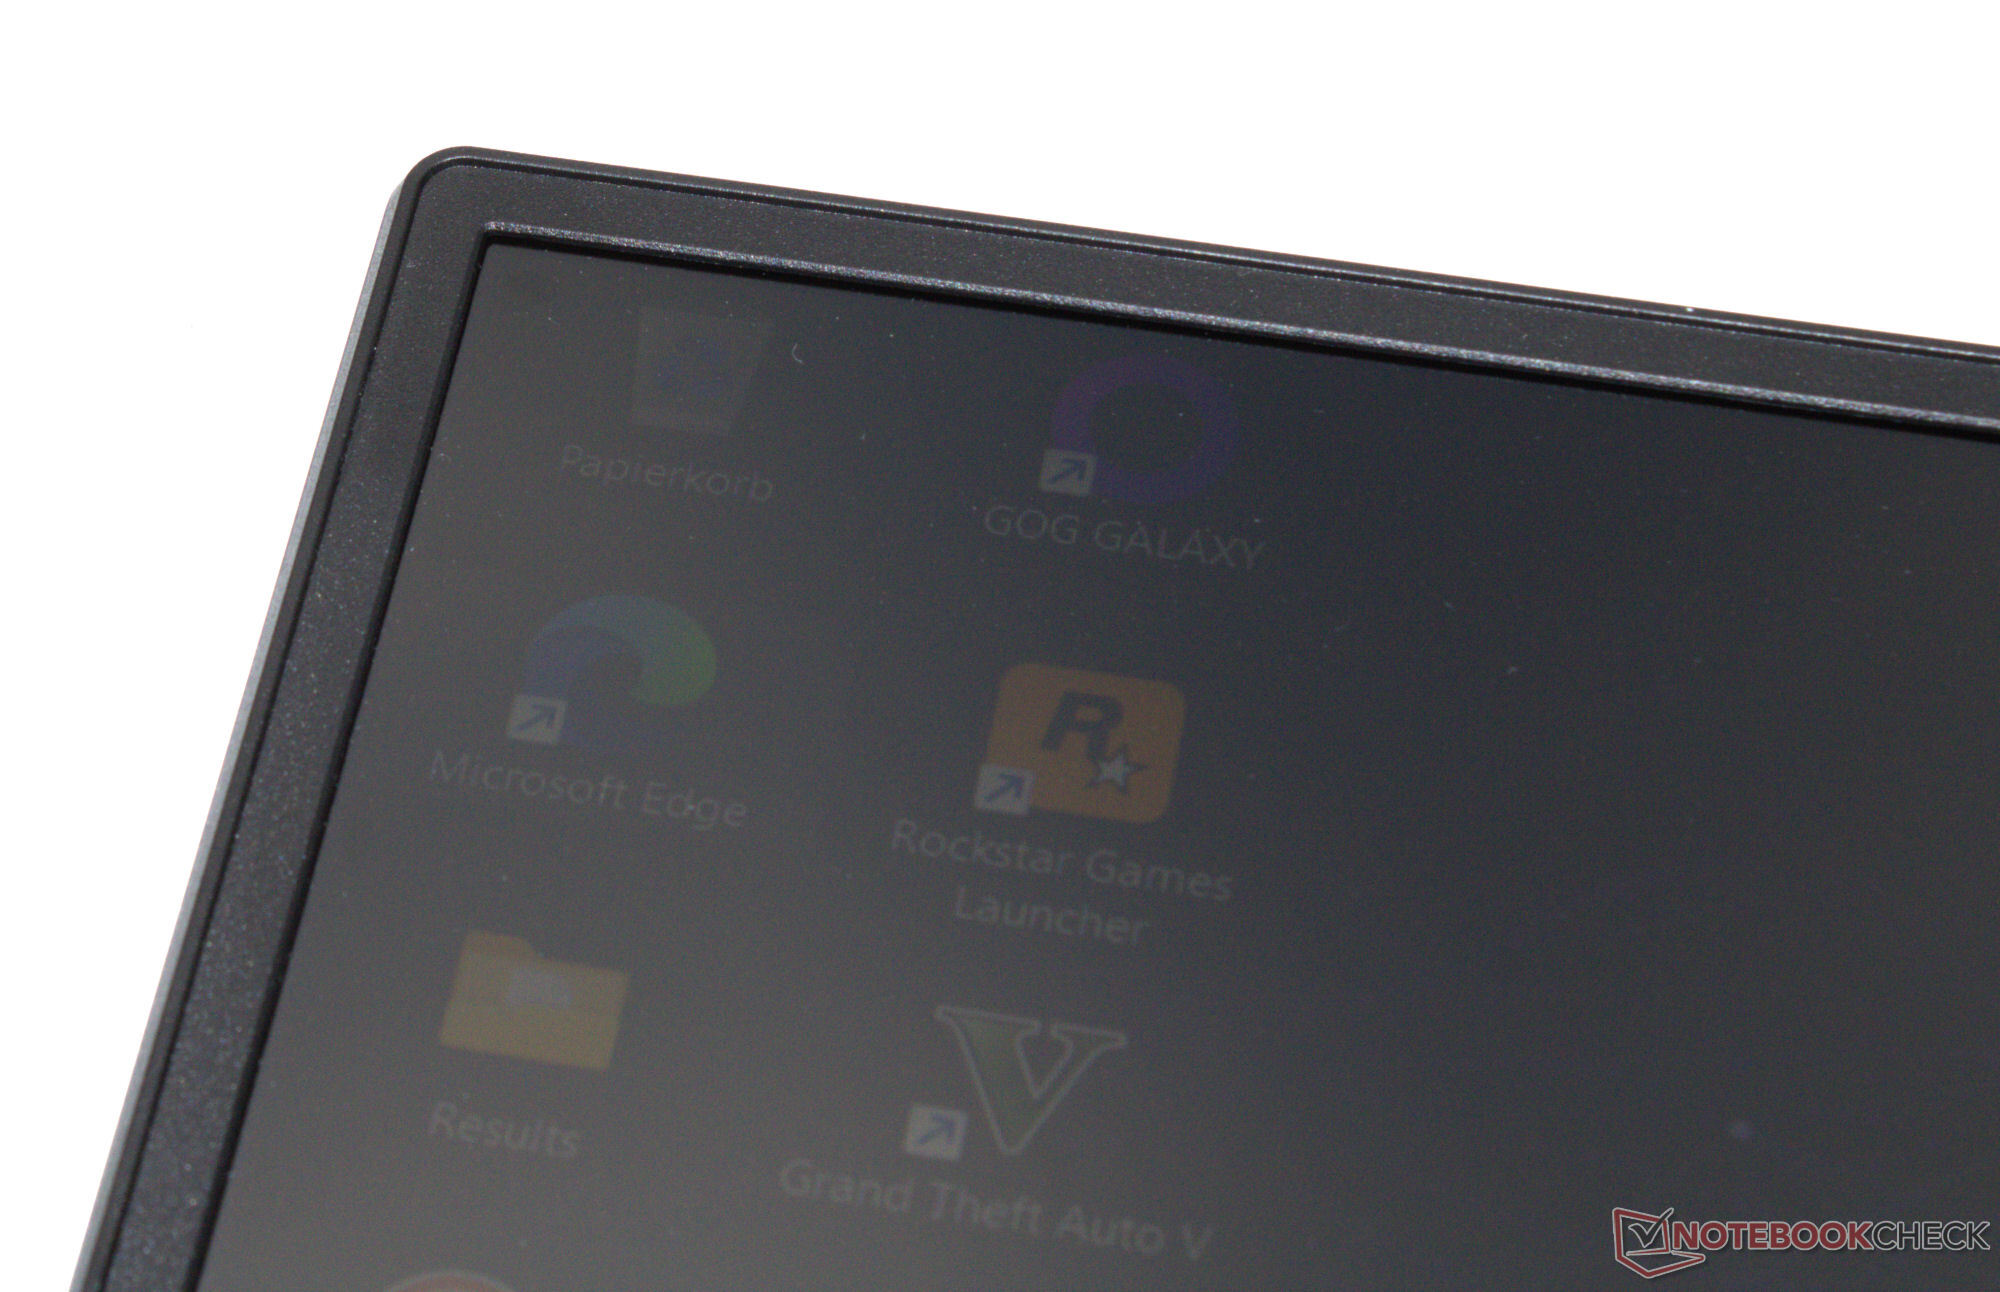
Display - IPS on board
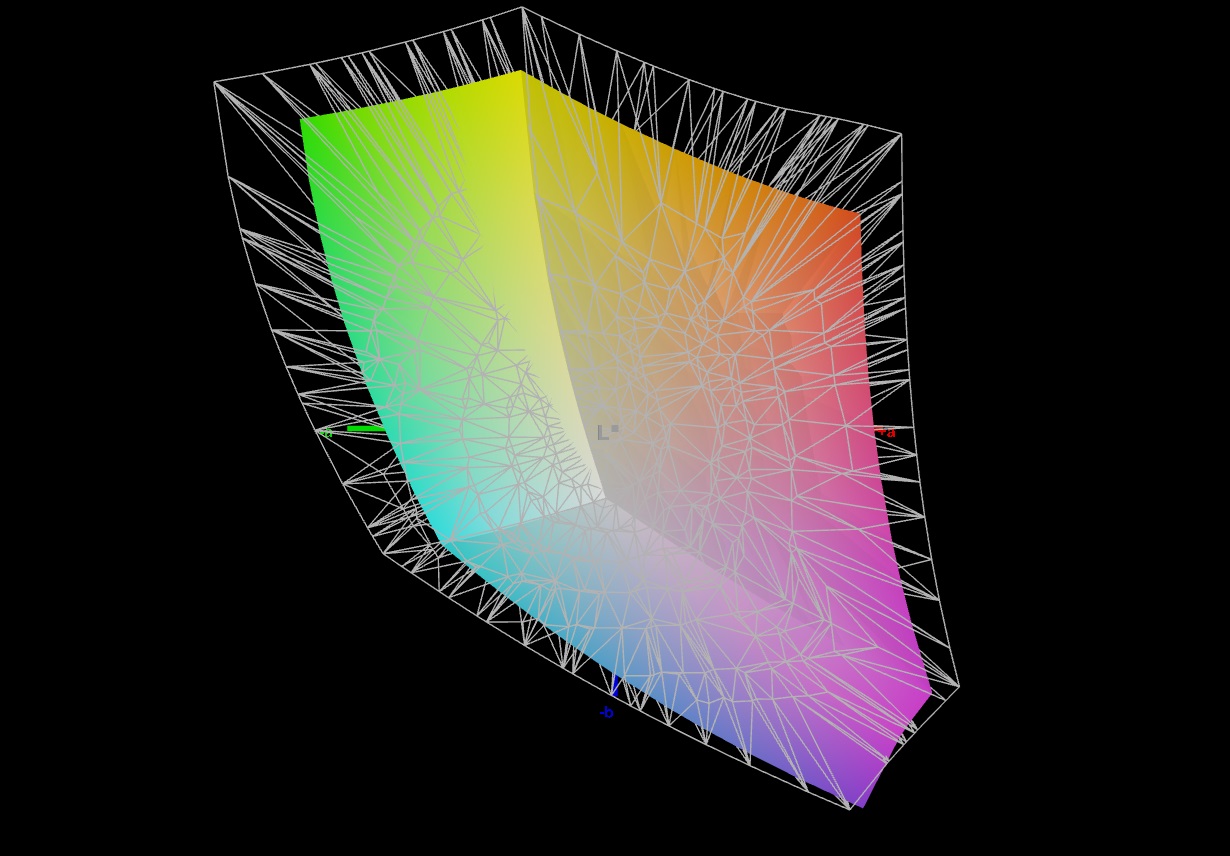
Lenovo has equipped the LOQ with a viewing-angle-stable 144 Hz panel (FHD, IPS) with an aspect ratio of 16:9 including G-Sync support. Good contrasts are offset by a slightly too low maximum brightness. In general, the display is designed for indoor use, but it could also be read from outdoors in suitable weather conditions. PWM flickering wasn't detected in our test.

| |||||||||||||||||||||||||
Brightness Distribution: 88 %
Center on Battery: 306 cd/m²
Contrast: 1457:1 (Black: 0.21 cd/m²)
ΔE ColorChecker Calman: 2.25 | ∀{0.5-29.43 Ø4.71}
calibrated: 1.45
ΔE Greyscale Calman: 2.4 | ∀{0.09-98 Ø4.96}
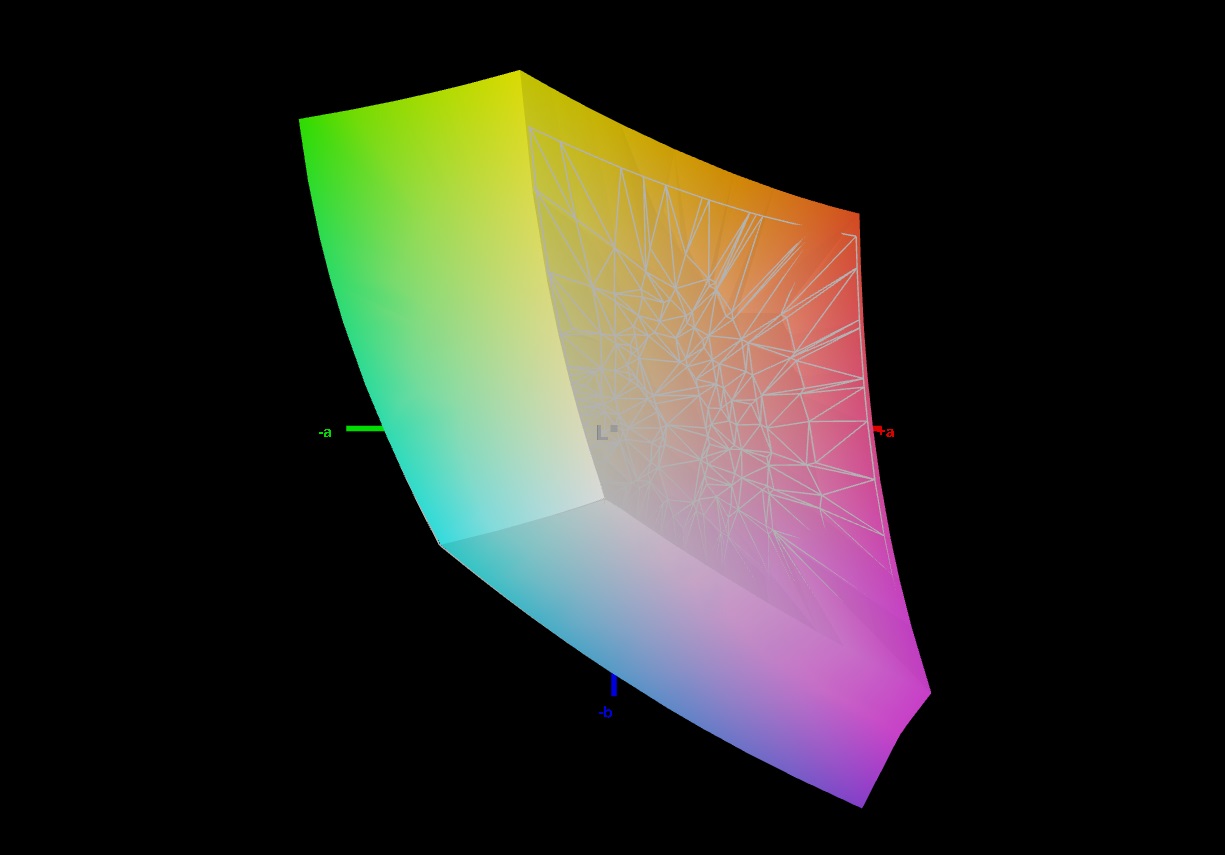
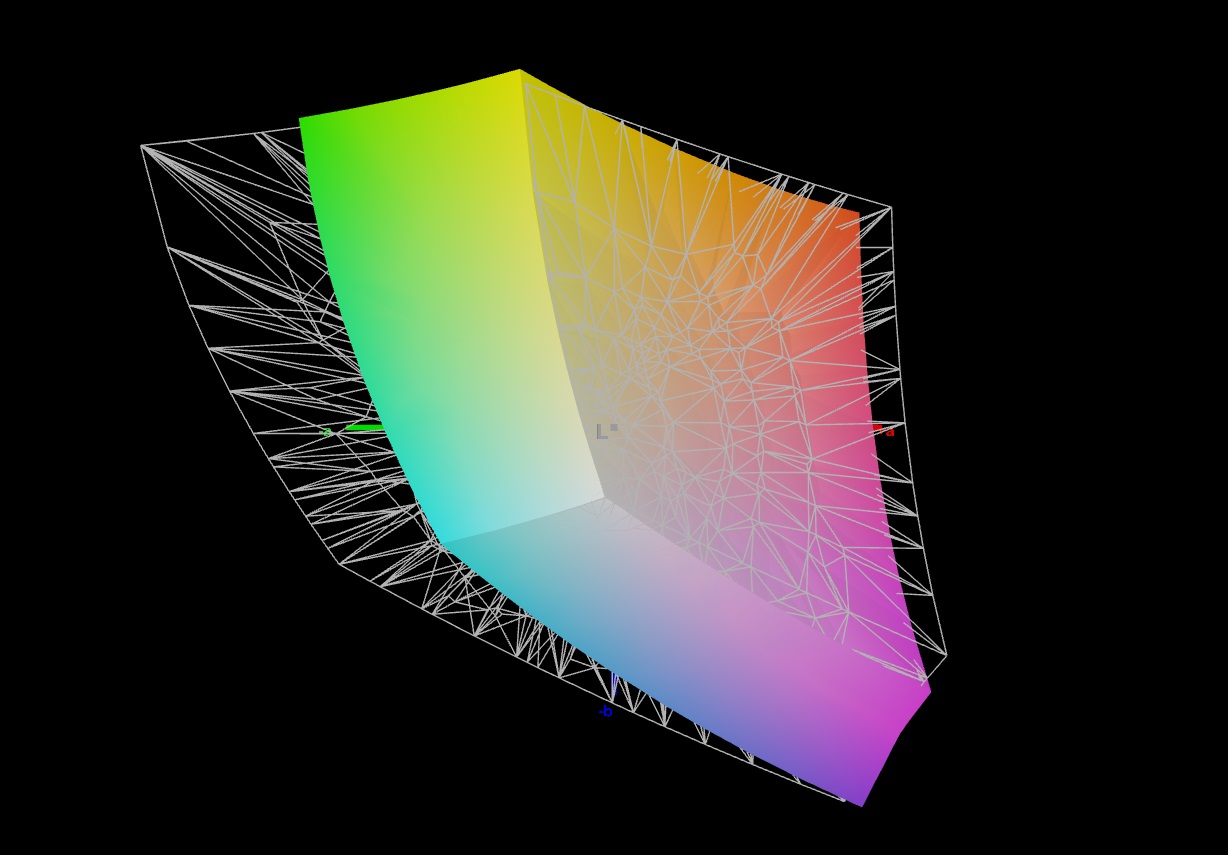
72.6% AdobeRGB 1998 (Argyll 3D)
99.1% sRGB (Argyll 3D)
73.7% Display P3 (Argyll 3D)
Gamma: 2.259
CCT: 6790 K
| Lenovo LOQ 15IRX9 BOE NJ NE156FHM-NX9, IPS, 1920x1080, 15.6" | Schenker XMG Core 15 (M24) BOE NJ NE153QDM-NZ1 (BOE0C8E), IPS, 2560x1600, 15.3" | Gigabyte G6X 9KG (2024) BOE NE160WUM-NX6, IPS, 1920x1200, 16" | HP Victus 16 (2024) Chi Mei CMN163E, IPS, 1920x1080, 16.1" | Dell G16, i7-13650HX, RTX 4060 Chi Mei CMN161D (160GME), IPS, 2560x1600, 16" | |
|---|---|---|---|---|---|
| Display | 1% | -40% | -41% | -5% | |
| Display P3 Coverage (%) | 73.7 | 73.2 -1% | 41.8 -43% | 41.3 -44% | 67.5 -8% |
| sRGB Coverage (%) | 99.1 | 100 1% | 62.4 -37% | 61.7 -38% | 98.5 -1% |
| AdobeRGB 1998 Coverage (%) | 72.6 | 74.6 3% | 43.3 -40% | 42.7 -41% | 69.3 -5% |
| Response Times | 68% | 4% | 25% | 68% | |
| Response Time Grey 50% / Grey 80% * (ms) | 42.2 ? | 9.6 ? 77% | 40.5 ? 4% | 28.6 ? 32% | 7.6 ? 82% |
| Response Time Black / White * (ms) | 22.6 ? | 9.2 ? 59% | 21.6 ? 4% | 18.7 ? 17% | 10.4 ? 54% |
| PWM Frequency (Hz) | |||||
| Screen | 6% | -68% | -78% | -15% | |
| Brightness middle (cd/m²) | 306 | 635 108% | 353 15% | 287 -6% | 369 21% |
| Brightness (cd/m²) | 287 | 604 110% | 318 11% | 288 0% | 344 20% |
| Brightness Distribution (%) | 88 | 91 3% | 81 -8% | 86 -2% | 89 1% |
| Black Level * (cd/m²) | 0.21 | 0.64 -205% | 0.21 -0% | 0.19 10% | 0.26 -24% |
| Contrast (:1) | 1457 | 992 -32% | 1681 15% | 1511 4% | 1419 -3% |
| Colorchecker dE 2000 * | 2.25 | 1.89 16% | 5.21 -132% | 5.46 -143% | 3.04 -35% |
| Colorchecker dE 2000 max. * | 4.84 | 3.14 35% | 19.95 -312% | 20.36 -321% | 5.56 -15% |
| Colorchecker dE 2000 calibrated * | 1.45 | 1.14 21% | 3.61 -149% | 3.52 -143% | 2.35 -62% |
| Greyscale dE 2000 * | 2.4 | 2.53 -5% | 3.6 -50% | 4.8 -100% | 3.38 -41% |
| Gamma | 2.259 97% | 2.36 93% | 2.367 93% | 2.108 104% | 2.47 89% |
| CCT | 6790 96% | 6434 101% | 7138 91% | 6442 101% | 6040 108% |
| Total Average (Program / Settings) | 25% /
14% | -35% /
-52% | -31% /
-55% | 16% /
-1% |
* ... smaller is better
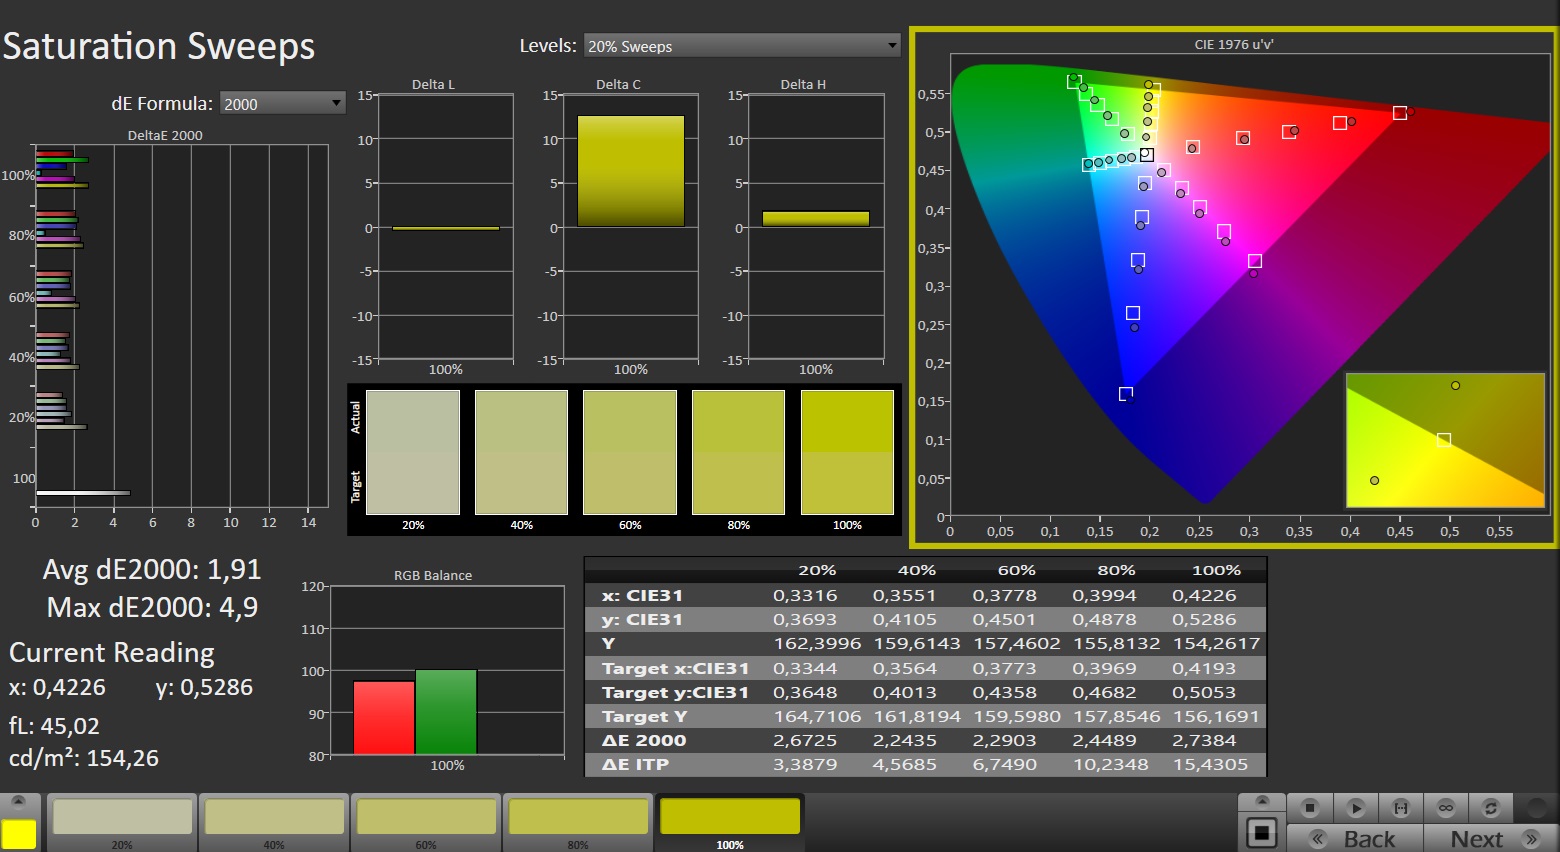
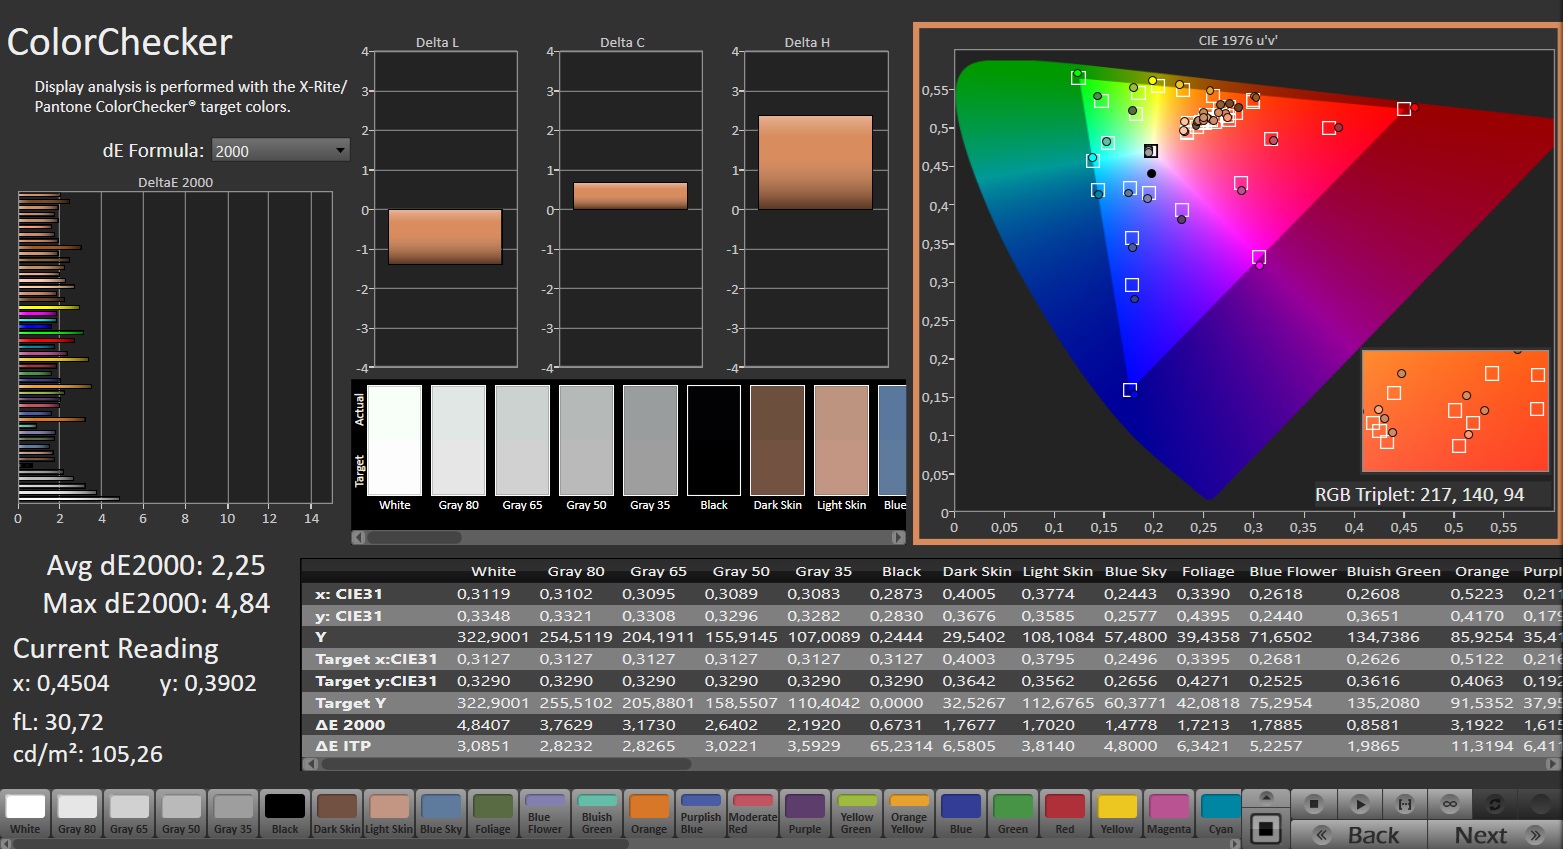
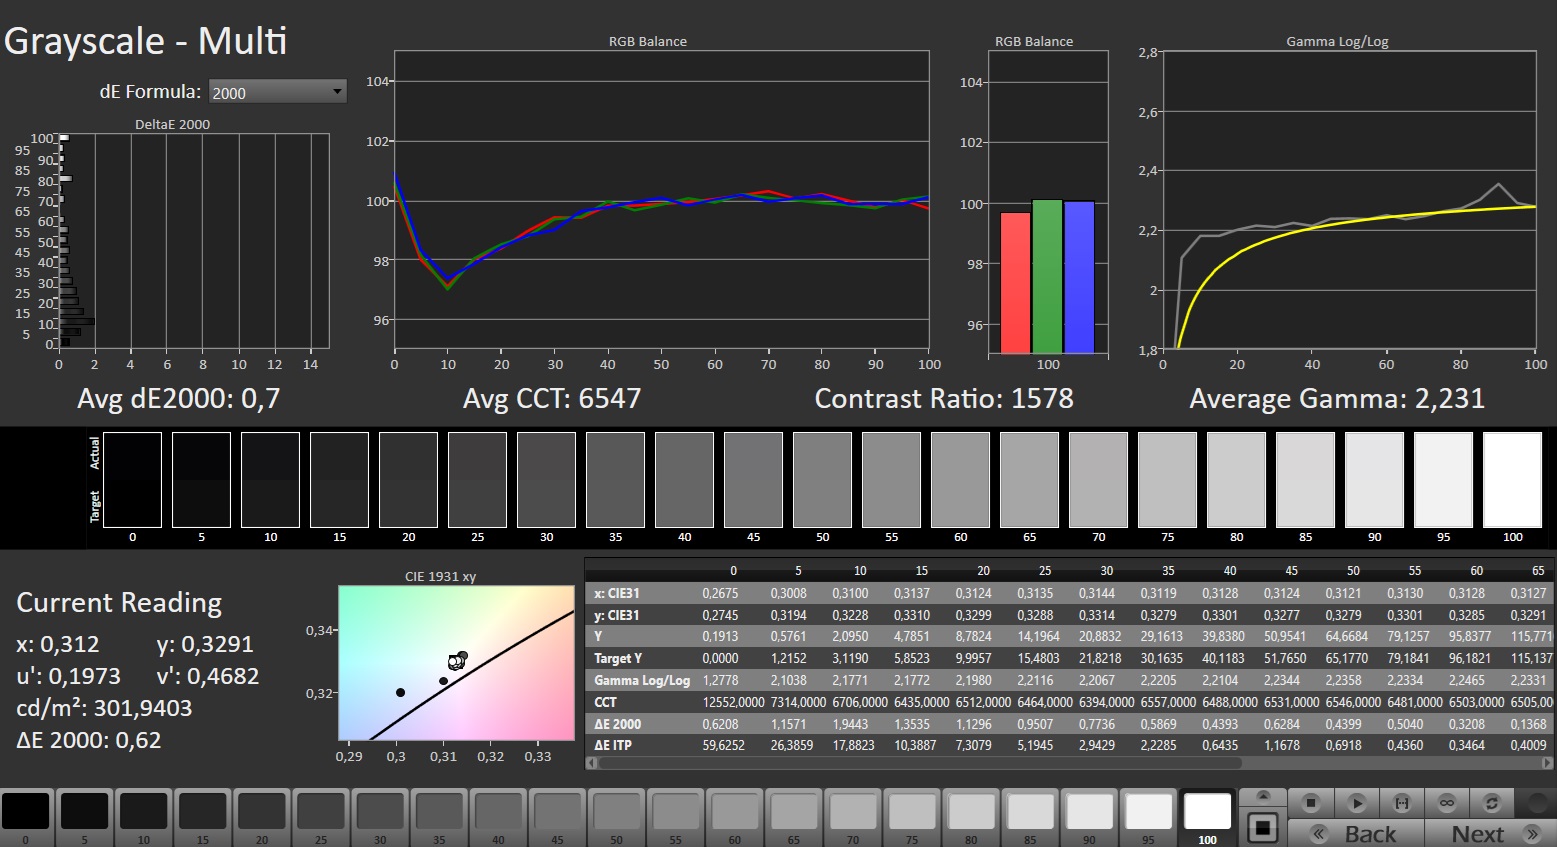
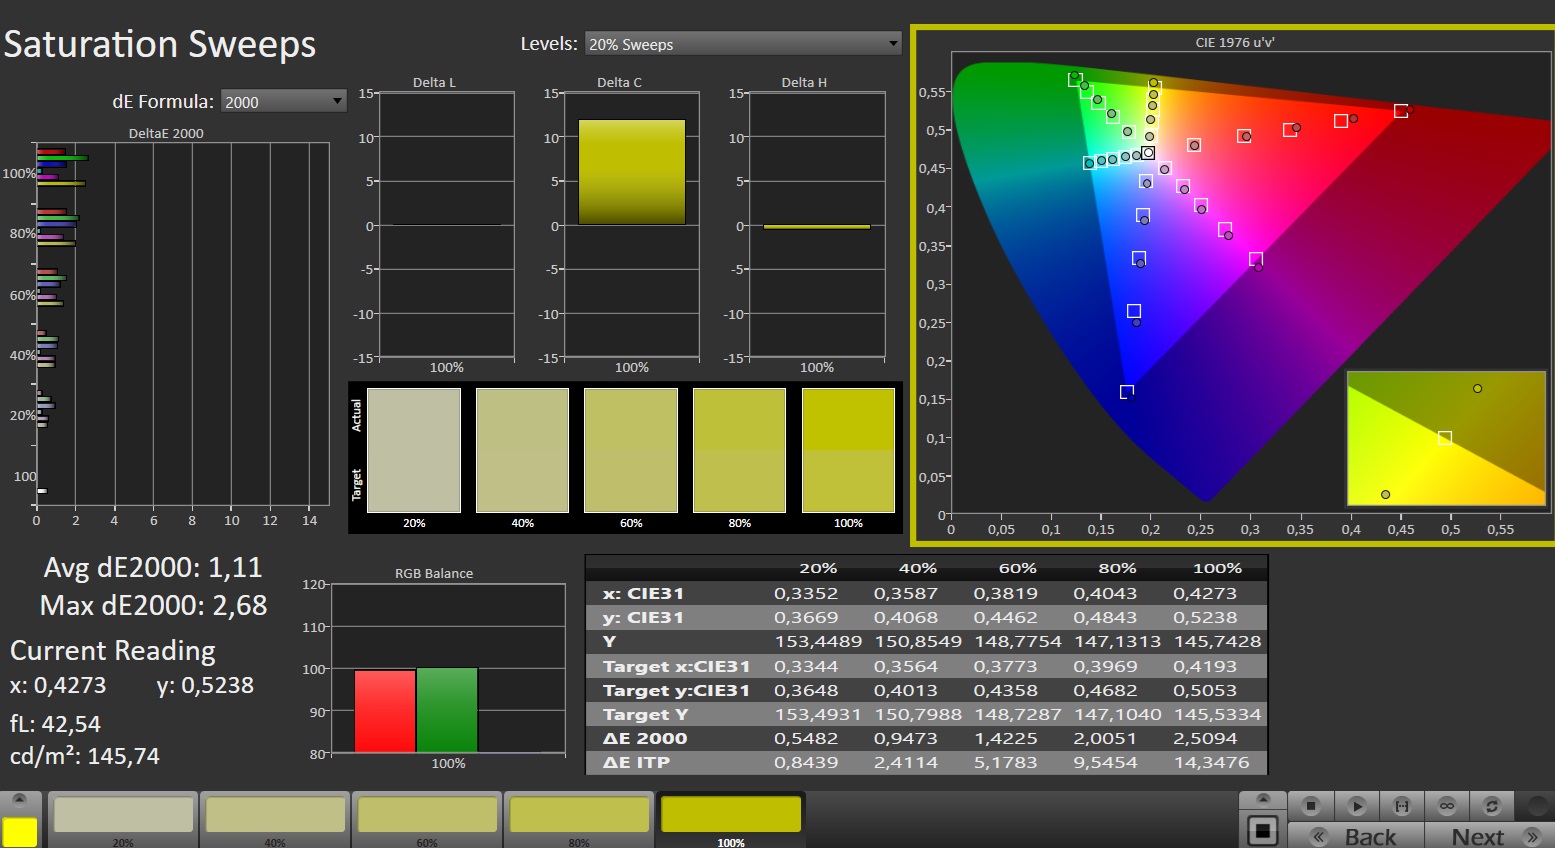
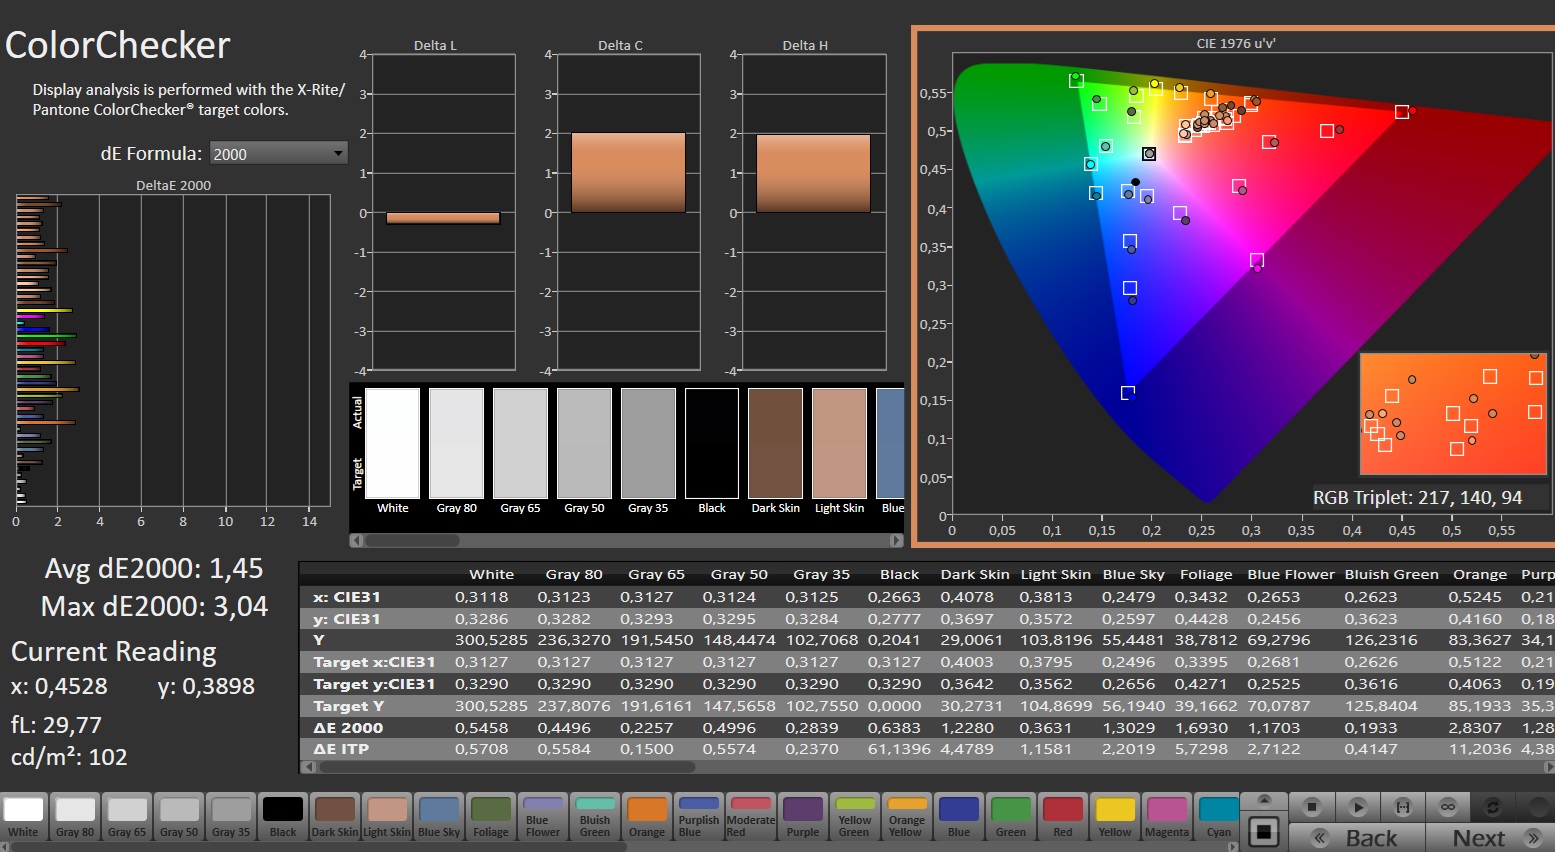
Straight out of the box, the display is well-calibrated: With a deviation of about 2.25, the target value (DeltaE < 3) has been met. Calibrating the screen brings its deviations down to 1.45 and ensures more balanced gray tones. The panel can depict the sRGB space nearly in its entirety, but not the AdobeRGB and DCI P3 spaces.

Display Response Times
| ↔ Response Time Black to White | ||
|---|---|---|
| 22.6 ms ... rise ↗ and fall ↘ combined | ↗ 11.2 ms rise | 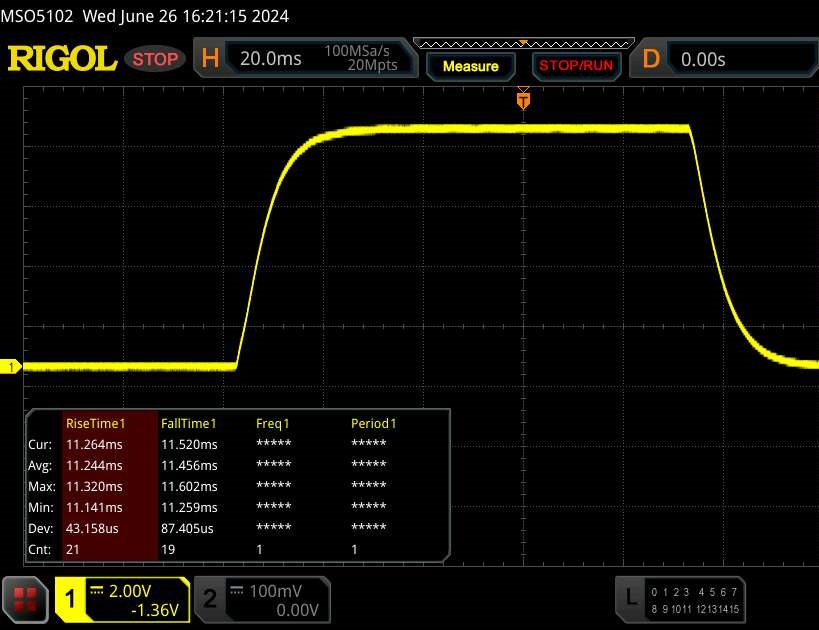 |
| ↘ 11.4 ms fall | ||
| The screen shows good response rates in our tests, but may be too slow for competitive gamers. In comparison, all tested devices range from 0.1 (minimum) to 240 (maximum) ms. » 51 % of all devices are better. This means that the measured response time is worse than the average of all tested devices (19.8 ms). | ||
| ↔ Response Time 50% Grey to 80% Grey | ||
| 42.2 ms ... rise ↗ and fall ↘ combined | ↗ 19.1 ms rise | 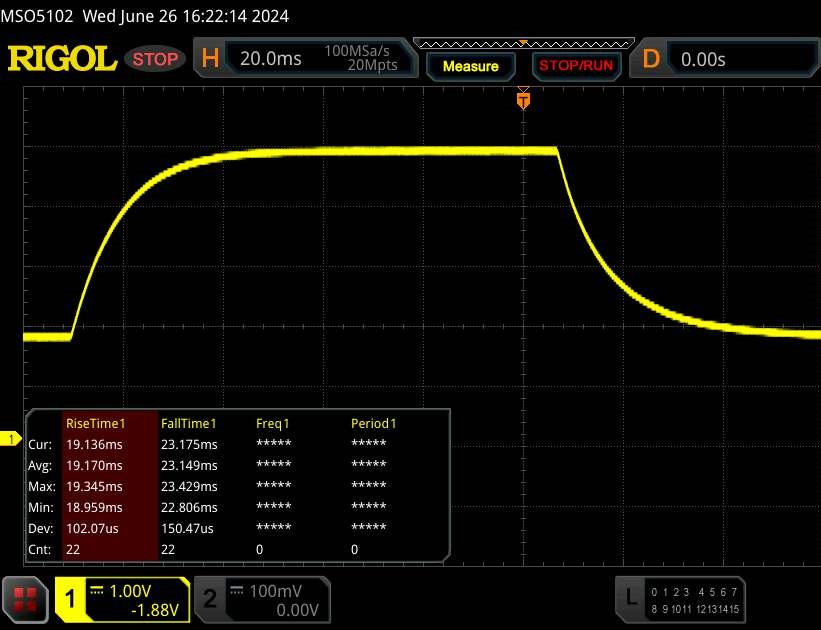 |
| ↘ 23.1 ms fall | ||
| The screen shows slow response rates in our tests and will be unsatisfactory for gamers. In comparison, all tested devices range from 0.165 (minimum) to 636 (maximum) ms. » 70 % of all devices are better. This means that the measured response time is worse than the average of all tested devices (31 ms). | ||
Screen Flickering / PWM (Pulse-Width Modulation)
| Screen flickering / PWM not detected | 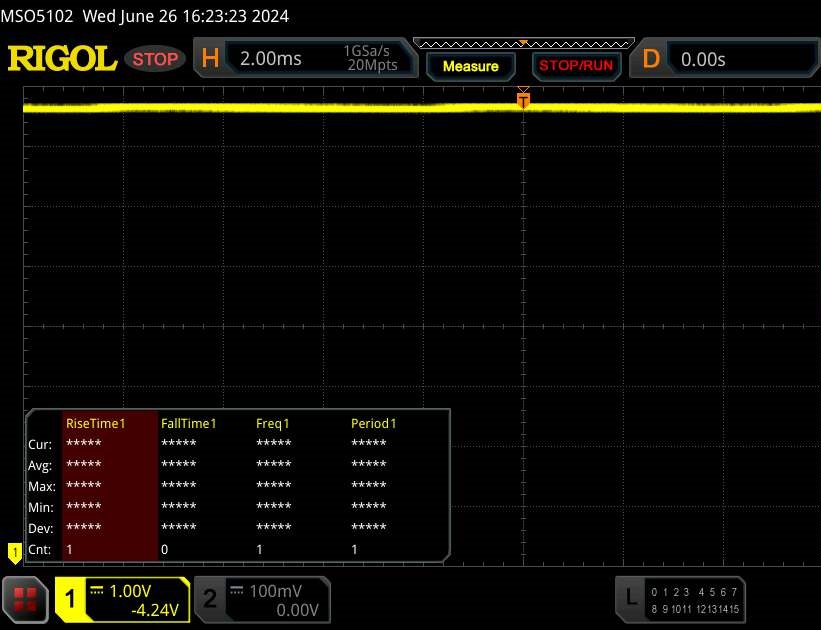 | ||
In comparison: 52 % of all tested devices do not use PWM to dim the display. If PWM was detected, an average of 7747 (minimum: 5 - maximum: 343500) Hz was measured. | |||
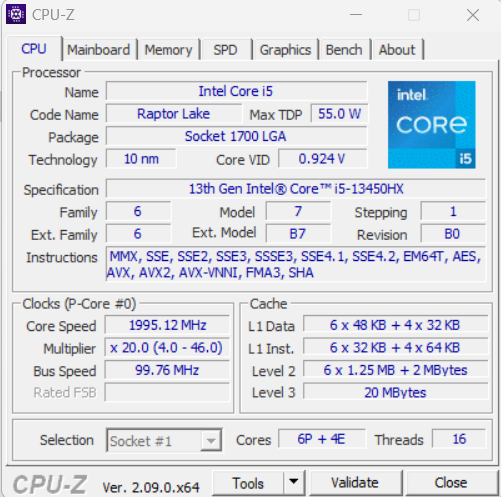
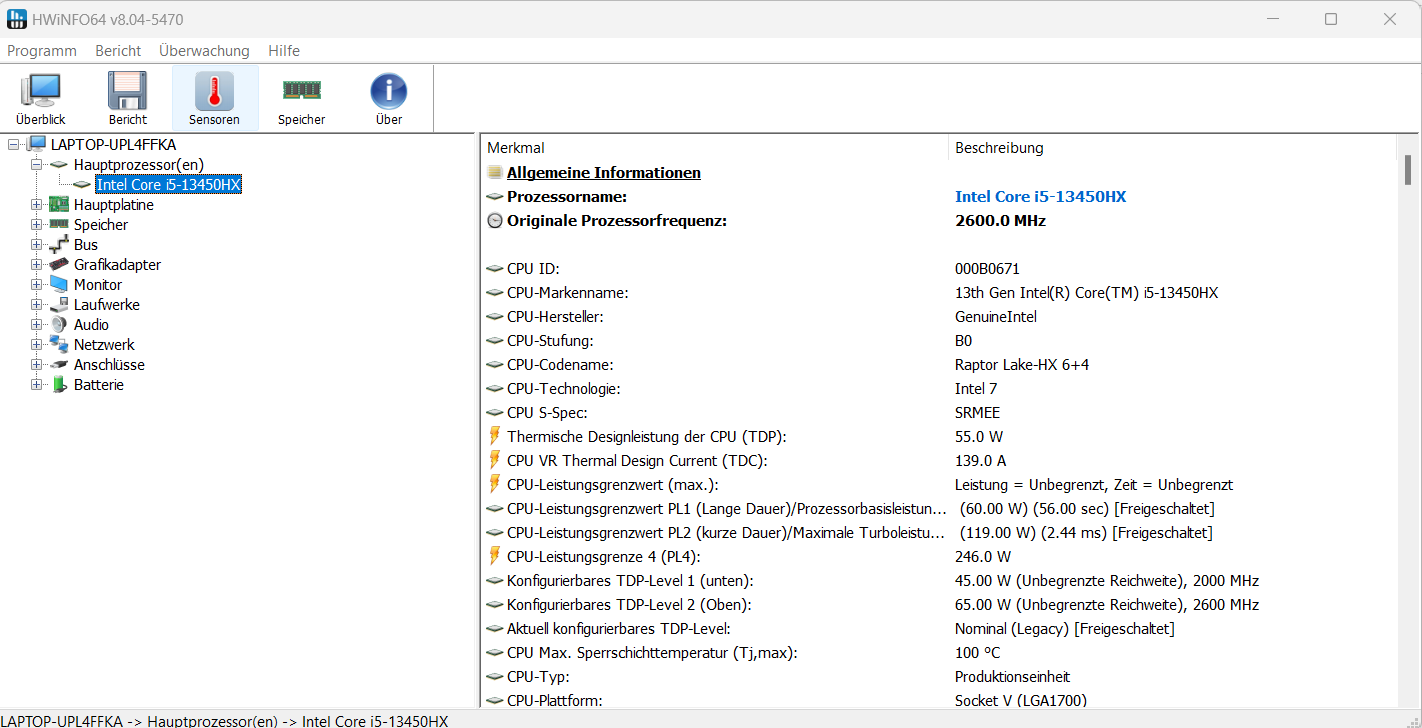
Performance - Raptor Lake and Ada Lovelace power the laptop
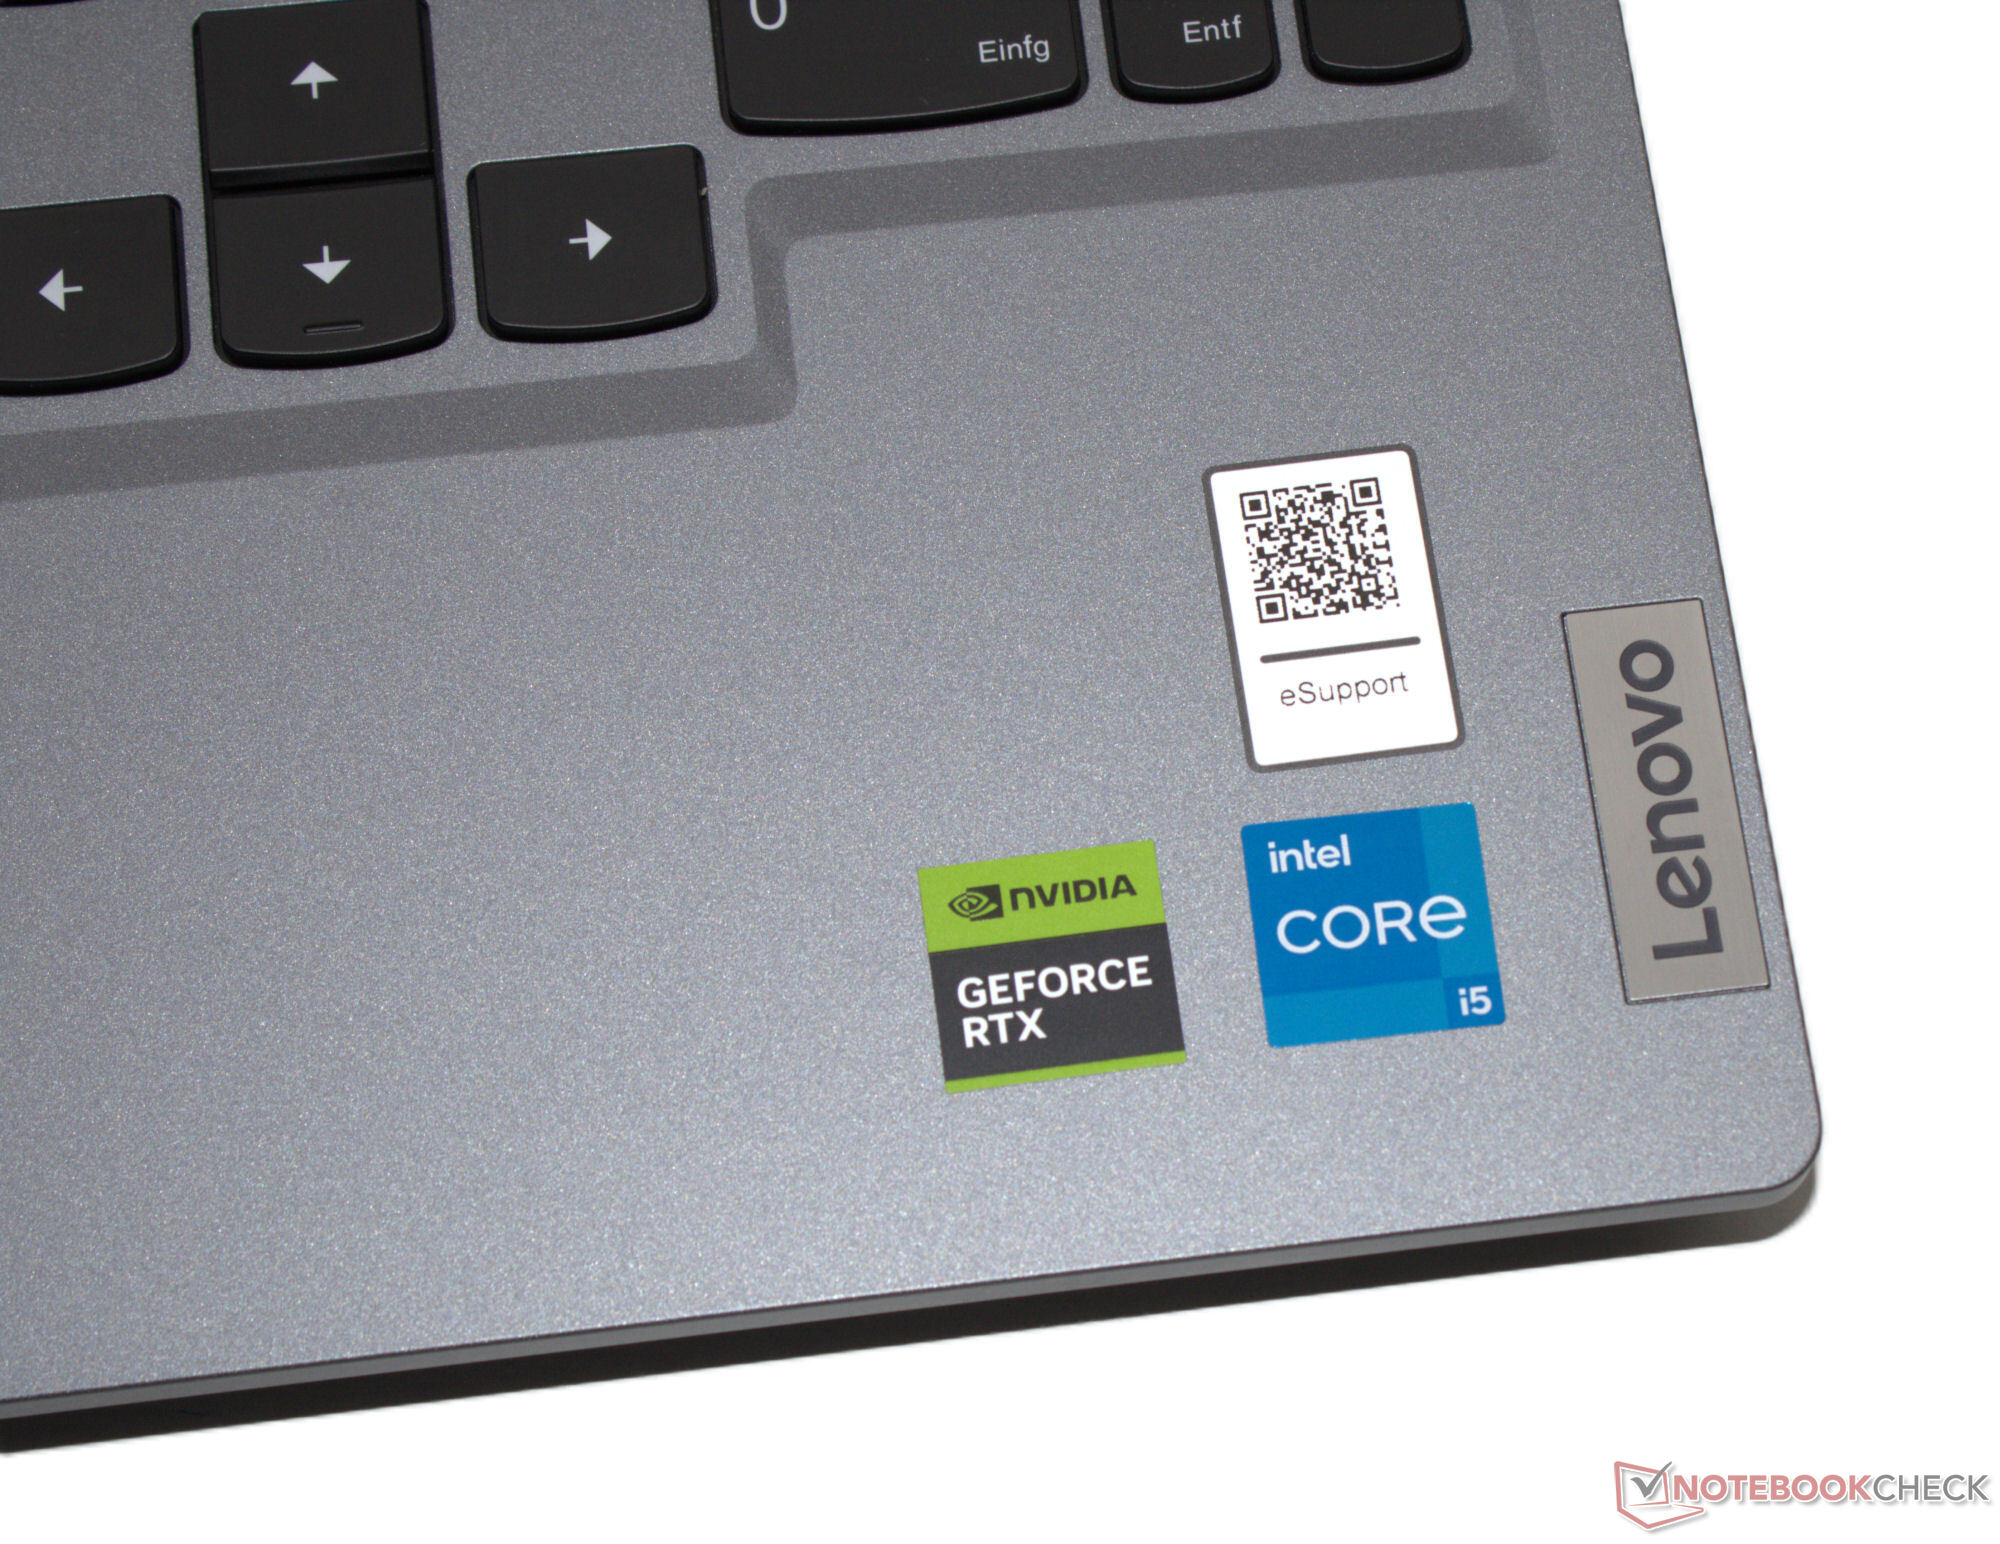
The LOQ models are entry-level gaming laptops. Lenovo has a variety of different configurations on offer—with AMD APUs as well as Intel CPUs. Raptor Lake and Ada Lovelace in the form of the Core i5-13450HX and the GeForce RTX 4060 power the present test device. It can be had for about US$1,300 (with Windows 11) or just over US$1,000 (without Windows).
Testing conditions
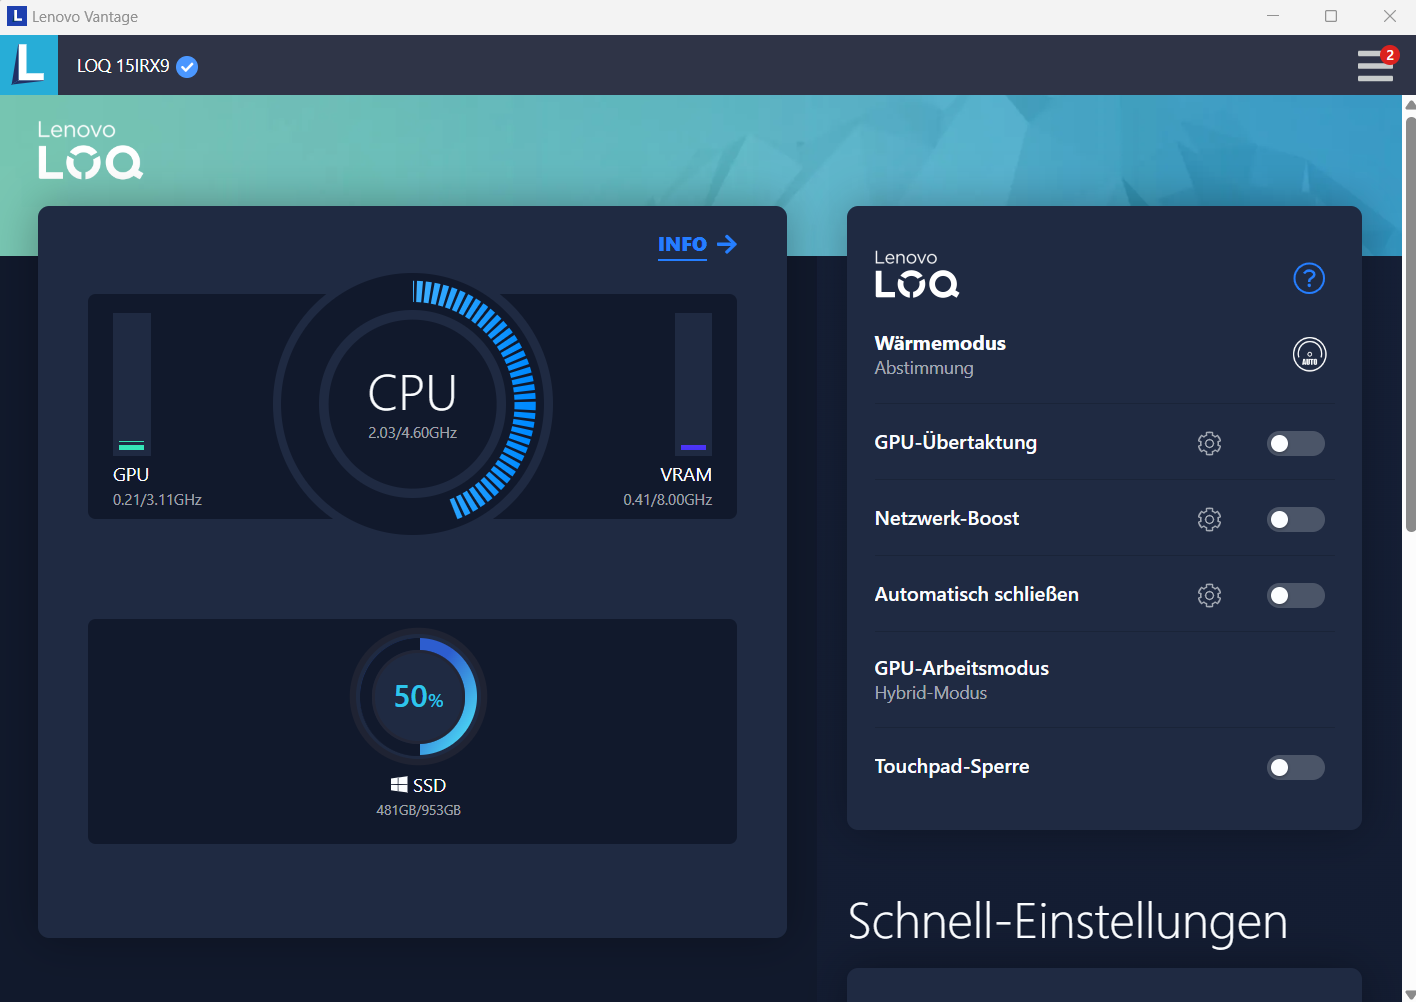
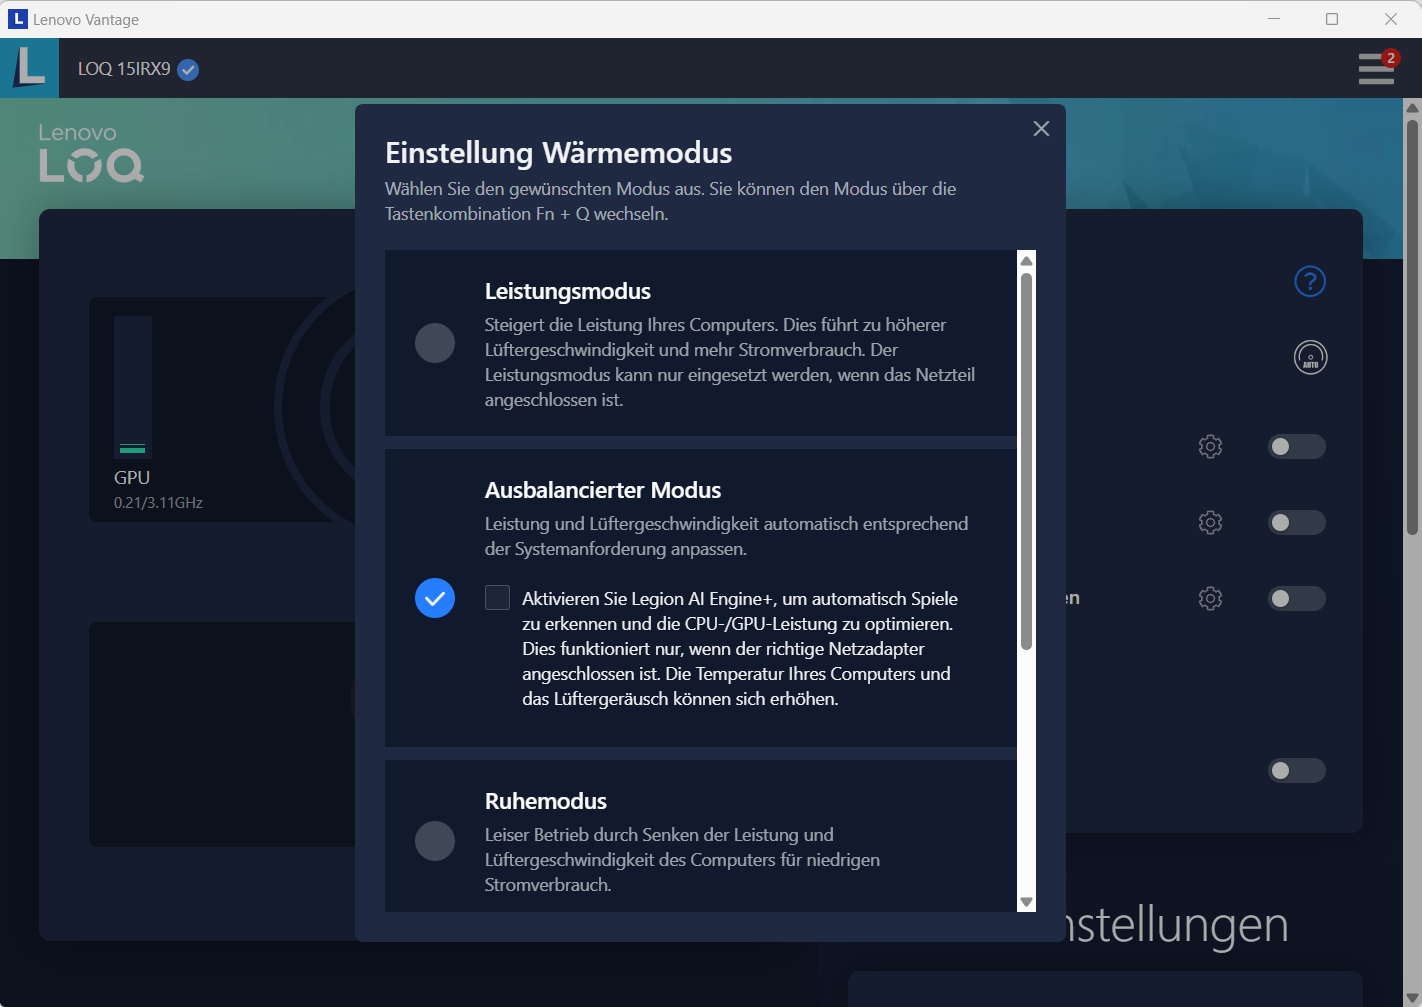
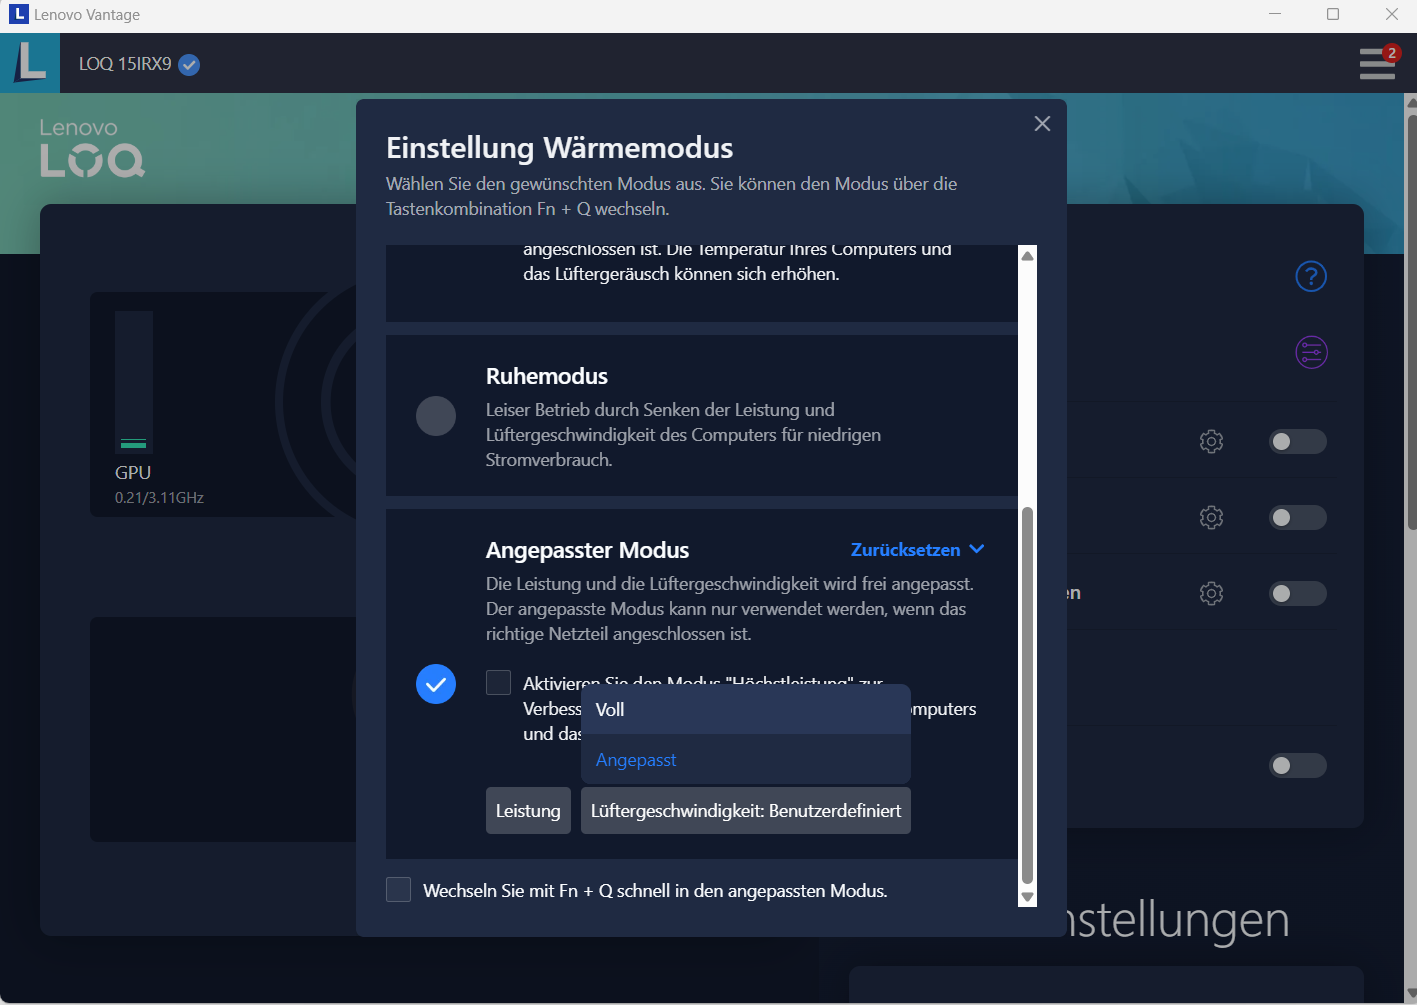
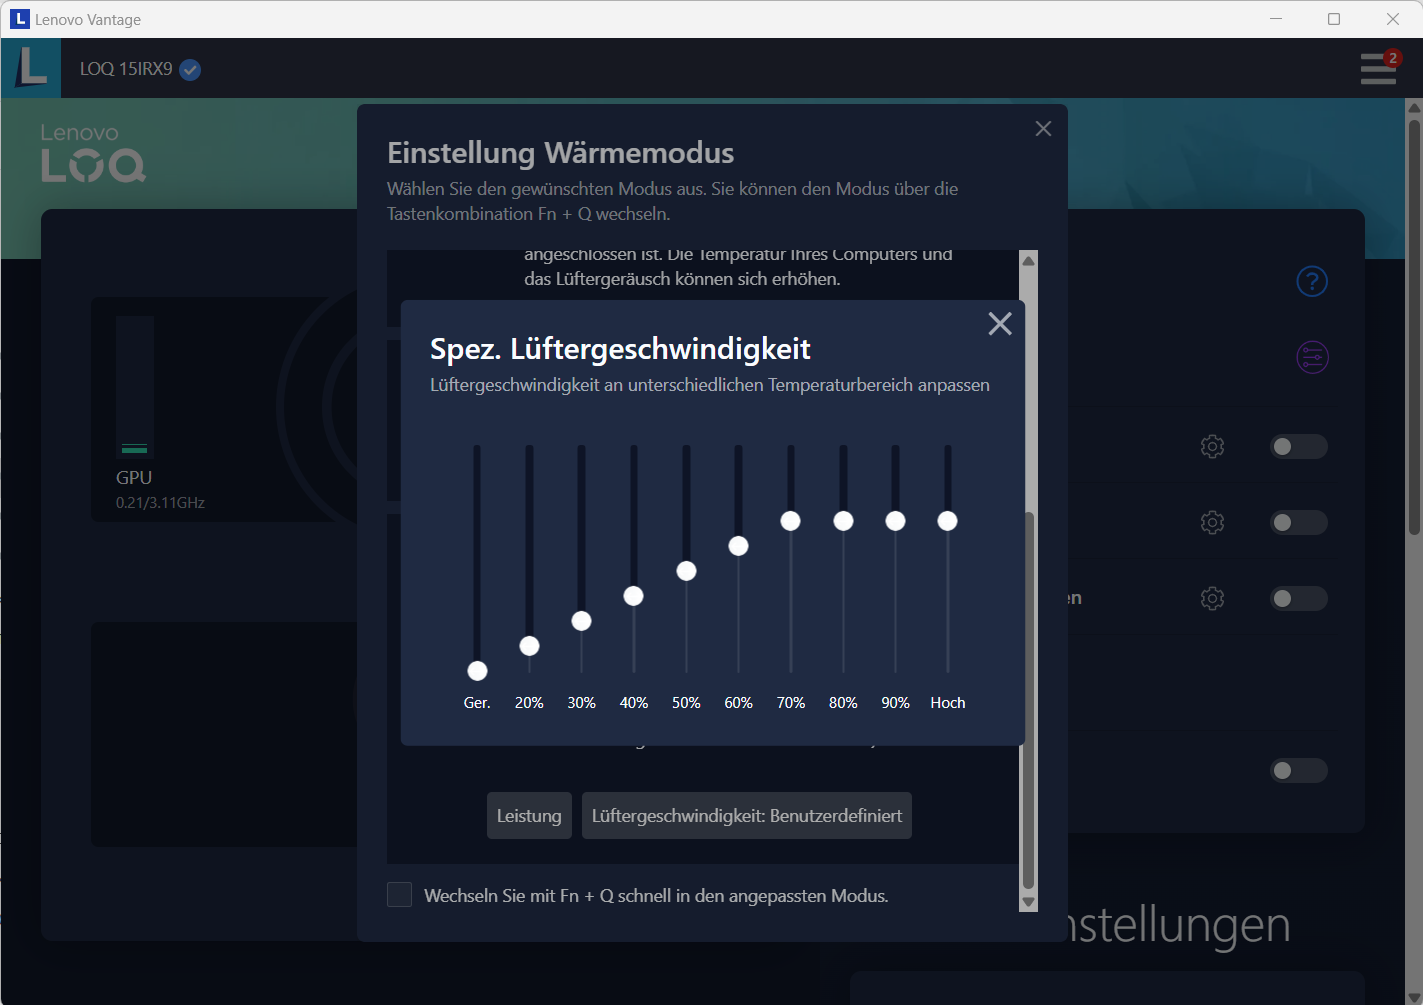
The laptop offers three manufacturer-specific performance modes (see table), which can be switched between using the key combination “Fn” + “Q”. We used the modes balanced (benchmarks) and quiet (battery test).
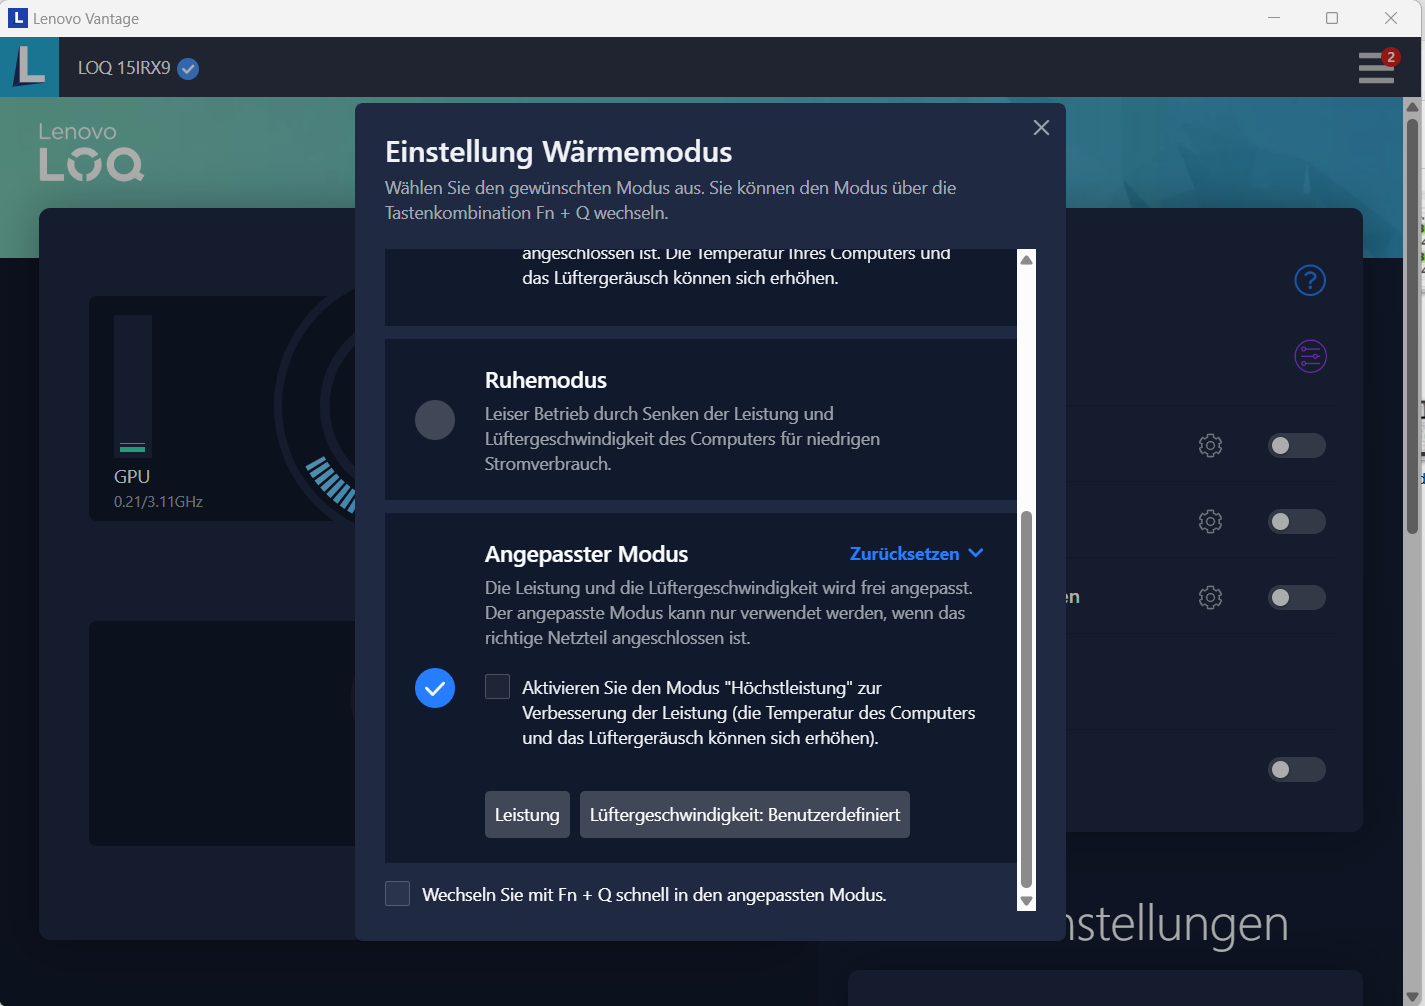
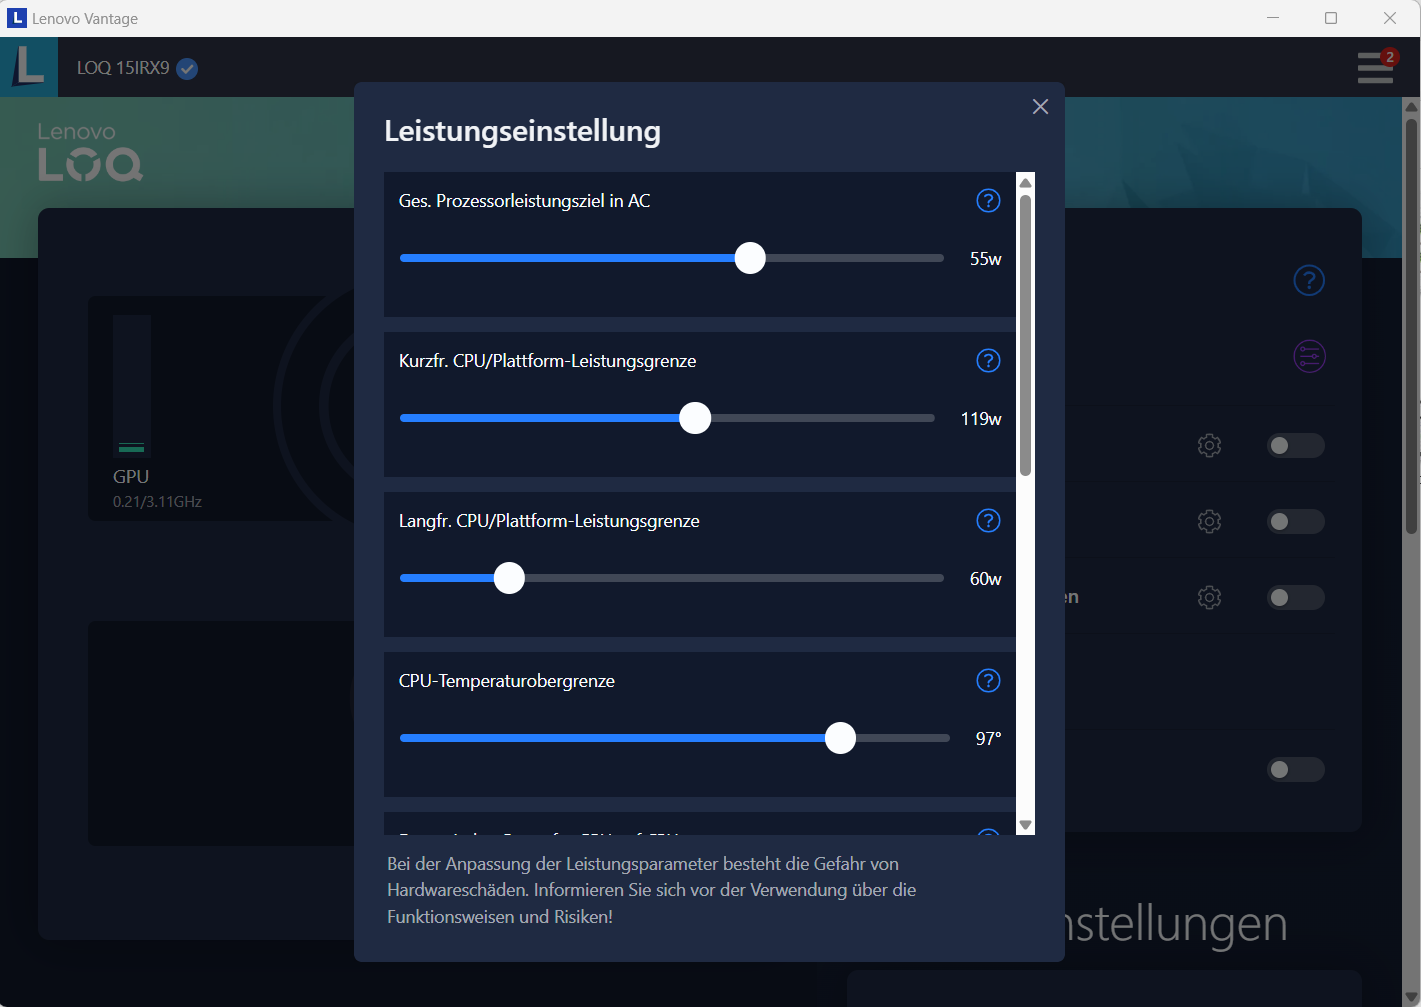
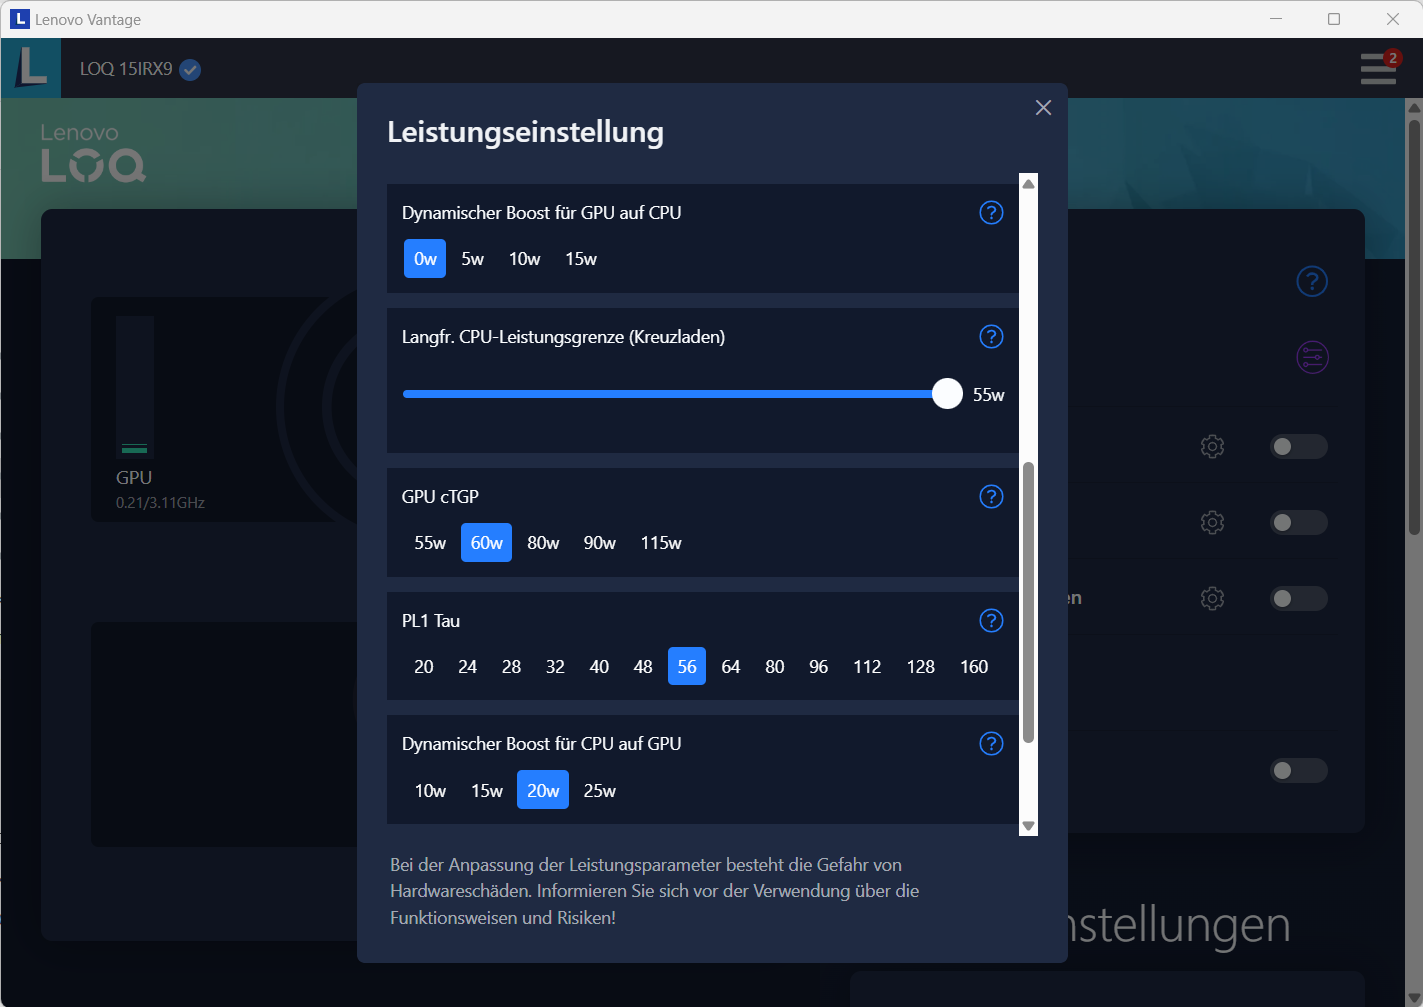
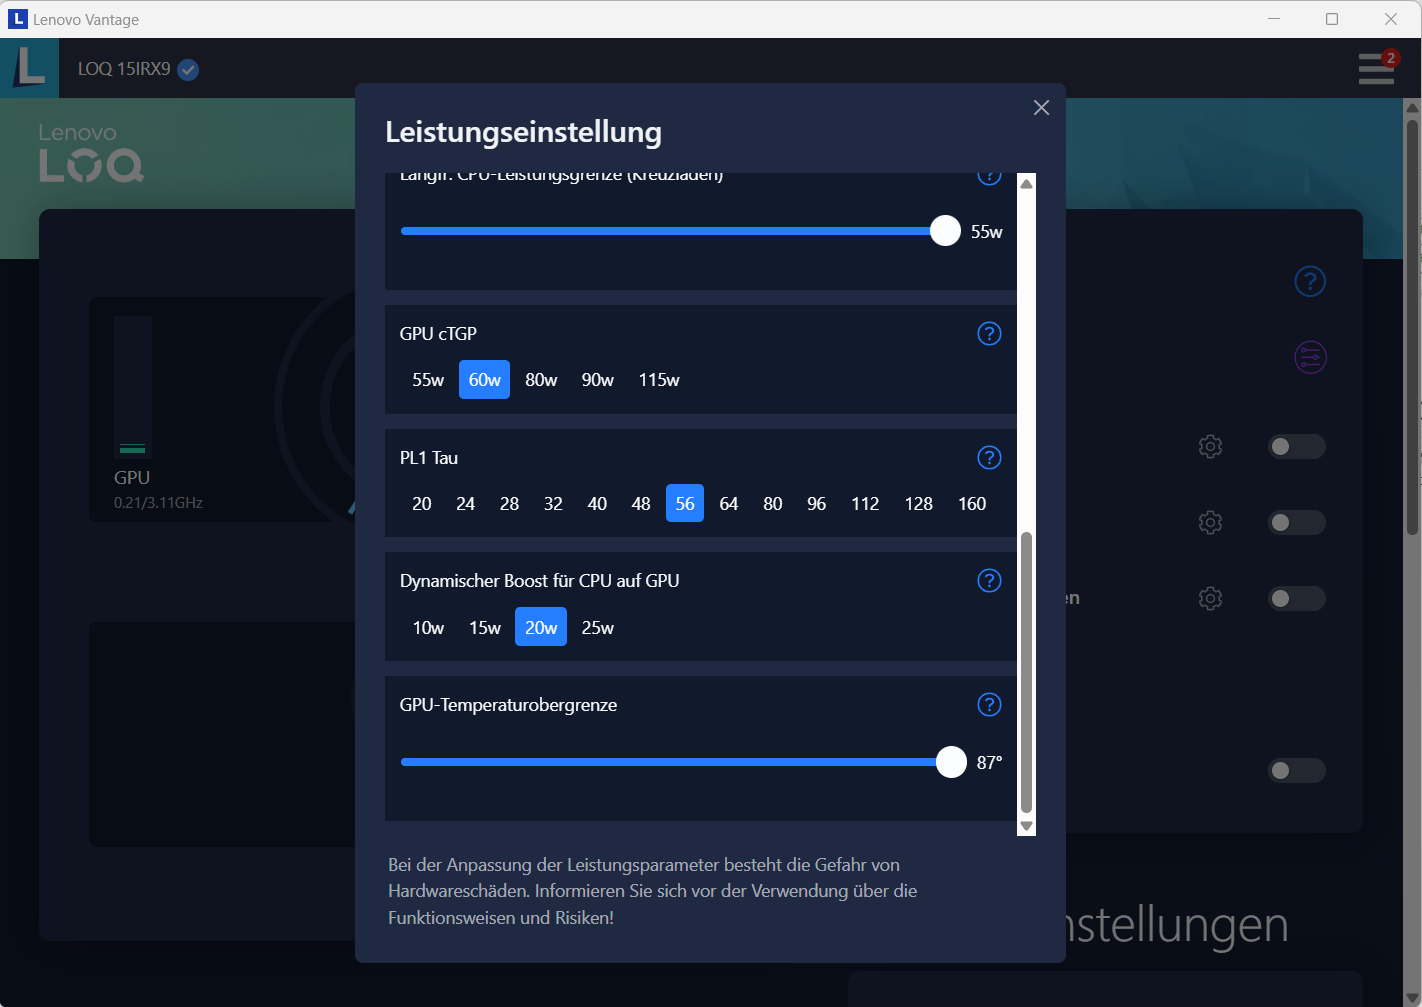
A fourth mode (customized) can be selected via Lenovo Vantage (control center of the laptop). This allows the performance settings of the processor (Power Limit) or GPU (TGP, Dynamic Boost, temperature limit) and the fan speed to be set individually. It is also possible to overclock the GPU and graphics memory independently of the profile.
| Performance mode | Balanced mode | Quiet mode | |
|---|---|---|---|
| Power Limit 1 (HWInfo) | 90 watts | 60 watts | 55 watts |
| Power Limit 2 (HWInfo) | 162 watts | 119 watts | 65 watts |
| Noise (CP 2077 Phantom Liberty) | 54 dB(A) | 48 dB(A) | 39 dB(A) |
| Performance (CP 2077 Phantom Liberty) | 70 fps | 66 fps | 52 fps |
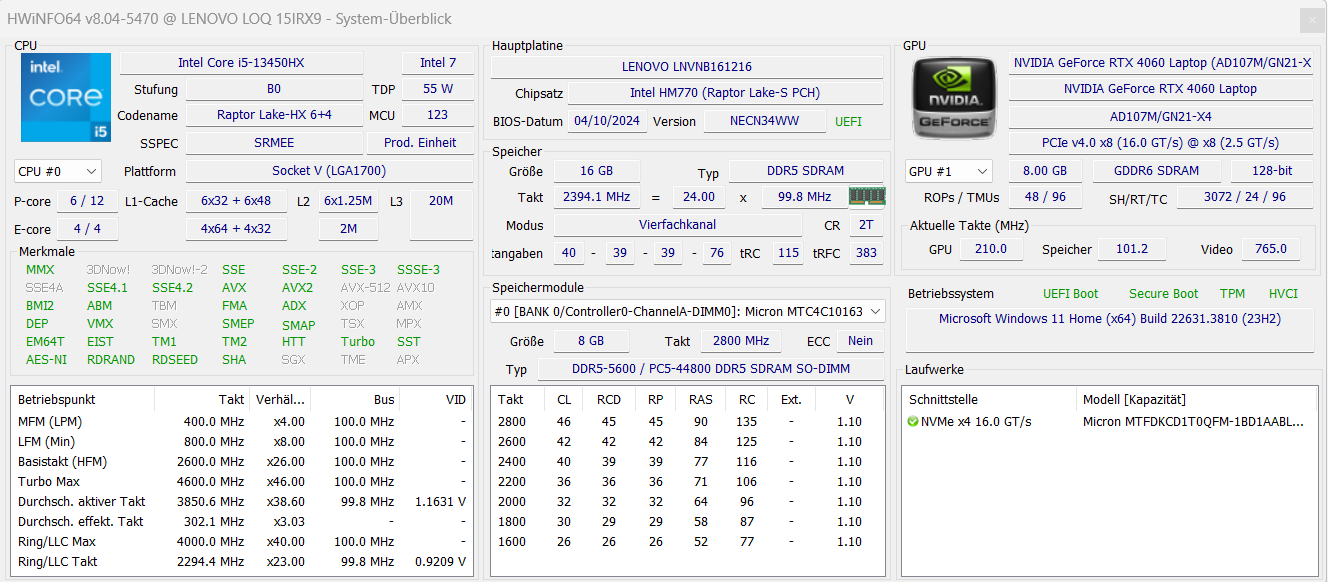
Processor
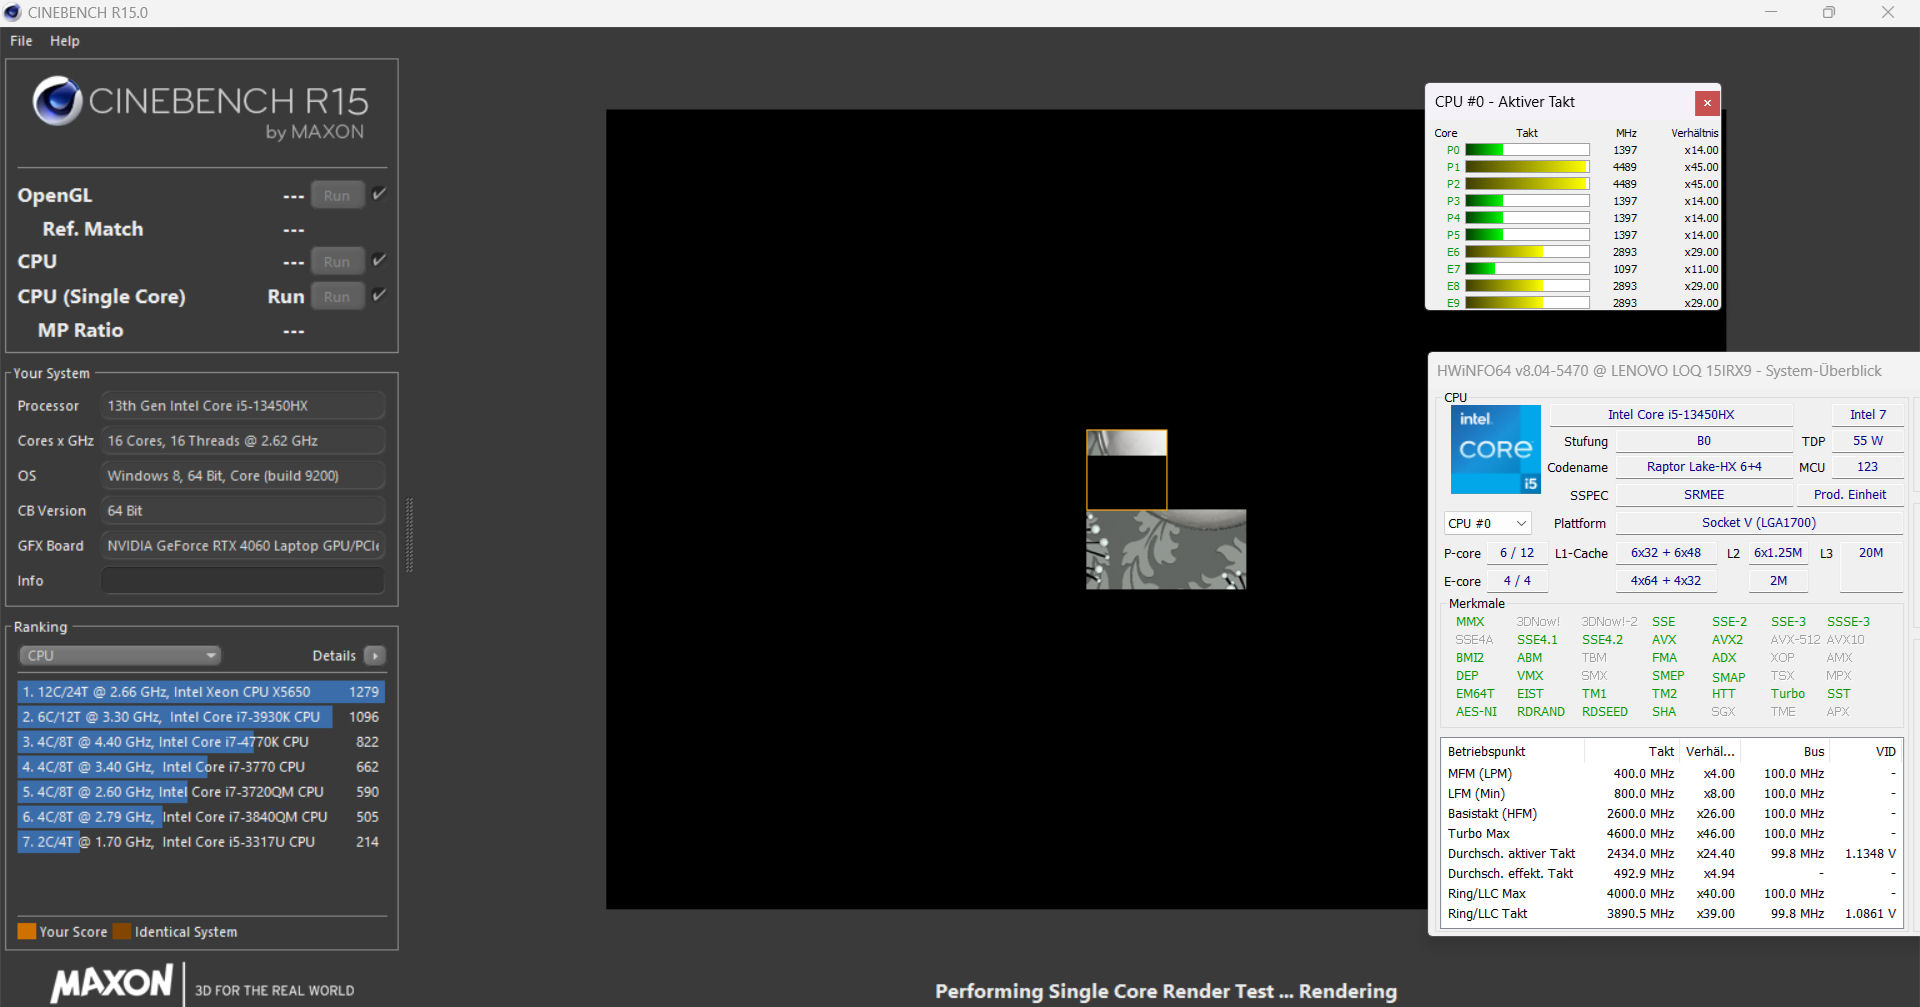
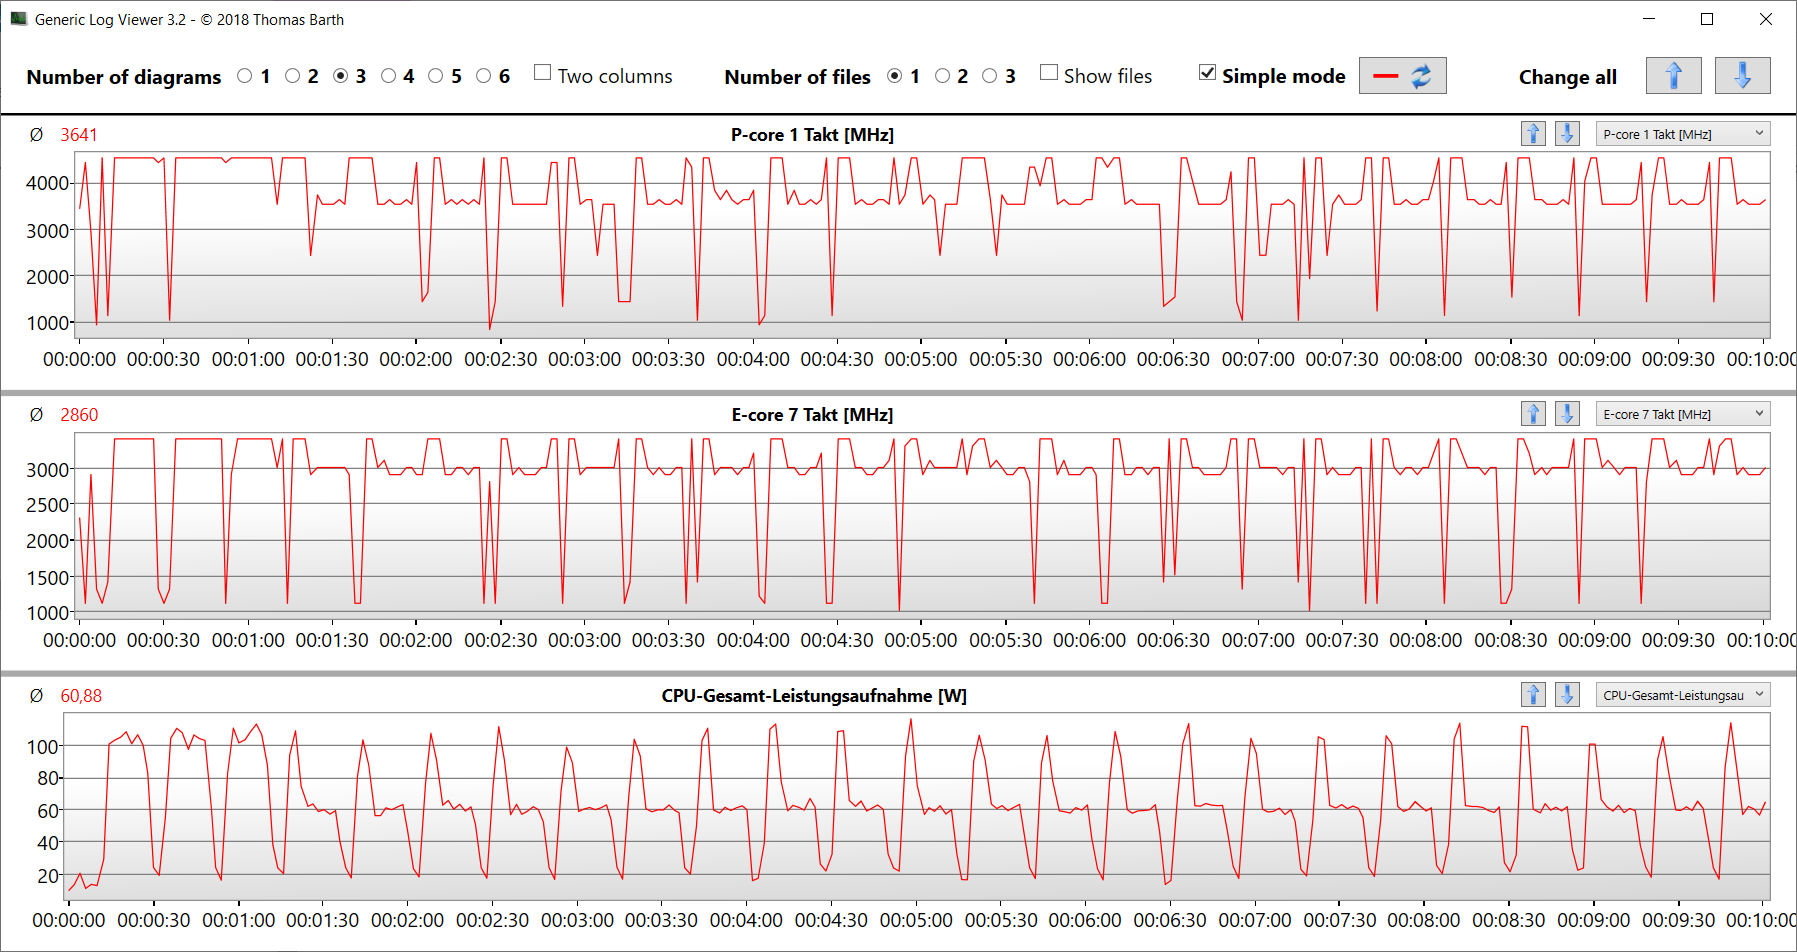
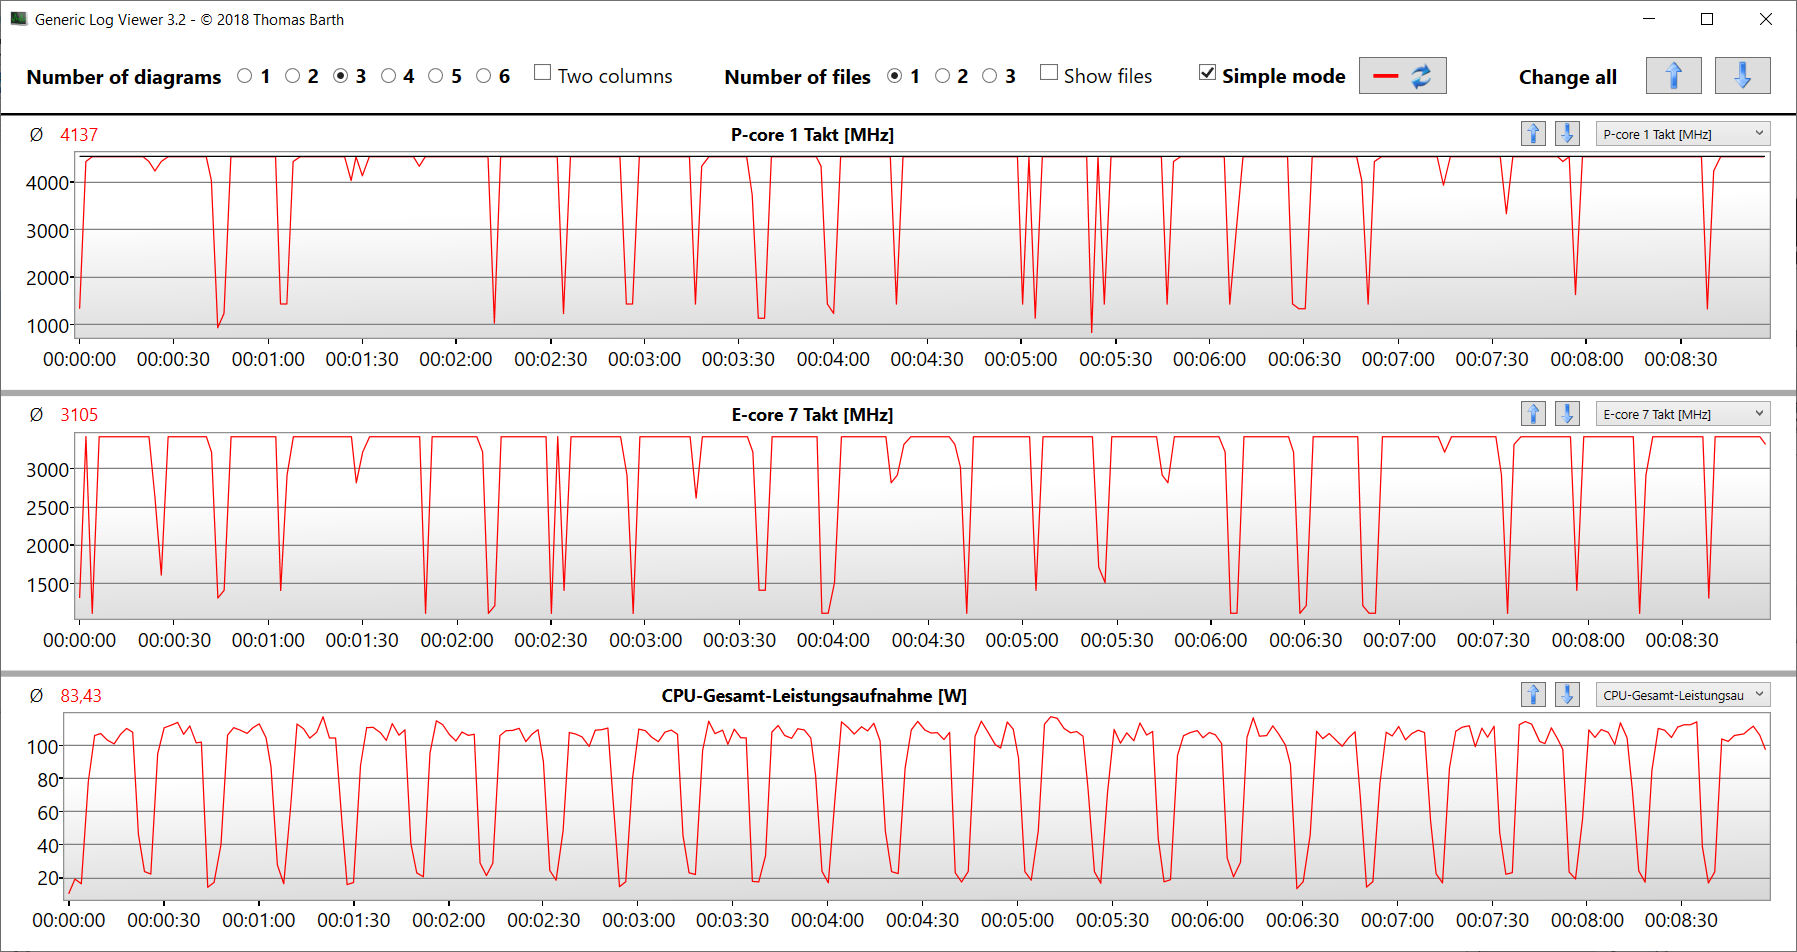
The Core i5-13450HX's (Raptor Lake) 10 CPU cores (6P + 4E = 16 threads) achieve maximum clock rates of 4.6 GHz (P) and 3.4 GHz (E). Continuous multi-thread load (CB15 Loop) resulted in its clock rate sinking from the first to the fourth run (balanced mode). Afterwards, it remained stable. Performance mode keeps the clock rate at a permanently high level.
The benchmark results were just as we expected (balanced mode), and performance mode resulted in a (very small) advantage. Within the comparison field, the Core i5 did the worst as it has the fewest number of computing cores. The CPU is a fitting choice for a budget gamer.

Cinebench R15 Multi continuous test
| CPU Performance rating - Percent | |
| Average of class Gaming | |
| HP Victus 16 (2024) | |
| Schenker XMG Core 15 (M24) | |
| Dell G16, i7-13650HX, RTX 4060 | |
| Gigabyte G6X 9KG (2024) | |
| Lenovo LOQ 15IRX9 | |
| Average Intel Core i5-13450HX | |
| Lenovo LOQ 15IRX9 | |
| Cinebench R23 | |
| Multi Core | |
| Average of class Gaming (10488 - 42661, n=107, last 2 years) | |
| HP Victus 16 (2024) | |
| Dell G16, i7-13650HX, RTX 4060 | |
| Gigabyte G6X 9KG (2024) | |
| Schenker XMG Core 15 (M24) | |
| Lenovo LOQ 15IRX9 (Leistungsmodus) | |
| Average Intel Core i5-13450HX (16575 - 17234, n=3) | |
| Lenovo LOQ 15IRX9 | |
| Single Core | |
| Average of class Gaming (1166 - 2415, n=107, last 2 years) | |
| Dell G16, i7-13650HX, RTX 4060 | |
| Gigabyte G6X 9KG (2024) | |
| Schenker XMG Core 15 (M24) | |
| Lenovo LOQ 15IRX9 (Leistungsmodus) | |
| Average Intel Core i5-13450HX (1710 - 1766, n=3) | |
| Lenovo LOQ 15IRX9 | |
| HP Victus 16 (2024) | |
| Cinebench R20 | |
| CPU (Multi Core) | |
| Average of class Gaming (4029 - 16433, n=106, last 2 years) | |
| HP Victus 16 (2024) | |
| Dell G16, i7-13650HX, RTX 4060 | |
| Gigabyte G6X 9KG (2024) | |
| Schenker XMG Core 15 (M24) | |
| Lenovo LOQ 15IRX9 (Leistungsmodus) | |
| Average Intel Core i5-13450HX (6489 - 6595, n=3) | |
| Lenovo LOQ 15IRX9 | |
| CPU (Single Core) | |
| Average of class Gaming (442 - 913, n=106, last 2 years) | |
| Dell G16, i7-13650HX, RTX 4060 | |
| Gigabyte G6X 9KG (2024) | |
| Schenker XMG Core 15 (M24) | |
| Lenovo LOQ 15IRX9 (Leistungsmodus) | |
| Average Intel Core i5-13450HX (652 - 680, n=3) | |
| Lenovo LOQ 15IRX9 | |
| HP Victus 16 (2024) | |
| Cinebench R15 | |
| CPU Multi 64Bit | |
| Average of class Gaming (1578 - 6330, n=105, last 2 years) | |
| HP Victus 16 (2024) | |
| Dell G16, i7-13650HX, RTX 4060 | |
| Schenker XMG Core 15 (M24) | |
| Gigabyte G6X 9KG (2024) | |
| Lenovo LOQ 15IRX9 (Leistungsmodus) | |
| Lenovo LOQ 15IRX9 | |
| Average Intel Core i5-13450HX (2427 - 2505, n=3) | |
| CPU Single 64Bit | |
| Average of class Gaming (188.8 - 350, n=106, last 2 years) | |
| Schenker XMG Core 15 (M24) | |
| Dell G16, i7-13650HX, RTX 4060 | |
| Gigabyte G6X 9KG (2024) | |
| Lenovo LOQ 15IRX9 (Leistungsmodus) | |
| Average Intel Core i5-13450HX (239 - 251, n=3) | |
| Lenovo LOQ 15IRX9 | |
| HP Victus 16 (2024) | |
| Blender - v2.79 BMW27 CPU | |
| Lenovo LOQ 15IRX9 | |
| Gigabyte G6X 9KG (2024) | |
| Average Intel Core i5-13450HX (196 - 229, n=3) | |
| Lenovo LOQ 15IRX9 (Leistungsmodus) | |
| Schenker XMG Core 15 (M24) | |
| HP Victus 16 (2024) | |
| Dell G16, i7-13650HX, RTX 4060 | |
| Average of class Gaming (79 - 330, n=104, last 2 years) | |
| 7-Zip 18.03 | |
| 7z b 4 | |
| Average of class Gaming (33491 - 148086, n=105, last 2 years) | |
| HP Victus 16 (2024) | |
| Dell G16, i7-13650HX, RTX 4060 | |
| Schenker XMG Core 15 (M24) | |
| Gigabyte G6X 9KG (2024) | |
| Lenovo LOQ 15IRX9 (Leistungsmodus) | |
| Average Intel Core i5-13450HX (59026 - 62204, n=3) | |
| Lenovo LOQ 15IRX9 | |
| 7z b 4 -mmt1 | |
| Schenker XMG Core 15 (M24) | |
| Average of class Gaming (4199 - 7436, n=105, last 2 years) | |
| Dell G16, i7-13650HX, RTX 4060 | |
| Gigabyte G6X 9KG (2024) | |
| HP Victus 16 (2024) | |
| Lenovo LOQ 15IRX9 (Leistungsmodus) | |
| Average Intel Core i5-13450HX (5370 - 5576, n=3) | |
| Lenovo LOQ 15IRX9 | |
| Geekbench 6.7 | |
| Multi-Core | |
| Average of class Gaming (6625 - 22850, n=106, last 2 years) | |
| HP Victus 16 (2024) (6.2.1) | |
| Schenker XMG Core 15 (M24) (6.2.1) | |
| Dell G16, i7-13650HX, RTX 4060 (6.2.1) | |
| Gigabyte G6X 9KG (2024) (6.2.1) | |
| Lenovo LOQ 15IRX9 (6.2.1, Leistungsmodus) | |
| Average Intel Core i5-13450HX (12619 - 12799, n=3) | |
| Lenovo LOQ 15IRX9 (6.2.1) | |
| Single-Core | |
| Average of class Gaming (1490 - 3259, n=106, last 2 years) | |
| Schenker XMG Core 15 (M24) (6.2.1) | |
| Dell G16, i7-13650HX, RTX 4060 (6.2.1) | |
| Gigabyte G6X 9KG (2024) (6.2.1) | |
| Lenovo LOQ 15IRX9 (6.2.1, Leistungsmodus) | |
| Average Intel Core i5-13450HX (2381 - 2448, n=3) | |
| Lenovo LOQ 15IRX9 (6.2.1) | |
| HP Victus 16 (2024) (6.2.1) | |
| Geekbench 5.5 | |
| Multi-Core | |
| Average of class Gaming (6460 - 28263, n=105, last 2 years) | |
| HP Victus 16 (2024) | |
| Gigabyte G6X 9KG (2024) | |
| Schenker XMG Core 15 (M24) | |
| Dell G16, i7-13650HX, RTX 4060 | |
| Lenovo LOQ 15IRX9 | |
| Average Intel Core i5-13450HX (11973 - 12022, n=3) | |
| Lenovo LOQ 15IRX9 (Leistungsmodus) | |
| Single-Core | |
| Average of class Gaming (986 - 2474, n=105, last 2 years) | |
| Schenker XMG Core 15 (M24) | |
| Dell G16, i7-13650HX, RTX 4060 | |
| Gigabyte G6X 9KG (2024) | |
| Lenovo LOQ 15IRX9 (Leistungsmodus) | |
| Average Intel Core i5-13450HX (1696 - 1763, n=3) | |
| HP Victus 16 (2024) | |
| Lenovo LOQ 15IRX9 | |
| HWBOT x265 Benchmark v2.2 - 4k Preset | |
| Average of class Gaming (11.5 - 44.4, n=105, last 2 years) | |
| Schenker XMG Core 15 (M24) | |
| HP Victus 16 (2024) | |
| Lenovo LOQ 15IRX9 (Leistungsmodus) | |
| Dell G16, i7-13650HX, RTX 4060 | |
| Gigabyte G6X 9KG (2024) | |
| Average Intel Core i5-13450HX (16.9 - 20.5, n=3) | |
| Lenovo LOQ 15IRX9 | |
| LibreOffice - 20 Documents To PDF | |
| Average Intel Core i5-13450HX (49.5 - 96.6, n=3) | |
| Lenovo LOQ 15IRX9 (6.3.4.2) | |
| HP Victus 16 (2024) (6.3.4.2) | |
| Dell G16, i7-13650HX, RTX 4060 (6.3.4.2) | |
| Average of class Gaming (33.2 - 88.8, n=105, last 2 years) | |
| Lenovo LOQ 15IRX9 (6.3.4.2, Leistungsmodus) | |
| Schenker XMG Core 15 (M24) (6.3.4.2) | |
| Gigabyte G6X 9KG (2024) (6.3.4.2) | |
| R Benchmark 2.5 - Overall mean | |
| HP Victus 16 (2024) | |
| Lenovo LOQ 15IRX9 | |
| Average Intel Core i5-13450HX (0.4582 - 0.4838, n=3) | |
| Lenovo LOQ 15IRX9 (Leistungsmodus) | |
| Gigabyte G6X 9KG (2024) | |
| Schenker XMG Core 15 (M24) | |
| Average of class Gaming (0.3439 - 0.759, n=106, last 2 years) | |
| Dell G16, i7-13650HX, RTX 4060 | |
| Dell G16, i7-13650HX, RTX 4060 | |
* ... smaller is better
AIDA64: FP32 Ray-Trace | FPU Julia | CPU SHA3 | CPU Queen | FPU SinJulia | FPU Mandel | CPU AES | CPU ZLib | FP64 Ray-Trace | CPU PhotoWorxx
| Performance rating | |
| Average of class Gaming | |
| Schenker XMG Core 15 (M24) | |
| Dell G16, i7-13650HX, RTX 4060 | |
| HP Victus 16 (2024) | |
| Lenovo LOQ 15IRX9 | |
| Average Intel Core i5-13450HX | |
| Gigabyte G6X 9KG (2024) | |
| Lenovo LOQ 15IRX9 | |
| AIDA64 / FP32 Ray-Trace | |
| Average of class Gaming (10227 - 85542, n=105, last 2 years) | |
| Schenker XMG Core 15 (M24) (v6.92.6600) | |
| Dell G16, i7-13650HX, RTX 4060 (v6.92.6600) | |
| Lenovo LOQ 15IRX9 (v6.92.6600, Leistungsmodus) | |
| HP Victus 16 (2024) (v6.92.6600) | |
| Average Intel Core i5-13450HX (13747 - 17767, n=3) | |
| Lenovo LOQ 15IRX9 (v6.92.6600) | |
| Gigabyte G6X 9KG (2024) (v6.92.6600) | |
| AIDA64 / FPU Julia | |
| Average of class Gaming (51376 - 238426, n=105, last 2 years) | |
| Schenker XMG Core 15 (M24) (v6.92.6600) | |
| Dell G16, i7-13650HX, RTX 4060 (v6.92.6600) | |
| HP Victus 16 (2024) (v6.92.6600) | |
| Lenovo LOQ 15IRX9 (v6.92.6600, Leistungsmodus) | |
| Average Intel Core i5-13450HX (71834 - 83862, n=3) | |
| Lenovo LOQ 15IRX9 (v6.92.6600) | |
| Gigabyte G6X 9KG (2024) (v6.92.6600) | |
| AIDA64 / CPU SHA3 | |
| Average of class Gaming (2180 - 10115, n=105, last 2 years) | |
| Schenker XMG Core 15 (M24) (v6.92.6600) | |
| Dell G16, i7-13650HX, RTX 4060 (v6.92.6600) | |
| HP Victus 16 (2024) (v6.92.6600) | |
| Lenovo LOQ 15IRX9 (v6.92.6600) | |
| Lenovo LOQ 15IRX9 (v6.92.6600, Leistungsmodus) | |
| Average Intel Core i5-13450HX (3519 - 3530, n=3) | |
| Gigabyte G6X 9KG (2024) (v6.92.6600) | |
| AIDA64 / CPU Queen | |
| HP Victus 16 (2024) (v6.92.6600) | |
| Schenker XMG Core 15 (M24) (v6.92.6600) | |
| Average of class Gaming (49785 - 173351, n=90, last 2 years) | |
| Gigabyte G6X 9KG (2024) (v6.92.6600) | |
| Dell G16, i7-13650HX, RTX 4060 (v6.92.6600) | |
| Lenovo LOQ 15IRX9 (v6.92.6600) | |
| Average Intel Core i5-13450HX (85888 - 86148, n=3) | |
| Lenovo LOQ 15IRX9 (v6.92.6600, Leistungsmodus) | |
| AIDA64 / FPU SinJulia | |
| Schenker XMG Core 15 (M24) (v6.92.6600) | |
| Average of class Gaming (4424 - 33636, n=105, last 2 years) | |
| HP Victus 16 (2024) (v6.92.6600) | |
| Dell G16, i7-13650HX, RTX 4060 (v6.92.6600) | |
| Lenovo LOQ 15IRX9 (v6.92.6600, Leistungsmodus) | |
| Lenovo LOQ 15IRX9 (v6.92.6600) | |
| Average Intel Core i5-13450HX (9325 - 9354, n=3) | |
| Gigabyte G6X 9KG (2024) (v6.92.6600) | |
| AIDA64 / FPU Mandel | |
| Average of class Gaming (25115 - 128721, n=105, last 2 years) | |
| Schenker XMG Core 15 (M24) (v6.92.6600) | |
| Dell G16, i7-13650HX, RTX 4060 (v6.92.6600) | |
| Lenovo LOQ 15IRX9 (v6.92.6600, Leistungsmodus) | |
| HP Victus 16 (2024) (v6.92.6600) | |
| Average Intel Core i5-13450HX (34956 - 42825, n=3) | |
| Lenovo LOQ 15IRX9 (v6.92.6600) | |
| Gigabyte G6X 9KG (2024) (v6.92.6600) | |
| AIDA64 / CPU AES | |
| Average of class Gaming (39258 - 247074, n=105, last 2 years) | |
| Schenker XMG Core 15 (M24) (v6.92.6600) | |
| Dell G16, i7-13650HX, RTX 4060 (v6.92.6600) | |
| HP Victus 16 (2024) (v6.92.6600) | |
| Average Intel Core i5-13450HX (70296 - 70680, n=3) | |
| Lenovo LOQ 15IRX9 (v6.92.6600) | |
| Lenovo LOQ 15IRX9 (v6.92.6600, Leistungsmodus) | |
| Gigabyte G6X 9KG (2024) (v6.92.6600) | |
| AIDA64 / CPU ZLib | |
| Average of class Gaming (574 - 2531, n=105, last 2 years) | |
| Dell G16, i7-13650HX, RTX 4060 (v6.92.6600) | |
| HP Victus 16 (2024) (v6.92.6600) | |
| Gigabyte G6X 9KG (2024) (v6.92.6600) | |
| Lenovo LOQ 15IRX9 (v6.92.6600) | |
| Average Intel Core i5-13450HX (977 - 1002, n=3) | |
| Lenovo LOQ 15IRX9 (v6.92.6600, Leistungsmodus) | |
| Schenker XMG Core 15 (M24) (v6.92.6600) | |
| AIDA64 / FP64 Ray-Trace | |
| Average of class Gaming (5509 - 45446, n=105, last 2 years) | |
| Schenker XMG Core 15 (M24) (v6.92.6600) | |
| Dell G16, i7-13650HX, RTX 4060 (v6.92.6600) | |
| Lenovo LOQ 15IRX9 (v6.92.6600, Leistungsmodus) | |
| HP Victus 16 (2024) (v6.92.6600) | |
| Average Intel Core i5-13450HX (7428 - 9561, n=3) | |
| Lenovo LOQ 15IRX9 (v6.92.6600) | |
| Gigabyte G6X 9KG (2024) (v6.92.6600) | |
| AIDA64 / CPU PhotoWorxx | |
| Average of class Gaming (12271 - 89891, n=105, last 2 years) | |
| Schenker XMG Core 15 (M24) (v6.92.6600) | |
| HP Victus 16 (2024) (v6.92.6600) | |
| Gigabyte G6X 9KG (2024) (v6.92.6600) | |
| Lenovo LOQ 15IRX9 (v6.92.6600) | |
| Lenovo LOQ 15IRX9 (v6.92.6600, Leistungsmodus) | |
| Average Intel Core i5-13450HX (36014 - 36764, n=3) | |
| Dell G16, i7-13650HX, RTX 4060 (v6.92.6600) | |
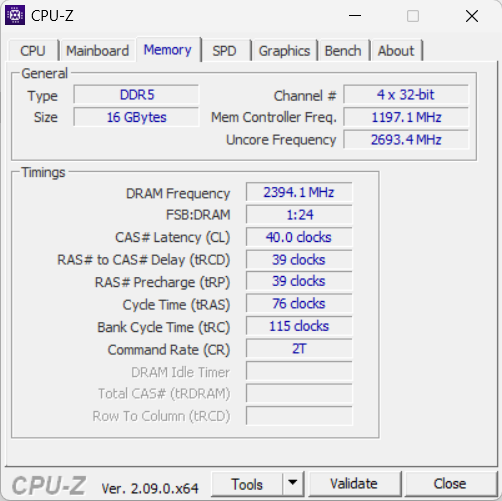
System performance
The smooth-running system is not lacking in performance: the computer handles gaming, rendering and streaming without any problems. The RAM's transfer rates are as expected for DDR5-5600 RAM.

CrossMark: Overall | Productivity | Creativity | Responsiveness
WebXPRT 3: Overall
WebXPRT 4: Overall
Mozilla Kraken 1.1: Total
| PCMark 10 / Score | |
| Schenker XMG Core 15 (M24) | |
| Average of class Gaming (5828 - 12414, n=93, last 2 years) | |
| Gigabyte G6X 9KG (2024) | |
| HP Victus 16 (2024) | |
| Dell G16, i7-13650HX, RTX 4060 | |
| Lenovo LOQ 15IRX9 | |
| Average Intel Core i5-13450HX, NVIDIA GeForce RTX 4060 Laptop GPU (n=1) | |
| PCMark 10 / Essentials | |
| HP Victus 16 (2024) | |
| Average of class Gaming (8810 - 11935, n=97, last 2 years) | |
| Gigabyte G6X 9KG (2024) | |
| Schenker XMG Core 15 (M24) | |
| Dell G16, i7-13650HX, RTX 4060 | |
| Lenovo LOQ 15IRX9 | |
| Average Intel Core i5-13450HX, NVIDIA GeForce RTX 4060 Laptop GPU (n=1) | |
| PCMark 10 / Productivity | |
| Schenker XMG Core 15 (M24) | |
| Average of class Gaming (6845 - 25323, n=95, last 2 years) | |
| Gigabyte G6X 9KG (2024) | |
| Dell G16, i7-13650HX, RTX 4060 | |
| HP Victus 16 (2024) | |
| Lenovo LOQ 15IRX9 | |
| Average Intel Core i5-13450HX, NVIDIA GeForce RTX 4060 Laptop GPU (n=1) | |
| PCMark 10 / Digital Content Creation | |
| Average of class Gaming (7602 - 19954, n=95, last 2 years) | |
| Schenker XMG Core 15 (M24) | |
| Dell G16, i7-13650HX, RTX 4060 | |
| Gigabyte G6X 9KG (2024) | |
| Lenovo LOQ 15IRX9 | |
| Average Intel Core i5-13450HX, NVIDIA GeForce RTX 4060 Laptop GPU (n=1) | |
| HP Victus 16 (2024) | |
| CrossMark / Overall | |
| Average of class Gaming (1366 - 2409, n=94, last 2 years) | |
| Gigabyte G6X 9KG (2024) | |
| HP Victus 16 (2024) | |
| Schenker XMG Core 15 (M24) | |
| Dell G16, i7-13650HX, RTX 4060 | |
| Lenovo LOQ 15IRX9 | |
| Average Intel Core i5-13450HX, NVIDIA GeForce RTX 4060 Laptop GPU (n=1) | |
| CrossMark / Productivity | |
| Gigabyte G6X 9KG (2024) | |
| Average of class Gaming (1386 - 2254, n=94, last 2 years) | |
| Schenker XMG Core 15 (M24) | |
| HP Victus 16 (2024) | |
| Dell G16, i7-13650HX, RTX 4060 | |
| Lenovo LOQ 15IRX9 | |
| Average Intel Core i5-13450HX, NVIDIA GeForce RTX 4060 Laptop GPU (n=1) | |
| CrossMark / Creativity | |
| Average of class Gaming (1343 - 2786, n=94, last 2 years) | |
| HP Victus 16 (2024) | |
| Schenker XMG Core 15 (M24) | |
| Gigabyte G6X 9KG (2024) | |
| Dell G16, i7-13650HX, RTX 4060 | |
| Lenovo LOQ 15IRX9 | |
| Average Intel Core i5-13450HX, NVIDIA GeForce RTX 4060 Laptop GPU (n=1) | |
| CrossMark / Responsiveness | |
| Gigabyte G6X 9KG (2024) | |
| HP Victus 16 (2024) | |
| Lenovo LOQ 15IRX9 | |
| Average Intel Core i5-13450HX, NVIDIA GeForce RTX 4060 Laptop GPU (n=1) | |
| Average of class Gaming (1226 - 2334, n=94, last 2 years) | |
| Dell G16, i7-13650HX, RTX 4060 | |
| Schenker XMG Core 15 (M24) | |
| WebXPRT 3 / Overall | |
| Average of class Gaming (220 - 532, n=98, last 2 years) | |
| Schenker XMG Core 15 (M24) (Chrome 82) | |
| Gigabyte G6X 9KG (2024) (Chrome 82) | |
| HP Victus 16 (2024) (Chrome 82) | |
| Dell G16, i7-13650HX, RTX 4060 (Chrome 82) | |
| Lenovo LOQ 15IRX9 (Chrome 82) | |
| Average Intel Core i5-13450HX, NVIDIA GeForce RTX 4060 Laptop GPU (n=1) | |
| WebXPRT 4 / Overall | |
| Average of class Gaming (165 - 354, n=98, last 2 years) | |
| Schenker XMG Core 15 (M24) (Chrome 105.0.0.0) | |
| Gigabyte G6X 9KG (2024) (Chrome 105.0.0.0) | |
| HP Victus 16 (2024) (Chrome 105.0.0.0) | |
| Lenovo LOQ 15IRX9 (Chrome 105.0.0.0) | |
| Average Intel Core i5-13450HX, NVIDIA GeForce RTX 4060 Laptop GPU (n=1) | |
| Mozilla Kraken 1.1 / Total | |
| Lenovo LOQ 15IRX9 (Chrome 82) | |
| Average Intel Core i5-13450HX, NVIDIA GeForce RTX 4060 Laptop GPU (n=1) | |
| HP Victus 16 (2024) (Chrome 82) | |
| Gigabyte G6X 9KG (2024) (Chrome 82) | |
| Dell G16, i7-13650HX, RTX 4060 (Chrome 82) | |
| Schenker XMG Core 15 (M24) (Chrome 82) | |
| Average of class Gaming (391 - 590, n=100, last 2 years) | |
* ... smaller is better
| PCMark 10 Score | 6929 points | |
Help | ||
| AIDA64 / Memory Copy | |
| Average of class Gaming (21750 - 129946, n=105, last 2 years) | |
| Schenker XMG Core 15 (M24) (v6.92.6600) | |
| HP Victus 16 (2024) (v6.92.6600) | |
| Gigabyte G6X 9KG (2024) (v6.92.6600) | |
| Dell G16, i7-13650HX, RTX 4060 (v6.92.6600) | |
| Average Intel Core i5-13450HX (58673 - 58861, n=3) | |
| Lenovo LOQ 15IRX9 (v6.92.6600) | |
| AIDA64 / Memory Read | |
| HP Victus 16 (2024) (v6.92.6600) | |
| Average of class Gaming (22956 - 118858, n=105, last 2 years) | |
| Gigabyte G6X 9KG (2024) (v6.92.6600) | |
| Lenovo LOQ 15IRX9 (v6.92.6600) | |
| Average Intel Core i5-13450HX (66626 - 69024, n=3) | |
| Dell G16, i7-13650HX, RTX 4060 (v6.92.6600) | |
| Schenker XMG Core 15 (M24) (v6.92.6600) | |
| AIDA64 / Memory Write | |
| Schenker XMG Core 15 (M24) (v6.92.6600) | |
| Average of class Gaming (22297 - 135096, n=105, last 2 years) | |
| HP Victus 16 (2024) (v6.92.6600) | |
| Gigabyte G6X 9KG (2024) (v6.92.6600) | |
| Lenovo LOQ 15IRX9 (v6.92.6600) | |
| Average Intel Core i5-13450HX (58540 - 60196, n=3) | |
| Dell G16, i7-13650HX, RTX 4060 (v6.92.6600) | |
| AIDA64 / Memory Latency | |
| Average of class Gaming (75.3 - 259, n=105, last 2 years) | |
| HP Victus 16 (2024) (v6.92.6600) | |
| Lenovo LOQ 15IRX9 (v6.92.6600) | |
| Average Intel Core i5-13450HX (90 - 94.2, n=3) | |
| Dell G16, i7-13650HX, RTX 4060 (v6.92.6600) | |
| Gigabyte G6X 9KG (2024) (v6.92.6600) | |
| Schenker XMG Core 15 (M24) (v6.92.6600) | |
* ... smaller is better
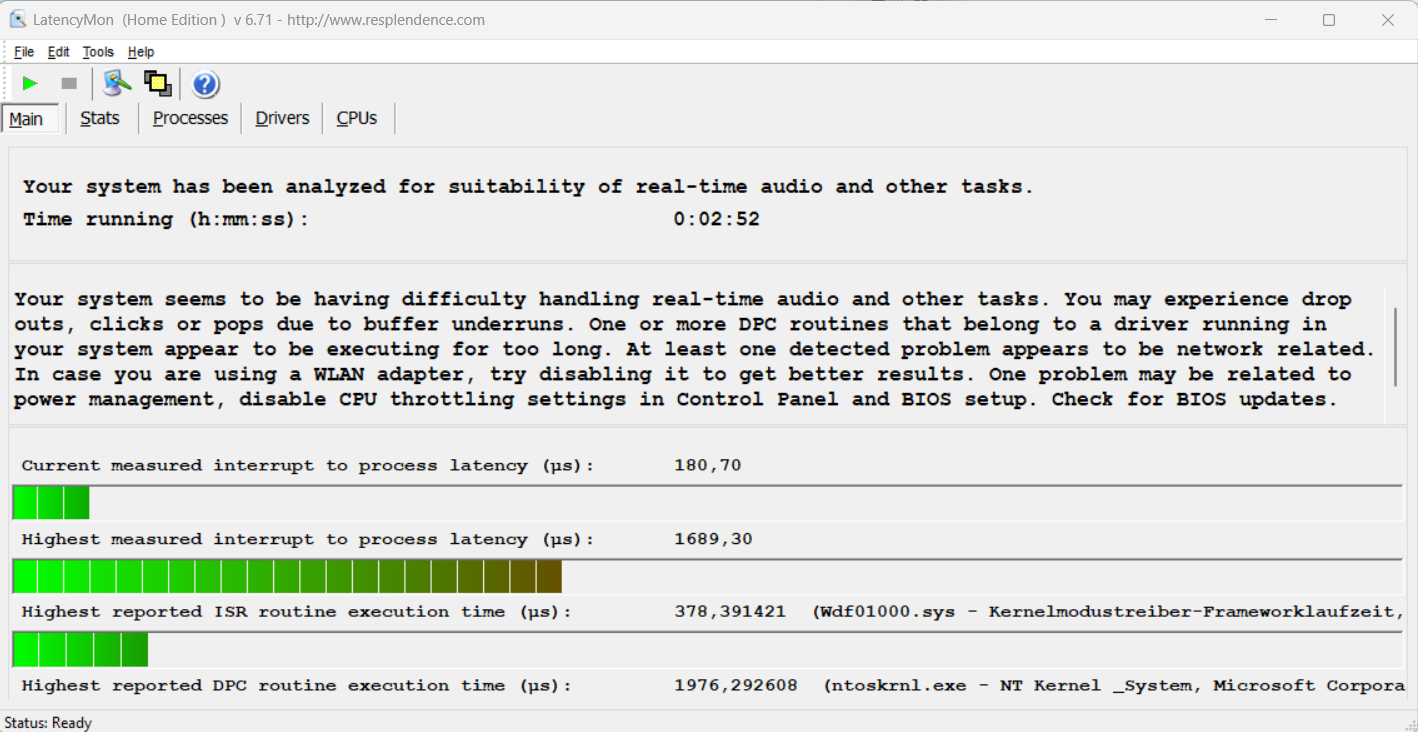
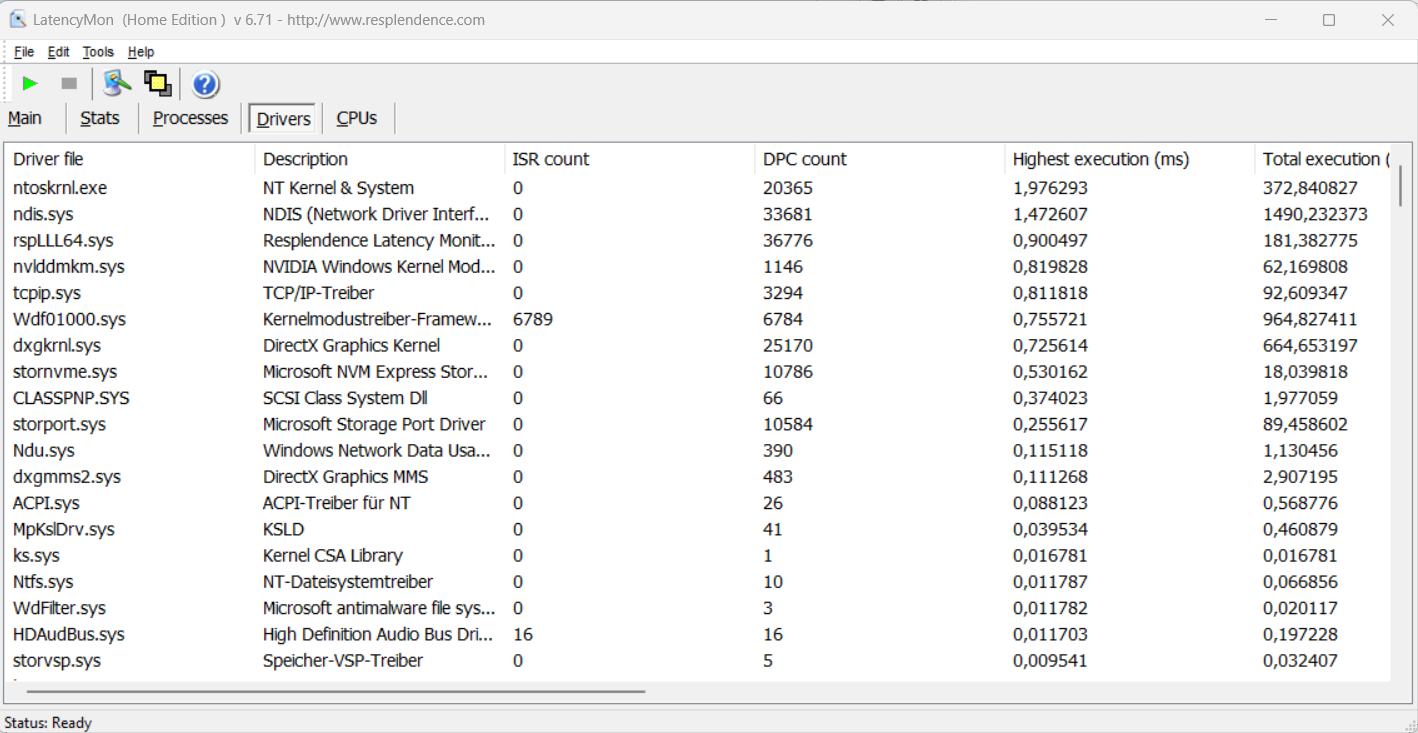
DPC latencies
The standardized latency test (web surfing, 4k video playback, Prime95 high-load) revealed some anomalies. The system doesn't appear to be suitable for video and audio editing in real-time. Future software updates could lead to improvements or even deteriorations.
| DPC Latencies / LatencyMon - interrupt to process latency (max), Web, Youtube, Prime95 | |
| Gigabyte G6X 9KG (2024) | |
| Lenovo LOQ 15IRX9 | |
| Schenker XMG Core 15 (M24) | |
| Dell G16, i7-13650HX, RTX 4060 | |
| HP Victus 16 (2024) | |
* ... smaller is better
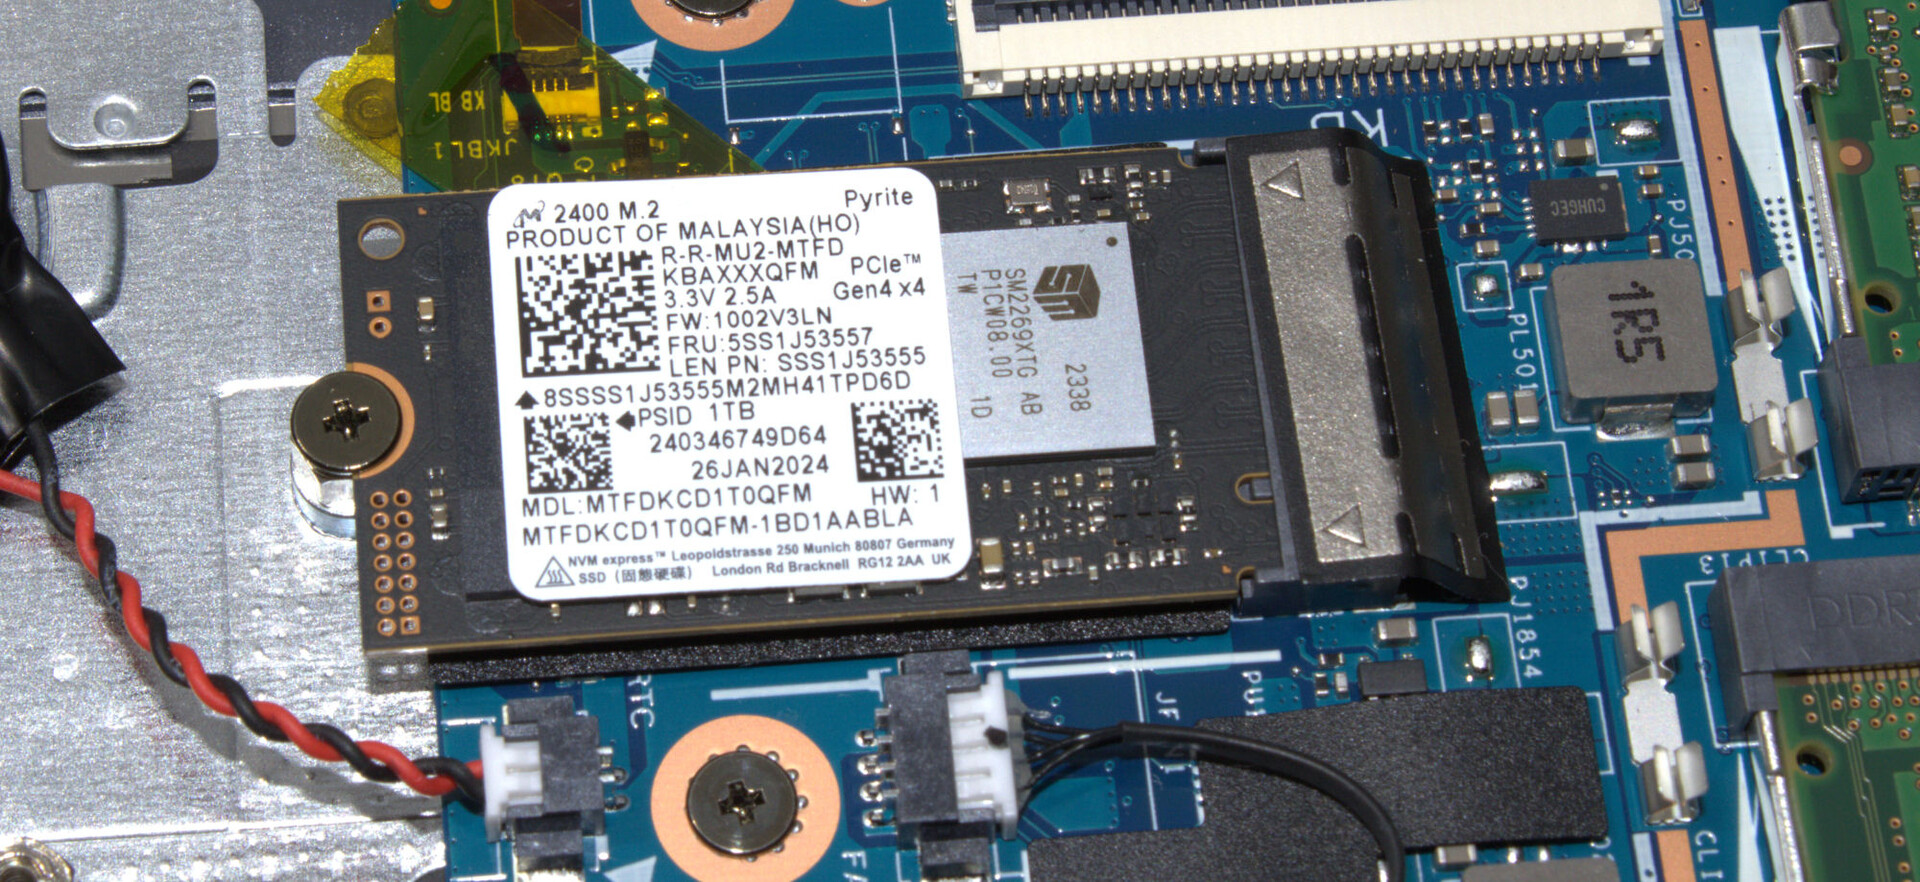
Storage devices
The LOQ has space for a total of two PCIe 4 SSDs (M.2 2280 or M.2 2242). The Micron SSD (1 TB, M.2 2242) inside our test device delivers good data rates, but it can't be classed as one of the top-of-the-range SSD models. During the later course of the DiskSpd loop, we noted some thermally induced throttling.

* ... smaller is better
Reading continuous performance: DiskSpd Read Loop, Queue Depth 8
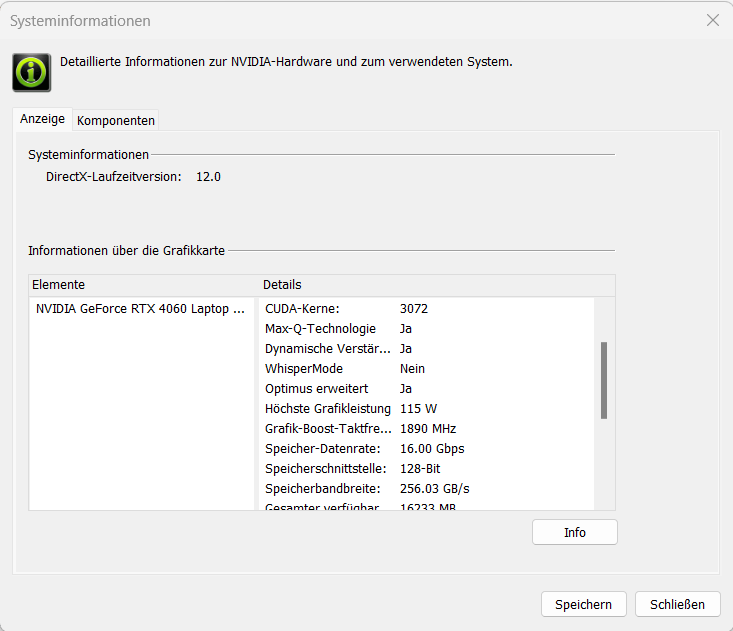
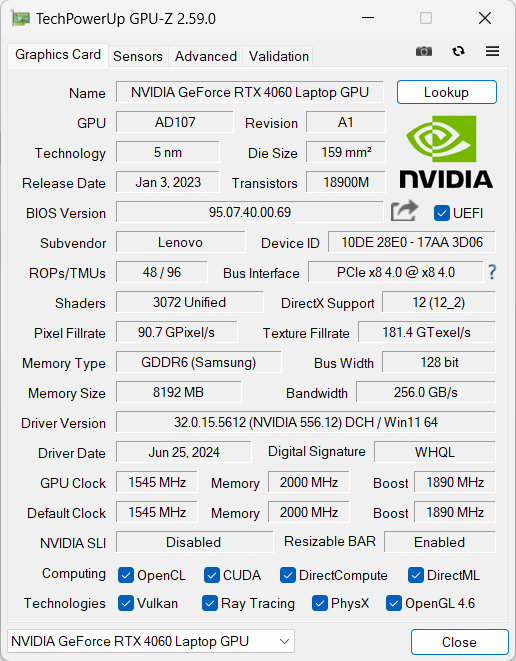
Graphics card
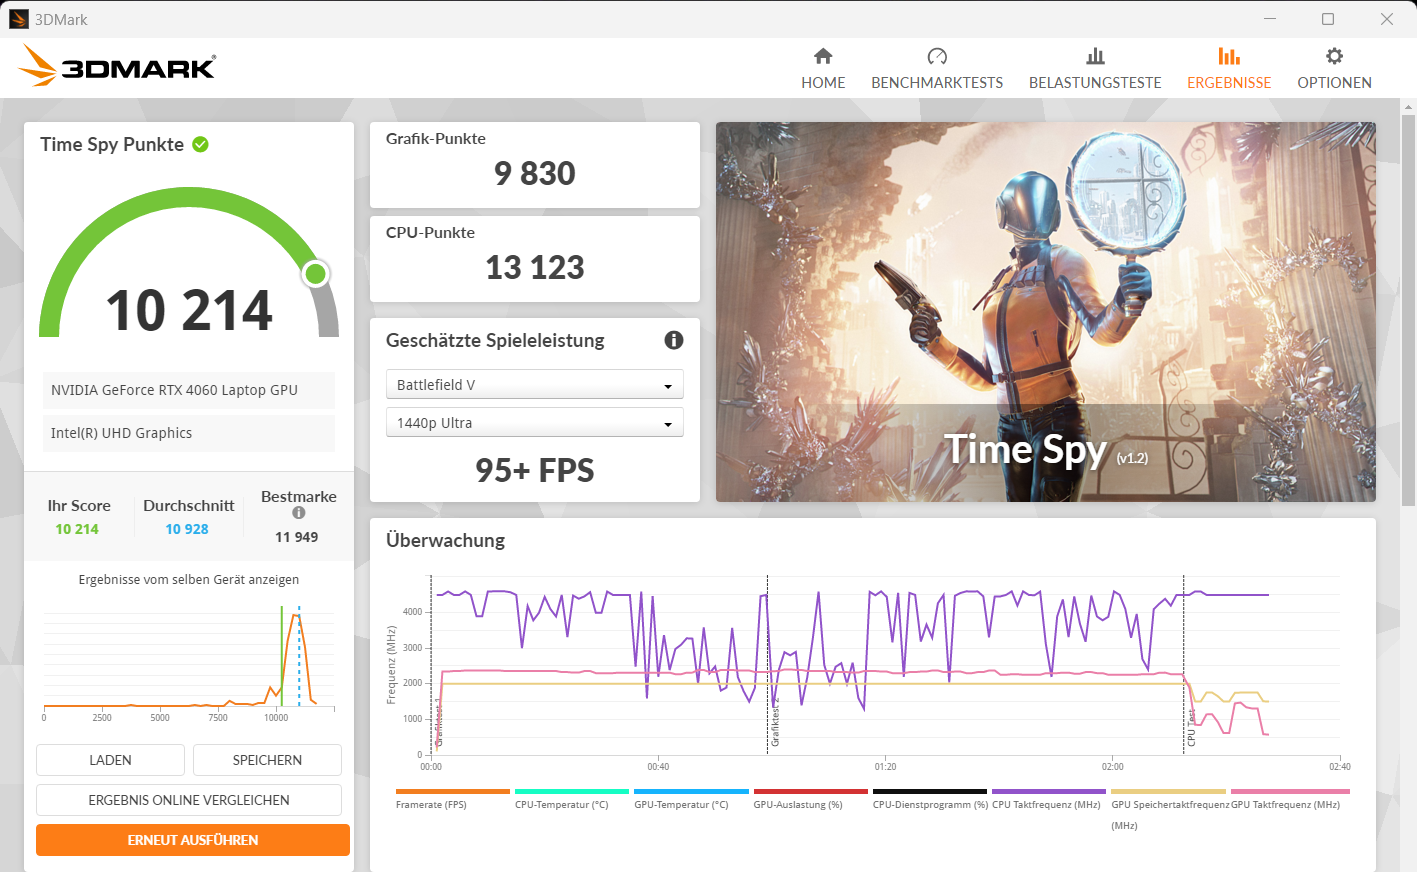
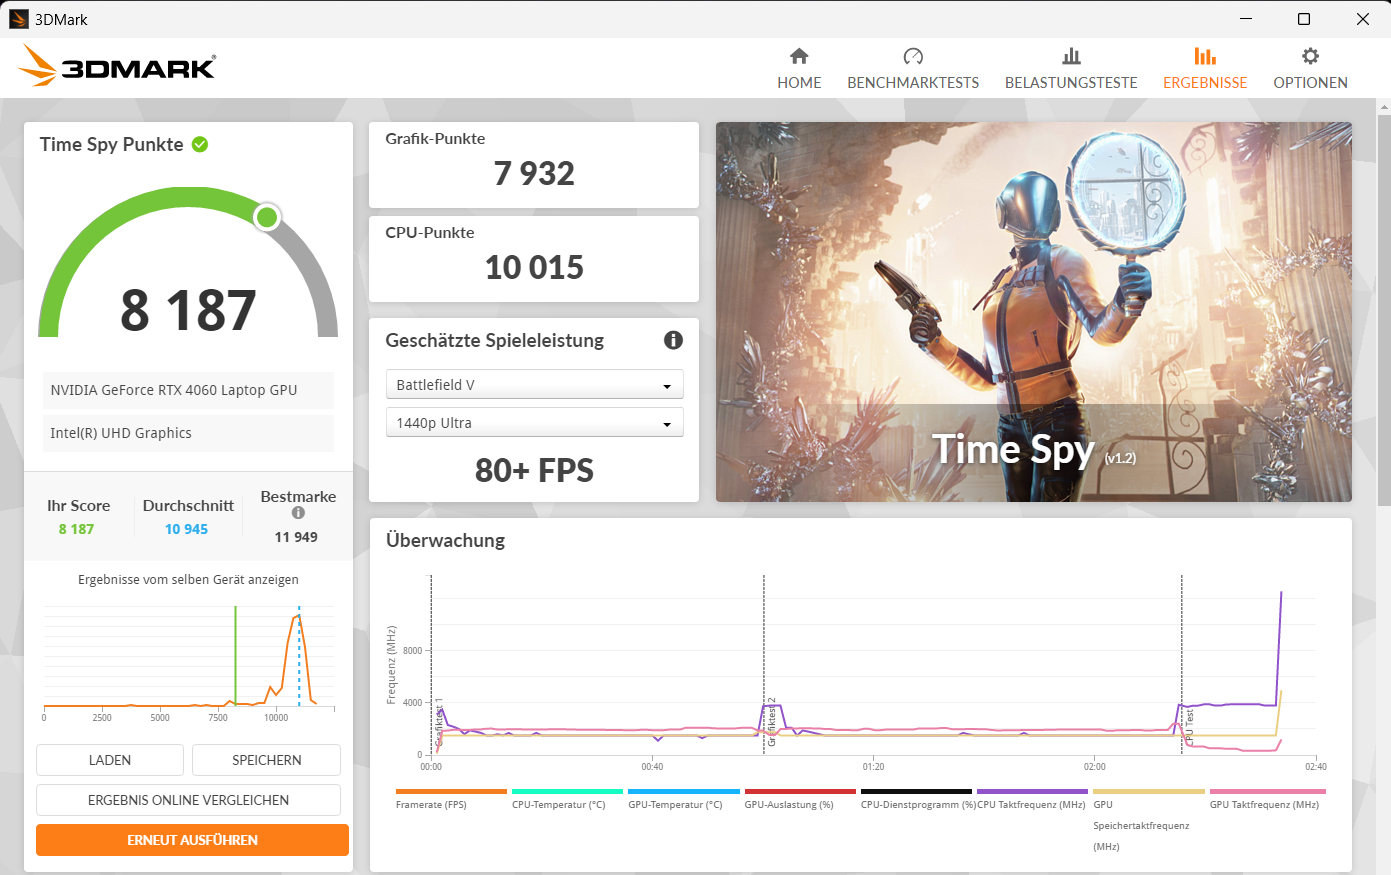
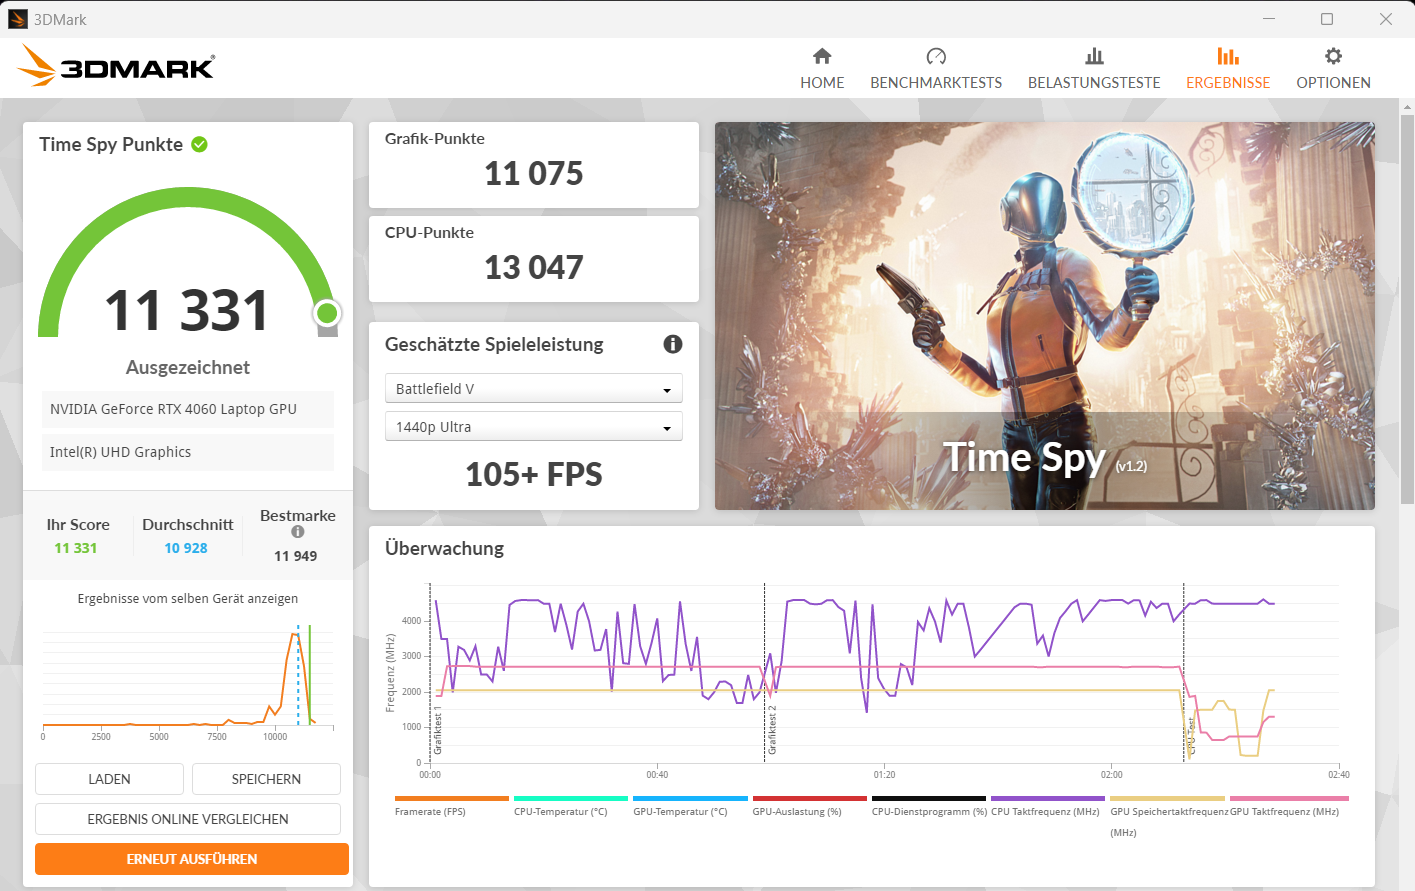
The GeForce RTX 4060 (3,072 shaders, 128-bit bus, 8 GB GDDR6, 115 watts) represents the mid-range within Nvidia's current lineup of mobile GPUs. It allows for FHD gaming at high to maximum settings. Its benchmark results and frame rates are roughly on par with the RTX-4060 average (balanced mode). Performance mode resulted in improved values. Changing between the dGPU and Optimus doesn't require a restart: Advanced Optimus is supported.
| 3DMark Performance rating - Percent | |
| Average of class Gaming | |
| Schenker XMG Core 15 (M24) | |
| Lenovo LOQ 15IRX9 | |
| Dell G16, i7-13650HX, RTX 4060 | |
| Lenovo LOQ 15IRX9 | |
| Gigabyte G6X 9KG (2024) | |
| HP Victus 16 (2024) | |
| Average NVIDIA GeForce RTX 4060 Laptop GPU | |
| 3DMark 11 - 1280x720 Performance GPU | |
| Average of class Gaming (21841 - 80022, n=104, last 2 years) | |
| Schenker XMG Core 15 (M24) | |
| Lenovo LOQ 15IRX9 (Leistungsmodus) | |
| Dell G16, i7-13650HX, RTX 4060 | |
| Lenovo LOQ 15IRX9 | |
| Gigabyte G6X 9KG (2024) | |
| HP Victus 16 (2024) | |
| Average NVIDIA GeForce RTX 4060 Laptop GPU (28136 - 38912, n=57) | |
| 3DMark | |
| 1920x1080 Fire Strike Graphics | |
| Average of class Gaming (12242 - 62849, n=115, last 2 years) | |
| Schenker XMG Core 15 (M24) | |
| Lenovo LOQ 15IRX9 (Leistungsmodus) | |
| Lenovo LOQ 15IRX9 | |
| Gigabyte G6X 9KG (2024) | |
| Dell G16, i7-13650HX, RTX 4060 | |
| HP Victus 16 (2024) | |
| Average NVIDIA GeForce RTX 4060 Laptop GPU (20533 - 29656, n=54) | |
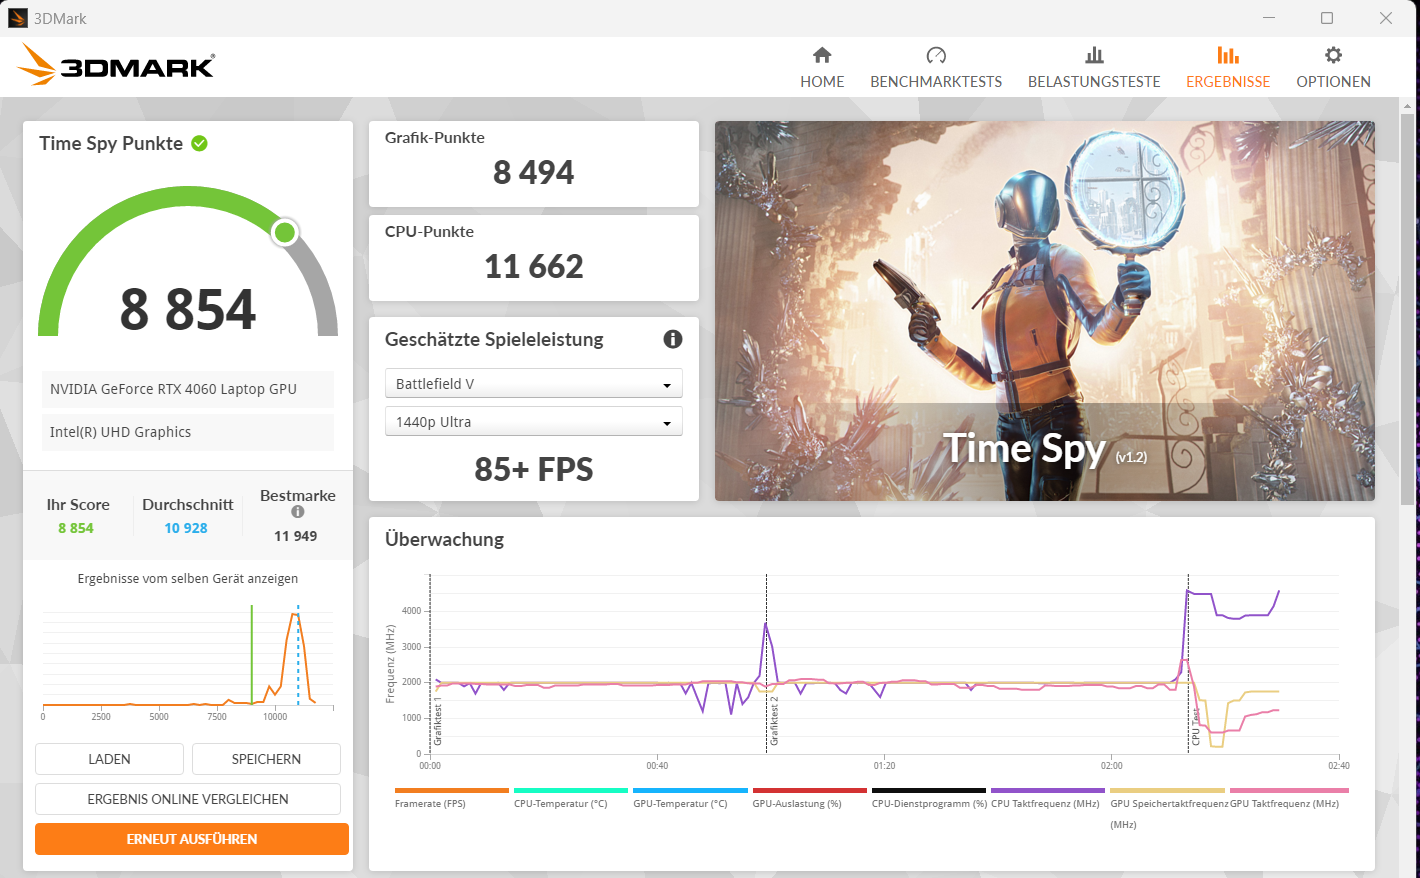
| 2560x1440 Time Spy Graphics | |
| Average of class Gaming (5012 - 26212, n=114, last 2 years) | |
| Schenker XMG Core 15 (M24) | |
| Lenovo LOQ 15IRX9 (Leistungsmodus) | |
| Dell G16, i7-13650HX, RTX 4060 | |
| Average NVIDIA GeForce RTX 4060 Laptop GPU (7484 - 11451, n=56) | |
| HP Victus 16 (2024) | |
| Gigabyte G6X 9KG (2024) | |
| Lenovo LOQ 15IRX9 | |
| 3DMark 11 Performance | 30755 points | |
| 3DMark Fire Strike Score | 22788 points | |
| 3DMark Time Spy Score | 10214 points | |
| 3DMark Steel Nomad Score | 2143 points | |
Help | ||
| Blender | |
| v3.3 Classroom OPTIX/RTX | |
| Lenovo LOQ 15IRX9 (3.3.3) | |
| Dell G16, i7-13650HX, RTX 4060 (3.3.3) | |
| Average NVIDIA GeForce RTX 4060 Laptop GPU (19 - 28, n=53) | |
| HP Victus 16 (2024) (3.3.3) | |
| Lenovo LOQ 15IRX9 (3.3.3, Leistungsmodus) | |
| Gigabyte G6X 9KG (2024) (3.3.3) | |
| Schenker XMG Core 15 (M24) (3.3.3) | |
| Average of class Gaming (9 - 32, n=106, last 2 years) | |
| v3.3 Classroom CUDA | |
| Dell G16, i7-13650HX, RTX 4060 (3.3.3) | |
| Lenovo LOQ 15IRX9 (3.3.3) | |
| Average NVIDIA GeForce RTX 4060 Laptop GPU (39 - 53, n=53) | |
| Lenovo LOQ 15IRX9 (3.3.3, Leistungsmodus) | |
| HP Victus 16 (2024) (3.3.3) | |
| Gigabyte G6X 9KG (2024) (3.3.3) | |
| Schenker XMG Core 15 (M24) (3.3.3) | |
| Average of class Gaming (15 - 228, n=106, last 2 years) | |
| v3.3 Classroom CPU | |
| Gigabyte G6X 9KG (2024) (3.3.3) | |
| Lenovo LOQ 15IRX9 (3.3.3) | |
| Lenovo LOQ 15IRX9 (3.3.3, Leistungsmodus) | |
| HP Victus 16 (2024) (3.3.3) | |
| Average NVIDIA GeForce RTX 4060 Laptop GPU (189 - 452, n=53) | |
| Schenker XMG Core 15 (M24) (3.3.3) | |
| Dell G16, i7-13650HX, RTX 4060 (3.3.3) | |
| Average of class Gaming (122 - 565, n=102, last 2 years) | |
| Geekbench 5.5 | |
| OpenCL Score | |
| Average of class Gaming (80702 - 277970, n=101, last 2 years) | |
| Schenker XMG Core 15 (M24) | |
| Lenovo LOQ 15IRX9 (Leistungsmodus) | |
| Lenovo LOQ 15IRX9 | |
| Gigabyte G6X 9KG (2024) | |
| Dell G16, i7-13650HX, RTX 4060 | |
| HP Victus 16 (2024) | |
| Average NVIDIA GeForce RTX 4060 Laptop GPU (5039 - 112238, n=53) | |
| Vulkan Score 5.5 | |
| Average of class Gaming (18857 - 246759, n=76, last 2 years) | |
| Schenker XMG Core 15 (M24) | |
| Lenovo LOQ 15IRX9 (Leistungsmodus) | |
| Lenovo LOQ 15IRX9 | |
| Average NVIDIA GeForce RTX 4060 Laptop GPU (46347 - 87612, n=30) | |
| HP Victus 16 (2024) | |
| Gigabyte G6X 9KG (2024) | |
| Geekbench 6.7 | |
| GPU OpenCL | |
| Average of class Gaming (67235 - 253130, n=103, last 2 years) | |
| Gigabyte G6X 9KG (2024) (6.2.1) | |
| Schenker XMG Core 15 (M24) (6.2.1) | |
| HP Victus 16 (2024) (6.2.1) | |
| Dell G16, i7-13650HX, RTX 4060 (6.2.1) | |
| Lenovo LOQ 15IRX9 (6.2.1, Leistungsmodus) | |
| Average NVIDIA GeForce RTX 4060 Laptop GPU (76525 - 100831, n=39) | |
| Lenovo LOQ 15IRX9 (6.2.1) | |
| GPU Vulkan | |
| Average of class Gaming (7562 - 244348, n=59, last 2 years) | |
| Schenker XMG Core 15 (M24) (6.2.1) | |
| Lenovo LOQ 15IRX9 (6.2.1, Leistungsmodus) | |
| Gigabyte G6X 9KG (2024) (6.2.1) | |
| Lenovo LOQ 15IRX9 (6.2.1) | |
| Average NVIDIA GeForce RTX 4060 Laptop GPU (75631 - 101001, n=24) | |
| HP Victus 16 (2024) (6.2.1) | |
| V-Ray 5 Benchmark | |
| GPU RTX | |
| Average of class Gaming (1146 - 4363, n=33, last 2 years) | |
| Gigabyte G6X 9KG (2024) (5.0.1) | |
| HP Victus 16 (2024) (5.0.1) | |
| Lenovo LOQ 15IRX9 (5.0.1, Leistungsmodus) | |
| Dell G16, i7-13650HX, RTX 4060 (5.0.1) | |
| Average NVIDIA GeForce RTX 4060 Laptop GPU (1387 - 1817, n=28) | |
| Lenovo LOQ 15IRX9 (5.0.1) | |
| GPU CUDA | |
| Average of class Gaming (887 - 3288, n=33, last 2 years) | |
| Lenovo LOQ 15IRX9 (5.0.1, Leistungsmodus) | |
| Gigabyte G6X 9KG (2024) (5.0.1) | |
| Lenovo LOQ 15IRX9 (5.0.1) | |
| HP Victus 16 (2024) (5.0.1) | |
| Average NVIDIA GeForce RTX 4060 Laptop GPU (957 - 1294, n=29) | |
| Dell G16, i7-13650HX, RTX 4060 (5.0.1) | |
| CPU | |
| Average of class Gaming (5864 - 30302, n=32, last 2 years) | |
| HP Victus 16 (2024) (5.0.1) | |
| Average NVIDIA GeForce RTX 4060 Laptop GPU (8364 - 21065, n=28) | |
| Gigabyte G6X 9KG (2024) (5.0.1) | |
| Lenovo LOQ 15IRX9 (5.0.1, Leistungsmodus) | |
| Dell G16, i7-13650HX, RTX 4060 (5.0.1) | |
| Lenovo LOQ 15IRX9 (5.0.1) | |
| V-Ray Benchmark Next 4.10 | |
| GPU | |
| Average of class Gaming (427 - 1627, n=99, last 2 years) | |
| Schenker XMG Core 15 (M24) (v4.10.07 ) | |
| Gigabyte G6X 9KG (2024) (v4.10.07 ) | |
| Lenovo LOQ 15IRX9 (v4.10.07, Leistungsmodus) | |
| Average NVIDIA GeForce RTX 4060 Laptop GPU (483 - 715, n=46) | |
| HP Victus 16 (2024) (v4.10.07 ) | |
| Lenovo LOQ 15IRX9 (v4.10.07 ) | |
| CPU | |
| Average of class Gaming (10048 - 45327, n=97, last 2 years) | |
| HP Victus 16 (2024) (v4.10.07 ) | |
| Average NVIDIA GeForce RTX 4060 Laptop GPU (12680 - 32360, n=46) | |
| Schenker XMG Core 15 (M24) (v4.10.07 ) | |
| Gigabyte G6X 9KG (2024) (v4.10.07 ) | |
| Lenovo LOQ 15IRX9 (v4.10.07, Leistungsmodus) | |
| Lenovo LOQ 15IRX9 (v4.10.07 ) | |
* ... smaller is better
| Performance rating - Percent | |
| Average of class Gaming | |
| Schenker XMG Core 15 (M24) | |
| Dell G16, i7-13650HX, RTX 4060 | |
| Lenovo LOQ 15IRX9 | |
| Gigabyte G6X 9KG (2024) | |
| Average NVIDIA GeForce RTX 4060 Laptop GPU | |
| HP Victus 16 (2024) | |
| Lenovo LOQ 15IRX9 | |
| Cyberpunk 2077 - 1920x1080 Ultra Preset (FSR off) | |
| Average of class Gaming (17.7 - 169.9, n=115, last 2 years) | |
| Schenker XMG Core 15 (M24) (2.12) | |
| Lenovo LOQ 15IRX9 (2.02, Leistungsmodus) | |
| Average NVIDIA GeForce RTX 4060 Laptop GPU (56.4 - 93.1, n=31) | |
| Lenovo LOQ 15IRX9 (2.02) | |
| Dell G16, i7-13650HX, RTX 4060 (2.11) | |
| Gigabyte G6X 9KG (2024) (2.02) | |
| HP Victus 16 (2024) (2.02) | |
| GTA V - 1920x1080 Highest AA:4xMSAA + FX AF:16x | |
| Average of class Gaming (48.3 - 186.9, n=93, last 2 years) | |
| Dell G16, i7-13650HX, RTX 4060 | |
| Schenker XMG Core 15 (M24) | |
| Lenovo LOQ 15IRX9 (Leistungsmodus) | |
| Gigabyte G6X 9KG (2024) | |
| Lenovo LOQ 15IRX9 | |
| HP Victus 16 (2024) | |
| Average NVIDIA GeForce RTX 4060 Laptop GPU (76.9 - 126.3, n=48) | |
| Final Fantasy XV Benchmark - 1920x1080 High Quality | |
| Average of class Gaming (41 - 215, n=95, last 2 years) | |
| Lenovo LOQ 15IRX9 (1.3, Leistungsmodus) | |
| Schenker XMG Core 15 (M24) (1.3) | |
| Dell G16, i7-13650HX, RTX 4060 (1.3) | |
| Gigabyte G6X 9KG (2024) (1.3) | |
| Lenovo LOQ 15IRX9 (1.3) | |
| HP Victus 16 (2024) (1.3) | |
| Average NVIDIA GeForce RTX 4060 Laptop GPU (75.1 - 109.8, n=51) | |
| Strange Brigade - 1920x1080 ultra AA:ultra AF:16 | |
| Average of class Gaming (76.3 - 456, n=86, last 2 years) | |
| Schenker XMG Core 15 (M24) (1.47.22.14 D3D12) | |
| Dell G16, i7-13650HX, RTX 4060 (1.47.22.14 D3D12) | |
| Lenovo LOQ 15IRX9 (1.47.22.14 D3D12, Leistungsmodus) | |
| Lenovo LOQ 15IRX9 (1.47.22.14 D3D12) | |
| Gigabyte G6X 9KG (2024) (1.47.22.14 D3D12) | |
| Average NVIDIA GeForce RTX 4060 Laptop GPU (135.3 - 210, n=50) | |
| HP Victus 16 (2024) (1.47.22.14 D3D12) | |
| Dota 2 Reborn - 1920x1080 ultra (3/3) best looking | |
| Average of class Gaming (84.8 - 248, n=107, last 2 years) | |
| HP Victus 16 (2024) | |
| Dell G16, i7-13650HX, RTX 4060 | |
| Average NVIDIA GeForce RTX 4060 Laptop GPU (115 - 183.8, n=53) | |
| Lenovo LOQ 15IRX9 (Leistungsmodus) | |
| Gigabyte G6X 9KG (2024) | |
| Lenovo LOQ 15IRX9 | |
| Schenker XMG Core 15 (M24) | |
| X-Plane 11.11 - 1920x1080 high (fps_test=3) | |
| Dell G16, i7-13650HX, RTX 4060 | |
| Gigabyte G6X 9KG (2024) | |
| Average NVIDIA GeForce RTX 4060 Laptop GPU (60.7 - 141.1, n=54) | |
| Lenovo LOQ 15IRX9 (Leistungsmodus) | |
| HP Victus 16 (2024) | |
| Average of class Gaming (55.5 - 143.5, n=109, last 2 years) | |
| Schenker XMG Core 15 (M24) | |
| Lenovo LOQ 15IRX9 | |
| Dragon's Dogma 2 - 1920x1080 High Preset | |
| Average of class Gaming (61.5 - 99.3, n=6, last 2 years) | |
| HP Victus 16 (2024) | |
| Lenovo LOQ 15IRX9 | |
| Average NVIDIA GeForce RTX 4060 Laptop GPU (57.2 - 67.7, n=5) | |
| Razer Blade 14 Mid 23 | |
| F1 24 - 1920x1080 Ultra High Preset AA:T AF:16x | |
| Average of class Gaming (58.8 - 163.6, n=58, last 2 years) | |
| Average NVIDIA GeForce RTX 4060 Laptop GPU (47.5 - 61.6, n=10) | |
| Razer Blade 14 Mid 23 | |
| Lenovo LOQ 15IRX9 (1122588) | |
| Counter-Strike 2 - 1920x1080 Very High Preset | |
| Average of class Gaming (26.2 - 275, n=5, last 2 years) | |
| Razer Blade 14 Mid 23 | |
| Average NVIDIA GeForce RTX 4060 Laptop GPU (123.9 - 139.1, n=2) | |
| Lenovo LOQ 15IRX9 | |
| Senua's Saga Hellblade 2 - 1920x1080 High Preset | |
| Average of class Gaming (33.9 - 86.1, n=12, last 2 years) | |
| Average NVIDIA GeForce RTX 4060 Laptop GPU (37.6 - 39.5, n=3) | |
| Lenovo LOQ 15IRX9 | |
| Razer Blade 14 Mid 23 | |
| Ghost of Tsushima - 1920x1080 Very High Preset AA:T | |
| Average of class Gaming (28.5 - 108.1, n=14, last 2 years) | |
| Lenovo LOQ 15IRX9 | |
| Average NVIDIA GeForce RTX 4060 Laptop GPU (55.6 - 63.4, n=5) | |
| Razer Blade 14 Mid 23 | |
Cyberpunk 2077 ultra FPS diagram
| low | med. | high | ultra | |
|---|---|---|---|---|
| GTA V (2015) | 184.4 | 181.5 | 175.5 | 112.6 |
| Dota 2 Reborn (2015) | 171.2 | 156.8 | 149.4 | 141 |
| Final Fantasy XV Benchmark (2018) | 198.9 | 138.5 | 99.9 | |
| X-Plane 11.11 (2018) | 139.6 | 118.4 | 92.2 | |
| Strange Brigade (2018) | 425 | 260 | 209 | 182.7 |
| Cyberpunk 2077 (2023) | 118.9 | 94.3 | 80.1 | 71.4 |
| Counter-Strike 2 (2023) | 195.3 | 195 | 157 | 123.9 |
| Dragon's Dogma 2 (2024) | 70.6 | 63.3 | ||
| Ghost of Tsushima (2024) | 91 | 81.7 | 74.5 | 60.6 |
| Senua's Saga Hellblade 2 (2024) | 64.1 | 53.2 | 38.4 | |
| F1 24 (2024) | 216 | 201 | 162.5 | 54.1 |
Emissions & power - The Lenovo LOQ with a below-average battery life
Noise emissions
When it comes to noise emissions, the laptop performs as expected for its class: Under load, it produces a lot of noise. Playing Cyberpunk 2077 results in noise emissions of 48 dB(A) (balanced mode) and 54 dB(A) (performance mode). Quiet mode brings noise levels down to more moderate values—at the cost of the laptop's performance. Gaming should still be possible—with reduced settings.
The fan control needs some readjustment: When idling, the fans repeatedly start up briefly—a very annoying behavior in the long run. Sometimes they also run permanently at a clearly audible level.
Noise level
| Idle |
| 26 / 34 / 36 dB(A) |
| Load |
| 48 / 50 dB(A) |
 | ||
30 dB silent 40 dB(A) audible 50 dB(A) loud |
||
min: | ||
| Lenovo LOQ 15IRX9 GeForce RTX 4060 Laptop GPU, i5-13450HX, Micron 2400 MTFDKCD1T0QFM | Schenker XMG Core 15 (M24) GeForce RTX 4060 Laptop GPU, R7 8845HS, Samsung 990 Pro 1 TB | Gigabyte G6X 9KG (2024) GeForce RTX 4060 Laptop GPU, i7-13650HX, Gigabyte AG450E1024-SI | HP Victus 16 (2024) GeForce RTX 4060 Laptop GPU, i7-14700HX, Kioxia XG8 KXG80ZNV512G | Dell G16, i7-13650HX, RTX 4060 GeForce RTX 4060 Laptop GPU, i7-13650HX, WD PC SN740 SDDPNQD-1T00 | |
|---|---|---|---|---|---|
| Noise | 14% | -4% | 4% | 20% | |
| off / environment * (dB) | 25 | 23 8% | 26 -4% | 25 -0% | 23 8% |
| Idle Minimum * (dB) | 26 | 23 12% | 30 -15% | 28 -8% | 23 12% |
| Idle Average * (dB) | 34 | 23 32% | 32 6% | 29 15% | 23 32% |
| Idle Maximum * (dB) | 36 | 23 36% | 35 3% | 33 8% | 27.96 22% |
| Load Average * (dB) | 48 | 38.92 19% | 51 -6% | 45 6% | 27.96 42% |
| Cyberpunk 2077 ultra * (dB) | 48 | 52.06 -8% | |||
| Load Maximum * (dB) | 50 | 52.09 -4% | 54 -8% | 48 4% | 47.89 4% |
| Witcher 3 ultra * (dB) | 50.96 | 51 | 43 | 47.89 |
* ... smaller is better
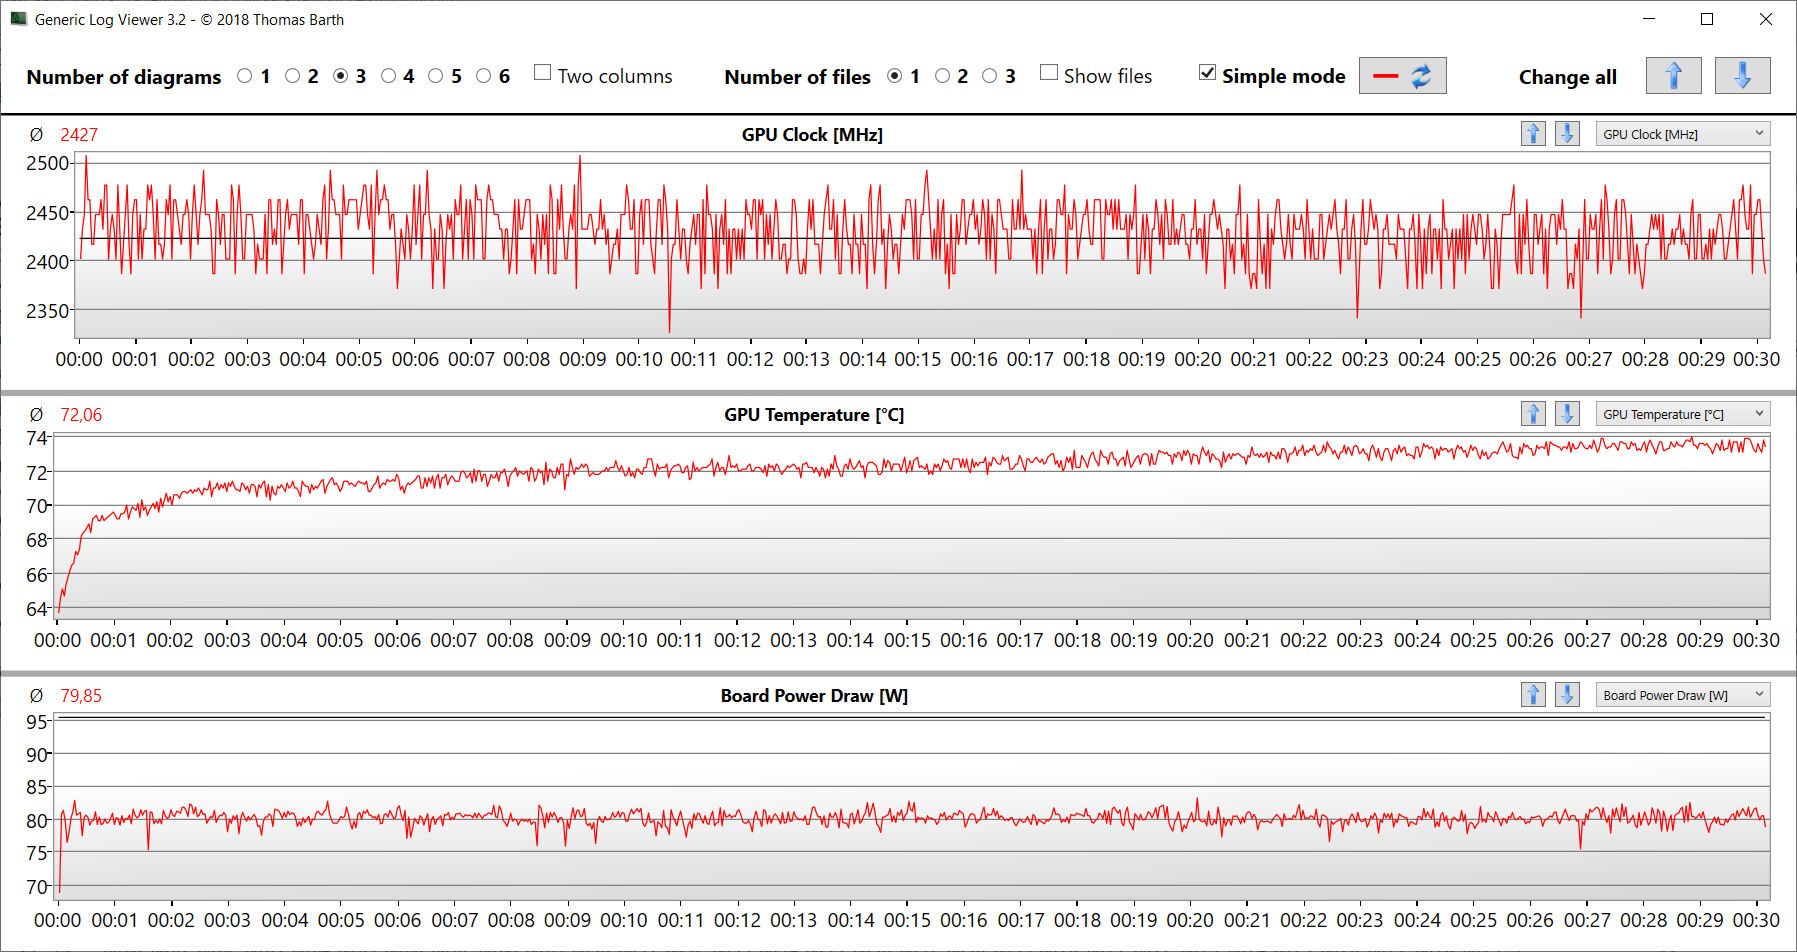
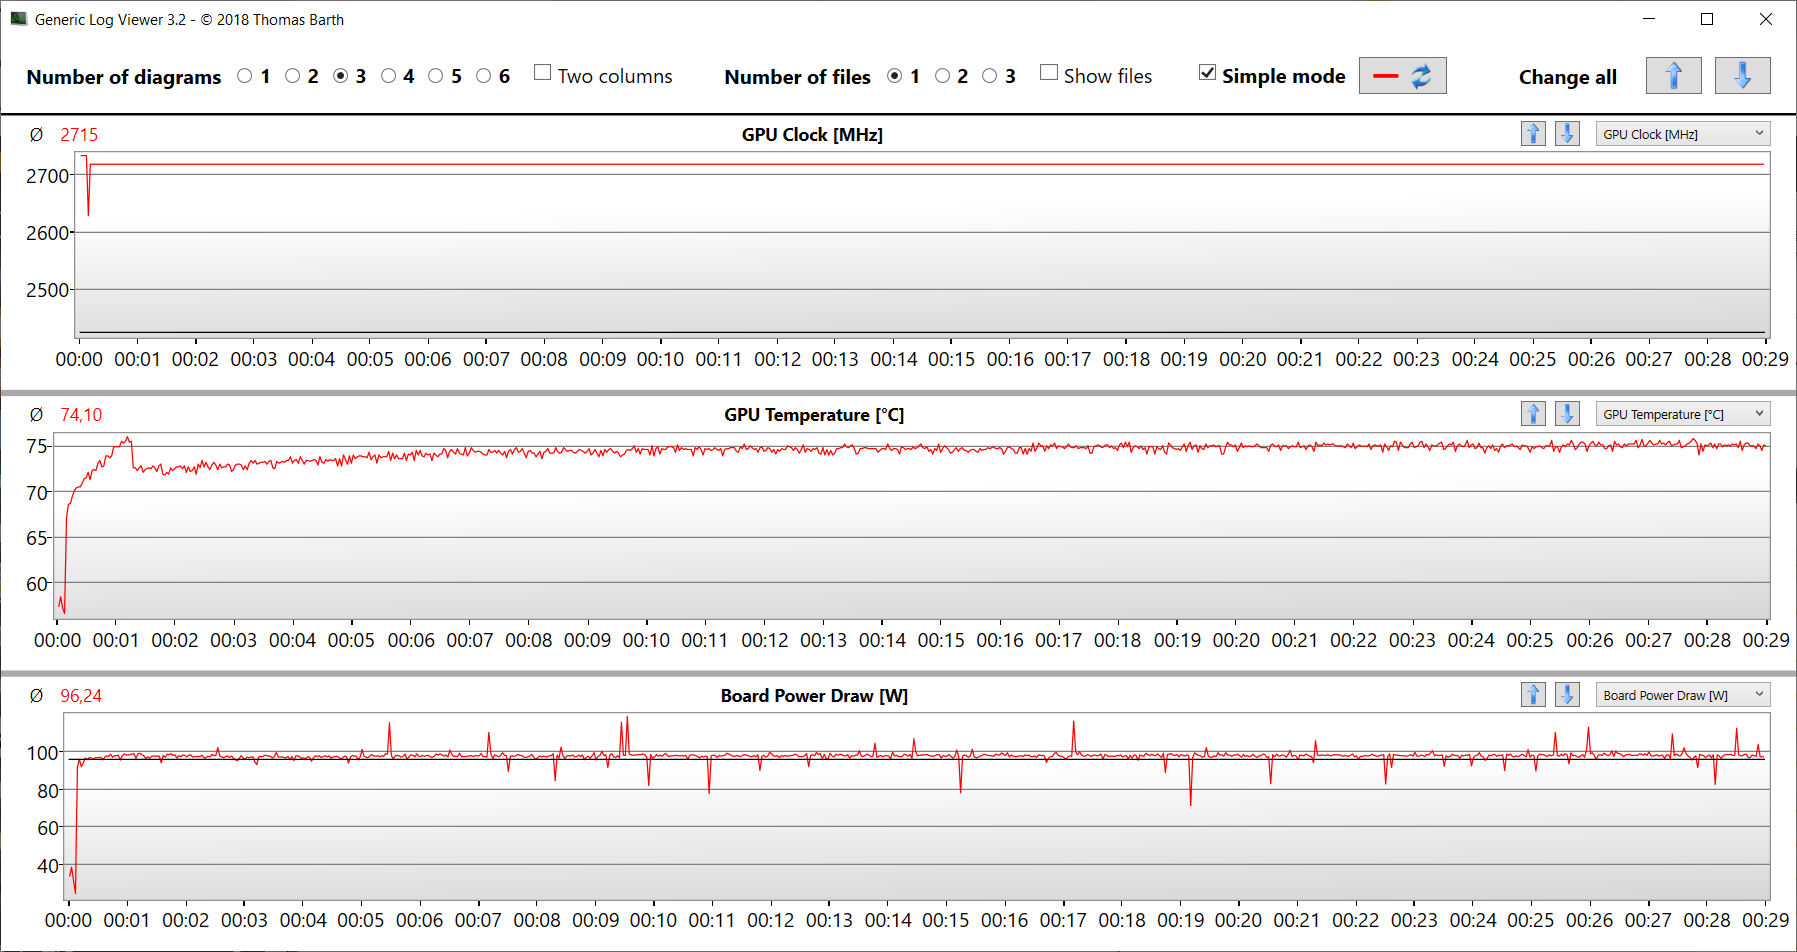
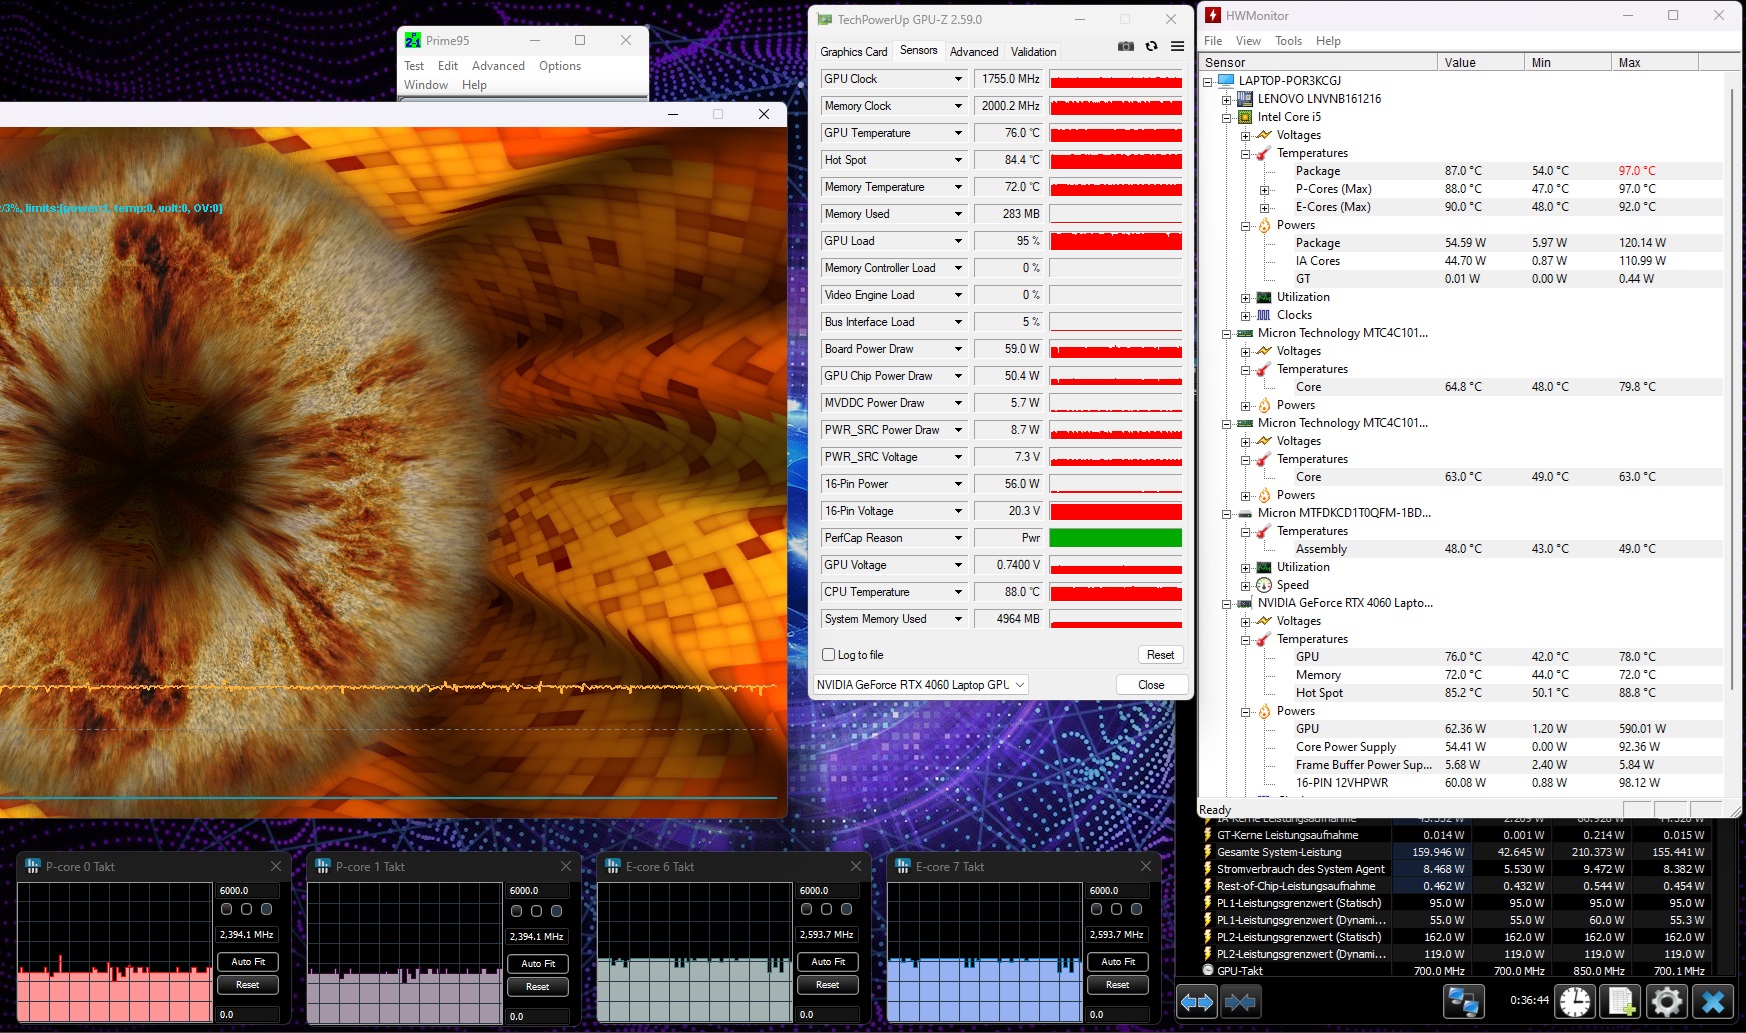
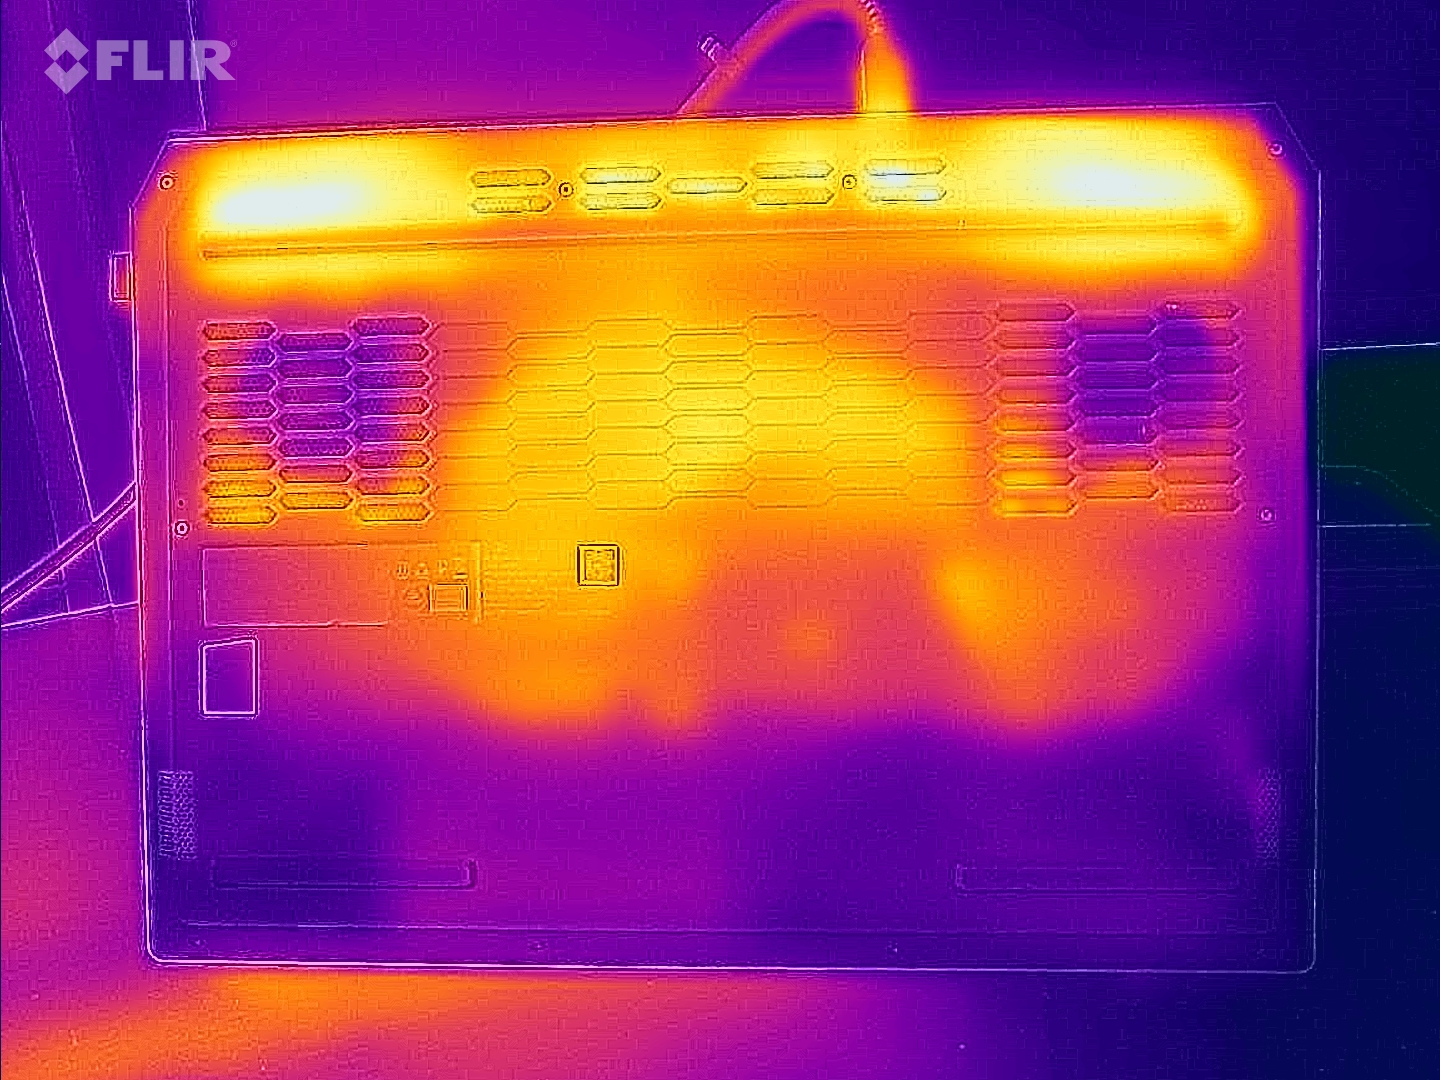
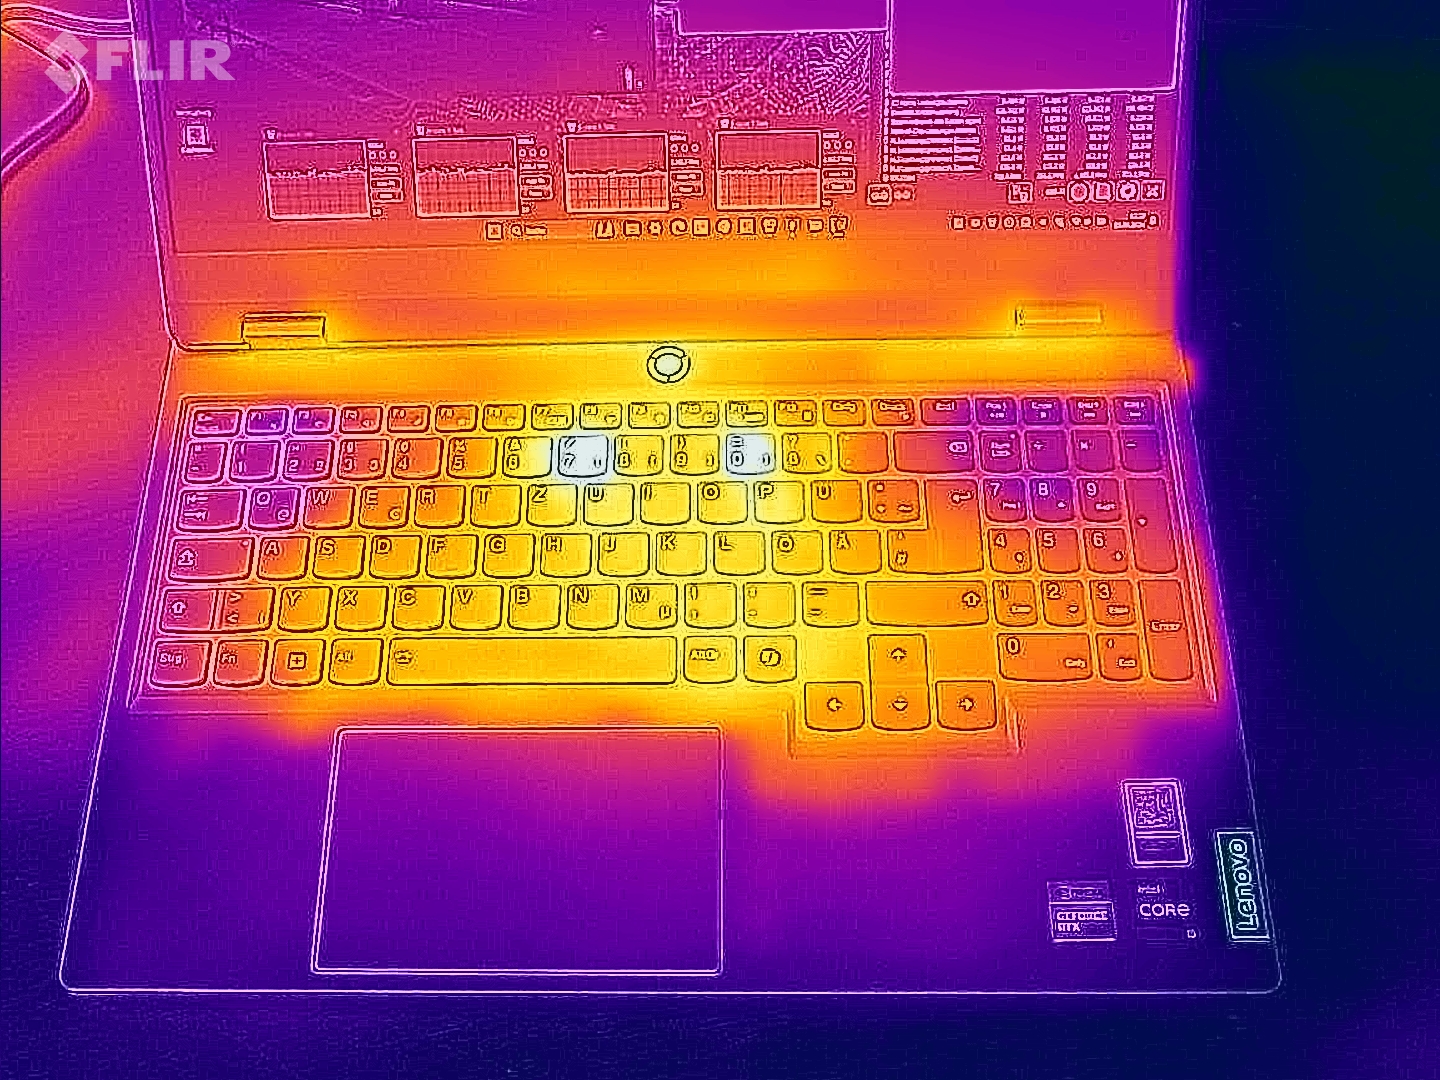
Temperature
Under load (stress test, Cyberpunk), the laptop gets noticeably warm: At times, it surpasses the 50-degree Celcius mark. It also reaches higher values during everyday use (office, internet) than many of the comparison devices. The palm rest's temperatures remain semi-reasonable.
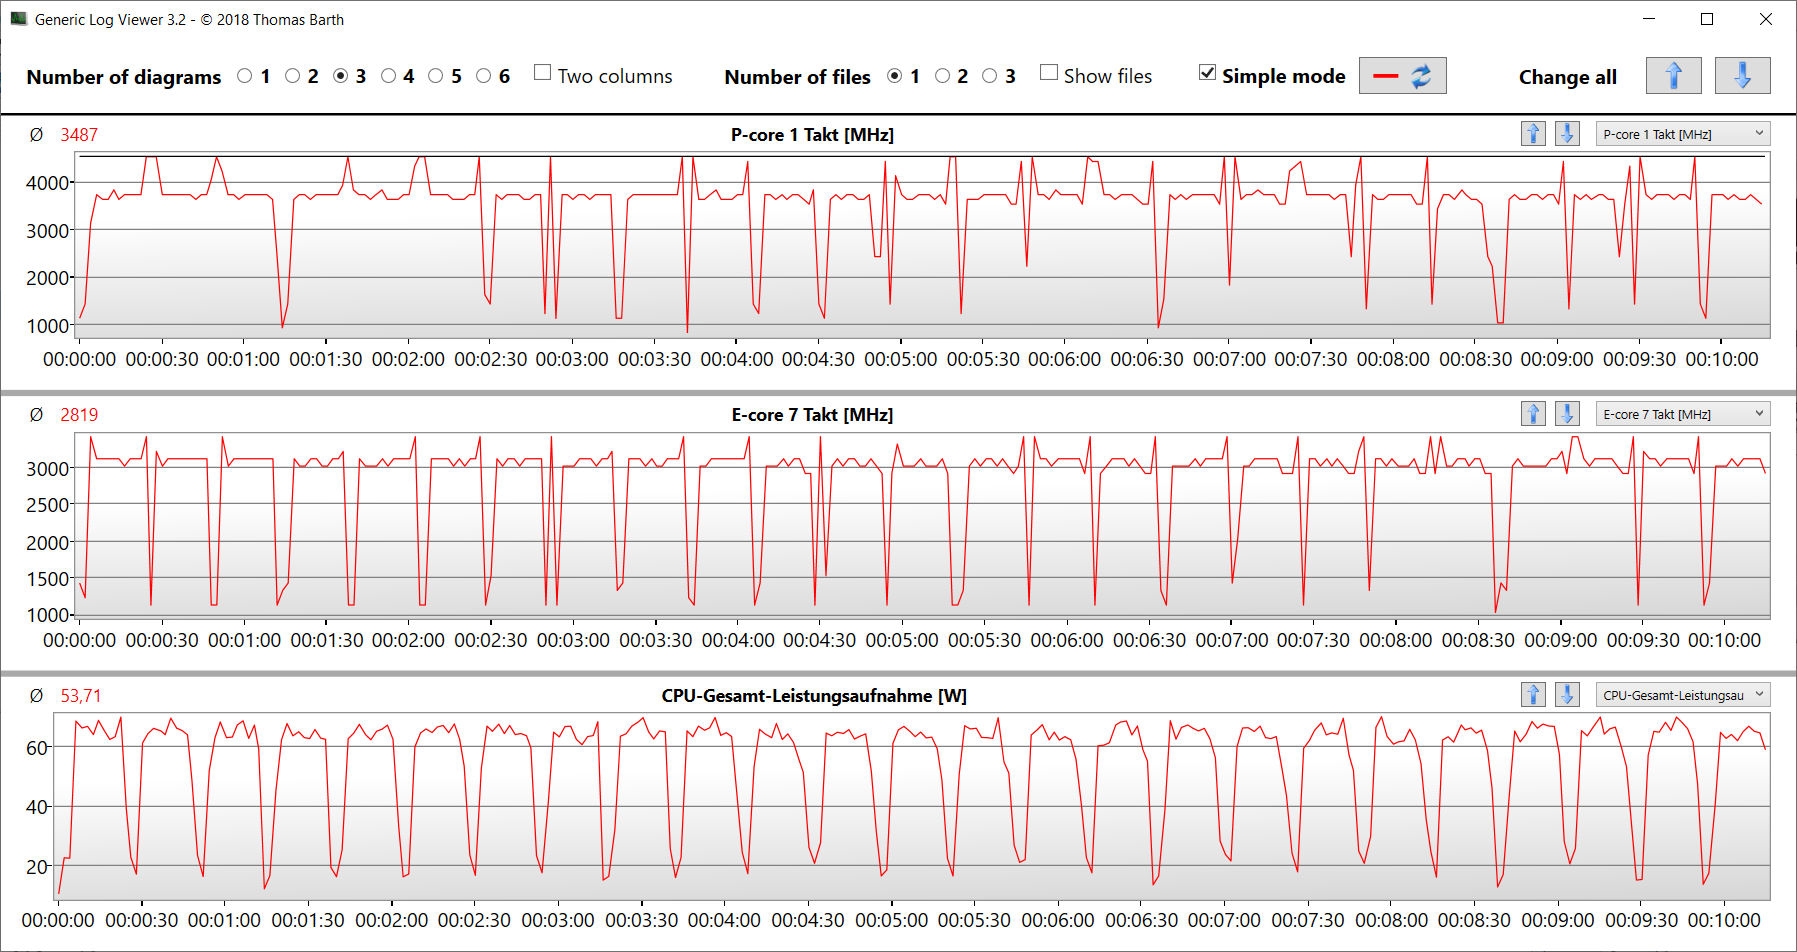
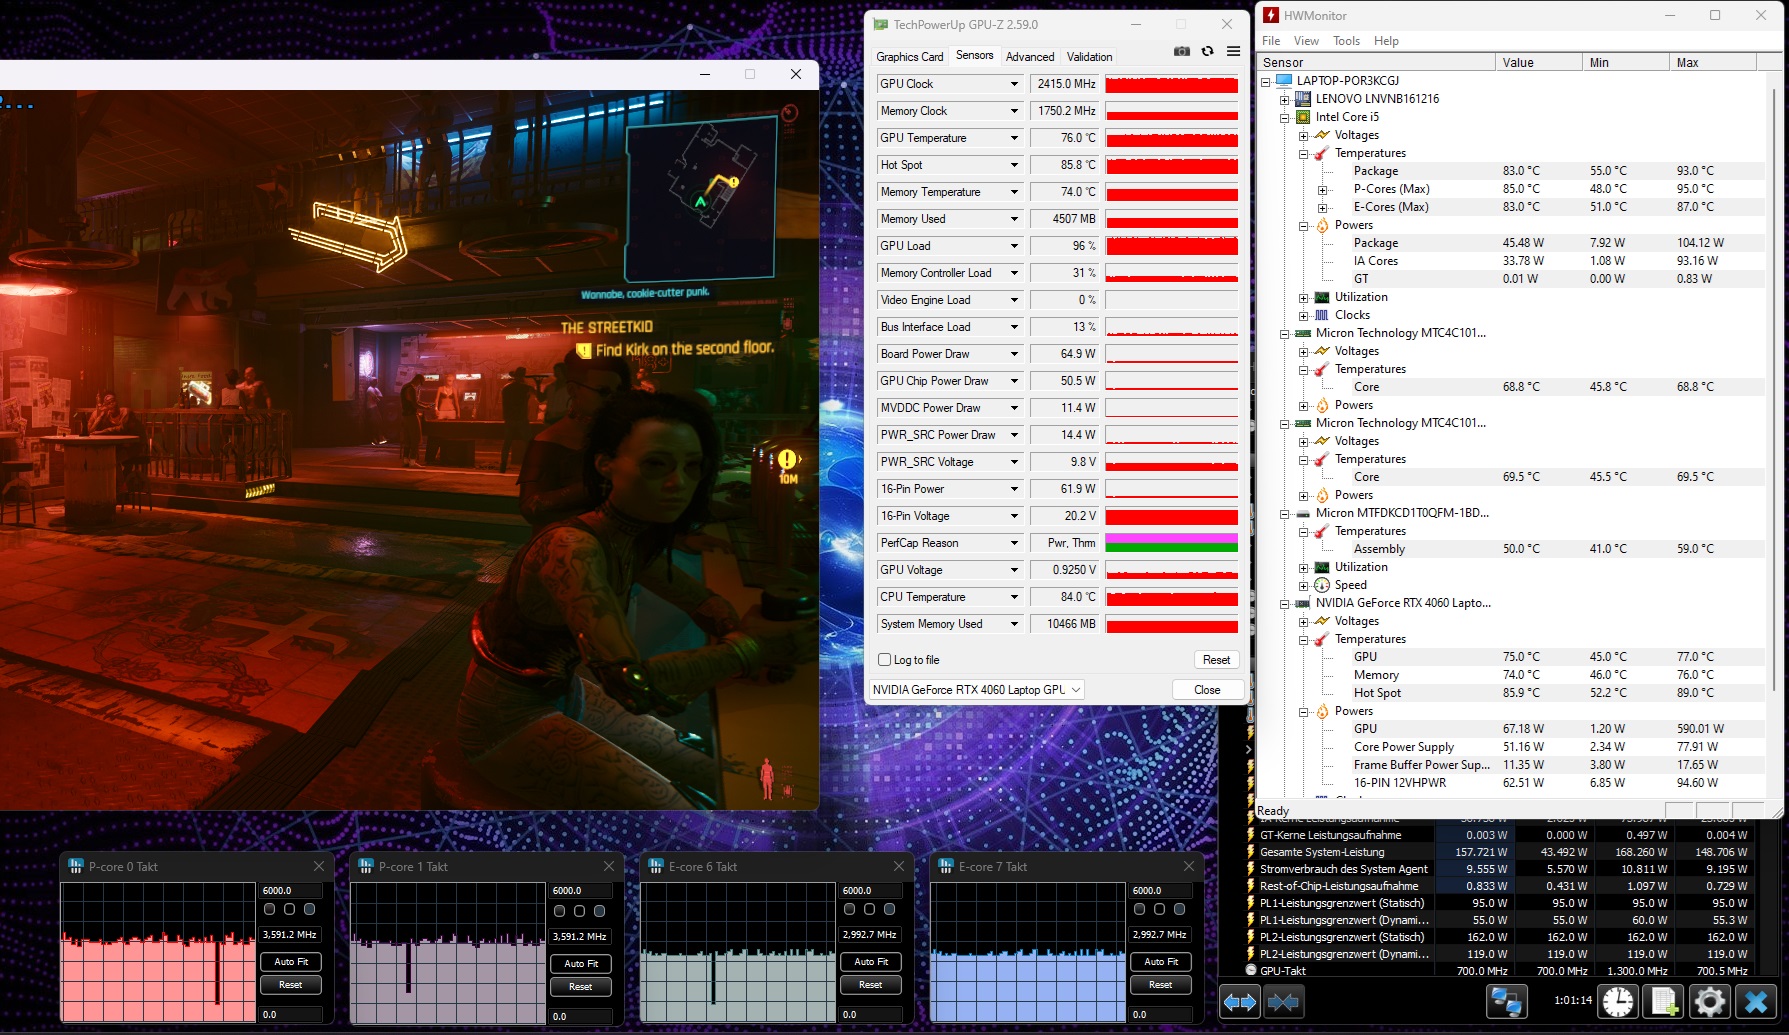
The extreme scenario (stress test using Prime95 and Furmark in continuous operation) checks the system's stability under full load. The CPU clocked at around 2.4 GHz (P) and 2.6 GHz (E), while the graphics core hit values around 1,800 MHz.
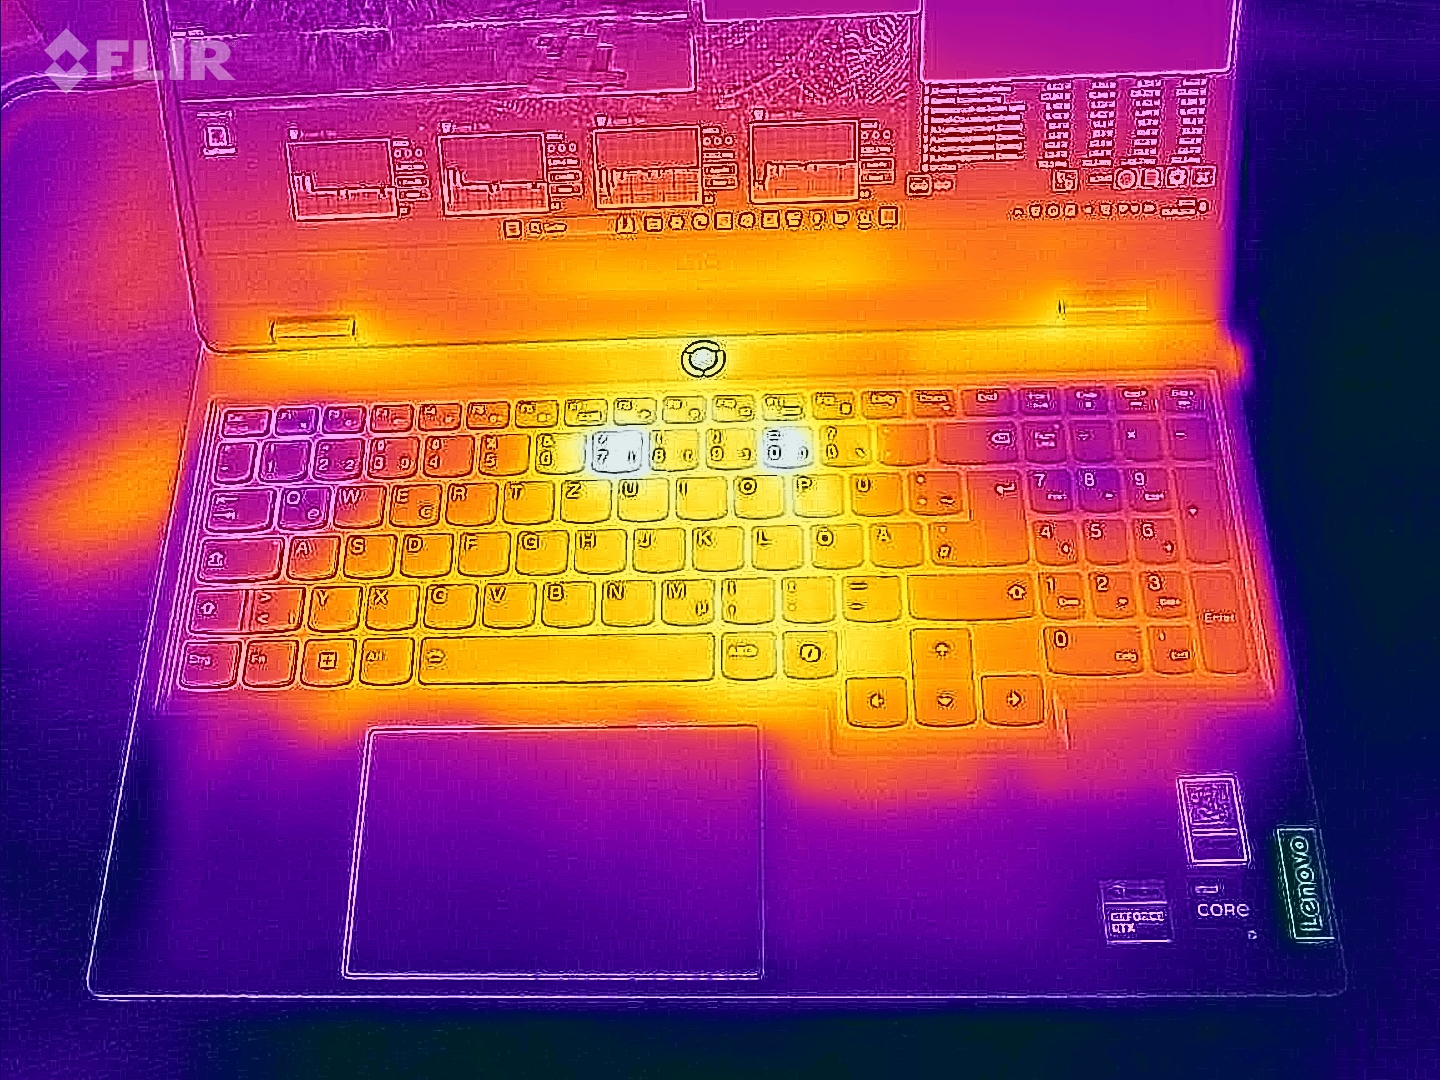
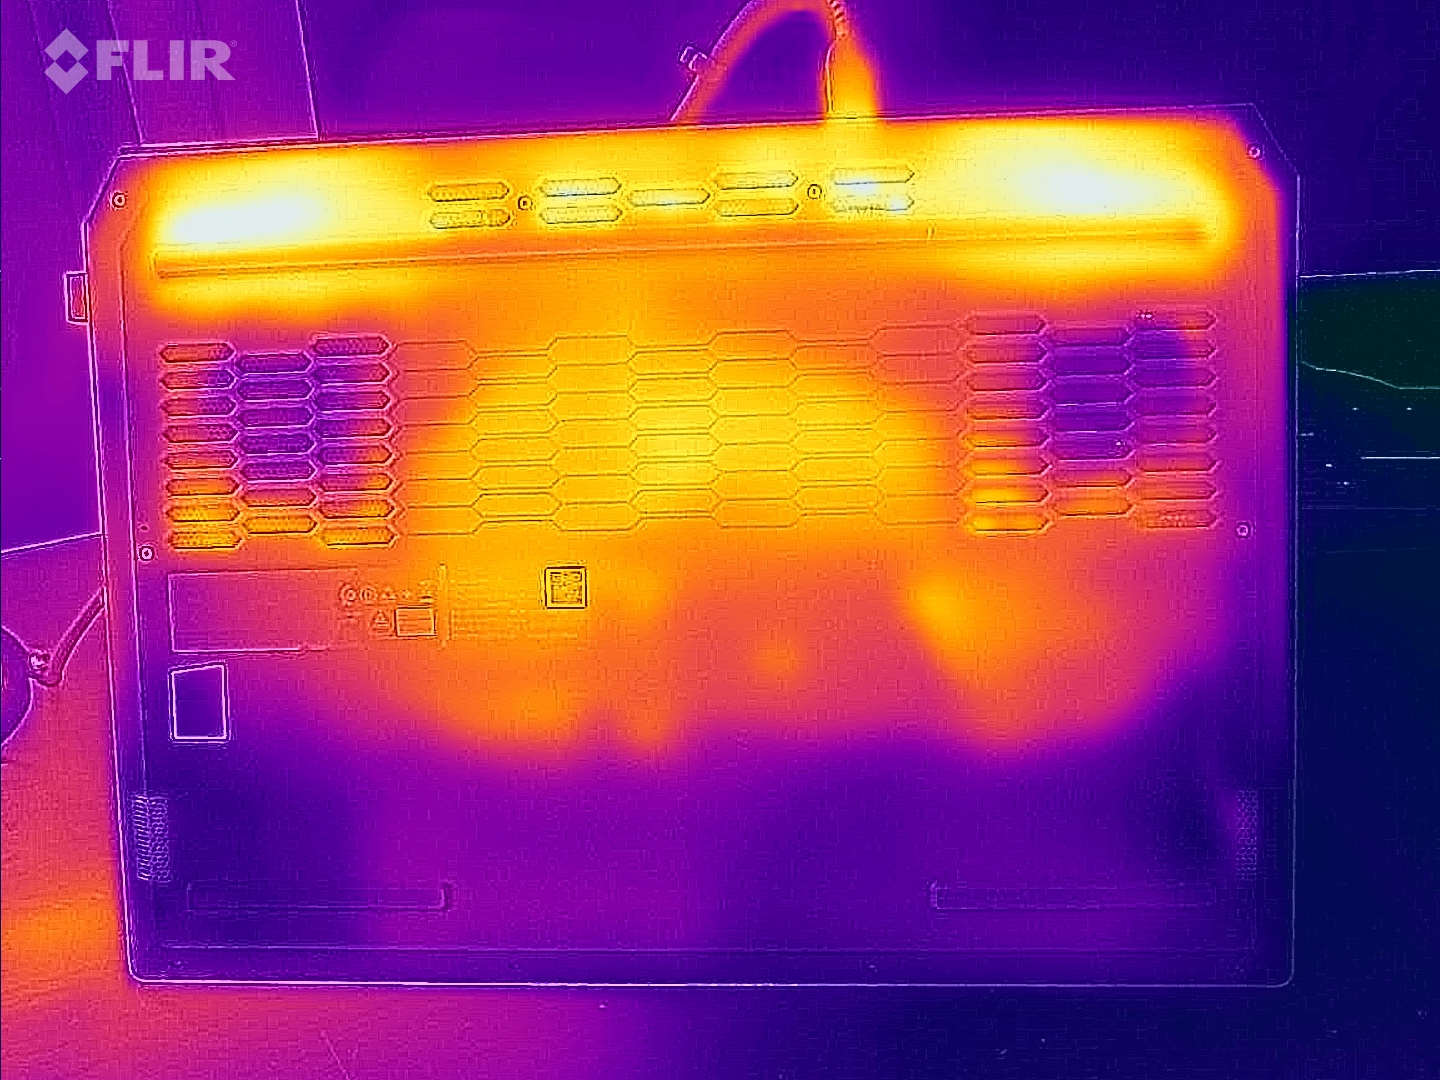
(-) The maximum temperature on the upper side is 47 °C / 117 F, compared to the average of 40.4 °C / 105 F, ranging from 21.2 to 68.8 °C for the class Gaming.
(-) The bottom heats up to a maximum of 58 °C / 136 F, compared to the average of 43.2 °C / 110 F
(+) In idle usage, the average temperature for the upper side is 30.2 °C / 86 F, compared to the device average of 33.9 °C / 93 F.
(-) 3: The average temperature for the upper side is 41.7 °C / 107 F, compared to the average of 33.9 °C / 93 F for the class Gaming.
(±) The palmrests and touchpad can get very hot to the touch with a maximum of 38 °C / 100.4 F.
(-) The average temperature of the palmrest area of similar devices was 28.8 °C / 83.8 F (-9.2 °C / -16.6 F).
| Lenovo LOQ 15IRX9 Intel Core i5-13450HX, NVIDIA GeForce RTX 4060 Laptop GPU | Schenker XMG Core 15 (M24) AMD Ryzen 7 8845HS, NVIDIA GeForce RTX 4060 Laptop GPU | Gigabyte G6X 9KG (2024) Intel Core i7-13650HX, NVIDIA GeForce RTX 4060 Laptop GPU | HP Victus 16 (2024) Intel Core i7-14700HX, NVIDIA GeForce RTX 4060 Laptop GPU | Dell G16, i7-13650HX, RTX 4060 Intel Core i7-13650HX, NVIDIA GeForce RTX 4060 Laptop GPU | |
|---|---|---|---|---|---|
| Heat | -8% | 9% | 15% | -3% | |
| Maximum Upper Side * (°C) | 47 | 52 -11% | 41 13% | 50 -6% | 49 -4% |
| Maximum Bottom * (°C) | 58 | 61 -5% | 43 26% | 50 14% | 58 -0% |
| Idle Upper Side * (°C) | 32 | 35 -9% | 32 -0% | 25 22% | 35 -9% |
| Idle Bottom * (°C) | 36 | 39 -8% | 37 -3% | 26 28% | 35 3% |
* ... smaller is better
Speakers
The stereo speakers produce a very acceptable soundscape overall. Still, a little more bass wouldn't go amiss.
Lenovo LOQ 15IRX9 audio analysis
(±) | speaker loudness is average but good (81 dB)
Bass 100 - 315 Hz
(±) | reduced bass - on average 14.6% lower than median
(±) | linearity of bass is average (9.6% delta to prev. frequency)
Mids 400 - 2000 Hz
(+) | balanced mids - only 2.1% away from median
(+) | mids are linear (3.6% delta to prev. frequency)
Highs 2 - 16 kHz
(±) | higher highs - on average 5.9% higher than median
(±) | linearity of highs is average (8.2% delta to prev. frequency)
Overall 100 - 16.000 Hz
(+) | overall sound is linear (14.7% difference to median)
Compared to same class
» 29% of all tested devices in this class were better, 7% similar, 64% worse
» The best had a delta of 6%, average was 18%, worst was 132%
Compared to all devices tested
» 19% of all tested devices were better, 4% similar, 77% worse
» The best had a delta of 4%, average was 23%, worst was 134%
Schenker XMG Core 15 (M24) audio analysis
(±) | speaker loudness is average but good (79.12 dB)
Bass 100 - 315 Hz
(-) | nearly no bass - on average 16.7% lower than median
(-) | bass is not linear (15.7% delta to prev. frequency)
Mids 400 - 2000 Hz
(+) | balanced mids - only 4.5% away from median
(+) | mids are linear (4.4% delta to prev. frequency)
Highs 2 - 16 kHz
(+) | balanced highs - only 1% away from median
(+) | highs are linear (2.7% delta to prev. frequency)
Overall 100 - 16.000 Hz
(+) | overall sound is linear (13.7% difference to median)
Compared to same class
» 21% of all tested devices in this class were better, 7% similar, 72% worse
» The best had a delta of 6%, average was 18%, worst was 132%
Compared to all devices tested
» 15% of all tested devices were better, 4% similar, 81% worse
» The best had a delta of 4%, average was 23%, worst was 134%
Power consumption
Its power consumption is pretty normal for the installed hardware. Cyberpunk and the stress tests were run with relatively constant power consumption. The power supply unit is just powerful enough at 230 watts.
| Off / Standby | |
| Idle | |
| Load |
|
Key:
min: | |
| Lenovo LOQ 15IRX9 Intel Core i5-13450HX, NVIDIA GeForce RTX 4060 Laptop GPU | Schenker XMG Core 15 (M24) AMD Ryzen 7 8845HS, NVIDIA GeForce RTX 4060 Laptop GPU | Gigabyte G6X 9KG (2024) Intel Core i7-13650HX, NVIDIA GeForce RTX 4060 Laptop GPU | HP Victus 16 (2024) Intel Core i7-14700HX, NVIDIA GeForce RTX 4060 Laptop GPU | Dell G16, i7-13650HX, RTX 4060 Intel Core i7-13650HX, NVIDIA GeForce RTX 4060 Laptop GPU | |
|---|---|---|---|---|---|
| Power Consumption | 20% | 2% | 1% | 6% | |
| Idle Minimum * (Watt) | 13 | 9.3 28% | 12 8% | 9 31% | 11 15% |
| Idle Average * (Watt) | 18 | 12.9 28% | 13 28% | 15 17% | 14.8 18% |
| Idle Maximum * (Watt) | 24 | 12.8 47% | 27 -13% | 23 4% | 16.8 30% |
| Load Average * (Watt) | 85 | 105 -24% | 123 -45% | 103.7 -22% | |
| Cyberpunk 2077 ultra * (Watt) | 155.7 | ||||
| Cyberpunk 2077 ultra external monitor * (Watt) | 150.9 | ||||
| Load Maximum * (Watt) | 232 | 286 -23% | 210 9% | 241 -4% | 255 -10% |
| Witcher 3 ultra * (Watt) | 167 | 167.8 | 143.7 | 185 |
* ... smaller is better
Power consumption Cyberpunk 2077 / stress test
Power consumption with external monitor
Runtimes
The 15.6-inch device managed a runtime of 5:20 hours in our practical WLAN test (mapping the load when accessing websites using a script)—not an outstanding value. Its comparatively low battery capacity (60 Wh) becomes apparent here.
Pros
Cons
Verdict - A solid budget gamer
The LOQ allows for FHD gaming at high to maximum settings—the Core i5-13450HX and GeForce RTX 4060 make this possible. In doing so, the CPU and GPU run with consistently high clock rates. A PCIe 4 SSD (1 TB) ensures that loading times are kept short.
Lenovo's LOQ 15IRX9 is an affordable FHD gaming laptop that suffers from one or two minor flaws.
High emissions can be brought down to moderate levels using quiet mode—at the cost of the laptop's performance. Its fan control could do with some improvement: In idle mode, the fans run permanently or pulsate, which is totally unnecessary.
You'll search for a 16:10 screen in vain, as Lenovo has stuck with a 16:9 aspect ratio. The installed 15.6-inch panel (FHD, 144 Hz, G-Sync, sRGB) works just fine, but it could do with being a little brighter. The laptop doesn't offer Thunderbolt 4 or USB 4. Still: Its USB-C port (USB 3.2 Gen 2) supports Power Delivery and the Display ALT mode. The device's battery life won't break any world records.
An alternative could be the Gigabyte G6X 9KG. It has a slightly more powerful CPU, a 16-inch 16:10 screen as well as better runtimes. In terms of color space coverage, it trails behind the LOQ.
Price and availability
At the time of writing, our configuration of the Lenovo LOQ 15IRX9 can be purchased via Amazon for US$1,279.
Please note: We have recently updated our rating system and the results of version 8 are not comparable with the results of version 7. More information is available here .
Lenovo LOQ 15IRX9
- 07/08/2024 v8
Sascha Mölck
 Total Sustainability Score:
 Transparency
The selection of devices to be reviewed is made by our editorial team. The test sample was provided to the author as a loan by the manufacturer or retailer for the purpose of this review. The lender had no influence on this review, nor did the manufacturer receive a copy of this review before publication. There was no obligation to publish this review. As an independent media company, Notebookcheck is not subjected to the authority of manufacturers, retailers or publishers.
This is how Notebookcheck is testing
Every year, Notebookcheck independently reviews hundreds of laptops and smartphones using standardized procedures to ensure that all results are comparable. We have continuously developed our test methods for around 20 years and set industry standards in the process. In our test labs, high-quality measuring equipment is utilized by experienced technicians and editors. These tests involve a multi-stage validation process. Our complex rating system is based on hundreds of well-founded measurements and benchmarks, which maintains objectivity. Further information on our test methods can be found here.
Price comparison

