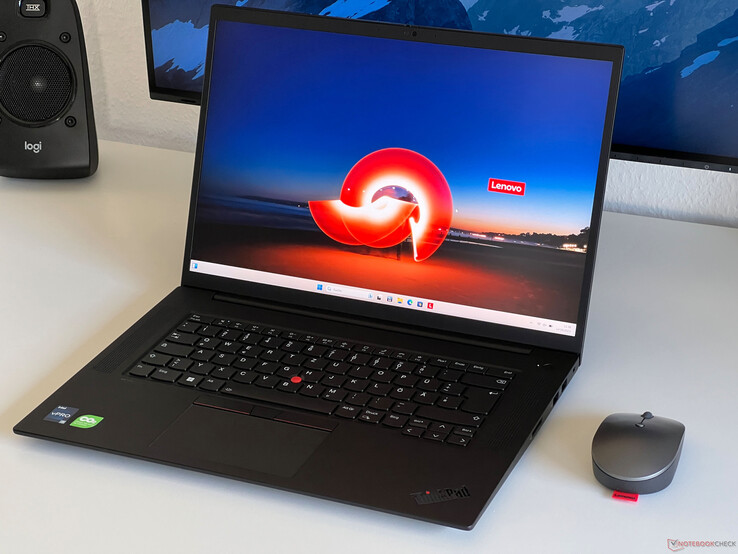
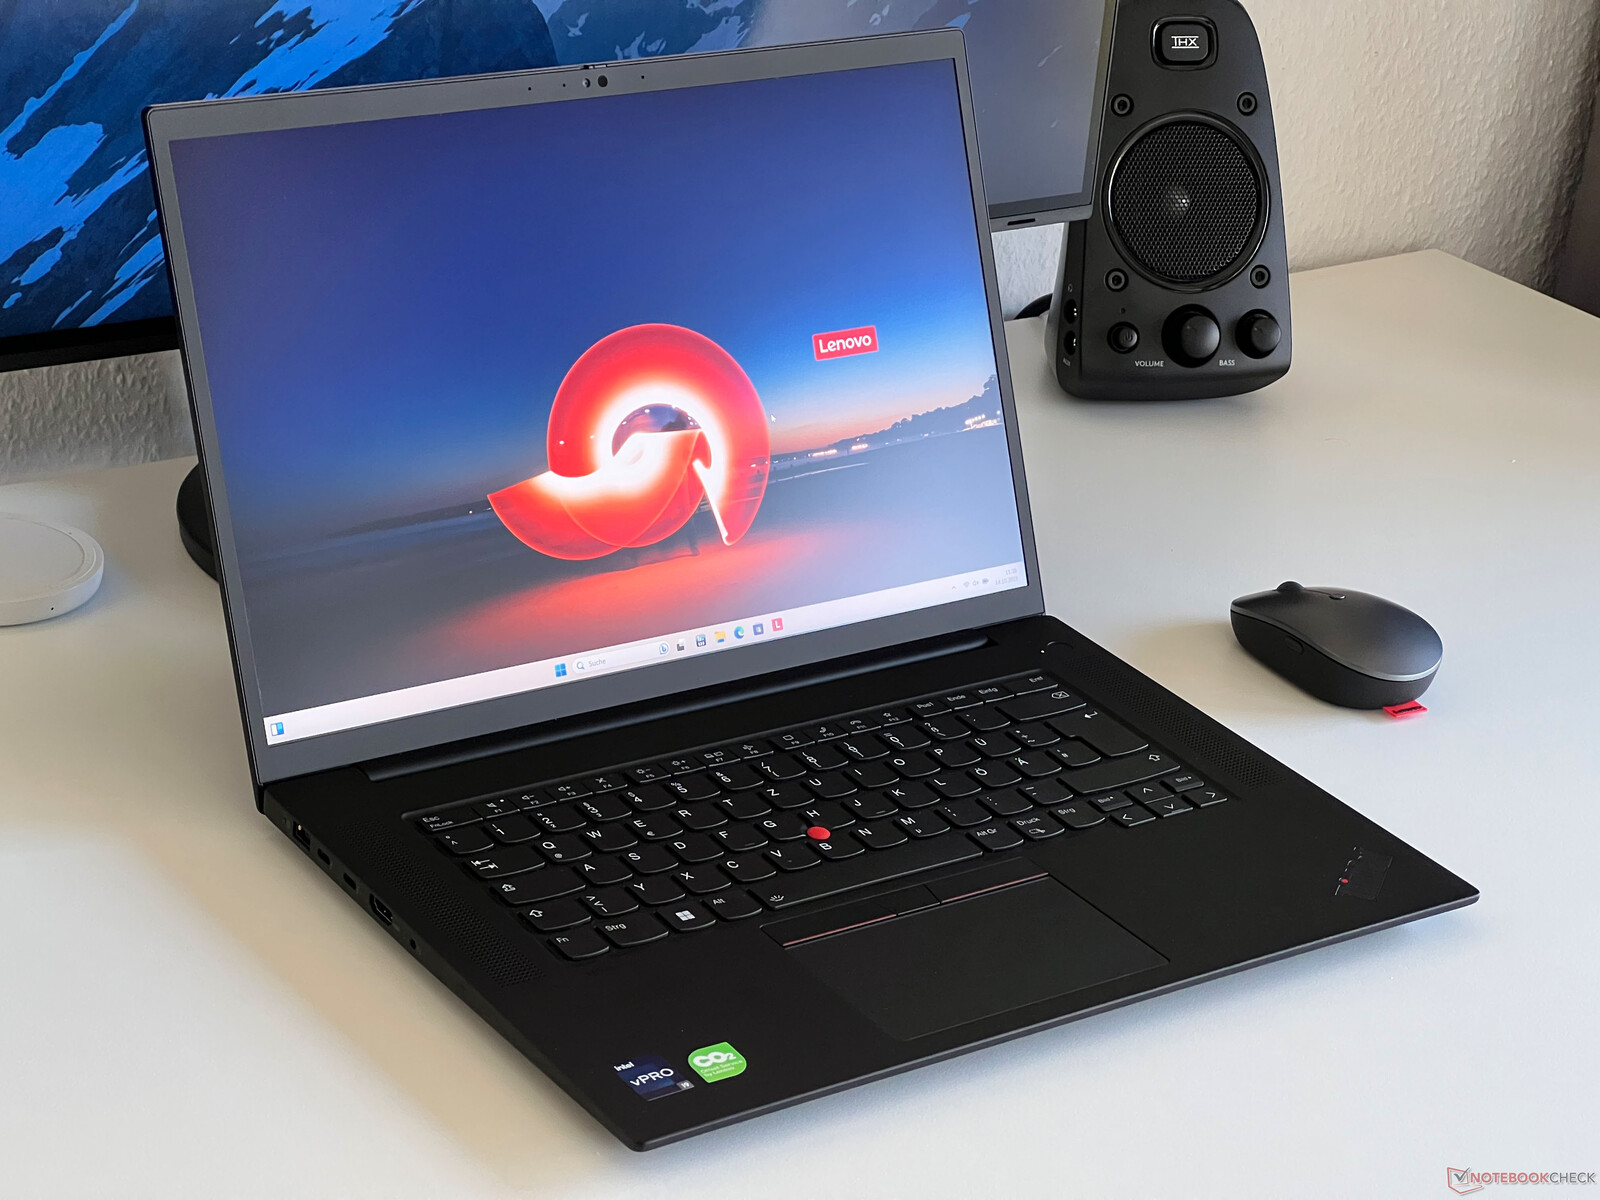
Lenovo ThinkPad P1 G6 laptop in review - Mobile workstation replaces the ThinkPad X1 Extreme
For years, Lenovo had two large 16-inch models in its lineup: the Lenovo ThinkPad X1 Extreme and its identically built workstation, the ThinkPad P1. Now, the portfolio has been streamlined, and the new ThinkPad P1 Gen 6 takes over both roles immediately. There is no successor to last year's ThinkPad X1 Extreme Gen 5 anymore. The new ThinkPad P1 Gen 6 is available with both consumer GeForce GPUs and professional-grade graphics adapters, offering versatility in choice. Notably, the case design remains largely unchanged, and two basic models are still offered. Depending on the chosen graphics card, either conventional cooling or a vapor chamber (for GeForce RTX 4060/RTX 3500 Ada) are being used.
The range of components in the ThinkPad P1 Gen 6 is extensive. It always uses Intel's newest 45-Watt Raptor-Lake CPUs, and the graphics card options range from the RTX 1000 Ada to the RTX 5000 Ada (or GeForce RTX 4060, 4080, or 4090). This large variety results in considerable pricing variances. The base model, equipped with Core i7-13700H, 32 GB RAM, and RTX 1000 Ada, currently starts at around ~$2850 USD. However, prices can easily surpass $6,350 USD for higher-end configurations featuring Core i9, RTX 5000 Ada, 96 GB RAM, and OLED display.
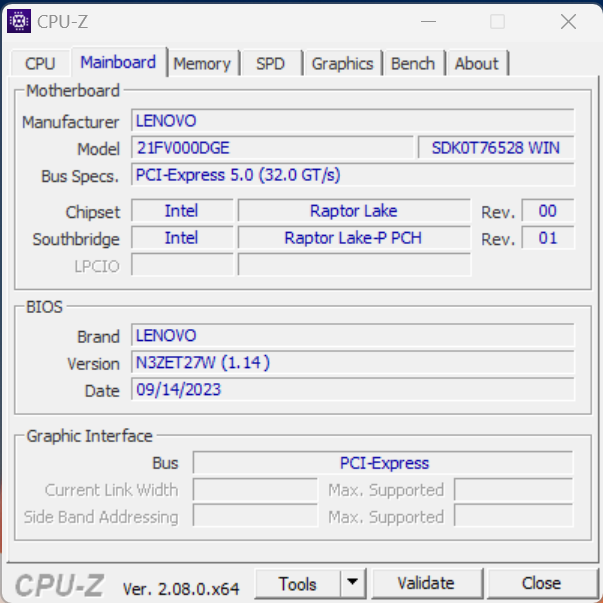
Our test device, identified by the product number 21FV000DGE, is currently priced at around ~$3,400 USD. It features the Core i9-13900H, RTX 2000 Ada, 32 GB of RAM, and a 1 TB SSD. Additionally, it also includes the optional WQHD IPS panel with a refresh rate of 165 Hz. Those with access to Lenovo's Campus program can get this model for approximately $3,000 USD.
Potential Competitors in Comparison
Rating | Date | Model | Weight | Height | Size | Resolution | Price |
|---|---|---|---|---|---|---|---|
| 91.7 % v7 (old) | 10 / 2023 | Lenovo ThinkPad P1 G6-21FV000DGE i9-13900H, RTX 2000 Ada Generation Laptop | 1.9 kg | 17.5 mm | 16.00" | 2560x1600 | |
| 89 % v7 (old) | 08 / 2023 | Dell Precision 5000 5680 i9-13900H, RTX 5000 Ada Generation Laptop | 2.3 kg | 22.17 mm | 16.00" | 3840x2400 | |
| 88.8 % v7 (old) | 05 / 2023 | Samsung Galaxy Book3 Ultra 16, i9-13900H RTX 4070 i9-13900H, GeForce RTX 4070 Laptop GPU | 1.8 kg | 16.8 mm | 16.00" | 2880x1800 | |
| 90.1 % v7 (old) | 11 / 2022 | HP ZBook Studio 16 G9 62U04EA i7-12800H, RTX A2000 Laptop GPU | 1.8 kg | 19 mm | 16.00" | 3840x2400 | |
| 84.3 % v7 (old) | 11 / 2022 | MSI CreatorPro Z16P B12UKST i7-12700H, RTX A3000 Laptop GPU | 2.4 kg | 19 mm | 16.00" | 2560x1600 | |
| 88.6 % v7 (old) | 07 / 2023 | Schenker VISION 16 Pro (M23) i7-13700H, GeForce RTX 4070 Laptop GPU | 1.6 kg | 17.1 mm | 16.00" | 2560x1600 |
Case - Stability is provided by carbon fiber and magnesium
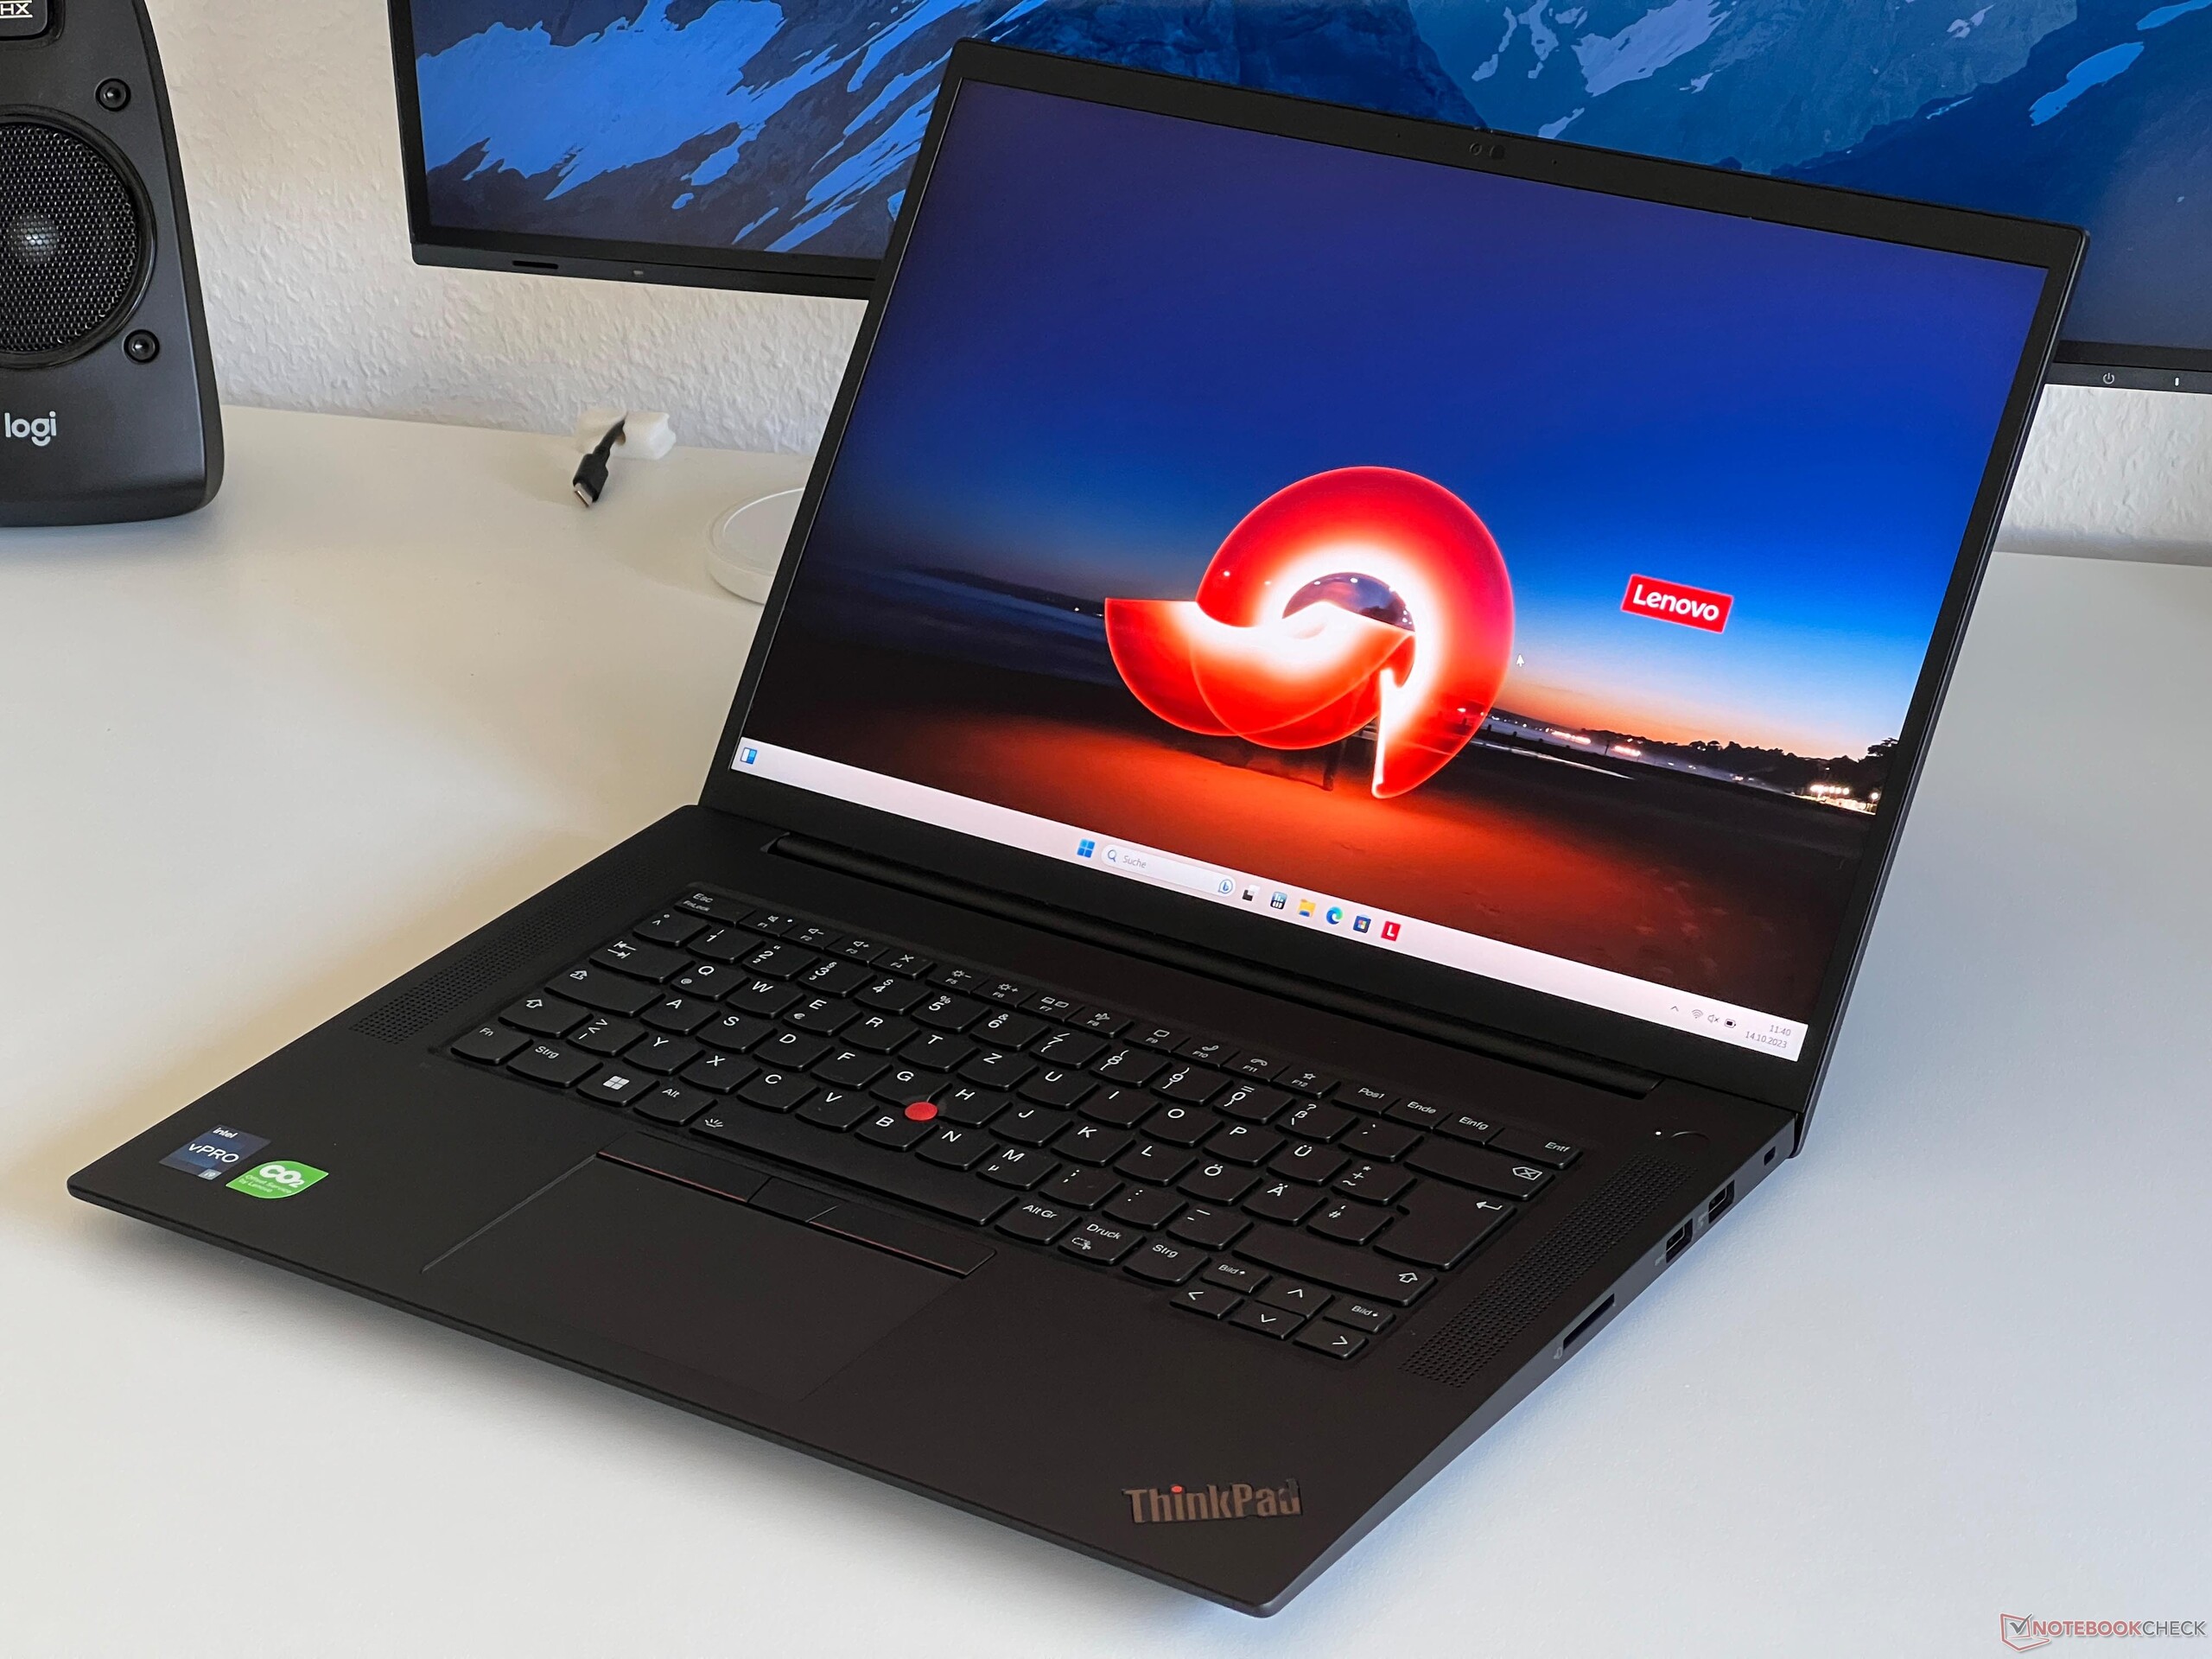
Lenovo retains the well-known design for the ThinkPad P1 Gen 6, maintaining consistency with its predecessors, the G4 and G5 generations. The black design can be perceived as either simple or unexciting, depending on individual perspectives. Nevertheless, the ThinkPad's distinctive identity remains unmistakable. Models with an OLED screen continue to showcase a screen lid with a carbon fiber pattern, although it's a printed design rather than actual carbon fiber. Overall, the design maintains a contemporary look, but the smooth surfaces are susceptible to dirt and grease buildup over time, necessitating regular cleaning.
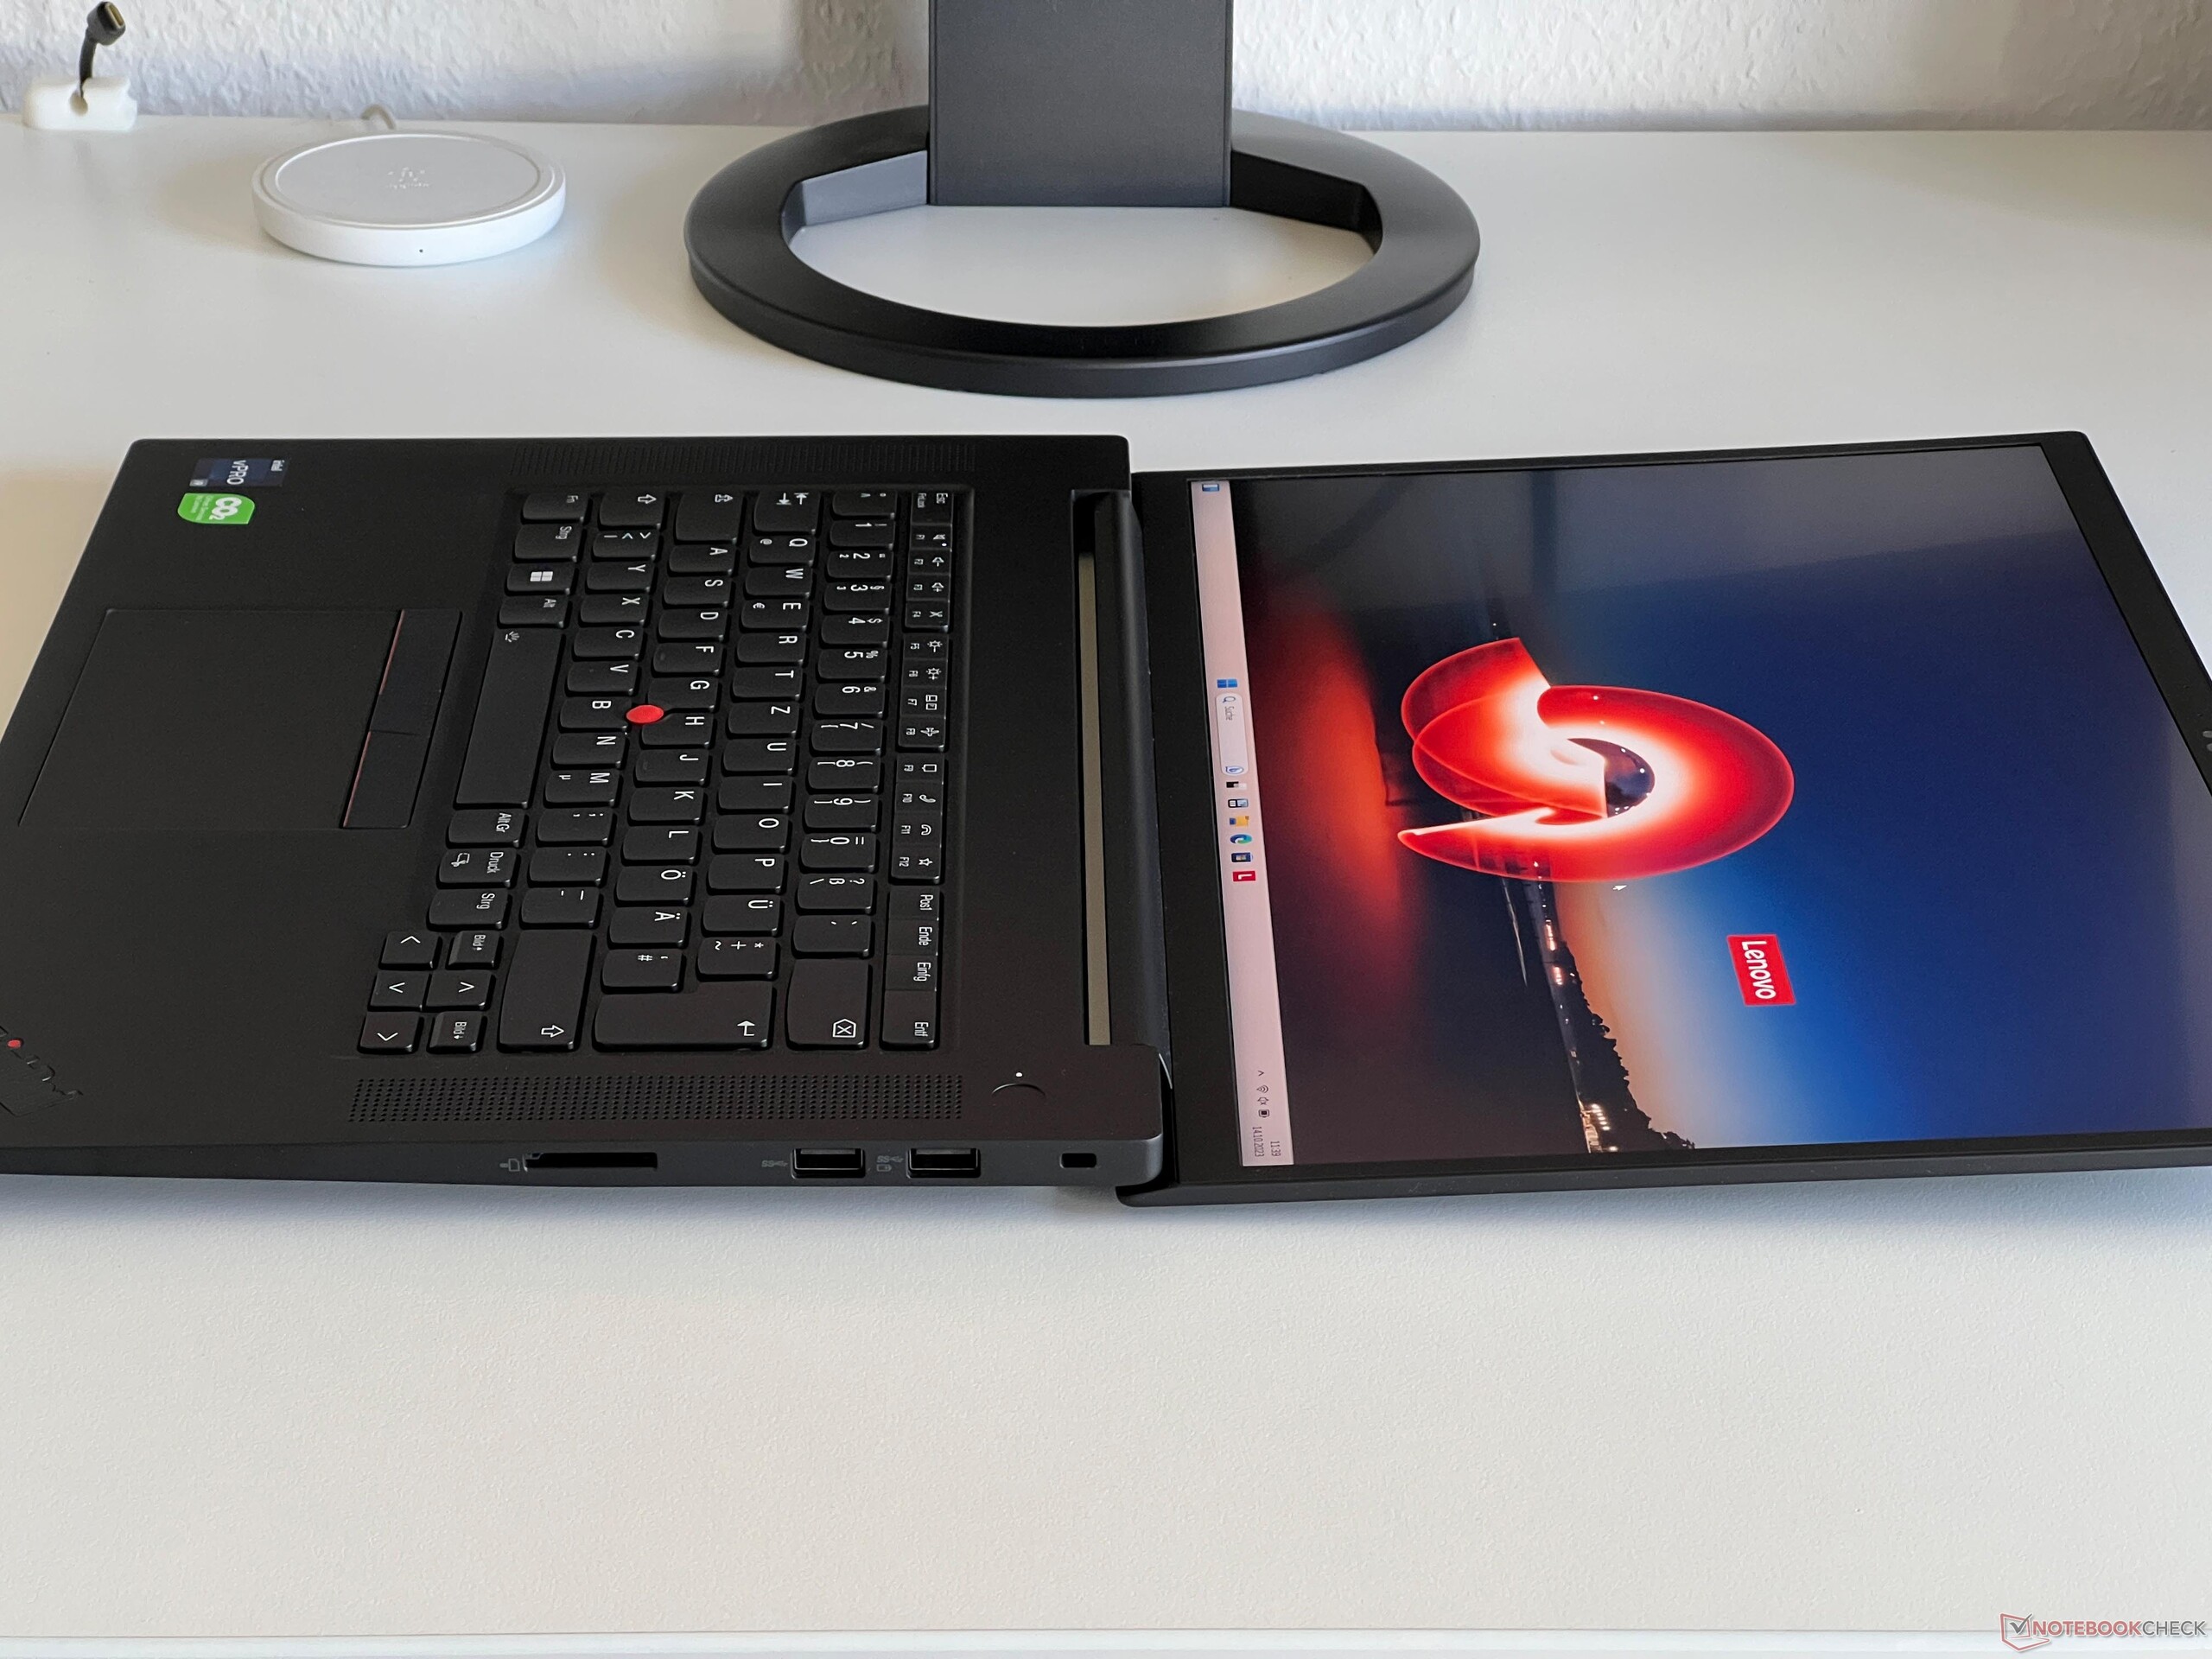
The construction combines carbon fiber and magnesium, guaranteeing exceptional stability. Both the base unit and the display lid are sturdy, with no noticeable twisting or pressure points. There are no issues with image distortions or creaking noises. The two hinges (maximum opening angle 180 degrees) allow the lid to be opened with one hand while maintaining sufficient tension to prevent any noticeable bouncing.
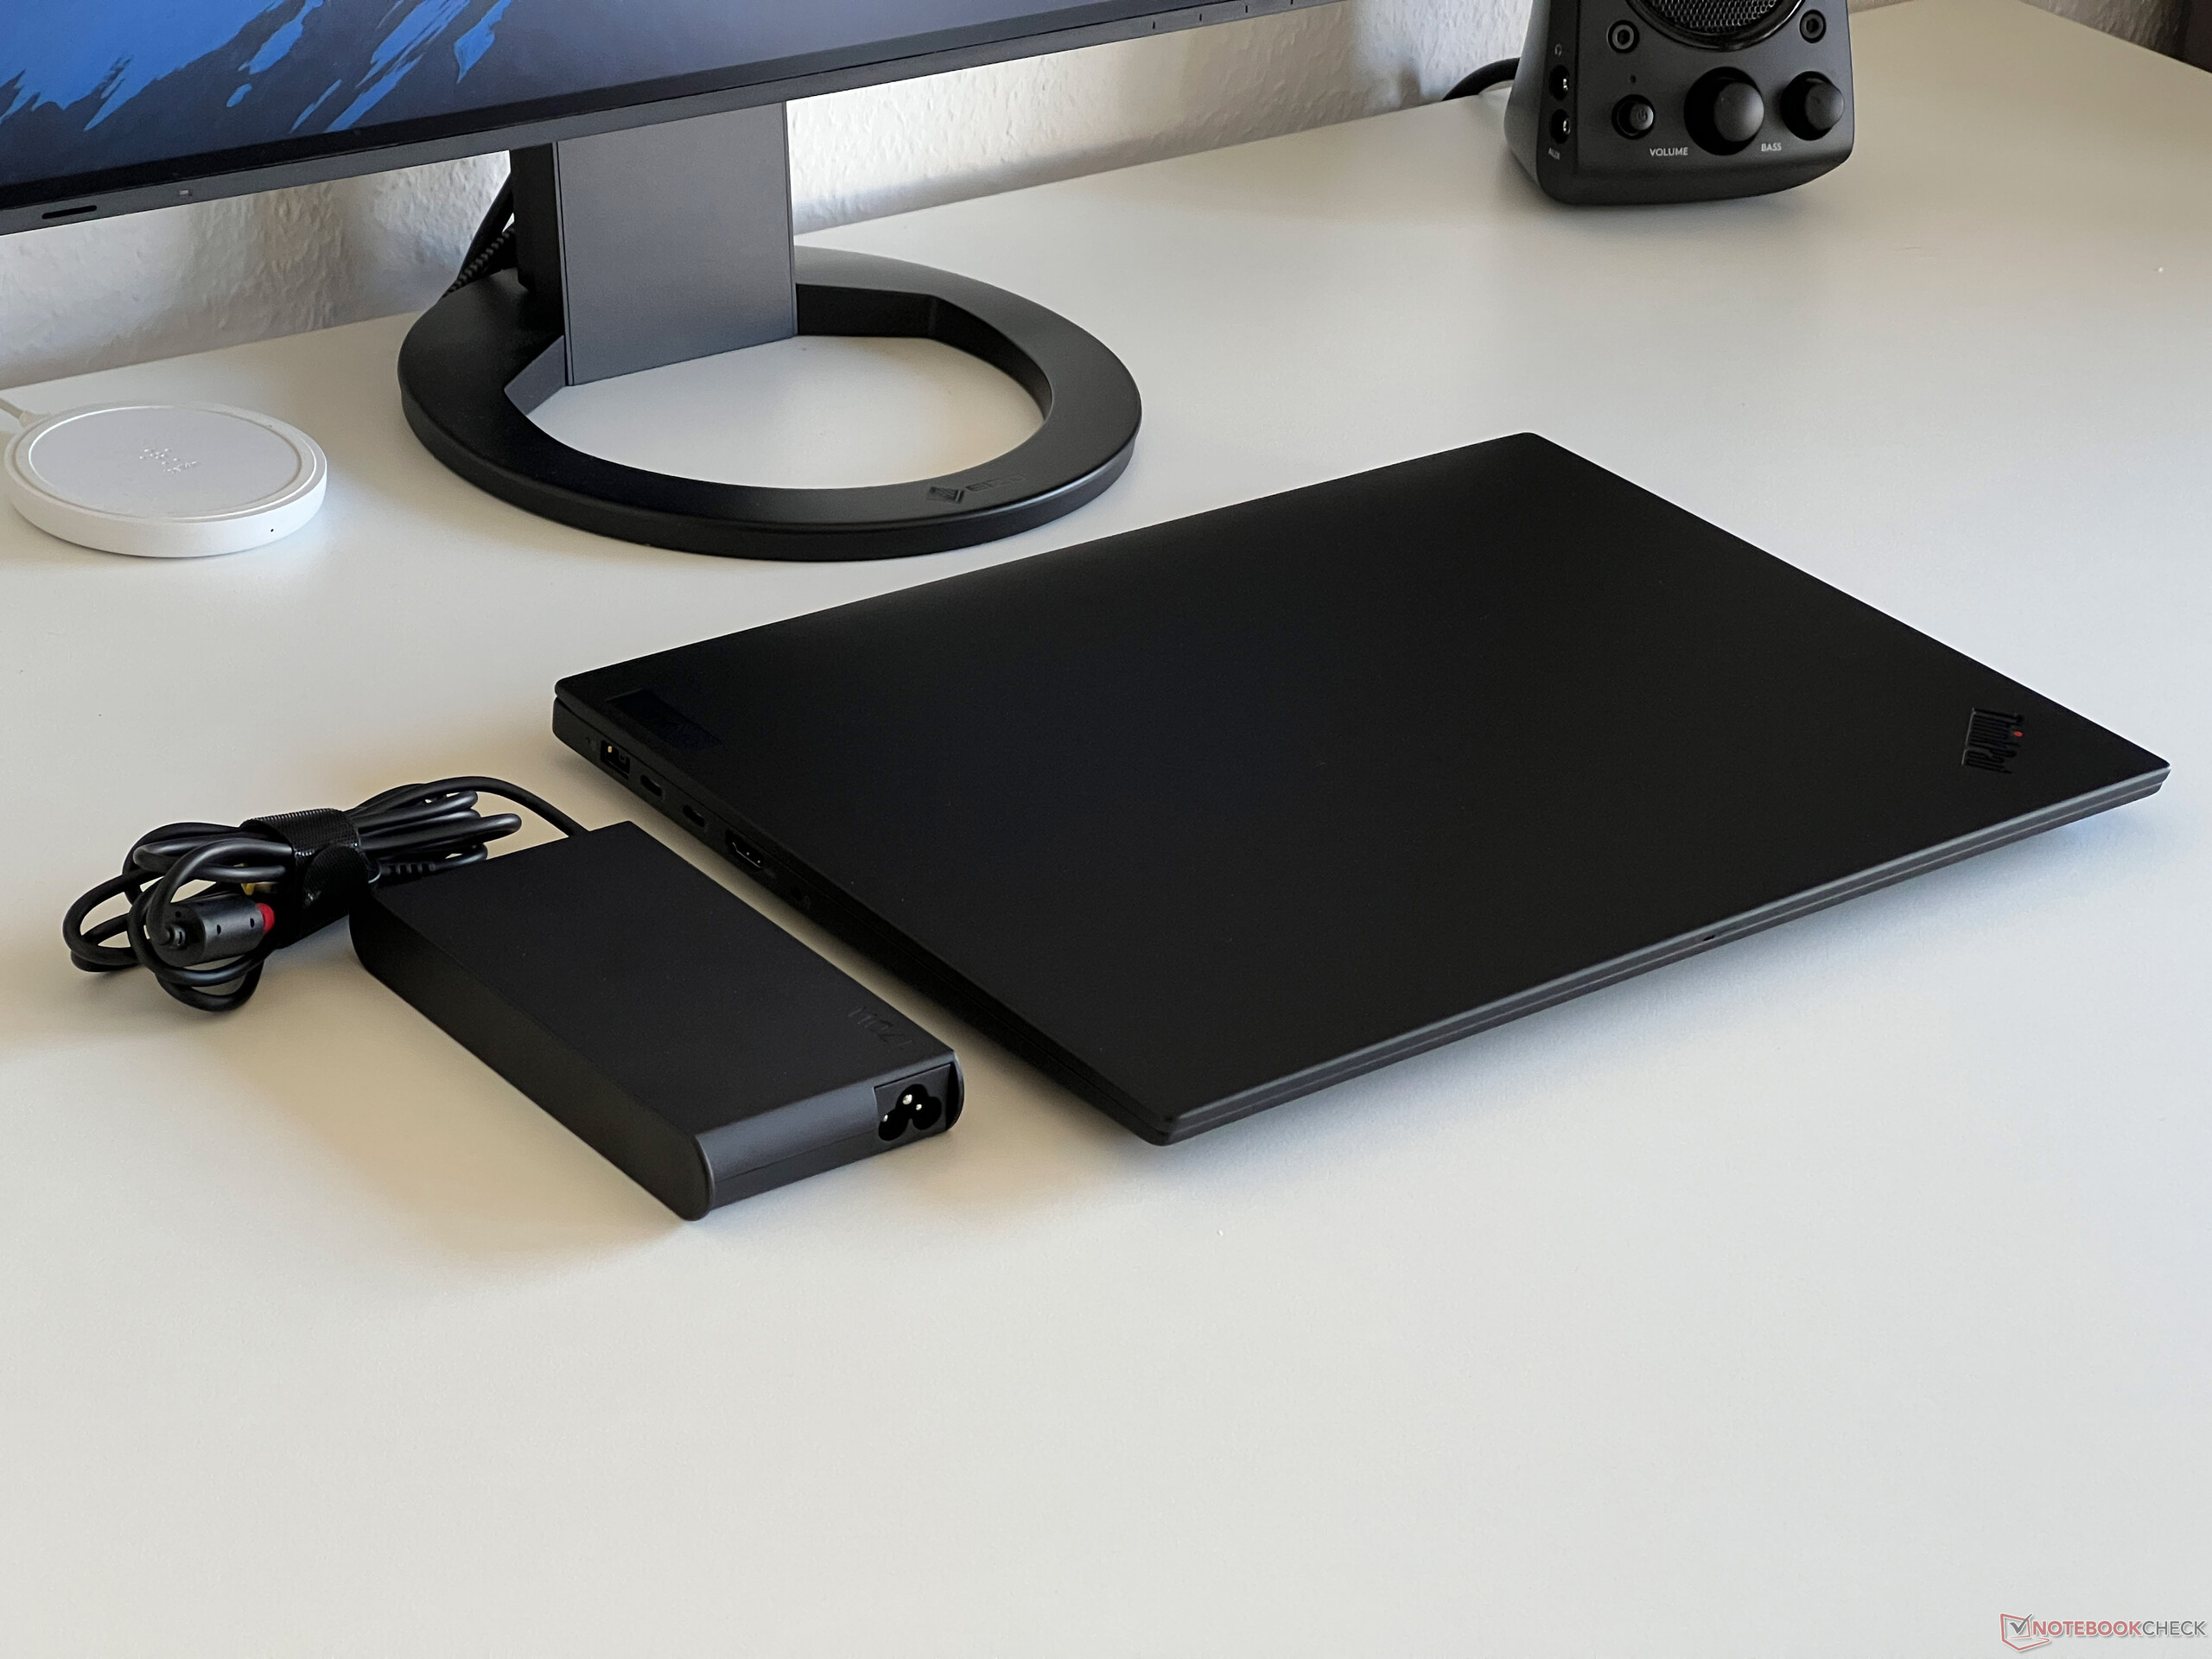
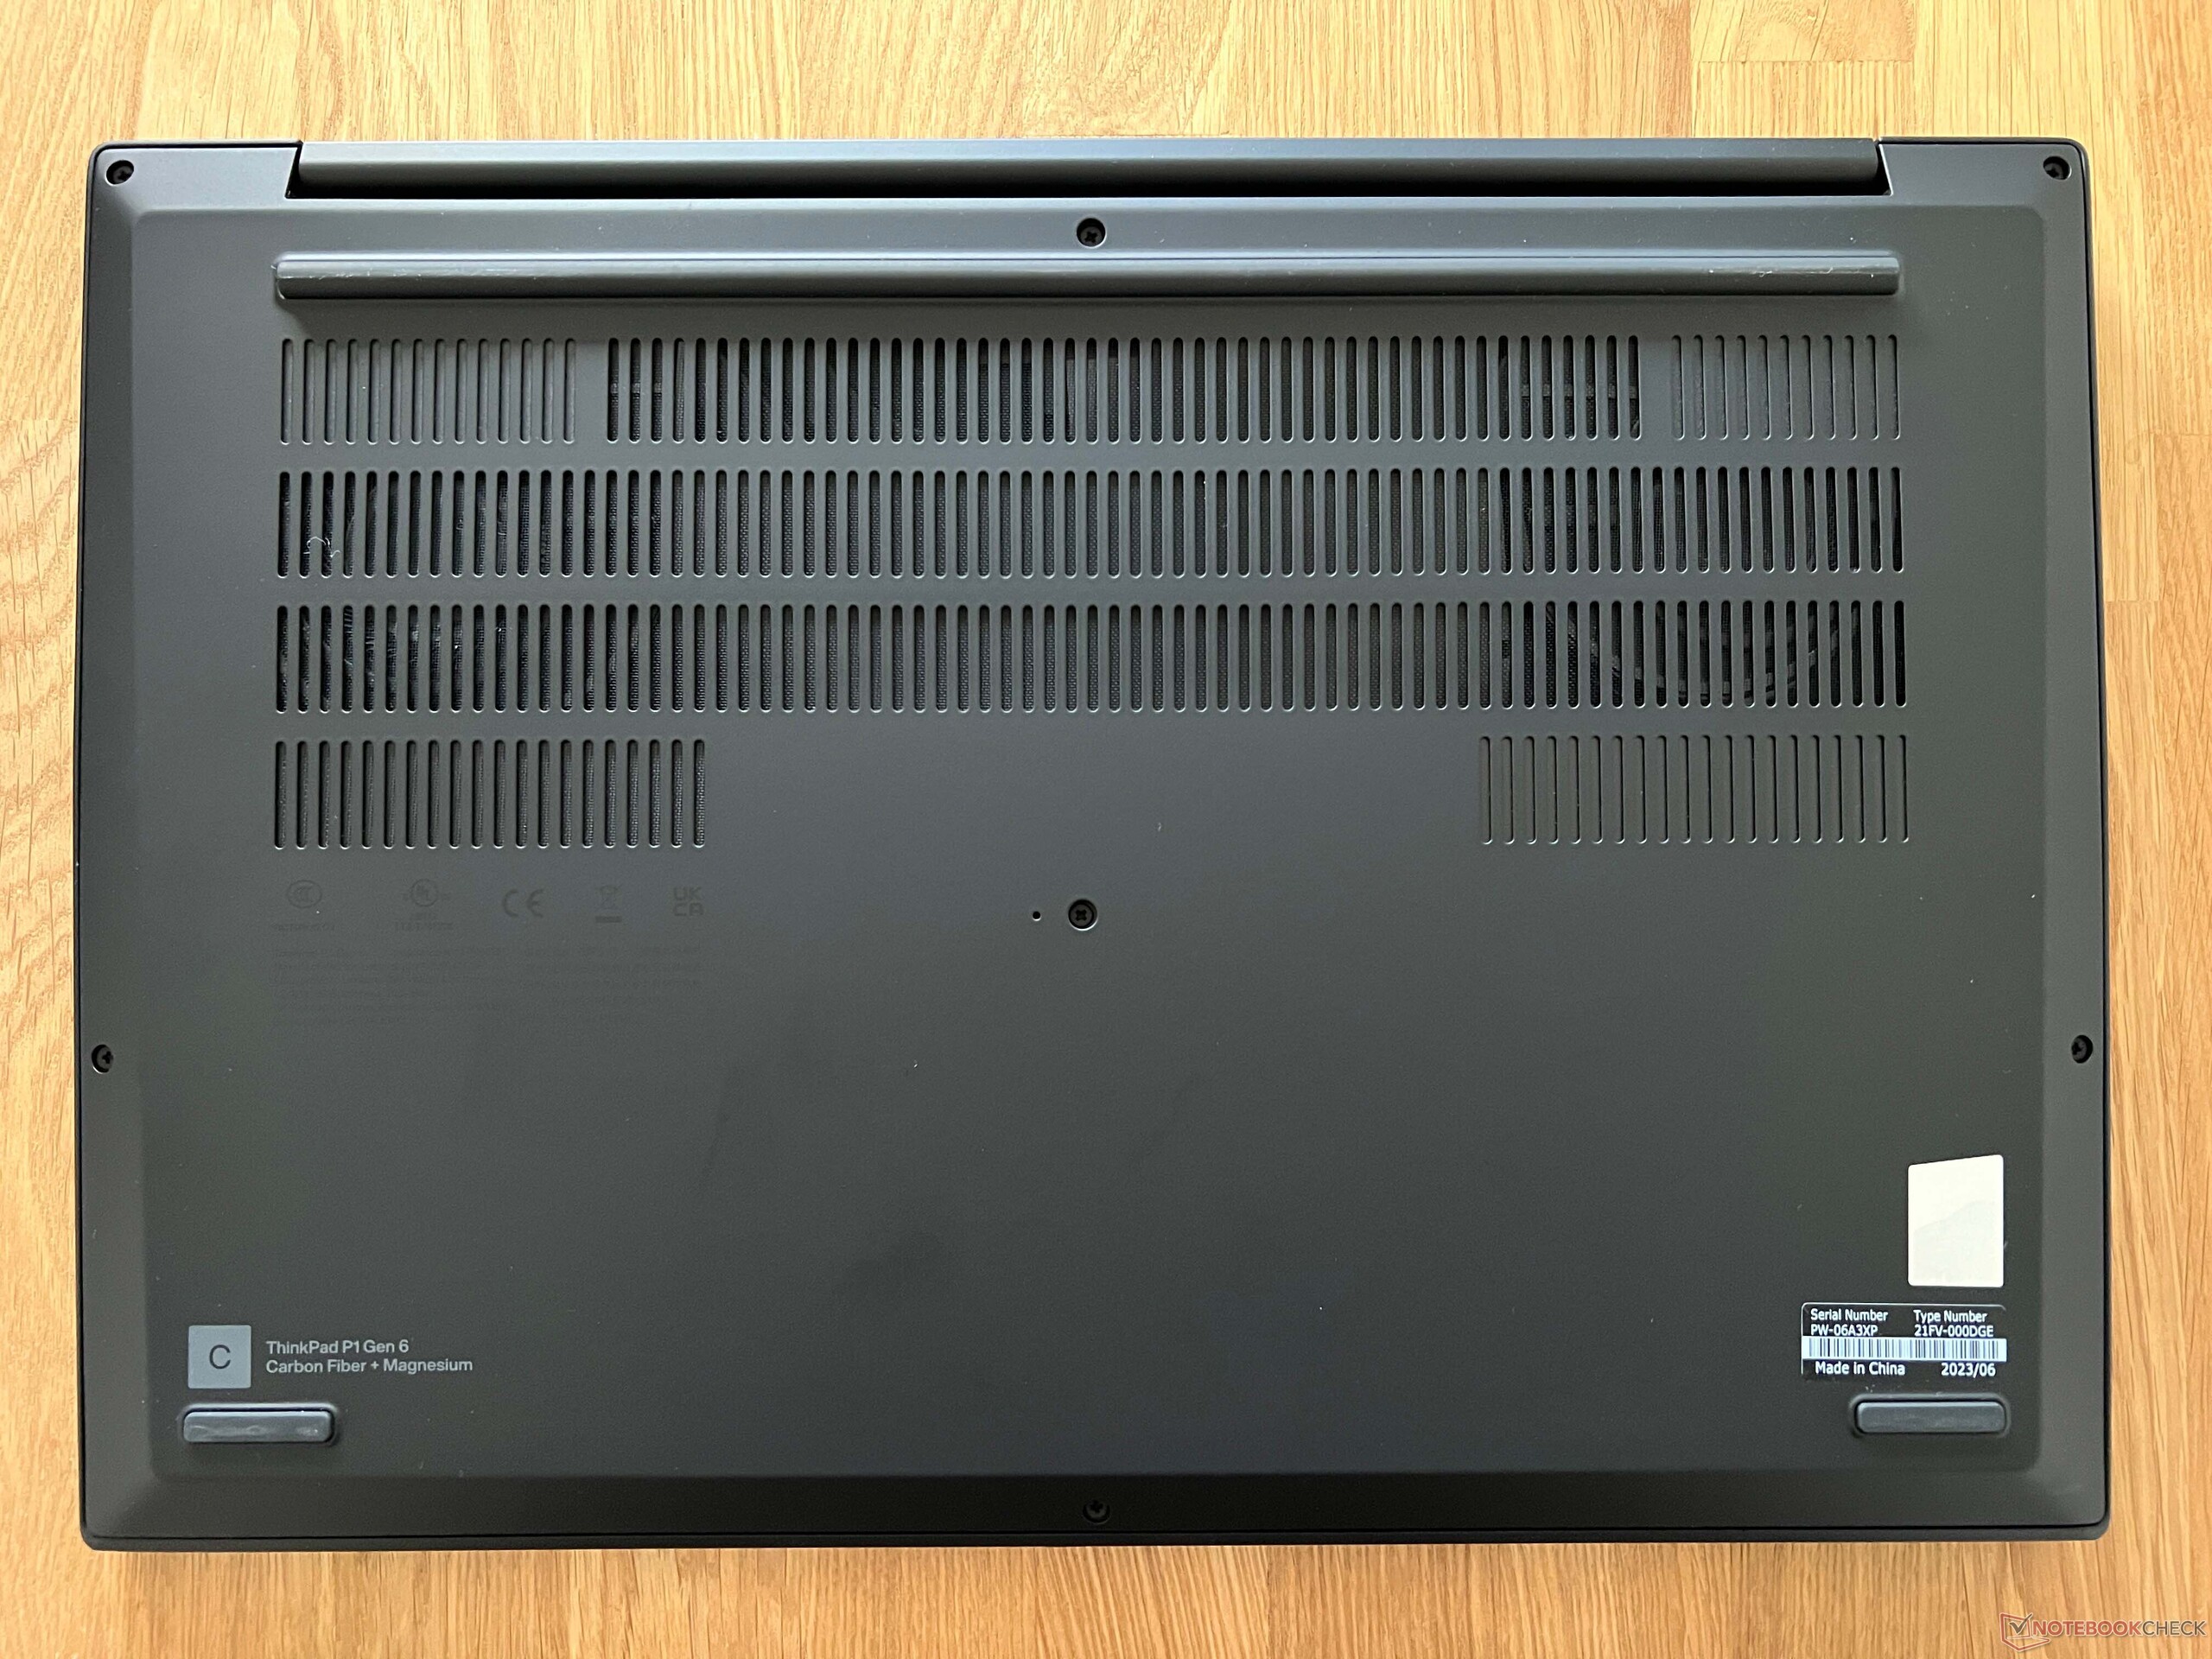
The comparable gadgets have a similar footprint, but they are significantly heavier. The ThinkPad P1 Gen 6 is one of the lightest variants, weighing little under 4.19 lbs and being outweighed only by the Schenker Vision 16. The 170-watt power supply adds an extra 1.23 lbs to the overall weight.
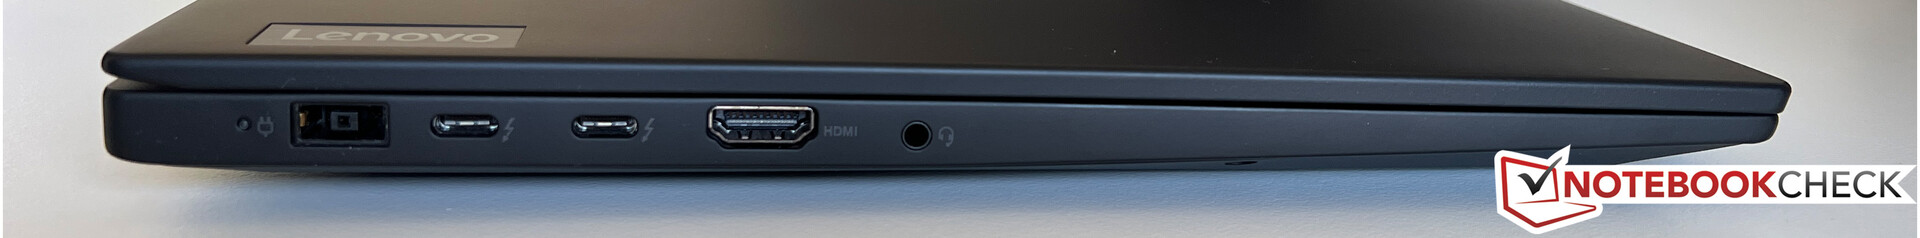
Connectivity - Thunderbolt and Wi-Fi 6E
There have been no changes to the ports, and all essential standards remain available. Additionally, the two USB-C ports with Thunderbolt 4 can be used for charging, delivering a minimum of 90 watts of power.
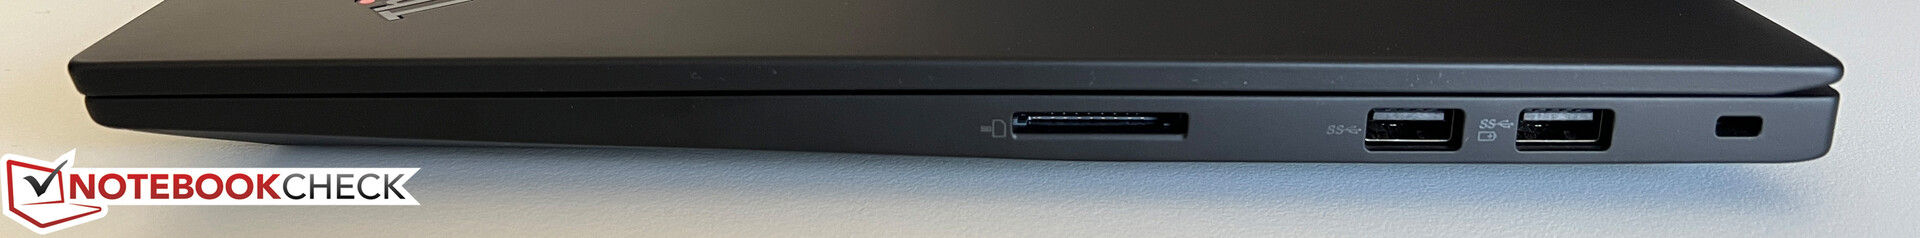
SD Card Reader
The right card reader only provides average transfer rates. The transfer rates are roughly 80 MB/s when combined with our reference card (Angelbird AV Pro V60).
| SD Card Reader | |
| average JPG Copy Test (av. of 3 runs) | |
| Dell Precision 5000 5680 (Toshiba Exceria Pro SDXC 64 GB UHS-II) | |
| Average of class Workstation (49.6 - 681, n=14, last 2 years) | |
| MSI CreatorPro Z16P B12UKST (AV Pro V60) | |
| Lenovo ThinkPad P1 G6-21FV000DGE (Angelbird AV Pro V60) | |
| Samsung Galaxy Book3 Ultra 16, i9-13900H RTX 4070 (AV Pro SD microSD 128 GB V60) | |
| HP ZBook Studio 16 G9 62U04EA (Angelbird AV PRO V60) | |
| Lenovo ThinkPad X1 Extreme G5-21DE003RGE (AV Pro V60) | |
| Schenker VISION 16 Pro (M23) (Angelbird AV Pro V60) | |
| maximum AS SSD Seq Read Test (1GB) | |
| Average of class Workstation (87.6 - 1455, n=14, last 2 years) | |
| Dell Precision 5000 5680 (Toshiba Exceria Pro SDXC 64 GB UHS-II) | |
| Samsung Galaxy Book3 Ultra 16, i9-13900H RTX 4070 (AV Pro SD microSD 128 GB V60) | |
| Lenovo ThinkPad P1 G6-21FV000DGE (Angelbird AV Pro V60) | |
| MSI CreatorPro Z16P B12UKST (AV Pro V60) | |
| Lenovo ThinkPad X1 Extreme G5-21DE003RGE (AV Pro V60) | |
| HP ZBook Studio 16 G9 62U04EA (Angelbird AV PRO V60) | |
| Schenker VISION 16 Pro (M23) (Angelbird AV Pro V60) | |
Communication
No changes regarding the WLAN module; the Intel AX211 card is still utilized, supporting modern 6 GHz networks. The transfer rates are excellent, and during our tests, we encountered no connection issues. Although there is no Ethernet port, it can be added through a compatible USB-C adapter. Inside the case, there's an M.2-2242 slot for a WWAN module; however, the necessary antennas are not pre-installed, preventing retrofits for WWAN connectivity.
| Networking | |
| Lenovo ThinkPad P1 G6-21FV000DGE | |
| iperf3 transmit AXE11000 | |
| iperf3 receive AXE11000 | |
| Dell Precision 5000 5680 | |
| iperf3 transmit AXE11000 | |
| iperf3 receive AXE11000 | |
| iperf3 transmit AXE11000 6GHz | |
| iperf3 receive AXE11000 6GHz | |
| Samsung Galaxy Book3 Ultra 16, i9-13900H RTX 4070 | |
| iperf3 transmit AXE11000 | |
| iperf3 receive AXE11000 | |
| iperf3 transmit AXE11000 6GHz | |
| iperf3 receive AXE11000 6GHz | |
| HP ZBook Studio 16 G9 62U04EA | |
| iperf3 transmit AXE11000 6GHz | |
| iperf3 receive AXE11000 6GHz | |
| MSI CreatorPro Z16P B12UKST | |
| iperf3 transmit AXE11000 6GHz | |
| iperf3 receive AXE11000 6GHz | |
| Schenker VISION 16 Pro (M23) | |
| iperf3 transmit AXE11000 | |
| iperf3 receive AXE11000 | |
| Lenovo ThinkPad X1 Extreme G5-21DE003RGE | |
| iperf3 transmit AXE11000 6GHz | |
| iperf3 receive AXE11000 6GHz | |
Webcam
The 1080p camera takes decent pictures in good lighting conditions and there is a mechanical shutter. In addition, an IR camera is available for facial recognition via Windows Hello.


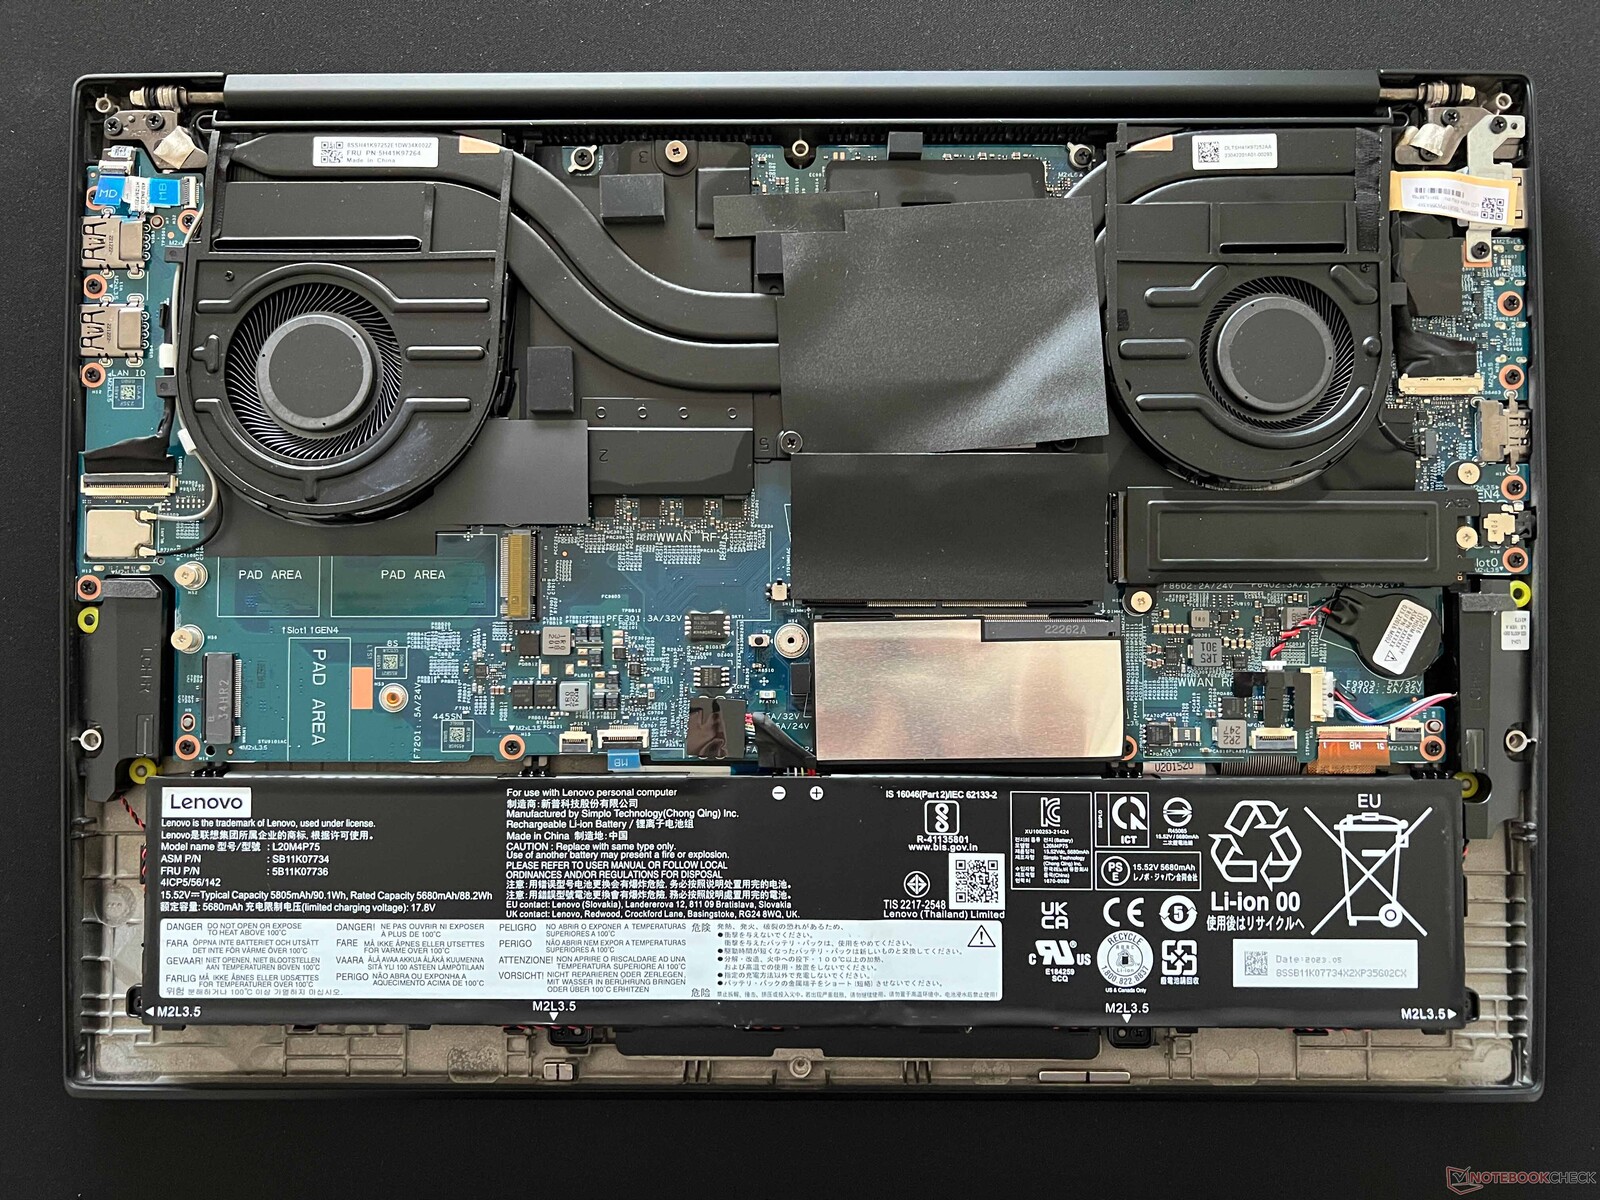
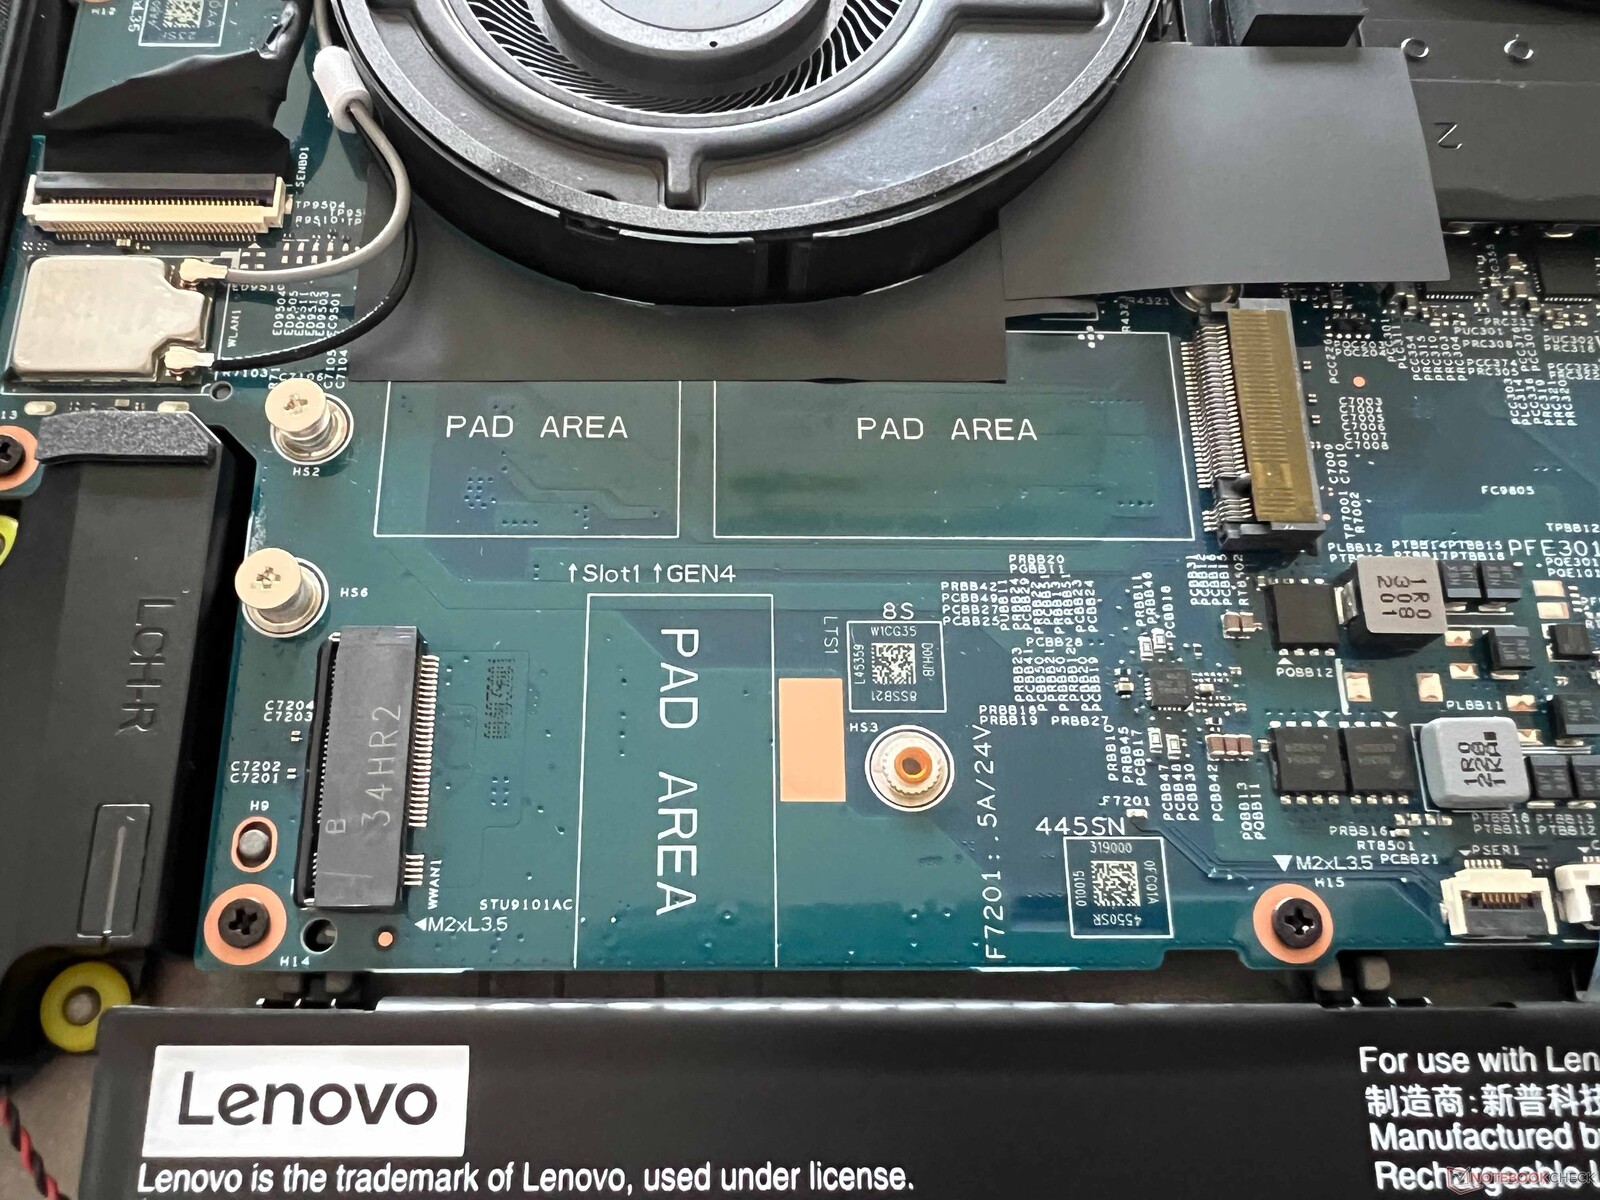
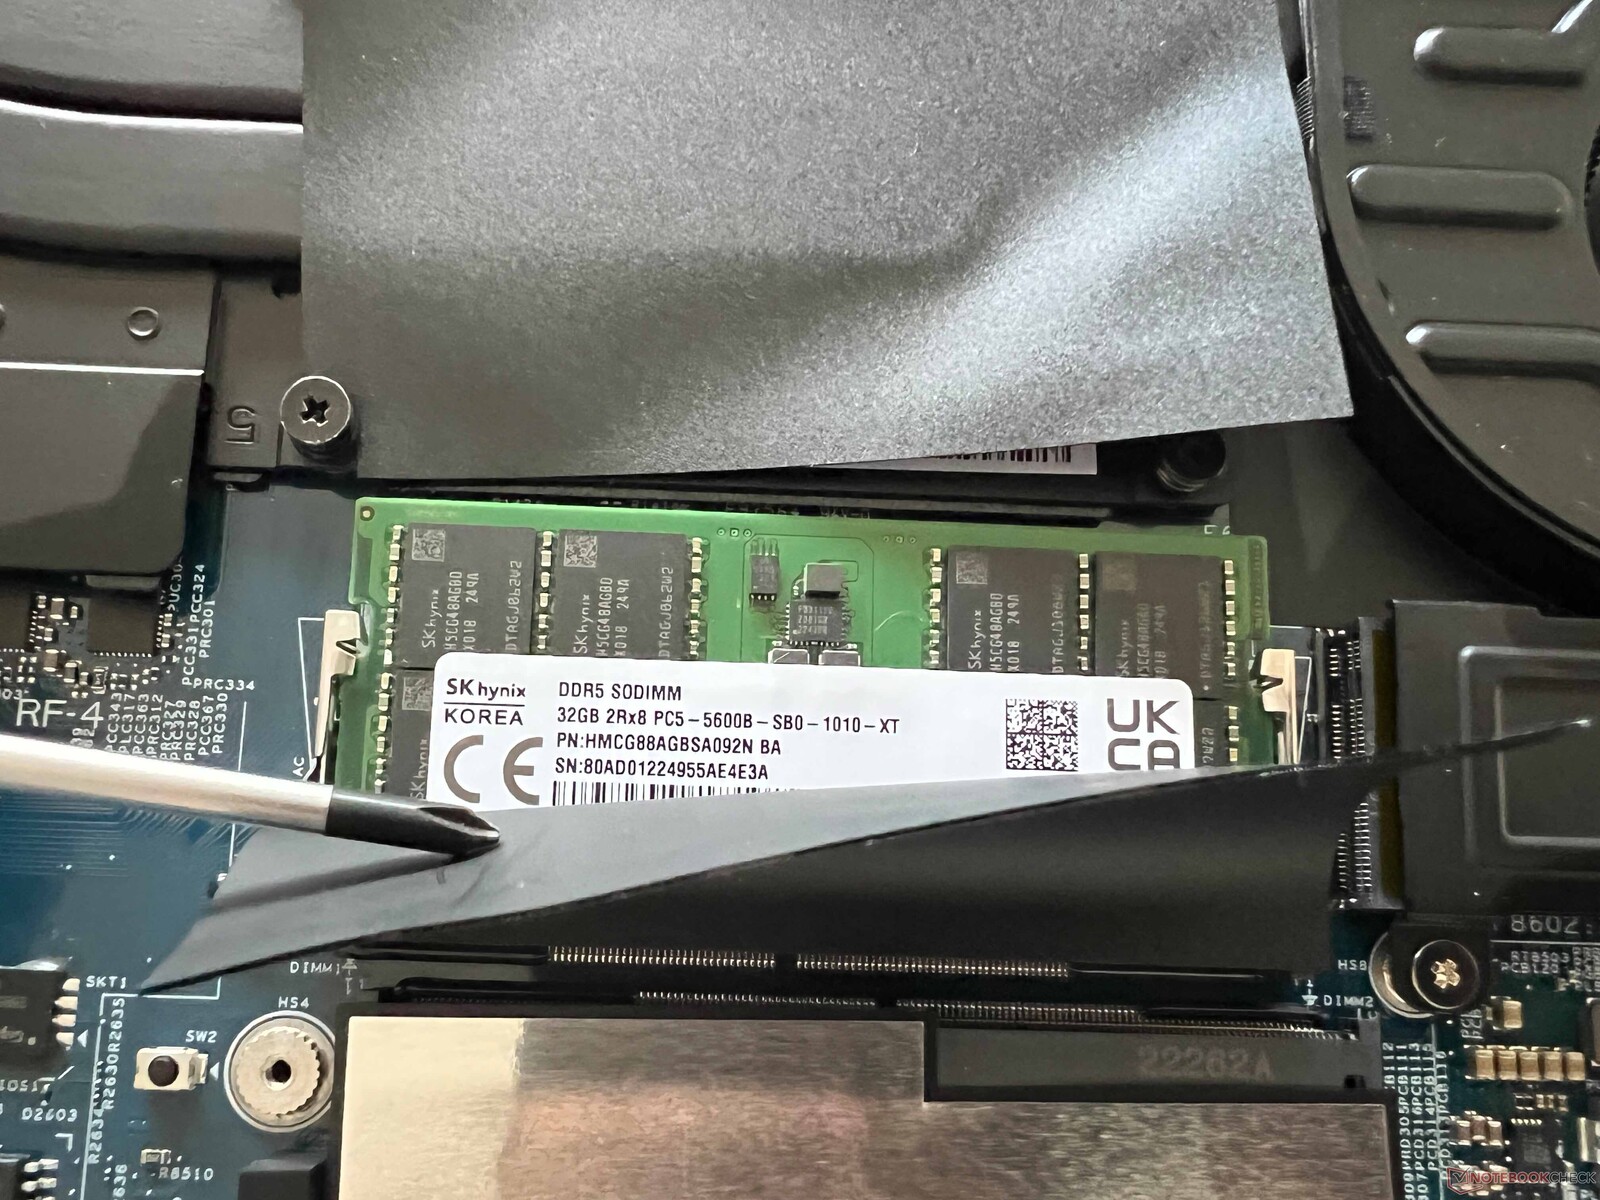
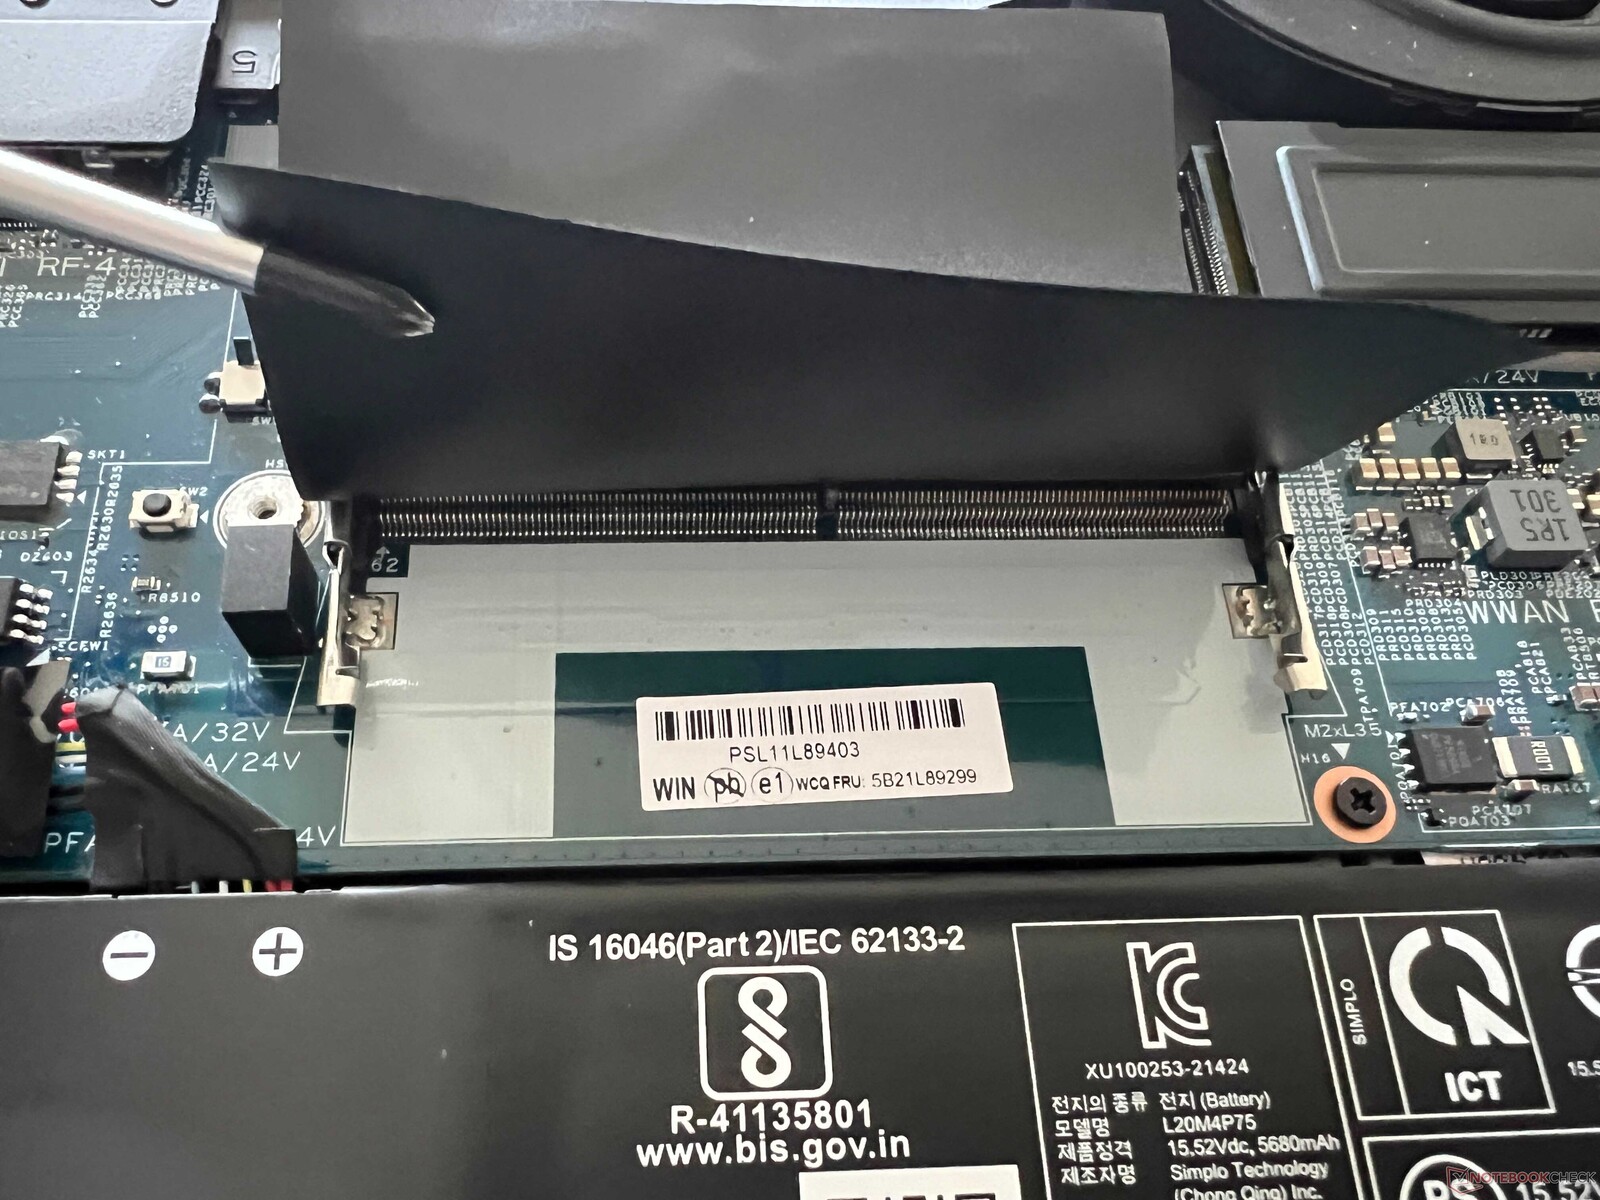
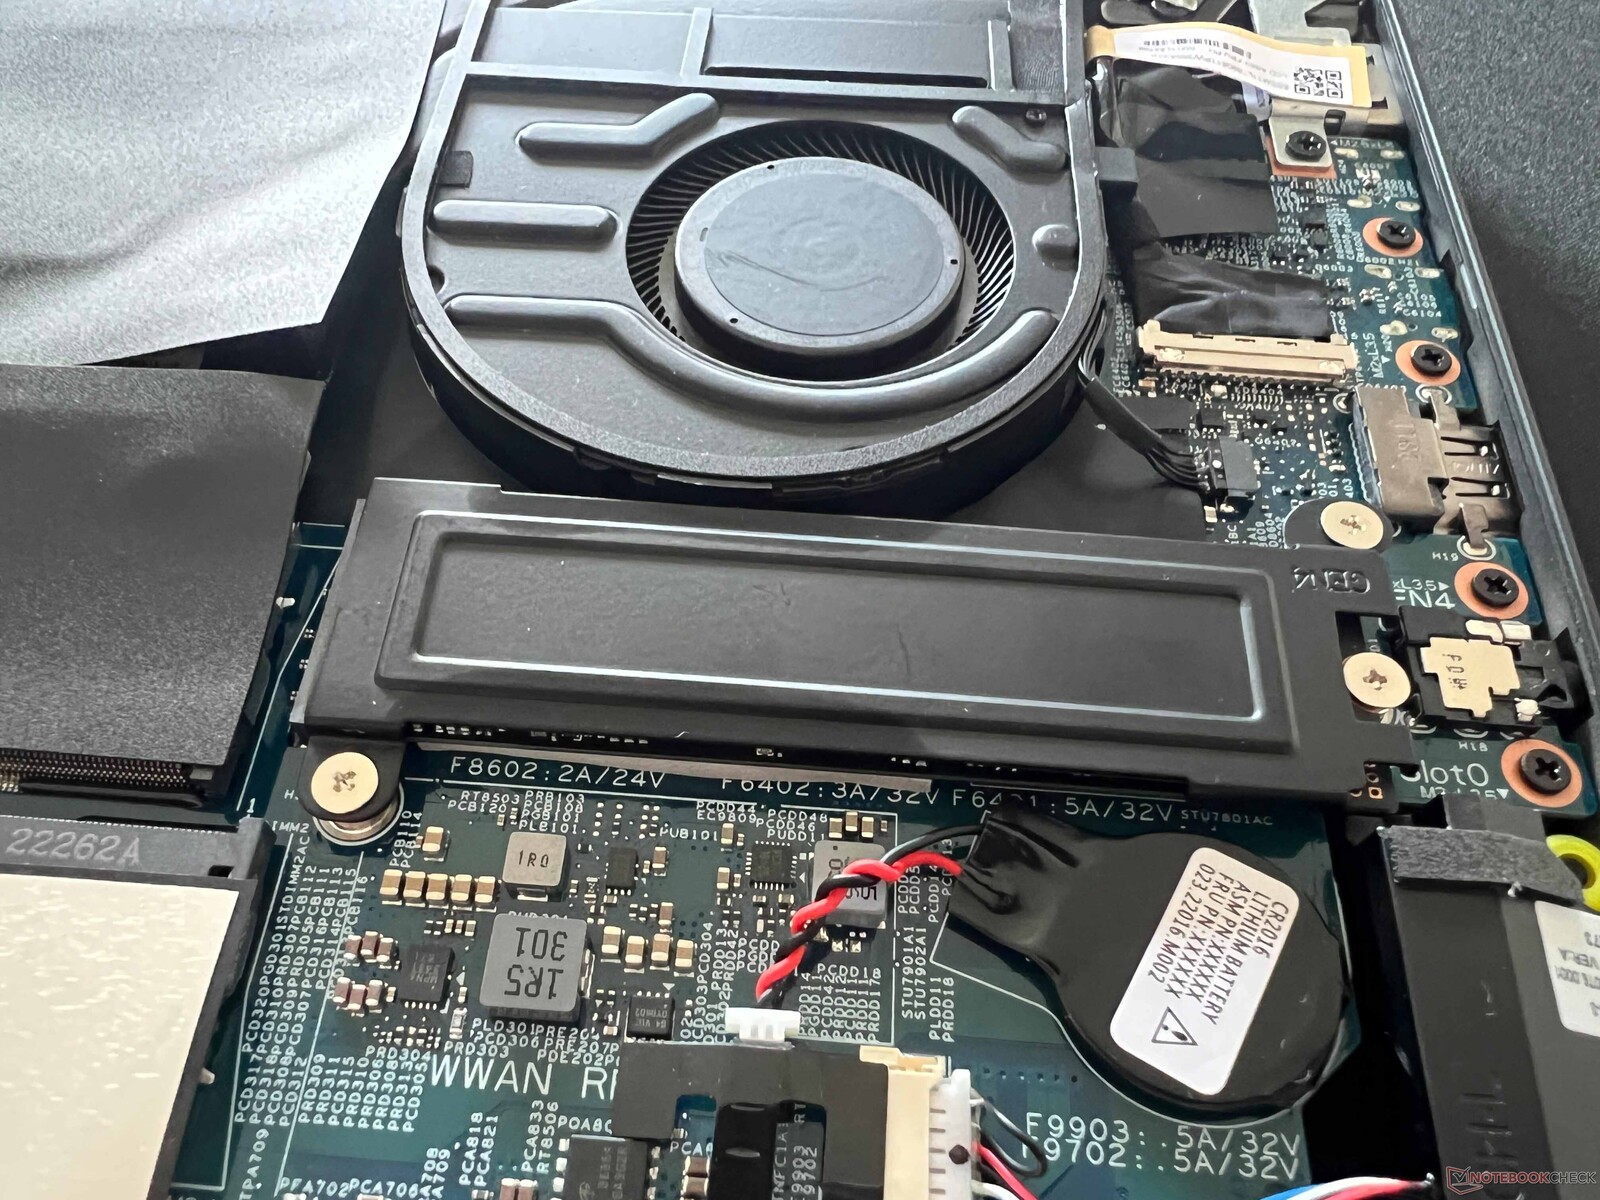
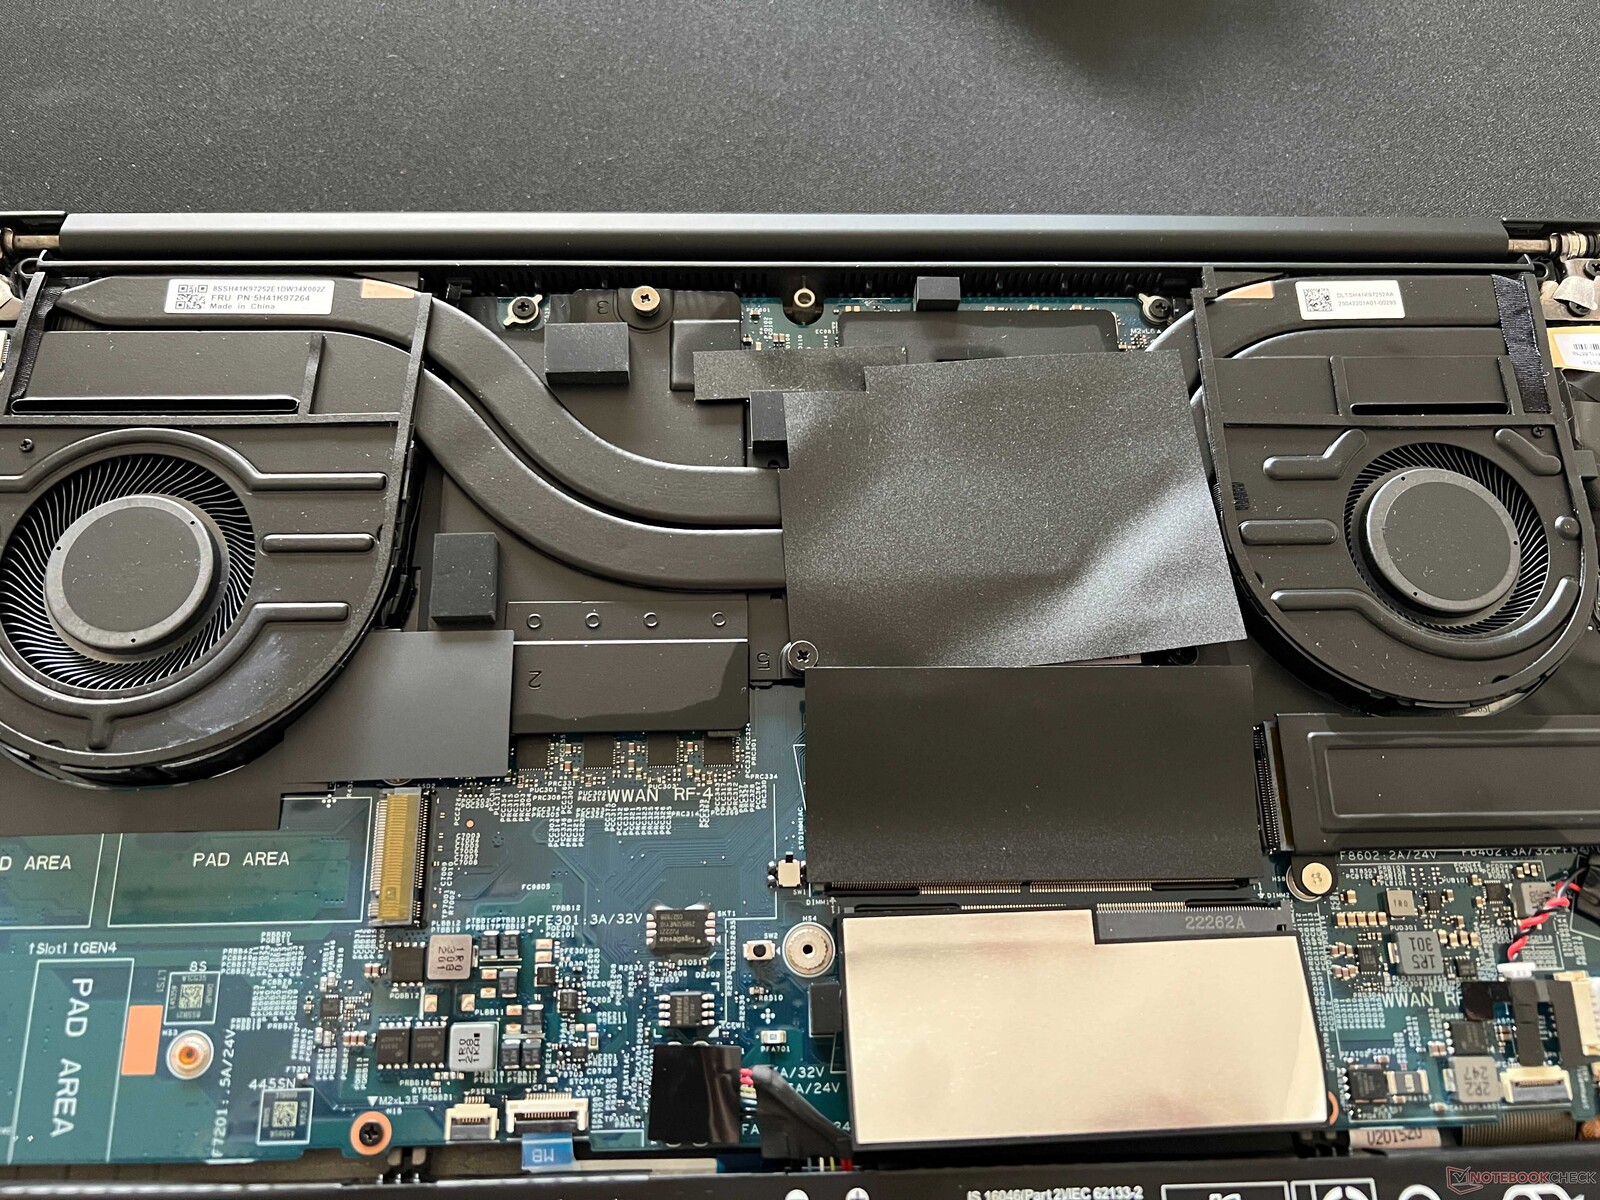
Maintenance
The lower casing cover can be easily removed. Our test device features conventional cooling with cooling fins, allowing for two slots for M.2-2280 SSDs. Additionally, there are two SODIMM slots for RAM modules, but the WLAN module cannot be swapped.
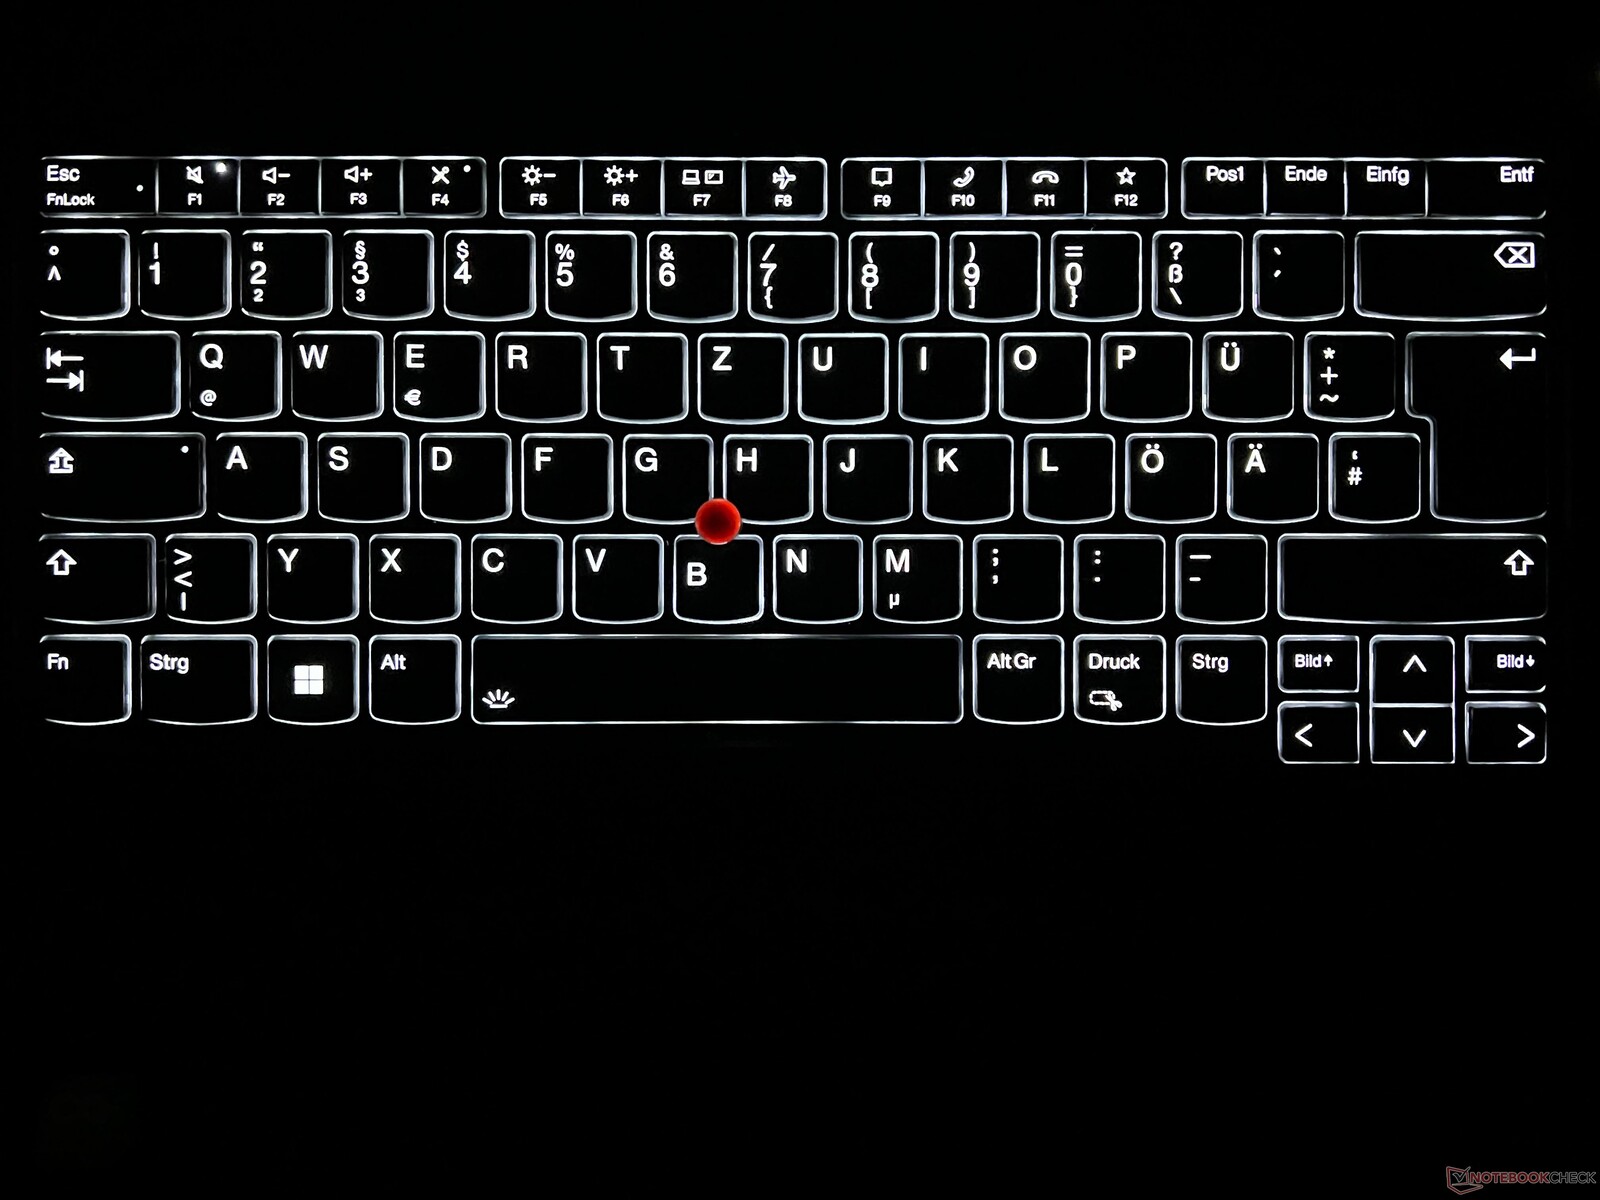
Input devices - 1.5 mm stroke
Lenovo has been using a keyboard with 0.06-inch stroke for the ThinkPad P1 for the past two years, unchanged in the current model. While the keyboard provides a comfortable typing experience, allowing for extended texts without issues, it no longer matches the quality of earlier models. In this regard, there are no significant advantages over competitors. The two-stage white backlight proves beneficial in dim lighting conditions, although it lacks automatic activation via a sensor.
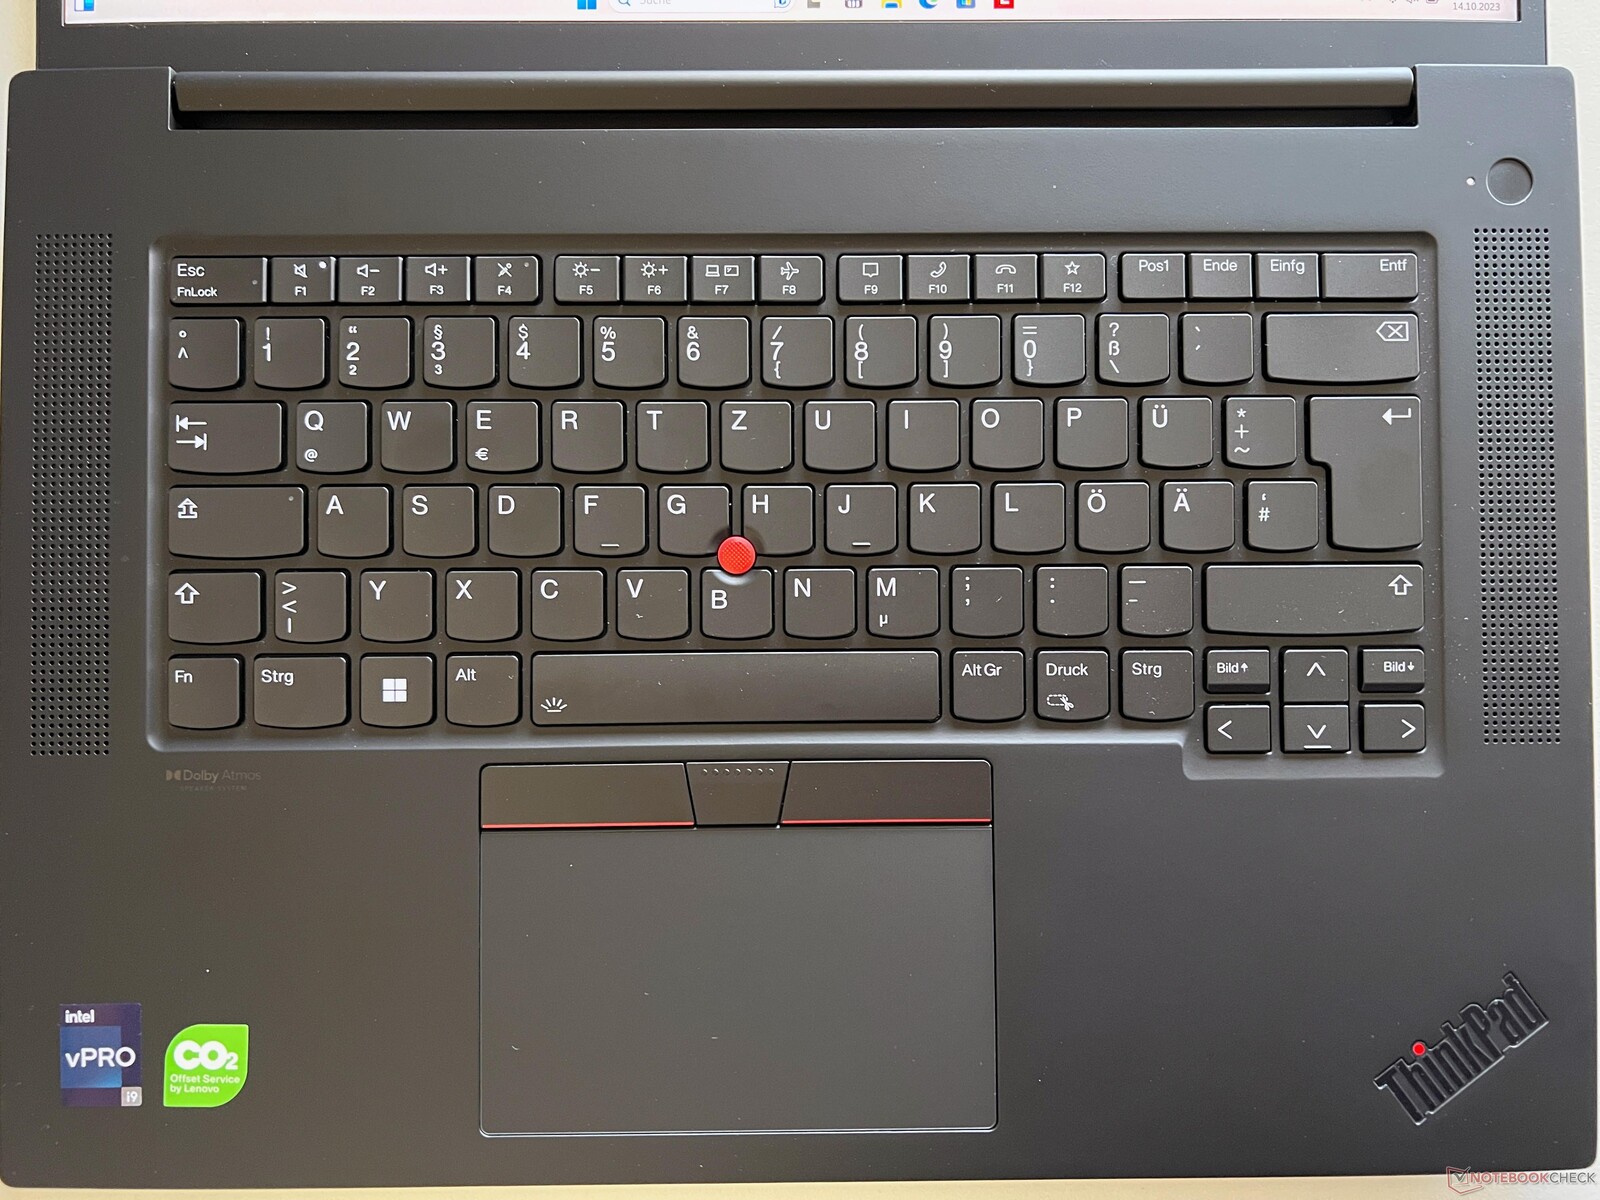
The ClickPad provides excellent gliding properties and a high-quality mechanism, offering quiet and smooth clicking noises. Additionally, for mouse control, the TrackPoint and dedicated buttons are available. The flat keys offer a good and quiet typing experience, functioning without issues; although the keys on our test device seem somewhat clattery.
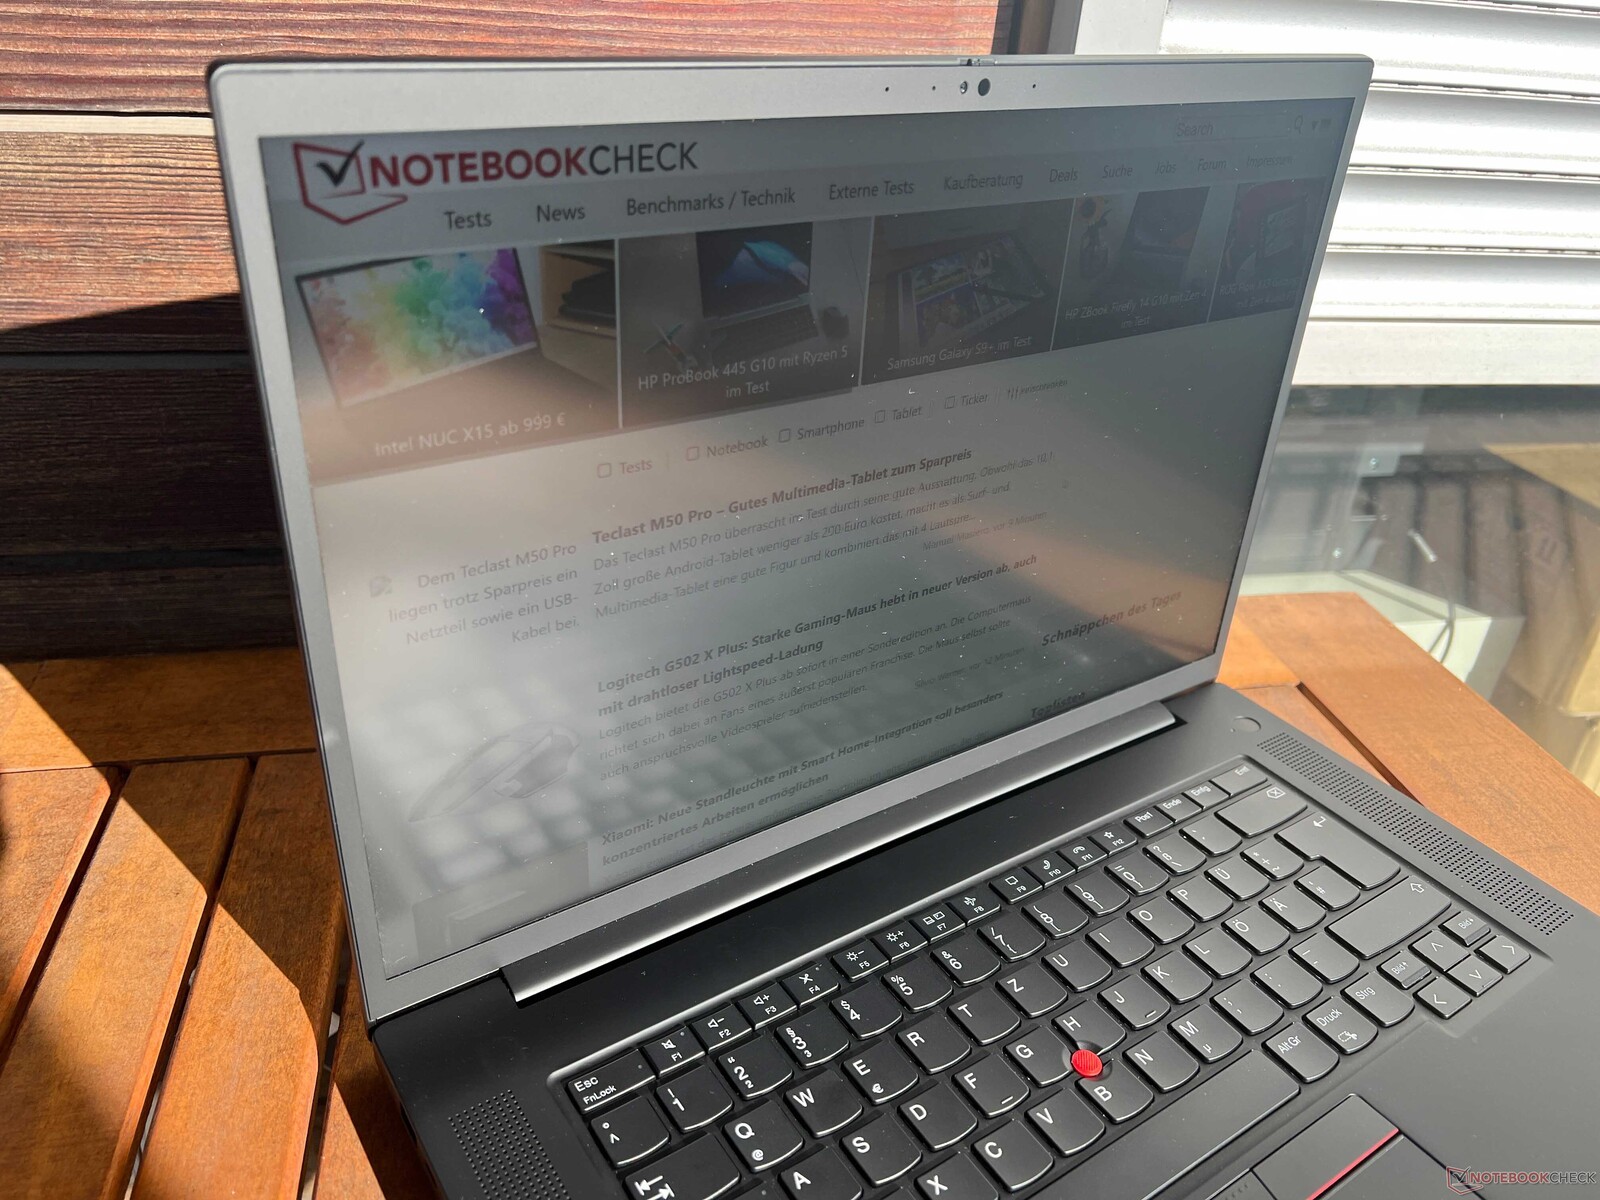
Display - Matte IPS panel with 165 Hz and 500 cd/m²


Lenovo introduced the optional 165 Hz display with WQHD resolution in last year's G5 generation, but we are only able to test it now. The standard configuration includes a matte Full HD panel with 300 cd/m² brightness. Additionally, there is an option for a 4K OLED screen with full P3 coverage. It's worth noting that the 4K IPS model with AdobeRGB coverage, which we tested in last year's ThinkPad X1 Extreme, is not available in this version.
The optional IPS screen in our review unit stands out for its excellent subjective picture quality. Colors appear vibrant, and movements are incredibly smooth due to the high refresh rate, rendering all content exceptionally sharp. Even in bright areas, there is no graininess, and the display does not exhibit any issues with PWM flickering. Furthermore, the response times are impressively fast, and there are no noticeable ghosting effects. At high brightness levels, slight halos are visible on a dark background, but this is not a significant issue in practical usage.
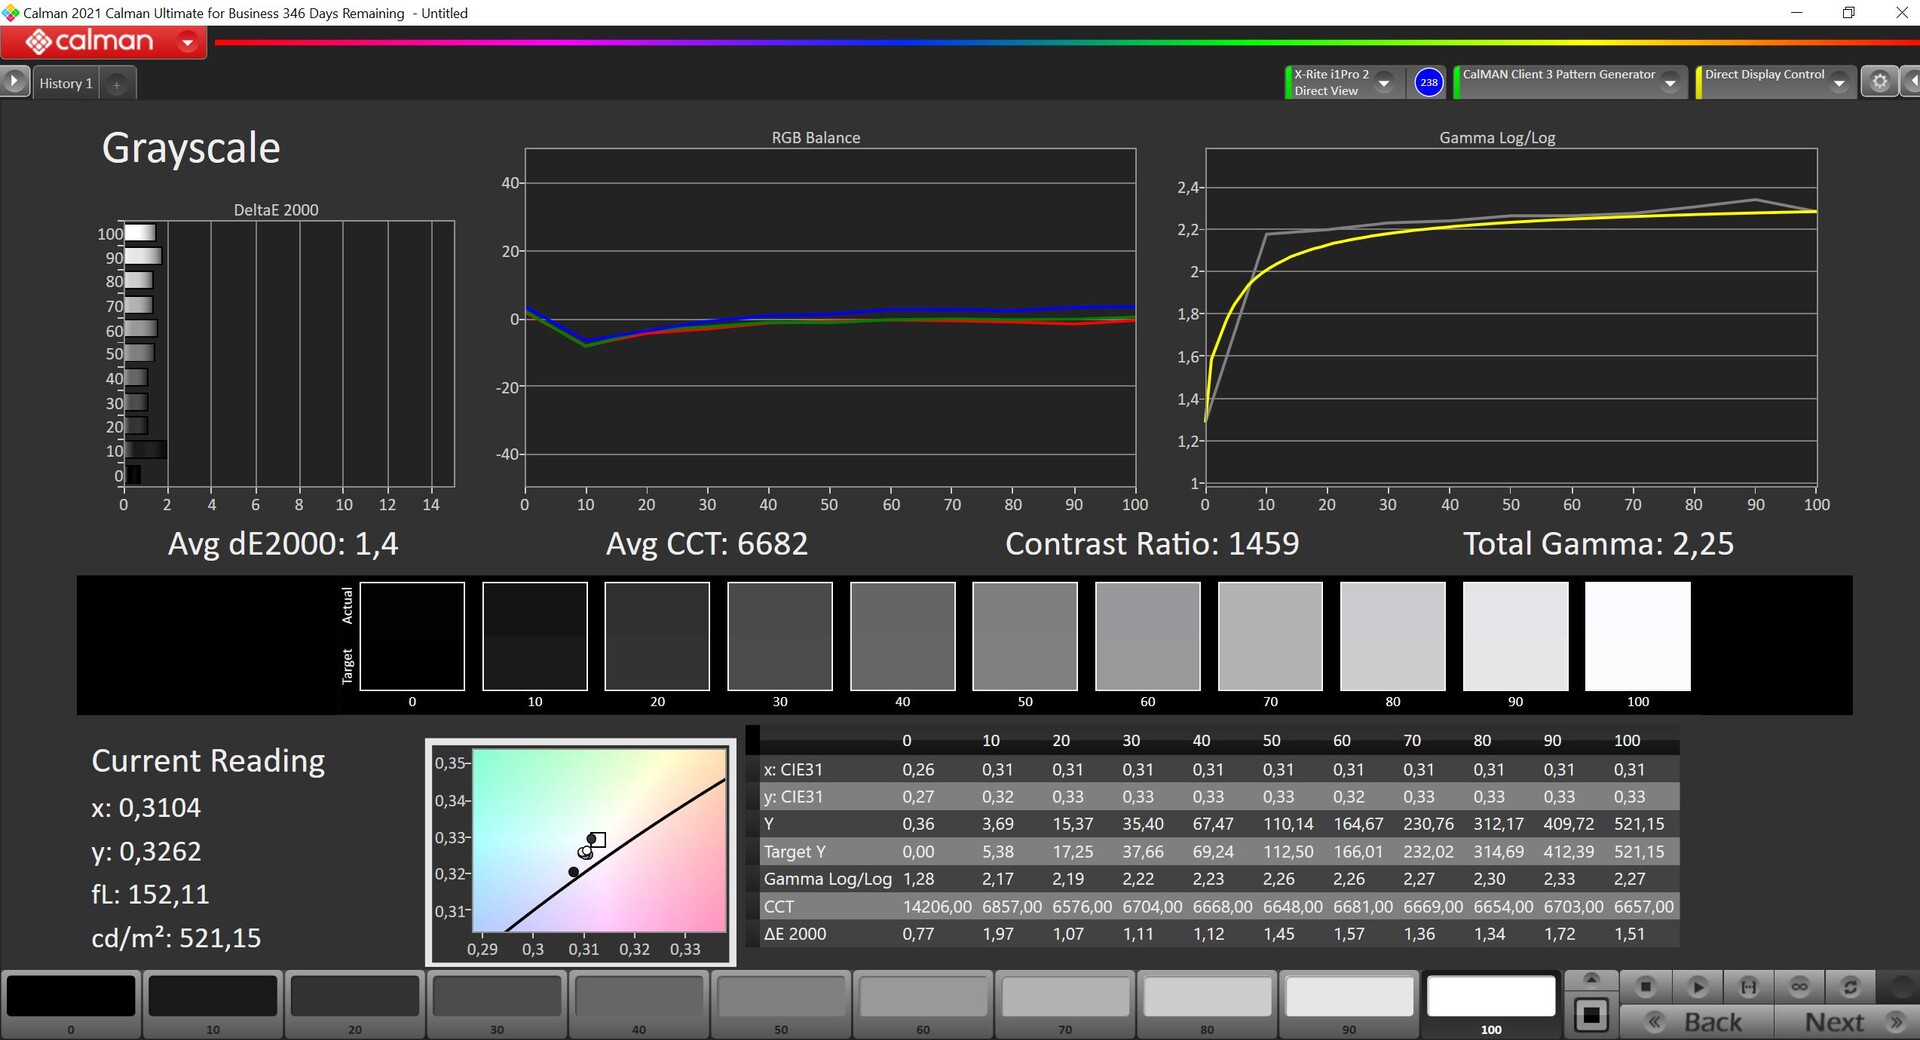
Lenovo claims a brightness of 500 cd/m², a figure we can confirm, at least in the center of the screen. The average brightness of our review sample measures just under 485 cd/m², representing a substantial improvement over the standard panel. The black value (0.36 cd/m²) is affected somewhat by the high brightness. Nonetheless, the maximum contrast ratio still exceeds 1400:1.
| |||||||||||||||||||||||||
Brightness Distribution: 89 %
Center on Battery: 520 cd/m²
Contrast: 1447:1 (Black: 0.36 cd/m²)
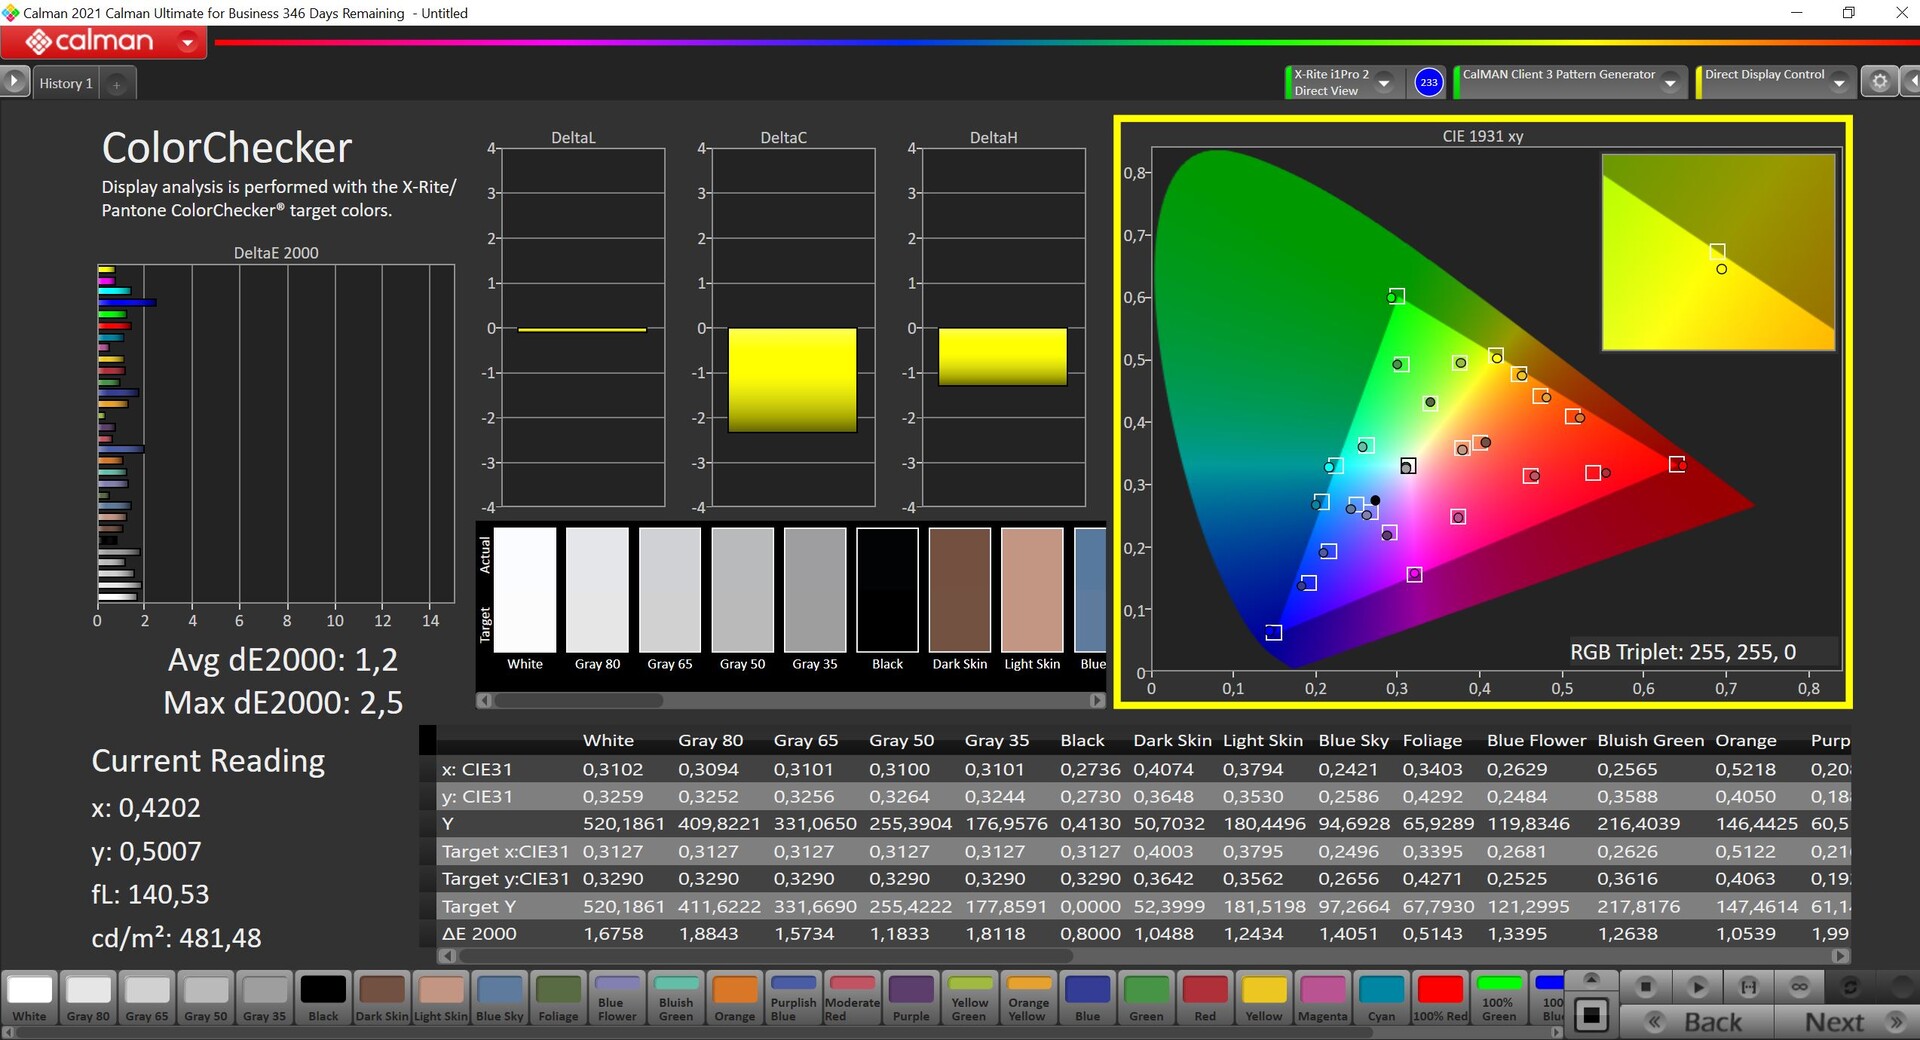
ΔE ColorChecker Calman: 1.2 | ∀{0.5-29.43 Ø4.72}
calibrated: 1
ΔE Greyscale Calman: 1.4 | ∀{0.09-98 Ø4.97}
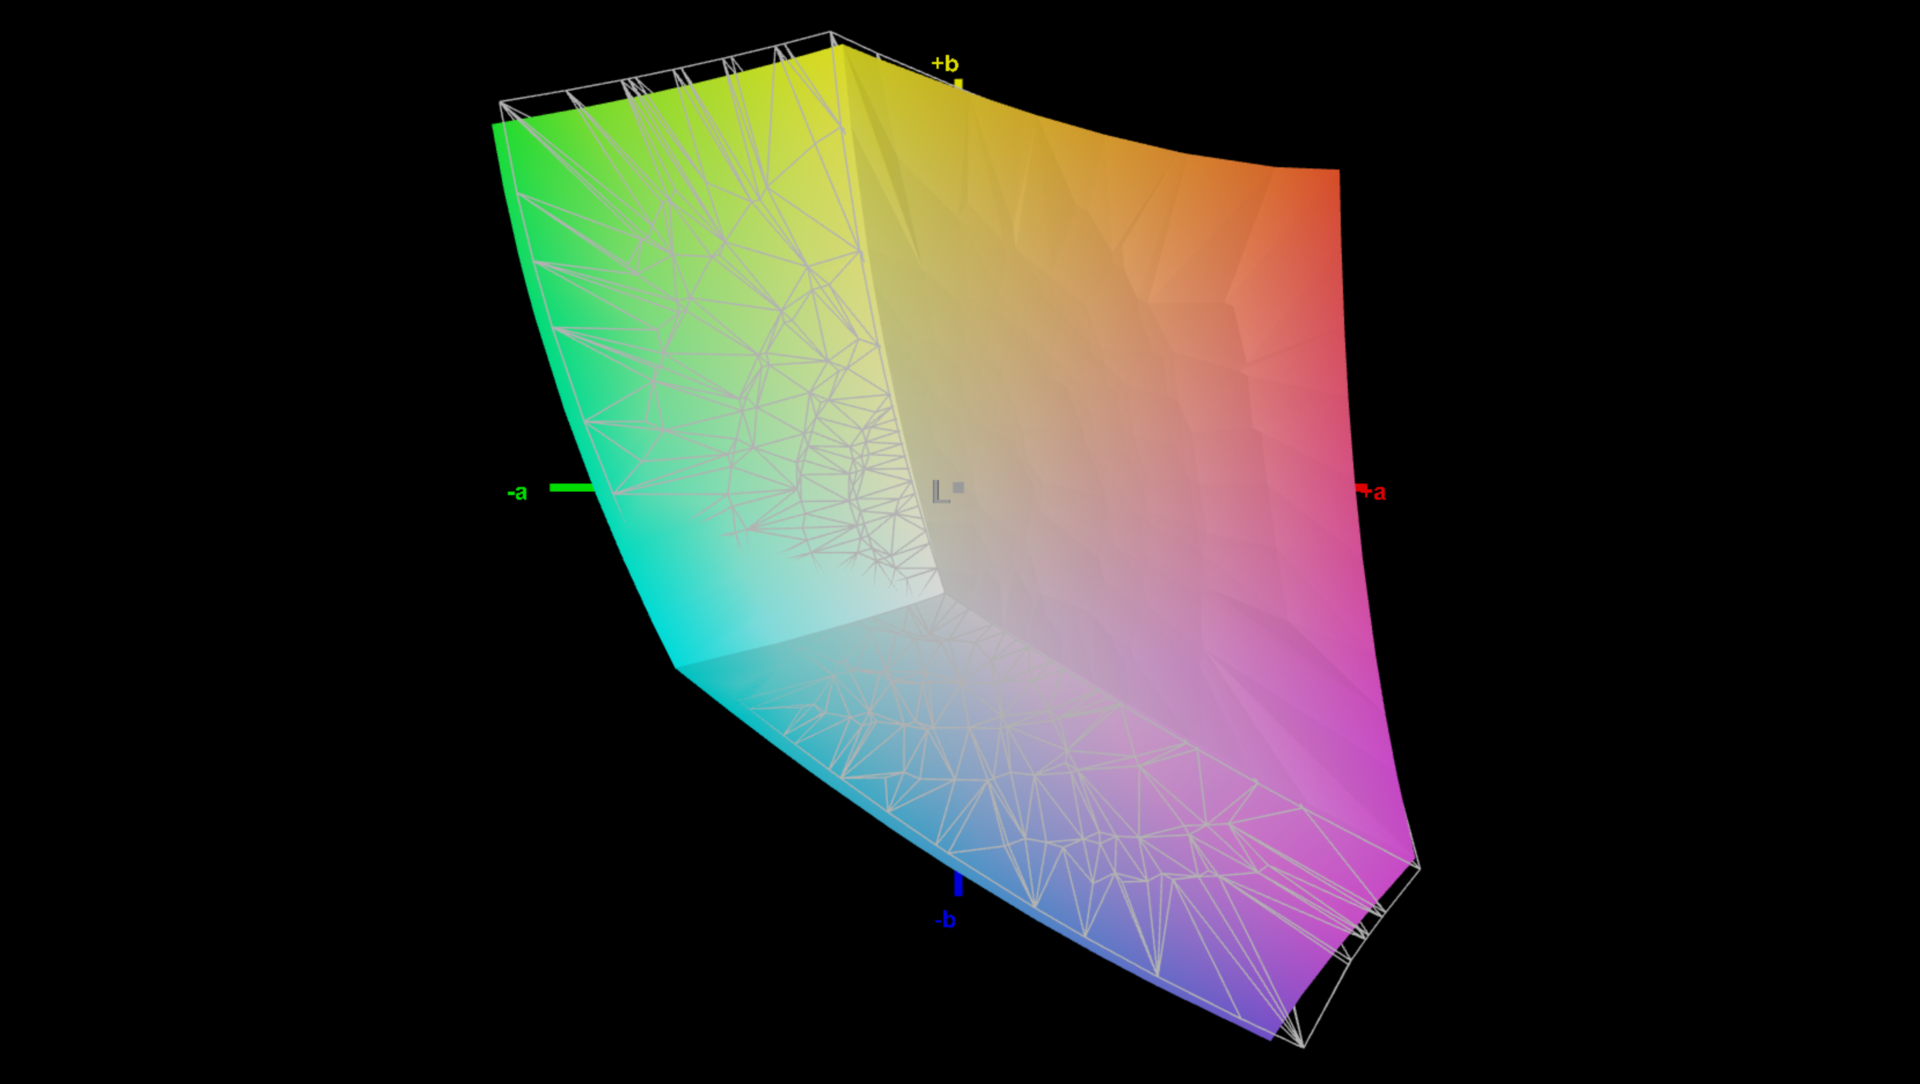
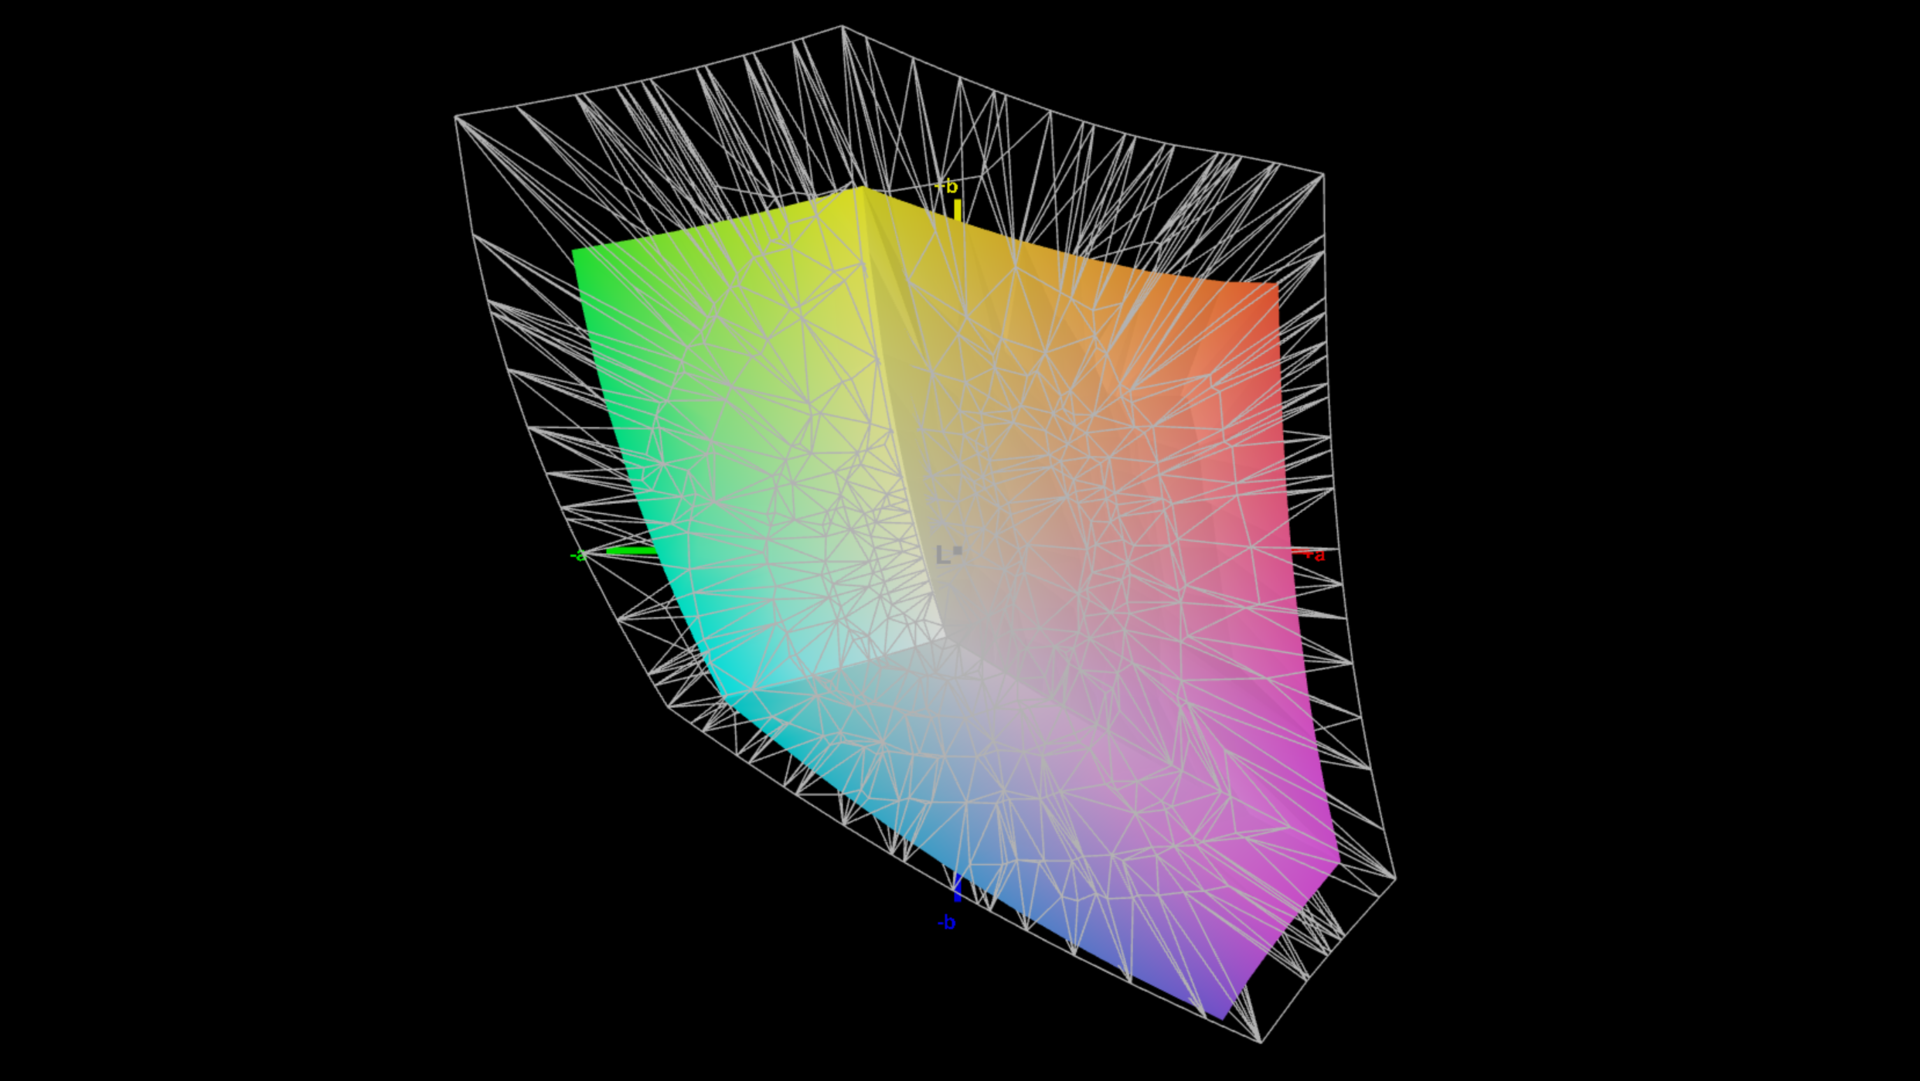
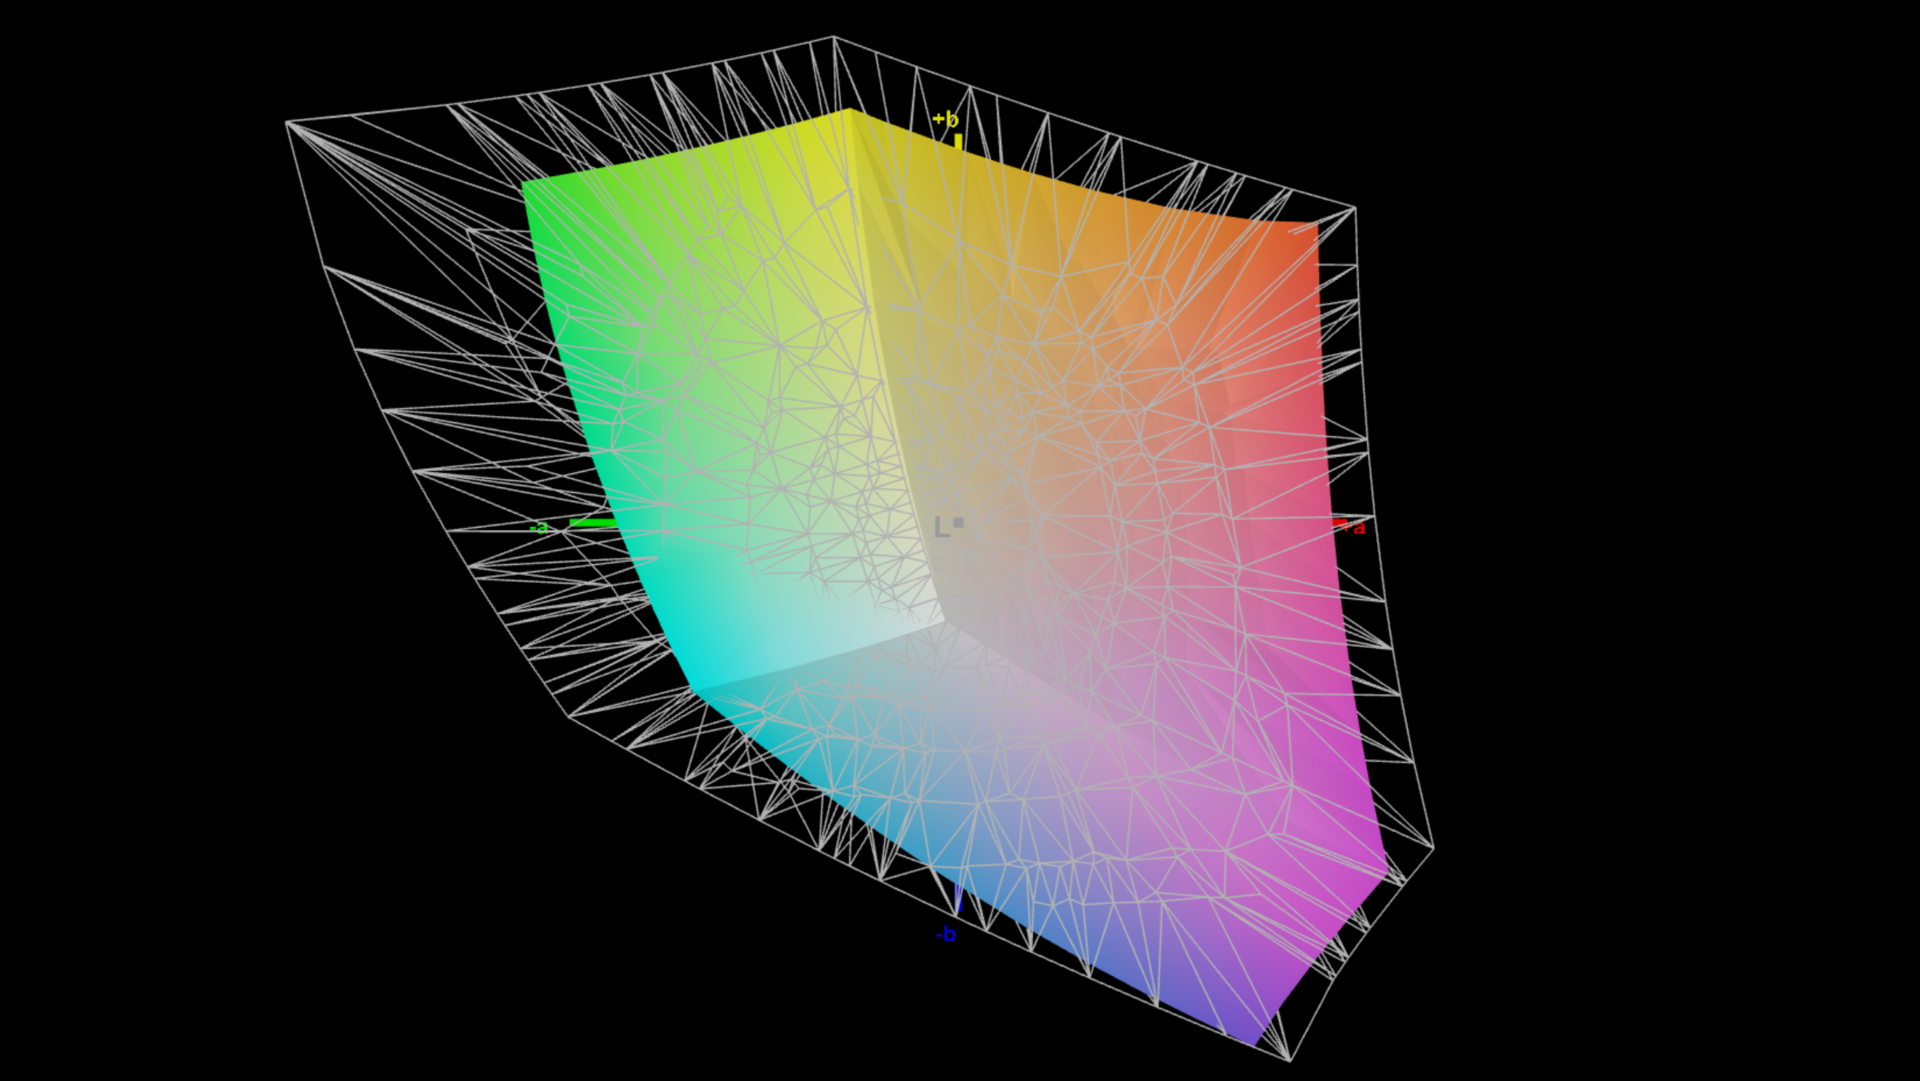
70.2% AdobeRGB 1998 (Argyll 3D)
97.5% sRGB (Argyll 3D)
68.1% Display P3 (Argyll 3D)
Gamma: 2.25
CCT: 6682 K
| Lenovo ThinkPad P1 G6-21FV000DGE NE160QDM-NY1, IPS, 2560x1600, 16" | Dell Precision 5000 5680 Samsung 160YV03, OLED, 3840x2400, 16" | Samsung Galaxy Book3 Ultra 16, i9-13900H RTX 4070 Samsung SDC4185 ATNA60CL03-0, OLED / AMOLED, 2880x1800, 16" | HP ZBook Studio 16 G9 62U04EA BOE0A52, IPS, 3840x2400, 16" | MSI CreatorPro Z16P B12UKST B160QAN02.N, IPS, 2560x1600, 16" | Schenker VISION 16 Pro (M23) NE160QDM-NZ1, IPS, 2560x1600, 16" | Lenovo ThinkPad X1 Extreme G5-21DE003RGE LP160UQ1-SPB1, IPS, 3840x2400, 16" | |
|---|---|---|---|---|---|---|---|
| Display | 30% | 27% | 23% | 23% | 1% | 22% | |
| Display P3 Coverage (%) | 68.1 | 99.9 47% | 95.3 40% | 97.5 43% | 97.6 43% | 68.8 1% | 84.6 24% |
| sRGB Coverage (%) | 97.5 | 100 3% | 99.1 2% | 99.9 2% | 99.9 2% | 98.8 1% | 99.2 2% |
| AdobeRGB 1998 Coverage (%) | 70.2 | 97.5 39% | 97.4 39% | 86.3 23% | 87.4 25% | 70 0% | 97.7 39% |
| Response Times | 85% | 82% | 12% | 15% | 8% | -168% | |
| Response Time Grey 50% / Grey 80% * (ms) | 13.7 ? | 1.68 ? 88% | 2 ? 85% | 15.3 ? -12% | 12.8 ? 7% | 13.7 ? -0% | 46 ? -236% |
| Response Time Black / White * (ms) | 9.6 ? | 1.77 ? 82% | 2 ? 79% | 6.1 ? 36% | 7.4 ? 23% | 8.1 ? 16% | 19.2 ? -100% |
| PWM Frequency (Hz) | 60 ? | 250 ? | |||||
| Screen | -79% | -51% | 0% | -10% | -74% | -29% | |
| Brightness middle (cd/m²) | 521 | 345.7 -34% | 403 -23% | 554 6% | 407 -22% | 384 -26% | 476 -9% |
| Brightness (cd/m²) | 484 | 349 -28% | 408 -16% | 516 7% | 388 -20% | 371 -23% | 470 -3% |
| Brightness Distribution (%) | 89 | 98 10% | 98 10% | 84 -6% | 88 -1% | 88 -1% | 90 1% |
| Black Level * (cd/m²) | 0.36 | 0.47 -31% | 0.36 -0% | 0.3 17% | 0.35 3% | ||
| Contrast (:1) | 1447 | 1179 -19% | 1131 -22% | 1280 -12% | 1360 -6% | ||
| Colorchecker dE 2000 * | 1.2 | 3.59 -199% | 2.63 -119% | 1 17% | 1.3 -8% | 3.4 -183% | 1.9 -58% |
| Colorchecker dE 2000 max. * | 2.5 | 7.02 -181% | 4.07 -63% | 2.4 4% | 2.5 -0% | 9.2 -268% | 4.7 -88% |
| Colorchecker dE 2000 calibrated * | 1 | 0.99 1% | 0.6 40% | 0.7 30% | 1.3 -30% | 1.3 -30% | |
| Greyscale dE 2000 * | 1.4 | 3.1 -121% | 2.69 -92% | 1.6 -14% | 2.1 -50% | 3.4 -143% | 2.4 -71% |
| Gamma | 2.25 98% | 2.13 103% | 2.48 89% | 2.29 96% | 2.26 97% | 2.16 102% | 2.24 98% |
| CCT | 6682 97% | 6448 101% | 6907 94% | 6458 101% | 6437 101% | 7462 87% | 6377 102% |
| Total Average (Program / Settings) | 12% /
-24% | 19% /
-5% | 12% /
7% | 9% /
1% | -22% /
-47% | -58% /
-38% |
* ... smaller is better
Every ThinkPad P1 Gen 6 screen is factory-calibrated, and customers can choose from a variety of color profiles. The default profile exhibits excellent values, as shown in our analysis using professional CalMAN software. These values are already very impressive, with no DeltaE-2000 deviations exceeding 3 in either the grayscale or the colors. The only minor drawback is the color temperature in the grayscale, which could be a bit warmer. This is an insignificant issue, and users are not required to undertake any further calibration. We were able to minimize the color discrepancies slightly and get the color temperature closer to the optimal value using our own calibration (the relevant profile is available for free download above).
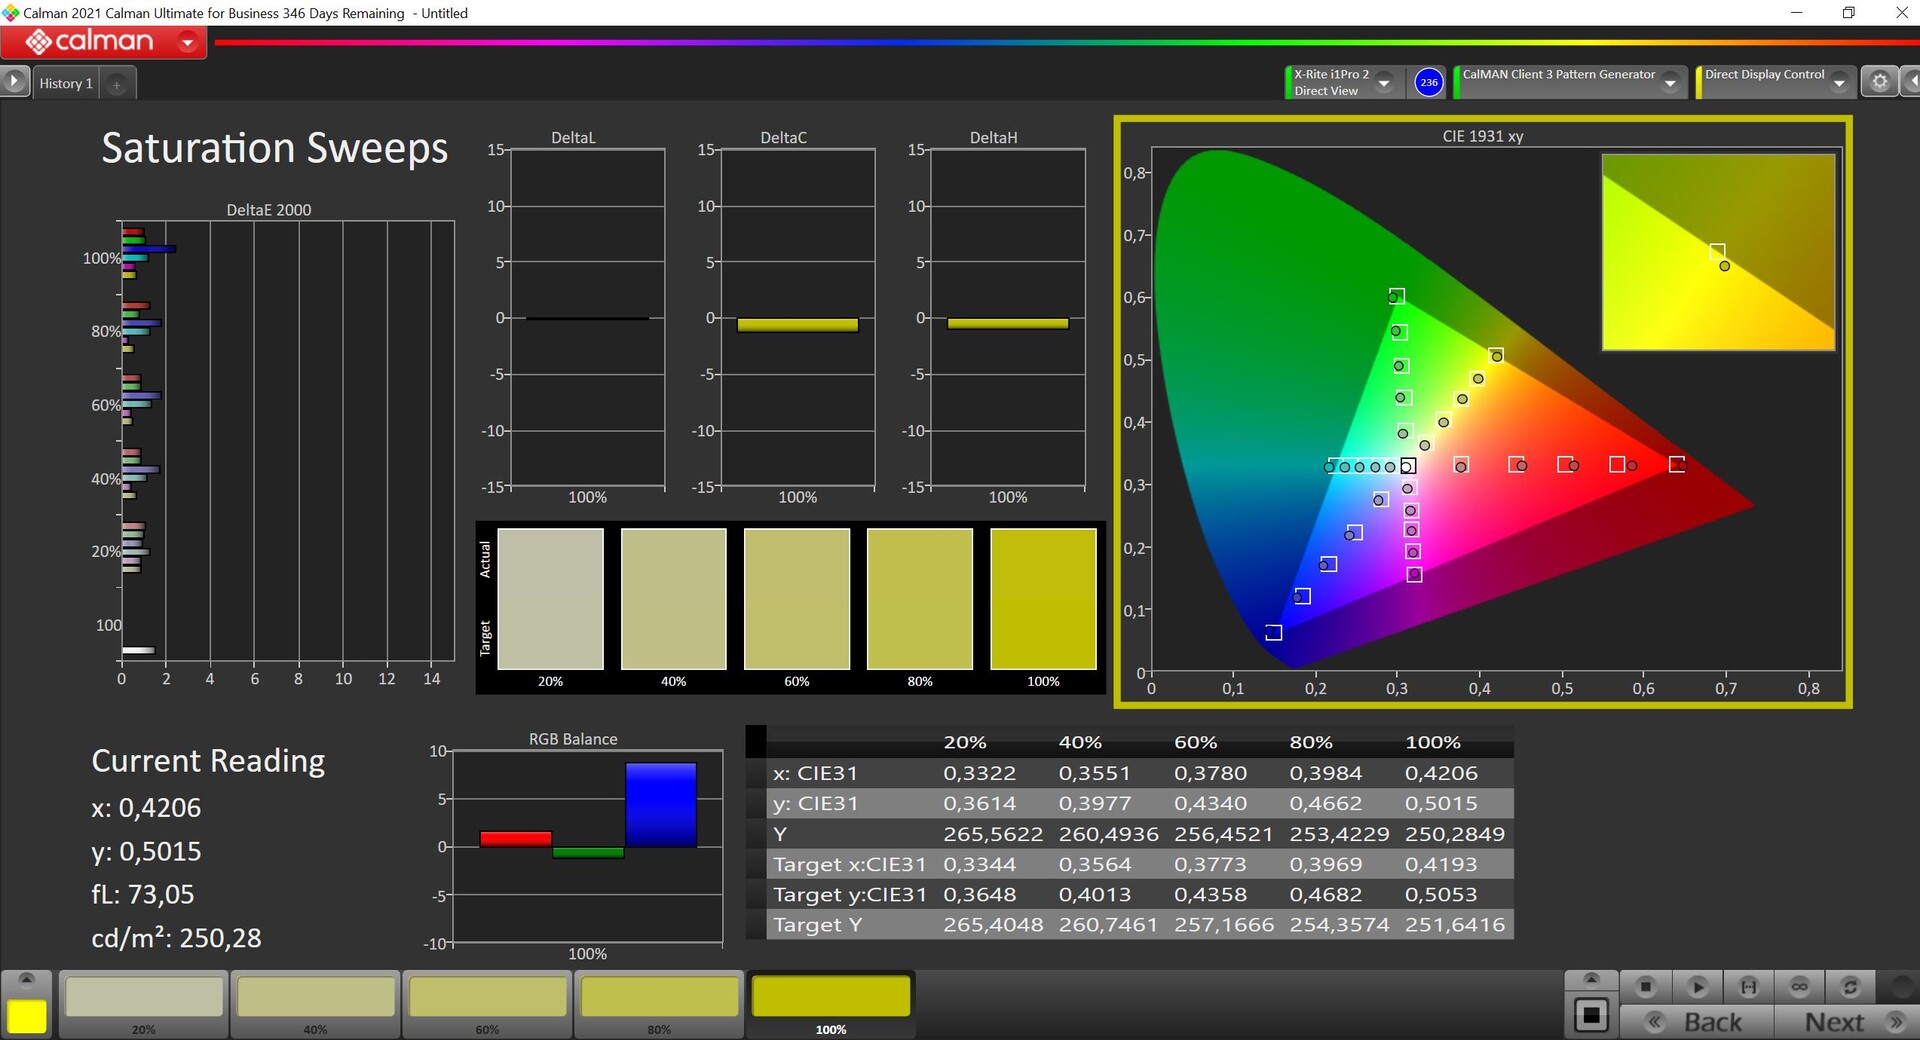

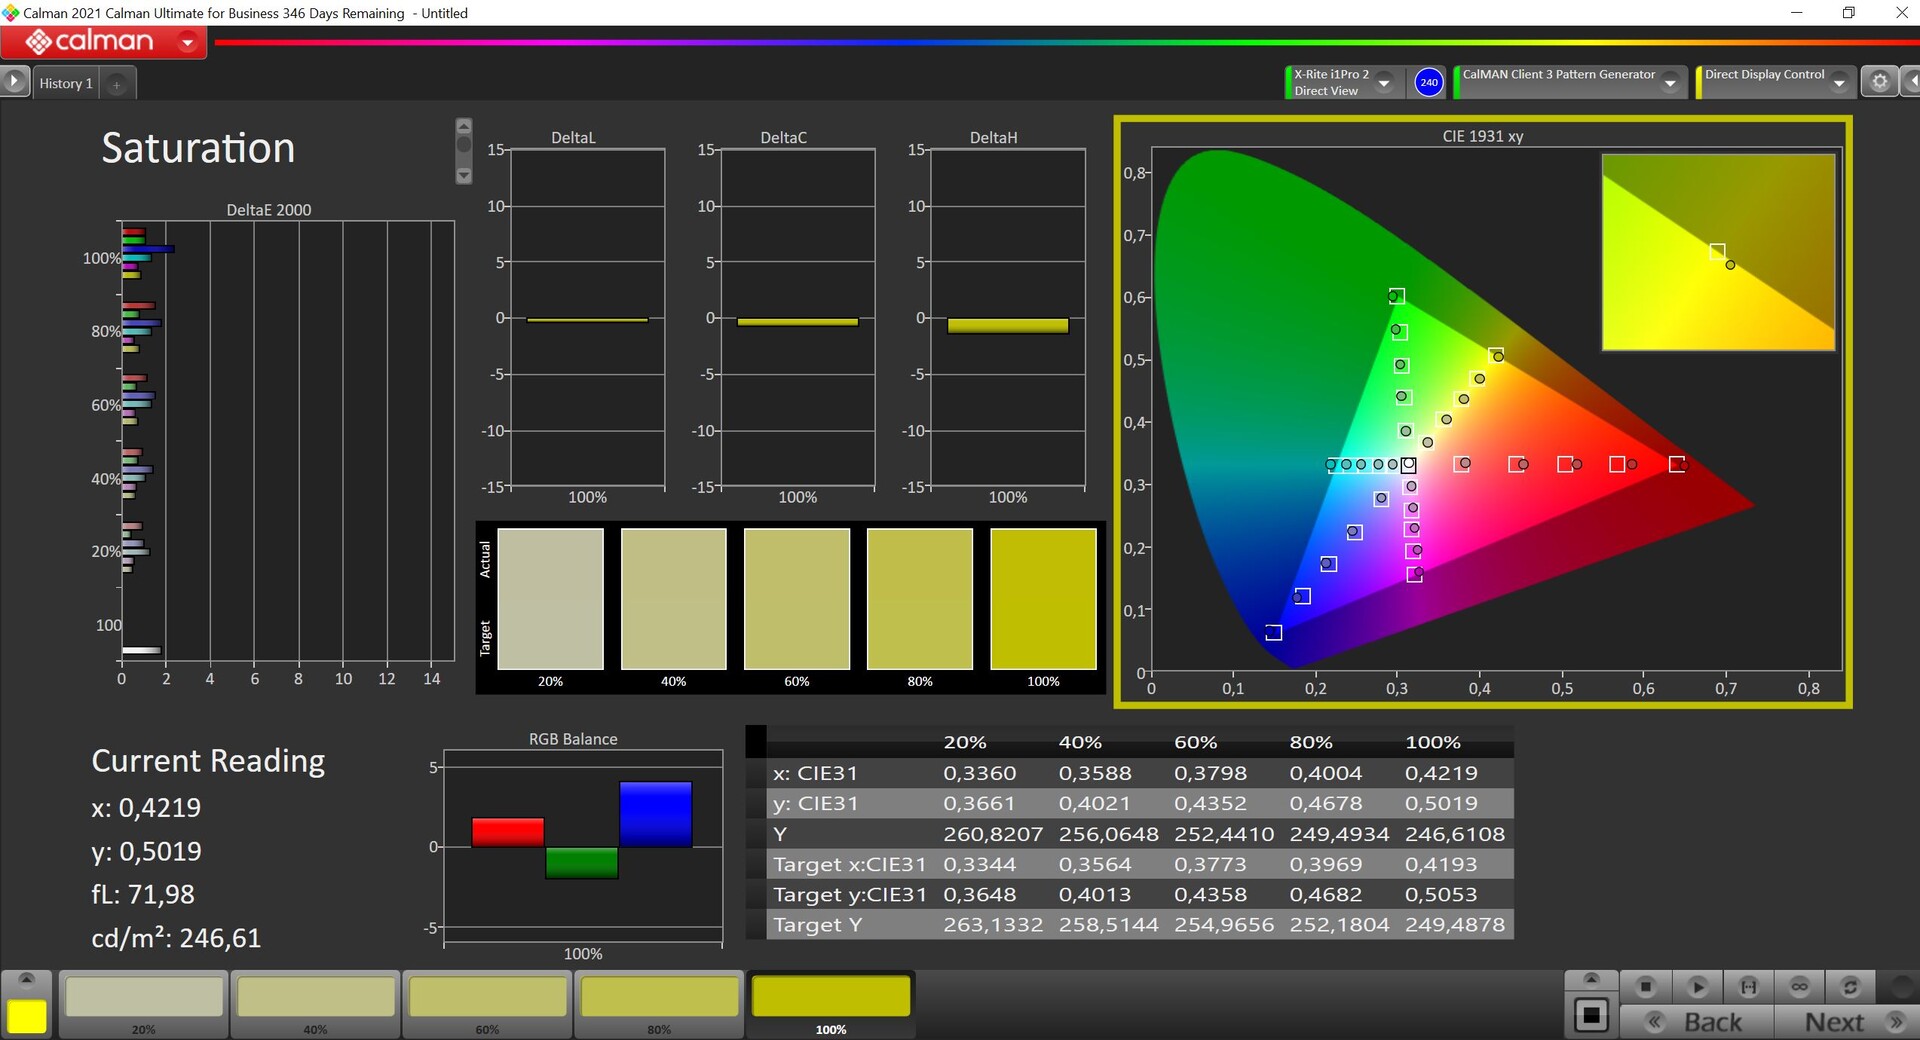

The display fully covers the smaller sRGB color space, which is adequate for many applications. If you require the larger P3 color space, you will need to use the OLED panel, but we typically recommend the 165 Hz panel due to OLED's disadvantages such as PWM and higher power consumption.
Display Response Times
| ↔ Response Time Black to White | ||
|---|---|---|
| 9.6 ms ... rise ↗ and fall ↘ combined | ↗ 4.8 ms rise | 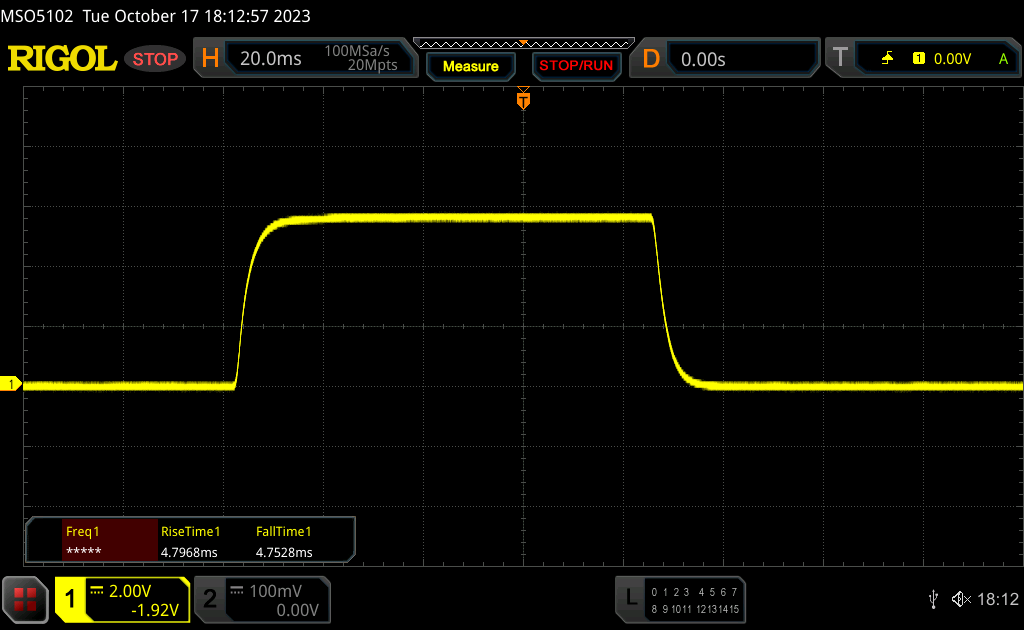 |
| ↘ 4.8 ms fall | ||
| The screen shows fast response rates in our tests and should be suited for gaming. In comparison, all tested devices range from 0.1 (minimum) to 240 (maximum) ms. » 26 % of all devices are better. This means that the measured response time is better than the average of all tested devices (19.8 ms). | ||
| ↔ Response Time 50% Grey to 80% Grey | ||
| 13.7 ms ... rise ↗ and fall ↘ combined | ↗ 6.7 ms rise | 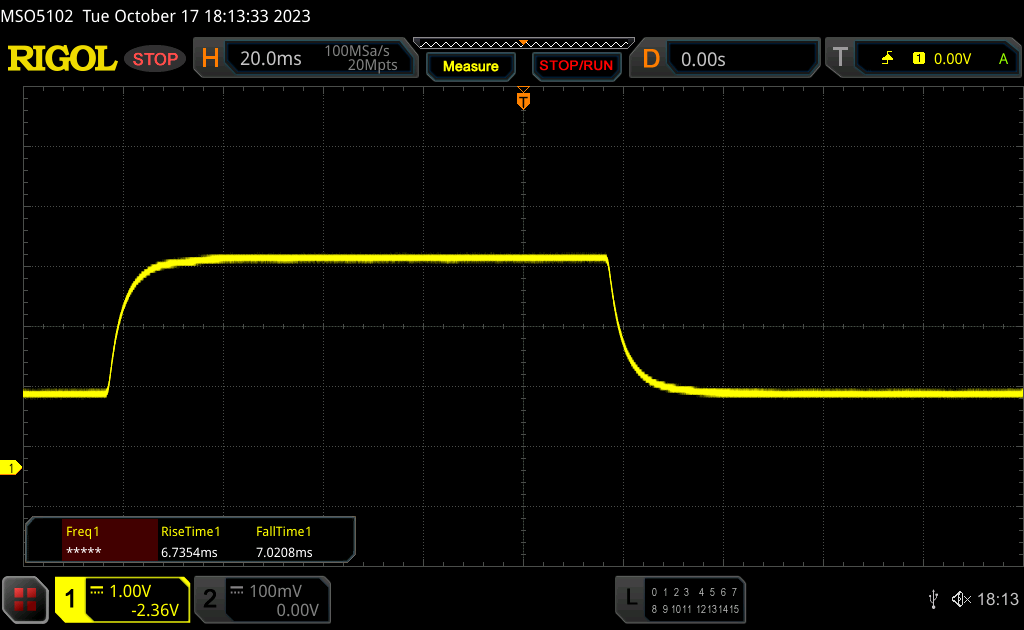 |
| ↘ 7 ms fall | ||
| The screen shows good response rates in our tests, but may be too slow for competitive gamers. In comparison, all tested devices range from 0.165 (minimum) to 636 (maximum) ms. » 27 % of all devices are better. This means that the measured response time is better than the average of all tested devices (31 ms). | ||
Screen Flickering / PWM (Pulse-Width Modulation)
| Screen flickering / PWM not detected | 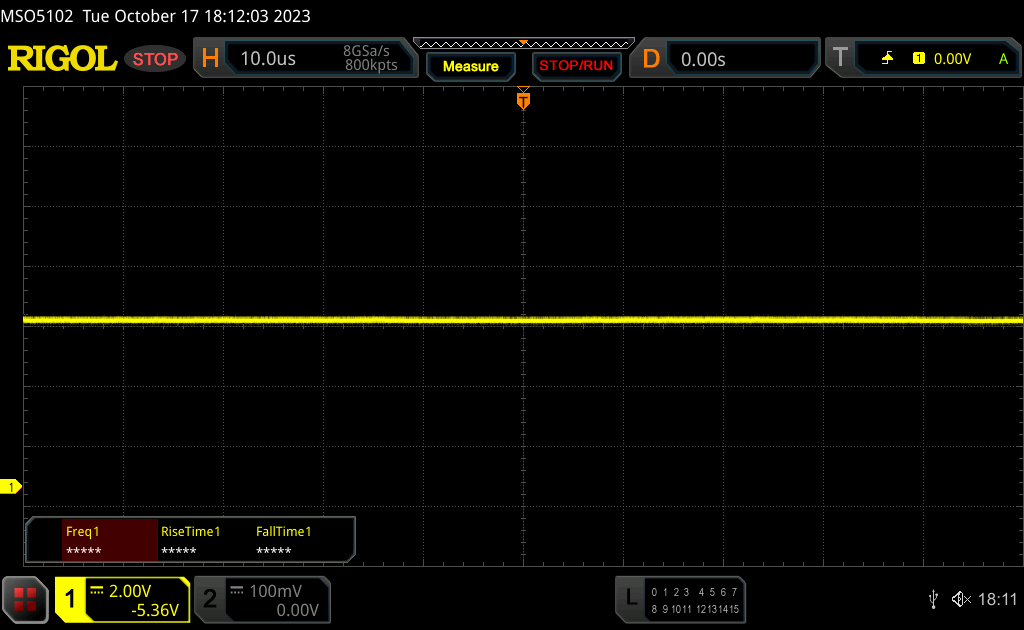 | ||
In comparison: 52 % of all tested devices do not use PWM to dim the display. If PWM was detected, an average of 7763 (minimum: 5 - maximum: 343500) Hz was measured. | |||
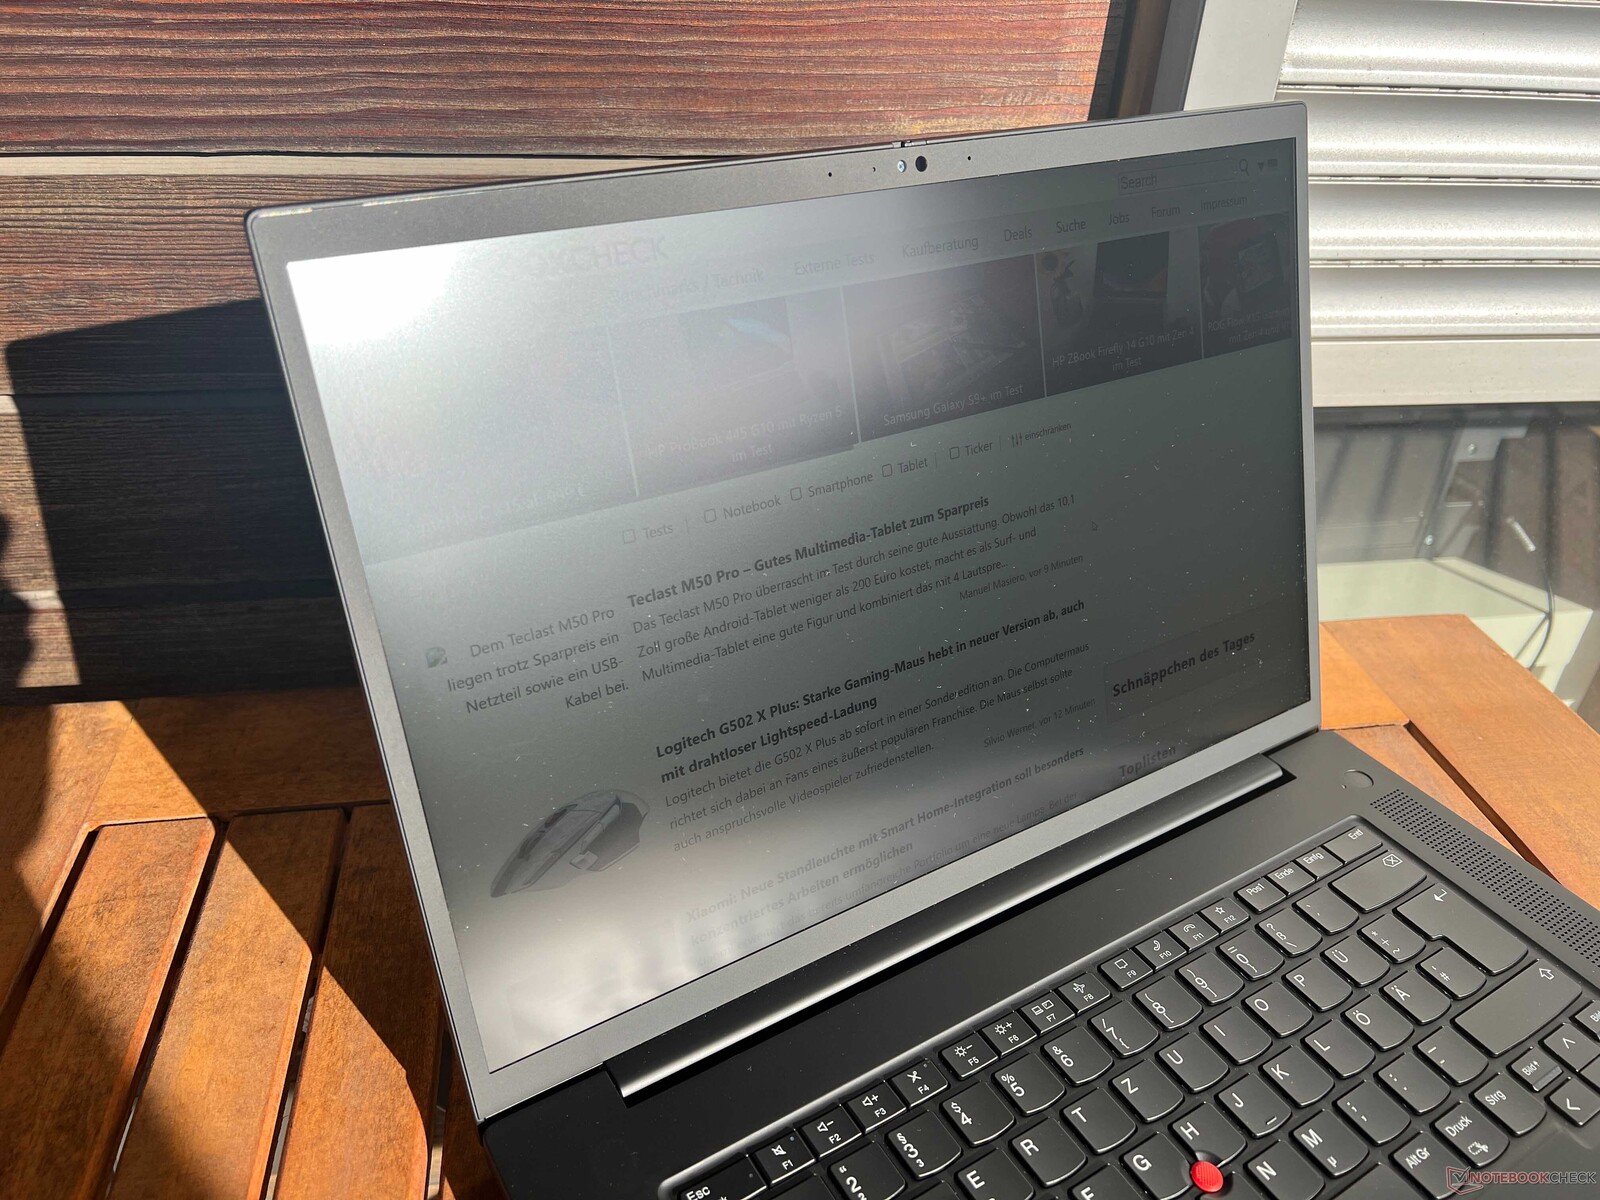
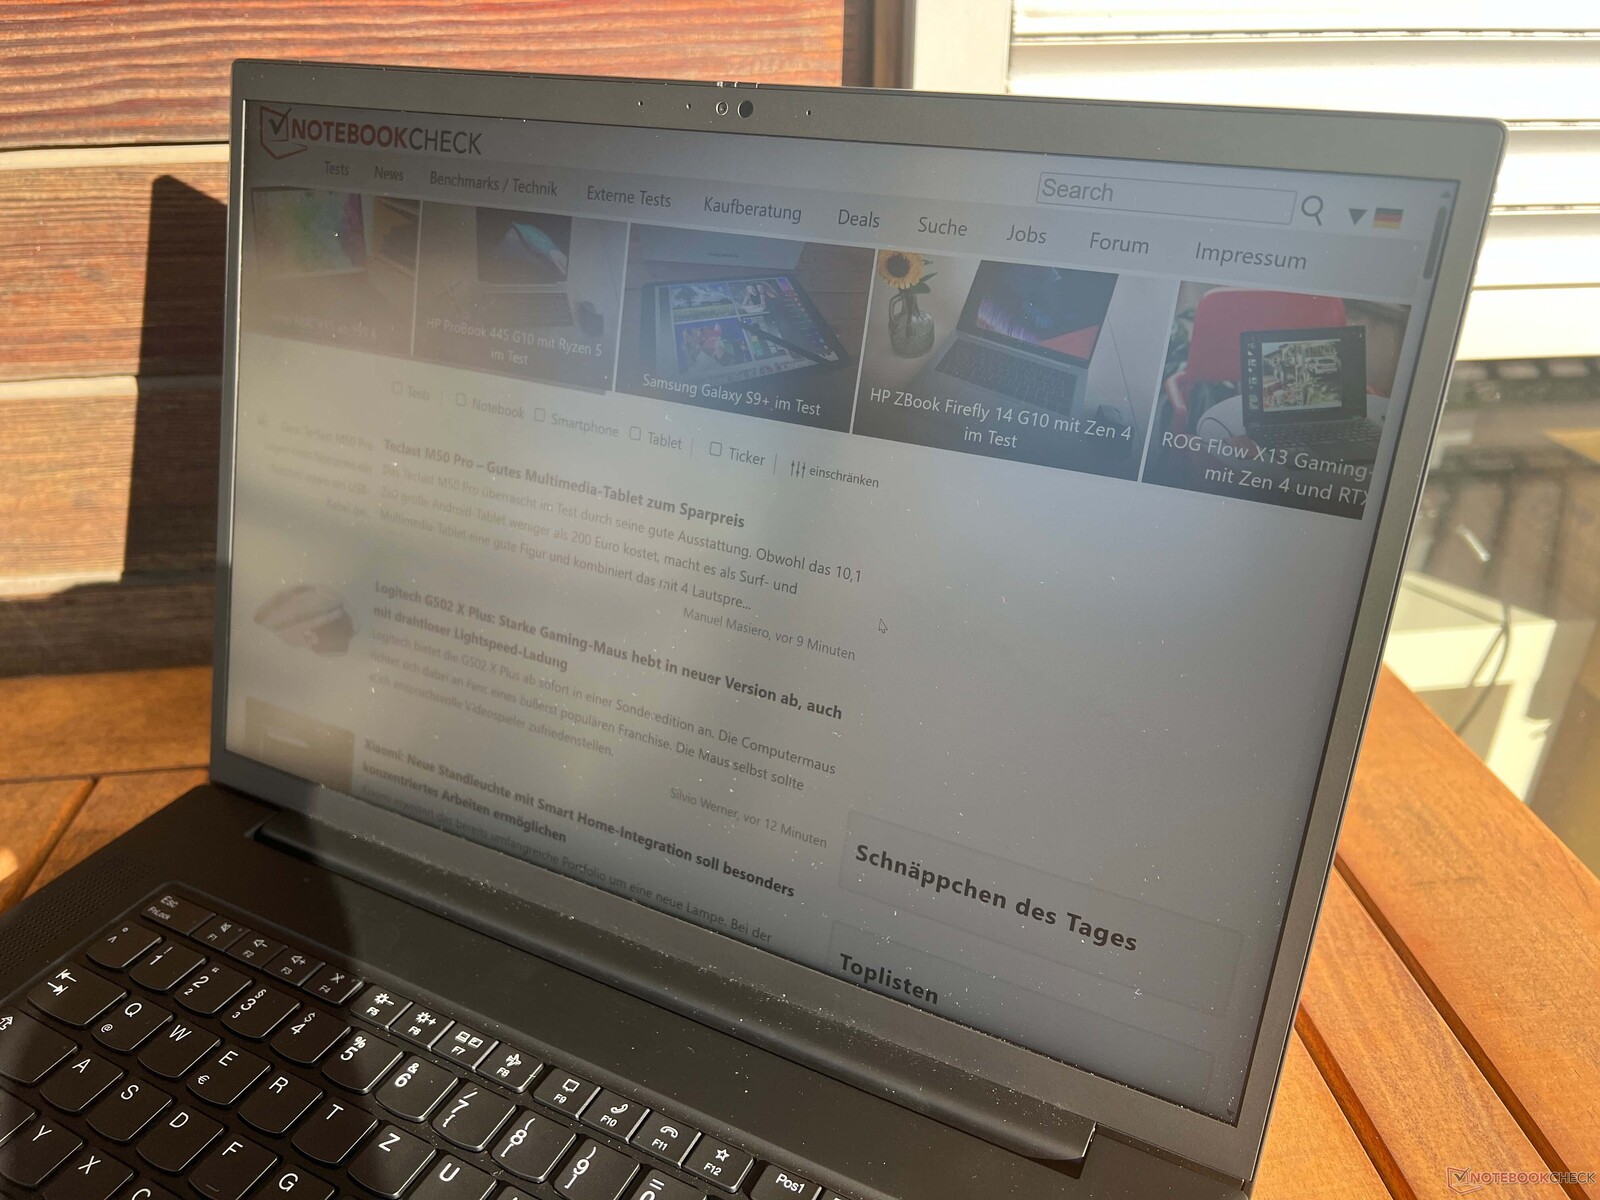
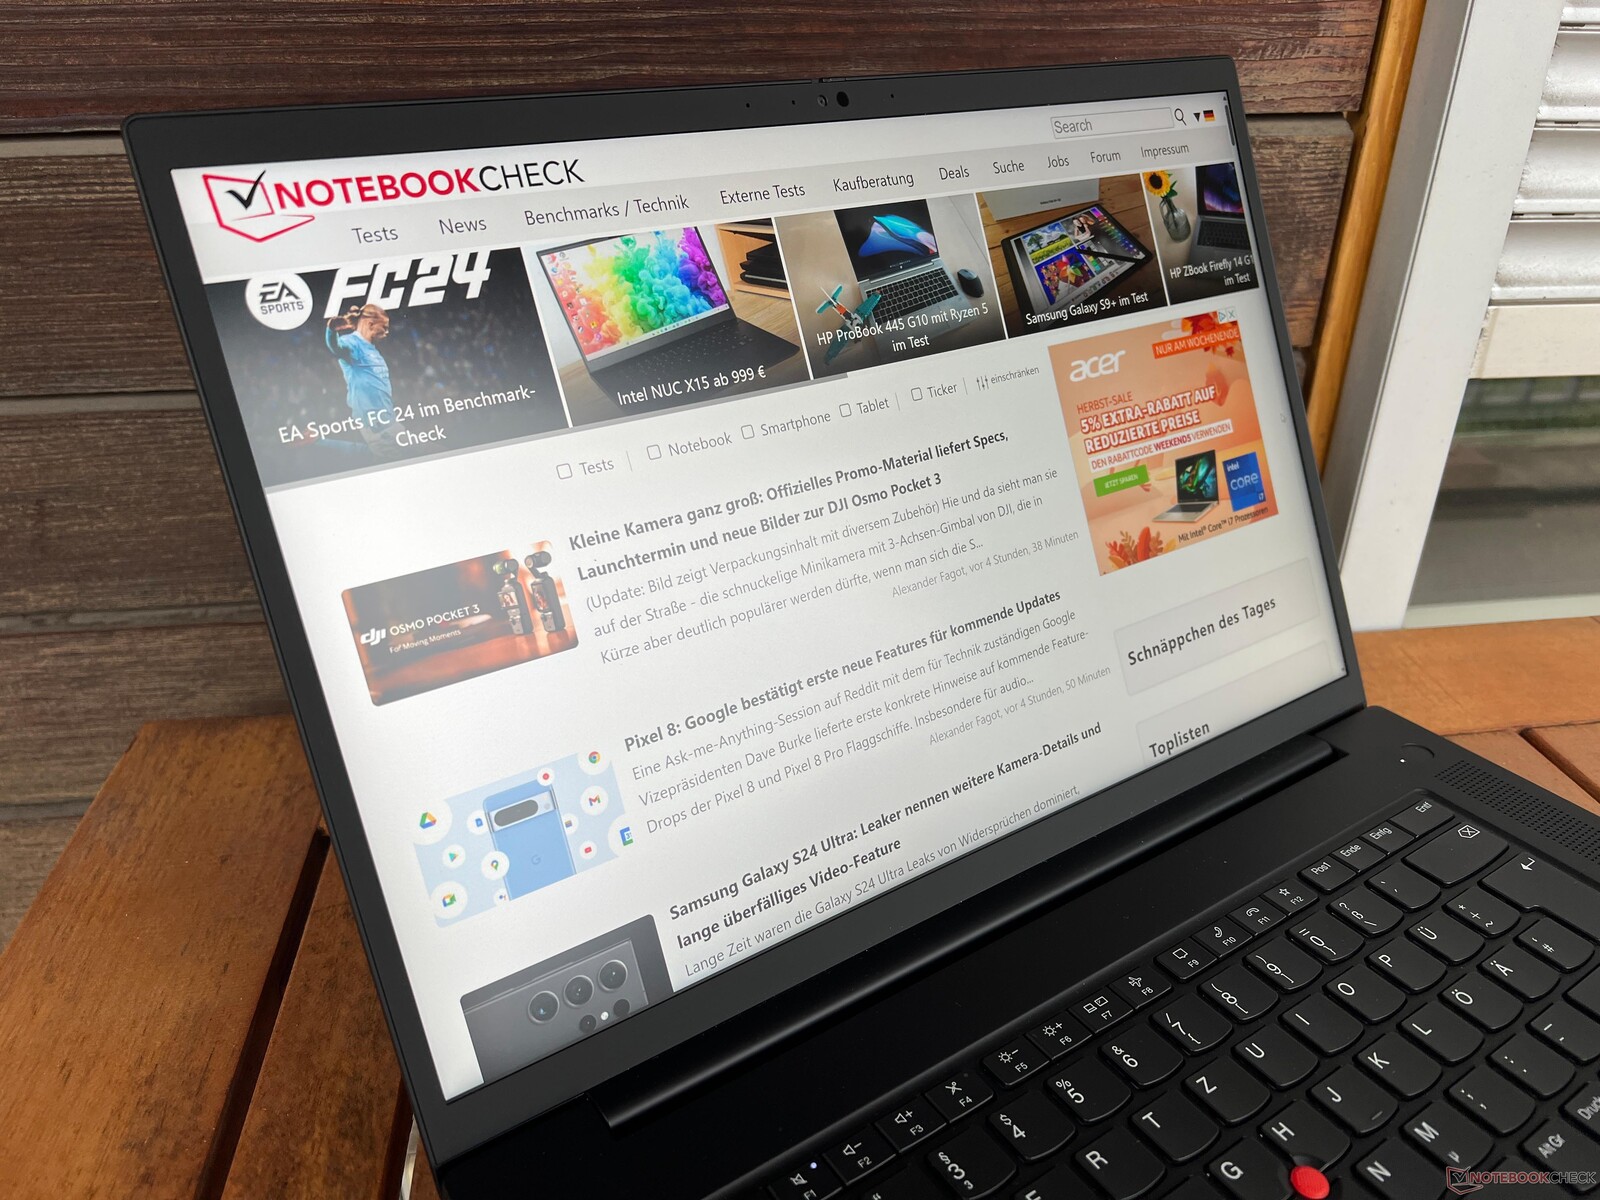
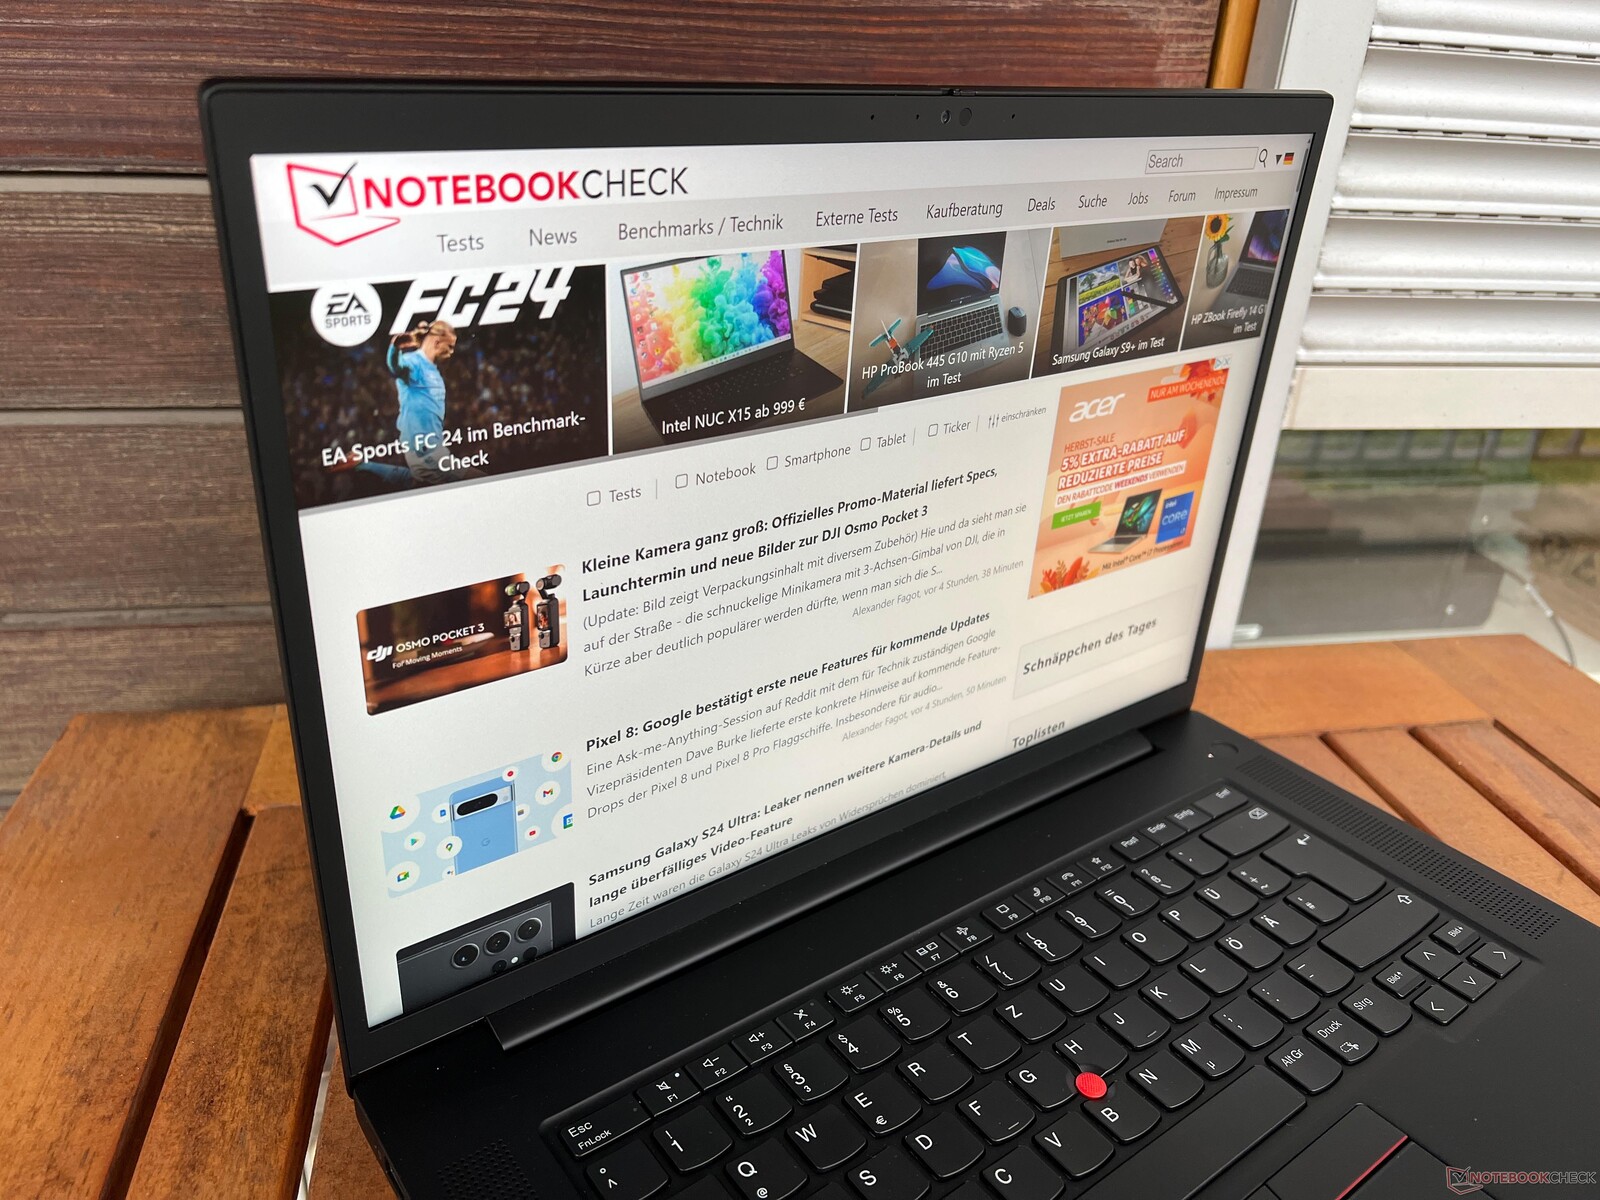

The matte display is usable outdoors, although it becomes challenging under direct sunlight. The IPS panel offers excellent viewing angle stability.

Performance - Raptor Lake and Ada Lovelace
Testing Conditions
Lenovo has not used separate power profiles on the ThinkPad models for quite some time. The Smart Cooling settings are directly linked to the standard Windows power profiles. For the following benchmarks and measurements, we used the Best Performance profile as the default setting.
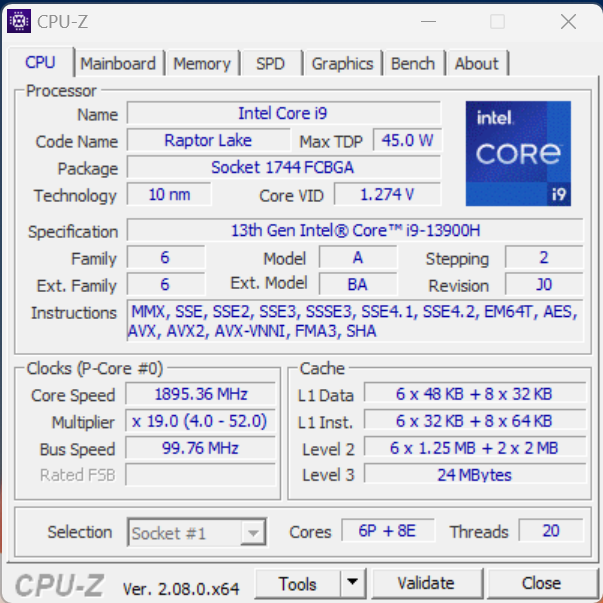
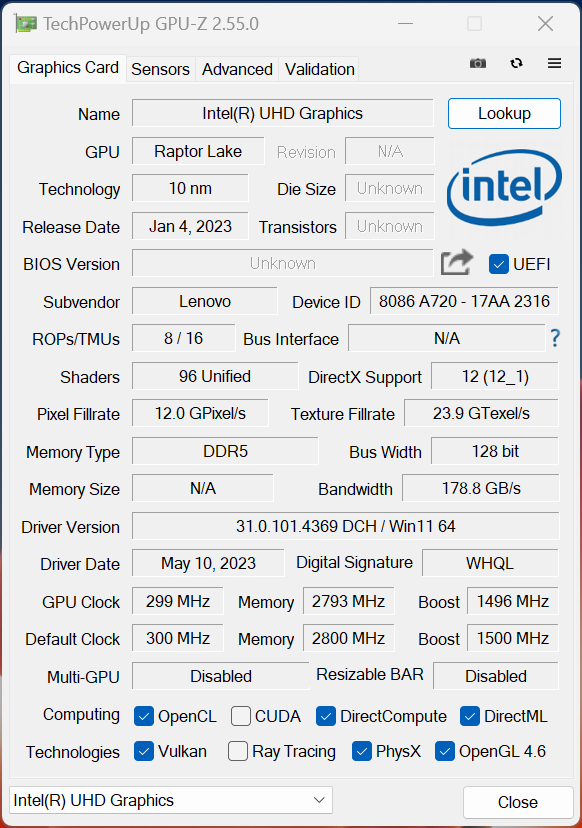
Processor - Core i7-13900H
The Intel Core i9-13900H from the Raptor-Lake generation has 6 high-performance and 8-efficiency cores and can handle up to 20 threads. It has significantly higher maximum clock speeds than the Core i7-13700H and supports vPro capabilities. Although there were minor changes in our Cinebench loop test, the CPU in our ThinkPad P1 Gen 6 may consume up to 96 watts temporarily and roughly 84 watts continually. Overall, the single-core scores are good, but multi-core performance has more potential. It's conceivable that CPUs with the vapor chamber provide better performance. When running on batteries, the CPU is limited to 57 watts of maximum power usage, resulting in about 25% poorer multi-core performance. More CPU benchmarks are listed in our technical section.
Cinebench R15 Multi Loop
Cinebench R23: Multi Core | Single Core
Cinebench R20: CPU (Multi Core) | CPU (Single Core)
Cinebench R15: CPU Multi 64Bit | CPU Single 64Bit
Blender: v2.79 BMW27 CPU
7-Zip 18.03: 7z b 4 | 7z b 4 -mmt1
Geekbench 5.5: Multi-Core | Single-Core
HWBOT x265 Benchmark v2.2: 4k Preset
LibreOffice : 20 Documents To PDF
R Benchmark 2.5: Overall mean
| CPU Performance rating | |
| Average of class Workstation | |
| Dell Precision 5000 5680 | |
| Lenovo ThinkPad P1 G6-21FV000DGE | |
| HP ZBook Studio 16 G9 62U04EA | |
| Lenovo ThinkPad X1 Extreme G5-21DE003RGE | |
| Average Intel Core i9-13900H | |
| MSI CreatorPro Z16P B12UKST | |
| Schenker VISION 16 Pro (M23) | |
| Samsung Galaxy Book3 Ultra 16, i9-13900H RTX 4070 | |
| Cinebench R23 / Multi Core | |
| Average of class Workstation (14621 - 38520, n=24, last 2 years) | |
| Dell Precision 5000 5680 | |
| Lenovo ThinkPad P1 G6-21FV000DGE | |
| Lenovo ThinkPad X1 Extreme G5-21DE003RGE | |
| MSI CreatorPro Z16P B12UKST | |
| Average Intel Core i9-13900H (11997 - 20385, n=28) | |
| HP ZBook Studio 16 G9 62U04EA | |
| Schenker VISION 16 Pro (M23) | |
| Samsung Galaxy Book3 Ultra 16, i9-13900H RTX 4070 | |
| Cinebench R23 / Single Core | |
| Lenovo ThinkPad P1 G6-21FV000DGE | |
| Dell Precision 5000 5680 | |
| Average of class Workstation (1712 - 2228, n=24, last 2 years) | |
| Average Intel Core i9-13900H (1297 - 2054, n=26) | |
| Schenker VISION 16 Pro (M23) | |
| HP ZBook Studio 16 G9 62U04EA | |
| Lenovo ThinkPad X1 Extreme G5-21DE003RGE | |
| MSI CreatorPro Z16P B12UKST | |
| Samsung Galaxy Book3 Ultra 16, i9-13900H RTX 4070 | |
| Cinebench R20 / CPU (Multi Core) | |
| Average of class Workstation (5760 - 15043, n=24, last 2 years) | |
| Dell Precision 5000 5680 | |
| Lenovo ThinkPad P1 G6-21FV000DGE | |
| Lenovo ThinkPad X1 Extreme G5-21DE003RGE | |
| MSI CreatorPro Z16P B12UKST | |
| Average Intel Core i9-13900H (4935 - 7716, n=25) | |
| HP ZBook Studio 16 G9 62U04EA | |
| Schenker VISION 16 Pro (M23) | |
| Samsung Galaxy Book3 Ultra 16, i9-13900H RTX 4070 | |
| Cinebench R20 / CPU (Single Core) | |
| Lenovo ThinkPad P1 G6-21FV000DGE | |
| Dell Precision 5000 5680 | |
| Average of class Workstation (671 - 857, n=24, last 2 years) | |
| Schenker VISION 16 Pro (M23) | |
| Average Intel Core i9-13900H (428 - 792, n=25) | |
| HP ZBook Studio 16 G9 62U04EA | |
| Lenovo ThinkPad X1 Extreme G5-21DE003RGE | |
| MSI CreatorPro Z16P B12UKST | |
| Samsung Galaxy Book3 Ultra 16, i9-13900H RTX 4070 | |
| Cinebench R15 / CPU Multi 64Bit | |
| Average of class Workstation (2489 - 5810, n=24, last 2 years) | |
| Lenovo ThinkPad X1 Extreme G5-21DE003RGE | |
| Average Intel Core i9-13900H (2061 - 3100, n=26) | |
| Lenovo ThinkPad P1 G6-21FV000DGE | |
| HP ZBook Studio 16 G9 62U04EA | |
| Dell Precision 5000 5680 | |
| Schenker VISION 16 Pro (M23) | |
| MSI CreatorPro Z16P B12UKST | |
| Samsung Galaxy Book3 Ultra 16, i9-13900H RTX 4070 | |
| Cinebench R15 / CPU Single 64Bit | |
| Average of class Workstation (191.4 - 328, n=24, last 2 years) | |
| Dell Precision 5000 5680 | |
| Lenovo ThinkPad P1 G6-21FV000DGE | |
| Schenker VISION 16 Pro (M23) | |
| HP ZBook Studio 16 G9 62U04EA | |
| Average Intel Core i9-13900H (211 - 297, n=26) | |
| Lenovo ThinkPad X1 Extreme G5-21DE003RGE | |
| MSI CreatorPro Z16P B12UKST | |
| Samsung Galaxy Book3 Ultra 16, i9-13900H RTX 4070 | |
| Blender / v2.79 BMW27 CPU | |
| Samsung Galaxy Book3 Ultra 16, i9-13900H RTX 4070 | |
| Schenker VISION 16 Pro (M23) | |
| Average Intel Core i9-13900H (166 - 268, n=24) | |
| MSI CreatorPro Z16P B12UKST | |
| Dell Precision 5000 5680 | |
| Lenovo ThinkPad P1 G6-21FV000DGE | |
| HP ZBook Studio 16 G9 62U04EA | |
| Lenovo ThinkPad X1 Extreme G5-21DE003RGE | |
| Average of class Workstation (91 - 222, n=24, last 2 years) | |
| 7-Zip 18.03 / 7z b 4 | |
| Average of class Workstation (60489 - 116969, n=24, last 2 years) | |
| Lenovo ThinkPad P1 G6-21FV000DGE | |
| Dell Precision 5000 5680 | |
| HP ZBook Studio 16 G9 62U04EA | |
| MSI CreatorPro Z16P B12UKST | |
| Average Intel Core i9-13900H (45045 - 79032, n=25) | |
| Lenovo ThinkPad X1 Extreme G5-21DE003RGE | |
| Schenker VISION 16 Pro (M23) | |
| Samsung Galaxy Book3 Ultra 16, i9-13900H RTX 4070 | |
| 7-Zip 18.03 / 7z b 4 -mmt1 | |
| Lenovo ThinkPad P1 G6-21FV000DGE | |
| Schenker VISION 16 Pro (M23) | |
| Average of class Workstation (5126 - 6960, n=24, last 2 years) | |
| Dell Precision 5000 5680 | |
| Average Intel Core i9-13900H (3665 - 6600, n=25) | |
| HP ZBook Studio 16 G9 62U04EA | |
| Lenovo ThinkPad X1 Extreme G5-21DE003RGE | |
| MSI CreatorPro Z16P B12UKST | |
| Samsung Galaxy Book3 Ultra 16, i9-13900H RTX 4070 | |
| Geekbench 5.5 / Multi-Core | |
| Average of class Workstation (11542 - 25554, n=24, last 2 years) | |
| Dell Precision 5000 5680 | |
| HP ZBook Studio 16 G9 62U04EA | |
| Average Intel Core i9-13900H (9094 - 15410, n=26) | |
| MSI CreatorPro Z16P B12UKST | |
| Schenker VISION 16 Pro (M23) | |
| Lenovo ThinkPad X1 Extreme G5-21DE003RGE | |
| Lenovo ThinkPad P1 G6-21FV000DGE | |
| Samsung Galaxy Book3 Ultra 16, i9-13900H RTX 4070 | |
| Geekbench 5.5 / Single-Core | |
| Dell Precision 5000 5680 | |
| Average of class Workstation (1783 - 2183, n=24, last 2 years) | |
| Lenovo ThinkPad P1 G6-21FV000DGE | |
| Average Intel Core i9-13900H (1140 - 2043, n=26) | |
| Schenker VISION 16 Pro (M23) | |
| HP ZBook Studio 16 G9 62U04EA | |
| Lenovo ThinkPad X1 Extreme G5-21DE003RGE | |
| MSI CreatorPro Z16P B12UKST | |
| Samsung Galaxy Book3 Ultra 16, i9-13900H RTX 4070 | |
| HWBOT x265 Benchmark v2.2 / 4k Preset | |
| Average of class Workstation (17.8 - 40.5, n=24, last 2 years) | |
| Dell Precision 5000 5680 | |
| HP ZBook Studio 16 G9 62U04EA | |
| MSI CreatorPro Z16P B12UKST | |
| Lenovo ThinkPad P1 G6-21FV000DGE | |
| Average Intel Core i9-13900H (14.1 - 22.3, n=25) | |
| Lenovo ThinkPad X1 Extreme G5-21DE003RGE | |
| Schenker VISION 16 Pro (M23) | |
| Samsung Galaxy Book3 Ultra 16, i9-13900H RTX 4070 | |
| LibreOffice / 20 Documents To PDF | |
| Samsung Galaxy Book3 Ultra 16, i9-13900H RTX 4070 | |
| Average of class Workstation (37.1 - 74.7, n=24, last 2 years) | |
| Schenker VISION 16 Pro (M23) | |
| Average Intel Core i9-13900H (34.4 - 82.8, n=25) | |
| Lenovo ThinkPad P1 G6-21FV000DGE | |
| HP ZBook Studio 16 G9 62U04EA | |
| Lenovo ThinkPad X1 Extreme G5-21DE003RGE | |
| Dell Precision 5000 5680 | |
| MSI CreatorPro Z16P B12UKST | |
| R Benchmark 2.5 / Overall mean | |
| Samsung Galaxy Book3 Ultra 16, i9-13900H RTX 4070 | |
| Lenovo ThinkPad X1 Extreme G5-21DE003RGE | |
| MSI CreatorPro Z16P B12UKST | |
| Average Intel Core i9-13900H (0.4052 - 0.723, n=25) | |
| HP ZBook Studio 16 G9 62U04EA | |
| Average of class Workstation (0.3825 - 0.603, n=24, last 2 years) | |
| Schenker VISION 16 Pro (M23) | |
| Lenovo ThinkPad P1 G6-21FV000DGE | |
| Dell Precision 5000 5680 | |
* ... smaller is better
AIDA64: FP32 Ray-Trace | FPU Julia | CPU SHA3 | CPU Queen | FPU SinJulia | FPU Mandel | CPU AES | CPU ZLib | FP64 Ray-Trace | CPU PhotoWorxx
| Performance rating | |
| Average of class Workstation | |
| MSI CreatorPro Z16P B12UKST | |
| Dell Precision 5000 5680 | |
| Lenovo ThinkPad P1 G6-21FV000DGE | |
| Average Intel Core i9-13900H | |
| HP ZBook Studio 16 G9 62U04EA | |
| Lenovo ThinkPad X1 Extreme G5-21DE003RGE | |
| Schenker VISION 16 Pro (M23) | |
| Samsung Galaxy Book3 Ultra 16, i9-13900H RTX 4070 | |
| AIDA64 / FP32 Ray-Trace | |
| Average of class Workstation (15143 - 61611, n=24, last 2 years) | |
| Lenovo ThinkPad P1 G6-21FV000DGE | |
| Lenovo ThinkPad X1 Extreme G5-21DE003RGE | |
| Dell Precision 5000 5680 | |
| HP ZBook Studio 16 G9 62U04EA | |
| Average Intel Core i9-13900H (6788 - 19557, n=25) | |
| Samsung Galaxy Book3 Ultra 16, i9-13900H RTX 4070 | |
| MSI CreatorPro Z16P B12UKST | |
| Schenker VISION 16 Pro (M23) | |
| AIDA64 / FPU Julia | |
| Average of class Workstation (81575 - 186971, n=24, last 2 years) | |
| Lenovo ThinkPad P1 G6-21FV000DGE | |
| Lenovo ThinkPad X1 Extreme G5-21DE003RGE | |
| HP ZBook Studio 16 G9 62U04EA | |
| Dell Precision 5000 5680 | |
| Average Intel Core i9-13900H (22551 - 95579, n=25) | |
| MSI CreatorPro Z16P B12UKST | |
| Schenker VISION 16 Pro (M23) | |
| Samsung Galaxy Book3 Ultra 16, i9-13900H RTX 4070 | |
| AIDA64 / CPU SHA3 | |
| Average of class Workstation (3833 - 8975, n=24, last 2 years) | |
| Lenovo ThinkPad X1 Extreme G5-21DE003RGE | |
| Lenovo ThinkPad P1 G6-21FV000DGE | |
| HP ZBook Studio 16 G9 62U04EA | |
| MSI CreatorPro Z16P B12UKST | |
| Average Intel Core i9-13900H (2491 - 4270, n=25) | |
| Dell Precision 5000 5680 | |
| Samsung Galaxy Book3 Ultra 16, i9-13900H RTX 4070 | |
| Schenker VISION 16 Pro (M23) | |
| AIDA64 / CPU Queen | |
| Dell Precision 5000 5680 | |
| Lenovo ThinkPad P1 G6-21FV000DGE | |
| HP ZBook Studio 16 G9 62U04EA | |
| Average of class Workstation (60778 - 144411, n=24, last 2 years) | |
| Average Intel Core i9-13900H (65121 - 120936, n=25) | |
| Lenovo ThinkPad X1 Extreme G5-21DE003RGE | |
| MSI CreatorPro Z16P B12UKST | |
| Schenker VISION 16 Pro (M23) | |
| Samsung Galaxy Book3 Ultra 16, i9-13900H RTX 4070 | |
| AIDA64 / FPU SinJulia | |
| Average of class Workstation (8165 - 29343, n=24, last 2 years) | |
| Lenovo ThinkPad P1 G6-21FV000DGE | |
| Dell Precision 5000 5680 | |
| Lenovo ThinkPad X1 Extreme G5-21DE003RGE | |
| Average Intel Core i9-13900H (6108 - 11631, n=25) | |
| HP ZBook Studio 16 G9 62U04EA | |
| MSI CreatorPro Z16P B12UKST | |
| Schenker VISION 16 Pro (M23) | |
| Samsung Galaxy Book3 Ultra 16, i9-13900H RTX 4070 | |
| AIDA64 / FPU Mandel | |
| Average of class Workstation (40055 - 98153, n=24, last 2 years) | |
| Lenovo ThinkPad P1 G6-21FV000DGE | |
| Lenovo ThinkPad X1 Extreme G5-21DE003RGE | |
| Dell Precision 5000 5680 | |
| HP ZBook Studio 16 G9 62U04EA | |
| Average Intel Core i9-13900H (11283 - 48474, n=25) | |
| Samsung Galaxy Book3 Ultra 16, i9-13900H RTX 4070 | |
| MSI CreatorPro Z16P B12UKST | |
| Schenker VISION 16 Pro (M23) | |
| AIDA64 / CPU AES | |
| MSI CreatorPro Z16P B12UKST | |
| Average of class Workstation (73133 - 187841, n=24, last 2 years) | |
| Average Intel Core i9-13900H (3691 - 149377, n=25) | |
| Lenovo ThinkPad X1 Extreme G5-21DE003RGE | |
| Lenovo ThinkPad P1 G6-21FV000DGE | |
| HP ZBook Studio 16 G9 62U04EA | |
| Dell Precision 5000 5680 | |
| Schenker VISION 16 Pro (M23) | |
| Samsung Galaxy Book3 Ultra 16, i9-13900H RTX 4070 | |
| AIDA64 / CPU ZLib | |
| Average of class Workstation (929 - 2148, n=24, last 2 years) | |
| Lenovo ThinkPad P1 G6-21FV000DGE | |
| Lenovo ThinkPad X1 Extreme G5-21DE003RGE | |
| HP ZBook Studio 16 G9 62U04EA | |
| Average Intel Core i9-13900H (789 - 1254, n=25) | |
| MSI CreatorPro Z16P B12UKST | |
| Dell Precision 5000 5680 | |
| Samsung Galaxy Book3 Ultra 16, i9-13900H RTX 4070 | |
| Schenker VISION 16 Pro (M23) | |
| AIDA64 / FP64 Ray-Trace | |
| Average of class Workstation (7813 - 32891, n=24, last 2 years) | |
| Lenovo ThinkPad P1 G6-21FV000DGE | |
| Lenovo ThinkPad X1 Extreme G5-21DE003RGE | |
| HP ZBook Studio 16 G9 62U04EA | |
| Dell Precision 5000 5680 | |
| Average Intel Core i9-13900H (3655 - 10716, n=25) | |
| MSI CreatorPro Z16P B12UKST | |
| Schenker VISION 16 Pro (M23) | |
| Samsung Galaxy Book3 Ultra 16, i9-13900H RTX 4070 | |
| AIDA64 / CPU PhotoWorxx | |
| Average of class Workstation (37151 - 93684, n=24, last 2 years) | |
| Samsung Galaxy Book3 Ultra 16, i9-13900H RTX 4070 | |
| Dell Precision 5000 5680 | |
| Schenker VISION 16 Pro (M23) | |
| MSI CreatorPro Z16P B12UKST | |
| Average Intel Core i9-13900H (10871 - 50488, n=25) | |
| HP ZBook Studio 16 G9 62U04EA | |
| Lenovo ThinkPad P1 G6-21FV000DGE | |
| Lenovo ThinkPad X1 Extreme G5-21DE003RGE | |
System Performance
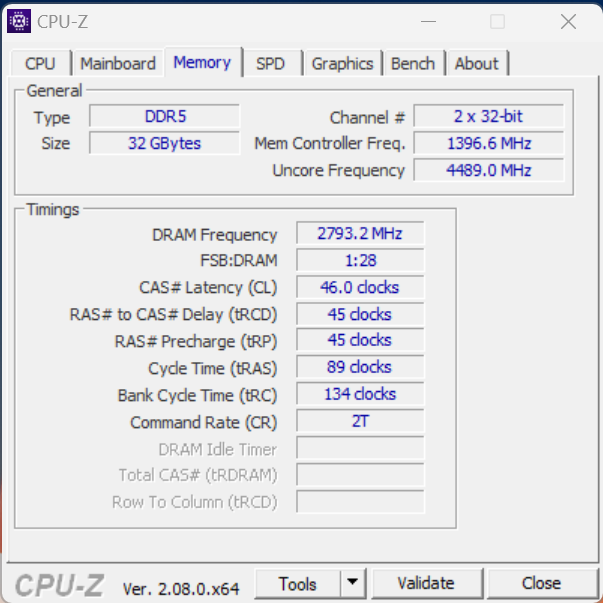
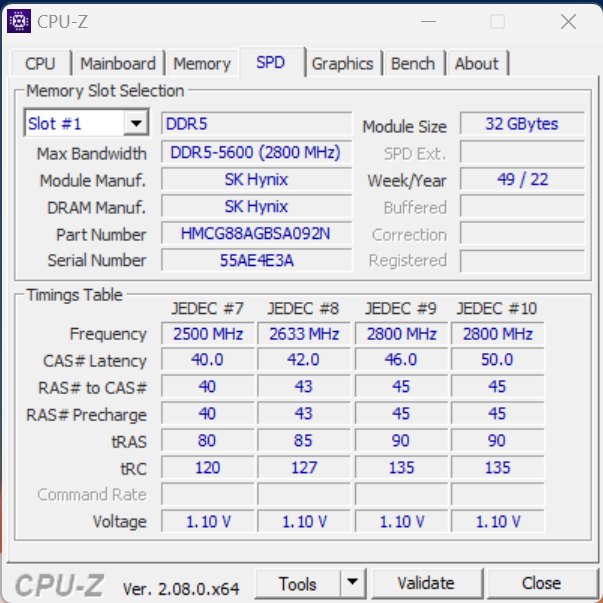
The system performance of the ThinkPad P1 Gen 6 is outstanding, a fact supported by both synthetic benchmarks and our subjective performance evaluation. As anticipated, the RAM benchmarks are slightly lower due to the single-channel configuration of the memory, compared to models with dual-channel RAM. Throughout the test, there were no issues with freezing or stuttering.
CrossMark: Overall | Productivity | Creativity | Responsiveness
| PCMark 10 / Score | |
| Dell Precision 5000 5680 | |
| Average of class Workstation (6563 - 10409, n=20, last 2 years) | |
| Lenovo ThinkPad P1 G6-21FV000DGE | |
| Average Intel Core i9-13900H, NVIDIA RTX 2000 Ada Generation Laptop (n=1) | |
| Schenker VISION 16 Pro (M23) | |
| Lenovo ThinkPad X1 Extreme G5-21DE003RGE | |
| MSI CreatorPro Z16P B12UKST | |
| HP ZBook Studio 16 G9 62U04EA | |
| Samsung Galaxy Book3 Ultra 16, i9-13900H RTX 4070 | |
| PCMark 10 / Essentials | |
| Dell Precision 5000 5680 | |
| Lenovo ThinkPad P1 G6-21FV000DGE | |
| Average Intel Core i9-13900H, NVIDIA RTX 2000 Ada Generation Laptop (n=1) | |
| Schenker VISION 16 Pro (M23) | |
| MSI CreatorPro Z16P B12UKST | |
| Lenovo ThinkPad X1 Extreme G5-21DE003RGE | |
| Average of class Workstation (9622 - 11157, n=20, last 2 years) | |
| HP ZBook Studio 16 G9 62U04EA | |
| Samsung Galaxy Book3 Ultra 16, i9-13900H RTX 4070 | |
| PCMark 10 / Productivity | |
| Average of class Workstation (8789 - 20616, n=20, last 2 years) | |
| Dell Precision 5000 5680 | |
| Lenovo ThinkPad P1 G6-21FV000DGE | |
| Average Intel Core i9-13900H, NVIDIA RTX 2000 Ada Generation Laptop (n=1) | |
| Schenker VISION 16 Pro (M23) | |
| Lenovo ThinkPad X1 Extreme G5-21DE003RGE | |
| MSI CreatorPro Z16P B12UKST | |
| Samsung Galaxy Book3 Ultra 16, i9-13900H RTX 4070 | |
| HP ZBook Studio 16 G9 62U04EA | |
| PCMark 10 / Digital Content Creation | |
| Dell Precision 5000 5680 | |
| Average of class Workstation (8108 - 15631, n=20, last 2 years) | |
| Schenker VISION 16 Pro (M23) | |
| Lenovo ThinkPad P1 G6-21FV000DGE | |
| Average Intel Core i9-13900H, NVIDIA RTX 2000 Ada Generation Laptop (n=1) | |
| Lenovo ThinkPad X1 Extreme G5-21DE003RGE | |
| MSI CreatorPro Z16P B12UKST | |
| HP ZBook Studio 16 G9 62U04EA | |
| Samsung Galaxy Book3 Ultra 16, i9-13900H RTX 4070 | |
| CrossMark / Overall | |
| MSI CreatorPro Z16P B12UKST | |
| Dell Precision 5000 5680 | |
| Average of class Workstation (1307 - 2267, n=23, last 2 years) | |
| Schenker VISION 16 Pro (M23) | |
| Lenovo ThinkPad P1 G6-21FV000DGE | |
| Average Intel Core i9-13900H, NVIDIA RTX 2000 Ada Generation Laptop (n=1) | |
| HP ZBook Studio 16 G9 62U04EA | |
| Lenovo ThinkPad X1 Extreme G5-21DE003RGE | |
| Samsung Galaxy Book3 Ultra 16, i9-13900H RTX 4070 | |
| CrossMark / Productivity | |
| MSI CreatorPro Z16P B12UKST | |
| Schenker VISION 16 Pro (M23) | |
| Dell Precision 5000 5680 | |
| Lenovo ThinkPad P1 G6-21FV000DGE | |
| Average Intel Core i9-13900H, NVIDIA RTX 2000 Ada Generation Laptop (n=1) | |
| Average of class Workstation (1130 - 2122, n=23, last 2 years) | |
| HP ZBook Studio 16 G9 62U04EA | |
| Lenovo ThinkPad X1 Extreme G5-21DE003RGE | |
| Samsung Galaxy Book3 Ultra 16, i9-13900H RTX 4070 | |
| CrossMark / Creativity | |
| Average of class Workstation (1657 - 2725, n=23, last 2 years) | |
| Dell Precision 5000 5680 | |
| HP ZBook Studio 16 G9 62U04EA | |
| MSI CreatorPro Z16P B12UKST | |
| Lenovo ThinkPad P1 G6-21FV000DGE | |
| Average Intel Core i9-13900H, NVIDIA RTX 2000 Ada Generation Laptop (n=1) | |
| Schenker VISION 16 Pro (M23) | |
| Lenovo ThinkPad X1 Extreme G5-21DE003RGE | |
| Samsung Galaxy Book3 Ultra 16, i9-13900H RTX 4070 | |
| CrossMark / Responsiveness | |
| MSI CreatorPro Z16P B12UKST | |
| Schenker VISION 16 Pro (M23) | |
| Average of class Workstation (993 - 2096, n=23, last 2 years) | |
| Lenovo ThinkPad P1 G6-21FV000DGE | |
| Average Intel Core i9-13900H, NVIDIA RTX 2000 Ada Generation Laptop (n=1) | |
| Dell Precision 5000 5680 | |
| HP ZBook Studio 16 G9 62U04EA | |
| Lenovo ThinkPad X1 Extreme G5-21DE003RGE | |
| Samsung Galaxy Book3 Ultra 16, i9-13900H RTX 4070 | |
| PCMark 10 Score | 7522 points | |
Help | ||
| AIDA64 / Memory Copy | |
| Average of class Workstation (56003 - 164795, n=24, last 2 years) | |
| Dell Precision 5000 5680 | |
| Samsung Galaxy Book3 Ultra 16, i9-13900H RTX 4070 | |
| Schenker VISION 16 Pro (M23) | |
| MSI CreatorPro Z16P B12UKST | |
| HP ZBook Studio 16 G9 62U04EA | |
| Average Intel Core i9-13900H (37448 - 74486, n=25) | |
| Lenovo ThinkPad P1 G6-21FV000DGE | |
| Lenovo ThinkPad X1 Extreme G5-21DE003RGE | |
| AIDA64 / Memory Read | |
| Average of class Workstation (55795 - 121563, n=24, last 2 years) | |
| Schenker VISION 16 Pro (M23) | |
| Samsung Galaxy Book3 Ultra 16, i9-13900H RTX 4070 | |
| Dell Precision 5000 5680 | |
| MSI CreatorPro Z16P B12UKST | |
| HP ZBook Studio 16 G9 62U04EA | |
| Average Intel Core i9-13900H (41599 - 75433, n=25) | |
| Lenovo ThinkPad P1 G6-21FV000DGE | |
| Lenovo ThinkPad X1 Extreme G5-21DE003RGE | |
| AIDA64 / Memory Write | |
| Samsung Galaxy Book3 Ultra 16, i9-13900H RTX 4070 | |
| Average of class Workstation (55663 - 214520, n=24, last 2 years) | |
| Dell Precision 5000 5680 | |
| Schenker VISION 16 Pro (M23) | |
| MSI CreatorPro Z16P B12UKST | |
| Average Intel Core i9-13900H (36152 - 88505, n=25) | |
| HP ZBook Studio 16 G9 62U04EA | |
| Lenovo ThinkPad P1 G6-21FV000DGE | |
| Lenovo ThinkPad X1 Extreme G5-21DE003RGE | |
| AIDA64 / Memory Latency | |
| Average of class Workstation (84.5 - 165.2, n=24, last 2 years) | |
| Samsung Galaxy Book3 Ultra 16, i9-13900H RTX 4070 | |
| MSI CreatorPro Z16P B12UKST | |
| Dell Precision 5000 5680 | |
| HP ZBook Studio 16 G9 62U04EA | |
| Average Intel Core i9-13900H (75.8 - 102.3, n=25) | |
| Lenovo ThinkPad X1 Extreme G5-21DE003RGE | |
| Schenker VISION 16 Pro (M23) | |
| Lenovo ThinkPad P1 G6-21FV000DGE | |
* ... smaller is better
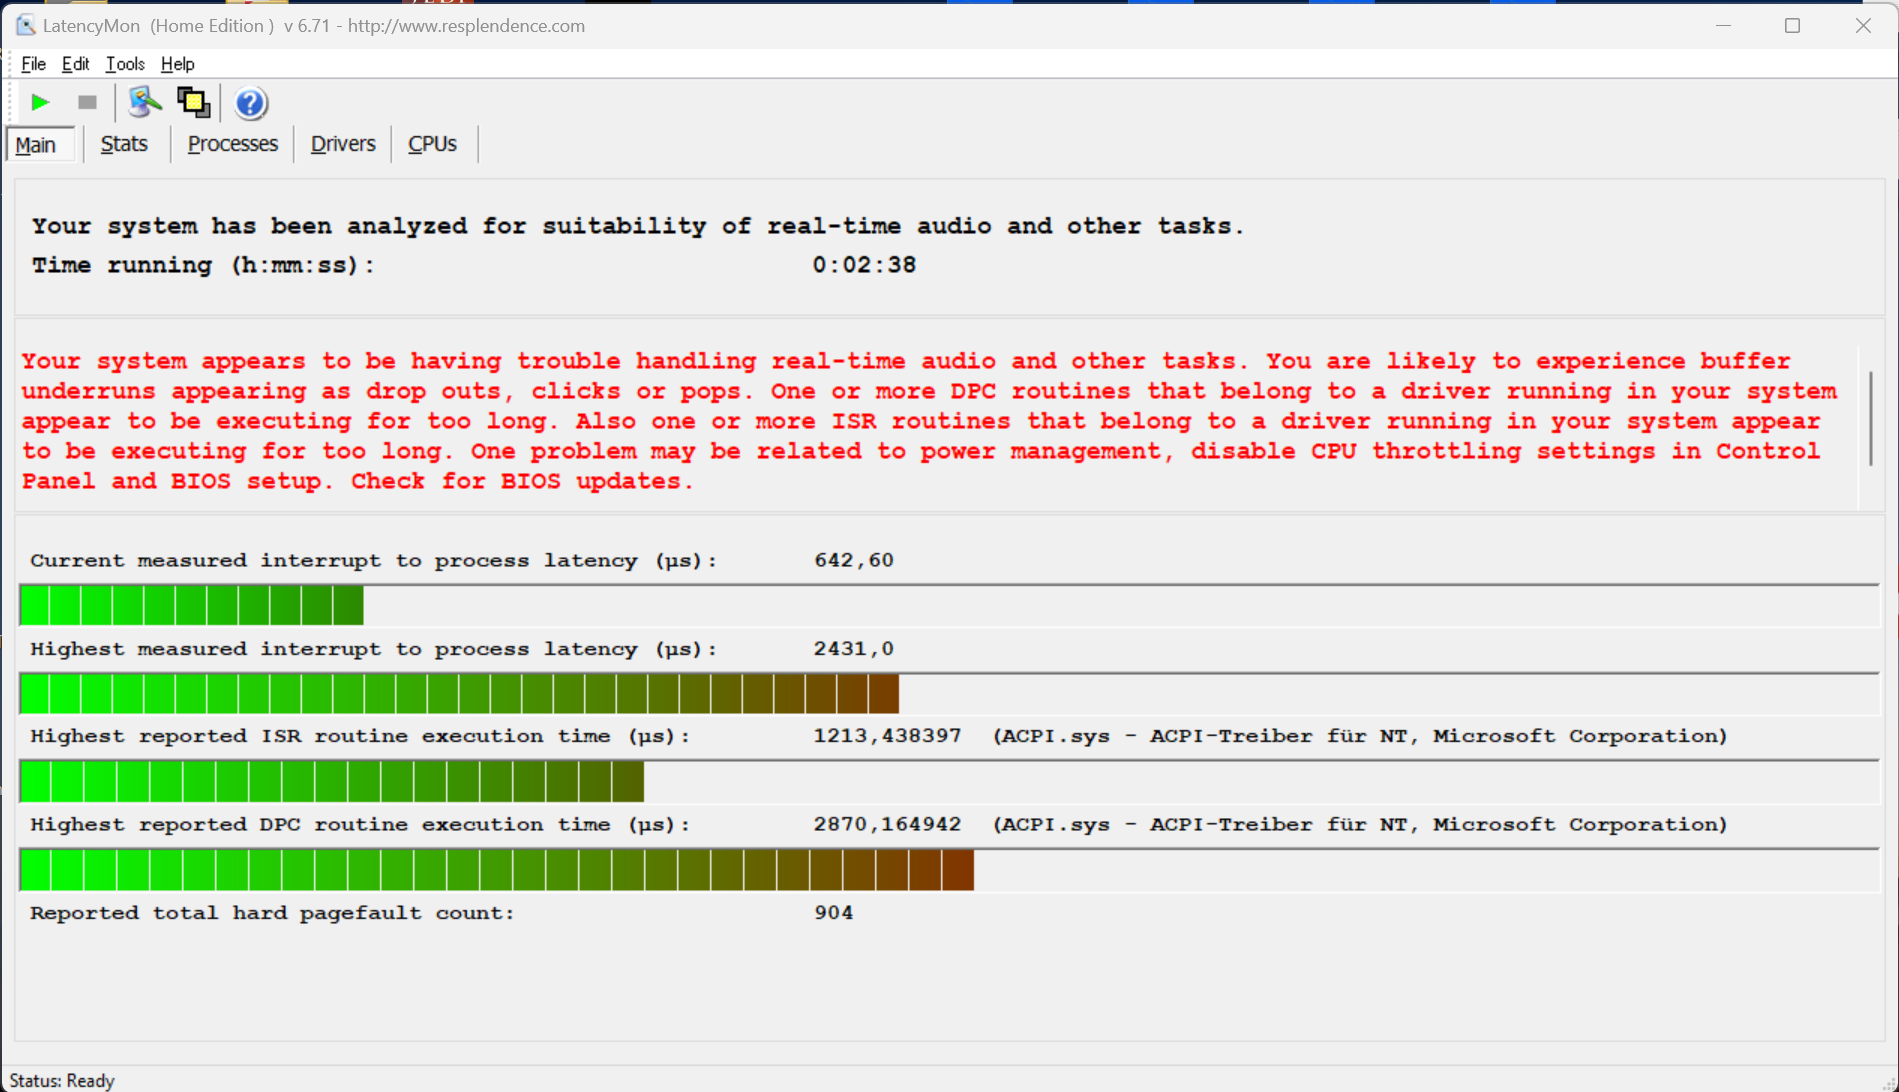
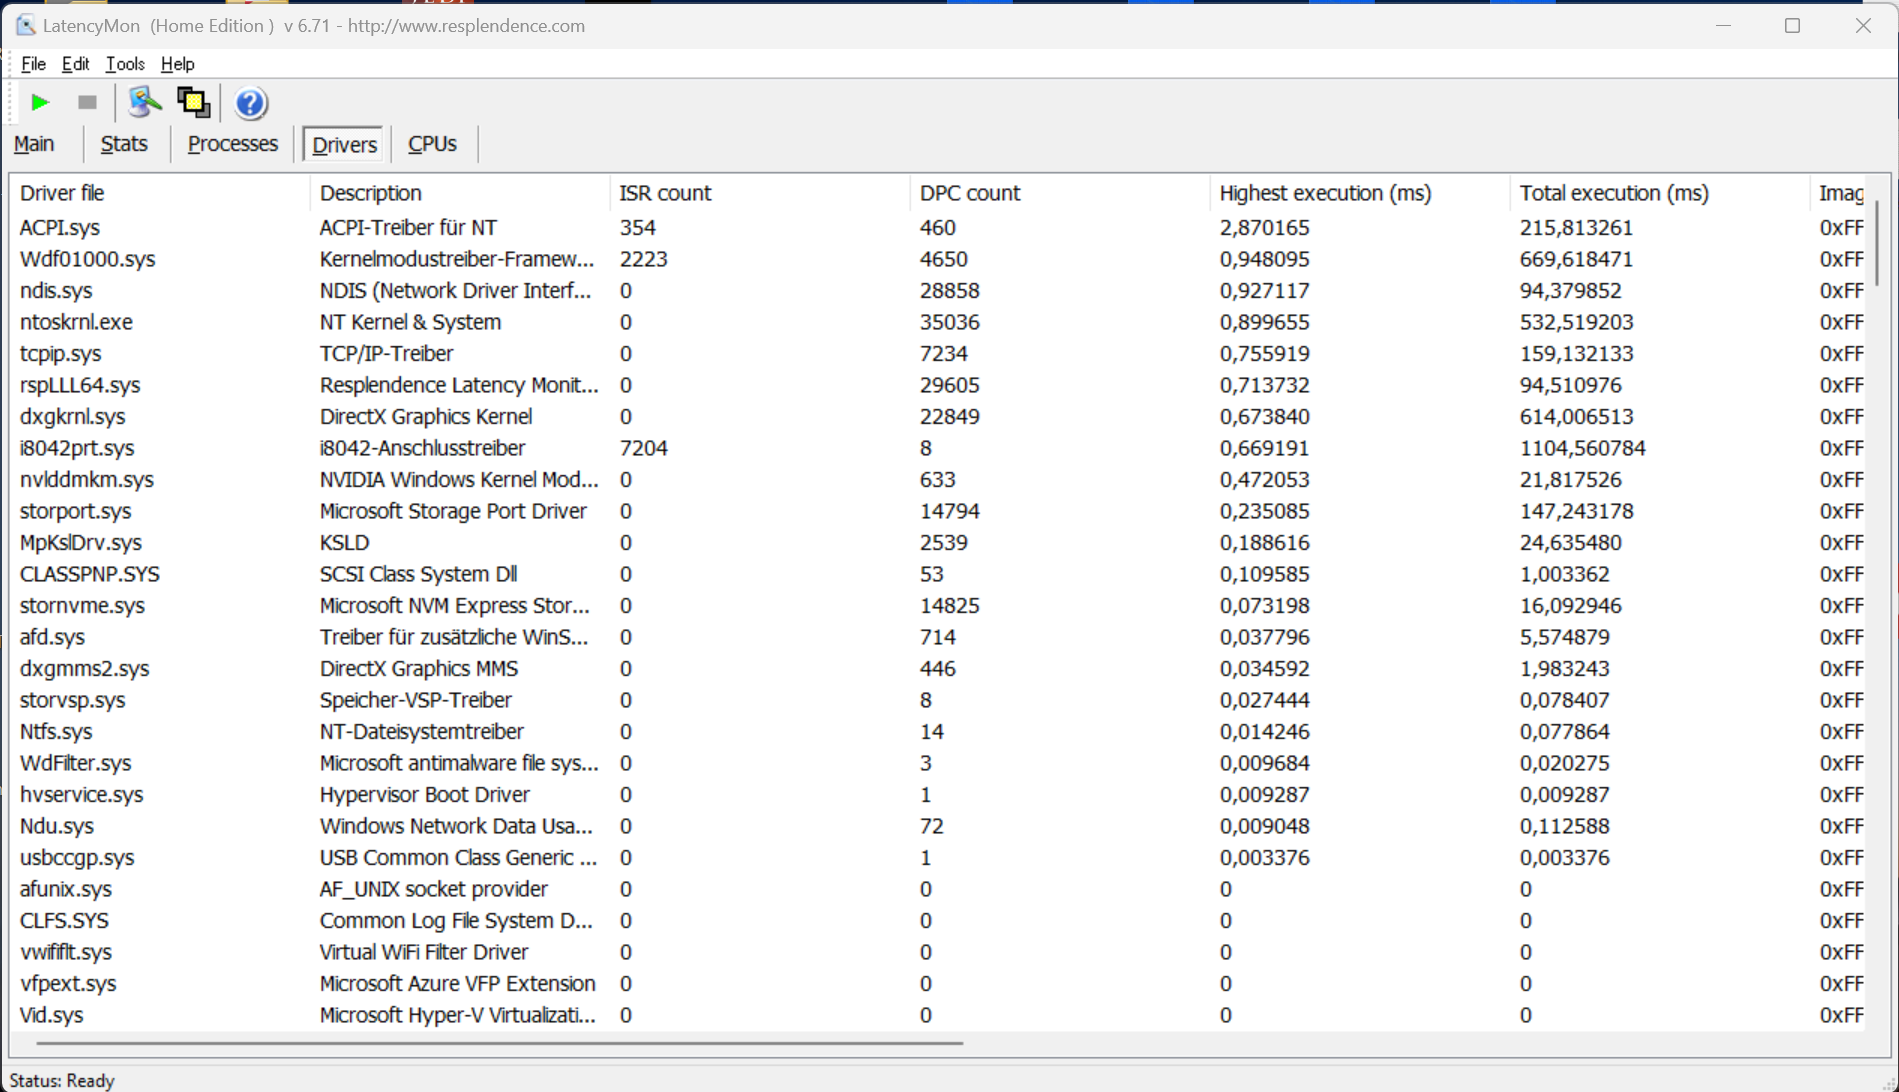
DPC Latency
Our test device displayed difficulties in real-time audio apps with the current BIOS version (1.14) in our standardized latency test, which included web surfing, 4K YouTube streaming, and CPU load. During video playback, however, no frames were lost.
| DPC Latencies / LatencyMon - interrupt to process latency (max), Web, Youtube, Prime95 | |
| Samsung Galaxy Book3 Ultra 16, i9-13900H RTX 4070 | |
| Lenovo ThinkPad P1 G6-21FV000DGE | |
| Dell Precision 5000 5680 | |
| Lenovo ThinkPad X1 Extreme G5-21DE003RGE | |
| HP ZBook Studio 16 G9 62U04EA | |
| Schenker VISION 16 Pro (M23) | |
| MSI CreatorPro Z16P B12UKST | |
* ... smaller is better
Storage Devices
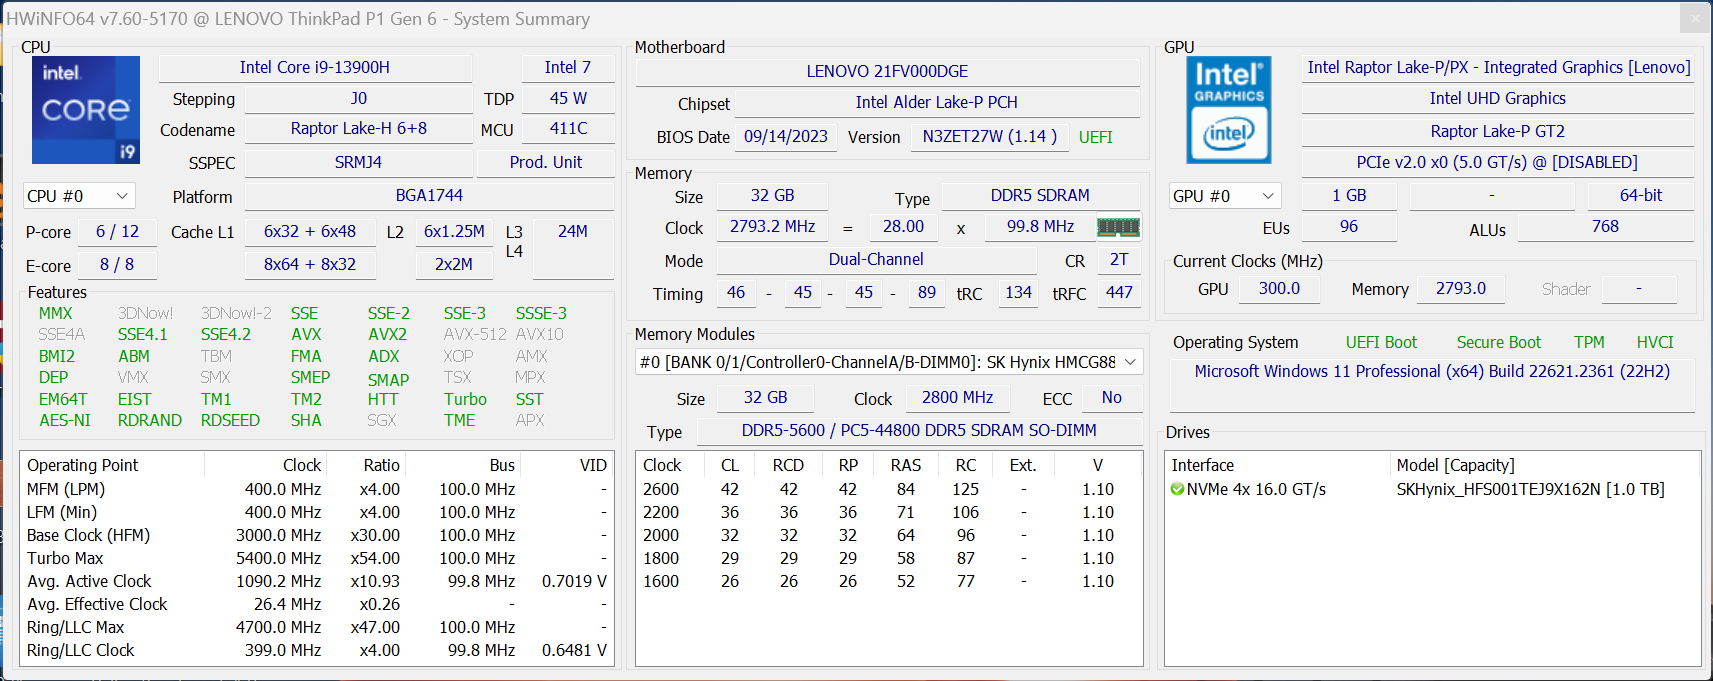
Two fast PCIe 4.0 slots are available in P1 G6 setups with conventional cooling. Our test device is equipped with the 1 TB SK Hynix PC711, which provides 897 GB of free RAM after the first configuration. The PCIe 4.0 SSD has exceptional transfer rates, reaching over 7 GB/s at peak performance. Lenovo also adds a metal plate to the SSD to provide consistent performance even under constant use. There are more SSD benchmarks accessible here.

* ... smaller is better
Continuous power read: DiskSpd Read Loop, Queue Depth 8
Graphics card - RTX 2000 Ada
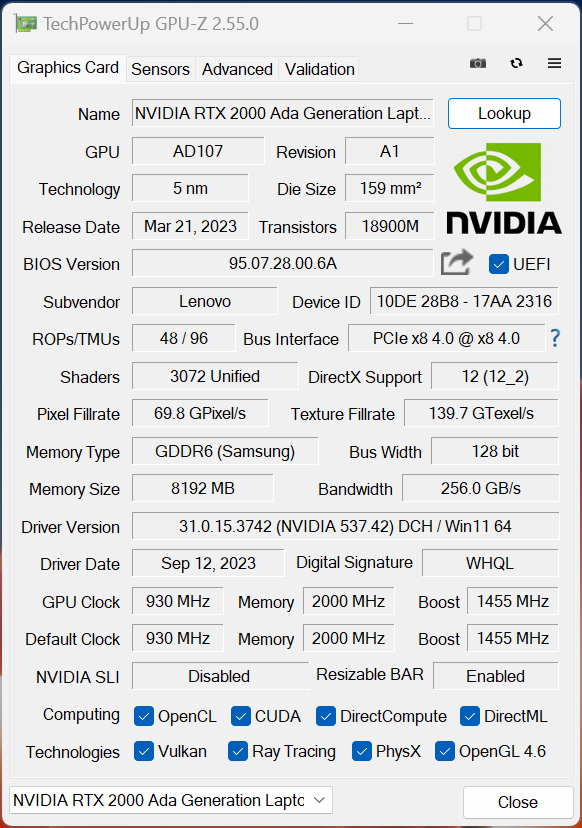
Lenovo now includes Nvidia's newest Ada Lovelace GPUs. In addition to the GeForce models RTX 4060 Laptop, RTX 4080 Laptop, and RTX 4090 Laptop (each with an 80-watt variant, as stated in the spec sheet), it also offers new professional models such as the RTX 1000 Ada (65 watts), RTX 2000 Ada (65 watts), RTX 3500 Ada, RTX 4000 Ada, and the flagship RTX 5000 Ada (80 watts TGP).
Surprisingly, the RTX 2000 Ada in our review sample is based on the GeForce RTX 4060 laptop, and Lenovo has opted for conventional cooling. As a result, it works at "only" 65 watts (including 15 watts Dynamic Boost). In 3DMark tests, the RTX 2000 Ada outperforms the GeForce RTX 4060 laptop in Asus' ROG Flow Z13 by a few percentage points, where the GPU is also allowed to consume 65 watts (including 15 watts Dynamic Boost). In terms of pure performance, the GPU represents a significant advancement, surpassing the older RTX A3000 and the RTX 3060 laptop in the previous ThinkPad X1 Extreme. Additionally, the advantage over the old RTX A2000 is nearly 70%.
In professional benchmarks, the RTX 2000 Ada consistently outperforms the older RTX A3000, and it often leaves behind the 50-watt version of the RTX 3000 Ada in the more compact Dell Precision 5480.
The GPU's consistent performance even under sustained stress is a major plus. When powered by a battery, the RTX 2000 Ada is limited to a maximum usage of 45 watts, resulting in about 15% poorer graphics performance (7,107 points @ Time Spy Graphics). More GPU benchmarks are listed here.
| 3DMark 06 Standard Score | 53707 points | |
| 3DMark Vantage P Result | 37844 points | |
| 3DMark 11 Performance | 27558 points | |
| 3DMark Fire Strike Score | 19987 points | |
| 3DMark Time Spy Score | 8849 points | |
Help | ||
| Geekbench 6.7 - GPU OpenCL | |
| HP ZBook Fury 16 G10 | |
| Dell Precision 5000 5680 | |
| Dell Precision 5480 | |
| Lenovo ThinkPad P1 G6-21FV000DGE | |
| Blender / v3.3 Classroom OPTIX/RTX | |
| HP ZBook Studio 16 G9 62U04EA | |
| Lenovo ThinkPad X1 Extreme G5-21DE003RGE | |
| MSI CreatorPro Z16P B12UKST | |
| Lenovo ThinkPad P1 G6-21FV000DGE | |
| Average NVIDIA RTX 2000 Ada Generation Laptop (25 - 31, n=4) | |
| Samsung Galaxy Book3 Ultra 16, i9-13900H RTX 4070 | |
| Schenker VISION 16 Pro (M23) | |
| Average of class Workstation (10 - 43, n=18, last 2 years) | |
| Dell Precision 5000 5680 | |
| Blender / v3.3 Classroom CUDA | |
| HP ZBook Studio 16 G9 62U04EA | |
| Average NVIDIA RTX 2000 Ada Generation Laptop (51 - 155, n=4) | |
| Lenovo ThinkPad X1 Extreme G5-21DE003RGE | |
| MSI CreatorPro Z16P B12UKST | |
| Lenovo ThinkPad P1 G6-21FV000DGE | |
| Samsung Galaxy Book3 Ultra 16, i9-13900H RTX 4070 | |
| Average of class Workstation (16 - 74, n=18, last 2 years) | |
| Schenker VISION 16 Pro (M23) | |
| Dell Precision 5000 5680 | |
| Blender / v3.3 Classroom CPU | |
| Samsung Galaxy Book3 Ultra 16, i9-13900H RTX 4070 | |
| Schenker VISION 16 Pro (M23) | |
| Dell Precision 5000 5680 | |
| MSI CreatorPro Z16P B12UKST | |
| HP ZBook Studio 16 G9 62U04EA | |
| Lenovo ThinkPad P1 G6-21FV000DGE | |
| Lenovo ThinkPad X1 Extreme G5-21DE003RGE | |
| Average NVIDIA RTX 2000 Ada Generation Laptop (291 - 347, n=4) | |
| Average of class Workstation (148 - 364, n=24, last 2 years) | |
* ... smaller is better
Gaming Performance
We encountered no issues with the professional driver during our gaming benchmarks, and the performance aligns with that of a GeForce RTX 4060 laptop with comparable TGP rates. Consequently, current games such as Star Wars Jedi Survivor, Assassins' Creed Mirage, or Cyberpunk can be played smoothly at maximum settings and 1080p resolution. For native WQHD resolution, users might need to resort to upscaling methods like Nvidia's DLSS. Importantly, the performance remains stable even during extended gaming sessions.
| Far Cry 6 | |
| 1920x1080 High Graphics Quality AA:T | |
| Lenovo ThinkPad P1 G6-21FV000DGE | |
| Average NVIDIA RTX 2000 Ada Generation Laptop (n=1) | |
| Average of class Workstation (n=1last 2 years) | |
| 1920x1080 Ultra Graphics Quality + HD Textures AA:T | |
| Lenovo ThinkPad P1 G6-21FV000DGE | |
| Average NVIDIA RTX 2000 Ada Generation Laptop (n=1) | |
| Star Wars Jedi Survivor | |
| 1920x1080 High Preset | |
| Schenker VISION 16 Pro (M23) | |
| Lenovo ThinkPad P1 G6-21FV000DGE | |
| Average NVIDIA RTX 2000 Ada Generation Laptop (n=1) | |
| 1920x1080 Epic Preset | |
| Schenker VISION 16 Pro (M23) | |
| Lenovo ThinkPad P1 G6-21FV000DGE | |
| Average NVIDIA RTX 2000 Ada Generation Laptop (n=1) | |
| Hogwarts Legacy | |
| 1920x1080 High Preset AA:High T | |
| Lenovo ThinkPad P1 G6-21FV000DGE | |
| Average NVIDIA RTX 2000 Ada Generation Laptop (n=1) | |
| Samsung Galaxy Book3 Ultra 16, i9-13900H RTX 4070 | |
| 1920x1080 Ultra Preset AA:High T | |
| Lenovo ThinkPad P1 G6-21FV000DGE | |
| Average NVIDIA RTX 2000 Ada Generation Laptop (n=1) | |
| Samsung Galaxy Book3 Ultra 16, i9-13900H RTX 4070 | |
| F1 23 | |
| 1920x1080 High Preset AA:T AF:16x | |
| Average NVIDIA RTX 2000 Ada Generation Laptop (142.1 - 147, n=2) | |
| Lenovo ThinkPad P1 G6-21FV000DGE | |
| Average of class Workstation (n=1last 2 years) | |
| 1920x1080 Ultra High Preset AA:T AF:16x | |
| Average NVIDIA RTX 2000 Ada Generation Laptop (44.4 - 49.2, n=2) | |
| Lenovo ThinkPad P1 G6-21FV000DGE | |
| Average of class Workstation (n=1last 2 years) | |
Witcher 3 FPS chart
| low | med. | high | ultra | QHD | |
|---|---|---|---|---|---|
| GTA V (2015) | 173 | 101.6 | 74.6 | ||
| The Witcher 3 (2015) | 390 | 261 | 164 | 79.6 | 65 |
| Dota 2 Reborn (2015) | 178.4 | 153.1 | 143.9 | 133.4 | |
| Final Fantasy XV Benchmark (2018) | 111.2 | 83.5 | 63.7 | ||
| X-Plane 11.11 (2018) | 149.2 | 131.6 | 108.9 | ||
| Far Cry 5 (2018) | 175 | 130 | 120 | 113 | 81 |
| Strange Brigade (2018) | 459 | 228 | 182.5 | 158.2 | 107.5 |
| F1 2021 (2021) | 353 | 230 | 186.6 | 99.2 | 74.9 |
| Far Cry 6 (2021) | 157 | 121 | 104 | 87 | 63 |
| Cyberpunk 2077 1.6 (2022) | 101 | 81 | 72 | 65 | 41 |
| F1 22 (2022) | 213 | 193.2 | 138.5 | 52.8 | 34.2 |
| Hogwarts Legacy (2023) | 101 | 80 | 64 | 53 | 38 |
| Star Wars Jedi Survivor (2023) | 49 | 45 | 42 | 40 | 27 |
| F1 23 (2023) | 202 | 192.1 | 142.1 | 44.4 | 27.6 |
| Assassin's Creed Mirage (2023) | 113 | 103 | 97 | 76 | 58 |
Emissions - ThinkPad often remains silent in everyday use
System Noise
During basic tasks, the ThinkPad's two fans often remain completely inactive. They only become audible when the processor or the dedicated graphics card is engaged. It's worth noting that when activated, the fans operate at a high speed instantly without a gradual buildup. In gaming scenarios, we measured noise levels ranging from approximately 41-48 dB(A), with 48 dB(A) representing the maximum fan volume during stress testing. In the two more efficient performance modes, the noise level reaches a maximum of 40.7 dB(A). Notably, there were no other electronic noises detected in our test device.
Noise level
| Idle |
| 24.5 / 24.5 / 24.5 dB(A) |
| Load |
| 48 / 48 dB(A) |
 | ||
30 dB silent 40 dB(A) audible 50 dB(A) loud |
||
min: | ||
| Lenovo ThinkPad P1 G6-21FV000DGE RTX 2000 Ada Generation Laptop, i9-13900H, SK Hynix PC711 1TB HFS001TDE9X084N | Dell Precision 5000 5680 RTX 5000 Ada Generation Laptop, i9-13900H, 2x SK hynix PC801 HFS512GEJ9X101N RAID 0 | Samsung Galaxy Book3 Ultra 16, i9-13900H RTX 4070 GeForce RTX 4070 Laptop GPU, i9-13900H, Samsung PM9A1 MZVL21T0HCLR | HP ZBook Studio 16 G9 62U04EA RTX A2000 Laptop GPU, i7-12800H, Micron 3400 1TB MTFDKBA1T0TFH | MSI CreatorPro Z16P B12UKST RTX A3000 Laptop GPU, i7-12700H, Samsung PM9A1 MZVL21T0HCLR | Schenker VISION 16 Pro (M23) GeForce RTX 4070 Laptop GPU, i7-13700H, Samsung 990 Pro 1 TB | Lenovo ThinkPad X1 Extreme G5-21DE003RGE GeForce RTX 3060 Laptop GPU, i7-12700H, Micron 3400 1TB MTFDKBA1T0TFH | |
|---|---|---|---|---|---|---|---|
| Noise | 2% | -4% | -2% | -4% | -13% | 3% | |
| off / environment * (dB) | 24.5 | 22.8 7% | 25.2 -3% | 24 2% | 24.1 2% | 25.9 -6% | 23.2 5% |
| Idle Minimum * (dB) | 24.5 | 23 6% | 25.2 -3% | 24 2% | 27.1 -11% | 25.9 -6% | 23.2 5% |
| Idle Average * (dB) | 24.5 | 23 6% | 25.2 -3% | 27.7 -13% | 27.1 -11% | 25.9 -6% | 23.2 5% |
| Idle Maximum * (dB) | 24.5 | 23 6% | 31.3 -28% | 27.7 -13% | 27.1 -11% | 32 -31% | 23.2 5% |
| Load Average * (dB) | 48 | 37.2 22% | 38.8 19% | 39.8 17% | 42.9 11% | 47.2 2% | 45.5 5% |
| Witcher 3 ultra * (dB) | 40.7 | 51 -25% | 44.3 -9% | 44 -8% | 53.1 -30% | 45.5 -12% | |
| Load Maximum * (dB) | 48 | 51 -6% | 51.2 -7% | 47.7 1% | 47 2% | 53.1 -11% | 45.5 5% |
* ... smaller is better
Temperature
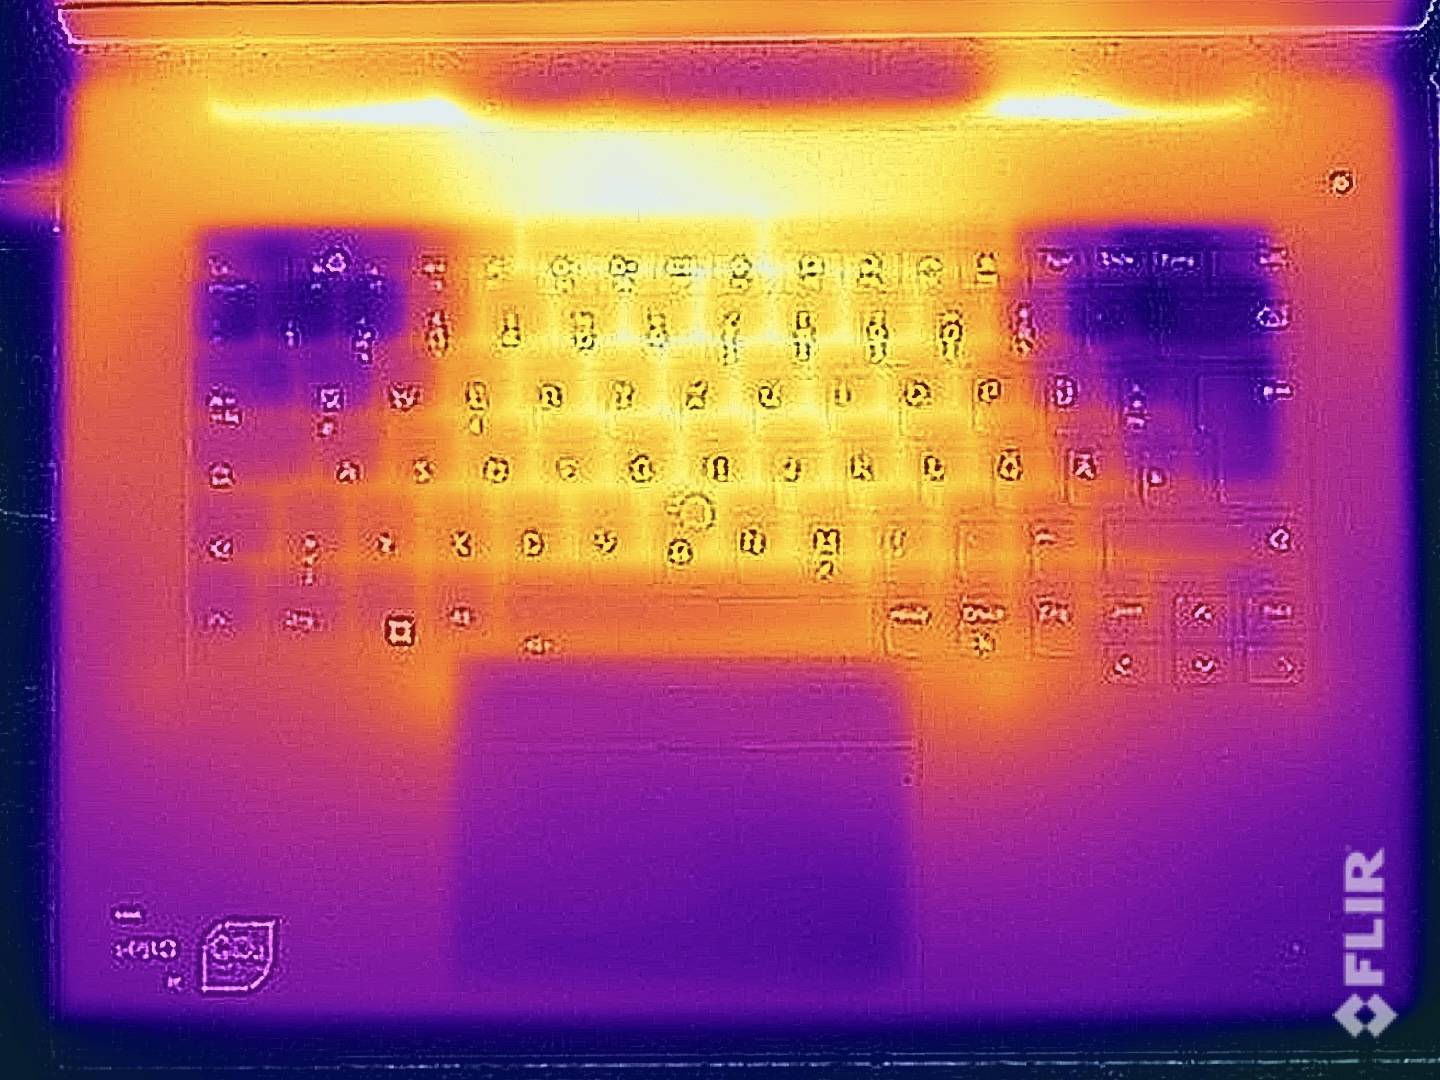
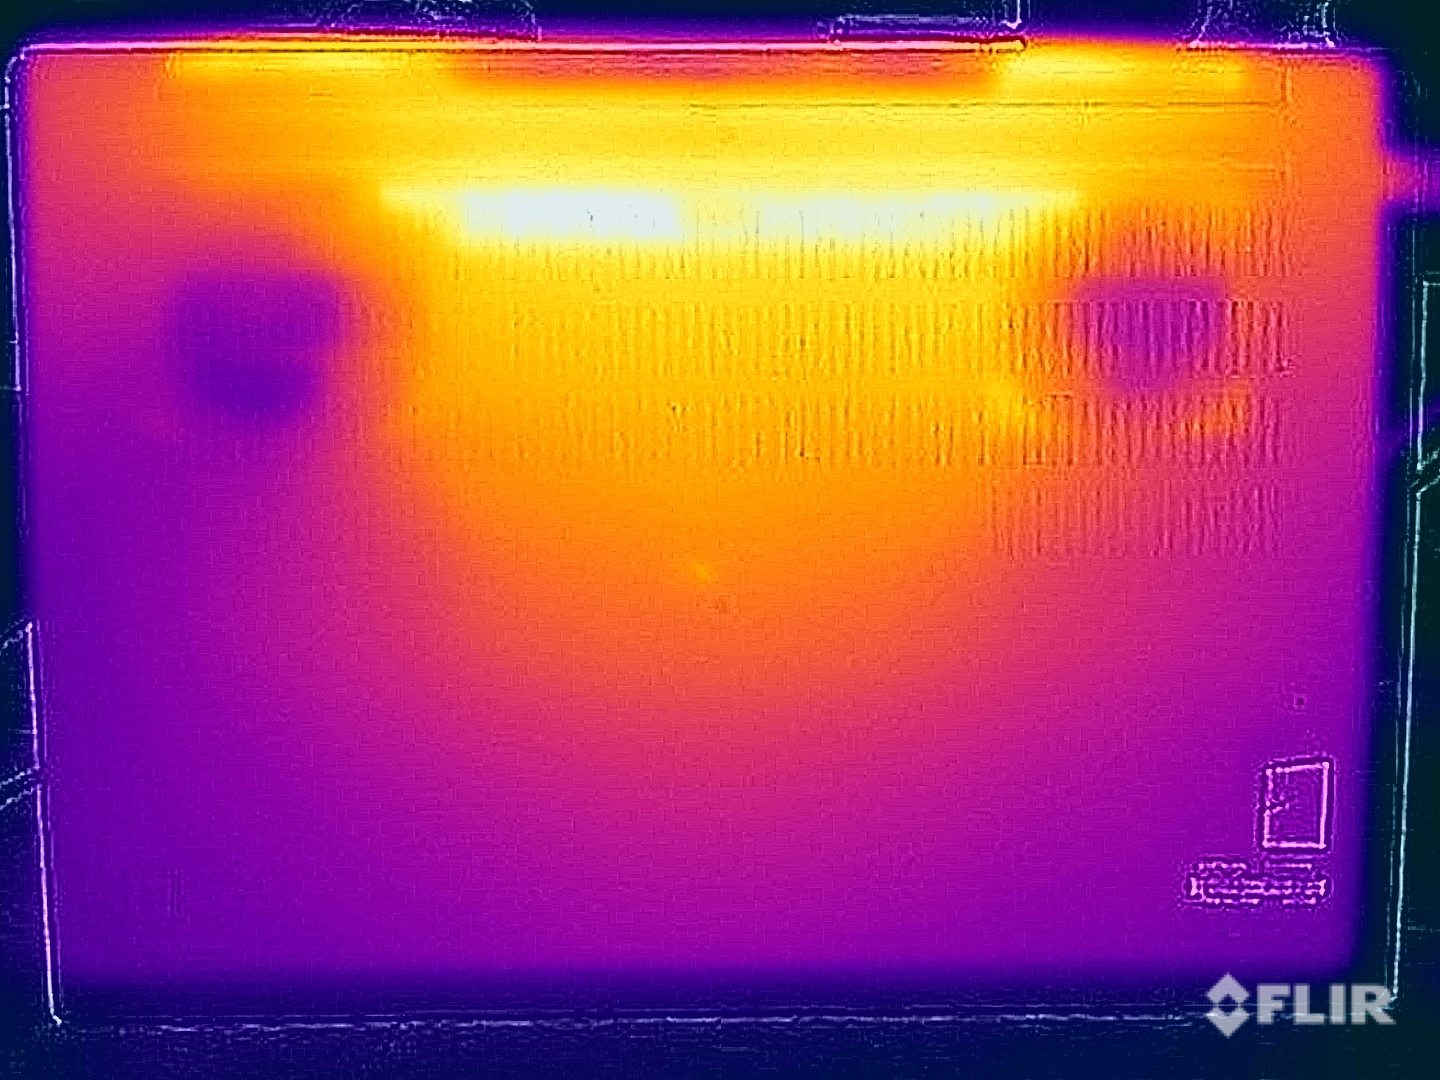
The surface temperatures remain completely safe during simple tasks, and the case barely warms up. Similar to the previous model, under heavy load, the temperatures exceed 50°C on the underside. It's advisable not to place the device on your thighs during such periods, although given its size, this scenario is unlikely. The keyboard area can also reach temperatures up to 47 °C, although we recorded even higher temperatures in the predecessor model. Typing under load (or while gaming) might result in warm fingers, but there are no significant discomforts.
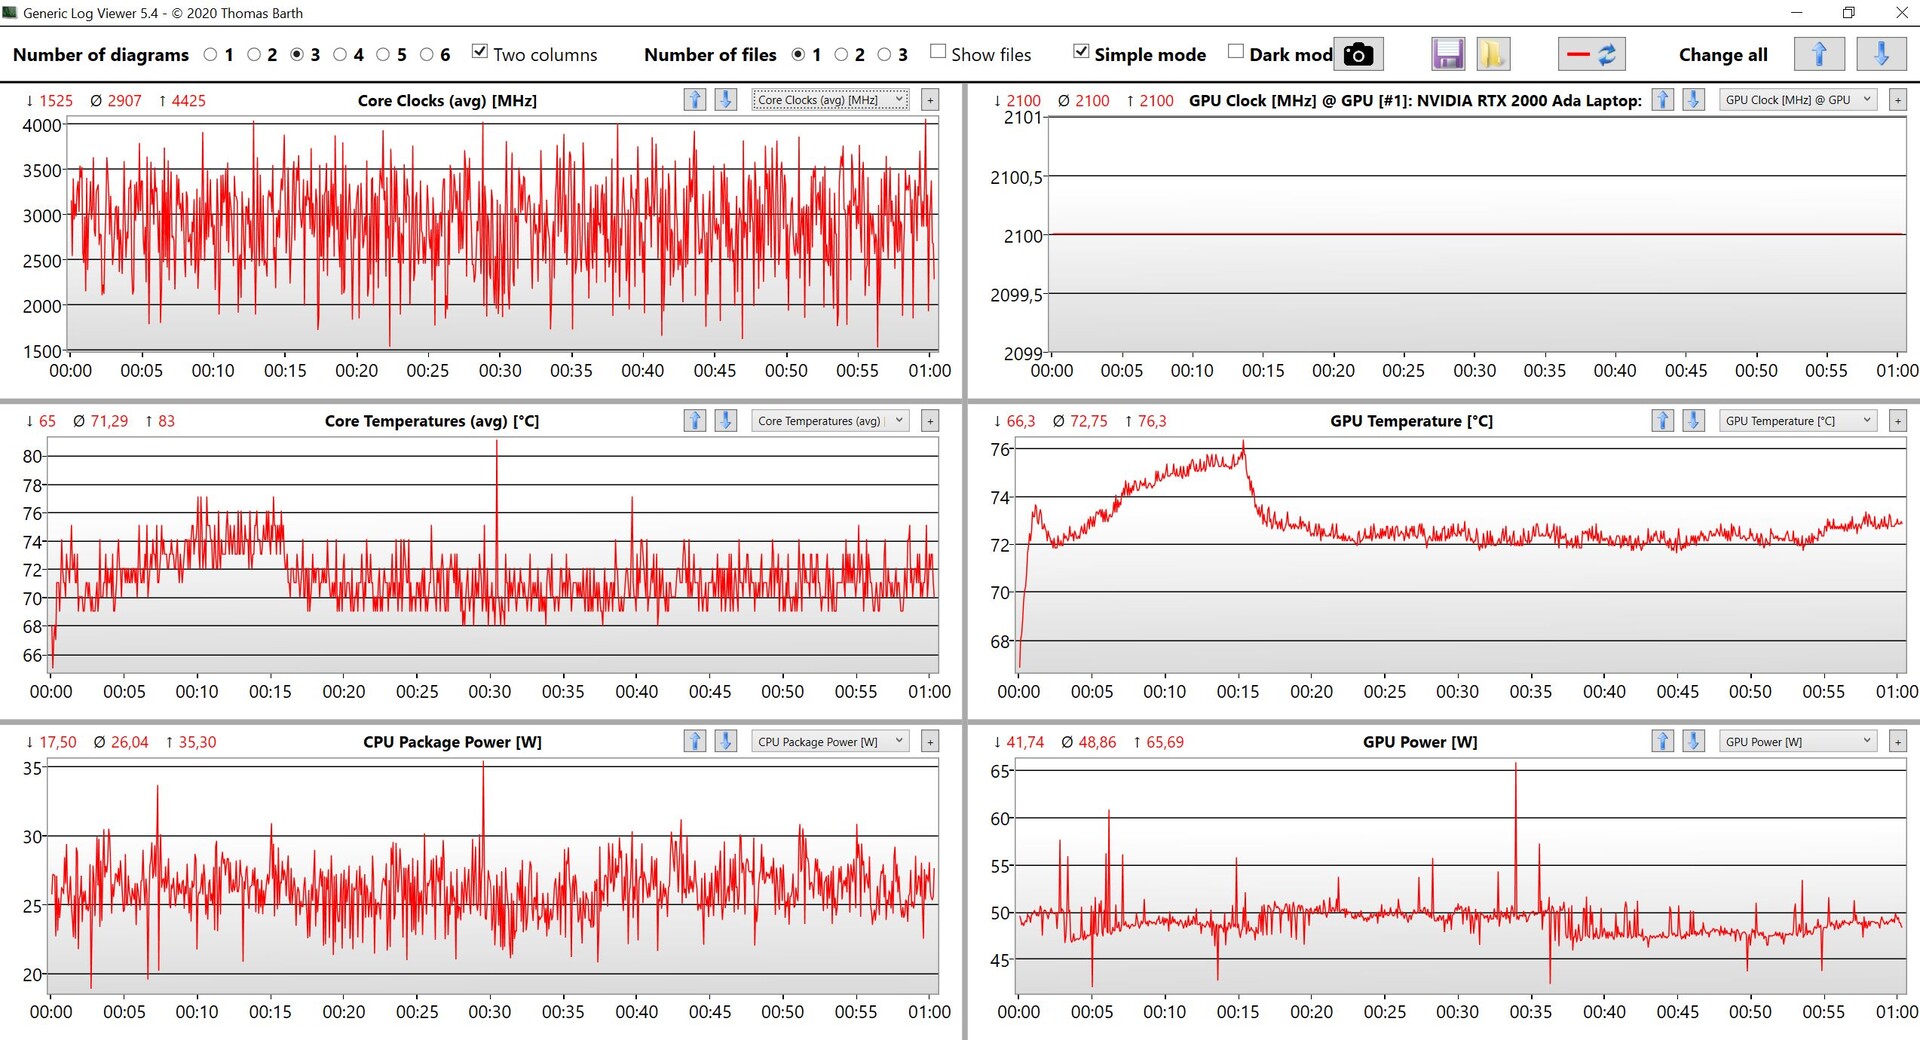
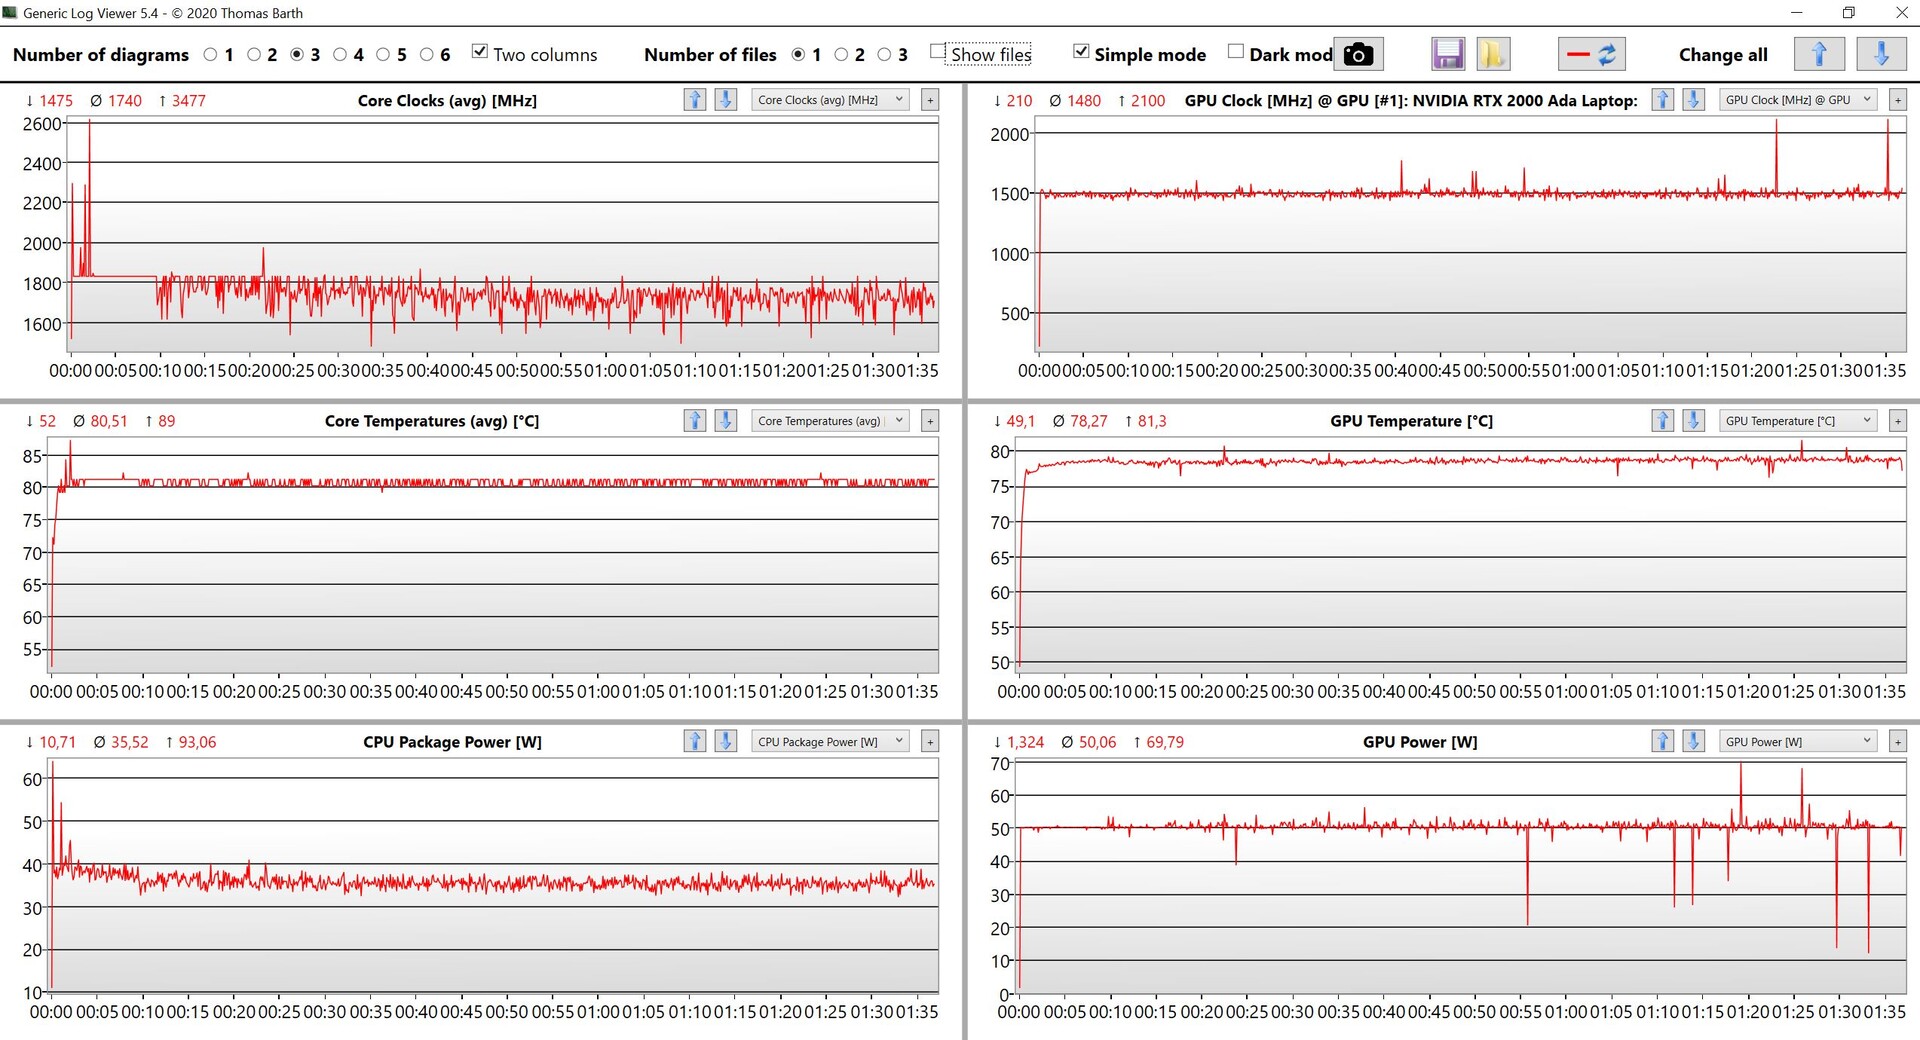
During the stress test, the dedicated graphics card runs at the specified 50 watts, while the processor stabilizes at around 35 watts. The system can handle a total cooling load of 85 watts continuously. For comparison, the G5 generation with the vapor chamber managed around 100 watts in total (60 watts for the GPU and 40 watts for the CPU).
(-) The maximum temperature on the upper side is 47.1 °C / 117 F, compared to the average of 38.2 °C / 101 F, ranging from 22.2 to 69.8 °C for the class Workstation.
(-) The bottom heats up to a maximum of 56.5 °C / 134 F, compared to the average of 41.1 °C / 106 F
(+) In idle usage, the average temperature for the upper side is 26.4 °C / 80 F, compared to the device average of 32 °C / 90 F.
(-) Playing The Witcher 3, the average temperature for the upper side is 39.1 °C / 102 F, compared to the device average of 32 °C / 90 F.
(+) The palmrests and touchpad are reaching skin temperature as a maximum (35.1 °C / 95.2 F) and are therefore not hot.
(-) The average temperature of the palmrest area of similar devices was 27.8 °C / 82 F (-7.3 °C / -13.2 F).
| Lenovo ThinkPad P1 G6-21FV000DGE Intel Core i9-13900H, NVIDIA RTX 2000 Ada Generation Laptop | Dell Precision 5000 5680 Intel Core i9-13900H, NVIDIA RTX 5000 Ada Generation Laptop | Samsung Galaxy Book3 Ultra 16, i9-13900H RTX 4070 Intel Core i9-13900H, NVIDIA GeForce RTX 4070 Laptop GPU | HP ZBook Studio 16 G9 62U04EA Intel Core i7-12800H, NVIDIA RTX A2000 Laptop GPU | MSI CreatorPro Z16P B12UKST Intel Core i7-12700H, NVIDIA RTX A3000 Laptop GPU | Schenker VISION 16 Pro (M23) Intel Core i7-13700H, NVIDIA GeForce RTX 4070 Laptop GPU | Lenovo ThinkPad X1 Extreme G5-21DE003RGE Intel Core i7-12700H, NVIDIA GeForce RTX 3060 Laptop GPU | |
|---|---|---|---|---|---|---|---|
| Heat | -3% | -6% | 3% | -6% | 4% | -1% | |
| Maximum Upper Side * (°C) | 47.1 | 50.2 -7% | 45.9 3% | 38.7 18% | 56.3 -20% | 46.7 1% | 52 -10% |
| Maximum Bottom * (°C) | 56.5 | 32 43% | 50.9 10% | 53.4 5% | 68.3 -21% | 54.1 4% | 56.4 -0% |
| Idle Upper Side * (°C) | 28.1 | 37.4 -33% | 31.6 -12% | 27.3 3% | 25.2 10% | 26.5 6% | 26.4 6% |
| Idle Bottom * (°C) | 27.6 | 31.2 -13% | 34.2 -24% | 31.6 -14% | 25.9 6% | 26.8 3% | 27.2 1% |
* ... smaller is better
Speakers
The speaker characteristics remain similar to the old model, and the maximum volume of nearly 82 dB(A) is also comparable. The current P1 G6 performs slightly better in our measurements, possibly due to software optimizations. We highly recommend activating the preloaded Dolby app for an enhanced audio experience. While the stereo speakers deliver good overall performance, rivals with more speakers still maintain an advantage in this aspect.
Lenovo ThinkPad P1 G6-21FV000DGE audio analysis
(±) | speaker loudness is average but good (81.8 dB)
Bass 100 - 315 Hz
(±) | reduced bass - on average 8.9% lower than median
(±) | linearity of bass is average (12.3% delta to prev. frequency)
Mids 400 - 2000 Hz
(+) | balanced mids - only 4.7% away from median
(+) | mids are linear (3.5% delta to prev. frequency)
Highs 2 - 16 kHz
(+) | balanced highs - only 4.1% away from median
(+) | highs are linear (6.1% delta to prev. frequency)
Overall 100 - 16.000 Hz
(+) | overall sound is linear (12.2% difference to median)
Compared to same class
» 18% of all tested devices in this class were better, 3% similar, 79% worse
» The best had a delta of 7%, average was 17%, worst was 35%
Compared to all devices tested
» 10% of all tested devices were better, 2% similar, 88% worse
» The best had a delta of 4%, average was 23%, worst was 134%
MSI CreatorPro Z16P B12UKST audio analysis
(+) | speakers can play relatively loud (83.3 dB)
Bass 100 - 315 Hz
(-) | nearly no bass - on average 18.7% lower than median
(±) | linearity of bass is average (7% delta to prev. frequency)
Mids 400 - 2000 Hz
(+) | balanced mids - only 3% away from median
(+) | mids are linear (6.8% delta to prev. frequency)
Highs 2 - 16 kHz
(+) | balanced highs - only 4.6% away from median
(+) | highs are linear (6.4% delta to prev. frequency)
Overall 100 - 16.000 Hz
(±) | linearity of overall sound is average (15.2% difference to median)
Compared to same class
» 33% of all tested devices in this class were better, 10% similar, 57% worse
» The best had a delta of 7%, average was 17%, worst was 35%
Compared to all devices tested
» 22% of all tested devices were better, 4% similar, 74% worse
» The best had a delta of 4%, average was 23%, worst was 134%
Energy Management - Good stamina with the IPS panel
Power Consumption
The ThinkPad P1 G6 with the WQHD panel demonstrates significantly higher efficiency compared to the old ThinkPad X1 Extreme with the 4K panel. Experience suggests that the optional 4K OLED screen will also require considerably more power. The maximum idle consumption at 165 Hz is 15.3 watts, and you can save approximately 1.5 watts in 60 Hz mode. The notebook remains quite efficient under load; during gaming, we measured just over 100 watts. In the predecessor, it was still about 130 watts despite lower performance. Although we briefly measured a maximum of 165 watts at the start of the stress test, it quickly settled at around 110 watts. The included 170-watt power supply is more than sufficient for these power requirements.
| Off / Standby | |
| Idle | |
| Load |
|
Key:
min: | |
| Lenovo ThinkPad P1 G6-21FV000DGE i9-13900H, RTX 2000 Ada Generation Laptop, SK Hynix PC711 1TB HFS001TDE9X084N, IPS, 2560x1600, 16" | Dell Precision 5000 5680 i9-13900H, RTX 5000 Ada Generation Laptop, 2x SK hynix PC801 HFS512GEJ9X101N RAID 0, OLED, 3840x2400, 16" | Samsung Galaxy Book3 Ultra 16, i9-13900H RTX 4070 i9-13900H, GeForce RTX 4070 Laptop GPU, Samsung PM9A1 MZVL21T0HCLR, OLED / AMOLED, 2880x1800, 16" | HP ZBook Studio 16 G9 62U04EA i7-12800H, RTX A2000 Laptop GPU, Micron 3400 1TB MTFDKBA1T0TFH, IPS, 3840x2400, 16" | MSI CreatorPro Z16P B12UKST i7-12700H, RTX A3000 Laptop GPU, Samsung PM9A1 MZVL21T0HCLR, IPS, 2560x1600, 16" | Schenker VISION 16 Pro (M23) i7-13700H, GeForce RTX 4070 Laptop GPU, Samsung 990 Pro 1 TB, IPS, 2560x1600, 16" | Lenovo ThinkPad X1 Extreme G5-21DE003RGE i7-12700H, GeForce RTX 3060 Laptop GPU, Micron 3400 1TB MTFDKBA1T0TFH, IPS, 3840x2400, 16" | Average NVIDIA RTX 2000 Ada Generation Laptop | Average of class Workstation | |
|---|---|---|---|---|---|---|---|---|---|
| Power Consumption | -14% | 29% | -12% | -21% | -0% | -43% | 9% | -7% | |
| Idle Minimum * (Watt) | 8.3 | 8 4% | 4.3 48% | 7.2 13% | 10.8 -30% | 8.6 -4% | 11.8 -42% | 6.88 ? 17% | 9.04 ? -9% |
| Idle Average * (Watt) | 14.5 | 10.4 28% | 4.6 68% | 18.1 -25% | 16.3 -12% | 12 17% | 22.4 -54% | 12.1 ? 17% | 13.8 ? 5% |
| Idle Maximum * (Watt) | 15.3 | 30.5 -99% | 11.4 25% | 18.5 -21% | 16.9 -10% | 12.4 19% | 23.1 -51% | 14.5 ? 5% | 17.7 ? -16% |
| Load Average * (Watt) | 91.8 | 75.4 18% | 97 -6% | 112.8 -23% | 111.7 -22% | 80 13% | 138 -50% | 86.9 ? 5% | 96.2 ? -5% |
| Witcher 3 ultra * (Watt) | 104.7 | 134 -28% | 100.9 4% | 106.7 -2% | 152.1 -45% | 147.7 -41% | 129.9 -24% | ||
| Load Maximum * (Watt) | 164.5 | 175 -6% | 107 35% | 186 -13% | 177.4 -8% | 173.1 -5% | 225.6 -37% | 161.1 ? 2% | 178.5 ? -9% |
* ... smaller is better
Power consumption Witcher 3 / stress test
Power consumption with external monitor
Battery Life
The battery retains its 90-watt-hour capacity, allowing for excellent battery runtimes, especially in the 60 Hz mode. During our WLAN test, the ThinkPad P1 G6 achieves approximately 9.5 hours at 150 cd/m² (equivalent to 63% of the maximum brightness in the test device) and 6 hours and 43 minutes at full brightness. Considering the large display and the high brightness of almost 500 cd/m², these results are quite impressive. It lasts for almost 11 hours during the video test (also at 150 cd/m2), but the runtimes are shorter in the 165 Hz mode, as seen in the table below:
| Mode | WLAN test (150 cd/m²) | WLAN test max. brightness | Video test (150 cd/m²) |
|---|---|---|---|
| 60 Hz | 567 minutes | 403 minutes | 674 minutes |
| 165 Hz | 500 minutes | 370 minutes | 548 minutes |
Under heavy usage, the battery can deplete in slightly over an hour, and it takes approximately 100 minutes to fully recharge when the device is powered on. About 45% charge is available after just under 20 minutes, and 80% is achieved after 50 minutes.
| Lenovo ThinkPad P1 G6-21FV000DGE i9-13900H, RTX 2000 Ada Generation Laptop, 90 Wh | Dell Precision 5000 5680 i9-13900H, RTX 5000 Ada Generation Laptop, 98 Wh | Samsung Galaxy Book3 Ultra 16, i9-13900H RTX 4070 i9-13900H, GeForce RTX 4070 Laptop GPU, 76 Wh | HP ZBook Studio 16 G9 62U04EA i7-12800H, RTX A2000 Laptop GPU, 86 Wh | MSI CreatorPro Z16P B12UKST i7-12700H, RTX A3000 Laptop GPU, 90 Wh | Schenker VISION 16 Pro (M23) i7-13700H, GeForce RTX 4070 Laptop GPU, 80 Wh | Lenovo ThinkPad X1 Extreme G5-21DE003RGE i7-12700H, GeForce RTX 3060 Laptop GPU, 90 Wh | Average of class Workstation | |
|---|---|---|---|---|---|---|---|---|
| Battery runtime | 30% | -18% | -19% | -39% | -10% | -3% | 2% | |
| H.264 (h) | 11.2 | 9 -20% | 8.5 -24% | 7.8 -30% | 7.3 -35% | 9.51 ? -15% | ||
| WiFi v1.3 (h) | 9.5 | 9.9 4% | 8 -16% | 6.3 -34% | 5.8 -39% | 7.8 -18% | 6.7 -29% | 8.52 ? -10% |
| Load (h) | 1.1 | 1.7 55% | 0.9 -18% | 1.1 0% | 1.3 18% | 1.7 55% | 1.429 ? 30% |
Pros
Cons
Verdict - Very good mobile workstation

The new ThinkPad P1 G6 meets expectations by retaining the unchanged case design and offering two different types of cooling (classic with heat pipes or vapor chamber) depending on the dedicated graphics card. The discontinuation of the ThinkPad X1 Extreme is solely a marketing decision, as both models were identical. Alongside professional Nvidia GPUs, Lenovo also provides consumer variants, although the choices are somewhat limited to the RTX 4060 Laptop, 4080 Laptop, and 4090 Laptop.
In terms of processor performance, the overall power is excellent, with the Core i9 excelling in single-core tests. Additionally, it is suspected that the stronger models with vapor chamber cooling might offer slightly better CPU performance. The new RTX 2000 Ada stands out as a significant upgrade, delivering superior graphics performance despite its relatively low TGP rating of 65 watts. It outperforms the old RTX A3000 and even the GeForce RTX 3060 Laptop. Although the GPU is similar to the one in the GeForce RTX 4060 laptop, it runs at 80 watts in the ThinkPad P1 G6 with more robust vapor-chamber cooling. Lenovo's differentiation in this regard is not entirely clear.
The ThinkPad P1 G6 excels as a mobile workstation, prioritizing mobility over raw performance. The Nvidia Ada GPUs offer impressive performance, and the optional IPS display with 500 nits brightness and a refresh rate of 165 Hz is highly recommended, especially if you don't require an extended color space.
While the display performs exceptionally well, its weak point lies in color space coverage, limited to the small sRGB standard. All other aspects of the display are excellent, making it a preferred choice over the optional OLED model. The only argument for the OLED screen is its larger color space coverage. It is unfortunate that Lenovo no longer offers the 4K IPS display with Adobe RGB color space.
The ThinkPad P1 G6 is a well-developed device without major flaws. Improvements could include a faster card reader, reverting to the old keyboards with 0.07-inch stroke, and pre-routing antennae for WWAN modules. Additionally, optimizing the fan behavior would enhance the overall user experience. The device's noise level peaks at 48 dB(A) under load, making it relatively noisy. In comparison, the predecessor's vapor chamber cooling was quieter.
Price & Availability
Our review sample of the ThinkPad P1 G6 can be ordered from Amazon for ~$3,000 USD. The P1 G6 can also be configured in Lenovo's online store.
Lenovo ThinkPad P1 G6-21FV000DGE
- 10/19/2023 v7 (old)
Andreas Osthoff
Transparency
The selection of devices to be reviewed is made by our editorial team. The test sample was provided to the author as a loan by the manufacturer or retailer for the purpose of this review. The lender had no influence on this review, nor did the manufacturer receive a copy of this review before publication. There was no obligation to publish this review. As an independent media company, Notebookcheck is not subjected to the authority of manufacturers, retailers or publishers.
This is how Notebookcheck is testing
Every year, Notebookcheck independently reviews hundreds of laptops and smartphones using standardized procedures to ensure that all results are comparable. We have continuously developed our test methods for around 20 years and set industry standards in the process. In our test labs, high-quality measuring equipment is utilized by experienced technicians and editors. These tests involve a multi-stage validation process. Our complex rating system is based on hundreds of well-founded measurements and benchmarks, which maintains objectivity. Further information on our test methods can be found here.
Price comparison

