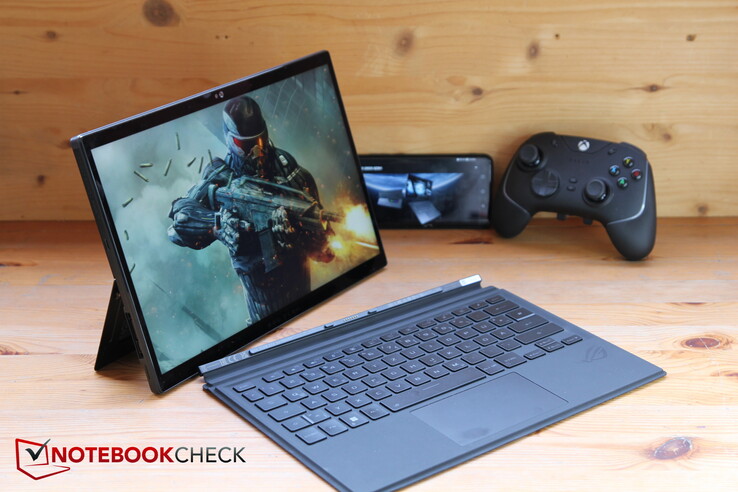
Asus ROG Flow Z13 in review: Madness - RTX 4060 in an impressive gaming tablet
Steam Deck, Asus ROG Ally and co. are currently making the concept of a small form factor gaming PC respectable. The new CPU and GPU generations are becoming more and more efficient, and manufacturers are now attempting to cover new niches by installing powerful components in ever smaller and thus more mobile cases.
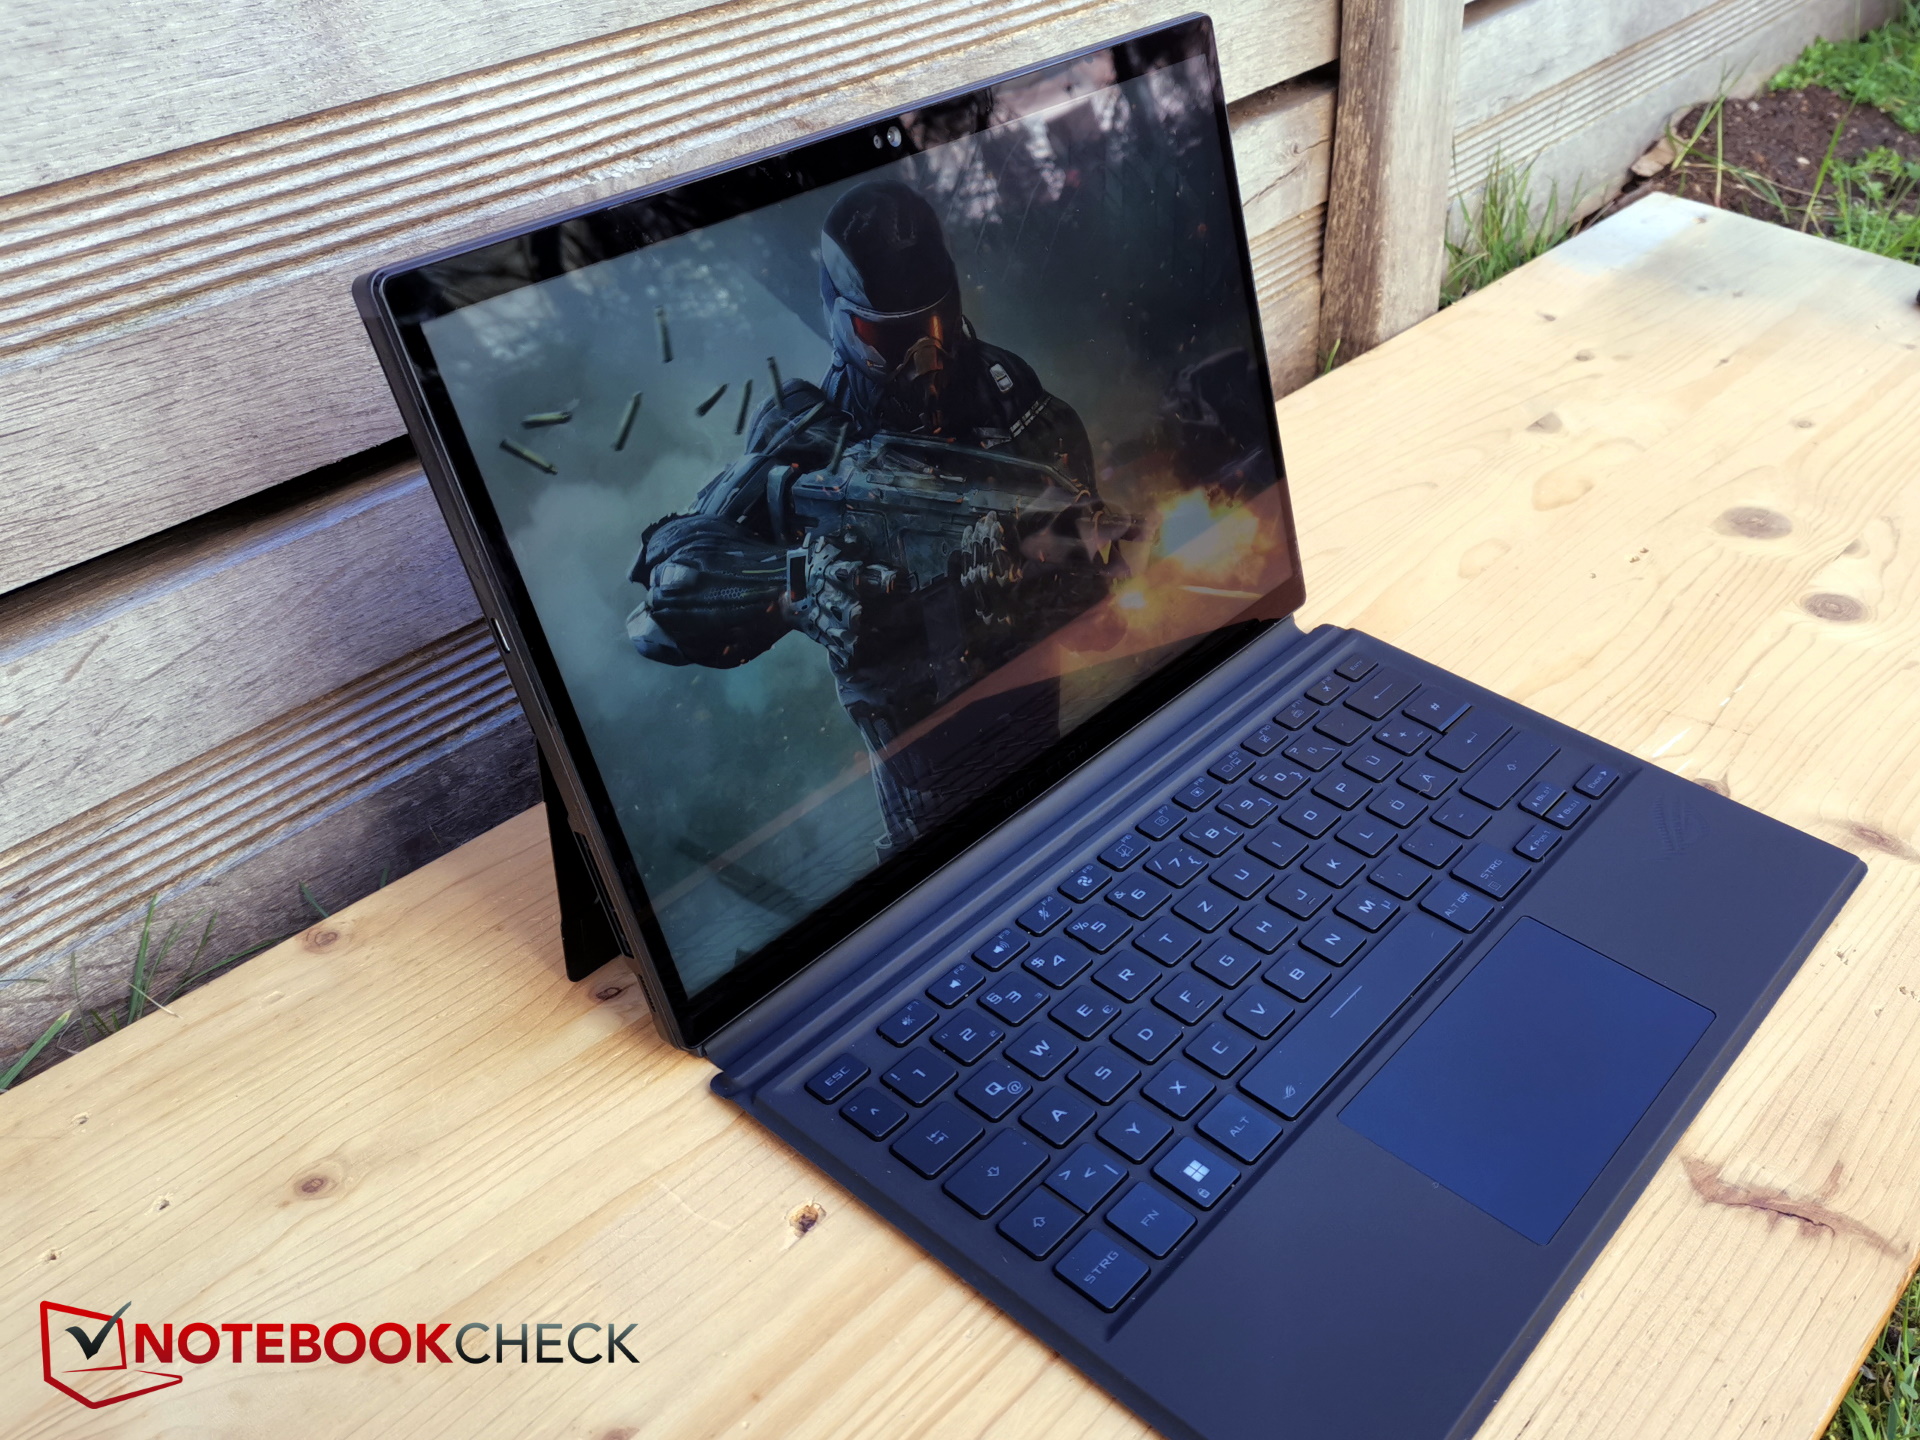
The Asus ROG Flow Z13 is a 13-inch tablet with a high-resolution touchscreen and a magnetically attachable keyboard case. What's special is that instead of tempered and economical office components, the not-so-thin tablet utilizes real high-end gaming hardware. The compact, powerful device should also appeal to content creators.
We also recently reviewed an special edition of the Z13. This one has a different case and an RTX 4070, whereas the predecessor only had an RTX 3050 Ti. Of course, we include both models for comparison.
The field of competitors for comparison is thin here, so we have to resort to real gaming laptops in on top of the predecessor and the special edition. For a comparison of the RTX 4060's performance, we use the new MSI Katana 17 as well as the MSI Cyborg 15, otherwise we compare it with last year's 14-inch Acer Predator Triton 300 SE (RTX 3060).
Possible competitors in comparison
Rating | Date | Model | Weight | Height | Size | Resolution | Price |
|---|---|---|---|---|---|---|---|
| 89.1 % v7 (old) | 04 / 2023 | Asus ROG Flow Z13 GZ301V i9-13900H, GeForce RTX 4060 Laptop GPU | 1.6 kg | 14.2 mm | 13.40" | 2560x1600 | |
| 89.4 % v7 (old) | 04 / 2023 | Asus ROG Flow Z13 ACRNM i9-13900H, GeForce RTX 4070 Laptop GPU | 1.7 kg | 20 mm | 13.40" | 2560x1600 | |
| 86.8 % v7 (old) | 03 / 2022 | Asus ROG Flow Z13 GZ301ZE i9-12900H, GeForce RTX 3050 Ti Laptop GPU | 1.2 kg | 12 mm | 13.40" | 1920x1200 | |
| 82.1 % v7 (old) | 02 / 2023 | MSI Katana 17 B13VFK i7-13620H, GeForce RTX 4060 Laptop GPU | 2.8 kg | 25.2 mm | 17.30" | 1920x1080 | |
| 86 % v7 (old) | 11 / 2022 | Acer Predator Triton 300 SE i9-12900H, GeForce RTX 3060 Laptop GPU | 1.7 kg | 19.8 mm | 14.00" | 2880x1800 | |
| 82.4 % v7 (old) | 04 / 2023 | MSI Cyborg 15 A12VF i7-12650H, GeForce RTX 4060 Laptop GPU | 2 kg | 22.9 mm | 15.60" | 1920x1080 |
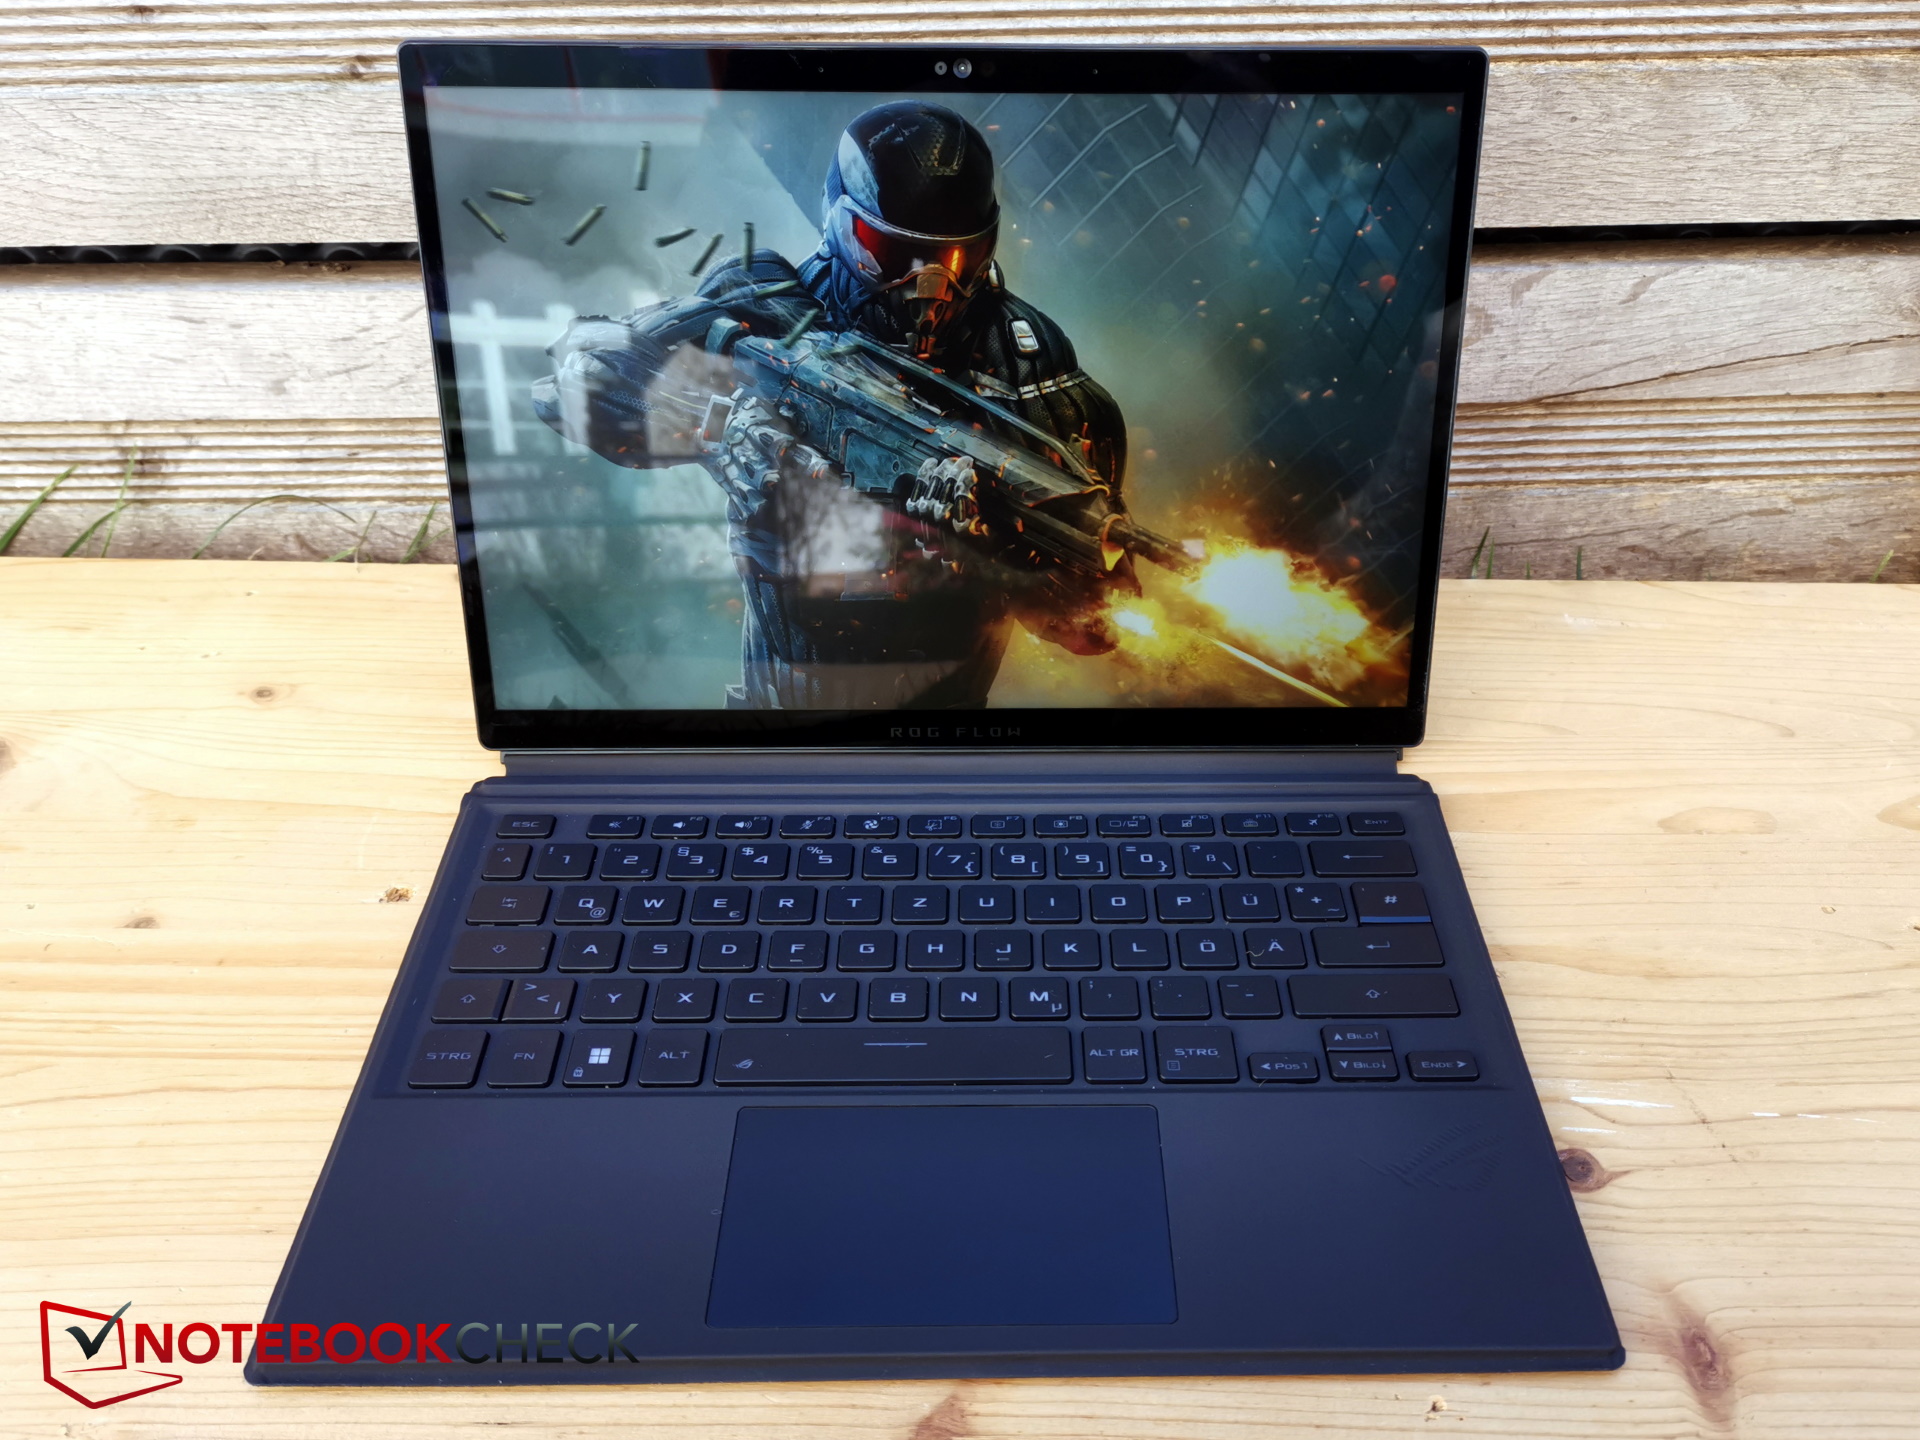
Case - The slightly thicker tablet
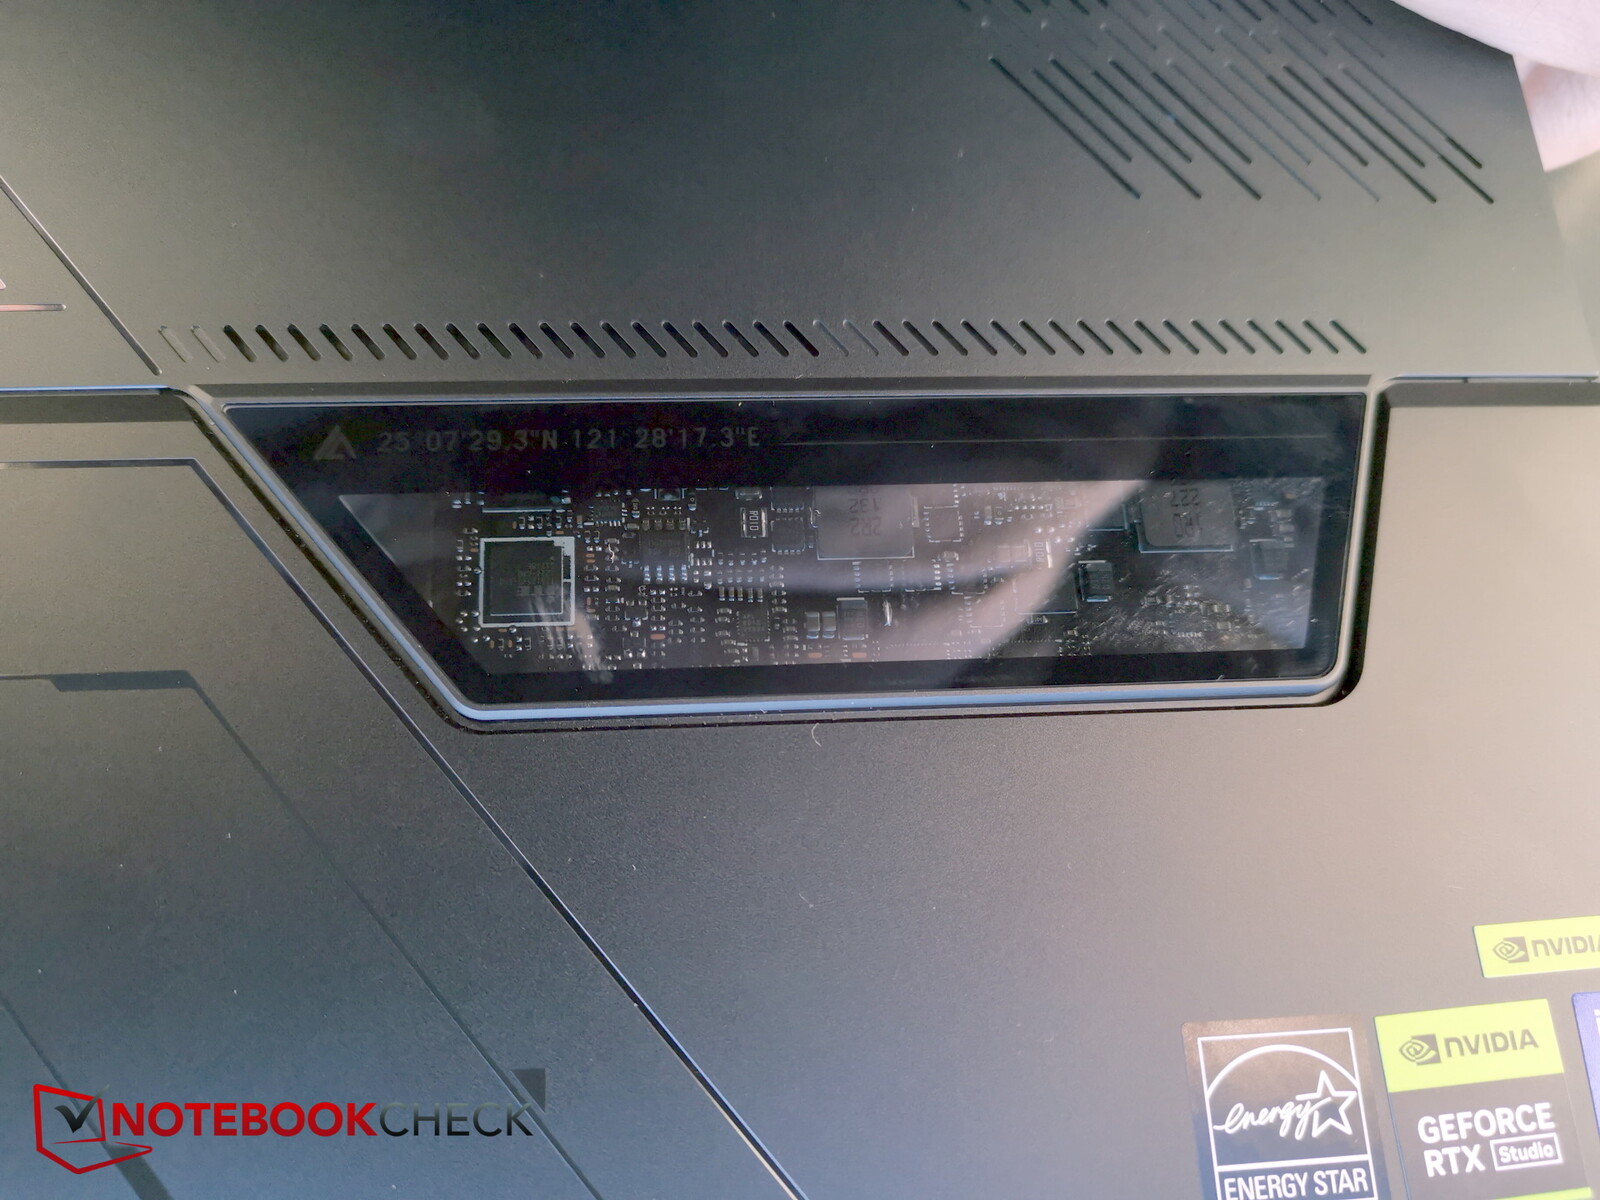
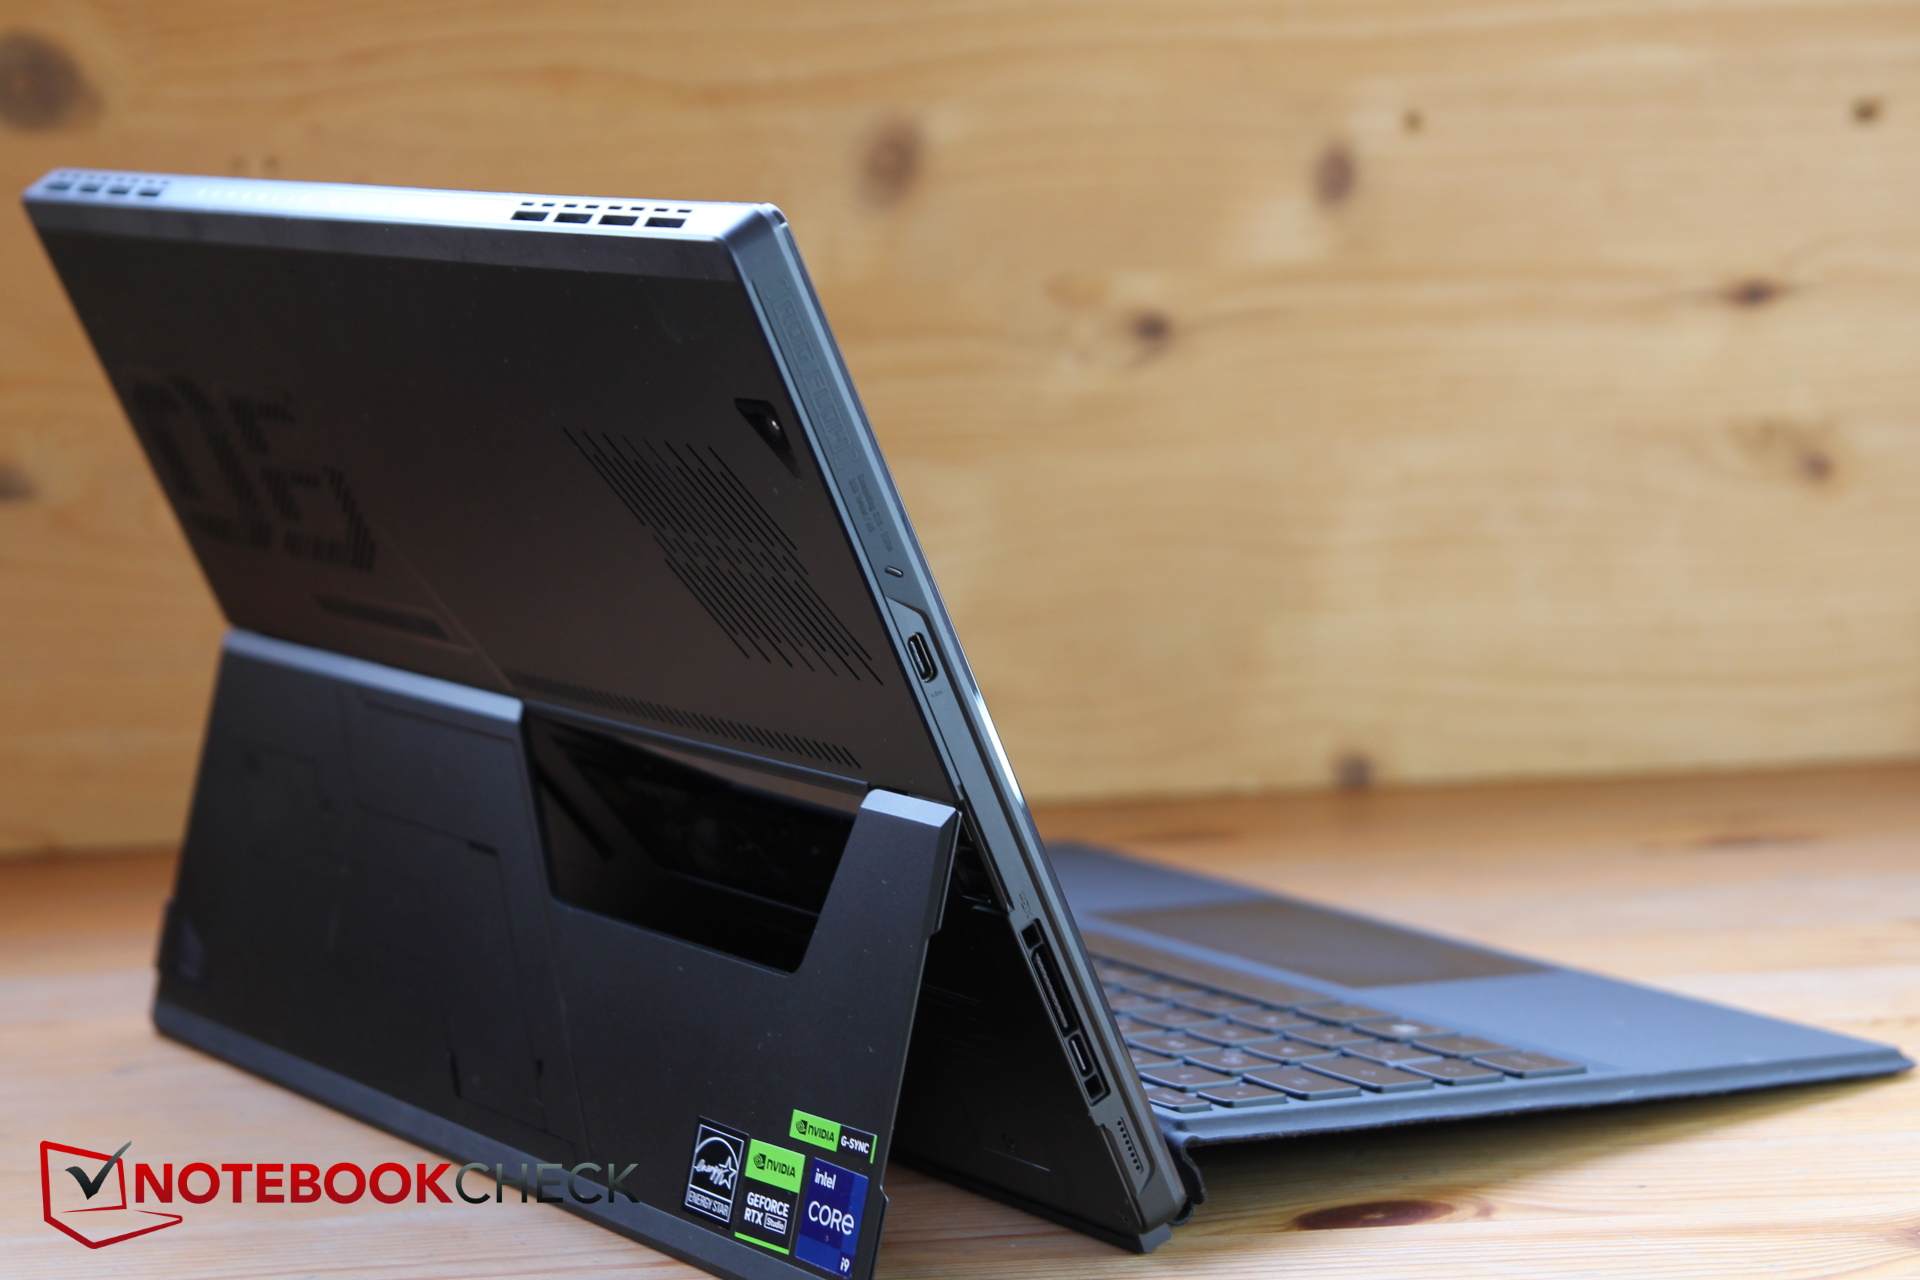
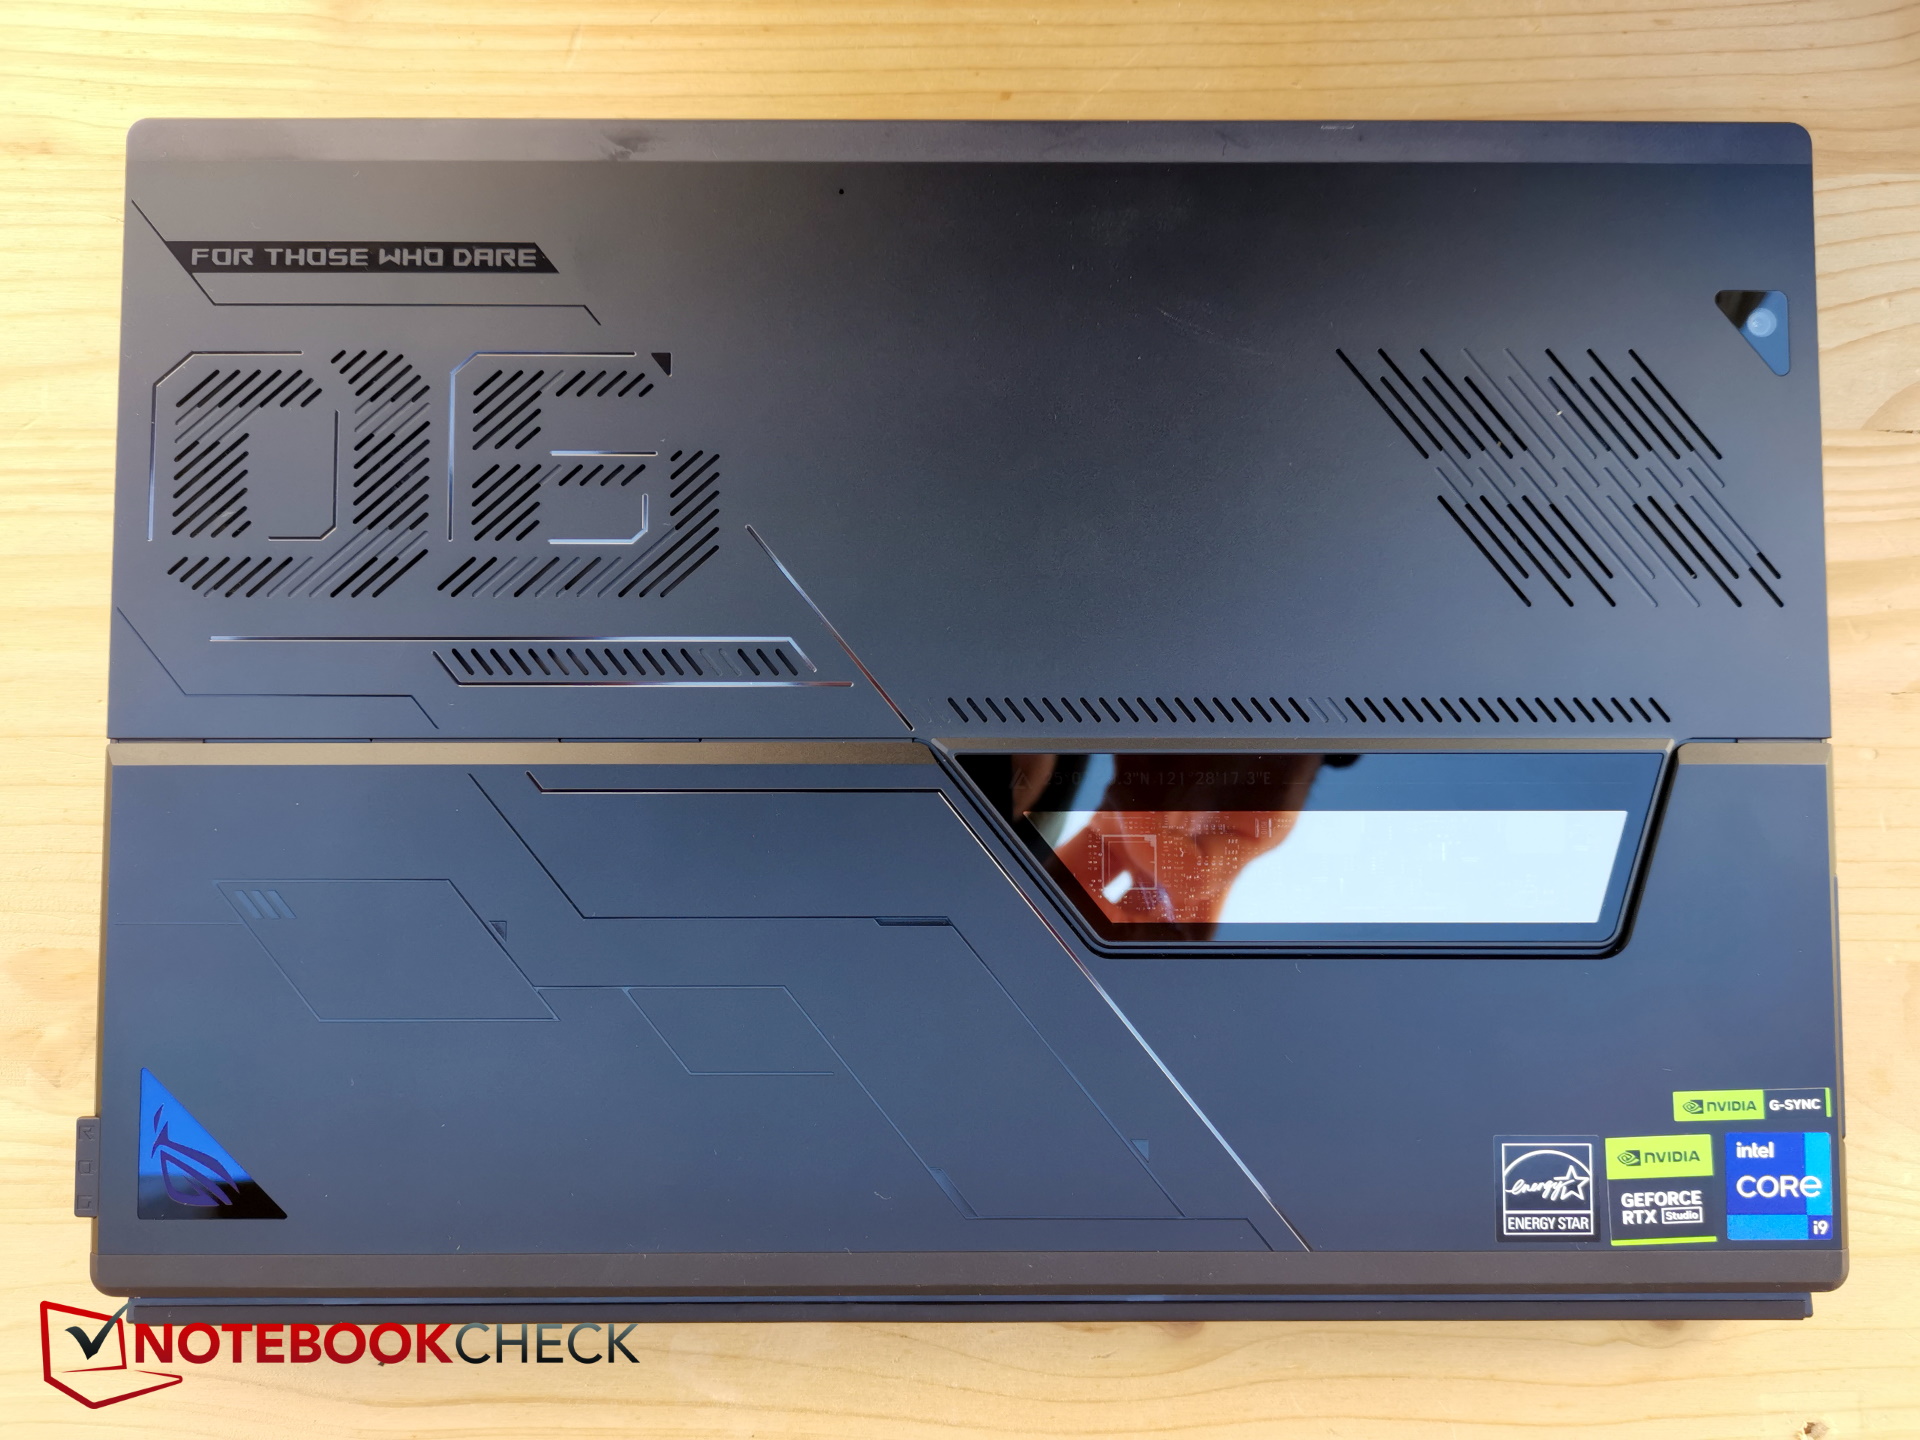
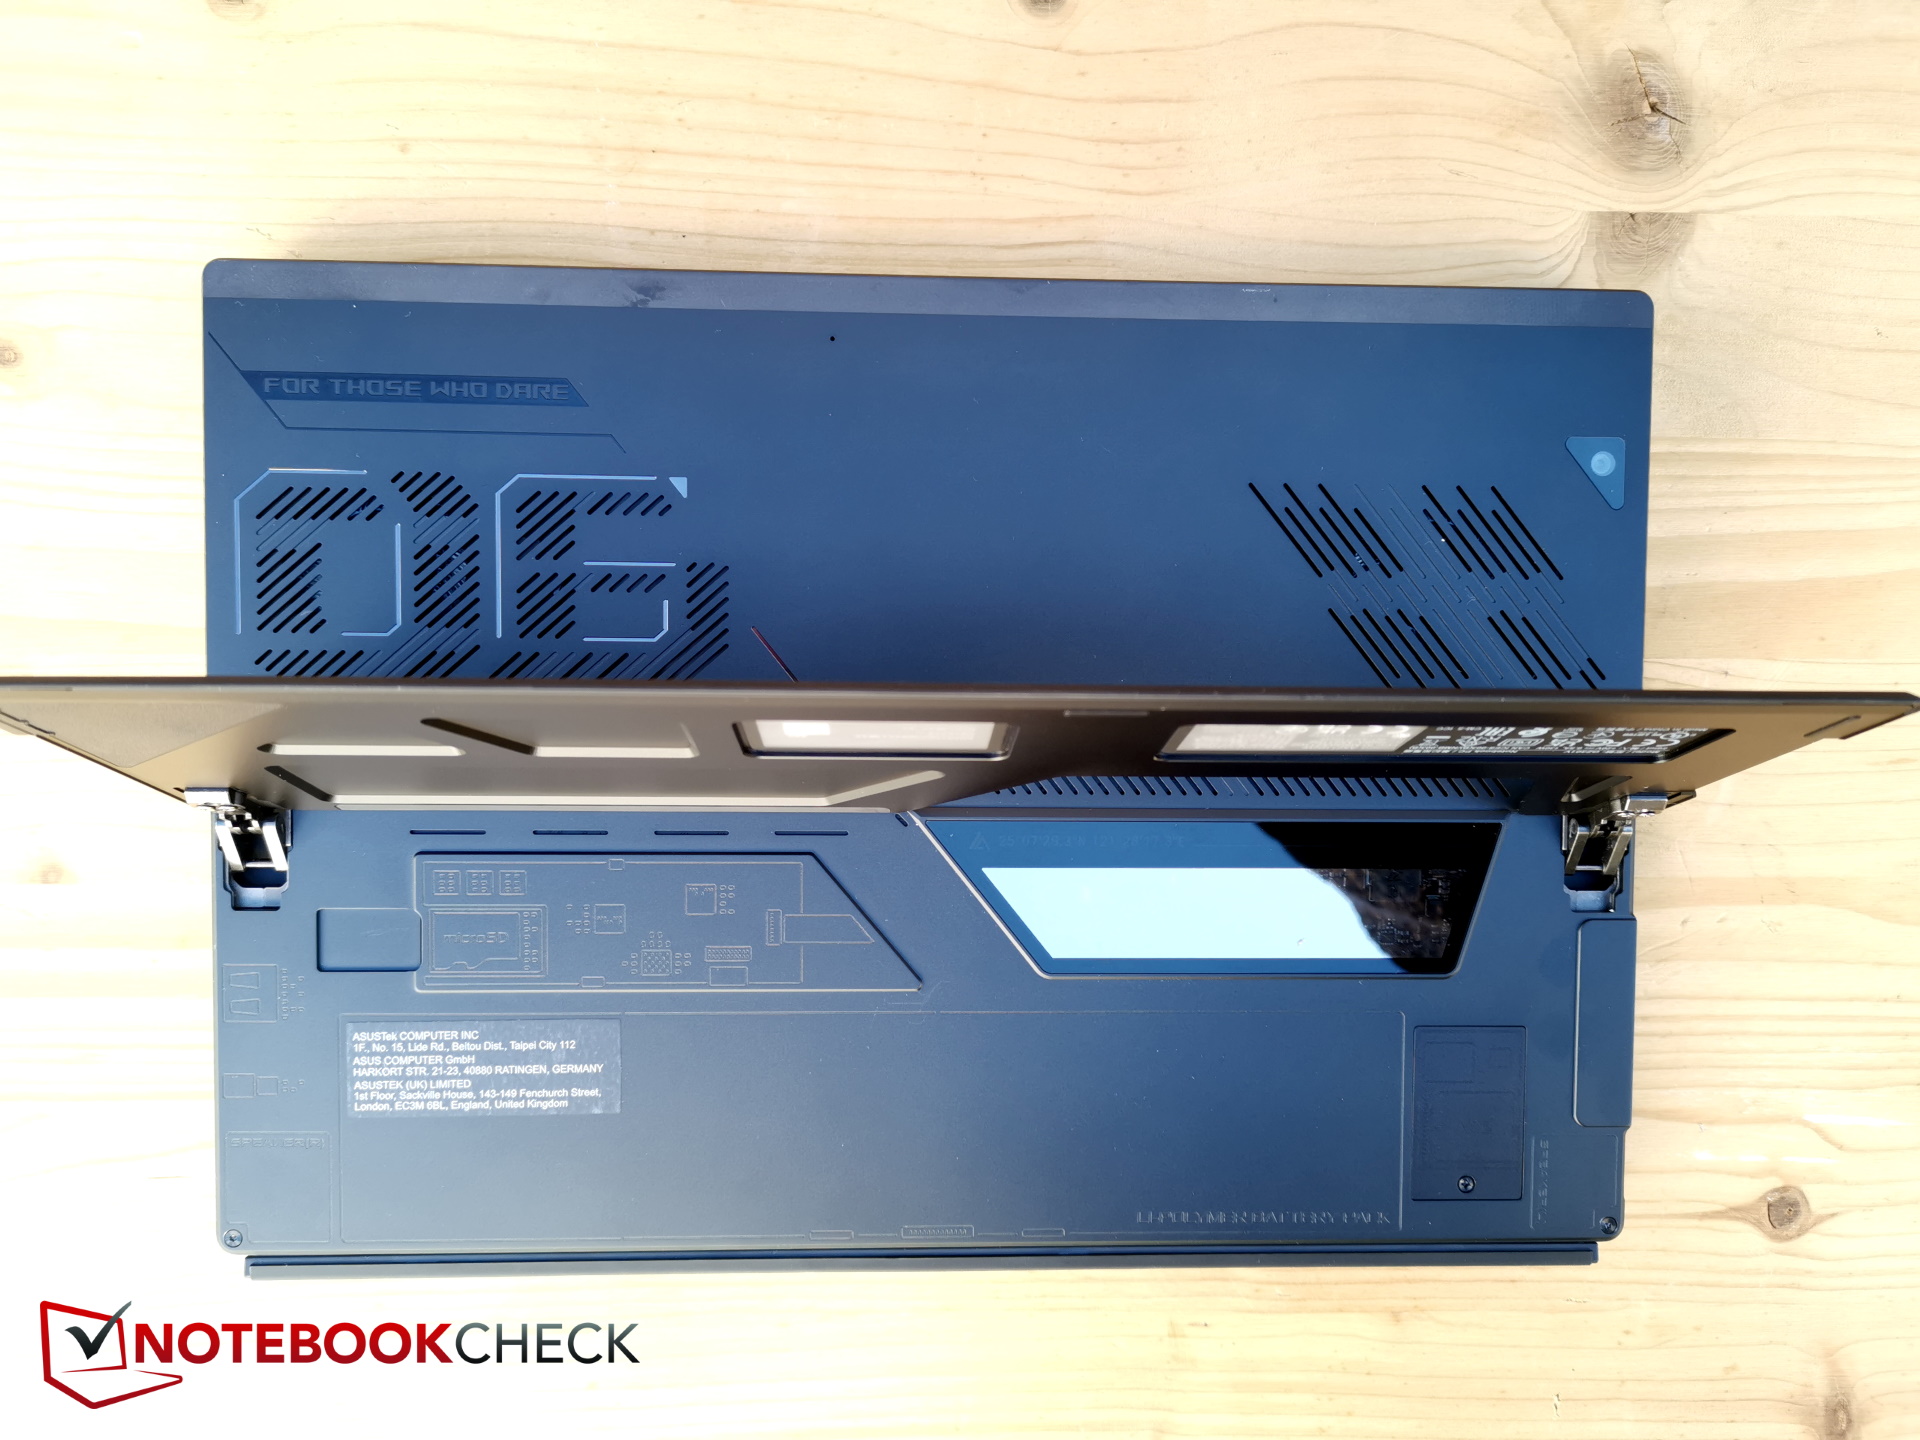
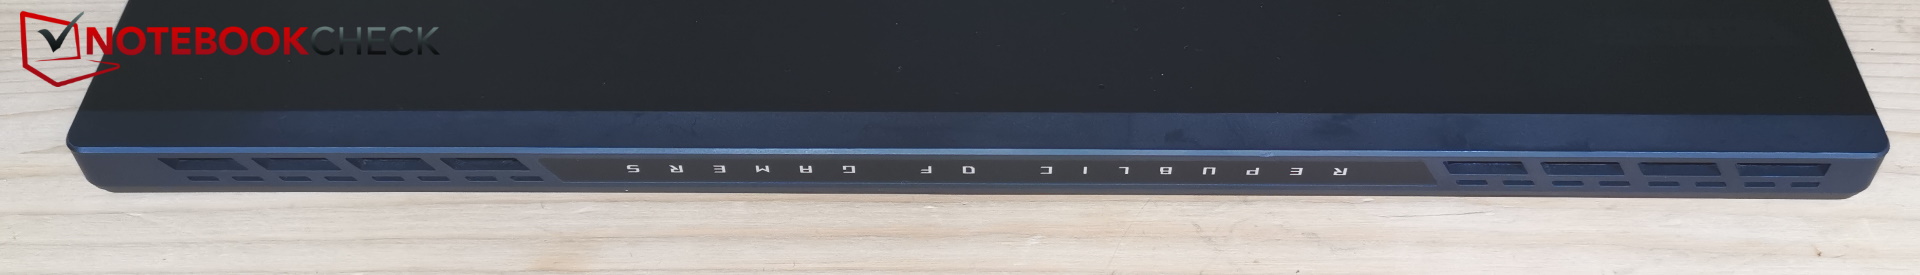
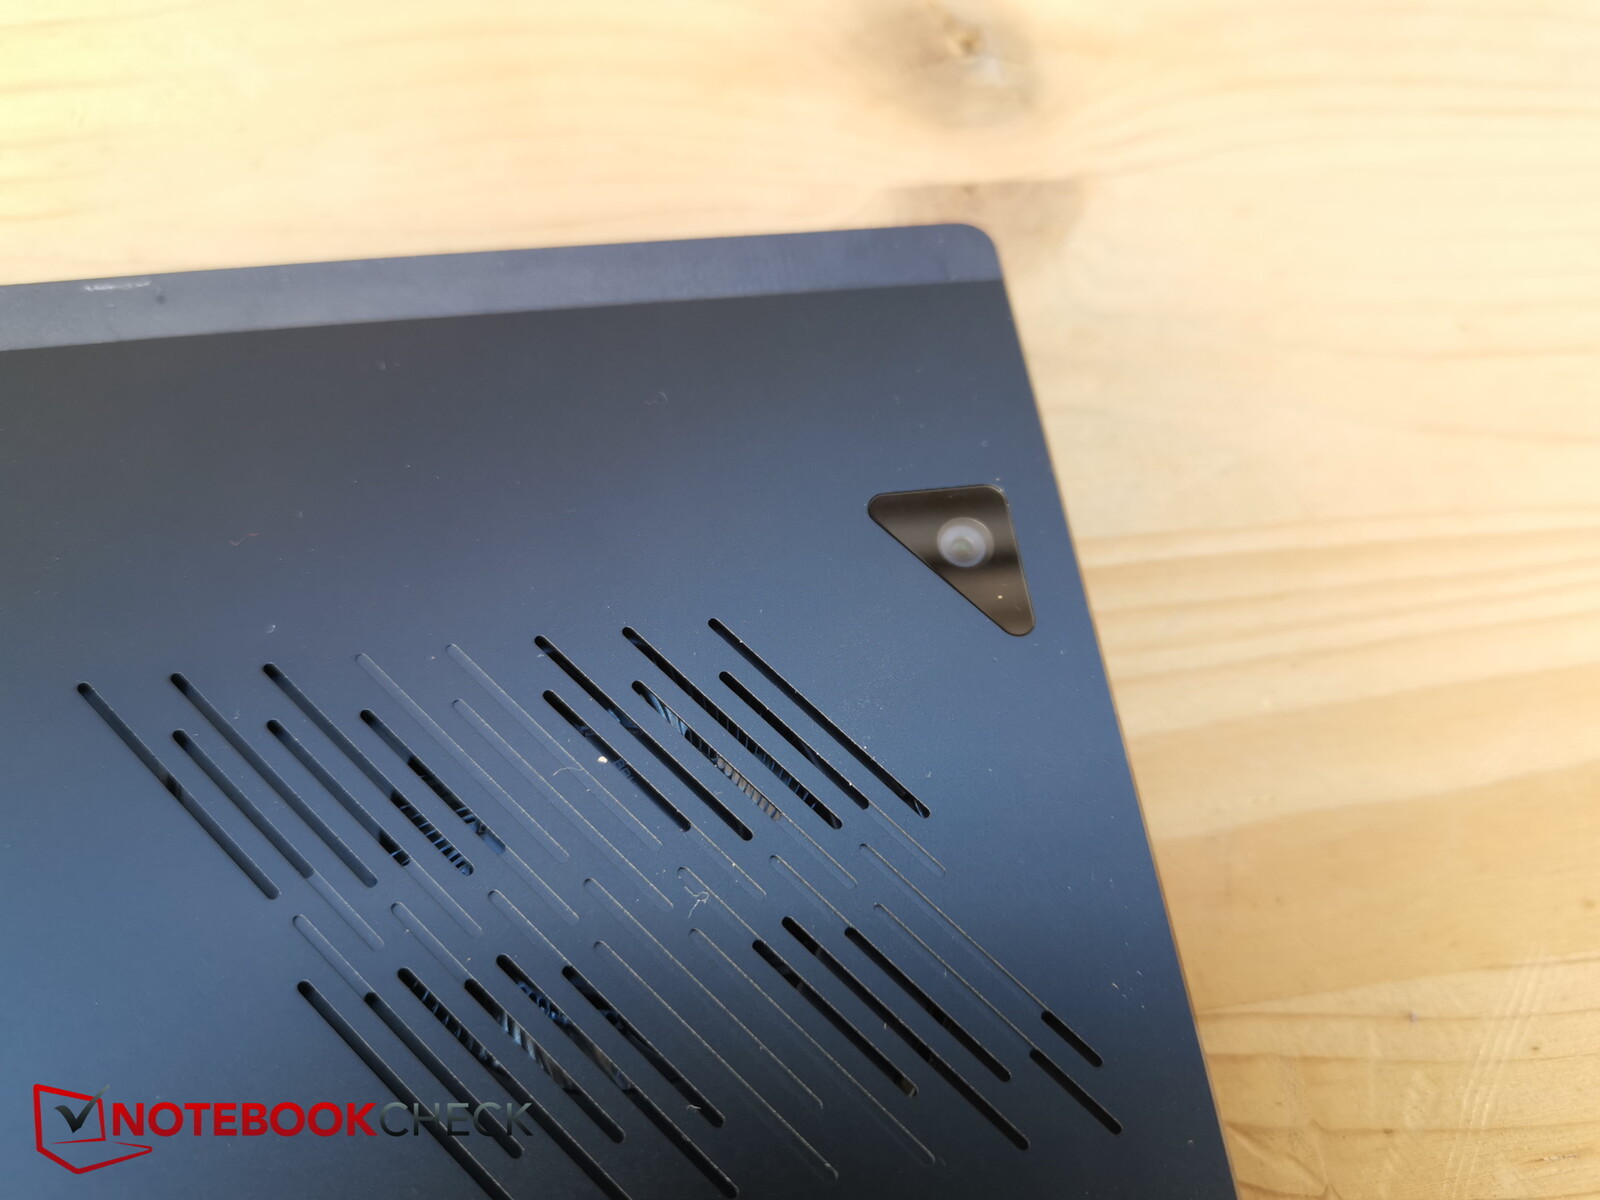
Even without the shoulder strap or the near-rugged design of the special edition, the Z13 is an eye-catcher: the back is mostly aluminum, the lower half of which folds out as a stand, and there's an interesting, narrow "viewing window" with a view to the internal hardware of the gaming tablet.
The exhaust vents are located at the top of the two corners and on the back. The main camera on the back blends almost inconspicuously into the generally stylish design on the top right.
The tablet itself is very stable due to the aluminum chassis and general thickness and cannot be twisted. The stand's hinges are also very stable and keep the tablet in a good position when standing.
The keyboard cover is magnetically docked. Of course, the thin dock is a little less torsion-resistant, but it serves its purpose.
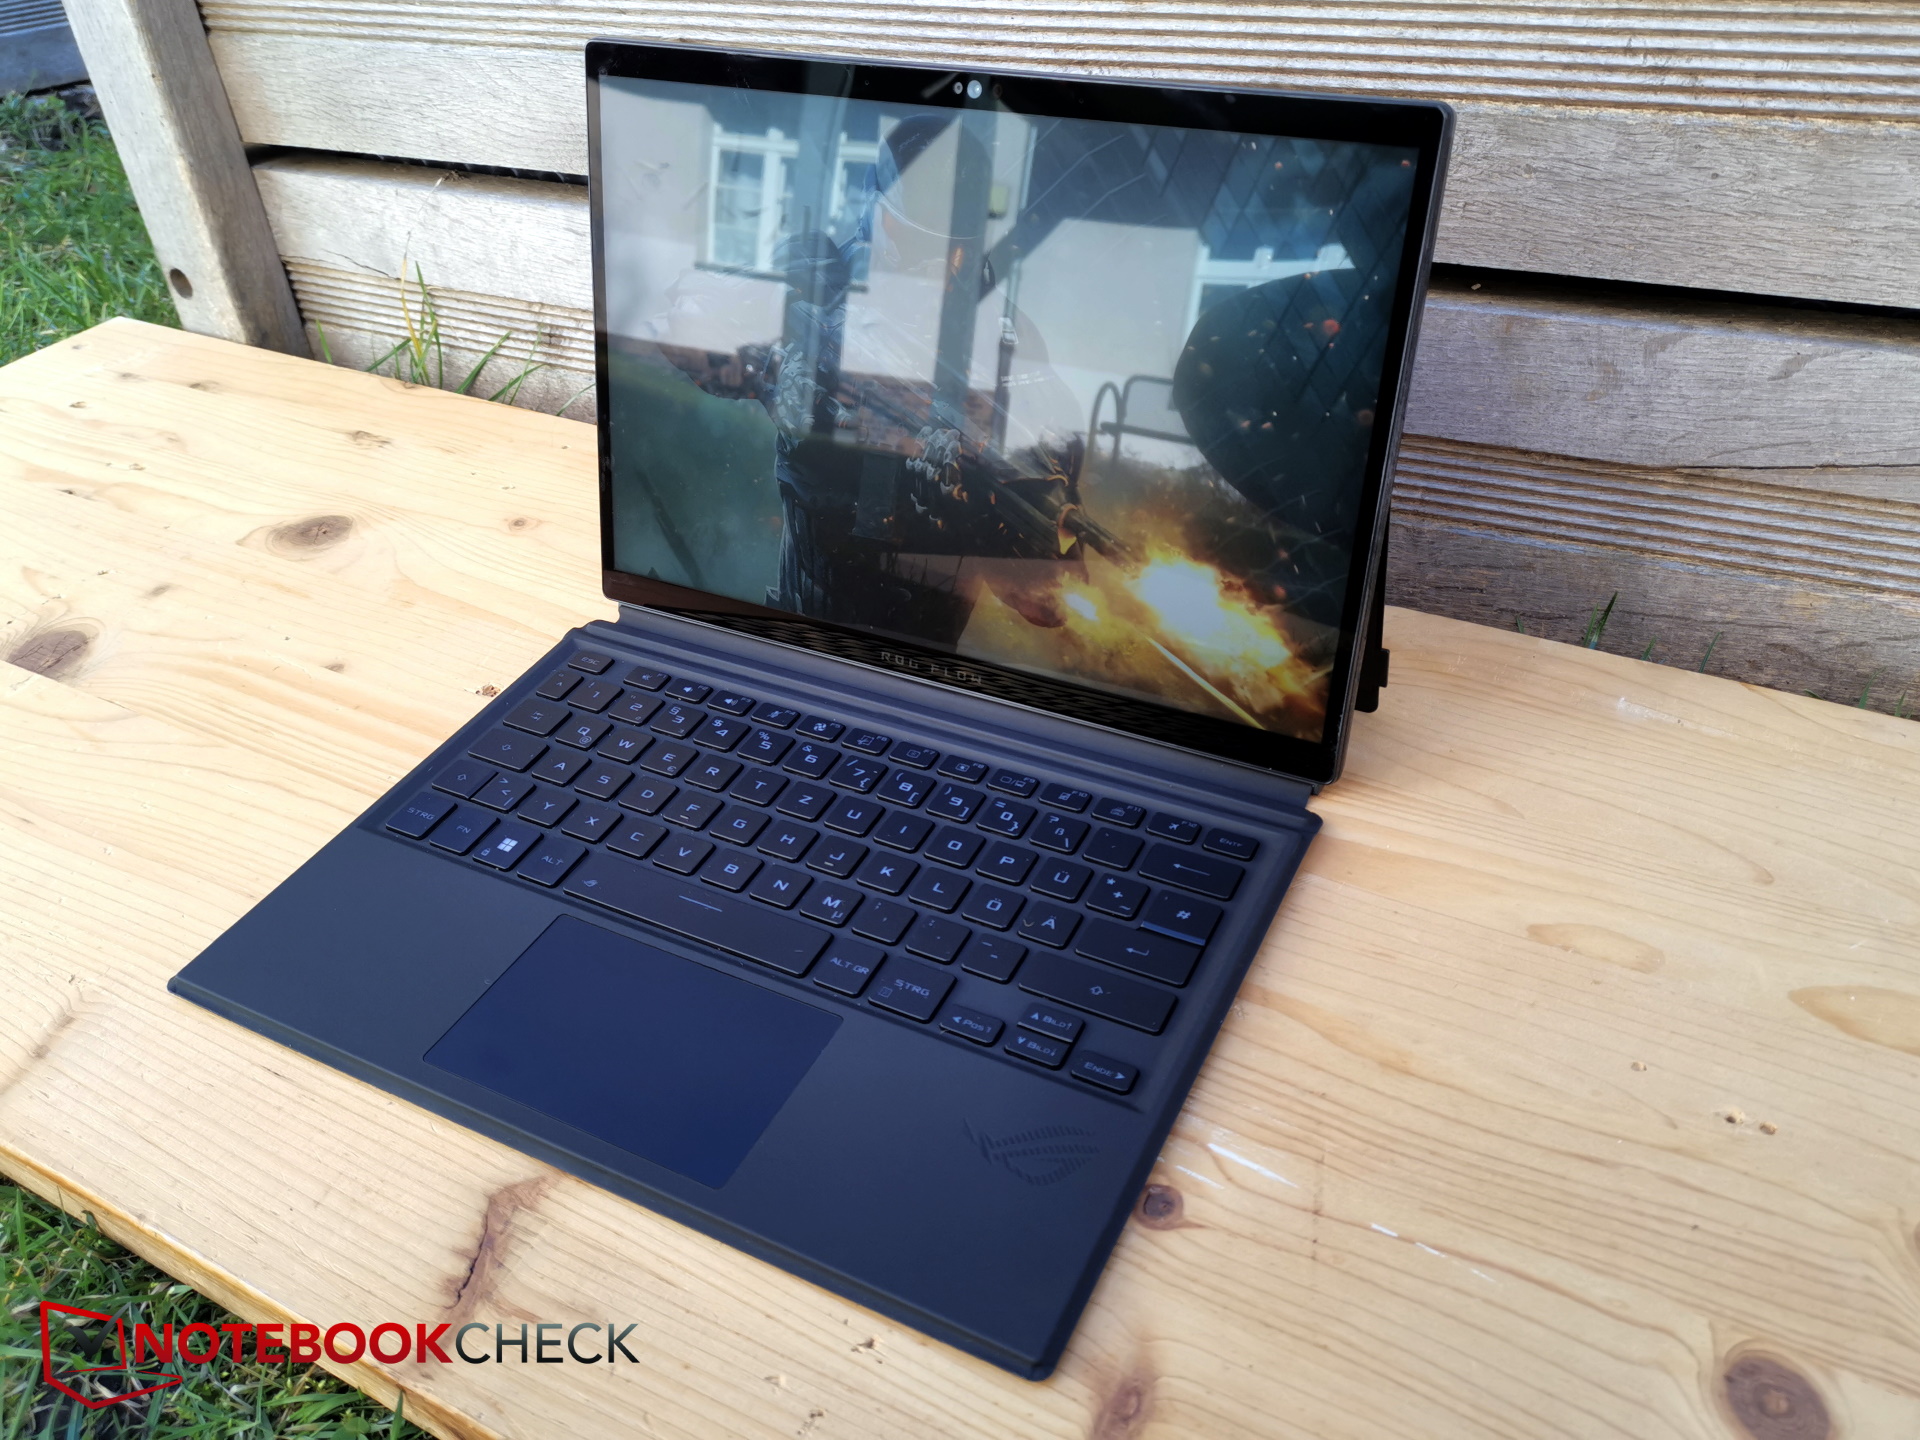
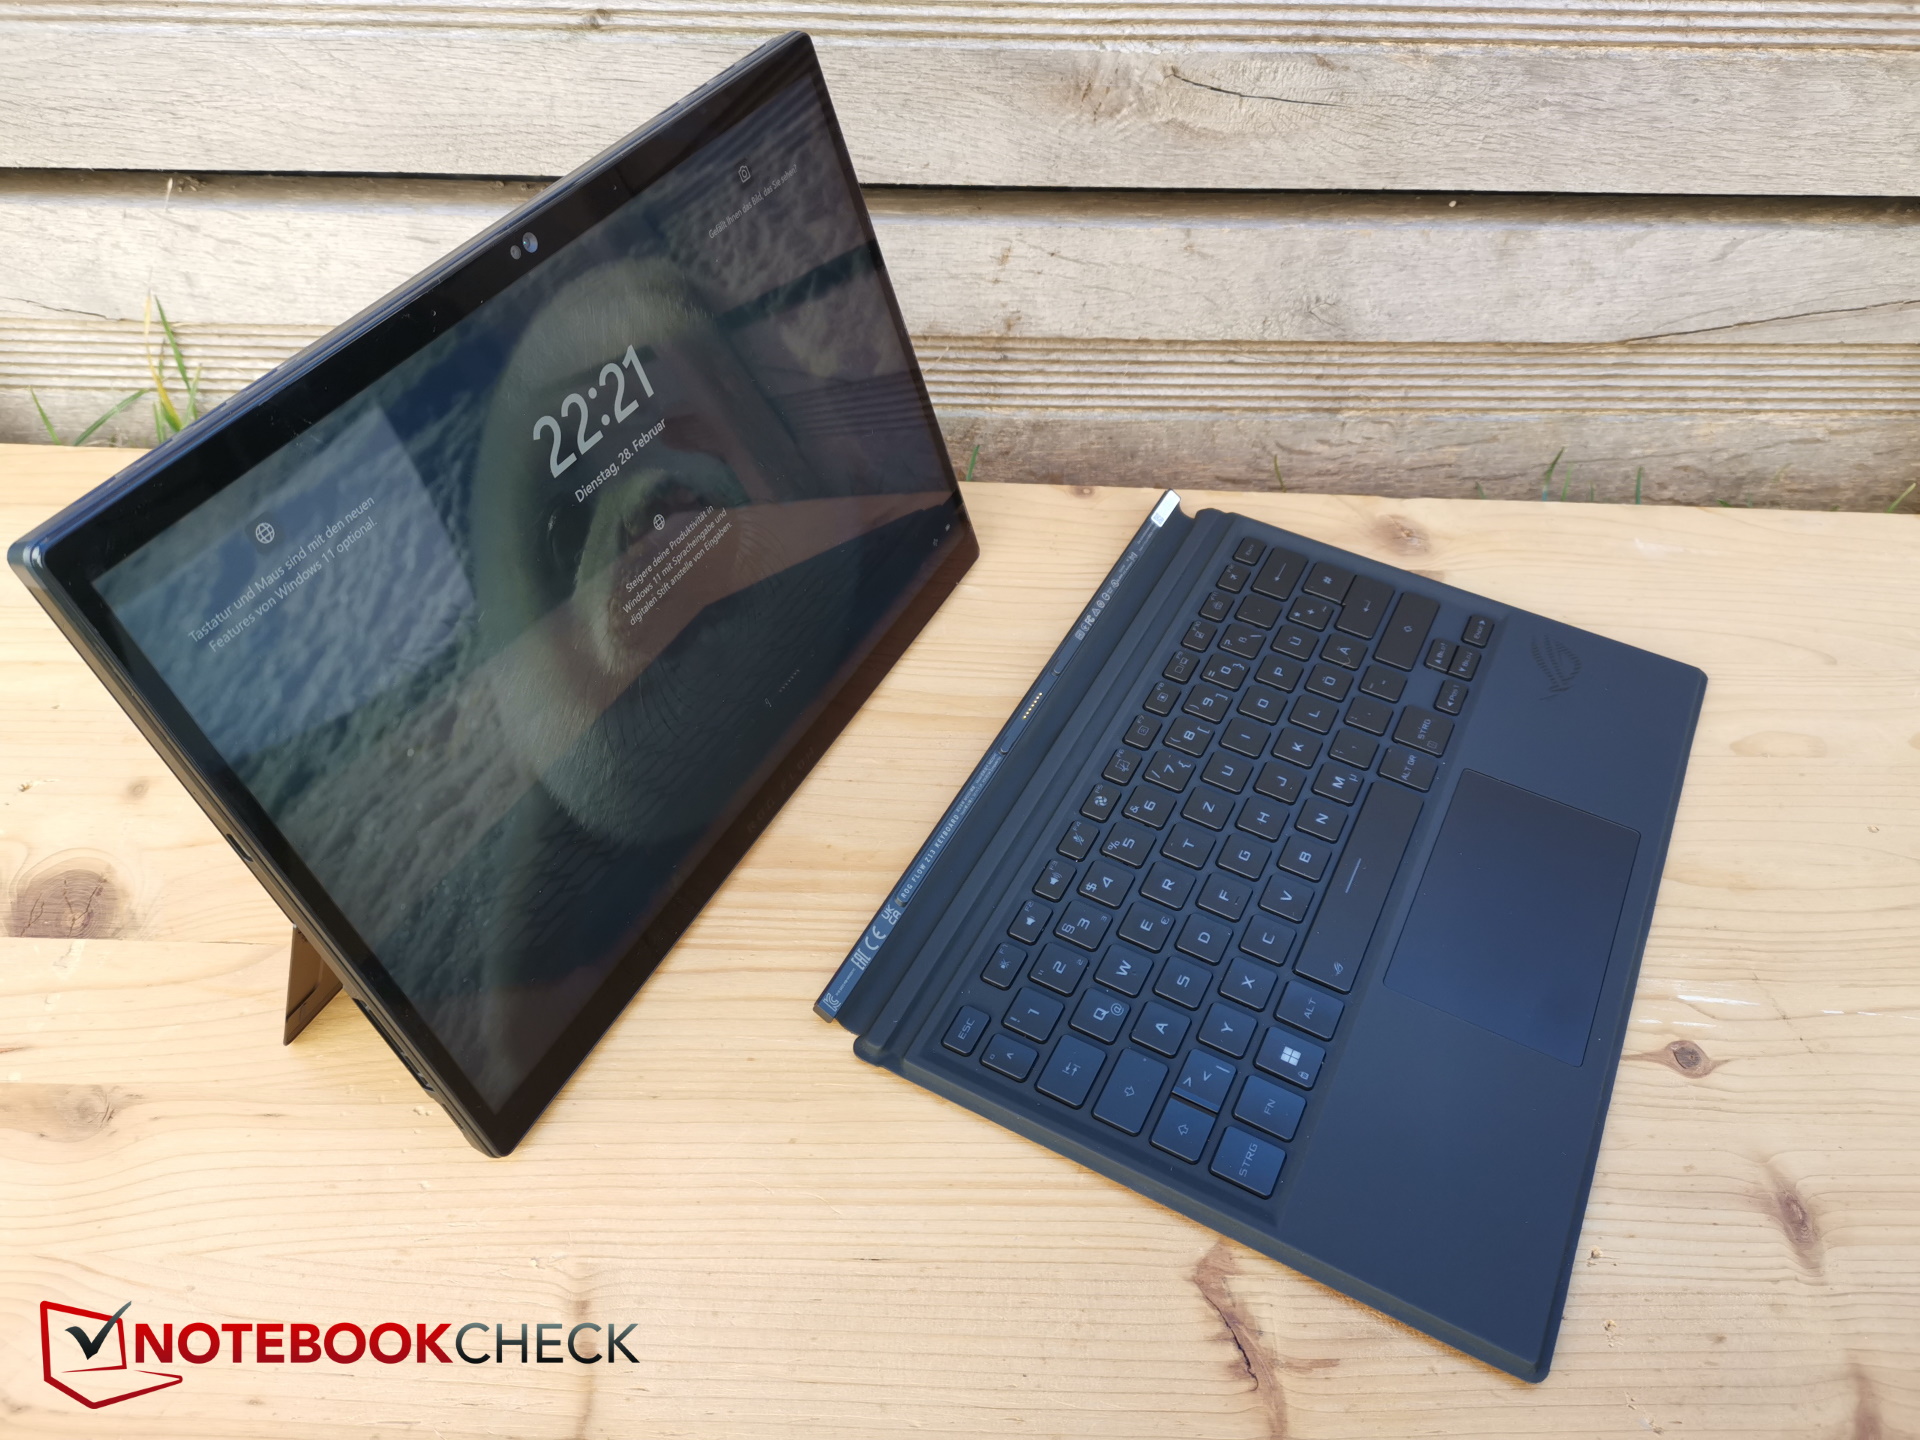
For a 13-inch tablet, the Z13 is comparatively thick and heavy. This is hardly surprising given the powerful hardware, and the device is still impressively small compared to much larger gaming laptops. The total weight includes the keyboard, while the tablet alone weighs around 360 g less.
The recorded dimensions, however, represent the tablet without the keyboard dock. With the keyboard, the width increases to 21.1 cm and the thickness to approx. 1.8 cm, which is still below the dimensions of the bulkier special edition. The predecessor was a little thinner at 12 mm.
Of course, other tablets are also thinner, such as the Apple iPad Pro 12.9, namely less than half as thin. In return, it is wider, but also not as long.
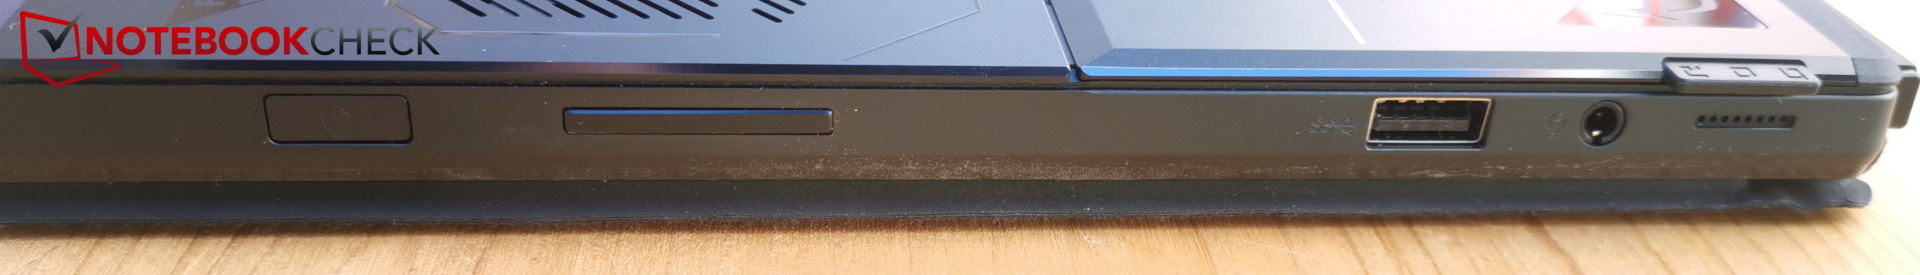
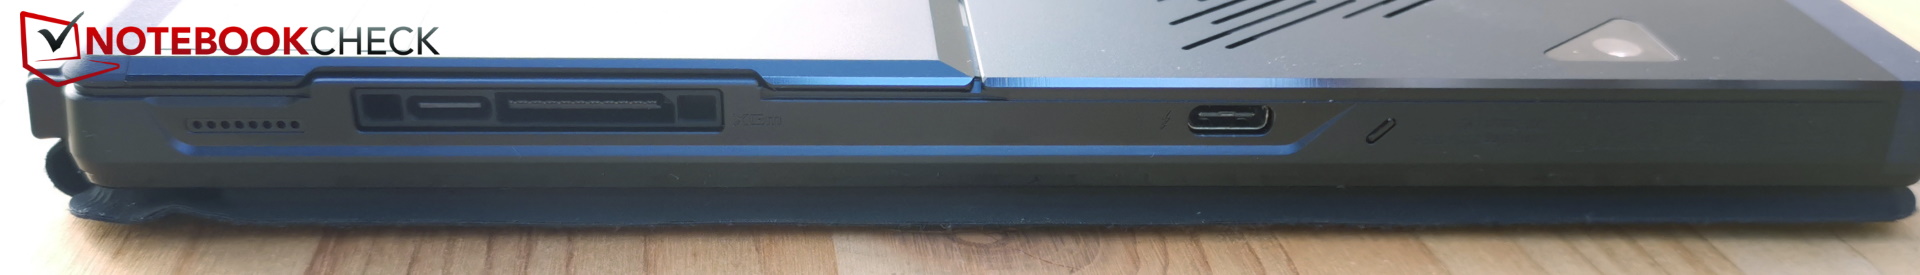
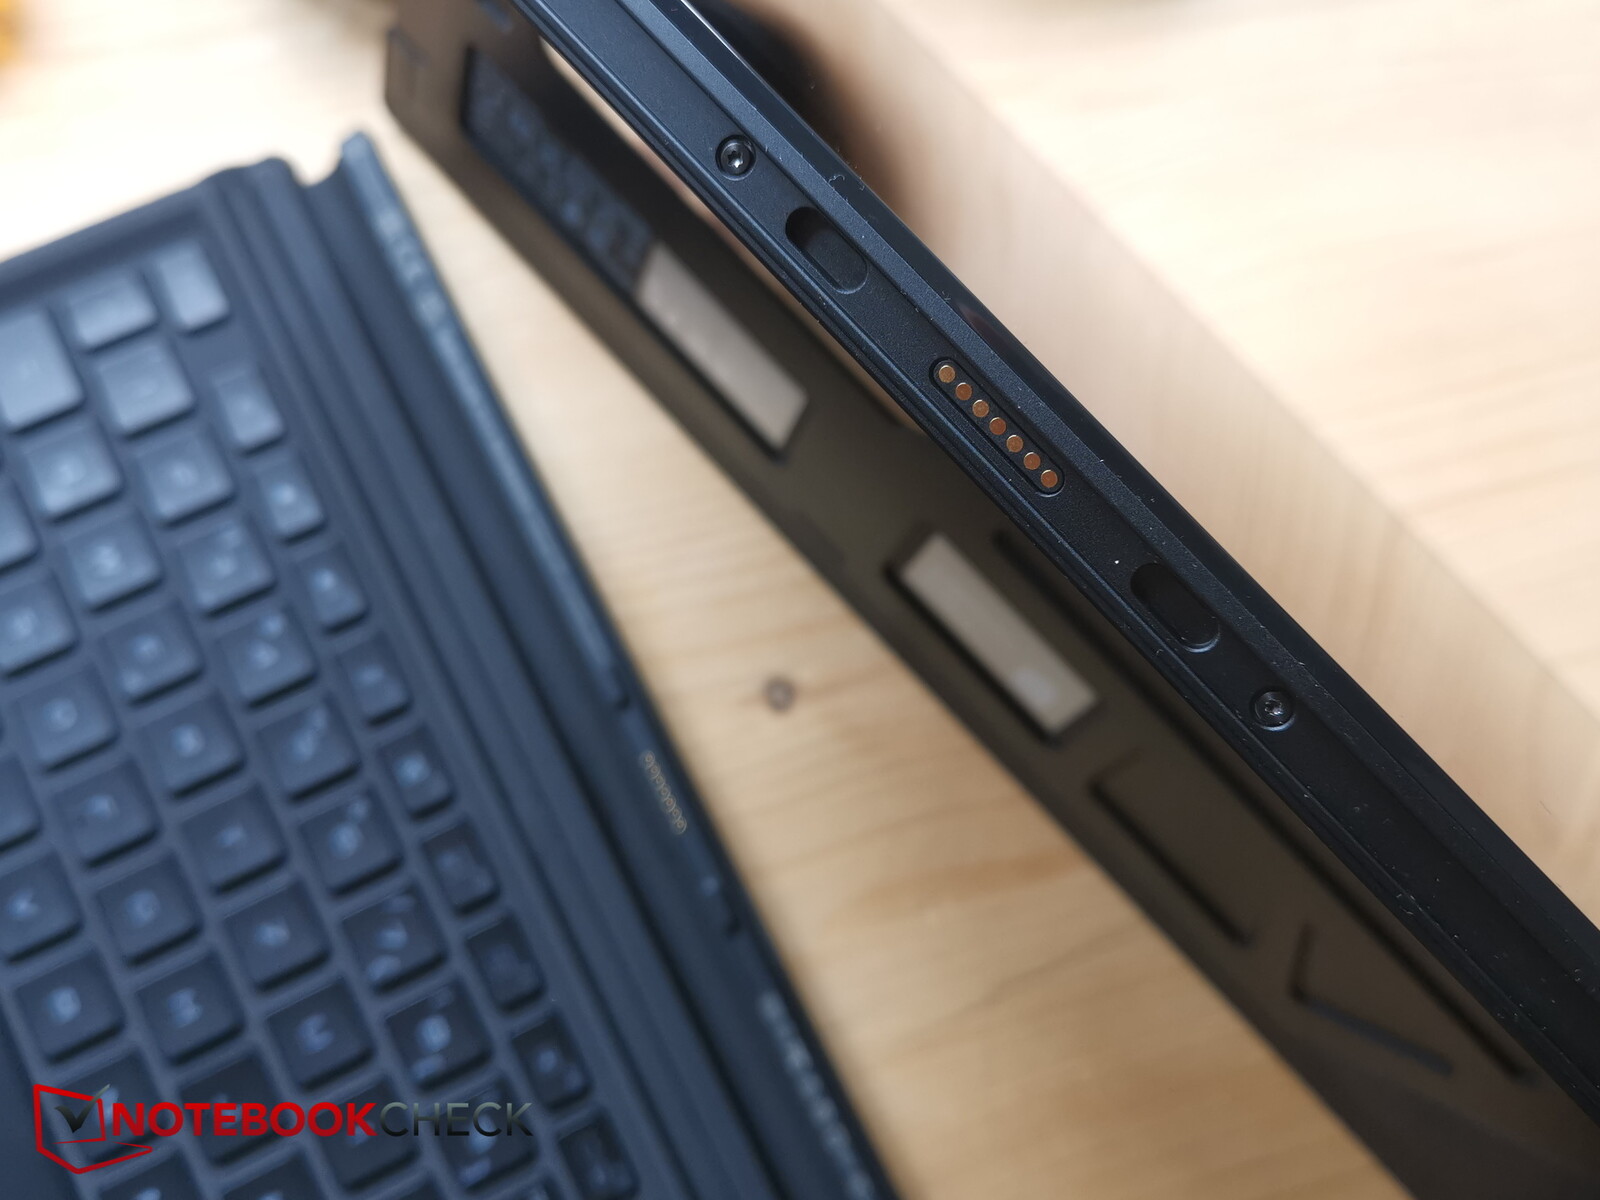
Equipment - Fit for RTX 4090!
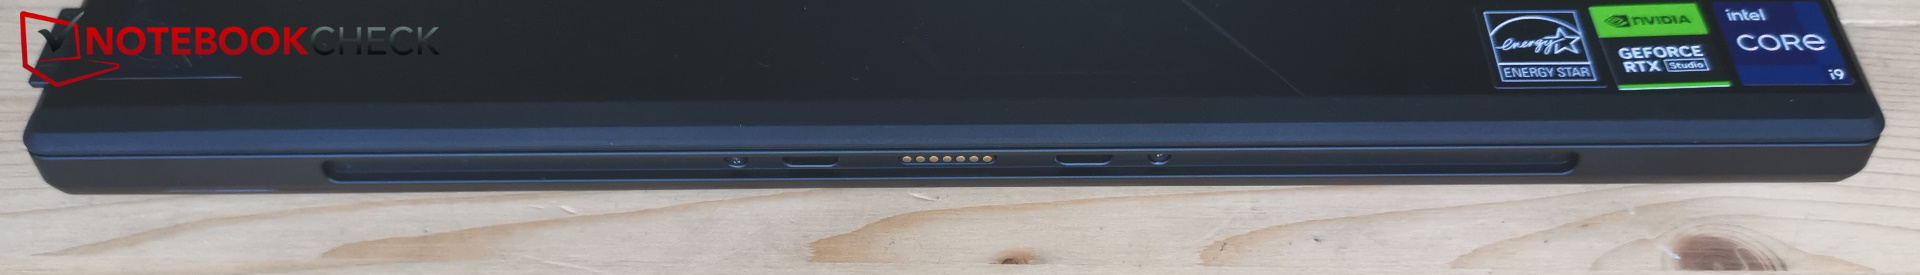
At first glance, there is only one USB-C port with Thunderbolt on the left side and one USB-A and a headset jack port on the right side. A rubber strip covers other ports, namely a docking port called ROG XG Mobile Interface and a second USB-C port. The XG Mobile is a dock with additional ports and houses an external RTX 4090. At US$1,999.99, the ROG XG Mobile costs at least as much as our Z13.
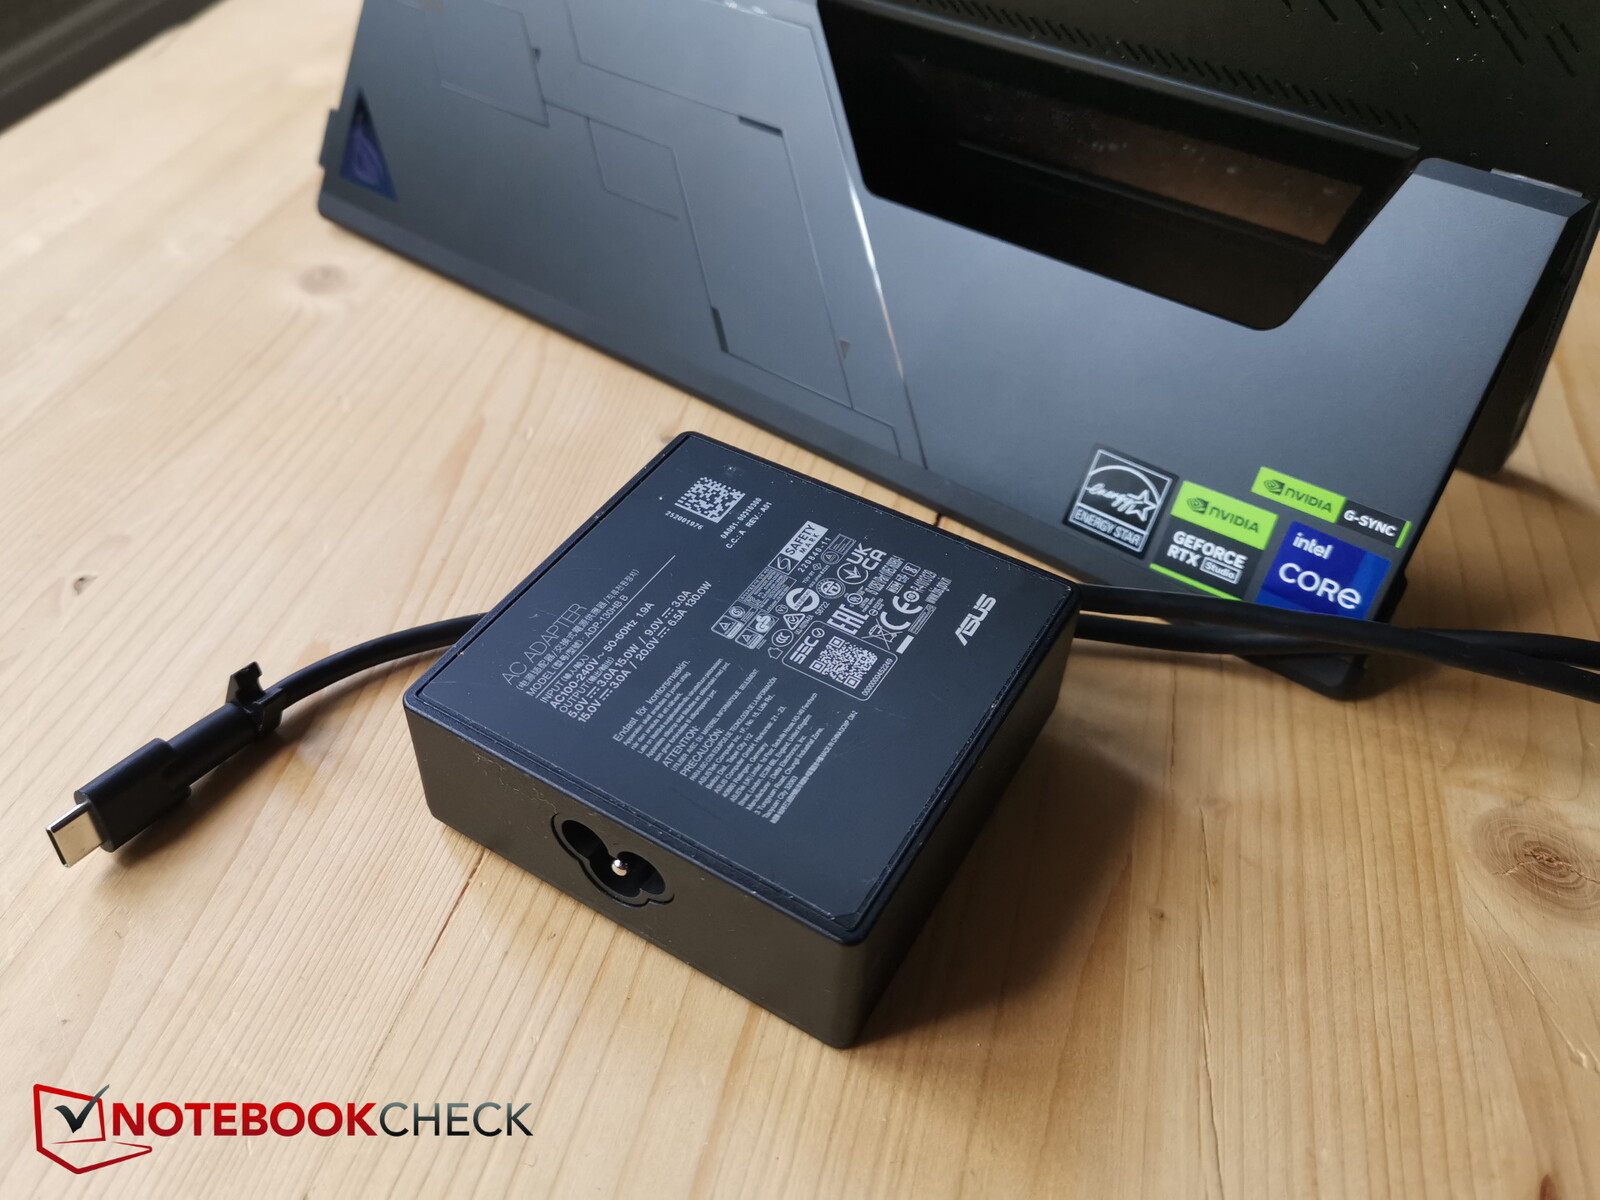
Both USB-C ports support DisplayPort and Power Delivery, so the tablet can also be charged via these ports. The included, smaller 130-W power supply is also of the USB-C type.
Of course, you have to do without dedicated ports such as LAN, HDMI and the like on a tablet. A UDB hub can help out if necessary, and the same applies to the connection of gamepads. At least there is a microSD reader.
SD Card Reader
The microSD reader is located underneath the stand, so it cannot be reached in tablet mode; you have to unfold the stand first. The reader took just over five seconds to copy 1 GB of images from our AV PRO microSD 128 GB V60 reference card to the desktop. The speed of the card reader is very high in the comparison field, particularly the read rates in the AS-SSD benchmark.
| SD Card Reader | |
| average JPG Copy Test (av. of 3 runs) | |
| Asus ROG Flow Z13 GZ301V | |
| Asus ROG Flow Z13 ACRNM (Angelbird AV Pro V60) | |
| Average of class Gaming (20.9 - 210, n=54, last 2 years) | |
| Asus ROG Flow Z13 GZ301ZE (Angelbird AV Pro V60) | |
| maximum AS SSD Seq Read Test (1GB) | |
| Asus ROG Flow Z13 GZ301ZE (Angelbird AV Pro V60) | |
| Asus ROG Flow Z13 ACRNM (Angelbird AV Pro V60) | |
| Asus ROG Flow Z13 GZ301V | |
| Average of class Gaming (25.5 - 261, n=51, last 2 years) | |
Communication
Intel provides the AX211 with Wifi6E as the Wi-Fi module, which means it also communicates in the 6 GHz range and is quite fast and very stable.
Webcam
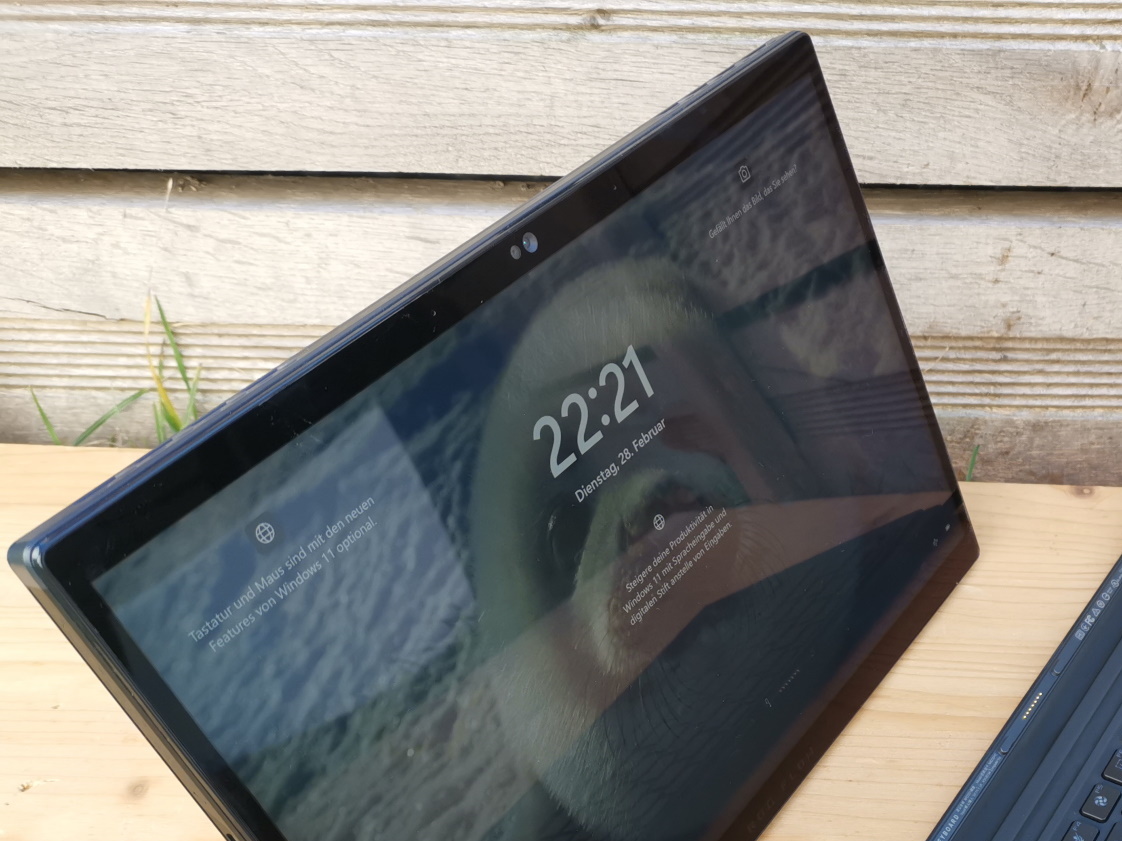
On the front, a 5 MP IR camera is used for taking selfies, logging in via Windows Hello and video calls. As usual for tablets, there is also a main camera on the back, which has a resolution of 13 MP.
Videos and photos are still "only" recorded in 2 MP or Full HD, but the quality of the webcam is significantly better than in most laptop models, especially in suboptimal light conditions. Although there is some image noise and red has too high color deviations, the colors and contrasts are still impressive.
The camera is the same as in the special edition. Our video review includes test shots of both cameras and the microphones.


Security
TPM 2.0 is on board, but other features such as Kensington or a fingerprint sensor are missing. In addition to TPM, Asus also includes the security features "BIOS Administrator Password" and "User Password Protection", which we like.
Accessories
The Z13 comes with a keyboard cover and the 130 W USB-C power adapter, but there are no other accessories.
Of course, the XG Mobile Interface is an extra accessory. It is a hub and eGPU (RTX 4090) in one, but costs an extra US$1,999.99.
Maintenance
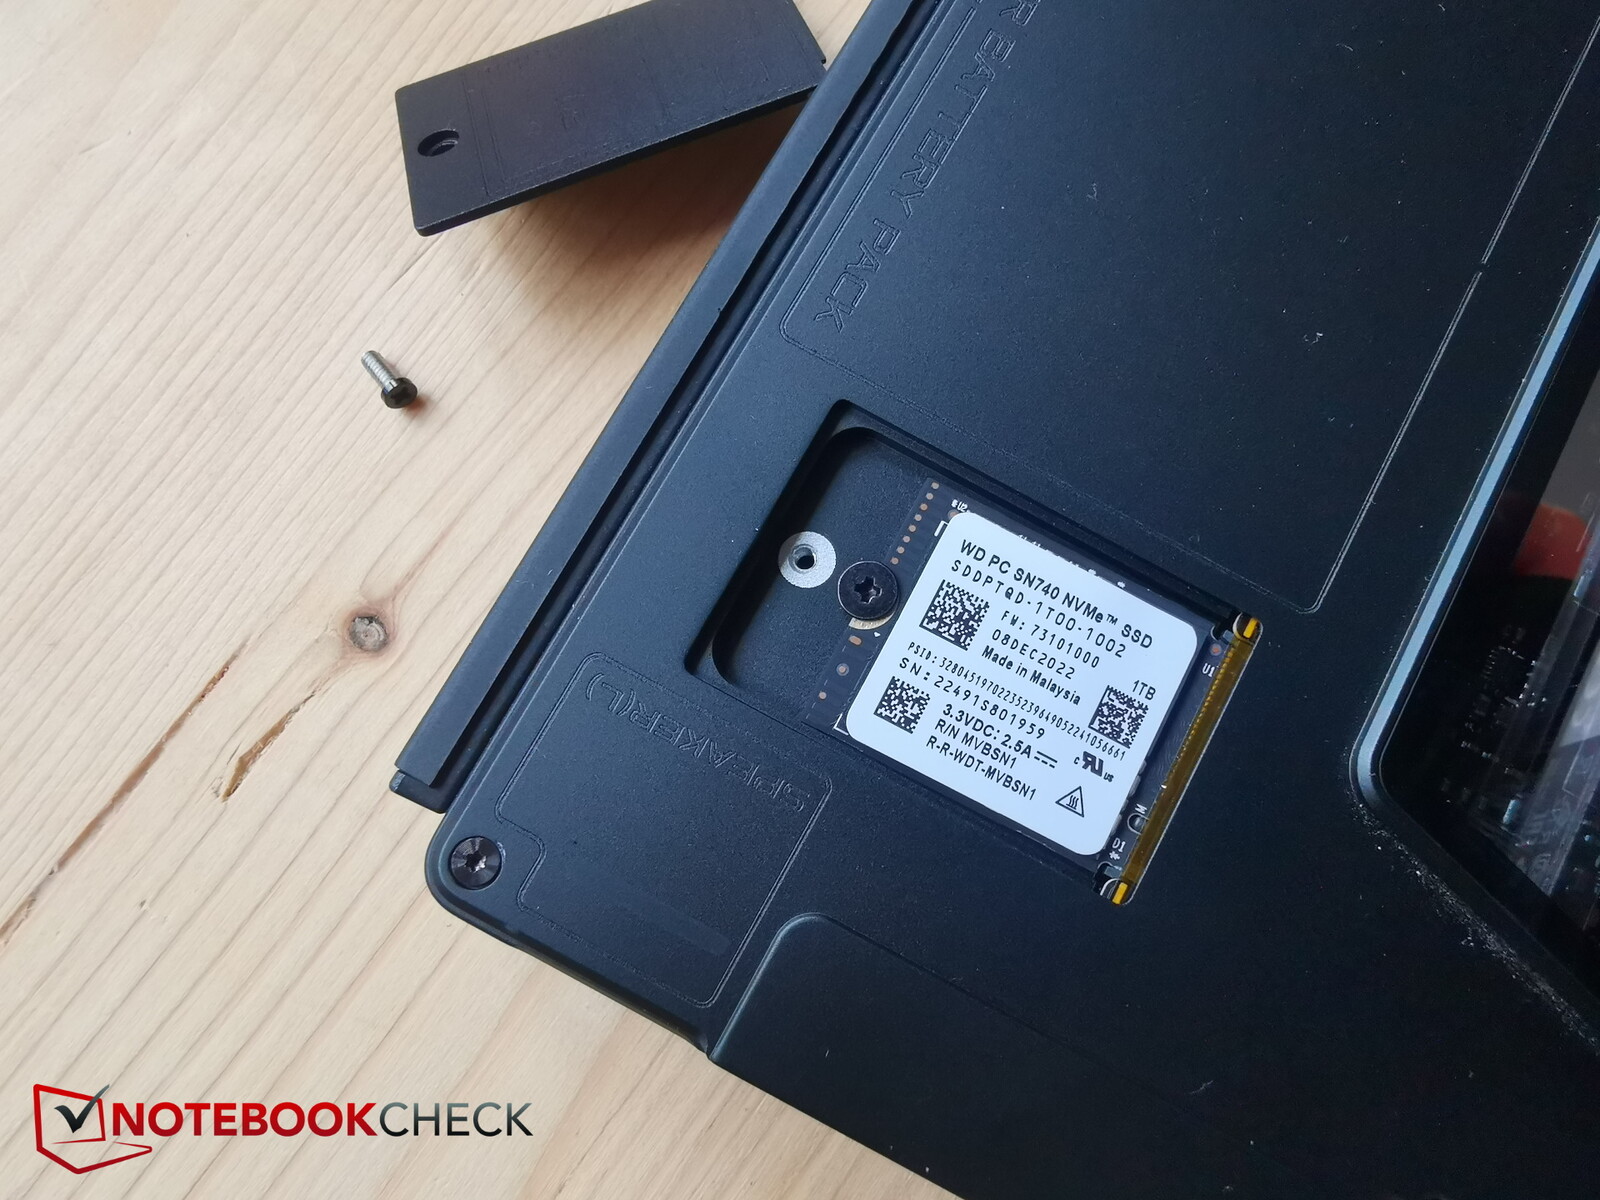
Sure, gaming on a tablet is awesome, but when it comes to maintenance, we encounter one of the disadvantages of the tablet compared to "normal" gaming laptops: the Z13 cannot be opened easily by the user. There is at least a small maintenance hatch under the hinge, through which you can access the SSD in the M.2 2230 form factor and swap it out. You can't dust off the fans, change the Wifi module or RAM on the Z13.
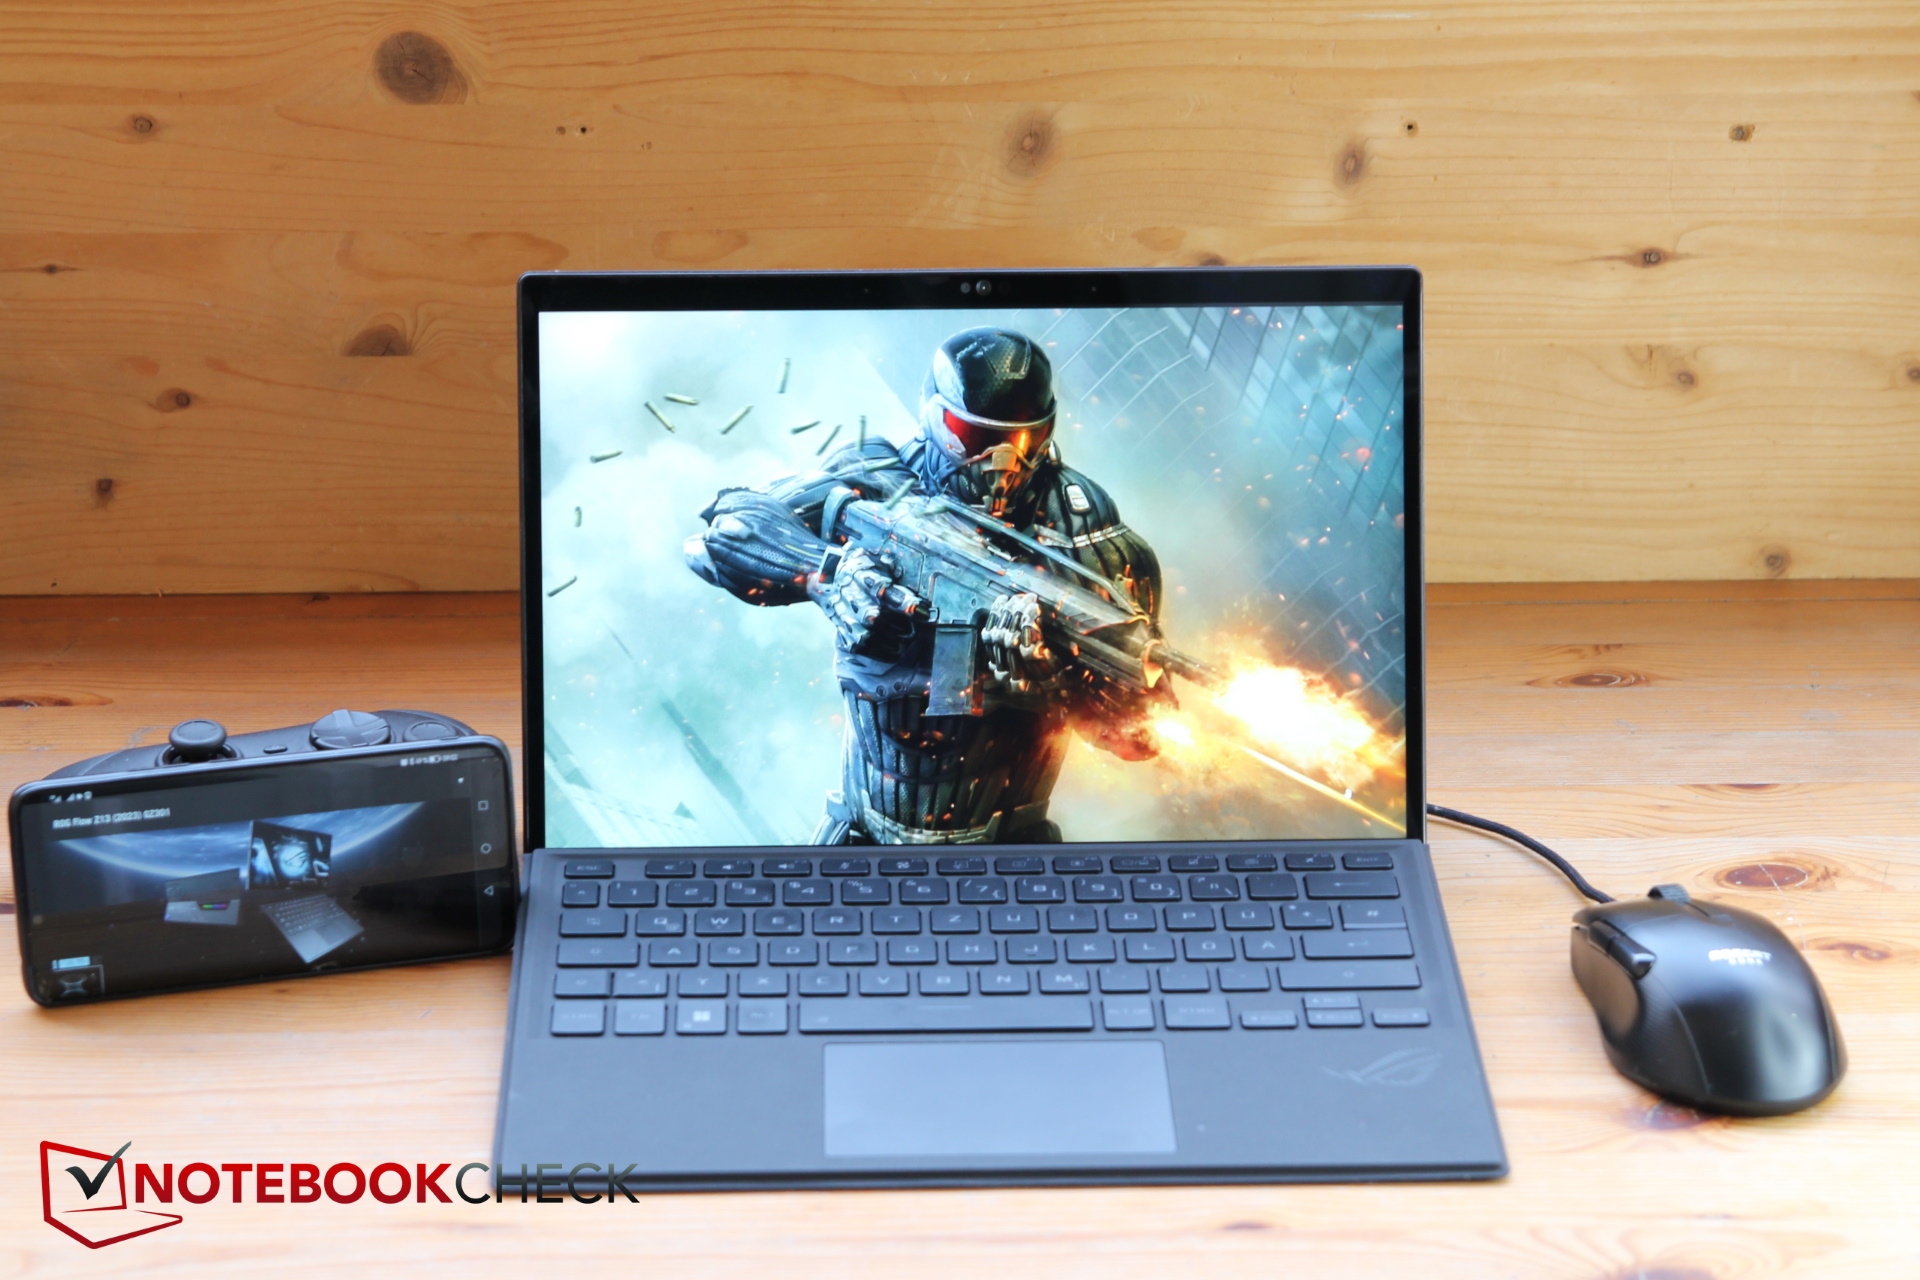
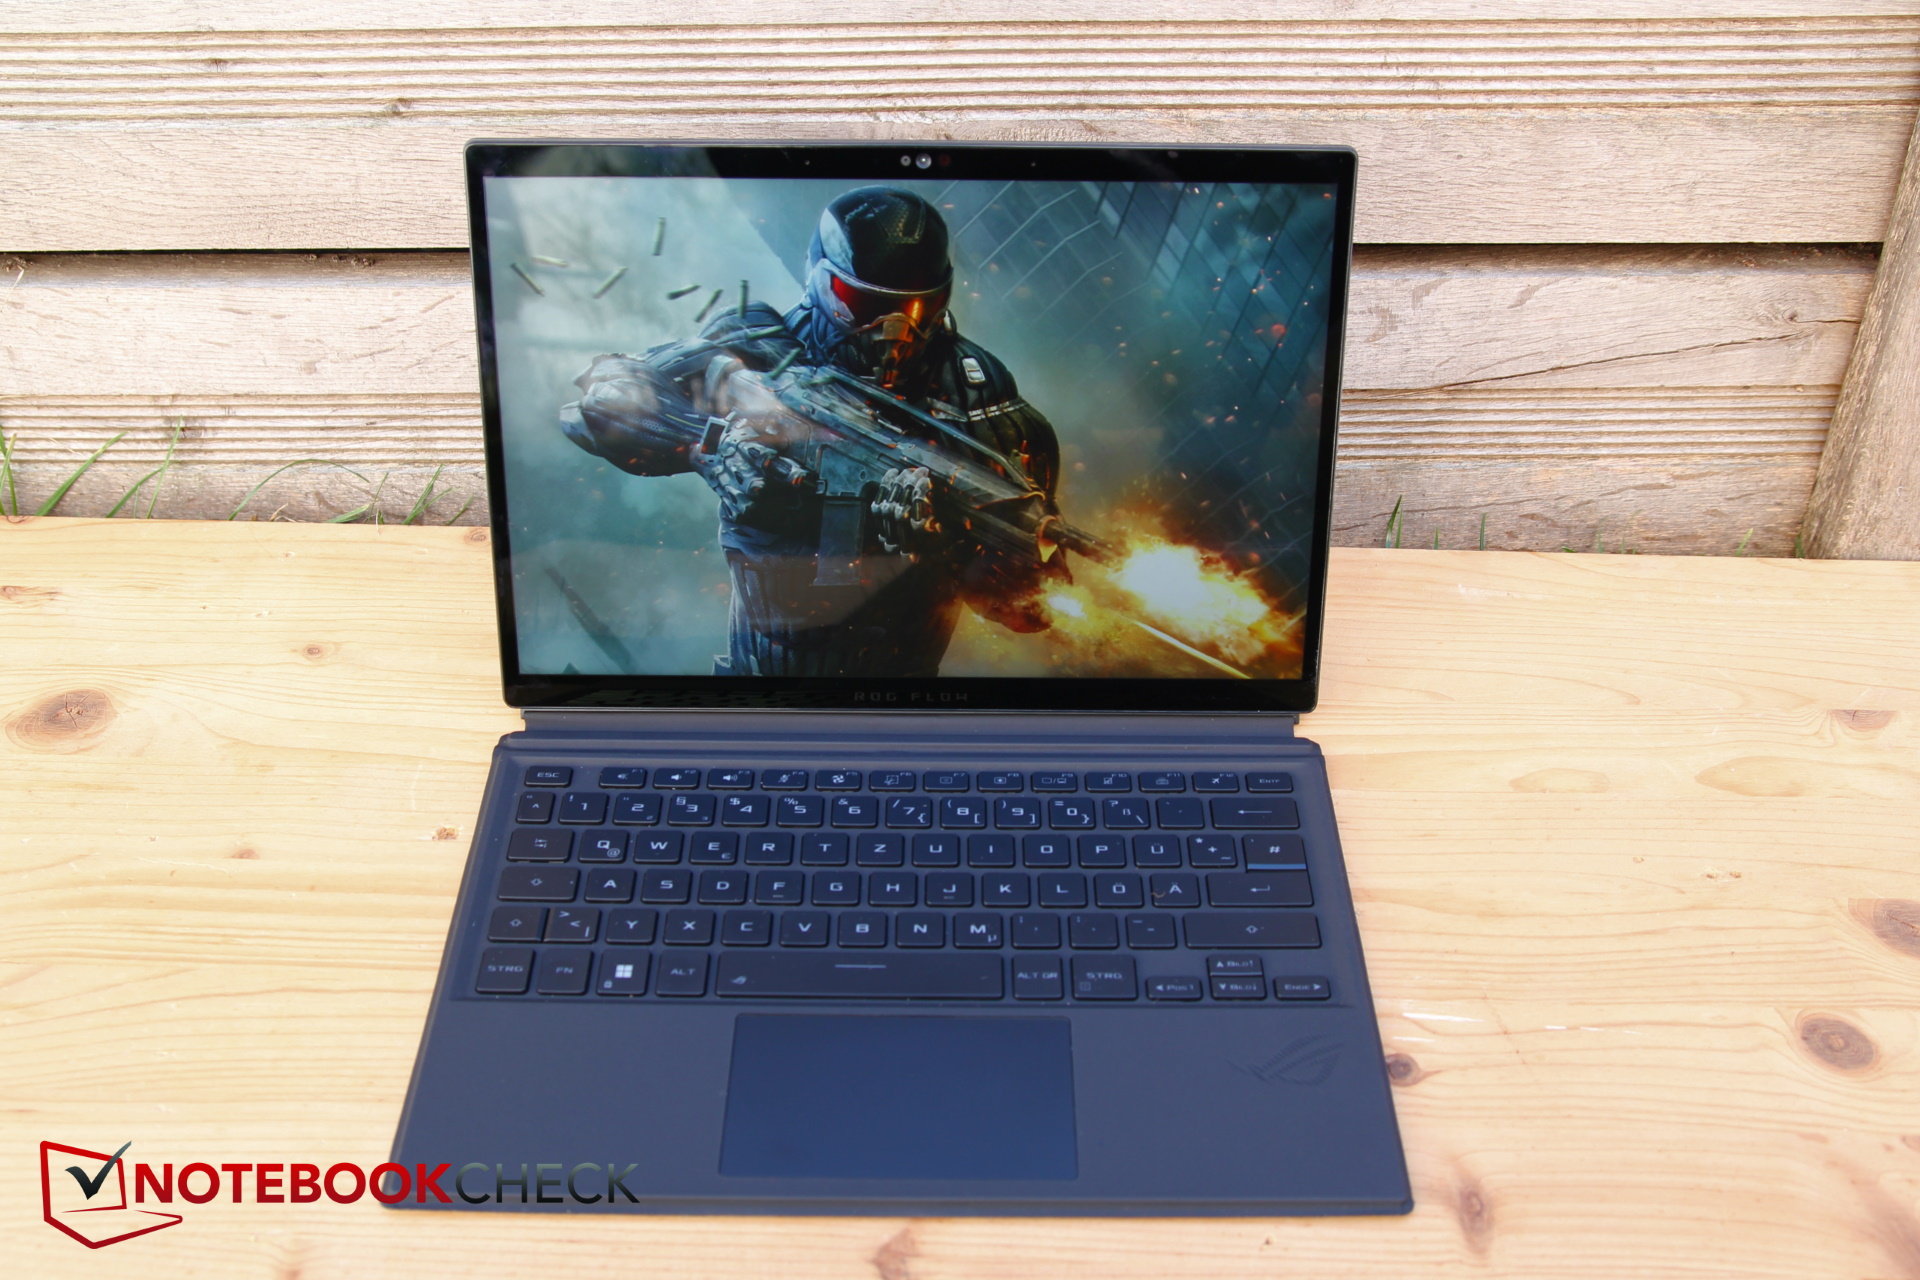
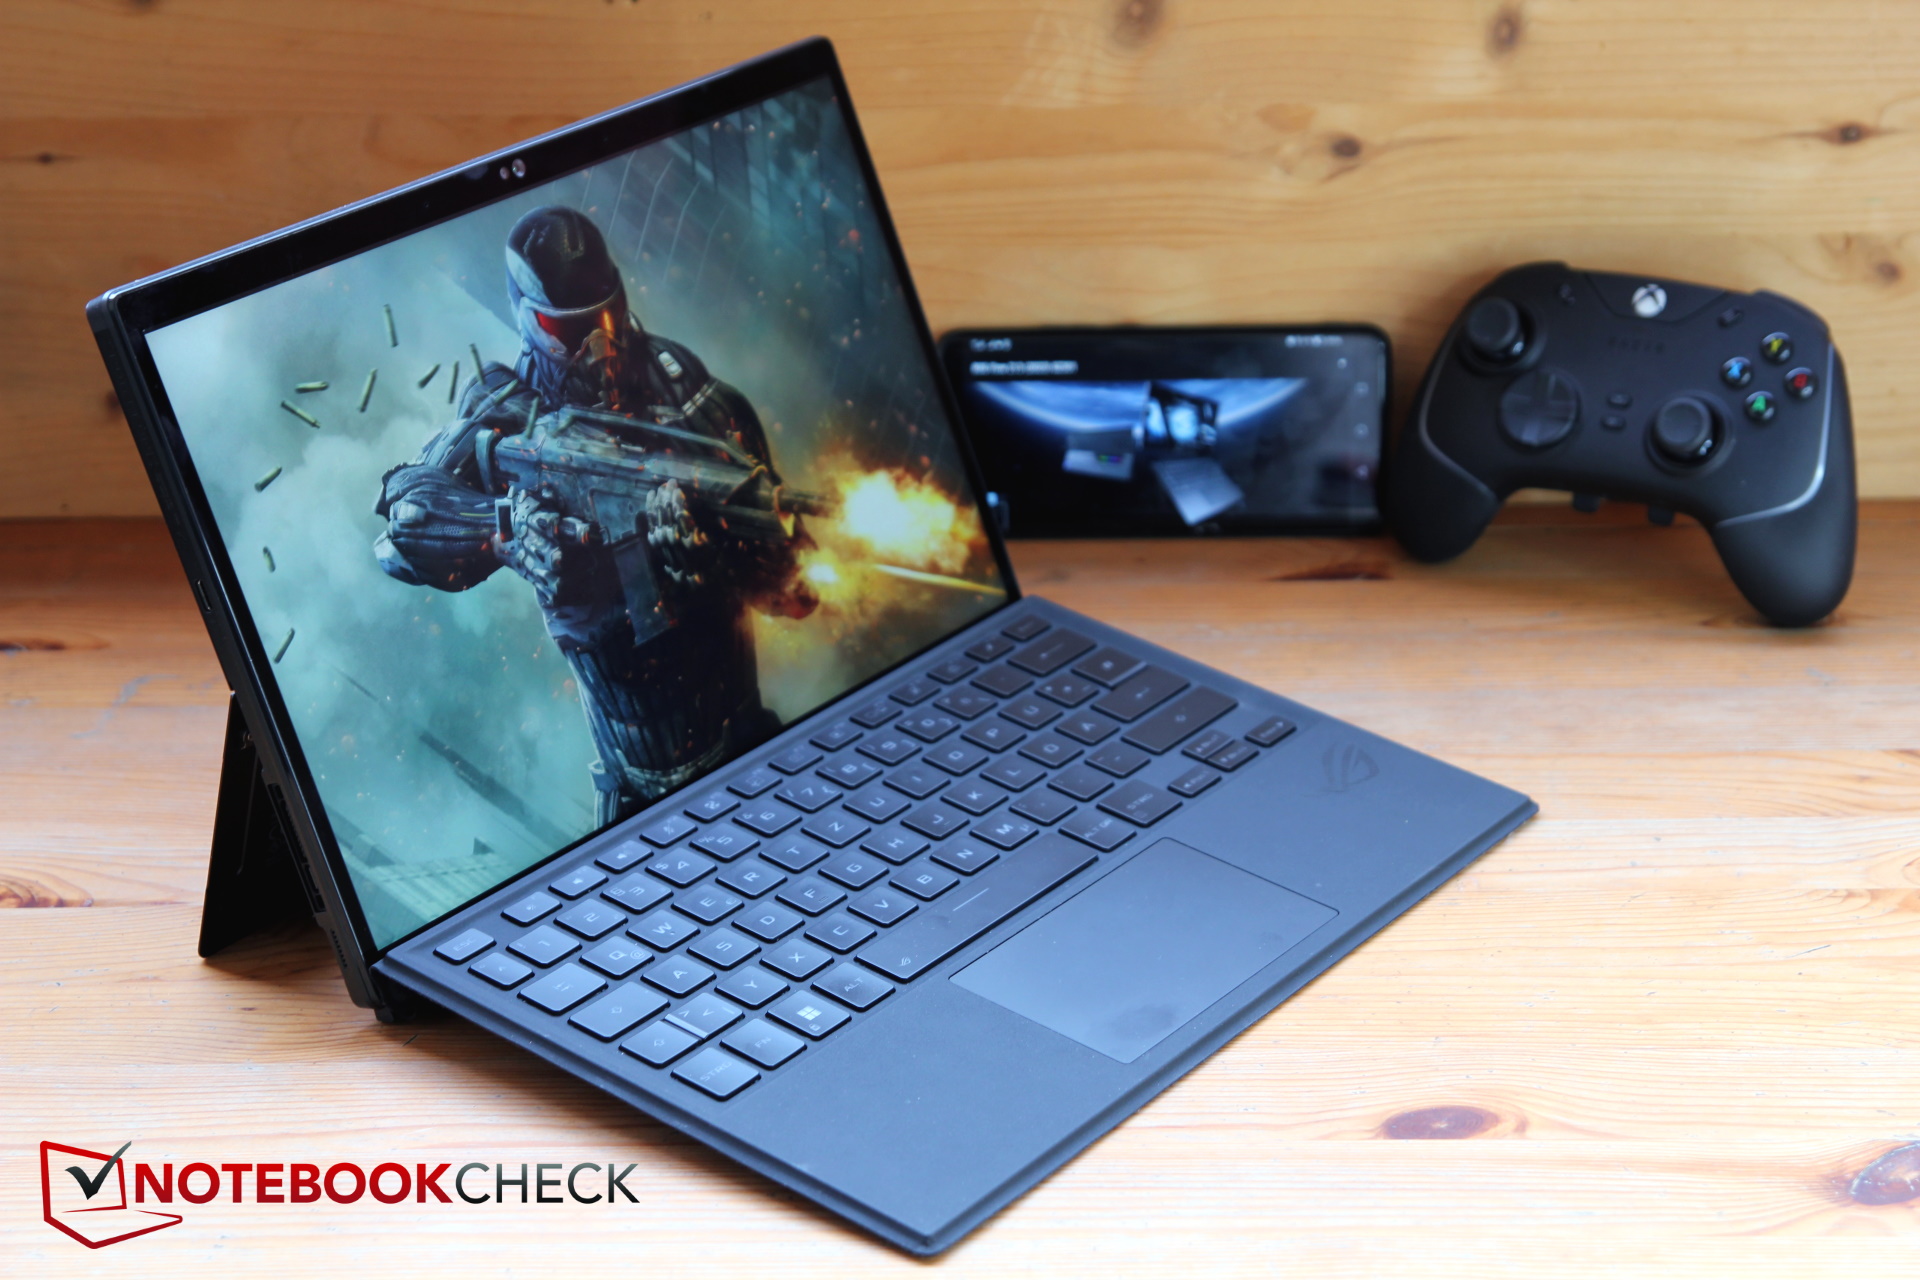
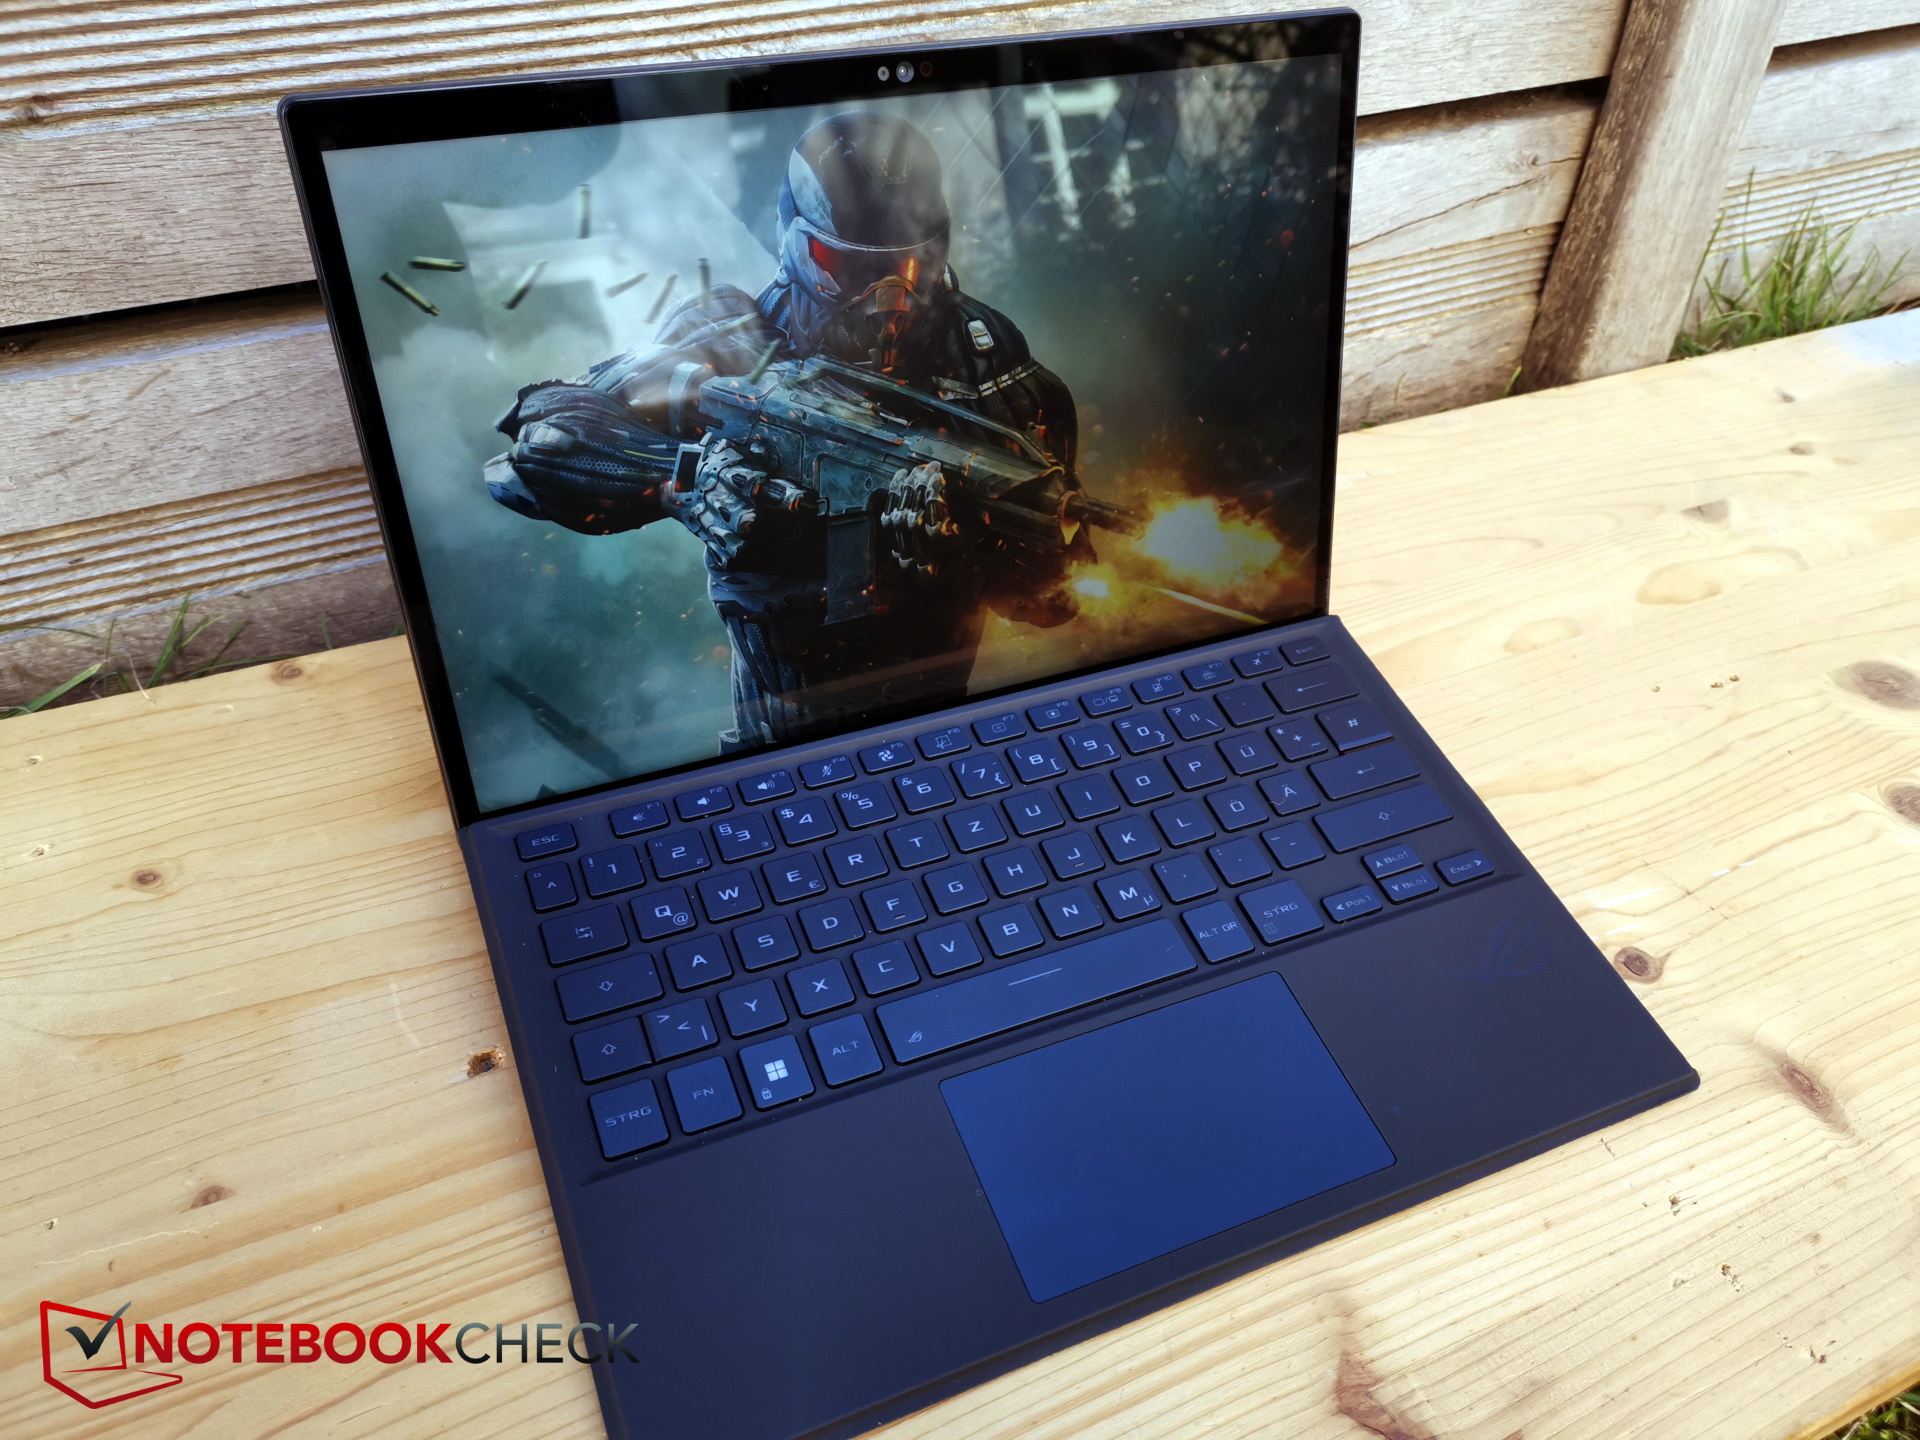
Input Devices - Z13 with keyboard cover or touchscreen
The tablet has a capacitive touchscreen, which works excellently and also supports pen input. However, the associated stylus is not included and costs an additional US$79.99.
The keyboard cover is attached to the lower edge of the Z13 using magnetic pins and also receives power for the backlight through this.
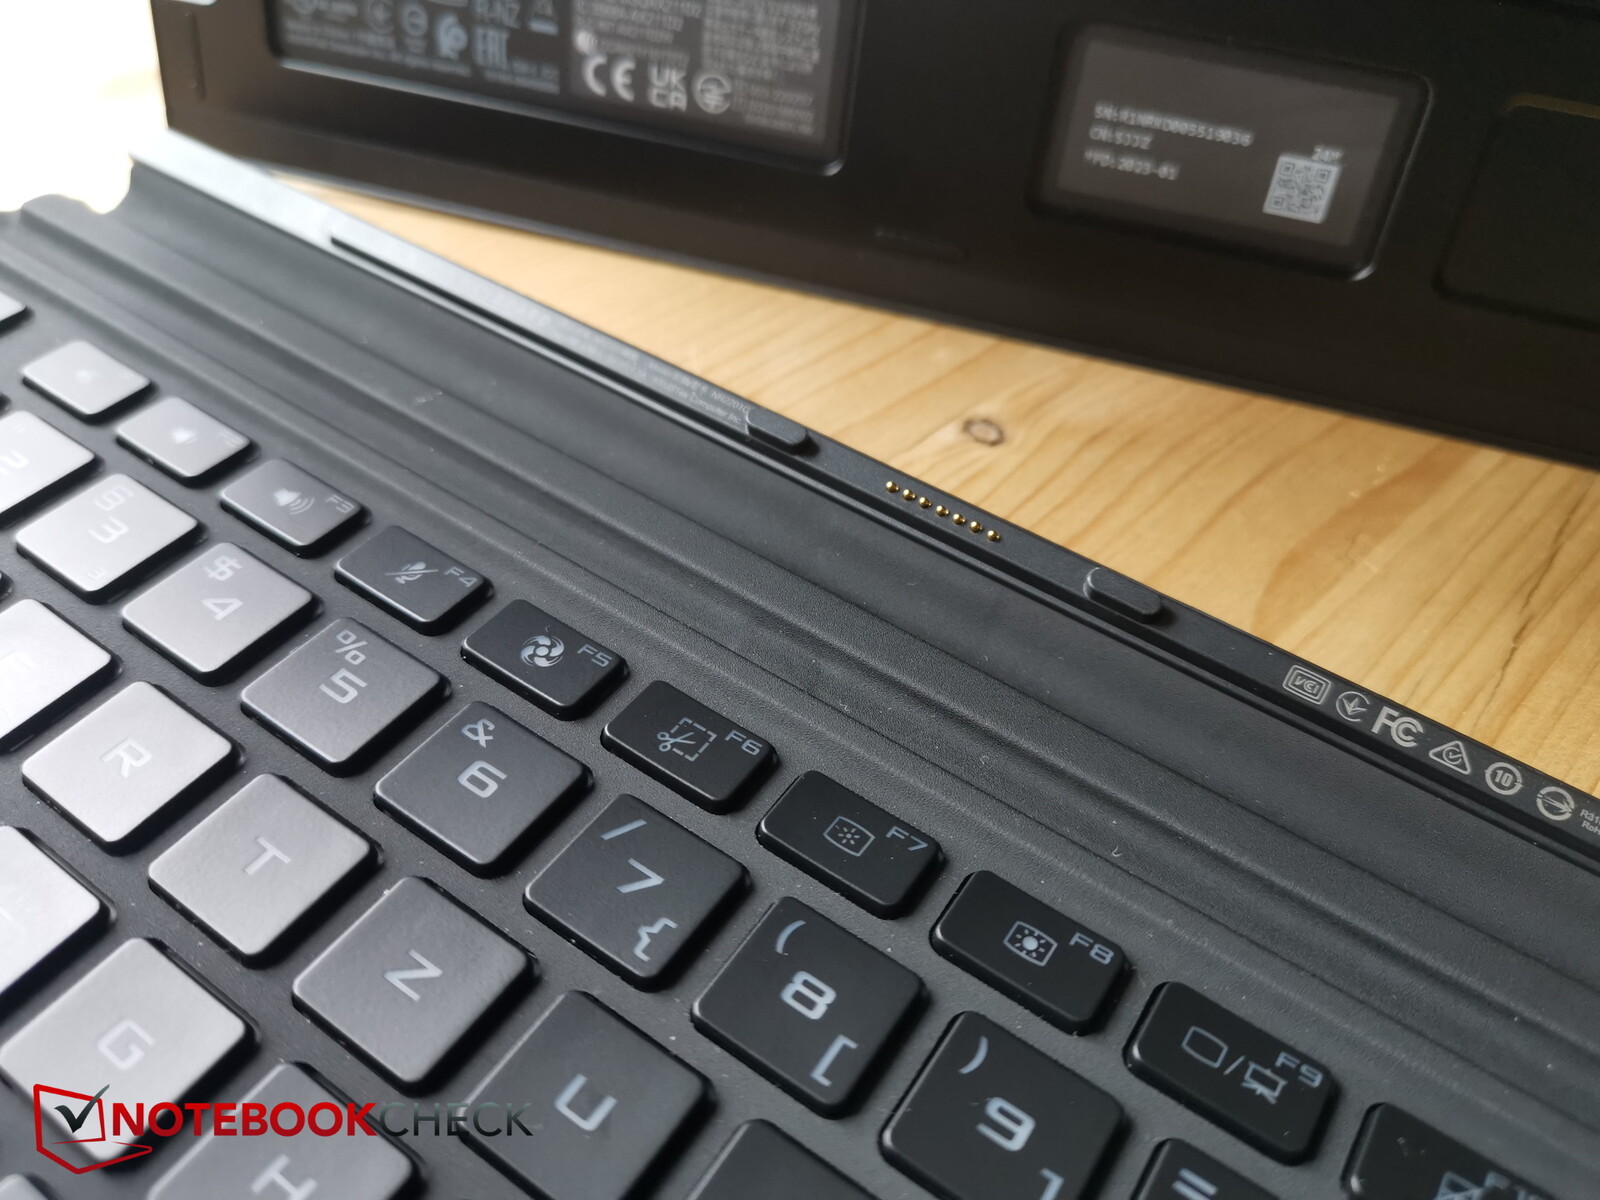
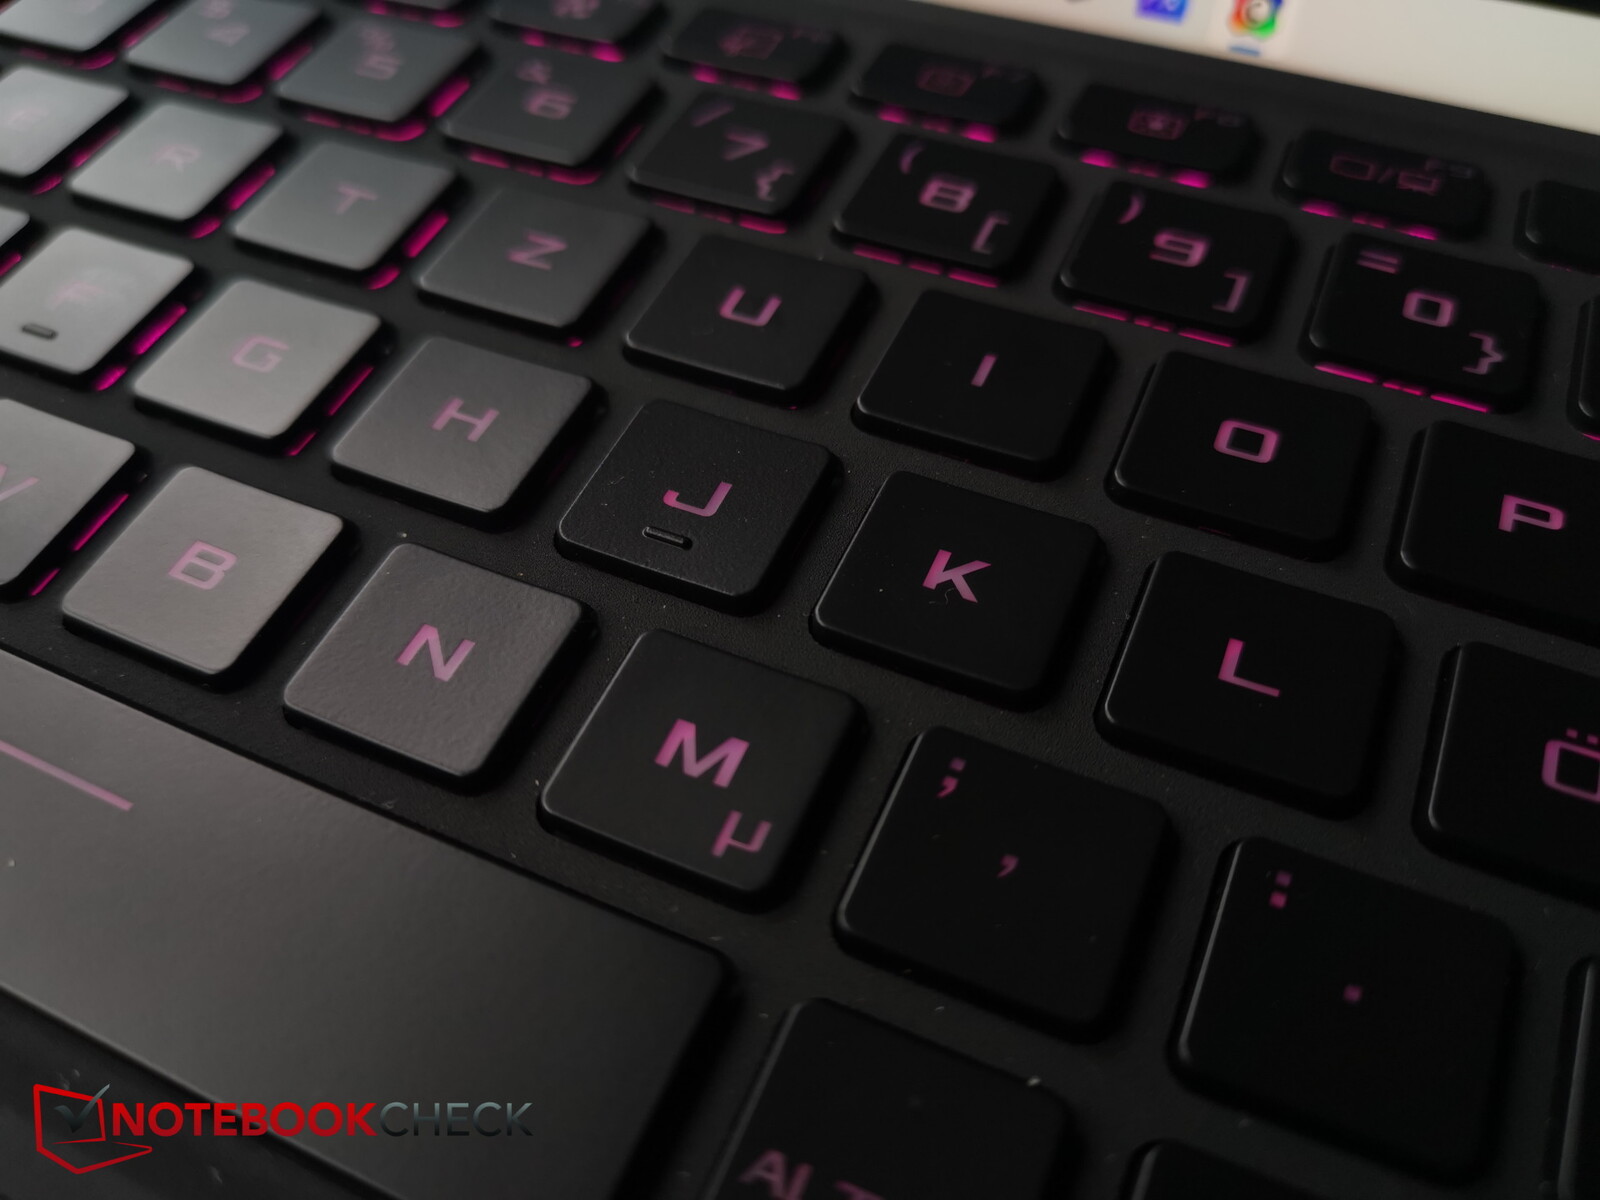
The keyboard lights up in different colors and in three brightness levels. It can either lie flat on the desk or be tilted slightly, which also changes the typing noise a little. But this is generally still moderate.
A cover keyboard is naturally a little less stable than a fixed keyboard. The typing board bends a little when typing, especially when tilted, but remains within tolerable limits. At least the key travel of 1.7 mm is quite deep for this type. The feedback is also noticeable, so that typing is quick despite the rather small key size.
The lettering is easy to see in decent light, but it could be a bit brighter to increase the contrast between the dark keys and the not so bright lettering. The backlight helps in the dark.
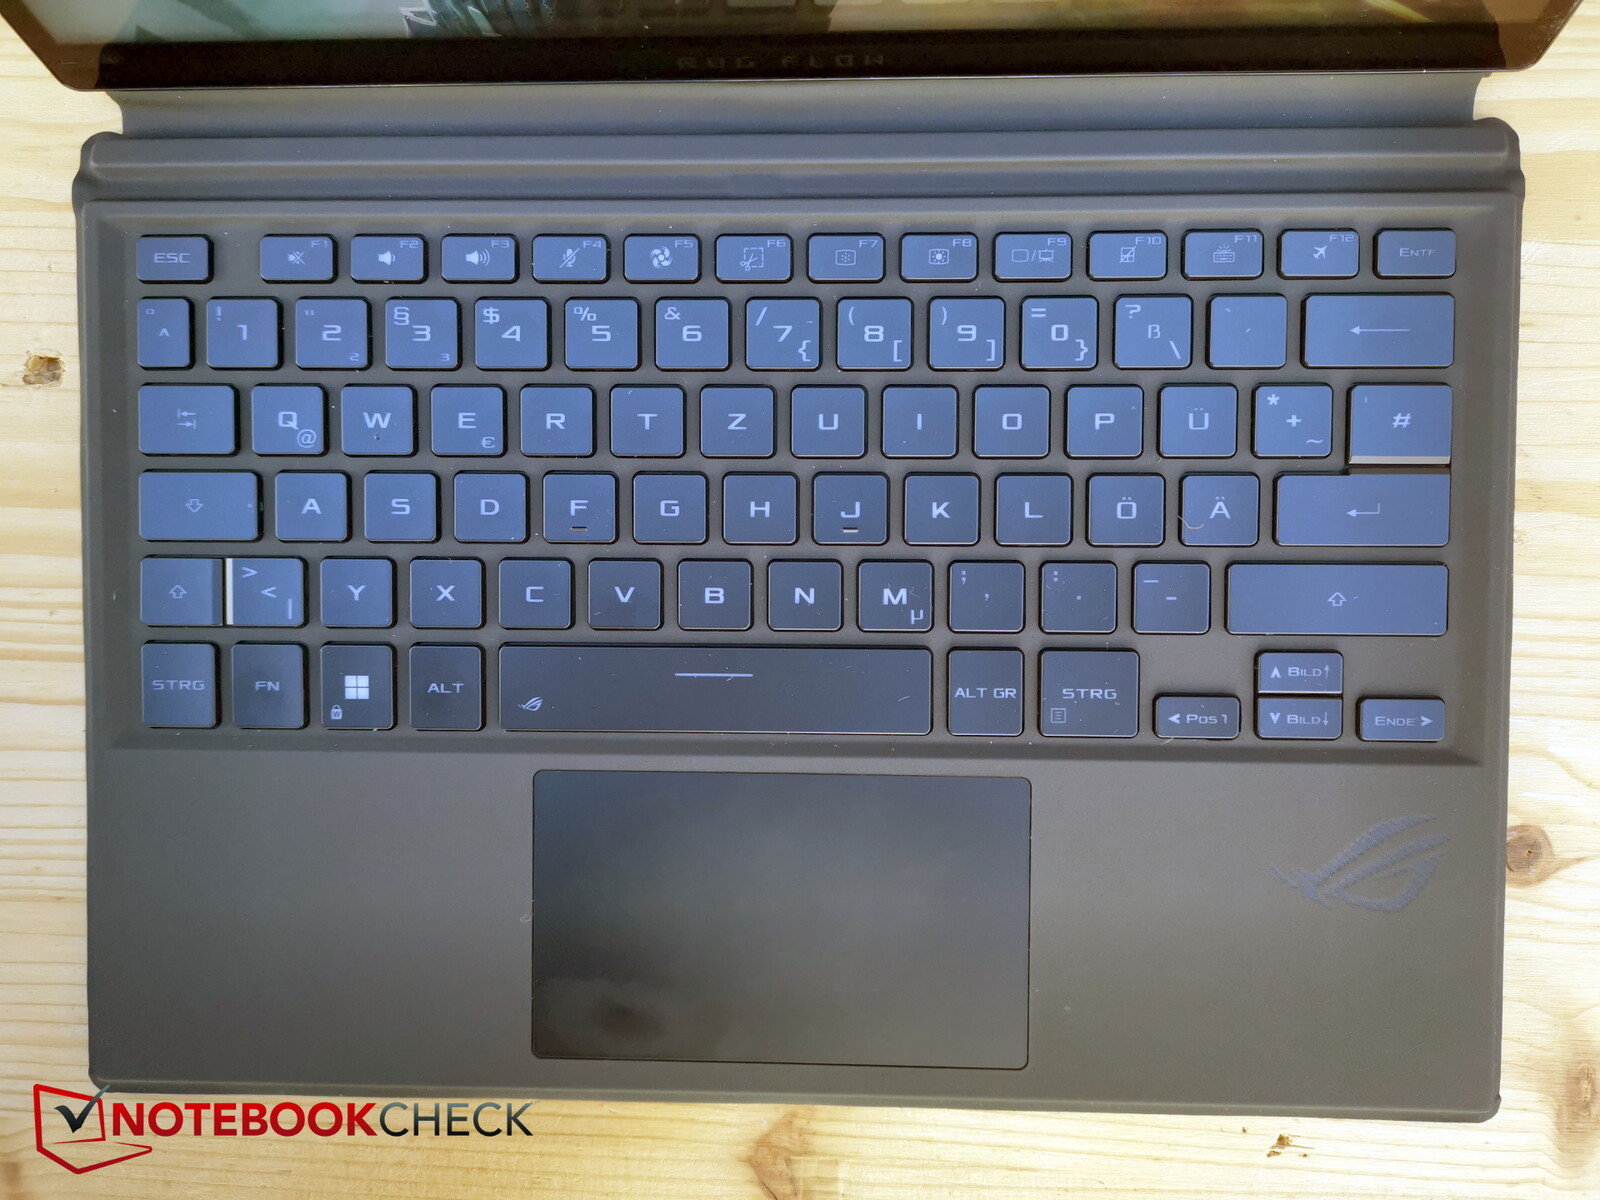
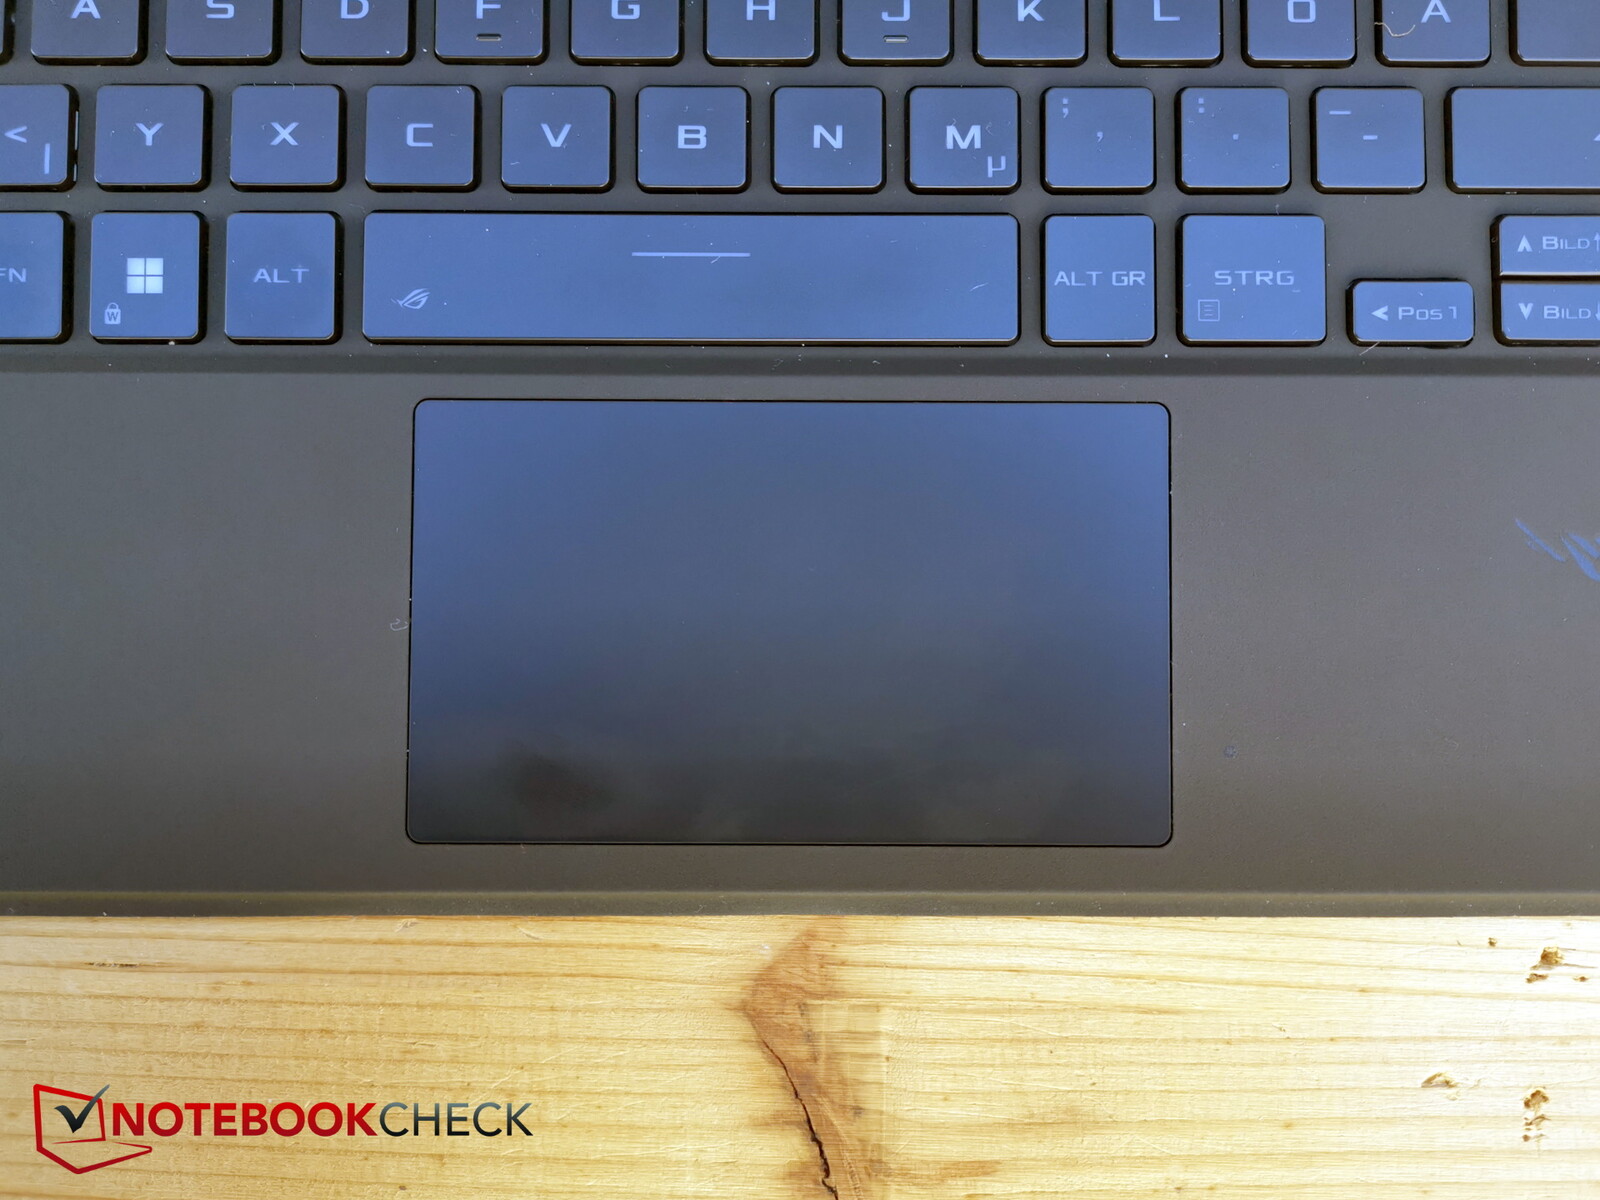
The touchpad is of course relatively small (approx. 10.5 x 6.1 cm), but offers good gliding properties and hardly falters, even during very slow movements.
The integrated keys have a very short travel, but noticeable feedback. The right button is a bit louder and feels like it has a deeper travel.
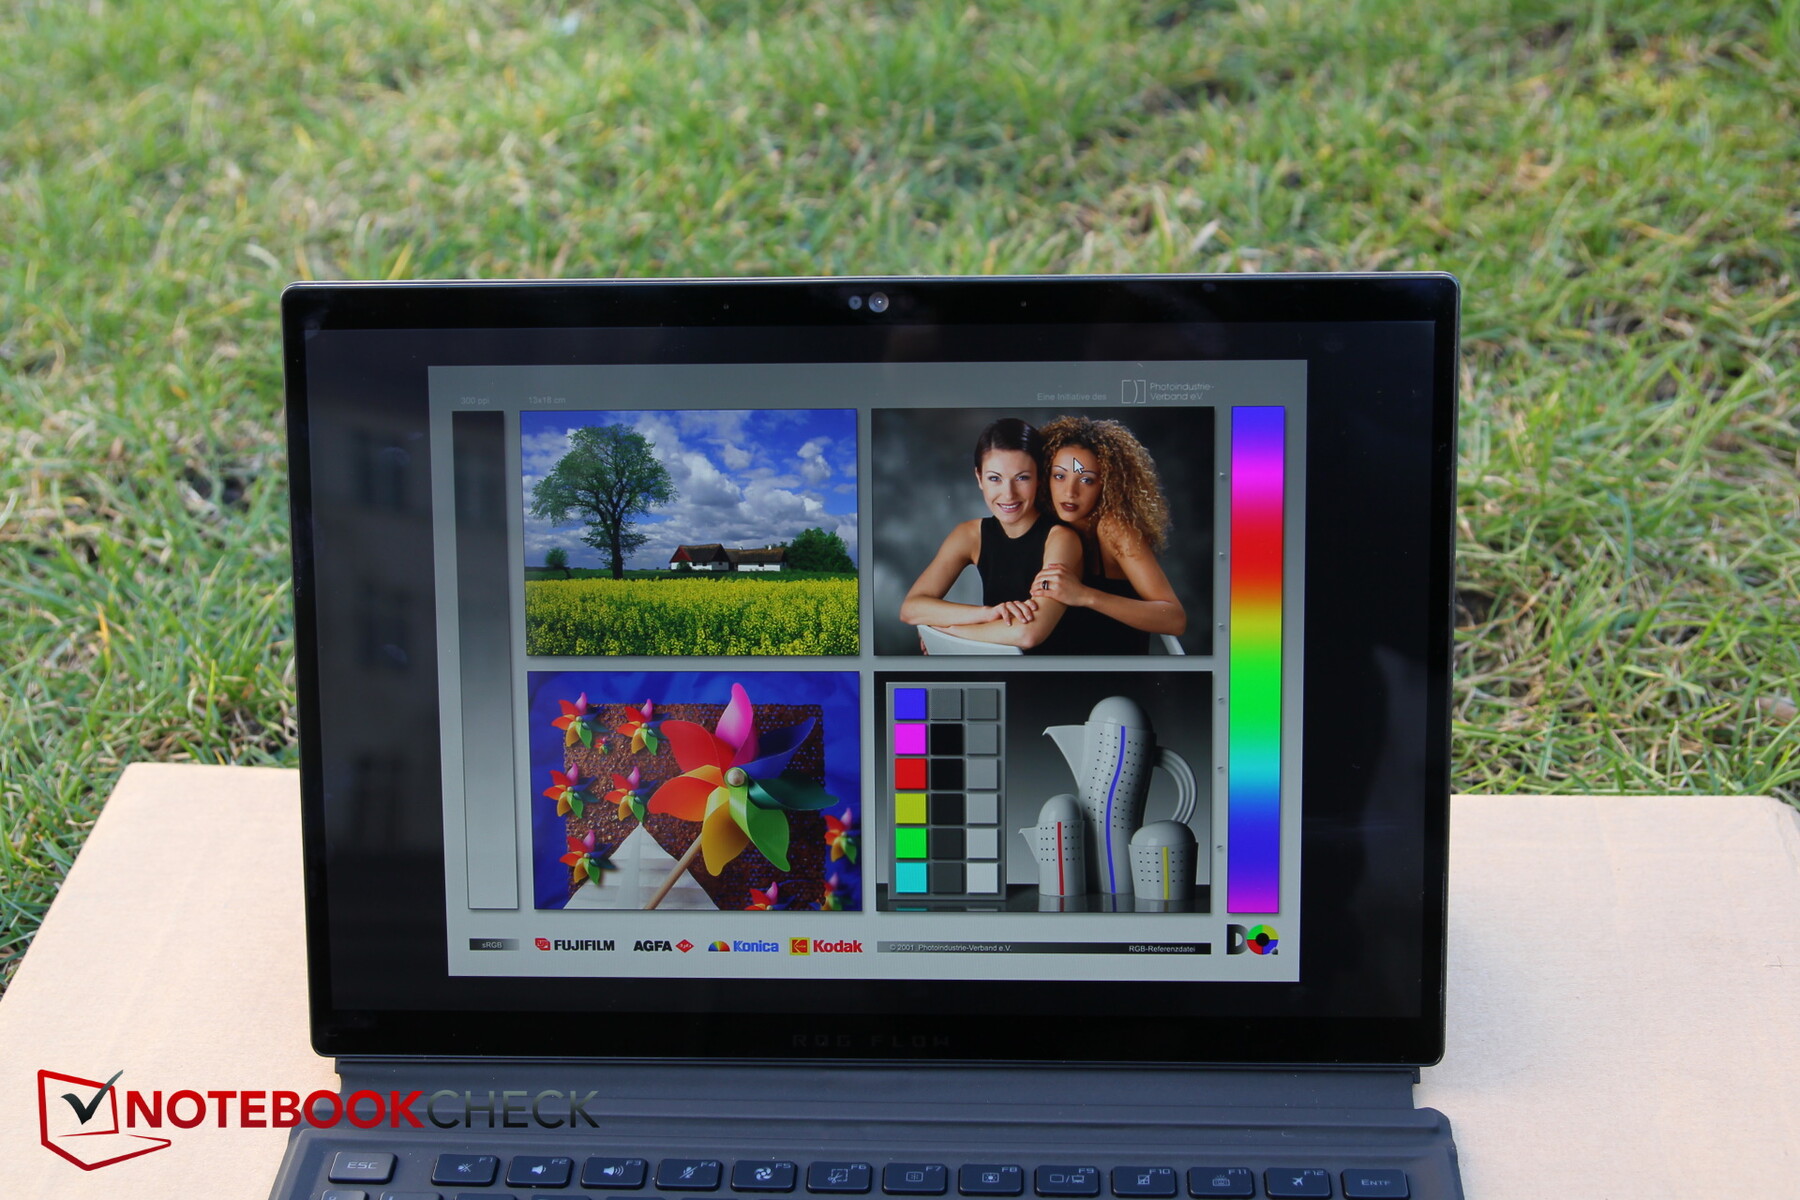
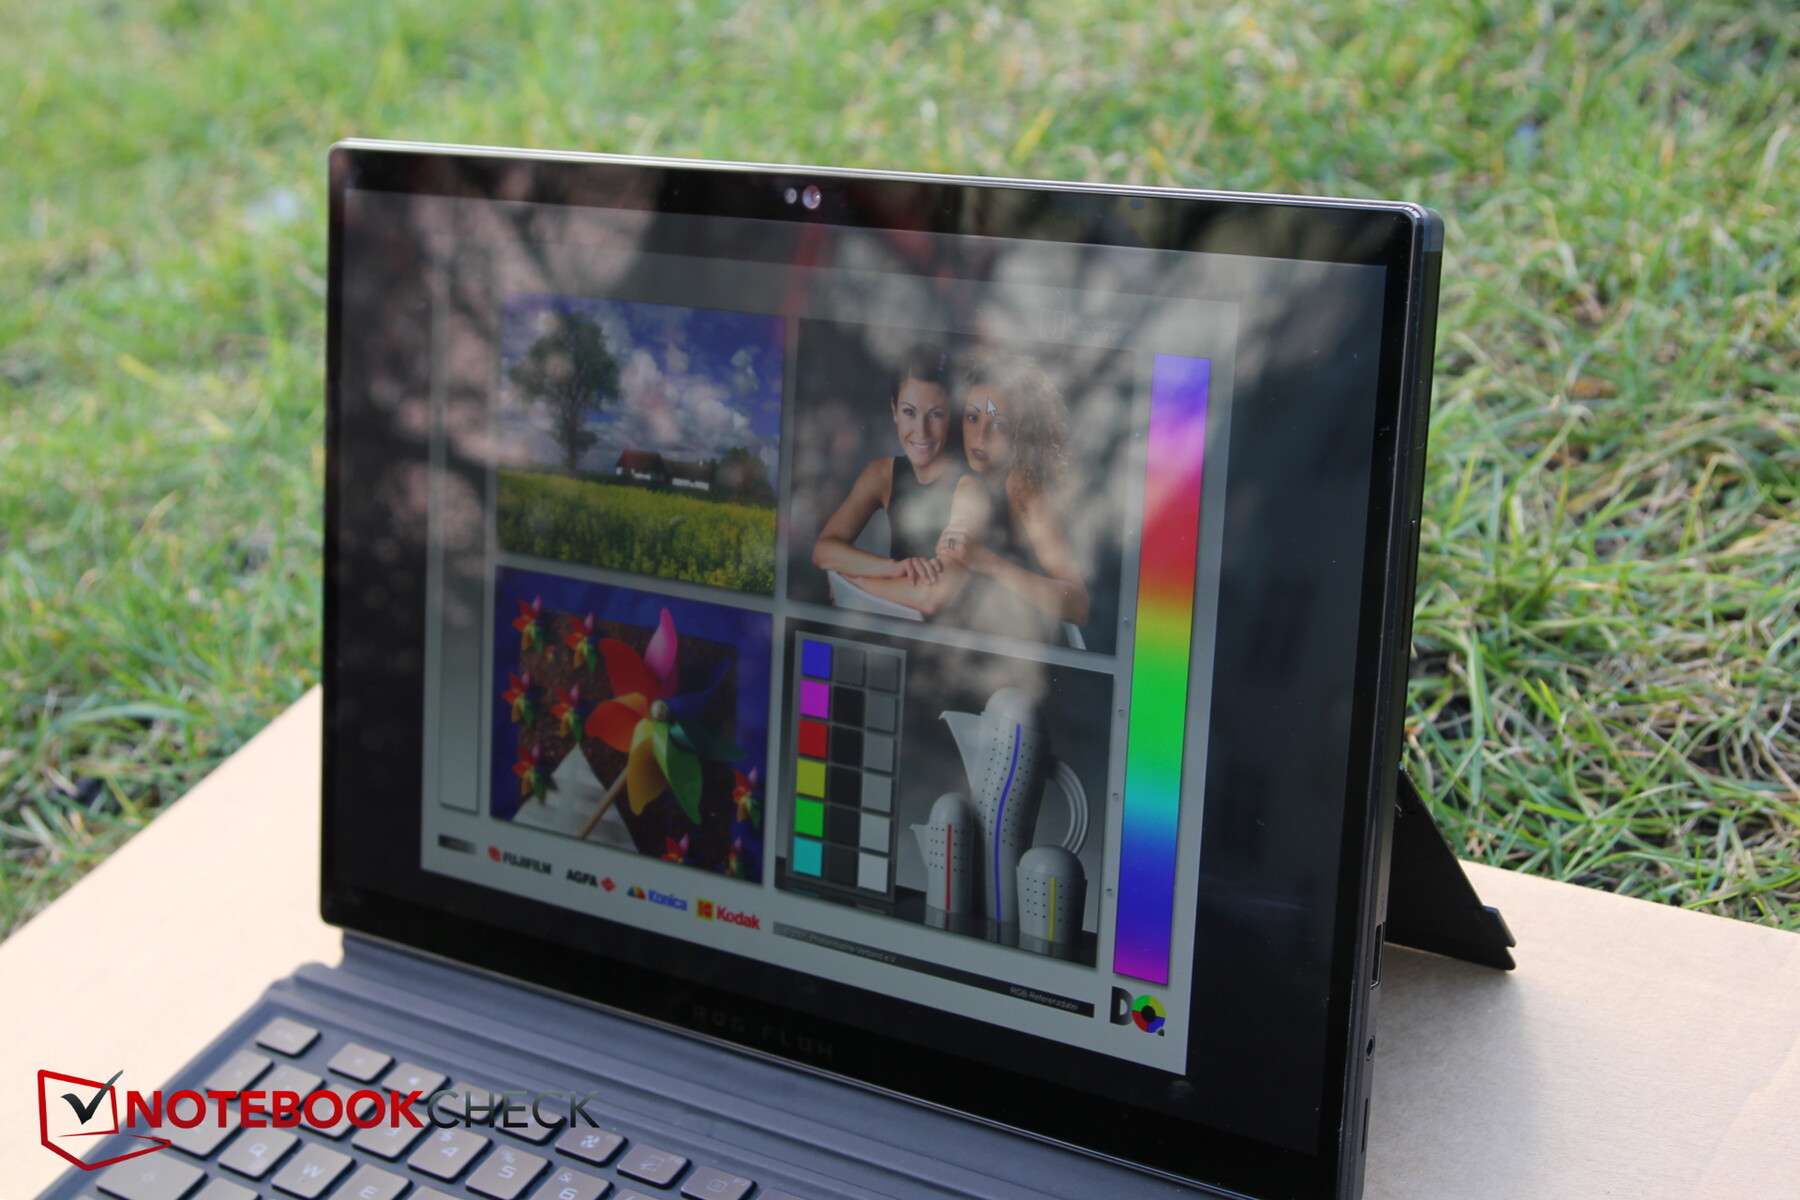
Display - ROG Nebula QHD+ and 500 nits
Asus has changed the panel - instead of Sharp, the new model comes from Tianma Micro Electronics, which is based in China and Japan. The 13.4-inch display has a resolution of 2,560 x 1,600 in a 16:10 aspect ratio and offers a refresh rate of 165 Hz.
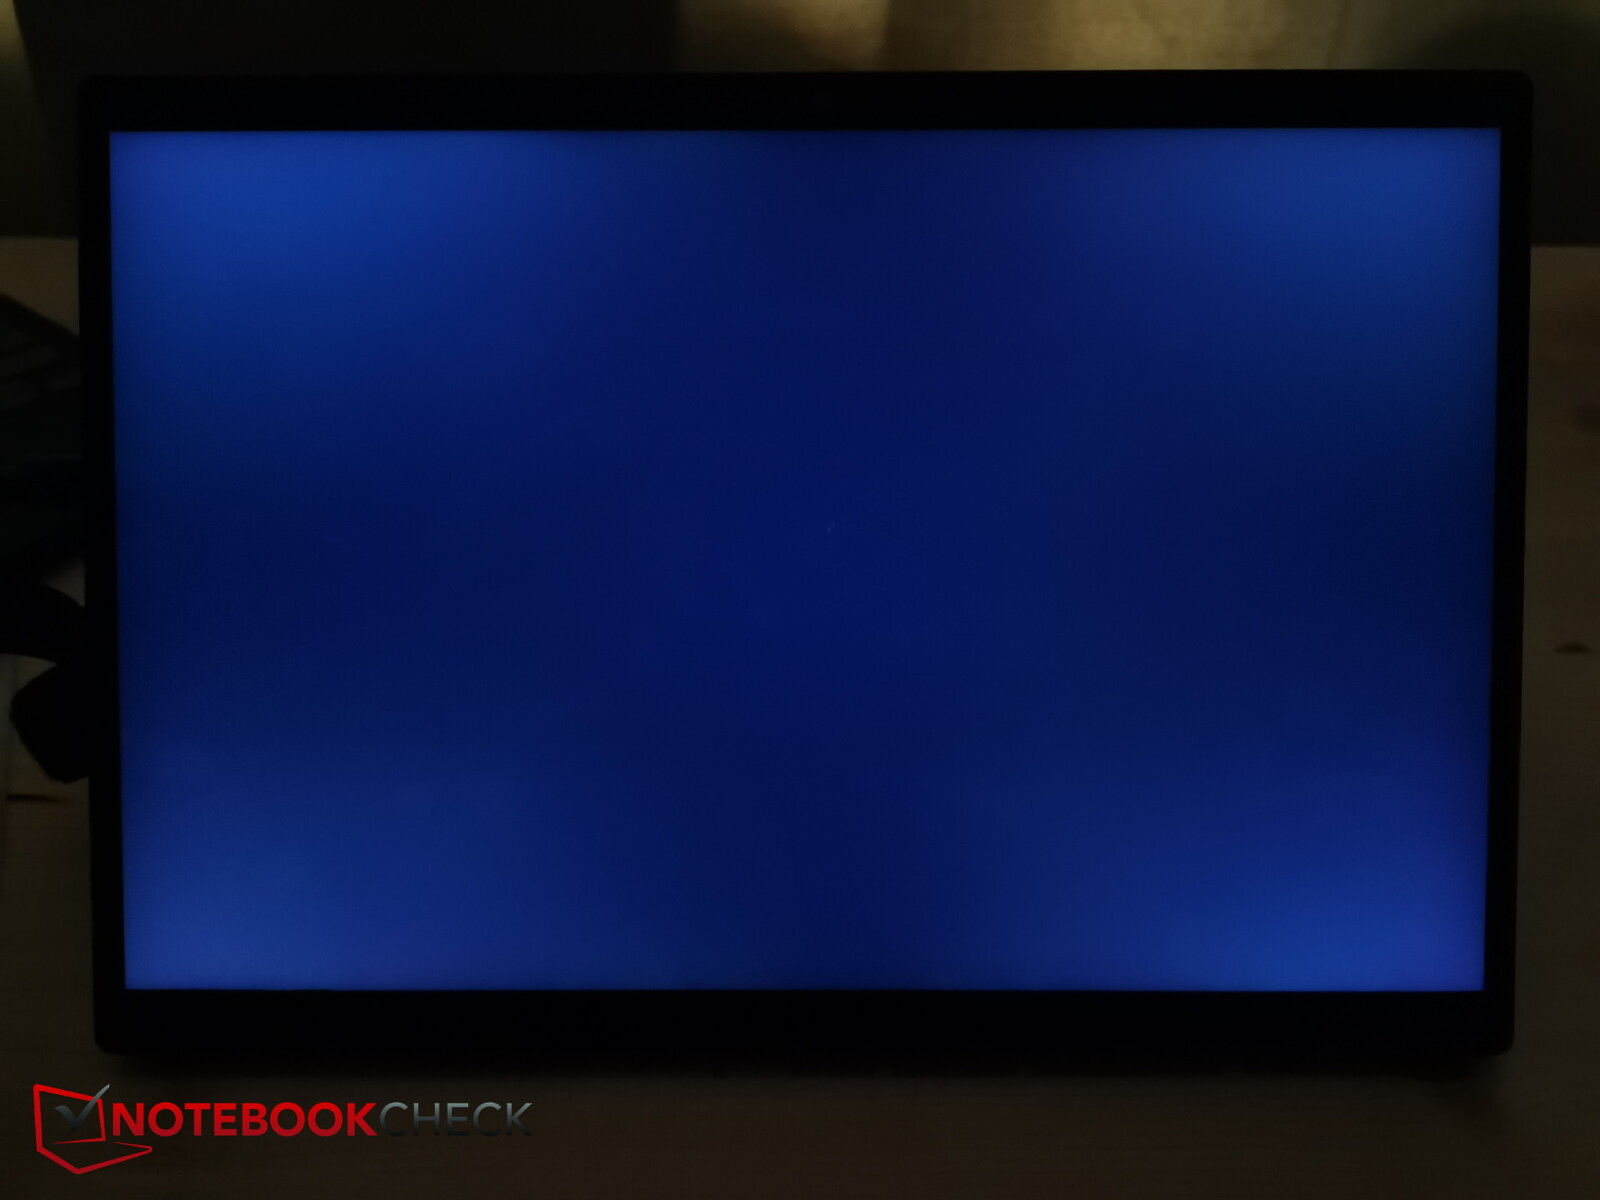
The brightness is very good at just over 500 nits in SDR mode, while the illumination (88%) decreases somewhat towards the lower right edge in particular. The black value is not nearly comparable to that of an OLED, but the contrast is still okay.
Response times are fast for both black to white and gray to gray. Screen bleeding is not visible on our Z13. Overall, we have a bright and high-resolution touch display here.
| |||||||||||||||||||||||||
Brightness Distribution: 88 %
Center on Battery: 538 cd/m²
Contrast: 1193:1 (Black: 0.45 cd/m²)
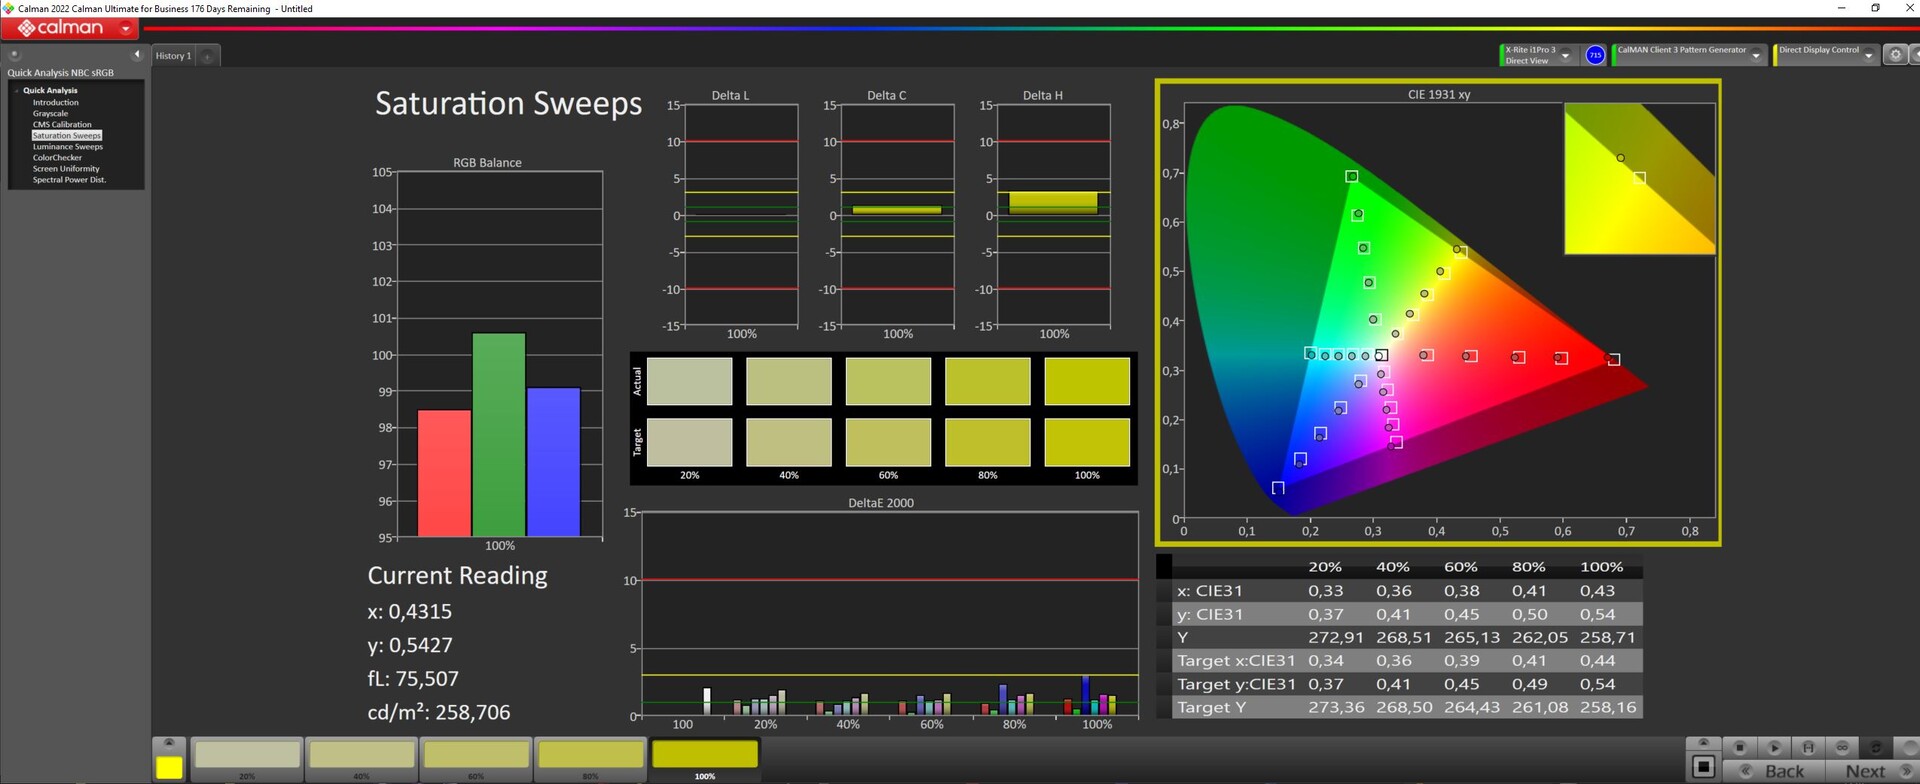
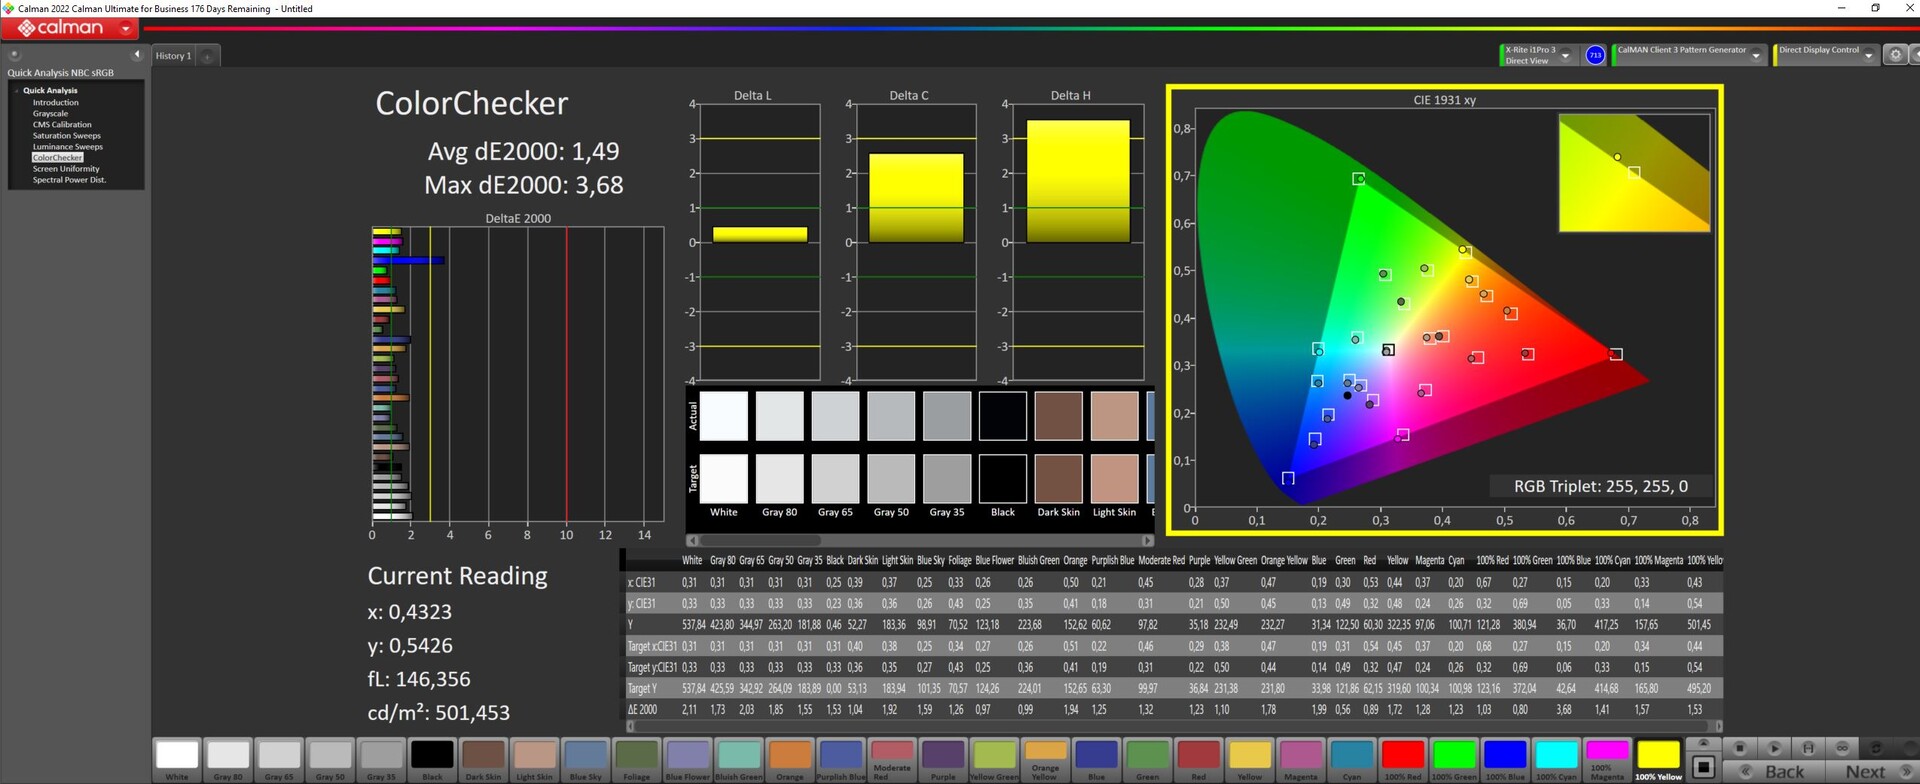
ΔE ColorChecker Calman: 1.49 | ∀{0.5-29.43 Ø4.72}
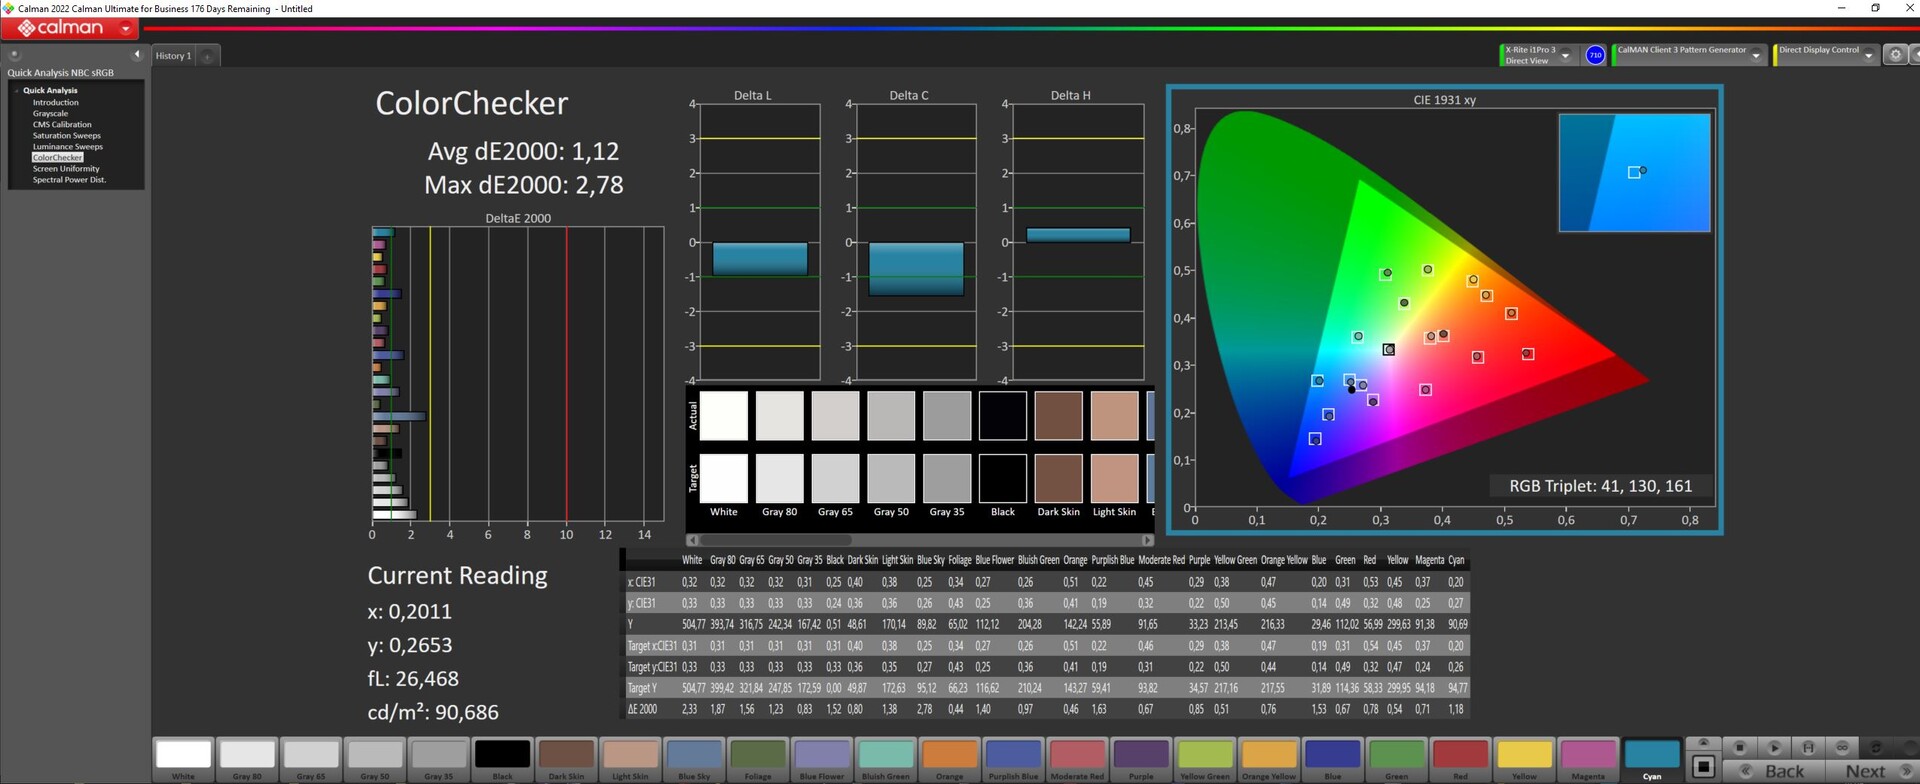
calibrated: 1.12
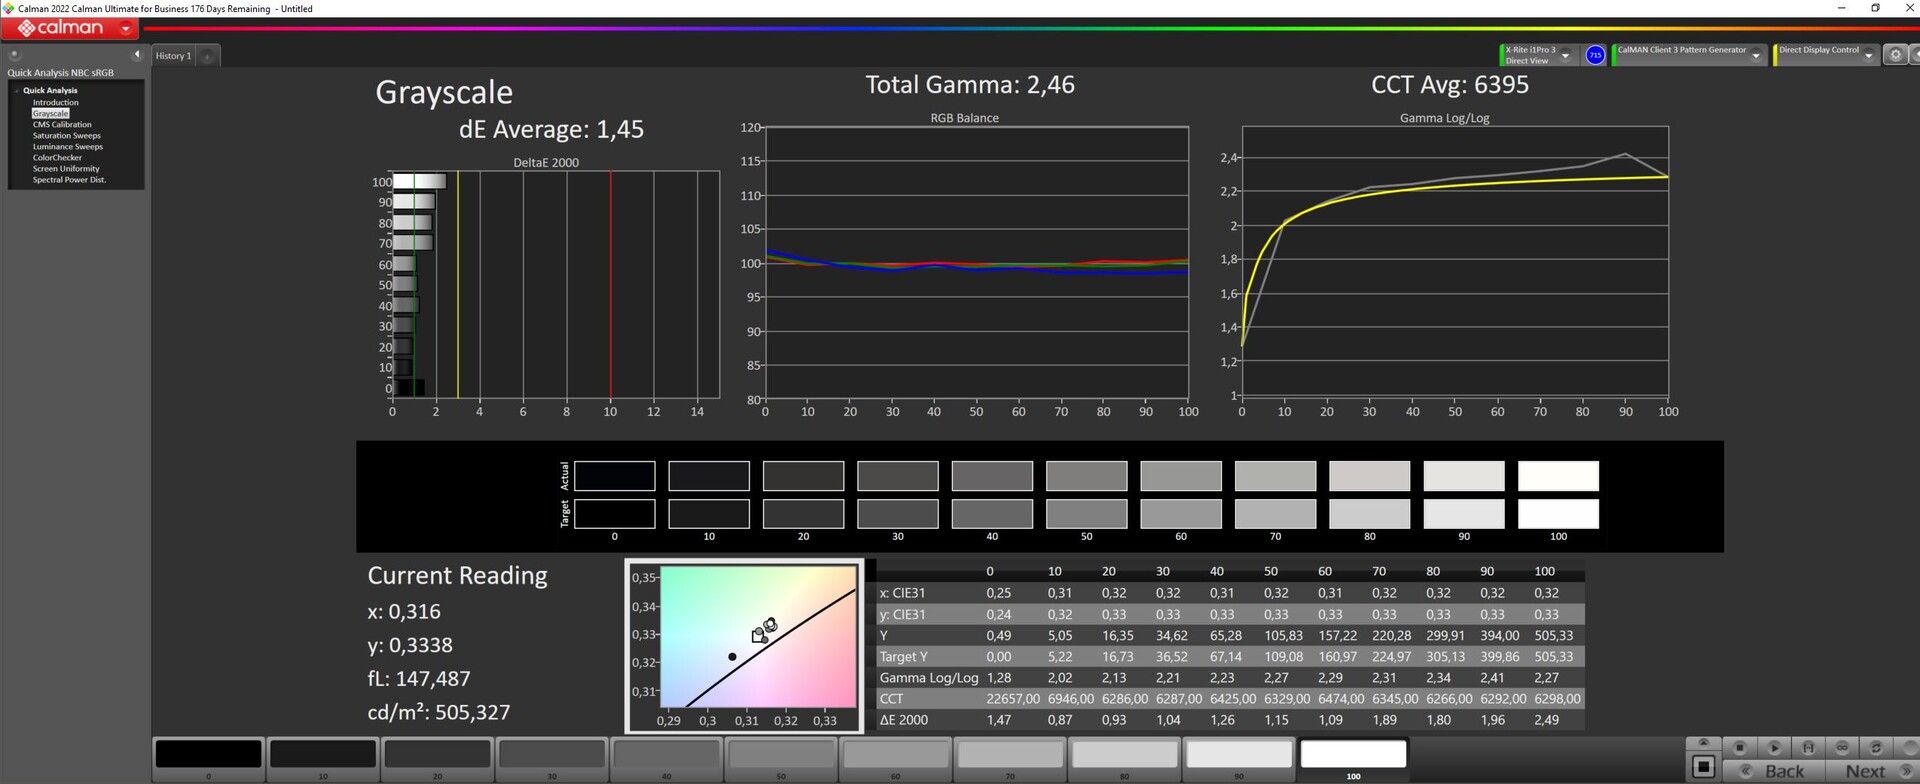
ΔE Greyscale Calman: 1.66 | ∀{0.09-98 Ø4.97}
85.3% AdobeRGB 1998 (Argyll 3D)
99.9% sRGB (Argyll 3D)
97% Display P3 (Argyll 3D)
Gamma: 2.43
CCT: 6772 K
| Asus ROG Flow Z13 GZ301V TL134ADXP01-0, IPS, 2560x1600, 13.4" | Asus ROG Flow Z13 ACRNM TL134ADXP01-0, IPS, 2560x1600, 13.4" | Asus ROG Flow Z13 GZ301ZE LQ134N1JW54, IPS, 1920x1200, 13.4" | MSI Katana 17 B13VFK B173HAN04.9, IPS LED, 1920x1080, 17.3" | Acer Predator Triton 300 SE Samsung ATNA40YK07-0, OLED, 2880x1800, 14" | MSI Cyborg 15 A12VF AU Optronics B156HAN15.1, IPS, 1920x1080, 15.6" | |
|---|---|---|---|---|---|---|
| Display | 0% | -17% | -49% | 6% | -47% | |
| Display P3 Coverage (%) | 97 | 96.94 0% | 67.5 -30% | 40.8 -58% | 99.9 3% | 42.3 -56% |
| sRGB Coverage (%) | 99.9 | 99.92 0% | 97.1 -3% | 61 -39% | 100 0% | 62.6 -37% |
| AdobeRGB 1998 Coverage (%) | 85.3 | 85.17 0% | 69.3 -19% | 42.2 -51% | 99 16% | 43.7 -49% |
| Response Times | 61% | -374% | -354% | 79% | -177% | |
| Response Time Grey 50% / Grey 80% * (ms) | 6.5 ? | 2.1 ? 68% | 44 ? -577% | 33 ? -408% | 1.36 ? 79% | 22 ? -238% |
| Response Time Black / White * (ms) | 6.5 ? | 3 ? 54% | 17.6 ? -171% | 26 ? -300% | 1.36 ? 79% | 14 ? -115% |
| PWM Frequency (Hz) | 367.6 ? | |||||
| Screen | -15% | -5% | -111% | -60% | -66% | |
| Brightness middle (cd/m²) | 537 | 464 -14% | 515 -4% | 267 -50% | 414.3 -23% | 247 -54% |
| Brightness (cd/m²) | 511 | 455 -11% | 476 -7% | 256 -50% | 416 -19% | 234 -54% |
| Brightness Distribution (%) | 88 | 89 1% | 87 -1% | 93 6% | 99 13% | 89 1% |
| Black Level * (cd/m²) | 0.45 | 0.4 11% | 0.35 22% | 0.21 53% | 0.25 44% | |
| Contrast (:1) | 1193 | 1160 -3% | 1471 23% | 1271 7% | 988 -17% | |
| Colorchecker dE 2000 * | 1.49 | 2 -34% | 1.6 -7% | 4.7 -215% | 4.68 -214% | 3.78 -154% |
| Colorchecker dE 2000 max. * | 3.68 | 4.2 -14% | 4 -9% | 20.4 -454% | 7.78 -111% | 6.42 -74% |
| Colorchecker dE 2000 calibrated * | 1.12 | 1.2 -7% | 1.2 -7% | 4.5 -302% | 3.94 -252% | |
| Greyscale dE 2000 * | 1.66 | 2.7 -63% | 2.5 -51% | 1.5 10% | 1.8 -8% | 2.16 -30% |
| Gamma | 2.43 91% | 2.24 98% | 2.2 100% | 2.12 104% | 2.22 99% | 2.33 94% |
| CCT | 6772 96% | 6832 95% | 6939 94% | 6552 99% | 6207 105% | 6906 94% |
| Total Average (Program / Settings) | 15% /
-1% | -132% /
-60% | -171% /
-132% | 8% /
-17% | -97% /
-78% |
* ... smaller is better
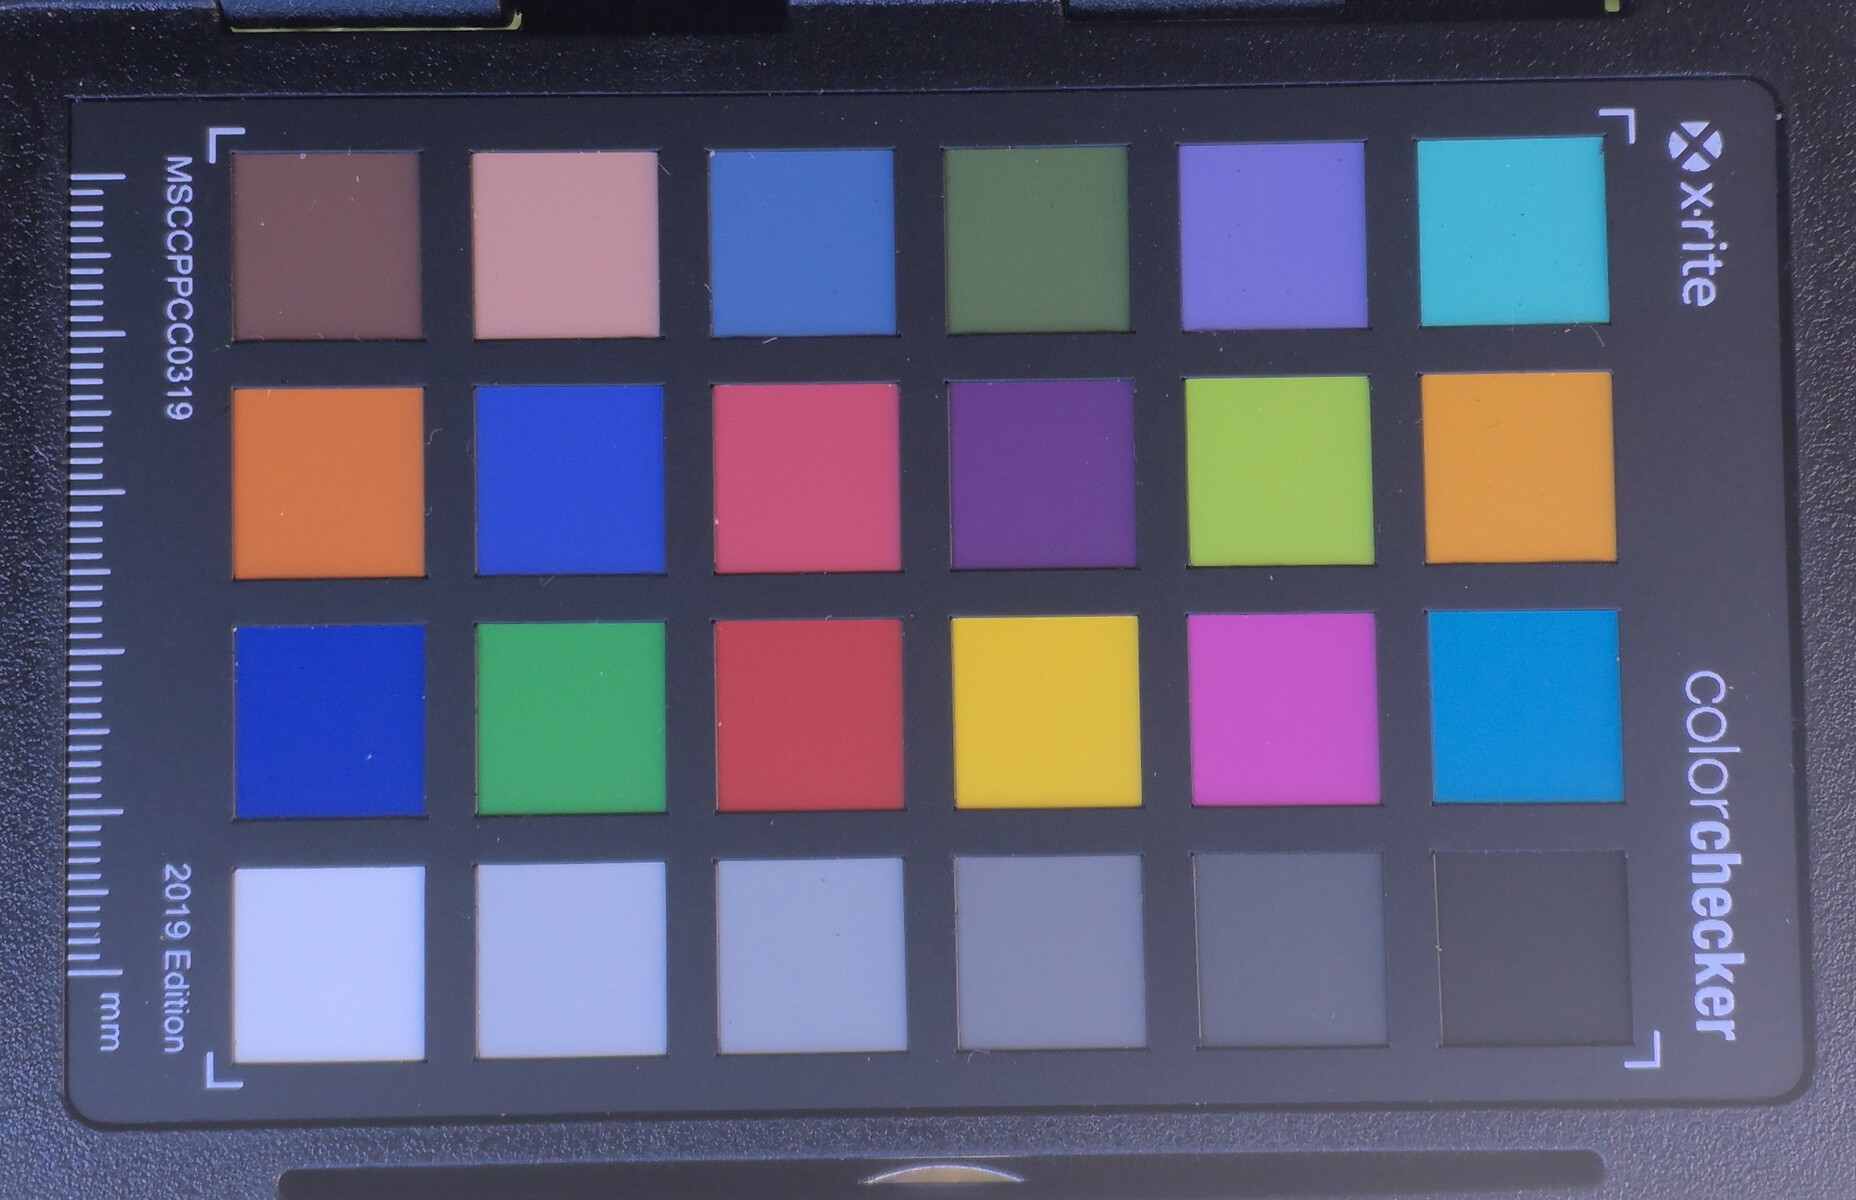
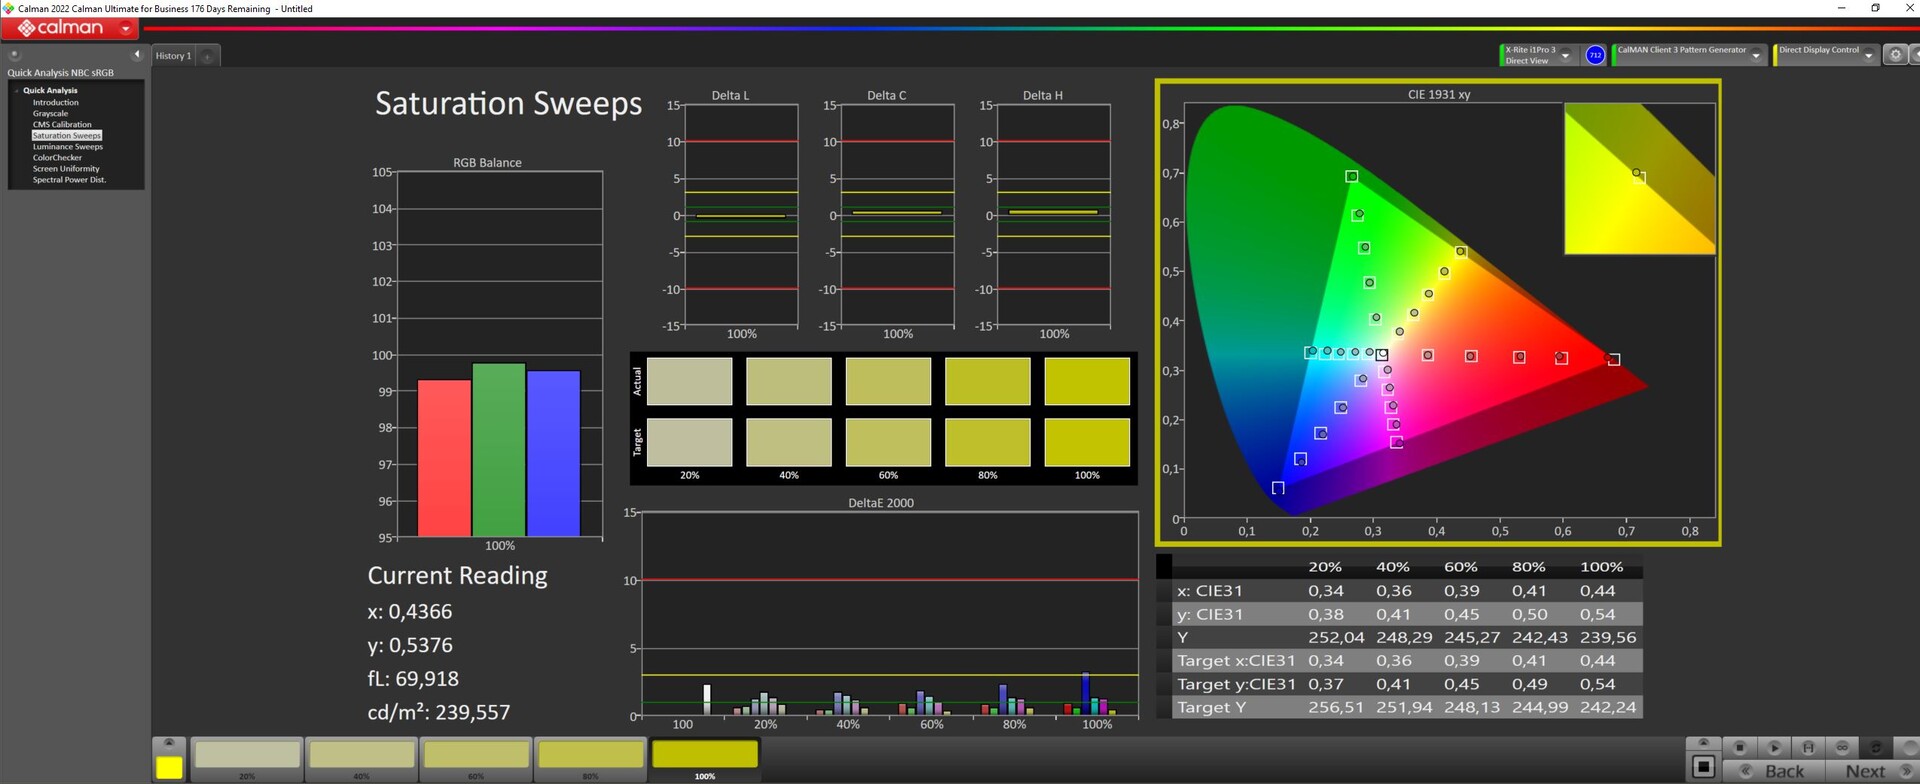
Asus specifies 100 percent DCI-P3; we measured 97%. AdobeRGB has 85% coverage, while sRGB is completely covered, of course.
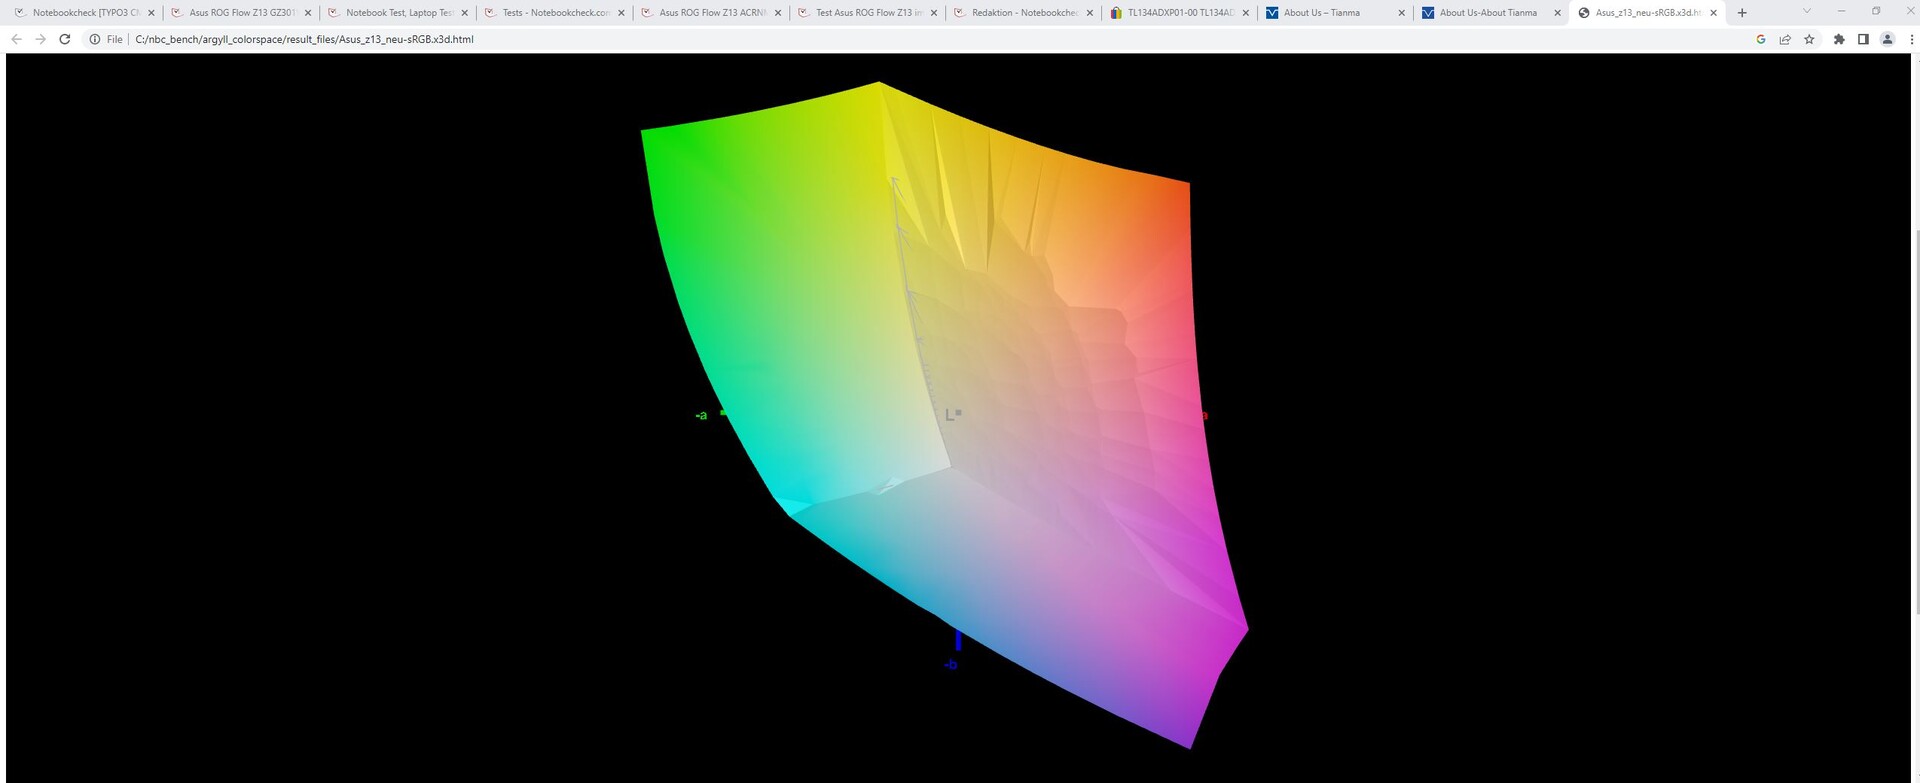
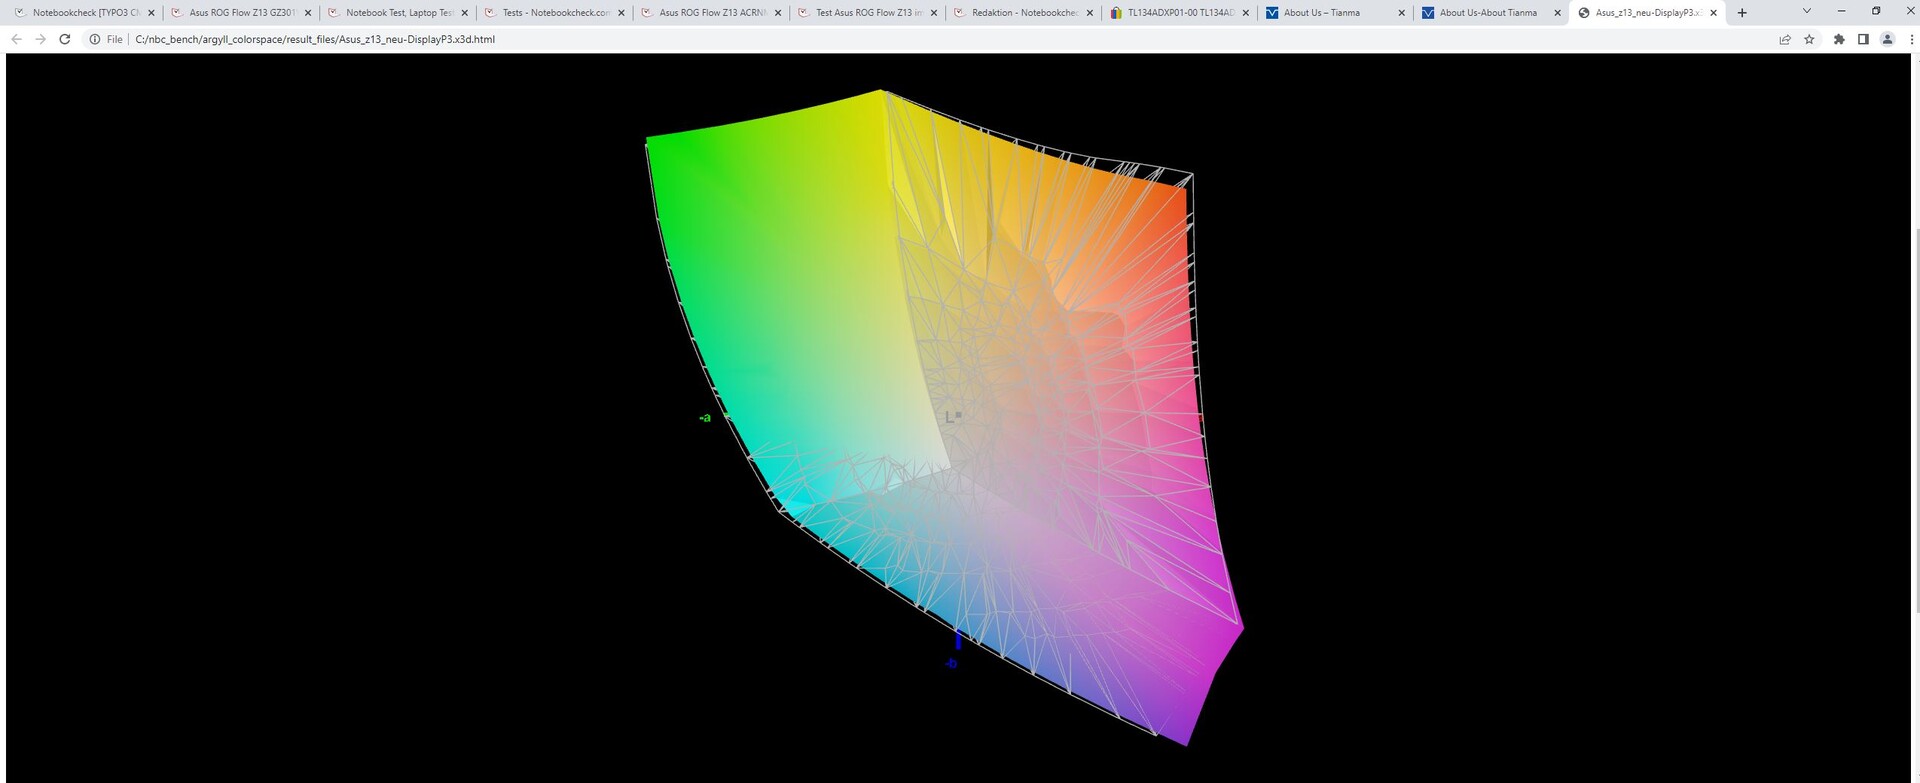
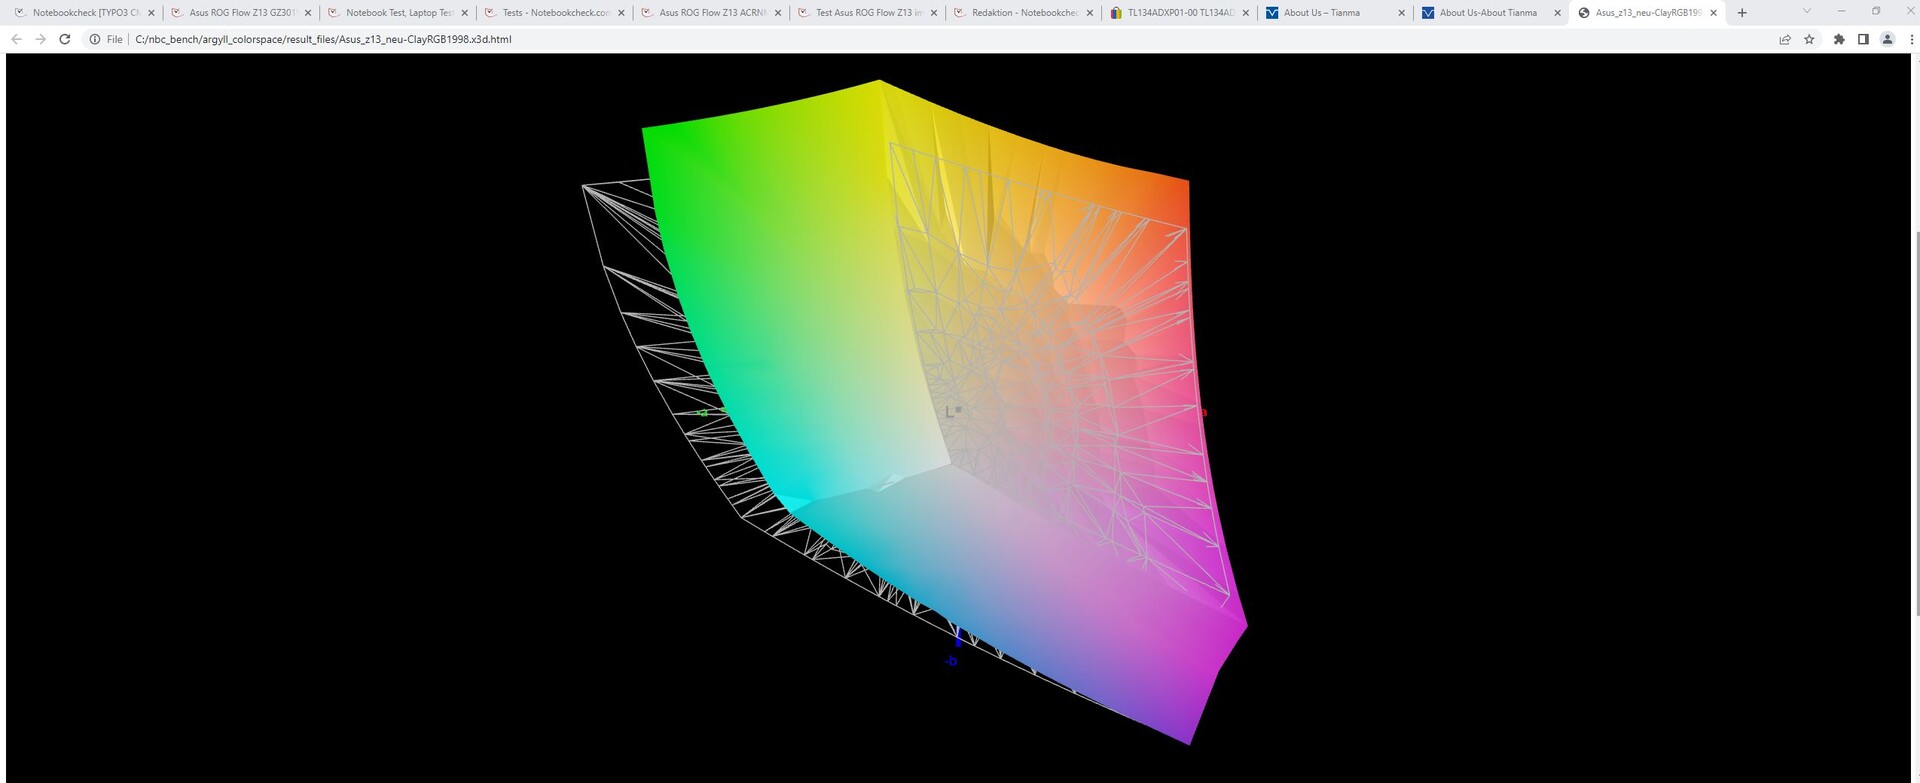
The display is already very well calibrated ex works and has DeltaE values, i.e. deviations of less than 2 for both the grayscale and ColorChecker. A manual calibration using Portrait Display's Calman Color Calibration reduces the deviations even further. Our icc profile can be downloaded above.
Together with good color space coverage, we have a display that is well suited to photo- and video editing.

Display Response Times
| ↔ Response Time Black to White | ||
|---|---|---|
| 6.5 ms ... rise ↗ and fall ↘ combined | ↗ 3.1 ms rise | 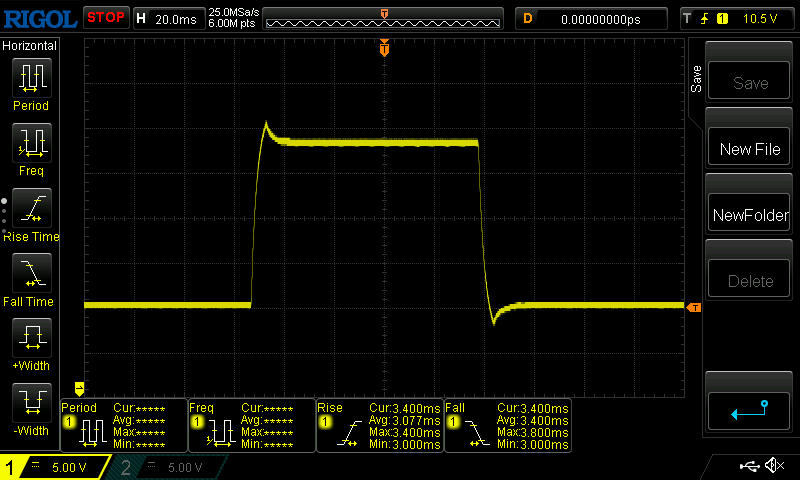 |
| ↘ 3.4 ms fall | ||
| The screen shows very fast response rates in our tests and should be very well suited for fast-paced gaming. In comparison, all tested devices range from 0.1 (minimum) to 240 (maximum) ms. » 21 % of all devices are better. This means that the measured response time is better than the average of all tested devices (19.8 ms). | ||
| ↔ Response Time 50% Grey to 80% Grey | ||
| 6.5 ms ... rise ↗ and fall ↘ combined | ↗ 3.1 ms rise | 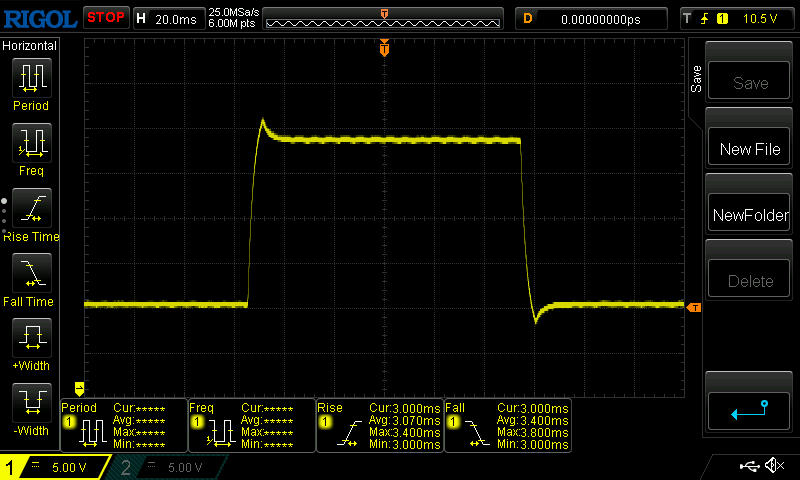 |
| ↘ 3.4 ms fall | ||
| The screen shows very fast response rates in our tests and should be very well suited for fast-paced gaming. In comparison, all tested devices range from 0.165 (minimum) to 636 (maximum) ms. » 20 % of all devices are better. This means that the measured response time is better than the average of all tested devices (31 ms). | ||
Screen Flickering / PWM (Pulse-Width Modulation)
| Screen flickering / PWM not detected | 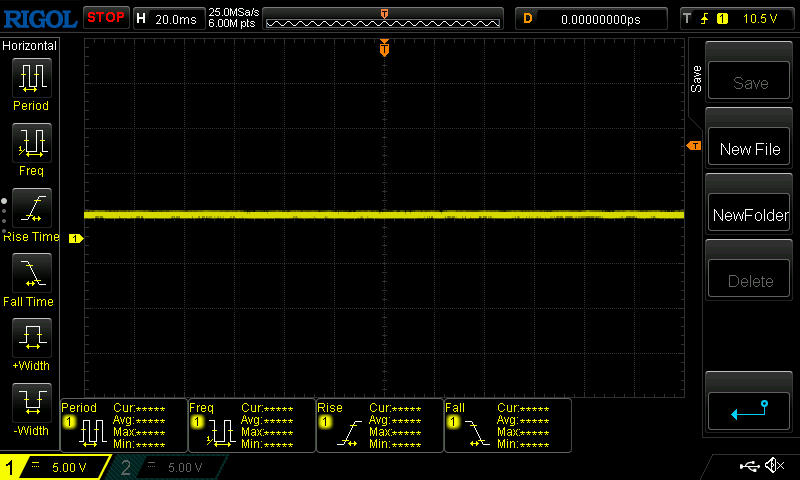 | ||
In comparison: 52 % of all tested devices do not use PWM to dim the display. If PWM was detected, an average of 7747 (minimum: 5 - maximum: 343500) Hz was measured. | |||
Outdoors, the Z13 is well positioned in shady areas without direct light, which is mainly due to the good brightness. However, the reflective surface quickly proves to be counterproductive in direct light.
When looking at the screen from the sides, it proves to be very viewing angle stable.

Performance - Tablet? No, gaming laptop!
This is no typical tablet, but rather a real gaming laptop, as the combination of a Core i9-13900H and an RTX 4060 as well as 16 GB RAM speak for themselves. Alternatively, the Z13 is also available with an RTX 4050, and the special edition, which differs in many areas, even has an RTX 4070.
So you should be able to play all current games on this tablet. At the same time, the powerful Asus tablet should also be exciting for content creators.
Testing Conditions
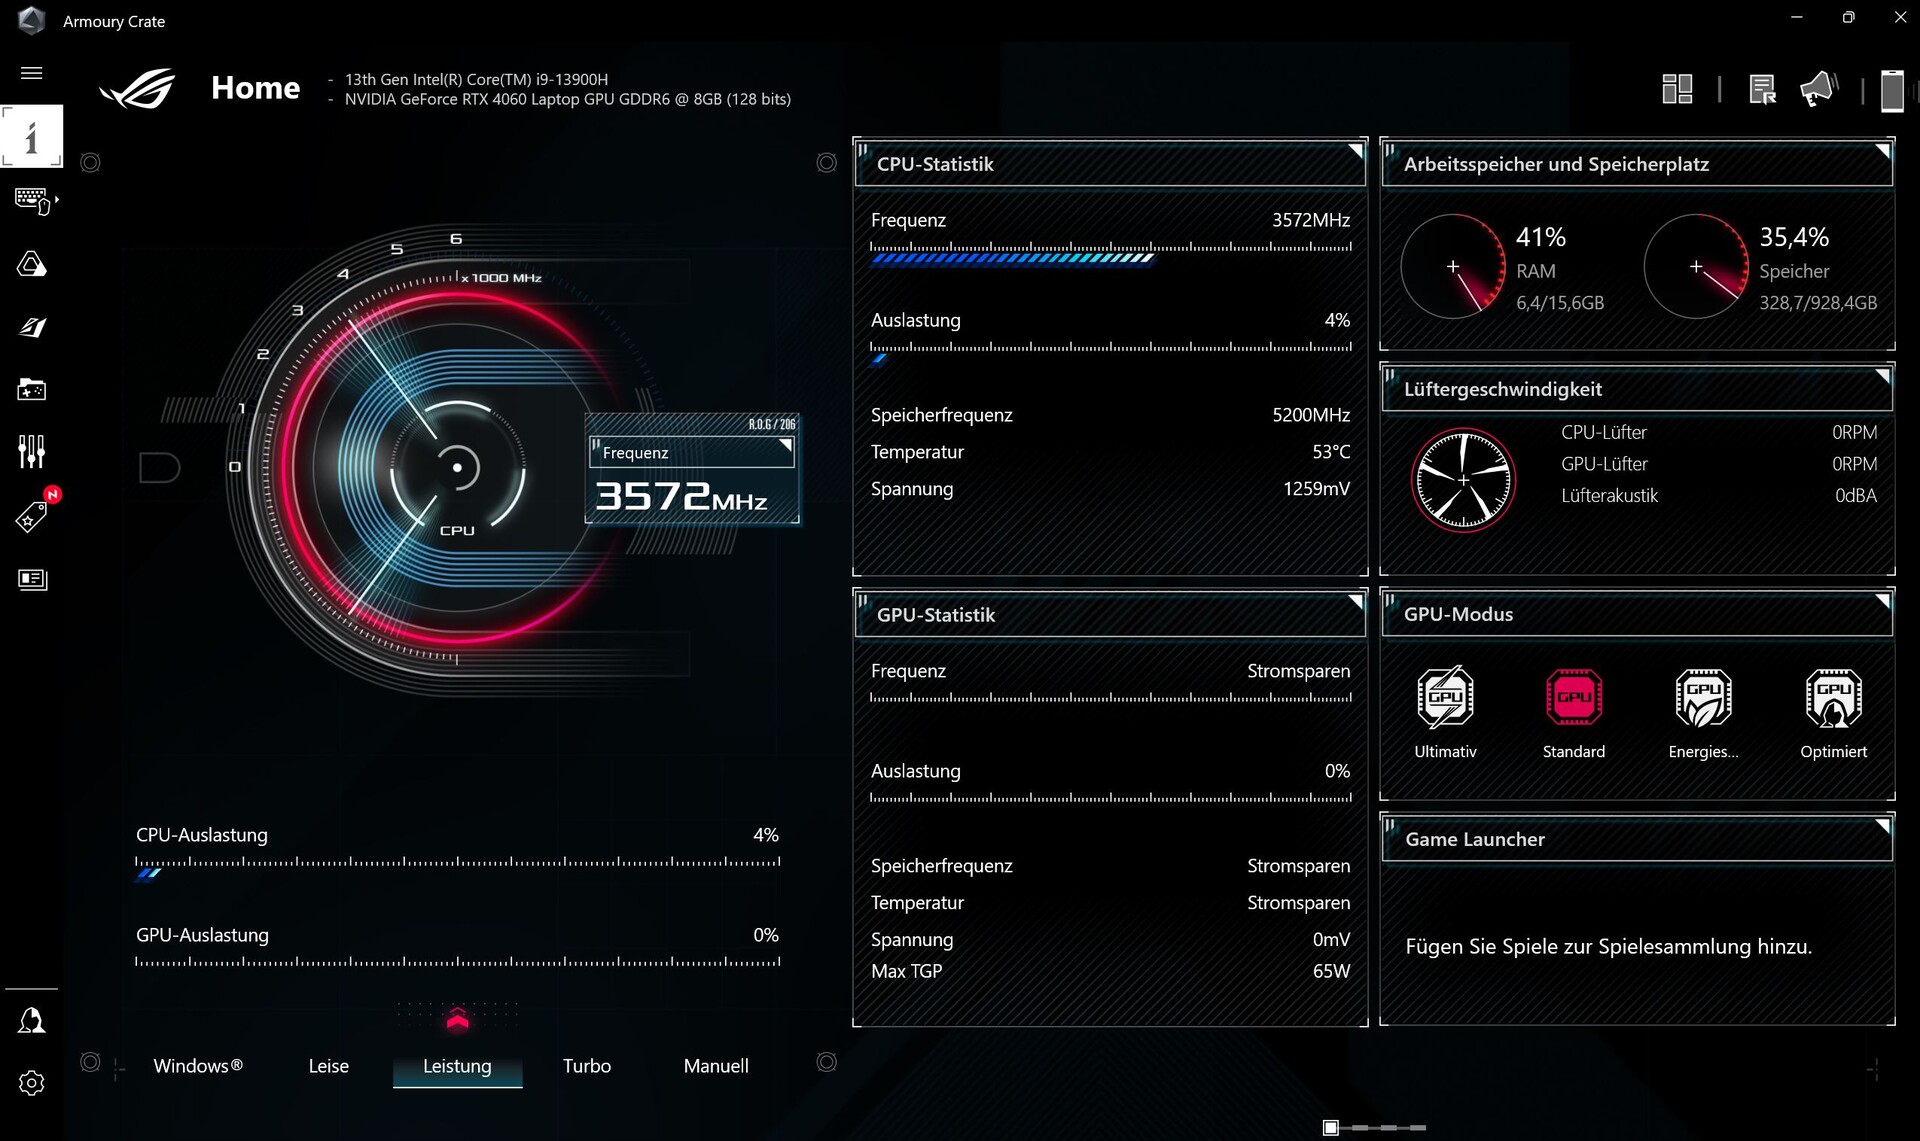
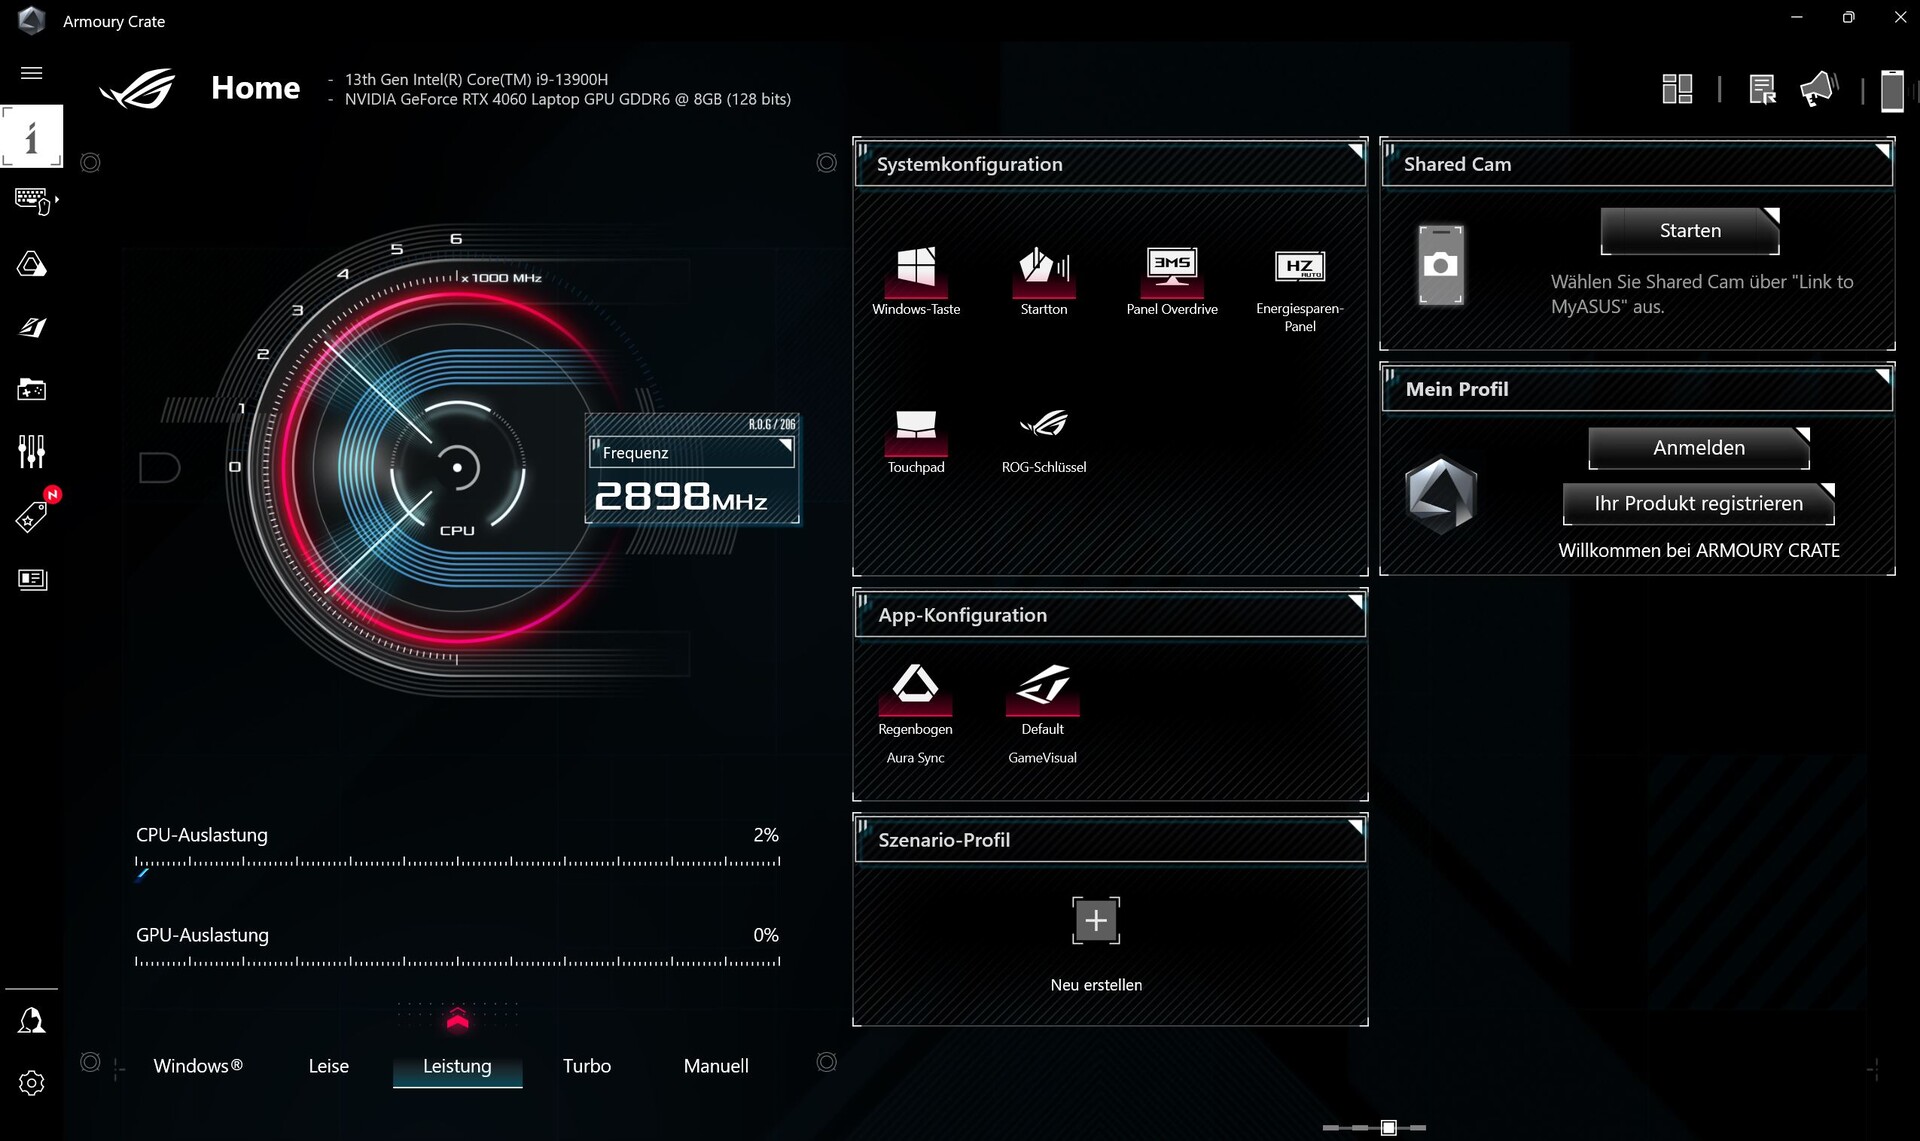
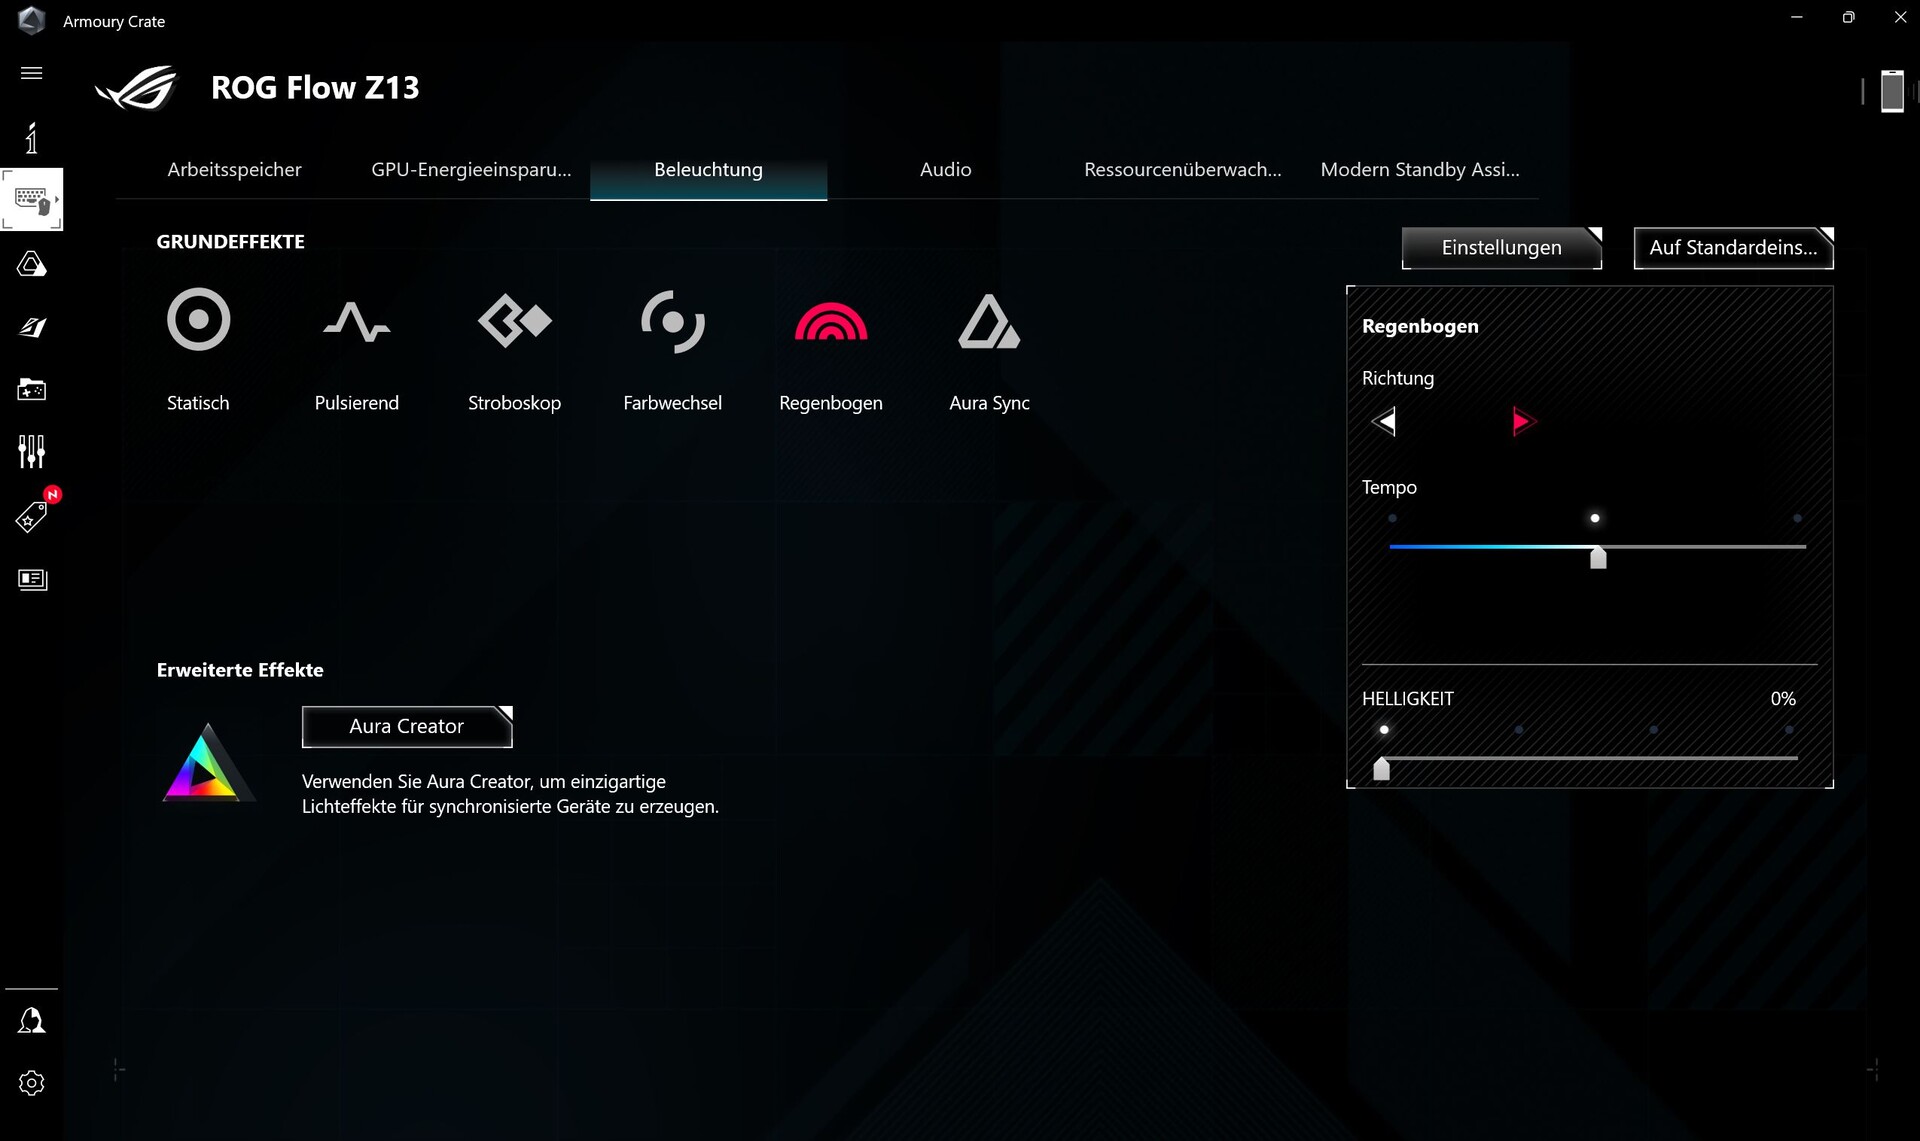
Asus' gaming devices always have at least two apps preinstalled. Updates and service information are available via MyAsus, while performance settings are made in the Armoury Crate app. The latter mimics the Control Center.
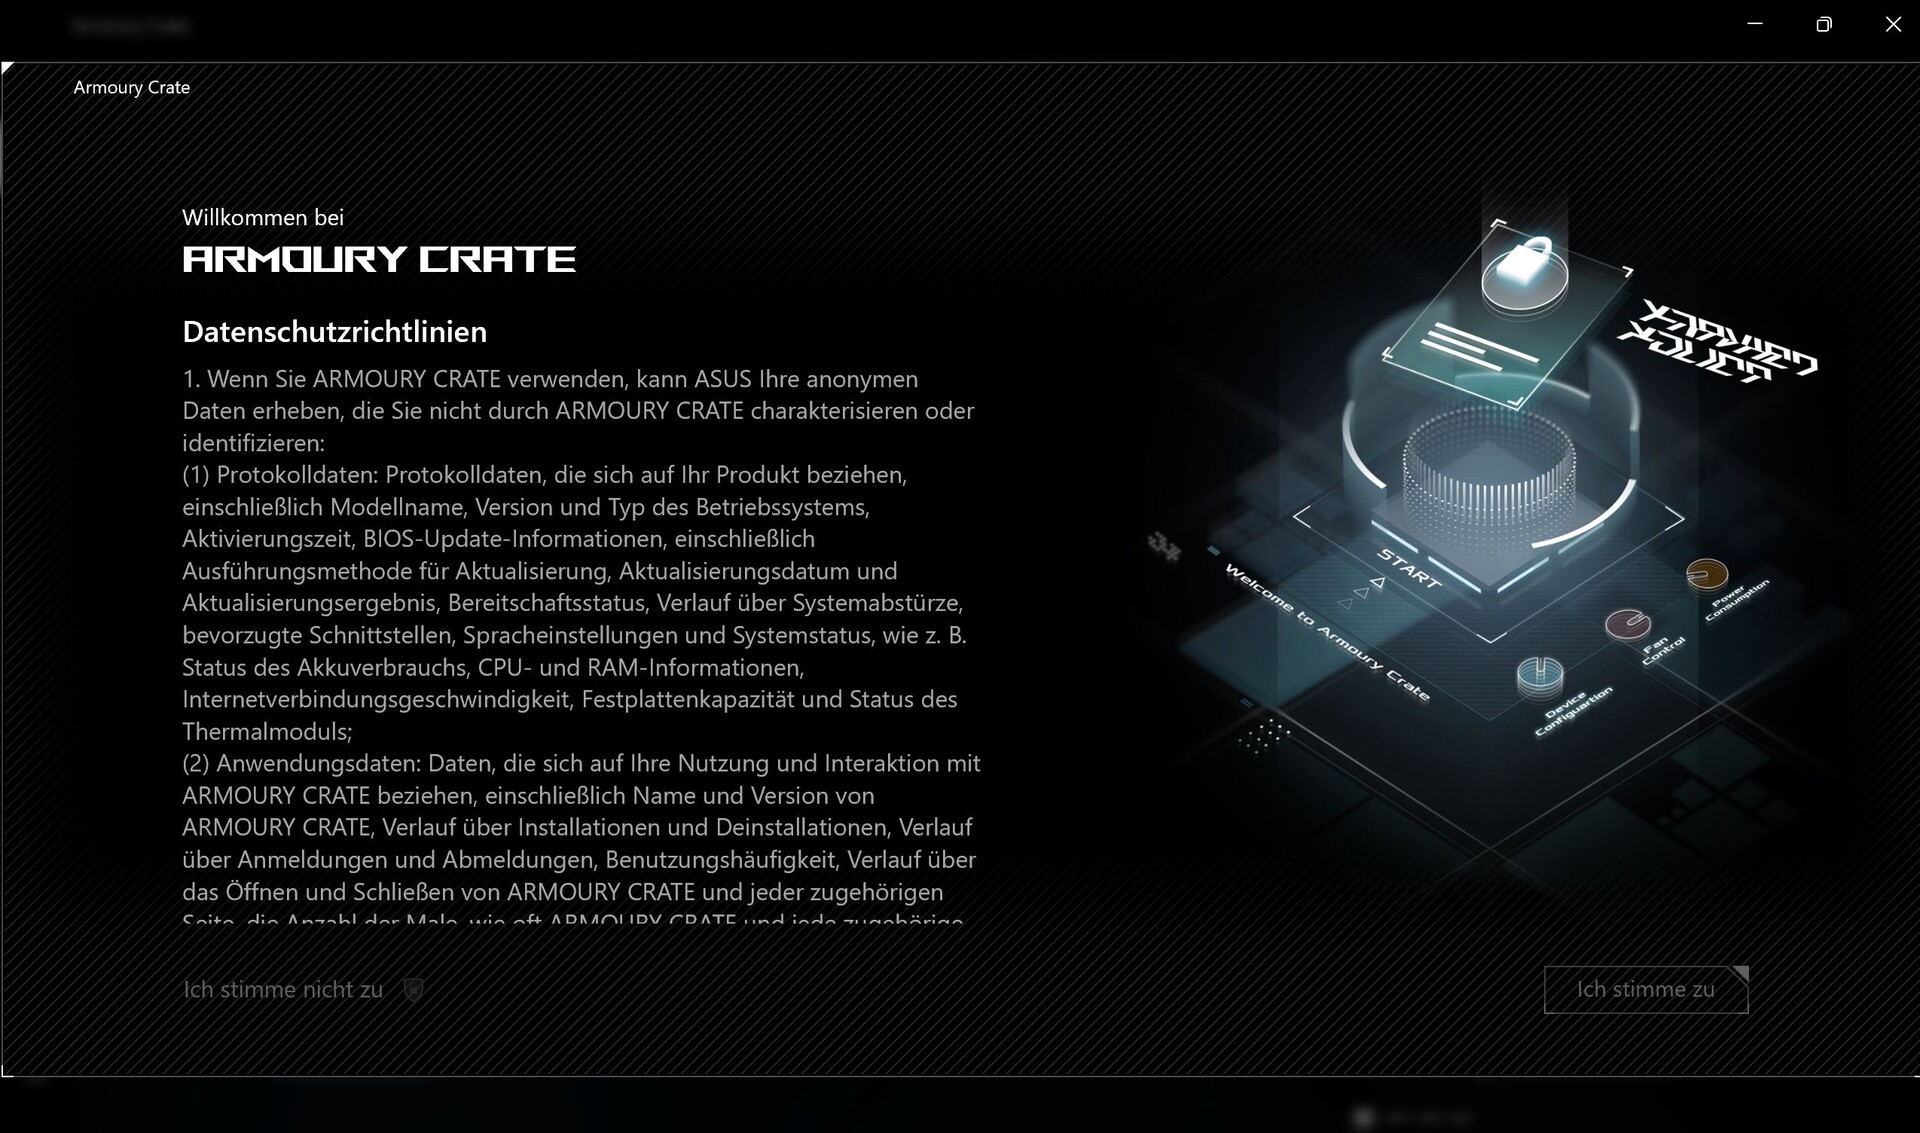
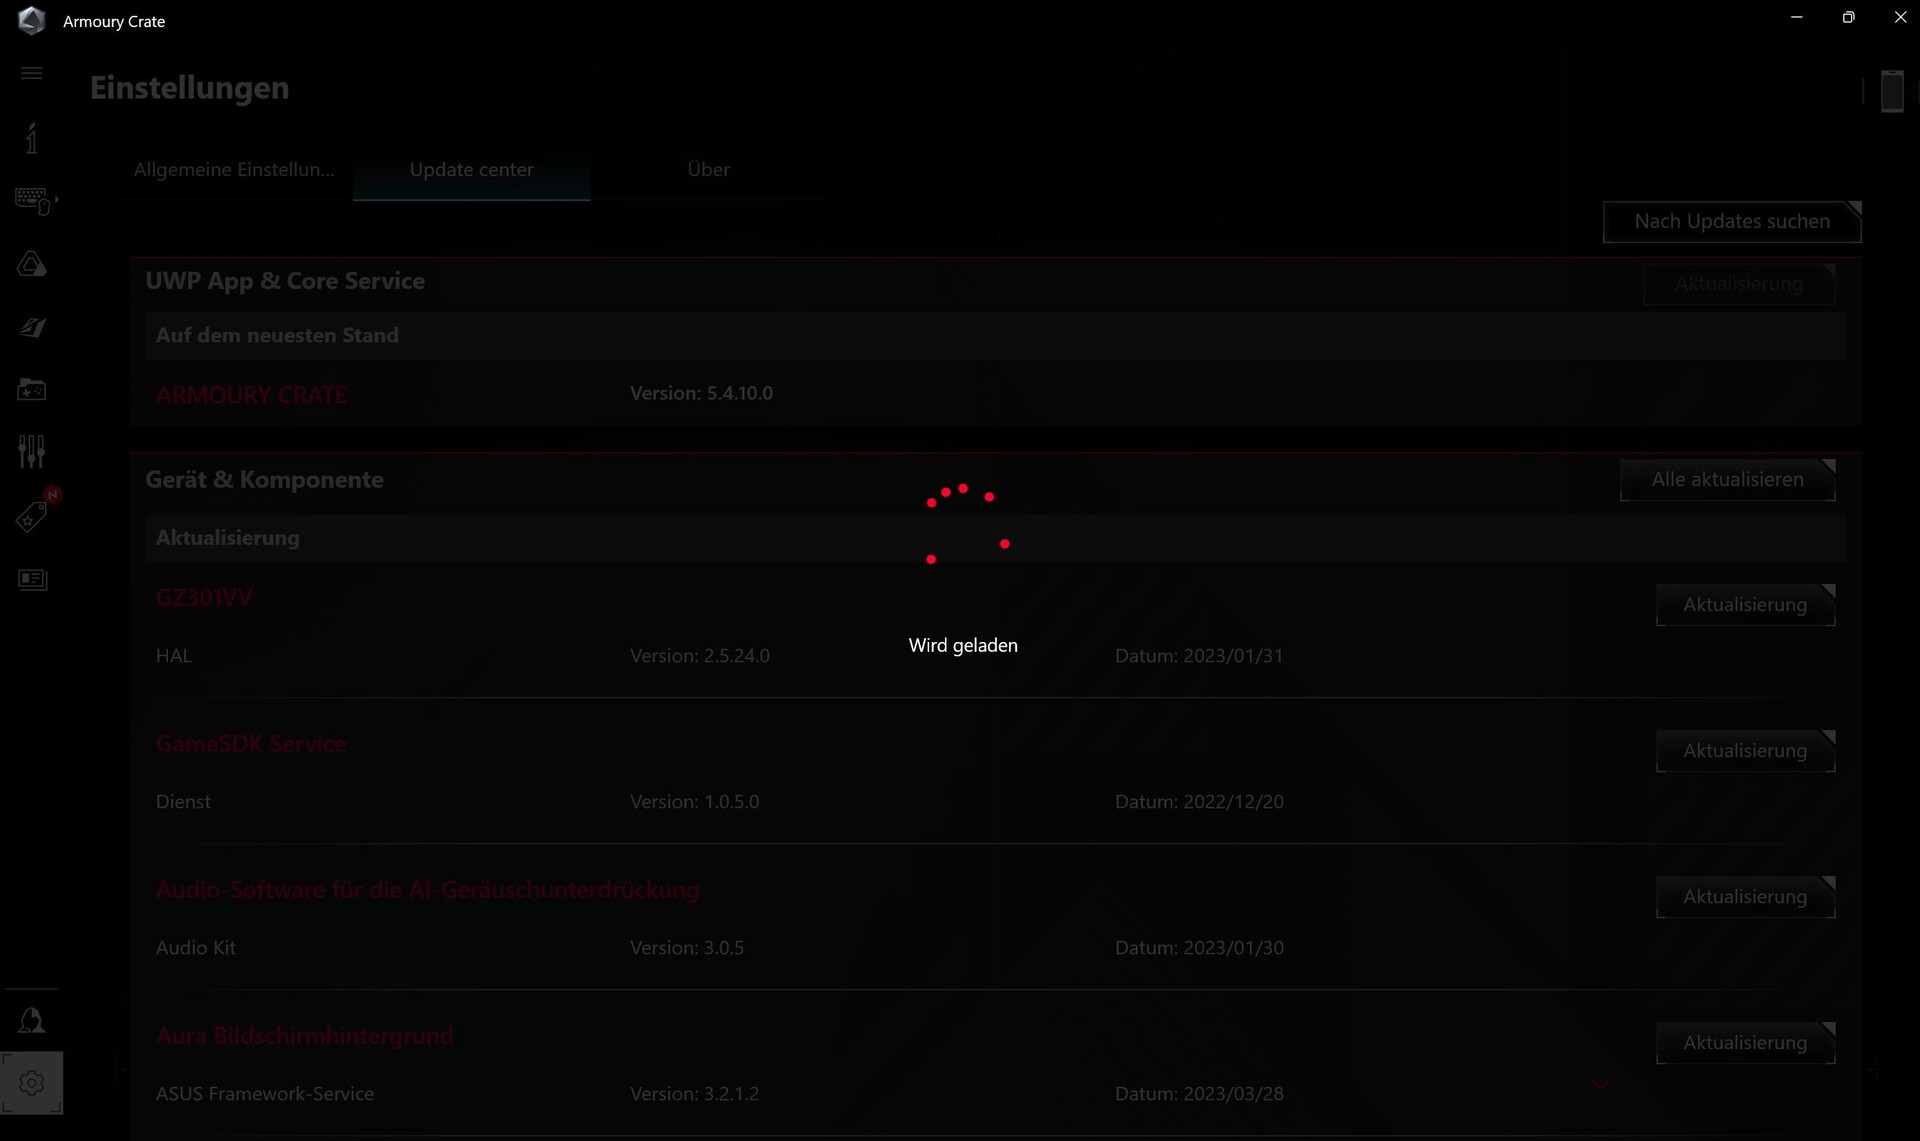
Users should familiarize themselves with the software: in addition to the four performance modes Quiet, Performance, Turbo and Manual, there is the option of switching the graphics, customizing the lighting, configuring the audio and much more. If you want to do this, you have to agree to Asus' (anonymized) data collection beforehand. The app also searches for updates for an agonizingly long time, and the search is occasionally triggered unintentionally. At least the app can be easily closed and restarted.
Because of its tablet-like character, we carried out all benchmarks in Performance mode, but we also present values for the Turbo and Quiet modes.
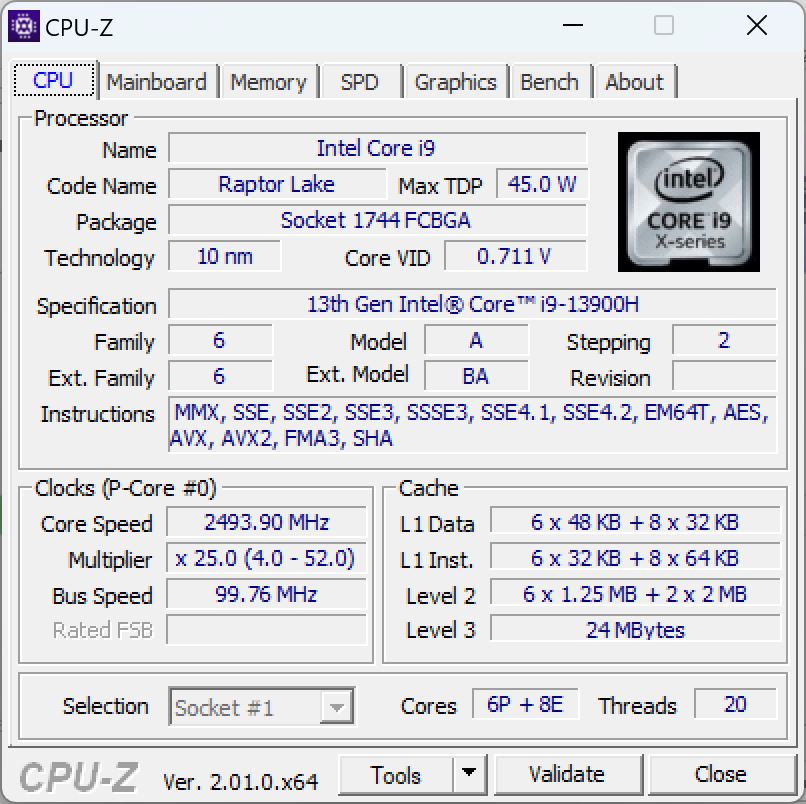
Processor
The Intel Core i9-13900H usually has no place in a tablet, as it is more likely to appear in gaming laptops. The high-end Gen13 CPU from the Alder-Lage series has all 6 P and 8 E cores, which clock between 1.9 (base clock E core) and 5.4 GHz (single turbo).
Depending on the performance mode, the PL1 and PL2 values vary:
| Performance modes | PL1 | PL2 | CB R23 Multi |
|---|---|---|---|
| Quiet | 20 | 36 | 8.686 |
| Performance | 55 | 95 | 15.788 |
| Turbo | 65 | 95 | 16.811 |
| Battery | 55 | 55 | 14.283 |
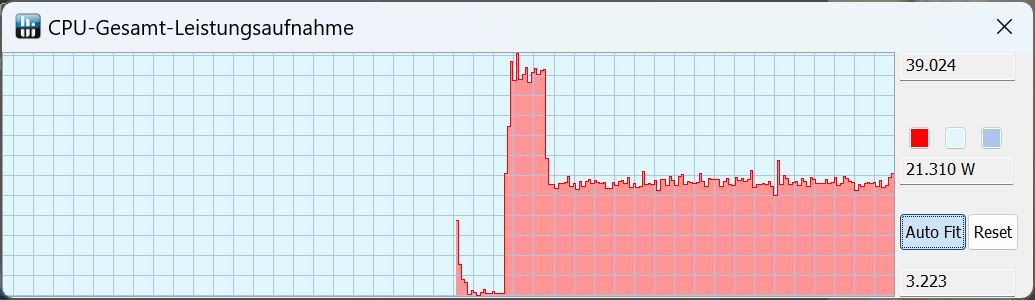
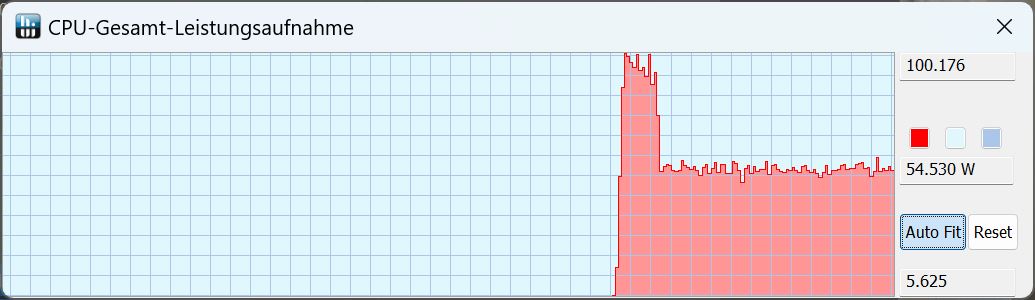
In the Cinebench loop, the Z13 initially reaches a TDP of 100 W, but this quickly drops to around 55 W before remaining stable. In parallel, the score is slightly higher in the first two CB15 runs, then drops a little and stabilizes, while other gamers with the same CPU are more consistent and thus also compute faster over time. On the other hand, the difference between the tablet and gaming laptops is remarkably small in terms of CPU performance.
Performance is top notch across all tests, the performance rating is exactly on par with an i9-13900H. You hardly notice that this is a tablet.
Away from the power socket, CPU performance drops from 2908 to 1875 points in Cinebench R15, a difference of around 35%.
Cinebench R15 Multi Sustained Load
Cinebench R23: Multi Core | Single Core
Cinebench R20: CPU (Multi Core) | CPU (Single Core)
Cinebench R15: CPU Multi 64Bit | CPU Single 64Bit
Blender: v2.79 BMW27 CPU
7-Zip 18.03: 7z b 4 | 7z b 4 -mmt1
Geekbench 5.5: Multi-Core | Single-Core
HWBOT x265 Benchmark v2.2: 4k Preset
LibreOffice : 20 Documents To PDF
R Benchmark 2.5: Overall mean
| CPU Performance rating | |
| Average of class Gaming | |
| Asus ROG Flow Z13 GZ301V | |
| Asus ROG Flow Z13 ACRNM | |
| Average Intel Core i9-13900H | |
| Asus ROG Flow Z13 GZ301ZE | |
| Acer Predator Triton 300 SE | |
| MSI Katana 17 B13VFK | |
| MSI Cyborg 15 A12VF | |
| Cinebench R23 / Multi Core | |
| Average of class Gaming (10488 - 40970, n=106, last 2 years) | |
| Asus ROG Flow Z13 ACRNM | |
| Asus ROG Flow Z13 GZ301V | |
| Average Intel Core i9-13900H (11997 - 20385, n=28) | |
| Acer Predator Triton 300 SE | |
| MSI Katana 17 B13VFK | |
| Asus ROG Flow Z13 GZ301ZE | |
| MSI Cyborg 15 A12VF | |
| Cinebench R23 / Single Core | |
| Asus ROG Flow Z13 GZ301V | |
| Asus ROG Flow Z13 ACRNM | |
| Average of class Gaming (1166 - 2387, n=106, last 2 years) | |
| Asus ROG Flow Z13 GZ301ZE | |
| Acer Predator Triton 300 SE | |
| Average Intel Core i9-13900H (1297 - 2054, n=26) | |
| MSI Katana 17 B13VFK | |
| MSI Cyborg 15 A12VF | |
| Cinebench R20 / CPU (Multi Core) | |
| Average of class Gaming (4029 - 16108, n=105, last 2 years) | |
| Asus ROG Flow Z13 ACRNM | |
| Asus ROG Flow Z13 GZ301V | |
| Average Intel Core i9-13900H (4935 - 7716, n=25) | |
| Acer Predator Triton 300 SE | |
| MSI Katana 17 B13VFK | |
| MSI Cyborg 15 A12VF | |
| Asus ROG Flow Z13 GZ301ZE | |
| Cinebench R20 / CPU (Single Core) | |
| Asus ROG Flow Z13 GZ301V | |
| Asus ROG Flow Z13 ACRNM | |
| Average of class Gaming (442 - 904, n=105, last 2 years) | |
| Asus ROG Flow Z13 GZ301ZE | |
| Acer Predator Triton 300 SE | |
| Average Intel Core i9-13900H (428 - 792, n=25) | |
| MSI Katana 17 B13VFK | |
| MSI Cyborg 15 A12VF | |
| Cinebench R15 / CPU Multi 64Bit | |
| Average of class Gaming (1578 - 6271, n=104, last 2 years) | |
| Asus ROG Flow Z13 GZ301V | |
| Asus ROG Flow Z13 ACRNM | |
| Asus ROG Flow Z13 GZ301ZE | |
| Average Intel Core i9-13900H (2061 - 3100, n=26) | |
| Acer Predator Triton 300 SE | |
| MSI Katana 17 B13VFK | |
| MSI Cyborg 15 A12VF | |
| Cinebench R15 / CPU Single 64Bit | |
| Average of class Gaming (188.8 - 344, n=105, last 2 years) | |
| Asus ROG Flow Z13 GZ301V | |
| Asus ROG Flow Z13 ACRNM | |
| Asus ROG Flow Z13 GZ301ZE | |
| Acer Predator Triton 300 SE | |
| Average Intel Core i9-13900H (211 - 297, n=26) | |
| MSI Katana 17 B13VFK | |
| MSI Cyborg 15 A12VF | |
| Blender / v2.79 BMW27 CPU | |
| MSI Cyborg 15 A12VF | |
| Asus ROG Flow Z13 GZ301ZE | |
| MSI Katana 17 B13VFK | |
| Average Intel Core i9-13900H (166 - 268, n=24) | |
| Acer Predator Triton 300 SE | |
| Asus ROG Flow Z13 GZ301V | |
| Asus ROG Flow Z13 ACRNM | |
| Average of class Gaming (80 - 330, n=103, last 2 years) | |
| 7-Zip 18.03 / 7z b 4 | |
| Average of class Gaming (33491 - 148086, n=104, last 2 years) | |
| Asus ROG Flow Z13 GZ301V | |
| Asus ROG Flow Z13 ACRNM | |
| Average Intel Core i9-13900H (45045 - 79032, n=25) | |
| Acer Predator Triton 300 SE | |
| Asus ROG Flow Z13 GZ301ZE | |
| MSI Katana 17 B13VFK | |
| MSI Cyborg 15 A12VF | |
| 7-Zip 18.03 / 7z b 4 -mmt1 | |
| Asus ROG Flow Z13 GZ301V | |
| Average of class Gaming (4199 - 7436, n=104, last 2 years) | |
| Asus ROG Flow Z13 ACRNM | |
| Asus ROG Flow Z13 GZ301ZE | |
| Average Intel Core i9-13900H (3665 - 6600, n=25) | |
| MSI Cyborg 15 A12VF | |
| MSI Katana 17 B13VFK | |
| Acer Predator Triton 300 SE | |
| Geekbench 5.5 / Multi-Core | |
| Average of class Gaming (6460 - 27010, n=104, last 2 years) | |
| Asus ROG Flow Z13 GZ301V | |
| Asus ROG Flow Z13 ACRNM | |
| Asus ROG Flow Z13 GZ301ZE | |
| Acer Predator Triton 300 SE | |
| Average Intel Core i9-13900H (9094 - 15410, n=26) | |
| MSI Katana 17 B13VFK | |
| MSI Cyborg 15 A12VF | |
| Geekbench 5.5 / Single-Core | |
| Average of class Gaming (986 - 2474, n=104, last 2 years) | |
| Asus ROG Flow Z13 GZ301V | |
| Asus ROG Flow Z13 ACRNM | |
| Average Intel Core i9-13900H (1140 - 2043, n=26) | |
| Asus ROG Flow Z13 GZ301ZE | |
| Acer Predator Triton 300 SE | |
| MSI Katana 17 B13VFK | |
| MSI Cyborg 15 A12VF | |
| HWBOT x265 Benchmark v2.2 / 4k Preset | |
| Average of class Gaming (11.5 - 44.3, n=104, last 2 years) | |
| Asus ROG Flow Z13 ACRNM | |
| Asus ROG Flow Z13 GZ301V | |
| Acer Predator Triton 300 SE | |
| Average Intel Core i9-13900H (14.1 - 22.3, n=25) | |
| Asus ROG Flow Z13 GZ301ZE | |
| MSI Katana 17 B13VFK | |
| MSI Cyborg 15 A12VF | |
| MSI Cyborg 15 A12VF | |
| LibreOffice / 20 Documents To PDF | |
| Asus ROG Flow Z13 ACRNM | |
| MSI Katana 17 B13VFK | |
| Average of class Gaming (33.2 - 88.8, n=104, last 2 years) | |
| Average Intel Core i9-13900H (34.4 - 82.8, n=25) | |
| Asus ROG Flow Z13 GZ301ZE | |
| Acer Predator Triton 300 SE | |
| Asus ROG Flow Z13 GZ301V | |
| MSI Cyborg 15 A12VF | |
| R Benchmark 2.5 / Overall mean | |
| MSI Cyborg 15 A12VF | |
| Average Intel Core i9-13900H (0.4052 - 0.723, n=25) | |
| MSI Katana 17 B13VFK | |
| Acer Predator Triton 300 SE | |
| Average of class Gaming (0.3439 - 0.759, n=105, last 2 years) | |
| Asus ROG Flow Z13 GZ301ZE | |
| Asus ROG Flow Z13 ACRNM | |
| Asus ROG Flow Z13 GZ301V | |
* ... smaller is better
AIDA64: FP32 Ray-Trace | FPU Julia | CPU SHA3 | CPU Queen | FPU SinJulia | FPU Mandel | CPU AES | CPU ZLib | FP64 Ray-Trace | CPU PhotoWorxx
| Performance rating | |
| Average of class Gaming | |
| Acer Predator Triton 300 SE | |
| Asus ROG Flow Z13 ACRNM | |
| Asus ROG Flow Z13 GZ301V | |
| Average Intel Core i9-13900H | |
| MSI Cyborg 15 A12VF | |
| MSI Katana 17 B13VFK | |
| Asus ROG Flow Z13 GZ301ZE | |
| AIDA64 / FP32 Ray-Trace | |
| Average of class Gaming (10227 - 85542, n=103, last 2 years) | |
| Asus ROG Flow Z13 ACRNM | |
| Asus ROG Flow Z13 GZ301V | |
| Acer Predator Triton 300 SE | |
| Average Intel Core i9-13900H (6788 - 19557, n=25) | |
| MSI Katana 17 B13VFK | |
| MSI Cyborg 15 A12VF | |
| Asus ROG Flow Z13 GZ301ZE | |
| AIDA64 / FPU Julia | |
| Average of class Gaming (51376 - 238426, n=103, last 2 years) | |
| Asus ROG Flow Z13 ACRNM | |
| Asus ROG Flow Z13 GZ301V | |
| Average Intel Core i9-13900H (22551 - 95579, n=25) | |
| Acer Predator Triton 300 SE | |
| MSI Cyborg 15 A12VF | |
| MSI Katana 17 B13VFK | |
| Asus ROG Flow Z13 GZ301ZE | |
| AIDA64 / CPU SHA3 | |
| Average of class Gaming (2180 - 9817, n=103, last 2 years) | |
| Asus ROG Flow Z13 ACRNM | |
| Acer Predator Triton 300 SE | |
| Average Intel Core i9-13900H (2491 - 4270, n=25) | |
| Asus ROG Flow Z13 GZ301V | |
| MSI Cyborg 15 A12VF | |
| MSI Katana 17 B13VFK | |
| Asus ROG Flow Z13 GZ301ZE | |
| AIDA64 / CPU Queen | |
| Average of class Gaming (49785 - 173351, n=89, last 2 years) | |
| Asus ROG Flow Z13 GZ301V | |
| Asus ROG Flow Z13 ACRNM | |
| Acer Predator Triton 300 SE | |
| Average Intel Core i9-13900H (65121 - 120936, n=25) | |
| Asus ROG Flow Z13 GZ301ZE | |
| MSI Cyborg 15 A12VF | |
| MSI Katana 17 B13VFK | |
| AIDA64 / FPU SinJulia | |
| Average of class Gaming (4424 - 33636, n=103, last 2 years) | |
| Asus ROG Flow Z13 ACRNM | |
| Asus ROG Flow Z13 GZ301V | |
| Acer Predator Triton 300 SE | |
| Average Intel Core i9-13900H (6108 - 11631, n=25) | |
| Asus ROG Flow Z13 GZ301ZE | |
| MSI Cyborg 15 A12VF | |
| MSI Katana 17 B13VFK | |
| AIDA64 / FPU Mandel | |
| Average of class Gaming (25115 - 128721, n=103, last 2 years) | |
| Asus ROG Flow Z13 ACRNM | |
| Asus ROG Flow Z13 GZ301V | |
| Average Intel Core i9-13900H (11283 - 48474, n=25) | |
| Acer Predator Triton 300 SE | |
| MSI Katana 17 B13VFK | |
| MSI Cyborg 15 A12VF | |
| Asus ROG Flow Z13 GZ301ZE | |
| AIDA64 / CPU AES | |
| Acer Predator Triton 300 SE | |
| Average of class Gaming (39258 - 247074, n=103, last 2 years) | |
| Average Intel Core i9-13900H (3691 - 149377, n=25) | |
| Asus ROG Flow Z13 GZ301ZE | |
| Asus ROG Flow Z13 ACRNM | |
| Asus ROG Flow Z13 GZ301V | |
| MSI Cyborg 15 A12VF | |
| MSI Katana 17 B13VFK | |
| AIDA64 / CPU ZLib | |
| Average of class Gaming (574 - 2531, n=103, last 2 years) | |
| Asus ROG Flow Z13 ACRNM | |
| Asus ROG Flow Z13 GZ301V | |
| Average Intel Core i9-13900H (789 - 1254, n=25) | |
| Acer Predator Triton 300 SE | |
| Asus ROG Flow Z13 GZ301ZE | |
| MSI Cyborg 15 A12VF | |
| MSI Katana 17 B13VFK | |
| AIDA64 / FP64 Ray-Trace | |
| Average of class Gaming (5509 - 45446, n=103, last 2 years) | |
| Asus ROG Flow Z13 ACRNM | |
| Asus ROG Flow Z13 GZ301V | |
| Average Intel Core i9-13900H (3655 - 10716, n=25) | |
| Acer Predator Triton 300 SE | |
| MSI Katana 17 B13VFK | |
| MSI Cyborg 15 A12VF | |
| Asus ROG Flow Z13 GZ301ZE | |
| AIDA64 / CPU PhotoWorxx | |
| Acer Predator Triton 300 SE | |
| Average of class Gaming (12271 - 89891, n=103, last 2 years) | |
| Asus ROG Flow Z13 ACRNM | |
| Asus ROG Flow Z13 GZ301ZE | |
| Asus ROG Flow Z13 GZ301V | |
| Average Intel Core i9-13900H (10871 - 50488, n=25) | |
| MSI Cyborg 15 A12VF | |
| MSI Katana 17 B13VFK | |
System Performance
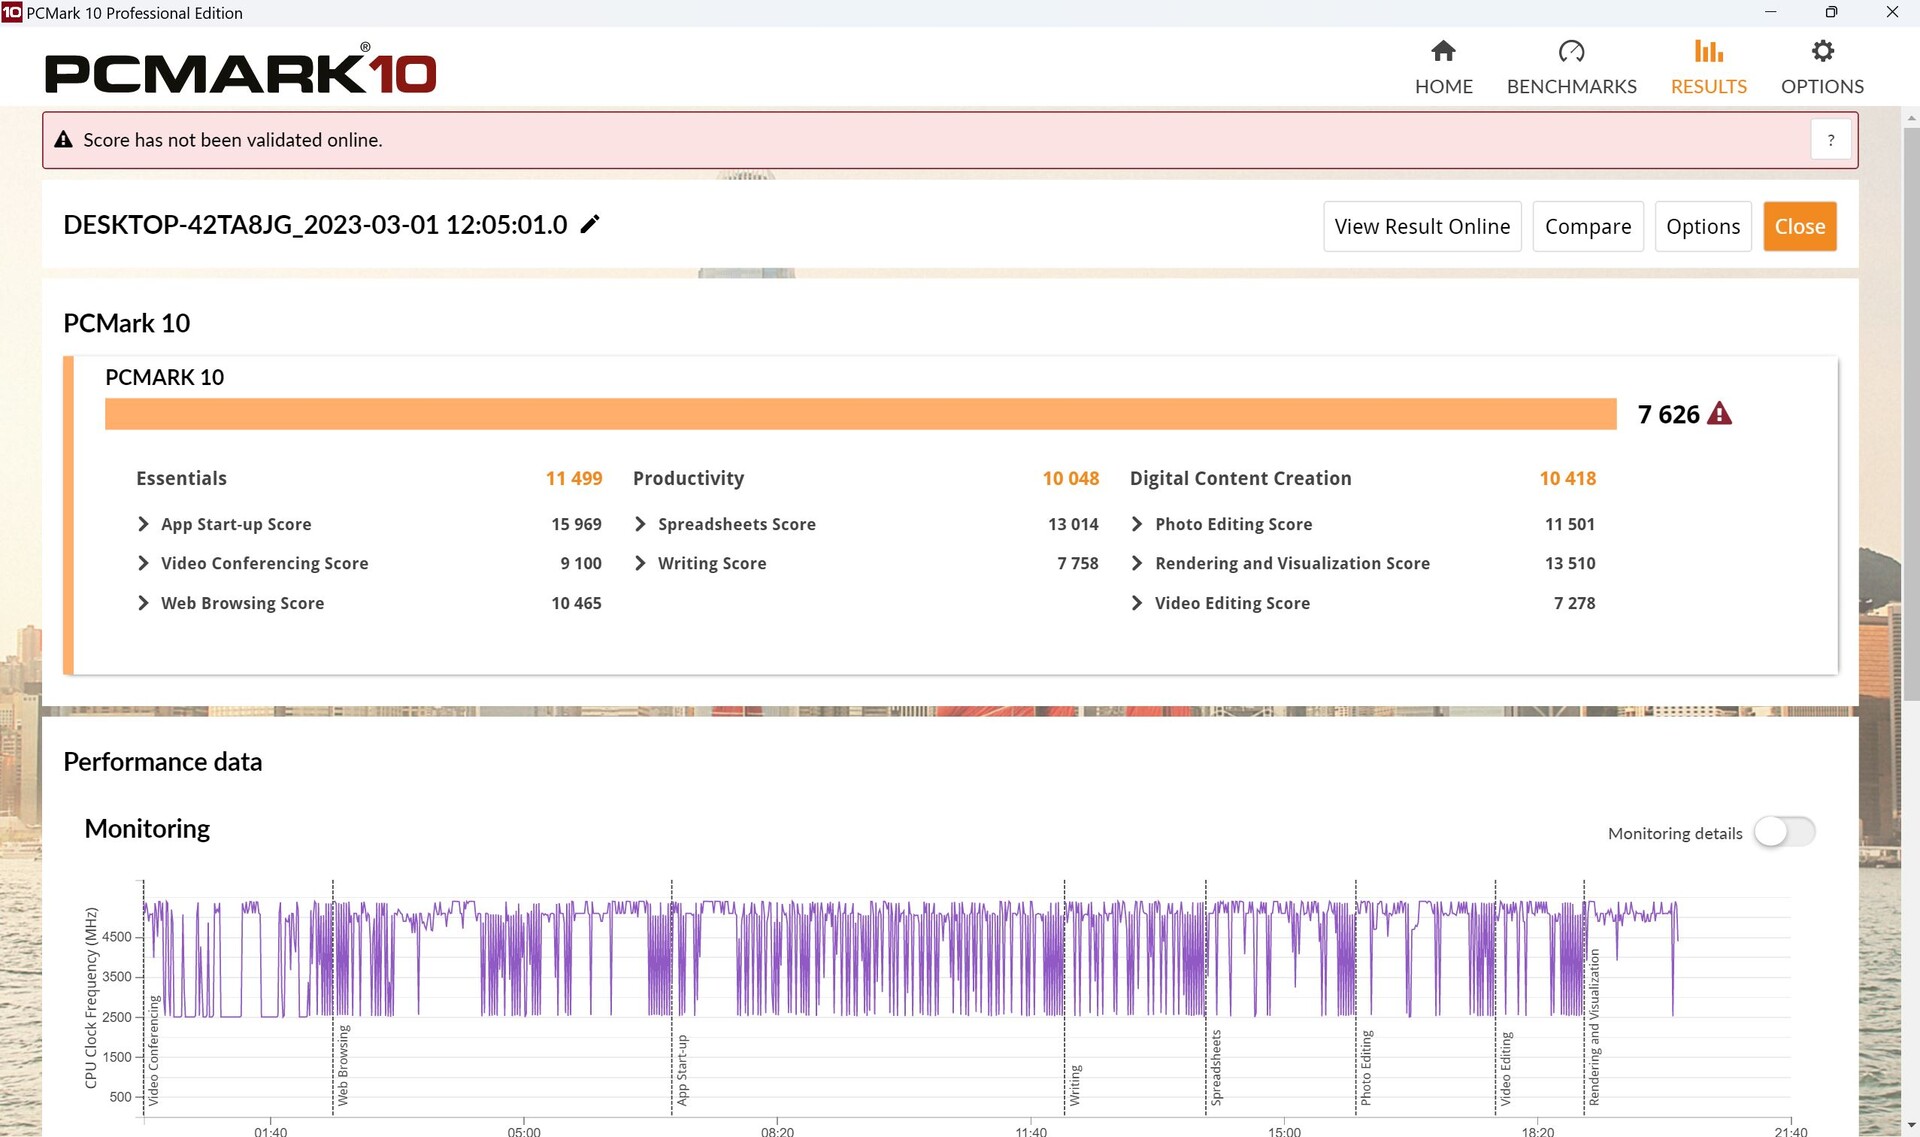
The Z13 does well in PCMark 10. It leaves its predecessor behind by around 17 percent; the Gigabyte Aero 16 laptop with the same CPU only has a lead of 6 percent, which is quite impressive for a tablet!
Everything also feels wonderfully smooth in everyday use.
CrossMark: Overall | Productivity | Creativity | Responsiveness
| PCMark 10 / Score | |
| Average of class Gaming (5828 - 11730, n=92, last 2 years) | |
| Asus ROG Flow Z13 ACRNM | |
| Average Intel Core i9-13900H, NVIDIA GeForce RTX 4060 Laptop GPU (7578 - 7884, n=3) | |
| Asus ROG Flow Z13 GZ301V | |
| Acer Predator Triton 300 SE | |
| MSI Katana 17 B13VFK | |
| MSI Cyborg 15 A12VF | |
| Asus ROG Flow Z13 GZ301ZE | |
| PCMark 10 / Essentials | |
| Asus ROG Flow Z13 GZ301V | |
| Average Intel Core i9-13900H, NVIDIA GeForce RTX 4060 Laptop GPU (11235 - 11539, n=3) | |
| Acer Predator Triton 300 SE | |
| Asus ROG Flow Z13 ACRNM | |
| MSI Katana 17 B13VFK | |
| Asus ROG Flow Z13 GZ301ZE | |
| MSI Cyborg 15 A12VF | |
| Average of class Gaming (8810 - 11935, n=96, last 2 years) | |
| PCMark 10 / Productivity | |
| Average of class Gaming (6845 - 21327, n=94, last 2 years) | |
| Acer Predator Triton 300 SE | |
| Average Intel Core i9-13900H, NVIDIA GeForce RTX 4060 Laptop GPU (9888 - 10222, n=3) | |
| Asus ROG Flow Z13 GZ301V | |
| MSI Cyborg 15 A12VF | |
| Asus ROG Flow Z13 ACRNM | |
| Asus ROG Flow Z13 GZ301ZE | |
| MSI Katana 17 B13VFK | |
| PCMark 10 / Digital Content Creation | |
| Average of class Gaming (7602 - 19954, n=94, last 2 years) | |
| Asus ROG Flow Z13 ACRNM | |
| Average Intel Core i9-13900H, NVIDIA GeForce RTX 4060 Laptop GPU (10418 - 11272, n=3) | |
| Acer Predator Triton 300 SE | |
| Asus ROG Flow Z13 GZ301V | |
| MSI Katana 17 B13VFK | |
| MSI Cyborg 15 A12VF | |
| Asus ROG Flow Z13 GZ301ZE | |
| CrossMark / Overall | |
| Asus ROG Flow Z13 GZ301ZE | |
| Asus ROG Flow Z13 GZ301V | |
| Average of class Gaming (1366 - 2409, n=93, last 2 years) | |
| Acer Predator Triton 300 SE | |
| Average Intel Core i9-13900H, NVIDIA GeForce RTX 4060 Laptop GPU (1874 - 1983, n=3) | |
| Asus ROG Flow Z13 ACRNM | |
| MSI Katana 17 B13VFK | |
| MSI Cyborg 15 A12VF | |
| CrossMark / Productivity | |
| Asus ROG Flow Z13 GZ301ZE | |
| Asus ROG Flow Z13 GZ301V | |
| Acer Predator Triton 300 SE | |
| Average of class Gaming (1386 - 2254, n=93, last 2 years) | |
| Average Intel Core i9-13900H, NVIDIA GeForce RTX 4060 Laptop GPU (1779 - 1889, n=3) | |
| Asus ROG Flow Z13 ACRNM | |
| MSI Katana 17 B13VFK | |
| MSI Cyborg 15 A12VF | |
| CrossMark / Creativity | |
| Average of class Gaming (1343 - 2729, n=93, last 2 years) | |
| Asus ROG Flow Z13 GZ301V | |
| Asus ROG Flow Z13 ACRNM | |
| Asus ROG Flow Z13 GZ301ZE | |
| Average Intel Core i9-13900H, NVIDIA GeForce RTX 4060 Laptop GPU (2104 - 2195, n=3) | |
| Acer Predator Triton 300 SE | |
| MSI Katana 17 B13VFK | |
| MSI Cyborg 15 A12VF | |
| CrossMark / Responsiveness | |
| Asus ROG Flow Z13 GZ301ZE | |
| Acer Predator Triton 300 SE | |
| MSI Katana 17 B13VFK | |
| Average of class Gaming (1226 - 2334, n=93, last 2 years) | |
| Asus ROG Flow Z13 GZ301V | |
| Asus ROG Flow Z13 ACRNM | |
| MSI Cyborg 15 A12VF | |
| Average Intel Core i9-13900H, NVIDIA GeForce RTX 4060 Laptop GPU (1548 - 1698, n=3) | |
| PCMark 10 Score | 7626 points | |
Help | ||
| AIDA64 / Memory Copy | |
| Asus ROG Flow Z13 GZ301ZE | |
| Acer Predator Triton 300 SE | |
| Average of class Gaming (21750 - 129946, n=103, last 2 years) | |
| Asus ROG Flow Z13 GZ301V | |
| Asus ROG Flow Z13 ACRNM | |
| Average Intel Core i9-13900H (37448 - 74486, n=25) | |
| MSI Cyborg 15 A12VF | |
| MSI Katana 17 B13VFK | |
| AIDA64 / Memory Read | |
| Acer Predator Triton 300 SE | |
| Average of class Gaming (22956 - 118858, n=103, last 2 years) | |
| Asus ROG Flow Z13 GZ301ZE | |
| MSI Cyborg 15 A12VF | |
| Asus ROG Flow Z13 ACRNM | |
| Asus ROG Flow Z13 GZ301V | |
| Average Intel Core i9-13900H (41599 - 75433, n=25) | |
| MSI Katana 17 B13VFK | |
| AIDA64 / Memory Write | |
| Average of class Gaming (22297 - 135096, n=103, last 2 years) | |
| Asus ROG Flow Z13 GZ301V | |
| Asus ROG Flow Z13 ACRNM | |
| Average Intel Core i9-13900H (36152 - 88505, n=25) | |
| Acer Predator Triton 300 SE | |
| Asus ROG Flow Z13 GZ301ZE | |
| MSI Cyborg 15 A12VF | |
| MSI Katana 17 B13VFK | |
| AIDA64 / Memory Latency | |
| Average of class Gaming (75.3 - 259, n=103, last 2 years) | |
| Asus ROG Flow Z13 GZ301ZE | |
| Acer Predator Triton 300 SE | |
| MSI Katana 17 B13VFK | |
| MSI Cyborg 15 A12VF | |
| Asus ROG Flow Z13 ACRNM | |
| Average Intel Core i9-13900H (75.8 - 102.3, n=25) | |
| Asus ROG Flow Z13 GZ301V | |
* ... smaller is better
DPC Latency
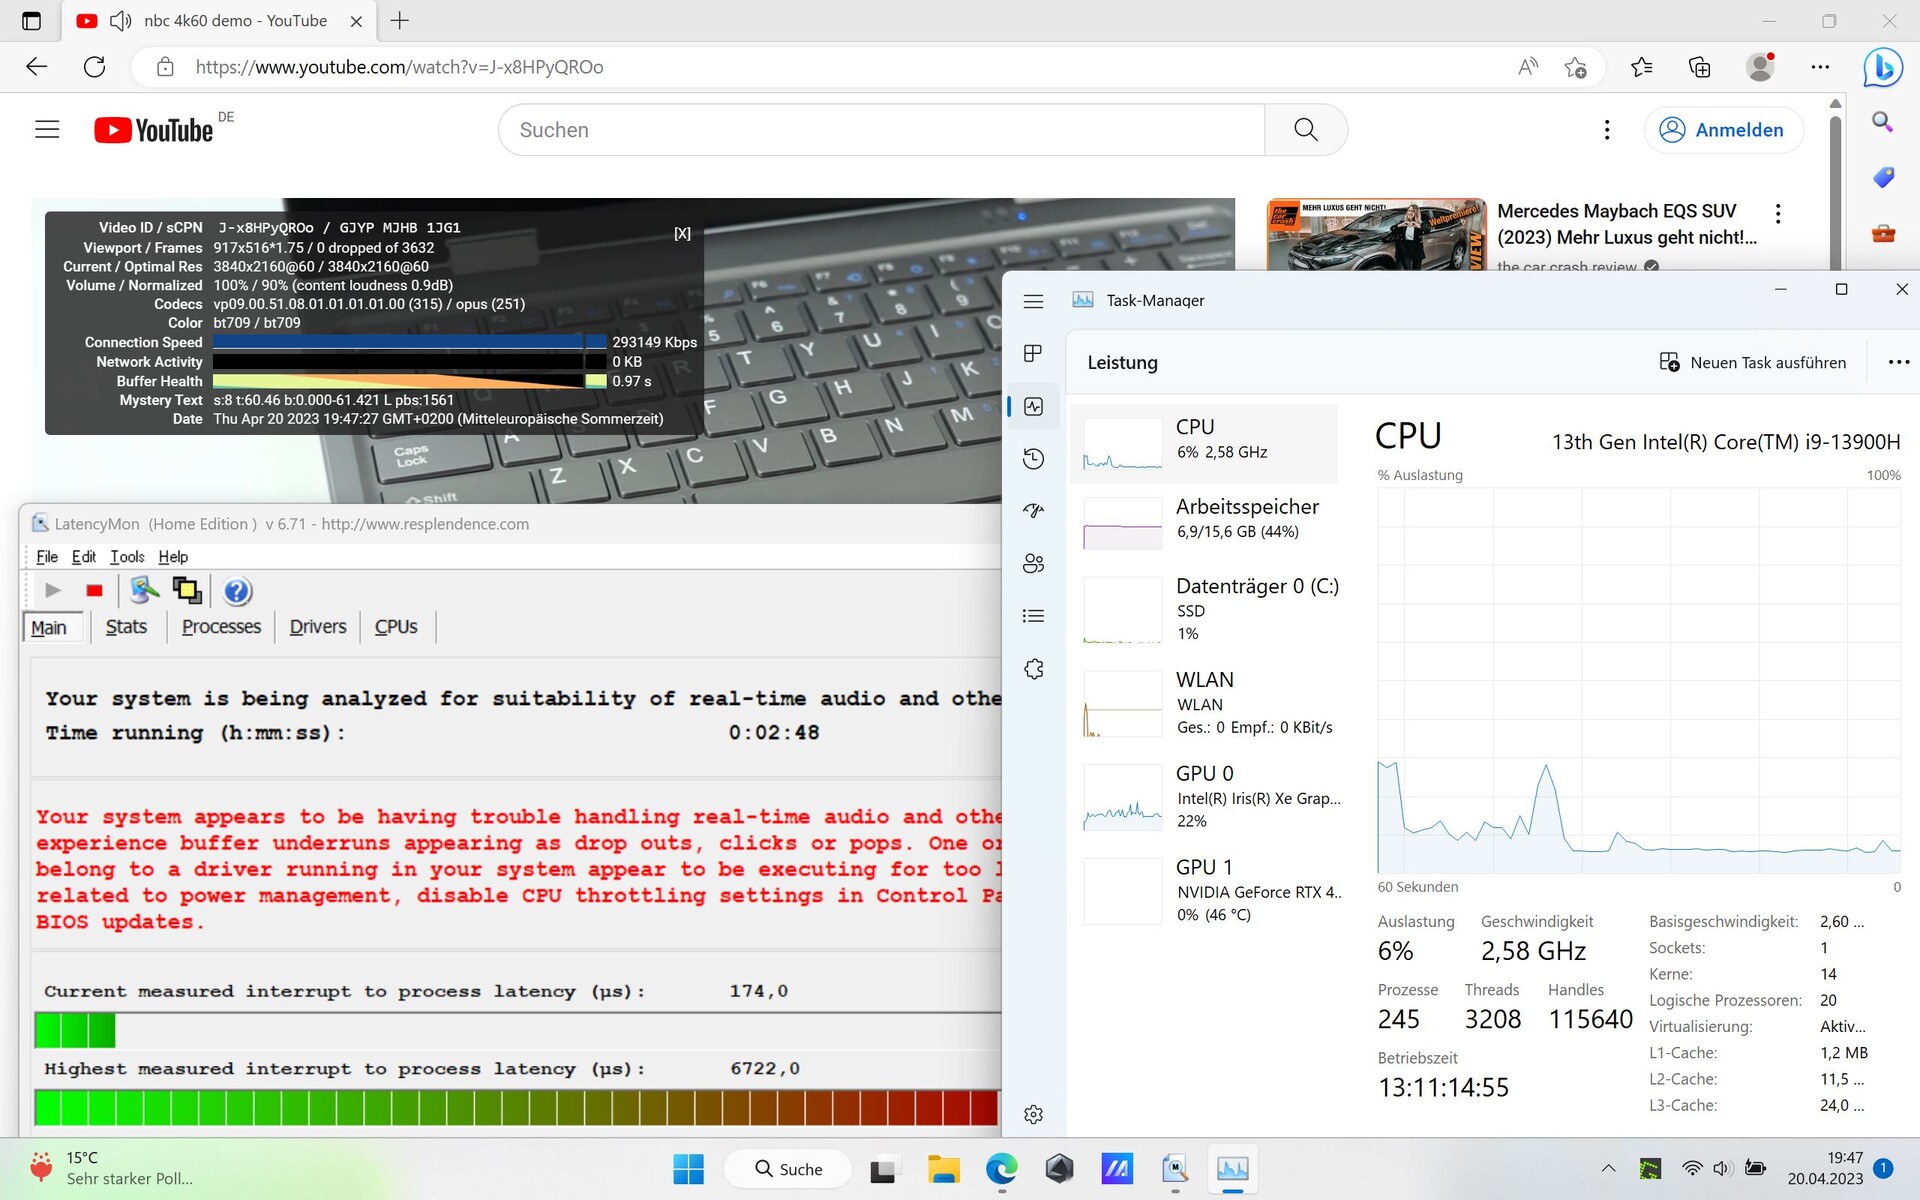
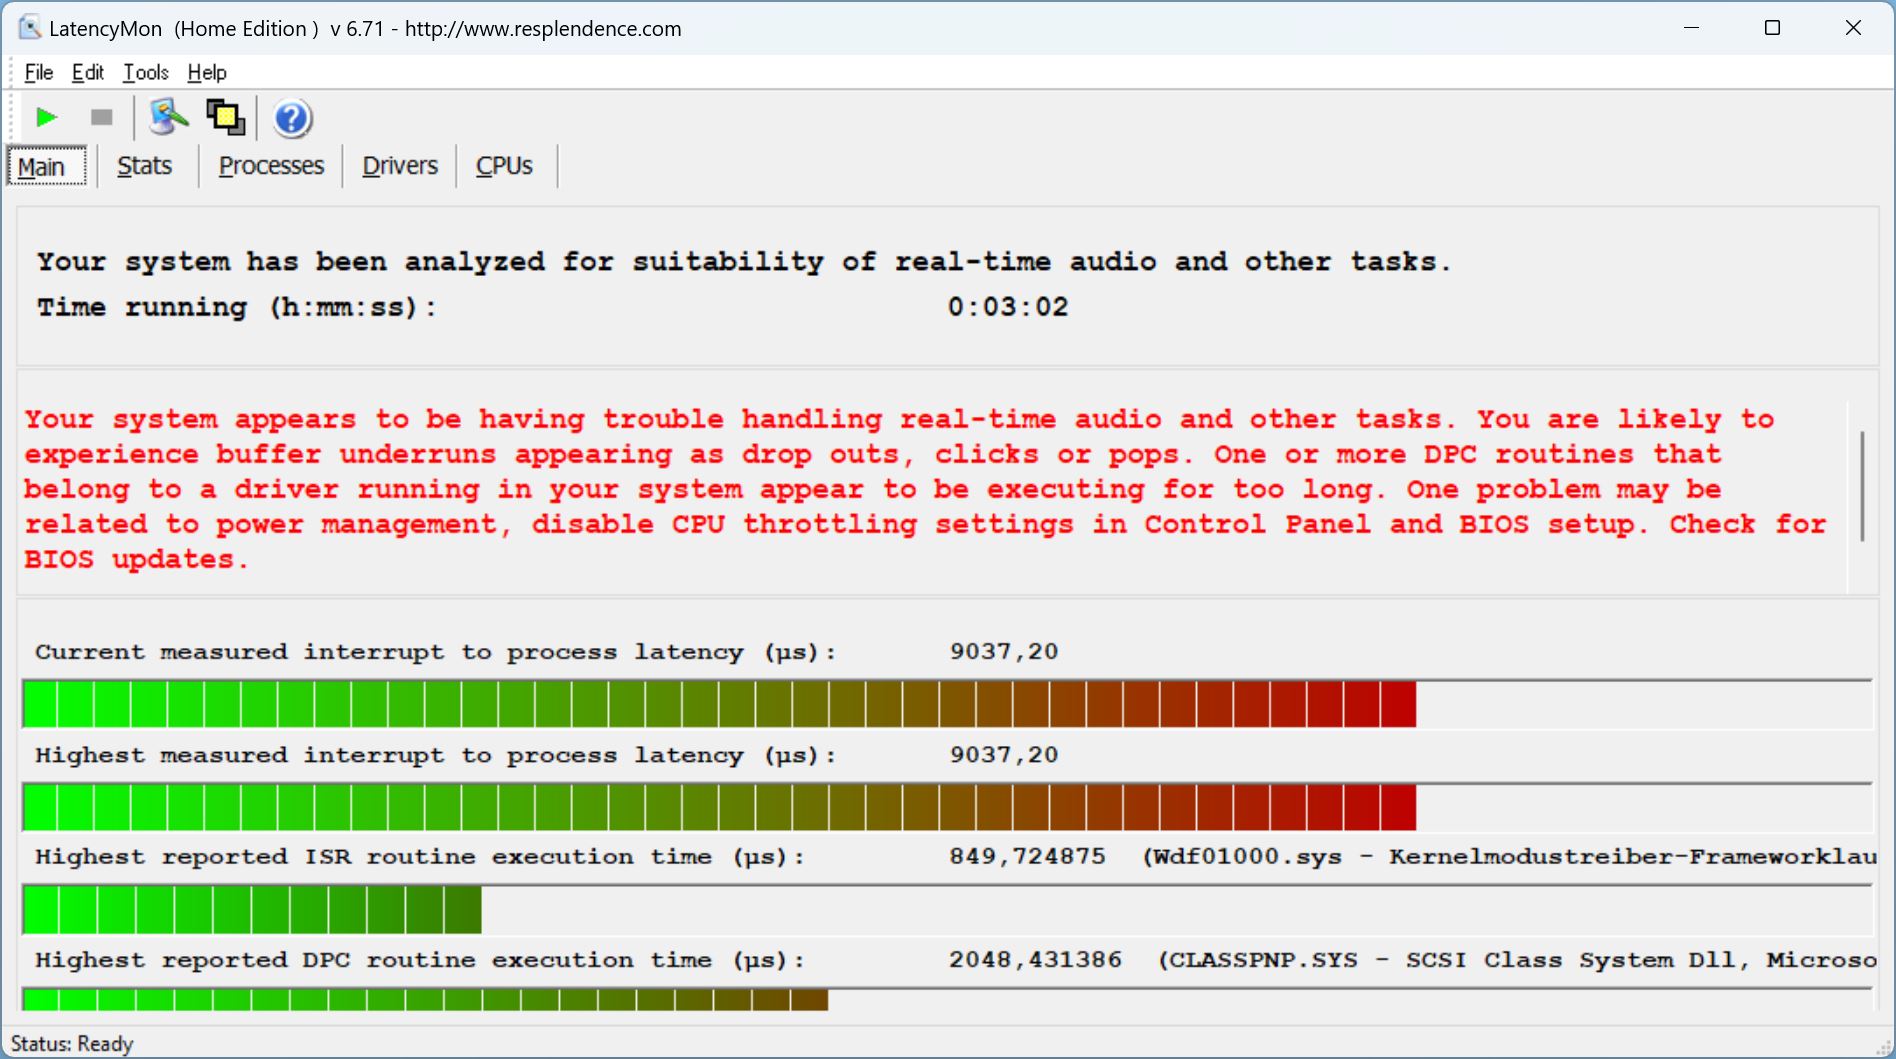
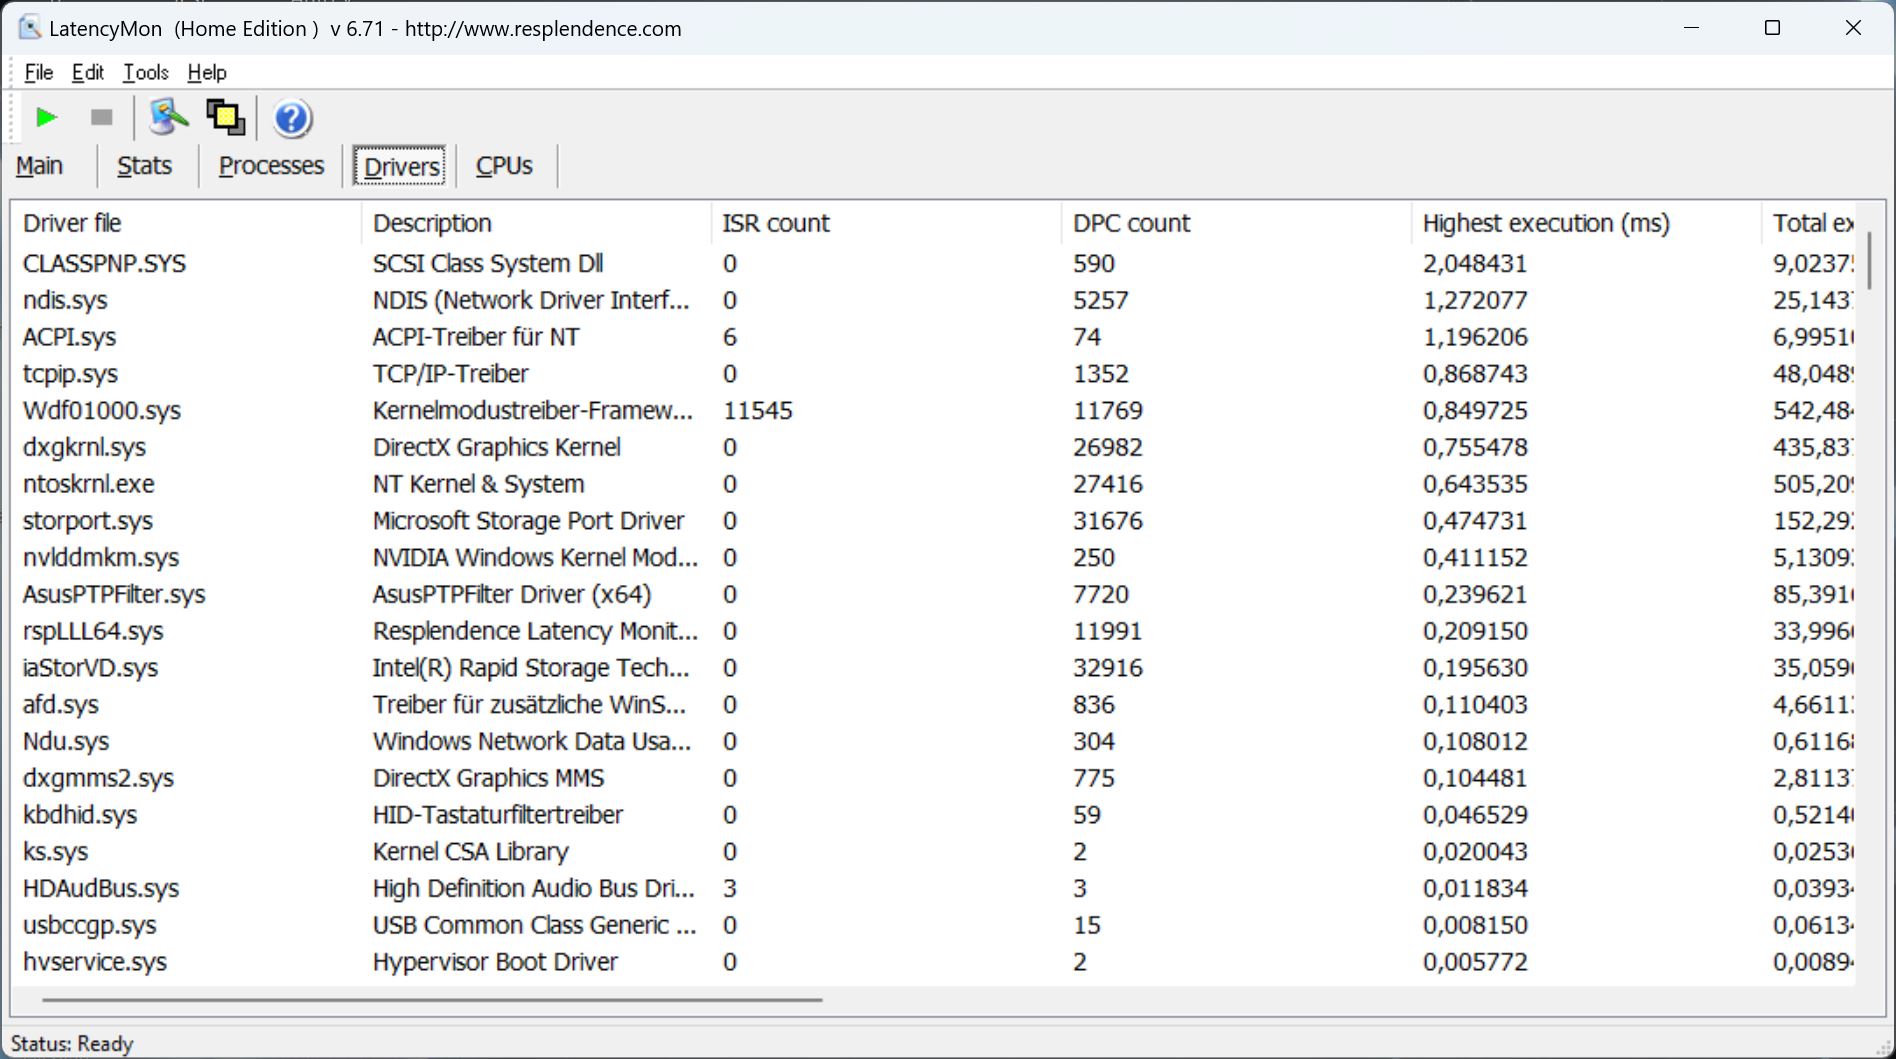
Upon opening the web browser, the first latencies set in, which are intensified by opening multiple tabs. Playing our 4K/60fps YouTube video also increases the latencies further, even though no frames are dropped. In the end, a very high value sets in, and the problem of high latencies in the current Nvidia drivers should be largely eliminated. Geforce 531.68 was released during our review, but the update didn't change anything about the high latency rates. So there is definitely room for improvement in the Z13 in this respect, especially if Asus wants to appeal to professionals.
Another test revealed a latency of more than 5,500 us when opening a text file and copying a URL to the clipboard.
| DPC Latencies / LatencyMon - interrupt to process latency (max), Web, Youtube, Prime95 | |
| Asus ROG Flow Z13 GZ301V | |
| Acer Predator Triton 300 SE | |
| MSI Katana 17 B13VFK | |
| Asus ROG Flow Z13 ACRNM | |
| Asus ROG Flow Z13 GZ301ZE | |
| MSI Cyborg 15 A12VF | |
* ... smaller is better
Storage Devices
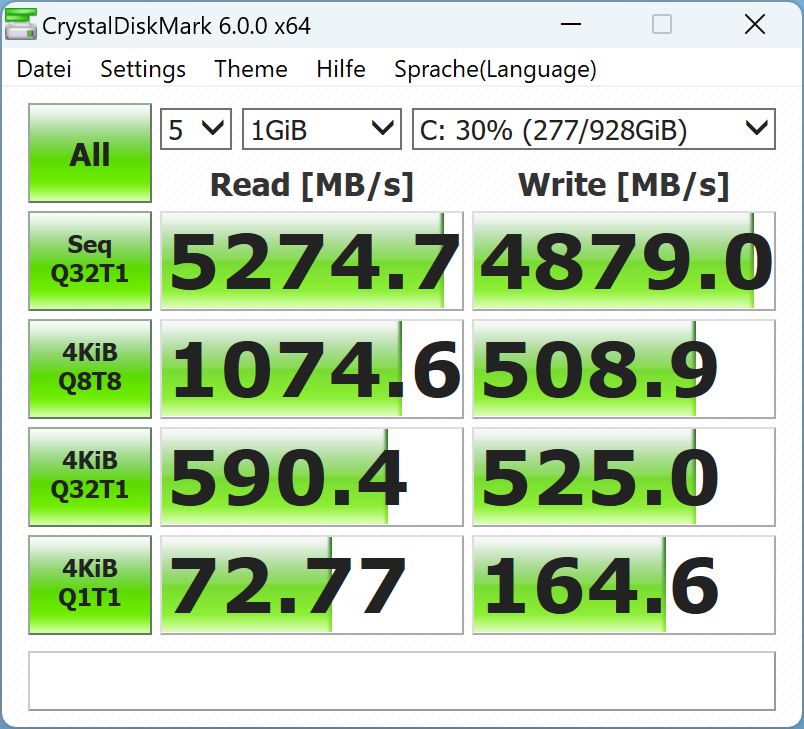
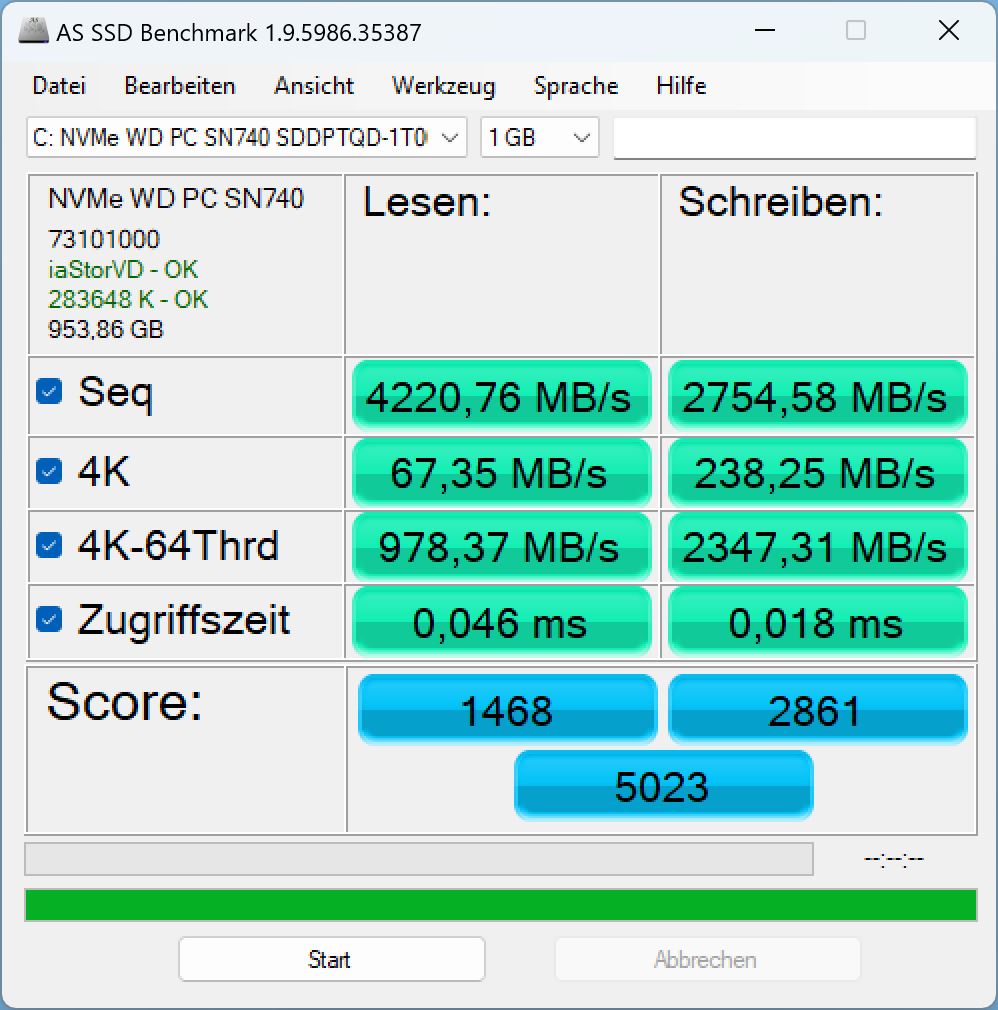
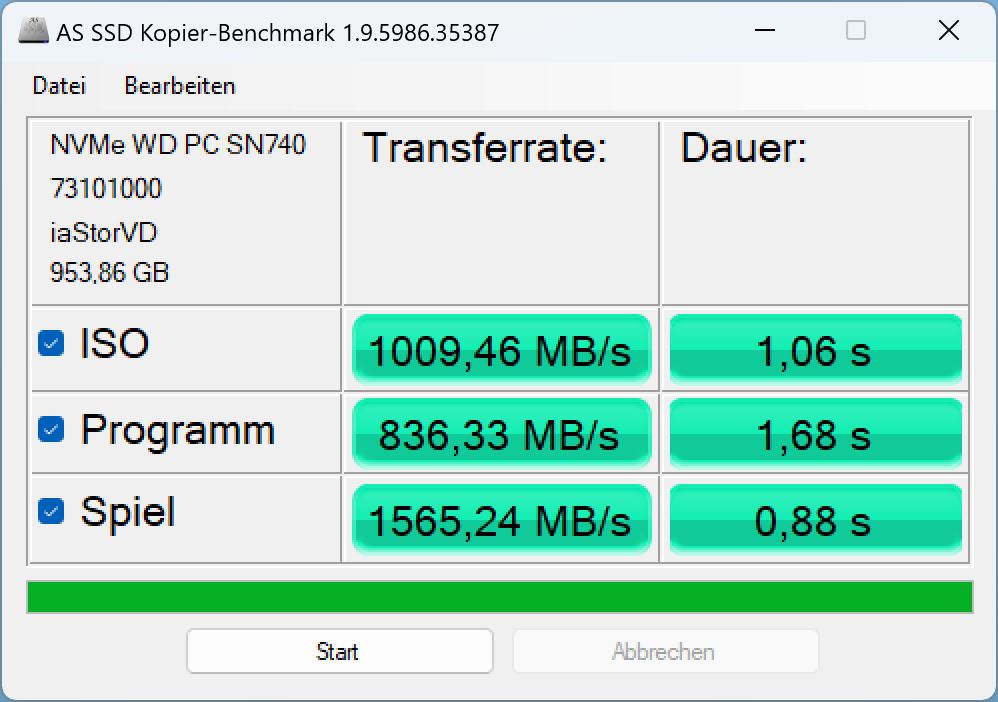
Due to the limited space available, Asus installs a 1 TB NVMe SSD in the small M.2 2230 format. Replacements for this are usually a little more expensive than the commonly used M.2 2280 SSDs. The Western Digital SN740 is ranked 110 in our best list, so it's not the fastest model, but it does support PCIe 4.0 and also achieves the targeted speed. Above all, it consistently achieves this speed, at least in Performance mode.

* ... smaller is better
Sustained Read Performance: DiskSpd Read Loop, Queue Depth 8
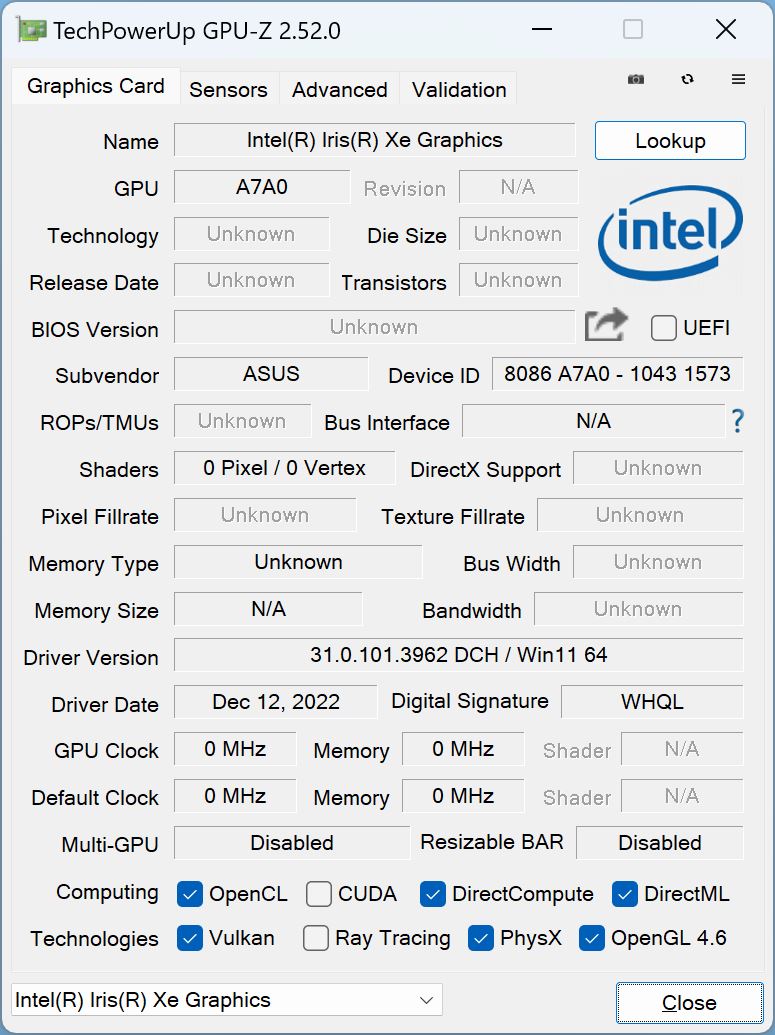
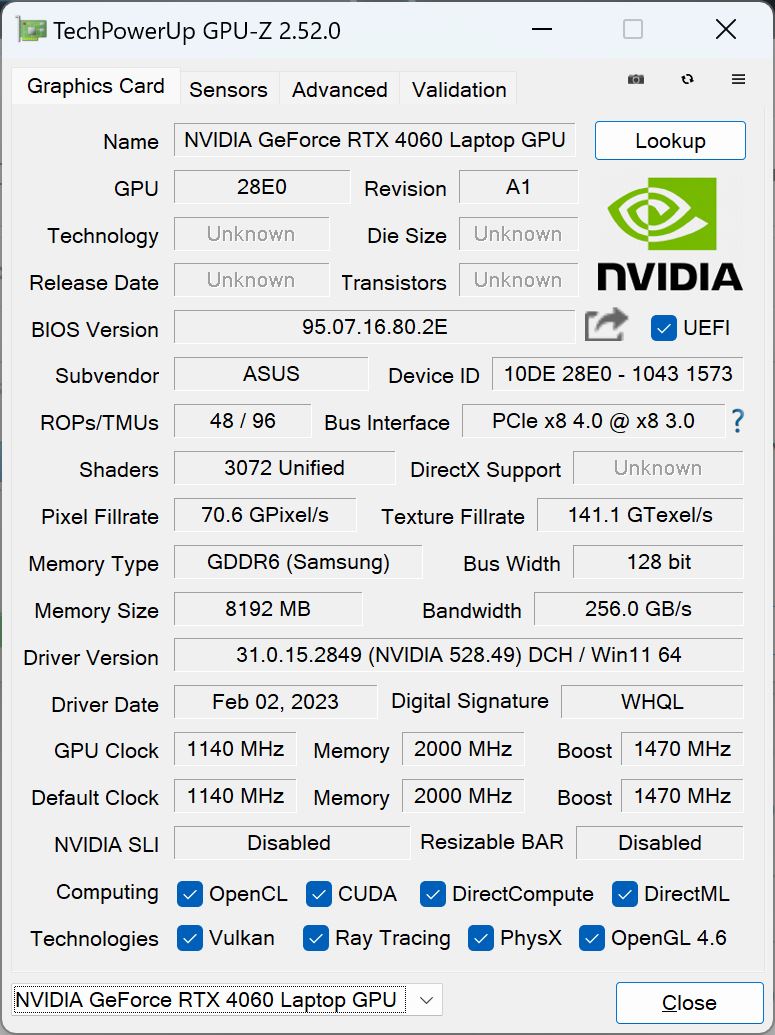
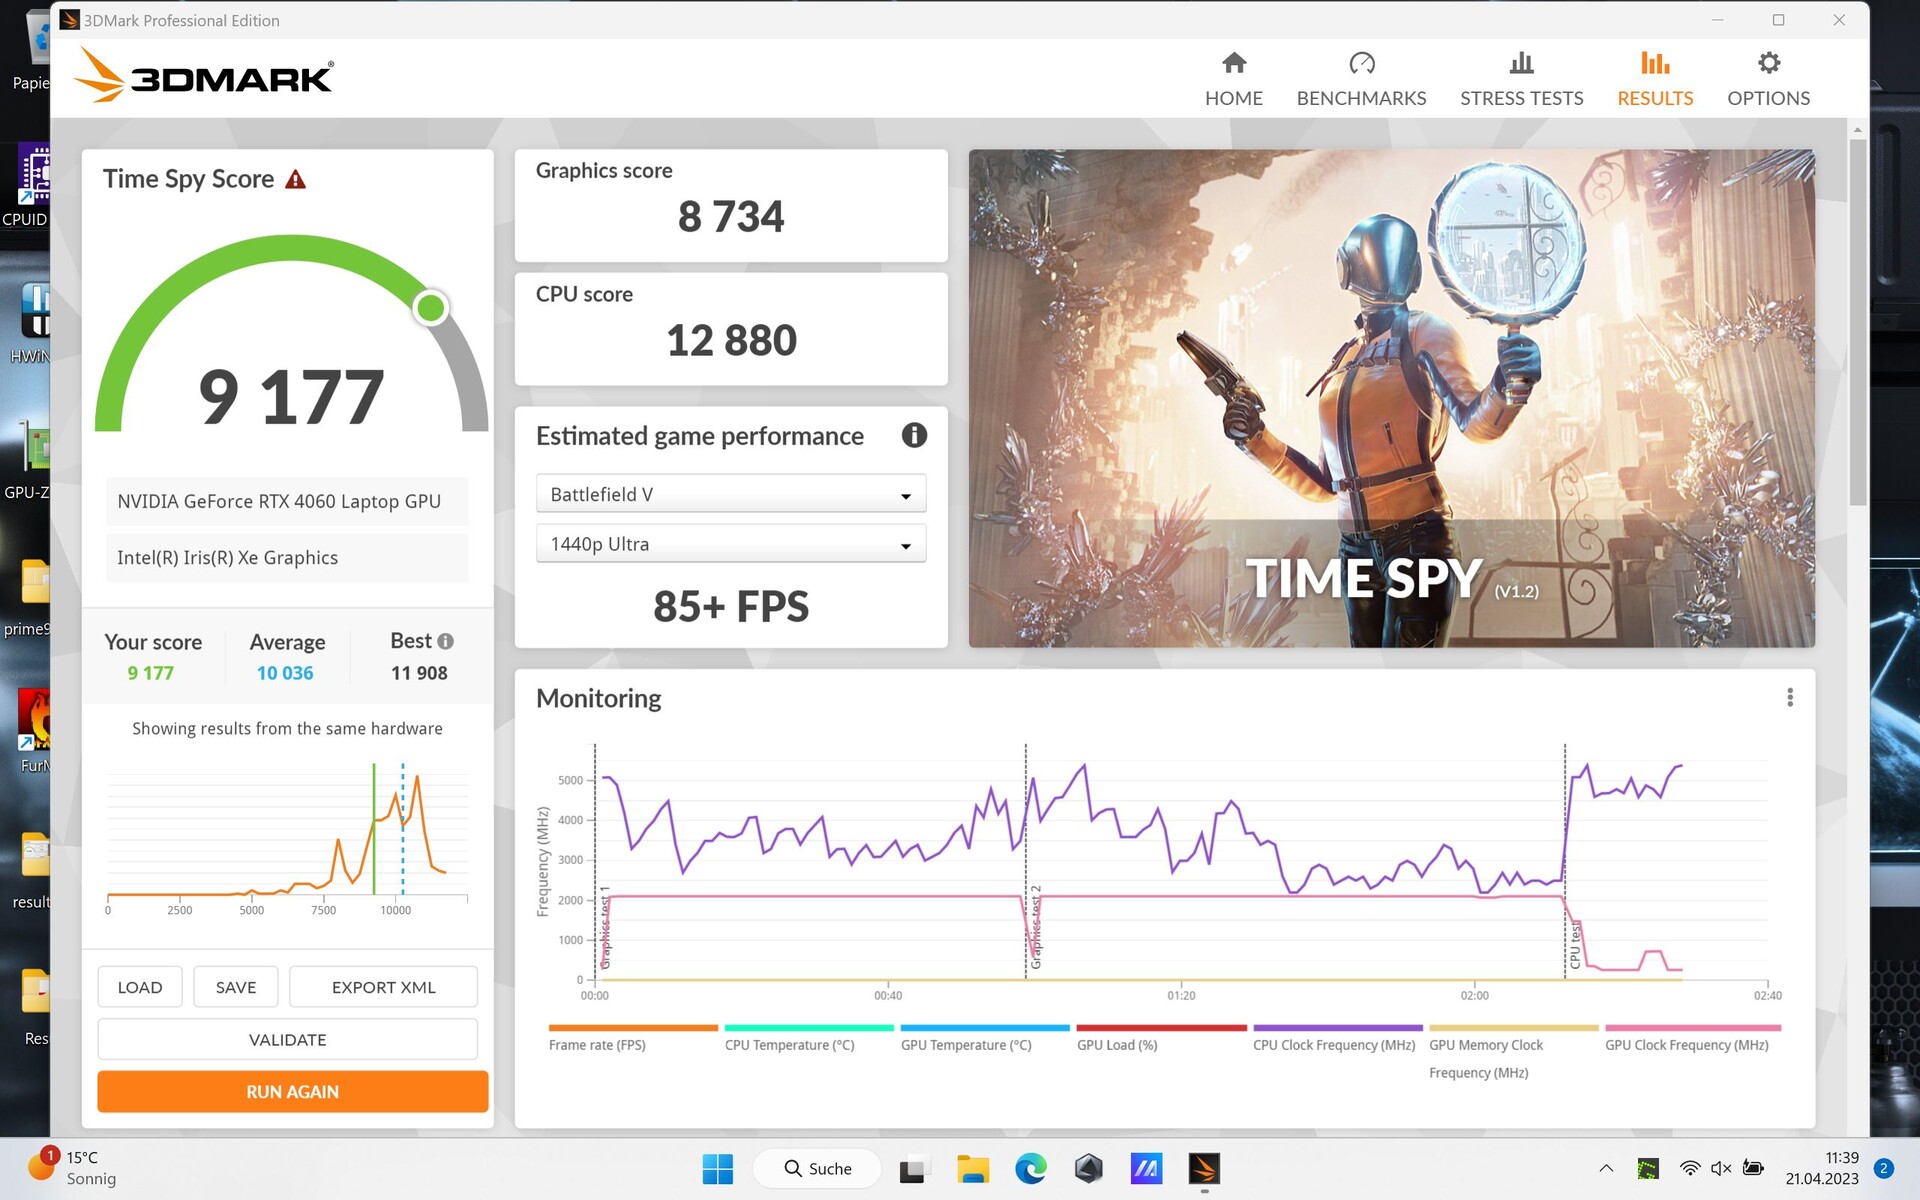
Graphics Card
The tablet contains an Nvidia Geforce RTX 4060 - the only question is where in the slim case. Of course, you have to accept a few 3D performance cuts with the tablet form factor, so the power consumption is limited to a maximum of 65 W (50 + 15 W Dynamic Boost).
In 3DMark, switching to the dGPU via Optimus sometimes doesn't work. If you switch to the dGPU via MUX, the scores are much closer to the competition after a restart.
In terms of results, the RTX 4060 in the Z13 performs about 17 to 18 percent less than the average gaming laptop with the same GPU.
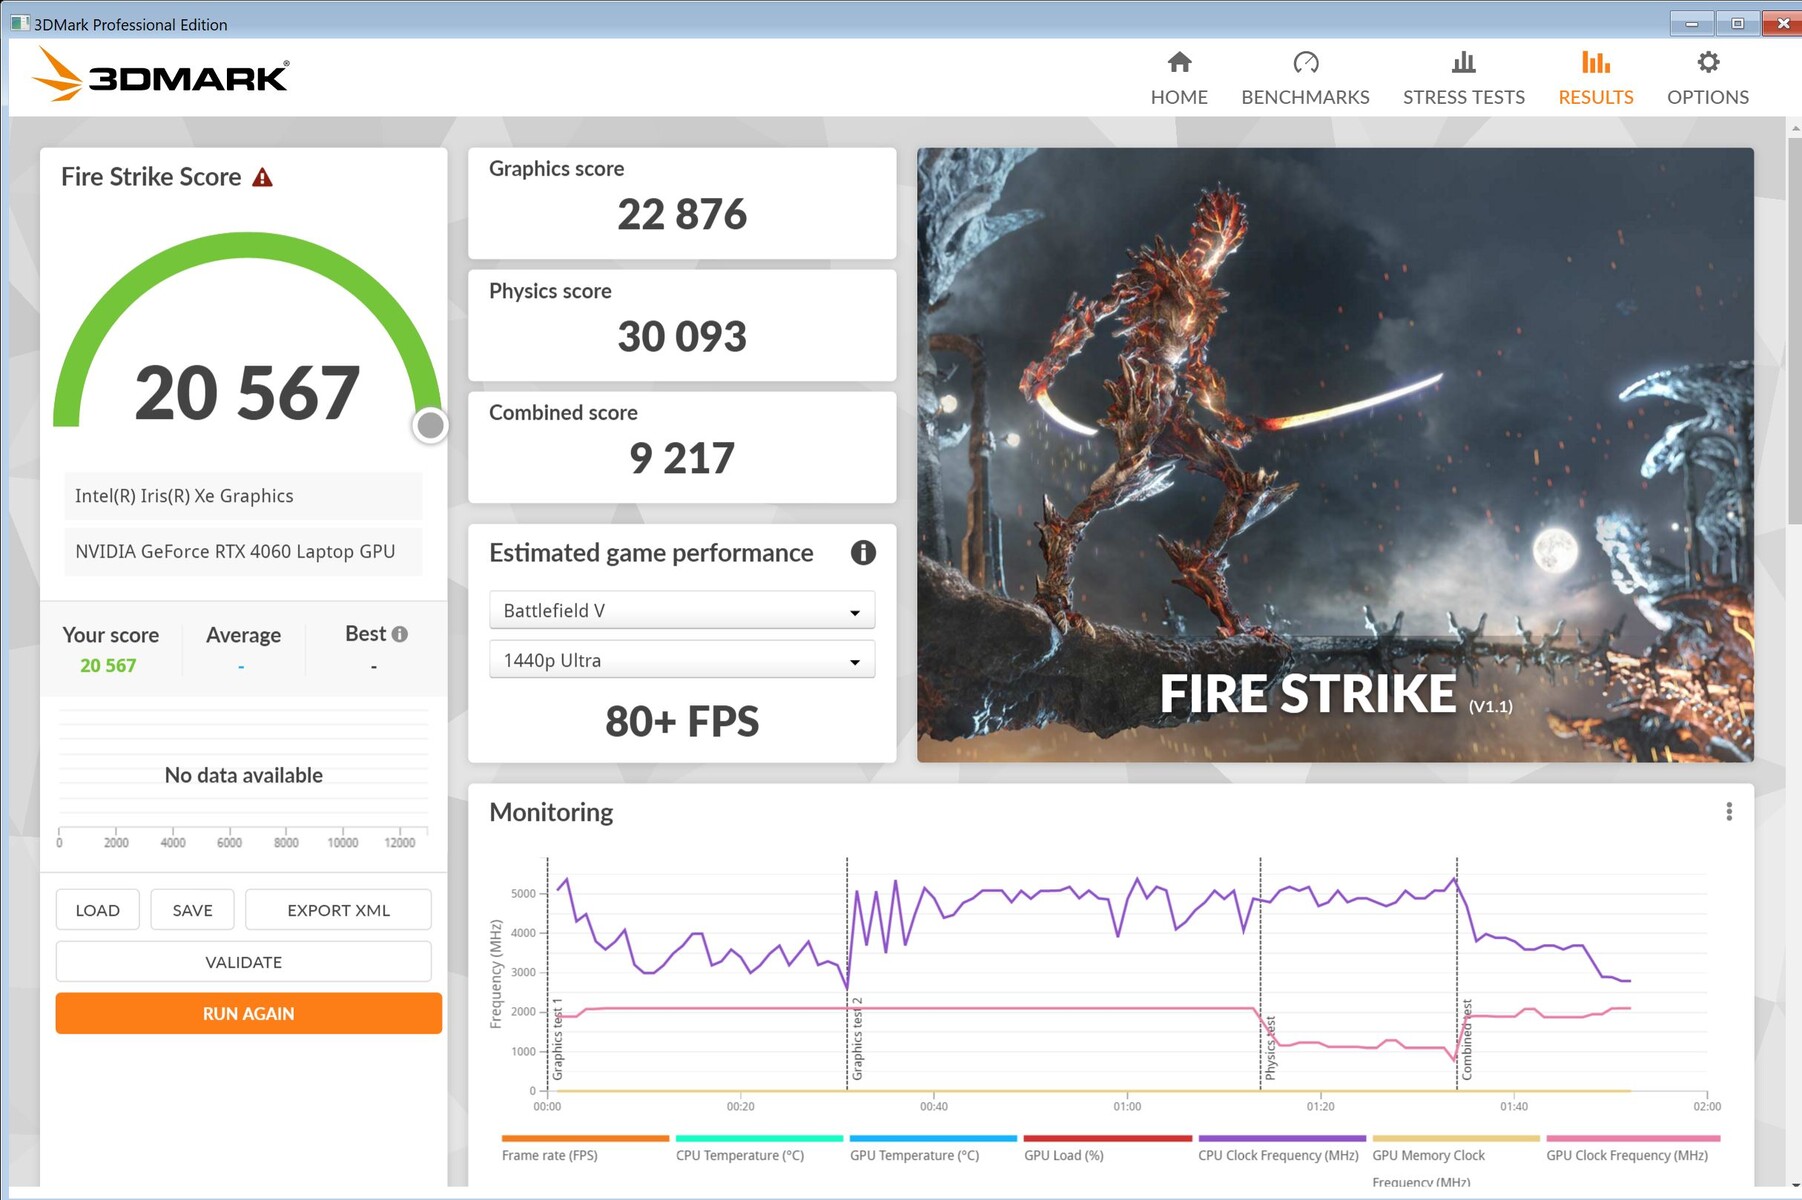
Unlike the CPU test, the scores in the synthetic benchmarks clearly benefit from Turbo mode. Here, the lead of laptop gamers in the performance rating narrows down to just four percent! The special edition with its RTX 4070 (also in Turbo Mode) is only seven percent faster.
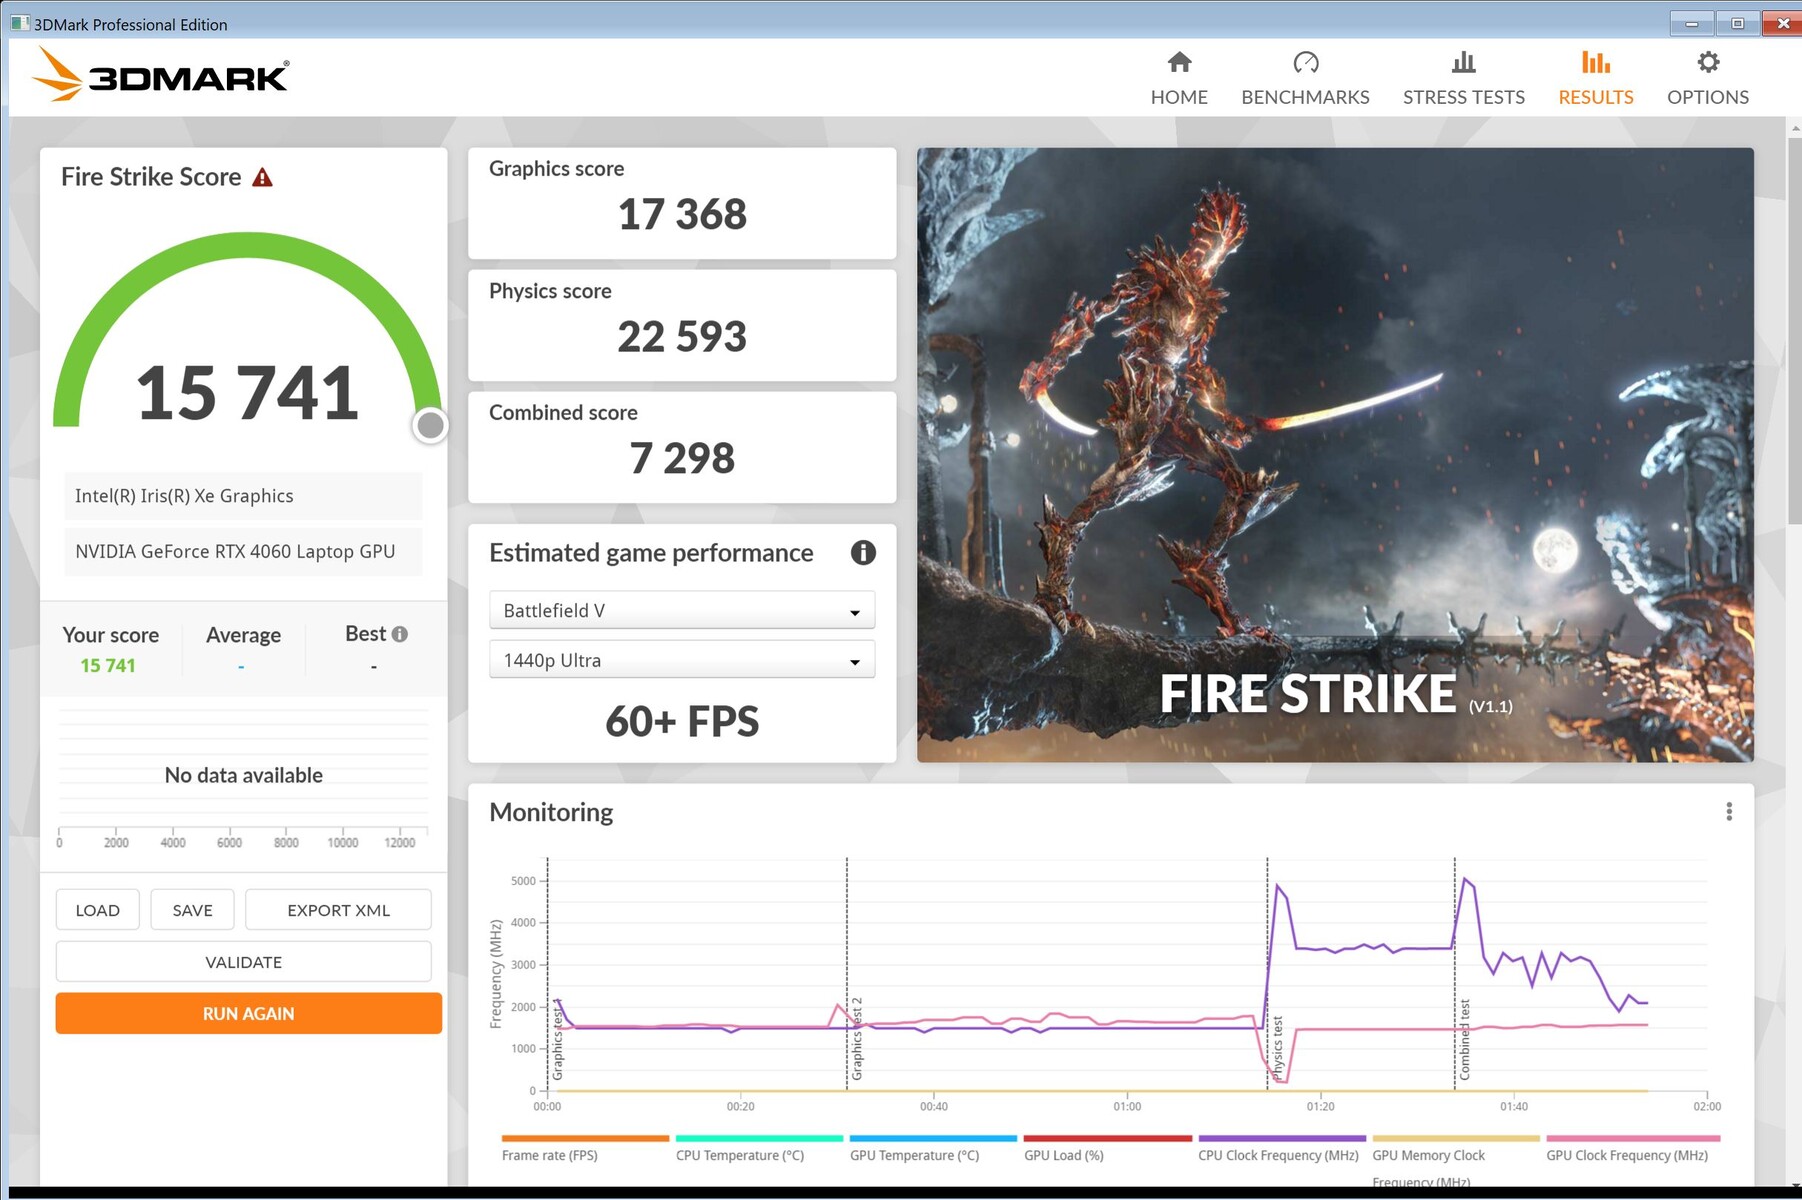
If you disconnect the tablet from the mains, 3D performance drops, but significantly less than we had expected, as another Fire Strike run still resulted in 17,368 3D points instead of the 20,553 points on the mains. So you can still play with the Z13 on the go without a power outlet, but the question is for how long. More on that below.
| 3DMark Performance rating - Percent | |
| Average of class Gaming | |
| MSI Katana 17 B13VFK | |
| Average NVIDIA GeForce RTX 4060 Laptop GPU | |
| ROG Flow Z13 Turbo | |
| Asus ROG Flow Z13 ACRNM -1! | |
| MSI Cyborg 15 A12VF | |
| ROG Flow Z13 Leistung | |
| Asus ROG Flow Z13 GZ301ZE -1! | |
| 3DMark 11 - 1280x720 Performance GPU | |
| Average of class Gaming (21841 - 80022, n=103, last 2 years) | |
| MSI Katana 17 B13VFK | |
| Average NVIDIA GeForce RTX 4060 Laptop GPU (28136 - 38912, n=57) | |
| Asus ROG Flow Z13 ACRNM | |
| ROG Flow Z13 Turbo | |
| ROG Flow Z13 Leistung | |
| MSI Cyborg 15 A12VF | |
| Asus ROG Flow Z13 GZ301ZE | |
| 3DMark | |
| 1280x720 Cloud Gate Standard Graphics | |
| MSI Katana 17 B13VFK | |
| Average NVIDIA GeForce RTX 4060 Laptop GPU (81407 - 180228, n=29) | |
| Average of class Gaming (86886 - 223650, n=59, last 2 years) | |
| MSI Cyborg 15 A12VF | |
| ROG Flow Z13 Turbo | |
| ROG Flow Z13 Leistung | |
| 1920x1080 Fire Strike Graphics | |
| Average of class Gaming (12242 - 62849, n=114, last 2 years) | |
| MSI Katana 17 B13VFK | |
| Average NVIDIA GeForce RTX 4060 Laptop GPU (20533 - 29656, n=54) | |
| Asus ROG Flow Z13 ACRNM | |
| ROG Flow Z13 Turbo | |
| MSI Cyborg 15 A12VF | |
| ROG Flow Z13 Leistung | |
| Asus ROG Flow Z13 GZ301ZE | |
| 2560x1440 Time Spy Graphics | |
| Average of class Gaming (5012 - 26212, n=114, last 2 years) | |
| MSI Katana 17 B13VFK | |
| Average NVIDIA GeForce RTX 4060 Laptop GPU (7484 - 11451, n=56) | |
| Asus ROG Flow Z13 ACRNM | |
| ROG Flow Z13 Turbo | |
| ROG Flow Z13 Leistung | |
| MSI Cyborg 15 A12VF | |
| Asus ROG Flow Z13 GZ301ZE | |
| 3DMark 11 Performance | 26702 points | |
| 3DMark Cloud Gate Standard Score | 55913 points | |
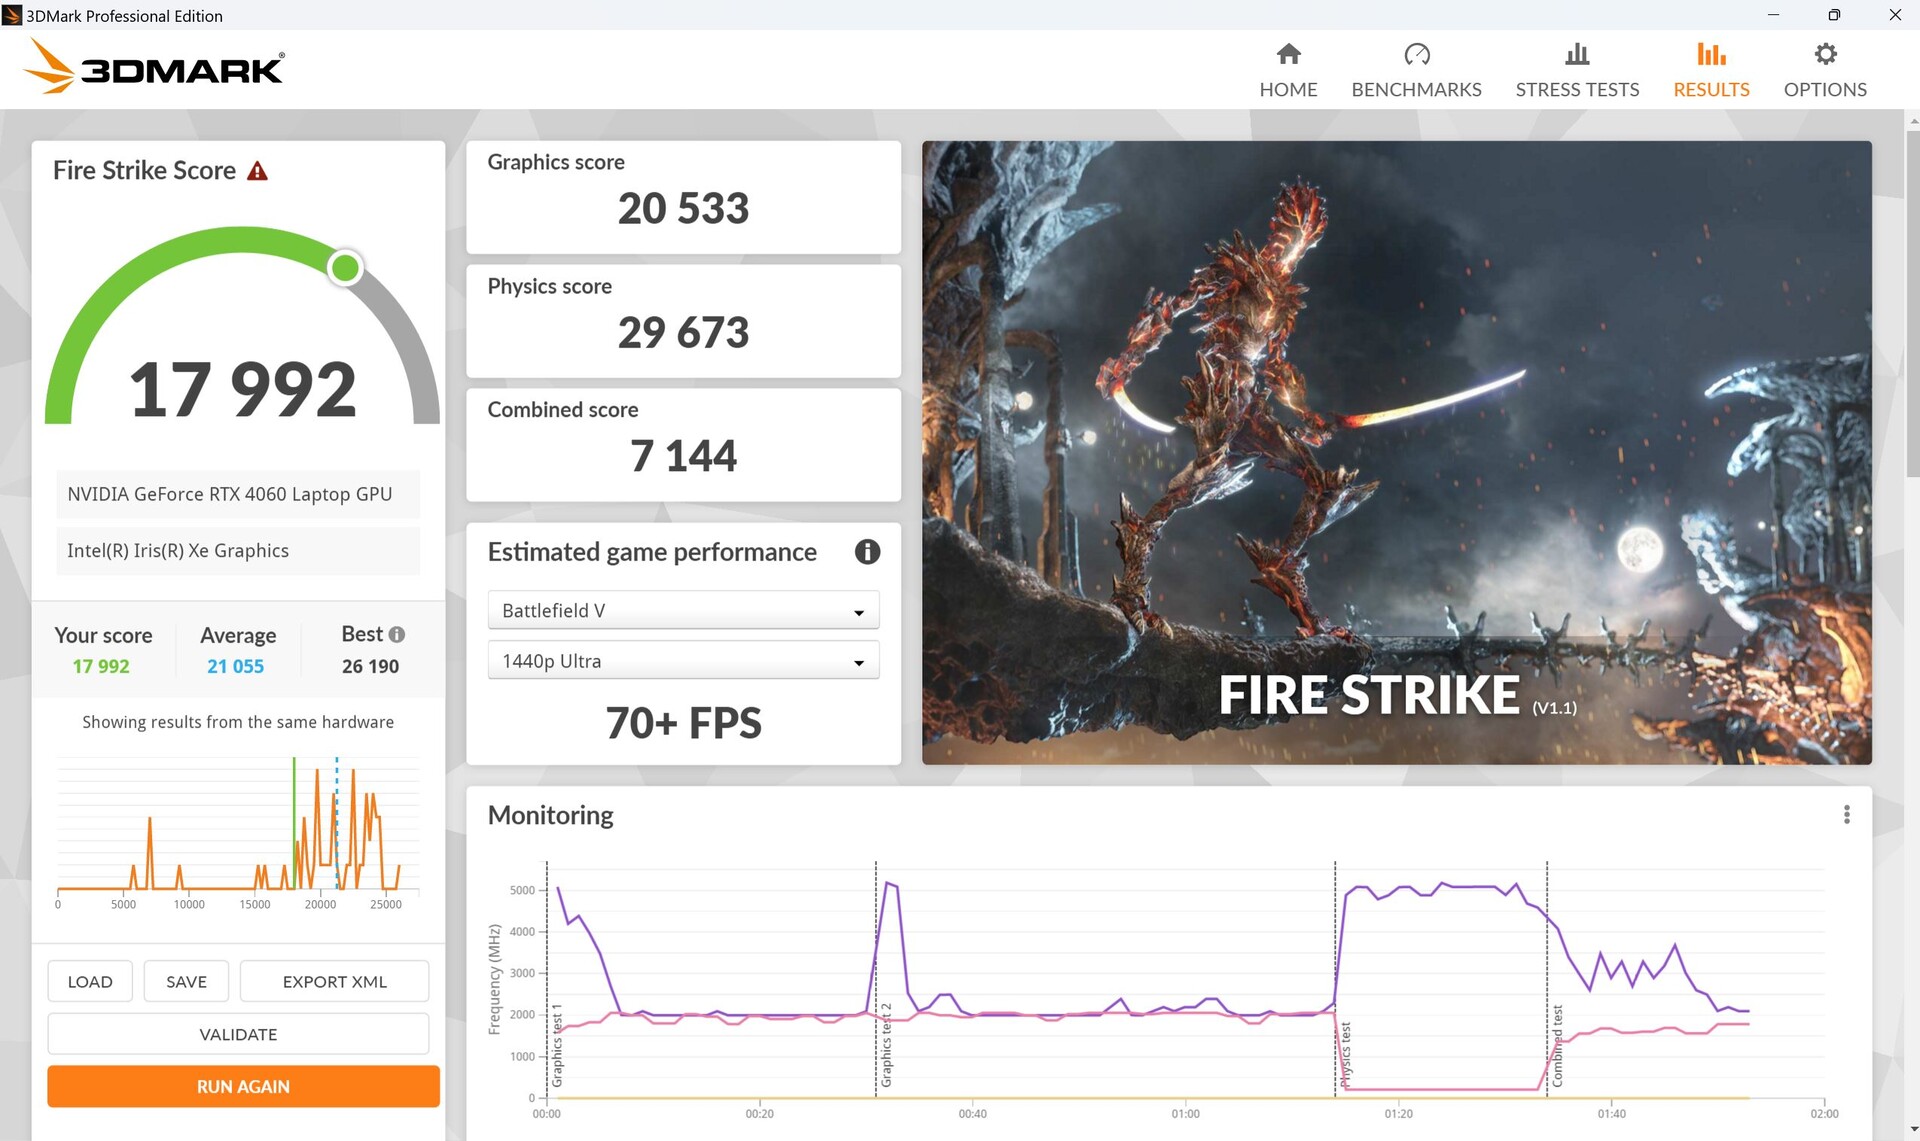
| 3DMark Fire Strike Score | 17992 points | |
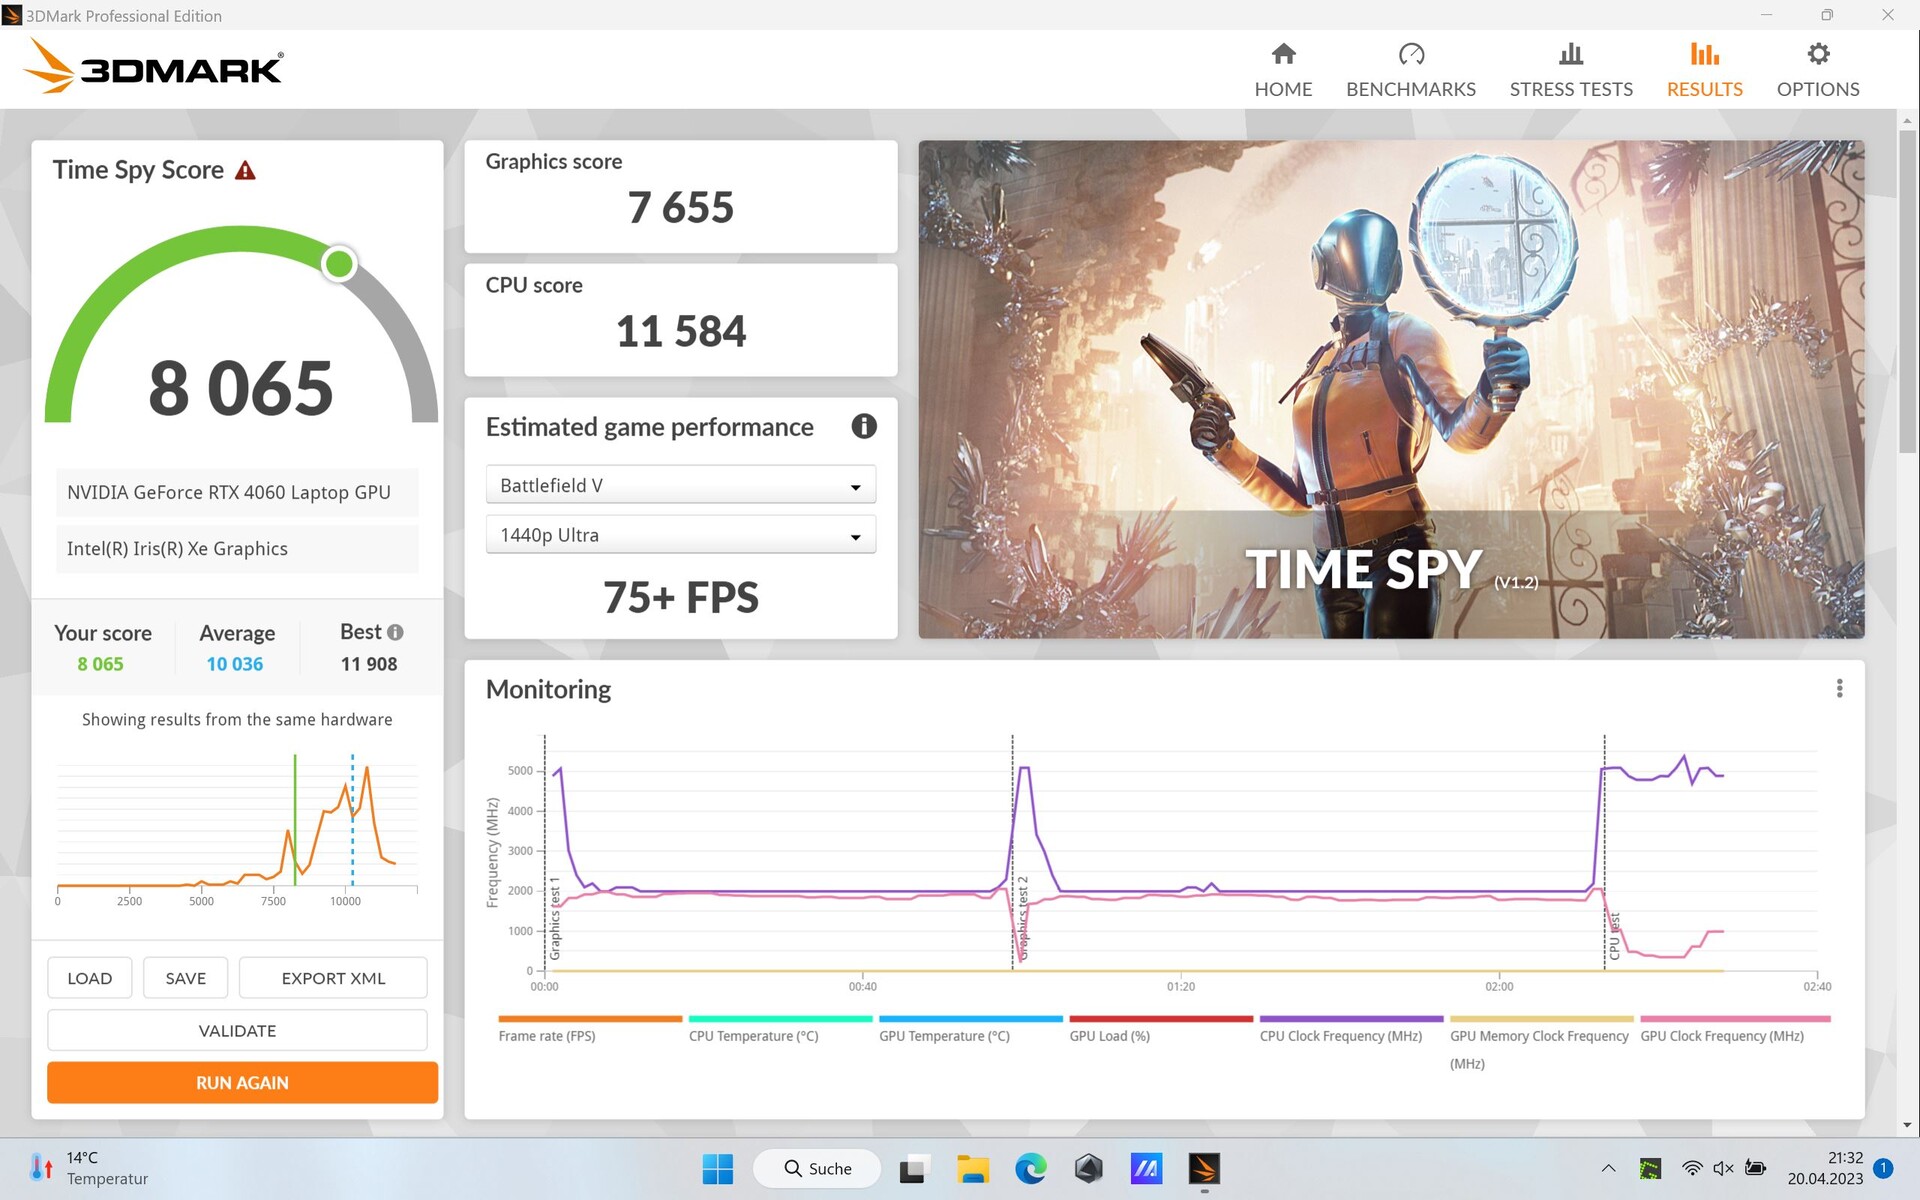
| 3DMark Time Spy Score | 8065 points | |
Help | ||
* ... smaller is better
Gaming Performance
Gaming on the tablet is perfectly possible with the Z13 in view of the benchmarks. However, that the RTX 4060 can only consume a maximum of 55 W quickly becomes clear. Bigger gamers such as the Katana 17 with the same GPU have a higher TGP and thus achieve better results; for example, the aforementioned Katana is a whole 28% faster in Witcher 3 Ultra. The MSI Cyborg achieves similar rates, but its RTX 4060 can only consume 45 W.
Far Cry 5 is still very playable at 71 fps in the 16:9 resolution of 2,560 x 1,440 in Performance mode, while Turbo mode squeezes a few more fps out of it.
Dying Light 2 runs at 52 fps in FHD and high settings and is thus 12% behind laptops with the same GPU. This is 56.7 fps in Turbo mode, almost on par with the average RTX 4060. 35 fps is the result in 2560x1440. Ray tracing can also be enabled, but only together with Frame Generation (AI support), which results in around 36 fps.
Almost every game can thus be played in high resolutions in FullHD, sometimes even in QHD. Impressive for a tablet.
| Performance modes | Witcher 3 FHD Ultra | Dying Light 2 FHD High |
|---|---|---|
| Quiet | 67 fps | 41 fps |
| Performance | 77 fps | 52 fps |
| Turbo | 83 fps | 56,7 fps |
| Performance rating - Percent | |
| Average of class Gaming | |
| MSI Katana 17 B13VFK | |
| Asus ROG Flow Z13 ACRNM | |
| MSI Cyborg 15 A12VF | |
| ROG Flow Z13 Leistung | |
| Asus ROG Flow Z13 GZ301ZE | |
| The Witcher 3 - 1920x1080 Ultra Graphics & Postprocessing (HBAO+) | |
| Average of class Gaming (104.7 - 240, n=6, last 2 years) | |
| MSI Katana 17 B13VFK | |
| Asus ROG Flow Z13 ACRNM | |
| MSI Cyborg 15 A12VF | |
| ROG Flow Z13 Leistung | |
| Asus ROG Flow Z13 GZ301ZE | |
| GTA V - 1920x1080 Highest AA:4xMSAA + FX AF:16x | |
| Average of class Gaming (48.3 - 186.9, n=93, last 2 years) | |
| MSI Katana 17 B13VFK | |
| Asus ROG Flow Z13 ACRNM | |
| MSI Cyborg 15 A12VF | |
| ROG Flow Z13 Leistung | |
| Asus ROG Flow Z13 GZ301ZE | |
| Final Fantasy XV Benchmark - 1920x1080 High Quality | |
| Average of class Gaming (41 - 215, n=94, last 2 years) | |
| Asus ROG Flow Z13 GZ301ZE | |
| MSI Katana 17 B13VFK | |
| Asus ROG Flow Z13 ACRNM | |
| MSI Cyborg 15 A12VF | |
| ROG Flow Z13 Leistung | |
| Strange Brigade - 1920x1080 ultra AA:ultra AF:16 | |
| Average of class Gaming (76.3 - 456, n=86, last 2 years) | |
| MSI Katana 17 B13VFK | |
| Asus ROG Flow Z13 ACRNM | |
| MSI Cyborg 15 A12VF | |
| ROG Flow Z13 Leistung | |
| Asus ROG Flow Z13 GZ301ZE | |
| Dota 2 Reborn - 1920x1080 ultra (3/3) best looking | |
| MSI Katana 17 B13VFK | |
| Average of class Gaming (84.8 - 248, n=106, last 2 years) | |
| ROG Flow Z13 Leistung | |
| Asus ROG Flow Z13 GZ301ZE | |
| MSI Cyborg 15 A12VF | |
| Asus ROG Flow Z13 ACRNM | |
| X-Plane 11.11 - 1920x1080 high (fps_test=3) | |
| MSI Katana 17 B13VFK | |
| Asus ROG Flow Z13 ACRNM | |
| ROG Flow Z13 Leistung | |
| Average of class Gaming (55.5 - 143.5, n=108, last 2 years) | |
| MSI Cyborg 15 A12VF | |
| Asus ROG Flow Z13 GZ301ZE | |
| The Witcher 3 | |
| 1920x1080 High Graphics & Postprocessing (Nvidia HairWorks Off) | |
| Average of class Gaming (n=1last 2 years) | |
| MSI Katana 17 B13VFK | |
| Average NVIDIA GeForce RTX 4060 Laptop GPU (110 - 229, n=36) | |
| Acer Predator Triton 300 SE | |
| Asus ROG Flow Z13 GZ301V | |
| MSI Cyborg 15 A12VF | |
| Asus ROG Flow Z13 GZ301ZE | |
| 1920x1080 Ultra Graphics & Postprocessing (HBAO+) | |
| Average of class Gaming (104.7 - 240, n=6, last 2 years) | |
| MSI Katana 17 B13VFK | |
| Average NVIDIA GeForce RTX 4060 Laptop GPU (77 - 159.7, n=42) | |
| Asus ROG Flow Z13 ACRNM | |
| MSI Cyborg 15 A12VF | |
| Asus ROG Flow Z13 GZ301V | |
| Acer Predator Triton 300 SE | |
| Asus ROG Flow Z13 GZ301ZE | |
| Dying Light 2 | |
| 1920x1080 High Quality | |
| MSI Katana 17 B13VFK | |
| Average NVIDIA GeForce RTX 4060 Laptop GPU (52 - 64.7, n=2) | |
| Asus ROG Flow Z13 GZ301V | |
| 2560x1440 High Quality | |
| MSI Katana 17 B13VFK | |
| Average NVIDIA GeForce RTX 4060 Laptop GPU (35.6 - 43.8, n=2) | |
| Asus ROG Flow Z13 GZ301V | |
| 1920x1080 High Quality Raytracing | |
| MSI Katana 17 B13VFK | |
| Average NVIDIA GeForce RTX 4060 Laptop GPU (23.5 - 30.8, n=2) | |
| Asus ROG Flow Z13 GZ301V | |
The Witcher 3 frame rate is very stable and exhibits the typical wave character (day/night change). An interesting observation is that in Turbo mode, our Z13 seems to be as fast as the special edition with its RTX 4070.
When looking at the log data, the maximum of 65 W is not exhausted in Performance mode. Here the GPU draws a maximum of 55 W from the power supply and an average of just under 50 W. The GPU heats up to around 64 °C and has an average clock rate of 1.9GHz. The memory clock fluctuates between 1,400 and 1,750 MHz.
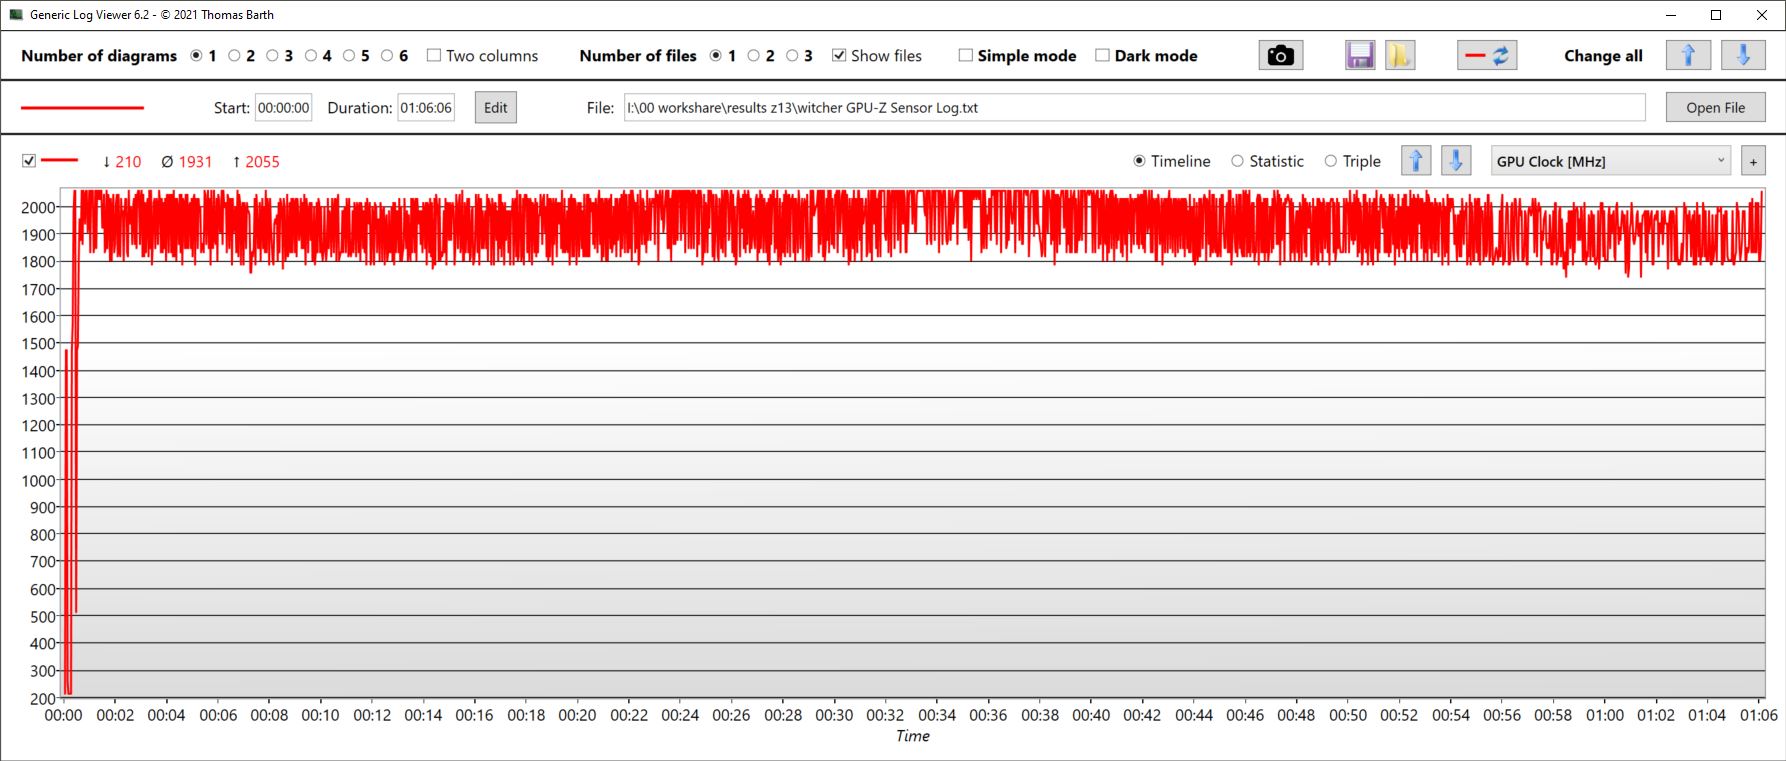
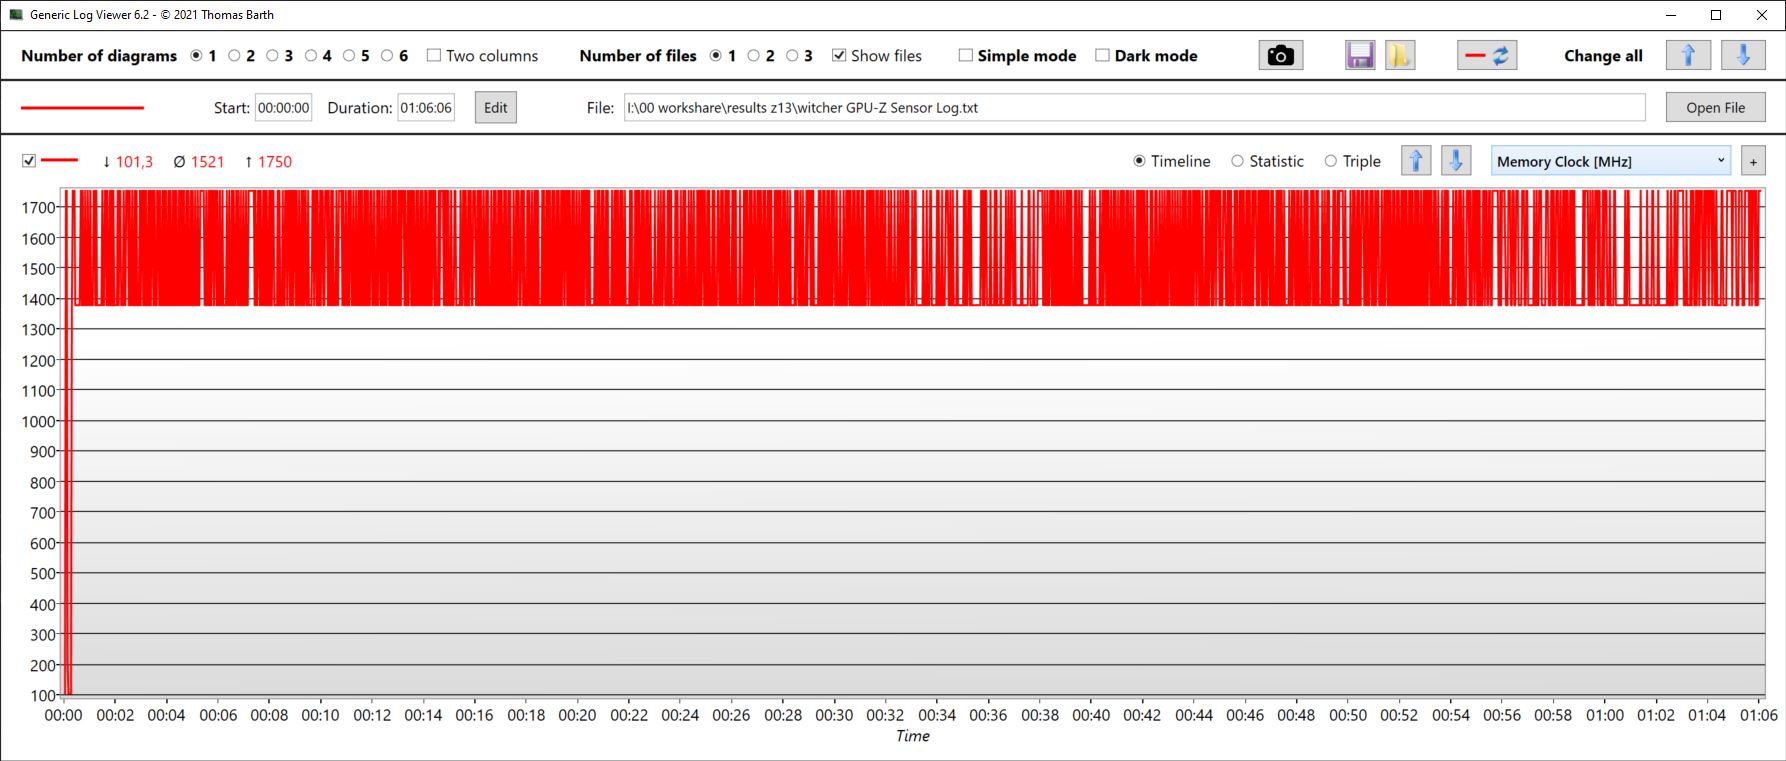
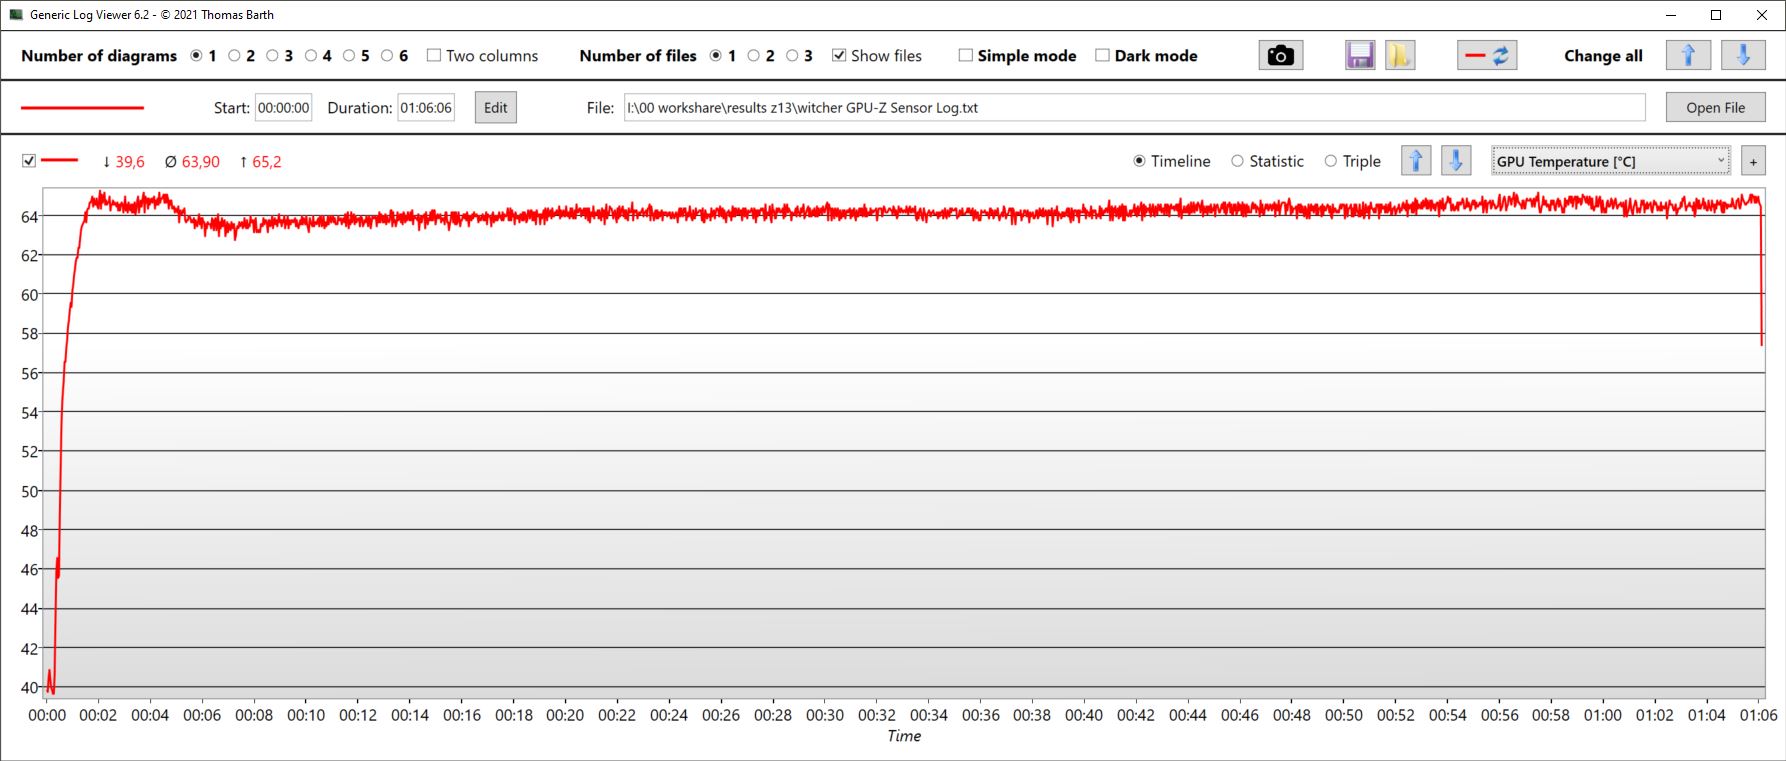
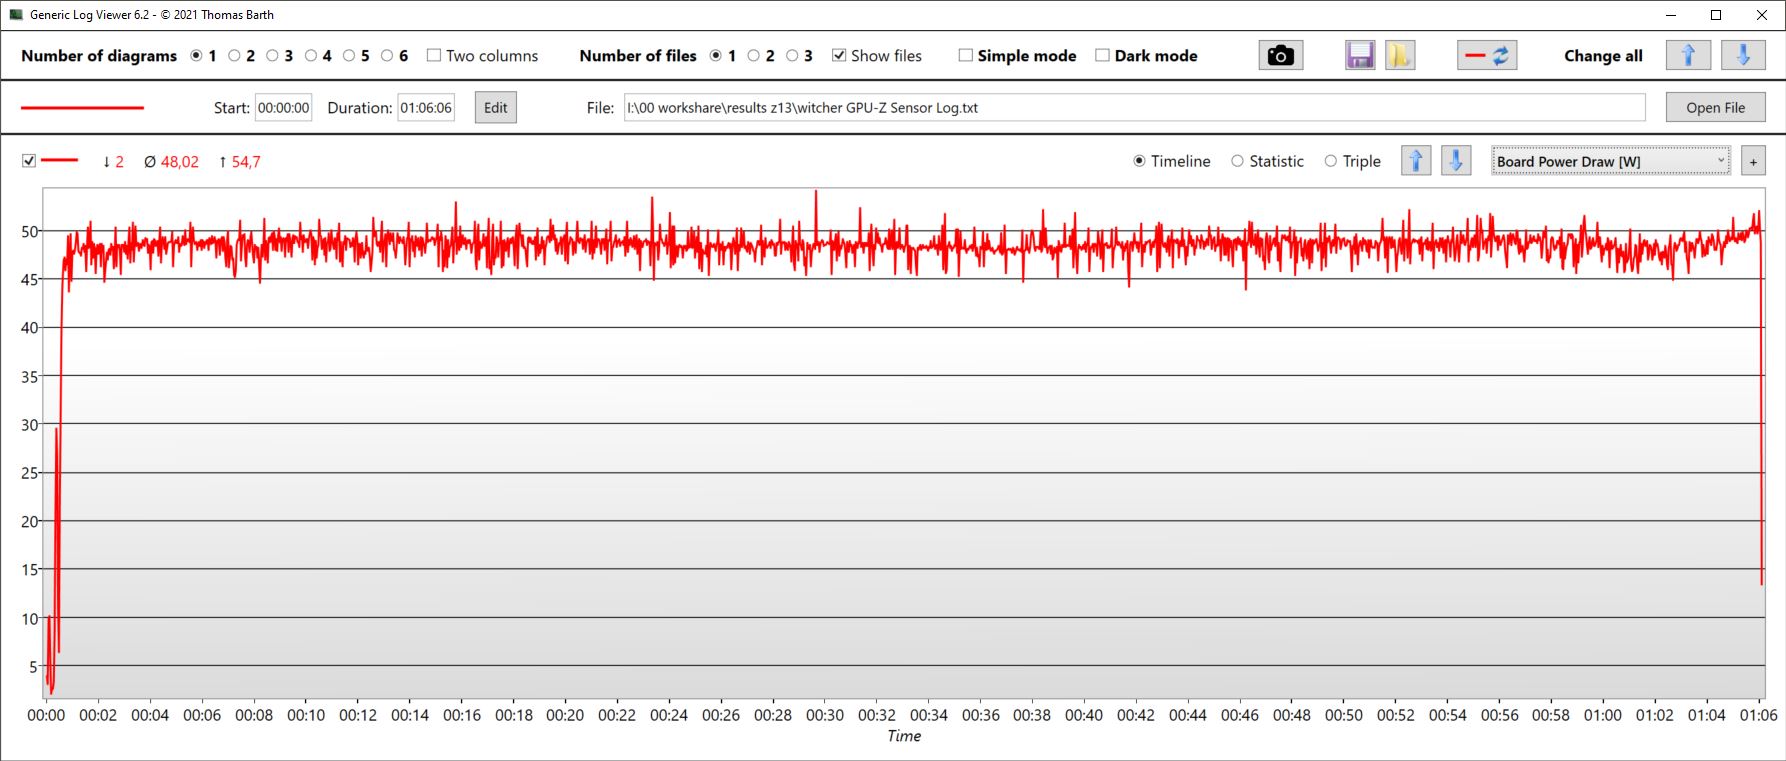
Witcher 3 FPS chart
| low | med. | high | ultra | QHD | 4K | |
|---|---|---|---|---|---|---|
| GTA V (2015) | 183.4 | 173.1 | 144 | 76.9 | ||
| The Witcher 3 (2015) | 325 | 228 | 143 | 77 | ||
| Dota 2 Reborn (2015) | 173.3 | 156 | 148.8 | 139.3 | ||
| Final Fantasy XV Benchmark (2018) | 100.8 | 75.1 | 56 | 32.2 | ||
| X-Plane 11.11 (2018) | 154.8 | 129.1 | 103.6 | |||
| Far Cry 5 (2018) | 154 | 110 | 104 | 95 | 71 | |
| Strange Brigade (2018) | 385 | 196.2 | 156.1 | 135.3 | ||
| Dying Light 2 (2022) | 80 | 64 | 52 | 35.6 |
Emissions - Quieter than some gaming laptops
Noise
Despite its small form factor, the Z13 is not overly loud compared to other gamers. In Performance mode, we measured around 41 dB during gaming. In Turbo mode, however, the volume increases to around 47 dB. This is of course loud for a tablet, but other gaming notebooks easily exceed 50 dB.
Incidentally, the internal fans spin at around 36 dB in Quiet mode. Compared to Turbo mode, you lose about 19% performance, but you get a 23% quieter device.
| Performance modes | Fan noise level | Refresh rate |
|---|---|---|
| Quiet | 36 dB | 67 fps |
| Performance | 41 dB | 77 fps |
| Turbo | 47 dB | 83 fps |
Noise level
| Idle |
| 24 / 24 / 24 dB(A) |
| Load |
| 38.61 / 43.59 dB(A) |
 | ||
30 dB silent 40 dB(A) audible 50 dB(A) loud |
||
min: | ||
| Asus ROG Flow Z13 GZ301V GeForce RTX 4060 Laptop GPU, i9-13900H, WD PC SN740 SDDPTQD-1T00 | Asus ROG Flow Z13 ACRNM GeForce RTX 4070 Laptop GPU, i9-13900H, WD PC SN740 SDDPTQD-1T00 | Asus ROG Flow Z13 GZ301ZE GeForce RTX 3050 Ti Laptop GPU, i9-12900H, Micron 2450 1TB MTFDKBK1T0TFK | MSI Katana 17 B13VFK GeForce RTX 4060 Laptop GPU, i7-13620H, Micron 2400 MTFDKBA1T0QFM | Acer Predator Triton 300 SE GeForce RTX 3060 Laptop GPU, i9-12900H, Micron 3400 1TB MTFDKBA1T0TFH | MSI Cyborg 15 A12VF GeForce RTX 4060 Laptop GPU, i7-12650H, Samsung PM9B1 1024GB MZVL41T0HBLB | |
|---|---|---|---|---|---|---|
| Noise | -11% | -1% | -24% | -18% | -36% | |
| off / environment * (dB) | 24 | 24 -0% | 24.5 -2% | 24.5 -2% | 23.8 1% | 27 -13% |
| Idle Minimum * (dB) | 24 | 24 -0% | 24.5 -2% | 24.5 -2% | 23.8 1% | 27 -13% |
| Idle Average * (dB) | 24 | 24 -0% | 24.5 -2% | 24.5 -2% | 23.8 1% | 37.5 -56% |
| Idle Maximum * (dB) | 24 | 36.5 -52% | 24.5 -2% | 40 -67% | 30.6 -28% | 38 -58% |
| Load Average * (dB) | 38.61 | 41.3 -7% | 41 -6% | 48.3 -25% | 44.2 -14% | 56.3 -46% |
| Witcher 3 ultra * (dB) | 41.24 | 44.7 -8% | 41 1% | 56 -36% | 60.1 -46% | |
| Load Maximum * (dB) | 43.59 | 46.9 -8% | 41 6% | 59.1 -36% | 60 -38% | 56.3 -29% |
* ... smaller is better
Temperature
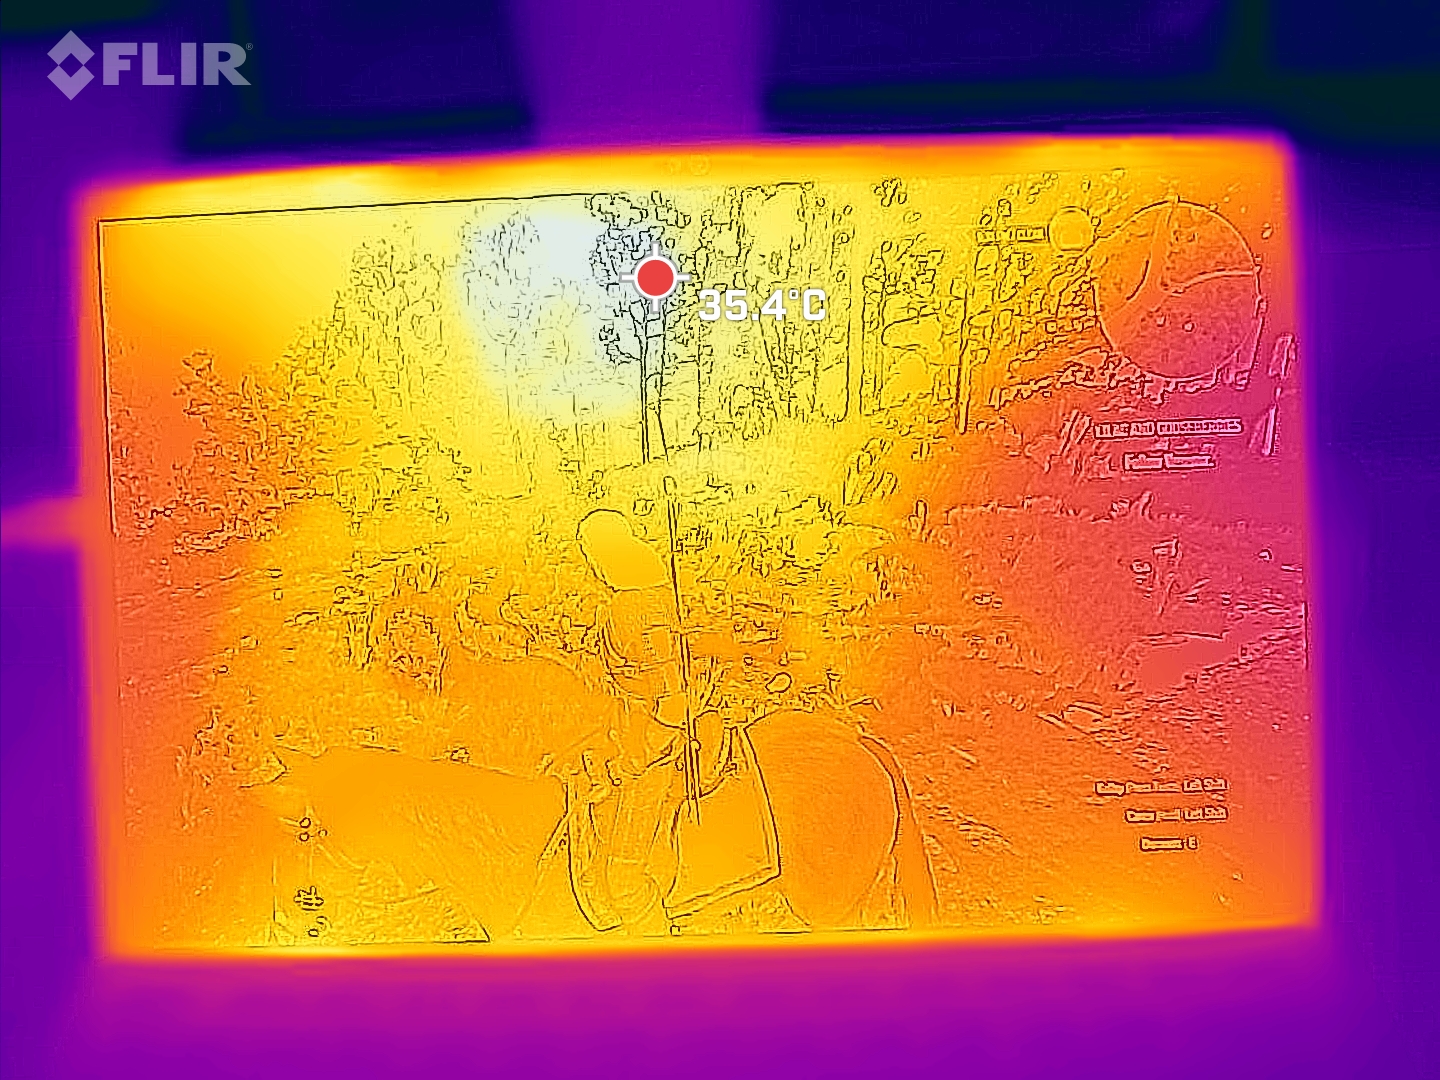
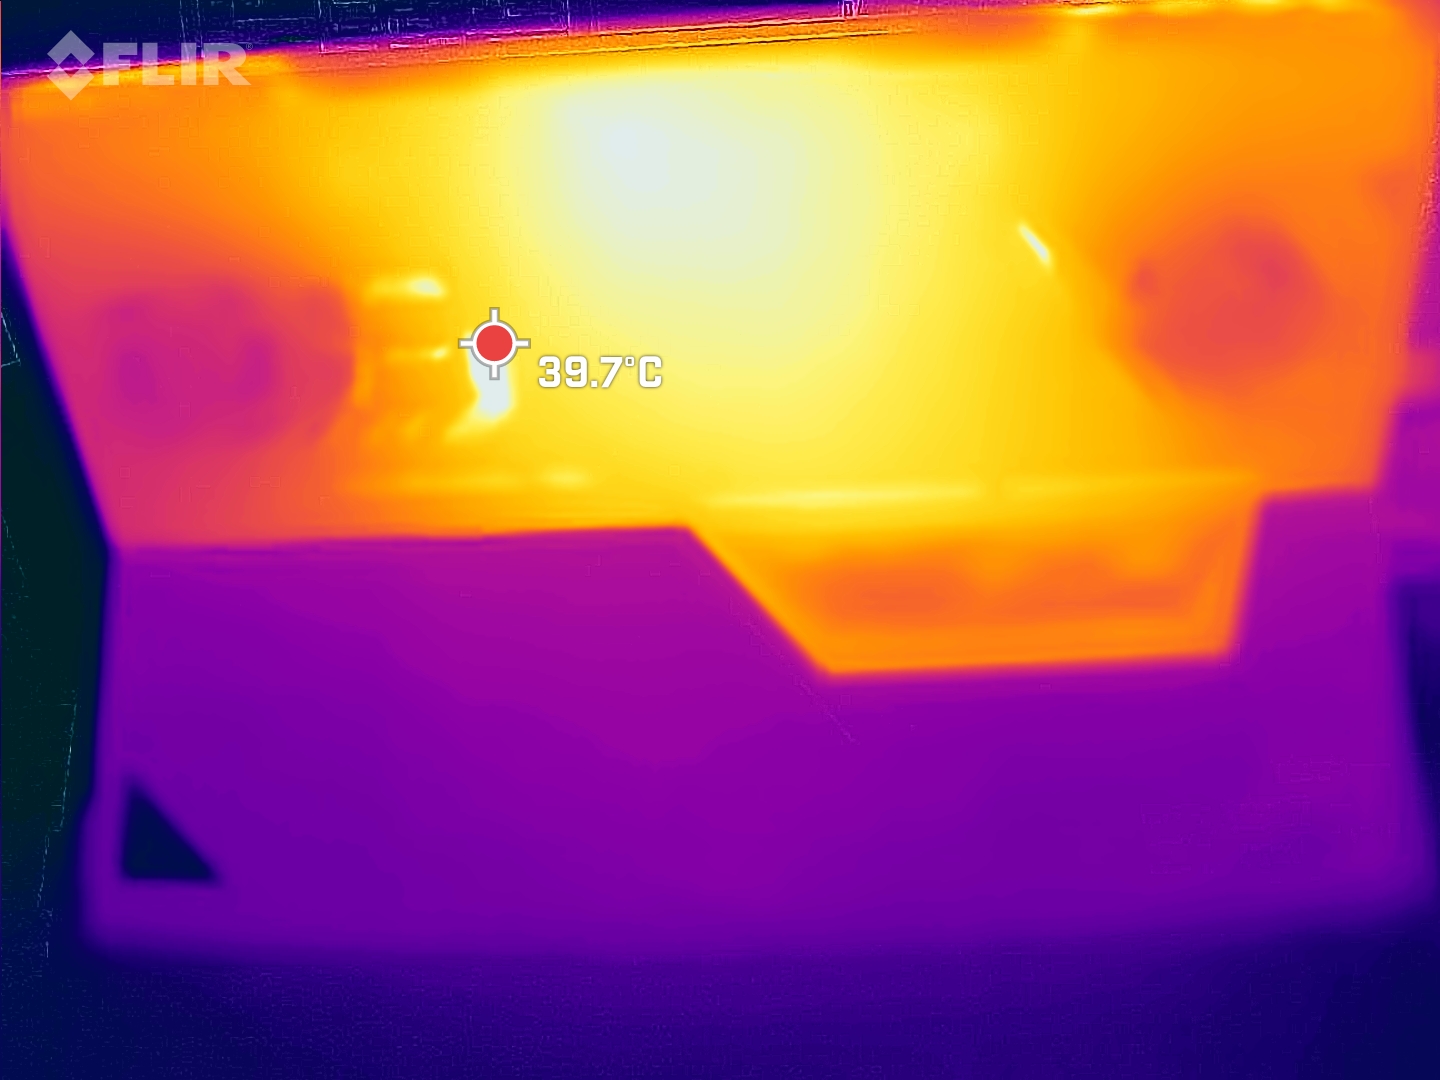
During gaming in particular, the Z13 heats up moderately, at least in Performance mode. We measured hot spots of 42 °C on the back during Witcher 3 Ultra. Surface temperatures increased up to 47 °C in the stress test. Since the keyboard is only docked, the palm rest and WASD keys always remain cool.
(±) The maximum temperature on the upper side is 42 °C / 108 F, compared to the average of 40.4 °C / 105 F, ranging from 21.2 to 68.8 °C for the class Gaming.
(-) The bottom heats up to a maximum of 47 °C / 117 F, compared to the average of 43.2 °C / 110 F
(+) In idle usage, the average temperature for the upper side is 25.8 °C / 78 F, compared to the device average of 33.9 °C / 93 F.
(±) Playing The Witcher 3, the average temperature for the upper side is 35.3 °C / 96 F, compared to the device average of 33.9 °C / 93 F.
(±) The palmrests and touchpad can get very hot to the touch with a maximum of 38 °C / 100.4 F.
(-) The average temperature of the palmrest area of similar devices was 28.8 °C / 83.8 F (-9.2 °C / -16.6 F).
| Asus ROG Flow Z13 GZ301V Intel Core i9-13900H, NVIDIA GeForce RTX 4060 Laptop GPU | Asus ROG Flow Z13 ACRNM Intel Core i9-13900H, NVIDIA GeForce RTX 4070 Laptop GPU | Asus ROG Flow Z13 GZ301ZE Intel Core i9-12900H, NVIDIA GeForce RTX 3050 Ti Laptop GPU | MSI Katana 17 B13VFK Intel Core i7-13620H, NVIDIA GeForce RTX 4060 Laptop GPU | Acer Predator Triton 300 SE Intel Core i9-12900H, NVIDIA GeForce RTX 3060 Laptop GPU | MSI Cyborg 15 A12VF Intel Core i7-12650H, NVIDIA GeForce RTX 4060 Laptop GPU | |
|---|---|---|---|---|---|---|
| Heat | 6% | -5% | -7% | 0% | 3% | |
| Maximum Upper Side * (°C) | 42 | 42.5 -1% | 45.3 -8% | 41.6 1% | 43 -2% | 47.5 -13% |
| Maximum Bottom * (°C) | 47 | 42.6 9% | 48.3 -3% | 43.1 8% | 46.4 1% | 35.5 24% |
| Idle Upper Side * (°C) | 27 | 26.2 3% | 29.2 -8% | 32 -19% | 28.2 -4% | 27.7 -3% |
| Idle Bottom * (°C) | 30 | 26 13% | 30 -0% | 35.8 -19% | 28.4 5% | 29.5 2% |
* ... smaller is better
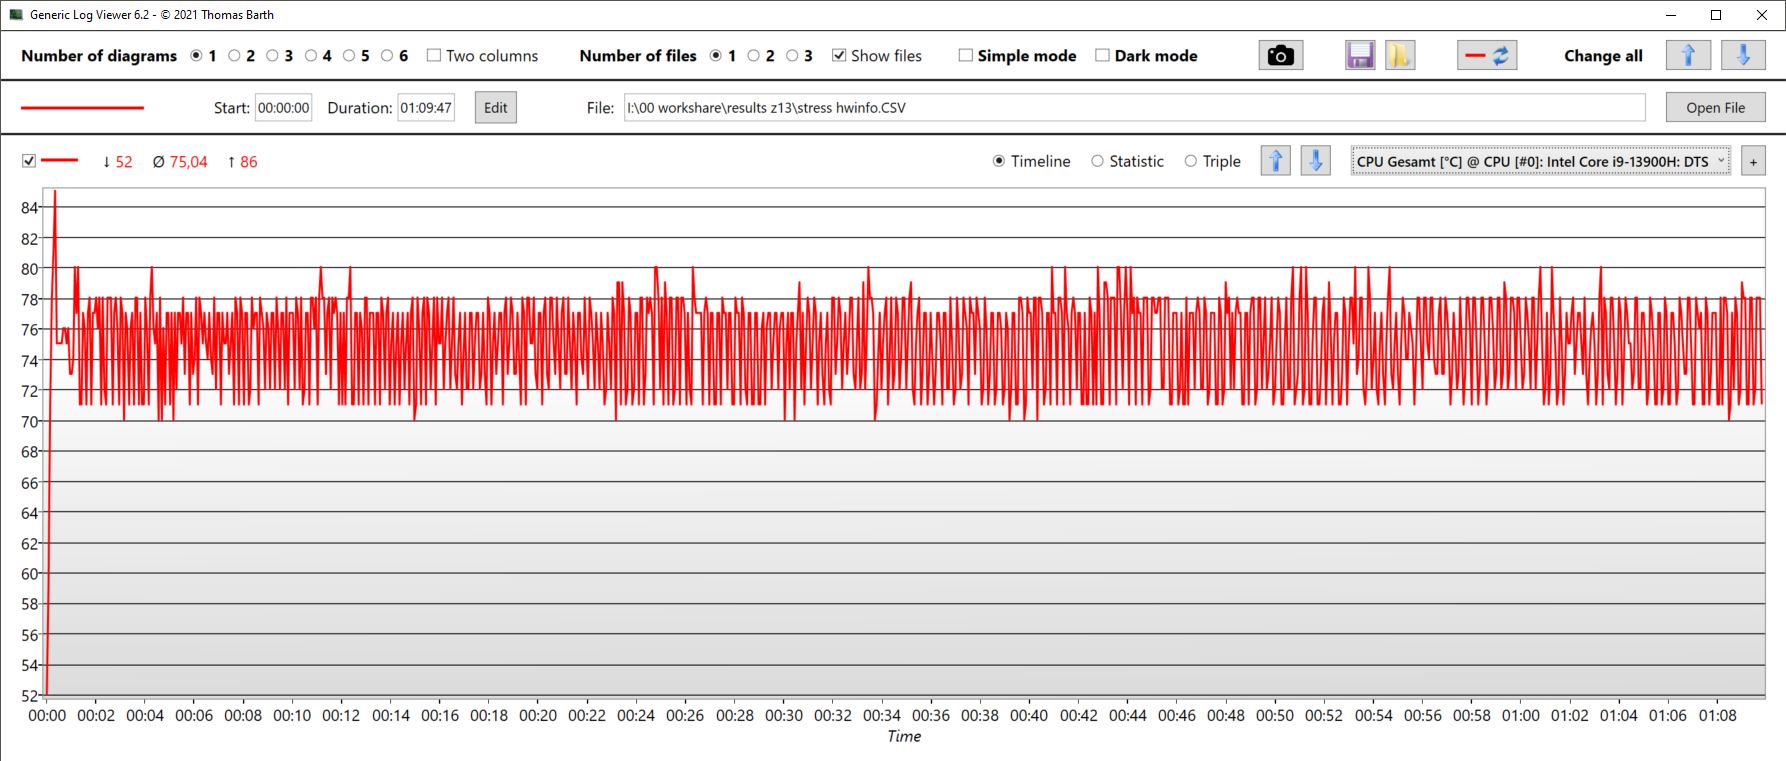
Stress Test
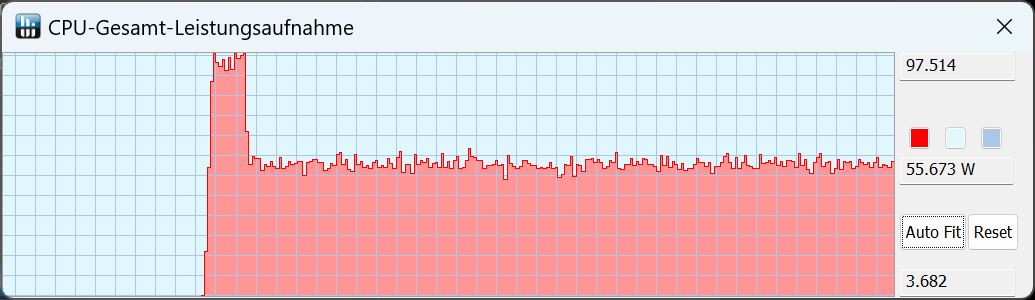
The CPU cores start our stress test briefly at 4.1 GHz and consume 95 W. The core temperature rises to 86 °C after just a few seconds, after which it throttles. Ultimately, the clock rates level off between 2 and 3.2 GHz with a power consumption of around 43 W, and the temperatures stabilize at around 75 °C.
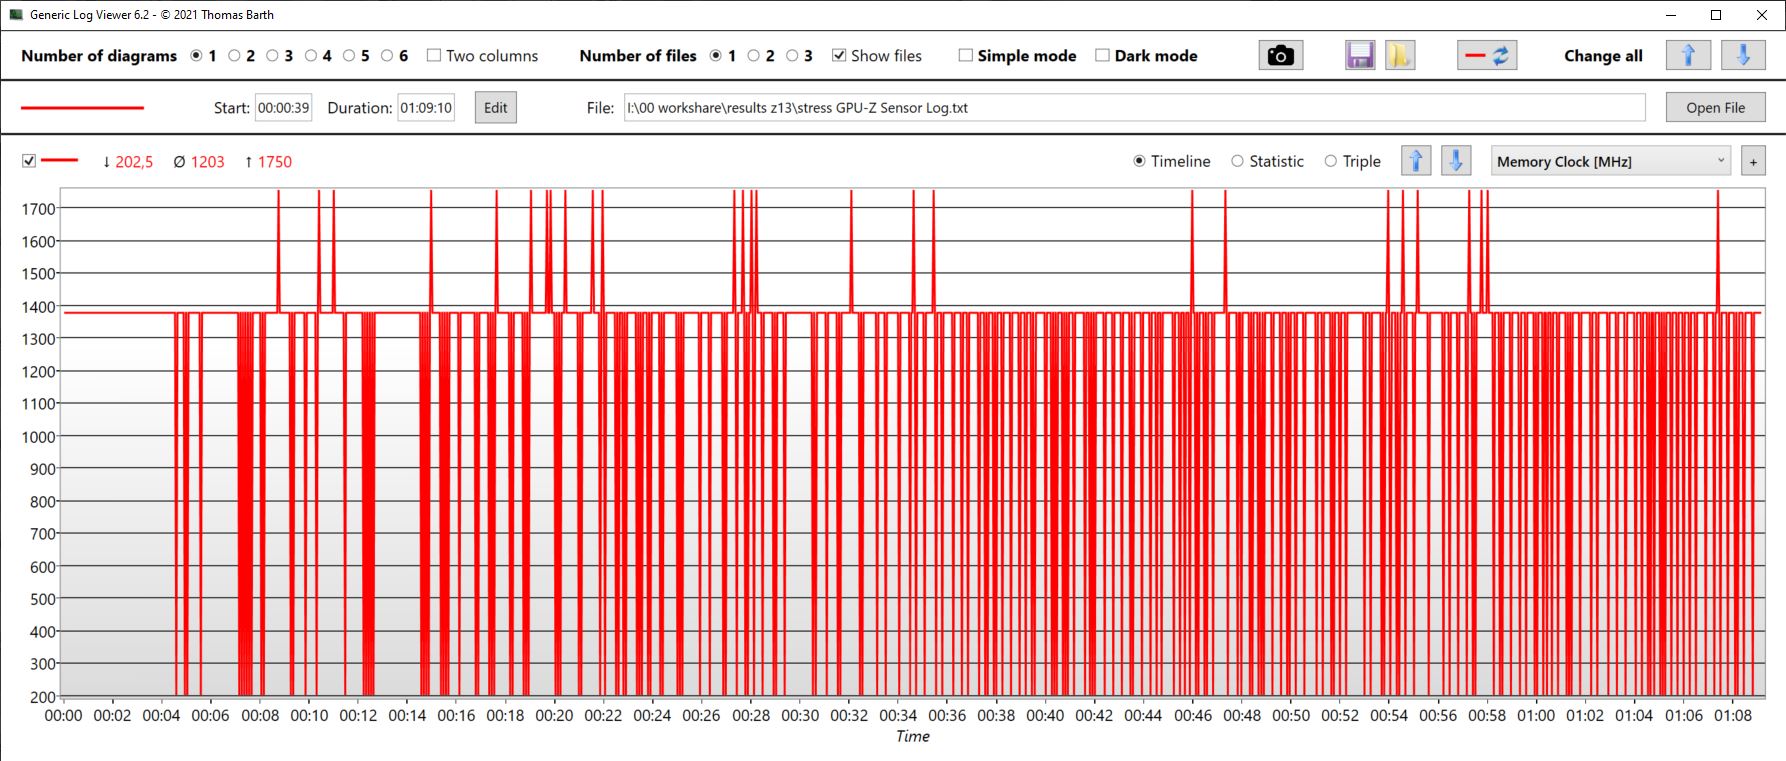
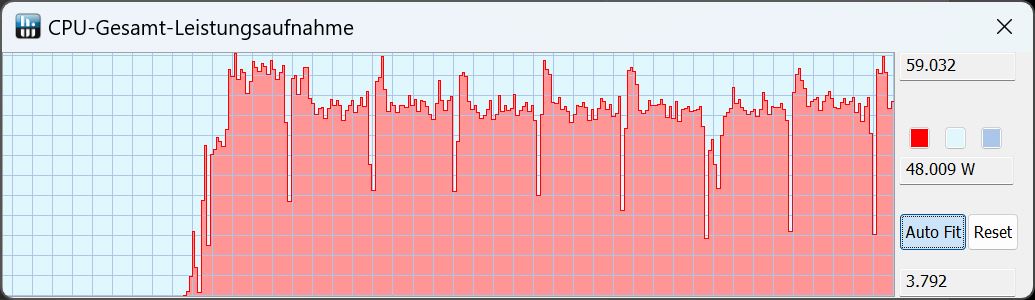
At the same time, the GPU clock fluctuates strongly between 750 and 2055 MHz over the entire test. The memory clock is also very inconsistent and tries to stay at 1.2 GHz, but regularly drops to 200 MHz. The graphics card heats up to around 64 °C, but never gets hotter than 70 °C. The power consumption also fluctuates, but is only 23 W on average. Load peaks of 50.5 W were measured.
So if both the CPU and the GPU are under heavy load, performance fluctuates greatly and 3D performance in particular is lost. The TDP of just 23 W and the drop in the memory clock rate to just 200 MHz clearly reflect this.
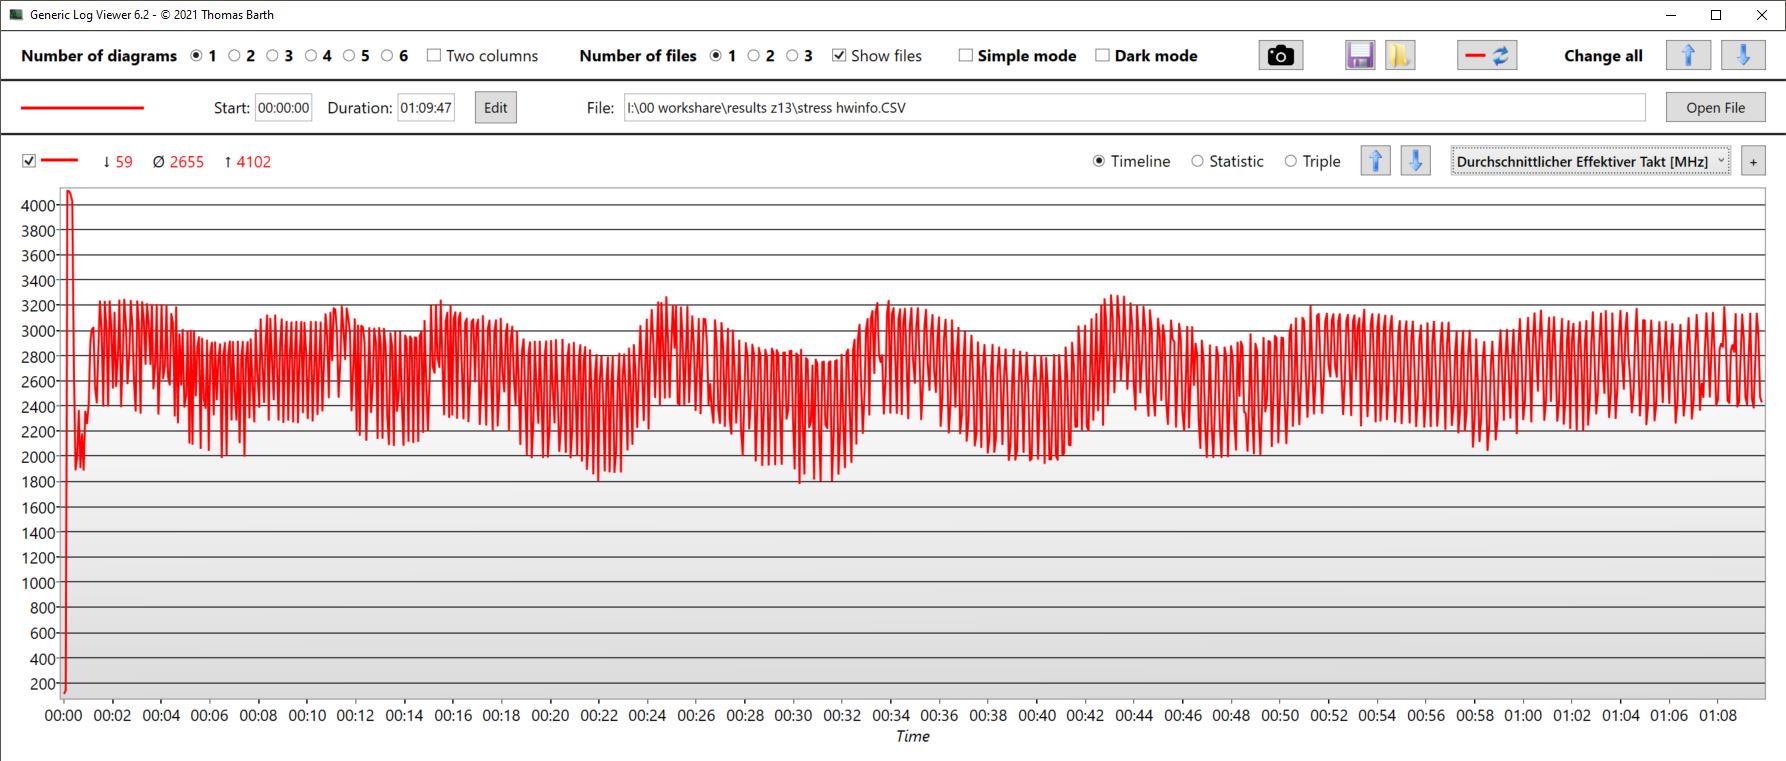
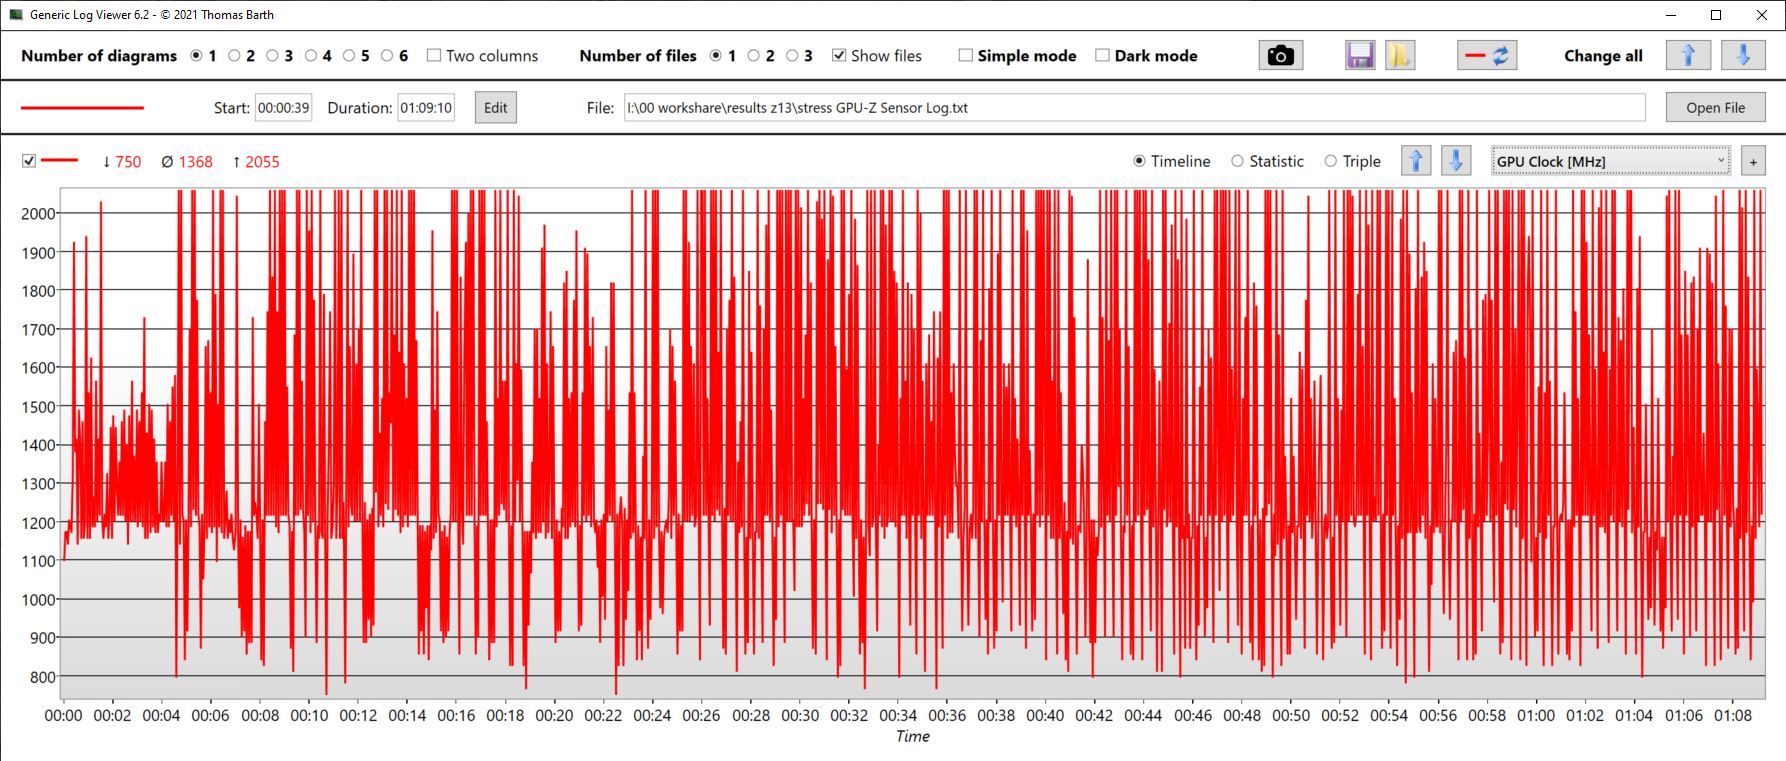
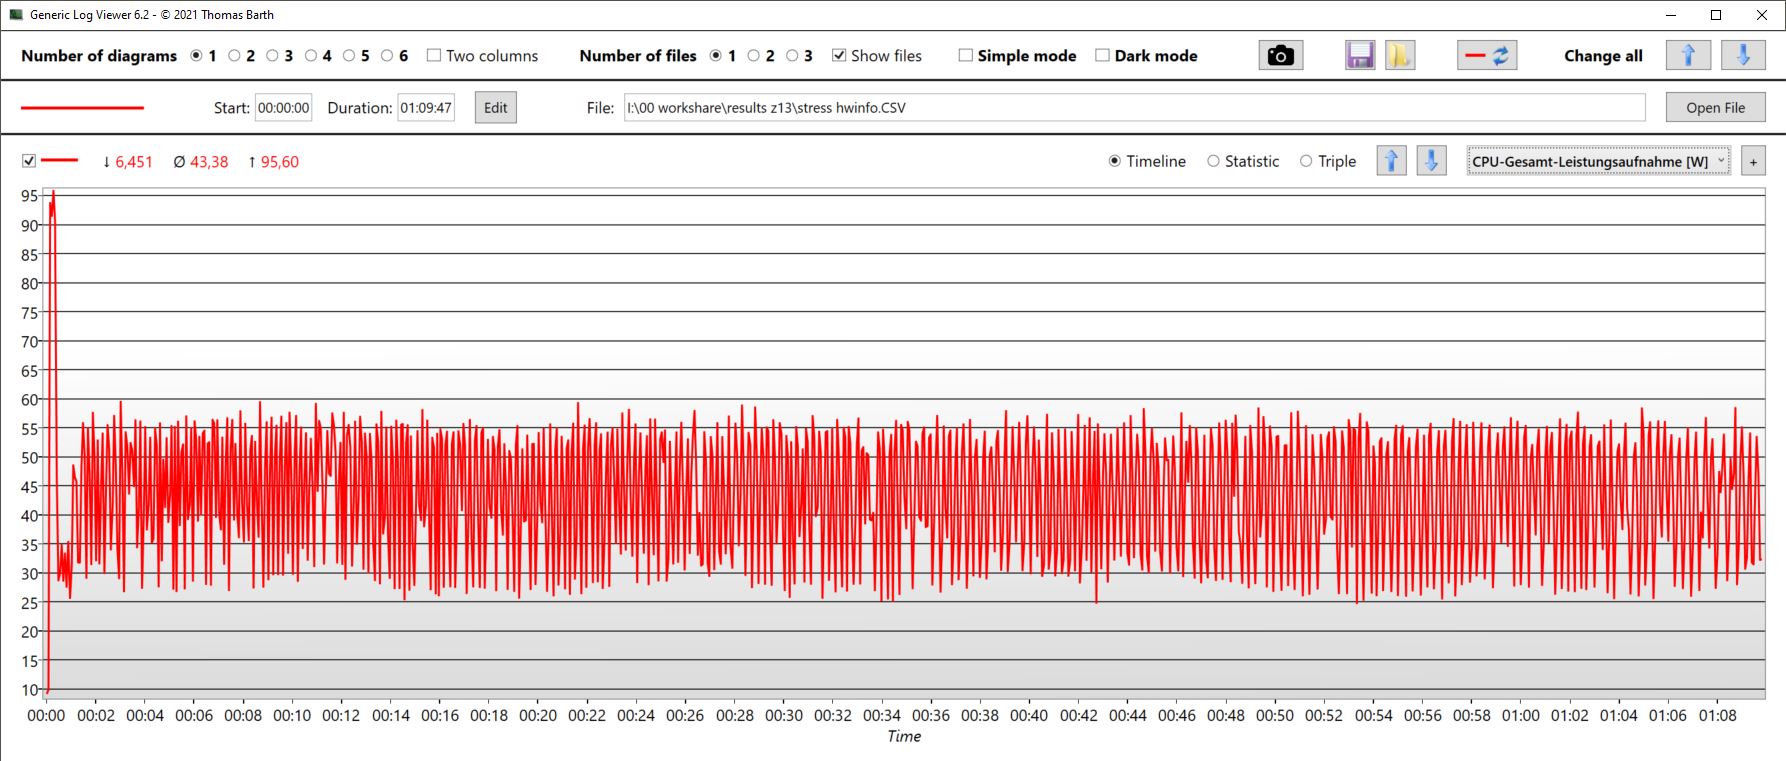
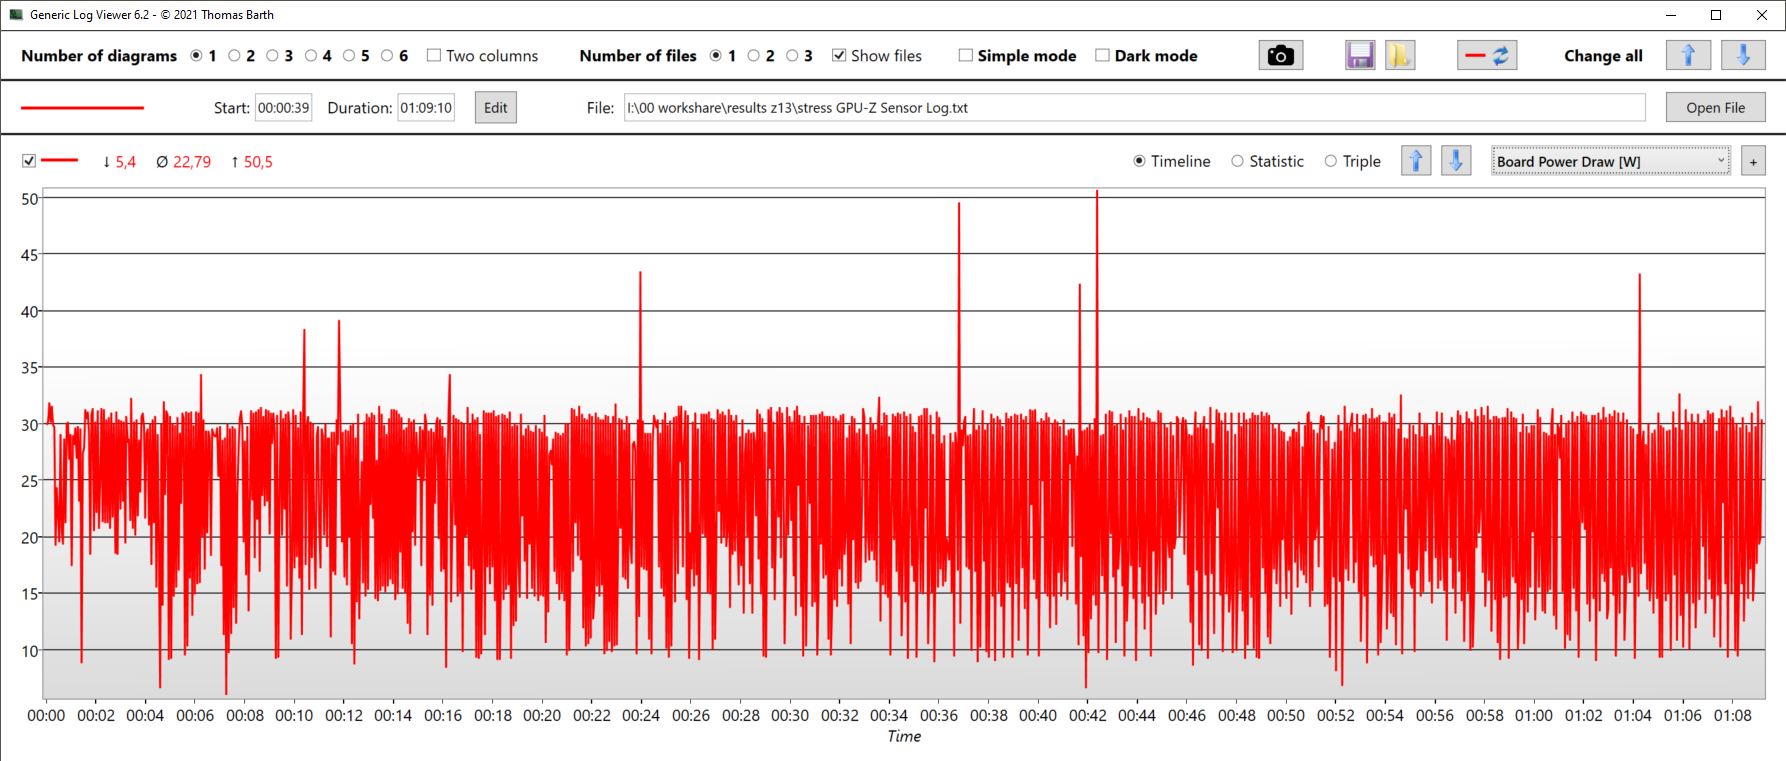
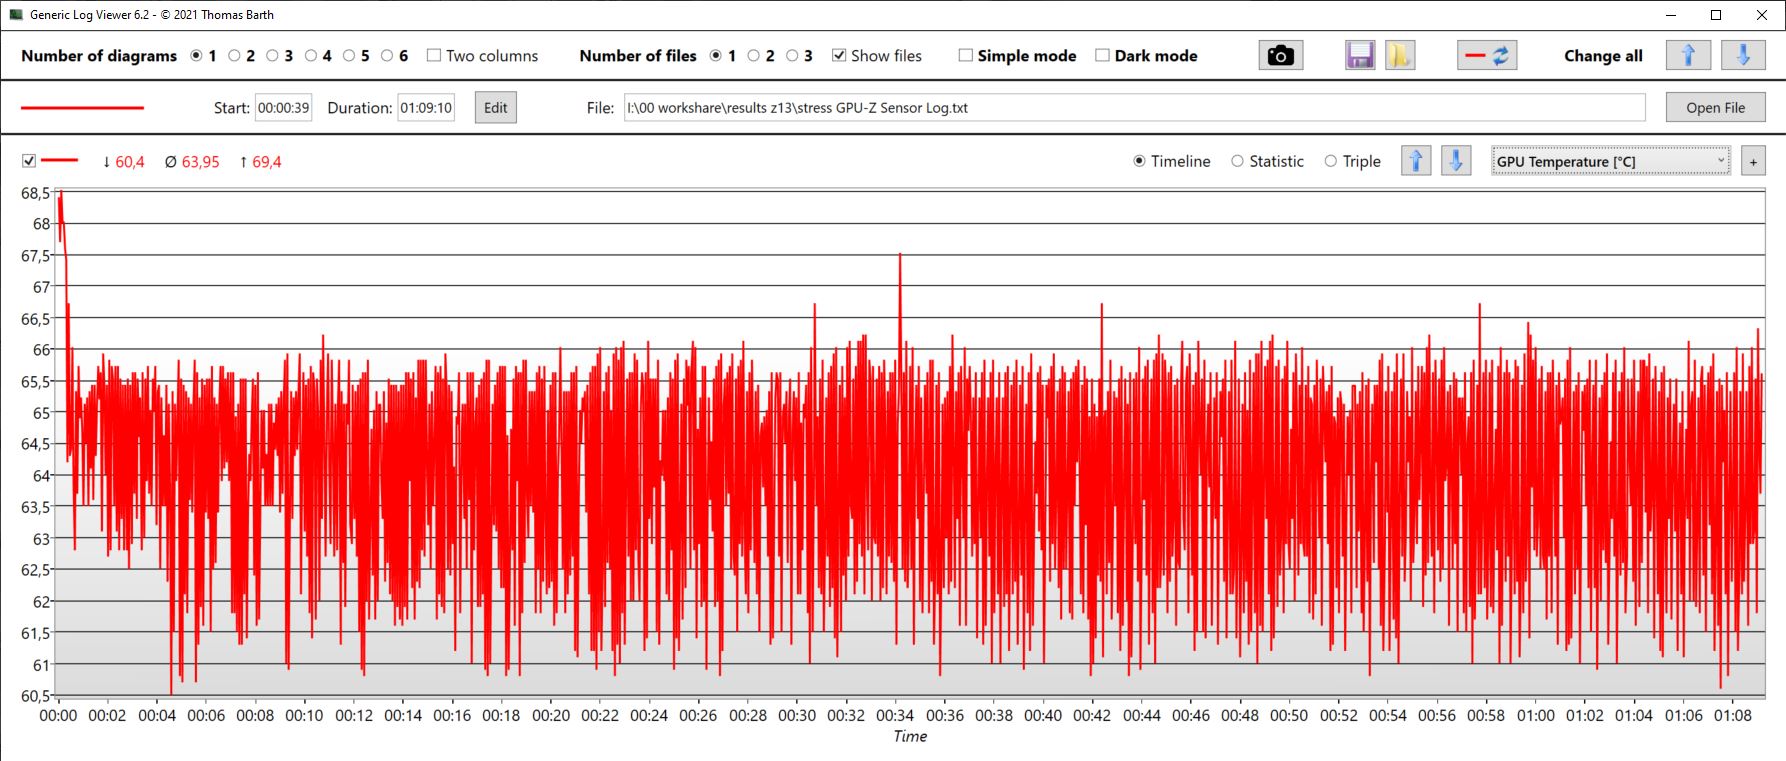
| CPU clock (GHz) | GPU clock (MHz) | average CPU temperature (°C) | average GPU temperature (°C) | |
| Prime95 + FurMark stress | 2,65 | 1.368 | 75 | 64 |
| Witcher 3 stress | 382 | 1.931 | 66 | 64 |
Speakers
Asus installs stereo speakers in the lower two corners of the tablet that direct outwards. Since sound is not directed to the front but rather to the sides, the speakers are not particularly loud.
The balanced mids and highs are good, the lack of bass less so. Audio devices can be connected via the headset port.
Asus ROG Flow Z13 GZ301V audio analysis
(±) | speaker loudness is average but good (78.64 dB)
Bass 100 - 315 Hz
(-) | nearly no bass - on average 17.5% lower than median
(±) | linearity of bass is average (7.5% delta to prev. frequency)
Mids 400 - 2000 Hz
(+) | balanced mids - only 2.9% away from median
(+) | mids are linear (5.8% delta to prev. frequency)
Highs 2 - 16 kHz
(+) | balanced highs - only 1.8% away from median
(+) | highs are linear (4.8% delta to prev. frequency)
Overall 100 - 16.000 Hz
(±) | linearity of overall sound is average (15% difference to median)
Compared to same class
» 32% of all tested devices in this class were better, 6% similar, 62% worse
» The best had a delta of 6%, average was 18%, worst was 132%
Compared to all devices tested
» 21% of all tested devices were better, 4% similar, 75% worse
» The best had a delta of 4%, average was 23%, worst was 134%
MSI Cyborg 15 A12VF audio analysis
(±) | speaker loudness is average but good (77.79 dB)
Bass 100 - 315 Hz
(-) | nearly no bass - on average 19.8% lower than median
(±) | linearity of bass is average (12.2% delta to prev. frequency)
Mids 400 - 2000 Hz
(+) | balanced mids - only 1.8% away from median
(+) | mids are linear (5% delta to prev. frequency)
Highs 2 - 16 kHz
(+) | balanced highs - only 4.2% away from median
(+) | highs are linear (3.9% delta to prev. frequency)
Overall 100 - 16.000 Hz
(+) | overall sound is linear (14.2% difference to median)
Compared to same class
» 25% of all tested devices in this class were better, 7% similar, 68% worse
» The best had a delta of 6%, average was 18%, worst was 132%
Compared to all devices tested
» 17% of all tested devices were better, 4% similar, 79% worse
» The best had a delta of 4%, average was 23%, worst was 134%
Power Management - Not particularly frugal
Power Consumption
A gaming tablet is obviously not so economical compared to other tablets. Nonetheless, the comparison with gaming laptops is surprising. For example, the MSI Cyborg consumes less overall despite a much larger screen and similar performance. While consumption rates are almost the same in gaming, the Z13 does not perform particularly well in idle consumption. The Cyborg is much more frugal here. The significantly lower idle consumption with an external monitor suggests that the bright and high-resolution Nebula display draws quite a bit of power.
The consumption differences in Witcher 3 Ultra (depending on performance mode) are listed in the table below.
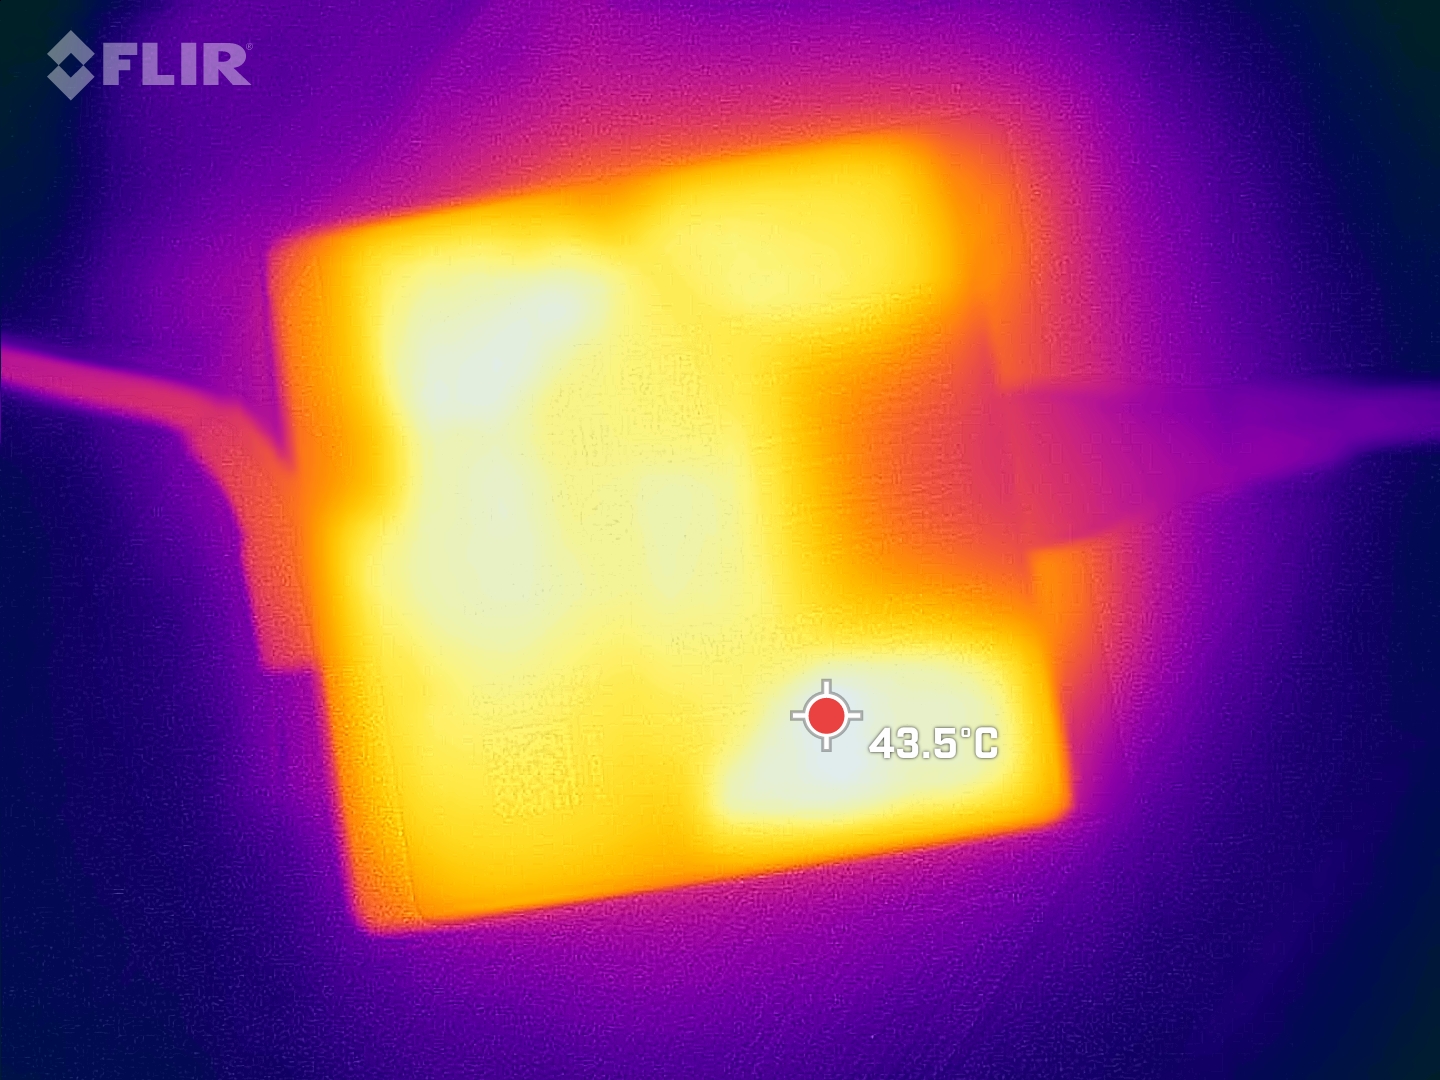
We measured short-term peaks of 135 W maximum. This is likely to exhaust the pleasantly small 130 W USB-C power supply, but we measured an average consumption of 102 W in the stress test, so there shouldn't be any problems here.
| Performance modes/Measurement values | Fan noise level | Refresh rate | Consumption |
|---|---|---|---|
| Quiet | 36 dB | 67 fps | 76 W |
| Performance | 41 dB | 77 fps | 88 W |
| Turbo | 47 dB | 83 fps | 105 W |
| Off / Standby | |
| Idle | |
| Load |
|
Key:
min: | |
| Asus ROG Flow Z13 GZ301V i9-13900H, GeForce RTX 4060 Laptop GPU, WD PC SN740 SDDPTQD-1T00, IPS, 2560x1600, 13.4" | Asus ROG Flow Z13 ACRNM i9-13900H, GeForce RTX 4070 Laptop GPU, WD PC SN740 SDDPTQD-1T00, IPS, 2560x1600, 13.4" | Asus ROG Flow Z13 GZ301ZE i9-12900H, GeForce RTX 3050 Ti Laptop GPU, Micron 2450 1TB MTFDKBK1T0TFK, IPS, 1920x1200, 13.4" | MSI Katana 17 B13VFK i7-13620H, GeForce RTX 4060 Laptop GPU, Micron 2400 MTFDKBA1T0QFM, IPS LED, 1920x1080, 17.3" | Acer Predator Triton 300 SE i9-12900H, GeForce RTX 3060 Laptop GPU, Micron 3400 1TB MTFDKBA1T0TFH, OLED, 2880x1800, 14" | MSI Cyborg 15 A12VF i7-12650H, GeForce RTX 4060 Laptop GPU, Samsung PM9B1 1024GB MZVL41T0HBLB, IPS, 1920x1080, 15.6" | Average NVIDIA GeForce RTX 4060 Laptop GPU | Average of class Gaming | |
|---|---|---|---|---|---|---|---|---|
| Power Consumption | -4% | 10% | -34% | -26% | 16% | -35% | -59% | |
| Idle Minimum * (Watt) | 8.5 | 8.9 -5% | 8.8 -4% | 12.2 -44% | 7.6 11% | 6 29% | 11.5 ? -35% | 13 ? -53% |
| Idle Average * (Watt) | 12.4 | 12.6 -2% | 12.1 2% | 14.9 -20% | 12.3 1% | 8.8 29% | 16 ? -29% | 18.7 ? -51% |
| Idle Maximum * (Watt) | 13.3 | 13 2% | 12.7 5% | 15.8 -19% | 17.6 -32% | 11.9 11% | 20.3 ? -53% | 24.3 ? -83% |
| Load Average * (Watt) | 93 | 92.5 1% | 72.3 22% | 85.22 8% | 111 -19% | 89 4% | 92.9 ? -0% | 110.2 ? -18% |
| Witcher 3 ultra * (Watt) | 87.8 | 104.4 -19% | 77.3 12% | 151.1 -72% | 117.1 -33% | 90.3 -3% | ||
| Load Maximum * (Watt) | 135 | 133.6 1% | 103.1 24% | 212.8 -58% | 245.8 -82% | 99 27% | 210 ? -56% | 258 ? -91% |
* ... smaller is better
Power consumption Witcher 3 / Stress test
Power consumption with an external monitor
Battery Life
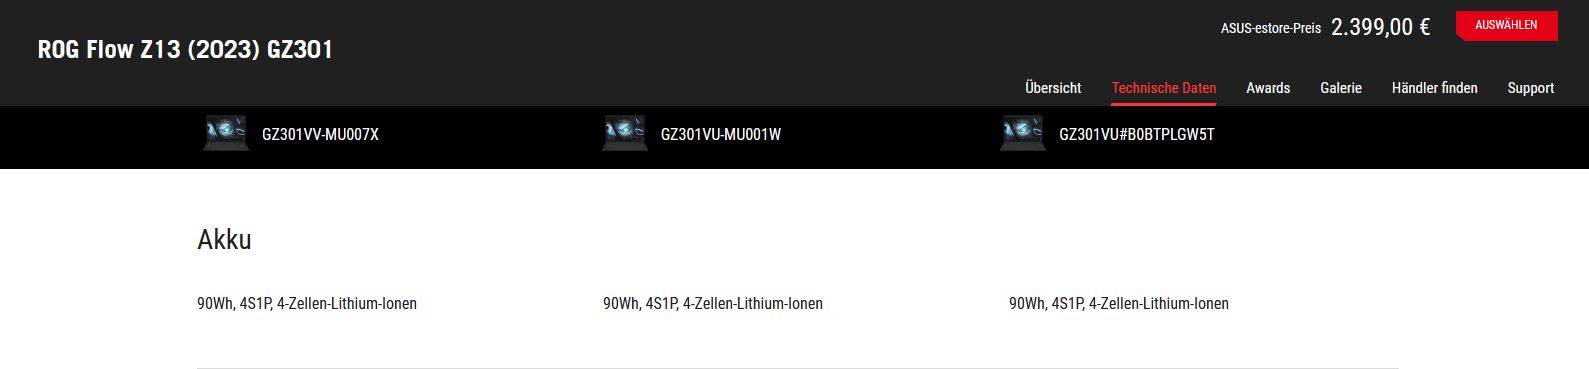
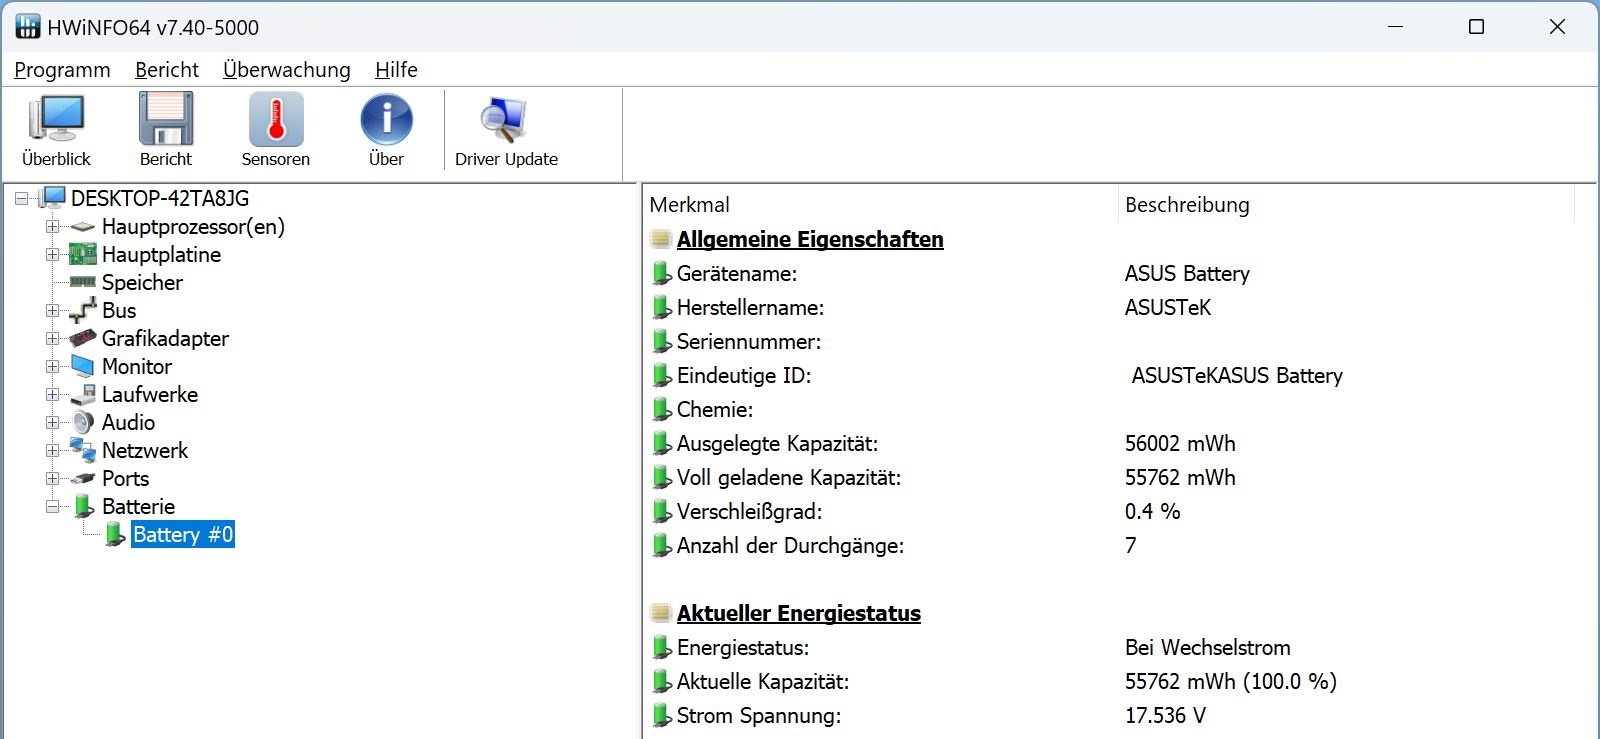
Asus specifies the battery as 90 Wh in the spec sheet on the Z13's website, which is wrong! Just like the predecessor and the special edition, the new Z13 has a 56 Wh battery installed, and a 90 Wh battery would hardly fit in the tablet. On the webshop, on the other hand, the battery is correctly specified as 56 Wh.
This is enough for just under 5 hours of web browsing at reduced brightness or a movie night of 5 hours and 44 minutes, also at 150 nits.
Earlier, we praised the relatively low performance loss when gaming. However, the comparatively high performance reduces the runtime so that you can only play Witcher 3 Ultra for 50 minutes.
The MSI Cyborg with similar performance and a similarly sized battery lasts much longer in all battery tests, while the Katana 17 performs worse under similar conditions.
| Asus ROG Flow Z13 GZ301V i9-13900H, GeForce RTX 4060 Laptop GPU, 56 Wh | Asus ROG Flow Z13 ACRNM i9-13900H, GeForce RTX 4070 Laptop GPU, 56 Wh | Asus ROG Flow Z13 GZ301ZE i9-12900H, GeForce RTX 3050 Ti Laptop GPU, 56 Wh | MSI Katana 17 B13VFK i7-13620H, GeForce RTX 4060 Laptop GPU, 53.5 Wh | Acer Predator Triton 300 SE i9-12900H, GeForce RTX 3060 Laptop GPU, 76 Wh | MSI Cyborg 15 A12VF i7-12650H, GeForce RTX 4060 Laptop GPU, 53.5 Wh | Average of class Gaming | |
|---|---|---|---|---|---|---|---|
| Battery runtime | 11% | 15% | -21% | 27% | 83% | 59% | |
| H.264 (h) | 4.7 | 5.2 11% | 6 28% | 8 70% | 8.64 ? 84% | ||
| WiFi v1.3 (h) | 5 | 6.6 32% | 5.6 12% | 2.9 -42% | 6.2 24% | 7.5 50% | 7.15 ? 43% |
| Witcher 3 ultra (h) | 0.8 | 0.8 0% | |||||
| Load (h) | 1 | 0.9 -10% | 1.2 20% | 1 0% | 1.3 30% | 2.3 130% | 1.502 ? 50% |
| Reader / Idle (h) | 8.1 | 13.6 | 8.71 ? |
Pros
Cons
Verdict - AAA gaming on the tablet is possible

To be honest, we expected the disadvantages of the small form factor to be much more pronounced with powerful hardware. But the Asus ROG Flow Z13 proves that AAA gaming can now also work on a tablet. Current games in Full HD can be played without hesitation.
Of course, the performance is a little lower than large gaming laptops with higher TGPs, but the trade-offs are rather small. At the same time, critical gaming parameters such as fan noise or temperatures are very moderate, sometimes even restrained.
If Asus can get the rather high dpc latencies under control, creators will also be happy about the high-performance tablet with its high-resolution Nebula display and comparatively good cameras.
You "only" have to do without a number of maintenance options, a decent keyboard and a wide range of ports.
The Asus ROG FLow Z13 can play current games smoothly in Full HD or even in native QHD+ resolution thanks to the RTX 4060.
Alternative gaming tablets at this level are rare so far, so the Z13 currently occupies a niche. You would have to look at one of the equally rare 13- or even 14-inch gaming laptops for an alternative.
Price and Availability
In Asus' USA webshop, only the RTX 4050 variant of the Z13 appears to be available for a price of $1,749.99, but is currently out of stock. Interested buyers in other locations are advised to check directly via Asus' webshop (where applicable) to see which configurations are available.
Asus ROG Flow Z13 GZ301V
- 04/26/2023 v7 (old)
Christian Hintze
Transparency
The selection of devices to be reviewed is made by our editorial team. The test sample was provided to the author as a loan by the manufacturer or retailer for the purpose of this review. The lender had no influence on this review, nor did the manufacturer receive a copy of this review before publication. There was no obligation to publish this review. As an independent media company, Notebookcheck is not subjected to the authority of manufacturers, retailers or publishers.
This is how Notebookcheck is testing
Every year, Notebookcheck independently reviews hundreds of laptops and smartphones using standardized procedures to ensure that all results are comparable. We have continuously developed our test methods for around 20 years and set industry standards in the process. In our test labs, high-quality measuring equipment is utilized by experienced technicians and editors. These tests involve a multi-stage validation process. Our complex rating system is based on hundreds of well-founded measurements and benchmarks, which maintains objectivity. Further information on our test methods can be found here.
Price comparison

