Asus ROG Flow Z13 GZ302EA Convertible Review - AMD's Strix Halo GPU is neck-and-neck with the RTX 4070 Laptop
The fastest CPU in a 13-inch device.
Asus starts to equip its gaming convertible ROG Flow Z13 with AMD’s latest Strix Halo processors. In addition to impressive CPU performance on par with the Ryzen 9 7945HX3D, the integrated Radeon 8060S competes with the GeForce RTX 4070 Laptop. Update: Additional video export & gaming benchmarksAndreas Osthoff 👁 (translated by Andreas Osthoff) Published 🇩🇪 🇫🇷 ...
Verdict - ROG Flow Z13 with AMD Strix Halo offers much more CPU performance
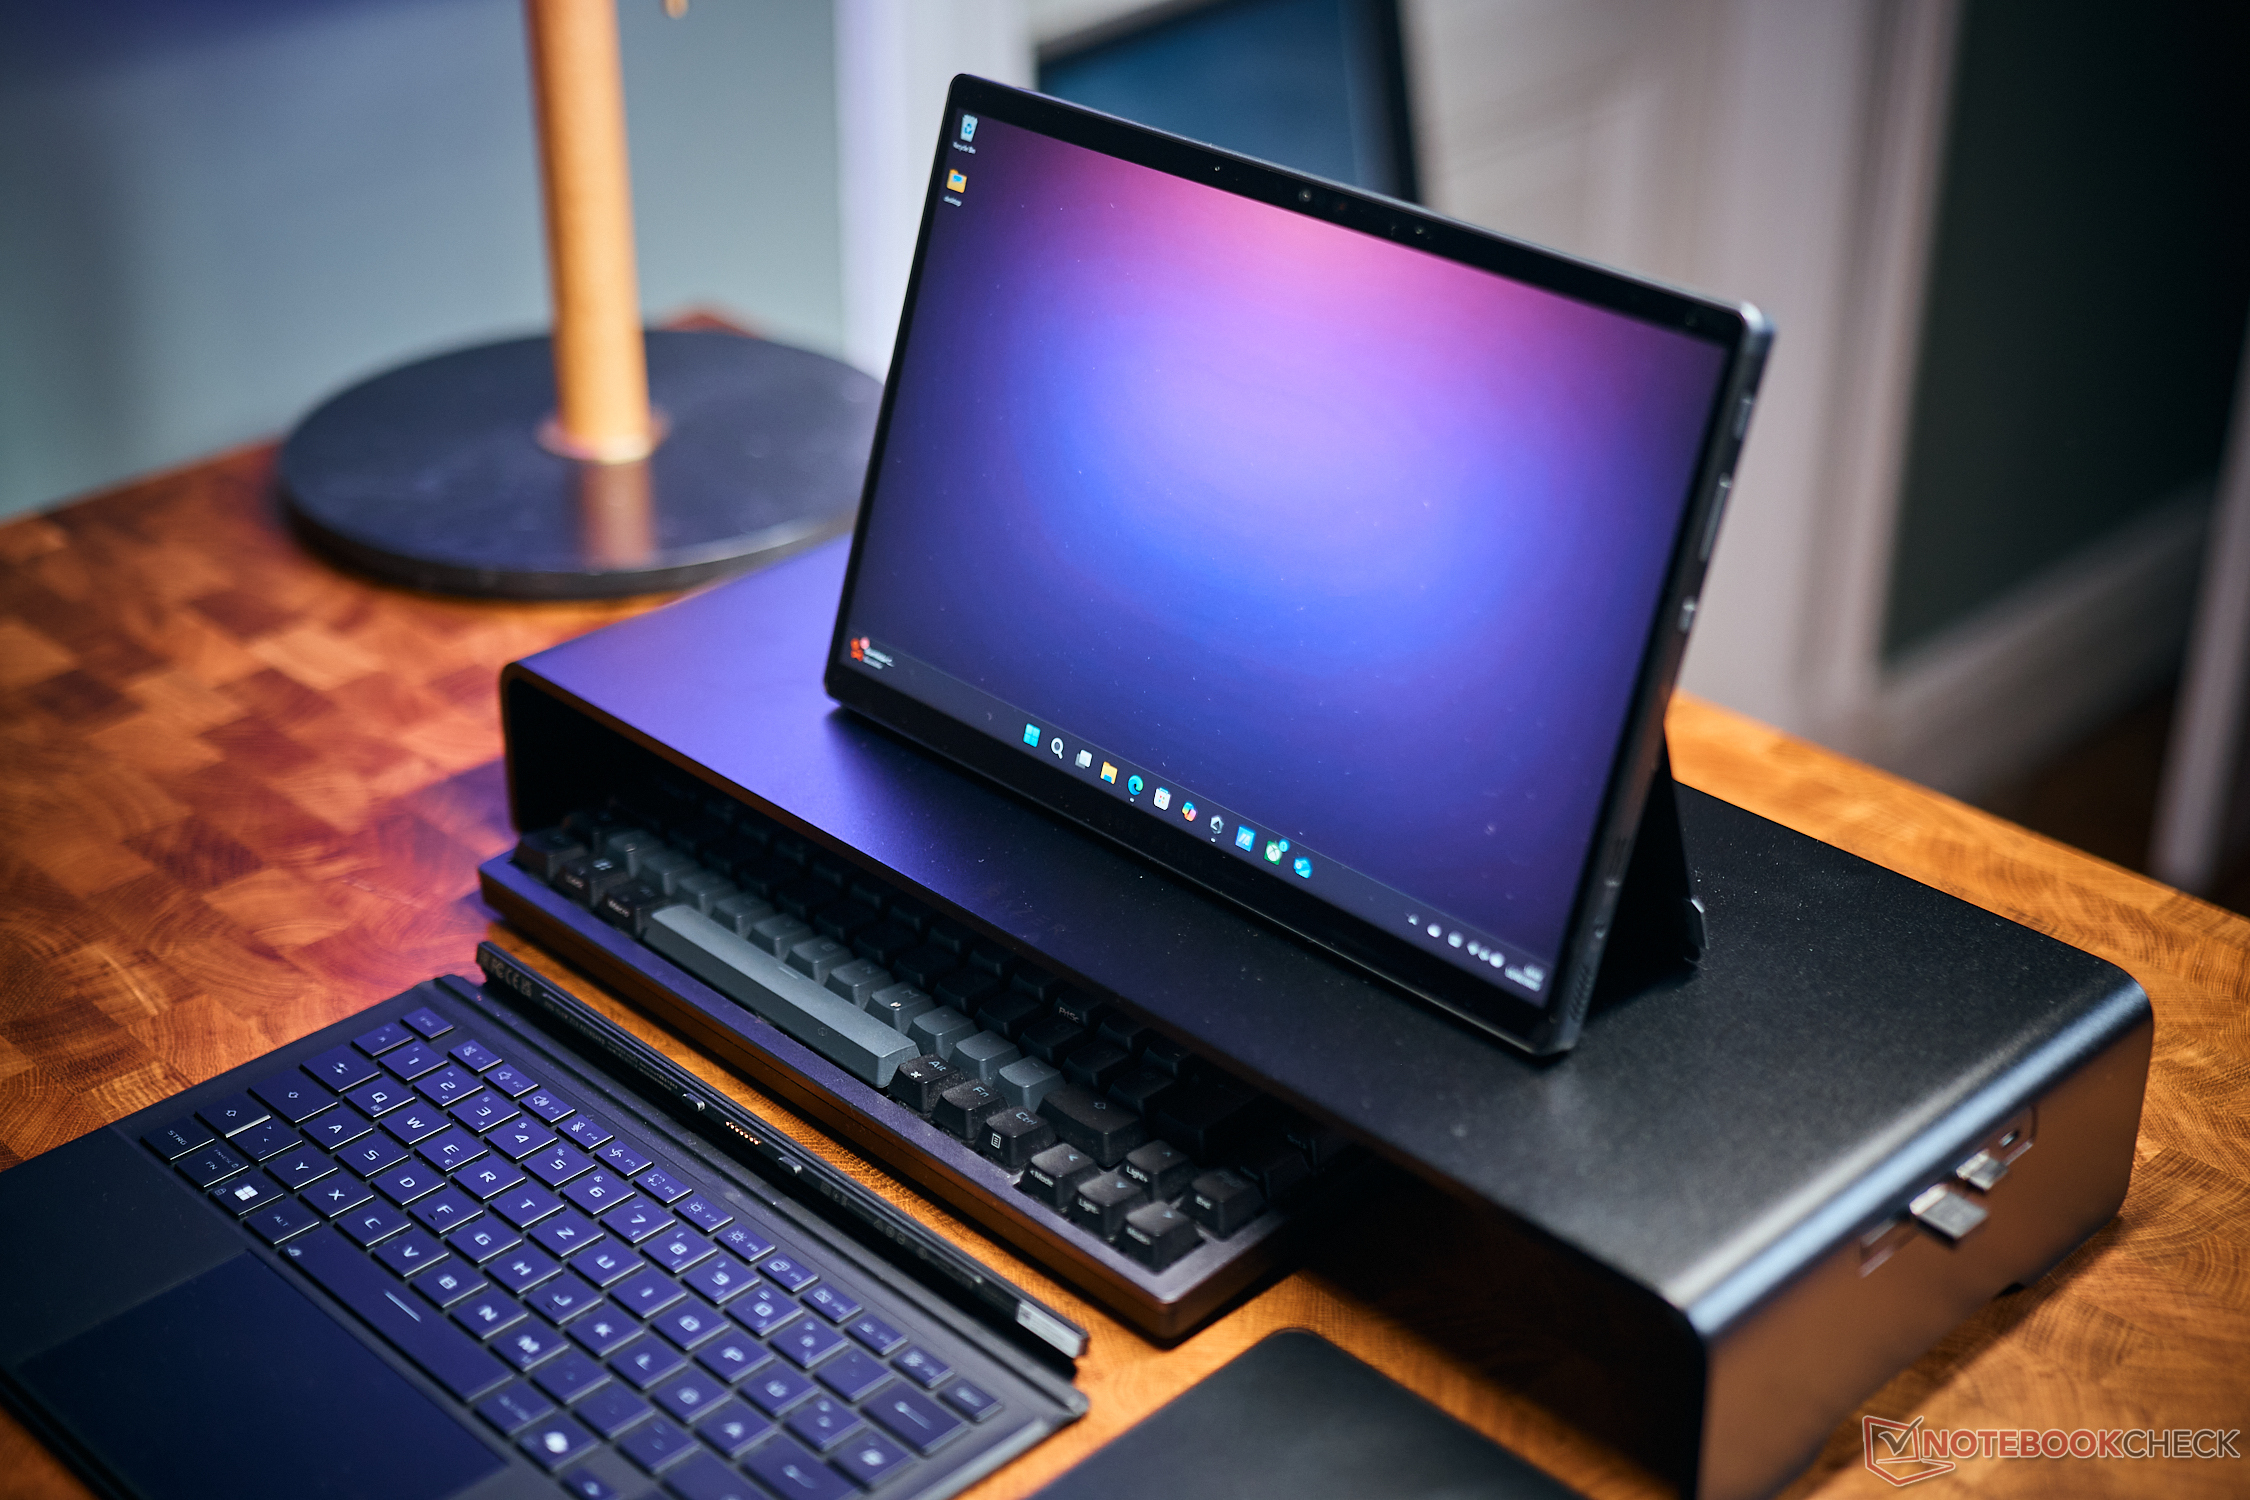
The 2025 version of the gaming convertible Asus ROG Flow Z13 is the first device with AMD’s new high-end mobile processor from the Strix Halo series. The Ryzen AI Max+ 395 offers enormous amounts of CPU performance in multi-core scenarios thanks to 16 Zen 5 cores, which rivals the Ryzen 9 7945HX3D. This is impressive for a 13-inch device and you will have to get the MacBook Pro 14 to get similar multi-core performance numbers in a similarly sized package.
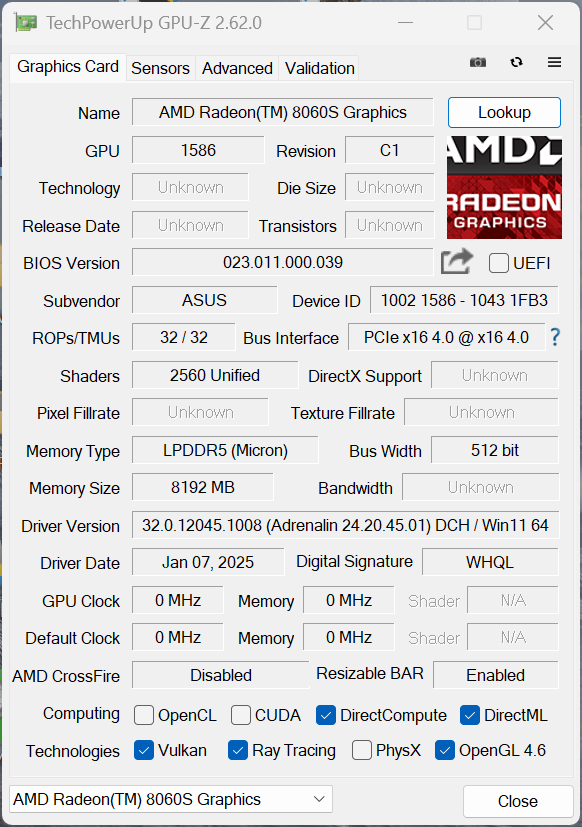
The integrated graphics card Radeon 8060S is by far the fastest x86 iGPU and is neck-and-neck with the GeForce RTX 4070 Laptop (with a TGP range between 65-75 Watts) in games. Depending on the title there will differences, but overall, the results are pretty comparable for modern titles. The Radeon APU is a bit more efficient and the new AMD chip is also interesting for picture/video editing if you need plenty of VRAM. Our review unit with 32 GB RAM can allocate up to 24 GB for the GPU, while other SKUs can allocate up to 48 or 96 GB VRAM.
Asus still uses an IPS display with the WQHD resolution, but the refresh rate was increased from 165 to 180 Hz. The overall image quality is good, but it cannot compete with the rich and high-contrast images of OLED screens. We believe there is simply no corresponding 13-inch OLED screens on the market. Thanks to a larger battery, the runtimes have improved as well.
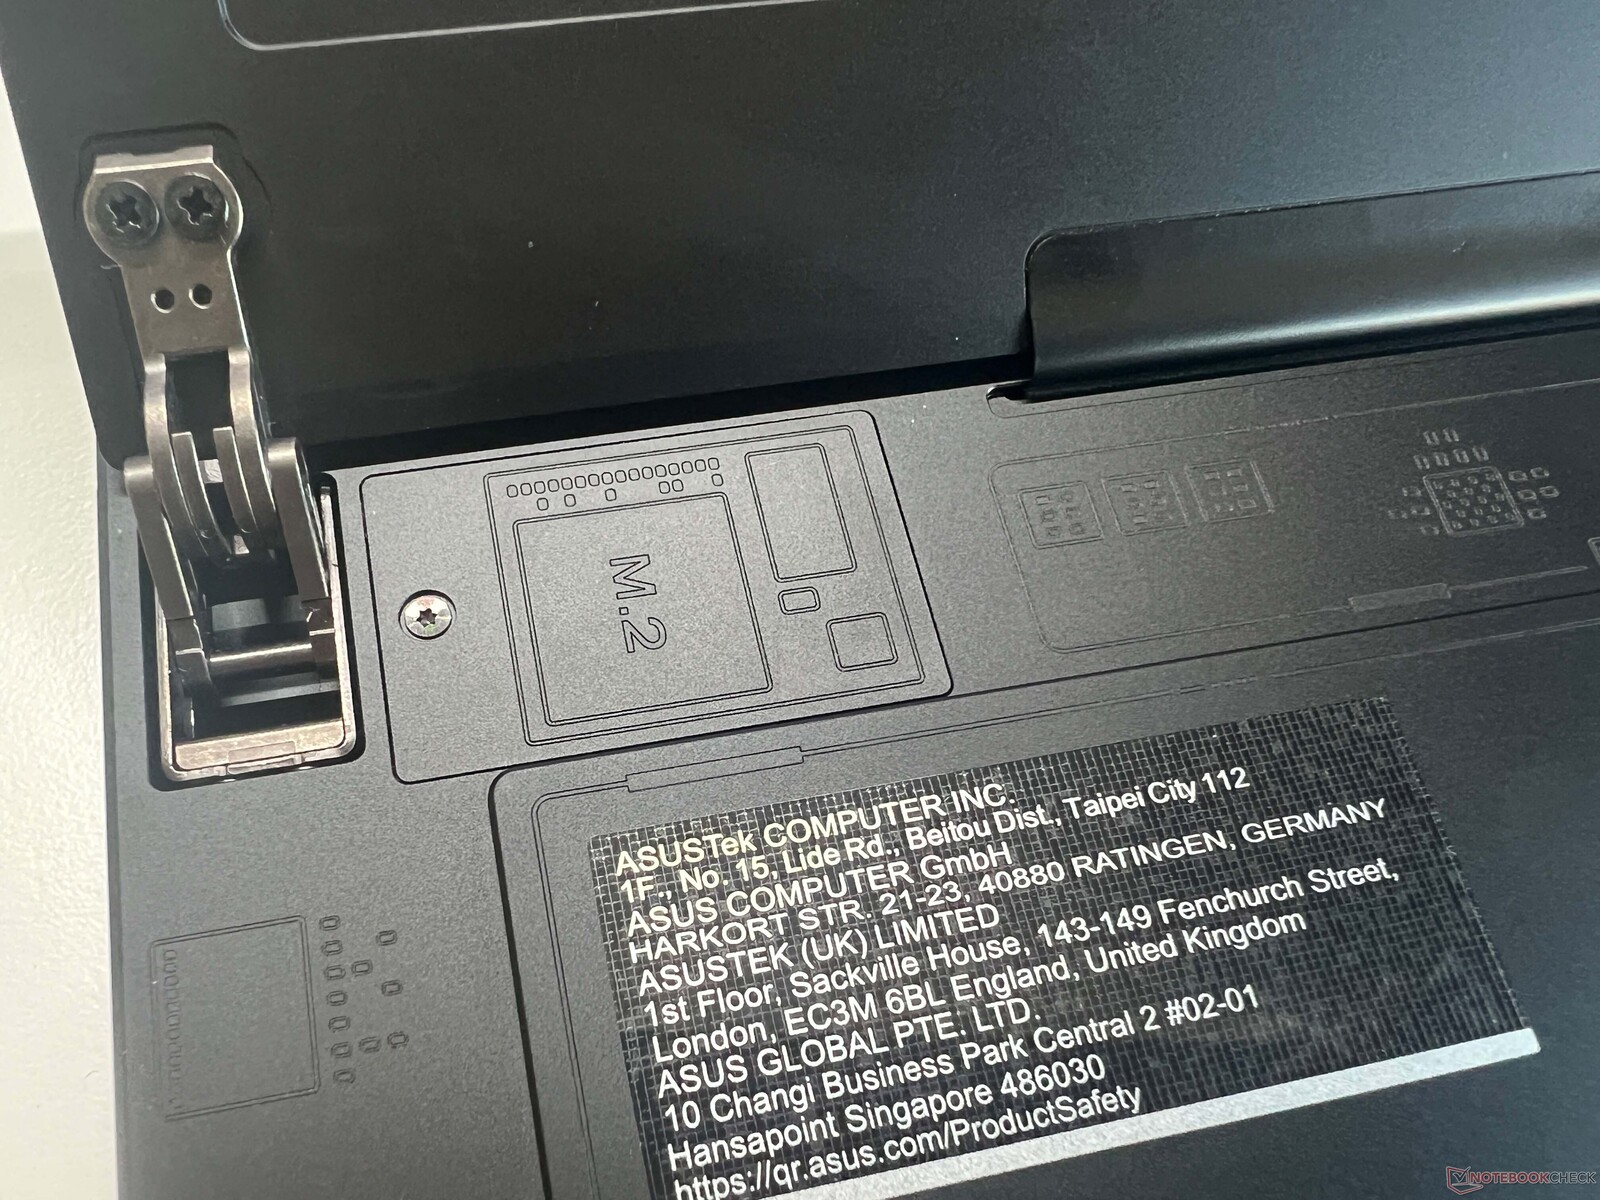
The cooling unit does a decent job, but you will hear the fans, especially in Turbo mode and we would recommend headphones, since the integrated speakers are not very good, either. Other disadvantages include the non-upgradeable RAM as well as the limited maintenance options overall. There is only a maintenance hatch for the compact M.2-2230 SSD. It is also quite an expensive convertible at 2499 Euros.
Pros
Cons
Price and Availability
The RRP of the ROG Flow Z13 GZ302EA in the test specification is 2499 Euros and it will be available on February 25th. We have no pricing information for SKUs with more RAM.
Potential Competitors in Comparison
Image | Model / Review | Price | Weight | Height | Display |
|---|---|---|---|---|---|
1. 86.8% 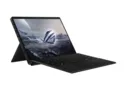 | Asus ROG Flow Z13 GZ302EA-RU073W AMD Ryzen AI Max+ 395 ⎘ AMD Radeon 8060S ⎘ 32 GB Memory, 512 GB SSD | Amazon: 1. $109.99 ROG 200W Charger for Asus RO... 2. $1,888.82 ASUS ROG Flow Z13 2.5K 180Hz... 3. $2,499.99 EXCaliberPC [2025] ASUS ROG ... List Price: 2499€ | 1.6 kg | 14.9 mm | 13.40" 2560x1600 225 PPI IPS |
2. 89.4% v7 (old) 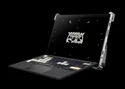 | Asus ROG Flow Z13 ACRNM Intel Core i9-13900H ⎘ NVIDIA GeForce RTX 4070 Laptop GPU ⎘ 32 GB Memory, 1024 GB SSD | Amazon: 1. $2,972.73 ASUS ROG Flow Z13 (2025) Gam... 2. $1,888.82 ASUS ROG Flow Z13 2.5K 180Hz... 3. $1,699.00 ASUS ROG Flow Z13 (2025) Gam... List Price: 3400€ | 1.7 kg | 20 mm | 13.40" 2560x1600 225 PPI IPS |
3. 86% 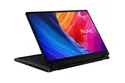 | Asus ProArt PX13 HN7306 AMD Ryzen AI 9 HX 370 ⎘ NVIDIA GeForce RTX 4070 Laptop GPU ⎘ 32 GB Memory, 1024 GB SSD | Amazon: List Price: 2999€ | 1.4 kg | 17.7 mm | 13.30" 2880x1800 255 PPI OLED |
4. 93% v7 (old) 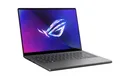 | Asus ROG Zephyrus G14 2024 GA403U AMD Ryzen 9 8945HS ⎘ NVIDIA GeForce RTX 4070 Laptop GPU ⎘ 32 GB Memory, 1024 GB SSD | Amazon: List Price: 2499€ | 1.5 kg | 16.3 mm | 14.00" 2880x1800 243 PPI OLED |
5. 89.7% v7 (old)  | Razer Blade 14 RZ09-0508 AMD Ryzen 9 8945HS ⎘ NVIDIA GeForce RTX 4070 Laptop GPU ⎘ 32 GB Memory, 1024 GB SSD | Amazon: List Price: 2700 USD | 1.9 kg | 17.99 mm | 14.00" 2560x1600 216 PPI IPS |
6. 88.7% v7 (old)  | Razer Blade 14 RTX 4070 AMD Ryzen 9 7940HS ⎘ NVIDIA GeForce RTX 4070 Laptop GPU ⎘ 16 GB Memory, 1024 GB SSD | Amazon: 1. $753.22 MSI Gaming RTX 4070 Super 12... 2. $1,149.99 Razer Blade 14 Gaming Laptop... 3. $3,788.88 Razer Blade 16 Gaming-Laptop... List Price: 2600 USD | 1.8 kg | 17.99 mm | 14.00" 2560x1600 216 PPI IPS |
7. 80.5%  | Acer Predator Helios Neo 14 (2024) Intel Core Ultra 9 185H ⎘ NVIDIA GeForce RTX 4070 Laptop GPU ⎘ 32 GB Memory, 1024 GB SSD | List Price: 2100 Euro | 1.9 kg | 20.9 mm | 14.50" 3072x1920 250 PPI IPS |
Table of Contents
- Verdict - ROG Flow Z13 with AMD Strix Halo offers much more CPU performance
- Specifications
- Case - Aluminum chassis with subtle illumination
- Connectivity - USB 4 & Wi-Fi 7
- Input Devices - Small improvements
- Display - IPS now with 180 Hz
- Performance - AMD Ryzen Max+ with up to 128 GB RAM
- Emissions - Convertible with vapor chamber
- Energy Management - Improved battery runtime
- Notebookcheck Rating
Asus refreshes its gaming convertible and now uses AMD’s latest Strix Halo APUs (Ryzen AI Max), which does not only offer a very powerful CPU, but also an iGPU that is supposed to rival dedicated graphics cards. There is also an update to a 180 Hz display as well as an improved vapor chamber cooling unit. Asus offered two versions of the previous model, one with the regular chassis and up to the GeForce RTX 4060 Laptop, and one much more visually striking ACRNM special edition with the RTX 4070 Laptop.
Our review unit has the model number ROG Flow Z13 GZ302-RU073W with the new flagship chip AMD Ryzen AI Max+ 395 (16 Zen 5 cores) as well as the Radeon 8060S iGPU combined with 32 GB RAM. The RRP for this SKU is 2499 Euros.
February 24, 2025 update: Additional benchmarks for video export and gaming added
Specifications
Case - Aluminum chassis with subtle illumination
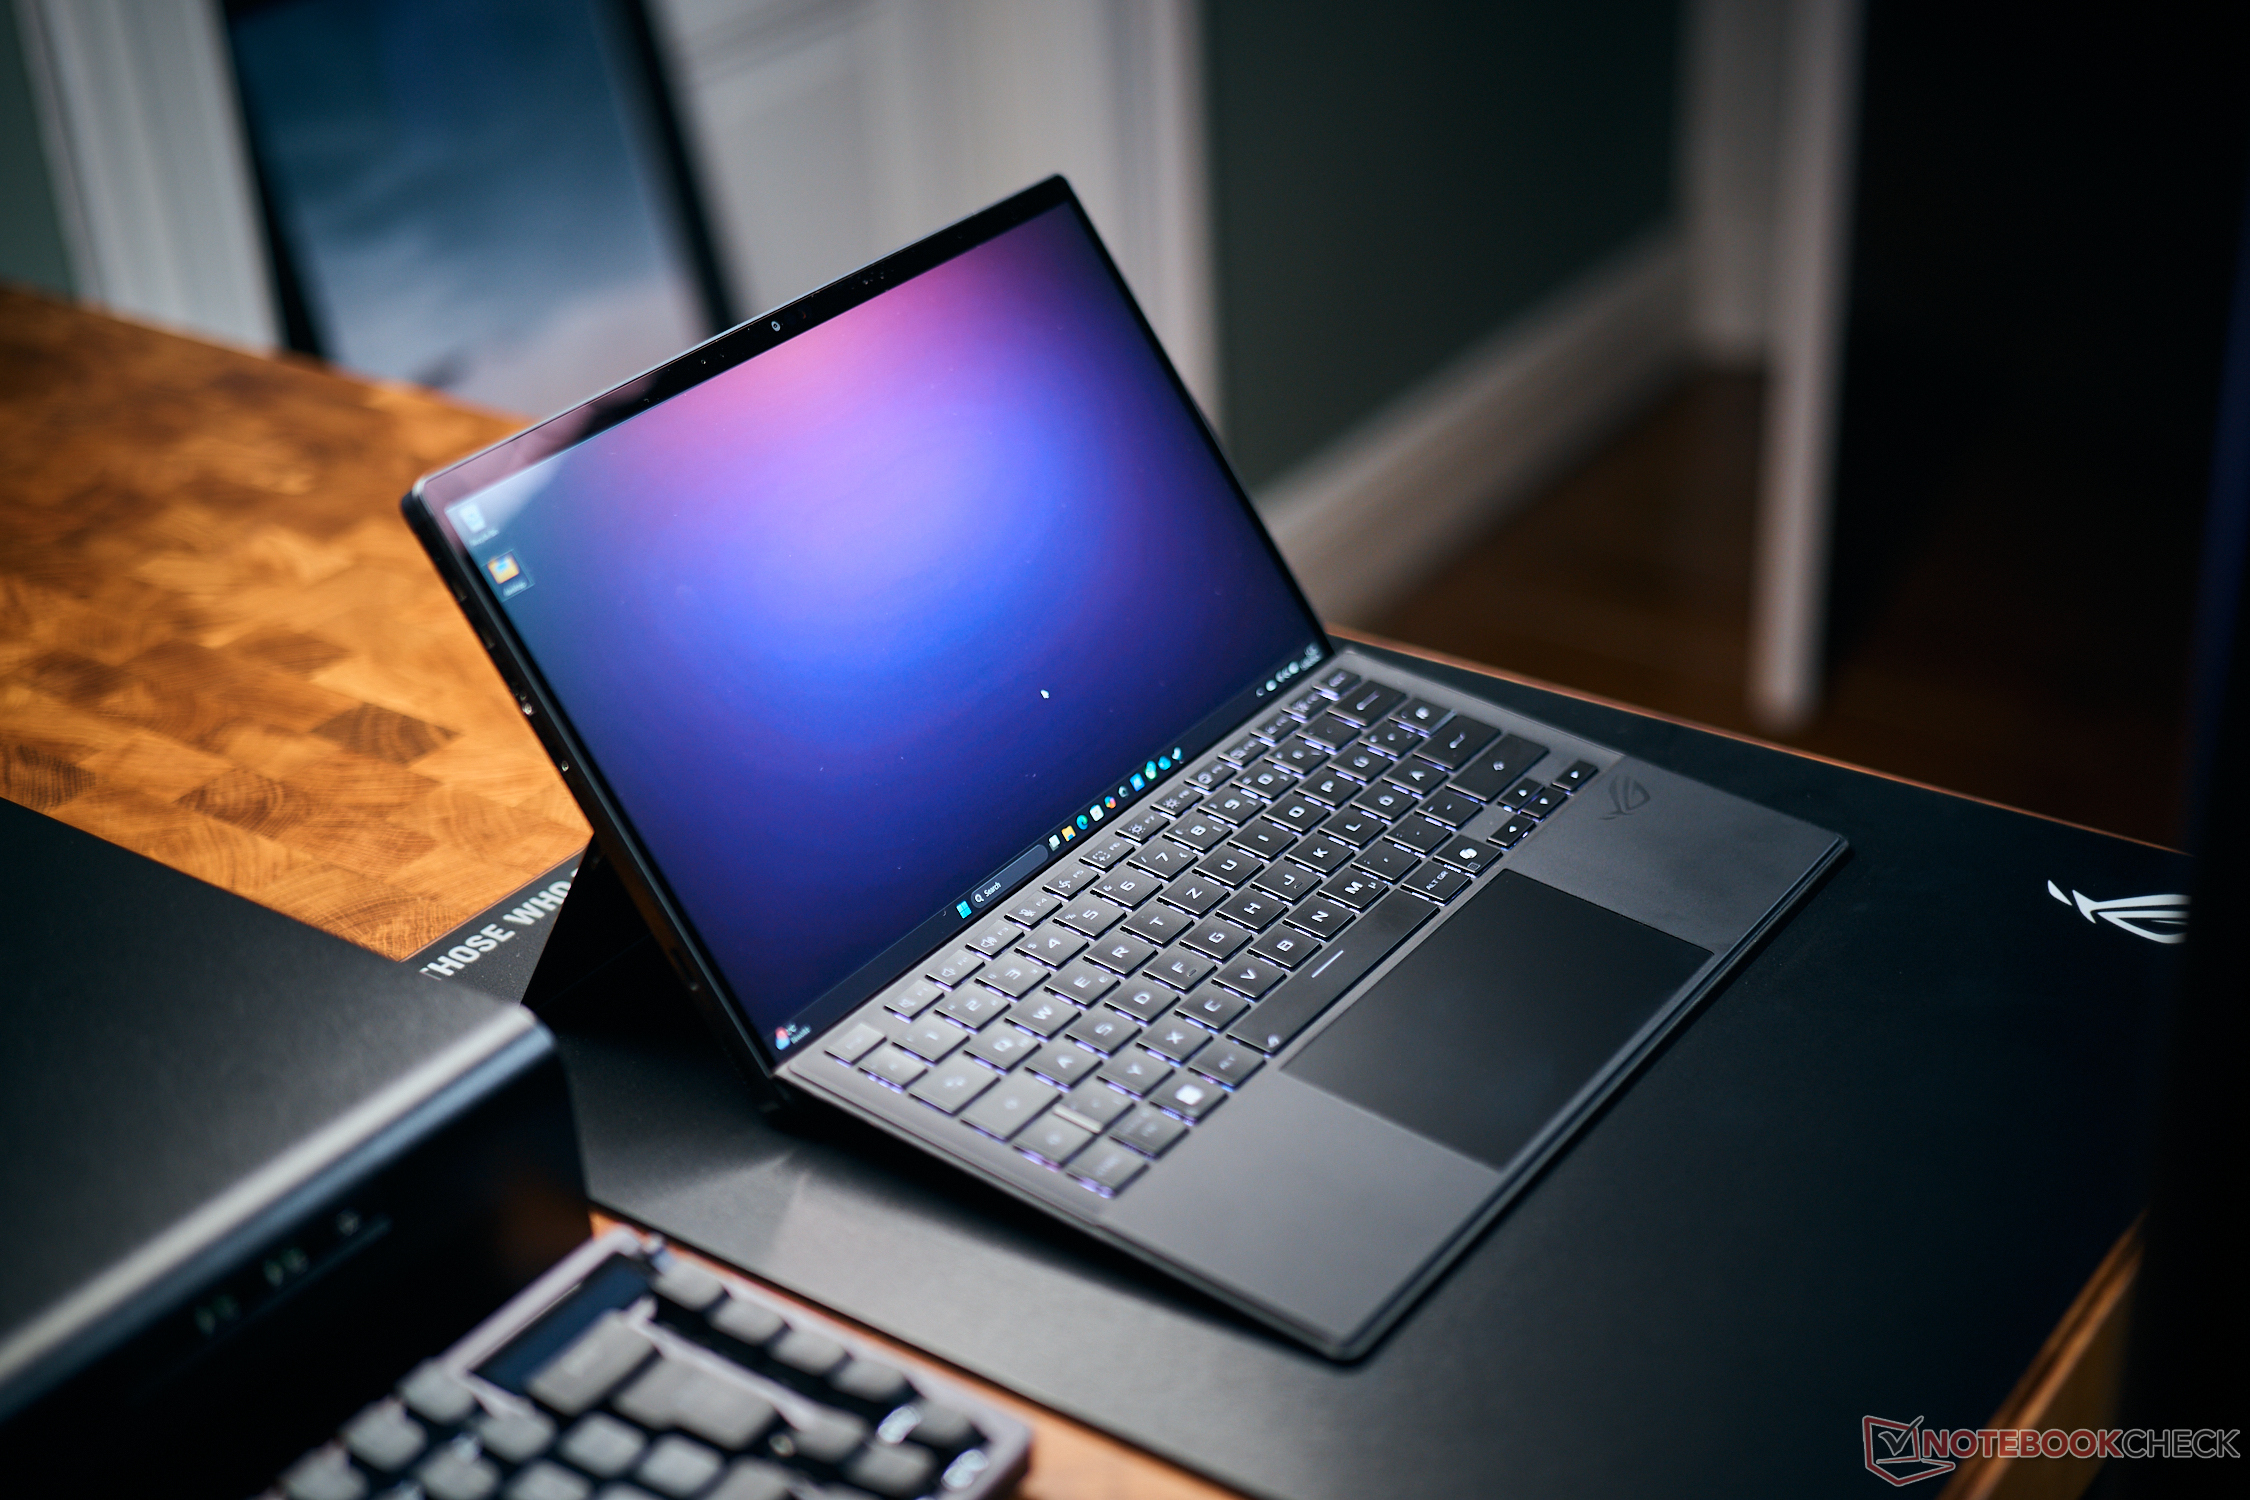
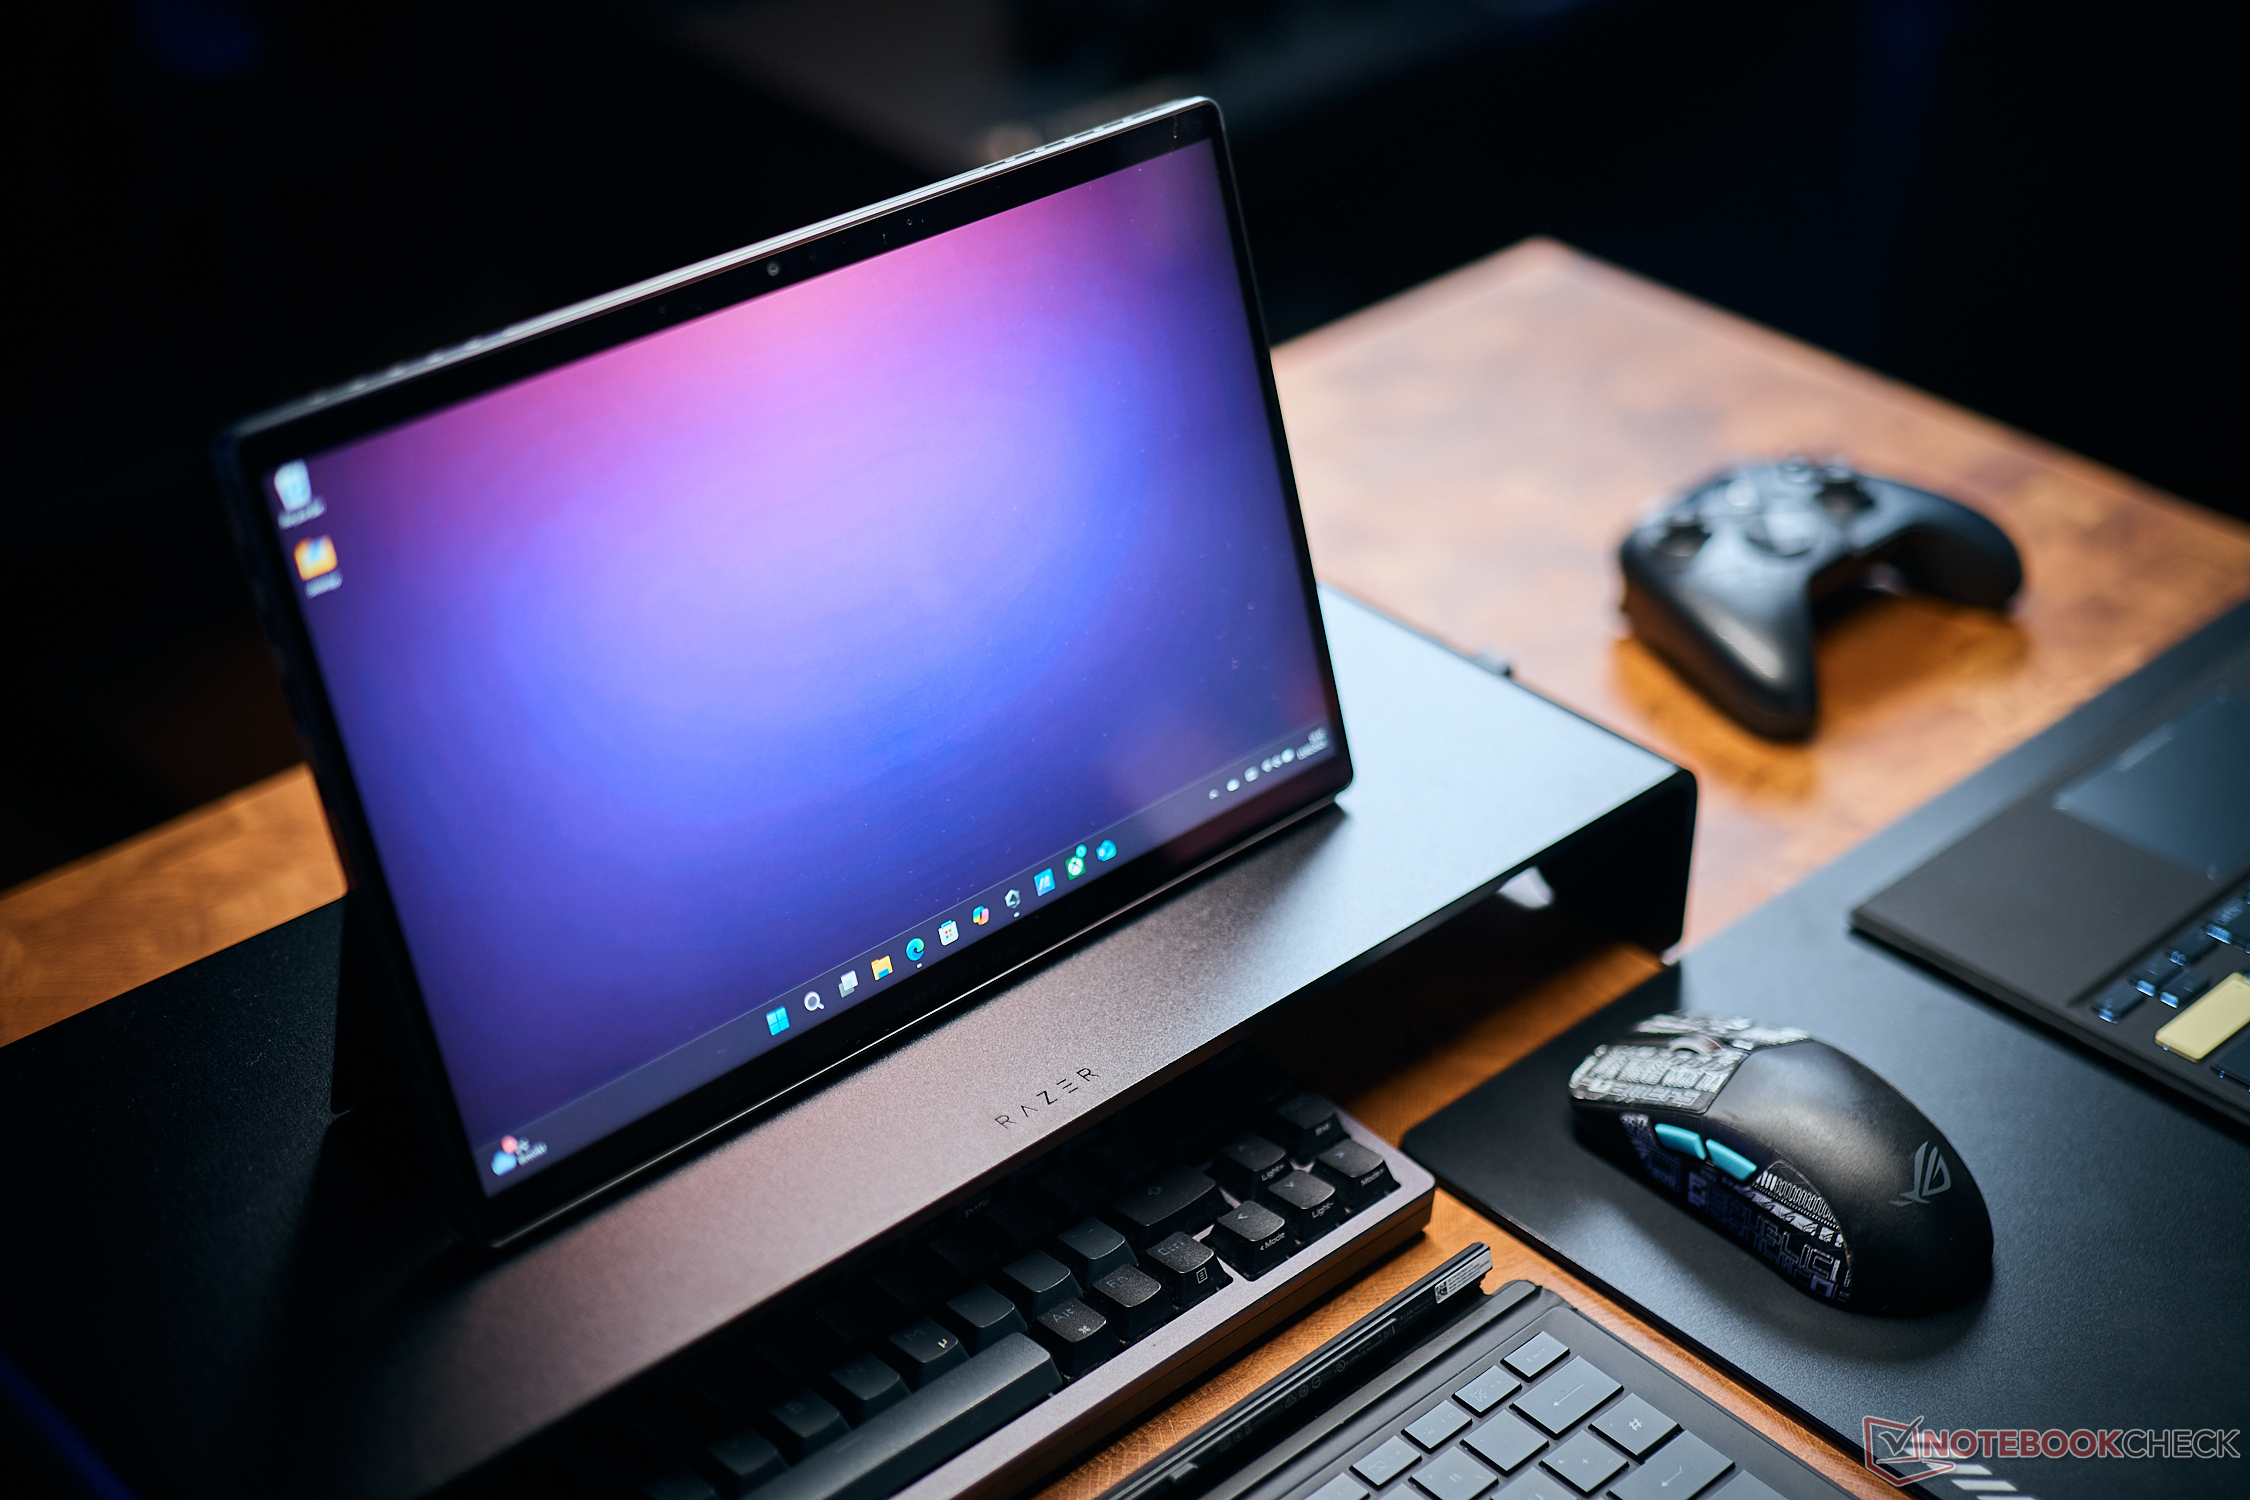
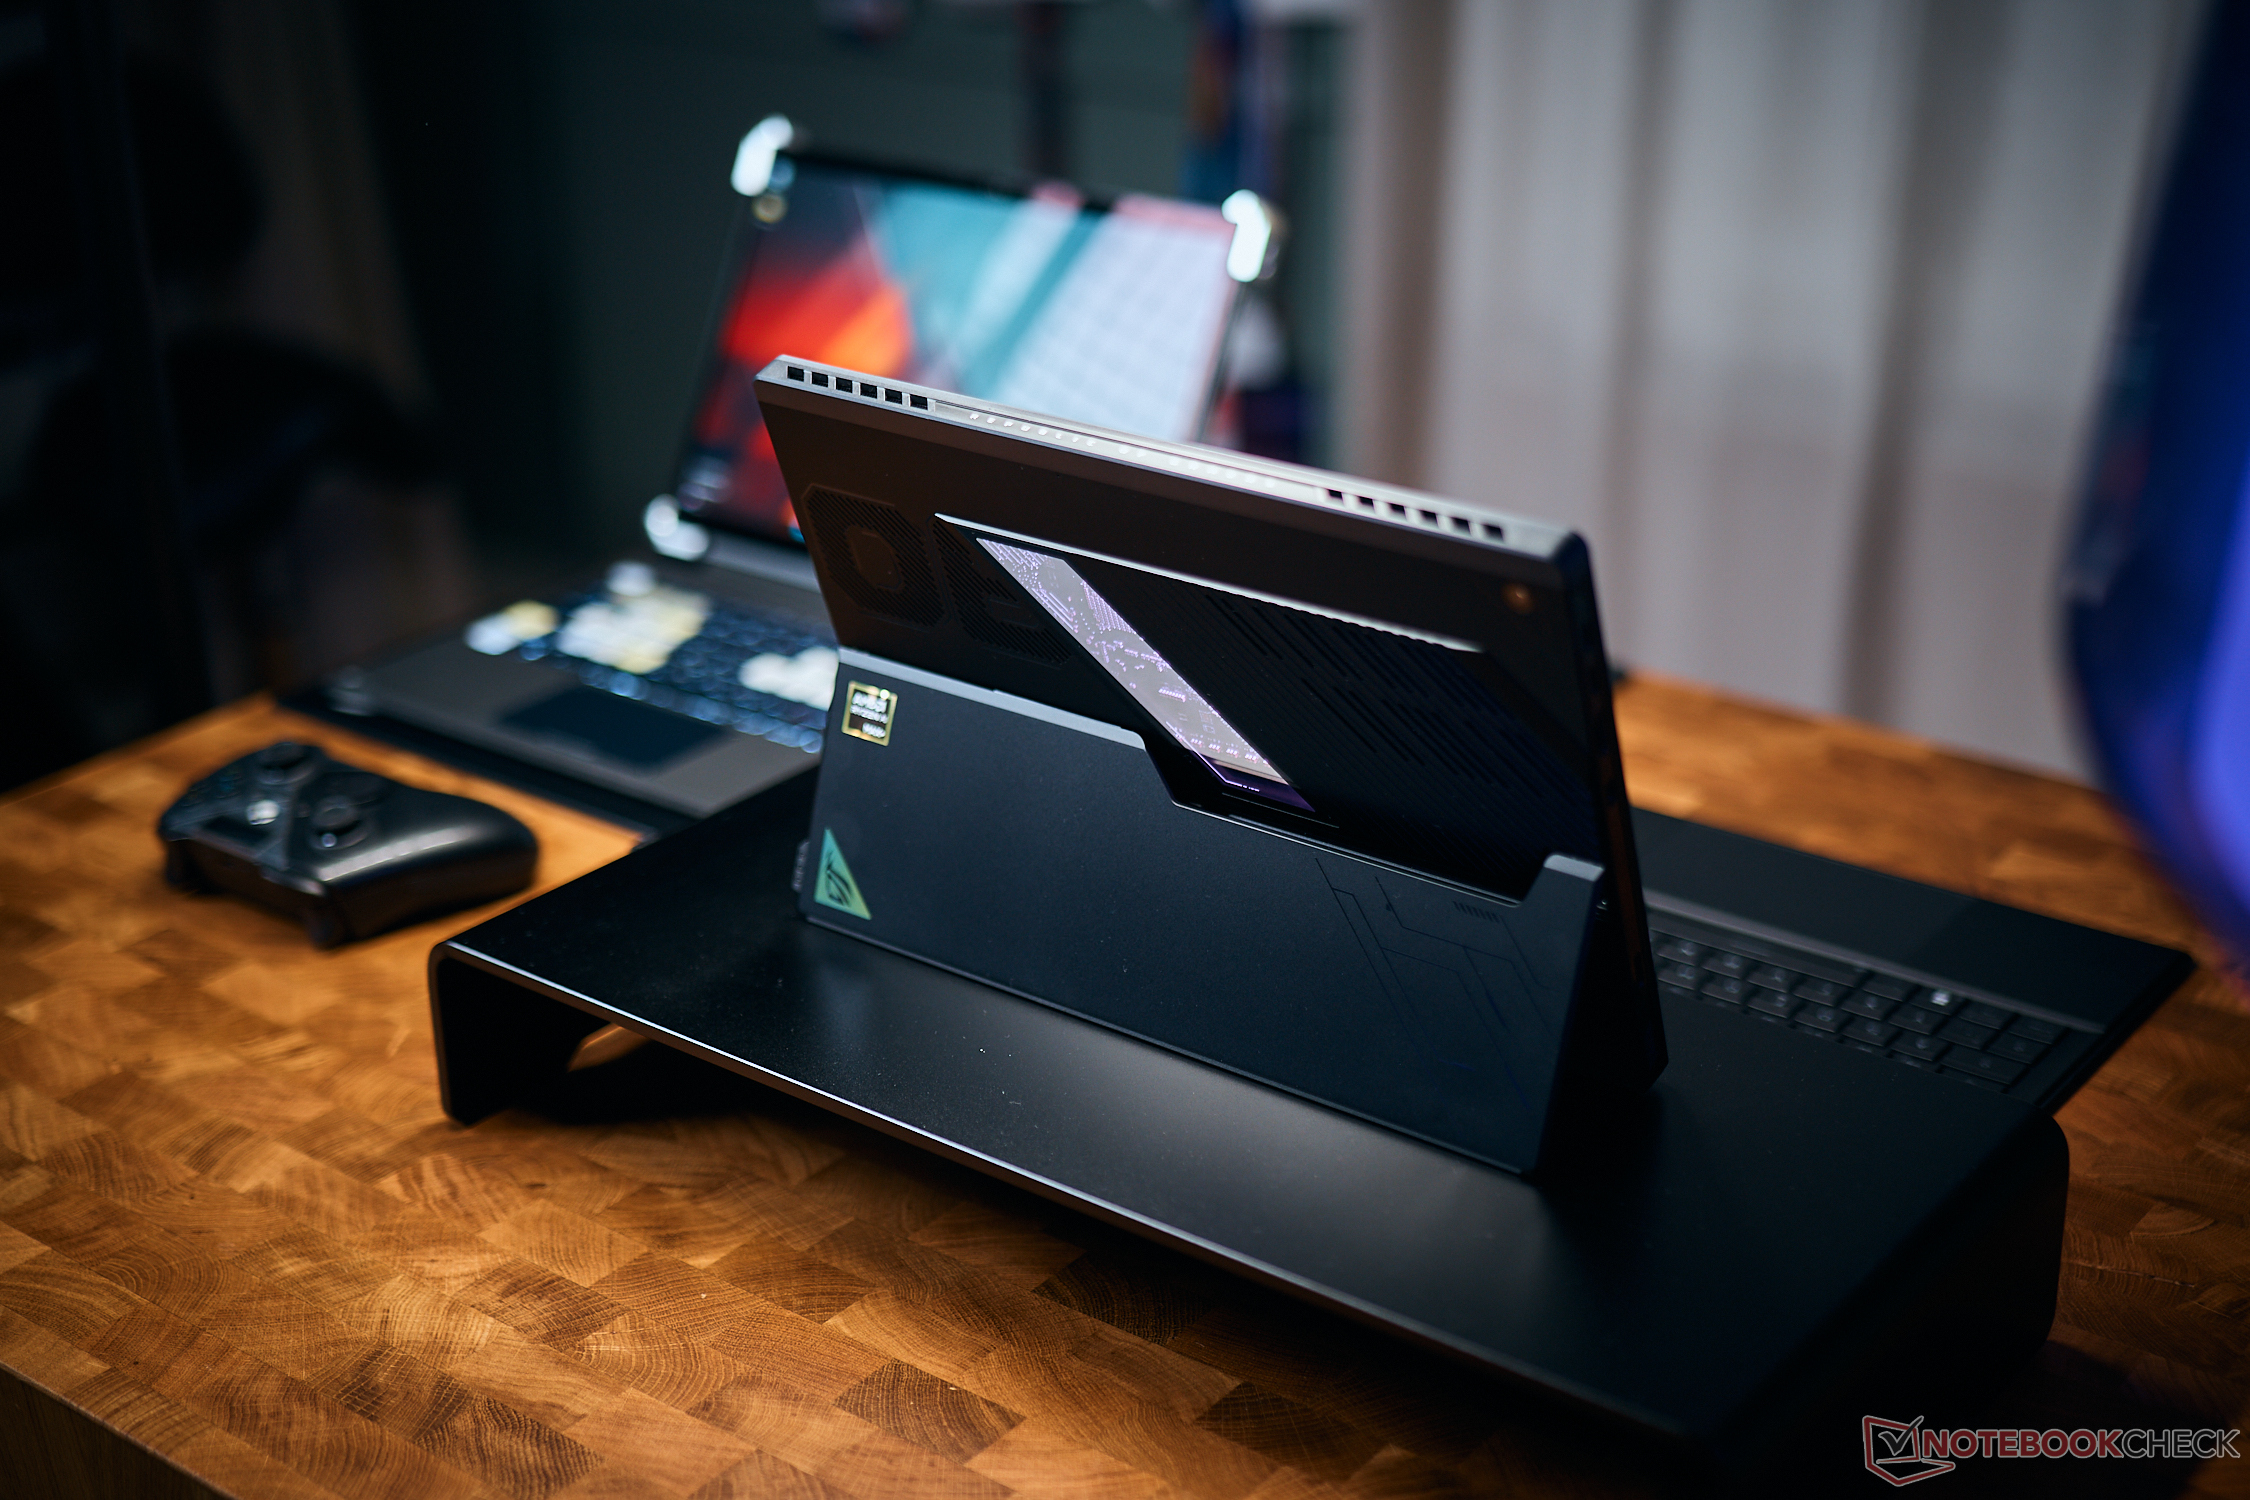
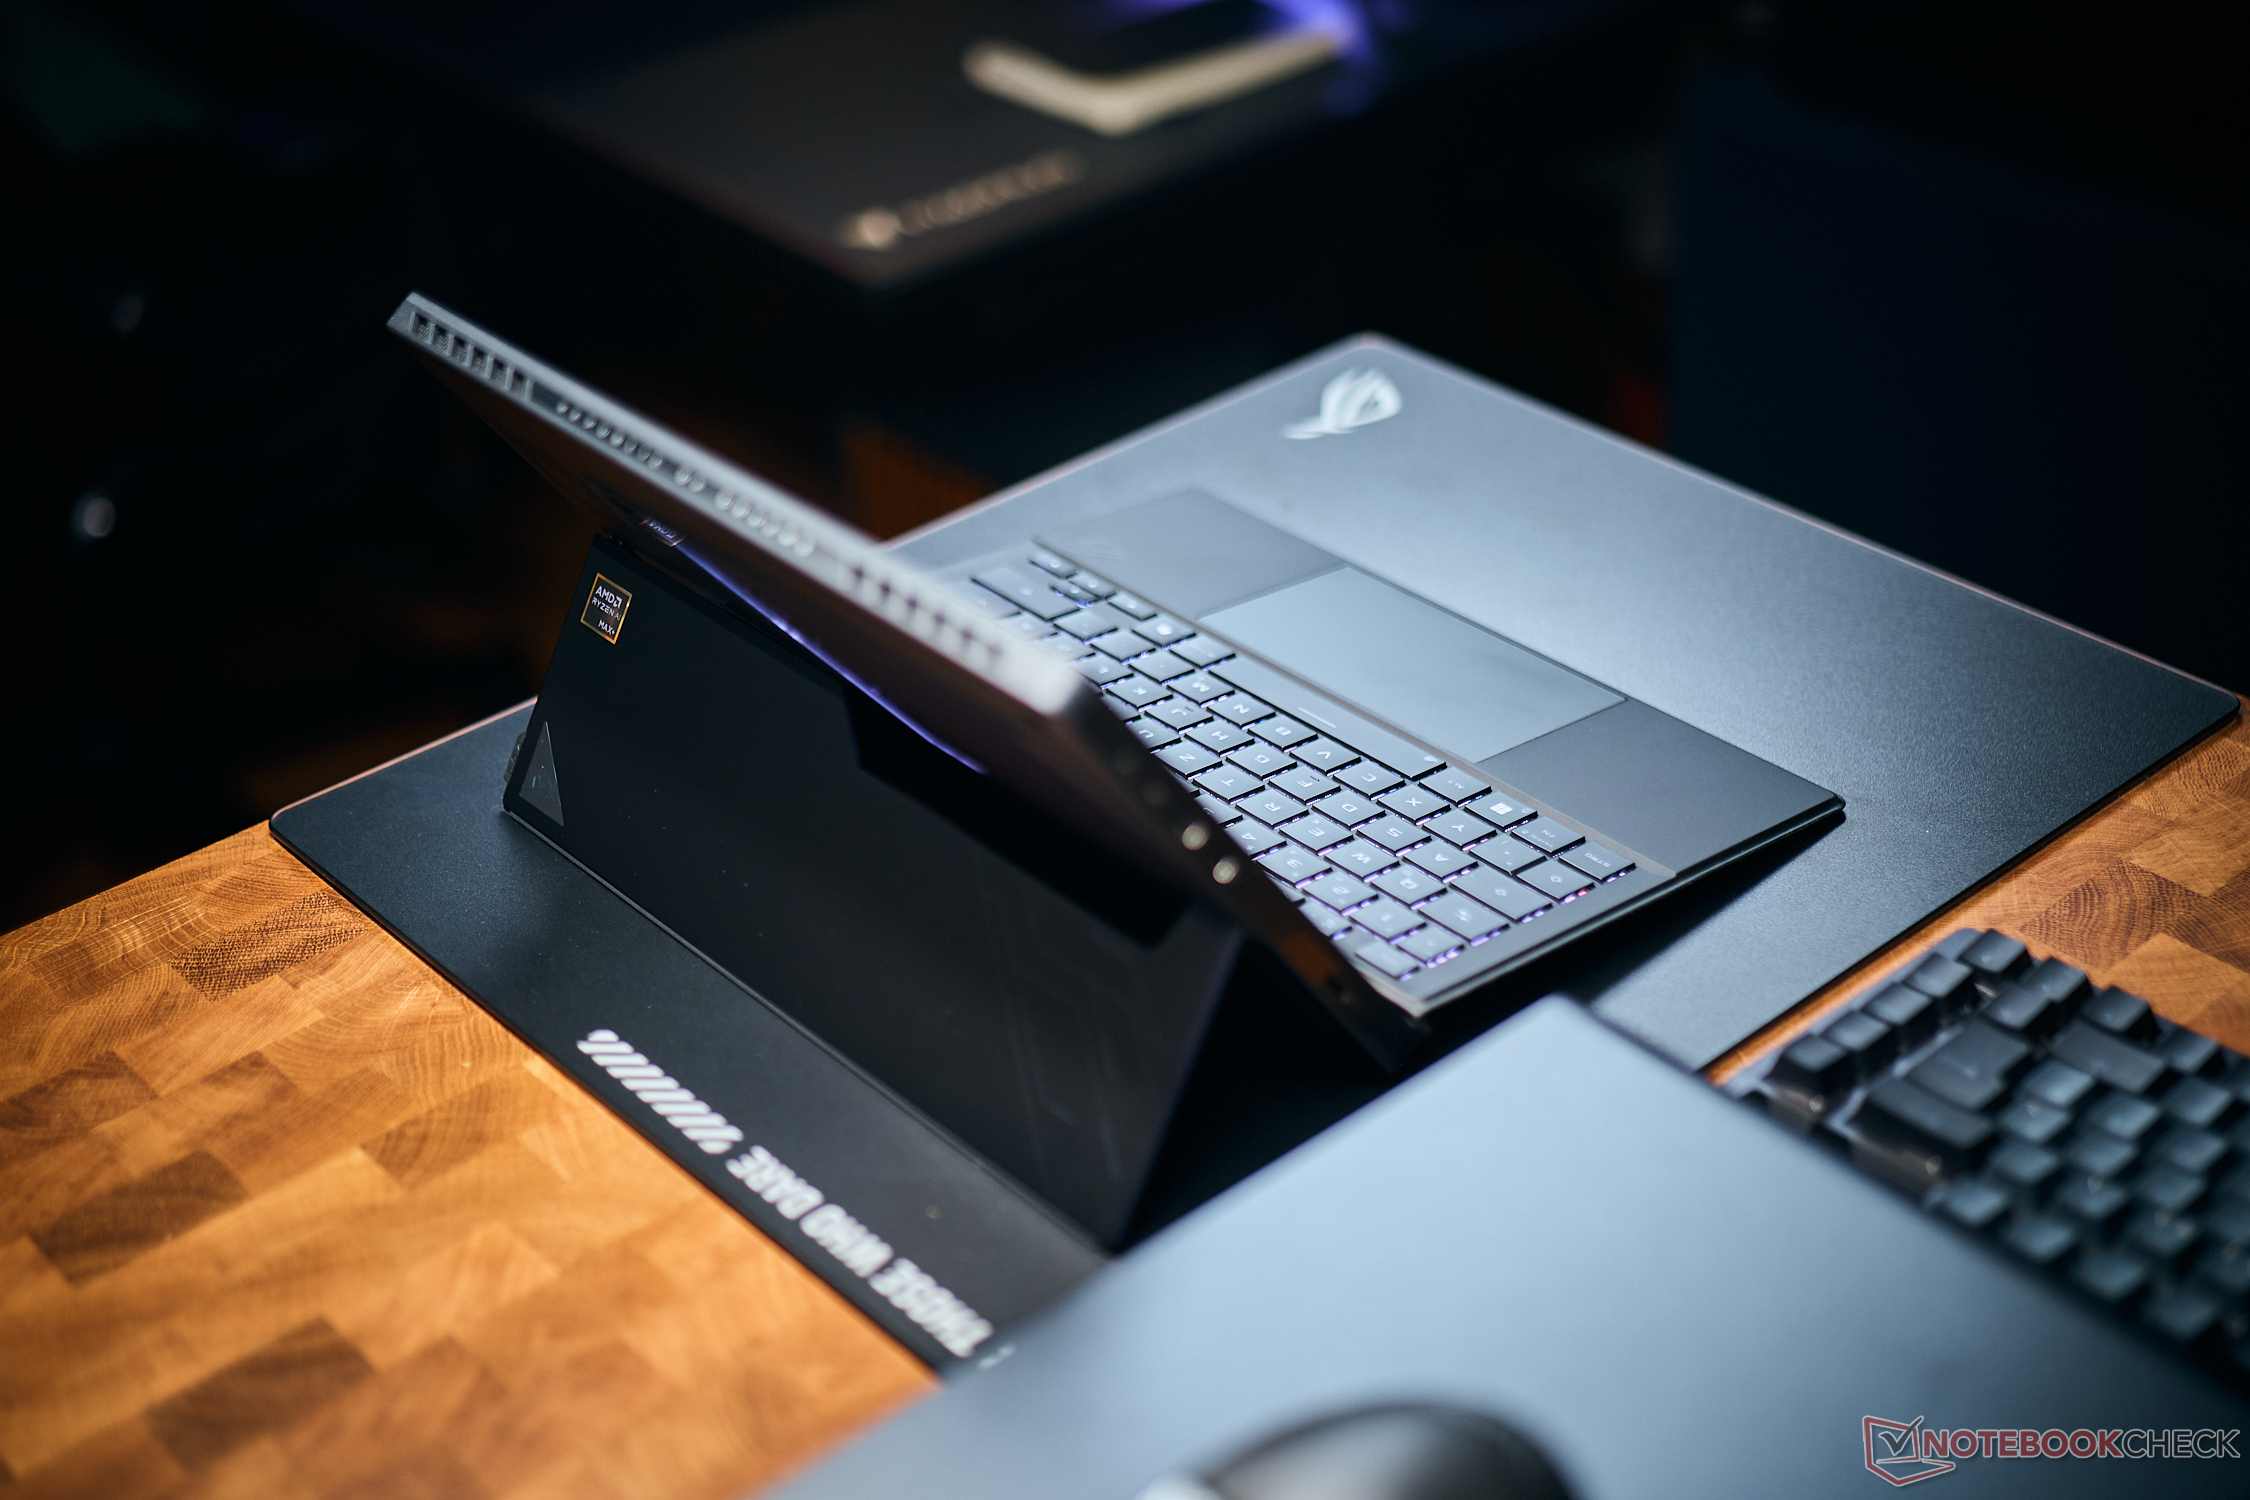
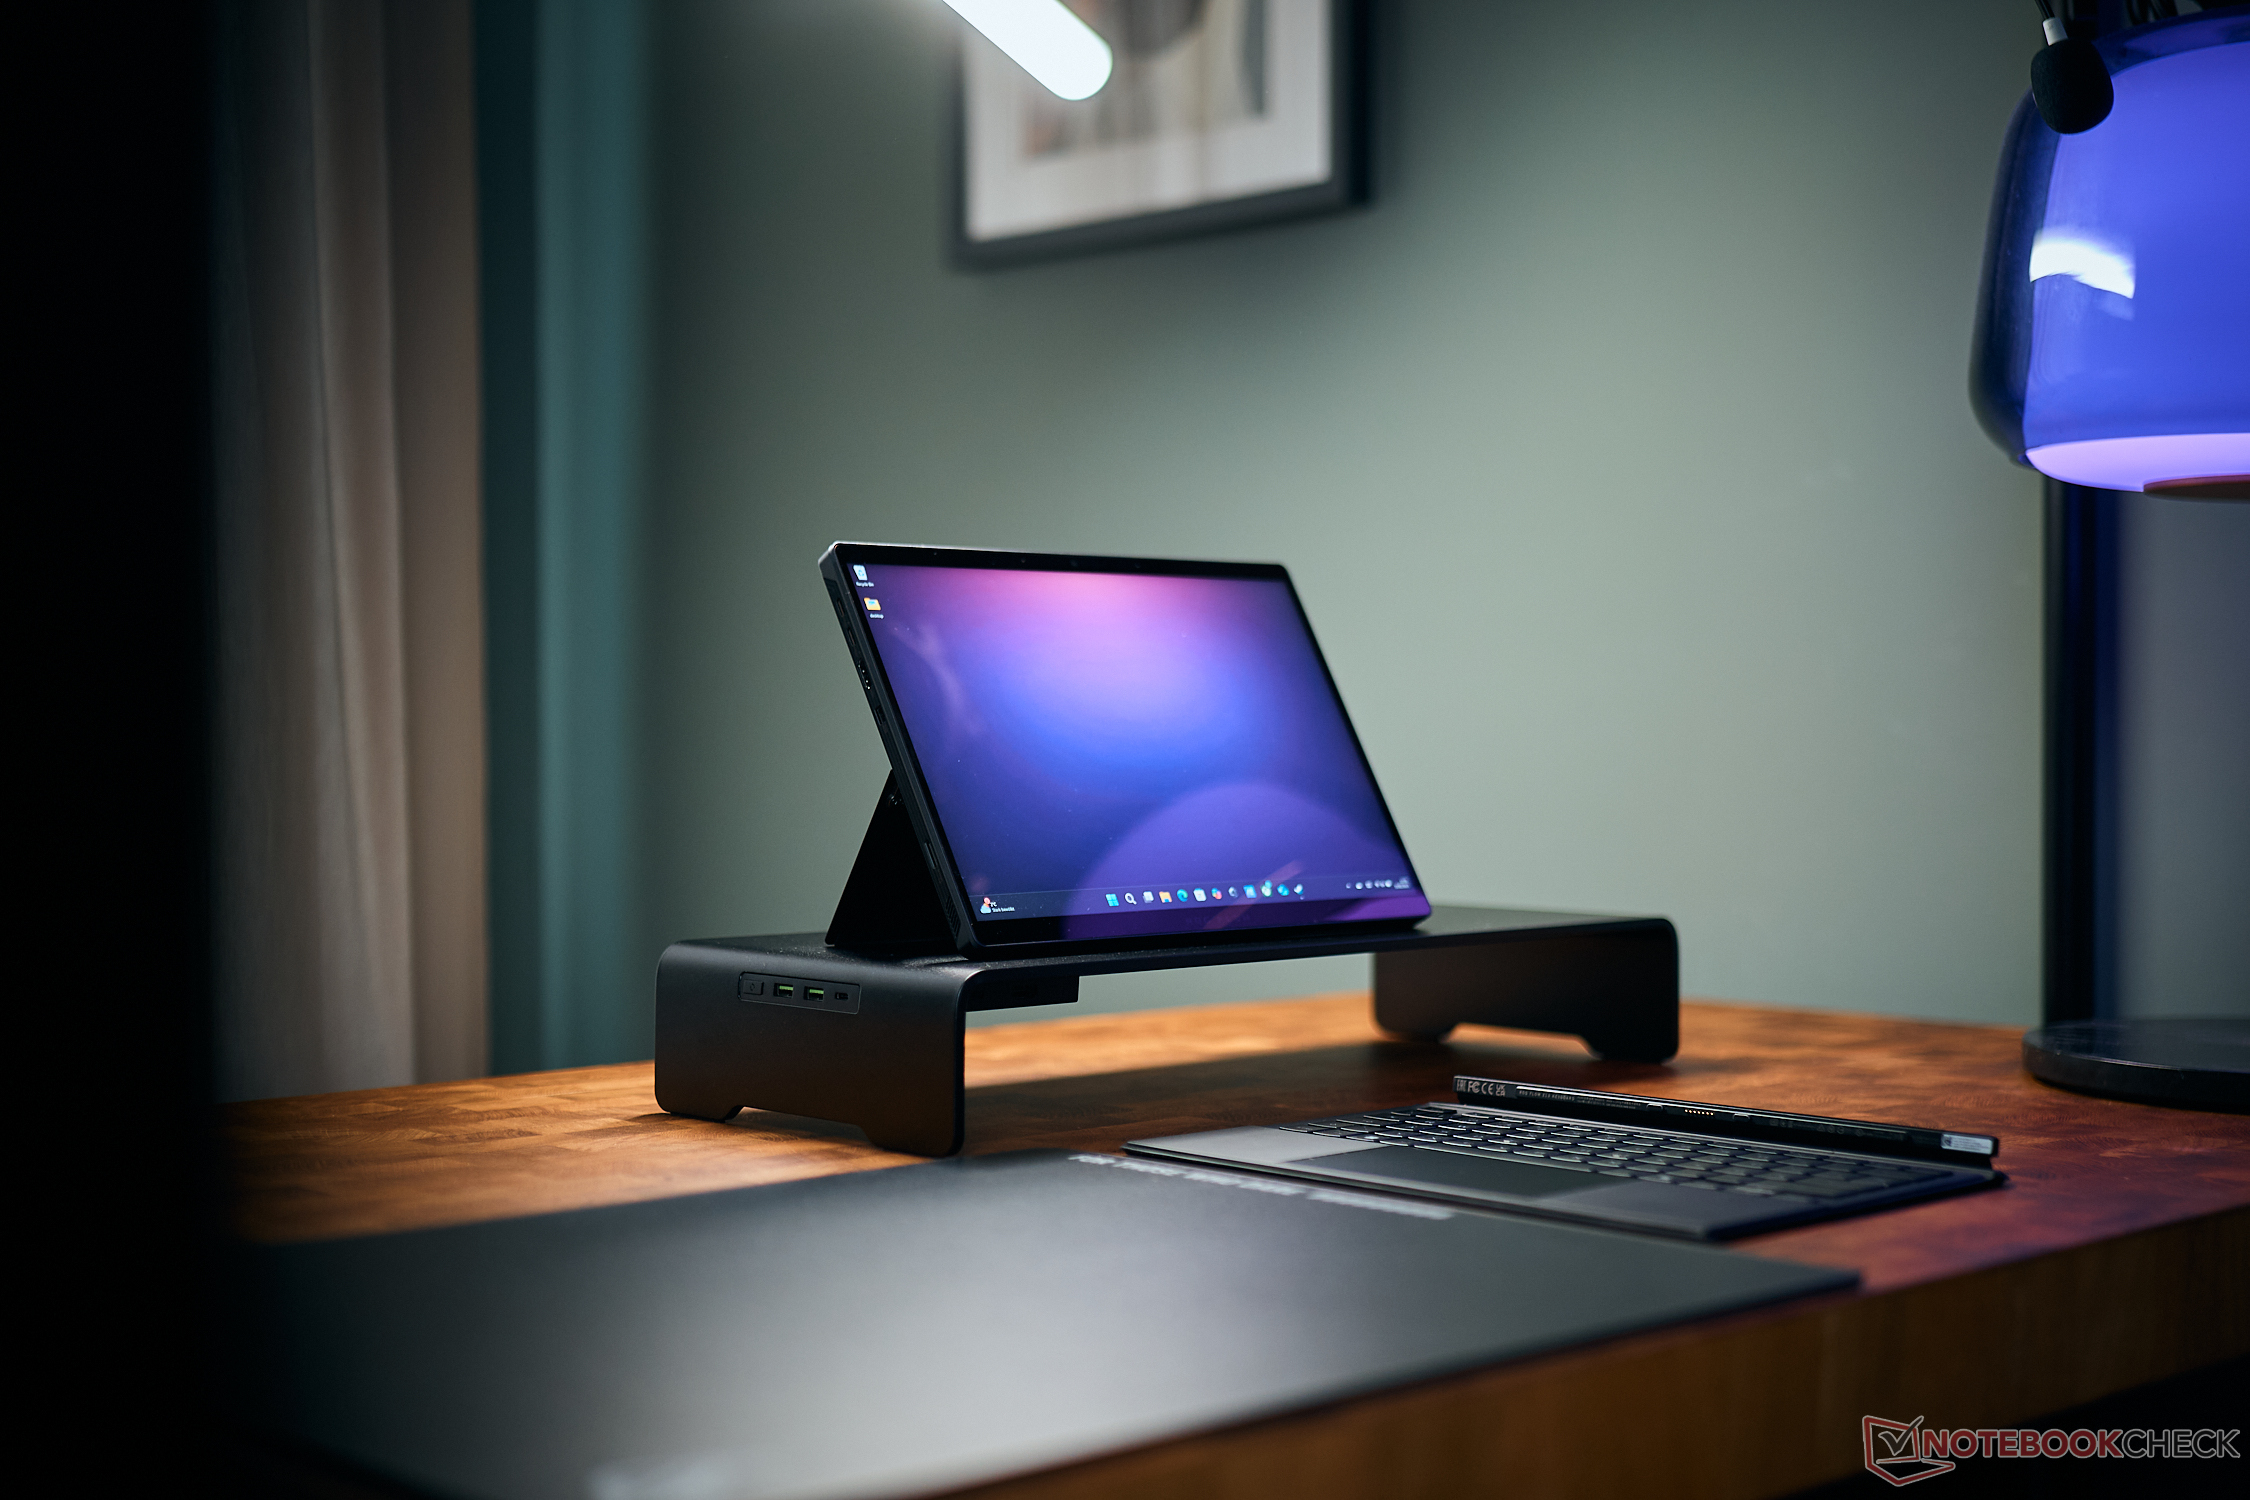
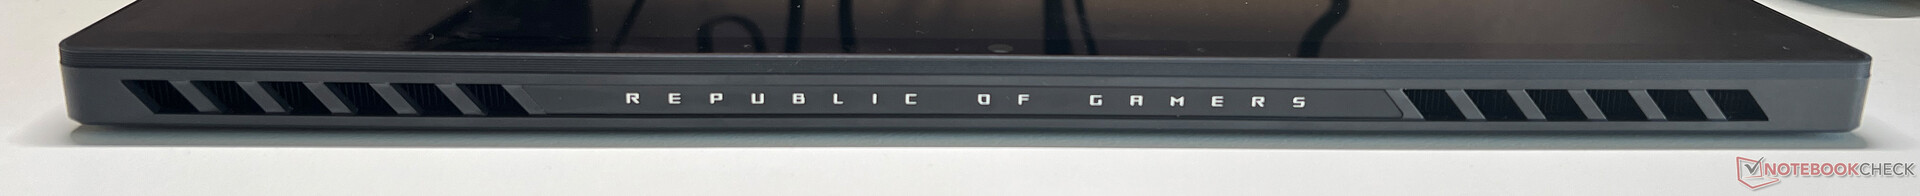
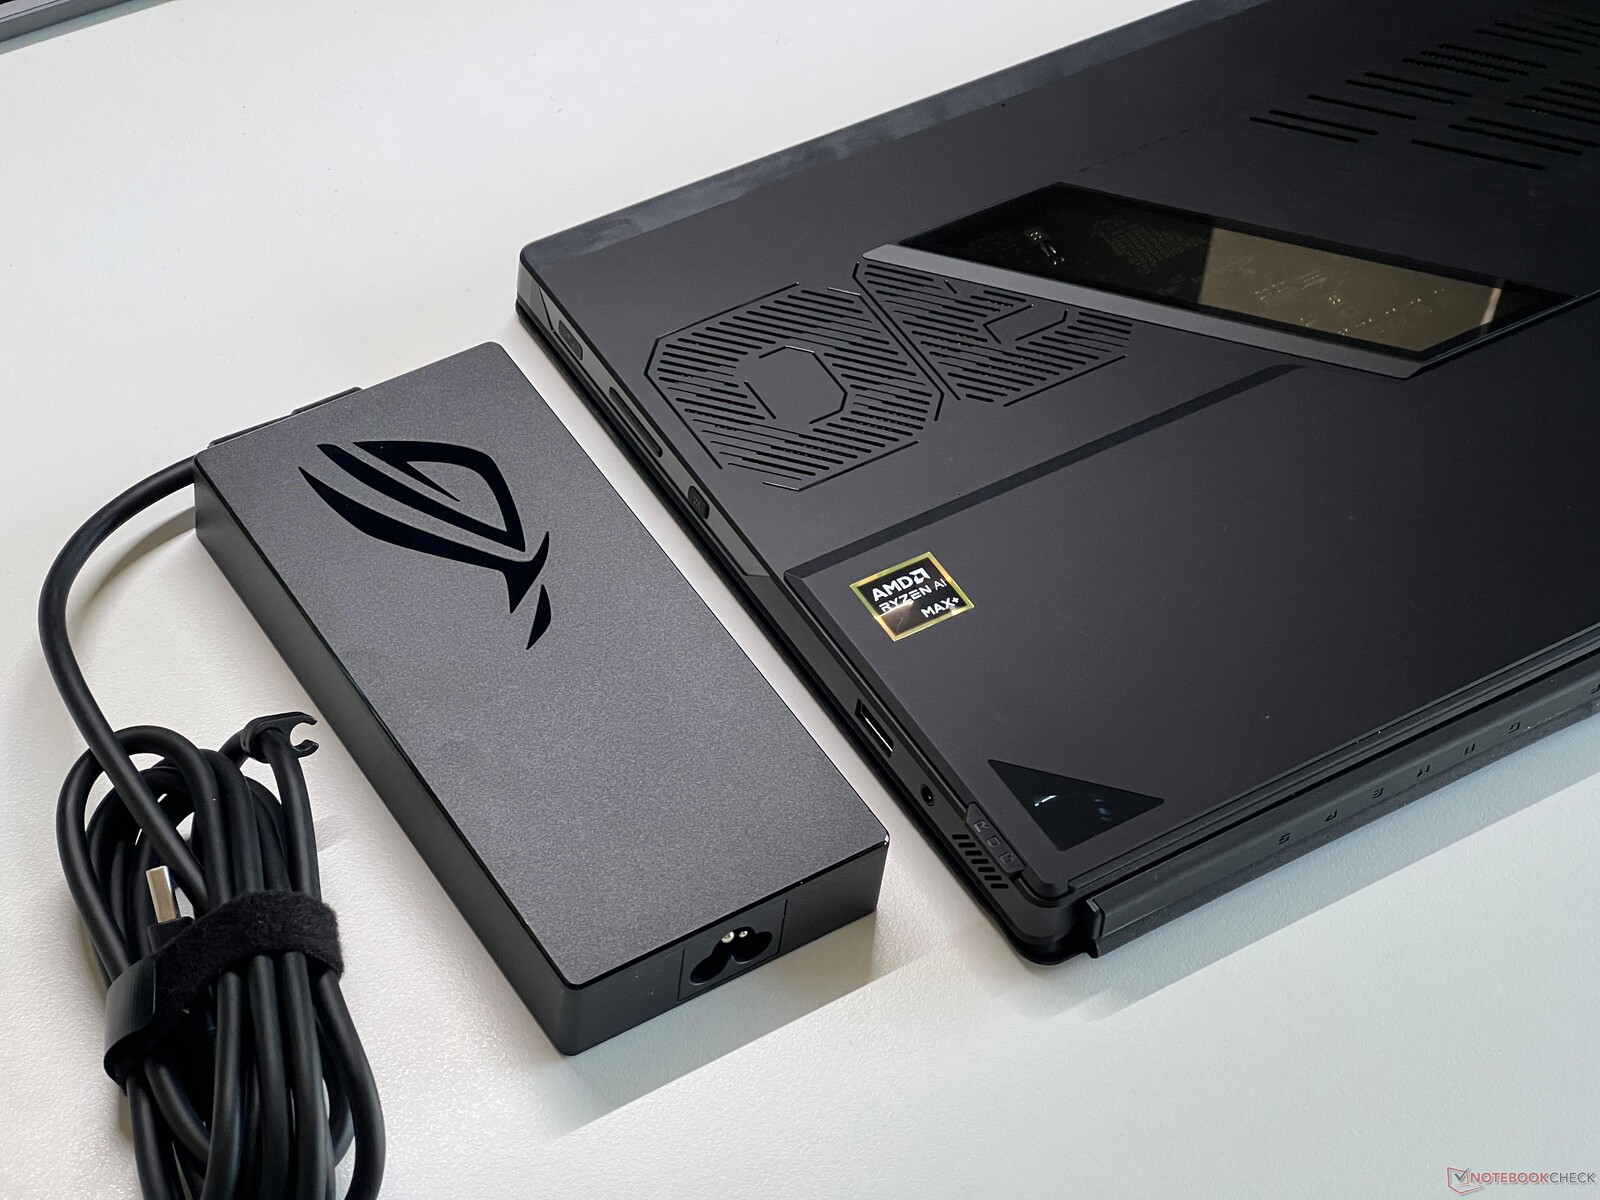
The chassis design is similar to the regular version of the previous model and the dark chassis looks pretty subtle for a gaming convertible. Only the cut-out on the rear panel, which shows some of the components, offers RGB illumination. The stability of the aluminum chassis is great and there is an anti-fingerprint coating, which works well. The integrated kickstand supports a maximum opening angle of 170 degrees and does the job, but there is a little wobble in the hinges, even though the resistance itself is decent.
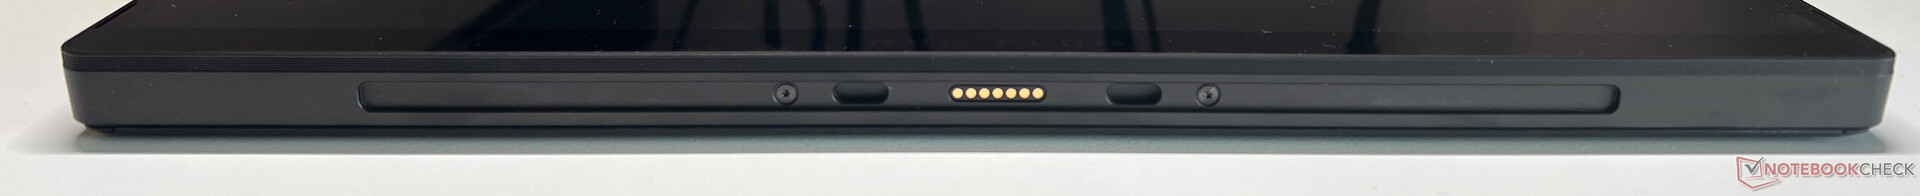
The included keyboard cover is magnetically attached at the bottom and does not fall off when you lift the convertible. It also acts as a screen protector when the device is closed and the bottom is made from a leather-like material, which leaves a sophisticated impression. The chassis itself cannot be opened, so the maintenance options are limited. There is only a maintenance cover for the M.2-2230 SSD.
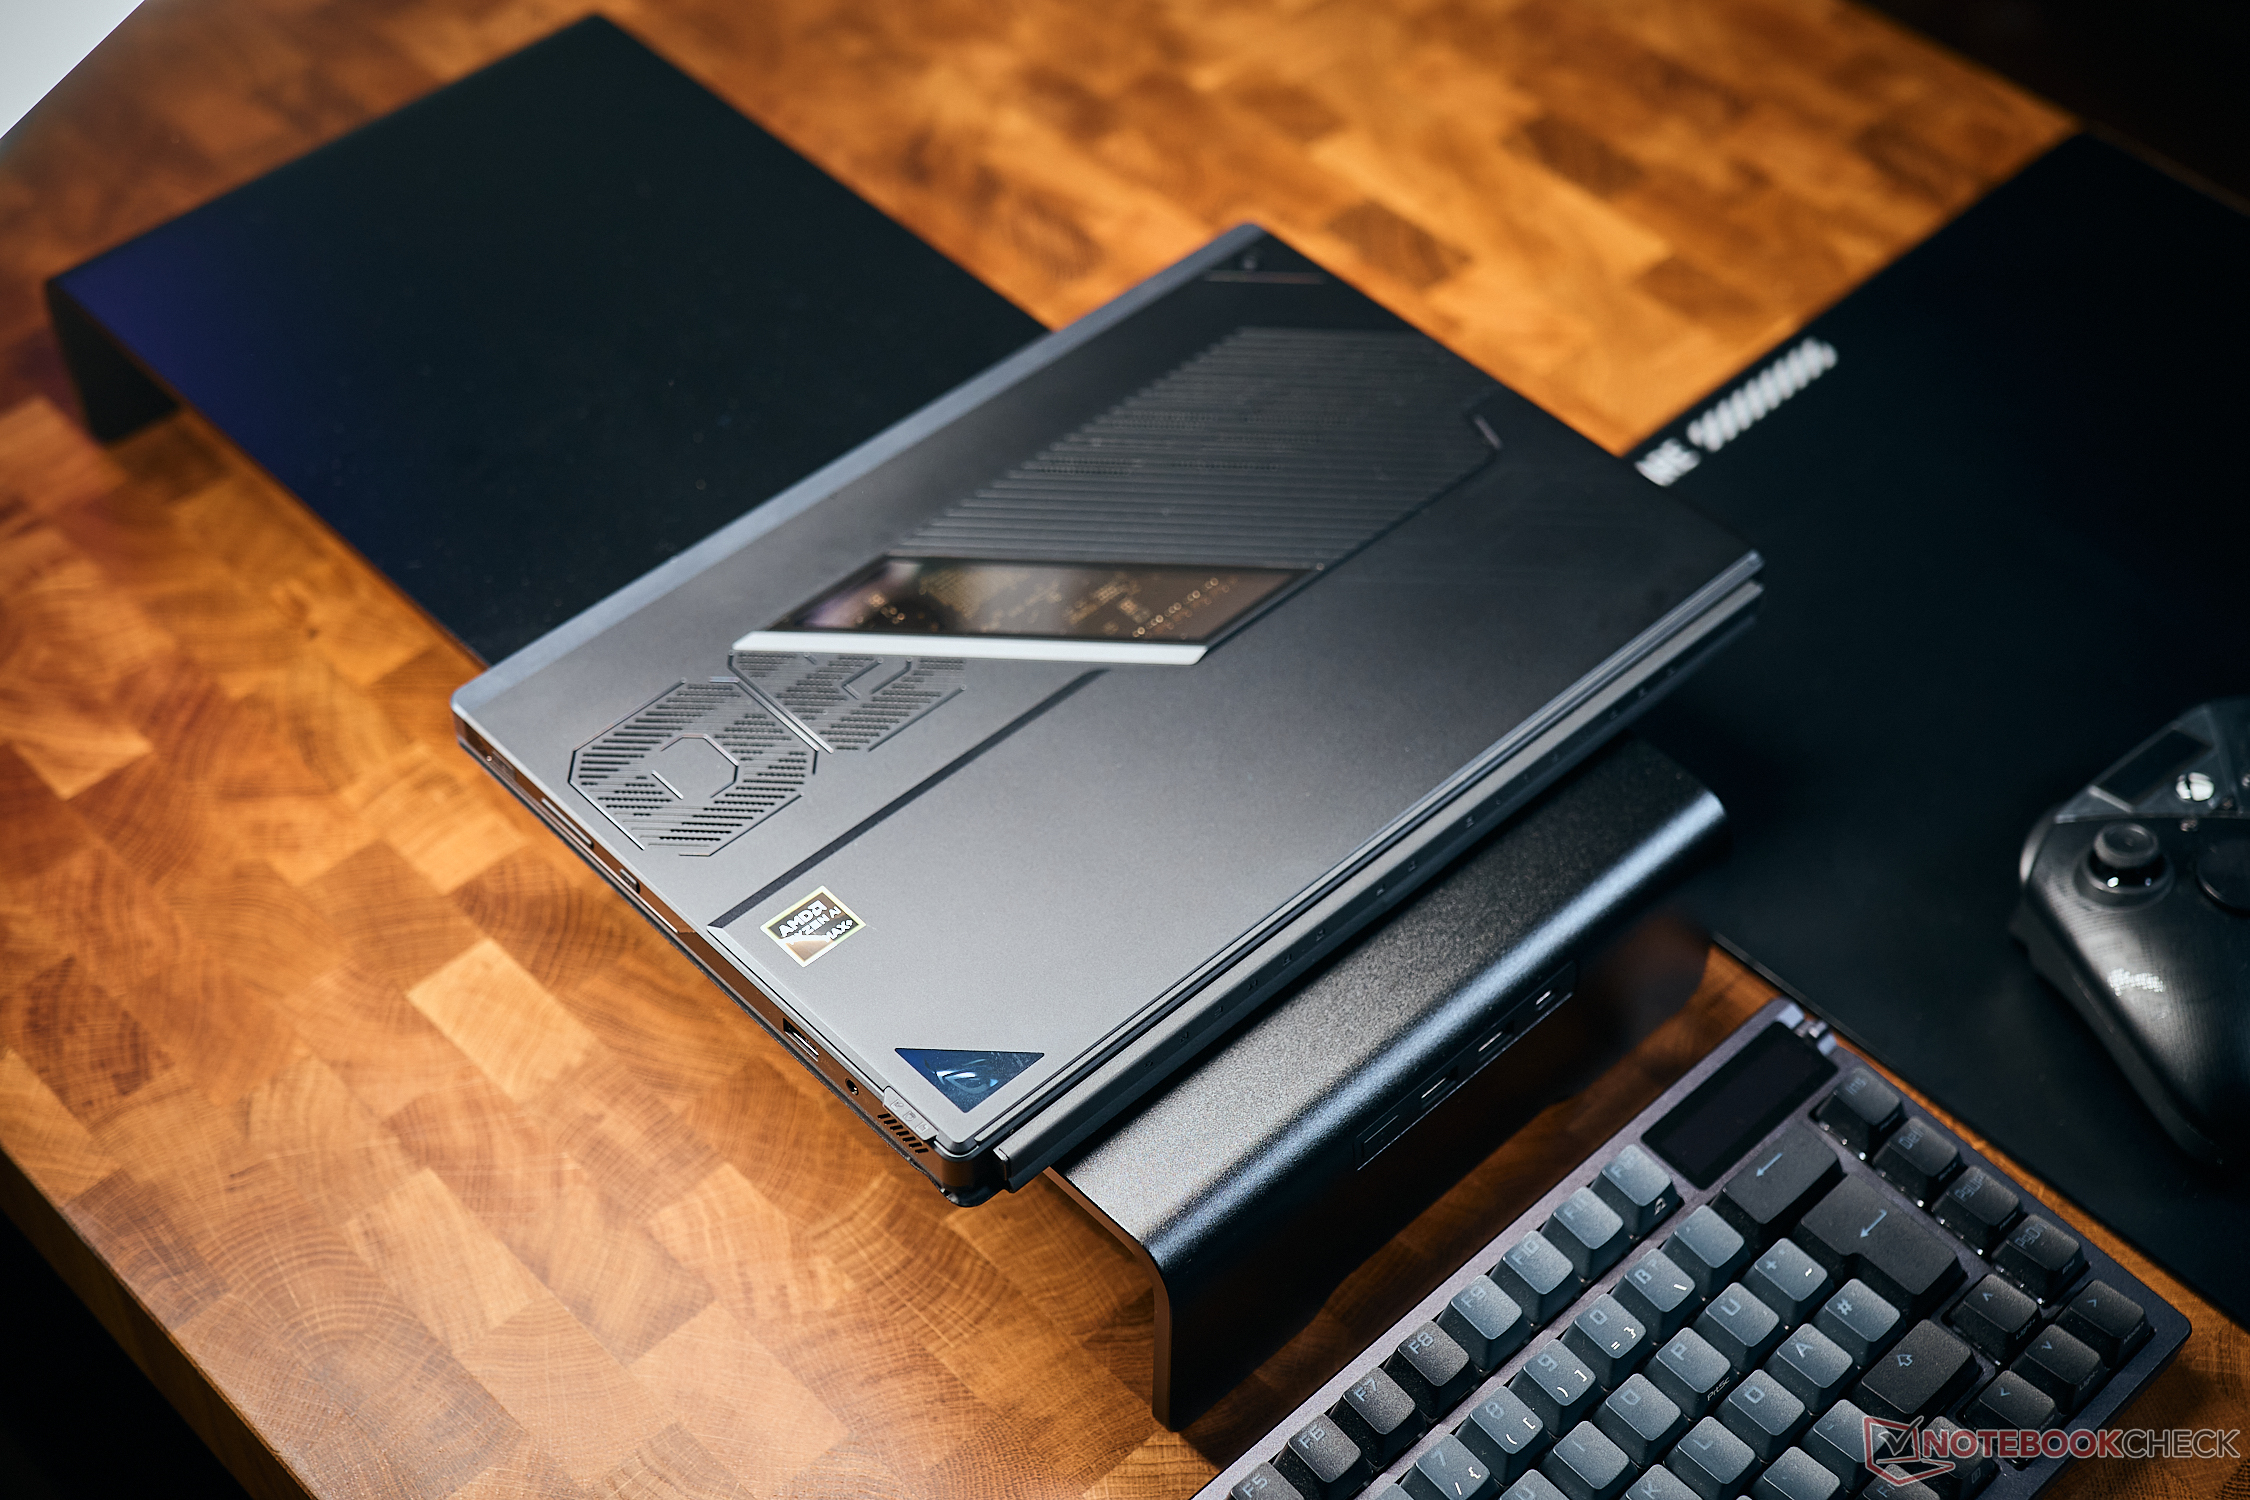
We measure a weight of around 1.23 kg for the convertible and 1.62 kg including the keyboard cover. The thickness is 14 and 20 mm with the keyboard, respectively, so the overall package is slightly heavier and thicker compared to the Asus ProArt PX13 or even the ROG Zephyrus G14. The 200W PSU tips the scale at 571 grams.
Connectivity - USB 4 & Wi-Fi 7
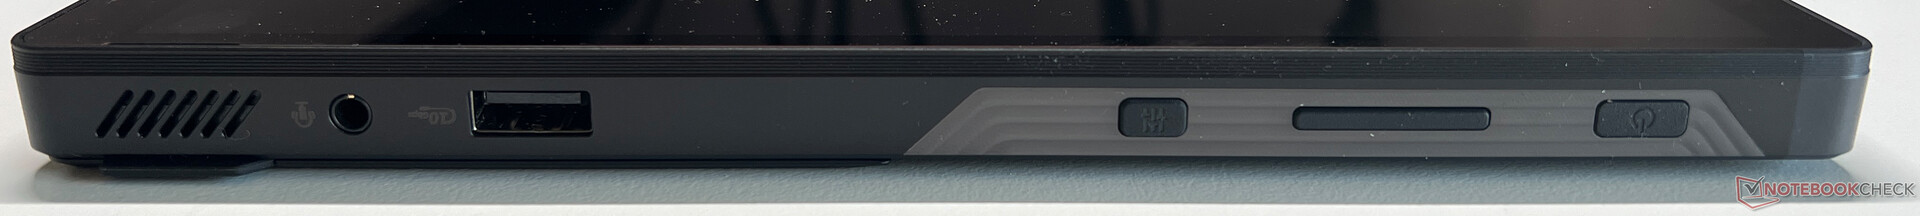
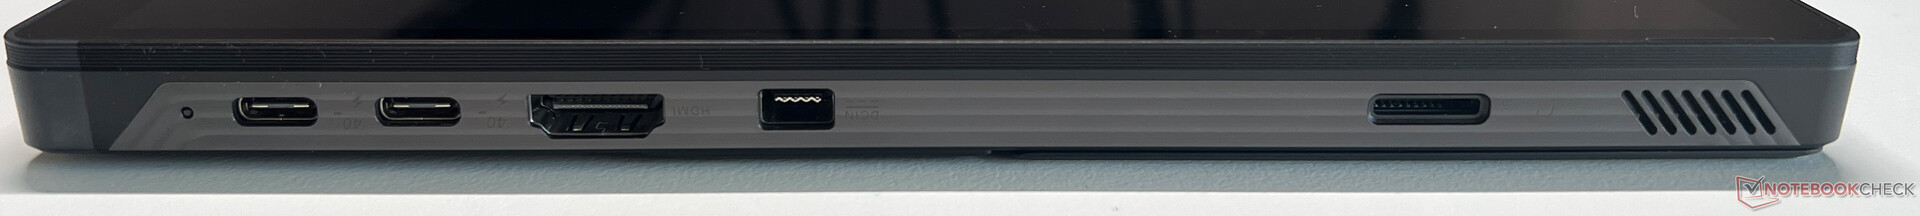
The Flow Z13 offers all important ports including two USB-C 4.0, HDMI as well as a regular USB-A port. On the right side you get a power button, a volume rocker, and a command center button. The layout is functional and you can even connect the external Asus XG Mobile (RTX 5090 Laptop). It is possible to charge the device via USB-C and it is a Copilot+ device thanks to the powerful NPU with 50 TOPS.
SD Card Reader
The microSD-card reader (spring mechanism) on the left side manages excellent transfer rates of up to 250 MB/s with our reference card (Angelbird AV Pro v60). While copying files from the card, the performance is significantly lower at ~85 MB/s though.
| SD Card Reader | |
| average JPG Copy Test (av. of 3 runs) | |
| Asus ROG Flow Z13 ACRNM (Angelbird AV Pro V60) | |
| Asus ROG Zephyrus G14 2024 GA403U (Angelbird AV Pro V60) | |
| Asus ROG Flow Z13 GZ302EA-RU073W (Angelbird AV Pro V60) | |
| Average of class Convertible (28.1 - 197, n=24, last 2 years) | |
| Asus ProArt PX13 HN7306 (Angelbird AV Pro V60) | |
| Acer Predator Helios Neo 14 (2024) (AV PRO microSD 128 GB V60) | |
| maximum AS SSD Seq Read Test (1GB) | |
| Asus ProArt PX13 HN7306 (Angelbird AV Pro V60) | |
| Asus ROG Flow Z13 GZ302EA-RU073W (Angelbird AV Pro V60) | |
| Asus ROG Flow Z13 ACRNM (Angelbird AV Pro V60) | |
| Asus ROG Zephyrus G14 2024 GA403U (Angelbird AV Pro V60) | |
| Average of class Convertible (28.9 - 254, n=23, last 2 years) | |
| Acer Predator Helios Neo 14 (2024) (AV PRO microSD 128 GB V60) | |
Communication
Asus uses a Wi-Fi module from MediaTek (MT9725), which supports the latest Wi-Fi 7 as well as Bluetooth 5.4. Our standardized Wi-Fi test with the reference router from Asus determines very good and stable transfer rates. We did not notice any stability issues during the review period, either.
| Networking | |
| Asus ROG Flow Z13 GZ302EA-RU073W | |
| iperf3 transmit AXE11000 | |
| iperf3 receive AXE11000 | |
| Asus ROG Flow Z13 ACRNM | |
| iperf3 transmit AXE11000 | |
| iperf3 receive AXE11000 | |
| Asus ProArt PX13 HN7306 | |
| iperf3 transmit AXE11000 | |
| iperf3 receive AXE11000 | |
| Asus ROG Zephyrus G14 2024 GA403U | |
| iperf3 transmit AXE11000 | |
| iperf3 receive AXE11000 | |
| Razer Blade 14 RZ09-0508 | |
| iperf3 transmit AXE11000 | |
| iperf3 receive AXE11000 | |
| iperf3 transmit AXE11000 6GHz | |
| iperf3 receive AXE11000 6GHz | |
| Razer Blade 14 RTX 4070 | |
| iperf3 transmit AXE11000 | |
| iperf3 receive AXE11000 | |
| iperf3 transmit AXE11000 6GHz | |
| iperf3 receive AXE11000 6GHz | |
| Acer Predator Helios Neo 14 (2024) | |
| iperf3 transmit AXE11000 | |
| iperf3 receive AXE11000 | |
Webcam
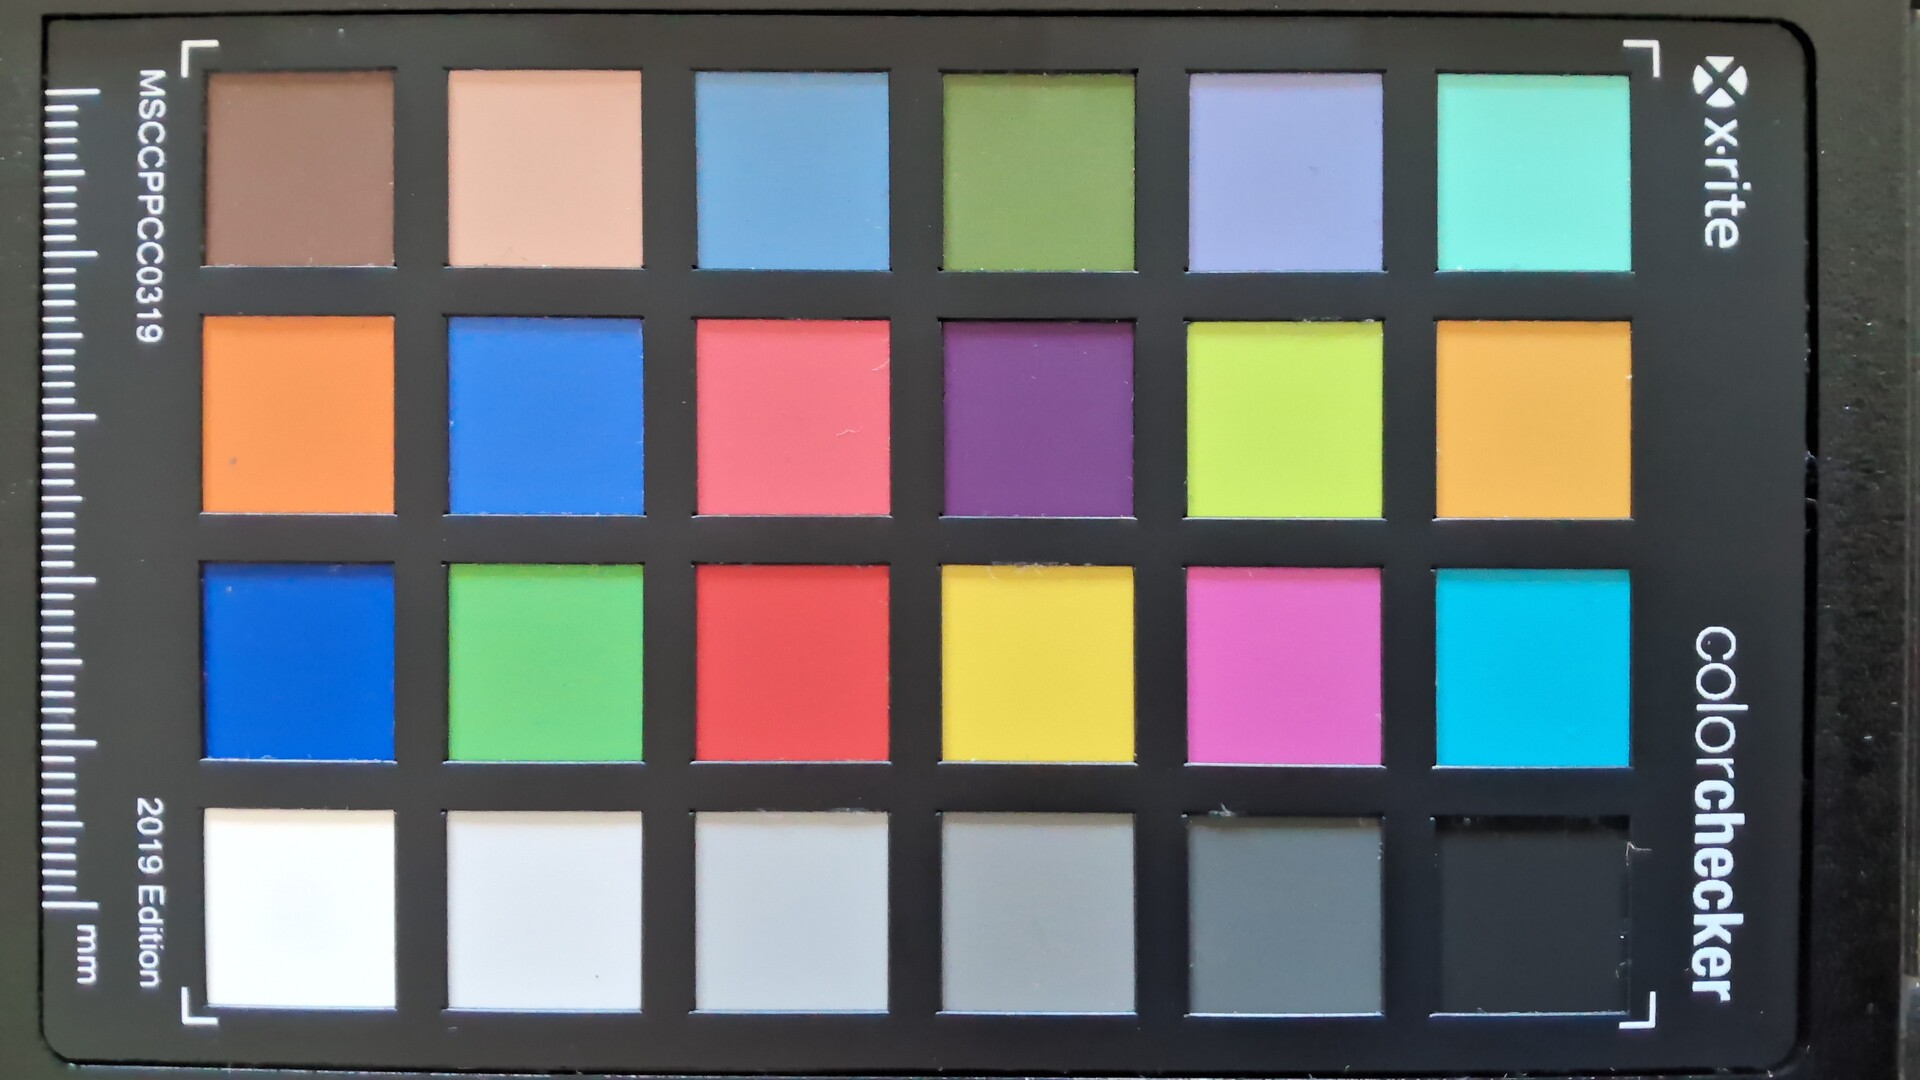
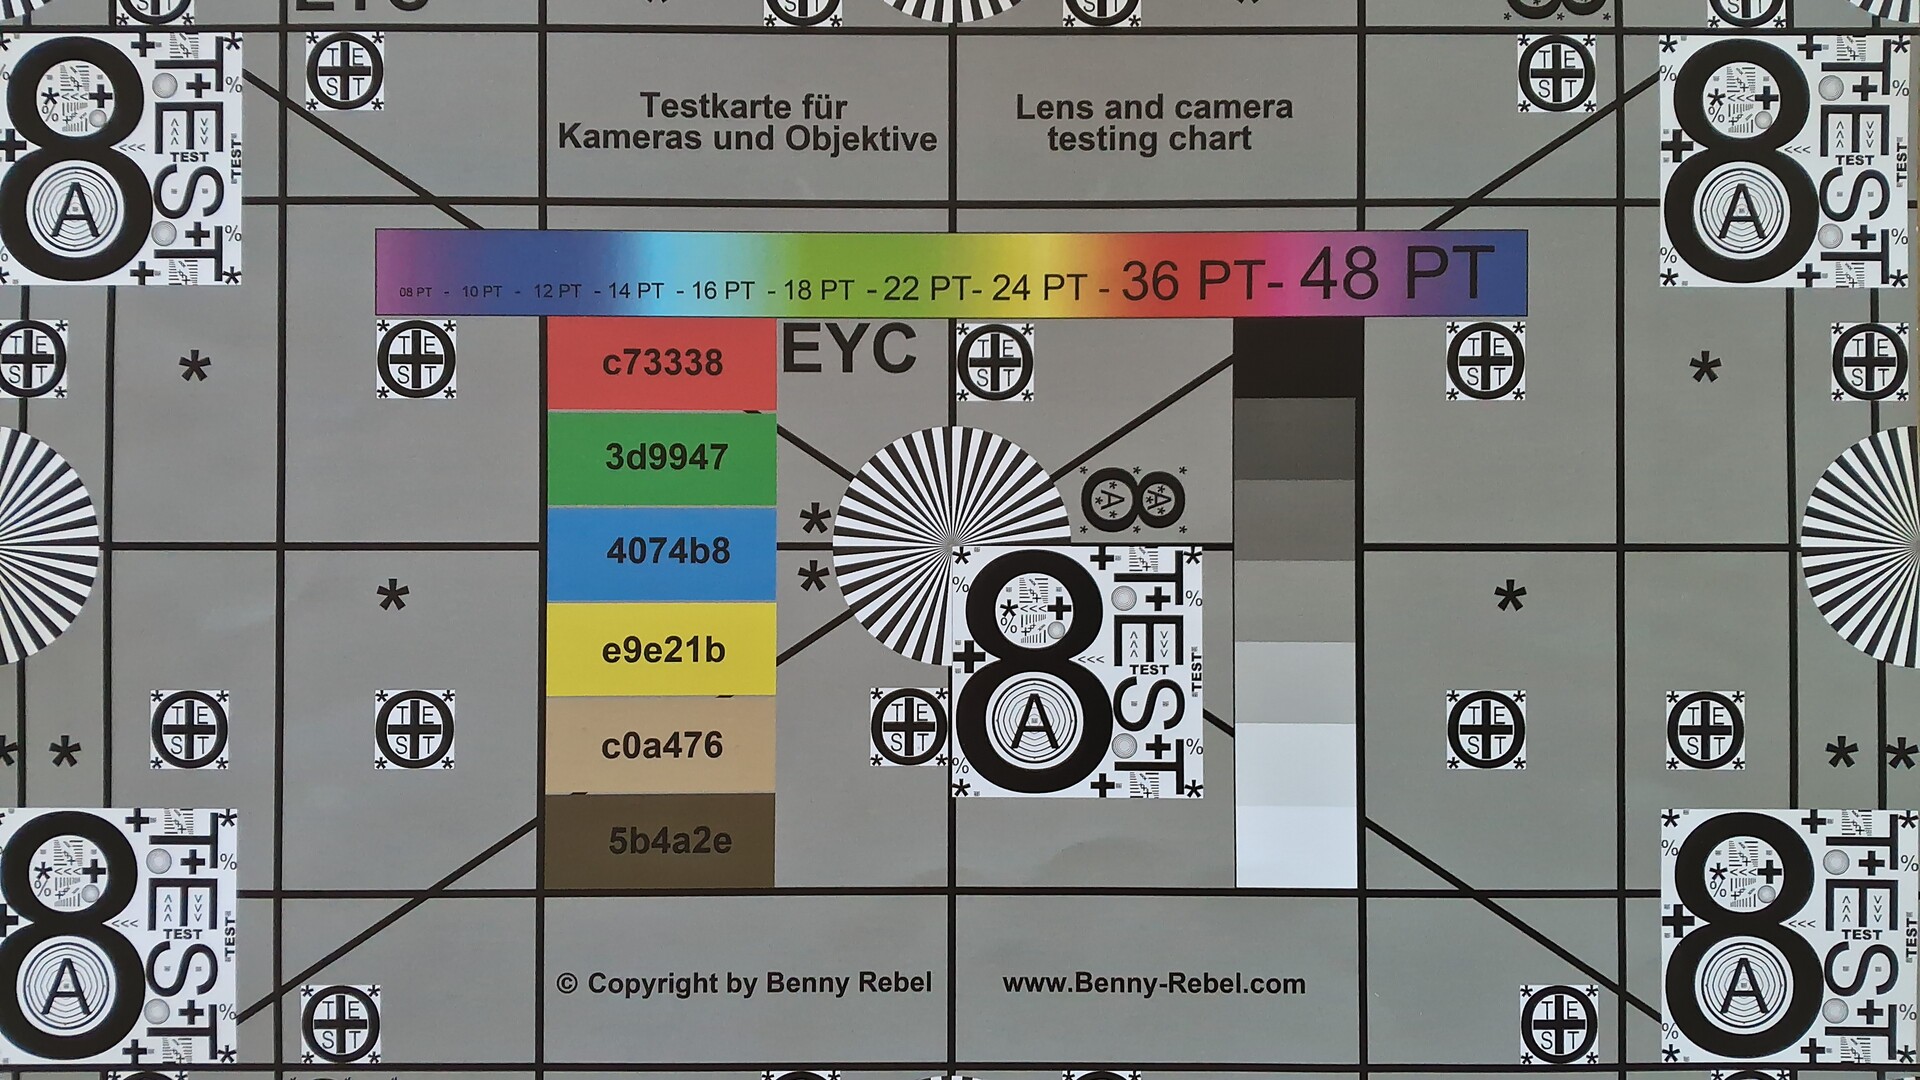
The Z13 still offers two webcams: One 5 MP sensor at the front (including IR module for facial recognition) as well as a 13 MP sensor at the rear. Studio effects for the webcam are supported and the picture quality of the 5 MP camera is better compared to regular 1080p sensors. The 13 MP camera takes even better (especially sharper) images.


Maintenance
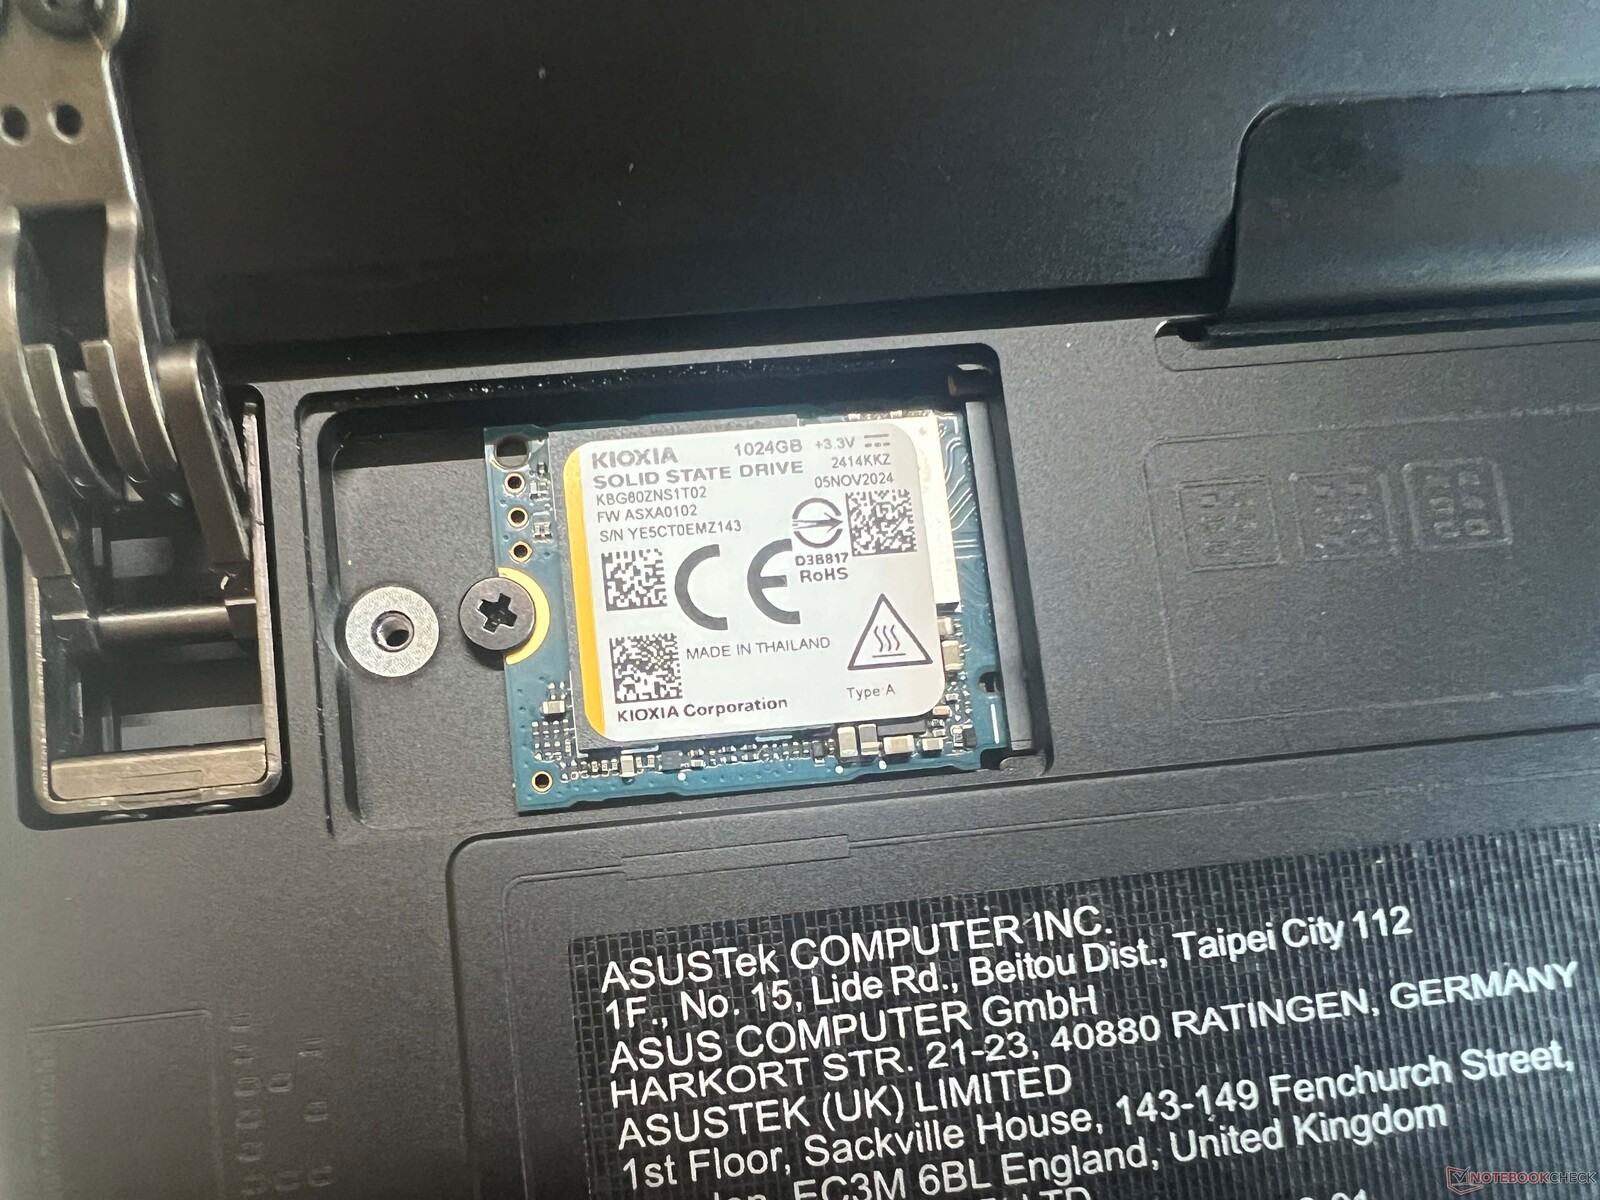
We already mentioned that the maintenance options are very limited and you can only access the compact M.2-2230 SSD via maintenance hatch at the rear.
Sustainability
Asus does offer any information about recycled materials for the device or the CO₂ footprint during production. The packaging is mostly recyclable though.
Input Devices - Small improvements
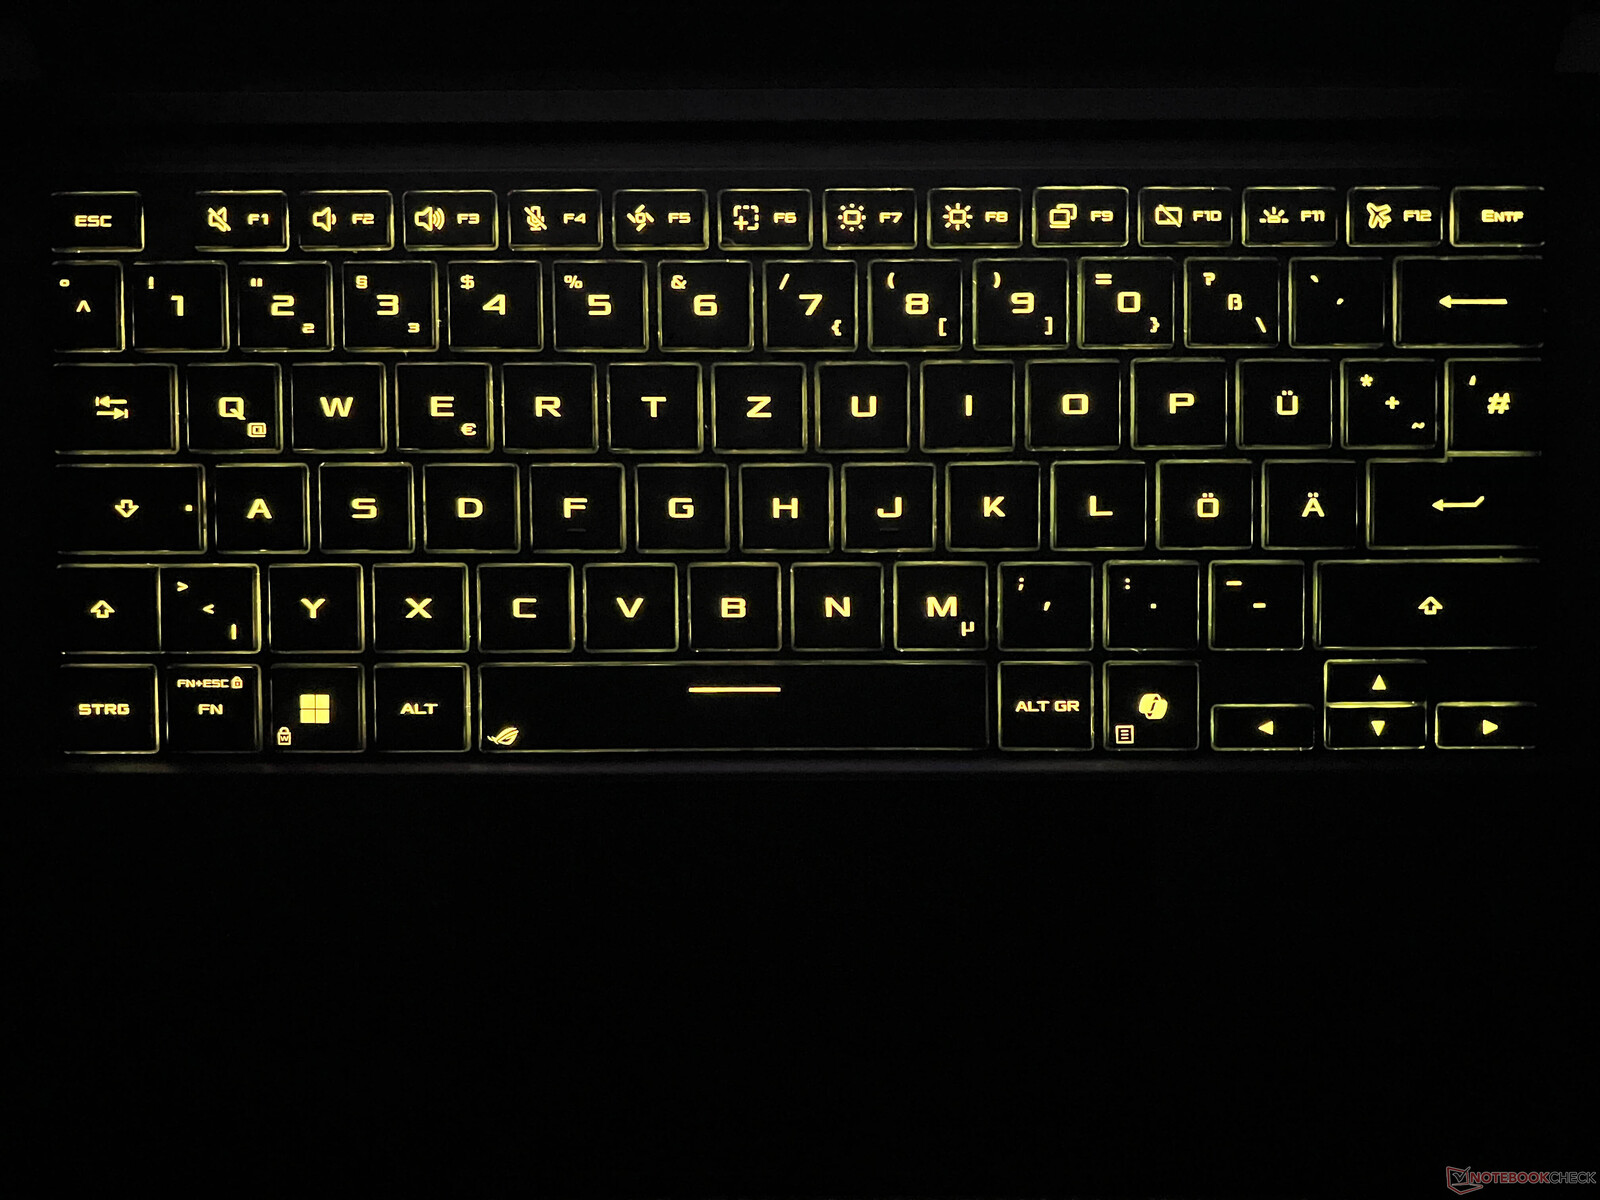
The attachable keyboard cover is once again included in the box and it can be used in a flat or slightly angled position. A direct comparison with the previous unit reveals a slightly firmer and more precise typing experience, which is mainly a result of the increased stability. The key caps are also slightly larger. The keyboard offers a three-stage background illumination with customizable color (single zone). All in all, it is a solid keyboard.
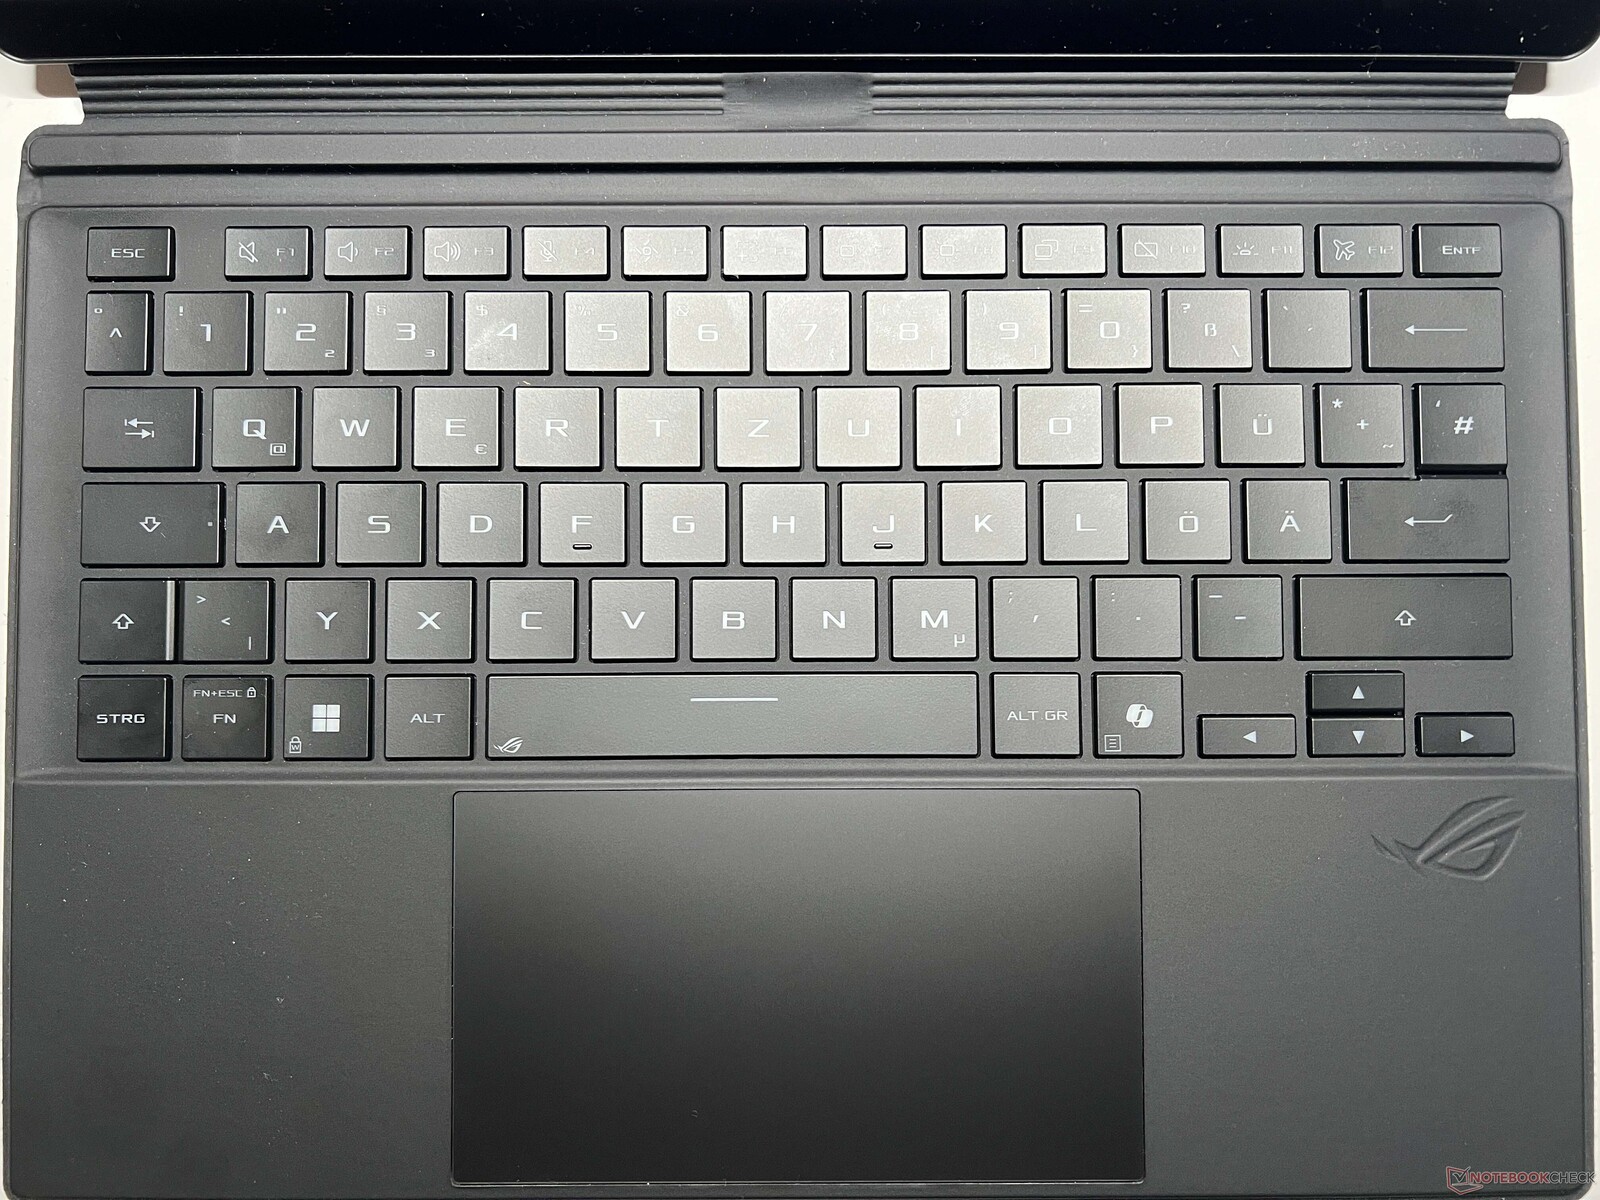
The clickpad size went up from 10.5 x 6.1 to 12.8 x 7.2 cm, which is immediately noticeable when you use the device. The gliding capabilities are very good and we did not notice any issues with cursor controls or gestures during our review period. The only drawback is the loud clicking sound when you press the pad. You can obviously use the capacitive touchscreen (Gorilla Glass DCX) as well, which works as flawlessly as expected. Stylus inputs are supported as well, but there is no stylus included in the box.
Display - IPS now with 180 Hz
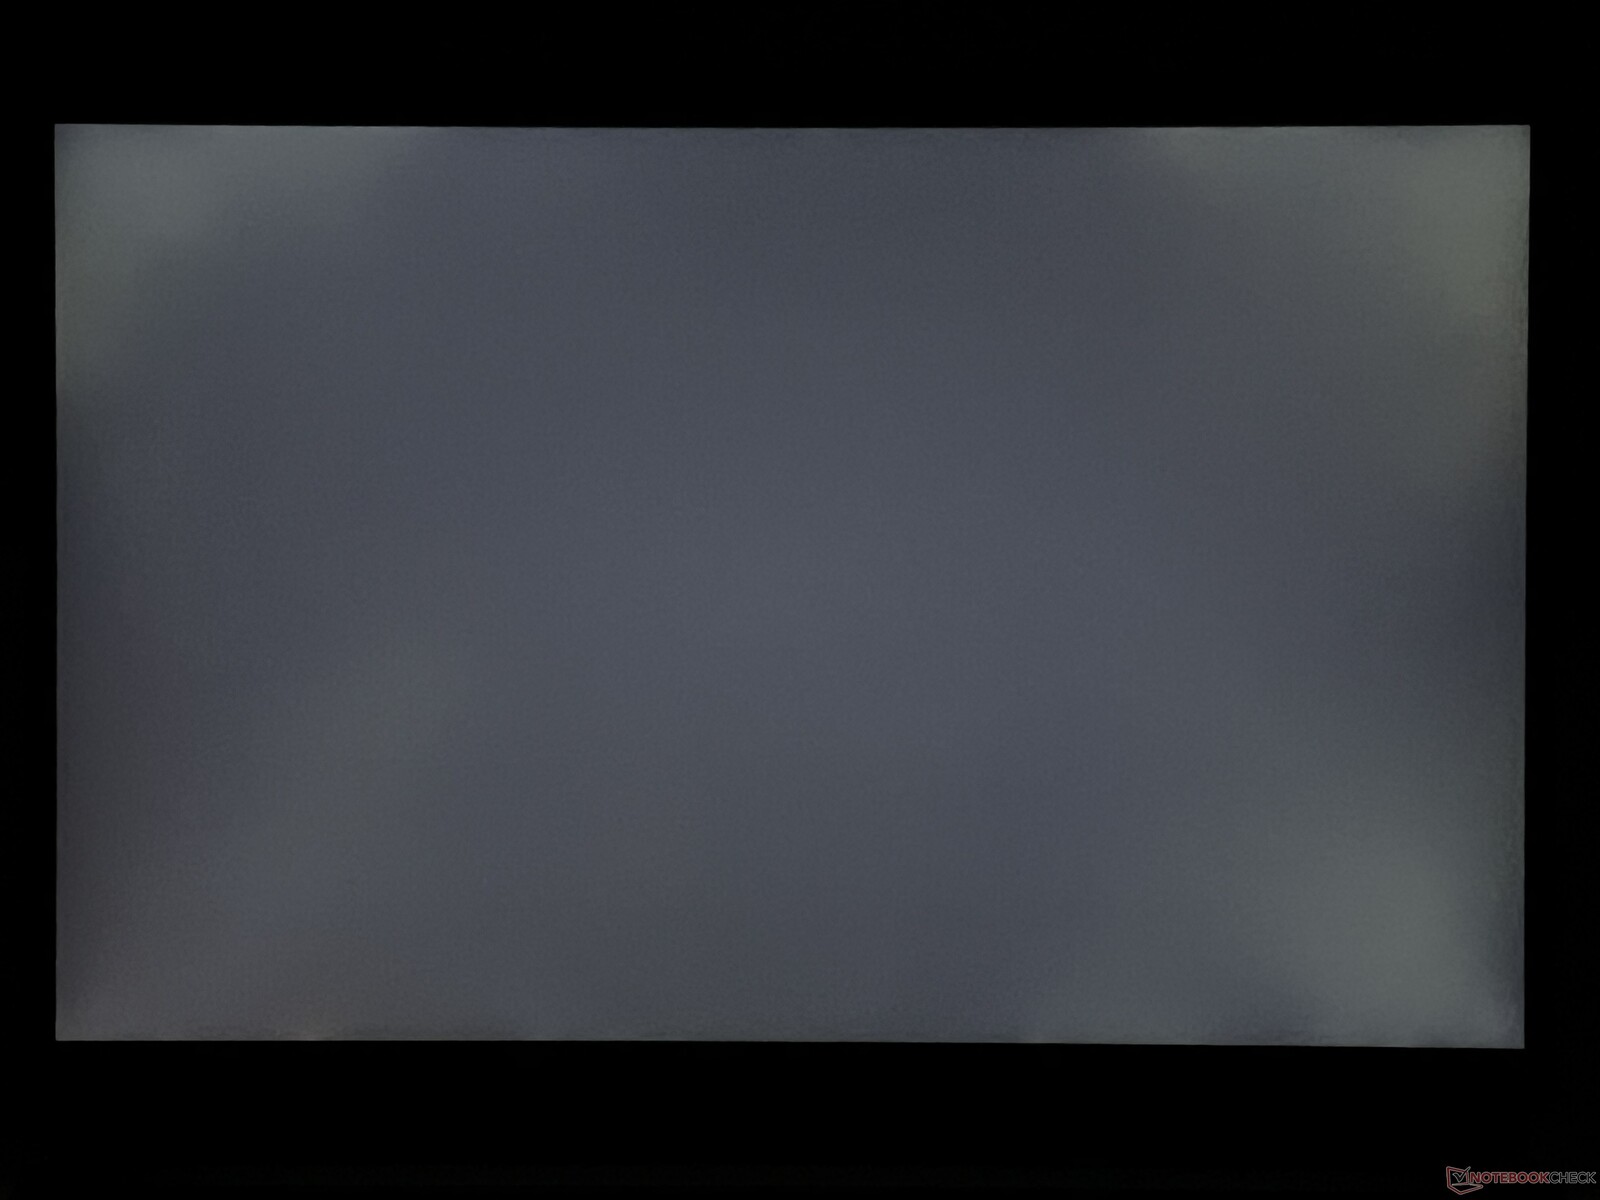
Similar to last year’s model we once again get a 13.4-inch IPS screen with a resolution of 2560 x 1600 pixels (16:10), but the refresh rate was increased from 165 to 180 Hz. The subjective image performance is still very good, even though OLED screens offer an even richer image with higher contrast levels. However, the IPS panel does not use PWM flickering in return and the response times are very fast, so there are no limitations for gaming. At high brightness levels you will notice some backlight bleeding on dark backgrounds, but this is not really visible in practice. You can also notice a slightly grainy effect on bright images when you look closely, which is caused by the touchscreen layer (but this is moaning on a high level). Neither the brightness, nor the color temperature can be controlled via sensor and HDR contents are not supported.
Asus still advertises a brightness of 500 nits and we can confirm that for our review unit (up to 518 nits, ~490 nits on average). It is therefore slightly brighter than the previous model and the maximum contrast ratio (black value 0.3 cd/m²) is also better at ~1700:1. The minimum brightness, however, is a bit too bright for very dark environments at around 28 nits.
| |||||||||||||||||||||||||
Brightness Distribution: 91 %
Center on Battery: 518 cd/m²
Contrast: 1727:1 (Black: 0.3 cd/m²)
ΔE ColorChecker Calman: 1.5 | ∀{0.5-29.43 Ø4.73}
calibrated: 1.1
ΔE Greyscale Calman: 1.6 | ∀{0.09-98 Ø4.97}
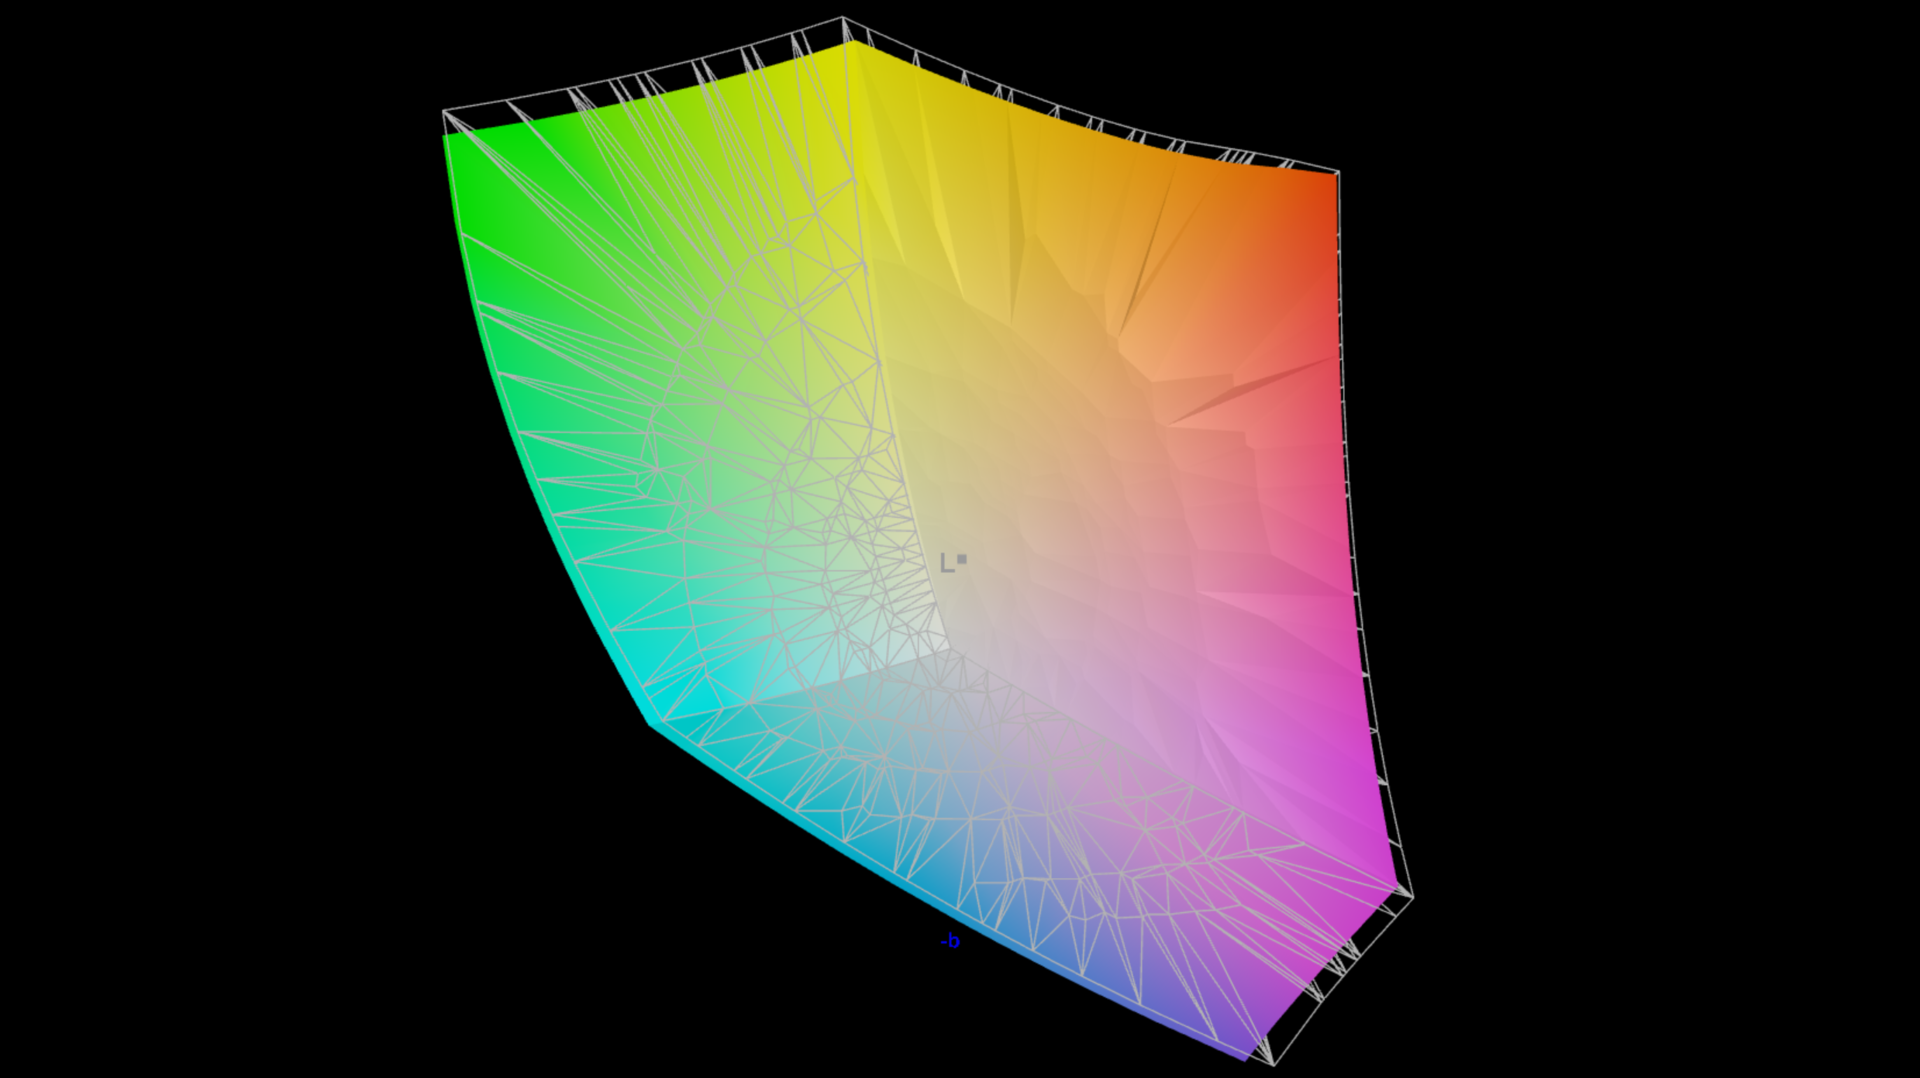
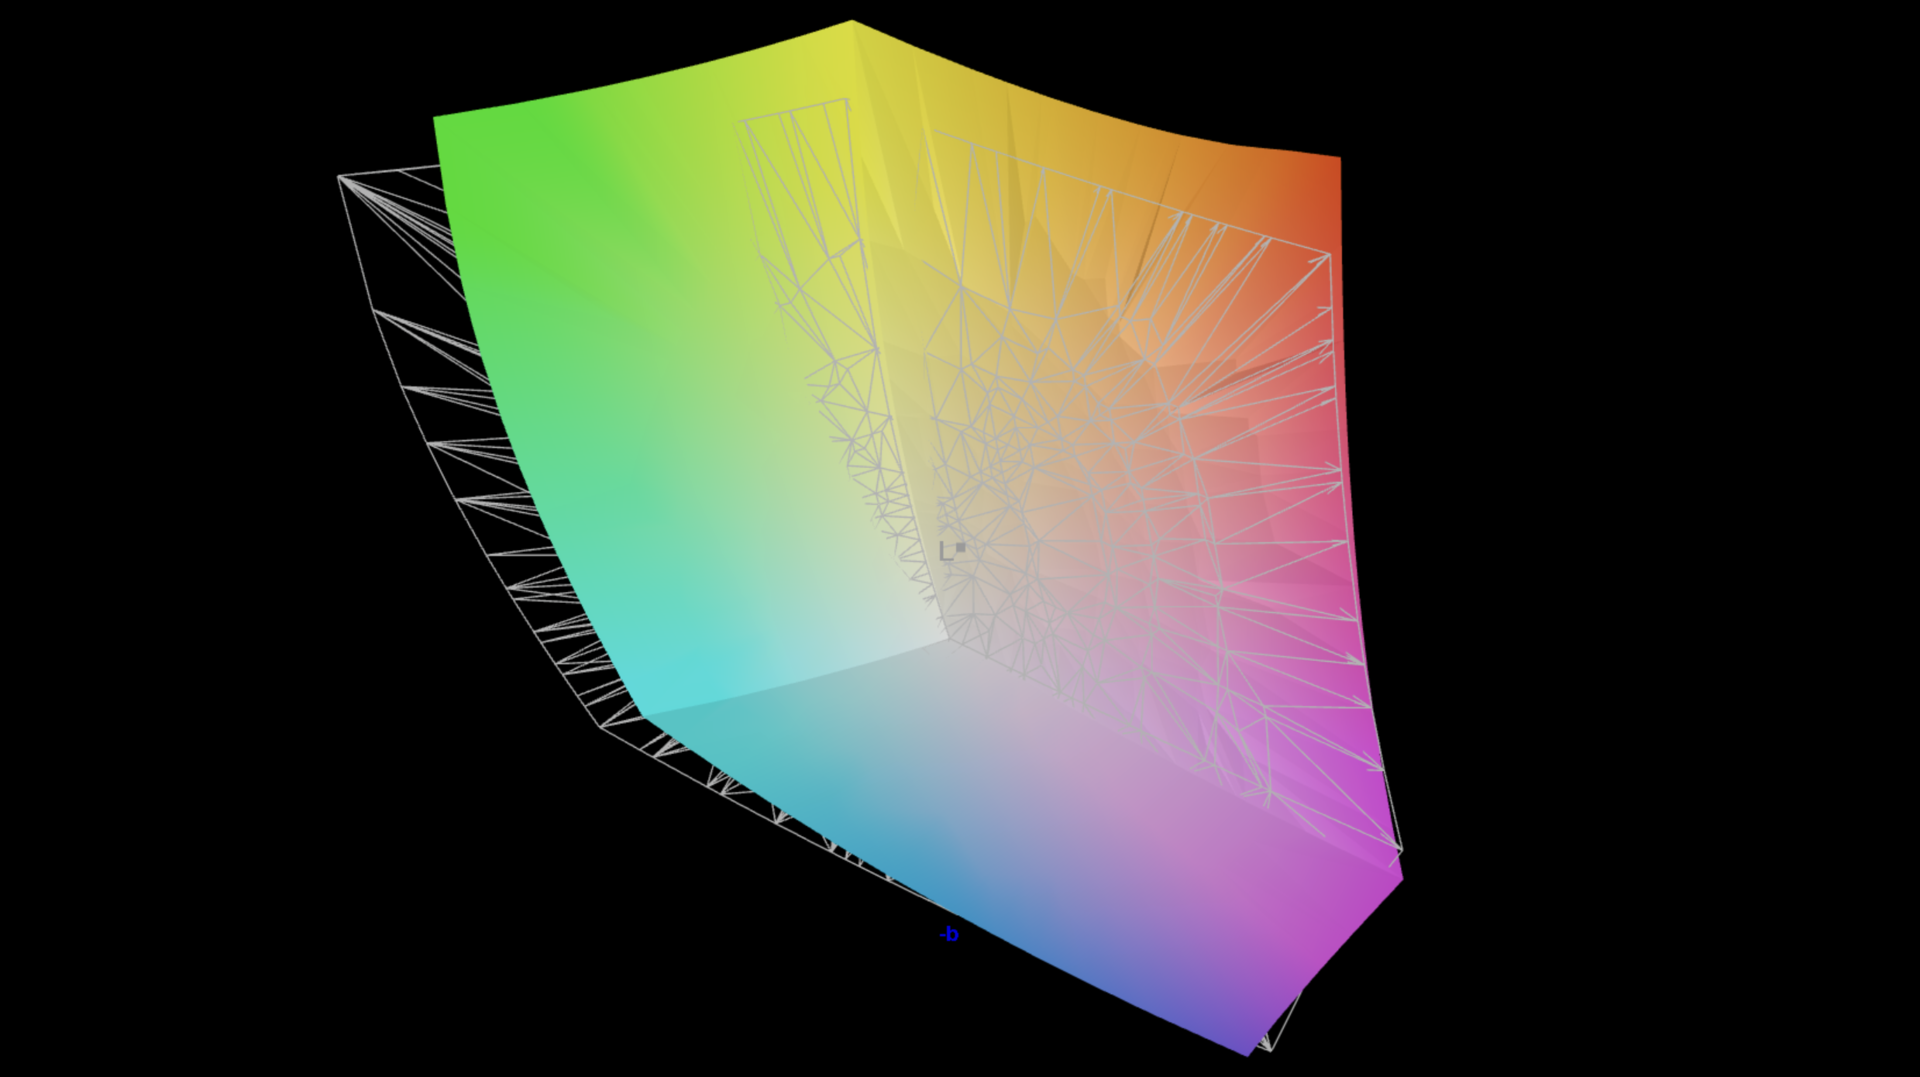
89.7% AdobeRGB 1998 (Argyll 3D)
99.6% sRGB (Argyll 3D)
95.1% Display P3 (Argyll 3D)
Gamma: 2.23
CCT: 6536 K
| Asus ROG Flow Z13 GZ302EA-RU073W TL134ADXP03, IPS, 2560x1600, 13.4", 180 Hz | Asus ROG Flow Z13 ACRNM TL134ADXP01-0, IPS, 2560x1600, 13.4", 165 Hz | Asus ProArt PX13 HN7306 ATNA33AA08-0, OLED, 2880x1800, 13.3", 60 Hz | Asus ROG Zephyrus G14 2024 GA403U ATNA40CU05-0, OLED, 2880x1800, 14", 120 Hz | Razer Blade 14 RZ09-0508 TL140ADXP04-0, IPS, 2560x1600, 14", 240 Hz | Razer Blade 14 RTX 4070 AU Optronics B140QAN06.U, IPS, 2560x1600, 14", 240 Hz | Acer Predator Helios Neo 14 (2024) BOE CQ NE145F8M-NY1, IPS, 3072x1920, 14.5", 165 Hz | |
|---|---|---|---|---|---|---|---|
| Display | -1% | 1% | 2% | -1% | -1% | -21% | |
| Display P3 Coverage (%) | 95.1 | 96.94 2% | 99.4 5% | 99.6 5% | 96.9 2% | 97.3 2% | 65 -32% |
| sRGB Coverage (%) | 99.6 | 99.92 0% | 100 0% | 100 0% | 99.8 0% | 99.8 0% | 95.3 -4% |
| AdobeRGB 1998 Coverage (%) | 89.7 | 85.17 -5% | 88.9 -1% | 89.9 0% | 85 -5% | 85.3 -5% | 66.8 -26% |
| Response Times | 45% | 63% | 87% | -55% | -105% | -20% | |
| Response Time Grey 50% / Grey 80% * (ms) | 5.4 ? | 2.1 ? 61% | 1.94 ? 64% | 0.62 ? 89% | 6 ? -11% | 11.9 ? -120% | 5.4 ? -0% |
| Response Time Black / White * (ms) | 4.2 ? | 3 ? 29% | 1.63 ? 61% | 0.68 ? 84% | 8.3 ? -98% | 8 ? -90% | 5.9 ? -40% |
| PWM Frequency (Hz) | 240 ? | 960 ? | |||||
| PWM Amplitude * (%) | 50 | ||||||
| Screen | -22% | 134% | 323% | -11% | -71% | -41% | |
| Brightness middle (cd/m²) | 518 | 464 -10% | 360 -31% | 423 -18% | 484.1 -7% | 559.3 8% | 450 -13% |
| Brightness (cd/m²) | 489 | 455 -7% | 358 -27% | 424 -13% | 466 -5% | 560 15% | 433 -11% |
| Brightness Distribution (%) | 91 | 89 -2% | 98 8% | 98 8% | 89 -2% | 88 -3% | 87 -4% |
| Black Level * (cd/m²) | 0.3 | 0.4 -33% | 0.02 93% | 0.01 97% | 0.38 -27% | 0.44 -47% | 0.45 -50% |
| Contrast (:1) | 1727 | 1160 -33% | 18000 942% | 42300 2349% | 1274 -26% | 1271 -26% | 1000 -42% |
| Colorchecker dE 2000 * | 1.5 | 2 -33% | 1.1 27% | 0.7 53% | 2.23 -49% | 4.44 -196% | 2.26 -51% |
| Colorchecker dE 2000 max. * | 4 | 4.2 -5% | 2.3 43% | 1.8 55% | 4.57 -14% | 9.3 -133% | 7.5 -88% |
| Colorchecker dE 2000 calibrated * | 1.1 | 1.2 -9% | 0.74 33% | 0.39 65% | 1.21 -10% | ||
| Greyscale dE 2000 * | 1.6 | 2.7 -69% | 1.4 13% | 0.8 50% | 1.6 -0% | 6.8 -325% | 3.2 -100% |
| Gamma | 2.23 99% | 2.24 98% | 2.16 102% | 2.18 101% | 2.24 98% | 2.3 96% | 2.214 99% |
| CCT | 6536 99% | 6832 95% | 6554 99% | 6505 100% | 6816 95% | 6242 104% | 6121 106% |
| Total Average (Program / Settings) | 7% /
-8% | 66% /
92% | 137% /
212% | -22% /
-15% | -59% /
-61% | -27% /
-34% |
* ... smaller is better
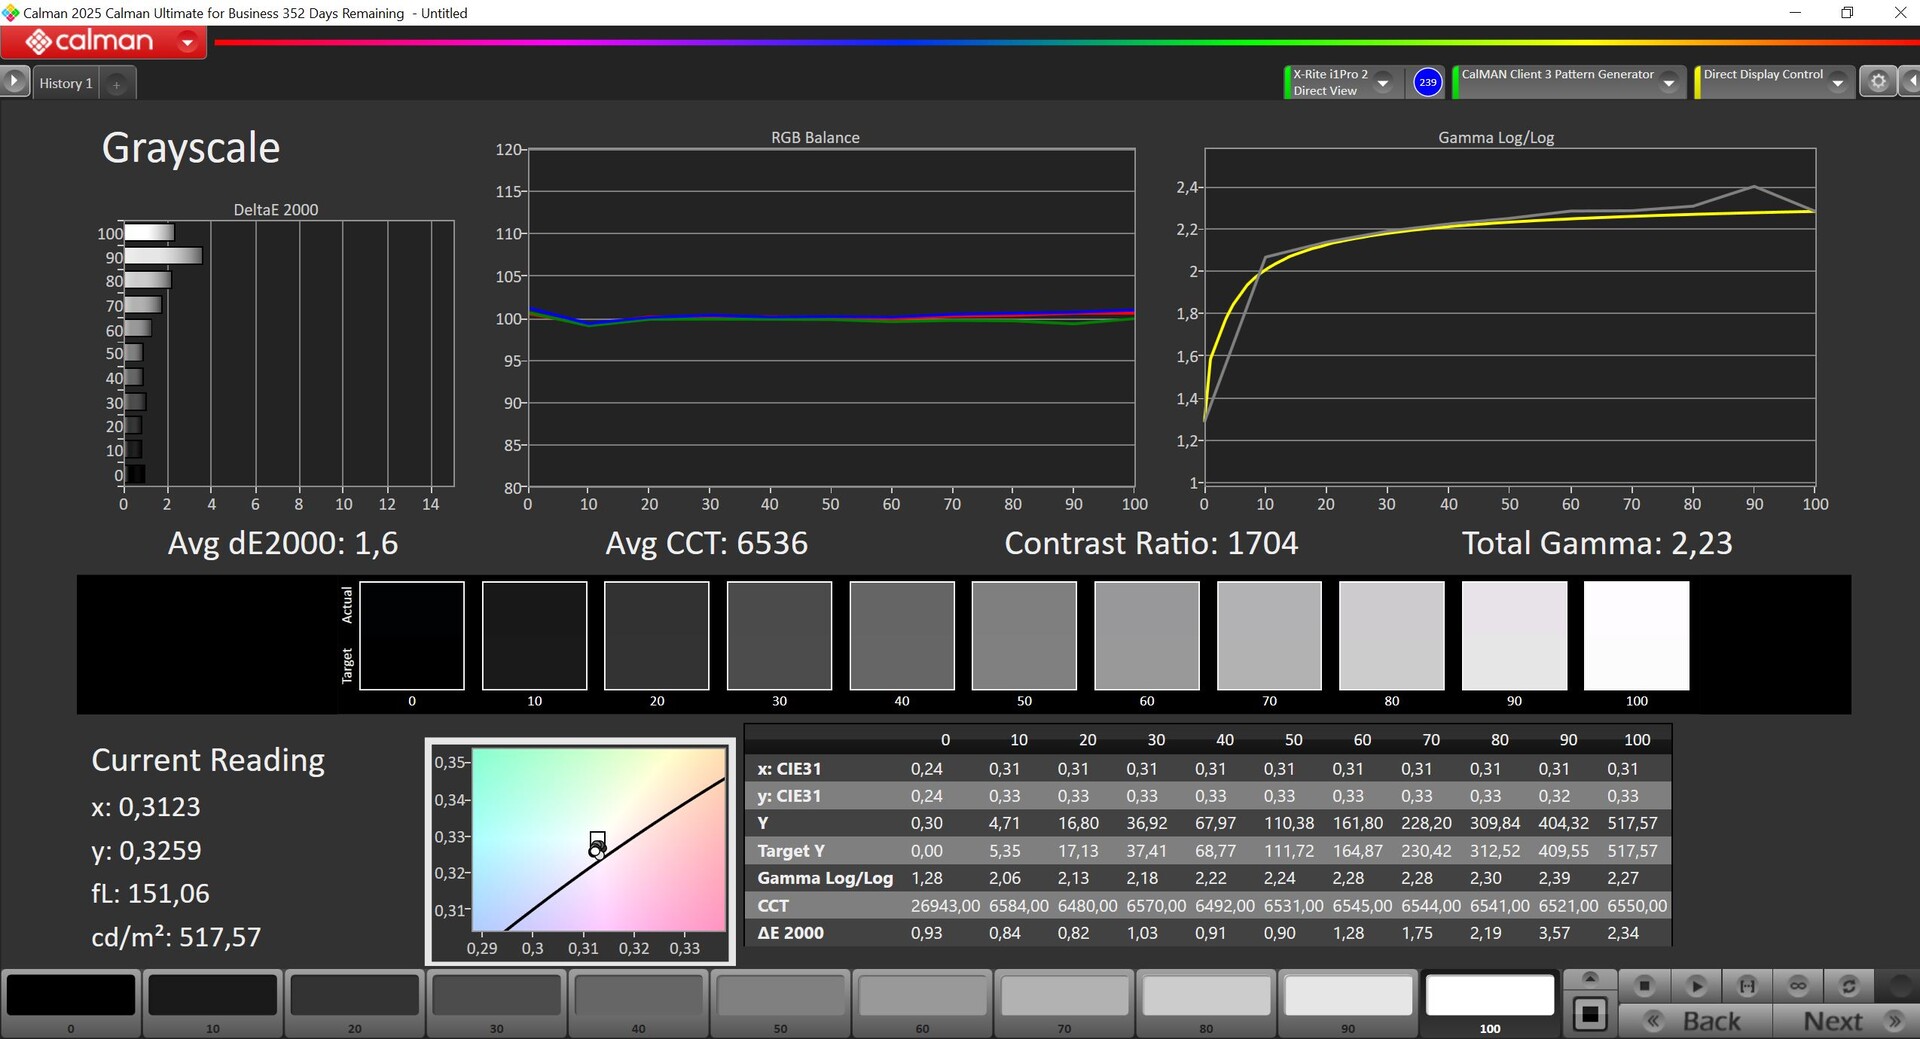
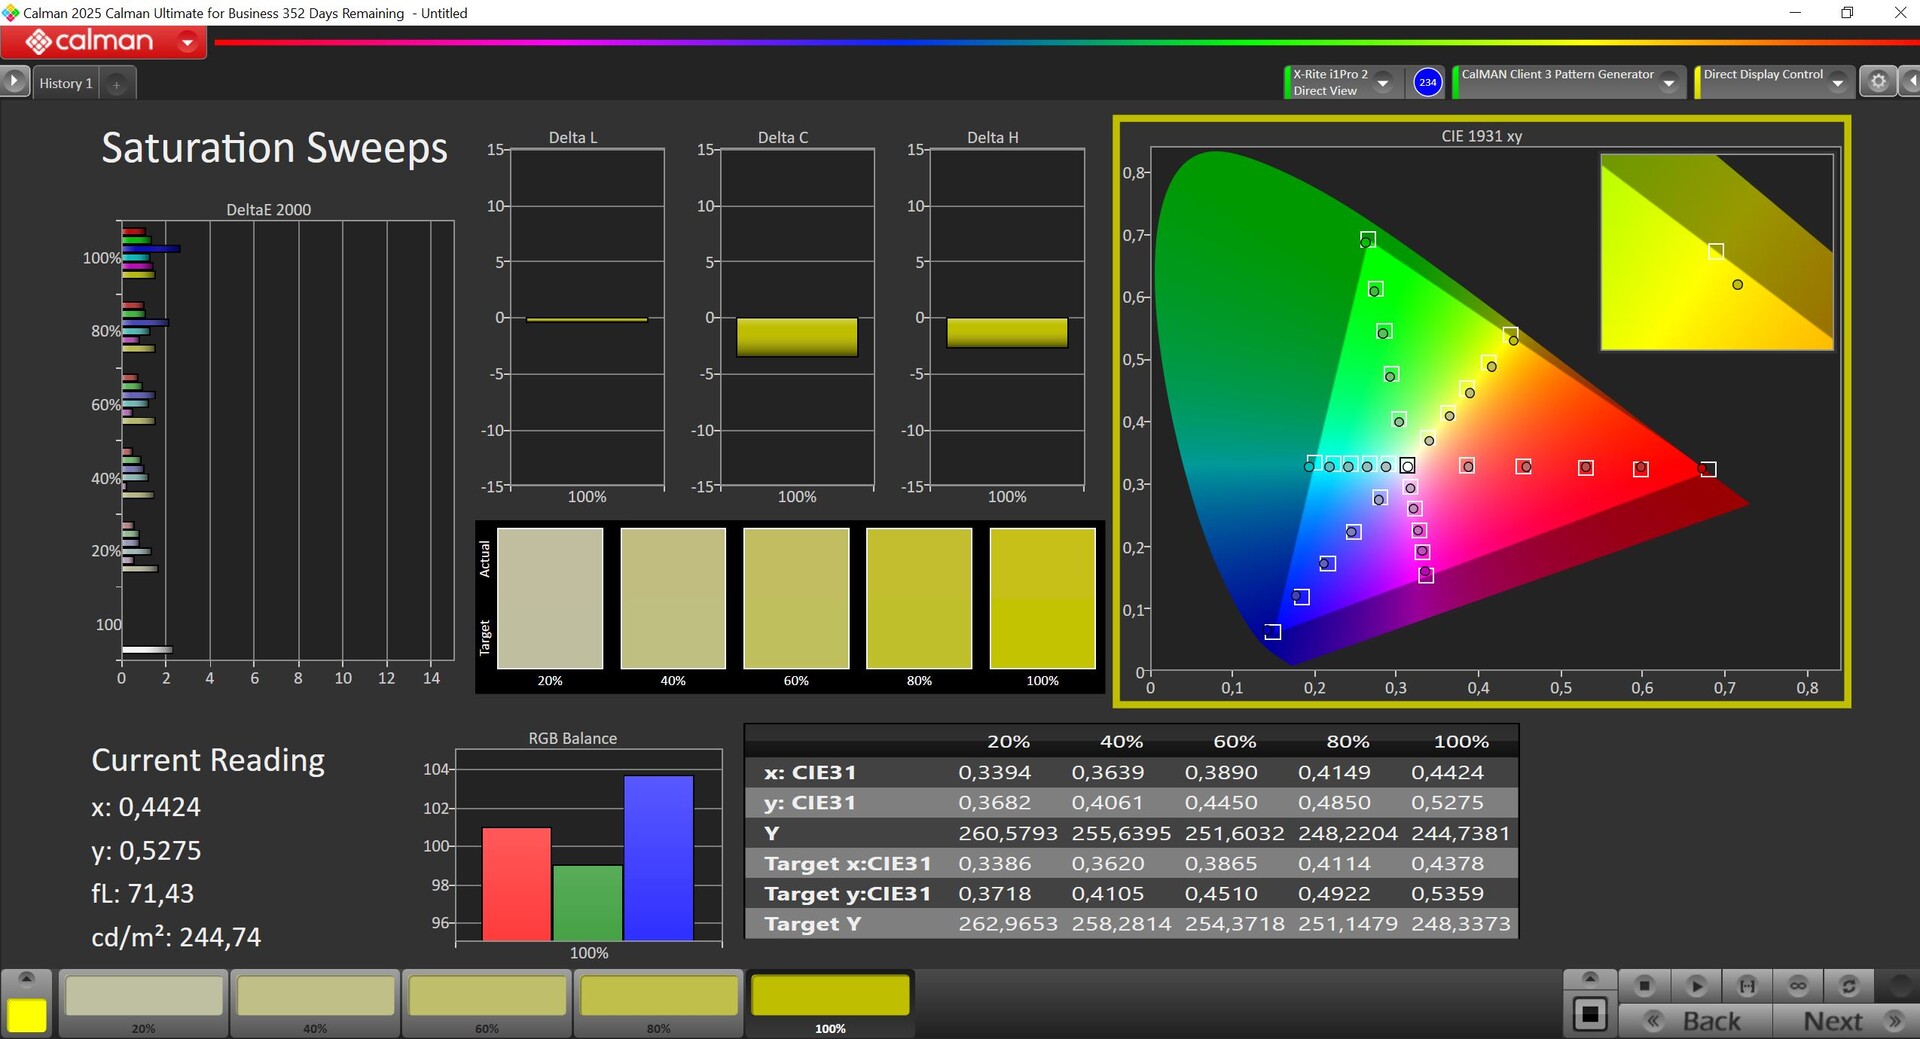

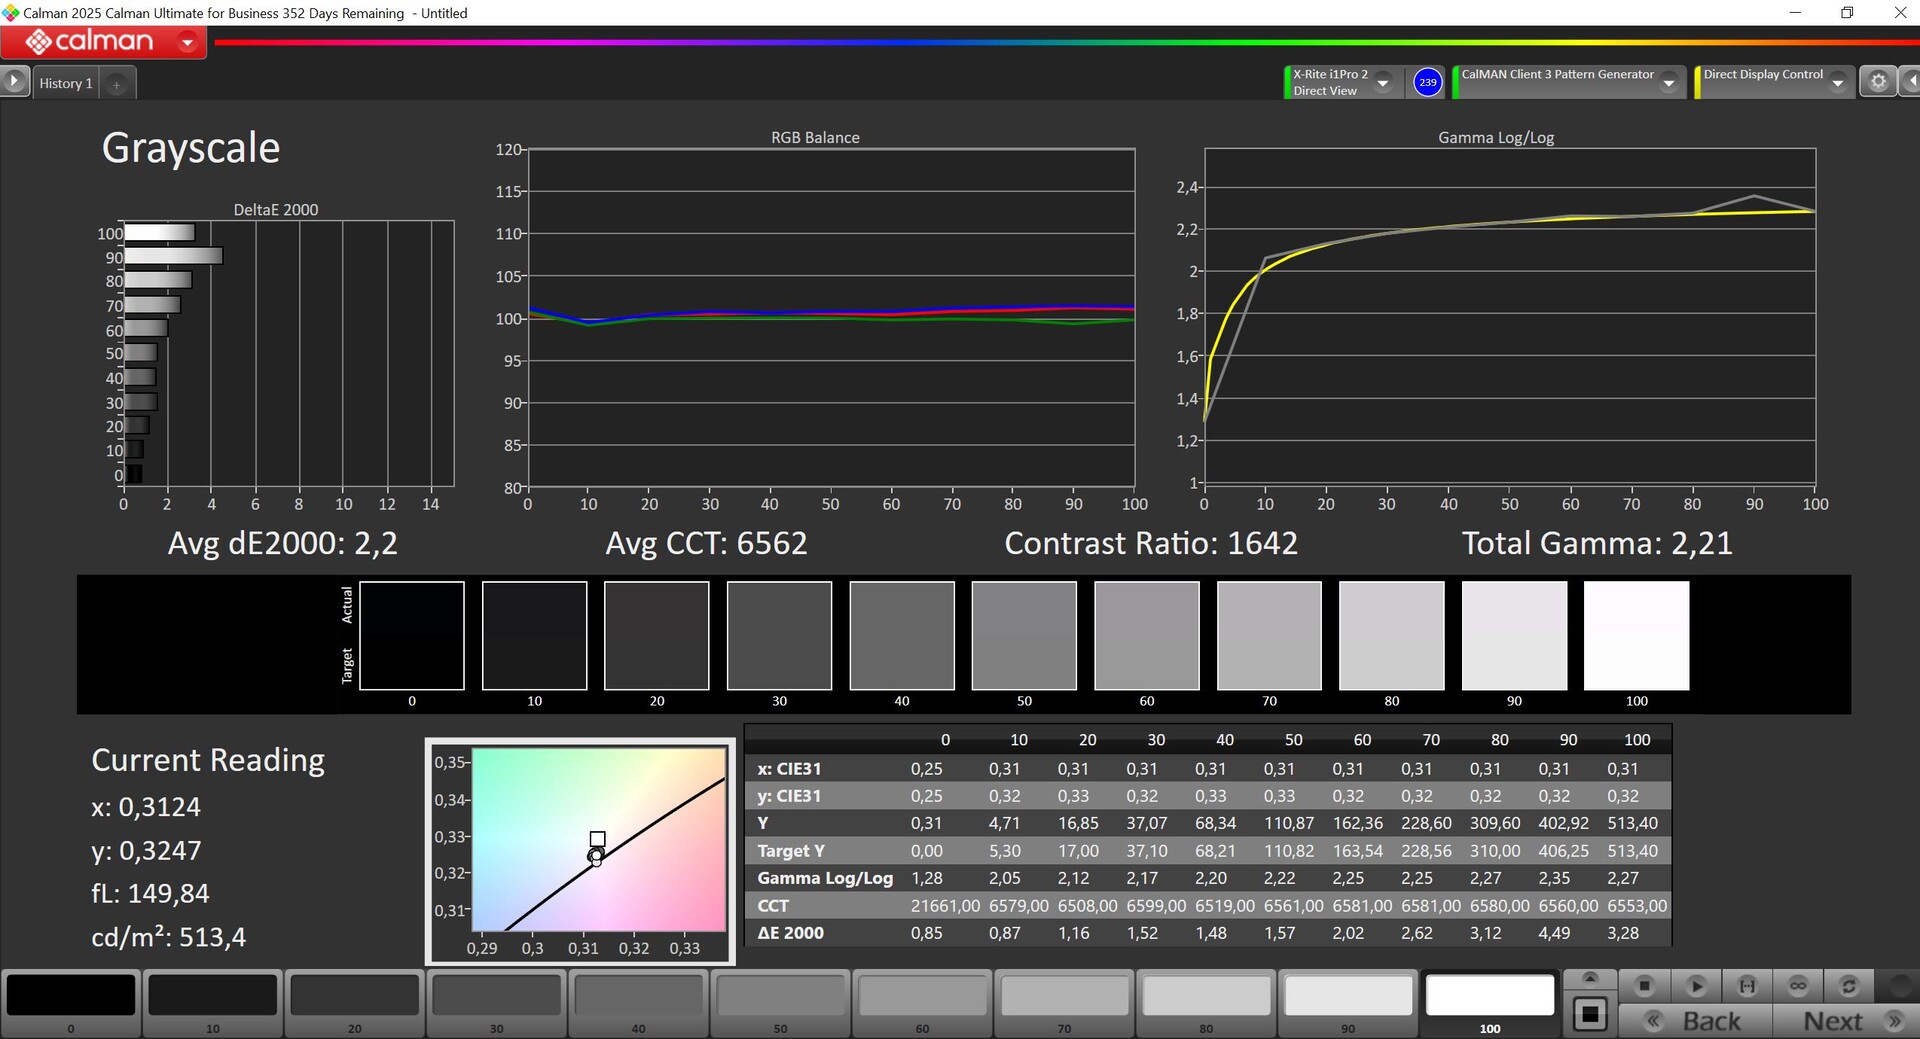
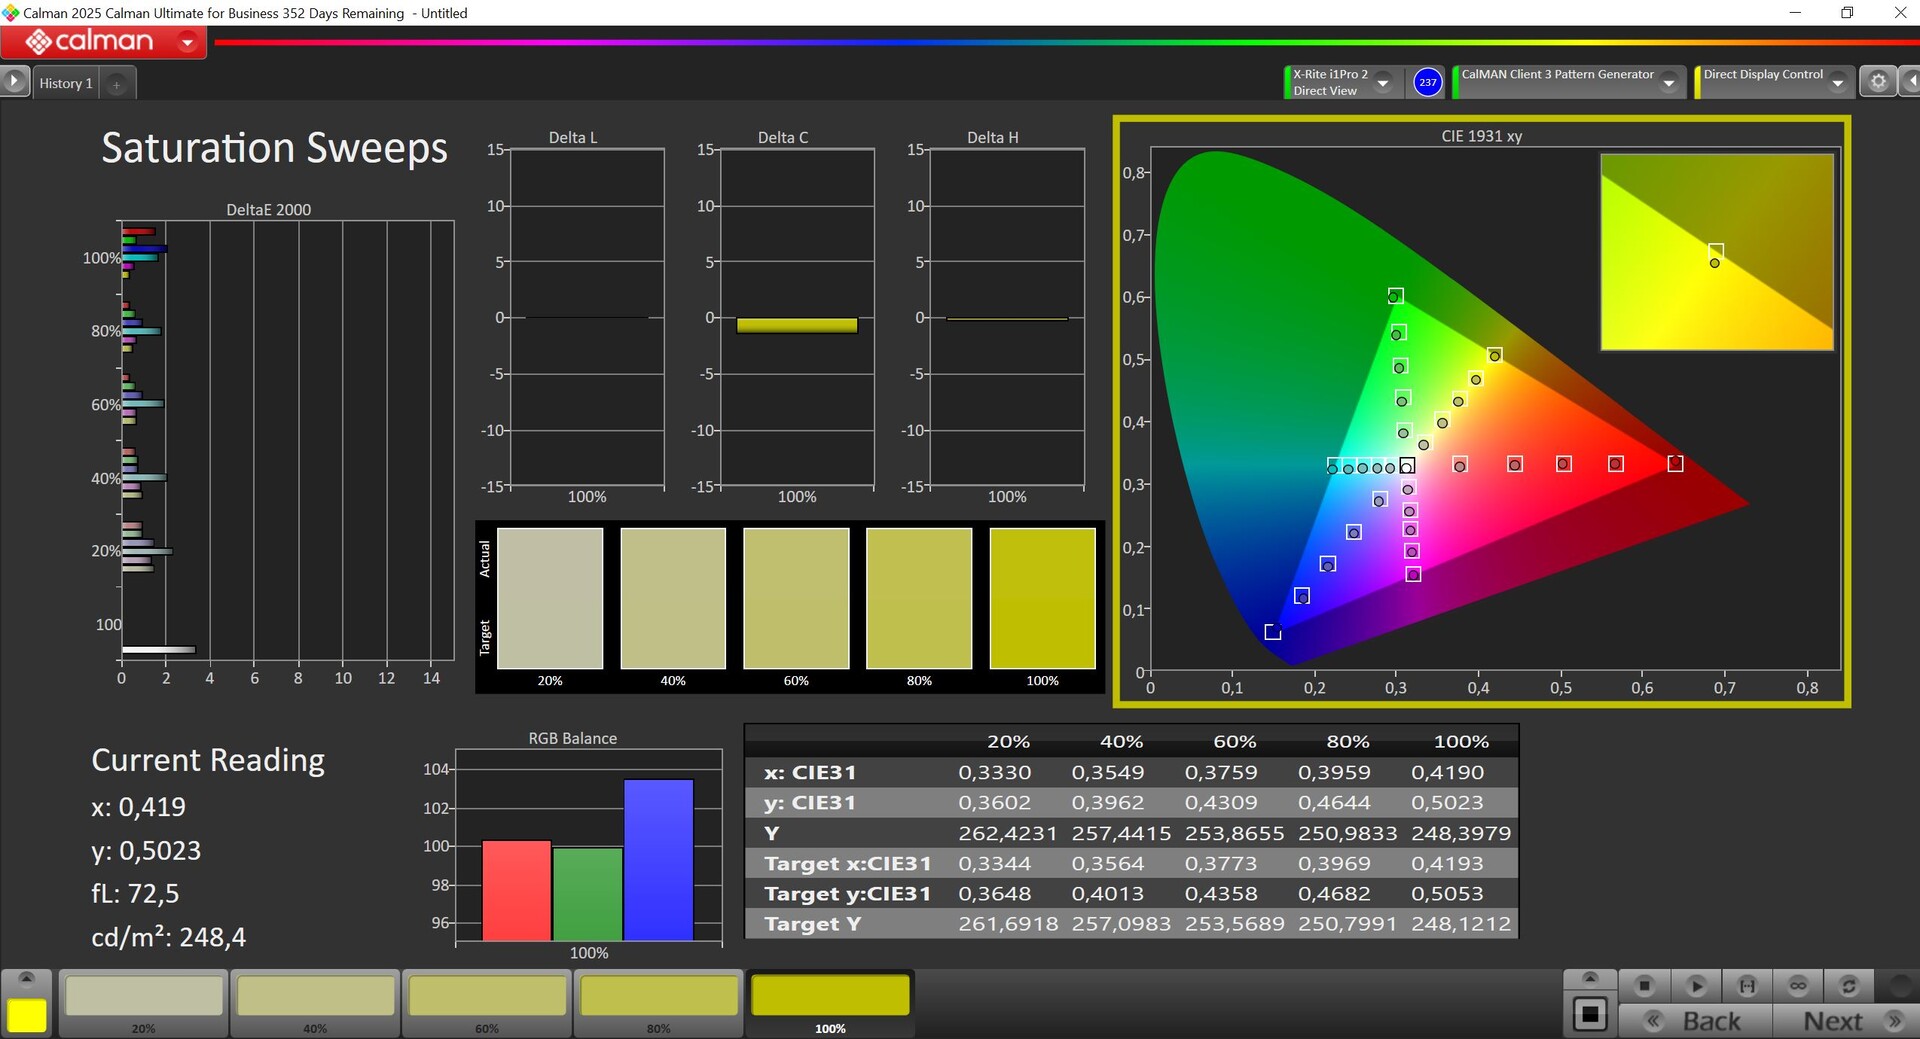

The preinstalled Armoury Crate software offers different color profile and we tested them with the professional CalMAN software. We were a bit surprised about the good accuracy of the default Native profile, and that there is no noticeable difference to the P3 profile. Native profiles on Asus devices are usually slightly over-saturated for richer colors. The deviations both for the grayscale as well as the colors are already very low and a calibration is not really necessary. We still tried and managed to improve the image quality even further (the corresponding profile can be downloaded in the box above for free). You also get a very accurate sRGB profile and the P3 color gamut is almost fully covered.


Display Response Times
| ↔ Response Time Black to White | ||
|---|---|---|
| 4.2 ms ... rise ↗ and fall ↘ combined | ↗ 1.4 ms rise | 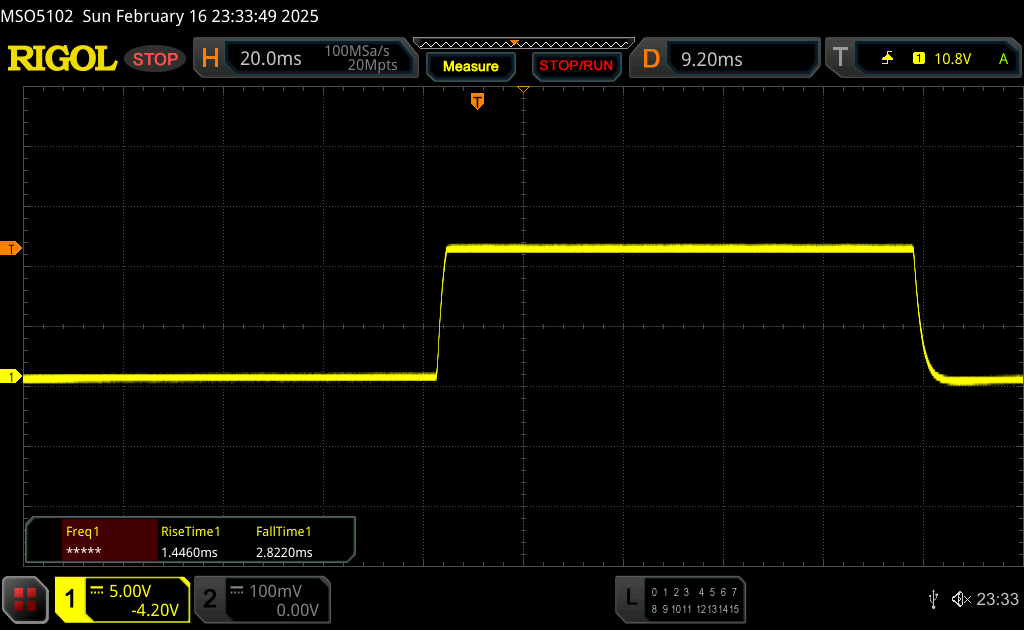 |
| ↘ 2.8 ms fall | ||
| The screen shows very fast response rates in our tests and should be very well suited for fast-paced gaming. In comparison, all tested devices range from 0.1 (minimum) to 240 (maximum) ms. » 17 % of all devices are better. This means that the measured response time is better than the average of all tested devices (19.9 ms). | ||
| ↔ Response Time 50% Grey to 80% Grey | ||
| 5.4 ms ... rise ↗ and fall ↘ combined | ↗ 2.4 ms rise | 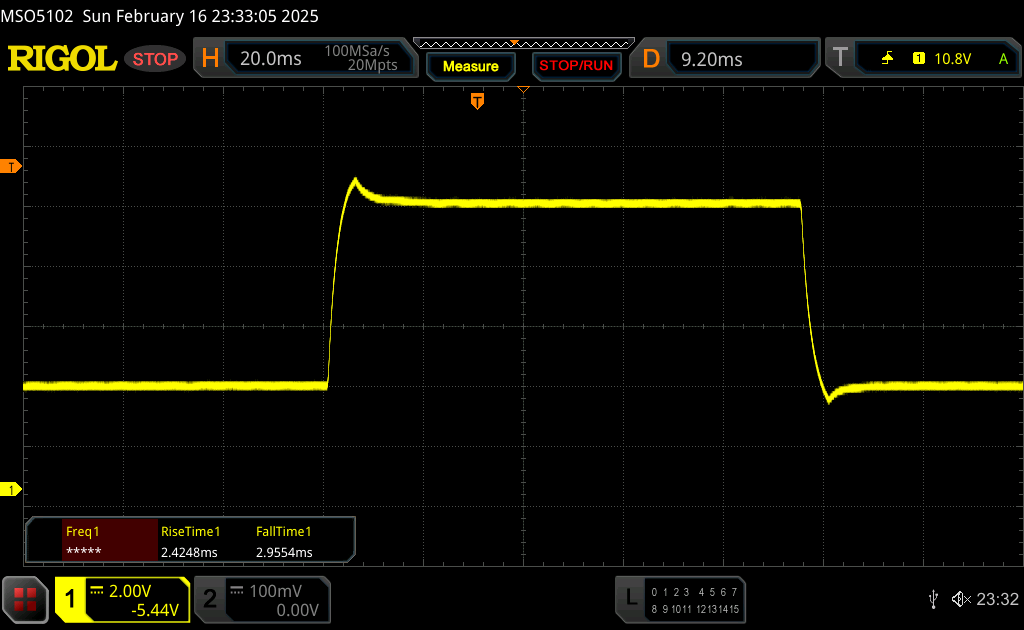 |
| ↘ 3 ms fall | ||
| The screen shows very fast response rates in our tests and should be very well suited for fast-paced gaming. In comparison, all tested devices range from 0.165 (minimum) to 636 (maximum) ms. » 17 % of all devices are better. This means that the measured response time is better than the average of all tested devices (31.1 ms). | ||
Screen Flickering / PWM (Pulse-Width Modulation)
| Screen flickering / PWM not detected | ≤ 87 % brightness setting | 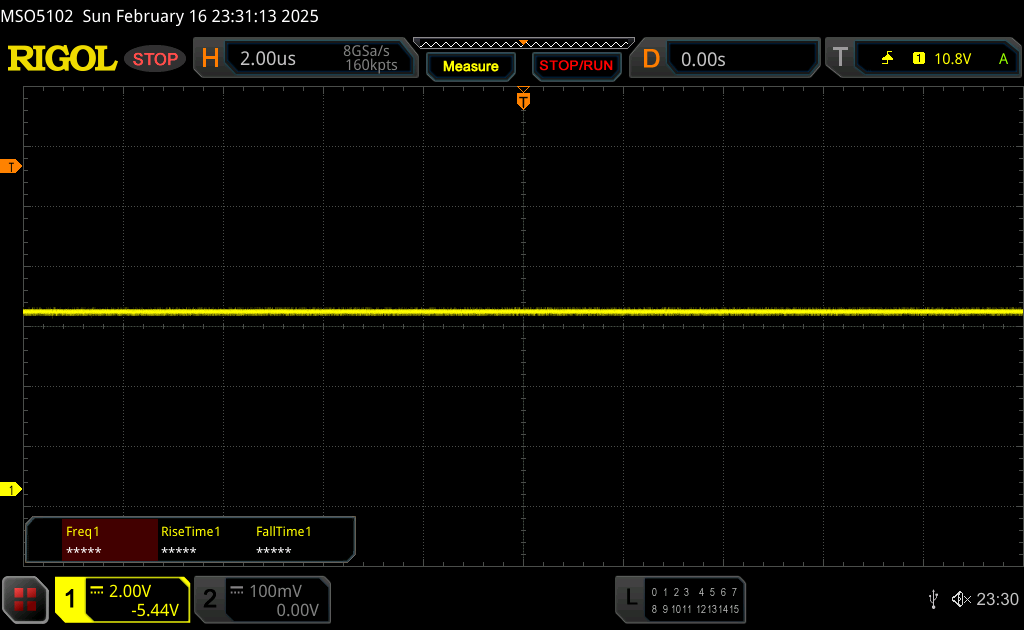 | |
In comparison: 52 % of all tested devices do not use PWM to dim the display. If PWM was detected, an average of 7804 (minimum: 5 - maximum: 343500) Hz was measured. | |||
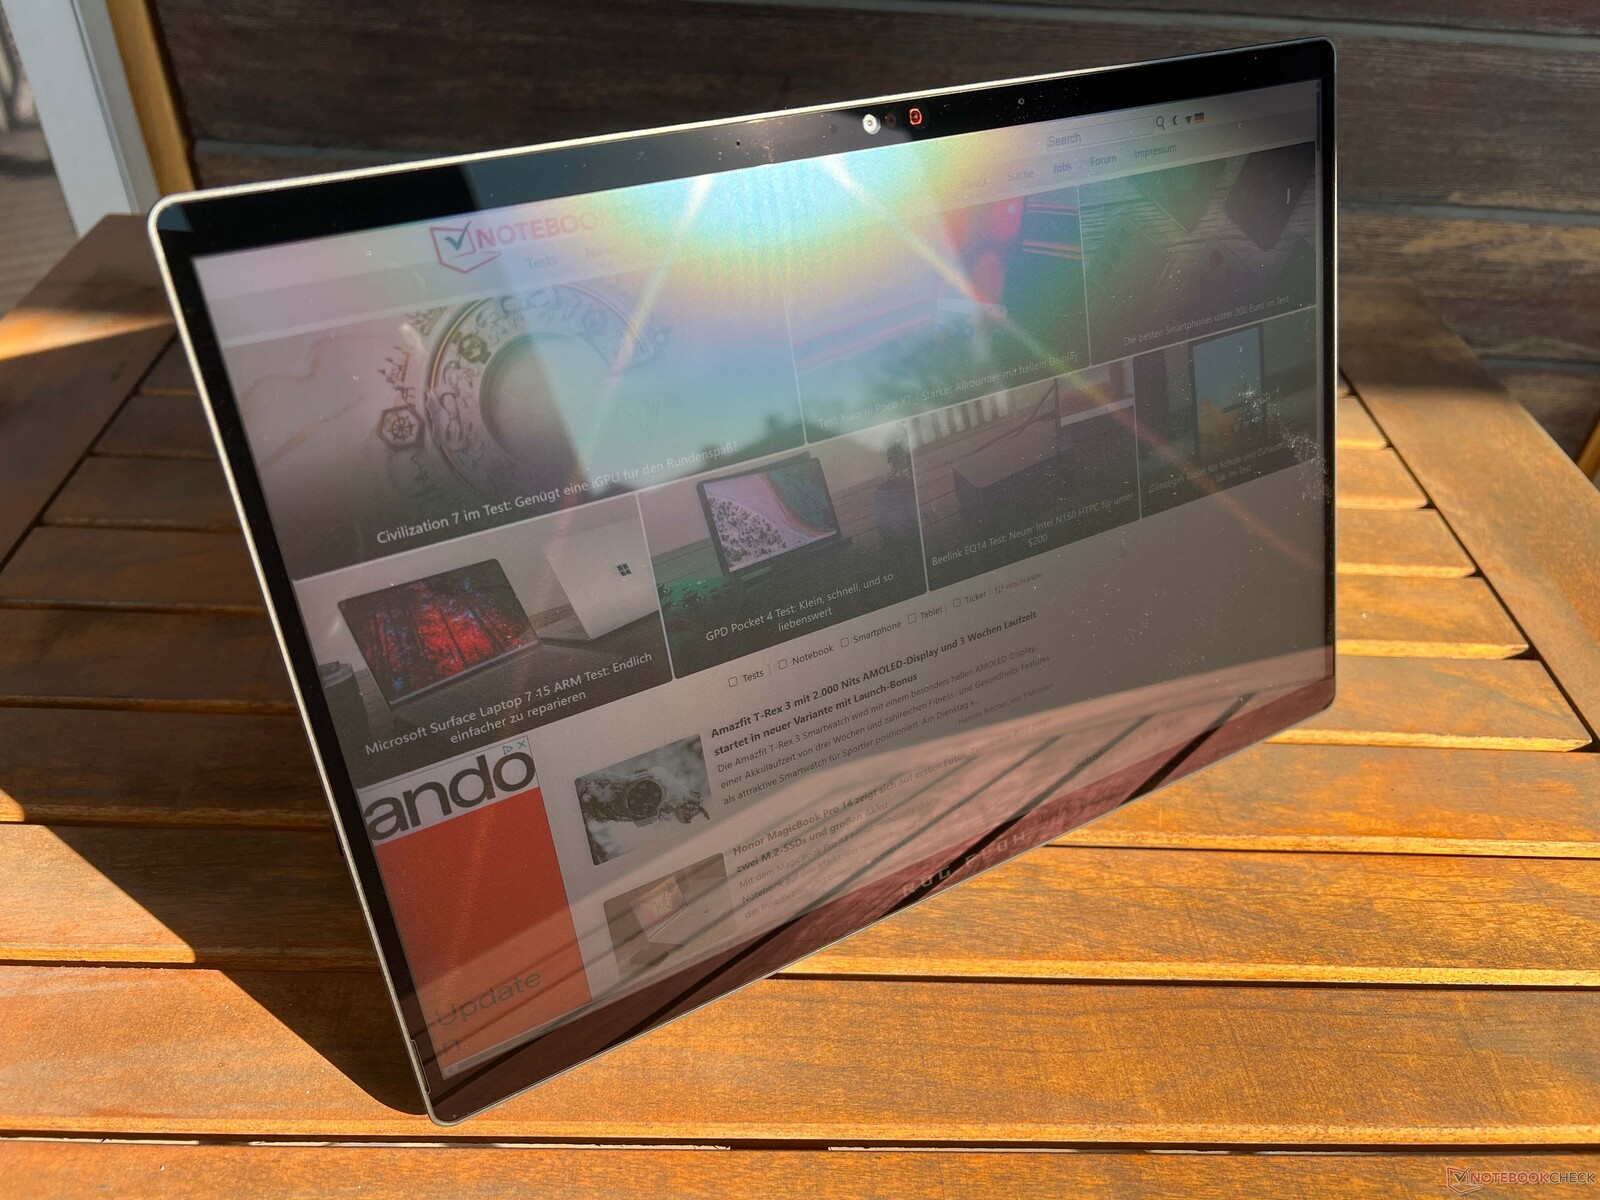

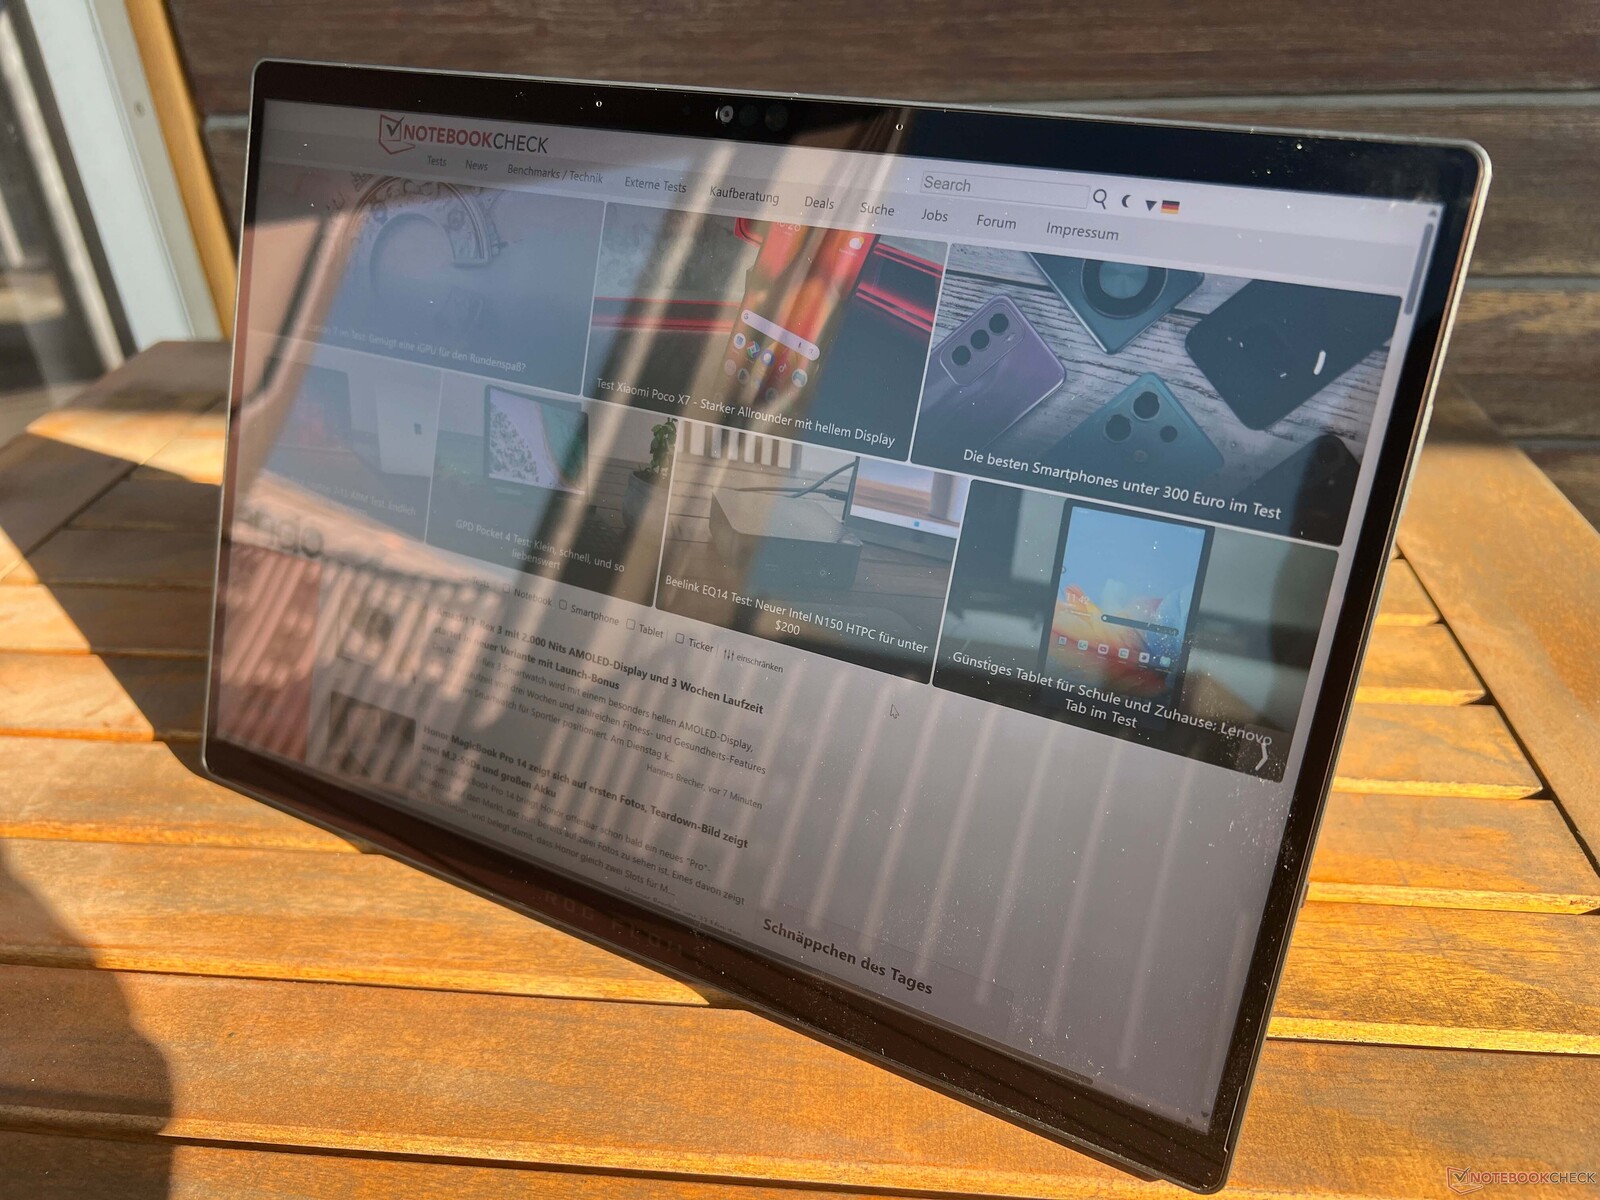


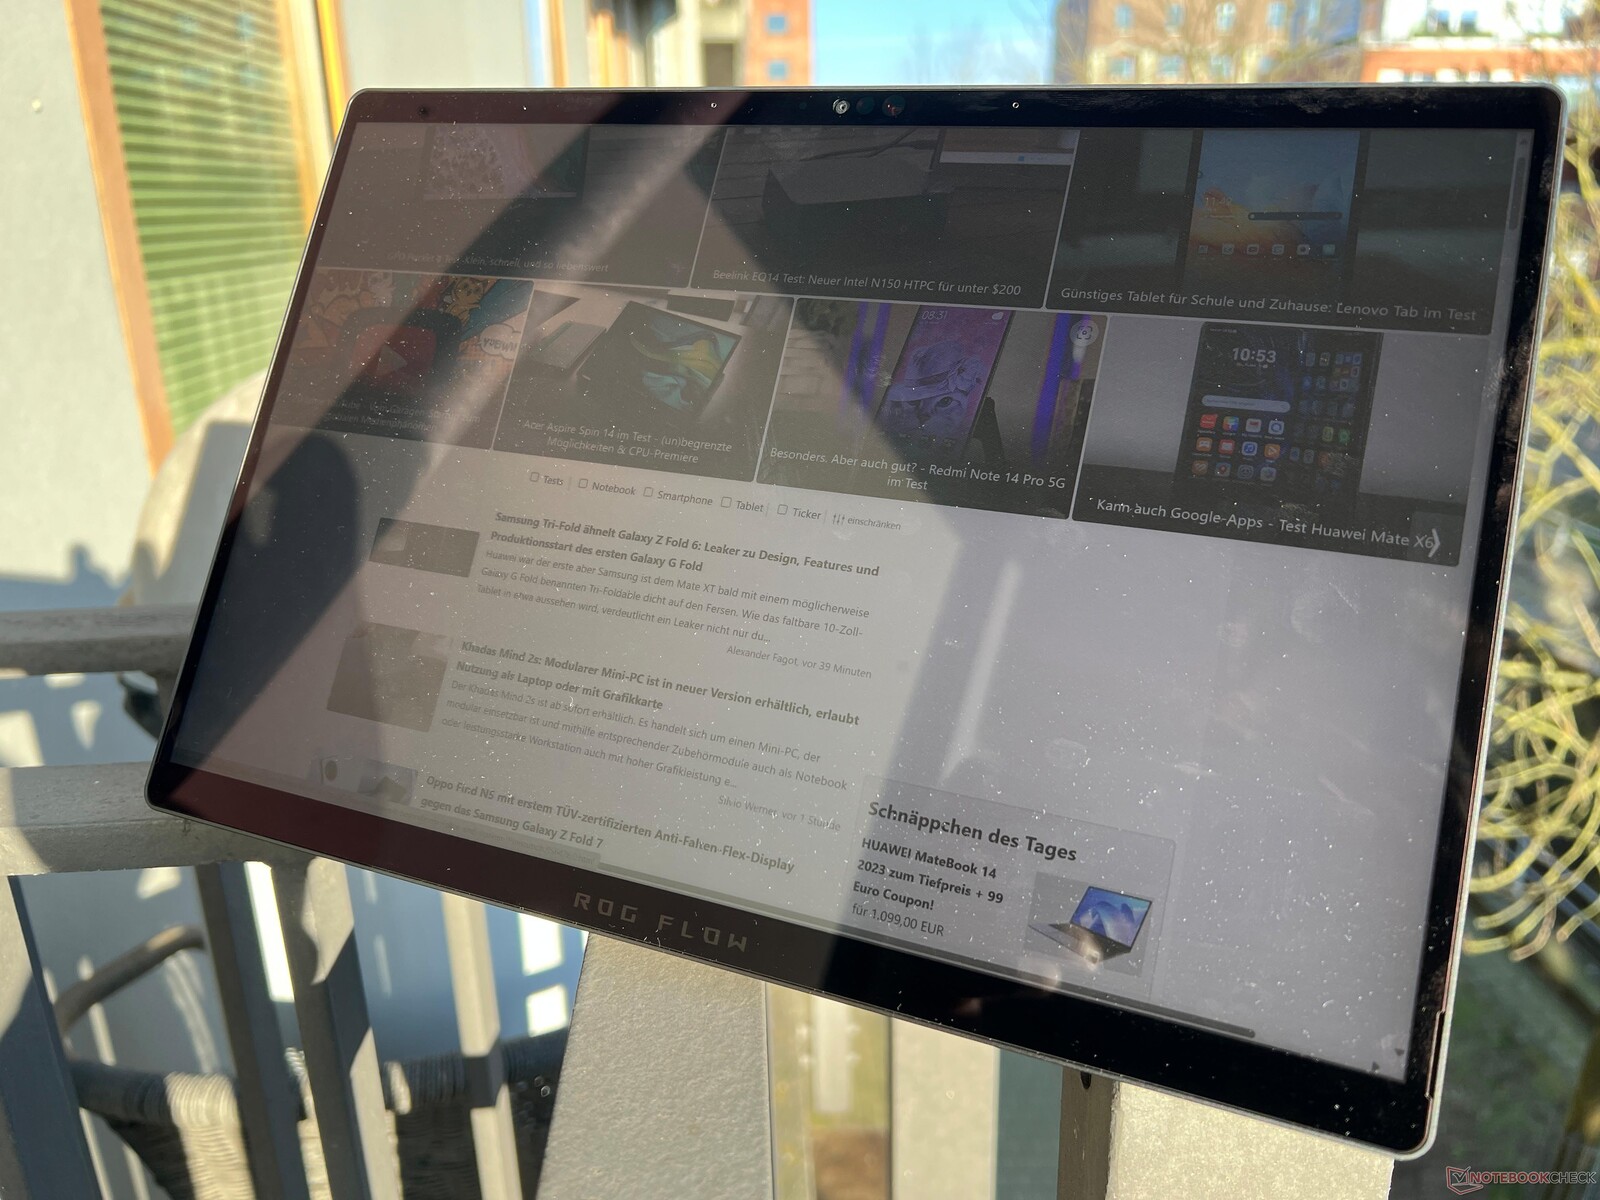


The touchscreen of the ROG Flow Z13 is glossy, but the reflections could be worse. As long as you avoid direct light sources, you can still use the device in bright environments quite decently. The viewing angle stability of the IPS panel is good overall, but there is a visible contrast drop when you look at the screen at angles from above.

Performance - AMD Ryzen Max+ with up to 128 GB RAM
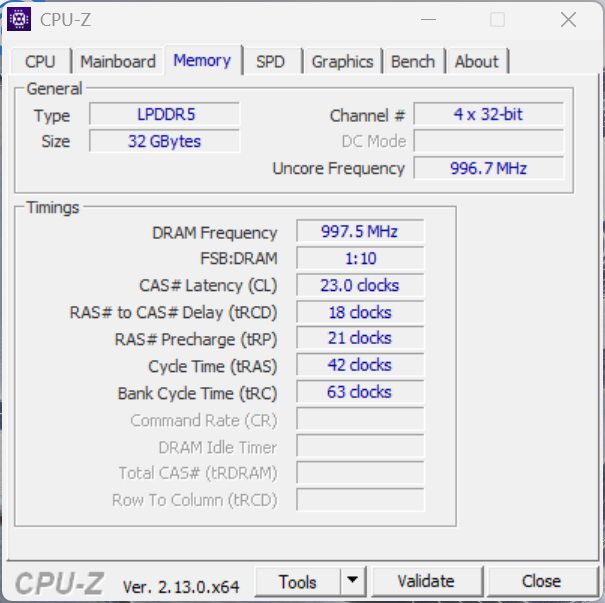
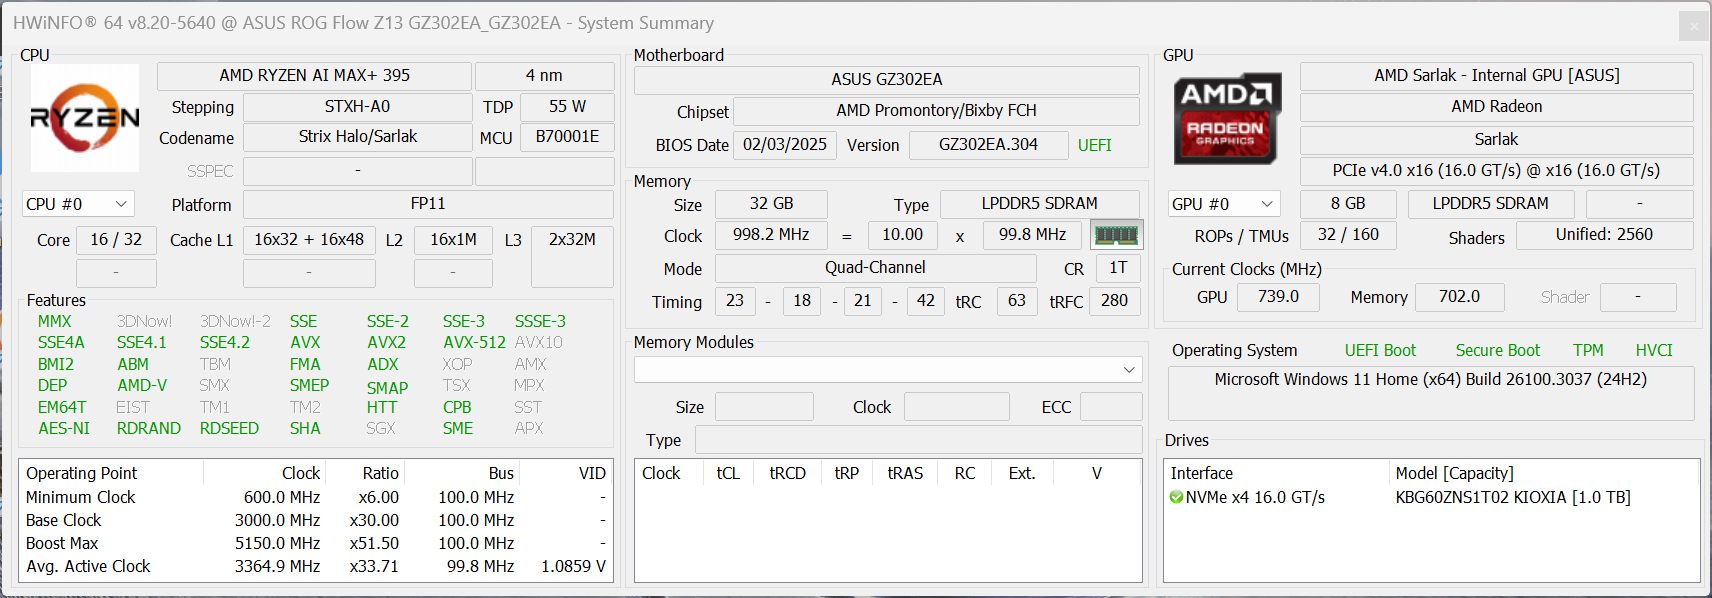
The new ROG Flow Z13 is either available with the Ryzen AI Max+ 395 (16 CPU cores) or the Ryzen AI Max 390 (12 CPU cores). You get at least 32 GB RAM (LPDDR5x-8000), but there are also models with 64 or even 128 GB.
Review Settings
The preinstalled Armoury Crate software offers three power profiles (Quiet, Performance, Turbo) as well as a manual mode where you can adjust the power limits as well as the fan curve (within certain parameters). The power profiles are also linked to the power settings of Windows. We performed all the following benchmarks and measurements in Turbo mode. On battery power, you are limited to the Performance mode.
| Power profile | TDP/TGP | CB2024 Multi | Time Spy Graphics | CP2077 QHD Ultra | max. fan noise |
|---|---|---|---|---|---|
| Quiet | 55/40/35 Watts | 1289 points | 6026 points | 28 fps | 33 dB(A) |
| Performance | 70/52/45 Watts | 1403 points | 8524 points | 39 fps | 39.1 dB(A) |
| Turbo | 86/70/60 Watts | 1648 points | 10224 points | 46 fps | 45.4 dB(A) |
| Manual | up to 93/92/80/ Watts | 1757 points | 10787 points | 51 fps | 49.8 dB(A) |
The 32 GB of RAM are shared memory, so the GPU can access it as well. You can allocate a certain amount of dedicated VRAM for the GPU with settings between 0.5 up to 24 GB for our review unit. We tested different settings and dedicated VRAM can have an advantage, especially while gaming. However, the Auto settings also worked quite well. Asus recommends using 8 GB dedicated VRAM, which is what we used for our benchmarks. SKUs with 64 GB RAM can allocate up to 48 GB for the GPU and SKUs with 128 GB up to 96 GB VRAM.
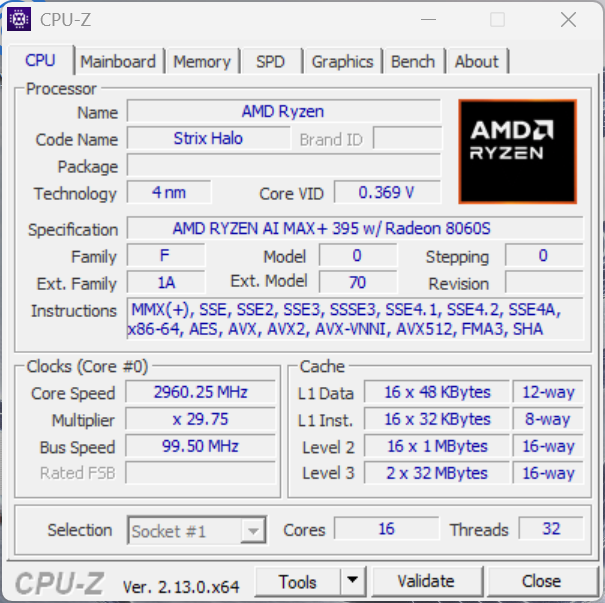
Processor - 16 Zen 5 cores for impressive performance figures
The Ryzen AI Max+ 395 uses 16 Zen 5 cores (32 threads) with a maximum clock of 5.1 GHz and 80 MB cache. The CPU can consume up to 86 Watts and then levels off at 70 Watts. The processor performance in multi-core scenarios is impressive and the old Flow Z13 with the Core i9-13900H is beaten by roughly 50-70 %. All in all, the new Max+ 395 is comparable to the Ryzen 9 7945HX3D (Zen4) running at 115 Watts. If you want similar multi-core performance in a somewhat similarly sized package, you will have to get the current Apple M4 Pro. We have a closer look at the ARM competition in our Strix Halo analysis article.
The single-core performance is on the typical Zen 5 level and therefore slightly slower compared to the current chips from Intel (fast Arrow Lake and Lunar Lake models) as well as fast versions of the Snapdragon X Elite series. Apple’s M3 and especially M4 generation is on a completely different level though.
The multi-core performance is very stable under sustained workloads, but drops by around 12 % on battery power (power profile: Performance, 70/52 Watts). More CPU benchmarks are available in our tech section.
Cinebench R15 Multi Loop
Cinebench 2024: CPU Multi Core | CPU Single Core
Cinebench R23: Multi Core | Single Core
Cinebench R20: CPU (Multi Core) | CPU (Single Core)
Cinebench R15: CPU Multi 64Bit | CPU Single 64Bit
Blender: v2.79 BMW27 CPU
7-Zip 18.03: 7z b 4 | 7z b 4 -mmt1
Geekbench 6.6: Multi-Core | Single-Core
Geekbench 5.5: Multi-Core | Single-Core
HWBOT x265 Benchmark v2.2: 4k Preset
LibreOffice : 20 Documents To PDF
R Benchmark 2.5: Overall mean
| CPU Performance rating | |
| Asus ROG Strix Scar 17 G733PYV-LL053X | |
| Average AMD Ryzen AI Max+ 395 | |
| Asus ROG Flow Z13 GZ302EA-RU073W | |
| Asus ProArt PX13 HN7306 | |
| Asus ROG Flow Z13 ACRNM | |
| Razer Blade 14 RZ09-0508 | |
| Acer Predator Helios Neo 14 (2024) | |
| Razer Blade 14 RTX 4070 -4! | |
| Asus ROG Zephyrus G14 2024 GA403U | |
| Average of class Convertible | |
| Cinebench 2024 / CPU Multi Core | |
| Average AMD Ryzen AI Max+ 395 (1648 - 1912, n=9) | |
| Asus ROG Strix Scar 17 G733PYV-LL053X | |
| Asus ROG Flow Z13 GZ302EA-RU073W | |
| Asus ProArt PX13 HN7306 | |
| Acer Predator Helios Neo 14 (2024) | |
| Razer Blade 14 RZ09-0508 | |
| Asus ROG Flow Z13 ACRNM | |
| Asus ROG Zephyrus G14 2024 GA403U | |
| Average of class Convertible (271 - 1673, n=47, last 2 years) | |
| Cinebench 2024 / CPU Single Core | |
| Asus ROG Flow Z13 ACRNM | |
| Asus ROG Flow Z13 GZ302EA-RU073W | |
| Asus ProArt PX13 HN7306 | |
| Average AMD Ryzen AI Max+ 395 (114 - 116.8, n=9) | |
| Asus ROG Strix Scar 17 G733PYV-LL053X | |
| Average of class Convertible (88 - 129.8, n=41, last 2 years) | |
| Razer Blade 14 RZ09-0508 | |
| Acer Predator Helios Neo 14 (2024) | |
| Asus ROG Zephyrus G14 2024 GA403U | |
| Cinebench R23 / Multi Core | |
| Average AMD Ryzen AI Max+ 395 (29063 - 37423, n=9) | |
| Asus ROG Strix Scar 17 G733PYV-LL053X | |
| Asus ROG Flow Z13 GZ302EA-RU073W | |
| Asus ProArt PX13 HN7306 | |
| Asus ROG Flow Z13 ACRNM | |
| Acer Predator Helios Neo 14 (2024) | |
| Razer Blade 14 RZ09-0508 | |
| Razer Blade 14 RTX 4070 | |
| Asus ROG Zephyrus G14 2024 GA403U | |
| Average of class Convertible (1317 - 30959, n=50, last 2 years) | |
| Cinebench R23 / Single Core | |
| Average AMD Ryzen AI Max+ 395 (2027 - 2052, n=9) | |
| Asus ProArt PX13 HN7306 | |
| Asus ROG Flow Z13 GZ302EA-RU073W | |
| Asus ROG Flow Z13 ACRNM | |
| Asus ROG Strix Scar 17 G733PYV-LL053X | |
| Acer Predator Helios Neo 14 (2024) | |
| Razer Blade 14 RTX 4070 | |
| Razer Blade 14 RZ09-0508 | |
| Asus ROG Zephyrus G14 2024 GA403U | |
| Average of class Convertible (740 - 2188, n=50, last 2 years) | |
| Cinebench R20 / CPU (Multi Core) | |
| Average AMD Ryzen AI Max+ 395 (11357 - 14641, n=9) | |
| Asus ROG Strix Scar 17 G733PYV-LL053X | |
| Asus ROG Flow Z13 GZ302EA-RU073W | |
| Asus ProArt PX13 HN7306 | |
| Asus ROG Flow Z13 ACRNM | |
| Acer Predator Helios Neo 14 (2024) | |
| Razer Blade 14 RZ09-0508 | |
| Razer Blade 14 RTX 4070 | |
| Asus ROG Zephyrus G14 2024 GA403U | |
| Average of class Convertible (595 - 12102, n=50, last 2 years) | |
| Cinebench R20 / CPU (Single Core) | |
| Asus ProArt PX13 HN7306 | |
| Average AMD Ryzen AI Max+ 395 (791 - 803, n=9) | |
| Asus ROG Flow Z13 GZ302EA-RU073W | |
| Asus ROG Flow Z13 ACRNM | |
| Asus ROG Strix Scar 17 G733PYV-LL053X | |
| Acer Predator Helios Neo 14 (2024) | |
| Razer Blade 14 RTX 4070 | |
| Razer Blade 14 RZ09-0508 | |
| Asus ROG Zephyrus G14 2024 GA403U | |
| Average of class Convertible (273 - 834, n=50, last 2 years) | |
| Cinebench R15 / CPU Multi 64Bit | |
| Asus ROG Strix Scar 17 G733PYV-LL053X | |
| Average AMD Ryzen AI Max+ 395 (4739 - 5881, n=9) | |
| Asus ROG Flow Z13 GZ302EA-RU073W | |
| Asus ProArt PX13 HN7306 | |
| Asus ROG Flow Z13 ACRNM | |
| Razer Blade 14 RZ09-0508 | |
| Razer Blade 14 RTX 4070 | |
| Acer Predator Helios Neo 14 (2024) | |
| Asus ROG Zephyrus G14 2024 GA403U | |
| Average of class Convertible (478 - 4940, n=49, last 2 years) | |
| Cinebench R15 / CPU Single 64Bit | |
| Asus ROG Flow Z13 GZ302EA-RU073W | |
| Average AMD Ryzen AI Max+ 395 (313 - 318, n=9) | |
| Asus ROG Strix Scar 17 G733PYV-LL053X | |
| Asus ProArt PX13 HN7306 | |
| Asus ROG Flow Z13 ACRNM | |
| Razer Blade 14 RTX 4070 | |
| Razer Blade 14 RZ09-0508 | |
| Asus ROG Zephyrus G14 2024 GA403U | |
| Acer Predator Helios Neo 14 (2024) | |
| Average of class Convertible (149.8 - 317, n=49, last 2 years) | |
| Blender / v2.79 BMW27 CPU | |
| Average of class Convertible (105 - 1051, n=49, last 2 years) | |
| Asus ROG Zephyrus G14 2024 GA403U | |
| Razer Blade 14 RZ09-0508 | |
| Razer Blade 14 RTX 4070 | |
| Asus ROG Flow Z13 ACRNM | |
| Acer Predator Helios Neo 14 (2024) | |
| Asus ProArt PX13 HN7306 | |
| Asus ROG Flow Z13 GZ302EA-RU073W | |
| Asus ROG Strix Scar 17 G733PYV-LL053X | |
| Average AMD Ryzen AI Max+ 395 (86 - 107, n=7) | |
| 7-Zip 18.03 / 7z b 4 | |
| Asus ROG Strix Scar 17 G733PYV-LL053X | |
| Average AMD Ryzen AI Max+ 395 (116237 - 136872, n=7) | |
| Asus ROG Flow Z13 GZ302EA-RU073W | |
| Asus ProArt PX13 HN7306 | |
| Razer Blade 14 RZ09-0508 | |
| Acer Predator Helios Neo 14 (2024) | |
| Asus ROG Zephyrus G14 2024 GA403U | |
| Asus ROG Flow Z13 ACRNM | |
| Razer Blade 14 RTX 4070 | |
| Average of class Convertible (12977 - 121368, n=49, last 2 years) | |
| 7-Zip 18.03 / 7z b 4 -mmt1 | |
| Asus ROG Strix Scar 17 G733PYV-LL053X | |
| Asus ROG Flow Z13 GZ302EA-RU073W | |
| Razer Blade 14 RTX 4070 | |
| Razer Blade 14 RZ09-0508 | |
| Average AMD Ryzen AI Max+ 395 (6474 - 6540, n=7) | |
| Asus ROG Flow Z13 ACRNM | |
| Asus ProArt PX13 HN7306 | |
| Asus ROG Zephyrus G14 2024 GA403U | |
| Acer Predator Helios Neo 14 (2024) | |
| Average of class Convertible (3672 - 6655, n=49, last 2 years) | |
| Geekbench 6.6 / Multi-Core | |
| Asus ROG Flow Z13 GZ302EA-RU073W | |
| Average AMD Ryzen AI Max+ 395 (16510 - 22157, n=7) | |
| Asus ROG Strix Scar 17 G733PYV-LL053X | |
| Asus ProArt PX13 HN7306 | |
| Asus ROG Flow Z13 ACRNM | |
| Acer Predator Helios Neo 14 (2024) | |
| Razer Blade 14 RZ09-0508 | |
| Asus ROG Zephyrus G14 2024 GA403U | |
| Average of class Convertible (2291 - 21269, n=51, last 2 years) | |
| Geekbench 6.6 / Single-Core | |
| Asus ROG Flow Z13 GZ302EA-RU073W | |
| Average AMD Ryzen AI Max+ 395 (2791 - 2978, n=7) | |
| Asus ROG Strix Scar 17 G733PYV-LL053X | |
| Asus ProArt PX13 HN7306 | |
| Asus ROG Flow Z13 ACRNM | |
| Razer Blade 14 RZ09-0508 | |
| Asus ROG Zephyrus G14 2024 GA403U | |
| Acer Predator Helios Neo 14 (2024) | |
| Average of class Convertible (1003 - 3020, n=52, last 2 years) | |
| Geekbench 5.5 / Multi-Core | |
| Asus ROG Flow Z13 GZ302EA-RU073W | |
| Asus ROG Strix Scar 17 G733PYV-LL053X | |
| Average AMD Ryzen AI Max+ 395 (16535 - 24593, n=7) | |
| Asus ProArt PX13 HN7306 | |
| Asus ROG Flow Z13 ACRNM | |
| Acer Predator Helios Neo 14 (2024) | |
| Razer Blade 14 RZ09-0508 | |
| Asus ROG Zephyrus G14 2024 GA403U | |
| Razer Blade 14 RTX 4070 | |
| Average of class Convertible (1608 - 22023, n=49, last 2 years) | |
| Geekbench 5.5 / Single-Core | |
| Asus ROG Flow Z13 GZ302EA-RU073W | |
| Average AMD Ryzen AI Max+ 395 (2184 - 2275, n=7) | |
| Asus ROG Strix Scar 17 G733PYV-LL053X | |
| Asus ProArt PX13 HN7306 | |
| Asus ROG Flow Z13 ACRNM | |
| Razer Blade 14 RTX 4070 | |
| Razer Blade 14 RZ09-0508 | |
| Acer Predator Helios Neo 14 (2024) | |
| Asus ROG Zephyrus G14 2024 GA403U | |
| Average of class Convertible (806 - 2275, n=49, last 2 years) | |
| HWBOT x265 Benchmark v2.2 / 4k Preset | |
| Asus ROG Strix Scar 17 G733PYV-LL053X | |
| Asus ROG Flow Z13 GZ302EA-RU073W | |
| Average AMD Ryzen AI Max+ 395 (31.8 - 40.3, n=7) | |
| Asus ProArt PX13 HN7306 | |
| Razer Blade 14 RZ09-0508 | |
| Razer Blade 14 RTX 4070 | |
| Asus ROG Zephyrus G14 2024 GA403U | |
| Asus ROG Flow Z13 ACRNM | |
| Acer Predator Helios Neo 14 (2024) | |
| Average of class Convertible (3.43 - 36.2, n=49, last 2 years) | |
| LibreOffice / 20 Documents To PDF | |
| Asus ROG Flow Z13 ACRNM | |
| Asus ProArt PX13 HN7306 | |
| Average of class Convertible (42.5 - 84.3, n=49, last 2 years) | |
| Asus ROG Zephyrus G14 2024 GA403U | |
| Average AMD Ryzen AI Max+ 395 (45.8 - 58.4, n=7) | |
| Razer Blade 14 RZ09-0508 | |
| Asus ROG Flow Z13 GZ302EA-RU073W | |
| Asus ROG Strix Scar 17 G733PYV-LL053X | |
| Razer Blade 14 RTX 4070 | |
| Acer Predator Helios Neo 14 (2024) | |
| R Benchmark 2.5 / Overall mean | |
| Average of class Convertible (0.3915 - 0.84, n=49, last 2 years) | |
| Asus ROG Zephyrus G14 2024 GA403U | |
| Acer Predator Helios Neo 14 (2024) | |
| Razer Blade 14 RTX 4070 | |
| Razer Blade 14 RZ09-0508 | |
| Asus ROG Flow Z13 ACRNM | |
| Asus ROG Strix Scar 17 G733PYV-LL053X | |
| Asus ProArt PX13 HN7306 | |
| Average AMD Ryzen AI Max+ 395 (0.3915 - 0.4094, n=7) | |
| Asus ROG Flow Z13 GZ302EA-RU073W | |
* ... smaller is better
AIDA64: FP32 Ray-Trace | FPU Julia | CPU SHA3 | CPU Queen | FPU SinJulia | FPU Mandel | CPU AES | CPU ZLib | FP64 Ray-Trace | CPU PhotoWorxx
| Performance rating | |
| Average AMD Ryzen AI Max+ 395 | |
| Asus ROG Flow Z13 GZ302EA-RU073W | |
| Asus ProArt PX13 HN7306 | |
| Razer Blade 14 RZ09-0508 | |
| Razer Blade 14 RTX 4070 | |
| Asus ROG Zephyrus G14 2024 GA403U | |
| Asus ROG Flow Z13 ACRNM | |
| Acer Predator Helios Neo 14 (2024) | |
| Average of class Convertible | |
| AIDA64 / FP32 Ray-Trace | |
| Average AMD Ryzen AI Max+ 395 (62222 - 82725, n=8) | |
| Asus ROG Flow Z13 GZ302EA-RU073W | |
| Asus ProArt PX13 HN7306 | |
| Razer Blade 14 RTX 4070 | |
| Razer Blade 14 RZ09-0508 | |
| Asus ROG Zephyrus G14 2024 GA403U | |
| Acer Predator Helios Neo 14 (2024) | |
| Asus ROG Flow Z13 ACRNM | |
| Average of class Convertible (1480 - 64158, n=49, last 2 years) | |
| AIDA64 / FPU Julia | |
| Average AMD Ryzen AI Max+ 395 (183760 - 363782, n=8) | |
| Asus ROG Flow Z13 GZ302EA-RU073W | |
| Asus ProArt PX13 HN7306 | |
| Razer Blade 14 RTX 4070 | |
| Razer Blade 14 RZ09-0508 | |
| Asus ROG Zephyrus G14 2024 GA403U | |
| Acer Predator Helios Neo 14 (2024) | |
| Asus ROG Flow Z13 ACRNM | |
| Average of class Convertible (11392 - 184800, n=49, last 2 years) | |
| AIDA64 / CPU SHA3 | |
| Average AMD Ryzen AI Max+ 395 (8151 - 9475, n=8) | |
| Asus ROG Flow Z13 GZ302EA-RU073W | |
| Asus ProArt PX13 HN7306 | |
| Razer Blade 14 RTX 4070 | |
| Razer Blade 14 RZ09-0508 | |
| Asus ROG Zephyrus G14 2024 GA403U | |
| Acer Predator Helios Neo 14 (2024) | |
| Asus ROG Flow Z13 ACRNM | |
| Average of class Convertible (797 - 8291, n=49, last 2 years) | |
| AIDA64 / CPU Queen | |
| Average AMD Ryzen AI Max+ 395 (145339 - 154404, n=7) | |
| Asus ROG Flow Z13 GZ302EA-RU073W | |
| Razer Blade 14 RZ09-0508 | |
| Razer Blade 14 RTX 4070 | |
| Asus ROG Zephyrus G14 2024 GA403U | |
| Asus ROG Flow Z13 ACRNM | |
| Asus ProArt PX13 HN7306 | |
| Acer Predator Helios Neo 14 (2024) | |
| Average of class Convertible (14686 - 148874, n=42, last 2 years) | |
| AIDA64 / FPU SinJulia | |
| Average AMD Ryzen AI Max+ 395 (29096 - 31931, n=8) | |
| Asus ROG Flow Z13 GZ302EA-RU073W | |
| Asus ProArt PX13 HN7306 | |
| Razer Blade 14 RZ09-0508 | |
| Razer Blade 14 RTX 4070 | |
| Asus ROG Zephyrus G14 2024 GA403U | |
| Acer Predator Helios Neo 14 (2024) | |
| Asus ROG Flow Z13 ACRNM | |
| Average of class Convertible (1120 - 29155, n=49, last 2 years) | |
| AIDA64 / FPU Mandel | |
| Average AMD Ryzen AI Max+ 395 (96454 - 192994, n=8) | |
| Asus ROG Flow Z13 GZ302EA-RU073W | |
| Asus ProArt PX13 HN7306 | |
| Razer Blade 14 RTX 4070 | |
| Razer Blade 14 RZ09-0508 | |
| Asus ROG Zephyrus G14 2024 GA403U | |
| Acer Predator Helios Neo 14 (2024) | |
| Asus ROG Flow Z13 ACRNM | |
| Average of class Convertible (4929 - 97193, n=49, last 2 years) | |
| AIDA64 / CPU AES | |
| Average AMD Ryzen AI Max+ 395 (133256 - 190280, n=7) | |
| Asus ROG Flow Z13 GZ302EA-RU073W | |
| Razer Blade 14 RZ09-0508 | |
| Asus ROG Zephyrus G14 2024 GA403U | |
| Razer Blade 14 RTX 4070 | |
| Acer Predator Helios Neo 14 (2024) | |
| Asus ProArt PX13 HN7306 | |
| Asus ROG Flow Z13 ACRNM | |
| Average of class Convertible (5271 - 190280, n=49, last 2 years) | |
| AIDA64 / CPU ZLib | |
| Asus ROG Flow Z13 GZ302EA-RU073W | |
| Average AMD Ryzen AI Max+ 395 (2017 - 2431, n=8) | |
| Asus ProArt PX13 HN7306 | |
| Acer Predator Helios Neo 14 (2024) | |
| Asus ROG Flow Z13 ACRNM | |
| Razer Blade 14 RTX 4070 | |
| Razer Blade 14 RZ09-0508 | |
| Asus ROG Zephyrus G14 2024 GA403U | |
| Average of class Convertible (218 - 2017, n=49, last 2 years) | |
| AIDA64 / FP64 Ray-Trace | |
| Average AMD Ryzen AI Max+ 395 (34220 - 43587, n=8) | |
| Asus ROG Flow Z13 GZ302EA-RU073W | |
| Asus ProArt PX13 HN7306 | |
| Razer Blade 14 RTX 4070 | |
| Razer Blade 14 RZ09-0508 | |
| Asus ROG Zephyrus G14 2024 GA403U | |
| Asus ROG Flow Z13 ACRNM | |
| Acer Predator Helios Neo 14 (2024) | |
| Average of class Convertible (1169 - 34297, n=49, last 2 years) | |
| AIDA64 / CPU PhotoWorxx | |
| Average AMD Ryzen AI Max+ 395 (81626 - 96843, n=8) | |
| Asus ROG Flow Z13 GZ302EA-RU073W | |
| Asus ProArt PX13 HN7306 | |
| Acer Predator Helios Neo 14 (2024) | |
| Average of class Convertible (14193 - 85327, n=49, last 2 years) | |
| Asus ROG Flow Z13 ACRNM | |
| Razer Blade 14 RZ09-0508 | |
| Asus ROG Zephyrus G14 2024 GA403U | |
| Razer Blade 14 RTX 4070 | |
System Performance
The system performance is excellent, which is confirmed both by the synthetic benchmarks (at the top of the comparison group) as well as our subjective performance impression. We did not encounter any stability issues, either. The results in the two PugetBench tests for Adobe Photoshop as well as Premiere Pro are also decent, but there were limitations for DaVinci Resolve. The Basic benchmark test result is better compared to the RTX 4070 Laptop rivals, but we encountered two crashes while editing one of our review videos, which almost never happens with Nvidia GPUs. At this time, we cannot verify whether this problem is caused by the software or the GPU drivers.
CrossMark: Overall | Productivity | Creativity | Responsiveness
WebXPRT 3: Overall
WebXPRT 4: Overall
Mozilla Kraken 1.1: Total
| PCMark 10 / Score | |
| Asus ROG Flow Z13 GZ302EA-RU073W | |
| Average AMD Ryzen AI Max+ 395, AMD Radeon 8060S (8732 - 10111, n=7) | |
| Razer Blade 14 RZ09-0508 | |
| Razer Blade 14 RTX 4070 | |
| Asus ROG Flow Z13 ACRNM | |
| Asus ProArt PX13 HN7306 | |
| Acer Predator Helios Neo 14 (2024) | |
| Acer Nitro 14 AN14-41-R3MX | |
| Asus ROG Zephyrus G14 2024 GA403U | |
| Microsoft Surface Laptop Studio 2 RTX 4060 | |
| Average of class Convertible (3229 - 10123, n=46, last 2 years) | |
| PCMark 10 / Essentials | |
| Asus ROG Flow Z13 GZ302EA-RU073W | |
| Average AMD Ryzen AI Max+ 395, AMD Radeon 8060S (10949 - 12005, n=7) | |
| Razer Blade 14 RZ09-0508 | |
| Asus ROG Flow Z13 ACRNM | |
| Razer Blade 14 RTX 4070 | |
| Acer Predator Helios Neo 14 (2024) | |
| Microsoft Surface Laptop Studio 2 RTX 4060 | |
| Average of class Convertible (7233 - 12222, n=46, last 2 years) | |
| Asus ProArt PX13 HN7306 | |
| Asus ROG Zephyrus G14 2024 GA403U | |
| Acer Nitro 14 AN14-41-R3MX | |
| PCMark 10 / Productivity | |
| Average AMD Ryzen AI Max+ 395, AMD Radeon 8060S (9762 - 16652, n=7) | |
| Razer Blade 14 RTX 4070 | |
| Asus ROG Flow Z13 GZ302EA-RU073W | |
| Razer Blade 14 RZ09-0508 | |
| Asus ProArt PX13 HN7306 | |
| Acer Nitro 14 AN14-41-R3MX | |
| Asus ROG Flow Z13 ACRNM | |
| Average of class Convertible (5062 - 17914, n=46, last 2 years) | |
| Asus ROG Zephyrus G14 2024 GA403U | |
| Microsoft Surface Laptop Studio 2 RTX 4060 | |
| Acer Predator Helios Neo 14 (2024) | |
| PCMark 10 / Digital Content Creation | |
| Asus ROG Flow Z13 GZ302EA-RU073W | |
| Average AMD Ryzen AI Max+ 395, AMD Radeon 8060S (15152 - 16981, n=7) | |
| Razer Blade 14 RZ09-0508 | |
| Asus ROG Flow Z13 ACRNM | |
| Razer Blade 14 RTX 4070 | |
| Asus ProArt PX13 HN7306 | |
| Asus ROG Zephyrus G14 2024 GA403U | |
| Acer Nitro 14 AN14-41-R3MX | |
| Acer Predator Helios Neo 14 (2024) | |
| Microsoft Surface Laptop Studio 2 RTX 4060 | |
| Average of class Convertible (2496 - 16551, n=46, last 2 years) | |
| CrossMark / Overall | |
| Asus ROG Flow Z13 GZ302EA-RU073W | |
| Average AMD Ryzen AI Max+ 395, AMD Radeon 8060S (1948 - 2274, n=7) | |
| Asus ROG Flow Z13 ACRNM | |
| Acer Predator Helios Neo 14 (2024) | |
| Razer Blade 14 RZ09-0508 | |
| Razer Blade 14 RTX 4070 | |
| Asus ProArt PX13 HN7306 | |
| Asus ROG Zephyrus G14 2024 GA403U | |
| Acer Nitro 14 AN14-41-R3MX | |
| Microsoft Surface Laptop Studio 2 RTX 4060 | |
| Average of class Convertible (524 - 2274, n=50, last 2 years) | |
| CrossMark / Productivity | |
| Average AMD Ryzen AI Max+ 395, AMD Radeon 8060S (1701 - 2790, n=7) | |
| Asus ROG Flow Z13 GZ302EA-RU073W | |
| Acer Predator Helios Neo 14 (2024) | |
| Asus ROG Flow Z13 ACRNM | |
| Razer Blade 14 RZ09-0508 | |
| Razer Blade 14 RTX 4070 | |
| Acer Nitro 14 AN14-41-R3MX | |
| Asus ROG Zephyrus G14 2024 GA403U | |
| Microsoft Surface Laptop Studio 2 RTX 4060 | |
| Asus ProArt PX13 HN7306 | |
| Average of class Convertible (554 - 1942, n=50, last 2 years) | |
| CrossMark / Creativity | |
| Asus ROG Flow Z13 GZ302EA-RU073W | |
| Average AMD Ryzen AI Max+ 395, AMD Radeon 8060S (2331 - 2949, n=7) | |
| Asus ProArt PX13 HN7306 | |
| Asus ROG Flow Z13 ACRNM | |
| Acer Predator Helios Neo 14 (2024) | |
| Microsoft Surface Laptop Studio 2 RTX 4060 | |
| Asus ROG Zephyrus G14 2024 GA403U | |
| Razer Blade 14 RTX 4070 | |
| Razer Blade 14 RZ09-0508 | |
| Acer Nitro 14 AN14-41-R3MX | |
| Average of class Convertible (550 - 2949, n=50, last 2 years) | |
| CrossMark / Responsiveness | |
| Acer Predator Helios Neo 14 (2024) | |
| Asus ROG Flow Z13 GZ302EA-RU073W | |
| Acer Nitro 14 AN14-41-R3MX | |
| Razer Blade 14 RZ09-0508 | |
| Asus ROG Flow Z13 ACRNM | |
| Average AMD Ryzen AI Max+ 395, AMD Radeon 8060S (1533 - 1719, n=7) | |
| Razer Blade 14 RTX 4070 | |
| Asus ROG Zephyrus G14 2024 GA403U | |
| Microsoft Surface Laptop Studio 2 RTX 4060 | |
| Average of class Convertible (381 - 1719, n=50, last 2 years) | |
| Asus ProArt PX13 HN7306 | |
| WebXPRT 3 / Overall | |
| Asus ROG Flow Z13 GZ302EA-RU073W | |
| Average AMD Ryzen AI Max+ 395, AMD Radeon 8060S (302 - 358, n=7) | |
| Razer Blade 14 RZ09-0508 | |
| Razer Blade 14 RTX 4070 | |
| Asus ROG Flow Z13 ACRNM | |
| Microsoft Surface Laptop Studio 2 RTX 4060 | |
| Asus ROG Zephyrus G14 2024 GA403U | |
| Acer Nitro 14 AN14-41-R3MX | |
| Average of class Convertible (171 - 426, n=50, last 2 years) | |
| Acer Predator Helios Neo 14 (2024) | |
| Asus ProArt PX13 HN7306 | |
| WebXPRT 4 / Overall | |
| Asus ROG Flow Z13 GZ302EA-RU073W | |
| Asus ROG Flow Z13 ACRNM | |
| Average AMD Ryzen AI Max+ 395, AMD Radeon 8060S (252 - 317, n=7) | |
| Microsoft Surface Laptop Studio 2 RTX 4060 | |
| Razer Blade 14 RZ09-0508 | |
| Razer Blade 14 RTX 4070 | |
| Acer Predator Helios Neo 14 (2024) | |
| Asus ROG Zephyrus G14 2024 GA403U | |
| Average of class Convertible (91.2 - 317, n=49, last 2 years) | |
| Acer Nitro 14 AN14-41-R3MX | |
| Asus ProArt PX13 HN7306 | |
| Mozilla Kraken 1.1 / Total | |
| Acer Nitro 14 AN14-41-R3MX | |
| Average of class Convertible (386 - 1089, n=53, last 2 years) | |
| Asus ROG Zephyrus G14 2024 GA403U | |
| Acer Predator Helios Neo 14 (2024) | |
| Razer Blade 14 RTX 4070 | |
| Microsoft Surface Laptop Studio 2 RTX 4060 | |
| Razer Blade 14 RZ09-0508 | |
| Asus ROG Flow Z13 ACRNM | |
| Asus ProArt PX13 HN7306 | |
| Average AMD Ryzen AI Max+ 395, AMD Radeon 8060S (424 - 470, n=7) | |
| Asus ROG Flow Z13 GZ302EA-RU073W | |
* ... smaller is better
| Photoshop PugetBench / Overall Score 1.01 | |
| Apple MacBook Pro 16 M4 Max | |
| Apple MacBook Pro 16 2024 M4 Pro | |
| Asus ROG Flow Z13 GZ302EA-RU073W | |
| Apple MacBook Pro 14 2024 M4 | |
| Razer Blade 16 2024, RTX 4090 | |
| Tuxedo Gemini 17 Gen3 AMD | |
| Asus ZenBook Duo OLED UX8406CA | |
| Asus ROG Flow Z13 ACRNM | |
| Lenovo ThinkPad T14s Gen 6 21M2S00G00 | |
| Dell XPS 13 9350 | |
| Premiere Pro PugetBench / Overall Score 1.1 | |
| Apple MacBook Pro 16 M4 Max | |
| Razer Blade 16 2024, RTX 4090 | |
| Tuxedo Gemini 17 Gen3 AMD | |
| Apple MacBook Pro 16 2024 M4 Pro | |
| Asus ROG Flow Z13 GZ302EA-RU073W | |
| Asus ROG Flow Z13 ACRNM | |
| Apple MacBook Pro 14 2024 M4 | |
| Asus ZenBook Duo OLED UX8406CA | |
| Dell XPS 13 9350 | |
| Lenovo ThinkPad T14s Gen 6 21M2S00G00 | |
| DaVinci Resolve PugetBench / Basic Score 1.1 | |
| Razer Blade 16 2024, RTX 4090 | |
| Asus ROG Flow Z13 GZ302EA-RU073W | |
| Asus ROG Zephyrus G16 GA605WI | |
| Asus ROG Flow Z13 ACRNM | |
| Asus ZenBook Duo OLED UX8406CA | |
| PCMark 10 Score | 9125 points | |
Help | ||
| AIDA64 / Memory Copy | |
| Asus ROG Flow Z13 GZ302EA-RU073W | |
| Average AMD Ryzen AI Max+ 395 (148904 - 163031, n=8) | |
| Asus ProArt PX13 HN7306 | |
| Average of class Convertible (23880 - 161475, n=49, last 2 years) | |
| Acer Predator Helios Neo 14 (2024) | |
| Asus ROG Zephyrus G14 2024 GA403U | |
| Razer Blade 14 RZ09-0508 | |
| Asus ROG Flow Z13 ACRNM | |
| Razer Blade 14 RTX 4070 | |
| AIDA64 / Memory Read | |
| Average AMD Ryzen AI Max+ 395 (121832 - 123769, n=8) | |
| Asus ROG Flow Z13 GZ302EA-RU073W | |
| Asus ProArt PX13 HN7306 | |
| Acer Predator Helios Neo 14 (2024) | |
| Average of class Convertible (19931 - 131960, n=49, last 2 years) | |
| Asus ROG Flow Z13 ACRNM | |
| Razer Blade 14 RZ09-0508 | |
| Razer Blade 14 RTX 4070 | |
| Asus ROG Zephyrus G14 2024 GA403U | |
| AIDA64 / Memory Write | |
| Asus ROG Flow Z13 GZ302EA-RU073W | |
| Average AMD Ryzen AI Max+ 395 (209523 - 216896, n=8) | |
| Asus ProArt PX13 HN7306 | |
| Asus ROG Zephyrus G14 2024 GA403U | |
| Average of class Convertible (17473 - 216896, n=49, last 2 years) | |
| Razer Blade 14 RZ09-0508 | |
| Razer Blade 14 RTX 4070 | |
| Asus ROG Flow Z13 ACRNM | |
| Acer Predator Helios Neo 14 (2024) | |
| AIDA64 / Memory Latency | |
| Acer Predator Helios Neo 14 (2024) | |
| Average AMD Ryzen AI Max+ 395 (131.9 - 140.5, n=8) | |
| Asus ROG Flow Z13 GZ302EA-RU073W | |
| Average of class Convertible (6.9 - 536, n=48, last 2 years) | |
| Asus ProArt PX13 HN7306 | |
| Asus ROG Zephyrus G14 2024 GA403U | |
| Razer Blade 14 RZ09-0508 | |
| Razer Blade 14 RTX 4070 | |
| Asus ROG Flow Z13 ACRNM | |
* ... smaller is better
February 24, 2025 update: We performed additional video export tests with DaVinci Resolve and our review video for the ROG Flow Z13 in the 4K resolution, which is 17 around minutes long. We also checked the influence of the allocated VRAM size on the export time. You can clearly see that DaVinci Resolve benefits from more VRAM, but only if there is sufficient system RAM left. If we increase the VRAM size from 4 GB to 8 GB, we can see an improvement of about one minute, while the switch to 16 GB VRAM only gains a couple of seconds. If we set the VRAM to 24 GB, however, the export time is noticeably longer because of the limited amount of system RAM. The export times are very good in general, especially compared to the GeForce RTX 4070 Laptop.
| System | Graphics Card | Export time |
|---|---|---|
| ROG Flow Z13 | Radeon 8060S (4 GB) | 10:02 minutes |
| ROG Flow Z13 | Radeon 8060S (8 GB) | 09:11 minutes |
| ROG Flow Z13 | Radeon 8060S (16 GB) | 09:06 minutes |
| ROG Flow Z13 | Radeon 8060S (24 GB) | 16:58 minutes |
| ROG Flow Z13 | GeForce RTX 4070 Laptop | 12:28 minutes |
| Razer Blade 14 | GeForce RTX 4070 Laptop | 11:31 minutes |
| ROG Zephyrus G14 | GeForce RTX 4090 Laptop | 07:36 minutes |
| Desktop | GeForce RTX 5090 | 03:31 minutes |
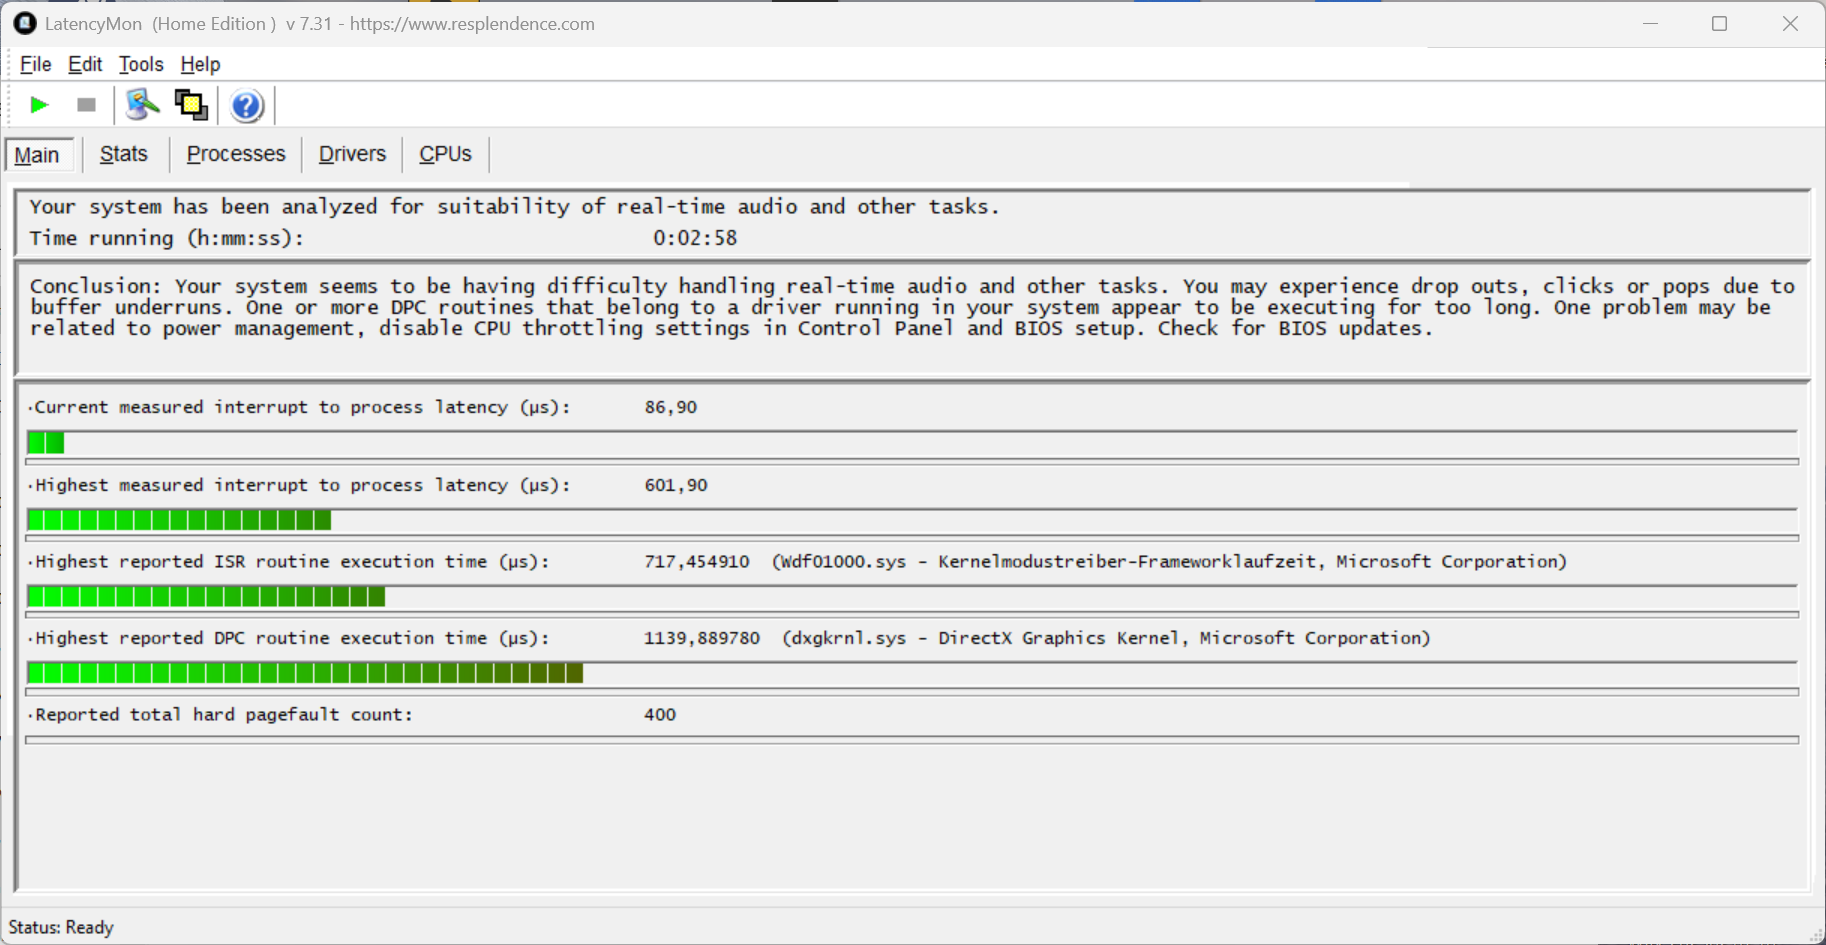
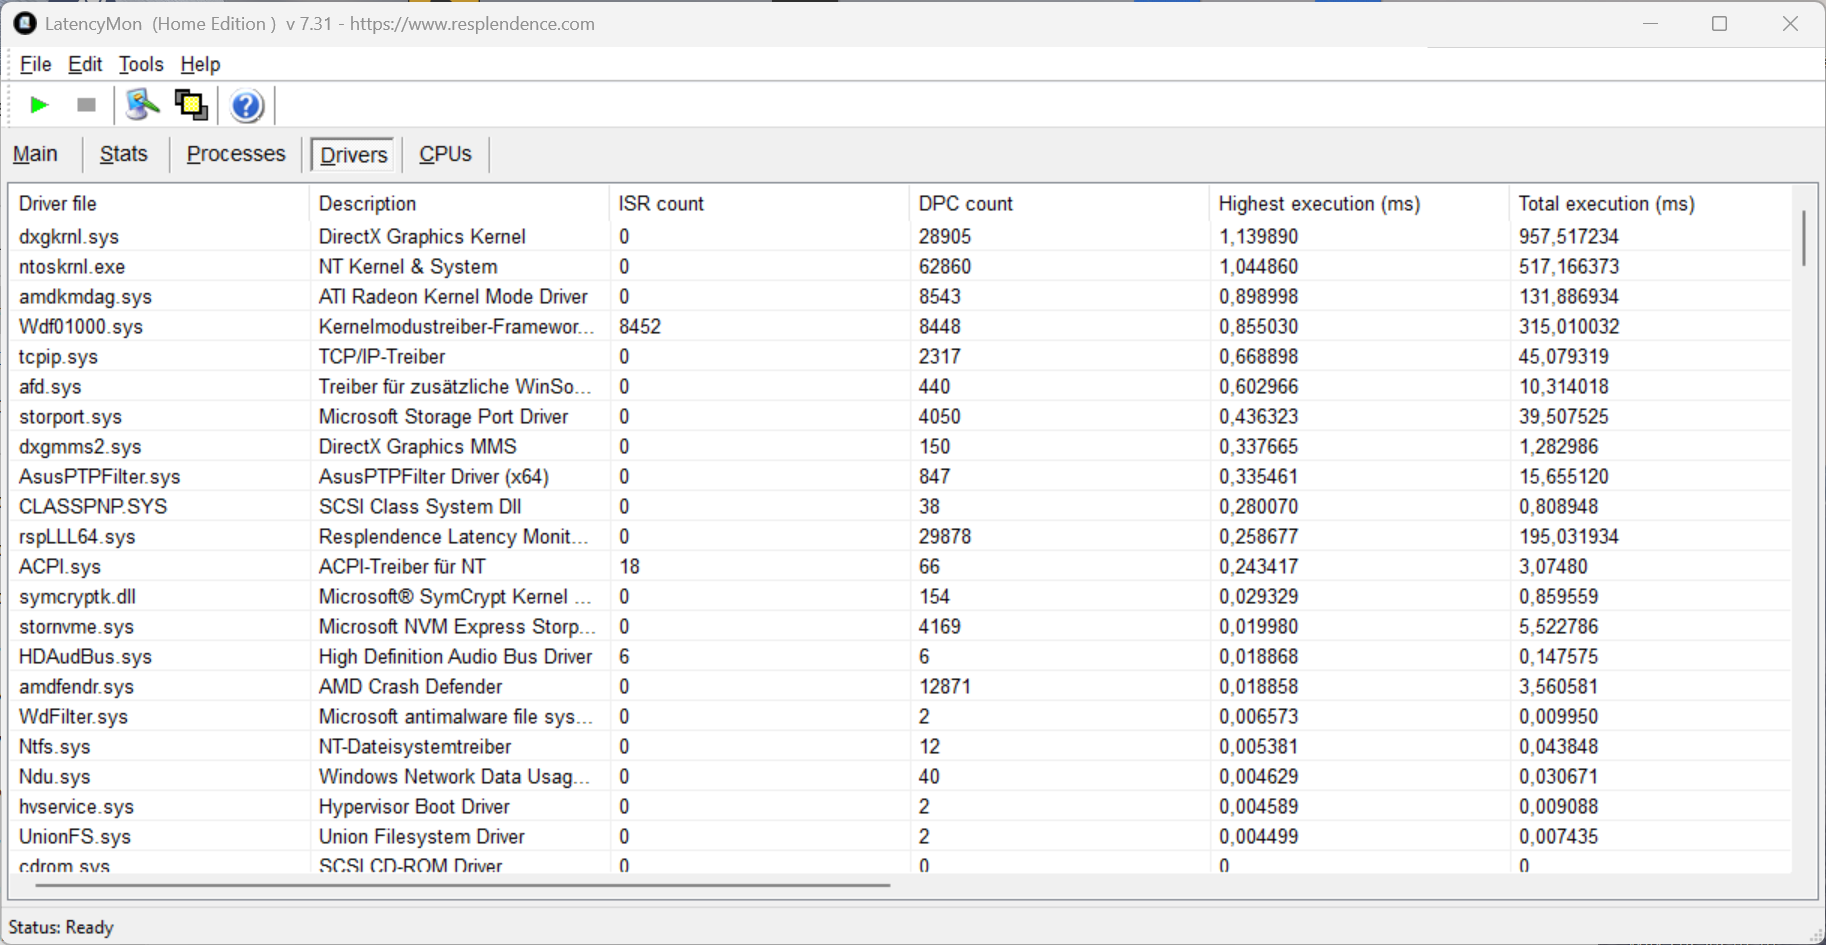
DPC Latency
Our standardized latency test (web browsing, 4K YouTube playback, CPU load) does not show any problems for the review unit with the current BIOS version. One driver shows a spike, but the important “interrupt-to-process-latency” value is very low.
| DPC Latencies / LatencyMon - interrupt to process latency (max), Web, Youtube, Prime95 | |
| Asus ROG Flow Z13 ACRNM | |
| Acer Predator Helios Neo 14 (2024) | |
| Razer Blade 14 RZ09-0508 | |
| Razer Blade 14 RTX 4070 | |
| Asus ROG Flow Z13 GZ302EA-RU073W | |
| Asus ROG Zephyrus G14 2024 GA403U | |
* ... smaller is better
Storage Devices
The Flow Z13 is equipped with a compact M.2 2230 SSD, in this case from Kioxia with a storage capacity of 1 TB. After the initial set-up you can use 859 GB for your own files and apps. The transfer rates of the PCIe 4.0 drive are very good and also stable under sustained workloads. More SSD benchmarks are listed here.

* ... smaller is better
Disk Throttling: DiskSpd Read Loop, Queue Depth 8
GPU Performance
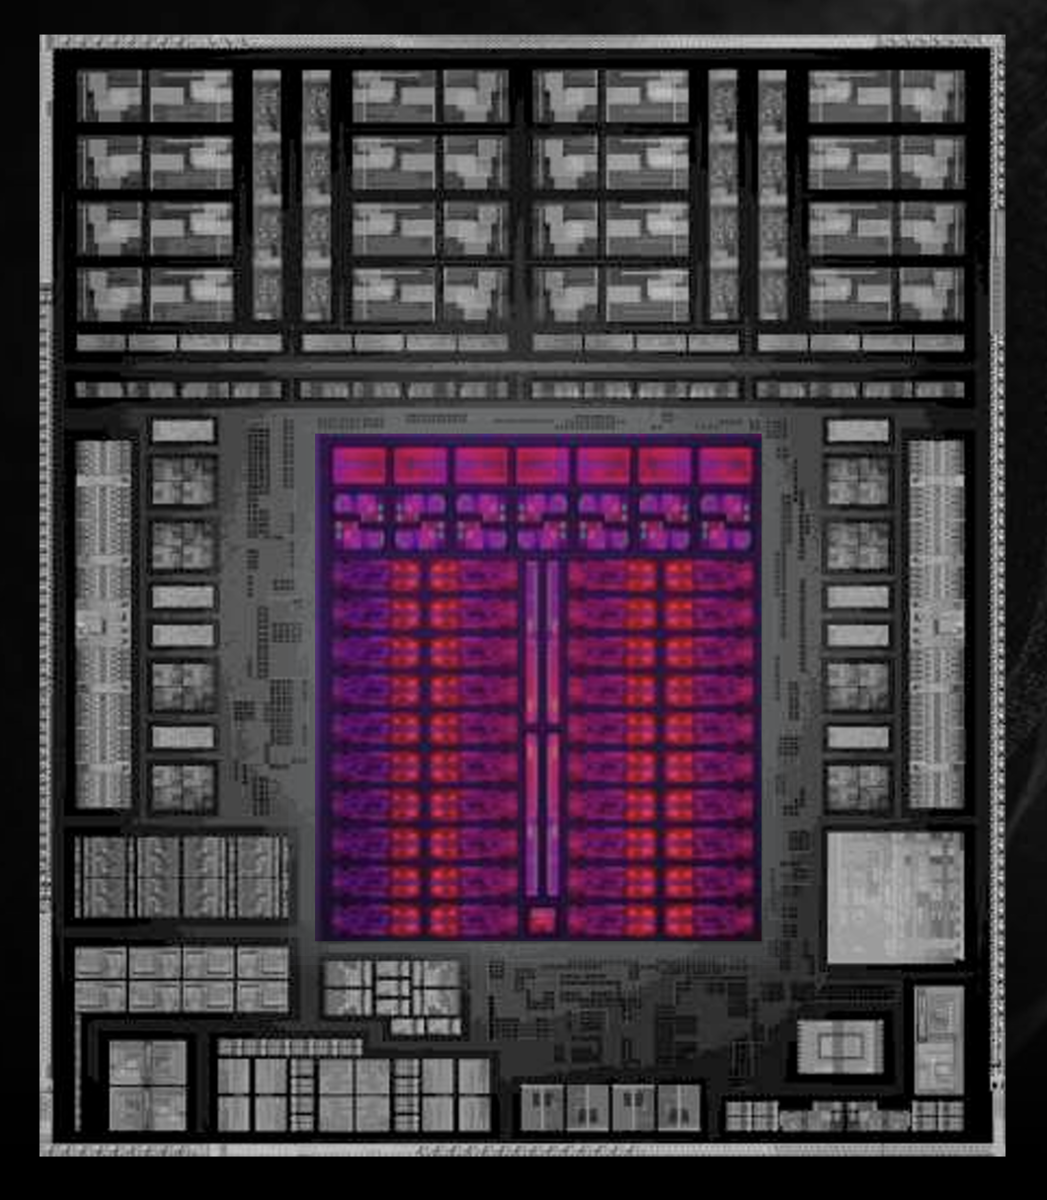
In addition to the powerful CPU, the Radeon 8060S iGPU is another highlight of the Ryzen AI Max+ 395, because AMD wants to offer the fastest integrated x86-GPU. All tech specs are listed in our analysis article, so we want to focus on the performance. We can confirm AMD’s claim and the Radeon 8060S even beats the GeForce RTX 4070 Laptop (65 Watts) in the old ROG Flow Z13 in our default 3DMark tests. The ProArt PX13 with the 75W version of the RTX 4070 Laptop is also comparable. The two x86-iGPUs Radeon 890M as well as Arc Graphics 140V are beaten by the factor 2.6 and 2.8, respectively. The GPU performance is stable under sustained workloads, but there is a drop of ~13 % on battery power.
We also tested the new Radeon 8060S against the ARM competition from Apple as well as Qualcomm. The fastest version of the Qualcomm Adreno X1-85 (4.6 TFLOPS) does not stand a chance against the new Strix Halo iGPU. The situation changes compared to Apple’s GPUs, and depending on the benchmark the 8060S is sitting right between the two M4 Pro GPUs or slightly ahead, respectively. The M4 Max GPU on the other hand is out of reach.
GFXBench: 3840x2160 4K Aztec Ruins High Tier Offscreen | on screen Aztec Ruins High Tier Onscreen
Geekbench 6.6: GPU OpenCL
| 3DMark 06 Standard Score | 66409 points | |
| 3DMark Vantage P Result | 92510 points | |
| 3DMark 11 Performance | 33493 points | |
| 3DMark Fire Strike Score | 23537 points | |
| 3DMark Time Spy Score | 10370 points | |
| 3DMark Steel Nomad Score | 1874 points | |
| 3DMark Steel Nomad Light Score | 9653 points | |
Help | ||
| Blender / v3.3 Classroom CPU | |
| Average of class Convertible (159 - 2067, n=50, last 2 years) | |
| Asus ROG Flow Z13 ACRNM | |
| Asus ROG Zephyrus G14 2024 GA403U | |
| Acer Predator Helios Neo 14 (2024) | |
| Razer Blade 14 RTX 4070 | |
| Razer Blade 14 RZ09-0508 | |
| Asus ROG Flow Z13 GZ302EA-RU073W | |
| Average AMD Radeon 8060S (132 - 163, n=9) | |
| Blender / v3.3 Classroom OPTIX/RTX | |
| Asus ROG Flow Z13 ACRNM | |
| Asus ROG Zephyrus G14 2024 GA403U | |
| Razer Blade 14 RTX 4070 | |
| Asus ProArt PX13 HN7306 | |
| Acer Predator Helios Neo 14 (2024) | |
| Razer Blade 14 RZ09-0508 | |
| Blender / v3.3 Classroom CUDA | |
| Asus ROG Flow Z13 ACRNM | |
| Razer Blade 14 RTX 4070 | |
| Asus ROG Zephyrus G14 2024 GA403U | |
| Asus ProArt PX13 HN7306 | |
| Acer Predator Helios Neo 14 (2024) | |
| Razer Blade 14 RZ09-0508 | |
* ... smaller is better
Gaming Performance
The actual gaming benchmarks are obviously more important than the synthetic tests, and the results are slightly worse here. In our default gaming test, the new ROG Flow Z13 is slightly behind the old Flow Z13 with the RTX 4070 Laptop (-6 %) as well as the ProArt PX13 (-2 %), so the deficit is not huge. The ROG Flow Z13 with the RTX 4060 Laptop is slower though and the other current iGPUs from AMD and Intel once again do not stand a chance. The gaming performance also stays stable during longer sessions.
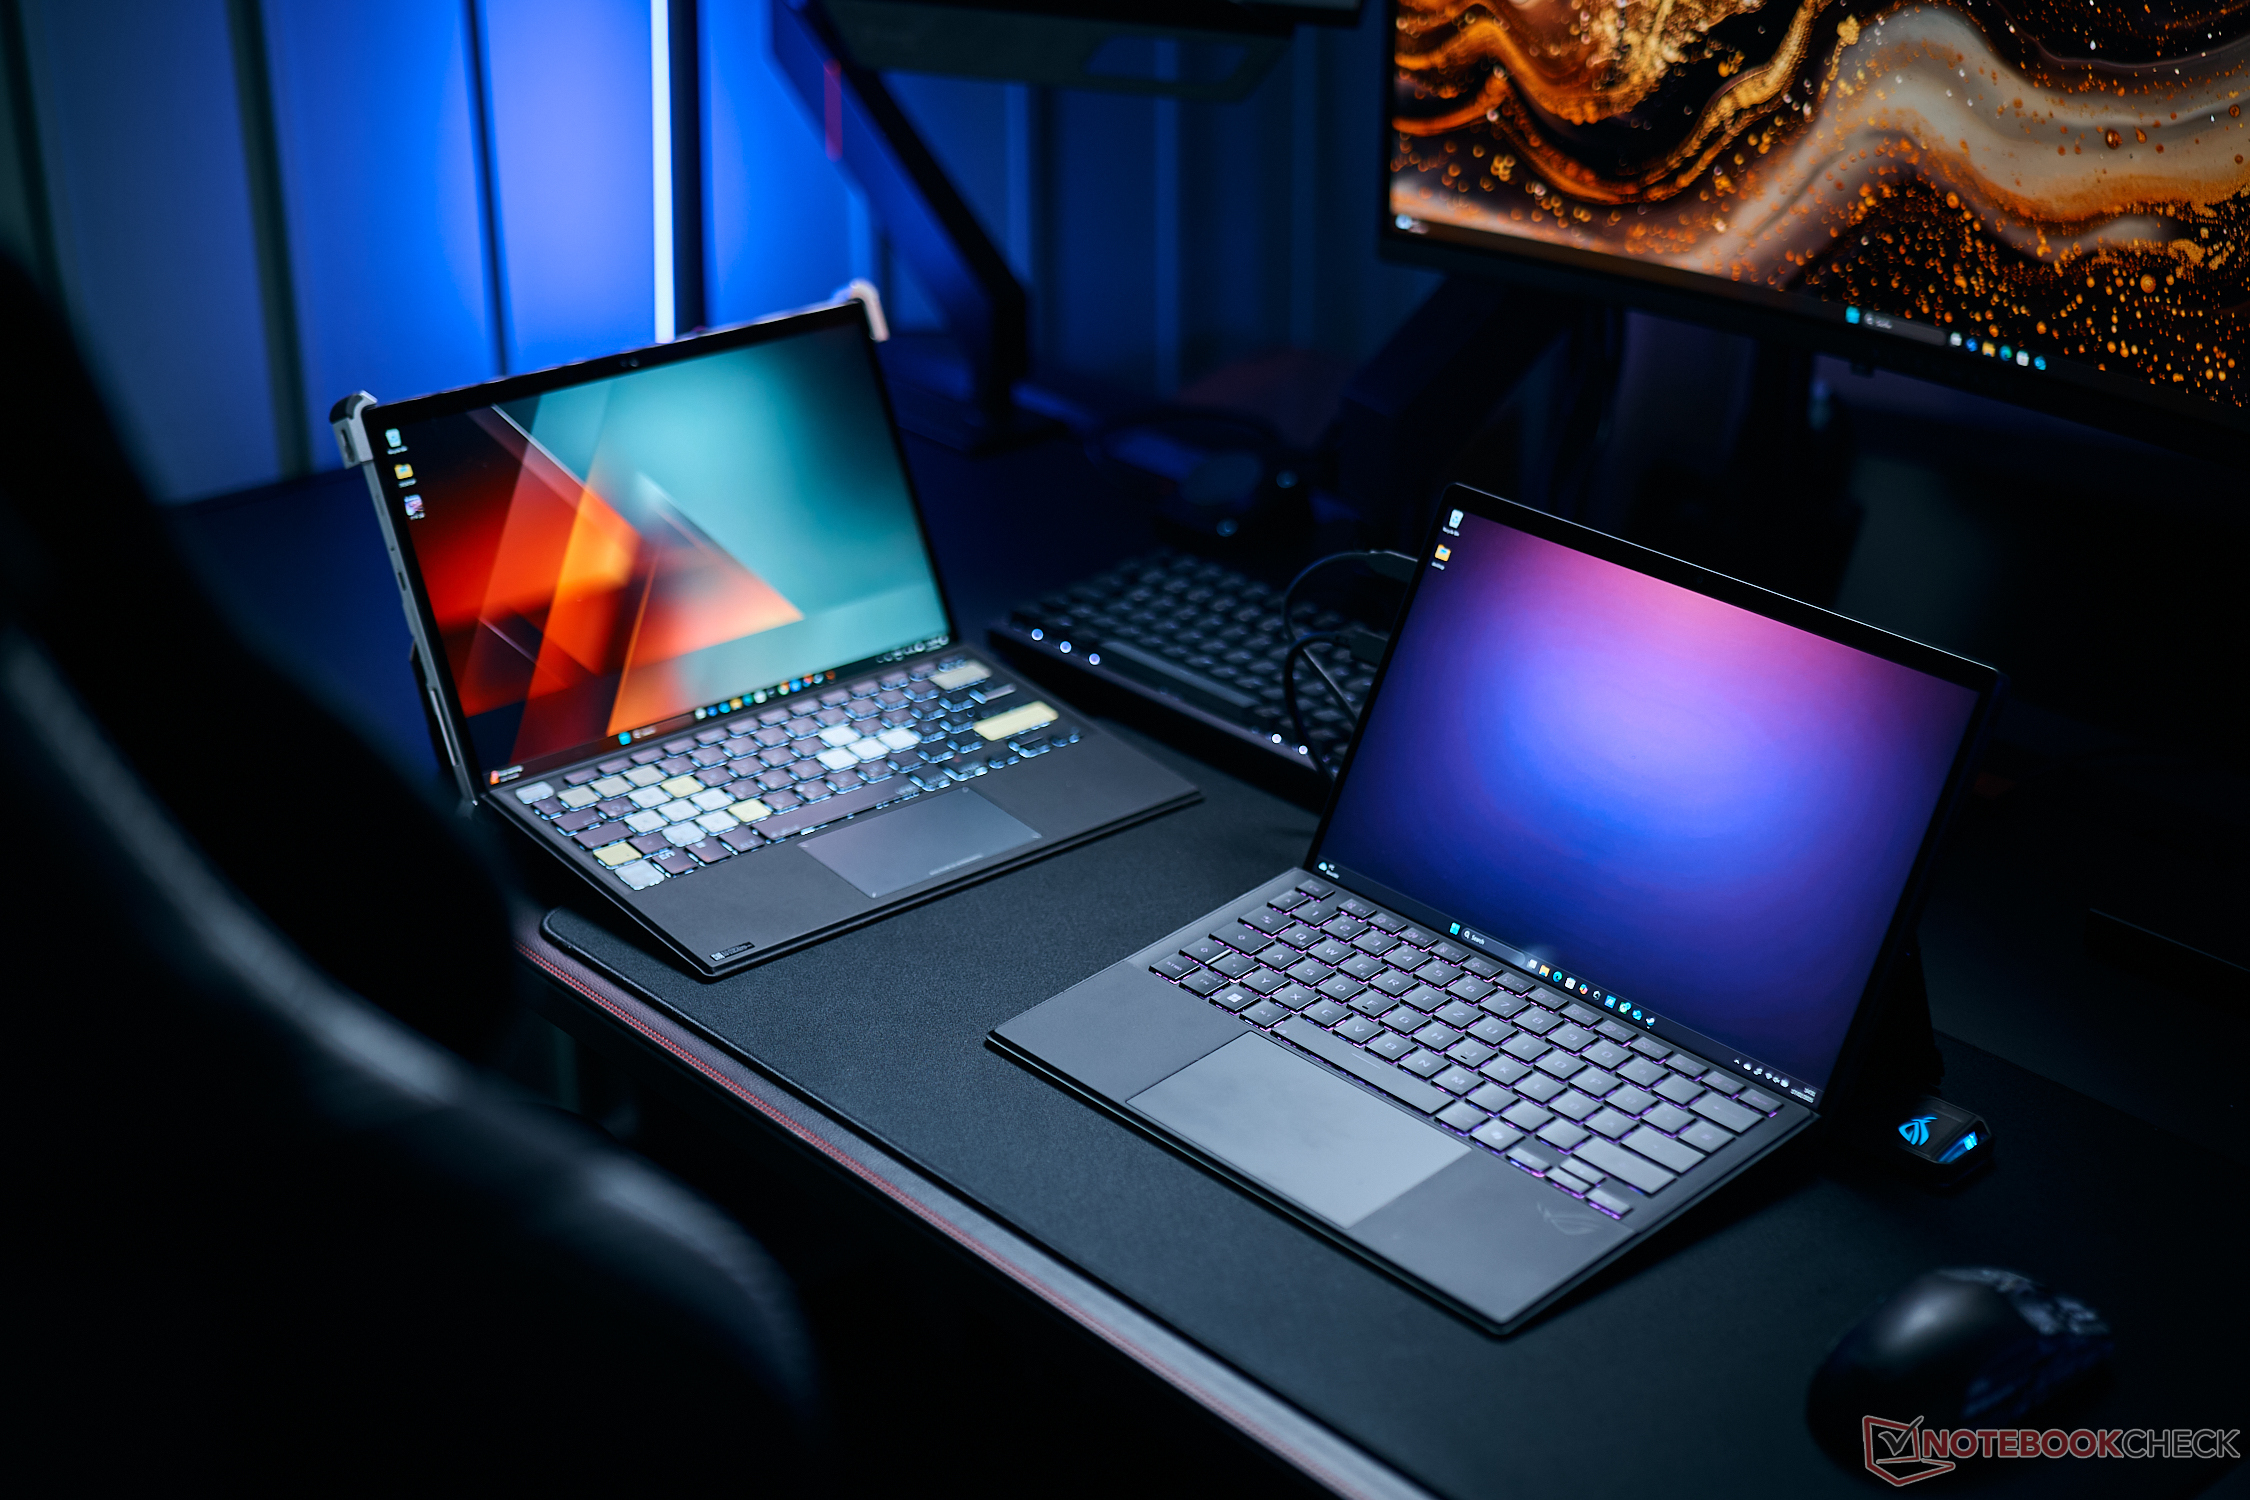
We also had the old Flow Z13 with the RTX 4070 Laptop on hand, so we used it for a direct head-to-head comparison in modern titles (Turbo mode on both devices). The situation looks better for the new Radeon 8060S in 1080p and maximum details. Titles like Cyberpunk 2077 or Call of Duty Black Ops 6 show an advantage of 13-17 % for the AMD GPU, while many titles show comparable results. There are also some negative examples like GTA V or F1 24 (-12 up to -21 %). All in all, the two devices are pretty much on par.
| Gaming 1080p Ultra Performance rating - Percent | |
| Asus ROG Flow Z13 ACRNM | |
| Asus ROG Flow Z13 GZ302EA-RU073W | |
| Cyberpunk 2077 - 1920x1080 Ultra Preset (FSR off) | |
| Asus ROG Flow Z13 GZ302EA-RU073W | |
| Asus ROG Flow Z13 ACRNM | |
| Baldur's Gate 3 - 1920x1080 Ultra Preset AA:T | |
| Asus ROG Flow Z13 ACRNM | |
| Asus ROG Flow Z13 GZ302EA-RU073W | |
| GTA V - 1920x1080 Highest AA:4xMSAA + FX AF:16x | |
| Asus ROG Flow Z13 ACRNM | |
| Asus ROG Flow Z13 GZ302EA-RU073W | |
| Horizon Forbidden West - 1920x1080 Very High Preset AA:T | |
| Asus ROG Flow Z13 ACRNM | |
| Asus ROG Flow Z13 GZ302EA-RU073W | |
| F1 24 - 1920x1080 Ultra High Preset AA:T AF:16x | |
| Asus ROG Flow Z13 ACRNM | |
| Asus ROG Flow Z13 GZ302EA-RU073W | |
| Black Myth: Wukong - 1920x1080 cinematic TSR 100 | |
| Asus ROG Flow Z13 GZ302EA-RU073W | |
| Asus ROG Flow Z13 ACRNM | |
| God of War Ragnarök - 1920x1080 Ultra Preset AA:T | |
| Asus ROG Flow Z13 ACRNM | |
| Asus ROG Flow Z13 GZ302EA-RU073W | |
| Call of Duty Black Ops 6 - 1920x1080 Extreme Preset | |
| Asus ROG Flow Z13 GZ302EA-RU073W | |
| Asus ROG Flow Z13 ACRNM | |
| Ghost of Tsushima - 1920x1080 Very High Preset AA:T | |
| Asus ROG Flow Z13 ACRNM | |
| Asus ROG Flow Z13 GZ302EA-RU073W | |
| Monster Hunter Wilds - 1920x1080 ultra, RT: high, no upscaling | |
| Asus ROG Flow Z13 ACRNM | |
| Asus ROG Flow Z13 GZ302EA-RU073W | |
| Indiana Jones and the Great Circle - 1920x1080 Very Ultra Preset | |
| Asus ROG Flow Z13 GZ302EA-RU073W | |
| Asus ROG Flow Z13 ACRNM | |
| Star Wars Outlaws - 1920x1080 cinem. ultra | |
| Asus ROG Flow Z13 ACRNM | |
| Asus ROG Flow Z13 GZ302EA-RU073W | |
The situation is very similar in the QHD resolution, even though the GeForce Flow Z13 has a slightly bigger lead (+5 %). Many titles are generally playable in QHD and maximum details, only very demanding games like Black Myth: Wukong, Star Wars Outlaws, Indiana Jones or Monster Hunter Wilds drop below the 30 fps mark.
| Gaming QHD Ultra Performance rating - Percent | |
| Asus ROG Flow Z13 ACRNM | |
| Asus ROG Flow Z13 GZ302EA-RU073W | |
| Cyberpunk 2077 - 2560x1440 Ultra Preset (FSR off) | |
| Asus ROG Flow Z13 GZ302EA-RU073W | |
| Asus ROG Flow Z13 ACRNM | |
| Baldur's Gate 3 - 2560x1440 Ultra Preset AA:T | |
| Asus ROG Flow Z13 ACRNM | |
| Asus ROG Flow Z13 GZ302EA-RU073W | |
| GTA V - 2560x1440 Highest AA:4xMSAA + FX AF:16x | |
| Asus ROG Flow Z13 ACRNM | |
| Asus ROG Flow Z13 GZ302EA-RU073W | |
| Horizon Forbidden West - 2560x1440 Very High Preset AA:T | |
| Asus ROG Flow Z13 ACRNM | |
| Asus ROG Flow Z13 GZ302EA-RU073W | |
| F1 24 - 2560x1440 Ultra High Preset AA:T AF:16x | |
| Asus ROG Flow Z13 ACRNM | |
| Asus ROG Flow Z13 GZ302EA-RU073W | |
| Black Myth: Wukong - 2560x1440 cinematic TSR 100 | |
| Asus ROG Flow Z13 GZ302EA-RU073W | |
| Asus ROG Flow Z13 ACRNM | |
| God of War Ragnarök - 2560x1440 Ultra Preset AA:T | |
| Asus ROG Flow Z13 ACRNM | |
| Asus ROG Flow Z13 GZ302EA-RU073W | |
| Call of Duty Black Ops 6 - 2560x1440 Extreme Preset | |
| Asus ROG Flow Z13 GZ302EA-RU073W | |
| Asus ROG Flow Z13 ACRNM | |
| Ghost of Tsushima - 2560x1440 Very High Preset AA:T | |
| Asus ROG Flow Z13 ACRNM | |
| Asus ROG Flow Z13 GZ302EA-RU073W | |
| Monster Hunter Wilds - 2560x1440 ultra, RT: high, no upscaling | |
| Asus ROG Flow Z13 ACRNM | |
| Asus ROG Flow Z13 GZ302EA-RU073W | |
| Star Wars Outlaws - 2560x1440 cinem. ultra | |
| Asus ROG Flow Z13 ACRNM | |
| Asus ROG Flow Z13 GZ302EA-RU073W | |
Some titles also support FSR 3 upscaling to improve the performance, but the support is more limited compared to Nvidia’s DLSS technology. We checked the results in some modern titles and even though FSR 3 already improves the performance noticeably, you will see the biggest improvements with additional frame generation. The native results can often be more than doubles and even demanding titles like Black Myth Wukong, Monster Hunter Wilds or Star Wars Outlaws will reach smooth fps numbers. At least in theory, because the gaming experience can vary heavily. Star Wars Outlaws or Horizon Forbidden West, for instance, suffered from visible artifacts and image distortions especially during movements.
| Game | Native | FSR 3 | FSR3 + FG |
|---|---|---|---|
| Ghost of Tsushima | 40.1 fps | 52.4 fps | 90.8 fps |
| GoW Ragnarök | 57.5 fps | 49.7 fps | 81.4 fps |
| Cyberpunk 2077 | 46.4 fps | 64.5 fps | 109.7 fps |
| Monster Hunter Wilds | 28.4 fps | 36.4 fps | 59.3 fps |
| Horizon Forbidden West | 38.3 fps | 44.8 fps | 69 fps |
| Black Myth: Wukong | 16 fps | 25 fps | 48 fps |
| Star Wars Outlaws | 19.8 fps | 27.4 fps | 54.3 fps |
| CoD Black Ops 6 | 64 fps | 79 fps | 114 fps |
February 24, 2025 update: Shortly after we published our review of the Flow Z13, there was a major update for Indiana Jones and the Great Circle with support for FSR upscaling as well as frame generation on AMD systems. Indiana Jones is also a title that benefits from 16 GB VRAM. We can once again notice a big improvement with FSR, especially in combination with frame generation.
| Game | Native | FSR 3 | FSR3 + FG |
|---|---|---|---|
| Indiana Jones (8 GB VRAM) | 27.4 fps | ||
| Indiana Jones (16 GB VRAM) | 35.5 fps | 46.6 fps | 65.1 fps |
Cyberpunk 2077 ultra FPS chart
| low | med. | high | ultra | QHD FSR | QHD | 4K | |
|---|---|---|---|---|---|---|---|
| GTA V (2015) | 166.9 | 83.5 | 64.3 | 72.9 | |||
| The Witcher 3 (2015) | 101 | ||||||
| Dota 2 Reborn (2015) | 223 | 192.3 | 164.4 | 142 | 87 | ||
| Final Fantasy XV Benchmark (2018) | 182.7 | 117.6 | 86.6 | 63.6 | 34.7 | ||
| X-Plane 11.11 (2018) | 138.8 | 104.9 | 76.7 | 60.4 | |||
| Strange Brigade (2018) | 453 | 221 | 192.7 | 167.9 | 109.9 | 57.6 | |
| Baldur's Gate 3 (2023) | 128.8 | 100.9 | 87.9 | 85.3 | 55.2 | 28.6 | |
| Cyberpunk 2077 (2023) | 124.8 | 105.3 | 85 | 75.6 | 46.4 | 18.8 | |
| Horizon Forbidden West (2024) | 48.7 | 44.8 | 38.3 | ||||
| Ghost of Tsushima (2024) | 78.1 | 65.1 | 59.2 | 51.2 | 40.1 | 23 | |
| F1 24 (2024) | 207 | 185.6 | 147.7 | 46 | 28.8 | 13 | |
| Black Myth: Wukong (2024) | 27 | 28 | 20 | ||||
| Star Wars Outlaws (2024) | 32.7 | 33.3 | 23.1 | ||||
| God of War Ragnarök (2024) | 111.8 | 96.4 | 82.8 | 76.1 | 49.7 | 57.5 | 33.2 |
| Call of Duty Black Ops 6 (2024) | 83 | 79 | 64 | ||||
| Indiana Jones and the Great Circle (2024) | 77.2 | 49.4 | 40.3 | 27.4 | |||
| Monster Hunter Wilds (2025) | 59.8 | 50.2 | 39.2 | 28.8 | 15.9 | ||
| Doom: The Dark Ages (2025) | 57.7 | 49.4 | 44.4 | 42.7 |
Emissions - Convertible with vapor chamber
System Noise
The cooling unit consists of a vapor chamber and two fans, which are always silent while idling. As soon as you start to stress the system, the fan activity and noise levels mainly depend on the power profile. In Turbo mode, we measure between 34-37 dB(A) for common tasks as well as 45 dB(A) while playing games and during our stress test. This is very noticeable, so you should use headphones. The other two power profiles stay quieter at 33 and 39 dB(A), respectively, so we recommend you try them with your favorite games as well and test the performance. If you select the Manual mode and use the highest power limits, the fan noise will reach almost 50 dB(A). Our test unit did not have any problems with electronic noises like coil whine.
Noise level
| Idle |
| 23.6 / 23.6 / 23.6 dB(A) |
| Load |
| 37.5 / 45.4 dB(A) |
 | ||
30 dB silent 40 dB(A) audible 50 dB(A) loud |
||
min: | ||
| Asus ROG Flow Z13 GZ302EA-RU073W Radeon 8060S, Ryzen AI Max+ 395, Kioxia BG6 KBG60ZNS1T02 | Asus ROG Flow Z13 ACRNM GeForce RTX 4070 Laptop GPU, i9-13900H, WD PC SN740 SDDPTQD-1T00 | Asus ProArt PX13 HN7306 GeForce RTX 4070 Laptop GPU, Ryzen AI 9 HX 370, WD PC SN740 SDDPTQD-1T00 | Asus ROG Zephyrus G14 2024 GA403U GeForce RTX 4070 Laptop GPU, R9 8945HS, WD PC SN560 SDDPNQE-1T00 | Razer Blade 14 RZ09-0508 GeForce RTX 4070 Laptop GPU, R9 8945HS, Samsung PM9A1 MZVL21T0HCLR | Razer Blade 14 RTX 4070 GeForce RTX 4070 Laptop GPU, R9 7940HS, Samsung PM9A1 MZVL21T0HCLR | Acer Predator Helios Neo 14 (2024) GeForce RTX 4070 Laptop GPU, Ultra 9 185H, SK Hynix PC801 HFS001TEJ9X125N | |
|---|---|---|---|---|---|---|---|
| Noise | -12% | -16% | -5% | -4% | -1% | -23% | |
| off / environment * (dB) | 23.6 | 24 -2% | 24.7 -5% | 23.9 -1% | 24.3 -3% | 22.7 4% | 24 -2% |
| Idle Minimum * (dB) | 23.6 | 24 -2% | 24.7 -5% | 23.9 -1% | 25 -6% | 23.4 1% | 29 -23% |
| Idle Average * (dB) | 23.6 | 24 -2% | 28.4 -20% | 23.9 -1% | 25 -6% | 23.4 1% | 31 -31% |
| Idle Maximum * (dB) | 23.6 | 36.5 -55% | 30.9 -31% | 23.9 -1% | 25 -6% | 23.4 1% | 36 -53% |
| Load Average * (dB) | 37.5 | 41.3 -10% | 43 -15% | 46.2 -23% | 33 12% | 33 12% | 47 -25% |
| Cyberpunk 2077 ultra * (dB) | 45.4 | 53.3 -17% | 50 -10% | ||||
| Load Maximum * (dB) | 45.4 | 46.9 -3% | 53.3 -17% | 46.2 -2% | 51.9 -14% | 55.6 -22% | 52 -15% |
| Witcher 3 ultra * (dB) | 44.7 | 46.2 | 49.5 | 51.8 |
* ... smaller is better
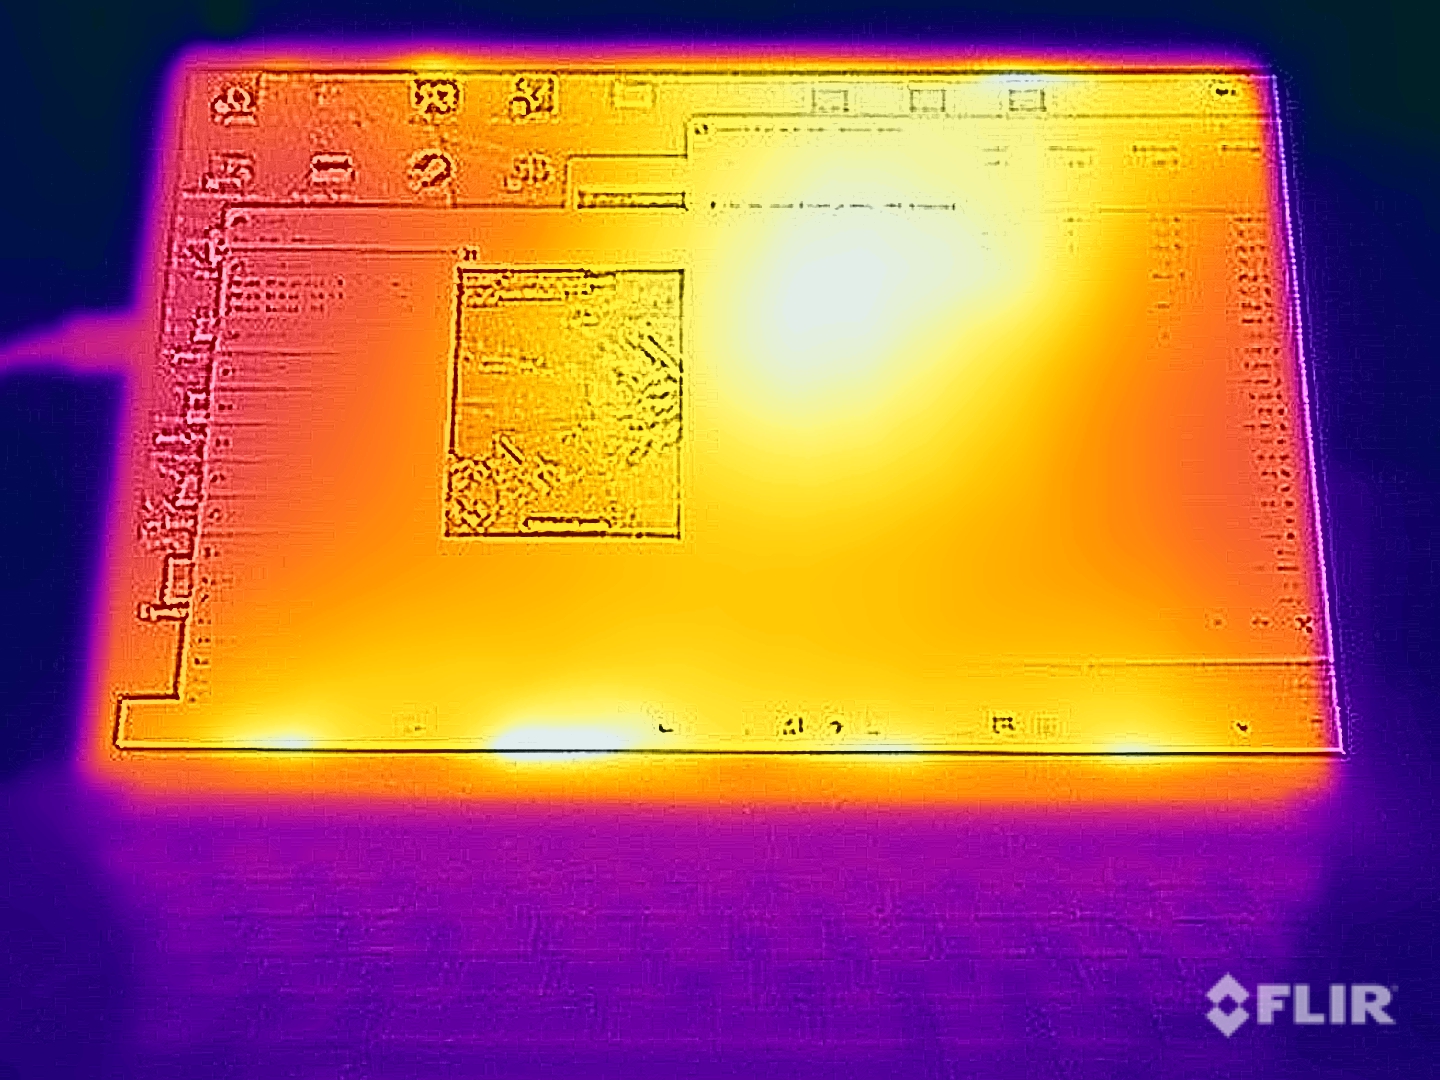
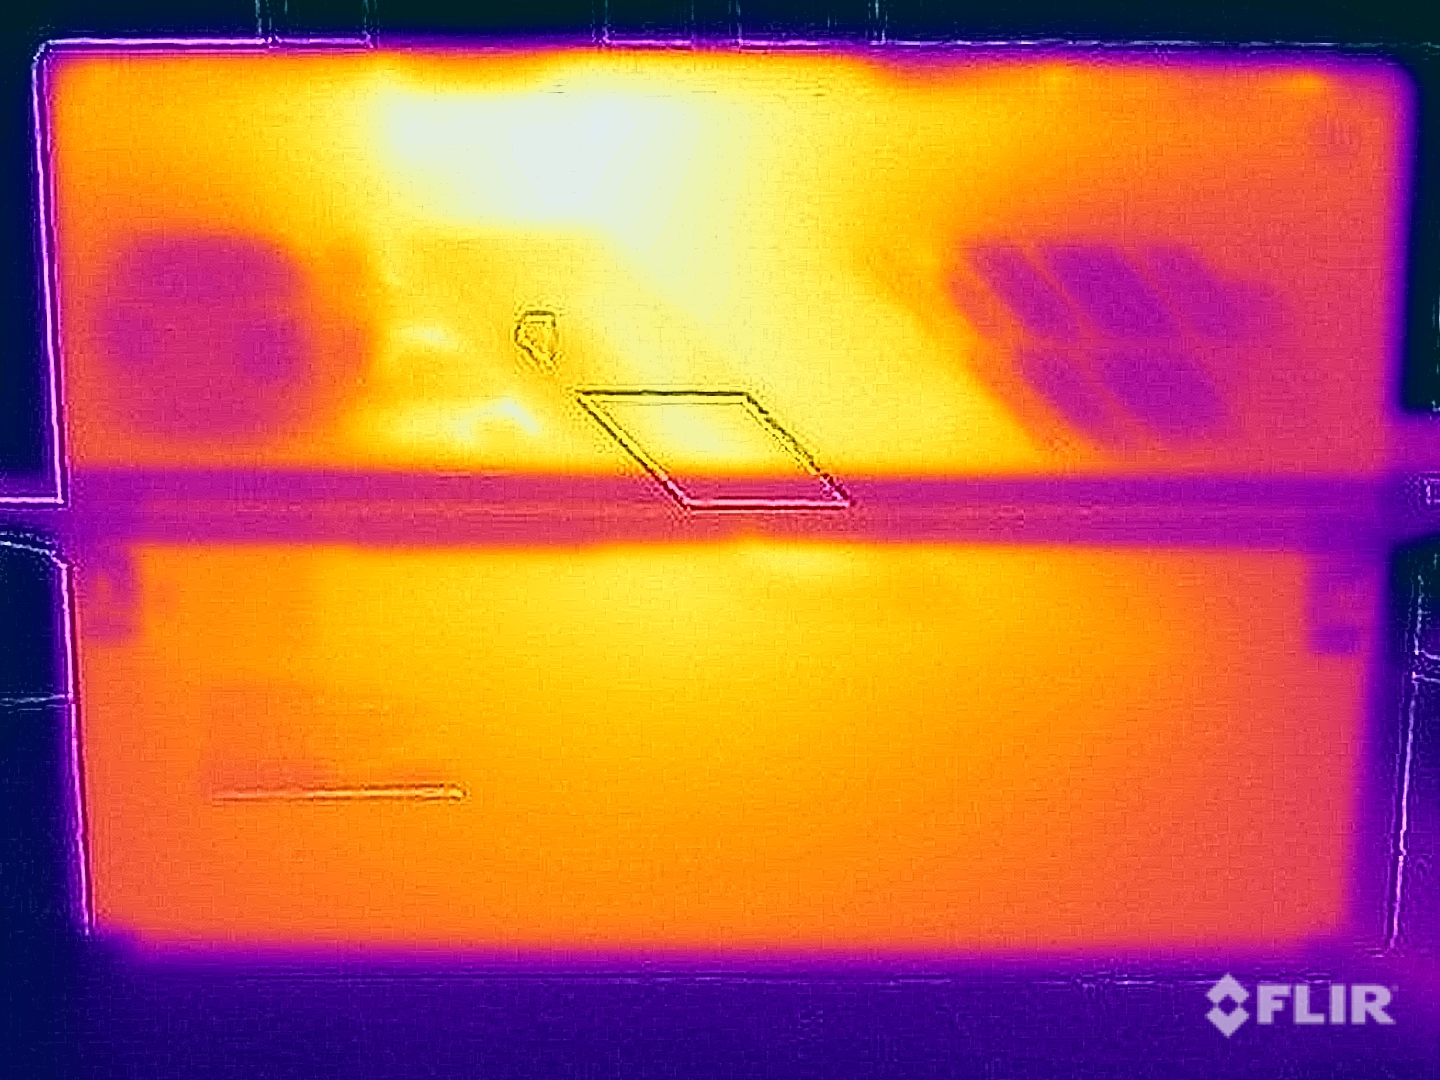
Temperature
The aluminum chassis stays very cool while idling and light workloads, but the temperatures are also far away from critical under higher loads. We measure up to 45 °C at the rear and 42 °C at the front, but since you will hardly come in contact with these spots (except when you lift the device, for example), there are no limitations and you can use it on your lap as well. The keyboard does not warm up at all and the fans dissipate the warm air at the top of the device.
Our stress test with combined CPU/GPU load shows a short peak at 86 Watts before the consumption drops to 70 Watts for a few minutes before it levels off at around 62 Watts. This is for both the CPU and GPU, and according to the sensors, the split is pretty even between the two.

(±) The maximum temperature on the upper side is 42.5 °C / 109 F, compared to the average of 35.4 °C / 96 F, ranging from 19.6 to 60 °C for the class Convertible.
(±) The bottom heats up to a maximum of 44.9 °C / 113 F, compared to the average of 36.9 °C / 98 F
(+) In idle usage, the average temperature for the upper side is 27.9 °C / 82 F, compared to the device average of 30.3 °C / 87 F.
(-) 3: The average temperature for the upper side is 40.1 °C / 104 F, compared to the average of 30.3 °C / 87 F for the class Convertible.
(-) The palmrests and touchpad can get very hot to the touch with a maximum of 41.3 °C / 106.3 F.
(-) The average temperature of the palmrest area of similar devices was 28 °C / 82.4 F (-13.3 °C / -23.9 F).
| Asus ROG Flow Z13 GZ302EA-RU073W AMD Ryzen AI Max+ 395, AMD Radeon 8060S | Asus ROG Flow Z13 ACRNM Intel Core i9-13900H, NVIDIA GeForce RTX 4070 Laptop GPU | Asus ProArt PX13 HN7306 AMD Ryzen AI 9 HX 370, NVIDIA GeForce RTX 4070 Laptop GPU | Asus ROG Zephyrus G14 2024 GA403U AMD Ryzen 9 8945HS, NVIDIA GeForce RTX 4070 Laptop GPU | Razer Blade 14 RZ09-0508 AMD Ryzen 9 8945HS, NVIDIA GeForce RTX 4070 Laptop GPU | Razer Blade 14 RTX 4070 AMD Ryzen 9 7940HS, NVIDIA GeForce RTX 4070 Laptop GPU | Acer Predator Helios Neo 14 (2024) Intel Core Ultra 9 185H, NVIDIA GeForce RTX 4070 Laptop GPU | |
|---|---|---|---|---|---|---|---|
| Heat | 7% | -3% | 0% | -9% | -0% | -19% | |
| Maximum Upper Side * (°C) | 42.5 | 42.5 -0% | 45.3 -7% | 46.6 -10% | 41.8 2% | 37.4 12% | 57 -34% |
| Maximum Bottom * (°C) | 44.9 | 42.6 5% | 47.9 -7% | 47.8 -6% | 42.2 6% | 35.2 22% | 55 -22% |
| Idle Upper Side * (°C) | 29.6 | 26.2 11% | 28.5 4% | 26.7 10% | 34.8 -18% | 33.2 -12% | 32 -8% |
| Idle Bottom * (°C) | 29.5 | 26 12% | 29.9 -1% | 27.8 6% | 37.4 -27% | 36.2 -23% | 33 -12% |
* ... smaller is better
Speakers
The two stereo speakers remain a weak point of the gaming convertible. They are not particularly loud and not very powerful, either. We would therefore recommend headphones, especially while playing games.
Asus ROG Flow Z13 GZ302EA-RU073W audio analysis
(±) | speaker loudness is average but good (79.9 dB)
Bass 100 - 315 Hz
(±) | reduced bass - on average 10.7% lower than median
(±) | linearity of bass is average (10.6% delta to prev. frequency)
Mids 400 - 2000 Hz
(±) | higher mids - on average 6.7% higher than median
(+) | mids are linear (6.3% delta to prev. frequency)
Highs 2 - 16 kHz
(±) | higher highs - on average 9.2% higher than median
(±) | linearity of highs is average (9.7% delta to prev. frequency)
Overall 100 - 16.000 Hz
(±) | linearity of overall sound is average (23.7% difference to median)
Compared to same class
» 72% of all tested devices in this class were better, 4% similar, 24% worse
» The best had a delta of 6%, average was 20%, worst was 57%
Compared to all devices tested
» 71% of all tested devices were better, 6% similar, 23% worse
» The best had a delta of 4%, average was 24%, worst was 134%
Asus ROG Flow Z13 ACRNM audio analysis
(±) | speaker loudness is average but good (80.3 dB)
Bass 100 - 315 Hz
(-) | nearly no bass - on average 18.3% lower than median
(±) | linearity of bass is average (10.1% delta to prev. frequency)
Mids 400 - 2000 Hz
(+) | balanced mids - only 3.4% away from median
(+) | mids are linear (4.5% delta to prev. frequency)
Highs 2 - 16 kHz
(±) | higher highs - on average 6.1% higher than median
(+) | highs are linear (3.5% delta to prev. frequency)
Overall 100 - 16.000 Hz
(±) | linearity of overall sound is average (19% difference to median)
Compared to same class
» 63% of all tested devices in this class were better, 8% similar, 29% worse
» The best had a delta of 6%, average was 18%, worst was 132%
Compared to all devices tested
» 45% of all tested devices were better, 7% similar, 48% worse
» The best had a delta of 4%, average was 24%, worst was 134%
Asus ProArt PX13 HN7306 audio analysis
(±) | speaker loudness is average but good (81.5 dB)
Bass 100 - 315 Hz
(±) | reduced bass - on average 7.3% lower than median
(±) | linearity of bass is average (8.6% delta to prev. frequency)
Mids 400 - 2000 Hz
(±) | higher mids - on average 5.6% higher than median
(+) | mids are linear (5.2% delta to prev. frequency)
Highs 2 - 16 kHz
(+) | balanced highs - only 3.2% away from median
(+) | highs are linear (3.6% delta to prev. frequency)
Overall 100 - 16.000 Hz
(+) | overall sound is linear (12.9% difference to median)
Compared to same class
» 26% of all tested devices in this class were better, 4% similar, 70% worse
» The best had a delta of 5%, average was 17%, worst was 45%
Compared to all devices tested
» 12% of all tested devices were better, 3% similar, 85% worse
» The best had a delta of 4%, average was 24%, worst was 134%
Asus ROG Zephyrus G14 2024 GA403U audio analysis
(+) | speakers can play relatively loud (84.7 dB)
Bass 100 - 315 Hz
(+) | good bass - only 3.5% away from median
(±) | linearity of bass is average (7.3% delta to prev. frequency)
Mids 400 - 2000 Hz
(+) | balanced mids - only 3.8% away from median
(+) | mids are linear (3.6% delta to prev. frequency)
Highs 2 - 16 kHz
(+) | balanced highs - only 1.4% away from median
(+) | highs are linear (3.5% delta to prev. frequency)
Overall 100 - 16.000 Hz
(+) | overall sound is linear (5.8% difference to median)
Compared to same class
» 0% of all tested devices in this class were better, 0% similar, 100% worse
» The best had a delta of 6%, average was 18%, worst was 132%
Compared to all devices tested
» 0% of all tested devices were better, 0% similar, 100% worse
» The best had a delta of 4%, average was 24%, worst was 134%
Razer Blade 14 RZ09-0508 audio analysis
(±) | speaker loudness is average but good (79.2 dB)
Bass 100 - 315 Hz
(±) | reduced bass - on average 14% lower than median
(±) | linearity of bass is average (12.7% delta to prev. frequency)
Mids 400 - 2000 Hz
(+) | balanced mids - only 2.7% away from median
(+) | mids are linear (2.6% delta to prev. frequency)
Highs 2 - 16 kHz
(±) | higher highs - on average 6.2% higher than median
(±) | linearity of highs is average (7% delta to prev. frequency)
Overall 100 - 16.000 Hz
(±) | linearity of overall sound is average (17.1% difference to median)
Compared to same class
» 46% of all tested devices in this class were better, 12% similar, 43% worse
» The best had a delta of 6%, average was 18%, worst was 132%
Compared to all devices tested
» 31% of all tested devices were better, 8% similar, 61% worse
» The best had a delta of 4%, average was 24%, worst was 134%
Razer Blade 14 RTX 4070 audio analysis
(+) | speakers can play relatively loud (82.7 dB)
Bass 100 - 315 Hz
(-) | nearly no bass - on average 15.9% lower than median
(±) | linearity of bass is average (12.3% delta to prev. frequency)
Mids 400 - 2000 Hz
(+) | balanced mids - only 4.3% away from median
(+) | mids are linear (3.1% delta to prev. frequency)
Highs 2 - 16 kHz
(±) | higher highs - on average 6.2% higher than median
(+) | highs are linear (5.5% delta to prev. frequency)
Overall 100 - 16.000 Hz
(±) | linearity of overall sound is average (16.7% difference to median)
Compared to same class
» 43% of all tested devices in this class were better, 10% similar, 47% worse
» The best had a delta of 6%, average was 18%, worst was 132%
Compared to all devices tested
» 29% of all tested devices were better, 7% similar, 64% worse
» The best had a delta of 4%, average was 24%, worst was 134%
Acer Predator Helios Neo 14 (2024) audio analysis
(+) | speakers can play relatively loud (87 dB)
Bass 100 - 315 Hz
(-) | nearly no bass - on average 25.5% lower than median
(±) | linearity of bass is average (11.2% delta to prev. frequency)
Mids 400 - 2000 Hz
(+) | balanced mids - only 3.1% away from median
(+) | mids are linear (5.5% delta to prev. frequency)
Highs 2 - 16 kHz
(+) | balanced highs - only 4.6% away from median
(±) | linearity of highs is average (8.1% delta to prev. frequency)
Overall 100 - 16.000 Hz
(±) | linearity of overall sound is average (15.9% difference to median)
Compared to same class
» 38% of all tested devices in this class were better, 7% similar, 56% worse
» The best had a delta of 6%, average was 18%, worst was 132%
Compared to all devices tested
» 25% of all tested devices were better, 5% similar, 70% worse
» The best had a delta of 4%, average was 24%, worst was 134%
Energy Management - Improved battery runtime
Power Consumption
The idle consumption figures at maximum brightness are around 4-5 Watts higher compared to the previous model, which can be a result of the new 180 Hz display and/or the Strix Halo processor. We measure around 110 Watts while gaming, which is about 10-12 Watts less compared to the ProArt PX13, despite the slightly better performance. During the stress test, we measure up to 138 initially, but it quickly levels off at 110-116 Watts. The provided 200W power adapter is therefore more than sufficient. SKUs with 64 or 128 GB RAM should have an even higher peak consumption figure. The consumption during standby and when the device is turned off are extremely low.
| Off / Standby | |
| Idle | |
| Load |
|
Key:
min: | |
| Asus ROG Flow Z13 GZ302EA-RU073W Ryzen AI Max+ 395, Radeon 8060S, Kioxia BG6 KBG60ZNS1T02, IPS, 2560x1600, 13.4" | Asus ROG Flow Z13 ACRNM i9-13900H, GeForce RTX 4070 Laptop GPU, WD PC SN740 SDDPTQD-1T00, IPS, 2560x1600, 13.4" | Asus ProArt PX13 HN7306 Ryzen AI 9 HX 370, GeForce RTX 4070 Laptop GPU, WD PC SN740 SDDPTQD-1T00, OLED, 2880x1800, 13.3" | Asus ROG Zephyrus G14 2024 GA403U R9 8945HS, GeForce RTX 4070 Laptop GPU, WD PC SN560 SDDPNQE-1T00, OLED, 2880x1800, 14" | Razer Blade 14 RZ09-0508 R9 8945HS, GeForce RTX 4070 Laptop GPU, Samsung PM9A1 MZVL21T0HCLR, IPS, 2560x1600, 14" | Razer Blade 14 RTX 4070 R9 7940HS, GeForce RTX 4070 Laptop GPU, Samsung PM9A1 MZVL21T0HCLR, IPS, 2560x1600, 14" | Acer Predator Helios Neo 14 (2024) Ultra 9 185H, GeForce RTX 4070 Laptop GPU, SK Hynix PC801 HFS001TEJ9X125N, IPS, 3072x1920, 14.5" | Average AMD Radeon 8060S | Average of class Convertible | |
|---|---|---|---|---|---|---|---|---|---|
| Power Consumption | 14% | 12% | 27% | -56% | -45% | -13% | 15% | 54% | |
| Idle Minimum * (Watt) | 10.4 | 8.9 14% | 7.5 28% | 6.9 34% | 20.9 -101% | 19.5 -88% | 6 42% | 7.31 ? 30% | 4.29 ? 59% |
| Idle Average * (Watt) | 17 | 12.6 26% | 9.3 45% | 8.6 49% | 25.6 -51% | 24.7 -45% | 11 35% | 9.71 ? 43% | 7.1 ? 58% |
| Idle Maximum * (Watt) | 17.3 | 13 25% | 9.6 45% | 9 48% | 32.1 -86% | 27 -56% | 21 -21% | 13.2 ? 24% | 8.68 ? 50% |
| Load Average * (Watt) | 92.9 | 92.5 -0% | 74.1 20% | 75.2 19% | 72.7 22% | 83.2 10% | 93 -0% | 83.6 ? 10% | 44.1 ? 53% |
| Cyberpunk 2077 ultra * (Watt) | 109.3 | 121.6 -11% | 147.9 -35% | ||||||
| Cyberpunk 2077 ultra external monitor * (Watt) | 113.2 | 121.5 -7% | 146.3 -29% | ||||||
| Load Maximum * (Watt) | 138.1 | 133.6 3% | 185 -34% | 161.6 -17% | 228.4 -65% | 204.5 -48% | 252 -82% | 179.4 ? -30% | 67.2 ? 51% |
| Witcher 3 ultra * (Watt) | 104.4 | 109.7 | 182.1 | 165.8 |
* ... smaller is better
Power consumption Cyberpunk / Stress test
Power consumption external screen
Battery Runtime
Asus increased the battery capacity from 56 to 70 Wh, which has a positive effect on the runtimes. Our Wi-Fi test at 150 nits (40 % of the maximum brightness on our review unit) runs for 9:20 hours at 60 Hz and 7:30 hours at 180 Hz. At maximum brightness, these results drop to 6:18 hours (60 Hz) and 5:43 hours (180 Hz), respectively. Video playback at 150 nits is possible for 12:44 hours. If you really try (maximum load, maximum brightness), you can drain the battery in less than one hour.
A full recharge takes 99 minutes when the device is turned on. The first 60 % are recharged very quickly in just 32 minutes; 80 % of the capacity is recharged after around 48 minutes.
| Asus ROG Flow Z13 GZ302EA-RU073W Ryzen AI Max+ 395, Radeon 8060S, 70 Wh | Asus ROG Flow Z13 ACRNM i9-13900H, GeForce RTX 4070 Laptop GPU, 56 Wh | Asus ProArt PX13 HN7306 Ryzen AI 9 HX 370, GeForce RTX 4070 Laptop GPU, 73 Wh | Asus ROG Zephyrus G14 2024 GA403U R9 8945HS, GeForce RTX 4070 Laptop GPU, 73 Wh | Razer Blade 14 RZ09-0508 R9 8945HS, GeForce RTX 4070 Laptop GPU, 68 Wh | Razer Blade 14 RTX 4070 R9 7940HS, GeForce RTX 4070 Laptop GPU, 68 Wh | Acer Predator Helios Neo 14 (2024) Ultra 9 185H, GeForce RTX 4070 Laptop GPU, 76 Wh | Asus ROG Flow Z13 GZ301V i9-13900H, GeForce RTX 4060 Laptop GPU, 56 Wh | Average of class Convertible | |
|---|---|---|---|---|---|---|---|---|---|
| Battery runtime | -29% | 2% | 6% | 5% | -11% | 19% | -33% | 50% | |
| H.264 (h) | 12.7 | 5.2 -59% | 10.3 -19% | 12.1 -5% | 9.3 -27% | 4.7 -63% | 15.3 ? 20% | ||
| WiFi v1.3 (h) | 9.3 | 6.6 -29% | 8.5 -9% | 9.3 0% | 7.1 -24% | 6.2 -33% | 8.7 -6% | 5 -46% | 11.9 ? 28% |
| Load (h) | 0.9 | 0.9 0% | 1.2 33% | 1.1 22% | 1.2 33% | 1 11% | 1.7 89% | 1 11% | 1.805 ? 101% |
| Witcher 3 ultra (h) | 0.8 |
Notebookcheck Rating
The latest version of the gaming convertible ROG Flow Z13 is the first device with AMD's monster APU Ryzen AI Max+ 395, which leaves a very good overall impression. The multi-core CPU performance is excellent and there is currently other 13-inch device that can keep up. The integrated Radeon 8060S is the fastest x86-iGPU by far and is neck and neck with the GeForce RTX 4070 Laptop when running at TGP levels between 65-75 Watts. The battery runtime is improved, but the overall package of the convertible and keyboard cover is comparatively thick and heavy.
Asus ROG Flow Z13 GZ302EA-RU073W
- 02/17/2025 v8
Andreas Osthoff
 Total Sustainability Score:
 Transparency
The selection of devices to be reviewed is made by our editorial team. The test sample was provided to the author as a loan by the manufacturer or retailer for the purpose of this review. The lender had no influence on this review, nor did the manufacturer receive a copy of this review before publication. There was no obligation to publish this review. As an independent media company, Notebookcheck is not subjected to the authority of manufacturers, retailers or publishers.
This is how Notebookcheck is testing
Every year, Notebookcheck independently reviews hundreds of laptops and smartphones using standardized procedures to ensure that all results are comparable. We have continuously developed our test methods for around 20 years and set industry standards in the process. In our test labs, high-quality measuring equipment is utilized by experienced technicians and editors. These tests involve a multi-stage validation process. Our complex rating system is based on hundreds of well-founded measurements and benchmarks, which maintains objectivity. Further information on our test methods can be found here.
