Asus ROG Flow Z13 ACRNM Review - Gaming Convertible with RTX 4070 Laptop
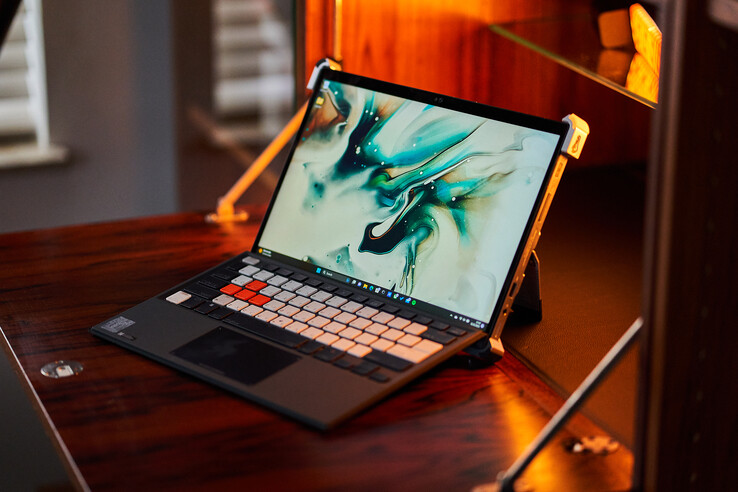
The Asus ROG Flow Z13 is a gaming tablet with a powerful processor and dedicated graphics card. In addition to the regular 2023 model with the Core i9-13900H and up to the GeForce RTX 4060 Laptop, which is currently also in review, Asus also offers a special edition in cooperation with the German fashion brand ACRONYM, which gets a completely redesigned chassis as well as the more powerful GeForce RTX 4070 Laptop. We review the gaming convertible to find out, whether the price of 3400 Euros is justified. The convertible also features a 13.4-inch WQHD IPS screen with 165 Hz refresh rate, 32 GB LPDDR5-RAM as well as a compact 1 TB M.2-2230 SSD, which can be replaced.
It is also possible to use the gaming convertible with the external Asus XG Mobile GPU with the RTX 4090 Laptop, but it is a very expensive option at 2500 Euros. We will also include some eGPU benchmarks during the review.
Potential rivals
Rating | Date | Model | Weight | Height | Size | Resolution | Price |
|---|---|---|---|---|---|---|---|
| 89.4 % v7 (old) | 04 / 2023 | Asus ROG Flow Z13 ACRNM i9-13900H, GeForce RTX 4070 Laptop GPU | 1.7 kg | 20 mm | 13.40" | 2560x1600 | |
| 86.8 % v7 (old) | 03 / 2022 | Asus ROG Flow Z13 GZ301ZE i9-12900H, GeForce RTX 3050 Ti Laptop GPU | 1.2 kg | 12 mm | 13.40" | 1920x1200 | |
| 86.7 % v7 (old) | 03 / 2022 | Alienware x14 i7 RTX 3060 i7-12700H, GeForce RTX 3060 Laptop GPU | 1.8 kg | 14.5 mm | 14.00" | 1920x1080 | |
| 89.4 % v7 (old) | 05 / 2022 | Razer Blade 14 Ryzen 9 6900HX R9 6900HX, GeForce RTX 3070 Ti Laptop GPU | 1.8 kg | 16.8 mm | 14.00" | 2560x1440 | |
| 86.7 % v7 (old) | 03 / 2022 | Asus ROG Zephyrus G14 GA402RK R9 6900HS, Radeon RX 6800S | 1.7 kg | 19.5 mm | 14.00" | 2560x1600 |
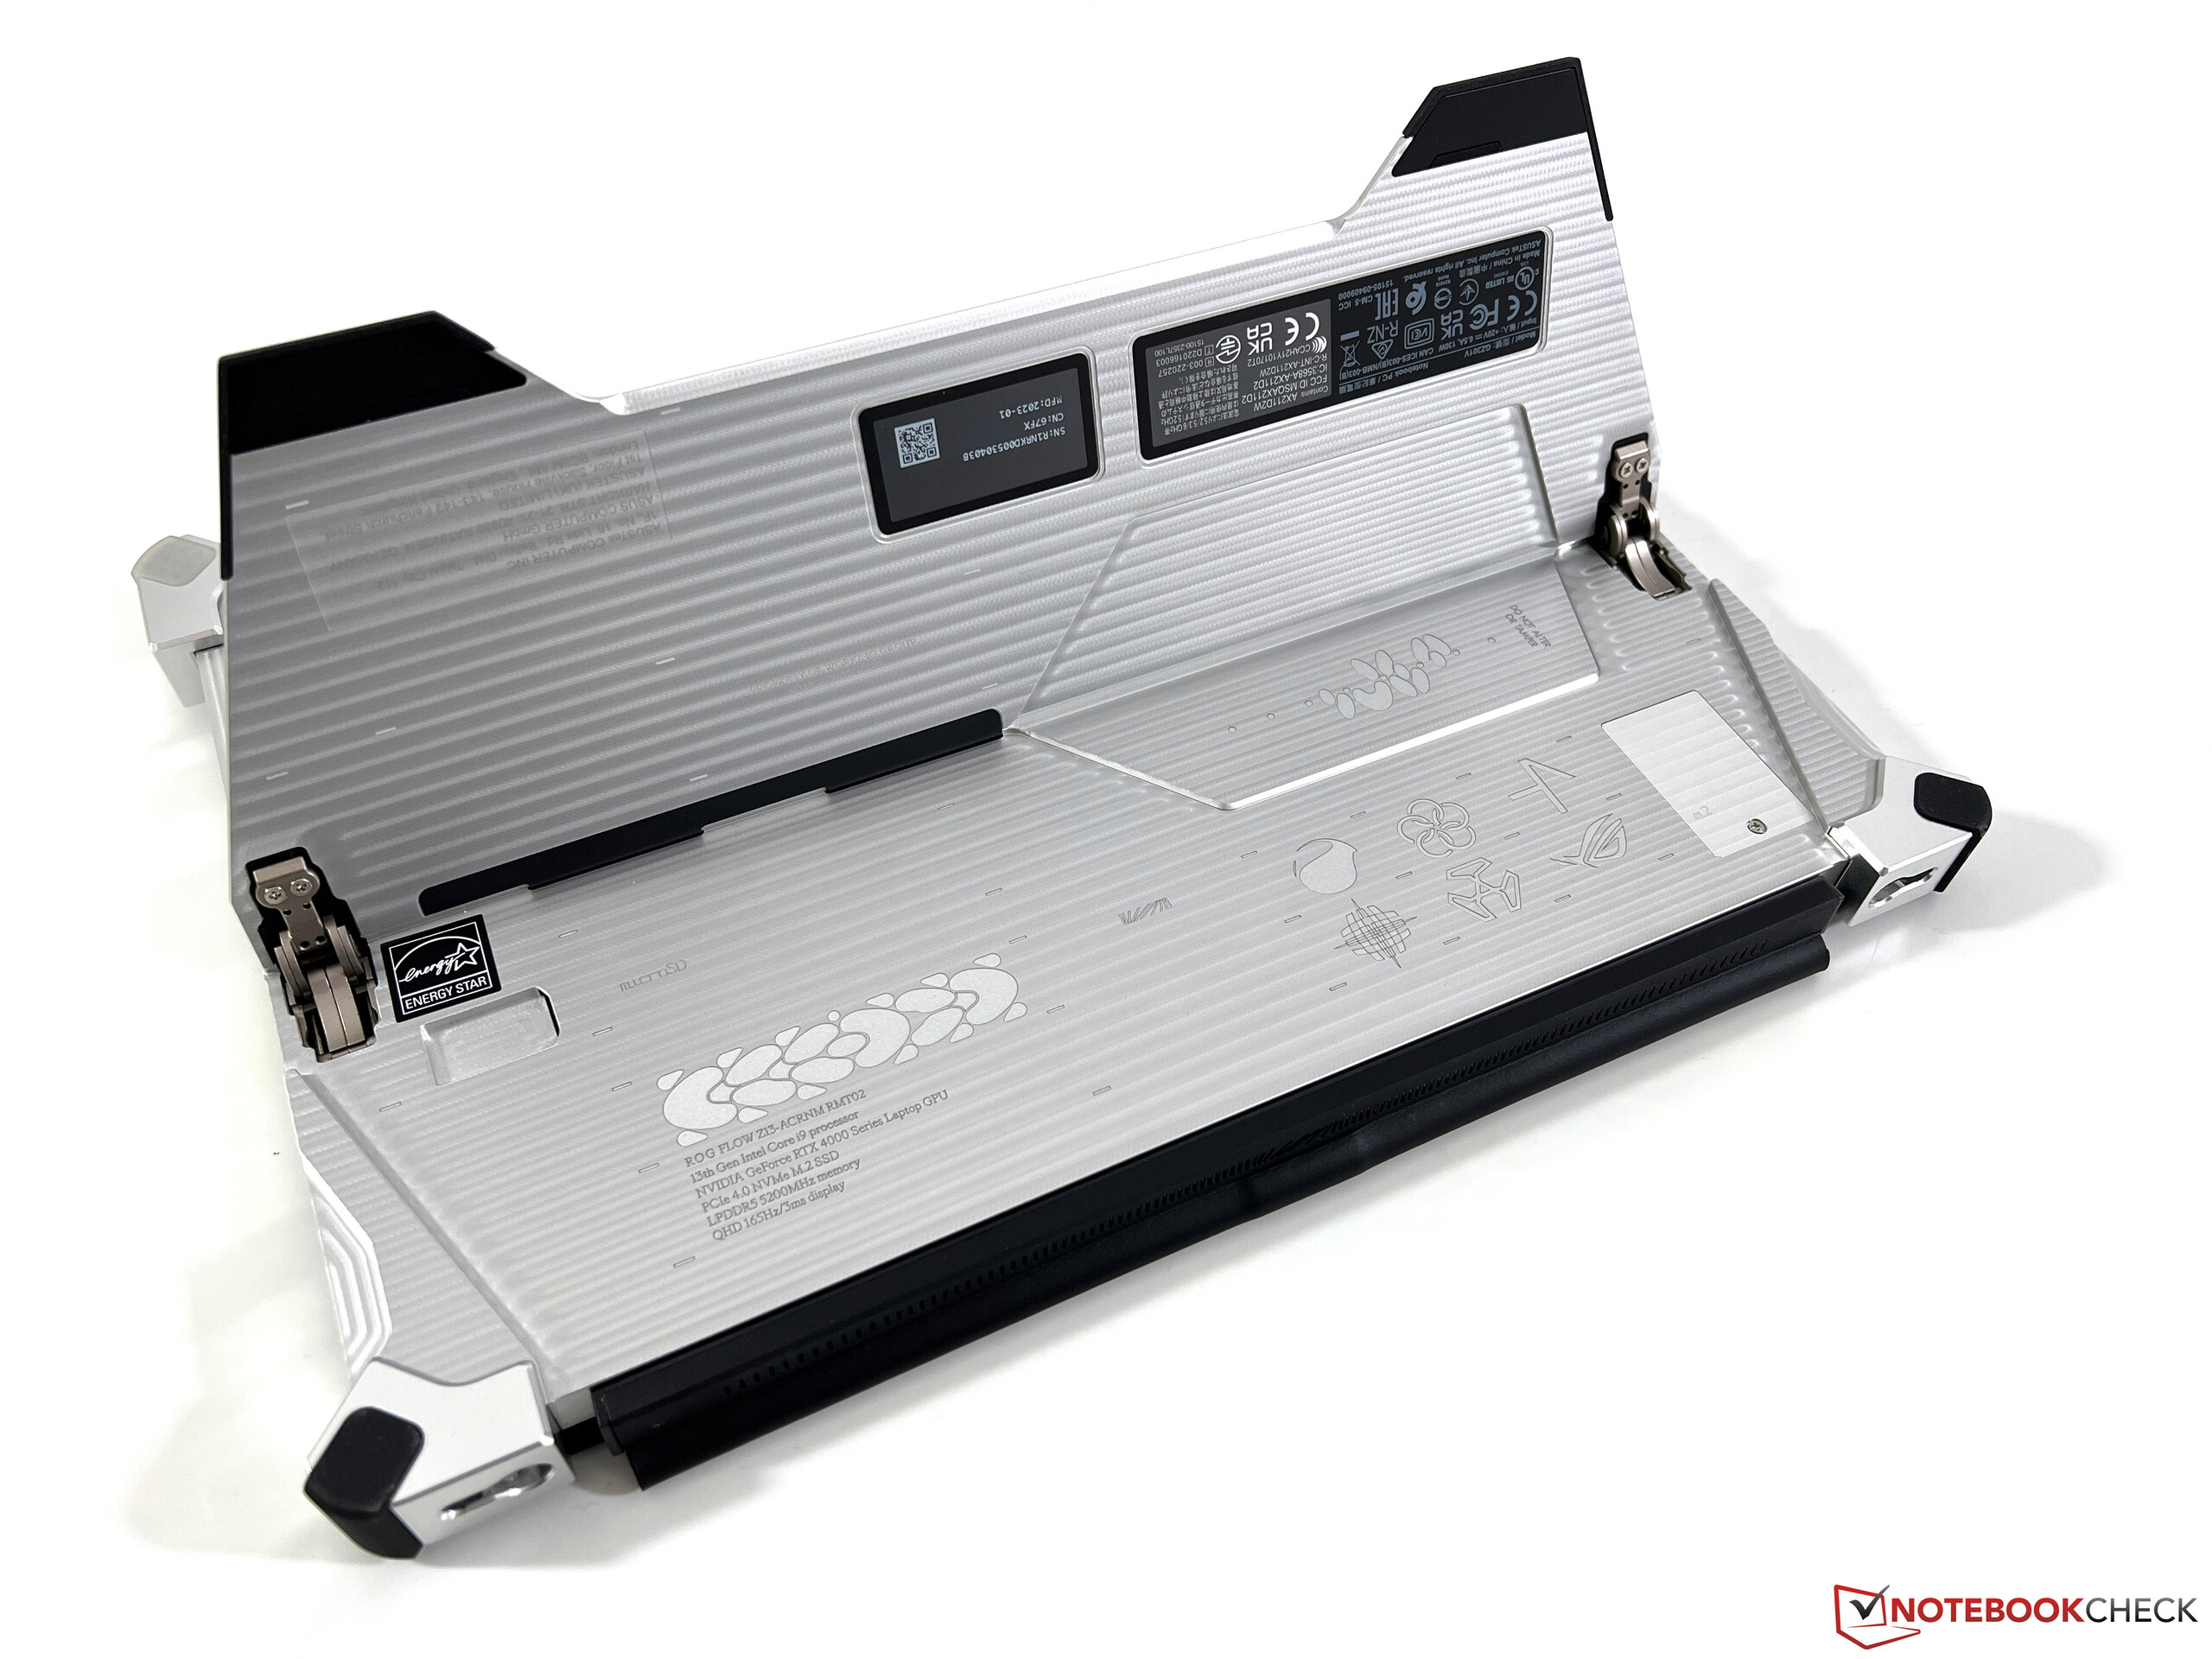
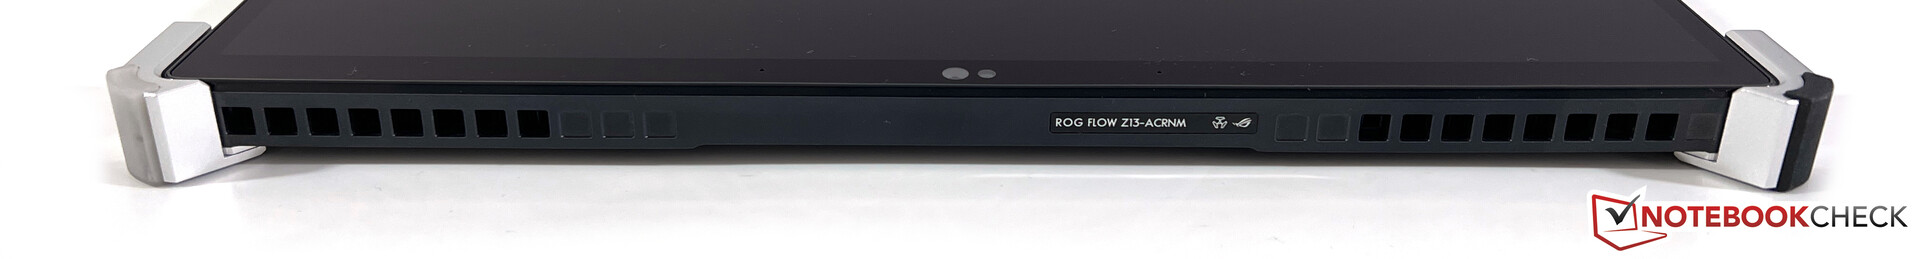
Case - Flow Z13 with striking aluminum chassis
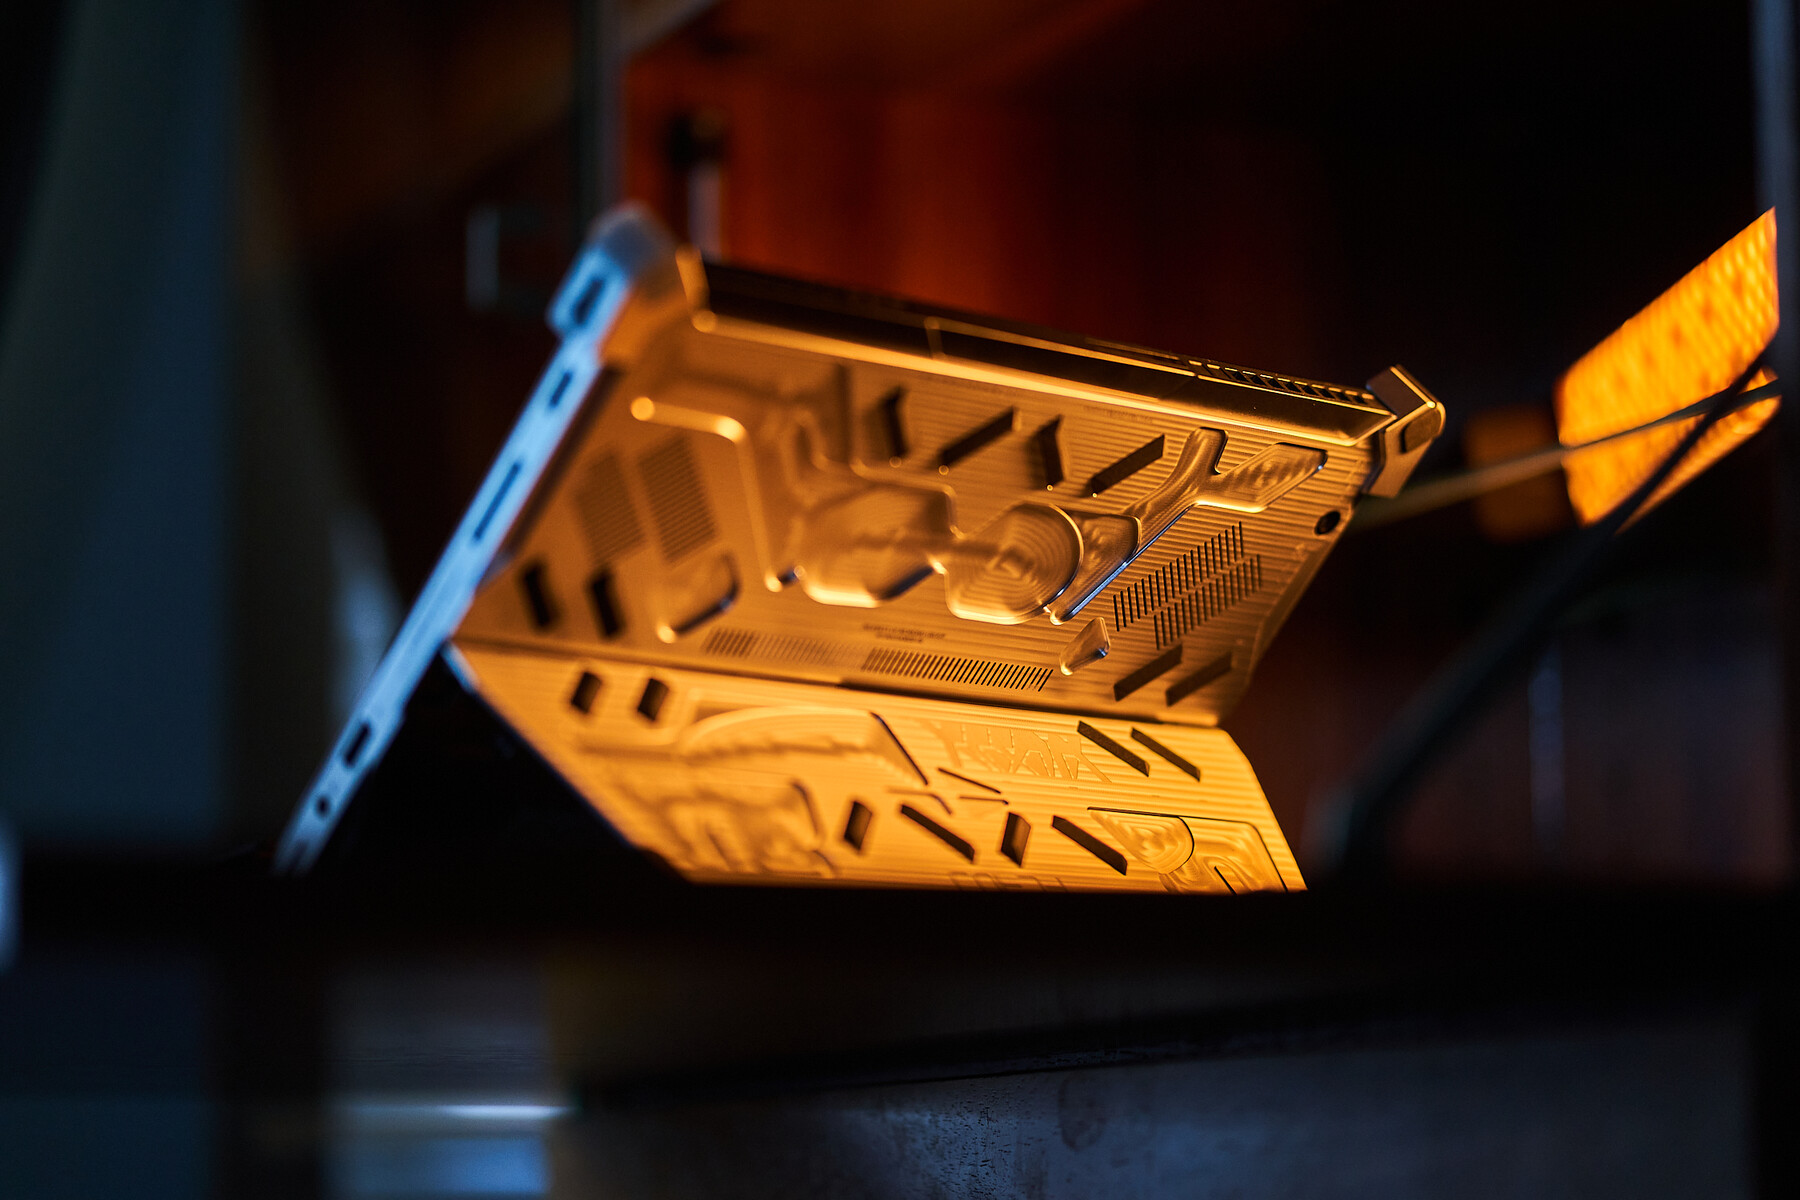
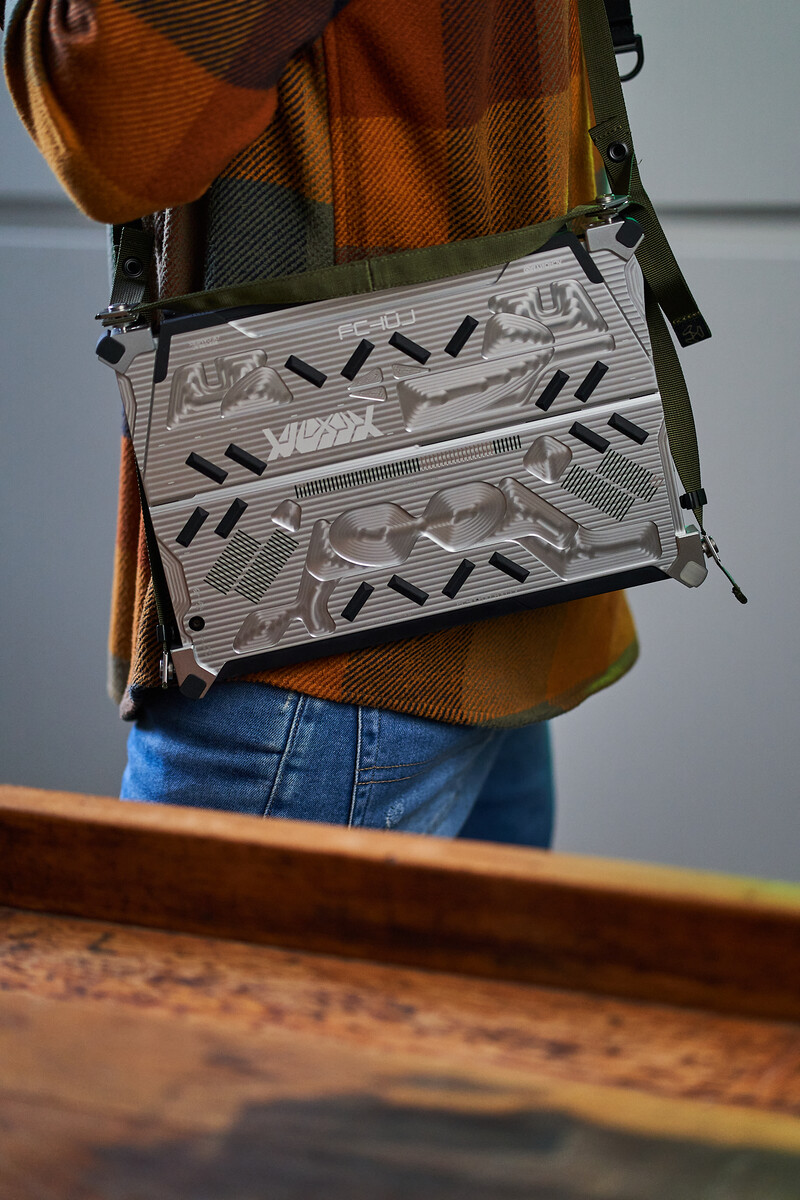
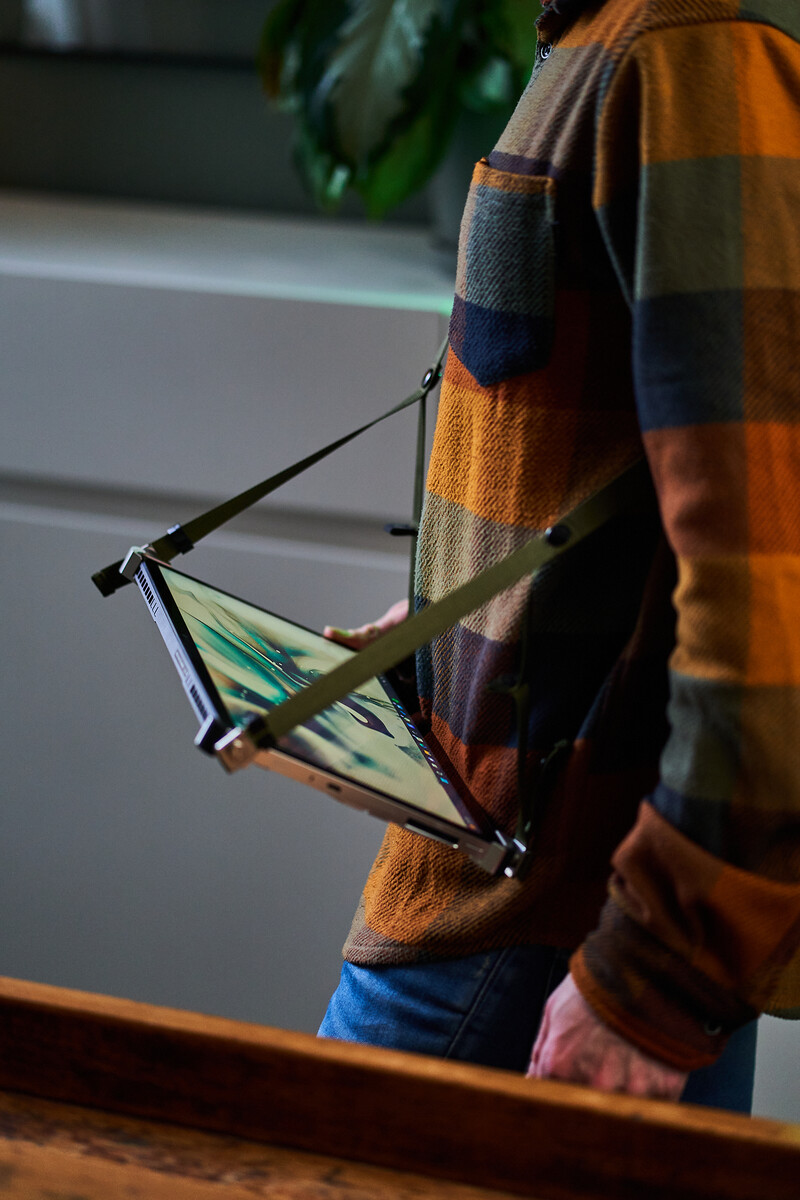
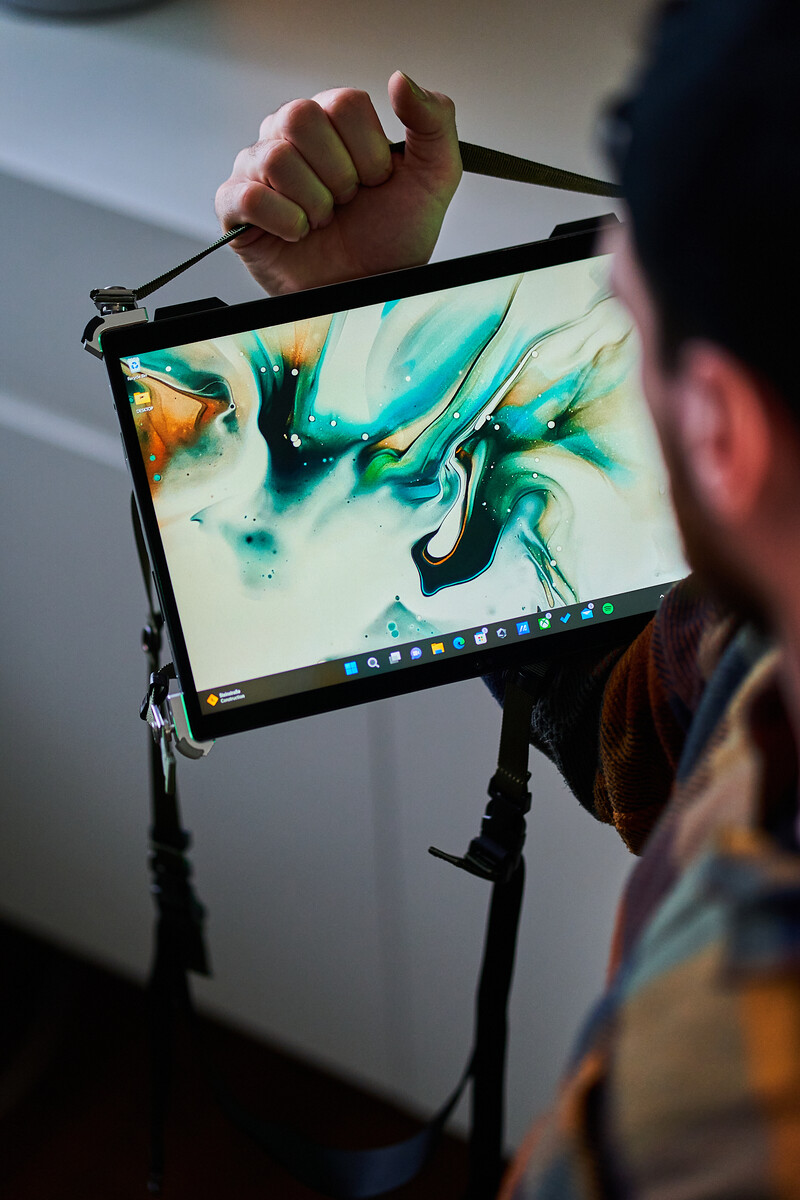
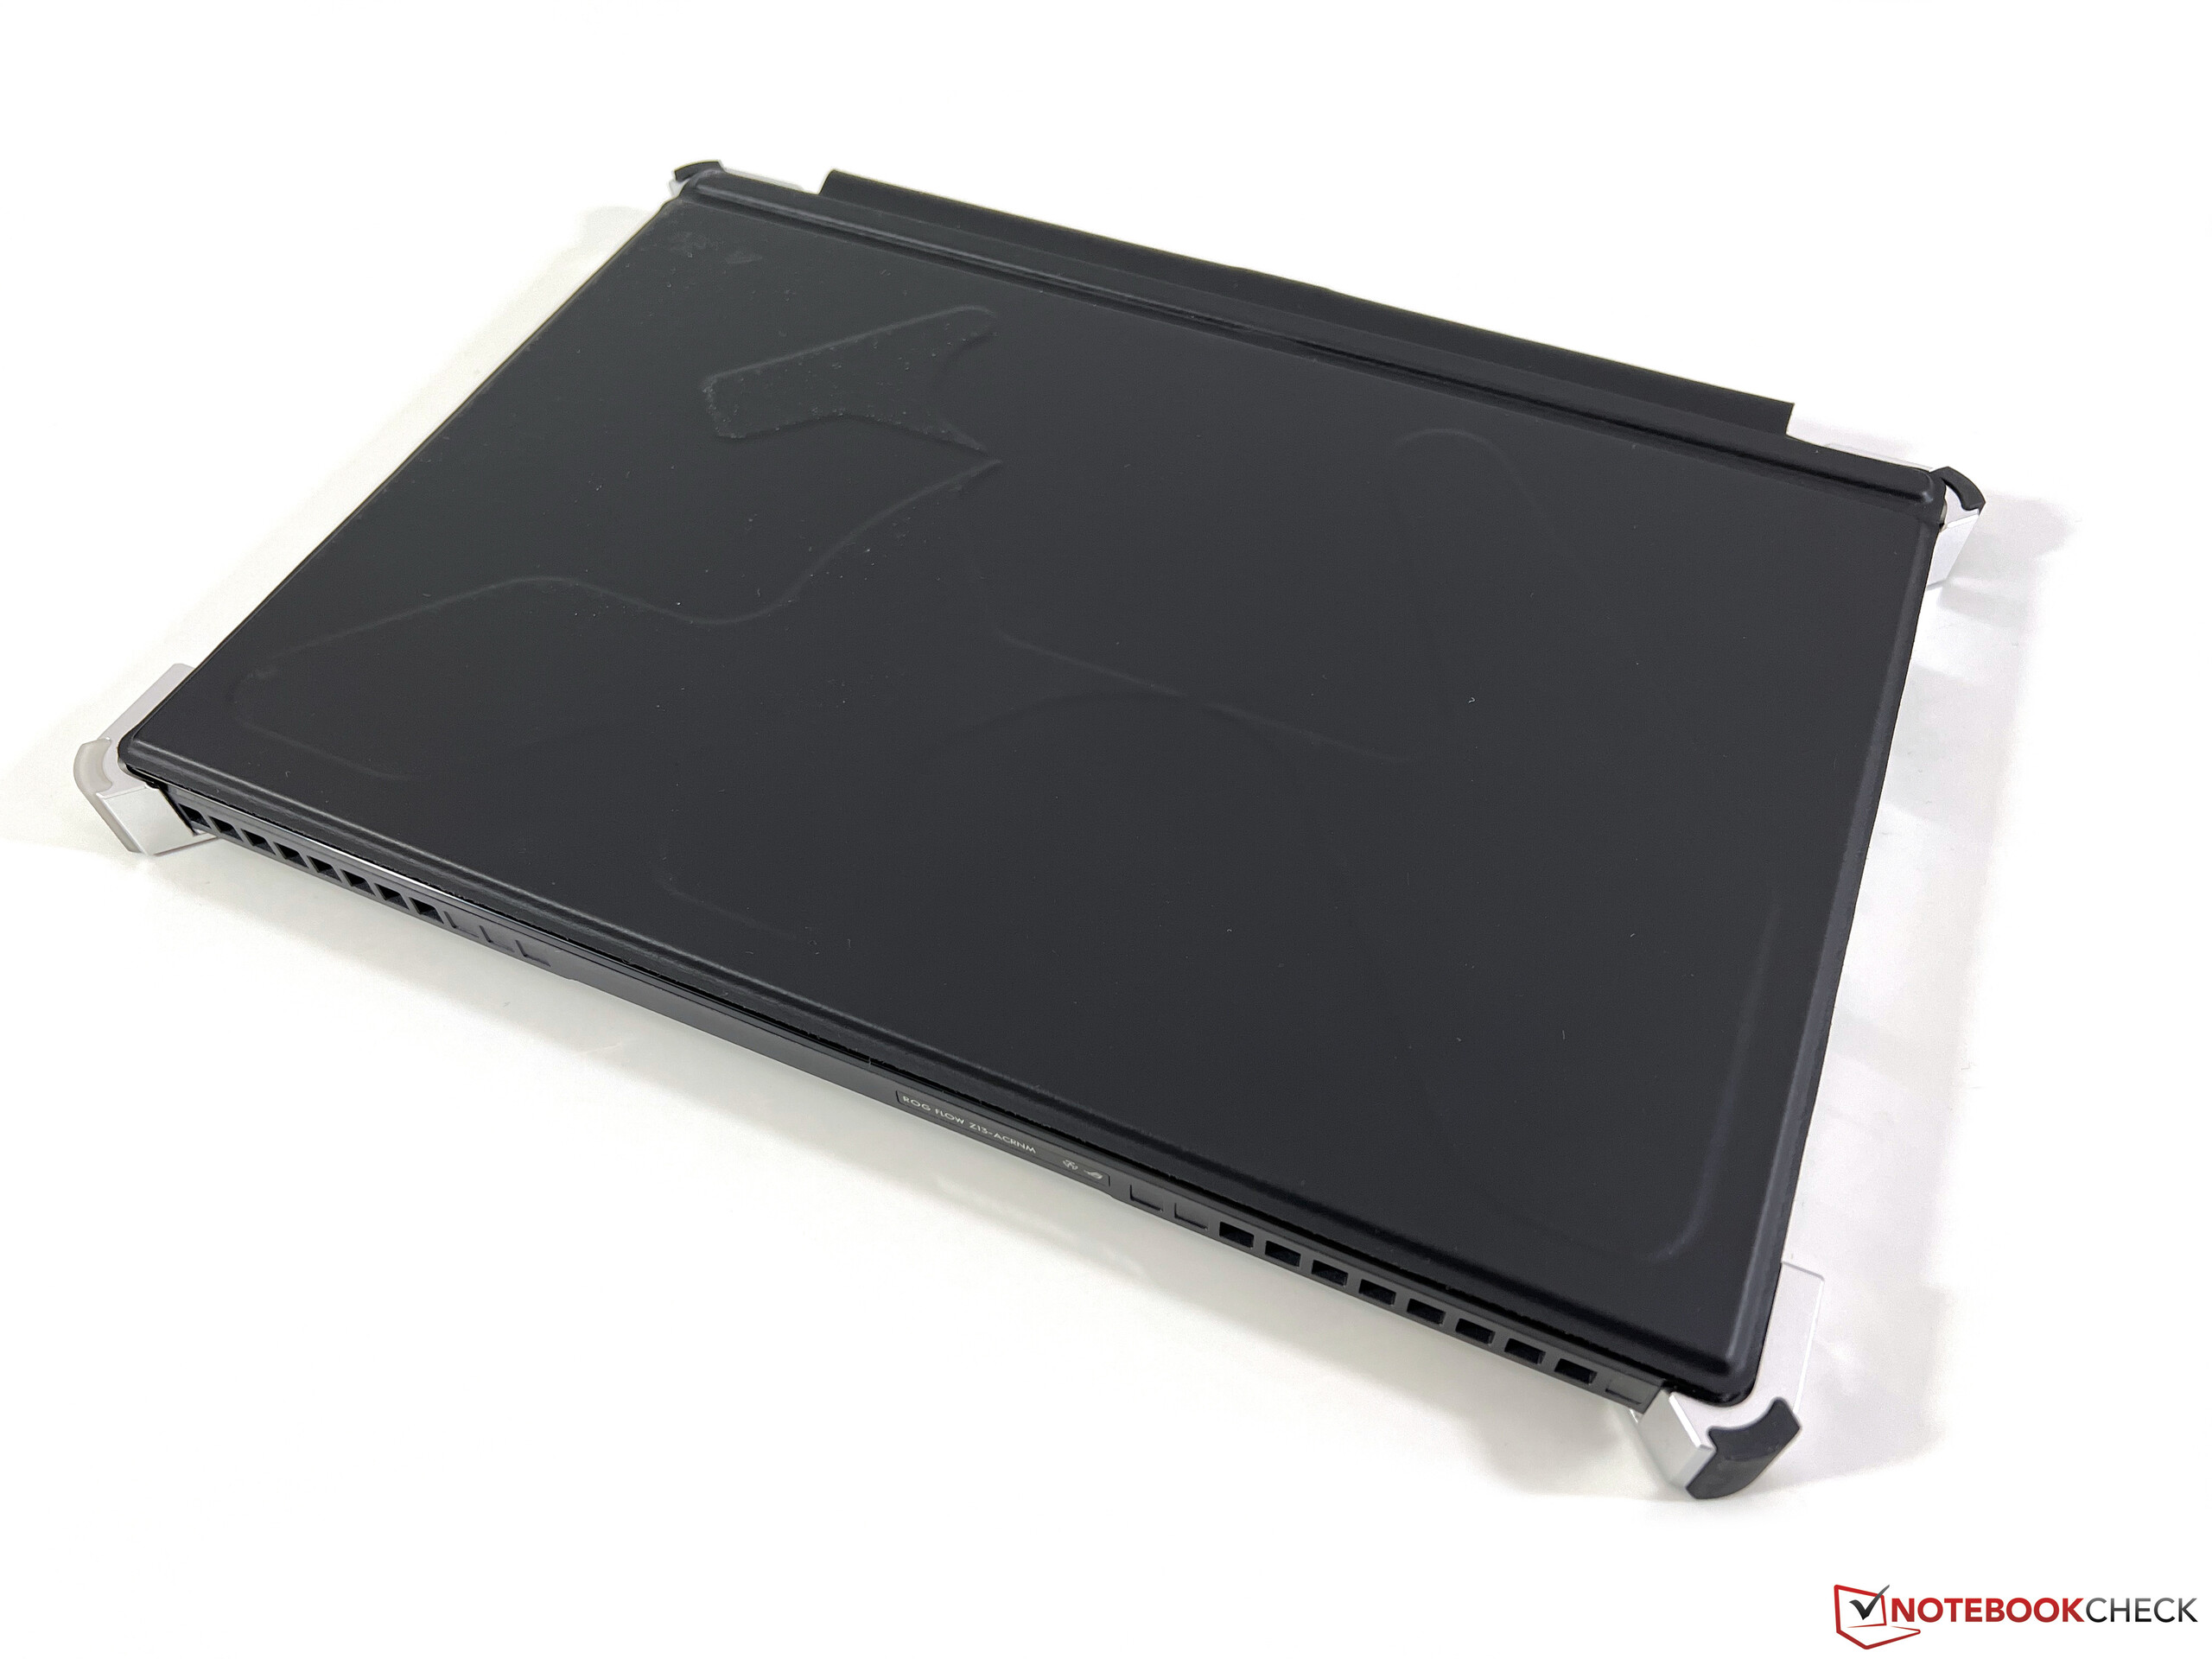
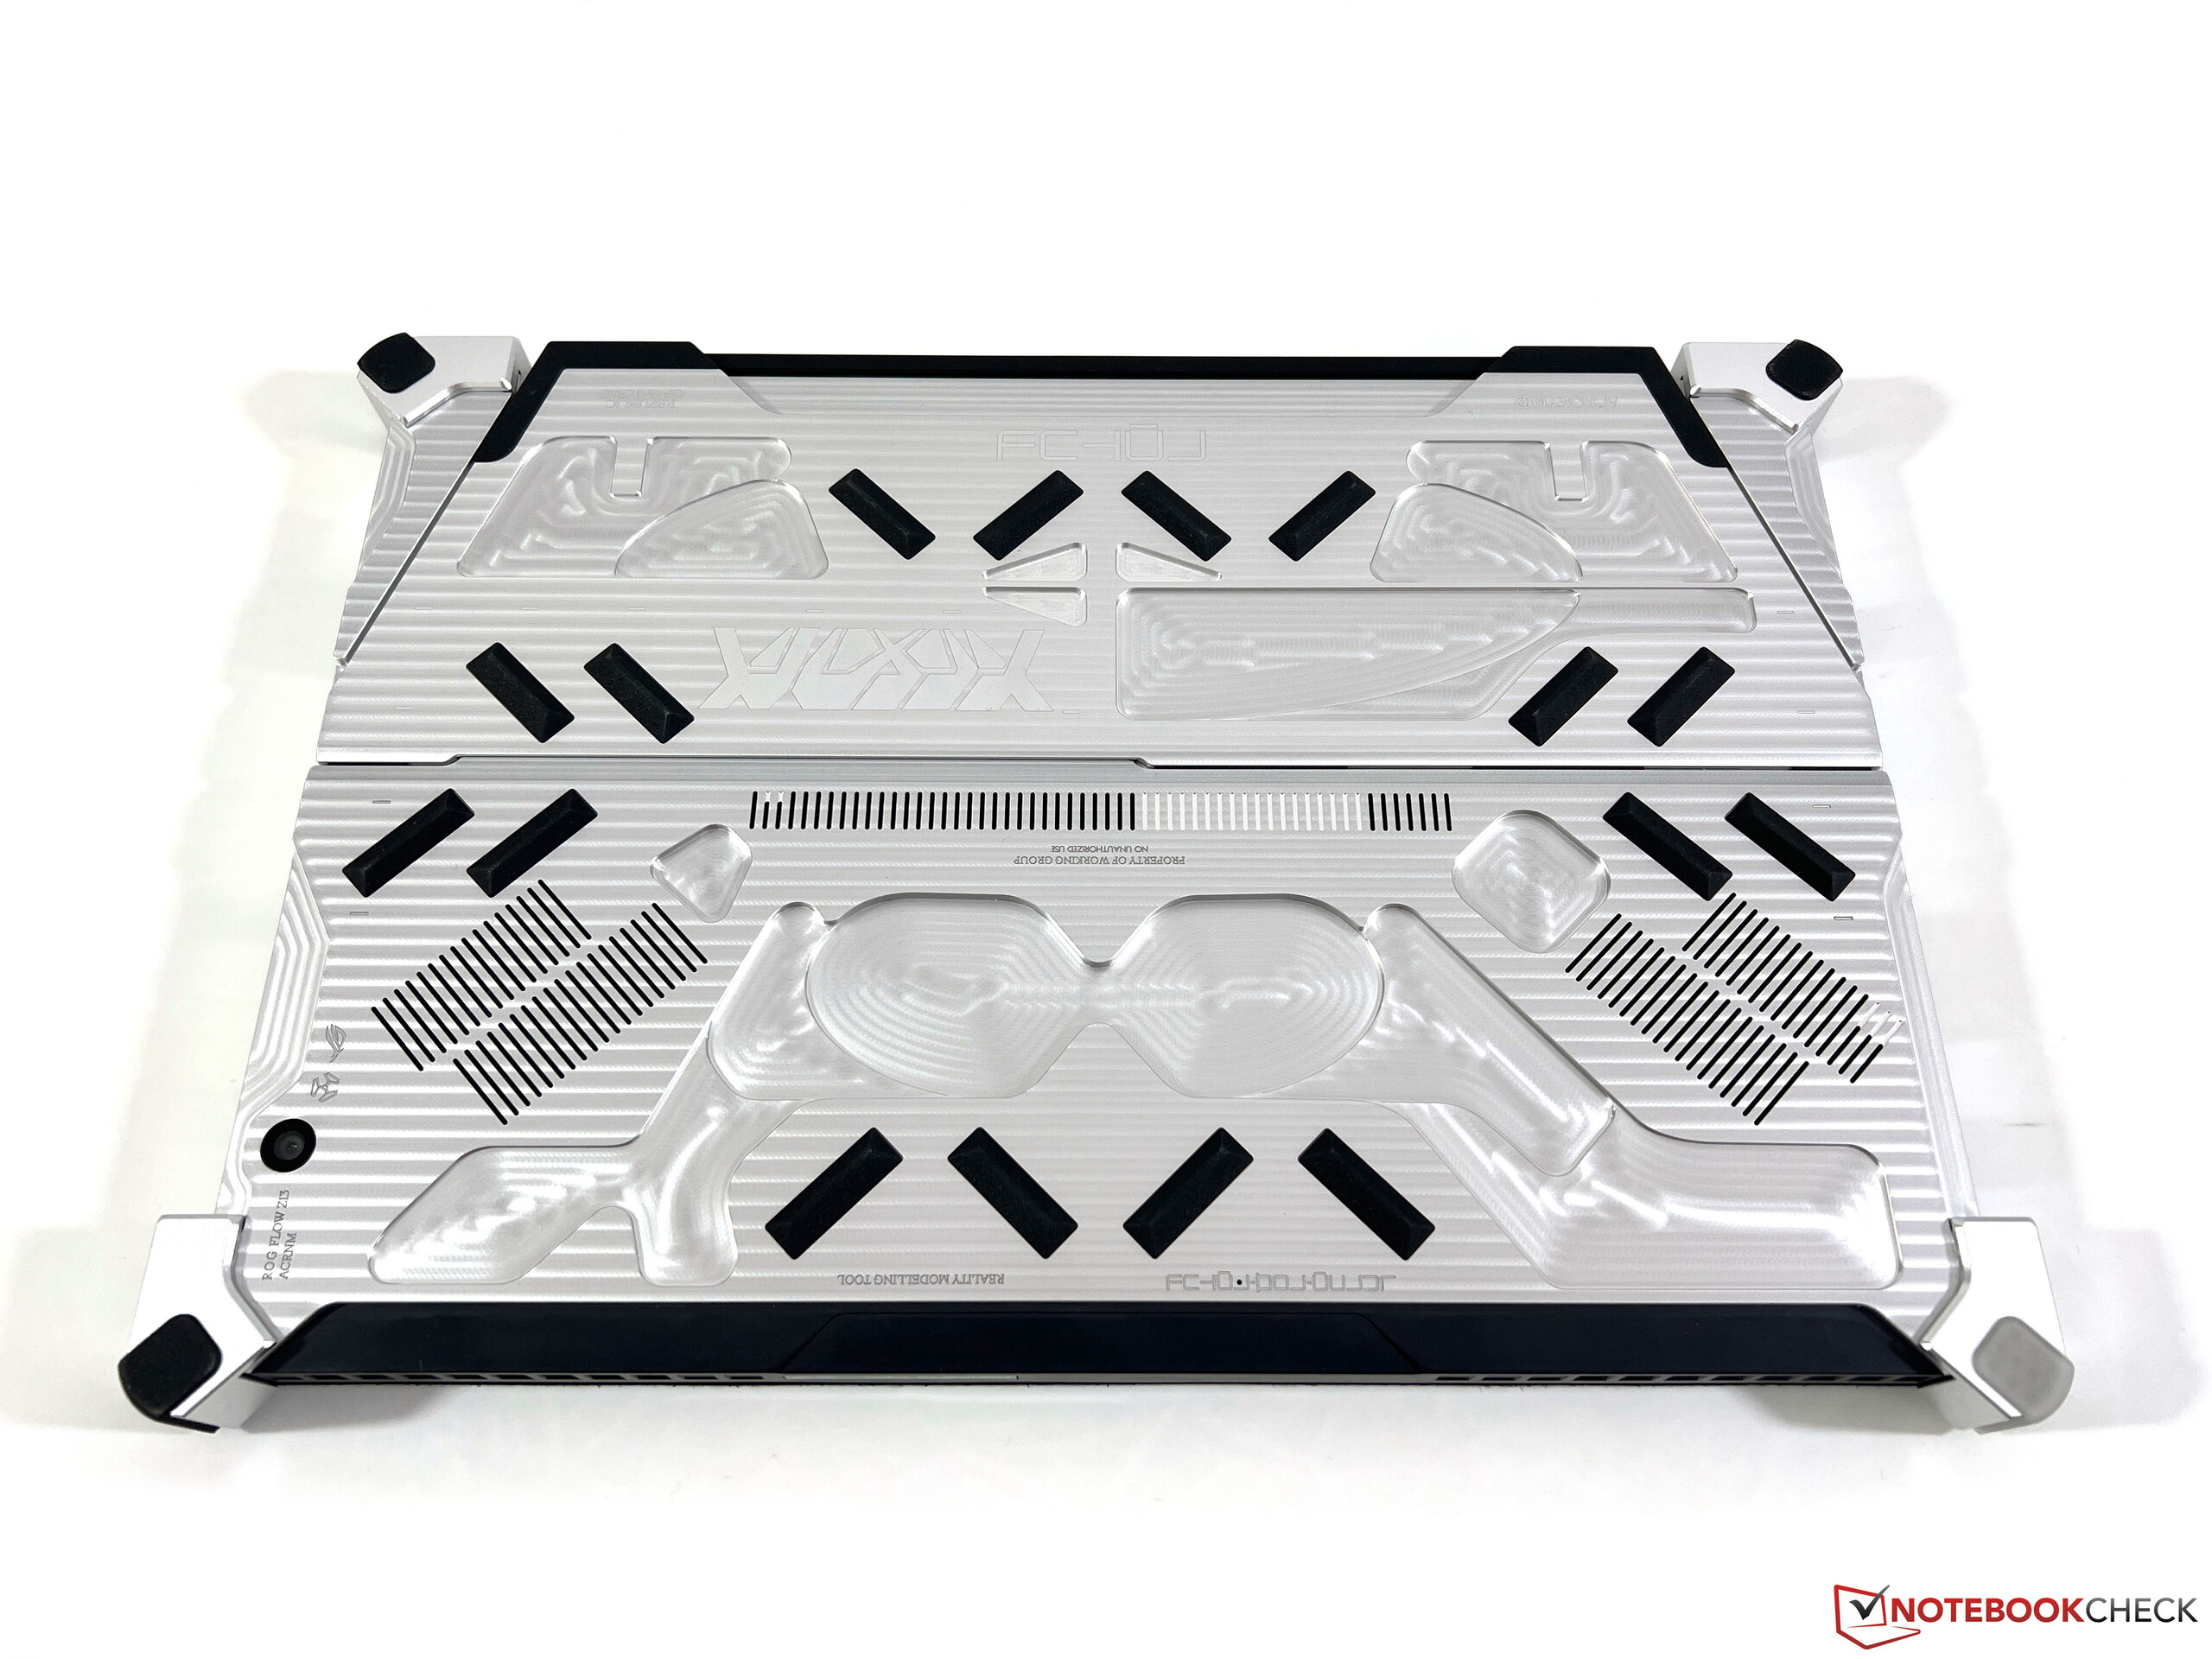
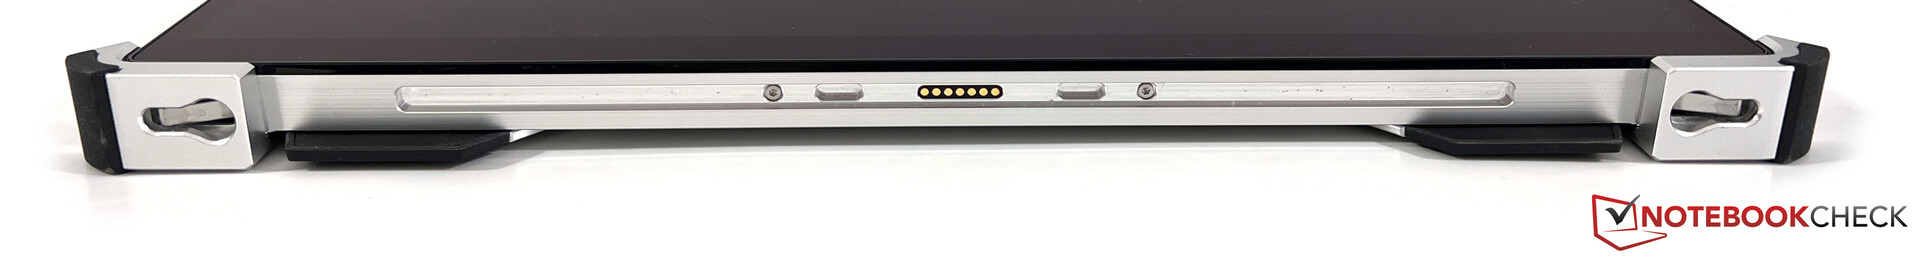
You can immediately see that the ACRNM special edition uses a completely different chassis compared to the regular ROG Flow Z13. The most striking feature is the CNC machined aluminum back cover and you can really see where the machine removed material. Asus also included rubberized strips for better grip and there is additional material around the corners. The ROG Flow Z13 ACRNM almost looks like a ruggedized tablet and the stability would most certainly meet the requirements, but the device is also quite heavy as a result at 1.7 kg (convertible + keyboard cover). Asus knows this as well and the four corners are also attachment points for the included straps. They can be used to carry the device like a bag around your shoulder or use it in front of your body, which is illustrated in the pictures below.
The integrated kickstand at the rear also leaves a good impression and there is no wobble in the hinges. We particularly like the fact that the corners of the kickstand are also rubberized, which means there is no scratching and you can even use the convertible in portrait mode.
All in all, the ACRNM edition of the ROG Flow Z13 is definitely a very striking design and not everybody will like it. We like it and we think is suits the orientation of the device. It is not possible to open the chassis to clean the fans, for example, but you can at least access the compact M.2-2230 SSD via maintenance hatch at the back.
We already mentioned the high weight of 1.7 kg (tablet section ~1.3 kg) and the chassis is also bulkier compared to the regular ROG Flow Z13. The compact 130W power adapter tips the scale at 565 grams.
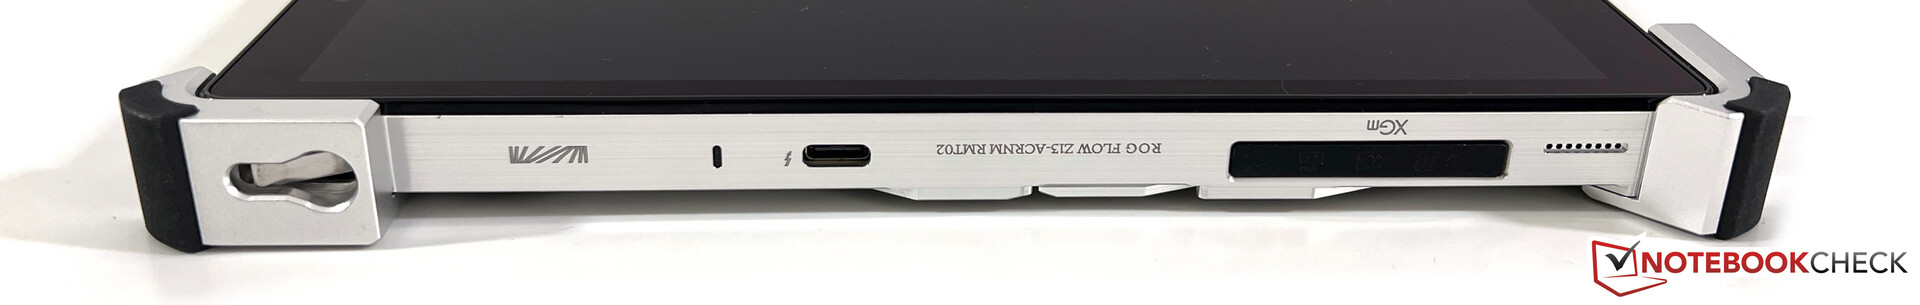
Connectivity - Thunderbolt and eGPU
The Flow Z13 is still a convertible, so the port variety is limited. However, the situation is not that bad and you get one regular USB-A port in combination with two USB-C ports as well as the connector for the external GPU. Both USB-C ports can be used to charge the convertible and they also support video output.
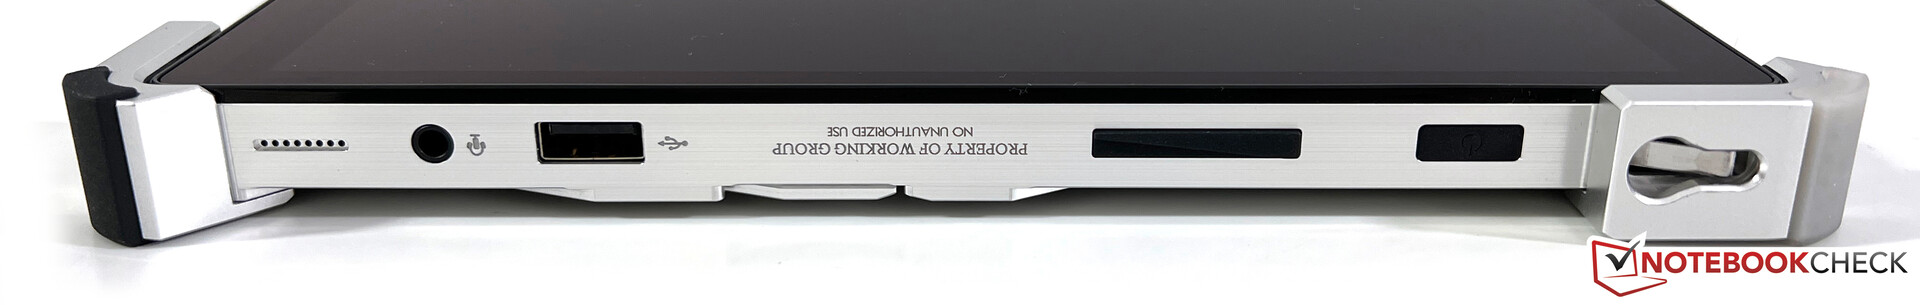
SD Card Reader
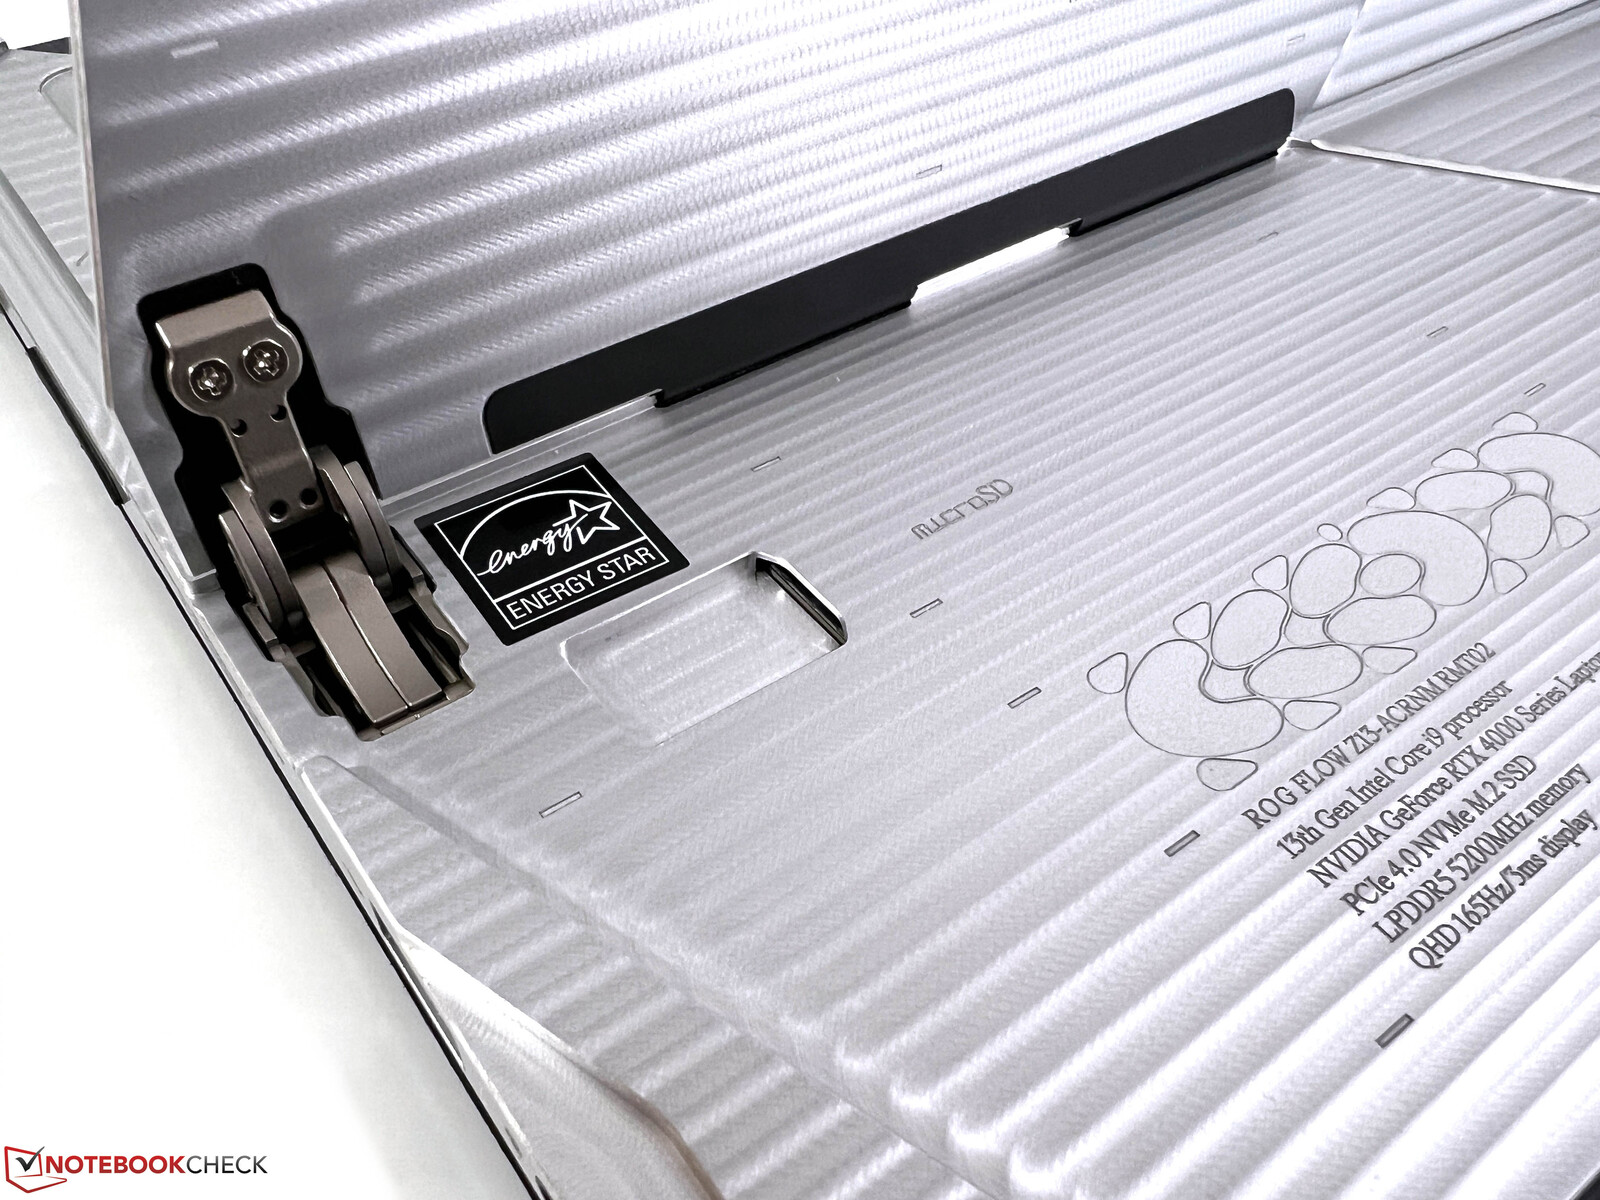
Asus implemented a microSD reader (spring mechanism) behind the kickstand, which is easy to access. We measure transfer rates of up to 211 MB/s and 190 MB/s when we copy image files from our reference card (Angelbird AV Pro V60).
| SD Card Reader | |
| average JPG Copy Test (av. of 3 runs) | |
| Alienware x14 i7 RTX 3060 (Angelbird AV Pro V60) | |
| Asus ROG Flow Z13 ACRNM (Angelbird AV Pro V60) | |
| Asus ROG Zephyrus G14 GA402RK (AV PRO microSD 128 GB V60) | |
| Average of class Gaming (20.9 - 210, n=54, last 2 years) | |
| Asus ROG Flow Z13 GZ301ZE (Angelbird AV Pro V60) | |
| maximum AS SSD Seq Read Test (1GB) | |
| Asus ROG Flow Z13 GZ301ZE (Angelbird AV Pro V60) | |
| Alienware x14 i7 RTX 3060 (Angelbird AV Pro V60) | |
| Asus ROG Flow Z13 ACRNM (Angelbird AV Pro V60) | |
| Asus ROG Zephyrus G14 GA402RK (AV PRO microSD 128 GB V60) | |
| Average of class Gaming (25.5 - 261, n=51, last 2 years) | |
Communication
The ROG Flow Z13 uses the current Intel Wi-Fi module AX211, which also supports the latest Wi-Fi 6E standard. However, we could establish a connection with the corresponding 6 GHz network of our reference router from Asus, but the performance with the 5 GHz network was also very good and stable.
| Networking | |
| Asus ROG Flow Z13 ACRNM | |
| iperf3 transmit AXE11000 | |
| iperf3 receive AXE11000 | |
| Asus ROG Flow Z13 GZ301ZE | |
| iperf3 transmit AX12 | |
| iperf3 receive AX12 | |
| Alienware x14 i7 RTX 3060 | |
| iperf3 transmit AX12 | |
| iperf3 receive AX12 | |
| Razer Blade 14 Ryzen 9 6900HX | |
| iperf3 transmit AX12 | |
| iperf3 receive AX12 | |
| Asus ROG Zephyrus G14 GA402RK | |
| iperf3 transmit AXE11000 | |
| iperf3 receive AXE11000 | |
Webcam
In addition to a 5 MP IR camera for Windows Hello, Asus also includes a new 13 MP camera in the upper display bezel. The picture quality is much better compared to regular 720p or even 1080p cameras in regular laptops. We also included a sample recording (video and audio) in our YouTube review, so you can get a better impression of the performance.


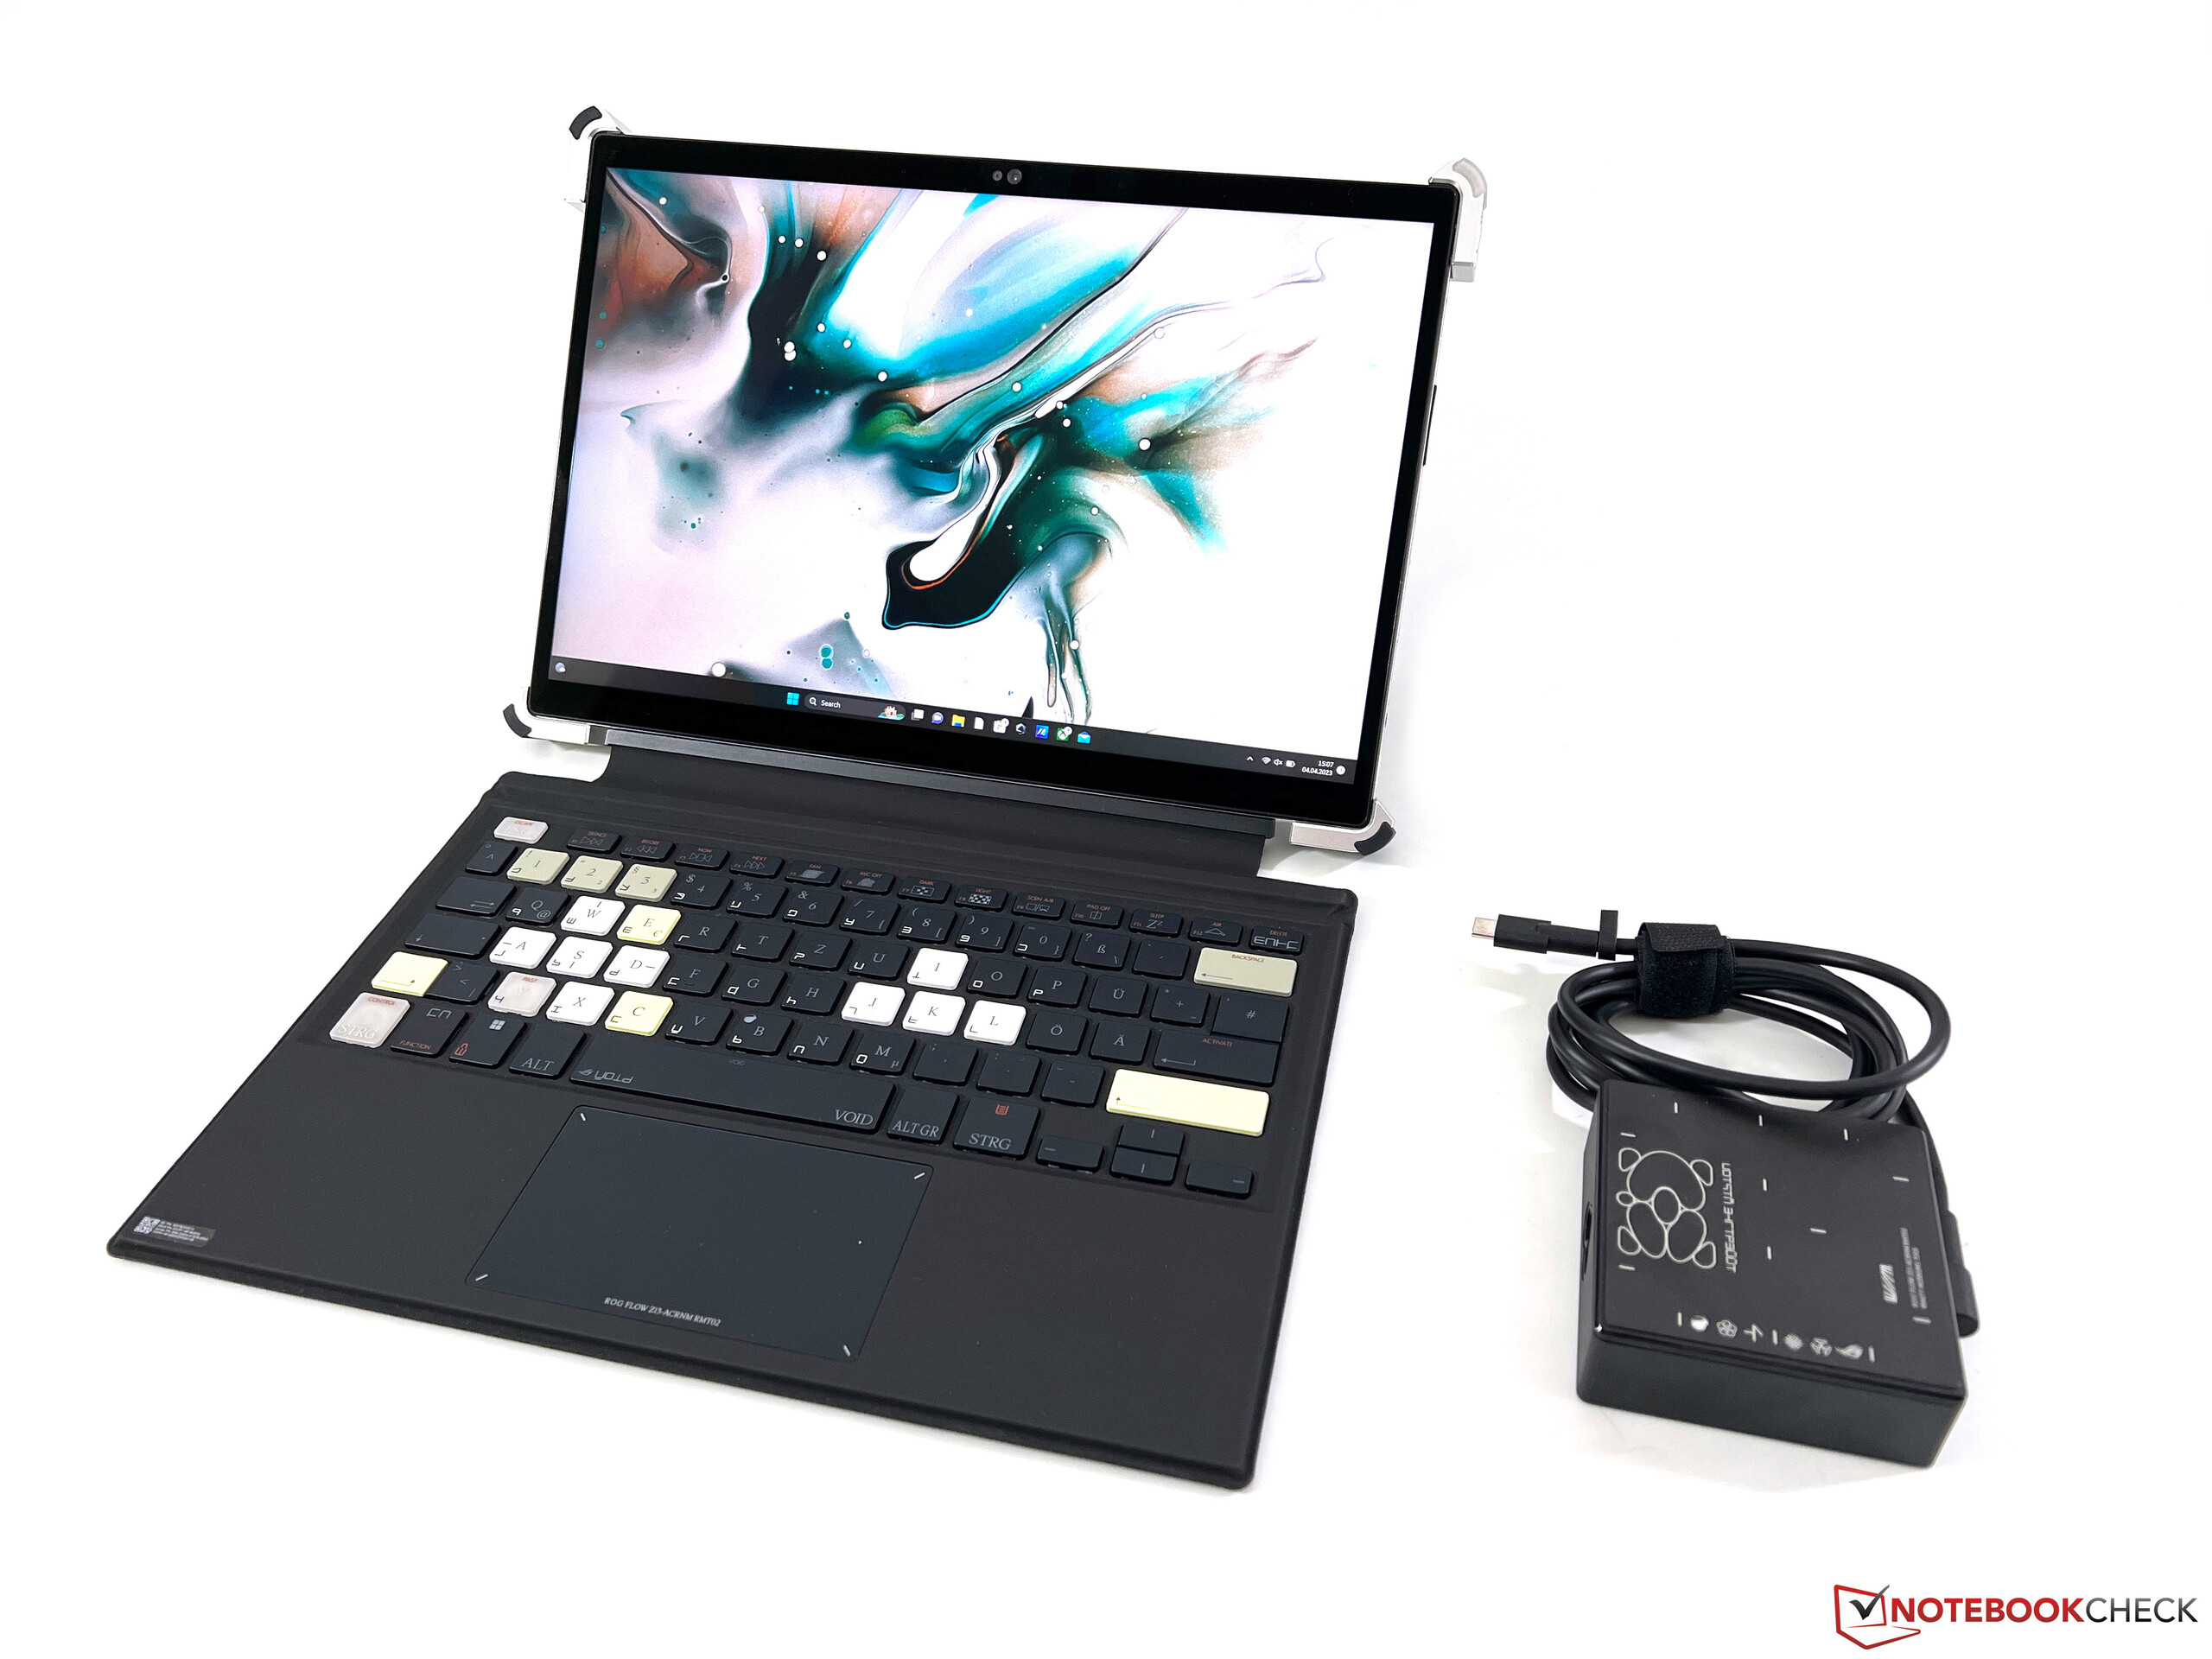
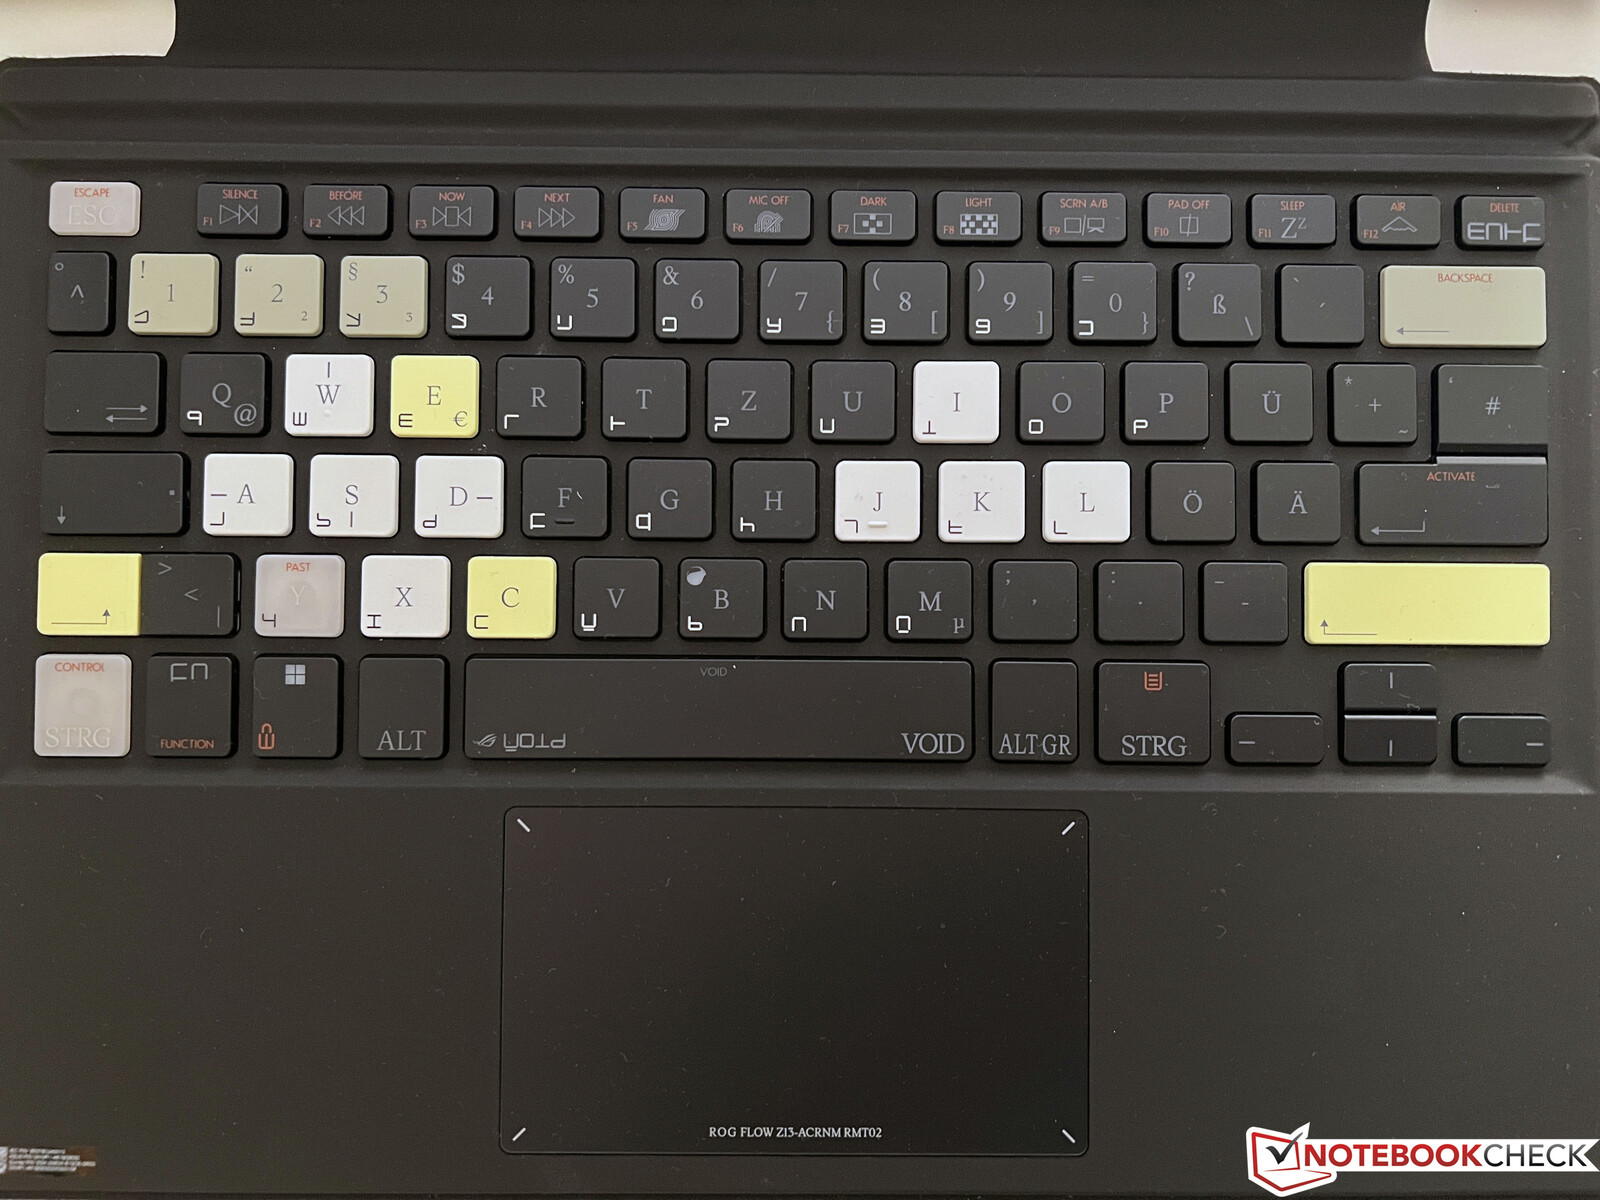
Input Devices - ROG Flow with two keyboards
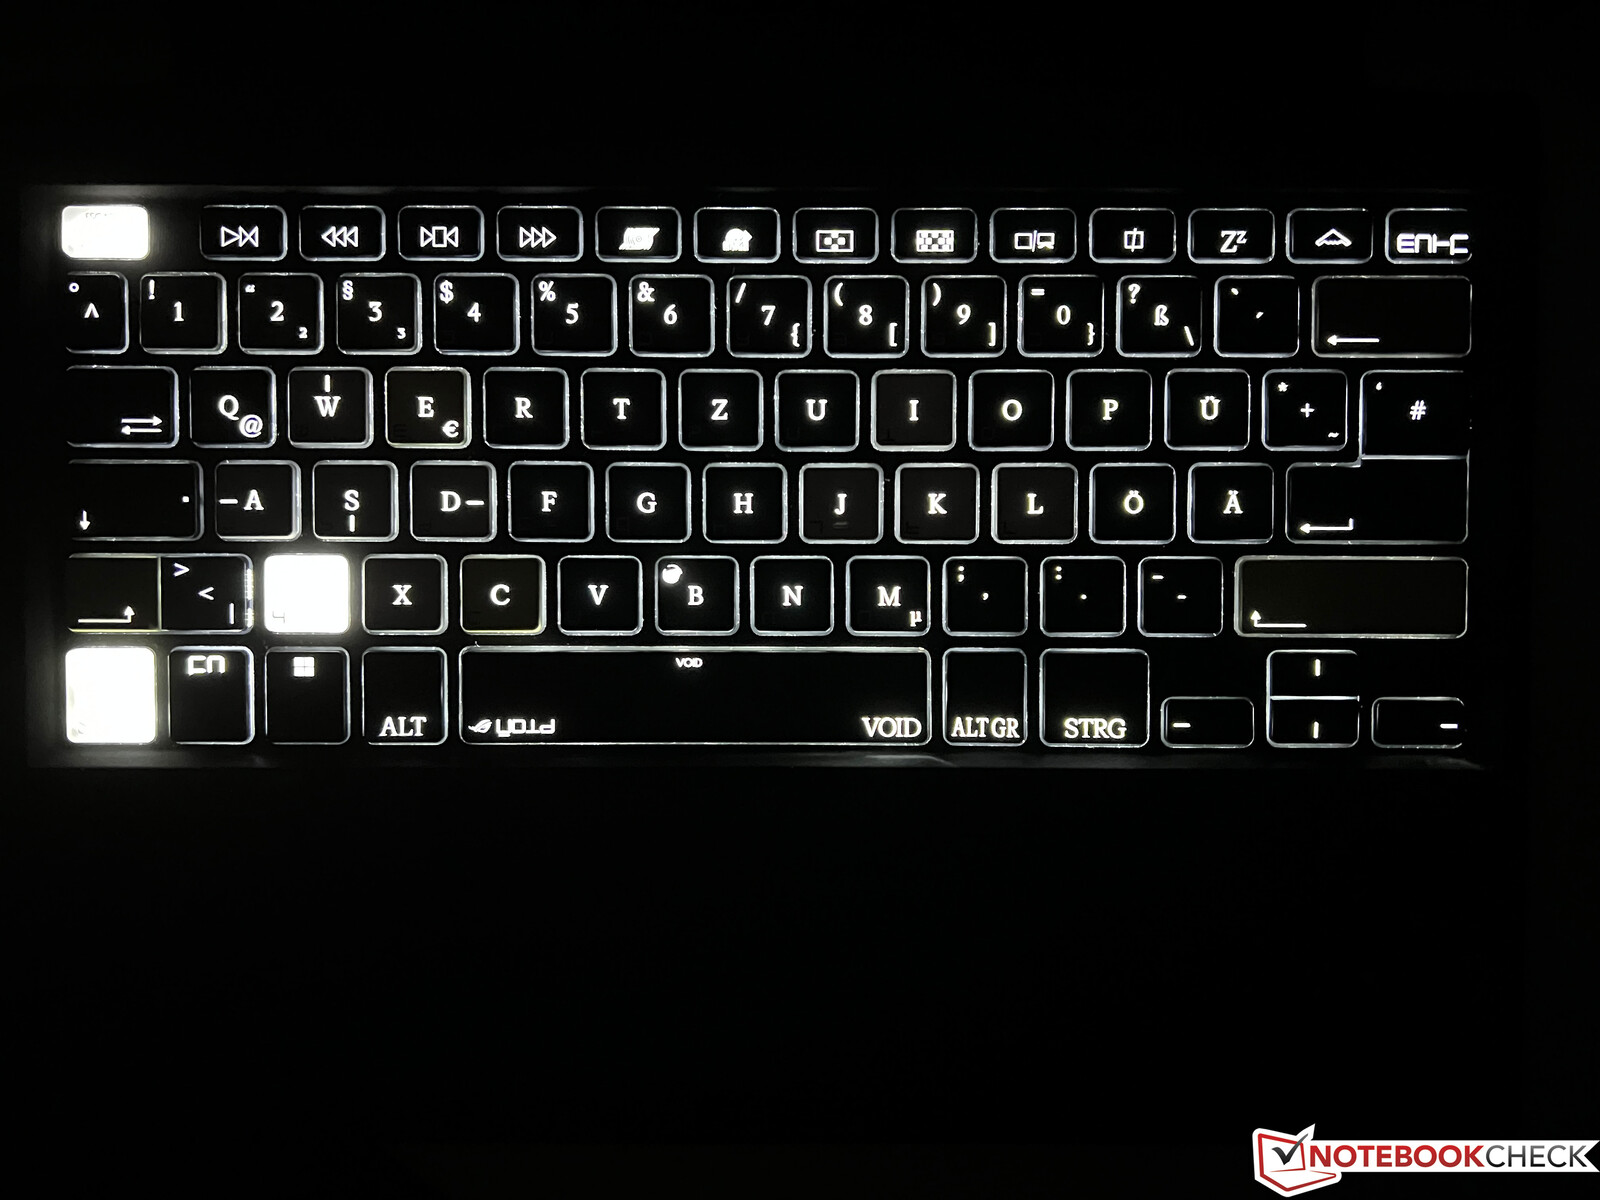
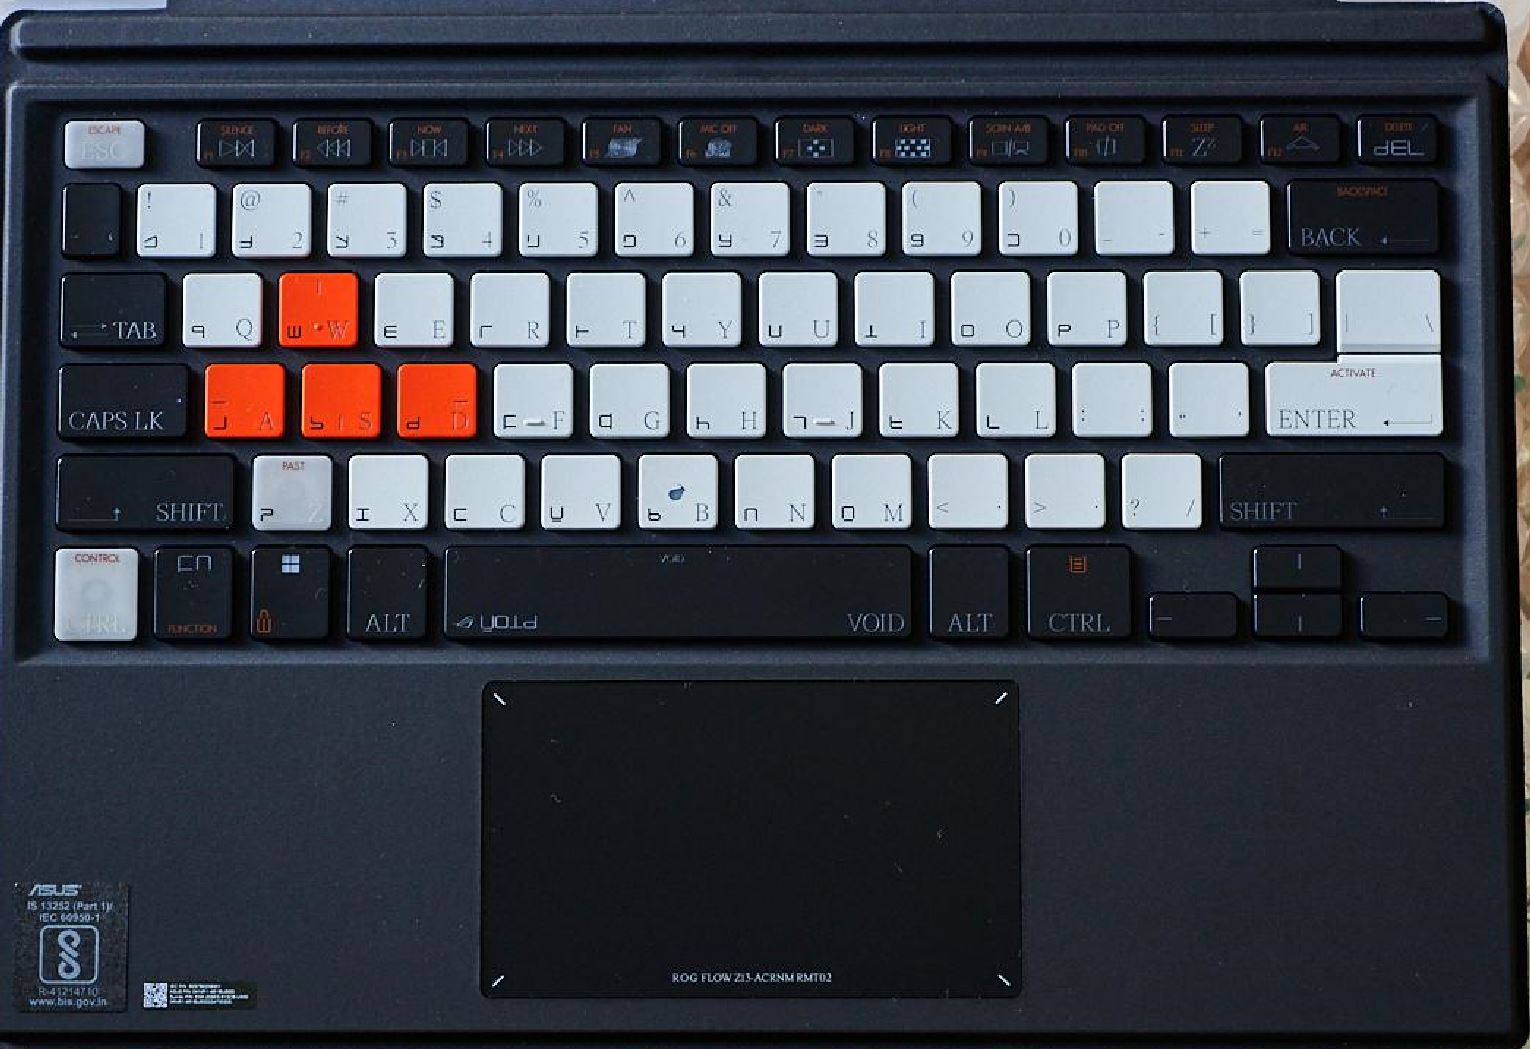
Asus ships the ROG Flow z13 ACRNM edition with two different keyboard covers, which are also quite heavy (358 grams) and thick for a convertible. As per usually, you can use the keyboard in two angles, either flat on the surface or slightly tilted. The keyboard is surprisingly sturdy and the key travel is also quite long for a detachable keyboard.
The design of the keys is as unusual as the chassis and that creates some issues, since the additional symbols on the keys can be quite confusing on a daily basis when you cannot type without looking. The contrast of the black keys is just not sufficient, while the additional symbols have a high contrast at the same time, which is irritating. The problem is gone in dark environments since the keyboard illumination only lights up the important symbols.
The touchpad is pretty small at 10.5 x 6 cm and the clicking sounds are pretty loud, but it works well. The capacitive touchscreen does not reveal any issues and you can also use it with a digitizer. Asus ships the convertible with the SA203 stylus (4096 pressure levels) and we did not notice any problems.
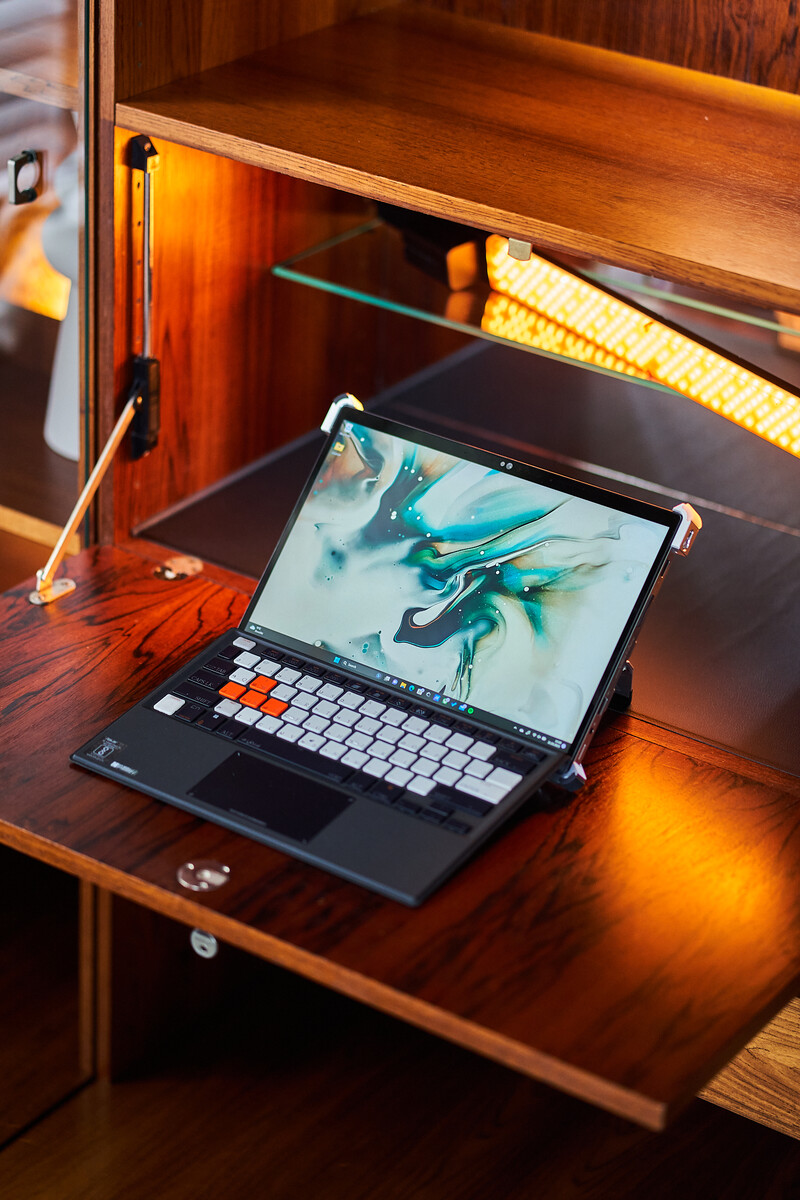
Display - WQHD with 165 Hz

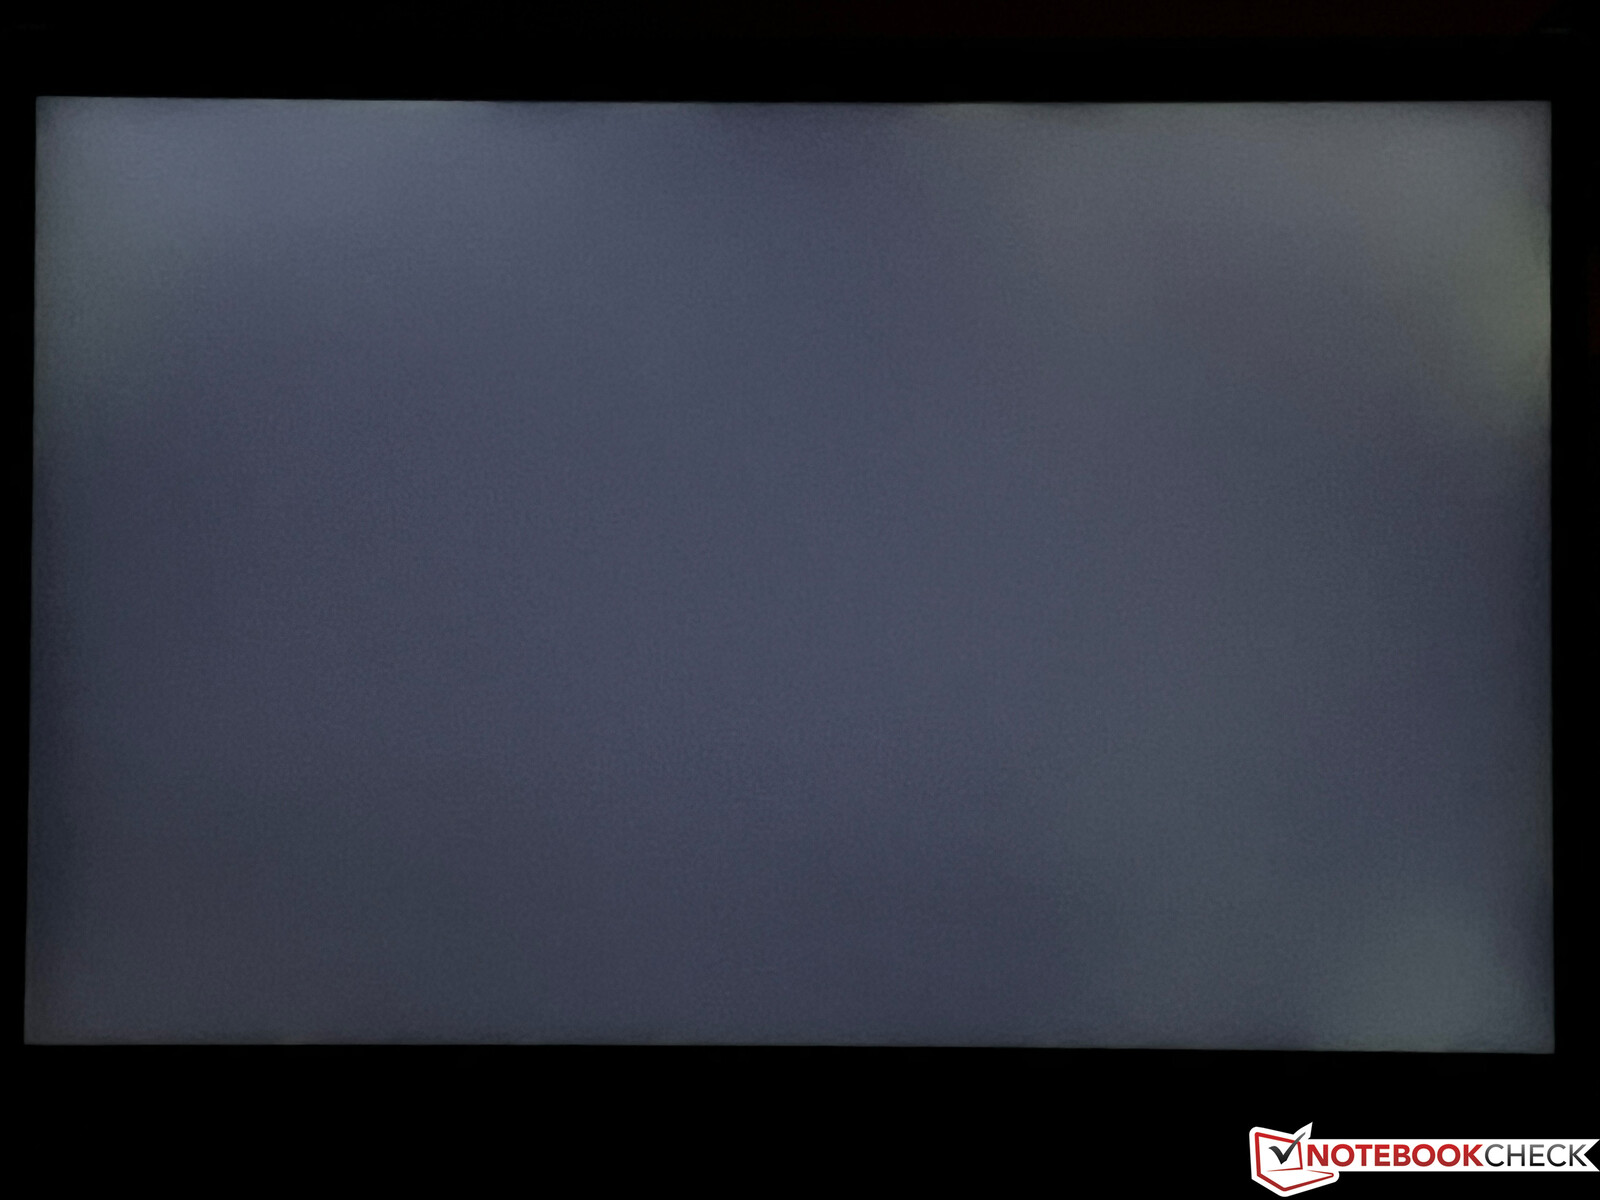
Asus also upgraded the display and there is no difference between our ACRNM edition and the regular version of the ROG Flow Z13. Both use a higher-resolution WQHD panel (2560 x 1600 pixels, 16:10) with a higher 165 Hz refresh rate. The subjective picture quality is excellent and movements are very smooth. We also determine fast response times and there is no sign of PWM flickering. Our review unit did not have massive issues with backlight bleeding, either.
We determine an average brightness of 455 nits in combination with a slightly raised black value of 0.4, which results in a contrast ratio of 1160:1. This is a decent result, but all IPS-based rivals (including the predecessor) except for the Razer Blade 14 offer better contrast results. The panel brightness cannot be controlled via ambient light sensor.
| |||||||||||||||||||||||||
Brightness Distribution: 89 %
Center on Battery: 464 cd/m²
Contrast: 1160:1 (Black: 0.4 cd/m²)
ΔE ColorChecker Calman: 2 | ∀{0.5-29.43 Ø4.73}
calibrated: 1.2
ΔE Greyscale Calman: 2.7 | ∀{0.09-98 Ø4.97}
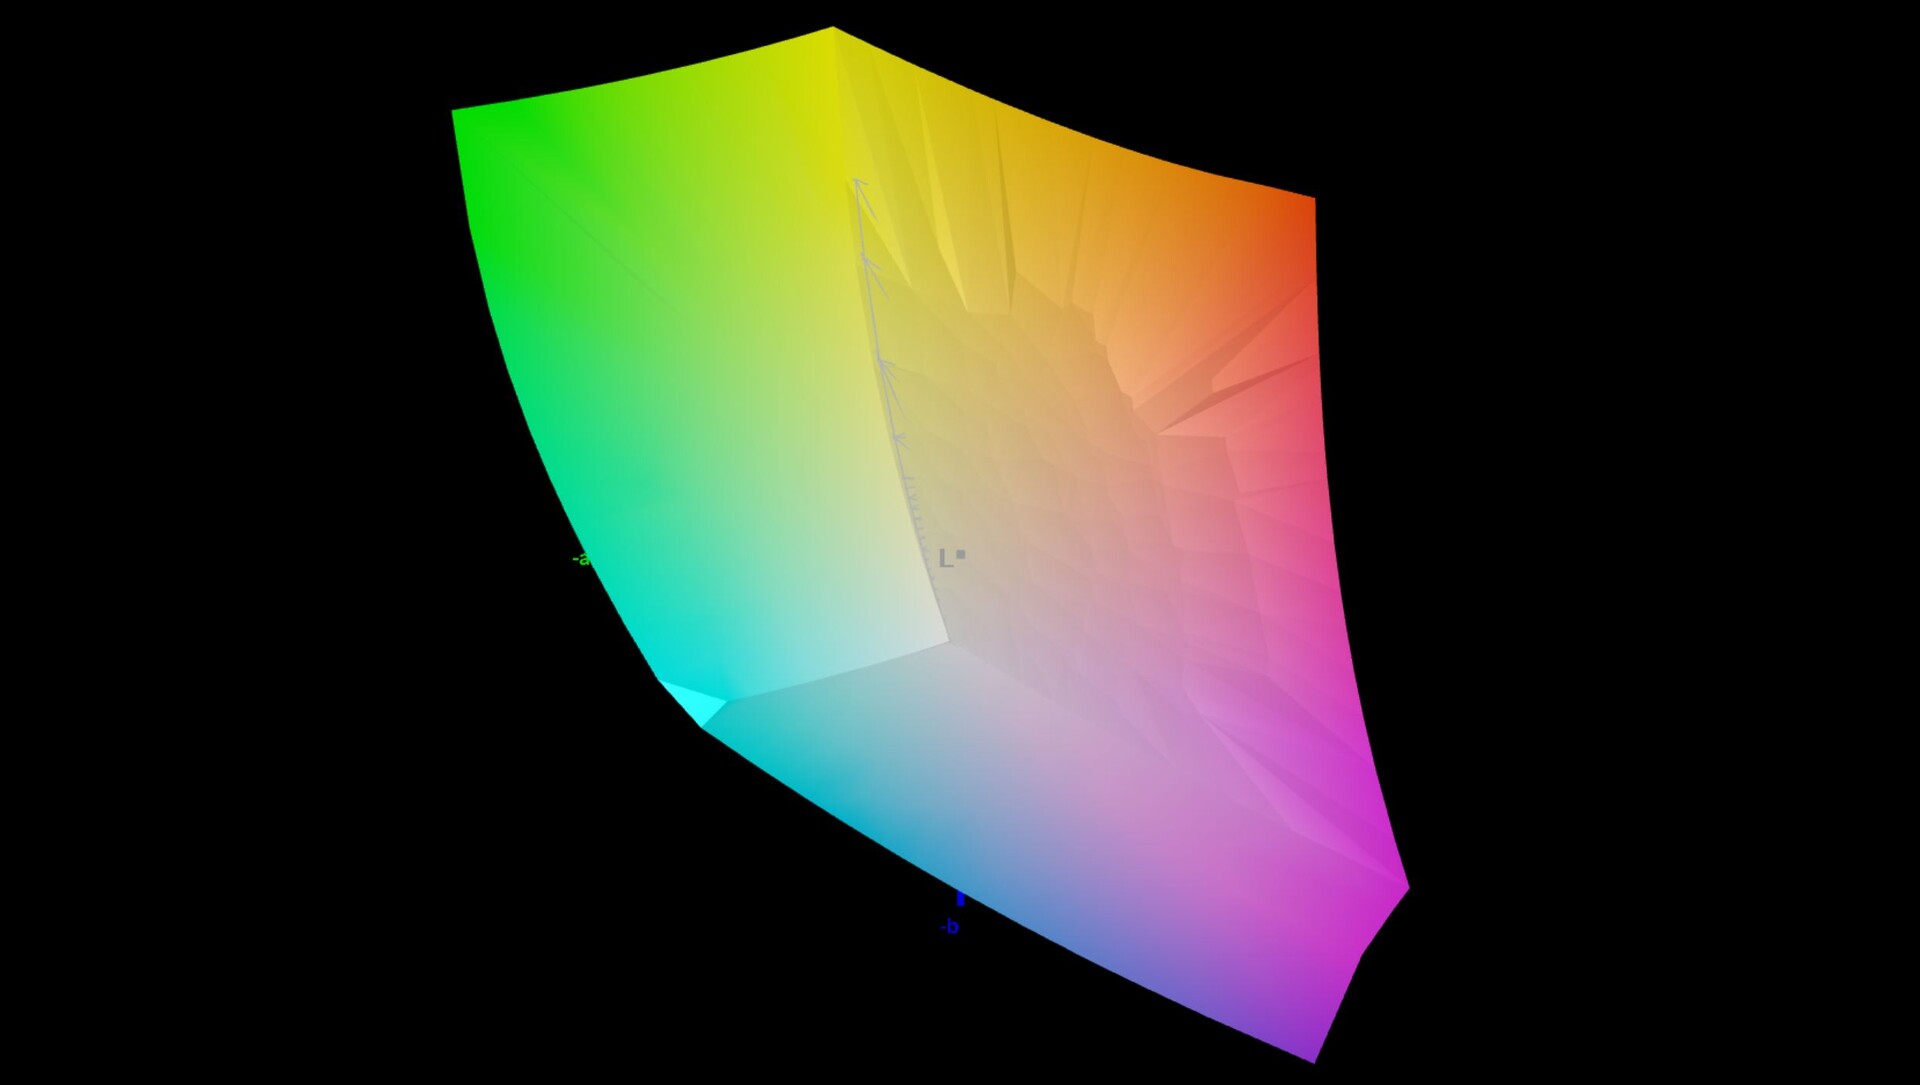
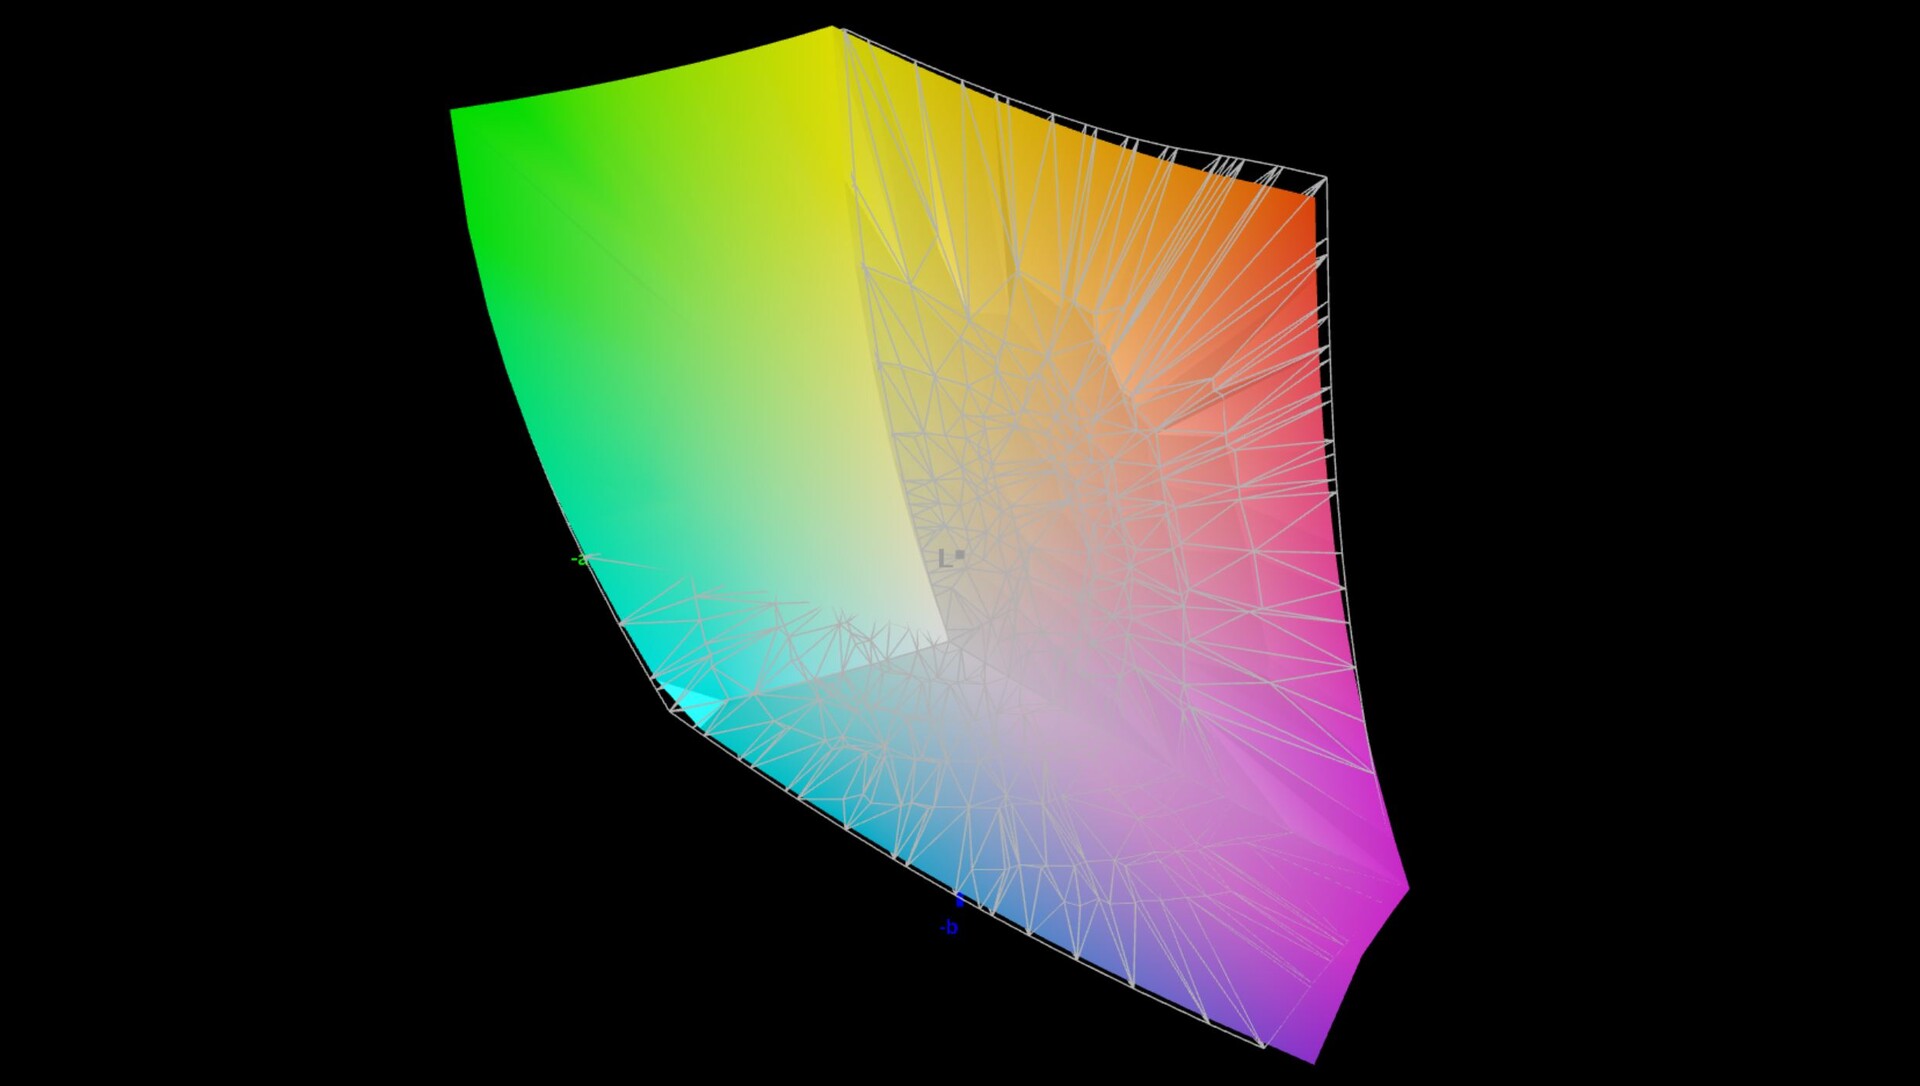
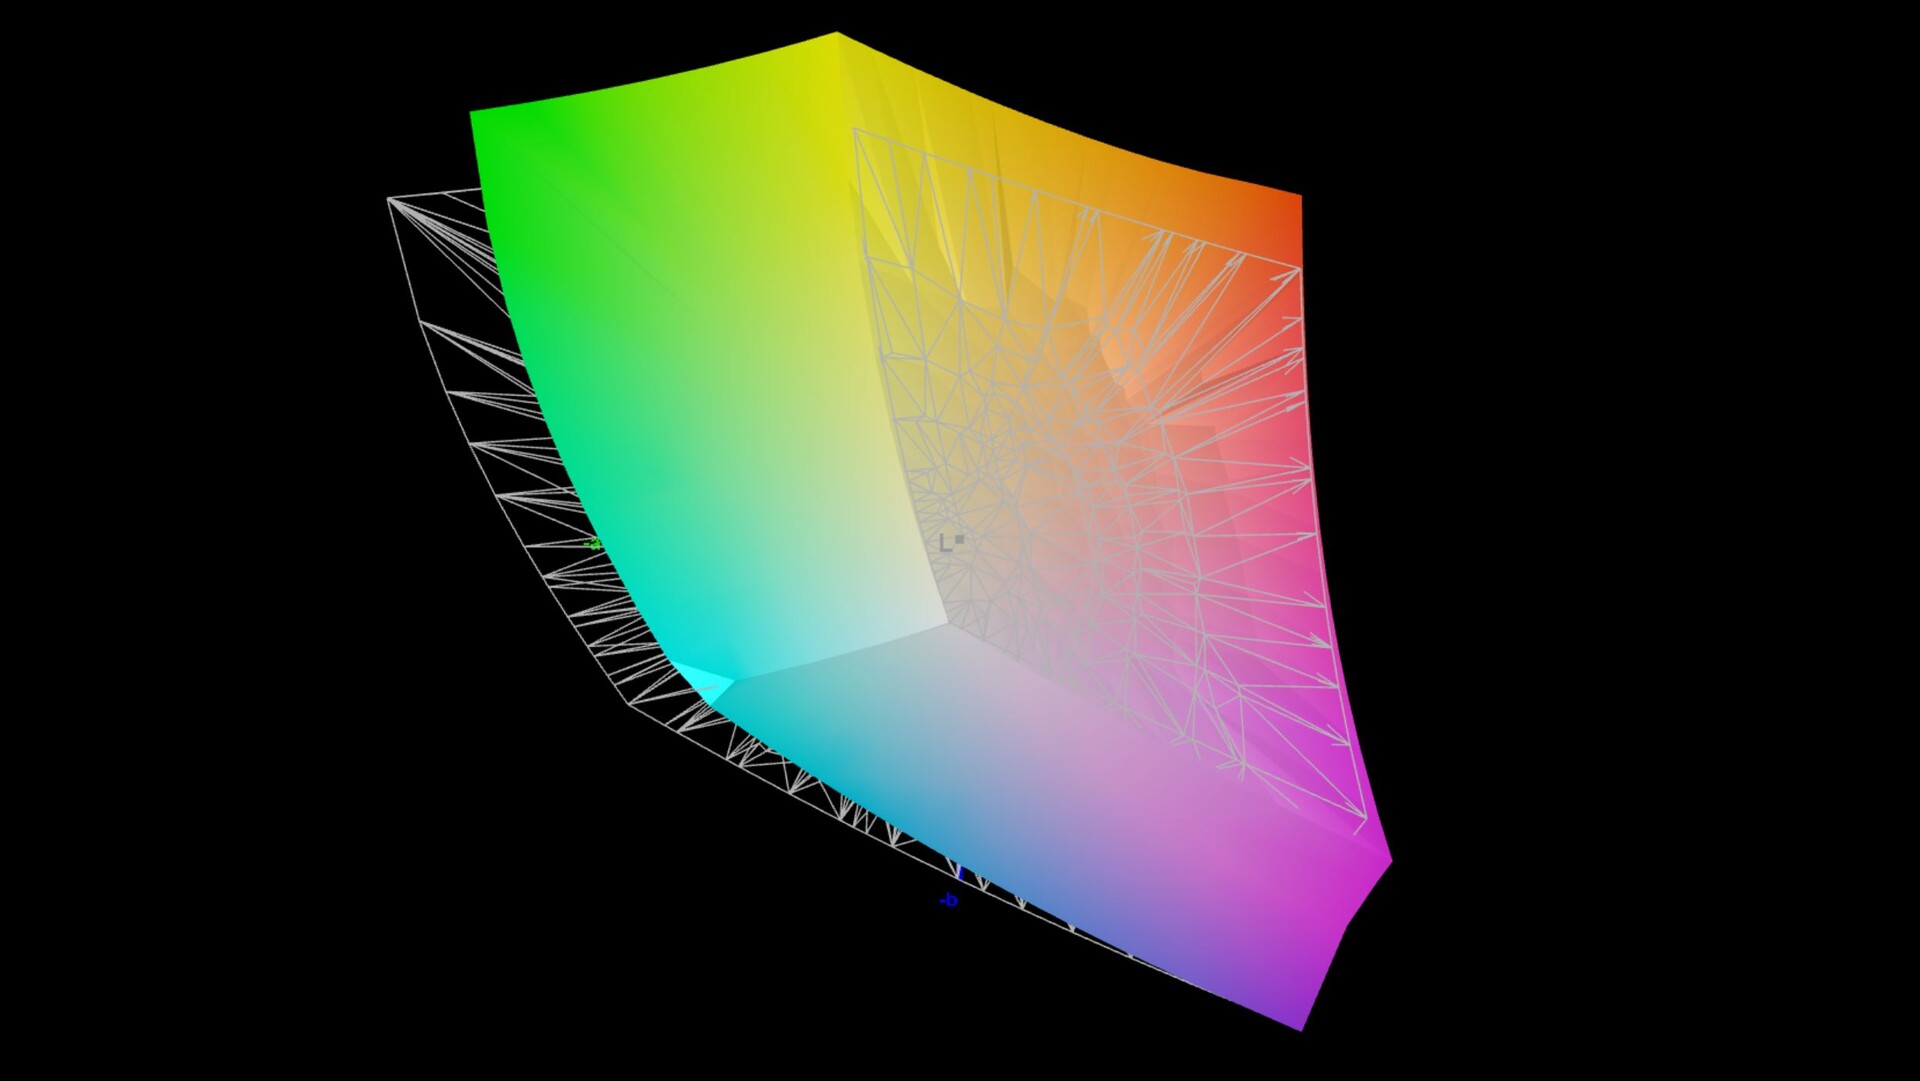
85.17% AdobeRGB 1998 (Argyll 3D)
99.92% sRGB (Argyll 3D)
96.94% Display P3 (Argyll 3D)
Gamma: 2.24
CCT: 6832 K
| Asus ROG Flow Z13 ACRNM TL134ADXP01-0, IPS, 2560x1600, 13.4" | Asus ROG Flow Z13 GZ301ZE LQ134N1JW54, IPS, 1920x1200, 13.4" | Alienware x14 i7 RTX 3060 SHP154D, IPS, 1920x1080, 14" | Razer Blade 14 Ryzen 9 6900HX TL140BDXP02-0, IPS, 2560x1440, 14" | Asus ROG Zephyrus G14 GA402RK NE140QDM-NX1 (BOE0A1D), IPS-Level, 2560x1600, 14" | |
|---|---|---|---|---|---|
| Display | -17% | 2% | 0% | 0% | |
| Display P3 Coverage (%) | 96.94 | 67.5 -30% | 99.6 3% | 97.2 0% | 97.4 0% |
| sRGB Coverage (%) | 99.92 | 97.1 -3% | 100 0% | 99.9 0% | 99.9 0% |
| AdobeRGB 1998 Coverage (%) | 85.17 | 69.3 -19% | 87.6 3% | 85.7 1% | 85.5 0% |
| Response Times | -1241% | -255% | -554% | -210% | |
| Response Time Grey 50% / Grey 80% * (ms) | 2.1 ? | 44 ? -1995% | 9.6 ? -357% | 16.8 ? -700% | 8.8 ? -319% |
| Response Time Black / White * (ms) | 3 ? | 17.6 ? -487% | 7.6 ? -153% | 15.2 ? -407% | 6 ? -100% |
| PWM Frequency (Hz) | 27170 ? | ||||
| Screen | 10% | -11% | 0% | -20% | |
| Brightness middle (cd/m²) | 464 | 515 11% | 434 -6% | 354 -24% | 480 3% |
| Brightness (cd/m²) | 455 | 476 5% | 411 -10% | 328 -28% | 456 0% |
| Brightness Distribution (%) | 89 | 87 -2% | 89 0% | 86 -3% | 80 -10% |
| Black Level * (cd/m²) | 0.4 | 0.35 13% | 0.25 37% | 0.37 7% | 0.48 -20% |
| Contrast (:1) | 1160 | 1471 27% | 1736 50% | 957 -17% | 1000 -14% |
| Colorchecker dE 2000 * | 2 | 1.6 20% | 3 -50% | 1.66 17% | 2.62 -31% |
| Colorchecker dE 2000 max. * | 4.2 | 4 5% | 7.1 -69% | 3.83 9% | 6.71 -60% |
| Colorchecker dE 2000 calibrated * | 1.2 | 1.2 -0% | 0.7 42% | 1.12 7% | |
| Greyscale dE 2000 * | 2.7 | 2.5 7% | 5.1 -89% | 1.6 41% | 4.2 -56% |
| Gamma | 2.24 98% | 2.2 100% | 2.19 100% | 2.23 99% | 2.16 102% |
| CCT | 6832 95% | 6939 94% | 6204 105% | 6542 99% | 7122 91% |
| Total Average (Program / Settings) | -416% /
-175% | -88% /
-43% | -185% /
-85% | -77% /
-43% |
* ... smaller is better
We analyzed the panel with the professional CalMAN software (X-Rite i1 Pro2) with the native color profile of the Armoury Crate software. There is also a dedicated sRGB profile when you want to work in the smaller color space. The results are already decent out of the box and only a handful of colors deviate from the DeltaE-2000 target of 3. There is also a minor blue cast in combination with a slightly cooler color temperature, but this is only noticeable in direct comparison with a calibrated screen.
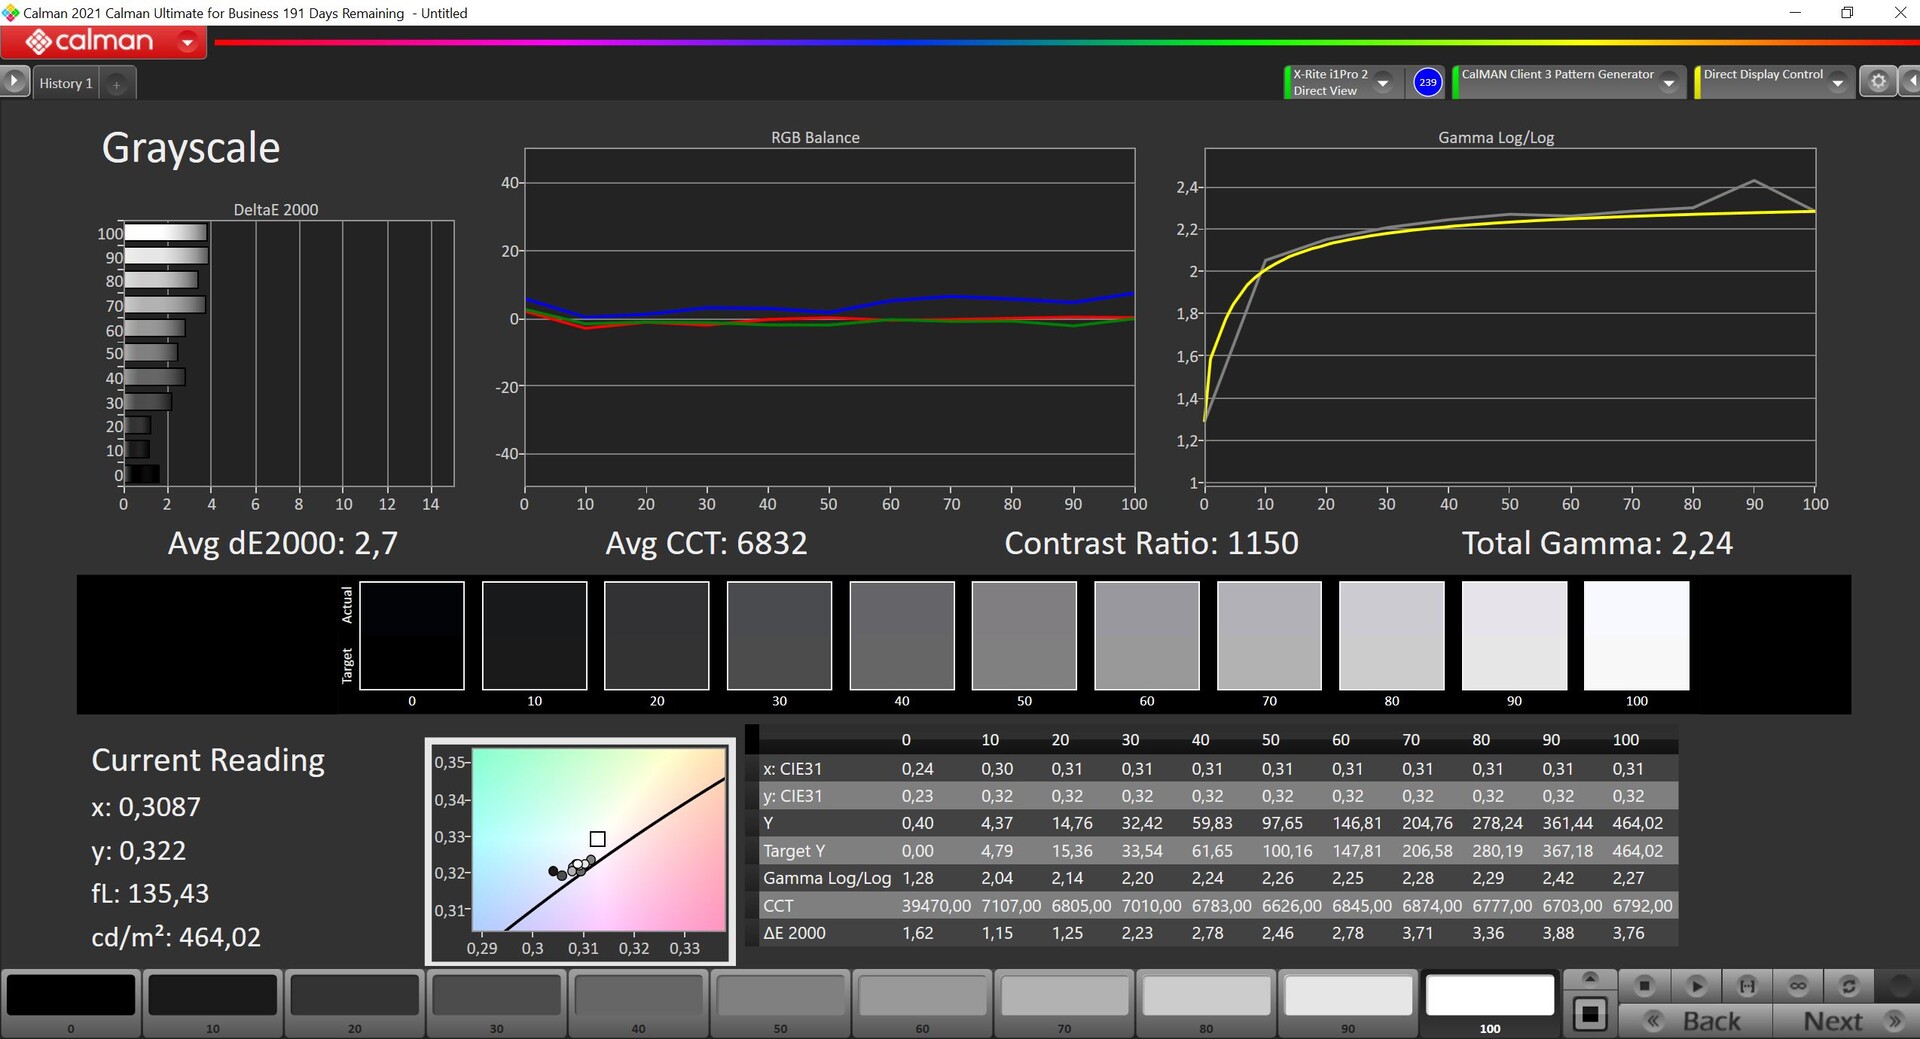
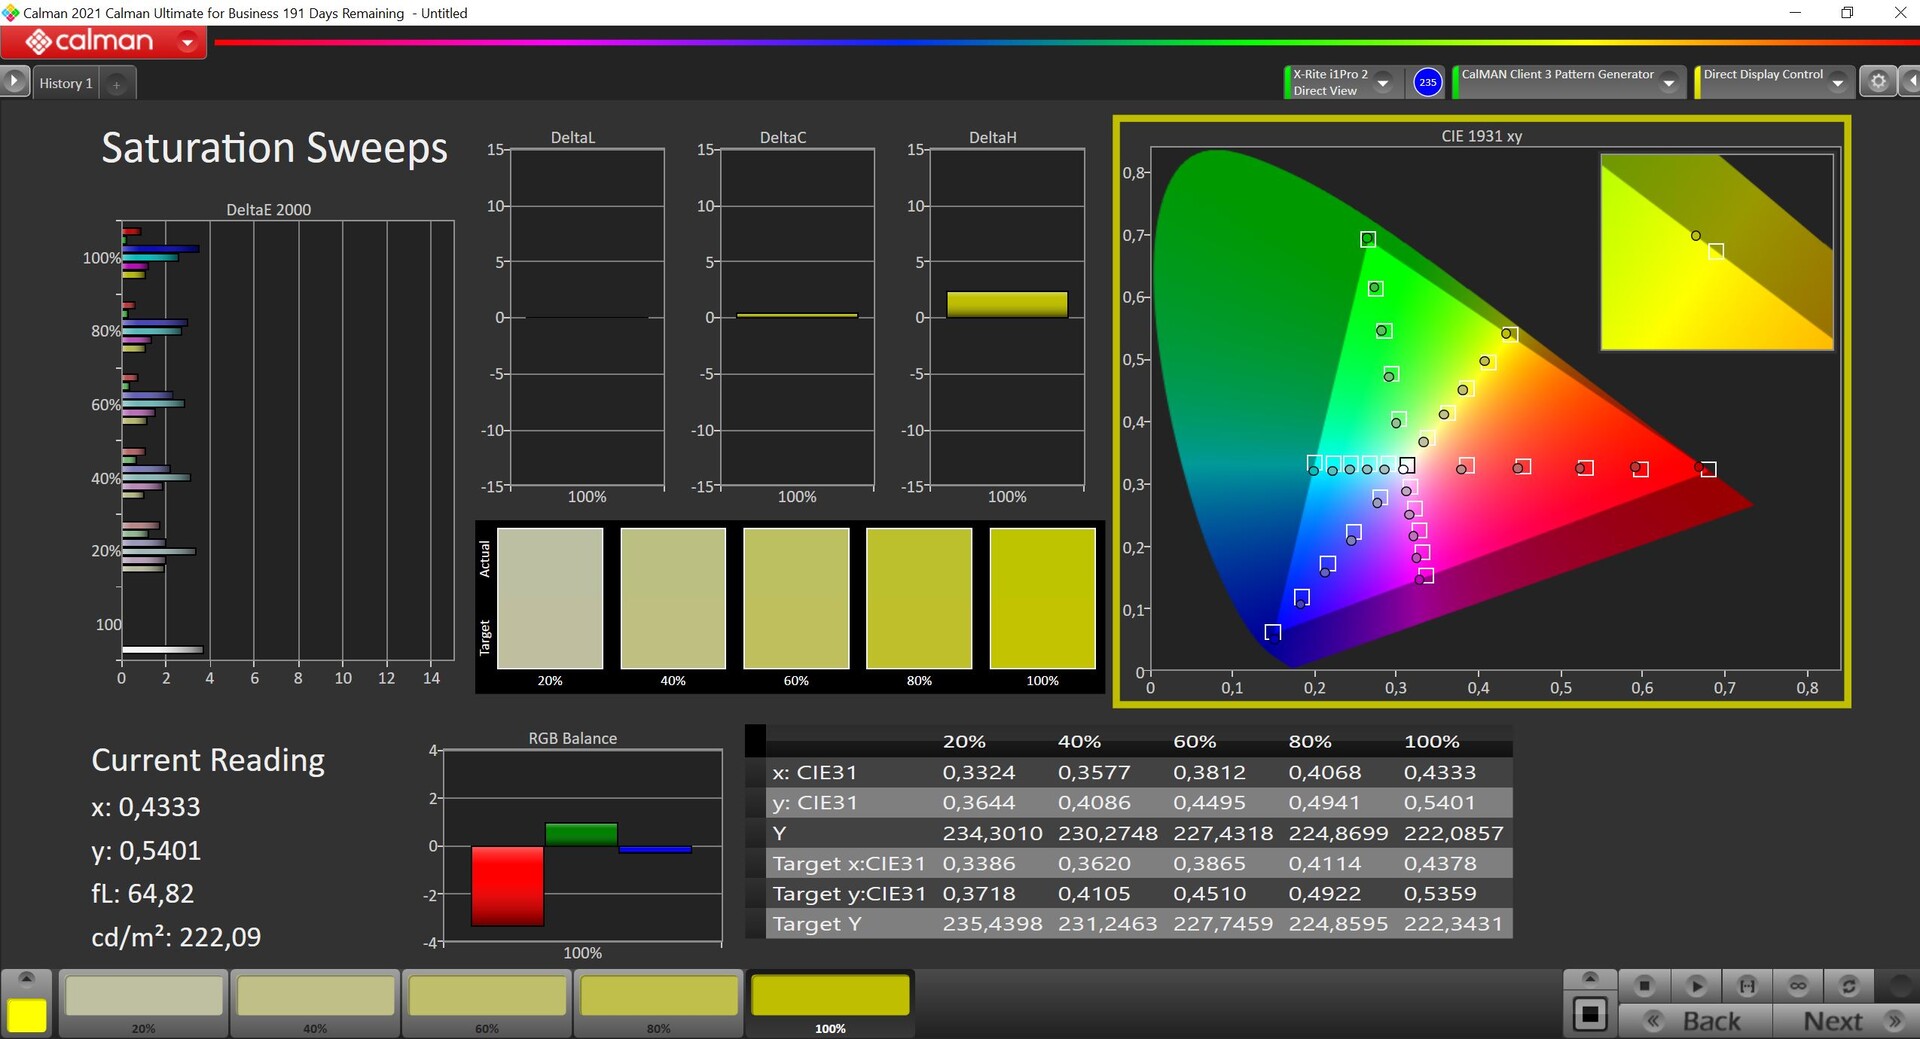
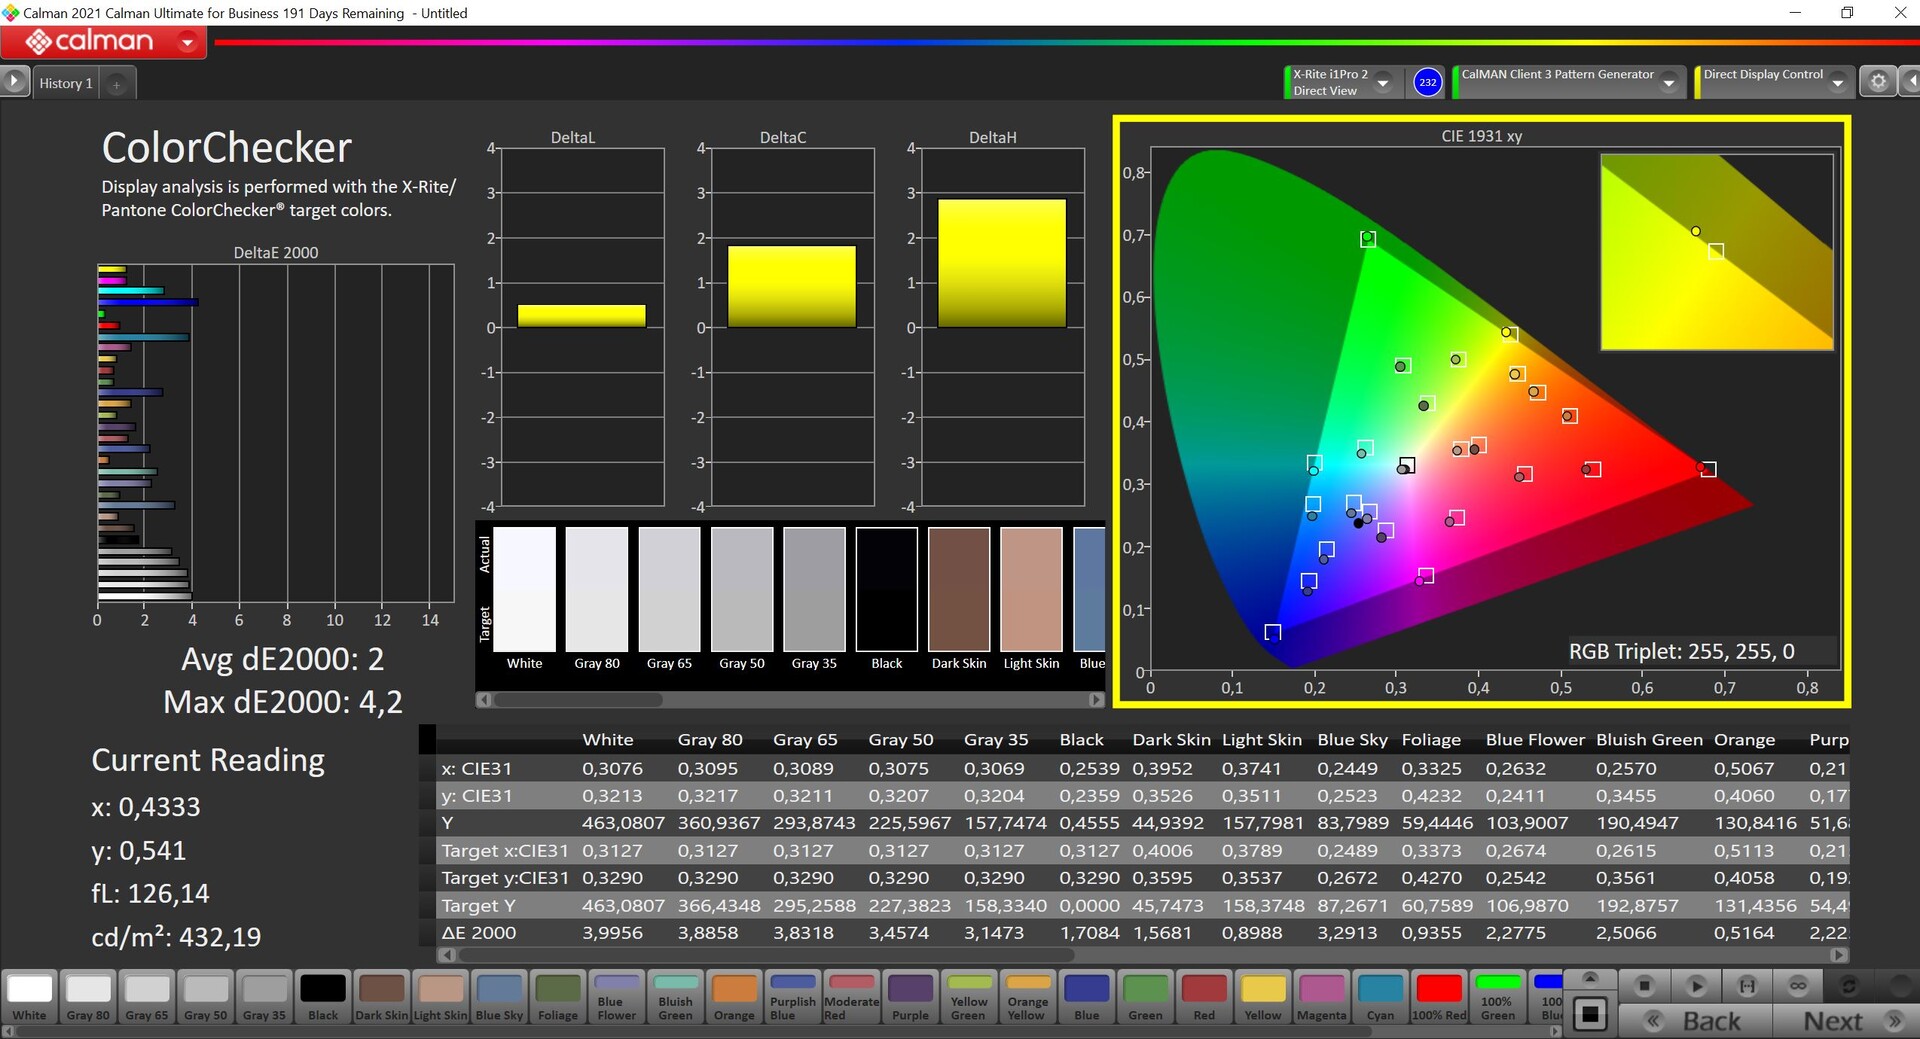
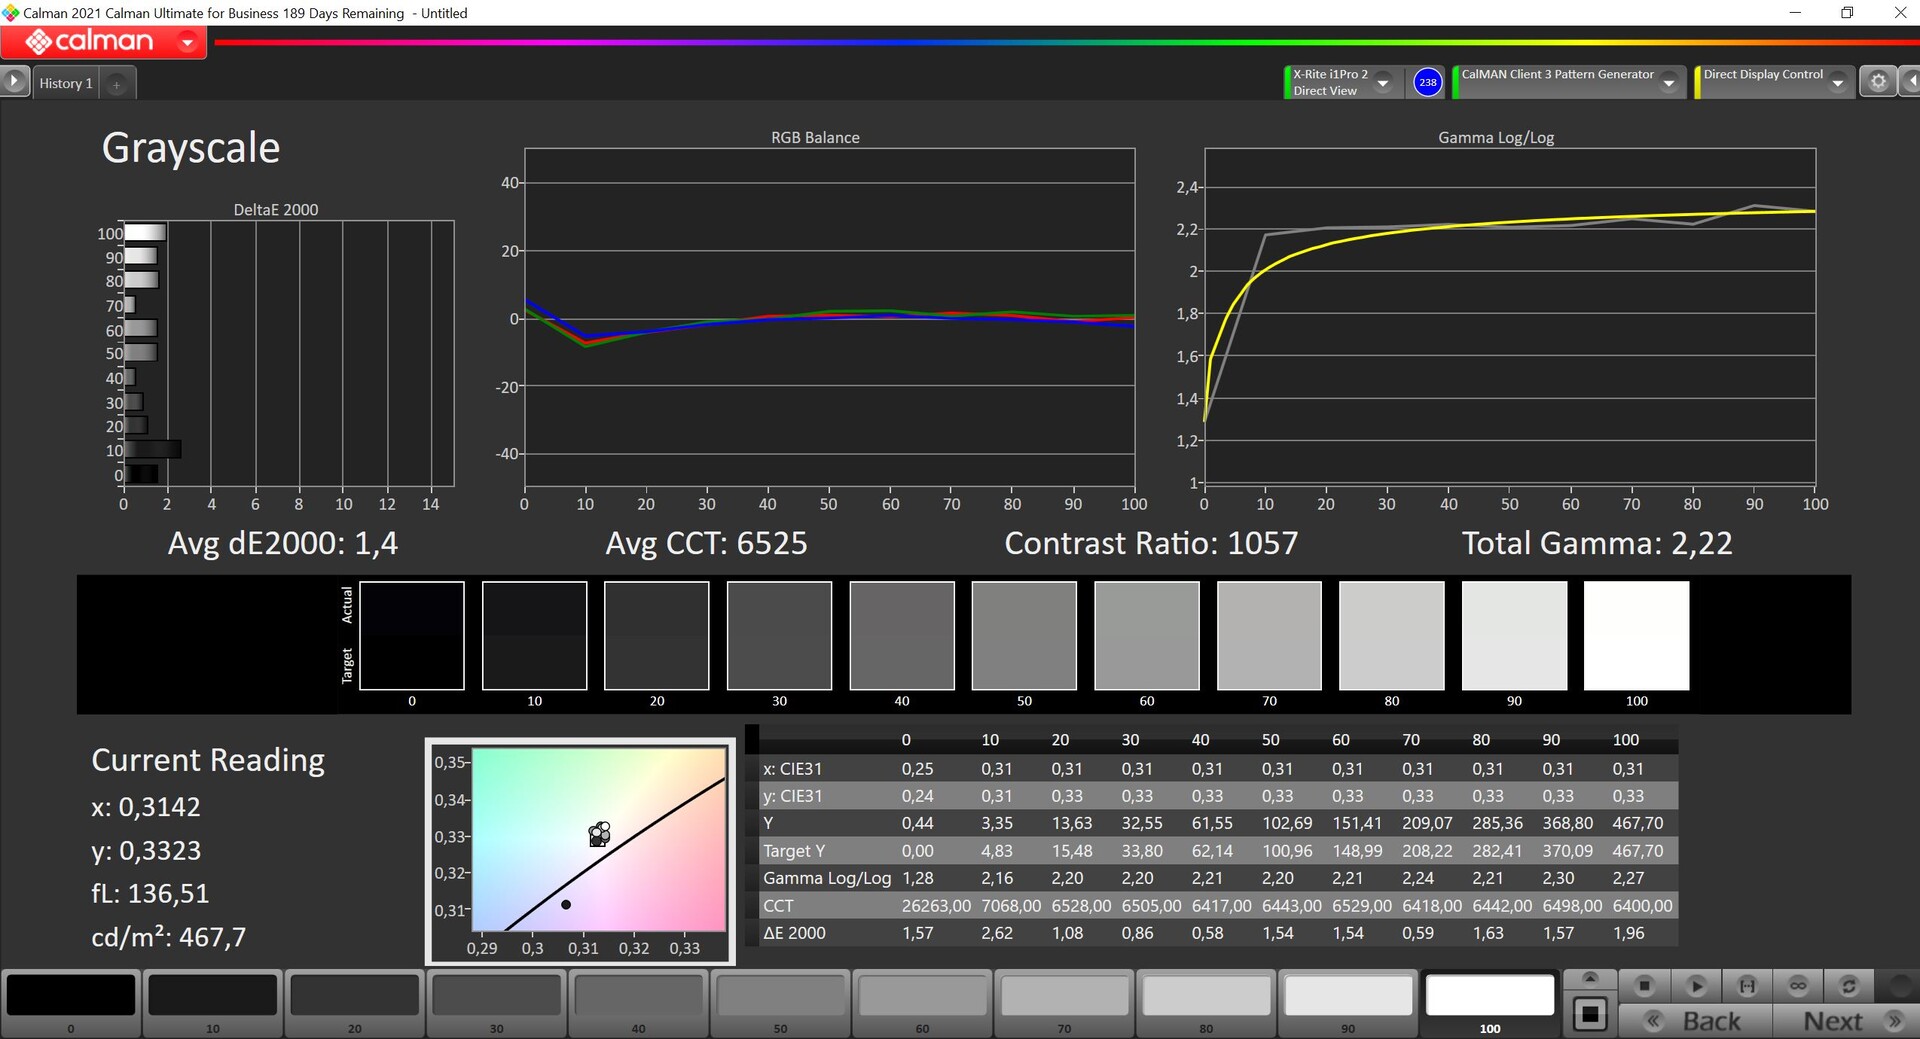
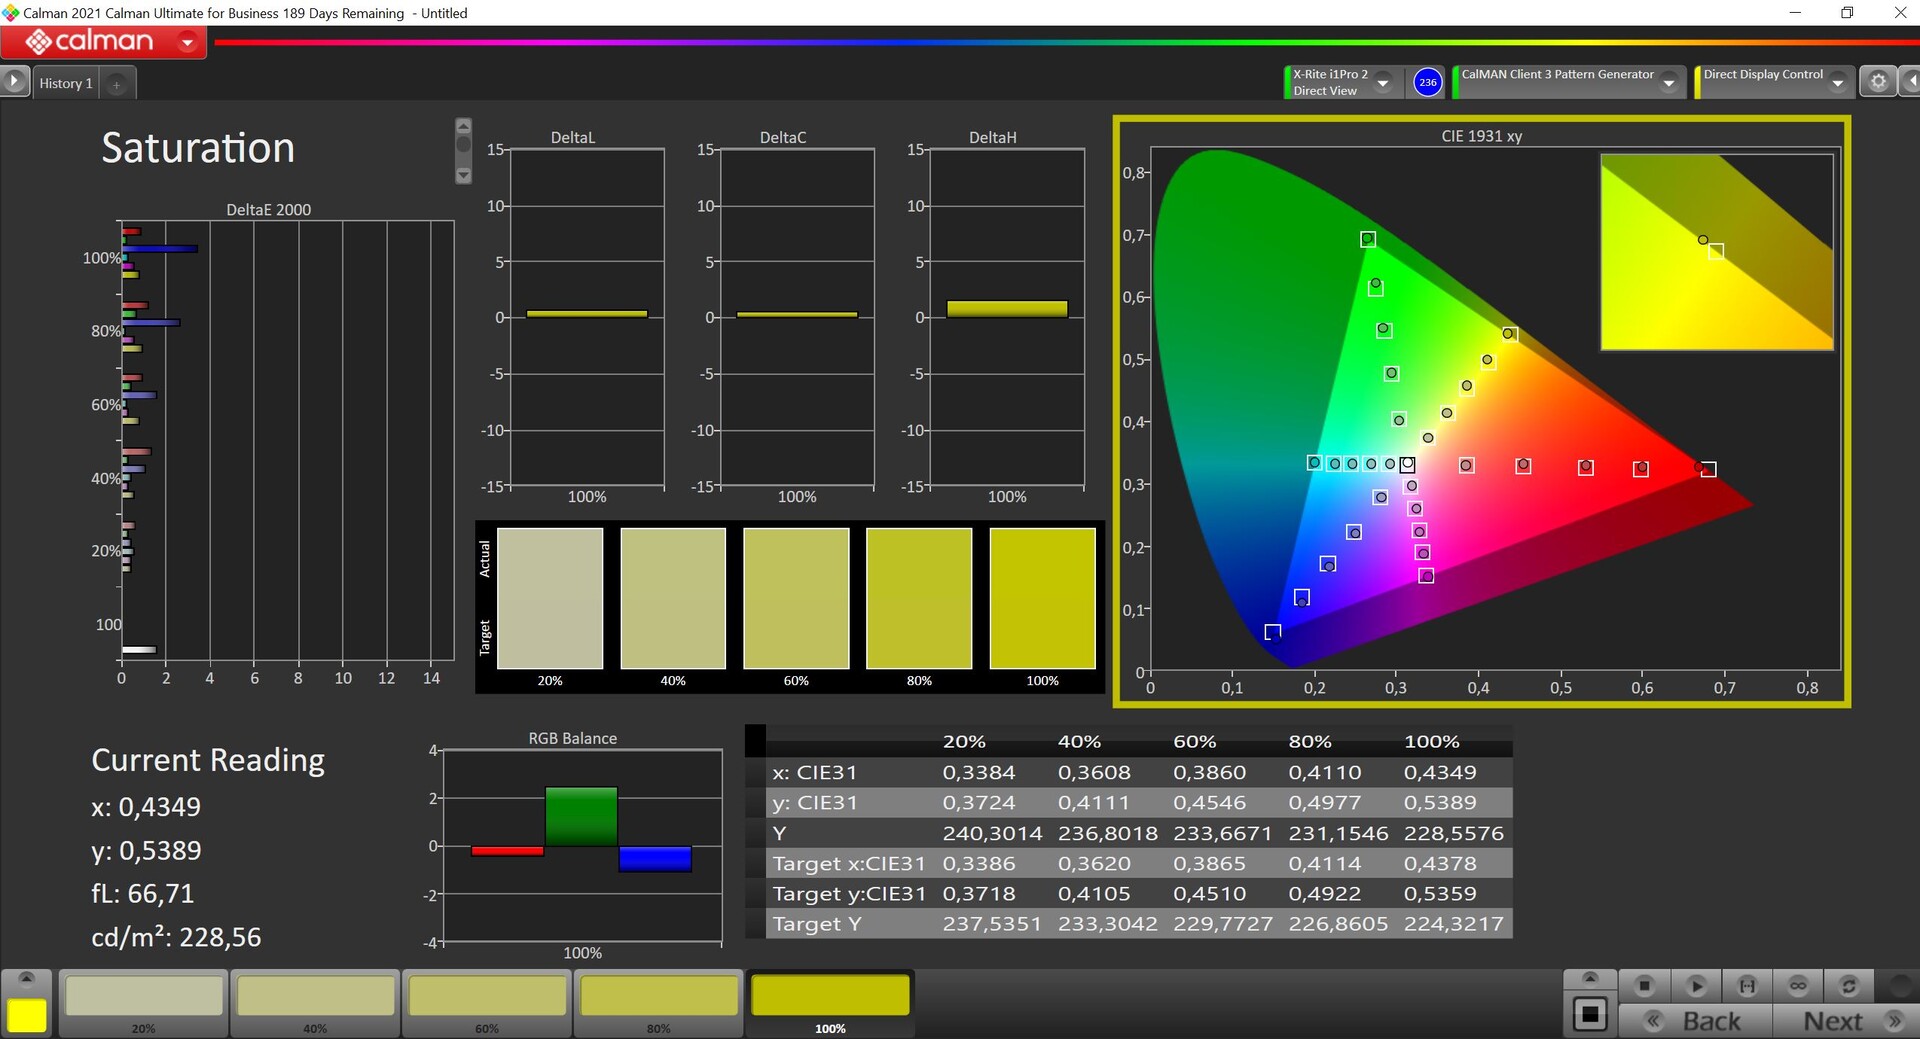
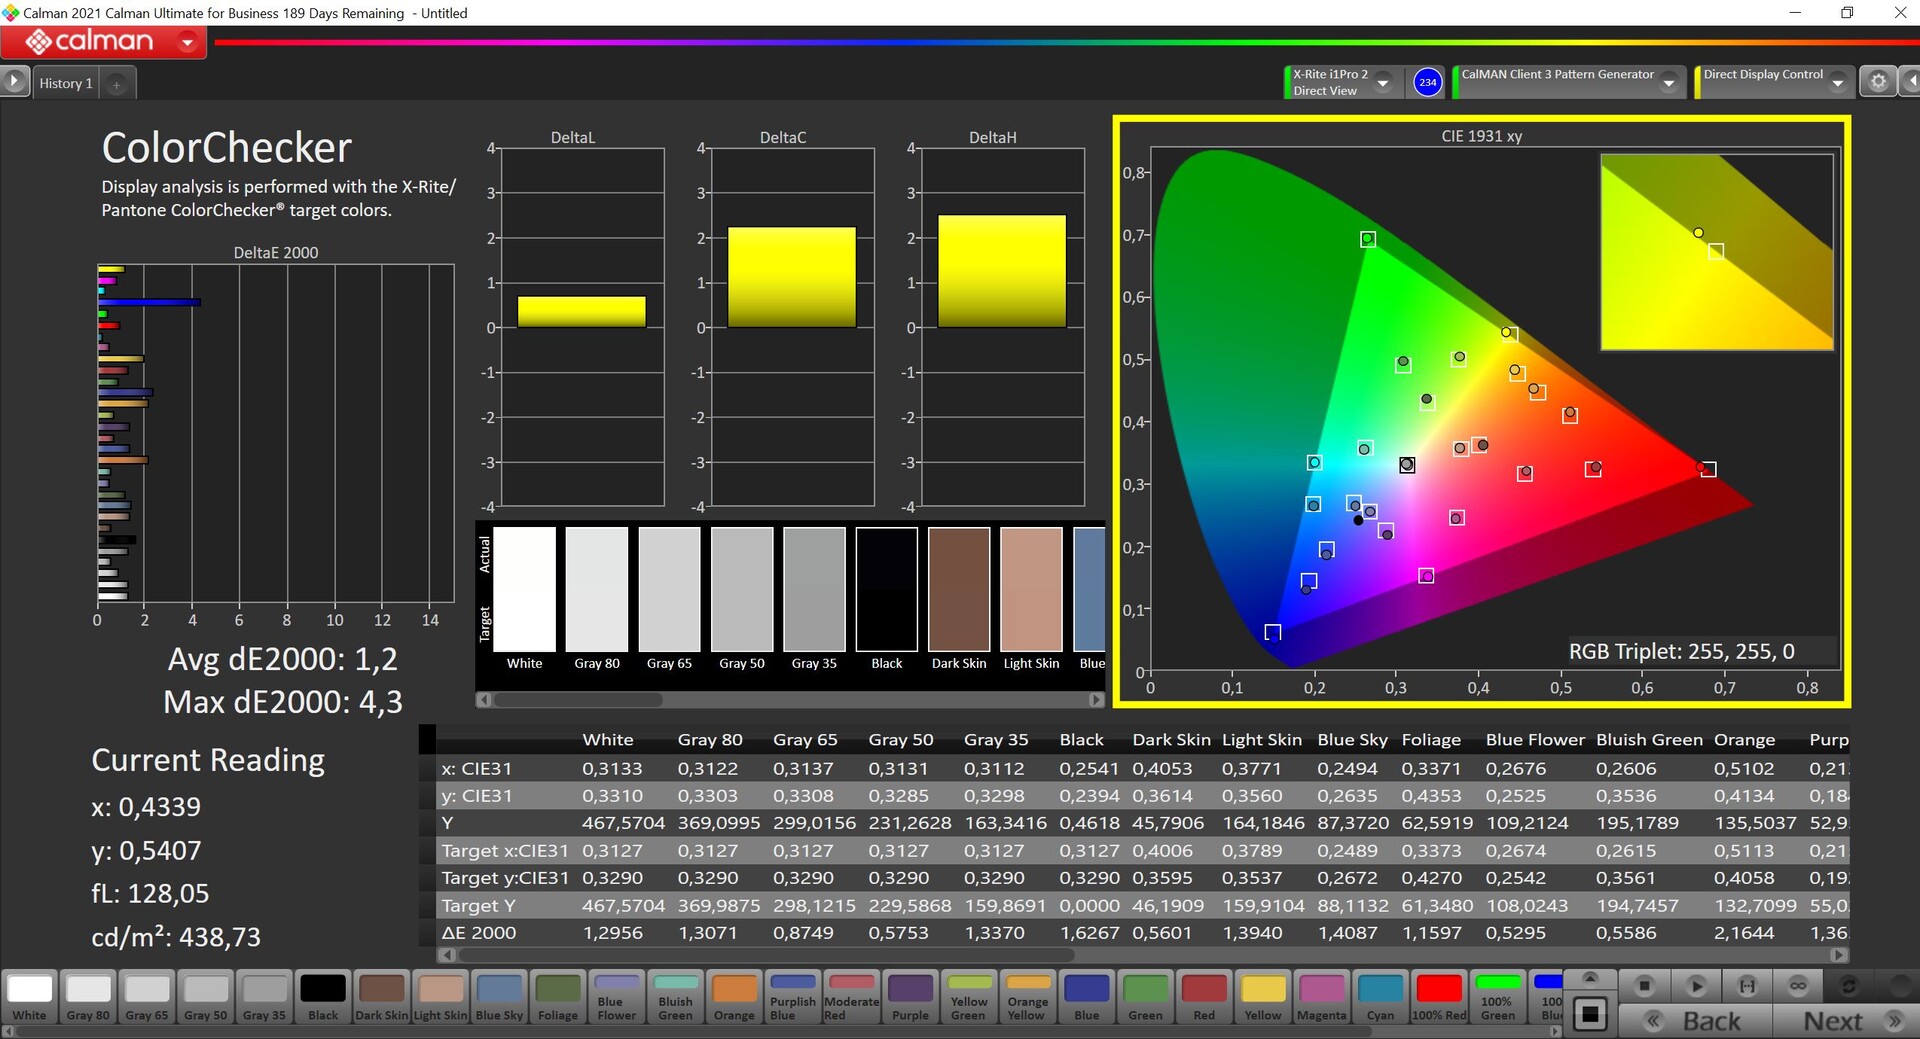
Our own calibration (corresponding profile can be downloaded in the box above for free) improves the quality of the grayscale as well as color presentation. Only 100 % blue is still an outlier, but you can still use the panel for some picture and video editing in combination with the high DCI-P3 coverage. If you just want to play games with the Flow Z13, it is not really necessary to calibrate the screen.
Display Response Times
| ↔ Response Time Black to White | ||
|---|---|---|
| 3 ms ... rise ↗ and fall ↘ combined | ↗ 3 ms rise | 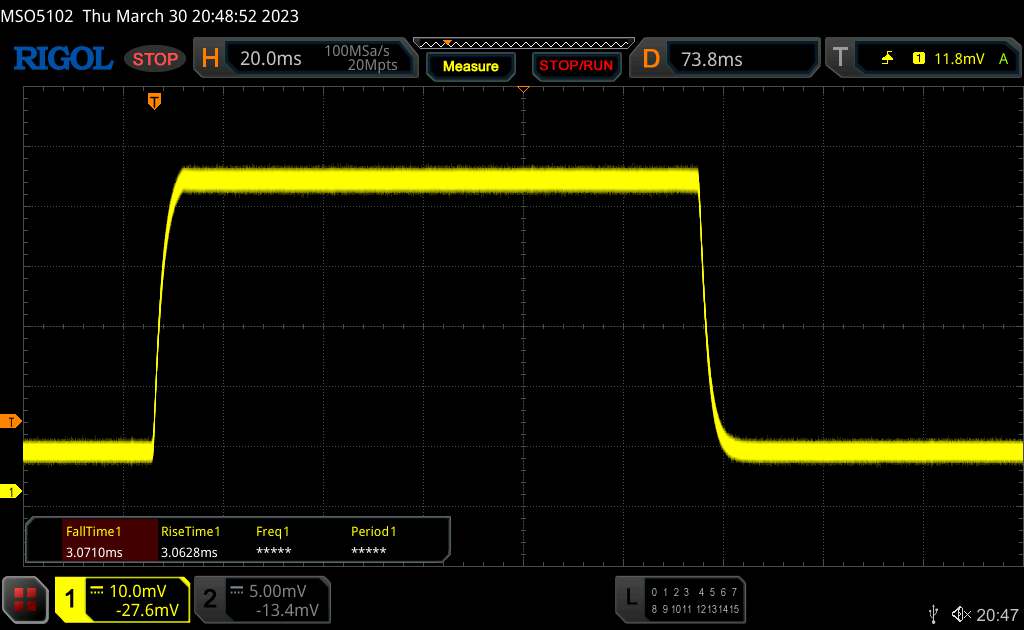 |
| ↘ 3 ms fall | ||
| The screen shows very fast response rates in our tests and should be very well suited for fast-paced gaming. In comparison, all tested devices range from 0.1 (minimum) to 240 (maximum) ms. » 14 % of all devices are better. This means that the measured response time is better than the average of all tested devices (19.9 ms). | ||
| ↔ Response Time 50% Grey to 80% Grey | ||
| 2.1 ms ... rise ↗ and fall ↘ combined | ↗ 2.1 ms rise | 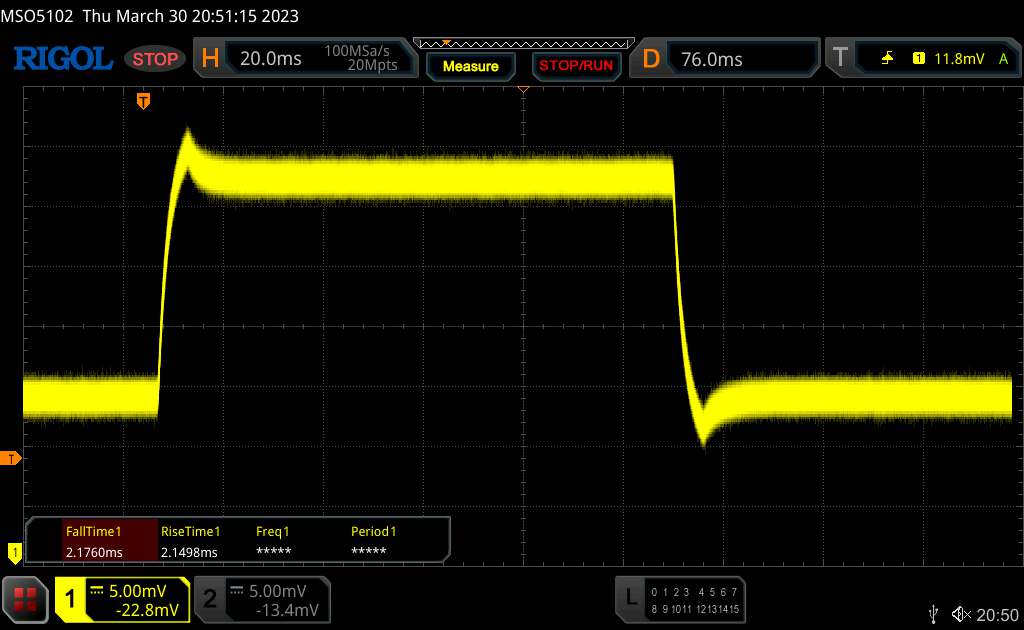 |
| ↘ 2.1 ms fall | ||
| The screen shows very fast response rates in our tests and should be very well suited for fast-paced gaming. In comparison, all tested devices range from 0.165 (minimum) to 636 (maximum) ms. » 11 % of all devices are better. This means that the measured response time is better than the average of all tested devices (31.1 ms). | ||
Screen Flickering / PWM (Pulse-Width Modulation)
| Screen flickering / PWM not detected | 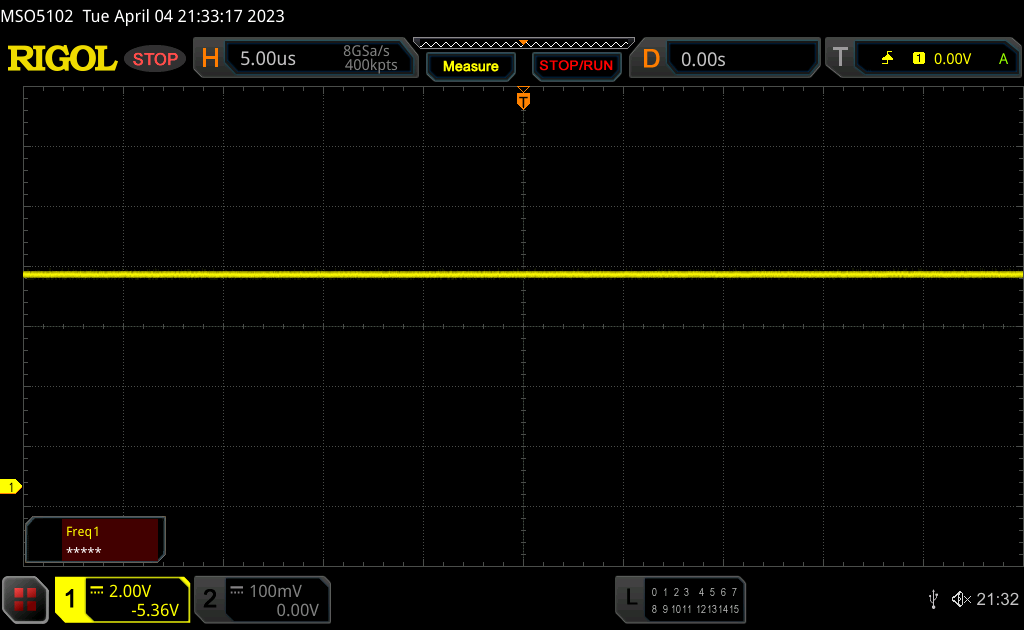 | ||
In comparison: 52 % of all tested devices do not use PWM to dim the display. If PWM was detected, an average of 7794 (minimum: 5 - maximum: 343500) Hz was measured. | |||
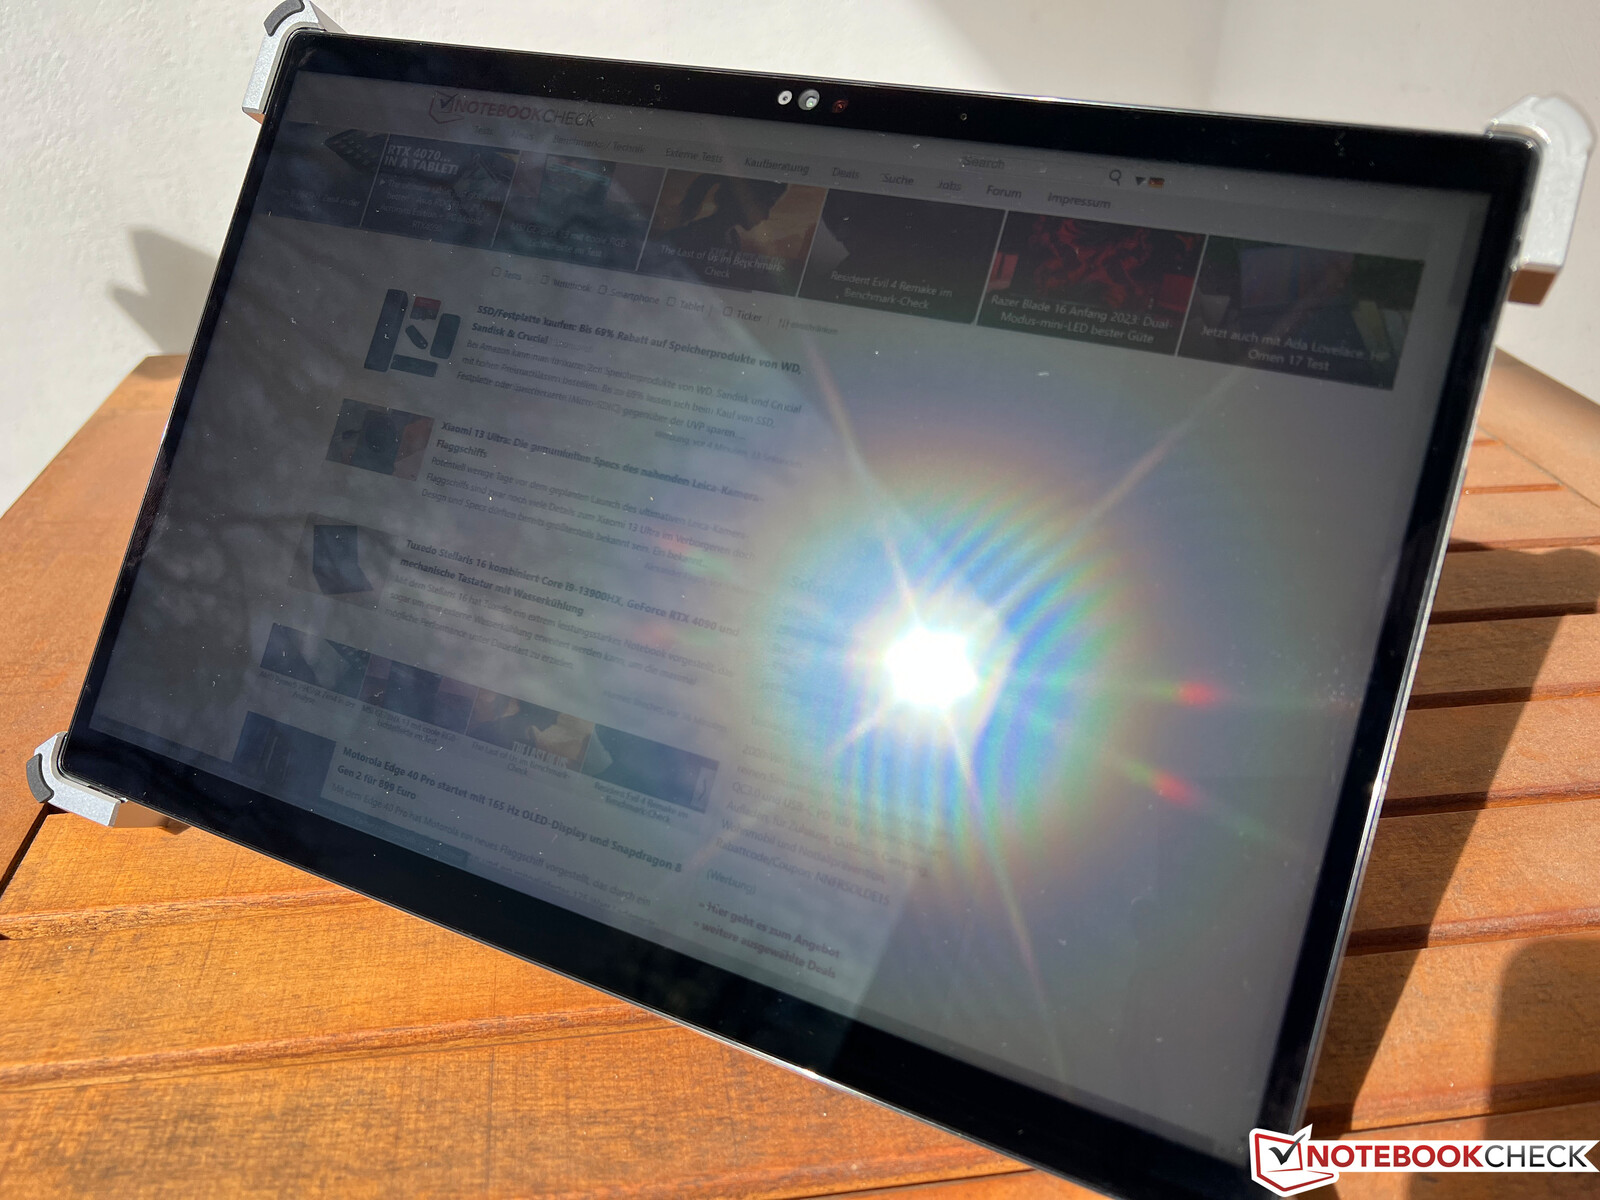
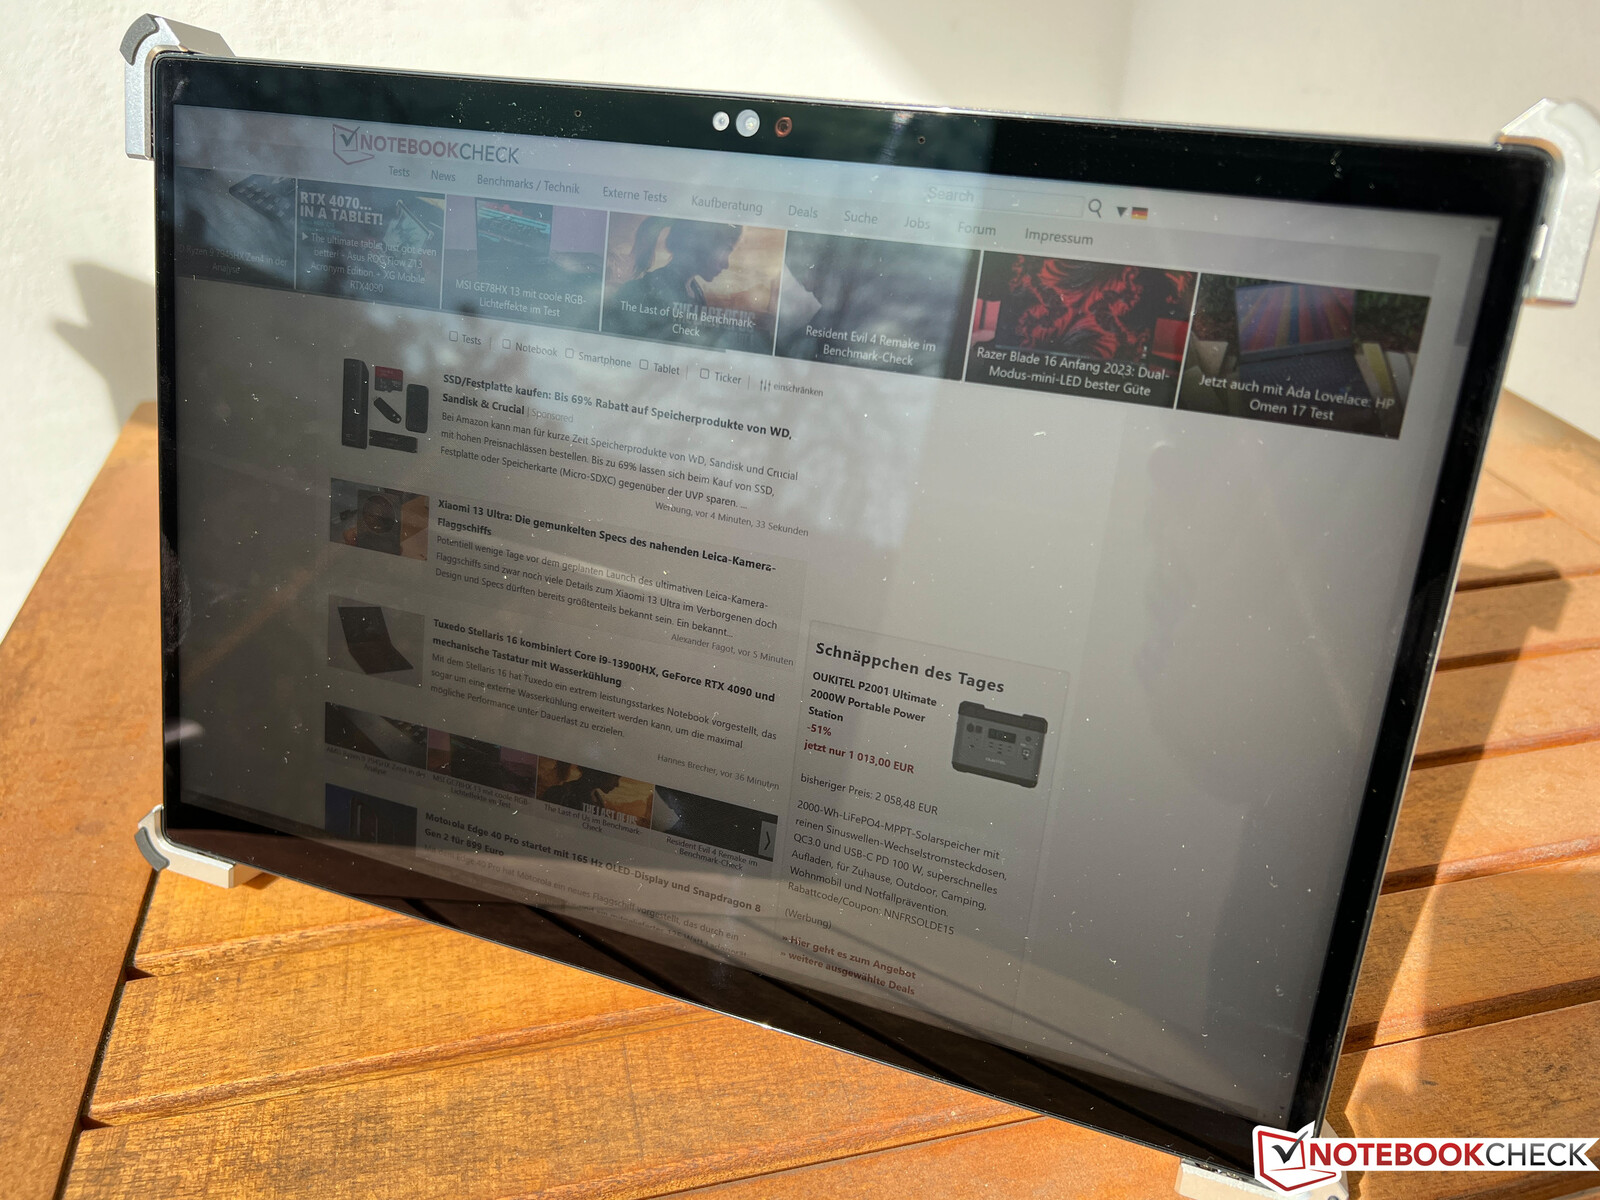
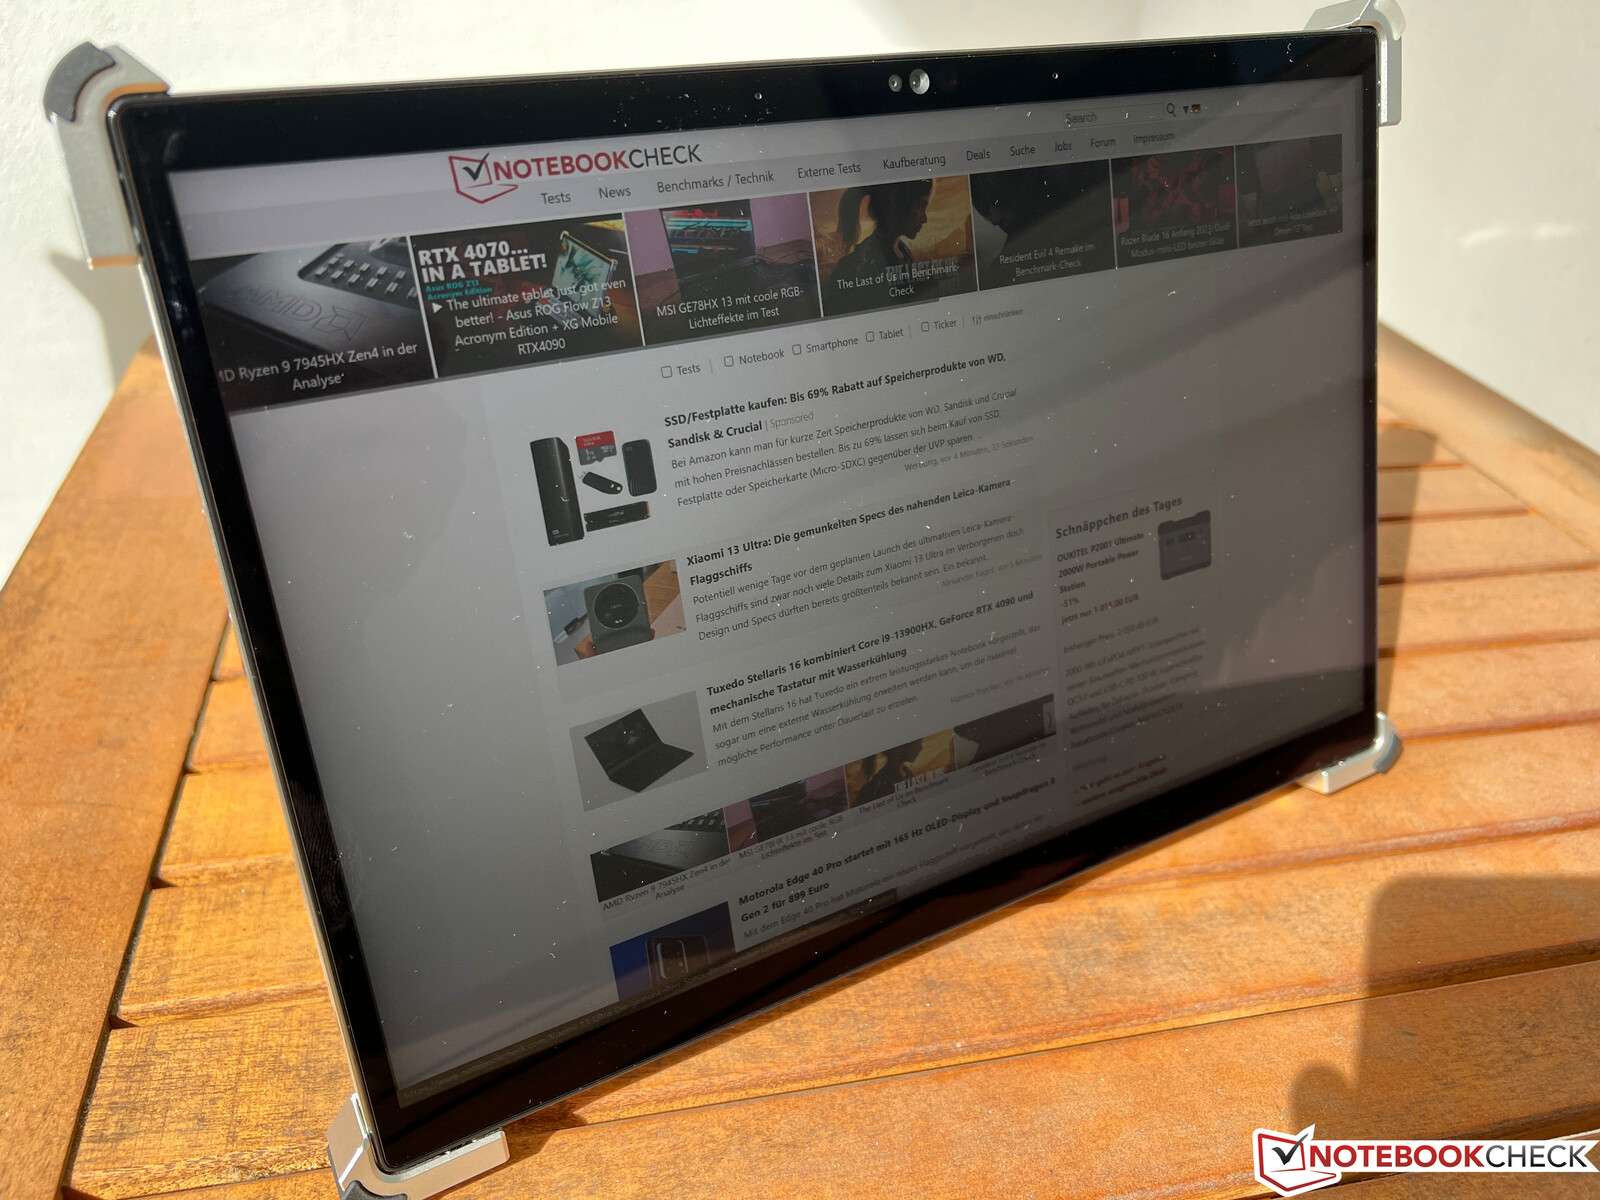
You should obviously avoid reflections from direct light sources on the glossy touchscreen, but it is not as reflective as many other panels and you can actually still use the convertible in very bright environments. The viewing angle stability of the IPS screen is very good.

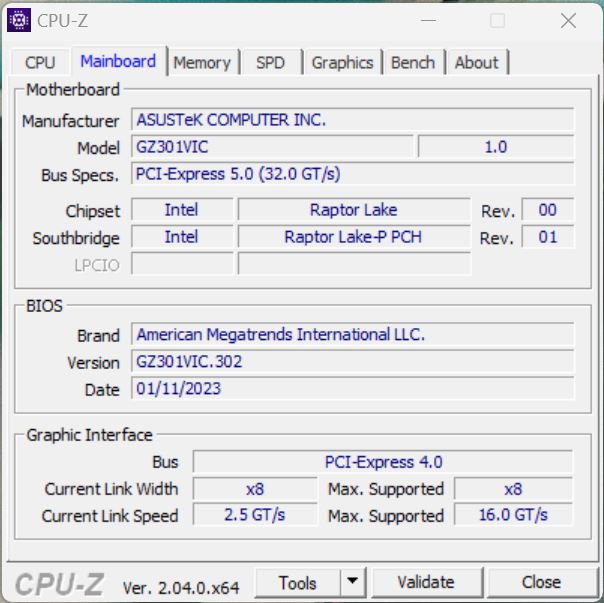
Performance - Raptor Lake and Ada Lovelace
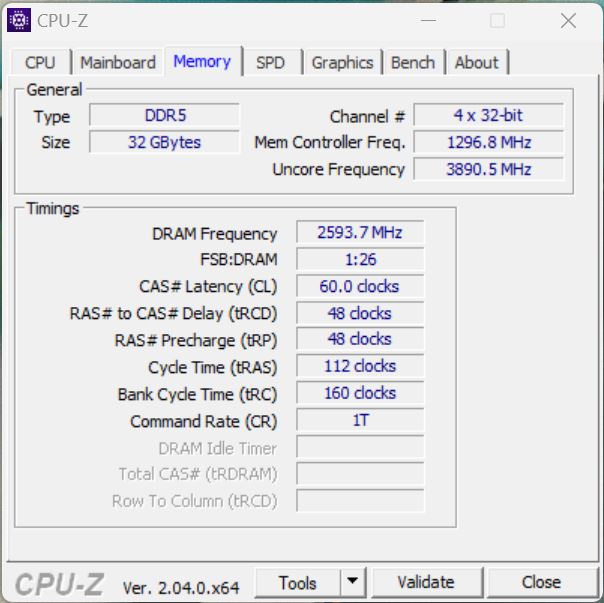
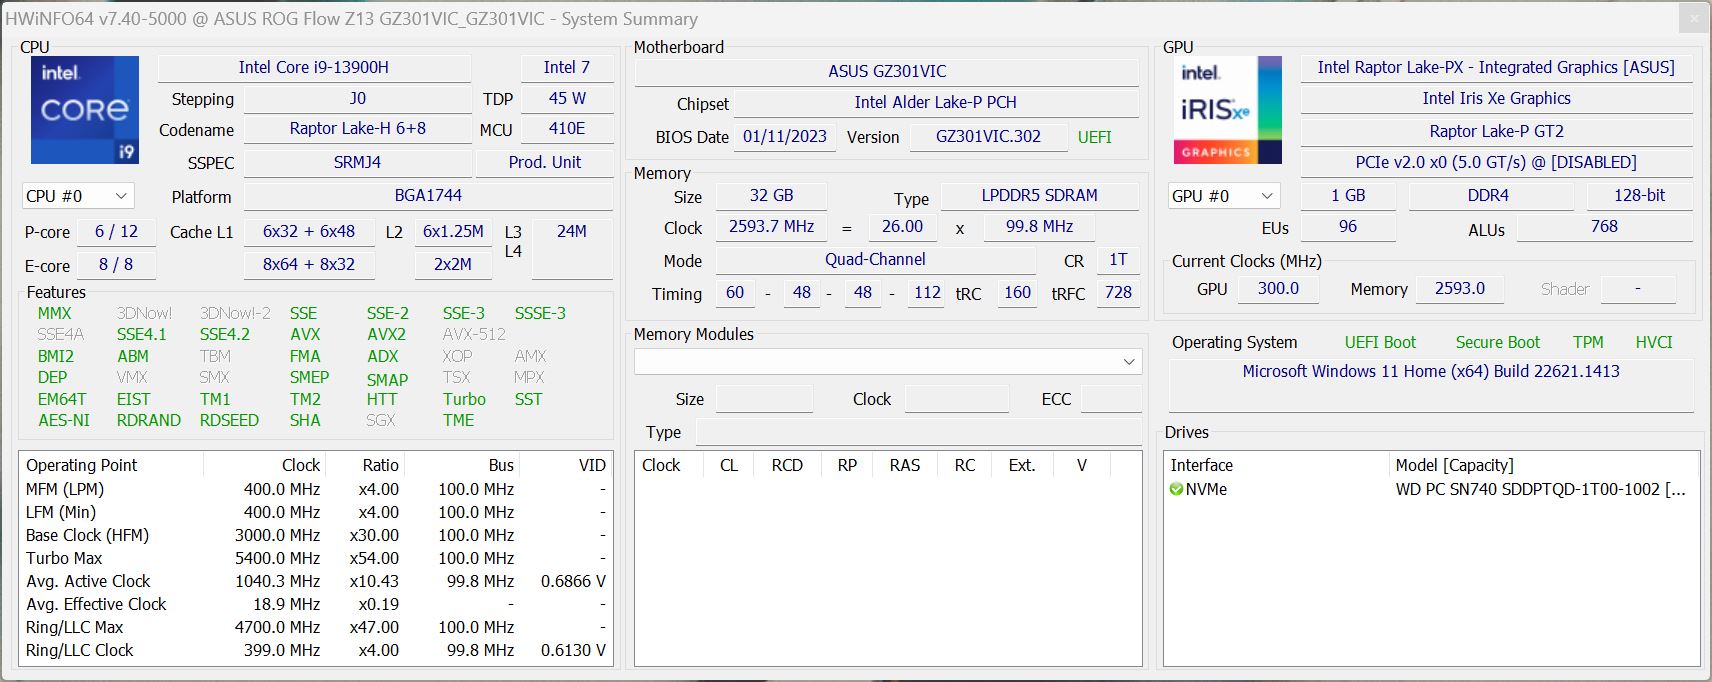
All versions of the 2023 ROG Flow Z13 are equipped with the Intel Core i9-13900H, but our ACRNM special edition also gets the new Nvidia GeForce RTX 4070 Laptop (65W version). Our unit is shipped with 32 GB LPDDR5-5200 RAM as well as a 1 TB PCIe-4.0 SSD.
Review Settings
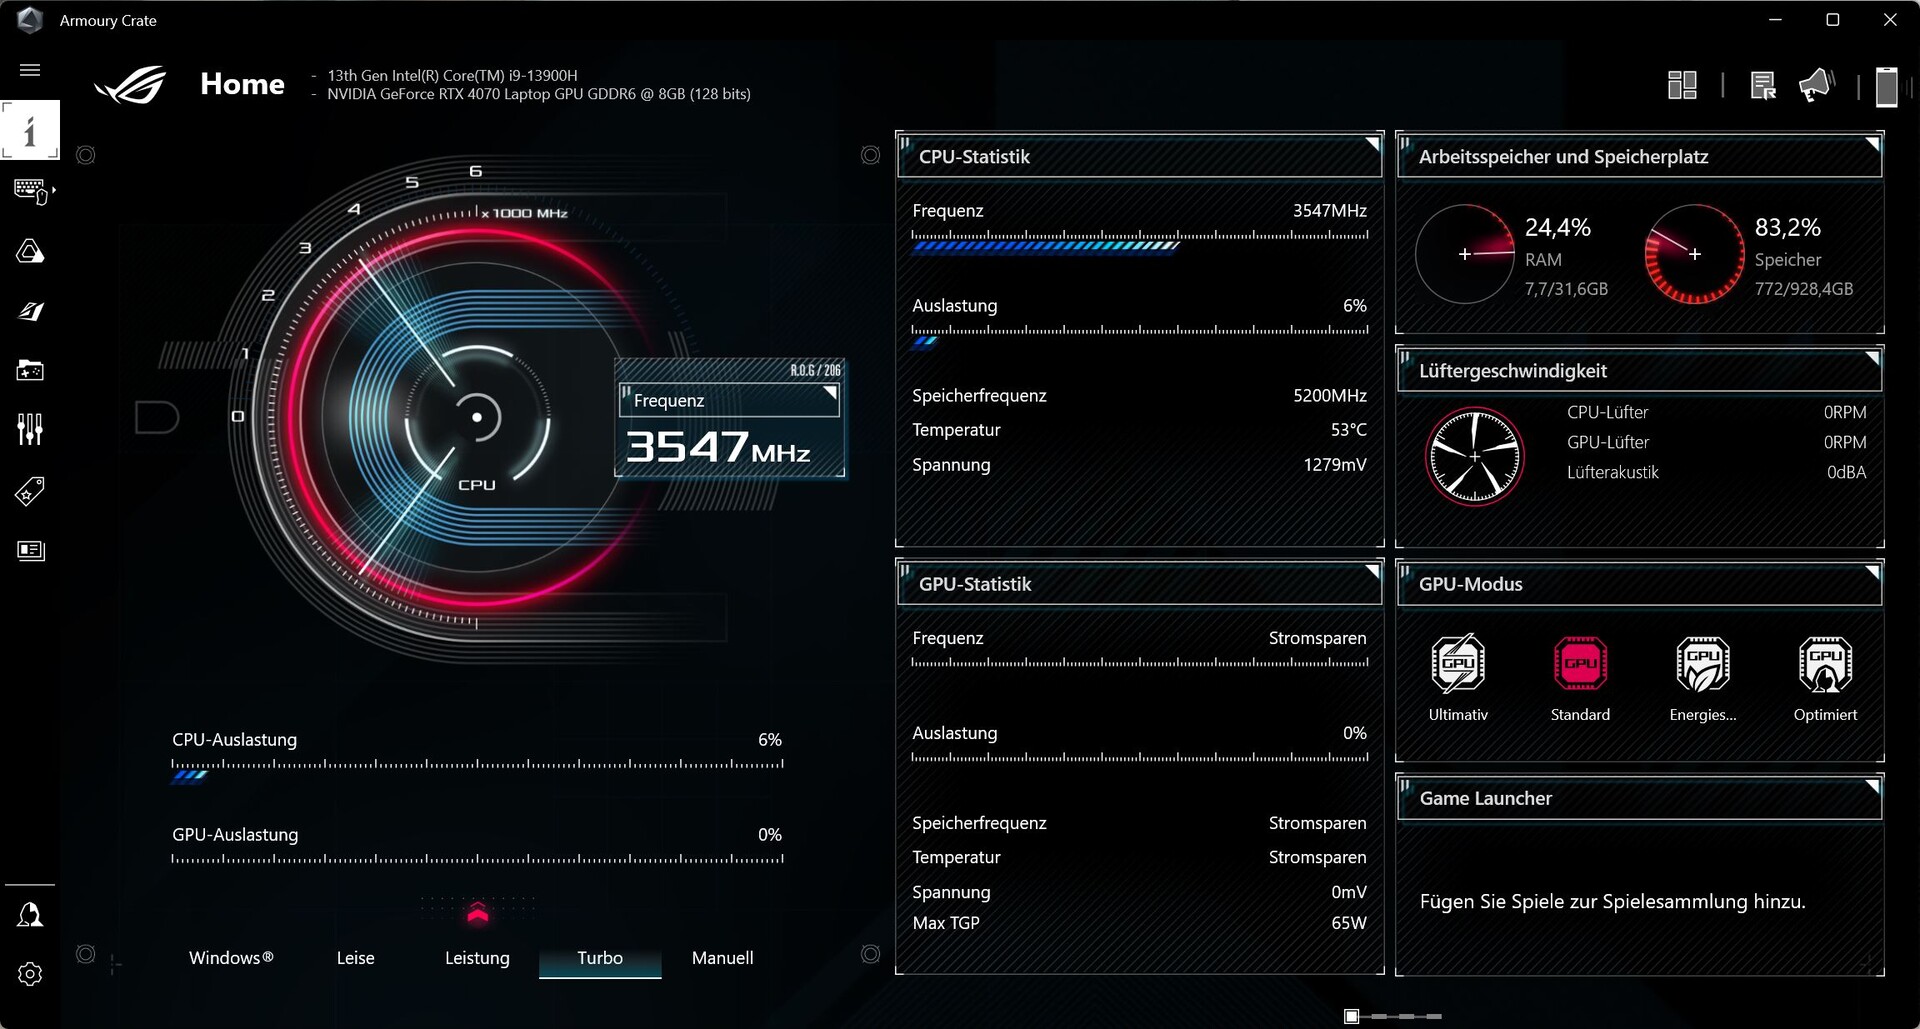
We are already familiar with the Armoury Crate software from other ROG devices and it offers comprehensive settings for the power modes as well as the behavior of the GPUs. It is, for example, possible to deactivate the iGPU completely. Similar to other ROG models, we noticed that the dedicated GPU must be active when you attach an external screen, which will increase the power consumption in daily situations. We listed the ROG power modes in the following table:
| CPU load | GPU load | Stress test | Max. fan noise | CB R23 Multi | Time Spy Graphics | |
|---|---|---|---|---|---|---|
| Quiet | 36/20 Watts | 35 Watts | CPU: 20 Watts GPU: 35 Watts |
36.5 dB(A) | 8207 points | 7344 points |
| Performance | 100/55 Watts | 50 Watts | CPU: ~35 Watts GPU: 30 Watts |
43.4 dB(A) | 15557 points | 8720 points |
| Turbo | 100/65 Watts | 65 Watts | CPU: 30-50 Watts GPU: 45 Watts |
46.9 dB(A) | 18682 points | 9513 points |
We used the Turbo mode for our benchmarks and measurements for the maximum GPU performance. Please note that the Turbo mode is only available when the PSU is attached. We will also take a look at the fan noise with the other power profiles.
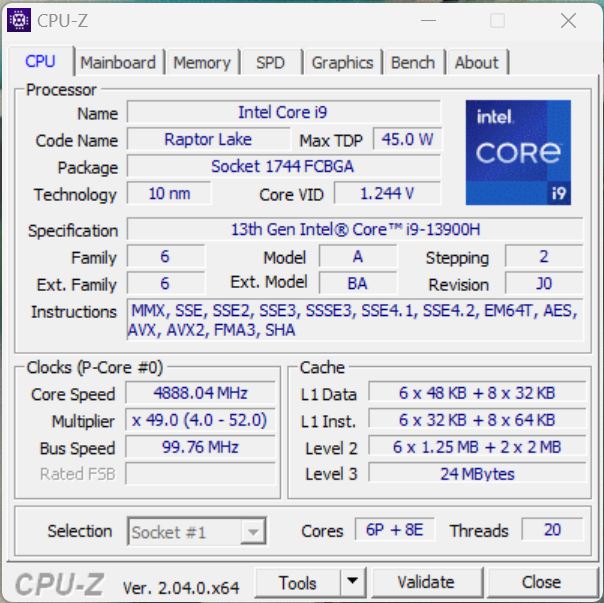
Processor - Core i9-13900H
The new Intel Raptor Lake Core i9-13900H is basically the old Core i9-12900H from the previous version with slightly increased Turbo frequencies. The CPU can consume 100 Watts for short periods and 65 Watts for sustained workloads in the Turbo power mode. This means we are still pretty far away from the maximum potential of the Core i9, but the overall results are still very good considering the compact size. The battery power consumption is limited to 40 Watts, which means you will lose around 25 % CPU performance in multi-core scenarios. Please see our tech section for more benchmarks.
Cinebench R15 Multi Loop
Cinebench R23: Multi Core | Single Core
Cinebench R20: CPU (Multi Core) | CPU (Single Core)
Cinebench R15: CPU Multi 64Bit | CPU Single 64Bit
Blender: v2.79 BMW27 CPU
7-Zip 18.03: 7z b 4 | 7z b 4 -mmt1
Geekbench 5.5: Multi-Core | Single-Core
HWBOT x265 Benchmark v2.2: 4k Preset
LibreOffice : 20 Documents To PDF
R Benchmark 2.5: Overall mean
| CPU Performance rating | |
| Average of class Gaming | |
| Asus ROG Zephyrus M16 GU604VY-NM042X | |
| Asus ROG Flow Z13 GZ301V | |
| Asus ROG Flow Z13 ACRNM | |
| Asus ROG Flow Z13 GZ301ZE | |
| Average Intel Core i9-13900H | |
| Gigabyte AERO 16 OLED BSF | |
| Apple MacBook Pro 14 2023 M2 Pro -6! | |
| Alienware x14 i7 RTX 3060 | |
| Razer Blade 14 Ryzen 9 6900HX | |
| Asus ROG Zephyrus G14 GA402RK | |
| Microsoft Surface Pro 9, i7-1255U | |
| Cinebench R23 / Multi Core | |
| Average of class Gaming (10488 - 40970, n=112, last 2 years) | |
| Asus ROG Zephyrus M16 GU604VY-NM042X | |
| Gigabyte AERO 16 OLED BSF | |
| Asus ROG Flow Z13 ACRNM | |
| Asus ROG Flow Z13 GZ301V | |
| Average Intel Core i9-13900H (11997 - 20385, n=28) | |
| Alienware x14 i7 RTX 3060 | |
| Asus ROG Flow Z13 GZ301ZE | |
| Apple MacBook Pro 14 2023 M2 Pro | |
| Razer Blade 14 Ryzen 9 6900HX | |
| Asus ROG Zephyrus G14 GA402RK | |
| Microsoft Surface Pro 9, i7-1255U | |
| Cinebench R23 / Single Core | |
| Asus ROG Flow Z13 GZ301V | |
| Asus ROG Flow Z13 ACRNM | |
| Average of class Gaming (1166 - 2356, n=112, last 2 years) | |
| Asus ROG Zephyrus M16 GU604VY-NM042X | |
| Asus ROG Flow Z13 GZ301ZE | |
| Average Intel Core i9-13900H (1297 - 2054, n=26) | |
| Alienware x14 i7 RTX 3060 | |
| Gigabyte AERO 16 OLED BSF | |
| Microsoft Surface Pro 9, i7-1255U | |
| Apple MacBook Pro 14 2023 M2 Pro | |
| Asus ROG Zephyrus G14 GA402RK | |
| Razer Blade 14 Ryzen 9 6900HX | |
| Cinebench R20 / CPU (Multi Core) | |
| Average of class Gaming (4029 - 16108, n=111, last 2 years) | |
| Asus ROG Zephyrus M16 GU604VY-NM042X | |
| Gigabyte AERO 16 OLED BSF | |
| Asus ROG Flow Z13 ACRNM | |
| Asus ROG Flow Z13 GZ301V | |
| Average Intel Core i9-13900H (4935 - 7716, n=25) | |
| Alienware x14 i7 RTX 3060 | |
| Asus ROG Flow Z13 GZ301ZE | |
| Razer Blade 14 Ryzen 9 6900HX | |
| Asus ROG Zephyrus G14 GA402RK | |
| Apple MacBook Pro 14 2023 M2 Pro | |
| Microsoft Surface Pro 9, i7-1255U | |
| Cinebench R20 / CPU (Single Core) | |
| Asus ROG Flow Z13 GZ301V | |
| Asus ROG Flow Z13 ACRNM | |
| Average of class Gaming (442 - 895, n=111, last 2 years) | |
| Asus ROG Zephyrus M16 GU604VY-NM042X | |
| Asus ROG Flow Z13 GZ301ZE | |
| Average Intel Core i9-13900H (428 - 792, n=25) | |
| Alienware x14 i7 RTX 3060 | |
| Gigabyte AERO 16 OLED BSF | |
| Microsoft Surface Pro 9, i7-1255U | |
| Asus ROG Zephyrus G14 GA402RK | |
| Razer Blade 14 Ryzen 9 6900HX | |
| Apple MacBook Pro 14 2023 M2 Pro | |
| Cinebench R15 / CPU Multi 64Bit | |
| Average of class Gaming (1578 - 6271, n=111, last 2 years) | |
| Asus ROG Zephyrus M16 GU604VY-NM042X | |
| Gigabyte AERO 16 OLED BSF | |
| Asus ROG Flow Z13 GZ301V | |
| Asus ROG Flow Z13 ACRNM | |
| Asus ROG Flow Z13 GZ301ZE | |
| Average Intel Core i9-13900H (2061 - 3100, n=26) | |
| Alienware x14 i7 RTX 3060 | |
| Razer Blade 14 Ryzen 9 6900HX | |
| Apple MacBook Pro 14 2023 M2 Pro | |
| Asus ROG Zephyrus G14 GA402RK | |
| Microsoft Surface Pro 9, i7-1255U | |
| Cinebench R15 / CPU Single 64Bit | |
| Asus ROG Flow Z13 GZ301V | |
| Average of class Gaming (188.8 - 343, n=111, last 2 years) | |
| Asus ROG Zephyrus M16 GU604VY-NM042X | |
| Asus ROG Flow Z13 ACRNM | |
| Asus ROG Flow Z13 GZ301ZE | |
| Average Intel Core i9-13900H (211 - 297, n=26) | |
| Asus ROG Zephyrus G14 GA402RK | |
| Alienware x14 i7 RTX 3060 | |
| Razer Blade 14 Ryzen 9 6900HX | |
| Gigabyte AERO 16 OLED BSF | |
| Apple MacBook Pro 14 2023 M2 Pro | |
| Microsoft Surface Pro 9, i7-1255U | |
| Blender / v2.79 BMW27 CPU | |
| Microsoft Surface Pro 9, i7-1255U | |
| Asus ROG Zephyrus G14 GA402RK | |
| Alienware x14 i7 RTX 3060 | |
| Razer Blade 14 Ryzen 9 6900HX | |
| Asus ROG Flow Z13 GZ301ZE | |
| Average Intel Core i9-13900H (166 - 268, n=24) | |
| Asus ROG Flow Z13 GZ301V | |
| Asus ROG Flow Z13 ACRNM | |
| Gigabyte AERO 16 OLED BSF | |
| Asus ROG Zephyrus M16 GU604VY-NM042X | |
| Average of class Gaming (80 - 330, n=109, last 2 years) | |
| 7-Zip 18.03 / 7z b 4 | |
| Average of class Gaming (33491 - 148086, n=110, last 2 years) | |
| Asus ROG Zephyrus M16 GU604VY-NM042X | |
| Gigabyte AERO 16 OLED BSF | |
| Asus ROG Flow Z13 GZ301V | |
| Asus ROG Flow Z13 ACRNM | |
| Alienware x14 i7 RTX 3060 | |
| Average Intel Core i9-13900H (45045 - 79032, n=25) | |
| Asus ROG Flow Z13 GZ301ZE | |
| Razer Blade 14 Ryzen 9 6900HX | |
| Asus ROG Zephyrus G14 GA402RK | |
| Microsoft Surface Pro 9, i7-1255U | |
| 7-Zip 18.03 / 7z b 4 -mmt1 | |
| Asus ROG Flow Z13 GZ301V | |
| Average of class Gaming (4199 - 7436, n=110, last 2 years) | |
| Asus ROG Flow Z13 ACRNM | |
| Asus ROG Zephyrus M16 GU604VY-NM042X | |
| Asus ROG Flow Z13 GZ301ZE | |
| Average Intel Core i9-13900H (3665 - 6600, n=25) | |
| Asus ROG Zephyrus G14 GA402RK | |
| Razer Blade 14 Ryzen 9 6900HX | |
| Alienware x14 i7 RTX 3060 | |
| Gigabyte AERO 16 OLED BSF | |
| Microsoft Surface Pro 9, i7-1255U | |
| Geekbench 5.5 / Multi-Core | |
| Average of class Gaming (6460 - 27010, n=110, last 2 years) | |
| Asus ROG Zephyrus M16 GU604VY-NM042X | |
| Apple MacBook Pro 14 2023 M2 Pro | |
| Asus ROG Flow Z13 GZ301V | |
| Asus ROG Flow Z13 ACRNM | |
| Asus ROG Flow Z13 GZ301ZE | |
| Gigabyte AERO 16 OLED BSF | |
| Alienware x14 i7 RTX 3060 | |
| Average Intel Core i9-13900H (9094 - 15410, n=26) | |
| Asus ROG Zephyrus G14 GA402RK | |
| Razer Blade 14 Ryzen 9 6900HX | |
| Microsoft Surface Pro 9, i7-1255U | |
| Geekbench 5.5 / Single-Core | |
| Average of class Gaming (986 - 2474, n=110, last 2 years) | |
| Asus ROG Flow Z13 GZ301V | |
| Asus ROG Flow Z13 ACRNM | |
| Asus ROG Zephyrus M16 GU604VY-NM042X | |
| Apple MacBook Pro 14 2023 M2 Pro | |
| Average Intel Core i9-13900H (1140 - 2043, n=26) | |
| Asus ROG Flow Z13 GZ301ZE | |
| Alienware x14 i7 RTX 3060 | |
| Gigabyte AERO 16 OLED BSF | |
| Microsoft Surface Pro 9, i7-1255U | |
| Asus ROG Zephyrus G14 GA402RK | |
| Razer Blade 14 Ryzen 9 6900HX | |
| HWBOT x265 Benchmark v2.2 / 4k Preset | |
| Average of class Gaming (11.5 - 44.3, n=110, last 2 years) | |
| Asus ROG Zephyrus M16 GU604VY-NM042X | |
| Gigabyte AERO 16 OLED BSF | |
| Asus ROG Flow Z13 ACRNM | |
| Asus ROG Flow Z13 GZ301V | |
| Average Intel Core i9-13900H (14.1 - 22.3, n=25) | |
| Razer Blade 14 Ryzen 9 6900HX | |
| Alienware x14 i7 RTX 3060 | |
| Asus ROG Flow Z13 GZ301ZE | |
| Asus ROG Zephyrus G14 GA402RK | |
| Microsoft Surface Pro 9, i7-1255U | |
| LibreOffice / 20 Documents To PDF | |
| Asus ROG Flow Z13 ACRNM | |
| Gigabyte AERO 16 OLED BSF | |
| Microsoft Surface Pro 9, i7-1255U | |
| Asus ROG Zephyrus M16 GU604VY-NM042X | |
| Razer Blade 14 Ryzen 9 6900HX | |
| Average of class Gaming (19 - 88.8, n=110, last 2 years) | |
| Asus ROG Zephyrus G14 GA402RK | |
| Average Intel Core i9-13900H (34.4 - 82.8, n=25) | |
| Asus ROG Flow Z13 GZ301ZE | |
| Asus ROG Flow Z13 GZ301V | |
| Alienware x14 i7 RTX 3060 | |
| R Benchmark 2.5 / Overall mean | |
| Microsoft Surface Pro 9, i7-1255U | |
| Gigabyte AERO 16 OLED BSF | |
| Razer Blade 14 Ryzen 9 6900HX | |
| Asus ROG Zephyrus G14 GA402RK | |
| Alienware x14 i7 RTX 3060 | |
| Average Intel Core i9-13900H (0.4052 - 0.723, n=25) | |
| Average of class Gaming (0.3439 - 0.759, n=111, last 2 years) | |
| Asus ROG Flow Z13 GZ301ZE | |
| Asus ROG Flow Z13 ACRNM | |
| Asus ROG Zephyrus M16 GU604VY-NM042X | |
| Asus ROG Flow Z13 GZ301V | |
* ... smaller is better
AIDA64: FP32 Ray-Trace | FPU Julia | CPU SHA3 | CPU Queen | FPU SinJulia | FPU Mandel | CPU AES | CPU ZLib | FP64 Ray-Trace | CPU PhotoWorxx
| Performance rating | |
| Average of class Gaming | |
| Gigabyte AERO 16 OLED BSF | |
| Razer Blade 14 Ryzen 9 6900HX | |
| Asus ROG Flow Z13 ACRNM | |
| Asus ROG Zephyrus G14 GA402RK | |
| Asus ROG Flow Z13 GZ301V | |
| Average Intel Core i9-13900H | |
| Alienware x14 i7 RTX 3060 | |
| Asus ROG Flow Z13 GZ301ZE | |
| AIDA64 / FP32 Ray-Trace | |
| Average of class Gaming (10227 - 85542, n=109, last 2 years) | |
| Gigabyte AERO 16 OLED BSF | |
| Asus ROG Flow Z13 ACRNM | |
| Razer Blade 14 Ryzen 9 6900HX | |
| Asus ROG Flow Z13 GZ301V | |
| Average Intel Core i9-13900H (6788 - 19557, n=25) | |
| Asus ROG Zephyrus G14 GA402RK | |
| Alienware x14 i7 RTX 3060 | |
| Asus ROG Flow Z13 GZ301ZE | |
| AIDA64 / FPU Julia | |
| Average of class Gaming (51376 - 238426, n=109, last 2 years) | |
| Razer Blade 14 Ryzen 9 6900HX | |
| Gigabyte AERO 16 OLED BSF | |
| Asus ROG Zephyrus G14 GA402RK | |
| Asus ROG Flow Z13 ACRNM | |
| Asus ROG Flow Z13 GZ301V | |
| Average Intel Core i9-13900H (22551 - 95579, n=25) | |
| Alienware x14 i7 RTX 3060 | |
| Asus ROG Flow Z13 GZ301ZE | |
| AIDA64 / CPU SHA3 | |
| Average of class Gaming (2180 - 9817, n=109, last 2 years) | |
| Gigabyte AERO 16 OLED BSF | |
| Asus ROG Flow Z13 ACRNM | |
| Average Intel Core i9-13900H (2491 - 4270, n=25) | |
| Asus ROG Flow Z13 GZ301V | |
| Razer Blade 14 Ryzen 9 6900HX | |
| Asus ROG Zephyrus G14 GA402RK | |
| Alienware x14 i7 RTX 3060 | |
| Asus ROG Flow Z13 GZ301ZE | |
| AIDA64 / CPU Queen | |
| Average of class Gaming (49785 - 173351, n=100, last 2 years) | |
| Asus ROG Flow Z13 GZ301V | |
| Asus ROG Flow Z13 ACRNM | |
| Average Intel Core i9-13900H (65121 - 120936, n=25) | |
| Asus ROG Flow Z13 GZ301ZE | |
| Asus ROG Zephyrus G14 GA402RK | |
| Razer Blade 14 Ryzen 9 6900HX | |
| Alienware x14 i7 RTX 3060 | |
| Gigabyte AERO 16 OLED BSF | |
| AIDA64 / FPU SinJulia | |
| Average of class Gaming (4424 - 33636, n=109, last 2 years) | |
| Razer Blade 14 Ryzen 9 6900HX | |
| Asus ROG Zephyrus G14 GA402RK | |
| Asus ROG Flow Z13 ACRNM | |
| Gigabyte AERO 16 OLED BSF | |
| Asus ROG Flow Z13 GZ301V | |
| Average Intel Core i9-13900H (6108 - 11631, n=25) | |
| Alienware x14 i7 RTX 3060 | |
| Asus ROG Flow Z13 GZ301ZE | |
| AIDA64 / FPU Mandel | |
| Average of class Gaming (25115 - 128721, n=109, last 2 years) | |
| Razer Blade 14 Ryzen 9 6900HX | |
| Asus ROG Zephyrus G14 GA402RK | |
| Gigabyte AERO 16 OLED BSF | |
| Asus ROG Flow Z13 ACRNM | |
| Asus ROG Flow Z13 GZ301V | |
| Average Intel Core i9-13900H (11283 - 48474, n=25) | |
| Alienware x14 i7 RTX 3060 | |
| Asus ROG Flow Z13 GZ301ZE | |
| AIDA64 / CPU AES | |
| Gigabyte AERO 16 OLED BSF | |
| Razer Blade 14 Ryzen 9 6900HX | |
| Asus ROG Zephyrus G14 GA402RK | |
| Average of class Gaming (39258 - 247074, n=109, last 2 years) | |
| Alienware x14 i7 RTX 3060 | |
| Average Intel Core i9-13900H (3691 - 149377, n=25) | |
| Asus ROG Flow Z13 GZ301ZE | |
| Asus ROG Flow Z13 ACRNM | |
| Asus ROG Flow Z13 GZ301V | |
| AIDA64 / CPU ZLib | |
| Average of class Gaming (574 - 2531, n=109, last 2 years) | |
| Asus ROG Flow Z13 ACRNM | |
| Gigabyte AERO 16 OLED BSF | |
| Asus ROG Flow Z13 GZ301V | |
| Average Intel Core i9-13900H (789 - 1254, n=25) | |
| Alienware x14 i7 RTX 3060 | |
| Asus ROG Flow Z13 GZ301ZE | |
| Razer Blade 14 Ryzen 9 6900HX | |
| Asus ROG Zephyrus G14 GA402RK | |
| AIDA64 / FP64 Ray-Trace | |
| Average of class Gaming (5509 - 45446, n=109, last 2 years) | |
| Gigabyte AERO 16 OLED BSF | |
| Asus ROG Flow Z13 ACRNM | |
| Razer Blade 14 Ryzen 9 6900HX | |
| Asus ROG Flow Z13 GZ301V | |
| Average Intel Core i9-13900H (3655 - 10716, n=25) | |
| Asus ROG Zephyrus G14 GA402RK | |
| Alienware x14 i7 RTX 3060 | |
| Asus ROG Flow Z13 GZ301ZE | |
| AIDA64 / CPU PhotoWorxx | |
| Alienware x14 i7 RTX 3060 | |
| Gigabyte AERO 16 OLED BSF | |
| Average of class Gaming (12271 - 89891, n=109, last 2 years) | |
| Asus ROG Flow Z13 ACRNM | |
| Asus ROG Flow Z13 GZ301ZE | |
| Asus ROG Flow Z13 GZ301V | |
| Average Intel Core i9-13900H (10871 - 50488, n=25) | |
| Asus ROG Zephyrus G14 GA402RK | |
| Razer Blade 14 Ryzen 9 6900HX | |
System Performance
The system performance of the ROG Flow Z13 is excellent, which is supported by the good benchmark scores as well as our subjective performance impression.
CrossMark: Overall | Productivity | Creativity | Responsiveness
| PCMark 10 / Score | |
| Average of class Gaming (5828 - 11574, n=95, last 2 years) | |
| Gigabyte AERO 16 OLED BSF | |
| Asus ROG Flow Z13 ACRNM | |
| Asus ROG Flow Z13 ACRNM | |
| Asus ROG Zephyrus G14 GA402RK | |
| Average Intel Core i9-13900H, NVIDIA GeForce RTX 4070 Laptop GPU (5855 - 8538, n=8) | |
| Asus ROG Flow Z13 GZ301V | |
| Razer Blade 14 Ryzen 9 6900HX | |
| Alienware x14 i7 RTX 3060 | |
| Asus ROG Flow Z13 GZ301ZE | |
| PCMark 10 / Essentials | |
| Asus ROG Flow Z13 ACRNM | |
| Asus ROG Flow Z13 GZ301V | |
| Gigabyte AERO 16 OLED BSF | |
| Asus ROG Flow Z13 ACRNM | |
| Razer Blade 14 Ryzen 9 6900HX | |
| Asus ROG Zephyrus G14 GA402RK | |
| Average Intel Core i9-13900H, NVIDIA GeForce RTX 4070 Laptop GPU (8835 - 11940, n=8) | |
| Asus ROG Flow Z13 GZ301ZE | |
| Average of class Gaming (8810 - 12600, n=99, last 2 years) | |
| Alienware x14 i7 RTX 3060 | |
| PCMark 10 / Productivity | |
| Average of class Gaming (6845 - 18766, n=97, last 2 years) | |
| Asus ROG Flow Z13 ACRNM | |
| Asus ROG Flow Z13 GZ301V | |
| Asus ROG Flow Z13 ACRNM | |
| Average Intel Core i9-13900H, NVIDIA GeForce RTX 4070 Laptop GPU (7967 - 10991, n=8) | |
| Asus ROG Zephyrus G14 GA402RK | |
| Asus ROG Flow Z13 GZ301ZE | |
| Alienware x14 i7 RTX 3060 | |
| Gigabyte AERO 16 OLED BSF | |
| Razer Blade 14 Ryzen 9 6900HX | |
| PCMark 10 / Digital Content Creation | |
| Average of class Gaming (7602 - 19657, n=97, last 2 years) | |
| Gigabyte AERO 16 OLED BSF | |
| Asus ROG Flow Z13 ACRNM | |
| Asus ROG Zephyrus G14 GA402RK | |
| Average Intel Core i9-13900H, NVIDIA GeForce RTX 4070 Laptop GPU (7738 - 13575, n=8) | |
| Asus ROG Flow Z13 ACRNM | |
| Razer Blade 14 Ryzen 9 6900HX | |
| Asus ROG Flow Z13 GZ301V | |
| Alienware x14 i7 RTX 3060 | |
| Asus ROG Flow Z13 GZ301ZE | |
| CrossMark / Overall | |
| Asus ROG Flow Z13 GZ301ZE | |
| Asus ROG Flow Z13 GZ301V | |
| Average of class Gaming (1366 - 2409, n=97, last 2 years) | |
| Asus ROG Flow Z13 ACRNM | |
| Alienware x14 i7 RTX 3060 | |
| Gigabyte AERO 16 OLED BSF | |
| Average Intel Core i9-13900H, NVIDIA GeForce RTX 4070 Laptop GPU (1104 - 1974, n=7) | |
| CrossMark / Productivity | |
| Asus ROG Flow Z13 GZ301ZE | |
| Asus ROG Flow Z13 GZ301V | |
| Average of class Gaming (1386 - 2254, n=97, last 2 years) | |
| Asus ROG Flow Z13 ACRNM | |
| Alienware x14 i7 RTX 3060 | |
| Gigabyte AERO 16 OLED BSF | |
| Average Intel Core i9-13900H, NVIDIA GeForce RTX 4070 Laptop GPU (1058 - 1914, n=7) | |
| CrossMark / Creativity | |
| Average of class Gaming (1343 - 2729, n=97, last 2 years) | |
| Asus ROG Flow Z13 GZ301V | |
| Asus ROG Flow Z13 ACRNM | |
| Asus ROG Flow Z13 GZ301ZE | |
| Alienware x14 i7 RTX 3060 | |
| Average Intel Core i9-13900H, NVIDIA GeForce RTX 4070 Laptop GPU (1178 - 2254, n=7) | |
| Gigabyte AERO 16 OLED BSF | |
| CrossMark / Responsiveness | |
| Asus ROG Flow Z13 GZ301ZE | |
| Gigabyte AERO 16 OLED BSF | |
| Alienware x14 i7 RTX 3060 | |
| Average of class Gaming (1226 - 2334, n=97, last 2 years) | |
| Asus ROG Flow Z13 GZ301V | |
| Asus ROG Flow Z13 ACRNM | |
| Average Intel Core i9-13900H, NVIDIA GeForce RTX 4070 Laptop GPU (1037 - 1952, n=7) | |
| PCMark 10 Score | 8018 points | |
Help | ||
| AIDA64 / Memory Copy | |
| Alienware x14 i7 RTX 3060 | |
| Asus ROG Flow Z13 GZ301ZE | |
| Average of class Gaming (21750 - 129946, n=109, last 2 years) | |
| Asus ROG Flow Z13 GZ301V | |
| Asus ROG Flow Z13 ACRNM | |
| Gigabyte AERO 16 OLED BSF | |
| Average Intel Core i9-13900H (37448 - 74486, n=25) | |
| Asus ROG Zephyrus G14 GA402RK | |
| Razer Blade 14 Ryzen 9 6900HX | |
| AIDA64 / Memory Read | |
| Alienware x14 i7 RTX 3060 | |
| Average of class Gaming (22956 - 118858, n=109, last 2 years) | |
| Asus ROG Flow Z13 GZ301ZE | |
| Gigabyte AERO 16 OLED BSF | |
| Asus ROG Flow Z13 ACRNM | |
| Asus ROG Flow Z13 GZ301V | |
| Average Intel Core i9-13900H (41599 - 75433, n=25) | |
| Asus ROG Zephyrus G14 GA402RK | |
| Razer Blade 14 Ryzen 9 6900HX | |
| AIDA64 / Memory Write | |
| Average of class Gaming (22297 - 135096, n=109, last 2 years) | |
| Asus ROG Flow Z13 GZ301V | |
| Asus ROG Flow Z13 ACRNM | |
| Gigabyte AERO 16 OLED BSF | |
| Average Intel Core i9-13900H (36152 - 88505, n=25) | |
| Alienware x14 i7 RTX 3060 | |
| Asus ROG Flow Z13 GZ301ZE | |
| Asus ROG Zephyrus G14 GA402RK | |
| Razer Blade 14 Ryzen 9 6900HX | |
| AIDA64 / Memory Latency | |
| Alienware x14 i7 RTX 3060 | |
| Average of class Gaming (75.3 - 259, n=109, last 2 years) | |
| Asus ROG Flow Z13 GZ301ZE | |
| Gigabyte AERO 16 OLED BSF | |
| Asus ROG Flow Z13 ACRNM | |
| Average Intel Core i9-13900H (75.8 - 102.3, n=25) | |
| Asus ROG Flow Z13 GZ301V | |
| Razer Blade 14 Ryzen 9 6900HX | |
| Asus ROG Zephyrus G14 GA402RK | |
* ... smaller is better
DPC Latency
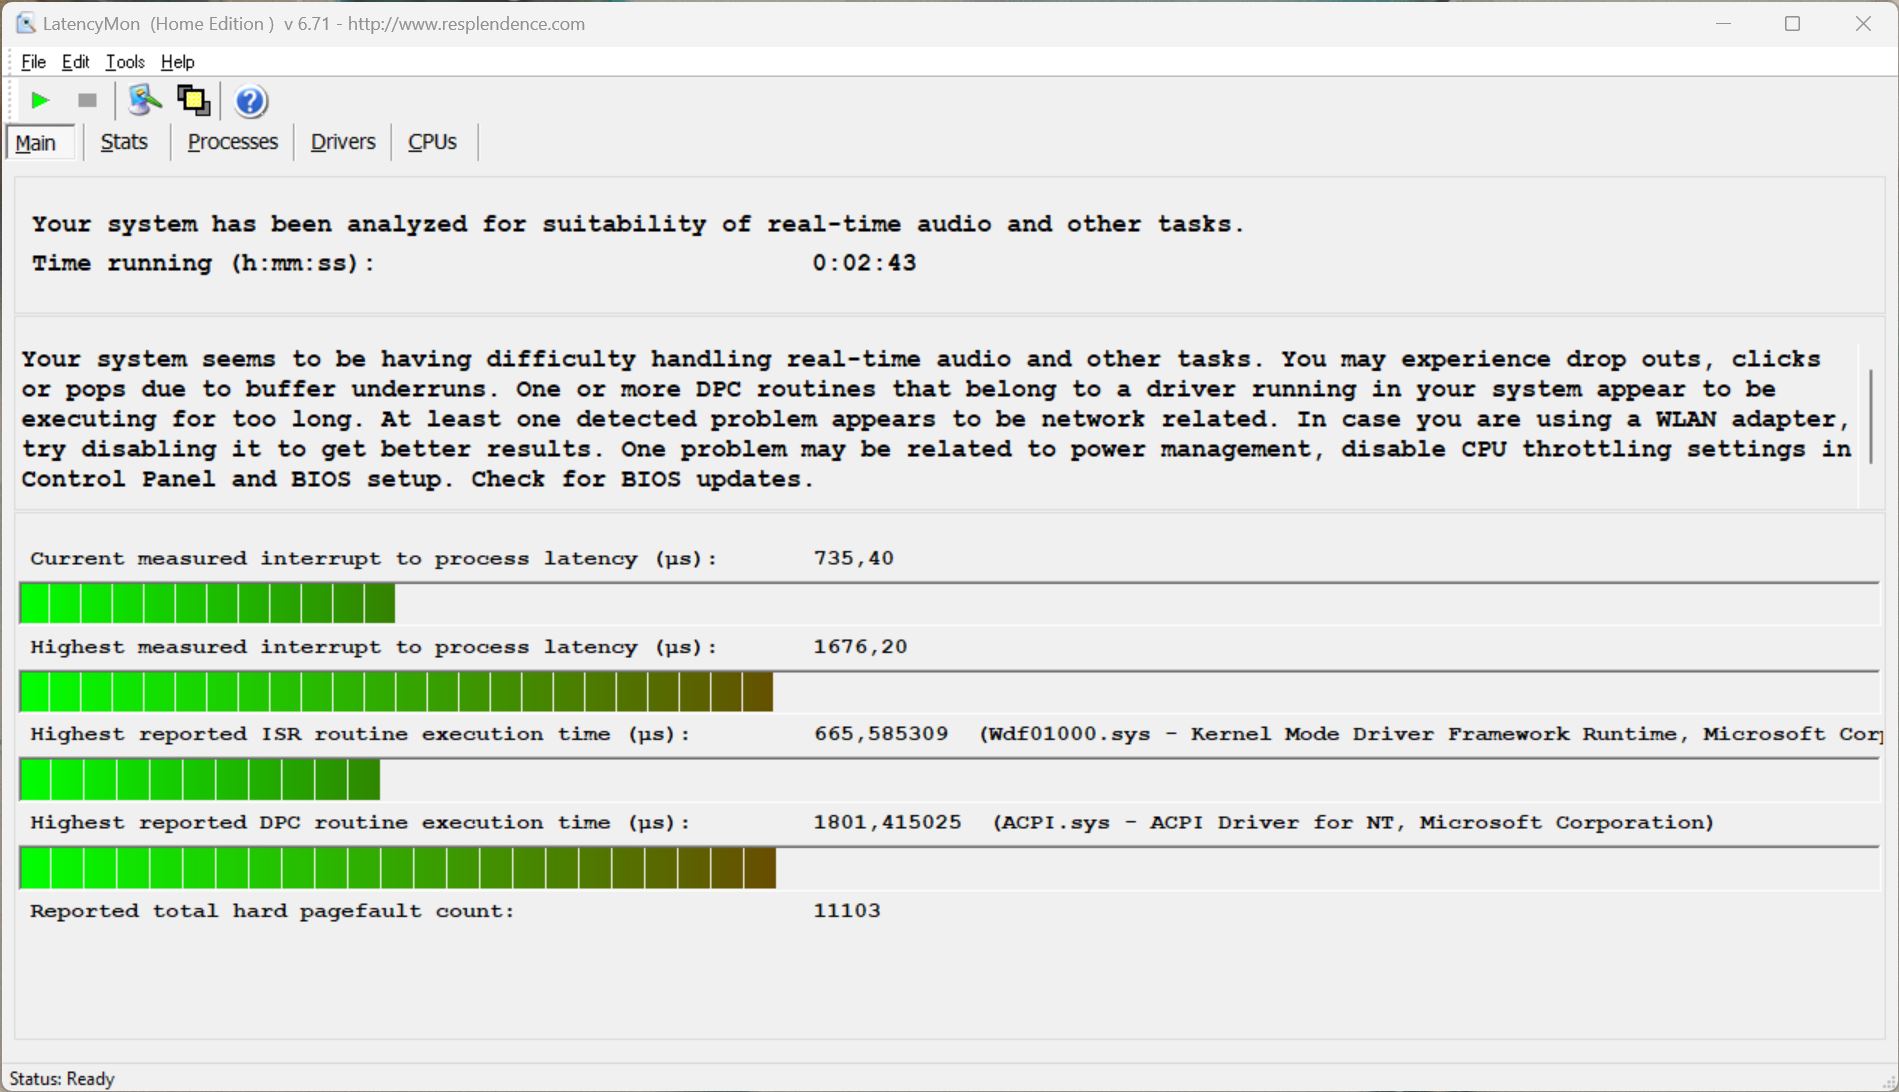
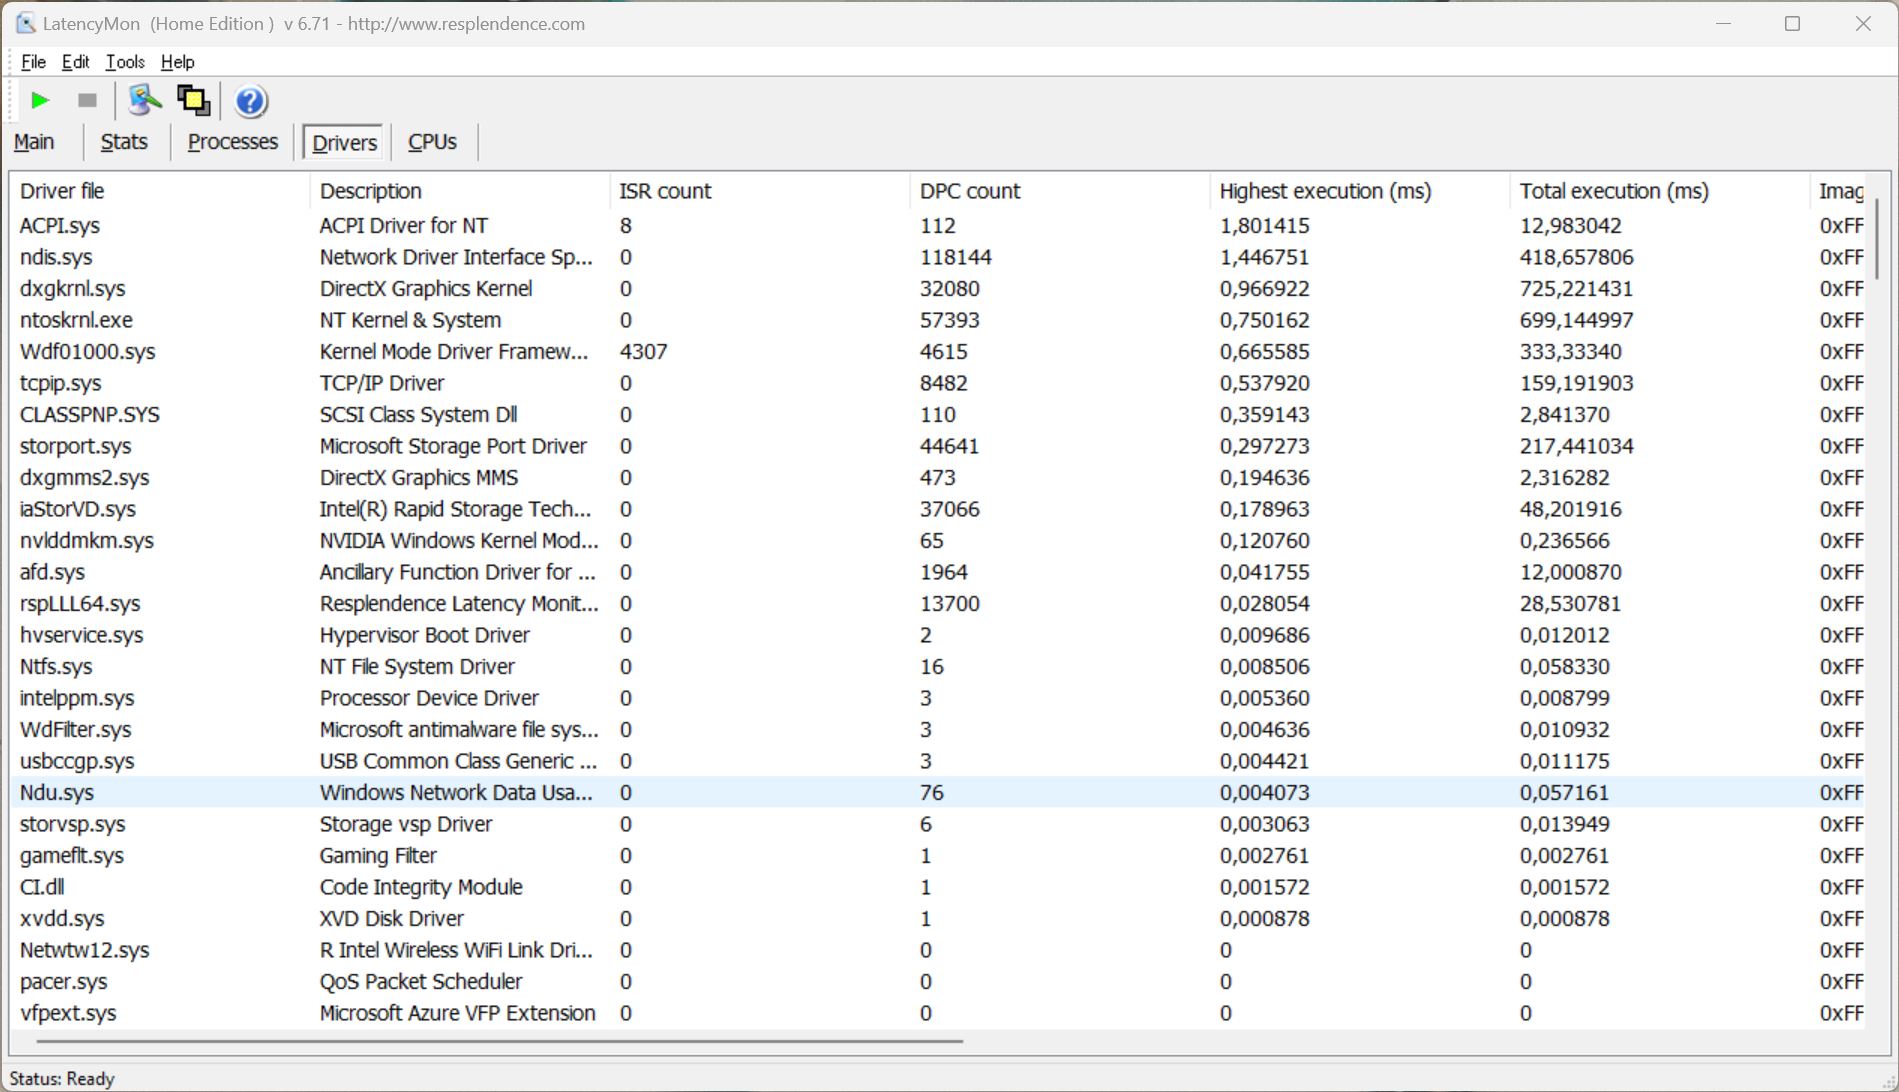
Our standardized latency test (web browsing, YouTube 4K playback, CPU load) shows some issues with the current BIOS version, but it could also be a result of the Nvidia GPU driver (there are reported DPC latency issues for a while now). The situation might improve with future software updates.
| DPC Latencies / LatencyMon - interrupt to process latency (max), Web, Youtube, Prime95 | |
| Asus ROG Zephyrus G14 GA402RK | |
| Asus ROG Flow Z13 ACRNM | |
| Asus ROG Flow Z13 GZ301ZE | |
| Razer Blade 14 Ryzen 9 6900HX | |
| Alienware x14 i7 RTX 3060 | |
* ... smaller is better
Storage Devices
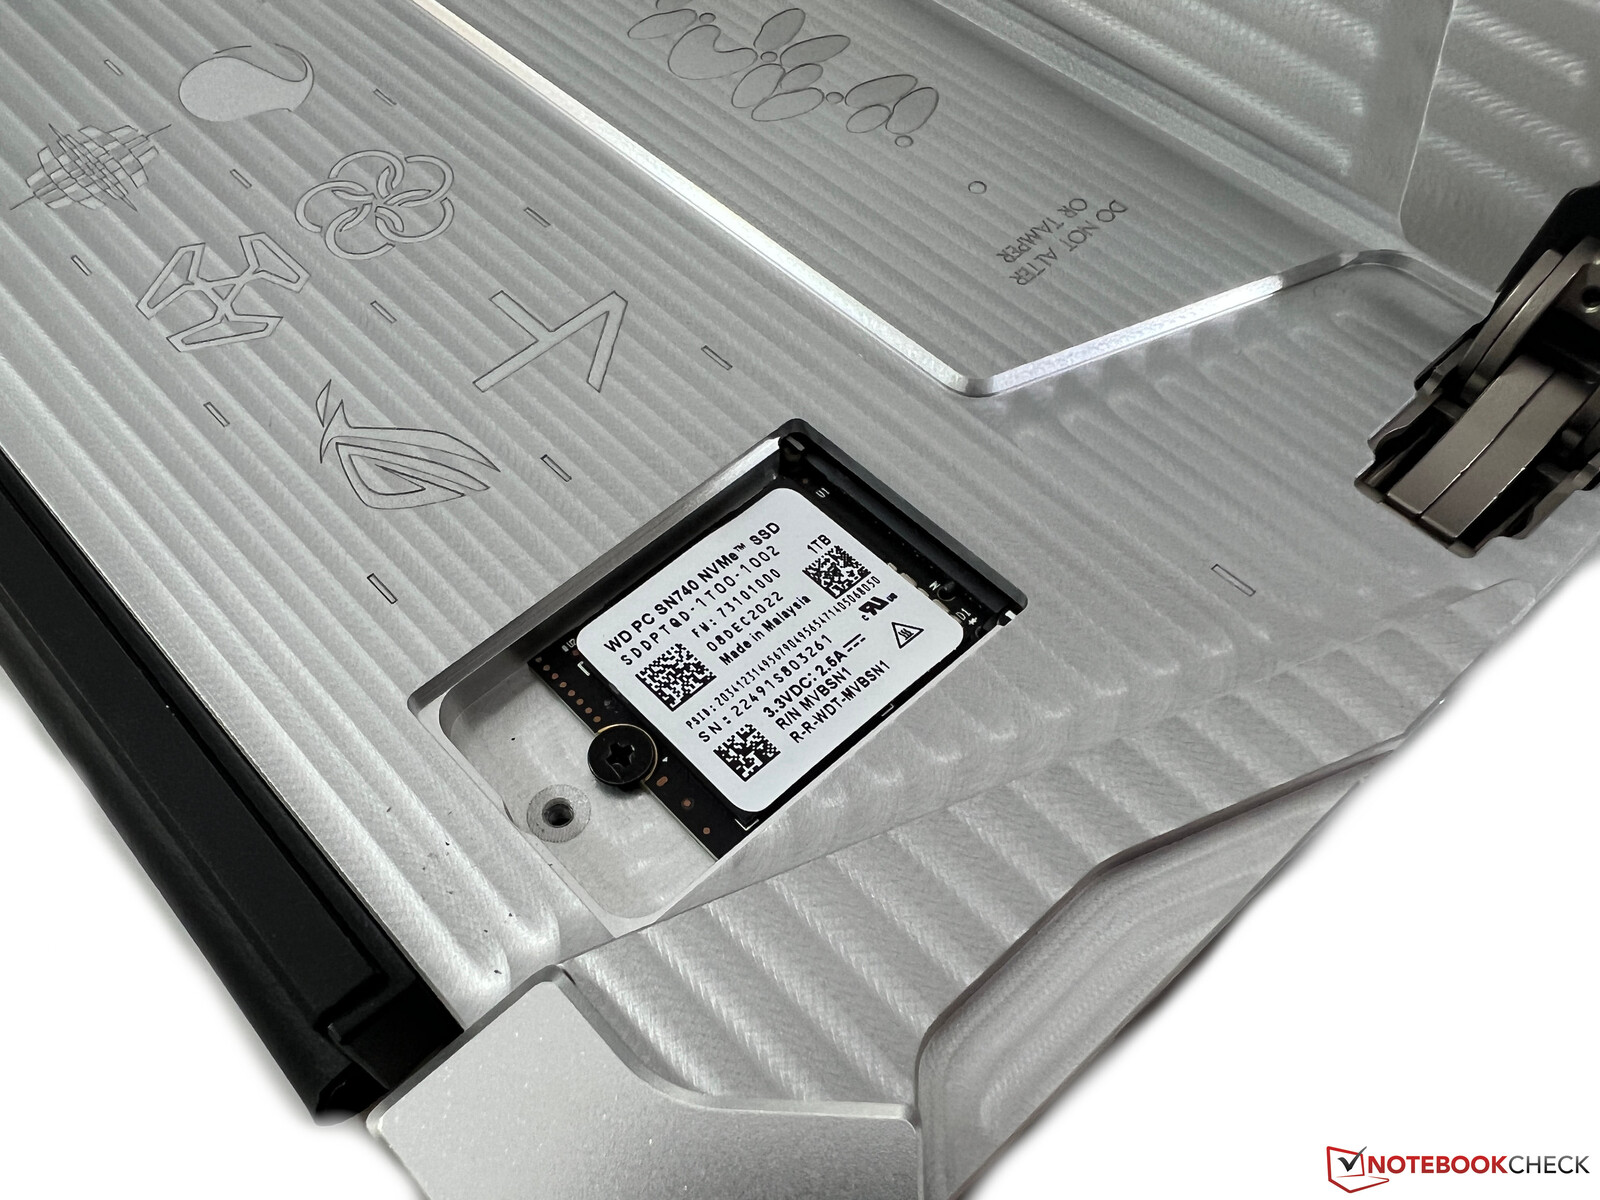
Asus uses an extremely compact M.2-2230 NVMe-SSD, which can be accessed and replaced via maintenance hatch at the rear of the tablet. Our review unit is equipped with the 1 TB version of the Western Digital SN740, a modern PCIe 4.0 drive with maximum transfer rates of 5150 MB/s. This means it is not the fastest drive, but it reaches the advertised performance and the it is stable even under sustained workloads. All in all, a good result for the compact SSD. More SSD benchmarks are listed here.

* ... smaller is better
Disk throttling: DiskSpd Read Loop, Queue Depth 8
GPU Performance
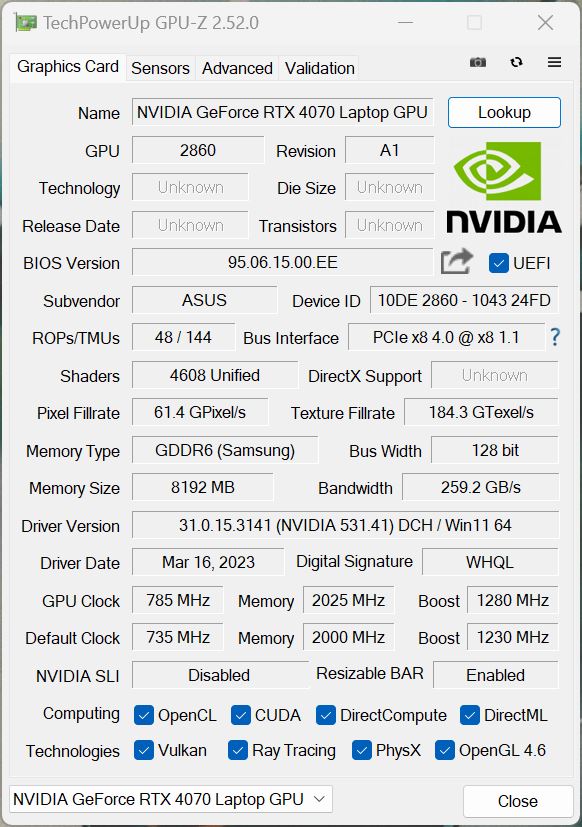
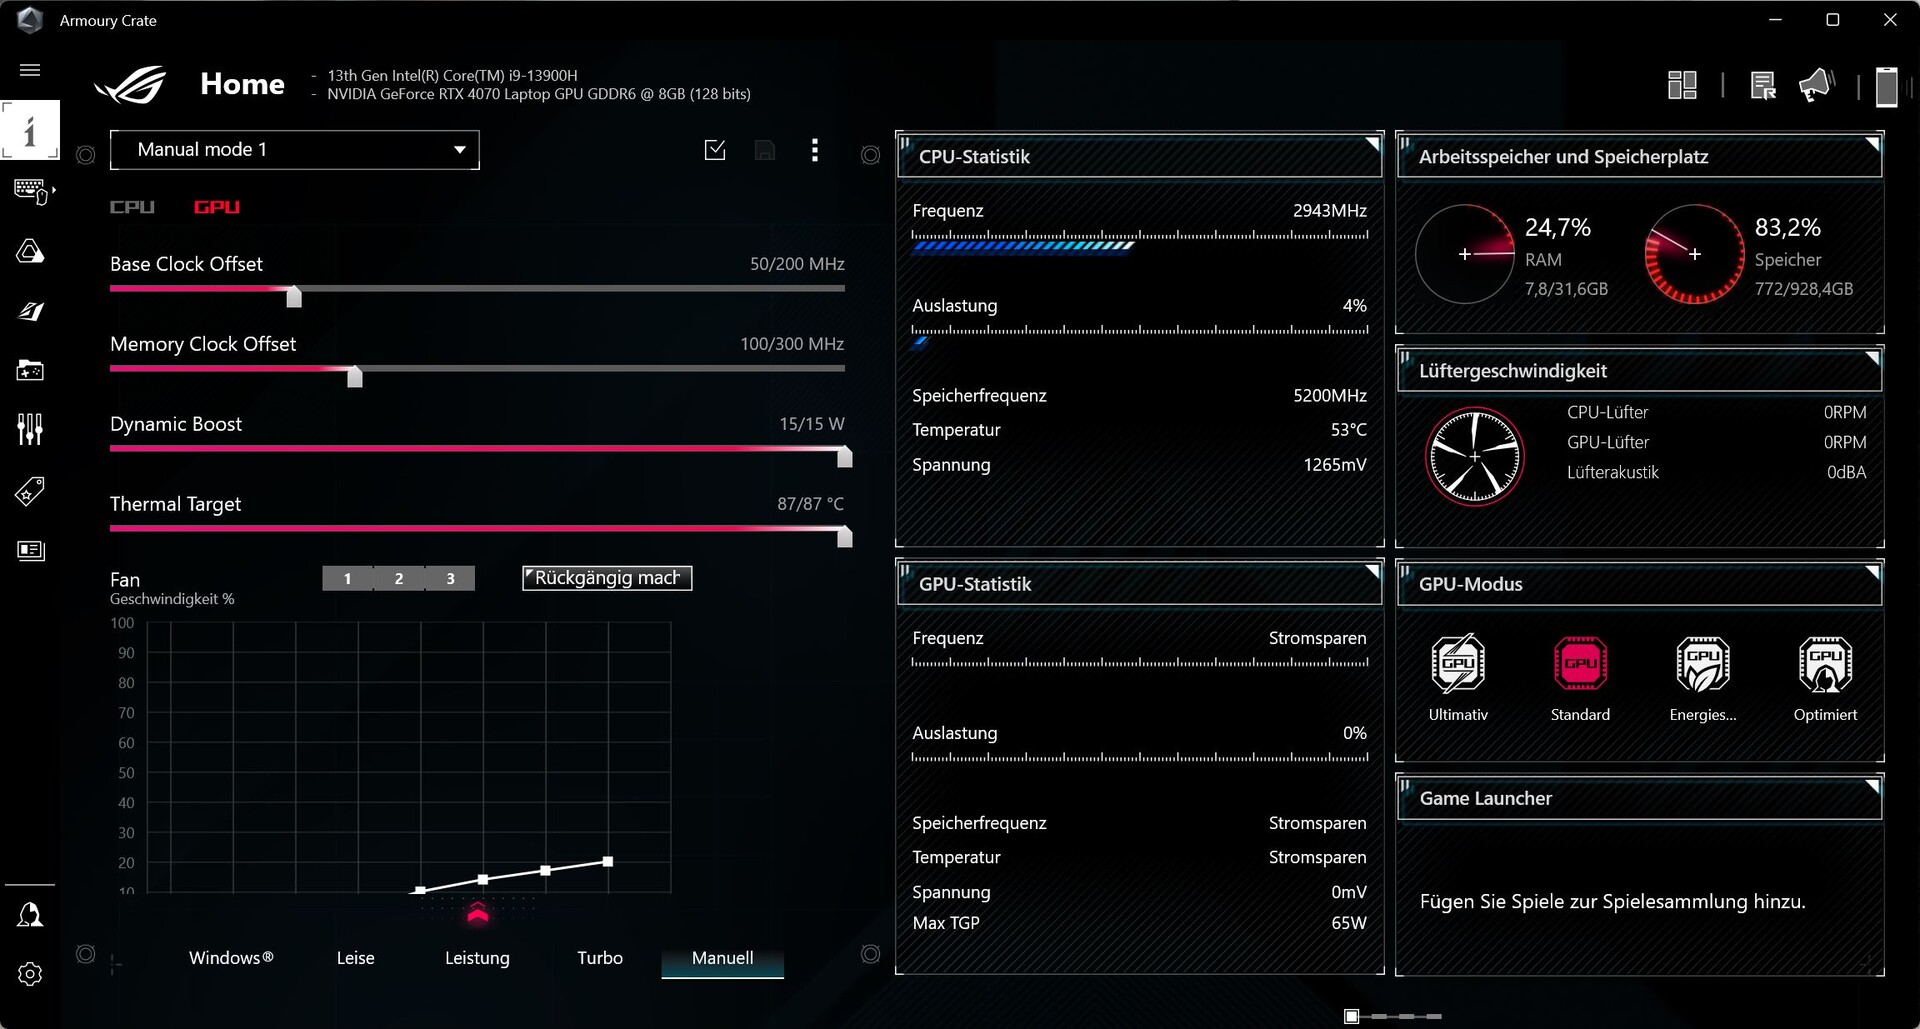
The ACRNM edition of the ROG Flow Z13 is equipped with the new Nvidia GeForce RTX 4070 Laptop, while the regular version is limited to the RTX 4060 Laptop. Both models use the 65W variants though, which means the performance is not comparable to versions that consume 100-110 Watts these GPU can consume (they do not need more power during gaming, higher TGP numbers are irrelevant for these GPUs). The GPU alone has a TGP of 50 Watts in combination with 15 Watts Dynamic Boost from the processor.
The RTX 4070 Laptop is obviously a massive upgrade compared to the RTX 3050 Ti of the predecessor and we see an advantage of almost 130 % for the new model in the synthetic benchmarks. The regular Flow Z13 with the RTX 4060 Laptop on the other hand is about 20 % slower. Compared to the fastest version of the RTX 4070 Laptop, like it is used in the Gigabyte Aero 16, the 65W model is around 20 % slower and the fastest RTX 4060 Laptop (MSI Katana 17, for example) is also a bit faster. However, the 65W RTX 4070 Laptop is still ahead of the old RTX 3070 Ti in the Razer Blade 14 and also the RTX 3060 in the Alienware x14. If you invest in the XG Mobile eGPU with the RTX 4090 Laptop (max. TGP of 150W), you can pretty much double the GPU performance.
The overall GPU performance is very good when you consider the small form factor and the performance is also very stable under sustained workloads (Time Spy stress test: 96.3 %). The power consumption of the GPU is limited to 35 Watts on battery power though, which results in a performance deficit of ~25 %. More GPU benchmarks are available in our tech section.
| 3DMark 11 Performance | 29603 points | |
| 3DMark Fire Strike Score | 20875 points | |
| 3DMark Time Spy Score | 9917 points | |
| 3DMark Steel Nomad Score | 2228 points | |
| 3DMark Steel Nomad Light Score | 9949 points | |
Help | ||
| Blender / v3.3 Classroom OPTIX/RTX | |
| Asus ROG Flow Z13 GZ301V | |
| Asus ROG Flow Z13 ACRNM | |
| Average NVIDIA GeForce RTX 4070 Laptop GPU (18 - 30, n=68) | |
| Gigabyte AERO 16 OLED BSF | |
| Average of class Gaming (9 - 32, n=111, last 2 years) | |
| Asus ROG Flow Z13 ACRNM | |
| Blender / v3.3 Classroom CUDA | |
| Asus ROG Flow Z13 GZ301V | |
| Asus ROG Flow Z13 ACRNM | |
| Average NVIDIA GeForce RTX 4070 Laptop GPU (32 - 50, n=67) | |
| Gigabyte AERO 16 OLED BSF | |
| Average of class Gaming (15 - 228, n=111, last 2 years) | |
| Blender / v3.3 Classroom CPU | |
| Asus ROG Flow Z13 GZ301V | |
| Asus ROG Flow Z13 ACRNM | |
| Gigabyte AERO 16 OLED BSF | |
| Average NVIDIA GeForce RTX 4070 Laptop GPU (158 - 440, n=67) | |
| Average of class Gaming (122 - 565, n=107, last 2 years) | |
* ... smaller is better
Gaming Performance
The gaming performance is also very good and you can also play modern titles in the native QHD resolution at maximum details. Ray tracing will often be too challenging, though, so you will have to use upscaling. The Flow Z13 with the 65W version of the RTX 4070 Laptop once again falls behind the most powerful versions of the RTX 4070 Laptop and also 4060 Laptop, but stays ahead of the RTX 3070 Ti. You once again have to consider the compact form factor, and the gaming performance is also stable during longer gaming sessions.
| Performance rating - Percent | |
| Average of class Gaming | |
| Asus ROG Flow Z13 ACRNM | |
| Gigabyte AERO 16 OLED BSF | |
| MSI Katana 17 B13VFK | |
| Asus ROG Flow Z13 ACRNM | |
| Razer Blade 14 Ryzen 9 6900HX | |
| Alienware x14 i7 RTX 3060 -1! | |
| Asus ROG Zephyrus G14 GA402RK | |
| The Witcher 3 - 1920x1080 Ultra Graphics & Postprocessing (HBAO+) | |
| Asus ROG Flow Z13 ACRNM | |
| Average of class Gaming (95 - 240, n=8, last 2 years) | |
| Gigabyte AERO 16 OLED BSF | |
| MSI Katana 17 B13VFK | |
| Razer Blade 14 Ryzen 9 6900HX | |
| Asus ROG Zephyrus G14 GA402RK | |
| Asus ROG Flow Z13 ACRNM | |
| Alienware x14 i7 RTX 3060 | |
| Alienware x14 i7 RTX 3060 | |
| GTA V - 1920x1080 Highest AA:4xMSAA + FX AF:16x | |
| Average of class Gaming (48.3 - 186.9, n=102, last 2 years) | |
| Gigabyte AERO 16 OLED BSF | |
| MSI Katana 17 B13VFK | |
| Asus ROG Flow Z13 ACRNM | |
| Asus ROG Flow Z13 ACRNM | |
| Razer Blade 14 Ryzen 9 6900HX | |
| Alienware x14 i7 RTX 3060 | |
| Asus ROG Zephyrus G14 GA402RK | |
| Final Fantasy XV Benchmark - 1920x1080 High Quality | |
| Asus ROG Flow Z13 ACRNM | |
| Average of class Gaming (41 - 215, n=103, last 2 years) | |
| Gigabyte AERO 16 OLED BSF | |
| Razer Blade 14 Ryzen 9 6900HX | |
| MSI Katana 17 B13VFK | |
| Asus ROG Flow Z13 ACRNM | |
| Asus ROG Zephyrus G14 GA402RK | |
| Alienware x14 i7 RTX 3060 | |
| Strange Brigade - 1920x1080 ultra AA:ultra AF:16 | |
| Average of class Gaming (76.3 - 456, n=93, last 2 years) | |
| Asus ROG Flow Z13 ACRNM | |
| Gigabyte AERO 16 OLED BSF | |
| MSI Katana 17 B13VFK | |
| Razer Blade 14 Ryzen 9 6900HX | |
| Asus ROG Zephyrus G14 GA402RK | |
| Asus ROG Flow Z13 ACRNM | |
| Alienware x14 i7 RTX 3060 | |
| Dota 2 Reborn - 1920x1080 ultra (3/3) best looking | |
| MSI Katana 17 B13VFK | |
| Alienware x14 i7 RTX 3060 | |
| Average of class Gaming (84.8 - 248, n=112, last 2 years) | |
| Gigabyte AERO 16 OLED BSF | |
| Asus ROG Flow Z13 ACRNM | |
| Asus ROG Flow Z13 ACRNM | |
| Razer Blade 14 Ryzen 9 6900HX | |
| Asus ROG Zephyrus G14 GA402RK | |
| X-Plane 11.11 - 1920x1080 high (fps_test=3) | |
| MSI Katana 17 B13VFK | |
| Gigabyte AERO 16 OLED BSF | |
| Asus ROG Flow Z13 ACRNM | |
| Asus ROG Flow Z13 ACRNM | |
| Average of class Gaming (52.1 - 143.5, n=115, last 2 years) | |
| Razer Blade 14 Ryzen 9 6900HX | |
| Asus ROG Zephyrus G14 GA402RK | |
| Cyberpunk 2077 1.6 - 2560x1440 Ultra Preset | |
| Asus ROG Flow Z13 ACRNM | |
| Asus ROG Flow Z13 ACRNM | |
| Average NVIDIA GeForce RTX 4070 Laptop GPU (30 - 63.9, n=24) | |
| Gigabyte AERO 16 OLED BSF | |
| MSI Katana 17 B13VFK | |
| Razer Blade 14 Ryzen 9 6900HX | |
| Asus ROG Zephyrus G14 GA402RK | |
| Call of Duty Modern Warfare 2 2022 - 2560x1440 Extreme Quality Preset AA:T2X Filmic SM | |
| Asus ROG Flow Z13 ACRNM | |
| Average NVIDIA GeForce RTX 4070 Laptop GPU (59 - 77, n=9) | |
| Gigabyte AERO 16 OLED BSF | |
| Razer Blade 15 OLED (Early 2022) | |
| MSI Katana 17 B13VFK | |
| Asus ROG Flow Z13 ACRNM | |
| Far Cry 6 - 2560x1440 Ultra Graphics Quality + HD Textures AA:T | |
| Asus ROG Flow Z13 ACRNM | |
| Average of class Gaming (74.5 - 116.7, n=2, last 2 years) | |
| Average NVIDIA GeForce RTX 4070 Laptop GPU (70 - 91, n=11) | |
| Asus ROG Zephyrus G14 GA402RK | |
| Asus ROG Flow Z13 ACRNM | |
| MSI Katana 17 B13VFK | |
| GTA V - 2560x1440 Highest AA:4xMSAA + FX AF:16x | |
| Average of class Gaming (36.9 - 183.9, n=74, last 2 years) | |
| Asus ROG Flow Z13 ACRNM | |
| Razer Blade 15 OLED (Early 2022) | |
| Razer Blade 15 OLED (Early 2022) | |
| Gigabyte AERO 16 OLED BSF | |
| Razer Blade 14 Ryzen 9 6900HX | |
| Average NVIDIA GeForce RTX 4070 Laptop GPU (36.9 - 102.2, n=51) | |
| MSI Katana 17 B13VFK | |
| Asus ROG Flow Z13 ACRNM | |
| Spider-Man Miles Morales - 2560x1440 Very High Preset AA:T | |
| Asus ROG Flow Z13 ACRNM | |
| Razer Blade 15 OLED (Early 2022) | |
| Average NVIDIA GeForce RTX 4070 Laptop GPU (53.1 - 86, n=3) | |
| Gigabyte AERO 16 OLED BSF | |
| MSI Katana 17 B13VFK | |
| Asus ROG Flow Z13 ACRNM | |
Witcher 3 FPS chart
| low | med. | high | ultra | QHD DLSS | QHD | 4K | |
|---|---|---|---|---|---|---|---|
| GTA V (2015) | 182.2 | 175.4 | 165.8 | 94.8 | 75.9 | ||
| The Witcher 3 (2015) | 83.2 | ||||||
| Dota 2 Reborn (2015) | 171 | 152.5 | 142.8 | 135 | 107 | ||
| Final Fantasy XV Benchmark (2018) | 128.2 | 93.3 | 71.6 | 40.3 | |||
| X-Plane 11.11 (2018) | 165.7 | 141.8 | 110.3 | 103.4 | |||
| Strange Brigade (2018) | 393 | 249 | 202 | 174.8 | 122.8 | ||
| Shadow of the Tomb Raider (2018) | 117 | 86 | |||||
| Assassin´s Creed Valhalla (2020) | 86 | 65 | |||||
| Far Cry 6 (2021) | 92 | 70 | |||||
| Cyberpunk 2077 1.6 (2022) | 71.62 | 53.88 | |||||
| Tiny Tina's Wonderlands (2022) | 79.7 | 57.61 | |||||
| F1 22 (2022) | 192.3 | 190 | 163 | 61.8 | 40.9 | ||
| Call of Duty Modern Warfare 2 2022 (2022) | 80 | 59 | |||||
| Spider-Man Miles Morales (2022) | 82.3 | 53.1 | |||||
| Baldur's Gate 3 (2023) | 86.1 | 62.3 | |||||
| Cyberpunk 2077 (2023) | 66.79 | 49.7 | 40.1 | ||||
| Horizon Forbidden West (2024) | 56.1 | 54.6 | 45.5 | ||||
| Ghost of Tsushima (2024) | 55.3 | 57 | 43.6 | ||||
| F1 24 (2024) | 58.4 | 57 | 36.8 | ||||
| Black Myth: Wukong (2024) | 25 | 28 | 18 | ||||
| Star Wars Outlaws (2024) | 35.4 | 35.3 | 25.9 | ||||
| God of War Ragnarök (2024) | 76.2 | 78 | 60.5 | ||||
| Call of Duty Black Ops 6 (2024) | 71 | 60 | 52 | ||||
| Indiana Jones and the Great Circle (2024) | 97.5 | 55 | 39.4 | ||||
| Monster Hunter Wilds (2025) | 39.7 | 35.69 | 29 |
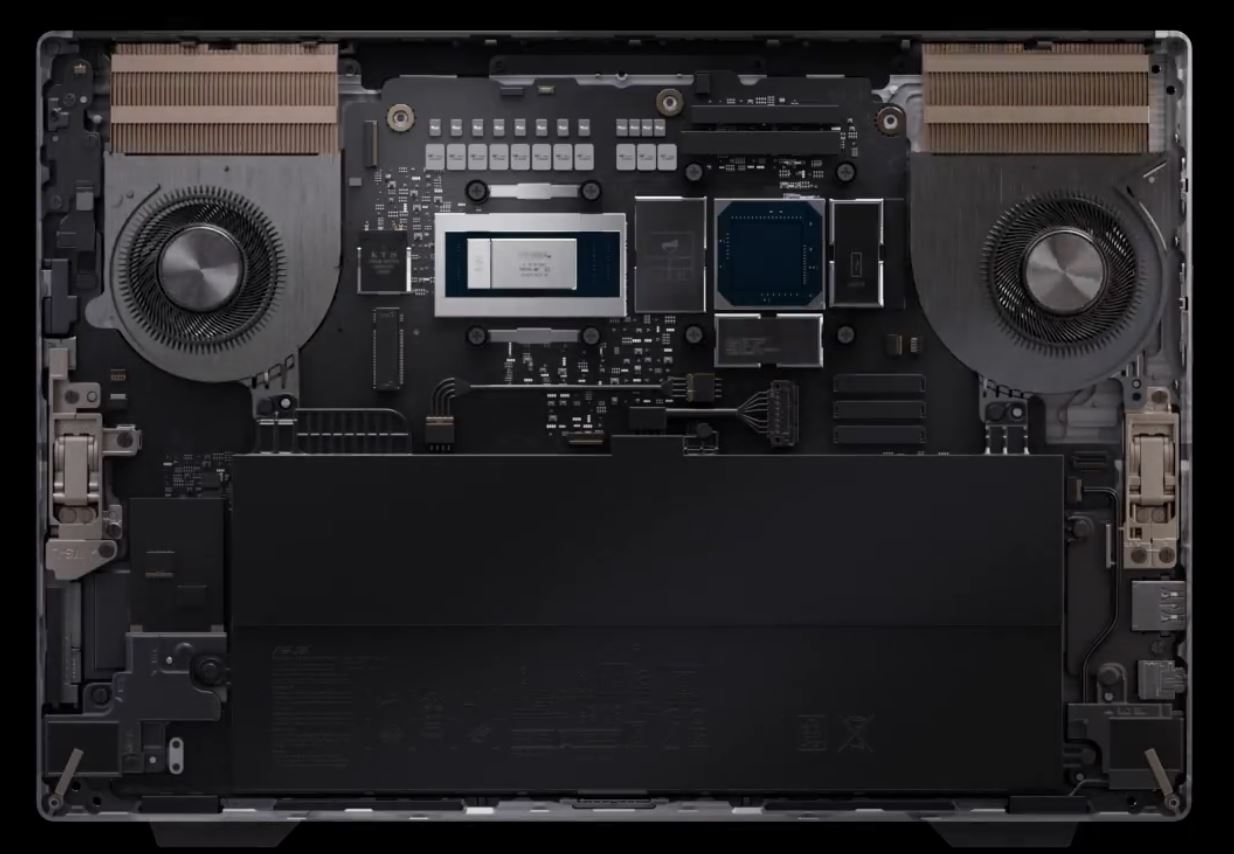
Emissions - Weak speakers
System Noise
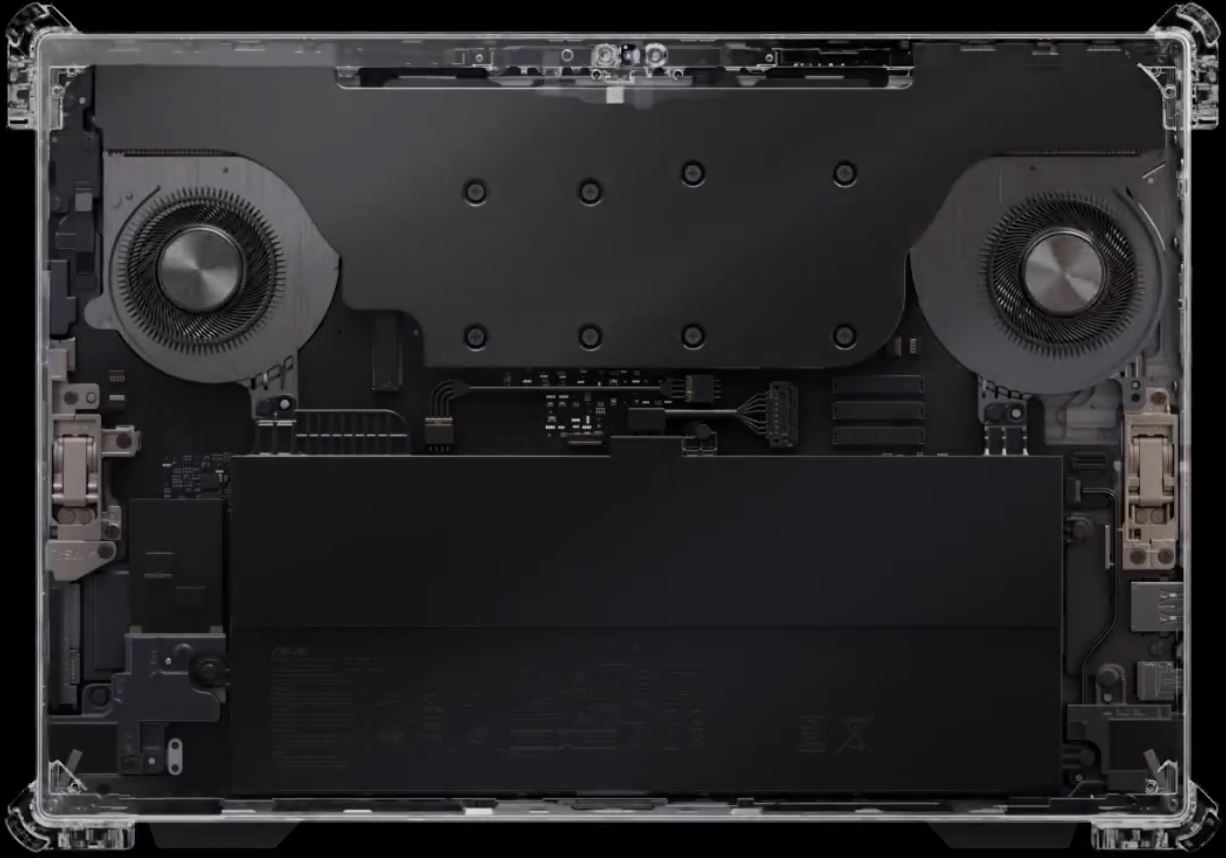
Asus uses two fans, liquid metal for better heat dissipation as well as a vapor chamber for the cooling solution. The fan noise mainly depends on the power profile you selected and we would not recommend the Turbo mode for daily workloads since the fans immediately jump to 37 dB(A) in this mode when they start spinning. The Quiet mode is much better suited and is much quieter for light workloads. The fans are generally louder under load compared to the old ROG Flow Z13 with the RTX 3050 Ti. The fan murmur itself is not annoying, but you notice a slight vibration at higher fan speeds. We listed the noise results with different power modes in the table below:
| Quiet | Performance | Turbo | |
|---|---|---|---|
| Load Average | 31.3 dB(A) | 40.6 dB(A) | 41.3 dB(A) |
| Witcher 3 Ultra settings | 35.7 dB(A) | 40.6 dB(A) | 44.7 dB(A) |
| Stress test | 36.5 dB(A) | 43.4 dB(A) | 46.9 dB(A) |
We also noticed a high-pitched noise when the device is in standby and the power adapter is attached. It is quiet, but definitely noticeable and annoying. Asus should have a look at this issue.
Noise level
| Idle |
| 24 / 24 / 36.5 dB(A) |
| Load |
| 41.3 / 46.9 dB(A) |
 | ||
30 dB silent 40 dB(A) audible 50 dB(A) loud |
||
min: | ||
| Asus ROG Flow Z13 ACRNM GeForce RTX 4070 Laptop GPU, i9-13900H, WD PC SN740 SDDPTQD-1T00 | Asus ROG Flow Z13 GZ301ZE GeForce RTX 3050 Ti Laptop GPU, i9-12900H, Micron 2450 1TB MTFDKBK1T0TFK | Alienware x14 i7 RTX 3060 GeForce RTX 3060 Laptop GPU, i7-12700H, WDC PC SN810 1TB | Razer Blade 14 Ryzen 9 6900HX GeForce RTX 3070 Ti Laptop GPU, R9 6900HX, Samsung PM9A1 MZVL21T0HCLR | Asus ROG Zephyrus G14 GA402RK Radeon RX 6800S, R9 6900HS, Micron 2450 1TB MTFDKBK1T0TFK | |
|---|---|---|---|---|---|
| Noise | 7% | -2% | 11% | 1% | |
| off / environment * (dB) | 24 | 24.5 -2% | 24.7 -3% | 23.3 3% | 24 -0% |
| Idle Minimum * (dB) | 24 | 24.5 -2% | 24.7 -3% | 23.3 3% | 24 -0% |
| Idle Average * (dB) | 24 | 24.5 -2% | 24.7 -3% | 23.3 3% | 26 -8% |
| Idle Maximum * (dB) | 36.5 | 24.5 33% | 30.9 15% | 23.3 36% | 31 15% |
| Load Average * (dB) | 41.3 | 41 1% | 40 3% | 34.7 16% | 45 -9% |
| Witcher 3 ultra * (dB) | 44.7 | 41 8% | 51.5 -15% | 42.1 6% | 43 4% |
| Load Maximum * (dB) | 46.9 | 41 13% | 51.5 -10% | 42.1 10% | 45 4% |
* ... smaller is better
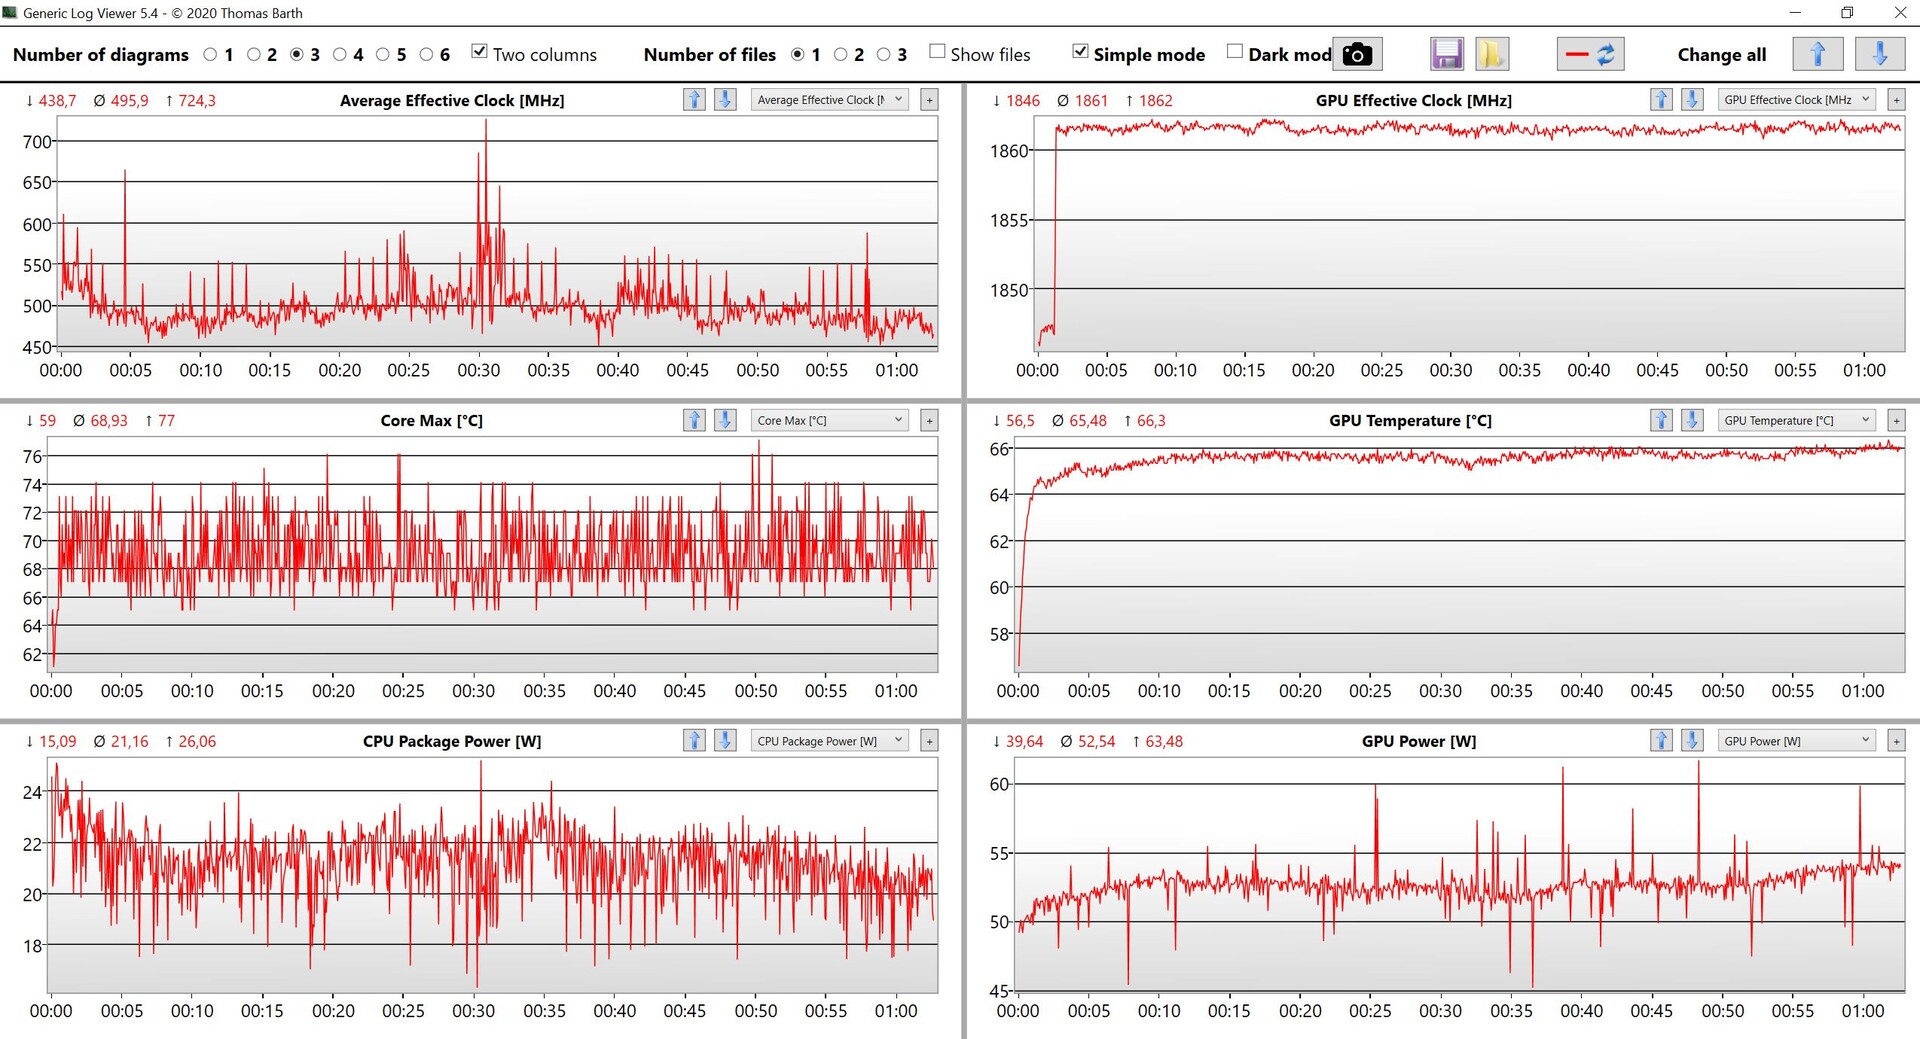
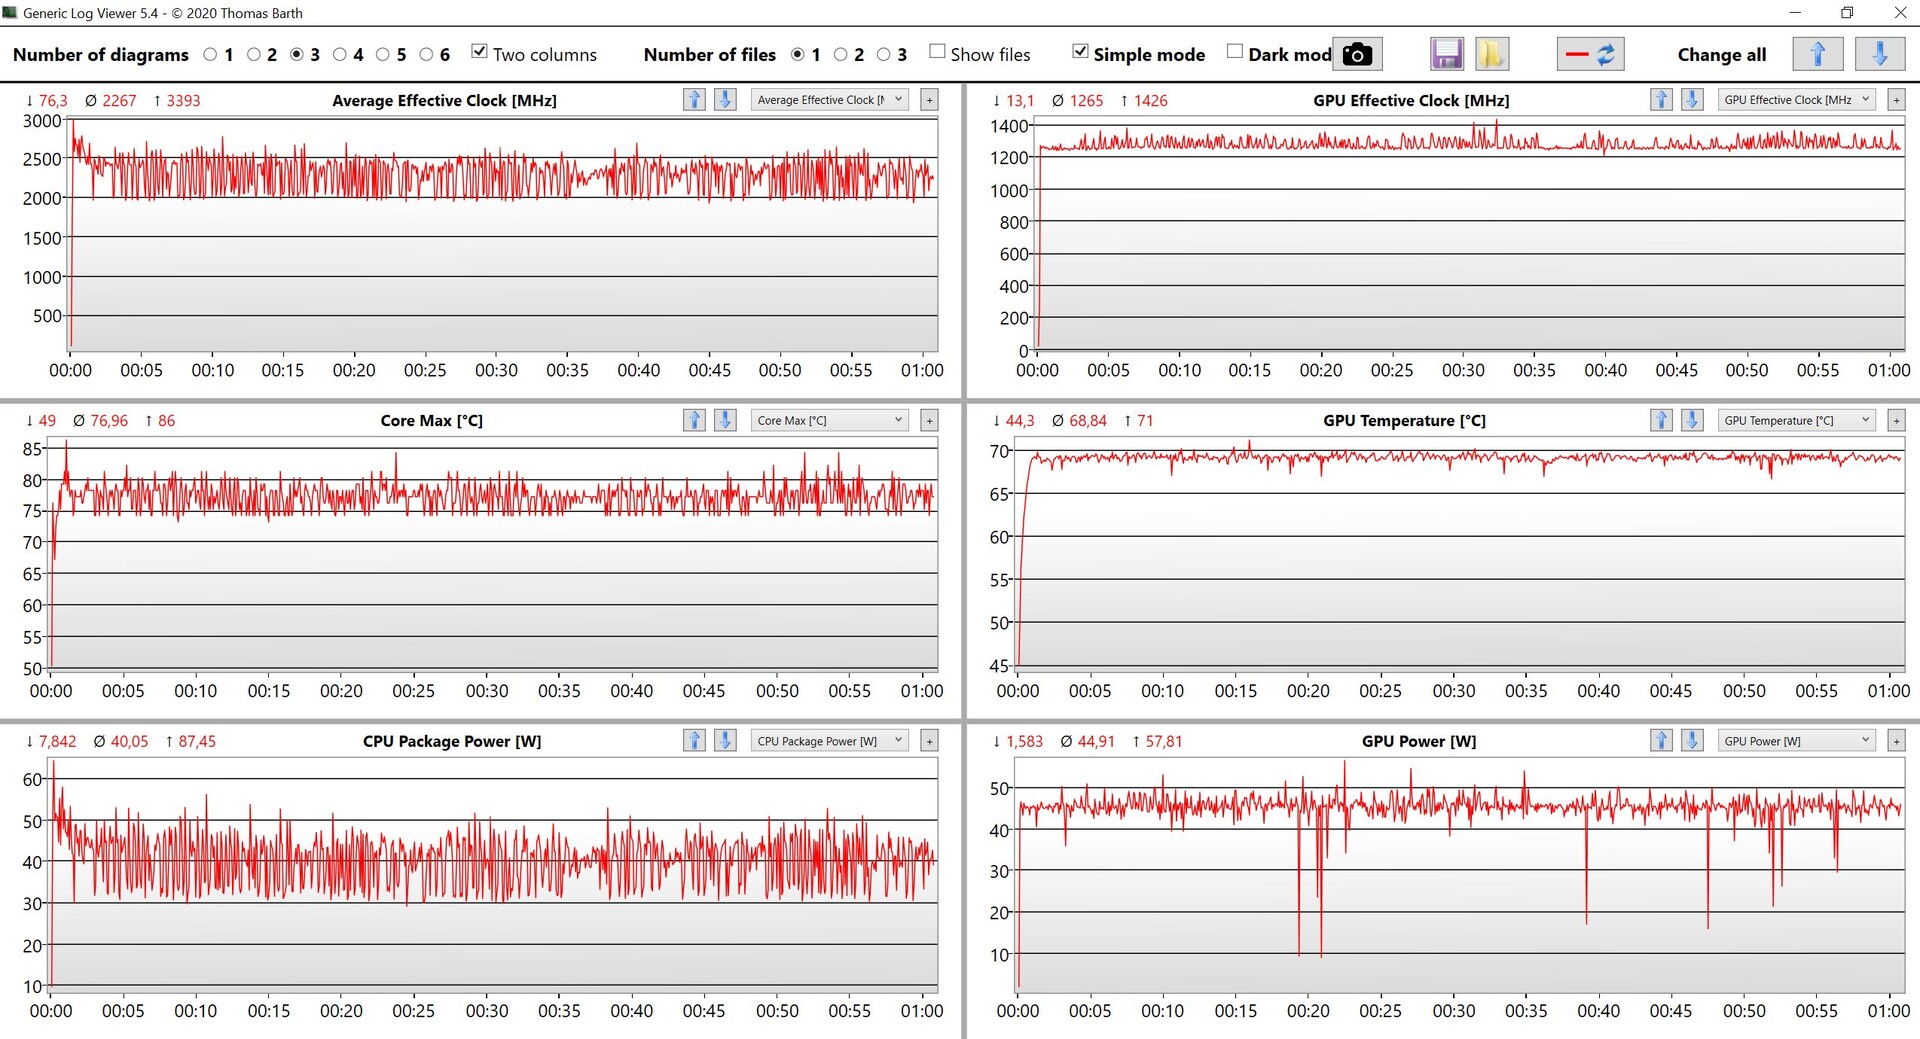
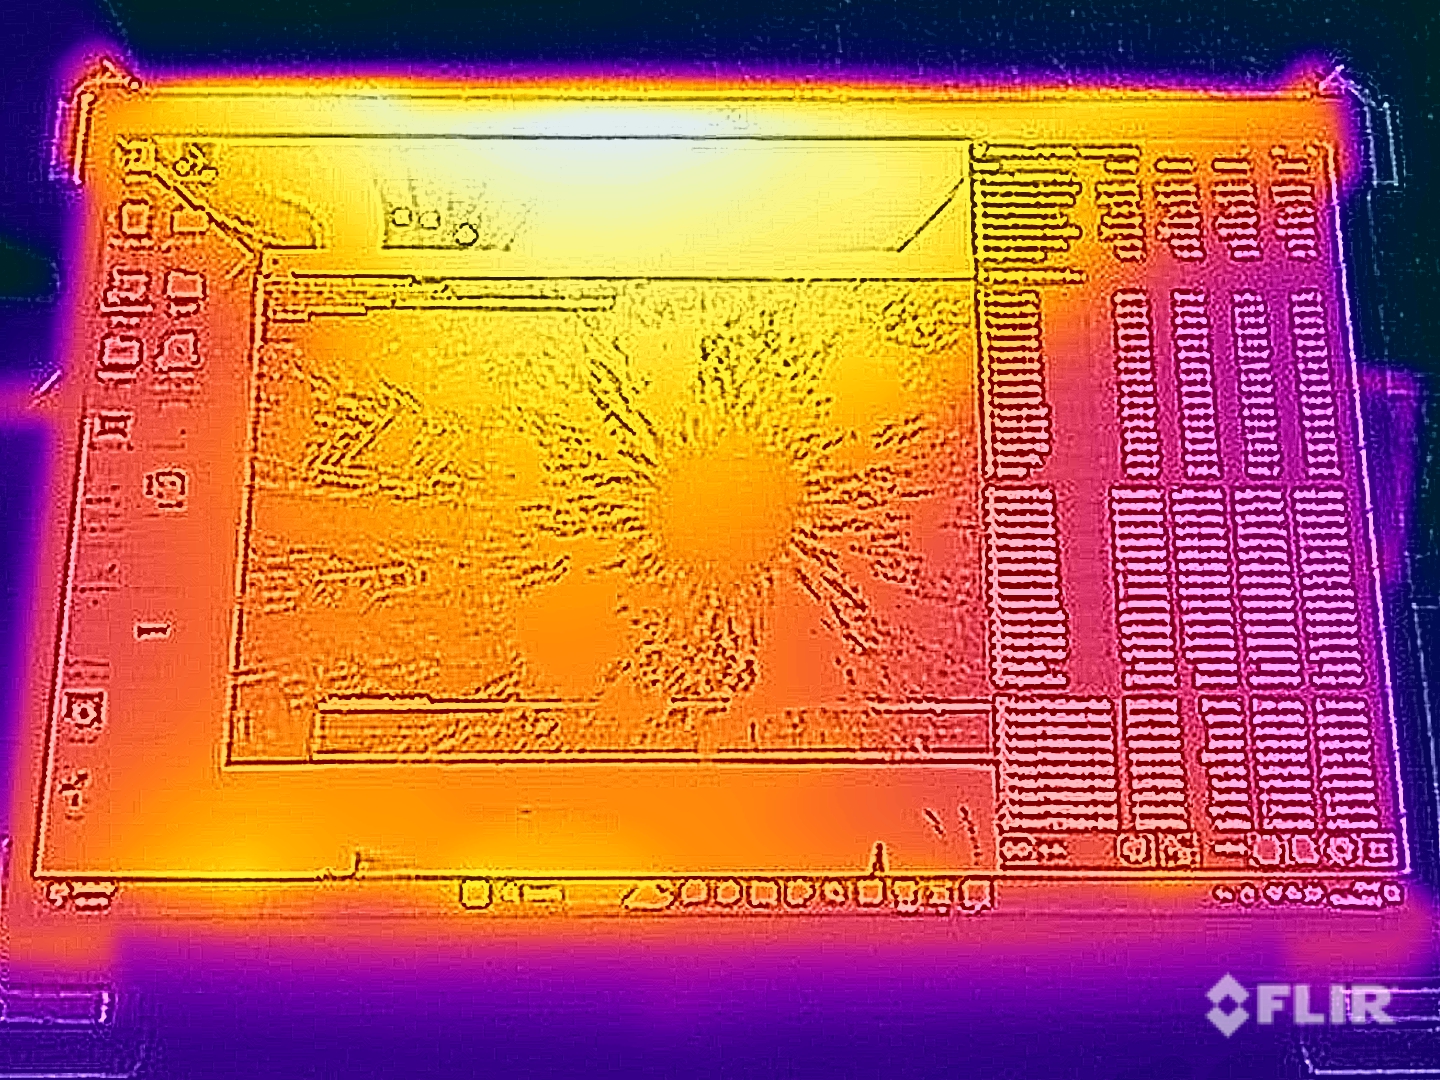
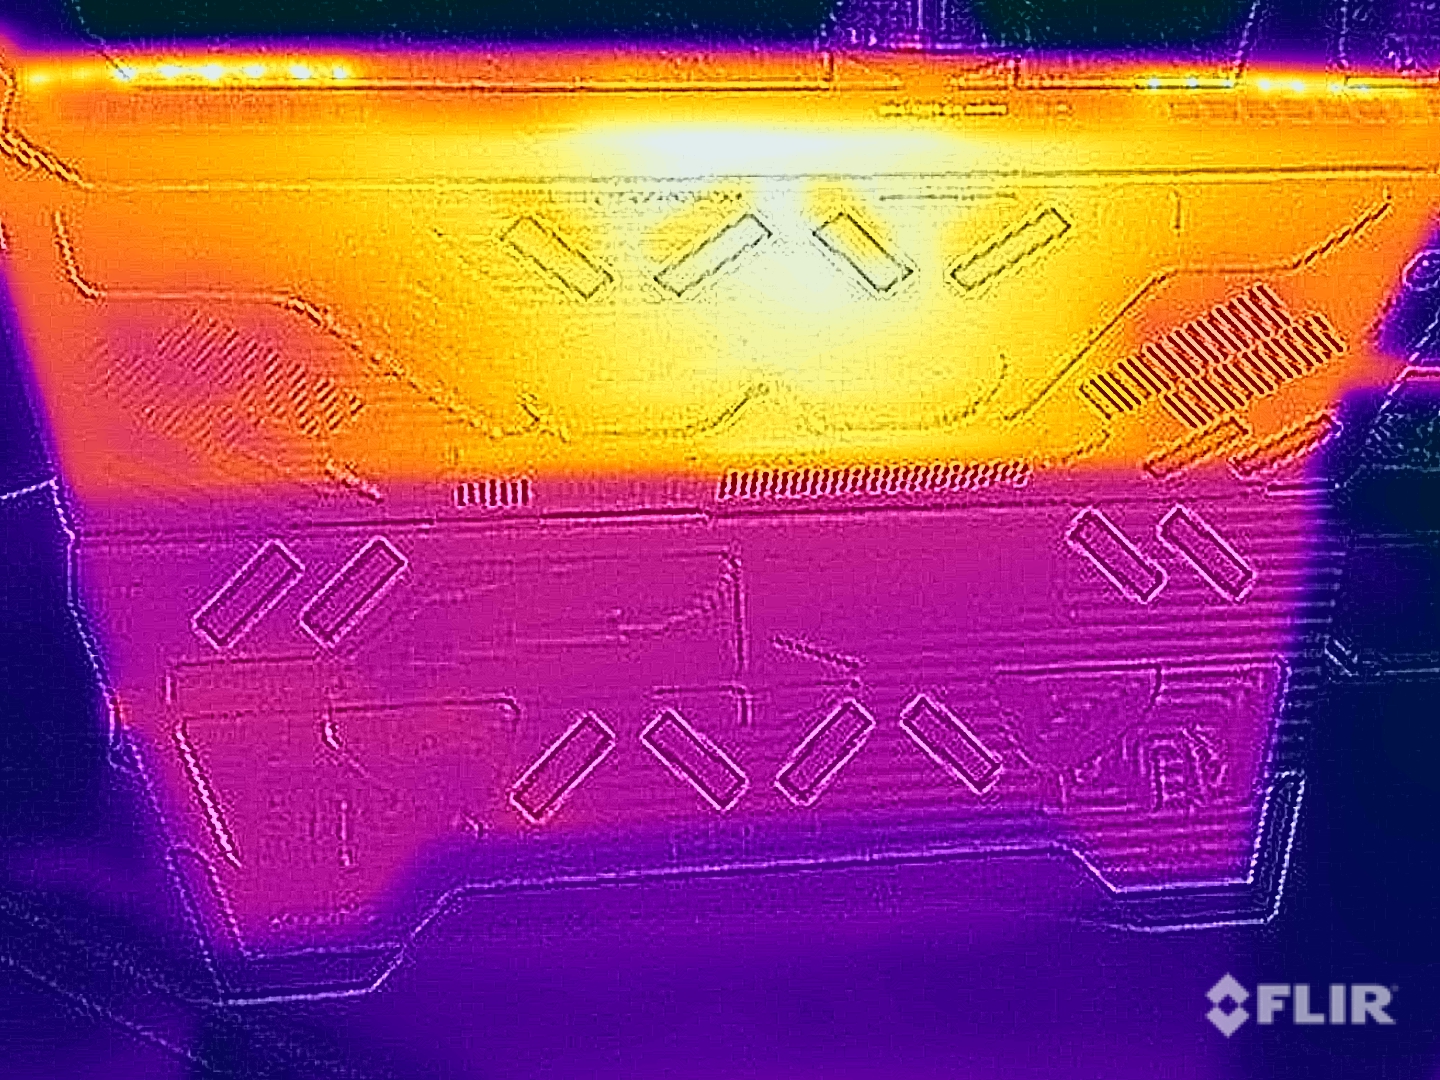
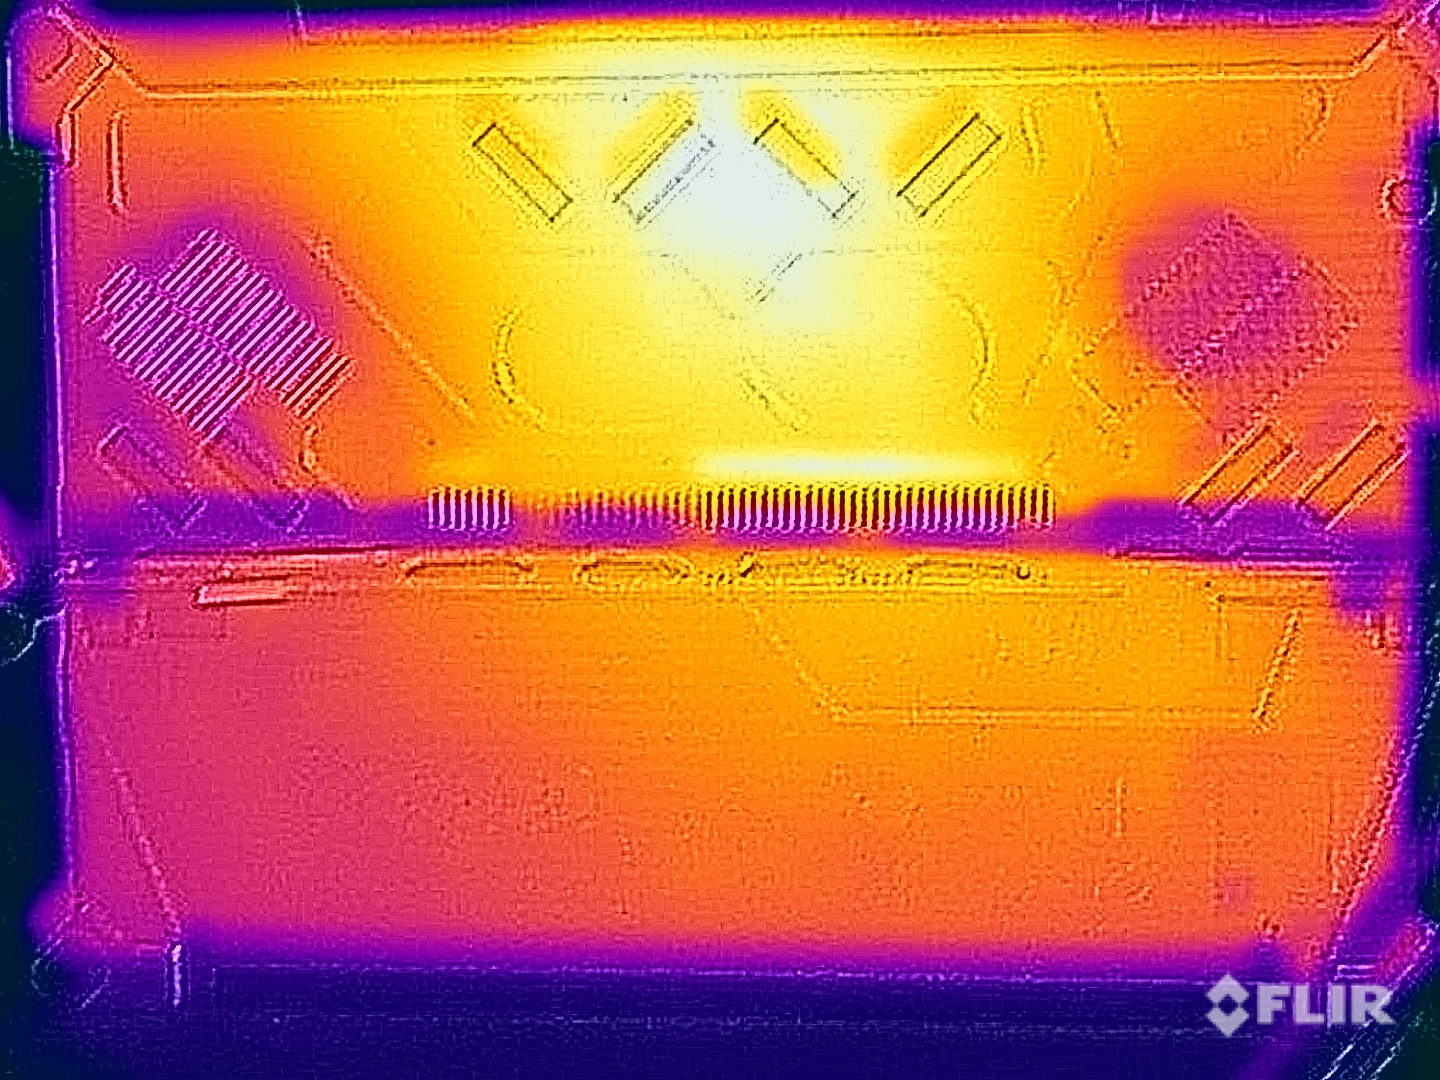
Temperature
Asus manages the surface temperatures of the Flow Z13 ACRNM very well and the bulkier chassis definitely has a positive impact on the results. The device is very cool in light workload scenarios and you can still use it as a tablet under maximum load without any limitations. We can measure up to ~42 °C at the back, which is a noticeable improvement compared to the predecessor with the RTX 3050 Ti (up to 48 °C).
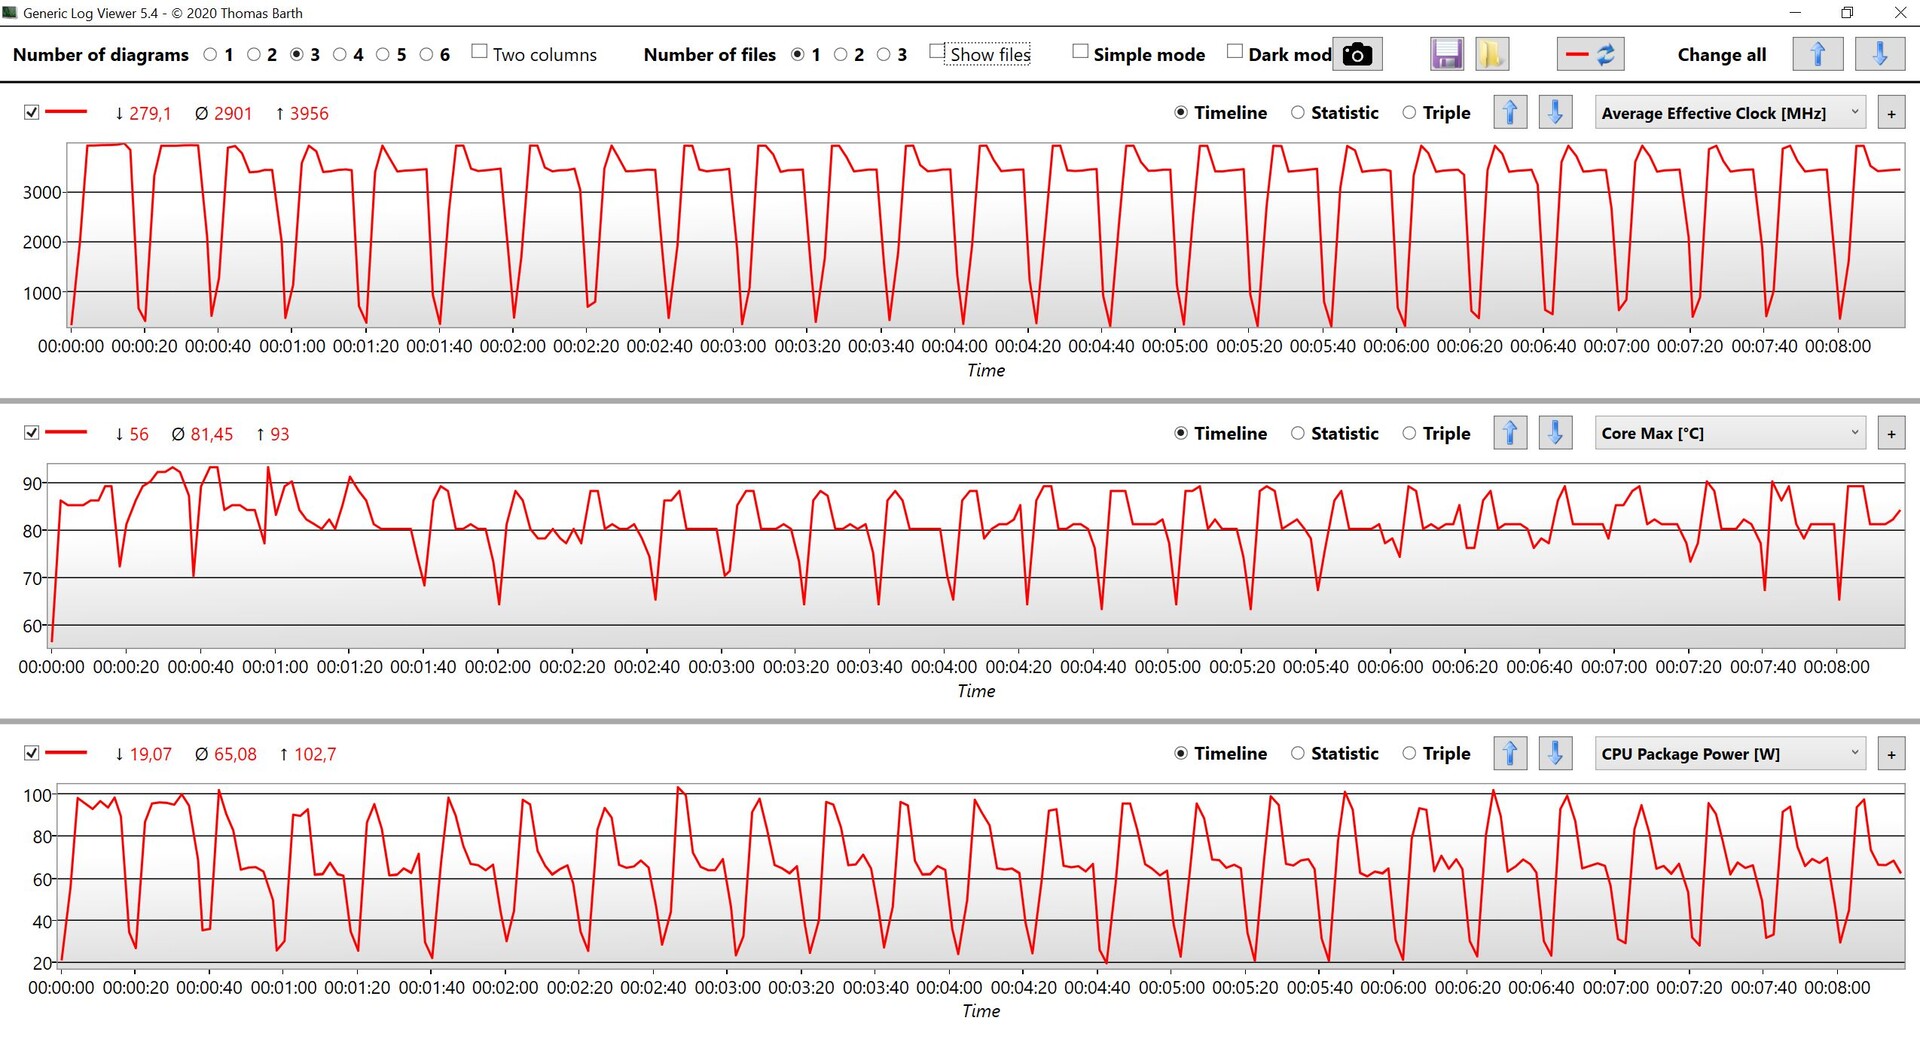
The performance during our stress test is also good. The GPU maintains 45 Watts and the processor consumption fluctuates between 30-50 Watts. These values drop to 18W for the CPU and 26W for the GPU on battery power. We did not notice a performance drop immediately after the stress test.
(±) The maximum temperature on the upper side is 42.5 °C / 109 F, compared to the average of 40.4 °C / 105 F, ranging from 21.2 to 68.8 °C for the class Gaming.
(±) The bottom heats up to a maximum of 42.6 °C / 109 F, compared to the average of 43.2 °C / 110 F
(+) In idle usage, the average temperature for the upper side is 25.6 °C / 78 F, compared to the device average of 33.9 °C / 93 F.
(±) Playing The Witcher 3, the average temperature for the upper side is 37.4 °C / 99 F, compared to the device average of 33.9 °C / 93 F.
(+) The palmrests and touchpad are reaching skin temperature as a maximum (35.2 °C / 95.4 F) and are therefore not hot.
(-) The average temperature of the palmrest area of similar devices was 28.8 °C / 83.8 F (-6.4 °C / -11.6 F).
| Asus ROG Flow Z13 ACRNM Intel Core i9-13900H, NVIDIA GeForce RTX 4070 Laptop GPU | Asus ROG Flow Z13 GZ301ZE Intel Core i9-12900H, NVIDIA GeForce RTX 3050 Ti Laptop GPU | Alienware x14 i7 RTX 3060 Intel Core i7-12700H, NVIDIA GeForce RTX 3060 Laptop GPU | Razer Blade 14 Ryzen 9 6900HX AMD Ryzen 9 6900HX, NVIDIA GeForce RTX 3070 Ti Laptop GPU | Asus ROG Zephyrus G14 GA402RK AMD Ryzen 9 6900HS, AMD Radeon RX 6800S | |
|---|---|---|---|---|---|
| Heat | -12% | -8% | -21% | -24% | |
| Maximum Upper Side * (°C) | 42.5 | 45.3 -7% | 51.3 -21% | 40.6 4% | 55 -29% |
| Maximum Bottom * (°C) | 42.6 | 48.3 -13% | 44.4 -4% | 42.6 -0% | 55 -29% |
| Idle Upper Side * (°C) | 26.2 | 29.2 -11% | 27.2 -4% | 38 -45% | 30 -15% |
| Idle Bottom * (°C) | 26 | 30 -15% | 26.6 -2% | 37 -42% | 32 -23% |
* ... smaller is better
Speakers
The two stereo speakers are definitely a weak point of the convertible because the sound is very thin and lacks bass. Neither music, movies, nor games are really that enjoyable and you also get fan noise during gaming, so we recommend a headset.
Asus ROG Flow Z13 ACRNM audio analysis
(±) | speaker loudness is average but good (80.3 dB)
Bass 100 - 315 Hz
(-) | nearly no bass - on average 18.3% lower than median
(±) | linearity of bass is average (10.1% delta to prev. frequency)
Mids 400 - 2000 Hz
(+) | balanced mids - only 3.4% away from median
(+) | mids are linear (4.5% delta to prev. frequency)
Highs 2 - 16 kHz
(±) | higher highs - on average 6.1% higher than median
(+) | highs are linear (3.5% delta to prev. frequency)
Overall 100 - 16.000 Hz
(±) | linearity of overall sound is average (19% difference to median)
Compared to same class
» 63% of all tested devices in this class were better, 8% similar, 29% worse
» The best had a delta of 6%, average was 18%, worst was 132%
Compared to all devices tested
» 45% of all tested devices were better, 7% similar, 48% worse
» The best had a delta of 4%, average was 24%, worst was 134%
Apple MacBook Pro 16 2021 M1 Pro audio analysis
(+) | speakers can play relatively loud (84.7 dB)
Bass 100 - 315 Hz
(+) | good bass - only 3.8% away from median
(+) | bass is linear (5.2% delta to prev. frequency)
Mids 400 - 2000 Hz
(+) | balanced mids - only 1.3% away from median
(+) | mids are linear (2.1% delta to prev. frequency)
Highs 2 - 16 kHz
(+) | balanced highs - only 1.9% away from median
(+) | highs are linear (2.7% delta to prev. frequency)
Overall 100 - 16.000 Hz
(+) | overall sound is linear (4.6% difference to median)
Compared to same class
» 0% of all tested devices in this class were better, 0% similar, 100% worse
» The best had a delta of 5%, average was 17%, worst was 45%
Compared to all devices tested
» 0% of all tested devices were better, 0% similar, 100% worse
» The best had a delta of 4%, average was 24%, worst was 134%
Energy Management - 165 Hz costs runtime
Power Consumption
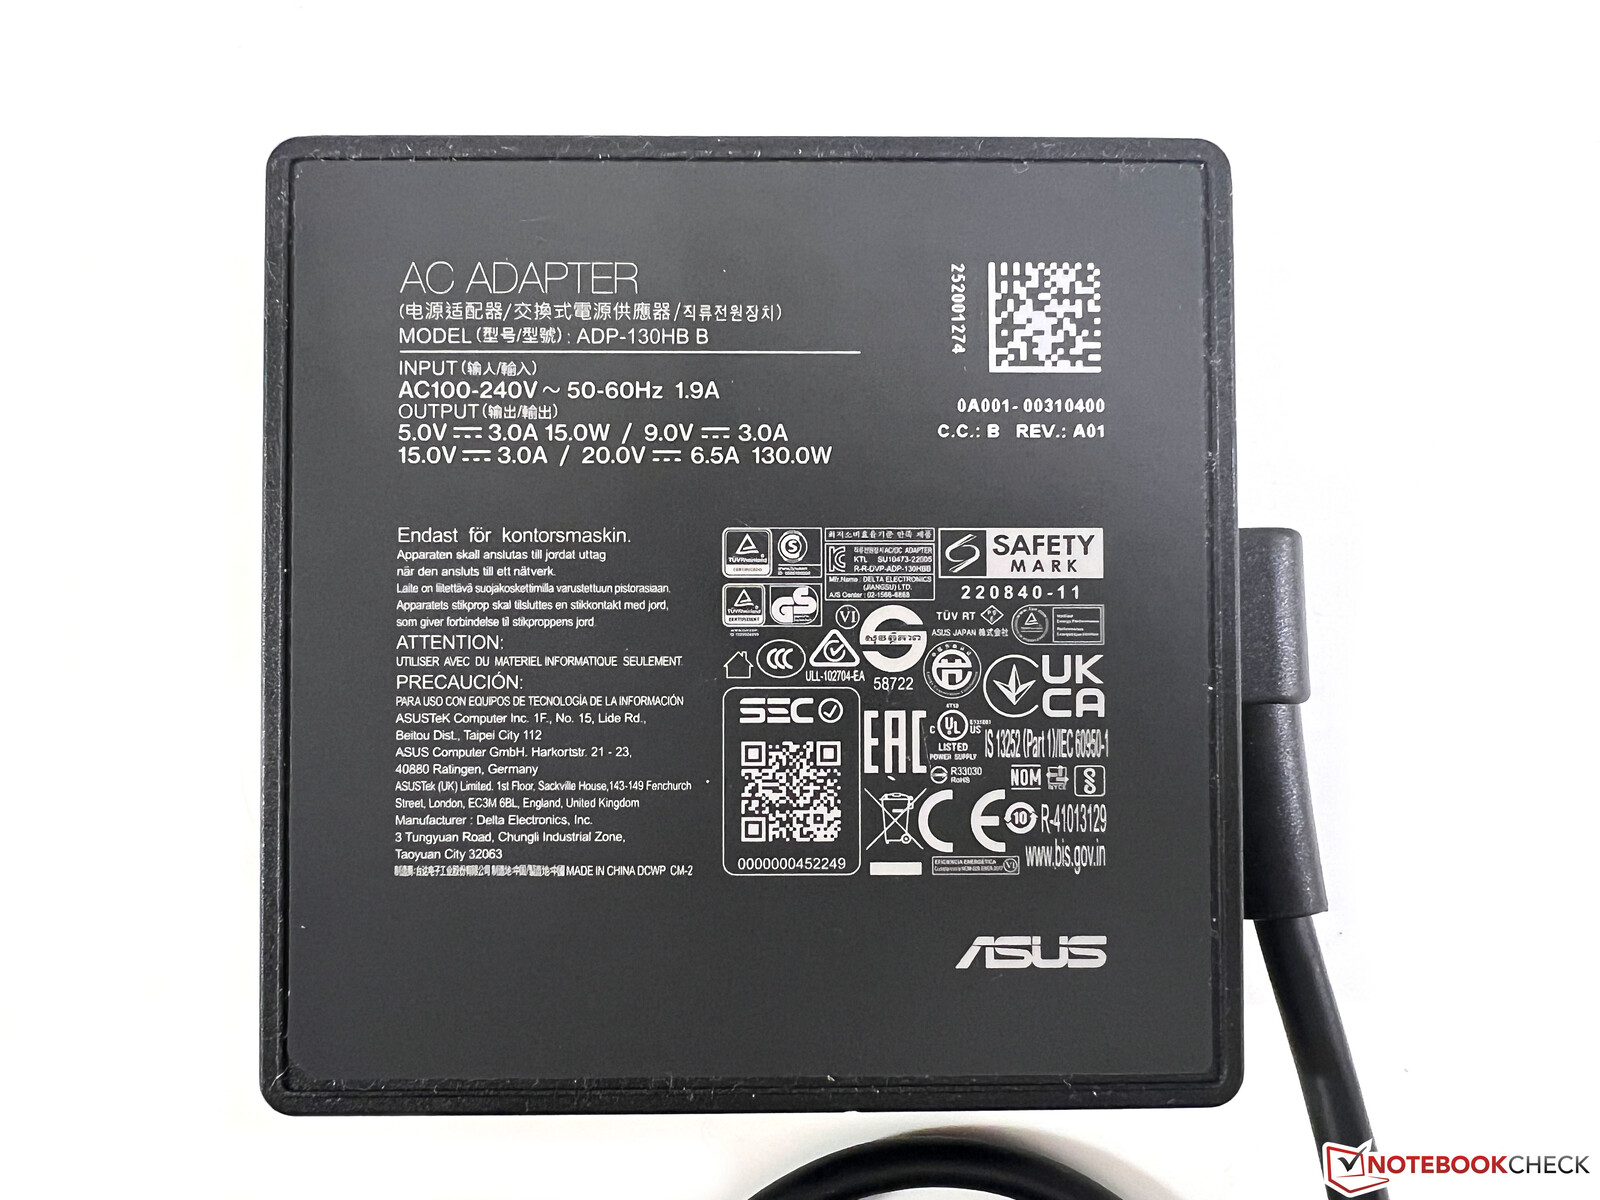
The idle power consumption is pretty much identical compared to the old Flow Z13, but the new version needs much more power under load. We measure around 100 Watts during gaming, but the device needs more than the maximum 133.6 Watts at the beginning of the stress test. The system also draws between 4-18 Watts from the battery in the first couple of seconds, but the consumption will then level off at around 115 Watts. This is an extreme scenario and the included 130W power adapter is otherwise sufficient.
| Off / Standby | |
| Idle | |
| Load |
|
Key:
min: | |
| Asus ROG Flow Z13 ACRNM i9-13900H, GeForce RTX 4070 Laptop GPU, WD PC SN740 SDDPTQD-1T00, IPS, 2560x1600, 13.4" | Asus ROG Flow Z13 GZ301ZE i9-12900H, GeForce RTX 3050 Ti Laptop GPU, Micron 2450 1TB MTFDKBK1T0TFK, IPS, 1920x1200, 13.4" | Alienware x14 i7 RTX 3060 i7-12700H, GeForce RTX 3060 Laptop GPU, WDC PC SN810 1TB, IPS, 1920x1080, 14" | Razer Blade 14 Ryzen 9 6900HX R9 6900HX, GeForce RTX 3070 Ti Laptop GPU, Samsung PM9A1 MZVL21T0HCLR, IPS, 2560x1440, 14" | Asus ROG Zephyrus G14 GA402RK R9 6900HS, Radeon RX 6800S, Micron 2450 1TB MTFDKBK1T0TFK, IPS-Level, 2560x1600, 14" | Average NVIDIA GeForce RTX 4070 Laptop GPU | Average of class Gaming | |
|---|---|---|---|---|---|---|---|
| Power Consumption | 13% | 1% | -58% | -24% | -50% | -58% | |
| Idle Minimum * (Watt) | 8.9 | 8.8 1% | 7.9 11% | 10.2 -15% | 7 21% | 13.2 ? -48% | 13.2 ? -48% |
| Idle Average * (Watt) | 12.6 | 12.1 4% | 11.1 12% | 26 -106% | 14 -11% | 18.2 ? -44% | 18.9 ? -50% |
| Idle Maximum * (Watt) | 13 | 12.7 2% | 11.8 9% | 26.7 -105% | 22 -69% | 24.6 ? -89% | 24.3 ? -87% |
| Load Average * (Watt) | 92.5 | 72.3 22% | 107.4 -16% | 89.3 3% | 98 -6% | 97 ? -5% | 108 ? -17% |
| Witcher 3 ultra * (Watt) | 104.4 | 77.3 26% | 111 -6% | 158.7 -52% | 141 -35% | ||
| Load Maximum * (Watt) | 133.6 | 103.1 23% | 140.4 -5% | 227.5 -70% | 188 -41% | 221 ? -65% | 254 ? -90% |
* ... smaller is better
Power consumption Witcher 3 / Stress test
Power consumption with external screen
Battery Runtime
The battery capacity is still 56 Wh and we determine a runtime of more than 6.5 hours at 60 Hz (~5.5 hours at 165 Hz) for our Wi-Fi test at an adjusted brightness of 150 nits (52 % of the maximum brightness for our review unit). At maximum brightness, our Wi-Fi test runs for little more than 5 hours at 60 Hz and slightly more than 4 hours at 165 Hz. These results are obviously not great, but also not surprising considering the powerful hardware and the comparatively small battery. You should definitely include some charging stops when you are on a longer trip. A charge from 5-60 % only takes around 30 minutes when the device is turned on; a full charge takes around 80 minutes.
| Asus ROG Flow Z13 ACRNM i9-13900H, GeForce RTX 4070 Laptop GPU, 56 Wh | Alienware x14 i7 RTX 3060 i7-12700H, GeForce RTX 3060 Laptop GPU, 80 Wh | Razer Blade 14 Ryzen 9 6900HX R9 6900HX, GeForce RTX 3070 Ti Laptop GPU, 62 Wh | Asus ROG Zephyrus G14 GA402RK R9 6900HS, Radeon RX 6800S, 76 Wh | Asus ROG Flow Z13 GZ301ZE i9-12900H, GeForce RTX 3050 Ti Laptop GPU, 56 Wh | Average of class Gaming | |
|---|---|---|---|---|---|---|
| Battery runtime | 35% | 61% | 22% | 11% | 43% | |
| H.264 (h) | 5.2 | 9.4 81% | 6 15% | 8.26 ? 59% | ||
| WiFi v1.3 (h) | 6.6 | 8.9 35% | 9.5 44% | 9.5 44% | 5.6 -15% | 7.02 ? 6% |
| Load (h) | 0.9 | 0.8 -11% | 1.6 78% | 0.9 0% | 1.2 33% | 1.47 ? 63% |
| Witcher 3 ultra (h) | 0.8 | 0.8 |
Pros
Cons
Verdict - ROG Flow Z13 ACRNM impresses with design and performance
Last year’s ROG Flow Z13 was already a pretty unique product with the Core i9-12900H and the GeForce RTX 3050 Ti, but the 2023 model is a massive improvement, especially in terms of GPU performance. Our special ACRNM edition is equipped with the new GeForce RTX 4070 Laptop, which has no problems with modern games in the native QHD resolution. The Core i9-13900H is once again a very powerful processor, but the most striking aspect of the special edition is obviously the chassis design with the CNC machined back cover as well as additional material in the corners including attachment point for the including straps. We like the design and the convertible is extremely robust – almost like a ruggedized device, which is also reflected by the high weight of 1.7 kg (including keyboard cover).
The keyboard cover of the ACRNM edition also differs from the regular ROG Flow Z13 and you even get two different models. You have to differentiate between to aspects though. Both keyboard covers are a bit thicker than the regular version, which is good for the stability and we never reviewed a detachable keyboard with such a good typing experience so far. The lettering and the contrast (or the lack there of) on the other hand is a catastrophe and the design was clearly more important than the ergonomics. This will be an issue if you do not type blindly.
The ACRNM edition of the Asus ROG Flow Z13 is a very powerful gaming convertible with a striking design. Thanks to the new RTX 4070 Laptop it can even handle modern games on the WQHD screen.
The performance of the RTX 4070 Laptop is good, but you have to keep in mind that this is only the 65W version. Larger gaming laptops with the RTX 4070 Laptop and even the RTX 4060 Laptop will offer more performance, but the overall performance is still excellent considering the compact size of the Flow Z13 and there is also a massive improvement over the previous model. The fans are very audible in the Turbo mode and there are slight vibrations. We also noticed a high-pitched sound during standby.
The display now features the WQHD resolution with 165 Hz and is used for the ACRNM as well as the regular version of the Flow Z13. All in all, the IPS screen leaves a good impression for gaming with the high frequency and the fast response times. It can also handle picture editing and we did not detect any PWM flickering.
The regular ROG Flow Z13 is unfortunately only available with the RTX 4060 Laptop (or 4050 Laptop and RTX 2050 Laptop, respectively), but all of them are also 65W versions, so this limitation is not necessary. The design of the regular model is much more conservative and more appealing for some users. We are also reviewing the regular version with the RTX 4060 Laptop right now and the review will be published soon. Our perfect ROG Flow Z13 would use the regular chassis with the RTX 4070 Laptop and the thicker keyboard cover of the ACRNM edition, but without the unnecessary lettering. There is still hardly any competition ROG Flow Z13 within the convertible market and you will have to get a 14-inch gaming notebook for a comparable level of performance.
Price and Availability
The ROG Flow Z13 ACRNM can be ordered in the Asus eStore for $2499.
Asus ROG Flow Z13 ACRNM
- 04/09/2023 v7 (old)
Andreas Osthoff
Transparency
The selection of devices to be reviewed is made by our editorial team. The test sample was provided to the author as a loan by the manufacturer or retailer for the purpose of this review. The lender had no influence on this review, nor did the manufacturer receive a copy of this review before publication. There was no obligation to publish this review. As an independent media company, Notebookcheck is not subjected to the authority of manufacturers, retailers or publishers.
This is how Notebookcheck is testing
Every year, Notebookcheck independently reviews hundreds of laptops and smartphones using standardized procedures to ensure that all results are comparable. We have continuously developed our test methods for around 20 years and set industry standards in the process. In our test labs, high-quality measuring equipment is utilized by experienced technicians and editors. These tests involve a multi-stage validation process. Our complex rating system is based on hundreds of well-founded measurements and benchmarks, which maintains objectivity. Further information on our test methods can be found here.
Price comparison
