Alienware x14 Review - The world's thinnest gaming notebook requires compromises

After Alienware released the two new gaming laptops x15 and x17 last year, the manufacturer now launches a 14-inch system. The new Alienware x14 follows the same design language and wants to attract customers with its very slim chassis, which contains brand-new Alder Lake CPUs from Intel as well as RTX 3000 GPUs from Nvidia for sufficient gaming performance. There is currently just one 1080p screen with 144 Hz and a DCI-P3 gamut provided for this laptop. The entry-level spec with a Core i5 and RTX 3050 starts at 1899 Euros, but we review the high-end model with the Core i7-12700H, 16 GB LPDDR5 RAM, Nvidia GeForce RTX 3060 as well as a 1 TB PCIe-SSD for 2399 Euros.
Potential rivals
Rating | Date | Model | Weight | Height | Size | Resolution | Price |
|---|---|---|---|---|---|---|---|
| 86.7 % v7 (old) | 03 / 2022 | Alienware x14 i7 RTX 3060 i7-12700H, GeForce RTX 3060 Laptop GPU | 1.8 kg | 14.5 mm | 14.00" | 1920x1080 | |
| 86.7 % v7 (old) | 03 / 2022 | Asus ROG Zephyrus G14 GA402RK R9 6900HS, Radeon RX 6800S | 1.7 kg | 19.5 mm | 14.00" | 2560x1600 | |
| 87.5 % v7 (old) | 06 / 2021 | Razer Blade 14 Ryzen 9 RTX 3070 R9 5900HX, GeForce RTX 3070 Laptop GPU | 1.8 kg | 16.8 mm | 14.00" | 2560x1440 | |
| 83.5 % v7 (old) | 06 / 2021 | Asus Zephyrus G14 GA401QM R9 5900HS, GeForce RTX 3060 Laptop GPU | 1.7 kg | 19.9 mm | 14.00" | 1920x1080 | |
| 87.2 % v7 (old) | 09 / 2021 | Alienware x15 RTX 3070 P111F i7-11800H, GeForce RTX 3070 Laptop GPU | 2.4 kg | 15.9 mm | 15.60" | 2560x1440 |
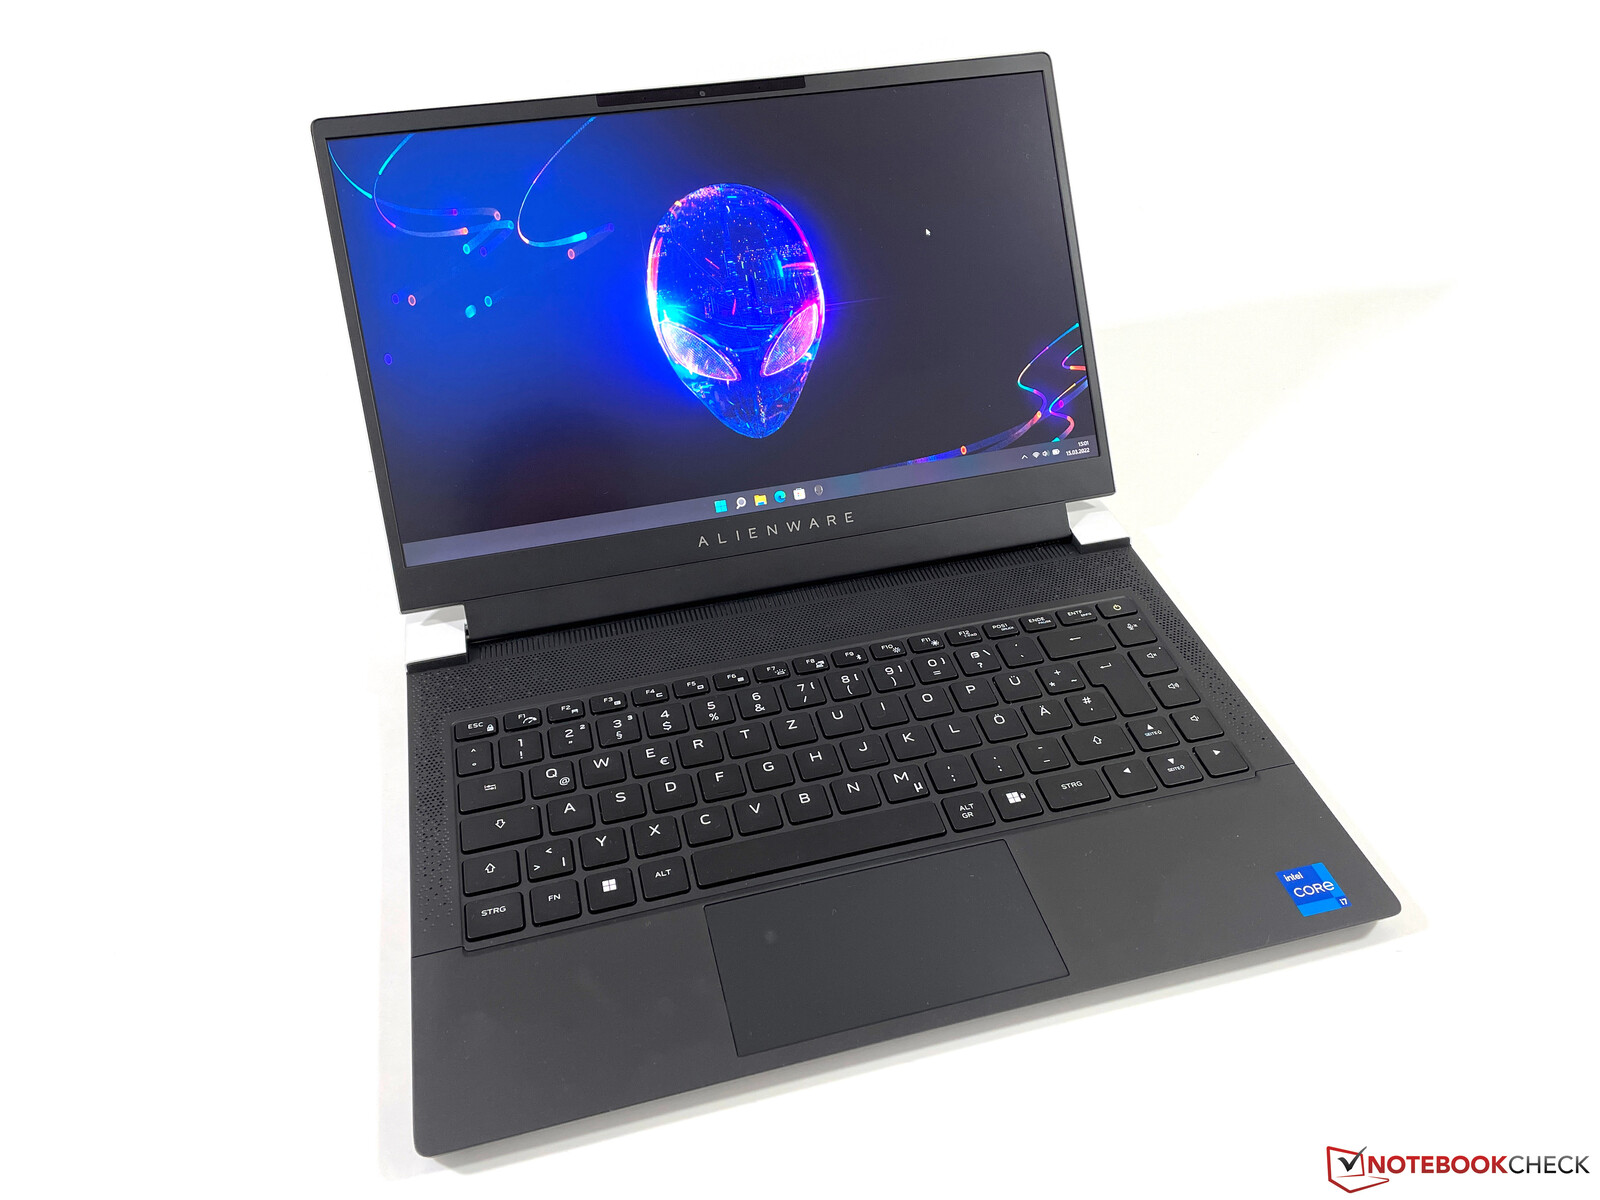
Case - A small version of the Alienware x15
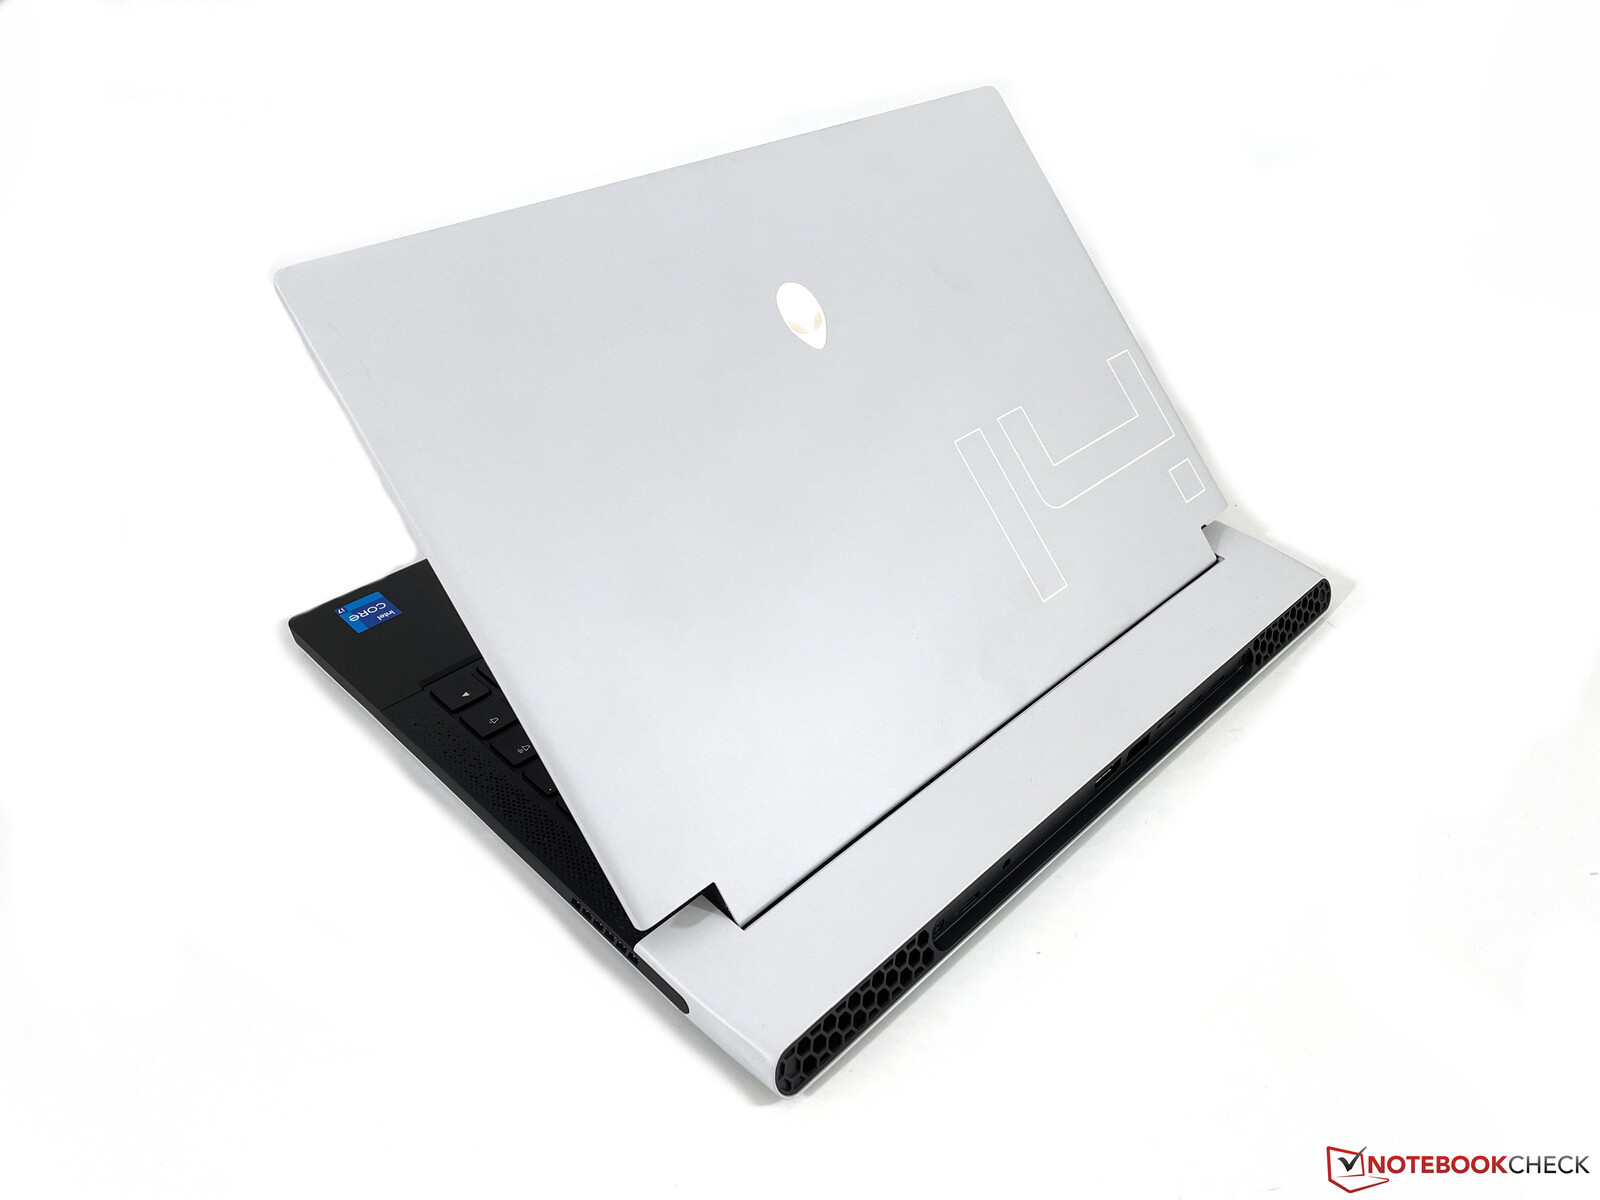
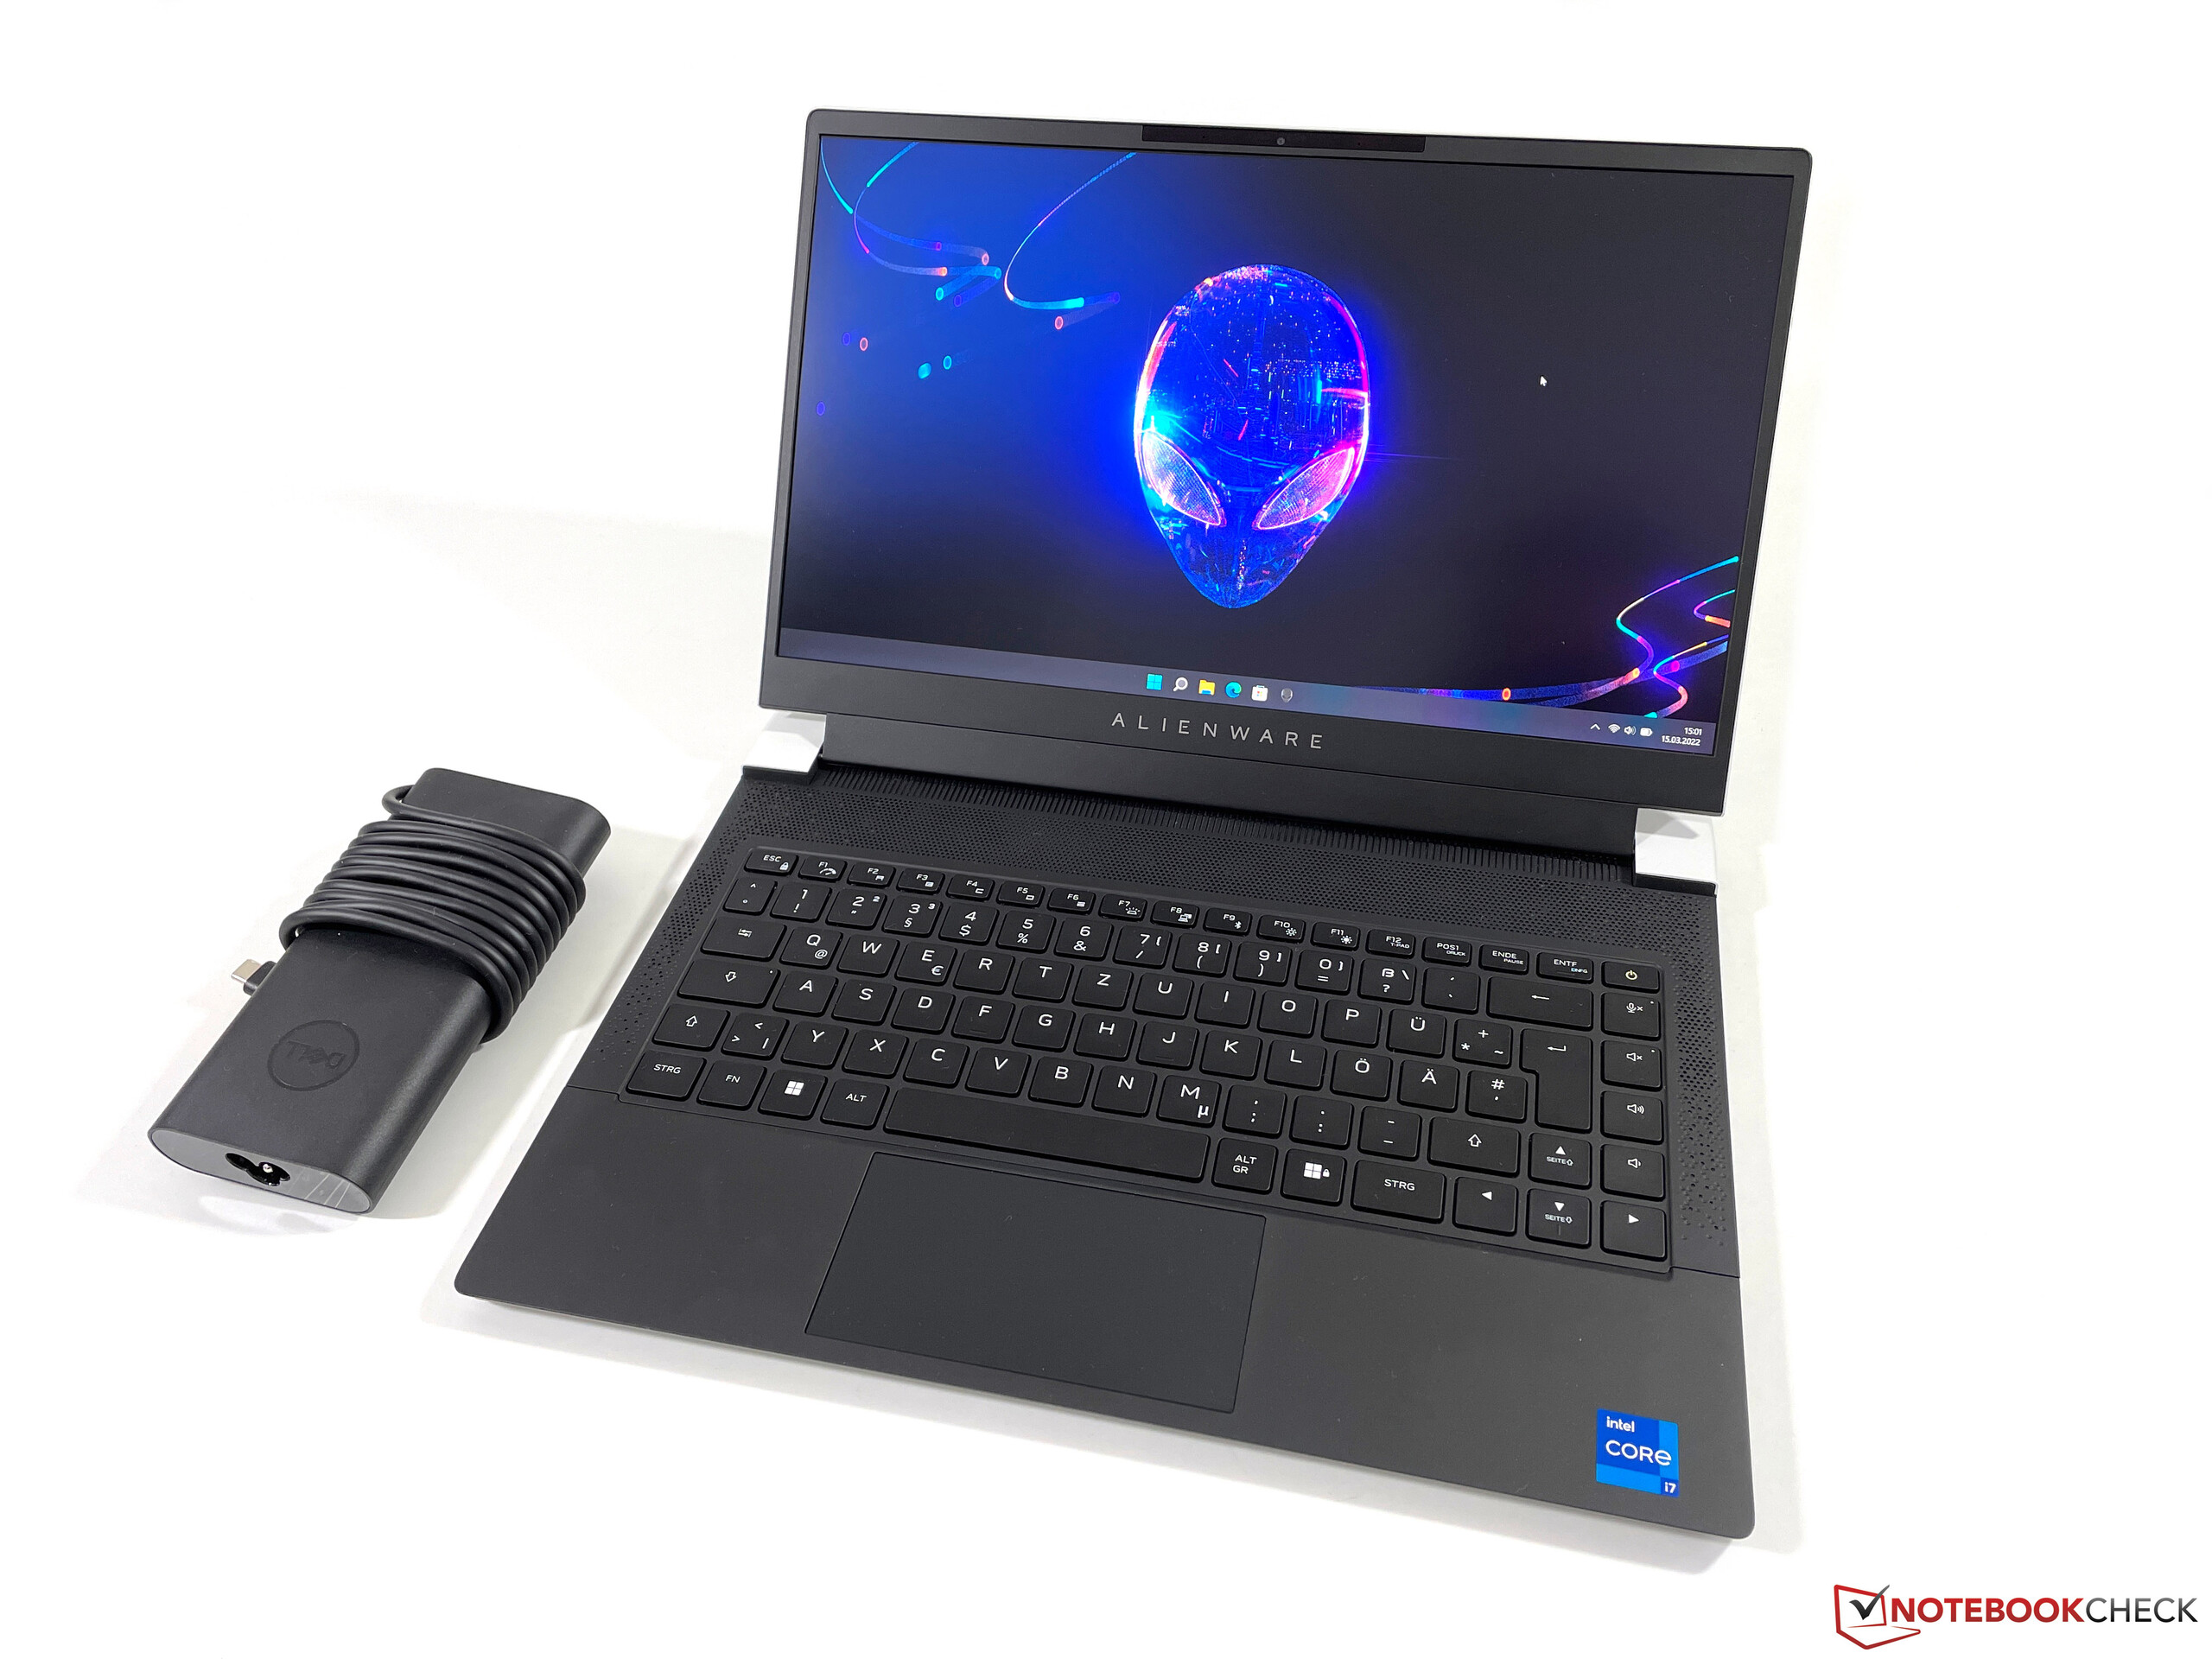
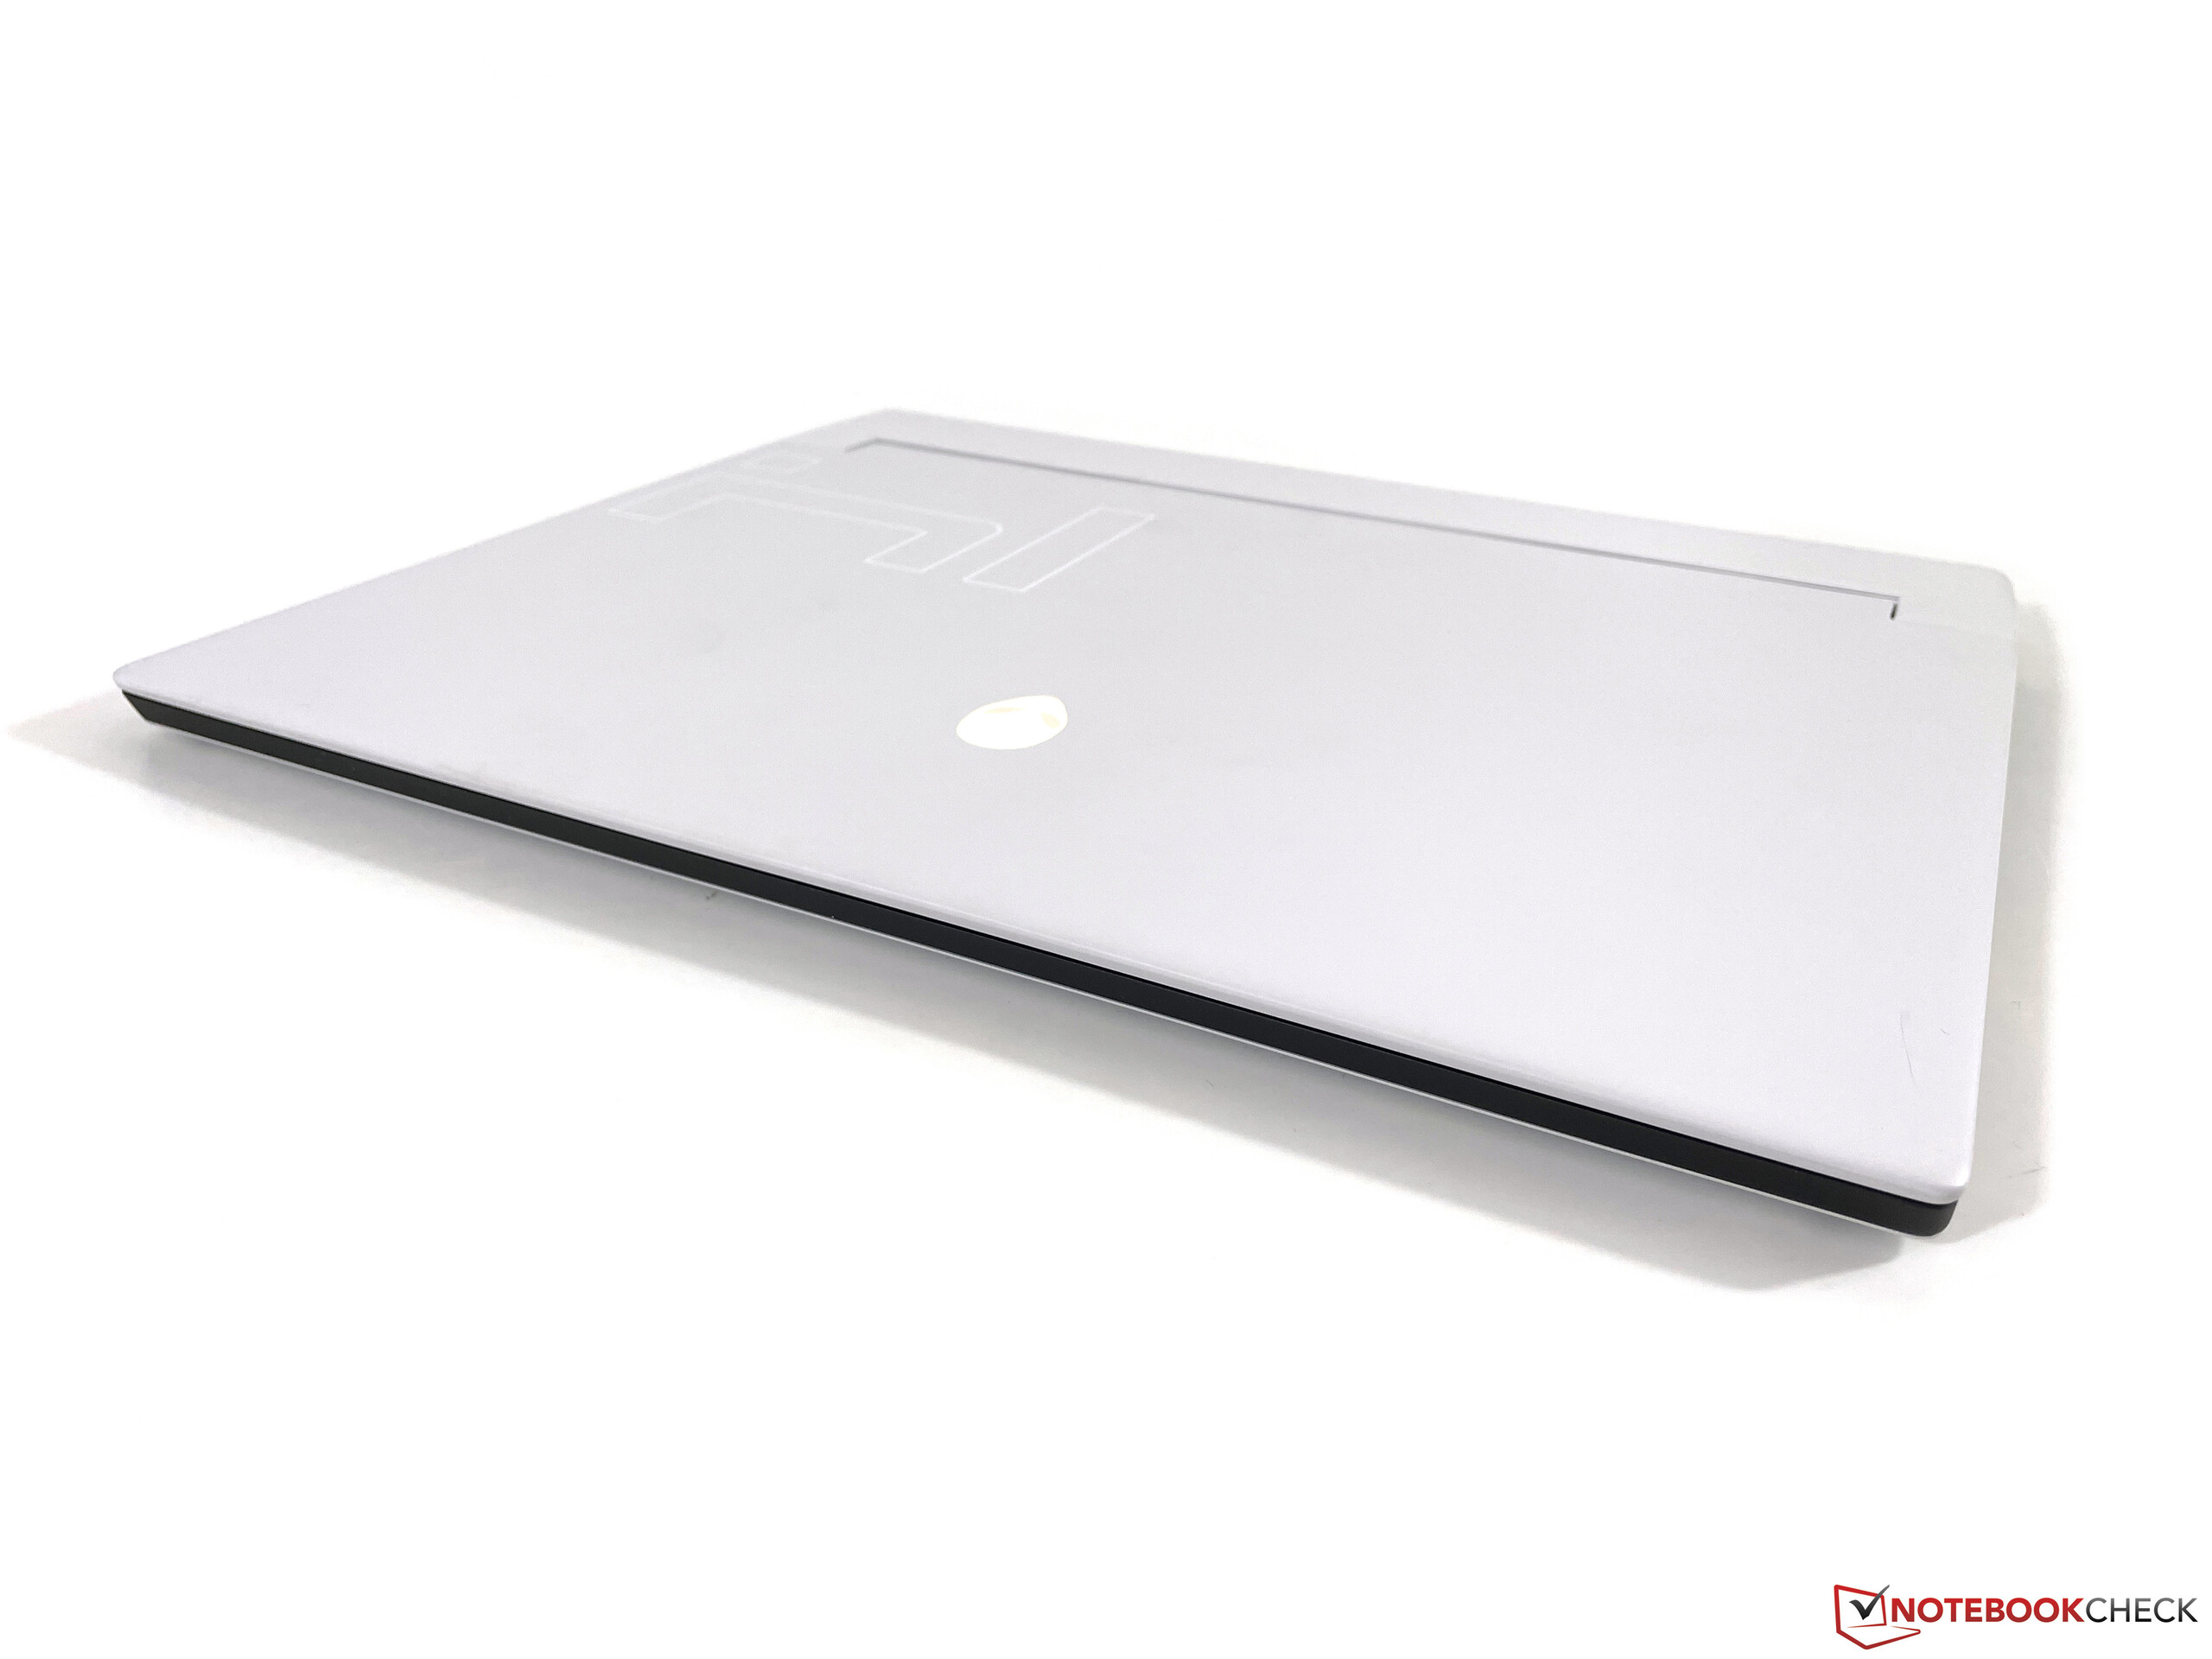
The design of the new Alienware x14 hardly differs from its larger siblings x15 and x17. The case is supposed to be as slim as possible, but due to the construction where the display hinge is shifted towards the front, the laptop is very deep. For the 14-inch model, in particular, this means the keyboard is also shifted towards the front of the base unit and the palm rests are pretty small. Compared to the larger siblings, there is no illumination at the rear either, only the keyboard and the alien head on the lid of the x14 can be illuminated.
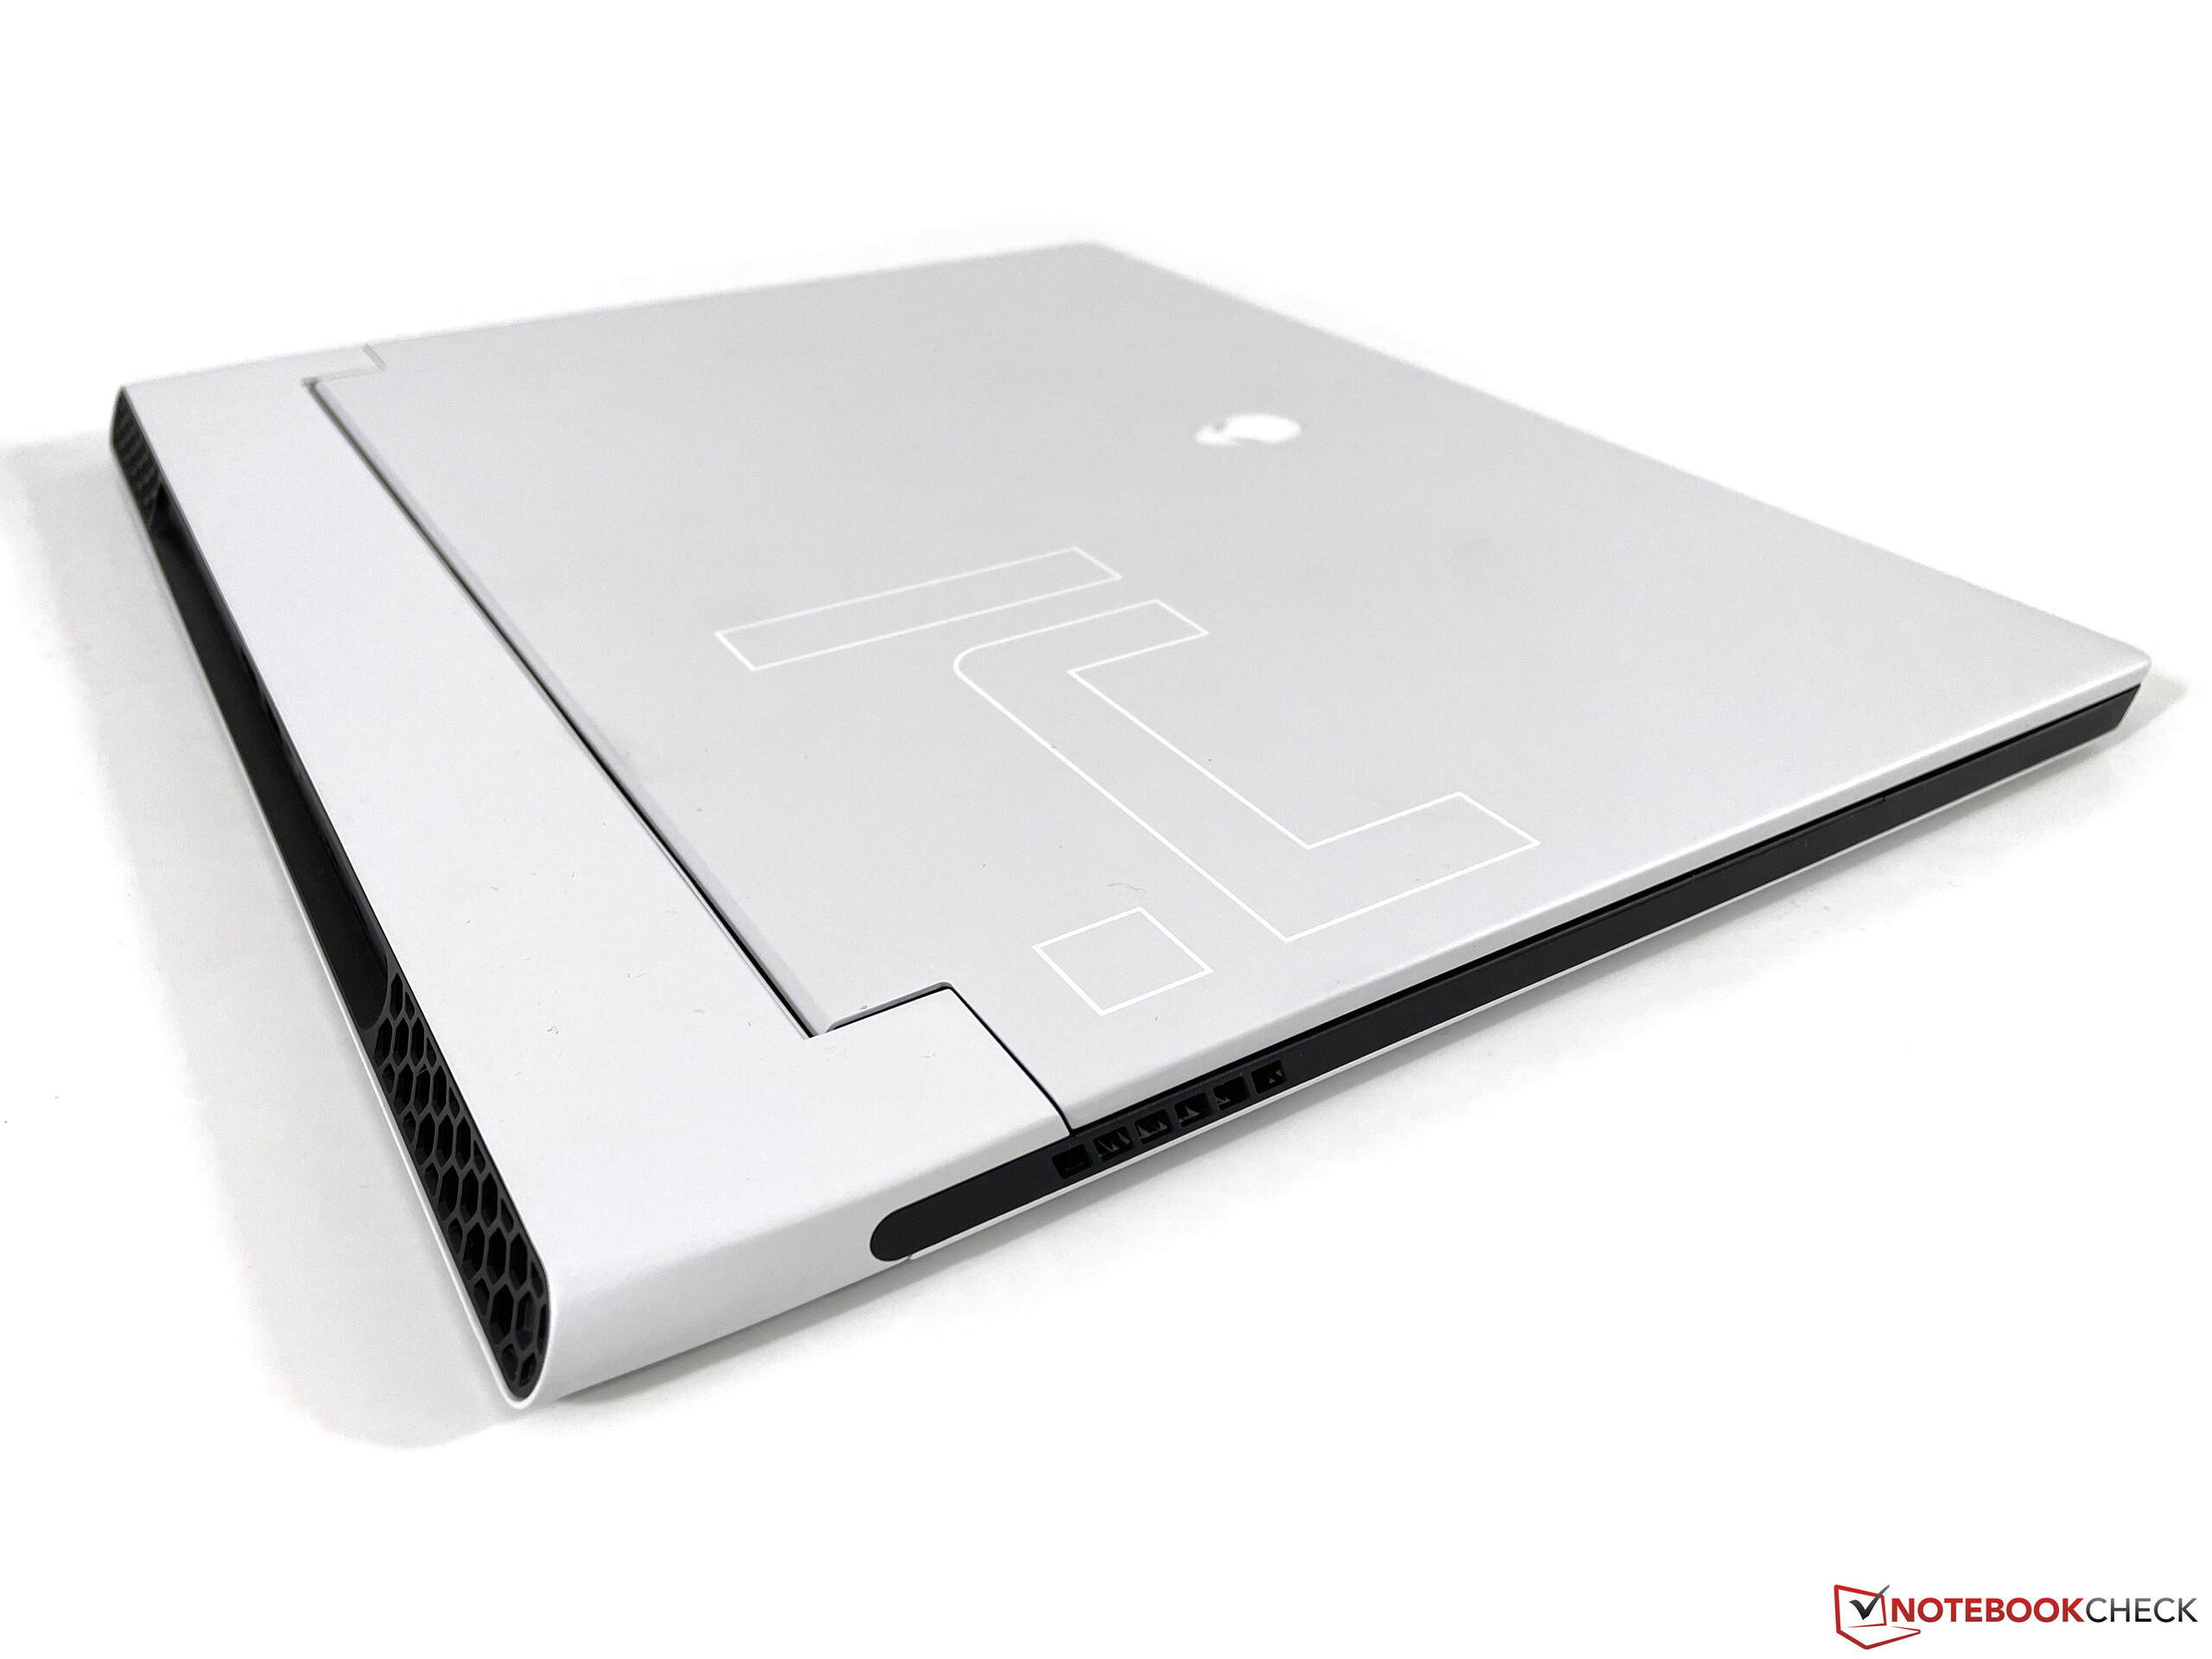
You can only get the new x14 in the Lunar Silver color, which looks good in pictures, but its bright surfaces quickly attract dirt and you have to clean them quite often. The upper part of the base unit, the rear, as well as the display frame, is black, which creates a nice contrast. The bezels at the sides are pretty slim, but the lower bezel, in particular, is very wide and we are quite sure that a 16:10 panel would have fitted here as well. The screen-to-body ratio of the new x14 is just 64% due to the chassis construction.
There is not much criticism for the quality because Dell uses high-quality materials, the build quality of our test unit is flawless, and the stability leaves a good impression as well. We generally like the display hinge as well, but there is still some bouncing when you adjust the opening angle. The maximum opening angle is also limited to around 135 degrees due to the position of the screen.
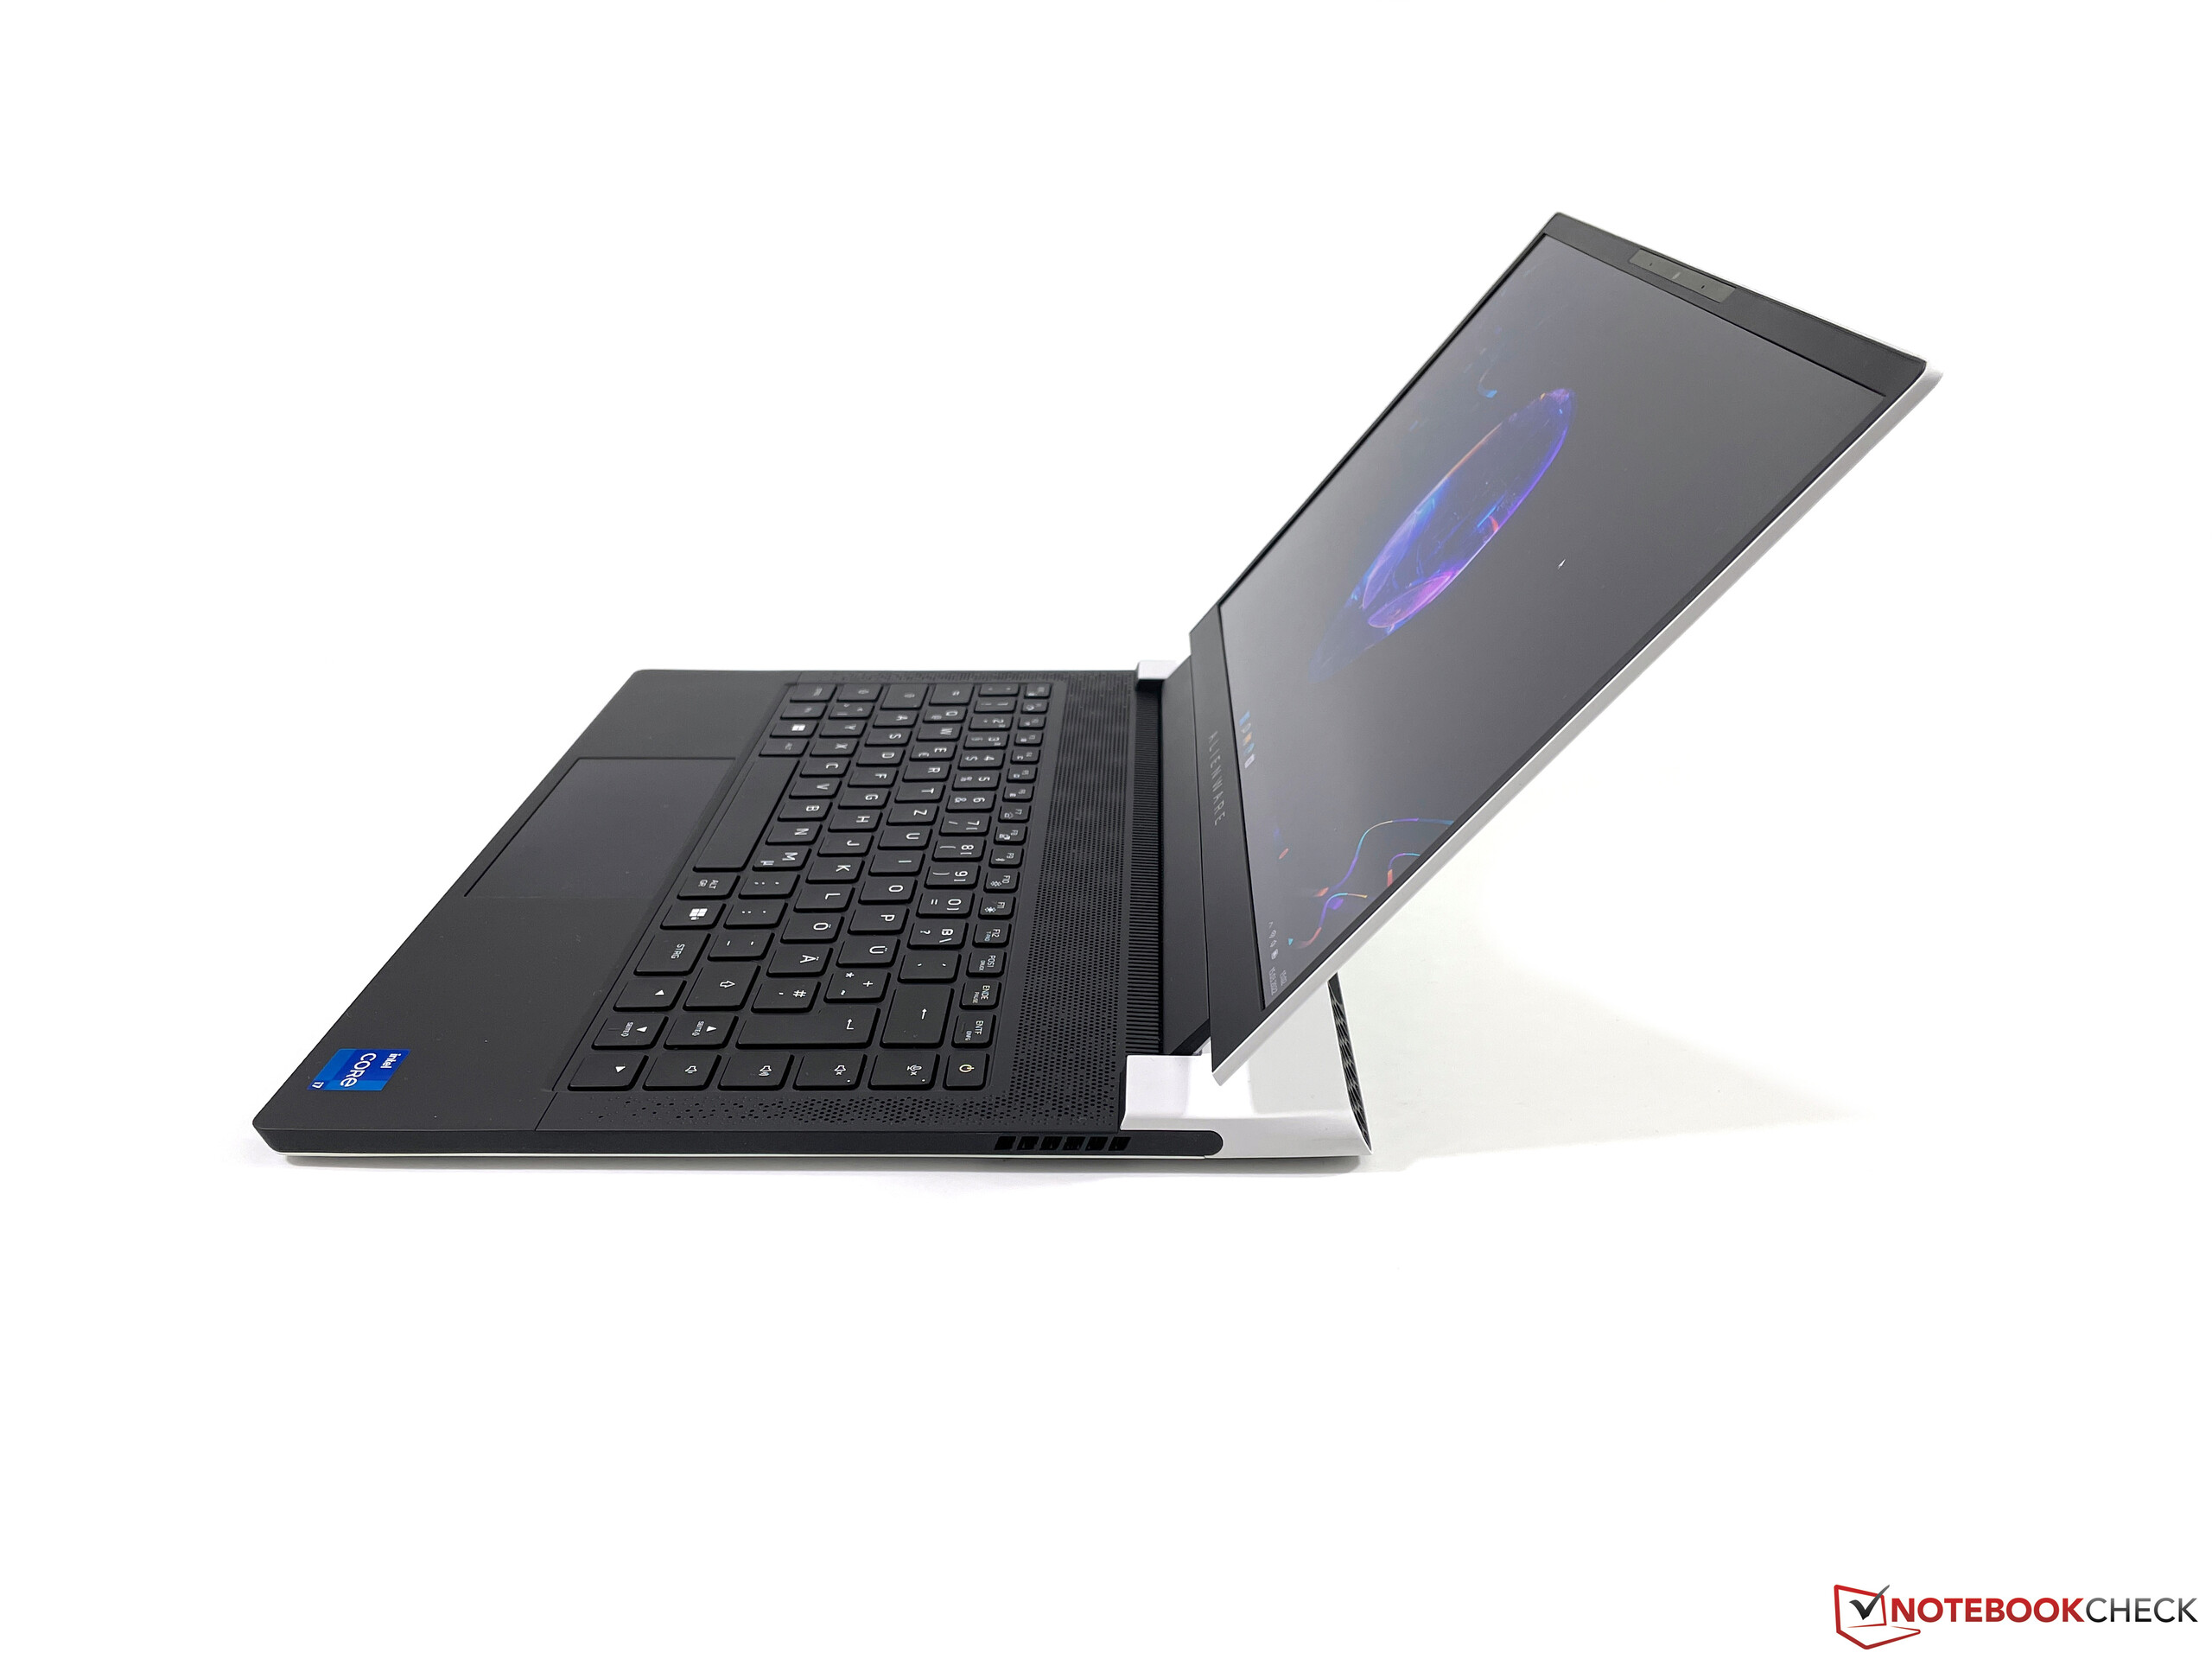
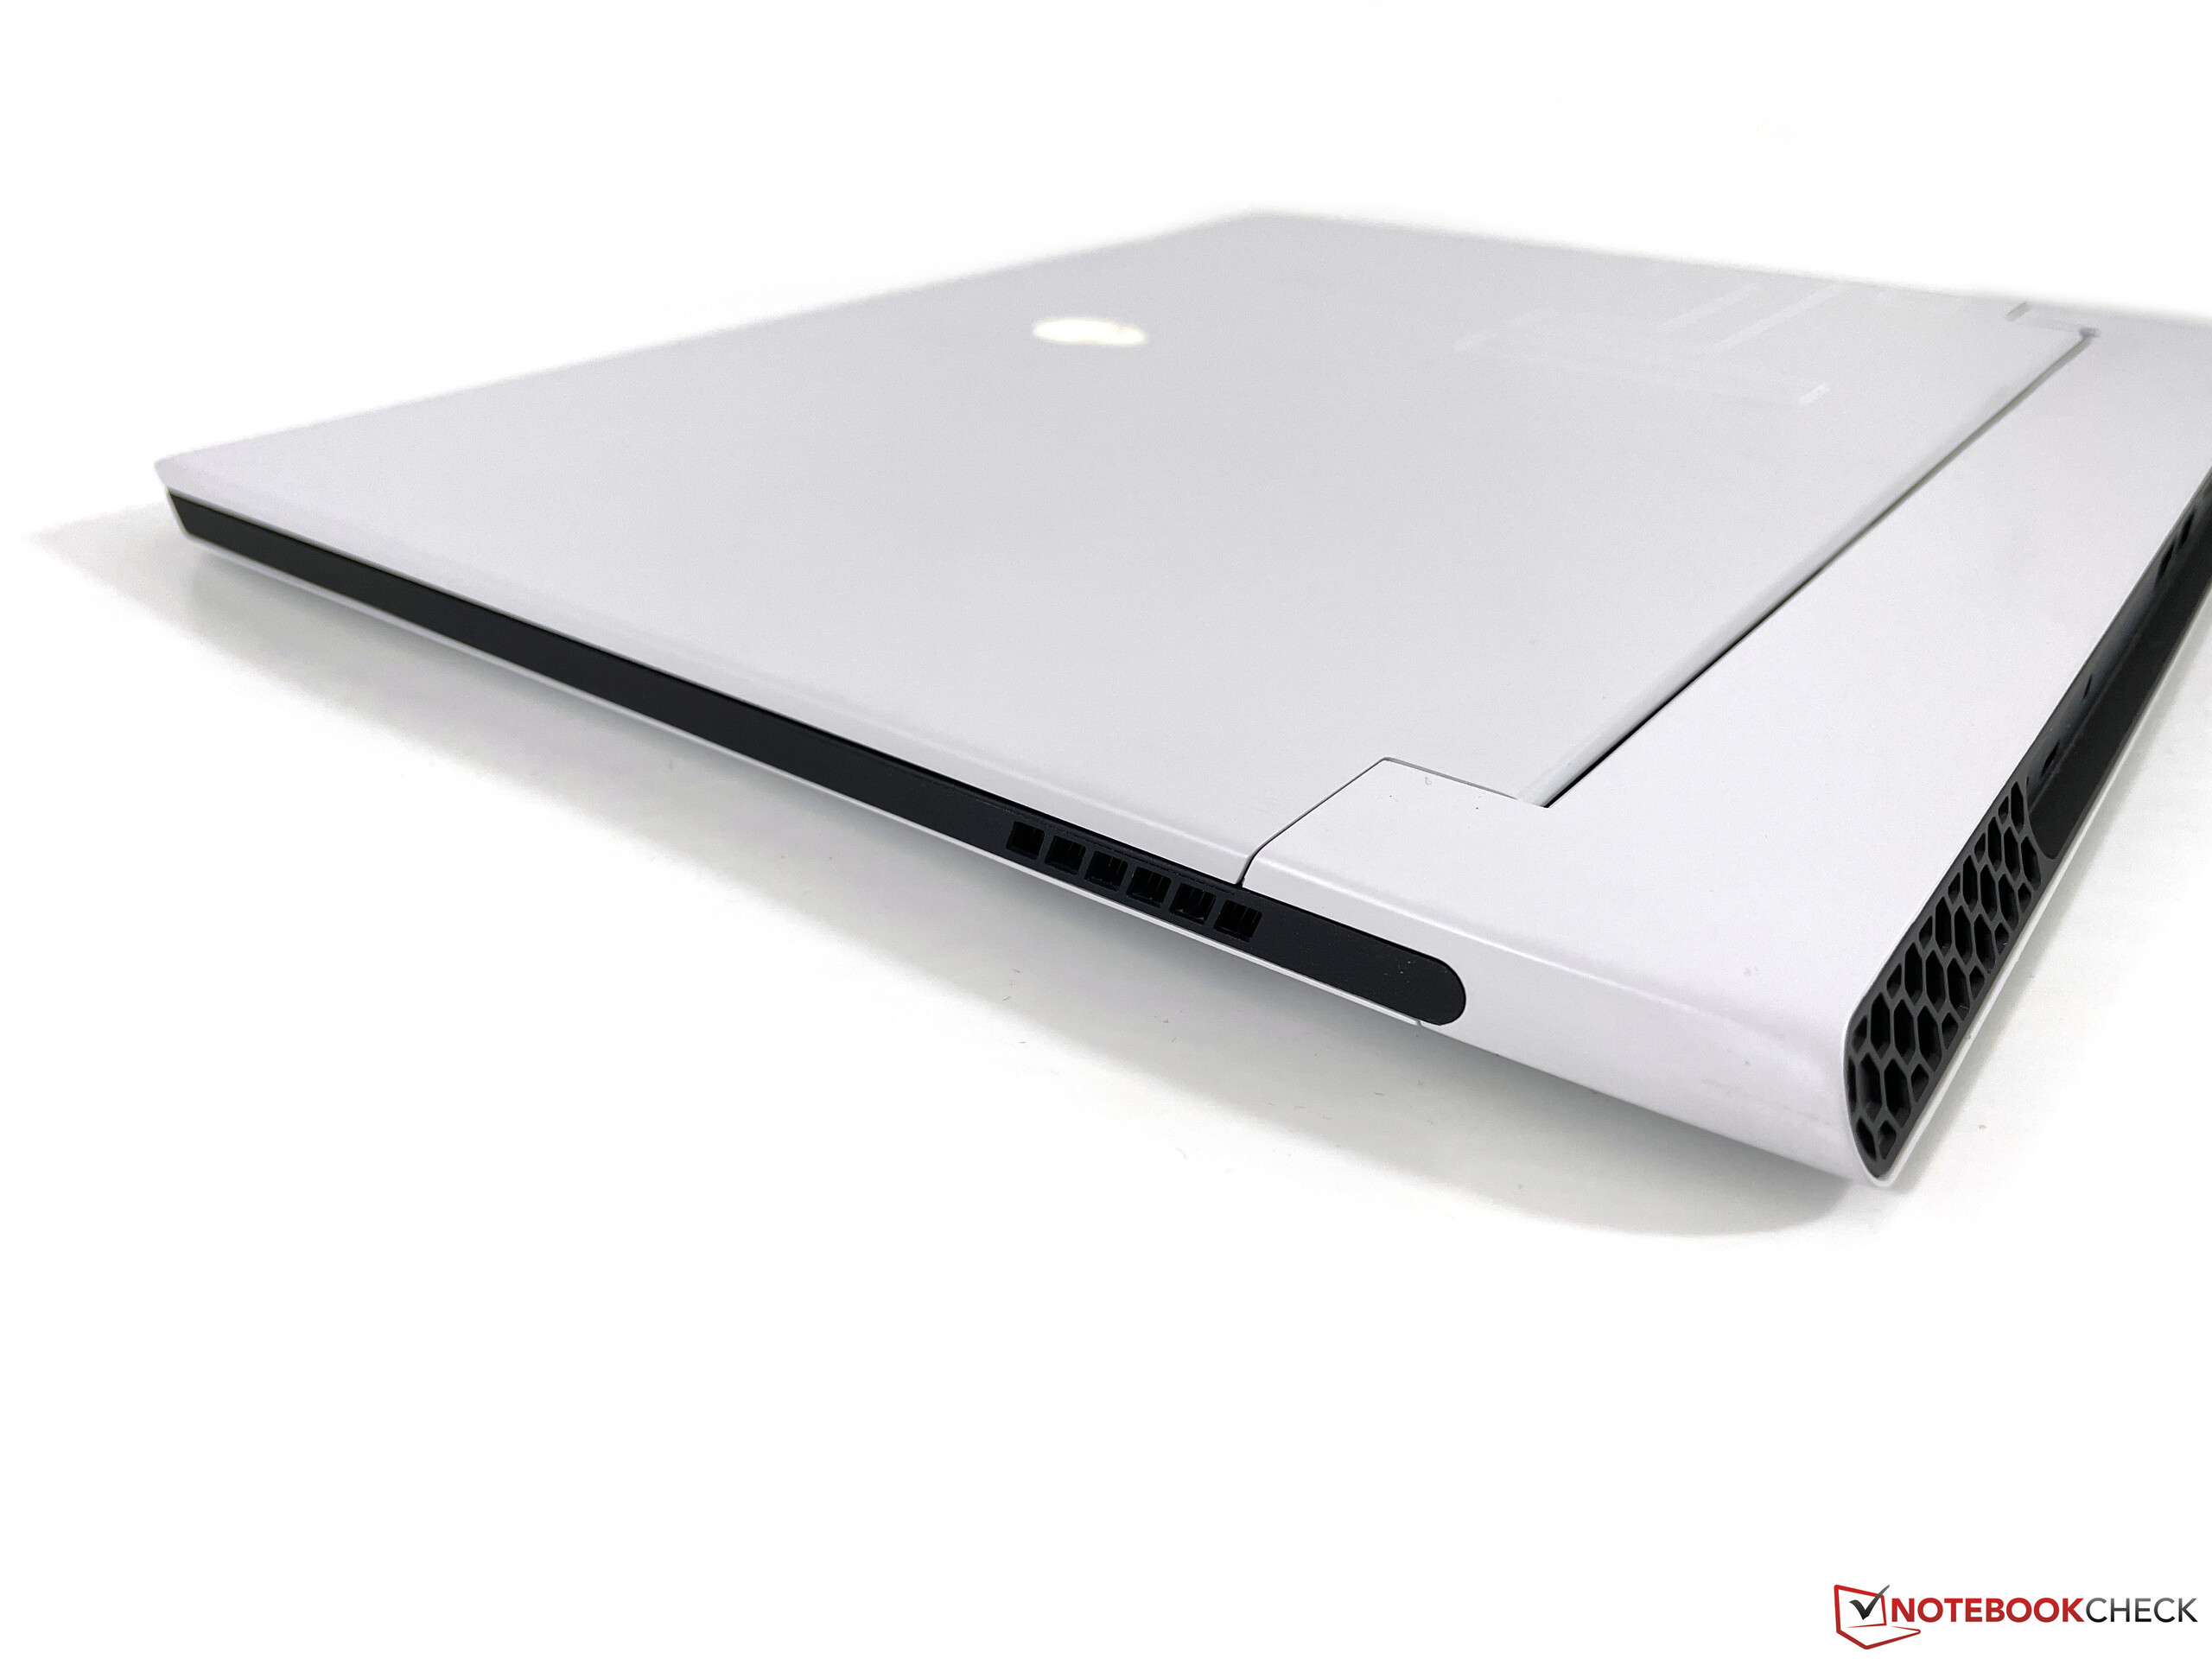
The new x14 is very slim at just 14.5 mm, but the gaming laptop is very deep due to its chassis design and it has by far the largest footprint compared to the other 14-inch laptops in our comparison group. All the rivals are pretty close in terms of weight, and in addition to the 1.8 kg for the laptop itself, you also have to add 486 grams for the 130W power adapter.
Connectivity - Alienware with Thunderbolt 4 & HDMI 2.1
There is no criticism for the ports because Dell uses the latest standards including Thunderbolt 4 and HDMI 2.1. In addition to three USB-C ports (one of them is usually blocked by the power adapter), there is also a regular USB-A port. The problem, however, is that all ports are located at the rear (even the stereo jack) and therefore hard to access.
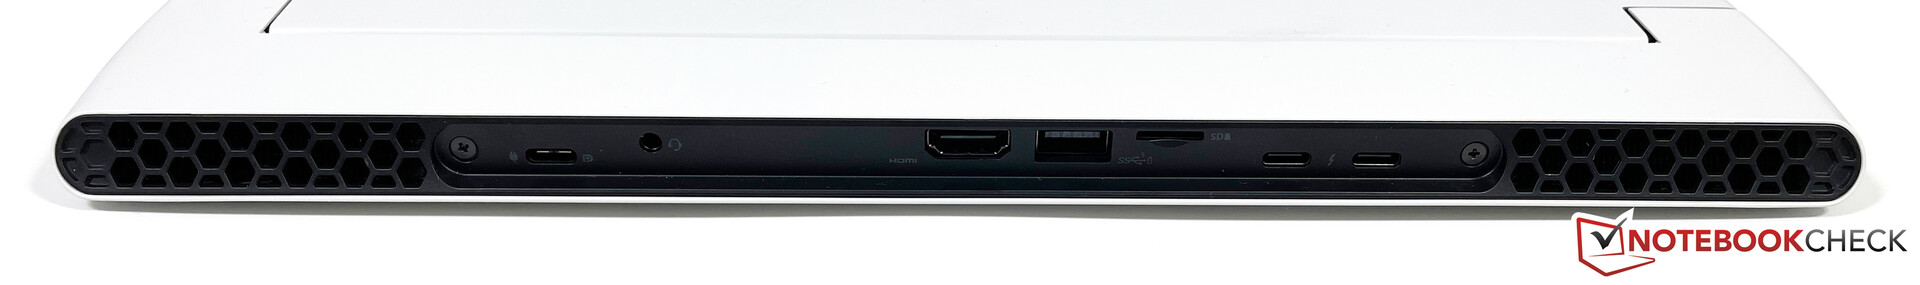
SD Card Reader
The x14 offers a microSD card reader (spring-loaded) at the rear and it accommodates the SD cards almost completely. It is a very fast module and we determine transfer rates of up to 220 MB/s and still 190 MB/s when we copy files from our reference card (Angelbird AV Pro V60).
| SD Card Reader | |
| average JPG Copy Test (av. of 3 runs) | |
| Alienware x15 RTX 3070 P111F (AV Pro V60) | |
| Alienware x14 i7 RTX 3060 (Angelbird AV Pro V60) | |
| Asus ROG Zephyrus G14 GA402RK (AV PRO microSD 128 GB V60) | |
| Average of class Gaming (20.9 - 210, n=54, last 2 years) | |
| maximum AS SSD Seq Read Test (1GB) | |
| Alienware x15 RTX 3070 P111F (AV Pro V60) | |
| Alienware x14 i7 RTX 3060 (Angelbird AV Pro V60) | |
| Asus ROG Zephyrus G14 GA402RK (AV PRO microSD 128 GB V60) | |
| Average of class Gaming (25.5 - 261, n=51, last 2 years) | |
Communication
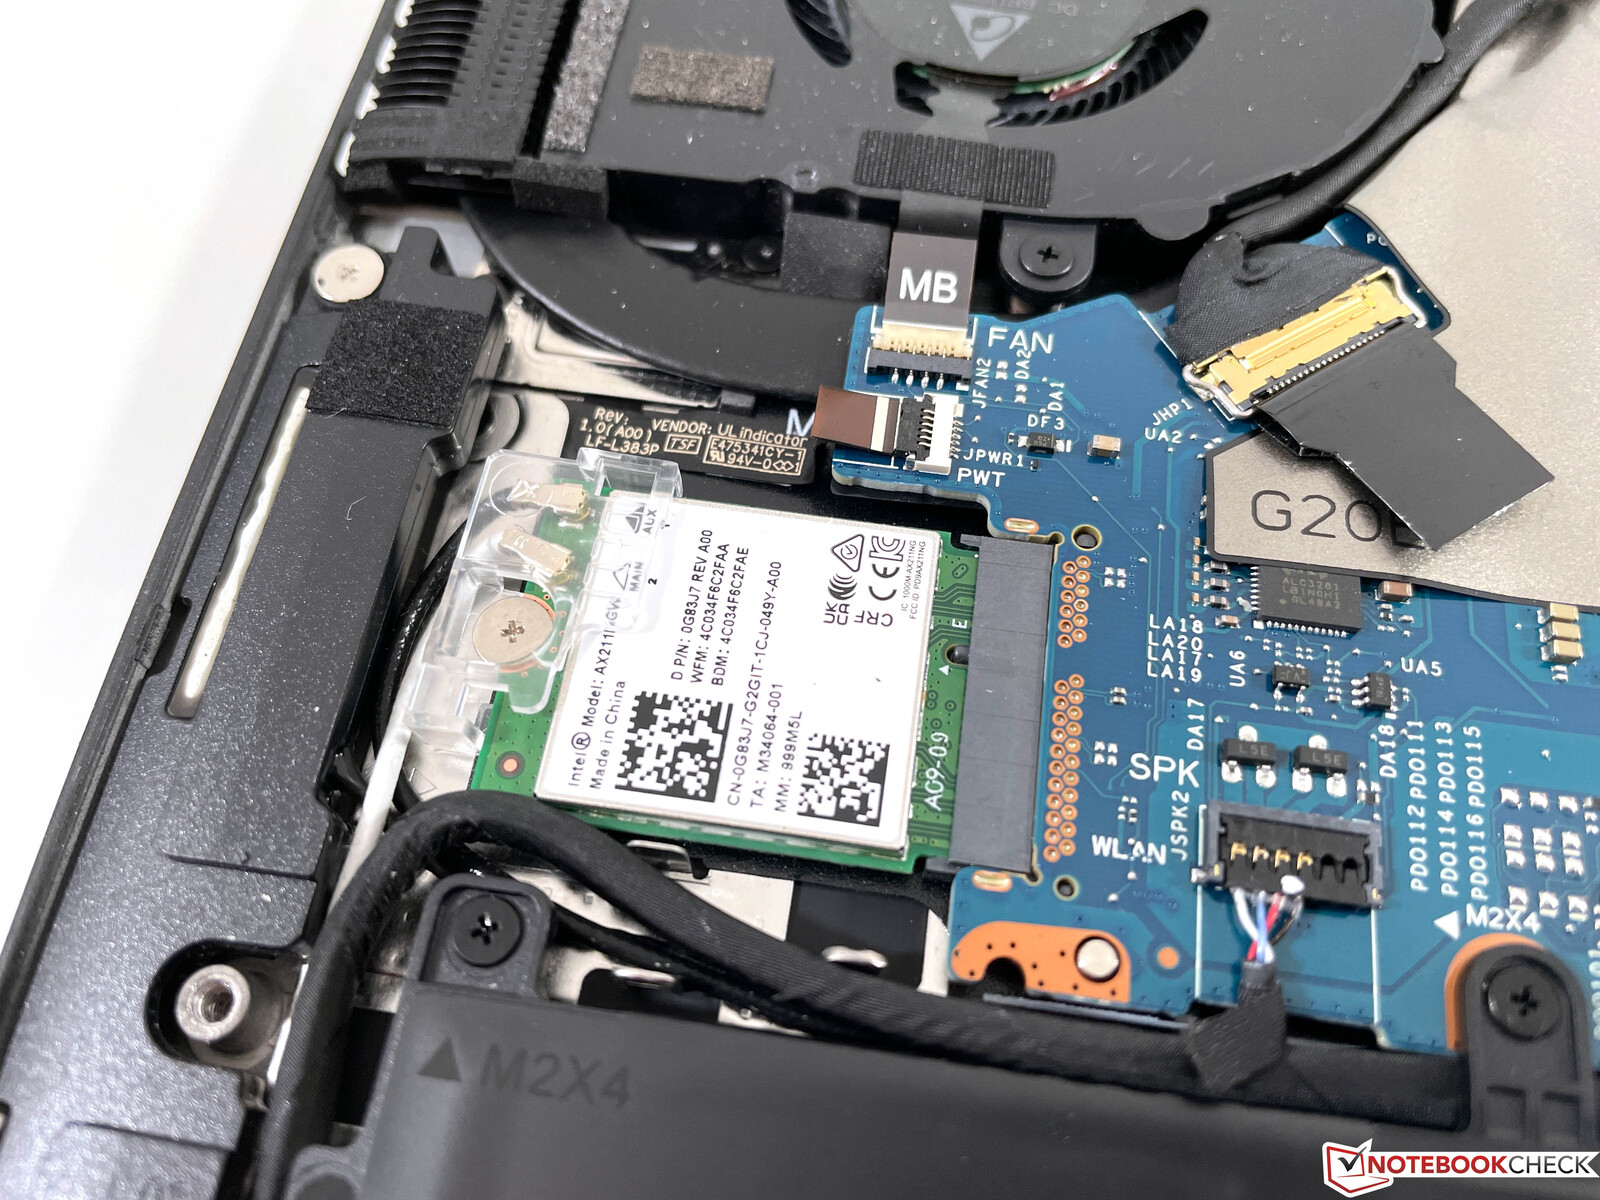
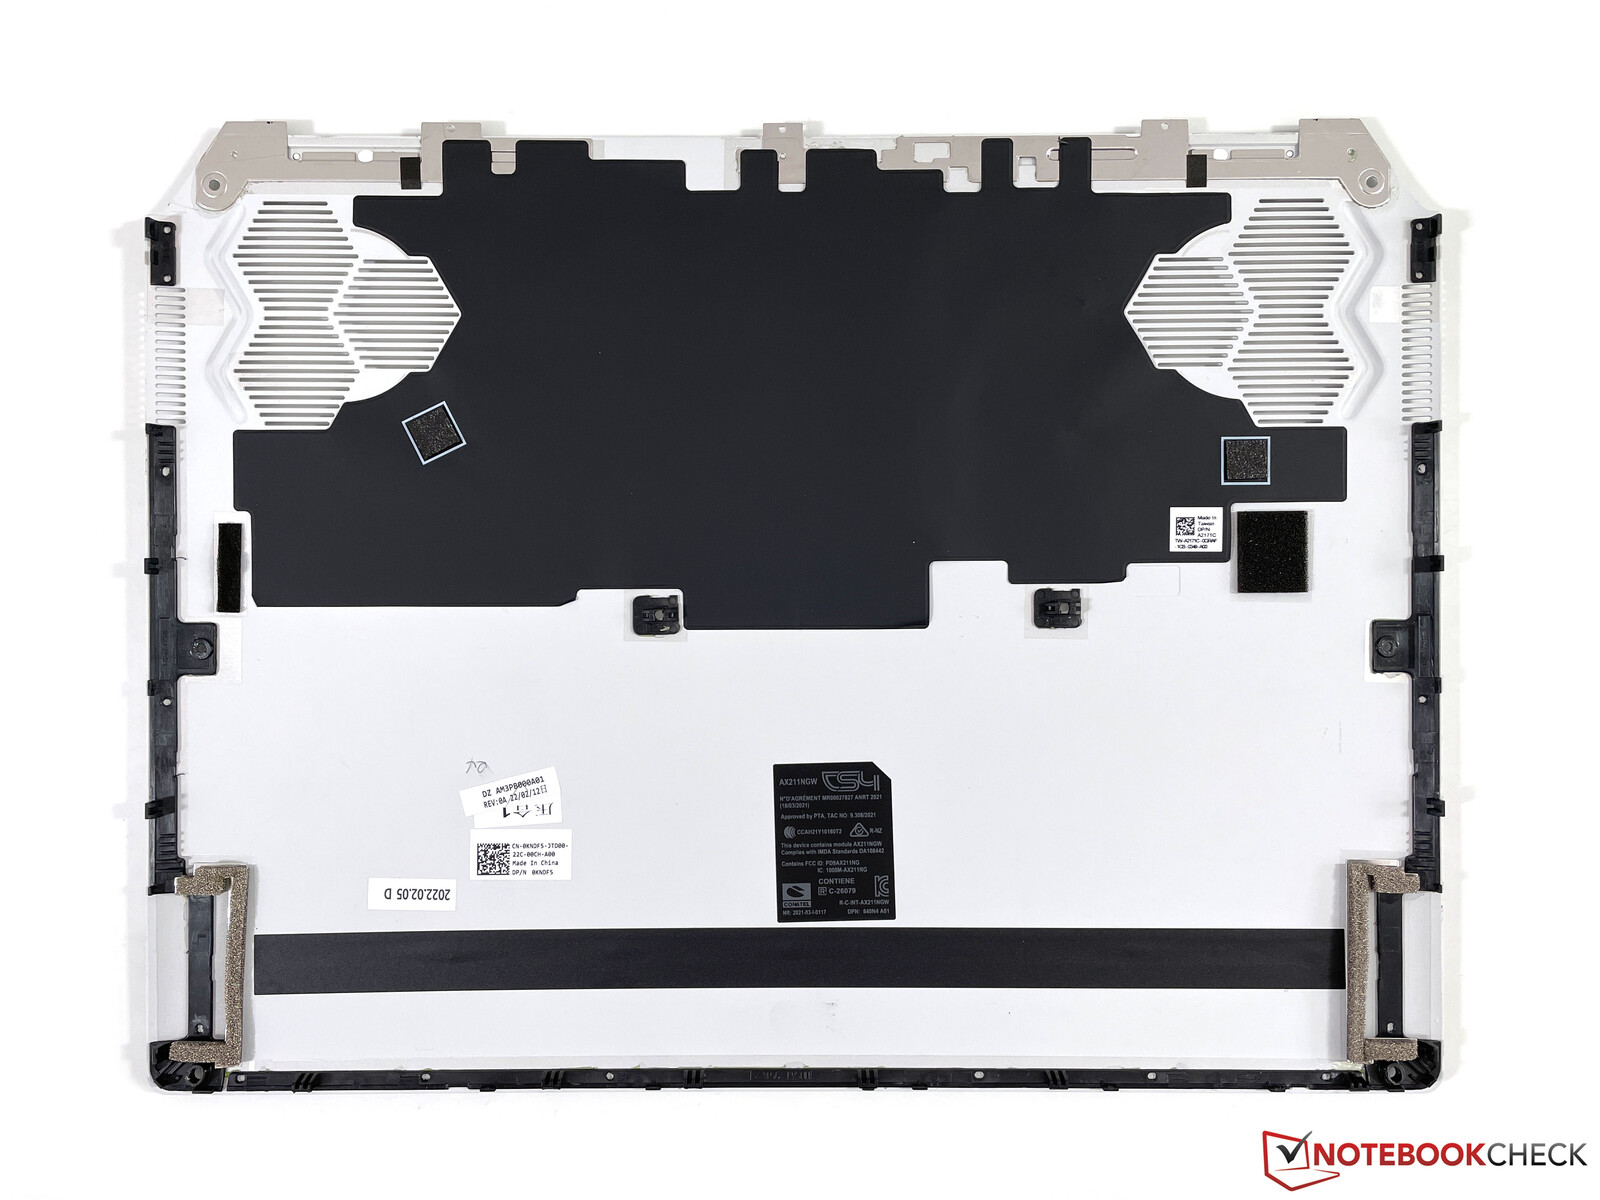
The Wi-Fi module from Intel (AX211) also supports the latest Wi-Fi 6E standard (802.11ax) including 6 GHz networks as well as Bluetooth 5.2. We determined very good transfer rates in combination with our reference router from Netgear (Nighthawk AX12) and we did not notice any issues with the signal quality during our review period, either. There is no dedicated Ethernet module, if you want to use a wired network, you will have to use a corresponding Thunderbolt adapter.
Webcam
We were a bit surprised that the Alienware x14 only features a 720p webcam, even though there seems to be sufficient space for a better sensor in the top bezel. The picture quality is not good, even in good lighting conditions, and the results are just not very crisp. The webcam does its job, but that’s about it. There is also an IR camera for facial recognition via Windows Hello.


Accessories
The box of the Alienware x14 only contains the 130W power adapter (USB-C). Dell offers plenty of accessories with the Alienware branding, including input devices, headsets, and displays.
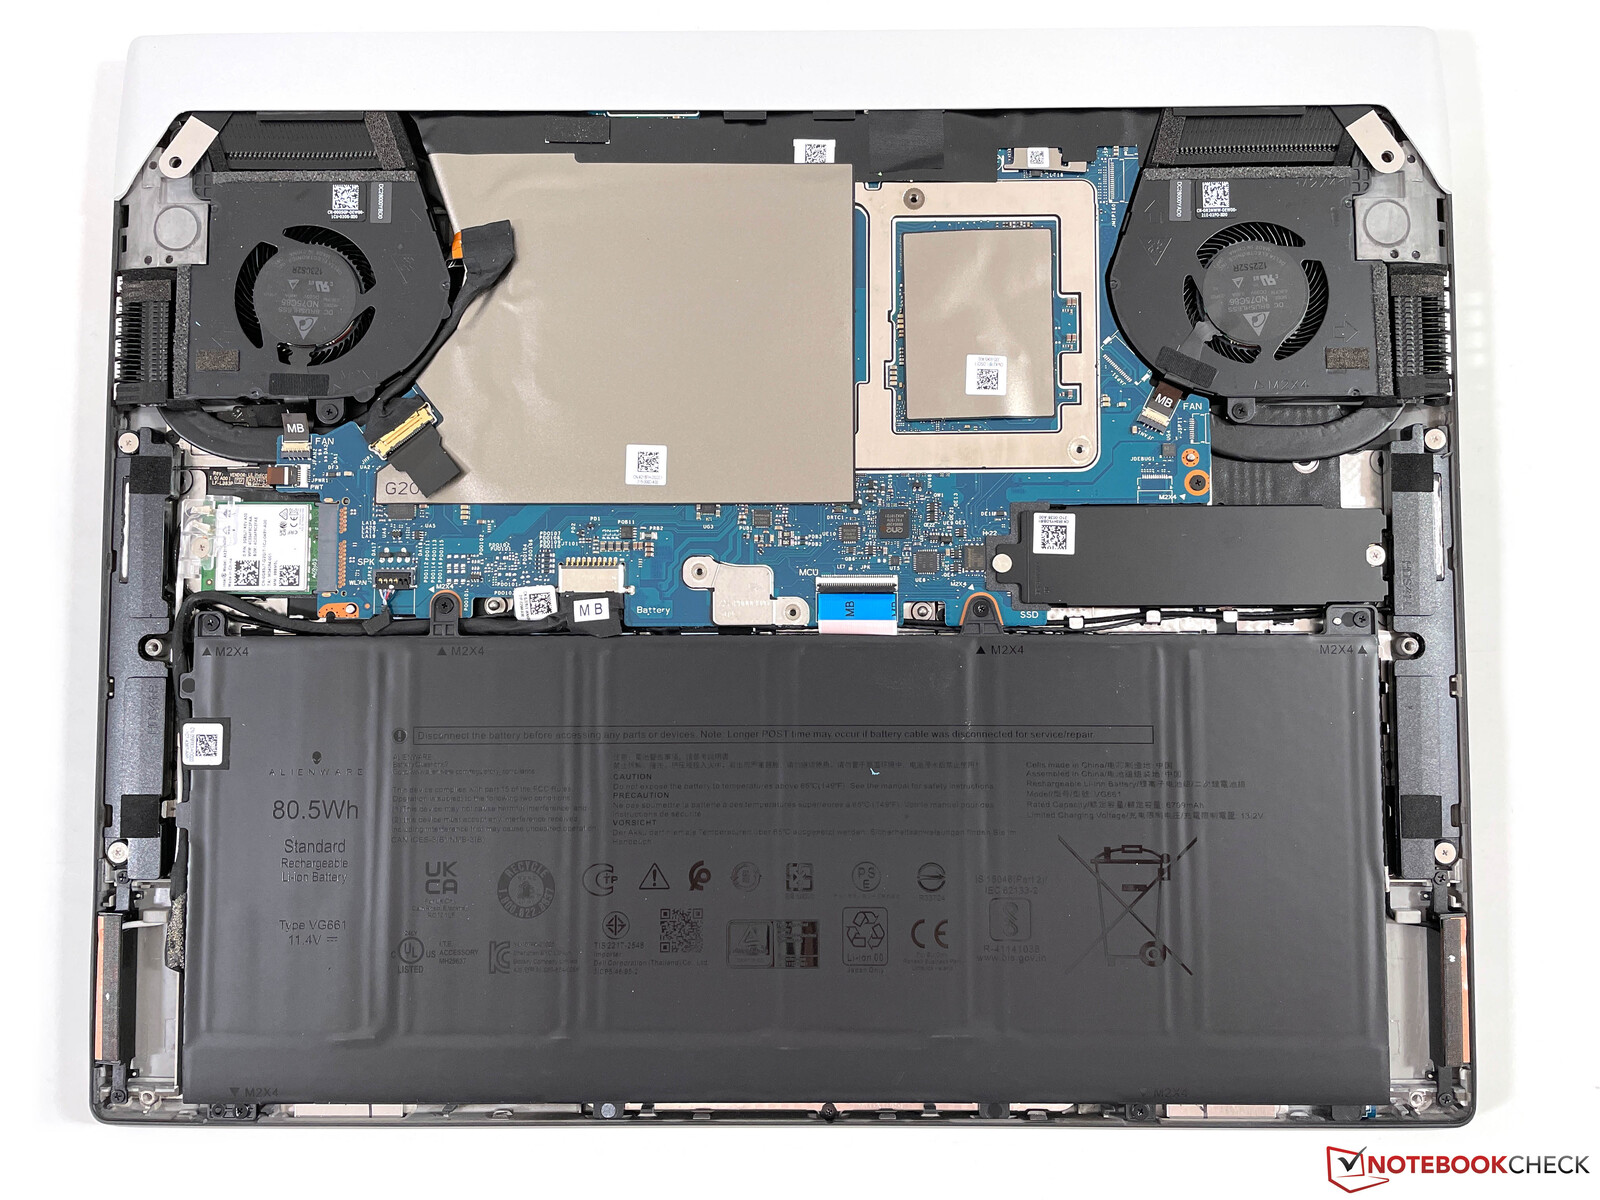
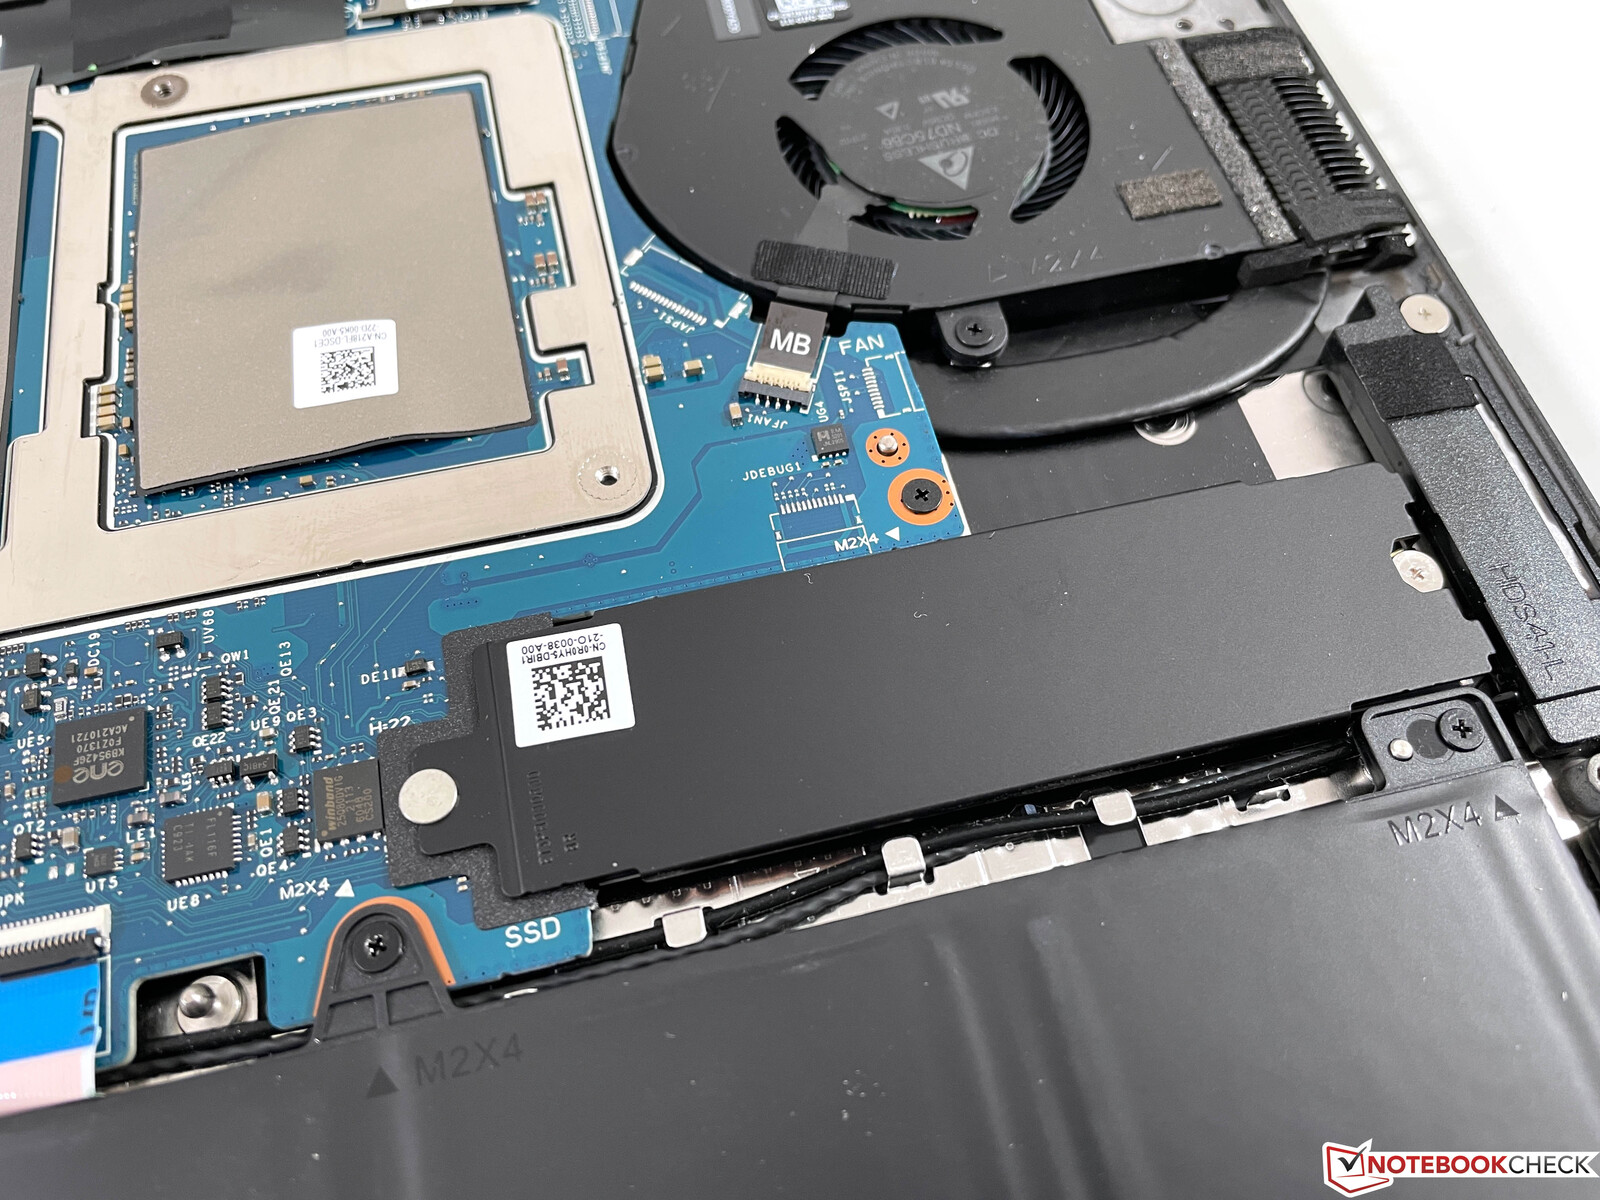
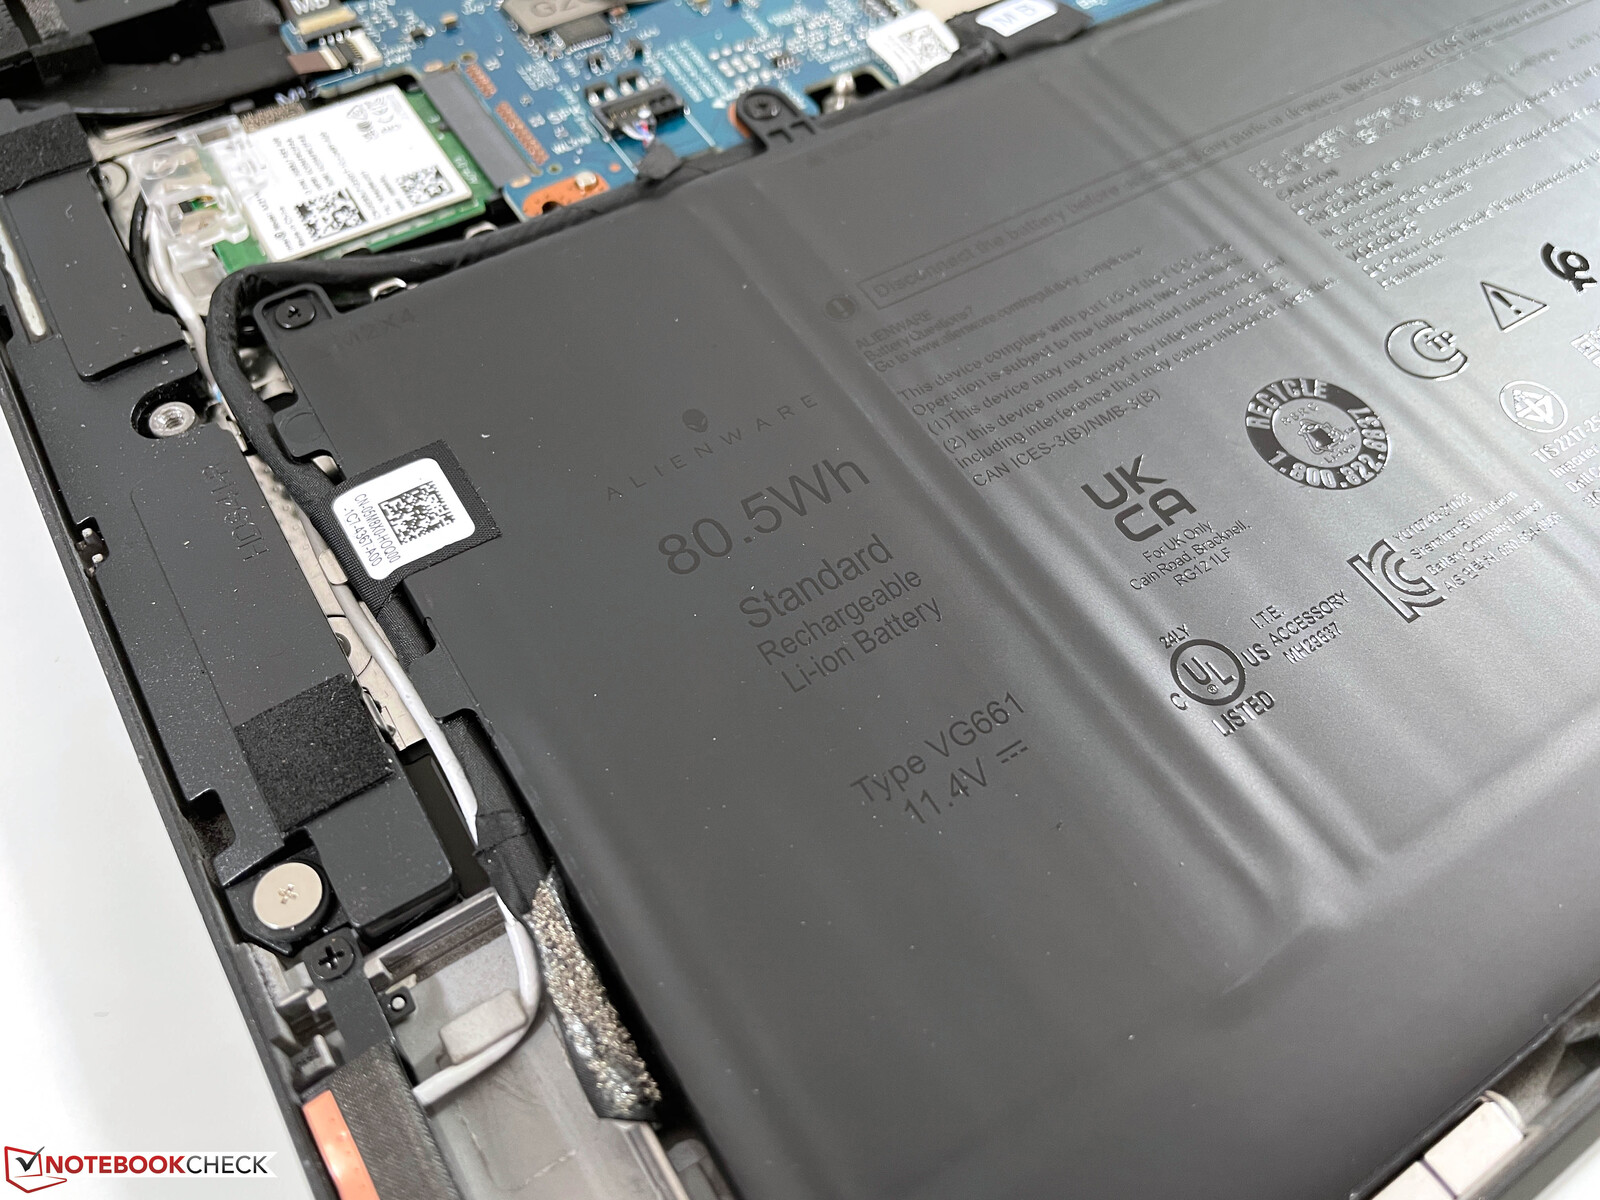
Maintenance
The panel on the bottom of the chassis is secured by six standard Philips screws, but there are additional plastic clips, which are very firm and have to be loosened first. After that, you can lift the front part and pull the whole panel towards the front. The first thing you will notice is the large battery and your maintenance options are limited to cleaning the fans and replacing the Wi-Fi module as well as the M.2 2280 SSD.
Warranty
The new x14 is shipped with premium support by default, which also included an on-site service. However, the service is limited to 12 months and you have to pay 323 Euros for an extension to three years or 562 Euros to four years. If you want to be on the safe side, there is also Premium Support Plus, which includes accidental damages (three years for 479 Euros and four years for 657 Euros).
Input Devices - x14 with reduced key travel
Keyboard
The slim construction also affects the keyboard. The basic layout (including full-size arrow keys) is identical to the larger Alienware x15, but the key travel is reduced from 1.5 mm to 1.2 mm and this is noticeable. The typing experience is not bad by any means and keystrokes are still very precise and comparatively quiet, but it is just not comfortable compared to the larger x15. The keyboard supports N-key rollover for multiple keyboard inputs simultaneously.
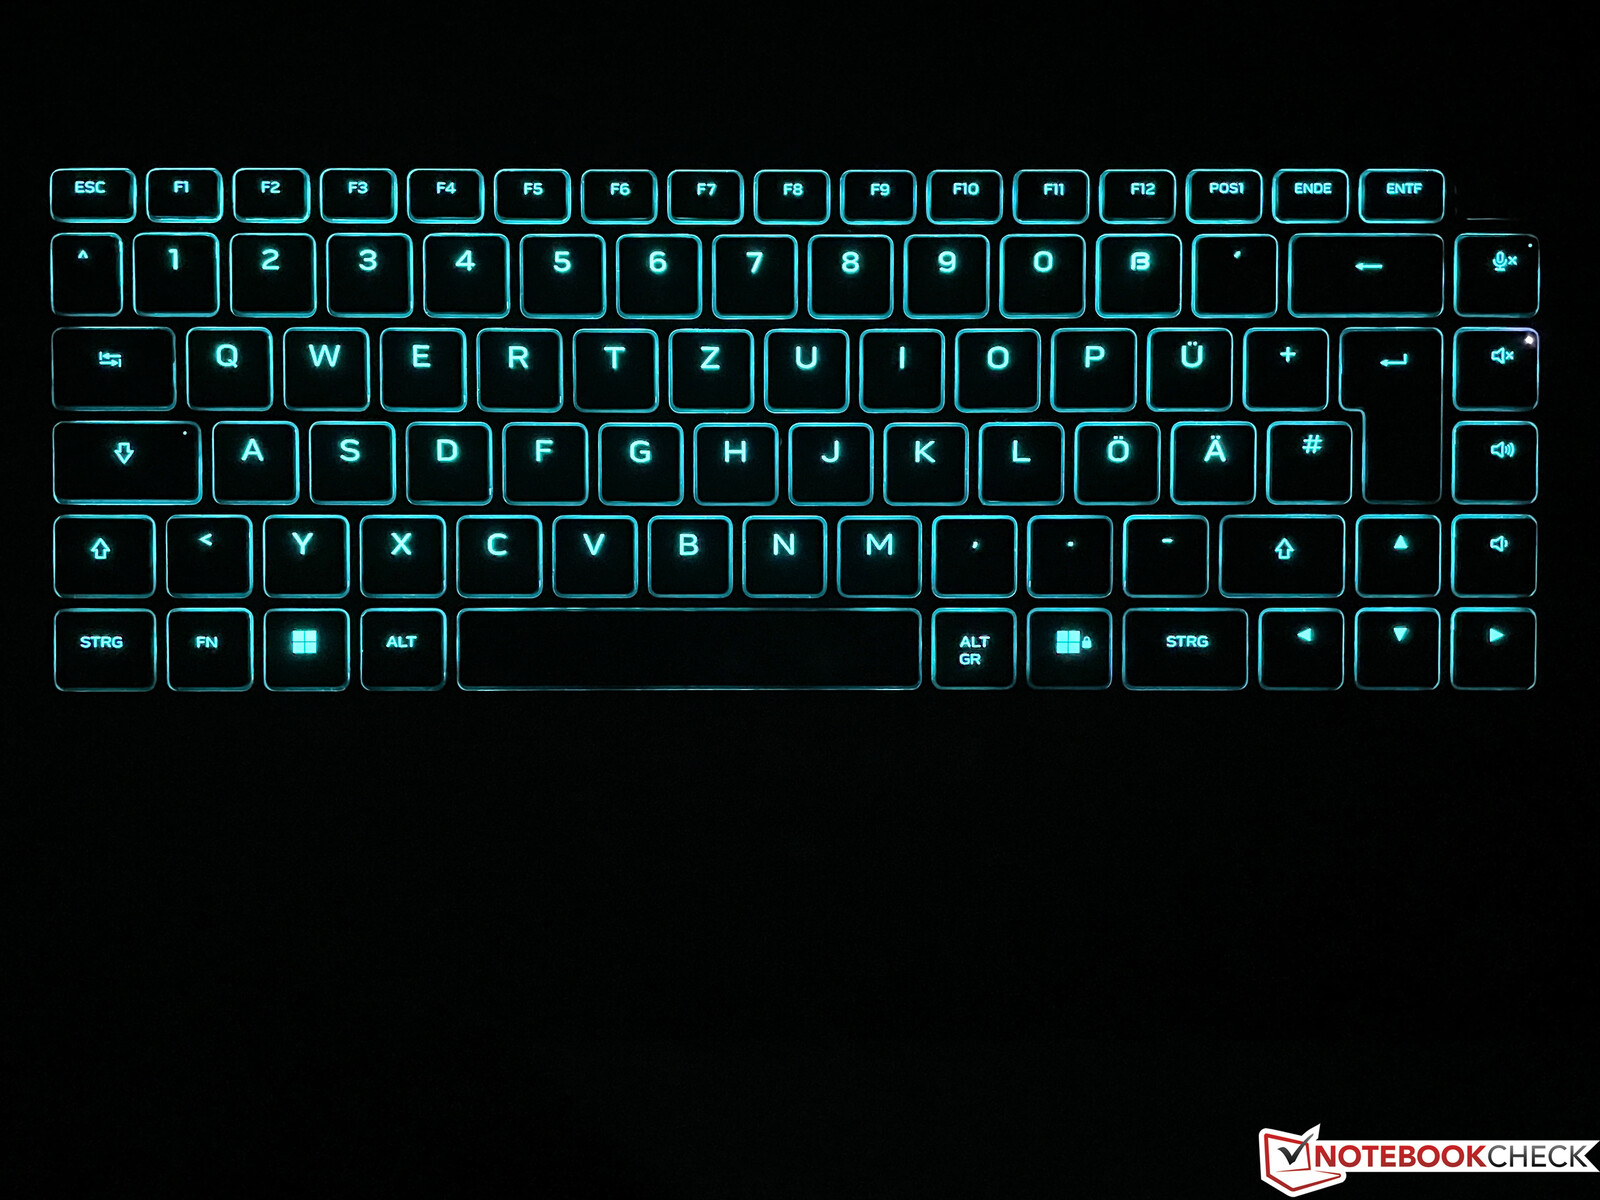
You can adjust the color of the keyboard illumination, but there is just one zone. The special functions are once again not illuminated (like volume or brightness control), which was already annoying on the larger x15. It is just hard to see the small pictograms in darker environments. The small palm rest will also be an issue if you have large hands because your palm will have to rest on the front edge of the base unit.
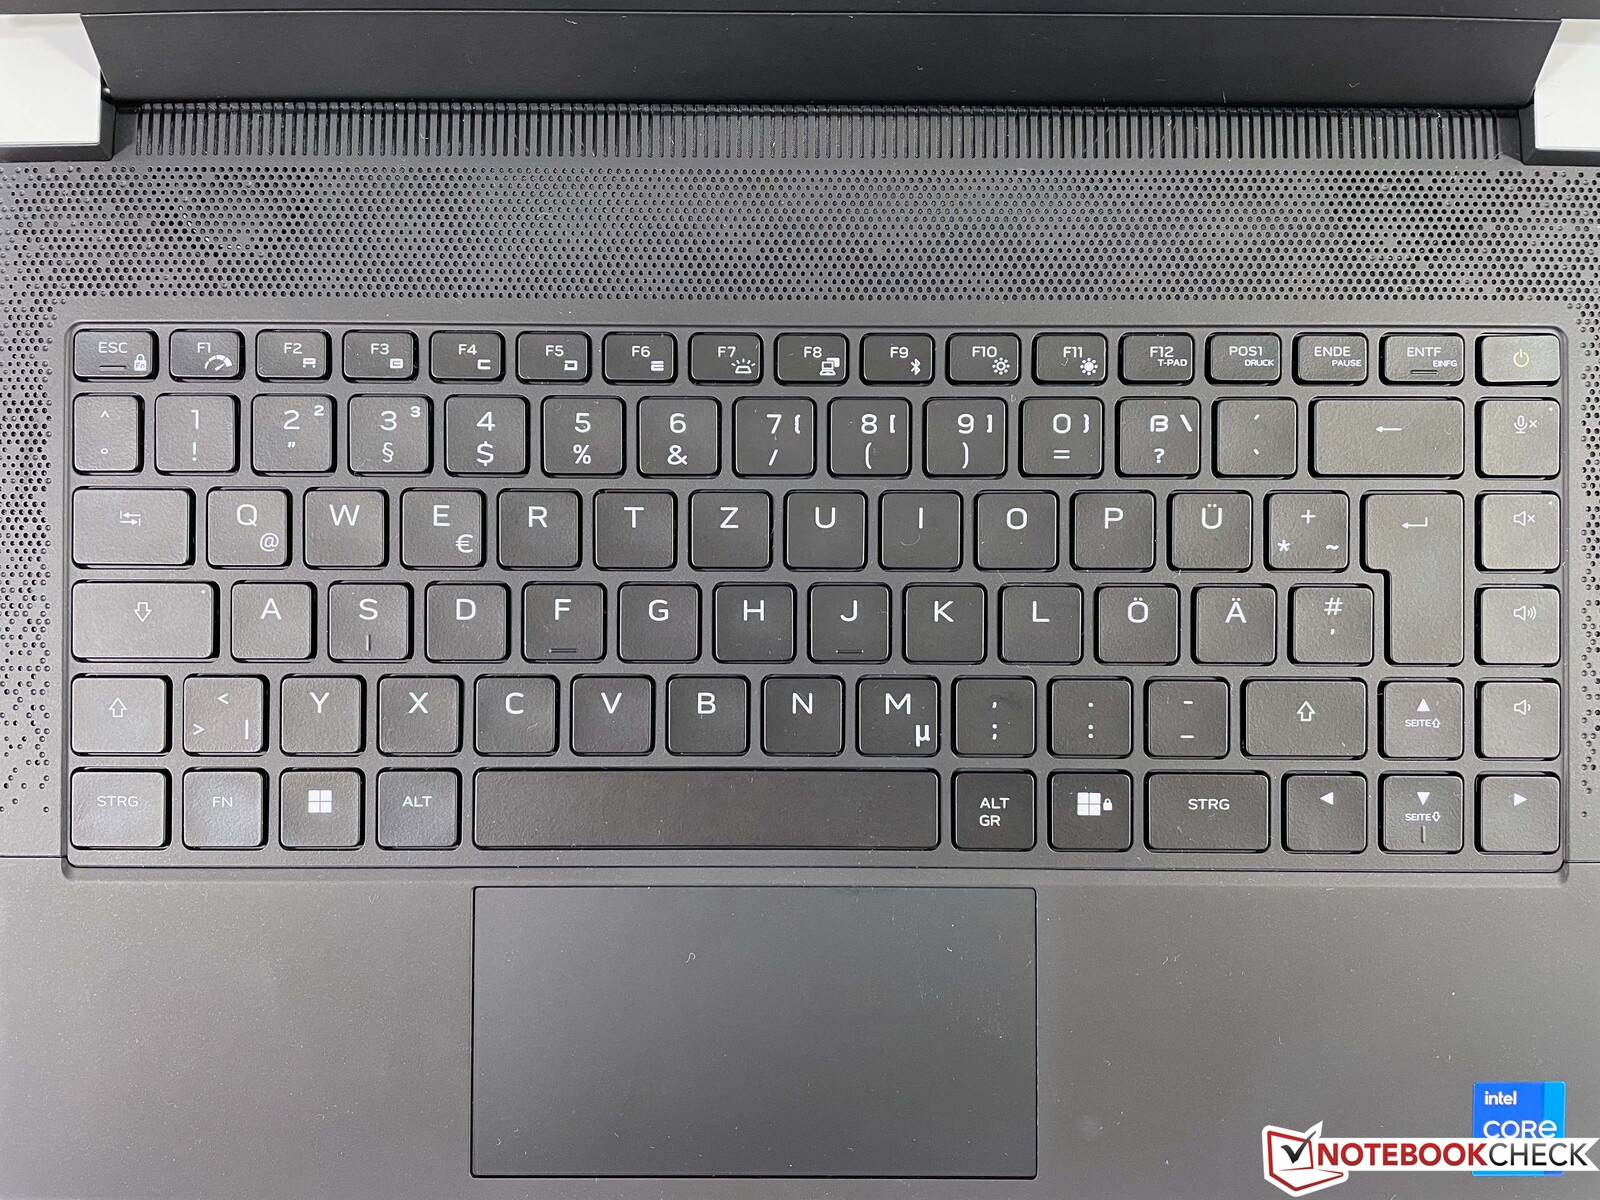
Touchpad
Due to the shifted keyboard position, there is not much room for a large touchpad, either. The height of the clickpad on the Alienware x14 is very limited at just 10.8 x 5.5 cm and you will have to reposition your fingers quite often, even during standard cursor movements. The pad itself works well and it sits a bit lower in the base unit, so it is easy to locate with the fingers, but clicking it will result in very loud noises, which appear cheap.
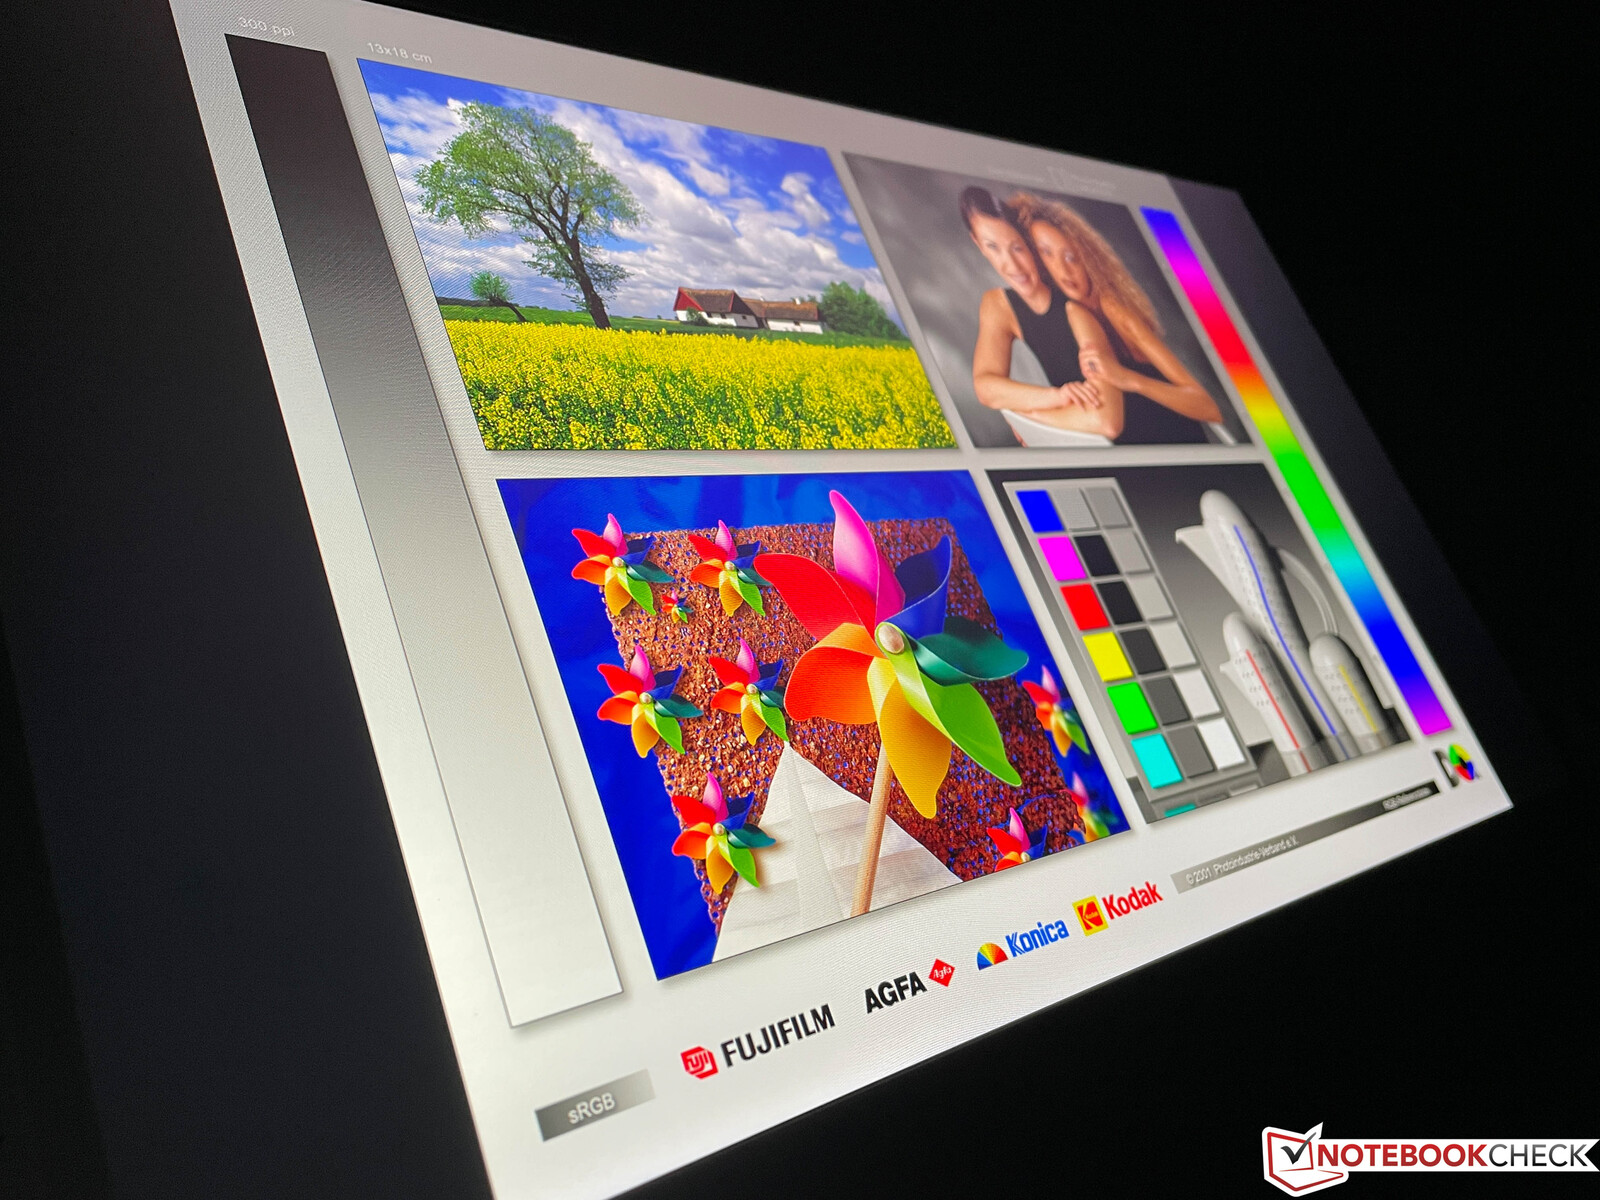
Display - x14 with 1080p and 144 Hz

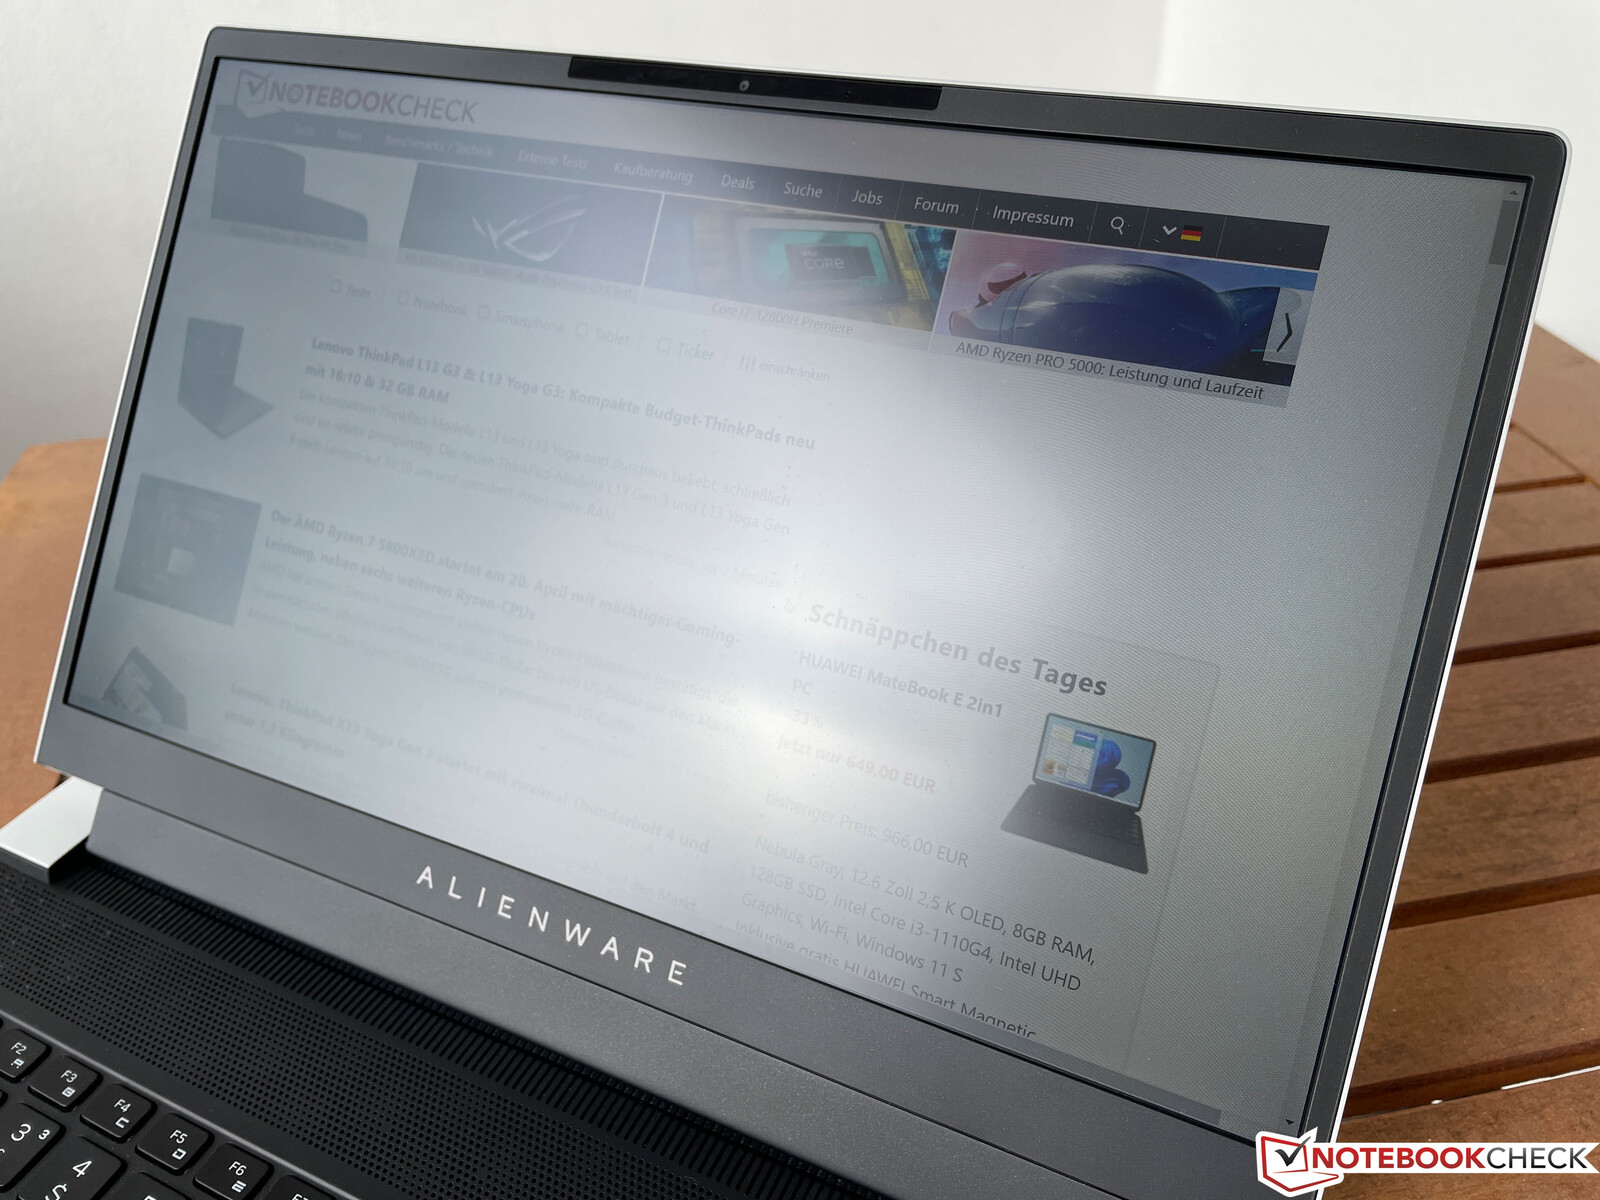
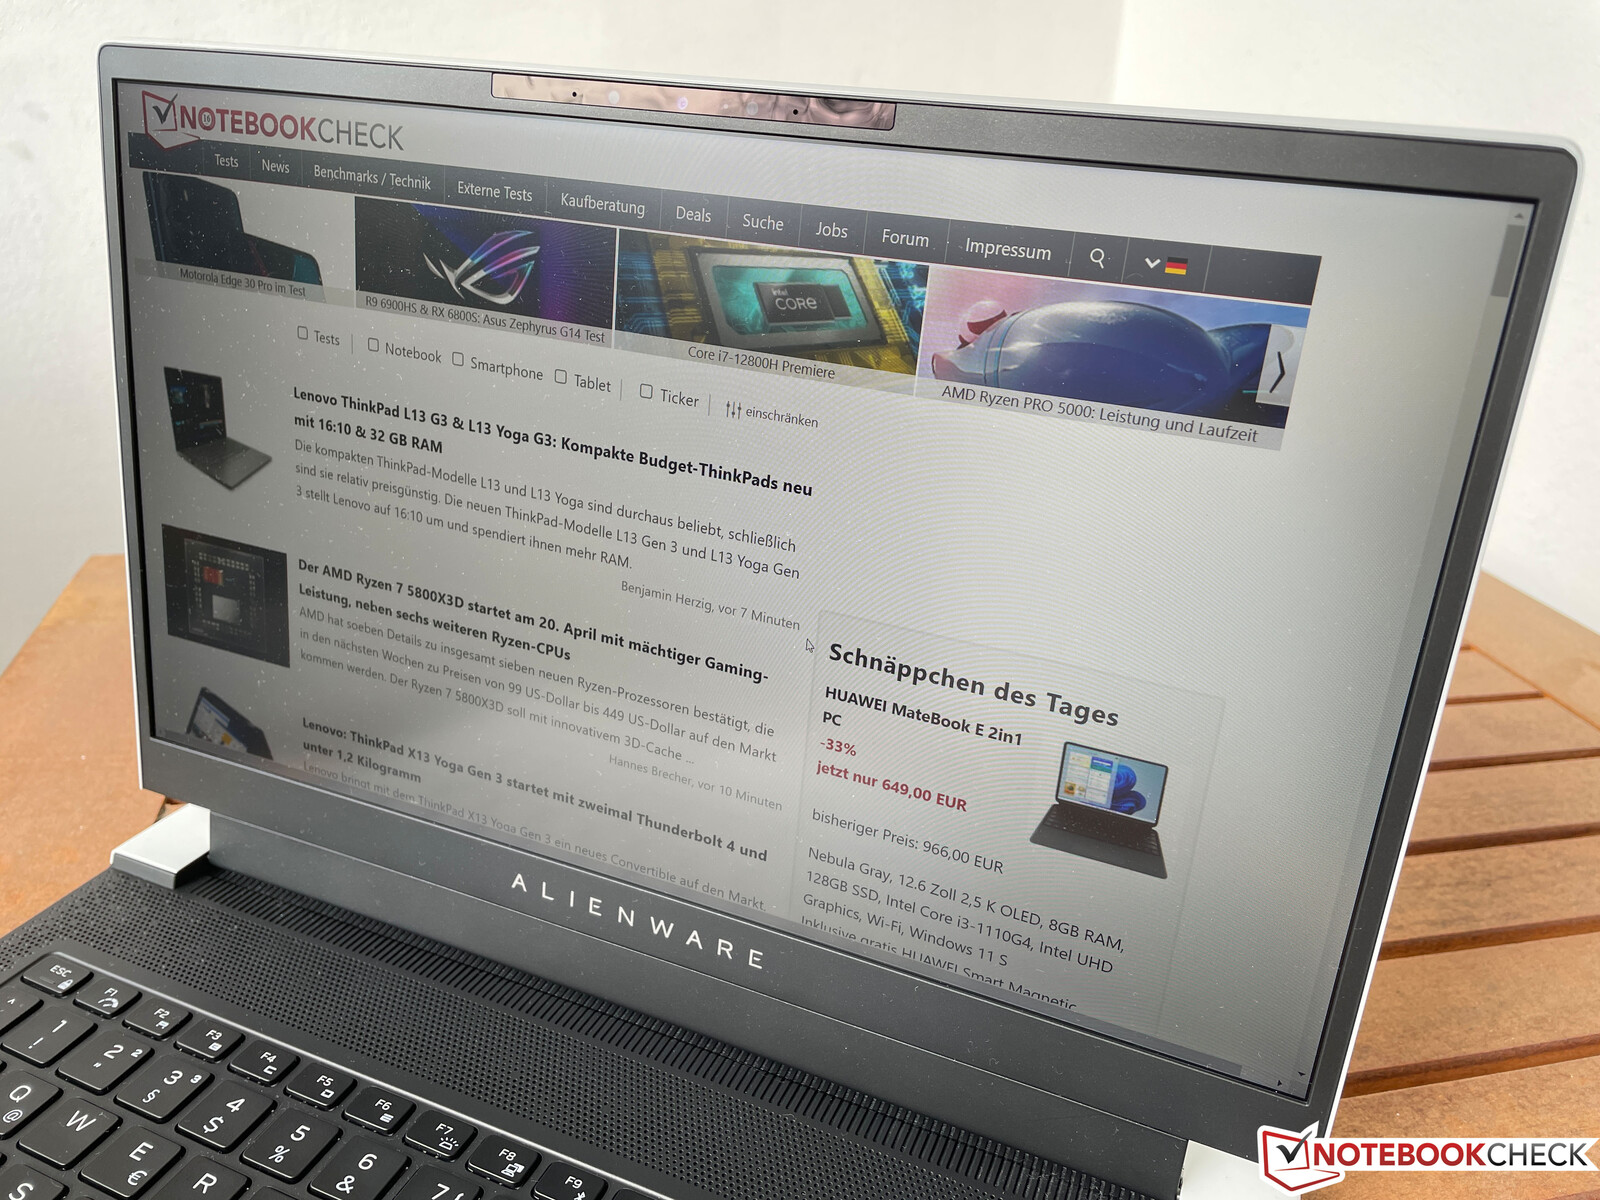
Dell only offers one display for the new Alienware x14: A matte 1080p IPS screen with 1920 x 1080 pixels (16:9) including fast response times and a high refresh rate of 144 Hz. This is certainly a good choice for a gaming laptop, but some users would probably prefer a higher-res option. The display from Sharp also supports Nvidia’s G-Sync as well as Advanced Optimus technologies.
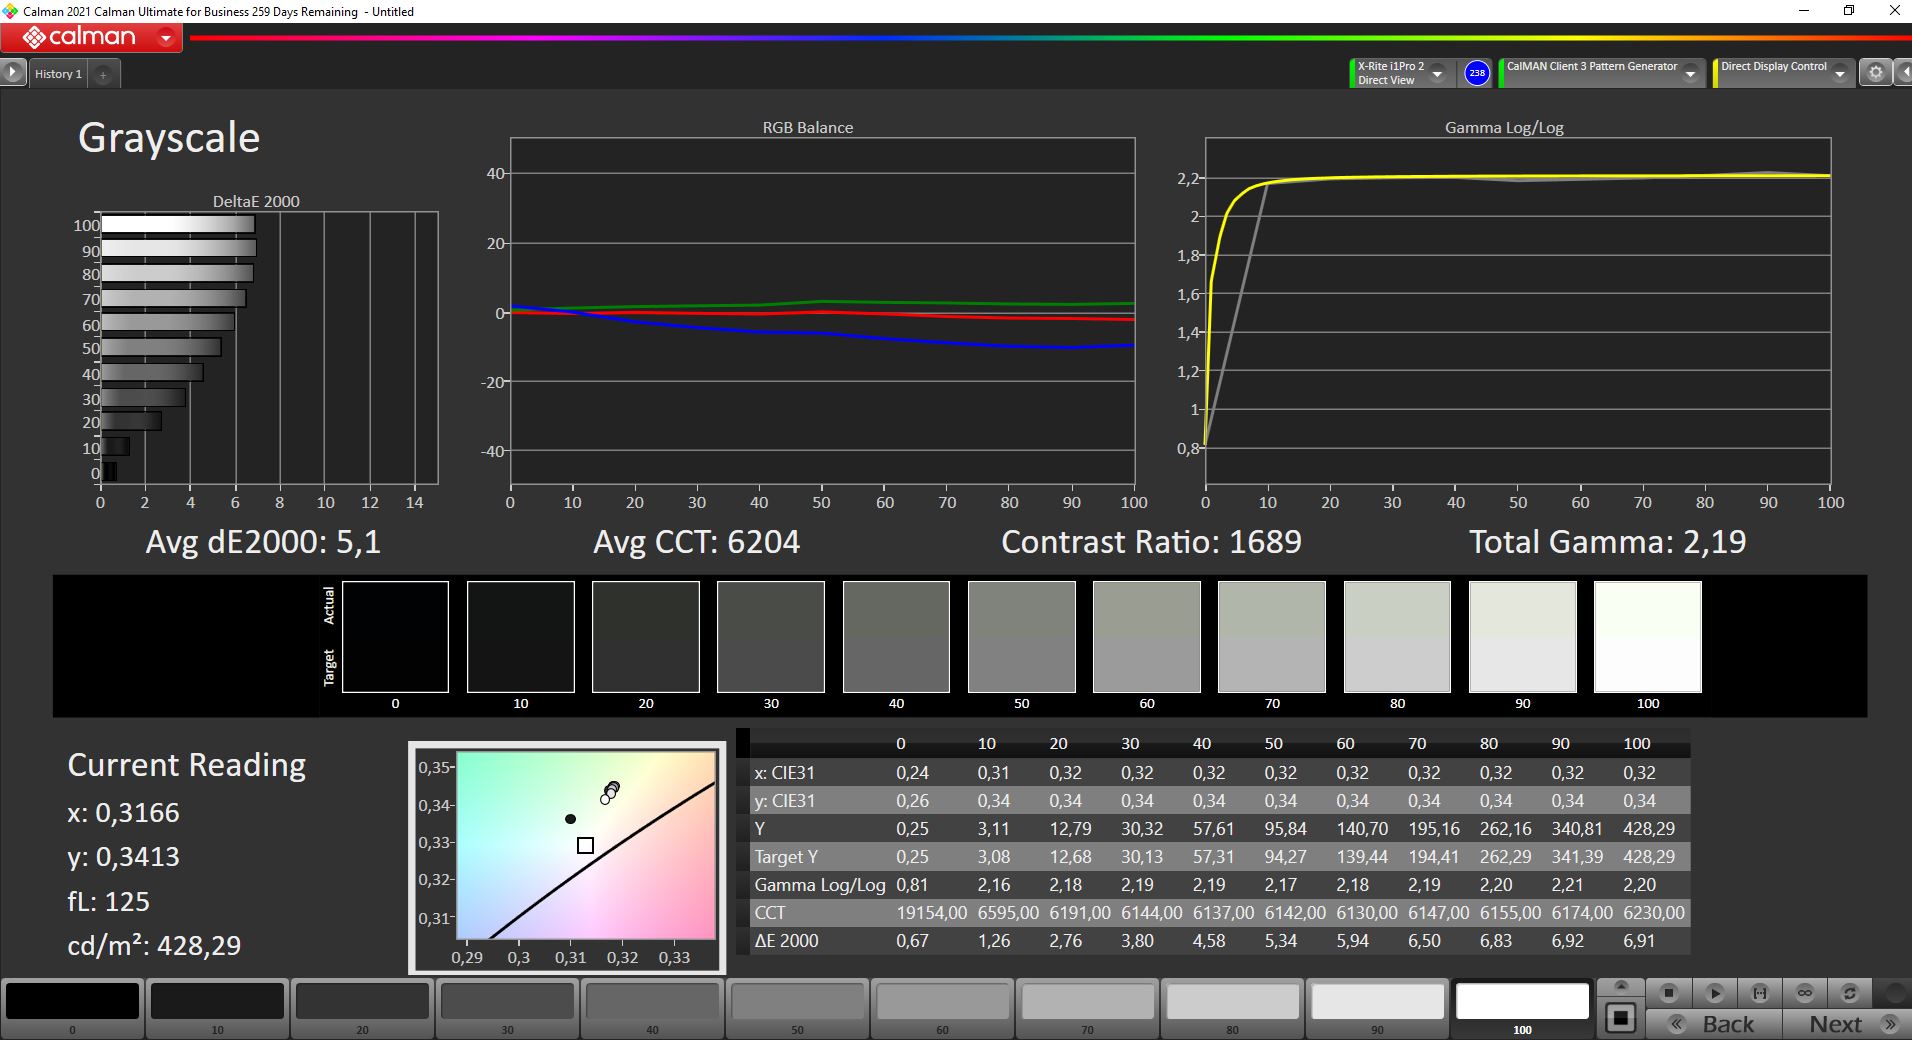
We determine an average brightness of little more than 400 nits and the decent black value of 0.25 results in a very good contrast ratio of more than 1700:1. The subjective picture impression is also very good and movements, in particular, are very smooth thanks to the refresh rate and the fast response times. However, compared to OLED screens, the pictures are just not vibrant and crisp.
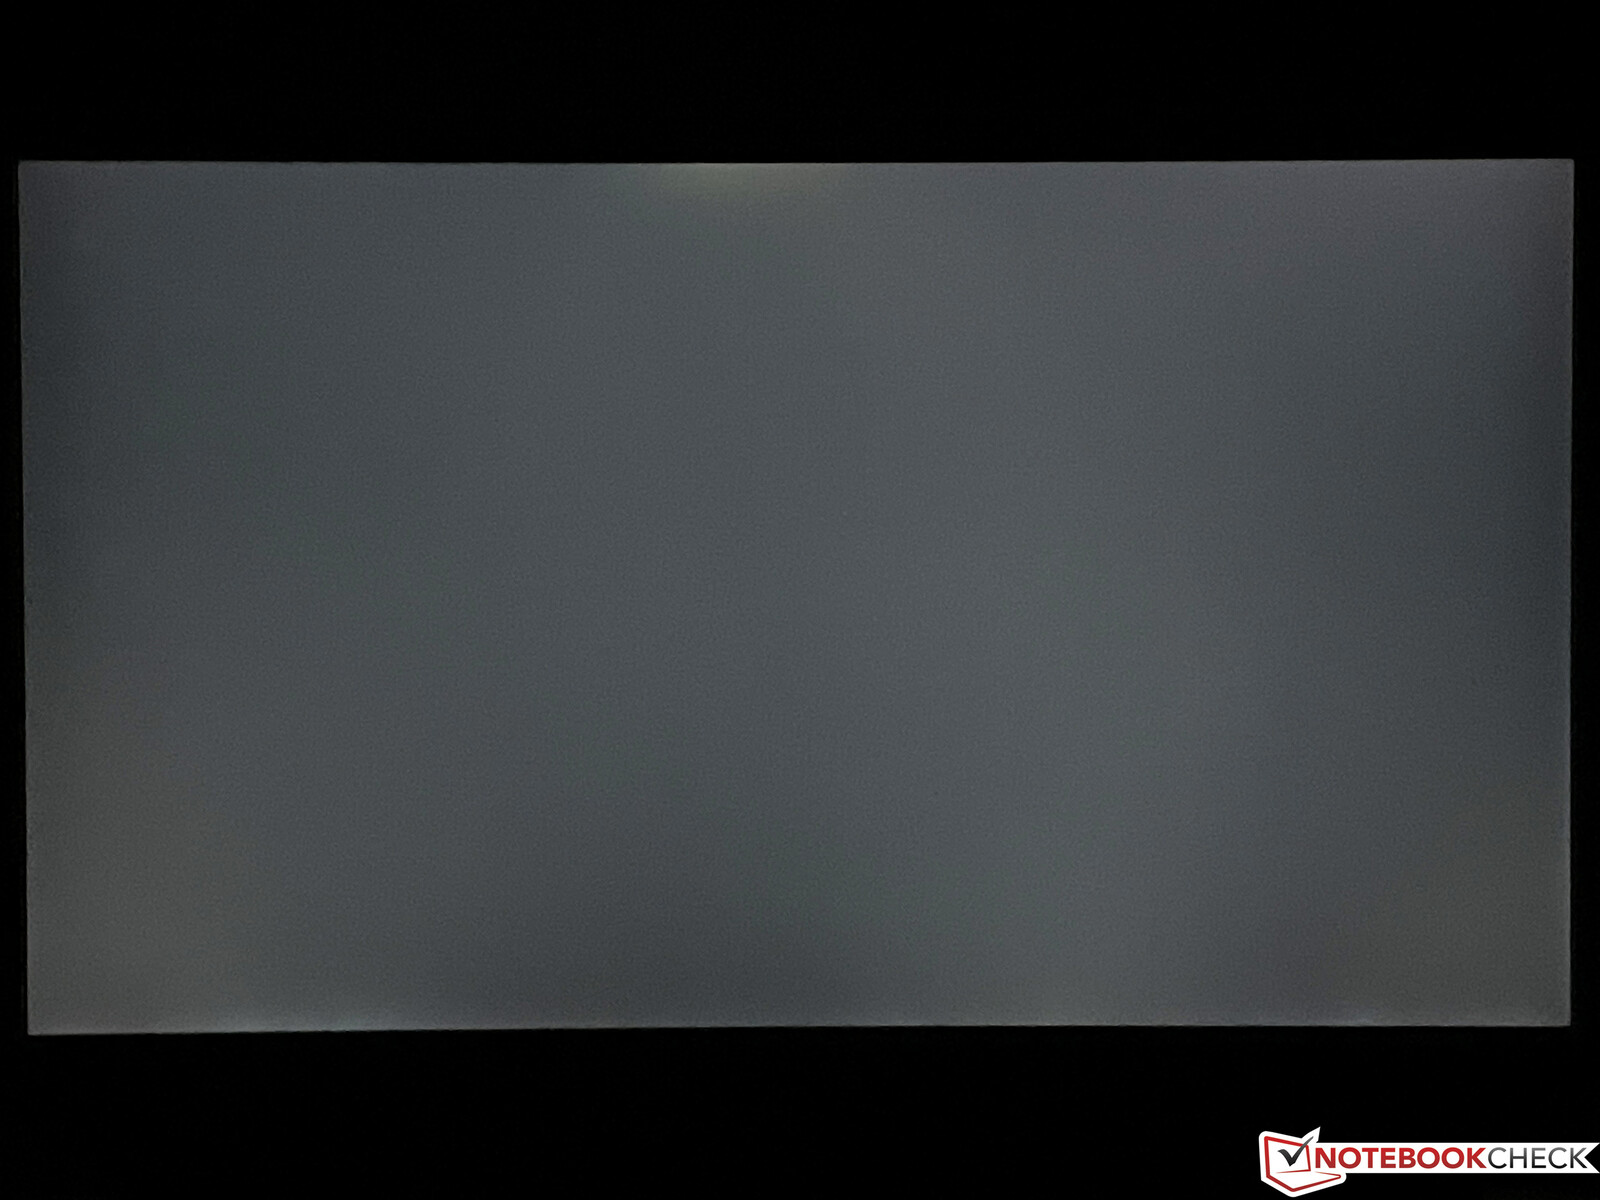
You can only notice some backlight bleeding along the edges on a dark background with high brightness levels, but they are not visible in everyday scenarios. We cannot detect PWM flickering and the measured response times are very fast.
| |||||||||||||||||||||||||
Brightness Distribution: 89 %
Center on Battery: 432 cd/m²
Contrast: 1736:1 (Black: 0.25 cd/m²)
ΔE ColorChecker Calman: 3 | ∀{0.5-29.43 Ø4.71}
calibrated: 0.7
ΔE Greyscale Calman: 5.1 | ∀{0.09-98 Ø4.96}
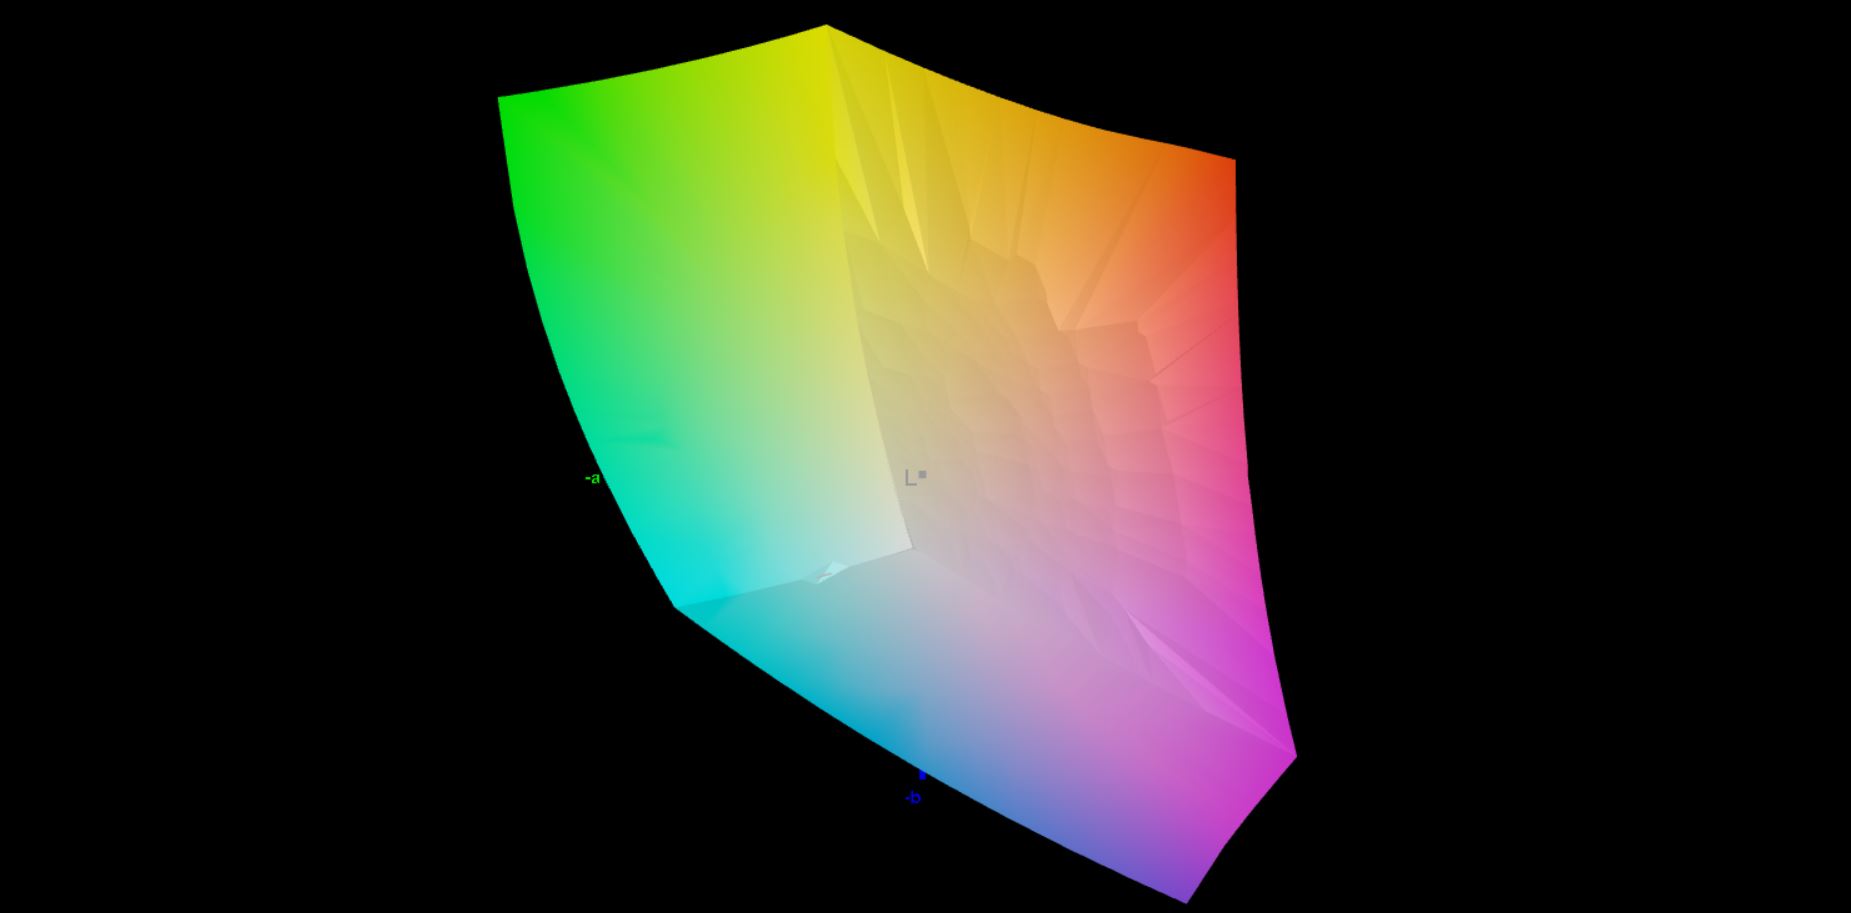
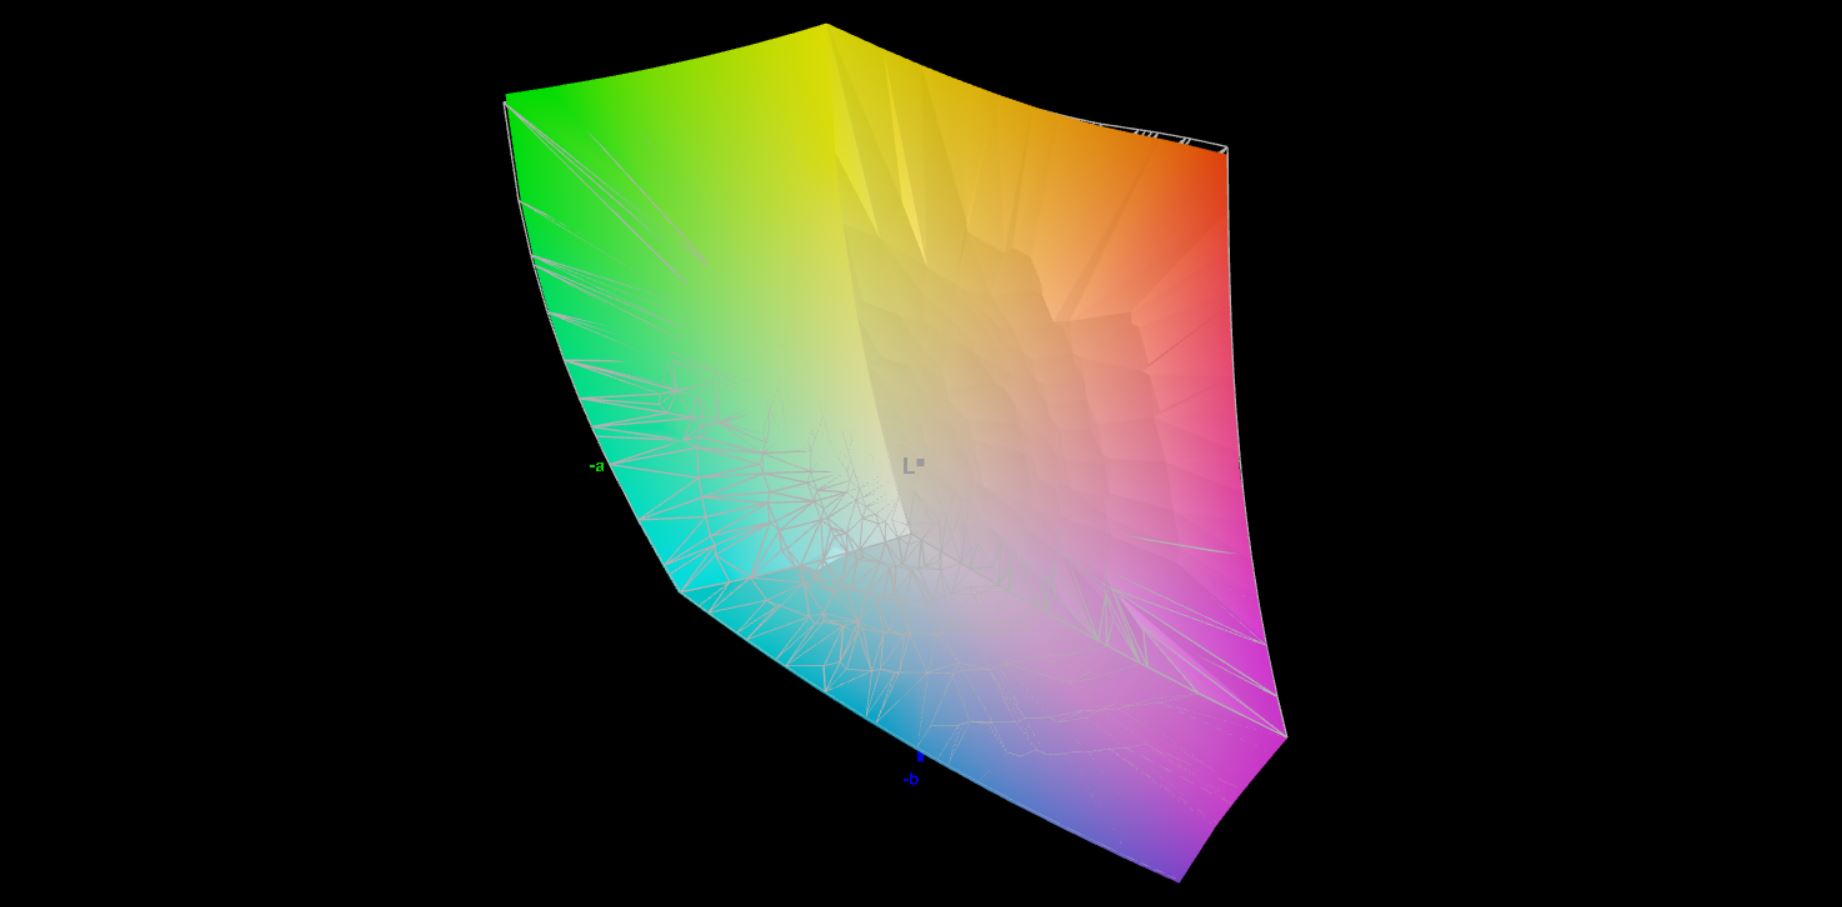
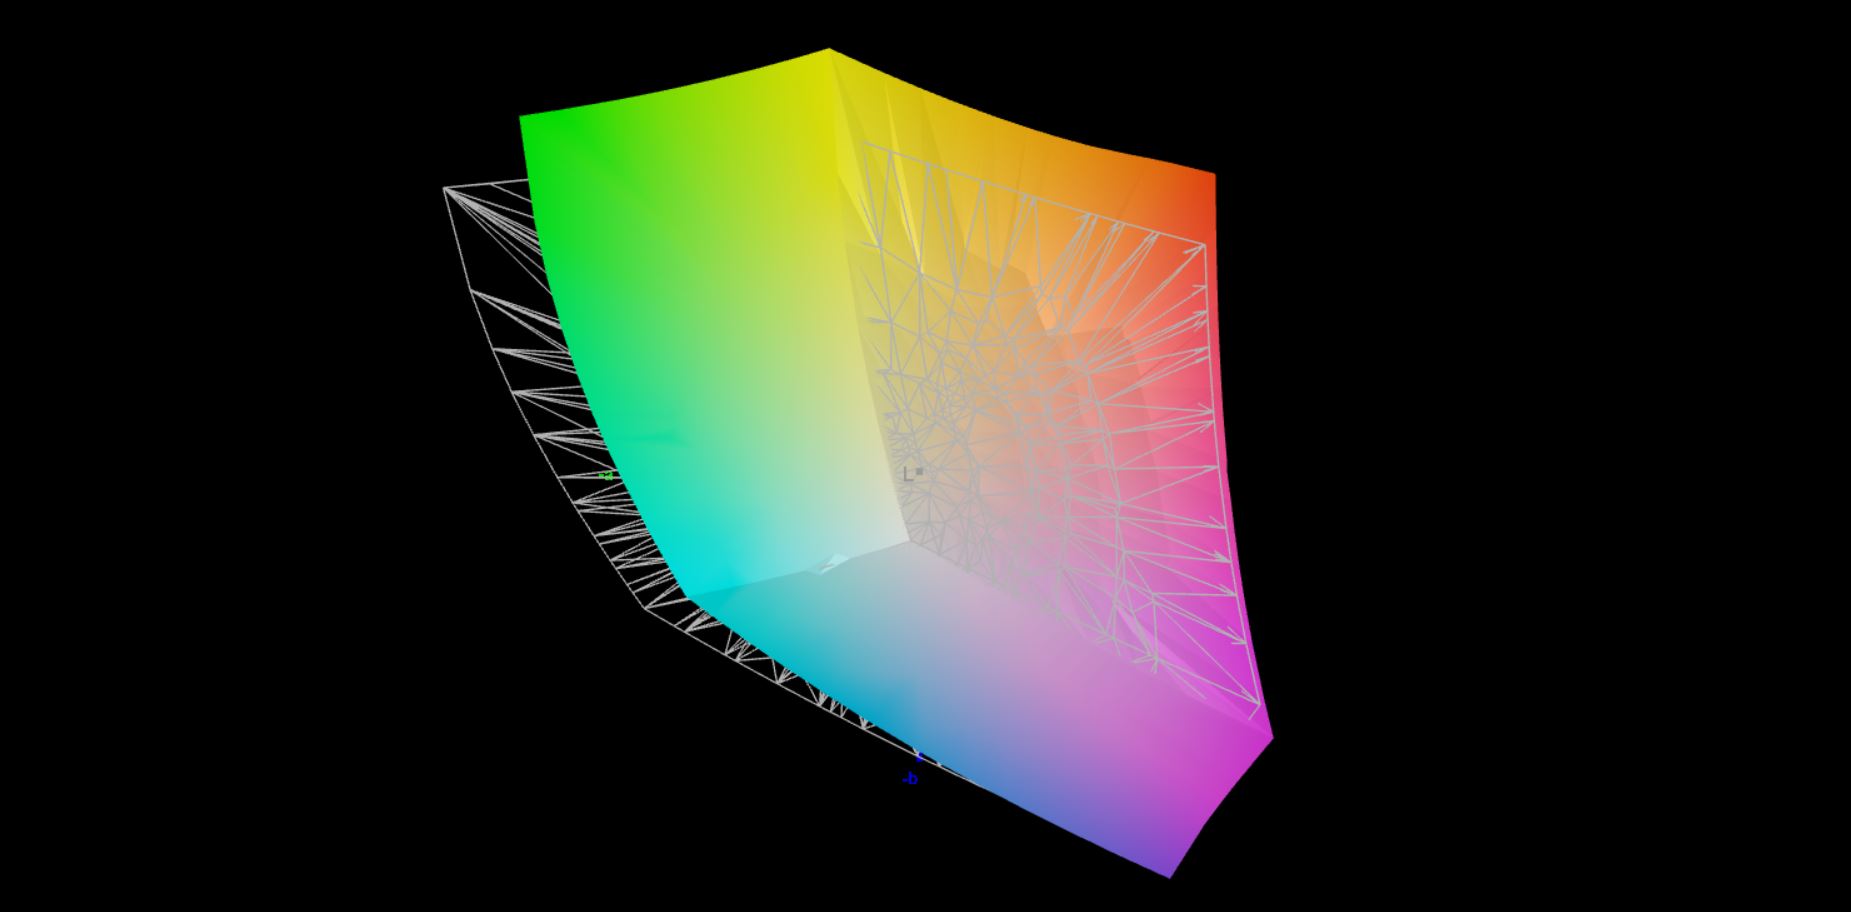
87.6% AdobeRGB 1998 (Argyll 3D)
100% sRGB (Argyll 3D)
99.6% Display P3 (Argyll 3D)
Gamma: 2.19
CCT: 6204 K
| Alienware x14 i7 RTX 3060 SHP154D, IPS, 1920x1080, 14" | Asus ROG Zephyrus G14 GA402RK NE140QDM-NX1 (BOE0A1D), IPS-Level, 2560x1600, 14" | Razer Blade 14 Ryzen 9 RTX 3070 TL140BDXP02-2, IPS, 2560x1440, 14" | Asus Zephyrus G14 GA401QM LM140LF-1F02, IPS, 1920x1080, 14" | Alienware x15 RTX 3070 P111F LG Philips 156QHG, IPS, 2560x1440, 15.6" | |
|---|---|---|---|---|---|
| Display | -1% | -2% | -21% | -1% | |
| Display P3 Coverage (%) | 99.6 | 97.4 -2% | 97.2 -2% | 68.1 -32% | 97.8 -2% |
| sRGB Coverage (%) | 100 | 99.9 0% | 99.9 0% | 92.4 -8% | 99.9 0% |
| AdobeRGB 1998 Coverage (%) | 87.6 | 85.5 -2% | 85.4 -3% | 67.7 -23% | |
| Response Times | 15% | -57% | -261% | -31% | |
| Response Time Grey 50% / Grey 80% * (ms) | 9.6 ? | 8.8 ? 8% | 16.4 ? -71% | 34.4 ? -258% | 12 ? -25% |
| Response Time Black / White * (ms) | 7.6 ? | 6 ? 21% | 10.8 ? -42% | 27.6 ? -263% | 10.4 ? -37% |
| PWM Frequency (Hz) | 27170 ? | ||||
| Screen | -16% | -1% | -69% | -20% | |
| Brightness middle (cd/m²) | 434 | 480 11% | 331.1 -24% | 329.4 -24% | 409.5 -6% |
| Brightness (cd/m²) | 411 | 456 11% | 318 -23% | 311 -24% | 390 -5% |
| Brightness Distribution (%) | 89 | 80 -10% | 91 2% | 90 1% | 88 -1% |
| Black Level * (cd/m²) | 0.25 | 0.48 -92% | 0.36 -44% | 0.39 -56% | 0.47 -88% |
| Contrast (:1) | 1736 | 1000 -42% | 920 -47% | 845 -51% | 871 -50% |
| Colorchecker dE 2000 * | 3 | 2.62 13% | 2.25 25% | 4.01 -34% | 3.48 -16% |
| Colorchecker dE 2000 max. * | 7.1 | 6.71 5% | 4.62 35% | 8.21 -16% | 6.31 11% |
| Colorchecker dE 2000 calibrated * | 0.7 | 1.12 -60% | 3.89 -456% | 0.89 -27% | |
| Greyscale dE 2000 * | 5.1 | 4.2 18% | 1.7 67% | 3.2 37% | 5 2% |
| Gamma | 2.19 100% | 2.16 102% | 2.3 96% | 2.2 100% | 2.16 102% |
| CCT | 6204 105% | 7122 91% | 6751 96% | 7070 92% | 6591 99% |
| Total Average (Program / Settings) | -1% /
-9% | -20% /
-10% | -117% /
-86% | -17% /
-19% |
* ... smaller is better
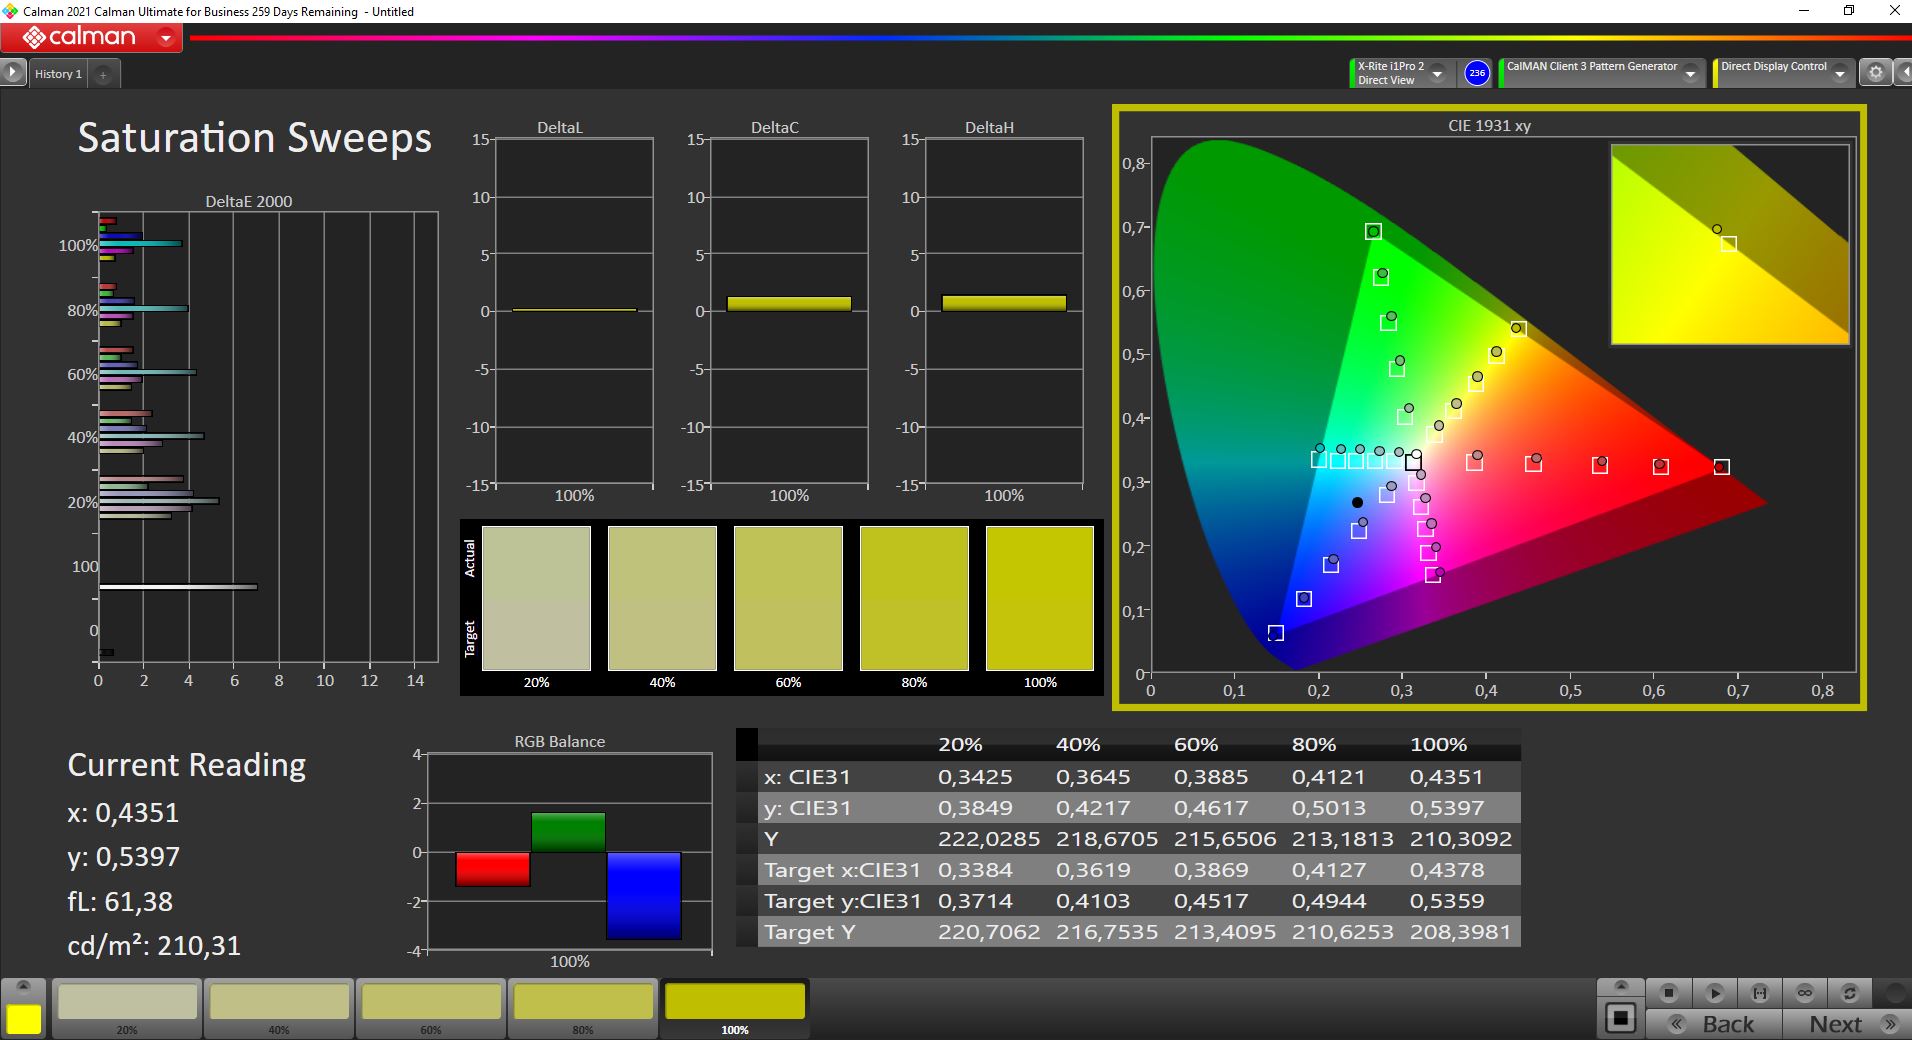
We analyzed the display with the professional CalMAN software and the X-Rite i1 Pro 2 spectrophotometer. The picture quality is already decent out of the box, but the color temperature is a bit warm and you can see a slight color cast towards yellow. The color deviations are also very small and there are just some outliers with DeltaE-2000 deviations (compared to the P3 reference color space) of more than 3.
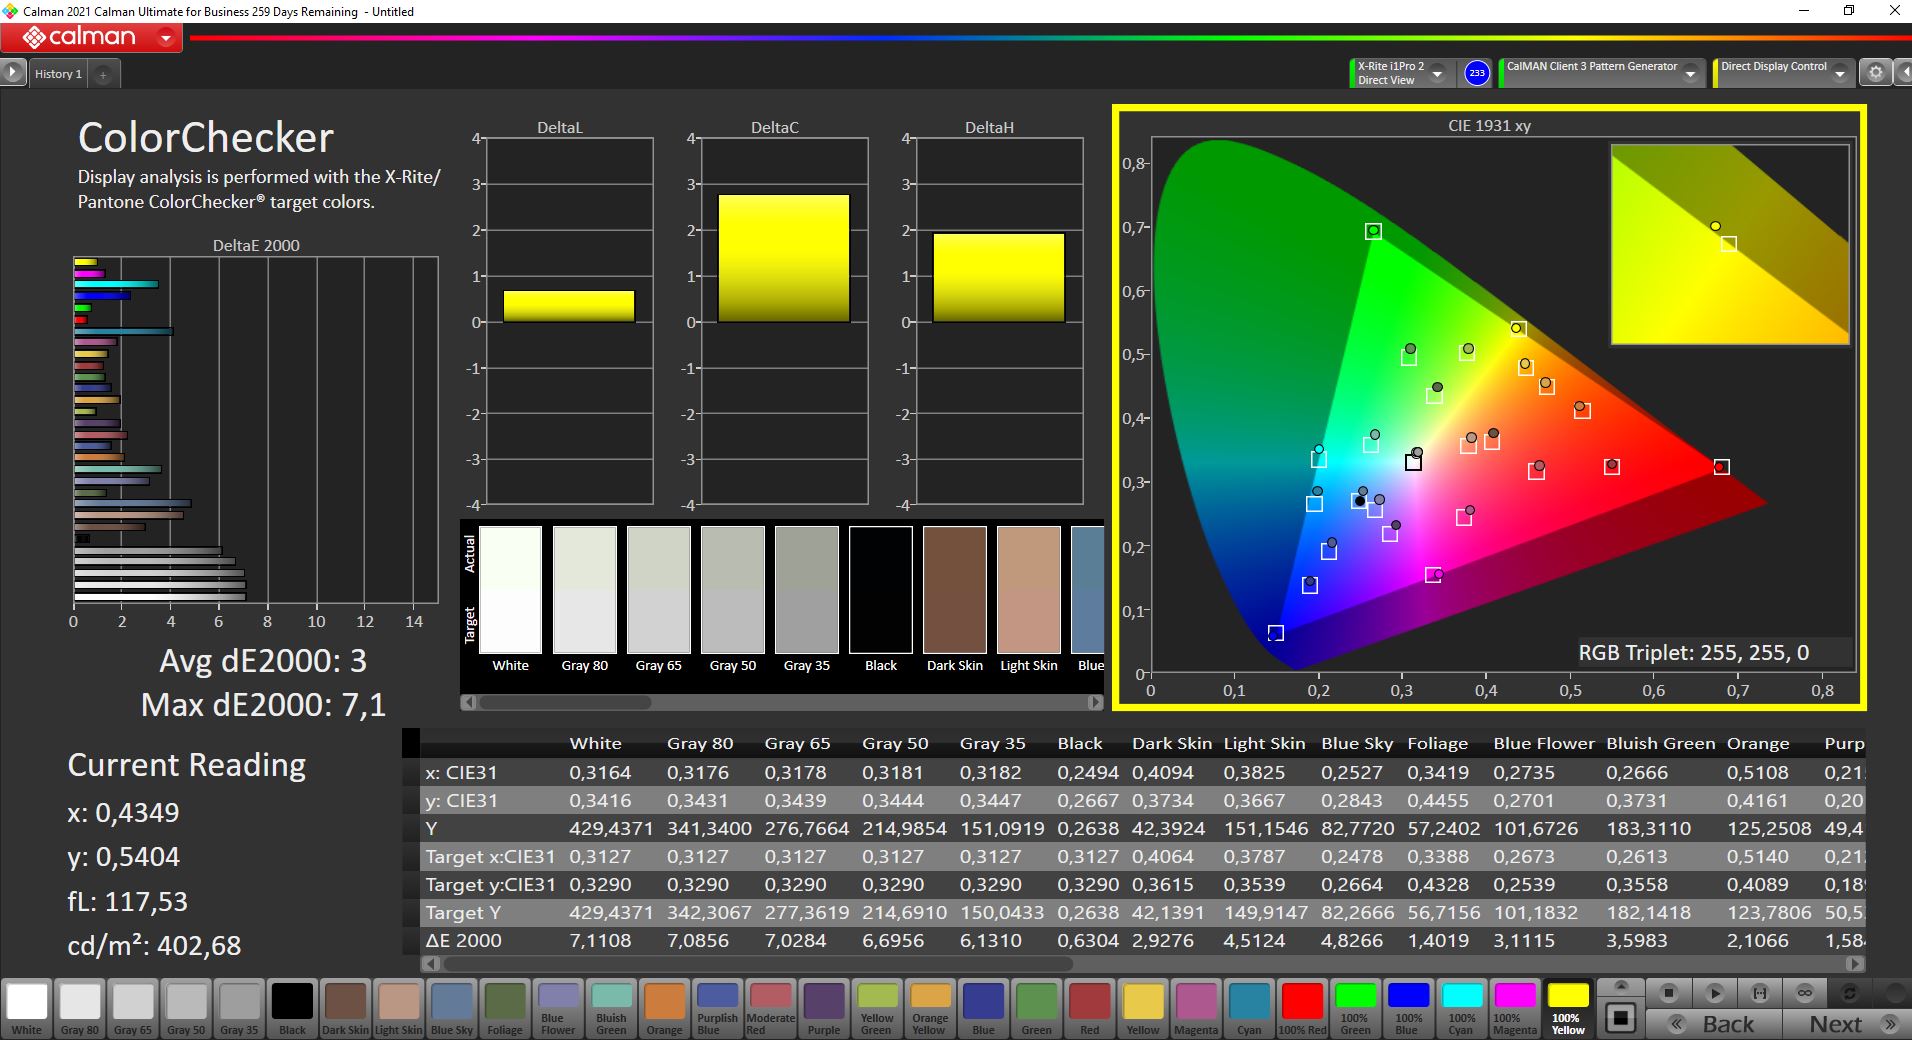
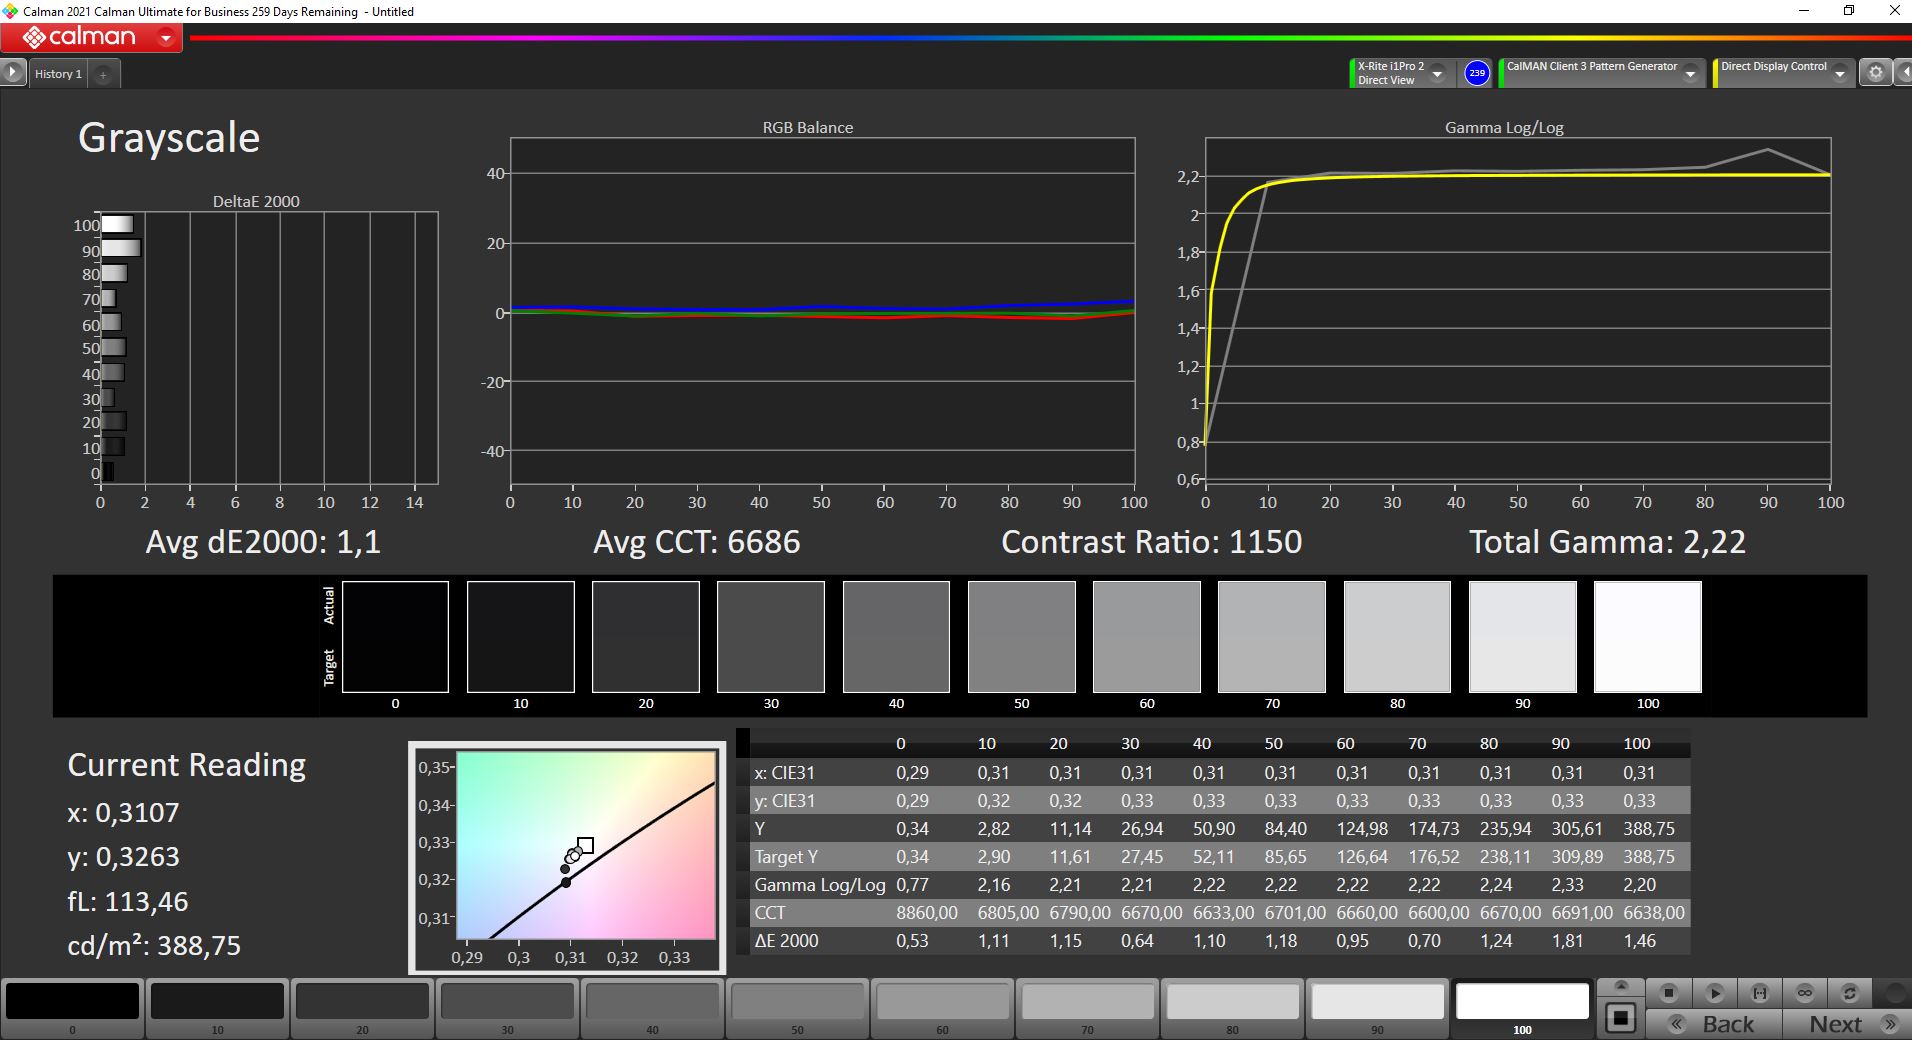
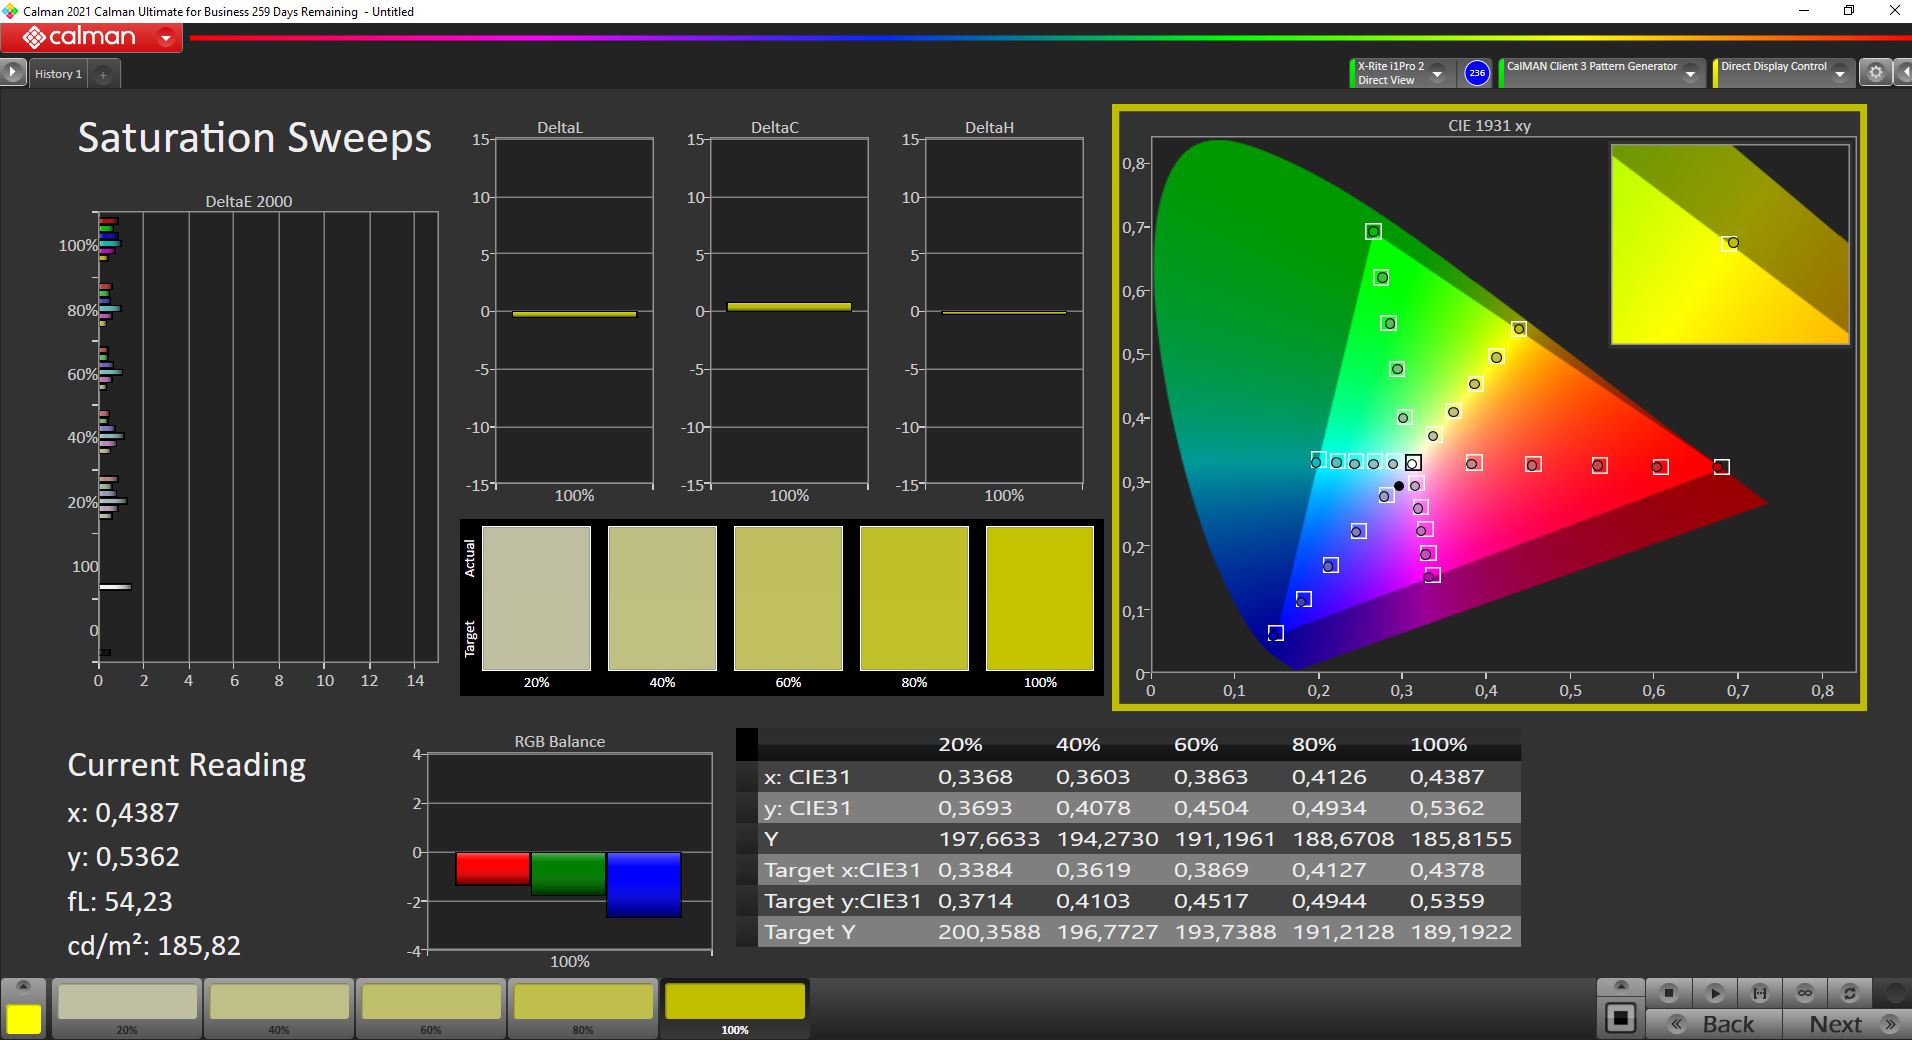
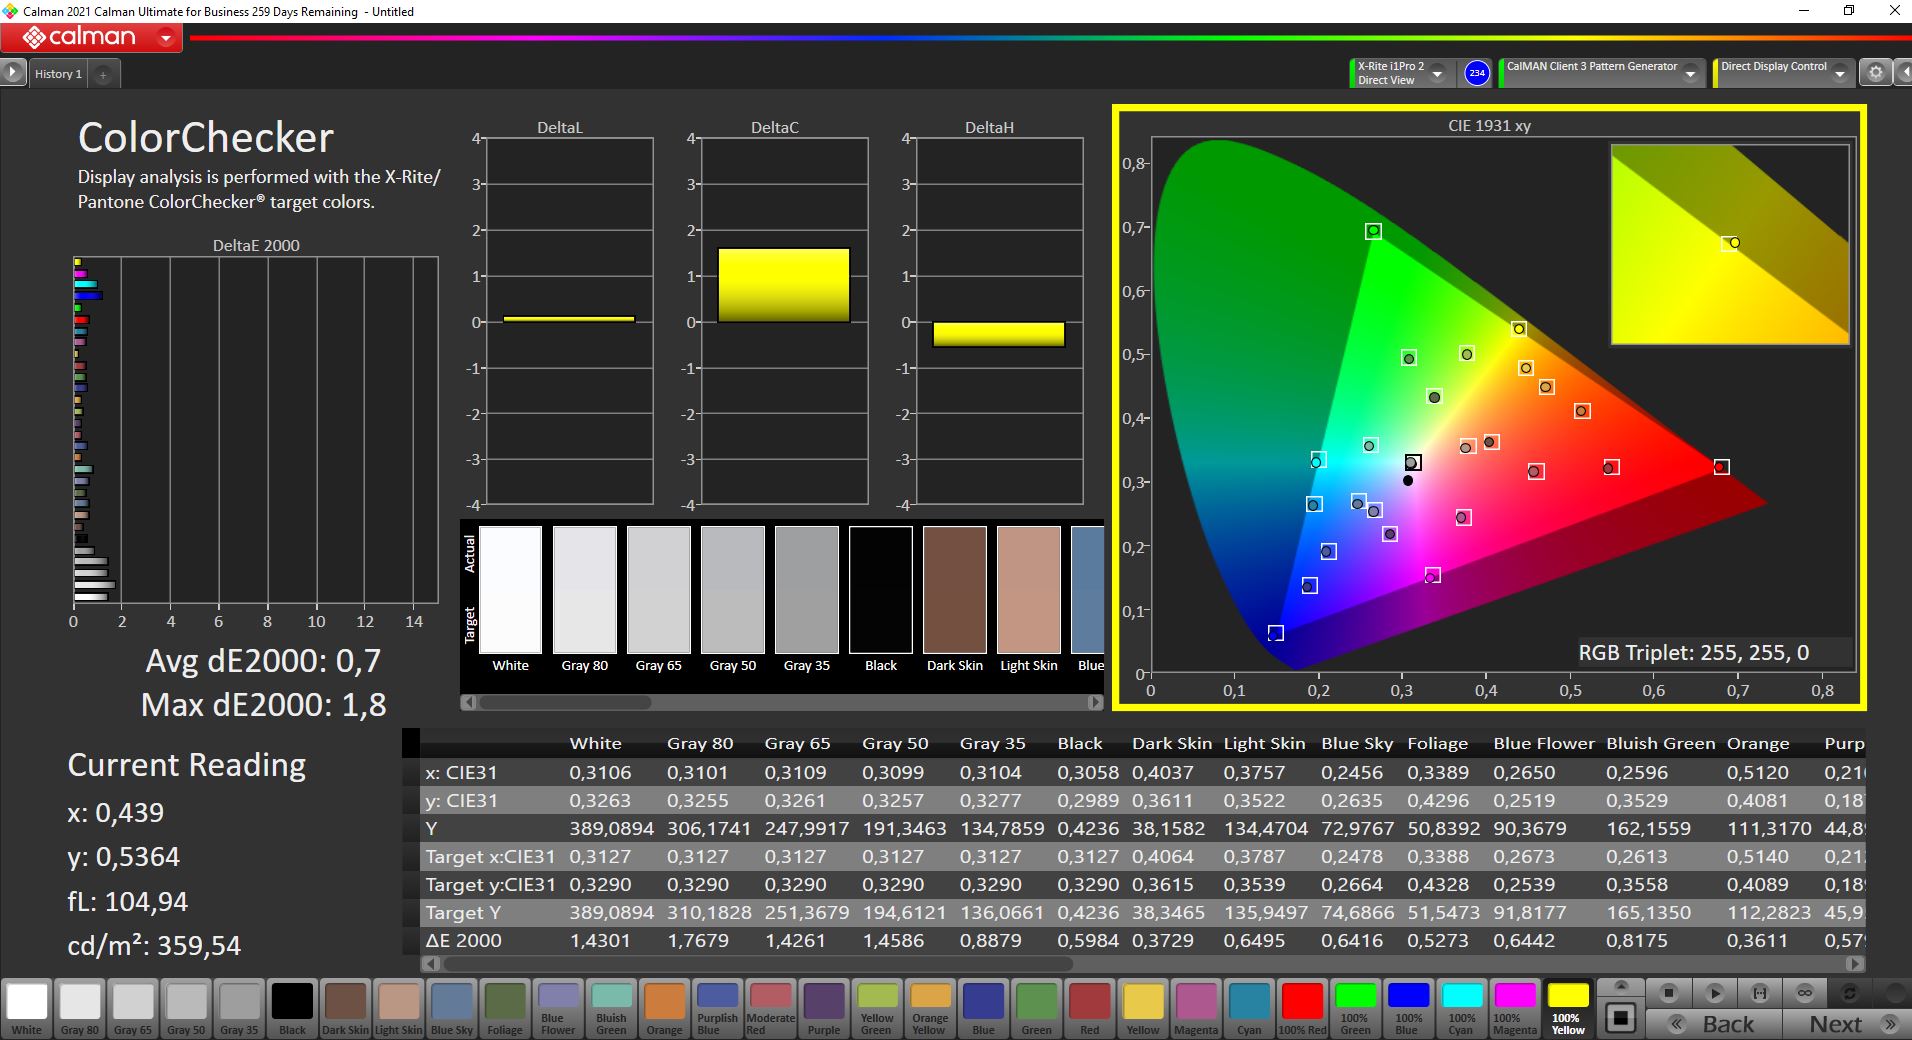
Our calibration (profile can be downloaded for free in the box above) reduced the maximum brightness by around 40 nits, but it shows the full potential of the screen. The average DeltaE-2000 deviations are very low and all the colors are very accurate. Combined with the fill DCI-P3 gamut, the panel is an excellent choice for picture and video editing.
Display Response Times
| ↔ Response Time Black to White | ||
|---|---|---|
| 7.6 ms ... rise ↗ and fall ↘ combined | ↗ 2.8 ms rise | 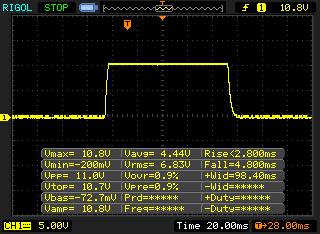 |
| ↘ 4.8 ms fall | ||
| The screen shows very fast response rates in our tests and should be very well suited for fast-paced gaming. In comparison, all tested devices range from 0.1 (minimum) to 240 (maximum) ms. » 22 % of all devices are better. This means that the measured response time is better than the average of all tested devices (19.8 ms). | ||
| ↔ Response Time 50% Grey to 80% Grey | ||
| 9.6 ms ... rise ↗ and fall ↘ combined | ↗ 4.4 ms rise | 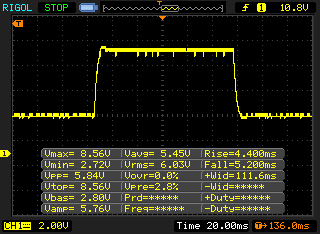 |
| ↘ 5.2 ms fall | ||
| The screen shows fast response rates in our tests and should be suited for gaming. In comparison, all tested devices range from 0.165 (minimum) to 636 (maximum) ms. » 23 % of all devices are better. This means that the measured response time is better than the average of all tested devices (31 ms). | ||
Screen Flickering / PWM (Pulse-Width Modulation)
| Screen flickering / PWM not detected |  | ||
In comparison: 52 % of all tested devices do not use PWM to dim the display. If PWM was detected, an average of 7747 (minimum: 5 - maximum: 343500) Hz was measured. | |||
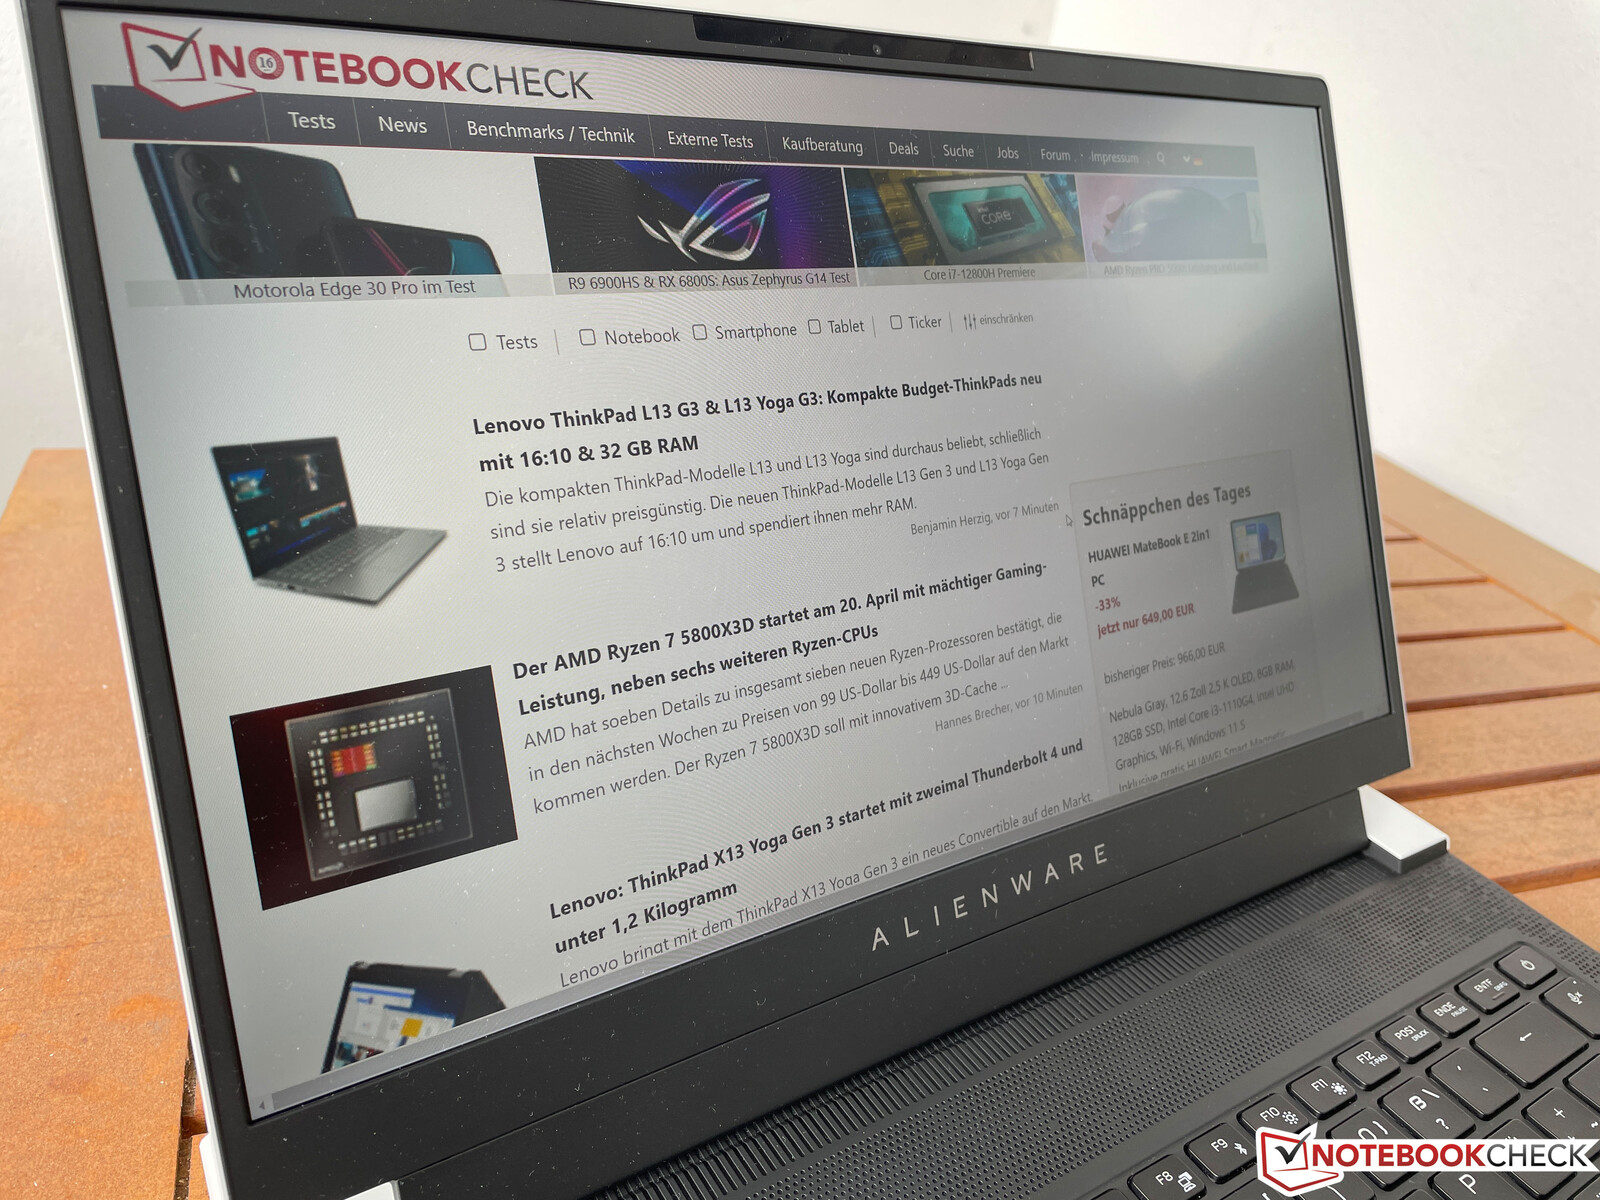
Display contents are still visible outdoors as long as you can avoid direct reflections from light sources. The viewing angle stability of the IPS screen is very good.
Performance - Dell's thin gamer uses Intel Alder Lake
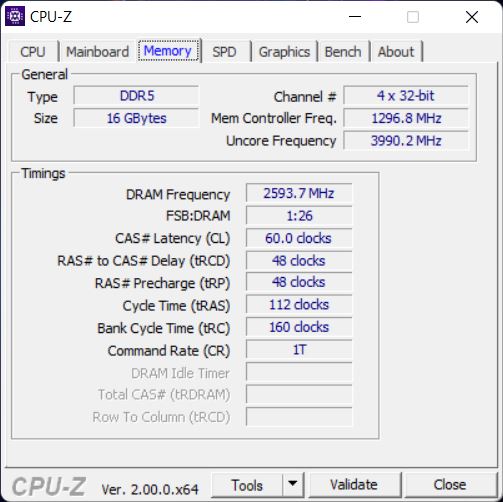
You can choose between the Core i7-12700H and the slightly slower Core i5-12500H, which has two fewer performance cores compared to the i7. You get at least 16 GB LPDDR5 RAM, but only the slower 4800 modules in combination with the GeForce RTX 3050 or RTX 3050 Ti (both with a TGP of 50W & 15W Dynamic Boost). The faster 5200 RAM is only available in combination with the RTX 3060, just like the upgrade to 32 GB.
Review Settings
We were initially surprised by the TDP configuration of the processor, which was set to 45 Watts. During our test, there was an update from Intel (via Windows Update), which increased the TDP to 115W. This value is not reached by the x14, but it means the cooling solution is the only limiting factor. We, therefore, repeated all our benchmarks and measurements to show the performance level with the updated TDP values.
The preloaded Command Center offers different settings for the cooling, but they do not affect the performance. There is also an additional High-Performance mode, which can be activated via key combination Fn+F1. However, the effect on the actual gaming performance (even during longer sessions) is negligible, but it uses a more aggressive fan curve and the notebook just reaches its maximum fan noise (which is also a bit higher) quicker. We performed all our benchmarks and measurements with the following settings: Normal mode, Thermal: Balanced, Windows Performance slider: Best Performance.
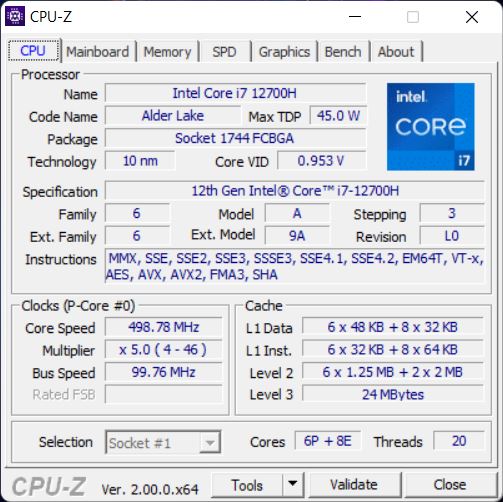
Processor - Core i7-12700H
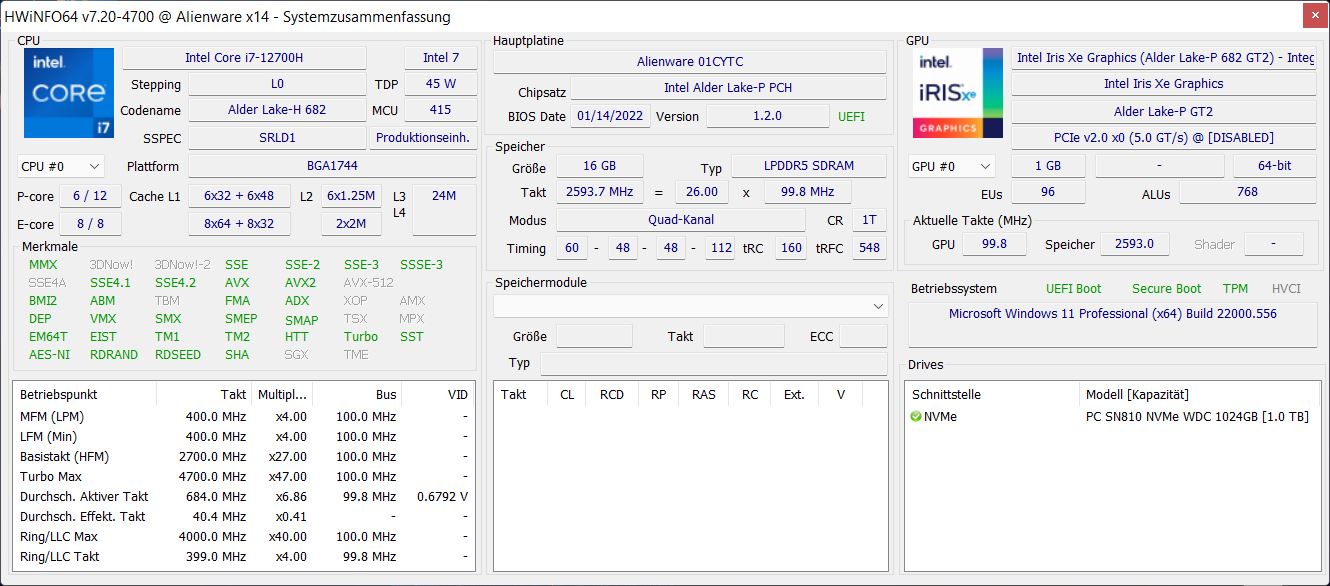
The Core i7-12700H is a chip from Intel’s new Alder Lake generation and uses a hybrid architecture. In addition to six performance cores running up to 4.8 GHz (including Hyper Threading), it uses eight efficiency cores (up to 3.7 GHz), so the i7-12700H can execute up to 20 threads simultaneously. It is, in theory, a 45W processor, but the CPU can consume much more power, especially in peak load scenarios.
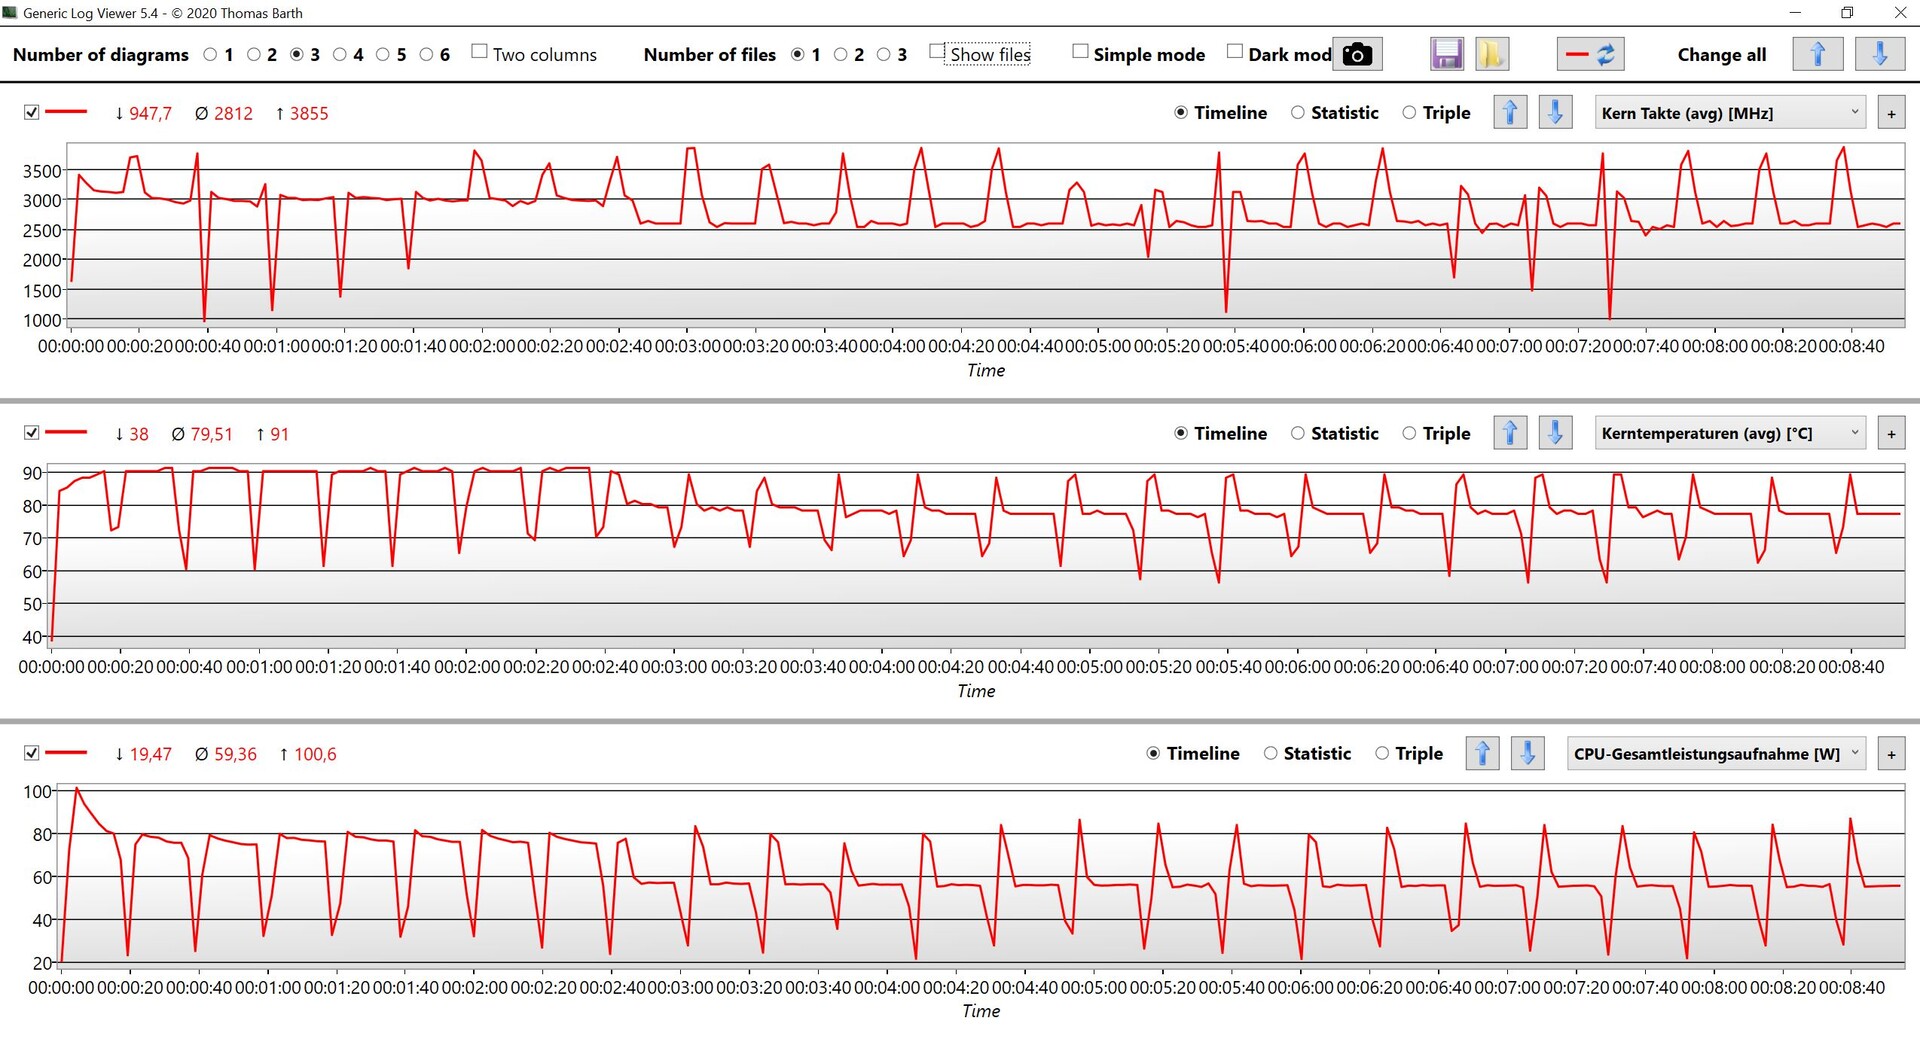
We record consumption of up to 100W for a brief period at the start of benchmarks and it will eventually level off at 55W. You can see this behavior very well in our chart from the Cinebench R15 Multi loop below, where the second run is already limited to 80W. The CPU performance is better compared to the rivals in the first couple of minutes but will eventually drop to the level of the AMD Ryzen 5000 chips or the Alienware x15 with the Core i7-11800H in multi-core tests.
Cinebench R15 Multi Loop
Thanks to the new performance cores and the high clocks, the new Core i7-12700H can often secure the lead in single-core tests. All in all, the results are good for a compact gaming laptop, but we are still quite far away from the performance potential of the Core i7-12700H. This chip needs slightly more than 120W for the maximum clock on all cores (around 3000 points @ CB R15 Multi).
The power consumption of the CPU is limited to 80W on battery power and therefore just slightly lower compared to mains. More CPU benchmarks are available in our tech section.
Cinebench R23: Multi Core | Single Core
Cinebench R20: CPU (Multi Core) | CPU (Single Core)
Cinebench R15: CPU Multi 64Bit | CPU Single 64Bit
Blender: v2.79 BMW27 CPU
7-Zip 18.03: 7z b 4 | 7z b 4 -mmt1
Geekbench 5.5: Multi-Core | Single-Core
HWBOT x265 Benchmark v2.2: 4k Preset
LibreOffice : 20 Documents To PDF
R Benchmark 2.5: Overall mean
| CPU Performance rating | |
| Average of class Gaming | |
| Alienware x14 i7 RTX 3060 | |
| Average Intel Core i7-12700H | |
| Asus ROG Zephyrus G14 GA402RK | |
| Alienware x15 RTX 3070 P111F -2! | |
| Asus Zephyrus G14 GA401QM -2! | |
| Razer Blade 14 Ryzen 9 RTX 3070 -2! | |
| Cinebench R23 / Multi Core | |
| Average of class Gaming (10488 - 42661, n=107, last 2 years) | |
| Alienware x14 i7 RTX 3060 | |
| Average Intel Core i7-12700H (4032 - 19330, n=64) | |
| Alienware x15 RTX 3070 P111F | |
| Asus Zephyrus G14 GA401QM | |
| Razer Blade 14 Ryzen 9 RTX 3070 | |
| Asus ROG Zephyrus G14 GA402RK | |
| Cinebench R23 / Single Core | |
| Average of class Gaming (1166 - 2415, n=107, last 2 years) | |
| Alienware x14 i7 RTX 3060 | |
| Average Intel Core i7-12700H (778 - 1826, n=63) | |
| Asus ROG Zephyrus G14 GA402RK | |
| Alienware x15 RTX 3070 P111F | |
| Asus Zephyrus G14 GA401QM | |
| Razer Blade 14 Ryzen 9 RTX 3070 | |
| Cinebench R20 / CPU (Multi Core) | |
| Average of class Gaming (4029 - 16433, n=106, last 2 years) | |
| Alienware x14 i7 RTX 3060 | |
| Average Intel Core i7-12700H (1576 - 7407, n=64) | |
| Alienware x15 RTX 3070 P111F | |
| Asus Zephyrus G14 GA401QM | |
| Razer Blade 14 Ryzen 9 RTX 3070 | |
| Asus ROG Zephyrus G14 GA402RK | |
| Cinebench R20 / CPU (Single Core) | |
| Average of class Gaming (442 - 913, n=106, last 2 years) | |
| Alienware x14 i7 RTX 3060 | |
| Average Intel Core i7-12700H (300 - 704, n=64) | |
| Asus ROG Zephyrus G14 GA402RK | |
| Alienware x15 RTX 3070 P111F | |
| Asus Zephyrus G14 GA401QM | |
| Razer Blade 14 Ryzen 9 RTX 3070 | |
| Cinebench R15 / CPU Multi 64Bit | |
| Average of class Gaming (1578 - 6330, n=105, last 2 years) | |
| Alienware x14 i7 RTX 3060 | |
| Average Intel Core i7-12700H (1379 - 2916, n=70) | |
| Alienware x15 RTX 3070 P111F | |
| Asus Zephyrus G14 GA401QM | |
| Asus ROG Zephyrus G14 GA402RK | |
| Razer Blade 14 Ryzen 9 RTX 3070 | |
| Cinebench R15 / CPU Single 64Bit | |
| Average of class Gaming (188.8 - 350, n=106, last 2 years) | |
| Asus ROG Zephyrus G14 GA402RK | |
| Average Intel Core i7-12700H (113 - 263, n=65) | |
| Alienware x14 i7 RTX 3060 | |
| Asus Zephyrus G14 GA401QM | |
| Alienware x15 RTX 3070 P111F | |
| Razer Blade 14 Ryzen 9 RTX 3070 | |
| Blender / v2.79 BMW27 CPU | |
| Razer Blade 14 Ryzen 9 RTX 3070 | |
| Asus ROG Zephyrus G14 GA402RK | |
| Asus Zephyrus G14 GA401QM | |
| Average Intel Core i7-12700H (168 - 732, n=63) | |
| Alienware x14 i7 RTX 3060 | |
| Alienware x15 RTX 3070 P111F | |
| Average of class Gaming (79 - 330, n=104, last 2 years) | |
| 7-Zip 18.03 / 7z b 4 | |
| Average of class Gaming (33491 - 148086, n=105, last 2 years) | |
| Alienware x14 i7 RTX 3060 | |
| Average Intel Core i7-12700H (22844 - 73067, n=63) | |
| Asus ROG Zephyrus G14 GA402RK | |
| Asus Zephyrus G14 GA401QM | |
| Razer Blade 14 Ryzen 9 RTX 3070 | |
| Alienware x15 RTX 3070 P111F | |
| 7-Zip 18.03 / 7z b 4 -mmt1 | |
| Average of class Gaming (4199 - 7436, n=105, last 2 years) | |
| Asus ROG Zephyrus G14 GA402RK | |
| Average Intel Core i7-12700H (2743 - 5972, n=63) | |
| Asus Zephyrus G14 GA401QM | |
| Alienware x14 i7 RTX 3060 | |
| Alienware x15 RTX 3070 P111F | |
| Razer Blade 14 Ryzen 9 RTX 3070 | |
| Geekbench 5.5 / Multi-Core | |
| Average of class Gaming (6460 - 28263, n=105, last 2 years) | |
| Alienware x14 i7 RTX 3060 | |
| Average Intel Core i7-12700H (5144 - 13745, n=64) | |
| Asus ROG Zephyrus G14 GA402RK | |
| Geekbench 5.5 / Single-Core | |
| Average of class Gaming (986 - 2474, n=105, last 2 years) | |
| Alienware x14 i7 RTX 3060 | |
| Average Intel Core i7-12700H (803 - 1851, n=64) | |
| Asus ROG Zephyrus G14 GA402RK | |
| HWBOT x265 Benchmark v2.2 / 4k Preset | |
| Average of class Gaming (11.5 - 44.4, n=105, last 2 years) | |
| Alienware x14 i7 RTX 3060 | |
| Average Intel Core i7-12700H (4.67 - 21.8, n=64) | |
| Alienware x15 RTX 3070 P111F | |
| Asus ROG Zephyrus G14 GA402RK | |
| Asus Zephyrus G14 GA401QM | |
| Razer Blade 14 Ryzen 9 RTX 3070 | |
| LibreOffice / 20 Documents To PDF | |
| Razer Blade 14 Ryzen 9 RTX 3070 | |
| Asus Zephyrus G14 GA401QM | |
| Average of class Gaming (33.2 - 88.8, n=105, last 2 years) | |
| Alienware x15 RTX 3070 P111F | |
| Asus ROG Zephyrus G14 GA402RK | |
| Average Intel Core i7-12700H (34.2 - 95.3, n=63) | |
| Alienware x14 i7 RTX 3060 | |
| R Benchmark 2.5 / Overall mean | |
| Razer Blade 14 Ryzen 9 RTX 3070 | |
| Alienware x15 RTX 3070 P111F | |
| Asus Zephyrus G14 GA401QM | |
| Asus ROG Zephyrus G14 GA402RK | |
| Average Intel Core i7-12700H (0.4441 - 1.052, n=63) | |
| Alienware x14 i7 RTX 3060 | |
| Average of class Gaming (0.3439 - 0.759, n=106, last 2 years) | |
* ... smaller is better
AIDA64: FP32 Ray-Trace | FPU Julia | CPU SHA3 | CPU Queen | FPU SinJulia | FPU Mandel | CPU AES | CPU ZLib | FP64 Ray-Trace | CPU PhotoWorxx
| Performance rating | |
| Average of class Gaming | |
| Asus ROG Zephyrus G14 GA402RK | |
| Asus Zephyrus G14 GA401QM | |
| Razer Blade 14 Ryzen 9 RTX 3070 | |
| Alienware x14 i7 RTX 3060 | |
| Average Intel Core i7-12700H | |
| Alienware x15 RTX 3070 P111F -9! | |
| AIDA64 / FP32 Ray-Trace | |
| Average of class Gaming (10227 - 85542, n=105, last 2 years) | |
| Asus Zephyrus G14 GA401QM | |
| Razer Blade 14 Ryzen 9 RTX 3070 | |
| Asus ROG Zephyrus G14 GA402RK | |
| Average Intel Core i7-12700H (2585 - 17957, n=64) | |
| Alienware x14 i7 RTX 3060 | |
| AIDA64 / FPU Julia | |
| Average of class Gaming (51376 - 238426, n=105, last 2 years) | |
| Asus Zephyrus G14 GA401QM | |
| Razer Blade 14 Ryzen 9 RTX 3070 | |
| Asus ROG Zephyrus G14 GA402RK | |
| Average Intel Core i7-12700H (12439 - 90760, n=64) | |
| Alienware x14 i7 RTX 3060 | |
| AIDA64 / CPU SHA3 | |
| Average of class Gaming (2180 - 10115, n=105, last 2 years) | |
| Asus Zephyrus G14 GA401QM | |
| Razer Blade 14 Ryzen 9 RTX 3070 | |
| Asus ROG Zephyrus G14 GA402RK | |
| Average Intel Core i7-12700H (833 - 4242, n=64) | |
| Alienware x14 i7 RTX 3060 | |
| AIDA64 / CPU Queen | |
| Average of class Gaming (49785 - 173351, n=90, last 2 years) | |
| Asus Zephyrus G14 GA401QM | |
| Asus ROG Zephyrus G14 GA402RK | |
| Alienware x14 i7 RTX 3060 | |
| Average Intel Core i7-12700H (57923 - 103202, n=63) | |
| Razer Blade 14 Ryzen 9 RTX 3070 | |
| AIDA64 / FPU SinJulia | |
| Average of class Gaming (4424 - 33636, n=105, last 2 years) | |
| Asus ROG Zephyrus G14 GA402RK | |
| Asus Zephyrus G14 GA401QM | |
| Razer Blade 14 Ryzen 9 RTX 3070 | |
| Alienware x14 i7 RTX 3060 | |
| Average Intel Core i7-12700H (3249 - 9939, n=64) | |
| AIDA64 / FPU Mandel | |
| Average of class Gaming (25115 - 128721, n=105, last 2 years) | |
| Asus Zephyrus G14 GA401QM | |
| Razer Blade 14 Ryzen 9 RTX 3070 | |
| Asus ROG Zephyrus G14 GA402RK | |
| Average Intel Core i7-12700H (7135 - 44760, n=64) | |
| Alienware x14 i7 RTX 3060 | |
| AIDA64 / CPU AES | |
| Asus Zephyrus G14 GA401QM | |
| Asus ROG Zephyrus G14 GA402RK | |
| Razer Blade 14 Ryzen 9 RTX 3070 | |
| Average of class Gaming (39258 - 247074, n=105, last 2 years) | |
| Alienware x14 i7 RTX 3060 | |
| Average Intel Core i7-12700H (31839 - 144360, n=64) | |
| AIDA64 / CPU ZLib | |
| Average of class Gaming (574 - 2531, n=105, last 2 years) | |
| Alienware x14 i7 RTX 3060 | |
| Average Intel Core i7-12700H (305 - 1171, n=64) | |
| Asus Zephyrus G14 GA401QM | |
| Asus ROG Zephyrus G14 GA402RK | |
| Razer Blade 14 Ryzen 9 RTX 3070 | |
| Alienware x15 RTX 3070 P111F | |
| AIDA64 / FP64 Ray-Trace | |
| Average of class Gaming (5509 - 45446, n=105, last 2 years) | |
| Razer Blade 14 Ryzen 9 RTX 3070 | |
| Asus Zephyrus G14 GA401QM | |
| Asus ROG Zephyrus G14 GA402RK | |
| Average Intel Core i7-12700H (1437 - 9692, n=64) | |
| Alienware x14 i7 RTX 3060 | |
| AIDA64 / CPU PhotoWorxx | |
| Alienware x14 i7 RTX 3060 | |
| Average of class Gaming (12271 - 89891, n=105, last 2 years) | |
| Average Intel Core i7-12700H (12863 - 52207, n=64) | |
| Asus ROG Zephyrus G14 GA402RK | |
| Razer Blade 14 Ryzen 9 RTX 3070 | |
| Asus Zephyrus G14 GA401QM | |
System Performance
The Alienware x14 is a very responsive system thanks to the modern components including the PCIe 4.0 SSD and the subjective performance impression is excellent. This is also supported by the synthetic benchmark scores, where the test unit can secure a good spot. All the rivals are very close on a high level, however, and you will not be able to notice a difference between them when you do daily stuff. We did not experience any other issues during our review period, either.
CrossMark: Overall | Productivity | Creativity | Responsiveness
| PCMark 10 / Score | |
| Average of class Gaming (5828 - 12414, n=93, last 2 years) | |
| Asus ROG Zephyrus G14 GA402RK | |
| Average Intel Core i7-12700H, NVIDIA GeForce RTX 3060 Laptop GPU (5986 - 8156, n=12) | |
| Alienware x15 RTX 3070 P111F | |
| Alienware x14 i7 RTX 3060 | |
| Razer Blade 14 Ryzen 9 RTX 3070 | |
| Asus Zephyrus G14 GA401QM | |
| PCMark 10 / Essentials | |
| Asus ROG Zephyrus G14 GA402RK | |
| Average of class Gaming (8810 - 11935, n=97, last 2 years) | |
| Average Intel Core i7-12700H, NVIDIA GeForce RTX 3060 Laptop GPU (9289 - 12144, n=12) | |
| Alienware x15 RTX 3070 P111F | |
| Asus Zephyrus G14 GA401QM | |
| Razer Blade 14 Ryzen 9 RTX 3070 | |
| Alienware x14 i7 RTX 3060 | |
| PCMark 10 / Productivity | |
| Average of class Gaming (6845 - 25323, n=95, last 2 years) | |
| Asus ROG Zephyrus G14 GA402RK | |
| Alienware x14 i7 RTX 3060 | |
| Asus Zephyrus G14 GA401QM | |
| Razer Blade 14 Ryzen 9 RTX 3070 | |
| Average Intel Core i7-12700H, NVIDIA GeForce RTX 3060 Laptop GPU (6161 - 10362, n=12) | |
| Alienware x15 RTX 3070 P111F | |
| PCMark 10 / Digital Content Creation | |
| Average of class Gaming (7602 - 19954, n=95, last 2 years) | |
| Asus ROG Zephyrus G14 GA402RK | |
| Alienware x15 RTX 3070 P111F | |
| Average Intel Core i7-12700H, NVIDIA GeForce RTX 3060 Laptop GPU (8950 - 12554, n=12) | |
| Alienware x14 i7 RTX 3060 | |
| Razer Blade 14 Ryzen 9 RTX 3070 | |
| Asus Zephyrus G14 GA401QM | |
| CrossMark / Overall | |
| Average of class Gaming (1366 - 2409, n=94, last 2 years) | |
| Alienware x14 i7 RTX 3060 | |
| Average Intel Core i7-12700H, NVIDIA GeForce RTX 3060 Laptop GPU (1649 - 2017, n=11) | |
| CrossMark / Productivity | |
| Average of class Gaming (1386 - 2254, n=94, last 2 years) | |
| Alienware x14 i7 RTX 3060 | |
| Average Intel Core i7-12700H, NVIDIA GeForce RTX 3060 Laptop GPU (1536 - 1958, n=11) | |
| CrossMark / Creativity | |
| Average of class Gaming (1343 - 2786, n=94, last 2 years) | |
| Alienware x14 i7 RTX 3060 | |
| Average Intel Core i7-12700H, NVIDIA GeForce RTX 3060 Laptop GPU (1816 - 2084, n=11) | |
| CrossMark / Responsiveness | |
| Alienware x14 i7 RTX 3060 | |
| Average of class Gaming (1226 - 2334, n=94, last 2 years) | |
| Average Intel Core i7-12700H, NVIDIA GeForce RTX 3060 Laptop GPU (1210 - 2207, n=11) | |
| PCMark 10 Score | 7170 points | |
Help | ||
| AIDA64 / Memory Copy | |
| Alienware x14 i7 RTX 3060 | |
| Average of class Gaming (21750 - 129946, n=105, last 2 years) | |
| Average Intel Core i7-12700H (25615 - 80511, n=64) | |
| Asus ROG Zephyrus G14 GA402RK | |
| Razer Blade 14 Ryzen 9 RTX 3070 | |
| Asus Zephyrus G14 GA401QM | |
| AIDA64 / Memory Read | |
| Alienware x14 i7 RTX 3060 | |
| Average of class Gaming (22956 - 118858, n=105, last 2 years) | |
| Average Intel Core i7-12700H (25586 - 79442, n=64) | |
| Asus ROG Zephyrus G14 GA402RK | |
| Razer Blade 14 Ryzen 9 RTX 3070 | |
| Asus Zephyrus G14 GA401QM | |
| AIDA64 / Memory Write | |
| Average of class Gaming (22297 - 135096, n=105, last 2 years) | |
| Alienware x14 i7 RTX 3060 | |
| Asus ROG Zephyrus G14 GA402RK | |
| Average Intel Core i7-12700H (23679 - 88660, n=64) | |
| Asus Zephyrus G14 GA401QM | |
| Razer Blade 14 Ryzen 9 RTX 3070 | |
| AIDA64 / Memory Latency | |
| Alienware x14 i7 RTX 3060 | |
| Average of class Gaming (75.3 - 259, n=105, last 2 years) | |
| Razer Blade 14 Ryzen 9 RTX 3070 | |
| Asus ROG Zephyrus G14 GA402RK | |
| Asus Zephyrus G14 GA401QM | |
| Average Intel Core i7-12700H (76.2 - 133.9, n=62) | |
| Alienware x15 RTX 3070 P111F | |
* ... smaller is better
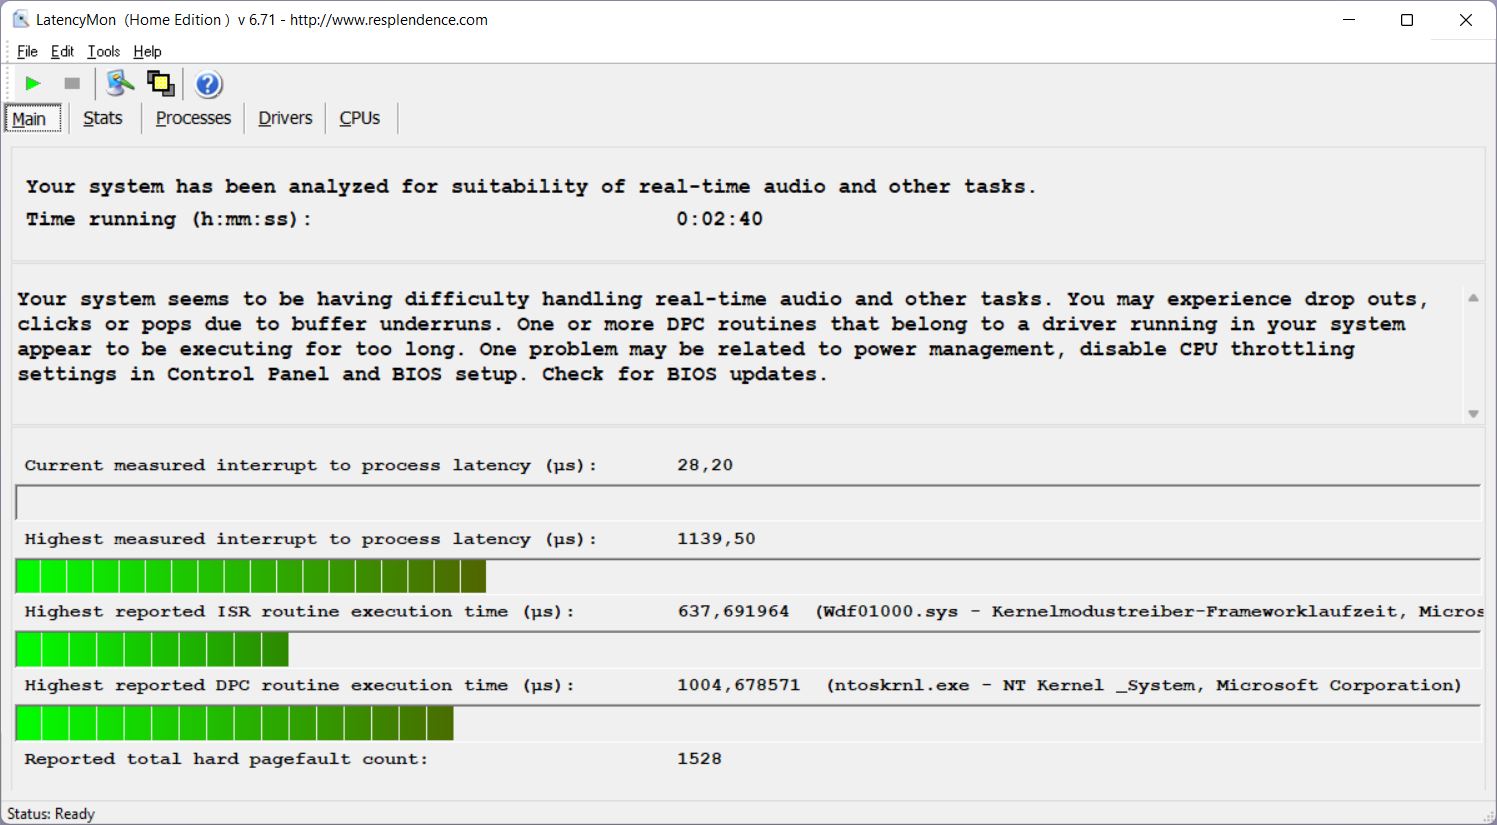
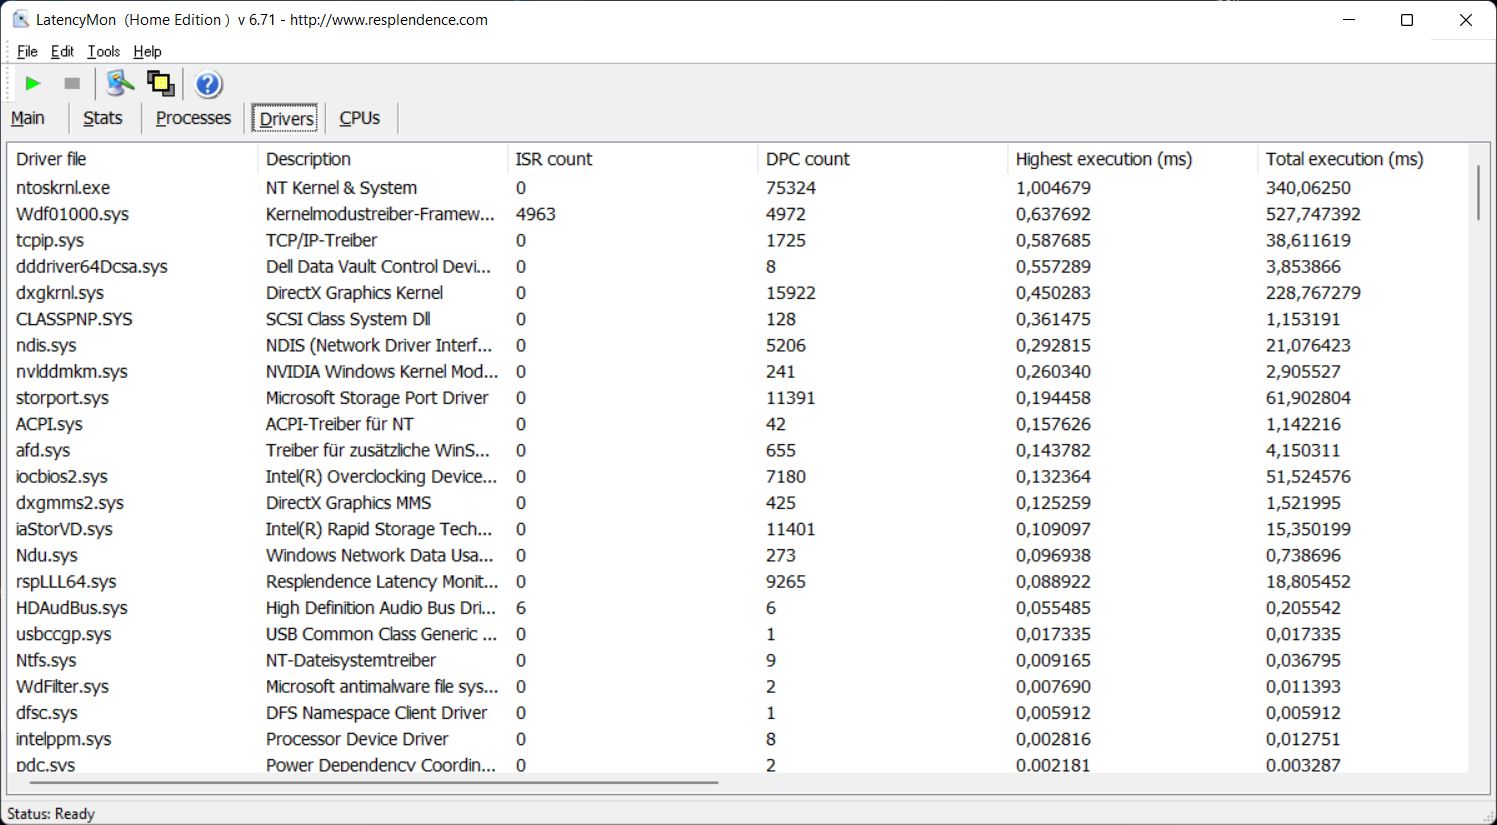
DPC Latency
Our standardized latency test includes different scenarios like web browsing, 4K YouTube playback, and CPU load. Our test unit shows some issues and is not ideal for real-time audio applications with the current BIOS versions, but future updates can improve the situation.
| DPC Latencies / LatencyMon - interrupt to process latency (max), Web, Youtube, Prime95 | |
| Asus Zephyrus G14 GA401QM | |
| Asus ROG Zephyrus G14 GA402RK | |
| Alienware x15 RTX 3070 P111F | |
| Alienware x14 i7 RTX 3060 | |
| Razer Blade 14 Ryzen 9 RTX 3070 | |
* ... smaller is better
Storage Devices
Our review unit is shipped with a 1 TB NVMe SSD from Western Digital (SN810), which already supports the modern PCIe 4.0 standard and it manages transfer rates of more than 6 GB/s in our benchmarks. You can use 824 GB for your files and applications after the initial set-up. Dell also offers a 2 TB SSD in its online shop, which costs 100 Euros more compared to the 1 TB drive. More SSD benchmarks are available here.

* ... smaller is better
Disk Throttling: DiskSpd Read Loop, Queue Depth 8
GPU Performance - GeForce RTX 3060 with 75W TGP
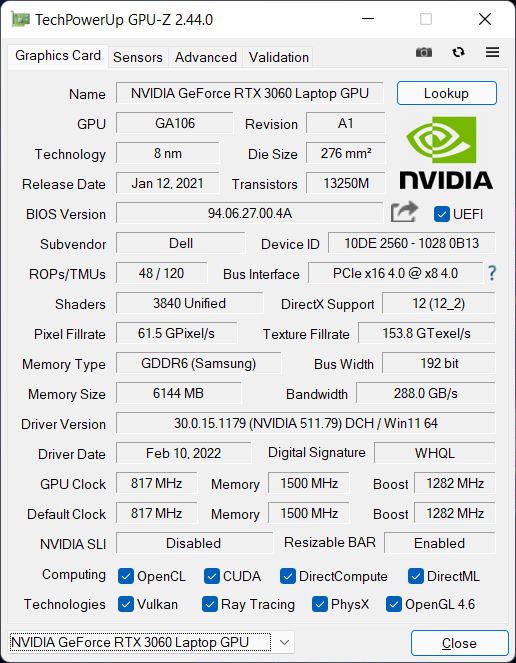
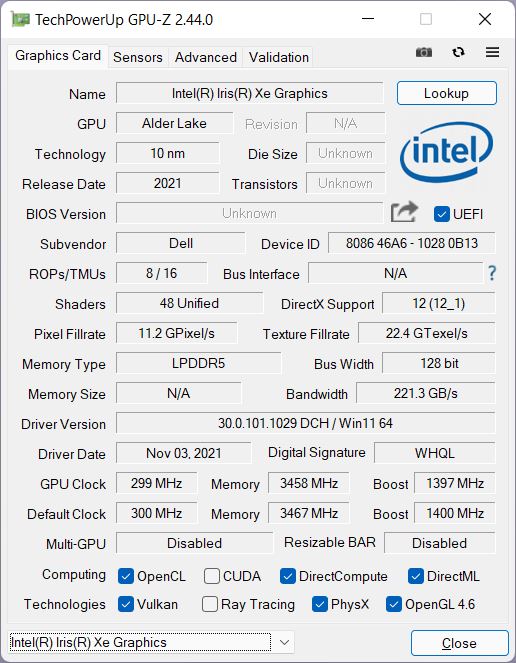
Simple workloads are usually handled by the integrated Iris Xe Graphics G7 and the dedicated Nvidia GeForce RTX 3060 with 6 GB GDDR6 VRAM automatically steps in when you need more performance (Advanced Optimus – enables switchable graphics in combination with G-Sync). It is one of the slowest versions of the RTX 3060 with a TGP of 60W, but it can use up to 15W from the processor depending on the workload, which results in a total TGP of 75W. We also saw this value during GPU benchmarks and the maximum core clock was 1687 MHz.
The new x14 is a bit slower than the average RTX 3060 in our database in the synthetic 3DMark benchmarks. Both the new Zephyrus G14 with the Radeon RX 6800S as well as the Blade 14 with the RTX 3070 are quite a bit faster and are closer to the larger Alienware x15, which is also equipped with the RTX 3070.
The performance is stable under sustained workloads and the system easily passes the Time Spy stress test at 99.3 %. The power consumption of the dGPU is limited to 60W on battery power, which results in a performance deficit of just 10 % (6700 vs. 7425 points @Time Spy Graphics). Please see our tech section for more GPU benchmarks.
| 3DMark Cloud Gate Standard Score | 53689 points | |
| 3DMark Fire Strike Score | 17786 points | |
| 3DMark Time Spy Score | 7915 points | |
Help | ||
Gaming Performance
The overall gaming performance is very good and sufficient for the native 1080p resolution of the Alienware x14, but the RTX 3060 just does not offer as much performance as the new Asus ROG Zephyrus G14 with the Radeon RX 6800S or the Razer Blade 14 with the RTX 3070, especially in very demanding titles with high GPU requirements (like Cyberpunk 2077). Still, you can play pretty much every modern game with high details on the new x14 right now and the performance is stable during longer gaming sessions as well.
| The Witcher 3 | |
| 1920x1080 High Graphics & Postprocessing (Nvidia HairWorks Off) | |
| Average of class Gaming (n=1last 2 years) | |
| Alienware x15 RTX 3070 P111F | |
| Razer Blade 14 Ryzen 9 RTX 3070 | |
| Asus ROG Zephyrus G14 GA402RK | |
| Average NVIDIA GeForce RTX 3060 Laptop GPU (81 - 186.8, n=41) | |
| Alienware x14 i7 RTX 3060 | |
| Asus Zephyrus G14 GA401QM | |
| 1920x1080 Ultra Graphics & Postprocessing (HBAO+) | |
| Average of class Gaming (104.7 - 240, n=6, last 2 years) | |
| Alienware x15 RTX 3070 P111F | |
| Asus ROG Zephyrus G14 GA402RK | |
| Razer Blade 14 Ryzen 9 RTX 3070 | |
| Average NVIDIA GeForce RTX 3060 Laptop GPU (58.2 - 91.5, n=48) | |
| Alienware x14 i7 RTX 3060 | |
| Alienware x14 i7 RTX 3060 (Battery) | |
| Asus Zephyrus G14 GA401QM | |
| Final Fantasy XV Benchmark | |
| 1920x1080 Standard Quality | |
| Average of class Gaming (85.7 - 236, n=82, last 2 years) | |
| Alienware x15 RTX 3070 P111F (1.3) | |
| Asus ROG Zephyrus G14 GA402RK | |
| Razer Blade 14 Ryzen 9 RTX 3070 (1.3) | |
| Average NVIDIA GeForce RTX 3060 Laptop GPU (70.4 - 133.5, n=37) | |
| Alienware x14 i7 RTX 3060 (1.3) | |
| Asus Zephyrus G14 GA401QM (1.3) | |
| 1920x1080 High Quality | |
| Average of class Gaming (41 - 215, n=95, last 2 years) | |
| Alienware x15 RTX 3070 P111F (1.3) | |
| Asus ROG Zephyrus G14 GA402RK | |
| Razer Blade 14 Ryzen 9 RTX 3070 (1.3) | |
| Average NVIDIA GeForce RTX 3060 Laptop GPU (55 - 100.9, n=42) | |
| Alienware x14 i7 RTX 3060 (1.3) | |
| Asus Zephyrus G14 GA401QM (1.3) | |
| Strange Brigade | |
| 1920x1080 high AA:high AF:8 | |
| Average of class Gaming (129.5 - 485, n=74, last 2 years) | |
| Alienware x15 RTX 3070 P111F (1.47.22.14 D3D12) | |
| Asus ROG Zephyrus G14 GA402RK (1.47.22.14 D3D12) | |
| Razer Blade 14 Ryzen 9 RTX 3070 (1.47.22.14 D3D12) | |
| Average NVIDIA GeForce RTX 3060 Laptop GPU (115.6 - 192.1, n=41) | |
| Alienware x14 i7 RTX 3060 | |
| Asus Zephyrus G14 GA401QM (1.47.22.14 D3D12) | |
| 1920x1080 ultra AA:ultra AF:16 | |
| Average of class Gaming (76.3 - 456, n=86, last 2 years) | |
| Alienware x15 RTX 3070 P111F (1.47.22.14 D3D12) | |
| Asus ROG Zephyrus G14 GA402RK (1.47.22.14 D3D12) | |
| Razer Blade 14 Ryzen 9 RTX 3070 (1.47.22.14 D3D12) | |
| Average NVIDIA GeForce RTX 3060 Laptop GPU (102.2 - 166.3, n=43) | |
| Alienware x14 i7 RTX 3060 | |
| Asus Zephyrus G14 GA401QM (1.47.22.14 D3D12) | |
| F1 2021 | |
| 1920x1080 High Preset AA:T AF:16x | |
| Asus ROG Zephyrus G14 GA402RK | |
| Average NVIDIA GeForce RTX 3060 Laptop GPU (119 - 227, n=9) | |
| Alienware x14 i7 RTX 3060 | |
| 1920x1080 Ultra High Preset + Raytracing AA:T AF:16x | |
| Asus ROG Zephyrus G14 GA402RK | |
| Alienware x14 i7 RTX 3060 | |
| Average NVIDIA GeForce RTX 3060 Laptop GPU (67 - 112.8, n=9) | |
The GPU usually consumes about 70W while playing games, but it can also be closer to the original TGP value of 60W when the game is more CPU heavy. It is also possible to play on battery power and we still record more than 60 fps in Witcher 3 (Ultra preset), so there is just a small deficit similar to the pure GPU performance. At least until the battery capacity drops below 50 %, when the power consumption of the GPU starts to fluctuate a bit, so the fps numbers fluctuate as well. Additional gaming benchmarks are available here.
Witcher 3 FPS chart
| low | med. | high | ultra | |
|---|---|---|---|---|
| GTA V (2015) | 185 | 181 | 165 | 88.6 |
| The Witcher 3 (2015) | 267 | 239 | 144 | 58.2 |
| Dota 2 Reborn (2015) | 184 | 168 | 161 | 153 |
| Final Fantasy XV Benchmark (2018) | 151 | 96.5 | 74.1 | |
| Far Cry 5 (2018) | 141 | 113 | 105 | 98 |
| Strange Brigade (2018) | 367 | 182 | 145 | 127 |
| F1 2021 (2021) | 347 | 205 | 165 | 94 |
| GRID Legends (2022) | 178 | 149 | 131 | 94 |
| Cyberpunk 2077 1.6 (2022) | 97 | 84 | 65 | 64 |
Emissions - Gaming on the x14 requires headphones
System Noise
Just like the larger Alienware x15, the x14 also uses modern technologies like vapor chamber cooling or a special gallium-silicone thermal interface material for improved heat dissipation, but it only uses two smaller fans. The laptop is usually silent when you just browse the web or watch videos, and there are no other electronic sounds like coil whine, either.
It gets much louder as soon as you start to stress the processor or the graphics card and the fan noise quickly reaches more than 40 dB(A) and 51.5 dB(A) after a couple of minutes when you play games, also on battery power. This means the Alienware is even a bit louder than the Razer Blade 14 and the ROG Zephyrus during gaming, despite the lower GPU performance. We definitely recommend headphones when you play. The fans will even get louder in the optional High-Performance mode at 53 dB(A).
Noise level
| Idle |
| 24.7 / 24.7 / 30.9 dB(A) |
| Load |
| 40 / 51.5 dB(A) |
 | ||
30 dB silent 40 dB(A) audible 50 dB(A) loud |
||
min: | ||
| Alienware x14 i7 RTX 3060 GeForce RTX 3060 Laptop GPU, i7-12700H, WDC PC SN810 1TB | Asus ROG Zephyrus G14 GA402RK Radeon RX 6800S, R9 6900HS, Micron 2450 1TB MTFDKBK1T0TFK | Razer Blade 14 Ryzen 9 RTX 3070 GeForce RTX 3070 Laptop GPU, R9 5900HX, Samsung PM981a MZVLB1T0HBLR | Asus Zephyrus G14 GA401QM GeForce RTX 3060 Laptop GPU, R9 5900HS, SK Hynix HFM001TD3JX013N | Alienware x15 RTX 3070 P111F GeForce RTX 3070 Laptop GPU, i7-11800H, WDC PC SN730 SDBPNTY-512G | |
|---|---|---|---|---|---|
| Noise | 3% | 7% | -7% | 3% | |
| off / environment * (dB) | 24.7 | 24 3% | 25.1 -2% | 24.8 -0% | 24.1 2% |
| Idle Minimum * (dB) | 24.7 | 24 3% | 25.2 -2% | 25.4 -3% | 26.6 -8% |
| Idle Average * (dB) | 24.7 | 26 -5% | 25.2 -2% | 34.5 -40% | 26.6 -8% |
| Idle Maximum * (dB) | 30.9 | 31 -0% | 25.2 18% | 34.5 -12% | 26.6 14% |
| Load Average * (dB) | 40 | 45 -13% | 31 22% | 35.4 11% | 30.9 23% |
| Witcher 3 ultra * (dB) | 51.5 | 43 17% | 44 15% | 52.7 -2% | 49.9 3% |
| Load Maximum * (dB) | 51.5 | 45 13% | 51.7 -0% | 52.3 -2% | 53.5 -4% |
* ... smaller is better
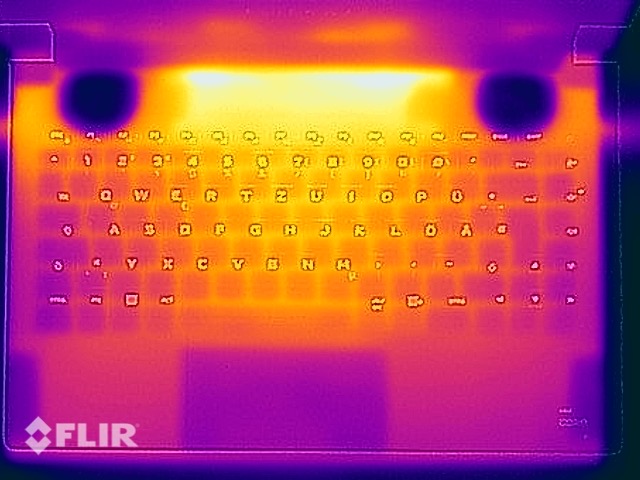
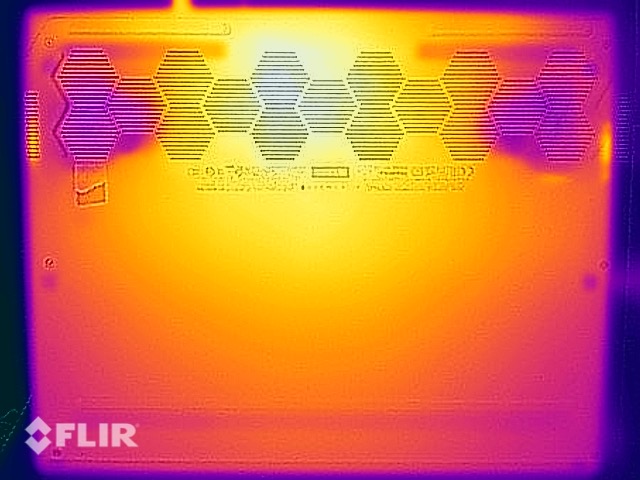
Temperature
We were positively surprised by the surface temperatures because the bottom of the base unit stays comparatively cool at up to 45 °C even under load (like gaming), so you can still put it on your lap in this scenario. We record the highest temperatures on the top of the base unit, but it is the area above the keyboard where you do not touch the surface. The keyboard area itself also warms up noticeably to 44 °C and you will get warm fingers, but there are no restrictions when you want to type. The chassis stays comfortably cool during light workloads.
(-) The maximum temperature on the upper side is 51.3 °C / 124 F, compared to the average of 40.4 °C / 105 F, ranging from 21.2 to 68.8 °C for the class Gaming.
(±) The bottom heats up to a maximum of 44.4 °C / 112 F, compared to the average of 43.2 °C / 110 F
(+) In idle usage, the average temperature for the upper side is 25.4 °C / 78 F, compared to the device average of 33.9 °C / 93 F.
(-) Playing The Witcher 3, the average temperature for the upper side is 42.5 °C / 109 F, compared to the device average of 33.9 °C / 93 F.
(±) The palmrests and touchpad can get very hot to the touch with a maximum of 39 °C / 102.2 F.
(-) The average temperature of the palmrest area of similar devices was 28.8 °C / 83.8 F (-10.2 °C / -18.4 F).
| Alienware x14 i7 RTX 3060 Intel Core i7-12700H, NVIDIA GeForce RTX 3060 Laptop GPU | Asus ROG Zephyrus G14 GA402RK AMD Ryzen 9 6900HS, AMD Radeon RX 6800S | Razer Blade 14 Ryzen 9 RTX 3070 AMD Ryzen 9 5900HX, NVIDIA GeForce RTX 3070 Laptop GPU | Asus Zephyrus G14 GA401QM AMD Ryzen 9 5900HS, NVIDIA GeForce RTX 3060 Laptop GPU | Alienware x15 RTX 3070 P111F Intel Core i7-11800H, NVIDIA GeForce RTX 3070 Laptop GPU | |
|---|---|---|---|---|---|
| Heat | -15% | -21% | -21% | -15% | |
| Maximum Upper Side * (°C) | 51.3 | 55 -7% | 45 12% | 55.4 -8% | 59.2 -15% |
| Maximum Bottom * (°C) | 44.4 | 55 -24% | 44.4 -0% | 62.2 -40% | 58 -31% |
| Idle Upper Side * (°C) | 27.2 | 30 -10% | 40.2 -48% | 31 -14% | 28.4 -4% |
| Idle Bottom * (°C) | 26.6 | 32 -20% | 39.2 -47% | 32.4 -22% | 29 -9% |
* ... smaller is better
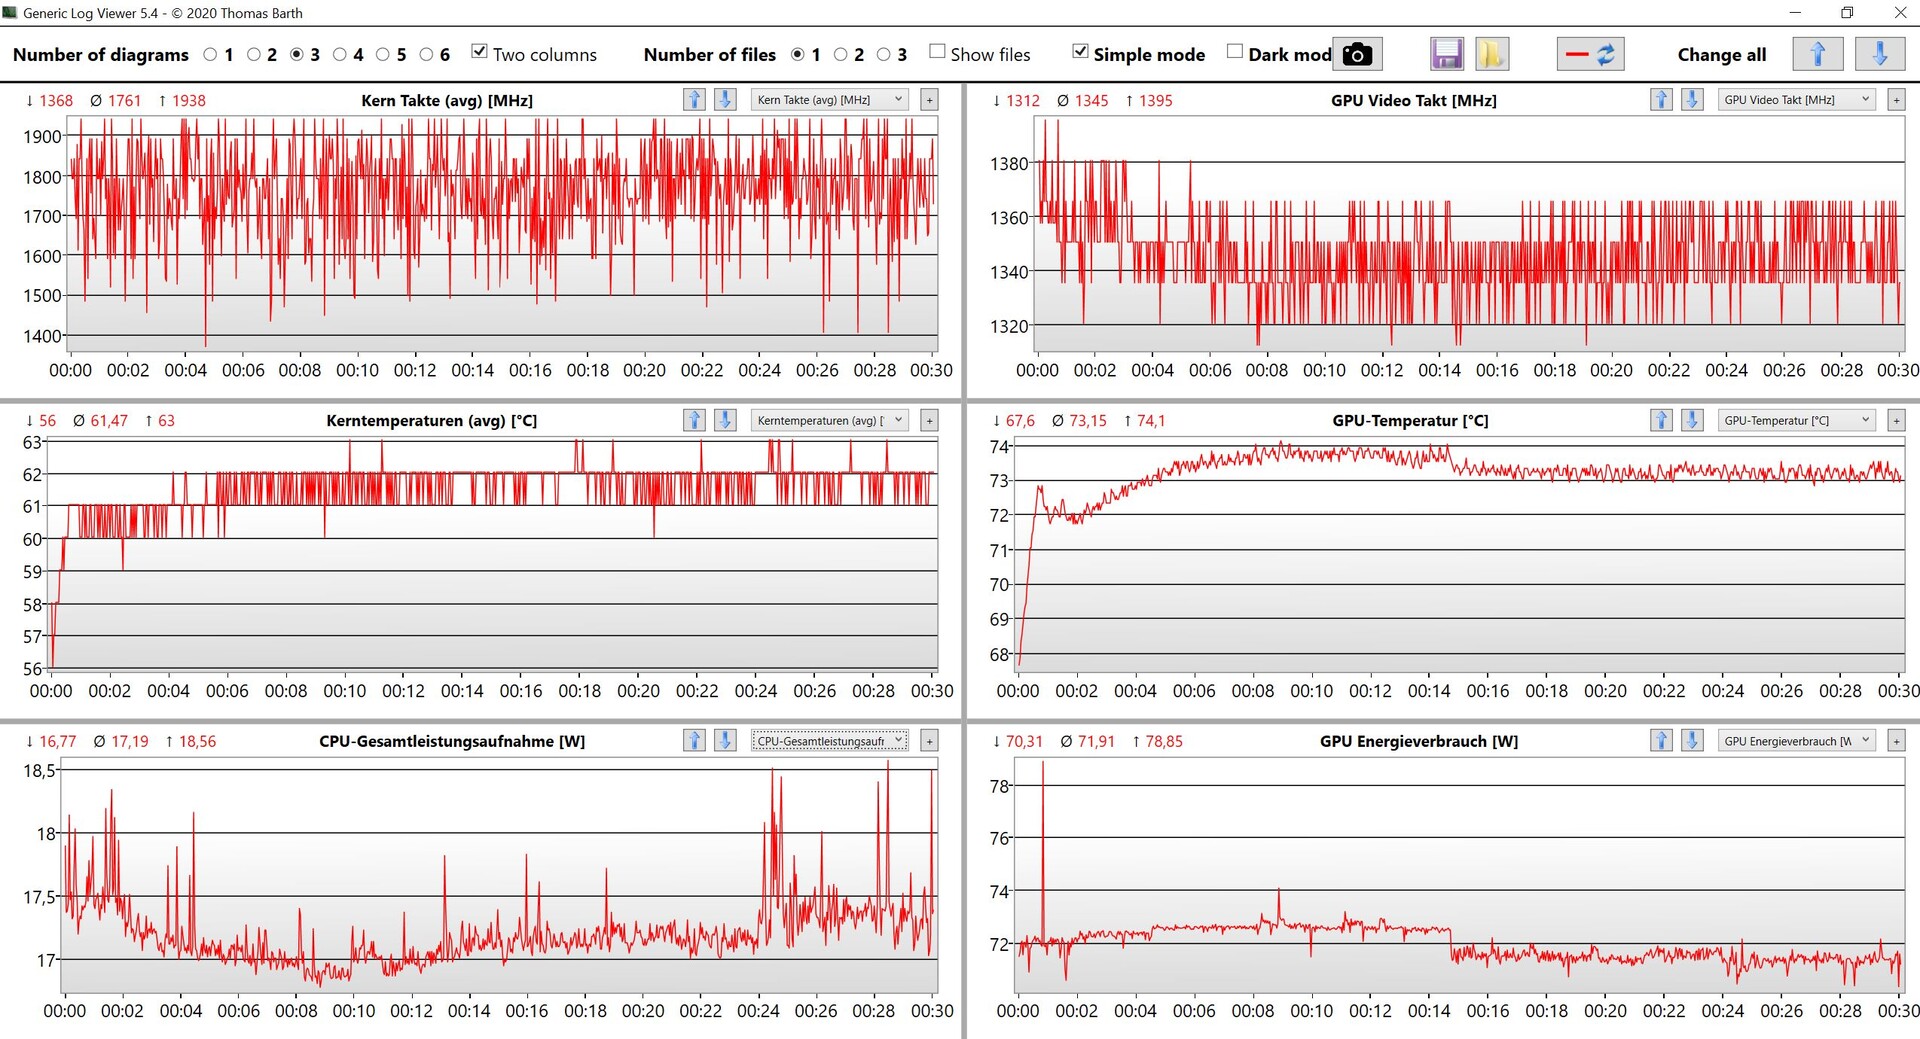
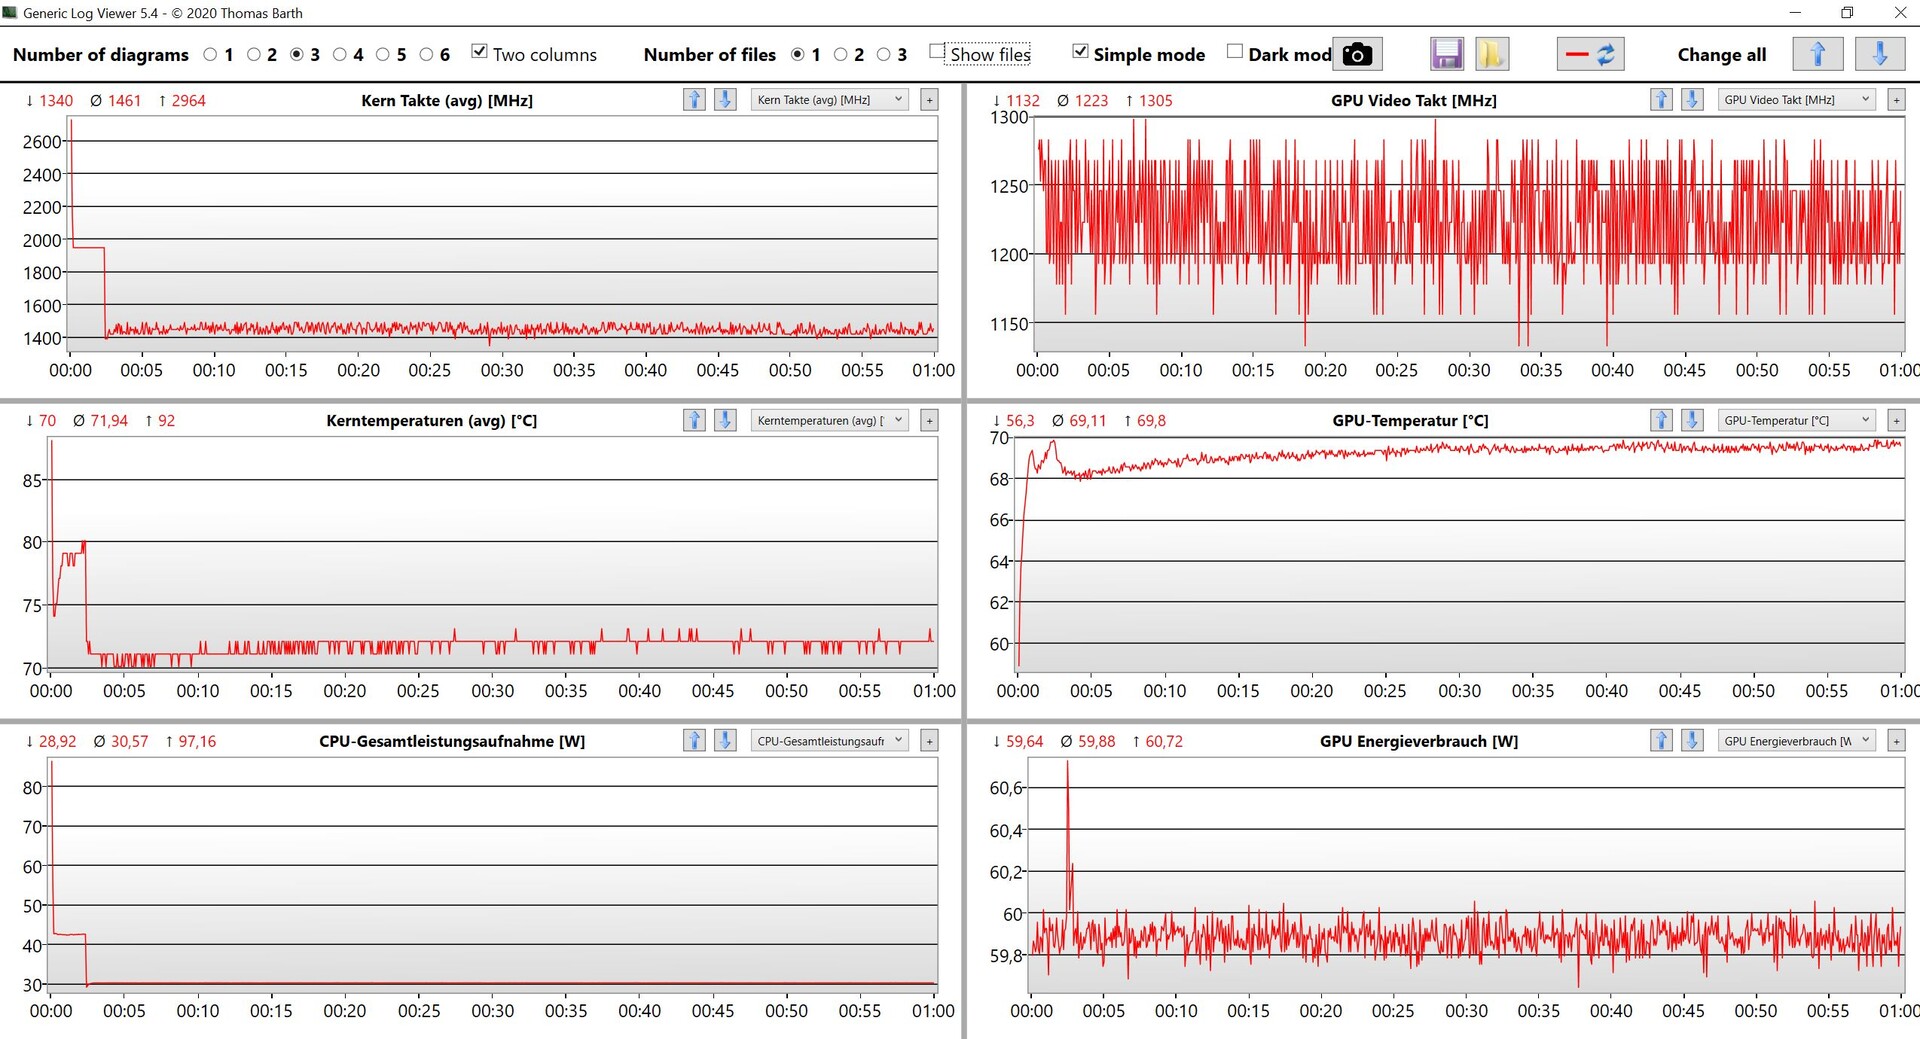
Stress test
The system favors the dedicated graphics cards during the stress test, which makes sense for a gaming laptop. The RTX 3060 runs at 60W all the time, while the Core i7 drops to just 30W. The behavior is pretty much identical to the High-Performance mode, the only difference is that the GPU consumes 5W more. All in all, the Alienware x14 can handle a 90-95W for longer periods. The stress test on the battery is identical up to a battery capacity of 50% when the consumption figures start to fluctuate a bit (GPU: 40-50W; CPU: 30-35W).
Speakers
Alienware ships the x14 with the Dolby Access app, which offers different presets and it results in a noticeable richer sound experience. The modules sound pretty tinny and powerless when you deactivate the software. The overall performance is okay and it is no problem to listen to some music or watch videos, but the speakers are pretty much useless when you play games because the fans are too loud.
Alienware x14 i7 RTX 3060 audio analysis
(±) | speaker loudness is average but good (79.5 dB)
Bass 100 - 315 Hz
(-) | nearly no bass - on average 18.3% lower than median
(±) | linearity of bass is average (10.9% delta to prev. frequency)
Mids 400 - 2000 Hz
(+) | balanced mids - only 2.9% away from median
(+) | mids are linear (4.2% delta to prev. frequency)
Highs 2 - 16 kHz
(+) | balanced highs - only 3.3% away from median
(+) | highs are linear (4.3% delta to prev. frequency)
Overall 100 - 16.000 Hz
(±) | linearity of overall sound is average (15.5% difference to median)
Compared to same class
» 35% of all tested devices in this class were better, 7% similar, 58% worse
» The best had a delta of 6%, average was 18%, worst was 132%
Compared to all devices tested
» 23% of all tested devices were better, 4% similar, 73% worse
» The best had a delta of 4%, average was 23%, worst was 134%
Razer Blade 14 Ryzen 9 RTX 3070 audio analysis
(±) | speaker loudness is average but good (78.1 dB)
Bass 100 - 315 Hz
(±) | reduced bass - on average 14.2% lower than median
(±) | linearity of bass is average (13.5% delta to prev. frequency)
Mids 400 - 2000 Hz
(±) | higher mids - on average 5.5% higher than median
(+) | mids are linear (6.6% delta to prev. frequency)
Highs 2 - 16 kHz
(+) | balanced highs - only 4.8% away from median
(±) | linearity of highs is average (8.9% delta to prev. frequency)
Overall 100 - 16.000 Hz
(±) | linearity of overall sound is average (18.6% difference to median)
Compared to same class
» 60% of all tested devices in this class were better, 9% similar, 31% worse
» The best had a delta of 6%, average was 18%, worst was 132%
Compared to all devices tested
» 42% of all tested devices were better, 8% similar, 50% worse
» The best had a delta of 4%, average was 23%, worst was 134%
Energy Management - Almost full performance on battery
Power Consumption
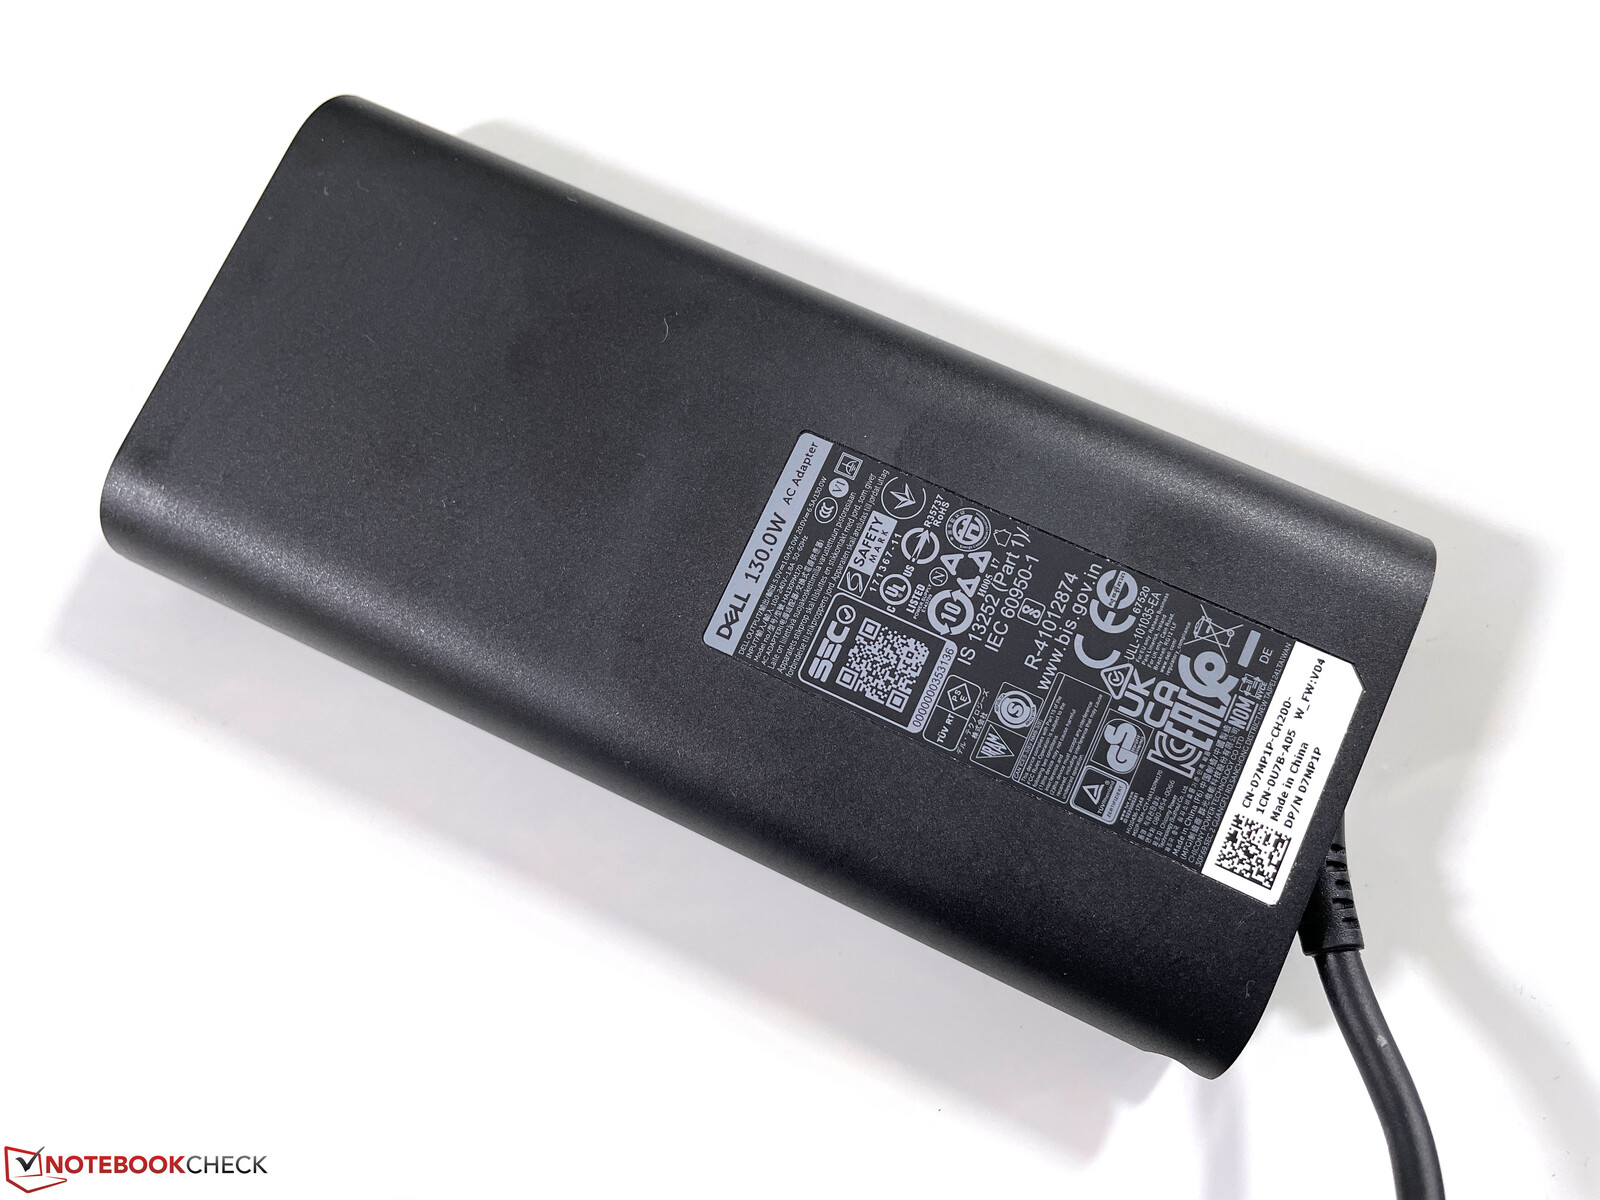
The Alienware x14 is powered via USB-C, which is no problem thanks to the new USB-C 2.1 standard (up to 240W). We measure a brief spike of up to 140W under load, which quickly settles at 130W and then ~114W after a couple of minutes. You can also expect these values during gaming, so the included 130W power adapter is sufficient.
The idle consumption values are pretty low for a powerful gaming laptop and we only measure 11.8W while idling at the maximum brightness. The consumption is also very low when the device is turned off, but Dell could have another look at the standby value (1.3W) and optimize it.
| Off / Standby | |
| Idle | |
| Load |
|
Key:
min: | |
| Alienware x14 i7 RTX 3060 i7-12700H, GeForce RTX 3060 Laptop GPU, WDC PC SN810 1TB, IPS, 1920x1080, 14" | Asus ROG Zephyrus G14 GA402RK R9 6900HS, Radeon RX 6800S, Micron 2450 1TB MTFDKBK1T0TFK, IPS-Level, 2560x1600, 14" | Razer Blade 14 Ryzen 9 RTX 3070 R9 5900HX, GeForce RTX 3070 Laptop GPU, Samsung PM981a MZVLB1T0HBLR, IPS, 2560x1440, 14" | Asus Zephyrus G14 GA401QM R9 5900HS, GeForce RTX 3060 Laptop GPU, SK Hynix HFM001TD3JX013N, IPS, 1920x1080, 14" | Alienware x15 RTX 3070 P111F i7-11800H, GeForce RTX 3070 Laptop GPU, WDC PC SN730 SDBPNTY-512G, IPS, 2560x1440, 15.6" | Average NVIDIA GeForce RTX 3060 Laptop GPU | Average of class Gaming | |
|---|---|---|---|---|---|---|---|
| Power Consumption | -26% | -35% | 1% | -86% | -39% | -65% | |
| Idle Minimum * (Watt) | 7.9 | 7 11% | 9.4 -19% | 5.6 29% | 15.7 -99% | 10.4 ? -32% | 13 ? -65% |
| Idle Average * (Watt) | 11.1 | 14 -26% | 15.8 -42% | 10.4 6% | 20.3 -83% | 14.5 ? -31% | 18.7 ? -68% |
| Idle Maximum * (Watt) | 11.8 | 22 -86% | 24.1 -104% | 18 -53% | 43 -264% | 21.4 ? -81% | 24.3 ? -106% |
| Load Average * (Watt) | 107.4 | 98 9% | 76.8 28% | 68 37% | 94.4 12% | 109.3 ? -2% | 110.2 ? -3% |
| Witcher 3 ultra * (Watt) | 111 | 141 -27% | 154 -39% | 113 -2% | 167 -50% | ||
| Load Maximum * (Watt) | 140.4 | 188 -34% | 189.7 -35% | 158.2 -13% | 183.4 -31% | 206 ? -47% | 258 ? -84% |
* ... smaller is better
Power Consumption Witcher 3 / Stress test
Power Consumption external screen
Battery Runtime
The large 80Wh battery provides long runtimes. Our practical Wi-Fi test at 150 nits (57% of the maximum brightness on our test unit) runs for almost 9 hours and is still 7 hours at the maximum brightness. Our video test at 150 nits determines almost 9.5 hours. This means the compact x14 has more stamina than the x15 and the Razer Blade 14, but the two models of the Asus ROG Zephyrus G14 manage longer runtimes.
It is noticeable that the performance is not really reduced all that much on battery power because the full charge is drained after just 45 minutes both during the stress test and while gaming. The charging speed is good for the first 35% (just 18 minutes) and then drops a bit (50% after 36 minutes, 80% after 72 minutes). A full charge takes about 130 minutes when the laptop is turned on.
| Alienware x14 i7 RTX 3060 i7-12700H, GeForce RTX 3060 Laptop GPU, 80 Wh | Asus ROG Zephyrus G14 GA402RK R9 6900HS, Radeon RX 6800S, 76 Wh | Razer Blade 14 Ryzen 9 RTX 3070 R9 5900HX, GeForce RTX 3070 Laptop GPU, 62 Wh | Asus Zephyrus G14 GA401QM R9 5900HS, GeForce RTX 3060 Laptop GPU, 76 Wh | Alienware x15 RTX 3070 P111F i7-11800H, GeForce RTX 3070 Laptop GPU, 87 Wh | Average of class Gaming | |
|---|---|---|---|---|---|---|
| Battery runtime | 10% | 23% | 54% | -9% | 20% | |
| H.264 (h) | 9.4 | 8.64 ? -8% | ||||
| WiFi v1.3 (h) | 8.9 | 9.5 7% | 7.3 -18% | 11.8 33% | 6.1 -31% | 7.11 ? -20% |
| Witcher 3 ultra (h) | 0.8 | |||||
| Load (h) | 0.8 | 0.9 13% | 1.3 63% | 1.4 75% | 0.9 13% | 1.502 ? 88% |
| Reader / Idle (h) | 18.1 | 13.8 | 21 | 9.7 | 8.71 ? |
Pros
Cons
Verdict - Alienware x14 is thinner, but also slower than the competition
The new Alienware x14 integrates seamlessly in the product line-up of the two slim gaming notebooks x15 and x17 and you get plenty of modern technology: Intel Alder Lake CPUs, GeForce RTX 3000 GPUs, Thunderbolt 4, PCIe 4.0, Wi-Fi 6E, G-Sync, and Advanced Optimus. However, the slim design has some drawbacks, just like its larger siblings. The shifted hinge position results in a very deep device with a large footprint compared to the other two current 14-inch gaming systems from Razer and Asus. All the ports are located at the rear, so it is not possible to connect a USB drive or even headphones at the sides. The keyboard is also located close to the front edge and the small palm rests will be an issue for larger hands. Dell also reduced the key travel from 1.5 mm on the x15 to just 1.2 mm, which is immediately noticeable.
The second problem is the performance. Ur review unit with the Alder Lake Core i7-12700H and the GeForce RTX 3060 is currently the most powerful version of the Alienware x14 and the performance utilization is really not bad. Gaming in the native 1080p resolution is no problem, but the rivals Razer Blade 14 and Asus ROG Zephyrus G14 just offer faster GPUs and therefore more gaming performance for the same money. The fans are also very loud (even in the normal mode) when you play games, so headphones or a headset are essential. The marketing phrase “world’s thinnest gaming notebook” sounds good, but we are pretty sure a slightly thicker chassis would have resulted in a better product.
The new Alienware x14 offers the latest technology and stable gaming performance, but the slim chassis requires some compromises. A thicker chassis would have probably been better for many customers.
There is currently just one display option: A matte IPS screen with a 1080p resolution. The subjective picture quality is not as good as on OLED screens, but it is without a doubt a good display without PWM flickering. We especially like the smooth movements thanks to the fast response times and 144 Hz refresh rate. The display also has plenty of potentials, because the colors are extremely accurate after our calibration and the screen covers the DCI-P3 gamut. This means it is no problem to edit pictures or videos on the go, and photographers, as well as drone pilots, will be happy about the fast microSD reader.
Thanks to the combination of the matte display with accurate colors and DCI-P3 gamut as well as the fast card reader, the Alienware x14 is a very interesting option for photographers who want to edit their pictures on the go.
Finally, there is the price. 2400 Euros for our review unit is no bargain. The two direct rivals are in a similar price range but offer more gaming performance thanks to faster GPUs. If you can live with the drawbacks of the slim chassis, the new Alienware x14 is definitely worth a look, especially if you can benefit from the accurate colors and the P3 gamut of the display.
Alienware x14 i7 RTX 3060
- 03/16/2022 v7 (old)
Andreas Osthoff
Price comparison
