Asus ROG Flow X13 GV302XV (2023) Review: Svelte gaming convertible that packs a punch with AMD Zen 4 Ryzen 9 7940HS and 60 W Nvidia RTX 4060

Gaming convertibles, especially the 13-inch variety, are a rare breed. Asus practically dominates this space with the ROG Flow lineup. We have previously reviewed the ROG Flow Z13 and the ROG Flow Z13 ACRNM, both powered by Intel Raptor Lake-H and Nvidia RTX 40 series GPUs.
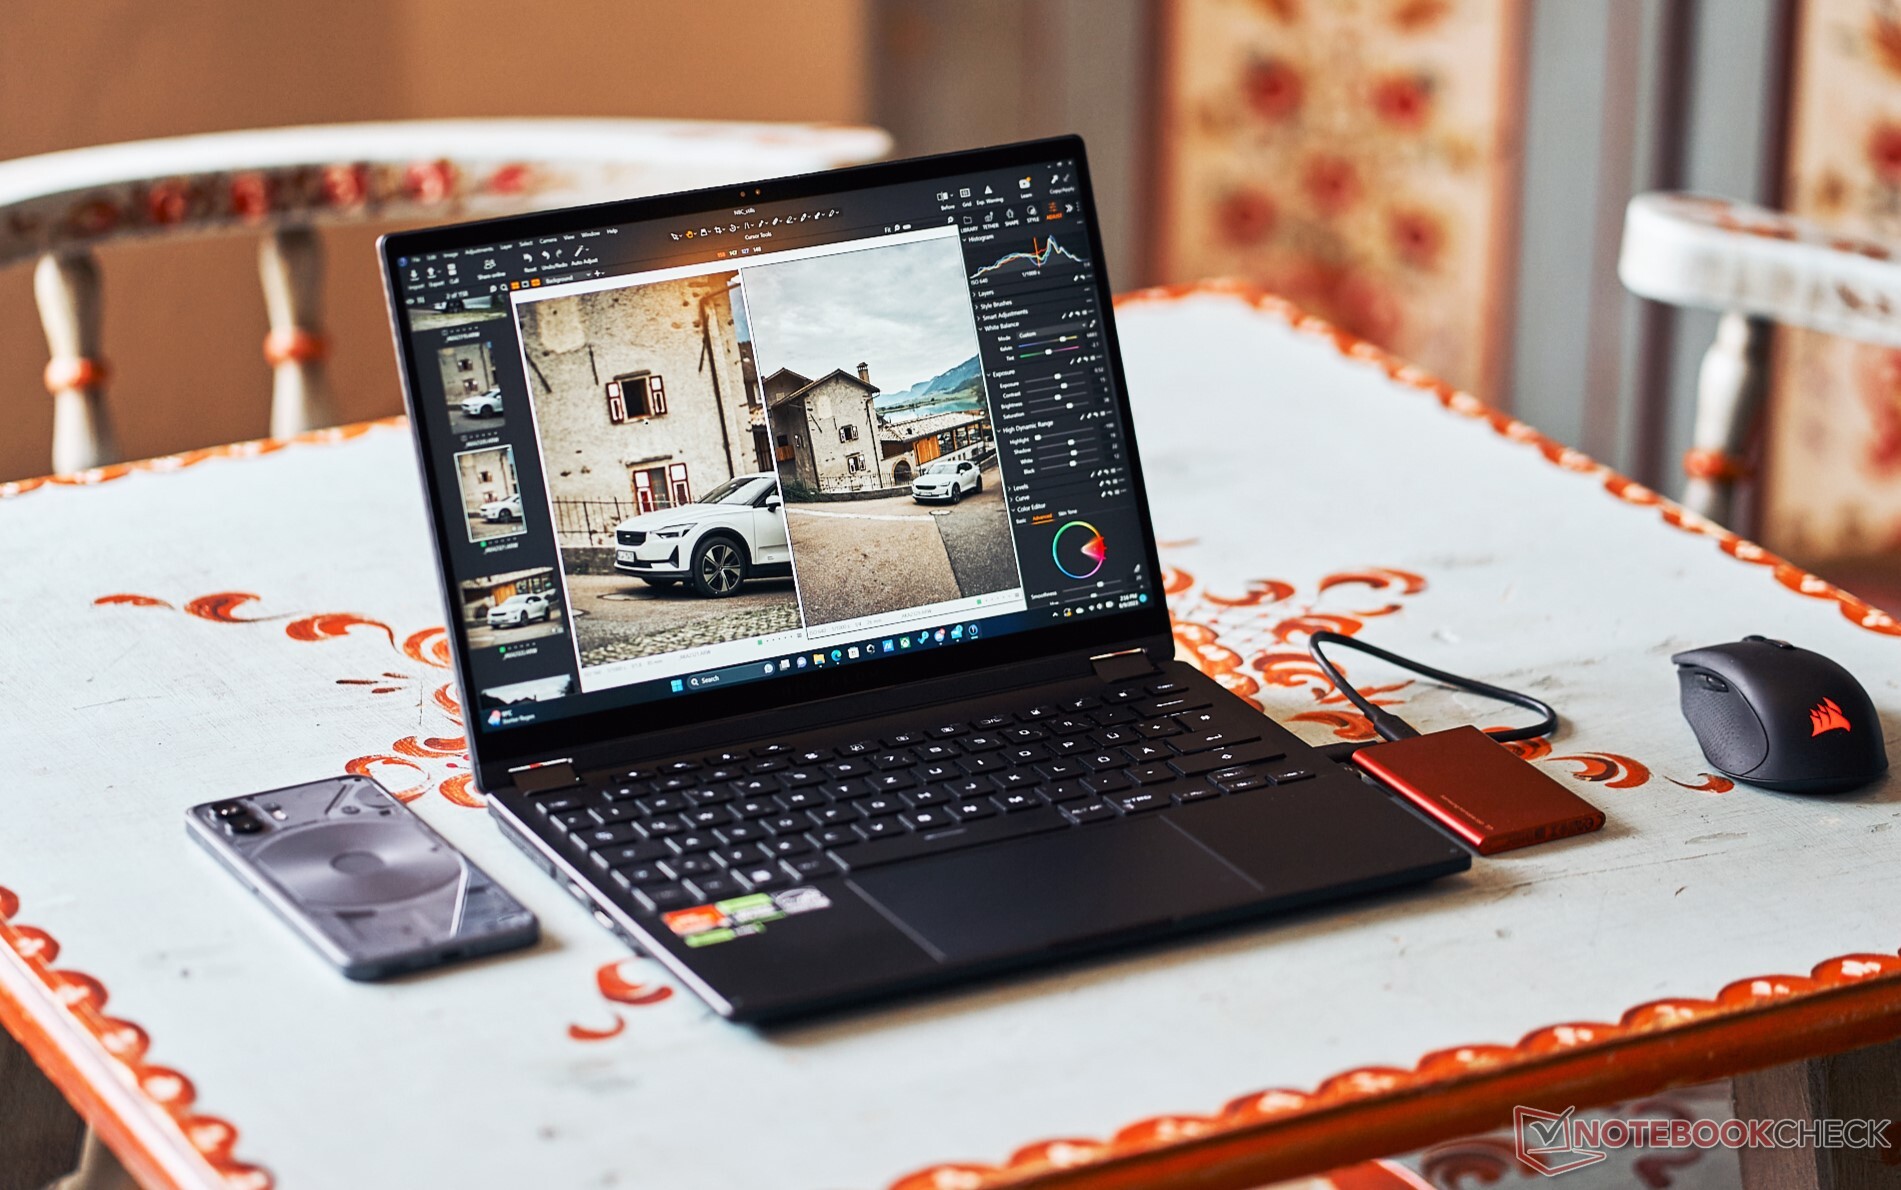
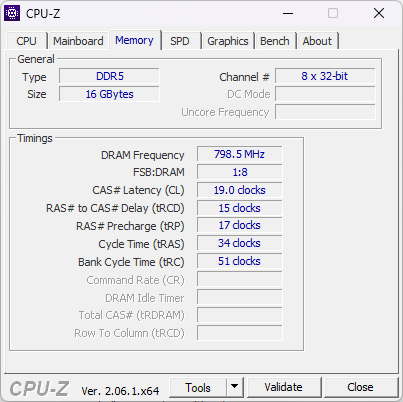
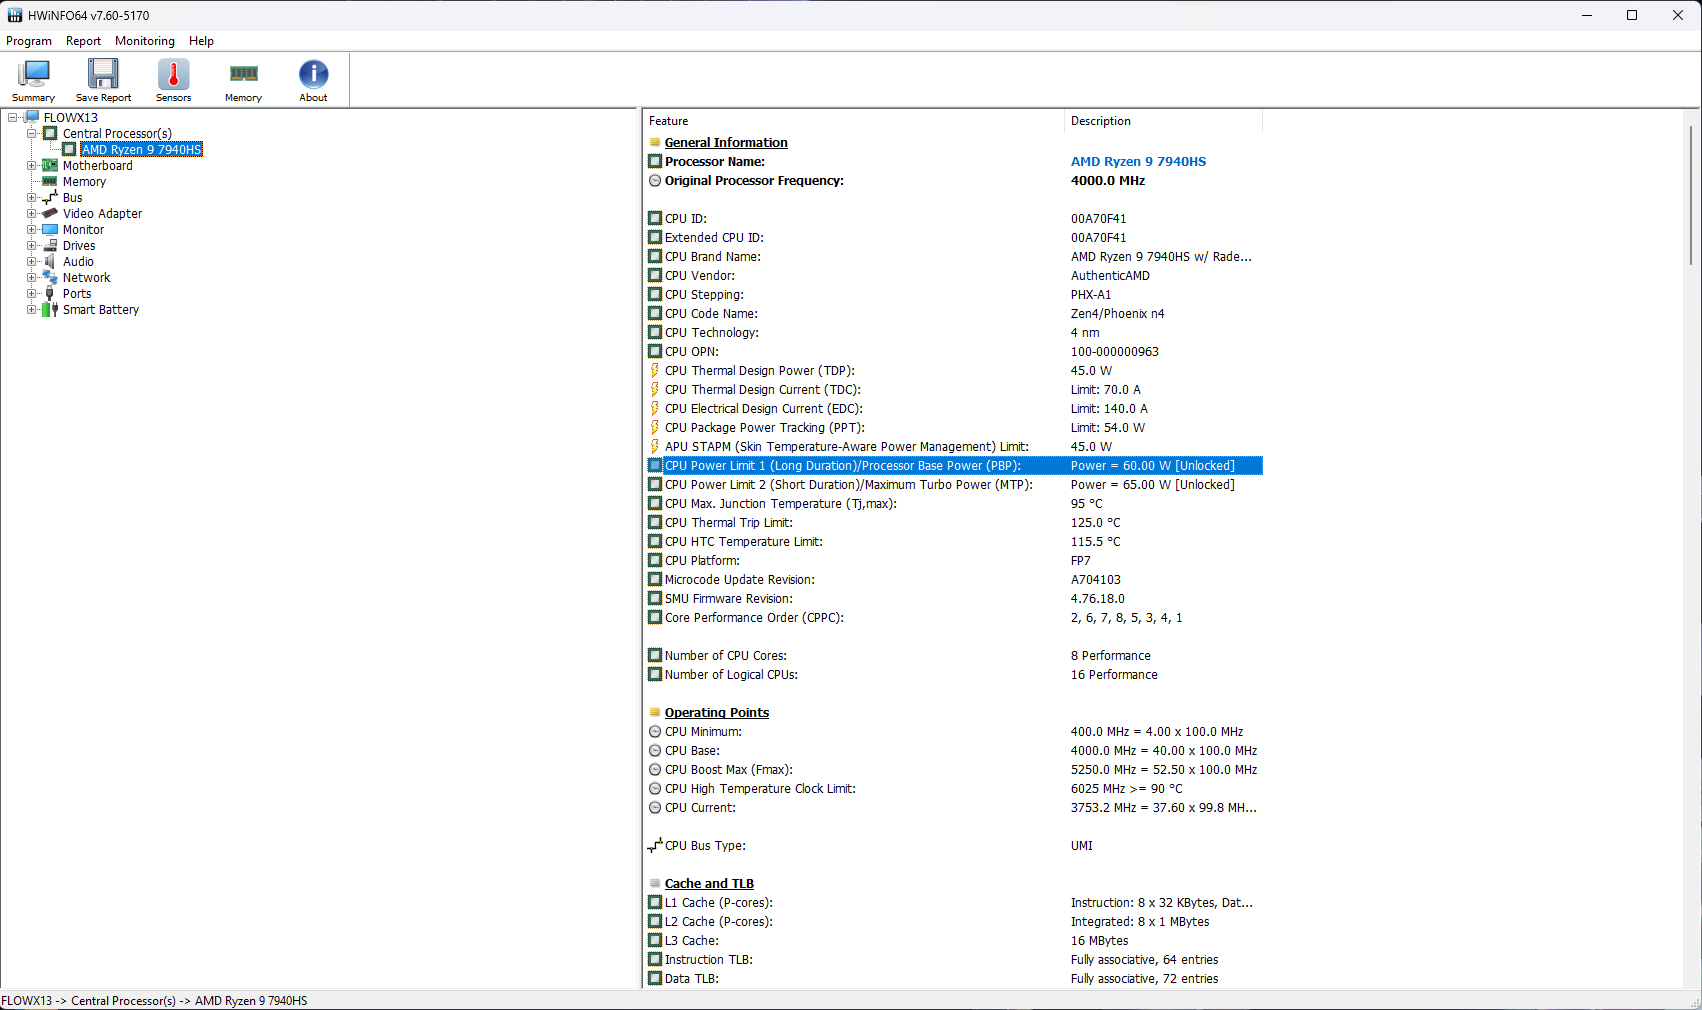
Now, we take a look at the AMD-flavored ROG Flow X13. Our ROG Flow X13 sample boasts an AMD Ryzen 9 7940HS APU and a 60 W Nvidia GeForce RTX 4060 Laptop GPU along with 16 GB LPDDR5-6400 RAM and a 1 TB PCIe Gen4 NVMe SSD. This configuration will set you back by ₹1,84,990 or US$2,500.
The ROG Flow X13 takes a different design approach than the detachable Z13. The Flow X13 lacks Thunderbolt, using USB4 instead. MediaTek Wi-Fi 6E replaces Intel connectivity. There's no secondary camera, but the Flow X13 sports a larger 75 WHr battery compared to the 56 WHr cell in the Z13.
Both the ROG Flow Z13 and X13 are priced similarly, which brings up a purchase conundrum. In this review, we take a good look at the ROG Flow X13 and see whether this AMD-based convertible makes for an overall better device compared to its Intel-based counterparts.
Potential competitors in comparison
Rating | Date | Model | Weight | Height | Size | Resolution | Price |
|---|---|---|---|---|---|---|---|
| 88.2 % v7 (old) | 10 / 2023 | Asus ROG Flow X13 GV302XV R9 7940HS, GeForce RTX 4060 Laptop GPU | 1.3 kg | 18.7 mm | 13.40" | 2560x1600 | |
| 89.4 % v7 (old) | 04 / 2023 | Asus ROG Flow Z13 ACRNM i9-13900H, GeForce RTX 4070 Laptop GPU | 1.7 kg | 20 mm | 13.40" | 2560x1600 | |
| 89.1 % v7 (old) | 04 / 2023 | Asus ROG Flow Z13 GZ301V i9-13900H, GeForce RTX 4060 Laptop GPU | 1.6 kg | 14.2 mm | 13.40" | 2560x1600 | |
| 88.7 % v7 (old) | 06 / 2023 | Razer Blade 14 RTX 4070 R9 7940HS, GeForce RTX 4070 Laptop GPU | 1.8 kg | 17.99 mm | 14.00" | 2560x1600 | |
| 86.9 % v7 (old) | 06 / 2023 | Asus TUF Gaming A16 FA617XS R9 7940HS, Radeon RX 7600S | 2.2 kg | 22.1 mm | 16.00" | 1920x1200 | |
| 87.7 % v7 (old) | 08 / 2023 | Lenovo Legion Slim 5 16APH8 R7 7840HS, GeForce RTX 4060 Laptop GPU | 2.4 kg | 25.2 mm | 16.00" | 2560x1600 | |
| 87.3 % v7 (old) | 07 / 2023 | Acer Predator Triton 14 PT14-51 i7-13700H, GeForce RTX 4050 Laptop GPU | 1.7 kg | 19.81 mm | 14.00" | 2560x1600 |
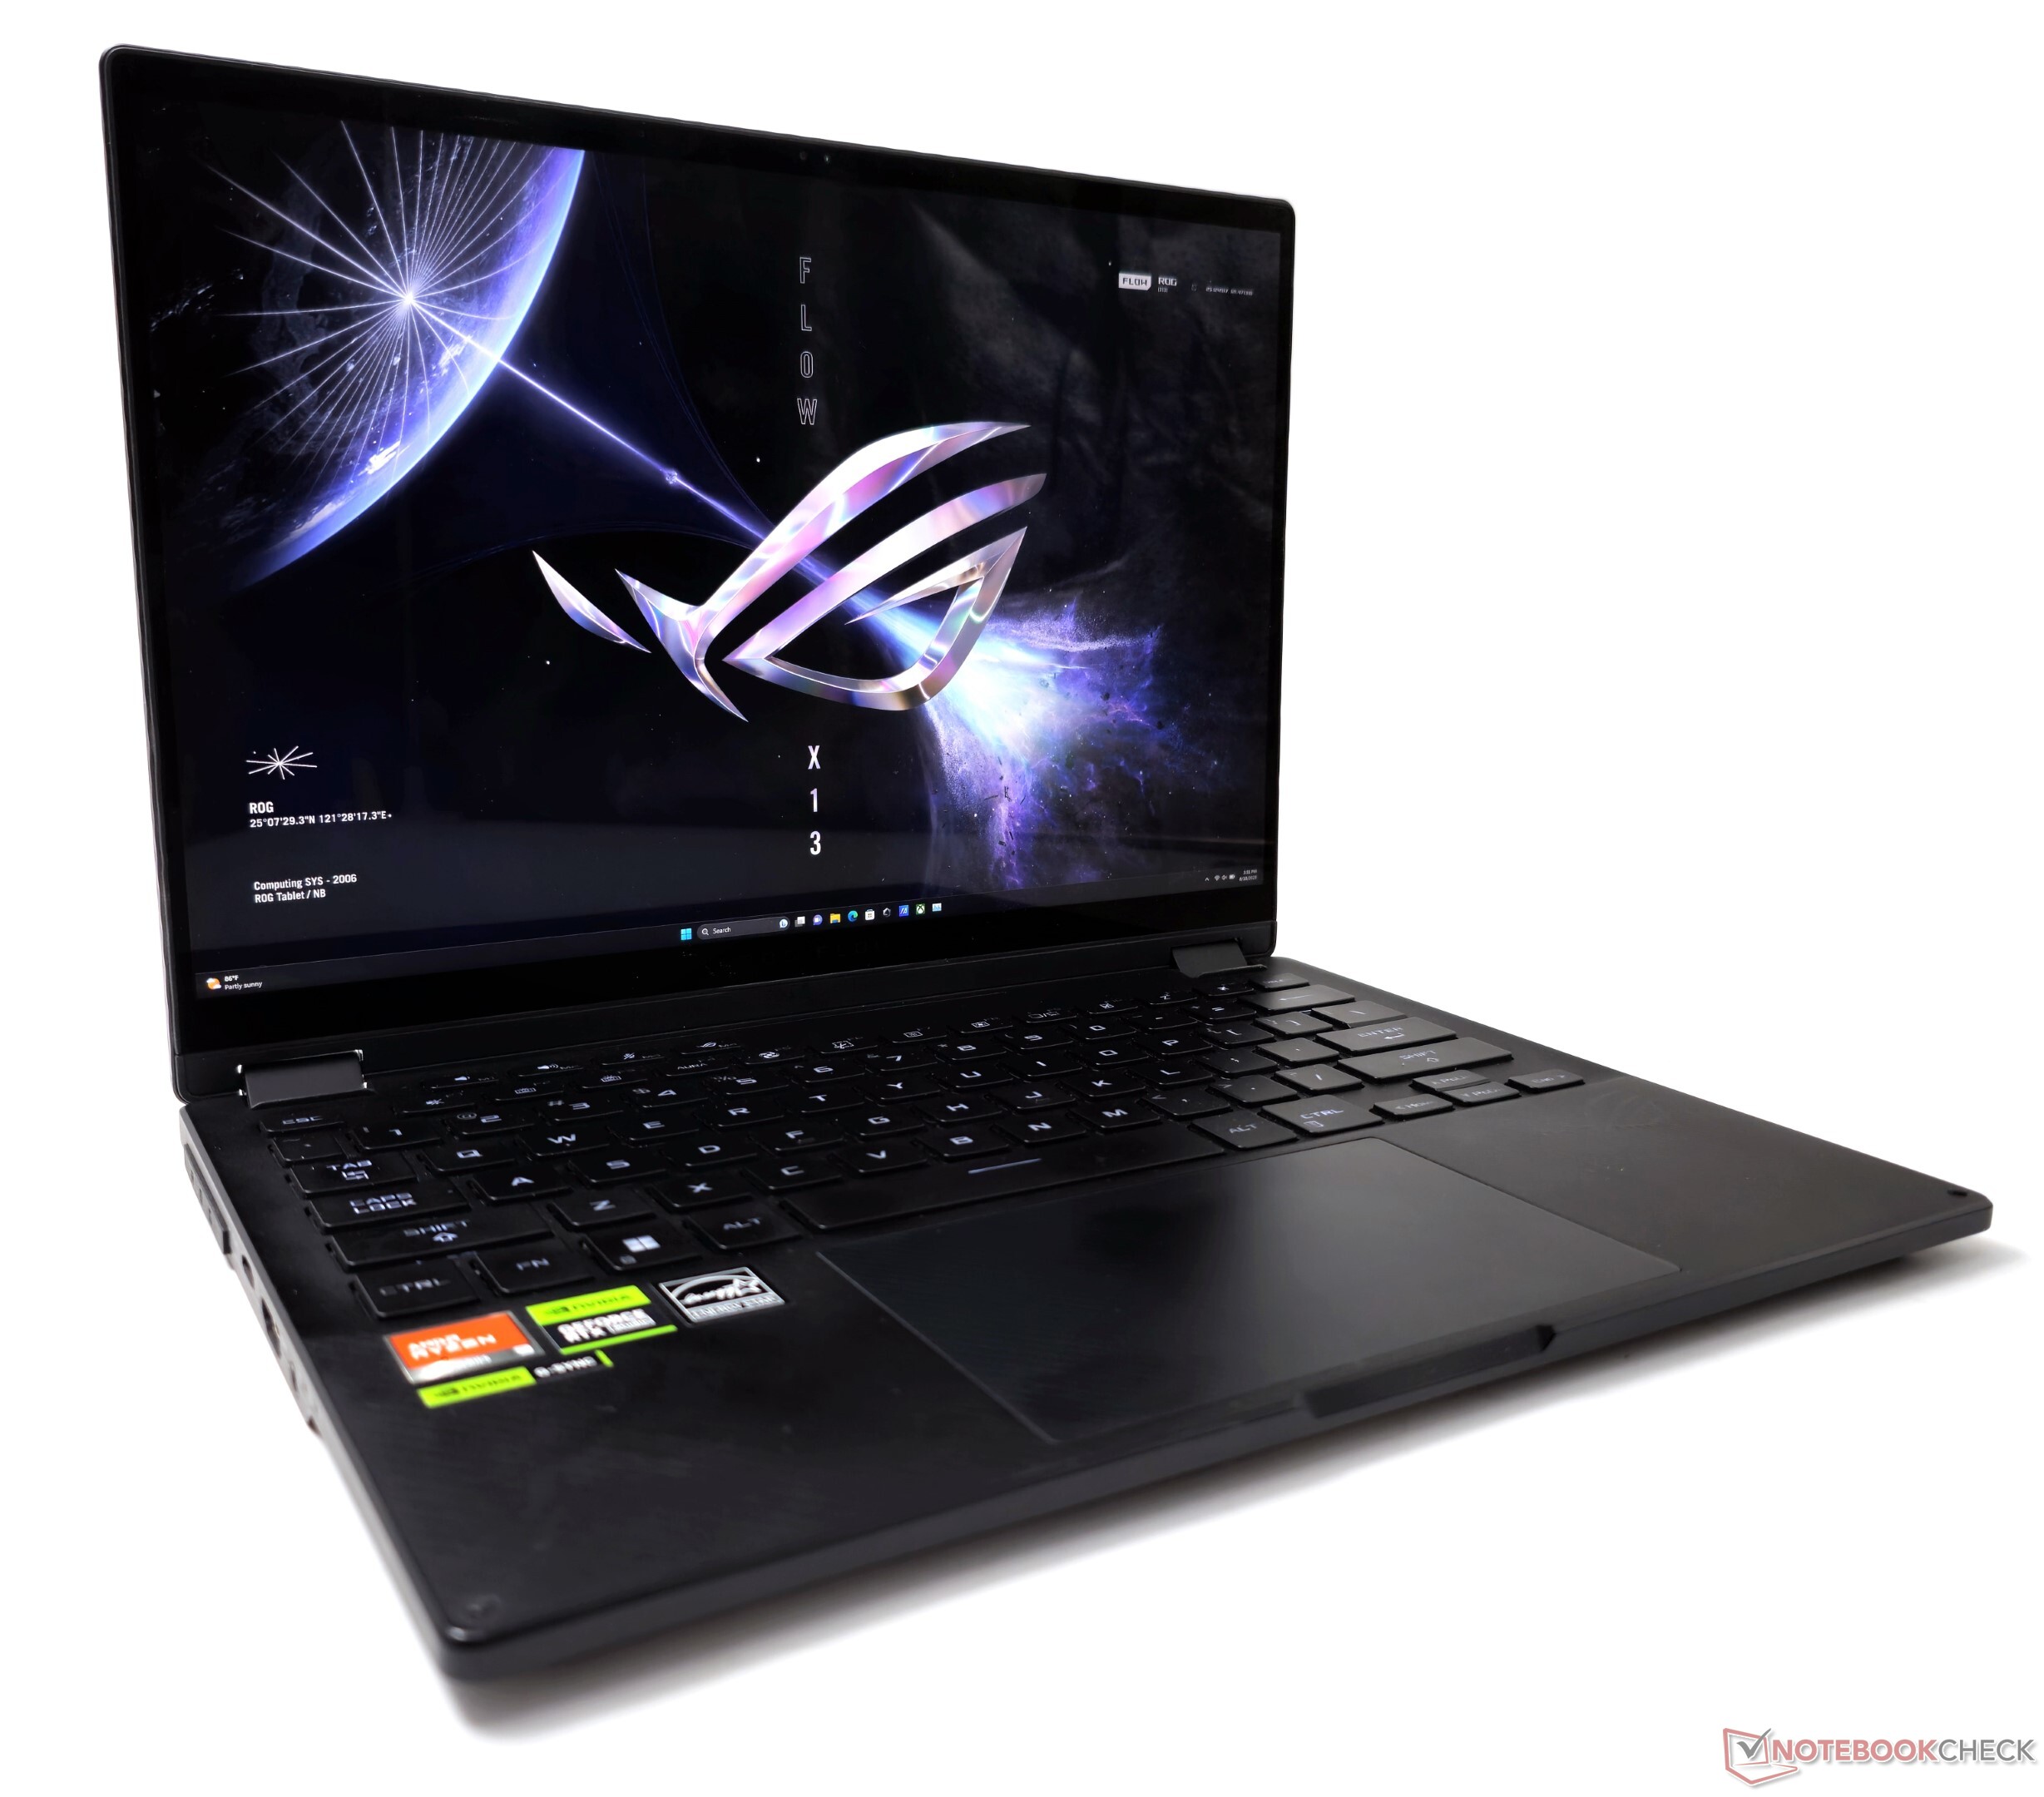
Chassis: Premium, understated elegance
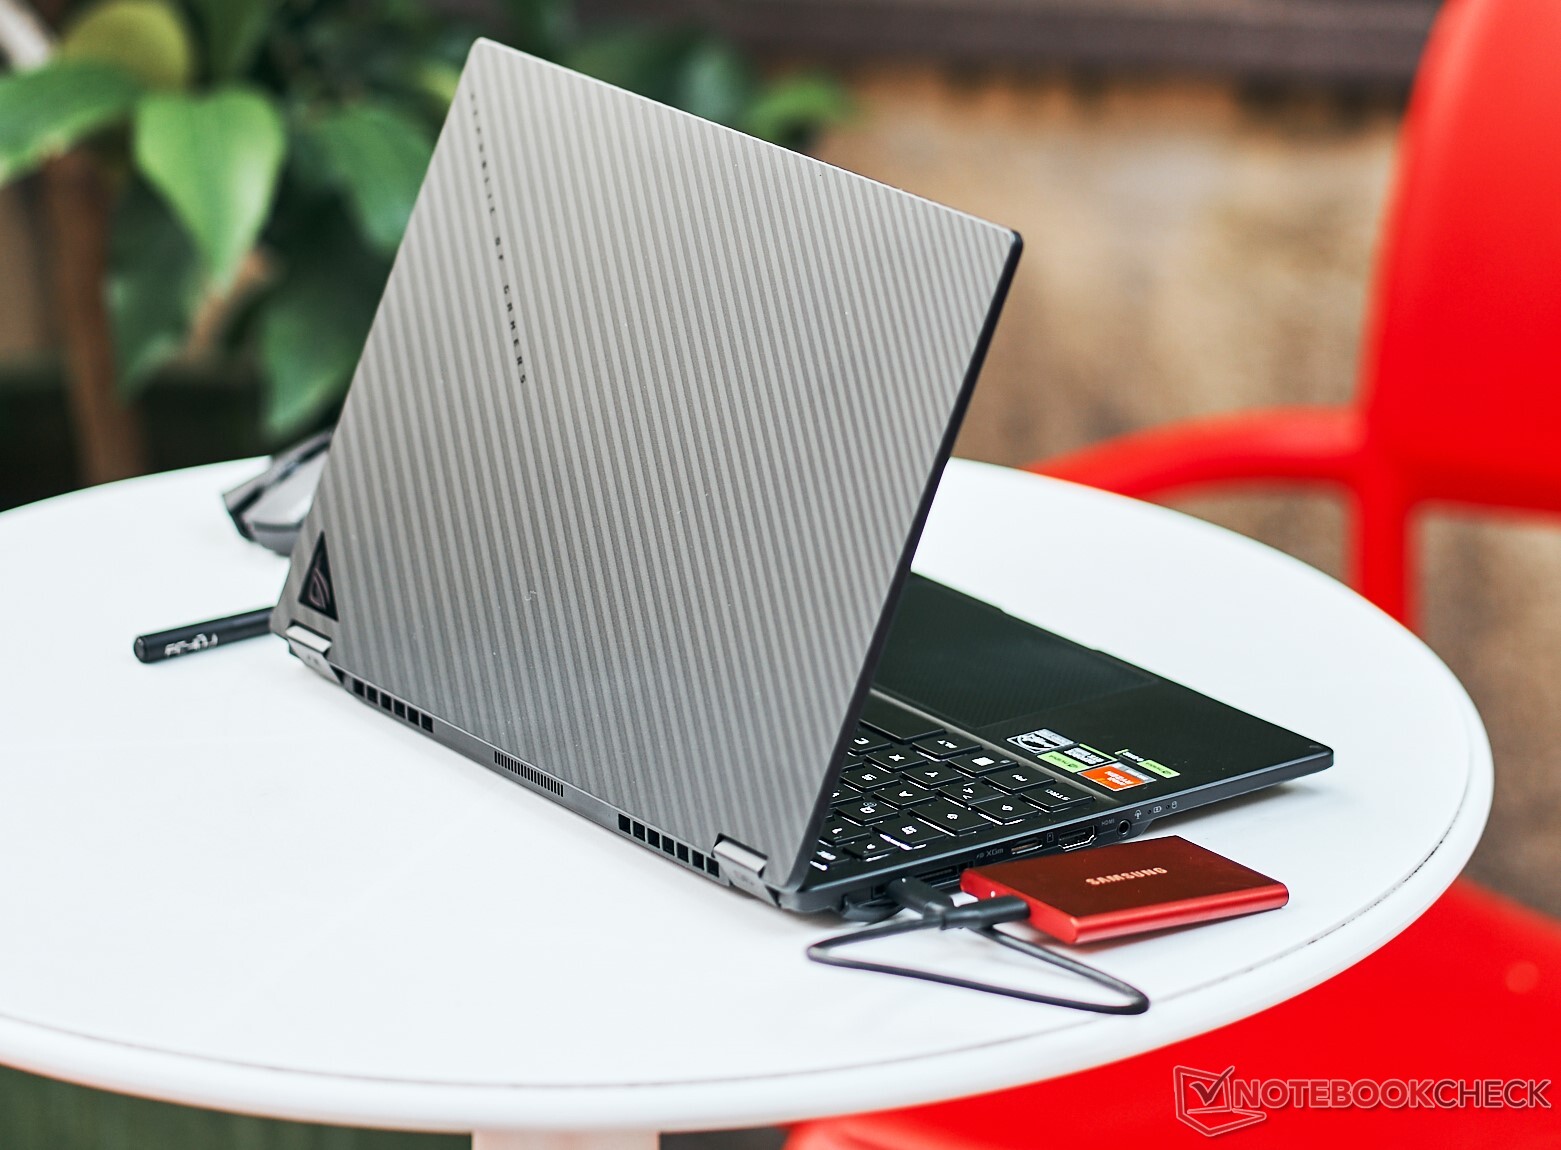
Clad in minimalist aluminum, the ROG Flow X13 eschews ostentatious "gamer" aesthetics for subtle sophistication. There is no internal "viewing window" as we've seen with the ROG Flow Z13.
The Flow X13's 13.4-inch frame strikes an ideal balance between portability and productivity, weighing just 1.3 kg for easy one-handed carrying. The distinctive textured lid adds stylistic flair while providing a grooved grip, opening smoothly with a single finger.
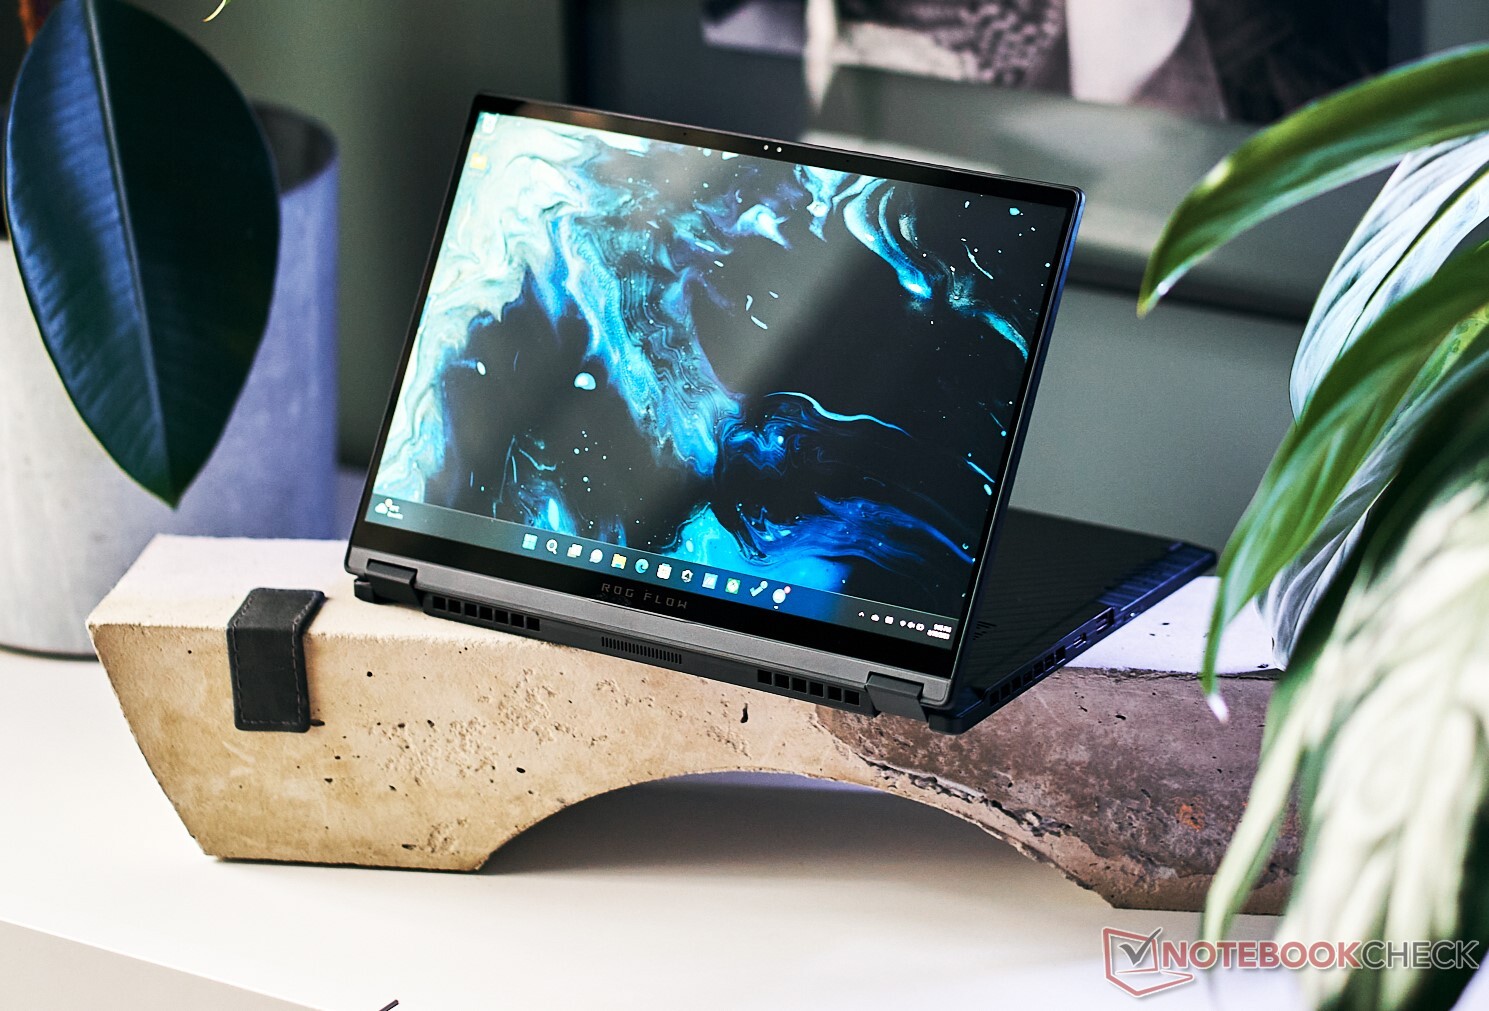
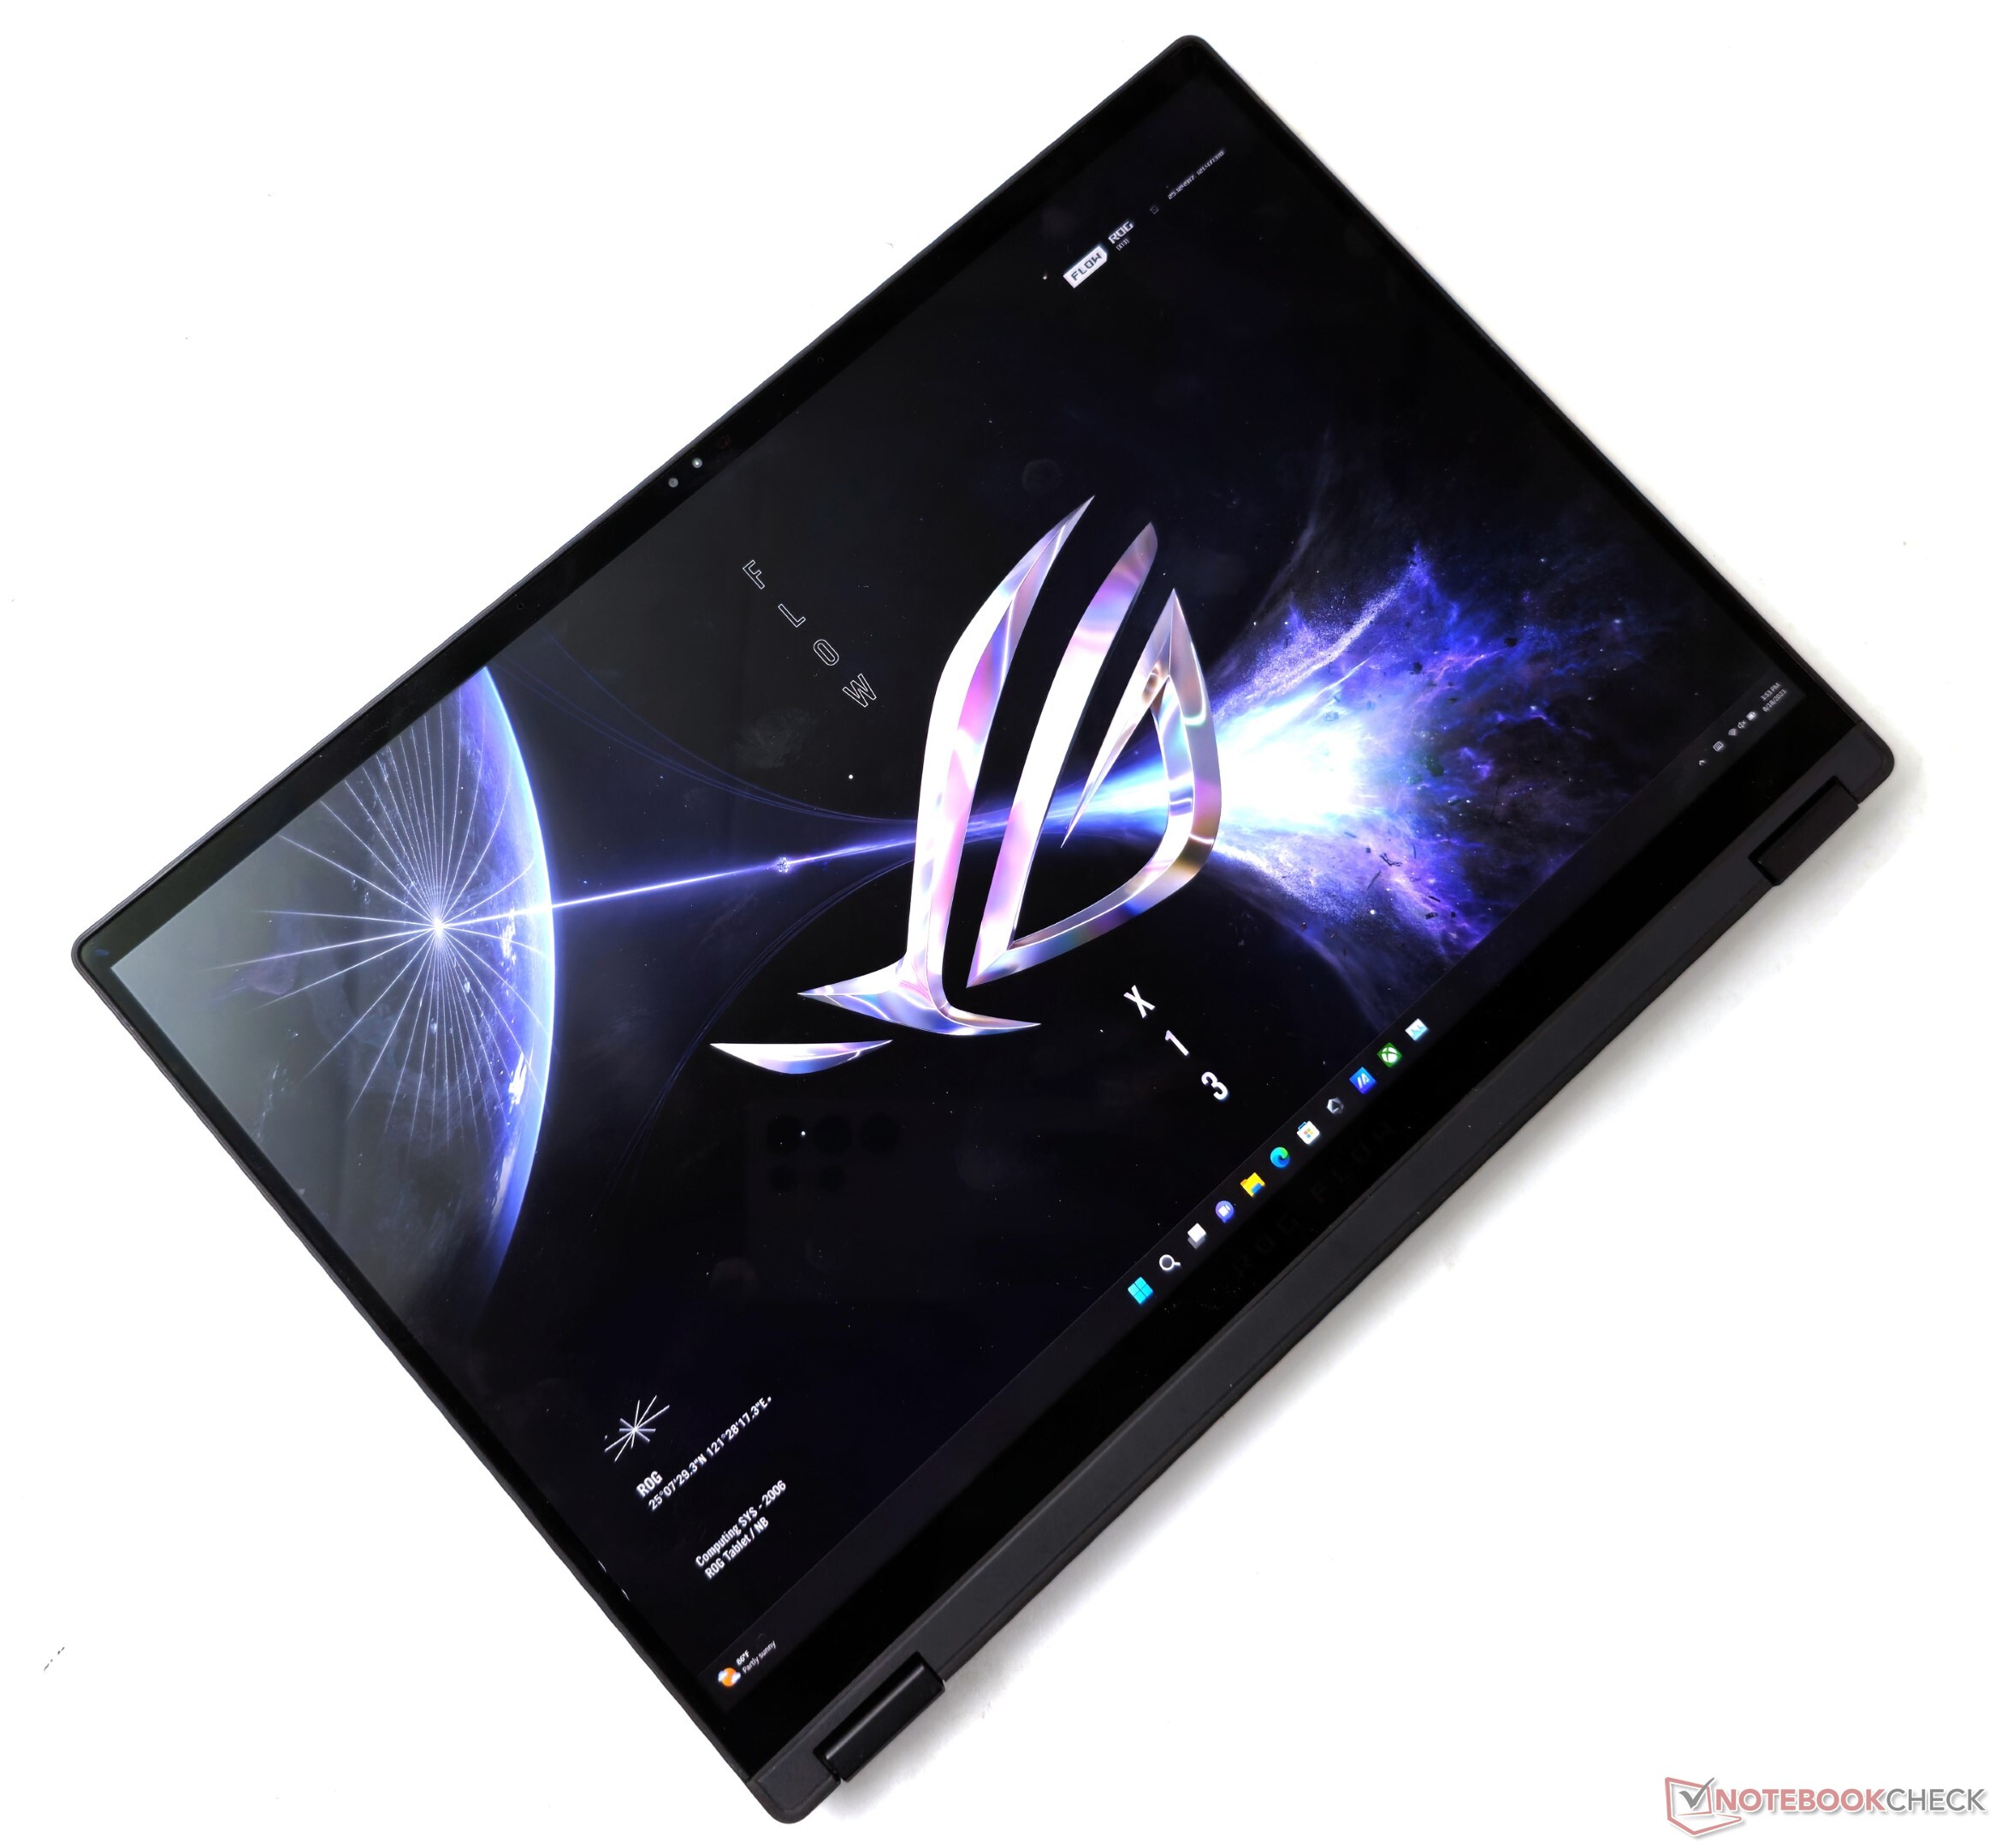
As a convertible, the Flow X13 can seamlessly morph between laptop, tablet, tent, or stand modes with sturdy, wobble-free hinges. Despite being just 18.7 mm thin, the chassis exhibits no flex or structural weaknesses in any mode.
Overall, Asus has delivered a premium convertible in a compact 13.4-inch form factor without any visible workmanship compromises.


Connectivity: USB4 and ROG XG Mobile interface
Despite its compact dimensions, the Flow X13 impresses with versatile connectivity. An exclusive ROG XG Mobile interface allows linking Asus' external GPU dock for added graphics horsepower up to an RTX 4090 Laptop GPU along with expanded I/O.
The ROG Flow X13 is among the handful of AMD laptops in 2023 with a USB4 port. We faced no obstruction while connecting multiple peripherals at once.
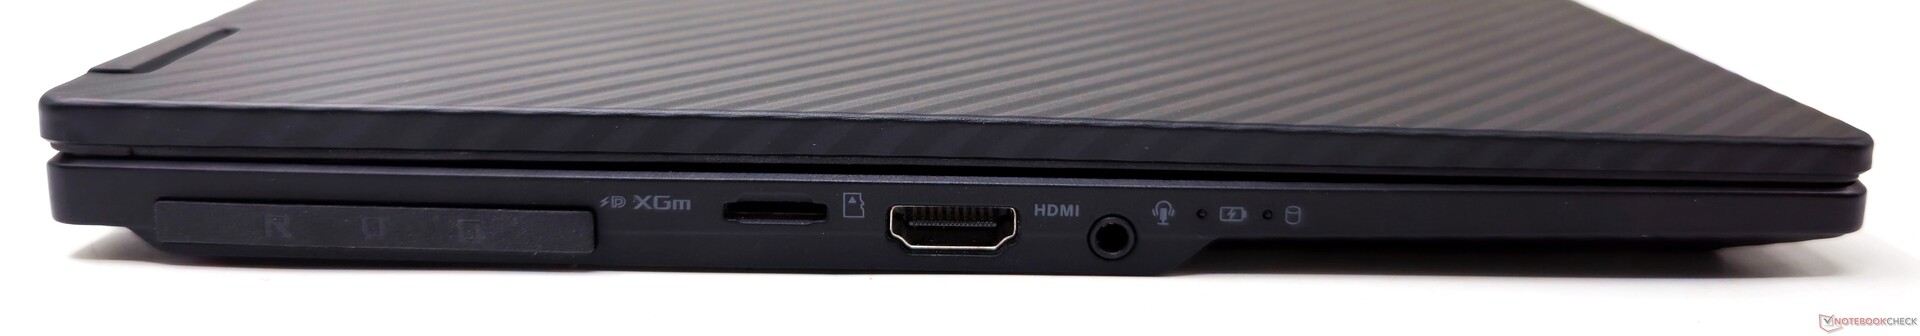
SD Card Reader
The Flow X13's microSD card reader performs admirably, with sequential speeds up to 256 MB/s. Assorted JPG copy speeds are comparable with those observed with the Flow Z13 models.
| SD Card Reader | |
| average JPG Copy Test (av. of 3 runs) | |
| Asus ROG Flow Z13 GZ301V | |
| Asus ROG Flow Z13 ACRNM (Angelbird AV Pro V60) | |
| Asus ROG Flow X13 GV302XV (Angelbird AV Pro V60) | |
| Average of class Convertible (29.4 - 186, n=21, last 2 years) | |
| Lenovo Legion Slim 5 16APH8 (PNY EliteX-Pro60 V60 256 GB) | |
| Acer Predator Triton 14 PT14-51 (AV PRO microSD 128 GB V60) | |
| maximum AS SSD Seq Read Test (1GB) | |
| Asus ROG Flow X13 GV302XV (Angelbird AV Pro V60) | |
| Asus ROG Flow Z13 ACRNM (Angelbird AV Pro V60) | |
| Asus ROG Flow Z13 GZ301V | |
| Average of class Convertible (67.5 - 254, n=20, last 2 years) | |
| Lenovo Legion Slim 5 16APH8 (PNY EliteX-Pro60 V60 256 GB) | |
| Acer Predator Triton 14 PT14-51 (AV PRO microSD 128 GB V60) | |
Communication
Being an AMD-powered device, the Flow X13 sports a MediaTek Wi-Fi 6E card rather than an Intel solution found in the Flow Z13. The Flow X13 gains minimal real-world benefit jumping from 5 GHz to the 6 GHz band, but the latter is less prone to interference.
When tested with Asus' ROG Rapture GT-AXE11000 router, 6E receive speeds proved virtually identical between the two models. However, the Flow X13 showed a slight advantage in 6E transmit tests.
The convertible struggled to maintain steady throughput initially in the test, but the performance smoothened out over time.
| Networking / iperf3 transmit AXE11000 | |
| Asus ROG Flow X13 GV302XV | |
| Asus ROG Flow Z13 ACRNM | |
| Lenovo Legion Slim 5 16APH8 | |
| Acer Predator Triton 14 PT14-51 | |
| Razer Blade 14 RTX 4070 | |
| Average MediaTek Wi-Fi 6E MT7922 160MHz Wireless LAN Card (358 - 1785, n=86) | |
| Average of class Convertible (131.3 - 1845, n=43, last 2 years) | |
| Asus TUF Gaming A16 FA617XS | |
| Networking / iperf3 receive AXE11000 | |
| Asus ROG Flow X13 GV302XV | |
| Acer Predator Triton 14 PT14-51 | |
| Asus ROG Flow Z13 ACRNM | |
| Razer Blade 14 RTX 4070 | |
| Lenovo Legion Slim 5 16APH8 | |
| Average MediaTek Wi-Fi 6E MT7922 160MHz Wireless LAN Card (644 - 1775, n=87) | |
| Average of class Convertible (492 - 1755, n=44, last 2 years) | |
| Asus TUF Gaming A16 FA617XS | |
| Networking / iperf3 transmit AXE11000 6GHz | |
| Asus ROG Flow X13 GV302XV | |
| Lenovo Legion Slim 5 16APH8 | |
| Asus ROG Flow Z13 GZ301V | |
| Razer Blade 14 RTX 4070 | |
| Average MediaTek Wi-Fi 6E MT7922 160MHz Wireless LAN Card (394 - 1890, n=61) | |
| Average of class Convertible (848 - 1825, n=25, last 2 years) | |
| Networking / iperf3 receive AXE11000 6GHz | |
| Asus ROG Flow Z13 GZ301V | |
| Asus ROG Flow X13 GV302XV | |
| Razer Blade 14 RTX 4070 | |
| Average of class Convertible (928 - 1775, n=27, last 2 years) | |
| Average MediaTek Wi-Fi 6E MT7922 160MHz Wireless LAN Card (684 - 1779, n=63) | |
| Lenovo Legion Slim 5 16APH8 | |
Webcam
The Flow X13's 1080p webcam gets the job done with a baseline of clarity. The webcam captures serviceable images with decent color reproduction. Details appear adequate for a laptop camera, though the sharpness leaves some room for improvement.


Security
The integrated IR camera allows fast and accurate Windows Hello-based biometric authentication. Additionally, a TPM 2.0 module is present for encryption.
Accessories and Warranty
Asus includes a handy ROG Sleeve in the box for easily carrying around the Flow X13. Retail units also include the Asus Pen SA203 stylus in some regions. Buyers can hook up optional accessories such as the ROG XG Mobile eGPU.
In India, the ROG Flow X13 comes with a standard one-year warranty. Buyers have the option of opting for a variety of warranty extension and accidental damage protection plans ranging from ₹999 for a one-year extension to ₹4,999 that includes a two-year extension and three years of damage protection.
More information and individual pricing can be found here.
Maintenance
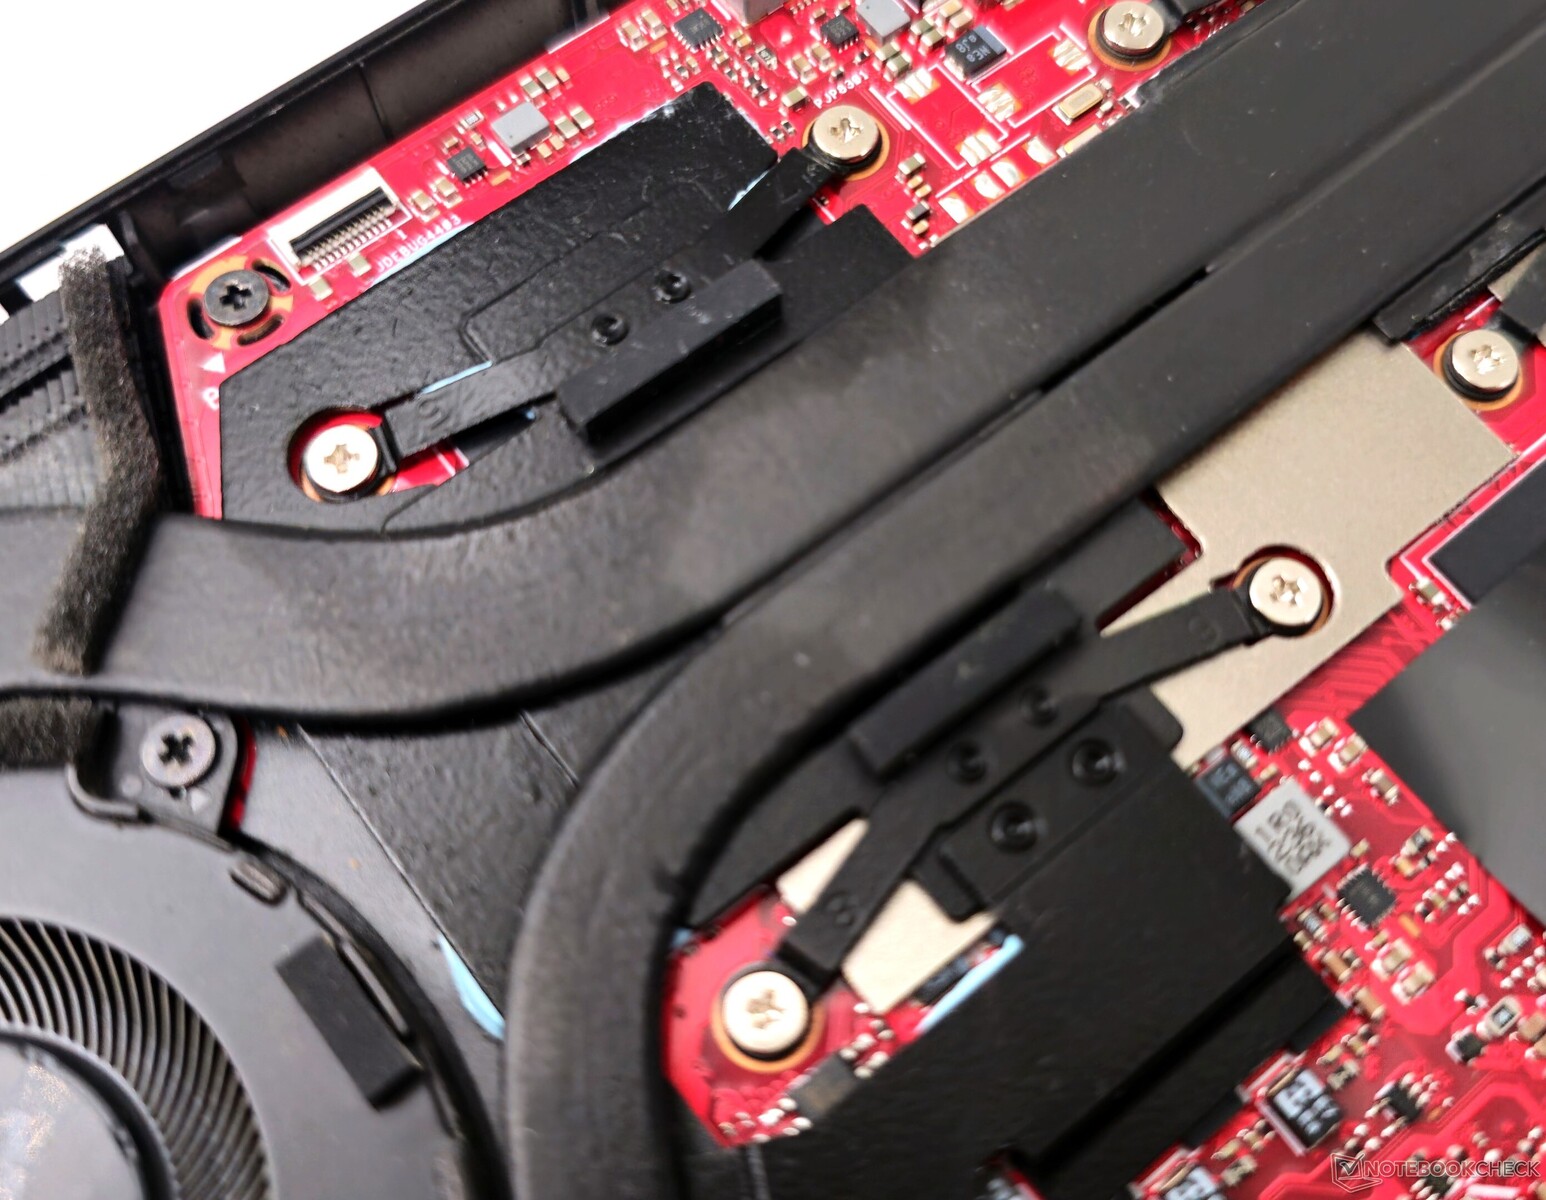
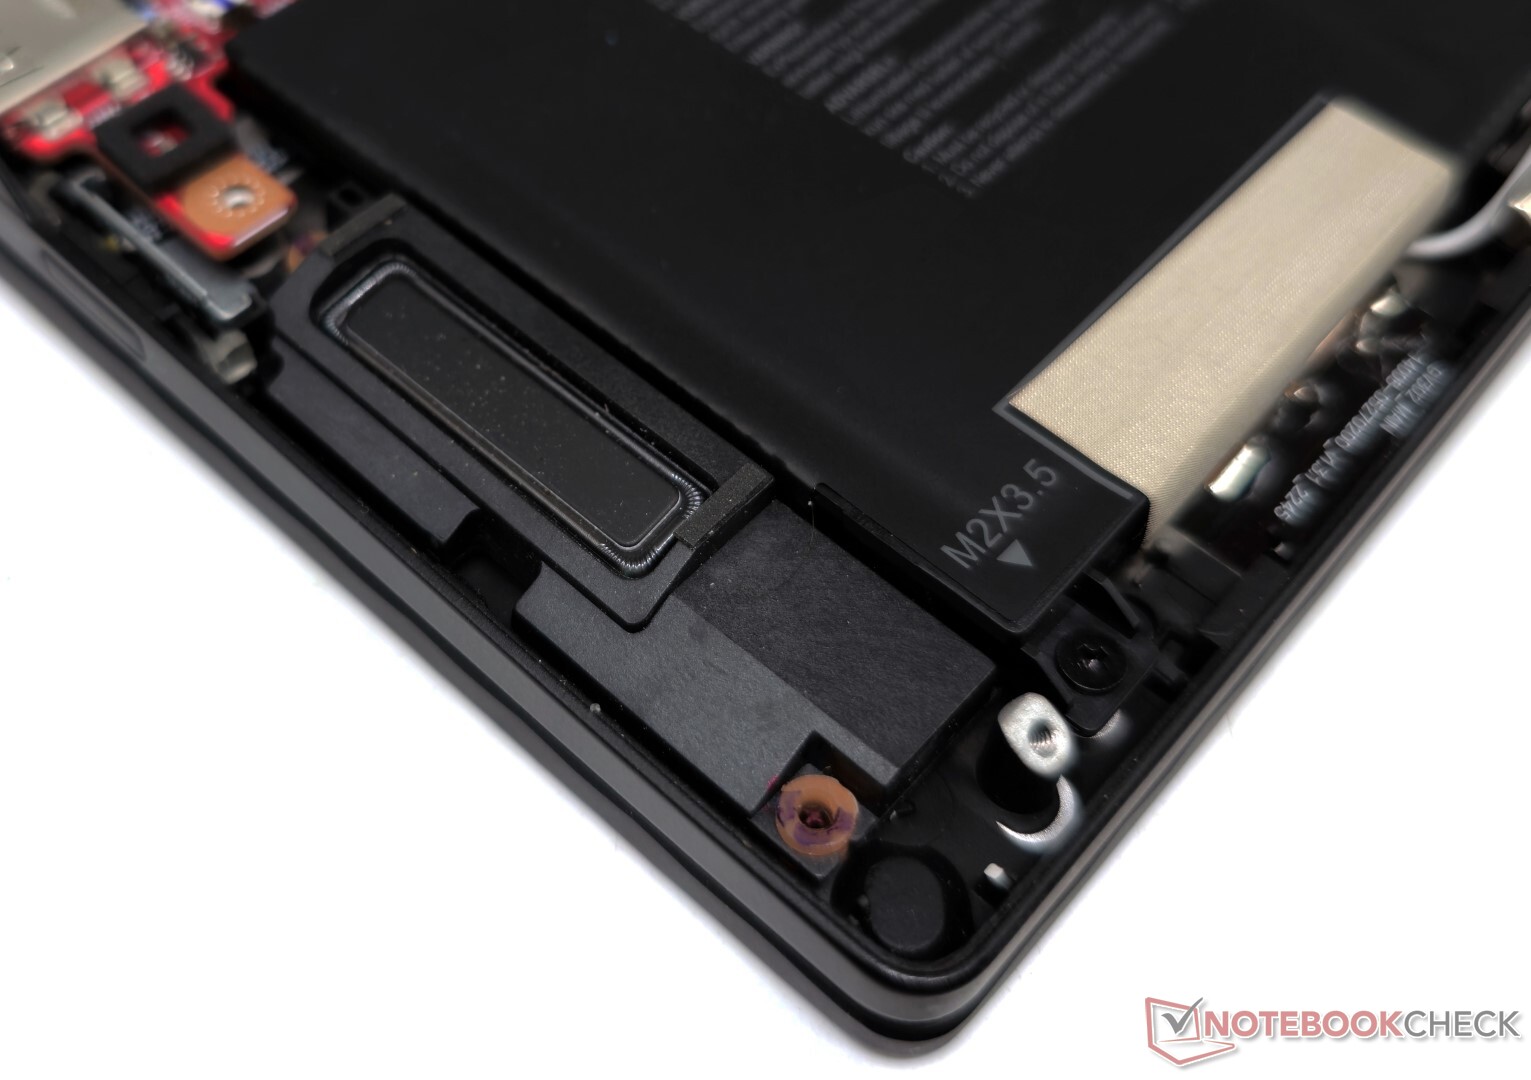
Removing the 10 PH00 screws on the bottom gives easy access to the Flow X13's internals. The RAM comes soldered, but the WLAN card and M.2 2230 SSD can be swapped out if needed. It is possible to unscrew and remove the battery.
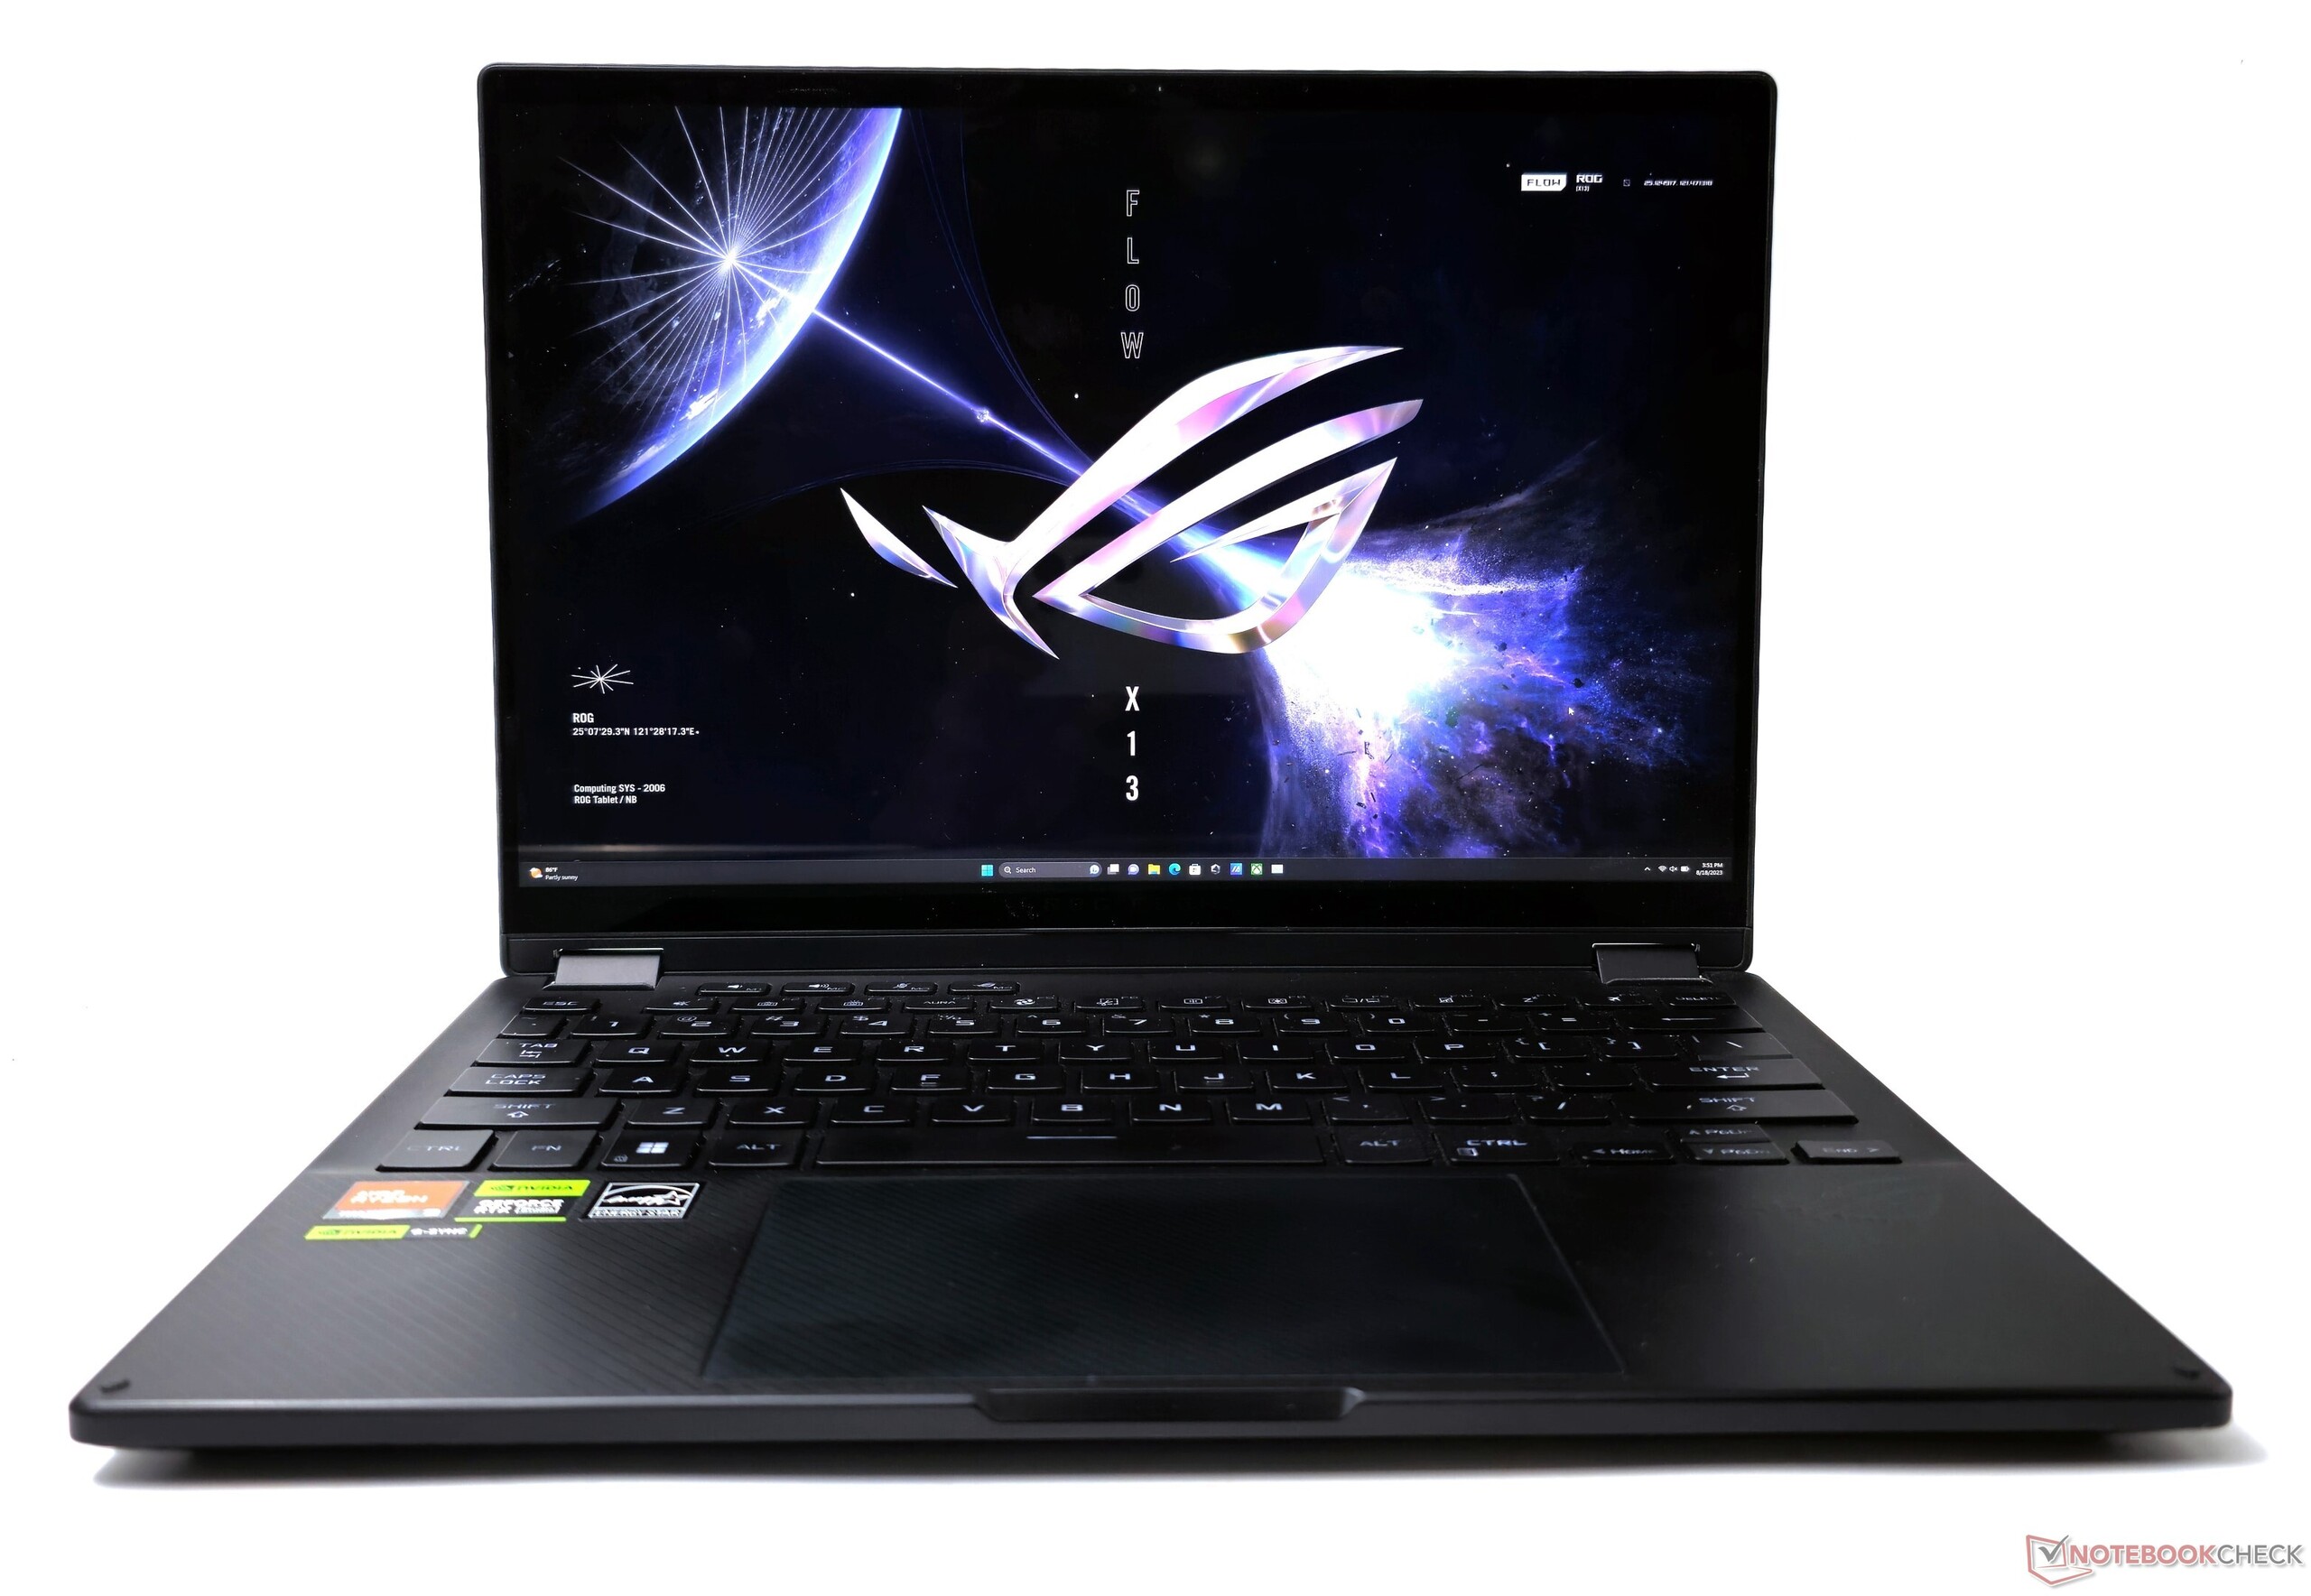
Input Devices: Effortless touchpad navigation
Keyboard
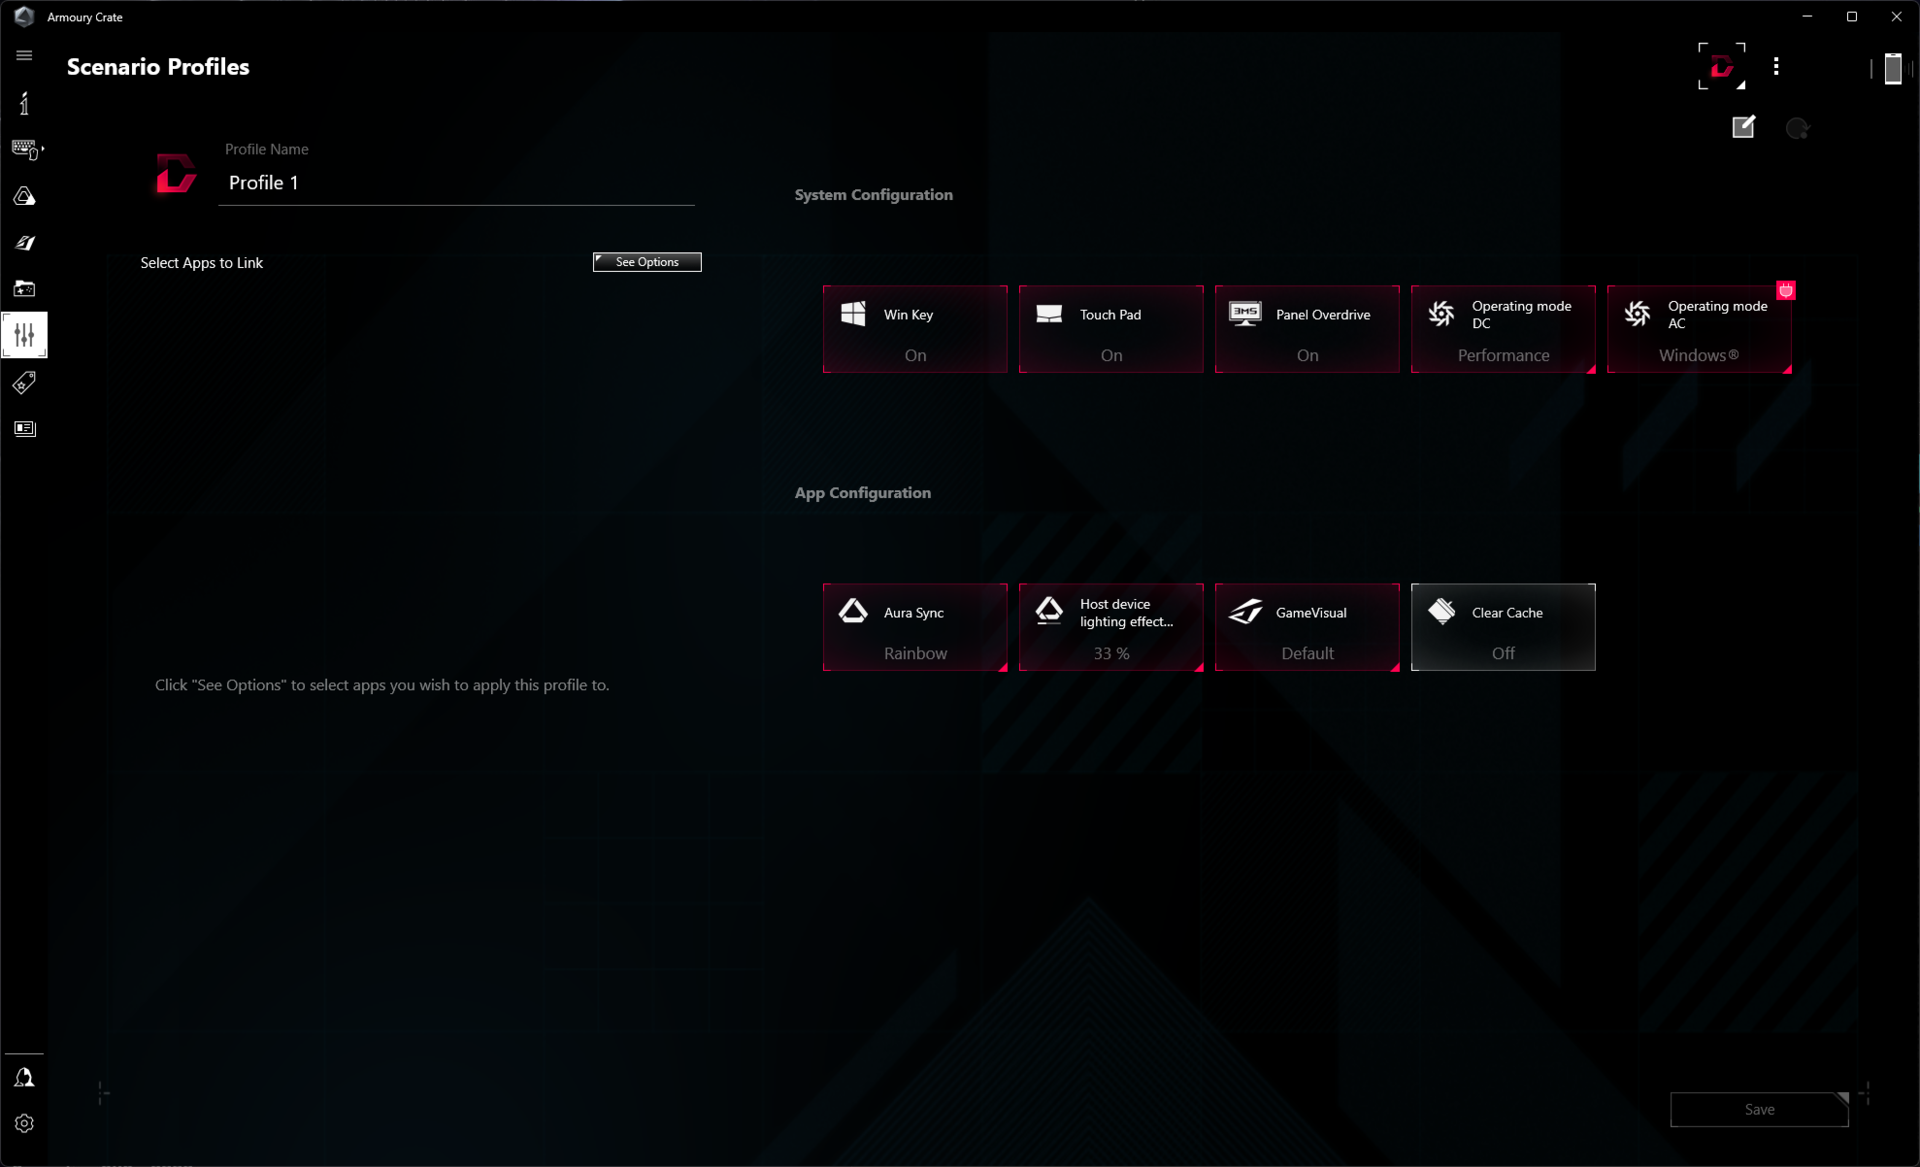
Typing on the Flow X13 is a pleasing experience thanks to well-spaced, tactile keys with decent travel. The top row offers handy shortcuts for volume, mic, and Armory Crate that can be customized as needed.
Additional functions like Aura Sync lighting and fan profiles are a button press away too. The half-height arrow keys work for basic navigation but can get tedious for gaming.
In lieu of flashy RGB, the keyboard employs soothing white backlighting adjustable in three brightness levels. The crisp white illumination remains clearly visible through the keycaps for comfortable typing in the dark.
Touchpad and Touchscreen
The expansive 7.5 cm x 13 cm touchpad provides a seamless glide surface for effortless control and is fully compatible with Windows Precision gestures.
Clicks issue softly without resistance or noise. Input registers accurately even at the corners. The entire surface acts as the left mouse button, though the clicks themselves seem to localize near the bottom of the touchpad.
The Flow X13 offers a multi-touch capacitive touchscreen, which Asus says has been given the Gorilla Glass DXC treatment. We had no issues with touchscreen, even towards the corners, in all supported modes.
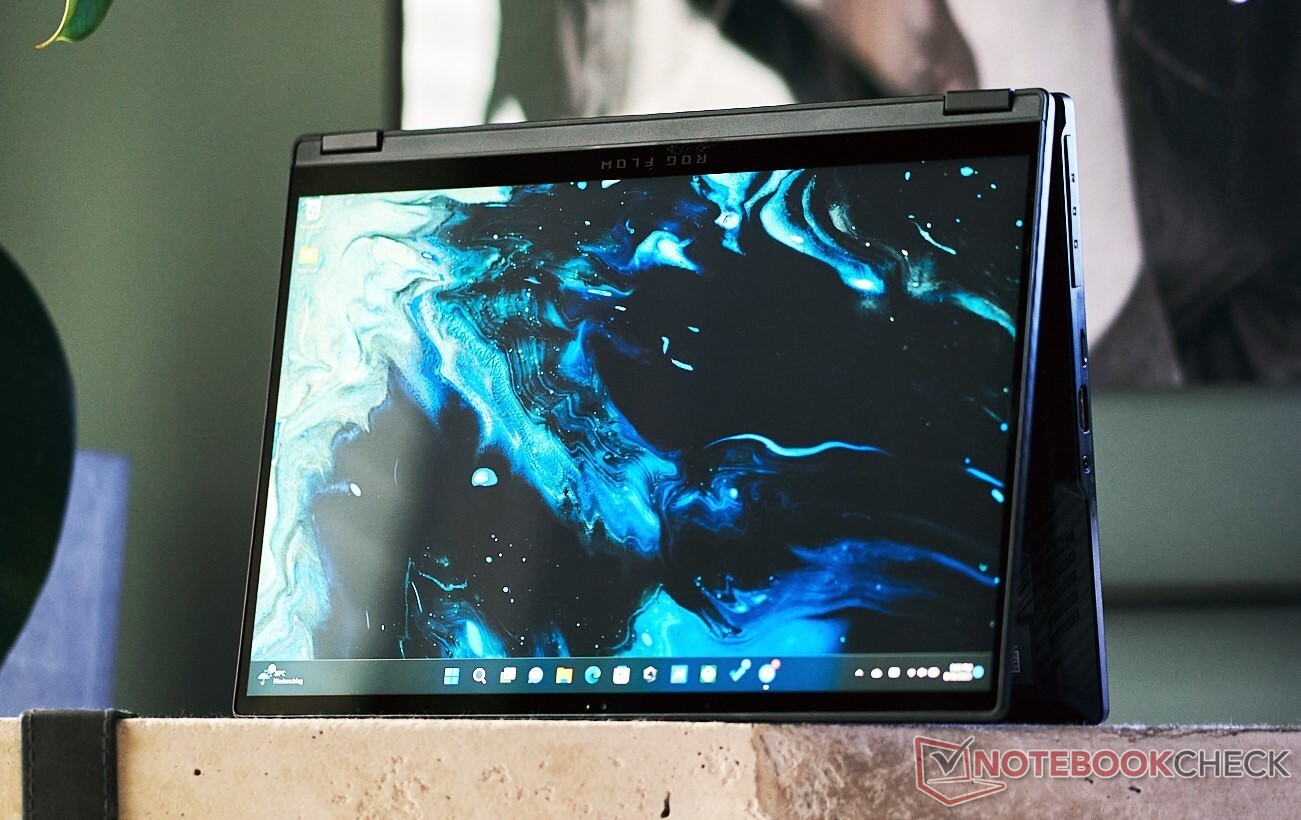
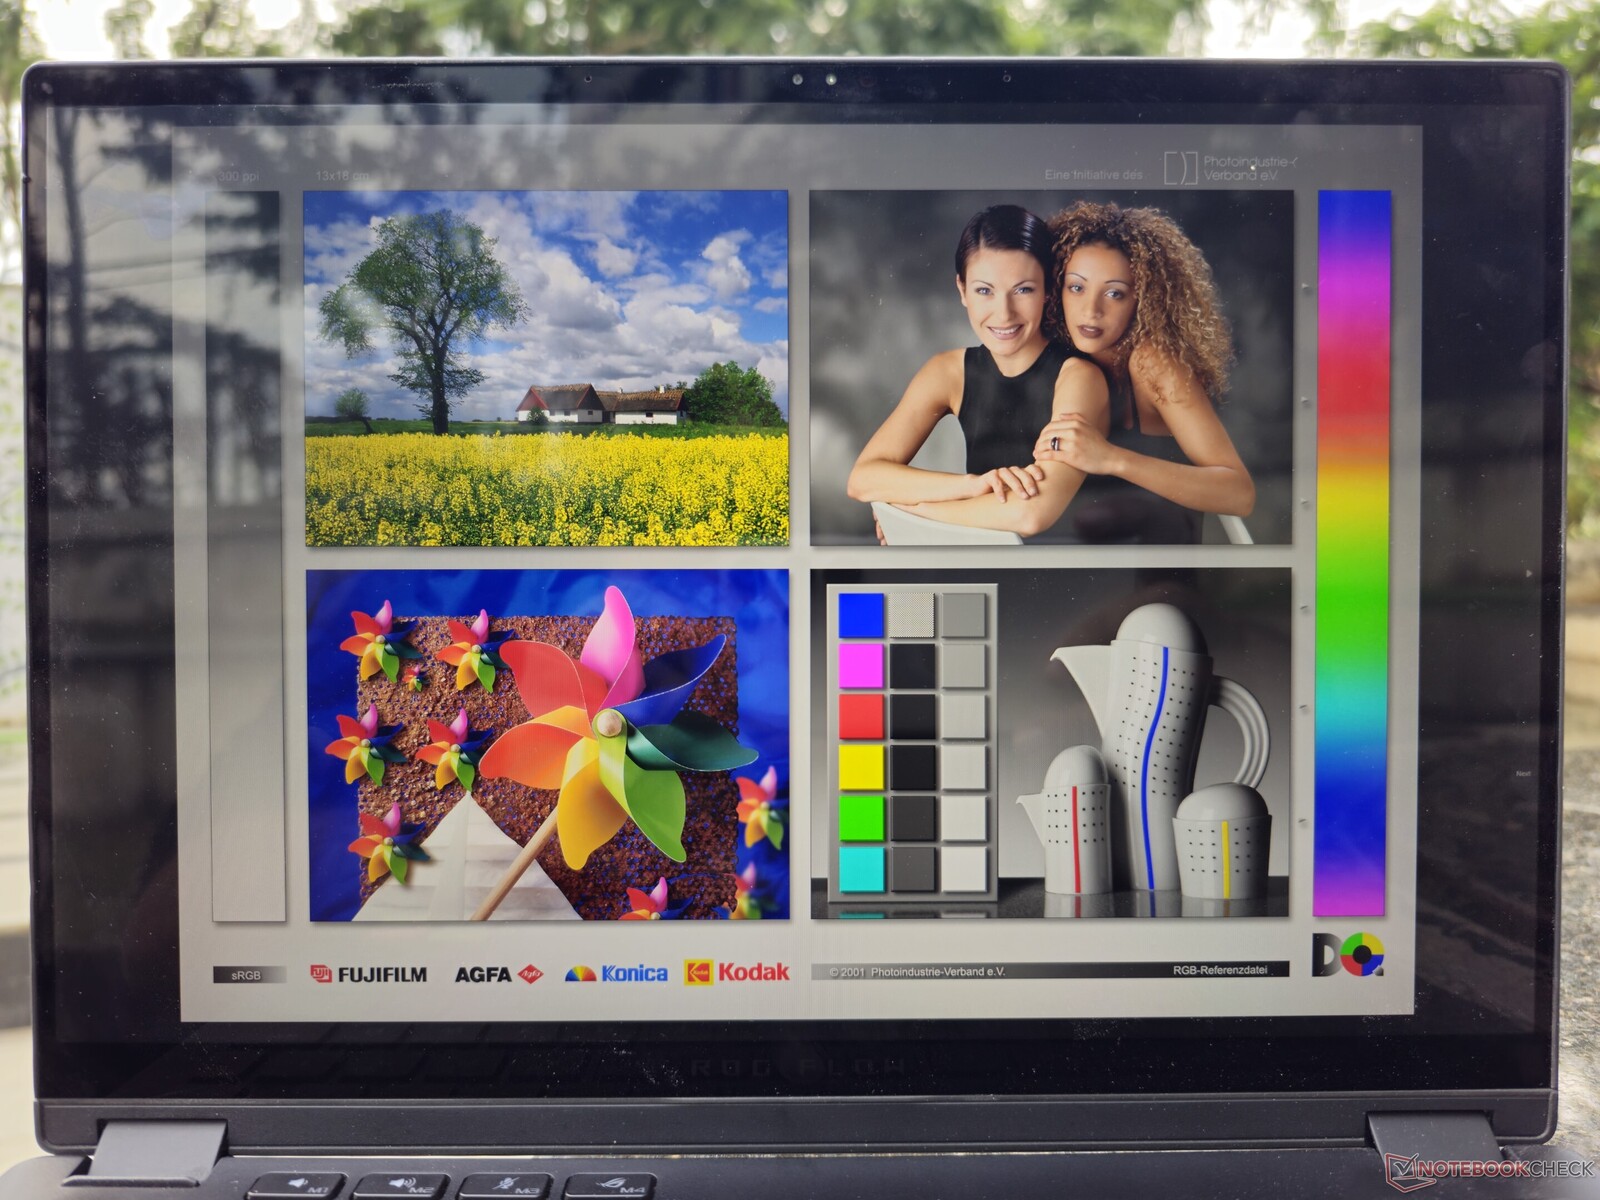
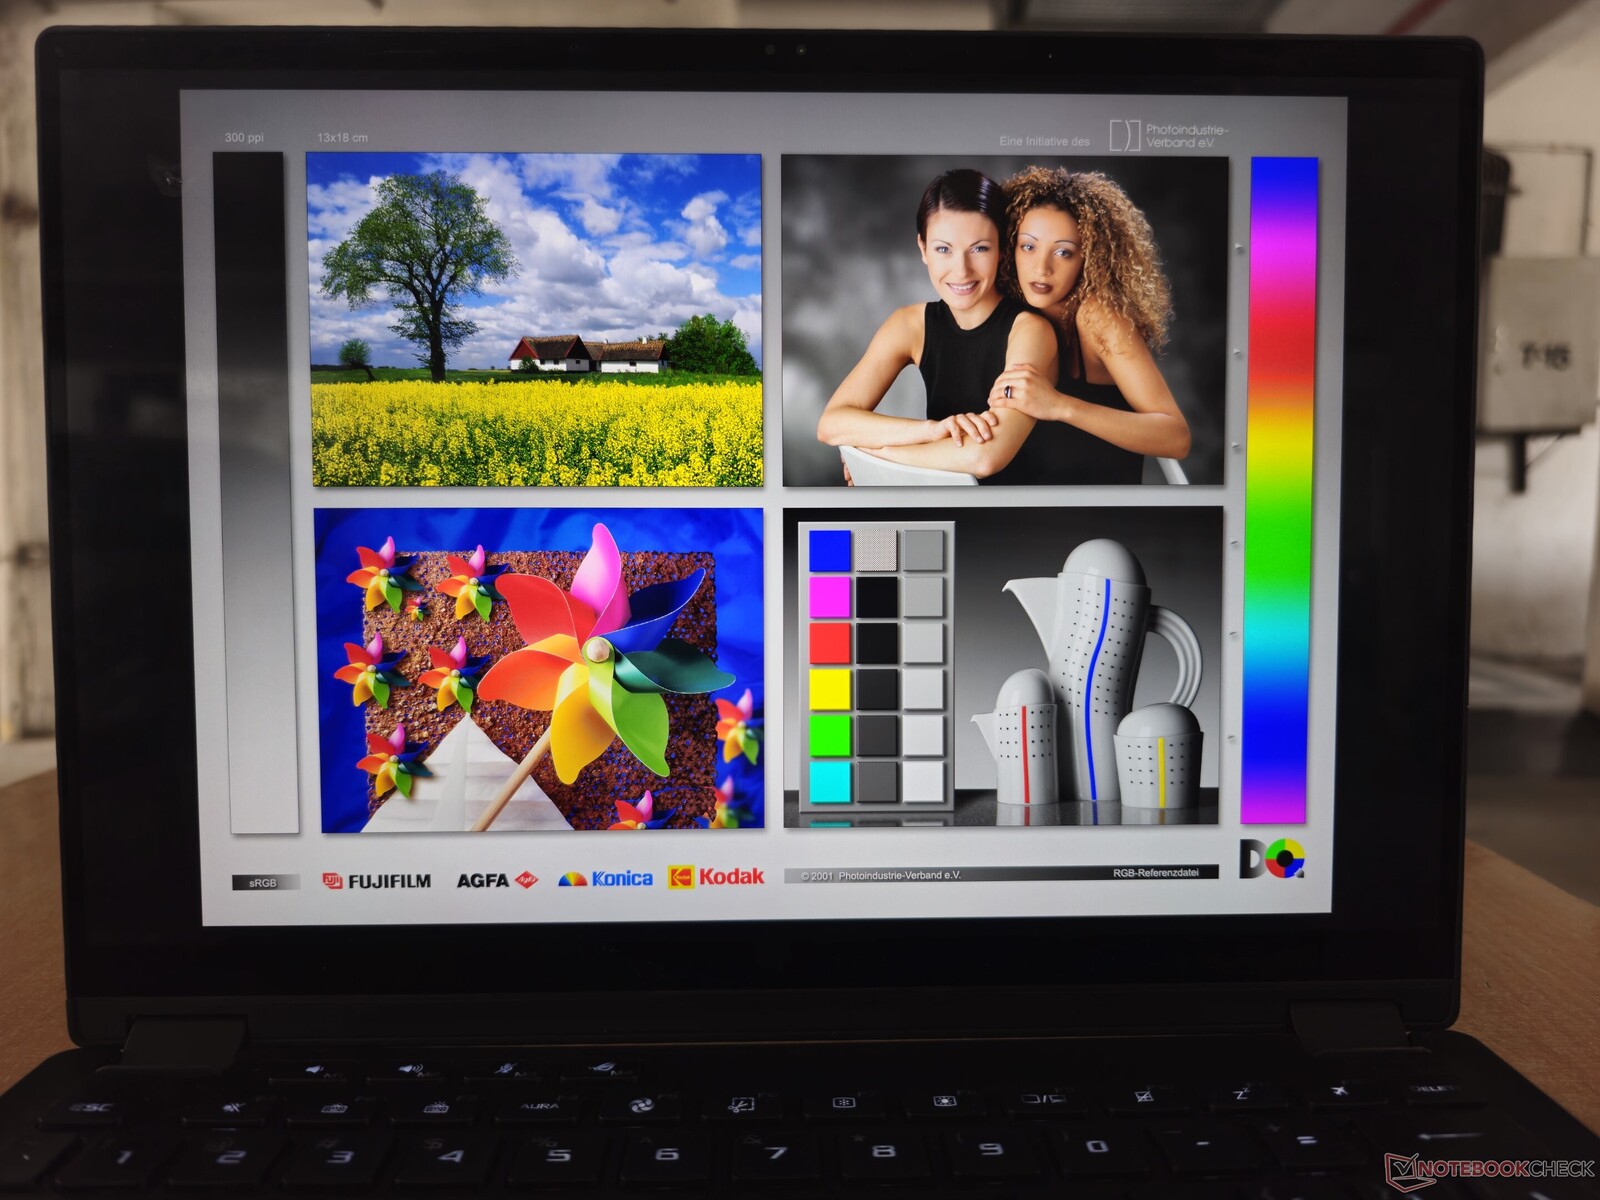
Display: 165 Hz QHD+ G-Sync touchscreen with Dolby Vision and no PWM
The ROG Flow X13's 13.4-inch 2560 x 1600 16:10 touch IPS panel offers a 165 Hz refresh rate with Nvidia G-Sync support and a dense 225 PPI pixel density. The panel supports Dolby Vision but not HDR10.
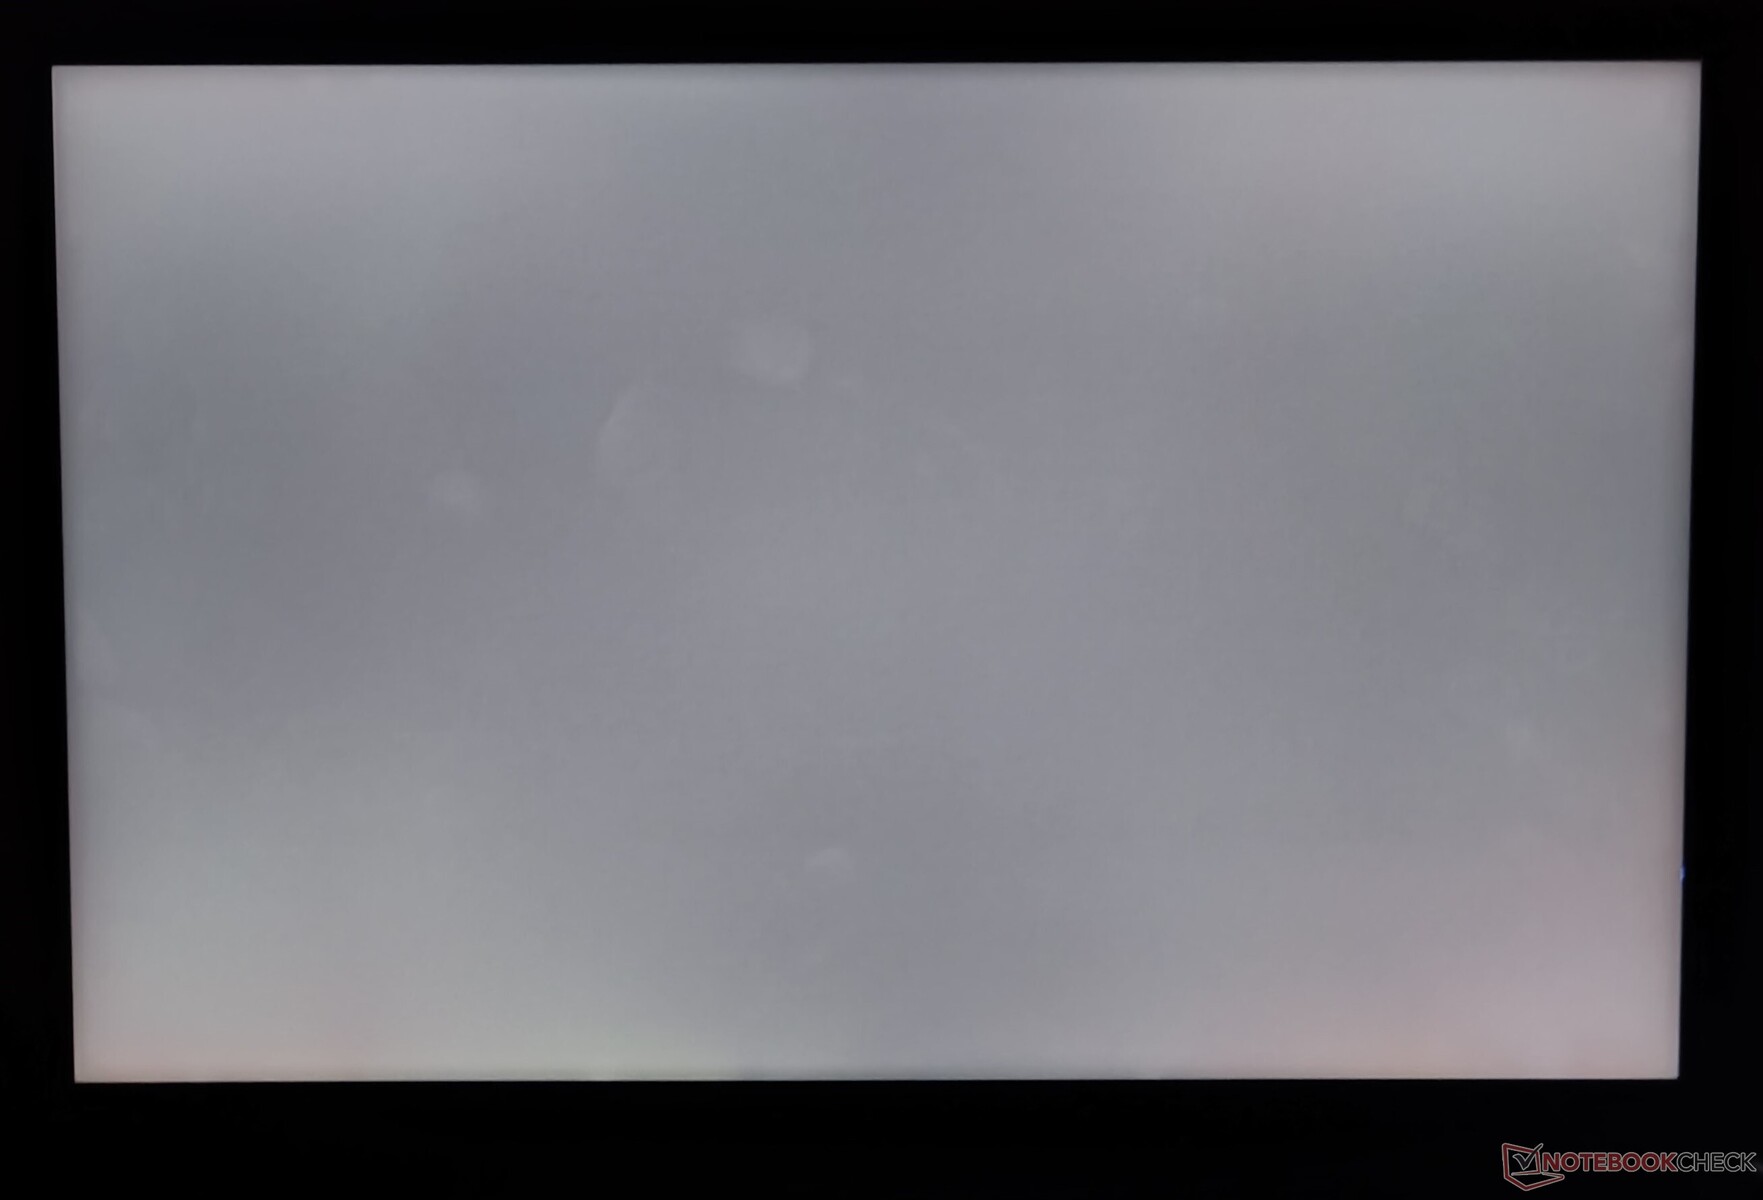
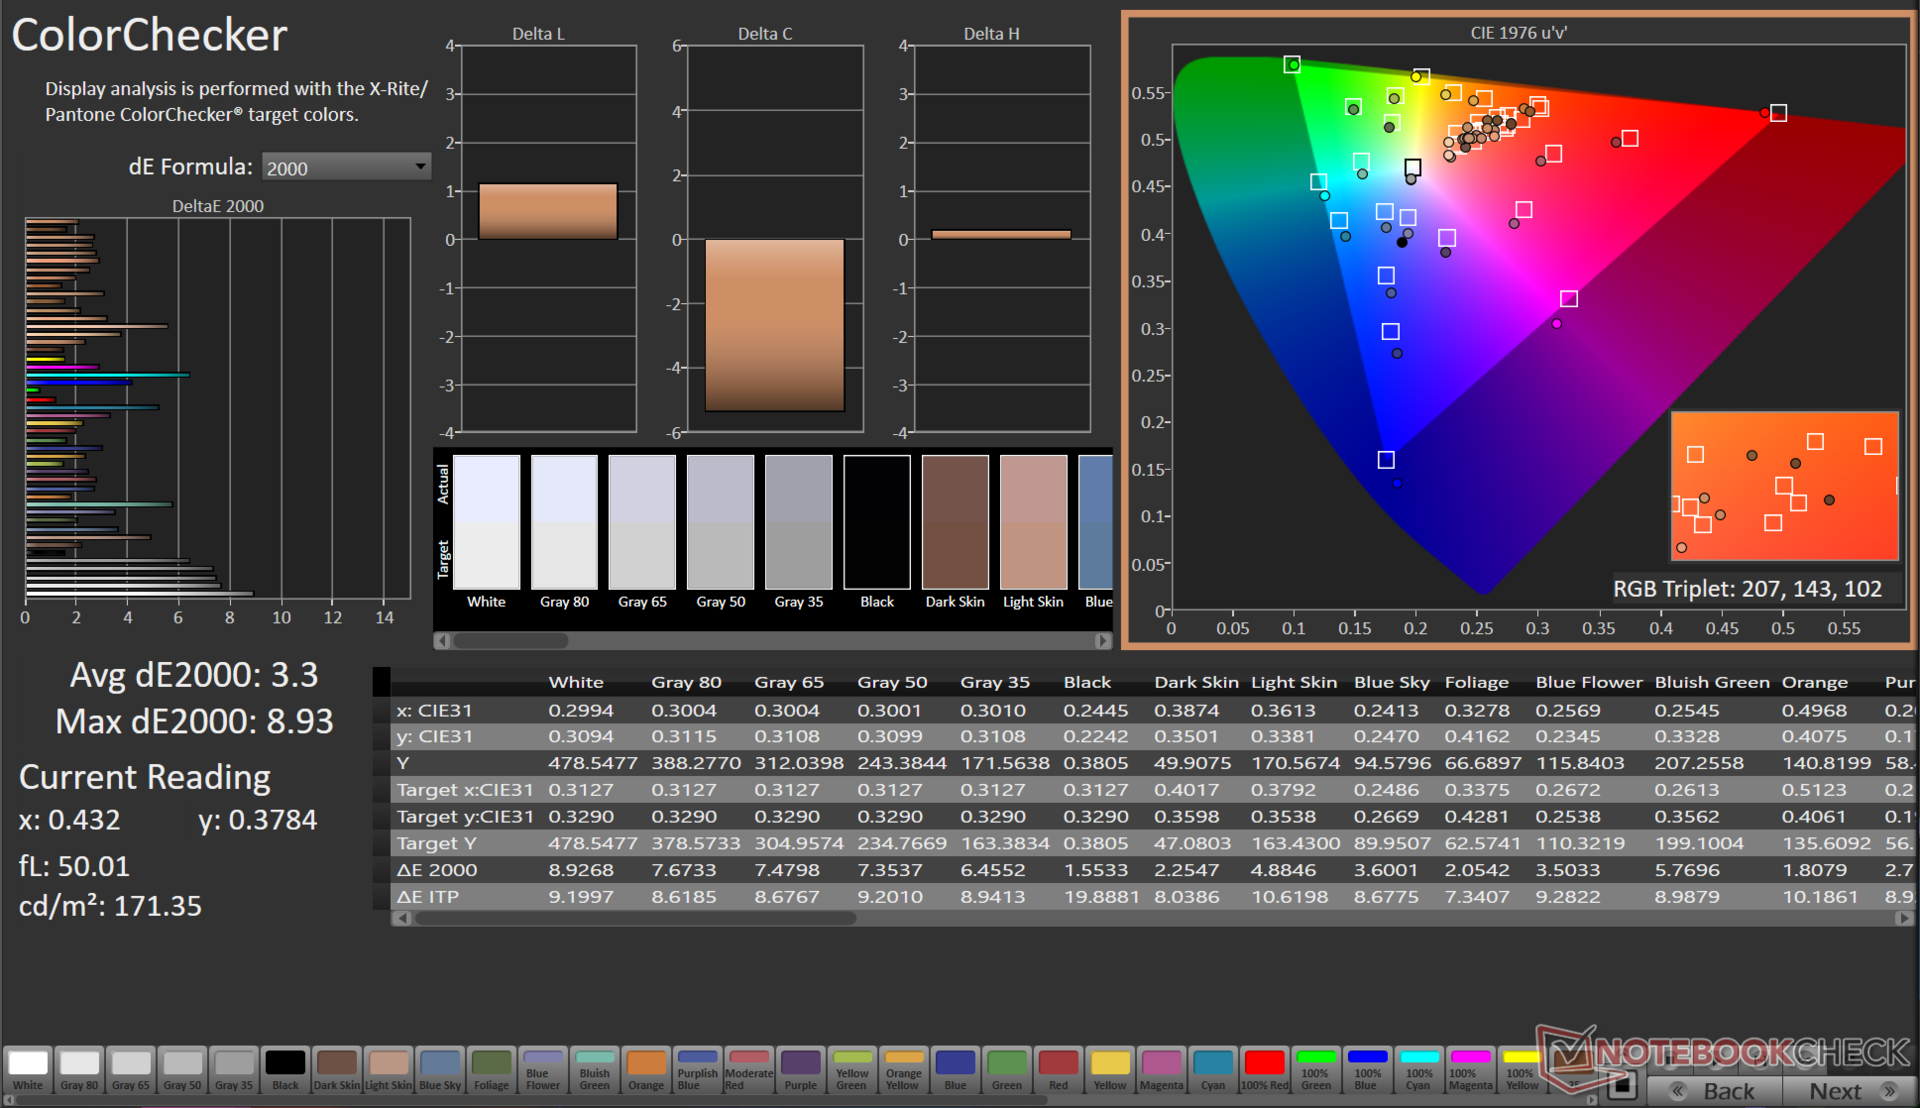
We measured a maximum brightness of 473 nits with a good 89% distribution and minimal light bleed-through. The measured 1,231:1 contrast ratio lends itself to a subjectively good viewing experience.

| |||||||||||||||||||||||||
Brightness Distribution: 89 %
Center on Battery: 305 cd/m²
Contrast: 1213:1 (Black: 0.39 cd/m²)
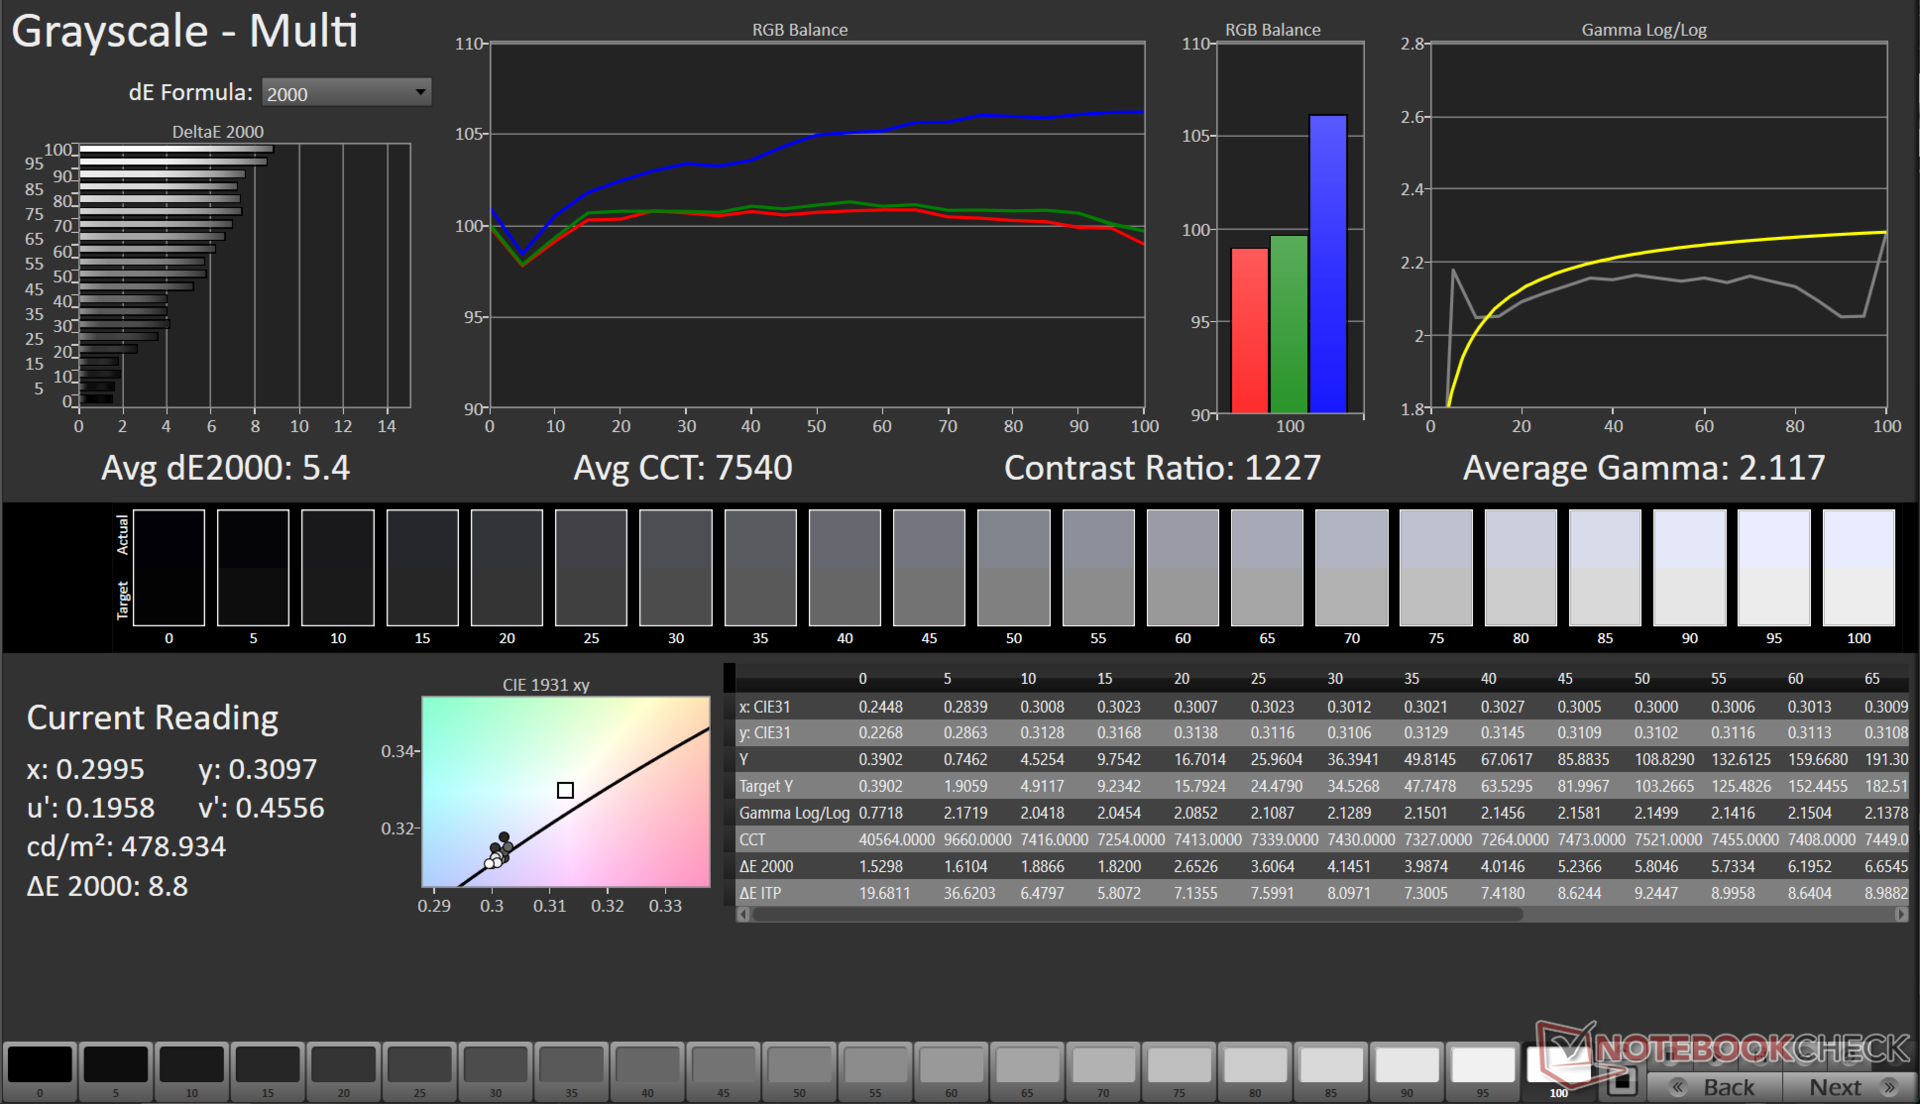
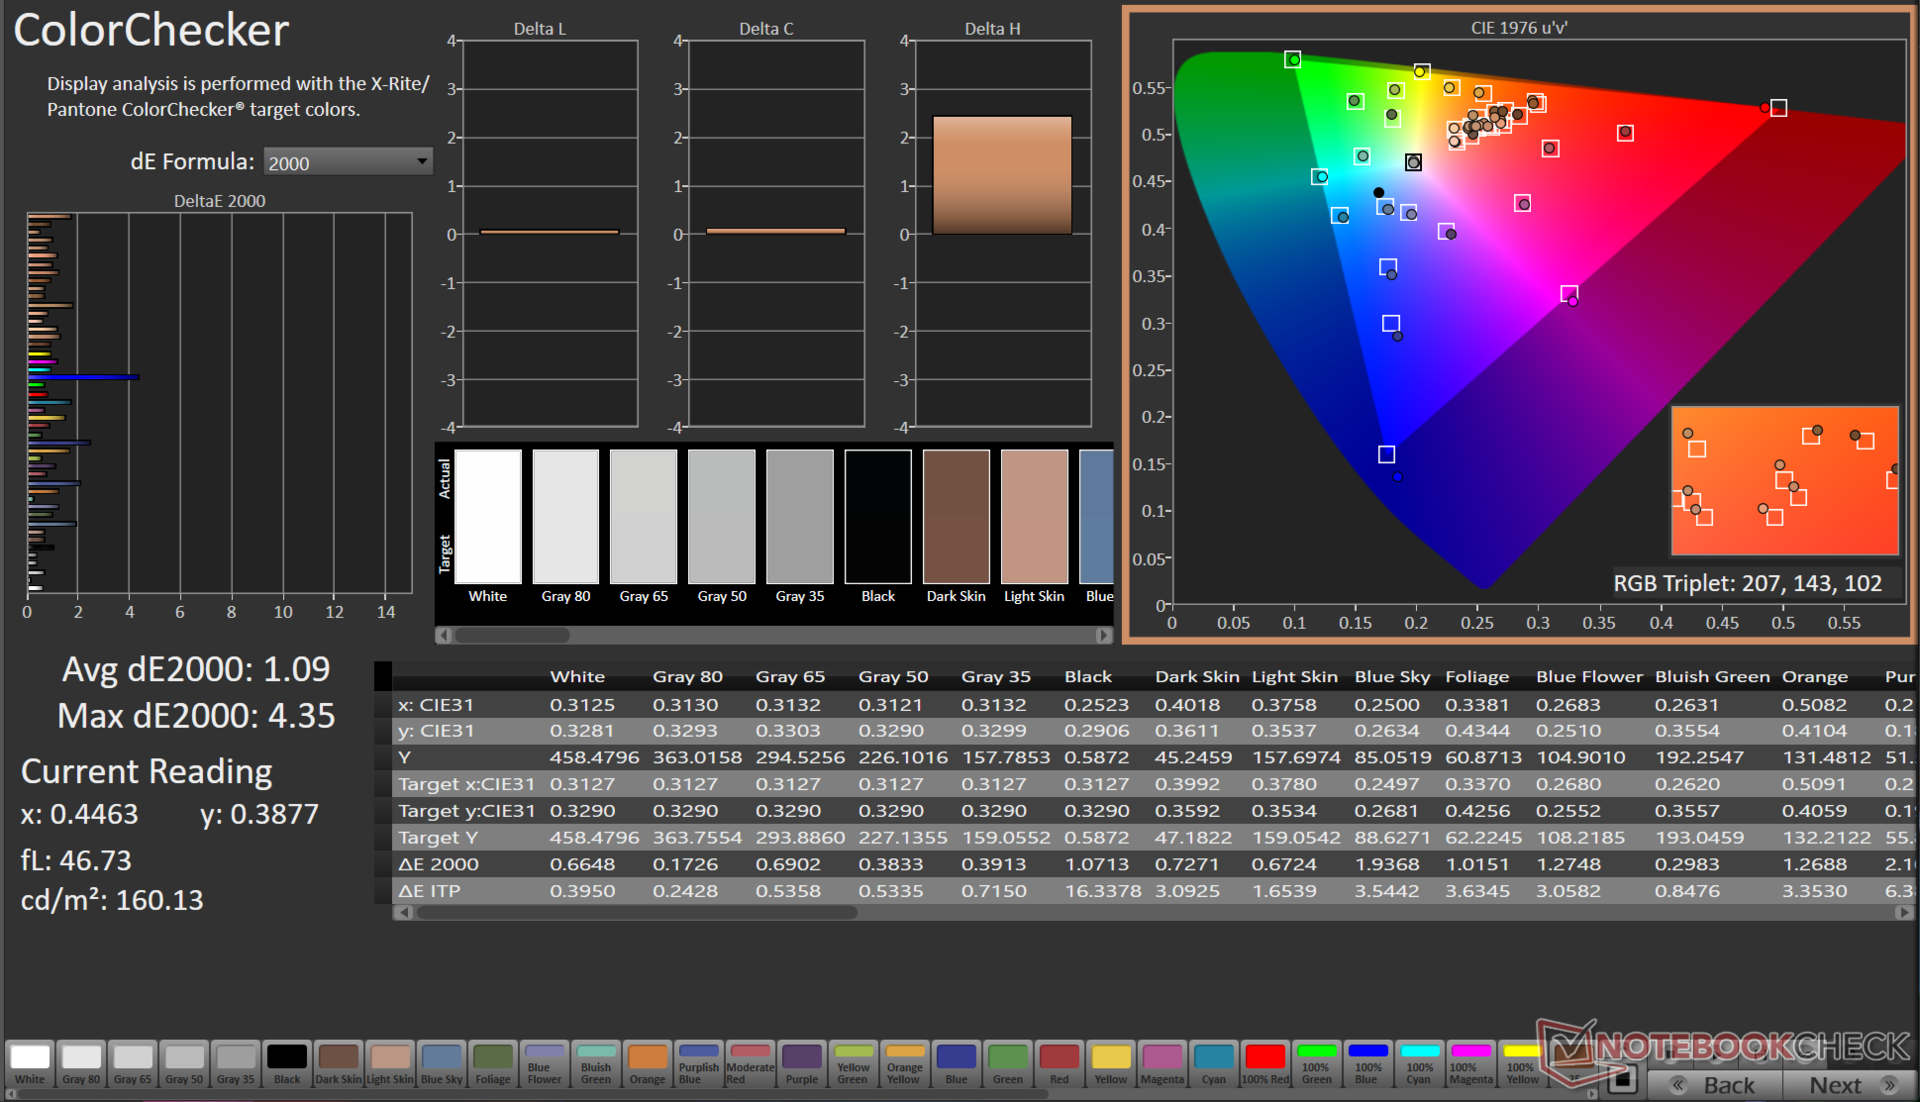
ΔE ColorChecker Calman: 3.3 | ∀{0.5-29.43 Ø4.71}
calibrated: 1.09
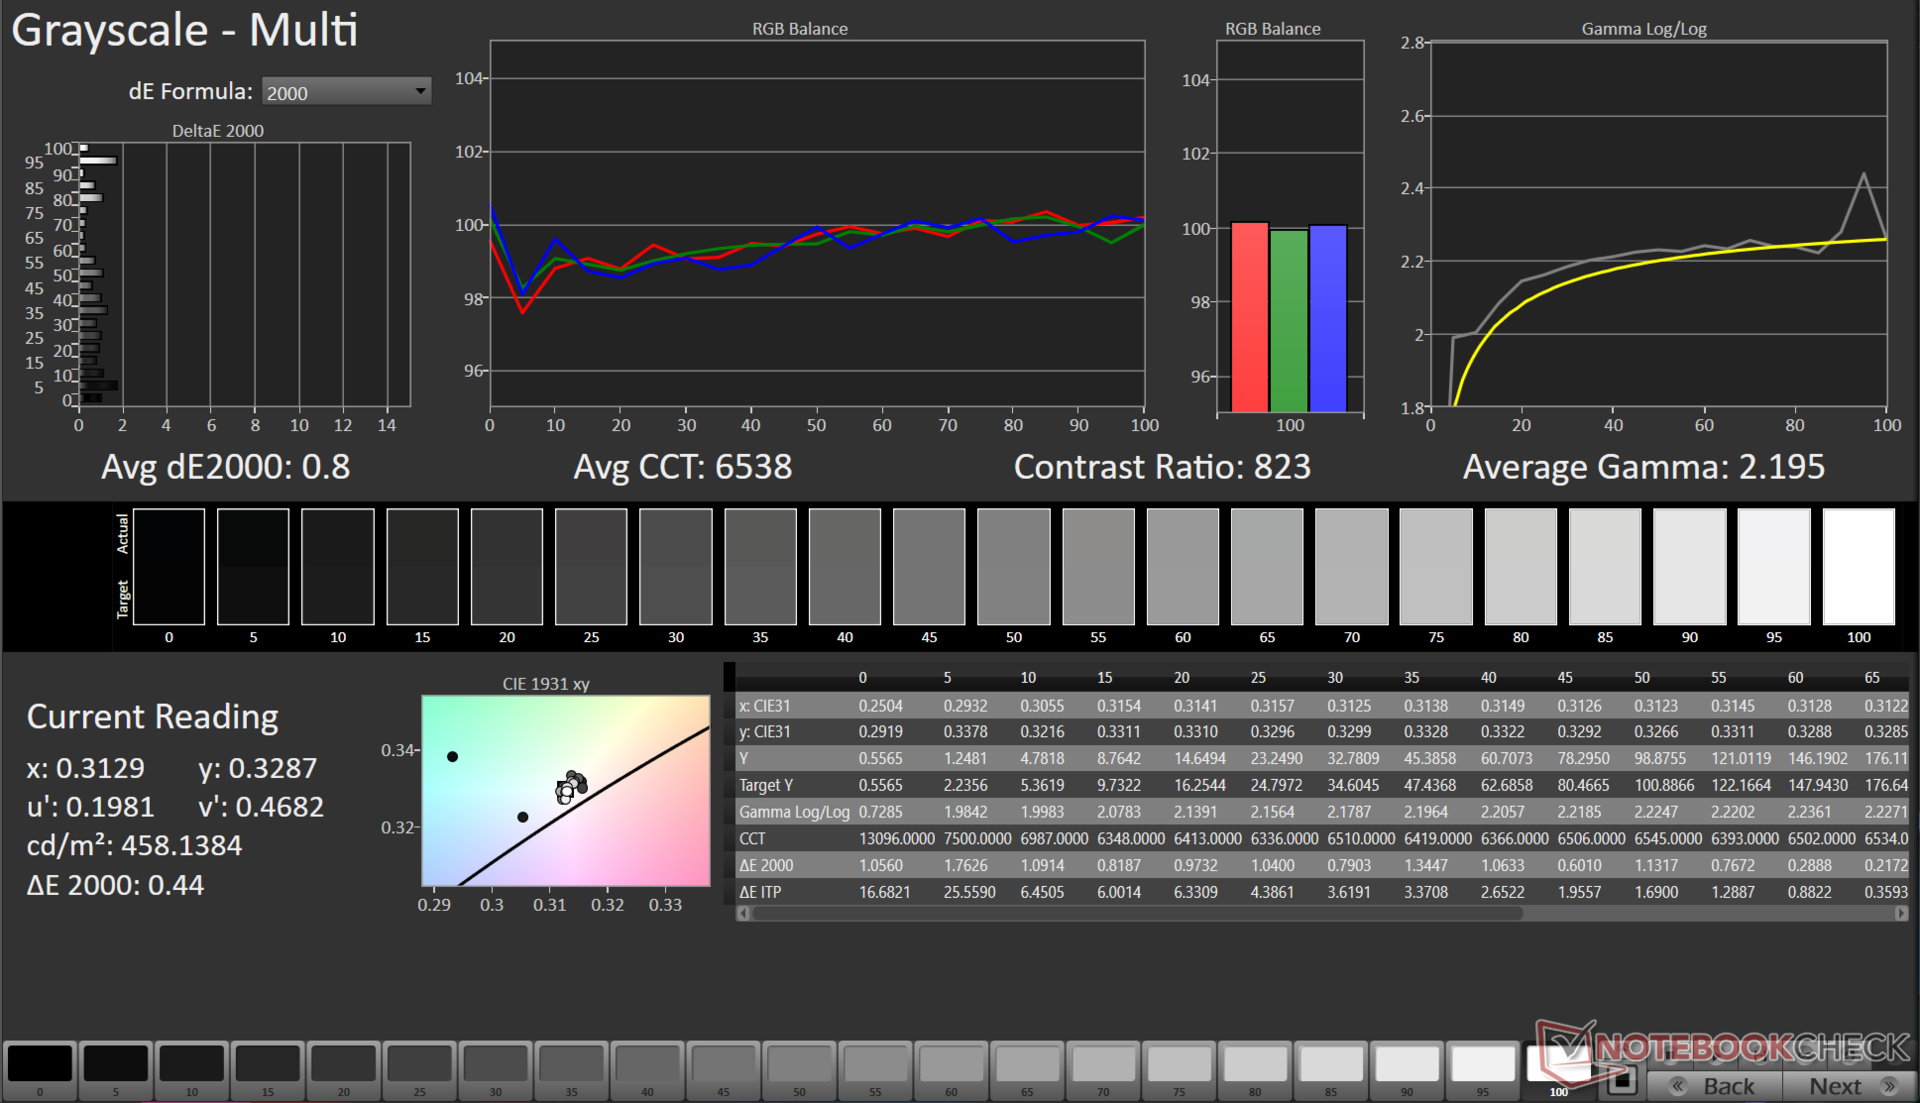
ΔE Greyscale Calman: 5.4 | ∀{0.09-98 Ø4.96}
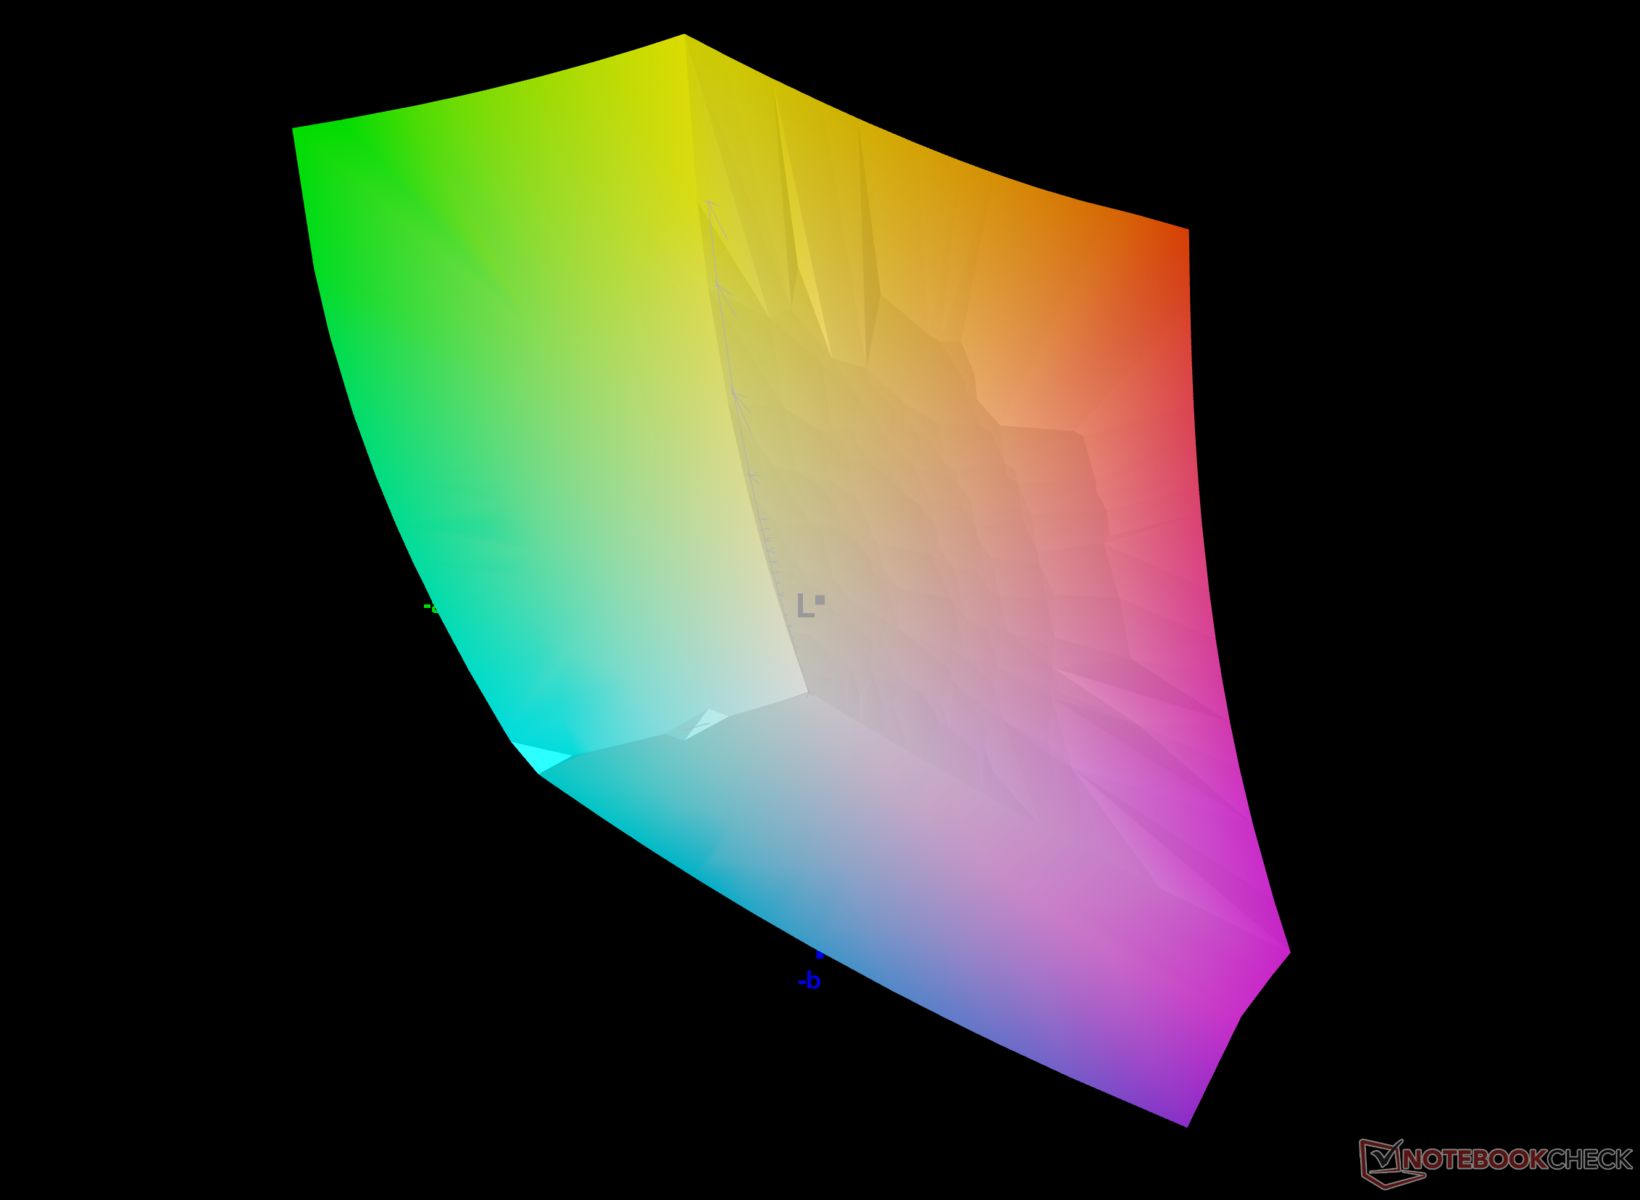
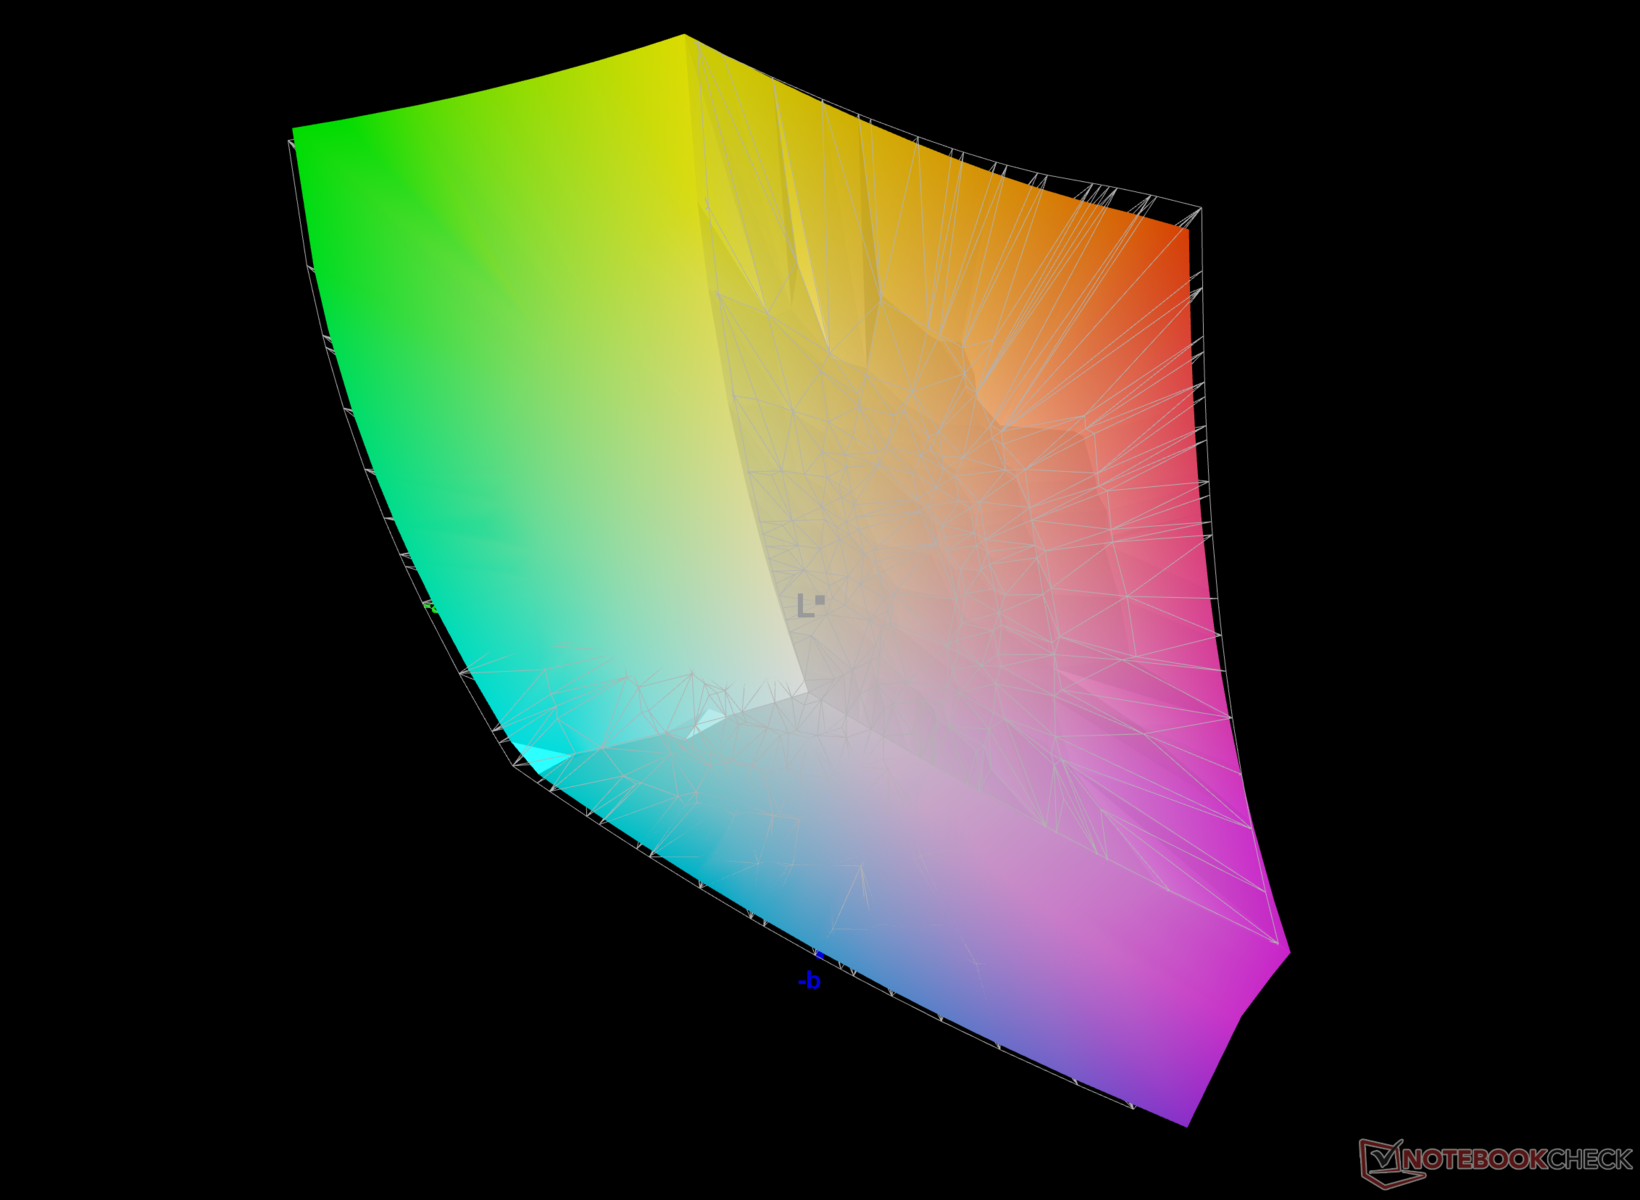
84.4% AdobeRGB 1998 (Argyll 3D)
99.7% sRGB (Argyll 3D)
95.1% Display P3 (Argyll 3D)
Gamma: 2.11
CCT: 7540 K
| Asus ROG Flow X13 GV302XV TL134ADXP01-0, IPS, 2560x1600, 13.4" | Asus ROG Flow Z13 ACRNM TL134ADXP01-0, IPS, 2560x1600, 13.4" | Asus ROG Flow Z13 GZ301V TL134ADXP01-0, IPS, 2560x1600, 13.4" | Razer Blade 14 RTX 4070 AU Optronics B140QAN06.U, IPS, 2560x1600, 14" | Asus TUF Gaming A16 FA617XS BOE NE160WUM-NX2, IPS, 1920x1200, 16" | Lenovo Legion Slim 5 16APH8 BOE NJ NE160QDM-NYC, IPS, 2560x1600, 16" | Acer Predator Triton 14 PT14-51 BOE NE140QDM-NY1, IPS, 2560x1600, 14" | |
|---|---|---|---|---|---|---|---|
| Display | 1% | 1% | 1% | -15% | -15% | 1% | |
| Display P3 Coverage (%) | 95.1 | 96.94 2% | 97 2% | 97.3 2% | 69.3 -27% | 69.3 -27% | 96.9 2% |
| sRGB Coverage (%) | 99.7 | 99.92 0% | 99.9 0% | 99.8 0% | 97.3 -2% | 100 0% | 99.9 0% |
| AdobeRGB 1998 Coverage (%) | 84.4 | 85.17 1% | 85.3 1% | 85.3 1% | 70.7 -16% | 70 -17% | 85.5 1% |
| Response Times | 55% | -19% | -87% | -141% | -72% | -103% | |
| Response Time Grey 50% / Grey 80% * (ms) | 4.79 ? | 2.1 ? 56% | 6.5 ? -36% | 11.9 ? -148% | 15.6 ? -226% | 10.7 ? -123% | 15.1 ? -215% |
| Response Time Black / White * (ms) | 6.42 ? | 3 ? 53% | 6.5 ? -1% | 8 ? -25% | 10 ? -56% | 7.8 ? -21% | 5.8 ? 10% |
| PWM Frequency (Hz) | |||||||
| Screen | 14% | 21% | 4% | 17% | 20% | -1% | |
| Brightness middle (cd/m²) | 473 | 464 -2% | 537 14% | 559.3 18% | 301 -36% | 371.6 -21% | 547 16% |
| Brightness (cd/m²) | 445 | 455 2% | 511 15% | 560 26% | 294 -34% | 343 -23% | 516 16% |
| Brightness Distribution (%) | 89 | 89 0% | 88 -1% | 88 -1% | 94 6% | 84 -6% | 88 -1% |
| Black Level * (cd/m²) | 0.39 | 0.4 -3% | 0.45 -15% | 0.44 -13% | 0.21 46% | 0.44 -13% | 0.56 -44% |
| Contrast (:1) | 1213 | 1160 -4% | 1193 -2% | 1271 5% | 1433 18% | 845 -30% | 977 -19% |
| Colorchecker dE 2000 * | 3.3 | 2 39% | 1.49 55% | 4.44 -35% | 1.79 46% | 1.52 54% | 3.28 1% |
| Colorchecker dE 2000 max. * | 8.93 | 4.2 53% | 3.68 59% | 9.3 -4% | 3.48 61% | 2.68 70% | 8.57 4% |
| Colorchecker dE 2000 calibrated * | 1.09 | 1.2 -10% | 1.12 -3% | 0.39 64% | 1.2 -10% | 0.33 70% | 1.09 -0% |
| Greyscale dE 2000 * | 5.4 | 2.7 50% | 1.66 69% | 6.8 -26% | 2.5 54% | 1.2 78% | 4.4 19% |
| Gamma | 2.11 104% | 2.24 98% | 2.43 91% | 2.3 96% | 2.265 97% | 2.1 105% | 2.168 101% |
| CCT | 7540 86% | 6832 95% | 6772 96% | 6242 104% | 6157 106% | 6503 100% | 7767 84% |
| Total Average (Program / Settings) | 23% /
17% | 1% /
11% | -27% /
-10% | -46% /
-13% | -22% /
-1% | -34% /
-15% |
* ... smaller is better
Though not on the same level as the OLED-based VivoBooks, the Flow X13's IPS display still offers an expansive color palette with excellent coverage across sRGB, Adobe RGB, and Display P3 color gamuts.

While the default color profile is serviceable, it shows high deviations in whites, cyan, and skin tones. Our calibration routine using the X-Rite i1Basic Pro 3 spectrophotometer and Calman Ultimate software from Portrait Displays fixes this to a large extent.
We could achieve significant improvements in Grayscale (average Delta E 0.8) and ColorChecker (average Delta E 1.09) values post-calibration. However, the panel still seems to have trouble in accurately reproducing the 100% Blue part of the spectrum.

Our calibrated ICC file can be downloaded from the link above.
Display Response Times
| ↔ Response Time Black to White | ||
|---|---|---|
| 6.42 ms ... rise ↗ and fall ↘ combined | ↗ 3.29 ms rise | 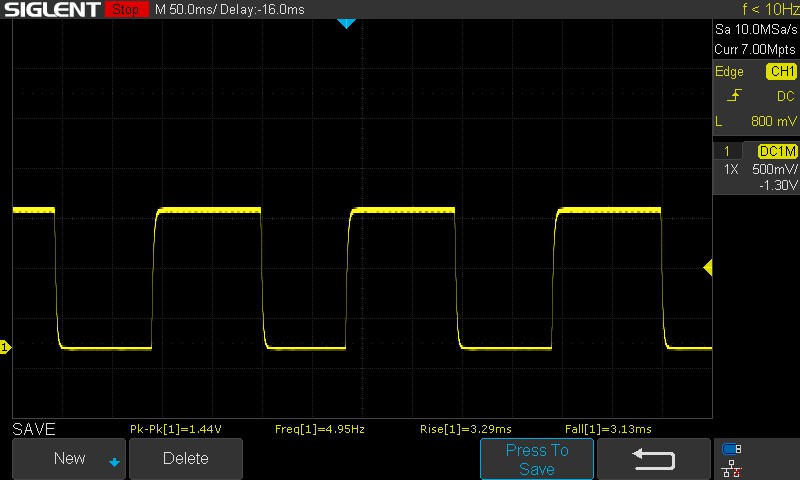 |
| ↘ 3.13 ms fall | ||
| The screen shows very fast response rates in our tests and should be very well suited for fast-paced gaming. In comparison, all tested devices range from 0.1 (minimum) to 240 (maximum) ms. » 21 % of all devices are better. This means that the measured response time is better than the average of all tested devices (19.8 ms). | ||
| ↔ Response Time 50% Grey to 80% Grey | ||
| 4.79 ms ... rise ↗ and fall ↘ combined | ↗ 2.26 ms rise | 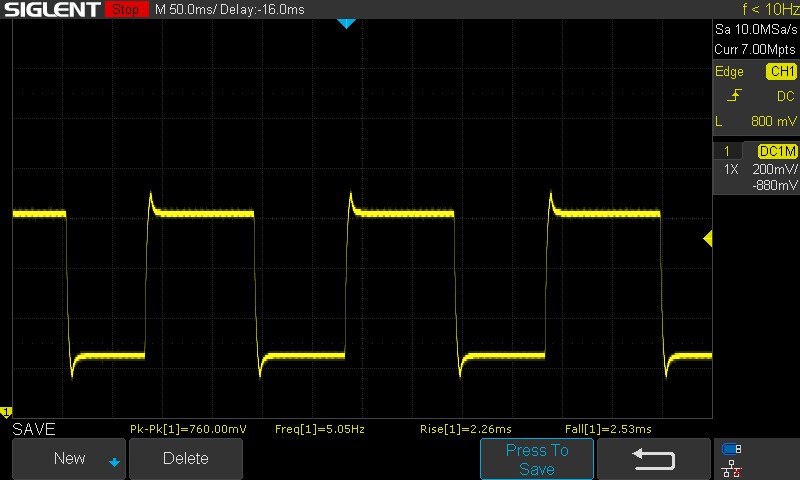 |
| ↘ 2.53 ms fall | ||
| The screen shows very fast response rates in our tests and should be very well suited for fast-paced gaming. In comparison, all tested devices range from 0.165 (minimum) to 636 (maximum) ms. » 17 % of all devices are better. This means that the measured response time is better than the average of all tested devices (30.9 ms). | ||
The Flow X13's display shows fairly quick 100% black to 100% white transitions. The panel uses overdrive by default, which allows for a fast 4.79 ms 50% grey to 80% grey response time.
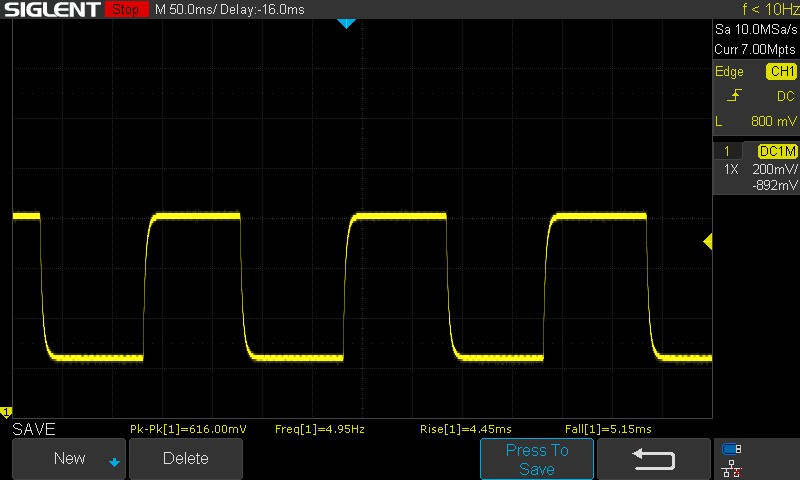
Disabling panel overdrive via Armory Crate increases the combined 50% grey to 80% grey transition to 9.6 ms.
We did not observe PWM at all tested brightness levels. Our article "Why PWM is such a headache" explains why this is a good thing.
Screen Flickering / PWM (Pulse-Width Modulation)
| Screen flickering / PWM not detected | ≤ 100 % brightness setting | 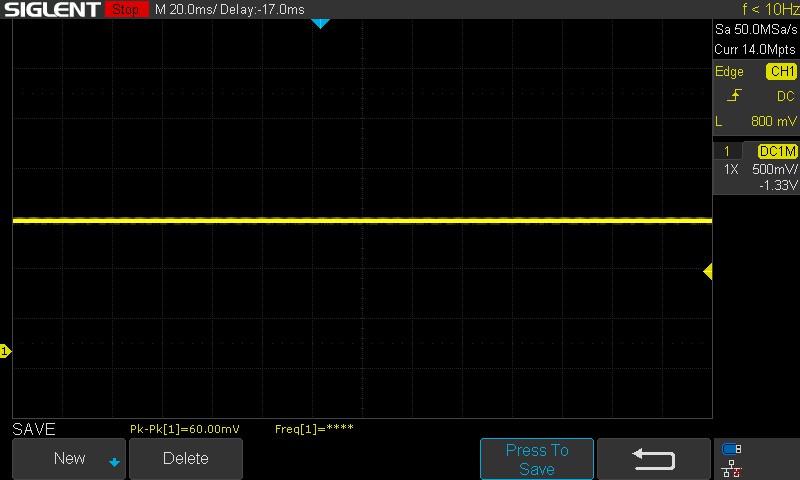 | |
In comparison: 52 % of all tested devices do not use PWM to dim the display. If PWM was detected, an average of 7748 (minimum: 5 - maximum: 343500) Hz was measured. | |||
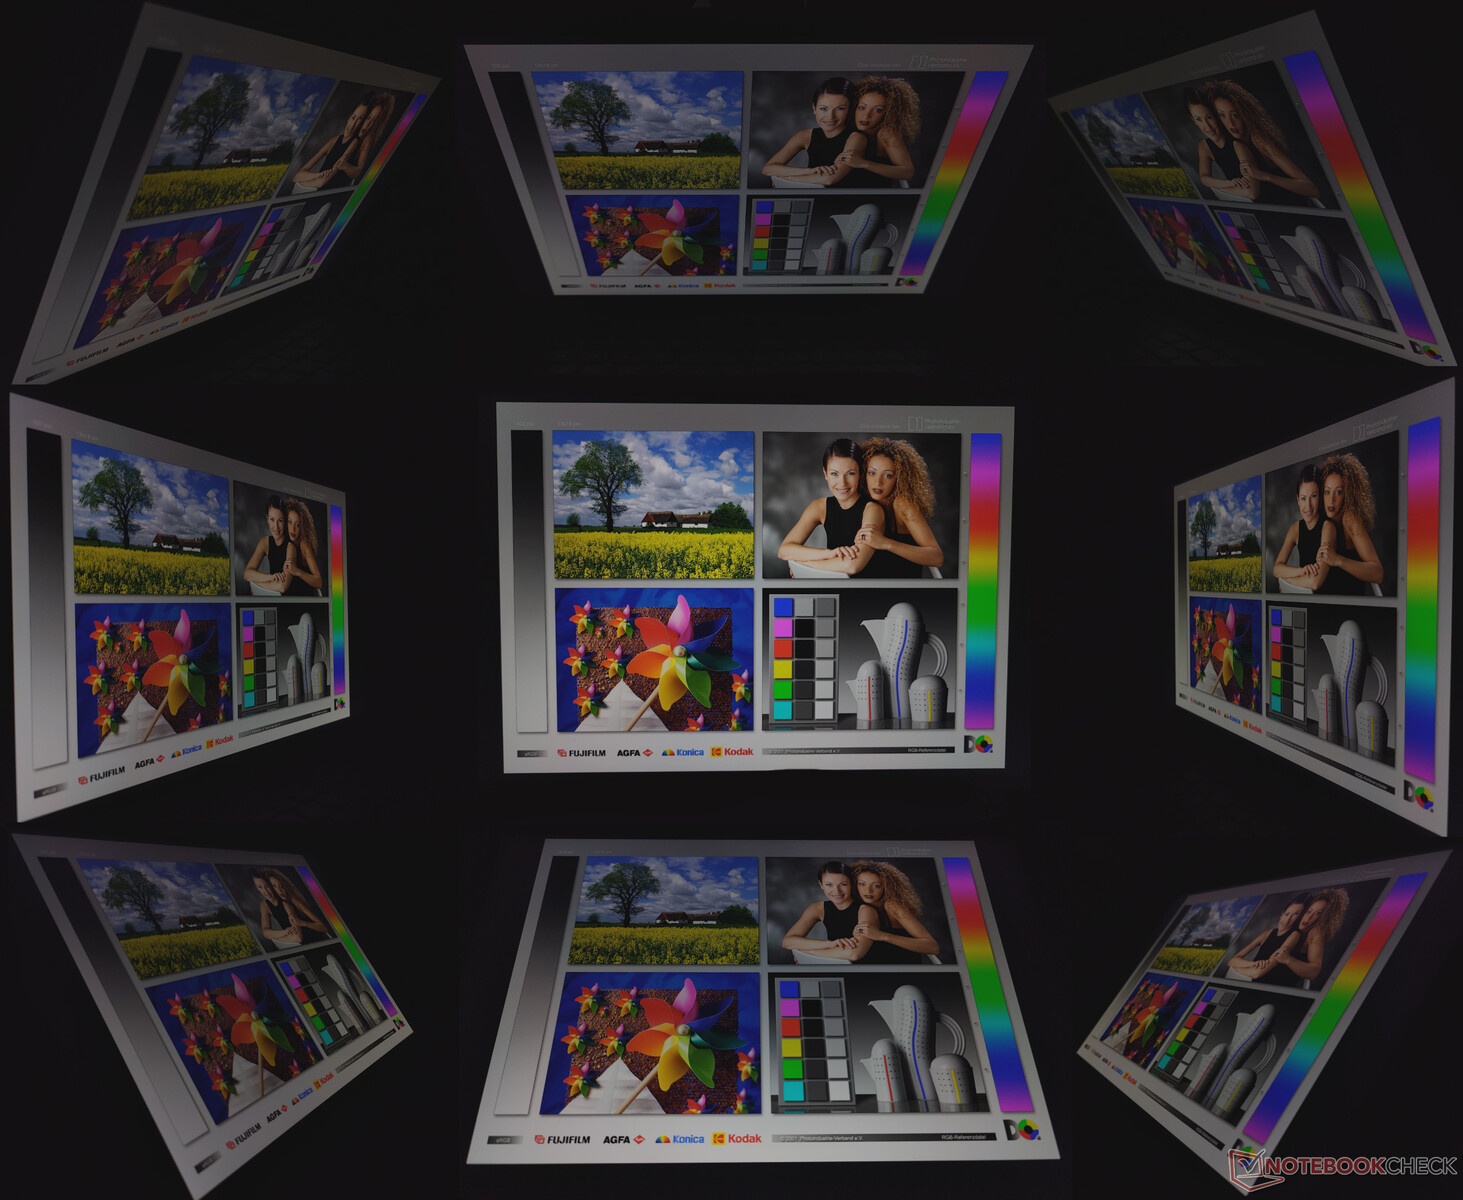
According to Asus, the Gorilla Glass DXC coating should help with better visibility outdoors. While outdoor visibility seems better than OLED VivoBooks, the glossy screen can still be quite reflective on a bright summer day.
Viewing angles are relatively stable save for some loss of brightness and color at the extremes.
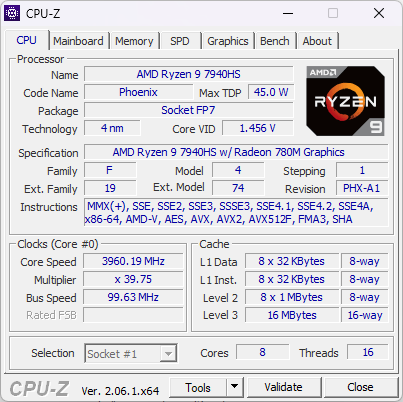
Performance: Formidable 65 W Ryzen 9 7940HS and 60 W RTX 4060 combo
In India, Asus offers two configurations of the ROG Flow X13 GV302, both with the AMD Ryzen 9 7940HS APU and QHD+ displays. Buyers can choose between 60 W RTX 4050 Laptop GPU or 60 W RTX 4060 Laptop GPU options.
US and European markets have access to a variant with a 60 W RTX 4070 Laptop GPU and 32 GB LPDDR5 RAM. There's also a SKU that downgrades to a Full HD+ display and relies solely on the Ryzen 9 7940HS's integrated Radeon 780M graphics.


Testing Conditions
The Flow X13's compact chassis naturally limits the Ryzen 9 7940HS's power ceiling. It can hit up to 65 W in Turbo mode here versus 114 W in the Asus TUF Gaming A16.
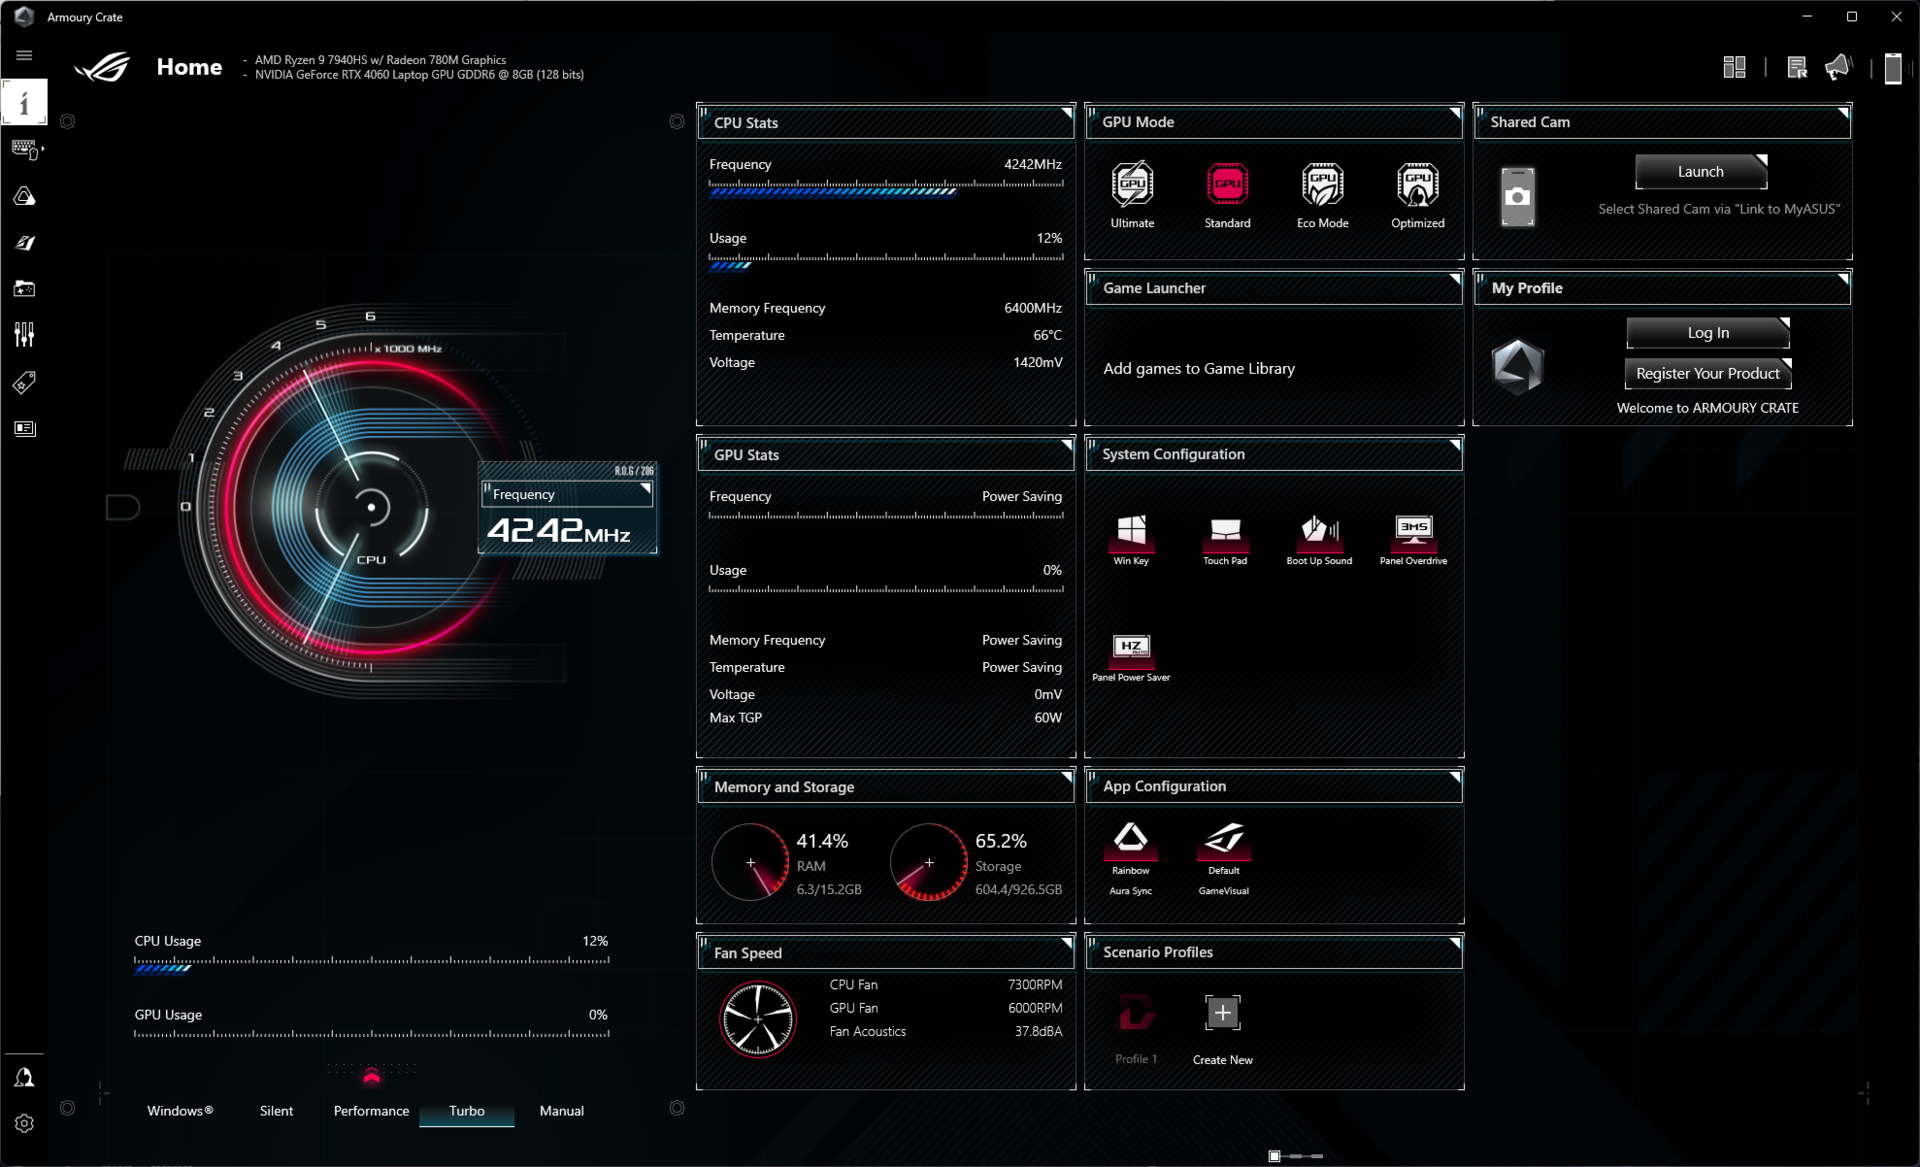
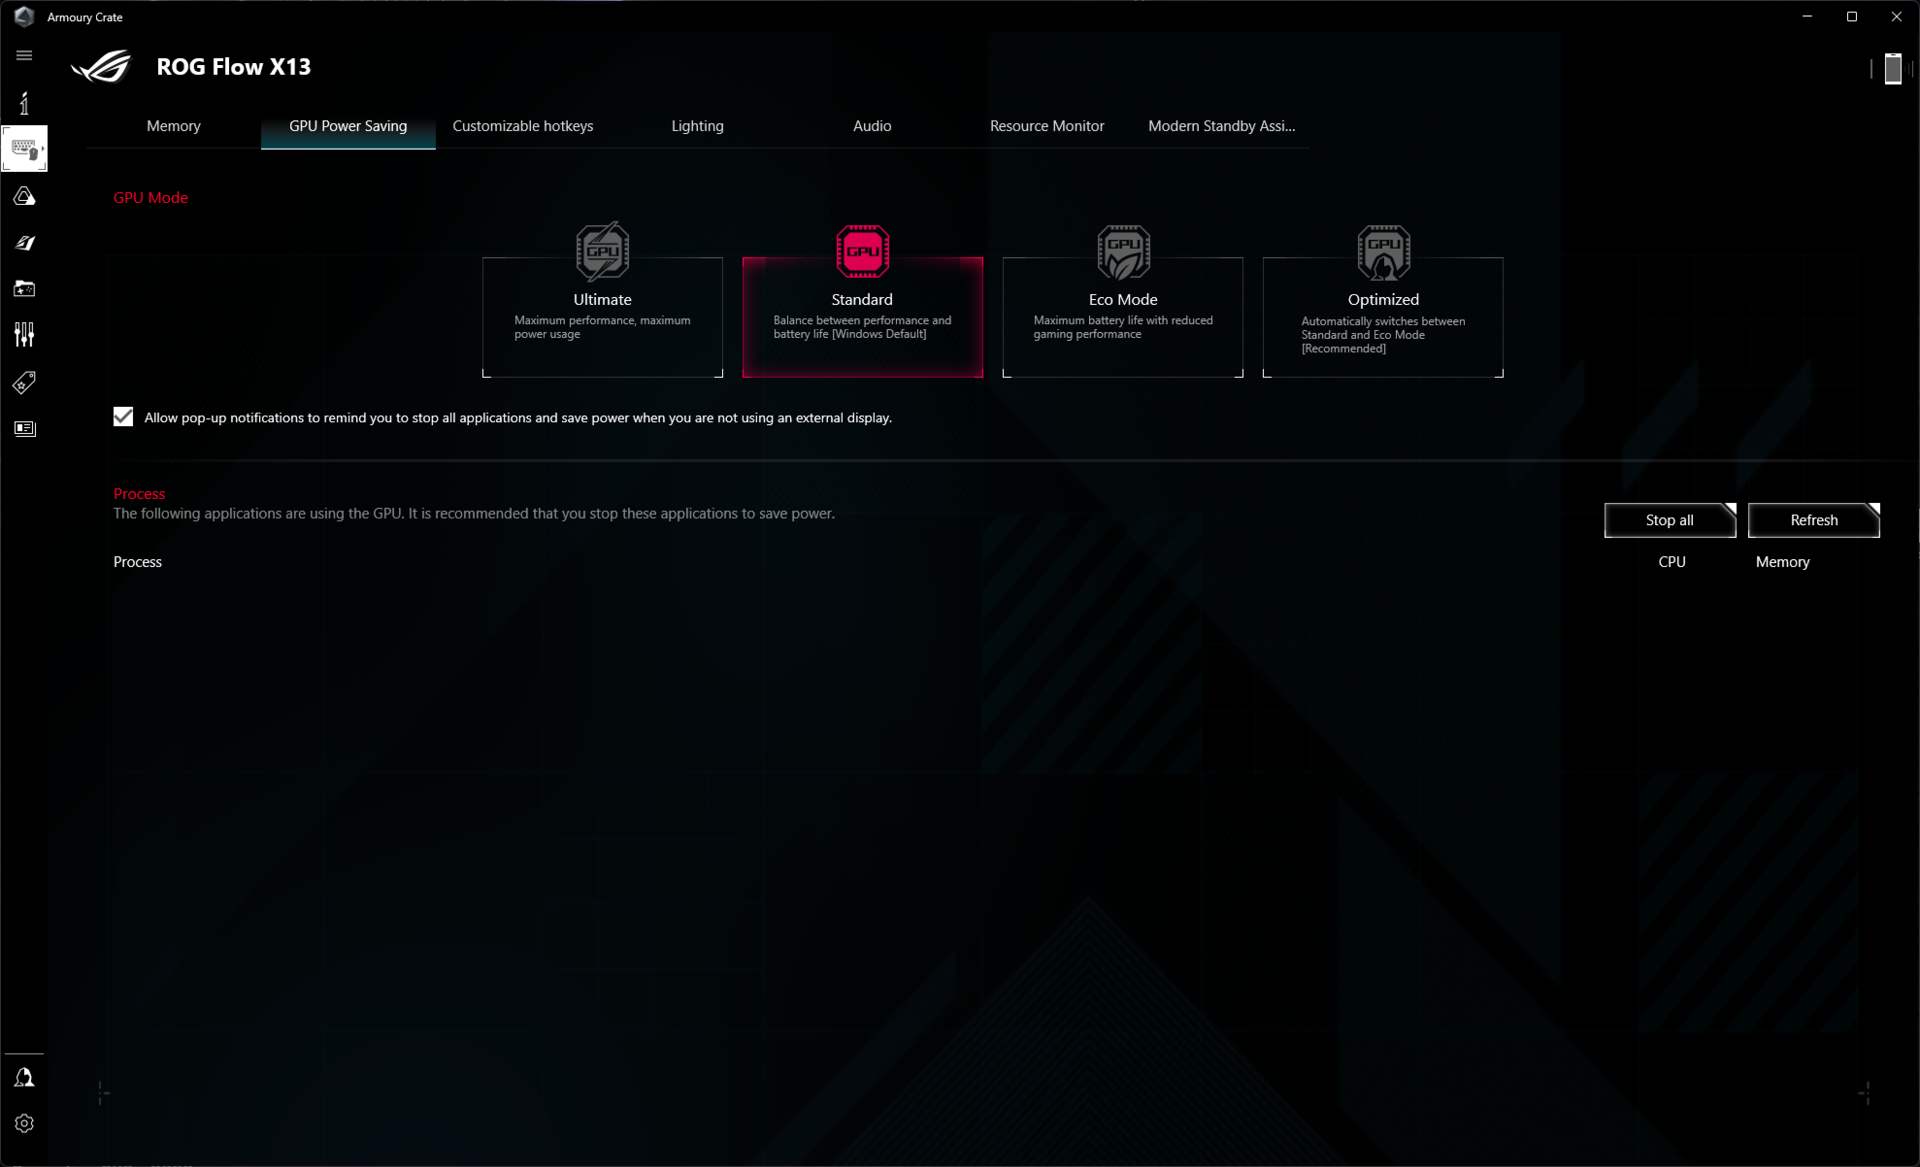
Asus's Armory Crate software allows adjusting various performance aspects of the Flow X13. Our benchmarks use the Turbo profile with GPU set to Ultimate, engaging exclusive dGPU mode. Battery tests employ the Windows profile and Standard GPU mode.
| Performance mode | STAPM | PL1 | PL2 | Cinebench R15 Multi score | Cinebench R15 Multi score (30 loops) |
|---|---|---|---|---|---|
| Silent | 45 W | 45 W | 65 W | 2476 (-6.12%) | 2094 (-12.05%) |
| Performance | 45 W | 54 W | 65 W | 2582 (-2.1%) | 2097 (-11.92%) |
| Turbo | 45 W | 60 W | 65 W | 2637.5 (100%) | 2381 (100%) |
Processor
The ROG Flow X13's Ryzen 9 7940HS lags behind the competition due to its lower operating headroom but not by much. The laptop shows a well-sustained performance in the Cinebench R15 multi-core loop test. Performance deltas in individual multi-core tests are somewhat higher than single-core runs overall.
There's only a 4% overall performance deficit compared to the 100 W PL2 Core i9-13900H-powered ROG Flow Z13 ACRNM, the 88 W PL2 Ryzen 9 7940HS in the Razer Blade 14, and the 114 W configuration in the TUF A16, indicating considerable efficiency gains despite a smaller form factor.
Cinebench R15 Multi Loop
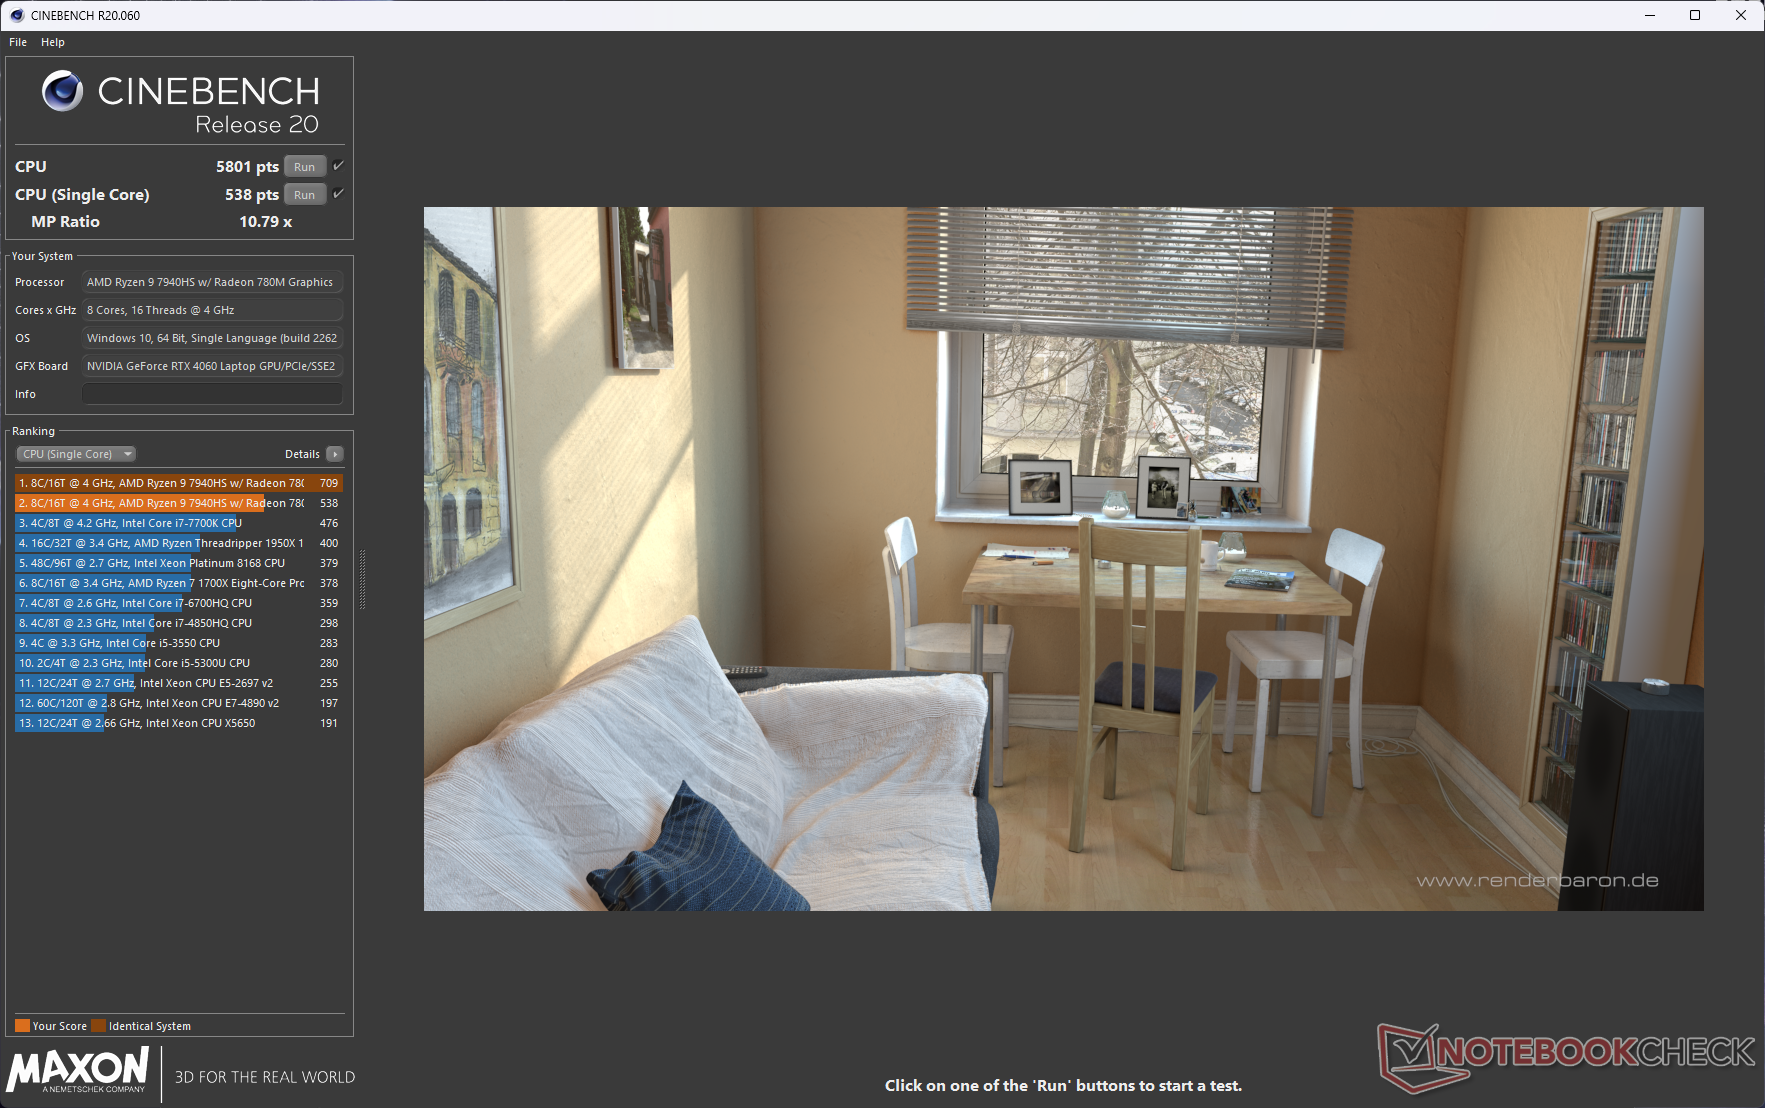
Cinebench R23: Multi Core | Single Core
Cinebench R20: CPU (Multi Core) | CPU (Single Core)
Cinebench R15: CPU Multi 64Bit | CPU Single 64Bit
Blender: v2.79 BMW27 CPU
7-Zip 18.03: 7z b 4 | 7z b 4 -mmt1
Geekbench 5.5: Multi-Core | Single-Core
HWBOT x265 Benchmark v2.2: 4k Preset
LibreOffice : 20 Documents To PDF
R Benchmark 2.5: Overall mean
| CPU Performance rating | |
| Asus ROG Flow Z13 GZ301V | |
| Asus ROG Flow Z13 ACRNM | |
| Razer Blade 14 RTX 4070 | |
| Lenovo Legion Slim 5 16APH8 | |
| Asus TUF Gaming A16 FA617XS | |
| Average AMD Ryzen 9 7940HS | |
| Acer Predator Triton 14 PT14-51 | |
| Asus ROG Flow X13 GV302XV | |
| Average of class Convertible | |
| Cinebench R23 / Multi Core | |
| Acer Predator Triton 14 PT14-51 | |
| Asus ROG Flow Z13 ACRNM | |
| Asus ROG Flow Z13 GZ301V | |
| Razer Blade 14 RTX 4070 | |
| Lenovo Legion Slim 5 16APH8 | |
| Asus TUF Gaming A16 FA617XS | |
| Average AMD Ryzen 9 7940HS (15556 - 18131, n=12) | |
| Asus ROG Flow X13 GV302XV | |
| Average of class Convertible (1317 - 30959, n=49, last 2 years) | |
| Cinebench R23 / Single Core | |
| Asus ROG Flow Z13 GZ301V | |
| Asus ROG Flow Z13 ACRNM | |
| Razer Blade 14 RTX 4070 | |
| Lenovo Legion Slim 5 16APH8 | |
| Asus TUF Gaming A16 FA617XS | |
| Average AMD Ryzen 9 7940HS (1733 - 1832, n=12) | |
| Asus ROG Flow X13 GV302XV | |
| Average of class Convertible (740 - 2188, n=49, last 2 years) | |
| Acer Predator Triton 14 PT14-51 | |
| Cinebench R20 / CPU (Multi Core) | |
| Acer Predator Triton 14 PT14-51 | |
| Asus ROG Flow Z13 ACRNM | |
| Asus ROG Flow Z13 GZ301V | |
| Razer Blade 14 RTX 4070 | |
| Lenovo Legion Slim 5 16APH8 | |
| Asus TUF Gaming A16 FA617XS | |
| Average AMD Ryzen 9 7940HS (6277 - 7111, n=12) | |
| Asus ROG Flow X13 GV302XV | |
| Average of class Convertible (595 - 12102, n=49, last 2 years) | |
| Cinebench R20 / CPU (Single Core) | |
| Asus ROG Flow Z13 GZ301V | |
| Asus ROG Flow Z13 ACRNM | |
| Asus ROG Flow X13 GV302XV | |
| Asus TUF Gaming A16 FA617XS | |
| Razer Blade 14 RTX 4070 | |
| Lenovo Legion Slim 5 16APH8 | |
| Average AMD Ryzen 9 7940HS (679 - 714, n=12) | |
| Average of class Convertible (273 - 834, n=49, last 2 years) | |
| Acer Predator Triton 14 PT14-51 | |
| Cinebench R15 / CPU Multi 64Bit | |
| Acer Predator Triton 14 PT14-51 | |
| Asus ROG Flow Z13 GZ301V | |
| Asus ROG Flow Z13 ACRNM | |
| Razer Blade 14 RTX 4070 | |
| Lenovo Legion Slim 5 16APH8 | |
| Asus TUF Gaming A16 FA617XS | |
| Average AMD Ryzen 9 7940HS (2470 - 2848, n=12) | |
| Asus ROG Flow X13 GV302XV | |
| Average of class Convertible (478 - 4940, n=48, last 2 years) | |
| Cinebench R15 / CPU Single 64Bit | |
| Asus ROG Flow Z13 GZ301V | |
| Asus ROG Flow Z13 ACRNM | |
| Asus ROG Flow X13 GV302XV | |
| Razer Blade 14 RTX 4070 | |
| Asus TUF Gaming A16 FA617XS | |
| Average AMD Ryzen 9 7940HS (258 - 288, n=12) | |
| Lenovo Legion Slim 5 16APH8 | |
| Average of class Convertible (149.8 - 317, n=48, last 2 years) | |
| Acer Predator Triton 14 PT14-51 | |
| Blender / v2.79 BMW27 CPU | |
| Average of class Convertible (105 - 1051, n=48, last 2 years) | |
| Asus ROG Flow X13 GV302XV | |
| Asus ROG Flow Z13 GZ301V | |
| Average AMD Ryzen 9 7940HS (182 - 202, n=11) | |
| Asus TUF Gaming A16 FA617XS | |
| Acer Predator Triton 14 PT14-51 | |
| Razer Blade 14 RTX 4070 | |
| Lenovo Legion Slim 5 16APH8 | |
| Asus ROG Flow Z13 ACRNM | |
| 7-Zip 18.03 / 7z b 4 | |
| Acer Predator Triton 14 PT14-51 | |
| Asus ROG Flow Z13 GZ301V | |
| Asus ROG Flow Z13 ACRNM | |
| Average AMD Ryzen 9 7940HS (63459 - 73434, n=12) | |
| Asus TUF Gaming A16 FA617XS | |
| Razer Blade 14 RTX 4070 | |
| Lenovo Legion Slim 5 16APH8 | |
| Asus ROG Flow X13 GV302XV | |
| Average of class Convertible (12977 - 121368, n=48, last 2 years) | |
| 7-Zip 18.03 / 7z b 4 -mmt1 | |
| Asus TUF Gaming A16 FA617XS | |
| Average AMD Ryzen 9 7940HS (6310 - 6776, n=12) | |
| Asus ROG Flow Z13 GZ301V | |
| Razer Blade 14 RTX 4070 | |
| Lenovo Legion Slim 5 16APH8 | |
| Asus ROG Flow X13 GV302XV | |
| Asus ROG Flow Z13 ACRNM | |
| Acer Predator Triton 14 PT14-51 | |
| Average of class Convertible (3672 - 6655, n=48, last 2 years) | |
| Geekbench 5.5 / Multi-Core | |
| Acer Predator Triton 14 PT14-51 | |
| Asus ROG Flow Z13 GZ301V | |
| Asus ROG Flow Z13 ACRNM | |
| Asus TUF Gaming A16 FA617XS | |
| Average AMD Ryzen 9 7940HS (10089 - 12500, n=13) | |
| Lenovo Legion Slim 5 16APH8 | |
| Razer Blade 14 RTX 4070 | |
| Asus ROG Flow X13 GV302XV | |
| Average of class Convertible (1608 - 22023, n=48, last 2 years) | |
| Geekbench 5.5 / Single-Core | |
| Asus TUF Gaming A16 FA617XS | |
| Asus ROG Flow Z13 GZ301V | |
| Lenovo Legion Slim 5 16APH8 | |
| Asus ROG Flow X13 GV302XV | |
| Average AMD Ryzen 9 7940HS (1823 - 2032, n=13) | |
| Asus ROG Flow Z13 ACRNM | |
| Razer Blade 14 RTX 4070 | |
| Average of class Convertible (806 - 2275, n=48, last 2 years) | |
| Acer Predator Triton 14 PT14-51 | |
| HWBOT x265 Benchmark v2.2 / 4k Preset | |
| Lenovo Legion Slim 5 16APH8 | |
| Razer Blade 14 RTX 4070 | |
| Average AMD Ryzen 9 7940HS (18.5 - 22.6, n=11) | |
| Asus TUF Gaming A16 FA617XS | |
| Asus ROG Flow Z13 ACRNM | |
| Acer Predator Triton 14 PT14-51 | |
| Asus ROG Flow X13 GV302XV | |
| Asus ROG Flow Z13 GZ301V | |
| Average of class Convertible (3.43 - 36.2, n=48, last 2 years) | |
| LibreOffice / 20 Documents To PDF | |
| Asus ROG Flow Z13 ACRNM | |
| Average of class Convertible (42.5 - 84.3, n=48, last 2 years) | |
| Asus ROG Flow X13 GV302XV | |
| Acer Predator Triton 14 PT14-51 | |
| Average AMD Ryzen 9 7940HS (36.9 - 54.8, n=12) | |
| Asus TUF Gaming A16 FA617XS | |
| Asus ROG Flow Z13 GZ301V | |
| Razer Blade 14 RTX 4070 | |
| Lenovo Legion Slim 5 16APH8 | |
| R Benchmark 2.5 / Overall mean | |
| Average of class Convertible (0.3915 - 0.84, n=48, last 2 years) | |
| Acer Predator Triton 14 PT14-51 | |
| Razer Blade 14 RTX 4070 | |
| Asus ROG Flow X13 GV302XV | |
| Lenovo Legion Slim 5 16APH8 | |
| Average AMD Ryzen 9 7940HS (0.4159 - 0.4467, n=12) | |
| Asus ROG Flow Z13 ACRNM | |
| Asus TUF Gaming A16 FA617XS | |
| Asus ROG Flow Z13 GZ301V | |
* ... smaller is better
The Ryzen 9 7940HS is able to attain boosts close to the 5 GHz mark at a peak package power of 65 W in all tested performance modes. We do not see much difference between the Turbo and Performance profiles in the first loop of the Cinebench R15 multi-core run.
However, stressing the CPU for 30 loops results in the clocks averaging out at about 4 GHz (39 W) in Turbo, 3.7 GHz (32.15 W) in Performance, and 3.48 GHz (28.7 W) in Silent modes. We see up to a 12% performance drop going from Turbo to Silent.
Performance regression on battery power seems quite significant with about 23.5% and 9.6% drops in Cinebench R20 single and multi-core scores, respectively.
AIDA64: FP32 Ray-Trace | FPU Julia | CPU SHA3 | CPU Queen | FPU SinJulia | FPU Mandel | CPU AES | CPU ZLib | FP64 Ray-Trace | CPU PhotoWorxx
| Performance rating | |
| Razer Blade 14 RTX 4070 | |
| Average AMD Ryzen 9 7940HS | |
| Asus ROG Flow X13 GV302XV | |
| Lenovo Legion Slim 5 16APH8 | |
| Asus TUF Gaming A16 FA617XS | |
| Acer Predator Triton 14 PT14-51 | |
| Asus ROG Flow Z13 ACRNM | |
| Asus ROG Flow Z13 GZ301V | |
| Average of class Convertible | |
| AIDA64 / FP32 Ray-Trace | |
| Razer Blade 14 RTX 4070 | |
| Lenovo Legion Slim 5 16APH8 | |
| Asus TUF Gaming A16 FA617XS | |
| Average AMD Ryzen 9 7940HS (25226 - 29109, n=10) | |
| Asus ROG Flow X13 GV302XV | |
| Asus ROG Flow Z13 ACRNM | |
| Acer Predator Triton 14 PT14-51 | |
| Asus ROG Flow Z13 GZ301V | |
| Average of class Convertible (1480 - 64158, n=48, last 2 years) | |
| AIDA64 / FPU Julia | |
| Razer Blade 14 RTX 4070 | |
| Asus TUF Gaming A16 FA617XS | |
| Lenovo Legion Slim 5 16APH8 | |
| Average AMD Ryzen 9 7940HS (106512 - 123214, n=10) | |
| Asus ROG Flow X13 GV302XV | |
| Acer Predator Triton 14 PT14-51 | |
| Asus ROG Flow Z13 ACRNM | |
| Asus ROG Flow Z13 GZ301V | |
| Average of class Convertible (11392 - 188126, n=48, last 2 years) | |
| AIDA64 / CPU SHA3 | |
| Razer Blade 14 RTX 4070 | |
| Lenovo Legion Slim 5 16APH8 | |
| Average AMD Ryzen 9 7940HS (4566 - 5119, n=10) | |
| Asus ROG Flow X13 GV302XV | |
| Asus TUF Gaming A16 FA617XS | |
| Acer Predator Triton 14 PT14-51 | |
| Asus ROG Flow Z13 ACRNM | |
| Asus ROG Flow Z13 GZ301V | |
| Average of class Convertible (797 - 8291, n=48, last 2 years) | |
| AIDA64 / CPU Queen | |
| Razer Blade 14 RTX 4070 | |
| Asus TUF Gaming A16 FA617XS | |
| Lenovo Legion Slim 5 16APH8 | |
| Average AMD Ryzen 9 7940HS (118174 - 124783, n=10) | |
| Asus ROG Flow X13 GV302XV | |
| Asus ROG Flow Z13 GZ301V | |
| Asus ROG Flow Z13 ACRNM | |
| Acer Predator Triton 14 PT14-51 | |
| Average of class Convertible (14686 - 148874, n=38, last 2 years) | |
| AIDA64 / FPU SinJulia | |
| Razer Blade 14 RTX 4070 | |
| Asus TUF Gaming A16 FA617XS | |
| Average AMD Ryzen 9 7940HS (14663 - 15551, n=10) | |
| Lenovo Legion Slim 5 16APH8 | |
| Asus ROG Flow X13 GV302XV | |
| Asus ROG Flow Z13 ACRNM | |
| Asus ROG Flow Z13 GZ301V | |
| Acer Predator Triton 14 PT14-51 | |
| Average of class Convertible (1120 - 29155, n=48, last 2 years) | |
| AIDA64 / FPU Mandel | |
| Razer Blade 14 RTX 4070 | |
| Lenovo Legion Slim 5 16APH8 | |
| Asus TUF Gaming A16 FA617XS | |
| Average AMD Ryzen 9 7940HS (56839 - 66238, n=10) | |
| Asus ROG Flow X13 GV302XV | |
| Asus ROG Flow Z13 ACRNM | |
| Acer Predator Triton 14 PT14-51 | |
| Asus ROG Flow Z13 GZ301V | |
| Average of class Convertible (4929 - 100132, n=48, last 2 years) | |
| AIDA64 / CPU AES | |
| Asus ROG Flow X13 GV302XV | |
| Acer Predator Triton 14 PT14-51 | |
| Average AMD Ryzen 9 7940HS (86309 - 171350, n=10) | |
| Razer Blade 14 RTX 4070 | |
| Asus TUF Gaming A16 FA617XS | |
| Asus ROG Flow Z13 ACRNM | |
| Asus ROG Flow Z13 GZ301V | |
| Lenovo Legion Slim 5 16APH8 | |
| Average of class Convertible (5271 - 190280, n=48, last 2 years) | |
| AIDA64 / CPU ZLib | |
| Asus ROG Flow Z13 ACRNM | |
| Acer Predator Triton 14 PT14-51 | |
| Razer Blade 14 RTX 4070 | |
| Lenovo Legion Slim 5 16APH8 | |
| Asus TUF Gaming A16 FA617XS | |
| Asus ROG Flow X13 GV302XV | |
| Average AMD Ryzen 9 7940HS (866 - 1152, n=10) | |
| Asus ROG Flow Z13 GZ301V | |
| Average of class Convertible (218 - 2017, n=48, last 2 years) | |
| AIDA64 / FP64 Ray-Trace | |
| Razer Blade 14 RTX 4070 | |
| Lenovo Legion Slim 5 16APH8 | |
| Asus TUF Gaming A16 FA617XS | |
| Average AMD Ryzen 9 7940HS (13175 - 15675, n=10) | |
| Asus ROG Flow X13 GV302XV | |
| Asus ROG Flow Z13 ACRNM | |
| Acer Predator Triton 14 PT14-51 | |
| Asus ROG Flow Z13 GZ301V | |
| Average of class Convertible (1169 - 34297, n=48, last 2 years) | |
| AIDA64 / CPU PhotoWorxx | |
| Acer Predator Triton 14 PT14-51 | |
| Average of class Convertible (14193 - 85327, n=48, last 2 years) | |
| Asus ROG Flow Z13 ACRNM | |
| Asus ROG Flow Z13 GZ301V | |
| Average AMD Ryzen 9 7940HS (22477 - 41567, n=10) | |
| Lenovo Legion Slim 5 16APH8 | |
| Asus ROG Flow X13 GV302XV | |
| Razer Blade 14 RTX 4070 | |
| Asus TUF Gaming A16 FA617XS | |
More information and benchmarks can be found in our dedicated AMD Ryzen 9 7940HS page.
System Performance
The ROG Flow X13 achieves a good PCMark 10 overall score, only next to the Asus ROG Zephyrus G14 with an RTX 4090 Laptop GPU. The device trails the competition in CrossMark, but we did not notice any particular areas of concern or sluggishness in day-to-day usage.
CrossMark: Overall | Productivity | Creativity | Responsiveness
AIDA64: Memory Copy | Memory Read | Memory Write | Memory Latency
| PCMark 10 / Score | |
| Asus ROG Zephyrus G14 GA402XY | |
| Asus ROG Flow X13 GV302XV | |
| Average AMD Ryzen 9 7940HS, NVIDIA GeForce RTX 4060 Laptop GPU (n=1) | |
| Asus ROG Flow Z13 GZ301V | |
| Acer Predator Triton 14 PT14-51 | |
| Lenovo Yoga Pro 9-14IRP G8 | |
| Lenovo Yoga Pro 7 14IRH G8 | |
| Gigabyte Aero 14 OLED BMF | |
| Average of class Convertible (3229 - 10123, n=46, last 2 years) | |
| MSI Stealth 14 Studio A13V | |
| PCMark 10 / Essentials | |
| Gigabyte Aero 14 OLED BMF | |
| Asus ROG Flow Z13 GZ301V | |
| Lenovo Yoga Pro 9-14IRP G8 | |
| Asus ROG Flow X13 GV302XV | |
| Average AMD Ryzen 9 7940HS, NVIDIA GeForce RTX 4060 Laptop GPU (n=1) | |
| Lenovo Yoga Pro 7 14IRH G8 | |
| Asus ROG Zephyrus G14 GA402XY | |
| Average of class Convertible (7233 - 12222, n=46, last 2 years) | |
| Acer Predator Triton 14 PT14-51 | |
| MSI Stealth 14 Studio A13V | |
| PCMark 10 / Productivity | |
| Asus ROG Zephyrus G14 GA402XY | |
| Asus ROG Flow Z13 GZ301V | |
| Average of class Convertible (5062 - 17914, n=46, last 2 years) | |
| Acer Predator Triton 14 PT14-51 | |
| Asus ROG Flow X13 GV302XV | |
| Average AMD Ryzen 9 7940HS, NVIDIA GeForce RTX 4060 Laptop GPU (n=1) | |
| Gigabyte Aero 14 OLED BMF | |
| Lenovo Yoga Pro 7 14IRH G8 | |
| Lenovo Yoga Pro 9-14IRP G8 | |
| MSI Stealth 14 Studio A13V | |
| PCMark 10 / Digital Content Creation | |
| Asus ROG Zephyrus G14 GA402XY | |
| Asus ROG Flow X13 GV302XV | |
| Average AMD Ryzen 9 7940HS, NVIDIA GeForce RTX 4060 Laptop GPU (n=1) | |
| Lenovo Yoga Pro 9-14IRP G8 | |
| Acer Predator Triton 14 PT14-51 | |
| MSI Stealth 14 Studio A13V | |
| Lenovo Yoga Pro 7 14IRH G8 | |
| Asus ROG Flow Z13 GZ301V | |
| Gigabyte Aero 14 OLED BMF | |
| Average of class Convertible (2496 - 16551, n=46, last 2 years) | |
| CrossMark / Overall | |
| Asus ROG Flow Z13 GZ301V | |
| Lenovo Yoga Pro 9-14IRP G8 | |
| Acer Predator Triton 14 PT14-51 | |
| Gigabyte Aero 14 OLED BMF | |
| Asus ROG Zephyrus G14 GA402XY | |
| Lenovo Yoga Pro 7 14IRH G8 | |
| Asus ROG Flow X13 GV302XV | |
| Average AMD Ryzen 9 7940HS, NVIDIA GeForce RTX 4060 Laptop GPU (n=1) | |
| MSI Stealth 14 Studio A13V | |
| Average of class Convertible (524 - 2274, n=49, last 2 years) | |
| CrossMark / Productivity | |
| Asus ROG Flow Z13 GZ301V | |
| Gigabyte Aero 14 OLED BMF | |
| Asus ROG Zephyrus G14 GA402XY | |
| Acer Predator Triton 14 PT14-51 | |
| Asus ROG Flow X13 GV302XV | |
| Average AMD Ryzen 9 7940HS, NVIDIA GeForce RTX 4060 Laptop GPU (n=1) | |
| Lenovo Yoga Pro 9-14IRP G8 | |
| Lenovo Yoga Pro 7 14IRH G8 | |
| MSI Stealth 14 Studio A13V | |
| Average of class Convertible (554 - 1942, n=49, last 2 years) | |
| CrossMark / Creativity | |
| Asus ROG Flow Z13 GZ301V | |
| Lenovo Yoga Pro 9-14IRP G8 | |
| Asus ROG Zephyrus G14 GA402XY | |
| Lenovo Yoga Pro 7 14IRH G8 | |
| Acer Predator Triton 14 PT14-51 | |
| Asus ROG Flow X13 GV302XV | |
| Average AMD Ryzen 9 7940HS, NVIDIA GeForce RTX 4060 Laptop GPU (n=1) | |
| Gigabyte Aero 14 OLED BMF | |
| MSI Stealth 14 Studio A13V | |
| Average of class Convertible (550 - 2949, n=49, last 2 years) | |
| CrossMark / Responsiveness | |
| Acer Predator Triton 14 PT14-51 | |
| Gigabyte Aero 14 OLED BMF | |
| Asus ROG Flow Z13 GZ301V | |
| MSI Stealth 14 Studio A13V | |
| Lenovo Yoga Pro 9-14IRP G8 | |
| Asus ROG Flow X13 GV302XV | |
| Average AMD Ryzen 9 7940HS, NVIDIA GeForce RTX 4060 Laptop GPU (n=1) | |
| Asus ROG Zephyrus G14 GA402XY | |
| Lenovo Yoga Pro 7 14IRH G8 | |
| Average of class Convertible (381 - 1719, n=49, last 2 years) | |
| AIDA64 / Memory Copy | |
| Average of class Convertible (23880 - 161475, n=48, last 2 years) | |
| Lenovo Yoga Pro 9-14IRP G8 | |
| Gigabyte Aero 14 OLED BMF | |
| Acer Predator Triton 14 PT14-51 | |
| Asus ROG Flow X13 GV302XV | |
| Average AMD Ryzen 9 7940HS, NVIDIA GeForce RTX 4060 Laptop GPU (n=1) | |
| Asus ROG Flow Z13 GZ301V | |
| Lenovo Yoga Pro 7 14IRH G8 | |
| MSI Stealth 14 Studio A13V | |
| AIDA64 / Memory Read | |
| Gigabyte Aero 14 OLED BMF | |
| Average of class Convertible (19931 - 131960, n=48, last 2 years) | |
| Lenovo Yoga Pro 9-14IRP G8 | |
| MSI Stealth 14 Studio A13V | |
| Lenovo Yoga Pro 7 14IRH G8 | |
| Acer Predator Triton 14 PT14-51 | |
| Asus ROG Flow Z13 GZ301V | |
| Asus ROG Flow X13 GV302XV | |
| Average AMD Ryzen 9 7940HS, NVIDIA GeForce RTX 4060 Laptop GPU (n=1) | |
| AIDA64 / Memory Write | |
| Gigabyte Aero 14 OLED BMF | |
| Asus ROG Flow X13 GV302XV | |
| Average AMD Ryzen 9 7940HS, NVIDIA GeForce RTX 4060 Laptop GPU (n=1) | |
| Lenovo Yoga Pro 9-14IRP G8 | |
| Average of class Convertible (17473 - 216896, n=48, last 2 years) | |
| Acer Predator Triton 14 PT14-51 | |
| Asus ROG Flow Z13 GZ301V | |
| Lenovo Yoga Pro 7 14IRH G8 | |
| MSI Stealth 14 Studio A13V | |
| AIDA64 / Memory Latency | |
| Average of class Convertible (6.9 - 536, n=48, last 2 years) | |
| Asus ROG Flow X13 GV302XV | |
| Average AMD Ryzen 9 7940HS, NVIDIA GeForce RTX 4060 Laptop GPU (n=1) | |
| Lenovo Yoga Pro 7 14IRH G8 | |
| Acer Predator Triton 14 PT14-51 | |
| Lenovo Yoga Pro 9-14IRP G8 | |
| Gigabyte Aero 14 OLED BMF | |
| MSI Stealth 14 Studio A13V | |
| Asus ROG Flow Z13 GZ301V | |
* ... smaller is better
| PCMark 8 Home Score Accelerated v2 | 5830 points | |
| PCMark 8 Work Score Accelerated v2 | 6089 points | |
| PCMark 10 Score | 7676 points | |
Help | ||
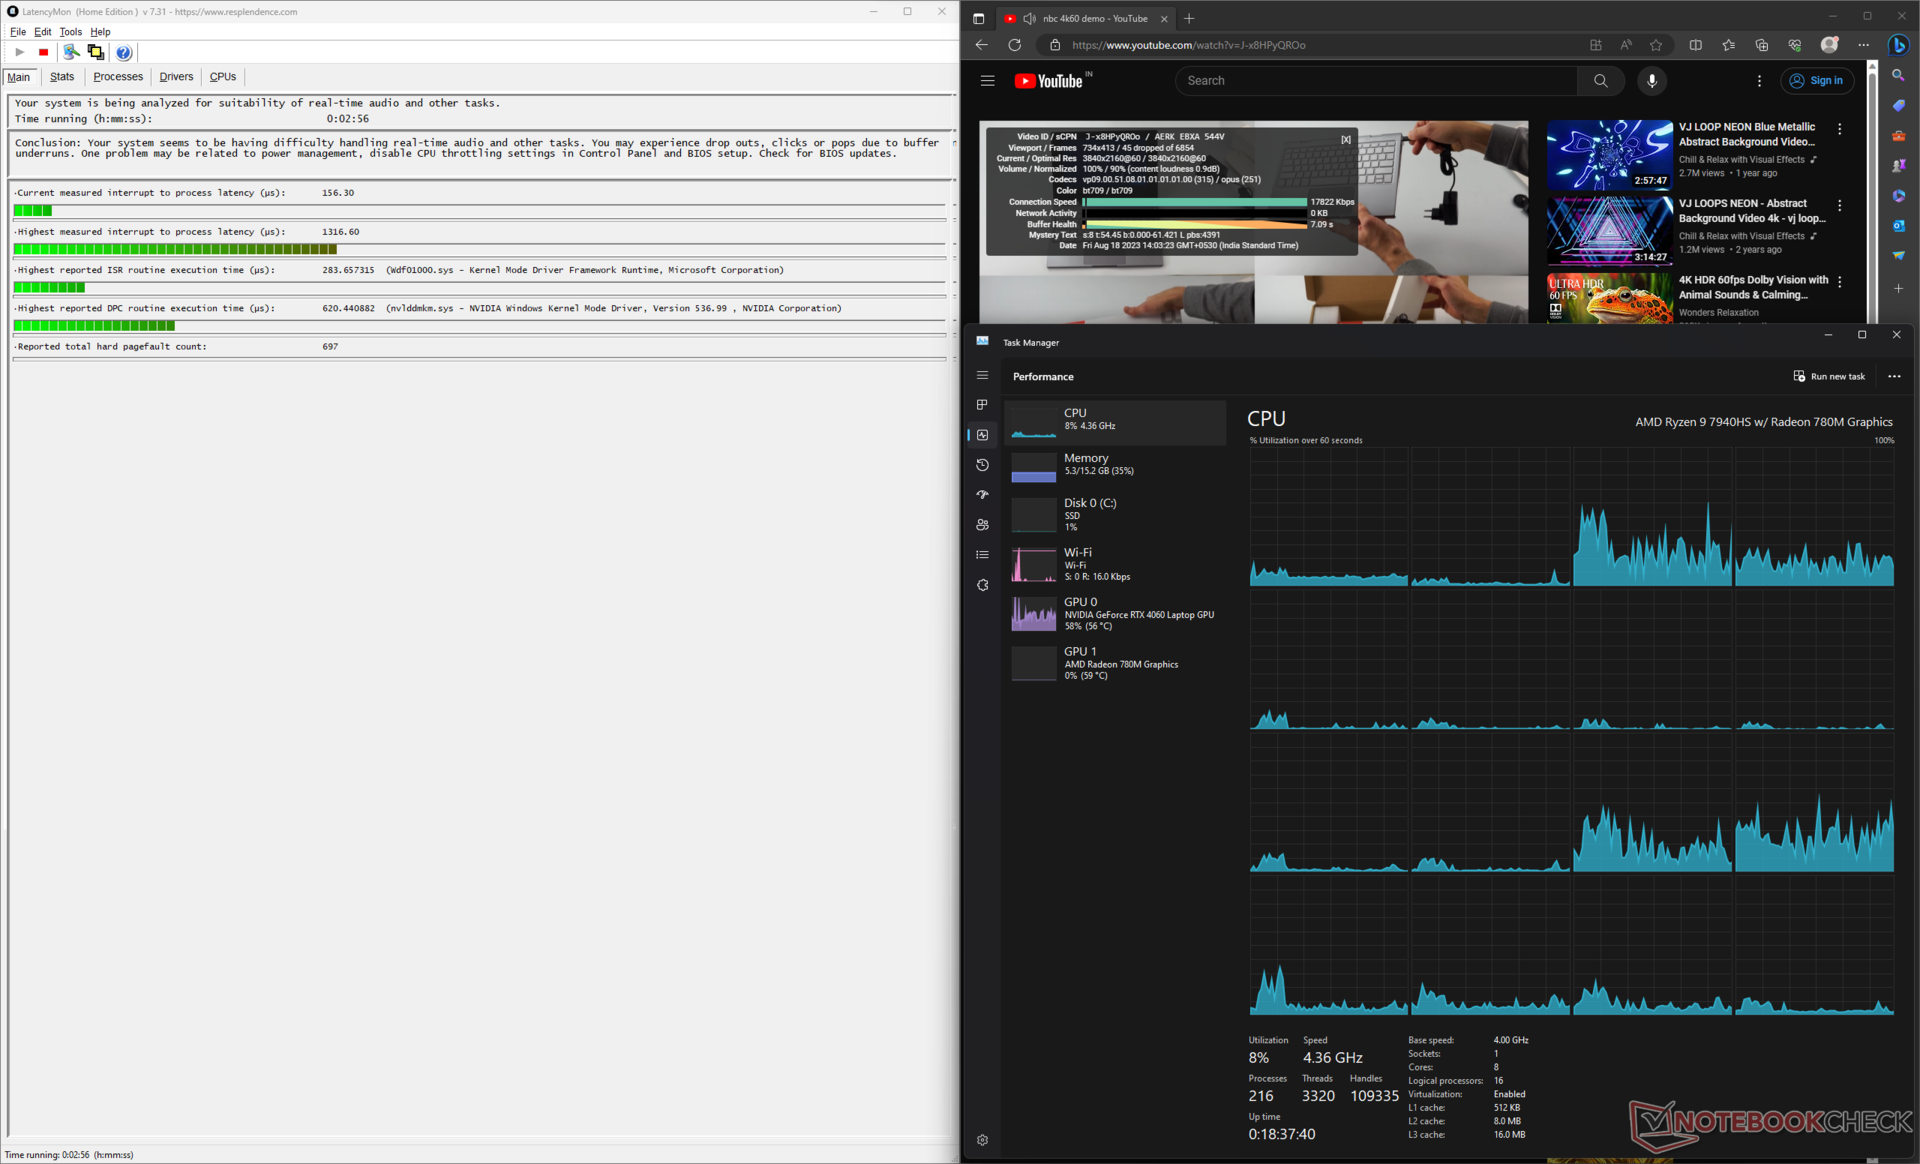
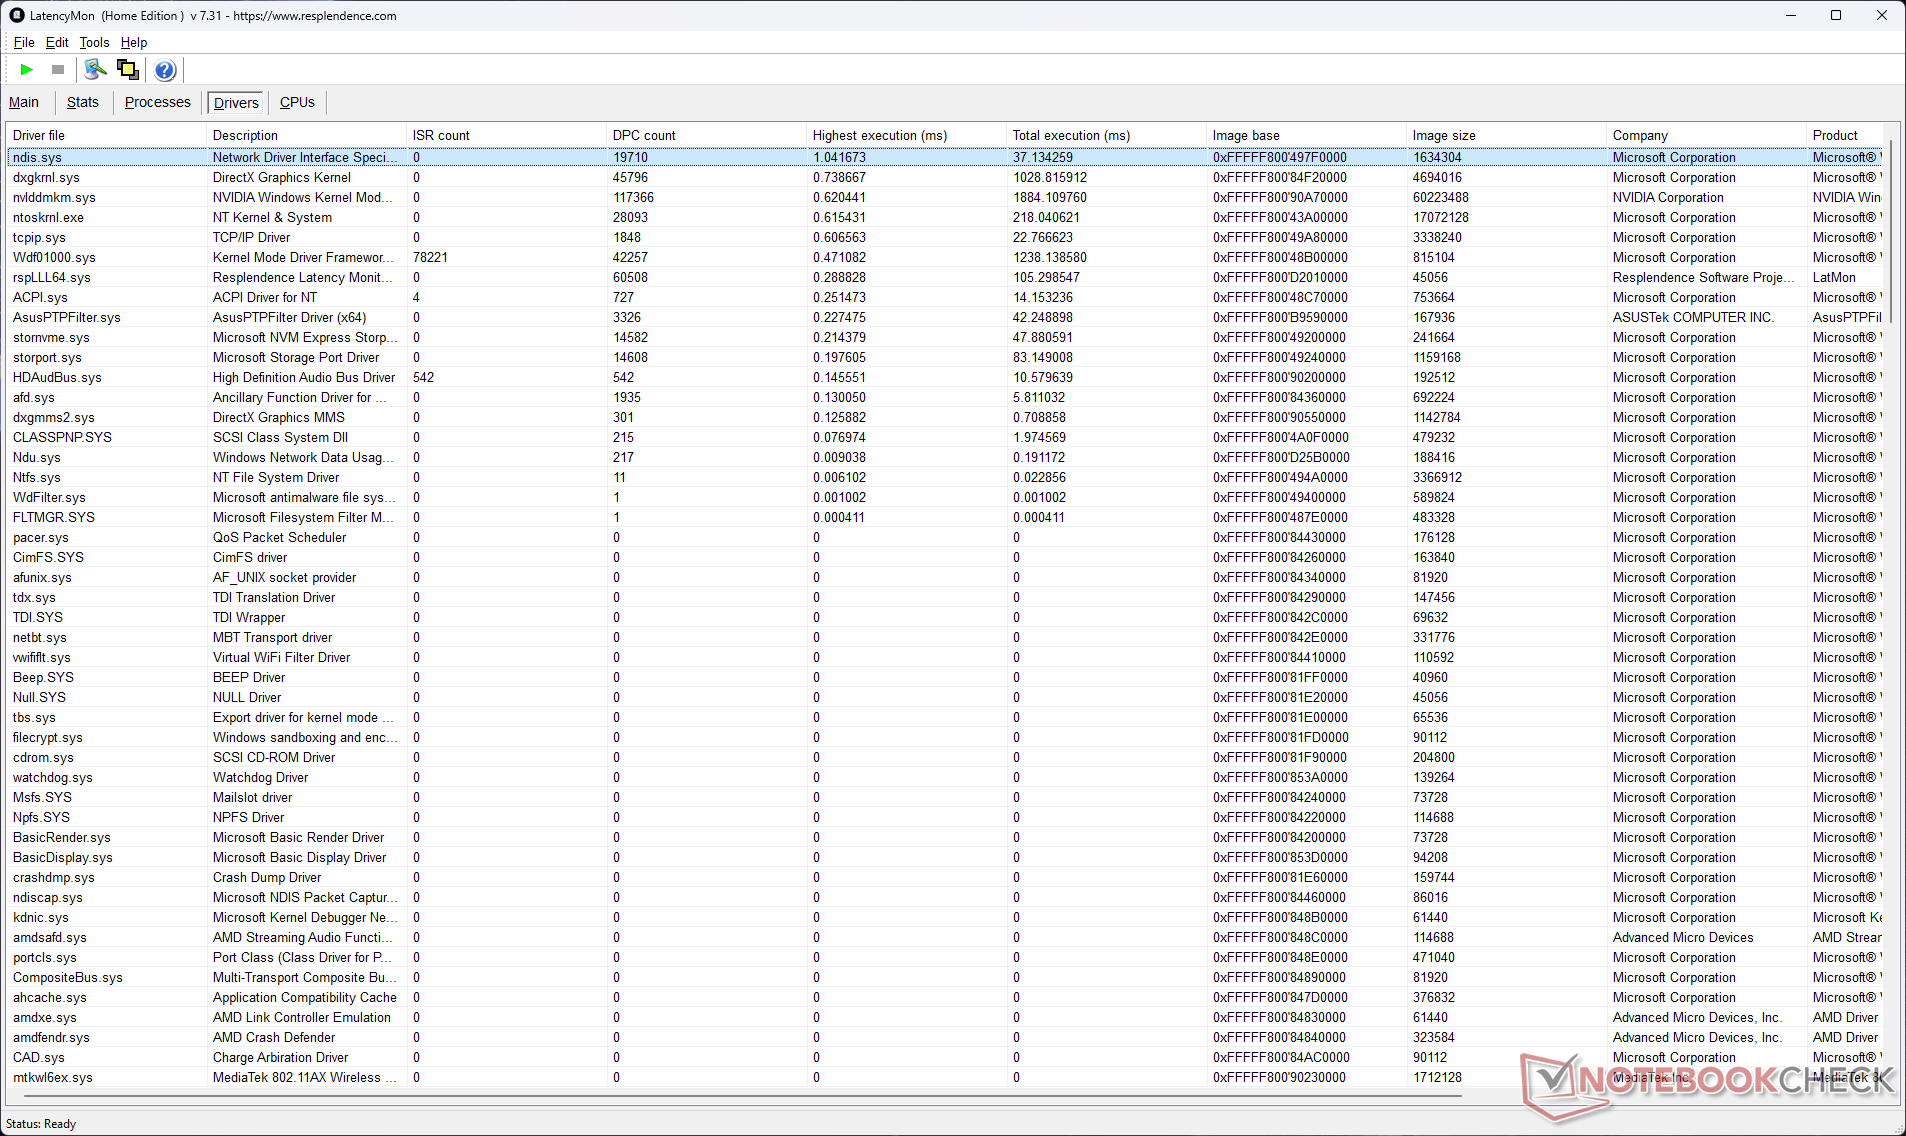
DPC Latency
DPC latency is on the higher side due to higher execution times of the Network Driver Interface Specification (NDIS) driver. This can cause minor hiccups with real-time audio and video workflows.
| DPC Latencies / LatencyMon - interrupt to process latency (max), Web, Youtube, Prime95 | |
| Asus ROG Flow Z13 GZ301V | |
| Asus ROG Flow Z13 ACRNM | |
| Acer Predator Triton 14 PT14-51 | |
| Asus ROG Flow X13 GV302XV | |
| Asus TUF Gaming A16 FA617XS | |
| Lenovo Legion Slim 5 16APH8 | |
| Razer Blade 14 RTX 4070 | |
* ... smaller is better
Check out our DPC Latency Ranking page for a comparison of measured latency across reviewed devices.
Storage Devices

Our Flow X13 unit packs a 1 TB Micron 2400 PCIe Gen4.0 M.2 2230 SSD. With no scope for internal storage expansion, users are confined to this lone drive. More capacious 2 TB M.2 2230 models are emerging but remain relatively costly versus the larger M.2 2280 SSDs.
Overall drive performance trails behind the WD PC SN740 M.2 2230 in the Flow Z13 models but should still be amenable for most gaming and creative workflows. We observed no throttling during the DiskSpd read loop test at a queue depth of 8.

* ... smaller is better
Disk Throttling: DiskSpd Read Loop, Queue Depth 8
Our HDD and SSD benchmarks page offers more storage performance comparisons.
GPU Performance
The Flow X13's 60 W Nvidia GeForce RTX 4060 Laptop GPU has a slight edge over the 65 W version found in the ROG Flow Z13 GZ301V while trailing the 65 W RTX 4070 Laptop GPU in the Flow Z13 ACRNM by 10% in cumulative 3DMark performance.
Interestingly, the 95 W RTX 4050 Laptop GPU in the Acer Predator Triton 14 trades blows in 3DMark with the 60 W RTX 4060 in the Flow X13. The Lenovo Legion Slim 5's 100 W RTX 4060 has a 9% lead, though we found that it operates mostly at 60 W similar to the Flow X13.
| 3DMark 11 Performance | 26182 points | |
| 3DMark Ice Storm Standard Score | 269199 points | |
| 3DMark Cloud Gate Standard Score | 59032 points | |
| 3DMark Fire Strike Score | 19903 points | |
| 3DMark Fire Strike Extreme Score | 9654 points | |
| 3DMark Time Spy Score | 8496 points | |
Help | ||
| Blender / v3.3 Classroom OPTIX/RTX | |
| Asus ROG Flow Z13 GZ301V | |
| Acer Predator Triton 14 PT14-51 | |
| Asus ROG Flow Z13 ACRNM | |
| Asus ROG Flow X13 GV302XV | |
| Average NVIDIA GeForce RTX 4060 Laptop GPU (19 - 28, n=53) | |
| Razer Blade 14 RTX 4070 | |
| Lenovo Legion Slim 5 16APH8 | |
| Blender / v3.3 Classroom CUDA | |
| Asus ROG Flow Z13 GZ301V | |
| Asus ROG Flow X13 GV302XV | |
| Acer Predator Triton 14 PT14-51 | |
| Lenovo Legion Slim 5 16APH8 | |
| Average NVIDIA GeForce RTX 4060 Laptop GPU (39 - 53, n=53) | |
| Asus ROG Flow Z13 ACRNM | |
| Razer Blade 14 RTX 4070 | |
| Blender / v3.3 Classroom CPU | |
| Average of class Convertible (159 - 2067, n=49, last 2 years) | |
| Asus ROG Flow Z13 GZ301V | |
| Asus ROG Flow X13 GV302XV | |
| Acer Predator Triton 14 PT14-51 | |
| Asus ROG Flow Z13 ACRNM | |
| Average NVIDIA GeForce RTX 4060 Laptop GPU (189 - 452, n=53) | |
| Asus TUF Gaming A16 FA617XS | |
| Lenovo Legion Slim 5 16APH8 | |
| Razer Blade 14 RTX 4070 | |
* ... smaller is better
Gaming Performance
The ROG Flow X13, with its 165 Hz G-Sync display and the RTX 4060, comes across as a highly capable gaming convertible. At 1080p Ultra, it cumulatively trails the Flow Z13 ACRNM's 65W 4070 by 10% and the Blade 14's 140W 4070 by 17%.
4K Ultra proves too demanding, but QHD Ultra offers a decent playing experience in somewhat older titles. In any case, gamers will find themselves making use of upscaling algorithms such as DLSS, FSR, or XeSS in supported titles for smooth gameplay.
| The Witcher 3 - 1920x1080 Ultra Graphics & Postprocessing (HBAO+) | |
| Razer Blade 14 RTX 4070 | |
| Asus TUF Gaming A16 FA617XS | |
| Lenovo Legion Slim 5 16APH8 | |
| Asus ROG Flow X13 GV302XV | |
| Asus ROG Flow Z13 ACRNM | |
| Acer Predator Triton 14 PT14-51 | |
| Asus ROG Flow Z13 GZ301V | |
| Average of class Convertible (13.4 - 101, n=3, last 2 years) | |
| The Witcher 3 | |
| 1920x1080 Ultra Graphics & Postprocessing (HBAO+) | |
| Razer Blade 14 RTX 4070 | |
| Average NVIDIA GeForce RTX 4060 Laptop GPU (77 - 159.7, n=42) | |
| Asus TUF Gaming A16 FA617XS | |
| Lenovo Legion Slim 5 16APH8 | |
| Asus ROG Flow X13 GV302XV | |
| Asus ROG Flow Z13 ACRNM | |
| Acer Predator Triton 14 PT14-51 | |
| Asus ROG Flow Z13 GZ301V | |
| Average of class Convertible (13.4 - 101, n=3, last 2 years) | |
| 2560x1440 Ultra Graphics & Postprocessing (HBAO+) | |
| Average NVIDIA GeForce RTX 4060 Laptop GPU (42.4 - 83.4, n=14) | |
| Asus ROG Flow X13 GV302XV | |
| Shadow of the Tomb Raider | |
| 1920x1080 Highest Preset AA:T | |
| Razer Blade 14 RTX 4070 | |
| Average NVIDIA GeForce RTX 4060 Laptop GPU (104 - 155.6, n=7) | |
| Asus ROG Flow Z13 ACRNM | |
| Asus ROG Flow X13 GV302XV | |
| Average of class Convertible (n=1last 2 years) | |
| 2560x1440 Highest Preset AA:T | |
| Razer Blade 14 RTX 4070 | |
| Average NVIDIA GeForce RTX 4060 Laptop GPU (71 - 120.7, n=6) | |
| Asus ROG Flow Z13 ACRNM | |
| Asus ROG Flow X13 GV302XV | |
| Average of class Convertible (n=1last 2 years) | |
| Far Cry 6 | |
| 1920x1080 Ultra Graphics Quality + HD Textures AA:T | |
| Razer Blade 14 RTX 4070 | |
| Asus TUF Gaming A16 FA617XS | |
| Average NVIDIA GeForce RTX 4060 Laptop GPU (76 - 117, n=5) | |
| Asus ROG Flow Z13 ACRNM | |
| Asus ROG Flow X13 GV302XV | |
| 2560x1440 Ultra Graphics Quality + HD Textures AA:T | |
| Razer Blade 14 RTX 4070 | |
| Asus ROG Flow Z13 ACRNM | |
| Average NVIDIA GeForce RTX 4060 Laptop GPU (32.6 - 83, n=5) | |
| Asus ROG Flow X13 GV302XV | |
| Cyberpunk 2077 1.6 | |
| 1920x1080 Ultra Preset | |
| Razer Blade 14 RTX 4070 | |
| Average NVIDIA GeForce RTX 4060 Laptop GPU (57.9 - 93.2, n=18) | |
| Asus ROG Flow Z13 ACRNM | |
| Lenovo Legion Slim 5 16APH8 | |
| Asus ROG Flow X13 GV302XV | |
| 2560x1440 Ultra Preset | |
| Razer Blade 14 RTX 4070 | |
| Asus ROG Flow Z13 ACRNM | |
| Average NVIDIA GeForce RTX 4060 Laptop GPU (39 - 58.6, n=13) | |
| Lenovo Legion Slim 5 16APH8 | |
| Asus ROG Flow X13 GV302XV | |
| 1920x1080 Ray Tracing Ultra Preset (DLSS off) | |
| Asus ROG Flow Z13 ACRNM | |
| Average NVIDIA GeForce RTX 4060 Laptop GPU (25.6 - 60, n=6) | |
| Asus ROG Flow X13 GV302XV | |
| Star Wars Jedi Survivor | |
| 1920x1080 Epic Preset | |
| Average NVIDIA GeForce RTX 4060 Laptop GPU (45.5 - 66.7, n=10) | |
| Acer Predator Triton 14 PT14-51 | |
| Asus ROG Flow X13 GV302XV | |
| 2560x1440 Epic Preset | |
| Average NVIDIA GeForce RTX 4060 Laptop GPU (30.3 - 41.7, n=10) | |
| Acer Predator Triton 14 PT14-51 | |
| Asus ROG Flow X13 GV302XV | |
| 1920x1080 Epic Preset + Ray Tracing | |
| Average NVIDIA GeForce RTX 4060 Laptop GPU (47 - 52.8, n=4) | |
| Acer Predator Triton 14 PT14-51 | |
| Call of Duty Modern Warfare 2 2022 | |
| 1920x1080 Extreme Quality Preset AA:T2X Filmic SM | |
| Razer Blade 14 RTX 4070 | |
| Average NVIDIA GeForce RTX 4060 Laptop GPU (68 - 94, n=9) | |
| Asus ROG Flow Z13 ACRNM | |
| Asus ROG Flow X13 GV302XV | |
| 2560x1440 Extreme Quality Preset AA:T2X Filmic SM | |
| Razer Blade 14 RTX 4070 | |
| Average NVIDIA GeForce RTX 4060 Laptop GPU (49 - 66, n=7) | |
| Asus ROG Flow Z13 ACRNM | |
| Asus ROG Flow X13 GV302XV | |
| Immortals of Aveum | |
| 1920x1080 Ultra AF:16x | |
| Average NVIDIA GeForce RTX 4060 Laptop GPU (33 - 48.9, n=4) | |
| Asus ROG Flow X13 GV302XV | |
| 2560x1440 Ultra AF:16x | |
| Average NVIDIA GeForce RTX 4060 Laptop GPU (20.5 - 32.8, n=4) | |
| Asus ROG Flow X13 GV302XV | |
The Witcher 3 FPS Chart
The Flow X13's RTX 4060 seems to be cooled well given that we see a relatively steady performance with no major frame drops when stressed with The Witcher 3 at 1080p Ultra.
| low | med. | high | ultra | QHD | 4K | |
|---|---|---|---|---|---|---|
| GTA V (2015) | 179.3 | 175.4 | 160 | 89.5 | 71.3 | 71.5 |
| The Witcher 3 (2015) | 354 | 257 | 155.3 | 87.4 | 62.7 | 52 |
| Dota 2 Reborn (2015) | 150.5 | 134.4 | 128.5 | 123.2 | 103.4 | |
| Final Fantasy XV Benchmark (2018) | 182.7 | 112.5 | 82.9 | 60.1 | 34.2 | |
| X-Plane 11.11 (2018) | 123.3 | 105.6 | 82.3 | 70.8 | ||
| Far Cry 5 (2018) | 135 | 115 | 109 | 103 | 77 | 40 |
| Strange Brigade (2018) | 407 | 230 | 182 | 157.9 | 105.8 | 56.8 |
| Shadow of the Tomb Raider (2018) | 104 | 71 | ||||
| Far Cry 6 (2021) | 76 | 60 | ||||
| Cyberpunk 2077 1.6 (2022) | 104.2 | 81.6 | 70.4 | 63.1 | 39 | 17.4 |
| F1 22 (2022) | 203 | 184.8 | 146.8 | 52.9 | 33.3 | 15.7 |
| Call of Duty Modern Warfare 2 2022 (2022) | 69 | 49 | ||||
| Star Wars Jedi Survivor (2023) | 45.5 | 30.3 | ||||
| Immortals of Aveum (2023) | 33 | 20.5 |
Emissions: Higher noise and surface temperatures in Turbo mode
System Noise

Fan noise under load is on the higher side with the Flow X13 compared to the Flow Z13 GZ301V. Asus seems to have capped the noise levels under each performance mode. Silent maxes out at 35 dB(A) while the Performance and Turbo modes can go up to 40 dB(A) and ~50 db(A), respectively.
These modes can impact performance as shown in the Cinebench R15 multi-core tests above, and also in The Witcher 3 1080p Ultra fps indicated in the table below.
Noise level
| Idle |
| 29.07 / 29.07 / 29.07 dB(A) |
| Load |
| 44.54 / 47.08 dB(A) |
 | ||
30 dB silent 40 dB(A) audible 50 dB(A) loud |
||
min: | ||
| Performance mode | Idle dB(A) | Load average dB(A) | Load maximum dB(A) | The Witcher 3 1080p Ultra dB(A) |
|---|---|---|---|---|
| Silent | 21.85 | 35.49 | 35.33 | 35.33 / 60 fps |
| Performance | 23.31 | 40.02 | 40.80 | 40.03 / 73 fps |
| Turbo | 29.07 | 44.54 | 47.08 | 45.05 / 84 fps |
| Asus ROG Flow X13 GV302XV R9 7940HS, GeForce RTX 4060 Laptop GPU | Asus ROG Flow Z13 ACRNM i9-13900H, GeForce RTX 4070 Laptop GPU | Asus ROG Flow Z13 GZ301V i9-13900H, GeForce RTX 4060 Laptop GPU | Razer Blade 14 RTX 4070 R9 7940HS, GeForce RTX 4070 Laptop GPU | Asus TUF Gaming A16 FA617XS R9 7940HS, Radeon RX 7600S | Lenovo Legion Slim 5 16APH8 R7 7840HS, GeForce RTX 4060 Laptop GPU | Acer Predator Triton 14 PT14-51 i7-13700H, GeForce RTX 4050 Laptop GPU | |
|---|---|---|---|---|---|---|---|
| Noise | 1% | 10% | 7% | -2% | 4% | -0% | |
| off / environment * (dB) | 21.42 | 24 -12% | 24 -12% | 22.7 -6% | 25 -17% | 22.9 -7% | 25 -17% |
| Idle Minimum * (dB) | 29.07 | 24 17% | 24 17% | 23.4 20% | 25 14% | 23.1 21% | 27 7% |
| Idle Average * (dB) | 29.07 | 24 17% | 24 17% | 23.4 20% | 26 11% | 23.1 21% | 29 -0% |
| Idle Maximum * (dB) | 29.07 | 36.5 -26% | 24 17% | 23.4 20% | 28 4% | 27.7 5% | 31 -7% |
| Load Average * (dB) | 44.54 | 41.3 7% | 38.61 13% | 33 26% | 43 3% | 33.3 25% | 42 6% |
| Witcher 3 ultra * (dB) | 45.1 | 44.7 1% | 41.24 9% | 51.8 -15% | 51 -13% | 54 -20% | 43 5% |
| Load Maximum * (dB) | 47.08 | 46.9 -0% | 43.59 7% | 55.6 -18% | 53 -13% | 54 -15% | 45 4% |
* ... smaller is better
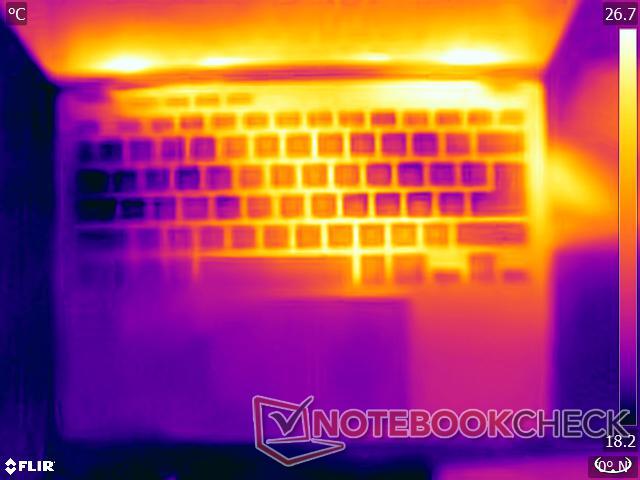
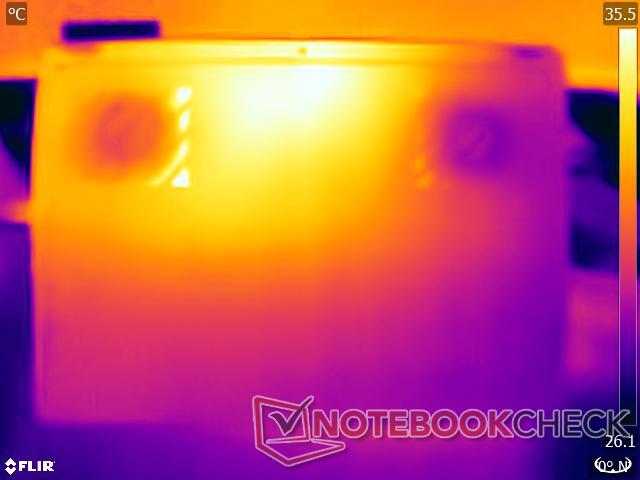
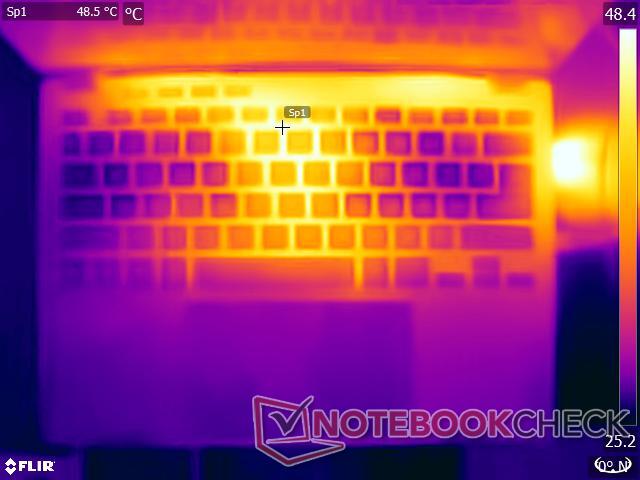
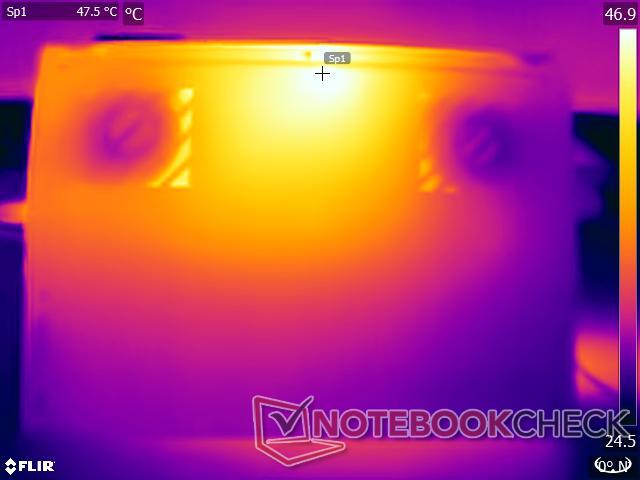
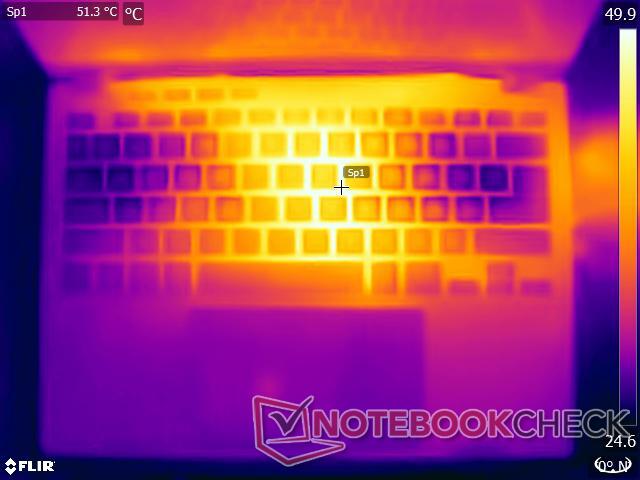
Temperature
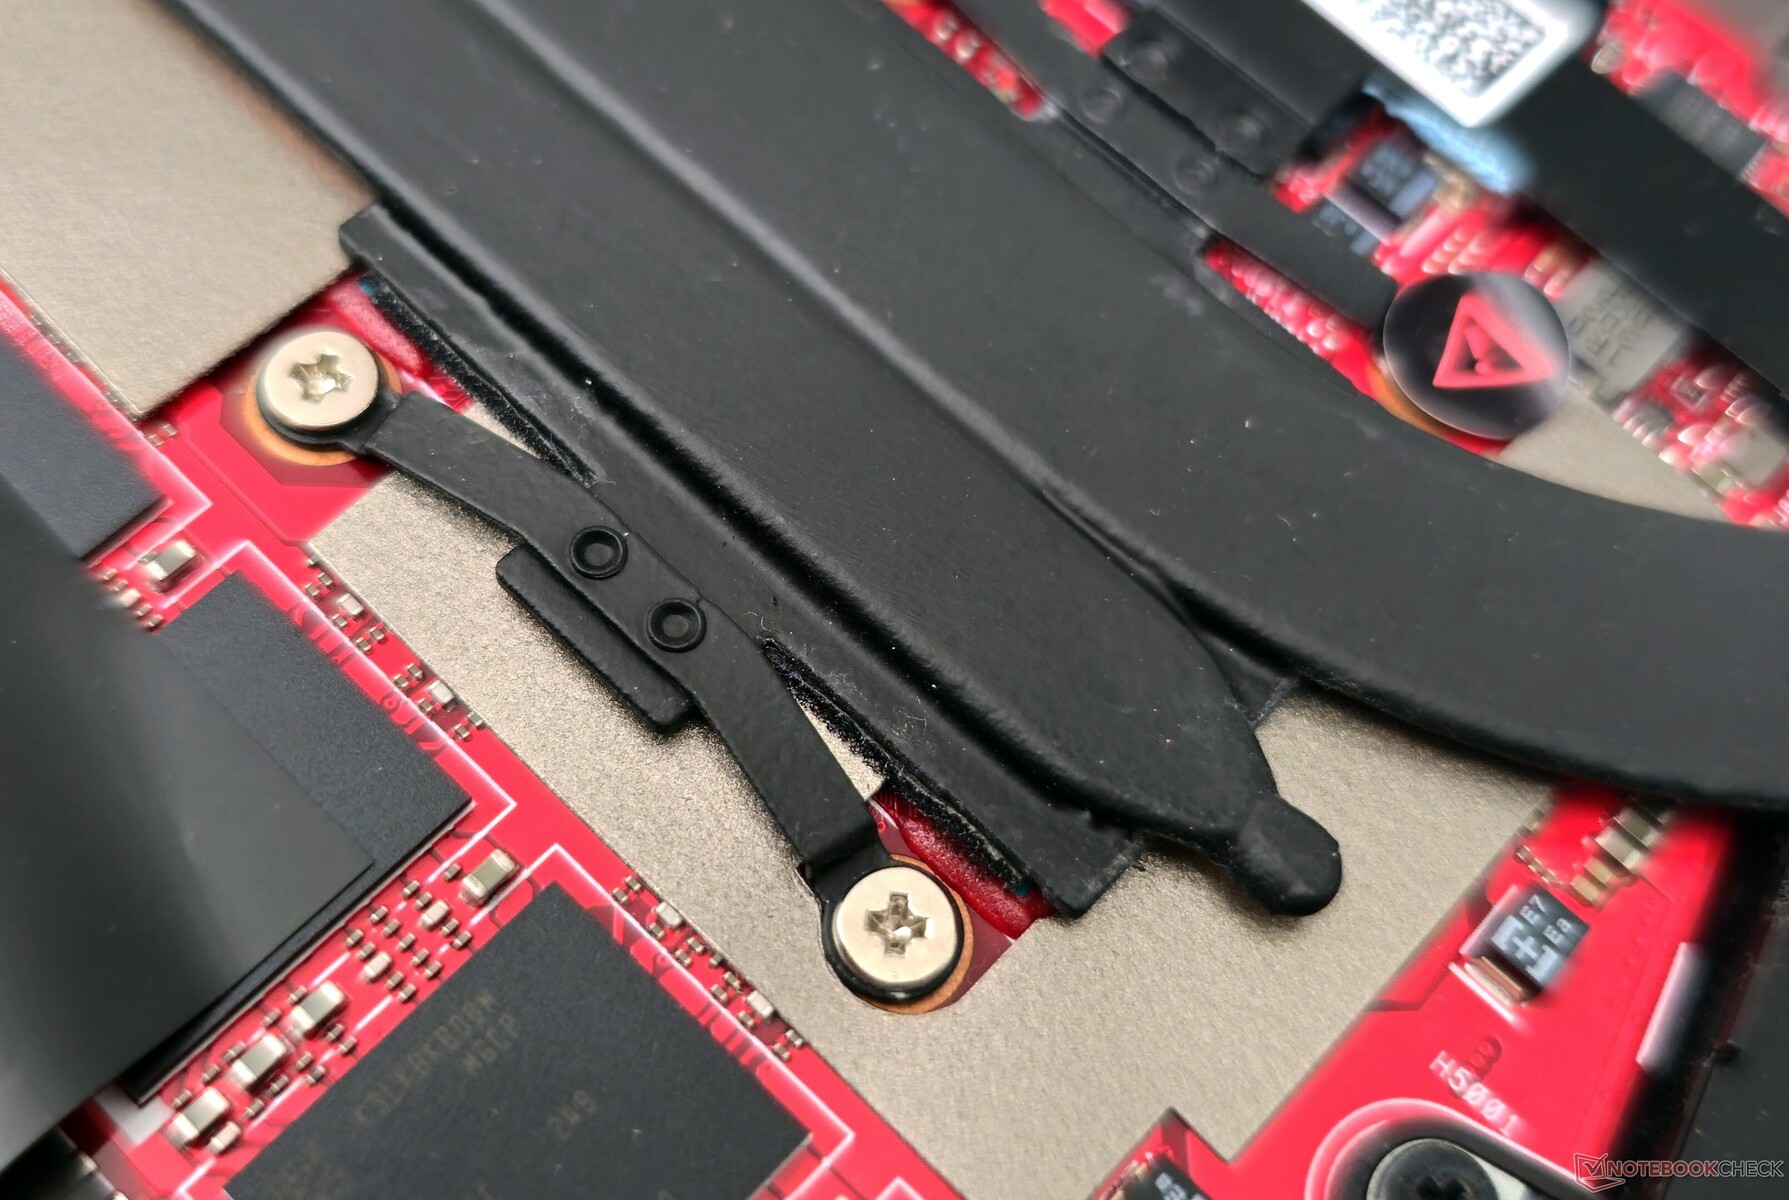
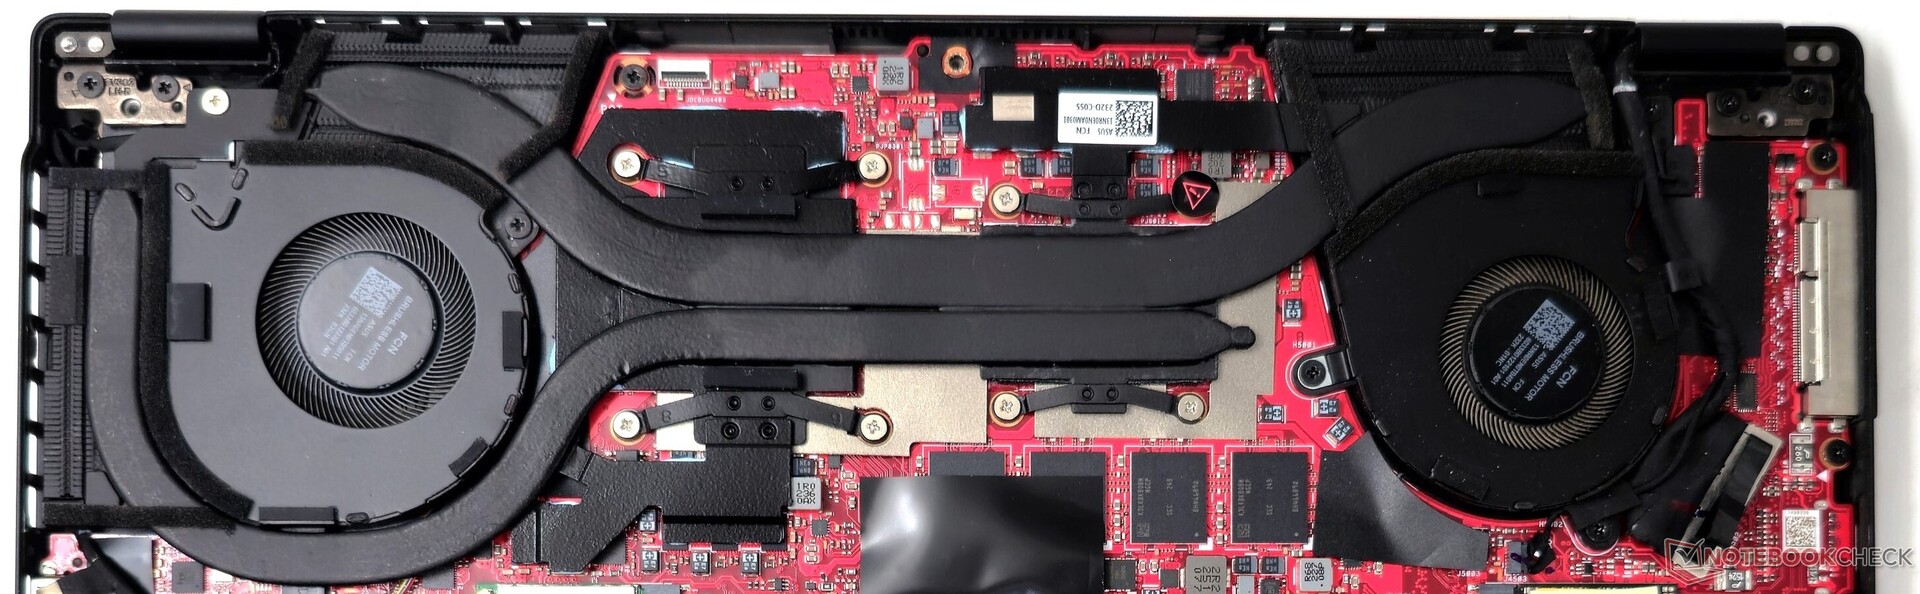
Asus employs liquid metal on the CPU and slimmer heatpipes to cool the Flow X13 in the slim chassis. This system capably sustains day-to-day performance without noticeable throttling. But stress tests still drive up surface temperatures as shown below.
Our stress tests represent extreme scenarios and are unlikely in daily usage. Using the Flow X13 as a tablet or on the lap for productivity or multimedia should not pose any problems, especially in the Silent or Performance profiles.
(-) The maximum temperature on the upper side is 45.6 °C / 114 F, compared to the average of 35.4 °C / 96 F, ranging from 19.6 to 60 °C for the class Convertible.
(±) The bottom heats up to a maximum of 44.2 °C / 112 F, compared to the average of 36.9 °C / 98 F
(+) In idle usage, the average temperature for the upper side is 31.2 °C / 88 F, compared to the device average of 30.3 °C / 87 F.
(-) Playing The Witcher 3, the average temperature for the upper side is 43.2 °C / 110 F, compared to the device average of 30.3 °C / 87 F.
(+) The palmrests and touchpad are reaching skin temperature as a maximum (33.8 °C / 92.8 F) and are therefore not hot.
(-) The average temperature of the palmrest area of similar devices was 28 °C / 82.4 F (-5.8 °C / -10.4 F).
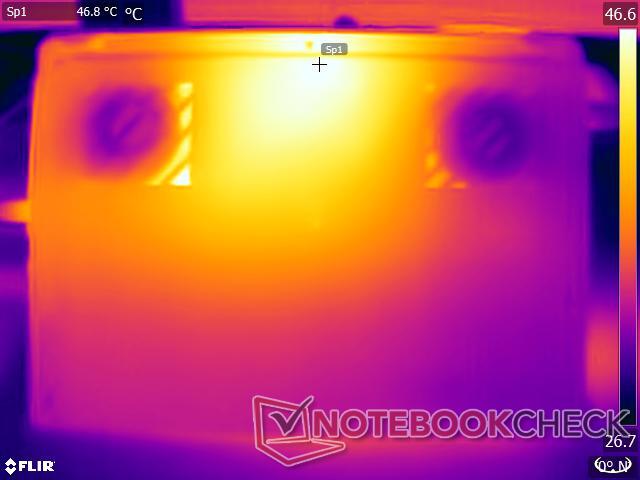
| Asus ROG Flow X13 GV302XV AMD Ryzen 9 7940HS, NVIDIA GeForce RTX 4060 Laptop GPU | Asus ROG Flow Z13 ACRNM Intel Core i9-13900H, NVIDIA GeForce RTX 4070 Laptop GPU | Asus ROG Flow Z13 GZ301V Intel Core i9-13900H, NVIDIA GeForce RTX 4060 Laptop GPU | Razer Blade 14 RTX 4070 AMD Ryzen 9 7940HS, NVIDIA GeForce RTX 4070 Laptop GPU | Asus TUF Gaming A16 FA617XS AMD Ryzen 9 7940HS, AMD Radeon RX 7600S | Lenovo Legion Slim 5 16APH8 AMD Ryzen 7 7840HS, NVIDIA GeForce RTX 4060 Laptop GPU | Acer Predator Triton 14 PT14-51 Intel Core i7-13700H, NVIDIA GeForce RTX 4050 Laptop GPU | |
|---|---|---|---|---|---|---|---|
| Heat | 14% | 8% | 8% | -1% | 13% | -8% | |
| Maximum Upper Side * (°C) | 45.6 | 42.5 7% | 42 8% | 37.4 18% | 53 -16% | 40.6 11% | 54 -18% |
| Maximum Bottom * (°C) | 44.2 | 42.6 4% | 47 -6% | 35.2 20% | 48 -9% | 42 5% | 56 -27% |
| Idle Upper Side * (°C) | 33.8 | 26.2 22% | 27 20% | 33.2 2% | 30 11% | 27.8 18% | 31 8% |
| Idle Bottom * (°C) | 32.8 | 26 21% | 30 9% | 36.2 -10% | 30 9% | 26.6 19% | 31 5% |
* ... smaller is better
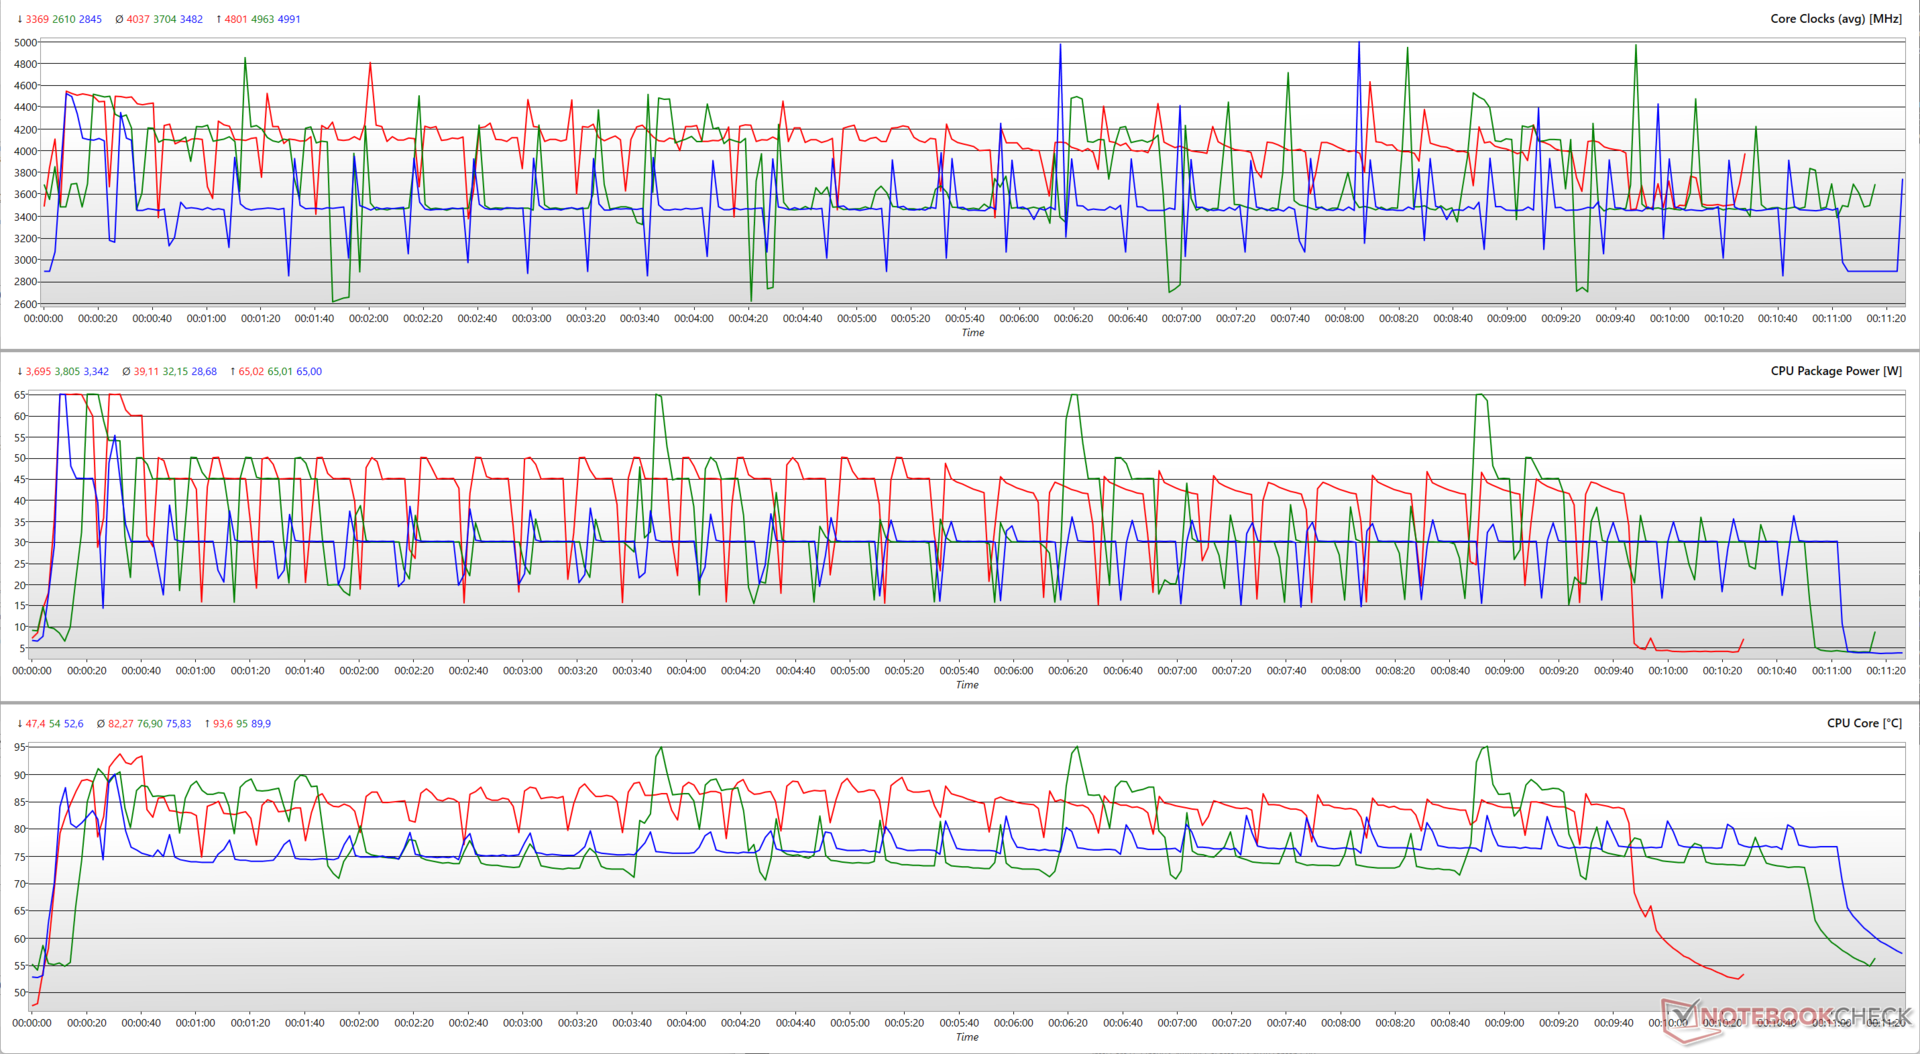
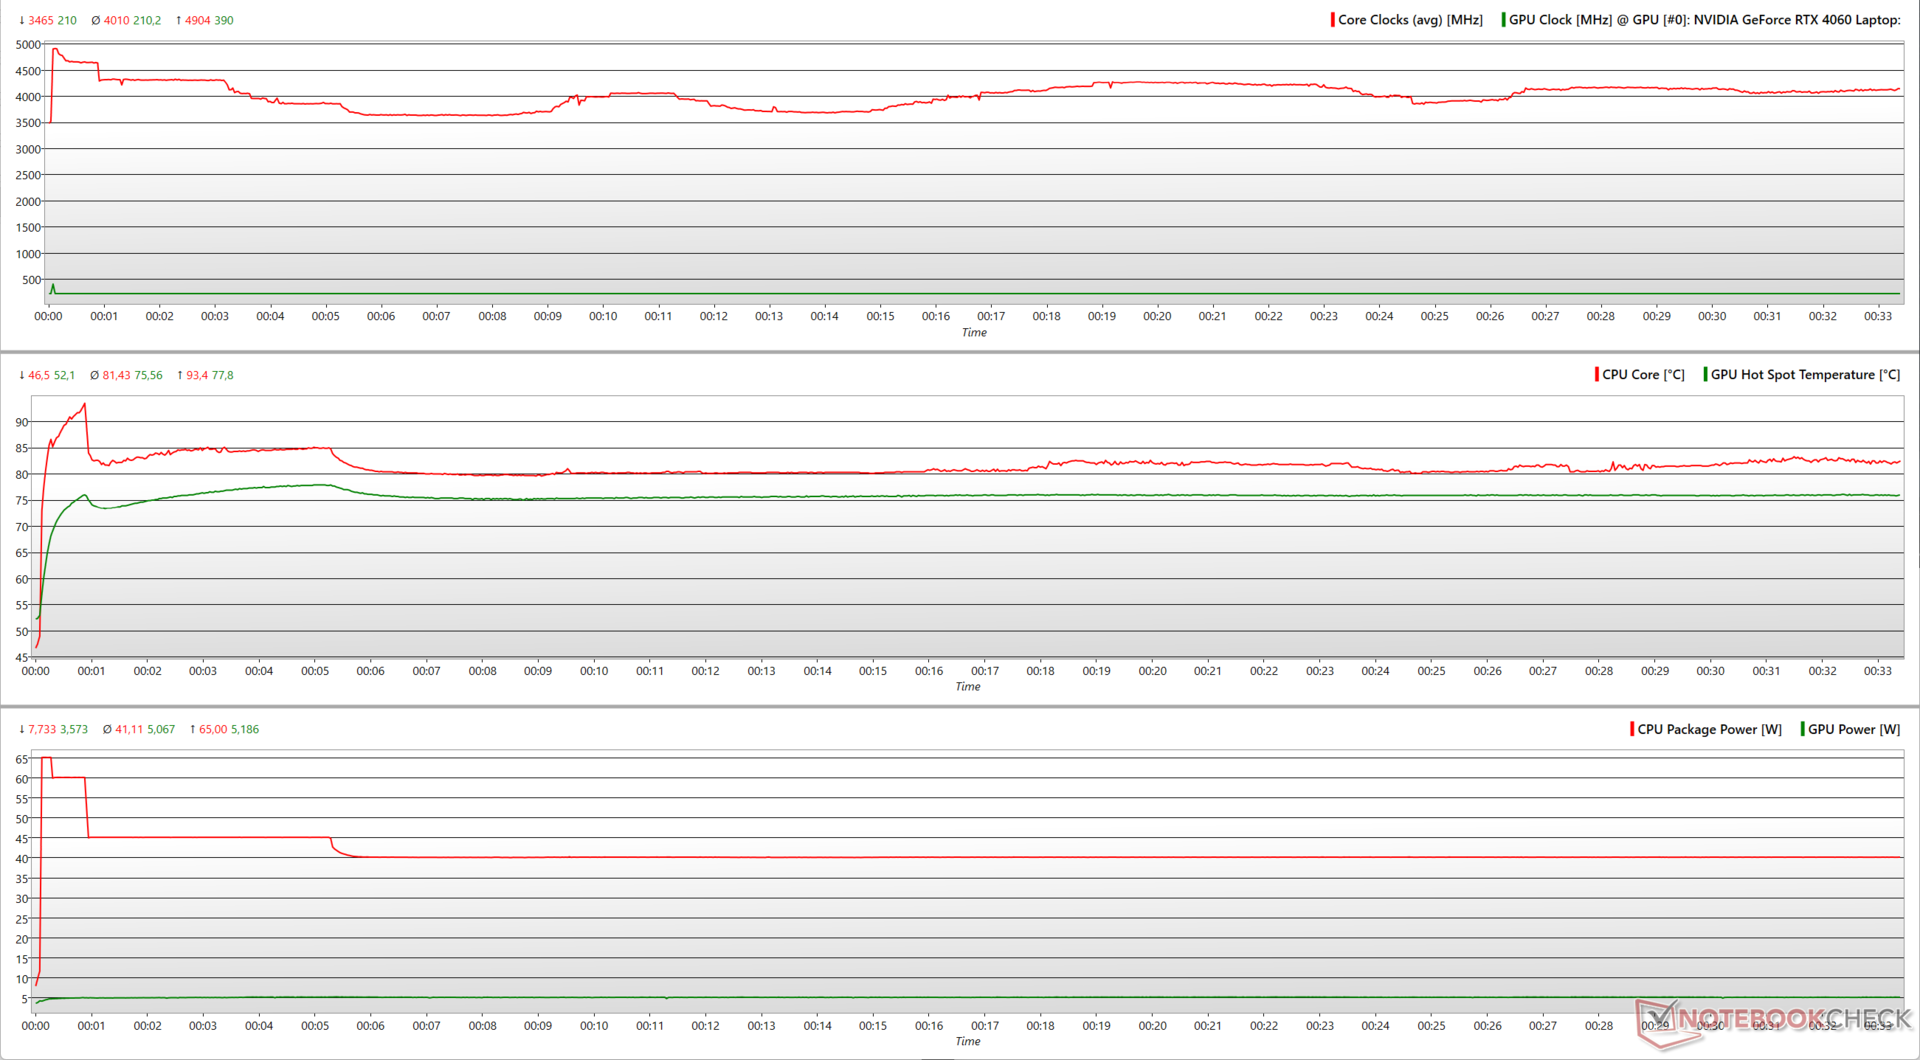
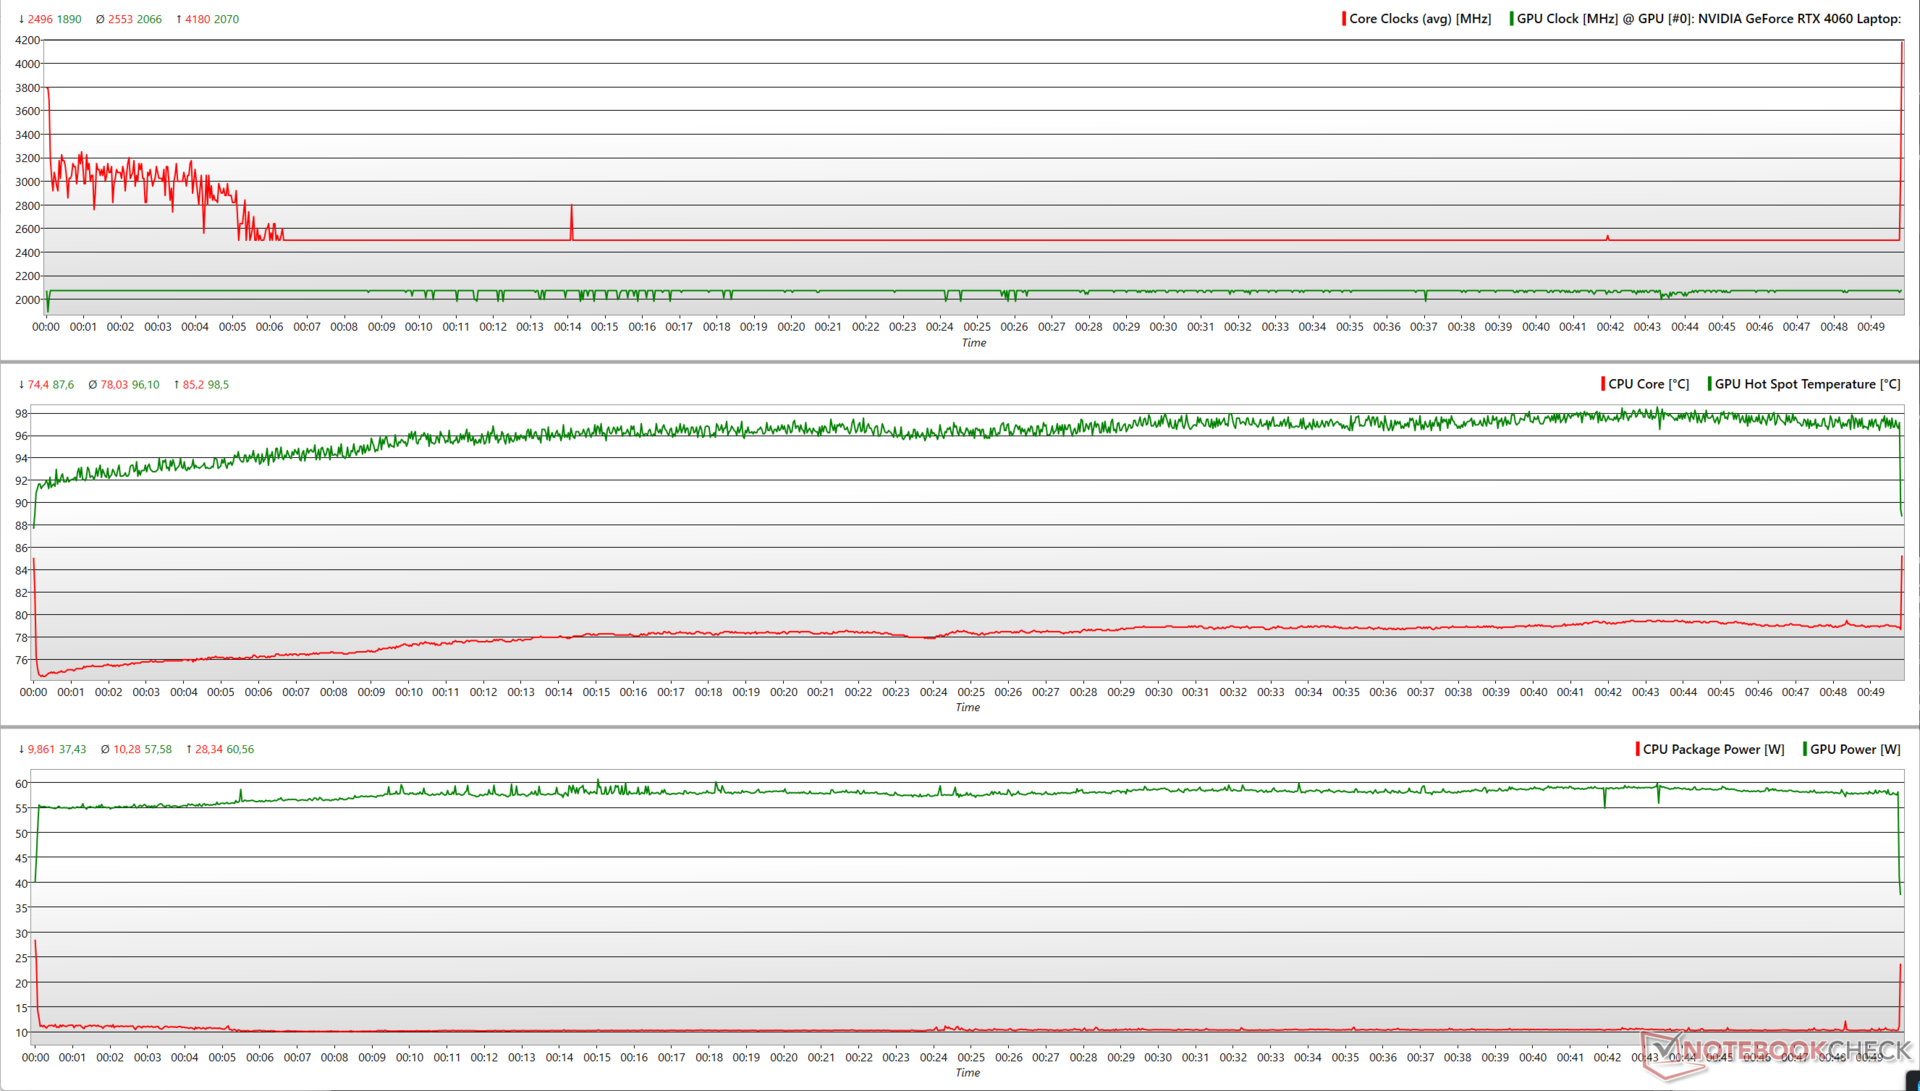
Stress Test
Stressing the ROG Flow X13 with Prime95 in-place FFTs sees the Ryzen 9 7940HS reach average clocks of 4.1 GHz while consuming about 41 W. Adding FurMark causes the CPU clocks to drop down to ~3 GHz and the package power to about 26 W. The remaining headroom is shared with the RTX 4060, which takes about 26 W and clocks at 1,638 MHz on average.
| Stress Test | CPU Clock (GHz) | GPU Clock (MHz) | Average CPU Temperature (°C) | Average GPU Temperature (°C) |
| System Idle | 3.7 | 210 | 41.6 | 41.4 |
| Prime95 | 4.1 | 210 | 80.7 | 65.4 |
| Prime95 + FurMark | 3 | 1,935 | 75.3 | 73 |
| The Witcher 3 1080p Ultra | 3.99 | 2,070 | 92.5 | 83.5 |
With a real-world stress like The Witcher 3 at 1080p Ultra, we see the RTX 4060 reaching its maximum clock at 2,070 MHz while consuming a peak power of 60.5 W. The Ryzen 9 7940HS is remains relatively unused here with average clocks of just 2.5 GHz at 10 W.
Essentially, the Flow X13 cannot sustain max clocks under stress for longer periods. The CPU and GPU together can consume up to a maximum of 110 W under load in the Turbo power profile.

Speakers
The Flow X13 is not the loudest laptop, but audio from the built-in speakers should still be clear at maximum volume in a quiet environment. Bass is perceivable but not very deep. The mids and highs sound balanced and are reproduced well.
Users can get a better audio experience with external wired audio or via Bluetooth 5.3.
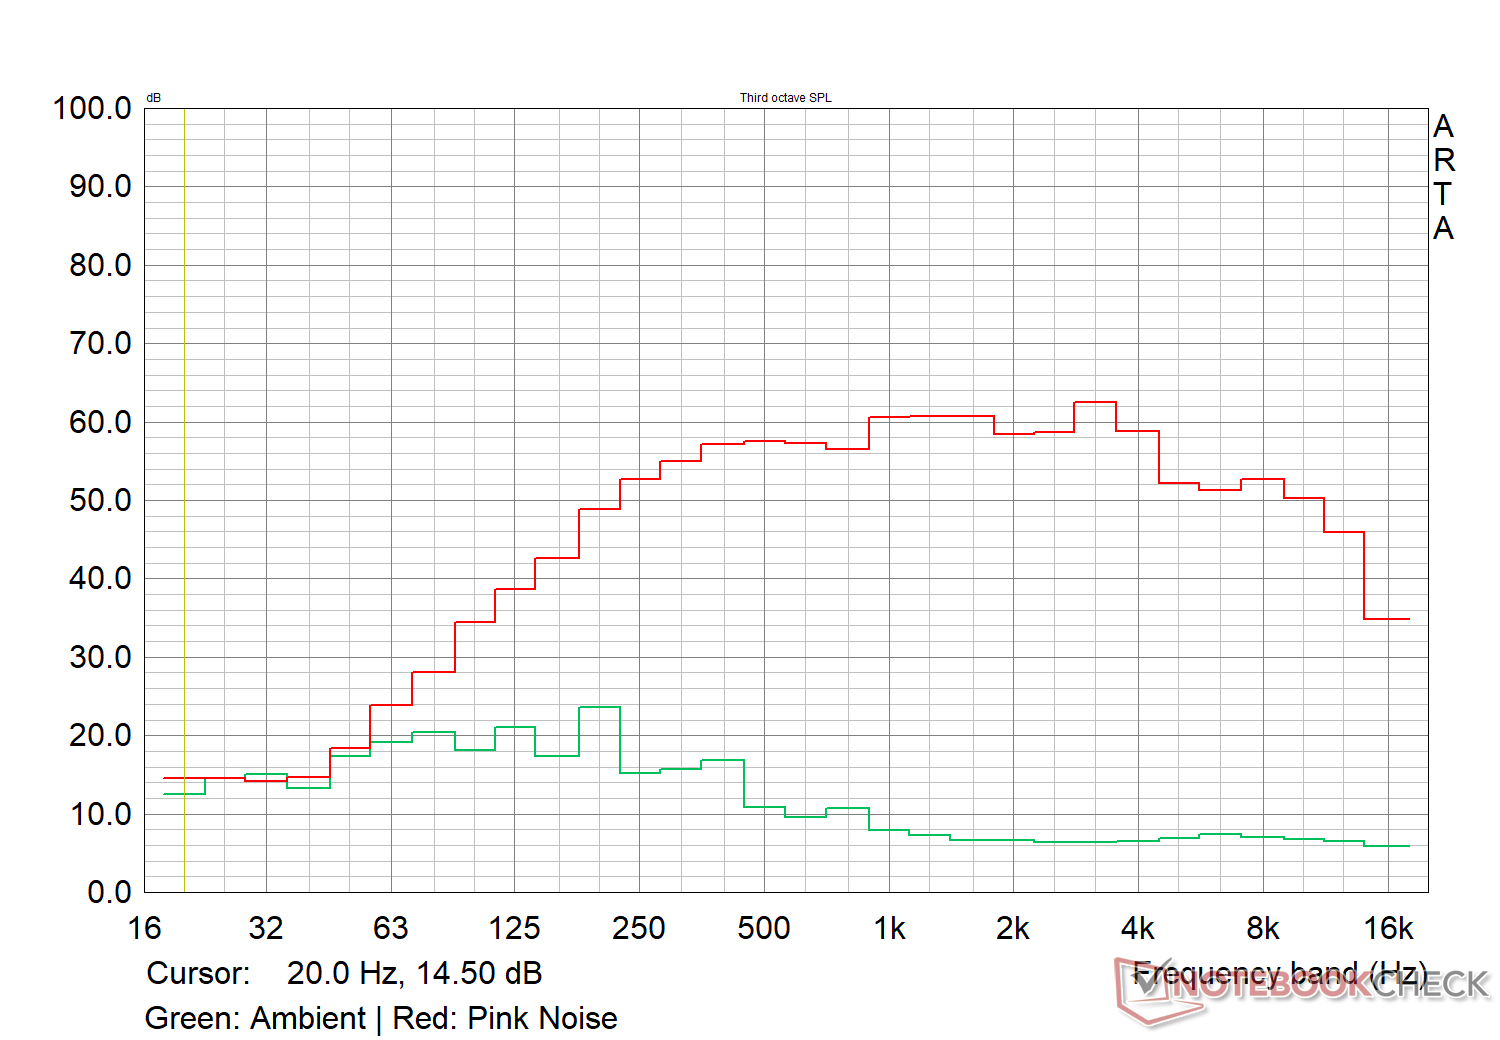
Asus ROG Flow X13 GV302XV audio analysis
(-) | not very loud speakers (70.6 dB)
Bass 100 - 315 Hz
(±) | reduced bass - on average 9.6% lower than median
(±) | linearity of bass is average (9.4% delta to prev. frequency)
Mids 400 - 2000 Hz
(+) | balanced mids - only 3.6% away from median
(+) | mids are linear (2.7% delta to prev. frequency)
Highs 2 - 16 kHz
(+) | balanced highs - only 4.1% away from median
(+) | highs are linear (5.7% delta to prev. frequency)
Overall 100 - 16.000 Hz
(±) | linearity of overall sound is average (15.8% difference to median)
Compared to same class
» 28% of all tested devices in this class were better, 3% similar, 69% worse
» The best had a delta of 6%, average was 20%, worst was 57%
Compared to all devices tested
» 24% of all tested devices were better, 5% similar, 70% worse
» The best had a delta of 4%, average was 23%, worst was 134%
Apple MacBook Pro 16 2021 M1 Pro audio analysis
(+) | speakers can play relatively loud (84.7 dB)
Bass 100 - 315 Hz
(+) | good bass - only 3.8% away from median
(+) | bass is linear (5.2% delta to prev. frequency)
Mids 400 - 2000 Hz
(+) | balanced mids - only 1.3% away from median
(+) | mids are linear (2.1% delta to prev. frequency)
Highs 2 - 16 kHz
(+) | balanced highs - only 1.9% away from median
(+) | highs are linear (2.7% delta to prev. frequency)
Overall 100 - 16.000 Hz
(+) | overall sound is linear (4.6% difference to median)
Compared to same class
» 0% of all tested devices in this class were better, 0% similar, 100% worse
» The best had a delta of 5%, average was 17%, worst was 45%
Compared to all devices tested
» 0% of all tested devices were better, 0% similar, 100% worse
» The best had a delta of 4%, average was 23%, worst was 134%
Energy Management: Prudent power consumption under load
Power Consumption
The Flow X13's idle power consumption is on the higher side, but the convertible is quite economical under load. We observed fluctuations in idle power consumption irrespective of the power profile chosen.
The Lenovo Legion Slim 5's Ryzen 7 7840HS/RTX 4060 combo shows a 73% higher power consumption in The Witcher 3 at 1080p Ultra. The supplied 130 W AC adapter can keep the Flow X13 adequately fed even under stress.
| Off / Standby | |
| Idle | |
| Load |
|
Key:
min: | |
| Asus ROG Flow X13 GV302XV R9 7940HS, GeForce RTX 4060 Laptop GPU, IPS, 2560x1600, 13.4" | Asus ROG Flow Z13 ACRNM i9-13900H, GeForce RTX 4070 Laptop GPU, IPS, 2560x1600, 13.4" | Asus ROG Flow Z13 GZ301V i9-13900H, GeForce RTX 4060 Laptop GPU, IPS, 2560x1600, 13.4" | Razer Blade 14 RTX 4070 R9 7940HS, GeForce RTX 4070 Laptop GPU, IPS, 2560x1600, 14" | Asus TUF Gaming A16 FA617XS R9 7940HS, Radeon RX 7600S, IPS, 1920x1200, 16" | Lenovo Legion Slim 5 16APH8 R7 7840HS, GeForce RTX 4060 Laptop GPU, IPS, 2560x1600, 16" | Acer Predator Triton 14 PT14-51 i7-13700H, GeForce RTX 4050 Laptop GPU, IPS, 2560x1600, 14" | Average NVIDIA GeForce RTX 4060 Laptop GPU | Average of class Convertible | |
|---|---|---|---|---|---|---|---|---|---|
| Power Consumption | 15% | 18% | -33% | 4% | -3% | -9% | -4% | 58% | |
| Idle Minimum * (Watt) | 16.63 | 8.9 46% | 8.5 49% | 19.5 -17% | 7 58% | 9.4 43% | 12 28% | 11.5 ? 31% | 4.28 ? 74% |
| Idle Average * (Watt) | 20.68 | 12.6 39% | 12.4 40% | 24.7 -19% | 10 52% | 15.5 25% | 14 32% | 16 ? 23% | 6.96 ? 66% |
| Idle Maximum * (Watt) | 29.88 | 13 56% | 13.3 55% | 27 10% | 15 50% | 24.4 18% | 26 13% | 20.3 ? 32% | 8.67 ? 71% |
| Load Average * (Watt) | 75.5 | 92.5 -23% | 93 -23% | 83.2 -10% | 86 -14% | 74.1 2% | 88 -17% | 92.9 ? -23% | 45.1 ? 40% |
| Witcher 3 ultra * (Watt) | 92.6 | 104.4 -13% | 87.8 5% | 165.8 -79% | 160.6 -73% | 112.9 -22% | 114.9 -24% | ||
| Load Maximum * (Watt) | 113.3 | 133.6 -18% | 135 -19% | 204.5 -80% | 172 -52% | 206.5 -82% | 213 -88% | 210 ? -85% | 67.7 ? 40% |
* ... smaller is better
Power Consumption: The Witcher 3 / Stress test
Power Consumption: External monitor
Battery Life
The 75 WHr cell provides long run times that should easily help you get through a typical workday, especially at lower brightness levels. While this is true for typical web browsing and video playback, the battery lasts only for about 90 minutes while gaming.
| Asus ROG Flow X13 GV302XV R9 7940HS, GeForce RTX 4060 Laptop GPU, 75 Wh | Asus ROG Flow Z13 ACRNM i9-13900H, GeForce RTX 4070 Laptop GPU, 56 Wh | Asus ROG Flow Z13 GZ301V i9-13900H, GeForce RTX 4060 Laptop GPU, 56 Wh | Razer Blade 14 RTX 4070 R9 7940HS, GeForce RTX 4070 Laptop GPU, 68 Wh | Asus TUF Gaming A16 FA617XS R9 7940HS, Radeon RX 7600S, 90 Wh | Lenovo Legion Slim 5 16APH8 R7 7840HS, GeForce RTX 4060 Laptop GPU, 80 Wh | Acer Predator Triton 14 PT14-51 i7-13700H, GeForce RTX 4050 Laptop GPU, 76.3 Wh | Average of class Convertible | |
|---|---|---|---|---|---|---|---|---|
| Battery runtime | -50% | -55% | -48% | 7% | -40% | -40% | 17% | |
| H.264 (h) | 11.4 | 5.2 -54% | 4.7 -59% | 12.4 9% | 9 -21% | 15 ? 32% | ||
| WiFi v1.3 (h) | 11.9 | 6.6 -45% | 5 -58% | 6.2 -48% | 12.4 4% | 7.1 -40% | 5 -58% | 12 ? 1% |
| Witcher 3 ultra (h) | 1.5 | 0.8 -47% | ||||||
| Load (h) | 0.9 | 1 | 1 | 0.9 | 1.2 | 1.8 | 1.713 ? | |
| Reader / Idle (h) | 8.6 | 20.3 | 11.7 | 11.2 | 26.7 ? |
Pros
Cons
Verdict: Good things come in small packages

The Asus ROG Flow X13 2023 sports great build quality, and the elegant 13.4-inch convertible form factor makes for easy adaptability depending on whether you want to create or consume content.
This year, Asus has refined the overall convertible experience including making use of a more practical QHD+ 165 Hz G-Sync touchscreen instead of last year's UHD+ 60 Hz panel, larger touchpad and comfortably spaced keyboard, USB4, and a FHD webcam.
The Flow X13's makes good of the AMD Ryzen 9 7940HS and RTX 4060 innards. Though power-limited compared to larger machines, the components still impress by hitting a combined 110 W under stress. Idle power consumption needs some fine-tuning, but the 75 WHr battery, up from the 62 WHr previously, enables true all-day productivity.
With its svelte chassis housing capable AMD and Nvidia hardware together with great battery life and ample connectivity, the Asus ROG Flow X13 is among the handful of gaming convertible that strikes an artful balance between performance and poise."
So, is the AMD-based ROG Flow X13 a better choice over the Intel-powered ROG Flow Z13 given the identical pricing? In many ways, that's a resounding yes!
The ROG Flow Z13 ACRNM and the ROG Flow Z13 GZ301V are more portable with their detachable displays. The Flow Z13s' Core i9-13900H, and the RTX 4070 in the ACRNM, do have perceivable performance advantages, but the Flow X13 strikes a better balance for on-the-go use and offers a larger battery with vastly longer run times. Gamers can further upgrade the Flow X13's graphics capabilities by splurging another two grand on the ROG XG Mobile with an RTX 4090 Laptop GPU if desired.
The Flow X13 trades blows with the Acer Predator Triton 14, but the latter's Core i7-13700H has obvious multi-core advantages due to its higher thread count. Asus's convertible is also within striking distance of the Razer Blade 14 in terms of overall CPU performance, but the Blade 14's RTX 4070 gives it quite a lead in GPU scores.
In the end, the Asus ROG Flow X13 is a convertible that has few peers. You will be coughing up a pretty sum for what is ultimately a power-limited RTX 4060 Zen 4 laptop, but the overall experience of using it makes it seem worth the premium if you cherish this form factor.
Price and Availability
The tested Asus ROG Flow X13 GV302 (2023) configuration can be had directly from the Asus India online store for ₹1,84,990. Amazon India is currently offering the RTX 4050 variant for ₹1,77,999.
In the US, the ROG Flow X13 with the RTX 4070 currently retails for US$2,499.99 on the Asus online store and Best Buy. The base SKU with FHD+ display and Radeon 780M iGPU is also available on Best Buy for US$1,249.99.
Asus ROG Flow X13 GV302XV
- 10/06/2023 v7 (old)
Vaidyanathan Subramaniam
