Asus ROG Flow X13 in review: Gaming convertible with an AMD Ryzen 9 5980H and an optional RTX 3080

The new Asus ROG Flow X13 could almost be described as being unrivaled, because a convertible with this configuration is a rarity. More precisely, Asus installs AMD's flagship in its 13-inch convertible: The Ryzen 9 5980HS. With its 8 cores and 16 threads, the compact device can easily handle demanding applications. The 32 GB of RAM and the 1 TB SSD round off the package. But this is not enough. Gamers should also get their money's worth with the device, since it's a device from the ROG range after all. An Nvidia GeForce GTX 1650 Max-Q with 4 GB OF VRAM is installed, which is sufficient for most games. However, those who need the ultimate performance for the most modern 3D games can expand the device with the external graphics dock. With the GeForce RTX 3080, the small 2-in-1 even outperforms modern desktop PCs, but you will have to be prepared for a price of 3,499 Euros (~$4,244). A somewhat watered-down version based on an AMD Ryzen 7 5800HS starts at 1,499 Euros (~$1,818). However, the external graphics dock is not included in this case. RAM is reduced to 16 GB, and there's only 512 GB of mass storage.
Unfortunately, we were only provided with the device without the graphics dock for this review. As soon as we receive it, we will provide the corresponding results.
Possible contenders in comparison
Rating | Date | Model | Weight | Height | Size | Resolution | Price |
|---|---|---|---|---|---|---|---|
| 84.7 % v7 (old) | 02 / 2021 | Asus ROG Flow X13 GV301QH R9 5980HS, GeForce GTX 1650 Max-Q | 1.4 kg | 15.8 mm | 13.40" | 3840x2400 | |
| 86.9 % v7 (old) | 06 / 2020 | Microsoft Surface Book 3 13.5 i7-1065G7, GeForce GTX 1650 Max-Q | 1.6 kg | 23 mm | 13.50" | 3000x2000 | |
| 89.4 % v7 (old) | 12 / 2020 | HP Spectre x360 14t-ea000 i7-1165G7, Iris Xe G7 96EUs | 1.3 kg | 17.2 mm | 13.50" | 1920x1280 | |
| 87.1 % v7 (old) | 12 / 2020 | Lenovo Yoga 9i 14ITL5 i5-1135G7, Iris Xe G7 80EUs | 1.4 kg | 15.7 mm | 14.00" | 1920x1080 | |
| 88.1 % v7 (old) | 09 / 2020 | Acer Spin 5 SP513-54N-79EY i7-1065G7, Iris Plus Graphics G7 (Ice Lake 64 EU) | 1.2 kg | 14.9 mm | 13.50" | 2256x1504 | |
| 86.3 % v7 (old) | 09 / 2020 | Asus ZenBook Flip S UX371 i7-1165G7, Iris Xe G7 96EUs | 1.2 kg | 13.9 mm | 13.30" | 3840x2160 |
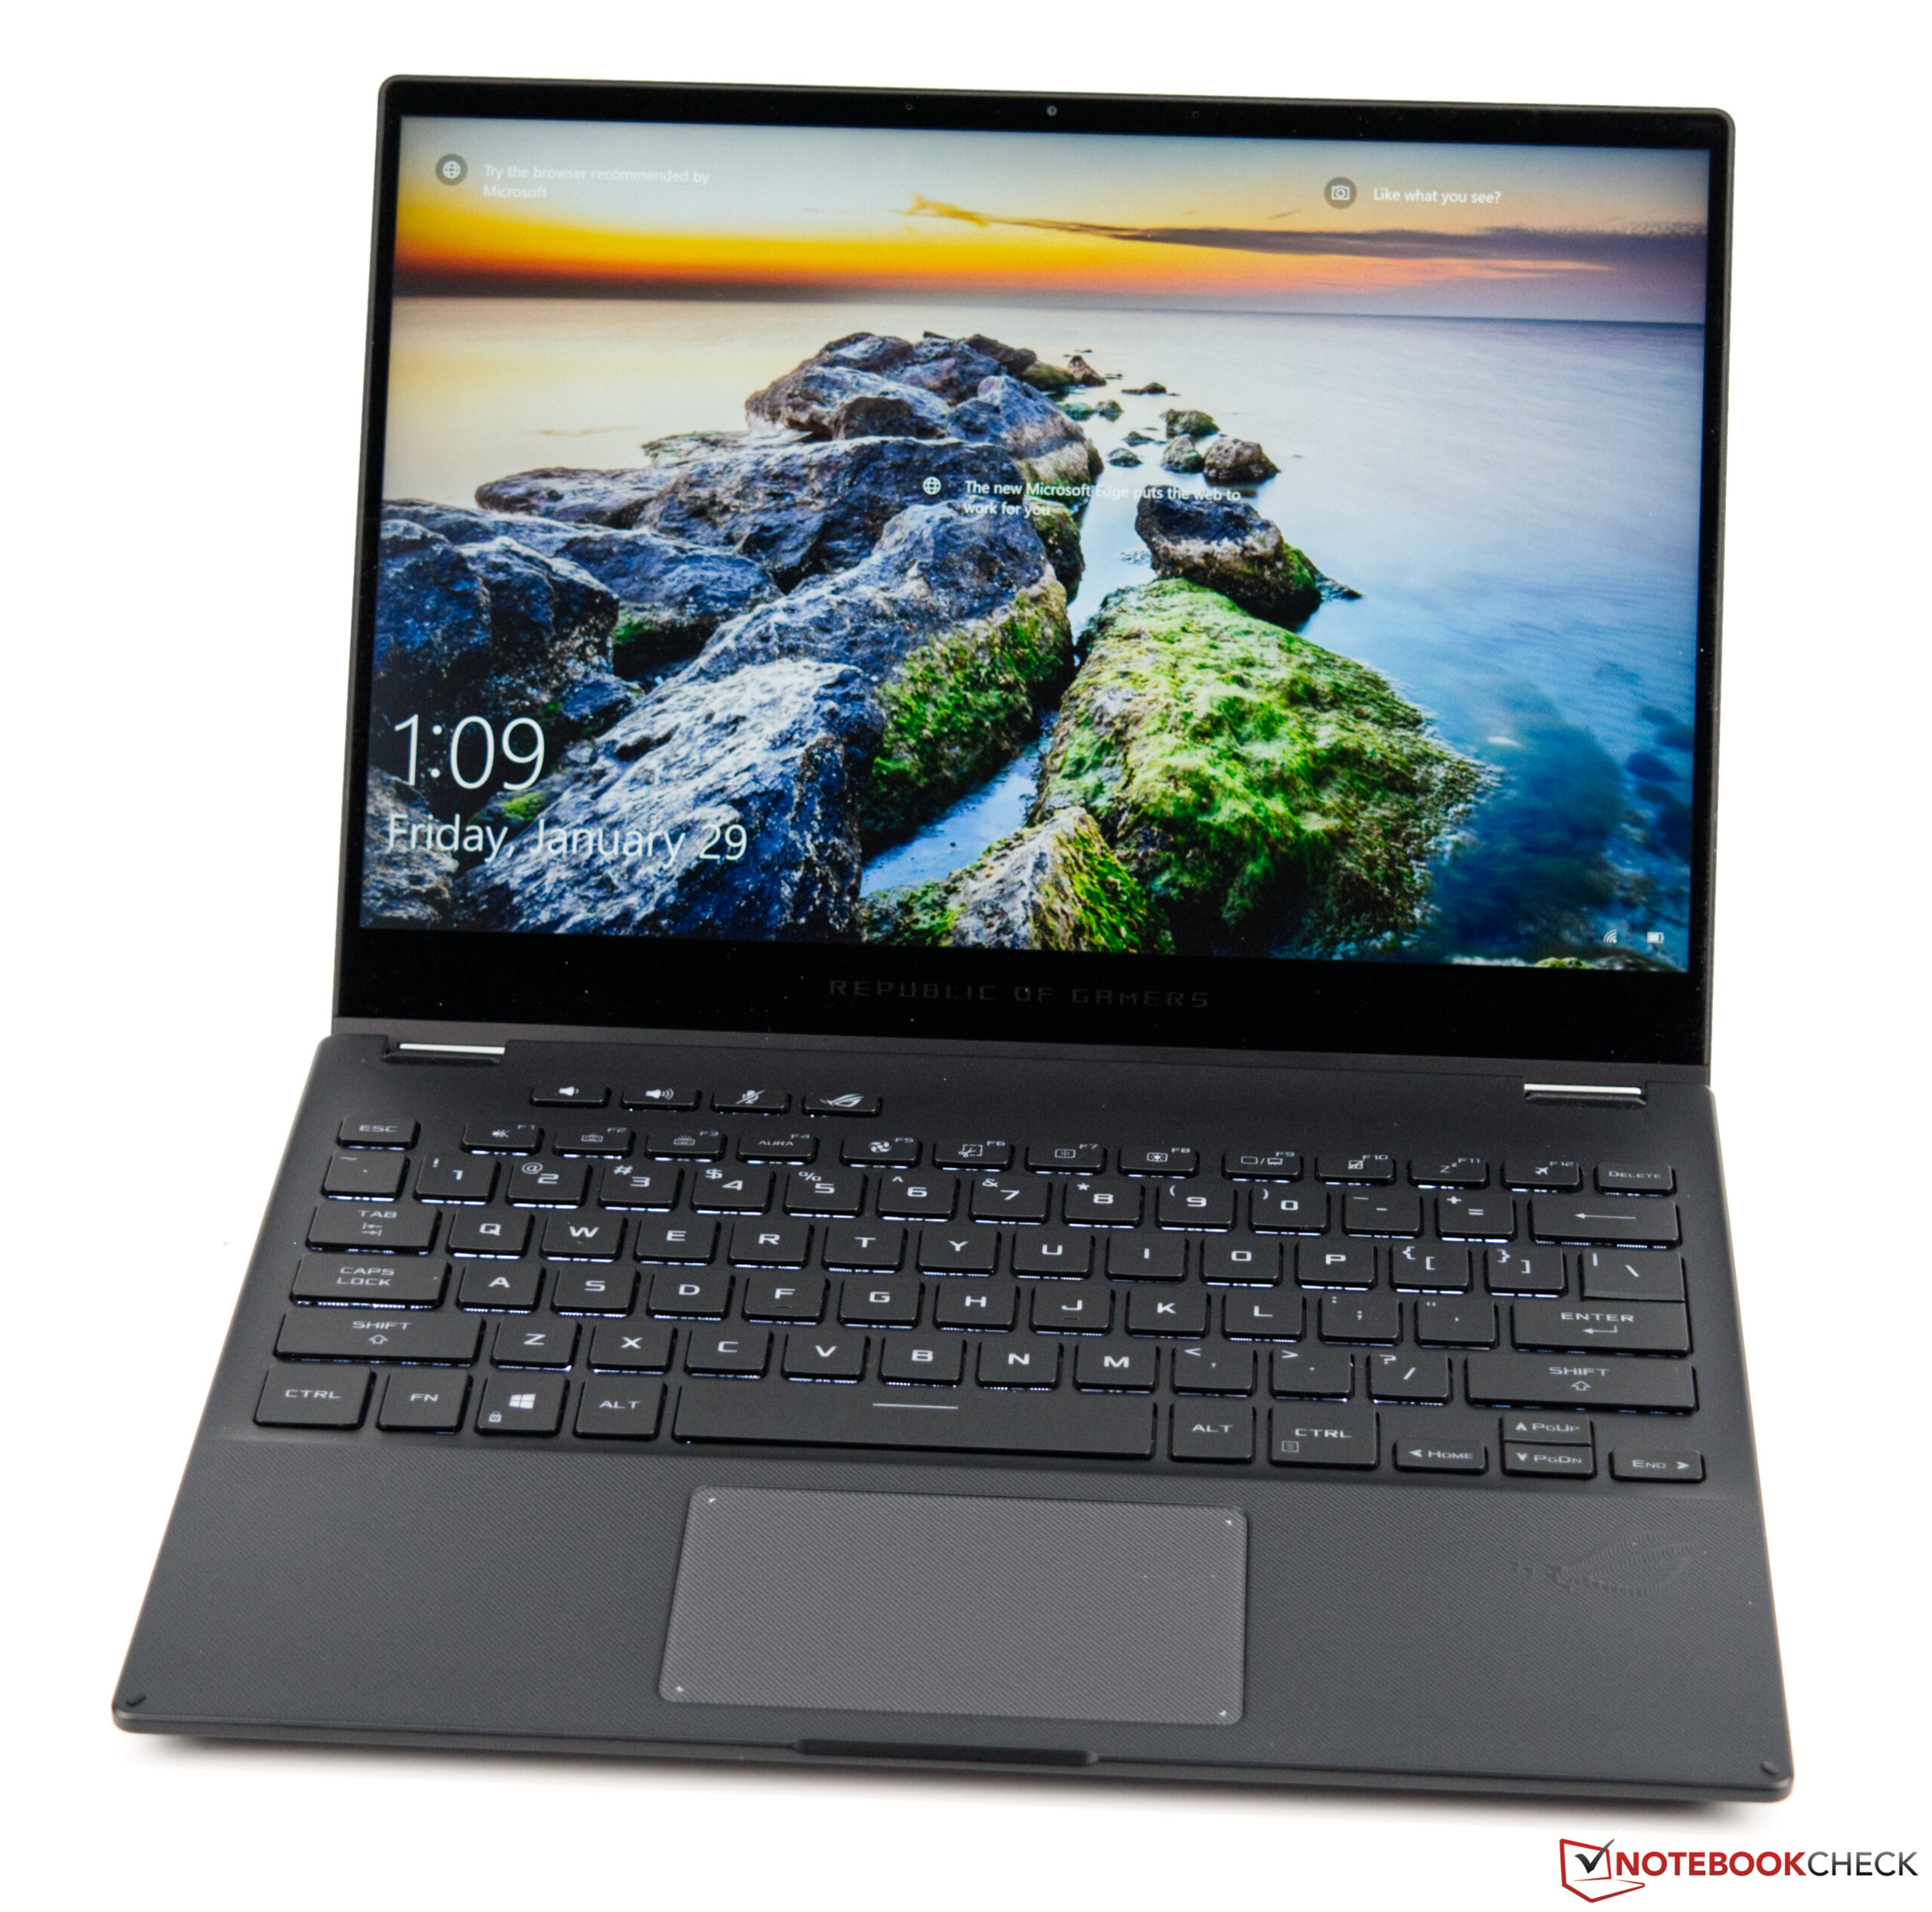
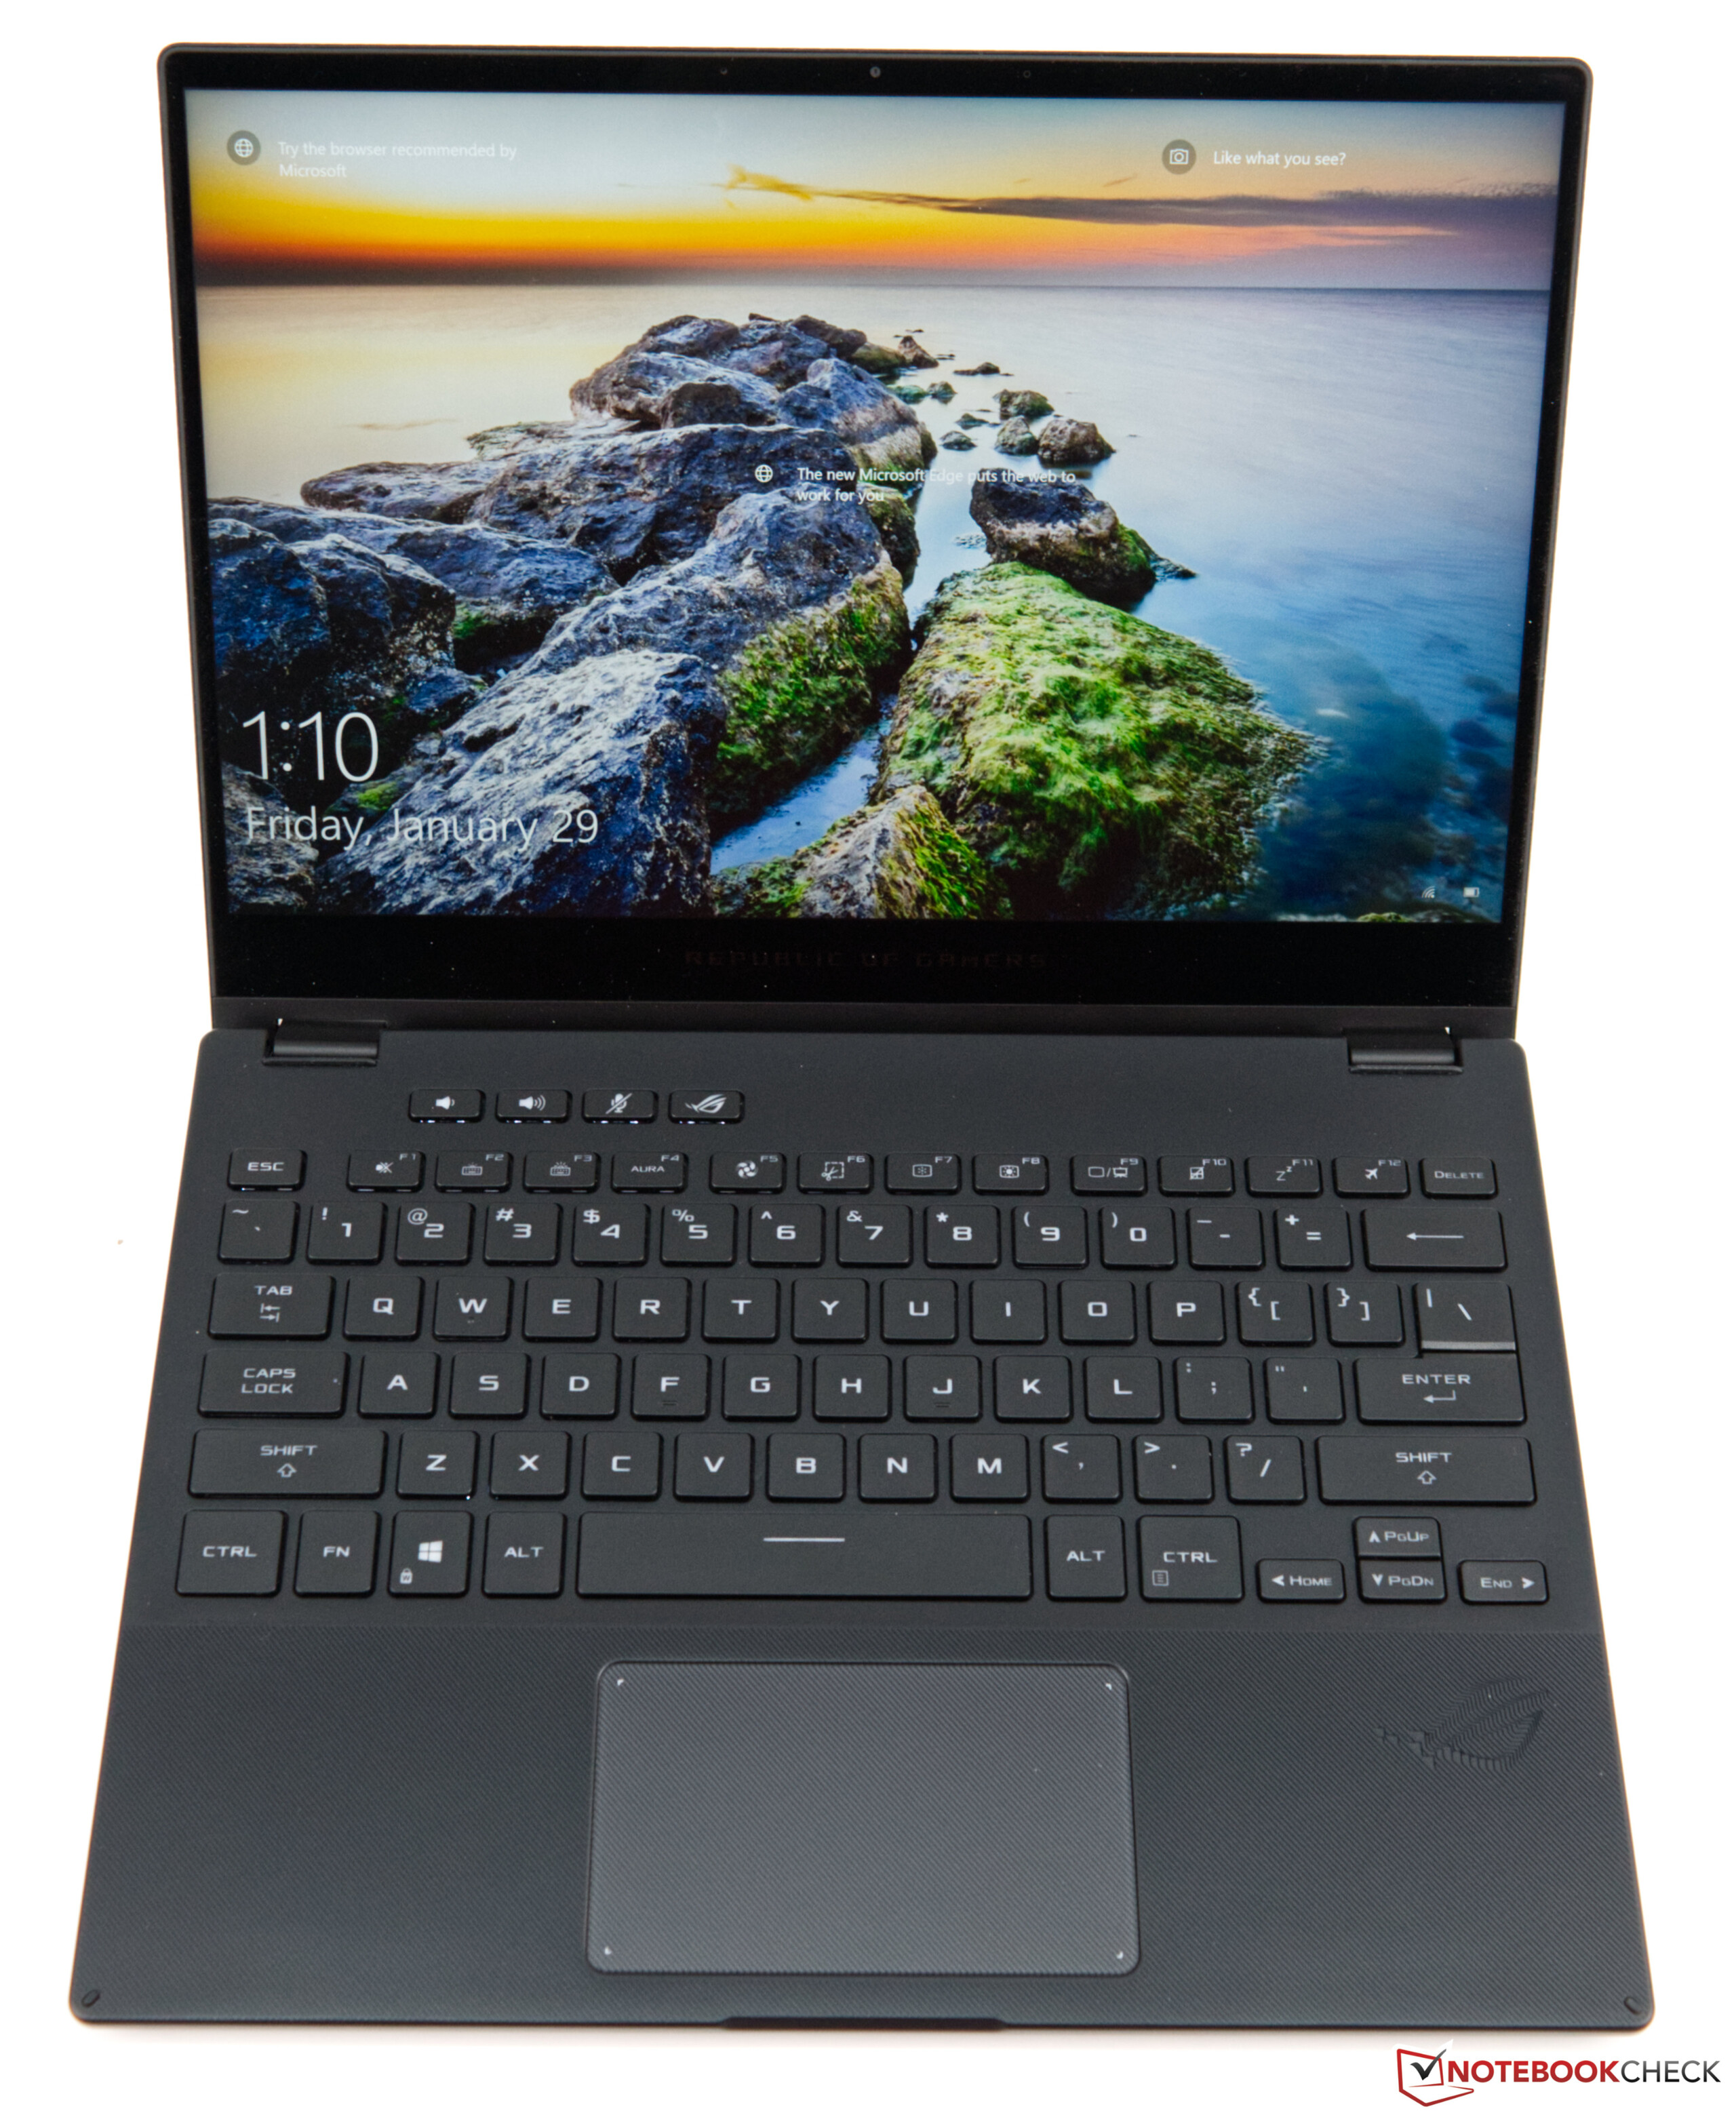
Case - Stable and modern
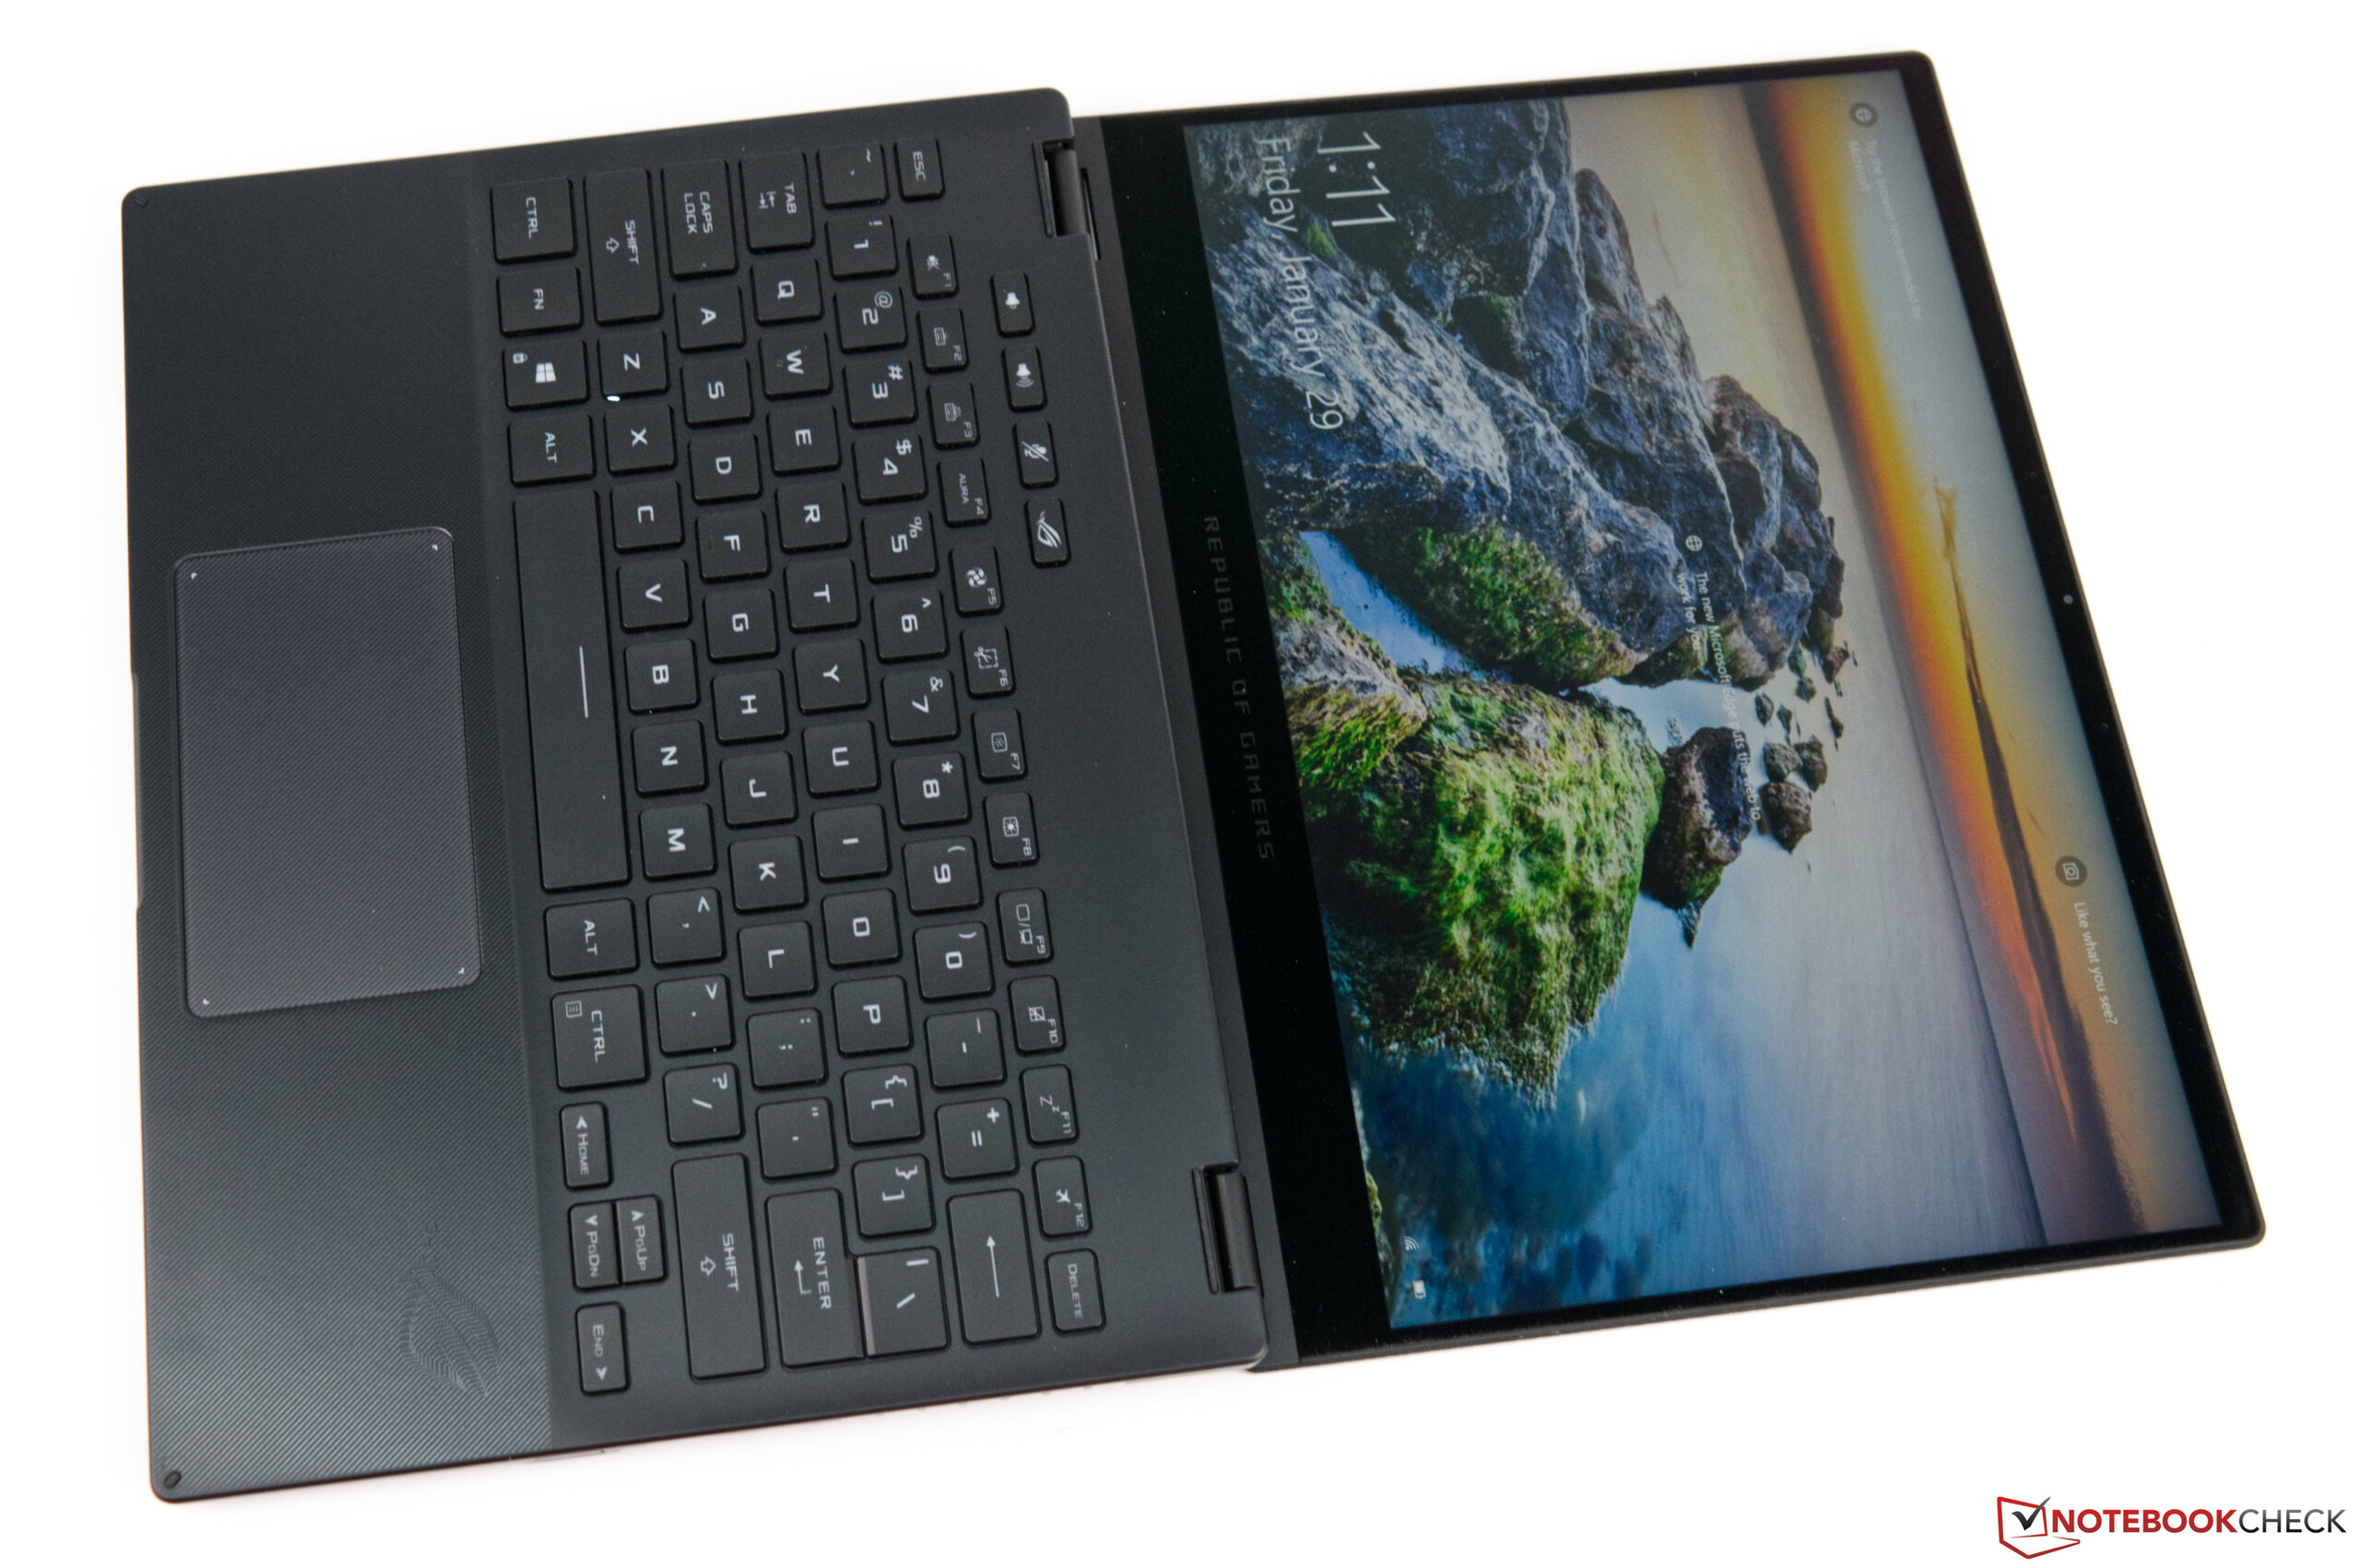
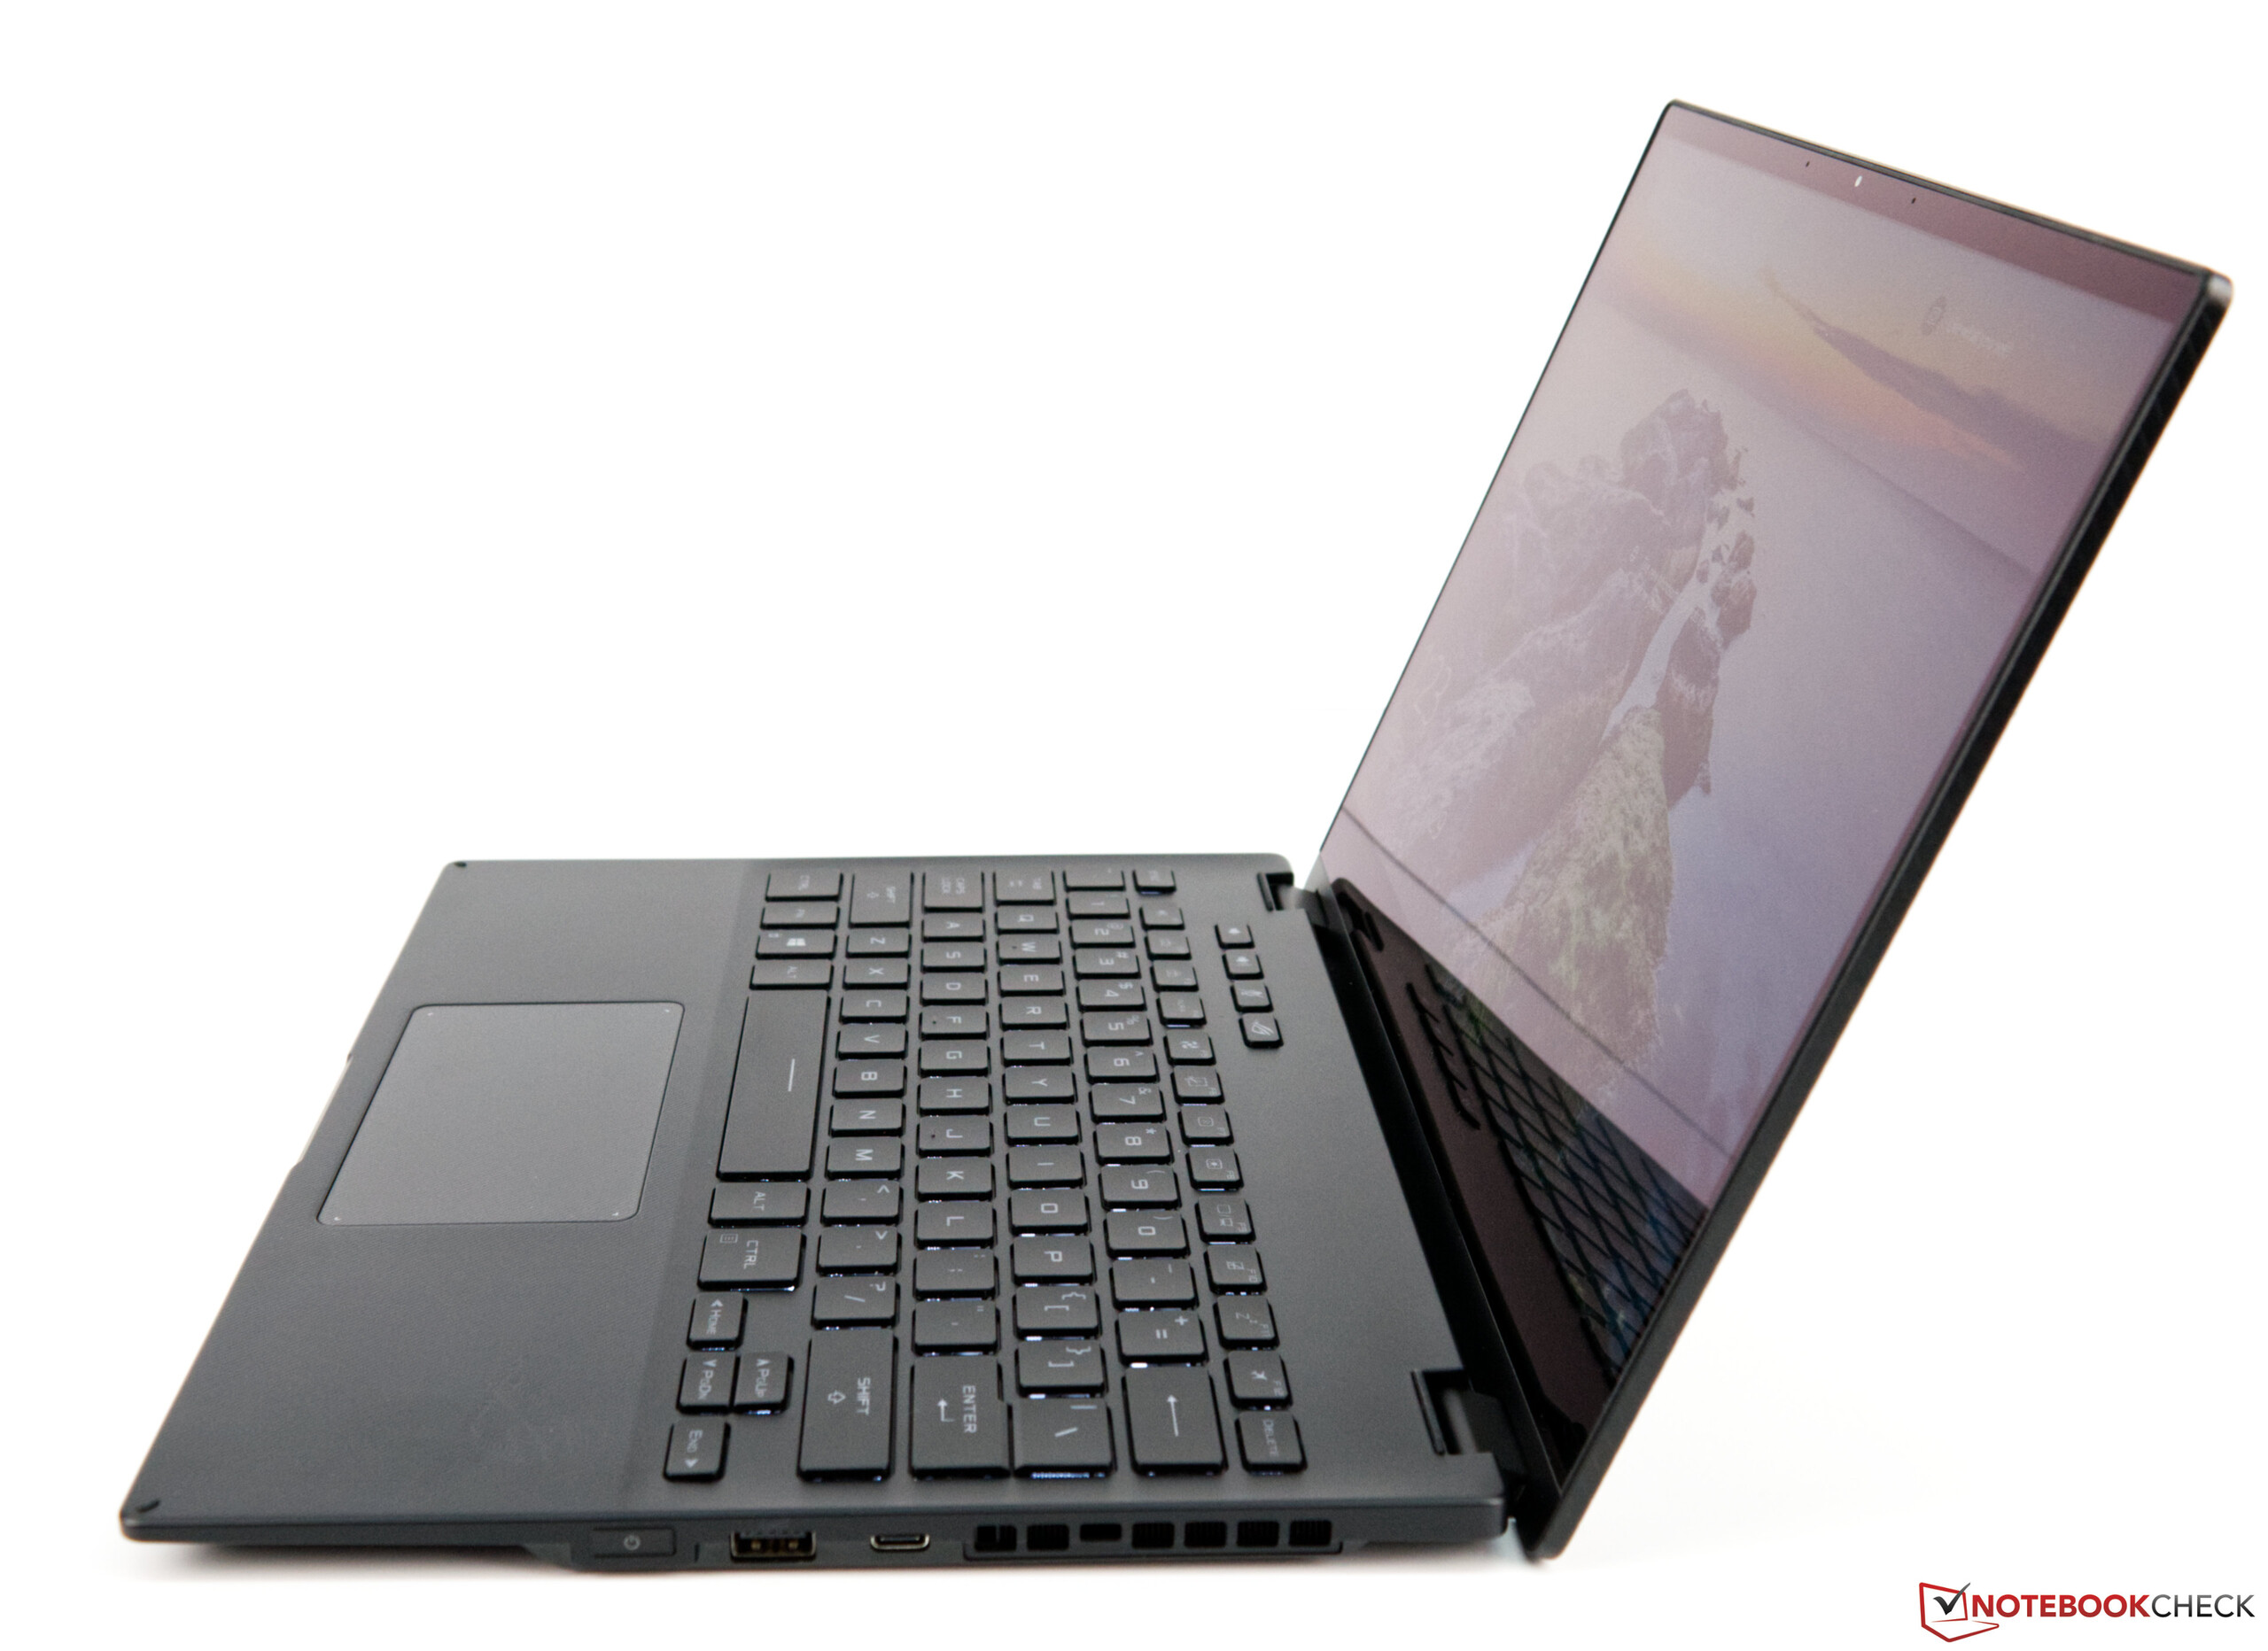
Asus uses a selection of high-quality materials for its Flow X13, such as magnesium and aluminum but also plastic, which we find on the base unit's top. The surfaces feel high-quality and offer a good grip. However, fingerprints are quickly visible on the matte surfaces and spoil the look a bit. Nevertheless, the 13-incher has a very stable construction. Rigidity is good, and the pressure test didn't reveal any weak points. Twisting of the base unit is also hardly possible. Only the display lid can be twisted with some effort.
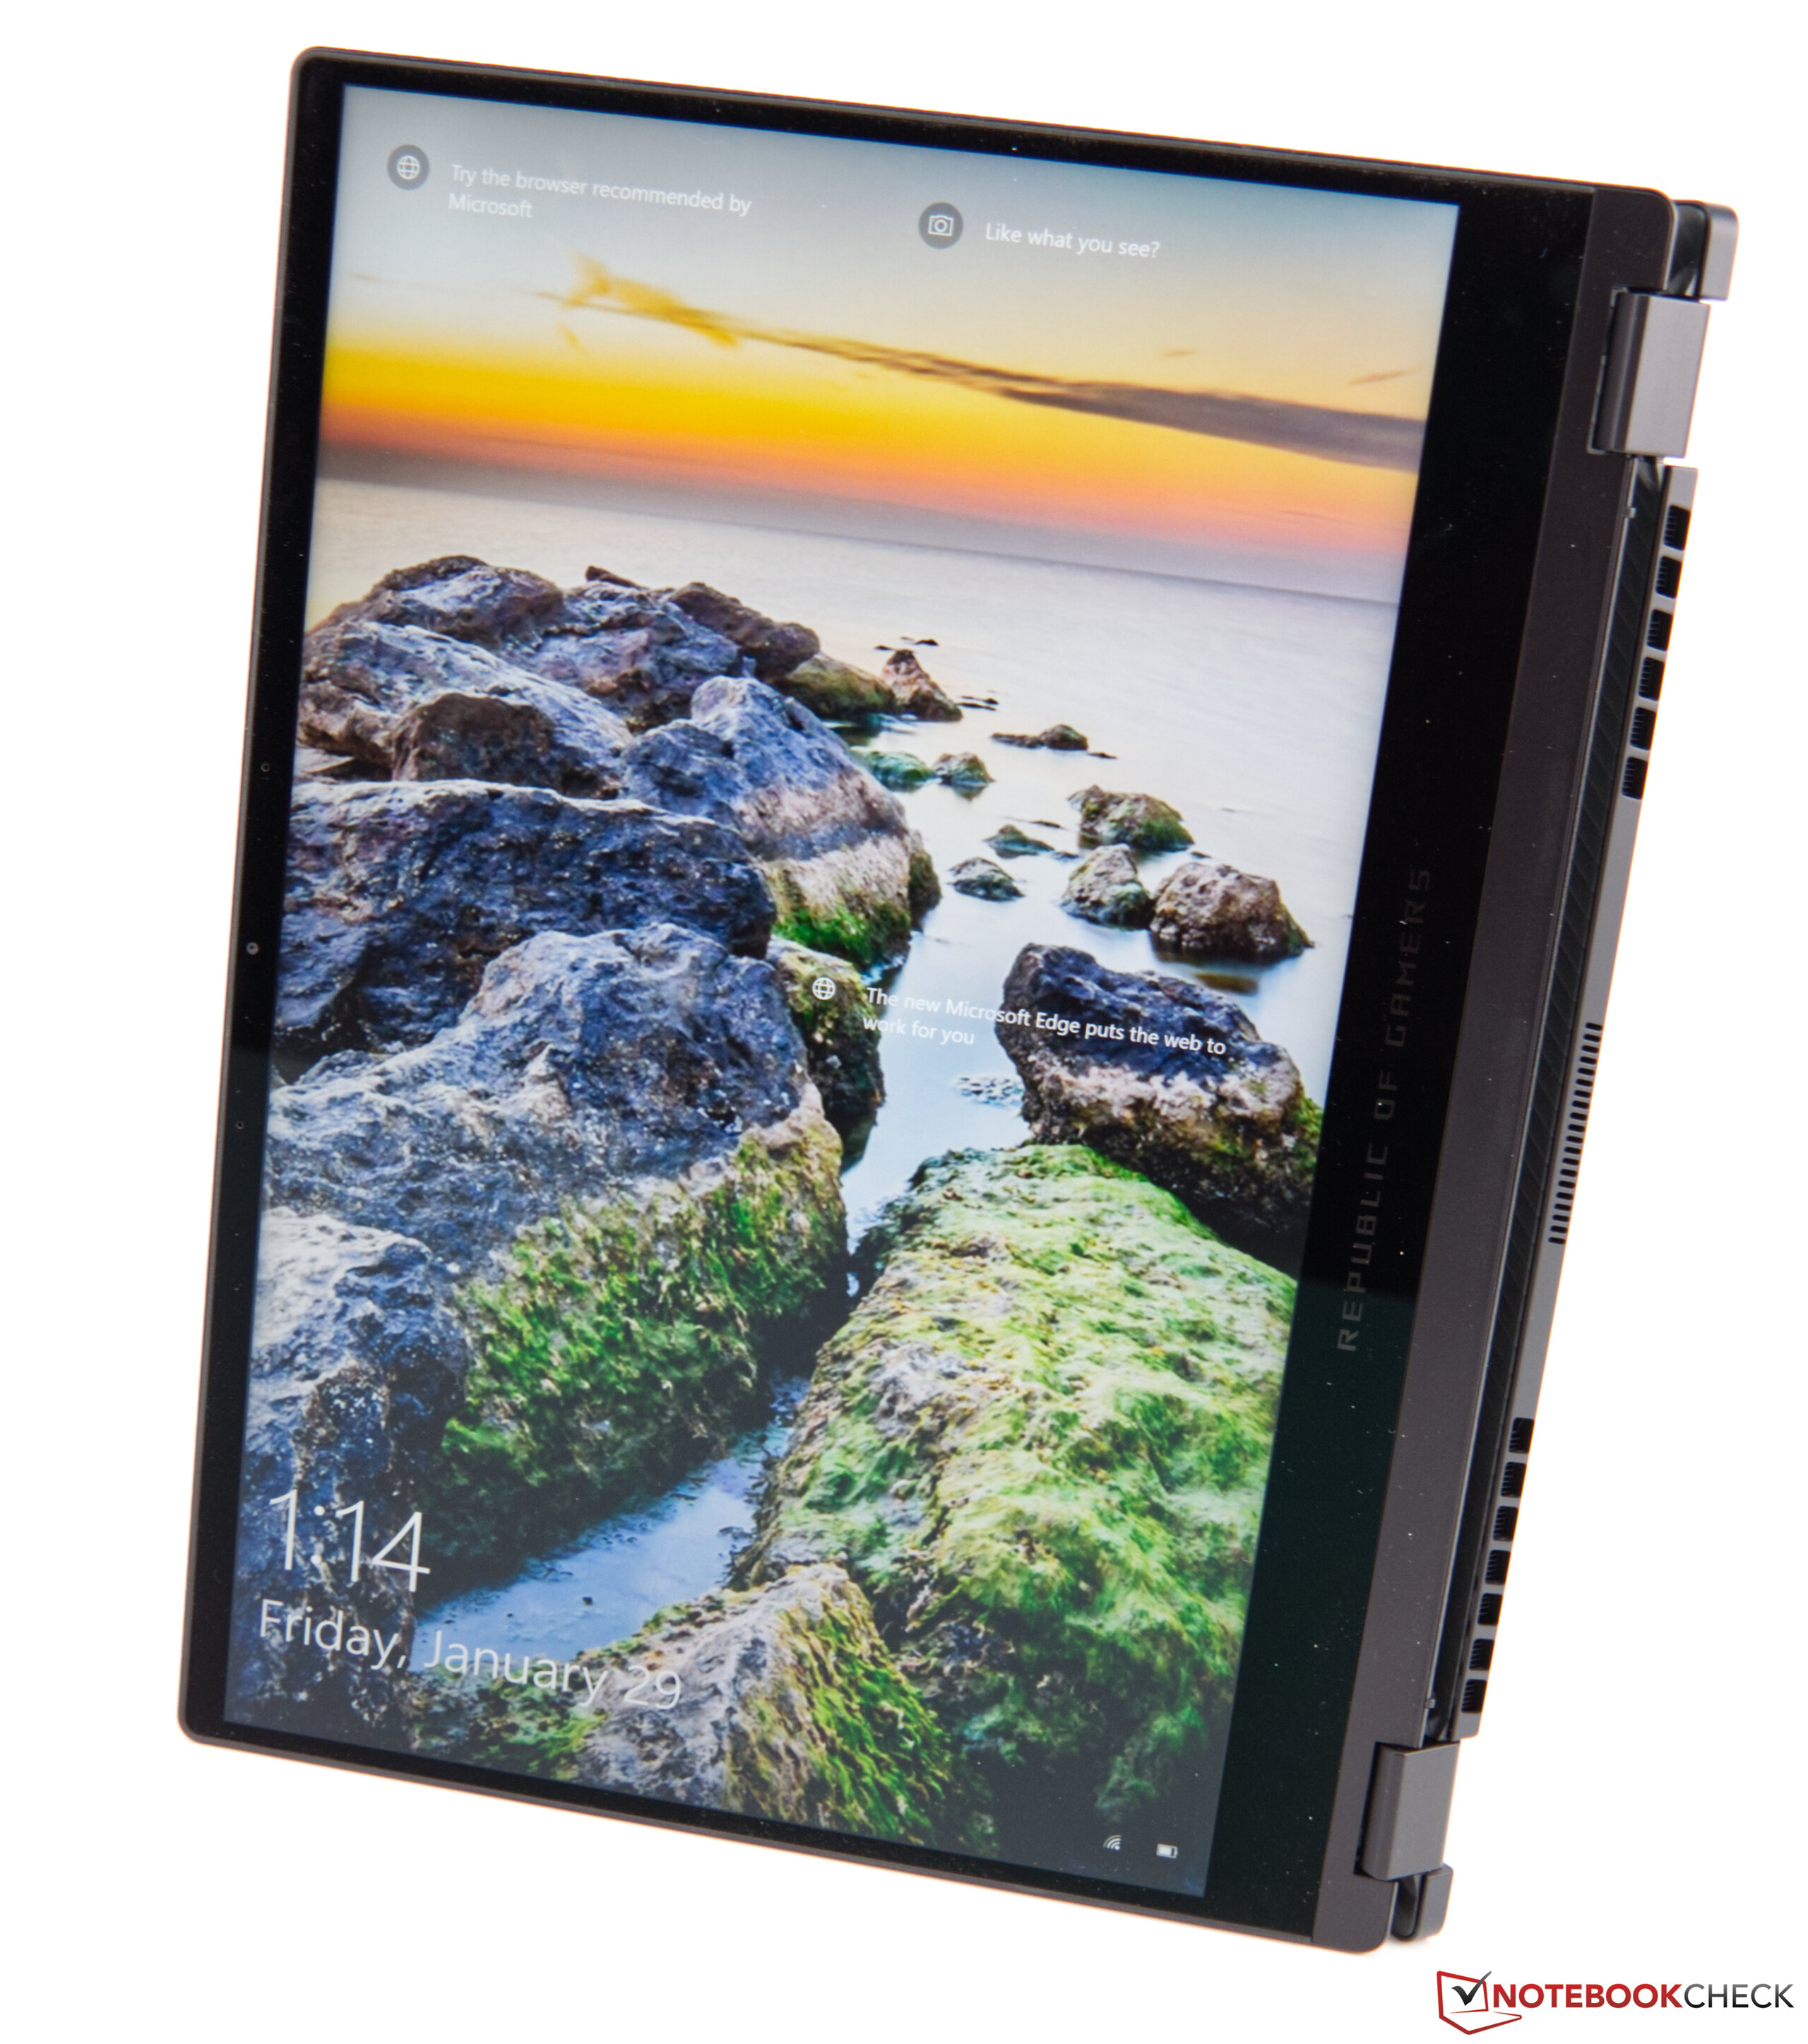
The installed 360-degree hinges work smoothly and even allow opening the device with one hand. Nevertheless, they can still prevent the display from wobbling for too long. Both in tablet mode as well as in presentation mode, small rubber strips protect the keyboard and the base unit, but only on hard and slippery surfaces.
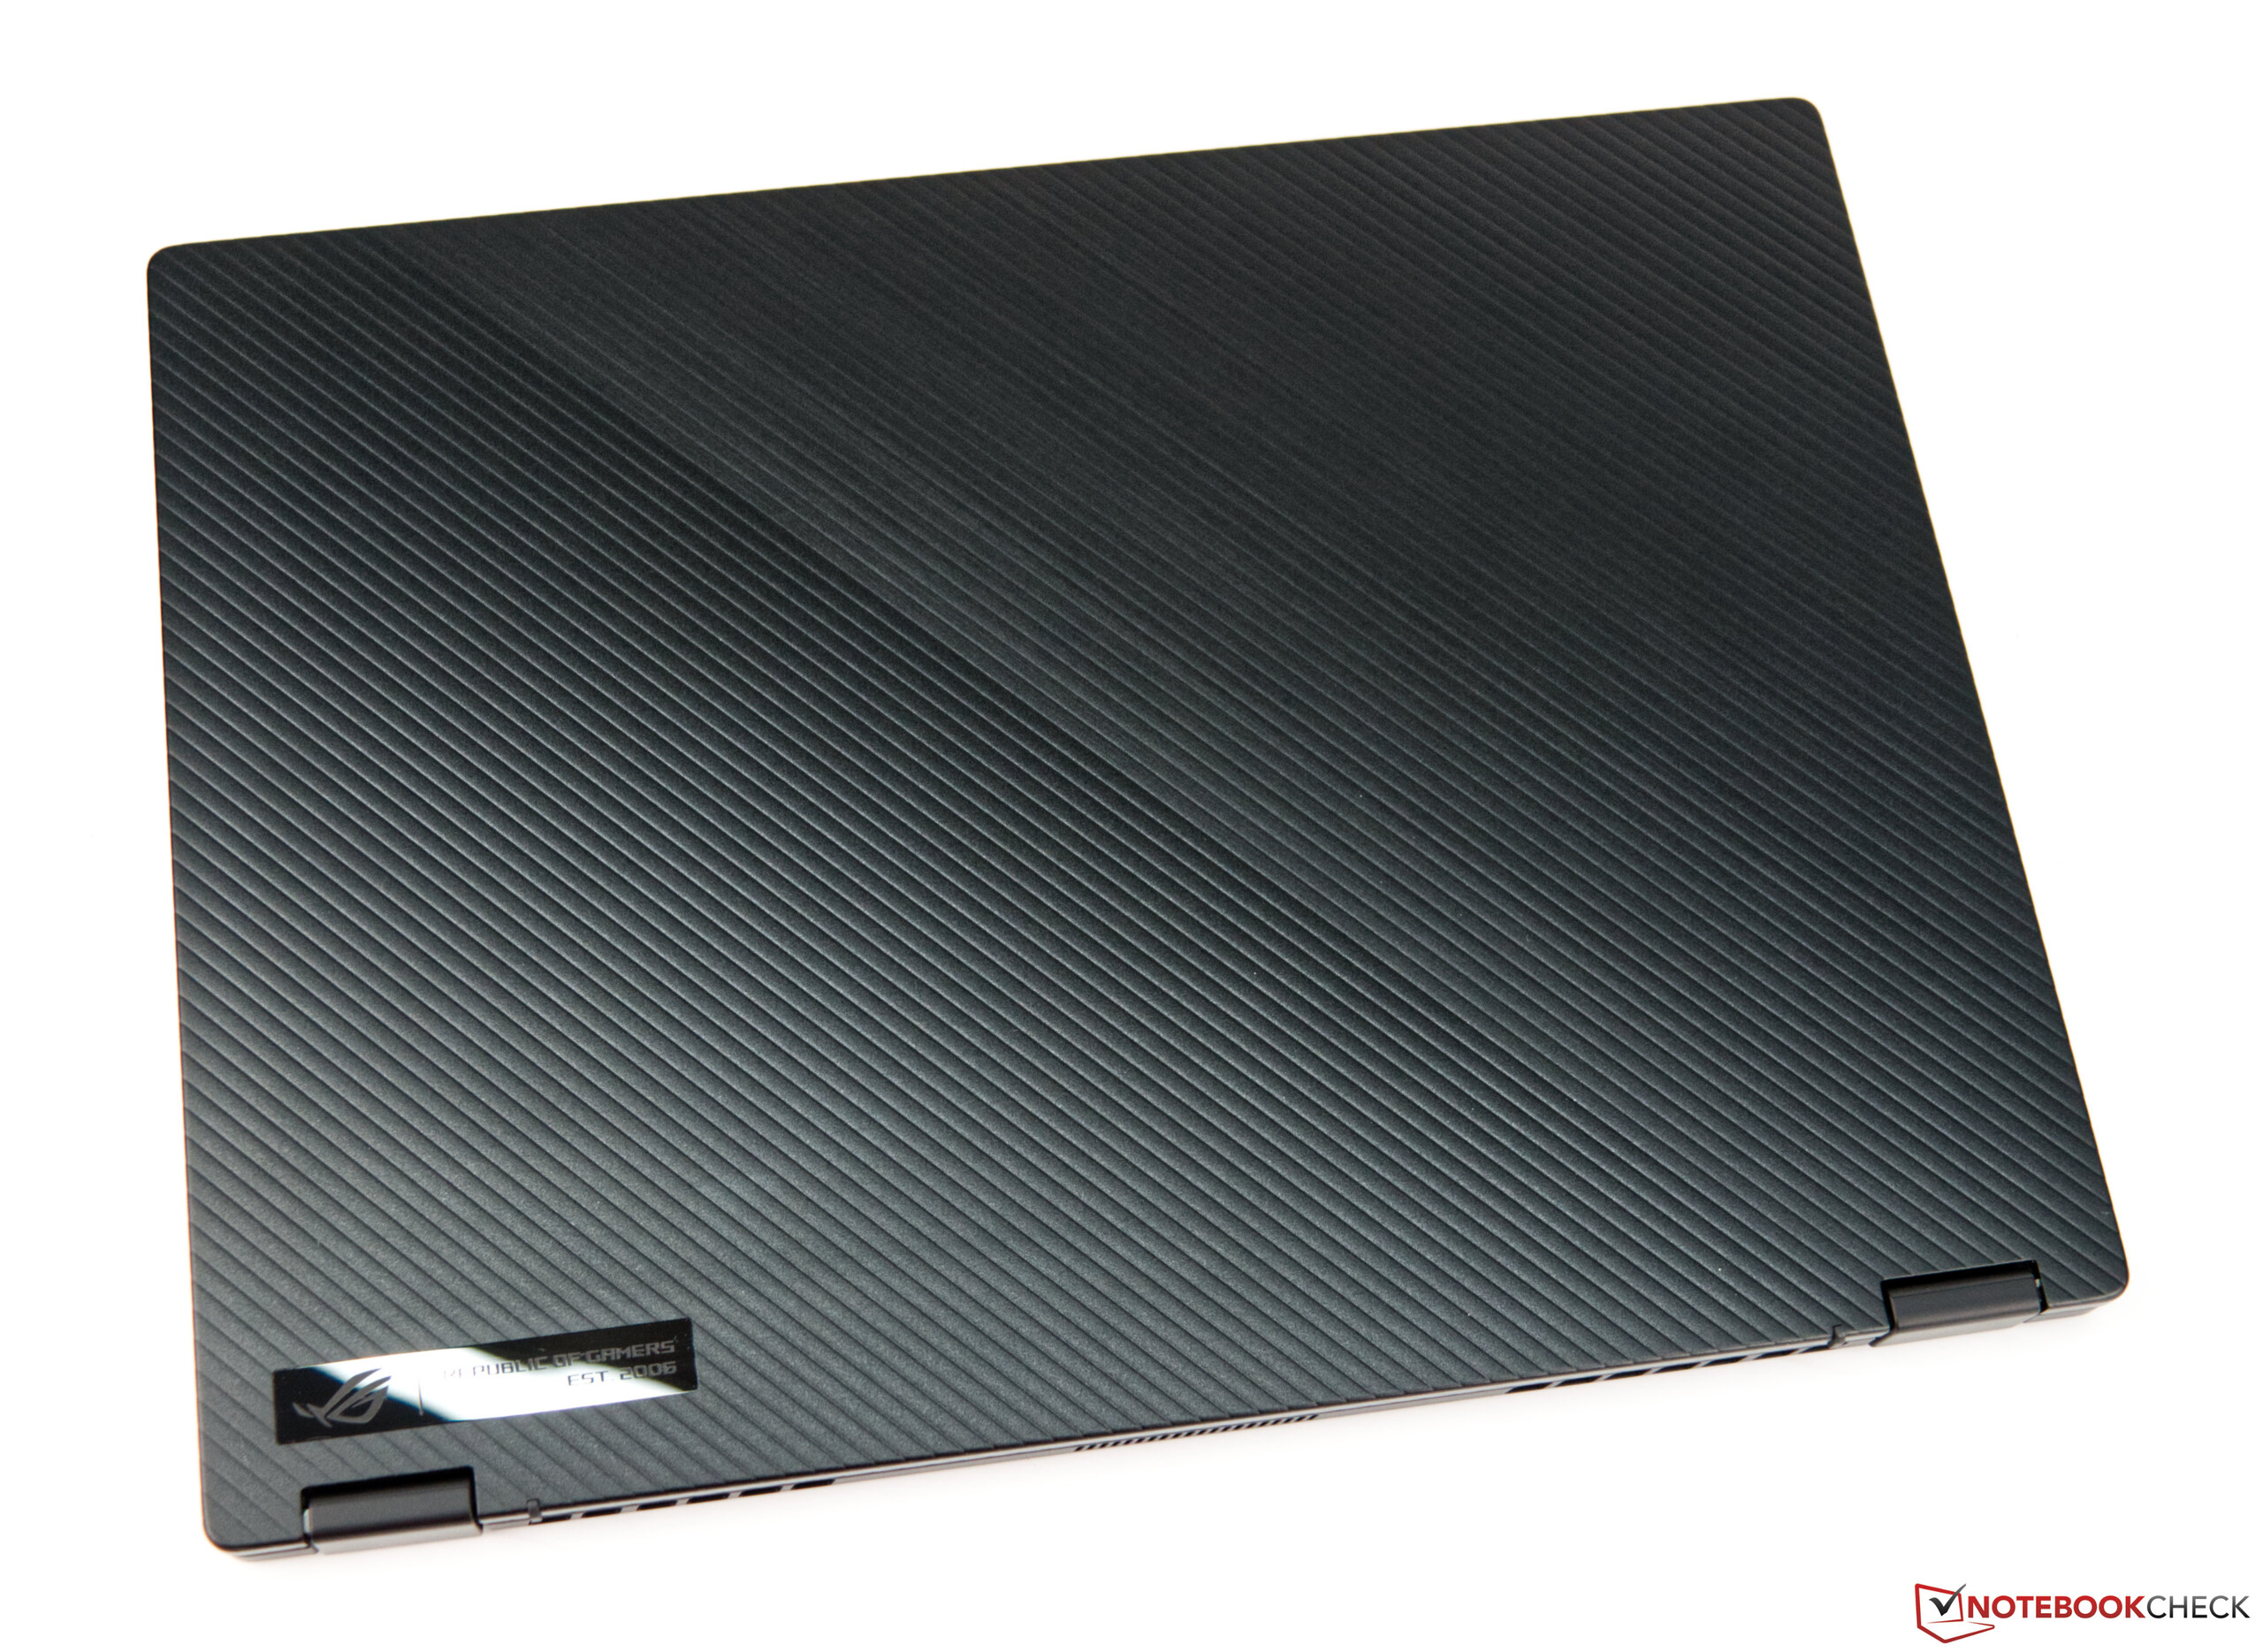
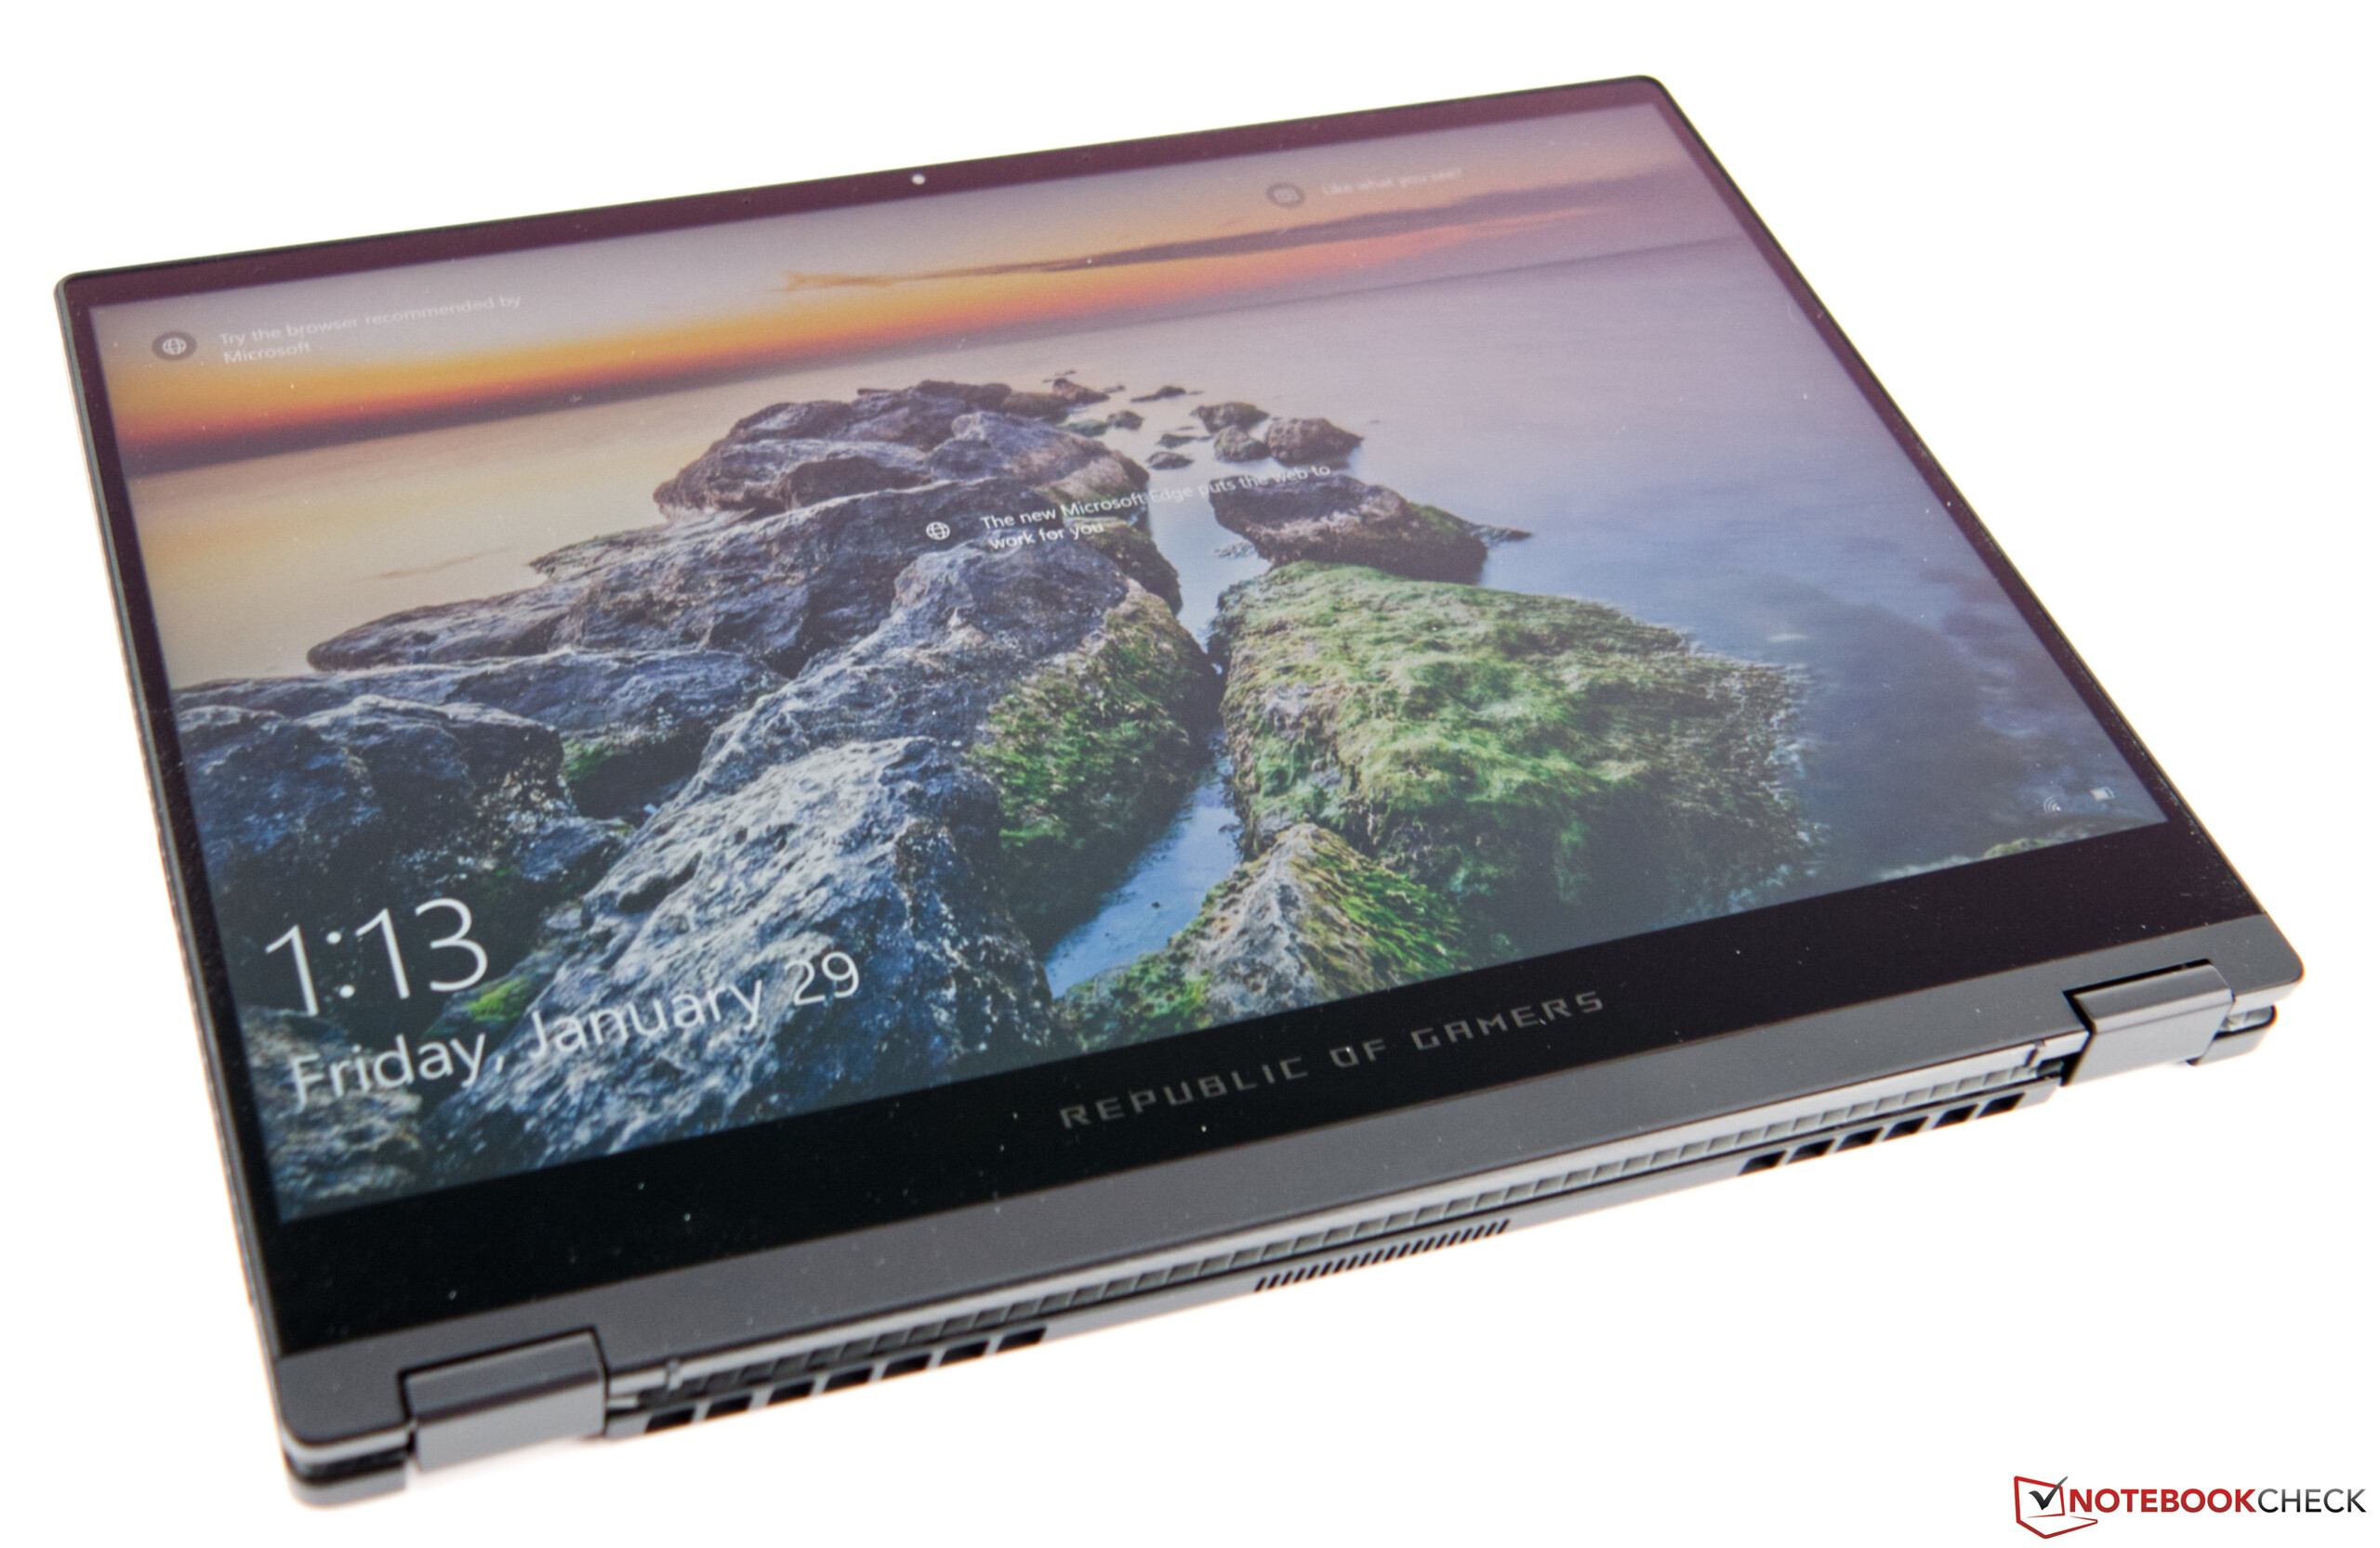
The footprint of the Asus ROG Flow X13 is slightly smaller compared to the competition. It's also quite slim at only 15.8 millimeters. At 1.4 kilograms, the device ranks in the midfield in terms of weight. The power adapter adds another 480 grams.
Connectivity - Minimalist
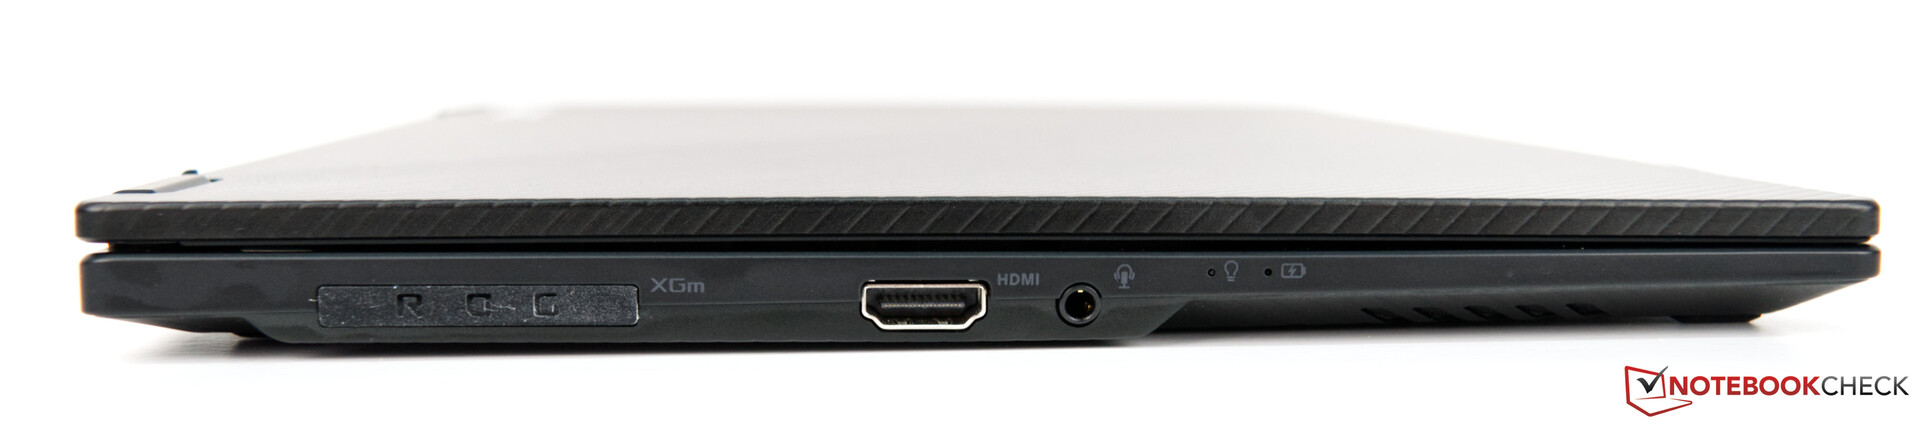
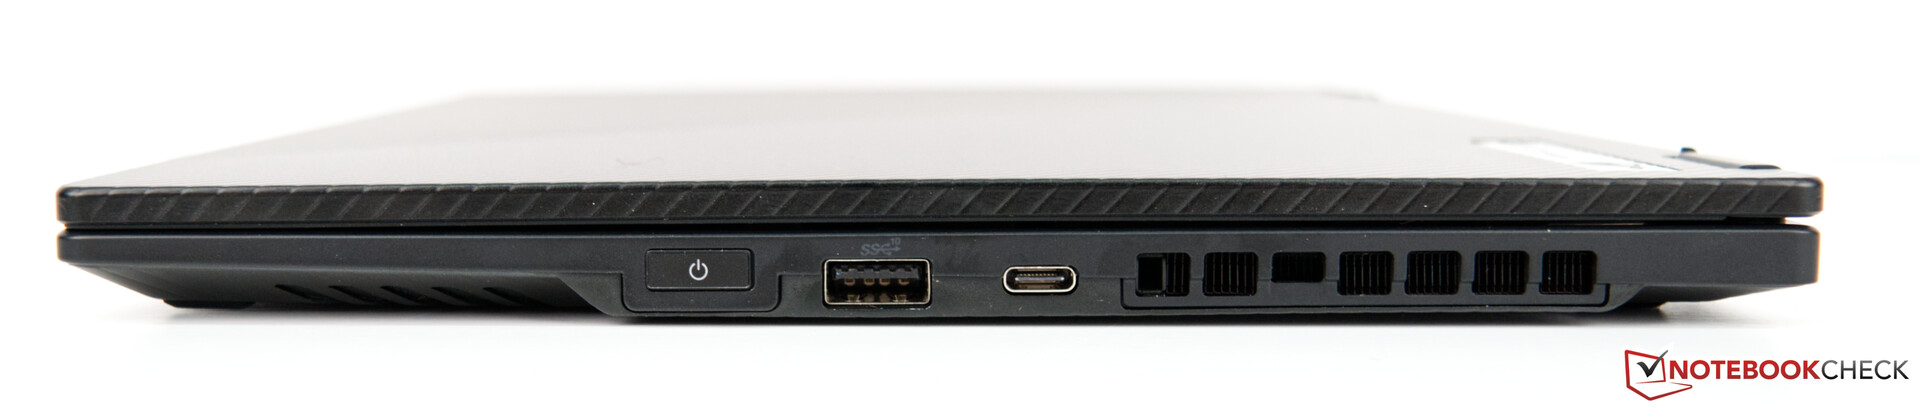
The ROG Flow X13 is somewhat restrained in terms of connectivity and external ports in particular. Nevertheless, there are three USB 3.2 Gen 2 ports that support Power Delivery and DisplayPort, one of them Type-A and two Type-C. The latter also supplies the device with power. The 2-in-1 also offers an HDMI port.
If you want to use the external GPU dock, you have to connect it to the proprietary ROG XG Mobile Interface on the left side.
Communication
An Intel Wi-Fi 6 AX200 module is installed in the Asus ROG Flow X13, and it only performs averagely. Our convertible loses the comparison with the competition. Nevertheless, the transfer rates are sufficient for everyday users.
Killer USB-C Ethernet Adapter - Upgrade to a stable connection
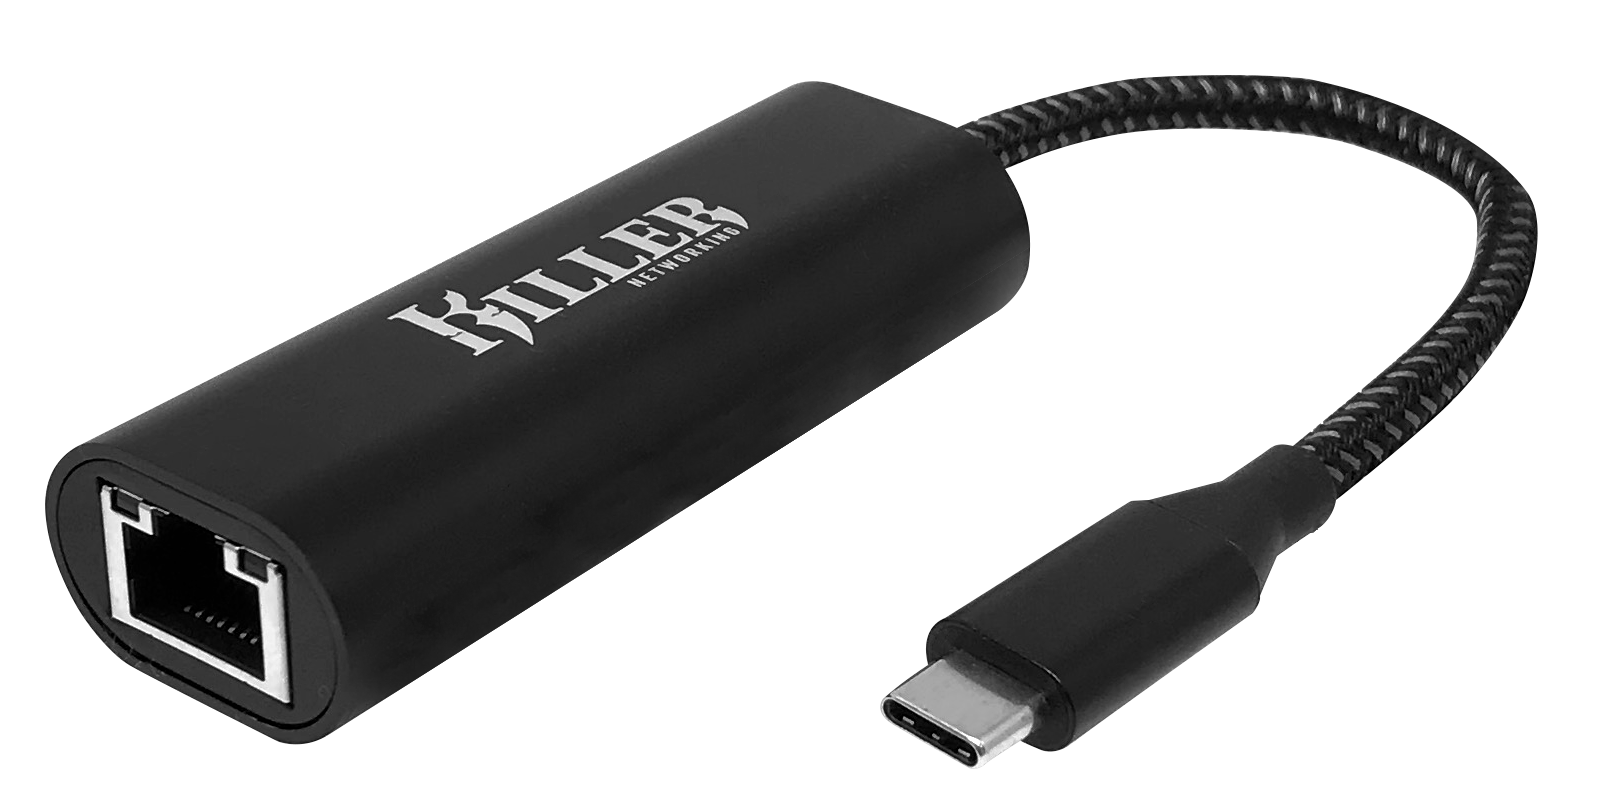
Despite advances in wireless networking, Ethernet is still the top choice for gamers and power users. The Killer 2.5G Ethernet to USB-C Adapter enables seamless Ethernet connectivity with full 2.5 Gbps throughput. It also brings the best of Killer technologies including the much acclaimed Killer Prioritization Engine, GameFast, Extreme Mode, and Intelligence Engine that ensure your favorite game or app gets the bandwidth and priority it deserves. For laptops already equipped with a Killer wireless card, Killer DoubleShot Pro offers bandwidth doubling and fine-grained control over network packets passing through each connection.
In our testing, the Killer 2.5G Ethernet Adapter lived up to the advertised speeds consistently throughout testing. You can read more about performance comparison with other USB Ethernet Adapters in our article.
The Killer 2.5G Ethernet to USB-C adapter can be purchased on Amazon for US$ 49.99
Accessories
No other accessories are included in the box of our test sample. Besides the device with the 100-watt power adapter, you only get the obligatory brochures with the warranty conditions. However, the feature that is probably the most important on the ROG Flow X13 is the external graphics dock with an RTX 3080.
Maintenance
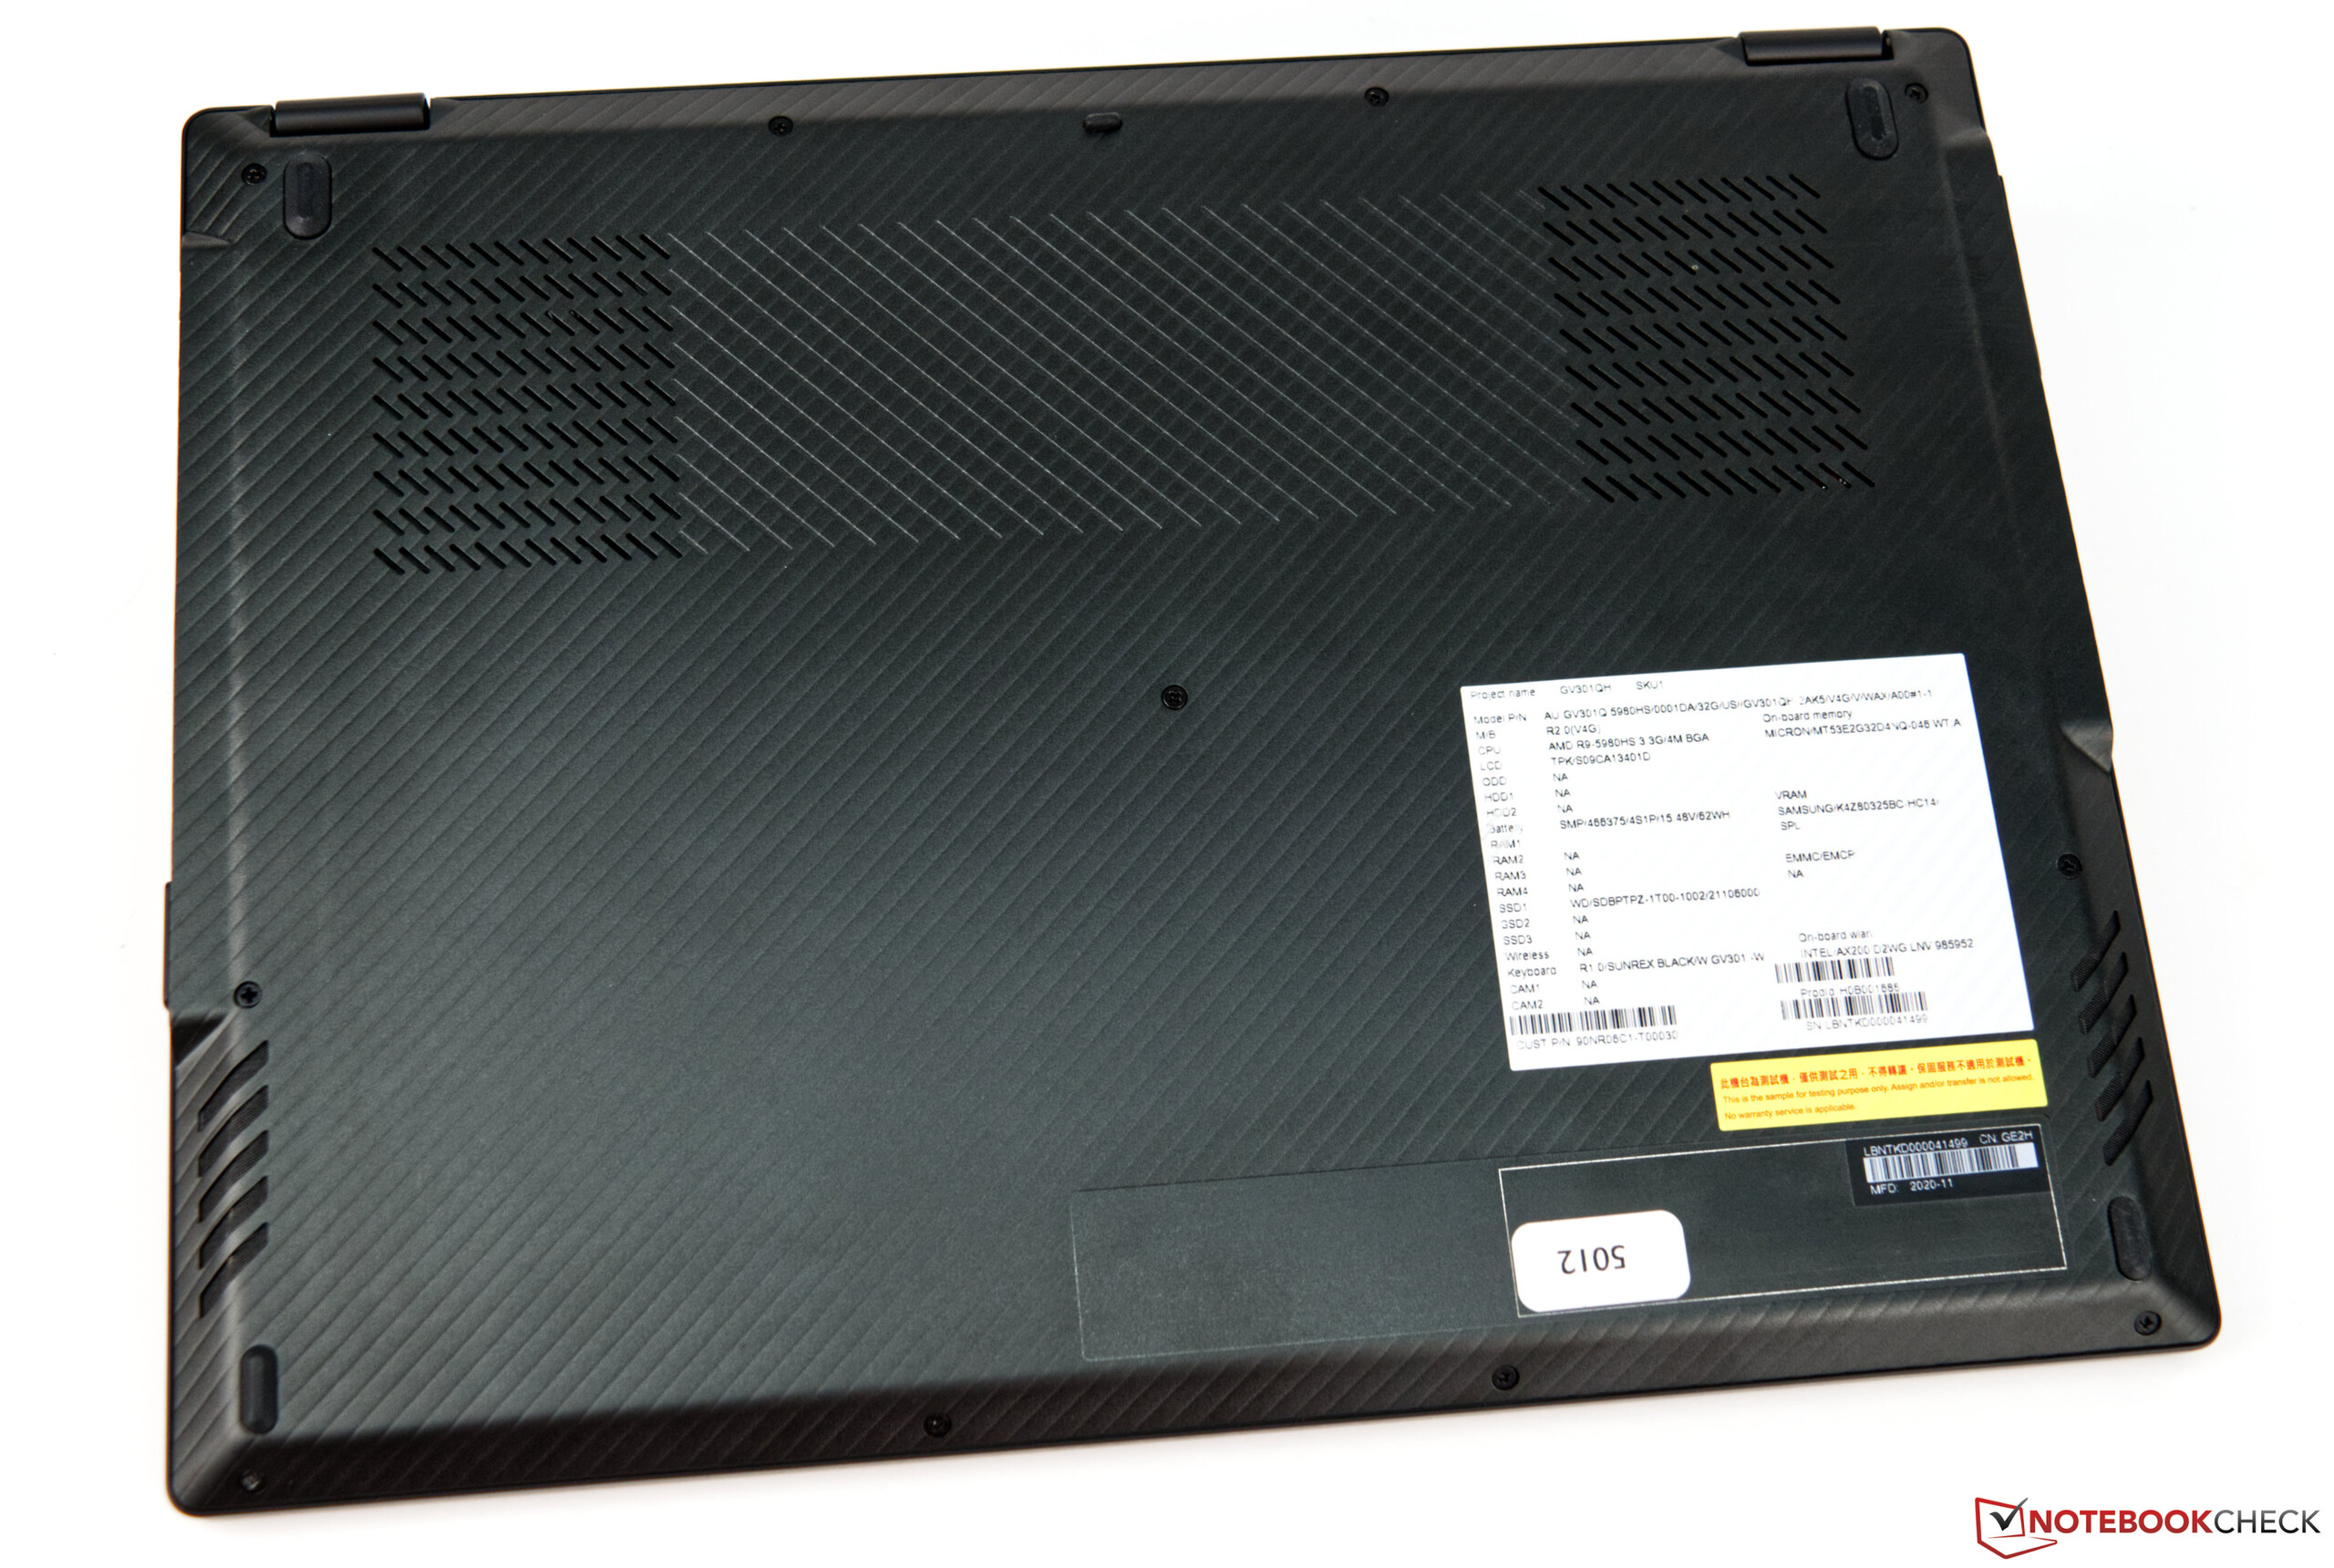
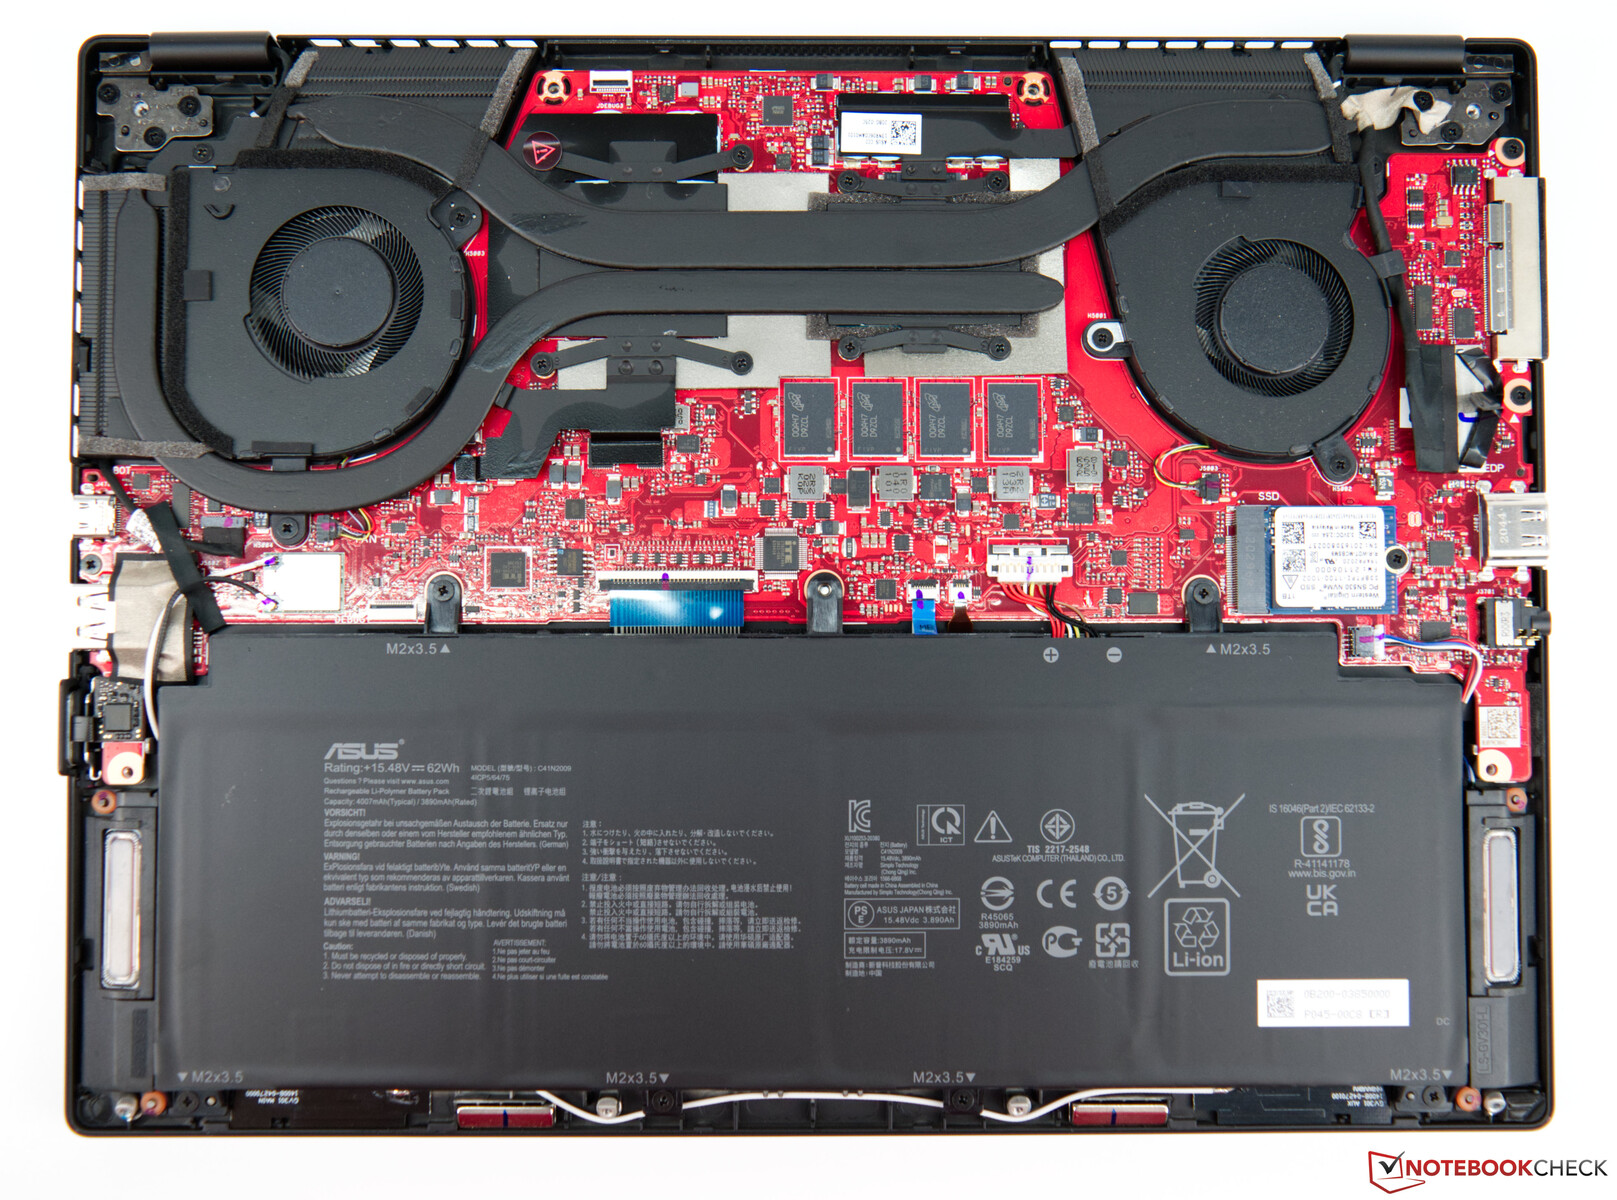
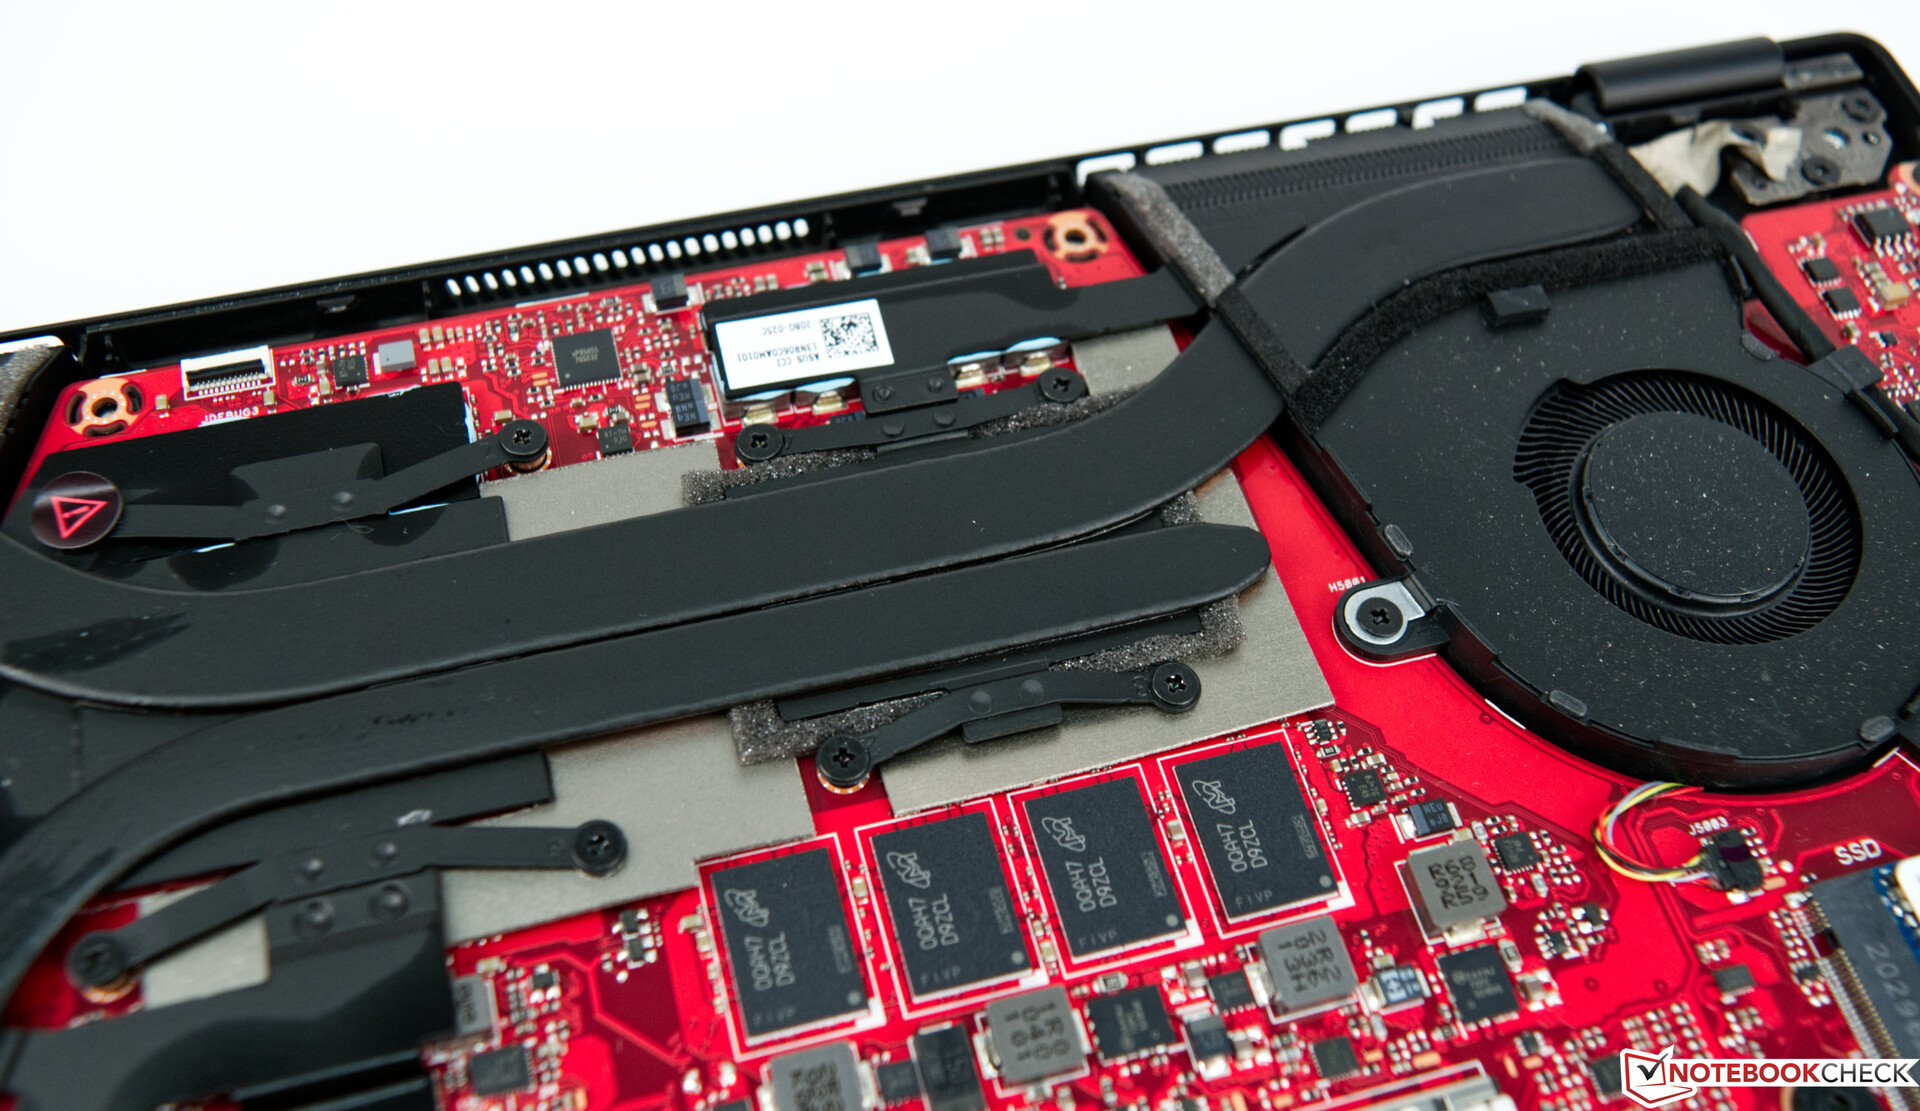
Eventual maintenance tasks are quite easy, even though there's no maintenance hatch. The bottom cover can be removed without issues with the right tools. However, there aren't many upgrade options anyway. Only the SSD can be replaced if necessary.
Warranty
Asus provides the customer with a 24-month warranty with pickup-and-return service when purchasing the ROG Flow X13.
Input devices
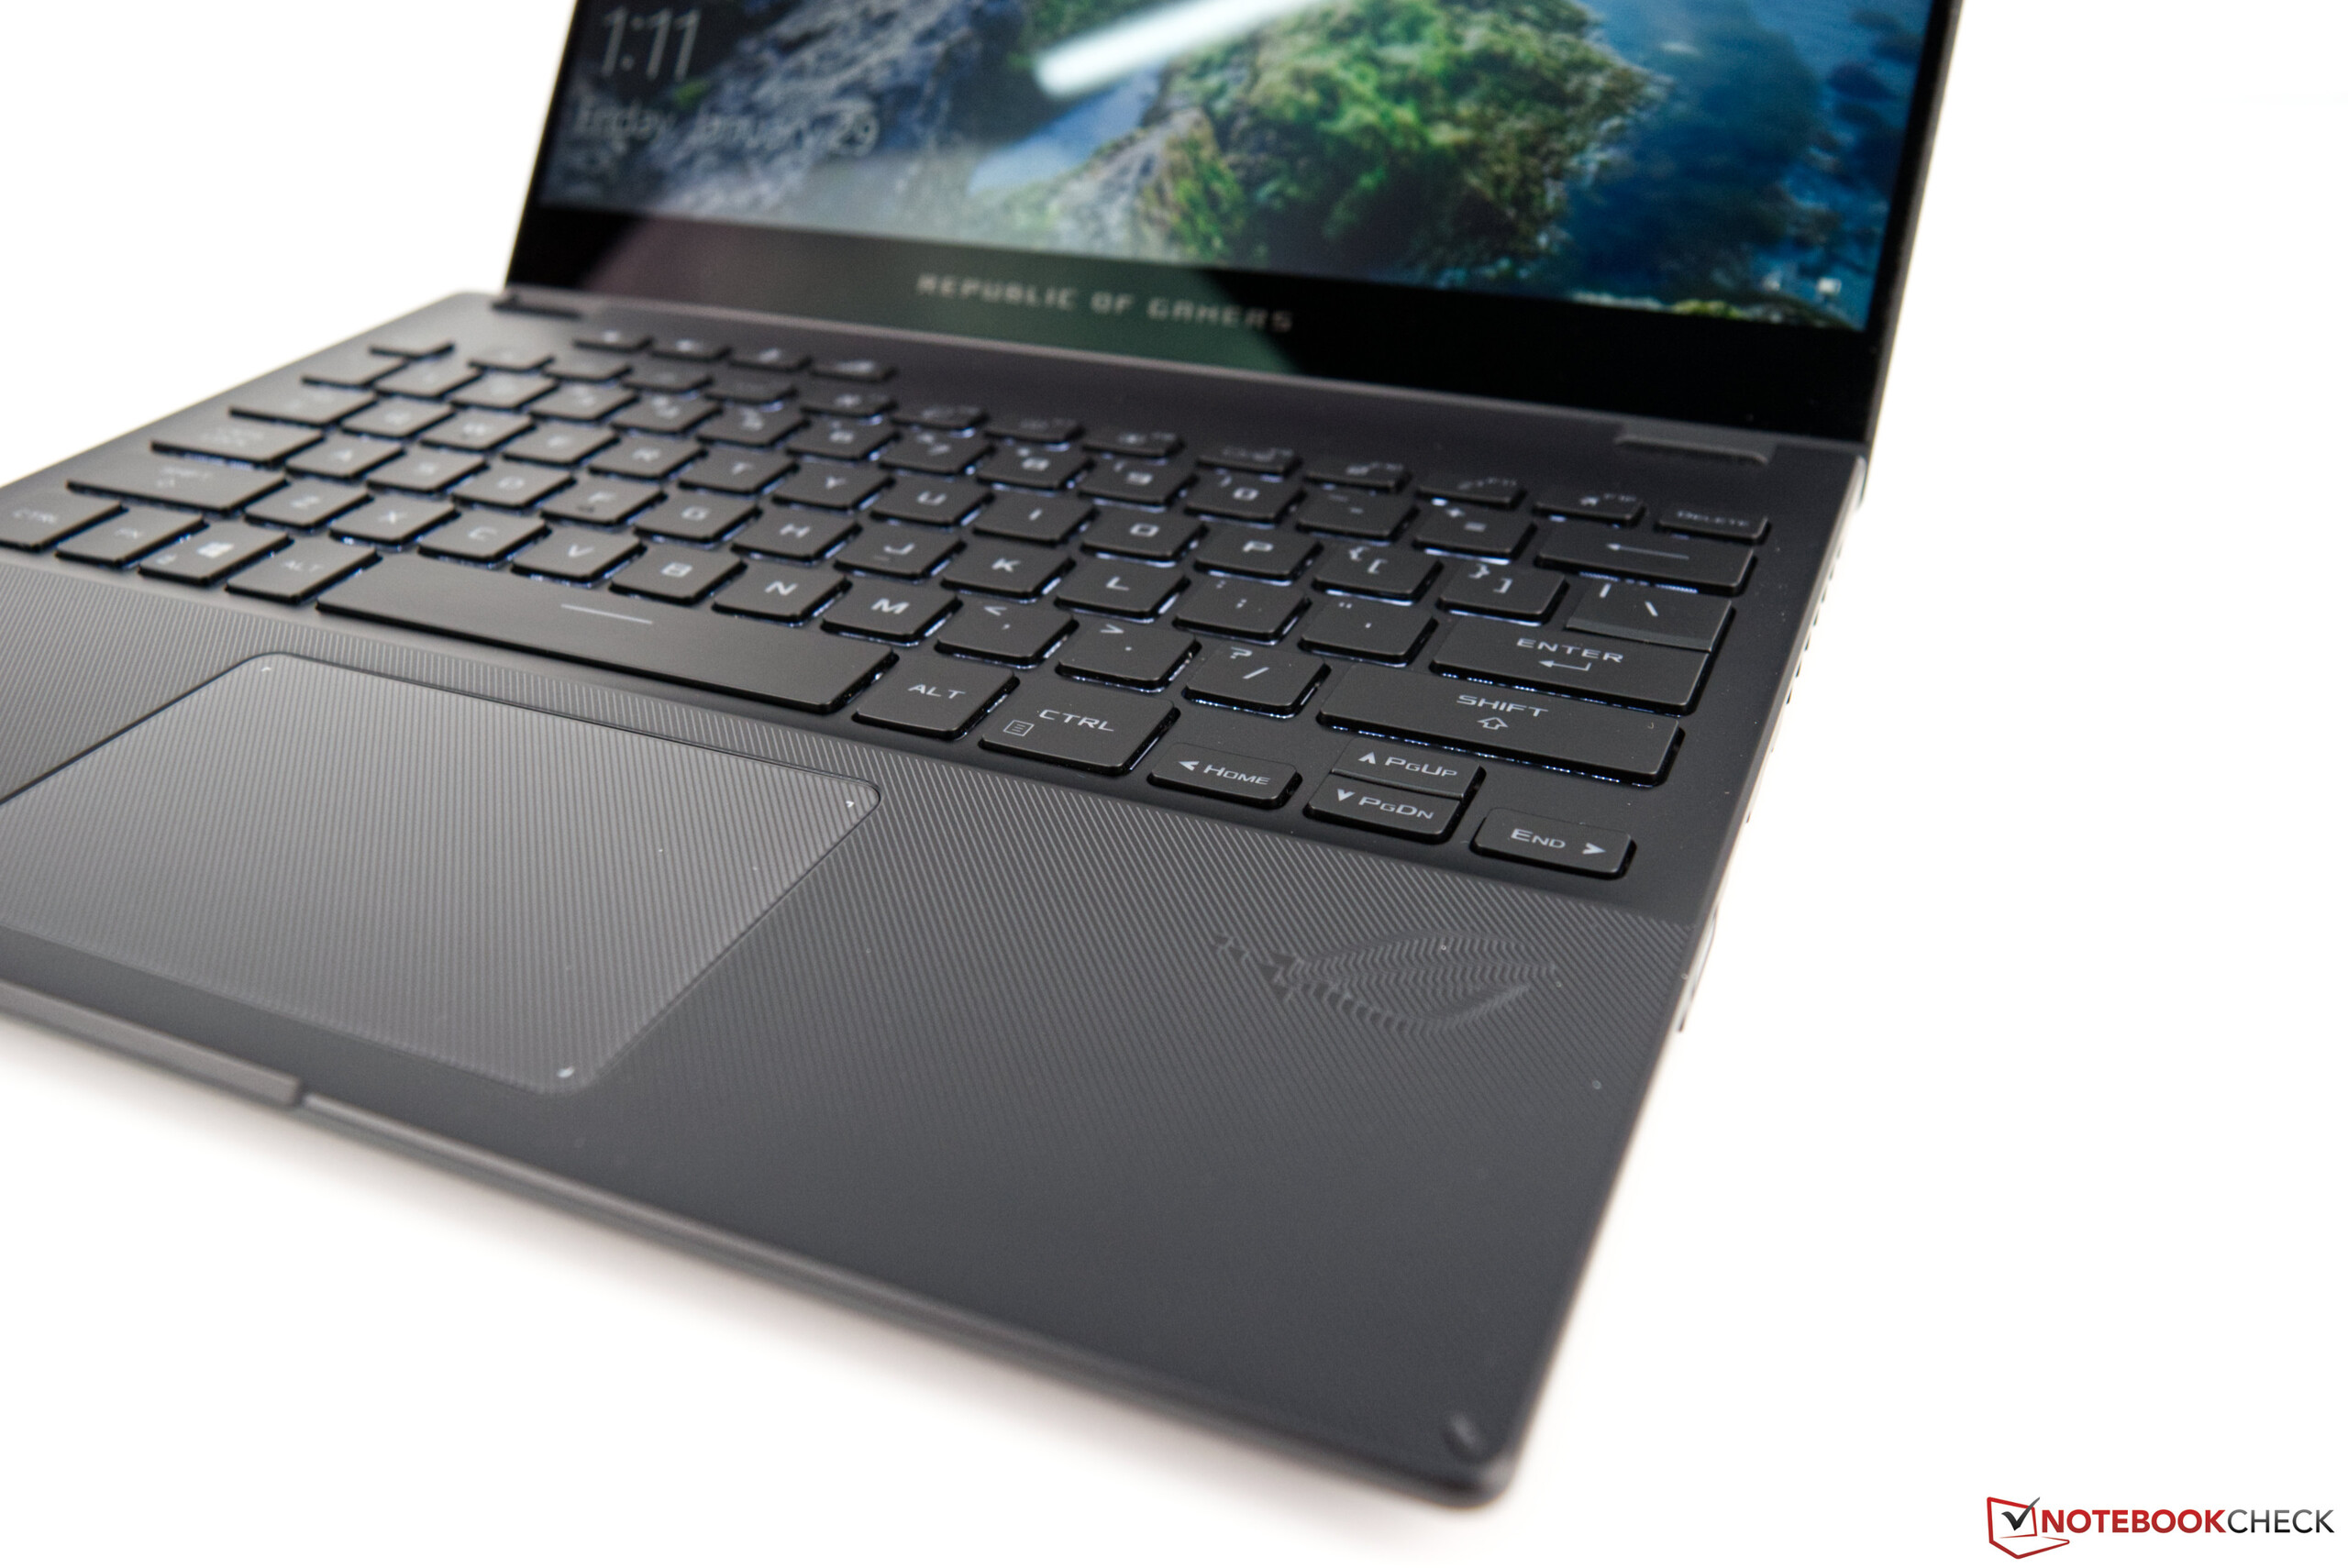
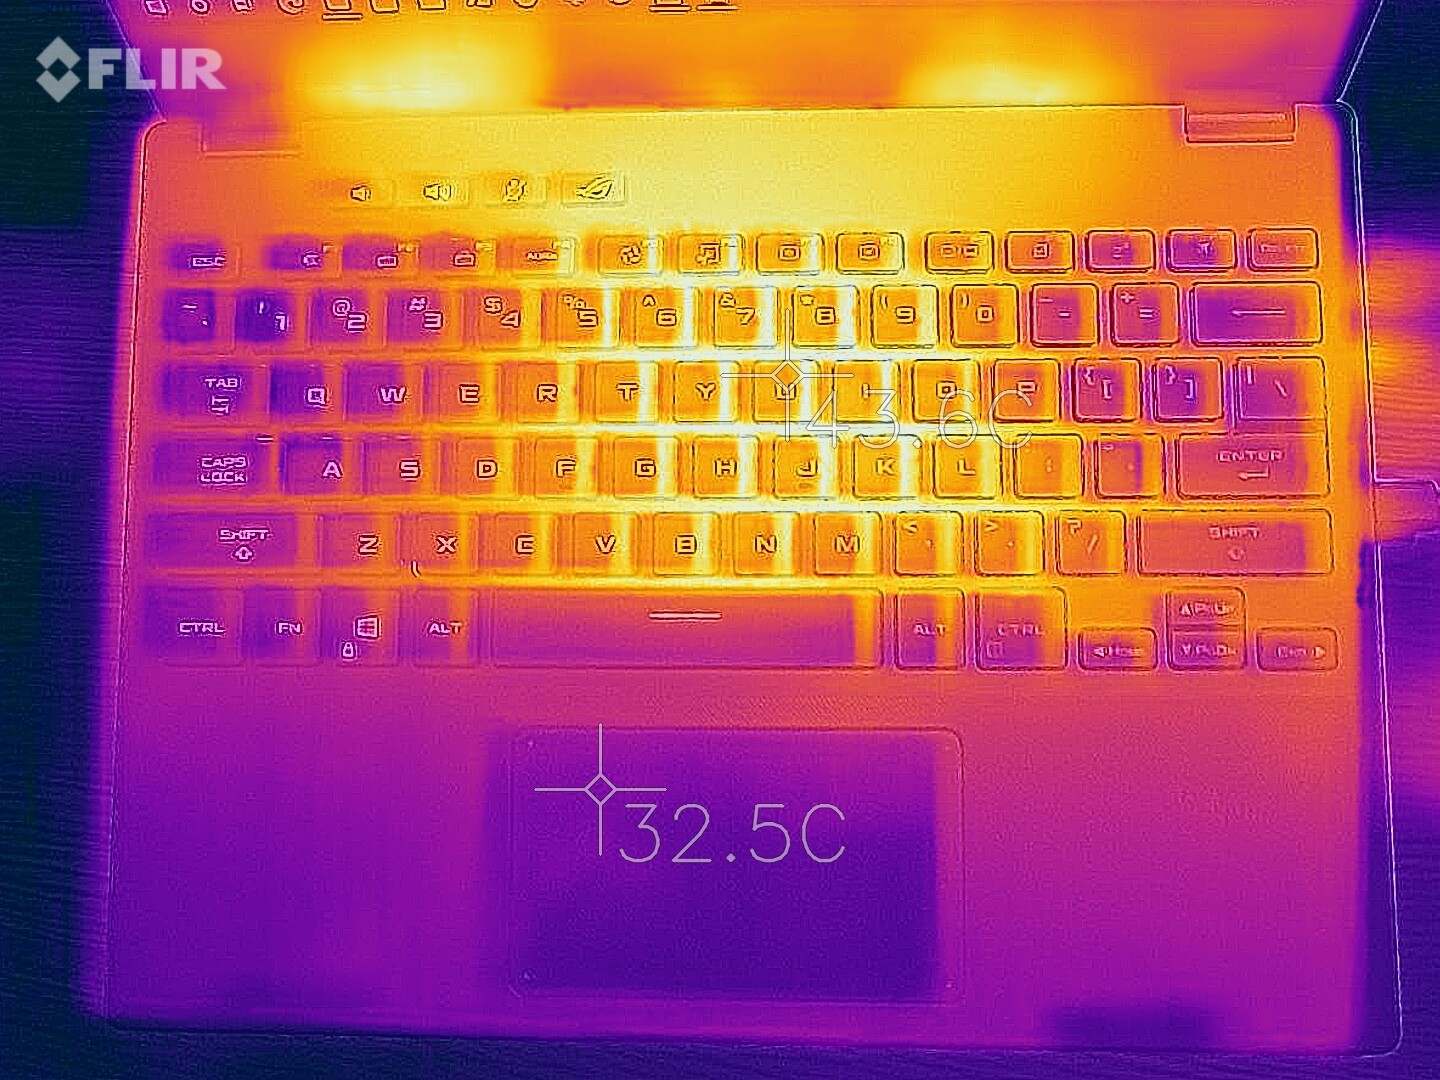
Keyboard
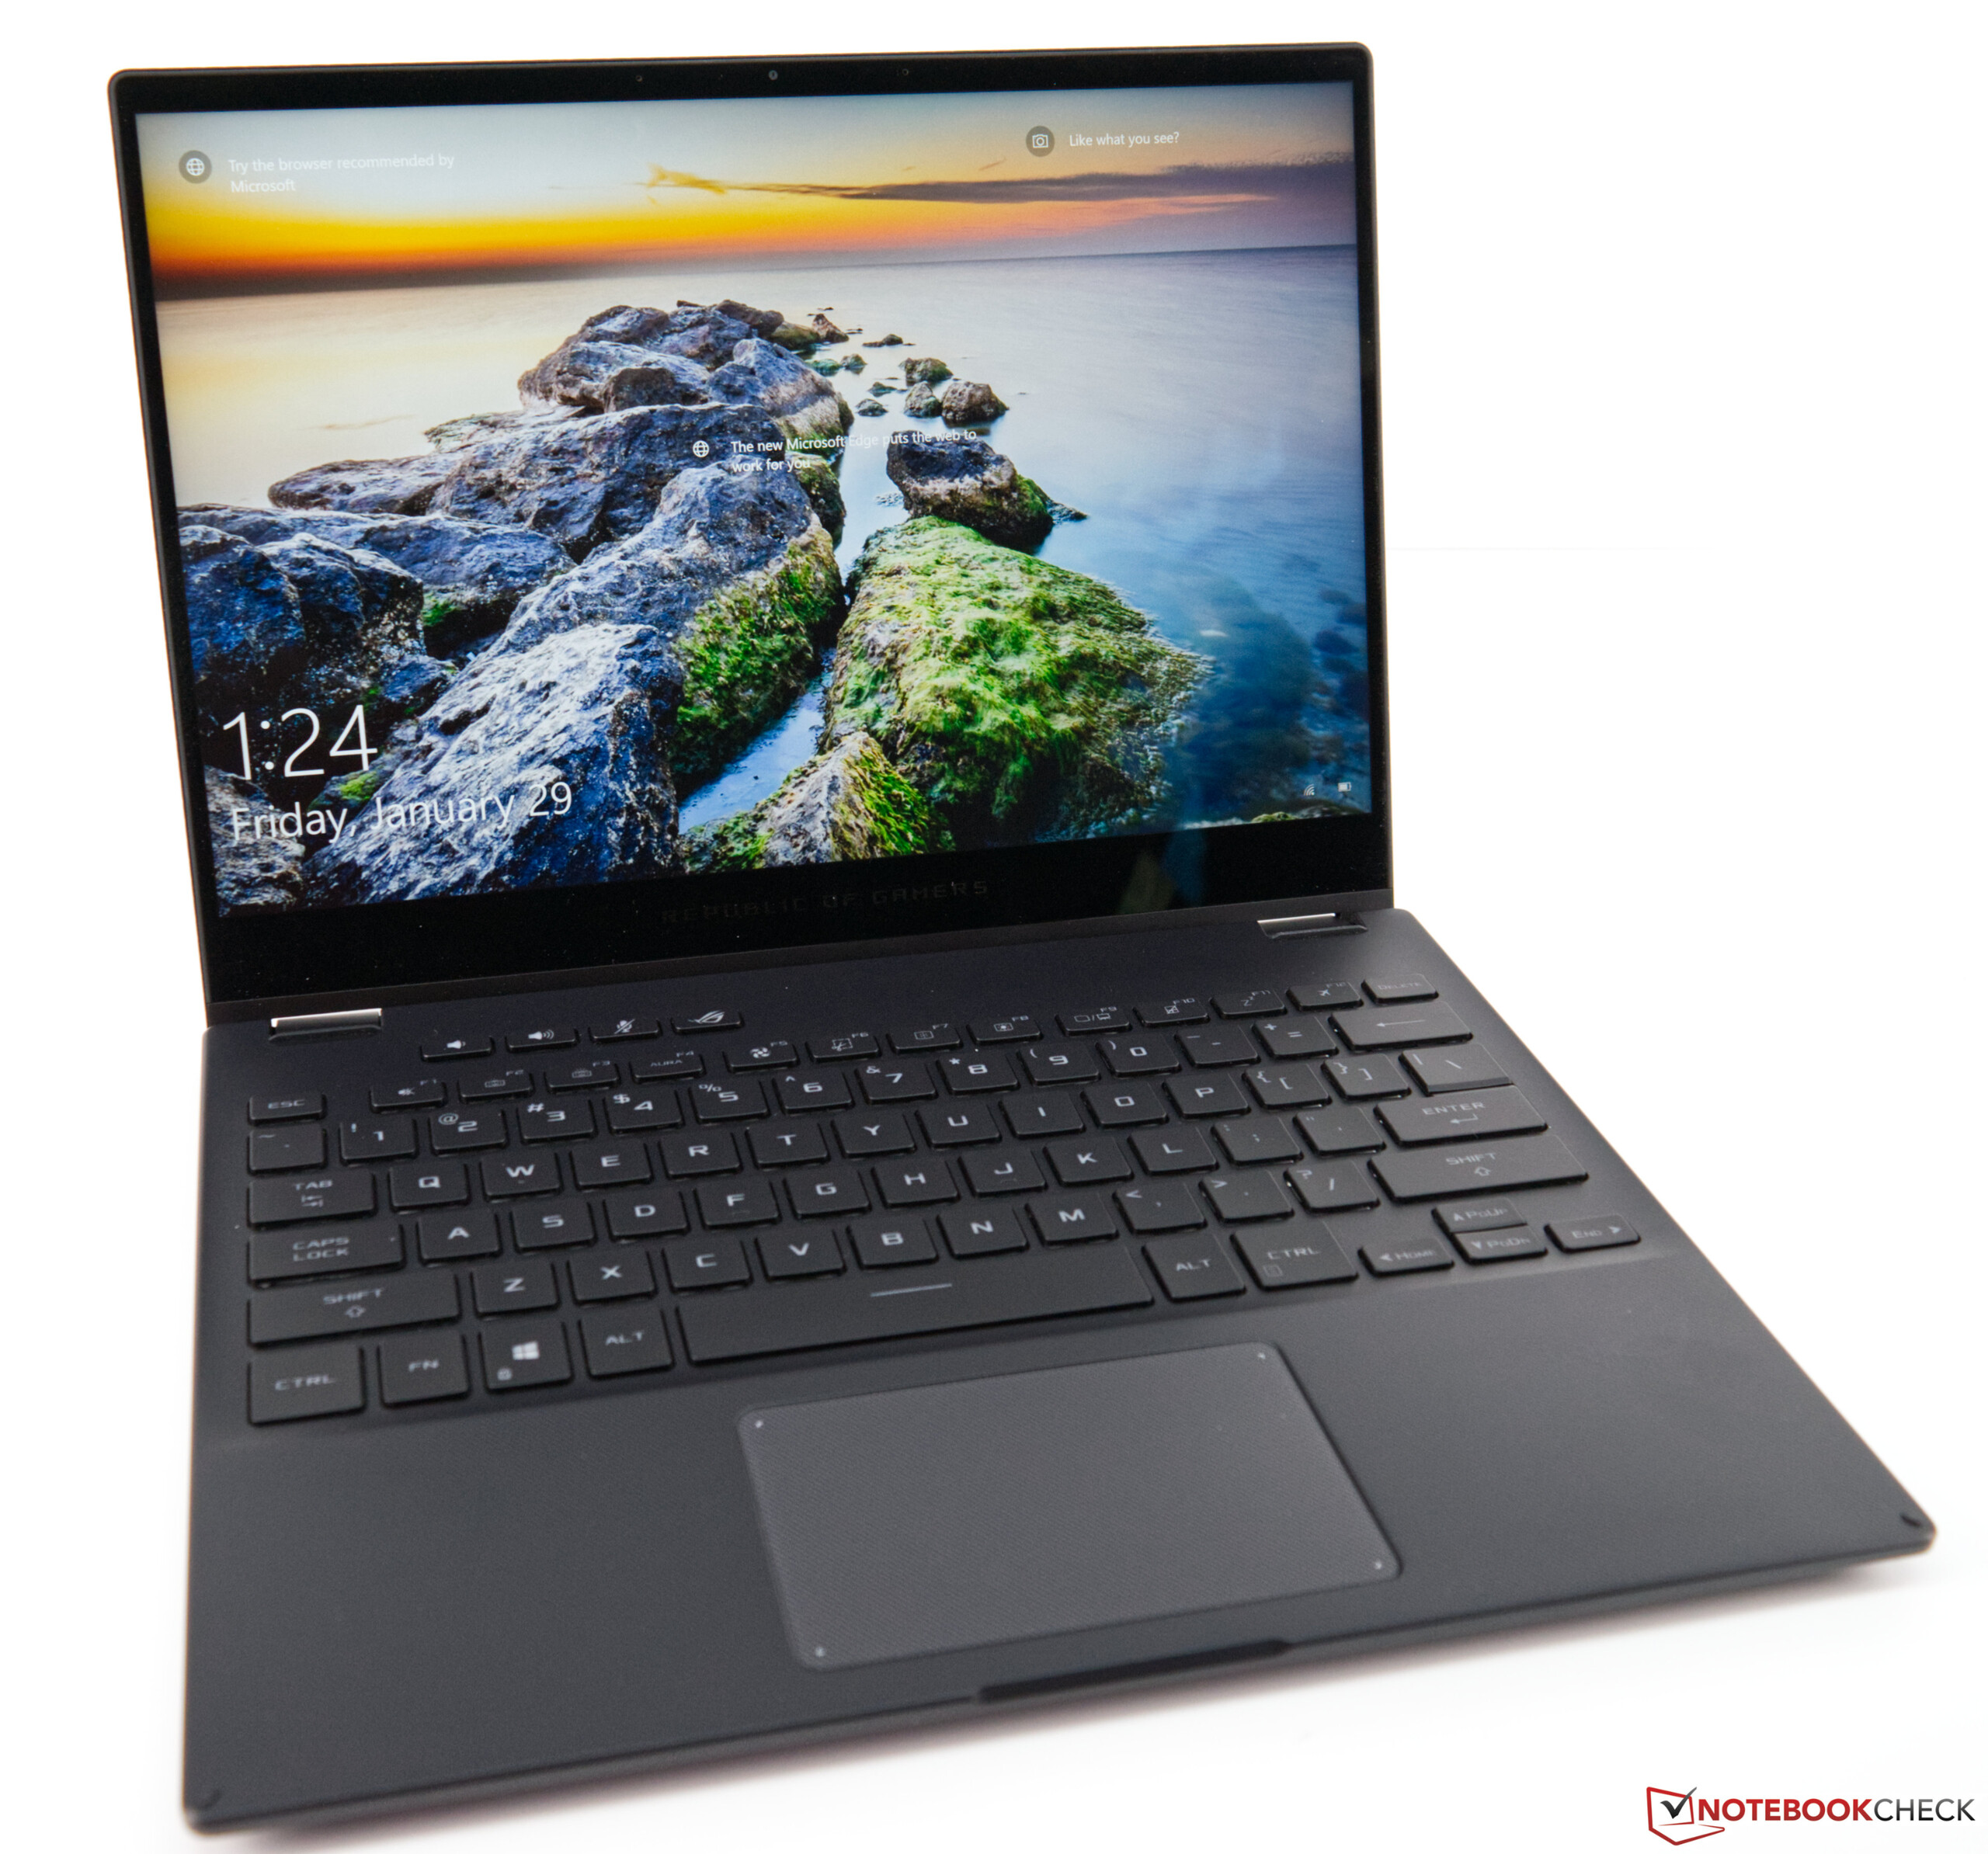
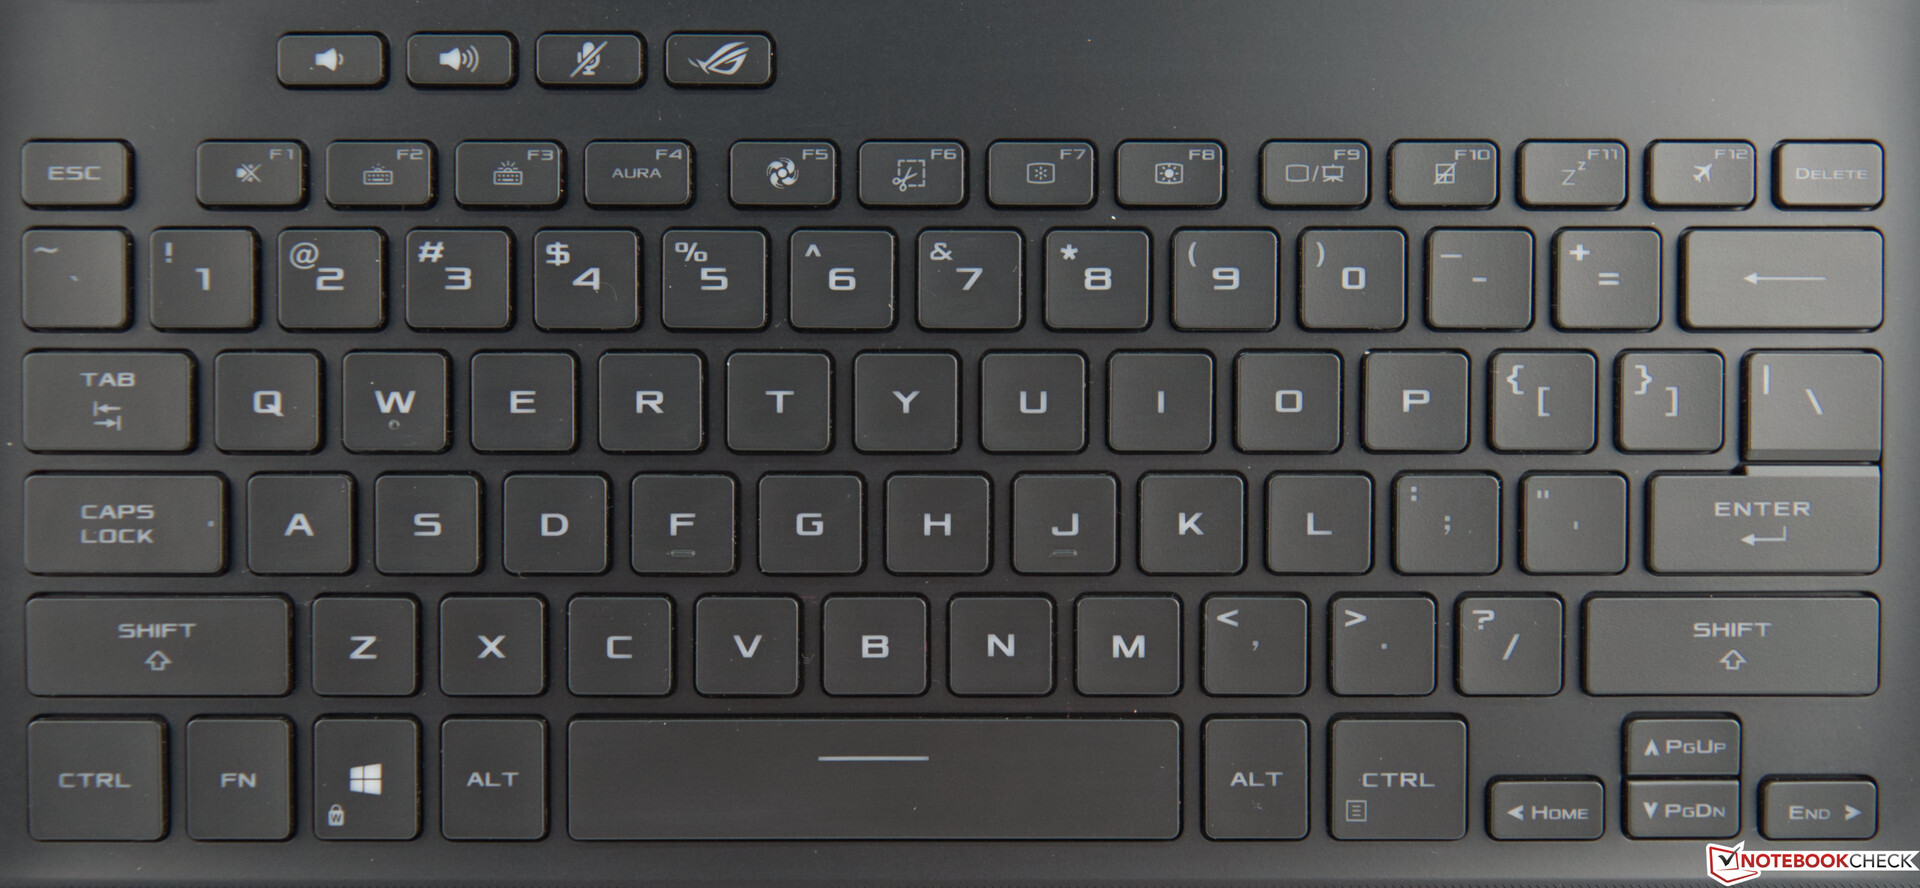
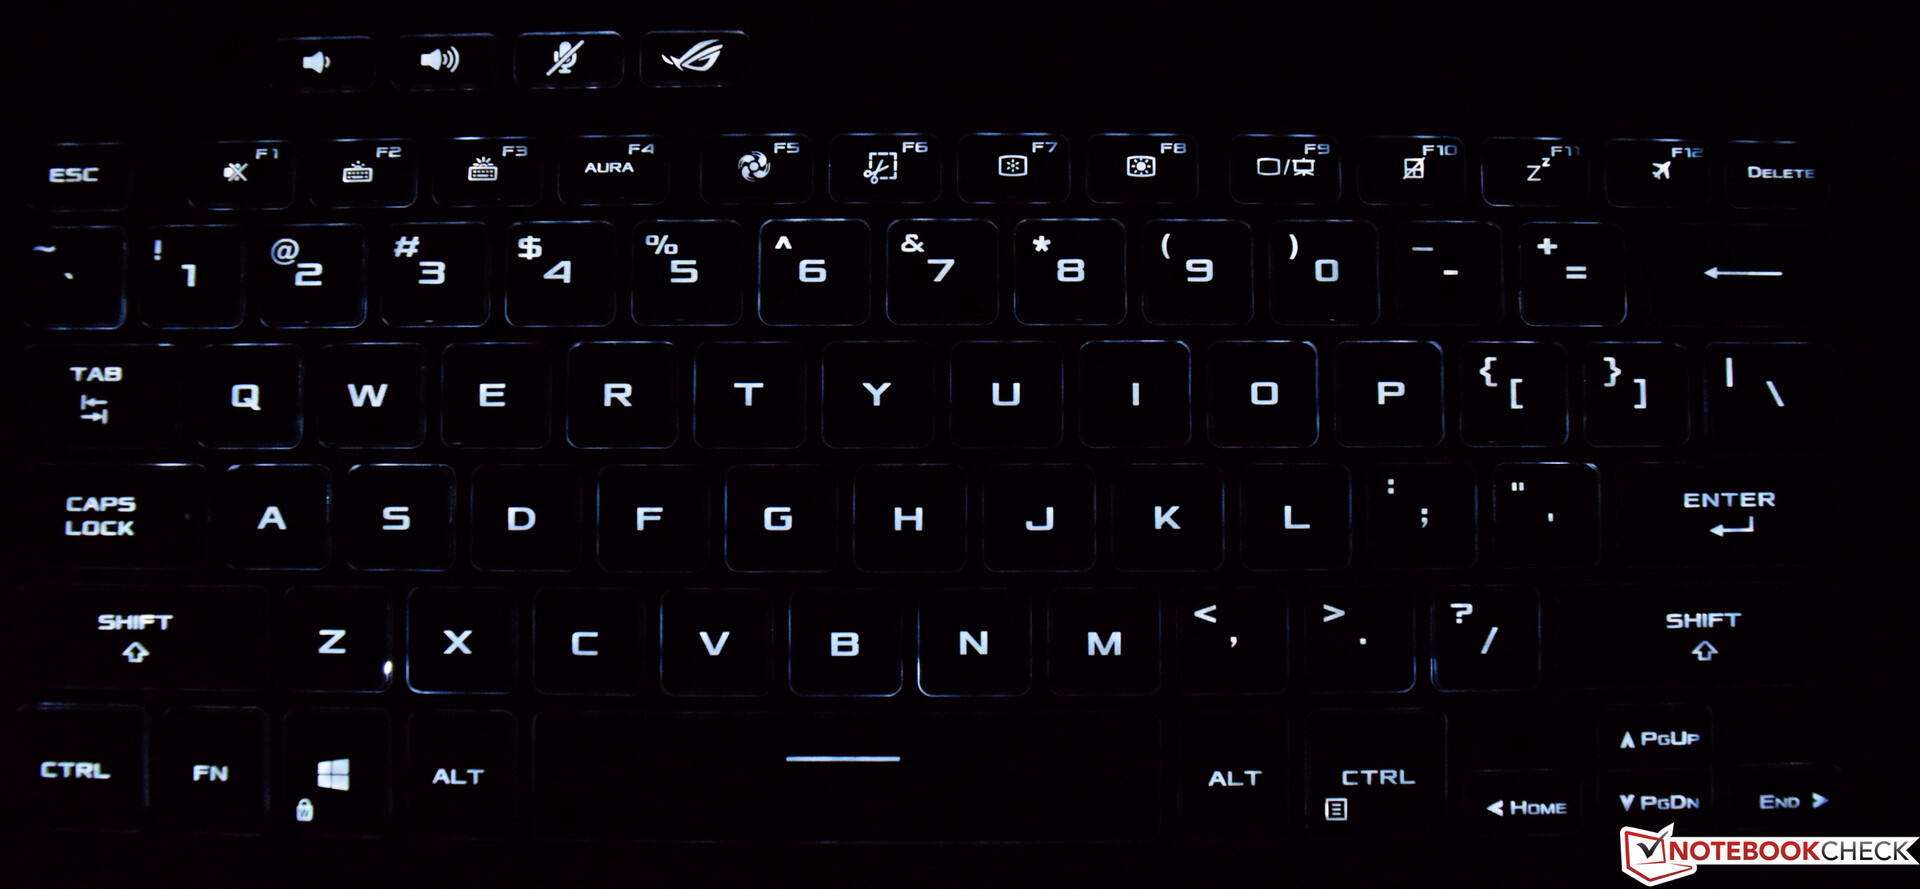
The 6-row chiclet keyboard of the ROG Flow X13 comes with a decent backlight that can be set to three different brightness levels. The surfaces of the keys offer a good grip, even though they aren't specially roughened. The short travel, together with the stroke that is not too muffled, provides a crisp typing experience. The pressure point is clearly defined and can be felt easily. Overall, the keyboard is also suitable for users who type a lot, and the slightly smaller arrow keys are no longer bothersome after a bit of familiarization.
Touchpad
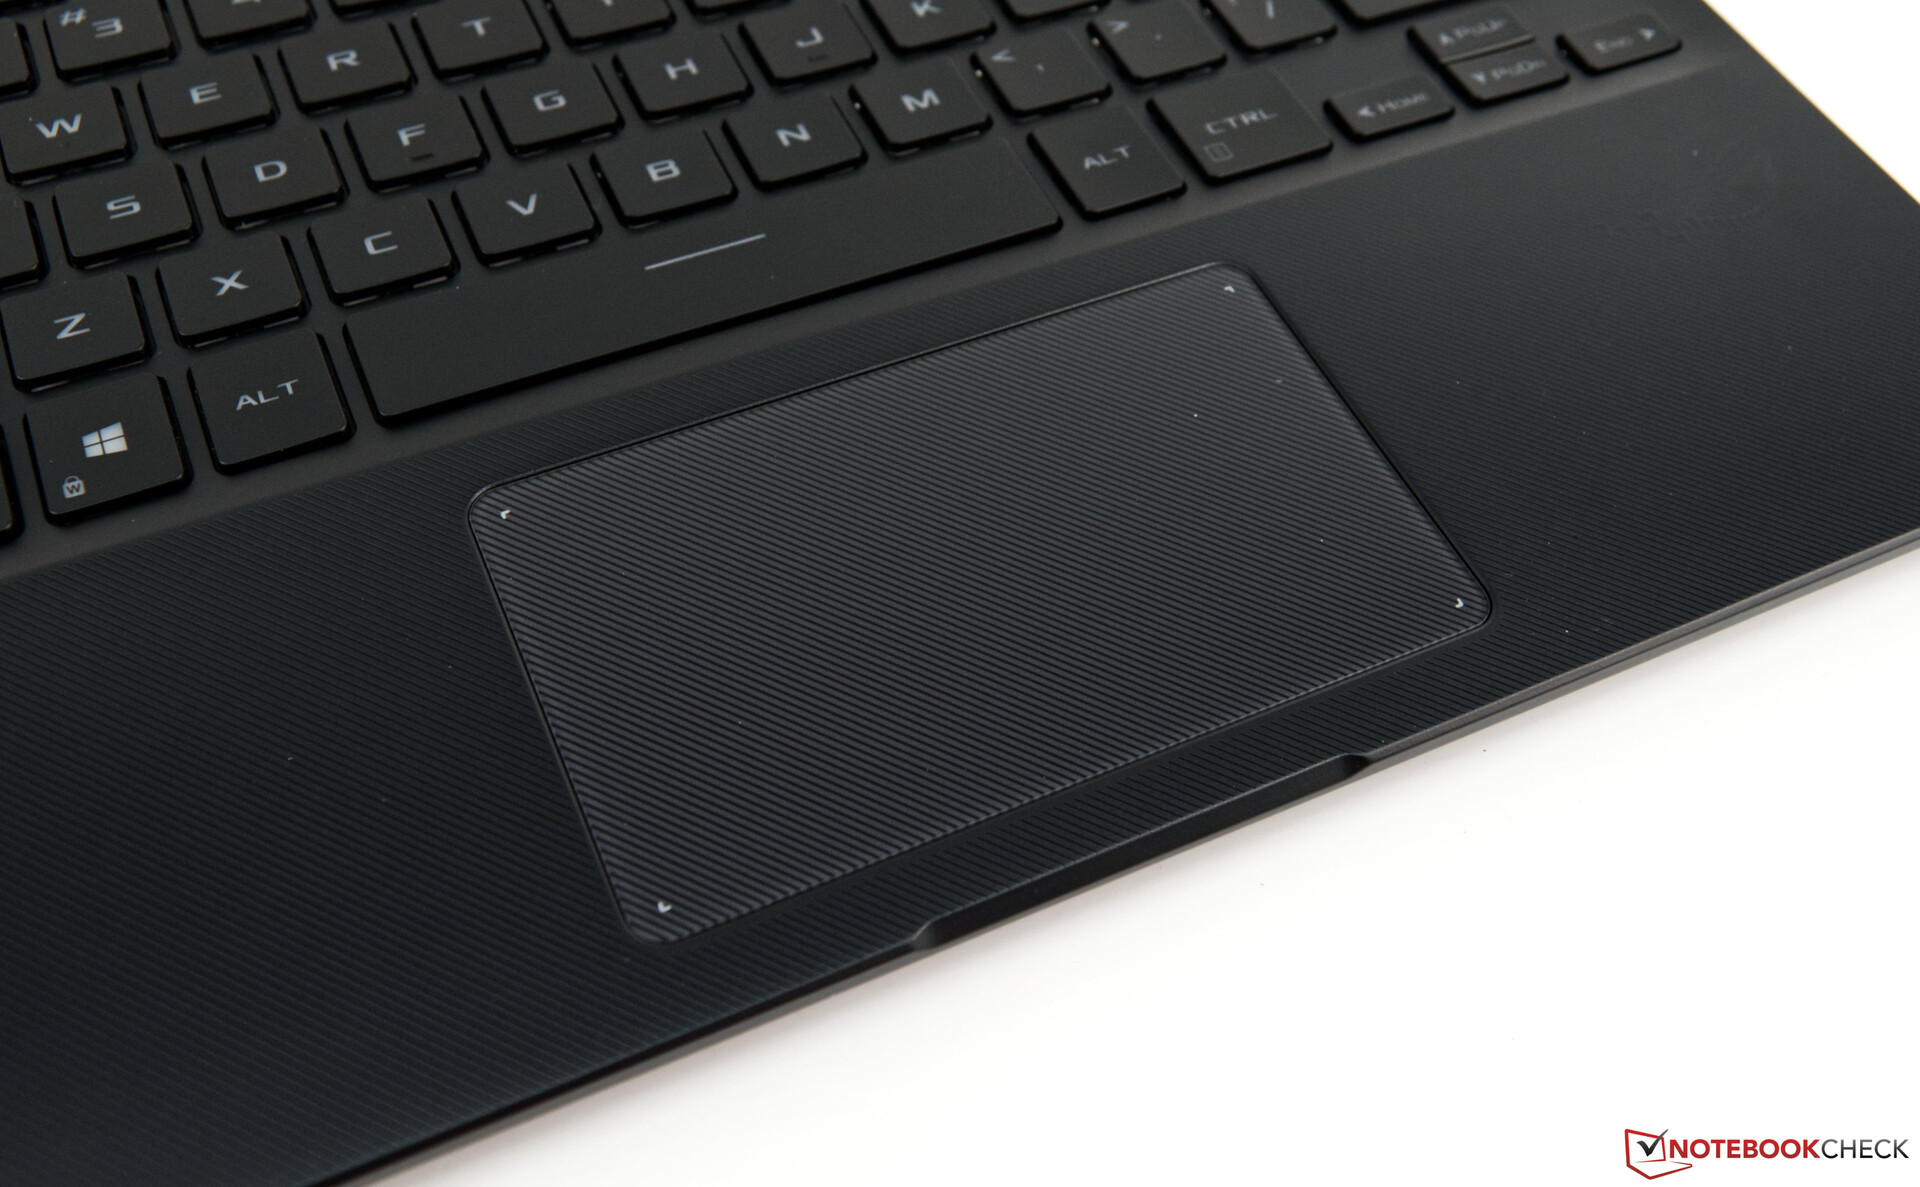
The ClickPad measures 10.6 x 6.2 centimeters and fits well into the base unit's structure in terms of looks. The surface is very smooth, which is a small drawback if your fingers are sweaty. The touchpad is very responsive, and precise inputs are no problem. The two input buttons are located in the lower area; these draw attention to themselves when pressed with a clear click sound.
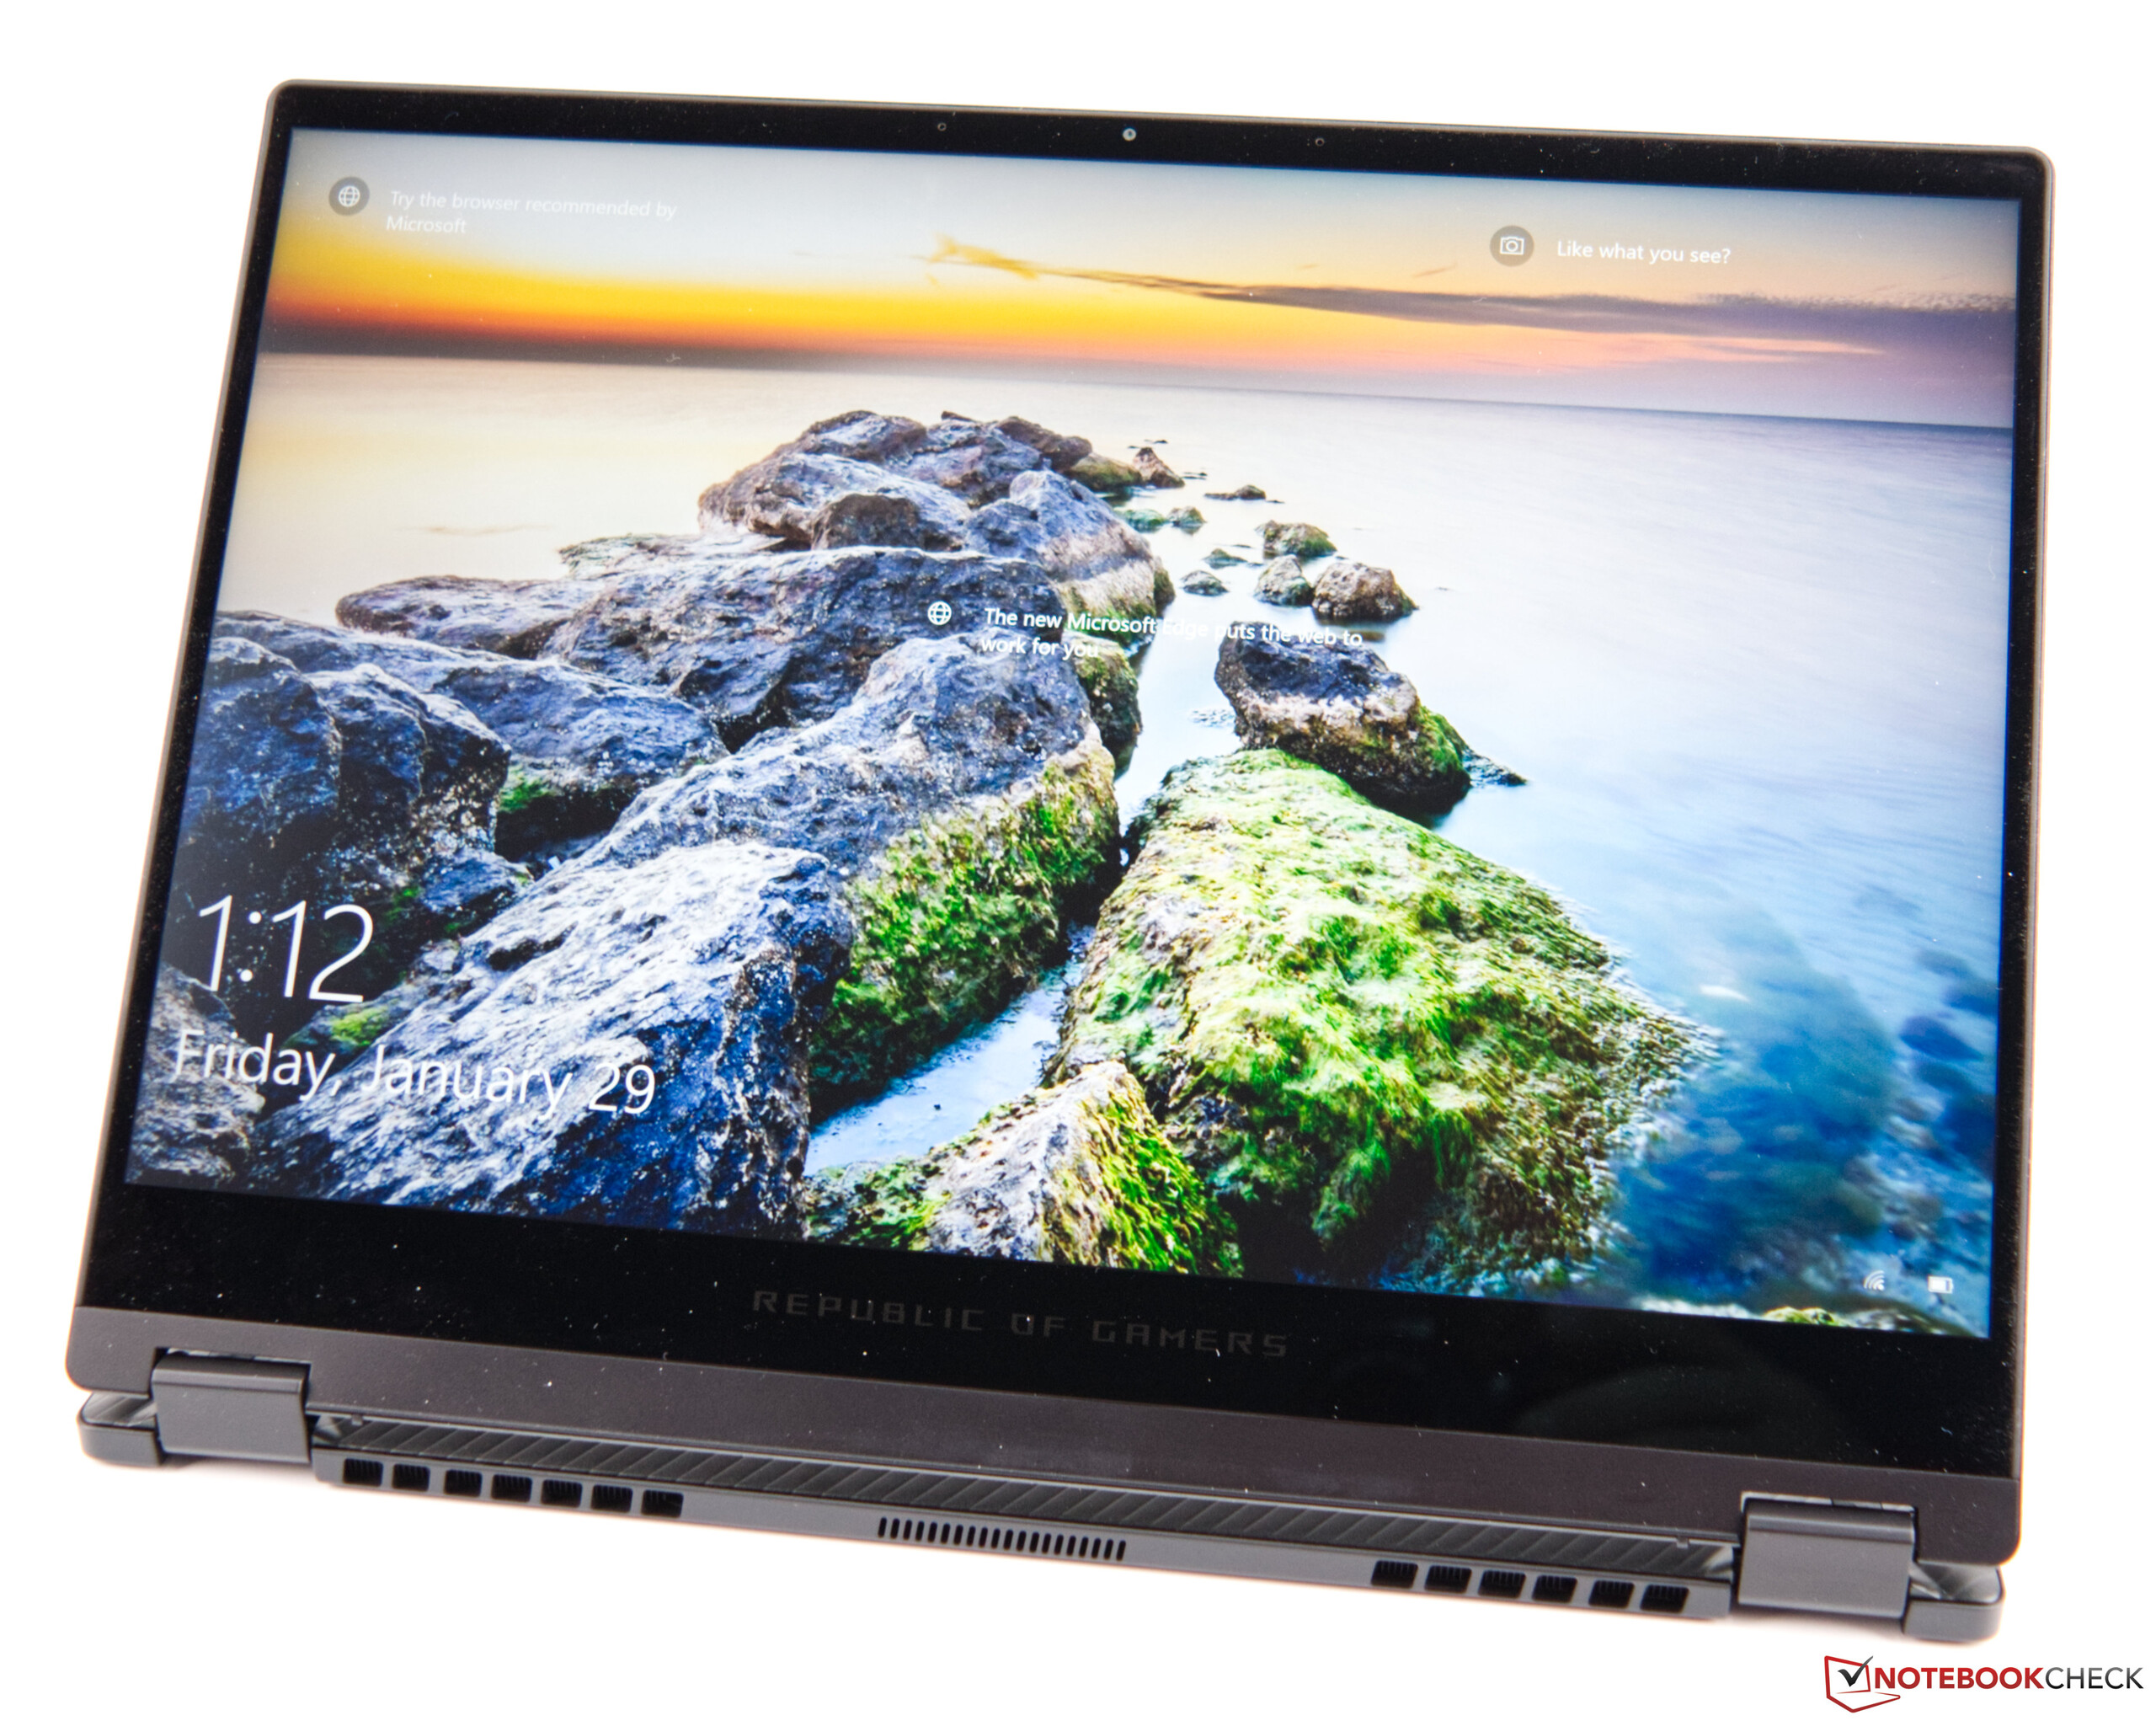
Display - 16:10 format

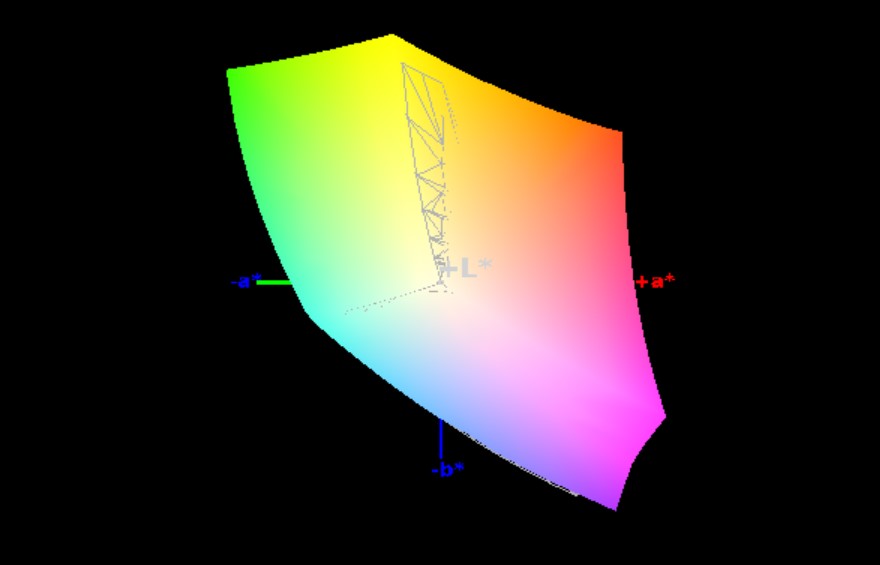
The installed display consists of a 16:10 panel with 3840x2400 pixels (WQUXGA) with a diagonal size of 13.4 inches. This results in a pixel density of 338 PPI. Alternatively, the Asus ROG Flow X13 is also available with a WUXGA display, which has 1920x1200 pixels.
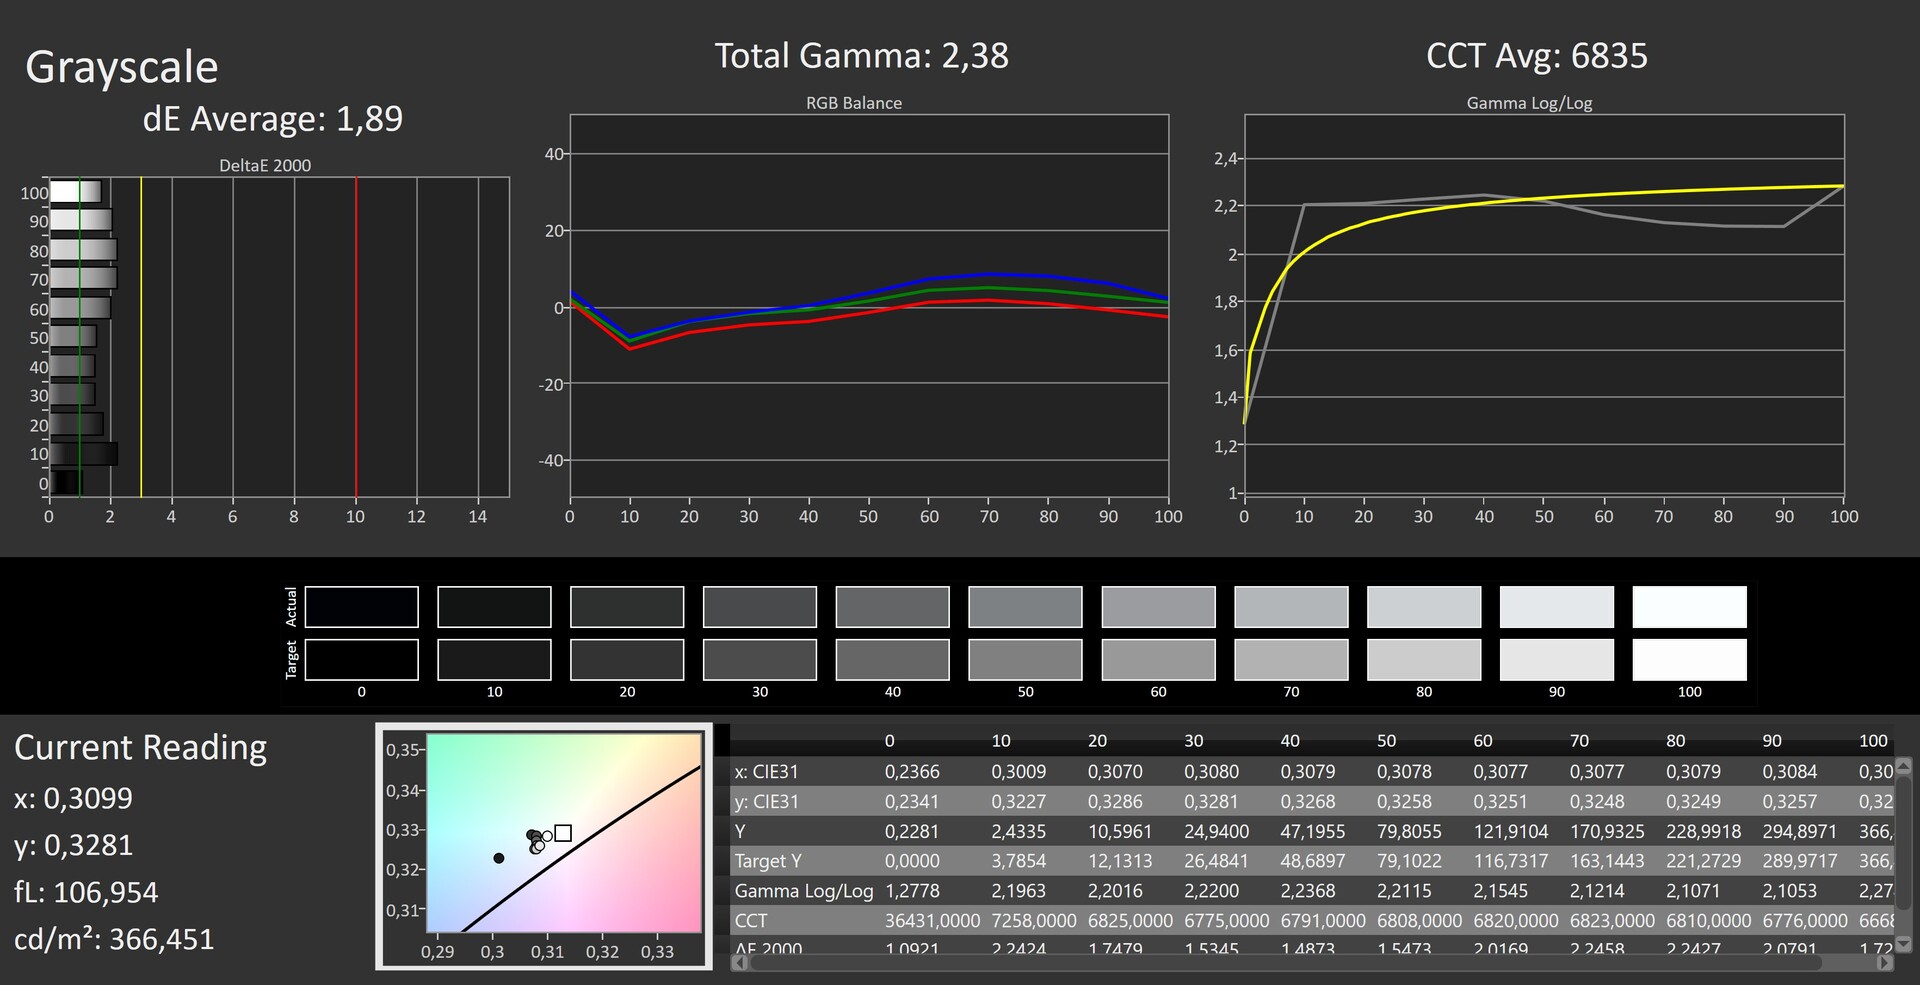
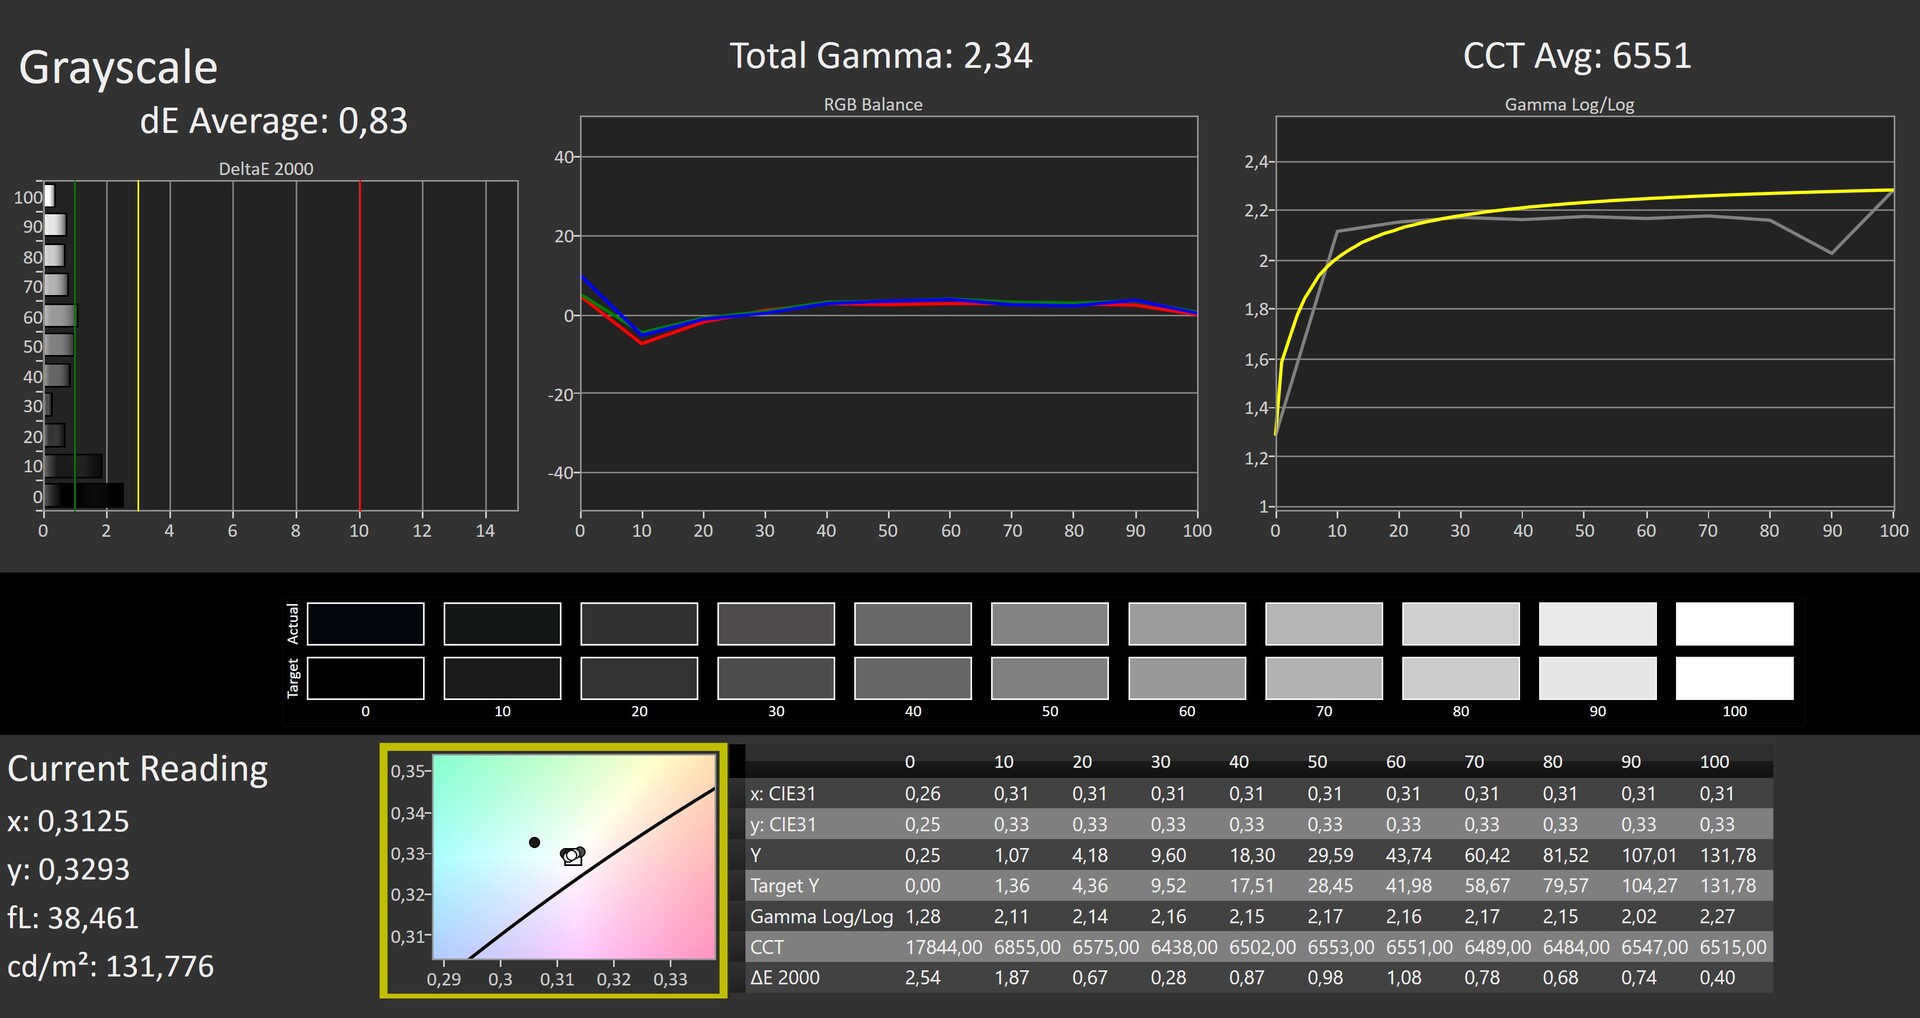
The average brightness is 331 cd/m². With a black level of 0.23, the display of our test sample achieves a contrast ratio of 1,561:1. Moreover, our test sample is a bit weaker in terms of response times. Nevertheless, only the Asus ZenBook Flip S offers better rates among the comparison devices. We would like to emphasize the positive fact that we didn't detect any clouding or PWM.
| |||||||||||||||||||||||||
Brightness Distribution: 86 %
Center on Battery: 207 cd/m²
Contrast: 1561:1 (Black: 0.23 cd/m²)
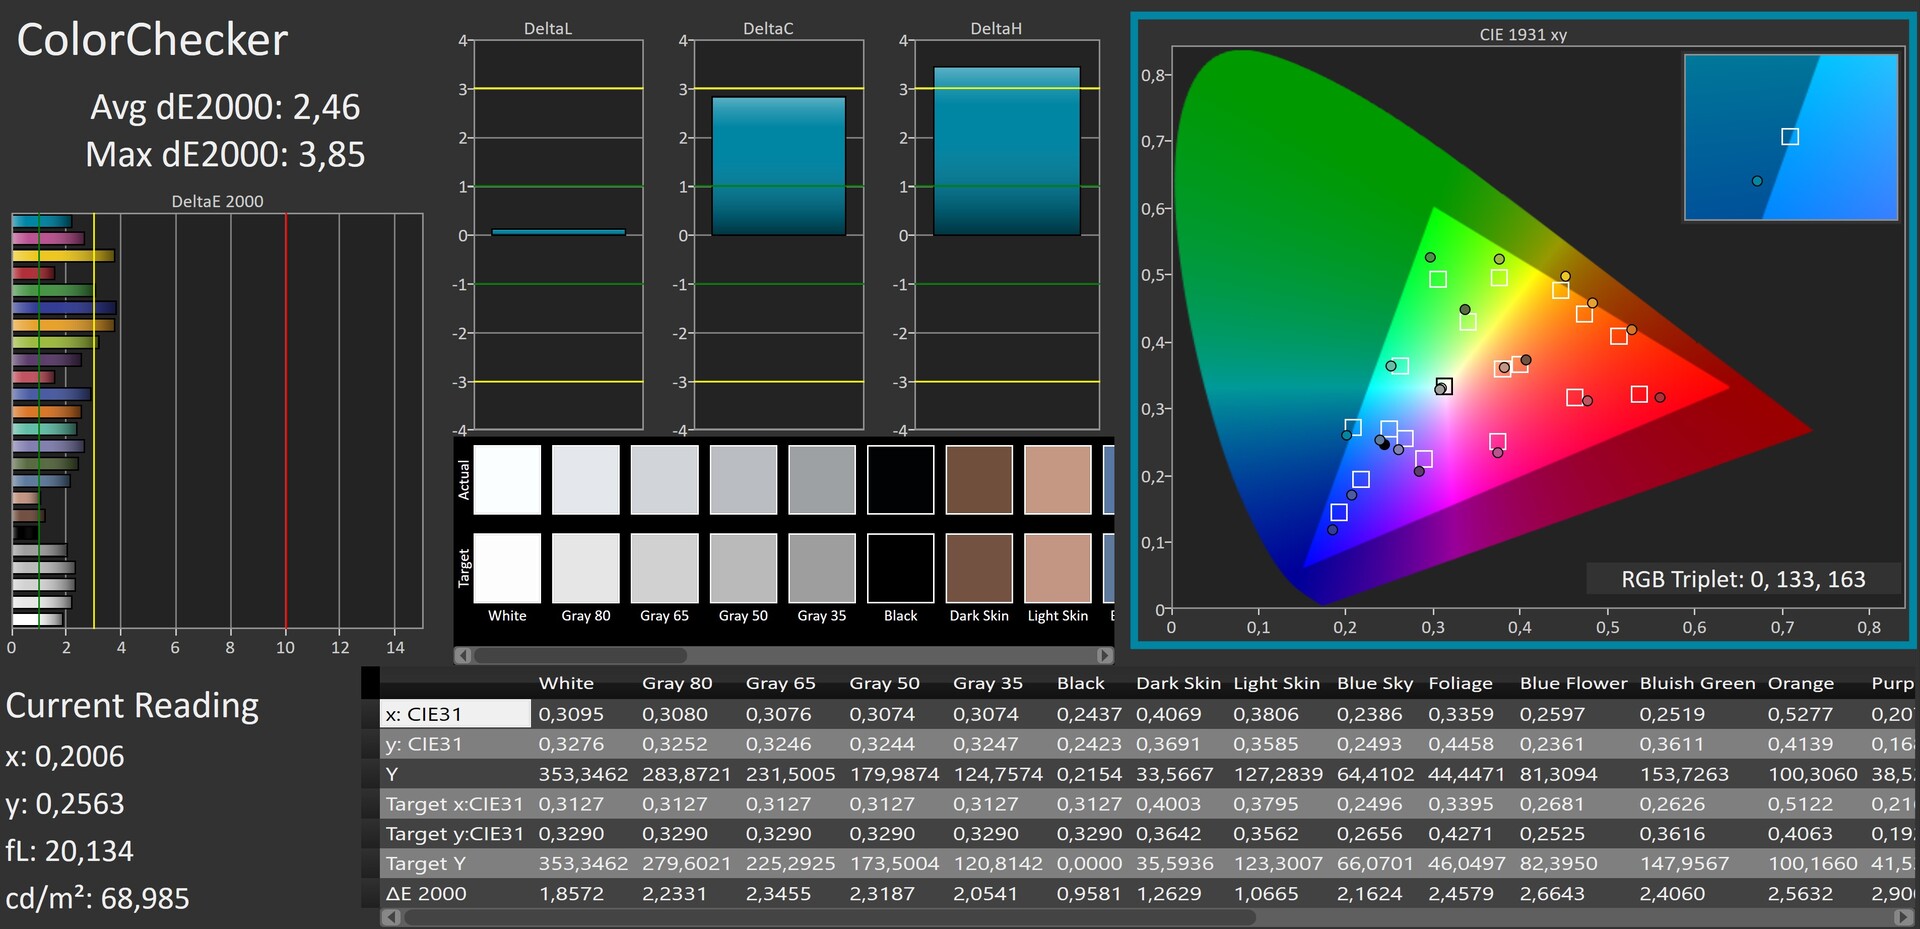
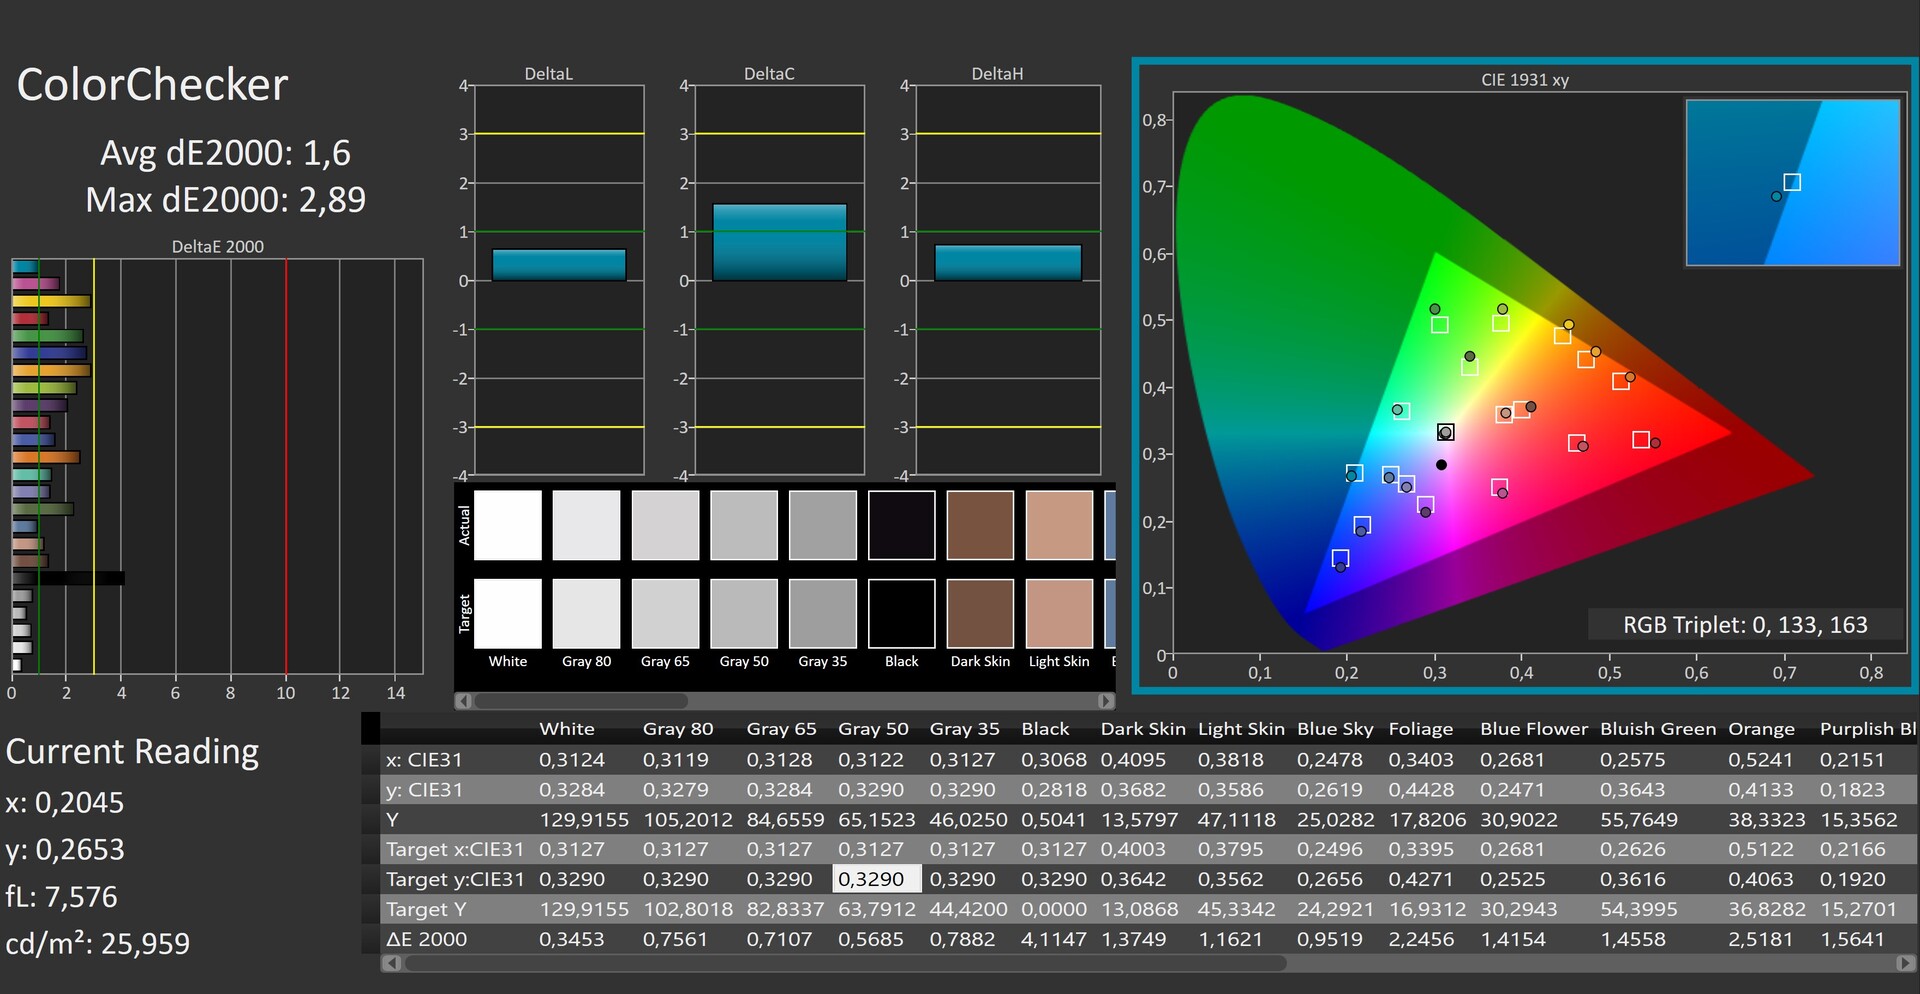
ΔE ColorChecker Calman: 2.46 | ∀{0.5-29.43 Ø4.73}
calibrated: 1.6
ΔE Greyscale Calman: 1.89 | ∀{0.09-98 Ø4.97}
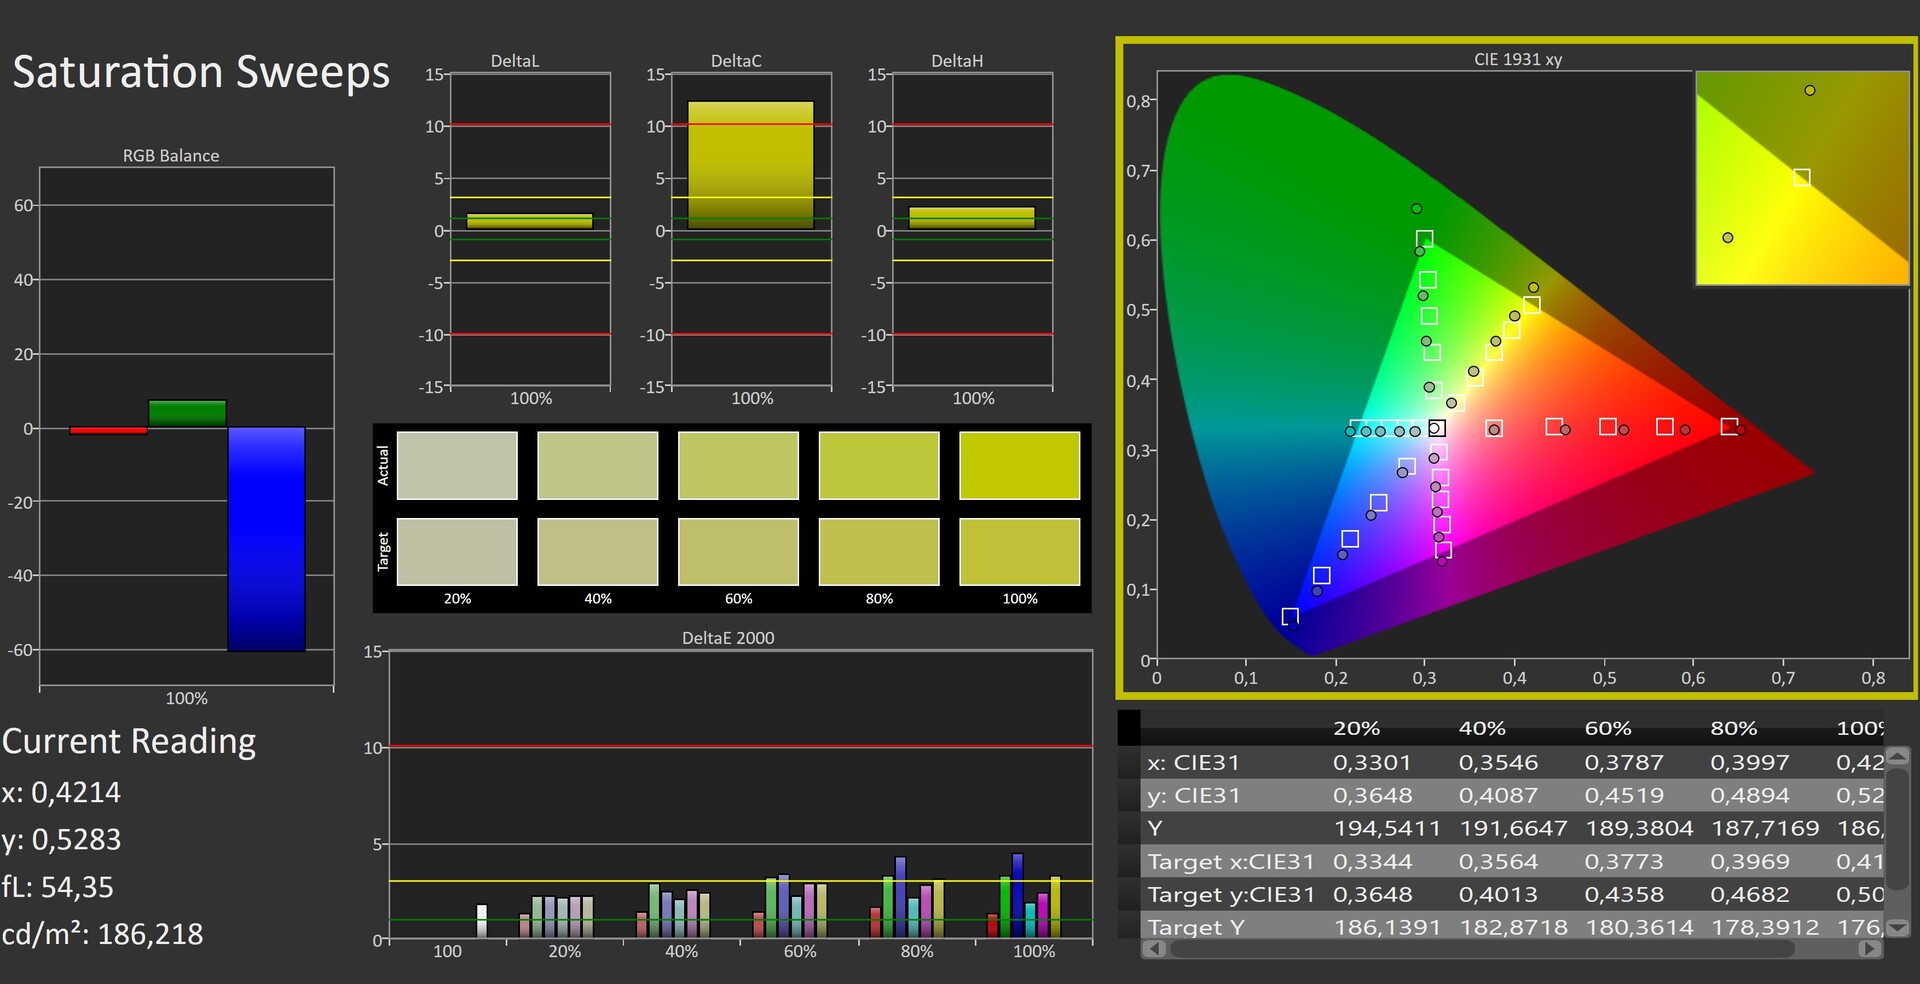
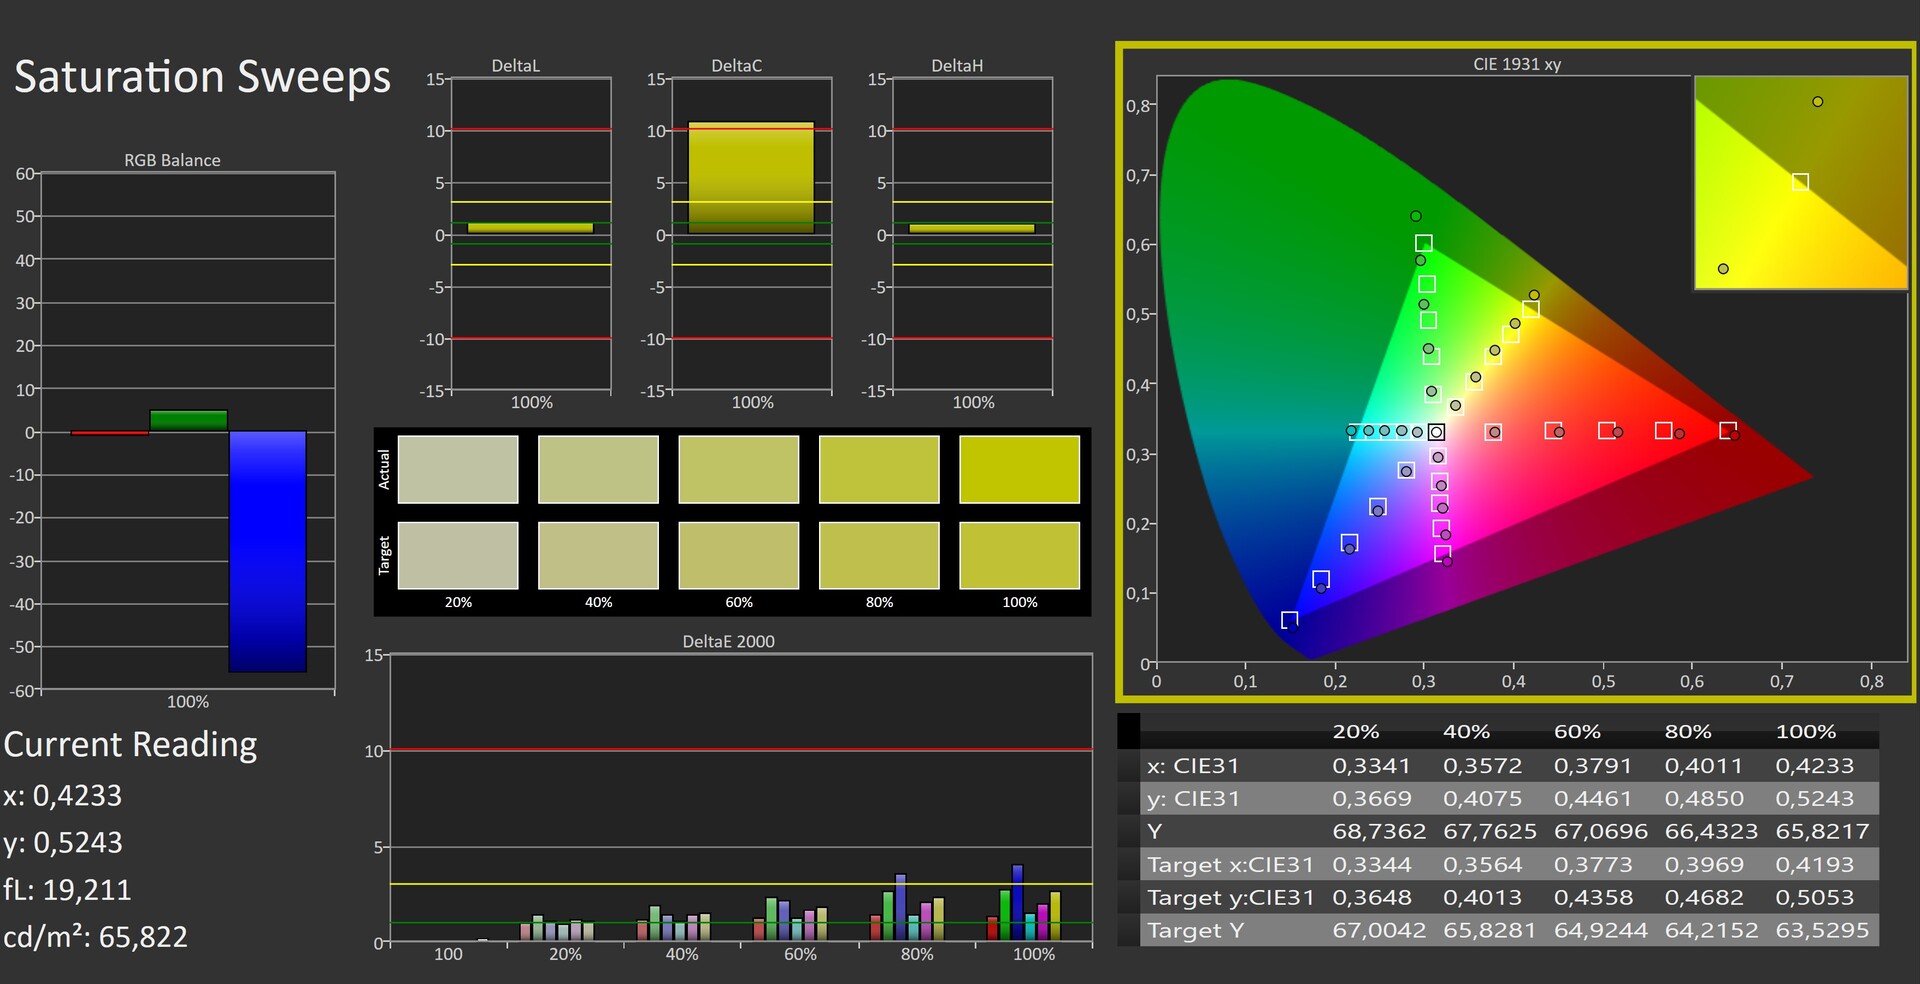
99.4% sRGB (Argyll 1.6.3 3D)
68.2% AdobeRGB 1998 (Argyll 1.6.3 3D)
76.8% AdobeRGB 1998 (Argyll 3D)
99.5% sRGB (Argyll 3D)
77.8% Display P3 (Argyll 3D)
Gamma: 2.38
CCT: 6835 K
| Asus ROG Flow X13 GV301QH LQ134R1JW51, IPS, 3840x2400, 13.4" | HP Spectre x360 14t-ea000 LG Philips LGD0663, IPS, 1920x1280, 13.5" | Lenovo Yoga 9i 14ITL5 LG Display LP140WF9-SPE2, IPS, 1920x1080, 14" | Acer Spin 5 SP513-54N-79EY BOE08BC, IPS, 2256x1504, 13.5" | Asus ZenBook Flip S UX371 SDC4147, OLED, 3840x2160, 13.3" | Microsoft Surface Book 3 13.5 Panasonic MEI96A2, IPS, 3000x2000, 13.5" | |
|---|---|---|---|---|---|---|
| Display | -9% | -12% | -6% | 20% | -12% | |
| Display P3 Coverage (%) | 77.8 | 65.8 -15% | 64.2 -17% | 69.4 -11% | 99.9 28% | 63.5 -18% |
| sRGB Coverage (%) | 99.5 | 98.2 -1% | 94.2 -5% | 99.6 0% | 100 1% | 95.1 -4% |
| AdobeRGB 1998 Coverage (%) | 76.8 | 67.9 -12% | 65 -15% | 71 -8% | 100 30% | 65.7 -14% |
| Response Times | -27% | -12% | 5% | 94% | -19% | |
| Response Time Grey 50% / Grey 80% * (ms) | 48 ? | 62 ? -29% | 55.2 ? -15% | 49 ? -2% | 2 ? 96% | 57 ? -19% |
| Response Time Black / White * (ms) | 32 ? | 39.6 ? -24% | 34.4 ? -8% | 28 ? 12% | 2.8 ? 91% | 38 ? -19% |
| PWM Frequency (Hz) | 208 ? | 59.5 ? | ||||
| Screen | -4% | -23% | 16% | 3% | -7% | |
| Brightness middle (cd/m²) | 359 | 443.5 24% | 365 2% | 454 26% | 365 2% | 391 9% |
| Brightness (cd/m²) | 331 | 394 19% | 346 5% | 426 29% | 372 12% | 367 11% |
| Brightness Distribution (%) | 86 | 78 -9% | 82 -5% | 91 6% | 91 6% | 86 0% |
| Black Level * (cd/m²) | 0.23 | 0.17 26% | 0.23 -0% | 0.33 -43% | 0.03 87% | 0.19 17% |
| Contrast (:1) | 1561 | 2609 67% | 1587 2% | 1376 -12% | 12167 679% | 2058 32% |
| Colorchecker dE 2000 * | 2.46 | 2.7 -10% | 3.65 -48% | 1.27 48% | 7.6 -209% | 3.07 -25% |
| Colorchecker dE 2000 max. * | 3.85 | 4.36 -13% | 6.69 -74% | 2.42 37% | 12.9 -235% | 4.74 -23% |
| Colorchecker dE 2000 calibrated * | 1.6 | 2.61 -63% | 1.61 -1% | 0.78 51% | 4.1 -156% | 1.52 5% |
| Greyscale dE 2000 * | 1.89 | 3.4 -80% | 4 -112% | 1.07 43% | 5.4 -186% | 3.6 -90% |
| Gamma | 2.38 92% | 2.09 105% | 2.33 94% | 2.39 92% | 1.6 138% | 2.29 96% |
| CCT | 6835 95% | 6144 106% | 6873 95% | 6530 100% | 6327 103% | 6330 103% |
| Color Space (Percent of AdobeRGB 1998) (%) | 68.2 | 62.1 -9% | 60.1 -12% | 65 -5% | 92 35% | 61 -11% |
| Color Space (Percent of sRGB) (%) | 99.4 | 98.5 -1% | 93.9 -6% | 100 1% | 100 1% | 95 -4% |
| Total Average (Program / Settings) | -13% /
-8% | -16% /
-19% | 5% /
11% | 39% /
18% | -13% /
-10% |
* ... smaller is better
Out of the box and compared to the sRGB color space, the measured Delta E 2000 color deviations are almost perfect and below the target value of 3. Nevertheless, we performed a manual calibration. However, this didn't result in an improvement. The Asus ROG Flow X13 scores points with good rates when it comes to the color-space coverage that we measured, and it's sufficient for professional use as well.

Display Response Times
| ↔ Response Time Black to White | ||
|---|---|---|
| 32 ms ... rise ↗ and fall ↘ combined | ↗ 16 ms rise | 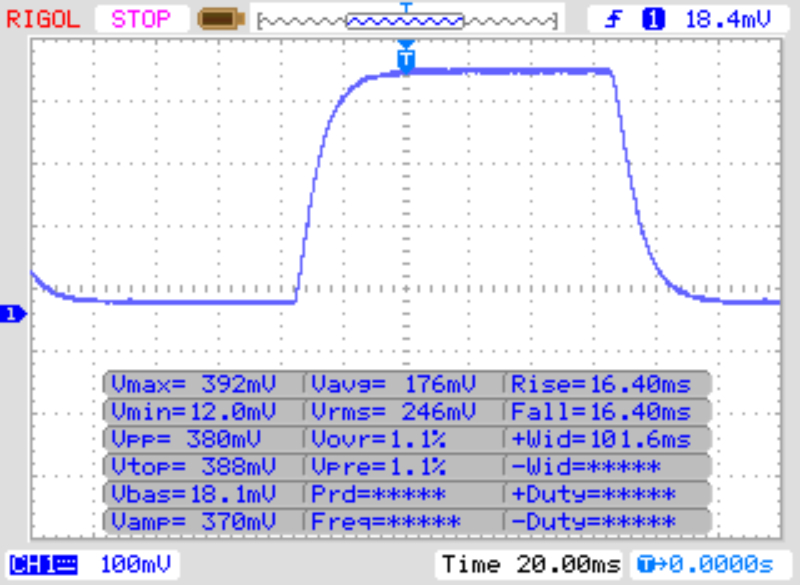 |
| ↘ 16 ms fall | ||
| The screen shows slow response rates in our tests and will be unsatisfactory for gamers. In comparison, all tested devices range from 0.1 (minimum) to 240 (maximum) ms. » 86 % of all devices are better. This means that the measured response time is worse than the average of all tested devices (19.9 ms). | ||
| ↔ Response Time 50% Grey to 80% Grey | ||
| 48 ms ... rise ↗ and fall ↘ combined | ↗ 23 ms rise | 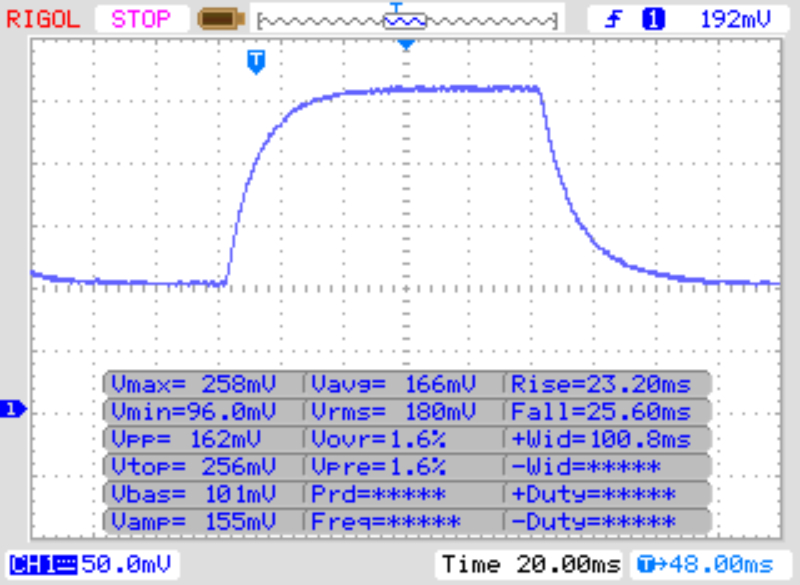 |
| ↘ 25 ms fall | ||
| The screen shows slow response rates in our tests and will be unsatisfactory for gamers. In comparison, all tested devices range from 0.165 (minimum) to 636 (maximum) ms. » 82 % of all devices are better. This means that the measured response time is worse than the average of all tested devices (31.1 ms). | ||
Screen Flickering / PWM (Pulse-Width Modulation)
| Screen flickering / PWM not detected | 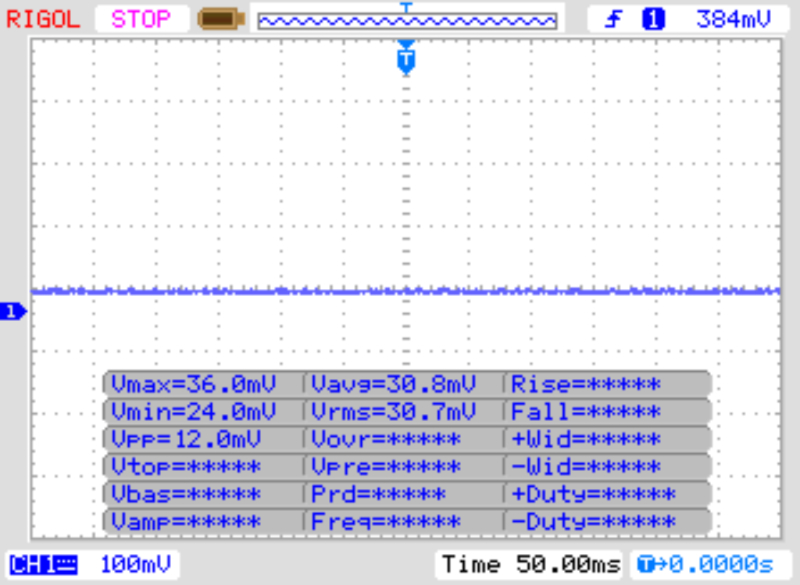 | ||
In comparison: 52 % of all tested devices do not use PWM to dim the display. If PWM was detected, an average of 7816 (minimum: 5 - maximum: 343500) Hz was measured. | |||
As expected, the Asus ROG Flow X13 performs very well in the viewing-angle test. The test image can be seen very well from all positions. The situation becomes a bit problematic when the Asus device is used outdoors. The glossy surface causes reflections on the display, which can be annoying under certain circumstances.

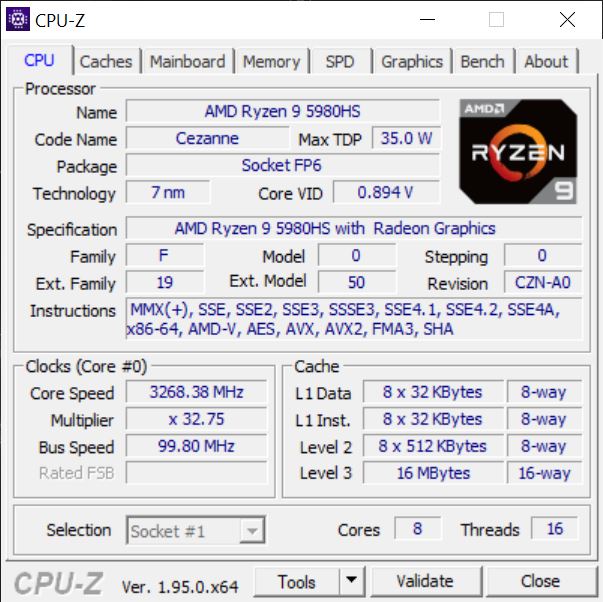
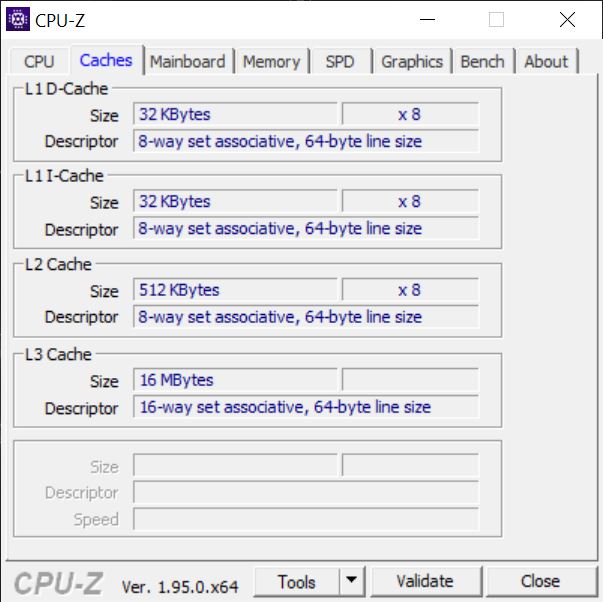
Performance - AMD Ryzen 9 and GeForce GTX under the hood
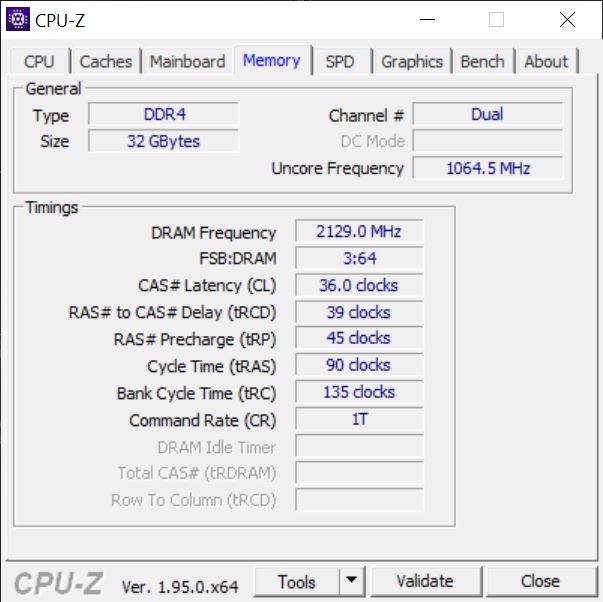
For a convertible that is only meant to be used for work, the Asus ROG Flow X13 offers more than enough performance. The AMD Ryzen 9 5980HS is the top model among CPUs and offers 8 cores and 16 threads. No corners have been cut when it comes to the RAM and the SSD, either. With 32 GB of DDR4 memory and a 1 TB SSD, you're also prepared for the future. Last but not least, the integrated Nvidia GeForce GTX 1650 Max-Q ensures a solid 3D performance.
Processor
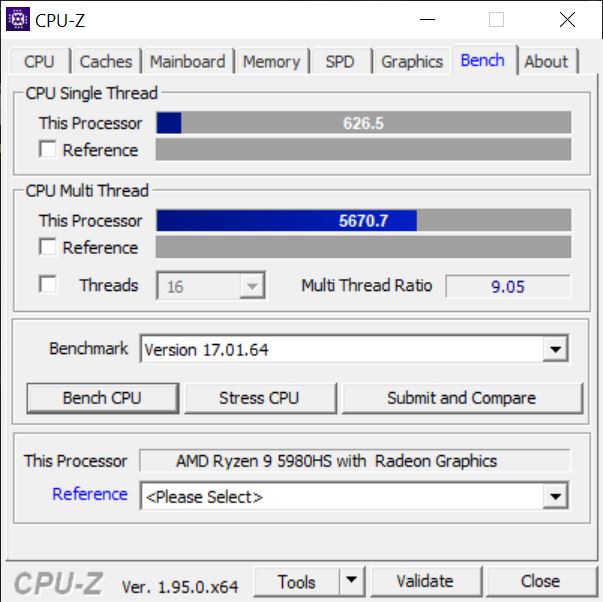
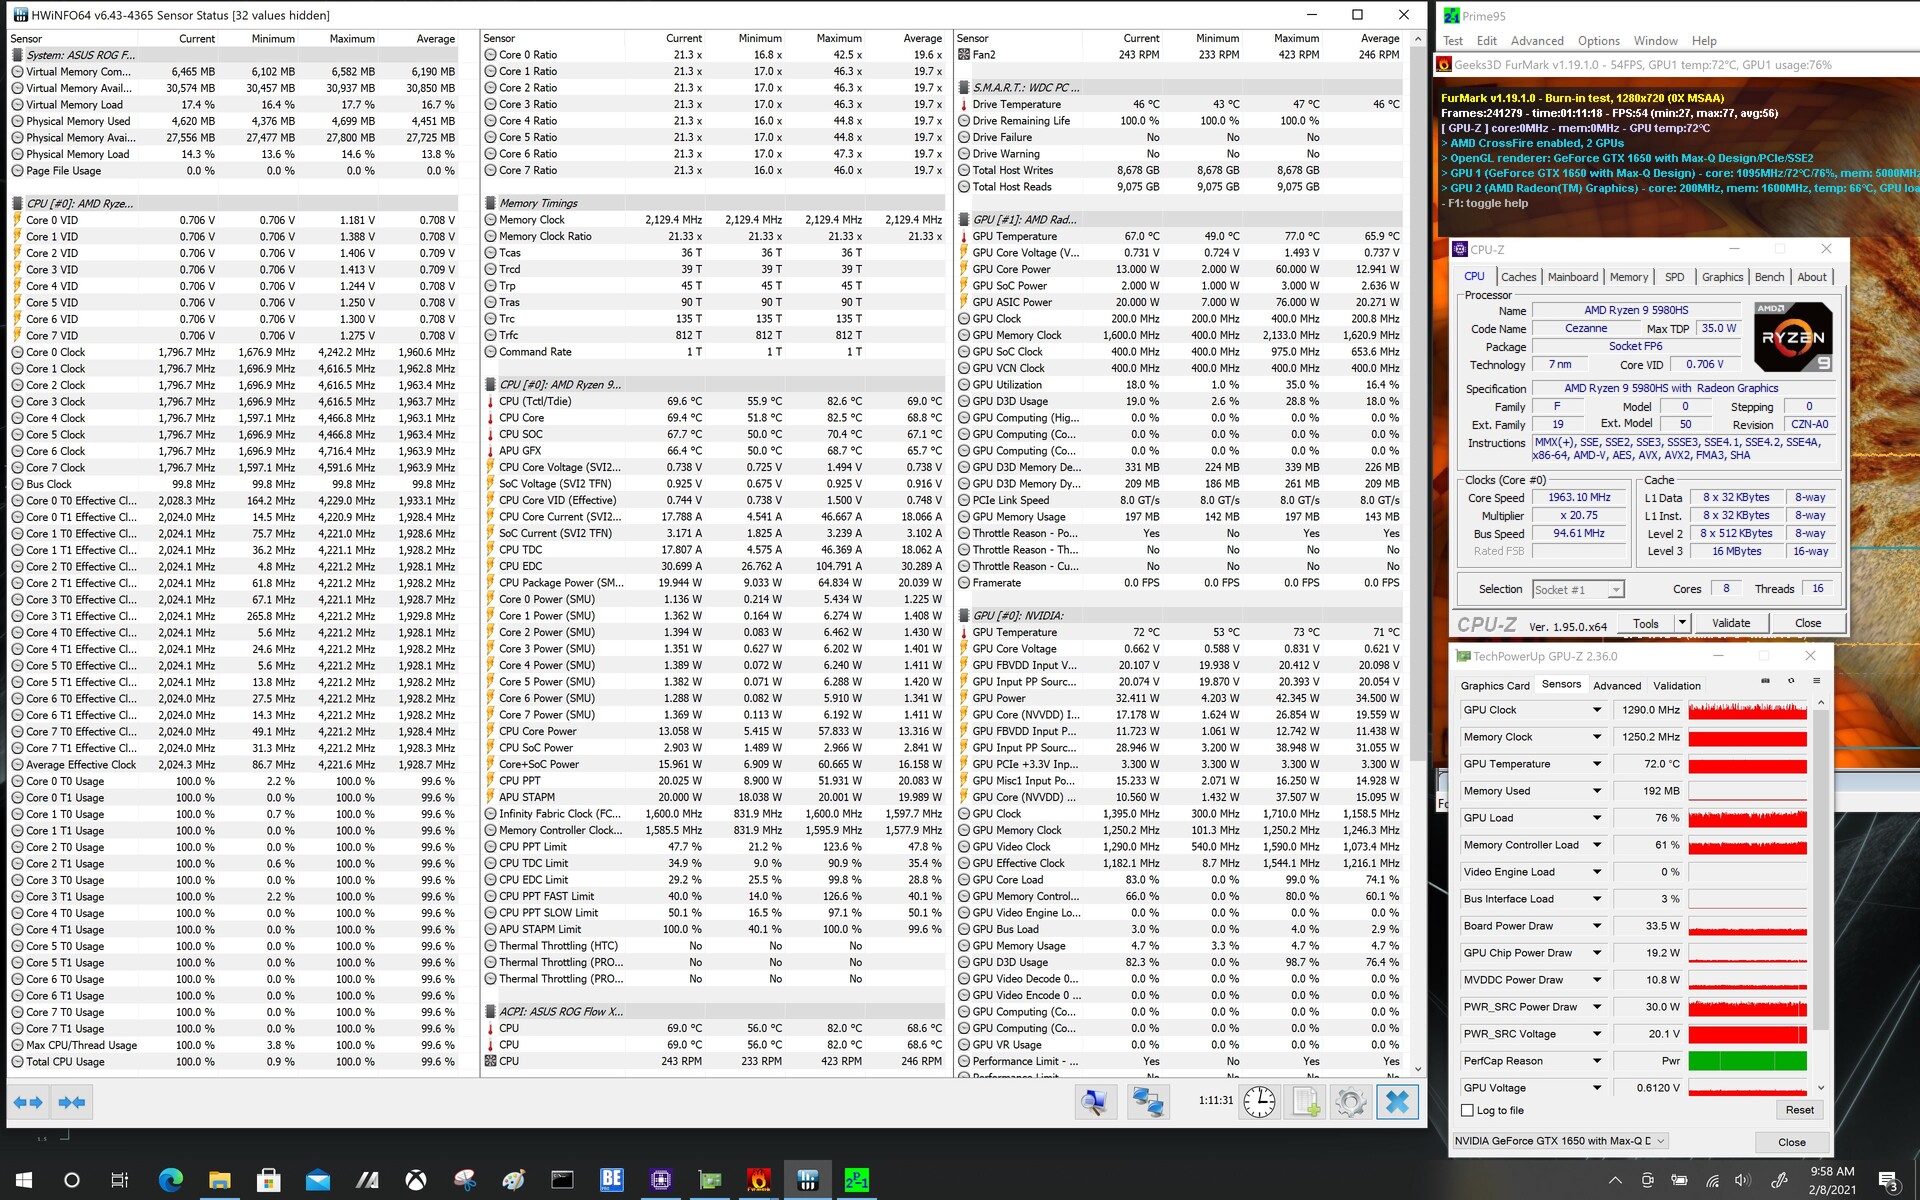
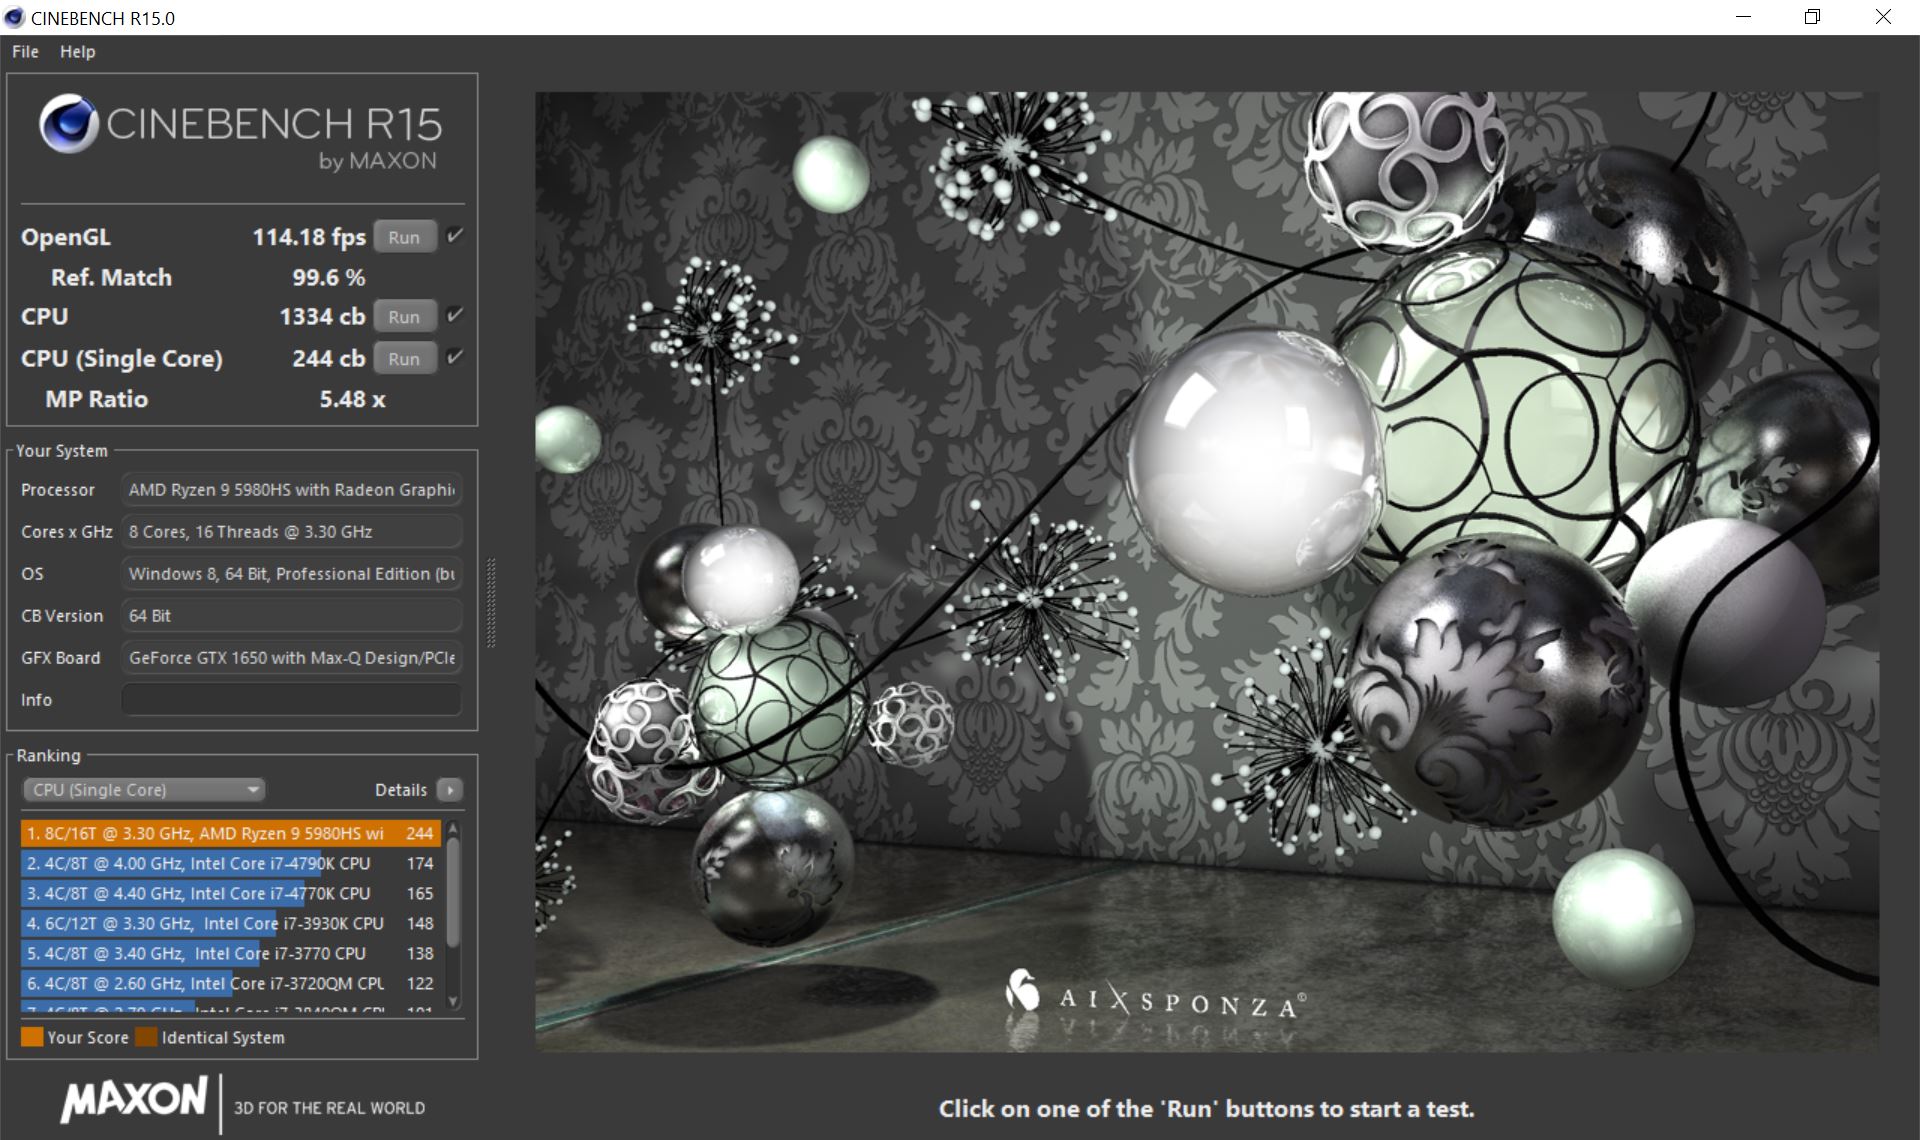
The AMD Ryzen 9 5980HS powers the Asus laptop. With its 8 cores and 16 threads, working on the device is really enjoyable. The base clock speed is 3.3 GHz. In Turbo mode, even up to 4.8 GHz is possible. As a result, the 35-watt SoC can consume up to 45 watts for a short time when the conditions allow it. In comparison, the AMD Ryzen 9 5980HS shows very good performance both in the single-core tests and in the multithread benchmarks.
In the Cinebench R15 Multi loop, the AMD Ryzen 9 5980HS starts at just under 2,090 points and settles at an average of 1,873 points in the further course of the test.
For further comparisons and benchmarks, you can take a look at our CPU comparison table.
Cinebench R15: CPU Single 64Bit | CPU Multi 64Bit
Blender: v2.79 BMW27 CPU
7-Zip 18.03: 7z b 4 -mmt1 | 7z b 4
Geekbench 5.5: Single-Core | Multi-Core
HWBOT x265 Benchmark v2.2: 4k Preset
LibreOffice : 20 Documents To PDF
R Benchmark 2.5: Overall mean
| Cinebench R20 / CPU (Single Core) | |
| Average of class Convertible (273 - 834, n=50, last 2 years) | |
| Asus ROG Flow X13 GV301QH | |
| Average AMD Ryzen 9 5980HS (601 - 604, n=2) | |
| HP Spectre x360 14t-ea000 | |
| Lenovo Yoga 9i 14ITL5 | |
| Asus ZenBook Flip S UX371 | |
| Acer Spin 5 SP513-54N-79EY | |
| Microsoft Surface Book 3 13.5 | |
| Cinebench R20 / CPU (Multi Core) | |
| Asus ROG Flow X13 GV301QH | |
| Average AMD Ryzen 9 5980HS (4349 - 4953, n=2) | |
| Average of class Convertible (595 - 12102, n=50, last 2 years) | |
| Lenovo Yoga 9i 14ITL5 | |
| HP Spectre x360 14t-ea000 | |
| Acer Spin 5 SP513-54N-79EY | |
| Asus ZenBook Flip S UX371 | |
| Microsoft Surface Book 3 13.5 | |
| Cinebench R15 / CPU Single 64Bit | |
| Average of class Convertible (149.8 - 317, n=49, last 2 years) | |
| Asus ROG Flow X13 GV301QH | |
| Average AMD Ryzen 9 5980HS (n=1) | |
| Asus ZenBook Flip S UX371 | |
| HP Spectre x360 14t-ea000 | |
| Lenovo Yoga 9i 14ITL5 | |
| Microsoft Surface Book 3 13.5 | |
| Acer Spin 5 SP513-54N-79EY | |
| Cinebench R15 / CPU Multi 64Bit | |
| Asus ROG Flow X13 GV301QH | |
| Average AMD Ryzen 9 5980HS (n=1) | |
| Average of class Convertible (478 - 4940, n=49, last 2 years) | |
| HP Spectre x360 14t-ea000 | |
| Asus ZenBook Flip S UX371 | |
| Asus ZenBook Flip S UX371 | |
| Asus ZenBook Flip S UX371 | |
| Lenovo Yoga 9i 14ITL5 | |
| Acer Spin 5 SP513-54N-79EY | |
| Microsoft Surface Book 3 13.5 | |
| Blender / v2.79 BMW27 CPU | |
| Microsoft Surface Book 3 13.5 | |
| Asus ZenBook Flip S UX371 | |
| Acer Spin 5 SP513-54N-79EY | |
| Lenovo Yoga 9i 14ITL5 | |
| HP Spectre x360 14t-ea000 | |
| Average of class Convertible (105 - 1051, n=49, last 2 years) | |
| Average AMD Ryzen 9 5980HS (n=1) | |
| Asus ROG Flow X13 GV301QH | |
| 7-Zip 18.03 / 7z b 4 -mmt1 | |
| Asus ROG Flow X13 GV301QH | |
| Average AMD Ryzen 9 5980HS (n=1) | |
| Average of class Convertible (3672 - 6655, n=49, last 2 years) | |
| HP Spectre x360 14t-ea000 | |
| Lenovo Yoga 9i 14ITL5 | |
| Asus ZenBook Flip S UX371 | |
| Acer Spin 5 SP513-54N-79EY | |
| Microsoft Surface Book 3 13.5 | |
| 7-Zip 18.03 / 7z b 4 | |
| Asus ROG Flow X13 GV301QH | |
| Average AMD Ryzen 9 5980HS (n=1) | |
| Average of class Convertible (12977 - 121368, n=49, last 2 years) | |
| Lenovo Yoga 9i 14ITL5 | |
| HP Spectre x360 14t-ea000 | |
| Acer Spin 5 SP513-54N-79EY | |
| Asus ZenBook Flip S UX371 | |
| Microsoft Surface Book 3 13.5 | |
| Geekbench 5.5 / Single-Core | |
| Average of class Convertible (806 - 2275, n=49, last 2 years) | |
| Asus ZenBook Flip S UX371 | |
| Asus ROG Flow X13 GV301QH | |
| Average AMD Ryzen 9 5980HS (n=1) | |
| HP Spectre x360 14t-ea000 | |
| Lenovo Yoga 9i 14ITL5 | |
| Microsoft Surface Book 3 13.5 | |
| Acer Spin 5 SP513-54N-79EY | |
| Geekbench 5.5 / Multi-Core | |
| Average of class Convertible (1608 - 22023, n=49, last 2 years) | |
| Asus ROG Flow X13 GV301QH | |
| Average AMD Ryzen 9 5980HS (n=1) | |
| Asus ZenBook Flip S UX371 | |
| HP Spectre x360 14t-ea000 | |
| Lenovo Yoga 9i 14ITL5 | |
| Microsoft Surface Book 3 13.5 | |
| Acer Spin 5 SP513-54N-79EY | |
| HWBOT x265 Benchmark v2.2 / 4k Preset | |
| Asus ROG Flow X13 GV301QH | |
| Average AMD Ryzen 9 5980HS (n=1) | |
| Average of class Convertible (3.43 - 36.2, n=49, last 2 years) | |
| Lenovo Yoga 9i 14ITL5 | |
| HP Spectre x360 14t-ea000 | |
| Asus ZenBook Flip S UX371 | |
| Microsoft Surface Book 3 13.5 | |
| LibreOffice / 20 Documents To PDF | |
| Asus ROG Flow X13 GV301QH | |
| Average AMD Ryzen 9 5980HS (n=1) | |
| Microsoft Surface Book 3 13.5 | |
| Asus ZenBook Flip S UX371 | |
| Acer Spin 5 SP513-54N-79EY | |
| Average of class Convertible (42.5 - 84.3, n=49, last 2 years) | |
| HP Spectre x360 14t-ea000 | |
| Lenovo Yoga 9i 14ITL5 | |
| R Benchmark 2.5 / Overall mean | |
| Microsoft Surface Book 3 13.5 | |
| Asus ZenBook Flip S UX371 | |
| Lenovo Yoga 9i 14ITL5 | |
| HP Spectre x360 14t-ea000 | |
| Asus ROG Flow X13 GV301QH | |
| Average AMD Ryzen 9 5980HS (n=1) | |
| Average of class Convertible (0.3915 - 0.84, n=49, last 2 years) | |
* ... smaller is better
System performance
The Asus laptop consistently achieves very good results in the PCMark 10 scores. The competition is often left behind. Only the Asus ZenBook Flip S can keep up to some extent.
| PCMark 10 Score | 5971 points | |
Help | ||
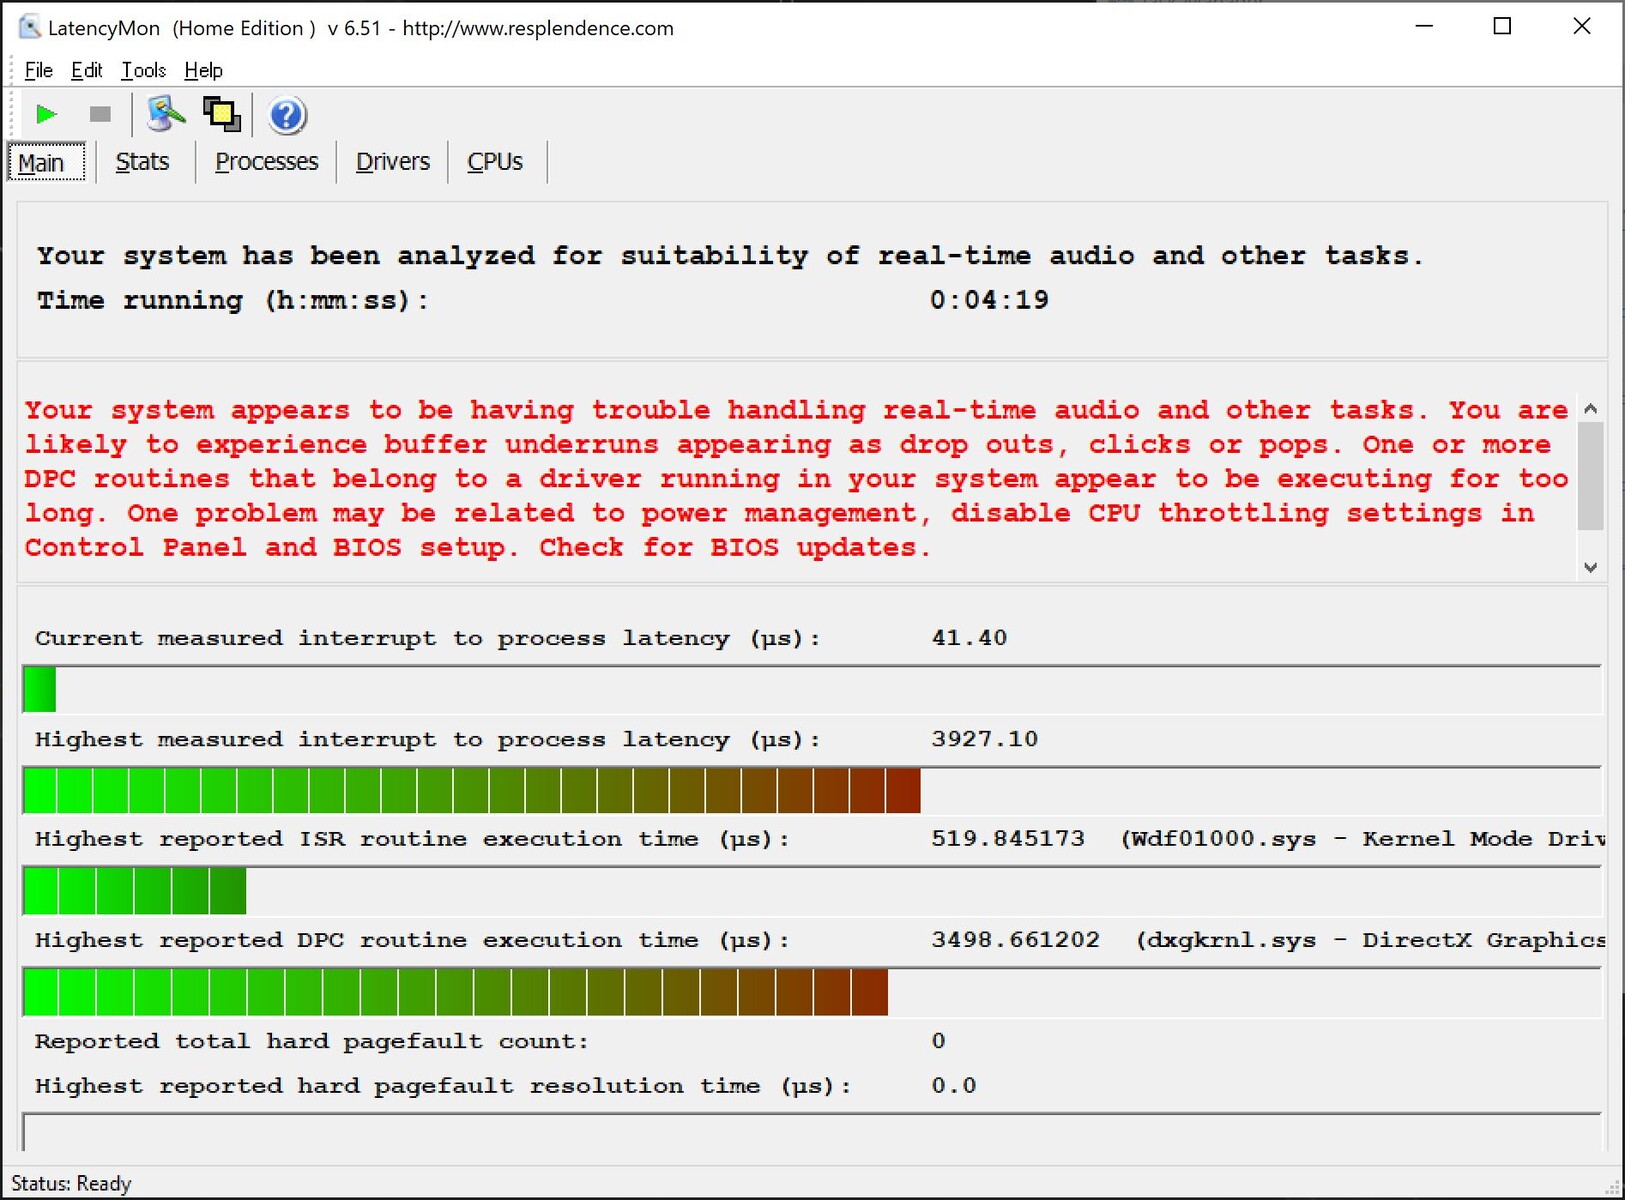
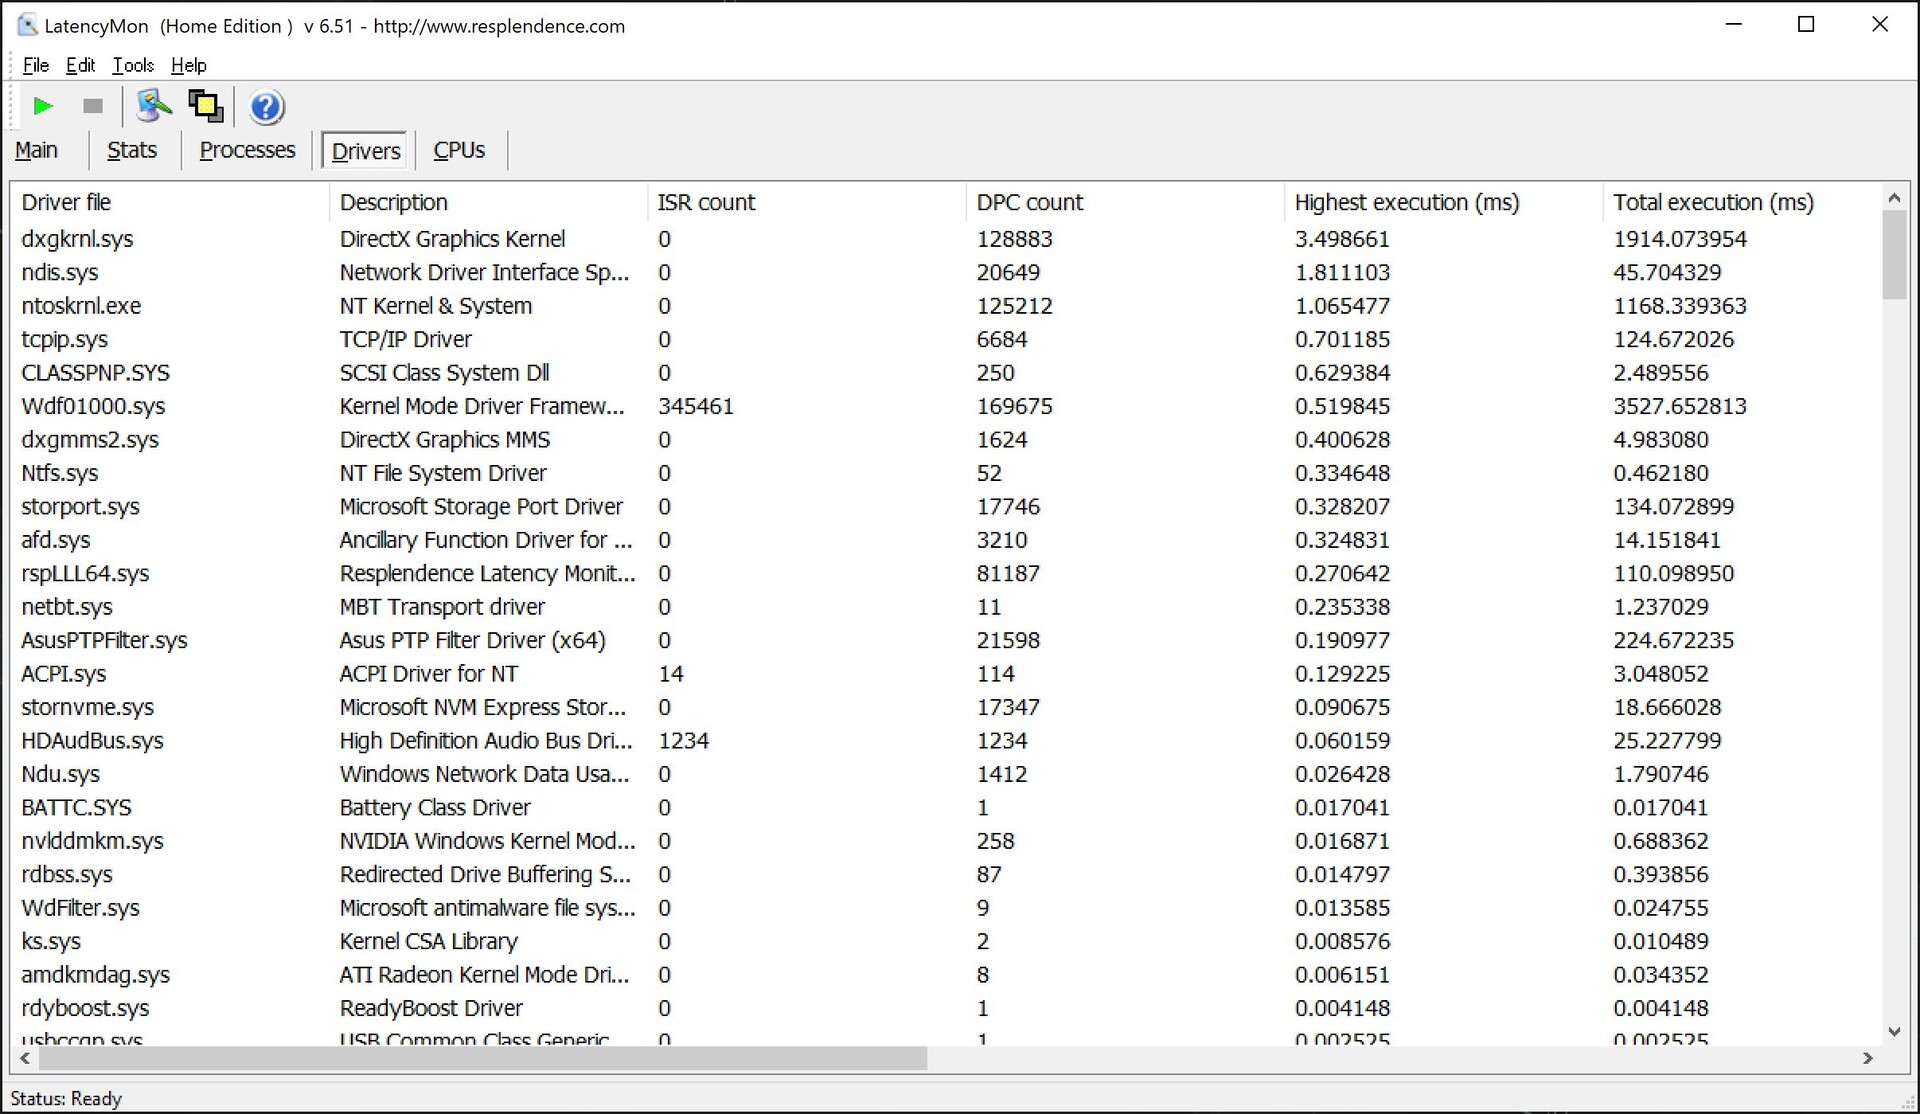
DPC latencies
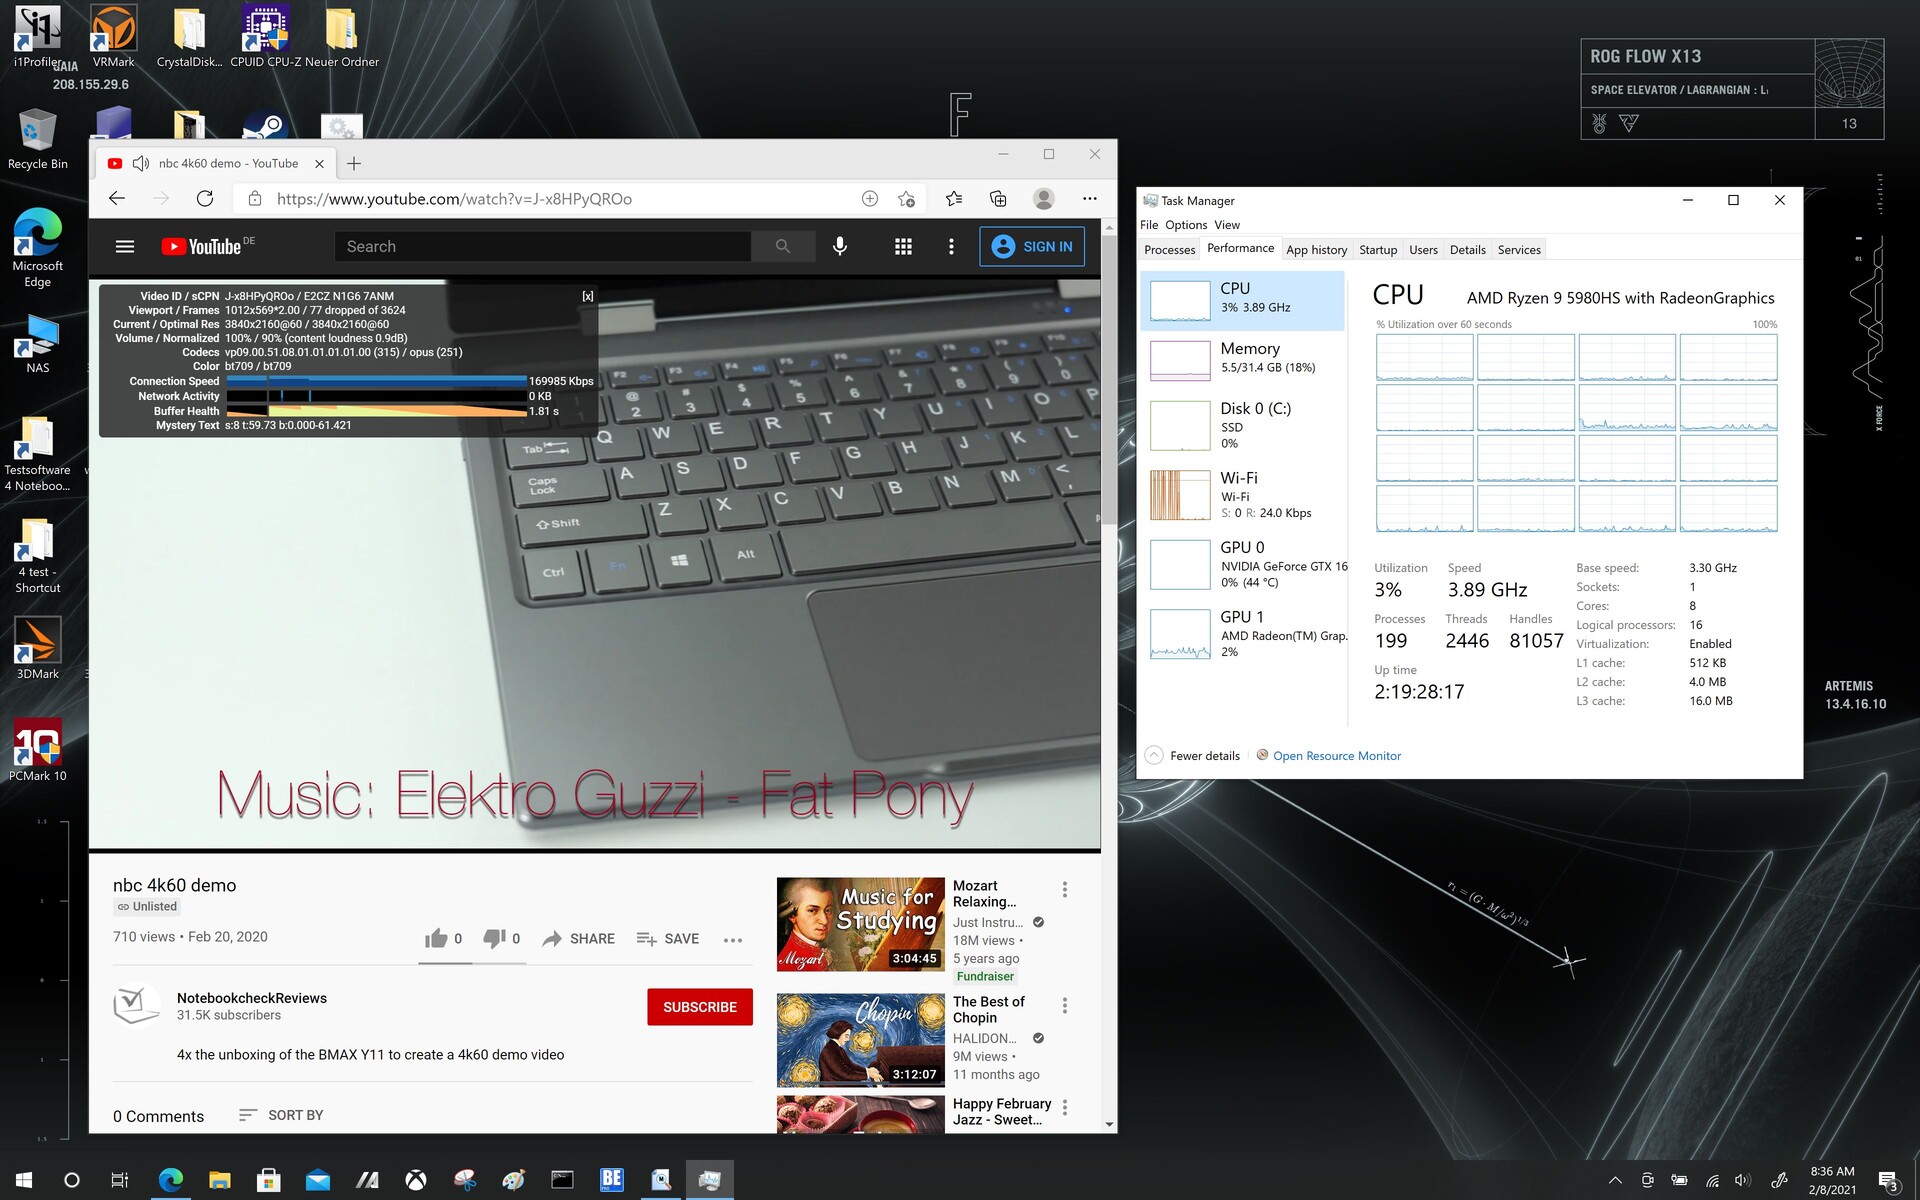
LatencyMon shows increased latencies when opening multiple browser tabs in Edge and when playing our 4K YouTube video; these increase slightly when Prime95 is started. The iGPU is loaded to an average of 20% when playing our test video.
| DPC Latencies / LatencyMon - interrupt to process latency (max), Web, Youtube, Prime95 | |
| Asus ROG Flow X13 GV301QH | |
* ... smaller is better
Storage
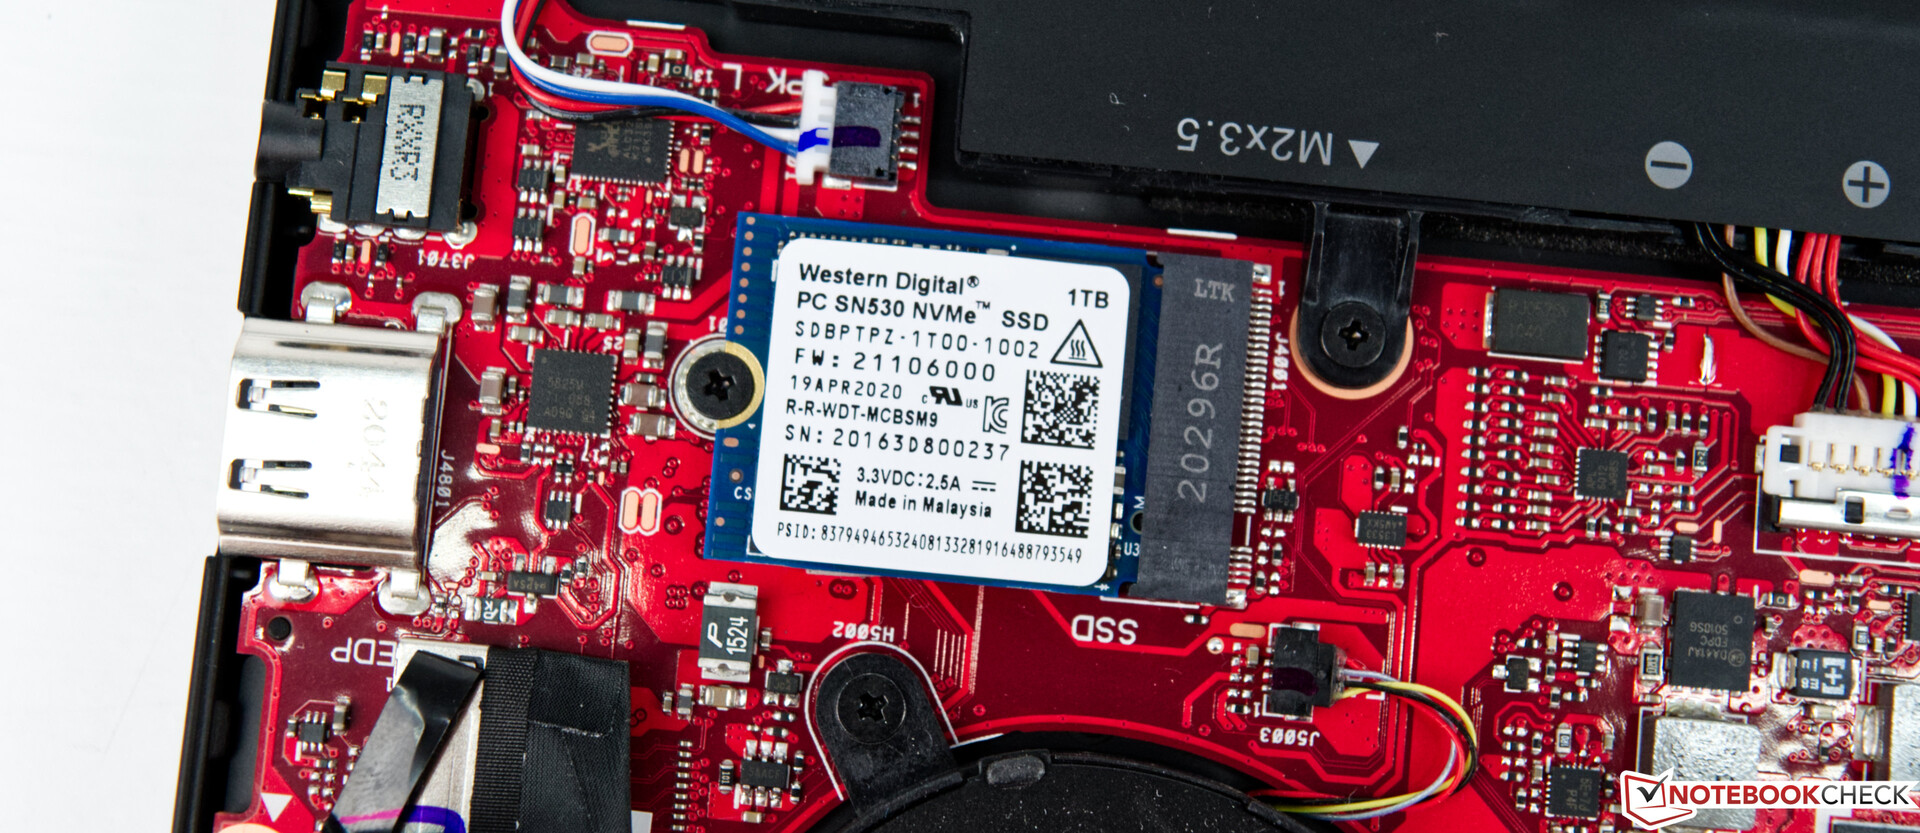
A fast NVMe SSD (M.2 2230) from Western Digital serves as the system drive. The installed SSD offers 1 TB of storage space and is faster than the competition in many areas in comparison. However, the Asus ROG Flow X13 only has room for one mass storage device.
For more comparisons and benchmarks, take a look at our comparison table.
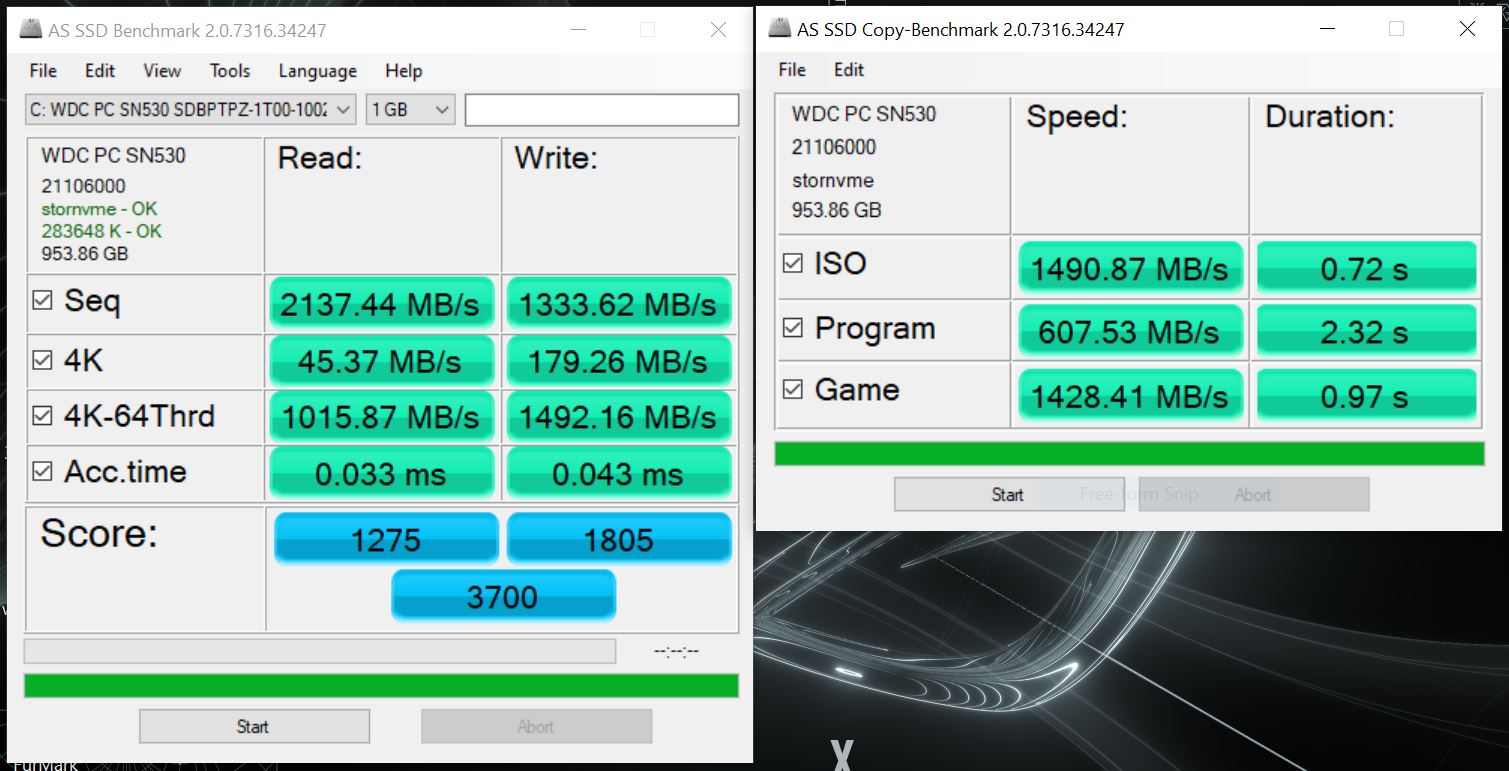
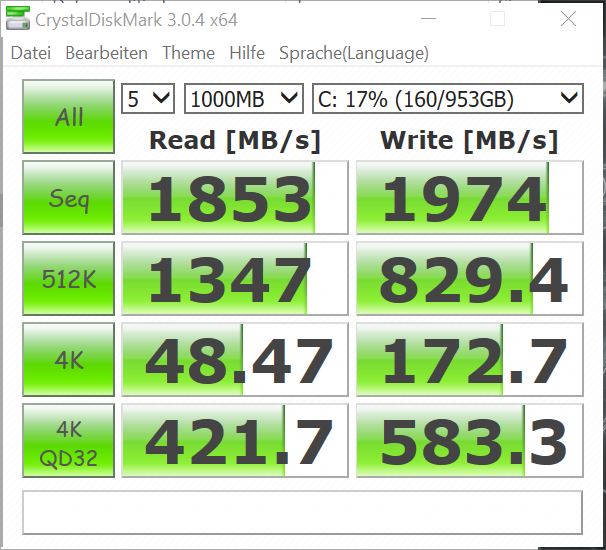
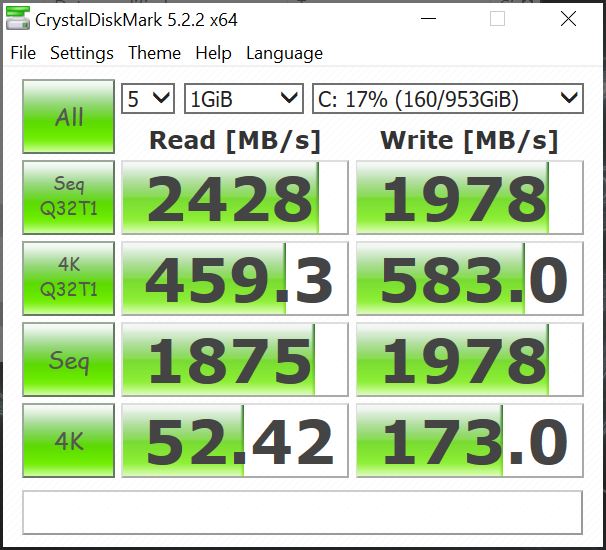
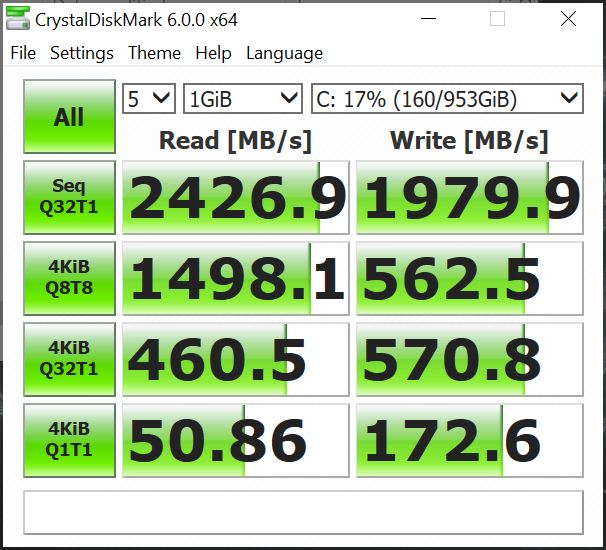
| Asus ROG Flow X13 GV301QH WDC PC SN530 SDBPNPZ-1T00 | Microsoft Surface Book 3 13.5 SK Hynix BC501 HFM512GDJTNG | HP Spectre x360 14t-ea000 Samsung SSD PM981a MZVLB512HBJQ | Lenovo Yoga 9i 14ITL5 Samsung SSD PM981a MZVLB256HBHQ | Acer Spin 5 SP513-54N-79EY Samsung PM991 MZVLQ1T0HALB | Asus ZenBook Flip S UX371 WDC PC SN730 SDBPNTY-1T00 | Average WDC PC SN530 SDBPNPZ-1T00 | |
|---|---|---|---|---|---|---|---|
| CrystalDiskMark 5.2 / 6 | -44% | 1% | -1% | -1% | -9% | 0% | |
| Write 4K (MB/s) | 173 | 88.4 -49% | 82.2 -52% | 139.6 -19% | 168.4 -3% | 133.4 -23% | 182.7 ? 6% |
| Read 4K (MB/s) | 52.4 | 39.53 -25% | 45.7 -13% | 37.3 -29% | 55 5% | 36.52 -30% | 48.6 ? -7% |
| Write Seq (MB/s) | 1978 | 691 -65% | 2000 1% | 1827 -8% | 1901 -4% | 1979 ? 0% | |
| Read Seq (MB/s) | 1875 | 1032 -45% | 2206 18% | 2253 20% | 2027 8% | 1828 ? -3% | |
| Write 4K Q32T1 (MB/s) | 571 | 279.6 -51% | 451.2 -21% | 467.9 -18% | 476.1 -17% | 317.8 -44% | 498 ? -13% |
| Read 4K Q32T1 (MB/s) | 460.5 | 261.6 -43% | 351 -24% | 366.7 -20% | 506 10% | 299.1 -35% | 573 ? 24% |
| Write Seq Q32T1 (MB/s) | 1980 | 868 -56% | 2982 51% | 2349 19% | 1492 -25% | 2602 31% | 1980 ? 0% |
| Read Seq Q32T1 (MB/s) | 2427 | 2075 -15% | 3529 45% | 3540 46% | 2357 -3% | 3142 29% | 2336 ? -4% |
| Write 4K Q8T8 (MB/s) | 563 | 930 65% | 563 ? 0% | ||||
| Read 4K Q8T8 (MB/s) | 1498 | 963 -36% | 1498 ? 0% | ||||
| AS SSD | -46% | -2% | -27% | -19% | -10% | -11% | |
| Seq Read (MB/s) | 2137 | 1707 -20% | 2188 2% | 2177 2% | 2071 -3% | 2726 28% | 2059 ? -4% |
| Seq Write (MB/s) | 1334 | 510 -62% | 1320 -1% | 813 -39% | 1462 10% | 1527 14% | 1812 ? 36% |
| 4K Read (MB/s) | 45.37 | 38.77 -15% | 53.5 18% | 53.2 17% | 49.82 10% | 45.44 0% | 37.4 ? -18% |
| 4K Write (MB/s) | 179.3 | 100.9 -44% | 123.7 -31% | 180 0% | 140.7 -22% | 152 -15% | 164.6 ? -8% |
| 4K-64 Read (MB/s) | 1016 | 630 -38% | 1010 -1% | 531 -48% | 869 -14% | 789 -22% | 765 ? -25% |
| 4K-64 Write (MB/s) | 1492 | 707 -53% | 1808 21% | 398.5 -73% | 729 -51% | 1345 -10% | 1431 ? -4% |
| Access Time Read * (ms) | 0.033 | 0.085 -158% | 0.055 -67% | 0.052 -58% | 0.069 -109% | 0.068 -106% | 0.0364 ? -10% |
| Access Time Write * (ms) | 0.043 | 0.035 19% | 0.076 -77% | 0.058 -35% | 0.028 35% | 0.028 35% | 0.07029 ? -63% |
| Score Read (Points) | 1275 | 839 -34% | 1282 1% | 802 -37% | 1126 -12% | 1107 -13% | 1008 ? -21% |
| Score Write (Points) | 1805 | 859 -52% | 2063 14% | 660 -63% | 1016 -44% | 1650 -9% | 1677 ? -7% |
| Score Total (Points) | 3700 | 2077 -44% | 3970 7% | 1822 -51% | 2700 -27% | 3274 -12% | 3337 ? -10% |
| Copy ISO MB/s (MB/s) | 1491 | 1644 10% | 1962 32% | 1574 6% | 1653 ? 11% | ||
| Copy Program MB/s (MB/s) | 608 | 920 51% | 522 -14% | 553 -9% | 528 ? -13% | ||
| Copy Game MB/s (MB/s) | 1428 | 1725 21% | 1258 -12% | 993 -30% | 1173 ? -18% | ||
| Total Average (Program / Settings) | -45% /
-45% | -1% /
-1% | -14% /
-18% | -10% /
-12% | -10% /
-9% | -6% /
-6% |
* ... smaller is better

Continuous load read: DiskSpd Read Loop, Queue Depth 8
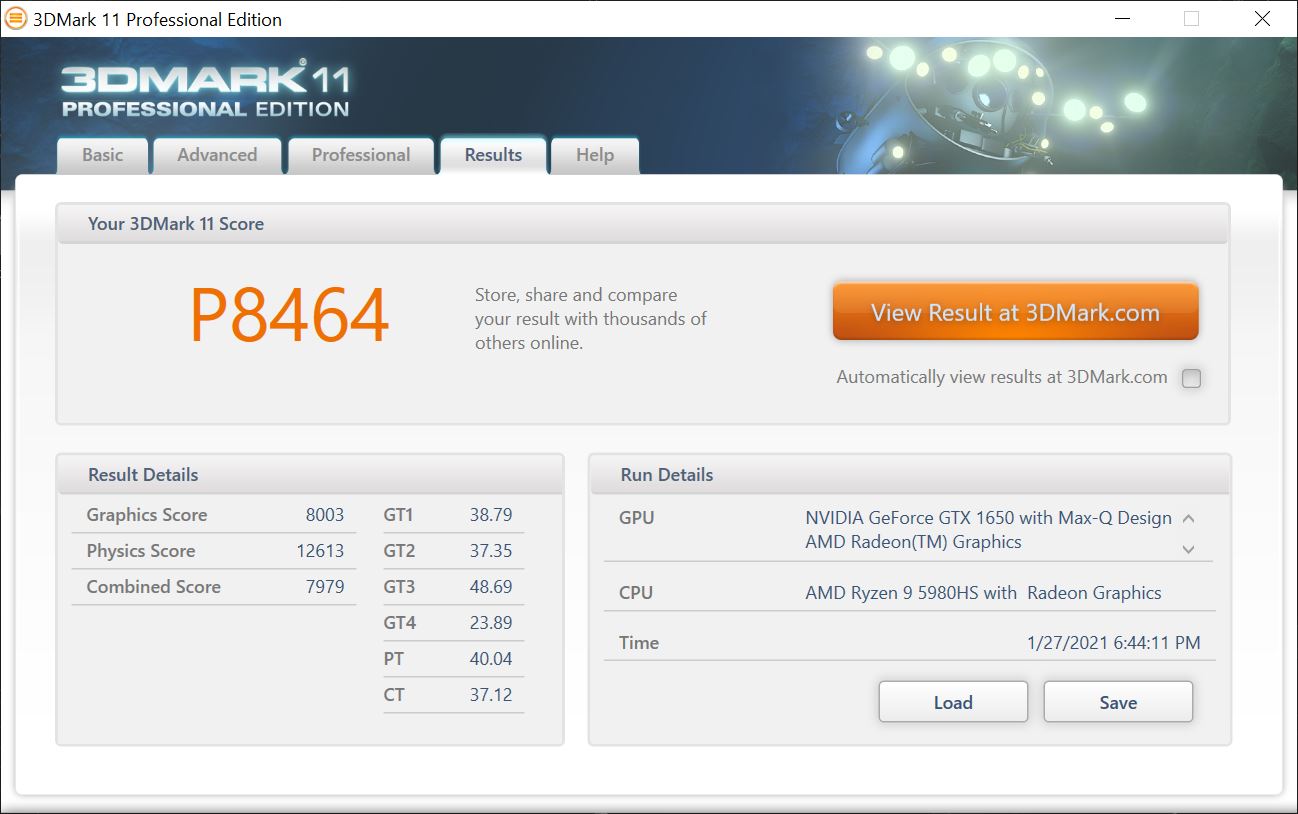
Graphics card
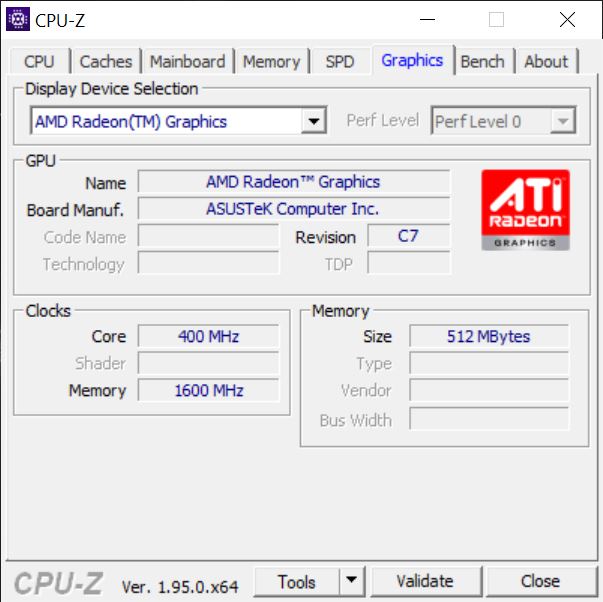
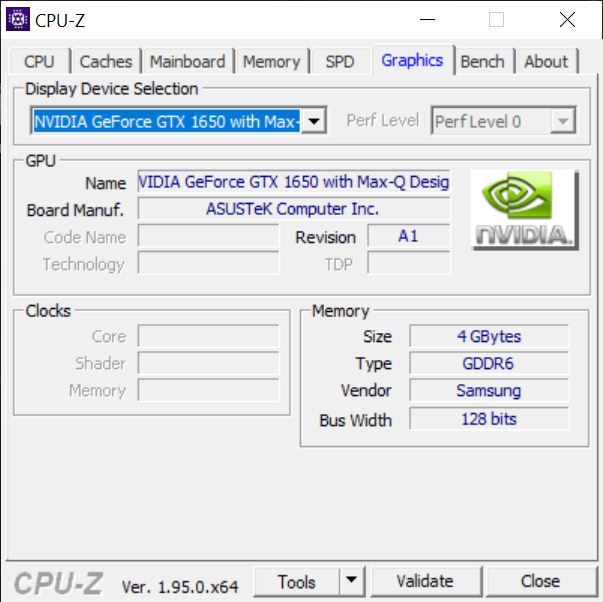
In addition to the iGPU, the Asus ROG Flow X13 also offers an Nvidia GeForce GTX 1650 Max-Q. With 4 GB of GDDR6, it has its own VRAM and roughly the same performance as the model in the Microsoft Surface Book 3. However, this GPU configuration provides considerably more power compared to the class average, so that our review sample is also definitely suitable for gaming with the dedicated GPU. The eGPU dock, which is equipped with a GeForce RTX 3080, provides the ultimate graphics power.
For more comparisons and benchmarks, please see our GPU comparison table.
| 3DMark 11 Performance | 10920 points | |
| 3DMark Ice Storm Standard Score | 42185 points | |
| 3DMark Cloud Gate Standard Score | 23604 points | |
| 3DMark Fire Strike Score | 7784 points | |
| 3DMark Fire Strike Extreme Score | 3957 points | |
Help | ||
Gaming performance
In terms of gaming performance, the Nvidia GeForce GTX 1650 Max-Q delivers a result that does the graphics card justice. It's not much faster than in the Microsoft Surface Book 3, but it's not slower either. However, this graphics card quickly reaches its limits in new titles. Older titles, on the other hand, are handled by the GeForce GTX 1650 Max-Q without any problems. The dedicated GDDR6 VRAM with 4 GB of memory should be emphasized. In 2D mode, the AMD Radeon RX Vega 8 takes over the graphics output.
| low | med. | high | ultra | QHD | |
|---|---|---|---|---|---|
| The Witcher 3 (2015) | 168 | 56.3 | 33 | ||
| Dota 2 Reborn (2015) | 132.5 | 120.1 | 110.8 | 105.6 | |
| Final Fantasy XV Benchmark (2018) | 91.2 | 45.7 | 33.1 | 23.4 | |
| X-Plane 11.11 (2018) | 88.1 | 77.6 | 64.4 | ||
| Far Cry 5 (2018) | 47 | 24 | 22 | 21 | |
| Far Cry New Dawn (2019) | 39 | 21 | 20 | 19 |
Emissions - Can't be ignored
Noise emissions
The measured noise emissions show that our Asus laptop is very quiet on the one hand, but it can also turn up quite a bit under load. The device is very quiet and often even silent at 32.1 dB(A) in idle usage as well as under low load. However, we measure a clearly audible noise level of 43 dB(A) under load, which can be perceived to be even louder due to the high-frequency fan noise. We measured a similarly high rate of 42.8 dB(A) during gaming.
Noise level
| Idle |
| 30.5 / 30.5 / 32.1 dB(A) |
| Load |
| 43 / 41.3 dB(A) |
 | ||
30 dB silent 40 dB(A) audible 50 dB(A) loud |
||
min: | ||
Temperature
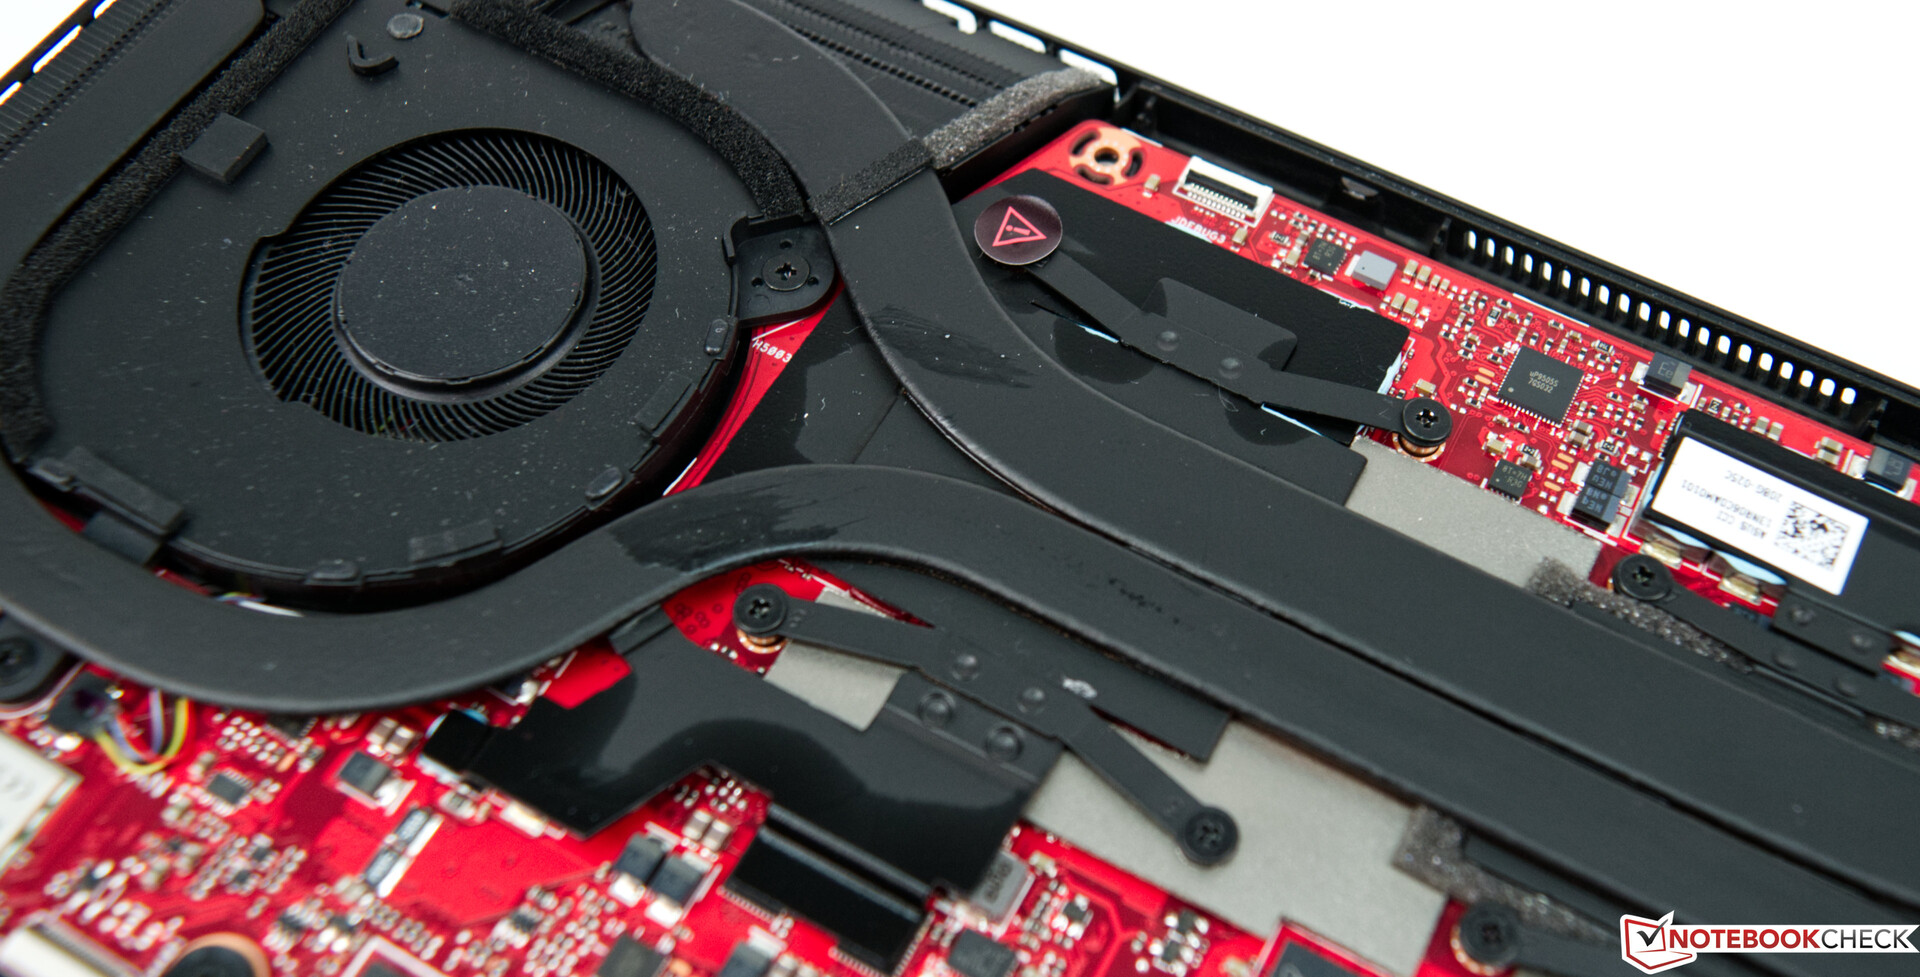
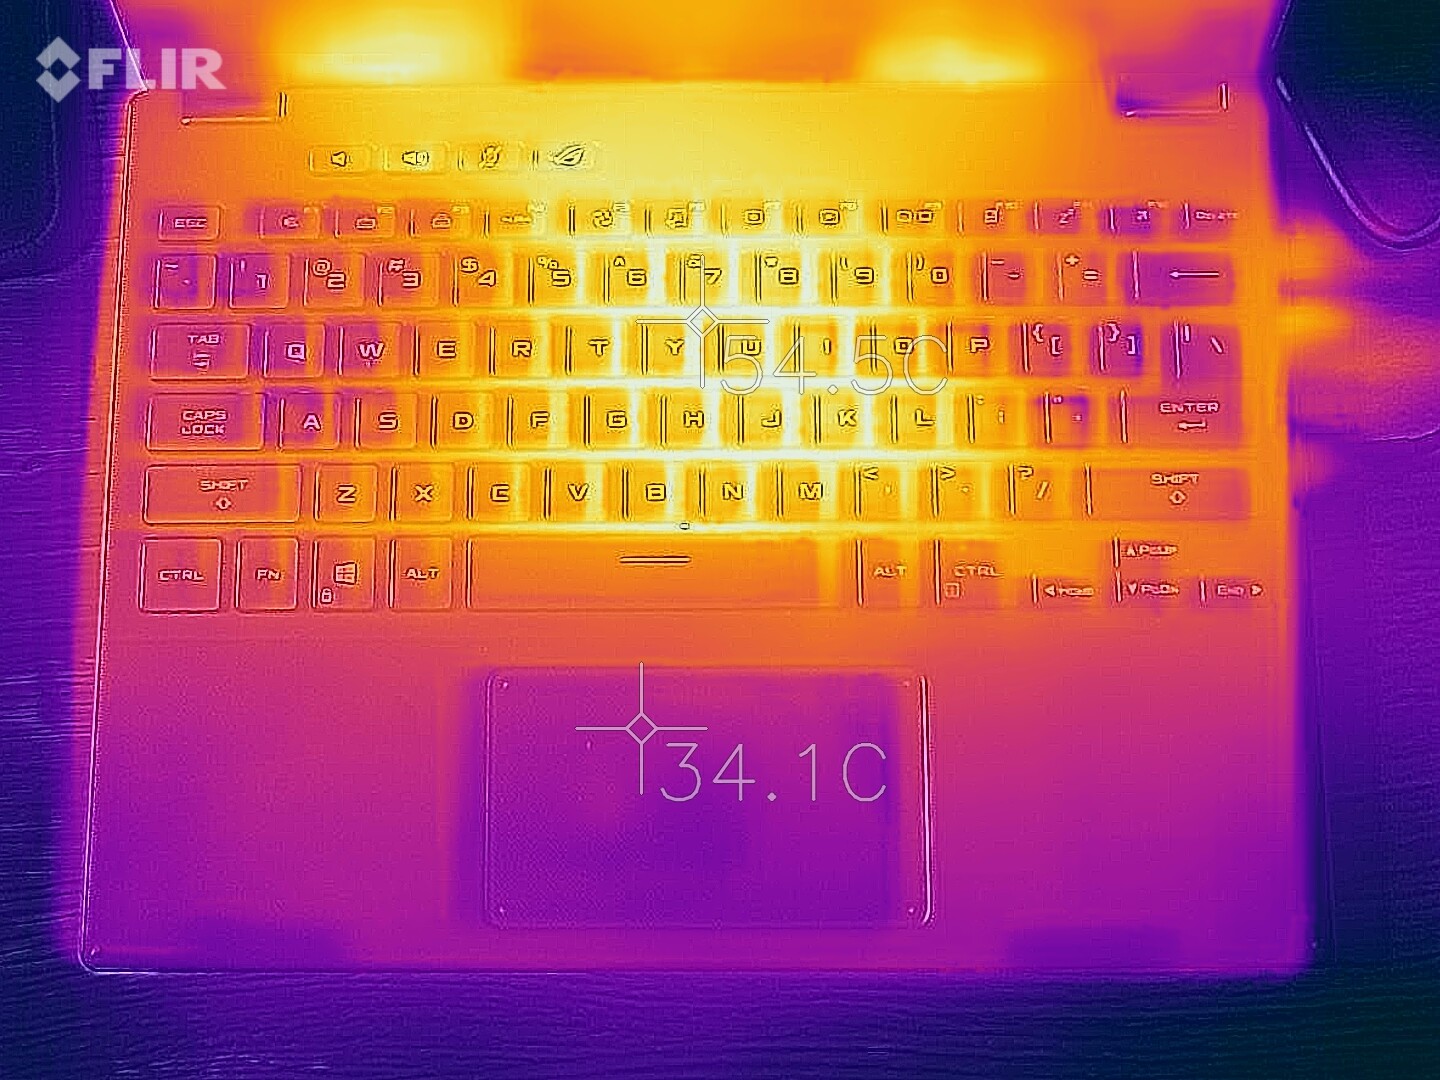
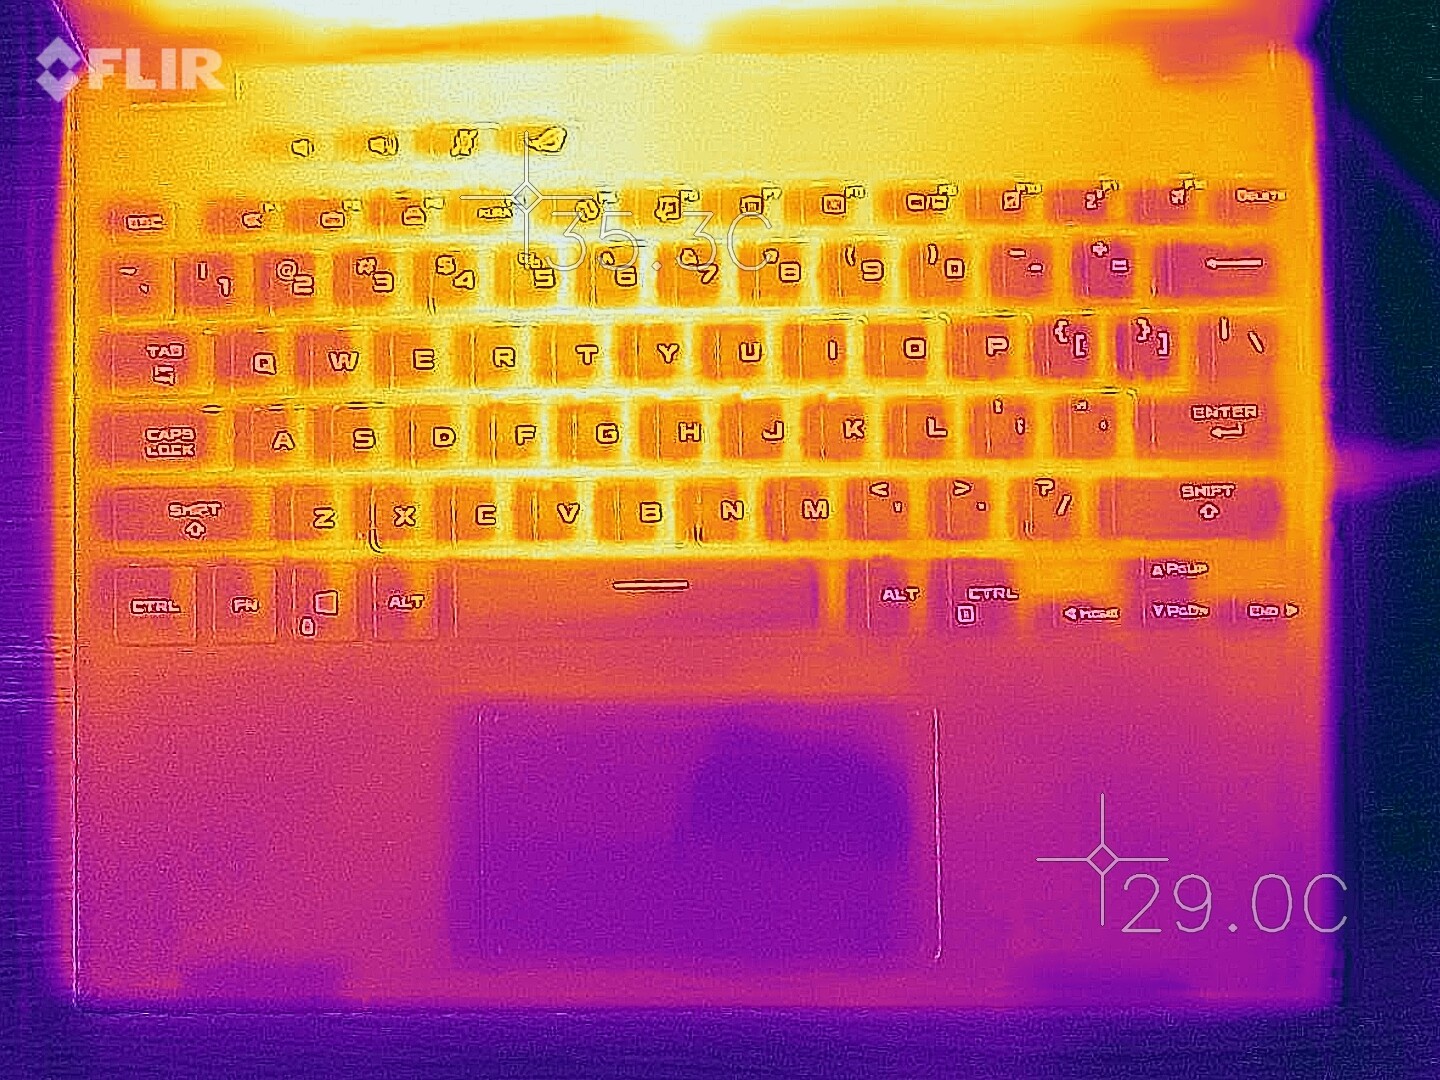
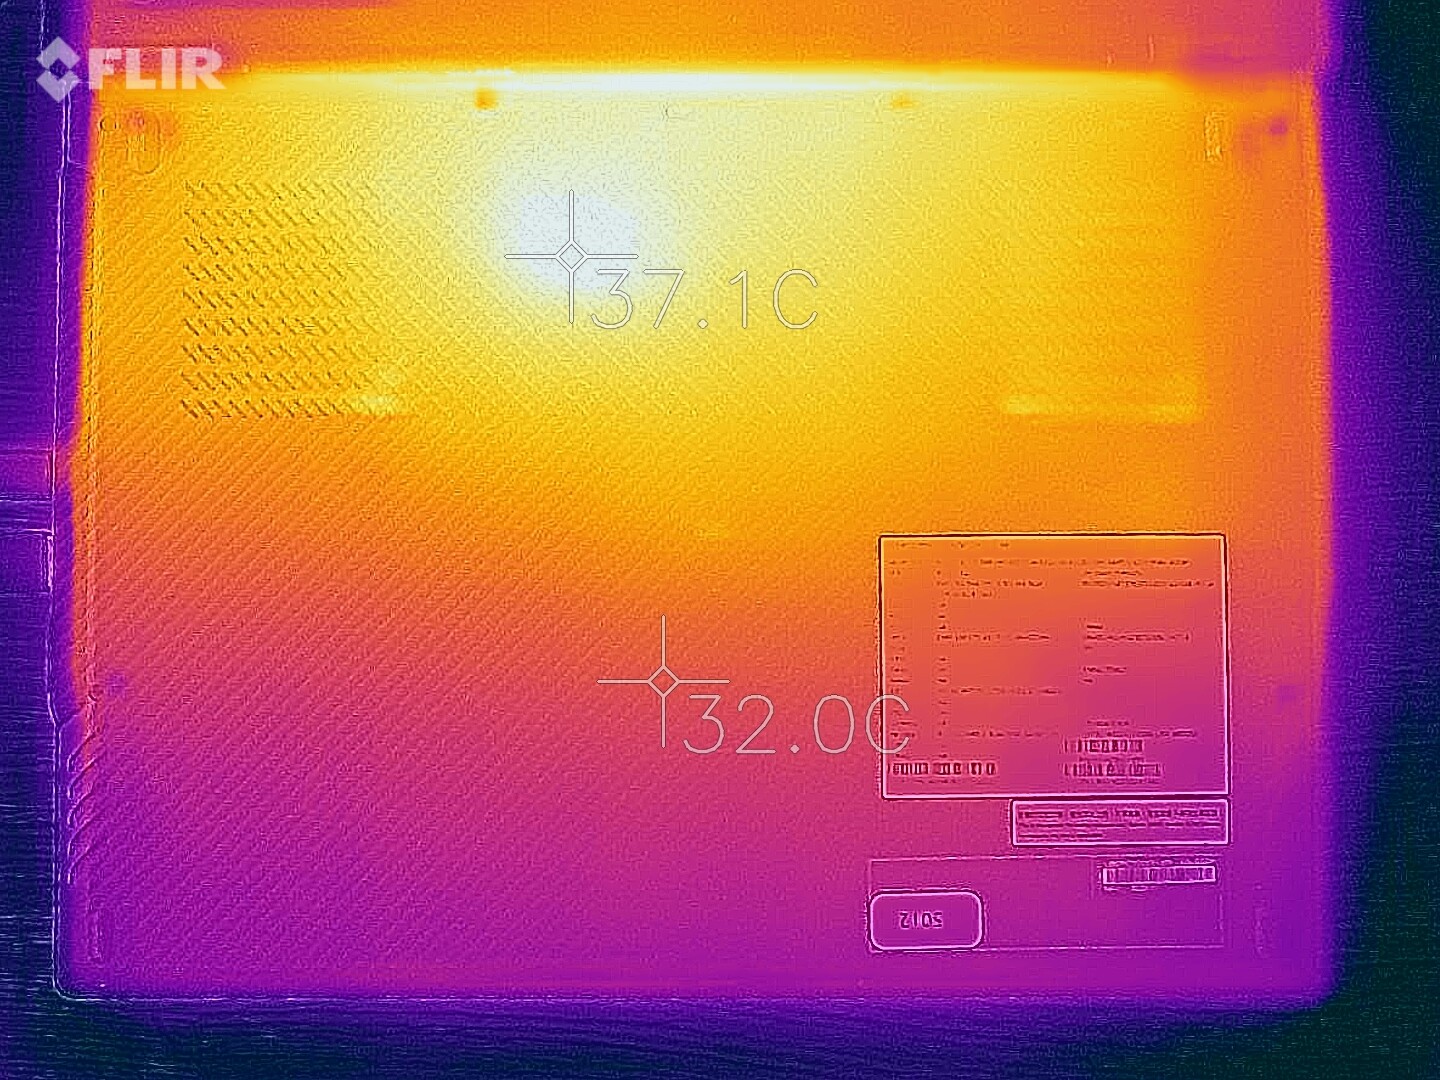
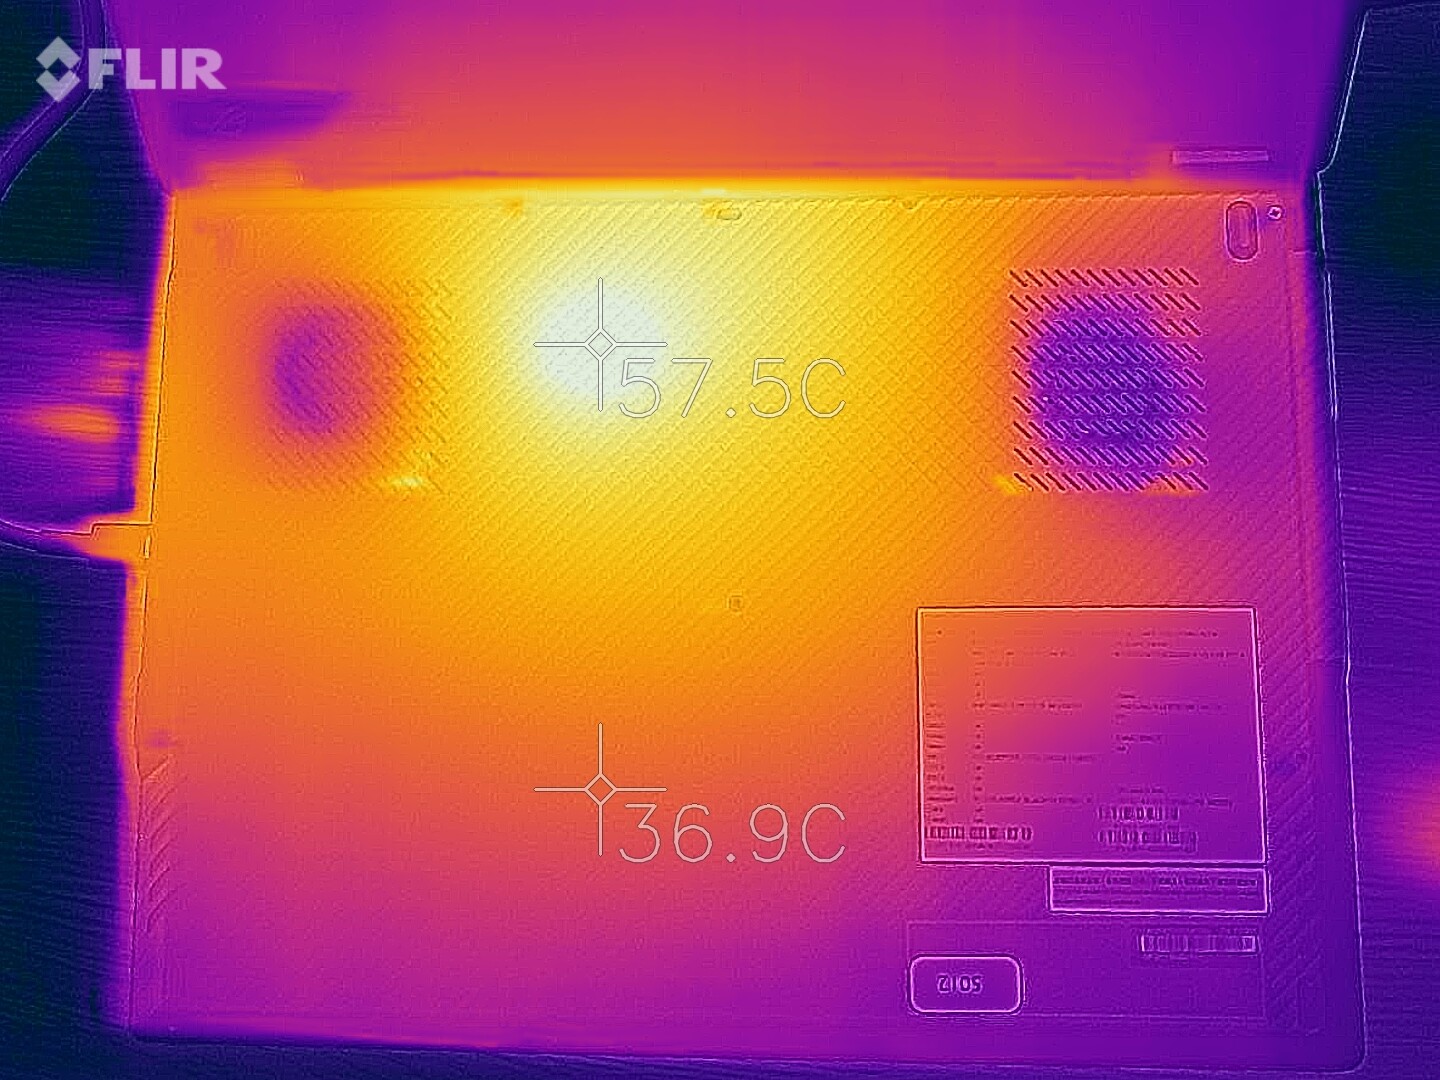
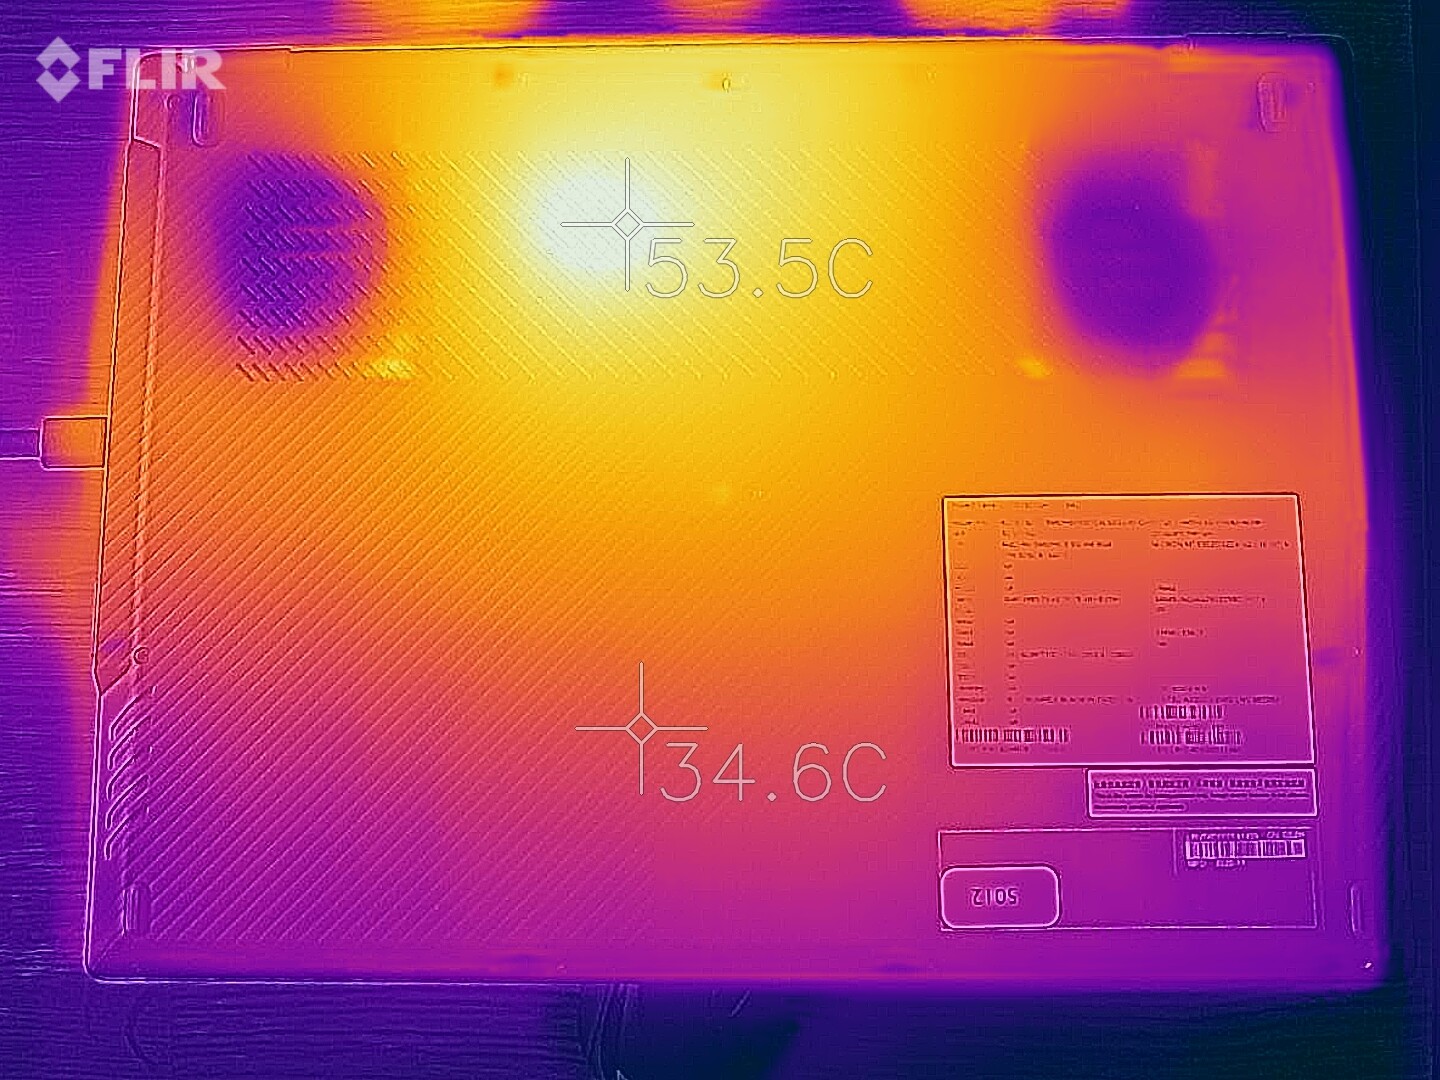
The compact and very slim base unit doesn't offer much volume for a large heat pipe. In addition, the conservative fan curve results in case temperatures that are clearly above 30 °C (~86 °F) in idle usage and under low load. Furthermore, the cooling system has its hands full with keeping the temperatures at a tolerable level under load. Over 50 °C (~122 °F) at the top and bottom is a lot and makes working on the device uncomfortable in the long run. It's best to use the laptop on a solid surface to ensure good air circulation.
When it comes to the components, this means a maximum temperature of 82 °C (~180 °F) for the SoC and 72 °C (~162 °F) for the dedicated graphics card during the stress test. The base clock speed can't be maintained in the long run. It settled at just under 2 GHz after a good hour of continuous load. A 3D benchmark performed directly afterwards did not show any negative effects due to the extreme, prolonged load from the stress test.
(-) The maximum temperature on the upper side is 51.8 °C / 125 F, compared to the average of 35.4 °C / 96 F, ranging from 19.6 to 60 °C for the class Convertible.
(-) The bottom heats up to a maximum of 52.8 °C / 127 F, compared to the average of 36.9 °C / 98 F
(±) In idle usage, the average temperature for the upper side is 33.6 °C / 92 F, compared to the device average of 30.3 °C / 87 F.
(-) Playing The Witcher 3, the average temperature for the upper side is 40.2 °C / 104 F, compared to the device average of 30.3 °C / 87 F.
(+) The palmrests and touchpad are reaching skin temperature as a maximum (33.3 °C / 91.9 F) and are therefore not hot.
(-) The average temperature of the palmrest area of similar devices was 28 °C / 82.4 F (-5.3 °C / -9.5 F).
Speakers
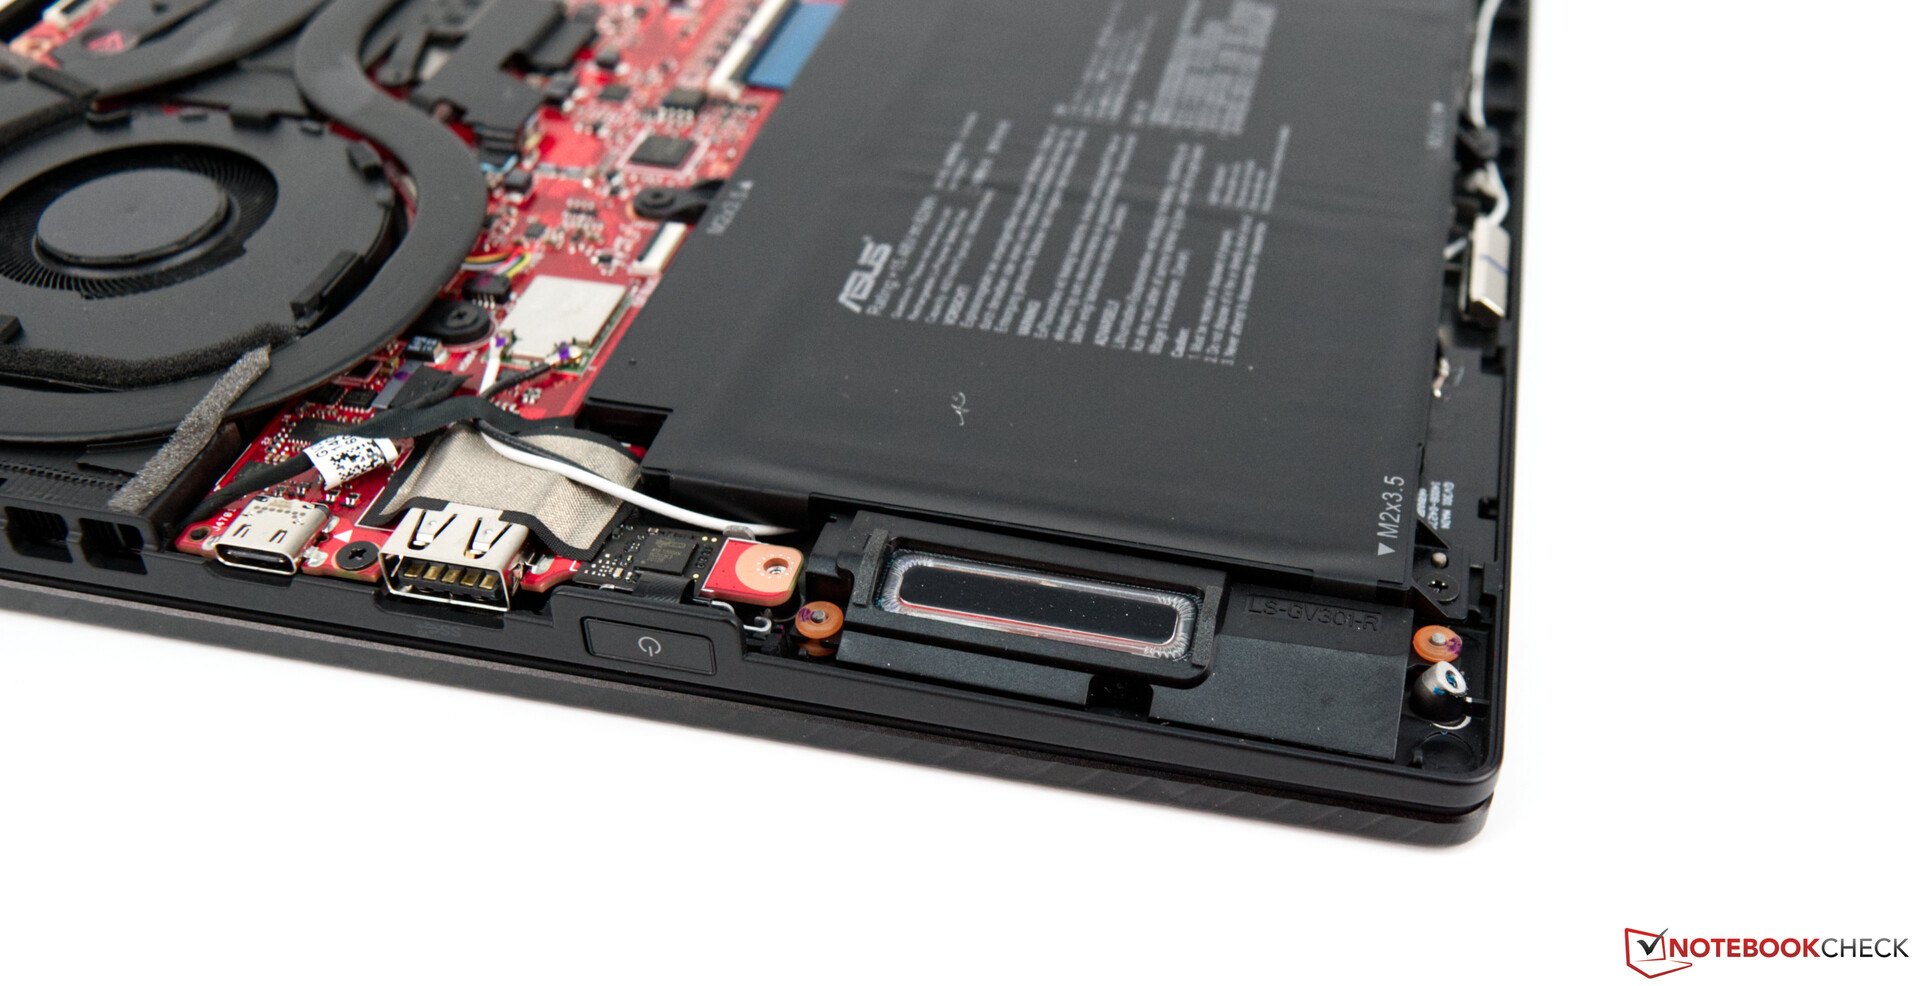
The two speakers are located under the palm rests and benefit from a hard surface. On a soft surface, sound becomes muffled and, therefore, much quieter. The sound of the two speakers is good and better than average. High tones don't predominate, and basses are also subtly present and not completely silent, which results in a well-balanced sound.
There was no noise or distortion at maximum volume. However, we recommend using a headset for a perfect sound experience. The 3.5 mm audio jack worked without issues in our device.
Asus ROG Flow X13 GV301QH audio analysis
(-) | not very loud speakers (61.3 dB)
Bass 100 - 315 Hz
(±) | reduced bass - on average 10.8% lower than median
(-) | bass is not linear (18.2% delta to prev. frequency)
Mids 400 - 2000 Hz
(+) | balanced mids - only 4.8% away from median
(+) | mids are linear (6% delta to prev. frequency)
Highs 2 - 16 kHz
(+) | balanced highs - only 3% away from median
(±) | linearity of highs is average (9.9% delta to prev. frequency)
Overall 100 - 16.000 Hz
(±) | linearity of overall sound is average (20.8% difference to median)
Compared to same class
» 55% of all tested devices in this class were better, 11% similar, 35% worse
» The best had a delta of 6%, average was 20%, worst was 57%
Compared to all devices tested
» 56% of all tested devices were better, 8% similar, 36% worse
» The best had a delta of 4%, average was 24%, worst was 134%
Lenovo Yoga 9i 14ITL5 audio analysis
(+) | speakers can play relatively loud (88.8 dB)
Bass 100 - 315 Hz
(±) | reduced bass - on average 9.4% lower than median
(±) | linearity of bass is average (8.7% delta to prev. frequency)
Mids 400 - 2000 Hz
(+) | balanced mids - only 3.7% away from median
(+) | mids are linear (3.6% delta to prev. frequency)
Highs 2 - 16 kHz
(+) | balanced highs - only 3% away from median
(+) | highs are linear (4% delta to prev. frequency)
Overall 100 - 16.000 Hz
(+) | overall sound is linear (9.5% difference to median)
Compared to same class
» 5% of all tested devices in this class were better, 1% similar, 94% worse
» The best had a delta of 6%, average was 20%, worst was 57%
Compared to all devices tested
» 4% of all tested devices were better, 1% similar, 96% worse
» The best had a delta of 4%, average was 24%, worst was 134%
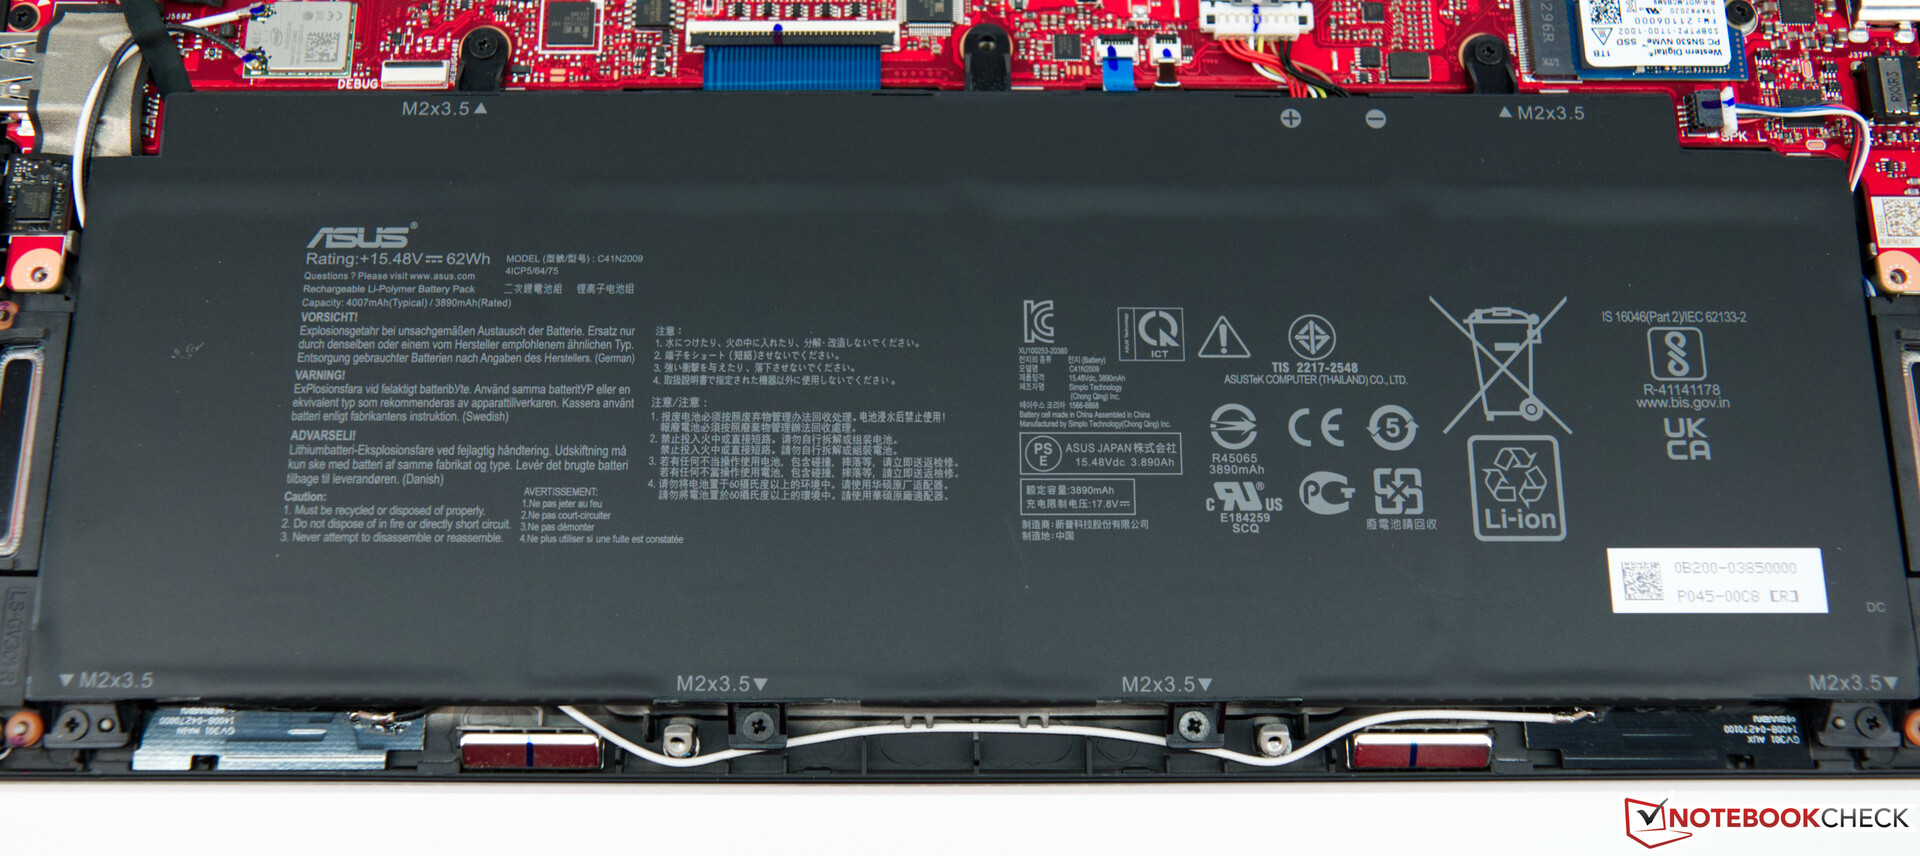
Energy management
Energy consumption
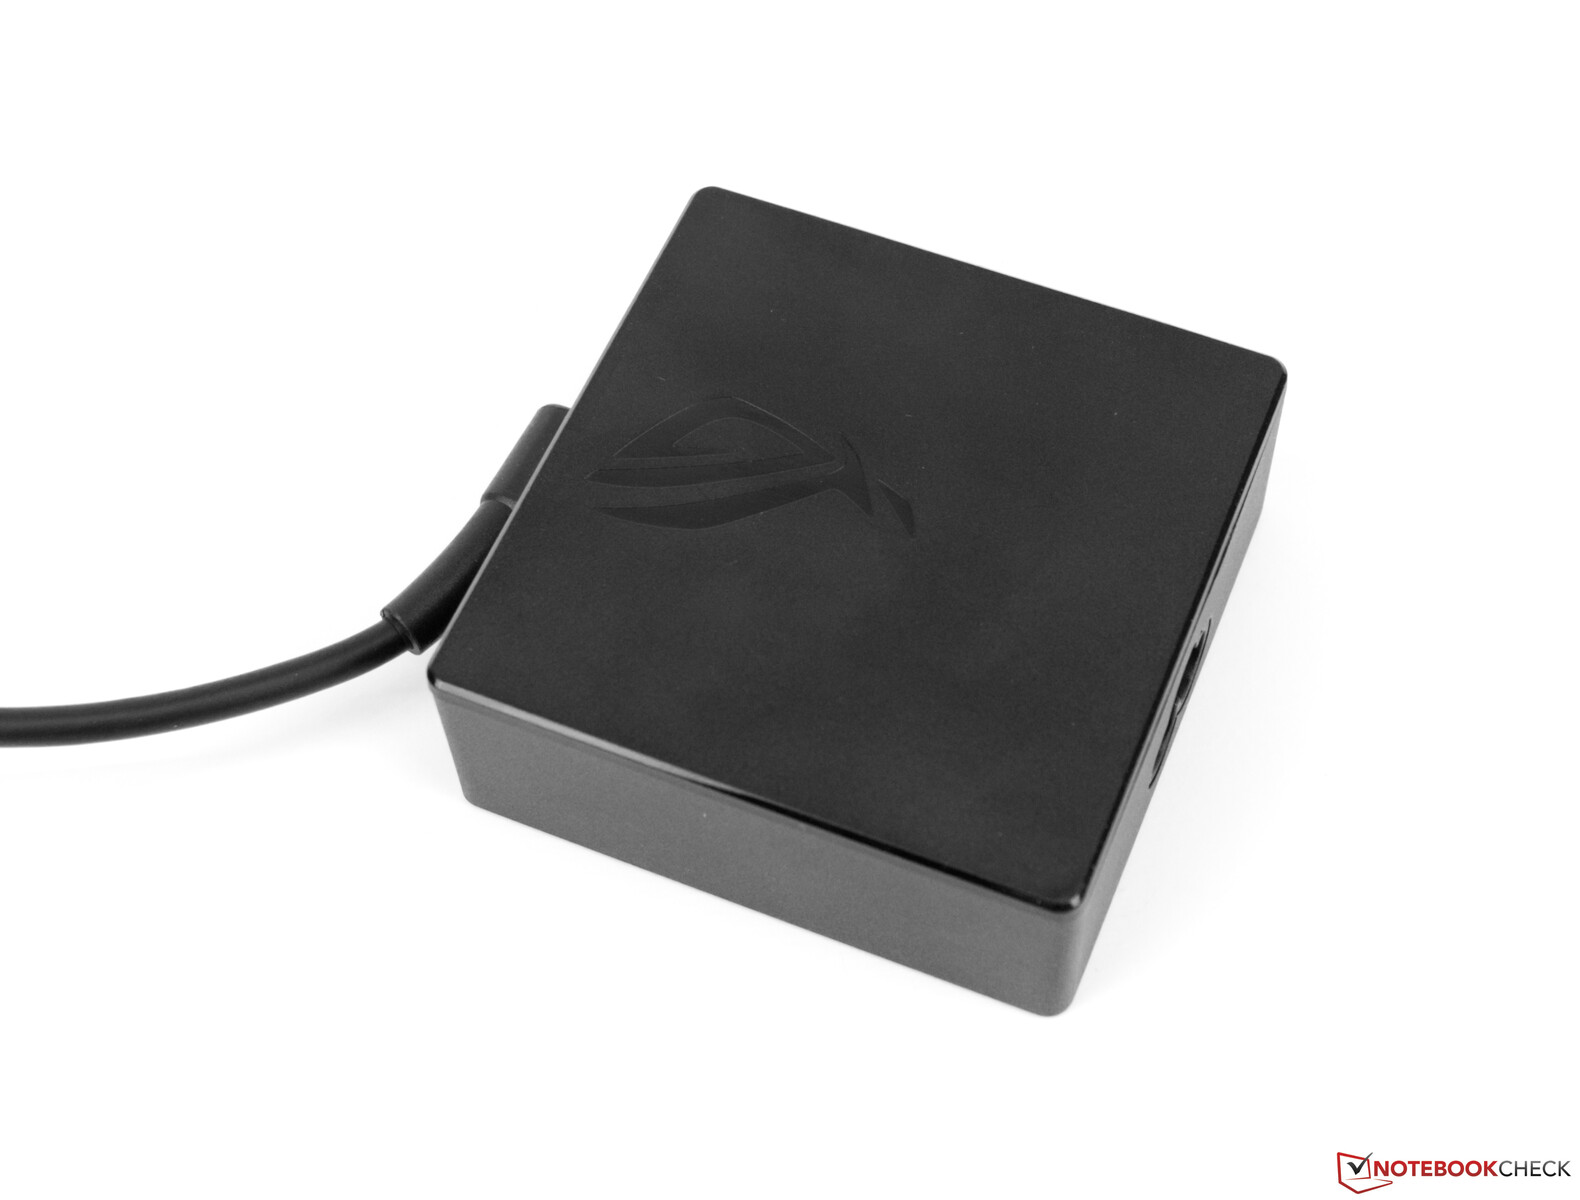
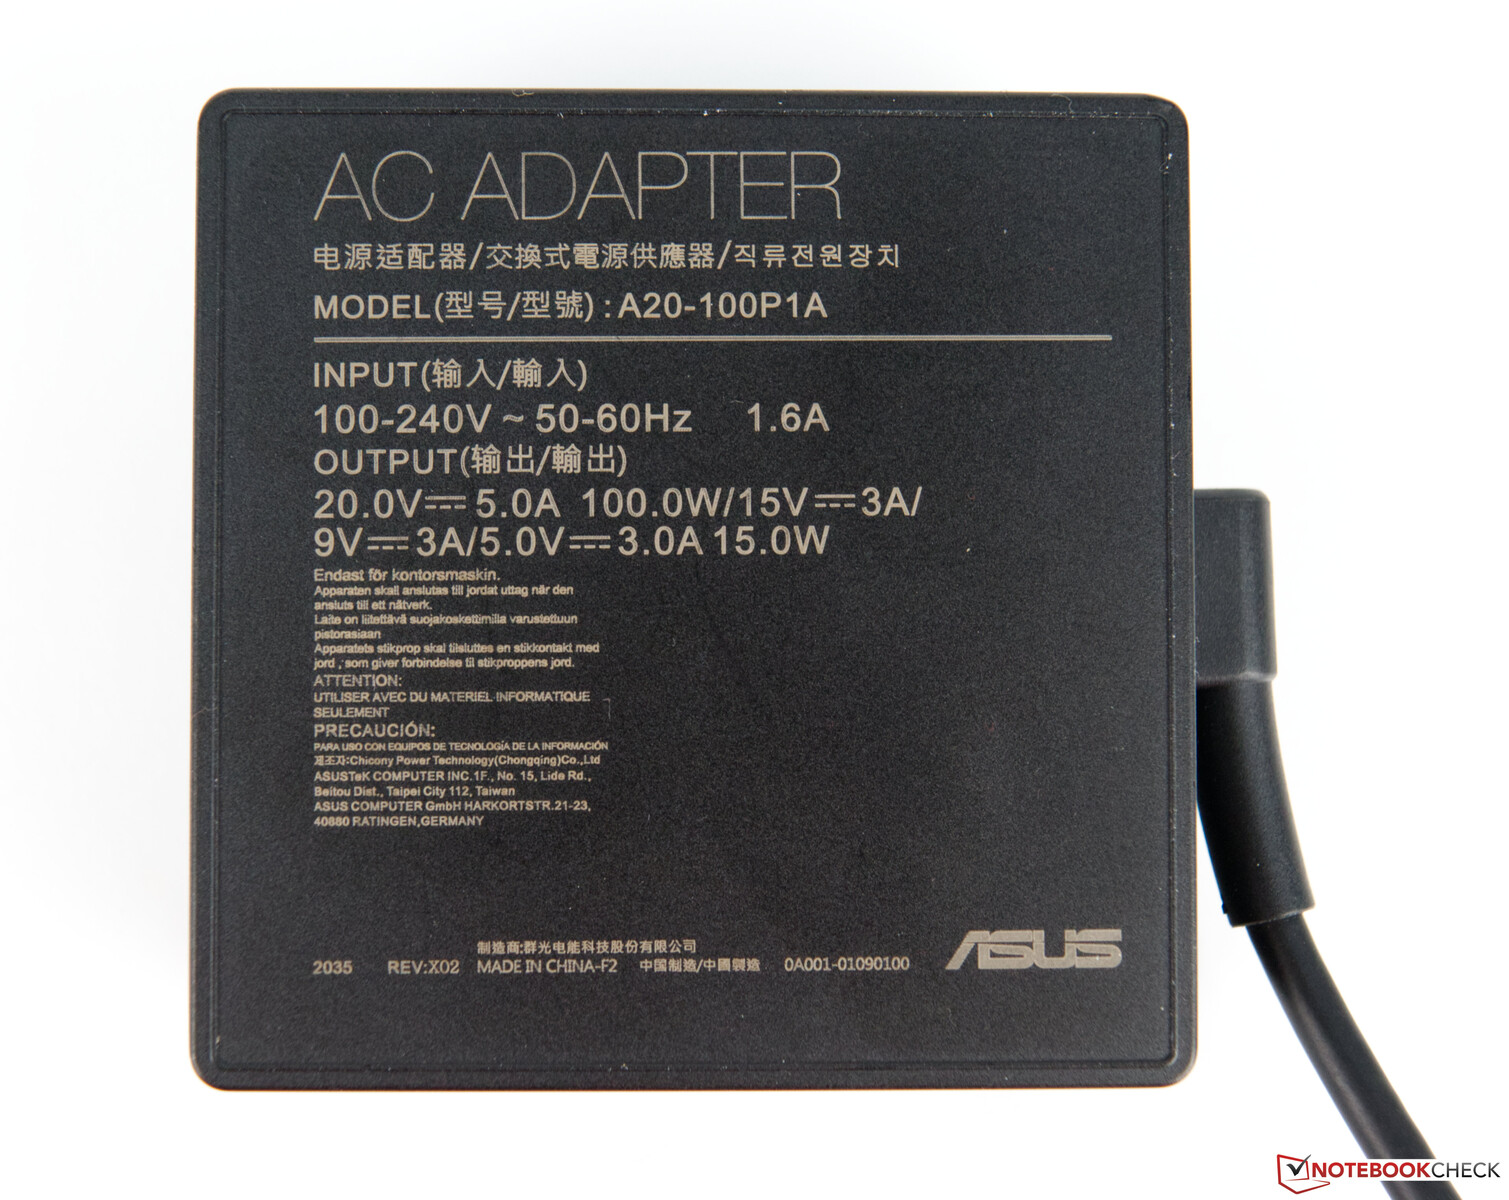
The power consumption of the Asus device is worse compared to the competition, which is due to the components that are installed. The device requires considerably more in idle usage with a consumption of 7.4 to 13.4 watts. Asus could possibly improve this with a slightly better energy management. We measured an average of 78 watts under load, with which the 100-watt power adapter has no problems. The power adapter even handles the briefly measured peaks of up to 104 watts. We weren't able to determine a discharge of the battery under full load.
| Off / Standby | |
| Idle | |
| Load |
|
Key:
min: | |
| Asus ROG Flow X13 GV301QH R9 5980HS, GeForce GTX 1650 Max-Q, WDC PC SN530 SDBPNPZ-1T00, IPS, 3840x2400, 13.4" | HP Spectre x360 14t-ea000 i7-1165G7, Iris Xe G7 96EUs, Samsung SSD PM981a MZVLB512HBJQ, IPS, 1920x1280, 13.5" | Lenovo Yoga 9i 14ITL5 i5-1135G7, Iris Xe G7 80EUs, Samsung SSD PM981a MZVLB256HBHQ, IPS, 1920x1080, 14" | Acer Spin 5 SP513-54N-79EY i7-1065G7, Iris Plus Graphics G7 (Ice Lake 64 EU), Samsung PM991 MZVLQ1T0HALB, IPS, 2256x1504, 13.5" | Asus ZenBook Flip S UX371 i7-1165G7, Iris Xe G7 96EUs, WDC PC SN730 SDBPNTY-1T00, OLED, 3840x2160, 13.3" | Microsoft Surface Book 3 13.5 i7-1065G7, GeForce GTX 1650 Max-Q, SK Hynix BC501 HFM512GDJTNG, IPS, 3000x2000, 13.5" | Average NVIDIA GeForce GTX 1650 Max-Q | Average of class Convertible | |
|---|---|---|---|---|---|---|---|---|
| Power Consumption | 47% | 40% | 52% | 17% | 10% | -16% | 33% | |
| Idle Minimum * (Watt) | 7.4 | 3 59% | 3.3 55% | 2.8 62% | 6.1 18% | 4.8 35% | 7.75 ? -5% | 4.29 ? 42% |
| Idle Average * (Watt) | 10.3 | 5.1 50% | 6.7 35% | 5.4 48% | 10.6 -3% | 9.4 9% | 11.8 ? -15% | 7.1 ? 31% |
| Idle Maximum * (Watt) | 13.4 | 6.4 52% | 6.9 49% | 7.6 43% | 13.8 -3% | 11.2 16% | 16.6 ? -24% | 8.68 ? 35% |
| Load Average * (Watt) | 75.9 | 39.6 48% | 41.4 45% | 36.6 52% | 32.2 58% | 72 5% | 75.2 ? 1% | 44.1 ? 42% |
| Load Maximum * (Watt) | 78 | 56.2 28% | 64.7 17% | 37 53% | 64.7 17% | 90 -15% | 105.5 ? -35% | 67.2 ? 14% |
| Witcher 3 ultra * (Watt) | 39.6 | 39.3 | 28.3 |
* ... smaller is better
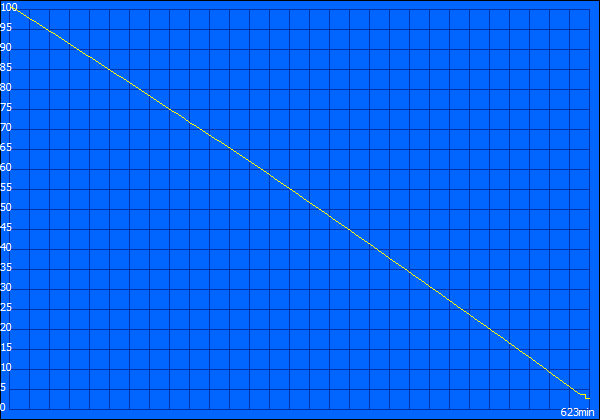
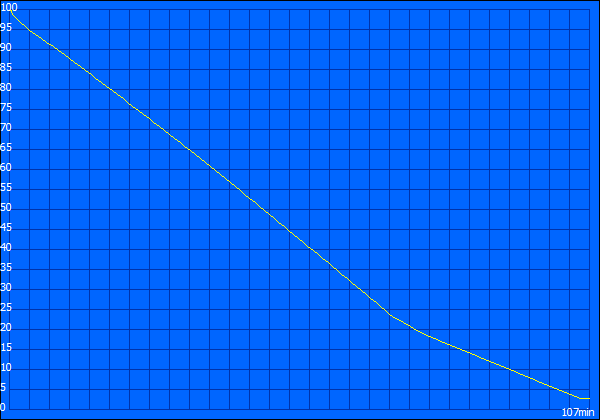
Battery life
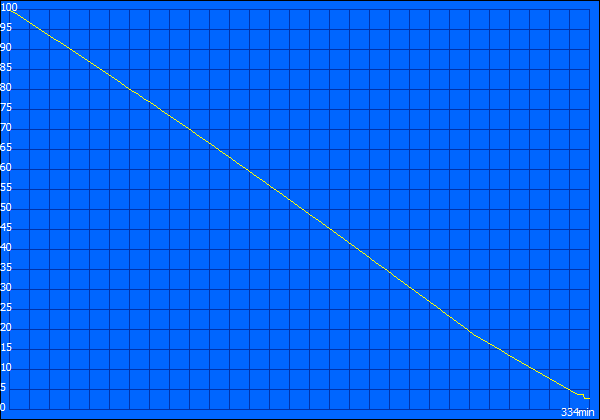
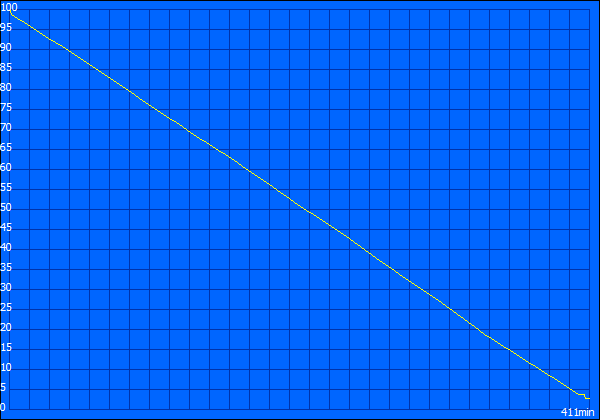
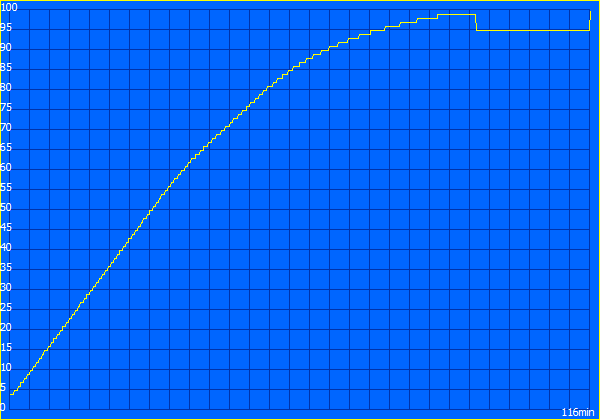
The Asus ROG Flow X13 has a 62 Wh battery, which can supply the device with energy for almost 6 hours according to our WLAN test. The brightness was reduced to 78% in order to achieve our standardized value of 150 cd/m². The same conditions are also present in the H.264 test, which turned out a bit better at just under 7 hours. As a result, the device is also suitable for an extended video evening. Just under 2 hours should be allotted for a recharge, which is perfectly acceptable due to the battery's size.
If you want to use the device for mobile gaming, you should keep in mind that both the CPU and GPU performance is somewhat throttled on battery power.
| Asus ROG Flow X13 GV301QH R9 5980HS, GeForce GTX 1650 Max-Q, 62 Wh | HP Spectre x360 14t-ea000 i7-1165G7, Iris Xe G7 96EUs, 66 Wh | Lenovo Yoga 9i 14ITL5 i5-1135G7, Iris Xe G7 80EUs, 60 Wh | Acer Spin 5 SP513-54N-79EY i7-1065G7, Iris Plus Graphics G7 (Ice Lake 64 EU), 55 Wh | Asus ZenBook Flip S UX371 i7-1165G7, Iris Xe G7 96EUs, 67 Wh | Microsoft Surface Book 3 13.5 i7-1065G7, GeForce GTX 1650 Max-Q, 69 Wh | Average of class Convertible | |
|---|---|---|---|---|---|---|---|
| Battery runtime | 129% | 109% | 72% | 33% | 48% | 97% | |
| Reader / Idle (h) | 10.4 | 36.4 250% | 37.7 263% | 21.7 109% | 16.5 59% | 27 ? 160% | |
| H.264 (h) | 6.9 | 10.5 52% | 8.7 26% | 15.3 ? 122% | |||
| WiFi v1.3 (h) | 5.8 | 11.8 103% | 9.9 71% | 10.8 86% | 6.7 16% | 6.6 14% | 11.9 ? 105% |
| Load (h) | 1.8 | 2.4 33% | 1.7 -6% | 2.5 39% | 2.8 56% | 3.1 72% | 1.805 ? 0% |

Pros
Cons
Verdict - Powerful and unrivaled

The Asus ROG Flow X13 is not an off-the-shelf convertible. This quickly becomes clear when you take a closer look at the technical specs. Not only do they indicate very good rates on paper, but these were also confirmed in our test. The AMD Ryzen 9 5980HS is a state-of-the-art SoC with 8 cores and 16 threads, which also makes the 2-in-1 interesting as a work device. With 32 GB of RAM and a 1 TB SSD, gamers are also well taken care of. The dedicated Nvidia GeForce GTX 1650 Max-Q fits well into the overall concept and ensures a solid 3D performance. With the eGPU dock, which is equipped with a GeForce RTX 3080, the small convertible transforms into a full-fledged desktop replacement in terms of performance.
There's nothing to complain about when it comes to the build quality. However, the available ports might definitely be too few, because the three USB ports can be used very quickly. In addition, one Type-C port is usually in use anyway due to the power adapter.
The Asus ROG Flow X13 is a lightning-fast, AMD-based convertible with optional high-end graphics power.
We also liked the great 16:10 display with its good color-space coverage and very low color deviations. As a result, content creators can go for this device without hesitation.
Minus points are given for the rather weak battery life in the WLAN test. The competition can deliver better results in this regard, even though the computing power is also significantly lower here. Consequently, users will have to decide for themselves what's more important to them. Another point of criticism is directed at the internals of the Asus ROG Flow X13: RAM is soldered and can't be expanded, which could have been solved differently. In addition, the built-in M.2 SSD is only 30 millimeters long, which clearly limits the replacement options.
Price and availability
At the time of writing our review, the device only seems to be listed on Asus's online store, but it's unavailable to purchase yet. A configuration with the AMD Ryzen 9 5900HS, 16 GB of RAM, a 1 TB PCIe NVMe SSD, and a WUXGA display that is bundled with the RTX 3080 eGPU is listed for $2,999.98, while the laptop by itself (without the eGPU) and in this same configuration is listed for $1,499.99.
Asus ROG Flow X13 GV301QH
- 02/08/2021 v7 (old)
Sebastian Bade
Price comparison

